- Analytics
- News and Tools
- Market News
CFD Markets News and Forecasts — 26-04-2022
- The cable has plunged around 3.70% in the last four trading sessions.
- A breakdown of the Falling Channel formation has strengthened the greenback bulls.
- Investors seek a pullback for making a short entry.
The GBP/USD pair is falling like a house of cards since Friday after slipping below the two-week-old barricade at 1.2973. The asset has eased around 3.70% in the last four trading sessions and is showing no sign of reversal yet.
The downside breaking of the Falling Channel on the daily scale has vigorously strengthened the greenback bulls. The upper boundary of the above-mentioned chart pattern is placed from June 2021 highs at 1.4249 while the lower boundary is plotted from April 2021 low at 1.3669. A breakdown of the Falling Channel results in volume expansion and wider ticks.
The 10- and 20-period Exponential Moving Averages (EMAs) at 1.2838 and 1.2945 respectively are trending lower, which adds to the downside filters.
Also, the Relative Strength Index (RSI) (14) has shifted into the bearish range of 20.00-40.00, which signals a fresh downside impulsive wave ahead.
After a juggernaut downside, a pullback looks likely. Therefore, investors should wait for a pullback to near the round level barricade of 1.2800 for building fresh shorts. Responsive selling at 1.2800 will drag the asset towards the round level supports at 1.2600 and 1.2500 respectively.
On the flip side, the cable can perform well if the asset oversteps the psychological resistance of 1.3000. This will send the pair towards Thursday’s high at 1.3090, followed by a three-week high at 1.3147.
GBP/USD daily chart
-637866122021949126.png)
- The USD/CHF remains bullish and is up in the month by 4.50%.
- China’s Covid-19 outbreak, Ukraine’s conflict, and a firm US dollar weighed on the CHF.
- USD/CHF Price Forecast: The steepness of the uptrend suggests consolidation might lie ahead.
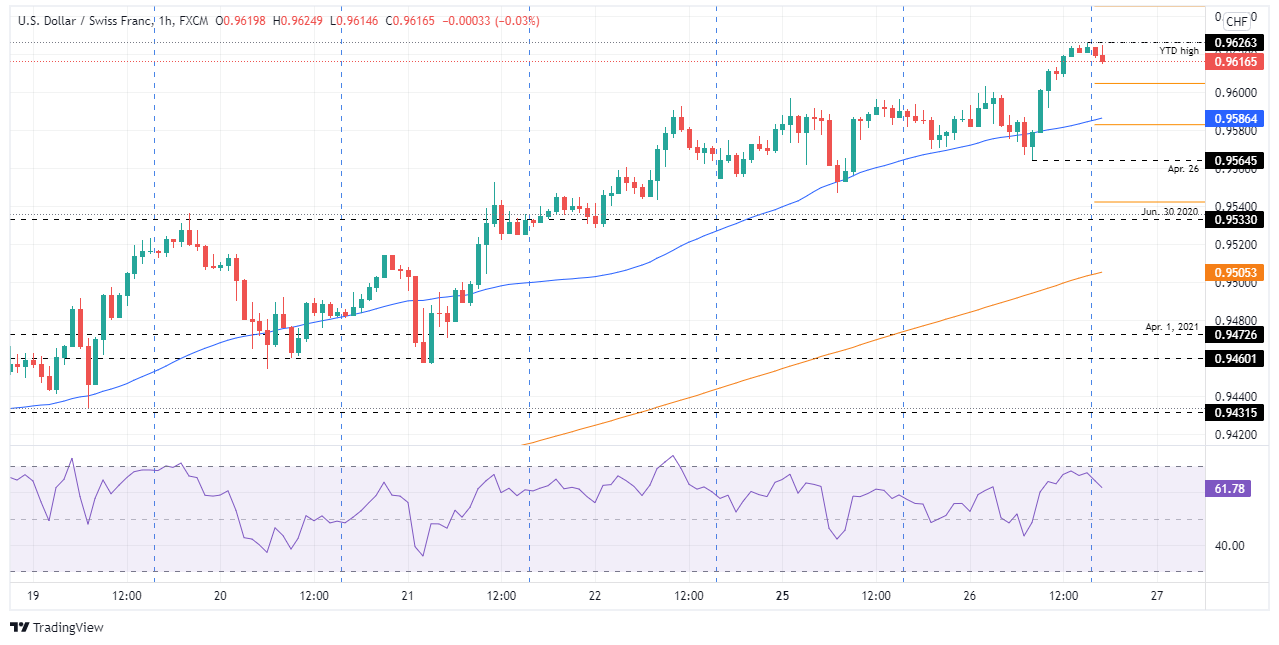
On Tuesday, the USD/CHF rallied for the third consecutive day and reached a 21-month high at 0.9626. However, as the Asian Pacific session begins, the USD/CHF print modest losses of 0.06%, down from YTD highs, and is trading in the high 0.9610s at the time of writing.
The market mood soared on the back of increasing Covid-19 cases in China. Its last outbreak, which began in Shanghai, triggered lockdowns and isolations. However, contagion expanded to some districts of Beijing and also Mongolia. That keeps investors worried because the Chinese authorities’ zero-covid policy, alongside increasing infections, creates the perfect storm to disrupt the supply side and trigger a raft of inflation.
Elsewhere, the Ukraine-Russia conflict keeps grabbing some headlines. The Polish company PGNIG said that Russia would stop gas deliveries starting April 27th, and they need to be paid in Russian roubles. Later, the retaliation reached Bulgaria, as Gazprom halted gas deliveries, as reported by Reuters.
On Tuesday, the USD/CHF meandered in the 0.9560-90 area, but near the close of Wall Street, broke decisively above the 0.9600 figure, and closed near the YTD high at 0.9623.
USD/CHF Price Forecast: Technical outlook
The USD/CHF remains upward biased and is just shy of June’s 5 2020 swing high around 0.9650. Nevertheless, the USD/CHF’s steeper upside move triggered a sharp move in the Relative Strength Index (RSI) to 75.85, well within overbought conditions, signaling that the USD/CHF might be headed for consolidation before resuming the uptrend.
If that scenario plays out, the USD/CHF’s first support would be the daily pivot at 0.9600. A breach of the latter would expose the 50-1 hour simple moving average (SMA) above the S1 daily pivot, each at 0.9586 and 8.9580, respectively, followed by April’s 26 daily low of 0.9564.
However, if the USD/CHF continues trending up, the USD/CHF’s first resistance would be the YTD high at 0.9626. Once cleared, the next supply zone would be the confluence of the R1 daily pivot and June’s 5 2020 cycle high around 0.9650, followed by the R2 daily pivot at 0.9670, short of the 0.9700 mark.
- EUR/USD finds some bids after an intense sell-off to near 1.0640 on souring market mood.
- The renewed fears of stagflation in Europe have underpinned the greenback against the shared currency.
- Investors are focusing on the speech from ECB’s Lagarde.
The EUR/USD pair is displaying a dead cat bounce after printing a fresh two-year low at 1.0636 in the late New York session as the risk-off impulse mounts higher. The uncertainty over the interest rate decision to be taken by the Federal Reserve (Fed) in May has put the market participants on their toes. This is resulting in a higher appeal for the US dollar index (DXY) and a sell-off in the risk-perceived currencies whose effect is clearly witnessed in the recent sell-off of the shared currency.
The eurozone is underperforming against the greenback as the renewed fears of stagflation amid the Ukraine crisis have worsened the decision-making for European Central Bank (ECB) policymakers. Soaring inflation in Europe due to high energy bills and food prices along with the expectation of a slash in the growth forecast stated by ECB President Christine Lagarde in her testimony at the International Monetary Fund (IMF) meeting has restricted the ECB from marching toward policy tightening.
Meanwhile, the US dollar index (DXY) is facing a minor pullback as profit-booking kicks in after the DXY printed a two-year high at 102.36. On a broader note, the DXY is firmer and will resume its upward journey after a minute correction.
For further guidance, investors will keep an eye on the speech from ECB’s Lagarde, which is due on Wednesday. This will provide insights into the likely monetary policy action by the ECB in June. On the DXY front, the market participants will focus on the annual Gross Domestic Product (GDP) numbers, which are likely to land at 1.1%. While the quarterly GDP is expected to print at 7.2%.
- The NZD/JPY collapses more than 1.50% on Tuesday.
- China’s Covid-19 woes triggered a flight to safe-haven assets, and the JPY rose.
- NZD/JPY Price Forecast: Mixed signals between price action and market sentiment suggest that the NZD/JPY is tilted to the downside.
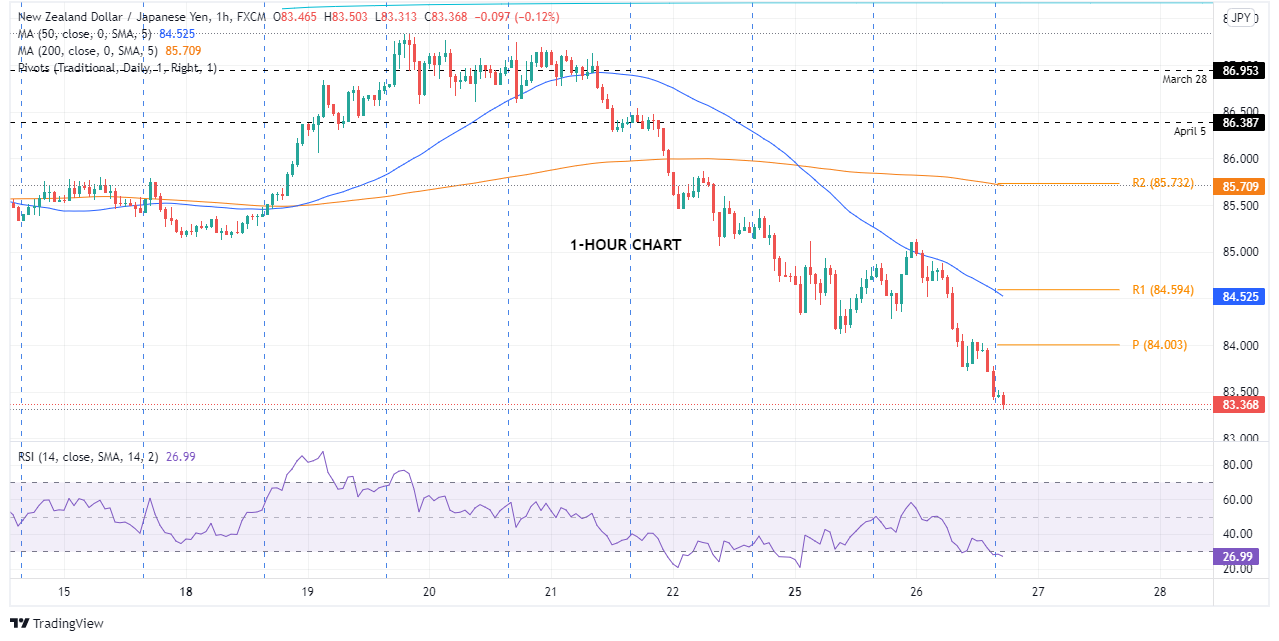
The New Zealand dollar follows the footsteps of the risk-sensitive currencies battered on Tuesday, amid increasing concerns that China’s coronavirus outbreak and its zero-covid policy create a cocktail that threatens to disrupt the supply chain, spurring elevated prices. Those factors weighed on market sentiment, propelling further yen upside. At the time of writing, the NZD/JPY is trading at 83.36.
Additionally, the Ukraine-Russia hostilities remain and escalated. According to Reuters, Gazprom halted gas deliveries to Bulgaria, while Polish firm PGNIG said Russia would stop gas deliveries starting April 27th.
On Tuesday, the NZD/JPY began the session around 84.73, shy of the daily highs, and dipped towards 84.50 due to negative sentiment in the markets. Nevertheless, the PBoC cutting RRR 100 bps caused a bounce towards the 85.00-14 area, retreating afterward towards the daily low around 83.40, on a negative sentiment shift.
NZD/JPY Price Forecast: Technical outlook
From a technical perspective in the daily chart, the NZD/JPY pair is upward biased. However, the market is being driven by market sentiment, and given that the NZD/JPY broke below March’s 31 low at 84.24, it opened the door for a fall towards October 2021 highs around 82.50.
With that said, the NZD/JPY first support would be the 83.00 figure. A breach of the latter would expose the S1 daily pivot at 82.56, followed by October 2021 highs near 82.50. Once cleared, the next line of defense downwards would be the S2 daily pivot at 82.27.
Key Technical Levels
- Gold price is looking vulnerable at around $1,900.00, eyes more downside after breaking the consolidation.
- The DXY has climbed above 102.00 despite weak US Durable Goods Orders.
- The formation of an Inverted Flag is dictating more weakness ahead.
Gold (XAU/USD) is oscillating in a minor range of $1,891.56-1,911.31 since Monday after an intense sell-off from Friday’s high at $1,955.71. The gold prices are stabilizing currently in a concise range but price action is favoring an extreme imbalance on the downside amid the rising US dollar index (DXY).
Soaring expectations of a 50 basis point (bps) interest rate hike by the Federal Reserve (Fed) in May monetary policy is pushing the DXY higher like there is no tomorrow. The asset is exploding its all barricades swiftly and has climbed above the round level resistance of 102.00 firmly. Despite an underperformance from the economic data, the DXY is scaling higher. The US Census Bureau on Tuesday reported the monthly Durable Goods Orders at 0.8% lower than the market consensus of 1%. So it would not be wrong to claim that higher odds of a jumbo rate hike by the Fed have infused fresh blood into the DXY, also it is forcing the gold prices to remain vulnerable from the past few trading sessions.
Going forward, investors will focus on Thursday’s US Gross Domestic Product (GDP) numbers. A preliminary estimate for the yearly US GDP at 1.1%, advocates an underperformance in comparison with the prior print of 6.9%.
Gold Technical Analysis
On an hourly scale, XAU/USD is forming an Inverted Flag chart pattern that signals a consolidation phase after a swift downside move. In this consolidation phase, those investors participate who failed to enjoy the previous fall and those who prefer a continuation bet rather than a reversal. The 50- and 200-period Exponential Moving Averages (EMAs) at $1,910.23 and $1,935.43 respectively are scaling lower, which signals that a bearish trend is intact. Meanwhile, the Relative Strength Index (RSI) (14) is oscillating in the 40.00-60.00 range, which signals a consolidation.
Gold hourly chart
-637866072318799355.png)
- NZD/USD is under pressure and is tracking stocks lower.
- Risk-off sentiment is firmly weighing on the high beta currencies.
NZD/USD is trading down some 0.74% into the start of the early Asian session. The bears are focused on the January 2022 lows on a day that saw the US dollar run higher as per the DXY to fresh bull cycle highs at 102.363.
At 0.6565, the price is 80 pips below the highs of the day at 0.6645.''Reports that Russia has halted gas supplies to Poland raised concerns of a broadening energy stand-off with Europe which would have negative implications for the European manufacturing sector,'' analysts at ANZ Bank said. ''The USD is the main beneficiary of this uncertainty and its strength is broad-based, including against the NZD. Asian FX weakness vs USD is also weighing on the kiwi.''
A combination of risk-off themes has weighed on financial markets this week. For one, the Chinese capital, Beijing, has launched a COVID-19 testing drive for most of its 21 million people in a race to contain a growing coronavirus outbreak and avert a city-wide lockdown.
Beijing reported 33 new COVID-19 infections on Tuesday, bringing the total number of infections found in the capital to 80 since Friday. However, while the numbers seem minuscule, the zero-COVID policy is implemented and authorities are anxious to avoid the kind of spiralling outbreak that has plunged the commercial hub of Shanghai into a strict lockdown for weeks.
The lockdowns in China add to the worries over world trade and inflation risks at a time when NATO is on the brink of war with Russia. It was a 'sell-everything' day on Wall Street as a consequence with the Nasdaq closing at its lowest since December 2020 as investors worried about slowing global growth and a more aggressive Federal Reserve.
Meanwhile, data showed US Consumer Confidence edged lower in April. Additionally, the Atlanta Fed Gross Domestic Product nowcast estimate for the first quarter growth was revised sharply lower to 0.4% from 1.3% on April 19. The next update is on Wednesday, the final estimate before the Bureau of Economic Analysis releases its advance reading of Q1 GDP on Thursday.
- Fears of China’s Covid-19 outbreak would trigger additional lockdowns spurred a dismal market mood.
- Russia retaliates against Poland and Bulgaria to halt gas exports by April 27th.
- The US Dollar Index (DXY) records for a second-consecutive day a new YTD high at 102.36.
- The Australian economic docket to unveil inflation figures.
- AUD/USD Price Forecast: Downward biased, and a test of the 0.7100 is on the cards.
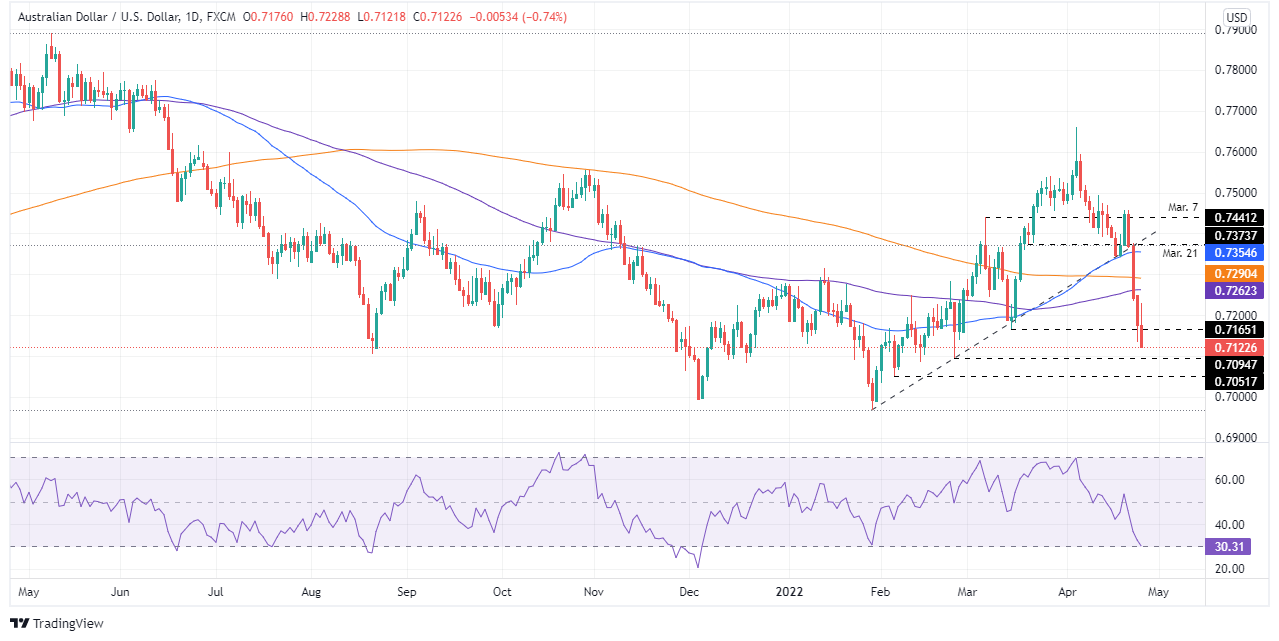
The AUD/USD falls for the fourth consecutive day and records a fresh two-month low around 0.7134, courtesy of a dismal market mood and a resilient US dollar, which extends its gains. At 0.7122, the AUD/USD is aiming toward the 0.7100 level now that March’s 15 cycle low at 0.7165 has been broken.
A dismal market mood boosts the safe-haven currencies
US equities remain trading with losses as the New York session is about to end, while the CBOT Volatility Index (VIX), also called the “fear index,” rose close to 19%, up at 32.09. The aforementioned is the reflection of a dampened market mood. The spread of the China Covid-19 outbreak from Shanghai to some districts of Beijing threatens to spur additional lockdowns, which consequently will disrupt the supply chain. Meanwhile, the Ukraine-Russia conflict escalated as Gazprom halted gas deliveries to Bulgaria, while Polish firm PGNIG said Russia would stop gas deliveries starting April 27th, according to Reuters.
In the FX space, the safe-haven peers benefitted from a pure market sentiment play. The US Dollar Index, a measurement of the greenback’s value against a basket of G8 currencies, recorded a new YTD peak at around 102.36. in the meantime, the US 10-year Treasury yield fell eight basis points and ended around 2.741%.
On Tuesday, the US economic docket featured the CB Consumer Confidence for April, which came at 107.3, lower than the 108 foreseen. Despite being a worse than expected report, Lynn Franco, Senior director of economic indicators at the Conference Board( CB), said that “the Present Situation Index declined, but remains quite high, suggesting the economy continued to expand in the early second quarter.” Furthermore, Franco added that “expectations, while still weak, did not deteriorate further amid high prices, especially at the gas pump, and the war in Ukraine. Vacation intentions cooled but intentions to buy big-ticket items like automobiles, and many appliances rose somewhat.”
Earlier, March’s Durable Good Orders rose by 0.8% m/m, lower than the 1%, but better than the 1.7% contraction of February.
The week ahead, the Australian economic docket will feature inflation figures on Wednesday. The Australian Inflation Rate is expected to jump 1.7% q/q, while on a yearly basis, it is anticipated an uptick from 3.5% to 4.6%. In the US docket on Thursday would be the release of the Q1 GDP and March’s Core PCE inflation on Friday.
AUD/USD Price Forecast: Technical outlook
The AUD/USD broke below March’s 15 daily low at 0.7165, so the pair’s bias is downwards. The AUD/USD first support would be February’s 24 cycle low at 0.7094. A breach of the latter would expose February’s 4 pivot low at 0.7051, followed by January’s 22 swing and YTD low at 0.6967.
What you need to know on Wednesday 27 April:
FX trade was once again dominated by risk-off flows this Tuesday, with the safe-haven yen and US dollar’s outperforming as a result, as US equities cratered. Traders cited everything from China lockdown risk, rising economic and military tensions between Russia/NATO amid the ongoing Russo-Ukraine war, a worsening global growth outlook and the prospect of aggressive monetary tightening from many major central banks as weighing on sentiment. Regarding geopolitics, reports that Russia’s Gazprom is to begin halting gas supplies to Poland and through Bulgaria as soon as 27 April did little to help sentiment late in the session.
The yen extended its recent run of gains against its G10 counterparts, with USD/JPY dropping back to the mid-127.00s versus last week’s highs above 129.00 and EUR/JPY hitting two weeks in the mid-135.00s. Meanwhile, GBP/JPY extended its three-day run of losses from last week’s highs above 168.00 to nearly 5.0%, with the pair eyeing a test of 160.00.
The US Dollar Index (DXY), meanwhile, hit fresh multi-month highs in the 102.30s, as it continues to hone in one 2020 highs near 103.00. The bulk of the gains for the DXY were driven by losses in EUR/USD and GBP/USD, with the euro and sterling the two worst performers of the major G10 currencies. The former came within a whisker of hitting its 2020 low at 1.0936 and posted a 0.7% on-the-day drop, while the latter slumped over 1.2% to fall into the upper 1.2500s, taking its three-day run of losses to around 3.5%.
Traders cited receding BoE tightening bets and concerning UK government borrowing data for the 2021/22 year as weighing on sentiment towards the pound and the usual concerns about energy-related stagflation in the Eurozone as weighing on the euro. Meanwhile, robust US March Durable Goods, February S&P/Case-Shiller House Price Index and April Conference Board Consumer Confidence survey data released earlier in the day did not have an impact on USD sentiment.
Turning to the rest of the major G10 currencies; the Aussie, kiwi and loonie all held up better than sterling, losing roughly 0.6% on the day each versus the buck, with the losses cushioned as energy prices gained on geopolitical tensions. AUD/USD nontheless fell to its lowest levels since late February in the 0.7130s, NZD/USD fell back under 0.6600 and USDCAD hit new multi-week highs above 1.2800.
Attention turns in the upcoming session to the release of Australian Q1 2022 Consumer Price Inflation figures and Chinese February Industrial Profits data at 0230BST. However, the main driver of sentiment through the coming Asia Pacific session is likely to remain the state of the Covid-19 outbreak/lockdown situation in China.
- The euro weakened vs. the Japanese yen amidst a risk-off mood, and the EUR/JPY fell 1.13%.
- China’s coronavirus outbreak, and Russia-Ukraine jitters, weighed on sentiment.
- EUR/JPY Price Forecast: The pair bias is neutral-upwards, but downside risks remain around 135.27.
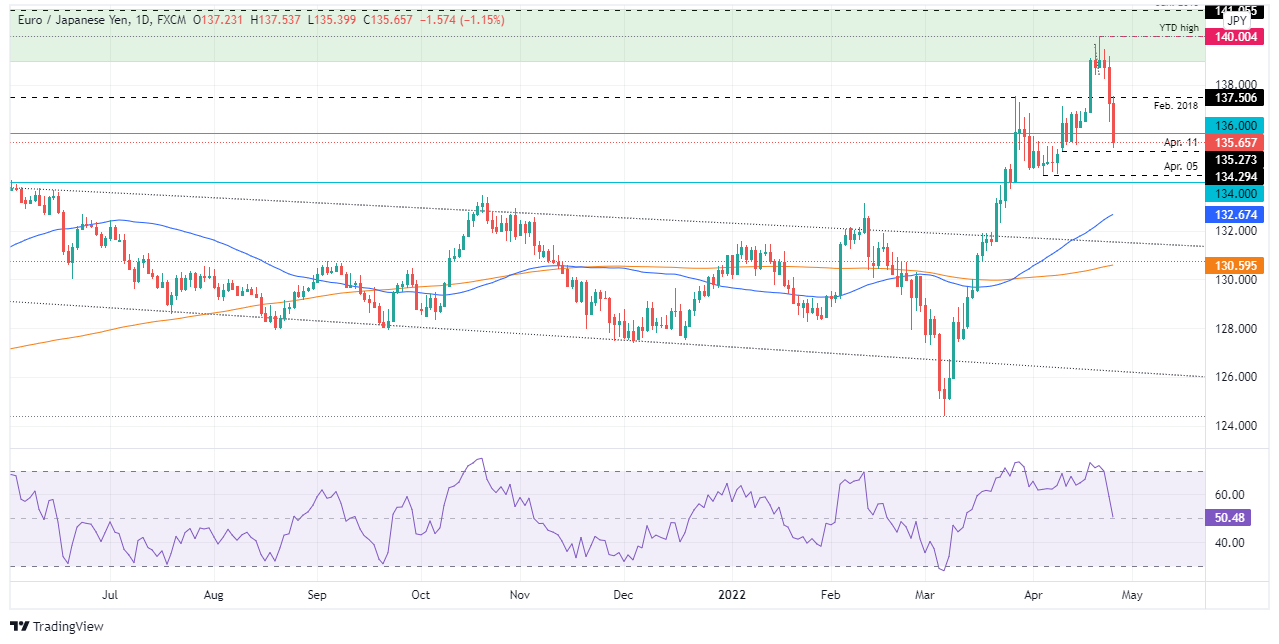
On Tuesday, the EUR/JPY dropped to a fresh two-week-low on a second-consecutive risk-off trading session, favoring safe-haven currencies like the JPY, the CHF, and the greenback. At the time of writing, the EUR/JPY is trading at 135.65, near a 200-pip fall.
Dampened market mood boosts the safe-haven yen
US equities remain trading with losses as the New York session end looms. The aforementioned is the reflection of a dampened market mood. China’s coronavirus outbreak that started in Shanghai disseminated to some Beijing districts. Meanwhile, in China’s inner Mongolia, Baotou city imposed a lockdown due to Covid-19 cases. In the Russia-Ukraine conflict, online talks continued, but hostilities remained,
During Tuesday’s overnight session, the EUR/JPY opened shy of the daily highs, around 137.25, and weakened some towards 136.50 but recovered to 137.50. However, once European traders got to their offices, and market sentiment turned sour, the EUR/JPY nosedived towards the weekly lows at 135.39.
EUR/JPY Price Forecast: Technical outlook
The EUR/JPY remains tilted neutral-upwards from the daily chart perspective. In the last two days, the price action fell shy of April’s 11 daily low at 135.27, a fundamental level. A break of the latter could pave the way for a EUR/JPY move towards April’s 5 swing low at 134.30. However, unless that happens, the bias remains neutral-upwards.
The EUR/JPY’s first resistance would be 136.00. A break above would expose the 137.00 figure, followed by February’s 2020 swing high at 137.50 and the YTD high at 140.00.
- USD/JPY bears could be about to move in a critical area on the hourly chart.
- The US dollar has been relentless and has gone on to score a fresh bull cycle high in DXY.
At 127.58, the price of USD/JPY is down 0.43% and was pressured to fresh bear corrective lows on Tuesday at 127.02. In recent trade, however, the US dollar has rallied and pushed the yen back to 127.63.
The US dollar improved versus its major trading partners early Tuesday, with the DXY up 0.59% printing fresh cycle highs yet again. However, the yen can attract a safe haven bid also which raises the prospects of a downside continuation as soon as the US dollar bulls start to move out.
The focus will turn to the Bank of Japan meets Wednesday and Thursday and is expected to maintain its ultra-low interest rate policy. The BoJ continues to buy securities to defend its interest rate cap. Japan’s position as a net importer of commodities combined with the very dovish position of the BoJ has been weighing heavily on JPY, which can all stall any significant advance in the yen for the meanwhile.
Meanwhile, Wall Street tumbled on Tuesday, led lower by the Nasdaq as investors worried about slowing global growth and a more aggressive Federal Reserve. Additionally, the Atlanta Fed Gross Domestic Product nowcast estimate for the first quarter growth was revised sharply lower to 0.4% from 1.3% on April 19. The next update is on Wednesday, the final estimate before the Bureau of Economic Analysis releases its advance reading of Q1 GDP on Thursday.
Personal income and spending on Friday will also be a key release for the US while Federal Reserve officials remain in quiet period before the May 3-4 Federal Open Market Committee meeting. markets expect that a 50-basis point increase is a distinct possibility based on recent comments from officials.
USD/JPY H1 chart
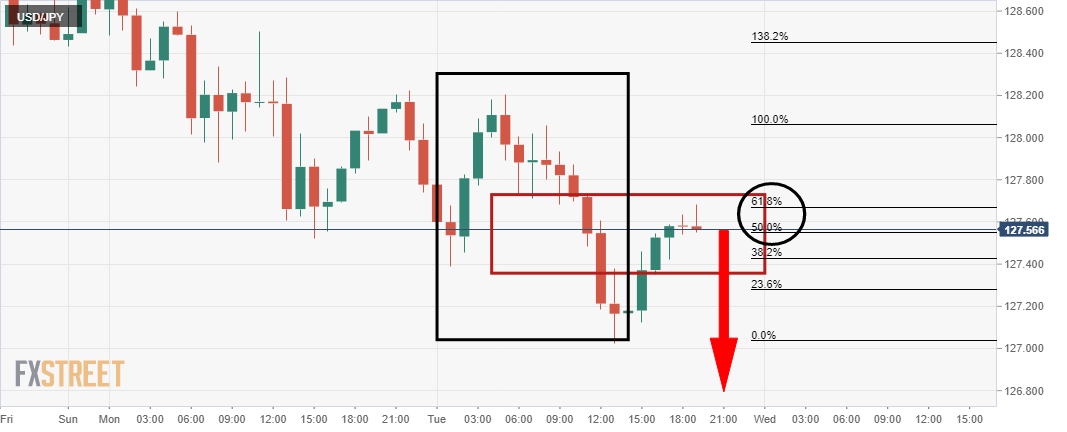
The M-formation is a reversion pattern that has drawn in the price to the neckline of the pattern. This is seeing the price start to decelerate in the correction near a 50% and 61.8% ratio area. Therefore, there has been a significant enough correction to attract in the bears again at a discount that could lead to a downside continuation.
Russian state-owned gas supplier Gazprom is to halt supplies going through Bulgaria into Europe as of Wednesday 27 April, Bloomberg reported on Tuesday, citing the Bulgarian Energy Ministry.
The report comes after Gazprom earlier notified Poland's gas supplier PGNIG that it would be halting gas supplies as of 0800CET on Wednesday.
Bloomberg framed the news as a "major escalation in the fight between Moscow and Europe over crucial energy supplies", noting it comes against the backdrop of a standoff between the two sides over Russian demands for gas payments to be made in roubles.
- AUD/JPY hit fresh monthly lows beneath the 91.00 level on Tuesday, the pair heavily weighed amid risk-off flows.
- An energy price bounce has helped AUD/JPY recover above 91.00, though it still trades 5.0% lower versus last week’s highs.
- Risk appetite will remain the key driver, though Aussie CPI and the BoJ’s policy announcement will be worth watching.
AUD/JPY hit fresh monthly lows beneath the 91.00 level on Tuesday, the pair heavily weighed amid as a steep sell-off engulfed global equity markets with investors fretting about everything from China lockdown risk, economic and military tensions with Russia amid the ongoing Russo-Ukraine war, a worsening global growth outlook and the prospect of aggressive tightening from many of the world’s major central banks in the coming quarters.
A bounce in energy prices in the latter half of US trade amid fears that Russia is on the verge of cutting gas supplies to the EU has helped the commodity-sensitive recovery some poise in recent trade. As a result, AUD/JPY has been able to recover back to the north of the 91.00 level. But the pair is still trading nearly 5.0% lower versus last week’s highs close to the 96.00 mark.
If risk appetite remains ropey and global yields remain on the back foot as a result, the prospect for a continued recovery in the yen, which had up until the last few days suffered a beating in April, may continue. AUD/JPY bears will be looking for a break below support in the form of the late March lows at 90.75, which could open the door to a test of support from 2015 and 2017 in the respective 90.70s and 90.30s areas.
AUD/JPY traders should also keep an eye on scheduled economic events this week, which include key Australian Q1 Consumer Price Inflation figures out on Wednesday ahead of the BoJ’s monetary policy announcement on Thursday. Should the Australian inflation data spur fresh RBA tightening bets, and the BoJ double down on its dovish policy stance of negative interest rates and yield curve control (as expected), that could provide AUD/JPY with some bullish impetus.
- The EUR/GBP hits four-week highs just shy of 0.8460, up 0.62% on Tuesday.
- The British pound remains battered as the GBP/USD breaks below 1.2600.
- EUR/GBP Price Forecast: It is neutral biased, but a daily close above the 200-DMA would further cement the case for a shift in the trend.
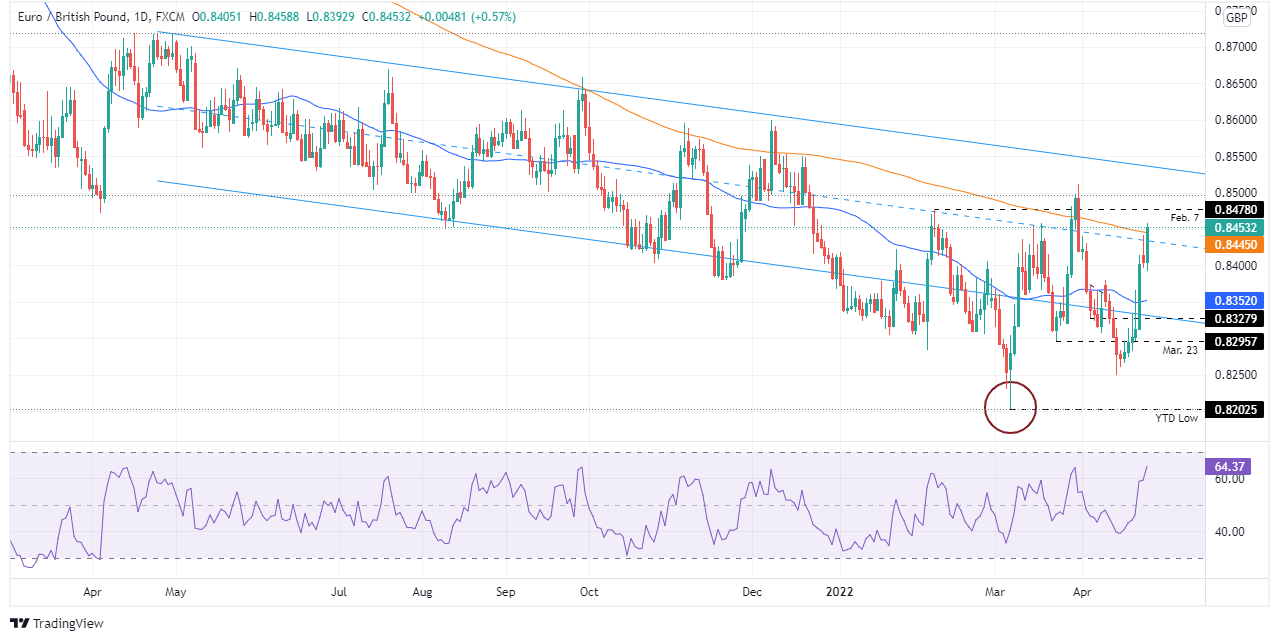
The EUR/GBP surged to four-week new highs around 0.8458 on Tuesday, amid a risk-off market sentiment, which sent the British pound tumbling across the board, losing 0.61% vs. the euro, and 1% against the greenback. At the time of writing, the EUR/GBP is trading at 0.8453.
Risk-aversion keeps the GBP as the laggard in the FX space
European and US equities are still on the back foot, trading with losses. The recent China coronavirus outbreak in Shanghai, which extended to Beijing and Mongolia, keeps investors on their toes because, based on China's Covid-19 zero-tolerance, it could trigger another raft of inflation courtesy of supply chain disruptions. Also, escalations in the Ukraine-Russia conflict summed up the dismal market mood.
On Tuesday, the EUR/GBP opened around the 0.8400 figure in the Asian session. However, as European traders took over, the GBP weakened, sending the EUR/GBP rallying from 0.8393 to 0.8456.
EUR/GBP Price Forecast: Technical outlook
The EUR/GBP remains neutral biased. However, it is trading above the 200-day moving average (DMA), which lies at 0.8445, signaling that the bias will shift to neutral-bullish if a daily close above the latter is achieved. A break above 0.8512 would shift the bias to bullish, but solid resistance lies ahead. It is worth noting that the EUR/GBP upside in the last three trading sessions caused a jump in the Relative Strength Index (RSI), but at 64.66, it would provide some upward room for the EUR/GBP if bulls attempt to push prices higher.
With that said, the EUR/GBP's first resistance would be the February 7 daily high at 0.8478. A breach of the latter would expose the 0.8500 figure. Once cleared, the next resistance would be the 1-year-old downslope trendline lying around the 0.8535-50 area.
GBP/USD has dumped on Tuesday in widespread risk-off, breaking below 1.26 the figure in a fresh bear-cycle low for 2022:
GBP/USD daily chart
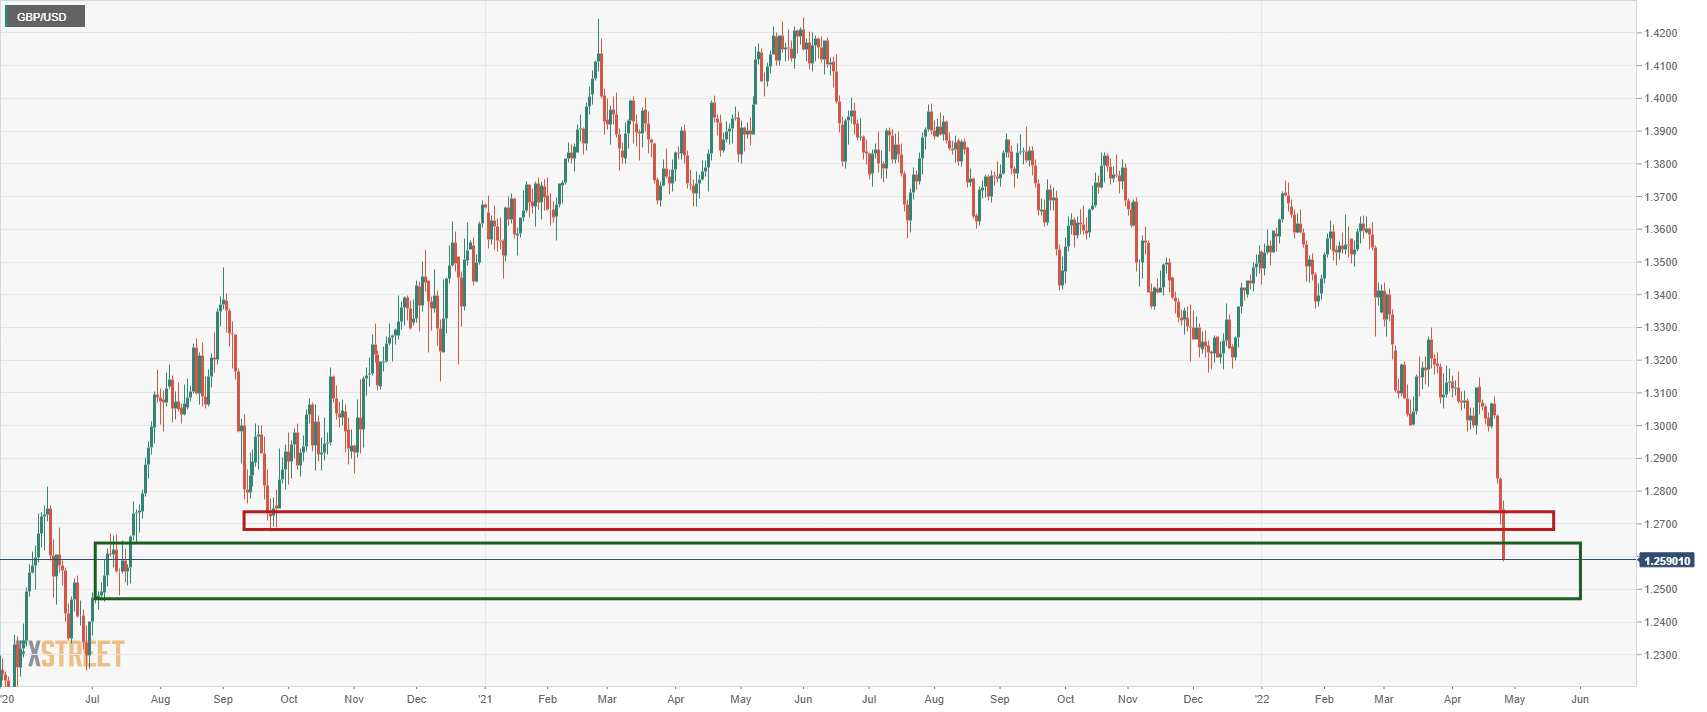
A number of risk-off factors are being built into the price, from lower growth forecasts for the global economy, China's covid spread and the contagion risks associated with the Ukraine crisis.
The US dollar (DXY) was up for a fourth straight day on Tuesday, hitting its highest level since March 2020, and is now up nearly 7% on the year.
Meanwhile, the Chicago Board of Options Exchange Market Volatility Index, or VIX, a measure of implied volatility based on the prices of a basket of S&P 500 Index options with 30 days to expiration, surged more than 16% to 31.78.
The Dow Jones Industrial Average has slumped 1.69% to 33,392 the low with the S&P 500 down 1.9% to 4,200 and the Nasdaq Composite 2.67% lower at 13,099.
Bond yields eased ahead of next week's meeting of the Federal Reserve's policy meeting where traders are in anticipation that the meeting will end with an interest-rate hike of up to 50 basis points. The yield on the US 10-year note was making a fresh low of 2.726%.
Domestically, the sterling has been pressured of late by a weak economic outlook and less hawkish Bank of England expectations that are concerned about risks of a possible recession.
Data released on Friday showed sliding retail sales and consumer confidence approaching all-time lows.
Additionally, Brexit risks are back at the fore. Prime Minister Boris Johnson said last Friday that the nation does not rule out taking further steps to address problems in Northern Ireland caused by post-Brexit arrangements.
A political crisis as lawmakers triggered an investigation into whether Johnson had misled parliament over Downing Street parties during lockdown is also simmering away in the background.
- Bears are fully in control targeting a break of critical market structure.
- AUD/USD bulls looking for an optimal entry and correction opportunities.
AUD/USD is heavily offered as the US dollar continues to rally in a risk-off setting. However, corrections could be on the cards and the Aussie is testing a critical level of market structure that opens prospects of trading opportunities.
AUD/USD daily chart
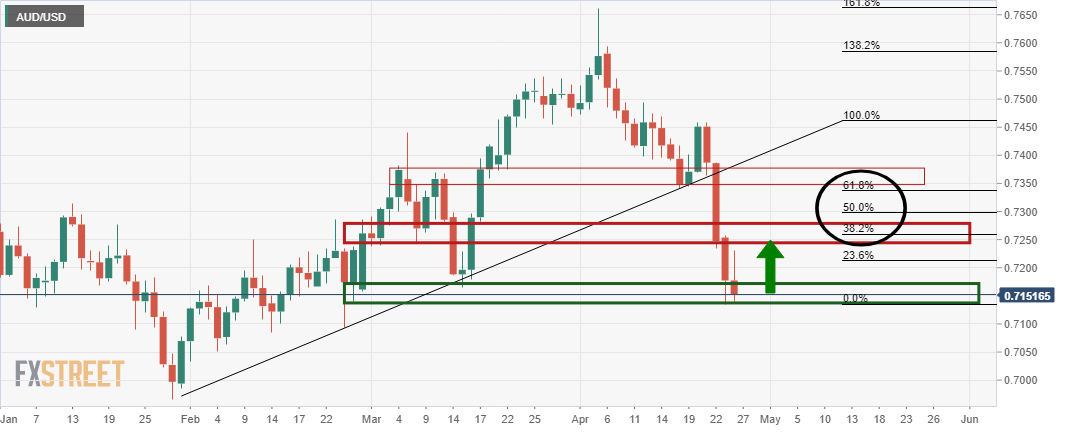
The daily chart shows that the price is firmly offered but is now meeting a daily support area that could hold and lead to a significant bullish correction. The 38.2% Fibonacci retracement level is located at 0.7258.
AUD/USD H1 chart
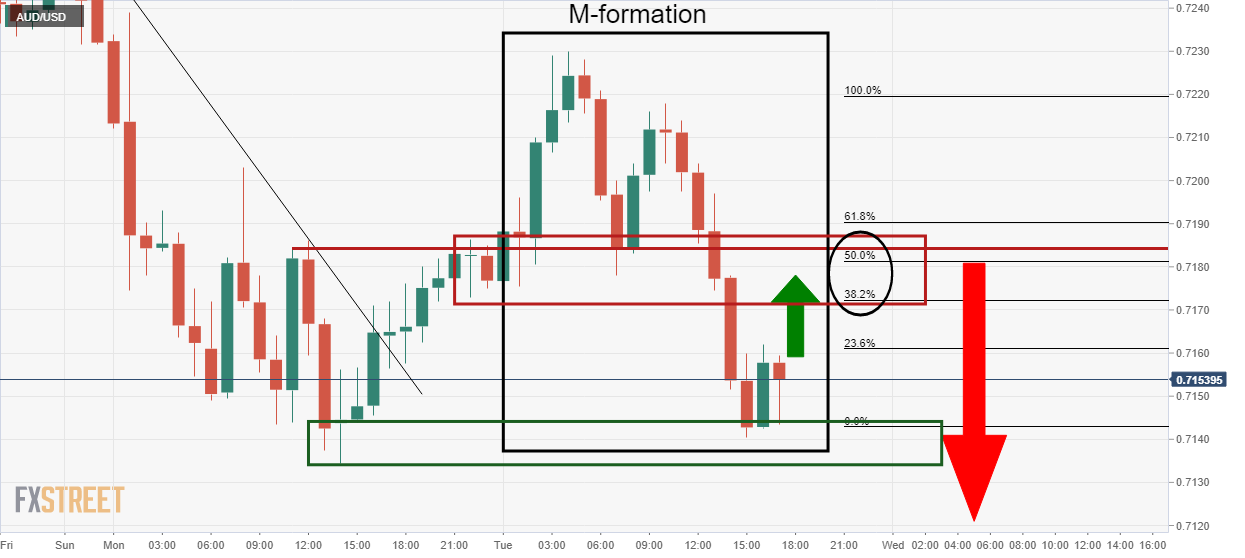
The hourly chart's M-formation is a reversion pattern. The price that has been supported at the prior lows would be expected to continue to correct towards the neckline of the pattern that has a confluence with a 50% mean reversion ratio near 0.7180.
AUD/USD M1 chart
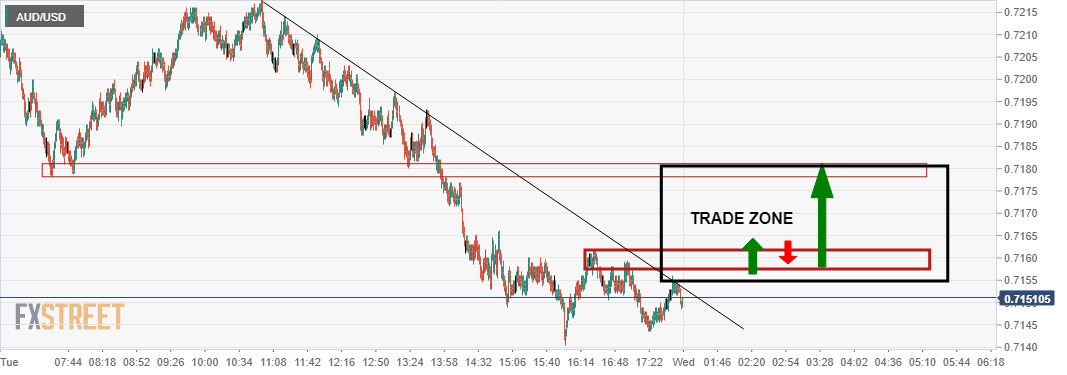
On the 1-minute chart, where scalpers are looking for trading opportunities on a very short term time frame, should the market correct towards the hourly objective, a break of the resistance will open the prospects of a rally in order to mitigate around 20 pips of the imbalance of price between there and the neckline of the M-formation.
At the next FOMC meeting (May 3-4), the Federal Reserve is expected to raise interest rates by 50 basis points. According to analysts at Wells Fargo, the first 50 bps rate hike in over 20 years and the start of balance sheet runoff shows that the Fed means business in its fight against inflation.
Key Quotes:
“The FOMC raised its target range for the fed funds rate by 25 bps at its March 15-16 meeting. However, the minutes of the meeting revealed that some members would have supported a 50 bps rate hike had the conflict in Ukraine, which began only three weeks earlier, not clouded the outlook.”
“We look for the FOMC to announce a 50 bps rate hike at the conclusion of its May 3-4 meeting. A parade of Fed speakers have signaled over the past few weeks that they would be comfortable hiking the funds rate by 50 bps at that meeting.”
“In our view, the risk that the Committee surprises the market with a 75 bps rate hike, although not our base case call, is materially greater than a 25 bps surprise increase. We expect that the FOMC will hike rates by another 50 bps at its June 14-15 meeting before beginning to raise rates at a more gradual 25 bps-per-meeting pace in July.”
“We also look for the FOMC to announce a plan at its May 3-4 meeting to start shrinking its balance sheet by no longer reinvesting the principal payments received from its securities holdings, up to a monthly cap.”
“We look for the Fed to shrink its balance sheet from roughly $9 trillion today to about $6.5 trillion at end-2024.”
“Regardless of the exact magnitude, the May 3-4 FOMC meeting likely will send a clear signal from monetary policymakers. The first 50 bps rate hike in over 20 years and the start of balance sh
- Aside from strength in energy stocks amid higher oil prices, US equity markets were a see of red on Tuesday.
- The S&P 500 fell back to test the 4,200 level and eyed a break towards March lows.
- China lockdowns, Russo-Ukraine war/Russo-Western tensions, growth concerns and expectations for central bank tightening have all been cited as hurting sentiment.
Aside from strength in energy stocks amid a rebound in oil prices, US equity markets were a sea of red on Tuesday, with the major indices led lower most notably by weakness in mega-cap tech stocks ahead of earnings in the coming days.
Apple was last trading down 2.6%, Microsoft 2.7%, Alphabet 2.9%, Facebook 3.0% and Amazon 4.0%, while Tesla shares slid more than 11%. Microsoft and Alphabet will both be reporting Q1 figures after Tuesday’s closing bell, while a third of the companies in the S&P 500 will be reporting their Q1 results just this week.
The S&P 500 index was last trading down over 2.0% and testing the 4,200 level, a break below which would likely see it test March lows in the 4,160 region next. The much more heavily tech/growth stock weighted Nasdaq 100 index was last trading down over 3.0% and eyeing an imminent test of its March lows just above 13,000.
The Dow was holding up a tad better, though still not well, and was last trading down about 1.9% in the 33,400 area, where it still resides about 2.5% above its March lows. The S&P 500 CBOE Volatility Index (VIX), often referred to as Wall Street’s “fear gauge” broke back above 30.00 and to its highest level in more than one month in the mid-31.00s.
Driving the day
Analysts highlighted a combination of bearish factors as weighing on investor sentiment on Tuesday. These include concerns about the impact of Chinese lockdowns and concerns about potential escalation of Russia/West economic tensions and violence in Ukraine/Europe as Russian officials again jawbone about nuclear war risks.
Both of these themes are contributing to concerns about longer-lasting inflationary pressures and stagflationary risks. And these bearish themes come against the backdrop of aggressive (expected) tightening from most of the world’s major central bank (excluding China and Japan). This puts valuations under pressure amid a higher risk-free rate and puts earnings under pressure, assuming higher rates equal weaker long-term growth.
Robust US March Durable Goods, February S&P/Case-Shiller House Price Index and April Conference Board Consumer Confidence survey data released earlier in the day did not have an impact on sentiment. The highlights of the economic calendar this week include the first estimate of US Q1 GDP growth figures on Thursday followed by March Core PCE inflation data on Friday.
- The USD/CAD is surging by some 0.45% on Tuesday.
- A downbeat market mood courtesy of China’s Covid-19 outbreak, Russo-Ukraine tussles, and a firm US dollar, a tailwind for the USD/CAD.
- USD/CAD Price Forecast: Bullish biased and aiming towards 1.2800.
The USD/CAD soars and records a six-week high near 1.2826 amid a risk-aversion environment that spurred appetite for safe-haven assets, boosting the greenback, the JPY, and the CHF. At the time of writing, the USD/CAD retreated from daily highs and is trading at 1.2795, shy of the 1.2800 figure.
Risk-aversion keeps the US dollar buoyant
Global equities remain defensive amidst increased Covid-19 cases in China. The outbreak that started in Shanghai already expanded to some districts of Beijing and Mongolia, threatening to trigger another raft of lockdowns that could spur a jump in inflation due to supply chain disruptions. In the geopolitical environment, Russia-Ukraine talks continue, but most news around the conflict depicts an escalation of the battle.
In the meantime, the US Dollar Index, a measurement of the greenback’s value against a basket of six peers, recorded a new two-year and half high at 102.235, but it is gaining 0.47%, sitting at 102.215. Contrarily, the US 10-year Treasury yield is losing eight and a half basis points, down to 2.740%.
An absent Canadian economic docket left USD/CAD traders adrift of the US busy week. The US docket featured the Durable Good Orders for March, which rose by 0.8% m/m, lower than the 1% estimated but far better than the 1.7% contraction of February.
Late, the CB Consumer Confidence for April at 107.3, lower than the 108 expected. Despite being a worse than expected report, Lynn Franco, Senior director of economic indicators at the Conference Board( CB), said that “the Present Situation Index declined, but remains quite high, suggesting the economy continued to expand in early second quarter.” Furthermore, Franco added that “expectations, while still weak, did not deteriorate further amid high prices, especially at the gas pump, and the war in Ukraine. Vacation intentions cooled but intentions to buy big-ticket items like automobiles and many appliances rose somewhat.”
Ahead in the US docket on Thursday would be the release of the Q1 GDP and March’s Core PCE inflation on Friday.
USD/CAD Price Forecast: Technical outlook
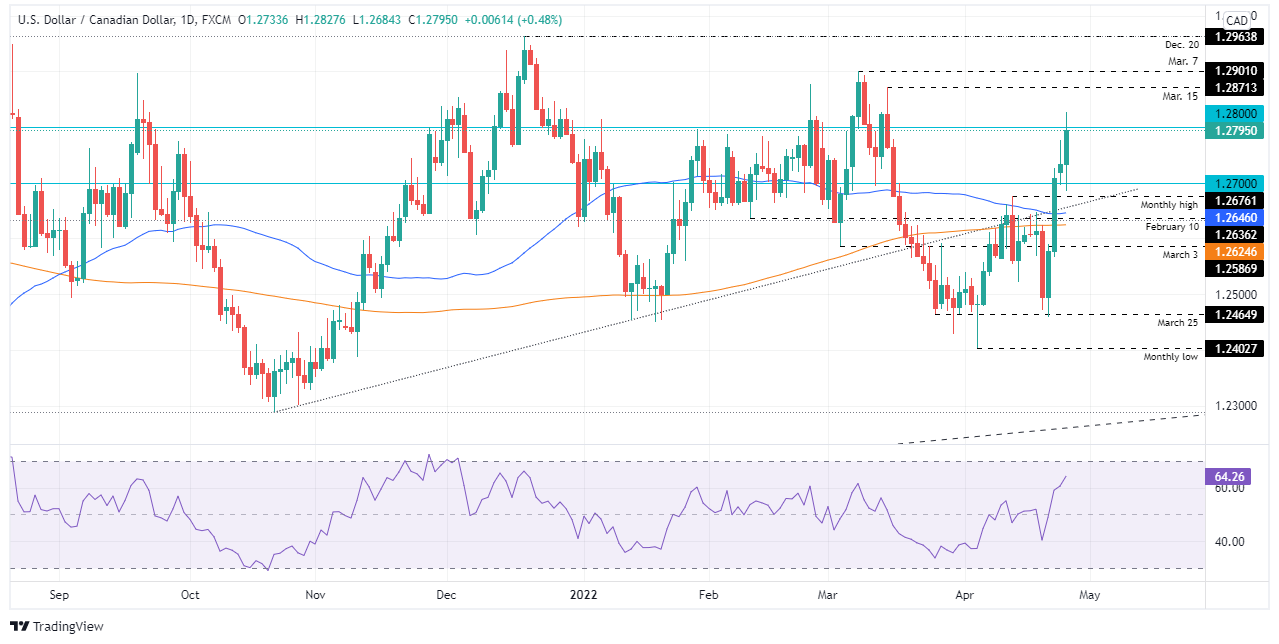
The USD/CAD recorded a six-week high at 1.2826 but retreated. Nevertheless, the USD/CAD bias is tilted to the upside. The Relative Strength Index (RSI) at 64.36 accelerates towards the 70 mark (overbought conditions), but with enough room, so the USD/CAD can print another leg up.
With that said, the USD/CAD first resistance would be 1.2800. A breach of the latter would expose the March 15 daily high at 1.2871, followed by the March 7 swing high at 1.2901 and then 2021 yearly high at 1.2963.
Major Russia state-owned gas supplier Gazprom informed Polish gas company PGNIG on Tuesday that it will halt supplies of gas as of 0800CET on Wednesday, a breach of the Yamal contract, PGNIG said according to Reuters.
PGNIG said it will take steps to reinstate the flow of gas according to the Yamal contract, adding that it is prepared to obtain gas from various other sources, including gas connections on the west and south of the Polish border.
PGNIG said it is in touch with the Gaz-system and companies are monitoring Gazprom's decision to cease gas supplies.
Bloomberg framed the news as a "major escalation in the fight between Moscow and Europe over crucial energy supplies", noting it comes against the backdrop of a standoff between the two sides over Russian demands for gas payments to be made in roubles.
Market Reaction
Once the reports of Russia halting gas flows to Poland as of Wednesday started doing the rounds on Twitter and in the financial press, markets started to move on the story. WTI recently rallied to session highs in the mid-$102.00s, while the S&P 500 is currently trading at session lows and testing 4200. The DXY is also remains firmly on the front foot and at its highest levels since March 2020 in the 102.20 area.
Data released on Tuesday showed an 0.8% increse in Durable Goods Orders in March, below the 1% of market consensus. Despite a disappointing headline print due to a drop in aircraft bookings, the March durable goods report shows that capital spending remained intact in March with orders rising across all core categories, explained analysts at Wells Fargo.
Key Quotes:
“The fact that orders for durable goods increased just 0.8% in March rather than the 1.0% that had been expected by the consensus is partly a function of weakness in aircraft orders. Civilian aircraft orders were down 9.9% and defense aircraft orders tumbled 25.6%. But transportation as a whole was actually positive for the month thanks to a surge in bookings for motor vehicles.”
“The underlying trend in nondefense capital goods shipments remains strong, up 9% at an annualized rate over the past three months. But after adjusting for the run up in prices, we expect to see a more muted outturn for first quarter equipment spending when first quarter GDP is released on Thursday.”
“Despite all the hand-wringing over rising interest rates and high inflation, an overlooked positive for economic growth is the fact that capital spending remains intact. The rebound in this cycle for core capital goods spending has already handily eclipsed the rebounds that followed the early 2000s tech-wreck and the downturn associated with the financial crisis in 2008 & 2009.”
- Kiwi fails to recover versus US dollar, back at monthly lows.
- Consolidation under 0.6600 to keep the pair under pressure.
- US dollar rises across the board as US stocks drop sharply.
The NZD/USD erased all the bounce and is back at the 11-week low area, under 0.6600. Earlier on Tuesday, the pair climbed to 0.6644, hitting a two-day high, but it reversed and turned again to the downside as market sentiment deteriorated.
Risk aversion weighs on NZD/USD
The US dollar is among the top performers on Tuesday boosted by risk aversion. The DXY trades at the highest level since March 2020 above 102.00, even as US yields decline sharply. The Dow Jones is falling by 1.68%, and the Nasdaq plummets 3.22% ahead of important earnings reports.
The rally in Treasuries is not affecting the dollar. The US 10-year stands at 2.74%, and the 30-year at 2.83%, levels not seen since April 14. The greenback remains strong as the move is being driven by deterioration in market sentiment and not by a change in expectations regarding Federal Reserve’s monetary policy.
The NZD/USD will likely remain under pressure while below 0.6600. It recently dropped to 0.6578, hitting the lowest level since early February. It is hovering near the lows. The next support might be located at 0.6560 followed by the 2022 low around 0.6530.
Technical levels
- US dollar accelerates to the upside, DXY hits fresh two-year highs above 102.00.
- Risk aversion weighs on the pound, Nasdaq tumbles 3%.
- GBP/USD at lowest since July 2020, eyes 1.2600.
After a short-lived recovery, the GBP/USD pair resumed its downtrend, breaking under 1.2670. It bottomed at 1.2616, hitting the lowest level since July 2020.
Pound among worst performers
The pound is under pressure amid risk aversion. EUR/GBP trades at 0.8440, at the highest in three weeks, GBP/JPY bottomed at 160.40 (is down almost 300 pips for the day), and AUD/GBP is losing a hundred pips, reversing sharply from the monthly high it reached on Monday at 1.7885.
In Wall Street, the Dow Jones is falling by 1.46% and the Nasdaq tumbles by 3.10%. In Europe, the main stock indices are down 0.75% on average. Investors await earnings reports from Microsoft and Alphabet.
The dollar, measured by the US Dollar Index, trades with a gain of 0.41% at 102.15, the highest level since March 2020. At the same time, US yields are at weekly lows as demand for Treasuries surges on the back of the deterioration in market sentiment. The US 10-year bottomed at 2.72% and the 30-year at 2.83%.
Oversold, but who cares?
The GBP/USD is falling for the fourth consecutive day, accumulating a decline of more than 400 pips. Technical indicators are in oversold territory but no signs of a consolidation or a correction are seen.
The negative momentum in cable remains intact. The next resistance might be seen around 1.2600, followed by 1.2580. On the upside, resistance levels are seen at 1.2665, followed by 1.2700 and 1.2770.
Technical levels
- GBP/JPY’s sharp reversal back from multi-year highs above 168.00 printed at the start of last week extended on Tuesday.
- The pair shed another 1.6%, taking its three-day run of losses to nearly 4.0%.
- Risk-off flows, lower UK yields, receding BoE tightening bets and worrying UK government borrowing data in 2021/22 are all weighing.
GBP/JPY’s sharp reversal back from multi-year highs above 168.00 printed at the start of last week extended on Tuesday, with the pair shedding another 1.6%, taking its three-day run of losses to nearly 4.0%. At current levels just above 160.50, the pair now trades over 4.5% below last week’s multi-year peaks and has nearly erased the entirety of its monthly gains.
The ongoing reversal lower in GBP/JPY is being driven by a combination of bearish factors. The risk-sensitive pair is being weighed by continued selling pressure in global equity markets as investors fret about globally rising interest rates and how this might impact long-term growth. Meanwhile, UK yields have reversed sharply lower in tandem with some of their global peers, reducing the UK’s yield advantage over the yen and weighing on the pair.
Meanwhile, many analysts have for some time been warning that expectations for BoE monetary tightening this year (money markets were last pricing a further six 25 bps hikes) are overly excessive. The BoE has been coming across as more and more concerned about UK economic weakness as a result of the ongoing cost-of-living squeeze, concerns which will only have risen in wake of last week’s week UK Retail Sales figures.
A paring back on BoE tightening bets thus might also be weighing on the pair. If risk appetite remains on the ropes in the coming sessions, GBP/JPY bears will likely be looking for a break under 160 and a test of key support in the upper 158.00s (the 50-Day Moving Average) and at 158.00 (the 2021 highs).
UK borrowing 20% higher than expected in 2021/22
Analysts also highlighted UK government borrowing data released on Tuesday as weighing on the pound, with government borrowing in the just ended 2021/22 fiscal year coming in 20% higher than forecast by the UK Office for Budget Responsibility (OBR) just one month ago.
Analysts said the data highlights the challenges faced by UK Chancellor Rishi Sunak. On the one hand, Sunak is under pressure to ease the impact of the most severe cost-of-living crisis in the UK in multiple decades. However, on the other, Sunak faces pressure to get UK government finances in order following a pandemic-related spending splurge in 2020 and 2021.
It is more than two months since Russia started its large-scale attack on Ukraine. With the May 9 Victory Day approaching, economists at Danske Bank think Russia is likely to step up their offensive against Ukraine.
Russian offensive is likely to expand and become nastier
“We think Russia’s clear underperformance in the conventional warfare increases the risk of them resorting to the use of tactical nuclear weapons or chemical or biological weapons. Such action could prompt a more aggressive response by the West/NATO, which could lead to an escalation.”
“We think the latest developments could constitute a false flag operation by Russia, marking an escalation as Russia may be seeking a pretext to expand its military operations to Moldova in an effort to step up pressure in the southwest of Ukraine.”
“As another recent twist, Germany reversed its earlier decision not to send heavy weapons directly to Ukraine. While further military support to Ukraine and tighter sanctions are needed to halt the Russian offensive, and the latest action by Germany highlights the sense of urgency, we think they also raise the risk of an escalation in the conflict.”
“Russia announced on Tuesday April 26 that it will again hold joint drills with Belarus from April 26 to 29. The previous joint military drills were held in the period of February 10-20. Russia attacked Ukraine on February 24.”
- Oil prices have stabilised on Tuesday with WTI near the $100 level as traders mull geopolitics and China lockdown risks.
- WTI has stayed within $10 of the $100 mark since the start of April.
Oil prices have seen stabilisation on Tuesday following Monday’s choppy trading conditions, as traders mull China lockdown risks against a still very tense geopolitical backdrop as Western arm shipments in Ukraine continue and the EU mulls fresh sanctions. Front-month WTI futures rallied back to, but were unable to hold above, the $100 per barrel mark, and at current levels in the mid-$99.00s, trade with on the day gains of a little over $1.0.
An FT report on Tuesday suggested the EU is mulling imposing a price cap on what it pays Russia for oil imports, after reports over the weekend the EU is looking at various “smart sanctions” that would inflict maximum damage on Russia whilst minimizing the impact on the Eurozone. Either way, risks remain tilted towards greater disruption to Russian supply, not less, with various analysts thinking Russian output will have declined by as much as 3M barrels per day by the start of next month versus pre-war levels.
But WTI prices remain in the red on the week, as the cloud of uncertainty relating to Chinese demand amid a growing risk of more major cities going into lockdown continues to hang over the market. A Bloomberg report at the end of last week estimated that as much as 10% of Chinese demand might already have been lost as a result of the lockdowns in China and Beijing could be next, with all 22M residents now partaking in mass testing that could result in strict lockdowns in some districts.
Looking ahead, geopolitics and Russian energy sanctions, the demand situation in China, plus other themes like OPEC+ output struggles and US/Iran nuclear deal talks will remain key driving forces in the market. Since the start of April, WTI has stayed within at least $10 of the $100 level and that seems likely to remain the case in the coming days, provided the situation in China doesn’t significantly worse. In this scenario, a break lower towards $90.00 would be on the cards.
- EUR/USD extends the recent breach of the 1.0700 level.
- Next on the downside emerges the 2020 low at 1.0635.
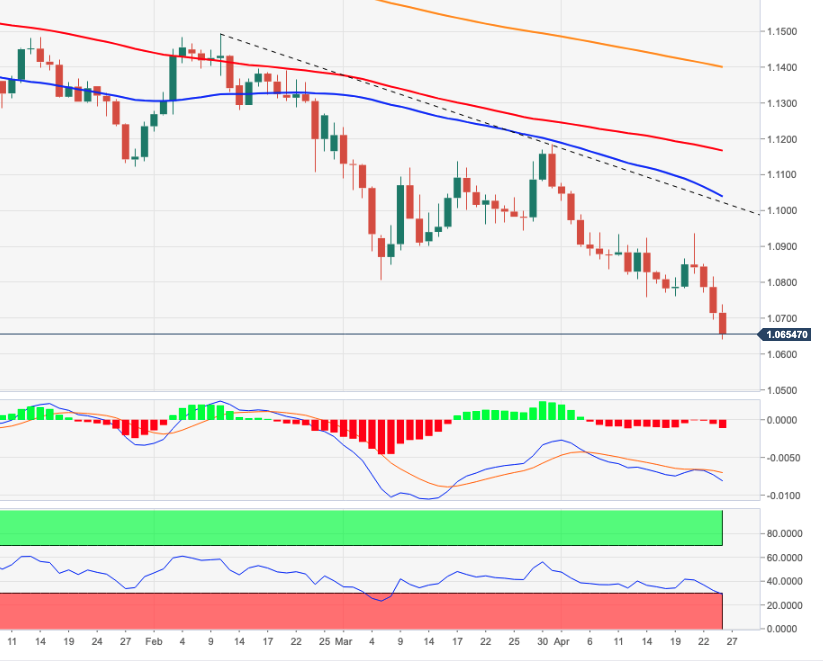
EUR/USD drops further and prints new lows for the year around 1.0650 on Tuesday.
The downside momentum in the pair gathers extra steam and now the door looks wide open to a potential visit to the 2020 low at 1.0635 (March 23) in the short-term horizon.
While below the 2-month line around 1.1020, extra losses remain well on the cards for the pair.
EUR/USD daily chart
Having reached a recent peak in the 0.7661 area in early April, the AUD/USD pair dived on Mondayday back to an intraday low around 0.7135. A weaker outlook for China is the main risk that could prevent the aussie to reach the 0.77 level over the next six months, economists at Rabobank report.
RBA signaling a hawkish position to support AUD
“We maintain that AUD/USD can shift higher in the coming months. This view is based on the improvement in Australia’s terms of trade which stems from higher energy prices linked with the Russia/Ukraine conflict. It also assumes the development of a hawkish stance from the RBA and the likelihood that the USD will finish the year lower vs. a broad basket on currencies. A sharp slowdown in growth in China this year linked with Covid outbreaks is a risk to this view.”
“Australian economic strength and a more hawkish RBA can lift AUD/USD to the 0.77 area on a six-month view.”
- AUD/USD struggled to capitalize on its modest intraday gains amid an extension of the USD rally.
- Aggressive Fed rate hike bets, mostly upbeat US macro data lifted the USD to over a two-year high.
- The risk-off mood, weaker iron ore prices further collaborated to cap the resources-linked aussie.
The AUD/USD pair surrendered a major part of its intraday gains and retreated below the 0.7200 mark, closer to the daily low during the early North American session.
The pair attracted some buying on Tuesday, though the intraday positive move ran out of steam near the 0.7230 region amid the uninterrupted US dollar rally to the highest level since March 2020. Expectations that the Fed would hike interest rates by 50 bps at each of its next four meetings in May, June, July and September continued underpinning the buck.
Adding to this, the risk-off mood further benefitted the greenback's relative safe-haven status and acted as a headwind for the perceived riskier aussie. The prospects for a more aggressive policy tightening by the Fed, along with prolonged COVID-19 lockdowns in China, fueled concerns about slowing global economic growth and weighed on investors' sentiment.
On the economic data front, the headline US Durable Goods Orders fell short of market expectations and increased by 0.8% MoM in March. This, however, marked a solid rebound from the previous month's upwardly revised reading of -1.7%. Adding to this, orders excluding transportation items climbed 1.1% against 0.6% expected and continued lending support to the USD.
Apart from this, an extended slump in iron ore prices further collaborate to cap any meaningful upside for the resources-linked Australian dollar. The fundamental backdrop seems tilted firmly in favour of bearish traders and supports prospects for an extension of the AUD/USD pair's recent sharp pullback from the 0.7660 region, or the YTD peak touched earlier this month.
Technical levels to watch
- DXY records new highs just above the 102.00 yardstick on Tuesday.
- Extra gains could see the 2020 high near 103.00 retested.
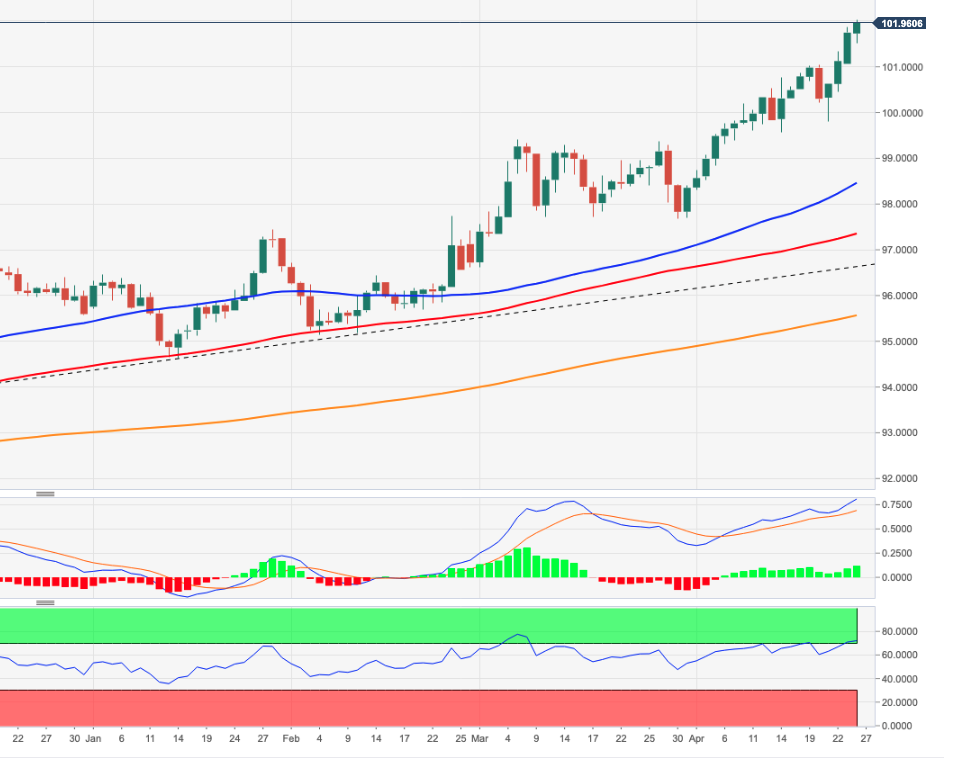
The upside bias in the dollar remains unabated and pushes DXY to record fresh highs in levels last traded back in March 2020 above the 102.00 barrier on Tuesday.
The ongoing intense upside has just entered the overbought territory – as per the daily RSI above 70 - and this could be the prologue to a potential technical correction in the short-term horizon. The underlying bullish bias, however, remains intact and still targets the 2020 high at 102.99 (March 20).
The current bullish stance in the index remains supported by the 7-month line near 96.70, while the longer-term outlook for the dollar is seen constructive while above the 200-day SMA at 95.55.
DXY daily chart
- Silver has recovered some poise on Tuesday after losing over 6.0% in the past three sessions.
- But the precious metal remains at risk of further losses against the backdrop of a strengthening US dollar.
- After XAG/USD failed to retake its 200DMA in the $23.80s, bears are calling for further downside and eyeing 2022 lows.
Spot silver (XAG/USD) prices have recovered some poise on Tuesday after dropping more than 6.0% between last Thursday and Monday. XAG/USD currently trades flat on the day near the $23.60 per troy ounce mark, though failed in an earlier attempt to push back above the 200-Day Moving Average at $23.85 and test key resistance around $24.00.
Precious metal markets owe their stabilisation on Tuesday to a continued drop in US and global bond yields as investors fret about global growth prospects, but continue to face difficulties in staging a rebound as a result of the strong US dollar. The US Dollar Index (DXY) rose momentarily above the 102.00 level for the first time since March 2020 in earlier trade, primarily as a result of weakness in the euro and pound.
Traders are citing a combination of still very ropey broader market risk appetite conditions (which tend to benefit the safe-haven buck) and expectations that the Fed will outpace many of its major G10 central bank peers (like the ECB and BoE) in terms of monetary tightening as supporting the buck on Tuesday and in recent sessions.
While weakness in risk appetite would traditionally be seen as a positive for the likes of silver and other precious metals, a stronger US dollar makes USD-denominated precious metals more expensive for foreign buyers, thus reducing demand. If the buck is strong as a result of Fed tightening expectations, that’s a double whammy, as higher interest rates raise the “opportunity cost” of holding non-yielding assets like silver, further reducing demand.
Technicians might interpret XAG/USD’s failure to retake its 200DMA as a bearish sign moving forward. US Q1 GDP and March Core PCE data out later this week is likely to underline expectations that Fed tightening is on autopilot for the rest of the year, and could further undermine silver as the week drags on. Longer-term bears will be eyeing an eventual pullback all the way lower to support in the form of the 2022 lows in the $22.00 area.
In the opinion of economists at Scotiabank, the EUR/GBP could extend its advance towards 0.86 if the Bank of England (BoE) pushes back against rate expectations at next week’s decision.
EUR/GBP to test 0.85 in the coming days
“We see the EUR extending its gains versus the GBP to a test of 0.85 in the coming days and a move towards 0.86 (at least) if the BoE pushes back against rate expectations at next week’s rate announcement.”
“The run of Eurozone CPI releases that starts on Thursday with data from Germany and Spain would, all else equal, likely add fuel to the fire of ECB hike bets. However, there is a risk of a big miss versus forecasts that could check ECB expectations (and thus weigh on the EUR) owing to lower energy and gasoline prices in Spain and a tax cut on German fuel.”
EUR/SEK is now trading around pre-Ukraine-war levels. In the opinion of economists at ING, the Riksbank should continue to be a broadly supportive factor for the krona in the coming months as a radical shift in its rhetoric.
More support to the krona, but watch for external risks
“This week’s policy decision can continue to offer support to the krona. Naturally, a rate hike this Thursday would likely see SEK rally, but we also think that a hawkish shift in the rate projections and some endorsement of the market’s tightening expectations can be enough to put some mild pressure on EUR/SEK. We think only a clear pushback against market pricing would have a material negative impact on SEK.”
“The Riksbank should continue to be a broadly supportive factor for SEK in the coming months. However, the external environment should continue to prove quite challenging for the krona, which may suffer from its high beta to both global risk sentiment and eurozone’s economic outlook.”
“EUR/SEK risks are by and large balanced for Q2, and we expect it to hover around the 10.40 mark into the summer months. Later in the year, some stabilisation in sentiment and the Riksbank’s advantage over the ECB in the tightening cycle can push EUR/SEK to the 10.20-10.00 area.”
- After dropping under 1.0700 during APac trade, EUR/USD continues to press lower towards its 2020 lows in the 1.0630s.
- The pair continues to suffer as a result of expectations for Fed/ECB policy divergence, as well as Russo-Ukraine war risks.
After dipping back under the 1.0700 level during Asia Pacific trading hours, EUR/USD has continued to trade with a negative bias throughout European trading hours and continues to make bearish headway towards its 2020 lows in the 1.0630s. At current levels around 1.0670, the pair is trading with on the day losses of about 0.4%, with the euro failing to take advantage of the hawkish comments from ECB policymaker Martin Kazaks.
Kazaks reiterated his preference for the bank to begin rate hikes in July and called expectations for two or three hikes this year “quite reasonable”. As analysts have noted, the recent hawkish shift in policy guidance from the ECB towards rate hikes in Q3 has failed to lift the euro against the US dollar because the recent hawkish shift from the Fed has been larger.
The Fed is now expected to lift interest rates in 50 bps intervals at its next few meetings and is likely to take interest rates back to neutral (around 2.5%) by the end of the year, with the risk of much higher rates to follow in 2023 dependant on inflation outcomes. This divergence, as well as higher stagflation risks in the Eurozone versus US as a result of the Russo-Ukraine war, explains why EUR/USD has had such a tough time holding onto rallies in recent weeks.
If the pair does break below its 2020 lows in the coming days, as is very possible, the door would be open to a drop to the next key area of support in the form of the 2017 lows at 1.0340, which would mark a further more than 3.0% decline from current levels.
Signs point to the Bank of England (BoE) disappointing market expectations for the rest of the year. Another leg lower in yield differentials could dive the GBP/USD pair to a test of 1.25, economists at Scotiabank report.
BoE repricing is a risk
“The spread of 2-yr Gilts vs USTs has oscillated around -1% for the past four weeks or so but looks set to mark a new pandemic low in the coming weeks that would drive additional GBP weakness.”
“Another leg lower in yield differentials amid a cautious BoE vs a hawkish Fed (as well as some near-term political anxiety ahead of the May 5 local elections) could fuel GBP losses to a test of 1.25.”
EUR/USD is nearing a test of the March 2020 low near 1.0635. Further losses are likely, economists at BBH report.
ECB tightening expectations have eased a bit
“The swaps market is now pricing in 125 bp of tightening over the next 12 months vs. 150 bp at the start of this week, with another 75 bp of tightening priced in over the following 12 months that would see the deposit rate peak near 1.5%. This still seems way too aggressive to us.”
“We look for a test of the March 2020 low near 1.0635. After that is the February 2017 low near 1.05 and then the January 2017 low near 1.0340.”
- USD/CAD attracted aggressive dip-buying on Tuesday and rallied to a fresh multi-week high.
- Aggressive Fed rate hikes continued boosting the USD and remained supportive of the move.
- An intraday bounce in crude oil prices failed to underpin the loonie or hinder the momentum.
The USD/CAD pair rallied over 100 pips from the daily swing low and shot to the 1.2800 neighbourhood, or a fresh six-week high during the early North American session.
Rising bets for a more aggressive policy tightening by the Fed, along with the prevalent risk-off mood, pushed the safe-haven US dollar to its highest level since March 2020. This, in turn, was seen as a key factor that acted as a tailwind for the USD/CAD pair. Bulls seemed rather unaffected by an intraday pickup in crude oil prices, which tend to underpin the commodity-linked loonie.
From a technical perspective, last week's sustained breakthrough the 50% Fibonacci retracement level of the 1.2901-1.2403 downfall was seen as a fresh trigger for bullish traders. The emergence of aggressive dip-buying on Tuesday and acceptance above the 61.8% Fibo. level adds credence to the constructive outlook. This, in turn, supports prospects for a further appreciating move.
Hence, some follow-through strength towards the next relevant hurdle, around the 1.2825-1.2830 region, remains a distinct possibility. The positive momentum could further get extended and allow the USD/CAD pair to aim back to conquer the 1.2900 round-figure mark, or the YTD peak touched in March.
On the flip side, the 1.2740 region now seems to protect the immediate downside ahead of the 1.2700 mark, or the 61.8% Fibo. level. Any further decline might continue to tempt bullish traders near the 1.2685-1.2675 region. This, in turn, should help limit the downside near the 50% Fibo. level, around mid-1.2600s, which should now act as strong base for the USD/CAD pair.
USD/CAD daily chart
-637865762719668164.png)
Key levels to watch
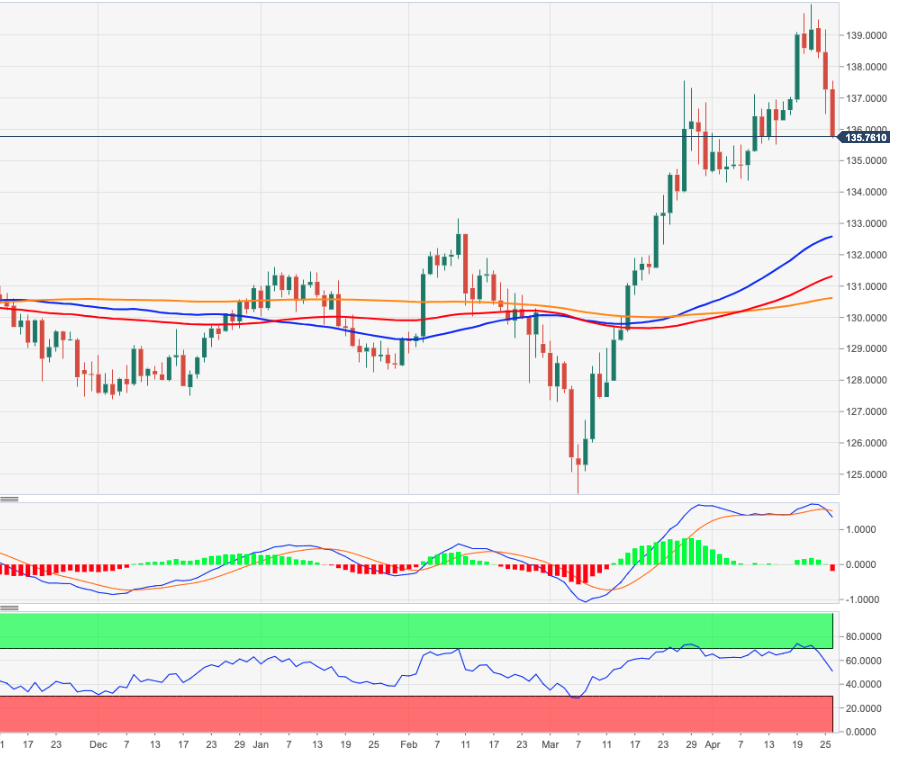
- EUR/JPY adds to Monday’s weakness and breaks below 136.00.
- Next on the downside comes the April lows around 134.30.
EUR/JPY keeps correcting lower and breaches the 136.00 support to clinch new multi-day lows on Tuesday.
Further weakness remains well in place in the very near term. Against that, the corrective move in the cross could extend further and revisit the monthly lows around 134.30.
In the meantime, while above the 200-day SMA at 130.59, the outlook for the cross is expected to remain constructive.
EUR/JPY daily chart
According to the latest headline S&P/Case-Shiller Home Price Index released by Standard & Poors (S&P), home prices were up 20.2% YoY in February, above expectations for a 19% gain and up from January's YoY gain of 19.2%. The headline index showed that house prices gained 2.4% MoM in February, above the expected gain of 1.5% and above January's 1.7% gain.
According to the House Price Index released by the Federal Housing Finance Agency at the same time, house prices were up 19.4% YoY in February and 2.1% MoM.
Market Reaction
There was no reaction to the latest Durable Goods Orders figures, with the DXY still trading just under the 102.00 and, thus, still at multi-month highs.
- GBP/USD witnessed heavy selling for the fourth straight day and dived to a fresh YTD low.
- Aggressive Fed rate hikes, the risk-off mood underpinned the USD and exerted pressure.
- Mostly upbeat US Durable Goods Orders remained supportive of the strong USD bid tone.
The GBP/USD pair continued losing ground through the early North American session and dived to its lowest level since September 2020, around the 1.2675 region in the last hour.
The US dollar surged to a more than two-year peak and continued drawing support from growing acceptance that the Fed would tighten its monetary policy at a faster pace to curb soaring inflation. In fact, the markets now expect the US central bank to raise interest rates by 50 bps at each of its next four meetings in May, June, July and September.
This, along with the prevalent risk-off environment, drove haven flows towards the greenback. The prospects for rapid interest rate hikes in the US, along with prolonged COVID-19 lockdowns in China, fueled concerns about the global economic slowdown. This, in turn, took its toll on the risk sentiment and benefitted traditional safe-haven assets.
On the economic data front, the headline US Durable Goods Orders fell short of market expectations and increased by 0.8% MoM in March. This, however, marked a solid rebound from the previous month's upwardly revised reading of -1.7%. Adding to this, orders excluding transportation items climbed 1.1% against 0.6% expected and underpinned the buck.
Conversely, the British pound was weighed down by the recent disappointing domestic data, which indicated that the UK economy is under stress from the soaring cost of living. This might have forced investors to scale back their bets on future interest rate hikes by the Bank of England and supports prospects for a further depreciating move for the GBP/USD pair.
With the latest leg down, spot prices have retreated over 400 pips from the vicinity of the 1.3100 round-figure mark touched last week. That said, slightly oversold conditions on short-term charts might hold back bearish traders from placing aggressive bets and help limit any further losses for the GBP/USD pair, at least for the time being.
Technical levels to watch
- US Durable Goods Orders rose 0.8% MoM in March, a tad under the expected 1.0% gain.
- FX markets did not reaction, with the DXY remaining close to mutli-month highs near 102.00.
US Durable Goods Orders rose 0.8% MoM in March, data released by the US Census Bureau on Tuesday showed. That was a tad under median expectations for a 1.0% MoM gain but nonetheless marked an improvement versus February's 1.7% MoM decline, which had been revised slightly higher from a 2.1% decline.
Core Durable Goods Orders saw a larger than expected MoM gain of 1.1% versus median forecasts for a 0.6% reading, a decent improvement after February's 0.5% decline, which had been revised a little higher from a 0.6% decline.
Market Reaction
There was no reaction to the latest Durable Goods Orders figures, with the DXY still trading just under the 102.00 and, thus, still at multi-month highs.
- USD/JPY edged lower for the second straight day and dropped to a one-week low on Tuesday.
- The risk-off mood benefitted the safe-haven JPY and exerted pressure amid sliding US bond yields.
- The technical setup favours bearish traders, though the Fed-BoJ policy divergence should limit losses.
The USD/JPY pair witnessed some selling for the second successive day and dropped to a one-week low during the early part of trading on Tuesday. The pair remained depressed through the mid-European session and was last seen trading just above the mid-127.00s.
The prevalent risk-off mood benefitted the safe-haven Japanese yen and exerted downward pressure on the USD/JPY pair. Bearish traders further took cues from retreating US Treasury bond yields, though sustained US dollar buying should help limit any further losses.
From a technical perspective, the USD/JPY pair was flirting with the 23.6% Fibonacci retracement level of the 121.28-129.41 parabolic rise. The said support coincides with the 200-hour SMA, which, in turn, should now act as a pivotal point for short-term traders.
Given the overnight break through an ascending trend-line extending from the monthly low, the bias seems tilted in favour of bears. Hence, some follow-through selling would set the stage for an extension of the corrective pullback from the 129.40 area, or a fresh 20-year high.
The USD/JPY pair might then accelerate the fall and turn vulnerable to weaken further below the 127.00 round-figure mark. The downward trajectory could then get extended and drag spot prices to the next relevant support near the 126.35 area, or the 38.2% Fibo. level.
On the flip side, the 128.00 mark now seems to act as an immediate resistance ahead of the ascending trend-line support breakpoint, around the 128.20 zone. Sustained strength beyond will suggest that the corrective slide has run its course and pave the way for additional gains.
That said, any meaningful upside is likely to remain capped near the 129.00 mark ahead of the Bank of Japan policy decision on Thursday. Nevertheless, the BoJ-Fed policy divergence should continue to act as a tailwind, suggesting that the downtick could be seen as a buying opportunity.
USD/JPY 1-hour chart
-637865726090487142.png)
Key levels to watch
Russian Foreign Minister Sergey Lavrov said on Tuesday that it is too early to talk about mediation in talks with Ukraine, though Russia remains committed to a diplomatic solution, reported Reuters.
His comments come after Russian President Vladimir Putin last week accused Ukraine of not being ready to seek mutually acceptable solutions.
An FT report this morning suggested that the EU is mulling a cap on the price paid for Russian oil as a way to hit Kremlin revenues in its next sanctions package.
Russia would like to avoid a scenario where it would need to intervene in the situation in Moldova's breakaway region of Transnistria, Russia's state-run new agency RIA reported on Tuesday, as cited by Reuters.
The US earlier said it is watching events in the sovereign nation of Moldova closely, adding that it is too soon to comment on recent explosions in the government buildings of the self-declared breakaway region of Transnistria.
Russia is being accused by Ukraine of staging false flag operations in Transnistria, a region occupied by Russian troops, that could justify opening a new front to the Russo-Ukraine war. Moldova's region of Transnistria borders Ukraine to the southwest (near Odesa).
US durable goods orders overview
Tuesday's US economic docket highlights the release of Durable Goods Orders data for March. The US Census Bureau will publish the monthly report at 12:30 GMT and is expected to show that headline orders rose 1% during the reported month as compared to the 2.1% fall reported in February. Orders excluding transportation items, which tend to have a broader impact, are anticipated to have increased by 0.6% in March and reversed the previous month's decline.
How could it affect EUR/USD?
A surprisingly stronger than expected readings would lift expectations from Thursday's release of the Advance Q1 GDP report and reinforce bets for a more aggressive policy tightening by the Fed. This would result in higher US Treasury bond yields, which should allow the US dollar to prolong its recent bullish trajectory to the highest level since March 2020.
Conversely, any disappointment is more likely to be overshadowed by concerns about the economic fallout from prolonged COVID-19 lockdowns in China. This, along with the prevalent risk-off mood, should act as a tailwind for the safe-haven buck, suggesting that the path of least resistance for the EUR/USD pair is to the downside.
Meanwhile, Eren Sengezer, Editor at FXStreet, provided a brief technical outlook for the EUR/USD pair: “The latest candle on the four-hour chart closed below 1.0700. The Relative Strength Index (RSI) indicator on the same chart stays near 40 and the descending line coming from April 21 stays intact, highlighting EUR/USD's bearish bias in the near term.”
Eren also offered important technical levels to trade the major: “It's worth noting that EUR/USD will touch its weakest level since April 2017 with a drop below 1.0635. Sellers might see such a move as a profit-taking opportunity and trigger a correction in the pair. In that case, 1.0700 (psychological level) aligns as the next recovery target before 1.0730 (static level) and 1.0760 (static level).”
“On the downside, a daily close below 1.0640 is likely to open the door for additional losses toward 1.0600 (psychological level) and 1.0570 (static level from March 2017),” Eren added further.
Key Notes
• EUR/USD Forecast: Bears eye 1.0640 as next target
• EUR/USD: Unlikely to break out broad downtrend until Eurozone’s macro backdrop improves – HSBC
• EUR/USD: Downside risks dominate – Commerzbank
About US durable goods orders
The Durable Goods Orders, released by the US Census Bureau, measures the cost of orders received by manufacturers for durable goods, which means goods planned to last for three years or more, such as motor vehicles and appliances. As those durable products often involve large investments they are sensitive to the US economic situation. The final figure shows the state of US production activity. Generally speaking, a high reading is bullish for the USD.
Pentagon Spokesperson John Kirby said on Tuesday that Russia is already a weaker military and is a weaker state (since its invasion of Ukraine) and that the US wants Russia to be unable to threaten its neighbors again in the future.
The US is watching events in the sovereign nation of Moldova closely, Kirby noted, adding that it is too soon to comment on recent explosions in the government buildings of the self-declared breakaway region of Transnistria. Russia is being accused by Ukraine of staging false flag operations in Transnistria, a region occupied by Russian troops, that could justify opening a new front to the Russo-Ukraine war. Moldova's region of Transnistria borders Ukraine to the southwest (near Odesa).
Chinese President Xi Jinping commented on Monday that China will step up infrastructure construction, including of oil and gas pipelines, and that China will speed up the construction of its green and low carbon energy base, reported Reuters citing Chinese state media. China will build a batch of regional and general aviation and cargo airports, Xi added, and to meet financing needs from infrastructure construction, China will step up fiscal spending.
Xi's comments come after he pledged to step up fiscal support to border and less developed areas one week ago.
UOB Group’s Economist Barnabas Gan reviews the latest inflation figures in Singapore.
Key Takeaways
“Singapore’s consumer prices rose at its fastest rate in a decade at 5.4% y/y (+1.2% m/m nsa) in Mar 2022. This is significantly faster compared to market expectations for a 4.7% y/y (+0.8% m/m nsa) print. Core inflation also accelerated to 2.9% y/y in the same month (Feb: +2.2% y/y).”
“Headline inflation has climbed for seven straight months, while core inflation stayed above the 2.0% handle for the fourth straight reading. In line with the recent MAS policy statement, authorities have upgraded their headline and core inflation forecast to 4.5 – 5.5% (from 2.5 – 3.5%) and 2.5% - 3.5% (from 2.0 – 3.0%) in 2022, respectively.”
“As discussed in our latest MAS policy and GDP report, we keep our headline inflation forecast to average 4.5%. Moreover, we expect core inflation to breach 3.0% for the rest of this year, and average 3.5% for the year.”
Una nueva jornada negativa en los activos asociados al riesgo ve al EUR/USD retroceder por debajo del soporte de 1.0700 y registrar nuevos mínimos para lo que va del año en la zona de 1.0670 hoy martes.
Como siempre, el rally en el billete verde permanece sin cambios y siempre fortalecido por la persistente y renovada aversión al riesgo, que ha empujado al Indice Dólar (DXY) a nuevos topes de ciclo en la vecindad de 102.00, valores observados por última vez en marzo de 2020.
La actual preferencia de los participantes del mercado por activos considerados más seguros obedece a la (creciente) especulación acerca de la posibilidad de una desaceleración en la economía china debido a la reimposición de medidas de restricción a la actividad social y económica como respuesta al abrupto resurgimiento de casos de COVID.
Colaborando con la perspectiva anterior, comienza a notarse cierta preocupación entre los inversores acerca de la posibilidad que la economía americana pueda entrar en recesión como respuesta a una normalización más “agresiva” por parte de la Reserva Federal para lo que resta del año.
Nada para destacar en lo que hace al calendario doméstico, mientras que del otro lado del océano verán la luz los pedidos de bienes duraderos, resultados del sector de viviendas y la siempre crítica confianza del consumidor medida por el Conference Board.
Enfoque técnico de corto plazo
El descenso en EUR/USD ha generado más tracción y ha registrado un nuevo mínimo del año en 1.0672 el 26 de abril. De continuar con esa tendencia, el par podría visitar el mínimo de 2020 en 1.0635 del 23 de marzo más temprano que tarde.
Ocasionales rebotes deberían encontrar resistencia inicial en el tope semanal en 1.0936 (abril 21) para luego intentar probar la barrera psicológica de 1.1000. Una vez superada, aparecería la valla transitoria en la media móvil de 55-días en 1.1038, que precede al máximo semanal del 31 de marzo en 1.1184. En el camino ascendente, el par debería superar la línea de resistencia de 8-meses en la zona de 1.1160 para aliviar la presión vendedora y habilitar una probable prueba de los máximos semanales en 1.1390 (febrero 21) y 1.1395 (febrero 16).
En el más largo plazo, la perspectiva del par se mantiene negativa siempre que navegue por debajo de la crítica media móvil de 200-días, hoy en 1.1399.
- USD/CHF witnessed subdued/range-bound price moves through the first half of the European session.
- The risk-off mood drove some haven flows towards the CHF and kept a lid on any meaningful gains.
- Hawkish Fed expectations pushed the USD to over a two-year high and continued lending support.
The USD/CHF pair consolidated its recent strong gains to the highest level since June 2020 and seesawed between tepid gains/minor losses through the first half of the European session. The pair was last seen trading around the 0.9585 region, nearly unchanged for the day.
A combination of diverging forces failed to provide any meaningful impetus to the USD/CHF pair and led to subdued/range-bound price action on Tuesday. The prospects for a more aggressive policy tightening by the Fed pushed the US dollar to a more than two-year high and acted as a tailwind for spot prices. That said, the prevalent risk-off mood drove some haven flows towards the Swiss franc and capped the upside for the major, at least for the time being.
Investors now seem convinced that the Fed would tighten its monetary policy at a faster pace to curb soaring inflation. In fact, the markets have been pricing in jumbo rate hikes at each of the next four FOMC meetings in May, June, July and September. The bets were reaffirmed by hawkish comments by various FOMC officials last week, including Fed Chair Jerome Powell, saying that a 50 bps rate hike will be on the table at the upcoming meeting in May.
Expectations for rapid US interest rate hikes, along with prolonged COVID-19 curbs in China, fueled concerns about a global economic slowdown. This, in turn, tempered investors' appetite for perceived riskier assets, which was evident from a generally weaker tone around the equity markets. The anti-risk flow was reinforced by a further pullback in the US Treasury bond yields, which held back bulls from placing fresh bets around the USD/CHF pair.
Hence, it will be prudent to wait for some follow-through buying and sustained strength beyond the 0.9600 mark before positioning for any further near-term appreciating move for the USD/CHF pair. Traders now look forward to the US economic docket, featuring the release of Durable Goods Orders and the Conference Board's Consumer Confidence Index. This, along with the US bond yields, will influence the USD price dynamics and provide some impetus to the USD/CHF pair.
Technical levels to watch
FX option expiries for April 26 NY cut at 10:00 Eastern Time, via DTCC, can be found below.
- EUR/USD: EUR amounts
- 1.0700 757m
- 1.0725 1.3b
- 1.0750 1.1b
- 1.0800 1.6b
- USD/JPY: USD amounts
- 126.20 810m
- 126.75 600m
- 128.00 655m
- AUD/USD: AUD amounts
- 0.7150 420m
- 0.7220 1.2b
- 0.7350 741m
- USD/CAD: USD amounts
- 1.2675 655m
- 1.2785 740m
- NZD/USD: NZD amounts
- 0.6830 565M
- Gold Price consolidates the rebound, not out of the woods yet.
- Markets remain risk-averse amid Beijing lockdown fears, Fed rate hikes.
- US dollar index closes in on 102.00, holds near two-year highs.
Nothing much has changed fundamentally for Gold Price over the past 24 hours, although bulls are seeing some temporary reprieve. The bearish potential remains intact for XAUUSD, as the US dollar holds near two-year highs vs. its main rivals. Markets remain cautious and prefer to seek refuge in the US currency amid rising worries over the Fed’s aggressive tightening stance and Beijing's covid lockdown, which may temper the global economic recovery. Traders now await the US economic releases for fresh dollar valuations, eventually impacting Gold Price.
Also read: Gold Price Forecast: XAUUSD remains exposed to $1,880 on hawkish Fed bets
Gold Price: Key levels to watch
The Technical Confluences Detector shows that Gold Price is stuck in a narrow range despite the rebound, as the pivot point one-week S1 at $1,906 limits the immediate upside.
If that level is scaled, then bulls need to yield a decisive break above $1,909, the confluence of the Fibonacci 38.2% one-day and the previous high four-hour.
The next stop for XAUUSD bulls is envisioned at the SMA10 four-hour at $1,911. Further up, the convergence of the Fibonacci 61.8% one-day and SMA200 15-minutes at $1,918 will be eyed.
On the downside, $1,900 acts as powerful support, where the Bollinger Band one-day Lower lies.
Should bears take out that downside cap, then a retest of the daily lows at $1,896 will be inevitable.
The previous day’s low of $1,892 will be next on the sellers’ radars. The line in the sand for Gold buyers is the previous month’s low at $1,890.
Here is how it looks on the tool
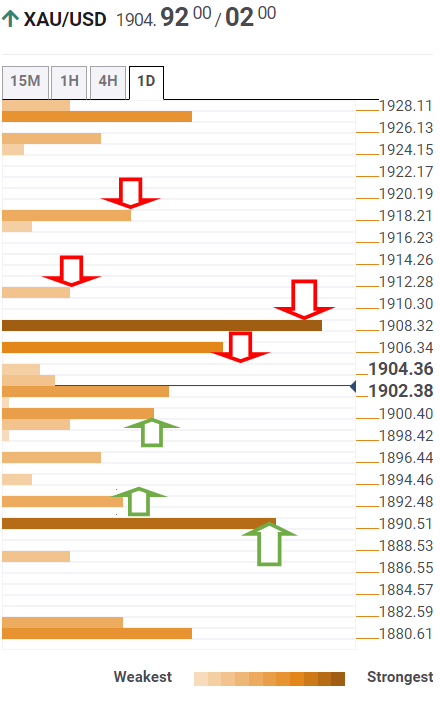
About Technical Confluences Detector
The TCD (Technical Confluences Detector) is a tool to locate and point out those price levels where there is a congestion of indicators, moving averages, Fibonacci levels, Pivot Points, etc. If you are a short-term trader, you will find entry points for counter-trend strategies and hunt a few points at a time. If you are a medium-to-long-term trader, this tool will allow you to know in advance the price levels where a medium-to-long-term trend may stop and rest, where to unwind positions, or where to increase your position size.
- USD/CAD attracted some dip-buying on Tuesday and was supported by a combination of factors.
- Weaker crude oil prices undermined the loonie and acted as a tailwind amid sustained USD buying.
- Retreating US bond yields held back bulls from placing aggressive bets and capped gains for the pair.
The USD/CAD pair recovered over 50 pips from the daily low and touched a fresh intraday high, around the 1.2745 region during the first half of the European session.
A combination of factors assisted the USD/CAD pair to attract some dip-buying near the 1.2685 region on Tuesday and turned positive for the fourth successive day. Crude oil prices languished near a two-week low amid worries that renewed COVID-19 curbs in China will hamper fuel demand. This, in turn, weighed on the commodity-linked loonie and acted as a tailwind for spot prices amid the underlying strong bullish sentiment surrounding the US dollar.
The market conviction that the Fed would tighten its monetary policy at a faster pace to curb soaring inflation, along with the prevalent risk-off mood, lifted the USD to a more than two-year high. Investors now expect the US central bank to hike interest rates by 50 bps at each of the next four FOMC meetings in May, June, July and September. Apart from this, concerns about slowing global economic growth tempered investors' appetite for perceived riskier assets.
That said, the ongoing retracement slide held back the USD bulls from placing aggressive bets and kept a lid on any further gains for the USD/CAD pair, at least for the time being. This makes it prudent to wait for some follow-through buying before positioning for any further near-term appreciating move. Traders now look forward to the US economic docket, featuring the release of Durable Goods Orders and the Conference Board's Consumer Confidence Index.
Apart from this, the US bond yields, along with the broader market risk sentiment, will influence the USD and provide some impetus to the USD/CAD pair. Traders will further take cues from oil price dynamics to grab some short-term opportunities.
Technical levels to watch
Japanese Prime Minister Fumio Kishida said on Tuesday. The government’s JPY13.2 trillion emergency relief package will help ease the pressure off the households and companies from rising fuel and raw material costs.
Additional quotes
“The government will tap reserves set aside under the current fiscal year's budget to fund some of the measures that require fresh spending.”
“Will lay out by June action plan on steps to promote 'new style capitalism,' long-term fiscal and economic policy guideline.”
“Will compile an extra budget, aim to pass it through current parliament session.”
“Important to promote the use of nuclear power, renewable energy to stabilize energy market.”
“Will layout after upper house election comprehensive package of policies, including on energy, to promote change in Japan’s society.”
Also read: BOJ offers to buy unlimited amounts of 10-year JBGs at 0.25%
Market reaction
USD/JPY was last seen trading at 127.75, down 0.27% on the day.
UOB Group’s Senior Economist Julia Goh and Economist Loke Siew Ting assess the latest inflation figures in Malaysia.
Key Takeaways
“Headline inflation held steady at 2.2% y/y in Mar, matching our estimate but defying Bloomberg consensus of an uptick to 2.3%. The steady inflation reading was primarily due to the continued fuel subsidies that helped to bring down transport price inflation amid favourable base effects. It also helped to offset persistent rise in prices of other CPI components particularly food items.”
“Domestic demand continued to recover with both core and services inflation jumping further to more than two-year high of 2.0% and 1.6% respectively (from 1.8% and 1.5% in Feb respectively). This uptrend is expected to persist as Malaysia has transitioned into endemicity from 1 Apr with borders reopened to international travellers.”
“Overall, inflation risks are still tilted to the upside, going by a recovering economy, prolonged supply chain bottlenecks, elevated commodity prices, and a higher national minimum wage. The lapse of base effects particularly in electricity rates in 3Q22 and review of the government’s fuel subsidy mechanism are also sources of upside risks to the inflation outlook this year. We reiterate our 2022 full-year inflation projection at 3.0% (BNM est: 2.2%-3.2%, 2021: 2.5%).”
- AUD/USD stalls its recovery as the USD regains poise amid cautious markets.
- S&P 500 futures erase Asian gains to now drop 0.25% so far.
- All eyes on Wednesday’s Australian inflation data for fresh hints on RBA.
AUD/USD is trading around 0.7200, having stalled its Asian recovery momentum heading into the European open.
The latest leg down in the aussie came on the back of resurgent US dollar demand, as the markets turn cautious, reflective of the 0.25% drop in the S&P 500 futures, which were up modestly during the Asian trading.
Reports of stringent lockdown measures in the Chinese capital of Beijing due to the rapid rise of coronavirus cases. Meanwhile, death in Shanghai city rise, threatening the reopening optimism. Chinese covid lockdowns-driven supply chain and growth concerns weigh on the market sentiment, reviving the dollar’s safe-haven demand.
Additionally, global growth concerns also remain ignited amidst the aggressive Fed tightening expectations, keeping the sentiment around the greenback underpinned. Investors also prefer to hold the US currency ahead of the Durable Good and CB Consumer Confidence data.
Meanwhile, Wednesday’s Australian quarterly inflation release keeps aussie bulls restricted. “The annual rate is expected to have reached 4.6% in the first quarter of the year, up from 3.5% in Q4 2021. The RBA's Trimmed Mean core CPI is foreseen at 3.4%, much higher than the previous 2.6% and above the upper end of the Reserve Bank of Australia’s target for the first time in over a decade,” FXStreet’s Chief Analyst Valeria Bednarik noted. The inflation data will be key for the RBA’s next policy action.
AUD/USD: Technical levels to consider
EUR/USD has dropped below 1.07. Significant support aligns at 1.0640 and sellers could look to book their profits in case the pair falls toward that level, FXStreet’s Eren Sengezer reports.
Bears eye 1.0640 as next target
“March Durable Goods Orders and New Home Sales data from the US will be looked upon for fresh impetus. The Conference Board will release the April Consumer Confidence Index as well. Even if these data come in better than expected, it might not be enough for risk flows to dominate the markets.”
“It's worth noting that EUR/USD will touch its weakest level since April 2017 with a drop below 1.0635. Sellers might see such a move as a profit-taking opportunity and trigger a correction in the pair. In that case, 1.07 (psychological level) aligns as the next recovery target before 1.0730 (static level) and 1.0760 (static level).”
“A daily close below 1.0640 is likely to open the door for additional losses toward 1.06 (psychological level) and 1.0570 (static level from March 2017).”
- EUR/USD remains depressed and breaches the 1.0700 mark.
- The greenback climbs further and trades in fresh cycle peaks.
- Investors’ attention will be on the US Consumer Confidence.
Pessimism around the single currency continues to build up and drags EUR/USD to new lows in the 1.0670 region on turnaround Tuesday.
EUR/USD depressed on risk-off sentiment
EUR/USD sheds ground for the fourth consecutive session on Tuesday on the back of the intense march north in the greenback, which in turn has propelled the US Dollar Index (DXY) to new cycle tops in the boundaries of the 102.00 yardstick.
The persistent depreciation of the euro comes in line with the broad-based selling bias in the rest of the risk-linked galaxy, all in response to geopolitical jitters and concerns over a probable slowdown of the Chinese economy in light of the so far unabated progress of the coronavirus pandemic.
Also collaborating with the downtrend in the pair appears the rising speculation that the US economy could slip back into recession led by a tighter normalization of the Fed’s monetary conditions.
The persevering risk aversion, in addition, continues to put yields on both sides of the ocean under further downside pressure, with the US 10y benchmark returning to the 2.80% area and the 10y German bund hovering around 0.85%.
Nothing scheduled data wise in Euroland on Tuesday should leave all the attention to the US calendar, where the Conference Board’s Consumer Confidence will take centre stage seconded by Durable Goods Orders, the FHFA’s House Price Index and New Home Sales.
What to look for around EUR
EUR/USD’s price action shows further deterioration and revisits the sub-1.0700 area, opening the door at the same time to a potential visit to the 2020 low in the 1.0630 zone sooner rather than later. The outlook for the pair still remains tilted towards the bearish side, always in response to dollar dynamics, geopolitical concerns and the Fed-ECB divergence. Occasional pockets of strength in the single currency, in the meantime, should appear reinforced by speculation the ECB could raise rates before the end of the year, while higher German yields, elevated inflation, the decent pace of the economic recovery and auspicious results from key fundamentals in the region are also supportive of a rebound in the euro.
Key events in the euro area this week: Germany GfK Consumer Confidence (Wednesday) – ECB 2021 Annual Report, Consumer Confidence, Economic Sentiment, Germany Flash Inflation Rate (Thursday) – Germany, EMU Flash Q1 GDP Growth Rate, EMU Flash Inflation Rate (Friday).
Eminent issues on the back boiler: Asymmetric economic recovery post-pandemic in the euro area. Speculation of ECB tightening/tapering later in the year. Second round of the presidential elections in France (April 24). Impact on the region’s economic growth prospects of the war in Ukraine.
EUR/USD levels to watch
So far, spot is down 0.22% at 1.0687 and a break below 1.0672 (2022 low April 26) would target 1.0635 (2020 low March 23) en route to 1.0569 (low April 10 2017). On the upside, the next hurdle appears at 1.0936 (weekly high April 21) seconded by 1.1000 (round level) and finally 1.1038 (55-day SMA).
- GBP/USD turned lower for the fourth straight day amid sustained USD buying interest.
- Aggressive Fed rate hike bets, the risk-off mood pushed the USD to over a two-year high.
- Diminishing odds for any further tightening by the BoE also weighed on the British pound.
The GBP/USD pair witnessed some selling during the early part of the European session and dropped to the 1.2700 neighbourhood, back closer to the YTD low touched the previous day.
Following an early uptick to the 1.2770 region, the GBP/USD pair met with a fresh supply on Tuesday and turned lower for the fourth successive day amid the emergence of fresh US dollar buying. The prospects for rapid interest rate hikes in the US, along with the prevalent risk-off mood, pushed the USD to its highest level since March 2020 and exerted downward pressure on spot prices.
The markets have been betting on a more aggressive policy tightening by the Fed and expect a 50 bps rate hike at each of the next four FOMC meetings in May, June, July and September. Apart from this, fresh COVID-19 lockdowns in China fueled concerns about a global economic slowdown, which took its toll on the global risk sentiment and benefitted traditional safe-haven assets, including the buck.
On the other hand, the British pound was weighed down by the recent disappointing domestic data, which indicated that the UK economy is under stress from the soaring cost of living. This forced investors to scale back their bets on future interest rate hikes by the Bank of England and supports prospects for a further depreciating move for the GBP/USD pair amid absent relevant economic releases from the UK.
Later during the early North American session, traders will take cues from the US economic docket - featuring the release of Durable Goods Orders and the Conference Board's Consumer Confidence Index. Apart from this, the broader market risk sentiment will influence the USD price dynamics and produce some short-term trading opportunities around the GBP/USD pair.
Technical levels to watch
Further upside momentum could encourage USD/CNH to test the 6.6300 region in the near term, suggested FX Strategists at UOB Group Lee Sue Ann and Quek Ser Leang.
Key Quotes
24-hour view: “The strong surge in USD to 6.6090 came as a surprise (we were expecting a higher USD but we were of the view that 6.5600 is out of reach). The sharp pullback from the high amid overbought conditions suggests that the strong rally over the past few days is ready to take a breather. In other words, USD is likely to trade sideways for today, expected to be within a range of 6.5500/6.6000.”
Next 1-3 weeks: “We highlighted yesterday (25 Apr, spot at 6.5330) that upward momentum remains strong and USD could advance further. We indicated that resistance levels are at 6.5600 and 6.5880. USD subsequent blew past both levels as it surged to 6.6090 before pulling back. Further USD strength is not ruled out but overbought shorter-term conditions could lead to 1 to 2 days of consolidation first. Looking ahead, the next resistance above 6.6090 is at 6.6300. On the downside, a breach of 6.4900 (‘strong support’ level was at 6.4750 yesterday) would indicate that the strong phase in USD that started late last week (see annotations in the chart below) has run its course.”
- DXY extends the upside momentum near the 102.00 mark.
- Yields extend the corrective downside along the curve.
- CB’s Consumer Confidence, housing sector in the limelight.
The greenback, in terms of the US Dollar Index (DXY), remains bid and now trades at shouting distance from the key 102.00 yardstick on turnaround Tuesday.
US Dollar Index looks to risk trends, data
The index advances fore the fourth consecutive session on Tuesday and records new cycle peaks just below 102.00 the figure, always on the back of the persevering risk aversion sentiment and the pessimism surrounding the risk complex.
The preference for the safe haven universe, in the meantime, keeps underpinning the demand for bonds and therefore putting US yields under persistent downside pressure. On this, investors remain concerned about the impact of current lockdown measures in China on its economic growth prospects as well as the likelihood of a Fed-led recession in the US economy.
Data wise in the US, all the attention will be on the release of the Consumer Confidence gauged by the Conference Board as well as Durable Goods Orders and results from the housing sector.
What to look for around USD
The dollar faces renewed buying interest and challenges the 102.00 neighbourhood in the first half of the week amidst persistent risk-off mood and declining US yields. So far, the greenback’s price action continues to be dictated by the likeliness of a tighter rate path by the Fed and its potential effects on the economy as well as geopolitics. The tightening of the Fed’s normalization process appears so far propped up by elevated inflation and the solid health of the labour market.
Key events in the US this week: Durable Goods Orders, House Price Index, CB Consumer Confidence, New Home Sales (Tuesday) – MBA Mortgage Applications, Flash Goods Trade Balance, Pending Home Sales (Wednesday) – Advanced Q1 GDP Growth Rate, Initial Claims (Thursday) – Core PCE, PCE, Final Consumer Sentiment, Personal Income/Spending (Friday).
Eminent issues on the back boiler: Escalating geopolitical effervescence vs. Russia and China. Fed’s rate path this year. US-China trade conflict. Future of Biden’s Build Back Better plan.
US Dollar Index relevant levels
Now, the index is advancing 0.19% at 101.92 and the breakout of 101.96 (2022 high April 26) would open the door to 102.00 (round level) and finally 102.99 (2020 high March 20). On the other hand, initial contention emerges at 99.81 (weekly low April 21) seconded by 99.57 (weekly low April 14) and then 97.68 (weekly low March 30).
According to FX Strategists at UOB Group Lee Sue Ann and Quek Ser Leang, USD/JPY could retest 126.30 in case 126.90 is cleared.
Key Quotes
24-hour view: “USD traded between 127.51 and 128.86 yesterday before closing at 128.12 (-0.34%). USD traded on a weak note during early Asian hours and the bias for today is on the downside. That said, any weakness is expected to face solid support at 126.90. The next support at 126.30 is unlikely to come into the picture. Resistance is at 127.90 followed by 128.40.”
Next 1-3 weeks: “We have held the same view since last Thursday (21 Apr, spot at 128.20) where USD is likely to consolidate and trade within a range of 126.90/129.40. While there is no change in our view, shorter-term downward momentum is beginning to build and the risk a deeper pullback has increased. From here, a clear break of 126.90 could lead to a pullback to 126.30. At this stage, the chance for a clear break of 126.90 is not high but it would remain intact as long as USD does not move above 128.80 (‘strong resistance’ level) within these 1 to 2 days.”
Further downside in AUD/USD could visit the sub-0.7100 area in the next weeks, comment FX Strategists at UOB Group Lee Sue Ann and Quek Ser Leang.
Key Quotes
24-hour view: “We expected AUD to weaken yesterday but we were of the view that ‘deeply oversold conditions suggest that the next support at 0.7165 is likely out of reach’. We underestimated the weakness in AUD as it cracked 0.7165 and dropped to 0.7135 before rebounding. Conditions remain oversold and downward momentum is showing tentative signs of slowing. AUD is unlikely to weaken much further. For today, AUD is more likely to trade sideways between 0.7130 and 0.7230.”
Next 1-3 weeks: “Yesterday (25 Apr, spot at 0.7230), we highlighted that there is room for the sharp decline in AUD to extend to 0.7165. We added, a break of this strong support could lead to further sharp drop. AUD subsequently cracked 0.7165 and dropped to 0.7135. AUD is likely to weaken further and the next support is at 0.7095. Overall, only a breach of 0.7270 (‘strong resistance’ level was at 0.7330 yesterday) would indicate that the current weakness has stabilized.”
Here is what you need to know on Tuesday, April 26:
Led by impressive gains witnessed in technology shares, Wall Street's main indexes staged a decisive rebound late Monday to close in positive territory. Although the greenback lost its bullish momentum on improving sentiment, it managed to cling to its strong gains. The market mood remains cautious early Tuesday with the Shanghai Composite Index losing more than 1% US stock index futures trading modestly lower on the day. Durable Goods Orders and New Home Sales data for March will be featured in the US economic docket alongside the Conference Board's Consumer Confidence data for April.
Conference Board Consumer Confidence April Preview: Watching as US consumption dwindles.
China has expanded the mass coronavirus testing in Beijing and markets grow increasingly worried about a lockdown that would cause protracted supply-chain issues. Meanwhile, Russia's First Deputy Envoy to the UN said late Monday that there was no point in agreeing to a ceasefire in Ukraine, arguing that Kyiv could use it as an opportunity to make provocations.
EUR/USD dipped below 1.0700 on Monday and failed to stage a meaningful rebound. The Financial Times reported that the European Union was mulling the option of introducing price caps on Russian oil to hit Kremlin's revenues. The pair trades at its lowest level in more than two years below 1.0700 early Tuesday.
GBP/USD dropped to its lowest level since September 2020 below 1.2700 on Monday before recovering toward 1.2750. The British pound is struggling to find demand in the European morning and the pair is, once again, edging lower toward 1.2700.
USD/JPY lost 80 pips on Monday as the Japanese yen capitalized on safe-haven flows throughout the day. The pair is fluctuating in a tight range below 128.00 on Tuesday. The Bank of Japan (BOJ) announced earlier in the day that it will purchase unlimited amounts of 10-year government bonds at 0.25% on April 27 and 28.
Gold fell nearly 2% and closed below $1,900 for the first time since late February on Monday. XAU/USD is having a difficult time gaining traction on Tuesday with the greenback holding its ground.
AUD/USD fell to its lowest level in two months at 0.7135 on Monday. The pair seems to have gone into a consolidation phase below 0.7200 after inching higher earlier in the day. The first-quarter Consumer Price Index (CPI) data from Australia will be released in the early trading hours of the Asian session on Wednesday.
Bitcoin took advantage of the positive shift witnessed in risk sentiment and reclaimed $40,000. Ethereum rose nearly 3% on Monday and was last seen moving sideways near $3,000.
CME Group’s flash data for crude oil futures markets noted traders added just 808 contracts to their open interest positions at the beginning of the week, clinching the second daily build in a row. Volume followed suit and went up by around 207.6K contracts, reversing three daily pullbacks in a row.
WTI met initial support around $95.00
Monday’s drop in prices of the WTI tested and rebounded from the $95.00 region amidst rising open interest, which could be indicative that further recovery remains in the pipeline in the very near term. So far, initial contention has turned up around the $95.00 region.
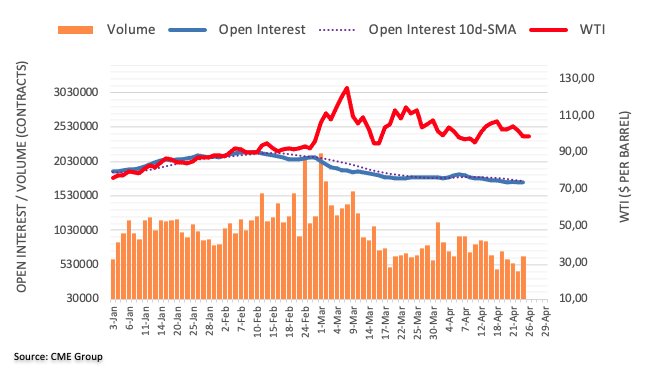
The Bank of Japan (BOJ) announced that it will conduct consecutive unlimited fixed-rate purchase operations for Japanese Government Bonds (JGBs).
The Japanese central bank will conduct consecutive unlimited fixed-rate purchase operations for 10-year JBGs at 0.25% on April 27 and 28.
The BOJ offered to buy unlimited amounts of 10-year JBGs at 0.25%.
Market reaction
USD/JPY has returned below 128.00, with the latest headlines supporting the demand for the yen alongside a cautious market mood.
At the time of writing, the pair is trading at 127.82, down 0.23% on the day.
- Modest USD pullback dragged USD/JPY lower for the second successive day on Tuesday.
- The Fed-BoJ policy divergence acted as a tailwind and helped limit any meaningful slide.
- Investors now eye US economic data for some impetus ahead of the BoJ on Thursday.
The USD/JPY pair remained on the defensive through the early European session and was last seen trading with modest intraday losses, just below the 128.00 mark.
The US dollar eased a bit from its highest level since March 2020 touched the previous session, which, in turn, was seen as a key factor that dragged the USD/JPY pair lower for the second straight day. The downside, however, remains cushioned amid a big divergence in the monetary policy stance adopted by the Fed and the Bank of Japan.
Hawkish comments by various FOMC officials last week, including Fed Chair Jerome Powell, reaffirmed that the Fed would tighten its monetary policy at a faster pace to curb soaring inflation. In fact, the markets now expect the US central bank to raise interest rates by 50 bps at each of its next four meetings in May, June, July and September.
In contrast, the BoJ has repeatedly said that it remains ready to use tools to avoid long-term rates from rising too much and sustain the current powerful monetary easing to support the economy. It is worth recalling that the BoJ last week again offered to buy unlimited amounts of Japanese government bonds to defend the 0.25% yield cap.
This, along with modest uptick in the US Treasury bond yields, favour bulls and support prospects for the emergence of some dip-buying around the USD/JPY pair. Traders, however, might refrain from placing aggressive bets and prefer to wait on the sidelines ahead of the BoJ monetary policy decision and the economic outlook report on Thursday.
In the meantime, traders will take cues from the US economic docket, featuring the release of Durable Goods Orders and the Conference Board's Consumer Confidence Index. This, along with the US bond yields, will influence the USD price dynamics. Apart from this, the broader market risk sentiment should provide some impetus to the USD/JPY pair.
Technical levels to watch
FX Strategists at UOB Group Lee Sue Ann and Quek Ser Leang noted further downside in GBP/USD could target the 1.2650 level and probably 1.2600 in the short term.
Key Quotes
24-hour view: “While we expected GBP to ‘weaken further’ yesterday, we were of the view that ‘any further weakness could be limited to a test of 1.2770’. The subsequent weakness exceeded our expectations by a wide margin as GBP plunged to a low of 1.2697 before rebounding. Conditions remain deeply oversold and GBP is unlikely to weaken much further. For today, GBP is more likely to trade between 1.2690 and 1.2790.”
Next 1-3 weeks: “We turned negative in GBP yesterday (25 Apr, spot at 1.2830) and we were of the view that it ‘could weaken to 1.2770, as low as 1.2730’. We did not expect the ease by GBP cracked both 1.2770 and 1.2730 as it plunged to 1.2697. We continue to hold a negative view even though oversold shorter-term conditions could lead to 1 to 2 days of consolidation first. Looking ahead, the next levels to monitor are at 1.2650 and 1.2600. Overall, GBP is expected to stay under pressure as long as it does not move above 1.2900 (‘strong resistance’ level was at 1.2940 yesterday.”
Gold is sharply lower by 4.7% against its mid-April high of $1,998. Benjamin Wong, Strategist at DBS Bank, sees XAUUSD’s ongoing decline as being corrective.
Gold has high probability to test late March low at $1,890
“Quick sequential loss of the $1,944 and $1,925 support pegs returns the focus to gold’s late March lows at $1,890, and thereafter the next Fibonacci support cluster at $1,849.”
“Our base case is that for gold to abandon its rally inherent from March 2021’s $1,677 lows would be a slip under $1,780-$1,763. Otherwise, gold needs to rebuild its credentials with a move over $1,967-$1,980 resistance patch.”
Open interest in gold futures markets shrank for the fifth consecutive session on Monday, this time by around 11.3K contracts according to preliminary readings from CME Group. Volume, on the other hand, went up by around 63.5K contracts, reaching the third daily build in a row.
Gold: Next support of note comes at $1890
Gold started the week on the back footing and closed the session just below the $1900 mark. The negative price action was on the back of shrinking open interest, however, hinting at the idea that a deeper drop appears somewhat unlikely in the very near term. Against that, the next support of note emerges at the March low at $1890 per ounce troy (March 29).
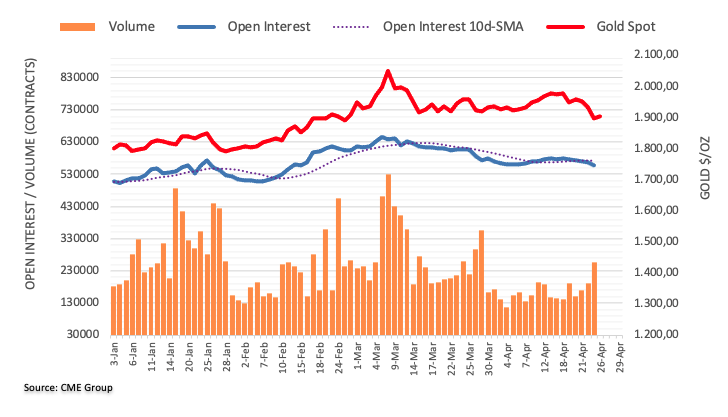
FX markets are calmer today after Monday's wild ride. For today, economists at ING are set to look out for US consumer confidence data and what it means for the Federal Reserve. They think the US Dollar Index (DXY) is poised to reach the 103 level.
Volatility on the rise
“More freely floating renminbi plus the steady withdrawal of central bank liquidity over coming months and quarters warn that FX volatility will only rise further.”
“For today, we are interested to see whether US data like consumer confidence has any impact on Fed expectations. Will today's release of April Conference Board consumer confidence have any impact on the pricing of the Fed cycle? We suspect not.
“DXY may now be due some consolidation in the 101-102 area, but the trend towards testing the March 2020 high near 103 remains intact. “
European Central Bank (ECB) tightening expectations take a hit. Furthermore, developments in Ukraine are also at a dangerous phase. However, EUR/USD could stabilise in a 1.07-1.08 range before moving lower toward the March 2020 low of 1.0635, economists at ING report.
Sharp adjustment in ECB tightening expectations
“Having priced 85bp of ECB tightening by year-end last Friday, those expectations have dropped to just 72bp. The ECB debate over whether it hikes 50bp, 75bp or 100bp this year is being rather swamped by the potential 250-300bp adjustments to be made elsewhere in the world.”
“Russia now seems to be targeting Western military aid for Ukraine more directly with attacks on rail infrastructure, questioning whether attacks move closer to the border with NATO partners. Escalation is clearly a risk.”
“For today, EUR/USD can consolidate in a 1.07-1.08 range before making a move towards the March 2020 low at 1.0635.”
UK Chancellor Rishi Sunak said on Tuesday that the British government continues to adhere to the fiscal rules, weathering the global economic headwinds.
Additional comments
“We must manage public finances sustainably to avoid saddling future generations with further debt.”
“The UK is showing commitment to sustainable public finances while supporting long-term growth and addressing cost of living pressures.”
Market reaction
GBP/USD is back in the red, having wiped out the recovery gains, as the US dollar regains poise. The spot was last seen trading at 1.2733, down 0.05% on the day.
In opinion of Quek Ser Leang at UOB Group’s Global Economics & Markets Research, EUR/USD could extend the leg lower and revisit the 2020 low in the 1.0630 region in the near term.
Key Quotes
“… when EUR/USD was trading at 1.0865, we highlighted that the risk for 2Q22 is on the downside but EUR/USD ‘has to break the long-term support at 1.0805 first before further weakness is likely’. While EUR/USD dropped below 1.0805 two weeks ago, it was unable to make much headway on the downside until yesterday (25 Apr) when it lurched lower and dropped to 1.0695.”
“Shorter-term downward momentum has improved considerably and a break of the 2020 low of 1.0635 would not be surprising. The next support below 1.0635 is near 1.0340, the low in 2017. It is left to be seen if EUR/USD can break 1.0340 within these 1 to 2 months. In order to maintain the current downward momentum, EUR/USD should ideally stay below 1.1030. However, only a breach of the 21-week exponential moving average (currently at 1.1110) would indicate that the weakness in EUR/USD has stabilized.”
Gold Price is catching a sigh of relief after a three-day turmoil. Nonetheless, XAUUSD remains exposed to $1,880, FXStreet’s Dhwani Mehta reports.
Recovery path to be shallow
“Any recovery attempts appear limited near $1,935, the confluence of the previous day’s high, 50 and 21-DMAs. If XAU bulls remain resilient to the bearish odds, then a retest of the $1,950 psychological level will be inevitable.”
“If the selling spiral resumes, then bears will challenge the previous day’s low of $1,892 once again. The last line of defense for gold bulls will be the February 24 low of $1,878 before the ascending 100-DMA support gets exposed.”
Sterling continues to trade on a fragile footing. Economists at ING expect the GBP/USD pair to test the 1.25 level.
EUR/GBP could move back lower into a 0.83-0.84 range
“Most now feel that GBP/USD has to test 1.2500, and 1.2850 will now act as strong resistance – should it get that high.”
“One of the key stories this year will be whether central banks push ahead with tightening even as growth slows. That will clearly deliver flatter or inverted yield curves, but could actually see currencies staying strong. So until the Bank of England (BoE) waves the white flag on the rest of its tightening cycle, we think it may be too early to write off sterling – particularly against the euro.”
“Don't be surprised if EUR/GBP sinks back into a 0.8300-0.8400 range.”
Emmanuel Macron has been re-elected, with initial results indicating a 58% vs. 42% victory over Marine Le Pen. This implies policy continuity, and the EUR may see some modest and short-term upside on the largely expected result. Yet, the Eurozone’s increasingly negative macro backdrop will likely cap EUR gains, in the view of economists at HSBC.
Short-term modest upside for EUR amid French elections
“The EUR may see some modest and short-term upside on the news that Macron looks set to remain France’s president. However, the fact that this should not come as a major surprise to the market and the challenging broader picture for the EUR should ensure that any move higher in EUR is capped, however.”
“Investors taking short EUR positions have been less interested in French politics and more focused on the Eurozone’s increasingly negative macro backdrop and worsening growth-inflation trade-off. Until this starts to show signs of improving, it will be difficult for EUR/USD to break out of the broad downtrend that has been firmly in place since June 2021.”
Beijing lockdown fears hit markets. The Chinese yuan has lost around 3% versus the US dollar over the past week, dropping to a one-year low. Economists at ABN Amro have raised their USD/CNY end-2022 forecast to 6.60 from 6.30 previously.
PBoC remains hesitant to ease monetary policy more broadly
“The broadening of lockdowns is exacerbating headwinds to China’s economic growth and is adding to supply bottlenecks, with spillovers to global supply chains. We have already cut our near-term growth forecasts for China, with risks still tilted to the downside. Our annual growth forecast for 2022 (5.0%) is already 0.5 pp below Beijing’s growth target of 5.5%.”
“The People's Bank of China remains hesitant to ease monetary policy more broadly, with other major central banks on a hiking path.”
“While we still think that the authorities will not allow a disorderly depreciation, we have adjusted our end-2022 forecast for USD/CNY to 6.60 (from 6.30).”
See: USD/CNY to advance nicely towards 6.80 by year-end – TDS
The Chinese yuan has fallen sharply over recent sessions versus the US dollar. Further depreciation is expected in the months ahead but a sharp slide in the currency is unlikely, economists at TD Securities report.
Downside risks to CNY in the months ahead
“Over the near-term, pressure on the CNY is likely to remain in place, with the authorities appearing to condone the recent move in the currency as it provides another channel of stimulus.”
“In the near-term, the 23.6% Fib resistance level around USD/CNY 6.6028 will be the immediate focus while a break of this level could see a test of the 50% Fib level around 6.7139.”
“We expect the pace of CNY depreciation to slow eventually and now expect USD/CNY to reach 6.80 by end-2022 from 6.45 previously.”
- An H&S formation has brought a firmer reversal in the asset.
- Loonie bulls are strengthened as the 20- and 50-EMAs turned lower.
- Momentum oscillator RSI (14) has shifted into a bearish range of 20.00-40.00
The USD/CAD pair is witnessing a steep fall since Monday after forming a weekly high at 1.2777. The greenback bulls have extended their losses in the Asian session after breaking the consolidation formed in a narrow range of 1.2720-1.2746.
A textbook similar Head and Shoulder chart formation on the hourly scale has resulted in a weakness in the counter. Usually, a Head and Shoulder formation denotes inventory distribution from institutional investors to retail participants after forming a potential top on the chart.
The 20- and 50-period Exponential Moving Averages (EMAs) at 1.2722 and 1.2701 respectively have turned lower, which signals no more upside in the counter.
Meanwhile, the Relative Strength Index (RSI) (14) has shifted into a bearish range of 20.00-40.00 swiftly from the bullish range that signals the strength of the loonie bulls.
Should the asset drops below Tuesday’s low at 1.2685, loonie bulls will drag the asset towards April 19 high at 1.2647, followed by the round level support at 1.2600.
On the flip side, greenback bulls can regain control if the asset oversteps Monday’s average traded price at 1.2752. This will drive the asset towards the Monday’s high and February 25 high at 1.2777 and 1.2820 respectively.
USD/CAD hourly chart
-637865509392884194.png)
Pressure on the Reserve Bank of Australia (RBA) to end its expansionary monetary policy is mounting. However, things remain difficult for the aussie, economists at Commerzbank report.
RBA might give itself some more time
“As the market is already expecting that the RBA will hike its key rate next week the effect on AUD is likely to be limited. On the contrary: if the RBA comes to the conclusion that May is too early for lift-off after all AUD might come under downside pressure.”
“I assume that the RBA might give itself some more time and will not act quite that quickly. Otherwise, the move from ‘patient’ as far as rate hikes are concerned towards an ‘immediate hike’ would be a little abrupt after all.”
“The AUD is going to struggle at present anyway as increased concerns about the Chinese economy as a result of the lockdowns there are likely to dominate over monetary policy thus putting pressure on AUD for now.”
Two things seem to have a lot of staying power for the market at present: the covid restrictions in China and the resulting supply chain constraints and the conflict in Ukraine. Two factors that can put pressure on the euro, according to economists at Commerzbank.
Staying power and a weak euro?
“The supply chain constraints entail the risk of inflation pressure continuing for longer than had been assumed anyway. There is also an increased risk that the continued covid restrictions will increasingly stifle growth prospects for China, thus possibly also affecting those in Europe – and that against the background of rising interest rates in the eurozone.”
“The longer the conflict in Ukraine continues and the more intense the fighting gets, the higher the risk becomes of an energy crisis as a result of a complete embargo of energy imports to Europe, also increasing the downside risk for the European economy and that of the eurozone.”
NZD/USD suffered a turbulent start to the week. The kiwi could drop as low as the 0.6530 in the next few days, economists at Westpac report.
Scope for 0.70 in the second half of the year
“The multi-week decline remains in progress, with potential to reach 0.6530 during the week ahead.”
“The USD is likely to remain strong into the 4 May FOMC, and yields spreads (for longer maturities) are likely to be a headwind for the NZD near-term (in the wake of the RBNZ’s ‘dovish hike’).”
“Multi-month, we remain bullish NZD, with potential for 0.70 in H2 as the strong commodity price trend starts to dominate again.”
European Central Bank’s (ECB) policymaker Martins Kazaks said on Tuesday, he prefers the first-rate hike in July after the asset purchase programme (APP) ends at the start of the month
Additional quotes
“Two to three rate hikes priced by markets are quite reasonable.”
“No reason for rate hikes to pause at 0%.”
Also read: ECB's Kazaks: A rate hike is possible as soon as July
Market reaction
The shared currency picked up a few bids on the above comments, with EUR/USD now trading at 1.0732 vs. 1.0725 before Kazaks’ remarks. The spot is up 0.20% so far.
- USD/INR slides to near 76.50 amid a minor correction in DXY.
- The confluence of demand and supply worries has complicated the situation for investors.
- A jumbo rate hike expectations have bolstered after Fed Powell stated that a 50 bps rate hike is on cards.
The USD/INR pair has witnessed a steep fall at open and is establishing below 76.50 as oil prices fall on global demand worries. The asset has remained in positive territory this month amid a strong upside in the greenback.
Oil prices are going through a rough time these trading sessions as a significant cut in the global growth forecasts by the International Monetary Fund (IMF) and supply worries due to the prohibition of Russian oil by the Western leaders has complicated the situation for the market participants. However, the recent price action indicates that demand worries have been underpinned by investors, which is why oil prices have lost the psychological support of $100.00.
Meanwhile, a minor pullback has been displayed by the US dollar index (DXY) in the late Asian session. The DXY has printed a fresh two-year high at 101.86 as expectations of a jumbo rate hike by the Federal Reserve (Fed) have bolstered. The odds of a 50 basis point (bps) rate hike by the Fed are substantially higher after Fed chair Jerome Powell stated that a rate hike of half a percent in May is on the cards. Also, the thinks tanks in the market are expecting the outset of balance sheet reduction sooner. The agenda of withdrawing helicopter money from the market will result in weakness for the risk-sensitive assets.
- EUR/USD attempts a dead cat bounce above 1.0700.
- But EUR bulls lack conviction amid a bearish technical structure.
- The pair needs to recapture 1.0746 convincingly to cement the recovery.
EUR/USD is consolidating the recovery above 1.0700, as the bulls lack the follow-through upside bias, despite the improving market mood and a broad US dollar retreat.
Reports that the European Union (EU) may consider a cap on the price paid to Russian oil importers, in another way to hit the Kremlin revenues, are also weighing on EUR bulls.
Meanwhile, the pullback in the US dollar appears temporary, as China covid concerns and the hawkish Fed bets will keep the buck broadly favored.
The focus now shifts towards the US Durable Goods and Consumer Confidence data amid a data-empty EU docket. Investors also assess Monday’s German IFO survey, which surprised markets to the upside.
Separately, Goldman Sachs said in its latest report that it expects the ECB to hike interest rates by 25-bps in July.
developing story ...
In a report published on Monday, economist Sven Jari Stehn at Goldman Sachs noted that the European Central Bank (ECB) is seen lifting the key interest rate by 25 basis points (bps) in July.
Key quotes
“The ECB will boost its key rate another four times in 2023 to lift it to 1.25%.”
“Given continued cost-push pressures and limited evidence of a sustained demand hit, recent ECB commentary has emphasized rising concerns.”
“While a sharper slowdown in growth or renewed sovereign stresses could lead to a slower policy normalization, clearer signs of second-round effects could require a faster exit.”
Related reads
- EU weighs cap on price paid for Russian oil as way to hit Kremlin revenues – FT
- EUR/USD sees a dead cat bounce above 1.0700 ahead of US Durable Goods
As the European Union (EU) member states remain reluctant to announce an immediate embargo on Russian oil imports, they are contemplating imposing a ceiling on what they would pay for Russian oil as a way to hit Kremlin revenues, the Financial Times (FT) reported, citing one person familiar with the conversations.
developig story ...
- GBP/JPY recovers intraday losses despite slippage in Japan’s Unemployment Rate at 2.6%.
- Soaring inflation in the UK is demanding one more rate hike by the BOE.
- The BOJ is likely to maintain a neutral stance in its monetary policy statement on Thursday.
The GBP/JPY pair is highly expected to display an open rejection-reversion session. The pair opened at 163.21, witnessed some selling pressure but bounced back later after printing a low of 162.30 and has now overstepped the opening price. The cross has formed a double-bottom chart formation on a lower timeframe and is indicating a bullish reversal.
The asset has rebounded despite the release of a lower-than-expected Unemployment Rate of 2.6%. The Statistics Bureau of Japan has reported the Unemployment Rate at 2.6%, lower than the forecast and prior print of 2.7%. An improvement in Japan’s labor market has failed to cheer the Japanese yen, which has eventually underpinned the sterling. In a broader sense, the ultra-loose monetary policy by the Bank of Japan (BOJ) has resulted in an intense sell-off in the Japanese yen in the past few trading weeks.
Meanwhile, the pound bulls are strengthening on expectations of a fourth rate hike by the Bank of England (BOE) in May. Soaring inflation in the pound area is compelling for more hawkish monetary policy announcements by BOE Governor Andrew Bailey.
Going forward, investors will focus on the interest rate decision announcement by the BOJ on Thursday. BOJ policymakers are likely to keep a neutral stance considering the lower inflation rate and the requirement of massive stimulus to spurt the growth rate.
- AUD/USD bulls correcting from the lows of the daily drop.
- The greenback is under pressure and has been faded from near to two-year highs.
AUD/USD is perky in mid-day Tokyo as the US dollar is faded following a strong performance at the start of the week. At 0.7226, AUD/USD is 0.56% higher and counting. The pair has rallied from a low of 0.7169 and has reached a high of 0.7228.
The US dollar has benefitted from a risk-off start this week and it rallied vs. a basket of rivals, as measured by the DXY index. The index hit a two-year high as investors moved away from risk assets in fear of the knock- effect of the Chinese lockdowns pertaining to the covid spread. Not only that, the Ukraine crisis is a dark cloud over markets as are the prospects of rapidly increasing inflation pressures and interest rates.
''Recent Fed rhetoric is strongly suggestive of a string of back-to-back 50bp hikes so as to get the fed funds rate back to neutral expeditiously,'' analysts at ANZ Bank said.
''The market is pricing almost 4-straight 50bp hikes at the May, June, July, and September meetings. Fed Chair Powell says markets are factoring in Fed communications and are reacting appropriately.''
As for Ukraine, the Aussie trees as a proxy to the commodity markets and the nation's distance from the conflict had been a positive for the currency initially. However, despite the prospects of higher prices and a trade balance surplus which would be expected to continue supporting AUD, the commodity market is also absorbing China’s growth concerns with energy and metals facing some considerable bearish momentum. For instance, Iron ore, Australia’s main export, plunged below $140/t at the start of the week.
''Tangshan is under lockdown, which is a key concern for steel production. Investors are also reassessing the impact of infrastructure investments on the property market. Property indicators are still negative, while construction activity is slowing due to lockdowns,'' analysts at ANZ Bank explained.
Another troubling feature in the FX space is the yen sinking to a 20-year low against the US dollar last week. There has been some relief this week but there are concerns over the potential volatility this could cause in US Treasury markets and more broadly global financial markets which could hurt the Aussie for its high beta status to equities.
AUD/USD technical analysis
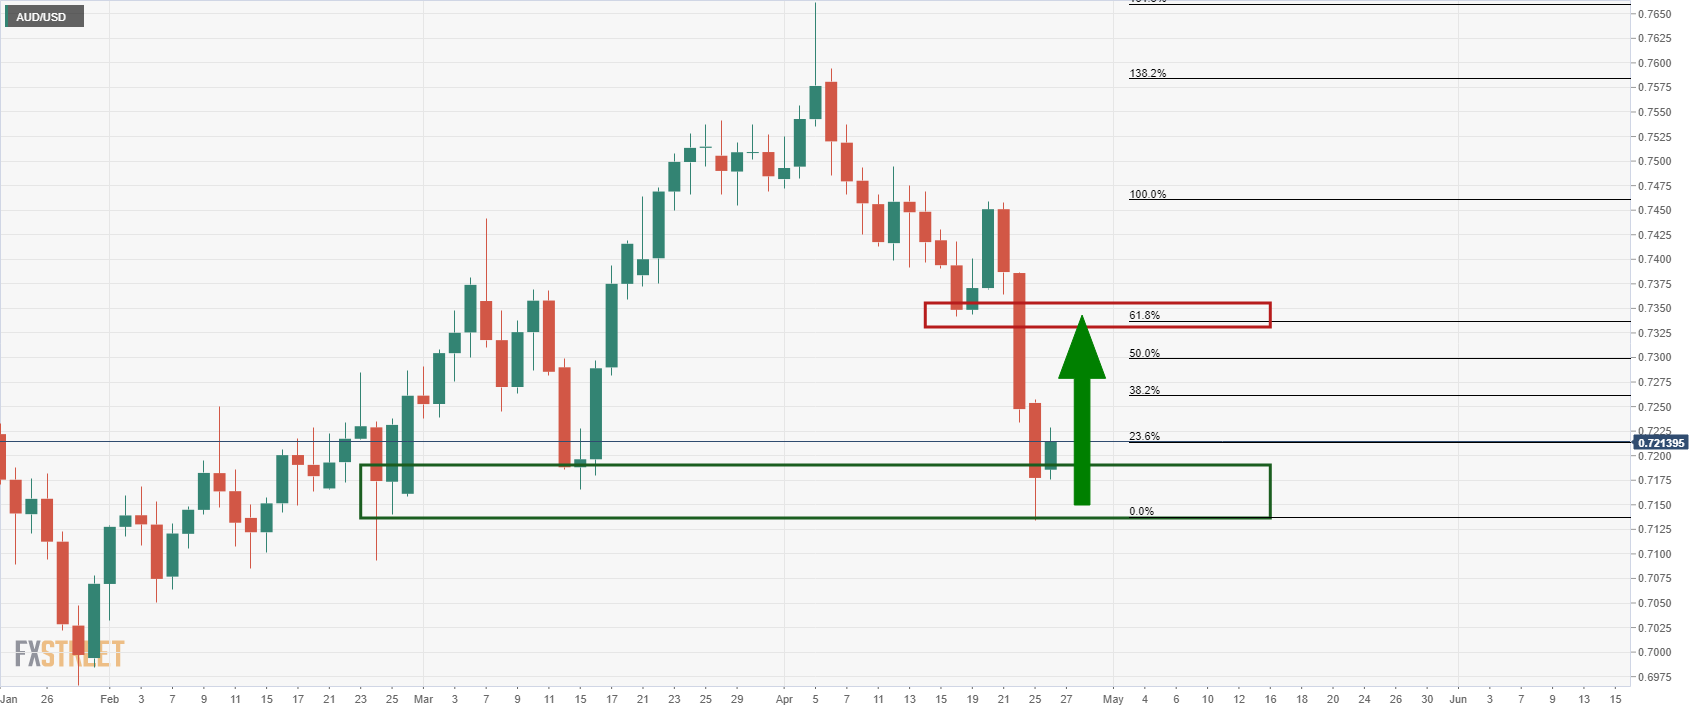
Bulls step in and a correction towards the prior lows could be on the cards for the days ahead. A 38.2% Fibonacci level through 0.7250 would be a reasonable target for the bulls in the first instance, mitigating some of the price imbalance left behind from the daily sell-off.
- USD/JPY is on the back foot amid USD retreat, upbeat Japanese data.
- Improving mood is aiding the recovery in the pair ahead of US data.
- Bull flag is in the making on the daily sticks, with Thursday’s BOJ awaited.
Having failed to find acceptance above 129.00 in the previous week, USD/JPY sellers have regained control, as the downside extends into the second straight day this Tuesday.
The latest decline in the pair could be attributed to the broad-based retreat in the US dollar while Monday’s risk-aversion also kept the safe-haven demand for the yen underpinned.
Over the last hour, however, the market mood is seen improving, adding further to the dollar while helping ease the buying pressure around the yen. At the time of writing, USD/JPY is trimming losses to trade at 127.80, still down 0.24% on the day.
The major reached five-day lows of 127.34 in early Asia after the yen received a fresh boost from the Japanese labor market report, which showed that the country’s jobless rate fell to 2.6% in March, while the availability of jobs increased, per the government data.
All eyes now turn towards the US Durable Goods data due for release later on Tuesday while Thursday’s Bank of Japan (BOJ) policy decision and US Q1 Advance GDP will be the main event risks for the major this week.
Technically, USD/JPY’s daily chart shows that the price is carving out a bull flag formation, in the face of the recent consolidation that followed a vertical rise from March 31.
The BOJ decision could validate the bull flag if the yen slump on a dovish stance reassured by the central bank this Thursday.
A sustained move above 128.70 will confirm the bullish continuation pattern, opening doors towards the 20-year highs of 129.40 once again.
The 14-day Relative Strength Index (RSI) has moved away from extremely overbought territory, offering some hopes for bulls to re-enter.
USD/JPY: Daily chart
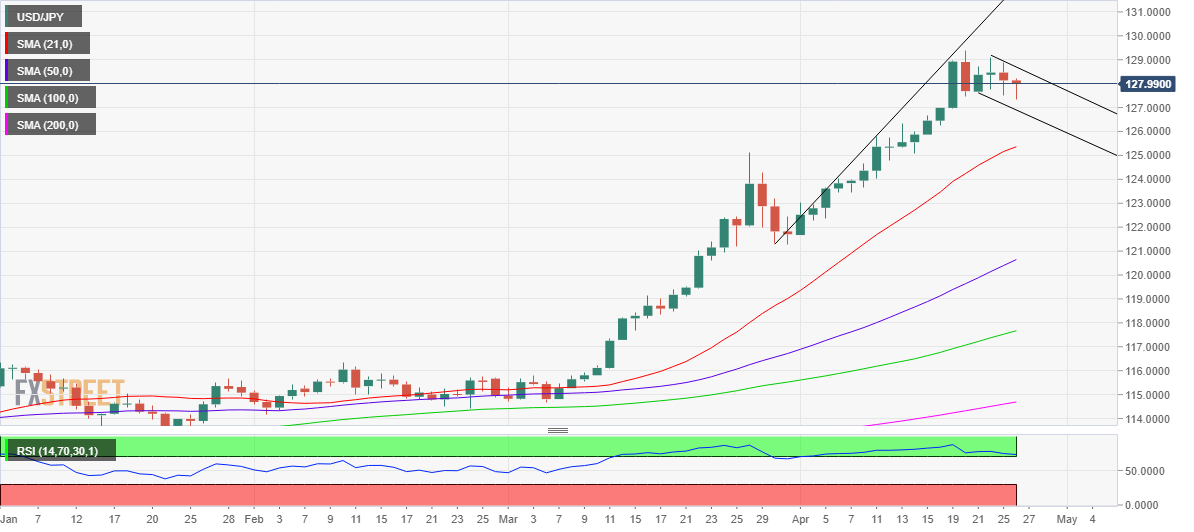
In case of a hawkish pivot from the BOJ or strong verbal intervention, USD/JPY could breach the falling trendline support at 126.70.
Daily closing below the latter will invalidate the bullish formation, prompting bears to resume the correction towards the bullish 21-Daily Moving Average (DMA) at 125.35.
USD/JPY: Additional levels to consider
- GBP/USD bulls seeking a break of 1.2765 in the sessions ahead.
- Bulls eye a significant correction from weekly support.
GBP/USD is an interesting schematic on the charts. Following a negative start to the week, where the weekly chart has extended further to the downside, there are now prospects of a meaningful correction from what could prove to be a firm area of support. The following analysis illustrates this from a bullish bias across the weekly, daily and hourly time frames.
GBP/USD weekly chart
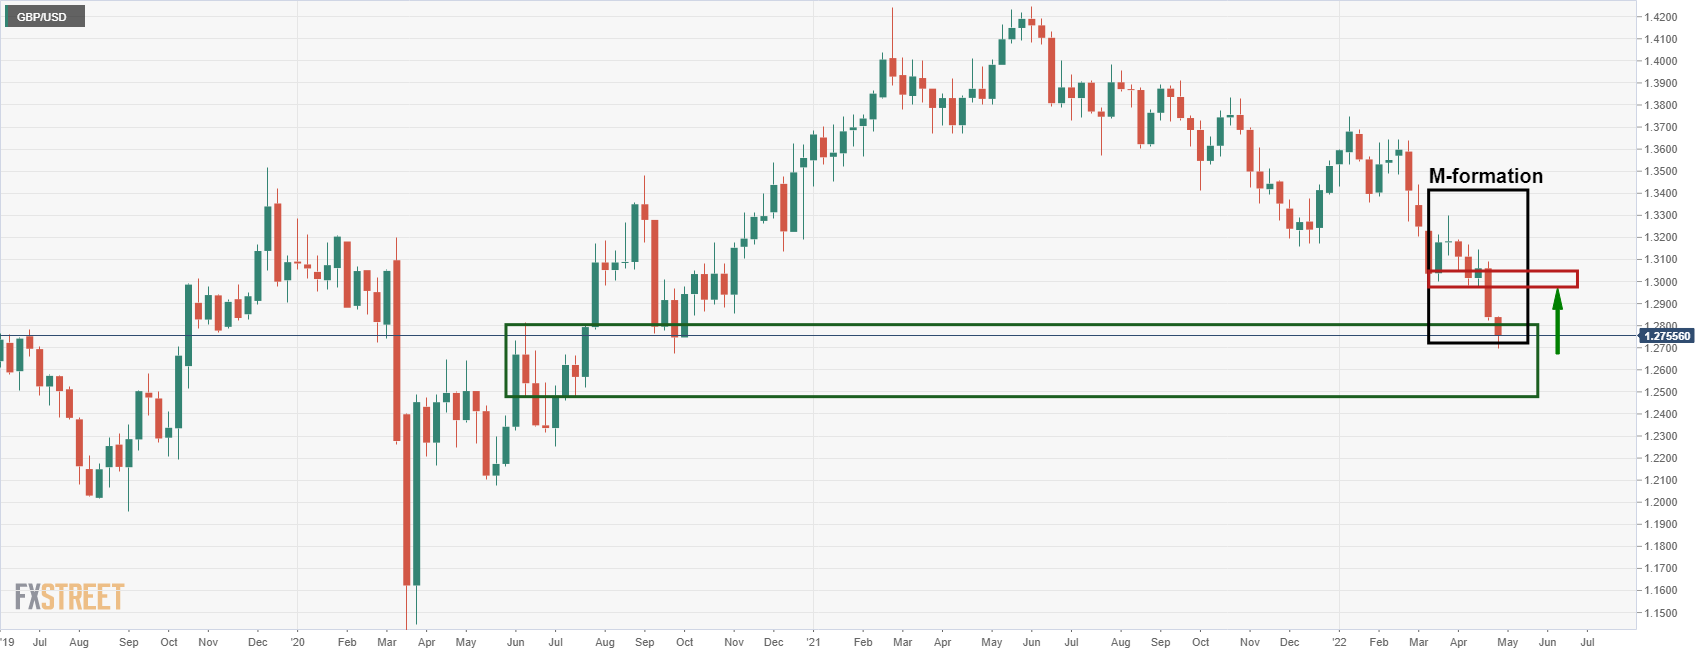
The weekly chart's demand zone could prove to be an interim level of support. The M-formation is a reversion pattern and the price might be expected to retrace towards the old support near 1.2970.
GBP/USD daily chart
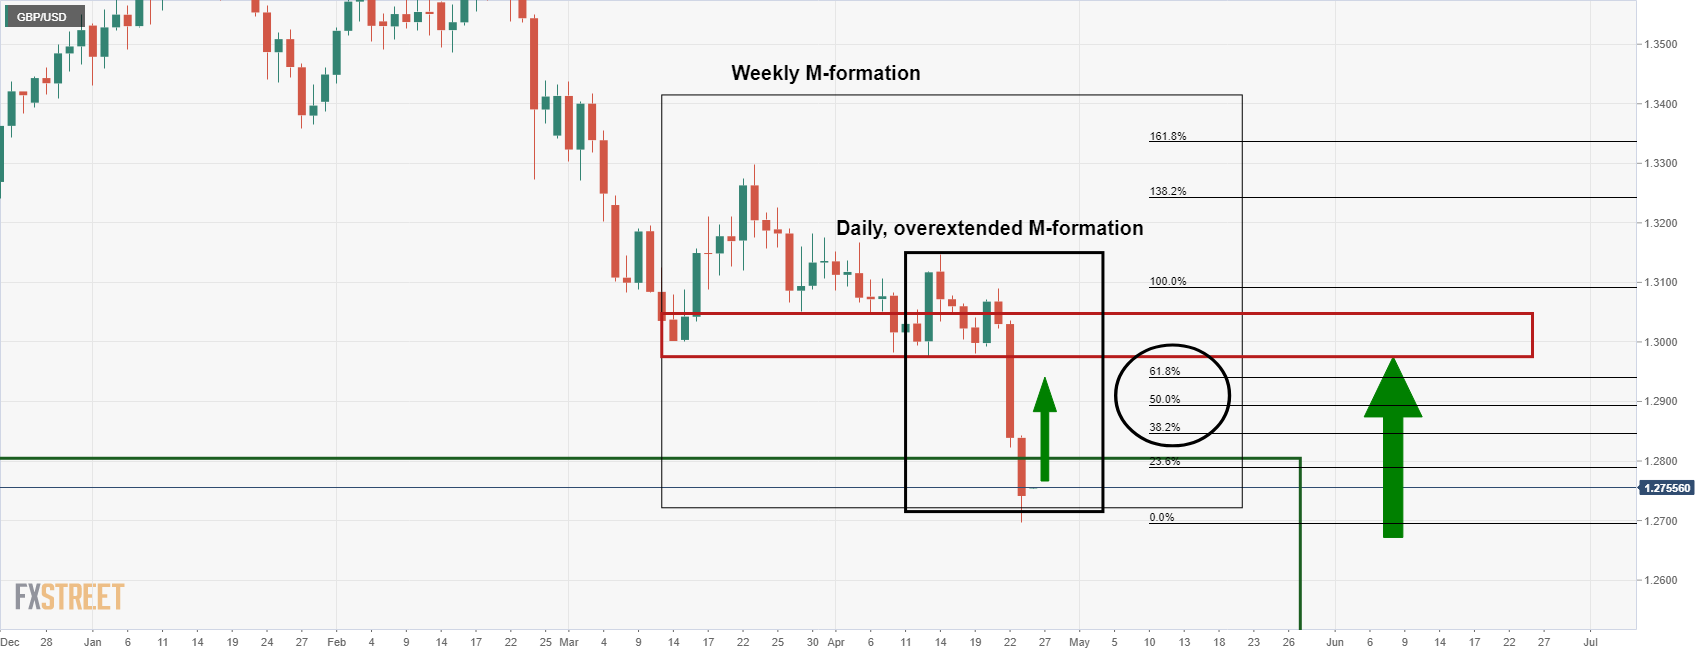
The daily chart also presents an M-formation. However, it is overextended which might see the bears stepping in before the weekly target. The Fibonacci scale can be monitored for potential areas of resistance between the 38.2%, 50% and 61.8% ratios.
GBP/USD H1 chart
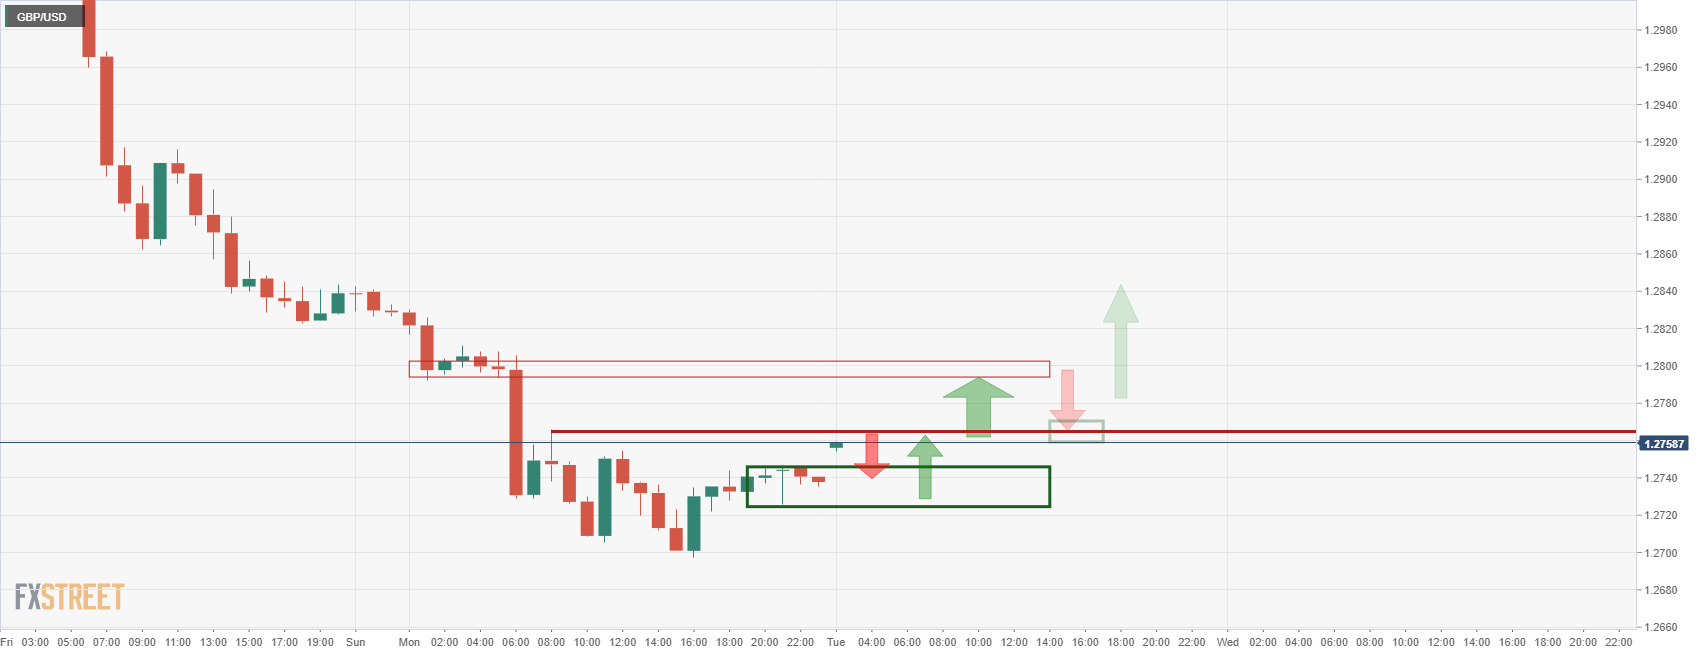
Meanwhile, the price is accumulating on the hourly chart but it has a layer of resistance to get through if the bulls are going to get back control. 1.2765 is key for the immediate future in this respect.
Analysts at Morgan Stanley revised down China’s 2022 GDP growth forecast to 4.2%, in line with the downgrade by Bank of America and Nomura over the last week.
The US banking giant noted that COVID-19 disruption across the economy is leading to the cuts in GDP projections.
On Monday, Analysts at Morgan Stanley lowered their forecasts for Eurozone GDP growth this year and the next to 2.7% and 1.3% respectively.
-
USD/CNY fix: Weakest level since April 2 2021, 6.5590
Japanese Finance Minister Shunichi Suzuki reiterates that his government “will closely watch the impact of recent yen falls on Japan's economy and price with a sense of urgency.”
Additional quotes
FX stability important.
Rapid moves undesirable.
No comment on FX levels.
No truth to reports to Japan / US joint FX intervention.
Separately, Japanese former Deputy Finance Minister Hiroshi Watanabe said that he doesn't believe the government intends to intervene in the forex market right now while speaking in a Bloomberg interview.
Market reaction
USD/JPY is holding the lower ground just below 127.50, losing 0.50% on the day. The broad US dollar retreat combined with a cautious market mood is aiding the downside in the spot.
- USD/CAD consolidates above 1.2700 amid USD retreat, firmer WTI.
- BOC Macklem confirms a 50bps rate hike to counter raging inflation.
- Focus shifts to key US data and BOC Lane’s speech.
USD/CAD is on the back foot, keeping its range above 1.2700 amid a broad pullback in the US dollar and firmer WTI prices.
The US dollar is seeing a bit of a correction against its major peers after opening the week with a bang amid strong risk-aversion, spurred by global growth fears on raging inflation and hawkish Fed bets.
Meanwhile, WTI is staging a modest comeback after the previous meltdown on demand concerns after covid outbreaks in China spread to the capital, with markets speculating the risks of a lockdown in Beijing. Note that China is the world’s second-biggest oil consumer.
The US oil is currently trading at $98.80, looking to extend its recovery mode from weekly lows of $95.07 reached Monday.
Additionally, the Canadian dollar continues to draw support from hawkish remarks from Bank of Canada (BOC) Governor Tiff Macklem. Speaking with the Federal Finance Committee on Monday, Macklem said the BOC was considering a second consecutive 0.5% increase in an effort to tackle runaway inflation.
Looking ahead, the pair will continue to follow the price action in the dollar, as well as, the US oil, in absence of any top-tier economic releases from the US and Canada. Although the speech by Bank of Canada (BOC) Governor Tiff Macklem will also hog the limelight.
Next of relevance for the major remains the US Durable Goods and CB Consumer Confidence data due later in the NA session this Tuesday. Also, of note remains the speech by the BOC Deputy Governor Timothy Lane.
USD/CAD: Technical levels to consider
| Raw materials | Closed | Change, % |
|---|---|---|
| Brent | 102.66 | -2.44 |
| Silver | 23.597 | -2.29 |
| Gold | 1897.63 | -1.78 |
| Palladium | 2142.23 | -8.73 |
- EUR/USD has witnessed a minute bounce after nosediving to near 1.0700.
- The ECB will move to rate hike measures after concluding the APP.
- The greenback will remain strengthened on a prolonged liquidity shrinking plan.
The EUR/USD pair is displaying a minor bounce after dropping to near the psychological support of 1.0700 in the Asian session. The pair has been plunging from a few trading sessions amid renewed fears of stagflation in the eurozone and a stronger greenback on progressive odds of a jumbo rate hike by the Federal Reserve (Fed) in May.
The insights from the testimony of European Central Bank (ECB) President Christine Lagarde have cleared that a rate hike from the ECB is a little far still now. The ECB official stated that the conclusion of the Asset Purchase Program (APP) will be followed by a rate hike. The APP will conclude in the third quarter of this year, therefore investors should brace for a rate hike by the end of the year. Apart from that, ECB sees a decent slash in the growth forecasts along with soaring inflation this year. The Ukraine crisis has complicated the situation for the ECB and it is unable to follow the footprints of other Western leaders.
Meanwhile, the US dollar index (DXY) has witnessed a minor sell-off from its recent high at 101.86. The dictations from Fed chair Jerome Powell and his colleagues are signaling that the Fed will return to the neutral rates at a quick pace. A rate hike by 50 basis points (bps) in May seems next to confirm and one more jumbo rate hike this year is highly likely. This will continue to strengthen the greenback against the shared currency.
- The oil prices seek more filters despite the breakout of an ascending triangle.
- Short-term to long-term EMAs are overlapping each other which indicates a consolidative move ahead.
- A responsive buying activity at descending trendline signals a short-term cushion in the asset.
West Texas Intermediate (WTI), futures on NYMEX, has witnessed a decent rebound after slipping near the round level support at $95.00. The oil prices have attracted bids after a sheer downside from April 18 high at $109.13. Considering the price action, some back and forth wild moves could be displayed by the asset going forward.
The asset is auctioning above the descending triangle chart pattern whose descending trendline placed from March’s high at $126.51, followed by March 24 high at $115.87. The horizontal support is plotted from March’s low at $92.37. The asset is still finding support despite giving a breakout of the descending triangle formation.
The 20- and 200-period Exponential Moving Averages (EMAs) at $100.12 and $101.36 respectively are overlapping each other, which signals volatility contraction and lackluster performance going forward.
Meanwhile, the Relative Strength Index (RSI) (14) has bounced after slipping below 40.00. This indicates a responsive buying activity as investors are considering it a value bet.
A decisive breach above the 200-EMA at $101.36 will drive the asset towards April 13 high at $104.02, followed by Monday’s high at $109.13.
On the flip side, the asset may lose strength if it drops below April 24 low at $95.07. This will drag oil prices to March 15 low and February 25 low at $92.37 and $89.59 respectively.
WTI four-hour chart
-637865332638656009.png)
In recent trade today, the People’s Bank of China (PBOC) set the yuan (CNY) at 6.5590 vs. the estimate of 6.5585 and the last close of 6.5615.
Today's fix was the weakest level since April 2 2021.
About the fix
China maintains strict control of the yuan’s rate on the mainland.
The onshore yuan (CNY) differs from the offshore one (CNH) in trading restrictions, this last one is not as tightly controlled.
Each morning, the People’s Bank of China (PBOC) sets a so-called daily midpoint fix, based on the yuan’s previous day closing level and quotations taken from the inter-bank dealer.
- AUD/USD is stalling on the offer and the bulls eye the Fibonacci scale.
- A significant correction could be on the cards for the days ahead.
AUD/USD is correcting the heavy losses from the start of this week and is higher by some 0.2% at the time of writing after rallying from a low of 0.7169 to a high of 0.7191 so far. The following illustrates the potential for an upside recovery into test the prior lows from current support on the daily time frame and how this might play out on the hourly:
AUD/USD daily chart
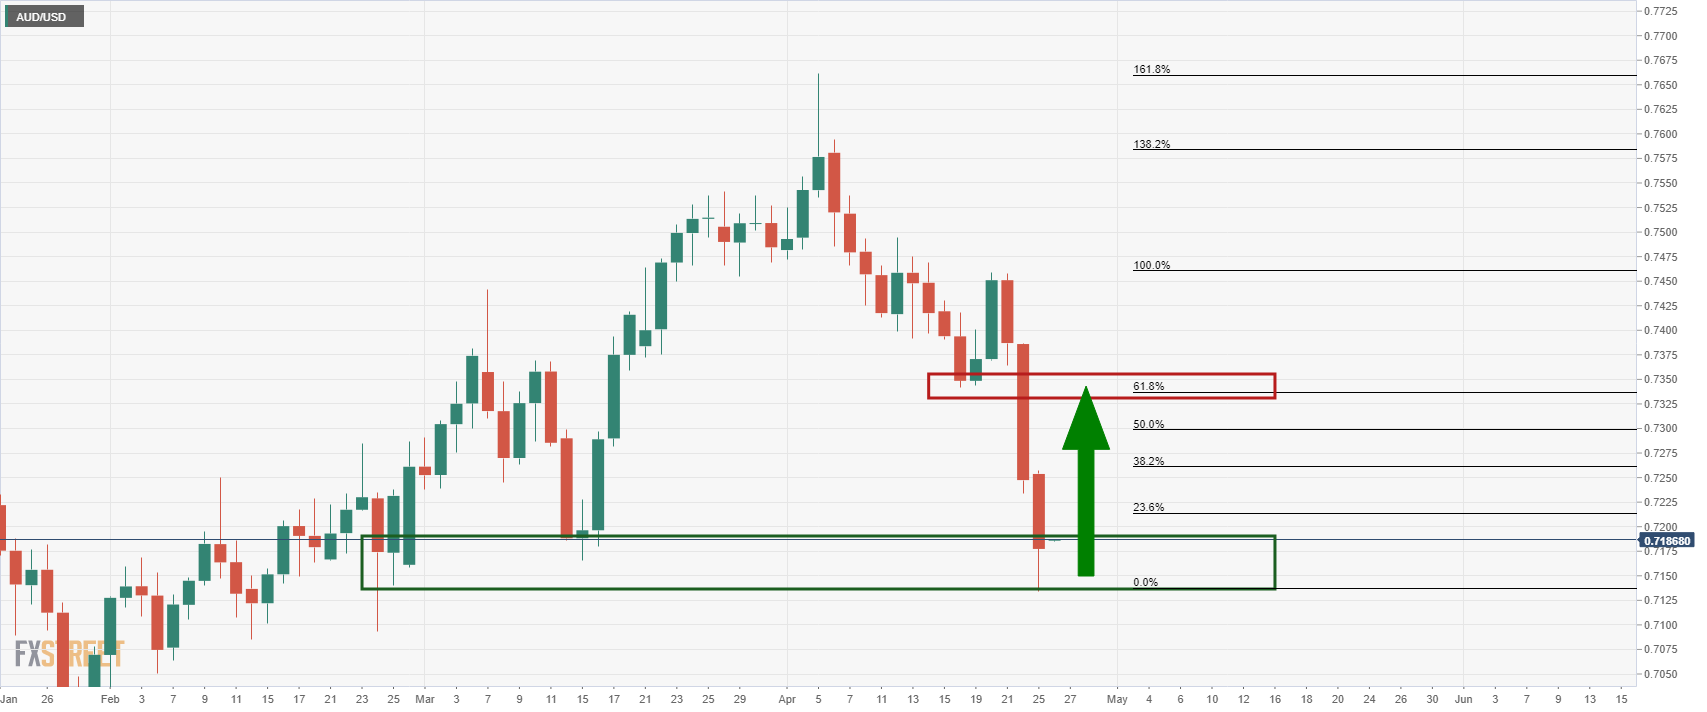
The price has fallen into a demand area on the daily chart where a phase of accumulation could playout for the days ahead. In doing so, the price n the lower time frames would be expected to form a bullish market structure from which bulls will be looking to engage from with a view to mitigating the price imbalance left behind from the past few sessions of supply.
AUD/USD H1 chart
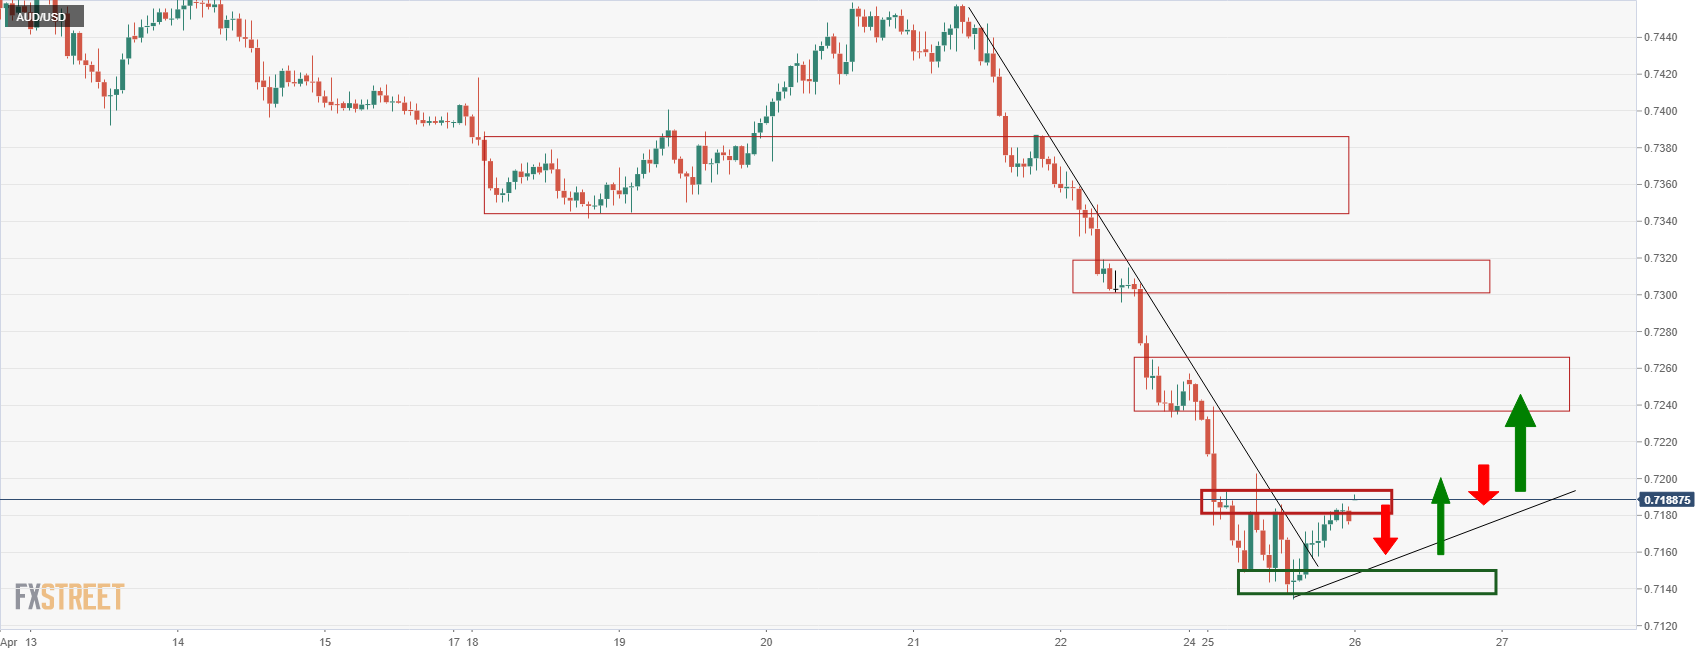
On the other hand, should the US dollar continue to firm, then a break of the current lows opens prospects of a break of 0.70 the figure for the days ahead:
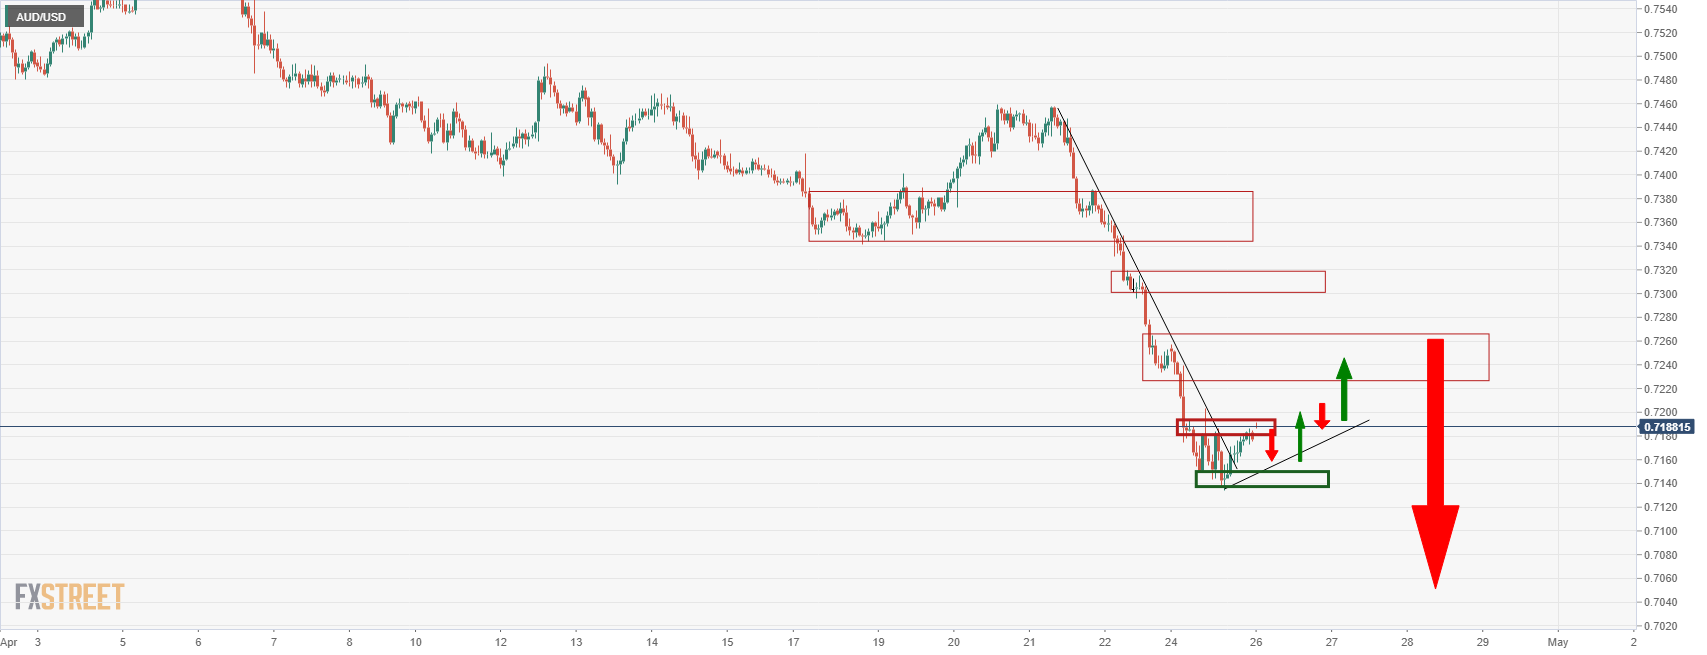
| Index | Change, points | Closed | Change, % |
|---|---|---|---|
| NIKKEI 225 | -514.48 | 26590.78 | -1.9 |
| Hang Seng | -769.18 | 19869.34 | -3.73 |
| KOSPI | -47.58 | 2657.13 | -1.76 |
| FTSE 100 | -141.16 | 7380.54 | -1.88 |
| DAX | -217.92 | 13924.17 | -1.54 |
| CAC 40 | -132.04 | 6449.38 | -2.01 |
| Dow Jones | 238.06 | 34049.46 | 0.7 |
| S&P 500 | 24.34 | 4296.12 | 0.57 |
| NASDAQ Composite | 165.56 | 13004.85 | 1.29 |
- USD/JPY has recorded a vertical downside a little later than the release of Japan’s Unemployment Rate.
- Lower-than-expected Jobless Rate of 2.6% has underpinned the Japanese yen.
- The DXY is facing the headwinds as the momentum oscillators have turned extremely overbought.
The USD/JPY pair has slipped to near 127.70 as the Statistics Bureau of Japan has reported the Unemployment Rate at 2.6%, lower than the forecast and prior print of 2.7%. A modest fall has been recorded in the asset after the release of the labor market data. The improvement in the labor market has underpinned the Japanese yen against the greenback. Also, the Jobs/Applicants ratio has landed a 1.22, in line with the market forecasts but a little higher than the prior print of 1.21%.
An extremely tight labor market in Japan has brought an intense sell-off in the counter. On a broader note, the Japanese yen is experiencing a bullish pullback after consistently drifting lower on ultra-loose monetary policy. The Bank of Japan (BOJ) is keeping a dovish stance on liquidity status as the economy has not yet reached its pre-pandemic levels. It won’t be wrong to say that profit-booking is dragging the asset lower, however, the long-term bullish stance is still intact.
On the dollar front, the US dollar index (DXY) is facing barricades while attempting a touch to 102.00. The DXY is facing the headwinds of a little extended upside as the momentum oscillators have turned extremely overbought on various timeframes. Higher expectations of a jumbo rate hike by the Federal Reserve (Fed) in its May monetary policy are continuously keeping the bulls in the driving seat. Meanwhile, the 10-year US Treasury yields have failed to reclaim 3% for the very first time in the past three years.
| Pare | Closed | Change, % |
|---|---|---|
| AUDUSD | 0.7182 | -0.89 |
| EURJPY | 137.304 | -1.1 |
| EURUSD | 1.0712 | -0.87 |
| GBPJPY | 163.323 | -0.98 |
| GBPUSD | 1.27423 | -0.75 |
| NZDUSD | 0.66202 | -0.23 |
| USDCAD | 1.2733 | 0.2 |
| USDCHF | 0.95897 | 0.26 |
| USDJPY | 128.188 | -0.25 |
IMF Asia states that the Bank of Japan is very appropriately continuing to conduct accommodative monetary policy as inflation has yet to pick up significantly in Japan.
The following are comments coming from IMF's Gukde Wolf, the Deputy Director of Asa and Pacific.
- Asian region faces a stagflationary outlook with growth being lower than previously expected and inflation being higher.
- The larger-than-expected slowdown in china due to prolonged or more widespread lockdowns, a longer-than-expected slump in the property market, constitutes to be a significant risk for Asia
- Monetary tightening will be needed in most countries, with speed of tightening depending on domestic inflation developments and external pressures.
- Despite recent uptick, inflation remains subdued in Japan, allowing BoJ to be more accommodative than the Fed and ECB.
- Imports become more expensive for Japan with weak yen, but exports also increase and offsets the impact.
- We do see scope for Japan to take support for households in very targeted matter to mitigate impact from weak yen.
There has been no reaction to the comments in the market, but the yen is firm in the Tokyo open, printing a high of 127.55 so far vs the greenback.
© 2000-2026. All rights reserved.
This site is managed by Teletrade D.J. LLC 2351 LLC 2022 (Euro House, Richmond Hill Road, Kingstown, VC0100, St. Vincent and the Grenadines).
The information on this website is for informational purposes only and does not constitute any investment advice.
The company does not serve or provide services to customers who are residents of the US, Canada, Iran, The Democratic People's Republic of Korea, Yemen and FATF blacklisted countries.
Making transactions on financial markets with marginal financial instruments opens up wide possibilities and allows investors who are willing to take risks to earn high profits, carrying a potentially high risk of losses at the same time. Therefore you should responsibly approach the issue of choosing the appropriate investment strategy, taking the available resources into account, before starting trading.
Use of the information: full or partial use of materials from this website must always be referenced to TeleTrade as the source of information. Use of the materials on the Internet must be accompanied by a hyperlink to teletrade.org. Automatic import of materials and information from this website is prohibited.
Please contact our PR department if you have any questions or need assistance at pr@teletrade.global.


