- Analytics
- News and Tools
- Market News
CFD Markets News and Forecasts — 25-09-2024
- EUR/USD fell four-tenths of a percent after flubbing the 1.12 handle on Wednesday.
- Markets pivoted into Greenback bids in the midweek market session.
- US economic data and Fedspeak to dominate market cycle for the rest of the week.
EUR/USD pulled back on Wednesday, tumbling back through the 1.1200 handle and falling into familiar near-term congestion just north of 1.1100. Fiber shed nearly half of a percent after briefly setting a new 14-month high this week.
Thursday brings an entire raft of speeches from central banks, with an appearance from European Central Bank (ECB) President Christine Lagarde, as well as talking points from ECB Executive Board Member Isabel Schnabel. Friday will follow with a full slates of consumer and business sentiment surveys for September from the pan-EU economic area.
US consumer confidence indicators fell this week as the average US consumer doesn’t share in the stock market’s exuberance over Fed rate cuts, with key confidence readings falling to their lowest levels in three years and consumer inflation expectations for the next 12 months ticking higher. This Friday will see a fresh update to US Personal Consumption Expenditure (PCE) inflation figures.
New home sales also fell in August, declining 4.7% to 716K from the previous month’s revised 751K. Meanwhile, investors will see another print of US Gross Domestic Product (GDP) growth for the second quarter, expected to hold steady at 3.0% on an annualized basis. Thursday will also bring a slew of speeches and public appearances from several Fed officials, including Fed Chair Jerome Powell.
Economic Indicator
New Home Sales Change (MoM)
The number of New Home sales released by the US Census Bureau is an important measure of housing market conditions. House buyers spend money on furnishing and financing their homes so as a result the demand for goods, services and the employees is stimulated. Generally, a high reading is seen as bullish for the USD, whereas a low reading is seen as bearish.
Read more.Last release: Wed Sep 25, 2024 14:00
Frequency: Monthly
Actual: -4.7%
Consensus: -
Previous: 10.6%
Source: US Census Bureau
EUR/USD price forecast
Despite notching in a quick, fresh 14-month high on Wednesday, Fiber tumbled back through the 1.1200 handle in short order, plunging back into near-term consolidation after markets pivoted back into bidding the Greenback higher. EUR/USD is still deep in bull country, trading well north of the 50-day Exponential Moving Average (EMA) near 1.1030.
EUR/USD daily chart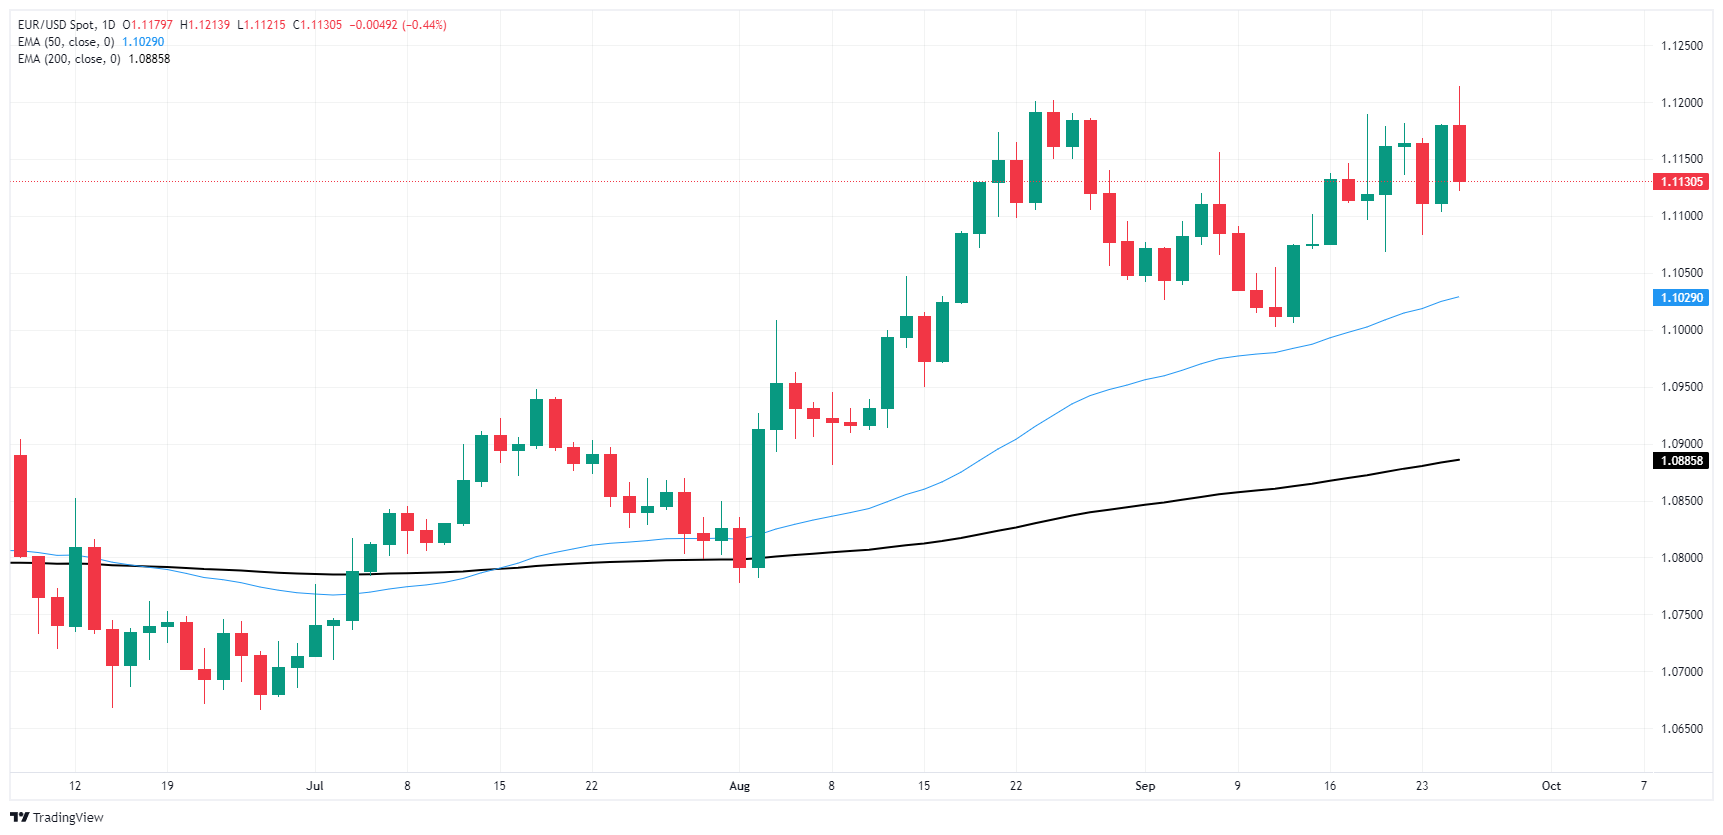
Euro FAQs
The Euro is the currency for the 20 European Union countries that belong to the Eurozone. It is the second most heavily traded currency in the world behind the US Dollar. In 2022, it accounted for 31% of all foreign exchange transactions, with an average daily turnover of over $2.2 trillion a day. EUR/USD is the most heavily traded currency pair in the world, accounting for an estimated 30% off all transactions, followed by EUR/JPY (4%), EUR/GBP (3%) and EUR/AUD (2%).
The European Central Bank (ECB) in Frankfurt, Germany, is the reserve bank for the Eurozone. The ECB sets interest rates and manages monetary policy. The ECB’s primary mandate is to maintain price stability, which means either controlling inflation or stimulating growth. Its primary tool is the raising or lowering of interest rates. Relatively high interest rates – or the expectation of higher rates – will usually benefit the Euro and vice versa. The ECB Governing Council makes monetary policy decisions at meetings held eight times a year. Decisions are made by heads of the Eurozone national banks and six permanent members, including the President of the ECB, Christine Lagarde.
Eurozone inflation data, measured by the Harmonized Index of Consumer Prices (HICP), is an important econometric for the Euro. If inflation rises more than expected, especially if above the ECB’s 2% target, it obliges the ECB to raise interest rates to bring it back under control. Relatively high interest rates compared to its counterparts will usually benefit the Euro, as it makes the region more attractive as a place for global investors to park their money.
Data releases gauge the health of the economy and can impact on the Euro. Indicators such as GDP, Manufacturing and Services PMIs, employment, and consumer sentiment surveys can all influence the direction of the single currency. A strong economy is good for the Euro. Not only does it attract more foreign investment but it may encourage the ECB to put up interest rates, which will directly strengthen the Euro. Otherwise, if economic data is weak, the Euro is likely to fall. Economic data for the four largest economies in the euro area (Germany, France, Italy and Spain) are especially significant, as they account for 75% of the Eurozone’s economy.
Another significant data release for the Euro is the Trade Balance. This indicator measures the difference between what a country earns from its exports and what it spends on imports over a given period. If a country produces highly sought after exports then its currency will gain in value purely from the extra demand created from foreign buyers seeking to purchase these goods. Therefore, a positive net Trade Balance strengthens a currency and vice versa for a negative balance.
- GBP/USD turned bearish and dropped back below 1.34 on Wednesday.
- Markets pared back their recent tilt into a Pound Sterling bull run.
- The US Dollar recovered ground as investors weigh the state of the US economy.
GBP/USD struck an abnormally nearish tone on Wednesday, plunging back below the 1.3400 handle amid a broad-market pullback from full-bore risk appetite. The Pound Sterling paused its recent one-sided trend into the high side, while the Greenback pared recent losses.
The Pound Sterling will be entirely absent from the economic calendar data docket for the remainder of the week, leaving GBP/USD traders to grapple with Friday’s upcoming US inflation print.
US consumer confidence indicators fell this week as the average US consumer doesn’t share in the stock market’s exuberance over Fed rate cuts, with key confidence readings falling to their lowest levels in three years and consumer inflation expectations for the next 12 months ticking higher. This Friday will see a fresh update to US Personal Consumption Expenditure (PCE) inflation figures.
New home sales also fell in August, declining 4.7% to 716K from the previous month’s revised 751K. Meanwhile, investors will see another print of US Gross Domestic Product (GDP) growth for the second quarter, expected to hold steady at 3.0% on an annualized basis. Thursday will also bring a slew of speeches and public appearances from several Fed officials, including Fed Chair Jerome Powell.
Economic Indicator
New Home Sales Change (MoM)
The number of New Home sales released by the US Census Bureau is an important measure of housing market conditions. House buyers spend money on furnishing and financing their homes so as a result the demand for goods, services and the employees is stimulated. Generally, a high reading is seen as bullish for the USD, whereas a low reading is seen as bearish.
Read more.Last release: Wed Sep 25, 2024 14:00
Frequency: Monthly
Actual: -4.7%
Consensus: -
Previous: 10.6%
Source: US Census Bureau
GBP/USD price forecast
Wednesday’s bearish reversal has pulled Cable back below 1.3400, and price action is poised for a continuation into the low side. Particularly brassve short sellers will be targeting the 50-day Exponential Moving Average (EMA) all the way down at 1.3062. GBP/USD bidders will be looking to recover ground back into 30-month highs set this week at 1.3430.
GBP/USD daily chart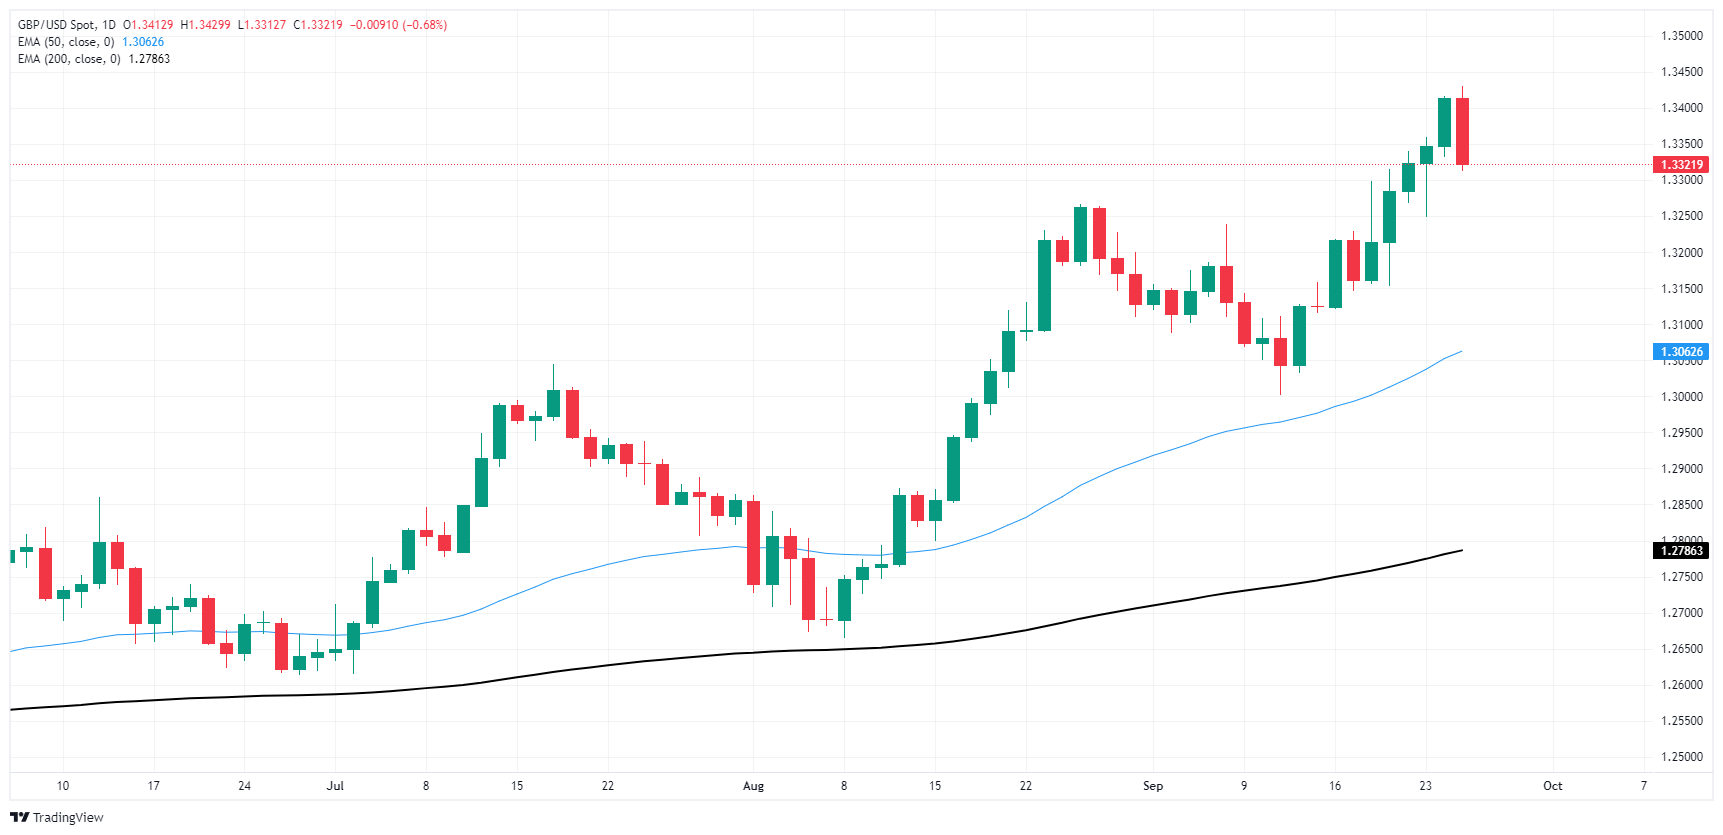
Pound Sterling FAQs
The Pound Sterling (GBP) is the oldest currency in the world (886 AD) and the official currency of the United Kingdom. It is the fourth most traded unit for foreign exchange (FX) in the world, accounting for 12% of all transactions, averaging $630 billion a day, according to 2022 data. Its key trading pairs are GBP/USD, aka ‘Cable’, which accounts for 11% of FX, GBP/JPY, or the ‘Dragon’ as it is known by traders (3%), and EUR/GBP (2%). The Pound Sterling is issued by the Bank of England (BoE).
The single most important factor influencing the value of the Pound Sterling is monetary policy decided by the Bank of England. The BoE bases its decisions on whether it has achieved its primary goal of “price stability” – a steady inflation rate of around 2%. Its primary tool for achieving this is the adjustment of interest rates. When inflation is too high, the BoE will try to rein it in by raising interest rates, making it more expensive for people and businesses to access credit. This is generally positive for GBP, as higher interest rates make the UK a more attractive place for global investors to park their money. When inflation falls too low it is a sign economic growth is slowing. In this scenario, the BoE will consider lowering interest rates to cheapen credit so businesses will borrow more to invest in growth-generating projects.
Data releases gauge the health of the economy and can impact the value of the Pound Sterling. Indicators such as GDP, Manufacturing and Services PMIs, and employment can all influence the direction of the GBP. A strong economy is good for Sterling. Not only does it attract more foreign investment but it may encourage the BoE to put up interest rates, which will directly strengthen GBP. Otherwise, if economic data is weak, the Pound Sterling is likely to fall.
Another significant data release for the Pound Sterling is the Trade Balance. This indicator measures the difference between what a country earns from its exports and what it spends on imports over a given period. If a country produces highly sought-after exports, its currency will benefit purely from the extra demand created from foreign buyers seeking to purchase these goods. Therefore, a positive net Trade Balance strengthens a currency and vice versa for a negative balance.
Federal Reserve Governor Adriana Kugler said on Wednesday that she “strongly supported” the Fed’s decision to cut the interest rates by a half point last week. Kugler further stated that it will be appropriate to make additional rate cuts if inflation continues to ease as expected, per Bloomberg.
Key quotes
Says she will support additional rate cuts going forward.
Fed should keep focusing on reducing inflation and also shift attention to maximum employment.
Estimates of PCE inflation at 2.2% in August, Core PCE at 2.7% in signs of progress towards goal.
May take some time to feel that prices are back to normal.
There has been a significant moderation in the labor market recently.
Expect spending to grow at a somewhat more moderate pace moving forward.
Fed must now ‘balance. Its focus' is to continue to make progress on inflation while avoiding unnecessary pain in the economy.
We're at a place where we don't want labor market to weaken further.
Makes sense to shift attention to the employment mandate.
Inflation measures excluding housing are near 2%, but that's not what we target.
We are making very good progress, but not at 2% yet.
I don't see that we will overshoot on inflation.
It will still take us some time to get to 2% inflation.
We have begun to recalibrate rates.
We need to continue normalizing rates.
Maybe some Fed policymakers would be willing to move expected 2025 rate cuts forward to 2024, or vice versa, depending on data.
We don't pay a whole lot of attention to the neutral rate because there is a lot of uncertainty about it.
Below 100K monthly job gain would be 'very low', must be mindful of potential downward revisions.
The breakeven number for monthly job gains is anywhere from 100K to 240K.
The policy is restrictive.
With disinflation, we need to cut even to just keep where we are in terms of restiveness.
Market reaction
The US Dollar Index (DXY) is trading 0.01% higher on the day at 100.93, as of writing.
Fed FAQs
Monetary policy in the US is shaped by the Federal Reserve (Fed). The Fed has two mandates: to achieve price stability and foster full employment. Its primary tool to achieve these goals is by adjusting interest rates. When prices are rising too quickly and inflation is above the Fed’s 2% target, it raises interest rates, increasing borrowing costs throughout the economy. This results in a stronger US Dollar (USD) as it makes the US a more attractive place for international investors to park their money. When inflation falls below 2% or the Unemployment Rate is too high, the Fed may lower interest rates to encourage borrowing, which weighs on the Greenback.
The Federal Reserve (Fed) holds eight policy meetings a year, where the Federal Open Market Committee (FOMC) assesses economic conditions and makes monetary policy decisions. The FOMC is attended by twelve Fed officials – the seven members of the Board of Governors, the president of the Federal Reserve Bank of New York, and four of the remaining eleven regional Reserve Bank presidents, who serve one-year terms on a rotating basis.
In extreme situations, the Federal Reserve may resort to a policy named Quantitative Easing (QE). QE is the process by which the Fed substantially increases the flow of credit in a stuck financial system. It is a non-standard policy measure used during crises or when inflation is extremely low. It was the Fed’s weapon of choice during the Great Financial Crisis in 2008. It involves the Fed printing more Dollars and using them to buy high grade bonds from financial institutions. QE usually weakens the US Dollar.
Quantitative tightening (QT) is the reverse process of QE, whereby the Federal Reserve stops buying bonds from financial institutions and does not reinvest the principal from the bonds it holds maturing, to purchase new bonds. It is usually positive for the value of the US Dollar.
- USD/CAD trades flat near 1.3485 in Thursday’s early Asian session.
- Dovish Fed might continue to undermine the US dollar in the near term.
- BoC’s Macklem said it's reasonable to expect more rate cuts.
The USD/CAD pair flatlines around 1.3485 after retracing to 1.3420, the lowest level since March 8, during the early Asian session on Thursday. Investors ponder the Federal Reserve’s (Fed) path of rate cuts and digest US housing market data. The Fed’s Chair Jerome Powell speech will take center stage later in the day.
Traders await fresh catalysts after last week’s jumbo rate cut by 50 basis points (bps) by the US central bank. Fed Governor Adriana Kugler said on Wednesday that she “strongly supported” the central bank’s decision last week, adding that it would be appropriate to cut further rates if inflation continues to ease as expected. The dovish comments from the Fed officials are likely to exert some selling pressure on the Greenback in the near term.
Sales of new homes in the US fell 4.7% MoM to 716,000 in August from a revised 751,000 in July, the Commerce Department reported Wednesday. This figure came in better than the expectations.
Later on Thursday, the Fed’s Susan Collins, Adriana Kugler, Michelle Bowman, John Williams, Michael Barr, Neel Kashkari and Jerome Powell are scheduled to speak. Traders will take cues from the remarks as they might offer some hints about the US interest rate outlook. Also, the US weekly Initial Jobless Claims, Durable Goods Orders and final US Gross Domestic Product (GDP) Annualized for the second quarter (Q2) will be published.
The Bank of Canada (BoC) Governor Tiff Macklem said on Tuesday that the central bank has made in bringing inflation back down to the 2% target, so it is reasonable to expect more rate cuts. The BoC’s next interest rate decision is scheduled for October 23, and the money markets see over 58% possibility of 50 bps rate cuts. Another 25 bps cut is priced in for its last meeting of the year in December.
Canadian Dollar FAQs
The key factors driving the Canadian Dollar (CAD) are the level of interest rates set by the Bank of Canada (BoC), the price of Oil, Canada’s largest export, the health of its economy, inflation and the Trade Balance, which is the difference between the value of Canada’s exports versus its imports. Other factors include market sentiment – whether investors are taking on more risky assets (risk-on) or seeking safe-havens (risk-off) – with risk-on being CAD-positive. As its largest trading partner, the health of the US economy is also a key factor influencing the Canadian Dollar.
The Bank of Canada (BoC) has a significant influence on the Canadian Dollar by setting the level of interest rates that banks can lend to one another. This influences the level of interest rates for everyone. The main goal of the BoC is to maintain inflation at 1-3% by adjusting interest rates up or down. Relatively higher interest rates tend to be positive for the CAD. The Bank of Canada can also use quantitative easing and tightening to influence credit conditions, with the former CAD-negative and the latter CAD-positive.
The price of Oil is a key factor impacting the value of the Canadian Dollar. Petroleum is Canada’s biggest export, so Oil price tends to have an immediate impact on the CAD value. Generally, if Oil price rises CAD also goes up, as aggregate demand for the currency increases. The opposite is the case if the price of Oil falls. Higher Oil prices also tend to result in a greater likelihood of a positive Trade Balance, which is also supportive of the CAD.
While inflation had always traditionally been thought of as a negative factor for a currency since it lowers the value of money, the opposite has actually been the case in modern times with the relaxation of cross-border capital controls. Higher inflation tends to lead central banks to put up interest rates which attracts more capital inflows from global investors seeking a lucrative place to keep their money. This increases demand for the local currency, which in Canada’s case is the Canadian Dollar.
Macroeconomic data releases gauge the health of the economy and can have an impact on the Canadian Dollar. Indicators such as GDP, Manufacturing and Services PMIs, employment, and consumer sentiment surveys can all influence the direction of the CAD. A strong economy is good for the Canadian Dollar. Not only does it attract more foreign investment but it may encourage the Bank of Canada to put up interest rates, leading to a stronger currency. If economic data is weak, however, the CAD is likely to fall.
- NZD/JPY snaps a seven-day streak and consolidates above 90.00.
- RSI holds near 60, indicating bullish momentum; MACD flat, suggests flattening buying pressure.
- Bulls target resistance at 91.00, breakout could extend gains.
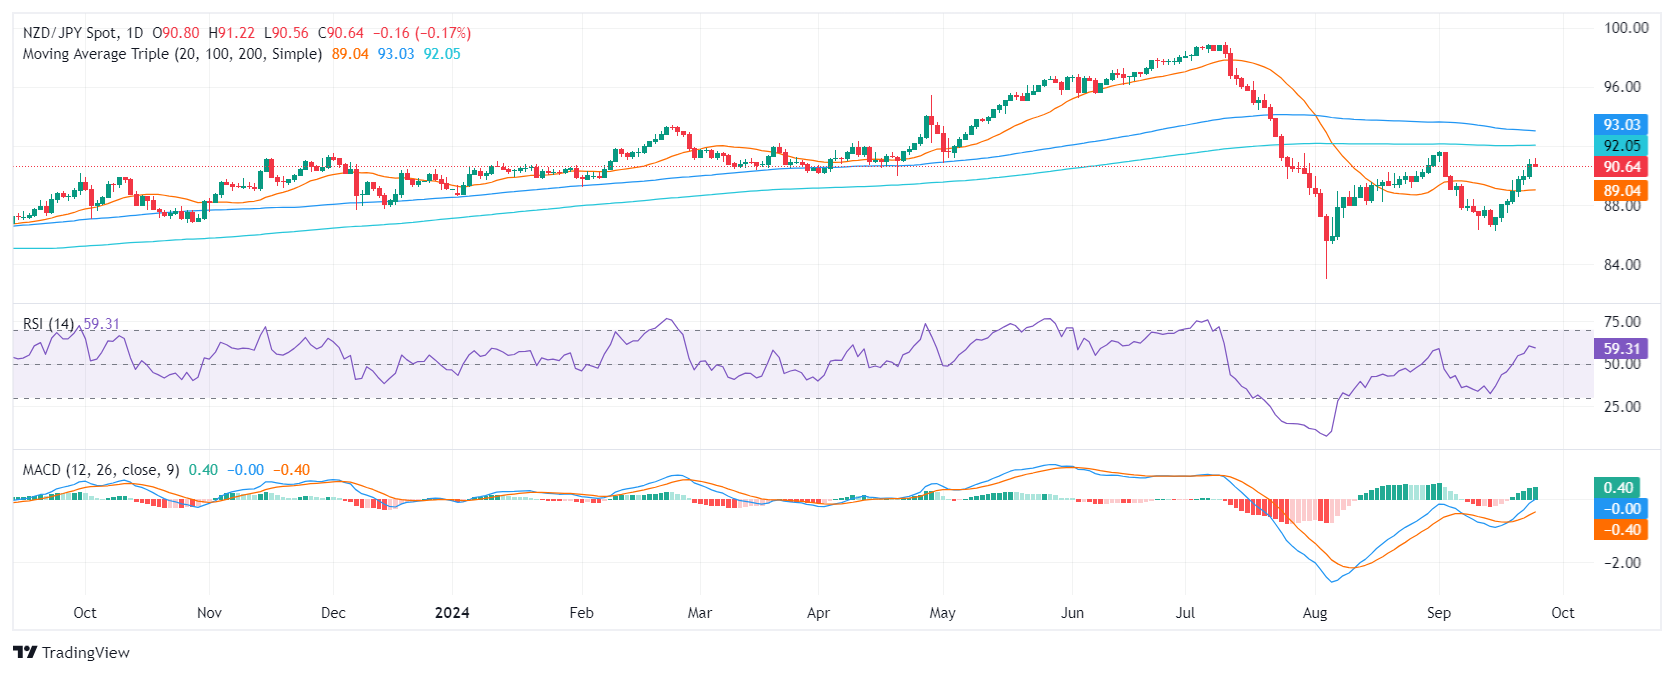
The NZD/JPY pair, after posting a 0.20% drop on Wednesday, continues to consolidate above the 90.00 mark. The bulls are holding on to their control of the market, with the technical indicators indicating a still-bullish outlook. The Relative Strength Index (RSI) currently stands at 60, suggesting that buying pressure persists. On the other hand, the Moving Average Convergence Divergence (MACD), a momentum indicator, is showing flat green bars, which points to a flattening of buying pressure. Overall, the NZD/JPY outlook remains positive, with the bulls looking towards a potential breakout above the 91.00 mark.
Since mid-September, the cross tallied a seven-day winning streak which improved the short-term outlook as it positioned the pair above the 20-day Simple Moving Average (SMA). With the buying pressure weakening the pair could find support at 90.00, 89.30, and 89.00 as well as resistance levels at 90.50, 90.80, and 91.00.
NZD/JPY daily chart
- USD/CHF rises over 0.84%, nearing the weekly high of 0.8500 amid strong US Dollar momentum.
- Markets estimate a 63% chance of a 25 bps rate cut by the Swiss National Bank at Thursday’s meeting.
- Falling SNB currency reserves signal intervention efforts to weaken the Franc ahead of leadership changes.
The USD/CHF edges higher during the North American session, registering gains of over 0.84% as traders brace for the Swiss National Bank (SNB) monetary policy decision. This and a strong US Dollar, kept the major at around the highs of the week at around 0.8500.
Traders brace for a possible 25 bps SNB rate cut, as the Swiss Franc weakens on intervention rumors and falling currency reserves
Data-wise, the Swiss and US economic dockets remained scarce, as US housing data showed a deterioration in the sector, though a strong recovery of the US Dollar offset it.
Meanwhile, the Swiss National Bank (SNB) is expected to lower rates by 25 basis points to 1.25% on Thursday. Interest Rate Probabilities suggest that market players estimate a 63% chance of a quarter-percentage-point cut by the SNB, while for a larger one, the chances are at 37%.
According to FX Street Analyst Joaquin Monfort: “Complaints from Swiss exporters who claim the strength of CHF is making them uncompetitive have put pressure on the SNB to directly intervene in FX markets to weaken the CHF.”
“Last week data revealed that the SNB’s Foreign Currency Reserves fell to CHF 694 billion in August, down from CHF 704 billion in July. This marks the fourth consecutive decline, suggesting the SNB continues selling the Franc to dampen its value,” Monfort added.
Worth noting that this meeting would be the last for SNB Chairman Jordan, which will be replaced by the Vice-Chair Schlegel
Swiss Franc FAQs
The Swiss Franc (CHF) is Switzerland’s official currency. It is among the top ten most traded currencies globally, reaching volumes that well exceed the size of the Swiss economy. Its value is determined by the broad market sentiment, the country’s economic health or action taken by the Swiss National Bank (SNB), among other factors. Between 2011 and 2015, the Swiss Franc was pegged to the Euro (EUR). The peg was abruptly removed, resulting in a more than 20% increase in the Franc’s value, causing a turmoil in markets. Even though the peg isn’t in force anymore, CHF fortunes tend to be highly correlated with the Euro ones due to the high dependency of the Swiss economy on the neighboring Eurozone.
The Swiss Franc (CHF) is considered a safe-haven asset, or a currency that investors tend to buy in times of market stress. This is due to the perceived status of Switzerland in the world: a stable economy, a strong export sector, big central bank reserves or a longstanding political stance towards neutrality in global conflicts make the country’s currency a good choice for investors fleeing from risks. Turbulent times are likely to strengthen CHF value against other currencies that are seen as more risky to invest in.
The Swiss National Bank (SNB) meets four times a year – once every quarter, less than other major central banks – to decide on monetary policy. The bank aims for an annual inflation rate of less than 2%. When inflation is above target or forecasted to be above target in the foreseeable future, the bank will attempt to tame price growth by raising its policy rate. Higher interest rates are generally positive for the Swiss Franc (CHF) as they lead to higher yields, making the country a more attractive place for investors. On the contrary, lower interest rates tend to weaken CHF.
Macroeconomic data releases in Switzerland are key to assessing the state of the economy and can impact the Swiss Franc’s (CHF) valuation. The Swiss economy is broadly stable, but any sudden change in economic growth, inflation, current account or the central bank’s currency reserves have the potential to trigger moves in CHF. Generally, high economic growth, low unemployment and high confidence are good for CHF. Conversely, if economic data points to weakening momentum, CHF is likely to depreciate.
As a small and open economy, Switzerland is heavily dependent on the health of the neighboring Eurozone economies. The broader European Union is Switzerland’s main economic partner and a key political ally, so macroeconomic and monetary policy stability in the Eurozone is essential for Switzerland and, thus, for the Swiss Franc (CHF). With such dependency, some models suggest that the correlation between the fortunes of the Euro (EUR) and the CHF is more than 90%, or close to perfect.
- The NZD/USD pair declined by more than 1% on Wednesday, from highs since January.
- The RSI and MACD indicators are both pointing to decreasing buying momentum.
- Despite the pullback, the pair remains in a strongly bullish outlook.
On Wednesday, the NZD/USD pair encountered selling pressure, declining by 1.20% and settling at 0.6260. This reversal halted a five-day winning streak and marked a retreat from multi-month highs reached on Tuesday.
The technical indicators suggest that the buying pressure behind NZD/USD is decreasing. The Relative Strength Index (RSI) has risen near the overbought threshold, but it is currently declining sharply, indicating that buying pressure is easing. Similarly, the Moving Average Convergence Divergence (MACD) histogram remains green, but it is also decreasing, aligning with the RSI's bearish signals.
NZD/USD daily chart
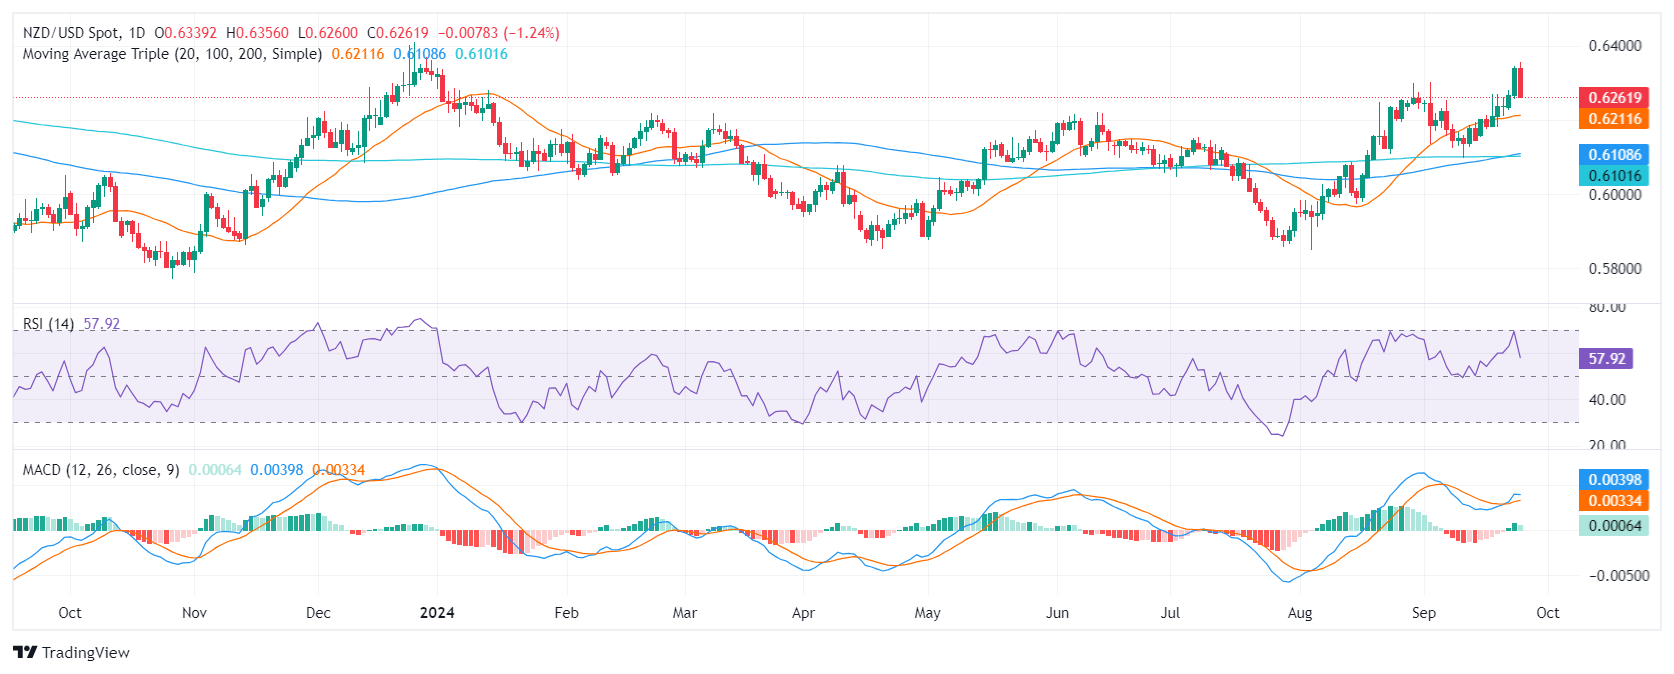
Despite the pullback, the NZD/USD pair maintains a strongly bullish outlook. The pair is trading above its key moving averages, and still near its yearly highs. On the upside, resistance levels to watch include 0.6300, 0.6350, and 0.6400. If the pair fails to jump back above 0.6300, it could experience a deeper correction, probably toward 0.6200.
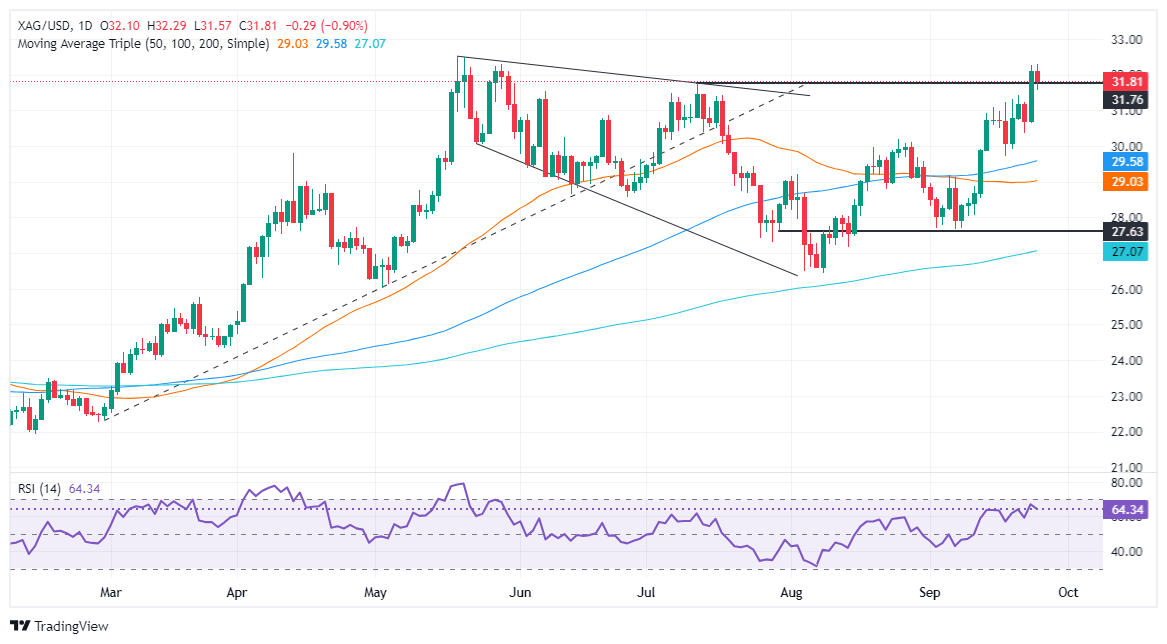
- Silver drops 0.85%, retreating from a daily peak of $32.26, pressured by rising US Treasury yields.
- XAG/USD must decisively clear $32.00 for a bullish continuation toward the YTD high of $32.51.
- Failure to hold above $32.00 risks a slide towards $31.44, with $31.00 as key support.
Silver price retraces after matching the September 24 daily peak of $32.26 and drops beneath the $32.00 figure, losing over 0.85%, weighed by higher US Treasury yields. Also, a recovery of the US Dollar and investors' reluctance to push the grey metal prices higher kept XAG/USD at familiar levels.
XAG/USD Price Forecast: Technical outlook
The uptrend on Silver remains in place, but price action suggests that buyers are struggling to keep the spot price above the $32.00 mark. During the year, XAG/USD has cracked the $32.00 barrier eight times, but after that, the non-yielding metal, dove.
For a bullish continuation, the XAG/USD must decisively clear the $32.00 mark. After that, traders need to test the year-to-date (YTD) high at $32.51, followed by the $33.00 mark. On further strength, XAG/USD could aim towards the October 1, 2012, peak at $35.40.
Conversely, if XAG/USD falls below $32.00, the next support would be the September 20 daily high at $31.44 before testing $31.00.
XAG/USD Price Action – Daily Chart
Silver FAQs
Silver is a precious metal highly traded among investors. It has been historically used as a store of value and a medium of exchange. Although less popular than Gold, traders may turn to Silver to diversify their investment portfolio, for its intrinsic value or as a potential hedge during high-inflation periods. Investors can buy physical Silver, in coins or in bars, or trade it through vehicles such as Exchange Traded Funds, which track its price on international markets.
Silver prices can move due to a wide range of factors. Geopolitical instability or fears of a deep recession can make Silver price escalate due to its safe-haven status, although to a lesser extent than Gold's. As a yieldless asset, Silver tends to rise with lower interest rates. Its moves also depend on how the US Dollar (USD) behaves as the asset is priced in dollars (XAG/USD). A strong Dollar tends to keep the price of Silver at bay, whereas a weaker Dollar is likely to propel prices up. Other factors such as investment demand, mining supply – Silver is much more abundant than Gold – and recycling rates can also affect prices.
Silver is widely used in industry, particularly in sectors such as electronics or solar energy, as it has one of the highest electric conductivity of all metals – more than Copper and Gold. A surge in demand can increase prices, while a decline tends to lower them. Dynamics in the US, Chinese and Indian economies can also contribute to price swings: for the US and particularly China, their big industrial sectors use Silver in various processes; in India, consumers’ demand for the precious metal for jewellery also plays a key role in setting prices.
Silver prices tend to follow Gold's moves. When Gold prices rise, Silver typically follows suit, as their status as safe-haven assets is similar. The Gold/Silver ratio, which shows the number of ounces of Silver needed to equal the value of one ounce of Gold, may help to determine the relative valuation between both metals. Some investors may consider a high ratio as an indicator that Silver is undervalued, or Gold is overvalued. On the contrary, a low ratio might suggest that Gold is undervalued relative to Silver.
- Gold price steadied at $2,660 after hitting a record high of $2,670.
- Traders assign a 60% chance for another 50 bps of Fed rate cuts in November.
- US Treasury yields and a stronger US Dollar limited Gold's upside despite bullish momentum.
Gold price remains steadily above $2,650 for the second straight session on Wednesdayas traders increased the odds for another big interest rate cut by the Federal Reserve (Fed) at the upcoming November meeting. That and high US Treasury yields kept the XAU/USD from rising further, and it mostly traded near $2,660, up 0.14%.
Market sentiment shifted slightly sour during the US session as Wall Street traded in the red. Hence, Bullion prices hit a record high of $2,670 but retreated as US Treasury yields rose four and a half basis points (bps) to 3.775%.
In the meantime, the US Dollar Index (DXY), which tracks the buck’s value against another six currencies, bounced off a 14-month low and edged up 0.54% to 100.88.
During the week, US economic data showed that business activity in the manufacturing sector cooled while services remained resilient. However, a deterioration in Consumer Confidence via the Conference Board (CB) suggests that conditions in the labor market could be worse than projected.
Last week, the Fed lowered borrowing costs by 50 bps to 4.75%-5.00%, and traders seemed confident about back-to-back cuts of the same size. According to the CME FedWatch Tool, the odds for a 50 bps Fed cut are 60%, while 25 bps stands at 40%.
Bullion prices had risen 29% in 2024, sponsored by Gold’s physical demand and major central banks beginning their easing cycles. This and geopolitical tensions could keep traders setting their sights at $2,700.
Bullion has risen over 29% so far in 2024, with gains attributed to central bank easing and geopolitical issues.
Daily digest market movers: Gold price stays firm amid high US yields
- Gold price is capped by US Treasury bond yields.
- Tensions in the Middle East between Israel and Hezbollah underpin Gold prices.
- An uneventful US economic schedule on Wednesday left traders adrift to past data while they prepared for Fed Chair Jerome Powell's speech on Thursday.
- ETF flows, geopolitical tensions across the Middle East and China’s massive stimulus measures could drive Gold prices higher.
- According to the World Gold Council, global physically-backed Gold ETFs saw modest net inflows of 3 metric tons last week.
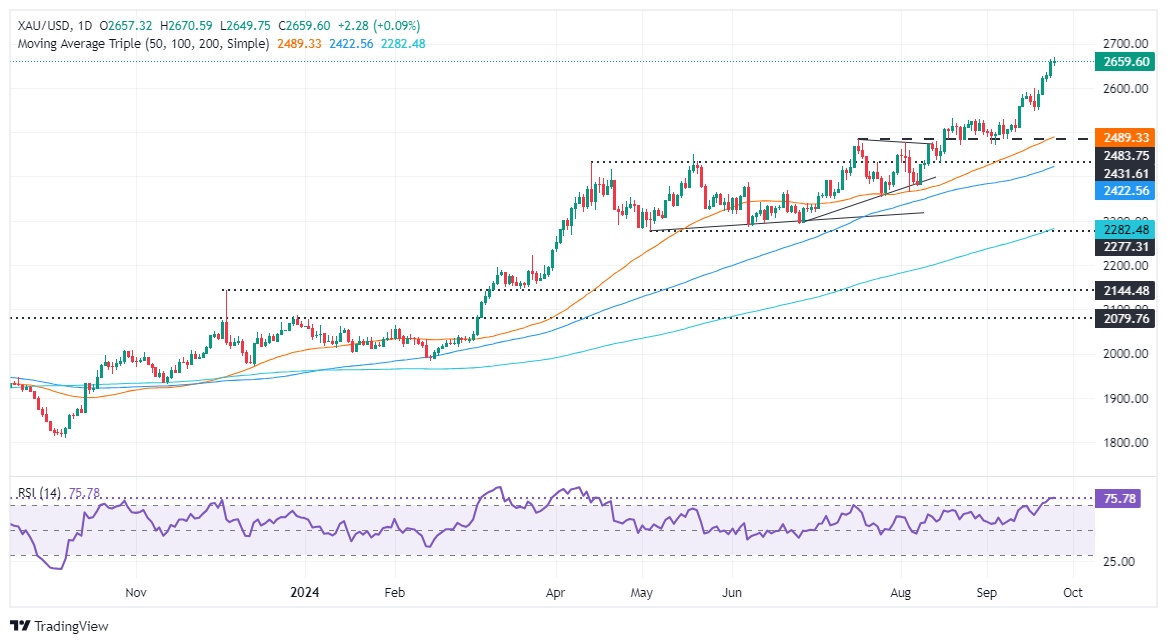
XAU/USD technical outlook: Gold price consolidates around $2,650-$2,660
Gold prices are set to extend the gains. However, price action turned sideways on Wednesday amid the lack of catalysts, which could push XAU/USD above its current record high toward $2,700.
From a momentum standpoint, the Relative Strength Index (RSI) signals that Gold is overbought, which could cause a leg-down before the rally resumes.
If XAU/USD extends its rally past the current year-to-date (YTD) peak of $2,670, look for a challenge of $2,675, followed by $2,700. Up next would be the $2,750 level, followed by $2,800.
On the flip side, if XAU/USD drops below $2,650, look for a test of the September 18 daily high at $2,600. The following key support levels to test will be the September 18 low of $2,546, followed by the 50-day Simple Moving Average (SMA) at $2,488.
Gold FAQs
Gold has played a key role in human’s history as it has been widely used as a store of value and medium of exchange. Currently, apart from its shine and usage for jewelry, the precious metal is widely seen as a safe-haven asset, meaning that it is considered a good investment during turbulent times. Gold is also widely seen as a hedge against inflation and against depreciating currencies as it doesn’t rely on any specific issuer or government.
Central banks are the biggest Gold holders. In their aim to support their currencies in turbulent times, central banks tend to diversify their reserves and buy Gold to improve the perceived strength of the economy and the currency. High Gold reserves can be a source of trust for a country’s solvency. Central banks added 1,136 tonnes of Gold worth around $70 billion to their reserves in 2022, according to data from the World Gold Council. This is the highest yearly purchase since records began. Central banks from emerging economies such as China, India and Turkey are quickly increasing their Gold reserves.
Gold has an inverse correlation with the US Dollar and US Treasuries, which are both major reserve and safe-haven assets. When the Dollar depreciates, Gold tends to rise, enabling investors and central banks to diversify their assets in turbulent times. Gold is also inversely correlated with risk assets. A rally in the stock market tends to weaken Gold price, while sell-offs in riskier markets tend to favor the precious metal.
The price can move due to a wide range of factors. Geopolitical instability or fears of a deep recession can quickly make Gold price escalate due to its safe-haven status. As a yield-less asset, Gold tends to rise with lower interest rates, while higher cost of money usually weighs down on the yellow metal. Still, most moves depend on how the US Dollar (USD) behaves as the asset is priced in dollars (XAU/USD). A strong Dollar tends to keep the price of Gold controlled, whereas a weaker Dollar is likely to push Gold prices up.
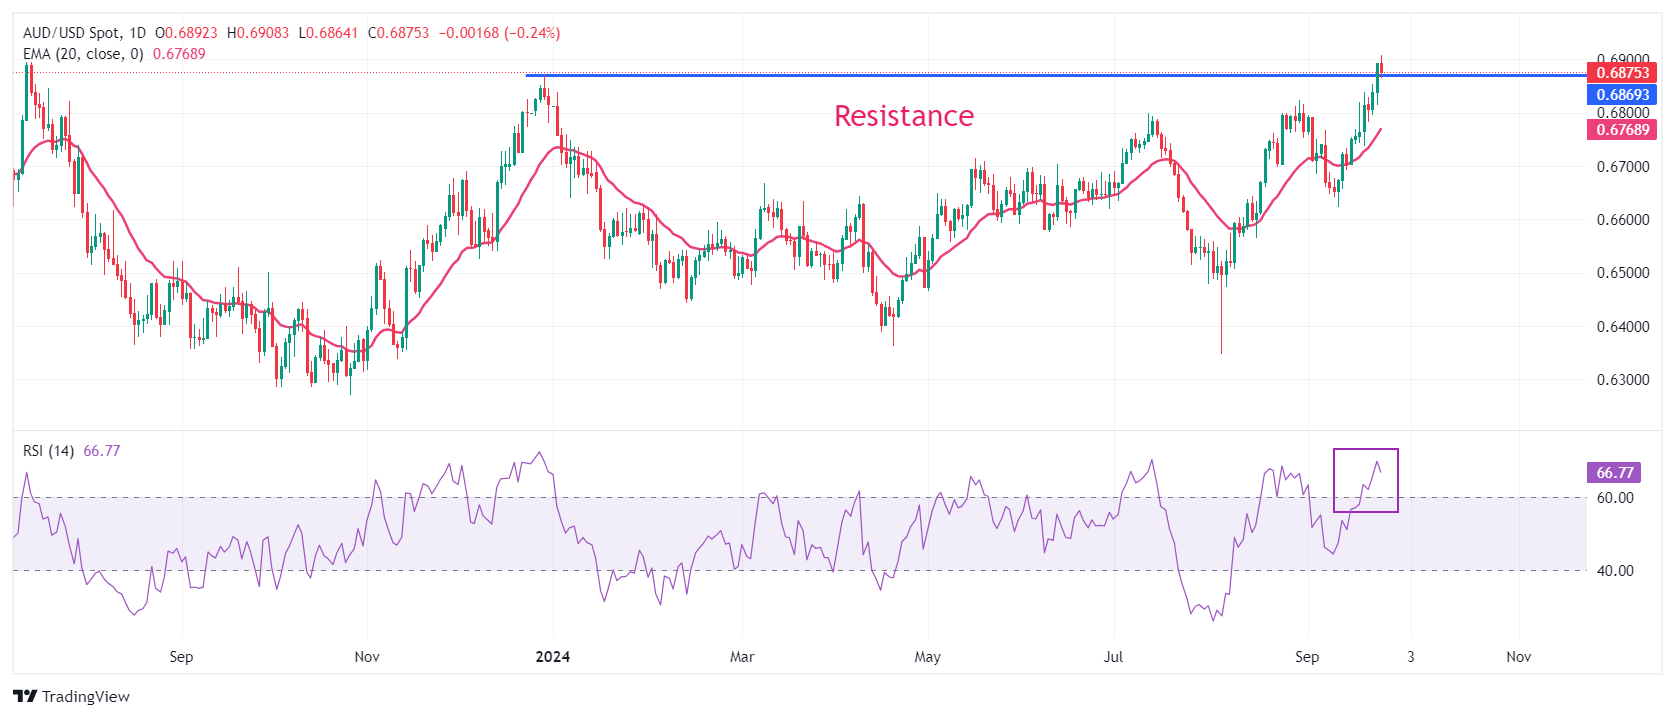
- AUD/USD retreats on resurgent demand for safe-haven US Dollar amid lingering global economic concerns.
- Hawkish RBA stance and market expectations of 50 bps Fed rate cut in November support the pair.
- Despite softer Australian CPI data, near-term RBA rate cuts remain unlikely.
The AUD/USD retreated on Wednesday, declining by 0.70% to 0.6850. The pair's decline came as the US Dollar regained its safe-haven appeal amidst persistent global economic concerns. Despite the weaker Australian Consumer Price Index (CPI) data, near-term RBA rate cuts remain unlikely, limiting the AUD/USD's downside potential. The upcoming speech from Federal Reserve (Fed) Chair Jerome Powell on Thursday and the US PCE Price Index on Friday will be closely watched for further cues on the central banks' monetary policy stance.
The Australian economy's outlook is uncertain due to contrasting indicators and the Reserve Bank of Australia's (RBA) aggressive stance on inflation. As a result, markets are anticipating a modest interest rate cut of only 0.25% in 2024, signaling a shift away from previous expectations of more significant easing.
Daily digest market movers: Australian Dollar declines as markets digest soft CPI, USD strength
- Despite positive news about China's new stimulus measures, global economic downturn concerns and geopolitical risks make investors cautious, leading to a weaker open in European equity markets.
- The safe-haven US Dollar rebounds from its lowest point this year, benefiting from risk aversion and driving flows away from the risk-sensitive Australian Dollar.
- The market predicts a 50-basis-point rate cut by the Fed in November, contrasting with the Reserve Bank of Australia's hawkish stance, supporting AUD/USD.
- RBA Governor Michele Bullock indicates that recent data has not significantly affected the policy outlook, reinforcing the hawkish stance and limiting AUD/USD downside.
- Australian CPI data showed a decline to 2.7% YoY in headline inflation to its lowest level since early 2022, offering some relief but insufficient to warrant RBA rate cuts.
AUD/USD technical outlook: AUD/USD take a breather, no sell signal
The AUD/USD saw sharp upward movements which propelled the pair to multi-month highs near 0.6900 in the last sessions. That improved the outlook which remains bullish.
The Relative Strength Index (RSI) and the Moving Average Convergence Divergence (MACD) took a big hit on Wednesday, but they shouldn't be considered a sell signal. The buyers seem to be taking a breather after reaching highs since December. A correction was necessary.
Australian Dollar FAQs
One of the most significant factors for the Australian Dollar (AUD) is the level of interest rates set by the Reserve Bank of Australia (RBA). Because Australia is a resource-rich country another key driver is the price of its biggest export, Iron Ore. The health of the Chinese economy, its largest trading partner, is a factor, as well as inflation in Australia, its growth rate and Trade Balance. Market sentiment – whether investors are taking on more risky assets (risk-on) or seeking safe-havens (risk-off) – is also a factor, with risk-on positive for AUD.
The Reserve Bank of Australia (RBA) influences the Australian Dollar (AUD) by setting the level of interest rates that Australian banks can lend to each other. This influences the level of interest rates in the economy as a whole. The main goal of the RBA is to maintain a stable inflation rate of 2-3% by adjusting interest rates up or down. Relatively high interest rates compared to other major central banks support the AUD, and the opposite for relatively low. The RBA can also use quantitative easing and tightening to influence credit conditions, with the former AUD-negative and the latter AUD-positive.
China is Australia’s largest trading partner so the health of the Chinese economy is a major influence on the value of the Australian Dollar (AUD). When the Chinese economy is doing well it purchases more raw materials, goods and services from Australia, lifting demand for the AUD, and pushing up its value. The opposite is the case when the Chinese economy is not growing as fast as expected. Positive or negative surprises in Chinese growth data, therefore, often have a direct impact on the Australian Dollar and its pairs.
Iron Ore is Australia’s largest export, accounting for $118 billion a year according to data from 2021, with China as its primary destination. The price of Iron Ore, therefore, can be a driver of the Australian Dollar. Generally, if the price of Iron Ore rises, AUD also goes up, as aggregate demand for the currency increases. The opposite is the case if the price of Iron Ore falls. Higher Iron Ore prices also tend to result in a greater likelihood of a positive Trade Balance for Australia, which is also positive of the AUD.
The Trade Balance, which is the difference between what a country earns from its exports versus what it pays for its imports, is another factor that can influence the value of the Australian Dollar. If Australia produces highly sought after exports, then its currency will gain in value purely from the surplus demand created from foreign buyers seeking to purchase its exports versus what it spends to purchase imports. Therefore, a positive net Trade Balance strengthens the AUD, with the opposite effect if the Trade Balance is negative.
- Market continues to overestimate Fed easing with the central bank pushing back against dovish expectations.
- Economic data remains solid as S&P Global preliminary September PMIs come in above expectations.
- Fed officials will try to push back on the dovish rhetoric.
The US Dollar Index (DXY), which measures the value of the USD against a basket of currencies, whipsaws in a volatile session on Wednesday, hovering around a 14-month low due to intensifying recession fears. Despite the market's persistent higher estimation of Federal Reserve (Fed) easing, the central bank has countered dovish expectations. Friday’s Personal Consumption Expenditures (PCE) figures from August will be closely watched.
While the US economy exhibits a slowdown in certain sectors, other areas remain resilient, supporting overall economic activity. Despite this mixed picture, the Fed emphasizes that the path of interest rate adjustments will hinge on forthcoming economic data.
Daily digest market movers: US Dollar gains despite steady dovish bets, markets await PCE figures
- Market continues to overestimate the extent of Fed easing despite some Fed Governors’ efforts to curb dovish expectations.
- Market is pricing in 75 bps of easing by year-end and 175-200 bps of total cuts over the next 12 months.
- On Thursday, Gross Domestic Product (GDP) and Friday’s PCE figures will be key for the USD dynamics.
- It is worth noticing that Jerome Powell stated that the pace of the easing cycle will depend on incoming data, so their outcome might shake the USD. Fed Chair Jerome Powell will be on the wires on Thursday.
DXY technical outlook: Bearish momentum persists, bulls lack strength
The DXY has largely bearish tradewinds casting it about on the technical charts.
The Relative Strength Index (RSI) and the Moving Average Convergence Divergence (MACD) gained some momentum, but the RSI remains below the negative zone, and the MACD continues to indicate flat green bars. These technical indicators suggest that the bears are in control and that buying pressure is weak.
Support levels can be found at 100.50, 100.30 and 100.00, while resistance levels are located at 101.00, 101.30 and 101.60.
US Dollar FAQs
The US Dollar (USD) is the official currency of the United States of America, and the ‘de facto’ currency of a significant number of other countries where it is found in circulation alongside local notes. It is the most heavily traded currency in the world, accounting for over 88% of all global foreign exchange turnover, or an average of $6.6 trillion in transactions per day, according to data from 2022. Following the second world war, the USD took over from the British Pound as the world’s reserve currency. For most of its history, the US Dollar was backed by Gold, until the Bretton Woods Agreement in 1971 when the Gold Standard went away.
The most important single factor impacting on the value of the US Dollar is monetary policy, which is shaped by the Federal Reserve (Fed). The Fed has two mandates: to achieve price stability (control inflation) and foster full employment. Its primary tool to achieve these two goals is by adjusting interest rates. When prices are rising too quickly and inflation is above the Fed’s 2% target, the Fed will raise rates, which helps the USD value. When inflation falls below 2% or the Unemployment Rate is too high, the Fed may lower interest rates, which weighs on the Greenback.
In extreme situations, the Federal Reserve can also print more Dollars and enact quantitative easing (QE). QE is the process by which the Fed substantially increases the flow of credit in a stuck financial system. It is a non-standard policy measure used when credit has dried up because banks will not lend to each other (out of the fear of counterparty default). It is a last resort when simply lowering interest rates is unlikely to achieve the necessary result. It was the Fed’s weapon of choice to combat the credit crunch that occurred during the Great Financial Crisis in 2008. It involves the Fed printing more Dollars and using them to buy US government bonds predominantly from financial institutions. QE usually leads to a weaker US Dollar.
Quantitative tightening (QT) is the reverse process whereby the Federal Reserve stops buying bonds from financial institutions and does not reinvest the principal from the bonds it holds maturing in new purchases. It is usually positive for the US Dollar.
The Greenback staged a robust comeback after flirting with 14-month lows, prompting quite a meaningful knee-jerk in the risk complex ahead of key data releases and the speech by Chair Powell.
Here is what you need to know on Thursday, September 26:
The US Dollar Index (DXY) rose markedly after bottoming out in new 2024 lows around 100.20. The final Q2 GDP Growth Rate figures are due, seconded by the usual weekly Initial Jobless Claims, Durable Goods Orders, and Pending Home Sales. In addition, the Fed’s Kugler, Barr, Kashkari, Collins, Williams, and Chief Powell are all due to speak.
EUR/USD failed to advance further north of the 1.1200 barrier and eventually succumbed to the strong reversal of the US Dollar. The German GfK’s Consumer Confidence is due along with the ECB’s M3 Money Supply. In addition, the ECB’s Elderson, Buch, Schnabel, McCaul, and Lagarde will also speak.
GBP/USD rose past 1.3400 the figure, although the move failed to consolidate and the pair corrected markedly lower in line with the Dollar’s bounce. Car Production will be the only release on the UK calendar.
The strong recovery in the US Dollar and US yields across the board motivated USD/JPY to leave behind two daily pullbacks in a row and retest the upper-144.00s. The BoJ will publish its Minutes, while weekly Foreign Bond Investment data are also expected.
Following a brief trespass of the 0.6900 barrier, AUD/USD embarked on a deep decline following the strong bounce in the Greenback. The RBA will release its Financial Stability Review (FSR).
WTI prices came under heavy pressure and tumbled to new four-day lows well south of the $70.00 mark per barrel.
Prices of Gold charted an all-time high around $2,670 per ounce troy amidst firm speculation of extra rate cuts by the Fed in the next few months. Silver retested the area of recent tops past the $32.00 mark per ounce, although they later succumbed to the generalized bid bias in the US Dollar.
- The Dow Jones tilted into the bearish side, falling 300 points.
- Exhaustion plays are on the cards with indexes deep in overbought territory.
- Despite a trim off the top, the Dow Jones is on pace for another record month.
The Dow Jones Industrial Average (DJIA) pulled back on Wednesday, shedding around 300 points and easing back below the 42,000 handle as the heavyweight equity index takes a breather after a period of repeated breaks into record territory.
Treasury yields ticked higher on Wednesday and most of the US indexes are testing into the red, with the Dow Jones taking the brunt of the damage, falling 0.8% through the US trading session. Market focus is shifting back to the state of the US economy following the Federal Reserve’s (Fed) bumper 50 bps rate cut last week.
US consumer confidence indicators fell this week as the average US consumer doesn’t share in the stock market’s exuberance over Fed rate cuts, with key confidence readings falling to their lowest levels in three years and consumer inflation expectations for the next 12 months ticking higher. This Friday will see a fresh update to US Personal Consumption Expenditure (PCE) inflation figures.
New home sales also fell in August, declining 4.7% to 716K from the previous month’s revised 751K. Meanwhile, investors will see another print of US Gross Domestic Product (GDP) growth for the second quarter, expected to hold steady at 3.0% on an annualized basis. Thursday will also bring a slew of speeches and public appearances from several Fed officials, including Fed Chair Jerome Powell.
Dow Jones news
Most of the Dow Jones equity index tilted into the red on Wednesday, with around two-thirds of the stock board easing for the day. Intel (INTC) still managed to extend a near-term rally, stretching another 2.5% to $23.40 per share, but the battered chipmaker still remains down over 53% YTD.
Amgen (AMGN) tumbled nearly 5% on Wednesday, dragging the Dow Jones lower overall and fell below $315 per share for the second time since the beginning of August. The pharmaceutical company’s recent exploration into a new eczema drug called rocatinlimab yielded results that undershot efficacy expectations, and also underperformed competitors’ products that already exist for treating atopic dermatitis.
Dow Jones price forecast
Wednesday’s bearish performance for the Dow Jones puts the index at risk of closing in the red for the week as over-exerted buyers run out of gas and give short pressure a chance to build back up. However, despite a near-term snap, the index is still planted firmly in the long side of the trend, and a buildup of short positions could give way to a snap back into record chart territory.
If the bears win the near-term tug-of-war, the Dow Jones could backslide to the 50-day Exponential Moving Average (EMA) near 40,800.
Dow Jones daily chart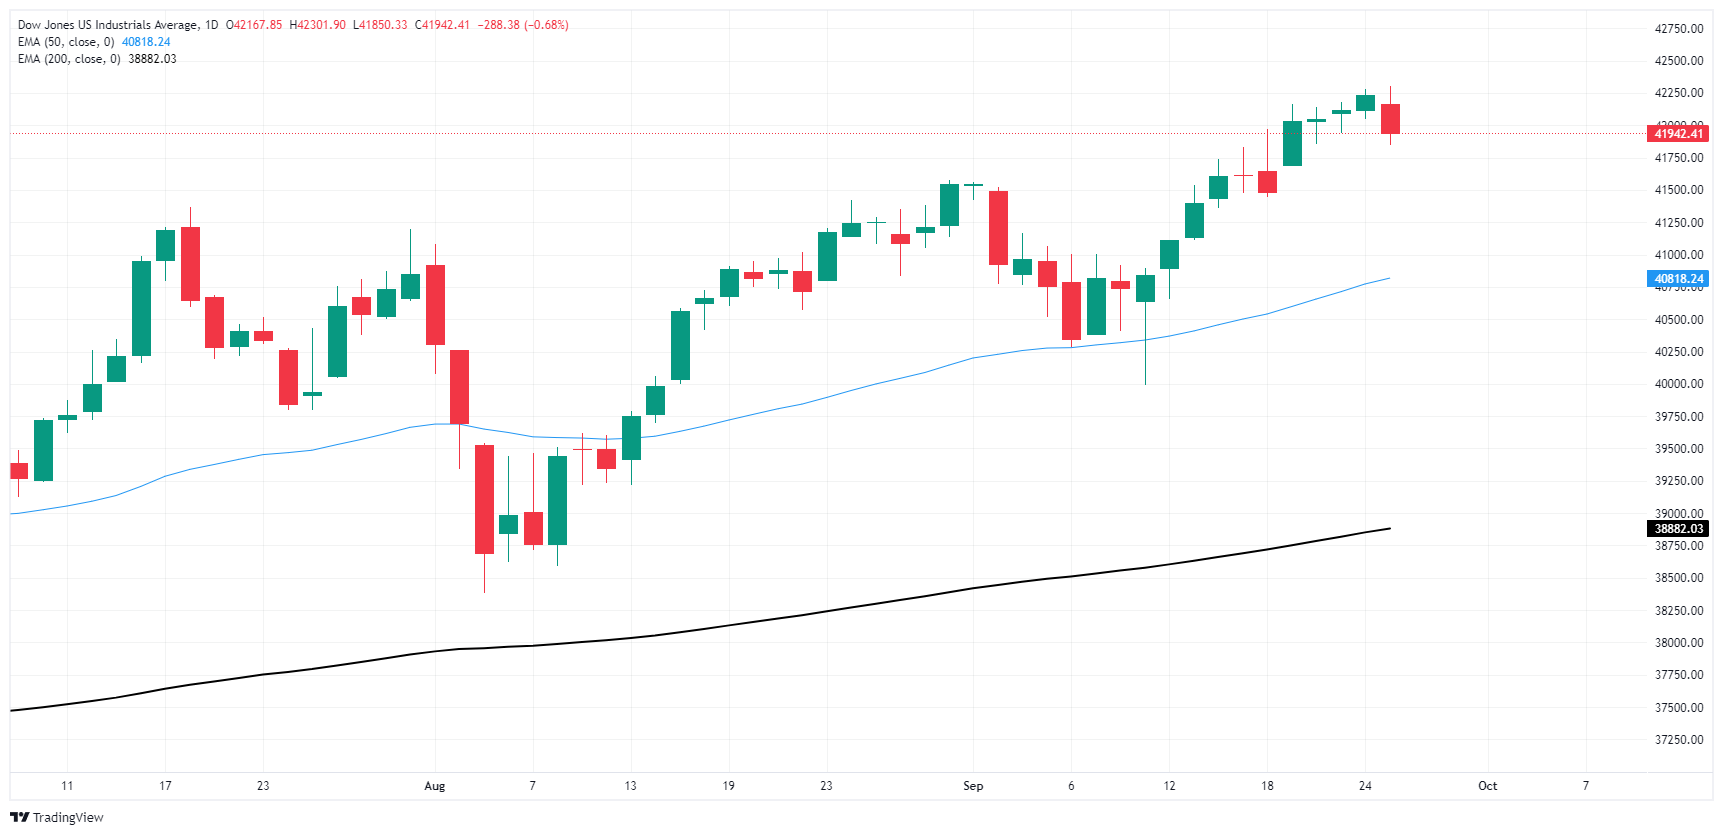
Dow Jones FAQs
The Dow Jones Industrial Average, one of the oldest stock market indices in the world, is compiled of the 30 most traded stocks in the US. The index is price-weighted rather than weighted by capitalization. It is calculated by summing the prices of the constituent stocks and dividing them by a factor, currently 0.152. The index was founded by Charles Dow, who also founded the Wall Street Journal. In later years it has been criticized for not being broadly representative enough because it only tracks 30 conglomerates, unlike broader indices such as the S&P 500.
Many different factors drive the Dow Jones Industrial Average (DJIA). The aggregate performance of the component companies revealed in quarterly company earnings reports is the main one. US and global macroeconomic data also contributes as it impacts on investor sentiment. The level of interest rates, set by the Federal Reserve (Fed), also influences the DJIA as it affects the cost of credit, on which many corporations are heavily reliant. Therefore, inflation can be a major driver as well as other metrics which impact the Fed decisions.
Dow Theory is a method for identifying the primary trend of the stock market developed by Charles Dow. A key step is to compare the direction of the Dow Jones Industrial Average (DJIA) and the Dow Jones Transportation Average (DJTA) and only follow trends where both are moving in the same direction. Volume is a confirmatory criteria. The theory uses elements of peak and trough analysis. Dow’s theory posits three trend phases: accumulation, when smart money starts buying or selling; public participation, when the wider public joins in; and distribution, when the smart money exits.
There are a number of ways to trade the DJIA. One is to use ETFs which allow investors to trade the DJIA as a single security, rather than having to buy shares in all 30 constituent companies. A leading example is the SPDR Dow Jones Industrial Average ETF (DIA). DJIA futures contracts enable traders to speculate on the future value of the index and Options provide the right, but not the obligation, to buy or sell the index at a predetermined price in the future. Mutual funds enable investors to buy a share of a diversified portfolio of DJIA stocks thus providing exposure to the overall index.
- Mexican Peso declines as USD/MXN climbs over 1.40%, driven by expectations of further Banxico rate cuts.
- Cooling inflation in early September bolsters the case for a Banxico rate reduction at the September 26 meeting.
- Bloomberg survey: 20 of 25 analysts expect Banxico to cut 25 bps to 10.50%, with some predicting a 50 bps reduction.
The Mexican Peso tumbles against the Greenback on Wednesday as the latter appreciates sharply against most emerging market currencies. There are expectations for further easing by the Bank of Mexico (Banxico) at its September 26 meeting. This environment has sponsored a leg-up in the exotic pair. At the time of writing, the USD/MXN trades at 19.58, a gain of over 1.40%.
Mexico’s economic docket remained absent on Wednesday, but data revealed on Monday and Tuesday paint a mixed economic picture. In annual data, Economic Activity improved in July, but Retail Sales extended its agony to three consecutive months of registering negative readings.
On Tuesday, the Instituto Nacional de Estadistica Geografía e Informatica (INEG) announced that monthly and yearly inflation figures for September's first half cooled.
The latest data set should allow Banxico to cut its interest rate by at least 25 basis points (bps) on Thursday. According to Bloomberg, 20 out of 25 analysts estimate that the central bank will lower borrowing costs to 10.50%. One expects rates to remain unchanged, and four estimate a 50 bps rate cut, following the Fed's footsteps.
If Banxico eases its policy, that would be negative for the Peso. Hence, the USD/MXN could extend its uptrend, with traders setting their sights on the psychological 20.00 figure.
Christian Lawrence, senior cross-asset strategist at Rabobank, noted, “We see room for bouts of downside on the back of tactical carry trade flows during periods of vol suppression. Still, our base is for further MXN weakness over the coming months as reforms and US elections add to MXN risk premia.”
Meanwhile, data in the United States (US) show that although the economy is slowing down, most market participants estimate a soft-landing scenario. On Tuesday, the Conference Board (CB) revealed that Consumer Sentiment in September deteriorated and hit its lowest level since August 2021 at 98.7, down from 105.6.
Daily digest market movers: Mexican Peso dips amid scarce economic docket
- USD/MXN extended its rally on Banxico rate cut expectations, alongside the Greenback’s recovery.
- US Dollar Index (DXY), which tracks the buck’s performance against a basket of six peers, climbs 0.56% and exchanges hands at 100.91.
- Banxico is expected to lower borrowing costs by 175 bps toward the end of 2025, according to the swaps markets.
- Market participants had fully priced in a 100% chance of a 25 bps rate cut by the Fed. However, the odds for 50 bps of easing are 60.8%, according to the CME FedWatch Tool.
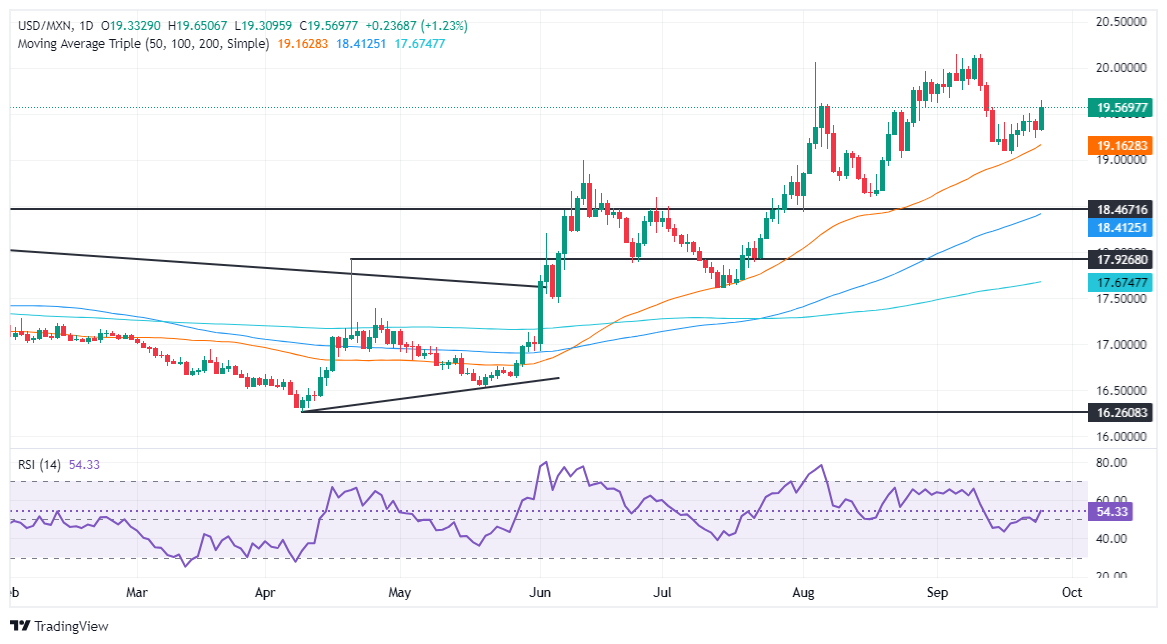
USD/MXN technical analysis: Mexican Peso slumps as USD/MXN surpasses 19.50
The USD/MXN resumed its uptrend on Wednesday and hit a daily high of 19.64 before stabilizing at current levels. Momentum favors further upside as the Relative Strength Index (RSI) is bullish.
The first key resistance level that buyers need to clear is the August 6 high at 19.61. Once surpassed, the next stop is 20.00, followed by the year-to-date (YTD) peak at 20.22.
On the flip side, if sellers drive USD/MXN below the September 23 low of 19.29, it will expose the confluence of the 50-day Simple Moving Average (SMA) and the September 18 low between 19.08 and 19.06.
Mexican Peso FAQs
The Mexican Peso (MXN) is the most traded currency among its Latin American peers. Its value is broadly determined by the performance of the Mexican economy, the country’s central bank’s policy, the amount of foreign investment in the country and even the levels of remittances sent by Mexicans who live abroad, particularly in the United States. Geopolitical trends can also move MXN: for example, the process of nearshoring – or the decision by some firms to relocate manufacturing capacity and supply chains closer to their home countries – is also seen as a catalyst for the Mexican currency as the country is considered a key manufacturing hub in the American continent. Another catalyst for MXN is Oil prices as Mexico is a key exporter of the commodity.
The main objective of Mexico’s central bank, also known as Banxico, is to maintain inflation at low and stable levels (at or close to its target of 3%, the midpoint in a tolerance band of between 2% and 4%). To this end, the bank sets an appropriate level of interest rates. When inflation is too high, Banxico will attempt to tame it by raising interest rates, making it more expensive for households and businesses to borrow money, thus cooling demand and the overall economy. Higher interest rates are generally positive for the Mexican Peso (MXN) as they lead to higher yields, making the country a more attractive place for investors. On the contrary, lower interest rates tend to weaken MXN.
Macroeconomic data releases are key to assess the state of the economy and can have an impact on the Mexican Peso (MXN) valuation. A strong Mexican economy, based on high economic growth, low unemployment and high confidence is good for MXN. Not only does it attract more foreign investment but it may encourage the Bank of Mexico (Banxico) to increase interest rates, particularly if this strength comes together with elevated inflation. However, if economic data is weak, MXN is likely to depreciate.
As an emerging-market currency, the Mexican Peso (MXN) tends to strive during risk-on periods, or when investors perceive that broader market risks are low and thus are eager to engage with investments that carry a higher risk. Conversely, MXN tends to weaken at times of market turbulence or economic uncertainty as investors tend to sell higher-risk assets and flee to the more-stable safe havens.
- EUR/GBP retraced Monday’s sharp downward movements.
- The daily RSI and MACD signals a stabilizing selling pressure.
- The pair might extend its current sideways trend in the next sessions.
EUR/GBP rose to 0.8370 on Wednesday, displaying some volatility during the European trading session. Nevertheless, the pair failed to hold on to gains, and it currently trades at 0.8350. The cross seems to be consolidating the start of the week’s sharp downward movements with sellers taking a breather.
The Relative Strength Index (RSI) on the daily chart stands at 37, suggesting that buyers are starting to take control after Monday’s selloff, and the RSI is gradually increasing. However, the RSI is still below the midline, indicating that the market is in a negative trend. The Moving Average Convergence Divergence (MACD) is flat, with the signal line above the MACD line, suggesting that selling is losing steam.
EUR/GBP daily chart
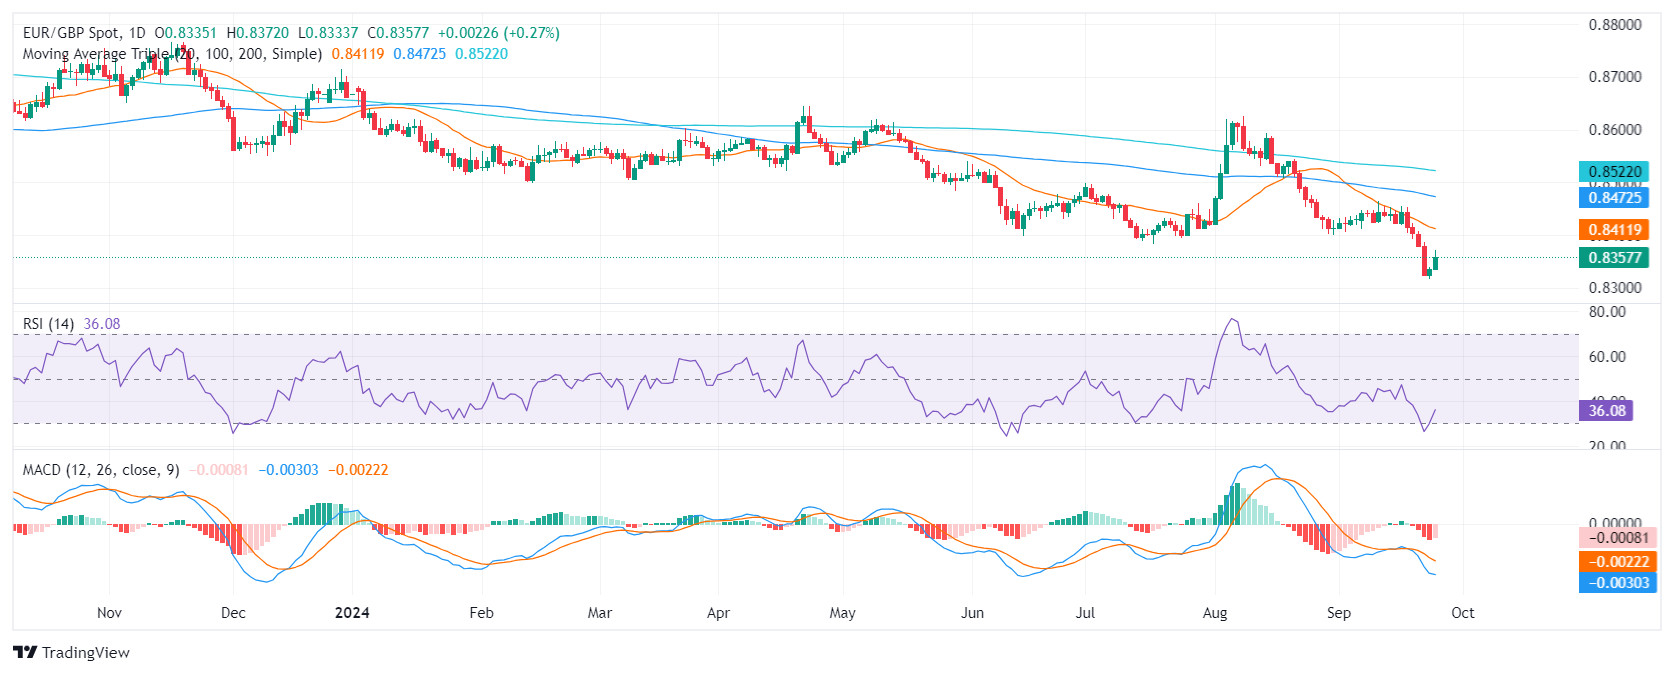
Based on the current technical picture, the EUR/GBP pair is likely to remain in a consolidation phase in the near term. With the pair in lows since 2022, the bears seem to have already done their part and they might step away to consolidate their movements. In the meantime, the bullish traction gained on Wednesday continues to be weak so the current bearish scenario isn’t threatened.
Support levels: 0.8315, 0.8330, 0.8340
Resistance levels :0.8400, 0.8430, 0.8440
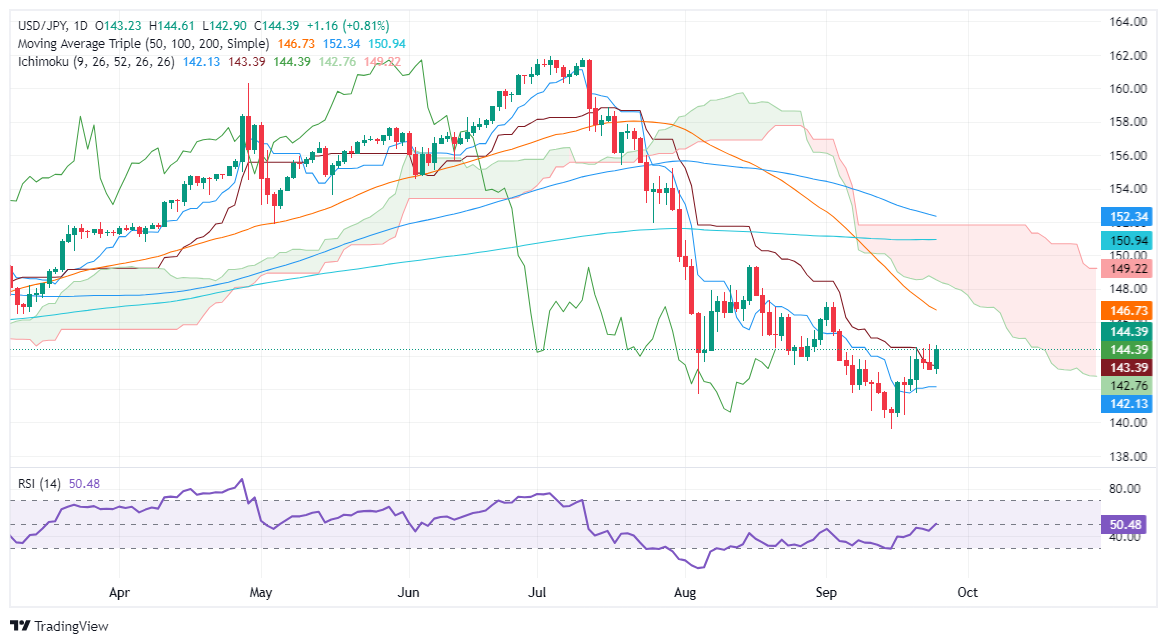
- USD/JPY climbs over 0.90% to 144.54, buoyed by a rise in the US 10-year Treasury yield.
- Despite the uptick, the pair shows a downward trend, remaining below the Ichimoku Cloud and 200-DMA.
- RSI crosses above the neutral line, suggesting potential for continued gains in the short term.
- Key resistance at 145.00, with subsequent levels at 146.73 (50-DMA) and 147.00.
- A fall below 144.00 could find support at 143.39 (Kijun-Sen), 142.76 (Senkou Span A), and 142.13 (Tenkan-Sen).
The USD/JPY edges up during the North American session, registering gains of over 0.90% as the US Dollar stages a comeback. The rise in the US 10-year T-note yield sponsored a leg-up in the pair, which trades at 144.54 at the time of writing.
USD/JPY Price Forecast: Technical outlook
Despite rallying during the session, the USD/JPY remains downward biased, as the exchange rate persists below the Ichimoku Cloud (Kumo) and the 200-day moving average (DMA).
The Relative Strength Index (RSI) has just pierced its neutral line, opening the door for further upside in the near term.
With that said, the USD/JPY next resistance would be the 145.00 psychological figure ahead of testing the 50-DMA at 146.73. On further strength, the pair could hit the 147.00 figure.
Conversely, if USD/JPY tumbles below 144.00, this could pave the way to challenge the Kijun-Sen at 143.39, followed by the Senkou Span A at 142.76 and the Tenkan Sen at 142.13.
USD/JPY Price Action – Daily Chart
Japanese Yen PRICE Today
The table below shows the percentage change of Japanese Yen (JPY) against listed major currencies today. Japanese Yen was the strongest against the New Zealand Dollar.
| USD | EUR | GBP | JPY | CAD | AUD | NZD | CHF | |
|---|---|---|---|---|---|---|---|---|
| USD | 0.22% | 0.51% | 0.82% | 0.26% | 0.75% | 0.91% | 0.68% | |
| EUR | -0.22% | 0.29% | 0.60% | 0.04% | 0.53% | 0.70% | 0.45% | |
| GBP | -0.51% | -0.29% | 0.27% | -0.25% | 0.24% | 0.37% | 0.18% | |
| JPY | -0.82% | -0.60% | -0.27% | -0.56% | -0.07% | 0.09% | -0.14% | |
| CAD | -0.26% | -0.04% | 0.25% | 0.56% | 0.49% | 0.66% | 0.43% | |
| AUD | -0.75% | -0.53% | -0.24% | 0.07% | -0.49% | 0.17% | -0.07% | |
| NZD | -0.91% | -0.70% | -0.37% | -0.09% | -0.66% | -0.17% | -0.24% | |
| CHF | -0.68% | -0.45% | -0.18% | 0.14% | -0.43% | 0.07% | 0.24% |
The heat map shows percentage changes of major currencies against each other. The base currency is picked from the left column, while the quote currency is picked from the top row. For example, if you pick the Japanese Yen from the left column and move along the horizontal line to the US Dollar, the percentage change displayed in the box will represent JPY (base)/USD (quote).
The SNB is widely expected to cut rates by 25 bps at Thursday’s quarterly policy meeting. The Bloomberg survey suggests that all but three forecasters expect a 25 bp cut, with only one predicting that the Bank will opt for a larger 50 bps move. The risk of the larger move from the SNB should not be overlooked, Rabobank’s FX strategist Jane Foley notes.
A 50 bp surprise would likely weaken the CHF
“This morning the Swiss KOP Economic Institute lowered its growth forecasts for Switzerland to 1.1% and predicted that inflation would be 1.2% in 2024 and just 0.7% in both 2025 and 2026. Swiss August CPI inflation registered a softer than expected 1.1% y/y, down from 1.3% y/y in July.”
“This suggests that inflation is on course to undershoot the 1.5% Q3 inflation forecast that the SNB published in June. It then forecast that inflation would be a 1.4% in 2024, assuming rates stayed at 1.25%. Clearly a strong exchange rate brings downside risks to inflation.”
“As a result, we see the SNB as incentivise to undermine the CHF bulls with a larger than expected rate cut this quarter, particularly since its next policy meeting is not scheduled until December. A 50 bp surprise would likely weaken the CHF, though the reaction may not be sustained.”
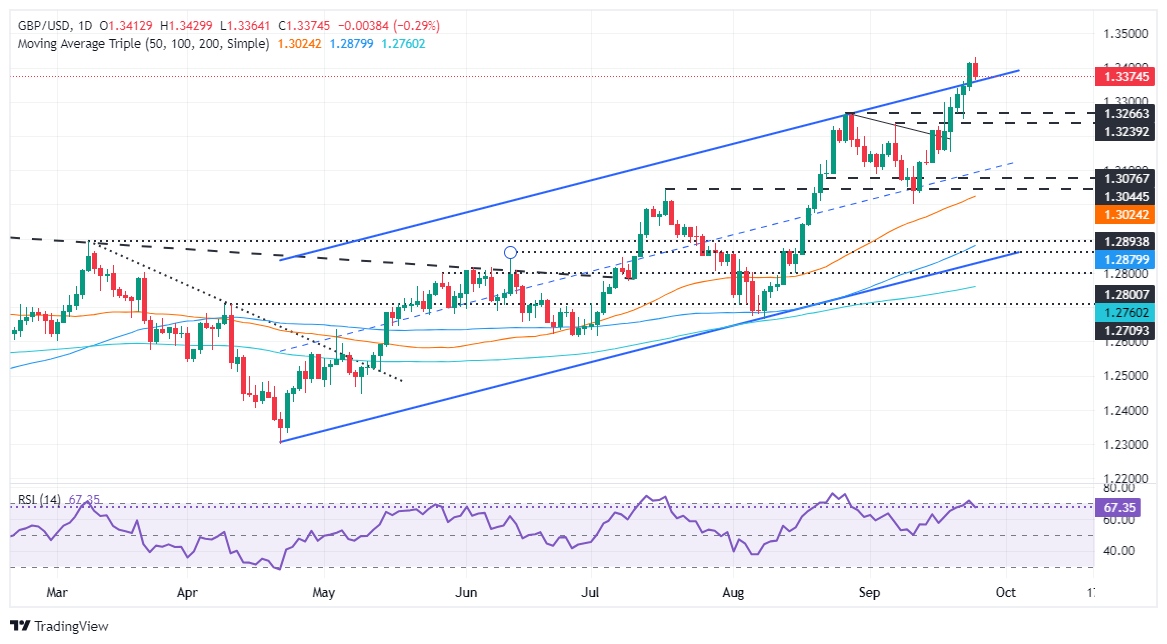
- GBP/USD drops to 1.3389 from a yearly high of 1.3429 as the US Dollar strengthens.
- Pullback to the top of an ascending channel at 1.3363 may offer buying opportunities, with RSI still favoring buyers.
- Maintaining above 1.3363 could push GBP/USD to retest the yearly high of 1.3429 and aim for 1.3437, 1.3450, and 1.3500.
- Falling below 1.3363 might lead to testing the week’s low at 1.3248 and further support at the September 19 low of 1.3153.
The Pound Sterling lost some steam against the US Dollar in early trading during Wednesday’s North American session after hitting a yearly peak of 1.3429. The GBP/USD trades at 1.3389, down 0.18%, as the Greenback recovers some ground.
GBP/USD Price Forecast: Technical outlook
From a technical standpoint, the GBP/USD pullback toward the top of an ascending channel at 1.3363 opened the door for further buying, as seen by price action.
The Relative Strength Index (RSI) hints that buyers remain in charge. However, in the short term, the GBP/USD might print another leg-down before resuming its rally, which could put the March 1, 2022, peak at 1.3437 to the test.
If GBP/USD remains above 1.3363, this could pave the way to challenge the current yearly high of 1.3429. On further strength, that will expose 1.3437, followed by the 1.3450 figure, ahead of 1.3500.
Conversely, if the pair slumps past 1.3363, it could hit the current week’s low of 1.3248. On further weakness, the bulls’ following line of defense will be the September 19 daily low of 1.3153.
GBP/USD Price Action – Daily Chart
British Pound PRICE Today
The table below shows the percentage change of British Pound (GBP) against listed major currencies today. British Pound was the strongest against the Japanese Yen.
| USD | EUR | GBP | JPY | CAD | AUD | NZD | CHF | |
|---|---|---|---|---|---|---|---|---|
| USD | 0.06% | 0.29% | 0.79% | 0.20% | 0.43% | 0.60% | 0.66% | |
| EUR | -0.06% | 0.24% | 0.74% | 0.14% | 0.37% | 0.56% | 0.59% | |
| GBP | -0.29% | -0.24% | 0.48% | -0.10% | 0.13% | 0.28% | 0.36% | |
| JPY | -0.79% | -0.74% | -0.48% | -0.58% | -0.35% | -0.19% | -0.13% | |
| CAD | -0.20% | -0.14% | 0.10% | 0.58% | 0.23% | 0.41% | 0.46% | |
| AUD | -0.43% | -0.37% | -0.13% | 0.35% | -0.23% | 0.19% | 0.23% | |
| NZD | -0.60% | -0.56% | -0.28% | 0.19% | -0.41% | -0.19% | 0.05% | |
| CHF | -0.66% | -0.59% | -0.36% | 0.13% | -0.46% | -0.23% | -0.05% |
The heat map shows percentage changes of major currencies against each other. The base currency is picked from the left column, while the quote currency is picked from the top row. For example, if you pick the British Pound from the left column and move along the horizontal line to the US Dollar, the percentage change displayed in the box will represent GBP (base)/USD (quote).
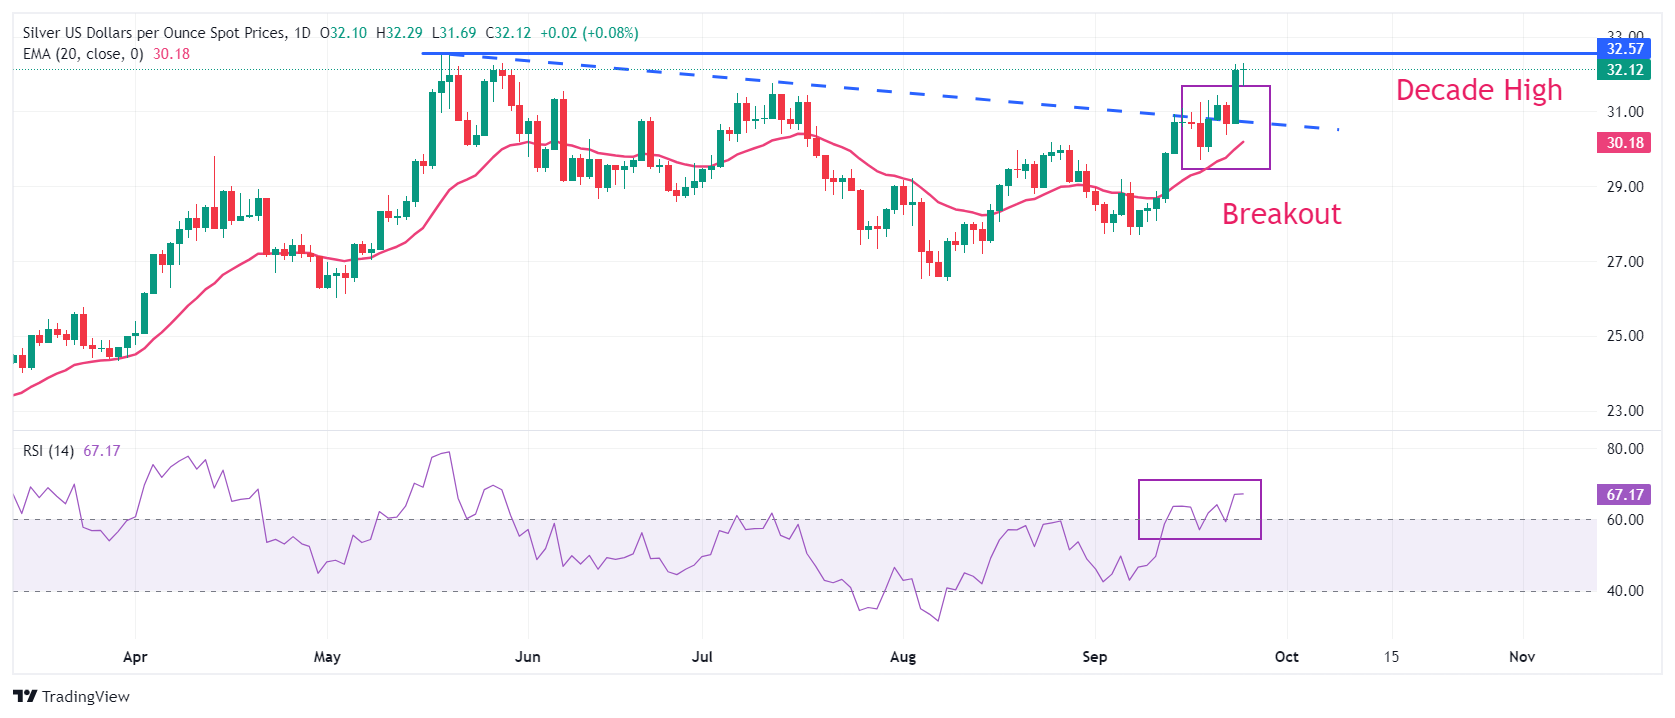
- Silver price clings to gains near $32.00 as Fed large rate cut bets swell.
- The next move in the US Dollar will be guided by the US core PCE inflation data.
- Silver price aims to recapture the decade-high of $32.50.
Silver price (XAG/USD) grips gains near the key resistance of $32.00 in Wednesday’s New York session. The white metal holds strength as the US Dollar remains under pressure amid growing speculation that the Federal Reserve (Fed) will deliver another sizable interest rate cut in any of the remaining two policy meetings this year.
The US Dollar Index (DXY), which tracks the Greenback’s value against six major currencies, hovers near the yearly low of 100.20. Meanwhile, 10-year US Treasury yields jump to near 3.77%. Historically, higher yields on interest-bearing assets increase the opportunity cost of holding an investment in non-yielding assets, such as Silver. But, in this case, the Silver price remains firm.
According to the CME FedWatch tool, the central bank is expected to reduce its key borrowing rates further by 75 bps in the remainder of the year, suggesting that there will be one 50 bps and one 25 bps rate cut. 30-day Federal fund futures pricing data shows that the probability of the Fed reducing interest rates by a larger-than-usual margin in November has increased to 59% from 37% a week ago.
Going forward, investors will focus on the United States (US) core Personal Consumption Expenditure price index (PCE) data for August, a Fed’s preferred inflation gauge, which will be published on Friday. Economists estimate the annual inflation measure to have accelerated to 2.7% from 2.6% in July.
Silver technical analysis
Silver price approaches the decade high of $32.50. The white metal strengthened after the breakout of the downward-sloping trendline from May 21 high of $32.50. Upward-sloping 20-day Exponential Moving Average (EMA) near $30.20 suggests that the near-term outlook of the Silver price is bullish.
The 14-day Relative Strength Index (RSI) strives to sustain in the 60.00-80.00. A bullish momentum would trigger if the oscillator manages to do so.
Silver daily chart
Silver FAQs
Silver is a precious metal highly traded among investors. It has been historically used as a store of value and a medium of exchange. Although less popular than Gold, traders may turn to Silver to diversify their investment portfolio, for its intrinsic value or as a potential hedge during high-inflation periods. Investors can buy physical Silver, in coins or in bars, or trade it through vehicles such as Exchange Traded Funds, which track its price on international markets.
Silver prices can move due to a wide range of factors. Geopolitical instability or fears of a deep recession can make Silver price escalate due to its safe-haven status, although to a lesser extent than Gold's. As a yieldless asset, Silver tends to rise with lower interest rates. Its moves also depend on how the US Dollar (USD) behaves as the asset is priced in dollars (XAG/USD). A strong Dollar tends to keep the price of Silver at bay, whereas a weaker Dollar is likely to propel prices up. Other factors such as investment demand, mining supply – Silver is much more abundant than Gold – and recycling rates can also affect prices.
Silver is widely used in industry, particularly in sectors such as electronics or solar energy, as it has one of the highest electric conductivity of all metals – more than Copper and Gold. A surge in demand can increase prices, while a decline tends to lower them. Dynamics in the US, Chinese and Indian economies can also contribute to price swings: for the US and particularly China, their big industrial sectors use Silver in various processes; in India, consumers’ demand for the precious metal for jewellery also plays a key role in setting prices.
Silver prices tend to follow Gold's moves. When Gold prices rise, Silver typically follows suit, as their status as safe-haven assets is similar. The Gold/Silver ratio, which shows the number of ounces of Silver needed to equal the value of one ounce of Gold, may help to determine the relative valuation between both metals. Some investors may consider a high ratio as an indicator that Silver is undervalued, or Gold is overvalued. On the contrary, a low ratio might suggest that Gold is undervalued relative to Silver.
Year-to-date Gold returns are currently staging their third-best performance since 1980, and, in reality, are only a rounding error away from the best all-time performance in the last 44 years.
A rounding error away from the best all-time performance
“While we can argue that fund FOMO is hard to account for, there is evidence of notable OTC interest in physical markets hitting the tapes with BOE Gold simultaneously trading tight. Since the Fed kickstarted its easing cycle with a 50bp cut, commodities prices, inflation swaps, and US long-end yields have simultaneously risen, and have even outpaced the rally in risk assets by some measures.”
“The cross-section of commodities prices continues to send signals of significant improvement in demand expectations, and while survey-based measures of consumer confidence are deteriorating, consumer spending patterns have remained strong. While this could easily ultimately be seen as an overreaction to the Fed's 50bp start to its cutting cycle, a persistence in this trend could signal more worrying signs that it may not be as easy as the Fed hopes to bring rates lower without reflation.”
“Conversely, if these trends simply reflect an overreaction to the start of the easing cycle, then it is worth highlighting that in the years that followed such a remarkable performance in Gold, drawdowns for the following year have averaged -27%.”
- AUD/USD struggles to extend its upside above 0.6900, while its upside remains firm.
- The Australian Dollar remains firm as the RBA is expected to keep interest rates steady at their current levels for the entire year.
- Firm Fed large rate cut bets weigh on the US Dollar.
The AUD/USD pair edges lower after posting a fresh yearly high around 0.6900 in Wednesday’s North American session. The broader outlook of the Aussie asset remains firm as the Reserve Bank of Australia (RBA) signaled in its monetary policy meeting on Tuesday that interest rates will remain at their current levels by the year-end.
The Australian Dollar (AUD) is also strengthened by the announcement of China’s massive stimulus to boost household spending and revive the real estate sector. Being a proxy for China’s economic growth, the AUD receives higher flows if China’s outlook improves.
Meanwhile, the US Dollar (USD) has fallen back after a short-lived recovery. The US Dollar Index (DXY), which tracks the Greenback’s value against six major currencies, retreats to 100.20, the lowest level seen in more than a year.
The US Dollar would continue to face pressure as market participants expect that the Federal Reserve (Fed) will cut interest rates consecutively for the second time by 50 basis points (bps) in the November monetary policy.
AUD/USD reclaims the horizontal resistance plotted from 28 December 2023 high of 0.6870 on a daily timeframe. The near-term trend is bullish as the 20-day Exponential Moving Average (EMA) at 0.6770 is sloping higher.
The 14-day Relative Strength Index (RSI) shifts above 60.00, suggesting an active bullish momentum.
The Aussie asset will witness a fresh upside move if it breaks above the intraday high of 0.6910, which will drive the asset to near the 16 February 2023 high of 0.6936, followed by the psychological resistance of 0.7000.
On the flip side, a downside move below September 19 of 0.6738 will drag the asset toward round-level support of 0.6700 and a September 12 low of 0.6656.
AUD/USD daily chart
Australian Dollar FAQs
One of the most significant factors for the Australian Dollar (AUD) is the level of interest rates set by the Reserve Bank of Australia (RBA). Because Australia is a resource-rich country another key driver is the price of its biggest export, Iron Ore. The health of the Chinese economy, its largest trading partner, is a factor, as well as inflation in Australia, its growth rate and Trade Balance. Market sentiment – whether investors are taking on more risky assets (risk-on) or seeking safe-havens (risk-off) – is also a factor, with risk-on positive for AUD.
The Reserve Bank of Australia (RBA) influences the Australian Dollar (AUD) by setting the level of interest rates that Australian banks can lend to each other. This influences the level of interest rates in the economy as a whole. The main goal of the RBA is to maintain a stable inflation rate of 2-3% by adjusting interest rates up or down. Relatively high interest rates compared to other major central banks support the AUD, and the opposite for relatively low. The RBA can also use quantitative easing and tightening to influence credit conditions, with the former AUD-negative and the latter AUD-positive.
China is Australia’s largest trading partner so the health of the Chinese economy is a major influence on the value of the Australian Dollar (AUD). When the Chinese economy is doing well it purchases more raw materials, goods and services from Australia, lifting demand for the AUD, and pushing up its value. The opposite is the case when the Chinese economy is not growing as fast as expected. Positive or negative surprises in Chinese growth data, therefore, often have a direct impact on the Australian Dollar and its pairs.
Iron Ore is Australia’s largest export, accounting for $118 billion a year according to data from 2021, with China as its primary destination. The price of Iron Ore, therefore, can be a driver of the Australian Dollar. Generally, if the price of Iron Ore rises, AUD also goes up, as aggregate demand for the currency increases. The opposite is the case if the price of Iron Ore falls. Higher Iron Ore prices also tend to result in a greater likelihood of a positive Trade Balance for Australia, which is also positive of the AUD.
The Trade Balance, which is the difference between what a country earns from its exports versus what it pays for its imports, is another factor that can influence the value of the Australian Dollar. If Australia produces highly sought after exports, then its currency will gain in value purely from the surplus demand created from foreign buyers seeking to purchase its exports versus what it spends to purchase imports. Therefore, a positive net Trade Balance strengthens the AUD, with the opposite effect if the Trade Balance is negative.
- EUR/GBP is rising for the second day in a row after comments from BoE’s Bailey
- The BoE Governor’s comments suggested interest rates would continue falling gradually as inflation eased.
- The Euro remains under pressure by weak data and rising bets of the ECB cutting rates in October.
EUR/GBP continues its recovery, trading up 0.40% in the 0.8360s on Wednesday. The Pound started losing ground against the single currency after commentary from Bank of England (BoE) governor Andrew Bailey, in which he said that he saw interest rates continuing to fall gradually. This, in turn, put pressure on Sterling since lower interest rates attract less capital inflows.
“I'm very encouraged that the path of inflation is downwards therefore I do think the path for interest rates will be downwards, gradually, to the ´neutral’ rate,” Bailey said on Tuesday. The neutral rate of interest is the long run equilibrium level, or “ideal” level for interest rates in the economy.
His remarks come after a close call five-to-four vote at the BoE’s August meeting backed up a quarter point cut from the bank, pushing borrowing costs down to 5.00%. Financial markets, meanwhile, are pricing in a drop to 4.5% by the end of 2024, and lower to 3.5% by the end of 2025.
BoE policymaker Megan Greene was more hawkish than Bailey on Wednesday when she said that a “cautious, steady-as-she-goes approach to monetary policy easing is appropriate.”
Greene added “I believe the risks to activity are to the upside, which could suggest that the long-run neutral rate is higher and - all else equal - our stance of policy isn’t as restrictive as we had thought.” Greene was one of four on the MPC who voted to hold rates in August.
EUR/GBP rebounds despite increasing odds of an ECB Autumn cut
The Euro rallies against the Pound despite increasing odds the European Central Bank (ECB) will announce a 0.25% cut to its main refinancing operations rate in October, bringing it down to 3.40% from 3.65%, and thereby increasing the differential with the BoE.
“Despite the Fed’s 50 bps cut, the ECB is widely expected to wait until December to deliver its next rate cut, though yesterday’s weak PMI readings as well as today’s Ifo have pushed market pricing closer to a 50/50 for a rate cut already at the next meeting in October," said Anders Svendsen, Chief Analyst at Nordea Bank.
The Euro solf-off heavily on Monday after the release of HCOB Purchasing Manager Index (PMI) data showed a stark decline in activity in the Eurozone economy, with the Composite PMI falling from growth territory (above 50) to contraction (below 50).
There then followed a below-expectations IFO German business sentiment index score in September – the IFO is a survey of 7,000 enterprises regarding the state of the economy and the outlook.
Both the IFO Business Climate and Current Assessment indexes fell below both previous readings for August and economists’ forecasts. The IFO Expectations index, meanwhile, matched forecasts but was still lower than the previous month’s reading. The data reinforces the view that the German economy is at risk of falling into a recession.
Stronger GBP unlikely to feedback into lower inflation - Commerzbank
Speculation that the strengthening Pound – the major that has risen the most against the US Dollar (GBP) since the beginning of 2024 – would lead to lower imported inflation and thereby bring down UK inflation as a whole, were dismissed by Commerzbank’s FX Analyst Michael Pfister, on Wednesday.
“In the UK, almost all inflationary pressure now comes from services. The role of goods is less important. In fact, in recent months we have even seen outright goods deflation in some areas, which has helped to push down the core rate. The slight turnaround that has since taken place confirms our view,” said Pfister in a note.
If a stronger Pound were to bring inflation down it would encourage the BoE to cut interest rates more aggressively, eventually weakening Sterling and counterbalancing the strength that had led to the lower inflation in the first place.
However, Pfister sees little chance of this unless GBP can rise substantially higher in order for deflationary goods inflation to completely smother services inflation.
“Since the beginning of the year, the GBP has gained almost 5% against the USD. That makes it by far the best performing G10 currency, but it probably won't be enough. GBP would probably need to appreciate much more for the persistently high services inflation to narrow the gap between the core rate and the target,” said the analyst.
In August, Rabobank lowered Brent forecasts for Q4 2024 to $82 from $86. Additionally, they also moved our 2025 full-year forecast down to $85/bbl from $92/bbl as the market moved into balance from deficit according to estimates, Rabobank’s economists note.
Markets look to be oversupplied next year
“Recent confirmation of poor Chinese and US demand data and a looming glut of supply with a long-term demographic shift have caused us to revisit our models and forecasts: we now expect Brent to average $71 in Q4 2024. Further out, we forecast 2025 prices to average $70, 2026 to rise to $72, and 2027 to trade around the $75 mark.”
“According to our sensitivity analysis, a half-million barrel per day oversupply implies a $10 shift in Brent prices. Markets look to be oversupplied next year by about 700,000 barrels per day, which reflects the dramatic move in our forecasts.”
“We still await the flattening and decline of US tight oil production in 2025 alongside Russian compensation cuts to inject some price appreciation later in the year and in 2026, but overall the market looks to be on a longer-term flat trajectory. Lower prices in the US will discourage new drilling.”
- The US Dollar is under pressure after investors are relocating investments.
- Recession fears are emerging again for the US after a batch of weak economic data.
- The US Dollar Index flirts with a fresh 15-month low and could slip below 100.00 if more selling pressure occurs.
The US Dollar (USD) trades flat in the early European session on Wednesday after easing against most major Asian currencies, such as the Chinese Yuan (CNY) or the Indian Rupee (INR), overnight. The reshuffle comes after investors relocate their investments from the US to Chinese equities. The move is triggered by a massive stimulus plan from the Chinese government that was implemented on Tuesday.
On the economic data front, there is a very light calendar ahead, with no real market-moving data on Wednesday. One element that might draw some attention is comments from Federal Reserve (Fed) Governor Adriana Kugler, who delivers a speech about the US economic outlook at the Harvard Kennedy School in Cambridge, Massachusetts. From there, markets will be on edge over the US Q2 Gross Domestic Product (GDP) release, and Fed Chairman Jerome Powell set to speak on Thursday.
Daily digest market movers: Expect some calmness
- “Sentiment is firing up in Asian markets after China announced a raft of policy stimulus measures,” damping demand for the Dollar, said Wei Liang Chang, a foreign exchange and credit strategist at DBS Bank in Singapore, Bloomberg reports.
- At 11:00 GMT, the Mortgage Bankers Association (MBA) released its weekly mortgage applications index. There was a surge of 11.0% in applications against 14.2% last week.
- Related to mortgages, New Home Sales are due at 14:00 GMT. Expectations are for a touch softer number at 0.700 million units in August against 0.739 million previously.
- The US Treasury will allocate a 5-year Note around 17:00 GMT.
- At 20:00 GMT, Federal Reserve Governor Adriana Kugler delivers a speech about the US economic outlook at the Harvard Kennedy School in Cambridge, Massachusetts.
- All equity markets are in the red, except for the Chinese equities which are rallying for a second day, supported by the Chinese stimulus measures.
- The CME Fedwatch Tool shows a 41.6% chance of a 25-basis-point rate cut at the next Fed meeting on November 7, while 58.4% is pricing in another 50-basis-point rate cut.
- The US 10-year benchmark rate trades at 3.73%, retreating from its attempt earlier to print a fresh monthly high.
US Dollar Index Technical Analysis: There is the catch up with reality
The US Dollar Index (DXY) is flirting with a fresh 15-month low after Tuesday’s data and China stimulus triggered some further devaluation for the Greenback. Going forward, rather the main data on Thursday and Friday will act as catalysts that might move the DXY. Watch out for the US Q2 Gross Domestic Product (GDP), that could trigger recession fears in case it drops.
The upper level of the September range remains at 101.90. Further up, the index could go to 103.18, with the 55-day Simple Moving Average (SMA) at 102.42 along the way. The next tranche up is very misty, with the 100-day SMA at 103.61 and the 200-day SMA at 103.76, just ahead of the big 104.00 round level.
On the downside, 100.22 (the September 18 low) is the first support, and a break could point to more weakness ahead. Should that take place, the low from July 14, 2023, at 99.58, will be the next level to look out for. If that level gives way, early levels from 2023 are coming in near 97.73.
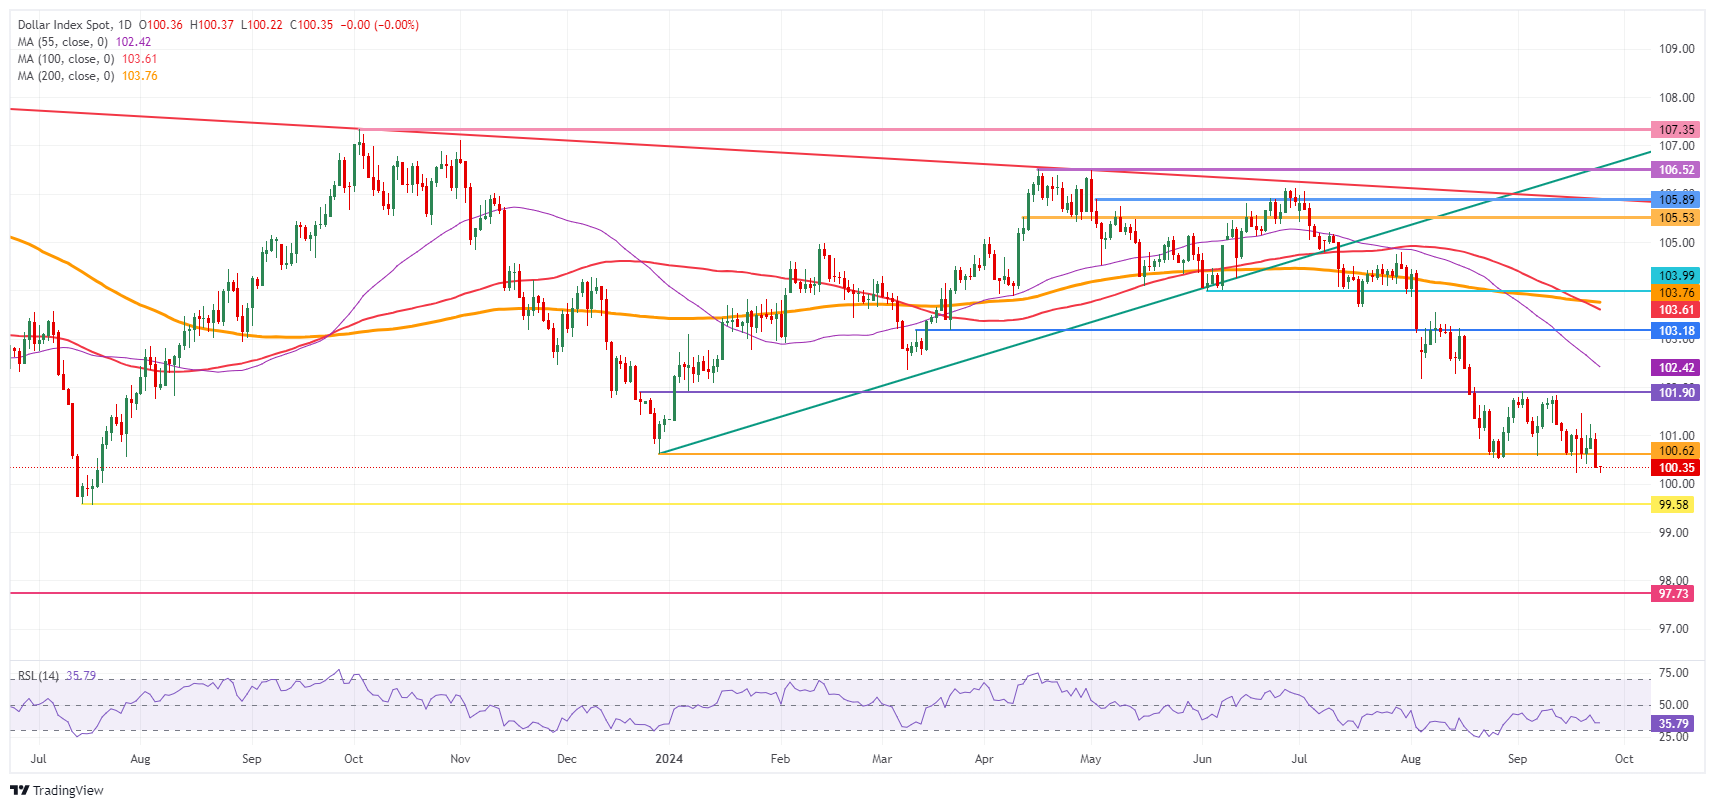
US Dollar Index: Daily Chart
US Dollar FAQs
The US Dollar (USD) is the official currency of the United States of America, and the ‘de facto’ currency of a significant number of other countries where it is found in circulation alongside local notes. It is the most heavily traded currency in the world, accounting for over 88% of all global foreign exchange turnover, or an average of $6.6 trillion in transactions per day, according to data from 2022. Following the second world war, the USD took over from the British Pound as the world’s reserve currency. For most of its history, the US Dollar was backed by Gold, until the Bretton Woods Agreement in 1971 when the Gold Standard went away.
The most important single factor impacting on the value of the US Dollar is monetary policy, which is shaped by the Federal Reserve (Fed). The Fed has two mandates: to achieve price stability (control inflation) and foster full employment. Its primary tool to achieve these two goals is by adjusting interest rates. When prices are rising too quickly and inflation is above the Fed’s 2% target, the Fed will raise rates, which helps the USD value. When inflation falls below 2% or the Unemployment Rate is too high, the Fed may lower interest rates, which weighs on the Greenback.
In extreme situations, the Federal Reserve can also print more Dollars and enact quantitative easing (QE). QE is the process by which the Fed substantially increases the flow of credit in a stuck financial system. It is a non-standard policy measure used when credit has dried up because banks will not lend to each other (out of the fear of counterparty default). It is a last resort when simply lowering interest rates is unlikely to achieve the necessary result. It was the Fed’s weapon of choice to combat the credit crunch that occurred during the Great Financial Crisis in 2008. It involves the Fed printing more Dollars and using them to buy US government bonds predominantly from financial institutions. QE usually leads to a weaker US Dollar.
Quantitative tightening (QT) is the reverse process whereby the Federal Reserve stops buying bonds from financial institutions and does not reinvest the principal from the bonds it holds maturing in new purchases. It is usually positive for the US Dollar.
- USD/CAD faces pressure as China’s big-bang stimulus strengthens the oil-linked Canadian Dollar.
- The BoC is expected to loosen its interest rate policy further.
- Market participants expect the US core PCE inflation to have accelerated to 2.7% in August.
The USD/CAD pair trades close to a fresh six-month low near 1.3430 in Wednesday’s European session. The Loonie asset remains under pressure as the Canadian Dollar (CAD) performs strongly on China’s massive stimulus announcement, which has strengthened the Oil price outlook.
It is worth noting that Canada is the leading exporter of Oil to the United States (US) and higher Oil prices result in an acceleration in inflows towards the Canadian Dollar. However, its outlook could worsen as the Bank of Canada (BoC) is expected to ease its monetary policy further.
Meanwhile, the US Dollar (USD) strives to gain ground above the yearly low, with the US Dollar Index (DXY) trading above 100.20. The US Dollar rebounds even though investors expect the Federal Reserve (Fed) to reduce interest rates further aggressively.
For fresh interest rate guidance, investors will focus on the US core Personal Consumption Expenditure price index (PCE) data for August, which will be published on Friday. The core PCE inflation is estimated to have grown by 2.7%, higher than 2.6% in July.
USD/CAD prints a fresh swing low near 1.3400 on a daily timeframe, suggesting a firm bearish trend. The Loonie asset weakens after slipping below the August 28 low of 1.3440. A declining 20-day Exponential Moving Average (EMA) near 1.3550 indicates more downside.
The 14-day Relative Strength Index delivers a range shift move into the 20.00-60.00 territory from 40.00-80.00, which suggests that pullbacks would be considered as selling opportunities by investors.
Going forward, a further correction by the major below the immediate support of 1.3400 would expose it to January 31 low of 1.3360 and June 9 low of 1.3340.
In an alternate scenario, a recovery move above the psychological support of 1.3500 would drive the asset towards April 5 low of 1.3540, followed by September 20 high of 1.3590.
USD/CAD daily chart
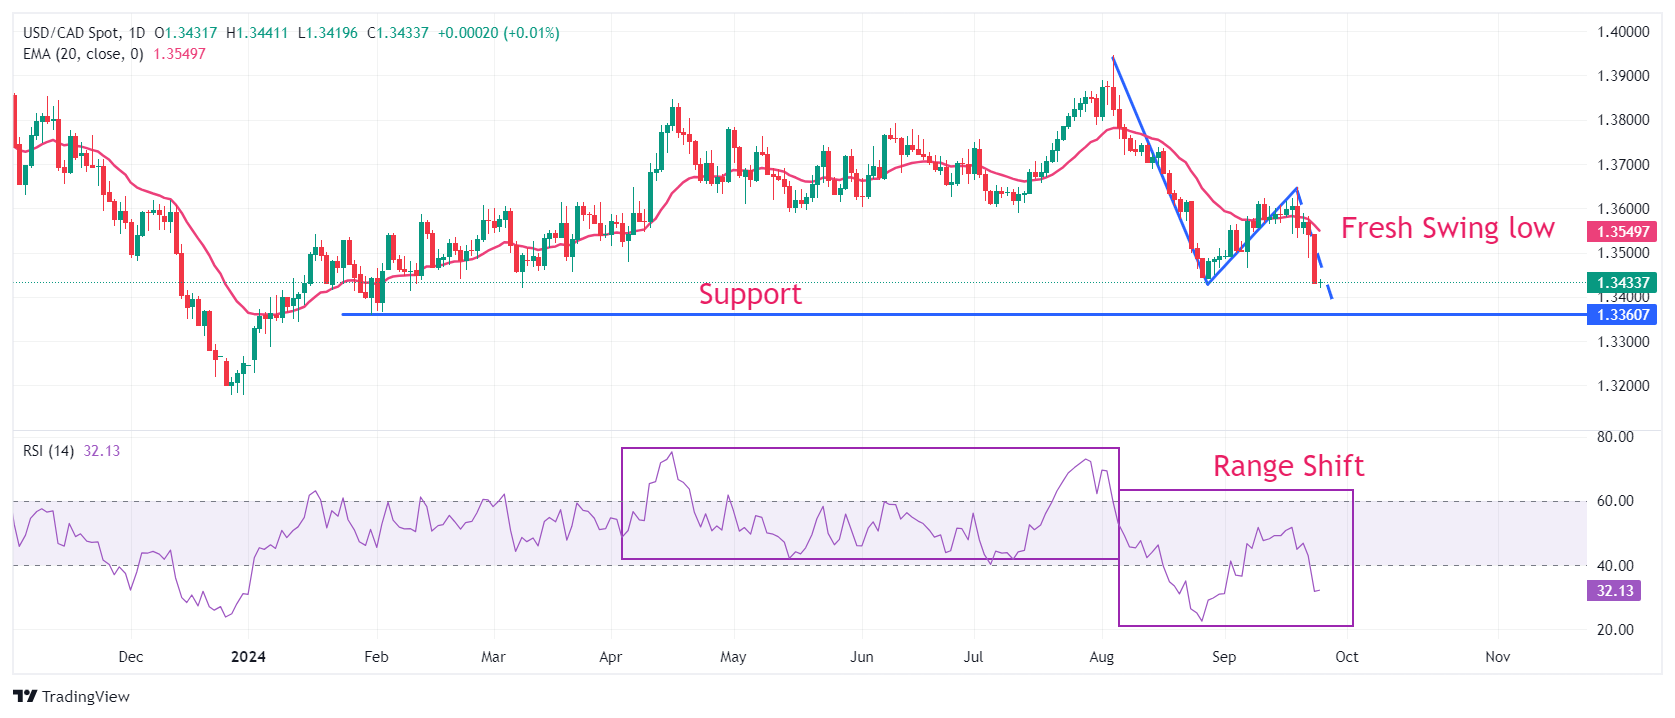
Canadian Dollar FAQs
The key factors driving the Canadian Dollar (CAD) are the level of interest rates set by the Bank of Canada (BoC), the price of Oil, Canada’s largest export, the health of its economy, inflation and the Trade Balance, which is the difference between the value of Canada’s exports versus its imports. Other factors include market sentiment – whether investors are taking on more risky assets (risk-on) or seeking safe-havens (risk-off) – with risk-on being CAD-positive. As its largest trading partner, the health of the US economy is also a key factor influencing the Canadian Dollar.
The Bank of Canada (BoC) has a significant influence on the Canadian Dollar by setting the level of interest rates that banks can lend to one another. This influences the level of interest rates for everyone. The main goal of the BoC is to maintain inflation at 1-3% by adjusting interest rates up or down. Relatively higher interest rates tend to be positive for the CAD. The Bank of Canada can also use quantitative easing and tightening to influence credit conditions, with the former CAD-negative and the latter CAD-positive.
The price of Oil is a key factor impacting the value of the Canadian Dollar. Petroleum is Canada’s biggest export, so Oil price tends to have an immediate impact on the CAD value. Generally, if Oil price rises CAD also goes up, as aggregate demand for the currency increases. The opposite is the case if the price of Oil falls. Higher Oil prices also tend to result in a greater likelihood of a positive Trade Balance, which is also supportive of the CAD.
While inflation had always traditionally been thought of as a negative factor for a currency since it lowers the value of money, the opposite has actually been the case in modern times with the relaxation of cross-border capital controls. Higher inflation tends to lead central banks to put up interest rates which attracts more capital inflows from global investors seeking a lucrative place to keep their money. This increases demand for the local currency, which in Canada’s case is the Canadian Dollar.
Macroeconomic data releases gauge the health of the economy and can have an impact on the Canadian Dollar. Indicators such as GDP, Manufacturing and Services PMIs, employment, and consumer sentiment surveys can all influence the direction of the CAD. A strong economy is good for the Canadian Dollar. Not only does it attract more foreign investment but it may encourage the Bank of Canada to put up interest rates, leading to a stronger currency. If economic data is weak, however, the CAD is likely to fall.
The DXY Index depreciated 0.4% to 100.47, its weakest closing level for the year, DBS FX analyst Philip Wee notes.
More Fed cuts to 4.5% by the end of this year
“The futures market is not ruling out another 50 bps cut at the FOMC meeting in November after the US Conference Board’s weak consumer report. The headline consumer confidence index declined to 98.7 in September from an upwardly revised 105.6 in August; consensus had expected a slight improvement to 104 from the previously estimated 103.3.
“Despite the overall index nearing the bottom of its two-year range, the present situation index fell to its lowest level since March 2021. Conducted before the last FOMC meeting on September 18, consumers turned negative on current business conditions and were less complacent about the labour market.”
“The weak consumer confidence report validates the Fed’s decision to deliver a larger 50 bps rate cut to 5% to avert a further cooling in the labour market. We maintain the view for the DXY to head below 100 based on our expectations for more Fed cuts to 4.5% by the end of this year and 3% by the end of 2025.”
- Natural Gas already trades at elevated levels after constant attacks on Lebanon by Israel.
- European Gas reserves are 94% full, though drawdowns are already being reported in Germany.
- The US Dollar Index is under pressure as China’s stimulus plan leads to investors relocating parts of their investments.
Natural Gas futures edge higher on Wednesday after a small pause in their rally the previous day. Heightened geopolitical tensions between Israel and Lebanon are still present, with supply concerns for Europe emerging as well on top. The underground Gas stockpile reserves in Europe are nearly 94% full, which is an excellent level, though more concerning is that the stockpiling is not picking up anymore and is even seeing some drawdowns locally, which triggers concerns for reserves over the winter.
Meanwhile, the US Dollar Index (DXY), which tracks the Greenback's value against six major currencies, is under selling pressure after the announcement of a massive stimulus plan from China, which improved the market mood. Additionally, weak economic data from the United States (US) also weighs on the Greenback. This Wednesday will be a very calm day regarding macroeconomic releases, with some minor housing data standing out. Moreover, this week's main events will be the US Q2 Gross Domestic Product (GDP) on Thursday and the US Personal Consumption Expenditures Price Index (PCE) release on Friday.
Natural Gas is trading at $2.92 per MMBtu at the time of writing.
Natural Gas news and market movers: European reserve face drawdowns already
- European weather is facing a cold front, which is already seeing Gas drawdowns from its reserves in Germany, for example, Bloomberg data reveals.
- Tropical Storm Helene is set to hit the shores of Florida in the US Mexican Gulf region by Thursday, the National Hurricane Center reports.
- Hotter-than-normal weather in Japan has seen extended Liquefied Natural Gas (LNG) consumption, increasing the need for more fuel before the seasonal peak in demand during the winter, Reuters reports.
- LNG tanker Pioneer is traveling through the Suez Canal toward the Red Sea, according to ship-tracking data from Bloomberg. The vessel was sanctioned by the US last month for being connected to Russia’s suspected LNG shadow fleet.
Natural Gas Technical Analysis: Demand to pick up again?
Natural Gas prices are on course for another leg higher. This time, the demand side comes into play. With European storage figures reporting drawdowns being bigger than deliveries, concerns could emerge that the tactical reserves will be too low to surpass the winter season.
On the upside, $3.08 is the first pivotal level to look out for. To keep in mind, once above $3.20, a fresh high for 2024 will be registered. Ultimately, $3.50 would be the next big resistance.
On the downside, three clear levels can be identified as support. The first is a bounce off the red descending trend line, near $2.80. Further down, the green ascending trend line near $2.70 and the 100-day Simple Moving Average (SMA) at $2.50 should be able to avoid further downturn.
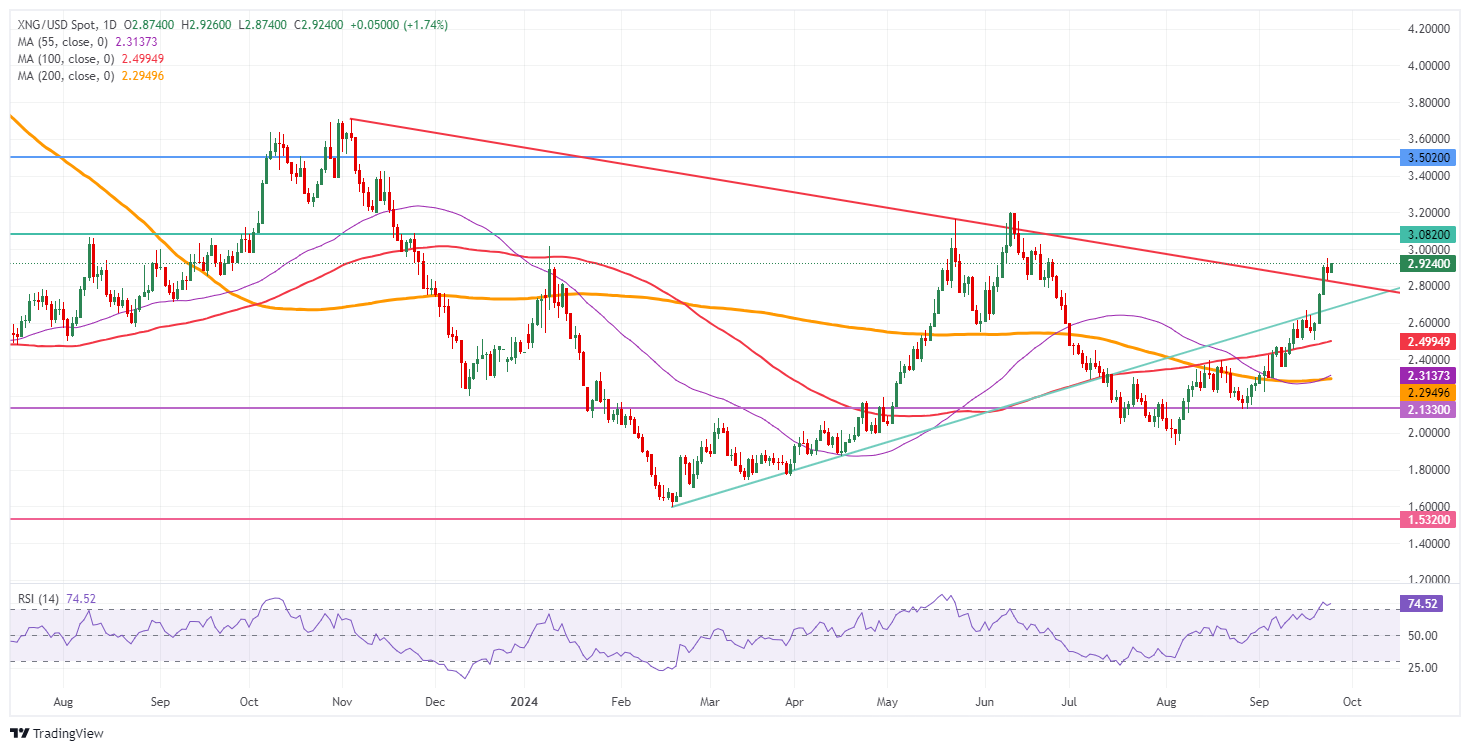
Natural Gas: Daily Chart
Natural Gas FAQs
Supply and demand dynamics are a key factor influencing Natural Gas prices, and are themselves influenced by global economic growth, industrial activity, population growth, production levels, and inventories. The weather impacts Natural Gas prices because more Gas is used during cold winters and hot summers for heating and cooling. Competition from other energy sources impacts prices as consumers may switch to cheaper sources. Geopolitical events are factors as exemplified by the war in Ukraine. Government policies relating to extraction, transportation, and environmental issues also impact prices.
The main economic release influencing Natural Gas prices is the weekly inventory bulletin from the Energy Information Administration (EIA), a US government agency that produces US gas market data. The EIA Gas bulletin usually comes out on Thursday at 14:30 GMT, a day after the EIA publishes its weekly Oil bulletin. Economic data from large consumers of Natural Gas can impact supply and demand, the largest of which include China, Germany and Japan. Natural Gas is primarily priced and traded in US Dollars, thus economic releases impacting the US Dollar are also factors.
The US Dollar is the world’s reserve currency and most commodities, including Natural Gas are priced and traded on international markets in US Dollars. As such, the value of the US Dollar is a factor in the price of Natural Gas, because if the Dollar strengthens it means less Dollars are required to buy the same volume of Gas (the price falls), and vice versa if USD strengthens.
Will the stronger pound lead to larger interest rate cuts by the Bank of England (BoE)? Does the recent strength of the Pound Sterling (GBP) mean that imported inflation will be lower and, conversely, that the Bank of England (BoE) will be able to cut interest rates more quickly? In principle, this is a very fascinating idea, and not just for the BoE, Commerzbank’s FX analyst Michael Pfister notes.
UK inflationary pressure now comes from services
“If central banks that are currently struggling with more stubborn inflationary pressures become relatively more hawkish, will the associated currency appreciation cause these inflationary pressures to subside? This in turn would lead to faster rate cuts. The best examples would be the Norges Bank and the Reserve Bank of Australia, next to the BoE.”
“In the UK, almost all inflationary pressure now comes from services. The role of goods is less important. In fact, in recent months we have even seen outright goods deflation in some areas, which has helped to push down the core rate. The slight turnaround that has since taken place confirms our view.”
“Since the beginning of the year, the GBP has gained almost 5% against the USD. That makes it by far the best performing G10 currency, but it probably won't be enough. GBP would probably need to appreciate much more for the persistently high services inflation to narrow the gap between the core rate and the target.”
USD/SGD fell sharply, driven by USD decline and RMB strength. Pair was last at 1.2851.
SGD strength may continue to stay
“Daily momentum turned bearish while RSI fell into oversold conditions. We still caution for rebound risks. Support here at 1.2820, 1.2740 levels. Resistance at 1.2910, 1.2990 (21 DMA).”
“We had shared that the recent uptick in core CPI for Aug may well suggest that it is premature for MAS to ease policy stance at Oct MPC unless MAS switches from inflation fighting mode to supporting growth. As such, SGD strength may continue to stay with us for a little longer, especially if USD softness presses on.”
Risks are lurking in the euro zone, and it is now more appropriate to look at the economy rather than inflation, Commerzbank’s FX analyst Antje Praefcke notes.
ECB is likely to focus increasingly on the economy
“The purchasing managers' indices from the euro zone at the beginning of the week and the German Ifo index yesterday briefly reminded the market that risks are also lurking in the euro zone. And these are significant economic risks.”
“The market does not really want to see them at the moment and is pushing them aside since the Fed and the dollar tend to overshadow everything. Nevertheless, they cannot be ignored, especially if the next leading indicators are similarly gloomy and the hard facts should deteriorate.”
“For the euro, too, it is now more appropriate to look at the economy rather than inflation. After all, the ECB is likely to focus increasingly on the economy as well, especially the doves of the Governing Council. Although the euro has weathered the bad data well this week, little strokes fell big oaks. That is why I will keep a close eye on data from the euro area in the coming weeks.”
After yesterday's 25bp rate cut in Hungary, expect the same move in the Czech Republic today from the Czech National Bank, ING’s FX strategist Frantisek Taborsky notes.
CNB can push EUR/CZK below 25.00 today
“Today's meeting is without a new forecast and the board will only discuss an internal update. However, communication in recent weeks points to a 25bp rate cut to 4.25%. So, the focus will be on forward guidance for the next meeting and especially next year. Inflation in August was above the CNB's forecast by 0.4pp, which may see the governor stay on the hawkish side again.”
“The market expects three 25bp rate cuts by the end of this year and a terminal rate next year at 2.75%. This is below our economists' forecasts. However, this is still a possible scenario for this year, while next year goes against the central bank's communication of the end of the cycle above the neutral rate of 3% for now.”
“The market is thus strongly on the dovish side, but in the current conditions we see it difficult to go against the market at the moment in the rates space but remain positive on the CZK, which we think will benefit the most from CNB's hawkishness. EUR/CZK jumped lower yesterday and is approaching 25.050. We believe the CNB can push EUR/CZK below 25.00 today.”
- USD/CHF surges to near 0.8500 amid a sharp decline in the Swiss Franc as traders brace for SNB’s policy decision.
- The SNB is expected to cut interest rates by 25 bps for the third time in a row.
- Investors expect the Fed to reduce its key borrowing rates further by 75 bps this year.
The USD/CHF pair gains sharply to near 0.8485 in Wednesday’s European session. The Swiss Franc asset strengthens as the Swiss Franc (CHF) performs weakly ahead of the Swiss National Bank’s (SNB) interest rate decision, which will be announced on Thursday.
Economists expect the SNB to ease interest rates further as the annual Consumer Price Index (CPI) in the Swiss economy has decelerated to 1.1% in August. The SNB is expected to cut interest rates by 25 basis points (bps) to 1%. This would be the third straight interest rate cut by the SNB.
Meanwhile, the US Dollar (USD) holds ground near the yearly low even though market participants expect that the Federal Reserve (Fed) will deliver one more larger-than-usual interest rate cut of 50 basis points (bps) in any of the two policy meetings remaining this year. The CME FedWatch tool shows that the Fed could cut interest rates further by 75 bps, a total in November and December meetings.
This week, investors will keenly for the United States (US) core Personal Consumption Expenditure price index (PCE) data for August as it will provide fresh cues on the interest rate outlook, which will be published on Friday.
USD/CHF oscillates in a tight range of 0.8370-0.8550 for almost a month. The asset struggles for direction amid an inventory adjustment process, a phase in which positions are transferred between retail participants and institutional investors.
The asset remains sticky to the 20-period Exponential Moving Average (EMA) near 0.8465, suggesting a sideways trend.
The 14-period Relative Strength Index (RSI) oscillates in the 40.00-60.00 range, indicating indecisiveness among market participants.
A recovery move above the monthly high near 0.8550 will drive the asset toward the round-level resistance of 0.8600, followed by an August 20 high of 0.8632.
On the flip side, more downside would appear if the asset breaks below the round-level support of 0.8400, which would drag the major towards the 28 December 2023 low of 0.8333 and round-level support of 0.8300.
USD/CHF four-hour chart
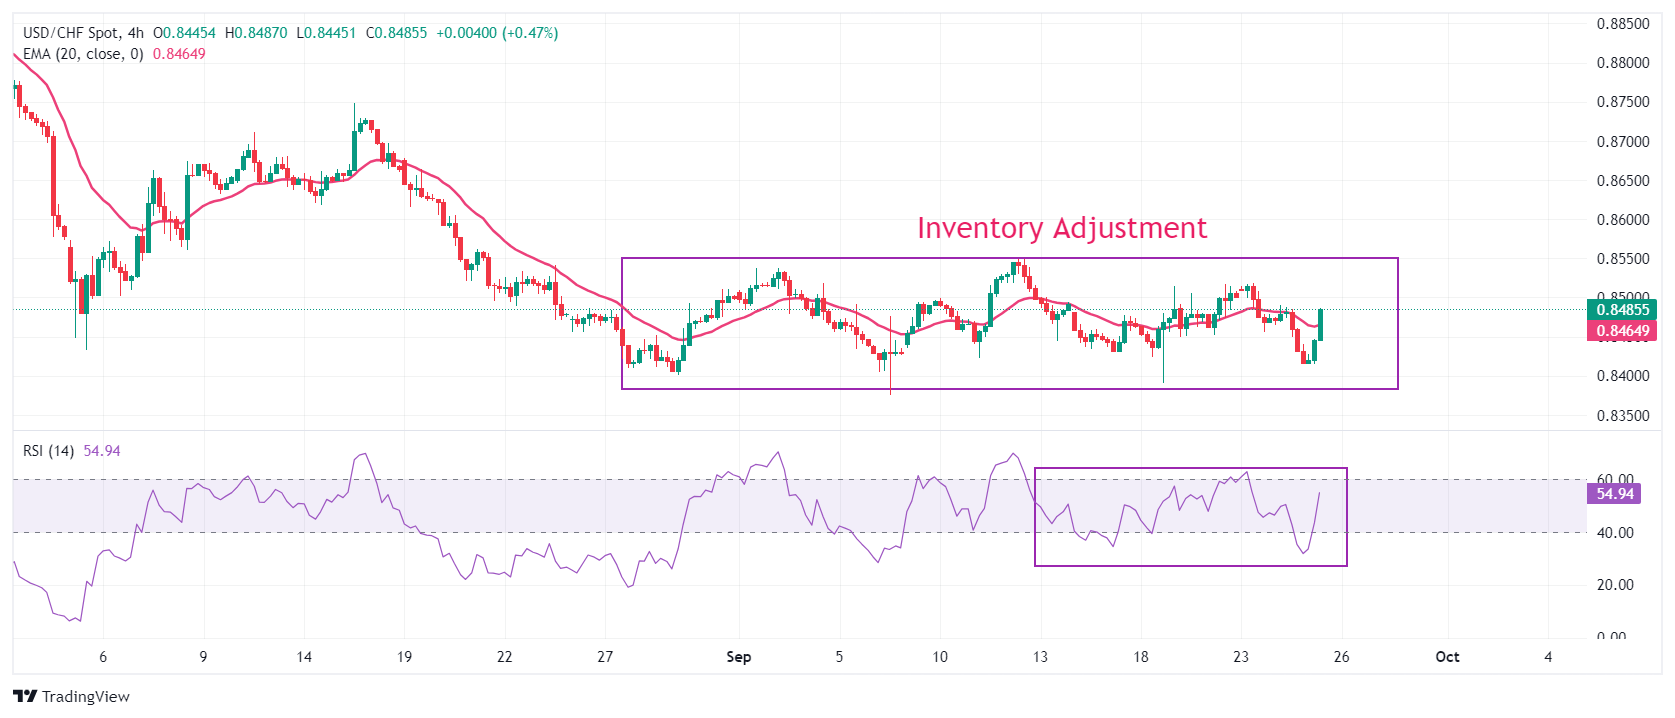
Economic Indicator
SNB Interest Rate Decision
The Swiss National Bank (SNB) announces its interest rate decision after each of the Bank’s four scheduled annual meetings, one per quarter. Generally, if the SNB is hawkish about the inflation outlook of the economy and raises interest rates, it is bullish for the Swiss Franc (CHF). Likewise, if the SNB has a dovish view on the economy and keeps interest rates unchanged, or cuts them, it is usually bearish for CHF.
Read more.Next release: Thu Sep 26, 2024 07:30
Frequency: Irregular
Consensus: 1%
Previous: 1.25%
Source: Swiss National Bank
Further sharp declines appear likely; support is at 6.9700. Not unreasonable to expect further US Dollar (USD) weakness, particularly when there are no significant support levels close by, UOB Group FX strategists Quek Ser Leang and Peter Chia note.
USD/CNH to continue to trade lower
24-HOUR VIEW: “The sharp selloff that sent USD plunging yesterday took us by surprise (we were expecting consolidation). Not surprisingly, further USD weakness seems likely today. As the next support is some distance away at 6.9700, we could continue to see sharp declines today. On the upside, any short-term rebound is likely to remain below 7.0380 with minor resistance at 7.0200.”
1-3 WEEKS VIEW: “We turned negative in USD last Friday (20 Sep, spot at 7.0700), indicating that it “is likely to trade with a downward bias towards 7.0500.” After USD fell sharply, in our most recent narrative from two days ago (23 Sep, spot at 7.0450), we indicated that “the sharp decline has resulted in further increase in downward momentum, and USD is likely to continue to weaken, potentially to 7.0100.” Yesterday, USD fell to 7.0117. Today, USD fell below 7.0000. Given the impulsive price movements, it is not unreasonable to expect further USD weakness, particularly when there are no significant support levels close by. Meanwhile, the short-term levels to monitor are 6.9700 and 6.9400. Overall, we will continue to expect a lower USD provided that 7.0600 (‘strong resistance’ level previously at 7.0770) is not breached.”
After a vulnerable start to the week, EUR/USD has come back bid. Efforts to reflate China have no doubt played a role – as did the soft US consumer confidence yesterday, ING’s FX strategist Chirs Turner notes.
EUR/USD range trading looks likely
“There is very little on the European calendar today, so EUR/USD range trading looks likely. But the fact that EUR/USD is holding above 1.1100 is encouraging for modest EUR/USD bulls like ourselves.”
“Elsewhere, we sent out a Swiss National Bank (SNB) preview yesterday. Our house call is a 25bp rather than a 50bp SNB cut – primarily because the SNB has such little room to manoeuvre on the downside. Given that the market is pricing a 37bp cut this Thursday, EUR/CHF could sell off if we're right with our 25bp call.”
“Perhaps the only way the SNB can verbally turn EUR/CHF now is by suggesting that there is no floor for the SNB policy rate – and by implication that rates could go negative again. We very much doubt the SNB is prepared to do that and therefore see EUR/CHF trading towards the lower end of a 0.93-0.95 range.”
USD/CHF fell amid broad USD softness. Pair was last at 0.8479 levels, OCBC’s FX strategists Frances Cheung and Christopher Wong note.
Risks are skewed to the downside
“Bullish momentum on daily chart intact but shows signs of fading while RSI fell. Risks are somewhat skewed to the downside. Support at 0.8375 (2024 low). Resistance at 0.8520 levels. SNB policy decision in focus tomorrow. It is likely policymakers will lower policy rate (by 25bp) to 1%, for the 3rd consecutive time this year.”
“There were some chatters if SNB may follow Fed in delivering a 50bp cut this Thu, but we doubt SNB needs to. Swiss inflation is well under control at 1.1%, in line with SNB’s expectations and a benign inflation profile allows for SNB to ease policy. In addition, industry lobby groups including watchmakers, technology manufacturers’ association have urged SNB and the government to support exporters by curbing the strength of CHF.”
“We are still of the view that recent CHF strength should slow but if broad bearish USD trend remain dominant, then USD/CHF may still be skewed to the downside. From a TWI perspective, we should expect CHF strength to slow.”
Sharp advance reinforces view that the US Dollar (USD) could recover further to 145.50, UOB Group FX strategists Quek Ser Leang and Peter Chia note.
USD/JPY can go up to 145.50
24-HOUR VIEW: “We expected USD to trade between 143.00 and 144.20 yesterday. USD subsequently traded in a wider range of 143.11/144.68, closing at 143.21 (-0.27%). The price action still seems to be part of a range trading phase, even though it is likely to trade in a lower range of 142.30/144.10 today.”
1-3 WEEKS VIEW: “Our update from two days ago (23 Sep, spot at 144.20) remains valid. As highlighted, the strong advance in USD last week reinforces our view that USD could recover further to 145.50. Our view will be invalidated if USD breaks below 141.90 (no change in ‘strong support’ level).”
- EUR/USD rises to near 1.1200 as the Euro gains despite deepening worries over Eurozone economic growth.
- The ECB is expected to cut interest rates once in any of the remaining two policy meetings this year.
- The next major trigger for the US Dollar will be the US core PCE inflation data for August on Friday.
EUR/USD extends its upside to near the yearly high of 1.1200 in Wednesday’s European session. The major currency pair gains as the US Dollar (USD) remains under pressure amid an improvement in investors’ risk appetite due to China’s massive stimulus plans announcement on Tuesday in an attempt to revive their economy from growing slowdown risks. Generally, investment flows to the US Dollar get reduced in times of cheerful market sentiment.
Apart from China’s massive stimulus, increasing Federal Reserve (Fed) large rate cut bets in November has also kept the US Dollar on the back foot. The US Dollar Index (DXY), which tracks the Greenback’s value against six major currencies, edges higher on Wednesday but remains close to the yearly low of 100.20.
The CME FedWatch tool shows that the likelihood of the Fed reducing interest rates by 50 basis points (bps) to the range of 4.25%-4.50% has increased to 60% from 37% a week ago. The Fed also started the policy-easing cycle on September 18 with a larger-than-usual rate cut of 50 bps as officials were concerned over declining labor demand.
This week, the major trigger for the US Dollar will be the United States (US) core Personal Consumption Expenditures Price Index (PCE) data for August, the Fed’s preferred inflation gauge, which will be published on Friday. The underlying inflation measure is estimated to have accelerated to 2.7% from 2.6% in July.
Before the Fed’s preferred inflation gauge, investors will focus on the US Durable Goods Orders for August, which will be published on Thursday. New Orders for Durable Goods are expected to have declined by 2.6% against a robust growth of 9.8% in July.
Daily digest market movers: EUR/USD rises as Euro performs strongly
- EUR/USD gains further to near 1.1200 in European trading hours as the Euro (EUR) performs strongly against its major peers despite growing concerns over Eurozone economic growth. Flash HCOB Composite Purchasing Managers Index (PMI), compiled by S&P Global and Hamburg Commercial Bank (HCOB) and released on Monday, unexpectedly contracted to 48.9 in September, the lowest level since January.
- The major decline in overall business activity came from a deeper contraction in activities in the manufacturing sector in the Eurozone’s major economies. German HCOB Manufacturing PMI came in at its lowest since September 2023 at 40.3, extending its contraction for 27 months in a row. Meanwhile, the French HCOB Composite PMI also returned to the contraction phase after expanding in August due to the one-off Olympic event.
- Going forward, the Euro will be guided by market expectations for European Central Bank (ECB) interest rate cut prospects for the rest of the year. The ECB is expected to deliver one interest rate cut in any of its two meetings remaining this year.
Technical Analysis: EUR/USD rises further to near 1.1200
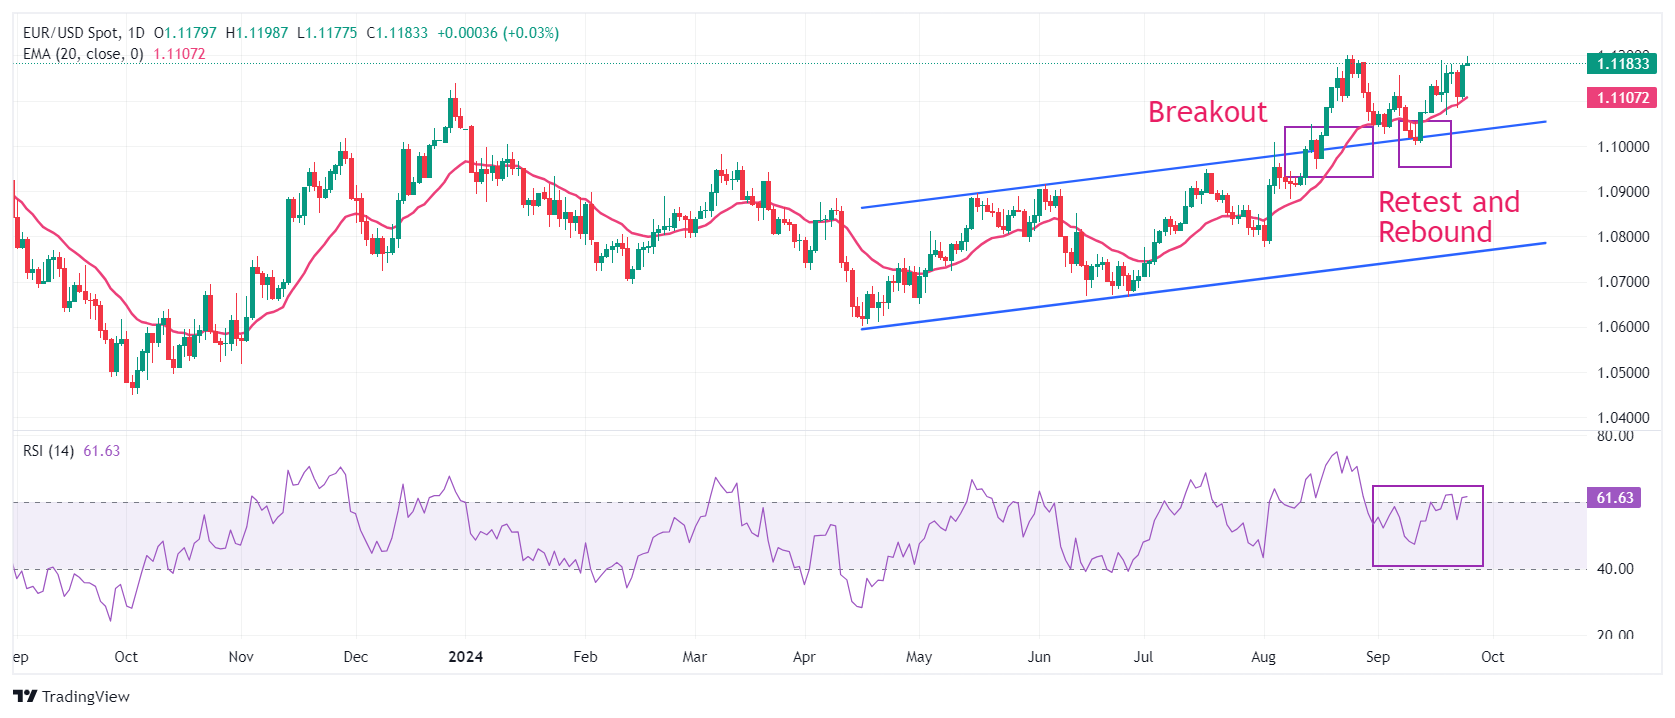
EUR/USD rises to near the key resistance of 1.1200 and aims to capture it in the European trading session on Wednesday. The major currency pair delivers a sharp recovery after finding strong buying interest near the 20-day Exponential Moving Average (EMA), which trades around 1.1100.
The outlook of the major currency pair would remain firm till it holds the breakout of the Rising Channel chart pattern formed on a daily time frame near the psychological support of 1.1000.
The 14-day Relative Strength Index (RSI) moves lower to 55.00, suggesting momentum is weakening.
Looking up, a decisive break above the round-level resistance of 1.1200 will result in further appreciation toward the July 2023 high of 1.1276. On the downside, the psychological level of 1.1000 and the July 17 high near 1.0950 will be major support zones.
Euro FAQs
The Euro is the currency for the 20 European Union countries that belong to the Eurozone. It is the second most heavily traded currency in the world behind the US Dollar. In 2022, it accounted for 31% of all foreign exchange transactions, with an average daily turnover of over $2.2 trillion a day. EUR/USD is the most heavily traded currency pair in the world, accounting for an estimated 30% off all transactions, followed by EUR/JPY (4%), EUR/GBP (3%) and EUR/AUD (2%).
The European Central Bank (ECB) in Frankfurt, Germany, is the reserve bank for the Eurozone. The ECB sets interest rates and manages monetary policy. The ECB’s primary mandate is to maintain price stability, which means either controlling inflation or stimulating growth. Its primary tool is the raising or lowering of interest rates. Relatively high interest rates – or the expectation of higher rates – will usually benefit the Euro and vice versa. The ECB Governing Council makes monetary policy decisions at meetings held eight times a year. Decisions are made by heads of the Eurozone national banks and six permanent members, including the President of the ECB, Christine Lagarde.
Eurozone inflation data, measured by the Harmonized Index of Consumer Prices (HICP), is an important econometric for the Euro. If inflation rises more than expected, especially if above the ECB’s 2% target, it obliges the ECB to raise interest rates to bring it back under control. Relatively high interest rates compared to its counterparts will usually benefit the Euro, as it makes the region more attractive as a place for global investors to park their money.
Data releases gauge the health of the economy and can impact on the Euro. Indicators such as GDP, Manufacturing and Services PMIs, employment, and consumer sentiment surveys can all influence the direction of the single currency. A strong economy is good for the Euro. Not only does it attract more foreign investment but it may encourage the ECB to put up interest rates, which will directly strengthen the Euro. Otherwise, if economic data is weak, the Euro is likely to fall. Economic data for the four largest economies in the euro area (Germany, France, Italy and Spain) are especially significant, as they account for 75% of the Eurozone’s economy.
Another significant data release for the Euro is the Trade Balance. This indicator measures the difference between what a country earns from its exports and what it spends on imports over a given period. If a country produces highly sought after exports then its currency will gain in value purely from the extra demand created from foreign buyers seeking to purchase these goods. Therefore, a positive net Trade Balance strengthens a currency and vice versa for a negative balance.
Chinese stimulus was the top story in FX markets yesterday. Metals markets rallied and the currencies of the emerging market commodity exporters in Latin America and South Africa had a good day. The jury is out on whether this theme can be maintained, ING’s FX strategist Chris Turner notes.
DXY to remain contained in a 100.50-101.00 range
“For example, were Chinese monetary stimulus backed up with some fiscal stimulus then we would have a little more confidence that these short-term trends could follow through. Additionally, we are starting to see USD/CNH trade below USD/CNY – something seen very rarely over the last couple of years.”
“If USD/CNH breaks with momentum below 7.00, we think it would be broadly supportive of global EM currencies and help tilt the dollar lower. In a surprise move yesterday, US consumer confidence was much weaker than expected. The market is very sensitive to this theme since the US consumer has been so resilient for so long.”
“There is only August new home sales data on the US calendar today, but we suspect the dollar can continue to trade on the soft side into the main event of the week, which is Friday's core PCE deflator for August. A low reading of say 0.1% month-on-month could deliver a leg lower in the dollar. Expect DXY to remain contained in a 100.50-101.00 range.”
Surge in momentum is likely to lead to further New Zealand Dollar (NZD) strength to 0.6380; 0.6410 is unlikely to come under threat. NZD is expected to continue to head higher, potentially to 0.6410, UOB Group FX strategists Quek Ser Leang and Peter Chia note.
NZD to head higher, potentially to 0.6410
24-HOUR VIEW: “After NZD rose sharply two days ago, we indicated yesterday that “the increase in momentum suggests further NZD strength towards 0.6290.” We added, “the major resistance at 0.6310 is unlikely to come into view.” NZD rose more than expected, soaring to a high of 0.6343 in late NY trade before continuing to rise in Asian trade today. The surge in momentum is likely to lead to further advance in NZD even though the major resistance at 0.6410 is unlikely to come under threat. The minor resistance at 0.6380 appears to be within reach. Support is at 0.6330, a breach of 0.6310 would suggest that NZD is not advancing further.”
1-3 WEEKS VIEW: “Yesterday (24 Sep, spot at 0.6265), we turned positive in NZD, indicating that it “could head higher to 0.6310, but at this time, the probability of it breaking clearly above this level is not high.” We added, “only a breach of 0.6215 (‘strong support’ level) would mean that the current buildup in upward momentum has eased.” Our view of a higher NZD was not wrong, but we did not anticipate the rapid manner in which it broke above 0.6310 and soared to 0.6343. We continue to expect a higher NZD, aiming for an advance to 0.6410. On the downside, the ‘strong support’ level has moved higher 0.6270.”
Silver prices (XAG/USD) fell on Wednesday, according to FXStreet data. Silver trades at $31.76 per troy ounce, down 1.05% from the $32.10 it cost on Tuesday.
Silver prices have increased by 33.47% since the beginning of the year.
| Unit measure | Silver Price Today in USD |
|---|---|
| Troy Ounce | 31.76 |
| 1 Gram | 1.02 |
The Gold/Silver ratio, which shows the number of ounces of Silver needed to equal the value of one ounce of Gold, stood at 83.60 on Wednesday, up from 82.79 on Tuesday.
Silver FAQs
Silver is a precious metal highly traded among investors. It has been historically used as a store of value and a medium of exchange. Although less popular than Gold, traders may turn to Silver to diversify their investment portfolio, for its intrinsic value or as a potential hedge during high-inflation periods. Investors can buy physical Silver, in coins or in bars, or trade it through vehicles such as Exchange Traded Funds, which track its price on international markets.
Silver prices can move due to a wide range of factors. Geopolitical instability or fears of a deep recession can make Silver price escalate due to its safe-haven status, although to a lesser extent than Gold's. As a yieldless asset, Silver tends to rise with lower interest rates. Its moves also depend on how the US Dollar (USD) behaves as the asset is priced in dollars (XAG/USD). A strong Dollar tends to keep the price of Silver at bay, whereas a weaker Dollar is likely to propel prices up. Other factors such as investment demand, mining supply – Silver is much more abundant than Gold – and recycling rates can also affect prices.
Silver is widely used in industry, particularly in sectors such as electronics or solar energy, as it has one of the highest electric conductivity of all metals – more than Copper and Gold. A surge in demand can increase prices, while a decline tends to lower them. Dynamics in the US, Chinese and Indian economies can also contribute to price swings: for the US and particularly China, their big industrial sectors use Silver in various processes; in India, consumers’ demand for the precious metal for jewellery also plays a key role in setting prices.
Silver prices tend to follow Gold's moves. When Gold prices rise, Silver typically follows suit, as their status as safe-haven assets is similar. The Gold/Silver ratio, which shows the number of ounces of Silver needed to equal the value of one ounce of Gold, may help to determine the relative valuation between both metals. Some investors may consider a high ratio as an indicator that Silver is undervalued, or Gold is overvalued. On the contrary, a low ratio might suggest that Gold is undervalued relative to Silver.
(An automation tool was used in creating this post.)
USD’s decline continued after US conference board consumer confidence unexpectedly fell. DXY was last at 100.49, OCBC’s FX strategists Frances Cheung and Christopher Wong note.
Decisive break below 100.20 puts 99.60, 99.10 in focus
“Elsewhere, markets were riding on risk-on mood after China unleashed a slew of support measures. Sharp gains in RMB not only fuelled momentum in AXJs but also spurred gains in DM FX, including AUD, EUR.”
“Daily momentum is flat while RSI fell. Interim double-bottom appears to be forming – we continue to watch price action. Resistance at 101.10 (21 DMA), 101.90. Support at 100.20levels (interim double bottom). Decisive break puts 99.60, 99.10 levels in focus. This week, we watch initial jobless gains (Thu), core PCE (Fri).”
“Should core PCE unexpectedly rebound, then worries of second-round inflation may play up and USD may bounce. Apart from Fedspeaks, there is a slew of Fed officials speaking this week, including Powell’s pre-recorded speech on Thu.”
- GBP/CAD is showing signs that it may be about to reverse lower.
- The pair formed a bearish candlestick pattern and has since declined.
GBP/CAD is threatening to reverse its uptrend after testing the upper channel line of its long-term rising channel and forming a bearish reversal candlestick pattern (orange rectangle on chart below).
GBP/CAD 4-hour Chart
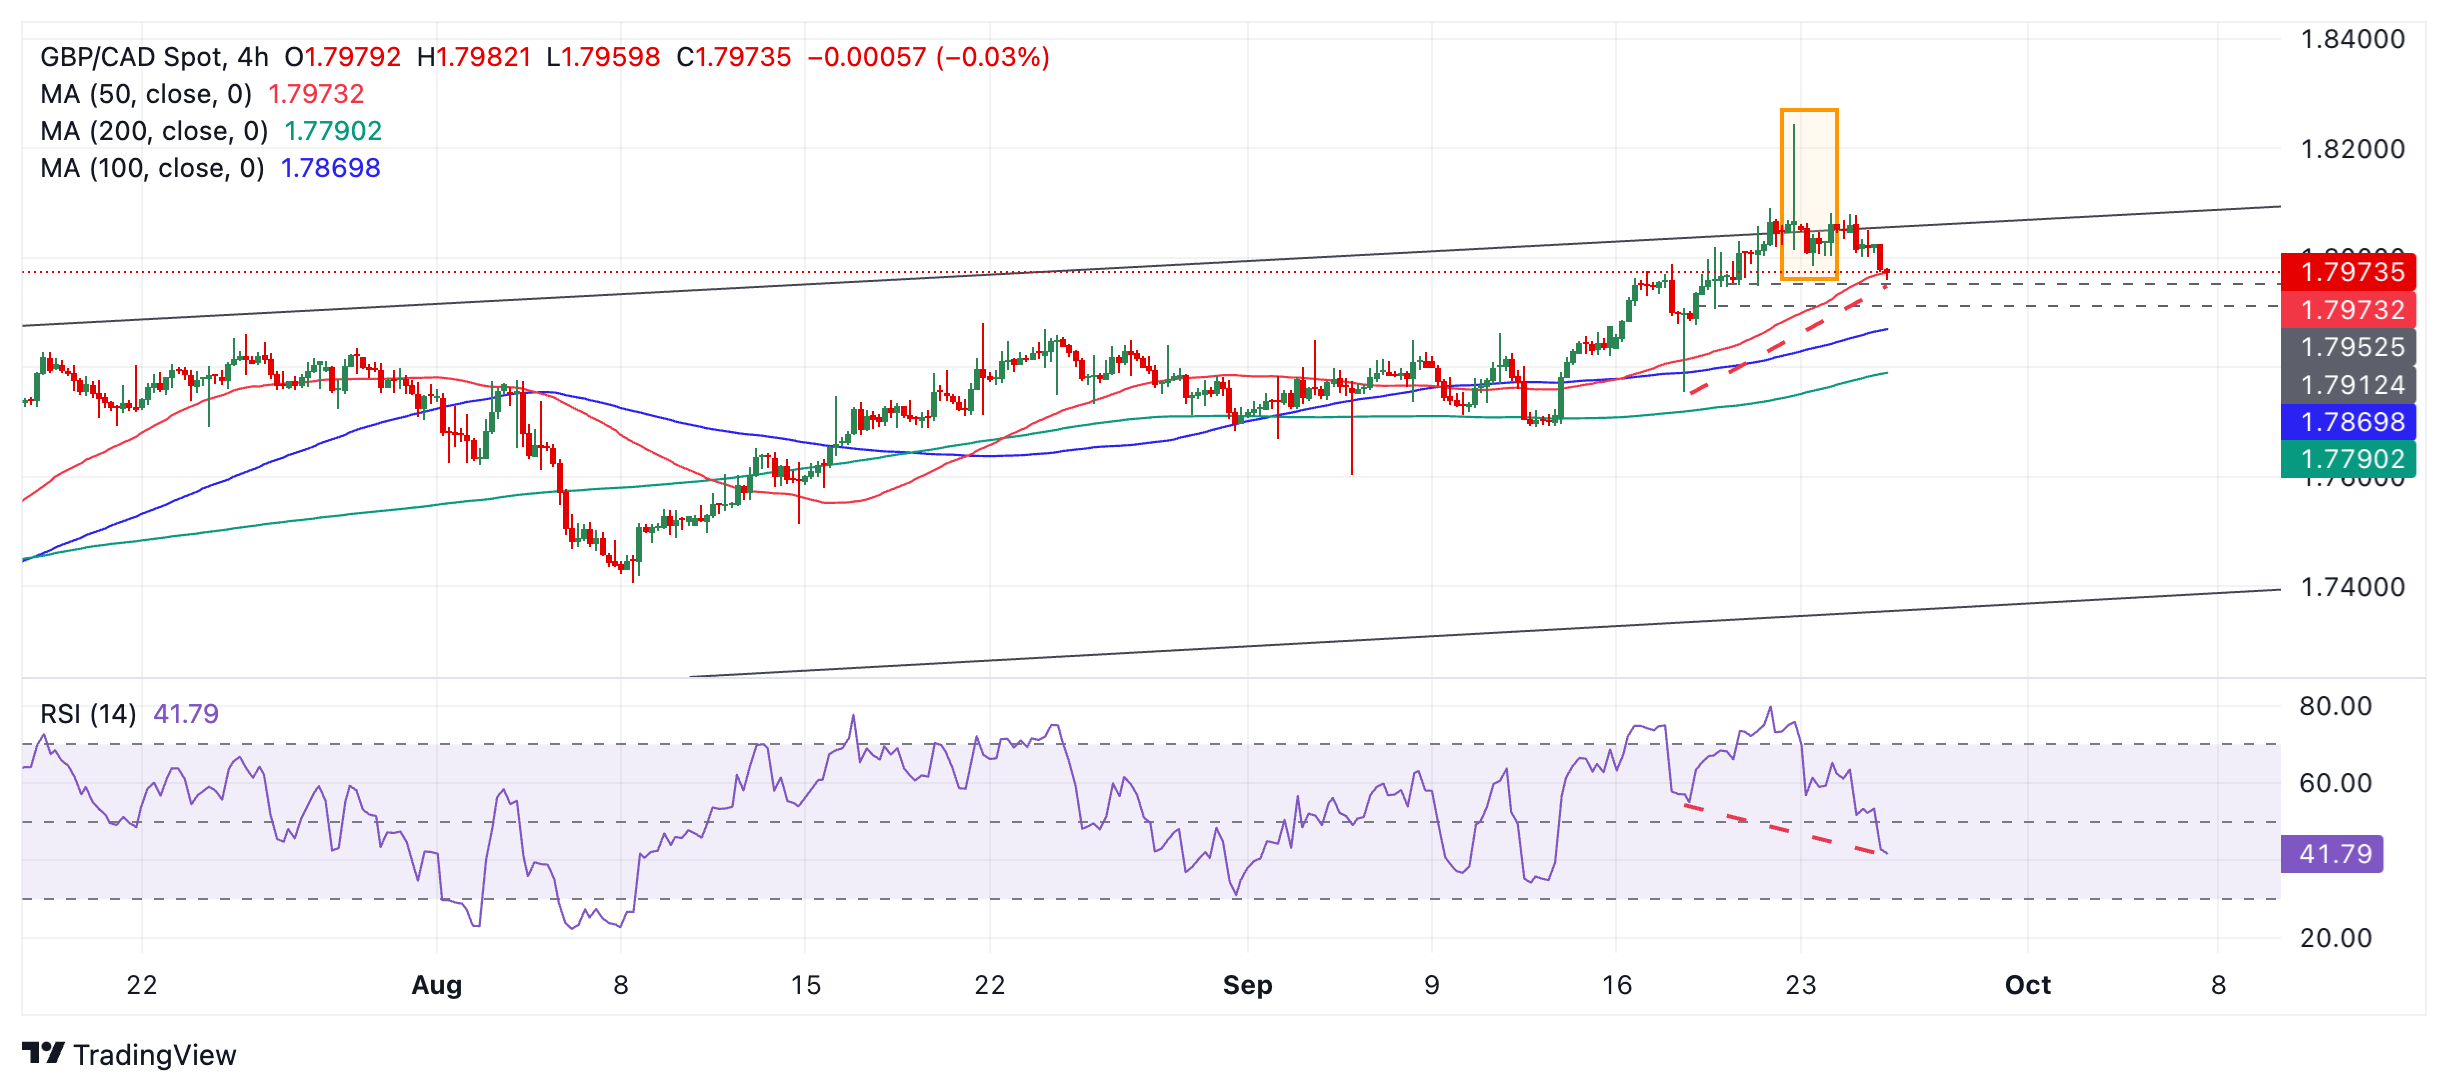
GBP/CAD formed a bearish Shooting Star Japanese candlestick pattern on both the Daily and 4-hour charts on September 20 after a false break above the upper channel line. The subsequent weakness suggests this candlestick may mark a top of the pair.
Although GBP/CAD is in a strong uptrend on all time frames, it is rising and falling within a channel and there is a growing chance the pair may be entering one of its counter-trend bear phases.
A break below 1.7949 (September 19 low) might confirm a reversal of the short-term trend and lower prices to come. A break below 1.7907 would provide stronger confirmation. Downside targets lie at 1.7754 (September 17 low and 50-day SMA), 1.7694 (September 16 low) and 1.7603 (September 4 low) and 1.7407 (August 8 low).
The Relative Strength Index (RSI) is also forming a bearish divergence with price compared to the September 17 low (red dashed line on chart above). Although the price was much lower on September 17 momentum was not, rather it is lower now. This suggests underlying weakness could push prices down.
A break above the high of the Shooting Star at 1.8245 would probably confirm that price is going even higher. If so, it might reach a target at 1.8278, the 61.8% extrapolation of the prior move higher.
Any further bullishness beyond the confines of the channel is likely to be short-lived, however. Such moves are signs of “exhaustion” and are a precursor to deeper corrections on the horizon.
- Gold rallies to a new record high after US Consumer Confidence data falls well below expectations.
- The data reinforces bets the Federal Reserve will have to take more drastic easing measures – a positive for Gold.
- XAU/USD is overbought but rallying on all timeframes and, given “the trend is your friend,” it is likely to continue.
Gold (XAU/USD) rallies to another record high of $2.670 per troy ounce on Wednesday after an unexpected drop in US Consumer Confidence data on Tuesday increased bets of more aggressive easing and deeper interest rate cuts from the Federal Reserve (Fed).
Lower interest rates are positive for Gold, as they reduce the opportunity cost of holding the non-interest-paying asset, making it more attractive to investors.
The biggest stimulus push since the Covid pandemic from the People’s Bank of China announced on Tuesday, including aggressive cuts to borrowing costs amongst a package of measures to inflate the flagging economy, also supported Gold’s rise.
The escalation of tensions in the Middle East after more bombing by Israel of Hezbollah targets in Lebanon is further pushing safe-haven flows into the yellow metal.
Gold rallies after US consumers lose confidence
Gold reaches a new peak after more bad news about the US economy suggests the Fed may need to continue drastically cutting interest rates.
The Conference Board Consumer Confidence Index fell to 98.7 in September from an upwardly revised 105.6 in August. The result was well below the 103.9 consensus estimate.
Following the release of the data, the market-based probabilities of the Fed making another double dose 50 basis points (bps), or 0.50%, rate cut increased to around 60% from 50% before, according to the CME FedWatch tool.
Commentary from Federal Reserve Governor Michelle Bowman (voter - hawkish) on Tuesday may have taken some of the edges off the bad news however, after she said, "with no clear signs of material weakening or fragility, in my view, beginning the rate-cutting cycle with a 1/4 percentage point move would have better reinforced the strength in economic conditions."
Bowman’s comments scored a 7.0 on FXStreet’s FedTracker, which gauges the tone of Fed officials’ speeches on a dovish-to-hawkish scale from 0 to 10, using a custom AI model.
Technical Analysis: Gold extends strong uptrend
Gold breaks to new highs on Wednesday, and given the principle in technical analysis that “the trend is your friend,” the odds favor even more upside for the yellow metal, in line with the dominant short, medium, and long-term uptrends.
XAU/USD Daily Chart
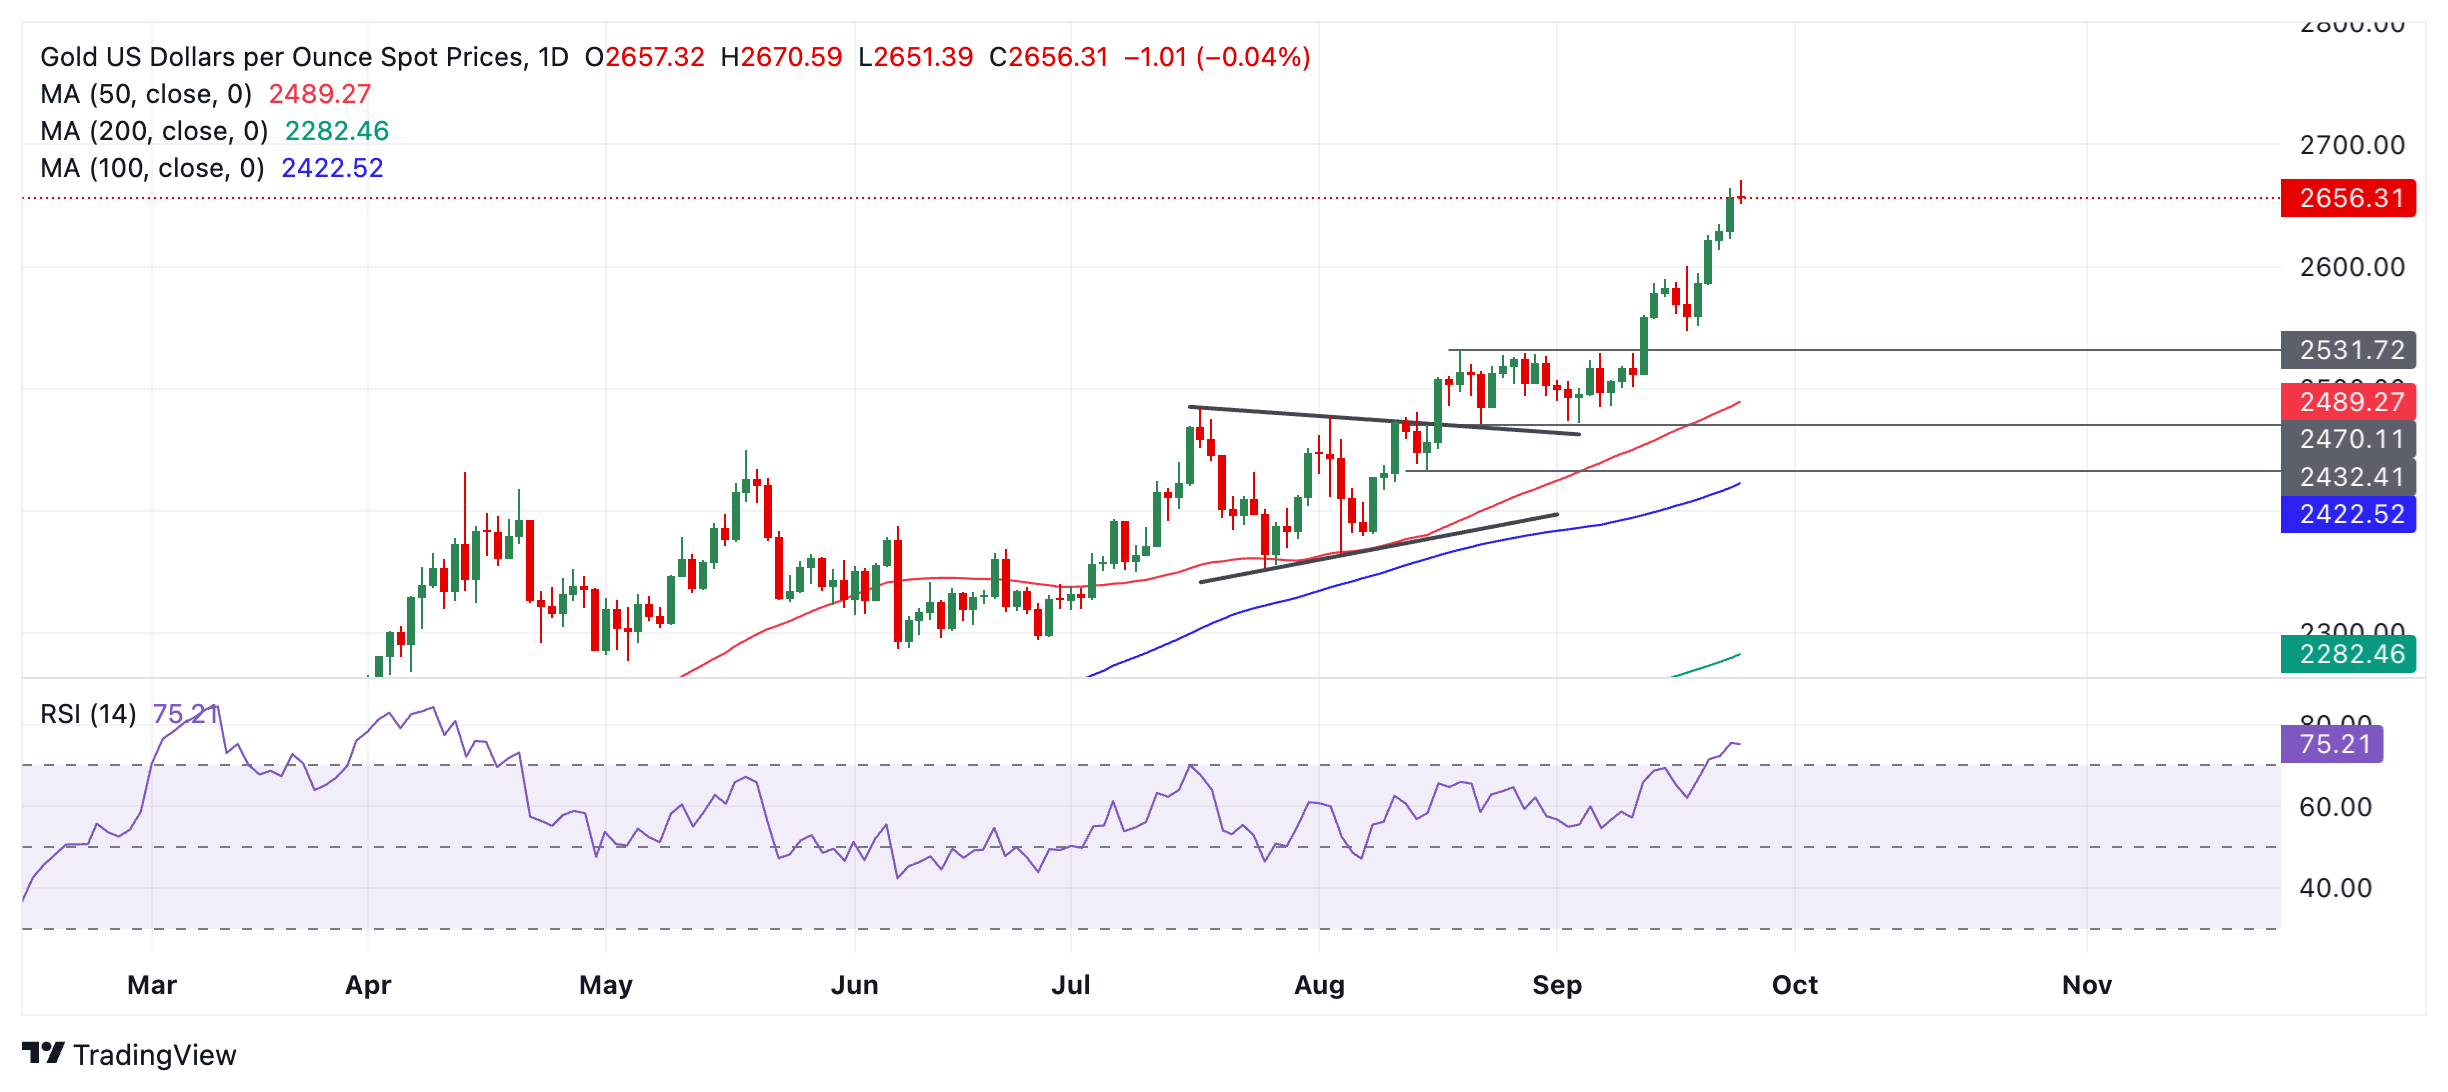
The next targets to the upside are the round numbers $2,700 and then $2,750. Confirmation would come from a break above the $2,670 peak.
Gold has entered overbought levels, according to the Relative Strength Index (RSI) in the daily chart. This advises traders not to add to their long positions. If Gold exits overbought, it will be a sign for them to close long positions and sell shorts, as it would suggest a deeper correction is in the process of unfolding.
If a correction evolves, firm support lies at $2,600 (September 18 high), $2,550 and $2,544 (0.382 Fibonacci retracement of the September rally).
Gold FAQs
Gold has played a key role in human’s history as it has been widely used as a store of value and medium of exchange. Currently, apart from its shine and usage for jewelry, the precious metal is widely seen as a safe-haven asset, meaning that it is considered a good investment during turbulent times. Gold is also widely seen as a hedge against inflation and against depreciating currencies as it doesn’t rely on any specific issuer or government.
Central banks are the biggest Gold holders. In their aim to support their currencies in turbulent times, central banks tend to diversify their reserves and buy Gold to improve the perceived strength of the economy and the currency. High Gold reserves can be a source of trust for a country’s solvency. Central banks added 1,136 tonnes of Gold worth around $70 billion to their reserves in 2022, according to data from the World Gold Council. This is the highest yearly purchase since records began. Central banks from emerging economies such as China, India and Turkey are quickly increasing their Gold reserves.
Gold has an inverse correlation with the US Dollar and US Treasuries, which are both major reserve and safe-haven assets. When the Dollar depreciates, Gold tends to rise, enabling investors and central banks to diversify their assets in turbulent times. Gold is also inversely correlated with risk assets. A rally in the stock market tends to weaken Gold price, while sell-offs in riskier markets tend to favor the precious metal.
The price can move due to a wide range of factors. Geopolitical instability or fears of a deep recession can quickly make Gold price escalate due to its safe-haven status. As a yield-less asset, Gold tends to rise with lower interest rates, while higher cost of money usually weighs down on the yellow metal. Still, most moves depend on how the US Dollar (USD) behaves as the asset is priced in dollars (XAU/USD). A strong Dollar tends to keep the price of Gold controlled, whereas a weaker Dollar is likely to push Gold prices up.
- The Mexican Peso trades flat in its major pairs the day before the Bank of Mexico policy meeting.
- The consensus expectation is for the bank to cut interest rates by 0.25% to 10.50%.
- USD/MXN pulls back from resistance as it steadily climbs within its rising channel.
The Mexican Peso (MXN) trades flat in its major pairs on Wednesday, ahead of the Bank of Mexico (Banxico) September policy meeting on Thursday, which is the main event for the currency this week.
Mexican Peso traders await Banxico’s decision
The Mexican Peso fluctuates between tepid gains and losses against its most heavily-traded peers as traders brace for the Banxico policy meeting on Thursday.
The consensus is for the central bank to cut interest rates by 25 basis points (bps), bringing the official rate down to 10.50% from 10.75% currently.
In a recent survey of 25 economists by Bloomberg, 20 expected a 25 bps cut whilst only one expected no-change.
There is also a growing wild-card bet for a larger 50 bps (0.50%) cut after Mexico’s inflation data, released on Tuesday, registered a deeper-than-expected slowdown in September. Four out of the 25 economists polled by Bloomberg prior to the inflation data expected a 50 bps cut – and this has probably increased after the release.
Data out on Tuesday showed headline inflation (INPC) over the last 12 months fell to 4.66% in Mexico in mid-September, and core inflation (Subyacente) to 3.95%, according to data from The Instituto Nacional de Estadística Geografía (INEGI).
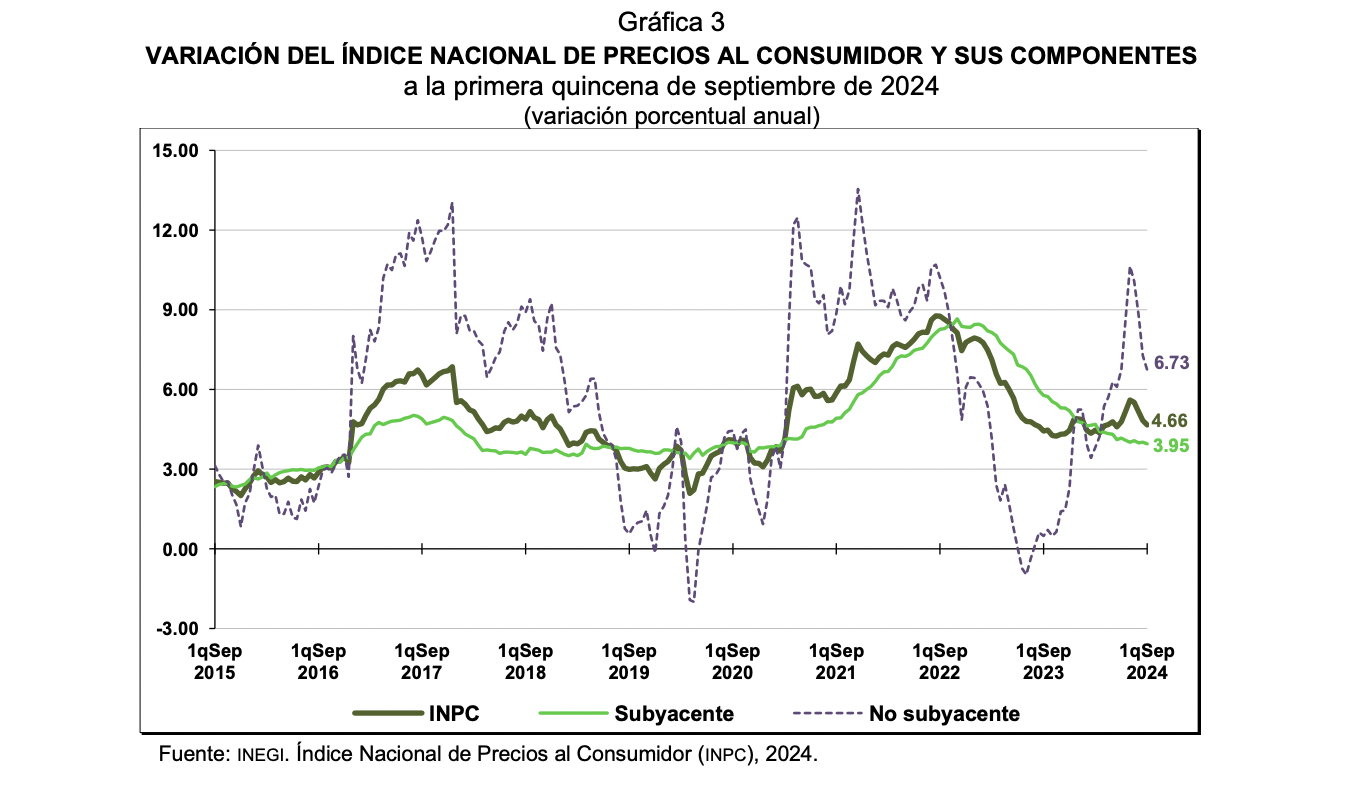
At the same time, a greater-than-expected growth in Mexico’s economic activity data for July suggests Banxico may take a more cautious approach, favoring a 25 bps cut over a 50 bps reduction.
“Earlier figures revealed a 3.8% year-on-year expansion in Mexico's economic activity in July, rebounding from a 0.6% decline in the previous month and surpassing market forecasts of a 1.8% rise. This was the sharpest growth in three months and the third-highest increase this year, potentially providing Banxico with more room to moderate its monetary easing, thus lending support to the Peso,” reported Trading Economics.
At the August meeting, Banxico decided to cut interest rates by 0.25%. The fact that the decision was a close call, with only three members voting for the cut versus two who wanted to keep rates unchanged, further makes it unlikely the central bank will opt for a larger 0.50% reduction.
“The larger-than-expected fall in Mexican inflation in the first half of September, to 4.7% y/y, supports our view that Banxico will continue its easing cycle with another 25bp cut on Thursday,” says Kimberley Sperrfechter, Emerging Markets Economist at Capital Economics in a note on Wednesday.
The market is more dovish, however, arguing a higher risk of a 50 bps cut exists, given it expected 75 bps of easing over the next three months and 250 bp of total easing over the next 12 months, according to Dr. Win Thin, Global Head of Markets Strategy and Brown Brothers Harriman (BBH).
Technical Analysis: USD/MXN pulls back from resistance within rising channel
USD/MXN edged higher on Monday to touch resistance (August 22-23 swing high) at 19.52 before pulling back down. Overall, it is in a medium and long-term uptrend within a rising channel.
USD/MXN Daily Chart
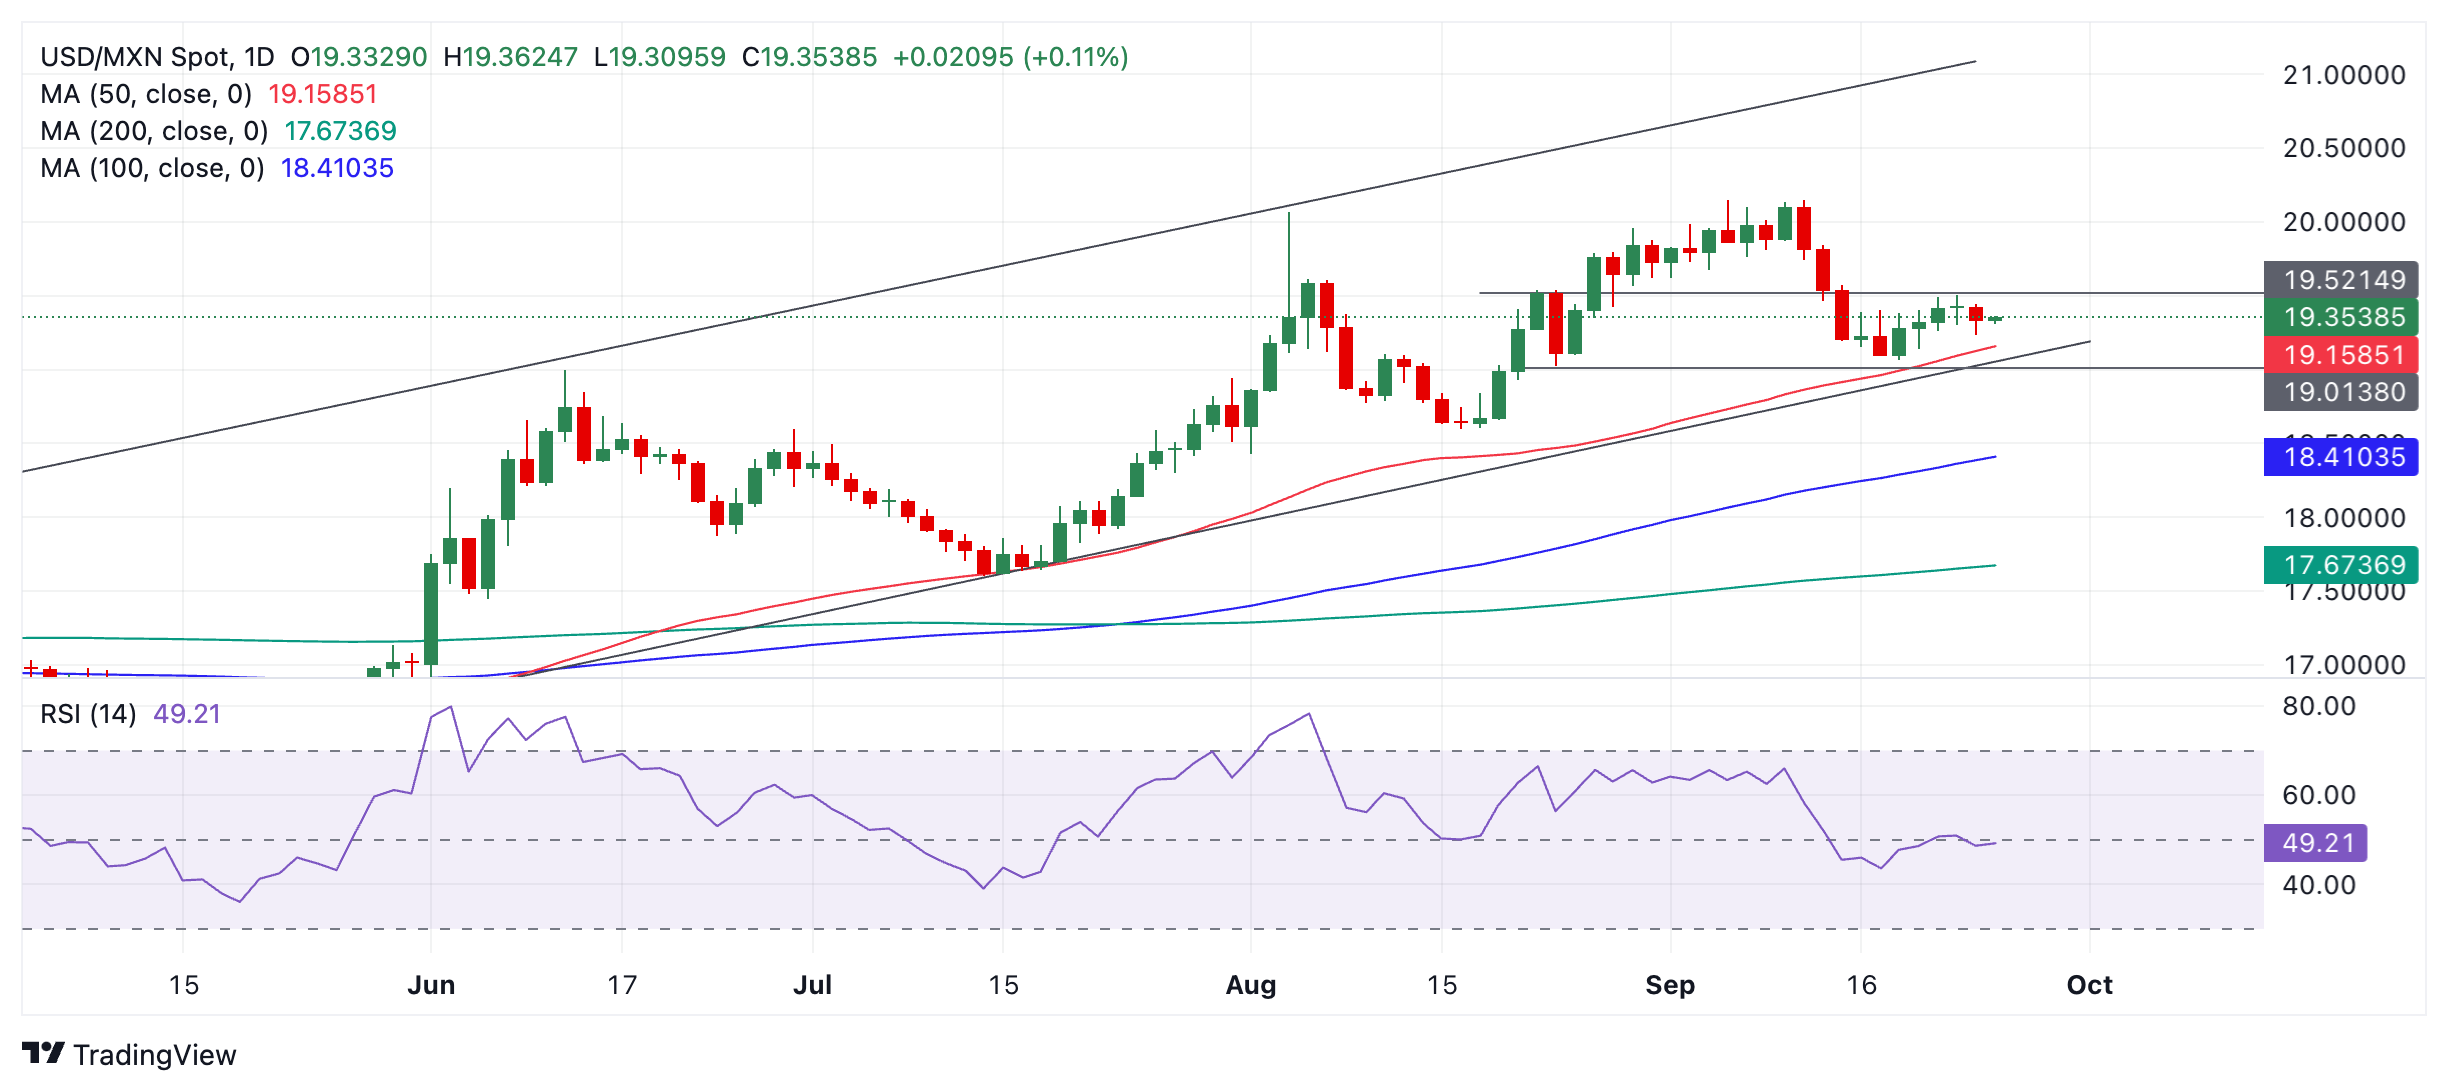
There is a possibility USD/MXN has begun a short-term uptrend within the channel. If so, the bias is for higher prices since it is a principle of technical analysis that “the trend is your friend”.
A close above 19.53 (August 23 swing high) on a 4-hour basis would provide bullish confirmation that the pair is in a short-term uptrend.
The 50-day Simple Moving Average is bolstering support at the base of the channel.
Banxico FAQs
The Bank of Mexico, also known as Banxico, is the country’s central bank. Its mission is to preserve the value of Mexico’s currency, the Mexican Peso (MXN), and to set the monetary policy. To this end, its main objective is to maintain low and stable inflation within target levels – at or close to its target of 3%, the midpoint in a tolerance band of between 2% and 4%.
The main tool of the Banxico to guide monetary policy is by setting interest rates. When inflation is above target, the bank will attempt to tame it by raising rates, making it more expensive for households and businesses to borrow money and thus cooling the economy. Higher interest rates are generally positive for the Mexican Peso (MXN) as they lead to higher yields, making the country a more attractive place for investors. On the contrary, lower interest rates tend to weaken MXN. The rate differential with the USD, or how the Banxico is expected to set interest rates compared with the US Federal Reserve (Fed), is a key factor.
Banxico meets eight times a year, and its monetary policy is greatly influenced by decisions of the US Federal Reserve (Fed). Therefore, the central bank’s decision-making committee usually gathers a week after the Fed. In doing so, Banxico reacts and sometimes anticipates monetary policy measures set by the Federal Reserve. For example, after the Covid-19 pandemic, before the Fed raised rates, Banxico did it first in an attempt to diminish the chances of a substantial depreciation of the Mexican Peso (MXN) and to prevent capital outflows that could destabilize the country.
The Australian Dollar (AUD) is likely to continue to rise; 0.6955 is probably out of reach for now. Outlook for AUD remains positive, and it could advance further to 0.6955, UOB Group FX strategists Quek Ser Leang and Peter Chia note.
The bullish target is at 0.6955
24-HOUR VIEW: “Our view for AUD to trade sideways yesterday was incorrect. Instead of trading sideways, AUD soared to 0.6894, and it continues to rise in early Asian trade today. Having breached the 0.6900, AUD is likely to continue to rise, even though 0.6955 is probably out of reach for now (there is another resistance level at 0.6930). In order to keep the momentum going, AUD must remain above 0.6850 (minor support is at 0.6870).”
1-3 WEEKS VIEW: “We have held a positive AUD view since early last week. In our most recent narrative from last Friday (20 Sep, spot at 0.6800), we highlighted that “while there is still room for AUD to continue to rise, it may not have enough momentum to challenge to significant resistance at 0.6870.” Yesterday, AUD took off and broke above 0.6870. Today, it rose above another significant resistance level at 0.6900. The breach of the resistance levels is accompanied by strong upward momentum, and we remain positive in AUD, anticipating a further advance to 0.6955. The positive outlook is intact as long as 0.6820 (‘strong support’ level was at 0.6770 yesterday) is not breached.”
Optimism from China’s recent support measures and renewed USD softness have manifested onto gains in the CNH, OCBC’s FX strategists Frances Cheung and Christopher Wong note.
USD softness manifests as gains in the CNH
“USD/CNH briefly traded a low of 6.9950 before rebounding. The big decline in USDCNH past key psychological level saw various USD/AXJs trade lower. For instance, USD/SGD traded close to 1.28-lows while USD/MYR went below 4.11 briefly (vs. close of 4.1578 yesterday). A combination of further gains in RMB, growth in the region looking well, Fed easing cycle and softer USD should continue to benefit AXJ FX.”
“On the daily fix, USD/CNY was set at 7.0202, largely in line with Bloomberg consensus for 7.0206. Markets were earlier watching if policymakers will explicitly push back against RMB appreciation (by signaling via the fix) and it appeared there was no strong push back. The momentum forward for RMB should take cues from China equity markets.”
“More sustained gains should see RMB trade with a tighter correlation. USD/CNH was last at 7.0130 levels. Bearish momentum on daily chart intact while RSI is near oversold conditions. Intra-day retracement not ruled out. Resistance at 7.0330 (50% fibo), 7.07 levels. Bias to sell rallies. Support at 6.99, 6.9540 (61.8% fibo).”
The Pound Sterling (GBP) could rise and potentially reach 1.3450; the next resistance at 1.3480 is unlikely to come into view. Boost in momentum indicates further GBP strength; the next level to watch is 1.3480, UOB Group FX strategists Quek Ser Leang and Peter Chia note.
Above 1.3450 GBP can reach 1.3480
24-HOUR VIEW: “While we expected GBP to strengthen yesterday, we indicated that it ‘is unlikely to reach the major resistance at 1.3400.’ The anticipated advance exceeded our expectations, as GBP soared and broke clearly above 1.3400. GBP continues to rise in early Asian trade today, and it could potentially reach 1.3450. The next resistance at 1.3480 is unlikely to come into view. Support levels are at 1.3400 and 1.3365.”
1-3 WEEKS VIEW: “Yesterday (24 Sep, spot at 1.3345), we highlighted after the price movements on Monday, ‘there has only been a slight increase in momentum, and it remains to be seen if GBP can break above the significant resistance at 1.3400.’ We were surprised by the ease with which GBP broke above 1.3400. The boost in momentum indicates further GBP strength is likely. The next level to watch is 1.3480. On the downside, if GBP breaches 1.3330 (‘strong support’ level previously at 1.3250), it would mean that the GBP strength from early last week has come to an end.”
- AUD/USD retreats after touching a 19-month peak amid reviving USD demand.
- Global economic woes and geopolitical risks benefit the safe-haven Greenback.
- The divergent Fed-RBA policy outlook limits any meaningful slide for the pair.
The AUD/USD pair struggles to find acceptance above the 0.6900 round figure and retreats a bit from its highest level since February 2023 touched earlier this Wednesday. The intraday descent drags spot prices to the 0.6880-0.6875 region, or a fresh daily low during the first half of the European session and is sponsored by a modest US Dollar (USD) uptick.
Despite the latest optimism over China's new stimulus measures, lingering concerns about a global economic downturn and persistent geopolitical risks temper investors' appetite for riskier assets. This is evident from a weaker opening across the European equity markets, which assists the safe-haven USD to rebound from the vicinity of the YTD low touched last week and drives flows away from the risk-sensitive Aussie. That said, a combination of factors should continue to act as a tailwind for the AUD/USD pair and help limit deeper losses.
The markets have been pricing in a greater chance that the Federal Reserve (Fed) will announce another 50 basis points (bps) rate cut in November. This marks a divergence in comparison to the Reserve Bank of Australia's (RBA) hawkish stance and should lend support to the AUD/USD pair. In fact, the RBA reiterated on Tuesday that policy will need to be restrictive until confidence returns that inflation is moving sustainably towards the target. Moreover, RBA Governor Michele Bullock stated that the recent data has not significantly influenced the policy outlook.
Meanwhile, official data released earlier today showed that the headline Australian Consumer Price Inflation (CPI) dropped in August to its lowest level since early 2022, though the decline in core inflation was less pronounced. The data was not enough to justify interest rate cuts by the RBA in the near term, which, in turn, suggests that any subsequent decline in the AUD/USD pair might still be seen as a buying opportunity and remain cushioned. Traders might also prefer to wait for Fed Chair Jerome Powell's speech on Thursday and the US PCE Price Index on Friday.
US Dollar PRICE Today
The table below shows the percentage change of US Dollar (USD) against listed major currencies today. US Dollar was the strongest against the Japanese Yen.
| USD | EUR | GBP | JPY | CAD | AUD | NZD | CHF | |
|---|---|---|---|---|---|---|---|---|
| USD | -0.05% | 0.26% | 0.53% | -0.00% | 0.15% | 0.34% | 0.39% | |
| EUR | 0.05% | 0.31% | 0.56% | 0.04% | 0.20% | 0.41% | 0.44% | |
| GBP | -0.26% | -0.31% | 0.25% | -0.27% | -0.11% | 0.04% | 0.14% | |
| JPY | -0.53% | -0.56% | -0.25% | -0.55% | -0.38% | -0.19% | -0.14% | |
| CAD | 0.00% | -0.04% | 0.27% | 0.55% | 0.17% | 0.37% | 0.41% | |
| AUD | -0.15% | -0.20% | 0.11% | 0.38% | -0.17% | 0.21% | 0.27% | |
| NZD | -0.34% | -0.41% | -0.04% | 0.19% | -0.37% | -0.21% | 0.03% | |
| CHF | -0.39% | -0.44% | -0.14% | 0.14% | -0.41% | -0.27% | -0.03% |
The heat map shows percentage changes of major currencies against each other. The base currency is picked from the left column, while the quote currency is picked from the top row. For example, if you pick the US Dollar from the left column and move along the horizontal line to the Japanese Yen, the percentage change displayed in the box will represent USD (base)/JPY (quote).
- Silver price loses ground amid concerns over whether China’s stimulus plans will be sufficient to boost demand.
- PBOC has reduced the Reserve Requirement Ratio by 50 basis points and the seven-day repo rate from 1.7% to 1.5%.
- The safe-haven Silver may regain ground due to rising tensions in the Middle East.
Silver price (XAG/USD) retraces its recent gains from the previous session, trading around $31.80 per troy ounce during Wednesday’s European hours. The prices of grey metal depreciate as traders re-evaluate the effectiveness of China’s stimulus plans to significantly boost its economy, the world's largest metals market.
Silver metal is vital to various industrial sectors, such as electronics, solar panels, and automotive components. As one of the world’s largest manufacturing hubs, China’s industrial demand for Silver plays a significant role in driving the global consumption of this precious metal.
On Tuesday, People's Bank of China (PBOC) Governor Pan Gongsheng announced that China will reduce the Reserve Requirement Ratio (RRR) by 50 basis points (bps). Gongsheng also noted that the central bank would lower the seven-day repo rate from 1.7% to 1.5%, and reduce the down payment for second homes from 25% to 15%.
However, JP Morgan, in a note, advised investors to monitor commodities and bond yields in light of the positive market outlook following China's stimulus proposals on Tuesday. The bank emphasized that global growth has received a new boost from China, a factor that has been lacking in recent years. This development notably reduces the risk of a recession and is seen as favorable for the markets. However, JP Morgan also cautioned about the potential risk of reinflation.
The downside risk for safe-haven Silver may be limited due to escalating tensions in the Middle East. An Israeli airstrike on Beirut killed a senior Hezbollah commander on Tuesday, heightening concerns of a potential full-scale war as cross-border rocket attacks intensified. Hezbollah confirmed on Wednesday that senior commander Ibrahim Qubaisi was killed in the Israeli airstrikes on the Lebanese capital, as previously reported by Israel, per Reuters.
Silver FAQs
Silver is a precious metal highly traded among investors. It has been historically used as a store of value and a medium of exchange. Although less popular than Gold, traders may turn to Silver to diversify their investment portfolio, for its intrinsic value or as a potential hedge during high-inflation periods. Investors can buy physical Silver, in coins or in bars, or trade it through vehicles such as Exchange Traded Funds, which track its price on international markets.
Silver prices can move due to a wide range of factors. Geopolitical instability or fears of a deep recession can make Silver price escalate due to its safe-haven status, although to a lesser extent than Gold's. As a yieldless asset, Silver tends to rise with lower interest rates. Its moves also depend on how the US Dollar (USD) behaves as the asset is priced in dollars (XAG/USD). A strong Dollar tends to keep the price of Silver at bay, whereas a weaker Dollar is likely to propel prices up. Other factors such as investment demand, mining supply – Silver is much more abundant than Gold – and recycling rates can also affect prices.
Silver is widely used in industry, particularly in sectors such as electronics or solar energy, as it has one of the highest electric conductivity of all metals – more than Copper and Gold. A surge in demand can increase prices, while a decline tends to lower them. Dynamics in the US, Chinese and Indian economies can also contribute to price swings: for the US and particularly China, their big industrial sectors use Silver in various processes; in India, consumers’ demand for the precious metal for jewellery also plays a key role in setting prices.
Silver prices tend to follow Gold's moves. When Gold prices rise, Silver typically follows suit, as their status as safe-haven assets is similar. The Gold/Silver ratio, which shows the number of ounces of Silver needed to equal the value of one ounce of Gold, may help to determine the relative valuation between both metals. Some investors may consider a high ratio as an indicator that Silver is undervalued, or Gold is overvalued. On the contrary, a low ratio might suggest that Gold is undervalued relative to Silver.
Sweden's Riksbank is widely expected to cut rates by another 25bp today, ING’s FX strategist Francesco Pesole notes.
SEK to remain more sensitive to external factors
“Riksbank is expected to cut rates by another 25bp today. Governor Erik Thedeen and his colleagues have been giving rather explicit forward guidance to markets, signalling three rate cuts by the end of the year.”
“Despite some modest speculation for a 50bp reduction in one of those meetings, we think that signs of stabilisation in Sweden's economic outlook should discourage moves larger than 25bp. Markets are fully pricing in 25bp today and probably a reiteration of the recent pledge to keep cutting this year.”
“Ultimately, SEK should remain more sensitive to external factors, as the ratecutting cycle is priced in and the Riksbank seems on a stable and predictable path. EUR/SEK can remain under some pressure and test 11.20 in the near term.”
- USD/JPY has broken out of a rising channel in a sign of weakness for the uptrend.
- RSI is diverging bearishly with price – a further negative sign.
USD/JPY has been rallying higher since it reversed at the December 2023 low on September 16.
It has established a sequence of higher highs and higher lows and could be said to be in a short-term uptrend.
USD/JPY 4-hour Chart
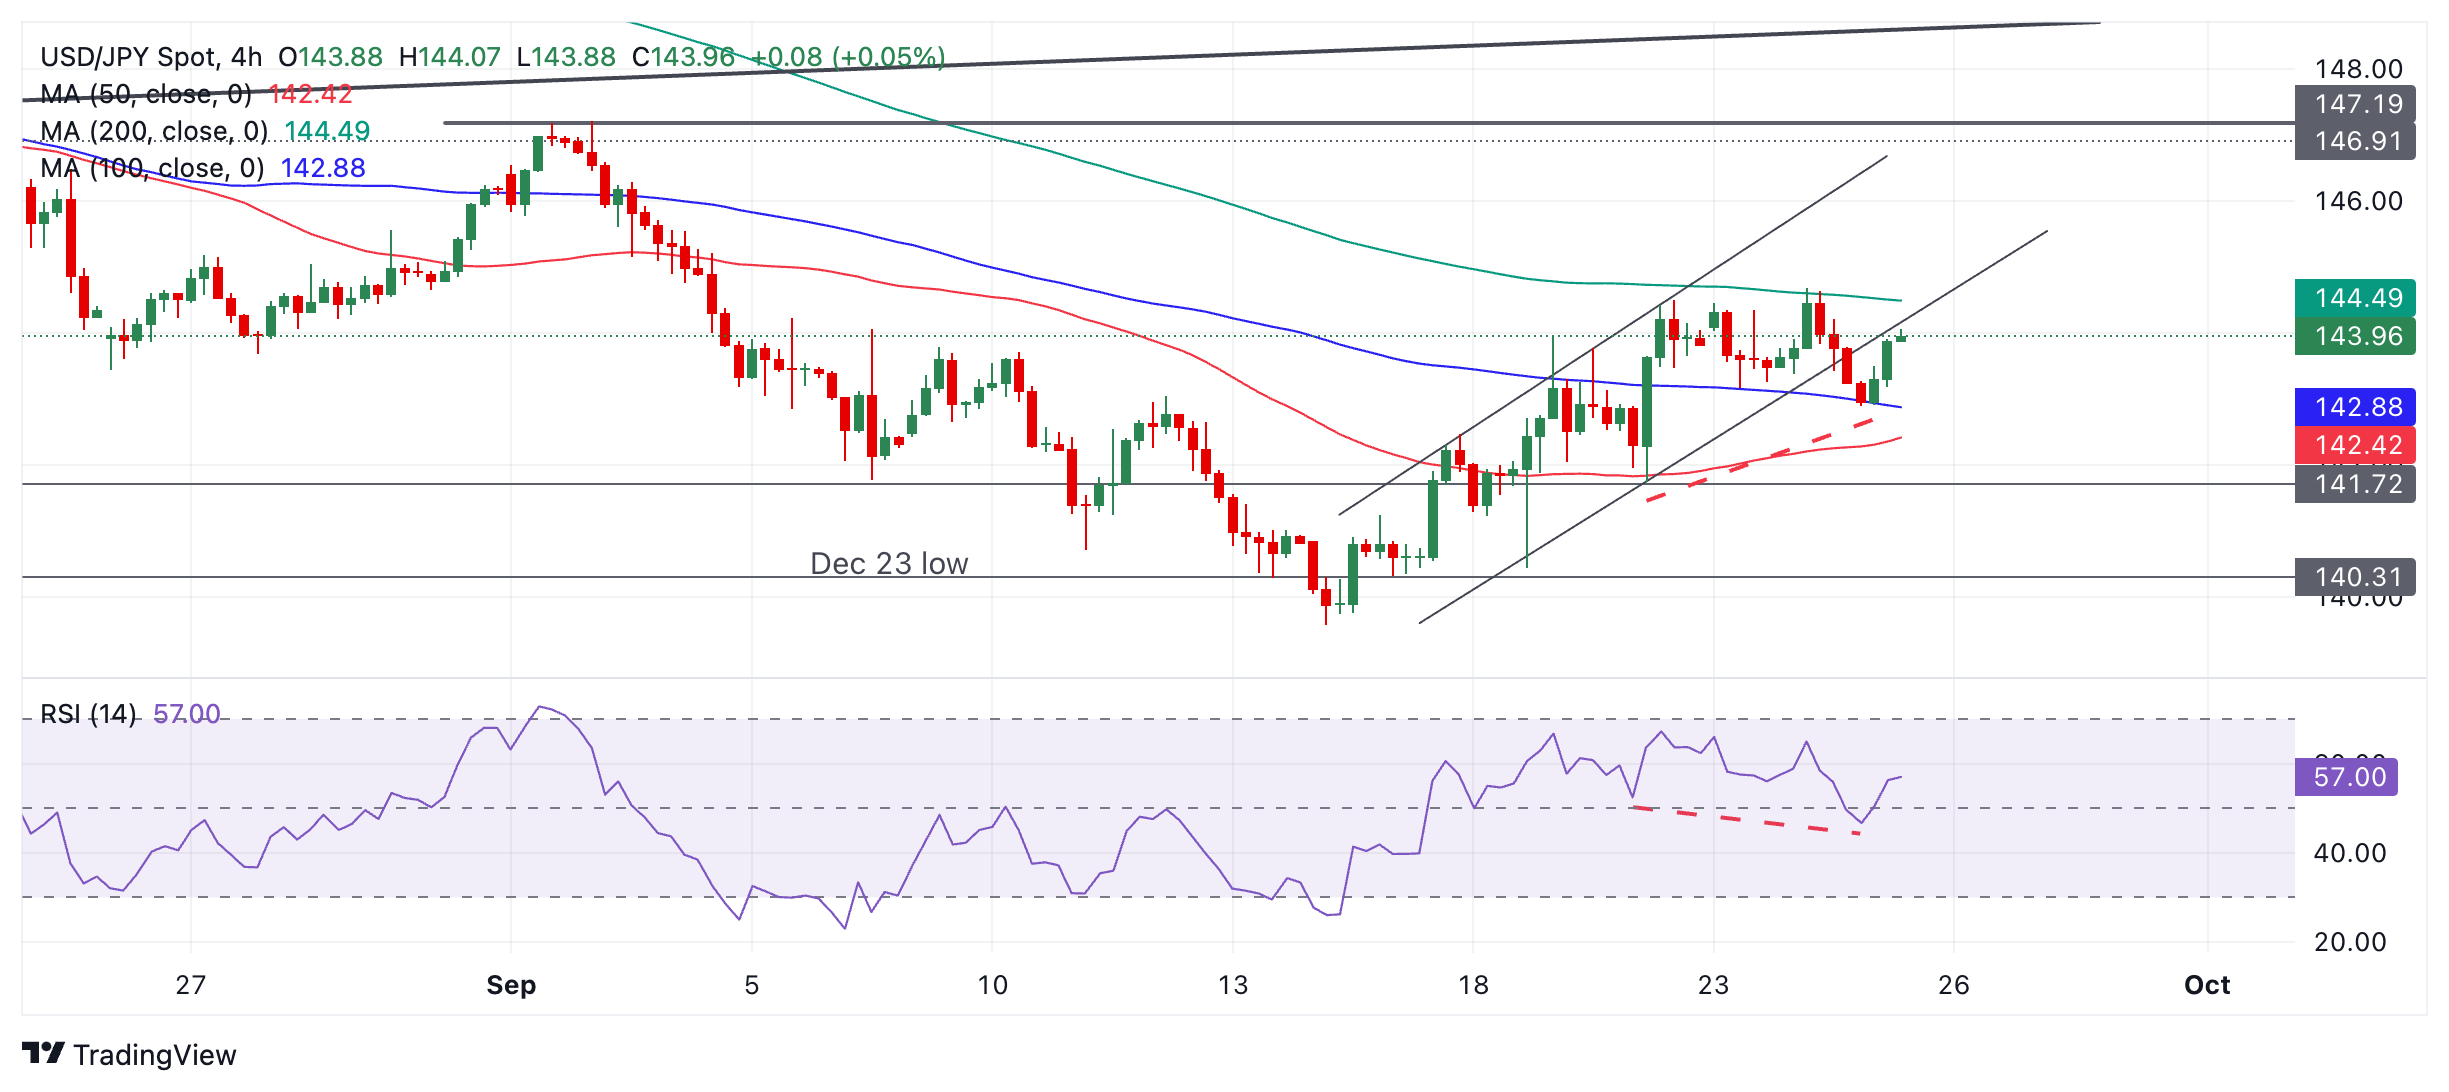
Given it is a principle of technical analysis that “the trend is your friend” the odds favor a continuation higher.
On Tuesday, however, price broke out of the rising channel, indicating weakness and that the established uptrend might be faltering. On its own, however, it is not sufficient to indicate a complete reversal lower.
The overall bias in the short-term is still mildly bullish, however it would now take a close above 144.68 (September 24 high) to provide stronger confirmation of more upside. Tentative targets then lie at 145.00, then 145.50 and finally in a bullish case 146.00.
The Relative Strength Index (RSI) is showing bearish divergence with price (red dashed line on chart above). Although price was not lower on the September 24 lows compared to the September 20 lows, the RSI was lower, indicating strong downside momentum in the recent sell-off. This could be a sign of underlying weakness.
The pair is in a medium-term downtrend suggesting a risk of a resumption lower, however, those risks are balanced by the fact that it is in a long-term uptrend.
FX option expiries for Sept 25 NY cut at 10:00 Eastern Time, via DTCC, can be found below.
EUR/USD: EUR amounts
- 1.1010 917m
- 1.1100 1.1b
- 1.1125 771m
- 1.1130 1.9b
- 1.1140 805m
- 1.1150 1.7b
- 1.1200 1.2b
- 1.1210 1.4b
- 1.1250 927m
GBP/USD: GBP amounts
- 1.3115 623m
- 1.3285 628m
USD/JPY: USD amounts
- 143.70 636m
- 144.95 563m
- 145.00 839m
USD/CHF: USD amounts
- 0.8350 525m
- 0.8445 820m
AUD/USD: AUD amounts
- 0.6740 498m
- 0.6850 961m
USD/CAD: USD amounts
- 1.3485 955m
- 1.3500 1.8b
- 1.3580 701m
- 1.3600 1.3b
NZD/USD: NZD amounts
- 0.6210 643m
- 0.6320 1b
Chance for the Euro (EUR) to rise above 1.1200. There does not appear to be enough momentum for it to reach 1.1230 today. In the longer run, firm short-term momentum suggests EUR could rise towards 1.1230, UOB Group FX strategists Quek Ser Leang and Peter Chia note.
EUR can rise towards 1.1230
24-HOUR VIEW: “After EUR fell sharply two days ago, we indicated that ‘the sharp drop appears to be a tad overdone, but barring a breach of 1.1150, there is room for EUR to test the 1.1080 level’. Our view was incorrect, as EUR rebounded strongly to 1.1180. Today, there is a chance for EUR to rise above 1.1200, but there does not appear to be enough momentum for it to reach 1.1230. Support is at 1.1165, a breach of 1.1145 would mean that the current upward pressure has faded.”
1-3 WEEKS VIEW: “EUR fell sharply two days ago. Yesterday (24 Sep, 1.1110), we indicated that EUR ‘is likely to edge lower, but any decline is expected to face strong support at 1.1050.’ We pointed out that ‘to maintain the momentum buildup, EUR must remain below 1.1175.’ Our view was invalidated quickly as EUR reversed and rebounded to 1.1180. While the choppy swings over the past couple of days has clouded the outlook, firm short-term momentum suggests EUR could rise towards 1.1230. EUR has to break clearly above this level before an advance to 1.1275 can be expected. The upside bias is intact as long as it remains above 1.1110.”
- GBP/JPY has tested a key resistance level and pulled back.
- Notwithstanding the roadblock, the short-term trend remains bullish and could lead to more gains.
GBP/JPY is seen rising for the eighth consecutive day on Wednesday. It has tested and then pulled back from the key September 2 high at 193.49, a major resistance level. The short-term trend is bullish despite the roadblock and could continue, pending a decisive break.
The 50% Fibonacci retracement level of the July decline at 194.03, could provide further resistance to bulls.
GBP/JPY Daily Chart
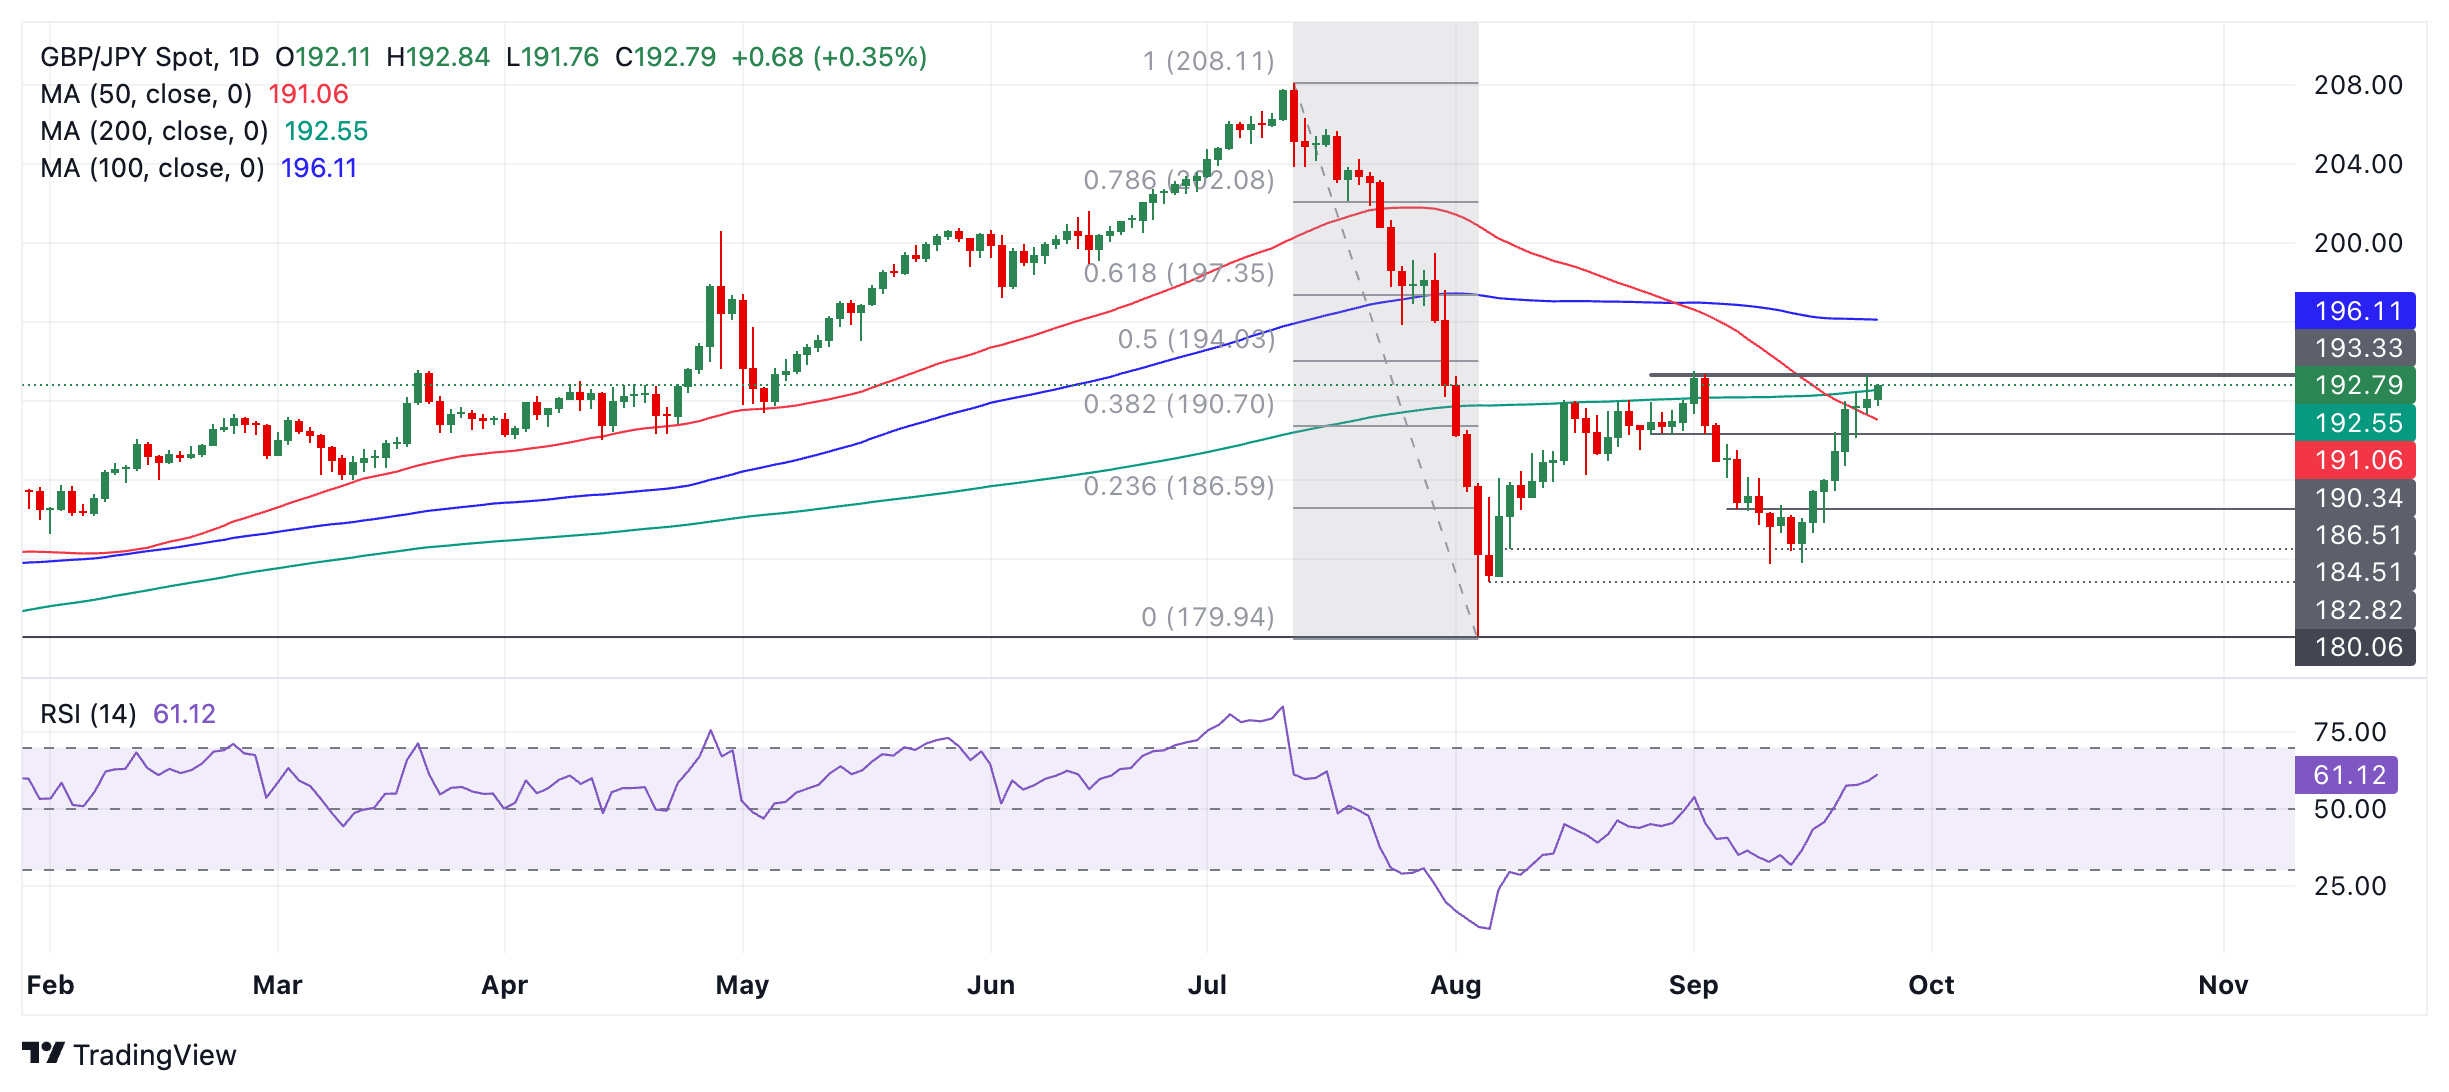
GBP/JPY is in an established short-term uptrend after rising up off the September 11 low. Since it is a principle of technical analysis that “the trend is your friend” this uptrend is more likely than not to extend.
The pair could simply continue higher, therefore, although it would need to decisively break above the resistance line at 193.49 to confirm such an extension.
A decisive break would be one accompanied by a longer-than-average green candle that closed near its high, or three green candles in a row that broke above the level.
The medium-term trend is sideways, however, signifying no bias in either direction, whilst the long-term trend is up.
Bank of England (BoE) policymaker Megan Greene said on Wednesday that a “cautious, steady-as-she-goes approach to monetary policy easing is appropriate.”
Additional quotes
Some slack in the economy needs to open up in order to return inflation sustainably to target over the medium-term.
Indicators of inflationary persistence have broadly been moving in the right direction.
Appropriate to take a gradual approach to removing restrictiveness.
Cautious, steady-as-she goes approach to monetary policy easing is appropriate.
Will be looking for incoming data to provide evidence that the risk of persistent inflation pressure is diminishing.
Wage growth has fallen but remains above what our suite of models can explain.
Risks to activity are to the upside, which could suggest that the long run neutral rate is higher.
Market reaction
The Pound Sterling fails to find inspiration from the prudent remarks by the BoE policymaker, with GBP/USD losing 0.25% on the day to trade near 1.3380, as of writing.
British Pound PRICE Today
The table below shows the percentage change of British Pound (GBP) against listed major currencies today. British Pound was the weakest against the Euro.
| USD | EUR | GBP | JPY | CAD | AUD | NZD | CHF | |
|---|---|---|---|---|---|---|---|---|
| USD | -0.08% | 0.23% | 0.52% | -0.03% | 0.15% | 0.30% | 0.23% | |
| EUR | 0.08% | 0.32% | 0.60% | 0.06% | 0.24% | 0.41% | 0.32% | |
| GBP | -0.23% | -0.32% | 0.25% | -0.26% | -0.09% | 0.04% | 0.00% | |
| JPY | -0.52% | -0.60% | -0.25% | -0.55% | -0.37% | -0.22% | -0.28% | |
| CAD | 0.03% | -0.06% | 0.26% | 0.55% | 0.18% | 0.34% | 0.27% | |
| AUD | -0.15% | -0.24% | 0.09% | 0.37% | -0.18% | 0.17% | 0.09% | |
| NZD | -0.30% | -0.41% | -0.04% | 0.22% | -0.34% | -0.17% | -0.08% | |
| CHF | -0.23% | -0.32% | -0.00% | 0.28% | -0.27% | -0.09% | 0.08% |
The heat map shows percentage changes of major currencies against each other. The base currency is picked from the left column, while the quote currency is picked from the top row. For example, if you pick the British Pound from the left column and move along the horizontal line to the US Dollar, the percentage change displayed in the box will represent GBP (base)/USD (quote).
- NZD/USD may regain ground as it is moving upward within an ascending channel pattern, indicating a bullish bias.
- The 14-day RSI is slightly below the 70 level, indicating a possible upward momentum, with a potential for consolidation.
- The upper boundary of the ascending channel at 0.6360 appears as the immediate resistance.
NZD/USD breaks its five-day winning streak, trading around 0.6330 during the European session on Wednesday. On the daily chart, the pair is moving upward within an ascending channel pattern, indicating a bullish bias.
Additionally, the 14-day Relative Strength Index (RSI) remains above the 50 level, confirming the ongoing bullish trend is intact. Although, the RSI is positioned slightly below the 70 mark, suggesting upward gains remain probable but could face a consolidation soon.
On the upside, the NZD/USD pair is testing the upper boundary of the ascending channel at the 0.6360 level. A breakthrough above the upper boundary could strengthen bullish bias and support the pair to explore the region around the psychological level of 0.6300.
In terms of support, the NZD/USD pair may test the nine-day Exponential Moving Average (EMA) at the 0.6257 level, which is aligned with the lower boundary of the ascending channel. A break below the channel could weaken the bullish sentiment and put pressure on the pair to navigate the area around its five-week low of 0.6106 level.
NZD/USD: Daily Chart
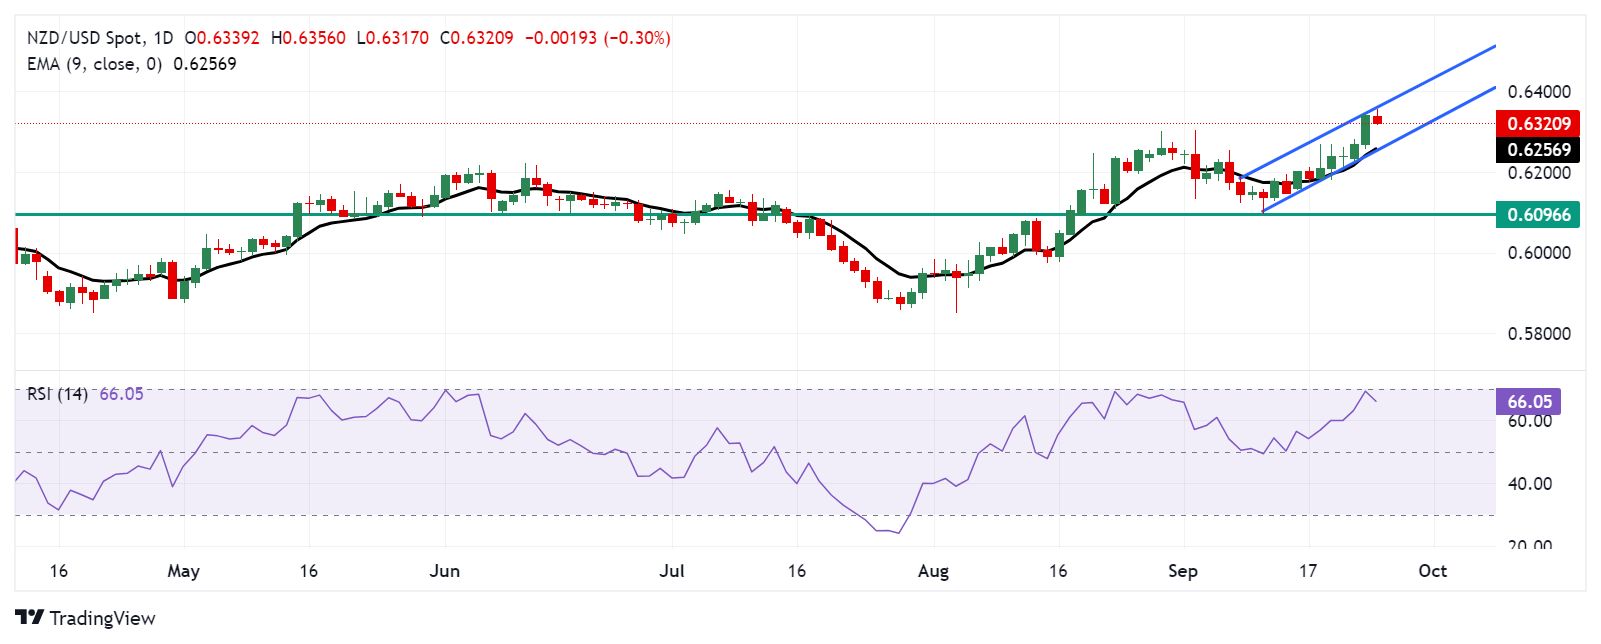
New Zealand Dollar PRICE Today
The table below shows the percentage change of New Zealand Dollar (NZD) against listed major currencies today. New Zealand Dollar was the weakest against the Euro.
| USD | EUR | GBP | JPY | CAD | AUD | NZD | CHF | |
|---|---|---|---|---|---|---|---|---|
| USD | -0.08% | 0.22% | 0.50% | -0.01% | 0.17% | 0.32% | 0.26% | |
| EUR | 0.08% | 0.32% | 0.61% | 0.08% | 0.25% | 0.42% | 0.34% | |
| GBP | -0.22% | -0.32% | 0.27% | -0.24% | -0.07% | 0.06% | 0.03% | |
| JPY | -0.50% | -0.61% | -0.27% | -0.53% | -0.35% | -0.20% | -0.25% | |
| CAD | 0.01% | -0.08% | 0.24% | 0.53% | 0.18% | 0.34% | 0.28% | |
| AUD | -0.17% | -0.25% | 0.07% | 0.35% | -0.18% | 0.17% | 0.10% | |
| NZD | -0.32% | -0.42% | -0.06% | 0.20% | -0.34% | -0.17% | -0.07% | |
| CHF | -0.26% | -0.34% | -0.03% | 0.25% | -0.28% | -0.10% | 0.07% |
The heat map shows percentage changes of major currencies against each other. The base currency is picked from the left column, while the quote currency is picked from the top row. For example, if you pick the New Zealand Dollar from the left column and move along the horizontal line to the US Dollar, the percentage change displayed in the box will represent NZD (base)/USD (quote).
- The Pound Sterling remains firm near 1.3400 against the US Dollar as the Fed is expected to cut interest rates again by 50 bps in November.
- BoE Governor Andrew Bailey sees a gradual decline in interest rates.
- Investors await the US PCE inflation data for August on Friday for fresh clues on the Fed’s interest rate prospects.
The Pound Sterling (GBP) edges lower in Wednesday’s London session but manages to cling to recent gains against the US Dollar (USD) near the round-level figure of 1.3400. The GBP/USD pair remains firm as the US Dollar extends its downside to near the yearly low on expectations that the Federal Reserve (Fed) could deliver one more big interest rate cut in one of the two policy meetings remaining this year.
The US Dollar Index (DXY), which tracks the Greenback’s value against six major currencies, hovers near 100.20.
Last week, the Fed started the policy-easing cycle with a 50-basis points (bps) reduction in interest rates to the range of 4.75%-5.00%, with the aim of reviving labor market strength. The Fed also gained confidence that inflation will sustainably return to the bank’s target of 2%. Out of the 12 members-led Federal Open Market Committee (FOMC), only Fed Governor Michelle Bowman supported a gradual beginning of the rate-cut cycle with a standard 25 bps cut.
According to the CME FedWatch tool, the central bank is expected to reduce its key borrowing rates further by 75 bps in the remainder of the year, suggesting that there will be one 50 bps and one 25 bps rate cut. The 30-day Federal fund futures pricing data shows that the probability of the Fed reducing interest rates by a double dose of 50 bps in November has increased to 59% from 37% a week ago.
Going forward, investors will shift focus to the United States (US) core Personal Consumption Expenditures Price Index (PCE) data for August, the Fed’s preferred inflation gauge, which will be published on Friday. Economists estimate the core annual inflation measure to have accelerated to 2.7% from 2.6% in July.
Daily digest market movers: Pound Sterling remains broadly firm as BoE’s Bailey expects a gradual rate-cut cycle
- The Pound Sterling exhibits a mixed performance against its major peers on Wednesday. The outlook of the British currency remains firm as investors expect that the Bank of England (BoE) will lower interest rates gradually. BoE Governor Andrew Bailey said in an interview with Kent Messenger newspaper on Tuesday, "I do think the path for interest rates will be downwards, gradually.”
- The comments from Bailey suggested that he is confident about inflation sustainably returning to the bank’s target of 2%. When asked about where interest rates will settle, Bailey didn’t provide a specific neutral rate but assured that he did not expect them to return to historic lows as seen in times of pandemic.
- In the United Kingdom (UK), the annual headline inflation hovered near the bank’s target of 2% in the last three months. However, high inflation in the services sector has remained a major concern for BoE policymakers, for which they closely track the Service Consumer Price Index (CPI), which increased to 5.6% in August from 5.2% in July.
Technical Analysis: Pound Sterling holds strength near 1.3400
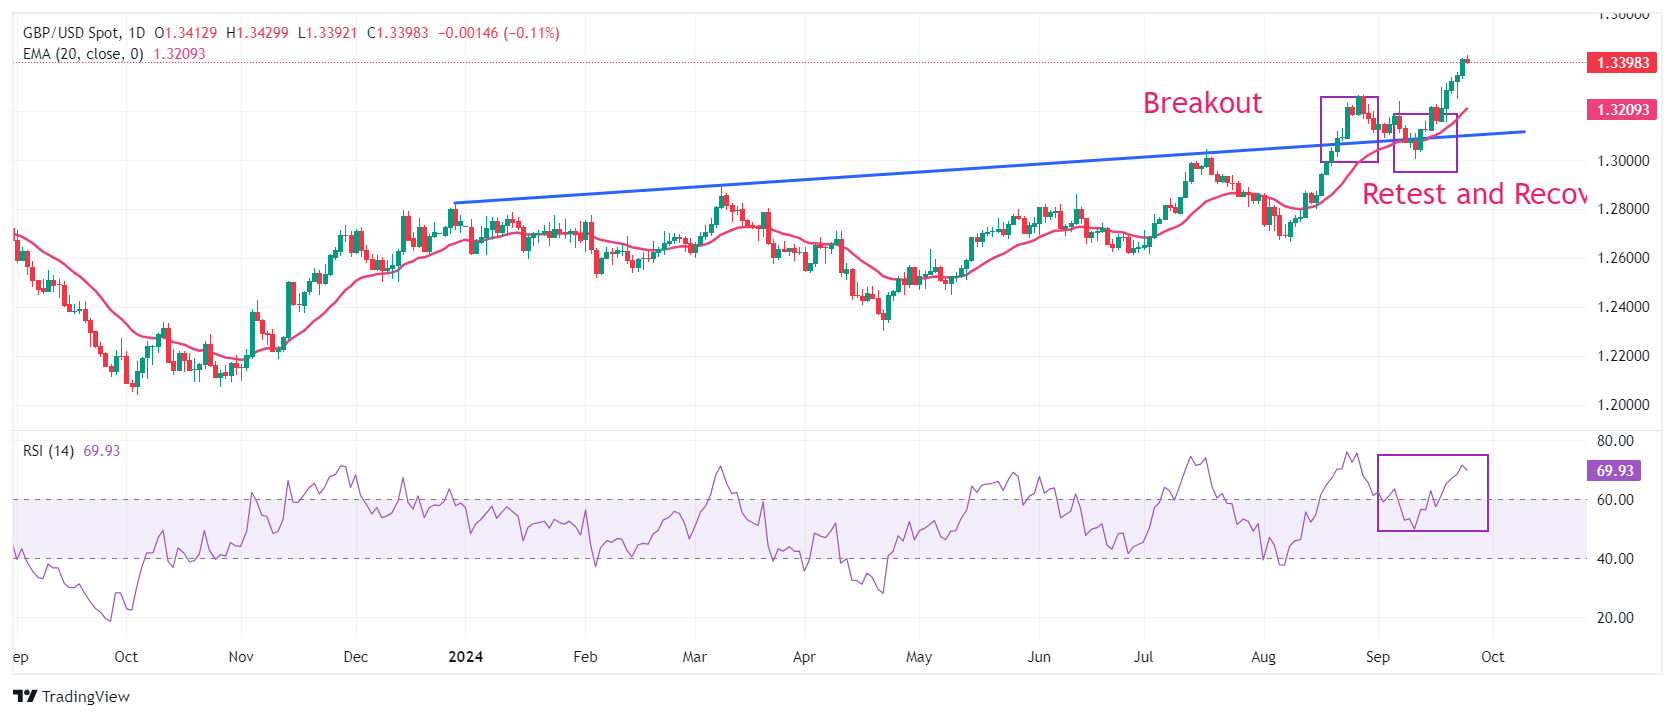
The Pound Sterling rises further to 1.3400 against the US Dollar in European trading hours. The near-term outlook of the GBP/USD pair remains firm as all short-to-long-term Exponential Moving Averages (EMAs) are sloping higher.
Earlier in September, the Cable strengthened after recovering from a corrective move to near the trendline plotted from the December 28, 2023, high of 1.2828, from where it delivered a sharp increase after a breakout on August 21.
The 14-day Relative Strength Index (RSI) shifts above 60.00, suggesting an active bullish momentum.
Looking up, the Cable will face resistance near the psychological level of 1.3500. On the downside, the psychological level of 1.3000 emerges as crucial support.
Pound Sterling FAQs
The Pound Sterling (GBP) is the oldest currency in the world (886 AD) and the official currency of the United Kingdom. It is the fourth most traded unit for foreign exchange (FX) in the world, accounting for 12% of all transactions, averaging $630 billion a day, according to 2022 data. Its key trading pairs are GBP/USD, aka ‘Cable’, which accounts for 11% of FX, GBP/JPY, or the ‘Dragon’ as it is known by traders (3%), and EUR/GBP (2%). The Pound Sterling is issued by the Bank of England (BoE).
The single most important factor influencing the value of the Pound Sterling is monetary policy decided by the Bank of England. The BoE bases its decisions on whether it has achieved its primary goal of “price stability” – a steady inflation rate of around 2%. Its primary tool for achieving this is the adjustment of interest rates. When inflation is too high, the BoE will try to rein it in by raising interest rates, making it more expensive for people and businesses to access credit. This is generally positive for GBP, as higher interest rates make the UK a more attractive place for global investors to park their money. When inflation falls too low it is a sign economic growth is slowing. In this scenario, the BoE will consider lowering interest rates to cheapen credit so businesses will borrow more to invest in growth-generating projects.
Data releases gauge the health of the economy and can impact the value of the Pound Sterling. Indicators such as GDP, Manufacturing and Services PMIs, and employment can all influence the direction of the GBP. A strong economy is good for Sterling. Not only does it attract more foreign investment but it may encourage the BoE to put up interest rates, which will directly strengthen GBP. Otherwise, if economic data is weak, the Pound Sterling is likely to fall.
Another significant data release for the Pound Sterling is the Trade Balance. This indicator measures the difference between what a country earns from its exports and what it spends on imports over a given period. If a country produces highly sought-after exports, its currency will benefit purely from the extra demand created from foreign buyers seeking to purchase these goods. Therefore, a positive net Trade Balance strengthens a currency and vice versa for a negative balance.
- USD/CAD loses ground due to rising dovish sentiment surrounding the Fed’s policy outlook.
- Fed’s Bowman urged caution regarding central bank rate cuts, citing inflation indicators above the 2% target.
- The commodity-linked CAD may struggle due to lower crude Oil prices amid investors re-assessing the effectiveness of China’s stimulus plans.
USD/CAD hovers around 1.3430 during the early European hours on Wednesday. The pair received downward pressure following the bumper interest rate cut of 50 basis points by the US Federal Reserve (Fed) last week.
The US Dollar (USD) may depreciate further due to expectations for further rate cuts by the Fed in 2024. According to the CME FedWatch Tool, markets are pricing in around 50% likelihood of a 75 basis point reduction, bringing the Fed's rate to a range of 4.0-4.25% by the end of this year.
Additionally, the lower US Treasury yields contribute to downward pressure for the Greenback. The US Dollar Index (DXY), which measures the value of the US Dollar against its six major peers, trading around 100.30 with 2-year and 10-year yields on US Treasury bonds standing at 3.51% and 3.73%, respectively, at the time of writing.
However, Federal Reserve Governor Michelle Bowman stated on Tuesday that key inflation indicators are still "uncomfortably above" the 2% target, urging caution as the Fed moves forward with interest rate cuts. Despite this, she expressed a preference for a more conventional approach, advocating for a quarter percentage point reduction.
The commodity-linked Canadian Dollar (CAD) could weaken as crude Oil prices face headwinds, with investors re-evaluating the effectiveness of China’s stimulus plans to significantly boost its economy and fuel demand growth in the world’s largest crude importer. West Texas Intermediate (WTI) crude Oil price trades around $71.00 per barrel at the time of writing.
On Tuesday, Bank of Canada (BoC) Governor Tiff Macklem stated that the central bank will closely monitor consumer conditions in Canada, stressing that the timing and pace of future rate cuts will be data-driven. "The timing and pace will be determined by incoming data and our assessment of what those data mean for future inflation," Macklem remarked.
Canadian Dollar FAQs
The key factors driving the Canadian Dollar (CAD) are the level of interest rates set by the Bank of Canada (BoC), the price of Oil, Canada’s largest export, the health of its economy, inflation and the Trade Balance, which is the difference between the value of Canada’s exports versus its imports. Other factors include market sentiment – whether investors are taking on more risky assets (risk-on) or seeking safe-havens (risk-off) – with risk-on being CAD-positive. As its largest trading partner, the health of the US economy is also a key factor influencing the Canadian Dollar.
The Bank of Canada (BoC) has a significant influence on the Canadian Dollar by setting the level of interest rates that banks can lend to one another. This influences the level of interest rates for everyone. The main goal of the BoC is to maintain inflation at 1-3% by adjusting interest rates up or down. Relatively higher interest rates tend to be positive for the CAD. The Bank of Canada can also use quantitative easing and tightening to influence credit conditions, with the former CAD-negative and the latter CAD-positive.
The price of Oil is a key factor impacting the value of the Canadian Dollar. Petroleum is Canada’s biggest export, so Oil price tends to have an immediate impact on the CAD value. Generally, if Oil price rises CAD also goes up, as aggregate demand for the currency increases. The opposite is the case if the price of Oil falls. Higher Oil prices also tend to result in a greater likelihood of a positive Trade Balance, which is also supportive of the CAD.
While inflation had always traditionally been thought of as a negative factor for a currency since it lowers the value of money, the opposite has actually been the case in modern times with the relaxation of cross-border capital controls. Higher inflation tends to lead central banks to put up interest rates which attracts more capital inflows from global investors seeking a lucrative place to keep their money. This increases demand for the local currency, which in Canada’s case is the Canadian Dollar.
Macroeconomic data releases gauge the health of the economy and can have an impact on the Canadian Dollar. Indicators such as GDP, Manufacturing and Services PMIs, employment, and consumer sentiment surveys can all influence the direction of the CAD. A strong economy is good for the Canadian Dollar. Not only does it attract more foreign investment but it may encourage the Bank of Canada to put up interest rates, leading to a stronger currency. If economic data is weak, however, the CAD is likely to fall.
- The US Dollar Index softens around 100.35 in Wednesday’s early European session.
- The negative outlook of the index prevails below the key 100-day EMA, with the bearish RSI indicator.
- The initial support level emerges at 100.25; the first upside barrier is seen at 101.23.
The US Dollar Index (DXY) remains on the defensive near 100.35 during the early European session on Wednesday. The improved risk appetite following the fresh Chinese stimulus plans and rising bets on a jumbo interest rate reduction from the US Federal Reserve (Fed) in November weigh on the DXY. The US New Home Sales data for August will be published later on Wednesday. Traders also await the Fed’s Governor Adriana Kugler speech for fresh impetus.
Technically, the DXY keeps the bearish vibe on the daily chart as the index holds below the key 100-day Exponential Moving Averages (EMA). The downward momentum is supported by the Relative Strength Index (RSI), which stands below the midline near 35.65. This suggests that further downside of DXY looks favorable.
A decisive break below the lower limit of the Bollinger Band at 100.25 could expose the 100.00 psychological mark. Extended losses could see a drop to 99.74, the low of July 13, 2023. The additional downside filter to watch is 99.57, the low of July 18, 2023.
On the bright side, the high of September 23 at 101.23 acts as an immediate resistance level for the US Dollar Index. Further north, the next upside barrier is seen at 101.84, the high of September 12. The round level and the upper boundary of Bollinger Band in the 102.00-102.05 zone appear to be a tough nut to crack for DXY bulls. A break above the mentioned level could see a rally to the 100-day EMA at 102.95.
US Dollar Index (DXY) Daily Chart
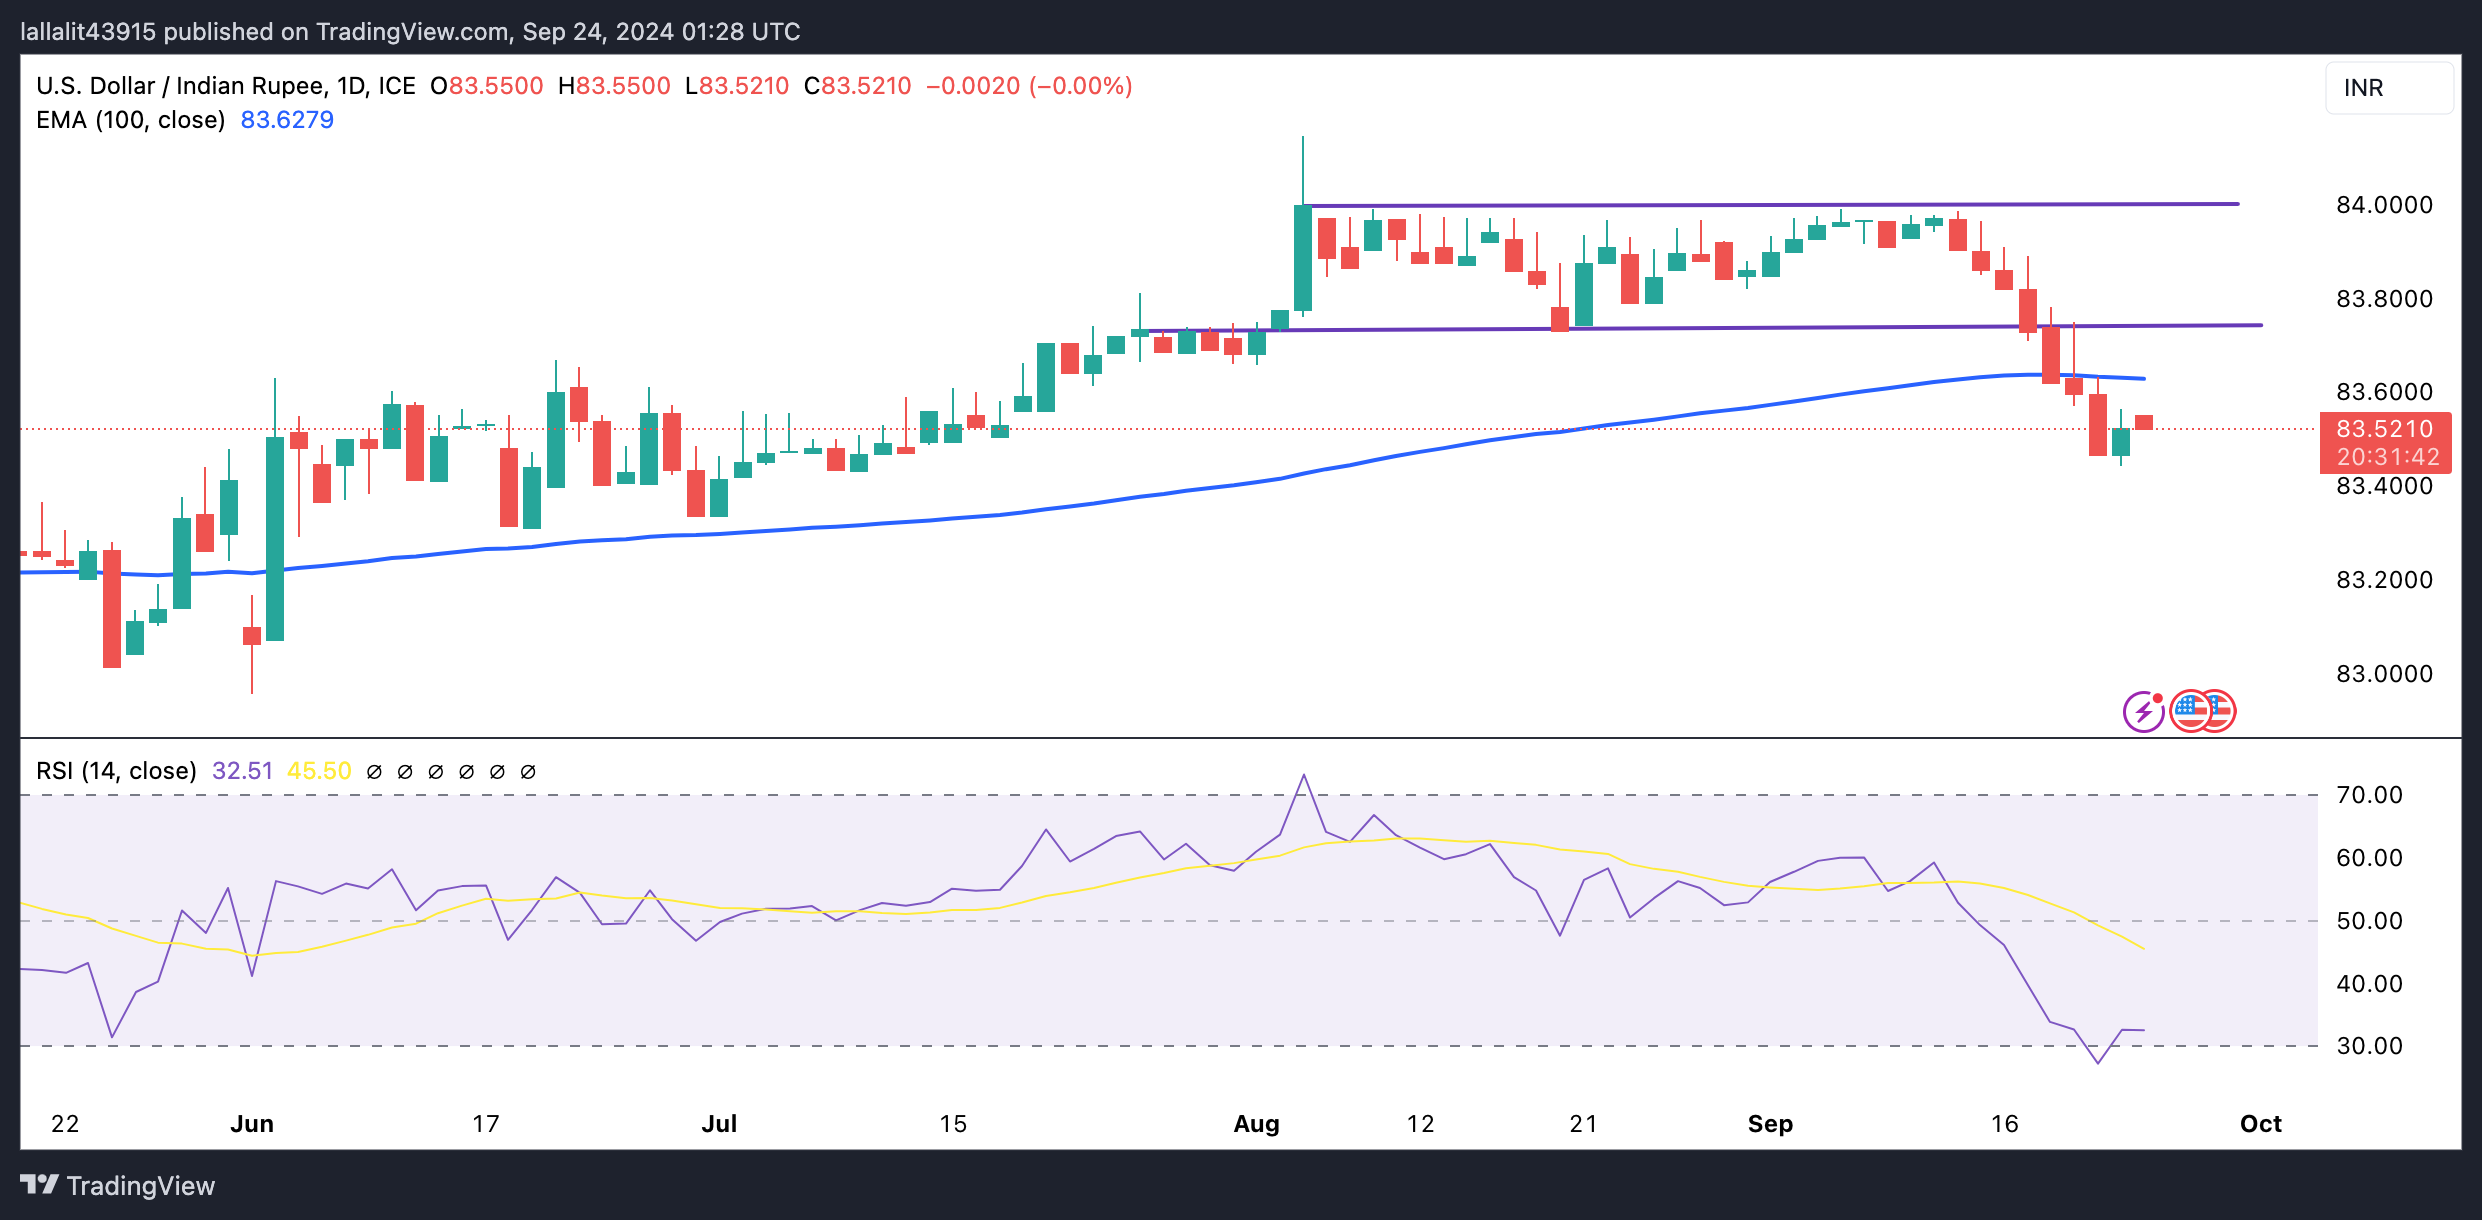
US Dollar FAQs
The US Dollar (USD) is the official currency of the United States of America, and the ‘de facto’ currency of a significant number of other countries where it is found in circulation alongside local notes. It is the most heavily traded currency in the world, accounting for over 88% of all global foreign exchange turnover, or an average of $6.6 trillion in transactions per day, according to data from 2022. Following the second world war, the USD took over from the British Pound as the world’s reserve currency. For most of its history, the US Dollar was backed by Gold, until the Bretton Woods Agreement in 1971 when the Gold Standard went away.
The most important single factor impacting on the value of the US Dollar is monetary policy, which is shaped by the Federal Reserve (Fed). The Fed has two mandates: to achieve price stability (control inflation) and foster full employment. Its primary tool to achieve these two goals is by adjusting interest rates. When prices are rising too quickly and inflation is above the Fed’s 2% target, the Fed will raise rates, which helps the USD value. When inflation falls below 2% or the Unemployment Rate is too high, the Fed may lower interest rates, which weighs on the Greenback.
In extreme situations, the Federal Reserve can also print more Dollars and enact quantitative easing (QE). QE is the process by which the Fed substantially increases the flow of credit in a stuck financial system. It is a non-standard policy measure used when credit has dried up because banks will not lend to each other (out of the fear of counterparty default). It is a last resort when simply lowering interest rates is unlikely to achieve the necessary result. It was the Fed’s weapon of choice to combat the credit crunch that occurred during the Great Financial Crisis in 2008. It involves the Fed printing more Dollars and using them to buy US government bonds predominantly from financial institutions. QE usually leads to a weaker US Dollar.
Quantitative tightening (QT) is the reverse process whereby the Federal Reserve stops buying bonds from financial institutions and does not reinvest the principal from the bonds it holds maturing in new purchases. It is usually positive for the US Dollar.
European Central Bank (ECB) Governing Council member and Bank of France President, François Villeroy de Galhau, commented on the French fiscal situation on Wednesday.
Key quotes
We cannot allow situation regarding deficit to last.
Those who are lending money to France are telling france that they must act over deficit.
Need to cure the illness regarding our deficit.
Our public debts are well above the average for Europe.
Market reaction
EUR/USD is flirting with 1.1200 in the early European morning, up 0.13% on the day.
Here is what you need to know on Wednesday, September 25:
Following another record close for Wall Street indices, the Asian equity markets also maintained a buoyant tone, led by the ongoing rally in Chinese stocks. The market’s optimism was enhanced by the People’s Bank of China (PBOC) cut to the one-year Medium-term Lending Facility (MLF) rate from 2.30% to 2.0%. The MLF rate reduction is one such measure among a host of other stimulus efforts rolled out by China lately to spur economic growth.
Traders brushed aside brewing Middle East tensions, with the latest news citing that an “Israeli airstrike in Beirut killed a senior Hezbollah commander on Tuesday, heightening fears of a full-scale war amid increasing cross-border rocket attacks between both sides,” per Reuters.
As risk appetite remains in vogue, the safe-haven US Dollar (USD) licks its wounds alongside the US Treasury bond yields, having witnessed a fresh leg lower in early Asian trades. The USD was thrown under the bus against its major rivals in Tuesday’s American trading on China’s stimulus-driven risk flows and weak US Conference Board (CB) Consumer Confidence and regional activity data. Weak US data ramped up bets for another outsized Federal Reserve (Fed) rate cut in November.
The CB Consumer Confidence Index dropped to 98.7 this month from an upwardly revised 105.6 in August, registering the largest decline since August 2021. Meanwhile, The Richmond Fed index fell to a 52-month low of -21 from a prior low of -19 in August and a low before that of -17 in July.
Markets are currently pricing in about a 60% chance of such a move, the CME Group’s Fed WatchTool shows. For the next two Fed meetings, rate futures are implying more than 80 bps in cuts. Additionally, the US Dollar also bore the brunt of the sell-off in US Treasury bond yields across the curve, triggered by a moderate auction of the US two-year government bonds.
The Greenback’s fate remains in the hands of the persisting risk trends and a speech from Fed Governor Adriana Kugler, in the absence of any top-tier US economic data release. Kugler is due to speak about the economic outlook at the Harvard Kennedy School, in Cambridge, later on Wednesday.
US Dollar PRICE Today
The table below shows the percentage change of US Dollar (USD) against listed major currencies today. US Dollar was the weakest against the Swiss Franc.
| USD | EUR | GBP | JPY | CAD | AUD | NZD | CHF | |
|---|---|---|---|---|---|---|---|---|
| USD | -0.12% | -0.00% | 0.03% | 0.00% | 0.10% | 0.15% | -0.13% | |
| EUR | 0.12% | 0.12% | 0.16% | 0.13% | 0.22% | 0.31% | -0.01% | |
| GBP | 0.00% | -0.12% | 0.02% | 0.00% | 0.10% | 0.13% | -0.12% | |
| JPY | -0.03% | -0.16% | -0.02% | -0.04% | 0.05% | 0.11% | -0.17% | |
| CAD | -0.01% | -0.13% | -0.01% | 0.04% | 0.10% | 0.15% | -0.13% | |
| AUD | -0.10% | -0.22% | -0.10% | -0.05% | -0.10% | 0.07% | -0.23% | |
| NZD | -0.15% | -0.31% | -0.13% | -0.11% | -0.15% | -0.07% | -0.29% | |
| CHF | 0.13% | 0.01% | 0.12% | 0.17% | 0.13% | 0.23% | 0.29% |
The heat map shows percentage changes of major currencies against each other. The base currency is picked from the left column, while the quote currency is picked from the top row. For example, if you pick the US Dollar from the left column and move along the horizontal line to the Japanese Yen, the percentage change displayed in the box will represent USD (base)/JPY (quote).
Across the FX board, AUD/USD hangs near $0.6900, close to the highest level since February 2023. Softer Australian monthly Consumer Price Index (CPI) data added to the dovish bets for an RBA rate cut. Australia’s CPI rose 2.7% YoY in August, down from 3.5% in July and back within the RBA’s 2%-3% target range. The risk-off mood, however, keeps the higher-yielding Aussie afloat.
USD/JPY stays on the front foot above 143.00 after facing rejection at 143.50. The pair draws support from prevalent risk-on sentiment, which weighs on the safe-haven Japanese Yen. The upside appears capped due to the recent US Dollar weakness.
USD/CAD holds lower ground, eyeing a test of 1.3400, despite the renewed weakness in Oil price. The black gold reverses the latest upside on renewed concerns that China's stimulus plans may not be enough to shore up demand for fuel in the world’s top consumer. WTI is down 0.35% on the day to trade near $71.
GBP/USD is consolidating just below 30-month highs, as risk flows dominate and underpin the risk currency – the Pound Sterling. Bank of England (BoE) Governor Andrew Bailey said Tuesday, “I'm very encouraged that the path of inflation is downwards therefore I do think the path for interest rates will be downwards, gradually.” His dovish comments failed to deter GBP buyers.
EUR/USD is approaching the August high, battling 1.1200 in early Europe. Increased bets for large Fed rate cuts outweigh the weakening Euro area growth prospects, supporting the pair.
Gold price keeps pushing higher, currently holding the renewed uptick to a fresh record high of $2,671. Overbought conditions on Gold’s daily chart point to a potential corrective decline in the near term. Traders look to Fed official Kugler’s speech for fresh policy cues.
- EUR/GBP drifts higher to 0.8345 in Wednesday’s early European session.
- The BoE’s dovish stance continues to weigh on the Pound Sterling.
- The downbeat German IFO reports have added to German recession fears, which might cap the cross’s upside.
The EUR/GBP pair rebounds near 0.8345 during the early European session on Wednesday. The dovish remarks from Bank of England (BoE) Governor Andrew Bailey weigh on the Pound Sterling (GBP). Investors will take more cues from the BoE’s Megan Greene later in the day.
The BoE Governor Andrew Bailey said he was “very encouraged” by the downward path of inflation, and he expected the path for interest rates will be downwards gradually. However, Bailey warned consumers not to expect a return to near-zero levels. Bailey’s comments suggested that the UK central bank would continue its easing policy over a long period, which exerts some selling pressure on the GBP. The financial markets anticipate the interest rates could drop to 4.5% by the end of 2024, and lower to 3.5% by the end of 2025.
On the Euro front, Germany’s IFO Index dropped for the fifth consecutive month, indicating the economy remains stuck in stagnation. The German IFO Business Climate Index declined to 85.4 in September from 86.6 in August, below the consensus of 86.0. The Current Economic Assessment Index dropped to 84.4 versus 86.4 prior (revised from 86.5). Finally, the IFO Expectations Index declined to 86.3 in September from 86.8 in August, matching the expectations.
The fall in Germany’s IFO reports has added to German recession fears, which might cap the upside for the cross in the near term. On Tuesday, the ECB governing council member Klaas Knot stated that the central bank would continue to reduce the interest rates at least through the first half of 2025 to a level between 2% and 3%, per Reuters.
BoE FAQs
The Bank of England (BoE) decides monetary policy for the United Kingdom. Its primary goal is to achieve ‘price stability’, or a steady inflation rate of 2%. Its tool for achieving this is via the adjustment of base lending rates. The BoE sets the rate at which it lends to commercial banks and banks lend to each other, determining the level of interest rates in the economy overall. This also impacts the value of the Pound Sterling (GBP).
When inflation is above the Bank of England’s target it responds by raising interest rates, making it more expensive for people and businesses to access credit. This is positive for the Pound Sterling because higher interest rates make the UK a more attractive place for global investors to park their money. When inflation falls below target, it is a sign economic growth is slowing, and the BoE will consider lowering interest rates to cheapen credit in the hope businesses will borrow to invest in growth-generating projects – a negative for the Pound Sterling.
In extreme situations, the Bank of England can enact a policy called Quantitative Easing (QE). QE is the process by which the BoE substantially increases the flow of credit in a stuck financial system. QE is a last resort policy when lowering interest rates will not achieve the necessary result. The process of QE involves the BoE printing money to buy assets – usually government or AAA-rated corporate bonds – from banks and other financial institutions. QE usually results in a weaker Pound Sterling.
Quantitative tightening (QT) is the reverse of QE, enacted when the economy is strengthening and inflation starts rising. Whilst in QE the Bank of England (BoE) purchases government and corporate bonds from financial institutions to encourage them to lend; in QT, the BoE stops buying more bonds, and stops reinvesting the principal maturing on the bonds it already holds. It is usually positive for the Pound Sterling.
- EUR/JPY attracts buyers for the second straight day, albeit remains below the weekly top.
- The technical setup supports prospects for a breakout through the weekly trading range.
- A convincing break below the 159.00 mark is needed to negate the near-term positive bias.
The EUR/JPY cross trades with a positive bias for the second successive day on Wednesday, albeit lacks bullish conviction and remains confined in a familiar range held since the beginning of this week. Spot prices currently trade around mid-160.00s, up nearly 0.25% for the day and draw support from a combination of factors.
The shared currency benefits from the prevalent US Dollar (USD) selling bias, fueled by rising bets for more aggressive policy easing by the Federal Reserve (Fed). Apart from this, the prevalent risk-on environment undermines the safe-haven Japanese Yen (JPY) and acts as a tailwind for the EUR/JPY cross. That said, the divergent Bank of Japan (BoJ)-European Central Bank (ECB) policy expectations keep a lid on any meaningful appreciating move for the currency pair.
From a technical perspective, the range-bound price action might be categorized as a bullish consolidation phase against the backdrop of the recent move-up witnessed over the past two weeks or so. Moreover, oscillators on the daily chart have just started gaining positive traction and support prospects for an eventual breakout to the upside. Bulls, however, need to wait for sustained strength and acceptance above the 161.00 mark before placing fresh bets. The EUR/JPY cross might then accelerate the move up to the 161.40-161.45 intermediate resistance en route to the 162.00 round figure.
The next relevant hurdle is pegged near the 162.45-162.50 region, above which bulls could aim to challenge the monthly peak, around the 162.90 area. Some follow-through buying beyond the 163.00 round figure will negate the negative outlook and shift the near-term bias in favor of bullish traders.
On the flip side, weakness back below the 160.00 psychological mark could find support near the 159.60-159.55 region ahead of the 159.00 round figure, or the lower boundary of the weekly range. A convincing break below the latter will suggest that the recent upward trajectory has run out of steam and drag the EUR/JPY cross further towards the 158.20 area. This is closely followed by the 158.00 round figure, below which spot prices could drop to mid-157.00s en route to the 157.00 mark.
EUR/JPY 4-hour chart
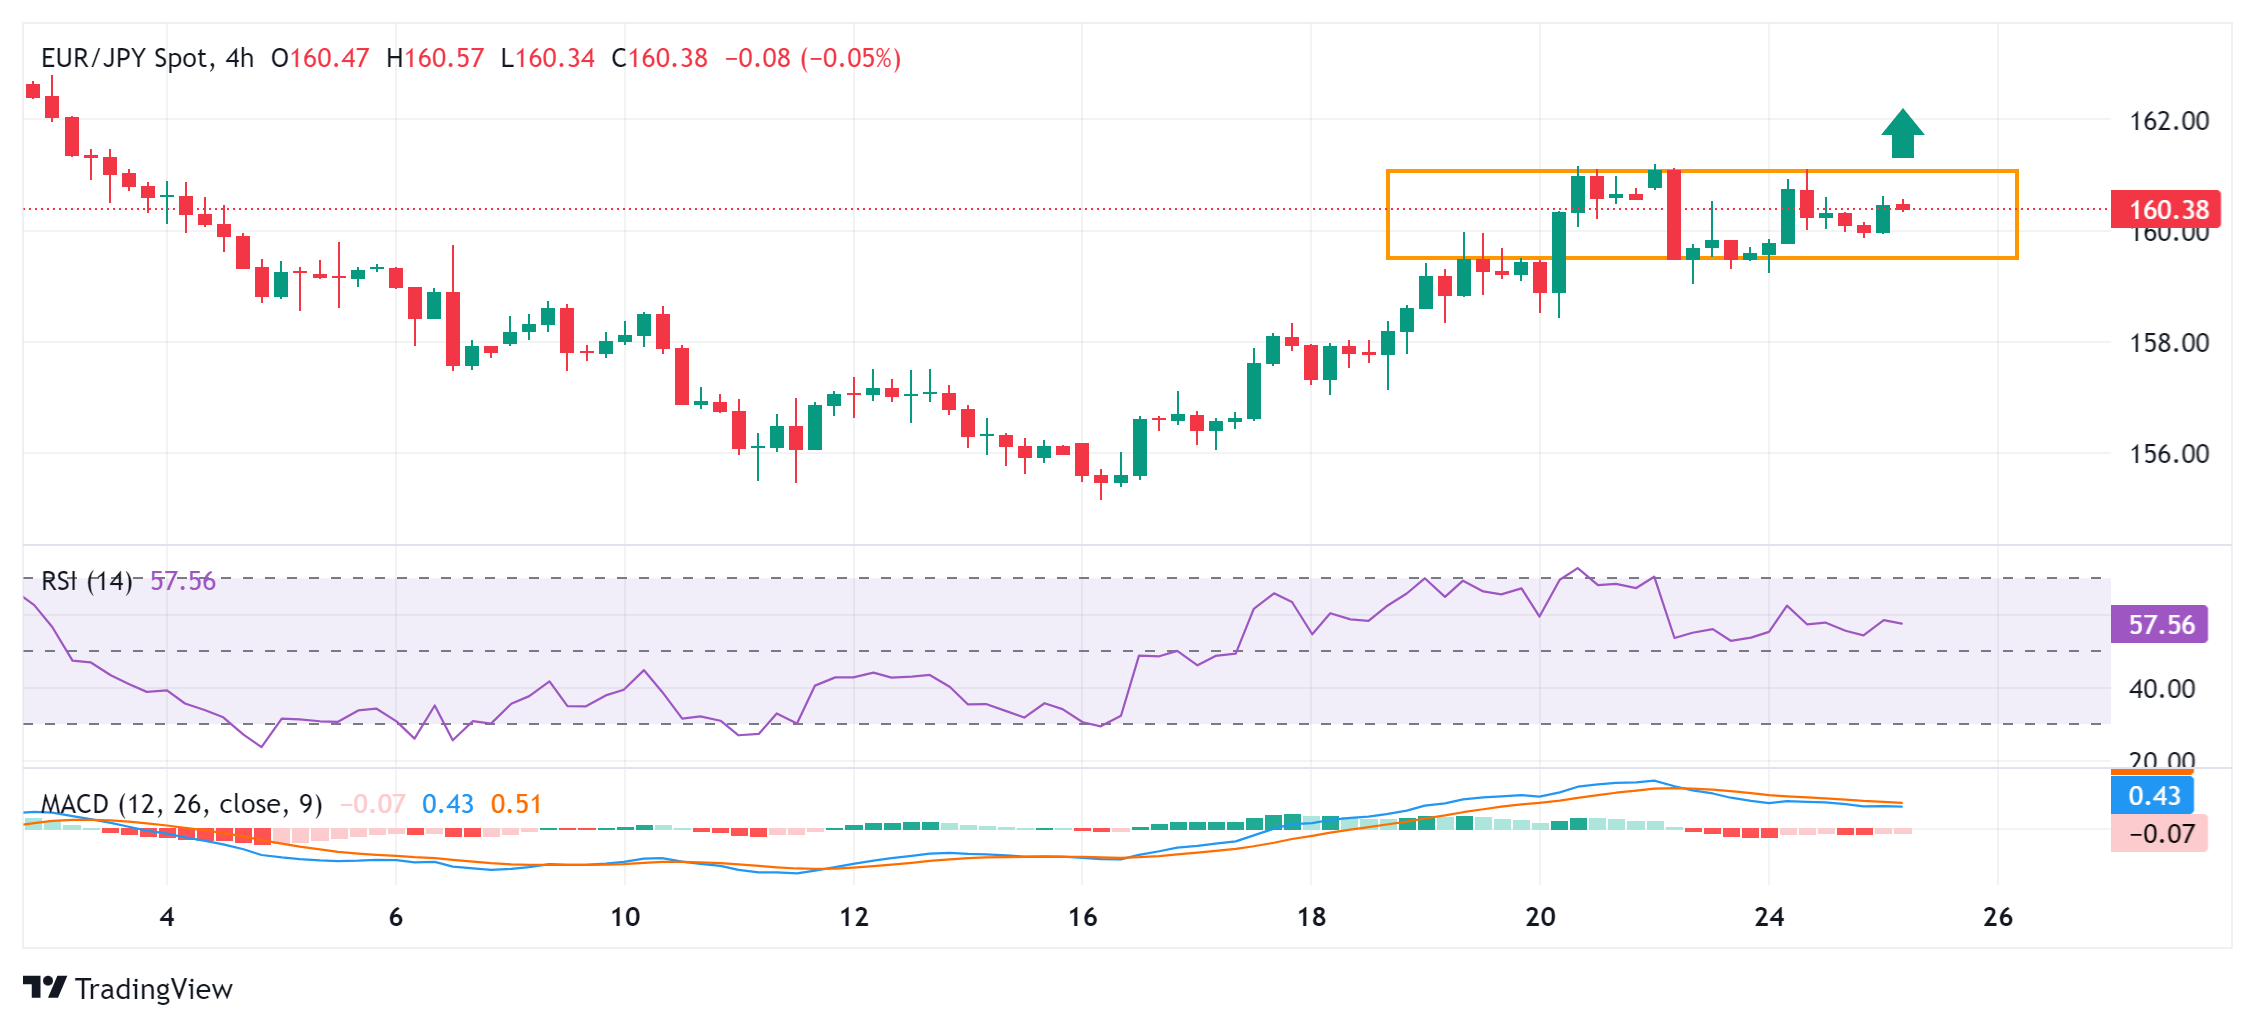
- USD/CHF faces challenges due to rising dovish sentiment surrounding the Fed’s policy outlook.
- The weaker US Consumer Confidence Index contributes to dovish expectations for the Fed for its upcoming policy decisions.
- The Swiss Franc may struggle as SNB is expected to implement a 25 basis point rate cut on Thursday.
USD/CHF extends its losses for the third successive day, trading around 0.8420 during the Asian hours on Wednesday. This downside of the pair could be attributed to the subdued US Dollar (USD) following the strengthening dovish sentiment surrounding the US Federal Reserve’s (Fed) policy outlook.
On Tuesday, the weaker US consumer confidence data added to dovish expectations for the Federal Reserve (Fed) for its upcoming policy decisions. US Consumer Confidence Index fell to 98.7 in September from a revised 105.6 in August. This figure registered the biggest decline since August 2021.
However, Federal Reserve Governor Michelle Bowman stated on Tuesday that key inflation indicators are still "uncomfortably above" the 2% target, urging caution as the Fed moves forward with interest rate cuts. Despite this, she expressed a preference for a more conventional approach, advocating for a quarter percentage point reduction.
The downside of the USD/CHF pair could be restrained as the Swiss Franc (CHF) may receive downward pressure as the Swiss National Bank (SNB) is expected to lower rates by 25 basis points (bps) on Thursday. Additionally, the probability of a 50-bps cut has increased, with markets now seeing a one-in-three chance, up from zero a month ago.
Traders will likely observe the ZEW Survey – Expectations (Sep) scheduled to be released on Wednesday, which may provide insights into the business and employment conditions in Switzerland.
Swiss Franc FAQs
The Swiss Franc (CHF) is Switzerland’s official currency. It is among the top ten most traded currencies globally, reaching volumes that well exceed the size of the Swiss economy. Its value is determined by the broad market sentiment, the country’s economic health or action taken by the Swiss National Bank (SNB), among other factors. Between 2011 and 2015, the Swiss Franc was pegged to the Euro (EUR). The peg was abruptly removed, resulting in a more than 20% increase in the Franc’s value, causing a turmoil in markets. Even though the peg isn’t in force anymore, CHF fortunes tend to be highly correlated with the Euro ones due to the high dependency of the Swiss economy on the neighboring Eurozone.
The Swiss Franc (CHF) is considered a safe-haven asset, or a currency that investors tend to buy in times of market stress. This is due to the perceived status of Switzerland in the world: a stable economy, a strong export sector, big central bank reserves or a longstanding political stance towards neutrality in global conflicts make the country’s currency a good choice for investors fleeing from risks. Turbulent times are likely to strengthen CHF value against other currencies that are seen as more risky to invest in.
The Swiss National Bank (SNB) meets four times a year – once every quarter, less than other major central banks – to decide on monetary policy. The bank aims for an annual inflation rate of less than 2%. When inflation is above target or forecasted to be above target in the foreseeable future, the bank will attempt to tame price growth by raising its policy rate. Higher interest rates are generally positive for the Swiss Franc (CHF) as they lead to higher yields, making the country a more attractive place for investors. On the contrary, lower interest rates tend to weaken CHF.
Macroeconomic data releases in Switzerland are key to assessing the state of the economy and can impact the Swiss Franc’s (CHF) valuation. The Swiss economy is broadly stable, but any sudden change in economic growth, inflation, current account or the central bank’s currency reserves have the potential to trigger moves in CHF. Generally, high economic growth, low unemployment and high confidence are good for CHF. Conversely, if economic data points to weakening momentum, CHF is likely to depreciate.
As a small and open economy, Switzerland is heavily dependent on the health of the neighboring Eurozone economies. The broader European Union is Switzerland’s main economic partner and a key political ally, so macroeconomic and monetary policy stability in the Eurozone is essential for Switzerland and, thus, for the Swiss Franc (CHF). With such dependency, some models suggest that the correlation between the fortunes of the Euro (EUR) and the CHF is more than 90%, or close to perfect.
Gold prices remained broadly unchanged in India on Wednesday, according to data compiled by FXStreet.
The price for Gold stood at 7,140.92 Indian Rupees (INR) per gram, broadly stable compared with the INR 7,137.65 it cost on Tuesday.
The price for Gold was broadly steady at INR 83,290.33 per tola from INR 83,252.11 per tola a day earlier.
| Unit measure | Gold Price in INR |
|---|---|
| 1 Gram | 7,140.92 |
| 10 Grams | 71,409.24 |
| Tola | 83,290.33 |
| Troy Ounce | 222,107.70 |
FXStreet calculates Gold prices in India by adapting international prices (USD/INR) to the local currency and measurement units. Prices are updated daily based on the market rates taken at the time of publication. Prices are just for reference and local rates could diverge slightly.
Gold FAQs
Gold has played a key role in human’s history as it has been widely used as a store of value and medium of exchange. Currently, apart from its shine and usage for jewelry, the precious metal is widely seen as a safe-haven asset, meaning that it is considered a good investment during turbulent times. Gold is also widely seen as a hedge against inflation and against depreciating currencies as it doesn’t rely on any specific issuer or government.
Central banks are the biggest Gold holders. In their aim to support their currencies in turbulent times, central banks tend to diversify their reserves and buy Gold to improve the perceived strength of the economy and the currency. High Gold reserves can be a source of trust for a country’s solvency. Central banks added 1,136 tonnes of Gold worth around $70 billion to their reserves in 2022, according to data from the World Gold Council. This is the highest yearly purchase since records began. Central banks from emerging economies such as China, India and Turkey are quickly increasing their Gold reserves.
Gold has an inverse correlation with the US Dollar and US Treasuries, which are both major reserve and safe-haven assets. When the Dollar depreciates, Gold tends to rise, enabling investors and central banks to diversify their assets in turbulent times. Gold is also inversely correlated with risk assets. A rally in the stock market tends to weaken Gold price, while sell-offs in riskier markets tend to favor the precious metal.
The price can move due to a wide range of factors. Geopolitical instability or fears of a deep recession can quickly make Gold price escalate due to its safe-haven status. As a yield-less asset, Gold tends to rise with lower interest rates, while higher cost of money usually weighs down on the yellow metal. Still, most moves depend on how the US Dollar (USD) behaves as the asset is priced in dollars (XAU/USD). A strong Dollar tends to keep the price of Gold controlled, whereas a weaker Dollar is likely to push Gold prices up.
(An automation tool was used in creating this post.)
- EUR/USD trades in positive territory for the second consecutive day around 1.1195 in Wednesday’s Asian session.
- A larger Fed rate cut expectation drags the USD down against the Euro.
- ECB policymaker signaled another interest-rate cut next month cannot be ruled out.
The EUR/USD pair extends upside to near 1.1195 on Wednesday during the Asian trading hours. The weakening of the Greenback amid rising speculation of a jumbo rate cut from the US Federal Reserve (Fed) in November provides some support to the major pair. France’s Consumer Confidence and US New Home Sales data are due on Wednesday. Also, Fed Governor Adriana Kugler is set to speak.
The bigger-than-expected cut in interest rates by the Fed drags the US Dollar (USD) lower broadly. The US central bank cut its benchmark Federal Funds Rate by half a percentage point to the 4.75% to 5% range “in light of the progress on inflation and the balance of risks.” Investors raise their bets that the Fed will cut further rate in November. According to the CME FedWatch Tool, the markets have priced in nearly 56% possibility of a second 50 bps rate cut in the November meeting, while the odds of 25 bps stands at 44%.
The improved risk appetite is likely to support the shared currency for the time being. However, the expectation of another interest-rate cut by the European Central Bank (ECB) or any signs of weakness in the Eurozone economy could cap the upside for the Euro (EUR) against the USD. The ECB governing council member Klaas Knot said on Tuesday that the central bank would continue to reduce the interest rates at least through the first half of 2025, to a level between 2% and 3%. Meanwhile, ECB policymaker Madis Muller noted another interest-rate cut next month cannot be ruled out, but reckons policymakers may lack sufficient data to make definitive judgments on the region’s struggling economy.
Euro FAQs
The Euro is the currency for the 20 European Union countries that belong to the Eurozone. It is the second most heavily traded currency in the world behind the US Dollar. In 2022, it accounted for 31% of all foreign exchange transactions, with an average daily turnover of over $2.2 trillion a day. EUR/USD is the most heavily traded currency pair in the world, accounting for an estimated 30% off all transactions, followed by EUR/JPY (4%), EUR/GBP (3%) and EUR/AUD (2%).
The European Central Bank (ECB) in Frankfurt, Germany, is the reserve bank for the Eurozone. The ECB sets interest rates and manages monetary policy. The ECB’s primary mandate is to maintain price stability, which means either controlling inflation or stimulating growth. Its primary tool is the raising or lowering of interest rates. Relatively high interest rates – or the expectation of higher rates – will usually benefit the Euro and vice versa. The ECB Governing Council makes monetary policy decisions at meetings held eight times a year. Decisions are made by heads of the Eurozone national banks and six permanent members, including the President of the ECB, Christine Lagarde.
Eurozone inflation data, measured by the Harmonized Index of Consumer Prices (HICP), is an important econometric for the Euro. If inflation rises more than expected, especially if above the ECB’s 2% target, it obliges the ECB to raise interest rates to bring it back under control. Relatively high interest rates compared to its counterparts will usually benefit the Euro, as it makes the region more attractive as a place for global investors to park their money.
Data releases gauge the health of the economy and can impact on the Euro. Indicators such as GDP, Manufacturing and Services PMIs, employment, and consumer sentiment surveys can all influence the direction of the single currency. A strong economy is good for the Euro. Not only does it attract more foreign investment but it may encourage the ECB to put up interest rates, which will directly strengthen the Euro. Otherwise, if economic data is weak, the Euro is likely to fall. Economic data for the four largest economies in the euro area (Germany, France, Italy and Spain) are especially significant, as they account for 75% of the Eurozone’s economy.
Another significant data release for the Euro is the Trade Balance. This indicator measures the difference between what a country earns from its exports and what it spends on imports over a given period. If a country produces highly sought after exports then its currency will gain in value purely from the extra demand created from foreign buyers seeking to purchase these goods. Therefore, a positive net Trade Balance strengthens a currency and vice versa for a negative balance.
- GBP/USD scales higher for the fifth straight day and climbs to a fresh 20-month peak.
- A combination of factors continues to weigh on the USD and lends support to the pair.
- The BoE’s relatively hawkish stance underpins the GBP and contributes to the move up.
The GBP/USD pair builds on its recent gains registered over the past two weeks and advances to its highest level since March 2022, around the 1.3430 region during the Asian session on Wednesday. Meanwhile, the fundamental backdrop suggests that the path of least resistance for spot prices is to the upside, though slightly overbought conditions on the daily chart warrant some caution for bullish traders.
The British Pound (GBP) continues to draw support from expectations that the Bank of England's (BoE) rate-cutting cycle is more likely to be slower than in the United States (US). In fact, BoE Governor Andrew Bailey said on Tuesday that the path for interest rates will be downwards, though the progress in this direction will be slow and unlikely to fall back to ultra-low levels without very big shocks. In contrast, the markets have been pricing in a more aggressive policy easing by the Federal Reserve (Fed), which keeps the US Dollar (USD) depressed near the YTD low and acts as a tailwind for the GBP/USD pair.
According to the CME Group's FedWatch Tool, the markets are currently pricing in over a 75% chance that the Federal Reserve will cut interest rates by another 50 basis points in November. Adding to this, Tuesday's weaker US macro data, along with the prevalent risk-on environment, continues to undermine the safe-haven buck and validates the near-term positive outlook for the GBP/USD pair. That said, the Relative Strength Index (RSI) on the daily chart has climbed beyond the 70 mark, making it prudent to wait for some near-term consolidation or a modest pullback and positioning for any further appreciating move.
Moving ahead, there isn't any relevant market-moving economic data due for release from the UK on Wednesday. That said, a scheduled speech by the BoE MPC Member Megan Greene might influence the GBP and provide some impetus to the GBP/USD pair. Later during the early North American session, New Home Sales data from the US might contribute to producing short-term trading opportunities. Traders, however, might refrain from placing aggressive bets ahead of speeches by influential FOMC members this week, including the Fed Chair Jerome Powell on Thursday, and the US PCE Price Index on Friday.
BoE FAQs
The Bank of England (BoE) decides monetary policy for the United Kingdom. Its primary goal is to achieve ‘price stability’, or a steady inflation rate of 2%. Its tool for achieving this is via the adjustment of base lending rates. The BoE sets the rate at which it lends to commercial banks and banks lend to each other, determining the level of interest rates in the economy overall. This also impacts the value of the Pound Sterling (GBP).
When inflation is above the Bank of England’s target it responds by raising interest rates, making it more expensive for people and businesses to access credit. This is positive for the Pound Sterling because higher interest rates make the UK a more attractive place for global investors to park their money. When inflation falls below target, it is a sign economic growth is slowing, and the BoE will consider lowering interest rates to cheapen credit in the hope businesses will borrow to invest in growth-generating projects – a negative for the Pound Sterling.
In extreme situations, the Bank of England can enact a policy called Quantitative Easing (QE). QE is the process by which the BoE substantially increases the flow of credit in a stuck financial system. QE is a last resort policy when lowering interest rates will not achieve the necessary result. The process of QE involves the BoE printing money to buy assets – usually government or AAA-rated corporate bonds – from banks and other financial institutions. QE usually results in a weaker Pound Sterling.
Quantitative tightening (QT) is the reverse of QE, enacted when the economy is strengthening and inflation starts rising. Whilst in QE the Bank of England (BoE) purchases government and corporate bonds from financial institutions to encourage them to lend; in QT, the BoE stops buying more bonds, and stops reinvesting the principal maturing on the bonds it already holds. It is usually positive for the Pound Sterling.
- The Japanese Yen receives downward pressure as traders assess BoJ's policy outlook.
- BoJ Ueda indicated to evaluate market and economic conditions before making any policy adjustments, signaling no urgency for rate hikes.
- The US Dollar faces challenges due to rising dovish sentiment surrounding the Fed’s policy outlook.
The Japanese Yen (JPY) inches lower against the US Dollar (USD) on Wednesday as investors assess the Bank of Japan's (BoJ) monetary policy outlook. On Tuesday, BoJ Governor Kazuo Ueda indicated that the central bank has time to evaluate market and economic conditions before making any policy adjustments, signaling that there is no urgency to raise interest rates again.
BoJ Governor Kazuo Ueda also noted that Japan's real interest rate remains deeply negative, which is helping to stimulate the economy and drive up prices. Additionally, Finance Minister Shunichi Suzuki expressed his expectation that the Bank of Japan will take appropriate monetary policy actions while continuing to coordinate closely with the government.
Traders are now focused on the release of the BoJ Monetary Policy Meeting Minutes on Thursday, followed by Tokyo’s inflation data on Friday, to provide further guidance on the economic outlook and potential monetary policy moves.
The USD/JPY pair received downward pressure as the US Dollar struggled following weaker consumer confidence data from the United States (US) released on Tuesday, which added to dovish expectations for the Federal Reserve (Fed) for its upcoming monetary policy decision.
Daily Digest Market Movers: Japanese Yen remains subdued amid confusion over BoJ policy outlook
- Federal Reserve Governor Michelle Bowman stated on Tuesday that key inflation indicators are still "uncomfortably above" the 2% target, urging caution as the Fed moves forward with interest rate cuts. Despite this, she expressed a preference for a more conventional approach, advocating for a quarter percentage point reduction.
- US Consumer Confidence Index fell to 98.7 in September from a revised 105.6 in August. This figure registered the biggest decline since August 2021.
- The Jibun Bank Japan Composite Purchasing Managers Index (PMI) declined to 52.5 in September, down from a final reading of 52.9 in August, which was the highest in 15 months. Despite this decrease, it marks the eighth consecutive month of growth in private sector activity this year, primarily driven by the service sector. The Services PMI increased to 53.9 in September, up from a final 53.7 in the previous month.
- The S&P Global US Composite PMI grew at a slower rate in September, registering 54.4 compared to 54.6 in August. The Manufacturing PMI unexpectedly dropped to 47.0, indicating contraction, while the Services PMI expanded more than anticipated, reaching 55.4.
- Minneapolis Fed President Neel Kashkari said on Monday that he believes there should be and will be additional interest rate cuts in 2024. However, Kashkari expects future cuts to be smaller than the one from the September meeting, per Reuters.
- Chicago Fed President Austan Goolsbee noted, “Many more rate cuts are likely needed over the next year, rates need to come down significantly.” Additionally, Atlanta Fed President Raphael Bostic said Monday that the US economy is close to normal rates of inflation and unemployment and the central bank needs monetary policy to "normalize" as well, per Reuters.
- On Monday, Japan's new "top currency diplomat," Atsushi Mimura, stated in an interview with NHK that the Yen carry trades accumulated in the past have likely been mostly unwound. Mimura cautioned that if such trades were to increase again, it could lead to heightened market volatility. "We are always monitoring the markets to ensure that does not happen," he added.
Technical Analysis: USD/JPY remains near 143.50; aligns with the upper boundary of a descending channel
USD/JPY trades around 143.40 on Wednesday. Analysis of the daily chart shows that the pair is moving within a descending channel, indicating a bearish bias. Additionally, the 14-day Relative Strength Index (RSI) is slightly below the 50 level, confirming the bearish sentiment is in play.
On the downside, the USD/JPY pair is currently testing the nine-day EMA at the 143.03 level. A break below this support could prompt the pair to target the 139.58 region, the lowest point since June 2023.
The USD/JPY pair may test the immediate barrier at the upper boundary of the descending channel, around the 144.10 level. A breakout above this resistance could allow the USD/JPY pair to challenge the psychological barrier of 145.00.
USD/JPY: Daily Chart
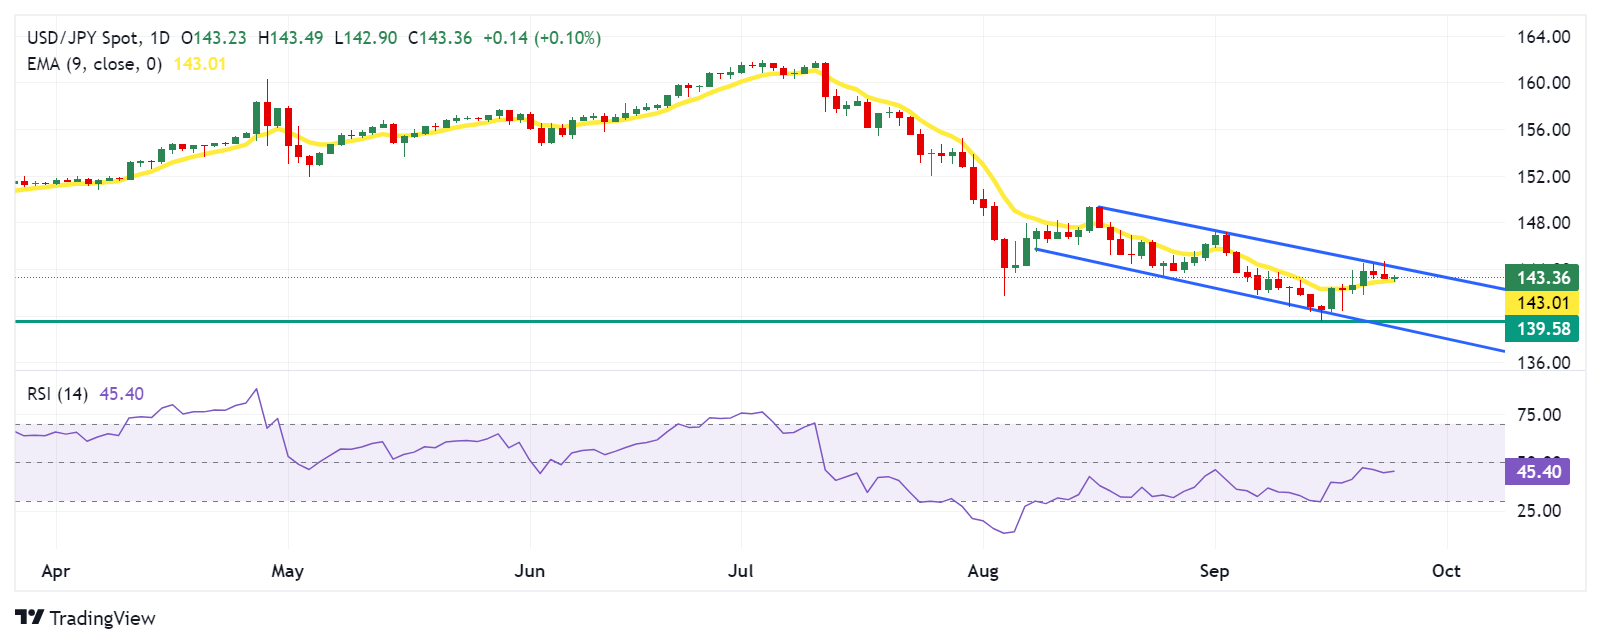
Japanese Yen PRICE Today
The table below shows the percentage change of Japanese Yen (JPY) against listed major currencies today. Japanese Yen was the weakest against the Euro.
| USD | EUR | GBP | JPY | CAD | AUD | NZD | CHF | |
|---|---|---|---|---|---|---|---|---|
| USD | -0.15% | -0.06% | 0.07% | -0.01% | 0.07% | 0.08% | -0.15% | |
| EUR | 0.15% | 0.10% | 0.22% | 0.15% | 0.23% | 0.26% | -0.00% | |
| GBP | 0.06% | -0.10% | 0.10% | 0.04% | 0.12% | 0.11% | -0.09% | |
| JPY | -0.07% | -0.22% | -0.10% | -0.07% | 0.01% | 0.02% | -0.21% | |
| CAD | 0.01% | -0.15% | -0.04% | 0.07% | 0.09% | 0.10% | -0.14% | |
| AUD | -0.07% | -0.23% | -0.12% | -0.01% | -0.09% | 0.03% | -0.22% | |
| NZD | -0.08% | -0.26% | -0.11% | -0.02% | -0.10% | -0.03% | -0.25% | |
| CHF | 0.15% | 0.00% | 0.09% | 0.21% | 0.14% | 0.22% | 0.25% |
The heat map shows percentage changes of major currencies against each other. The base currency is picked from the left column, while the quote currency is picked from the top row. For example, if you pick the Japanese Yen from the left column and move along the horizontal line to the US Dollar, the percentage change displayed in the box will represent JPY (base)/USD (quote).
Japanese Yen FAQs
The Japanese Yen (JPY) is one of the world’s most traded currencies. Its value is broadly determined by the performance of the Japanese economy, but more specifically by the Bank of Japan’s policy, the differential between Japanese and US bond yields, or risk sentiment among traders, among other factors.
One of the Bank of Japan’s mandates is currency control, so its moves are key for the Yen. The BoJ has directly intervened in currency markets sometimes, generally to lower the value of the Yen, although it refrains from doing it often due to political concerns of its main trading partners. The current BoJ ultra-loose monetary policy, based on massive stimulus to the economy, has caused the Yen to depreciate against its main currency peers. This process has exacerbated more recently due to an increasing policy divergence between the Bank of Japan and other main central banks, which have opted to increase interest rates sharply to fight decades-high levels of inflation.
The BoJ’s stance of sticking to ultra-loose monetary policy has led to a widening policy divergence with other central banks, particularly with the US Federal Reserve. This supports a widening of the differential between the 10-year US and Japanese bonds, which favors the US Dollar against the Japanese Yen.
The Japanese Yen is often seen as a safe-haven investment. This means that in times of market stress, investors are more likely to put their money in the Japanese currency due to its supposed reliability and stability. Turbulent times are likely to strengthen the Yen’s value against other currencies seen as more risky to invest in.
- Silver consolidates near a multi-month peak touched earlier this Wednesday.
- The technical setup favors bulls and supports prospects for additional gains.
- Any corrective slide could be seen as a buying opportunity and remain limited.
Silver (XAG/USD) enters a bullish consolidation phase after touching a four-month top during the Asian session on Wednesday and currently trades around the $32.10-$32.15 region, nearly unchanged for the day. The technical setup, meanwhile, supports prospects for an extension of the recent uptrend witnessed over the past two weeks or so.
The recent breakout through a short-term descending trend-line resistance and the overnight strong move up beyond the $31.50 supply zone was seen as a fresh trigger for bullish traders. Moreover, oscillators on the daily chart are holding comfortably in positive territory and are still away from being in the overbought zone. This, in turn, suggests that the path of least resistance for the XAG/USD is to the upside.
From current levels, any subsequent move up is likely to confront resistance near mid-$32.00s, or a one-decade top touched in May. Some follow-through buying will reaffirm the near-term positive outlook and pave the way for a further appreciating move towards conquering the $33.00 round-figure mark for the first time since December 2012.
On the flip side, any meaningful slide could be seen as a buying opportunity near the $31.50-$31.40 region. This is followed by support near the $31.25 area and the $31.00 mark, which if broken could drag the white metal to the $30.60-$30.55 zone. The XAG/USD could extend the slide to the $30.00 psychological mark en route to the $29.70-$29.65 area, or the descending trend-line resistance breakpoint, now turned support.
The latter now coincides with the 100-day Simple Moving Average (SMA) and should act as a key pivotal point. A convincing break below the said confluence support will suggest that the XAG/USD has topped out in the near term and prompt aggressive technical selling, paving the way for a deeper corrective decline.
Silver daily chart
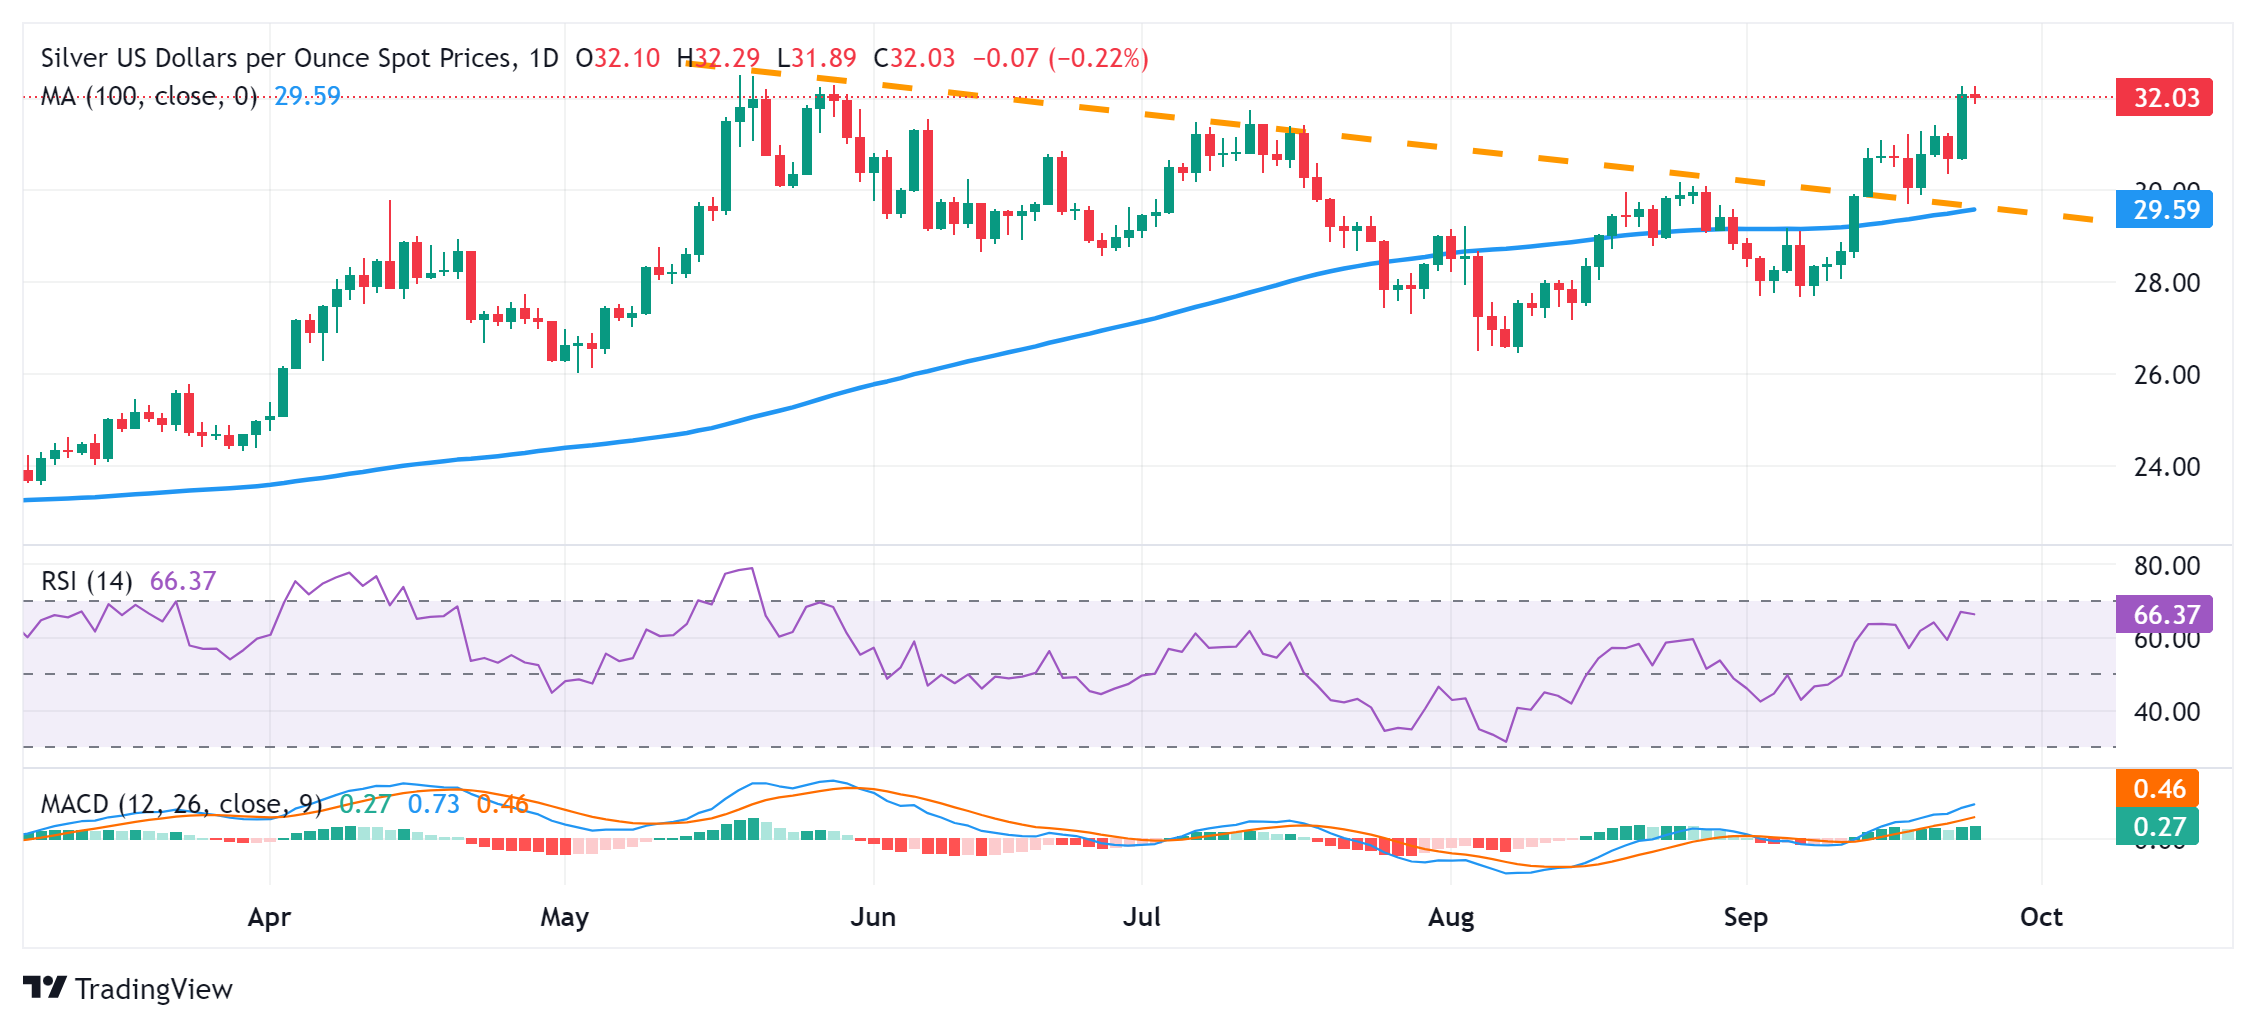
Silver FAQs
Silver is a precious metal highly traded among investors. It has been historically used as a store of value and a medium of exchange. Although less popular than Gold, traders may turn to Silver to diversify their investment portfolio, for its intrinsic value or as a potential hedge during high-inflation periods. Investors can buy physical Silver, in coins or in bars, or trade it through vehicles such as Exchange Traded Funds, which track its price on international markets.
Silver prices can move due to a wide range of factors. Geopolitical instability or fears of a deep recession can make Silver price escalate due to its safe-haven status, although to a lesser extent than Gold's. As a yieldless asset, Silver tends to rise with lower interest rates. Its moves also depend on how the US Dollar (USD) behaves as the asset is priced in dollars (XAG/USD). A strong Dollar tends to keep the price of Silver at bay, whereas a weaker Dollar is likely to propel prices up. Other factors such as investment demand, mining supply – Silver is much more abundant than Gold – and recycling rates can also affect prices.
Silver is widely used in industry, particularly in sectors such as electronics or solar energy, as it has one of the highest electric conductivity of all metals – more than Copper and Gold. A surge in demand can increase prices, while a decline tends to lower them. Dynamics in the US, Chinese and Indian economies can also contribute to price swings: for the US and particularly China, their big industrial sectors use Silver in various processes; in India, consumers’ demand for the precious metal for jewellery also plays a key role in setting prices.
Silver prices tend to follow Gold's moves. When Gold prices rise, Silver typically follows suit, as their status as safe-haven assets is similar. The Gold/Silver ratio, which shows the number of ounces of Silver needed to equal the value of one ounce of Gold, may help to determine the relative valuation between both metals. Some investors may consider a high ratio as an indicator that Silver is undervalued, or Gold is overvalued. On the contrary, a low ratio might suggest that Gold is undervalued relative to Silver.
- NZD/USD has marked a nine-month high of 0.6355 on Wednesday.
- The New Zealand Dollar gains ground as the largest export partner China has injected fresh monetary stimulus.
- The US Dollar struggles following a weaker consumer confidence data adding to dovish sentiment surrounding the Fed.
NZD/USD extends its gains for the third successive session, trading around 0.6340 during the Asian hours on Wednesday. The pair marked a nine-month high of 0.6355 earlier in the day. The upside of the New Zealand Dollar (NZD) could be attributed to a stronger outlook for foreign currency inflows amid fresh monetary stimulus by New Zealand’s largest export partner China.
People's Bank of China (PBOC) Governor Pan Gongsheng announced on Tuesday that China will reduce the reserve requirement ratio (RRR) by 50 basis points (bps). Gongsheng also noted that the central bank would lower the 7-day repo rate from 1.7% to 1.5%, and reduce the down payment for second homes from 25% to 15%. Additionally, the PBOC cut the one-year Medium-term Lending Facility (MLF) rate from 2.30% to 2.0% on Thursday, following the last reduction in July 2024, when the rate was lowered from 2.50%.
Additionally, the Kiwi Dollar receives support from the stronger purchasing power of neighboring Australians after a hawkish hold by the Reserve Bank of Australia (RBA) lifted the Australian Dollar (AUD). The RBA held the Official Cash Rate (OCR) steady at 4.35% on Tuesday. RBA Governor Michele Bullock also confirmed that rates will remain on hold for now and clarified that a rate hike was not explicitly considered during the meeting.
The US Dollar (USD) received downward pressure following softer-than-expected consumer confidence data from the United States (US) released on Tuesday, which added to dovish expectations for the Federal Reserve (Fed) for its further policy decision. US Consumer Confidence Index fell to 98.7 in September from an upwardly revised 105.6 in August. This figure registered the biggest decline since August 2021.
On Tuesday, Federal Reserve Governor Michelle Bowman stated that key inflation indicators are still "uncomfortably above" the 2% target, urging caution as the Fed moves forward with interest rate cuts. Despite this, she expressed a preference for a more conventional approach, advocating for a quarter percentage point reduction.
New Zealand Dollar FAQs
The New Zealand Dollar (NZD), also known as the Kiwi, is a well-known traded currency among investors. Its value is broadly determined by the health of the New Zealand economy and the country’s central bank policy. Still, there are some unique particularities that also can make NZD move. The performance of the Chinese economy tends to move the Kiwi because China is New Zealand’s biggest trading partner. Bad news for the Chinese economy likely means less New Zealand exports to the country, hitting the economy and thus its currency. Another factor moving NZD is dairy prices as the dairy industry is New Zealand’s main export. High dairy prices boost export income, contributing positively to the economy and thus to the NZD.
The Reserve Bank of New Zealand (RBNZ) aims to achieve and maintain an inflation rate between 1% and 3% over the medium term, with a focus to keep it near the 2% mid-point. To this end, the bank sets an appropriate level of interest rates. When inflation is too high, the RBNZ will increase interest rates to cool the economy, but the move will also make bond yields higher, increasing investors’ appeal to invest in the country and thus boosting NZD. On the contrary, lower interest rates tend to weaken NZD. The so-called rate differential, or how rates in New Zealand are or are expected to be compared to the ones set by the US Federal Reserve, can also play a key role in moving the NZD/USD pair.
Macroeconomic data releases in New Zealand are key to assess the state of the economy and can impact the New Zealand Dollar’s (NZD) valuation. A strong economy, based on high economic growth, low unemployment and high confidence is good for NZD. High economic growth attracts foreign investment and may encourage the Reserve Bank of New Zealand to increase interest rates, if this economic strength comes together with elevated inflation. Conversely, if economic data is weak, NZD is likely to depreciate.
The New Zealand Dollar (NZD) tends to strengthen during risk-on periods, or when investors perceive that broader market risks are low and are optimistic about growth. This tends to lead to a more favorable outlook for commodities and so-called ‘commodity currencies’ such as the Kiwi. Conversely, NZD tends to weaken at times of market turbulence or economic uncertainty as investors tend to sell higher-risk assets and flee to the more-stable safe havens.
- AUD/JPY attracts some follow-through buyers and reacts little to Australian inflation figures.
- The headline CPI eased to 2.7% YoY in August, while the core CPI remains above the RBA’s target.
- Bets for another BoJ rate hike in 2024 to limit the JPY losses and keep a lid on the currency pair.
The AUD/JPY cross trades with a positive bias during the Asian session on Wednesday and is currently placed just below the 99.00 mark, or over a three-week top touched the previous day. The mixed fundamental backdrop, meanwhile, warrants some caution for bullish traders and before positioning for an extension of the recent upward trajectory witnessed over the past two weeks or so.
Against the backdrop of bets for a more aggressive policy easing by the Federal Reserve (Fed), China's new stimulus measures to support the faltering economy boost investors' appetite for riskier assets. This is evident from the prevalent upbeat mood across the global equity markets, which is seen undermining the safe-haven Japanese Yen (JPY) and benefiting the risk-sensitive Aussie. Apart from this, the Reserve Bank of Australia's (RBA) hawkish stance acts as a tailwind for the AUD/JPY cross.
The Australian central bank reiterated on Tuesday that policy will need to be restrictive until confidence returns that inflation is moving sustainably towards the target range. Adding to this, RBA Governor Michele Bullock stated that the recent data has not significantly influenced the policy outlook. That said, official data released earlier today showed that Australian Consumer Price Inflation (CPI) dropped in August, to its lowest level since early 2022 due to state government rebates.
In fact, the Australian Bureau of Statistics reported that the headline CPI rose at an annual pace of 2.7% in August, down sharply from 3.5% in July. Meanwhile, core CPI decelerated to the 3.4% YoY rate from 3.8%, though remains above the RBA's 2-3% target band and is not enough to justify rate cuts in the near term. However, expectations that the Bank of Japan (BoJ) will hike interest rates again by the end of this year limit the JPY losses and should cap any further gains for the AUD/JPY cross.
Investors now look forward to the release of BoJ meeting minutes on Thursday, which, along with the broader risk sentiment, will drive the JPY demand and provide a fresh impetus to the AUD/JPY cross. From a technical perspective, a sustained move above the 50-day Simple Moving Average (SMA) could be seen as a fresh trigger for bullish traders. That said, any subsequent move up is likely to remain capped near the 100.00 psychological mark, representing the 200-day SMA.
Economic Indicator
Monthly Consumer Price Index (YoY)
The Monthly Consumer Price Index (CPI), released by the Australian Bureau of Statistics on a monthly basis, measures the changes in the price of a fixed basket of goods and services acquired by household consumers. The indicator was developed to provide inflation data at a higher frequency than the quarterly CPI. The YoY reading compares prices in the reference month to the same month a year earlier. A high reading is seen as bullish for the Australian Dollar (AUD), while a low reading is seen as bearish.
Read more.Last release: Wed Sep 25, 2024 01:30
Frequency: Monthly
Actual: 2.7%
Consensus: 2.8%
Previous: 3.5%
Source: Australian Bureau of Statistics
- Indian Rupee gathers strength in Wednesday’s Asian session.
- Improved risk appetite and a weakening USD support the INR.
- Investors await the US August New Home Sales and Fed’s Kugler speech on Wednesday.
The Indian Rupee (INR) edges higher on Wednesday. Improved risk appetite following China’s stimulus measures and the softer US Dollar (USD) boost the local currency on the day. Nonetheless, rising crude oil prices, outflows related to a rejig of the FTSE equity indexes and renewed USD demand from large Indian importers might exert some selling pressure on the INR.
The US New Home Sales data for August is due on Wednesday. Traders will take more cues from the US Federal Reserve’s (Fed) Governor Adriana Kugler speech. Any dovish remarks from the Fed officials are likely to weigh on the Greenback against the Indian Rupee. The highlight for this week will be the US August Personal Consumption Expenditures (PCE) Price Index data, which will be published on Friday.
Daily Digest Market Movers: Indian Rupee remains firmer amid a global risk-on mood
- S&P Global Ratings on Tuesday retained India's Gross Domestic Product (GDP) growth forecast at 6.8% while noting that the Reserve Bank of India (RBI) may cut interest rates in October.
- "We expect the rupee to trade with a positive bias amid improved global risk appetite following China's stimulus and softness in the dollar. However, elevated crude oil and other commodity prices may cap sharp upside," noted Anuj Choudhary, Research Analyst at Sharekhan by BNP Paribas.
- The Conference Board’s US Consumer Confidence Index dropped to 98.7 in September from a revised 105.6 in August. This figure registered the biggest decline since August 2021.
- Fed Governor Michelle Bowman said on Tuesday that key measures of inflation remain "uncomfortably above" the 2% target, warranting caution as the Fed proceeds with cutting interest rates. However, she preferred the Fed to lower by a quarter percentage point, more in line with the traditional moves at the central bank.
- The markets have priced in nearly 56% odds of a second 50 bps rate cut in the November meeting, while the chance of 25 bps stands at 44%, according to the CME FedWatch Tool.
Technical Analysis: USD/INR’s negative bias remains unchanged in the longer term
The Indian Rupee trades on a stronger note on the day. The negative outlook of the USD/INR pair prevails as the price remains capped under the key 100-day Exponential Moving Average (EMA) on the daily chart. The downward momentum is supported by the 14-day Relative Strength Index (RSI), which stands below the midline near 36.00.
The first downside target for the pair emerges at 83.44, the low of September 23. A breach of this level will see a drop to the crucial support level at 83.00, representing the psychological level and the low of May 24.
Sustained trading above the 100-day EMA at 83.62 could pave the way to the support-turned-resistance level at 83.75. The key barrier for USD/INR is located at the 84.00 round mark.

Indian Rupee FAQs
The Indian Rupee (INR) is one of the most sensitive currencies to external factors. The price of Crude Oil (the country is highly dependent on imported Oil), the value of the US Dollar – most trade is conducted in USD – and the level of foreign investment, are all influential. Direct intervention by the Reserve Bank of India (RBI) in FX markets to keep the exchange rate stable, as well as the level of interest rates set by the RBI, are further major influencing factors on the Rupee.
The Reserve Bank of India (RBI) actively intervenes in forex markets to maintain a stable exchange rate, to help facilitate trade. In addition, the RBI tries to maintain the inflation rate at its 4% target by adjusting interest rates. Higher interest rates usually strengthen the Rupee. This is due to the role of the ‘carry trade’ in which investors borrow in countries with lower interest rates so as to place their money in countries’ offering relatively higher interest rates and profit from the difference.
Macroeconomic factors that influence the value of the Rupee include inflation, interest rates, the economic growth rate (GDP), the balance of trade, and inflows from foreign investment. A higher growth rate can lead to more overseas investment, pushing up demand for the Rupee. A less negative balance of trade will eventually lead to a stronger Rupee. Higher interest rates, especially real rates (interest rates less inflation) are also positive for the Rupee. A risk-on environment can lead to greater inflows of Foreign Direct and Indirect Investment (FDI and FII), which also benefit the Rupee.
Higher inflation, particularly, if it is comparatively higher than India’s peers, is generally negative for the currency as it reflects devaluation through oversupply. Inflation also increases the cost of exports, leading to more Rupees being sold to purchase foreign imports, which is Rupee-negative. At the same time, higher inflation usually leads to the Reserve Bank of India (RBI) raising interest rates and this can be positive for the Rupee, due to increased demand from international investors. The opposite effect is true of lower inflation.
| Raw materials | Closed | Change, % |
|---|---|---|
| Silver | 32.105 | 4.6 |
| Gold | 265.702 | 1.14 |
| Palladium | 1061.4 | 2.11 |
- The Australian Dollar may regain its ground due to a hawkish sentiment surrounding the RBA.
- Australia’s Monthly Consumer Price Index increased 2.7% YoY in August, falling short of expected 2.8% rise and previous 3.5% rise.
- Fed’s Bowman urged caution regarding central bank rate cuts, citing inflation indicators above the 2% target.
The Australian Dollar (AUD) gave up its intraday gains against the US Dollar (USD) after a weaker-than-expected Monthly Consumer Price Index report on Monday. However, the commodity-linked Aussie found support as China, its largest trading partner, announced a new round of stimulus measures.
The Reserve Bank of Australia (RBA) held the Official Cash Rate (OCR) steady at 4.35% on Tuesday, offering support to the Australian Dollar and bolstering the AUD/USD pair. During the press conference following the policy decision, RBA Governor Michele Bullock confirmed that rates will remain on hold for now and clarified that a rate hike was not explicitly considered during the meeting.
People's Bank of China (PBOC) Governor Pan Gongsheng announced on Tuesday that China will reduce the reserve requirement ratio (RRR) by 50 basis points (bps). Gongsheng also noted that the central bank would lower the 7-day repo rate from 1.7% to 1.5%, and reduce the down payment for second homes from 25% to 15%. Additionally, the PBOC cut the one-year Medium-term Lending Facility (MLF) rate from 2.30% to 2.0% on Thursday, following the last reduction in July 2024, when the rate was lowered from 2.50%.
Daily Digest Market Movers: Australian Dollar remains solid due to a hawkish RBA
- Australia’s Monthly Consumer Price Index rose 2.7% year-over-year in August, down from the previous 3.5% rise and expected 2.8% increase.
- Federal Reserve Governor Michelle Bowman stated on Tuesday that key inflation indicators are still "uncomfortably above" the 2% target, urging caution as the Fed moves forward with interest rate cuts. Despite this, she expressed a preference for a more conventional approach, advocating for a quarter percentage point reduction.
- US Consumer Confidence Index fell to 98.7 in September from a revised 105.6 in August. This figure registered the biggest decline since August 2021.
- The ANZ-Roy Morgan Australia Consumer Confidence Index rose by 0.8 points to 84.9 this week. Despite this increase, Consumer Confidence has now remained below the 85.0 mark for 86 consecutive weeks. On a year-over-year basis, the index is up by 8.5 points from 76.4.
- The S&P Global US Composite Purchasing Managers Index (PMI) grew at a slower rate in September, registering 54.4 compared to 54.6 in August. The Manufacturing PMI unexpectedly dropped to 47.0, indicating contraction, while the Services PMI expanded more than anticipated, reaching 55.4.
- Chicago Fed President Austan Goolsbee noted, “Many more rate cuts are likely needed over the next year, rates need to come down significantly.” Additionally, Atlanta Fed President Raphael Bostic said Monday that the US economy is close to normal rates of inflation and unemployment and the central bank needs monetary policy to "normalize" as well, per Reuters.
- Australia’s Judo Bank Composite PMI declined to 49.8 in September from 51.7 in August, indicating a contraction in business activity as slower growth in the services sector was unable to counterbalance a deeper slump in manufacturing output. The Services PMI fell to 50.6 in September from 52.5 previously, while the Manufacturing PMI decreased to 46.7 from 48.5 in August.
Technical Analysis: Australian Dollar rises to near 0.6900, upper boundary of the ascending channel
The AUD/USD pair trades near 0.6890 on Wednesday. Technical analysis of the daily chart indicates that the pair is moving upward within the ascending channel pattern, suggesting a bullish bias. Additionally, the 14-day Relative Strength Index (RSI) has advanced towards the 70 mark, suggesting upward gains remain probable but could face a consolidation soon.
In terms of resistance, the AUD/USD pair could test the upper boundary of the ascending channel, around the 0.6930 level, followed by the psychological level of 0.6950.
The AUD/USD pair could find support at the lower boundary of the ascending channel, which coincides with the nine-day Exponential Moving Average (EMA) at 0.6816. The next significant support is at the psychological level of 0.6700. A break below this level could push the pair further down toward its six-week low of 0.6622.
AUD/USD: Daily Chart
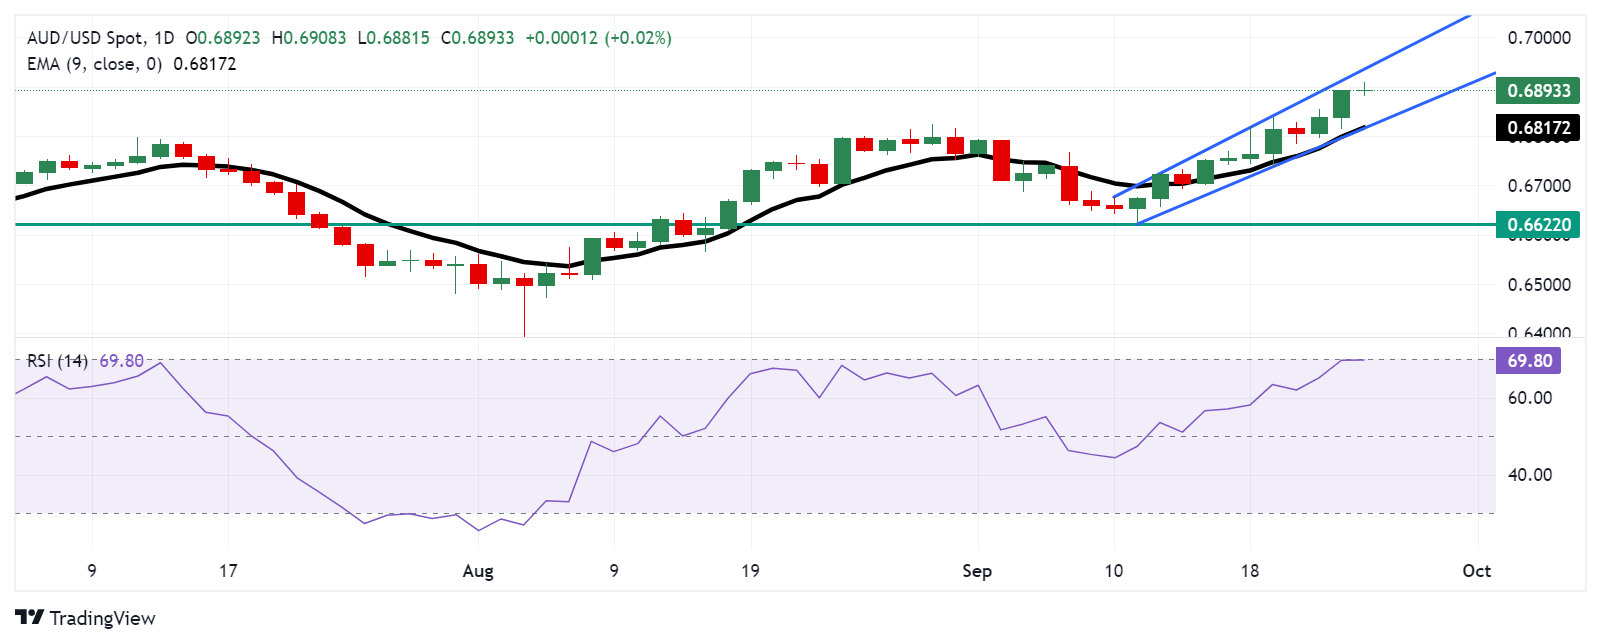
Australian Dollar PRICE Today
The table below shows the percentage change of Australian Dollar (AUD) against listed major currencies today. Australian Dollar was the strongest against the Japanese Yen.
| USD | EUR | GBP | JPY | CAD | AUD | NZD | CHF | |
|---|---|---|---|---|---|---|---|---|
| USD | -0.10% | -0.03% | 0.13% | -0.03% | 0.00% | -0.07% | -0.09% | |
| EUR | 0.10% | 0.07% | 0.21% | 0.07% | 0.09% | 0.05% | 0.00% | |
| GBP | 0.03% | -0.07% | 0.12% | -0.01% | 0.02% | -0.06% | -0.06% | |
| JPY | -0.13% | -0.21% | -0.12% | -0.16% | -0.12% | -0.19% | -0.20% | |
| CAD | 0.03% | -0.07% | 0.00% | 0.16% | 0.03% | -0.02% | -0.05% | |
| AUD | 0.00% | -0.09% | -0.02% | 0.12% | -0.03% | -0.05% | -0.07% | |
| NZD | 0.07% | -0.05% | 0.06% | 0.19% | 0.02% | 0.05% | -0.03% | |
| CHF | 0.09% | -0.00% | 0.06% | 0.20% | 0.05% | 0.07% | 0.03% |
The heat map shows percentage changes of major currencies against each other. The base currency is picked from the left column, while the quote currency is picked from the top row. For example, if you pick the Australian Dollar from the left column and move along the horizontal line to the US Dollar, the percentage change displayed in the box will represent AUD (base)/USD (quote).
Australian Dollar FAQs
One of the most significant factors for the Australian Dollar (AUD) is the level of interest rates set by the Reserve Bank of Australia (RBA). Because Australia is a resource-rich country another key driver is the price of its biggest export, Iron Ore. The health of the Chinese economy, its largest trading partner, is a factor, as well as inflation in Australia, its growth rate and Trade Balance. Market sentiment – whether investors are taking on more risky assets (risk-on) or seeking safe-havens (risk-off) – is also a factor, with risk-on positive for AUD.
The Reserve Bank of Australia (RBA) influences the Australian Dollar (AUD) by setting the level of interest rates that Australian banks can lend to each other. This influences the level of interest rates in the economy as a whole. The main goal of the RBA is to maintain a stable inflation rate of 2-3% by adjusting interest rates up or down. Relatively high interest rates compared to other major central banks support the AUD, and the opposite for relatively low. The RBA can also use quantitative easing and tightening to influence credit conditions, with the former AUD-negative and the latter AUD-positive.
China is Australia’s largest trading partner so the health of the Chinese economy is a major influence on the value of the Australian Dollar (AUD). When the Chinese economy is doing well it purchases more raw materials, goods and services from Australia, lifting demand for the AUD, and pushing up its value. The opposite is the case when the Chinese economy is not growing as fast as expected. Positive or negative surprises in Chinese growth data, therefore, often have a direct impact on the Australian Dollar and its pairs.
Iron Ore is Australia’s largest export, accounting for $118 billion a year according to data from 2021, with China as its primary destination. The price of Iron Ore, therefore, can be a driver of the Australian Dollar. Generally, if the price of Iron Ore rises, AUD also goes up, as aggregate demand for the currency increases. The opposite is the case if the price of Iron Ore falls. Higher Iron Ore prices also tend to result in a greater likelihood of a positive Trade Balance for Australia, which is also positive of the AUD.
The Trade Balance, which is the difference between what a country earns from its exports versus what it pays for its imports, is another factor that can influence the value of the Australian Dollar. If Australia produces highly sought after exports, then its currency will gain in value purely from the surplus demand created from foreign buyers seeking to purchase its exports versus what it spends to purchase imports. Therefore, a positive net Trade Balance strengthens the AUD, with the opposite effect if the Trade Balance is negative.
- Gold price is underpinned by dovish Fed expectations and geopolitical tensions.
- The upbeat market mood does little to dent the underlying strong bullish tone.
- Traders await speeches by Fed officials and the US PCE data for a fresh impetus.
Gold price (XAU/USD) rallied to the $2,664-2,665 region on Tuesday, hitting yet another record high amid rising bets for a more aggressive policy easing by the Federal Reserve (Fed) and escalating geopolitical tensions in the Middle East. Meanwhile, dovish Fed expectations, along with Tuesday's disappointing US macro data, keep the US Dollar (USD) depressed near the YTD low set last week. This, to a larger extent, overshadows the latest optimism led by China's new stimulus measures and acts as a tailwind for the non-yielding yellow metal.
Bulls, however, take a breather during the Asian session on Wednesday amid slightly overbought conditions on the daily chart. Furthermore, investors seem reluctant to place aggressive bets as more Fed officials are set to speak this week, including the Fed Chair Jerome Powell on Thursday. Also this week, the focus will be on the release of the US Personal Consumption Expenditure (PCE) Price Index on Friday, which might influence expectations about the Fed's rate-cut path and determine the next leg of a directional move for the Gold price.
Daily Digest Market Movers: Gold price holds ground near all-time peak amid bets for another 50 bps rate cut by the Fed
- According to the CME Group's FedWatch Tool, the markets are currently pricing in over a 75% chance that the Federal Reserve will cut interest rates by another 50 basis points in November.
- Adding to this, Tuesday's weaker US macro data weighed heavily on the US Dollar and dragged it back closer to the YTD low, lifting the non-yielding Gold price to a fresh all-time peak.
- The Conference Board's (CB) Consumer Confidence Index deteriorated in September and dropped to 98.7, from August's 105.6, while the Present Situation Index fell to 124.3 from 134.6.
- A survey from the Richmond Fed indicated that manufacturing activity remained sluggish and the composite manufacturing index declined to -21 in September from the previous -19.
- Israeli airstrikes in southern and eastern Lebanon on Monday, which killed over 500 people, raised the risk of a broader war in the Middle East and further boosted the safe-haven XAU/USD.
- The latest optimism led by China's new stimulus measures remains supportive of the risk-on rally, albeit does little to dent the strong bullish sentiment surrounding the precious metal.
- Speeches by Fed officials this week, including the Fed Chair Jerome Powell on Thursday, will be looked at for cues about the rate-cut path and provide a fresh impetus to the commodity.
- The focus, meanwhile, will remain glued to the release of the US Personal Consumption Expenditure (PCE) Price Index on Friday, which will drive the USD demand in the near term.
Technical Outlook: Gold price needs to consolidate before the next leg up, ascending channel acceleration in play
From a technical perspective, this week’s breakout through a short-term ascending channel and the subsequent move up supports prospects for additional gains. That said, the Relative Strength Index (RSI) on the daily chart has moved above the 70 mark, suggesting slightly overbought conditions. This, in turn, makes it prudent to wait for some near-term consolidating or a modest pullback before placing fresh bullish bets around the Gold price.
In the meantime, any corrective slide is more likely to attract some dip-buying and find decent support near the ascending channel resistance breakpoint, around the $2,625 region. This is followed by the $2,600 round figure, which if broken decisively might prompt some technical selling and drag the Gold price towards the $2,575 region en route to the $2,560 area and the $2,535-2,530 resistance-turned-support.
Gold FAQs
Gold has played a key role in human’s history as it has been widely used as a store of value and medium of exchange. Currently, apart from its shine and usage for jewelry, the precious metal is widely seen as a safe-haven asset, meaning that it is considered a good investment during turbulent times. Gold is also widely seen as a hedge against inflation and against depreciating currencies as it doesn’t rely on any specific issuer or government.
Central banks are the biggest Gold holders. In their aim to support their currencies in turbulent times, central banks tend to diversify their reserves and buy Gold to improve the perceived strength of the economy and the currency. High Gold reserves can be a source of trust for a country’s solvency. Central banks added 1,136 tonnes of Gold worth around $70 billion to their reserves in 2022, according to data from the World Gold Council. This is the highest yearly purchase since records began. Central banks from emerging economies such as China, India and Turkey are quickly increasing their Gold reserves.
Gold has an inverse correlation with the US Dollar and US Treasuries, which are both major reserve and safe-haven assets. When the Dollar depreciates, Gold tends to rise, enabling investors and central banks to diversify their assets in turbulent times. Gold is also inversely correlated with risk assets. A rally in the stock market tends to weaken Gold price, while sell-offs in riskier markets tend to favor the precious metal.
The price can move due to a wide range of factors. Geopolitical instability or fears of a deep recession can quickly make Gold price escalate due to its safe-haven status. As a yield-less asset, Gold tends to rise with lower interest rates, while higher cost of money usually weighs down on the yellow metal. Still, most moves depend on how the US Dollar (USD) behaves as the asset is priced in dollars (XAU/USD). A strong Dollar tends to keep the price of Gold controlled, whereas a weaker Dollar is likely to push Gold prices up.
Australia’s monthly Consumer Price Index (CPI) declined by 2.7% in the year to August, compared to a 3.5% increase seen in July, according to the data published by the Australian Bureau of Statistics (ABS) on Wednesday.
The market forecast was for 2.8% growth in the reported period.
Market reaction to the Australia’s monthly CPI inflation
At the time of writing, the AUD/USD pair is trading 0.09% lower on the day to trade at 0.6885.
Australian Dollar FAQs
One of the most significant factors for the Australian Dollar (AUD) is the level of interest rates set by the Reserve Bank of Australia (RBA). Because Australia is a resource-rich country another key driver is the price of its biggest export, Iron Ore. The health of the Chinese economy, its largest trading partner, is a factor, as well as inflation in Australia, its growth rate and Trade Balance. Market sentiment – whether investors are taking on more risky assets (risk-on) or seeking safe-havens (risk-off) – is also a factor, with risk-on positive for AUD.
The Reserve Bank of Australia (RBA) influences the Australian Dollar (AUD) by setting the level of interest rates that Australian banks can lend to each other. This influences the level of interest rates in the economy as a whole. The main goal of the RBA is to maintain a stable inflation rate of 2-3% by adjusting interest rates up or down. Relatively high interest rates compared to other major central banks support the AUD, and the opposite for relatively low. The RBA can also use quantitative easing and tightening to influence credit conditions, with the former AUD-negative and the latter AUD-positive.
China is Australia’s largest trading partner so the health of the Chinese economy is a major influence on the value of the Australian Dollar (AUD). When the Chinese economy is doing well it purchases more raw materials, goods and services from Australia, lifting demand for the AUD, and pushing up its value. The opposite is the case when the Chinese economy is not growing as fast as expected. Positive or negative surprises in Chinese growth data, therefore, often have a direct impact on the Australian Dollar and its pairs.
Iron Ore is Australia’s largest export, accounting for $118 billion a year according to data from 2021, with China as its primary destination. The price of Iron Ore, therefore, can be a driver of the Australian Dollar. Generally, if the price of Iron Ore rises, AUD also goes up, as aggregate demand for the currency increases. The opposite is the case if the price of Iron Ore falls. Higher Iron Ore prices also tend to result in a greater likelihood of a positive Trade Balance for Australia, which is also positive of the AUD.
The Trade Balance, which is the difference between what a country earns from its exports versus what it pays for its imports, is another factor that can influence the value of the Australian Dollar. If Australia produces highly sought after exports, then its currency will gain in value purely from the surplus demand created from foreign buyers seeking to purchase its exports versus what it spends to purchase imports. Therefore, a positive net Trade Balance strengthens the AUD, with the opposite effect if the Trade Balance is negative.
The People’s Bank of China (PBoC) set the USD/CNY central rate for the trading session ahead on Wednesday at 7.0202, as compared to the previous day's fix of 7.0510 and 7.0212 Reuters estimates.
The People's Bank of China (PBOC) cut the one-year Medium-term Lending Facility (MLF) rate from 2.30% to 2.0% on Thursday.
The one-year MLF was last cut in July 2024, from 2.50%.
On Tuesday, PBoC Governor Pan Gongsheng said during a press conference that China will cut the amount of the reserve requirement ratio (RRR) by 50 basis points (bps). Gongsheng added that the Chinese central bank would cut the 7-day repo rate to 1.5% from 1.7% and down payments for second homes will be cut to 15% from 25%.
Australian Dollar FAQs
One of the most significant factors for the Australian Dollar (AUD) is the level of interest rates set by the Reserve Bank of Australia (RBA). Because Australia is a resource-rich country another key driver is the price of its biggest export, Iron Ore. The health of the Chinese economy, its largest trading partner, is a factor, as well as inflation in Australia, its growth rate and Trade Balance. Market sentiment – whether investors are taking on more risky assets (risk-on) or seeking safe-havens (risk-off) – is also a factor, with risk-on positive for AUD.
The Reserve Bank of Australia (RBA) influences the Australian Dollar (AUD) by setting the level of interest rates that Australian banks can lend to each other. This influences the level of interest rates in the economy as a whole. The main goal of the RBA is to maintain a stable inflation rate of 2-3% by adjusting interest rates up or down. Relatively high interest rates compared to other major central banks support the AUD, and the opposite for relatively low. The RBA can also use quantitative easing and tightening to influence credit conditions, with the former AUD-negative and the latter AUD-positive.
China is Australia’s largest trading partner so the health of the Chinese economy is a major influence on the value of the Australian Dollar (AUD). When the Chinese economy is doing well it purchases more raw materials, goods and services from Australia, lifting demand for the AUD, and pushing up its value. The opposite is the case when the Chinese economy is not growing as fast as expected. Positive or negative surprises in Chinese growth data, therefore, often have a direct impact on the Australian Dollar and its pairs.
Iron Ore is Australia’s largest export, accounting for $118 billion a year according to data from 2021, with China as its primary destination. The price of Iron Ore, therefore, can be a driver of the Australian Dollar. Generally, if the price of Iron Ore rises, AUD also goes up, as aggregate demand for the currency increases. The opposite is the case if the price of Iron Ore falls. Higher Iron Ore prices also tend to result in a greater likelihood of a positive Trade Balance for Australia, which is also positive of the AUD.
The Trade Balance, which is the difference between what a country earns from its exports versus what it pays for its imports, is another factor that can influence the value of the Australian Dollar. If Australia produces highly sought after exports, then its currency will gain in value purely from the surplus demand created from foreign buyers seeking to purchase its exports versus what it spends to purchase imports. Therefore, a positive net Trade Balance strengthens the AUD, with the opposite effect if the Trade Balance is negative.
- USD/JPY flatlines around 143.20 in Wednesday’s early Asian session.
- Investors raise their bets on a jumbo rate cut from the US Fed in November.
- The BoJ Governor signals no rush to raise rates further.
The USD/JPY pair trades flat near 143.20 despite the weaker US Dollar (USD) during the early Asian session on Wednesday. However, the rising expectation of a jumbo rate cut by the US Federal Reserve (Fed) in November might continue to weigh on the pair.
Fed Governor Michelle Bowman said on Tuesday that key measures of inflation remain "uncomfortably above" the 2% target, warranting caution as the Fed proceeds with cutting interest rates. However, she preferred the Fed to lower by a quarter percentage point, more in line with the traditional moves at the central bank.
Fed Governor Adriana Kugler is set to speak later on Wednesday. The release of the US Personal Consumption Expenditures (PCE) Price Index for August will be in the spotlight on Friday. Any dovish comments from Fed officials and signs of softer inflation could undermine the USD against the Japanese Yen (JPY).
Data released by the Conference Board on Tuesday showed that the US Consumer Confidence Index fell to 98.7 in September from a revised 105.6 in August. This figure registered the biggest decline since August 2021.
On the other hand, the speculation that the Bank of Japan (BoJ) was in no rush to raise interest rates further might drag the JPY lower and cap the downside for USD/JPY. The BoJ Governor Kazuo Ueda said on Tuesday that the central bank can afford to spend time watching developments in financial markets and overseas economies as it sets monetary policy.
Japanese Yen FAQs
The Japanese Yen (JPY) is one of the world’s most traded currencies. Its value is broadly determined by the performance of the Japanese economy, but more specifically by the Bank of Japan’s policy, the differential between Japanese and US bond yields, or risk sentiment among traders, among other factors.
One of the Bank of Japan’s mandates is currency control, so its moves are key for the Yen. The BoJ has directly intervened in currency markets sometimes, generally to lower the value of the Yen, although it refrains from doing it often due to political concerns of its main trading partners. The current BoJ ultra-loose monetary policy, based on massive stimulus to the economy, has caused the Yen to depreciate against its main currency peers. This process has exacerbated more recently due to an increasing policy divergence between the Bank of Japan and other main central banks, which have opted to increase interest rates sharply to fight decades-high levels of inflation.
The BoJ’s stance of sticking to ultra-loose monetary policy has led to a widening policy divergence with other central banks, particularly with the US Federal Reserve. This supports a widening of the differential between the 10-year US and Japanese bonds, which favors the US Dollar against the Japanese Yen.
The Japanese Yen is often seen as a safe-haven investment. This means that in times of market stress, investors are more likely to put their money in the Japanese currency due to its supposed reliability and stability. Turbulent times are likely to strengthen the Yen’s value against other currencies seen as more risky to invest in.
| Index | Change, points | Closed | Change, % |
|---|---|---|---|
| NIKKEI 225 | 216.68 | 37940.59 | 0.57 |
| Hang Seng | 753.45 | 19000.56 | 4.13 |
| KOSPI | 29.67 | 2631.68 | 1.14 |
| ASX 200 | -10.9 | 8142 | -0.13 |
| DAX | 149.84 | 18996.63 | 0.8 |
| CAC 40 | 95.93 | 7604.01 | 1.28 |
| Dow Jones | 83.57 | 42208.22 | 0.2 |
| S&P 500 | 14.36 | 5732.93 | 0.25 |
| NASDAQ Composite | 100.25 | 18074.52 | 0.56 |
The European Central Bank (ECB) governing council member Klaas Knot said on Tuesday that the central bank is likely to continue to cut interest rates at least through the first half of 2025, to a level between 2% and 3%, per Reuters.
Key quotes
"I would expect us to continue to gradually reduce interest rates in the coming time, also in the first half of 2025.“
"I don't expect rates to return to the extremely low levels we saw before the pandemic. They will likely end up on a somewhat more natural level. I don't know where exactly, but somewhere starting with a 2.”
Market reaction
At the time of press, the EUR/USD pair was up 0.07% on the day at 1.1188.
ECB FAQs
The European Central Bank (ECB) in Frankfurt, Germany, is the reserve bank for the Eurozone. The ECB sets interest rates and manages monetary policy for the region. The ECB primary mandate is to maintain price stability, which means keeping inflation at around 2%. Its primary tool for achieving this is by raising or lowering interest rates. Relatively high interest rates will usually result in a stronger Euro and vice versa. The ECB Governing Council makes monetary policy decisions at meetings held eight times a year. Decisions are made by heads of the Eurozone national banks and six permanent members, including the President of the ECB, Christine Lagarde.
In extreme situations, the European Central Bank can enact a policy tool called Quantitative Easing. QE is the process by which the ECB prints Euros and uses them to buy assets – usually government or corporate bonds – from banks and other financial institutions. QE usually results in a weaker Euro. QE is a last resort when simply lowering interest rates is unlikely to achieve the objective of price stability. The ECB used it during the Great Financial Crisis in 2009-11, in 2015 when inflation remained stubbornly low, as well as during the covid pandemic.
Quantitative tightening (QT) is the reverse of QE. It is undertaken after QE when an economic recovery is underway and inflation starts rising. Whilst in QE the European Central Bank (ECB) purchases government and corporate bonds from financial institutions to provide them with liquidity, in QT the ECB stops buying more bonds, and stops reinvesting the principal maturing on the bonds it already holds. It is usually positive (or bullish) for the Euro.
| Pare | Closed | Change, % |
|---|---|---|
| AUDUSD | 0.68922 | 0.78 |
| EURJPY | 160.06 | 0.29 |
| EURUSD | 1.11777 | 0.58 |
| GBPJPY | 192.031 | 0.18 |
| GBPUSD | 1.34108 | 0.46 |
| NZDUSD | 0.63365 | 1.11 |
| USDCAD | 1.34318 | -0.73 |
| USDCHF | 0.84338 | -0.45 |
| USDJPY | 143.182 | -0.29 |
- WTI gains ground near $71.30 in Wednesday’s early Asian session, the highest since September 2.
- Chinese stimulus plan and continued fear over Middle Eastern tensions underpin the WTI price.
- US Crude oil inventories fell by 4.339 million barrels for the week ending September 20, according to the API.
West Texas Intermediate (WTI), the US crude oil benchmark, is trading around $71.30 on Wednesday. WTI price edges higher amid the positive development surrounding Chinese stimulus measures and ongoing geopolitical tensions in the Middle East.
Additional stimulus measures from China have provided some support to the WTI price as China is the world's top crude importer. People’s Bank of China (PBoC) unveiled a broad package of monetary stimulus measures to revive the economy. "The Chinese government's announcement of its largest stimulus package since the pandemic, combined with the sudden rise of geopolitical tension in the Middle East ... has dealt a blow to the bearish sentiment that dominated the oil markets in the past three weeks," said Claudio Galimberti, global market analysis director at Rystad Energy.
Meanwhile, the escalating geopolitical tensions in the Middle East contribute to the WTI’s upside as it raises concerns about oil supply disruptions. Israel has attacked Hezbollah in Lebanon every day for the past week from commander assassinations to the destruction of missile launchers, per Bloomberg.
US crude oil inventories fell more than expected last week. According to the American Petroleum Institute (API), crude oil stockpiles in the United States for the week ending September 20 fell by 4.339 million barrels, compared to an increase of 1.960 million barrels in the previous week. The market consensus estimated that stocks would decline by just 1.100 million barrels.
Oil traders will take more cues from the weekly EIA Crude Oil stockpiles report, which is due later on Wednesday. Additionally, Federal Reserve Governor Adriana Kugler is scheduled to speak later in the day.
WTI Oil FAQs
WTI Oil is a type of Crude Oil sold on international markets. The WTI stands for West Texas Intermediate, one of three major types including Brent and Dubai Crude. WTI is also referred to as “light” and “sweet” because of its relatively low gravity and sulfur content respectively. It is considered a high quality Oil that is easily refined. It is sourced in the United States and distributed via the Cushing hub, which is considered “The Pipeline Crossroads of the World”. It is a benchmark for the Oil market and WTI price is frequently quoted in the media.
Like all assets, supply and demand are the key drivers of WTI Oil price. As such, global growth can be a driver of increased demand and vice versa for weak global growth. Political instability, wars, and sanctions can disrupt supply and impact prices. The decisions of OPEC, a group of major Oil-producing countries, is another key driver of price. The value of the US Dollar influences the price of WTI Crude Oil, since Oil is predominantly traded in US Dollars, thus a weaker US Dollar can make Oil more affordable and vice versa.
The weekly Oil inventory reports published by the American Petroleum Institute (API) and the Energy Information Agency (EIA) impact the price of WTI Oil. Changes in inventories reflect fluctuating supply and demand. If the data shows a drop in inventories it can indicate increased demand, pushing up Oil price. Higher inventories can reflect increased supply, pushing down prices. API’s report is published every Tuesday and EIA’s the day after. Their results are usually similar, falling within 1% of each other 75% of the time. The EIA data is considered more reliable, since it is a government agency.
OPEC (Organization of the Petroleum Exporting Countries) is a group of 13 Oil-producing nations who collectively decide production quotas for member countries at twice-yearly meetings. Their decisions often impact WTI Oil prices. When OPEC decides to lower quotas, it can tighten supply, pushing up Oil prices. When OPEC increases production, it has the opposite effect. OPEC+ refers to an expanded group that includes ten extra non-OPEC members, the most notable of which is Russia.


© 2000-2026. All rights reserved.
This site is managed by Teletrade D.J. LLC 2351 LLC 2022 (Euro House, Richmond Hill Road, Kingstown, VC0100, St. Vincent and the Grenadines).
The information on this website is for informational purposes only and does not constitute any investment advice.
The company does not serve or provide services to customers who are residents of the US, Canada, Iran, The Democratic People's Republic of Korea, Yemen and FATF blacklisted countries.
Making transactions on financial markets with marginal financial instruments opens up wide possibilities and allows investors who are willing to take risks to earn high profits, carrying a potentially high risk of losses at the same time. Therefore you should responsibly approach the issue of choosing the appropriate investment strategy, taking the available resources into account, before starting trading.
Use of the information: full or partial use of materials from this website must always be referenced to TeleTrade as the source of information. Use of the materials on the Internet must be accompanied by a hyperlink to teletrade.org. Automatic import of materials and information from this website is prohibited.
Please contact our PR department if you have any questions or need assistance at pr@teletrade.global.
transfers