- Analytics
- News and Tools
- Market News
CFD Markets News and Forecasts — 24-07-2024
- USD/CAD trades on a flat note around 1.3805 in Thursday’s early Asian session.
- The BoC decided to cut the key interest rate to 4.5% at its July meeting on Wednesday, as widely expected.
- The flash US manufacturing sector saw a decline in July, while services business activity Index hit a 28-month high.
The USD/CAD pair trades flat near 1.3805 during the early Asian section on Thursday. The downside of the pair might be capped after the Bank of Canada (BoC) reduces its key borrowing rates again on Wednesday, which drags the Canadian Dollar (CAD) lower. On Thursday, investors will keep an eye on the advanced Gross Domestic Product (GDP) for the second quarter, followed by Durable Goods Orders and weekly Initial Jobless Claims.
The Canadian central bank cut its benchmark interest rate by 25 basis points (bps) to 4.5% on Wednesday, as widely expected by the markets. The BoC governor Tiff Macklem said during the press conference that it would be reasonable to expect further rate cuts if inflation continues to ease in line with the forecast. Financial markets expect one more 25 bps rate cut this year, with a nearly 53% odds that the BoC will cut rates again in its September meeting.
Meanwhile, the extended losses in crude oil prices might continue to undermine the Loonie. Lower oil prices generally weigh on the Canadian Dollar as Canada is the leading exporter of Oil to the United States (US).
On the other hand, mixed US S&P Purchasing Managers Index (PMI) for July and dovish comments from the Federal Reserve (Fed) are likely to exert some selling pressure on the Greenback.
Data released on Wednesday showed that the US S&P Global Composite PMI improved to 55.0 in July from 54.8 in June. Additionally, the S&P Global Manufacturing PMI dropped to 49.5 from 51.6 in the same period, weaker than the 51.7 expected. Finally, the Services PMI rose to 56.0 from 55.3.
Canadian Dollar FAQs
The key factors driving the Canadian Dollar (CAD) are the level of interest rates set by the Bank of Canada (BoC), the price of Oil, Canada’s largest export, the health of its economy, inflation and the Trade Balance, which is the difference between the value of Canada’s exports versus its imports. Other factors include market sentiment – whether investors are taking on more risky assets (risk-on) or seeking safe-havens (risk-off) – with risk-on being CAD-positive. As its largest trading partner, the health of the US economy is also a key factor influencing the Canadian Dollar.
The Bank of Canada (BoC) has a significant influence on the Canadian Dollar by setting the level of interest rates that banks can lend to one another. This influences the level of interest rates for everyone. The main goal of the BoC is to maintain inflation at 1-3% by adjusting interest rates up or down. Relatively higher interest rates tend to be positive for the CAD. The Bank of Canada can also use quantitative easing and tightening to influence credit conditions, with the former CAD-negative and the latter CAD-positive.
The price of Oil is a key factor impacting the value of the Canadian Dollar. Petroleum is Canada’s biggest export, so Oil price tends to have an immediate impact on the CAD value. Generally, if Oil price rises CAD also goes up, as aggregate demand for the currency increases. The opposite is the case if the price of Oil falls. Higher Oil prices also tend to result in a greater likelihood of a positive Trade Balance, which is also supportive of the CAD.
While inflation had always traditionally been thought of as a negative factor for a currency since it lowers the value of money, the opposite has actually been the case in modern times with the relaxation of cross-border capital controls. Higher inflation tends to lead central banks to put up interest rates which attracts more capital inflows from global investors seeking a lucrative place to keep their money. This increases demand for the local currency, which in Canada’s case is the Canadian Dollar.
Macroeconomic data releases gauge the health of the economy and can have an impact on the Canadian Dollar. Indicators such as GDP, Manufacturing and Services PMIs, employment, and consumer sentiment surveys can all influence the direction of the CAD. A strong economy is good for the Canadian Dollar. Not only does it attract more foreign investment but it may encourage the Bank of Canada to put up interest rates, leading to a stronger currency. If economic data is weak, however, the CAD is likely to fall.
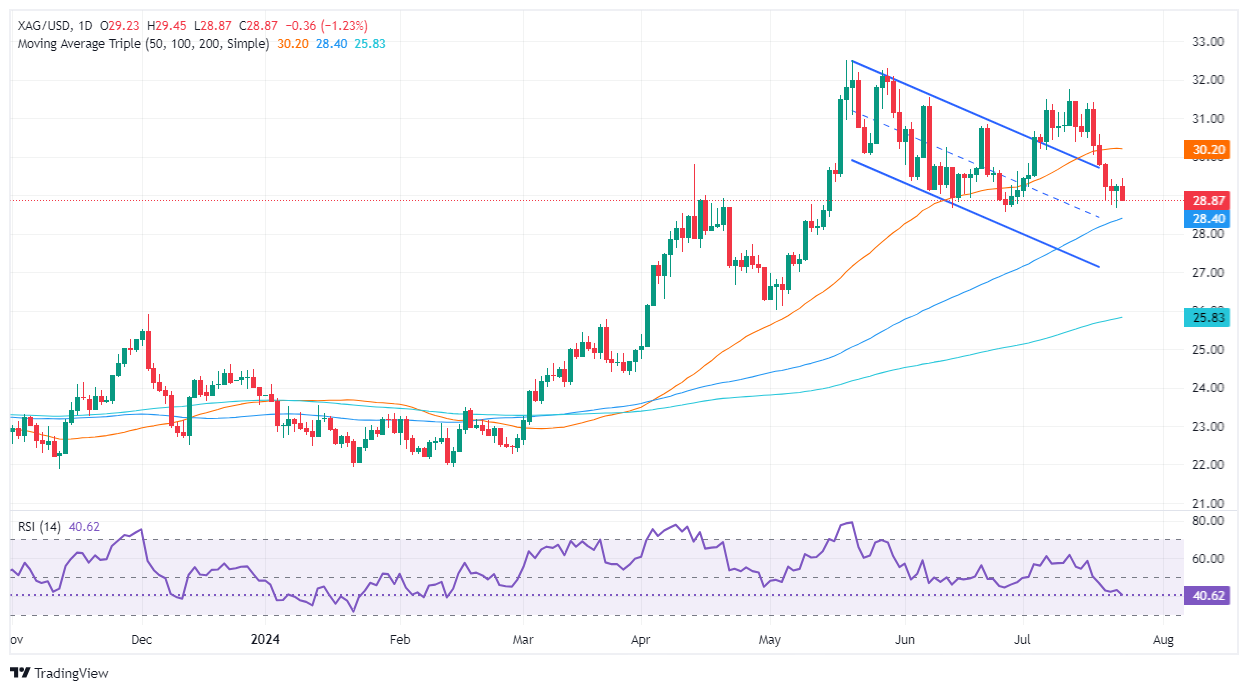
- Silver drops over 1%, closes below $29.00, pressured by higher US Treasury yields.
- Bearish momentum intensifies; RSI decline hints at further losses.
- Key supports: 100-DMA at $28.43, $28.00, and cycle low at $26.02 (May 2).
Silver price failed to extend its gains on Wednesday and lost over 1% as US Treasury yields rose following a US 5-year Note auction. The XAG/USD trades at $28.83, finally achieving a daily close beneath $29.00, opening the door for further downside.
XAG/USD Price Analysis: Technical outlook
From a technical perspective, the XAG/USD dropped beneath $29.00 and is set to extend its losses past the June 26 low of $28.57. Momentum shows that sellers are in charge as the Relative Strength Index (RSI) accelerates to the downside, remaining bearish and with enough room before turning oversold.
That said, the path of least resistance is to the downside. The XAG/USD's first support would be the 100-day moving average (DMA) at $28.43. Once cleared, the next stop would be the psychological area at $28.00 before edging towards the latest cycle low seen at $26.02, the May 2 low.
Conversely, the grey metal could test higher prices if XAG/USD rallies past the $29.00 mark. The first resistance would be the July 22 high of $29.42. Once surpasses, the next stop is seen above the July 19 peak at $29.83. Further upside is anticipated above that level, with the $30.00 mark lying overhead.
XAG/USD Price Action – Daily Chart
Silver FAQs
Silver is a precious metal highly traded among investors. It has been historically used as a store of value and a medium of exchange. Although less popular than Gold, traders may turn to Silver to diversify their investment portfolio, for its intrinsic value or as a potential hedge during high-inflation periods. Investors can buy physical Silver, in coins or in bars, or trade it through vehicles such as Exchange Traded Funds, which track its price on international markets.
Silver prices can move due to a wide range of factors. Geopolitical instability or fears of a deep recession can make Silver price escalate due to its safe-haven status, although to a lesser extent than Gold's. As a yieldless asset, Silver tends to rise with lower interest rates. Its moves also depend on how the US Dollar (USD) behaves as the asset is priced in dollars (XAG/USD). A strong Dollar tends to keep the price of Silver at bay, whereas a weaker Dollar is likely to propel prices up. Other factors such as investment demand, mining supply – Silver is much more abundant than Gold – and recycling rates can also affect prices.
Silver is widely used in industry, particularly in sectors such as electronics or solar energy, as it has one of the highest electric conductivity of all metals – more than Copper and Gold. A surge in demand can increase prices, while a decline tends to lower them. Dynamics in the US, Chinese and Indian economies can also contribute to price swings: for the US and particularly China, their big industrial sectors use Silver in various processes; in India, consumers’ demand for the precious metal for jewellery also plays a key role in setting prices.
Silver prices tend to follow Gold's moves. When Gold prices rise, Silver typically follows suit, as their status as safe-haven assets is similar. The Gold/Silver ratio, which shows the number of ounces of Silver needed to equal the value of one ounce of Gold, may help to determine the relative valuation between both metals. Some investors may consider a high ratio as an indicator that Silver is undervalued, or Gold is overvalued. On the contrary, a low ratio might suggest that Gold is undervalued relative to Silver.
- AUD/JPY extends losses, plunging to 101.20, marking the lowest level since early May.
- The bearish short-term trend continues to strengthen as the pair records four losing days in a row, shedding over 4% since last week.
In Wednesday's trading, the AUD/JPY pair has prolonged its downward spiral, tumbling by 1.50% to reach 101.20. This highlights the prominence of the sellers and further underscores the prevailing bearish short-term outlook as the pair reaches a new season low.
The daily Relative Strength Index (RSI) stands at 26, diving deeper below Tuesday's reading of 32, denoting the amplification of the bearish momentum. The same trend is signified by the Moving Average Convergence Divergence (MACD) which persists in recording rising red bars, signaling a continuation of selling activity, despite being in the oversold territory which hints at an impending correction.
AUD/JPY daily chart
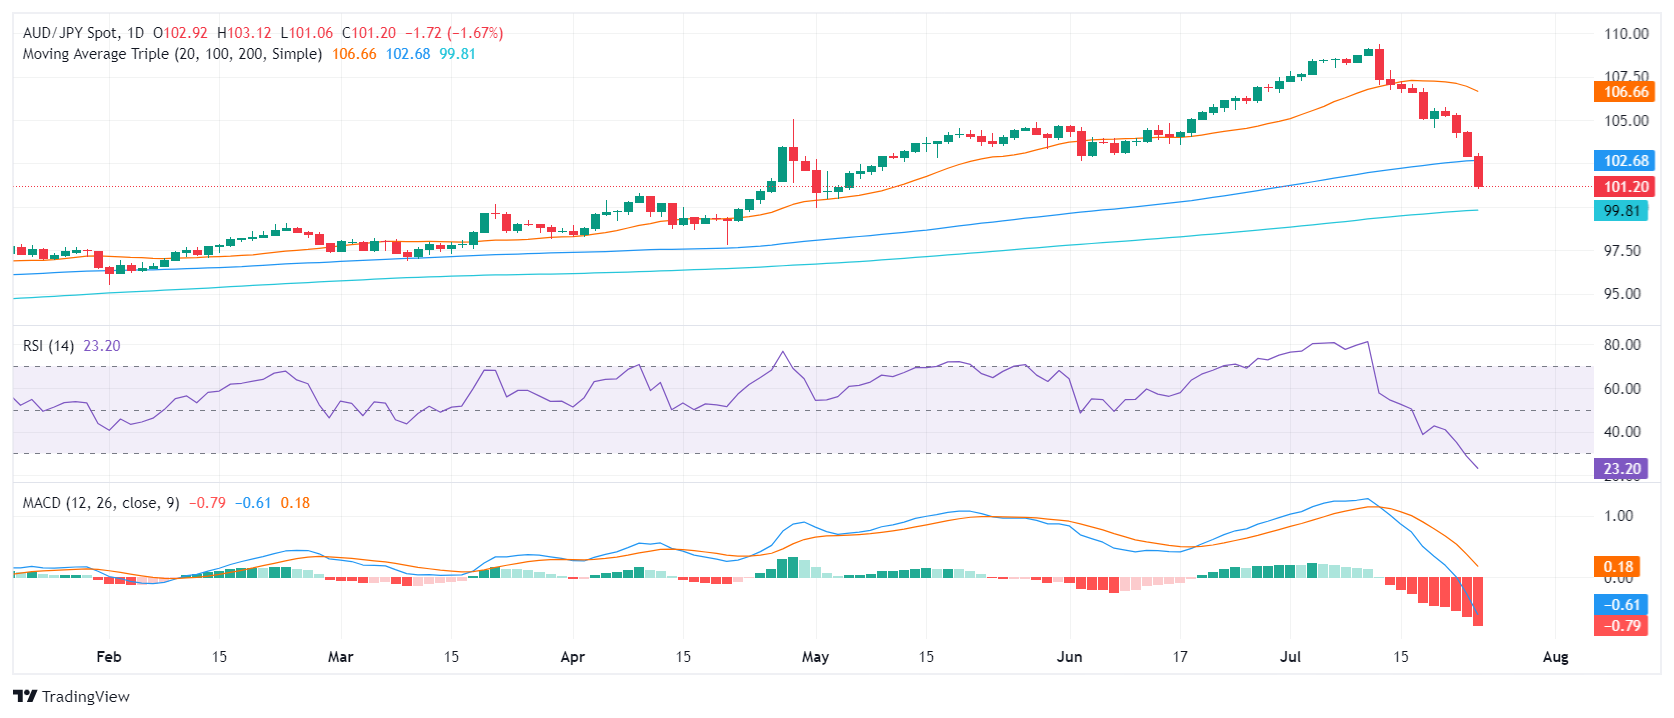
When viewed from a wide-angle perspective, the AUD/JPY's short-term bearish momentum appears to persist, with the pair far below the 20-day Simple Moving Average (SMA). After losing the 100-day SMA, the pair seems to be approaching the 200-day SMA, raising prospects of an extended bearish outlook. Looking forward, immediate support levels have been found around 101.00, a level which buyers must strive to hold to ward off a deeper retracement. In terms of recovery, the bulls will have to aim for the 102.70 area, where the 100-day SMA converges, to mitigate potential losses.
- NZD/USD deepens losses, slipping near the 0.5900 mark, marking a consistent bearish trend since last week.
- The pair lost almost 2.5% in the last five trading sessions.
In Wednesday's session, the NZD/USD extended its downward trajectory, decreasing by 0.55% and stabilizing at around 0.5925. The unceasing advance of the bears led to a further decline below the 0.5900 level, plummeting to the May lows around 0.5880 earlier in the session. This establishes a firm bearish sentiment surrounding the currency pair, with a five-day losing stream underlining this trend.
The daily technical indicators fortify this deteriorating trend. The Relative Strength Index (RSI) is now well within the oversold territory at 27. Concurrently, the Moving Average Convergence Divergence (MACD) shows rising red bars, further underlining the bearish sentiment. However, as RSI nears a highly oversold state, there might be potential for a correction looming on the horizon.
NZD/USD daily chart
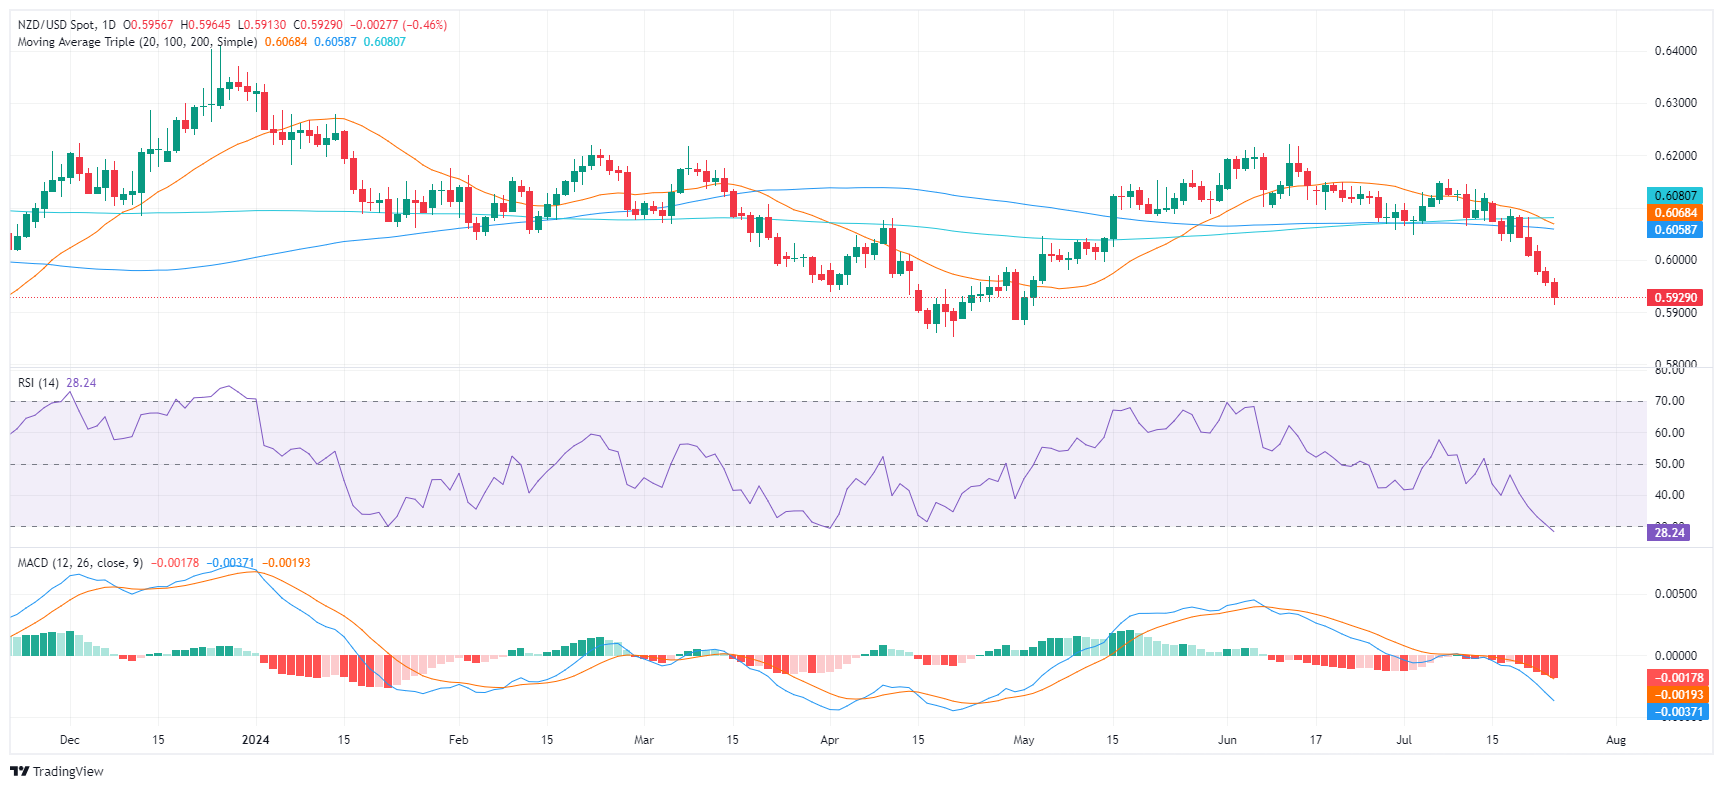
From a daily perspective, robust support is currently detected at the 0.5900 line, and further below that, at the May lows around 0.5880. Conversely, resistance is still seen at the former support level of 0.6000, followed by 0.6050.
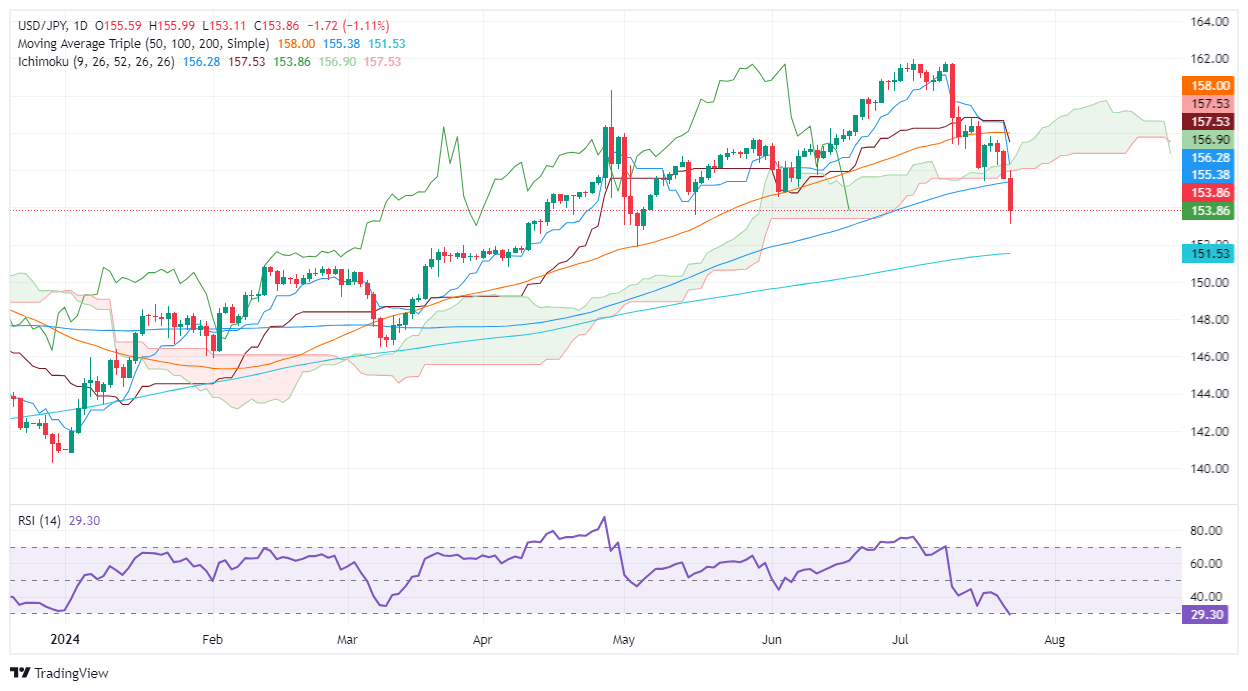
- USD/JPY falls more than 1.08%, breaking through key supports.
- Strong seller momentum; RSI suggests nearing oversold conditions.
- Key support at 151.86; resistance at 156.00 required for buyer control and Ichimoku Cloud breach.
The USD/JPY continues to fall off the cliff, dropping more than 1%, and is now more than 2% down in the week, as the pair breached key support levels. This is paving the way for further losses, and the pair trades at 153.11, down 1.08% on Wednesday.
USD/JPY Price Analysis: Technical outlook
The USD/JPY pair turned bearish after decisively breaching the Ichimoku Cloud (Kumo), opening the door to test lower prices. Momentum favors sellers, as shown by the Relative Strength Index (RSI), and it could turn oversold if the pair extends its losses toward the next support area.
USD/JPY's first support level would be the May 3 low at 151.86. Once surpassed, the pair could aim towards the October 21, 2022, peak, which turned support at 151.94.
Conversely, if USD/JPY buyers would like to regain control, they must reclaim the 156.00 figure so that they could lift prices above the Kumo.
USD/JPY Price Action – Daily Chart
Japanese Yen FAQs
The Japanese Yen (JPY) is one of the world’s most traded currencies. Its value is broadly determined by the performance of the Japanese economy, but more specifically by the Bank of Japan’s policy, the differential between Japanese and US bond yields, or risk sentiment among traders, among other factors.
One of the Bank of Japan’s mandates is currency control, so its moves are key for the Yen. The BoJ has directly intervened in currency markets sometimes, generally to lower the value of the Yen, although it refrains from doing it often due to political concerns of its main trading partners. The current BoJ ultra-loose monetary policy, based on massive stimulus to the economy, has caused the Yen to depreciate against its main currency peers. This process has exacerbated more recently due to an increasing policy divergence between the Bank of Japan and other main central banks, which have opted to increase interest rates sharply to fight decades-high levels of inflation.
The BoJ’s stance of sticking to ultra-loose monetary policy has led to a widening policy divergence with other central banks, particularly with the US Federal Reserve. This supports a widening of the differential between the 10-year US and Japanese bonds, which favors the US Dollar against the Japanese Yen.
The Japanese Yen is often seen as a safe-haven investment. This means that in times of market stress, investors are more likely to put their money in the Japanese currency due to its supposed reliability and stability. Turbulent times are likely to strengthen the Yen’s value against other currencies seen as more risky to invest in.
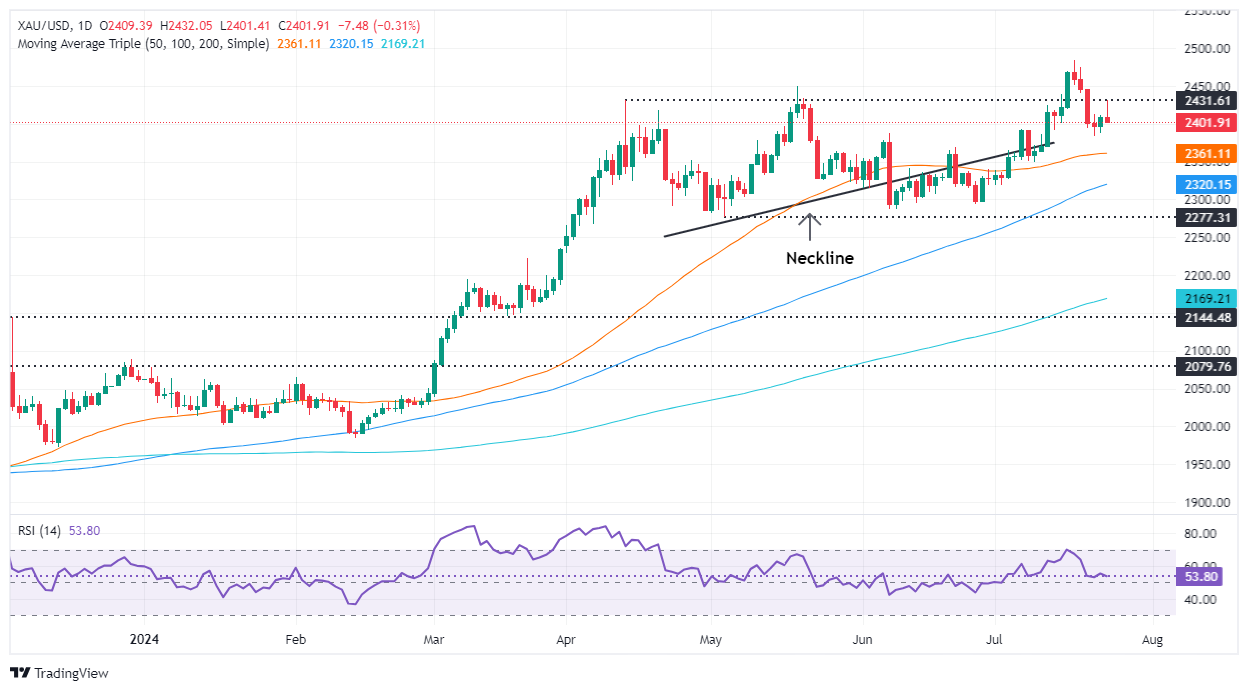
- Gold touches $2,432, then stabilizes near $2,400, pressured by US 10-year yields at 4.274%.
- FedWatch Tool forecasts 100% chance of a 25 bps rate cut in September, bolstering gold.
- India slashes import tax on precious metals, spurring demand; key US GDP, PCE data due Thursday.
Gold price is virtually unchanged late in the North American session, set to end the day around familiar levels of $2,400 after hitting a daily high of $2,432. Risk-aversion and rising US Treasury bond yields seem to have capped the non-yielding metal rally, which usually retreats as investors flock to US Treasuries.
Bullion traders lifted spot prices while US Treasury bond yields edged lower ahead of a US five-year note sale auction. Afterward, the US 10-year Treasury note coupon rose two basis points to 4.274%, a headwind for the golden metal. Meanwhile, the buck remains on the back foot, yet losses are trimmed as measured by the US Dollar Index (DXY). The DXY edges down 0.08% at 104.38.
Risk-off mood helped Gold buyers lift spot prices to a three-day peak, as traders had fully priced in a 25-basis point (bps) rate cut by the Federal Reserve at the upcoming September meeting.
The CME FedWatch Tool shows odds of a quarter of a percentage point cut at 100%, while data from the Chicago Board of Trade (CBOT) sees market participants estimate 53 bps of easing for 2024, via data of the December 2024 fed futures rate contract.
Data-wise the US economic docket revealed the Goods Trade Balance for July printed a narrower deficit than expected. Meanwhile, business activity as measured by the Purchasing Managers Index (PMI) report revealed by S&P was mixed, with manufacturing contracting for the first time since first time since December 2023.
Precious metals were also boosted by India’s decision to cut import taxes from 15% to 6%.
Traders brace for the release of the first reading of the Gross Domestic Product (GDP) for Q2 2024 in the United States (US) on Thursday. This would be followed by the release of the Fed’s preferred gauge for inflation, the Personal Consumption Expenditure (PCE) Price Index figures for June.
Daily digest market movers: Gold price remains glued to the $2,400 figure
- S&P Global revealed that Services and Composite PMIs for July exceeded estimates, coming at 56 and 55, with the former exceeding expectations of 55.
- The S&P Global Manufacturing PMI dropped from 51.6 to 49.5, missing the consensus of 51.7.
- The US Goods Trade Balance Advanced for June came at $-96.0 billion, below the $-98.0 billion and less than May’s $-99.4 billion.
- The Gross Domestic Product (GDP) for Q2 is projected to rise from 1.4% in Q1 2024 to 1.9% quarter-over-quarter (QoQ), indicating that the economy is accelerating as the year progresses.
- The Fed’s preferred measure of inflation, the Core PCE, is expected to dip from 2.6% to 2.5% year-over-year (YoY).
Technical analysis: Gold price falls below Tuesday’s high
After forming a ‘bullish haram,’ Gold prices hit a three-day peak above $2,430 but have retreated below the July 23 high of $2,412, hinting at buyers' lack of strength. A daily close below the latter could expose XAU/USD to further selling pressure, though US data would drive price action on Thursday and Friday.
The Relative Strength Index (RSI) is bullish, although the slope has turned flat, indicating buyers' and sellers' lack of direction and commitment.
XAU/USD needs to clear Wednesday’s peak at $2,430 for a bullish continuation. Once surpassed, the next resistance would be $2,450 before challenging the all-time high of $2,483. Up next would be the $2,500 figure.
Conversely, if XAU/USD tumbles below the July 22 low of $2,384, a deeper correction is on the cards. The next support would be the 50-day Simple Moving Average (SMA) at $2,359. Once sellers clear the 100-day SMA at $2,315, further losses are seen before falling toward $2,300.
Gold FAQs
Gold has played a key role in human’s history as it has been widely used as a store of value and medium of exchange. Currently, apart from its shine and usage for jewelry, the precious metal is widely seen as a safe-haven asset, meaning that it is considered a good investment during turbulent times. Gold is also widely seen as a hedge against inflation and against depreciating currencies as it doesn’t rely on any specific issuer or government.
Central banks are the biggest Gold holders. In their aim to support their currencies in turbulent times, central banks tend to diversify their reserves and buy Gold to improve the perceived strength of the economy and the currency. High Gold reserves can be a source of trust for a country’s solvency. Central banks added 1,136 tonnes of Gold worth around $70 billion to their reserves in 2022, according to data from the World Gold Council. This is the highest yearly purchase since records began. Central banks from emerging economies such as China, India and Turkey are quickly increasing their Gold reserves.
Gold has an inverse correlation with the US Dollar and US Treasuries, which are both major reserve and safe-haven assets. When the Dollar depreciates, Gold tends to rise, enabling investors and central banks to diversify their assets in turbulent times. Gold is also inversely correlated with risk assets. A rally in the stock market tends to weaken Gold price, while sell-offs in riskier markets tend to favor the precious metal.
The price can move due to a wide range of factors. Geopolitical instability or fears of a deep recession can quickly make Gold price escalate due to its safe-haven status. As a yield-less asset, Gold tends to rise with lower interest rates, while higher cost of money usually weighs down on the yellow metal. Still, most moves depend on how the US Dollar (USD) behaves as the asset is priced in dollars (XAU/USD). A strong Dollar tends to keep the price of Gold controlled, whereas a weaker Dollar is likely to push Gold prices up.
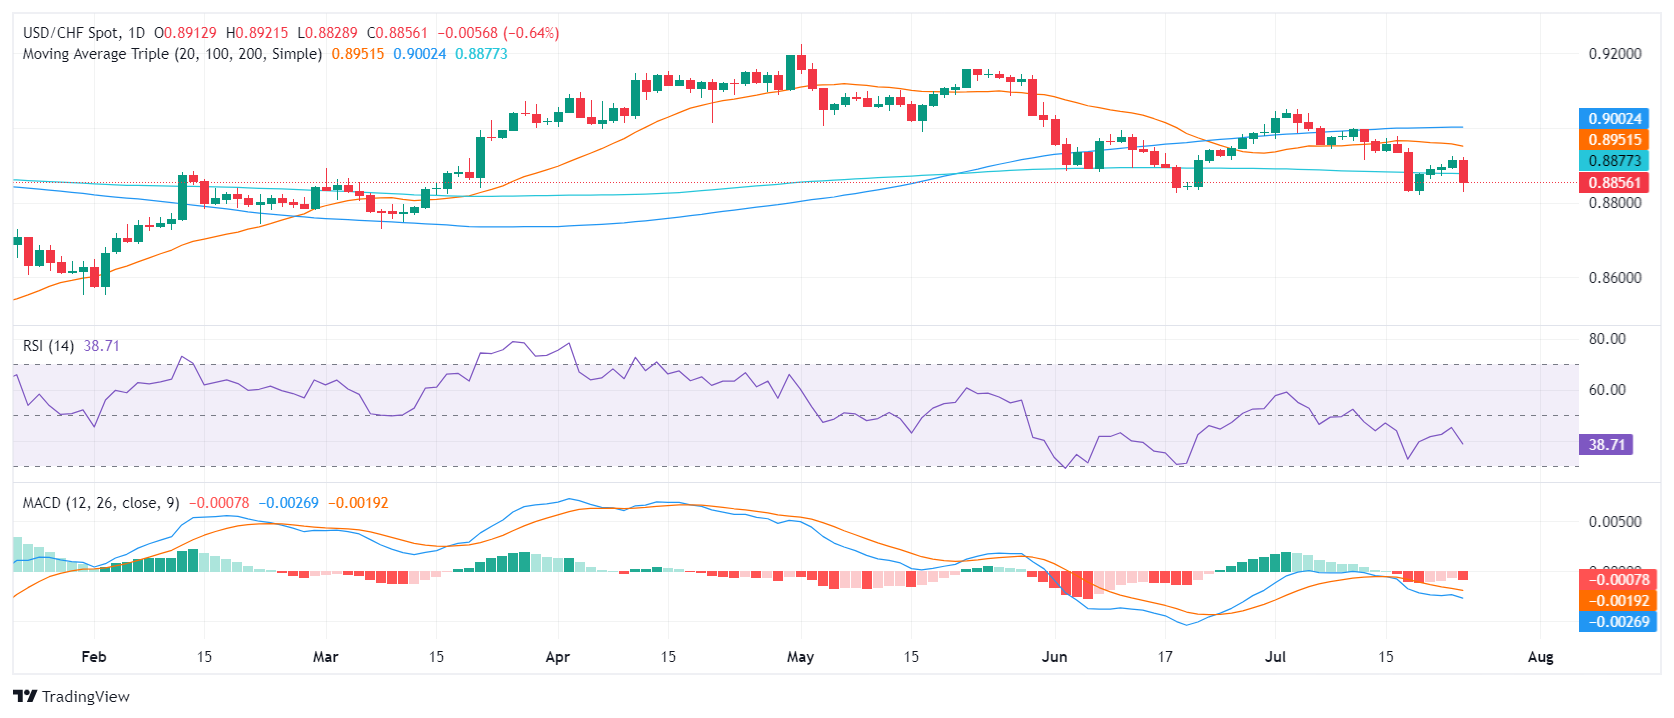
- USD/CHF declined towards 0.8840 and lost the 200-day SMA.
- Markets digest mixed US S&P PMIs released during the European session.
- Bets on cuts by the Fed and SNB remain high.
On Wednesday, the USD/CHF declined by 0.85% to 0.8835, reflecting a loss of momentum as markets process fresh S&P PMI readings from July.
The USD faced bearish pressure after the release of S&P PMIs. Business activity in the US private sector continued expanding at a healthy pace in July. The preliminary S&P Global Composite PMI rose to 55 from 54.8 in June. Although the S&P Global Manufacturing PMI saw a decline to 49.5 from 51.6 in June, the Services PMI increased to 56 from 55.3.
Key indicators including Q2 Gross Domestic Product (GDP) revisions, Personal Consumption Expenditures (PCE), Durable Goods Orders, and University of Michigan sentiment are due this week, which will likely drive the dynamics for USD. Market anticipates core PCE to print at 0.16% MoM, marking an increase in spending by 0.3% MoM. Personal income should also show a similar increase. The Federal Open Market Committee (FOMC) meeting in the following week will also be a focus but no further Fed remarks will be anticipated due to the blackout period so the steady dovish bets on the bank might continue weighing on the pair.
Regarding the Federal Reserve position, markets are betting on a 90% chance of a cut in September, but these odds might sway with this week’s economic data. Evidence of accelerating inflation should drive demand towards the USD while softish figures would give reasons to investors to bet on a more dovish Fed and hence apply selling pressure on the Greenback.
USD/CHF technical analysis
The USD/CHF technical outlook stands bearish, with the pair now below the 20, 100, and 200-day Simple Moving Average (SMA) having lost the latter on Wednesday which was a strong support since June. Meanwhile, technical indicators maintain their negative territory stance.
Key support levels have moved to 0.8830, and 0.8800, whereas resistance levels are at 0.8870, 0.8900, and 0.8930.
USD/CHF daily chart
- AUD/USD marked more losses on Wednesday reaching 0.6580.
- Concerns over China's economic health and falling commodity prices main cause of AUD's slide.
- Australia reported weak Judo PMIs during the Asian session.
In Wednesday's session, the Australian Dollar (AUD) faced further losses against the USD, with AUD/USD slipping below 0.6600. Worsening concerns over China's economic health, along with falling iron ore prices and weak Australian Judo Bank Flash PMI, were the primary contributors to the AUD's continued downfall.
Despite evident signs of faltering strength in the Australian economy, the Reserve Bank of Australia (RBA) stays firm on delaying rate cuts due to persistently high inflation. This stance could potentially restrict any further weakening of the AUD. The RBA appears set to be one of the last central banks among the G10 countries to implement rate cuts, a stance that may potentially extend further AUD gains.
Daily digest market movers: Aussie suffers a heavy blow amidst troubling economic signs in China, soft Judo PMIs contributes
- The Australian Dollar has experienced a significant sell-off heavily influenced by China's dismal economic prospects.
- China's Q2 Gross Domestic Product (GDP) fell short of expectations due to weak demand both domestically and overseas
- Worries regarding sluggish GDP growth in the world's second-largest economy deepened following the People’s Bank of China (PBoC)'s unexpected rate-cut decision on Monday and a lack of significant spending measures in the Third Plenum.
- On Wednesday's early Asian trading session, preliminary Judo Bank PMI readings indicated that the Composite PMI dipped to 50.2 from the previous release of 50.7.
- The Manufacturing PMI showed a slight improvement of 47.4, it fell back into contraction while the Service PMI expanded more slowly at 50.8.
AUD/USD technical analysis: AUD/USD expands correction and loses 100-day SMA, 200-day SMA threatened
The AUD/USD moving below the 20 and 100-day Simple Moving Average (SMA) indicates an area of concern and suggests that the downward movements might not be just a correction. However, as long as the pair retains a position above the 200-day SMA, the downward adjustments could still be considered 'corrective'.
Falling below this line could trigger a sell signal. The range traders should monitor for AUD/USD is 0.6600 - 0.6580 as buyers must maintain this area to prevent further losses.
Australian Dollar FAQs
One of the most significant factors for the Australian Dollar (AUD) is the level of interest rates set by the Reserve Bank of Australia (RBA). Because Australia is a resource-rich country another key driver is the price of its biggest export, Iron Ore. The health of the Chinese economy, its largest trading partner, is a factor, as well as inflation in Australia, its growth rate and Trade Balance. Market sentiment – whether investors are taking on more risky assets (risk-on) or seeking safe-havens (risk-off) – is also a factor, with risk-on positive for AUD.
The Reserve Bank of Australia (RBA) influences the Australian Dollar (AUD) by setting the level of interest rates that Australian banks can lend to each other. This influences the level of interest rates in the economy as a whole. The main goal of the RBA is to maintain a stable inflation rate of 2-3% by adjusting interest rates up or down. Relatively high interest rates compared to other major central banks support the AUD, and the opposite for relatively low. The RBA can also use quantitative easing and tightening to influence credit conditions, with the former AUD-negative and the latter AUD-positive.
China is Australia’s largest trading partner so the health of the Chinese economy is a major influence on the value of the Australian Dollar (AUD). When the Chinese economy is doing well it purchases more raw materials, goods and services from Australia, lifting demand for the AUD, and pushing up its value. The opposite is the case when the Chinese economy is not growing as fast as expected. Positive or negative surprises in Chinese growth data, therefore, often have a direct impact on the Australian Dollar and its pairs.
Iron Ore is Australia’s largest export, accounting for $118 billion a year according to data from 2021, with China as its primary destination. The price of Iron Ore, therefore, can be a driver of the Australian Dollar. Generally, if the price of Iron Ore rises, AUD also goes up, as aggregate demand for the currency increases. The opposite is the case if the price of Iron Ore falls. Higher Iron Ore prices also tend to result in a greater likelihood of a positive Trade Balance for Australia, which is also positive of the AUD.
The Trade Balance, which is the difference between what a country earns from its exports versus what it pays for its imports, is another factor that can influence the value of the Australian Dollar. If Australia produces highly sought after exports, then its currency will gain in value purely from the surplus demand created from foreign buyers seeking to purchase its exports versus what it spends to purchase imports. Therefore, a positive net Trade Balance strengthens the AUD, with the opposite effect if the Trade Balance is negative.
The incessant appreciation of the Japanese currency hurt the Greenback, dragging USD/JPY to new two-month lows near the 153.00 region. On another front, poor PMIs in the euro area undermined hopes of a sustained recovery in the region.
Here is what you need to know on Thursday, July 25:
The USD Index (DXY) receded modestly on the back of further advance in the Japanese yen and mixed US yields across the curve. On July 25, the advanced Q2 Growth Rate takes centre stage followed by Durable Goods Orders and weekly Initial Jobless Claims.
EUR/USD added to Tuesday’s losses and put the 200-day SMA near 1.0820 to the test ahead of key US data releasee. The IFO Business Climate in Germany comes on July 24 along with the speech by the ECB’s Lagarde.
GBP/USD alternated gains with losses around 1.2900 following erratic risk appetite trends. The CBI Industrial Trends Orders are expected on July 25.
The sell-off in USD/JPY approached the 153.00 region, or two-month lows, amidst the persistent recovery in the Japanese currency. Weekly Foreign Bond Investment figures are only due on July 25 on the Japanese docket.
AUD/USD remained on the back foot and dropped below the 0.6600 level to hit the key 200-day SMA and reach six-week lows. There will be no data releases in Oz on July 25.
WTI prices regained a small smile and retested the $78.00 mark per barrel after four consecutive daily pullbacks.
Gold prices faded the initial bullish attempt to three-day highs near $2,430 per ounce troy, eventually succumbing to the late bounce in the dollar. Silver prices set aside Tuesday’s gains and returned to the area below the $29.00 mark per ounce.
- The Dow Jones shed 300 points in the midweek market session.
- Investors balked after US PMIs came in firmly mixed.
- US Manufacturing set to slow further, but Services PMIs expanded.
The Dow Jones Industrial Average (DJIA) shed 300 points on Wednesday after US Purchasing Managers Index (PMI) figures came in broadly mixed, entirely reversing course on forecasts. US equity markets pulled back, however rate markets still see 100% odds of a September rate cut from the Federal Reserve (Fed). Still, a lopsided economic data release will put additional pressure on upcoming calendar prints through the rest of the week.
July’s US Manufacturing PMI tumbled back into contraction territory for the first time since January, easing to 49.5 compared to the previous month’s 51.6 and flouting the forecast uptick to 51.7. Meanwhile, US Services PMI survey results surged to a 26-month high of 56.0 compared to the previous 55.3, and well above the forecast backslide to 54.4.
A mixed PMI print did little to support broad market sentiment, sending equities lower and investors bracing ahead of further key US data due this week. Thursday’s annualized Q2 Gross Domestic Product (GDP) is expected to rise to 2.0% from the previous 1.4%, while the QoQ GDP figure for Q2 is forecast to ease back to 2.6% from the previous 3.1%.
Friday’s Personal Consumption Expenditure Price Index (PCE) inflation will be the week’s critical data print. As the Fed’s preferred method of tracking inflation, a miss in core PCE Price Index could send investors heading for the hills or stepping further into risk-on bets on rate cut hopes. June’s YoY core PCE inflation is forecast to tick down slightly to 2.5% from 2.6%, with the MoM figure expected to hold steady at 0.1%.
Dow Jones news
Roughly two-thirds of the Dow Jones’ constituent securities are in the red on Wednesday, with losses being led by Intel Corp. (INTC) which tumbled around -3.5% to $255.40 per share. On the high side, Verizon Communications Inc. (VZ) rose 2.34% to $39.80 per share.
Dow Jones technical outlook
The Dow Jones is adding onto a recent pullback from all-time highs as the index slides back towards 40,000.00. The DJIA set a record peak bid of 41,371.38 last week, but the index is now trading down -3.5% in a brief pullback.
An extended pullback will see the Dow Jones challenging the 50-day Exponential Moving Average (EMA) at 39,472.52, with a long-term technical floor priced in at the 200-day EMA at 37,862.50.
Dow Jones five minute chart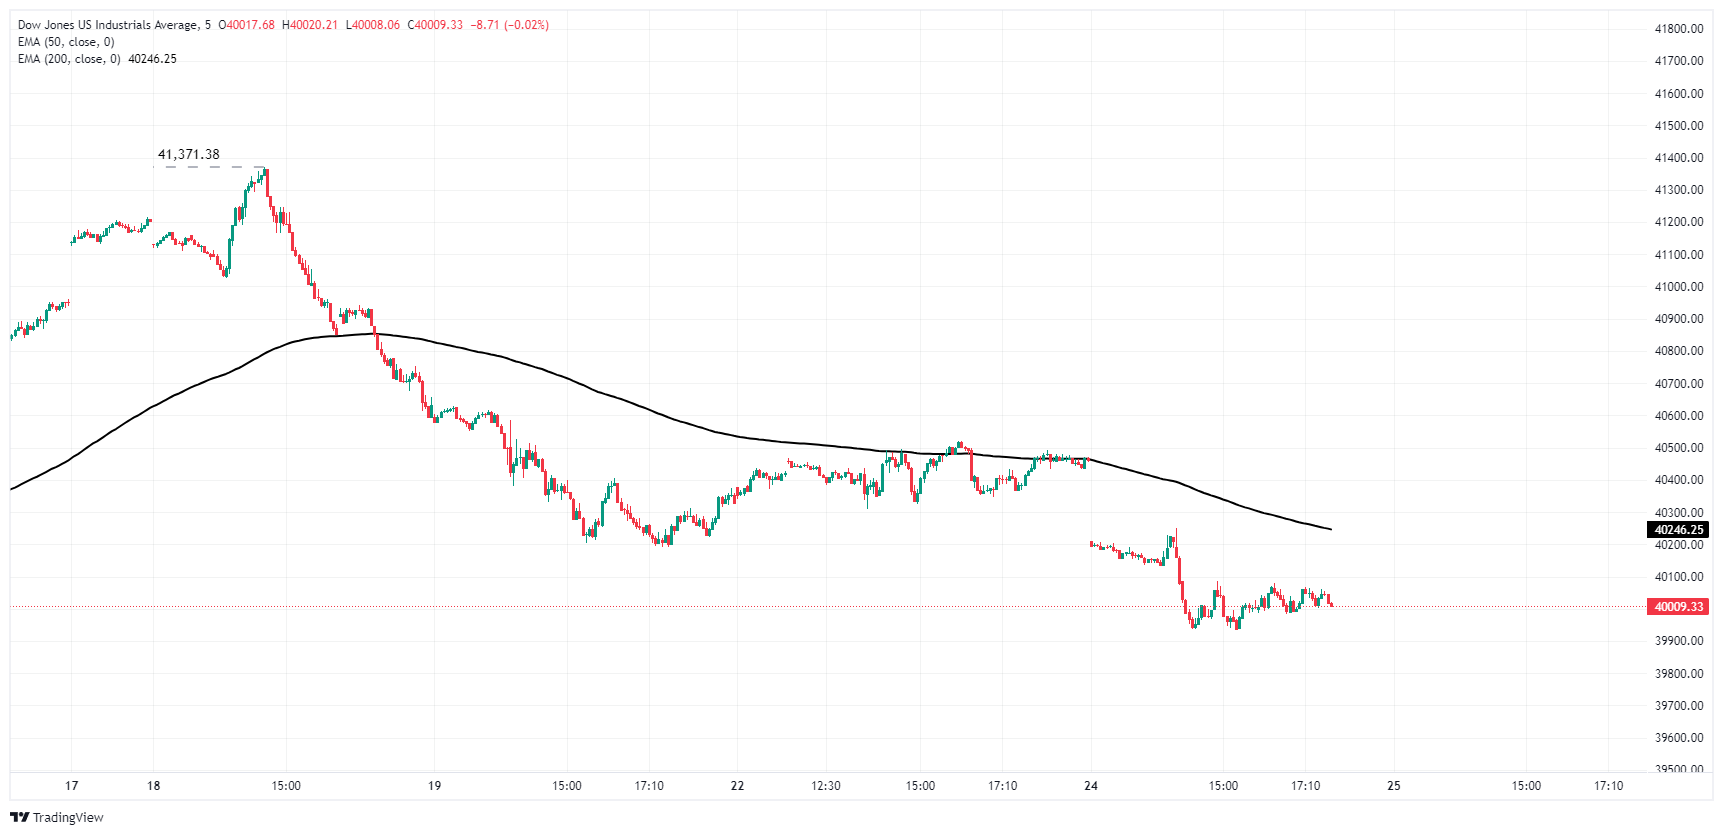
Dow Jones daily chart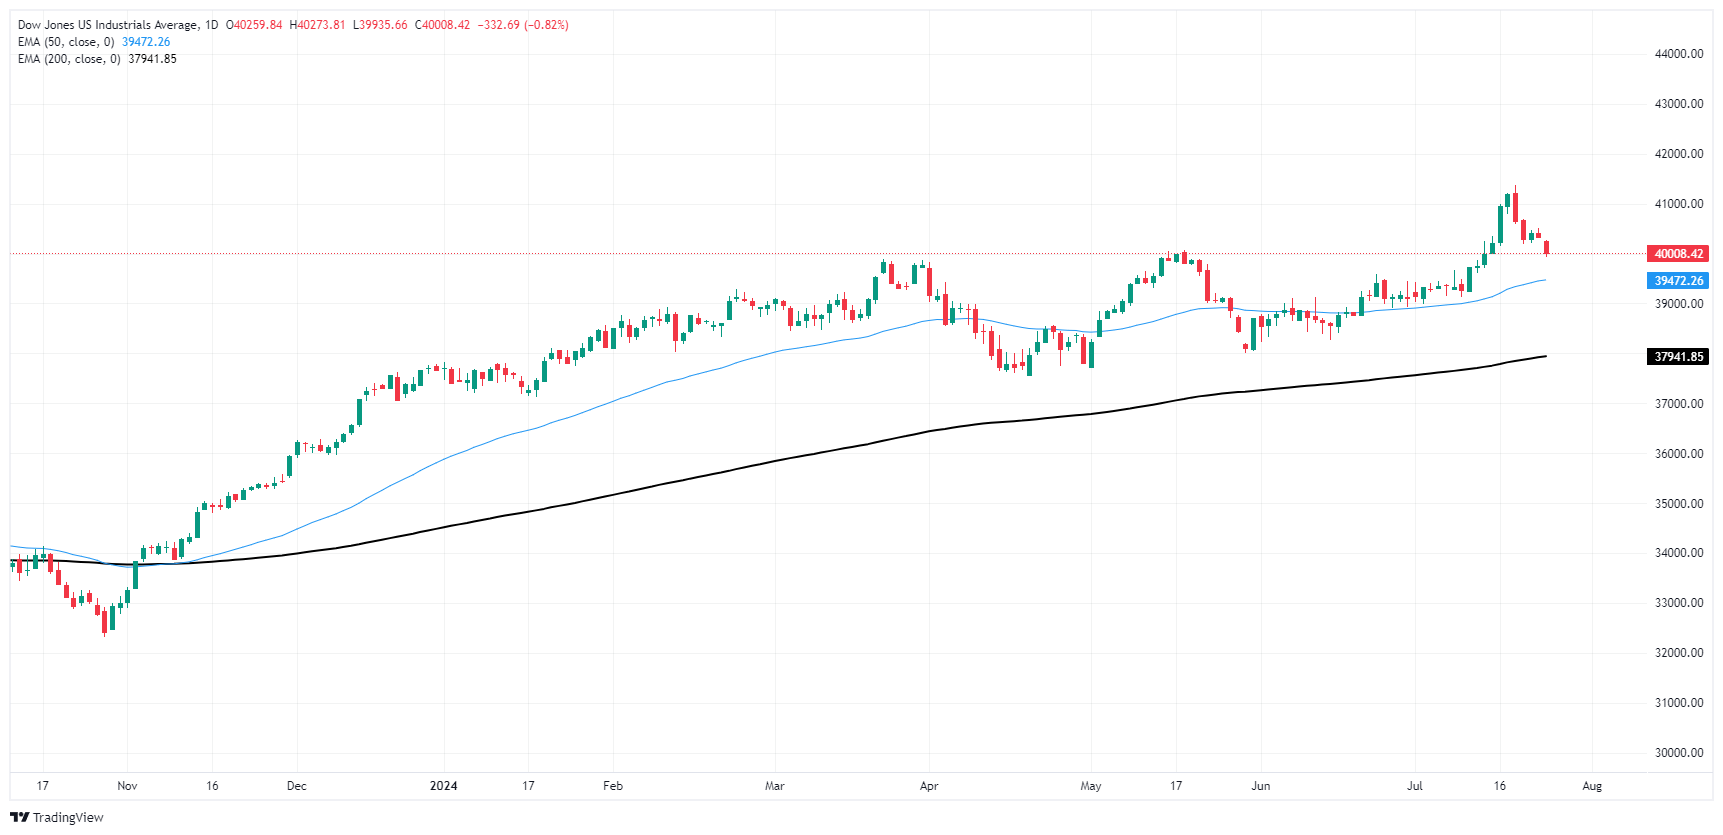
Dow Jones FAQs
The Dow Jones Industrial Average, one of the oldest stock market indices in the world, is compiled of the 30 most traded stocks in the US. The index is price-weighted rather than weighted by capitalization. It is calculated by summing the prices of the constituent stocks and dividing them by a factor, currently 0.152. The index was founded by Charles Dow, who also founded the Wall Street Journal. In later years it has been criticized for not being broadly representative enough because it only tracks 30 conglomerates, unlike broader indices such as the S&P 500.
Many different factors drive the Dow Jones Industrial Average (DJIA). The aggregate performance of the component companies revealed in quarterly company earnings reports is the main one. US and global macroeconomic data also contributes as it impacts on investor sentiment. The level of interest rates, set by the Federal Reserve (Fed), also influences the DJIA as it affects the cost of credit, on which many corporations are heavily reliant. Therefore, inflation can be a major driver as well as other metrics which impact the Fed decisions.
Dow Theory is a method for identifying the primary trend of the stock market developed by Charles Dow. A key step is to compare the direction of the Dow Jones Industrial Average (DJIA) and the Dow Jones Transportation Average (DJTA) and only follow trends where both are moving in the same direction. Volume is a confirmatory criteria. The theory uses elements of peak and trough analysis. Dow’s theory posits three trend phases: accumulation, when smart money starts buying or selling; public participation, when the wider public joins in; and distribution, when the smart money exits.
There are a number of ways to trade the DJIA. One is to use ETFs which allow investors to trade the DJIA as a single security, rather than having to buy shares in all 30 constituent companies. A leading example is the SPDR Dow Jones Industrial Average ETF (DIA). DJIA futures contracts enable traders to speculate on the future value of the index and Options provide the right, but not the obligation, to buy or sell the index at a predetermined price in the future. Mutual funds enable investors to buy a share of a diversified portfolio of DJIA stocks thus providing exposure to the overall index.
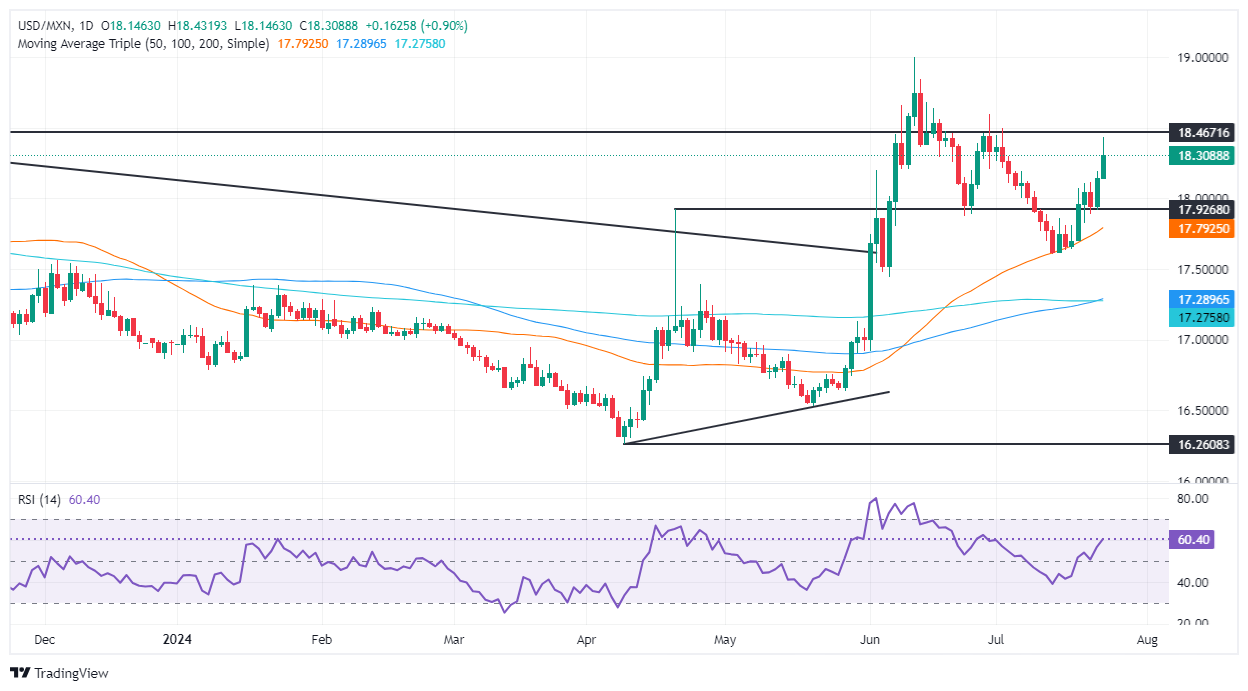
- Mexican Peso depreciates over 1% against USD, trades above 18.30.
- INEGI’s mid-month inflation data reveals mixed results, halting disinflation and raising concerns.
- Political uncertainty grows as Mexican Congress prepares to discuss judicial reforms impacts the Mexican currency.
The Mexican Peso depreciated over 1% against the Greenback after the National Statistics Agency (INEGI) revealed mixed mid-month Inflation data. Market participants, who remain risk averse, overlooked this, while the carry trade that favored the emerging market currency began to unwind, according to ING. The USD/MXN trades at 18.32 after bouncing off daily lows of 18.13.
On Wednesday, INEGI revealed that headline inflation rose above estimates while underlying prices ticked lower on monthly figures but not annually. The disinflation process seems to be halting due to the reacceleration of inflation that began in March and rose above the 5% threshold, hitting its highest level since May 2023.
Meanwhile, political woes hurt the Peso after newswires revealed that the Mexican Congress will begin to discuss President Andres Manuel Lopez Obrador's reform of the judiciary system on August 1. This is to prepare the bill for approval once the new Congress begins its three-year period on September 1.
ING mentioned that the low volatility environment I not favoring any rotation back to the carry trade. They said, “On the contrary, markets appear to be unwinding positions in some selected high yielding currencies like MXN and ZAR, while the funding JPY continues to perform very well.”
In the meantime, USD/MXN traders are also eyeing the release of crucial US economic data. On Thursday, the docket will feature Gross Domestic Product (GDP) data, followed by the release of the Federal Reserve’s (Fed) preferred gauge for inflation, the Core Personal Consumption Expenditure (PCE) Price Index.
Daily digest market movers: Mexican Peso plummets amid weaker US Dollar
- Mid-month Inflation for July rose by 0.71% MoM, which was higher than the 0.39% expected and crushed the previous reading of 0.21%. On a yearly basis, prices rose by 5.61% above forecasts of 5.27% and crushed the previous report of 4.78%.
- Mid-month core Inflation expanded by 0.18% MoM, a tenth higher than the previous report, lower than expected, and in the twelve months to mid-July, it dropped from 4.17% to 4.02% as foreseen.
- Citi Research Expectations survey shows that analysts estimate inflation to end at 4.30% YoY, up from 4.20%, while underlying inflation is foreseen to finish 2024 at 4.0%.
- Regarding growth, Mexico’s economy is expected to grow 1.9%, down from 2.0% in the last poll.
- The US Dollar Index (DXY), which tracks the buck’s value against the other six currencies, drops 0.24% to 104.22.
- US S&P Global PMIs expanded as expected in the Services and Composite sectors, but the Manufacturing figure contracted for the first time since December 2023
- The CME FedWatch Tools show that the chances of a quarter-percentage-rate cut to the federal funds rate in September are 100%.
- Data by the Chicago Board of Trade (CBOT) shows that traders are pricing in 53 basis points (bps) of easing towards the end of the year, as shown by the December 2024 fed funds rate futures contract.
Technical analysis: Mexican Peso drops as USD/MXN sticks above 18.00
The USD/MXN extends its gains above the psychological 18.00 figure and is set to extend its gains if it reclaims key resistance levels. Buyers are gathering momentum, as shown by the Relative Strength Index (RSI), aiming upwards after the exotic pair’s pullback from 18.59 to 17.58
If USD/MXN clears 18.50, the next resistance would be the year-to-date (YTD) high at 18.99.
Conversely, if USD/MXN retreated beneath 18.00, that would pave the way to challenge the 50-day Simple Moving Average (SMA) at 17.74, the first support level. The next support would be the latest cycle low of 17.58; the July 12 high turned support. A breach of the latter will expose the January 23 peak at 17.38.
Mexican Peso FAQs
The Mexican Peso (MXN) is the most traded currency among its Latin American peers. Its value is broadly determined by the performance of the Mexican economy, the country’s central bank’s policy, the amount of foreign investment in the country and even the levels of remittances sent by Mexicans who live abroad, particularly in the United States. Geopolitical trends can also move MXN: for example, the process of nearshoring – or the decision by some firms to relocate manufacturing capacity and supply chains closer to their home countries – is also seen as a catalyst for the Mexican currency as the country is considered a key manufacturing hub in the American continent. Another catalyst for MXN is Oil prices as Mexico is a key exporter of the commodity.
The main objective of Mexico’s central bank, also known as Banxico, is to maintain inflation at low and stable levels (at or close to its target of 3%, the midpoint in a tolerance band of between 2% and 4%). To this end, the bank sets an appropriate level of interest rates. When inflation is too high, Banxico will attempt to tame it by raising interest rates, making it more expensive for households and businesses to borrow money, thus cooling demand and the overall economy. Higher interest rates are generally positive for the Mexican Peso (MXN) as they lead to higher yields, making the country a more attractive place for investors. On the contrary, lower interest rates tend to weaken MXN.
Macroeconomic data releases are key to assess the state of the economy and can have an impact on the Mexican Peso (MXN) valuation. A strong Mexican economy, based on high economic growth, low unemployment and high confidence is good for MXN. Not only does it attract more foreign investment but it may encourage the Bank of Mexico (Banxico) to increase interest rates, particularly if this strength comes together with elevated inflation. However, if economic data is weak, MXN is likely to depreciate.
As an emerging-market currency, the Mexican Peso (MXN) tends to strive during risk-on periods, or when investors perceive that broader market risks are low and thus are eager to engage with investments that carry a higher risk. Conversely, MXN tends to weaken at times of market turbulence or economic uncertainty as investors tend to sell higher-risk assets and flee to the more-stable safe havens.
- US Dollar DXY declines towards 104.20 after mixed S&P PMIs
- Fed's steady dovish bets also added to the decline.
- PCE, durable goods orders, Q2 GDP revisions will be the highlights on Thursday and Friday.
On Wednesday, the US Dollar as measured by the DXY index went on a dip towards 104.20, largely influenced by mixed S&P PMI figures and the markets continuing to bet on a dovish Federal Reserve's (Fed) outlook.
With signs of disinflation steadily emerging, market participants are growing confident of a potential rate cut in September, yet the Fed officials continue their cautious approach, remaining dependent on the data. As such, attention is turning to key upcoming data, namely core Personal Consumption Expenditures (PCE), and Q2 Gross Domestic Product (GDP) figures on Thursday and Friday.
Daily digest market movers: DXY down as markets digest economic figures from the US
- The US private sector continued healthy expansion, with S&P Global Composite PMI rising to 55 from June's 54.8.
- Counterbalancing this, the S&P Global Manufacturing PMI fell to 49.5 from June's 51.6, while Service PMI rose slightly from 55.3 to 56.
- The CME FedWatch Tool continues to back a likely rate cut in September, although upcoming GDP and PCE data will largely determine the DXY dynamics for the remainder of the week.
Daily digest market movers: DXY flashes bearish signals
The DXY displays a neutral to bearish outlook, with key indicators remaining largely in the negative zone, including the Relative Strength Index (RSI) and Moving Average Convergence Divergence (MACD). Meanwhile, bearish signals from a completed cross-over between the 20-day and 100-day Simple Moving Average (SMA) at the 104.80 area remain, and the index has fallen below the 200-day SMA confirming a negative outlook. Support lies at 104.15, and 104.00, with resistances identified at 104.30 and 104.50.
US Dollar FAQs
The US Dollar (USD) is the official currency of the United States of America, and the ‘de facto’ currency of a significant number of other countries where it is found in circulation alongside local notes. It is the most heavily traded currency in the world, accounting for over 88% of all global foreign exchange turnover, or an average of $6.6 trillion in transactions per day, according to data from 2022. Following the second world war, the USD took over from the British Pound as the world’s reserve currency. For most of its history, the US Dollar was backed by Gold, until the Bretton Woods Agreement in 1971 when the Gold Standard went away.
The most important single factor impacting on the value of the US Dollar is monetary policy, which is shaped by the Federal Reserve (Fed). The Fed has two mandates: to achieve price stability (control inflation) and foster full employment. Its primary tool to achieve these two goals is by adjusting interest rates. When prices are rising too quickly and inflation is above the Fed’s 2% target, the Fed will raise rates, which helps the USD value. When inflation falls below 2% or the Unemployment Rate is too high, the Fed may lower interest rates, which weighs on the Greenback.
In extreme situations, the Federal Reserve can also print more Dollars and enact quantitative easing (QE). QE is the process by which the Fed substantially increases the flow of credit in a stuck financial system. It is a non-standard policy measure used when credit has dried up because banks will not lend to each other (out of the fear of counterparty default). It is a last resort when simply lowering interest rates is unlikely to achieve the necessary result. It was the Fed’s weapon of choice to combat the credit crunch that occurred during the Great Financial Crisis in 2008. It involves the Fed printing more Dollars and using them to buy US government bonds predominantly from financial institutions. QE usually leads to a weaker US Dollar.
Quantitative tightening (QT) is the reverse process whereby the Federal Reserve stops buying bonds from financial institutions and does not reinvest the principal from the bonds it holds maturing in new purchases. It is usually positive for the US Dollar.
- The Canadian Dollar struggles to hold flat against the Greenback after initial slide.
- Canada is headed for an uncertain growth patch as forecasts get revised lower.
- Mixed US PMIs also complicate the picture as the rest of the week looms large.
The Canadian Dollar (CAD) briefly slipped to a 14-week low against the Greenback after the Bank of Canada (BoC) cut rates by another 25 basis points, as markets broadly expected. Further downside revisions to the BoC’s Canadian growth forecasts hobbled the Canadian Dollar, and the USD/CAD pair is posed for a second straight week of gains.
Canada has delivered another rate cut, in-line with the BoC’s own promises of “a series of cuts” in the second half of 2024, but CAD traders are having a difficult time shrugging off steep downside adjustments to Canadian Gross Domestic Product (GDP) growth forecasts as well as a sharp Q1 revision. On the US side of things, US Purchasing Managers Index (PMI) figures came in mixed, with Manufacturing activity contracting and Services unexpectedly expanding to its highest level since April of 2022. Key US data will continue through the week, with US GDP on the docket for Thursday and US Personal Consumption Expenditure Price Index (PCE) inflation slated for Friday.
Daily digest market movers: BoC delivers expected cut, but revises growth forecasts lower
- As markets broadly expected, the BoC cut benchmark rates by a quarter-point to 4.5%.
- What surprised CAD traders was a steep downside revision in the BoC’s growth forecasts, which now expects 2024 GDP to grow by 1.2% for the year compared to April’s forecast 1.5%, an already-low figure.
- The BoC also sees 2024’s first-quarter growth at just 1.7% on an annualized basis, far lower than the previous forecast of 2.8%.
- BoC's Governor Macklem: Monetary policy is still restrictive
- US PMIs came in fiercely mixed, with Manufacturing PMI figures sinking into contraction territory while Services PMI activity surged to a 26-month high.
- Read more: US S&P Global Manufacturing PMI slumps to 49.5
Canadian Dollar PRICE Today
The table below shows the percentage change of Canadian Dollar (CAD) against listed major currencies today. Canadian Dollar was the strongest against the Australian Dollar.
| USD | EUR | GBP | JPY | CAD | AUD | NZD | CHF | |
|---|---|---|---|---|---|---|---|---|
| USD | 0.03% | -0.13% | -1.34% | 0.00% | 0.25% | 0.21% | -0.80% | |
| EUR | -0.03% | -0.17% | -1.40% | -0.01% | 0.23% | 0.22% | -0.85% | |
| GBP | 0.13% | 0.17% | -1.23% | 0.13% | 0.39% | 0.36% | -0.69% | |
| JPY | 1.34% | 1.40% | 1.23% | 1.40% | 1.63% | 1.59% | 0.55% | |
| CAD | -0.01% | 0.01% | -0.13% | -1.40% | 0.25% | 0.23% | -0.82% | |
| AUD | -0.25% | -0.23% | -0.39% | -1.63% | -0.25% | -0.03% | -1.04% | |
| NZD | -0.21% | -0.22% | -0.36% | -1.59% | -0.23% | 0.03% | -1.04% | |
| CHF | 0.80% | 0.85% | 0.69% | -0.55% | 0.82% | 1.04% | 1.04% |
The heat map shows percentage changes of major currencies against each other. The base currency is picked from the left column, while the quote currency is picked from the top row. For example, if you pick the Canadian Dollar from the left column and move along the horizontal line to the US Dollar, the percentage change displayed in the box will represent CAD (base)/USD (quote).
Technical analysis: CAD wobbles but so far holds steady against Greenback
The Canadian Dollar (CAD) is a mixed bag on Wednesday, finding scant gains against the Antipodeans while falling back against the still-recovering Japanese Yen. Chart churn on economic data releases has also left the CAD swimming in circles against the Greenback. The CAD gained around one-fifth of one percent against the Australian Dollar (AUD) and the New Zealand Dollar (NZD), but shed one-and-one-half percent against the Japanese Yen (JPY).
USD/CAD briefly rose to a 14-week high on Wednesday, crossing over the 1.3800 handle before settling back into the day’s opening range. Intraday price action is still holding north of 1.3780, but momentum is leaning increasingly in favor of Greenback buyers.
Daily candlesticks are buried in the middle of a heavy supply zone priced in above 1.3750, and a bearish turnaround from here could send USD/CAD tumbling backto the 200-day Exponential Moving Average (EMA) at 1.3609.
USD/CAD hourly chart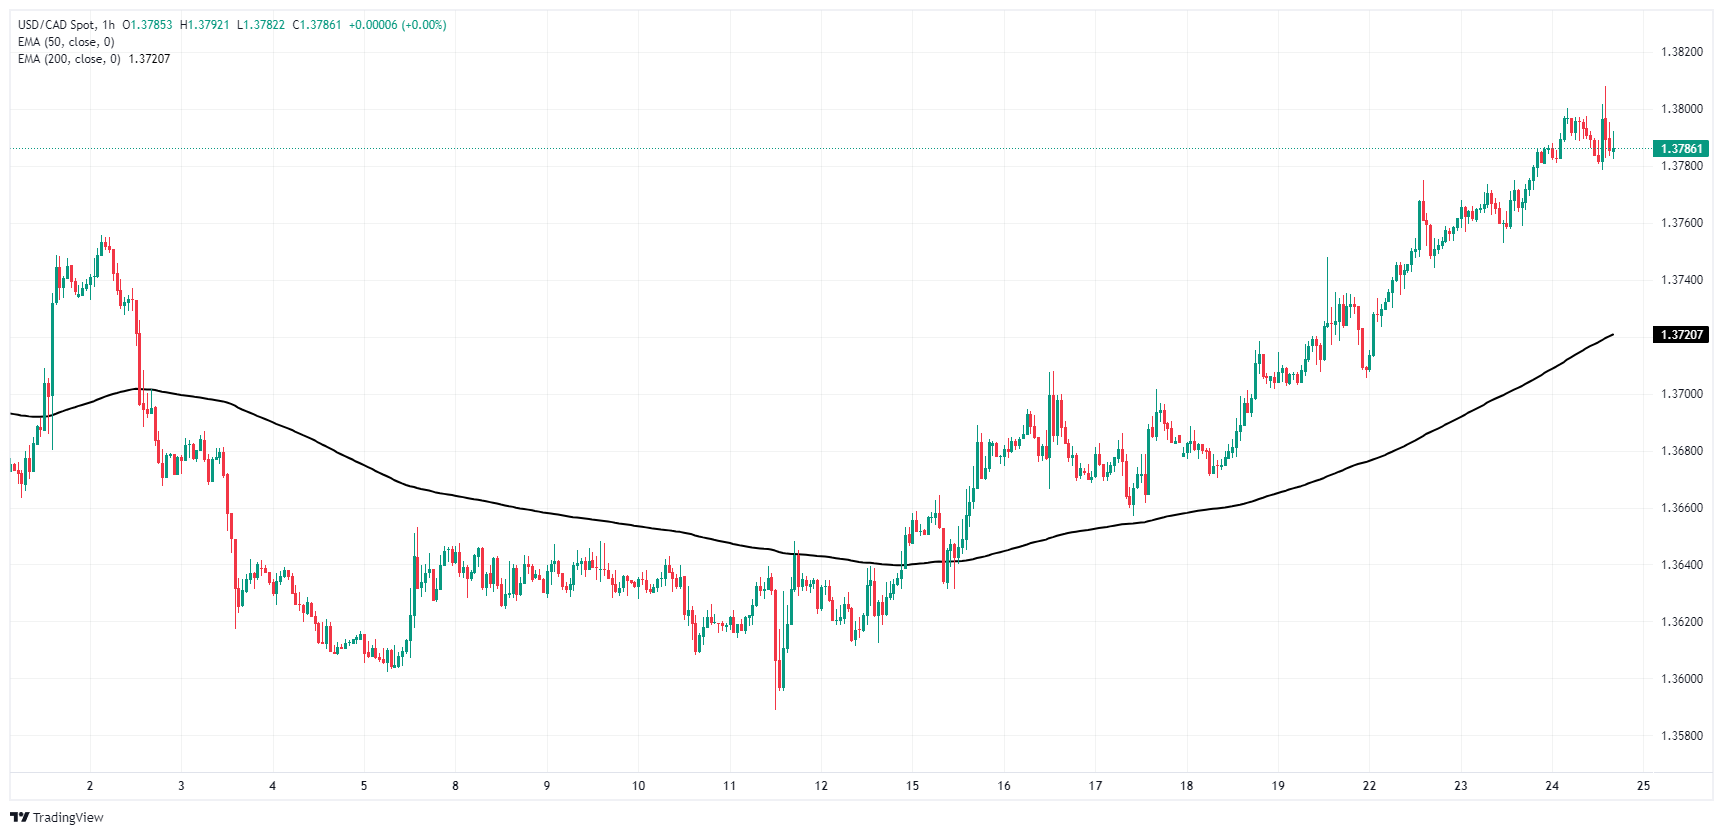
USD/CAD daily chart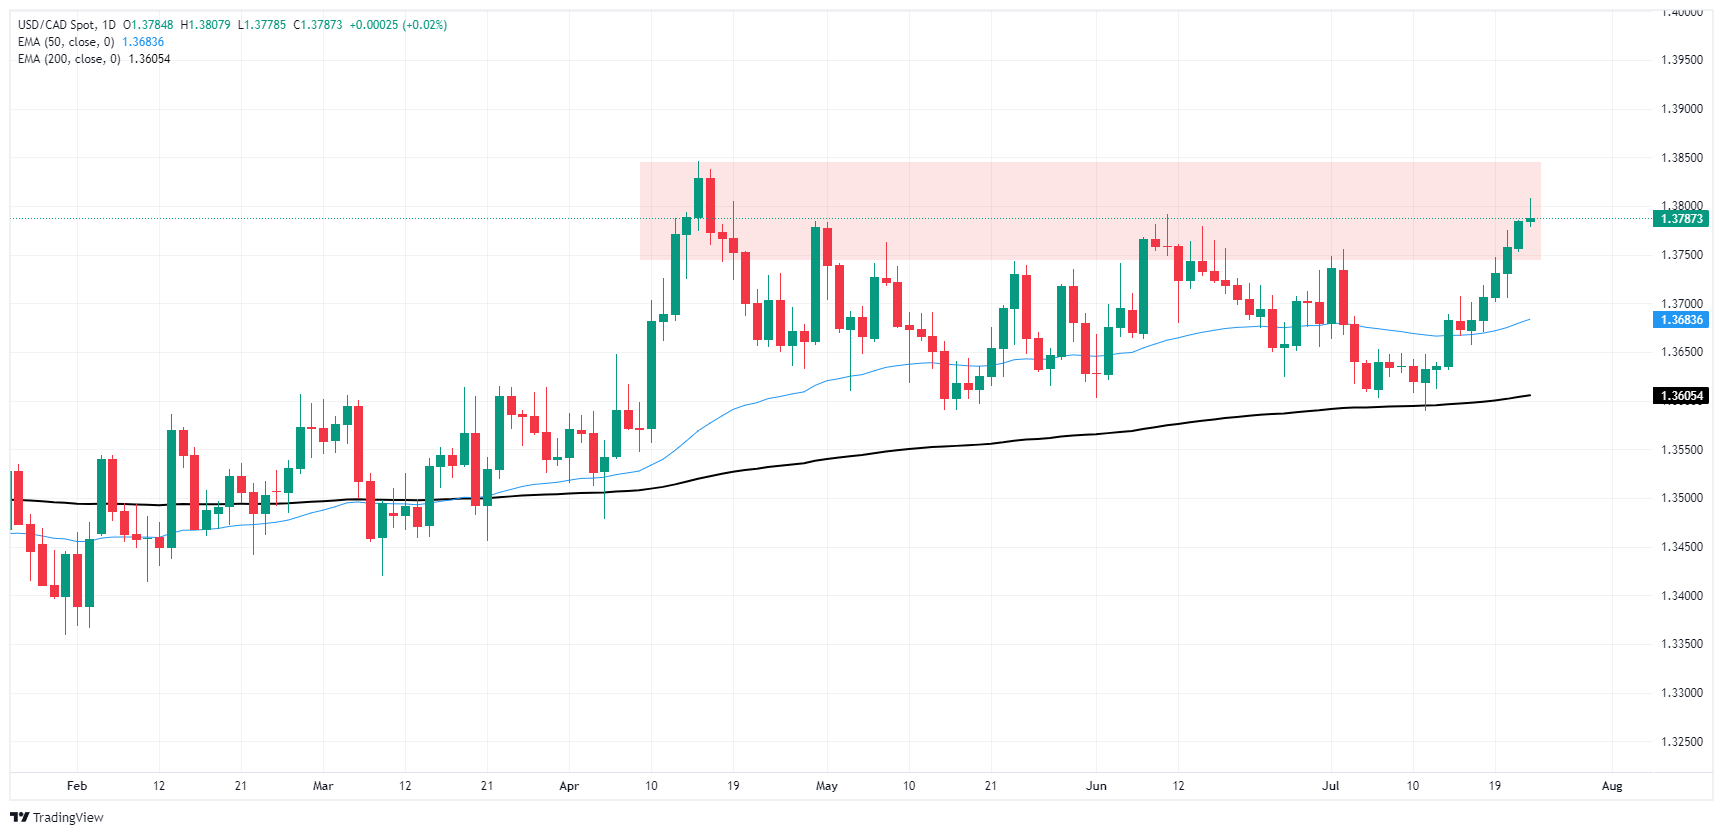
Canadian Dollar FAQs
The key factors driving the Canadian Dollar (CAD) are the level of interest rates set by the Bank of Canada (BoC), the price of Oil, Canada’s largest export, the health of its economy, inflation and the Trade Balance, which is the difference between the value of Canada’s exports versus its imports. Other factors include market sentiment – whether investors are taking on more risky assets (risk-on) or seeking safe-havens (risk-off) – with risk-on being CAD-positive. As its largest trading partner, the health of the US economy is also a key factor influencing the Canadian Dollar.
The Bank of Canada (BoC) has a significant influence on the Canadian Dollar by setting the level of interest rates that banks can lend to one another. This influences the level of interest rates for everyone. The main goal of the BoC is to maintain inflation at 1-3% by adjusting interest rates up or down. Relatively higher interest rates tend to be positive for the CAD. The Bank of Canada can also use quantitative easing and tightening to influence credit conditions, with the former CAD-negative and the latter CAD-positive.
The price of Oil is a key factor impacting the value of the Canadian Dollar. Petroleum is Canada’s biggest export, so Oil price tends to have an immediate impact on the CAD value. Generally, if Oil price rises CAD also goes up, as aggregate demand for the currency increases. The opposite is the case if the price of Oil falls. Higher Oil prices also tend to result in a greater likelihood of a positive Trade Balance, which is also supportive of the CAD.
While inflation had always traditionally been thought of as a negative factor for a currency since it lowers the value of money, the opposite has actually been the case in modern times with the relaxation of cross-border capital controls. Higher inflation tends to lead central banks to put up interest rates which attracts more capital inflows from global investors seeking a lucrative place to keep their money. This increases demand for the local currency, which in Canada’s case is the Canadian Dollar.
Macroeconomic data releases gauge the health of the economy and can have an impact on the Canadian Dollar. Indicators such as GDP, Manufacturing and Services PMIs, employment, and consumer sentiment surveys can all influence the direction of the CAD. A strong economy is good for the Canadian Dollar. Not only does it attract more foreign investment but it may encourage the Bank of Canada to put up interest rates, leading to a stronger currency. If economic data is weak, however, the CAD is likely to fall.
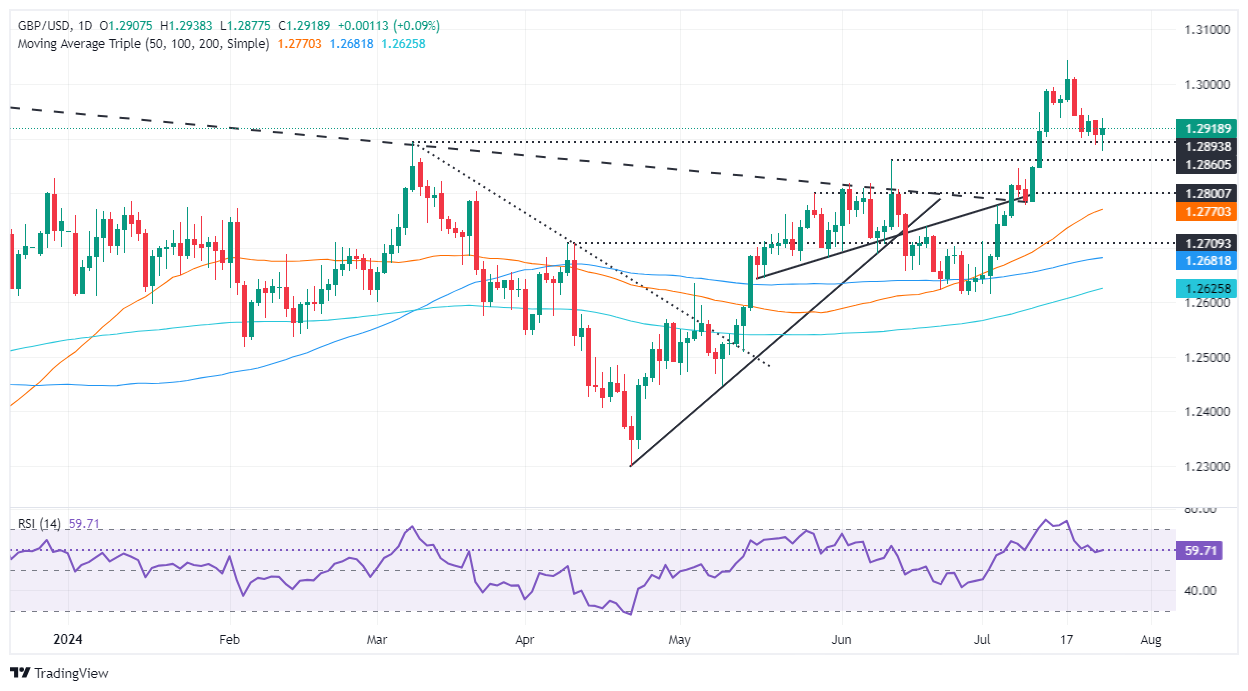
- GBP/USD remains subdued around 1.2900, bouncing off daily lows of 1.2877.
- Sellers failed to achieve a daily close below 1.2900, but momentum favors further losses.
- Key support levels at 1.2860 and 1.2779, with downside potential toward 100-DMA at 1.2678 if breached.
The Pound Sterling clings to minimal gains, though it remains stuck within the 1.2880-1.2940 range against the Greenback, unable to crack immediate resistance to push the GBP/USD pair toward the 1.3000 mark. At the time of writing, the major trades at 1.2926 after bouncing off daily lows of 1.2877.
GBP/USD Price Analysis: Technical outlook
The pair remained subdued for the fourth straight day, glued at around 1.2900; even though UK PMI data was stronger than expected, the pair failed to gain traction. Conversely, sellers pushed the GBP/USD three times below 1.2900 but failed to achieve a daily close below the latter, which could pave the way for a deeper pullback.
According to the Relative Strength Index (RSI), buyers have the edge from a momentum standpoint, but in the near term, sellers have moved in as the RSI slope aims downwards.
Hence, the GBP/USD could extend its losses. They will face key resistance at 1.2900 followed by the June 12 high at 1.2860. Once those levels are taken out, the next demand area will be the July 10 low at 1.2779, with further downside seen at the 100-day moving average (DMA) at 1.2678.
Conversely, if buyers lift the exchange rate past 1.2940, the next resistance would be 1.3000.
GBP/USD Price Action – Daily Chart
Pound Sterling FAQs
The Pound Sterling (GBP) is the oldest currency in the world (886 AD) and the official currency of the United Kingdom. It is the fourth most traded unit for foreign exchange (FX) in the world, accounting for 12% of all transactions, averaging $630 billion a day, according to 2022 data. Its key trading pairs are GBP/USD, aka ‘Cable’, which accounts for 11% of FX, GBP/JPY, or the ‘Dragon’ as it is known by traders (3%), and EUR/GBP (2%). The Pound Sterling is issued by the Bank of England (BoE).
The single most important factor influencing the value of the Pound Sterling is monetary policy decided by the Bank of England. The BoE bases its decisions on whether it has achieved its primary goal of “price stability” – a steady inflation rate of around 2%. Its primary tool for achieving this is the adjustment of interest rates. When inflation is too high, the BoE will try to rein it in by raising interest rates, making it more expensive for people and businesses to access credit. This is generally positive for GBP, as higher interest rates make the UK a more attractive place for global investors to park their money. When inflation falls too low it is a sign economic growth is slowing. In this scenario, the BoE will consider lowering interest rates to cheapen credit so businesses will borrow more to invest in growth-generating projects.
Data releases gauge the health of the economy and can impact the value of the Pound Sterling. Indicators such as GDP, Manufacturing and Services PMIs, and employment can all influence the direction of the GBP. A strong economy is good for Sterling. Not only does it attract more foreign investment but it may encourage the BoE to put up interest rates, which will directly strengthen GBP. Otherwise, if economic data is weak, the Pound Sterling is likely to fall.
Another significant data release for the Pound Sterling is the Trade Balance. This indicator measures the difference between what a country earns from its exports and what it spends on imports over a given period. If a country produces highly sought-after exports, its currency will benefit purely from the extra demand created from foreign buyers seeking to purchase these goods. Therefore, a positive net Trade Balance strengthens a currency and vice versa for a negative balance.
British Pound PRICE Today
The table below shows the percentage change of British Pound (GBP) against listed major currencies today. British Pound was the strongest against the New Zealand Dollar.
| USD | EUR | GBP | JPY | CAD | AUD | NZD | CHF | |
|---|---|---|---|---|---|---|---|---|
| USD | 0.00% | -0.08% | -1.49% | 0.03% | 0.14% | 0.17% | -0.82% | |
| EUR | -0.01% | -0.09% | -1.50% | 0.02% | 0.16% | 0.17% | -0.83% | |
| GBP | 0.08% | 0.09% | -1.41% | 0.11% | 0.24% | 0.26% | -0.76% | |
| JPY | 1.49% | 1.50% | 1.41% | 1.56% | 1.66% | 1.67% | 0.67% | |
| CAD | -0.03% | -0.02% | -0.11% | -1.56% | 0.11% | 0.15% | -0.87% | |
| AUD | -0.14% | -0.16% | -0.24% | -1.66% | -0.11% | 0.01% | -0.99% | |
| NZD | -0.17% | -0.17% | -0.26% | -1.67% | -0.15% | -0.01% | -1.01% | |
| CHF | 0.82% | 0.83% | 0.76% | -0.67% | 0.87% | 0.99% | 1.01% |
The heat map shows percentage changes of major currencies against each other. The base currency is picked from the left column, while the quote currency is picked from the top row. For example, if you pick the British Pound from the left column and move along the horizontal line to the US Dollar, the percentage change displayed in the box will represent GBP (base)/USD (quote).
- USD/CAD climbs to a fresh three-month high of 1.3800 as BoC cuts interest rates by 25 bps to 4.5% as expected.
- The US Dollar declines after a mixed US S&P Global flash PMI report for July.
- This week, investors will focus on the US PCE inflation for June.
The USD/CAD pair jumps to a fresh three-month high near the round-level resistance of 1.3800 in Wednesday’s American session. The Loonie asset strengthens as the announcement of Bank of Canada’s (BoC) subsequent rate cuts has weighed on the Canadian Dollar (CAD).
The Canadian currency weakens as the BoC reduces its key borrowing rates again by 25 basis points (bps) to 4.5%. The BoC was expected to lower its interest rates again amid cooling inflationary pressures and deteriorating labor market conditions.
The central bank forecasts consumer price inflation to stabilize at 2% by 2025 and has dialled down its growth forecast to 1.2% from 1.5%.
The appeal of the Canadian Dollar was already downbeat due to weak Oil prices. Weak Oil demand outlook due to China’s dismal economic prospects and easing supply concerns have beaten down the Oil price. It is worth noting that Canada is the leading exporter of Oil to the United States (US), and weak Oil prices weigh on the Canadian Dollar.
Meanwhile, the US Dollar (USD) has slumped after the release of the mix S&P Global PMI report for July. The Composite PMI data came in higher at 55.0 from the former release of 54.8. The US Dollar Index (DXY), which tracks the Greenback’s value against six major currencies, falls sharply from a weekly high of 104.50 to 104.20.
Going forward, investors will focus on the US Personal Consumption Expenditure Price Index (PCE) data for June, which will be published on Friday. The core PCE inflation, a Federal Reserve’s (Fed) preferred inflation tool, is estimated to have decelerated to 2.5% from May’s figure of 2.6%, with the monthly figure growing steadily by 0.1%.
Canadian Dollar FAQs
The key factors driving the Canadian Dollar (CAD) are the level of interest rates set by the Bank of Canada (BoC), the price of Oil, Canada’s largest export, the health of its economy, inflation and the Trade Balance, which is the difference between the value of Canada’s exports versus its imports. Other factors include market sentiment – whether investors are taking on more risky assets (risk-on) or seeking safe-havens (risk-off) – with risk-on being CAD-positive. As its largest trading partner, the health of the US economy is also a key factor influencing the Canadian Dollar.
The Bank of Canada (BoC) has a significant influence on the Canadian Dollar by setting the level of interest rates that banks can lend to one another. This influences the level of interest rates for everyone. The main goal of the BoC is to maintain inflation at 1-3% by adjusting interest rates up or down. Relatively higher interest rates tend to be positive for the CAD. The Bank of Canada can also use quantitative easing and tightening to influence credit conditions, with the former CAD-negative and the latter CAD-positive.
The price of Oil is a key factor impacting the value of the Canadian Dollar. Petroleum is Canada’s biggest export, so Oil price tends to have an immediate impact on the CAD value. Generally, if Oil price rises CAD also goes up, as aggregate demand for the currency increases. The opposite is the case if the price of Oil falls. Higher Oil prices also tend to result in a greater likelihood of a positive Trade Balance, which is also supportive of the CAD.
While inflation had always traditionally been thought of as a negative factor for a currency since it lowers the value of money, the opposite has actually been the case in modern times with the relaxation of cross-border capital controls. Higher inflation tends to lead central banks to put up interest rates which attracts more capital inflows from global investors seeking a lucrative place to keep their money. This increases demand for the local currency, which in Canada’s case is the Canadian Dollar.
Macroeconomic data releases gauge the health of the economy and can have an impact on the Canadian Dollar. Indicators such as GDP, Manufacturing and Services PMIs, employment, and consumer sentiment surveys can all influence the direction of the CAD. A strong economy is good for the Canadian Dollar. Not only does it attract more foreign investment but it may encourage the Bank of Canada to put up interest rates, leading to a stronger currency. If economic data is weak, however, the CAD is likely to fall.
A deterioration in downtrend signals on the horizon is expected. It can spark significant buying activity in WTI and Brent crudes over the coming sessions, as algos are forced to reaccumulate their recently liquidated length, TDS senior commodity strategist Daniel Ghali notes.
Buying activity in WTI and Brent crudes is due
“After all, our advanced positioning analytics have been highlighting that CTAs were likely to reaccumulate their length, even in a flat tape, which points to a natural deterioration in downtrend signals associated with moving windows.”
“Prices will need to remain on a downtrend only to keep algos from returning to the bid — which creates a set-up for a near-term reversal in prices. At the same time, our real-time gauge of commodity demand trends has finally sufficiently deteriorated towards oversold levels, suggesting that the reversal in demand sentiment may be overdone.”
“This week's Politburo meeting still presents a potential catalyst for a reversal in sentiment with a potential announcement of policy details designed to stimulate domestic demand following the Third Plenum.”
- NZD/USD recovers swiftly from 0.5910 as the US Dollar corrects.
- The US Dollar weakens after mixed US S&P flash PMI for July.
- China’s dismal economic prospects and increased RBNZ rate-cut bets have weighed on the New Zealand Dollar.
The NZD/USD pair recovers sharply after plunging to near 0.5910 in Wednesday’s American session. The Kiwi asset bounces back as the US Dollar (USD) corrects sharply after mix United States (US) S&P Global flash PMI data for July. The Manufacturing PMI surprisingly contracted, while the Services PMI expanded at a faster pace. The US Dollar Index (DXY), which tracks the Greenback’s value against six major currencies, declines from a fresh weekly high of 104.50.
Despite a decent recovery in the Kiwi asset, its near-term outlook remains vulnerable. The New Zealand Dollar (NZD) has delivered a negative closing against the US Dollar for four trading sessions in a row till Tuesday. Though the major has bounced back it is still in losses.
The Kiwi dollar has remained under pressure due to growing speculation that the Reserve Bank of New Zealand (RBNZ) will begin reducing interest rates this year. The expectations for early rate cuts have been prompted by easing price pressures. In the second quarter, inflationary pressures grew at a slower pace of 0.4% from the estimates and the former release of 0.6%. Annually, the price index has decelerated sharply to 3.5%.
Meanwhile, China’s dismal economic outlook has also weighed on the New Zealand Dollar. It is worth noting that New Zealand is one of the leading trading partners of China.
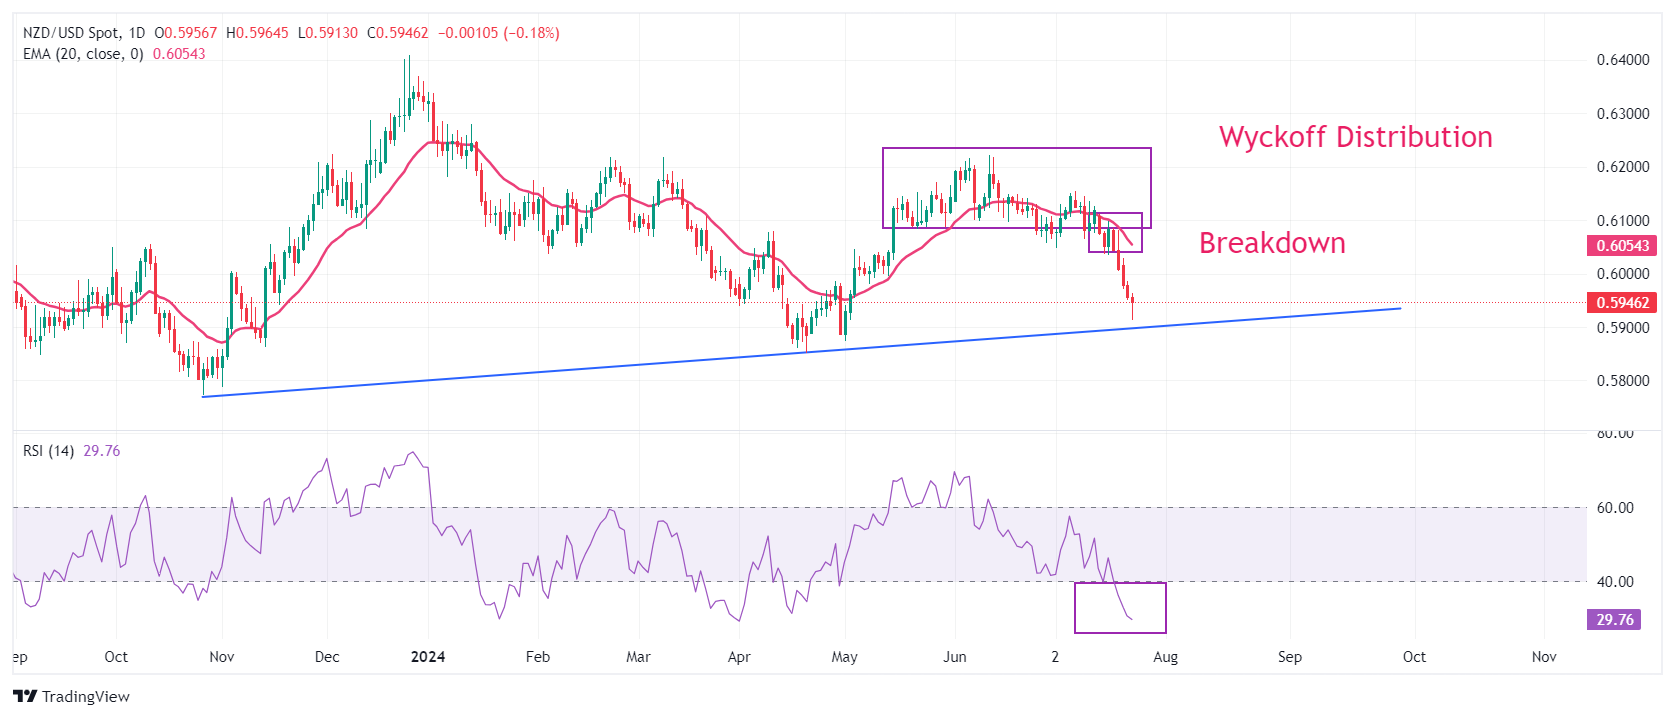
NZD/USD weakened after a breakdown of the Wyckoff Distribution formation on a daily timeframe. The Wyckoff Distribution exhibits the transfer of inventory from institutional investors to retail participants. The asset may find support near the trendline around 0.5900, plotted from 26 October 2023 low at 0.5770.
The declining 20-day Exponential Moving Average (EMA) near 0.6055 suggests that the overall trend is bearish.
The 14-day Relative Strength Index (RSI) declines into the bearish range of 20.00-40.00, suggesting that a bearish momentum has been triggered.
More downside would appear if the asset breaks below 19 April low around 0.5850. This would drag the asset towards the round-level support of 0.5800, followed by 26 October 2023 low at 0.5770.
In an alternate scenario, a recovery move above the psychological resistance of 0.6000 would shift the trend toward the upside. This would push the asset higher to May 3 high at 0.6046 and July 17 high near 0.6100.
NZD/USD daily chart
New Zealand Dollar FAQs
The New Zealand Dollar (NZD), also known as the Kiwi, is a well-known traded currency among investors. Its value is broadly determined by the health of the New Zealand economy and the country’s central bank policy. Still, there are some unique particularities that also can make NZD move. The performance of the Chinese economy tends to move the Kiwi because China is New Zealand’s biggest trading partner. Bad news for the Chinese economy likely means less New Zealand exports to the country, hitting the economy and thus its currency. Another factor moving NZD is dairy prices as the dairy industry is New Zealand’s main export. High dairy prices boost export income, contributing positively to the economy and thus to the NZD.
The Reserve Bank of New Zealand (RBNZ) aims to achieve and maintain an inflation rate between 1% and 3% over the medium term, with a focus to keep it near the 2% mid-point. To this end, the bank sets an appropriate level of interest rates. When inflation is too high, the RBNZ will increase interest rates to cool the economy, but the move will also make bond yields higher, increasing investors’ appeal to invest in the country and thus boosting NZD. On the contrary, lower interest rates tend to weaken NZD. The so-called rate differential, or how rates in New Zealand are or are expected to be compared to the ones set by the US Federal Reserve, can also play a key role in moving the NZD/USD pair.
Macroeconomic data releases in New Zealand are key to assess the state of the economy and can impact the New Zealand Dollar’s (NZD) valuation. A strong economy, based on high economic growth, low unemployment and high confidence is good for NZD. High economic growth attracts foreign investment and may encourage the Reserve Bank of New Zealand to increase interest rates, if this economic strength comes together with elevated inflation. Conversely, if economic data is weak, NZD is likely to depreciate.
The New Zealand Dollar (NZD) tends to strengthen during risk-on periods, or when investors perceive that broader market risks are low and are optimistic about growth. This tends to lead to a more favorable outlook for commodities and so-called ‘commodity currencies’ such as the Kiwi. Conversely, NZD tends to weaken at times of market turbulence or economic uncertainty as investors tend to sell higher-risk assets and flee to the more-stable safe havens.
- S&P Global Composite PMI in the US edged higher in July's flash estimate.
- US Dollar Index stays under bearish pressure, declines toward 104.00.
The business activity in the US private sector continued to expand at a healthy pace in July, with the preliminary S&P Global Composite PMI improving to 55 from 54.8 in June.
The S&P Global Manufacturing PMI declined to 49.5 from 51.6 in the same period, while the Services PMI rose to 56 from 55.3.
Assessing the PMI surveys' findings, "the flash PMI data signal a ‘Goldilocks’ scenario at the start of the third quarter, with the economy growing at a robust pace while inflation moderates," said Chris Williamson, Chief Business Economist at S&P Global Market Intelligence.
"In terms of inflation, the July survey saw input costs rise at an increased rate, linked to rising raw material, shipping and labour costs," Williamson added. "These higher costs could feed through to higher selling prices if sustained, or cause a squeeze on margins."
Market reaction
The US Dollar came under bearish pressure with the immediate reaction. At the time of press, the US Dollar Index was down 0.3% on the day at 104.15.
The Pound Sterling (GBP) is attracting some clear support after easing briefly under 1.29 earlier. Gains above 1.2940 would lift the GBP back towards 1.30, Scotiabank’s chief FX strategist Shaun Osborne notes.
Cable is set to extend1.2940
“UK preliminary PMI data was constructive. The July data advanced on June’s readings and were close to, or slightly better than, expectations. The data suggest steady, if uninspiring, growth momentum and leaves the debate over the near-term BoE policy outlook unresolved (11-12bps of cuts priced in for August 1).”
“The GBP is attracting some clear support after easing briefly under 1.29 earlier. Intraday trading patterns are turning more positive and suggest the squeeze higher in Cable may extend. Gains above 1.2940 would lift the GBP back towards 1.30.”
Soft and softer than expected preliminary Eurozone PMI data for July weighed on the Euro (EUR) earlier. EUR losses may be steadying ahead of a mass of support in the low 1.08s, Scotiabank’s chief FX strategist Shaun Osborne notes.
A modest bid for the EUR is developing around 1.0825/30
“Soft and softer than expected preliminary Eurozone PMI data for July weighed on the EUR earlier. France’s Services sector improved, rising above 50 to 50.7 but German data was soft, with Manufacturing easing back to 42.6. The Eurozone Composite index fell to 50.1 versus 50.9 in June and 50.9 forecast, casting some doubt over the momentum behind the recovery.”
“EUR losses may be steadying ahead of a mass of support in the low 1.08s. Intraday price patterns suggest a modest bid for the EUR is developing around 1.0825/30. The daily chart suggests a potential bull “hammer” pattern might form today (although there is a lot of ground to cover over the balance of the session).”
“Minor resistance sits at 1.0860/70. A move back above 1.0910 would be bullish.”
The Canadian Dollar (CAD) is on the defensive ahead of the Bank of Canada (BoC) policy decision, sliding to its lowest in three months against the US Dollar (USD). Oil has snapped 2%+ higher today but that will not alter CAD dynamics significantly, Scotiabank’s chief FX strategist Shaun Osborne notes.
The USD is heavily overbought on the intraday
“A quarter point cut from the BoC is more or less fully priced in at this point but the Bloomberg survey reflects a clear minority who favour a hold today. That seems unlikely based on the Bank’s track record. A hold today might also suggest that it was too quick off the mark in June with the first cut. The governor has sounded dovish and appears in a mood to ease.”
“Another cut is very likely to emerge today and the tone from the full suite of communications is likely to keep the door open to more cuts ahead. The CAD’s slide to 1.38 risks perhaps extending a little more but saving grace in the outlook at the moment is the IMM data reflecting an already heavily short CAD base exists in the market. Some profit-taking after the Bank decision might give the CAD a bit of a lift.”
There is no reason not to expect the USD’s steady advance from the 1.36 low reached on July 11th to extend. The USD has exceeded the June 11th high of 1.3790 so there is no clear impediment to the USD advancing to retest the April peak at 1.3846. The USD is heavily overbought on the intraday. Initial support sits at 1.3760, then 1.37.”
- EUR/GBP has fallen to a tough support level and stalled.
- The pair remains in a short and medium-term downtrend with some bullish signs complicating the picture.
EUR/GBP finds support at the June 14 lows and consolidates. The pair has been in a downtrend after breaking out of a sideways consolidation or wedge pattern which formed between February and May.
EUR/GBP Daily Chart
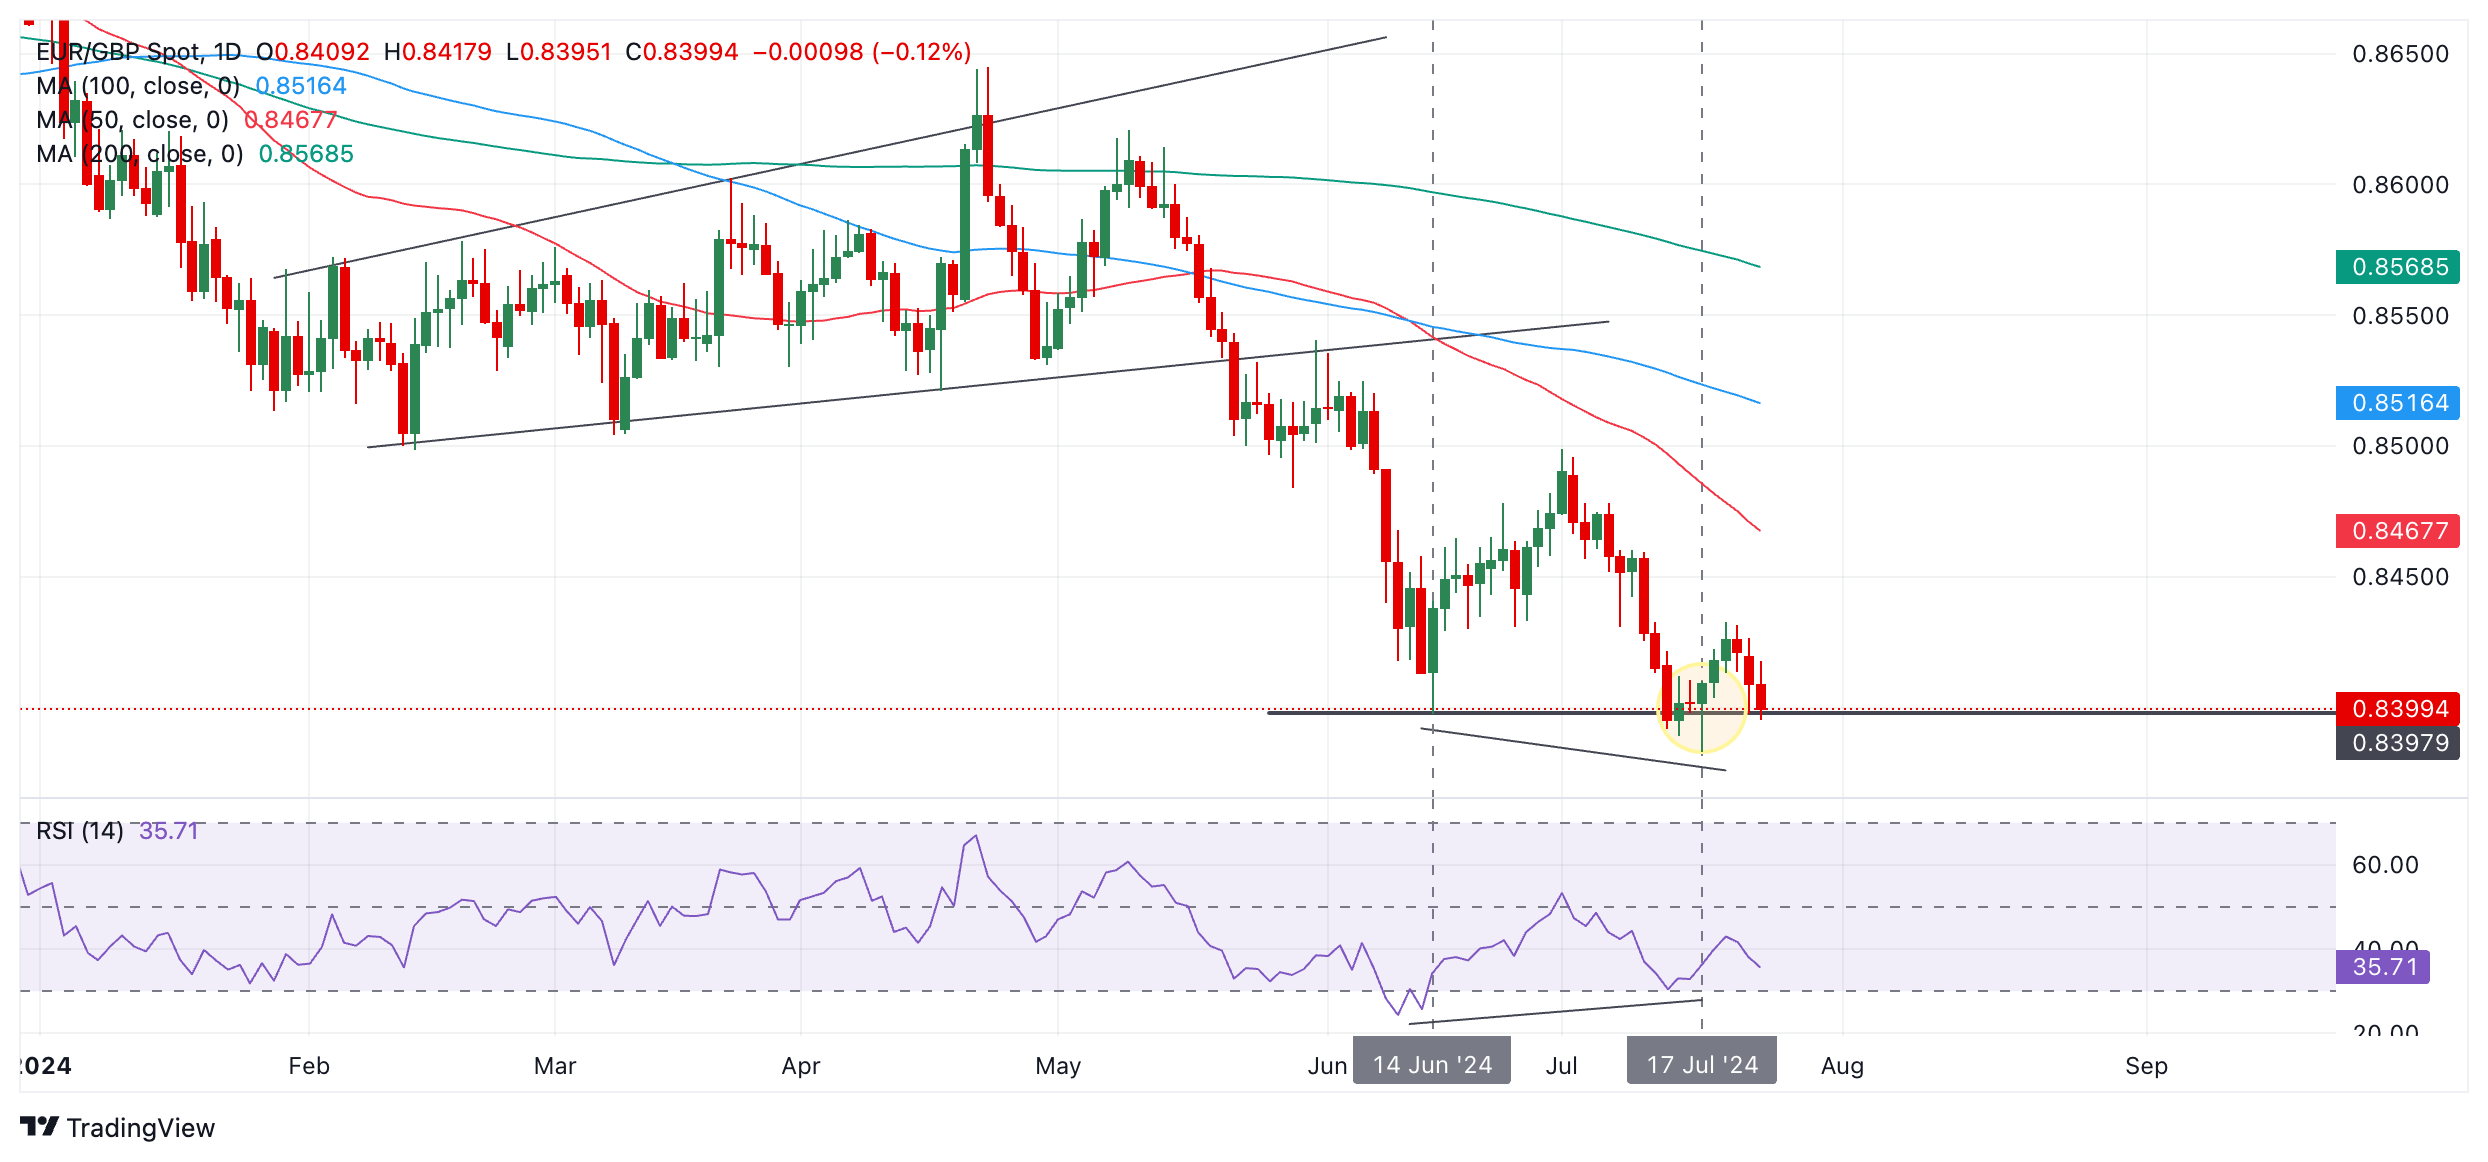
The June 14 low at 0.8398 will probably provide robust support and it is possible the pair could undergo a reversal using the level as a launchpad higher. However, there are only tentative secondary indications that this is happening. Price itself continues to fall, and price is the most important indicator.
That said, the pair formed a bullish Japanese Hammer candlestick pattern on July 17 and this was followed by a green up day further confirming the bullish pattern. Candlesticks, however, are more reliable as short-term signals.
EUR/GBP is converging bullishly with the Relative Strength Index (RSI) between the June 14 and July 17 lows. This is also a potentially bullish sign. This happens when price makes a new low, as it did in July, but the RSI does not also make a new low. This indicates a lack of bearish momentum, and can be an early warning sign of a reversal in the trend.
Despite these signs, the short and medium-term trends are still bearish which means broad downside pressure will probably persist, and the odds favor on balance more downside. A break below the lows of the Hammer candlestick at 0.8383 would usher in more weakness. The next target lower would probably be the round-number at 0.8350.
It would require a break above 0.8499 (July 1 high) to upend the downtrend and indicate the pair was in a more bullish environment.
The National Bank of Hungary delivered a 25bp rate cut to 6.75% yesterday, bringing it closer to its CEE peers again, ING’s FX strategist Frantisek Taborsky notes.
NBH rate cut encourages FX to weaken
“While NBH communication hasn't changed much, we saw openness to rate cuts for the next meetings. However, it is clear that the inflation rebound rate in the coming months and EUR/HUF will be crucial. On the inflation side, our economists still expect rather more than the current consensus with 5.3% at the end of the year. For now, we leave one additional rate cut for this year in our forecast.”
“The HUF therefore has a heavy burden to bear in our view. We have been bearish here for some time, and this is mainly due to the rally in the rates market in the last three weeks and the significant tightening of the rate differential that we discussed here earlier. Yesterday's rate cut is just a confirmation for markets of the current market pricing and will be a trigger for HUF to weaken.”
“Although summer low liquidity may bring surprises, we believe EUR/HUF will go up in the coming days, with 394 as the first stop. In the medium term, we maintain a trading range of 385-400 EUR/HUF, which makes sense for us to keep going forward. However, in the short term, we now see a move towards the upper range due to the NBH's stance and market pricing.”
- USD/JPY is extending its downmove as it continues selling-off.
- Both the short and medium-term trends are now probably bearish.
- The pair now targets the October 2021 high in the 151s.
USD/JPY is trading over 1.0% lower on Wednesday as it extends its bearish trend reversal after peaking at the July 10 highs and then rolling over.
After the recent bout of weakness, it could now be argued that both the short and probably medium-term trends have turned bearish. Given the old adage that “the trend is your friend” the odds favor a continuation lower over those time frames.
USD/JPY Daily Chart
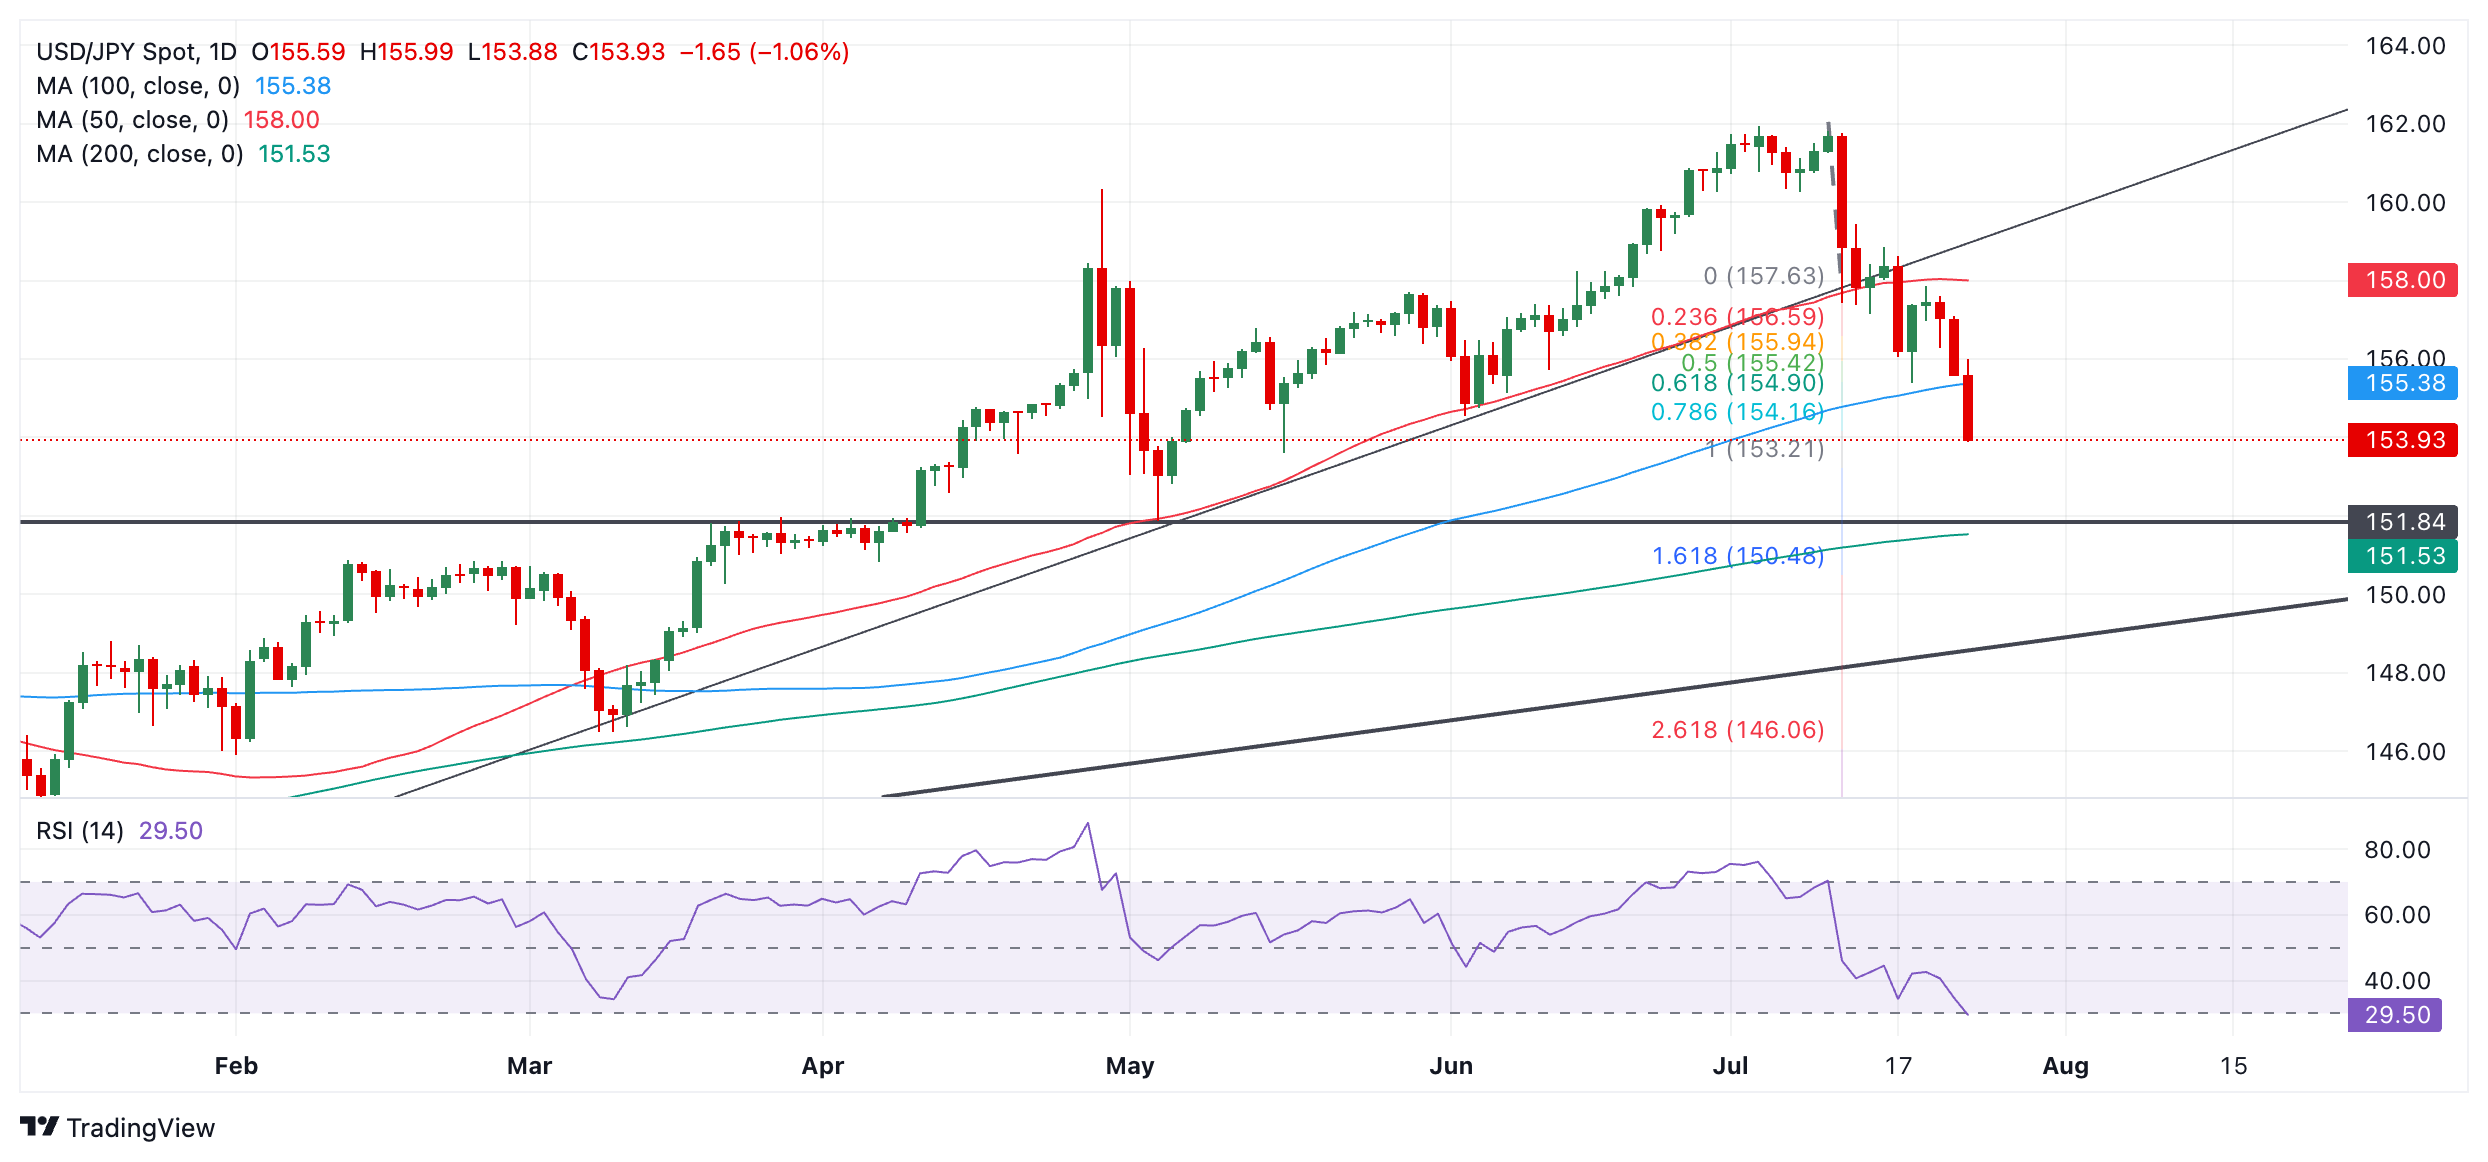
USD/JPY has reached its conservative downside target at 154.90, which is the 61.8% Fibonacci extension of the down move prior to the major trendline break, extrapolated lower. It has also now almost reached 153.21, the 100% extrapolation of the same.
It is possible prices could continue falling to the next obvious target at 151.84 and a key support level (October 2021 high).
The Relative Strength Index (RSI) is just about in oversold territory on an intraday basis. If the day ends with the RSI below 30 and, therefore, oversold there will be an increased risk of a pullback or consolidation developing and delaying the pair’s continued sell-off.
The long-term trend remains bullish with a break below 151.84 required to bring that into doubt.
- USD/CHF is in a tailspin amid growing expectations the Fed will make multiple cuts to interest rates in 2024, weakening the US Dollar.
- A string of below-par data releases and Kamala Harris’ growing popularity are weighing on the Greenback.
- USD/CHF falls over half a percent in a day.
The USD/CHF pair trades down in the 0.8850s on Wednesday, driven by growing expectations that the US Federal Reserve (Fed) will cut interest rates in September. Such a move would weaken the US Dollar (USD), as lower interest rates tend to attract less foreign capital inflows.
According to the CME FedWatch Tool, which uses the price of 30-day Fed Funds futures to calculate probabilities, there is a 95% chance of a Fed rate cut in September, with two more cuts likely by the end of the year. This expectation is weighing heavily on the USD, contributing to its decline against the Swiss Franc (CHF).
Another factor impacting USD/CHF is the news that US Vice President Kamala Harris has secured enough delegates to clinch the Democratic nomination. The latest Ipsos Reuters poll shows Harris leading Donald Trump, prompting some unwinding of the "Trump trade," which is typically correlated with higher US yields and a stronger USD.
Meanwhile, the Swiss National Bank (SNB) reduced its key policy rate by 0.25% to 1.25% in June 2024, following a similar move in the previous meeting. The move came as the country continued to experience lower inflation, partly as a result of the strength of the Swiss Franc (CHF). Inflation in Switzerland is currently driven mainly by higher prices for domestic services. The SNB's new conditional inflation forecast is similar to March's, predicting average annual inflation of 1.3% in 2024, 1.1% in 2025, and 1.0% in 2026, assuming the policy rate remains at 1.25%, according to Trading Economics. Official figures showed inflation edged down to 1.3% in June, matching the SNB's projections.
USD/CHF traders are now looking forward to upcoming US economic data for clarity on the trajectory of US interest rates. Key releases include the US Q2 Gross Domestic Product (GDP) growth data on Thursday and the Personal Consumption Expenditures (PCE) Price Index report for June on Friday. Additionally, the preliminary US July S&P Global Purchasing Managers Index (PMI) will be released on Wednesday, providing fresh impetus for traders.
The Q2 GDP growth advance estimate is expected to show a 1.9% expansion, up from 1.4% in Q1, while the PCE price index is forecasted to see a 0.1% uptick after remaining flat in May. Although cooling US headline consumer inflation has bolstered expectations for a September rate cut, the likelihood of further cuts remains uncertain. If the data surprises to the upside, the Fed may delay lowering interest rates beyond September, which would support the USD/CHF pair.
On the Swiss data front, the CHF was supported by trade surplus data, which increased to 4.9 billion CHF in June 2024 from an upwardly revised 4.2 billion CHF in the previous month, marking the largest trade surplus since September 2023. Exports increased by 1.2% month-on-month to 23.3 billion CHF, driven by higher sales of vehicles (+5%) and chemical-pharmaceutical products (+2.9%), said Trading Economics.
We expect the Bank of Canada to cut the policy rate by 25bp today. This is almost entirely priced in by markets (21bp), which currently expect a total 65bp of easing by year-end. Consensus is not unanimous, but the majority of economists call for a cut as opposed to a hold, ING’s FX strategist Francesco Pesole notes.
USD/CAD may find its way into the 1.38-1.39 range
“There is a strong case from a macro perspective to continue easing after the June cut. All main measures of inflation are now within the 1-3% BoC tolerance band, with the headline and median core rates coming in lower than expected in June at 2.7% and 2.6% respectively. The only argument for keeping rates on hold at this meeting is probably the divergence with the Fed.”
“The widening BoC-Fed gap has obvious repercussions on the Canadian Dollar (CAD), and there could be some concerns down the road that an excessive depreciation of the loonie raises inflationary risks. In our view, as long as USD/CAD stays under 1.40, the currency situation should remain very much secondary in the BoC’s decision-making.”
“There is a possibility that Governor Tiff Macklem will strike a caution tone on further easing and take shelter behind a data-dependent, meeting-by-meeting approach. Still, the risks are skewed towards the downside for CAD as markets will be tempted to fully price in another two cuts by year-end. USD/CAD may find its way well into the 1.38-1.39 range in the near term, and CAD could start losing some ground against other high-beta G10 currencies.”
The FX market got a little shake-up yesterday as EUR/USD broke lower from its recent flat trading. The US Dollar (USD) losses from the softer June CPI report have now been erased in most USD crosses, with Japanese Yen (JPY), Swiss CHF and GBP standing our as a few key winners, ING’s FX strategist Francesco Pesole notes.
Low FX volatility environment doesn’t favour carry trades
“Looking at the bottom of the FX scorecard, we sense the Trump trade is still very much at play. Scandinavian and Antipodeans are all 2.3-3.0% weaker against the dollar since the assassination attempt of Donald Trump on 13 July, and that’s despite some currency-positive news like above-consensus non-tradeable CPI in New Zealand and strong employment numbers in Australia.”
“This appears more an adjustment to the Trump re-election risk rather than the start of a multi-month trend. The Federal Reserve story remains negative for the USD and should ultimately put a cap to dollar gains short-term. Yesterday, a robust two-year Treasury auction drew the lowest yields from January, and we think that a BoC cut today can help further cement Fed cut expectations.”
“The FX market defaults to focusing on domestic stories while the currencies sensitive to the Trump trade struggle to recover in the near term. The low FX volatility environment is clearly not favouring any rotation back to carry trades. On the contrary, markets appear to be unwinding positions in some selected high-yielding currencies like MXN and ZAR, while the funding JPY continues to perform very well.”
The Euro (EUR) is the third best performing G10 currency in the year to date, after the Pound Sterling (GBP) and the US Dollar (USD). The EUR is also the third best performing G10 currency in the month to date, supported by relief that the far-right were beaten into third place in France’s run-off parliamentary elections, Rabobank’s senior FX strategist Jane Foley.
EUR/USD is currently trading in the upper half of the range
“The biggest influence on the EUR/USD exchange rate in the coming months is likely to be the US election. That said, EUR/USD is currently trading in the upper half of the range that has held through much of this year and the numerous bad spots in the Eurozone’s economic and political backdrop argue in favour of downside risk. We see EUR/USD moving lower, potentially to 1.05 on a 3-month view.”
“This year, the EUR has largely shrugged off Germany’s sluggish production sector, France’s budget woes and the fairly widespread move towards right wing politics across the region. The Eurozone maintains a current account surplus which should offer the EUR some protection from speculative flows and a souring in sentiment.”
“That said, assuming no surprise lurch in ECB-Fed rate expectations we see little justification for the EUR to hold levels in the upper-end of its range. Now that a September rate cut for the Fed is priced-in, we expect EUR/USD to edge lower. The 200-day sma is likely to offer some support around 1.0813.”
The Purchasing Managers' Index for the manufacturing and services sectors, the most reliable economic barometer for the euro area, fell for the second month in a row in July (from 50.9 to 50.1). This dampens hopes of a swift recovery in the euro area. This recovery is likely to start later and be weaker than many forecasts expect. This applies in particular to Germany, where the PMIs once again fell more sharply than the euro area average, Commerzbank economist Vincent Stamer notes.
Euro area PMIs dampen hopes of a recovery in the euro area
“The composite Purchasing Managers' Index eurozone fell for the second time in a row in July. The index fell from 50.9 to 50.1 (Table 1), disappointing expectations. The economists surveyed in advance had expected a stagnation. The unexpected setback in the previous month was therefore not a downward outlier.”
“Although the index is still just within the range in which the economy has grown in the past, the upward trend that has been in place since last year, has come to an end for the time being. The decline was particularly sharp in Germany. Here, the mood in both the manufacturing sector (from 43.5 to 42.6) and the service sector (from 53.1 to 52.0) deteriorated significantly.”
“Today's weak figures put a question mark over a noticeable economic recovery expected by many forecasters for the second half of the year. The only positive news comes from the sub-category of the sales prices for services. Both the weak momentum in the sentiment indicators and the assessment of service prices are likely to encourage the ECB to cut key interest rates again in September.”
- The Mexican Peso is declining after Mexican GDP and Retail Sales data missed economists’ expectations.
- The Banxico is now widely expected to cut interest rates in August, further weighing on the Peso.
- USD/MXN is now in a short-term uptrend, with sights set on the June 28 high.
The Mexican Peso (MXN) is trading lower in its most heavily traded pairs on Wednesday after a string of macroeconomic data releases showed below-expectations growth and activity in Mexico. This, in turn, has increased bets the Bank of Mexico (Banxico) will cut its main interest rate at its meeting in August. Such a move would be negative for the Peso since lower interest rates reduce foreign capital inflows.
Meanwhile, traders await the release of the latest Mexican inflation data on Wednesday, to further assess the likely outlook for monetary policy.
At the time of writing, one US Dollar (USD) buys 18.20 Mexican Pesos, EUR/MXN trades at 19.73, and GBP/MXN at 23.48.
Mexican Peso falls after weak macroeconomic data weighs
The Mexican Peso is weakening in its main pairs amid signs the Mexican economy is slowing down. Disappointing retail sales figures have contributed to a bleak outlook for Mexico's economic activity. This, combined with expectations of a 0.25% interest rate cut by Banxico in August, has led to a downward revision for the Peso’s year-end forecasts. The USD/MXN, which gives the number of Pesos a single US Dollar can purchase, is now forecast to rise from 18.70 to 18.80, according to the Citi Research Expectations survey.
The latest Economic Activity Indicator from the Instituto Nacional de Estadistica, Geografia e Informatica (INEGI) underscores ongoing economic challenges. According to INEGI, Mexico’s economy expanded by 1.6% year-over-year (YoY) in May, a notable deceleration from the near-two-year-high increase of 5.4% recorded in the previous month. Despite this slowdown, the growth exceeded market expectations of a 1.4% increase, buoyed by robust performance in services.
Retail sales for May grew by 0.3% from the same period in the previous year, significantly easing from a 3.2% increase in April. On a seasonally adjusted monthly basis, retail sales inched up by 0.1% following a 0.5% increase in April.
Adding to the economic uncertainty, Fitch Ratings reaffirmed Mexico’s BBB- rating but warned of potential impacts from proposed judicial reforms. Meanwhile, the International Monetary Fund (IMF) revised Mexico’s 2024 Gross Domestic Product (GDP) growth forecast down from 2.4% to 2.2%, citing a slowdown in manufacturing linked to reduced US economic activity. This has pressured Banxico to consider a more accommodative monetary stance.
Market participants are now focused on the release of Mexico’s mid-month inflation figures, scheduled for Wednesday at 12:00 GMT. Expectations are set for the mid-month Core Inflation Rate at 0.17% month-over-month (MoM) in July and at 4.01% YoY, down from 4.17% in June. The headline mid-month Inflation Rate is anticipated to rise to 0.38% MoM, with the YoY figure expected to increase to 5.26%, up from 4.78% in the previous month.
Furthermore, the Mexican Congress is set to discuss President Andrés Mañuel Lopez Obrador's judicial reform on August 1, in preparation for approval once the new Congress begins its term on September 1. This political development adds another layer of complexity to the economic landscape.
Technical Analysis: USD/MXN now targeting June 28 high at 18.60
USD/MXN found support at the 50-day Simple Moving Average (SMA) after completing an ABC correction lower, and has rebounded higher, hurdling the 18.00 barrier in the process.
USD/MXN Daily Chart
The short-term trend is now bullish for USD/MXN, and given that the “trend is your friend,” this still technically favors bullish bets over that timeframe.
The next target higher for the pair is the key June 28 swing high at 18.60.
Meanwhile, the direction of the medium and long-term trends remain in doubt.
Economic Indicator
1st half-month Inflation
The 1st half-month core inflation index released by the Bank of Mexico is a measure of price movements by the comparison between the retail prices of a representative shopping basket of goods and services. The purchase power of Mexican Peso is dragged down by inflation. The inflation index is a key indicator since it is used by the central bank to set interest rates. Generally speaking, a high reading is seen as positive (or bullish) for the Mexican Peso, while a low reading is seen as negative (or Bearish).
Read more.Next release: Wed Jul 24, 2024 12:00
Frequency: Monthly
Consensus: 0.38%
Previous: 0.21%
Source: National Institute of Statistics and Geography of Mexico
Silver prices (XAG/USD) rose on Wednesday, according to FXStreet data. Silver trades at $29.28 per troy ounce, up 0.18% from the $29.23 it cost on Tuesday.
Silver prices have increased by 23.07% since the beginning of the year.
| Unit measure | Silver Price Today in USD |
|---|---|
| Troy Ounce | 29.28 |
| 1 Gram | 0.94 |
The Gold/Silver ratio, which shows the number of ounces of Silver needed to equal the value of one ounce of Gold, stood at 82.42 on Wednesday, broadly unchanged from 82.43 on Tuesday.
Silver FAQs
Silver is a precious metal highly traded among investors. It has been historically used as a store of value and a medium of exchange. Although less popular than Gold, traders may turn to Silver to diversify their investment portfolio, for its intrinsic value or as a potential hedge during high-inflation periods. Investors can buy physical Silver, in coins or in bars, or trade it through vehicles such as Exchange Traded Funds, which track its price on international markets.
Silver prices can move due to a wide range of factors. Geopolitical instability or fears of a deep recession can make Silver price escalate due to its safe-haven status, although to a lesser extent than Gold's. As a yieldless asset, Silver tends to rise with lower interest rates. Its moves also depend on how the US Dollar (USD) behaves as the asset is priced in dollars (XAG/USD). A strong Dollar tends to keep the price of Silver at bay, whereas a weaker Dollar is likely to propel prices up. Other factors such as investment demand, mining supply – Silver is much more abundant than Gold – and recycling rates can also affect prices.
Silver is widely used in industry, particularly in sectors such as electronics or solar energy, as it has one of the highest electric conductivity of all metals – more than Copper and Gold. A surge in demand can increase prices, while a decline tends to lower them. Dynamics in the US, Chinese and Indian economies can also contribute to price swings: for the US and particularly China, their big industrial sectors use Silver in various processes; in India, consumers’ demand for the precious metal for jewellery also plays a key role in setting prices.
Silver prices tend to follow Gold's moves. When Gold prices rise, Silver typically follows suit, as their status as safe-haven assets is similar. The Gold/Silver ratio, which shows the number of ounces of Silver needed to equal the value of one ounce of Gold, may help to determine the relative valuation between both metals. Some investors may consider a high ratio as an indicator that Silver is undervalued, or Gold is overvalued. On the contrary, a low ratio might suggest that Gold is undervalued relative to Silver.
(An automation tool was used in creating this post.)
- AUD/USD tumbles to near 0.6600 on multiple headwinds.
- China’s poor economic outlook, sliding iron ore prices, and weak Aussie Judo Bank flash PMI have weighed heavily on the Australian Dollar.
- The US Dollar will dance to the tunes of the US PCE inflation report for June.
The AUD/USD pair extends its losing spell for the eighth trading session on Wednesday. The Aussie asset remains in the bearish trajectory due to multiple headwinds. China’s weak economic prospects, sliding base metals’ prices, and weak Judo Bank flash PMI have weighed heavily on the Australian Dollar (AUD).
The Australian Dollar has faced an intense sell-off due to China’s poor economic outlook. China’s Q2 Gross Domestic Product (GDP) grew weaker than projected due to vulnerable demand from domestic and in the overseas market. Concerns over GDP growth of world’s second-largest economy remaining sluggish deepened after a surprise rate-cut decision by the People’s Bank of China (PBoC) on Monday and an absence of significant spending measures in the Third Plenum. Being a proxy for China’s economic prospects, the Australian Dollar has been hit in the last few trading sessions.
Meanwhile, China’s poor economic outlook has resulted in a sharp fall in prices of base metals. Iron ore prices have hit their lowest level in three weeks. This has brought a negative impact on the Australian Dollar, being the largest exporter of the base metal in the world.
In early Asian trading hours on Wednesday, the preliminary Judo Bank PMI report showed that the Composite PMI dropped to 50.2 from the former release of 50.7. The Manufacturing PMI improved slightly to 47.4 but contracted again. A figure below the 50.0 threshold is considered a contraction in manufacturing activities. The Service PMI expanded at a slower pace to 50.8 from the former release of 51.2.
Dismal market sentiment has also kept pressure on the Aussie asset. While the US Dollar (USD) clings to gains due to deepening United States (US) political uncertainty. The US Dollar Index (DXY) grips gains to near 104.50.
This week, investors will keenly focus on the Personal Consumption Expenditure Price Index (PCE) data for June, which will be published on Friday. The inflation gauge will indicate whether current market expectations that the Federal Reserve (Fed) to begin reducing interest rates from September are appropriate.
Australian Dollar FAQs
One of the most significant factors for the Australian Dollar (AUD) is the level of interest rates set by the Reserve Bank of Australia (RBA). Because Australia is a resource-rich country another key driver is the price of its biggest export, Iron Ore. The health of the Chinese economy, its largest trading partner, is a factor, as well as inflation in Australia, its growth rate and Trade Balance. Market sentiment – whether investors are taking on more risky assets (risk-on) or seeking safe-havens (risk-off) – is also a factor, with risk-on positive for AUD.
The Reserve Bank of Australia (RBA) influences the Australian Dollar (AUD) by setting the level of interest rates that Australian banks can lend to each other. This influences the level of interest rates in the economy as a whole. The main goal of the RBA is to maintain a stable inflation rate of 2-3% by adjusting interest rates up or down. Relatively high interest rates compared to other major central banks support the AUD, and the opposite for relatively low. The RBA can also use quantitative easing and tightening to influence credit conditions, with the former AUD-negative and the latter AUD-positive.
China is Australia’s largest trading partner so the health of the Chinese economy is a major influence on the value of the Australian Dollar (AUD). When the Chinese economy is doing well it purchases more raw materials, goods and services from Australia, lifting demand for the AUD, and pushing up its value. The opposite is the case when the Chinese economy is not growing as fast as expected. Positive or negative surprises in Chinese growth data, therefore, often have a direct impact on the Australian Dollar and its pairs.
Iron Ore is Australia’s largest export, accounting for $118 billion a year according to data from 2021, with China as its primary destination. The price of Iron Ore, therefore, can be a driver of the Australian Dollar. Generally, if the price of Iron Ore rises, AUD also goes up, as aggregate demand for the currency increases. The opposite is the case if the price of Iron Ore falls. Higher Iron Ore prices also tend to result in a greater likelihood of a positive Trade Balance for Australia, which is also positive of the AUD.
The Trade Balance, which is the difference between what a country earns from its exports versus what it pays for its imports, is another factor that can influence the value of the Australian Dollar. If Australia produces highly sought after exports, then its currency will gain in value purely from the surplus demand created from foreign buyers seeking to purchase its exports versus what it spends to purchase imports. Therefore, a positive net Trade Balance strengthens the AUD, with the opposite effect if the Trade Balance is negative.
The new Modi government unveiled a responsible and prudent budget yesterday that focused on job creation, upskilling the youth and women, and improving infrastructure, Commerzbank FX strategist Charlie Lay notes.
Government maintains commitment to fiscal consolidation
“The Indian government maintained its commitment to fiscal consolidation and there were no signs of fiscal profligacy. Some had feared a ramp-up in populist spending after the weaker-than-expected performance by PM Modi’s Bharatiya Janata Party (BJP) in this year’s federal election. The government even lowered the fiscal deficit projection for the current fiscal year 2024-2025 to 4.9% of GDP vs the interim projection of 5.1% in February and against 5.6% for the previous year.”
“These are positive signs and pave the way for a rating upgrade in the next year or two. S&P upgraded India’s rating outlook to positive from neutral in May this year. It cited the robust growth environment and the improving quality of government spending. The budget allocated INR11.1trn or 3.4% of GDP to capex spending for the current fiscal year, aimed to improve the country’s infrastructure.”
“The SENSEX dipped initially but closed just slightly lower and the 10Y government bond yield was just 1bp higher at 6.98%. USD/INR was also just modestly higher around 83.70. The monthly PMI reports for the manufacturing and services sectors published this morning surprised to the upside and continue to point to a healthy expansion.”
This afternoon UK time, there is a good chance that the Bank of Canada (BoC) will become the second G10 central bank after the Swiss National Bank (SNB) to cut interest rates for the second time in the current cycle, Commerzbank FX strategist Michael Pfister notes.
BoC to cut interest rates for the second time
“The seasonally adjusted monthly rates of change, which have since been in line with the inflation target, and the continued weakness of the Canadian real economy support this view. Accordingly, the market has almost fully priced in the rate cut, and the Bloomberg consensus is clearly leaning towards another rate cut – including us.”
“Despite this accelerating turnaround in interest rates, the CAD has performed reasonably well in recent weeks. At first glance, this may seem surprising. However, Canadian inflation expectations have fallen sharply on the back of the latest figures, allowing the Canadian real interest rate to keep pace with its US counterpart. This is a factor that is currently supporting the CAD.”
“However, inflation expectations are unlikely to fall much further. Expectations are already lower than in the US or the euro area. If the BoC continues to cut rates, real interest rates are likely to fall at some point. Therefore, it is particularly important today to pay attention to the new forecasts and communication. If the forecasts point to further (larger) rate cuts, the CAD is likely to suffer.”
- Silver price remains steady ahead of US PMI data due on Wednesday.
- The slowdown in the Chinese economy could negatively impact the industrial demand for Silver.
- The safe-haven Silver may struggle due to the increased ceasefire optimism in the Middle East.
Silver price (XAG/USD) stays above $29.00 per troy ounce during the European session on Wednesday. The price of the grey metal grapples to continue its gains as investors awaited a slew of key US economic data that could shed light on the path of Federal Reserve monetary policy.
The US Purchasing Managers Index (PMI) data is scheduled to be released later in the North American session. Additionally, the focus will be on the Gross Domestic Product (GDP) Annualized (Q2) figures, which are set to be released on Thursday, and the latest Personal Consumption Expenditures (PCE) price index report on Friday. These reports are expected to provide new insights into the economic conditions in the United States.
Meanwhile, sluggish economic activity in China has added extra selling pressure on Silver. Concerns about the weak Chinese economy were intensified by an unexpected rate cut from the People's Bank of China (PBoC) on Monday. Silver, which is crucial for various industrial applications including electronics, solar panels, and automotive components, is particularly sensitive to these economic conditions. Given China's position as one of the world's largest manufacturing hubs, the country's industrial demand for silver is substantial.
India has reduced import duties on gold and silver from 15% to 6% to support its jewelry manufacturing sector, which has positively impacted the demand outlook in the world's second-largest consumer of bullion.
The safe-haven assets like Silver could lose some demand from the increased optimism surrounding potential ceasefire negotiations between Israel and Hamas. Israeli Prime Minister Benjamin Netanyahu has hinted that a ceasefire agreement, which could lead to the release of several hostages in Gaza, might be in the works. Netanyahu is currently in Washington to address Congress, according to The Associated Press.
Egypt, Qatar, and the United States (US) are working to broker a phased deal between Israel and Hamas to halt the fighting and secure the release of remaining hostages. Meanwhile, in China, Palestinian factions Hamas and Fatah have signed a declaration to form a unity government and resolve their long-standing rift.
Silver FAQs
Silver is a precious metal highly traded among investors. It has been historically used as a store of value and a medium of exchange. Although less popular than Gold, traders may turn to Silver to diversify their investment portfolio, for its intrinsic value or as a potential hedge during high-inflation periods. Investors can buy physical Silver, in coins or in bars, or trade it through vehicles such as Exchange Traded Funds, which track its price on international markets.
Silver prices can move due to a wide range of factors. Geopolitical instability or fears of a deep recession can make Silver price escalate due to its safe-haven status, although to a lesser extent than Gold's. As a yieldless asset, Silver tends to rise with lower interest rates. Its moves also depend on how the US Dollar (USD) behaves as the asset is priced in dollars (XAG/USD). A strong Dollar tends to keep the price of Silver at bay, whereas a weaker Dollar is likely to propel prices up. Other factors such as investment demand, mining supply – Silver is much more abundant than Gold – and recycling rates can also affect prices.
Silver is widely used in industry, particularly in sectors such as electronics or solar energy, as it has one of the highest electric conductivity of all metals – more than Copper and Gold. A surge in demand can increase prices, while a decline tends to lower them. Dynamics in the US, Chinese and Indian economies can also contribute to price swings: for the US and particularly China, their big industrial sectors use Silver in various processes; in India, consumers’ demand for the precious metal for jewellery also plays a key role in setting prices.
Silver prices tend to follow Gold's moves. When Gold prices rise, Silver typically follows suit, as their status as safe-haven assets is similar. The Gold/Silver ratio, which shows the number of ounces of Silver needed to equal the value of one ounce of Gold, may help to determine the relative valuation between both metals. Some investors may consider a high ratio as an indicator that Silver is undervalued, or Gold is overvalued. On the contrary, a low ratio might suggest that Gold is undervalued relative to Silver.
The Japanese Yen (JPY) no longer seems to weaken automatically after interventions in July by the Ministry of Finance (MOF) or the Bank of Japan (BoJ), Commerzbank FX strategist Antje Praefcke notes.
JPY continues gaining against the USD
“This may be due to the fact that ahead of the BoJ's interest rate decision next week more and more analysts see the risk that an interest rate hike could come now rather than in September. It will also be interesting to see what the BoJ says about its bond purchases and whether it could gradually reduce them.”
“If the BoJ becomes active as early as next week, this would mean that the interventions, although late, would finally be accompanied by a less expansive monetary policy and would therefore be less of a pure ‘leaning against the wind’.”
“As we have now fallen to the lowest level in USD/JPY since the beginning of June, I just wanted to write down my thoughts. However, I am still undecided about the long-term implications. You will certainly find out more about this here in the next few days.”
Last week European Central Bank (ECB) President Christine Lagarde emphasized the data dependency of future interest rate decisions. Of course, inflation data comes first, Commerzbank FX strategist Antje Praefcke notes.
Markets need clear signals about rate cuts
“Some Council members expressing concern about the growth outlook in recent weeks. Next week, Tuesday, there will be a look in the rear-view mirror with the GDP data for the second quarter. More important, however, is a look into the future. After all, the burden on the economy caused by higher interest rates should ease noticeably and sentiment indicators improved at the beginning of the year.
“However, the Purchasing Managers' Index for June suffered a severe setback. This is why the Purchasing Managers' Index for July is also likely to be scrutinized today for signs of a recovery and, if so, how long this will take. If it falls again, this would fuel doubts about a rapid recovery and weigh on the Euro. If the indicators rise again, this would suggest that the declines in June were an outlier and that the recovery is indeed imminent.”
“In this case, the Euro should be able to benefit. However, it is also quite possible that the indicators are neither fish nor fowl and do not provide any clear indications. In this case, the market would be left clueless for the time being and would be all the more eager to pounce on the upcoming data (such as July inflation figures next week).”
The Federal Reserve (Fed) is on a hiatus for the time being, as the blackout period ahead of next week's FOMC meeting has begun. Nevertheless, there still could see some movement in the US Dollar (USD) before the weekend, Commerzbank FX strategist Antje Praefcke notes.
USD can rise a little further
“After the last inflation figures for June, which surprised to the downside, the market once again reinforced its rate cut expectations for the Fed. A first move in September is now almost fully priced in, and the market also sees a good chance of two more cuts before the end of the year. September would be the better occasion for a first rate cut, as it could back them up with the corresponding forecasts.”
“The growth figures for the second quarter tomorrow are an indication of how resilient the US economy continues to be. The second quarter should be even better than the first. The PCE index, the Fed's preferred measure of inflation, will be published on Friday. However, thanks to the inflation figures already published for, this contains little new information.”
“If the data confirms the market's view that a rapid rate-cutting cycle is on the cards in the coming months, I expect a minor reaction in the USD. However, I would expect a stronger movement if the data cast doubt on market expectations. Because then the market would have to adjust them and the USD could rise a little further towards 1.08.”
- USD/CAD trades back and forth near 1.3800 ahead of BoC interest rate meeting.
- The BoC is expected to reduce interest rates further by 25 bps.
- The uncertainty over US presidential elections has dampened market sentiment.
The USD/CAD pair trades in a tight range near the round-level figure of 1.3800. The Loonie asset consolidates as investors shifts to the sidelines with focus on the Bank of Canada’s (BoC) monetary policy meeting scheduled for 13:45 GMT.
The BoC is expected to deliver subsequent rate cuts due to cooling inflationary pressures. BoC’s core Consumer Price Index (CPI) accelerated to 1.9% in June but remains below the bank’s target of 2%. Also, Canada’s labor market conditions have deteriorated due to higher interest rates. The central bank is expected to reduce interest rates again by 25 basis points (bps) to 4.5%. Earlier, the BoC pivoted to policy normalization in the June meeting.
Meanwhile, sheer weakness in the Oil price has dampened the Canadian Dollar’s (CAD) appeal. The Oil price remains in the bearish trajectory from past three weeks due to weak demand outlook and easing supply concerns. It is worth noting that Canada is the leading exporter of Oil to the United States (US) and lower Oil prices weakens the Canadian Dollar.
The market sentiment remains risk-averse amid United States (US) political uncertainty. S&P 500 futures have posted significant losses in European trading hours. The US Dollar Index (DXY), which tracks the Greenback’s value against six major currencies, clings to weekly gains near 104.50.
In today’s session, investors will focus on the US S&P Global flash Purchasing Managers’ Index (PMI) data for July, which will be published at 13:45 GMT. The report is expected to show that the Manufacturing PMI expanded at a nominal pace to 51.7 from June’s reading of 51.6. The Services PMI, a measure to activities in the service sector, is estimated to have expanded at a slower pace to 54.4 from the prior release of 55.3.
While the major trigger for the US Dollar will be the Personal Consumption Expenditure Price Index (PCE) data for June, which will be published on Friday. The inflation measure will provide cues about when the Federal Reserve (Fed) will start reducing interest rates.
Economic Indicator
BoC Interest Rate Decision
The Bank of Canada (BoC) announces its interest rate decision at the end of its eight scheduled meetings per year. If the BoC believes inflation will be above target (hawkish), it will raise interest rates in order to bring it down. This is bullish for the CAD since higher interest rates attract greater inflows of foreign capital. Likewise, if the BoC sees inflation falling below target (dovish) it will lower interest rates in order to give the Canadian economy a boost in the hope inflation will rise back up. This is bearish for CAD since it detracts from foreign capital flowing into the country.
Read more.Next release: Wed Jul 24, 2024 13:45
Frequency: Irregular
Consensus: 4.5%
Previous: 4.75%
Source: Bank of Canada
- Gold is trading higher as stagflation fears bite, suggesting inflation may remain elevated amid slower growth.
- The nomination of Kamala Harris as the Democrat presidential candidate further aids Gold as her policies are seen as less inflationary.
- Gold is potentially unfolding a down-leg within a widening sideways trading range.
Gold (XAU/USD) recovers for a second day in a row, trading back up in the $2,410s as “stagflation” fears mount. The term, which describes above-trend inflation coupled with weak growth and jobs data, is a portmanteau of “stagnant” and “inflation”. Economists are applying it to the current environment following the release of the Philadelphia non-manufacturing Business Outlook Survey, which combined a weak headline and a high prices paid component. At the same time, US Existing Home Sales fell 5.4% month-over-month in June – further evidence of a slowdown – according to analysts at Rabobank.
Gold trades higher amid US economic slowdown
Gold's recovery is also fueled by expectations of potential interest rate cuts from the Federal Reserve (Fed), which make non-interest-bearing assets like Gold more attractive to investors. The interplay of economic indicators and central bank policies will continue to be crucial in shaping Gold's price trajectory in the near term.
Traders now await the release of more US economic data later this week for clarity on the trajectory of US interest rates. Of major interest will be the US Q2 Gross Domestic Product (GDP) growth data on Thursday and the Personal Consumption Expenditures (PCE) Price Index report for June on Friday.
The Q2 GDP growth advance estimate is expected to show a 1.9% expansion, up from 1.4% in Q1, while the PCE price index is forecasted to see a 0.1% uptick after remaining flat in May. Although recently, cooling US headline consumer inflation bolstered expectations that the Fed will begin cutting interest rates in September, whether more cuts are likely before the end of the year remains open for debate. If the data surprises to the upside, the Fed may delay lowering interest rates beyond September. This would weigh on the Gold price.
Another factor impacting Gold price is that US Vice President Kamala Harris secured the support of enough delegates to clinch the Democratic nomination. This has prompted some unwinding of the “Trump trade” and dragged US bond yields lower – both positive factors for Gold. In some polls, Harris now leads Trump, suggesting a less inflationary outlook for the economy if she wins.
Wednesday's release of the preliminary US S&P Global Purchasing Managers Index (PMI) for July will be looked upon for fresh cues about the health of the global economy and potentially allow traders to grab short-term opportunities around the precious metal.
Technical Analysis: Gold potentially unfolding down leg in sideways consolidation
Gold looked like it broke out of the upside of a sideways range last week but failed to sustain any bullish follow-through. It has since capitulated back inside the range. It is possible to redraw the range with a slanting top, which would indicate the new high achieved on July 17 was still within the confines of the range rather than a breakout, as previously thought.
XAU/USD Daily Chart
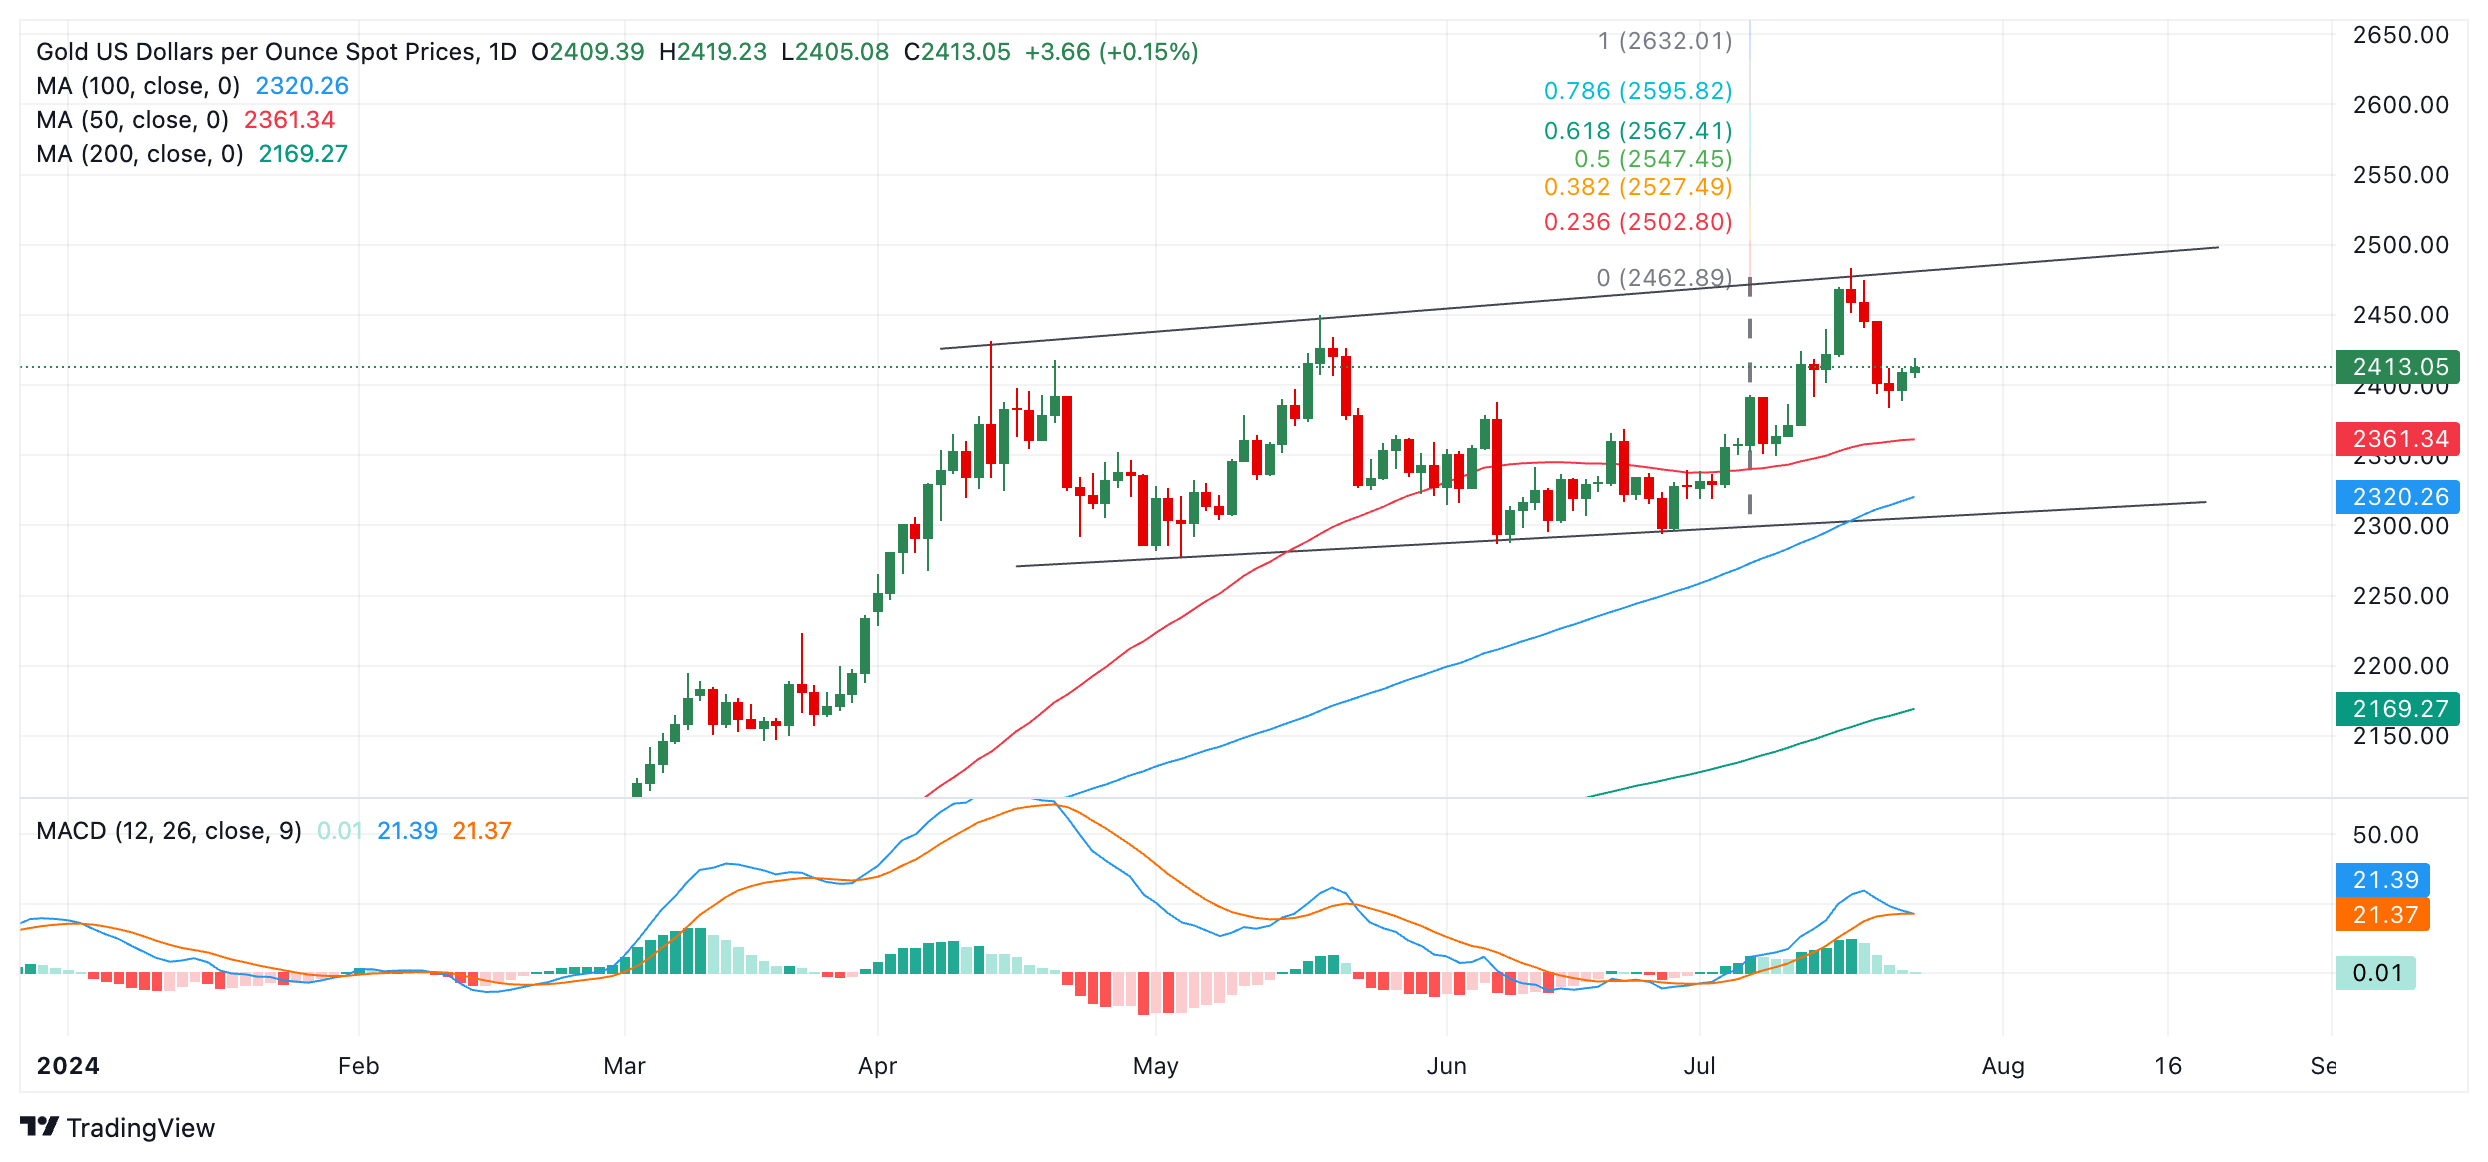
Such a revision would also now suggest the Gold price was unfolding a new down leg within the widening range towards the floor and the 100-day Simple Moving Average (SMA) at circa $2,320. The 50-day SMA at $2,360 is likely to present temporary support on the way down. A break below Monday’s low of $2,383 would provide bearish confirmation of more downside towards the range low.
Alternatively, above the $2,483 new all-time-high would indicate the establishment of a higher high and suggest the possibility of a breakout to the upside and an extension of the uptrend. Such a move might unlock Gold’s next upside target at roughly $2,555-$2,560, calculated by extrapolating the 0.618 Fibonacci ratio of the height of the range higher.
Gold FAQs
Gold has played a key role in human’s history as it has been widely used as a store of value and medium of exchange. Currently, apart from its shine and usage for jewelry, the precious metal is widely seen as a safe-haven asset, meaning that it is considered a good investment during turbulent times. Gold is also widely seen as a hedge against inflation and against depreciating currencies as it doesn’t rely on any specific issuer or government.
Central banks are the biggest Gold holders. In their aim to support their currencies in turbulent times, central banks tend to diversify their reserves and buy Gold to improve the perceived strength of the economy and the currency. High Gold reserves can be a source of trust for a country’s solvency. Central banks added 1,136 tonnes of Gold worth around $70 billion to their reserves in 2022, according to data from the World Gold Council. This is the highest yearly purchase since records began. Central banks from emerging economies such as China, India and Turkey are quickly increasing their Gold reserves.
Gold has an inverse correlation with the US Dollar and US Treasuries, which are both major reserve and safe-haven assets. When the Dollar depreciates, Gold tends to rise, enabling investors and central banks to diversify their assets in turbulent times. Gold is also inversely correlated with risk assets. A rally in the stock market tends to weaken Gold price, while sell-offs in riskier markets tend to favor the precious metal.
The price can move due to a wide range of factors. Geopolitical instability or fears of a deep recession can quickly make Gold price escalate due to its safe-haven status. As a yield-less asset, Gold tends to rise with lower interest rates, while higher cost of money usually weighs down on the yellow metal. Still, most moves depend on how the US Dollar (USD) behaves as the asset is priced in dollars (XAU/USD). A strong Dollar tends to keep the price of Gold controlled, whereas a weaker Dollar is likely to push Gold prices up.
- WTI prices halt its losing streak due to a drop in Weekly Crude Oil Stock in the previous week.
- EIA Crude Oil Stocks Change report is anticipated to show a 0.7 million-barrel increase for the week ending July 19.
- Israeli Prime Minister Benjamin Netanyahu will address US Congress, seeking to redirect American attention to the Middle East.
West Texas Intermediate (WTI) Oil price grapples to halt its four-day losing streak, trading around $77.40 per barrel during the European hours on Wednesday. The declining US crude inventories contribute support for the prices of the black Gold.
On Tuesday, the American Petroleum Institute (API) reported a drop of 3.9 million barrels in Weekly Crude Oil Stock for the week ending July 19, exceeding market expectations of a 2.47 million-barrel decrease. This follows a previous decline of 4.44 million barrels. The US Energy Information Administration’s (EIA) Crude Oil Stocks Change report, scheduled for Wednesday, is anticipated to show a 0.7 million-barrel increase for the same period.
However, crude Oil prices faced challenges during the Asian hours probably following a surge of optimism surrounding potential ceasefire negotiations between Israel and Hamas. Israeli Prime Minister Benjamin Netanyahu has hinted at a potential ceasefire agreement that could lead to the release of several hostages in Gaza.
Israeli Prime Minister Netanyahu is currently in Washington to address Congress. On Friday, Netanyahu will meet Republican presidential nominee Donald Trump at Trump's resort Mar-a-Lago, signaling an effort to improve ties between the two men, according to Reuters. US Vice President Kamala Harris will also meet with Netanyahu at the White House this week. However, Harris though will not preside over a joint session of Congress.
An aide of Harris told PTI, "We anticipate the Vice President will convey her view that it is time for the war to end in a way where Israel is secure, all hostages are released, the suffering of Palestinian civilians in Gaza ends, and the Palestinian people can enjoy their right to dignity, freedom, and self-determination. They will discuss efforts to reach an agreement on the ceasefire deal."
The rising odds of a Federal Reserve (Fed) rate cut in September put pressure on the US Dollar. A weaker Greenback could make Oil cheaper for buyers using other currencies, potentially contributing to demand for the commodity. Additionally, lower interest rates could stimulate economic activity in the United States, the world's largest Oil consumer, which may help support Oil prices.
Investors are expected to closely monitor the US Purchasing Managers Index (PMI) data, set to be released later in the North American session. Additionally, attention will be on the Gross Domestic Product (GDP) Annualized (Q2) figures, which will be released on Thursday. These reports are anticipated to offer fresh insights into the economic conditions in the United States.
WTI Oil FAQs
WTI Oil is a type of Crude Oil sold on international markets. The WTI stands for West Texas Intermediate, one of three major types including Brent and Dubai Crude. WTI is also referred to as “light” and “sweet” because of its relatively low gravity and sulfur content respectively. It is considered a high quality Oil that is easily refined. It is sourced in the United States and distributed via the Cushing hub, which is considered “The Pipeline Crossroads of the World”. It is a benchmark for the Oil market and WTI price is frequently quoted in the media.
Like all assets, supply and demand are the key drivers of WTI Oil price. As such, global growth can be a driver of increased demand and vice versa for weak global growth. Political instability, wars, and sanctions can disrupt supply and impact prices. The decisions of OPEC, a group of major Oil-producing countries, is another key driver of price. The value of the US Dollar influences the price of WTI Crude Oil, since Oil is predominantly traded in US Dollars, thus a weaker US Dollar can make Oil more affordable and vice versa.
The weekly Oil inventory reports published by the American Petroleum Institute (API) and the Energy Information Agency (EIA) impact the price of WTI Oil. Changes in inventories reflect fluctuating supply and demand. If the data shows a drop in inventories it can indicate increased demand, pushing up Oil price. Higher inventories can reflect increased supply, pushing down prices. API’s report is published every Tuesday and EIA’s the day after. Their results are usually similar, falling within 1% of each other 75% of the time. The EIA data is considered more reliable, since it is a government agency.
OPEC (Organization of the Petroleum Exporting Countries) is a group of 13 Oil-producing nations who collectively decide production quotas for member countries at twice-yearly meetings. Their decisions often impact WTI Oil prices. When OPEC decides to lower quotas, it can tighten supply, pushing up Oil prices. When OPEC increases production, it has the opposite effect. OPEC+ refers to an expanded group that includes ten extra non-OPEC members, the most notable of which is Russia.
The US Dollar (USD) is likely to trade in a sideways range between 7.2790 and 7.2960. USD, UOB Group FX analysts Quek Ser Leang and Lee Sue Ann.
Rangebound between 7.2790 and 7.2960
24-HOUR VIEW: “Our expectation for USD to edge higher did not turn out, as it traded sideways between 7.2856 and 7.2974, closing at 7.2884 (-0.12%). Further sideways trading seems likely, probably in a range of 7.2790 and 7.2960.”
1-3 WEEKS VIEW: “Our update from two days ago (22 Jul, spot at 7.2870) still stands. As highlighted, the recent price action suggest that USD is still trading in a 7.2600/7.3100 range.”
Room for the US Dollar (USD) to decline further. The next level to watch is 154.50, UOB Group FX analysts Quek Ser Leang and Lee Sue Ann.
USD is set to reach 154.50
24-HOUR VIEW: “We indicated yesterday that USD ‘could retest the 156.25 level before a more sustained recovery is likely.’ However, USD broke below 156.25, reaching a low of 155.55. While the sharp drop is oversold, there is room for USD to decline further, even though it remains to be seen if it can maintain a foothold below 155.35. The next major support at 154.50 is unlikely to come under threat. Resistance level is at 156.15, followed by 156.40.”
1-3 WEEKS VIEW: “Downward momentum is picking up again; if USD breaks and stays below 155.35, the next level to watch is 154.50. Our most recent narrative was from last Friday (19 Jul, spot at 157.35), wherein ‘a breach of 158.50 would suggest that the weakness in USD that started more than a week ago (as annotated in the chart below) has stabilised.’ Yesterday, USD dropped sharply to a low of 155.55. Downward momentum is picking up again, and if USD breaks and stays below 155.35, the next level to watch is 154.50. On the upside, the ‘strong resistance’ level has moved lower to 157.15 from 158.50.”
- EUR/USD falls to near 1.0830 as weak preliminary Eurozone PMI weighs on the Euro.
- The ECB is expected to cut interest rates two times more by the year-end.
- Investors await the US core PCE inflation for fresh guidance on interest rates.
EUR/USD weakens to near 1.0830 in Wednesday’s European session as the preliminary Eurozone Hamburg Commercial Bank (HCOB) Purchasing Managers’ Index (PMI) report for July showed that Composite numbers unexpectedly eased due to a slowdown in activities in the manufacturing as well as the service sectors.
The HCOB Composite PMI decreased to 50.1, just above the 50 threshold that separates expansion from contraction. Investors expected the Composite PMI to have expanded at a faster pace to 51.1 from the former release of 50.9. The HCOB Manufacturing PMI contracted to 45.6, while the Services PMI expanded at a slower pace of 51.9.
The comments from Dr. Cyrus de la Rubia, Chief Economist at Hamburg Commercial Bank, on flash PMI indicated that weak demand in the Eurozone’s largest economy has weighed heavily on the manufacturing sector. De la Rubia said, “French service providers increased their business activity in July due to the preparation for the Olympic Games. In contrast, demand in the German manufacturing sector seems to have dragged down overall private sector output.”
The Eurozone’s weak economic activity is expected to boost expectations of more rate cuts by the European Central Bank (ECB). However, price data didn’t offer any relief to ECB policymakers. According to the preliminary PMI report, input prices in the services sector increased at a faster rate, and selling prices rose at a pace similar to the previous survey period.
Currently, traders see the ECB delivering two more rate cuts this year. Also, a few ECB officials see market expectations of two more rate cuts as appropriate.
Daily digest market movers: EUR/USD slides while US Dollar advance
- EUR/USD faces an intense sell-off and extends its downside to near 1.0830 as the US Dollar (USD) advances. The US Dollar moves higher amid risk aversion that Donald Trump will come victorious in the United States (US) presidential elections in November and the uncertainty ahead of the Personal Consumption Expenditures Price Index (PCE) data for June, which will be published on Friday.
- The US Dollar Index (DXY), which tracks the Greenback’s value against six major currencies, posts a fresh weekly high at around 104.50. Expectations for Trump's return to power rose after an assassination attack on him. Meanwhile, Democrats have nominated Vice President Kamala Harris as leader to fight against Republicans.
- On the economic front, investors will keenly focus on the US core PCE inflation data as it would provide fresh cues about when the Federal Reserve (Fed) will start reducing interest rates. The report is expected to show that core PCE inflation, the Fed’s preferred inflation measure, decelerated to 2.5% from May’s figure of 2.6%, with monthly figure growing steadily by 0.1%.
- The scenario in which price pressures decline expectedly or at a faster pace will boost expectations of early rate cuts by the Fed. On the contrary, stubborn figures would weaken rate-cut bets. According to the CME FedWatch tool, 30-day Federal Fund futures show the central bank will begin lowering its key borrowing rates from their current levels in the September meeting.
- In Wednesday’s session, the US Dollar will be driven by the preliminary S&P Global PMI data for July, which will be published at 13:45 GMT. Economists expect that the Manufacturing PMI expanded at a nominal pace to 51.7 from June’s reading of 51.6. The Services PMI, a measure of activities in the service sector, is estimated to have expanded at a slower pace of 54.4 from the prior release of 55.3.
Technical Analysis: EUR/USD fails to hold Triangle breakout
EUR/USD returns inside the Symmetrical Triangle formation on a daily timeframe after failing to hold the breakout. The major currency pair extends its downside below the 20-day Exponential Moving Average (EMA), which trades around 1.0840. The shared currency pair could slide further towards round-level supports near 1.0800 and 1.0700.
The 14-day Relative Strength Index (RSI) returns within the 40.00-60.00 range, suggesting the bullish momentum has faded.
On the upside, the round-level resistance at 1.0900 will be a key barrier for the Euro bulls.
Euro FAQs
The Euro is the currency for the 20 European Union countries that belong to the Eurozone. It is the second most heavily traded currency in the world behind the US Dollar. In 2022, it accounted for 31% of all foreign exchange transactions, with an average daily turnover of over $2.2 trillion a day. EUR/USD is the most heavily traded currency pair in the world, accounting for an estimated 30% off all transactions, followed by EUR/JPY (4%), EUR/GBP (3%) and EUR/AUD (2%).
The European Central Bank (ECB) in Frankfurt, Germany, is the reserve bank for the Eurozone. The ECB sets interest rates and manages monetary policy. The ECB’s primary mandate is to maintain price stability, which means either controlling inflation or stimulating growth. Its primary tool is the raising or lowering of interest rates. Relatively high interest rates – or the expectation of higher rates – will usually benefit the Euro and vice versa. The ECB Governing Council makes monetary policy decisions at meetings held eight times a year. Decisions are made by heads of the Eurozone national banks and six permanent members, including the President of the ECB, Christine Lagarde.
Eurozone inflation data, measured by the Harmonized Index of Consumer Prices (HICP), is an important econometric for the Euro. If inflation rises more than expected, especially if above the ECB’s 2% target, it obliges the ECB to raise interest rates to bring it back under control. Relatively high interest rates compared to its counterparts will usually benefit the Euro, as it makes the region more attractive as a place for global investors to park their money.
Data releases gauge the health of the economy and can impact on the Euro. Indicators such as GDP, Manufacturing and Services PMIs, employment, and consumer sentiment surveys can all influence the direction of the single currency. A strong economy is good for the Euro. Not only does it attract more foreign investment but it may encourage the ECB to put up interest rates, which will directly strengthen the Euro. Otherwise, if economic data is weak, the Euro is likely to fall. Economic data for the four largest economies in the euro area (Germany, France, Italy and Spain) are especially significant, as they account for 75% of the Eurozone’s economy.
Another significant data release for the Euro is the Trade Balance. This indicator measures the difference between what a country earns from its exports and what it spends on imports over a given period. If a country produces highly sought after exports then its currency will gain in value purely from the extra demand created from foreign buyers seeking to purchase these goods. Therefore, a positive net Trade Balance strengthens a currency and vice versa for a negative balance.
As long as 0.5980 is not breached, the New Zealand Dollar (NZD) could decline further. The significant support at 0.5900 is highly unlikely to come under threat, UOB Group FX analysts Quek Ser Leang and Lee Sue Ann.
NZD is trading towards significant support at 0.5900
24-HOUR VIEW: “Yesterday, we held the view that ‘as long as 0.6005 (minor resistance is at 0.5995) is not breached, NZD could decline further.’ We were also of the view that ‘any decline is unlikely to reach 0.5940.’ Our view was not wrong, as NZD fell, reaching a low of 0.5951. While conditions are severely oversold, the weakness in NZD has not stabilised. Today, as long as 0.5980 is not breached (minor resistance is at 0.5965), NZD could weaken further. Given the oversold conditions, the significant support level at 0.5900 is highly unlikely to come under threat. There is another support level at 0.5925.”
1-3 WEEKS VIEW: “Yesterday (23 Jul, spot at 0.5980), we highlighted that ‘while the impulsive downward momentum suggests further NZD weakness, conditions are severely oversold, and it remains to be seen if NZD can break the next support at 0.5940.’ We did not quite expect the continuing sharp decline, as NZD fell to a low of 0.5951. Momentum remains strong, and a breach of 0.5940 will not be surprising. The next level to watch is 0.5900. Should NZD break above 0.6000 (‘strong resistance’ level was at 0.6030 yesterday), it would mean that the weakness that started in the middle of last week (as annotated in the chart below) has stabilised.”
The Australian Dollar (AUD) could dip below the major support at 0.6590 but is unlikely to be able to maintain a foothold below this level. Note that below 0.6590, there is another major support at 0.6570, UOB Group FX analysts Quek Ser Leang and Lee Sue Ann.
A breach below 0.6590 leads to 0.6570
24-HOUR VIEW: “Two days ago, AUD fell sharply. Yesterday, we indicated that ‘while the decline appears to be overdone, the weakness in AUD could extend to 0.6620 before stabilisation can be expected.’ We added, ‘the major support at 0.6590 is unlikely to come under threat.’ AUD subsequently fell more than expected to 0.6612. Conditions are severely oversold, but as long as 0.6645 (minor resistance is at 0.6630) is not breached, AUD could dip below the major support at 0.6590. In view of the oversold conditions, it is unlikely to be able to maintain a foothold below this level.”
1-3 WEEKS VIEW: “We have held a negative view in AUD since the middle of last week (as annotated in the chart below). Yesterday (23 Jul, spot at 0.6645), we highlighted that ‘further AUD weakness is not ruled out, but given that conditions are approaching oversold levels, the pace of any further decline is likely to be slower.’ We pointed out that ‘the levels to watch are 0.6620 and 0.6590.’ AUD then broke below 0.6620 (low of 0.6612) before closing lower for the seven straight days (0.6616, -0.41%). While we continue to hold a negative view, conditions are severely oversold, and AUD does not seem to have the potential to decline significantly from here. Note that below 0.6590, there is another major support at 0.6570. On the upside, a breach of 0.6675 (‘strong resistance’ level was at 0.6705 yesterday) would suggest the weakness in AUD has stabilised.”
There has been a slight increase in momentum; the Pound Sterling (GBP) is expected to drift lower, but any decline is unlikely to reach 1.2850, UOB Group FX analysts Quek Ser Leang and Lee Sue Ann.
Unlikely to reach 1.2850
24-HOUR VIEW: “We noted yesterday that ‘the price action appears to be consolidative,’ and we expected GBP to trade in a range of 1.2905/1.2955. GBP then traded in a lower and wider range of 1.2889/1.2934, closing on a soft note at 1.2906 (-0.19%). There has been a slight increase in momentum. Today, we expect GBP to drift lower, but any decline is unlikely to reach 1.2850 (there is another support level at 1.2875). On the upside, if GBP breaches 1.2935 with minor resistance at 1.2920, would suggest that the current mild downward pressure has eased.”
1-3 WEEKS VIEW: “Last Friday (19 Jul, spot at 1.2950), we highlighted that ‘the recent advance in GBP has come to an end.’ We also highlighted that GBP ‘appears to have entered a consolidation phase, and it is likely to trade between 1.2850 and 1.3020 for the time being.’ GBP traded in a relatively quiet manner over the past few days, and there is no change in our view.”
- EUR/GBP loses ground after PMI data releases from both economies.
- The Eurozone Composite PMI eased to 50.1 in July, reaching a five-month low.
- S&P Global Composite PMI rose to 52.7 in July from the previous reading of 52.3.
EUR/GBP extends its losses for the third successive day, trading around 0.8400 during the European hours on Wednesday. The EUR/GBP cross faces renewed selling pressure following the release of disappointing HCOB Purchasing Managers Index (PMI) data from the Eurozone and Germany.
Wednesday's data indicated a further contraction in the Eurozone's manufacturing sector, with a decline in services sector activity for July. The Eurozone Manufacturing PMI fell to 45.6 in July from 45.8 in June, missing the market consensus of 46.1 and marking a seven-month low.
The bloc’s Services PMI declined from 52.8 in June to 51.9 in July, falling short of the expectations of 53.0 and hit a four-month low. The HCOB Eurozone Composite PMI eased to 50.1 in July vs. 51.1 expected and June’s 50.9 figure. The index reached a five-month low.
The German manufacturing sector's contraction unexpectedly worsened, with the PMI dropping to 42.6 in July from 43.5 in June, significantly below the forecast of 44.0. This marks the lowest level in three months. Similarly, the services sector underperformed, with the Services PMI falling to 52.0 in July from 53.1 in June, missing market expectations of 53.1 and hitting a four-month low.
In the United Kingdom (UK), the S&P Global Composite PMI rose to 52.7 in July from the previous reading of 52.3. The Manufacturing PMI increased to 51.8 from the prior 50.9, indicating improved performance in the manufacturing sector. However, the Services PMI declined slightly to 52.4, missing the expected reading of 52.5 for July.
The reduced likelihood of an August rate cut by the Bank of England (BoE) is expected to support the British Pound (GBP) and weaken the EUR/GBP cross. Traders are awaiting the UK PMI activity survey results, which will be released during Wednesday’s London market session.
Economic Indicator
HCOB Composite PMI
The Composite Purchasing Managers’ Index (PMI), released on a monthly basis by S&P Global and Hamburg Commercial Bank (HCOB), is a leading indicator gauging private-business activity in the Eurozone for both the manufacturing and services sectors. The data is derived from surveys to senior executives. Each response is weighted according to the size of the company and its contribution to total manufacturing or services output accounted for by the sub-sector to which that company belongs. Survey responses reflect the change, if any, in the current month compared to the previous month and can anticipate changing trends in official data series such as Gross Domestic Product (GDP), industrial production, employment and inflation. The index varies between 0 and 100, with levels of 50.0 signaling no change over the previous month. A reading above 50 indicates that the private economy is generally expanding, a bullish sign for the Euro (EUR). Meanwhile, a reading below 50 signals that activity is generally declining, which is seen as bearish for EUR.
Read more.Last release: Wed Jul 24, 2024 08:00 (Prel)
Frequency: Monthly
Actual: 50.1
Consensus: 51.1
Previous: 50.9
Source: S&P Global
The Euro (EUR) is likely to trade with a downward bias. Tentative buildup in momentum suggests downside risk; any further decline in EUR is unlikely to break clearly below 1.0815, UOB Group FX analysts Quek Ser Leang and Lee Sue Ann.
EUR is unlikely to break clearly below 1.0815
24-HOUR VIEW: “We expected EUR to trade in a sideways range of 1.0875/1.0910 yesterday. Our view was incorrect, as EUR fell, reaching a low of 1.0842. EUR closed on a soft note at 1.0851 (-0.35%). Downward momentum is building, albeit tentatively. Today, the risk for EUR remains on the downside. Given the tentative buildup in momentum, any further decline is unlikely to break clearly below 1.0815. Resistance is at 1.0870; a breach of 1.0885 would mean that the momentum buildup has faded.”
1-3 WEEKS VIEW: “Two days ago (22 Jul, spot at 1.0895), we highlighted that ‘the recent EUR strength that started two weeks ago has come to an end.’ We added, ‘the current price action is likely part of a range trading phase,’ and we expected EUR to trade between 1.0845 and 1.0945. Yesterday, EUR fell slightly below the bottom of our expected range, reaching a low of 1.0842. Downward momentum is building, but not sufficiently enough to suggest a significant decline. From here, we expect EUR to trade with a downward bias, but the 1.0815 level is expected to provide solid support. The downward bias is intact as long as 1.0905 is not breached.”
- UK Services PMI rises to 52.4 in July, misses estimates.
- Manufacturing PMI in the UK climbs to 51.8 in July.
- GBP/USD keeps losses below 1.2900 after mixed UK business PMIs.
The seasonally adjusted S&P Global/CIPS UK Manufacturing Purchasing Managers’ Index (PMI) improved from 50.9 in June to 51.8 in July. The market forecast was for 51.1.
Meanwhile, the Preliminary UK Services Business Activity Index rose to 52.4 in July, missing the estimated 52.5 print. The previous figure stood at 52.1.
Commenting on the flash PMI data, Chris Williamson, Chief Business Economist at S&P Global Market Intelligence said: “The flash PMI survey data for July signal an encouraging start to the second half of the year, with output, order books and employment all growing at faster rates amid rebounding business confidence, while price pressures moderated.”
“The first post-election business survey paints a welcoming picture for the new government, with companies operating across manufacturing and services having gained optimism about the future, reporting a renewed surge in demand and taking on staff in greater numbers,” Chris added.
FX implications
GBP/USD remains unimpressed near 1.2885 after mixed UK PMI data. The pair is trading 0.14% lower on the day, as of writing.
British Pound PRICE Today
The table below shows the percentage change of British Pound (GBP) against listed major currencies today. British Pound was the weakest against the Japanese Yen.
| USD | EUR | GBP | JPY | CAD | AUD | NZD | CHF | |
|---|---|---|---|---|---|---|---|---|
| USD | 0.20% | 0.16% | -0.53% | 0.07% | 0.28% | 0.52% | -0.21% | |
| EUR | -0.20% | -0.04% | -0.74% | -0.14% | 0.09% | 0.32% | -0.41% | |
| GBP | -0.16% | 0.04% | -0.68% | -0.09% | 0.12% | 0.37% | -0.38% | |
| JPY | 0.53% | 0.74% | 0.68% | 0.62% | 0.82% | 1.05% | 0.32% | |
| CAD | -0.07% | 0.14% | 0.09% | -0.62% | 0.22% | 0.46% | -0.29% | |
| AUD | -0.28% | -0.09% | -0.12% | -0.82% | -0.22% | 0.24% | -0.53% | |
| NZD | -0.52% | -0.32% | -0.37% | -1.05% | -0.46% | -0.24% | -0.74% | |
| CHF | 0.21% | 0.41% | 0.38% | -0.32% | 0.29% | 0.53% | 0.74% |
The heat map shows percentage changes of major currencies against each other. The base currency is picked from the left column, while the quote currency is picked from the top row. For example, if you pick the British Pound from the left column and move along the horizontal line to the US Dollar, the percentage change displayed in the box will represent GBP (base)/USD (quote).
- Eurozone Manufacturing PMI declined to in July, missing the 46.1 forecast.
- Bloc’s Services PMI dropped to 51.9 in July vs. 53.0 expected.
- EUR/USD remains in the red below 1.0850 after German, Eurozone PMI data.
The Eurozone manufacturing sector contraction extended while the services sector activity lost its recovery momentum in July, according to the data from the HCOB's latest Purchasing Managers Index (PMI) Survey published on Wednesday.
The Eurozone Manufacturing Purchasing Managers Index (PMI) dropped from 45.8 in June to 45.6 in July, missing the market consensus of 46.1. The index slid to a seven-month trough.
The bloc’s Services PMI declined from 52.8 in June to 51.9 in July. The data fell short of the expectations of 53.0 and hit a four-month low.
The HCOB Eurozone PMI Composite eased to 50.1 in July vs. 51.1 expected and June’s 50.9 figure. The index reached a five-month low.
EUR/USD reaction to the Eurozone PMI data
EUR/USD is keeping the red near 1.0830 following the discouraging Eurozone PMIs. The pair is losing 0.22% on the day, at the press time.
Euro FAQs
The Euro is the currency for the 20 European Union countries that belong to the Eurozone. It is the second most heavily traded currency in the world behind the US Dollar. In 2022, it accounted for 31% of all foreign exchange transactions, with an average daily turnover of over $2.2 trillion a day. EUR/USD is the most heavily traded currency pair in the world, accounting for an estimated 30% off all transactions, followed by EUR/JPY (4%), EUR/GBP (3%) and EUR/AUD (2%).
The European Central Bank (ECB) in Frankfurt, Germany, is the reserve bank for the Eurozone. The ECB sets interest rates and manages monetary policy. The ECB’s primary mandate is to maintain price stability, which means either controlling inflation or stimulating growth. Its primary tool is the raising or lowering of interest rates. Relatively high interest rates – or the expectation of higher rates – will usually benefit the Euro and vice versa. The ECB Governing Council makes monetary policy decisions at meetings held eight times a year. Decisions are made by heads of the Eurozone national banks and six permanent members, including the President of the ECB, Christine Lagarde.
Eurozone inflation data, measured by the Harmonized Index of Consumer Prices (HICP), is an important econometric for the Euro. If inflation rises more than expected, especially if above the ECB’s 2% target, it obliges the ECB to raise interest rates to bring it back under control. Relatively high interest rates compared to its counterparts will usually benefit the Euro, as it makes the region more attractive as a place for global investors to park their money.
Data releases gauge the health of the economy and can impact on the Euro. Indicators such as GDP, Manufacturing and Services PMIs, employment, and consumer sentiment surveys can all influence the direction of the single currency. A strong economy is good for the Euro. Not only does it attract more foreign investment but it may encourage the ECB to put up interest rates, which will directly strengthen the Euro. Otherwise, if economic data is weak, the Euro is likely to fall. Economic data for the four largest economies in the euro area (Germany, France, Italy and Spain) are especially significant, as they account for 75% of the Eurozone’s economy.
Another significant data release for the Euro is the Trade Balance. This indicator measures the difference between what a country earns from its exports and what it spends on imports over a given period. If a country produces highly sought after exports then its currency will gain in value purely from the extra demand created from foreign buyers seeking to purchase these goods. Therefore, a positive net Trade Balance strengthens a currency and vice versa for a negative balance.
- The interest rate in Canada is set to be lowered by 25 bps to 4.50% on Wednesday.
- The Bank of Canada Governor Macklem’s words will be closely scrutinized for further policy cues.
- The Canadian Dollar is primed for a big reaction to the BoC policy announcements.
The Bank of Canada (BoC) is widely anticipated to lower its key interest rate by 25 basis points (bps) from 4.75% to 4.50% at its monetary policy meeting on Wednesday, July 24. The Canadian Dollar (CAD) is primed for a big volatility spike in reaction to the BoC policy announcements.
Bank of Canada set for another interest rate cut
The Canadian central bank is seen cutting rates for the second consecutive meeting and the decision will be announced at 13:45 GMT. Governor Tiff Macklem’s press conference will follow at 14:30 GMT.
In June, the BoC delivered its first interest-rate cut since a series of hikes that began in March 2022, slashing rates by 25 bps from 5.0% to 4.75%, as the central bank felt confident that inflation will continue to move towards the 2% target.
Governor Tiff Macklem mentioned that it is reasonable to expect more rate cuts if inflation continues to ease.
Since then, inflation in Canada slowed down further, with the headline annual Consumer Price Index (CPI) rising 2.7% in June, cooler than the BoC's 2.9% inflation forecast for the end of the first half of 2024.
“Month-over-month, the consumer price index was down 0.1%, compared with a forecast for no change. Statistics Canada data showed this was the first deceleration in the monthly inflation rate since December,” according to Reuters.
Loosening Canadian labor market conditions also cemented the case for another rate cut in July. The country lost 1,400 jobs in June while the Unemployment Rate rose to 6.4%, Statistics Canada reported earlier this month.
Markets are currently pricing in a 92% probability of a rate cut this week, with another cut also on the table later this year.
How will the BoC monetary policy decision affect USD/CAD?
As the rate cut is fully baked in, markets will closely scrutinize the language in the policy statement and Governor Macklem’s words for the bank’s next interest rate move. At the presser following the June policy meeting, BoC Governor Tiff Macklem said that “the timing of any further cuts will depend on data.”
Amidst sticky core inflation, it remains to be seen if the BoC adopts a prudent approach while hinting at the policy outlook in the coming months. In case the BoC cautions on the inflation outlook, the Canadian Dollar could receive a much-needed respite, as it would imply that the central bank could rein in its easing cycle.
If the bank acknowledges progress in disinflation and intends to lower rates further, the CAD may see an extension of the ongoing downtrend in the near future.
Dhwani Mehta, Asian Session Lead Analyst at FXStreet, offers key technicals for trading USD/CAD on the policy outcome.
"The USD/CAD pair is sitting at the highest level in six weeks at 1.3775 in the lead-up to the BoC showdown. Buyers appear to be biding time before the next leg higher, as the 14-day Relative Strength Index (RSI) stays firm above the 50 level while a Bull Cross remains in the making. The 21-day Simple Moving Average (SMA) is on the verge of crossing the 50-day SMA for the upside, which if realized daily closing basis will validate a bullish crossover.”
"On a renewed upside, USD/CAD could initiate a fresh advance toward the 2024 highs of 1.3846. Ahead of that, the 1.3800 barrier needs to be taken out decisively. The next target for buyers is aligned at the 1.3900 round level. Conversely, strong support is seen at around 1.3680, where the 21-day and 50-day SMA converge. Acceptance below that level will put the 100-day SMA of 1.3630 to the test. The last line of defense for USD/CAD optimists is at the 200-day SMA of 1.3595,” Dhwani adds.
Economic Indicator
BoC Interest Rate Decision
The Bank of Canada (BoC) announces its interest rate decision at the end of its eight scheduled meetings per year. If the BoC believes inflation will be above target (hawkish), it will raise interest rates in order to bring it down. This is bullish for the CAD since higher interest rates attract greater inflows of foreign capital. Likewise, if the BoC sees inflation falling below target (dovish) it will lower interest rates in order to give the Canadian economy a boost in the hope inflation will rise back up. This is bearish for CAD since it detracts from foreign capital flowing into the country.
Read more.Next release: Wed Jul 24, 2024 13:45
Frequency: Irregular
Consensus: 4.5%
Previous: 4.75%
Source: Bank of Canada
Bank of Canada FAQs
The Bank of Canada (BoC), based in Ottawa, is the institution that sets interest rates and manages monetary policy for Canada. It does so at eight scheduled meetings a year and ad hoc emergency meetings that are held as required. The BoC primary mandate is to maintain price stability, which means keeping inflation at between 1-3%. Its main tool for achieving this is by raising or lowering interest rates. Relatively high interest rates will usually result in a stronger Canadian Dollar (CAD) and vice versa. Other tools used include quantitative easing and tightening.
In extreme situations, the Bank of Canada can enact a policy tool called Quantitative Easing. QE is the process by which the BoC prints Canadian Dollars for the purpose of buying assets – usually government or corporate bonds – from financial institutions. QE usually results in a weaker CAD. QE is a last resort when simply lowering interest rates is unlikely to achieve the objective of price stability. The Bank of Canada used the measure during the Great Financial Crisis of 2009-11 when credit froze after banks lost faith in each other’s ability to repay debts.
Quantitative tightening (QT) is the reverse of QE. It is undertaken after QE when an economic recovery is underway and inflation starts rising. Whilst in QE the Bank of Canada purchases government and corporate bonds from financial institutions to provide them with liquidity, in QT the BoC stops buying more assets, and stops reinvesting the principal maturing on the bonds it already holds. It is usually positive (or bullish) for the Canadian Dollar.
- The US Dollar receives support from the increased risk aversion.
- The upside of the Greenback could be limited due to the dovish sentiment surrounding the Fed’s policy stance.
- The decline in the Treasury yields could put pressure on the US Dollar.
The US Dollar Index (DXY), which measures the value of the US Dollar (USD) against six other major currencies, moves sideways and trades around 104.50 during the early European hours on Wednesday. The decline in the US Treasury yields might have put pressure on the Greenback, with 2-year and 10-year yields on US bonds standing at 4.44% and 4.24%, respectively, at the time of writing.
However, the US Dollar (USD) may face pressure as expectations rise for a Federal Reserve (Fed) rate cut in September. Last week, Fed Chair Jerome Powell noted that the three US inflation readings this year "add somewhat to confidence" that inflation is on track to meet the Fed’s target sustainably, implying that interest rate cuts might be approaching.
According to CME Group’s FedWatch Tool, markets now indicate a 93.6% probability of a 25-basis point rate cut at the September Fed meeting, up from 88.5% a day earlier.
Meanwhile, investors seek fresh developments on the US presidential elections in November. Market experts see Donald Trump winning the elections despite Democrats rallying behind Vice President Kamala Harris as the leading candidate for the presidential nomination. NBC News projected that Harris had secured endorsements from a majority of the Democratic party’s pledged convention delegates. The threshold for securing the nomination is 1,976 delegates, and NBC estimates that Harris has received the support of 1,992 delegates, either through spoken or written endorsements.
Investors are expected to closely monitor the US Purchasing Managers Index (PMI) data, set to be released later in the North American session. Additionally, attention will be on the Gross Domestic Product (GDP) Annualized (Q2) figures, which will be released on Thursday. These reports are anticipated to offer fresh insights into the economic conditions in the United States.
US Dollar FAQs
The US Dollar (USD) is the official currency of the United States of America, and the ‘de facto’ currency of a significant number of other countries where it is found in circulation alongside local notes. It is the most heavily traded currency in the world, accounting for over 88% of all global foreign exchange turnover, or an average of $6.6 trillion in transactions per day, according to data from 2022. Following the second world war, the USD took over from the British Pound as the world’s reserve currency. For most of its history, the US Dollar was backed by Gold, until the Bretton Woods Agreement in 1971 when the Gold Standard went away.
The most important single factor impacting on the value of the US Dollar is monetary policy, which is shaped by the Federal Reserve (Fed). The Fed has two mandates: to achieve price stability (control inflation) and foster full employment. Its primary tool to achieve these two goals is by adjusting interest rates. When prices are rising too quickly and inflation is above the Fed’s 2% target, the Fed will raise rates, which helps the USD value. When inflation falls below 2% or the Unemployment Rate is too high, the Fed may lower interest rates, which weighs on the Greenback.
In extreme situations, the Federal Reserve can also print more Dollars and enact quantitative easing (QE). QE is the process by which the Fed substantially increases the flow of credit in a stuck financial system. It is a non-standard policy measure used when credit has dried up because banks will not lend to each other (out of the fear of counterparty default). It is a last resort when simply lowering interest rates is unlikely to achieve the necessary result. It was the Fed’s weapon of choice to combat the credit crunch that occurred during the Great Financial Crisis in 2008. It involves the Fed printing more Dollars and using them to buy US government bonds predominantly from financial institutions. QE usually leads to a weaker US Dollar.
Quantitative tightening (QT) is the reverse process whereby the Federal Reserve stops buying bonds from financial institutions and does not reinvest the principal from the bonds it holds maturing in new purchases. It is usually positive for the US Dollar.
- Germany’s Manufacturing PMI dropped to 42.6 in July vs. 44.0 anticipated.
- Services PMI for the German economy fell to 52.0 in July vs. 53.1 estimate.
- EUR/USD falls further below 1.0850 after downbeat German PMIs.
The German manufacturing sector contraction unexpectedly deteriorated in July while the services sector also underperformed, the preliminary business activity report published by the HCOB survey showed Wednesday.
The HCOB Manufacturing PMI in the Eurozone’s economic powerhouse came in at 42.6 this month, deteriorating from June’s 43.5 while much below the forecast of 44.0. The measure reached the lowest level in three months.
Meanwhile, Services PMI fell from 53.1 in June to 52.0 in July, missing the market expectations of 53.1 in the reported period. The gauge hit a four-month bottom.
The HCOB Preliminary German Composite Output Index came in at 48.7 in July vs. 50.7 anticipated and 50.4 registered in June. The index was also at its weakest in four months.
FX implications
EUR/USD has come under fresh selling pressure on the disappointing German data, currently trading 0.15% lower on the day at 1.0835.
Euro PRICE Today
The table below shows the percentage change of Euro (EUR) against listed major currencies today. Euro was the weakest against the Japanese Yen.
| USD | EUR | GBP | JPY | CAD | AUD | NZD | CHF | |
|---|---|---|---|---|---|---|---|---|
| USD | 0.16% | 0.15% | -0.50% | 0.05% | 0.22% | 0.39% | -0.12% | |
| EUR | -0.16% | -0.01% | -0.69% | -0.12% | 0.06% | 0.22% | -0.28% | |
| GBP | -0.15% | 0.00% | -0.68% | -0.10% | 0.07% | 0.24% | -0.28% | |
| JPY | 0.50% | 0.69% | 0.68% | 0.60% | 0.75% | 0.91% | 0.40% | |
| CAD | -0.05% | 0.12% | 0.10% | -0.60% | 0.16% | 0.34% | -0.19% | |
| AUD | -0.22% | -0.06% | -0.07% | -0.75% | -0.16% | 0.16% | -0.36% | |
| NZD | -0.39% | -0.22% | -0.24% | -0.91% | -0.34% | -0.16% | -0.52% | |
| CHF | 0.12% | 0.28% | 0.28% | -0.40% | 0.19% | 0.36% | 0.52% |
The heat map shows percentage changes of major currencies against each other. The base currency is picked from the left column, while the quote currency is picked from the top row. For example, if you pick the Euro from the left column and move along the horizontal line to the US Dollar, the percentage change displayed in the box will represent EUR (base)/USD (quote).
- The Pound Sterling dips amid firm BoE rate-cut prospects.
- Investors await the preliminary US/UK S&P Global PMIs for July.
- The Fed is expected to pivot to policy normalization in September.
The Pound Sterling (GBP) weakens against its major peers, except Asia-Pacific currencies, in Wednesday’s London session. The British currency remains defensive amid growing speculation that the Bank of England (BoE) will begin cutting interest rates in August.
Market experts see the United Kingdom’s (UK) economy struggling to cooperate with BoE’s high interest rates. The consequences of a restrictive monetary policy stance are clearly visible in households’ spending, as the UK’s Retail Sales, a key measure of consumer spending that prompts inflationary pressures, contracted at a faster-than-expected pace in June.
Meanwhile, BoE officials refrain from endorsing rate cuts due to high inflation in the service sector. UK service inflation grew steadily by 5.7% in June.
With preliminary UK S&P Global/CIPS Purchasing Managers’ Index (PMI) data for July in focus, investors will look for fresh cues about economic health. The Composite PMI is estimated to have expanded at a higher pace of 52.6 from the former release of 52.3 due to an increase in activities in the manufacturing as well as service sectors. The confidence of UK employers in economic prospects has also improved as the victory of UK Prime Minister Keir Starmer with an absolute majority has brought political stability.
Daily digest market movers: Pound Sterling underperforms against major peers
- The Pound Sterling weakens to nearly 1.2880 against the US Dollar (USD) in European trading hours on Wednesday. The GBP/USD pair extends its correction below 1.2900 amid increasing risk aversion. Meanwhile, the US Dollar clings to gains ahead of a slew of United States (US) economic data. The US Dollar Index (DXY), which tracks the Greenback’s value against six major currencies, hovers near a weekly high at around 104.50.
- In Wednesday’s session, investors will also focus on the preliminary US S&P Global PMI data for July, which will be published at 13:45 GMT. The report is expected to show that the Manufacturing PMI expanded at a nominal pace of 51.7 from June’s reading of 51.6. The Services PMI, a measure of activities in the service sector, is estimated to have expanded at a slower pace of 54.4 from the prior release of 55.3. The economic data will convey the current economic health.
- This week, the main triggers for the US Dollar will be the preliminary annualized Q2 Gross Domestic Product (GDP) and the Personal Consumption Expenditures Price Index (PCE) data for June, which will be published on Thursday and Friday, respectively. The US economy is estimated to have grown by 1.9% from the former release of 1.4%.
- Investors will keenly focus on the core PCE inflation, the Federal Reserve’s (Fed) preferred inflation measure, to get fresh cues about when the central bank will start reducing interest rates. Currently, financial markets expect the Fed to begin lowering its key borrowing rates in September.
- Meanwhile, investors seek fresh developments on the US presidential elections in November. Market experts see Donald Trump winning the elections despite Democrats nominating Vice President Kamala Harris as their leader.
Technical Analysis: Pound Sterling declines below 1.2900
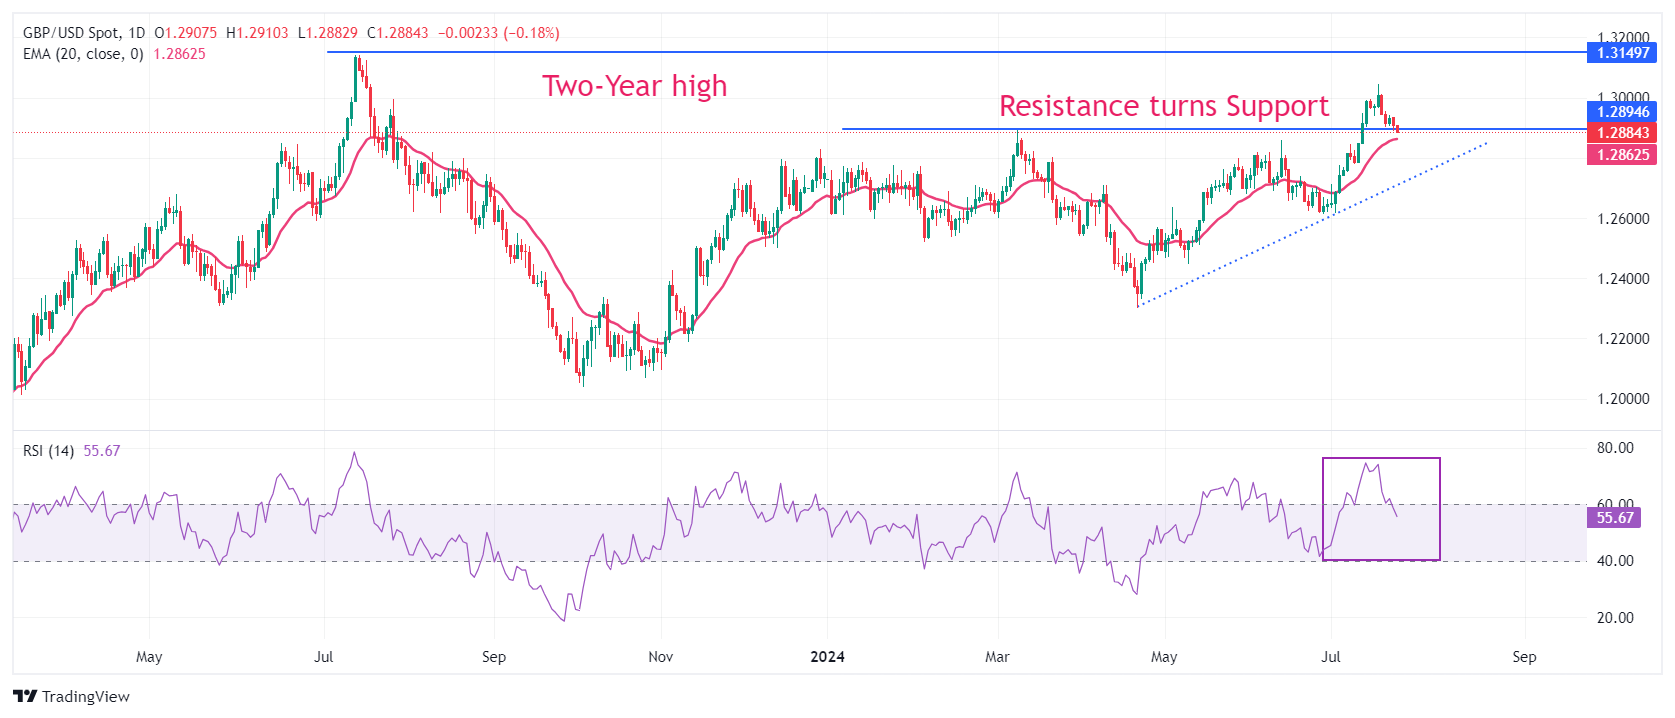
The Pound Sterling falls below the crucial support of 1.2900 against the US Dollar. The GBP/USD pair declines to near the horizontal support plotted from the March 8 high near 1.2900, which used to be a resistance for the Pound Sterling bulls. The Cable has dropped near the 20-day Exponential Moving Average (EMA), which trades around 1.2860.
The 14-day Relative Strength Index (RSI) returns within the 40.00-60.00 range, suggesting the bullish momentum has faded. However, the bullish bias remains intact.
On the upside, a two-year high near 1.3140 will be a key resistance zone for the pair. On the other hand, the upward-sloping trendline from the April 22 low will act as a major support zone around 1.2750.
Pound Sterling FAQs
The Pound Sterling (GBP) is the oldest currency in the world (886 AD) and the official currency of the United Kingdom. It is the fourth most traded unit for foreign exchange (FX) in the world, accounting for 12% of all transactions, averaging $630 billion a day, according to 2022 data. Its key trading pairs are GBP/USD, aka ‘Cable’, which accounts for 11% of FX, GBP/JPY, or the ‘Dragon’ as it is known by traders (3%), and EUR/GBP (2%). The Pound Sterling is issued by the Bank of England (BoE).
The single most important factor influencing the value of the Pound Sterling is monetary policy decided by the Bank of England. The BoE bases its decisions on whether it has achieved its primary goal of “price stability” – a steady inflation rate of around 2%. Its primary tool for achieving this is the adjustment of interest rates. When inflation is too high, the BoE will try to rein it in by raising interest rates, making it more expensive for people and businesses to access credit. This is generally positive for GBP, as higher interest rates make the UK a more attractive place for global investors to park their money. When inflation falls too low it is a sign economic growth is slowing. In this scenario, the BoE will consider lowering interest rates to cheapen credit so businesses will borrow more to invest in growth-generating projects.
Data releases gauge the health of the economy and can impact the value of the Pound Sterling. Indicators such as GDP, Manufacturing and Services PMIs, and employment can all influence the direction of the GBP. A strong economy is good for Sterling. Not only does it attract more foreign investment but it may encourage the BoE to put up interest rates, which will directly strengthen GBP. Otherwise, if economic data is weak, the Pound Sterling is likely to fall.
Another significant data release for the Pound Sterling is the Trade Balance. This indicator measures the difference between what a country earns from its exports and what it spends on imports over a given period. If a country produces highly sought-after exports, its currency will benefit purely from the extra demand created from foreign buyers seeking to purchase these goods. Therefore, a positive net Trade Balance strengthens a currency and vice versa for a negative balance.
Here is what you need to know on Wednesday, July 24:
Following the choppy action seen on Monday and Tuesday, the market volatility could heighten on key macroeconomic events midweek. S&P Global will release preliminary July Manufacturing and Services PMI data for Germany, the Eurozone, the UK and the US on Wednesday. During the American trading hours, the Bank of Canada (BoC) will announce monetary policy decisions. The US economic calendar will also feature Goods Trade Balance and Wholesale Inventories for June.
US Dollar PRICE This week
The table below shows the percentage change of US Dollar (USD) against listed major currencies this week. US Dollar was the strongest against the New Zealand Dollar.
| USD | EUR | GBP | JPY | CAD | AUD | NZD | CHF | |
|---|---|---|---|---|---|---|---|---|
| USD | 0.35% | 0.23% | -1.82% | 0.57% | 1.34% | 1.46% | 0.37% | |
| EUR | -0.35% | -0.14% | -2.20% | 0.16% | 1.03% | 1.04% | -0.07% | |
| GBP | -0.23% | 0.14% | -2.15% | 0.29% | 1.16% | 1.16% | 0.05% | |
| JPY | 1.82% | 2.20% | 2.15% | 2.45% | 3.29% | 3.29% | 2.13% | |
| CAD | -0.57% | -0.16% | -0.29% | -2.45% | 0.87% | 0.89% | -0.22% | |
| AUD | -1.34% | -1.03% | -1.16% | -3.29% | -0.87% | 0.01% | -1.11% | |
| NZD | -1.46% | -1.04% | -1.16% | -3.29% | -0.89% | -0.01% | -1.07% | |
| CHF | -0.37% | 0.07% | -0.05% | -2.13% | 0.22% | 1.11% | 1.07% |
The heat map shows percentage changes of major currencies against each other. The base currency is picked from the left column, while the quote currency is picked from the top row. For example, if you pick the US Dollar from the left column and move along the horizontal line to the Japanese Yen, the percentage change displayed in the box will represent USD (base)/JPY (quote).
The US Dollar (USD) benefited from the negative shift seen in risk sentiment and gathered strength against its major rivals on Tuesday, with the USD Index registering its highest daily close in nearly two weeks at around 104.50. Early Wednesday, the USD Index stays in a consolidation phase, while US stock index futures lose between 0.4% and 0.9%. In the meantime, the benchmark 10-year US Treasury bond yield holds comfortably above 4.2% after closing virtually unchanged on Tuesday.
The BoC is widely expected to cut the policy rate by 25 basis points to 4.5%. Following the announcement of the rate decision at 13:45 GMT, BoC Governor Tiff Macklem will speak on the policy outlook at a press conference and respond to questions from the press. USD/CAD registered gains for the fifth consecutive trading day on Tuesday and continued to stretch higher early Wednesday. At the time of press, the pair was trading at its highest level since mid-April near 1.3800.
After failing to reclaim 1.0900, EUR/USD came under bearish pressure on Tuesday and closed the day deep in negative territory. The pair stays on the back foot in the European morning on Wednesday and trades below 1.0850.
Although GBP/USD managed to erase a portion of its losses after dipping below 1.2900 on Tuesday, it failed to gather recovery momentum. The pair remains under modest bearish pressure below 1.2900 at the beginning of the European session.
During the Asian trading hours, the data from Australia showed that the Judo Bank Composite PMI edged lower to 50.2 in July's flash estimate from 50.7 in June. AUD/USD extended its downtrend early Wednesday and dropped below 0.6600 for the first time in over a month.
USD/JPY continued to push lower despite the renewed USD strength on Tuesday and lost nearly 1% on the day. The bearish pressure surrounding the pair remains intact early Wednesday. At the time of press, USD/JPY was trading at its lowest level since mid-May near 154.50, falling more than 0.5%.
After suffering heavy losses on Monday, Gold regained its traction and closed above $2,400 on Tuesday. XAU/USD holds its ground early Wednesday and edges higher toward $2,420.
Risk sentiment FAQs
In the world of financial jargon the two widely used terms “risk-on” and “risk off'' refer to the level of risk that investors are willing to stomach during the period referenced. In a “risk-on” market, investors are optimistic about the future and more willing to buy risky assets. In a “risk-off” market investors start to ‘play it safe’ because they are worried about the future, and therefore buy less risky assets that are more certain of bringing a return, even if it is relatively modest.
Typically, during periods of “risk-on”, stock markets will rise, most commodities – except Gold – will also gain in value, since they benefit from a positive growth outlook. The currencies of nations that are heavy commodity exporters strengthen because of increased demand, and Cryptocurrencies rise. In a “risk-off” market, Bonds go up – especially major government Bonds – Gold shines, and safe-haven currencies such as the Japanese Yen, Swiss Franc and US Dollar all benefit.
The Australian Dollar (AUD), the Canadian Dollar (CAD), the New Zealand Dollar (NZD) and minor FX like the Ruble (RUB) and the South African Rand (ZAR), all tend to rise in markets that are “risk-on”. This is because the economies of these currencies are heavily reliant on commodity exports for growth, and commodities tend to rise in price during risk-on periods. This is because investors foresee greater demand for raw materials in the future due to heightened economic activity.
The major currencies that tend to rise during periods of “risk-off” are the US Dollar (USD), the Japanese Yen (JPY) and the Swiss Franc (CHF). The US Dollar, because it is the world’s reserve currency, and because in times of crisis investors buy US government debt, which is seen as safe because the largest economy in the world is unlikely to default. The Yen, from increased demand for Japanese government bonds, because a high proportion are held by domestic investors who are unlikely to dump them – even in a crisis. The Swiss Franc, because strict Swiss banking laws offer investors enhanced capital protection.
- USD/CHF edges lower to 0.8905 in Wednesday’s early European session.
- Financial markets expect two or potentially three rate cuts this year, with the first rate cut starting in September.
- SNB rate-cut expectation might weigh on the CHF.
The USD/CHF pair trades on a weaker note near 0.8905 during the early European session on Wednesday. The weakness of the pair is supported by the prospect of US Federal Reserve (Fed) rate cuts this year, which drag the Greenback lower across the board. Traders await the preliminary US July S&P Global Purchasing Managers Index (PMI) for fresh impetus.
The rising bets that the Fed would start easing its monetary policy in September appear to cap the Greenback’s upside. The markets expect two or potentially three rate cuts this year. According to the CME FedWatch Tool, traders have priced in almost a 96% chance of a Fed rate cut in September this year.
However, these odds might be changed with key US economic data later this week. Investors expect to see an improvement in the US manufacturing sector, and the stronger-than-expected US PMI might cap the downside for USD/CHF. The US Gross Domestic Product (GDP) for the second quarter will be released on Thursday, followed by Personal Consumption Expenditures Price Index (PCE) data for June on Friday.
Data released on Tuesday from the US docket showed that the Existing Home Sales declined by 5.4% MoM in June from 4.11M to 3.89M, below the market consensus. Meanwhile, the Richmond Fed Manufacturing Index arrived at -17 in July versus -10 prior.
The expectation that the Swiss National Bank (SNB) might further cut interest rates in September has weighed on the Swiss Franc (CHF) in the previous sessions. FX markets analyst at Ballinger Group, Kyle Chapman, said that the SNB is expected to cut a third rate next quarter and potentially decide a fourth cut in December. Additionally, the political uncertainty in the United States contributes to volatility in the US Dollar (USD) and boosts safe-haven assets like the CHF.
Swiss Franc FAQs
The Swiss Franc (CHF) is Switzerland’s official currency. It is among the top ten most traded currencies globally, reaching volumes that well exceed the size of the Swiss economy. Its value is determined by the broad market sentiment, the country’s economic health or action taken by the Swiss National Bank (SNB), among other factors. Between 2011 and 2015, the Swiss Franc was pegged to the Euro (EUR). The peg was abruptly removed, resulting in a more than 20% increase in the Franc’s value, causing a turmoil in markets. Even though the peg isn’t in force anymore, CHF fortunes tend to be highly correlated with the Euro ones due to the high dependency of the Swiss economy on the neighboring Eurozone.
The Swiss Franc (CHF) is considered a safe-haven asset, or a currency that investors tend to buy in times of market stress. This is due to the perceived status of Switzerland in the world: a stable economy, a strong export sector, big central bank reserves or a longstanding political stance towards neutrality in global conflicts make the country’s currency a good choice for investors fleeing from risks. Turbulent times are likely to strengthen CHF value against other currencies that are seen as more risky to invest in.
The Swiss National Bank (SNB) meets four times a year – once every quarter, less than other major central banks – to decide on monetary policy. The bank aims for an annual inflation rate of less than 2%. When inflation is above target or forecasted to be above target in the foreseeable future, the bank will attempt to tame price growth by raising its policy rate. Higher interest rates are generally positive for the Swiss Franc (CHF) as they lead to higher yields, making the country a more attractive place for investors. On the contrary, lower interest rates tend to weaken CHF.
Macroeconomic data releases in Switzerland are key to assessing the state of the economy and can impact the Swiss Franc’s (CHF) valuation. The Swiss economy is broadly stable, but any sudden change in economic growth, inflation, current account or the central bank’s currency reserves have the potential to trigger moves in CHF. Generally, high economic growth, low unemployment and high confidence are good for CHF. Conversely, if economic data points to weakening momentum, CHF is likely to depreciate.
As a small and open economy, Switzerland is heavily dependent on the health of the neighboring Eurozone economies. The broader European Union is Switzerland’s main economic partner and a key political ally, so macroeconomic and monetary policy stability in the Eurozone is essential for Switzerland and, thus, for the Swiss Franc (CHF). With such dependency, some models suggest that the correlation between the fortunes of the Euro (EUR) and the CHF is more than 90%, or close to perfect.
FX option expiries for July 24 NY cut at 10:00 Eastern Time, via DTCC, can be found below.
EUR/USD: EUR amounts
- 1.0735 705m
- 1.0745 698m
- 1.0950 1b
- 1.0990 3.2b
- 1.1000 1b
GBP/USD: GBP amounts
- 1.2750 406m
- 1.2950 454m
USD/JPY: USD amounts
- 155.00 2.2b
- 155.50 825m
- 156.00 1.1b
- 156.05 1.2b
- 157.25 770m
USD/CHF: USD amounts
- 0.8765 500m
AUD/USD: AUD amounts
- 0.6600 1.7b
- 0.6660 456m
- 0.6720 1.1b
USD/CAD: USD amounts
- 1.3750 532m
- 1.3800 464m
EUR/GBP: EUR amounts
- 0.8400 530m
- GBP/JPY extends its losing streak due to the increased risk aversion.
- The Japanese Yen improves as traders expect the BoJ to raise rates in next week’s meeting.
- The Pound Sterling may limit its downside due to the reduced likelihood of an August rate cut by the BoE.
GBP/JPY continues to lose ground for the fourth consecutive day, trading around 199.50 during the Asian session on Wednesday. This downside could be attributed to the improved Japanese Yen (JPY) likely due to a return of risk-off flows. The Bank of Japan (BoJ) may raise interest rates at next week’s policy meeting, prompting short-sellers to exit their positions and providing support to the JPY.
On Tuesday, a senior official in the ruling party, Toshimitsu Motegi urged the Bank of Japan (BoJ) to more clearly communicate its plan to normalize monetary policy through gradual interest rate hikes, according to Reuters. Additionally, Prime Minister Fumio Kishida added that normalizing the central bank’s monetary policy would support Japan's transition to a growth-driven economy.
On data front, the Jibun Bank Japan Manufacturing PMI unexpectedly fell to 49.2 in July from 50.0 in the previous month, missing market forecasts of 50.5 and indicating the first decline in factory activity since April, according to preliminary estimates. In contrast, the Services PMI surged to 53.9 in July from a final reading of 49.4 in the prior month. This marks the sixth increase in the service sector this year and the steepest pace since April.
In the United Kingdom (UK), the reduced likelihood of an August rate cut by the Bank of England (BoE) is likely to support the British Pound (GBP) and mitigate declines in the GBP/JPY cross. Traders are anticipating the UK PMI activity survey results, set to be released during Wednesday’s London market session.
The market broadly expects a rebound in the July UK Services PMI, which fell to a seven-month low of 52.1 in June. Median forecasts predict a rise to 52.5. Additionally, the Manufacturing PMI is anticipated to increase to 51.1, up from the previous reading of 50.9.
Interest rates FAQs
Interest rates are charged by financial institutions on loans to borrowers and are paid as interest to savers and depositors. They are influenced by base lending rates, which are set by central banks in response to changes in the economy. Central banks normally have a mandate to ensure price stability, which in most cases means targeting a core inflation rate of around 2%. If inflation falls below target the central bank may cut base lending rates, with a view to stimulating lending and boosting the economy. If inflation rises substantially above 2% it normally results in the central bank raising base lending rates in an attempt to lower inflation.
Higher interest rates generally help strengthen a country’s currency as they make it a more attractive place for global investors to park their money.
Higher interest rates overall weigh on the price of Gold because they increase the opportunity cost of holding Gold instead of investing in an interest-bearing asset or placing cash in the bank. If interest rates are high that usually pushes up the price of the US Dollar (USD), and since Gold is priced in Dollars, this has the effect of lowering the price of Gold.
The Fed funds rate is the overnight rate at which US banks lend to each other. It is the oft-quoted headline rate set by the Federal Reserve at its FOMC meetings. It is set as a range, for example 4.75%-5.00%, though the upper limit (in that case 5.00%) is the quoted figure. Market expectations for future Fed funds rate are tracked by the CME FedWatch tool, which shapes how many financial markets behave in anticipation of future Federal Reserve monetary policy decisions.
Gold prices rose in India on Wednesday, according to data compiled by FXStreet.
The price for Gold stood at 6,496.98 Indian Rupees (INR) per gram, up compared with the INR 6,483.28 it cost on Tuesday.
The price for Gold increased to INR 75,788.88 per tola from INR 75,619.70 per tola a day earlier.
| Unit measure | Gold Price in INR |
|---|---|
| 1 Gram | 6,496.98 |
| 10 Grams | 64,977.84 |
| Tola | 75,788.88 |
| Troy Ounce | 202,078.70 |
FXStreet calculates Gold prices in India by adapting international prices (USD/INR) to the local currency and measurement units. Prices are updated daily based on the market rates taken at the time of publication. Prices are just for reference and local rates could diverge slightly.
Gold FAQs
Gold has played a key role in human’s history as it has been widely used as a store of value and medium of exchange. Currently, apart from its shine and usage for jewelry, the precious metal is widely seen as a safe-haven asset, meaning that it is considered a good investment during turbulent times. Gold is also widely seen as a hedge against inflation and against depreciating currencies as it doesn’t rely on any specific issuer or government.
Central banks are the biggest Gold holders. In their aim to support their currencies in turbulent times, central banks tend to diversify their reserves and buy Gold to improve the perceived strength of the economy and the currency. High Gold reserves can be a source of trust for a country’s solvency. Central banks added 1,136 tonnes of Gold worth around $70 billion to their reserves in 2022, according to data from the World Gold Council. This is the highest yearly purchase since records began. Central banks from emerging economies such as China, India and Turkey are quickly increasing their Gold reserves.
Gold has an inverse correlation with the US Dollar and US Treasuries, which are both major reserve and safe-haven assets. When the Dollar depreciates, Gold tends to rise, enabling investors and central banks to diversify their assets in turbulent times. Gold is also inversely correlated with risk assets. A rally in the stock market tends to weaken Gold price, while sell-offs in riskier markets tend to favor the precious metal.
The price can move due to a wide range of factors. Geopolitical instability or fears of a deep recession can quickly make Gold price escalate due to its safe-haven status. As a yield-less asset, Gold tends to rise with lower interest rates, while higher cost of money usually weighs down on the yellow metal. Still, most moves depend on how the US Dollar (USD) behaves as the asset is priced in dollars (XAU/USD). A strong Dollar tends to keep the price of Gold controlled, whereas a weaker Dollar is likely to push Gold prices up.
(An automation tool was used in creating this post.)
- EUR/USD drifts lower for the second straight day and drops to a nearly two-week low.
- The ECB’s dovish outlook continues to undermine the Euro and exerts some pressure.
- September Fed rate cut bets cap the USD and should lend support ahead of flash PMIs.
The EUR/USD pair prolongs its recent corrective slide from the vicinity of mid-1.0900s, or a four-month high touched last week, and remains under some selling pressure for the second straight day on Wednesday. This also marks the fourth day of a negative move in the previous five and drags spot prices to a nearly two-week low, around the 1.0840 region during the Asian session.
The shared currency is undermined by the European Central Bank's (ECB) downbeat view of the Eurozone's economic prospects and expectations that inflation would keep falling, which left the door for a rate cut in September wide open. The US Dollar (USD), on the other hand, has strengthened to its highest level since July 11 amid an uptick in the US Treasury bond yields. Apart from this, a softer risk tone benefits the Greenback's relative safe-haven status and contributes to the offered tone surrounding the EUR/USD pair.
Meanwhile, the markets seem convinced that the Federal Reserve (Fed) will lower borrowing costs in September and have been pricing in the possibility of two more rate cuts by year-end. This, in turn, could act as a headwind for the US bond yields and the Greenback. Furthermore, traders could unwind the 'Trump trade' amid increasing chances that US Vice President Kamala Harris will clinch the Democratic nomination. This might further contribute to capping the USD upside and lend some support to the EUR/USD pair.
Traders might also prefer to wait on the sidelines ahead of this week's key US macro data – the release of the Advance Q2 GDP print on Thursday and the Personal Consumption Expenditures (PCE) Price Index data. In the meantime, the flash Eurozone/US PMIs will be looked upon for short-term trading opportunities later this Wednesday. Nevertheless, the aforementioned mixed fundamental backdrop warrants some caution before placing aggressive bearish bets around the EUR/USD pair and positioning for further losses.
Economic Indicator
HCOB Composite PMI
The Composite Purchasing Managers’ Index (PMI), released on a monthly basis by S&P Global and Hamburg Commercial Bank (HCOB), is a leading indicator gauging private-business activity in the Eurozone for both the manufacturing and services sectors. The data is derived from surveys to senior executives. Each response is weighted according to the size of the company and its contribution to total manufacturing or services output accounted for by the sub-sector to which that company belongs. Survey responses reflect the change, if any, in the current month compared to the previous month and can anticipate changing trends in official data series such as Gross Domestic Product (GDP), industrial production, employment and inflation. The index varies between 0 and 100, with levels of 50.0 signaling no change over the previous month. A reading above 50 indicates that the private economy is generally expanding, a bullish sign for the Euro (EUR). Meanwhile, a reading below 50 signals that activity is generally declining, which is seen as bearish for EUR.
Read more.Next release: Wed Jul 24, 2024 08:00 (Prel)
Frequency: Monthly
Consensus: 51.1
Previous: 50.9
Source: S&P Global
- GBP/USD remains under some selling pressure for the second straight day on Wednesday.
- A combination of factors lends support to the USD and drags spot prices to a two-week low.
- The technical setup warrants caution for bears and before positioning for additional losses.
The GBP/USD pair drifts lower for the second successive day – also marking the fourth day of a negative move in the previous five – and drops to a nearly two-week low during the Asian session on Wednesday. Spot prices currently trade just below the 1.2900 mark, down 0.15% for the day amid a modest US Dollar (USD), though any meaningful depreciating move seems elusive.
In fact, the USD Index (DXY), which tracks the Greenback against a basket of currencies, climbed to a two-week high amid an uptick in the US Treasury bond yields. Apart from this, a softer risk tone further benefits the safe-haven buck, though bets for an imminent start of the Federal Reserve's (Fed) rate-cutting cycle in September cap gains. Apart from this, diminishing odds of an August rate cut by the Bank of England (BoE) should act as a tailwind for the British Pound (GBP) and the GBP/USD pair ahead of flash PMIs.
From a technical perspective, spot prices currently trade just above the 38.2% Fibonacci retracement level of the recent rally from the June monthly swing low. The said support is pegged near the 1.2880 region, below which a fresh bout of selling could drag the GBP/USD pair to the 1.2830-1.2835 area, or the 50% Fibo. level. The next relevant support is seen near the 1.2800 mark ahead of the 61.8% Fibo. level, around the 1.2780-1.2775 region. A convincing break below will be seen as a fresh trigger for bears and pave the way for deeper losses.
On the flip side, any positive beyond the 1.2900 mark is likely to attract fresh buyers and remain capped near the 1.2930-1.2940 resistance or the 23.6% Fibo. level support breakpoint. Some follow-through buying will suggest that the recent corrective slide has run its course and shift the bias back in favor of bulls. Given that oscillators on the daily chart are still holding in positive territory, the GBP/USD pair might then aim back to reclaim the 1.3000 psychological mark and retest the 1.3045 region, or the one-year peak touched last week.
GBP/USD daily chart
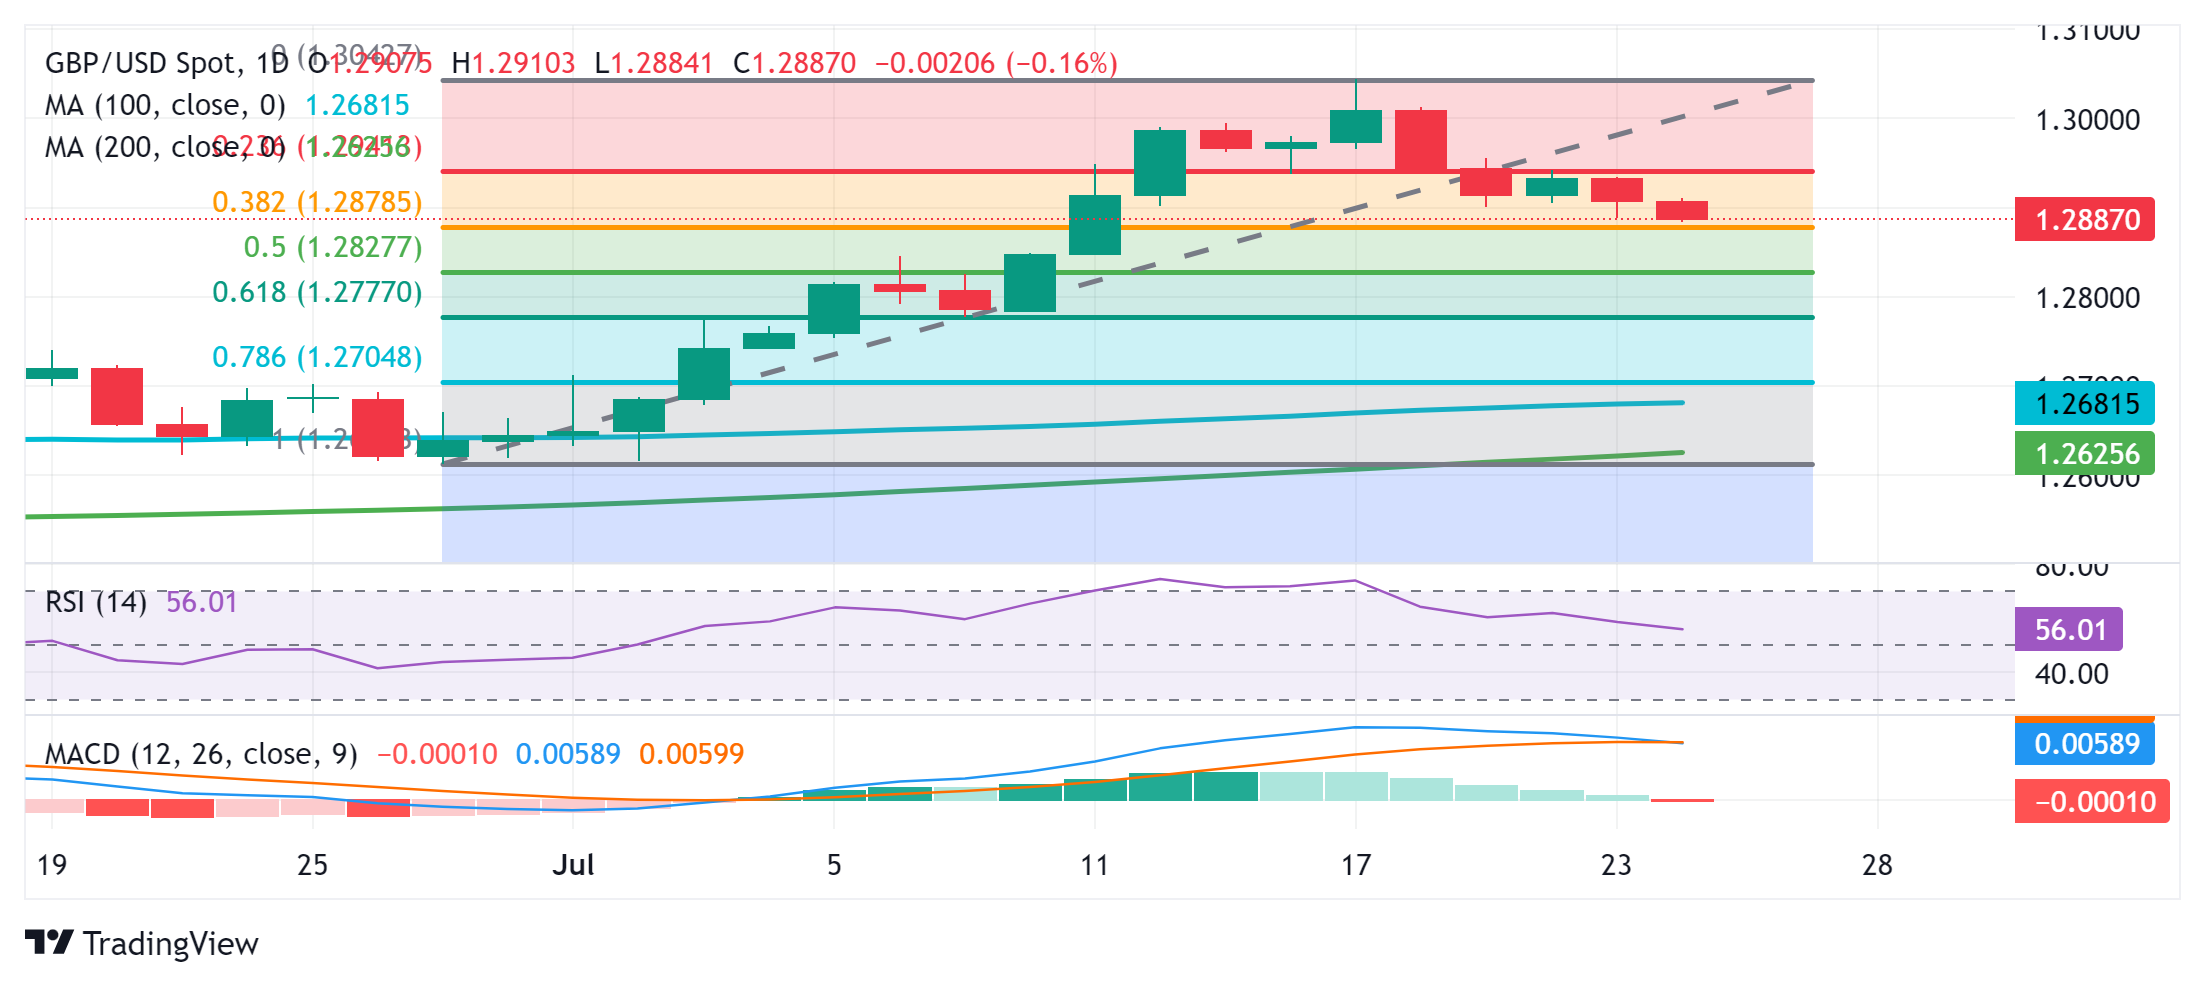
Pound Sterling FAQs
The Pound Sterling (GBP) is the oldest currency in the world (886 AD) and the official currency of the United Kingdom. It is the fourth most traded unit for foreign exchange (FX) in the world, accounting for 12% of all transactions, averaging $630 billion a day, according to 2022 data. Its key trading pairs are GBP/USD, aka ‘Cable’, which accounts for 11% of FX, GBP/JPY, or the ‘Dragon’ as it is known by traders (3%), and EUR/GBP (2%). The Pound Sterling is issued by the Bank of England (BoE).
The single most important factor influencing the value of the Pound Sterling is monetary policy decided by the Bank of England. The BoE bases its decisions on whether it has achieved its primary goal of “price stability” – a steady inflation rate of around 2%. Its primary tool for achieving this is the adjustment of interest rates. When inflation is too high, the BoE will try to rein it in by raising interest rates, making it more expensive for people and businesses to access credit. This is generally positive for GBP, as higher interest rates make the UK a more attractive place for global investors to park their money. When inflation falls too low it is a sign economic growth is slowing. In this scenario, the BoE will consider lowering interest rates to cheapen credit so businesses will borrow more to invest in growth-generating projects.
Data releases gauge the health of the economy and can impact the value of the Pound Sterling. Indicators such as GDP, Manufacturing and Services PMIs, and employment can all influence the direction of the GBP. A strong economy is good for Sterling. Not only does it attract more foreign investment but it may encourage the BoE to put up interest rates, which will directly strengthen GBP. Otherwise, if economic data is weak, the Pound Sterling is likely to fall.
Another significant data release for the Pound Sterling is the Trade Balance. This indicator measures the difference between what a country earns from its exports and what it spends on imports over a given period. If a country produces highly sought-after exports, its currency will benefit purely from the extra demand created from foreign buyers seeking to purchase these goods. Therefore, a positive net Trade Balance strengthens a currency and vice versa for a negative balance.
- WTI price extends its losing streak due to increased optimism surrounding ceasefire negotiations in the Middle East.
- Israeli Prime Minister Benjamin Netanyahu has suggested that a ceasefire agreement might be taking shape.
- API Weekly Crude Oil Stock fell by 3.9 million barrels for the previous week, against an expected 2.47 million-barrel decrease.
West Texas Intermediate (WTI) Oil price continues to decline for the fifth successive session, trading around $77.00 per barrel during the Asian hours on Wednesday. This decrease probably follows a surge of optimism surrounding potential ceasefire negotiations between Israel and Hamas.
Israeli Prime Minister Benjamin Netanyahu has hinted that a ceasefire agreement, which could lead to the release of several hostages in Gaza, might be in the works. Netanyahu is currently in Washington to address Congress, according to The Associated Press.
Egypt, Qatar, and the United States (US) are working to broker a phased deal between Israel and Hamas to halt the fighting and secure the release of remaining hostages. Meanwhile, in China, Palestinian factions Hamas and Fatah have signed a declaration to form a unity government and resolve their long-standing rift.
However, crude Oil prices found some support from declining US crude inventories. On Tuesday, the American Petroleum Institute (API) reported a drop of 3.9 million barrels in Weekly Crude Oil Stock for the week ending July 19, exceeding market expectations of a 2.47 million-barrel decrease. This follows a previous decline of 4.44 million barrels. The US Energy Information Administration’s (EIA) Crude Oil Stocks Change report, scheduled for Wednesday, is anticipated to show a 0.7 million-barrel increase for the same period.
The US Dollar (USD) faces challenges due to rising bets on a Federal Reserve (Fed) rate cut in September. According to CME Group’s FedWatch Tool, markets now indicate a 93.6% probability of a 25-basis point rate cut at the September Fed meeting, up from 88.5% a day earlier.
A weaker US Dollar could make oil cheaper for buyers using other currencies, potentially boosting demand for the commodity. Additionally, lower interest rates could stimulate economic activity in the United States, the world's largest Oil consumer, which may help support Oil prices.
Traders await the data release of the US Purchasing Managers Index (PMI) data on Wednesday and the Gross Domestic Product (GDP) Annualized (Q2) figures on Thursday. These figures are expected to provide new insights into the economic conditions of the United States.
WTI Oil FAQs
WTI Oil is a type of Crude Oil sold on international markets. The WTI stands for West Texas Intermediate, one of three major types including Brent and Dubai Crude. WTI is also referred to as “light” and “sweet” because of its relatively low gravity and sulfur content respectively. It is considered a high quality Oil that is easily refined. It is sourced in the United States and distributed via the Cushing hub, which is considered “The Pipeline Crossroads of the World”. It is a benchmark for the Oil market and WTI price is frequently quoted in the media.
Like all assets, supply and demand are the key drivers of WTI Oil price. As such, global growth can be a driver of increased demand and vice versa for weak global growth. Political instability, wars, and sanctions can disrupt supply and impact prices. The decisions of OPEC, a group of major Oil-producing countries, is another key driver of price. The value of the US Dollar influences the price of WTI Crude Oil, since Oil is predominantly traded in US Dollars, thus a weaker US Dollar can make Oil more affordable and vice versa.
The weekly Oil inventory reports published by the American Petroleum Institute (API) and the Energy Information Agency (EIA) impact the price of WTI Oil. Changes in inventories reflect fluctuating supply and demand. If the data shows a drop in inventories it can indicate increased demand, pushing up Oil price. Higher inventories can reflect increased supply, pushing down prices. API’s report is published every Tuesday and EIA’s the day after. Their results are usually similar, falling within 1% of each other 75% of the time. The EIA data is considered more reliable, since it is a government agency.
OPEC (Organization of the Petroleum Exporting Countries) is a group of 13 Oil-producing nations who collectively decide production quotas for member countries at twice-yearly meetings. Their decisions often impact WTI Oil prices. When OPEC decides to lower quotas, it can tighten supply, pushing up Oil prices. When OPEC increases production, it has the opposite effect. OPEC+ refers to an expanded group that includes ten extra non-OPEC members, the most notable of which is Russia.
- Silver gains some positive traction for the second successive day on Wednesday.
- The technical setup warrants some caution before positioning for further gains.
- A break below the 100-day SMA support will be seen as a fresh trigger for bears.
Silver (XAG/USD) ticks higher during the Asian session on Wednesday and looks to build on the previous day's modest bounce from the $28.70-$28.65 region, or a nearly one-month low. The white metal, however, remains below the weekly peak touched on Monday and currently trades around the $29.35 area, up over 0.30% for the day.
From a technical perspective, the breakdown through a short-term trading range was seen as a fresh trigger for bearish traders. Moreover, oscillators on the daily chart have just started gaining negative traction and suggest that the path of least resistance for the XAG/USD is to the downside. That said, the overnight bounce from the vicinity of the $28.60-$28.55 support zone, or the June monthly swing low, and the subsequent move-up warrants some caution.
In the meantime, momentum beyond the $29.40-$29.45 area, or the weekly peak, is likely to confront some hurdle near the $29.80 region. This is closely followed by the $30.00 psychological mark, above which a bout of a short-covering move could lift the XAG/USD back towards the $30.35-$30.40 trading range support breakpoint, now turned resistance. The momentum could extend further and allow the bulls to reclaim the $31.00 round-figure mark.
A sustained strength beyond the latter will negate any near-term negative bias and pave the way for a move towards the $31.40 supply zone. Some follow-through buying beyond the monthly peak, around the $31.80 area, has the potential to lift the XAG/USD towards the $32.00 mark en route to the YTD peak, near the mid-$32.00s touched in May.
On the flip side, weakness below the $29.00 mark might continue to find decent support near the $28.60-$28.55 region. The said area now coincides with the 100-day Simple Moving Average (SMA) and should act as a key pivotal point. A convincing break below would make the XAG/USD vulnerable to accelerate the slide further below the $28.00 round figure, towards testing the next relevant support near the $27.50-$27.40 horizontal resistance breakpoint.
Silver daily chart
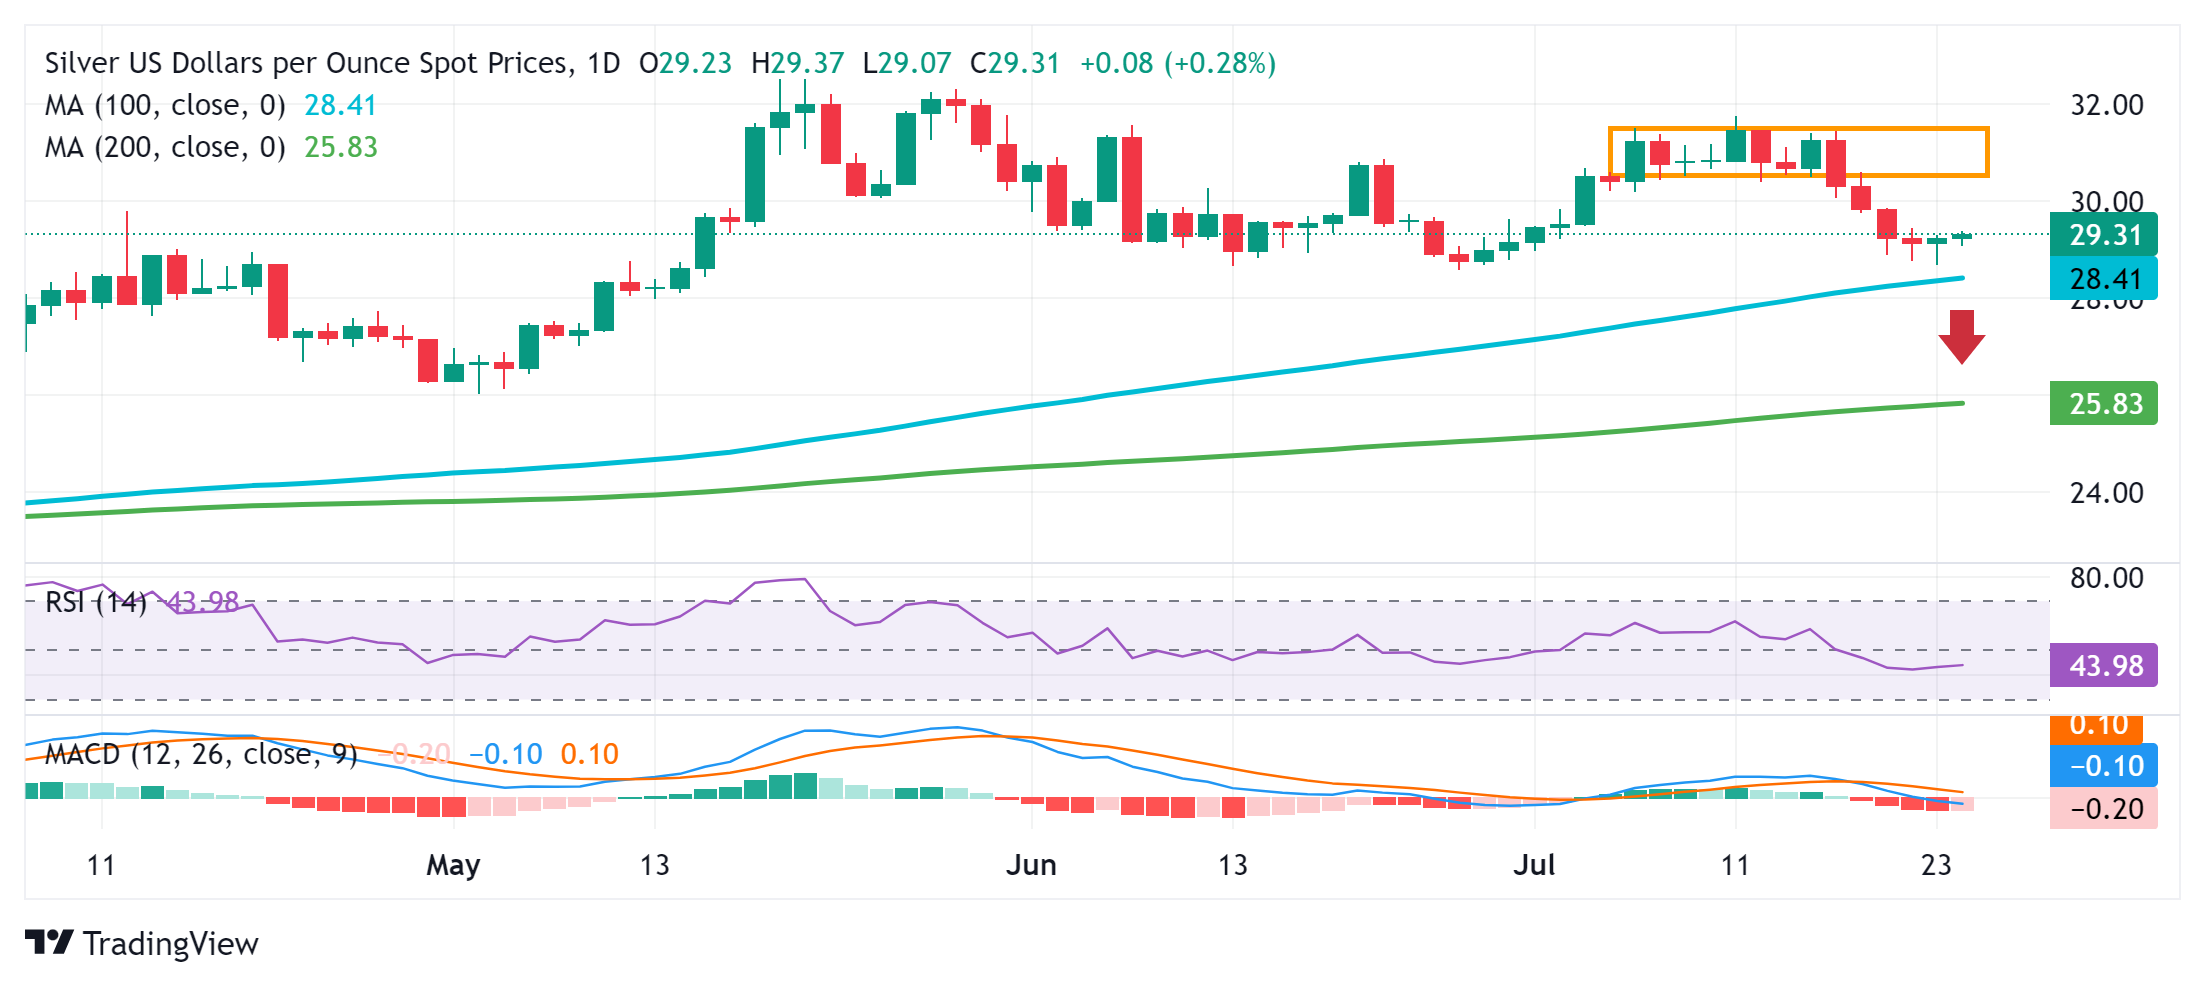
Silver FAQs
Silver is a precious metal highly traded among investors. It has been historically used as a store of value and a medium of exchange. Although less popular than Gold, traders may turn to Silver to diversify their investment portfolio, for its intrinsic value or as a potential hedge during high-inflation periods. Investors can buy physical Silver, in coins or in bars, or trade it through vehicles such as Exchange Traded Funds, which track its price on international markets.
Silver prices can move due to a wide range of factors. Geopolitical instability or fears of a deep recession can make Silver price escalate due to its safe-haven status, although to a lesser extent than Gold's. As a yieldless asset, Silver tends to rise with lower interest rates. Its moves also depend on how the US Dollar (USD) behaves as the asset is priced in dollars (XAG/USD). A strong Dollar tends to keep the price of Silver at bay, whereas a weaker Dollar is likely to propel prices up. Other factors such as investment demand, mining supply – Silver is much more abundant than Gold – and recycling rates can also affect prices.
Silver is widely used in industry, particularly in sectors such as electronics or solar energy, as it has one of the highest electric conductivity of all metals – more than Copper and Gold. A surge in demand can increase prices, while a decline tends to lower them. Dynamics in the US, Chinese and Indian economies can also contribute to price swings: for the US and particularly China, their big industrial sectors use Silver in various processes; in India, consumers’ demand for the precious metal for jewellery also plays a key role in setting prices.
Silver prices tend to follow Gold's moves. When Gold prices rise, Silver typically follows suit, as their status as safe-haven assets is similar. The Gold/Silver ratio, which shows the number of ounces of Silver needed to equal the value of one ounce of Gold, may help to determine the relative valuation between both metals. Some investors may consider a high ratio as an indicator that Silver is undervalued, or Gold is overvalued. On the contrary, a low ratio might suggest that Gold is undervalued relative to Silver.
- The Japanese Yen appreciates due to the hawkish sentiment surrounding the BoJ’s policy stance ahead of next week's meeting.
- Japan's Manufacturing PMI fell to 49.2 in July from a 50.0 reading; Services PMI surged to 53.9 from the prior 49.4.
- CME Group’s FedWatch Tool indicates an increase to 93.6% odds of a 25-basis point rate cut in September.
The Japanese Yen (JPY) extends its gains for the third consecutive session on Wednesday, likely due to a return of risk-off flows. The Bank of Japan (BoJ) is anticipated to raise interest rates at next week’s policy meeting, prompting short-sellers to exit their positions and providing support to the JPY.
A senior official in the ruling party, Toshimitsu Motegi urged the Bank of Japan (BoJ) to more clearly communicate its plan to normalize monetary policy through gradual interest rate hikes, according to Reuters. Prime Minister Fumio Kishida added that normalizing the central bank’s monetary policy would support Japan's transition to a growth-driven economy.
The US Dollar (USD) faces challenges due to rising bets on a Federal Reserve (Fed) rate cut in September, which put pressure on the USD/JPY pair. According to CME Group’s FedWatch Tool, markets now indicate a 93.6% probability of a 25-basis point rate cut at the September Fed meeting, up from 88.5% a day earlier.
Traders await the data release of the US Purchasing Managers Index (PMI) data on Wednesday and the Gross Domestic Product (GDP) Annualized (Q2) figures on Thursday. These figures are expected to provide new insights into the economic conditions of the United States.
Daily Digest Market Movers: Japanese Yen improves due to the return of the risk-off flows
- The Jibun Bank Japan Manufacturing PMI unexpectedly fell to 49.2 in July from 50.0 in the previous month, missing market forecasts of 50.5 and indicating the first decline in factory activity since April, according to preliminary estimates. In contrast, the Services PMI surged to 53.9 in July from a final reading of 49.4 in the prior month. This marks the sixth increase in the service sector this year and the steepest pace since April.
- Media reports say that Vice President Kamala Harris has just passed 1,976 Democratic delegates to secure the party's presidential nomination. Harris is now the Democratic Party’s Presumptive Nominee for November’s Presidential Election.
- Federal Reserve Bank of New York President John Williams stated on Friday that the long-term trends that caused declines in neutral interest rates before the pandemic continue to prevail. Williams noted, "My own Holston-Laubach-Williams estimates for r-star in the United States, Canada, and the Euro area are about the same level as they were before the pandemic," according to Bloomberg.
- Japan's National Consumer Price Index (CPI) for June held steady at 2.8%, matching the previous month's figure and remaining at the highest level since February. Meanwhile, Core CPI inflation rose to 2.6%, slightly above the previous reading of 2.5% but just below the consensus estimate of 2.7%.
- JP Morgan has anticipated no rate hike from the Bank of Japan (BoJ) in July or at any point in 2024. A July rate increase is not their base case, and they do not expect any hikes for the remainder of 2024. They believe it is too early to adopt a bullish stance on the Yen.
- Kazushige Kamiyama, a senior Bank of Japan (BoJ) official and the central bank’s Osaka branch manager, said on Thursday that the BoJ wants to maintain an accommodative monetary environment as much as possible, per Jiji News Agency.
- Last week, BoJ data suggested that authorities may have intervened by purchasing nearly ¥6 trillion on July 11-12. Additionally, data revealed that Japan sold approximately $22 billion in US Treasuries in May to raise dollars, bolstering its reserves for potential foreign exchange market operations, according to Reuters.
Technical Analysis: USD/JPY falls toward 155.00
USD/JPY trades around 155.20 on Wednesday. The daily chart analysis shows that the USD/JPY pair is within an ascending channel, indicating a dovish bias. Additionally, the 14-day Relative Strength Index (RSI) is below 50, reinforcing a bearish outlook. If the RSI breaks below the 30 level, it could indicate an oversold situation and a potential short-term rebound.
The USD/JPY pair may find significant support near June's low of 154.55, followed by the lower boundary of the ascending channel. A decline below this level could lead to a further drop toward May's low of 151.86.
On the upside, immediate resistance is at the nine-day EMA of 157.07, which aligns with the upper boundary of the ascending channel. A breakout above this level could push the USD/JPY pair toward the pullback resistance around the psychological level of 162.00.
USD/JPY: Daily Chart
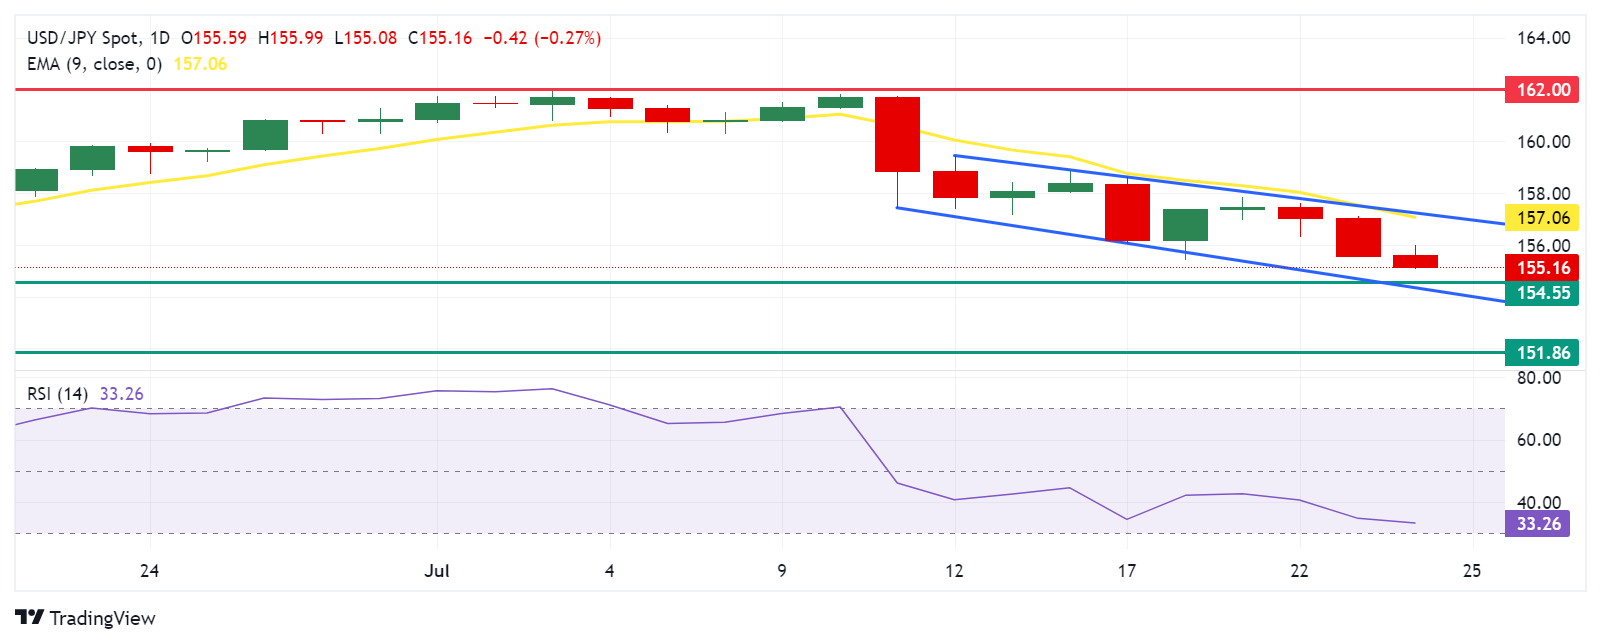
Japanese Yen PRICE Today
The table below shows the percentage change of Japanese Yen (JPY) against listed major currencies today. Japanese Yen was the strongest against the New Zealand Dollar.
| USD | EUR | GBP | JPY | CAD | AUD | NZD | CHF | |
|---|---|---|---|---|---|---|---|---|
| USD | 0.08% | 0.13% | -0.33% | 0.08% | 0.27% | 0.45% | 0.06% | |
| EUR | -0.08% | 0.05% | -0.42% | -0.01% | 0.20% | 0.36% | -0.02% | |
| GBP | -0.13% | -0.05% | -0.46% | -0.06% | 0.14% | 0.32% | -0.09% | |
| JPY | 0.33% | 0.42% | 0.46% | 0.40% | 0.59% | 0.75% | 0.37% | |
| CAD | -0.08% | 0.01% | 0.06% | -0.40% | 0.20% | 0.38% | -0.03% | |
| AUD | -0.27% | -0.20% | -0.14% | -0.59% | -0.20% | 0.17% | -0.23% | |
| NZD | -0.45% | -0.36% | -0.32% | -0.75% | -0.38% | -0.17% | -0.40% | |
| CHF | -0.06% | 0.02% | 0.09% | -0.37% | 0.03% | 0.23% | 0.40% |
The heat map shows percentage changes of major currencies against each other. The base currency is picked from the left column, while the quote currency is picked from the top row. For example, if you pick the Japanese Yen from the left column and move along the horizontal line to the US Dollar, the percentage change displayed in the box will represent JPY (base)/USD (quote).
Economic Indicator
Jibun Bank Services PMI
The Services Purchasing Managers Index (PMI), released on a monthly basis by Jibun Bank and S&P Global, is a leading indicator gauging business activity in Japan’s services sector. As the services sector dominates a large part of total GDP, the services PMI is an important indicator of the overall economic conditions in Japan. The data is derived from surveys of senior executives at private-sector companies from the services sector. Survey responses reflect the change, if any, in the current month compared to the previous month and can anticipate changing trends in official data series such as Gross Domestic Product (GDP), employment and inflation. A reading above 50 indicates that the services economy is generally expanding, a bullish sign for the Japanese Yen (JPY). Meanwhile, a reading below 50 signals that activity among service providers is generally declining, which is seen as bearish for JPY.
Read more.Last release: Wed Jul 24, 2024 00:30 (Prel)
Frequency: Monthly
Actual: 53.9
Consensus: -
Previous: 49.4
Source: S&P Global
- The Indian Rupee remains steady in Wednesday’s early Asian session.
- Finance Minister Nirmala Sitharaman announced raising the capital gains tax, which exerted selling pressure on the INR.
- Investors will monitor the preliminary Indian and US PMI data for July, which are due on Wednesday.
The Indian Rupee (INR) trades on a flat note on Wednesday despite the modest recovery of the Greenback. The upside of INR might be capped after India's finance minister Nirmala Sitharaman announced on Tuesday at the Budget Session of Parliament to raise capital gains tax from equity investments and equity derivative trades. However, the possibility that the Reserve Bank of India (RBI) will intervene in the market to prevent the local currency from depreciating and the fall in crude oil prices could help the INR’s losses.
Investors will watch the flash Indian HSBC Purchasing Managers Index (PMI) for July, which is due on Wednesday. On the US docket, the preliminary US S&P Global Purchasing Managers Index (PMI) for July will be released. The Manufacturing PMI is expected to improve slightly to 51.7 in July from 51.6 in June, while the Services PMI is forecast to ease to 54.4 from 55.3 in the same report period.
Daily Digest Market Movers: Indian Rupee’s potential upside might be limited amid multiple headwinds
- India's benchmark equity indexes, the BSE Sensex and Nifty 50, experienced significant losses on Tuesday, ending slightly lower after falling more than 1% earlier in the day.
- India’s Finance Minister Nirmala Sitharaman said at the Budget Session of Parliament on Tuesday that the Securities transaction tax on futures and options will be raised to 0.02% and 0.01%, respectively.
- Sitharaman stated that long-term capital gains on all financial and non-financial assets will be taxed at 12.5%. In addition, the limit of exemption for capital gains will be set at Rs 1.25 lakh.
- The government will reduce customs duty on gold, and silver to 6%, and platinum to 6.4%, said Nirmala Sitharaman.
- The Indian government is set to promote the Indian Rupee for overseas investments, noting that the rules and regulations for EDI will be simplified.
- India's budget struck a balance between higher spending on job creation and rural development, and a reduced fiscal deficit objective, according to Reuters. The Indian government reduced its fiscal deficit target to 4.9% of GDP, down from 5.1% in the February interim budget.
- The US Existing Home Sales dropped by 5.4% MoM in June from 4.11M to 3.89M, worse than expected. Meanwhile, the Richmond Fed Manufacturing Index came in at -17 in July versus -10 prior.
- Traders are now pricing in nearly a 96% possibility of a Fed rate cut in September, according to the CME FedWatch Tool.
Technical analysis: Indian Rupee maintains a bearish bias in the longer term
The Indian Rupee trades flat on the day. The constructive stance of the USD/INR pair remains intact as it confirms a breakout above the month-long trading range and holds above the key 100-day Exponential Moving Average (EMA). The upward momentum is supported by the 14-day Relative Strength Index (RSI), which stands in the bullish zone around 60.00.
The immediate resistance level for the pair is seen at the all-time high of 83.77. A bullish breakout above this level will see a rally to the 84.00 psychological level.
In the bearish case, any follow-through selling below the resistance-turned-support level at 83.65 might pave the way to 83.51, a low of July 12. The additional downside target to watch is 83.41, the 100-day EMA.
US Dollar price today
The table below shows the percentage change of US Dollar (USD) against listed major currencies today. US Dollar was the weakest against the Japanese Yen.
| USD | EUR | GBP | CAD | AUD | JPY | NZD | CHF | |
| USD | 0.05% | 0.09% | 0.07% | 0.27% | -0.42% | 0.42% | 0.03% | |
| EUR | -0.04% | 0.04% | 0.02% | 0.23% | -0.45% | 0.36% | -0.02% | |
| GBP | -0.09% | -0.04% | -0.02% | 0.19% | -0.49% | 0.32% | -0.06% | |
| CAD | -0.07% | -0.02% | 0.02% | 0.18% | -0.50% | 0.35% | -0.03% | |
| AUD | -0.27% | -0.21% | -0.18% | -0.22% | -0.69% | 0.15% | -0.24% | |
| JPY | 0.41% | 0.44% | 0.46% | 0.47% | 0.68% | 0.82% | 0.44% | |
| NZD | -0.42% | -0.35% | -0.32% | -0.34% | -0.14% | -0.81% | -0.38% | |
| CHF | -0.04% | 0.01% | 0.06% | 0.04% | 0.24% | -0.45% | 0.38% |
The heat map shows percentage changes of major currencies against each other. The base currency is picked from the left column, while the quote currency is picked from the top row. For example, if you pick the Euro from the left column and move along the horizontal line to the Japanese Yen, the percentage change displayed in the box will represent EUR (base)/JPY (quote).
Indian Rupee FAQs
The Indian Rupee (INR) is one of the most sensitive currencies to external factors. The price of Crude Oil (the country is highly dependent on imported Oil), the value of the US Dollar – most trade is conducted in USD – and the level of foreign investment, are all influential. Direct intervention by the Reserve Bank of India (RBI) in FX markets to keep the exchange rate stable, as well as the level of interest rates set by the RBI, are further major influencing factors on the Rupee.
The Reserve Bank of India (RBI) actively intervenes in forex markets to maintain a stable exchange rate, to help facilitate trade. In addition, the RBI tries to maintain the inflation rate at its 4% target by adjusting interest rates. Higher interest rates usually strengthen the Rupee. This is due to the role of the ‘carry trade’ in which investors borrow in countries with lower interest rates so as to place their money in countries’ offering relatively higher interest rates and profit from the difference.
Macroeconomic factors that influence the value of the Rupee include inflation, interest rates, the economic growth rate (GDP), the balance of trade, and inflows from foreign investment. A higher growth rate can lead to more overseas investment, pushing up demand for the Rupee. A less negative balance of trade will eventually lead to a stronger Rupee. Higher interest rates, especially real rates (interest rates less inflation) are also positive for the Rupee. A risk-on environment can lead to greater inflows of Foreign Direct and Indirect Investment (FDI and FII), which also benefit the Rupee.
Higher inflation, particularly, if it is comparatively higher than India’s peers, is generally negative for the currency as it reflects devaluation through oversupply. Inflation also increases the cost of exports, leading to more Rupees being sold to purchase foreign imports, which is Rupee-negative. At the same time, higher inflation usually leads to the Reserve Bank of India (RBI) raising interest rates and this can be positive for the Rupee, due to increased demand from international investors. The opposite effect is true of lower inflation.
- EUR/JPY turns lower for the third straight day and drops to over a one-month low on Wednesday.
- The recent suspected intervention, along with BoJ rate-hike bets continue to underpin the JPY.
- A softer risk tone further benefits the safe-haven JPY and exerts pressure ahead of global PMIs.
The EUR/JPY cross attracts fresh sellers following an early uptick to the 169.20 region during the Asian session and turns lower for the third successive day on Wednesday. The downward trajectory drags spot prices to the lowest level since June 17, around the 168.35-168.30 area in the last hour, and is sponsored by the emergence of fresh buying around the Japanese Yen (JPY).
Against the backdrop of a suspected intervention by Japanese authorities, bets that the Bank of Japan (BoJ) could hike rates again at its upcoming policy meeting continue to underpin the JPY. The expectations were lifted by the overnight comments by Japan's ruling Liberal Democratic Party official Toshimitsu Motegi, saying that the BoJ should clearly indicate its resolve to normalise monetary policy, including through steady interest rate hikes.
Furthermore, a slight deterioration in the global risk sentiment – as depicted by a weaker tone across the global equity markets – benefits the safe-haven JPY and exerts additional pressure on the EUR/JPY cross. The shared currency, on the other hand, is weighed down by the European Central Bank's (ECB) downbeat view of the Eurozone's economic prospects and softer inflation expectations, which keeps a September rate cut move on the table.
This, along with the overnight sustained breakdown through the 170.00 psychological mark favors bearish traders and suggests that the path of least resistance for the EUR/JPY cross is to the downside. Hence, a subsequent fall below the 168.00 round figure, towards the 100-day Simple Moving Average (SMA) support near the 167.80 region en route to the mid-167.00s, or the June monthly swing low, looks like a distinct possibility.
On the economic data front, the au Jibun Bank flash PMI showed that Japanese manufacturing activity unexpectedly shrank in July. However, the disappointment was largely offset by strength in the services sector and did little to provide any meaningful impetus to the EUR/JPY Cross. Moving ahead, market participants now look forward to the flash Eurozone PMIs for short-term trading opportunities.
Bank of Japan FAQs
The Bank of Japan (BoJ) is the Japanese central bank, which sets monetary policy in the country. Its mandate is to issue banknotes and carry out currency and monetary control to ensure price stability, which means an inflation target of around 2%.
The Bank of Japan has embarked in an ultra-loose monetary policy since 2013 in order to stimulate the economy and fuel inflation amid a low-inflationary environment. The bank’s policy is based on Quantitative and Qualitative Easing (QQE), or printing notes to buy assets such as government or corporate bonds to provide liquidity. In 2016, the bank doubled down on its strategy and further loosened policy by first introducing negative interest rates and then directly controlling the yield of its 10-year government bonds.
The Bank’s massive stimulus has caused the Yen to depreciate against its main currency peers. This process has exacerbated more recently due to an increasing policy divergence between the Bank of Japan and other main central banks, which have opted to increase interest rates sharply to fight decades-high levels of inflation. The BoJ’s policy of holding down rates has led to a widening differential with other currencies, dragging down the value of the Yen.
A weaker Yen and the spike in global energy prices have led to an increase in Japanese inflation, which has exceeded the BoJ’s 2% target. Still, the Bank judges that the sustainable and stable achievement of the 2% target has not yet come in sight, so any sudden change in the current policy looks unlikely.
- The Australian Dollar continues to lose ground following the release of PMI data on Wednesday.
- Australia's PMI improved to 47.4 in July from 47.2 in June; Services PMI dropped to 50.8 from 51.2.
- The US Dollar may be under pressure due to rising bets on a Fed rate cut in September.
The Australian Dollar (AUD) continues its losing streak for the eighth consecutive day following the release of mixed data from Australia's Judo Bank Purchasing Managers Index (PMI) on Wednesday. Moreover, sluggish economic activity in China has put additional selling pressure on the AUD. Concerns about the weak Chinese economy were heightened by an unexpected rate cut from the People's Bank of China (PBoC) on Monday.
Additionally, the weak outlook for the Chinese economy has caused a decline in iron ore prices, further pressuring the Australian Dollar. Iron ore prices depreciate toward $108.00, hitting its lowest level in three weeks. This decline is particularly impactful for Australia, the largest exporter of this precious metal.
The US Dollar (USD) may struggle due to rising bets on a Federal Reserve (Fed) rate cut in September, which could limit the downside of the AUD/USD pair. Traders await the data release of the Global Purchasing Managers Index (PMI) on Wednesday to gain fresh insights into the economic conditions of the United States (US).
According to CME Group’s FedWatch Tool, markets now indicate a 93.6% probability of a 25-basis point rate cut at the September Fed meeting, up from 88.5% a day earlier.
Daily Digest Market Movers: Australian Dollar depreciates due to China’s growing concerns
- Australia's Judo Bank Manufacturing PMI improved to 47.4 in July from 47.2 in June. Meanwhile, the Services PMI dropped to 50.8 in July from 51.2 in June. The Composite PMI also declined, falling to 50.2 in July from 50.7 in June.
- Media reports say that Vice President Kamala Harris has just passed 1,976 Democratic delegates to secure the party's presidential nomination. Harris is now the Democratic Party’s Presumptive Nominee for November’s Presidential Election.
- "The interest rate cuts by the People's Bank of China (PBoC) and the outcomes of the Third Plenum are too modest to convince market participants that a significant acceleration in the Chinese economy is in prospect," said Joseph Capurso, head of international economics at the Commonwealth Bank of Australia.
- The People’s Bank of China (PBoC) has cut one- and five-year loan prime rates by ten basis points to 3.35% and 3.85%, respectively. Any change in the Chinese economy could impact the Australian markets as both countries are close trade partners.
- Federal Reserve Bank of New York President John Williams stated on Friday that the long-term trends that caused declines in neutral interest rates before the pandemic continue to prevail. Williams noted, "My own Holston-Laubach-Williams estimates for r-star in the United States, Canada, and the Euro area are about the same level as they were before the pandemic," according to Bloomberg.
- Reuters cited Sean Langcake, head of macroeconomic forecasting for Oxford Economics Australia, saying, "The current pace of employment growth suggests demand is resilient and cost pressures will remain. We think the RBA will stay the course and keep rates on hold, but August is certainly a live meeting."
- Fed Chair Powell stated last week that the three US inflation readings from this year "add somewhat to confidence" that inflation is on track to meet the Fed’s target sustainably, suggesting that a shift to interest rate cuts may be imminent.
Technical Analysis: Australian Dollar falls to near 0.6600
The Australian Dollar trades around 0.6610 on Wednesday. The daily chart analysis shows that the AUD/USD pair is depreciating within a descending channel, indicating a bearish bias. The 14-day Relative Strength Index (RSI) is below the level of 50, confirming a bearish trend.
The AUD/USD pair tests the lower boundary of the descending channel near the psychological level of 0.6600. A decline below this level could push the pair toward the throwback support around 0.6590.
On the upside, key resistance is at the nine-day Exponential Moving Average (EMA) at 0.6671, followed by the psychological level of 0.6700. A breakthrough above this level could lead the AUD/USD pair to test the upper boundary of the descending channel around 0.6722, and then aim for a six-month high of 0.6798.
AUD/USD: Daily Chart
Australian Dollar PRICE Today
The table below shows the percentage change of Australian Dollar (AUD) against listed major currencies today. Australian Dollar was the weakest against the Japanese Yen.
| USD | EUR | GBP | JPY | CAD | AUD | NZD | CHF | |
|---|---|---|---|---|---|---|---|---|
| USD | 0.09% | 0.13% | -0.08% | 0.02% | 0.16% | 0.38% | 0.09% | |
| EUR | -0.09% | 0.03% | -0.19% | -0.07% | 0.08% | 0.28% | -0.01% | |
| GBP | -0.13% | -0.03% | -0.20% | -0.10% | 0.04% | 0.25% | -0.05% | |
| JPY | 0.08% | 0.19% | 0.20% | 0.13% | 0.26% | 0.45% | 0.17% | |
| CAD | -0.02% | 0.07% | 0.10% | -0.13% | 0.14% | 0.36% | 0.05% | |
| AUD | -0.16% | -0.08% | -0.04% | -0.26% | -0.14% | 0.21% | -0.08% | |
| NZD | -0.38% | -0.28% | -0.25% | -0.45% | -0.36% | -0.21% | -0.30% | |
| CHF | -0.09% | 0.00% | 0.05% | -0.17% | -0.05% | 0.08% | 0.30% |
The heat map shows percentage changes of major currencies against each other. The base currency is picked from the left column, while the quote currency is picked from the top row. For example, if you pick the Australian Dollar from the left column and move along the horizontal line to the US Dollar, the percentage change displayed in the box will represent AUD (base)/USD (quote).
Economic Indicator
Judo Bank Composite PMI
The Composite Purchasing Managers Index (PMI), released on a monthly basis by Judo Bank and S&P Global, is a leading indicator gauging private-business activity in Australia for both the manufacturing and services sectors. The data is derived from surveys to senior executives. Each response is weighted according to the size of the company and its contribution to total manufacturing or services output accounted for by the sub-sector to which that company belongs. Survey responses reflect the change, if any, in the current month compared to the previous month and can anticipate changing trends in official data series such as Gross Domestic Product (GDP), industrial production, employment and inflation. The index varies between 0 and 100, with levels of 50.0 signaling no change over the previous month. A reading above 50 indicates that the Australian private economy is generally expanding, a bullish sign for the Australian Dollar (AUD). Meanwhile, a reading below 50 signals that activity is generally declining, which is seen as bearish for AUD.
Read more.Last release: Tue Jul 23, 2024 23:00 (Prel)
Frequency: Monthly
Actual: 50.2
Consensus: -
Previous: 50.7
Source: S&P Global
| Raw materials | Closed | Change, % |
|---|---|---|
| Silver | 29.234 | 0.37 |
| Gold | 240.977 | 0.5 |
| Palladium | 923.25 | 2.19 |
- NZD/USD weakens around 0.5945 in Wednesday’s early Asian session, down 0.25% on the day.
- Rising expectations of RBNZ rate cuts and sluggish Chinese economic activity exert some pressure on the Kiwi.
- The Fed is expected to cut 25 bps in the September and December FOMC meeting, according to UBS analyst.
The NZD/USD pair faces some selling pressure near 0.5945 during the early Asian session on Wednesday. The risk-off sentiment and modest rebound of the Greenback drag the pair lower to the lowest level since May 2. Traders will keep an eye on preliminary US S&P Global PMIs for June on Wednesday for fresh impetus.
The New Zealand Dollar (NZD) edges lower due to rising expectations of an imminent rate cut by the Reserve Bank of New Zealand (RBNZ) after the softer Consumer Price Index (CPI) inflation for New Zealand in the second quarter (Q2). Additionally, the concerns about sluggish Chinese economic activity and a surprise rate cut by the People's Bank of China (PBoC) earlier this week contributed to the Kiwi's decline.
The markets expect the US Federal Reserve (Fed) to start cutting rates beginning with the Federal Open Market Committee's September 2024 meeting. Chief US economist at UBS, Jonathan Pingle, said "We expect a 25-basis-point reduction in the target range at the September and December FOMC meetings, barring a meaningful upside surprise in the inflation data.” Rate traders are currently pricing in a nearly 96% chance of a Fed rate cut in September, according to the CME FedWatch Tool. The rising bets of the Fed rate cut weigh on the Greenback broadly and might cap the downside for the pair.
Investors will take more cues from the US preliminary S&P Global PMIs for July to affirm the rate outlook. The Manufacturing PMI is projected to improve to 51.7 in July from 51.6 in June, while the Services PMI is forecast to ease slightly to 54.4 in July from 55.3.
New Zealand Dollar FAQs
The New Zealand Dollar (NZD), also known as the Kiwi, is a well-known traded currency among investors. Its value is broadly determined by the health of the New Zealand economy and the country’s central bank policy. Still, there are some unique particularities that also can make NZD move. The performance of the Chinese economy tends to move the Kiwi because China is New Zealand’s biggest trading partner. Bad news for the Chinese economy likely means less New Zealand exports to the country, hitting the economy and thus its currency. Another factor moving NZD is dairy prices as the dairy industry is New Zealand’s main export. High dairy prices boost export income, contributing positively to the economy and thus to the NZD.
The Reserve Bank of New Zealand (RBNZ) aims to achieve and maintain an inflation rate between 1% and 3% over the medium term, with a focus to keep it near the 2% mid-point. To this end, the bank sets an appropriate level of interest rates. When inflation is too high, the RBNZ will increase interest rates to cool the economy, but the move will also make bond yields higher, increasing investors’ appeal to invest in the country and thus boosting NZD. On the contrary, lower interest rates tend to weaken NZD. The so-called rate differential, or how rates in New Zealand are or are expected to be compared to the ones set by the US Federal Reserve, can also play a key role in moving the NZD/USD pair.
Macroeconomic data releases in New Zealand are key to assess the state of the economy and can impact the New Zealand Dollar’s (NZD) valuation. A strong economy, based on high economic growth, low unemployment and high confidence is good for NZD. High economic growth attracts foreign investment and may encourage the Reserve Bank of New Zealand to increase interest rates, if this economic strength comes together with elevated inflation. Conversely, if economic data is weak, NZD is likely to depreciate.
The New Zealand Dollar (NZD) tends to strengthen during risk-on periods, or when investors perceive that broader market risks are low and are optimistic about growth. This tends to lead to a more favorable outlook for commodities and so-called ‘commodity currencies’ such as the Kiwi. Conversely, NZD tends to weaken at times of market turbulence or economic uncertainty as investors tend to sell higher-risk assets and flee to the more-stable safe havens.
- Gold price struggles to capitalize on the previous day’s recovery from over a one-week trough.
- The USD climbs to a nearly two-week high on Wednesday and acts as a headwind for the metal.
- A softer risk tone and dovish Fed expectations should limit the downside ahead of global PMIs.
Gold price (XAU/USD) registered modest gains on Tuesday and snapped a four-day losing streak to a one-and-half-week low touched the previous day. The US Treasury bond yields edged lower after a weak housing market report and Vice President Kamala Harris won enough support to become the Democrats’ likely nominee in the November 5 general election. Apart from this, a slight deterioration in the global risk sentiment – as depicted by a weaker tone across the global equity markets – drove some haven flows towards the precious metal and contributed to the positive move.
The supporting factors, to a larger extent, were offset by a further US Dollar (USD) recovery from a nearly four-month trough, which acted as a headwind for the Gold price during the Asian session on Wednesday. Traders also seem reluctant and prefer to wait for more cues about the Fed's policy path before positioning for the next leg of a directional move for the non-yielding yellow metal. Hence, the focus remains on the release of the US Personal Consumption Expenditures (PCE) Price Index data on Friday. In the meantime, traders will take cues from the global flash PMIs due later today.
Daily Digest Market Movers: Gold price bulls remain on the sidelines amid mixed fundamental cues
- A modest slide in the US Treasury bond yields, along with a softer risk tone, assisted the Gold price to gain positive traction on Tuesday and move away from over a one-week low touched the previous day.
- The National Association of Realtors reported that US existing home sales fell 5.4% in June to a seasonally adjusted annual rate of 3.89 million units – the lowest since December and missing consensus estimates.
- The most recent survey from the Federal Reserve Bank of Richmond showed that manufacturing activity worsened in July and the composite manufacturing index fell to -17 in July from -10 in the previous month.
- US Vice President Kamala Harris secured the support of enough delegates to clinch the Democratic nomination, which prompted some unwinding of the 'Trump trade' and dragged the US bond yield lower.
- Investors, meanwhile, largely expect the US central bank to start lowering borrowing costs at its September meeting and have been pricing in the possibility of two more rate cuts by the end of this year.
- This, in turn, offers some support to the non-yielding yellow metal, though some follow-through US Dollar buying keeps a lid on any further appreciating move as traders await the key US macroeconomic data.
- The US Gross Domestic Product (GDP) report for the second quarter will be released on Thursday and will be followed by the crucial Personal Consumption Expenditures (PCE) Price Index data for June on Friday.
- This will provide fresh insight into the Fed's path for interest rates, which will play a key role in influencing the USD price dynamics and help in determining the next leg of a directional move for the XAU/USD.
- In the meantime, Wednesday's release of flash PMIs will be looked upon for cues about the health of the global economy and allow traders to grab short-term opportunities around the precious metal.
Technical Analysis: Gold price needs to surpass the $2,417-2,418 hurdle to attract meaningful buyers
From a technical perspective, this week's bounce from the $2,385 resistance breakpoint – now coinciding with the 100-period Simple Moving Average (SMA) on the 4-hour chart and the 50% retracement level of the June-July rally – warrants caution for bearish traders. The said area should now act as a key pivotal point, which if broken decisively should pave the way for deeper losses. The Gold price might then slide to 61.8% Fibo. level, around the $2,366-2,365 region, en route to the $2,352-2,350 zone before eventually dropping to 78.6% Fibo. level, near the $2,334-2,334 area, and the $2,300 mark.
On the flip side, any subsequent move up is likely to confront some resistance near the $2,417-2,418 zone, above which a fresh bout of a short-covering move could lift the Gold price to the $2,437-2,438 region. Some follow-through buying beyond the latter will suggest that the recent downfall witnessed over the past week or so has run its course and shift the near-term bias back in favor of bullish traders. The momentum could then extend back towards retesting the all-time peak, around the $2,482 area touched on July 17, with some intermediate resistance near the $2,458 region.
Gold FAQs
Gold has played a key role in human’s history as it has been widely used as a store of value and medium of exchange. Currently, apart from its shine and usage for jewelry, the precious metal is widely seen as a safe-haven asset, meaning that it is considered a good investment during turbulent times. Gold is also widely seen as a hedge against inflation and against depreciating currencies as it doesn’t rely on any specific issuer or government.
Central banks are the biggest Gold holders. In their aim to support their currencies in turbulent times, central banks tend to diversify their reserves and buy Gold to improve the perceived strength of the economy and the currency. High Gold reserves can be a source of trust for a country’s solvency. Central banks added 1,136 tonnes of Gold worth around $70 billion to their reserves in 2022, according to data from the World Gold Council. This is the highest yearly purchase since records began. Central banks from emerging economies such as China, India and Turkey are quickly increasing their Gold reserves.
Gold has an inverse correlation with the US Dollar and US Treasuries, which are both major reserve and safe-haven assets. When the Dollar depreciates, Gold tends to rise, enabling investors and central banks to diversify their assets in turbulent times. Gold is also inversely correlated with risk assets. A rally in the stock market tends to weaken Gold price, while sell-offs in riskier markets tend to favor the precious metal.
The price can move due to a wide range of factors. Geopolitical instability or fears of a deep recession can quickly make Gold price escalate due to its safe-haven status. As a yield-less asset, Gold tends to rise with lower interest rates, while higher cost of money usually weighs down on the yellow metal. Still, most moves depend on how the US Dollar (USD) behaves as the asset is priced in dollars (XAU/USD). A strong Dollar tends to keep the price of Gold controlled, whereas a weaker Dollar is likely to push Gold prices up.
On Wednesday, the People’s Bank of China (PBOC) set the USD/CNY central rate for the trading session ahead at 7.1358, as against the previous day's fix of 7.1334 and 7.2795 Reuters estimates.
- USD/JPY advances near 155.85 in Wednesday’s early Asian session, up 0.24% on the day.
- The higher possibility of a BoJ interest rate hike might support the Japanese Yen.
- Investors will monitor the US preliminary S&P Global PMIs for June, which is due later on Wednesday.
The USD/JPY pair trades on a stronger note around 155.85, snapping the two-day losing streak during the early Asian session on Wednesday. The upside of the pair might be limited amid the growing speculation that the Bank of Japan (BoJ) would continue hiking interest rates to boost the currency.
A senior official in the ruling party, Toshimitsu Motegi, said that the central bank should more clearly communicate its resolve to normalize monetary policy, including through steady interest rate hikes, per Reuters. The expectation that the BoJ will tighten its monetary policy further might lift the Japanese Yen (JPY) against the US Dollar (USD) for the time being.
However, many analysts believe that the Japanese central bank is likely to maintain an accommodative monetary environment as much as possible. JP Morgan analysts have expected no rate hikes from the BoJ in July or the remainder of 2024. The BoJ monetary policy meeting next week will be a closely watched event.
On the other hand, the Federal Reserve (Fed) is expected to cut the interest rate in September, with the market pricing in 96% odds of at least a quarter-point rate cut, according to the CME FedWatch Tool. Investors will take more cues from the key US economy data this week. The US preliminary S&P Global PMIs for June are due on Wednesday. The Manufacturing PMI is expected to improve to 51.7 in July from 51.6 in June, while the Services PMI is estimated to ease slightly to 54.4 in July from 55.3 in the previous reading. Later this week, the US Q2 Gross Domestic Product (GDP) and the Personal Consumption Expenditure Price Index (PCE) data for June will be in the spotlight.
Japanese Yen FAQs
The Japanese Yen (JPY) is one of the world’s most traded currencies. Its value is broadly determined by the performance of the Japanese economy, but more specifically by the Bank of Japan’s policy, the differential between Japanese and US bond yields, or risk sentiment among traders, among other factors.
One of the Bank of Japan’s mandates is currency control, so its moves are key for the Yen. The BoJ has directly intervened in currency markets sometimes, generally to lower the value of the Yen, although it refrains from doing it often due to political concerns of its main trading partners. The current BoJ ultra-loose monetary policy, based on massive stimulus to the economy, has caused the Yen to depreciate against its main currency peers. This process has exacerbated more recently due to an increasing policy divergence between the Bank of Japan and other main central banks, which have opted to increase interest rates sharply to fight decades-high levels of inflation.
The BoJ’s stance of sticking to ultra-loose monetary policy has led to a widening policy divergence with other central banks, particularly with the US Federal Reserve. This supports a widening of the differential between the 10-year US and Japanese bonds, which favors the US Dollar against the Japanese Yen.
The Japanese Yen is often seen as a safe-haven investment. This means that in times of market stress, investors are more likely to put their money in the Japanese currency due to its supposed reliability and stability. Turbulent times are likely to strengthen the Yen’s value against other currencies seen as more risky to invest in.
| Index | Change, points | Closed | Change, % |
|---|---|---|---|
| NIKKEI 225 | -4.61 | 39594.39 | -0.01 |
| Hang Seng | -166.52 | 17469.36 | -0.94 |
| KOSPI | 10.78 | 2774.29 | 0.39 |
| ASX 200 | 39.4 | 7971.1 | 0.5 |
| DAX | 150.63 | 18557.7 | 0.82 |
| CAC 40 | -23.39 | 7598.63 | -0.31 |
| Dow Jones | -57.35 | 40358.09 | -0.14 |
| S&P 500 | -8.67 | 5555.74 | -0.16 |
| NASDAQ Composite | -10.22 | 17997.35 | -0.06 |
| Pare | Closed | Change, % |
|---|---|---|
| AUDUSD | 0.66159 | -0.41 |
| EURJPY | 168.87 | -1.24 |
| EURUSD | 1.08534 | -0.35 |
| GBPJPY | 200.803 | -1.1 |
| GBPUSD | 1.29071 | -0.18 |
| NZDUSD | 0.5955 | -0.38 |
| USDCAD | 1.37795 | 0.19 |
| USDCHF | 0.891 | 0.18 |
| USDJPY | 155.58 | -0.89 |


© 2000-2026. All rights reserved.
This site is managed by Teletrade D.J. LLC 2351 LLC 2022 (Euro House, Richmond Hill Road, Kingstown, VC0100, St. Vincent and the Grenadines).
The information on this website is for informational purposes only and does not constitute any investment advice.
The company does not serve or provide services to customers who are residents of the US, Canada, Iran, The Democratic People's Republic of Korea, Yemen and FATF blacklisted countries.
Making transactions on financial markets with marginal financial instruments opens up wide possibilities and allows investors who are willing to take risks to earn high profits, carrying a potentially high risk of losses at the same time. Therefore you should responsibly approach the issue of choosing the appropriate investment strategy, taking the available resources into account, before starting trading.
Use of the information: full or partial use of materials from this website must always be referenced to TeleTrade as the source of information. Use of the materials on the Internet must be accompanied by a hyperlink to teletrade.org. Automatic import of materials and information from this website is prohibited.
Please contact our PR department if you have any questions or need assistance at pr@teletrade.global.
transfers