- Analytics
- News and Tools
- Market News
CFD Markets News and Forecasts — 23-09-2024
- EUR/USD declined in one of its worst days in H2 2024.
- EU PMI figures broadly came in below expectations, while US PMIs also printed lower.
- Tuesday is set to be a quiet day on the Fiber front.
EUR/USD trimmed recent bullish momentum, declining by one-half of one percent on Monday. Fiber declined in one of its worst trading days in the second half of the year after pan-EU Purchasing Managers Index (PMI) figures broadly missed expectations, while the US PMI data print faired only slightly better.
Tuesday will be a quiet affair on the EUR/USD front; little data is expected from either side of the Atlantic, though Federal Reserve (Fed) Governor Michelle Bowman is expected to make an appearance.
Despite a broad-market weakening in the Greenback following last week’s surprise double rate cut from the Fed, souring market sentiment on behalf of the Euro is keeping EUR/USD under wraps.
September’s S&P US Manufacturing PMI declined to 47.0 MoM, falling to its lowest level since July of 2023 as the US manufacturing sector sees a continued gloomy outlook on business activity. On the other hand, the S&P US Services PMI eased to 55.4 in September, down from August’s 55.7 but beating the expected print of 55.2.
Fed policymaker and Chicago Fed President Austan Goolsbee hit markets with cooling comments early Monday, noting that much further movement on rates from the Fed could be necessary. The Fed official highlighted that the Fed may need to shoot much lower on policy rates in order to keep business lending conditions sufficiently liquid enough to keep the US business landscape keel-side down as record tightness in the US labor market drains away.
EUR/USD price forecast
Fiber continues to get mired into the 1.1100 handle, and bulls are beginning to show signs of exhaustion from battling price action into the top end of near-term momentum. Despite intraday weakness, EUR/USD continues to remain overall well-bid, with the pair testing into yearly highs despite an inability to reclaim the 1.1200 handle.
EUR/USD daily chart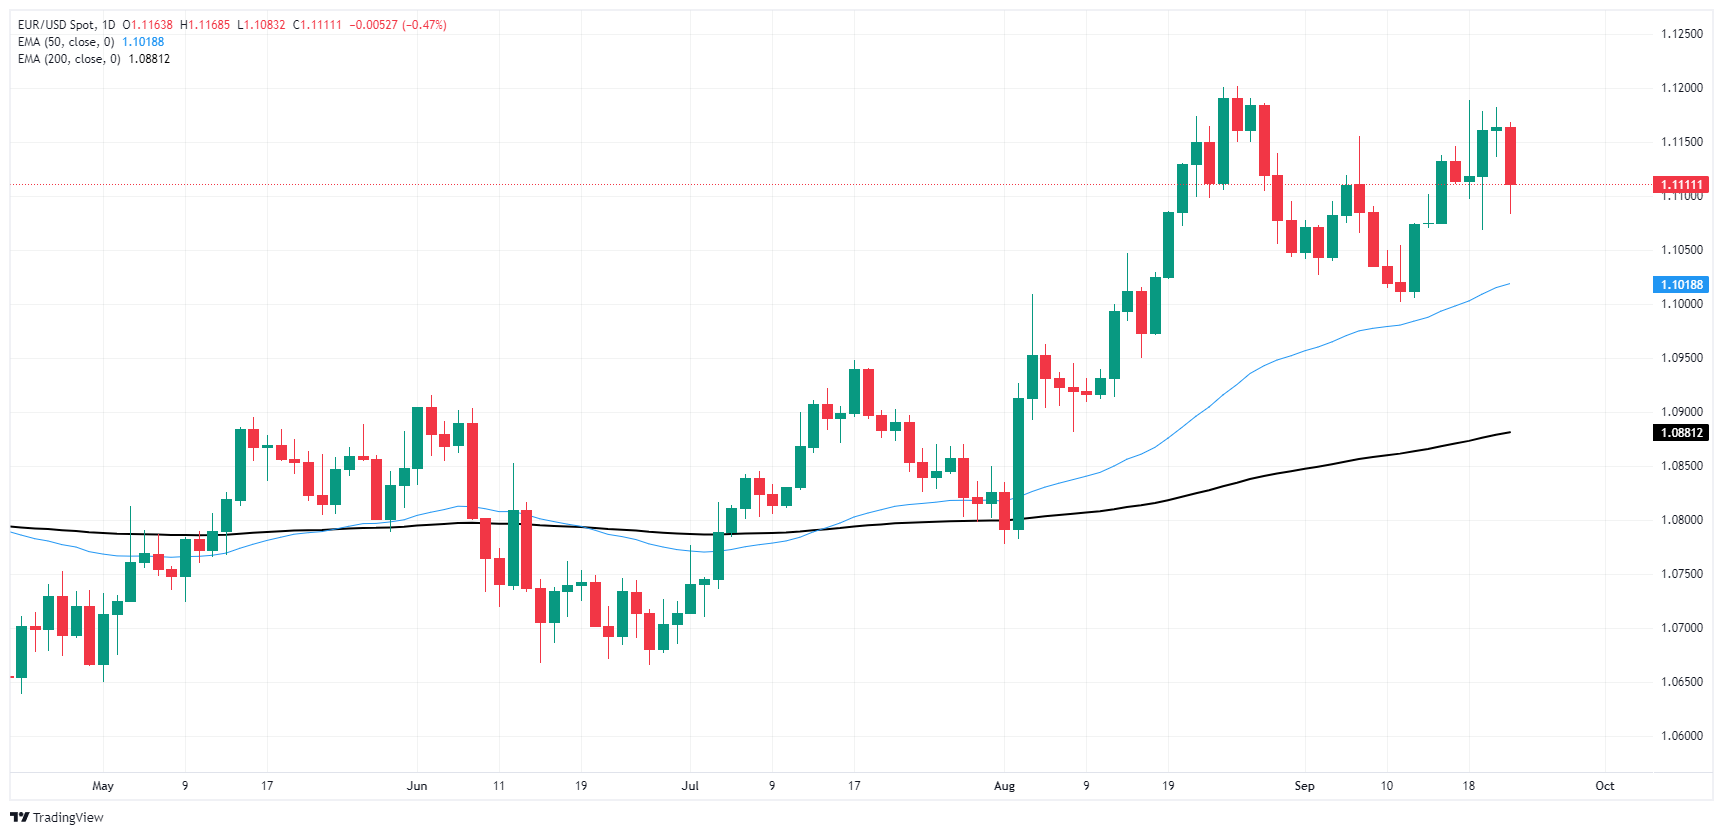
Euro FAQs
The Euro is the currency for the 20 European Union countries that belong to the Eurozone. It is the second most heavily traded currency in the world behind the US Dollar. In 2022, it accounted for 31% of all foreign exchange transactions, with an average daily turnover of over $2.2 trillion a day. EUR/USD is the most heavily traded currency pair in the world, accounting for an estimated 30% off all transactions, followed by EUR/JPY (4%), EUR/GBP (3%) and EUR/AUD (2%).
The European Central Bank (ECB) in Frankfurt, Germany, is the reserve bank for the Eurozone. The ECB sets interest rates and manages monetary policy. The ECB’s primary mandate is to maintain price stability, which means either controlling inflation or stimulating growth. Its primary tool is the raising or lowering of interest rates. Relatively high interest rates – or the expectation of higher rates – will usually benefit the Euro and vice versa. The ECB Governing Council makes monetary policy decisions at meetings held eight times a year. Decisions are made by heads of the Eurozone national banks and six permanent members, including the President of the ECB, Christine Lagarde.
Eurozone inflation data, measured by the Harmonized Index of Consumer Prices (HICP), is an important econometric for the Euro. If inflation rises more than expected, especially if above the ECB’s 2% target, it obliges the ECB to raise interest rates to bring it back under control. Relatively high interest rates compared to its counterparts will usually benefit the Euro, as it makes the region more attractive as a place for global investors to park their money.
Data releases gauge the health of the economy and can impact on the Euro. Indicators such as GDP, Manufacturing and Services PMIs, employment, and consumer sentiment surveys can all influence the direction of the single currency. A strong economy is good for the Euro. Not only does it attract more foreign investment but it may encourage the ECB to put up interest rates, which will directly strengthen the Euro. Otherwise, if economic data is weak, the Euro is likely to fall. Economic data for the four largest economies in the euro area (Germany, France, Italy and Spain) are especially significant, as they account for 75% of the Eurozone’s economy.
Another significant data release for the Euro is the Trade Balance. This indicator measures the difference between what a country earns from its exports and what it spends on imports over a given period. If a country produces highly sought after exports then its currency will gain in value purely from the extra demand created from foreign buyers seeking to purchase these goods. Therefore, a positive net Trade Balance strengthens a currency and vice versa for a negative balance.
Israel carried out airstrikes on targets in southern Lebanon, killing almost 500 people in one of the bloodiest days of fighting in nearly two decades and fuelling concerns of all-out conflict, per Bloomberg.
The Lebanese health ministry said that Israel unleashed its most widespread airstrikes against Hezbollah, killing at least 492 people. It marks the deadliest day of violence since the 1975-1990 civil war.
Market reaction
At the time of press, the Gold price was down 0.09% on the day at $2,626.
Risk sentiment FAQs
In the world of financial jargon the two widely used terms “risk-on” and “risk off'' refer to the level of risk that investors are willing to stomach during the period referenced. In a “risk-on” market, investors are optimistic about the future and more willing to buy risky assets. In a “risk-off” market investors start to ‘play it safe’ because they are worried about the future, and therefore buy less risky assets that are more certain of bringing a return, even if it is relatively modest.
Typically, during periods of “risk-on”, stock markets will rise, most commodities – except Gold – will also gain in value, since they benefit from a positive growth outlook. The currencies of nations that are heavy commodity exporters strengthen because of increased demand, and Cryptocurrencies rise. In a “risk-off” market, Bonds go up – especially major government Bonds – Gold shines, and safe-haven currencies such as the Japanese Yen, Swiss Franc and US Dollar all benefit.
The Australian Dollar (AUD), the Canadian Dollar (CAD), the New Zealand Dollar (NZD) and minor FX like the Ruble (RUB) and the South African Rand (ZAR), all tend to rise in markets that are “risk-on”. This is because the economies of these currencies are heavily reliant on commodity exports for growth, and commodities tend to rise in price during risk-on periods. This is because investors foresee greater demand for raw materials in the future due to heightened economic activity.
The major currencies that tend to rise during periods of “risk-off” are the US Dollar (USD), the Japanese Yen (JPY) and the Swiss Franc (CHF). The US Dollar, because it is the world’s reserve currency, and because in times of crisis investors buy US government debt, which is seen as safe because the largest economy in the world is unlikely to default. The Yen, from increased demand for Japanese government bonds, because a high proportion are held by domestic investors who are unlikely to dump them – even in a crisis. The Swiss Franc, because strict Swiss banking laws offer investors enhanced capital protection.
- GBP/USD clipped into another 30-month high on Monday.
- The Pound Sterling may be running out of runway despite Greenback weakness.
- UK could be headed for a rapid shift in economic conditions as UK PM mulls fiscal changes.
GBP/USD found its way into yet another 30-month high on to kick off the fresh trading week, pulling deeper into bull country on the back of broad-market Greenback selling pressure. The Federal Reserve’s (Fed) last-minute plunge into a double rate cut last week has sparked a weak stance in USD flows, helping to muscle GBP into the top end.
Markets will get a breather on Tuesday, with little data of note on the UK side. On the US economic calendar, it’s strictly a mid-tier showing, though investors will be keeping an eye out for comments from Fed Governor Michelle Bowman due during the US market session.
Political threats loom just over the horizon for the Pound Sterling; UK Prime Minister Keir Starmer has mused out loud that the UK’s domestic economy could be on a collision course with “painful” economic reforms that are needed, especially with UK inflation figures proving to be far stickier than in other countries.
September’s S&P US Manufacturing PMI declined to 47.0 MoM, falling to its lowest level since July of 2023 as the US manufacturing sector sees a continued gloomy outlook on business activity. On the other hand, the S&P US Services PMI eased to 55.4 in September, down from August’s 55.7 but beating the expected print of 55.2.
Fed policymaker and Chicago Fed President Austan Goolsbee hit markets with cooling comments early Monday, noting that much further movement on rates from the Fed could be necessary. The Fed official highlighted that the Fed may need to shoot much lower on policy rates in order to keep business lending conditions sufficiently liquid enough to keep the US business landscape keel-side down as record tightness in the US labor market drains away.
GBP/USD price forecast
Despite clipping into yet another consecutive fresh 30-month high on Monday, Cable bidders have struggled to push price action deeper into bull country, and markets will enter the midweek market sessions with prices hovering without a notable lack of technical support. A firm bullish trend is still baked into daily candlesticks with the pair climbing above the 50–day Exponential Moving Average (EMA) near 1.3000.
GBP/USD daily chart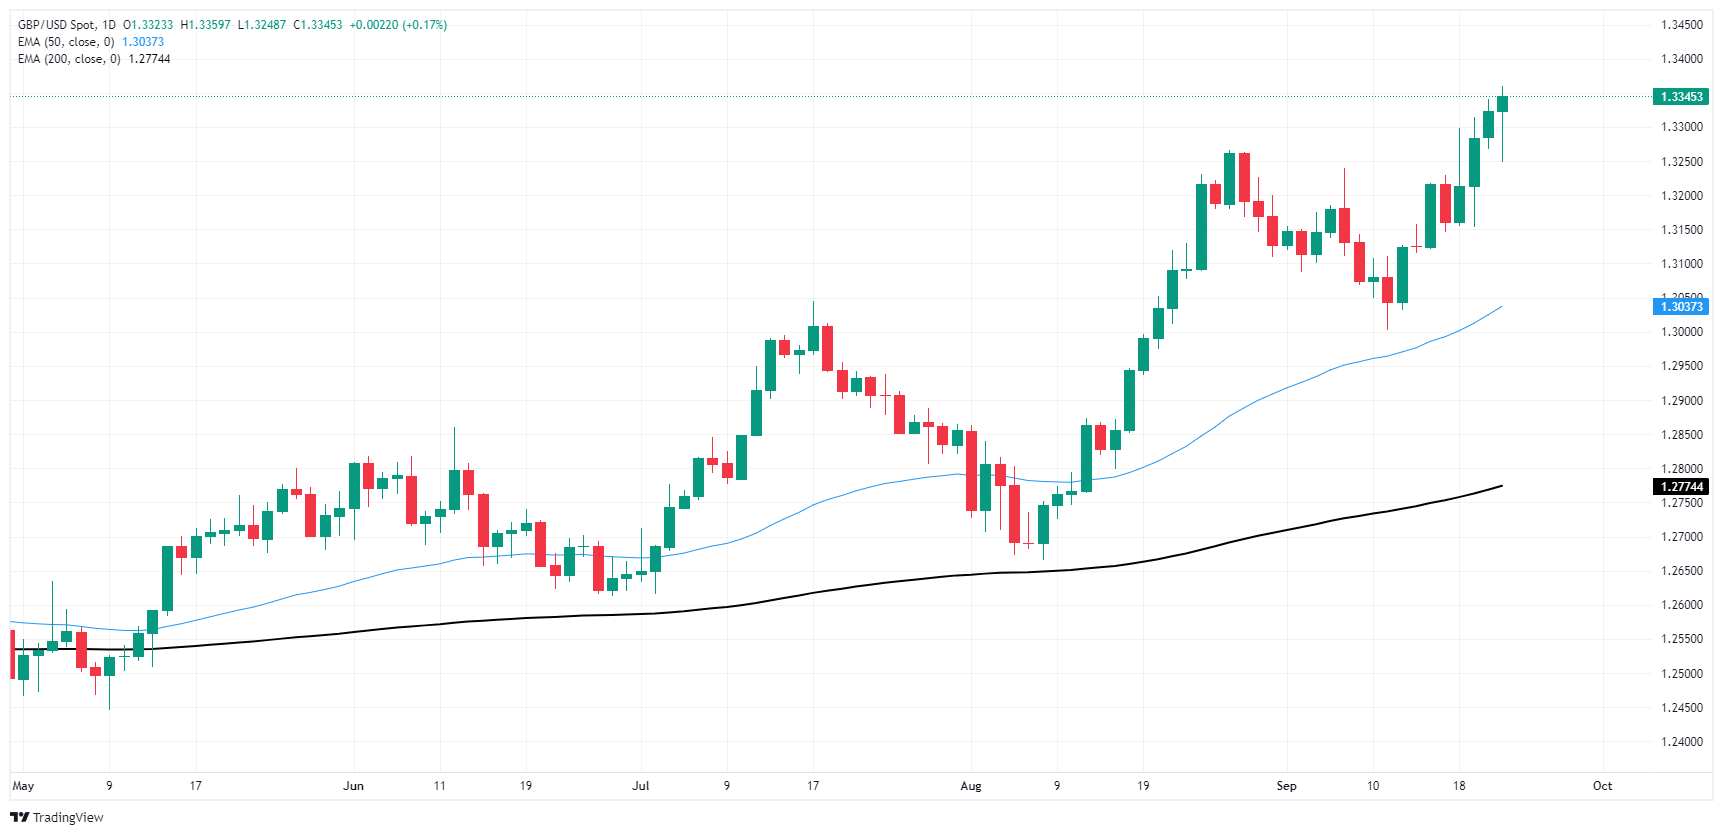
Pound Sterling FAQs
The Pound Sterling (GBP) is the oldest currency in the world (886 AD) and the official currency of the United Kingdom. It is the fourth most traded unit for foreign exchange (FX) in the world, accounting for 12% of all transactions, averaging $630 billion a day, according to 2022 data. Its key trading pairs are GBP/USD, aka ‘Cable’, which accounts for 11% of FX, GBP/JPY, or the ‘Dragon’ as it is known by traders (3%), and EUR/GBP (2%). The Pound Sterling is issued by the Bank of England (BoE).
The single most important factor influencing the value of the Pound Sterling is monetary policy decided by the Bank of England. The BoE bases its decisions on whether it has achieved its primary goal of “price stability” – a steady inflation rate of around 2%. Its primary tool for achieving this is the adjustment of interest rates. When inflation is too high, the BoE will try to rein it in by raising interest rates, making it more expensive for people and businesses to access credit. This is generally positive for GBP, as higher interest rates make the UK a more attractive place for global investors to park their money. When inflation falls too low it is a sign economic growth is slowing. In this scenario, the BoE will consider lowering interest rates to cheapen credit so businesses will borrow more to invest in growth-generating projects.
Data releases gauge the health of the economy and can impact the value of the Pound Sterling. Indicators such as GDP, Manufacturing and Services PMIs, and employment can all influence the direction of the GBP. A strong economy is good for Sterling. Not only does it attract more foreign investment but it may encourage the BoE to put up interest rates, which will directly strengthen GBP. Otherwise, if economic data is weak, the Pound Sterling is likely to fall.
Another significant data release for the Pound Sterling is the Trade Balance. This indicator measures the difference between what a country earns from its exports and what it spends on imports over a given period. If a country produces highly sought-after exports, its currency will benefit purely from the extra demand created from foreign buyers seeking to purchase these goods. Therefore, a positive net Trade Balance strengthens a currency and vice versa for a negative balance.
- USD/CAD weakens around 1.3530 in Tuesday’s early Asian session.
- Several Fed officials open the door to further large interest-rate cuts by the end of this year.
- Investors will closely watch the speeches from Fed’s Bowman and BoC’s Tiff Macklem on Tuesday.
The USD/CAD pair edges lower to near 1.3530 during the early Asian session on Tuesday. The weakness of the Greenback drags the pair lower. Investors will keep an eye on the US September Consumer Confidence data, along with the speech from the Federal Reserve's (Fed) Governor Michelle Bowman and the Bank of Canada’s (BoC) Governor Tiff Macklem on Tuesday.
Several Fed officials on Monday left the door open to additional large interest-rate cuts later this year. Chicago Fed President Austan Goolsbee said on Monday that more rate cuts over the next year would help the US central bank achieve a soft landing for the economy and manage inflation without hurting the labor market.
Meanwhile, Atlanta Fed President Raphael Bostic stated that cutting the cycle with a large move will help bring interest rates closer to neutral levels as the risks between inflation and employment become more balanced. Minneapolis Fed President Neel Kashkari said that he expects to lower interest rates by quarter-point moves at each of the central bank’s two remaining meetings this year, per Bloomberg.
The flash reading of the US Purchasing Managers Index (PMI) showed a slight slowdown in manufacturing activity in September, while the service sector continued to fall slowly. The Manufacturing PMI declined to 47.0 in September, a 15-month low, from 47.9 in August, worse than the expectation of 48.5. The Services PMI eased to 55.4 in August versus 55.7 prior, above the market consensus of 55.2.
However, this report provides little to no impact on the USD. The bigger-than-expected Fed rate cut and firmer expectation of additional rate reduction this year might continue to undermine the Greenback against the Canadian Dollar (CAD) in the near term.
The BoC Governor Tiff Macklem is scheduled to speak later on Tuesday. The speech might offer some hints about how much the Canadian central bank will cut interest rates by the year-end. “Now, the Bank of Canada must be careful about over-correcting with a monetary setting that pushes inflation through its target on the downside to any great degree. We estimate for Canada that the ‘neutral’ overnight rate is 2.25 percent, or two full percentage points lower than the current settings,” said TD Economics.
Canadian Dollar FAQs
The key factors driving the Canadian Dollar (CAD) are the level of interest rates set by the Bank of Canada (BoC), the price of Oil, Canada’s largest export, the health of its economy, inflation and the Trade Balance, which is the difference between the value of Canada’s exports versus its imports. Other factors include market sentiment – whether investors are taking on more risky assets (risk-on) or seeking safe-havens (risk-off) – with risk-on being CAD-positive. As its largest trading partner, the health of the US economy is also a key factor influencing the Canadian Dollar.
The Bank of Canada (BoC) has a significant influence on the Canadian Dollar by setting the level of interest rates that banks can lend to one another. This influences the level of interest rates for everyone. The main goal of the BoC is to maintain inflation at 1-3% by adjusting interest rates up or down. Relatively higher interest rates tend to be positive for the CAD. The Bank of Canada can also use quantitative easing and tightening to influence credit conditions, with the former CAD-negative and the latter CAD-positive.
The price of Oil is a key factor impacting the value of the Canadian Dollar. Petroleum is Canada’s biggest export, so Oil price tends to have an immediate impact on the CAD value. Generally, if Oil price rises CAD also goes up, as aggregate demand for the currency increases. The opposite is the case if the price of Oil falls. Higher Oil prices also tend to result in a greater likelihood of a positive Trade Balance, which is also supportive of the CAD.
While inflation had always traditionally been thought of as a negative factor for a currency since it lowers the value of money, the opposite has actually been the case in modern times with the relaxation of cross-border capital controls. Higher inflation tends to lead central banks to put up interest rates which attracts more capital inflows from global investors seeking a lucrative place to keep their money. This increases demand for the local currency, which in Canada’s case is the Canadian Dollar.
Macroeconomic data releases gauge the health of the economy and can have an impact on the Canadian Dollar. Indicators such as GDP, Manufacturing and Services PMIs, employment, and consumer sentiment surveys can all influence the direction of the CAD. A strong economy is good for the Canadian Dollar. Not only does it attract more foreign investment but it may encourage the Bank of Canada to put up interest rates, leading to a stronger currency. If economic data is weak, however, the CAD is likely to fall.
- The benchmark interest rate in Australia is likely to remain at 4.35% for the seventh straight meeting in September.
- The Reserve Bank of Australia Governor Michele Bullock’s press conference will hog the limelight.
- The RBA’s policy statement and Bullock’s words are set to inject volatility around the Australian Dollar.
The Reserve Bank of Australia (RBA) is likely to continue bucking the trend adopted by major central banks of the dovish policy pivot, opting to maintain the policy for the seventh consecutive meeting on Tuesday.
The RBA is widely expected to hold the Official Cash Rate (OCR) at 4.35% following its September monetary policy meeting. The decision will be announced at 04:30 GMT, with Governor Michele Bullock’s press conference to follow at 05:30 GMT.
No Reserve Bank of Australia rate cuts expected this year
Economists and industry experts unanimously expect the central bank to hold the policy rate yet again after RBA Governor Michele Bullock clearly said in her speech at the Anika Foundation earlier this month that “the board does not expect to be in a position to cut rates in the near term.”.
Bullock argued that inflation pressures, particularly in home construction, insurance and the rental market, continued to be high in some parts of the economy even though Australian Treasurer Jim Chalmers voiced concerns that interest rates have “smashed” the economy.
Australia’s economy, however, added more jobs than expected in August as the Unemployment Rate remained steady at 4.2%, the Australian Bureau of Statistics (ABS) reported on September 19. Strong Australian employment data indicated the labor market resilience, in the face of a slowing economy, supporting the RBA’s view that an interest-rate cut appears less likely in the short term.
RBA Assistant Governor (Economic) Sarah Hunter said earlier this month that “the labor market is still tight relative to full employment.” She added that the bank “viewed current conditions to be ‘above’ full employment with jobless rate needing to rise to ensure inflation’s retreat continued.”
Further, the RBA is unlikely to act until the release of the critical Consumer Price Index (CPI) data for Q3, due on October 30, which could validate the central bank’s progress on inflation.
Previewing the RBA policy decision, analysts at TD Securities (TDS) said: “RBA communication and the run of data since the Bank's August meeting provides no compelling reason for a shift in stance at this week's meeting, ruling out a rate cut this year.”
How will the RBA interest rate decision impact AUD/USD?
The Australian Dollar (AUD) is trading close to the highest level in eight months against the US Dollar (USD) heading into the RBA event risk. The ongoing uptrend in the AUD/USD pair could be mainly attributed to the divergent monetary policy outlooks between the US Federal Reserve (Fed), which has just started its easing cycle, and the RBA.
The Fed announced a 50 bps rate reduction at its September meeting last week, bringing the fed funds rate to the range of 4.75%-5.0%. In contrast, markets expect the RBA to go for the first 25 bps rate cut to 4.10% only by February 2025, according to the ASX RBA Rate Tracker.
If RBA Governor Bullock sticks to her hawkish rhetoric by reiterating that “it is premature to be thinking about rate cuts,” AUD/USD could extend the ongoing uptrend to test the 0.6900 threshold.
Alternatively, the pair could come under intense selling pressure and target the 0.6700 level in case Bullock acknowledged the economic slowdown, which could contribute to easing price pressures in the coming months.
With a no-rate change decision already a given, the language in the policy statement and Bullock’s remarks during the press conference are likely to grab the eyeballs and offer a fresh directional impetus to the Aussie traders.
Dhwani Mehta, Asian Session Lead Analyst at FXStreet, notes key technicals to trade AUD/USD on the policy outcome. “AUD/USD hangs close to eight-month highs above 0.6800 as the RBA decision looms. The 14-day Relative Strength Index (RSI) points north above the 50 level, currently near 64.50, backing the Aussie’s bullish potential.”
“Buyers need to scale the static resistance at around 0.6900 for a sustained uptrend. The next topside barrier is seen at the 0.6950 psychological level en route to the 0.7000 threshold. On the flip side, any corrective decline could meet the initial demand area at the 21-day Simple Moving Average (SMA) of 0.6747, below which a fresh downtrend toward 0.6670 cannot be ruled out. That level is the confluence of the 50-day and 100-day SMAs,” Dhwani adds.
Economic Indicator
RBA Interest Rate Decision
The Reserve Bank of Australia (RBA) announces its interest rate decision at the end of its eight scheduled meetings per year. If the RBA is hawkish about the inflationary outlook of the economy and raises interest rates it is usually bullish for the Australian Dollar (AUD). Likewise, if the RBA has a dovish view on the Australian economy and keeps interest rates unchanged, or cuts them, it is seen as bearish for AUD.
Read more.Next release: Tue Sep 24, 2024 04:30
Frequency: Irregular
Consensus: 4.35%
Previous: 4.35%
Source: Reserve Bank of Australia
RBA FAQs
The Reserve Bank of Australia (RBA) sets interest rates and manages monetary policy for Australia. Decisions are made by a board of governors at 11 meetings a year and ad hoc emergency meetings as required. The RBA’s primary mandate is to maintain price stability, which means an inflation rate of 2-3%, but also “..to contribute to the stability of the currency, full employment, and the economic prosperity and welfare of the Australian people.” Its main tool for achieving this is by raising or lowering interest rates. Relatively high interest rates will strengthen the Australian Dollar (AUD) and vice versa. Other RBA tools include quantitative easing and tightening.
While inflation had always traditionally been thought of as a negative factor for currencies since it lowers the value of money in general, the opposite has actually been the case in modern times with the relaxation of cross-border capital controls. Moderately higher inflation now tends to lead central banks to put up their interest rates, which in turn has the effect of attracting more capital inflows from global investors seeking a lucrative place to keep their money. This increases demand for the local currency, which in the case of Australia is the Aussie Dollar.
Macroeconomic data gauges the health of an economy and can have an impact on the value of its currency. Investors prefer to invest their capital in economies that are safe and growing rather than precarious and shrinking. Greater capital inflows increase the aggregate demand and value of the domestic currency. Classic indicators, such as GDP, Manufacturing and Services PMIs, employment, and consumer sentiment surveys can influence AUD. A strong economy may encourage the Reserve Bank of Australia to put up interest rates, also supporting AUD.
Quantitative Easing (QE) is a tool used in extreme situations when lowering interest rates is not enough to restore the flow of credit in the economy. QE is the process by which the Reserve Bank of Australia (RBA) prints Australian Dollars (AUD) for the purpose of buying assets – usually government or corporate bonds – from financial institutions, thereby providing them with much-needed liquidity. QE usually results in a weaker AUD.
Quantitative tightening (QT) is the reverse of QE. It is undertaken after QE when an economic recovery is underway and inflation starts rising. Whilst in QE the Reserve Bank of Australia (RBA) purchases government and corporate bonds from financial institutions to provide them with liquidity, in QT the RBA stops buying more assets, and stops reinvesting the principal maturing on the bonds it already holds. It would be positive (or bullish) for the Australian Dollar.
- NZD/JPY retreats from Monday's high, and consolidates around 90.00.
- RSI remains in positive territory, MACD rising green bars indicate bullish momentum.
- Bulls target resistance at 90.50, breakout could extend gains.
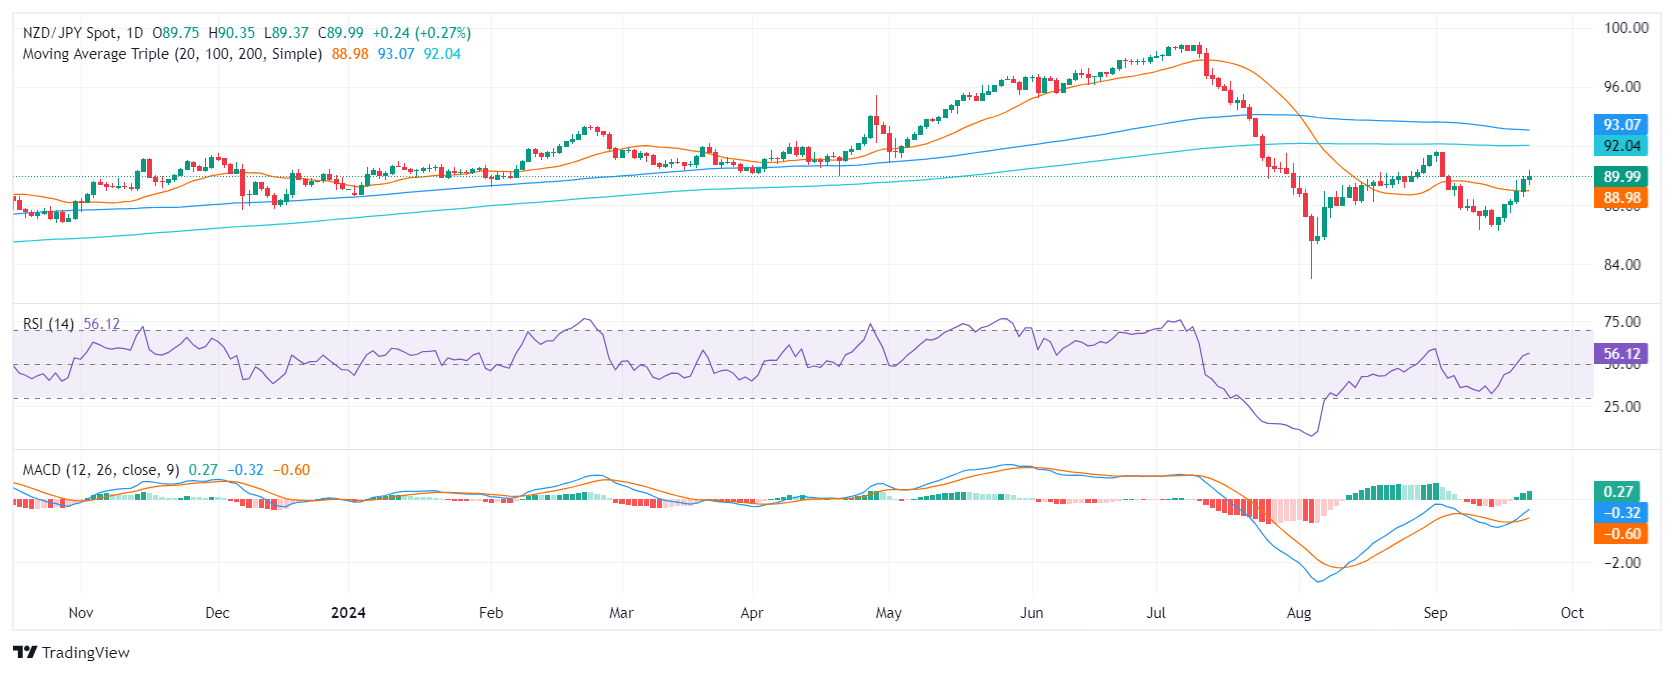
The NZD/JPY pair, after logging a 0.30% gain on Monday, retreated slightly and consolidated around the 90.00 level. The bulls remain in control in the near term, with the technical indicators painting a bullish picture. The Relative Strength Index (RSI) is currently at 56, indicating that buying pressure remains elevated and corresponds to a rising RSI slope, suggesting that buying pressure is increasing. The Moving Average Convergence Divergence (MACD) is also bullish, with the histogram rising and green.
Over the past seven sessions, NZD/JPY has traded sideways, fluctuating between the levels of 89.40 and 90.40. This consolidation period has formed three clear round support levels at 87.50, 88.00, and 88.50. Notably, the pair has also established resistance levels at 89.50, 90.00, and 90.50. The recent price action suggests that the bulls are in control, and a breakout above the 90.50 resistance level could lead to further gains in the near term.
NZD/JPY daily chart
- US Treasury yields hold firm as expectations rise for a second consecutive Fed rate cut following last week’s 50-bps reduction.
- Minneapolis Fed President Kashkari and Atlanta’s Bostic both support gradual cuts, with Kashkari forecasting rates at 4.4% by the end of 2024.
- Chicago Fed’s Austan Goolsbee signals more rate cuts are needed, while Bostic downplays the likelihood of future 50-bps cuts.
US Treasury yields finished the session firm amid increasing bets that the US Federal Reserve (Fed)will lower borrowing costs for the second consecutive meeting, following last week’s 50 basis points cut.
Fed officials confident in inflation trend, signal caution on further cuts
Fed officials had grown worried about the labor market, acknowledging that risks are tilted to the upside. Regarding inflation, they grew confident that prices are moving sustainably to hit the Fed’s 2% goal.
On Monday, Minneapolis Fed President Neel Kashkari said that cutting 50 basis points (bps) was correct, adding that he expects rates to finish 2024 at around 4.4%. Atlanta's Fed President Raphael Bostic echoed some of his comments, though he said that they wouldn’t be cutting rates in 50 bps chunks.
Bostic added that risks to the labor market had increased and didn’t expect the Unemployment Rate to increase much further.
Finally, Chicago’s Fed President Austan Goolsbee stated that many more rate cuts are needed over the next year and that the jobless rate is at levels many consider full employment.
Data-wise, S&P Global revealed September Flash PMIs, which portrayed a mixed reading regarding the US economy. The manufacturing activity index hit its lowest since June 2023, while the services PMI exceeded estimates of 55.3 and came at 55.4.
Fed FAQs
Monetary policy in the US is shaped by the Federal Reserve (Fed). The Fed has two mandates: to achieve price stability and foster full employment. Its primary tool to achieve these goals is by adjusting interest rates. When prices are rising too quickly and inflation is above the Fed’s 2% target, it raises interest rates, increasing borrowing costs throughout the economy. This results in a stronger US Dollar (USD) as it makes the US a more attractive place for international investors to park their money. When inflation falls below 2% or the Unemployment Rate is too high, the Fed may lower interest rates to encourage borrowing, which weighs on the Greenback.
The Federal Reserve (Fed) holds eight policy meetings a year, where the Federal Open Market Committee (FOMC) assesses economic conditions and makes monetary policy decisions. The FOMC is attended by twelve Fed officials – the seven members of the Board of Governors, the president of the Federal Reserve Bank of New York, and four of the remaining eleven regional Reserve Bank presidents, who serve one-year terms on a rotating basis.
In extreme situations, the Federal Reserve may resort to a policy named Quantitative Easing (QE). QE is the process by which the Fed substantially increases the flow of credit in a stuck financial system. It is a non-standard policy measure used during crises or when inflation is extremely low. It was the Fed’s weapon of choice during the Great Financial Crisis in 2008. It involves the Fed printing more Dollars and using them to buy high grade bonds from financial institutions. QE usually weakens the US Dollar.
Quantitative tightening (QT) is the reverse process of QE, whereby the Federal Reserve stops buying bonds from financial institutions and does not reinvest the principal from the bonds it holds maturing, to purchase new bonds. It is usually positive for the value of the US Dollar.
- The NZD/USD pair has broken out of a sideways range, suggesting that bullish pressure is building.
- The RSI and MACD indicators are both rising, indicating growing buying momentum.
- A close above the 0.6280 resistance level could open the door to further gains.
The NZD/USD pair, which rose to 0.6270 in Monday's session, has broken out of a sideways range that had been in place for the past seven sessions. The pair has been consolidating between 0.6210 and 0.6240, but it has now broken above the upper bound of this range, suggesting that bullish pressure is building.
The Relative Strength Index (RSI) is at 63 near the overbought area and has a rising slope while the Moving Average Convergence Divergence (MACD) is green and rising, which also suggests that buying pressure is increasing.
NZD/USD daily chart
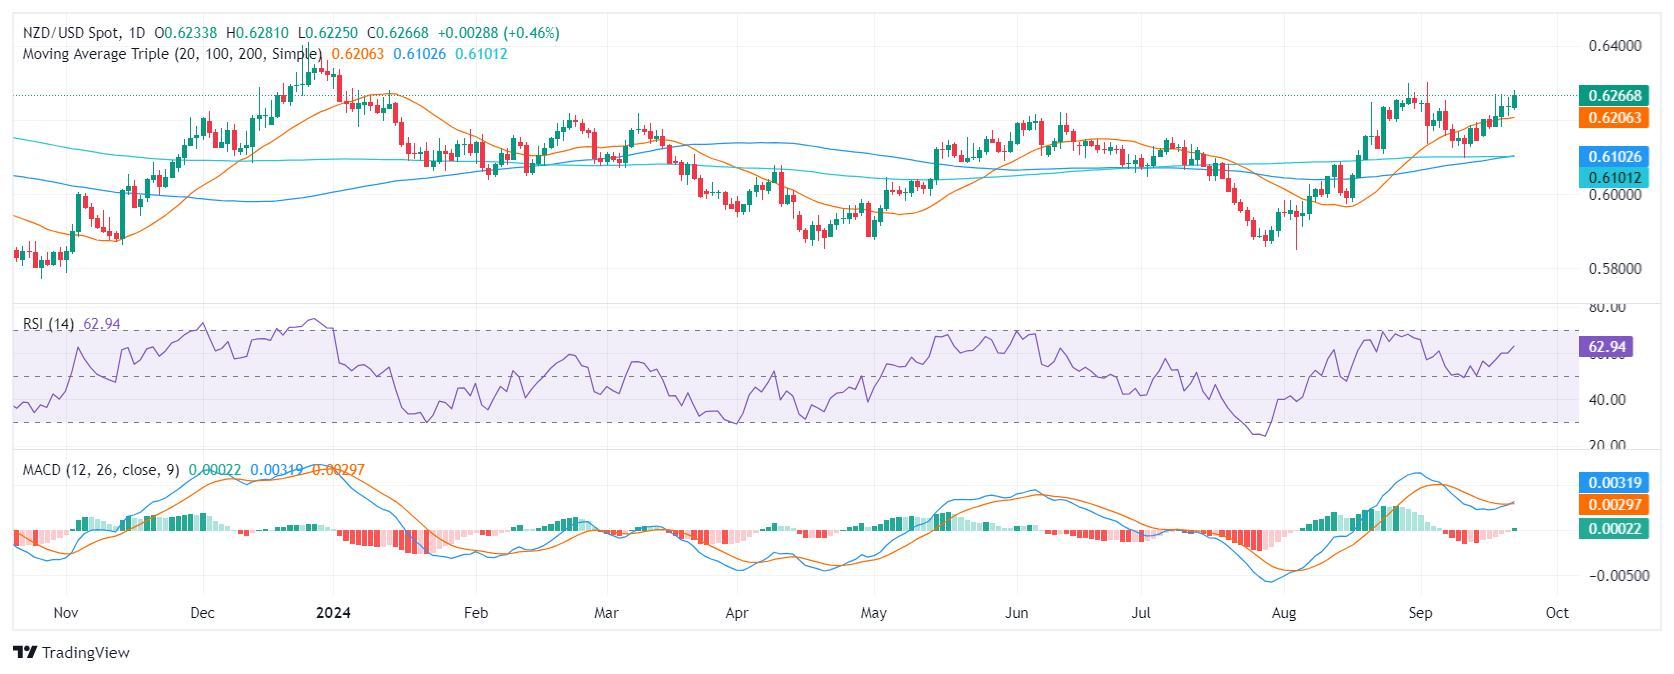
The overall outlook is bullish, as the pair is trading above its major moving averages. The pair has three formed support levels at 0.6200, 0.6180, and 0.6150 and it has formed resistance levels at 0.6280, 0.6300, and 0.6310. A close above the 0.6280 resistance level could open the door to further gains, with the next target being at early September highs near 0.6300.
That being said, bulls shouldn't focus entirely on looking upwards and must also consolidate their control above the 20-day Simple Moving Average (SMA). A loss of this level would worsen the Kiwi’s technical outlook.
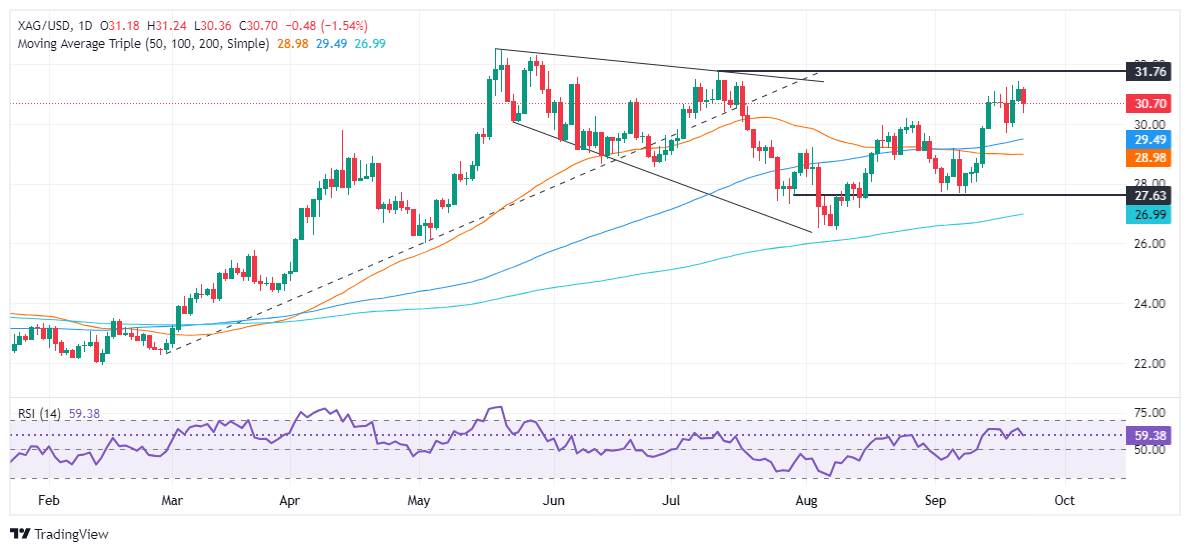
- Silver price drops over 1.5% after reaching a two-month high of $31.43, currently trading at $30.66.
- A daily close below $30.66 could exacerbate a drop toward the psychological $30.00 level, targeting the 100-day moving average (DMA) and the 50-DMA.
- If XAG/USD remains above $31.00, a re-test of the September 20 high at $31.44 is possible.
Silver price retreats after hitting a two-month high of $31.43, falls over 1.50% and trades at $30.66 at the time of writing. Although US economic data was soft and US Treasury yields remained unchanged, the grey metal failed to gain traction on Monday.
XAG/USD Price Forecast: Technical outlook
Silver is upward biased, though a decisive breach below the downslope resistance trendline turned support can pave the way for further downside. The Relative Strength Index (RSI) peaked shy of cracking 64 and edged lower, indicating that sellers are stepping in.
If XAG/USD prints a daily close below $30.66, that could exacerbate a drop to challenge the $30.00 mark. On further weakness, the next stop would be the 100-day moving average (DMA) at $29.47, followed by the 50-DMA at $28.96.
On the other hand, if XAG/USD stays above $31.00, look for a re-test of the daily September 20 high at $31.44.
XAG/USD Price Action – Daily Chart
Silver FAQs
Silver is a precious metal highly traded among investors. It has been historically used as a store of value and a medium of exchange. Although less popular than Gold, traders may turn to Silver to diversify their investment portfolio, for its intrinsic value or as a potential hedge during high-inflation periods. Investors can buy physical Silver, in coins or in bars, or trade it through vehicles such as Exchange Traded Funds, which track its price on international markets.
Silver prices can move due to a wide range of factors. Geopolitical instability or fears of a deep recession can make Silver price escalate due to its safe-haven status, although to a lesser extent than Gold's. As a yieldless asset, Silver tends to rise with lower interest rates. Its moves also depend on how the US Dollar (USD) behaves as the asset is priced in dollars (XAG/USD). A strong Dollar tends to keep the price of Silver at bay, whereas a weaker Dollar is likely to propel prices up. Other factors such as investment demand, mining supply – Silver is much more abundant than Gold – and recycling rates can also affect prices.
Silver is widely used in industry, particularly in sectors such as electronics or solar energy, as it has one of the highest electric conductivity of all metals – more than Copper and Gold. A surge in demand can increase prices, while a decline tends to lower them. Dynamics in the US, Chinese and Indian economies can also contribute to price swings: for the US and particularly China, their big industrial sectors use Silver in various processes; in India, consumers’ demand for the precious metal for jewellery also plays a key role in setting prices.
Silver prices tend to follow Gold's moves. When Gold prices rise, Silver typically follows suit, as their status as safe-haven assets is similar. The Gold/Silver ratio, which shows the number of ounces of Silver needed to equal the value of one ounce of Gold, may help to determine the relative valuation between both metals. Some investors may consider a high ratio as an indicator that Silver is undervalued, or Gold is overvalued. On the contrary, a low ratio might suggest that Gold is undervalued relative to Silver.
- Australian Dollar strengthens against its US counterpart due to RBA policy outlook.
- RBA is expected to maintain its Official Cash Rate unchanged at 4.35%.
- US S&P Global PMIs data came in mixed during the European session
On Monday the AUD/USD was seen rising by 0.40% to 0.6835 by late in the US session. The Reserve Bank of Australia's (RBA) hawkish policy outlook and the release of preliminary S&P Global PMI data for September from the US were the primary movers of the pair.
With uncertainty surrounding Australia's economic future and the RBA maintaining a cautious stance in response to persistent inflation, financial markets anticipate a modest 25 bps interest rate cut in 2024.
Daily digest market movers: Australian Dollar rises on RBA policy outlook, US Dollar recovers
- Australian Dollar edges higher ahead of RBA policy meeting, as investors anticipate an unchanged Official Cash Rate of 4.35%.
- RBA's forward guidance on interest rates beyond the current year will be closely scrutinized amid persistent inflationary pressure and a solid labor market.
- On the other hand, the US Dollar regained some ground, buoyed by skepticism regarding the Federal Reserve's aggressive rate-cutting path.
- CME FedWatch data indicates a total of 75 bps in rate cuts over November and December, with a 50% probability of a 50 bps reduction in November.
- Over 100 economists polled by Reuters forecast 25 bps rate cuts at both of the Fed's remaining meetings.
- On the data front, the composite S&P PMI expanded at a slower pace of 54.4 in September, down from 54.6 in August.
- Manufacturing PMI unexpectedly declined to 47.0, while the services PMI expanded at a better-than-projected 55.4.
AUD/USD technical outlook: Bulls surge and have more room to go
With the pair above 0.6800 and indicators showing strength, the AUD/USD might have more room to go higher. The Relative Strength Index (RSI) is at 64, which means that it isn’t yet in the overbought zone, while the Moving Average Convergence Divergence (MACD) indicator is printing rising green bars. The next target lies around 0.6850.
Australian Dollar FAQs
One of the most significant factors for the Australian Dollar (AUD) is the level of interest rates set by the Reserve Bank of Australia (RBA). Because Australia is a resource-rich country another key driver is the price of its biggest export, Iron Ore. The health of the Chinese economy, its largest trading partner, is a factor, as well as inflation in Australia, its growth rate and Trade Balance. Market sentiment – whether investors are taking on more risky assets (risk-on) or seeking safe-havens (risk-off) – is also a factor, with risk-on positive for AUD.
The Reserve Bank of Australia (RBA) influences the Australian Dollar (AUD) by setting the level of interest rates that Australian banks can lend to each other. This influences the level of interest rates in the economy as a whole. The main goal of the RBA is to maintain a stable inflation rate of 2-3% by adjusting interest rates up or down. Relatively high interest rates compared to other major central banks support the AUD, and the opposite for relatively low. The RBA can also use quantitative easing and tightening to influence credit conditions, with the former AUD-negative and the latter AUD-positive.
China is Australia’s largest trading partner so the health of the Chinese economy is a major influence on the value of the Australian Dollar (AUD). When the Chinese economy is doing well it purchases more raw materials, goods and services from Australia, lifting demand for the AUD, and pushing up its value. The opposite is the case when the Chinese economy is not growing as fast as expected. Positive or negative surprises in Chinese growth data, therefore, often have a direct impact on the Australian Dollar and its pairs.
Iron Ore is Australia’s largest export, accounting for $118 billion a year according to data from 2021, with China as its primary destination. The price of Iron Ore, therefore, can be a driver of the Australian Dollar. Generally, if the price of Iron Ore rises, AUD also goes up, as aggregate demand for the currency increases. The opposite is the case if the price of Iron Ore falls. Higher Iron Ore prices also tend to result in a greater likelihood of a positive Trade Balance for Australia, which is also positive of the AUD.
The Trade Balance, which is the difference between what a country earns from its exports versus what it pays for its imports, is another factor that can influence the value of the Australian Dollar. If Australia produces highly sought after exports, then its currency will gain in value purely from the surplus demand created from foreign buyers seeking to purchase its exports versus what it spends to purchase imports. Therefore, a positive net Trade Balance strengthens the AUD, with the opposite effect if the Trade Balance is negative.
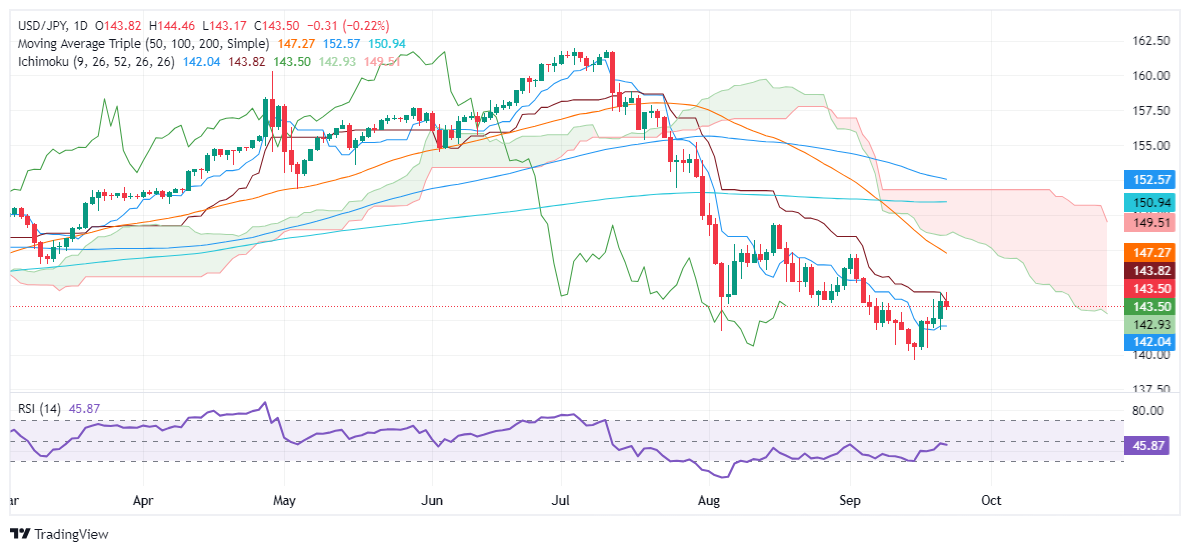
- USD/JPY falls to 143.45 after reaching a daily high of 144.46, pressured by softer US data fueling Fed rate cut speculation.
- Technical outlook remains bearish, with momentum favoring sellers as the pair fails to clear resistance at 143.81 (Kijun-Sen).
- Key support levels include the Senkou Span A at 142.92 and the Tenkan-Sen at 142.03, with further downside targeting 141.73 and 139.58.
The USD/JPY snapped two days of gains and dropped late in the North American session following softer-than-expected US economic data, fueling rate cut speculation by the Federal Reserve. At the time of writing, the pair trades at 143.45 after hitting a daily high of 144.46.
USD/JPY Price Forecast: Technical outlook
From a technical standpoint, the USD/JPY is downward biased despite printing a leg-up after bouncing from the September 16 low of 139.58 to the September 20 high of 144.49. It should be said that the rally continued to remain capped by the Kijun-Sen at 143.81, opening the door for further losses.
Momentum remains negative, as the Relative Strength Index (RSI) portrays. Therefore, tha path of least resistance is tilted to the downside.
The first support would be the Senkou Span Aat 142.92, followed by the Tenkan-Sen at 142.03, before challenging the September 20 swing low of 141.73. If surpassed, the USD/JPY could aim toward the September 16 pivot low of 139.58.
Conversely, if USD/JPY buyers move in and push prices above 144.00, further upside lies above the September 20 high of 144.49.
USD/JPY Price Action – Daily Chart
Japanese Yen FAQs
The Japanese Yen (JPY) is one of the world’s most traded currencies. Its value is broadly determined by the performance of the Japanese economy, but more specifically by the Bank of Japan’s policy, the differential between Japanese and US bond yields, or risk sentiment among traders, among other factors.
One of the Bank of Japan’s mandates is currency control, so its moves are key for the Yen. The BoJ has directly intervened in currency markets sometimes, generally to lower the value of the Yen, although it refrains from doing it often due to political concerns of its main trading partners. The current BoJ ultra-loose monetary policy, based on massive stimulus to the economy, has caused the Yen to depreciate against its main currency peers. This process has exacerbated more recently due to an increasing policy divergence between the Bank of Japan and other main central banks, which have opted to increase interest rates sharply to fight decades-high levels of inflation.
The BoJ’s stance of sticking to ultra-loose monetary policy has led to a widening policy divergence with other central banks, particularly with the US Federal Reserve. This supports a widening of the differential between the 10-year US and Japanese bonds, which favors the US Dollar against the Japanese Yen.
The Japanese Yen is often seen as a safe-haven investment. This means that in times of market stress, investors are more likely to put their money in the Japanese currency due to its supposed reliability and stability. Turbulent times are likely to strengthen the Yen’s value against other currencies seen as more risky to invest in.
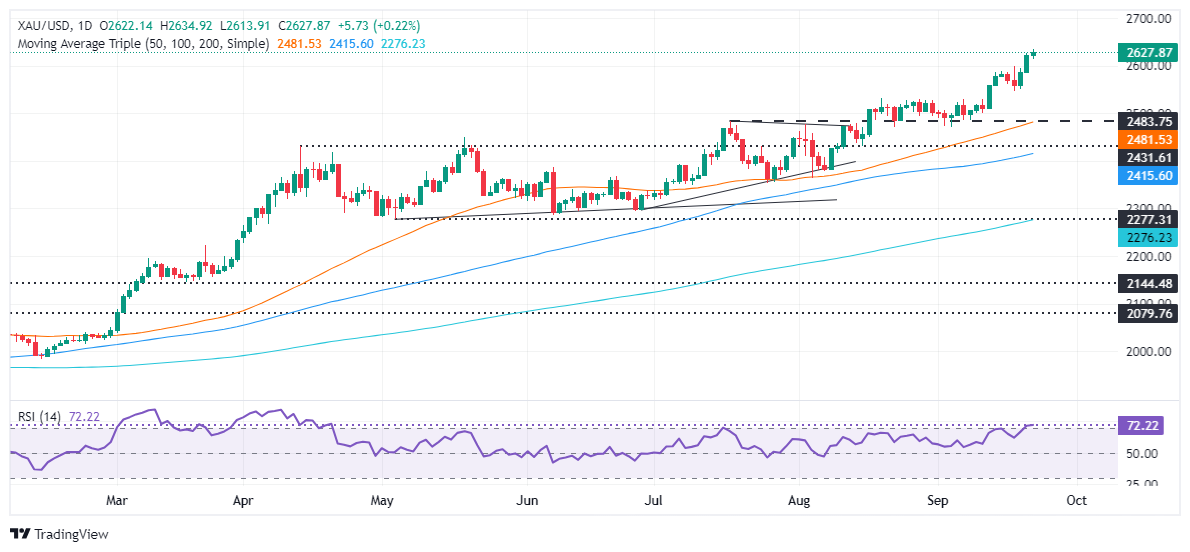
- Gold hits a new record high, driven by expectations of a Fed rate cut in November and falling US Treasury yields.
- Mixed US economic data reveals manufacturing weakness but services sector resilience, according to S&P Global Flash PMIs.
- Fed officials express caution about aggressive rate cuts, maintaining flexibility in policy while noting growing labor market risks.
- Rising tensions between Israel and Hezbollah heighten safe-haven appeal, potentially driving further demand for Gold.
Gold's price rose marginally on Monday, hitting an all-time high above $2,630, fueled by increasing bets that the US Federal Reserve (Fed) will lower interest rates in November. The XAU/USD trades at $2,627, registering more than 0.20% gains.
US equities showed an improvement in risk appetite on Monday. Bullion traders reached record peaks during the last two trading days, irrespective of a firm US Dollar. The main driver seems to be the drop in US Treasury yields, with the 10-year T-note yielding 3.741%, failing to edge higher amid the Fed speaker's pullback against aggressively lowering rates.
Data from the United States (US) was mixed. S&P Global revealed its Flash PMIs, painting a gloomy outlook for manufacturers, while the services sector remained resilient despite decelerating modestly compared to August’s data.
In the meantime, the Atlanta Fed GDP Now model projects the economy to grow 2.9% in Q3 2024, even though the labor market has softened.
On Monday, Fed regional presidents acknowledged that the risks of a weakening labor market have increased. Nonetheless, they pushed back against lowering interest rates at a 50 bps pace, keeping their options open for future meetings and signaling a gradual approach.
This capped the XAU/USD rally, though heightened tensions in the Middle East conflict between Israel and Hezbollah could dampen the risk appetite and increase Gold prices. According to the Associated Press, the US is sending more troops to the Middle East as violence has risen, the Pentagon said Monday.
Daily digest market movers: Gold price holds gains despite Fed commentary
- US S&P Global Manufacturing PMI in September deteriorated further from 47.9 in August to 47.0, below forecasts of 48.5.
- The S&P Global Services PMI expanded by 55.4, above estimates of 55.3 but beneath the previous month's 55.7, hinting that the US economy is decelerating.
- According to the World Gold Council, global physically-backed Gold ETFs saw modest net inflows of 3 metric tons last week.
- Minneapolis Fed President Neel Kashkari stated that the Fed remains data-dependent, affirming that the 50 bps rate cut was "the right decision" and projected the fed funds rate to end at 4.4% in 2024.
- Atlanta Fed President Raphael Bostic remarked that the half-point cut "does not lock in a cadence for future rate cuts" while acknowledging that labor market risks have increased.
- Chicago Fed President Austan Goolsbee added that more rate cuts will be needed next year.
XAU/USD technical outlook: Gold poised for retracement before extending gains
The XAU/USD is upwardly biased, though the rally seems overextended. Gold’s price action remains subdued within an anemic $20 range.
The Relative Strength Index (RSI) has turned overbought, hinting that buyers are in charge but that a pullback might be on the cards.
Expect a leg-down if XAU/USD drops below the September 18 daily high at $2,600. The following key support levels to test will be the September 18 low of $2,546, followed by the 50-day Simple Moving Average (SMA) at $2,481.
Conversely, if XAU/USD clears the all-time high (ATH) of $2,634, traders could eye the $2,650 area, followed by the $2,700 mark.
Gold FAQs
Gold has played a key role in human’s history as it has been widely used as a store of value and medium of exchange. Currently, apart from its shine and usage for jewelry, the precious metal is widely seen as a safe-haven asset, meaning that it is considered a good investment during turbulent times. Gold is also widely seen as a hedge against inflation and against depreciating currencies as it doesn’t rely on any specific issuer or government.
Central banks are the biggest Gold holders. In their aim to support their currencies in turbulent times, central banks tend to diversify their reserves and buy Gold to improve the perceived strength of the economy and the currency. High Gold reserves can be a source of trust for a country’s solvency. Central banks added 1,136 tonnes of Gold worth around $70 billion to their reserves in 2022, according to data from the World Gold Council. This is the highest yearly purchase since records began. Central banks from emerging economies such as China, India and Turkey are quickly increasing their Gold reserves.
Gold has an inverse correlation with the US Dollar and US Treasuries, which are both major reserve and safe-haven assets. When the Dollar depreciates, Gold tends to rise, enabling investors and central banks to diversify their assets in turbulent times. Gold is also inversely correlated with risk assets. A rally in the stock market tends to weaken Gold price, while sell-offs in riskier markets tend to favor the precious metal.
The price can move due to a wide range of factors. Geopolitical instability or fears of a deep recession can quickly make Gold price escalate due to its safe-haven status. As a yield-less asset, Gold tends to rise with lower interest rates, while higher cost of money usually weighs down on the yellow metal. Still, most moves depend on how the US Dollar (USD) behaves as the asset is priced in dollars (XAU/USD). A strong Dollar tends to keep the price of Gold controlled, whereas a weaker Dollar is likely to push Gold prices up.
The Greenback remains off-kilter following the Fed’s recent pivot into a rate-cutting cycle. Last week, the US central bank delivered a jumbo 50 bps rate cut. The US Dollar remains under pressure, but markets have quickly pivoted to more impatient waiting for the next rate call.
Here is what you need to know on Tuesday, September 24:
The US Dollar Index remains pinned on the low end following the Federal Reserve’s (Fed) 50 bps rate slash last week. The DXY continues to clatter along the floor, grinding sideways just above the 100.50 level. US economic data is strictly mid-tier on Tuesday, but investors will keep an eye out for Fed Governor Michelle Bowman. Chicago Fed President Neel Kashkari warned on Monday that the future pace of Fed rate cuts may be slower than many expect over the next year, signalling that the Fed may be poised to clamp down on outsized rate cuts moving forward.
EUR/USD is struggling to hold onto high territory to kick off the new trading week. Despite an overall softening in Greenback positioning, the Euro took a hit after pan-EU Purchasing Managers Index (PMI) figures for September broadly missed the mark on Monday.
GBP/USD was able to eke out further gains on Monday, climbing to a fresh 30-month high near 1.3360. Despite UK PMI figures printing broadly below expectations to start the week, the Pound Sterling’s recent bull run continues to chew through chart paper. However, political threats loom just over the horizon with UK Prime Minister Keir Starmer warning that the UK’s domestic economy could be on a collision course with “painful” economic reforms that are needed, especially with UK inflation figures proving to be far stickier than in other countries.
USD/JPY continues to grapple with the 144.00 handle, and the pair is struggling to develop meaningfully-bullish legs as the Yen continues to grind into fresh highs against the US Dollar. JPY traders will be keeping an eye out for Bank of Japan (BoJ) Governor Kazuo Ueda on Tuesday, with Japanese Tokyo Consumer Price Index (CPI) inflation figures due later in the week.
AUD/USD found a new nine-month high on Monday, testing north of 0.6850 for the first time since last December. Aussie traders are jostling for position ahead of the Reserve Bank of Australia’s (RBA) rate call, due early Tuesday. Despite recent signs of a potential economic slowdown in Australia, the Australian labor market remains tight overall, and the RBA is widely expected to remain on hold on rates for the time being.
West Texas Intermediate (WTI) US Crude Oil prices have recovered over 10.5% bottom-to-top since September 10’s bottom bids of $64.75, the key commodity’s lowest prices since May of 2022. Crude Oil prices are catching a bid heading into Tuesday after it was announced that the US is deploying additional military personnel to the Middle East as Israel continues to expand its military campaign against Palestinian Hamas, which crossed within the borders of Lebanon over the weekend. A fresh rocket barrage from Israel against Hamas targets within Lebanon claimed the lives of nearly 300 people and wounded over a thousand. Israel has stated the fresh round of explosive attacks are a retaliation against a recent Hamas rocket salvo that killed three people in Israel.
Gold continues to benefit healthily from the latest Fed rate cut, with XAU/USD climbing to a new record high just below $2,640. XAU/USD has closed flat or higher for all but one of the last 11 consecutive trading months, climbing over 45% in value from last October’s lows near $1,800.
- US Dollar holds its ground on Monday, rising despite softer PMI data.
- Market prices in 75 bps of Fed easing by year-end.
- Fed's Goolsbee pledged for “many cuts” will be needed next year.
The US economy is showing some signs of deceleration, but there are also some signs of the economic activity holding resilient. The Fed has stated that the pace of the easing cycle will depend on the incoming data.
On Monday, the Chicago Fed's Goolsbee stated that rates need to come down, adding that “many more rate cuts” will be needed next year. On the other hand, Minneapolis Fed President Neel Kashkari stated that the Fed is still focused on data to guide its decisions. The Atlanta Fed’s Bostic commented that the recent 50 bps cut last week doesn’t establish a pattern for future cuts, also noting that risks to the labor market have grown.
Daily digest market movers: US Dollar stays green after PMI data
- Composite S&P PMI expanded at a slower pace of 54.4 in September, down from 54.6 in August.
- Manufacturing PMI unexpectedly declined to 47.0, while the services PMI expanded at a better-than-projected 55.4.
- Market continues to veer toward a dovish Fed, pricing in 75 bps of easing by year-end.
- Traders will keep an eye on incoming Fed comments and if incoming data would justify a 50 or 75 bps cut.
- US Dollar is likely to remain vulnerable until the market reprices Fed expectations. Incoming data will be key.
DXY technical outlook: Bulls remain weak and go nowhere
The DXY index has shown some momentum, but indicators remain in a bearish zone. The Relative Strength Index (RSI) is at 40, indicating weak buying pressure. The Moving Average Convergence Divergence (MACD) is displaying diminishing green bars, further supporting the bearish trend.
Supports are located at 100.50, 100.30 and 100.00. Resistance levels are found at 101.00, 101.30 and 101.60. The DXY index is likely to face resistance at these levels if it continues to rise. Conversely, if it falls below the support levels, it could signal further weakness.
US Dollar FAQs
The US Dollar (USD) is the official currency of the United States of America, and the ‘de facto’ currency of a significant number of other countries where it is found in circulation alongside local notes. It is the most heavily traded currency in the world, accounting for over 88% of all global foreign exchange turnover, or an average of $6.6 trillion in transactions per day, according to data from 2022. Following the second world war, the USD took over from the British Pound as the world’s reserve currency. For most of its history, the US Dollar was backed by Gold, until the Bretton Woods Agreement in 1971 when the Gold Standard went away.
The most important single factor impacting on the value of the US Dollar is monetary policy, which is shaped by the Federal Reserve (Fed). The Fed has two mandates: to achieve price stability (control inflation) and foster full employment. Its primary tool to achieve these two goals is by adjusting interest rates. When prices are rising too quickly and inflation is above the Fed’s 2% target, the Fed will raise rates, which helps the USD value. When inflation falls below 2% or the Unemployment Rate is too high, the Fed may lower interest rates, which weighs on the Greenback.
In extreme situations, the Federal Reserve can also print more Dollars and enact quantitative easing (QE). QE is the process by which the Fed substantially increases the flow of credit in a stuck financial system. It is a non-standard policy measure used when credit has dried up because banks will not lend to each other (out of the fear of counterparty default). It is a last resort when simply lowering interest rates is unlikely to achieve the necessary result. It was the Fed’s weapon of choice to combat the credit crunch that occurred during the Great Financial Crisis in 2008. It involves the Fed printing more Dollars and using them to buy US government bonds predominantly from financial institutions. QE usually leads to a weaker US Dollar.
Quantitative tightening (QT) is the reverse process whereby the Federal Reserve stops buying bonds from financial institutions and does not reinvest the principal from the bonds it holds maturing in new purchases. It is usually positive for the US Dollar.
- The Canadian Dollar rose around half of a percent against the Greenback.
- Canada reports still disappointing housing price figures, but CAD rises anyway.
- Post-Fed rate cut landscape sees the Greenback broadly softer.
The Canadian Dollar (CAD) found higher ground on Monday, clipping one-half of one percent above the Greenback as investors find firmer footing after the Federal Reserve (Fed) trimmed rate cuts for the first time in over four years last week.
Canadian housing price figures missed the mark to kick off the new trading week, but the CAD found itself bolstered into the high end anyway as broader markets continue to squeeze the US Dollar lower. US data also came in mixed on Monday, helping to keep overall market momentum tepid.
Daily digest market movers
- The Canadian Dollar rallied on Monday, bolstered by post-cut Fed environment.
- Canadian News Housing Price Index slumped to a 0.0% MoM print in August, easing back from the previous 0.2% and missing the expected 0.1% uptick.
- On an annualized basis, the Canadian New Housing Price Index also hit a flat 0.0%, down from the previous annualized period’s underperforming 0.1% YoY.
- US Purchasing Managers Index (PMI) figures for September went lopsided on median market forecasts, with the Manufacturing PMI backsliding to a 14-month low of 47.0. The Services PMI component also fell, but less than expected, pumping the brakes at 55.4.
- CAD traders will be keeping an eye out for Bank of Canada (BoC) Governor Tiff Macklem on Tuesday, who will be giving talking points at the International Finance and Canadian Bankers Association Canada Forum, in Toronto.
Canadian Dollar price forecast
The Canadian Dollar (CAD) found a fresh three-week high against the US Dollar (USD) on Monday, sending the USD/CAD pair tumbling back below 1.3550 as intraday price action scrambles to find a foothold as bids slip below 1.3500. USD/CAD recently staged a technical freeze just south of the 200-day Exponential Moving Average (EMA) near 1.3600, but broad-market short Greenback pressure has left the pair on the precipice of confirming a fresh leg lower on the daily candlesticks.
USD/CAD daily chart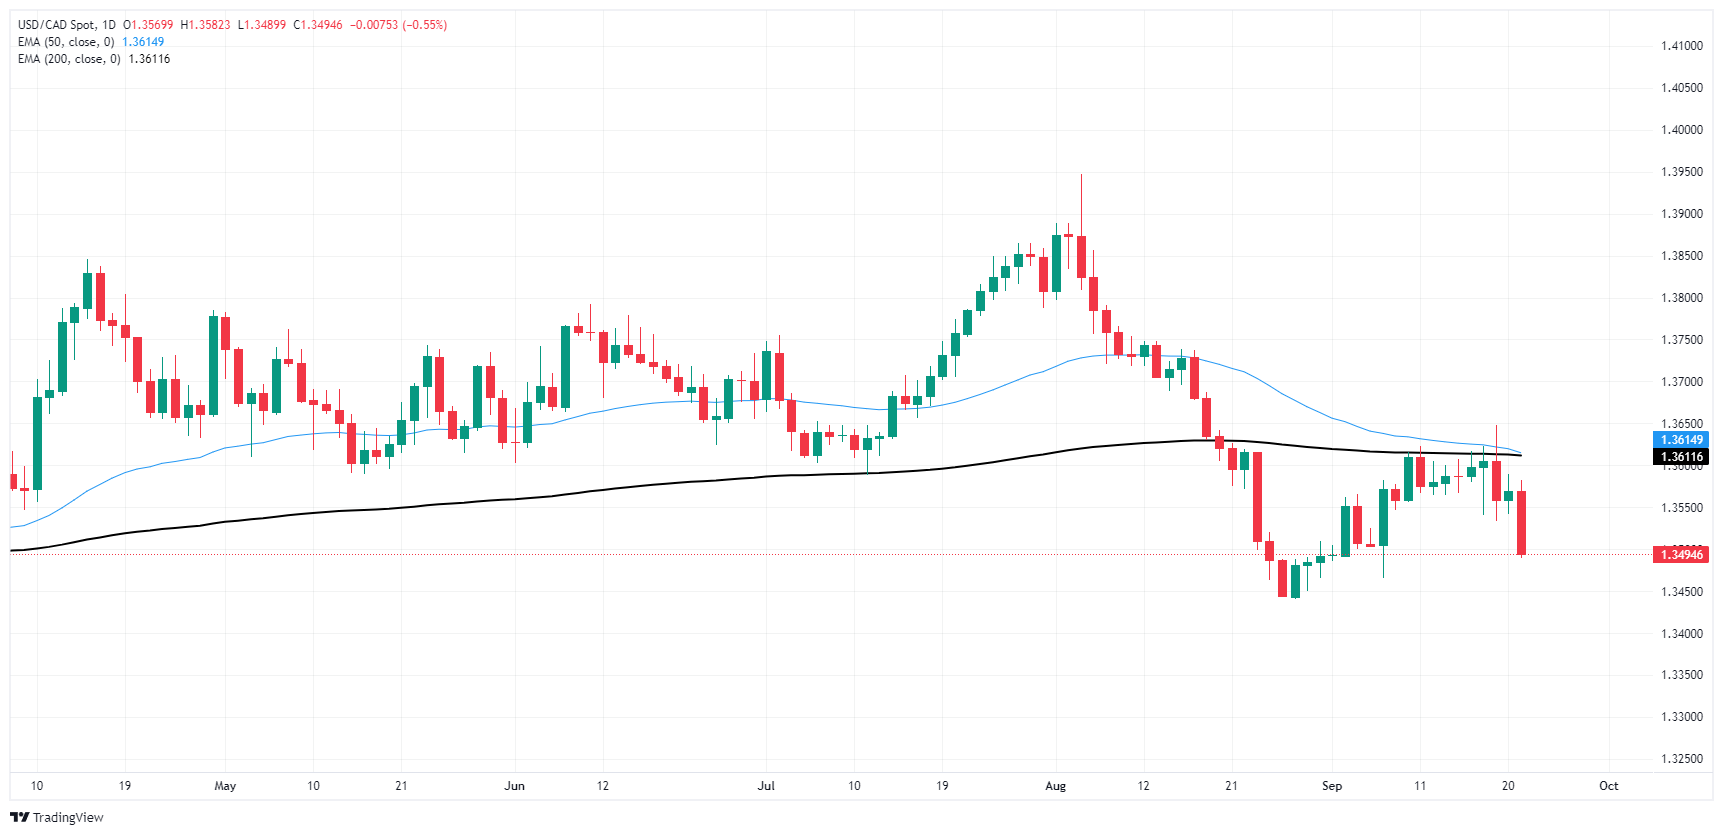
Canadian Dollar FAQs
The key factors driving the Canadian Dollar (CAD) are the level of interest rates set by the Bank of Canada (BoC), the price of Oil, Canada’s largest export, the health of its economy, inflation and the Trade Balance, which is the difference between the value of Canada’s exports versus its imports. Other factors include market sentiment – whether investors are taking on more risky assets (risk-on) or seeking safe-havens (risk-off) – with risk-on being CAD-positive. As its largest trading partner, the health of the US economy is also a key factor influencing the Canadian Dollar.
The Bank of Canada (BoC) has a significant influence on the Canadian Dollar by setting the level of interest rates that banks can lend to one another. This influences the level of interest rates for everyone. The main goal of the BoC is to maintain inflation at 1-3% by adjusting interest rates up or down. Relatively higher interest rates tend to be positive for the CAD. The Bank of Canada can also use quantitative easing and tightening to influence credit conditions, with the former CAD-negative and the latter CAD-positive.
The price of Oil is a key factor impacting the value of the Canadian Dollar. Petroleum is Canada’s biggest export, so Oil price tends to have an immediate impact on the CAD value. Generally, if Oil price rises CAD also goes up, as aggregate demand for the currency increases. The opposite is the case if the price of Oil falls. Higher Oil prices also tend to result in a greater likelihood of a positive Trade Balance, which is also supportive of the CAD.
While inflation had always traditionally been thought of as a negative factor for a currency since it lowers the value of money, the opposite has actually been the case in modern times with the relaxation of cross-border capital controls. Higher inflation tends to lead central banks to put up interest rates which attracts more capital inflows from global investors seeking a lucrative place to keep their money. This increases demand for the local currency, which in Canada’s case is the Canadian Dollar.
Macroeconomic data releases gauge the health of the economy and can have an impact on the Canadian Dollar. Indicators such as GDP, Manufacturing and Services PMIs, employment, and consumer sentiment surveys can all influence the direction of the CAD. A strong economy is good for the Canadian Dollar. Not only does it attract more foreign investment but it may encourage the Bank of Canada to put up interest rates, leading to a stronger currency. If economic data is weak, however, the CAD is likely to fall.
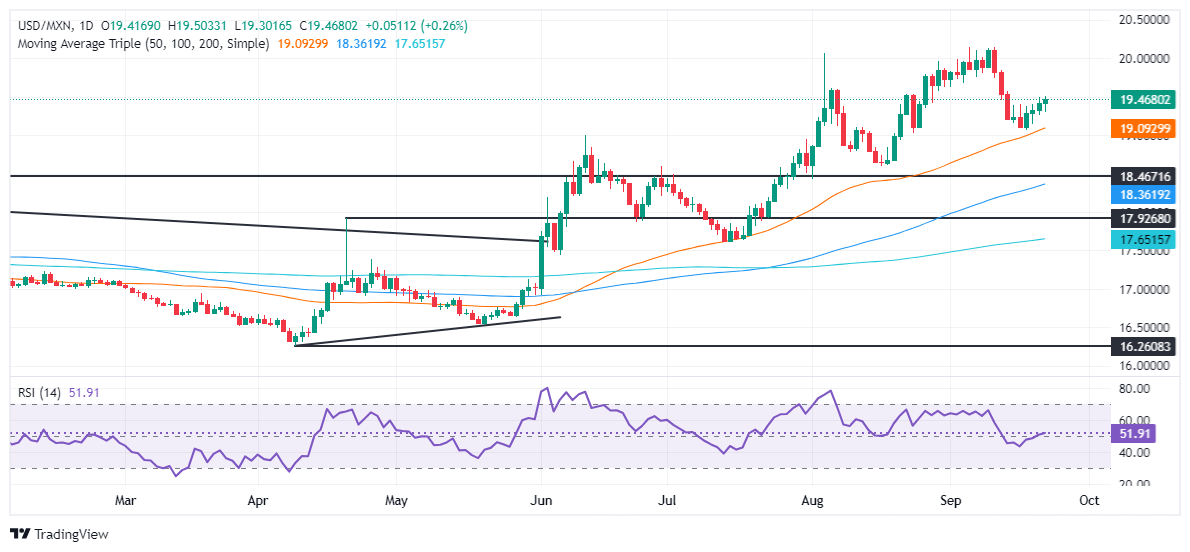
- Mexican Peso declines for fourth day as USD/MXN recovers from daily low of 19.29.
- Mexico’s Economic Activity expanded in July, but Retail Sales contracted for the third consecutive month, fueling Peso weakness.
- Citibanamex survey shows most economists expect Banxico to cut rates by 25 bps on Thursday, with some forecasting a 50-bps cut.
The Mexican Peso extended its losses for the fourth straight day against the Greenback, erasing earlier gains as traders digested mixed economic data from Mexico, while S&P Global revealed that business activity in the US remains solid but ticked lower. The USD/MXN trades at 19.45, bouncing off a daily low of 19.29, gaining 0.21%.
Mexico’s Instituto Nacional de Estadística Geografía e Informatica (INEGI) revealed that Economic Activity expanded in July, while Retail Sales contracted for the third straight month, yet improved compared to June’s reading.
Mexico’s economic docket will reveal September’s mid-month inflation figures on Tuesday, ahead of the Bank of Mexico (Banxico) monetary policy decision on Thursday. Citibanamex Expectations Survey showed that 28 of 36 economists await a 25-basis-point (bps) rate cut by the Mexican central bank. It’s worth noting that six of them forecast a 50 bps cut, and two others project the next cut until November 2024.
Across the border, US Flash PMIs were mixed, with manufacturing activity contracting deeper while services continued to underpin the economy. The Atlanta Fed GDP Now model estimates the US economy will grow 2.9% in the third quarter and will be updated on Friday following data releases.
Recently, the USD/MXN extended its losses after Fed speakers acknowledged that the risks of the labor market weakening had increased. However, they pushed back against lowering interest rates at a 50 bps pace, keeping their options open for the upcoming meetings.
Daily digest market movers: Mexican Peso retreats as Fed officials push back against aggressive easing cycle
- Mexico’s Economic Activity in July expanded by 0.6% MoM, up from 0% in June. In the 12 months to July, ur grew 3.8%, crushing expectations of 1.8% and June’s -0.6% contraction.
- Retail Sales improved from -0.5% to 0.7% MoMy. They shrank -0.6% YoY, more than estimates of -0.5% but improved from -3.1%.
- Banxico is expected to lower borrowing costs by 175 bps, according to the swaps markets.
- US S&P Global Manufacturing PMI in September deteriorated further from 47.9 in August to 47.0, below forecasts of 48.5. Nevertheless, the Services PMI expanded by 55.4, above estimates of 55.3 but beneath the previous month's 55.7, hinting that the US economy is decelerating.
- Regional Fed presidents crossed the newswires. Minneapolis’ Neel Kashkari said the Fed remains data-dependent, that cutting 50 bps was “the right decision,” and projected the fed funds rate to end at 4.4% in 2024.
- Atlanta Fed’s Raphael Bostic commented that a half-point cut “does not lock in a cadence for future rate cuts,” while adding that risks to the labor market had increased.
- Chicago Fed’s Austan Goolsbee said many more rate cuts are needed next year.
USD/MXN technical analysis: Mexican Peso drops after weak US PMI data
The USD/MXN is upwardly biased. It recovered slightly during the North American session and is set to extend its gains once the psychological 19.50 figure is surpassed. Momentum as measured by the Relative Strength Index (RSI) favors buyers, after crossing above its neutral line, opening the door for further gains.
The USD/MXN's next resistance will be 19.50, followed by the August 6 high at 19.61. Once cleared, the 20.00 will follow, followed by the year-to-date (YTD) peak at 20.22. Conversely, if USD/MXN extends its losses below the September 23 low of 19.29, it will expose the confluence of the 50-day Simple Moving Average (SMA) and the September 18 low near 19.08 to 19.06.
Mexican Peso FAQs
The Mexican Peso (MXN) is the most traded currency among its Latin American peers. Its value is broadly determined by the performance of the Mexican economy, the country’s central bank’s policy, the amount of foreign investment in the country and even the levels of remittances sent by Mexicans who live abroad, particularly in the United States. Geopolitical trends can also move MXN: for example, the process of nearshoring – or the decision by some firms to relocate manufacturing capacity and supply chains closer to their home countries – is also seen as a catalyst for the Mexican currency as the country is considered a key manufacturing hub in the American continent. Another catalyst for MXN is Oil prices as Mexico is a key exporter of the commodity.
The main objective of Mexico’s central bank, also known as Banxico, is to maintain inflation at low and stable levels (at or close to its target of 3%, the midpoint in a tolerance band of between 2% and 4%). To this end, the bank sets an appropriate level of interest rates. When inflation is too high, Banxico will attempt to tame it by raising interest rates, making it more expensive for households and businesses to borrow money, thus cooling demand and the overall economy. Higher interest rates are generally positive for the Mexican Peso (MXN) as they lead to higher yields, making the country a more attractive place for investors. On the contrary, lower interest rates tend to weaken MXN.
Macroeconomic data releases are key to assess the state of the economy and can have an impact on the Mexican Peso (MXN) valuation. A strong Mexican economy, based on high economic growth, low unemployment and high confidence is good for MXN. Not only does it attract more foreign investment but it may encourage the Bank of Mexico (Banxico) to increase interest rates, particularly if this strength comes together with elevated inflation. However, if economic data is weak, MXN is likely to depreciate.
As an emerging-market currency, the Mexican Peso (MXN) tends to strive during risk-on periods, or when investors perceive that broader market risks are low and thus are eager to engage with investments that carry a higher risk. Conversely, MXN tends to weaken at times of market turbulence or economic uncertainty as investors tend to sell higher-risk assets and flee to the more-stable safe havens.
- The Dow Jones clipped into an all-new record peak, but remains flat overall.
- Equities are tilted upwards, but overall market momentum remains limited.
- US S&P PMI figures came in mixed on Monday, but Fedspeak dominates.
The Dow Jones Industrial Average (DJIA) tested into a fresh record bid on Monday, but middling US data prints and cautious Fedspeak early in the day have kept risk appetite restrained. S&P US Purchasing Managers Index (PMI) figures printed on both sides of median market forecasts, and Federal Reserve (Fed) Bank of Chicago President Austan Goolsbee warned that despite the Fed’s extra-wide initial rate cut this month, further moves on the Fed’s reference rate could be needed over the next year to head off a potential deterioration of the US labor market.
September’s S&P US Manufacturing PMI declined to 47.0 MoM, falling to its lowest level since July of 2023 as the US manufacturing sector sees a continued gloomy outlook on business activity. On the other hand, the S&P US Services PMI eased to 55.4 in September, down from August’s 55.7 but beating the expected print of 55.2.
Fed policymaker and Chicago Fed President Austan Goolsbee hit markets with cooling comments early Monday, noting that much further movement on rates from the Fed could be necessary. The Fed official highlighted that the Fed may need to shoot much lower on policy rates in order to keep business lending conditions sufficiently liquid enough to keep the US business landscape keel-side down as record tightness in the US labor market drains away.
Economic Indicator
S&P Global Manufacturing PMI
The S&P Global Manufacturing Purchasing Managers Index (PMI), released on a monthly basis, is a leading indicator gauging business activity in the US manufacturing sector. The data is derived from surveys of senior executives at private-sector companies from the manufacturing sector. Survey responses reflect the change, if any, in the current month compared to the previous month and can anticipate changing trends in official data series such as Gross Domestic Product (GDP), industrial production, employment and inflation. A reading above 50 indicates that the manufacturing economy is generally expanding, a bullish sign for the US Dollar (USD). Meanwhile, a reading below 50 signals that activity in the manufacturing sector is generally declining, which is seen as bearish for USD.
Read more.Last release: Mon Sep 23, 2024 13:45 (Prel)
Frequency: Monthly
Actual: 47
Consensus: 48.5
Previous: 47.9
Source: S&P Global
Dow Jones news
Roughly half of the Dow Jones index tested the low side on Monday, forcing the equity board to middle on headline figures. Intel (INTC) rose nearly 3% early in the day after it was reported that Apollo Global Management has floated a $5 billion investment in Intel, which signaled that investors are growing confident that the chipmaker may be able to turn around their recent backslide. The investment exploration from (AGM) also helped to head off a possible acquisition bid from Intel’s immediate competitor in the silicon space, Qualcomm, which recently looked into purchasing the entirety of Intel outright.
Dow Jones price forecast
The Dow Jones continues to grind out chart paper near the 42,000 price handle despite a series of brief tests into all-time highs. The DJIA has rallied nearly 5.5% from the last swing low below 40,000 bottom-to-top, but near-term bullish momentum appears to be straining at the outer limits.
With bulls running out of technical levels to act as hard targets, the Dow Jones could be primed for a half-hearted bearish pullback with an immediate technical floor priced in near the 50-day Exponential Moving Average (EMA) rising from 40,700.
Dow Jones daily chart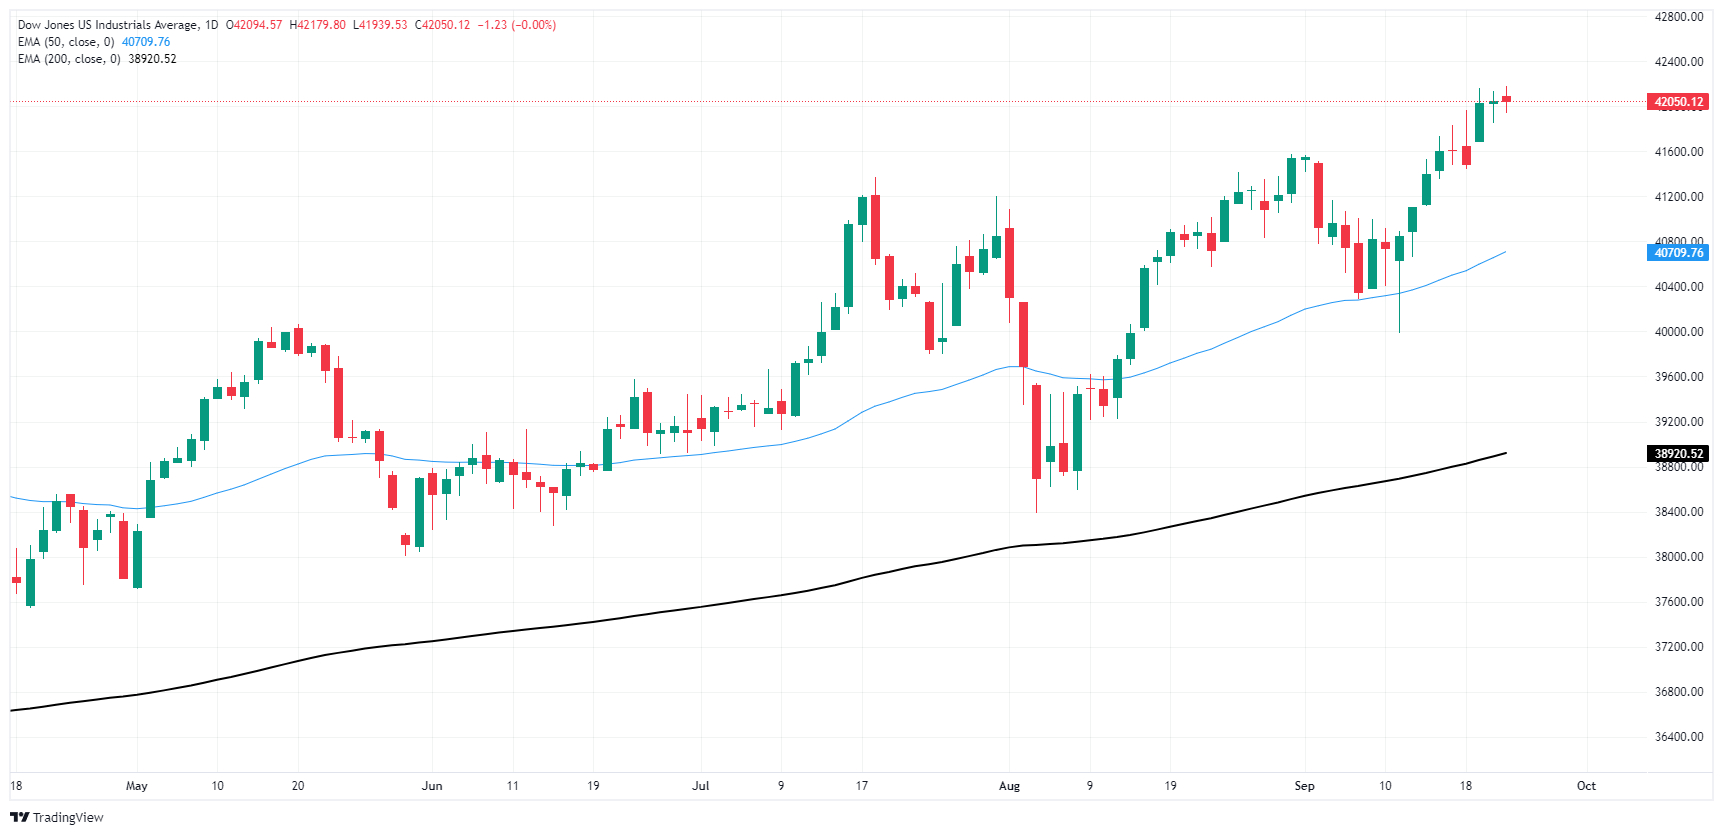
Dow Jones FAQs
The Dow Jones Industrial Average, one of the oldest stock market indices in the world, is compiled of the 30 most traded stocks in the US. The index is price-weighted rather than weighted by capitalization. It is calculated by summing the prices of the constituent stocks and dividing them by a factor, currently 0.152. The index was founded by Charles Dow, who also founded the Wall Street Journal. In later years it has been criticized for not being broadly representative enough because it only tracks 30 conglomerates, unlike broader indices such as the S&P 500.
Many different factors drive the Dow Jones Industrial Average (DJIA). The aggregate performance of the component companies revealed in quarterly company earnings reports is the main one. US and global macroeconomic data also contributes as it impacts on investor sentiment. The level of interest rates, set by the Federal Reserve (Fed), also influences the DJIA as it affects the cost of credit, on which many corporations are heavily reliant. Therefore, inflation can be a major driver as well as other metrics which impact the Fed decisions.
Dow Theory is a method for identifying the primary trend of the stock market developed by Charles Dow. A key step is to compare the direction of the Dow Jones Industrial Average (DJIA) and the Dow Jones Transportation Average (DJTA) and only follow trends where both are moving in the same direction. Volume is a confirmatory criteria. The theory uses elements of peak and trough analysis. Dow’s theory posits three trend phases: accumulation, when smart money starts buying or selling; public participation, when the wider public joins in; and distribution, when the smart money exits.
There are a number of ways to trade the DJIA. One is to use ETFs which allow investors to trade the DJIA as a single security, rather than having to buy shares in all 30 constituent companies. A leading example is the SPDR Dow Jones Industrial Average ETF (DIA). DJIA futures contracts enable traders to speculate on the future value of the index and Options provide the right, but not the obligation, to buy or sell the index at a predetermined price in the future. Mutual funds enable investors to buy a share of a diversified portfolio of DJIA stocks thus providing exposure to the overall index.
Further softness German data series could further undermine the outlook for the EUR. EUR/USD may suffer from dips to 1.10 in the weeks ahead, Rabobank’s FX strategist Jane Foley notes.
Further soft data may undermine the outlook for EUR
“This morning’s flash estimate of German September PMI saw business activity falling at the quickest pace in seven months. According to the survey provider, there was ‘a sharp an accelerated reduction in manufacturing production compounded by a near-stalling of growth in the service sector’.”
“It was also reported that ‘the decline in employment also gathered pace as business expectations turned pessimistic for the first time in a year.’ The latter warning may suggest that wage inflation is set to ease. This may hint at a softening in sticky services sector inflation. Further evidence of cooling in services sector inflation is broadly considered to be necessary to trigger further ECB rate cuts.”
“This morning’s data underpin the importance of this week’s German Sep IFO release. Further softness in this series could further undermine the outlook for the EUR. We continue to see scope for dips to EUR/USD1.10 in the weeks ahead.”
- EUR/GBP extended its downtrend on Monday, declining by 0.50% to 0.8335.
- The breach below 0.8350 marked a low since April 2022.
- The RSI has entered the oversold territory, while the MACD signals increasing bearish momentum.
The EUR/GBP pair continued its downward streak on Monday, declining by 0.50% to 0.8335, its lowest level since April 2022. The selling pressure remains relentless, and the technical indicators signal a negative trend, supporting the bearish outlook.
On the daily chart, the Relative Strength Index (RSI) has entered the oversold territory, with a value of 28. This sharp decline indicates that selling pressure is rising. The Moving Average Convergence Divergence (MACD) histogram remains red and rising, also suggesting increasing bearish momentum.
EUR/GBP daily chart
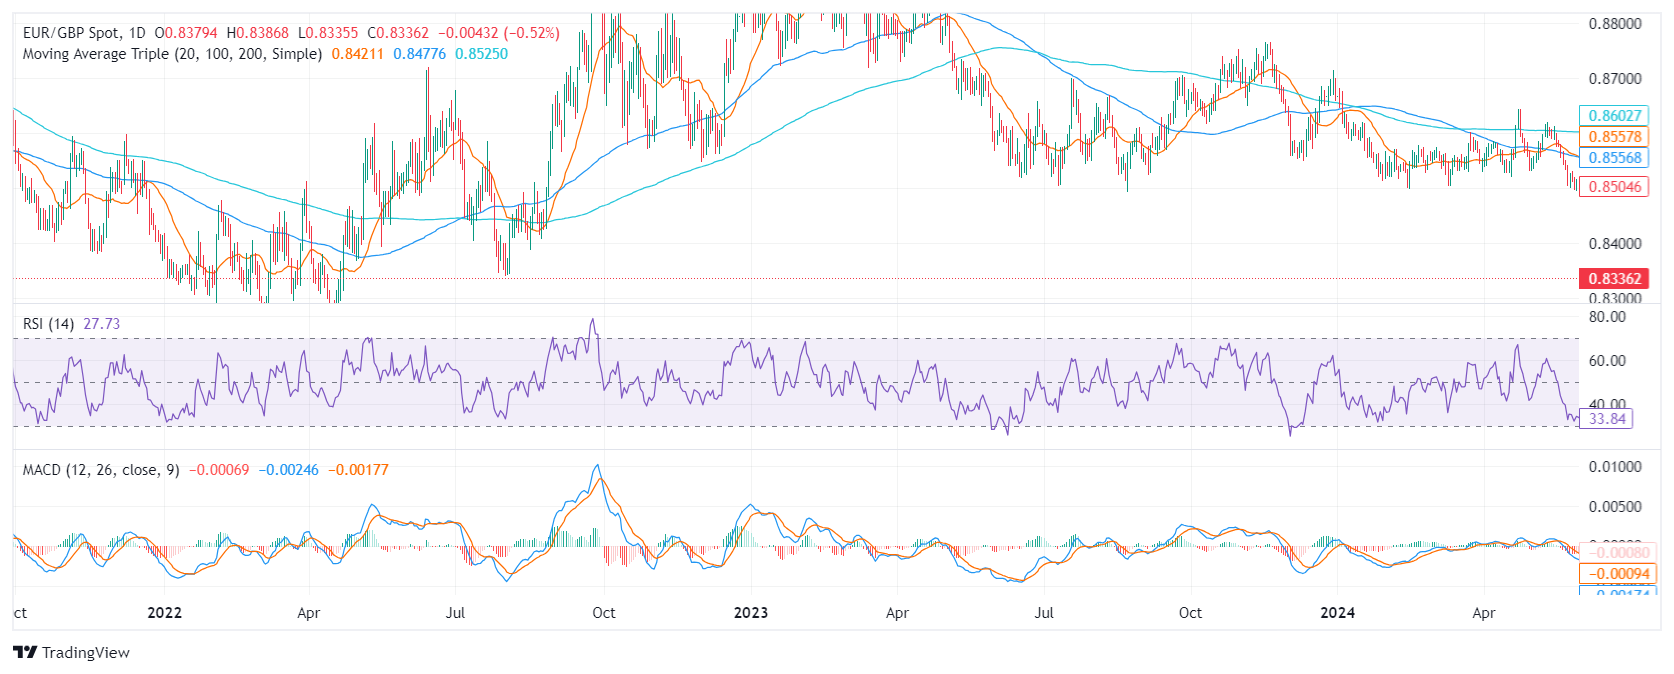
Based on the current technical picture, the EUR/GBP pair is likely to continue its downward trajectory. That being said, indicators entering oversold conditions may suggest that an upward correction may be incoming in the next session as sellers may take a breather to consolidate gains.
Support levels: 0.8330, 0.8310, 0.8300
Resistance levels: 0.8350, 0.8400, 0.8430
The yuan going to trade in the next couple of quarters a bit stronger than in the forecast made in August. But this is only because we now expect a dollar that is slightly weaker than in our previous forecast. The USD/CNY to remain above the 7 mark to reflect our view that the yuan will stay on the weak side before China’s economic fundamentals could improve visibly, Commerzbank’s FX strategist Tommy Wu notes.
USD/CNY to stay at around 7.05 in H1 2025
“The yuan strengthened against the USD in August and September along with other Asian currencies, as the markets repriced Fed rate cut expectations and US Treasury yields fell across the curve. The negative China-US yield spreads narrowed and alleviated pressures on the yuan. USD/CNY fell from as high as above 7.27 in July to 7.05 in mid-September.”
“We have revised our USD/CNY forecast lower for the next two quarters compared to our forecast in August. This reflects the recent strengthening of the yuan against the USD, and also our new USD forecast. We now expect a USD path that is slightly below the one in August because of the bigger initial rate cut by the Fed, plus we now expect one additional rate cut next year which brings the terminal rate to 3.5% by Q2 2025 instead of 4% previously.”
“Weak economic fundamentals in China will also continue to weigh on the yuan. In all, we expect USD/CNY to stay at around 7.05 in H1 2025. We expect the US growth advantage will return in H2 2025 following a soft patch, and the Fed will stop cutting rates by then. The markets will then adjust their expectations on Fed rate cuts and the dollar will likely strengthen for USD/CNY to rise back to 7.10.”
Macro fund positioning in Gold as a proportion of open interest reached a new all-time high last week, TDS Senior Commodity Strategist Daniel Ghali notes.
Risk for higher Gold prices remains
“We have highlighted that macro fund positioning is now extreme, but bets on the Fed's large cuts helped to inch our gauge even higher than notable historical precedents including the Brexit referendum, the ‘stealth QE’ narrative and even the depths of the pandemic crisis.”
“Western Gold ETFs are seeing modest inflows, but at the same time, Chinese Gold ETF outflows are persisting, and while the top Shanghai traders have marginally added to their net length in SHFE Gold, their positions have now remained near record-highs for months.”
“We closed our tactical short position in Gold following the Fed's larger-than-anticipated start to its cutting cycle, but note that positioning cues remain extreme nonetheless. The risk for higher Gold prices remains an even further broadening of the narrative attracting capital, potentially driven by fears of a 'macro reckless' Fed that has a historically and asymmetrically low bar for easing, despite decent data.”
- GBP/USD climbs as Flash PMIs from both UK and US indicate economic deceleration.
- The pair’s uptrend tests the top of an ascending channel, nearing key resistance at 1.3400.
- A dip below 1.3300 might prompt a correction to 1.3248 and 1.3200, with further supports at 1.3100 and 1.3001.
The Pound Sterling soars to new 2024 record high of 1.3355 versus the Greenback on Monday, rising over 0.20% as S&P Global Flash PMIs in the UK and the US show that both economies are slowing. Meanwhile, dovish comments by Chicago’s Fed President Austan Goolsbee weighed on the buck. The GBP/USD trades at 1.3350.
GBP/USD Price Forecast: Technical outlook
The GBP/USD daily chart hints that the uptrend is accelerating. It is testing the top of an ascending channel, which, if cleared, could pave the way to challenging the 1.3400 psychological figure.
The Relative Strength Index (RSI) portrays momentum favoring buyers. Hence, the GBP/USD might extend its gains in the short term.
If GBP/USD cleared 1.3400, the next resistance would be the March 1, 2022 peak at 1.3437. Once surpassed, the next ceiling level would be 1.3450, ahead of 1.3500.
Conversely, if GBP/USD retraces below 1.3300, this could pave the way for a correction. The first support will be the September 23 low of 1.3248, followed by the 1.3200 figure. On further weakness, the next stop wil be 1.3100, before diving to 1.3001 the September 11 cycle low.
GBP/USD Price Action – Daily Chart
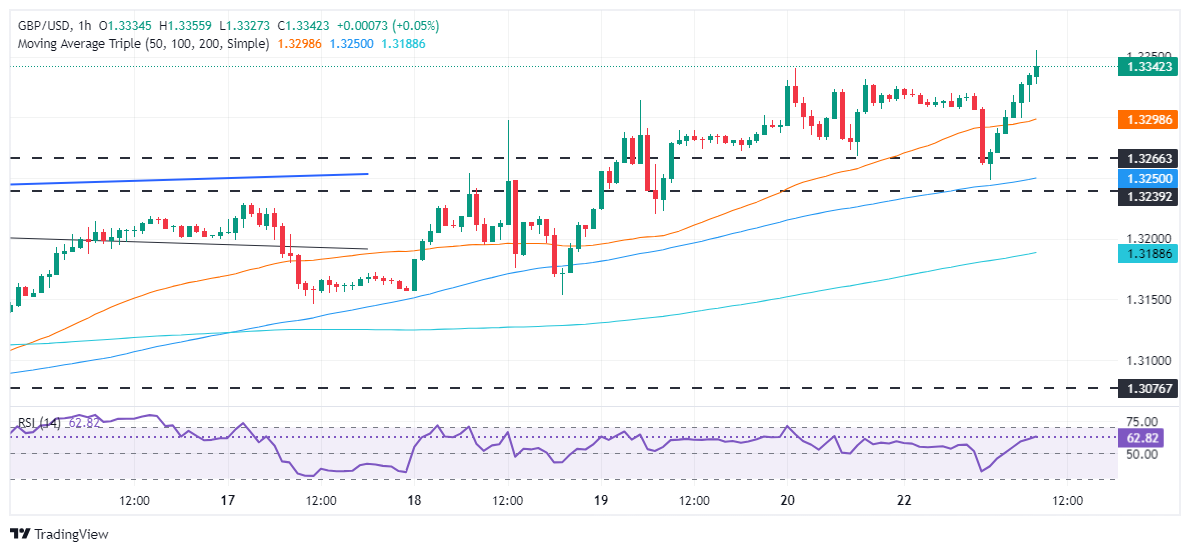
British Pound PRICE Today
The table below shows the percentage change of British Pound (GBP) against listed major currencies today. British Pound was the strongest against the Euro.
| USD | EUR | GBP | JPY | CAD | AUD | NZD | CHF | |
|---|---|---|---|---|---|---|---|---|
| USD | 0.25% | -0.14% | -0.13% | -0.41% | -0.53% | -0.47% | -0.18% | |
| EUR | -0.25% | -0.44% | -0.37% | -0.65% | -0.85% | -0.71% | -0.43% | |
| GBP | 0.14% | 0.44% | 0.15% | -0.20% | -0.41% | -0.27% | -0.00% | |
| JPY | 0.13% | 0.37% | -0.15% | -0.29% | -0.50% | -0.34% | -0.17% | |
| CAD | 0.41% | 0.65% | 0.20% | 0.29% | -0.07% | -0.06% | 0.21% | |
| AUD | 0.53% | 0.85% | 0.41% | 0.50% | 0.07% | 0.15% | 0.41% | |
| NZD | 0.47% | 0.71% | 0.27% | 0.34% | 0.06% | -0.15% | 0.27% | |
| CHF | 0.18% | 0.43% | 0.00% | 0.17% | -0.21% | -0.41% | -0.27% |
The heat map shows percentage changes of major currencies against each other. The base currency is picked from the left column, while the quote currency is picked from the top row. For example, if you pick the British Pound from the left column and move along the horizontal line to the US Dollar, the percentage change displayed in the box will represent GBP (base)/USD (quote).
Federal Reserve (Fed) Bank of Chicago President Austan Goolsbee participates in a fireside chat about the economic outlook and monetary policy at the National Association of State Treasurers Annual Conference in Chicago.
Key takeaways
“Many more rate cuts are likely needed over the next year, rates need to come down significantly.”
“I am comfortable with the Fed's 50 bps rate cut, it shows the Fed is focused on risks to employment, not just inflation.”
“Keeping rates at decade-high does not make sense when you want things to stay where they are.”
“The jobless rate is at levels many consider as full employment.”
“Labor market deterioration typically happens quickly.”
Market reaction
The US Dollar (USD) extends its intraday slump following the news, with the US Dollar Index now hovering at around 100.90.
- USD/JPY gains above 144.00 after the release of the mixed preliminary US S&P Global PMI data for September.
- The US Services PMI came in better-than-forecasted at 55.4.
- Investors await BoJ Ueda’s speech on Tuesday.
The USD/JPY pair moves higher above 144.00 in Monday’s North American session after the release of the mixed preliminary United States (US) S&P Global Purchasing Managers’ Index (PMI) data for September.
The report showed that the Composite PMI expanded at a slower pace to 54.4 from 54.6 in August. A sharp contraction in activities in the manufacturing sector was offset by better-than-projected service sector activity. The Manufacturing PMI declined unexpectedly to 47.0, which was expected to have improved to 48.5 from the prior release of 47.9. The Services PMI, a measure of activities in the services sector that accounts for two-thirds of the US economy, lands higher at 55.4 from the estimates of 55.2 but remained lower than the prior reading of 55.7.
Mixed flash US PMI has prompted some recovery in the US Dollar (USD) as the US Dollar Index (DXY) gathers strength to decisively break above 101.00. Going forward, the US Dollar will be guided by market expectations of the Federal Reserve’s (Fed) interest rate outlook.
The asset struggles for a direction as investors await the Bank of Japan (BoJ) Governor Kazuo Ueda’s speech on Tuesday, in which he is expected to provide fresh guidance on the interest rate outlook.
Last week, the comments from Kazuo Ueda in the press conference after the monetary policy decision indicated that the BoJ is in no rush to hike interest rates further. BoJ Governor Kazuo Ueda said, "Our decision on monetary policy will depend on economic, price, and financial developments at the time. Japan's real interest rates remain extremely low. If our economic and price forecasts are achieved, we will raise interest rates and adjust the degree of monetary support accordingly," at the press conference.
Japanese Yen FAQs
The Japanese Yen (JPY) is one of the world’s most traded currencies. Its value is broadly determined by the performance of the Japanese economy, but more specifically by the Bank of Japan’s policy, the differential between Japanese and US bond yields, or risk sentiment among traders, among other factors.
One of the Bank of Japan’s mandates is currency control, so its moves are key for the Yen. The BoJ has directly intervened in currency markets sometimes, generally to lower the value of the Yen, although it refrains from doing it often due to political concerns of its main trading partners. The current BoJ ultra-loose monetary policy, based on massive stimulus to the economy, has caused the Yen to depreciate against its main currency peers. This process has exacerbated more recently due to an increasing policy divergence between the Bank of Japan and other main central banks, which have opted to increase interest rates sharply to fight decades-high levels of inflation.
The BoJ’s stance of sticking to ultra-loose monetary policy has led to a widening policy divergence with other central banks, particularly with the US Federal Reserve. This supports a widening of the differential between the 10-year US and Japanese bonds, which favors the US Dollar against the Japanese Yen.
The Japanese Yen is often seen as a safe-haven investment. This means that in times of market stress, investors are more likely to put their money in the Japanese currency due to its supposed reliability and stability. Turbulent times are likely to strengthen the Yen’s value against other currencies seen as more risky to invest in.
- GBP/CAD has formed a bearish candlestick pattern after briefly breaking above a channel line.
- This could be a sign a pullback is about to unfold, however, downside pressure has been limited so far.
GBP/CAD has temporarily broken above the upper channel line of a long-term rising channel before falling back down and closing (on Friday) near where it opened.
The pattern thus formed is a Japanese Shooting Star candlestick (orange rectangle on chart below) which is a short-term bearish sign, especially if followed up by a bearish down day, as seems to be the case (so far) on Monday.
GBP/CAD Daily Chart
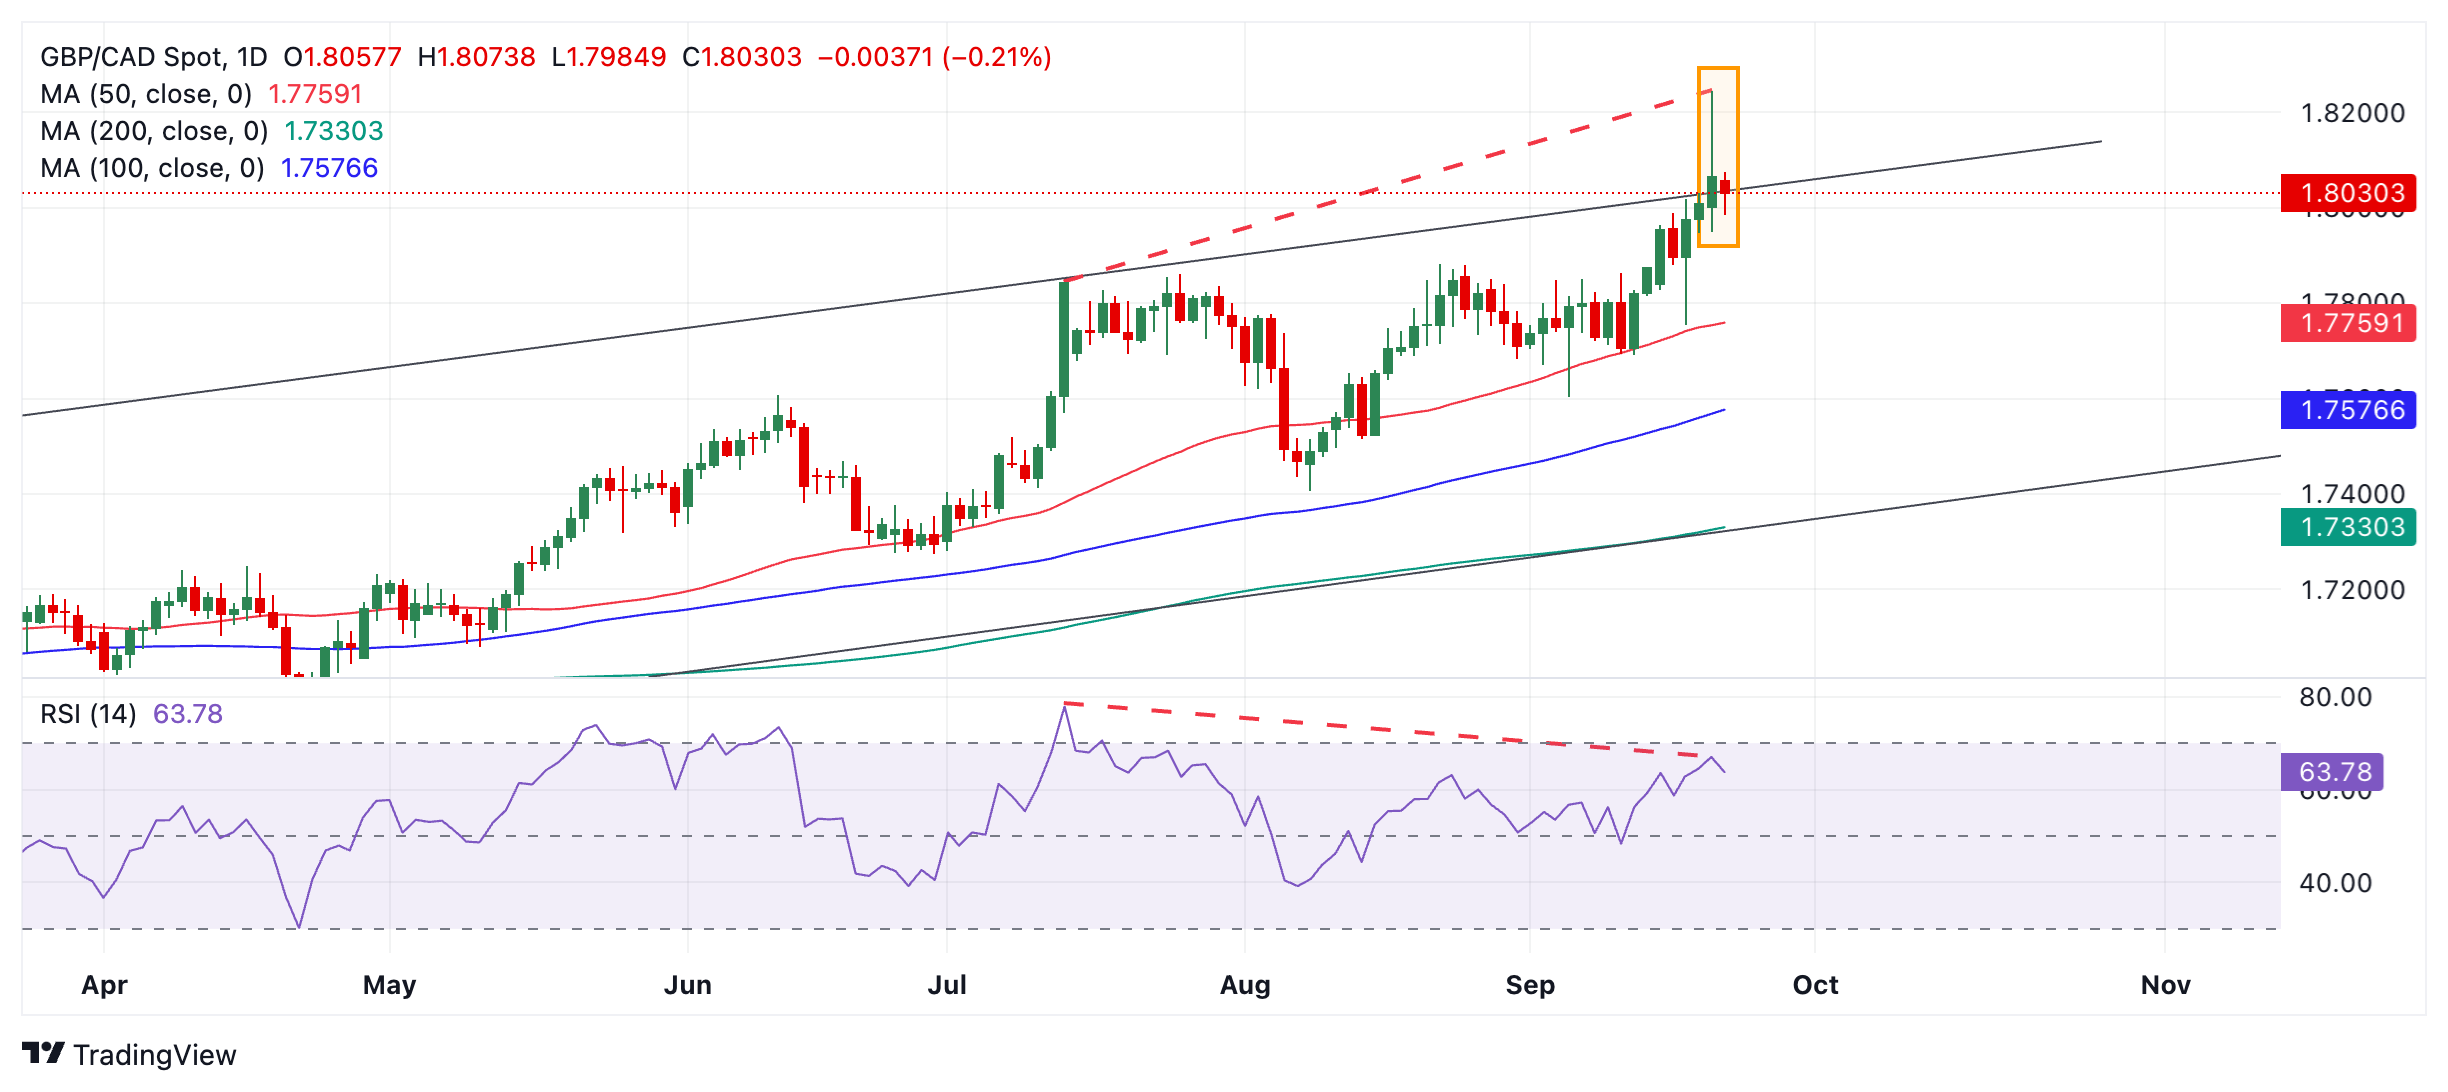
That said, GBP/CAD is in an uptrend on all three major time frames – the short, medium and long-term. This suggests that overall the “current” is flowing north. Given it is a principle of technical analysis that “the trend is your friend” this would suggest the odds continue to favor more upside.
However, GBP/CAD is also showing bearish divergence with the Moving Average Convergence Divergence (MACD) momentum indicator (red dashed lines). Although the price has risen to a much higher peak compared to July 12, the MACD is actually lower. This is a bearish sign and suggests a higher chance of a pull back evolving. Given the strong overarching uptrend, however, the pullback might just be a temporary sell-off.
If there is a correction, however, it might reach the 50-day Simple Moving Average (SMA) at 1.7753.
Alternatively, a break above the high of the Shooting Star at 1.8245 would probably confirm that price is going even higher. If so, it might reach a target at 1.8278, the 61.8% extrapolation of the prior move higher.
Any further bullishness beyond the confines of the channel is likely to be short-lived. Such moves often signal “exhaustion” and are a precursor to deeper corrections on the horizon.
- EUR/GBP is extending its short and medium-term downtrends.
- There is a possibility it could stall temporarily as it has reached its first downside target.
EUR/GBP has broken decisively below the July 18 (2024) low and reached the next key target level at 0.8343.
EUR/GBP Daily Chart
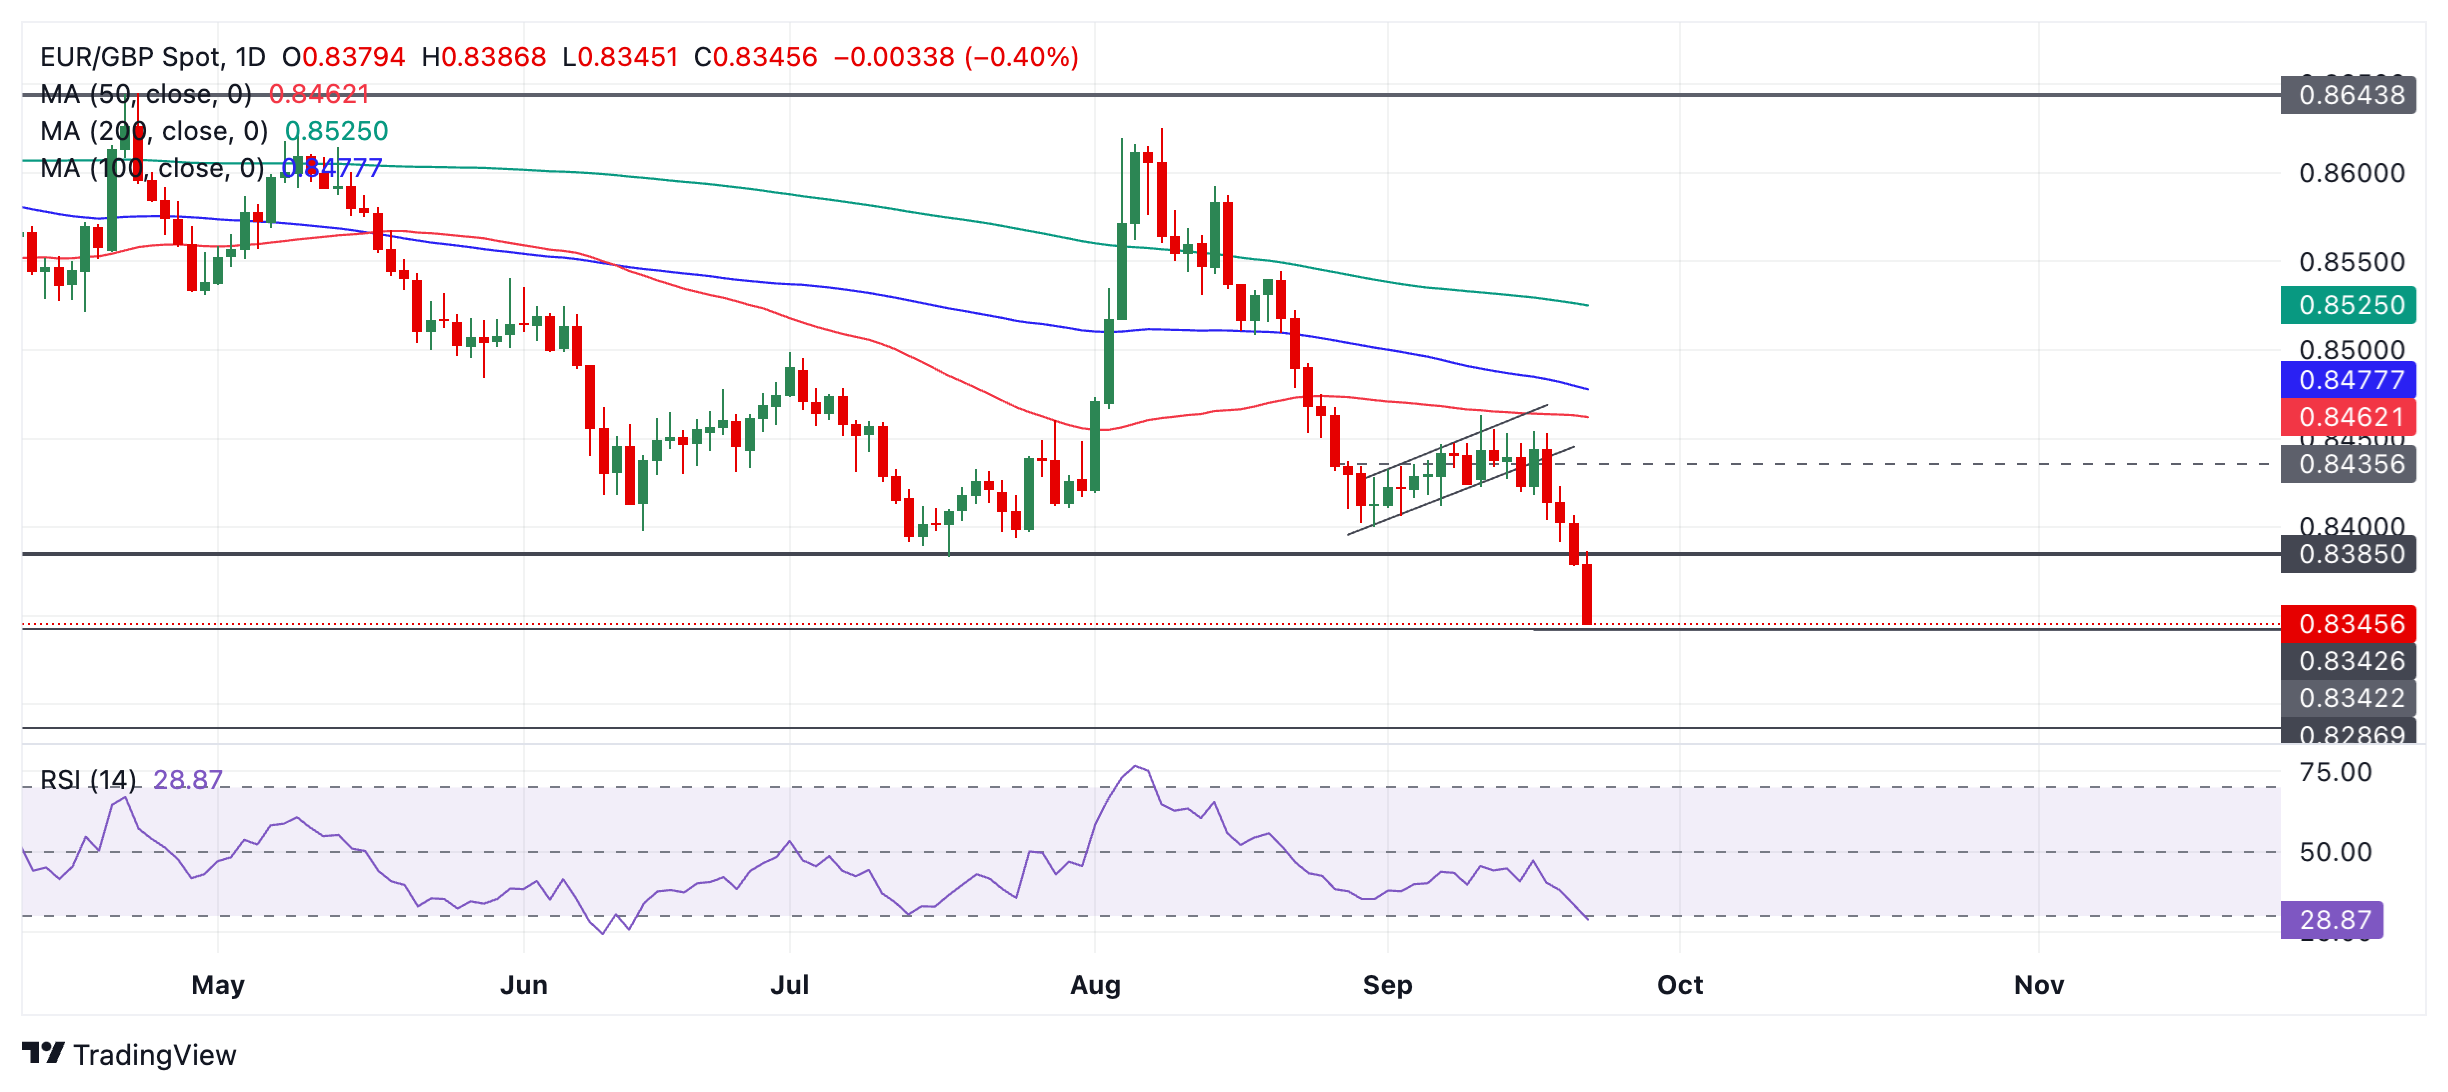
The trend is bearish both in the short and medium-term and given the principle that “the trend is your friend” this means the odds favor more downside.
EUR/GBP might stall at the current level but this is likely to be temporary.
If it closes below 0.8340 on a daily basis it will probably signal more downside towards the next target at 0.8287, the August 2022 low.
The Relative Strength Index (RSI) has entered the oversold region on an intraday basis. If it closes in oversold, it would advise traders not to add to their short positions as there is a risk of a pullback occurring.
UK PMI data reflected a softening in activity in September after the recovery in the economy seen earlier this year, Scotiabank’s Chief FX Strategist Shaun Osborne notes.
Undertone remains positive
“The Manufacturing PMI dipped a point to 51.5 while Services dropped to 52.8, from 53.7, to leave the Composite Index at 52.9, from 53.8. All the data were weaker than expected but remain solidly in expansion territory. Sterling dipped on the data but has recovered most of the lost ground to hold the 1.33 area ahead of the North American open.”
“The Pound Sterling (GBP) has reversed most of the losses seen through the European session relatively easily. The broader pattern and tone of the charts remain GBP-bullish, amid steady GBP gains and strong, upward momentum on the short-, medium– and long-term oscillators. GBP dips should remain relatively shallow.”
“Support is 1.3250. Sustained GBPUSD gains through 1.3330 long-term retracement resistance will be bullish. GBP resiliency should support further EURGBP losses towards support in the low 0.83 area, the last stopping point potentially for the cross ahead of a move back to 0.82.”
- NZD/USD has broken back above its medium-term range high.
- If it can close above the September 3 high it could signal a bullish breakout.
NZD/USD has recovered after its recent pullback to the September 11 low. It has broken back above the range high at 0.6248 and is creeping higher. It will probably match the 0.6303 September 3 high, however, the trend is unclear and there is no clear bias in any direction.
NZD/USD Daily Chart
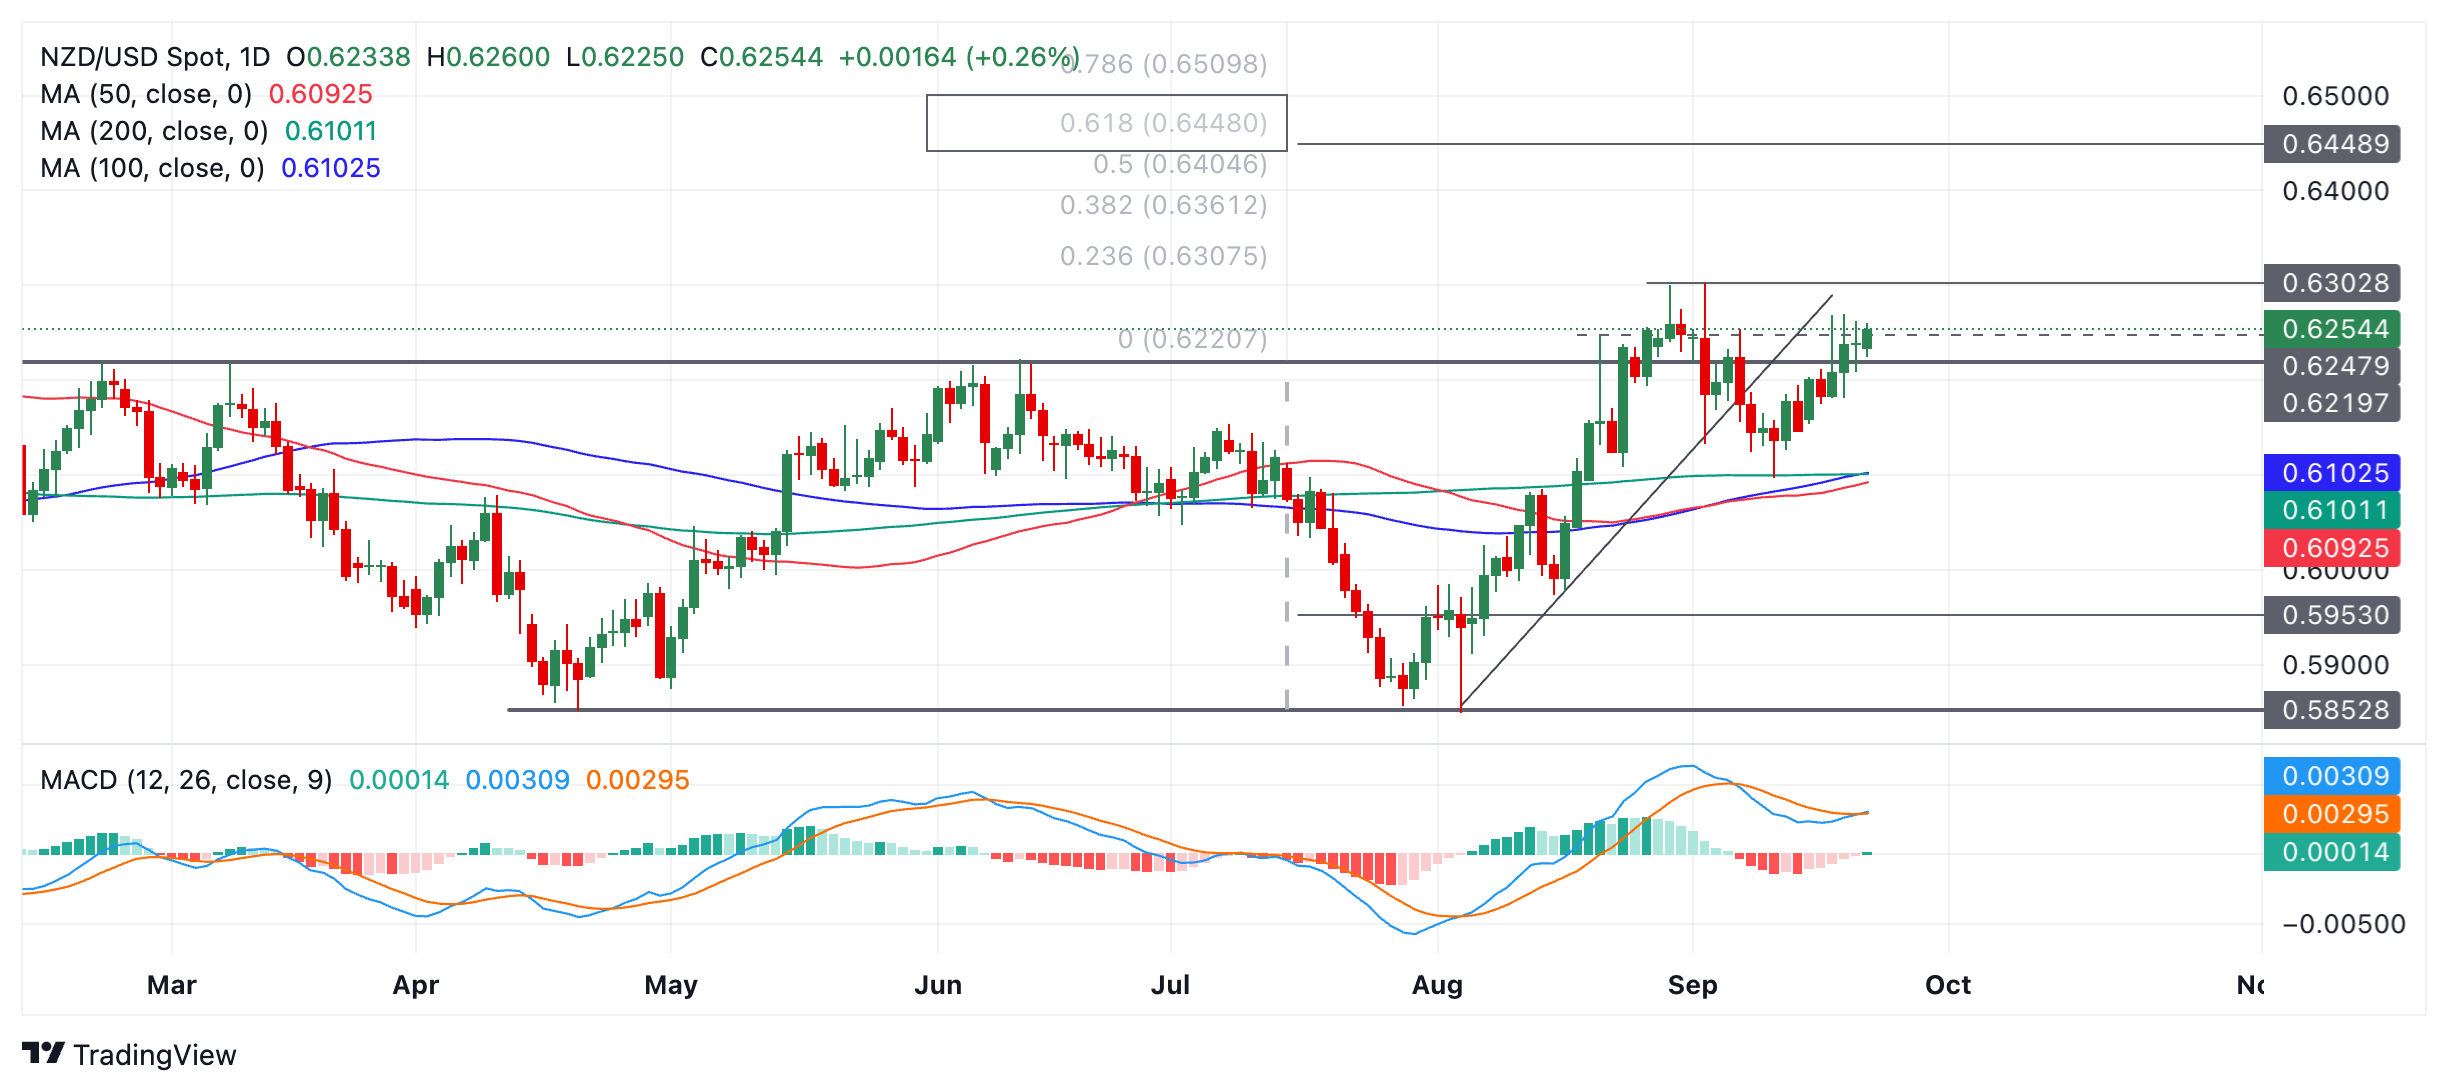
If the Kiwi can close above the September 3 high it will provide some bullish confirmation that a breakout of the sideways range has occurred. Such a move would then probably reach the next upside target at 0.6409, the December 2023 high. Another target is situated at 0.6448, the 0.618 ratio of the height of the range extrapolated higher.
The Moving Average Convergence Divergence (MACD) has closed above its red signal line which is a marginally bullish sign.
Monday morning, the PBoC cut one of its interest rates, the 14-day repo rate, Commerzbank’s FX analyst Volkmar Bauer notes.
The impact of the cut is likely to be negligible
“If you are wondering where a 14-day rate comes from, in addition to the 7-day repo rate, the 1-Year Medium Term Lending Facility and the two loan prime rates, you are probably not alone. And it describes quite well the problem that the PBoC has and perhaps likes to cultivate from time to time.”
“Despite all the reassurances, monetary policy in China remains very opaque. Just a few weeks ago, it was announced that the PBoC would focus more on the 7-day repo rate and no longer use the 1-year tender rate to steer interest rates in China.”
“This raises the question of why a cut in the 14-day repo rate is being sold today as monetary easing, even though this refinancing tool is rarely used and this move only mirrors the cut in the 7-day rate in June. In real economic terms, the impact is hence likely to be negligible, which is why this rate cut is unlikely to have any real impact on the currency.”
Eurozone PMI data were soft all round this month. German and French data all reflected weaker or slowing activity, Scotiabank’s Chief FX Strategist Shaun Osborne notes.
EUR dips as weak PMIs support mild contraction outlook
“French Services slumped after the Olympic boost faded and both French and German Composite readings are below 50 now, putting the preliminary Eurozone Composite data at 48.9, down from 51 in August and well below the 50.5 expected. Yields slipped, driving spreads against the USD wider as markets priced in marginal more risk of an October ECB rate cut (10bps priced in).”
“The Bundesbank’s monthly report last week already acknowledged that a mild contraction was likely already underway in Germany but the dip was not expected to be long-lasting. Policymakers may continue to focus on inflation rather than growth concerns for now.”
“Friday’s stall in the EUR and today’s losses—so far—may pave the way for some corrective weakness in the EUR in the short run. A low close for spot today would form a bearish 'evening star' pattern on the daily chart, strengthening EUR resistance in the 1.12 area and perhaps prompt some corrective EUR losses back to the 1.10 support area”
- Silver breaks tentatively above the trendline, however, it is pulling back on Monday.
- It is broadly in a short-term uptrend which could extend higher.
Silver (XAG/USD) has broken tentatively above a key trendline in the $30s. It is not clear whether the break is definitive, however, since Friday’s breakout day has been followed by a pullback on Monday which is testing the trendline.
Silver Daily Chart
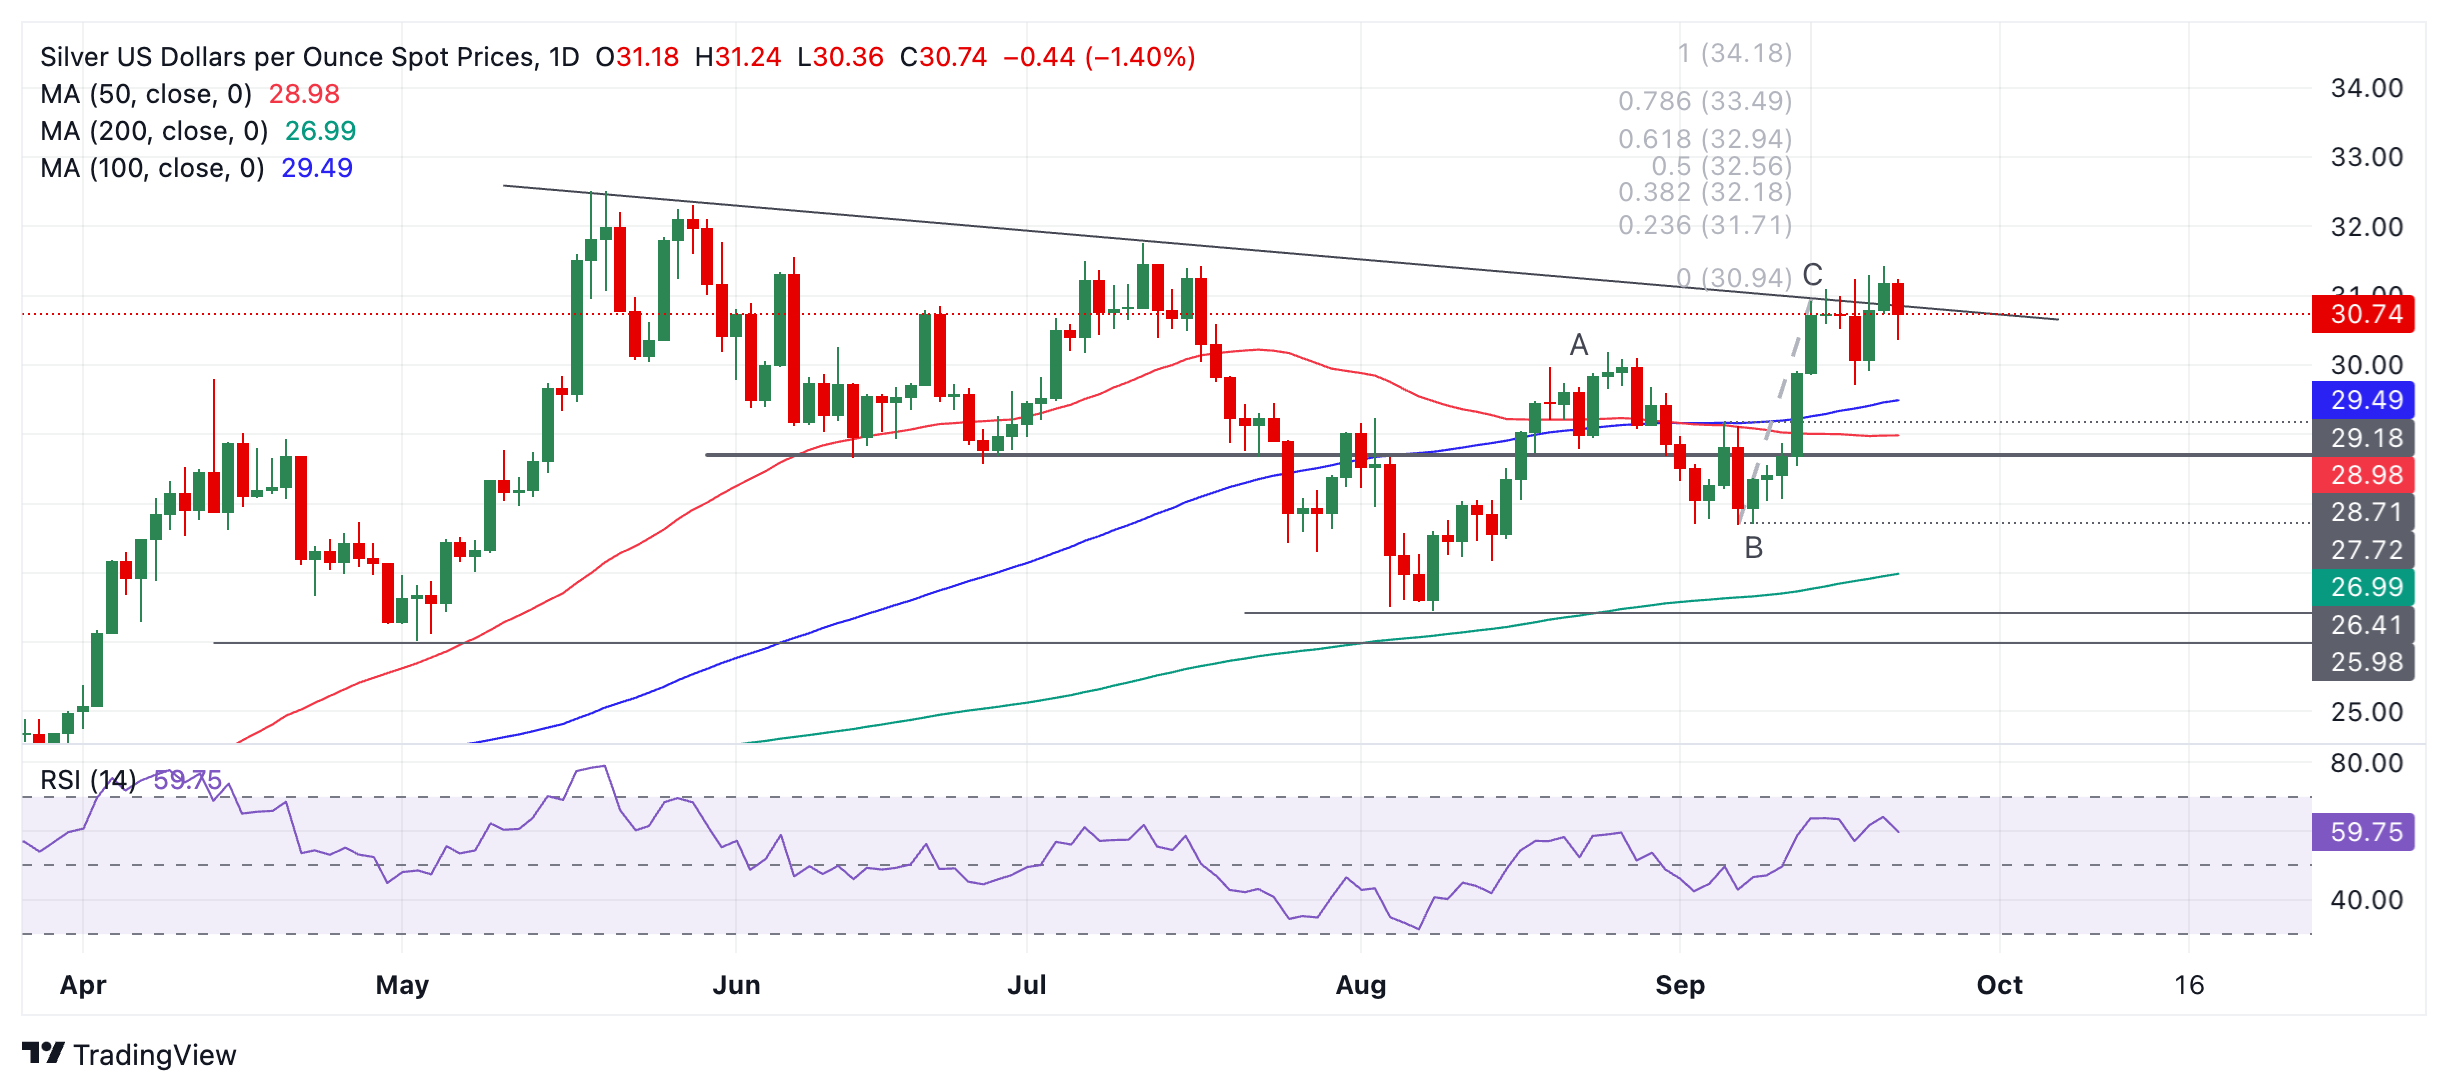
Silver has been in a short-term uptrend ever since the early August lows, except for a period between August 26 and September 3 when it corrected back. As it is a principle of technical analysis that “the trend is your friend” the odds favor more upside. A close above $31.43 (September 20 high) would indicate a probable follow-through to $32.94.
The move up from the August lows could also be characterized as a Measured Move price pattern. These are large zig-zags composed of three waves, labeled ABC. It is another characteristic of these patterns that waves A and C are usually of a similar length. This is the case with Silver. This suggests the pattern may have finished and prices could pullback, although there is no way of predicting how far. There are no strong signs it is about to correct.
There is initial support at around $29.50 from the 100-day Simple Moving Average (SMA) followed by $29.18 (June swing lows).
Silver is in a medium and longer-term sideways trend which provides no underlying cyclical bias in either direction.
Atlanta Federal Reserve President Raphael Bostic is speaking about the economic outlook and monetary policy at the University of London. His dovish comments align with the latest Federal Reserve’s (Fed) decision to trim the benchmark interest rate by 50 basis points (bps).
Key takeaways
“Businesses are becoming more careful in hiring but not considering layoffs.”
“The economy is effectively near conditions that would be considered normal.”
“Price increases have narrowed and become concentrated in housing.”
“Risks to the labour market have increased, with the possibility of broad weakness higher than a year ago.”
“A half-point cut at this meeting does not lock in a cadence for future rate cuts.”
“Recent data show convincingly that the US is on a sustainable path to price stability.”
“Business leaders say pricing power has all but evaporated.”
“Low recent levels of some recent inflation indicators portends well.”
“The Fed is now facing two, largely balanced risks.”
Market reaction
The US Dollar (USD) remained under mild selling pressure after the news, but it barely reacted, as the focus remains on United States (US) PMI figures scheduled for after Wall Street's opening.
The Canadian Dollar (CAD) is a mild out-performer on the session, in line with its commodity peers, which are all holding minor gains against a generally firmer USD, Scotiabank’s Chief FX Strategist Shaun Osborne notes.
CAD steady, holds in mid-1.35s
“European stocks are mixed while US equity futures are slightly firmer on the session and while crude oil is a little higher amid tensions in the Middle East. Metals are mostly lower. The AUD and NZD may have found some support from renewed hope that China may deliver more support for the economy after news that top PBoC officials will hold a news conference tomorrow on financial support for economic development. “
“The USDCAD charts are leaning CAD-positive. Resistance in the mid-1.36 area capped USD gains last week and Thursday’s USD fall marked a big, bearish outside range session on the daily chart. A low close on the week also formed a bearish outside range week. These developments should mean limited upside potential for the USD from here (low/mid-1.36s) and put more pressure on supports at 1.3530 and 1.3450.”
The US Dollar (USD) is firmer overall on the session but has nudged off its earlier highs against its major currency peers, Scotiabank’s Chief FX Strategist Shaun Osborne notes.
DXY consolidation may extend
“Weak Eurozone data dragged on the EUR in European trading, giving the USD a broader lift but the DXY is still trading within last week’s range and the potential for significant USD gains remains limited, at least while markets continue to price in additional, aggressive rate cuts by the Fed before year-end but relief for the USD today is coming from the mild pick up in ECB October easing speculation after this morning’s data reports.”
“There is plenty of US data to contend with this week but they may not have much impact on markets or the USD in the wake of the Fed decision. Friday’s core PCE data is expected to show a 0.2% increase over the month, nudging the Y/Y pace up slightly. With the Fed’s (excluding Bowman, perhaps) attention shifting from prices to jobs, that may not mean much for the USD. There are a number of Fed speakers on the calendar this week, including Chair Powell.”
“Kashkari said he backed the 50bps rate cut and projects a further 50bps in cuts this year. Some consolidation in the USD is possible in the short run after the index failed to push decisively below the 100.5 support area but scope for gains in the DXY is likely limited to the upper 101 area on charts. DXY gains above 102 would, however, suggest a little more strength may emerge.”
Many market participants do not believe in the BoJ's real economic and inflation forecasts. They don't even believe that their forecasts are honest, because they seem superficial because they provide arguments for a monetary policy that is pursued for completely different reasons, Commerzbank’s FX analyst Ulrich Leuchtmann notes.
BoJ officials are terrified of genuine re-inflation
“I believe that the BoJ officials are in fact terrified of genuine re-inflation, which would force them to trigger a normalization of monetary policy and, as a result, significantly higher long-term yields. This would very quickly lead to the Japanese treasury being hopelessly over-indebted. And then the BoJ would very quickly come under pressure to finance the struggling government with JGB purchases.”
“The economic literature infers from such a situation the risk of high inflation. In Japan, however, we see the opposite. The BoJ prevents an inflationary cycle by using inappropriate interest rate hikes to put an early end to any threat of re-inflation. Because and as long as the BoJ does this, there is no risk of fiscal imbalance.”
“That is why the BoJ was staying put during the past inflation shock, and why it is now raising its key rate when inflation risks are far less clear anymore. Of course, if this description is accurate, the potential to hike interest rates will be microscopic. Those who base their JPY long position on the hope of meaningful rate normalization could be wrong.”
- The US Dollar sees substantial buying in the European session on Monday.
- European PMIs collapsed in September, as traders await the US ones on Monday.
- The US Dollar Index pops higher and reclaims 101.00 in early Monday trading.
The US Dollar (USD) strengthens on Monday and trades above 101.00 after the preliminary S&P Global and Hamburg Commercial Bank (HCOB) Purchase Managers Index (PMI) data portrayed a very sketchy picture for France, Germany, and the broader Eurozone. The nosedive in activity means issues ahead and shifts the negative focus now towards Europe. The Greenback is seeing a flight to safety, away from the Euro, which is bleeding on all fronts.
On the economic data front, traders will be able to compare the PMIs from Europe with the ones out of the US. The S&P Global PMIs for the United States (US) will be released ahead of the US trading session, with the Services component as the most important one. With nearly all PMI indicators in Europe in contraction, it rather looks like Europe is heading into a recession, while the US is still enjoying resilient activity.
Daily digest market movers: Back to the usual message
- The main event this Monday will be the preliminary US S&P Global PMIs release for September:
- Services data is expected to tick lower to 55.2 from the previous reading of 55.7.
- Manufacturing reading is expected to see a small uptick, though it remains in contraction at 48.5. That is a bit better than the 47.9 from August.
- The Composite number was at 54.6 in August, with no forecast available.
- US Federal Reserve speakers are set to shine their light with some comments on the current monetary policy stance:
- At 12:00 GMT, Federal Reserve Bank of Atlanta President Raphael Bostic delivers a virtual speech about the US economic outlook at the Distinguished Speakers Seminar convened by the European Economics and Financial Centre at the University of London.
- Near 14:15 GMT, Federal Reserve Bank of Chicago President Austan Goolsbee delivers a speech about monetary policy and the US economy at the annual National Association of State Treasurers meeting in Chicago.
- Around 17:00 GMT, Federal Reserve Bank of Minneapolis President Neel Kashkari participates in a Q&A hosted by the Greater Kansas City Chamber of Commerce at the Science Museum of Minnesota.
- Equity markets are tumbling in Europe on the back of those ugly PMI numbers for Germany, France, and the broader Eurozone. Meanwhile, US futures are being dragged along and are down as well ahead of the US trading session.
- The CME Fedwatch Tool shows a 50.6% chance of a 25-basis-point rate cut at the next Fed meeting on November 7, while 49.4% is pricing in another 50-basis-point rate cut.
- The US 10-year benchmark rate trades at 3.74%, flirting with last week’s high at 3.76%.
US Dollar Index Technical Analysis: Watch out for the squeeze!
The US Dollar Index (DXY) seemed incapable of making a move higher last week when the Fed pulled the trigger on that 50 basis point rate cut. The Greenback could be the comeback kid this week, with the PMI releases on Monday probably painting a whole other picture for traders to consider. The European performance might be far bleaker than the US one, which means that the US Dollar deserves an upgrade (appreciation) to where it was trading last week.
The upper level of the September range remains at 101.90. Further up, the index could go to 103.18, with the 55-day Simple Moving Average (SMA) at 102.59 along the way. The next tranche up is very misty, with the 100-day SMA at 103.71 and the 200-day SMA at 103.78, just ahead of the big 104.00 round level.
On the downside, 100.62 (the low from December 28, 2023) is the first support, which could point to more weakness ahead. Should that take place, the low from July 14, 2023, at 99.58, will be the next level to look out for. If that level gives way, early levels from 2023 are coming in near 97.73.
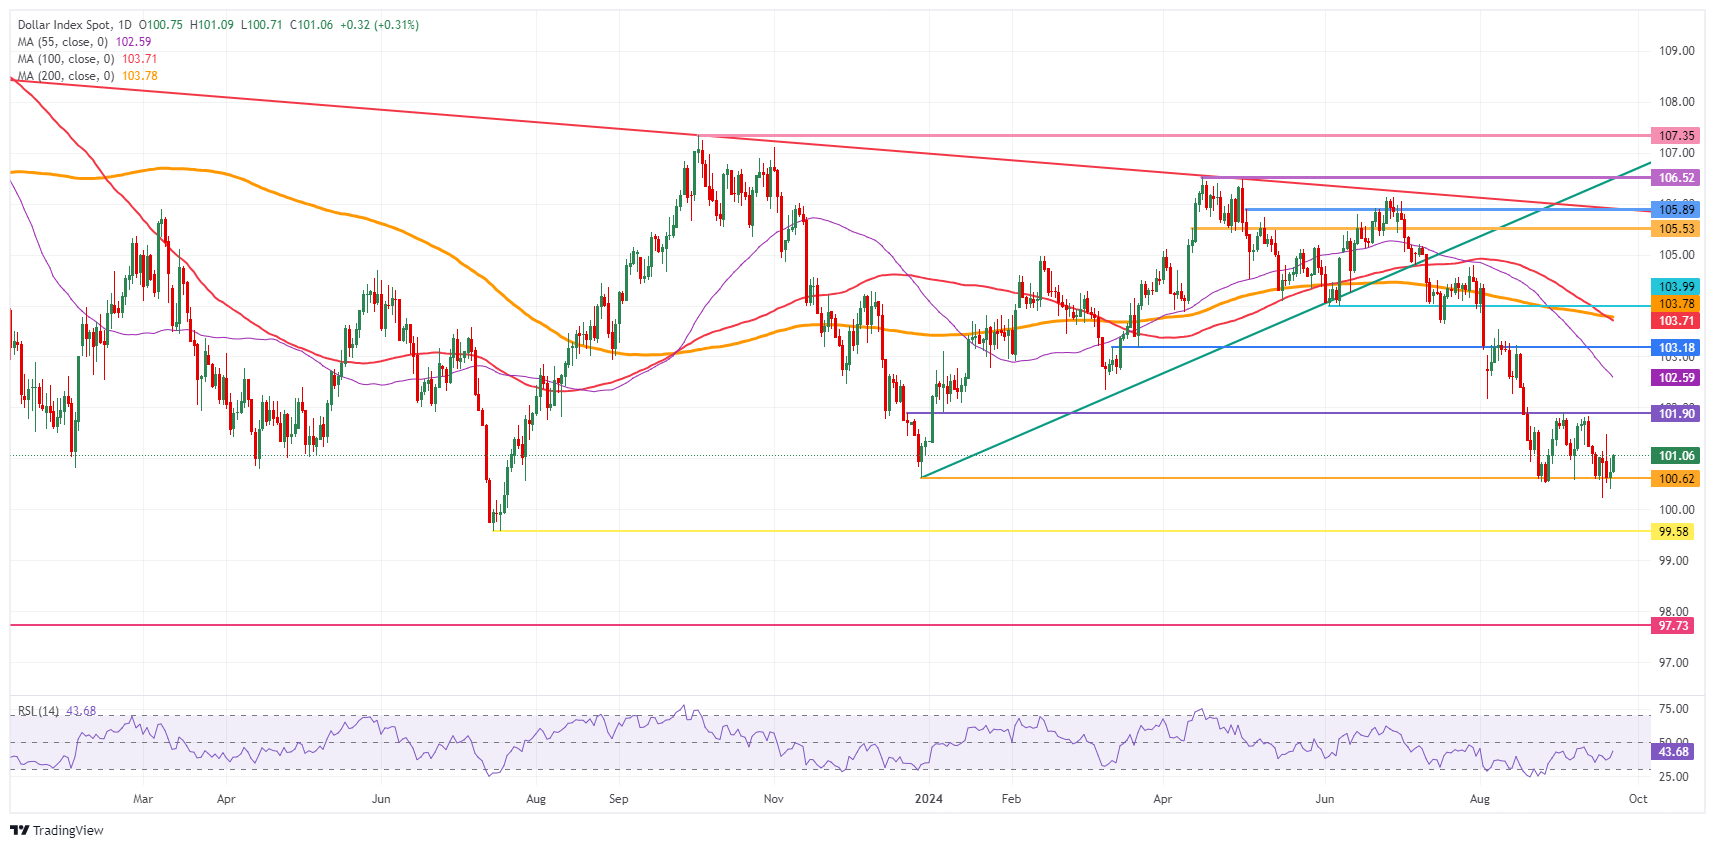
US Dollar Index: Daily Chart
US Dollar FAQs
The US Dollar (USD) is the official currency of the United States of America, and the ‘de facto’ currency of a significant number of other countries where it is found in circulation alongside local notes. It is the most heavily traded currency in the world, accounting for over 88% of all global foreign exchange turnover, or an average of $6.6 trillion in transactions per day, according to data from 2022. Following the second world war, the USD took over from the British Pound as the world’s reserve currency. For most of its history, the US Dollar was backed by Gold, until the Bretton Woods Agreement in 1971 when the Gold Standard went away.
The most important single factor impacting on the value of the US Dollar is monetary policy, which is shaped by the Federal Reserve (Fed). The Fed has two mandates: to achieve price stability (control inflation) and foster full employment. Its primary tool to achieve these two goals is by adjusting interest rates. When prices are rising too quickly and inflation is above the Fed’s 2% target, the Fed will raise rates, which helps the USD value. When inflation falls below 2% or the Unemployment Rate is too high, the Fed may lower interest rates, which weighs on the Greenback.
In extreme situations, the Federal Reserve can also print more Dollars and enact quantitative easing (QE). QE is the process by which the Fed substantially increases the flow of credit in a stuck financial system. It is a non-standard policy measure used when credit has dried up because banks will not lend to each other (out of the fear of counterparty default). It is a last resort when simply lowering interest rates is unlikely to achieve the necessary result. It was the Fed’s weapon of choice to combat the credit crunch that occurred during the Great Financial Crisis in 2008. It involves the Fed printing more Dollars and using them to buy US government bonds predominantly from financial institutions. QE usually leads to a weaker US Dollar.
Quantitative tightening (QT) is the reverse process whereby the Federal Reserve stops buying bonds from financial institutions and does not reinvest the principal from the bonds it holds maturing in new purchases. It is usually positive for the US Dollar.
Further US Dollar (USD) weakness appears likely; oversold conditions suggest declines could be relatively limited. In the longer run, sharp decline has resulted in increase in momentum; USD is likely to continue to weaken, potentially to 7.0100, UOB Group FX strategists Quek Ser Leang and Peter Chia note.
USD is likely to continue to weaken, potentially to 7.0100
24-HOUR VIEW: “Levels to watch are 7.0380 and 7.0270. Last Friday, we held the view that ‘there is scope for USD to break below 7.0600, but the next support 7.0500 is unlikely to come into view.’ The anticipated weakness exceeded our expectation as USD plummeted to a low of 7.0387, closing on a weak note at 7.0432 (- 0.41%). While further USD weakness appears likely today, oversold conditions suggest any further decline could be relatively limited. The levels to watch are 7.0380 and 7.0270. To maintain the momentum, USD must remain below 7.0610 with minor resistance at 7.0530.”
1-3 WEEKS VIEW: “We turned negative in USD last Friday (20 Sep, spot at 7.0700), indicating that it ‘is likely to trade with a downward bias towards 7.0500.’ While our view was not wrong, the subsequent sharp selloff that sent it to a low of 7.0387 was surprising. Not surprisingly, the sharp decline has resulted in further increase in downward momentum. USD is likely to continue to weaken, potentially to 7.0100. On the upside, a breach of 7.0770 (‘strong resistance’ was at 7.1100 last Friday) would mean that USD is not weakening further.”
Federal Reserve (Fed) Bank of Minneapolis President Neel Kashkari published an essay in the Minneapolis Fed website on Monday, explaining why he supported the 50 basis points (bps) interest rate cut delivered by the central bank last week.
“We have made substantial progress bringing inflation back down toward our 2 percent target and the labor market has softened, the balance of risks has shifted away from higher inflation and toward the risk of a further weakening of the labor market, warranting a lower federal funds rate,” Kashkari explained.
Even further, Kashkari added: “The increase in inflation in the first quarter appears to have been a bump, not a lasting trend,” while noting that “over the past six months, the labor market has shown signs of softening from the very tight conditions of the past couple years.”
He put a pinch of salt, saying that the “economy continues to offer mixed signals about its underlying strength. While a softening labor market suggests a weakening of economic activity, other economic measures suggest ongoing strength. For example, GDP and consumer spending continue to show surprising resilience, suggesting still-solid underlying demand.”
Finally, and about what’s next, Kashkari said: “ I have slowly increased my estimate of the longer-run federal funds rate as we have continued to be surprised by the economy’s resilience despite high policy rates, a combination that suggests the neutral rate may have climbed at least temporarily. The longer this economic resilience continues, the more signal I take that the temporary elevation of the neutral rate might in fact be more structural.”
Market reaction
These comments don't seem to be having a significant impact on the US Dollar's (USD) valuation. At the time of the release, the USD index was down for the day, just below the 101.00 level.
- Crude Oil remains trading at elevated levels on Monday after severe bombings in Lebanon during the weekend.
- European PMI data shows a substantial decline in Services and Manufacturing activity in the region.
- The US Dollar Index strengthens on Monday, with European investors heading into the safe haven Greenback.
Crude Oil starts the week at elevated levels and holds above $70 on Monday after Israel intensified its bombing of Lebanon’s key positions during the weekend. The heightened geopolitical concerns are expected to remain elevated on Monday. Meanwhile, European preliminary Purchase Managers Index (PMI) data for September reveal a severe nosedive in activity in both the Manufacturing and Services sectors, which could mean even less Oil demand is expected on the horizon for the region.
The US Dollar Index (DXY), which tracks the performance of the Greenback against six other currencies, is being bought on Monday. Investors are fleeing away from the Euro and heading into safe havens such as the Greenback after the preliminary PMI data for September showed nearly all PMI indicators in Europe in contraction. The Euro might be poised for more downturn later this Monday, should the US PMIs outperform market expectations.
At the time of writing, Crude Oil (WTI) trades at $70.89 and Brent Crude at $73.83.
Oil news and market movers: Quite dispersed
- More and heavier attacks to come, Israeli army spokesperson Avichay Adraee said on Monday, Reuters reports.
- The above comments come after heavy fighting that took place on Sunday between Hezbollah and Israel, with the Lebanese militant group launching missiles deep into northern Israeli territory following intense bombardment — some of the most severe in nearly a year of conflict, according to CNN.
- The amount of Crude Oil held worldwide on tankers that have been stationary for at least seven days fell to 56.31m bbl as of September 20, a drop of 12%, Bloomberg reports.
Oil Technical Analysis: Fragile equilibrium
Crude Oil is facing some push backs from the bad European economic data released on Monday to be able to break higher. In case the US data comes in softer-than-expected later in the day, a further decline in global demand could be at hand, offsetting the priced-in risk premium on the geopolitical tensions in the Middle East. A thin equilibrium, which could snap at any moment and on the back of any headline.
The first level to watch on the upside is $71.46 (the February 5 low), which returns to the table as the next level to look out for. Ultimately, a return to $75.27 (the January 12 high) is still possible, but would likely come if a seismic shift in current balances occurs.
On the downside, the initial support remains at $67.11, a triple bottom in the summer of 2023. Further down, the next level in line is $64.38, the low from March and May 2023. Should that level face a second test and snap, $61.65 becomes a target, with $60.00 as a psychologically big figure just below it, at least tempting to be tested.
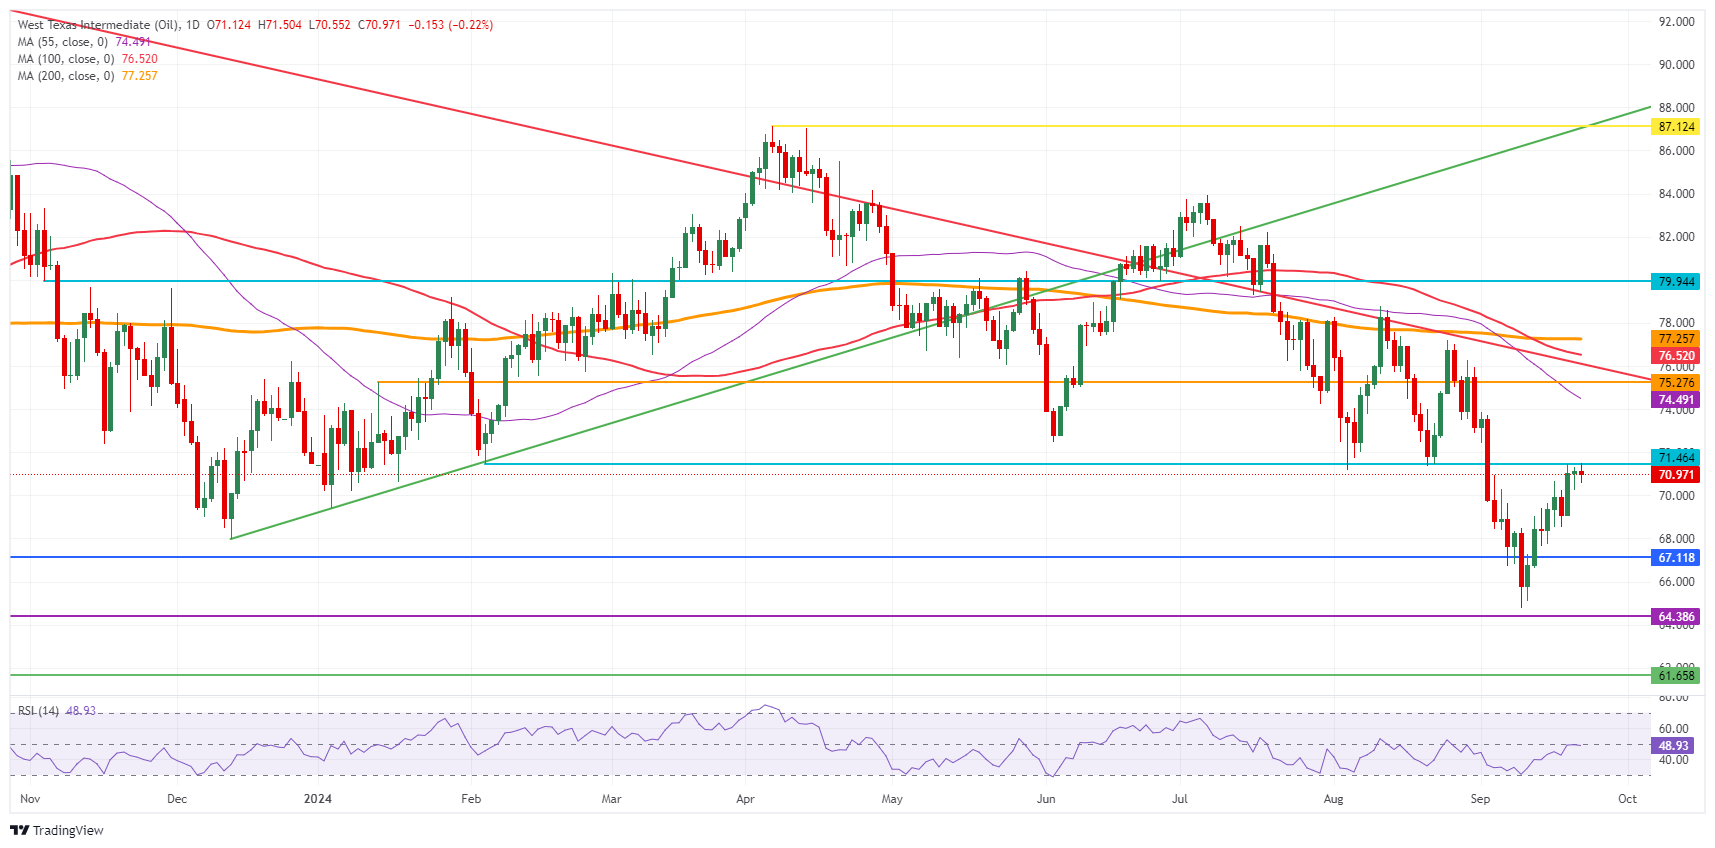
US WTI Crude Oil: Daily Chart
WTI Oil FAQs
WTI Oil is a type of Crude Oil sold on international markets. The WTI stands for West Texas Intermediate, one of three major types including Brent and Dubai Crude. WTI is also referred to as “light” and “sweet” because of its relatively low gravity and sulfur content respectively. It is considered a high quality Oil that is easily refined. It is sourced in the United States and distributed via the Cushing hub, which is considered “The Pipeline Crossroads of the World”. It is a benchmark for the Oil market and WTI price is frequently quoted in the media.
Like all assets, supply and demand are the key drivers of WTI Oil price. As such, global growth can be a driver of increased demand and vice versa for weak global growth. Political instability, wars, and sanctions can disrupt supply and impact prices. The decisions of OPEC, a group of major Oil-producing countries, is another key driver of price. The value of the US Dollar influences the price of WTI Crude Oil, since Oil is predominantly traded in US Dollars, thus a weaker US Dollar can make Oil more affordable and vice versa.
The weekly Oil inventory reports published by the American Petroleum Institute (API) and the Energy Information Agency (EIA) impact the price of WTI Oil. Changes in inventories reflect fluctuating supply and demand. If the data shows a drop in inventories it can indicate increased demand, pushing up Oil price. Higher inventories can reflect increased supply, pushing down prices. API’s report is published every Tuesday and EIA’s the day after. Their results are usually similar, falling within 1% of each other 75% of the time. The EIA data is considered more reliable, since it is a government agency.
OPEC (Organization of the Petroleum Exporting Countries) is a group of 13 Oil-producing nations who collectively decide production quotas for member countries at twice-yearly meetings. Their decisions often impact WTI Oil prices. When OPEC decides to lower quotas, it can tighten supply, pushing up Oil prices. When OPEC increases production, it has the opposite effect. OPEC+ refers to an expanded group that includes ten extra non-OPEC members, the most notable of which is Russia.
USD/CHF may not break above its four-week range of 0.8400-0.8550, even if SNB thinks a strong CHF was curbing imported inflation and hurting Swiss exporters amid weak demand from Europe, DBS’s FX analyst Philip Wee notes.
SNB needs a weaker CHF
“On September 26, the Swiss National Bank should lower rates a third time by 25 bps to 1%.”
“Last week, the Swiss State Secretariat (SECO) for Economic Affairs forecast CPI inflation decelerating to 0.7% in 2025 from 1.2% in 2024, aligning with the SNB’s view that a strong CHF was curbing imported inflation and hurting Swiss exporters amid weak demand from Europe.”
“However, USD/CHF may not break above its four-week range of 0.8400-0.8550. CFTC data suggested that its fall has been driven by an unwinding of short CHF positions, reflecting aggressive Fed cut expectations.”
Strong momentum suggests further US Dollar (USD) strength; the major resistance at 145.50 is likely out of reach. In the longer run, sharp advance reinforces view that USD could recover further to 145.50, UOB Group FX strategists Quek Ser Leang and Peter Chia note.
USD can recover further to 145.50
24-HOUR VIEW: “Our view for USD to trade in a 141.50/143.80 range last Friday was incorrect. USD dipped to a low of 141.72 and then lifted off, surging to a high of 144.49. While the rally is reaching overbought levels, strong momentum suggests further USD strength. However, any further advance is unlikely to reach the major resistance at 145.50 (there is another resistance level at 144.80). To keep the momentum going, USD must remain above 143.10 with minor support at 143.60.”
1-3 WEEKS VIEW: “Last Thursday (19 Sep), when USD was trading at 143.00, we indicated that ‘if USD can break clearly above 144.00, it could trigger a stronger recovery towards 145.50.’ We added, ‘the likelihood of USD breaking clearly above 144.00 will remain intact, provided that the ‘strong support’ level at 141.00 is not breached.’ On Friday, USD broke clearly above 144.00, reaching a high of 144.49. The sharp advance reinforces our view that USD could recover further to 145.50. On the downside, the ‘strong support’ level has moved higher to 141.90 from 141.00.”
The Dollar Index (DXY) to resume its depreciation into a lower 95-100 range through 2025 on the Fed’s rate-cutting cycle, DBS’s FX analyst Philip Wee notes.
USD to go down in the following year
“We have lowered our forecasts for the USD and US interest rates.”
“Barring shocks to the global economy and financial markets, we see DXY resuming its depreciation into a lower 95-100 range through 2025 on the Fed’s rate-cutting cycle.”
“This follows over 20 months of consolidation in a 100-107 range under the Fed’s ‘high for longer’ rates stance.”
- AUD/USD strengthens above 0.6800 with RBA policy on the horizon.
- The RBA is expected to leave interest rates unchanged on Tuesday.
- The US Dollar recovers amid growing uncertainty over the Fed’s interest rate outlook.
The AUD/USD pair performs strongly above 0.6800 in Monday’s European session. The Aussie asset gains as the Australian Dollar (AUD) outperforms its major peers ahead of the Reserve Bank of Australia’s (RBA) monetary policy decision, which will be announced on Tuesday.
Traders expect the RBA to leave its Official Cash Rate (OCR) unchanged at 4.35%, with inflationary pressures remaining persistent and upbeat job growth. Therefore, investors will focus on fresh guidance on interest rates for the remainder of the year. Currently, financial market participants expect that the RBA will keep its OCR at its current levels by the year-end.
Meanwhile, the US Dollar (USD) bounces back amid growing doubts over the Federal Reserve’s (Fed) likely monetary policy action in its remaining two monetary policy meetings this year. The US Dollar Index (DXY), which tracks the Greenback’s value against six major currencies, rises to near 101.00.
According to the CME FedWatch tool, the Fed will cut interest rates further by a total of 75 basis points (bps) in the November and December meetings, suggesting that there will be at least one 50 bps interest rate cut decision. For November’s policy meeting, the likelihood of the Fed reducing interest rates by 50 bps to 4.25%-4.50% is close to 50%.
On the contrary, a strong majority of over 100 economists expect that the Fed will cut its interest rates by 25 bps in each of its monetary policy meetings in the remaining year, according to a Reuters poll.
In today’s session, investors will keenly focus on the preliminary United States (US) S&P Global PMI data for September, which will be published at 13:45, as it will provide fresh cues on the nation’s current economic health.
The report is expected to show that the Manufacturing PMI came in higher at 48.5 than August’s print of 47.9 but remains below the 50.0 threshold. In the same period, activities in the service sector are estimated to have grown at a slower pace to 55.2 from the former reading of 55.7.
Australian Dollar FAQs
One of the most significant factors for the Australian Dollar (AUD) is the level of interest rates set by the Reserve Bank of Australia (RBA). Because Australia is a resource-rich country another key driver is the price of its biggest export, Iron Ore. The health of the Chinese economy, its largest trading partner, is a factor, as well as inflation in Australia, its growth rate and Trade Balance. Market sentiment – whether investors are taking on more risky assets (risk-on) or seeking safe-havens (risk-off) – is also a factor, with risk-on positive for AUD.
The Reserve Bank of Australia (RBA) influences the Australian Dollar (AUD) by setting the level of interest rates that Australian banks can lend to each other. This influences the level of interest rates in the economy as a whole. The main goal of the RBA is to maintain a stable inflation rate of 2-3% by adjusting interest rates up or down. Relatively high interest rates compared to other major central banks support the AUD, and the opposite for relatively low. The RBA can also use quantitative easing and tightening to influence credit conditions, with the former AUD-negative and the latter AUD-positive.
China is Australia’s largest trading partner so the health of the Chinese economy is a major influence on the value of the Australian Dollar (AUD). When the Chinese economy is doing well it purchases more raw materials, goods and services from Australia, lifting demand for the AUD, and pushing up its value. The opposite is the case when the Chinese economy is not growing as fast as expected. Positive or negative surprises in Chinese growth data, therefore, often have a direct impact on the Australian Dollar and its pairs.
Iron Ore is Australia’s largest export, accounting for $118 billion a year according to data from 2021, with China as its primary destination. The price of Iron Ore, therefore, can be a driver of the Australian Dollar. Generally, if the price of Iron Ore rises, AUD also goes up, as aggregate demand for the currency increases. The opposite is the case if the price of Iron Ore falls. Higher Iron Ore prices also tend to result in a greater likelihood of a positive Trade Balance for Australia, which is also positive of the AUD.
The Trade Balance, which is the difference between what a country earns from its exports versus what it pays for its imports, is another factor that can influence the value of the Australian Dollar. If Australia produces highly sought after exports, then its currency will gain in value purely from the surplus demand created from foreign buyers seeking to purchase its exports versus what it spends to purchase imports. Therefore, a positive net Trade Balance strengthens the AUD, with the opposite effect if the Trade Balance is negative.
The New Zealand Dollar (NZD) is expected to trade in a range between 0.6205 and 0.6255. In the longer run, NZD must break and remain above 0.6270 before an advance to 0.6310 can be expected, UOB Group FX strategists Quek Ser Leang and Peter Chia note.
Above 0.6270 NZD can reach 0.6310
24-HOUR VIEW: “We expected NZD to trade in a 0.6200/0.6270 range last Friday. NZD subsequently traded in a narrower range between 0.6210 and 0.6258, closing at 0.6236 (-0.10%). The quiet price action provides no fresh clues, and we continue to expect NZD to trade in a range today, probably between 0.6205 and 0.6255.”
1-3 WEEKS VIEW: “After NZD rose to 0.6269, we indicated last Friday (20 Sep, spot at 0.6230) that NZD must break and remain above 0.6270 before an advance to 0.6310 can be expected. We also indicated that ‘the chance of NZD breaking clearly above 0.6270 will remain intact provided that the ‘strong support’ level at 0.6180 is not breached.’ We continue to hold the same view.”
The Bank of England's broad, trade-weighted sterling index is on its highs of the year, ING’s FX strategist Chris Turner notes.
BoE's easing cycle to be repriced closer to that of the Fed
“We are all waiting for a catalyst for the BoE's easing cycle to be repriced closer to that of the Fed – but no such catalyst has been forthcoming. That seems unlikely again today, where the flash UK PMIs for September are expected to continue outshining those in the eurozone.”
“There is a sense that long GBP positioning is quite extreme. Yet the latest CFTC data published last Friday and covering activity to last Tuesday (17 September) actually showed quite a large reduction in GBP longs from the speculative community. In short, the speculative market is nowhere near as long GBP/USD as it was long USD/JPY in early July.”
- USD/CAD falls to near 1.3550 even though the US Dollar gains ground.
- Traders are divided over the Fed’s likely interest rate cut size in November.
- Investors await the BoC Macklem’s speech for fresh interest rate guidance.
The USD/CAD pair falls slightly to near 1.3560 in Monday’s European session even though the US Dollar (USD) has bounced back strongly. The USD recovers sharply as traders are split over the Federal Reserve’s (Fed) likely monetary policy action in the November meeting.
The market sentiment appears to be asset-specific, as European currencies have faced selling pressure while Asian peers have outperformed. Also, S&P 500 futures have posted decent gains in European trading hours. The US Dollar Index (DXY), which tracks the Greenback’s value against six major currencies, climbs above 101.00.
According to the CME FedWatch tool, traders see an almost 50% chance for the Fed delivering a second straight interest rate cut of 50 basis points (bps) to 4.25%-4.50%.
On the contrary, the latest Reuters poll shows that the Fed will cut its interest rates by 25 bps in each of its monetary policy meetings in the remaining year.
In today’s session, investors will focus on the preliminary United States (US) S&P Global PMI data for September, which will be published at 13:45 GMT. The US Composite PMI is estimated to have grown slower due to fragile expansion in activities in the service sector, along with continuous contraction in the manufacturing sector activity.
On the Loonie front, the Canadian Dollar (CAD) will be influenced by the Bank of Canada’s (BoC) Governor Tiff Macklem's speech, which is scheduled for Tuesday. Tiff Macklem is expected to provide fresh guidance on how much the central bank will reduce interest rates by the year-end.
Canadian Dollar FAQs
The key factors driving the Canadian Dollar (CAD) are the level of interest rates set by the Bank of Canada (BoC), the price of Oil, Canada’s largest export, the health of its economy, inflation and the Trade Balance, which is the difference between the value of Canada’s exports versus its imports. Other factors include market sentiment – whether investors are taking on more risky assets (risk-on) or seeking safe-havens (risk-off) – with risk-on being CAD-positive. As its largest trading partner, the health of the US economy is also a key factor influencing the Canadian Dollar.
The Bank of Canada (BoC) has a significant influence on the Canadian Dollar by setting the level of interest rates that banks can lend to one another. This influences the level of interest rates for everyone. The main goal of the BoC is to maintain inflation at 1-3% by adjusting interest rates up or down. Relatively higher interest rates tend to be positive for the CAD. The Bank of Canada can also use quantitative easing and tightening to influence credit conditions, with the former CAD-negative and the latter CAD-positive.
The price of Oil is a key factor impacting the value of the Canadian Dollar. Petroleum is Canada’s biggest export, so Oil price tends to have an immediate impact on the CAD value. Generally, if Oil price rises CAD also goes up, as aggregate demand for the currency increases. The opposite is the case if the price of Oil falls. Higher Oil prices also tend to result in a greater likelihood of a positive Trade Balance, which is also supportive of the CAD.
While inflation had always traditionally been thought of as a negative factor for a currency since it lowers the value of money, the opposite has actually been the case in modern times with the relaxation of cross-border capital controls. Higher inflation tends to lead central banks to put up interest rates which attracts more capital inflows from global investors seeking a lucrative place to keep their money. This increases demand for the local currency, which in Canada’s case is the Canadian Dollar.
Macroeconomic data releases gauge the health of the economy and can have an impact on the Canadian Dollar. Indicators such as GDP, Manufacturing and Services PMIs, employment, and consumer sentiment surveys can all influence the direction of the CAD. A strong economy is good for the Canadian Dollar. Not only does it attract more foreign investment but it may encourage the Bank of Canada to put up interest rates, leading to a stronger currency. If economic data is weak, however, the CAD is likely to fall.
The Australian Dollar (AUD) is expected to trade in a sideways range of 0.6775/0.6825. In the longer run, there is still room for AUD to rise further, but there may not be enough momentum for it to challenge 0.6870, UOB Group FX analysts Quek Ser Leang and Peter Chia note.
AUD may try to challenge 0.6870
24-HOUR VIEW: “AUD traded between 0.6784 and 0.6829 last Friday, narrower than our expected sideways trading range of 0.6780/0.6840. There has been no increase in either upward or downward momentum, and we continue to expect AUD to trade sideways. Expected range for today: 0.6775/0.6825.”
1-3 WEEKS VIEW: “We continue to hold the same view as last Friday (20 Sep, spot at 0.6800). As highlighted, while there is still room for AUD to continue to rise, it may not have enough momentum to challenge to significant resistance at 0.6870. On the downside, a breach of 0.6740 (no change in ‘strong support’ level) would mean that the upward pressure that started early last week has eased.”
- Gold is continuing its uptrend as markets continue to price in more interest rate cuts from the Fed.
- Such cuts would make Gold, a non-yielding asset, more attractive.
- Rising tensions between Israel and Lebanon push up haven demand for the precious metal.
Gold (XAU/USD) slightly retraces during the European session on Monday after being pushed up to a new all-time-high (ATH) of $2,631 earlier in the day, as markets continue to price in more aggressive interest rate cuts from the Federal Reserve (Fed) whilst rising geopolitical tensions stemming from the Middle East increase safe-haven demand for the precious metal.
In regard to Fed rate cuts, lower interest rates are positive for Gold, as they reduce the opportunity cost of holding the non-interest-paying asset, making it more attractive to investors.
As such, the decision by the People’s Bank of China (PboC) to lower its 14-day reverse repo rate by 10 basis points (bps) to 1.85% early Monday, as well as inject additional liquidity into the financial system, probably further added to the attractiveness of Gold.
Gold hits new highs as market foresees more cuts coming
Gold rallies to new ATHs on Monday as markets price in the possibility of another double-dose interest rate cut from the Federal Reserve before Christmas. The chances of the Fed reducing interest rates by 50 bps (0.50%) again at the next meeting in November currently stand at 51.6% versus 48.4% for a 25 bps cut, according to the CME FedWatch tool.
Recent commentary from Federal Reserve (Fed) Bank of Philadelphia Patrick Harker (voting member) late Friday suggested that whilst the labor market might be softening, there was a risk “the inflation decline could stall”. His comments scored a 5.8 on FXStreet’s FedTracker, which gauges the tone of Fed officials’ speeches on a dovish-to-hawkish scale from 0 to 10 using a custom AI model.
The week ahead sees more commentary from Fed members, which could impact expectations regarding Fed policy and the price of Gold:
- On Monday, Fed Bank of Atlanta President Raphael Bostic (voter - dovish) opens up proceedings, followed by Fed Bank of Chicago President Austan Goolsbee (non-voter - dovish), who “may give indications that he is looking for a continuation of large rate reductions” according to Jim Reid, Deutsche Bank’s Head of Macro Research. Later in the day, Federal Reserve Bank of Minneapolis President Neel Kashkari is also scheduled to speak.
- On Tuesday, Federal Reserve Governor Michelle Bowman (voter - hawkish) delivers a speech about the US economic outlook and monetary policy at the Kentucky Bankers Association Annual Convention.
- Fed Member of the Board of Governors Adriana Kugler (voter - neutral) speaks on Wednesday and then takes part in a fireside chat with President of the Fed Bank of Boston Susan Collins (non-voter - dovish) on Thursday.
- Also on Thursday, Fed Member of the Board of Governors Michelle Bowman will speak – she was the first governor to dissent at an FOMC since 2005. On the same day, there is the tenth annual US Treasury Market Conference. Governor of the Fed Jerome Powell opens it up with pre-recorded remarks.
- At the same conference, New York Fed President John Williams (voter - dovish) and Fed Vice Chair of Supervision Michael Barr (voter - dovish) will also speak.
UN warns of catastrophe in Middle East
The United Nations (UN) has warned that the Middle East is on the brink of a catastrophe as Israel and Lebanon inch closer to all-out war.
Over the weekend, Israel struck targets in Lebanon and Hezbollah retaliated with rocket strikes in northern Israel. It is possible Israel could mount a ground invasion of Lebanon, escalating the war further. Such an event would probably push up the price of Gold.
“If Hezbollah does not buckle, which I don’t think they will because fighting Israel is deep in their DNA, Israel has said they will ‘do more’,” says Jeremy Bowan, International Editor at the BBC. “That might be some kind of ground operation involving sending tanks and troops into Lebanon. And that, I think, then goes into a very escalatory and dangerous situation”, Bowan added.
Technical Analysis: Gold’s uptrend extends
Gold extends its uptrend, pushing to new record highs on Monday. Given the principle in technical analysis that “the trend is your friend,” the odds favor more upside for the yellow metal in line with the dominant long, medium, and short-term uptrends.
XAU/USD Daily Chart
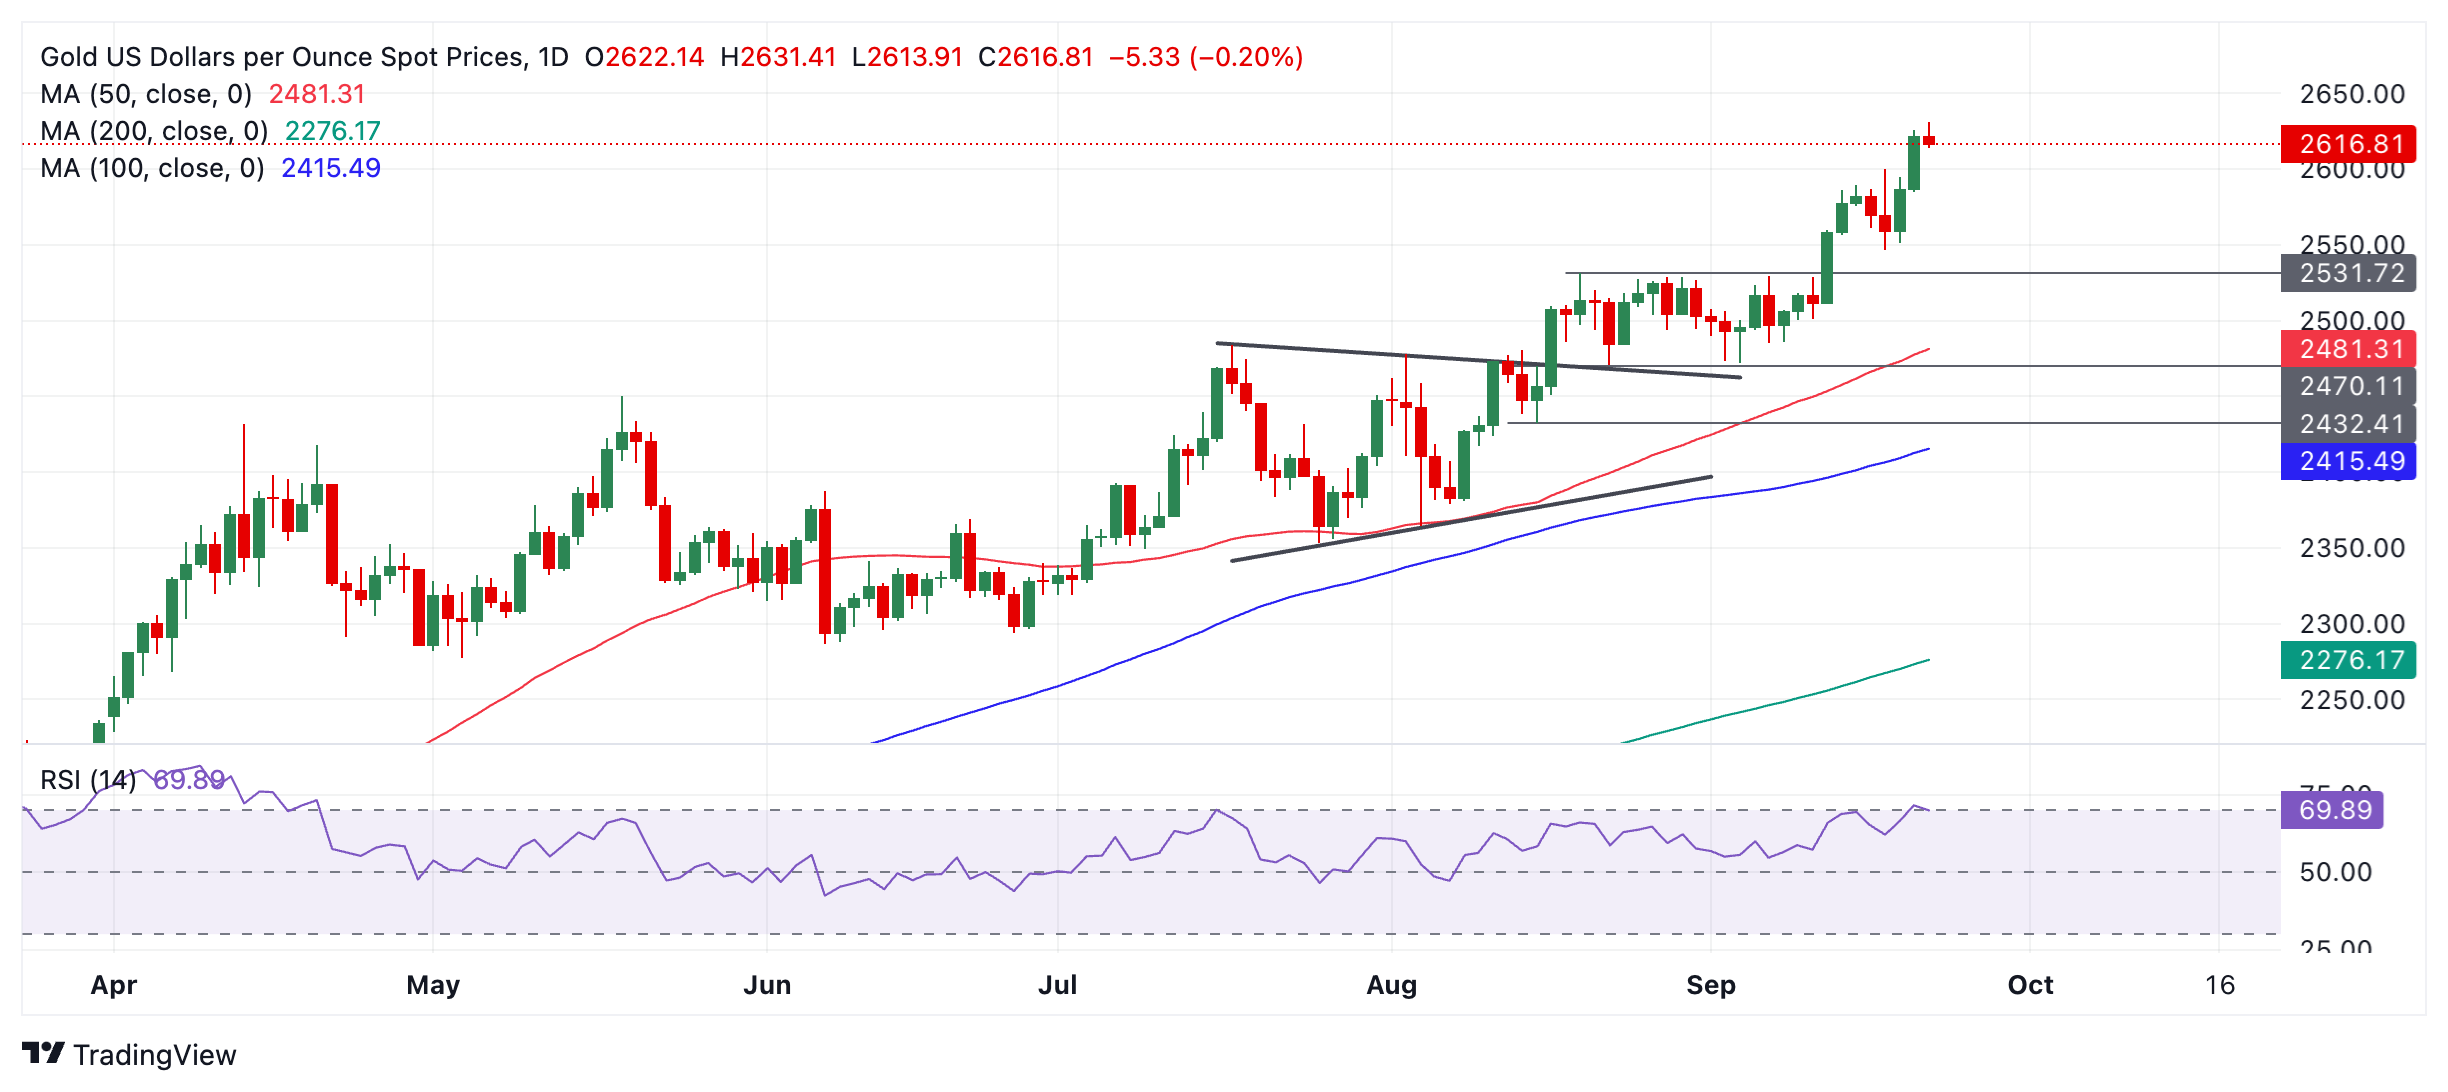
The next targets to the upside are the round numbers: $2,650 first and then $2,700.
Gold entered overbought levels, according to the Relative Strength Index (RSI), on Friday. This advises traders not to add to their long positions. If Gold exits overbought, it will be a sign for them to close long positions and sell shorts, as it would suggest a deeper correction is in the process of unfolding.
If a correction evolves, firm support lies at $2,600 (September 18 high), $2,550 and $2,544 (0.382 Fibonacci retracement of the September rally).
Markets show a renewed focus on French politics. Further EUR/USD consolidation in a 1.11-1.12 range seems likely, ING’s FX strategist Chirs Turner notes.
EUR/USD downside risks early this week
“The new French government has started to float the idea of tax hikes on businesses and the wealthy as a means of addressing France's nearly 6% of GDP budget deficit. This is not a great environment for the Euro, nor for EUR/USD to push above major resistance at 1.12. Further EUR/USD consolidation in a 1.11-1.12 range seems likely, with downside risks early this week.”
“Elsewhere, one of our favourite FX barometers for the global economic cycle – EUR/AUD – is coming lower. This move is fully consistent with a reflationary environment and a steeper US yield curve. The trend may also be helped from the Australian/China side tomorrow. Here, the Reserve Bank of Australia is expected to continue to hold its semi-hawkish line, which means it will be the last of the G10 central banks to cut.”
“And there is speculation that China could announce some domestic support measures tomorrow during a press conference held by the People's Bank of China and two other agencies. Look for EUR/AUD to retest the recent low at 1.6250 and probably head to the 1.60 area over the coming weeks and months.”
The Pound Sterling (GBP) is likely to trade in a range between 1.3270 and 1.3340. In the longer run, GBP could rise above 1.3350; the potential of it reaching 1.3400 seems low for now, UOB Group FX analysts Quek Ser Leang and Peter Chia note.
GBP can rise above 1.3350
24-HOUR VIEW: “After GBP rose sharply last Thursday, we highlighted on Friday that ‘while the rapid rise appears to be overextended, GBP seems to have enough momentum to test 1.3320 before leveling off.’ We added, ‘the next resistance at 1.3350 is unlikely to come under threat.’ GBP subsequently rose more than expected, reaching a high of 1.3341. Despite the advance, upward momentum has not increased much, and GBP is unlikely to rise further. Today, GBP is more likely to trade in a range, probably between 1.3270 and 1.3340.”
1-3 WEEKS VIEW: “We have held a positive GBP view since early last week (see annotations in the chart below). In our latest narrative from last Friday (20 Sep, spot at 1.3280), we highlighted that ‘while the price action continues to suggest GBP strength, overbought conditions could potentially limit any further advance.’ We added, ‘the next level to watch is 1.3350.’ GBP subsequently rose to 1.3341, closing at 1.3320 (+0.26%). Conditions remain overbought, but the advance is not showing sign of exhaustion just yet. That said, while GBP could rise above 1.3350, the potential of it reaching 1.3400 seems low for now. On the downside, should GBP break below 1.3210 (‘strong support’ level previously at 1.3160), it would mean that GBP is not strengthening further.”
The US Dollar (USD) is trading in mixed fashion and has not seen any follow-through selling from last Wednesday's 50bp Federal Reserve rate cut, ING’s Chirs Turner notes.
More data and Fed speakers
“The US calendar sees a mix of activity and price data. So far investors have bought into the soft-landing narrative offered by Chair Jerome Powell last week. And instead of the 50bp rate cut spooking equity markets, key benchmarks have continued to push higher. When it comes to activity, investors will be looking at today's S&P US PMI readings, consumer confidence data (Tuesday and Friday) and housing data (Wednesday).”
“None of these readings are expected to have fallen off a cliff. Friday then sees the August core PCE deflator reading, expected at an on target 0.2% month-on-month with a risk of 0.1% MoM. Interestingly our favorite Fed speaker, Christopher Waller, said he voted for a 50bp rate cut last week because inflation data was coming in too low. A 0.1% core PCE on Friday could potentially trigger another leg lower in US rates and the USD.”
“In addition, we have lots of Fed speakers this week including some prepared remarks from Jay Powell on Thursday. Markets currently price in 35bp of cuts for the November Fed meeting and a further 30/32bp for the December meeting. We doubt this week's US data will shift that pricing dramatically but nonetheless, DXY should continue to trade not far from major support at 100.”
- The Pound Sterling drops sharply as the preliminary UK S&P Global PMI came in lower than expected.
- Traders expect the BoE to deliver one more interest rate cut this year.
- The US Dollar bounces back on dismal market mood.
The Pound Sterling (GBP) falls sharply on Monday, driven by weaker-than-expected preliminary United Kingdom (UK) S&P Global Purchasing Managers’ Index (PMI) data for September and dismal market sentiment. The British currency underperforms against its major peers, except for the Euro (EUR), which has also been weighed down by the unexpected decline into contraction territory of the Eurozone PMI.
The UK Composite PMI came in at 52.9, down from 53.8 in August, suggesting that economic activity in the UK expanded at a slower pace. The indexes for both the manufacturing and the service sectors declined more than expected.
Still, the impact of the slower growth suggested by the PMI data is expected to remain limited considering comments from Chris Williamson, Chief Business Economist at S&P Global Market Intelligence, who appears to be upbeat on the overall economic outlook.
"A slight cooling of output growth across manufacturing and services in September should not be seen as too concerning, as the survey data are still consistent with the economy growing at a rate approaching 0.3% in the third quarter, which is in line with the Bank of England’s forecast," Williamson said.
Going forward, the Pound Sterling's valuation will be guided by market expectations over the Bank of England (BoE) interest-rate outlook. Traders expect the BoE to cut only once in the remaining two monetary policy meetings this year. The BoE kept its key borrowing rates unchanged at 5% last Thursday, with an 8-1 vote split, after cutting them by 25 basis points (bps) in August.
Daily digest market movers: Pound Sterling weakens against US Dollar
- The Pound Sterling drops to near 1.3250 against the US Dollar (USD) in Monday’s London session after the weaker-than-expected PMI release. Meanwhile, the US Dollar Index (DXY), which tracks the Greenback’s value against its major peers, jumps to near 101.20.
- Market expectations for the Federal Reserve (Fed) opting for a 50-bps interest rate cut for the second straight time increase as policymakers continue to remain concerned over the labor market outlook. The CME FedWatch tool shows that the probability of the Fed reducing interest rates by 50 bps to 4.25%-4.50% in November is close to 50%.
- On Friday, comments from Fed Governor Christopher Waller indicated that there will be more rate cuts if labor market conditions worsen.
- Investors will focus on the United States (US) preliminary S&P Global Purchasing Managers’ Index (PMI) data for September, which will be published at 13:45 GMT. Economists estimate the Manufacturing PMI to have increased to 48.5 from 47.9 in August. However, a figure below the 50.0 is considered as contraction. The Services PMI is expected to have declined to 55.2 from 55.7, suggesting a slight growth slowdown.
Technical Analysis: Pound Sterling falls to near 1.3250
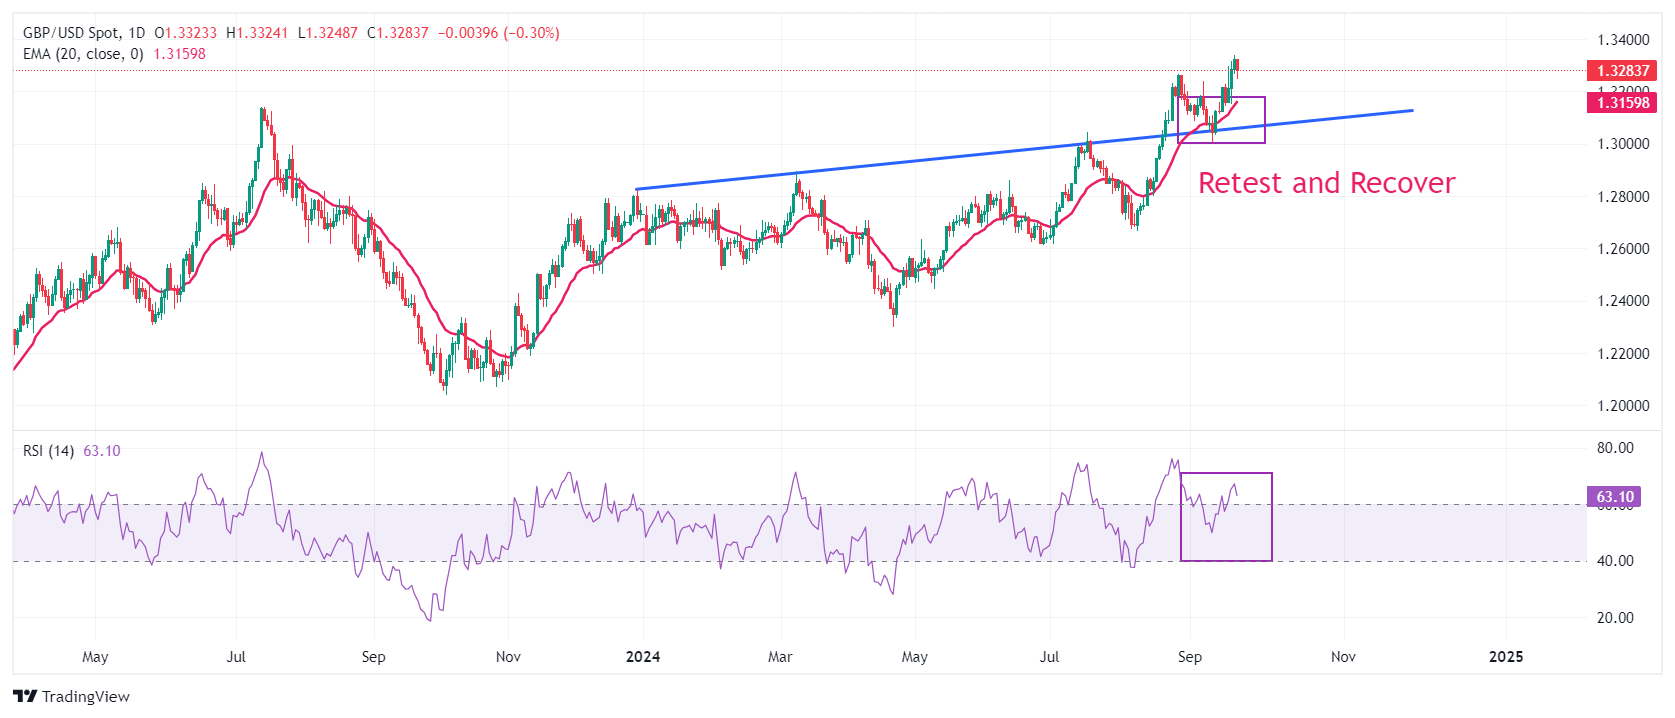
The Pound Sterling drops to near 1.3250 against the US Dollar in European trading hours. However, the near-term outlook of the GBP/USD pair remains firm as it holds above the 20-day Exponential Moving Average (EMA) near 1.3150. Earlier, the Cable strengthened after recovering from a corrective move to near the trendline plotted from the December 28, 2023, high of 1.2828, from where it delivered a sharp increase after a breakout on August 21.
The 14-day Relative Strength Index (RSI) falls slightly but remains above 60.00, suggesting an active bullish momentum.
Looking up, the Cable will face resistance near the psychological level of 1.3500. On the downside, the psychological level of 1.3000 emerges as crucial support.
Pound Sterling FAQs
The Pound Sterling (GBP) is the oldest currency in the world (886 AD) and the official currency of the United Kingdom. It is the fourth most traded unit for foreign exchange (FX) in the world, accounting for 12% of all transactions, averaging $630 billion a day, according to 2022 data. Its key trading pairs are GBP/USD, aka ‘Cable’, which accounts for 11% of FX, GBP/JPY, or the ‘Dragon’ as it is known by traders (3%), and EUR/GBP (2%). The Pound Sterling is issued by the Bank of England (BoE).
The single most important factor influencing the value of the Pound Sterling is monetary policy decided by the Bank of England. The BoE bases its decisions on whether it has achieved its primary goal of “price stability” – a steady inflation rate of around 2%. Its primary tool for achieving this is the adjustment of interest rates. When inflation is too high, the BoE will try to rein it in by raising interest rates, making it more expensive for people and businesses to access credit. This is generally positive for GBP, as higher interest rates make the UK a more attractive place for global investors to park their money. When inflation falls too low it is a sign economic growth is slowing. In this scenario, the BoE will consider lowering interest rates to cheapen credit so businesses will borrow more to invest in growth-generating projects.
Data releases gauge the health of the economy and can impact the value of the Pound Sterling. Indicators such as GDP, Manufacturing and Services PMIs, and employment can all influence the direction of the GBP. A strong economy is good for Sterling. Not only does it attract more foreign investment but it may encourage the BoE to put up interest rates, which will directly strengthen GBP. Otherwise, if economic data is weak, the Pound Sterling is likely to fall.
Another significant data release for the Pound Sterling is the Trade Balance. This indicator measures the difference between what a country earns from its exports and what it spends on imports over a given period. If a country produces highly sought-after exports, its currency will benefit purely from the extra demand created from foreign buyers seeking to purchase these goods. Therefore, a positive net Trade Balance strengthens a currency and vice versa for a negative balance.
The likelihood of the Euro (EUR) breaking above 1.1200 has increased, UOB Group FX analysts note.
Bulls may strive to touch 1.1200
24-HOUR VIEW: “While we expected EUR to edge higher last Friday, we held the view that it “is unlikely to be able to break the major resistance at 1.1200.” Our view did not materialise as EUR traded in a quiet manner between 1.1135 and 1.1181, closing largely unchanged at 1.1162 (+0.01%). Momentum indicators are turning neutral, and EUR could continue to trade in a quiet manner. Expected range for today: 1.1135/1.1185.”
1-3 WEEKS VIEW: “Our update from last Friday (20 Sep, spot at 1.1160) remains valid. As highlighted, the likelihood of EUR breaking above the year-to-date high of 1.1200 has increased. However, it remains to be seen if EUR has enough momentum to reach the next resistance at 1.1230. Overall, only a breach of 1.1100 (‘strong support’ level previously at 1.1060) would indicate that the upward pressure that started early last week (as annotated in the chart below) has faded.”
Silver prices (XAG/USD) fell on Monday, according to FXStreet data. Silver trades at $30.51 per troy ounce, down 2.16% from the $31.18 it cost on Friday.
Silver prices have increased by 28.20% since the beginning of the year.
| Unit measure | Silver Price Today in USD |
|---|---|
| Troy Ounce | 30.51 |
| 1 Gram | 0.98 |
The Gold/Silver ratio, which shows the number of ounces of Silver needed to equal the value of one ounce of Gold, stood at 85.84 on Monday, up from 84.10 on Friday.
Silver FAQs
Silver is a precious metal highly traded among investors. It has been historically used as a store of value and a medium of exchange. Although less popular than Gold, traders may turn to Silver to diversify their investment portfolio, for its intrinsic value or as a potential hedge during high-inflation periods. Investors can buy physical Silver, in coins or in bars, or trade it through vehicles such as Exchange Traded Funds, which track its price on international markets.
Silver prices can move due to a wide range of factors. Geopolitical instability or fears of a deep recession can make Silver price escalate due to its safe-haven status, although to a lesser extent than Gold's. As a yieldless asset, Silver tends to rise with lower interest rates. Its moves also depend on how the US Dollar (USD) behaves as the asset is priced in dollars (XAG/USD). A strong Dollar tends to keep the price of Silver at bay, whereas a weaker Dollar is likely to propel prices up. Other factors such as investment demand, mining supply – Silver is much more abundant than Gold – and recycling rates can also affect prices.
Silver is widely used in industry, particularly in sectors such as electronics or solar energy, as it has one of the highest electric conductivity of all metals – more than Copper and Gold. A surge in demand can increase prices, while a decline tends to lower them. Dynamics in the US, Chinese and Indian economies can also contribute to price swings: for the US and particularly China, their big industrial sectors use Silver in various processes; in India, consumers’ demand for the precious metal for jewellery also plays a key role in setting prices.
Silver prices tend to follow Gold's moves. When Gold prices rise, Silver typically follows suit, as their status as safe-haven assets is similar. The Gold/Silver ratio, which shows the number of ounces of Silver needed to equal the value of one ounce of Gold, may help to determine the relative valuation between both metals. Some investors may consider a high ratio as an indicator that Silver is undervalued, or Gold is overvalued. On the contrary, a low ratio might suggest that Gold is undervalued relative to Silver.
(An automation tool was used in creating this post.)
The Mexican Peso gears up for a busy calendar week.
- The Bank of Mexico holds its policy meeting Thursday and major inflation data is out on Tuesday.
- USD/MXN gains momentum as it rises back up within its ascending channel.
The Mexican Peso (MXN) seesaws between tepid gains and losses in its major pairs on Monday, ahead of a week in which a raft of key economic data will be released and the Bank of Mexico (Banxico) will hold its September policy meeting on Thursday – all factors that could influence the Peso.
Mexican Peso to feel impact of data releases, Banxico meeting
The Mexican Peso could be moved by domestic data releases and the Banxico policy meeting during the week ahead.
On Monday, Retail Sales for July will be released at 12:00 GMT. The data for June showed a 3.9% fall YoY and a 0.5% decline MoM. If the new data shows an improvement in consumer spending, it could support the Peso.
On Tuesday, 1st half-month inflation and core inflation for September will hit the wires at 12:00 GMT. The previous data showed a 0.03% decline in inflation and 0.1% rise in core inflation. If the new figures are higher, they could influence the Banxico decision on Thursday. Higher inflation will increase the probability that the central bank will keep interest rates high and vice versa for lower inflation.
On Thursday, Banxico will hold its policy meeting and could decide to adjust its key interest rate, currently at 10.75%. Most economists think the bank will cut by 0.25%, bringing it down to 10.50%. The expectation of lower interest rates is generally negative for a currency since it lessens foreign capital inflows.
At the August meeting, Banxico decided to cut interest rates by 0.25% (25 bps), bringing its official rate from 11.00% to 10.75%. The decision was a close call, with only three members voting for the cut versus two who wanted to keep rates where they were.
“Some members felt that the slowdown in activity was greater than expected and that risks are biased to the downside. All said that disinflation was expected to continue, but most felt that the balance of risks to inflation were biased to the upside and that the inflationary environment remains complex. Since that meeting, inflation readings have fallen further. Next Banxico meeting is September 26 and if disinflation continues, another 25 bp cut to 10.50% seems likely. The swaps market is pricing in 175 bp of easing over the next 12 months,” says Dr. Win Thin, Global Head of Markets Strategy at Brown Brothers Harriman (BBH).
Finally, Friday sees the release of Balance of Trade data. This registered a $0.072 billion deficit and a $1.168 billion surplus on a seasonally adjusted basis, in August. Generally consistent surpluses are positive for a currency and vice versa for deficits.
Technical Analysis: USD/MXN establishes short-term uptrend
USD/MXN continues its rise into the fourth day after finding technical support at the base of a long-term rising channel.
Although the pair declined sharply last week, it found key support from the base of a long-term rising channel and the 50-day Simple Moving Average (not shown on the chart below) at just above 19.00, which has so far prevented a deeper slide.
USD/MXN 4-hour Chart

There is a possibility USD/MXN has found stability at these support levels and begun a short-term uptrend within the channel. It is already in a medium and long-term uptrend so the direction of the “current” is north.
A close above 19.53 (August 23 swing high), however, would further confirm the pair was in a bullish short-term uptrend.
- EUR/GBP continues to lose ground following the lower-than-expected PMI data from both economies.
- The UK Manufacturing PMI fell to 51.5 in September, down from 52.5 in August, missing the market expectation of 52.3.
- The HCOB Eurozone Composite PMI fell to 48.9 in September, down from August's 51.0 and marking an eight-month low.
EUR/GBP extends its winning streak for the fourth successive day following the lower-than-expected Purchasing Managers Index (PMI) data from both the Eurozone and the United Kingdom (UK). The EUR/GBP cross trades around 0.8360 during the European hours on Monday.
The preliminary S&P Global/CIPS UK Manufacturing Purchasing Managers' Index (PMI) fell to 51.5 in September, down from 52.5 in August, missing the market expectation of 52.3. Similarly, the Services PMI declined to 52.8 in September from 53.7 in August, also below the market forecast of 53.5.
Chris Williamson, Chief Business Economist at S&P Global Market Intelligence said “A slight cooling of output growth across manufacturing and services in September should not be seen as too concerning.”
In the Eurozone, the HCOB Composite PMI fell to 48.9 in September, down from August's 51.0 and well below the expected 50.6, marking an eight-month low. The Services PMI dropped sharply to 50.5 from 52.9 in August, significantly underperforming the market forecast of 52.4 and hitting a seven-month low. Meanwhile, the Manufacturing PMI declined further, falling from 45.8 in August to 44.8 in September, missing the expected 45.6 and reaching a nine-month low.
On Friday, European Central Bank (ECB) President Christine Lagarde stated that monetary policy needs to stay adaptable in a constantly evolving world. Although the core objectives of monetary policy, particularly price stability, remain the same, central banks must maintain flexibility to respond to the challenges of a swiftly changing global economy, according to Euronews.
Economic Indicator
S&P Global/CIPS Manufacturing PMI
The Manufacturing Purchasing Managers Index (PMI), released on a monthly basis by both the Chartered Institute of Procurement & Supply and S&P Global, is a leading indicator gauging business activity in the UK’s manufacturing sector. The data is derived from surveys of senior executives at private-sector companies. Survey responses reflect the change, if any, in the current month compared to the previous month and can anticipate changing trends in official data series such as Gross Domestic Product (GDP), industrial production, employment and inflation. The index varies between 0 and 100, with levels of 50.0 signaling no change over the previous month. A reading above 50 indicates that the manufacturing economy is generally expanding, a bullish sign for the Pound Sterling (GBP). Meanwhile, a reading below 50 signals that activity among goods producers is generally declining, which is seen as bearish for GBP.
Read more.Last release: Mon Sep 23, 2024 08:30 (Prel)
Frequency: Monthly
Actual: 51.5
Consensus: 52.3
Previous: 52.5
Source: S&P Global
- UK Services PMI ticks down to 52.8 in September, beats estimates.
- Manufacturing PMI in the UK declines to 51.5 in September.
- GBP/USD sticks to losses near 1.3250 after downbeat UK business PMIs.
The seasonally adjusted S&P Global/CIPS UK Manufacturing Purchasing Managers’ Index (PMI) eased from 52.5 in August to 51.5 in September. The market forecast was for a 52.3 reading.
Meanwhile, the Preliminary UK Services Business Activity Index dipped to 52.8 in September, after registering 53.7 in August while coming in below the market consensus of 53.5.
Commenting on the flash PMI data, Chris Williamson, Chief Business Economist at S&P Global Market Intelligence said: “A slight cooling of output growth across manufacturing and services in September should not be seen as too concerning, as the survey data are still consistent with the economy growing at a rate approaching 0.3% in the third quarter, which is in line with the Bank of England’s forecast.”
FX implications
GBP/USD maintained the offered tone near 1.3250 after the dismal UK PMI data. The pair is trading 0.45% lower on the day, as of writing.
British Pound PRICE Today
The table below shows the percentage change of British Pound (GBP) against listed major currencies today. British Pound was the weakest against the Japanese Yen.
| USD | EUR | GBP | JPY | CAD | AUD | NZD | CHF | |
|---|---|---|---|---|---|---|---|---|
| USD | 0.64% | 0.46% | -0.27% | 0.10% | 0.03% | 0.05% | 0.15% | |
| EUR | -0.64% | -0.23% | -0.88% | -0.52% | -0.67% | -0.57% | -0.48% | |
| GBP | -0.46% | 0.23% | -0.59% | -0.29% | -0.44% | -0.34% | -0.27% | |
| JPY | 0.27% | 0.88% | 0.59% | 0.37% | 0.21% | 0.33% | 0.30% | |
| CAD | -0.10% | 0.52% | 0.29% | -0.37% | -0.02% | -0.07% | 0.03% | |
| AUD | -0.03% | 0.67% | 0.44% | -0.21% | 0.02% | 0.11% | 0.21% | |
| NZD | -0.05% | 0.57% | 0.34% | -0.33% | 0.07% | -0.11% | 0.08% | |
| CHF | -0.15% | 0.48% | 0.27% | -0.30% | -0.03% | -0.21% | -0.08% |
The heat map shows percentage changes of major currencies against each other. The base currency is picked from the left column, while the quote currency is picked from the top row. For example, if you pick the British Pound from the left column and move along the horizontal line to the US Dollar, the percentage change displayed in the box will represent GBP (base)/USD (quote).
- Silver price slumps to near $30.50 after a strong recovery in the US Dollar.
- Traders are split over whether the Fed will cut interest rates by 25 or 50 bps in November.
- Investors will focus on the preliminary US PMI for September.
Silver price (XAG/USD) faces sharp selling pressure above the key resistance of $31.00 and drops to near $30.50 in Monday’s European session. The white metal drops sharply as the US Dollar (USD) gains ground even though market speculation for the Federal Reserve (Fed) to opt for a second consecutive interest rate cut by 50 basis points (bps) remains firm.
The US Dollar Index (DXY), which tracks the Greenback’s value against six major currencies, rose swiftly by 0.4% above 101.00. A decent recovery in the Greenback makes investment in precious metals, such as Silver, an expensive bet for investors.
The CME FedWatch tool shows that the probability of the Fed reducing interest rates by 50 bps to 4.25%-4.50% in November is close to 50%. For the remainder of the year, trades have priced in a 75-bps interest rate cut. On the contrary, Fed policymakers see the federal fund rate heading to 4.4% by the year-end.
Going forward, investors will focus on the United States (US) preliminary S&P Global Purchasing Managers’ Index (PMI) data for September, which will be published at 13:45 GMT. Economists estimate the Manufacturing PMI to have improved to 48.5 from 47.9 in August. However, a figure below the 50.0 threshold is considered a contraction. The Services PMI is expected to have expanded at a slower pace to 53.5 from the prior release of 53.7.
Silver technical analysis
Silver price trades in a Rising Channel chart formation, on a four-hour timeframe, in which the upper portion acts as resistance. Each pullback is considered a buying opportunity by market participants.
The white metal has dropped to near the 50-period Exponential Moving Average (EMA) near $30.36, suggesting an uncertainty ahead. However, the upside bias remains intact.
The 14-period Relative Strength Index (RSI) oscillates in the 40.00-60.00 range, suggesting a weakening of momentum.
Silver four-hour chart
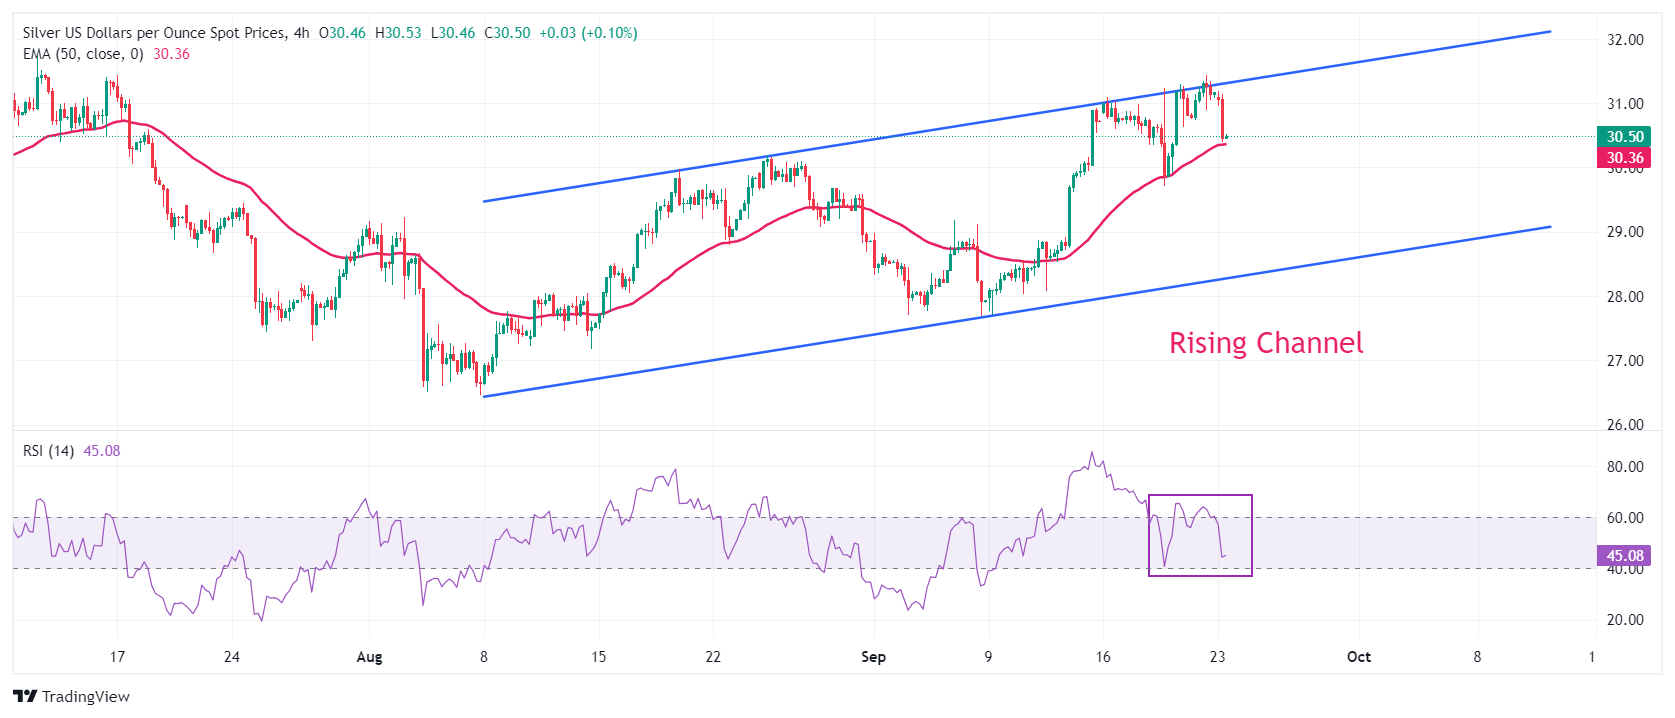
Silver FAQs
Silver is a precious metal highly traded among investors. It has been historically used as a store of value and a medium of exchange. Although less popular than Gold, traders may turn to Silver to diversify their investment portfolio, for its intrinsic value or as a potential hedge during high-inflation periods. Investors can buy physical Silver, in coins or in bars, or trade it through vehicles such as Exchange Traded Funds, which track its price on international markets.
Silver prices can move due to a wide range of factors. Geopolitical instability or fears of a deep recession can make Silver price escalate due to its safe-haven status, although to a lesser extent than Gold's. As a yieldless asset, Silver tends to rise with lower interest rates. Its moves also depend on how the US Dollar (USD) behaves as the asset is priced in dollars (XAG/USD). A strong Dollar tends to keep the price of Silver at bay, whereas a weaker Dollar is likely to propel prices up. Other factors such as investment demand, mining supply – Silver is much more abundant than Gold – and recycling rates can also affect prices.
Silver is widely used in industry, particularly in sectors such as electronics or solar energy, as it has one of the highest electric conductivity of all metals – more than Copper and Gold. A surge in demand can increase prices, while a decline tends to lower them. Dynamics in the US, Chinese and Indian economies can also contribute to price swings: for the US and particularly China, their big industrial sectors use Silver in various processes; in India, consumers’ demand for the precious metal for jewellery also plays a key role in setting prices.
Silver prices tend to follow Gold's moves. When Gold prices rise, Silver typically follows suit, as their status as safe-haven assets is similar. The Gold/Silver ratio, which shows the number of ounces of Silver needed to equal the value of one ounce of Gold, may help to determine the relative valuation between both metals. Some investors may consider a high ratio as an indicator that Silver is undervalued, or Gold is overvalued. On the contrary, a low ratio might suggest that Gold is undervalued relative to Silver.
- EUR/USD falls sharply below 1.1100 on weak Eurozone preliminary Purchasing Managers’ Index data of September.
- ECB policymakers appear to be increasingly concerned about inflation remaining persistent.
- Markets expect the Fed to deliver a second consecutive 50 bps interest-rate cut in November.
EUR/USD faces sharp selling pressure and falls below the crucial support of 1.1100 in Monday’s European session. The major currency pair weakens on multiple headwinds: poor Eurozone Purchasing Managers’ Index (PMI) data for September and a sharp recovery in the US Dollar (USD).
The Eurozone Composite PMI surprisingly contracted to 49.0. Economists expected that activities in the overall economy to have grown at a slower pace to 50.6 from 51.0 in August. A sharp contraction in the overall economic activity was majorly driven by weakness in the manufacturing sector and a slower expansion in the service sector activity.
Commenting on the flash PMI data, Dr. Cyrus de la Rubia, Chief Economist at Hamburg Commercial Bank, said, “The eurozone is heading towards stagnation. After the Olympic effect had temporarily boosted France, the eurozone heavyweight economy, the Composite PMI fell in September to the largest extent in 15 months. The index has now dipped below the expansionary threshold. Considering the rapid decline in new orders and the order backlog, it doesn't take much imagination to foresee a further weakening of the economy.
Signs of further weakness would increase market speculation for a third interest rate cut by the European Central Bank (ECB) in October. Meanwhile, the latest comments from ECB policymakers have indicated that they are more concerned about price pressures remaining persistent. ECB policymakers have emphasized the need for more data pointing to a further slowdown in inflation. On Friday, ECB Vice President Luis de Guindos said that he wants to see more good inflation data before slicing interest rates further. "We will have more information in December than in October," Guindos said.
Daily digest market movers: EUR/USD falls on multiple headwinds
- EUR/USD drops sharply as the US Dollar (USD) gains ground despite growing speculation that the Federal Reserve (Fed) will continue to opt for a larger-than-usual 50 basis points (bps) interest rate cut in the November meeting, as it delivered last Wednesday, amid growing concerns over job growth. According to the CME FedWatch tool, the likelihood of the Fed reducing interest rates by 50 bps to 4.25%-4.50% in November has increased to 51.7% from 29.3% a week ago.
- On the contrary, the latest Reuters poll to economists shows that the central bank will cut the federal fund rates by 25 bps in each of the monetary policy meetings to be held in November and December.
- Meanwhile, Fed Governor Michelle Bowman issued a statement on Friday explaining why she was against the decision to begin the policy-easing cycle with a 50-bps rate cut. Bowman, which voted to kick off the rate-cut process with a 25 bps cut, said a larger reduction could stoke overall demand given that inflationary pressures have yet not returned to the bank’s target of 2%.
- On the United States (US) economic data front, investors will focus on the preliminary S&P Global Purchasing Managers’ Index (PMI) data for September, which will be published at 13:45 GMT. The report is expected to show that the Manufacturing PMI came in higher at 48.5 than August’s print of 47.9 but remains below the 50.0 threshold. In the same period, the services PMI is estimated to decline to 55.2 from the former reading of 55.7.
Technical Analysis: EUR/USD drops vertically below 1.1100
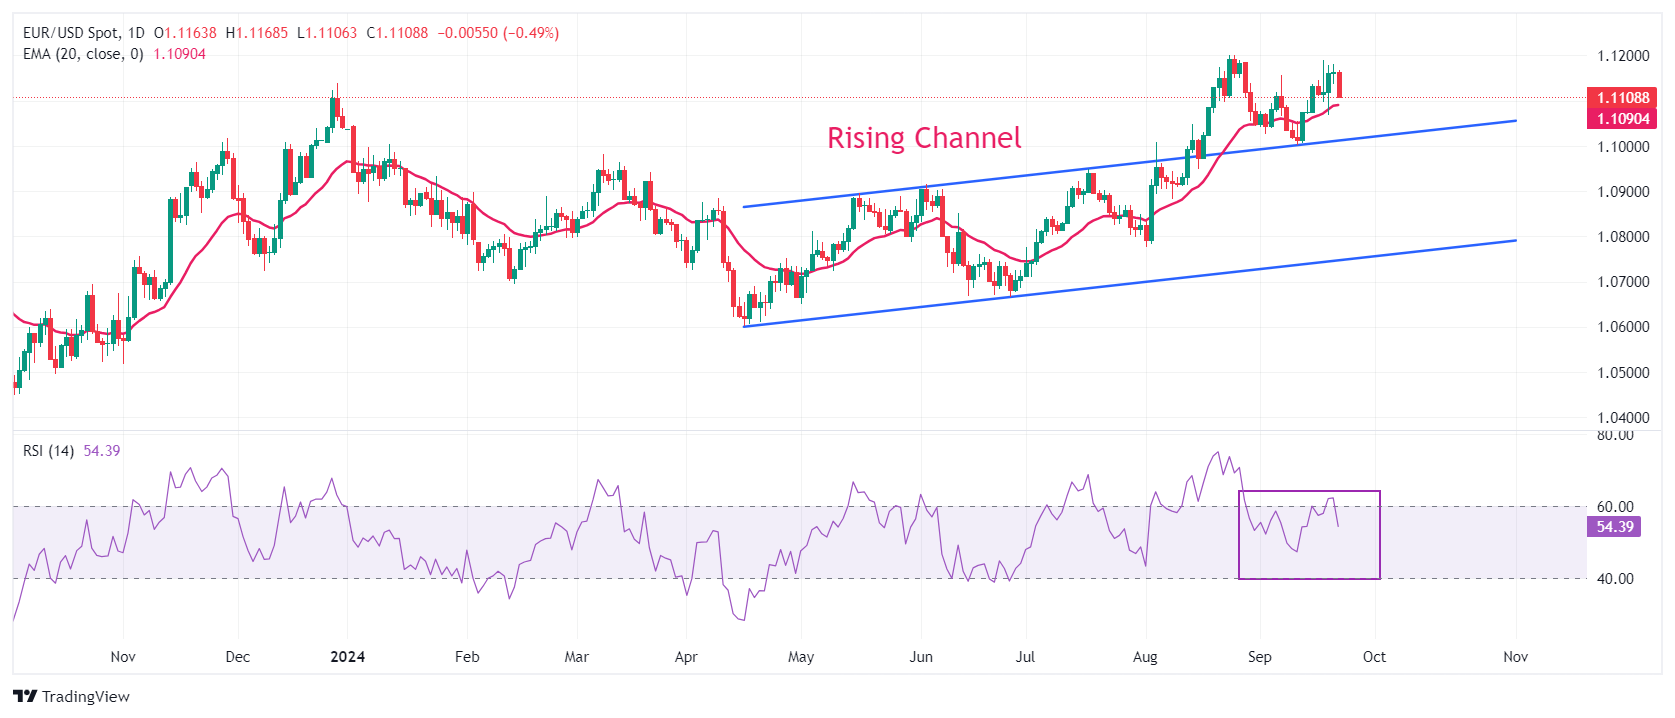
EUR/USD dips below 1.1100 in European trading hours. The near-term outlook of the currency pair is expected to find interim support near the 20-day Exponential Moving Average (EMA) near 1.1090.
The outlook of the major currency pair would remain firm till it hold the breakout of the Rising Channel chart pattern formed on a daily time frame near the psychological support of 1.1000.
The 14-day Relative Strength Index (RSI) moves lower to 55, suggesting momentum is weakening
Looking up, the round-level resistance of 1.1200 will act as a major barricade for the Euro bulls. A decisive break above the same would drive the asset toward July 2023 high of 1.1276. On the downside, the psychological level of 1.1000 and the July 17 high near 1.0950 will be major support zones.
Euro FAQs
The Euro is the currency for the 20 European Union countries that belong to the Eurozone. It is the second most heavily traded currency in the world behind the US Dollar. In 2022, it accounted for 31% of all foreign exchange transactions, with an average daily turnover of over $2.2 trillion a day. EUR/USD is the most heavily traded currency pair in the world, accounting for an estimated 30% off all transactions, followed by EUR/JPY (4%), EUR/GBP (3%) and EUR/AUD (2%).
The European Central Bank (ECB) in Frankfurt, Germany, is the reserve bank for the Eurozone. The ECB sets interest rates and manages monetary policy. The ECB’s primary mandate is to maintain price stability, which means either controlling inflation or stimulating growth. Its primary tool is the raising or lowering of interest rates. Relatively high interest rates – or the expectation of higher rates – will usually benefit the Euro and vice versa. The ECB Governing Council makes monetary policy decisions at meetings held eight times a year. Decisions are made by heads of the Eurozone national banks and six permanent members, including the President of the ECB, Christine Lagarde.
Eurozone inflation data, measured by the Harmonized Index of Consumer Prices (HICP), is an important econometric for the Euro. If inflation rises more than expected, especially if above the ECB’s 2% target, it obliges the ECB to raise interest rates to bring it back under control. Relatively high interest rates compared to its counterparts will usually benefit the Euro, as it makes the region more attractive as a place for global investors to park their money.
Data releases gauge the health of the economy and can impact on the Euro. Indicators such as GDP, Manufacturing and Services PMIs, employment, and consumer sentiment surveys can all influence the direction of the single currency. A strong economy is good for the Euro. Not only does it attract more foreign investment but it may encourage the ECB to put up interest rates, which will directly strengthen the Euro. Otherwise, if economic data is weak, the Euro is likely to fall. Economic data for the four largest economies in the euro area (Germany, France, Italy and Spain) are especially significant, as they account for 75% of the Eurozone’s economy.
Another significant data release for the Euro is the Trade Balance. This indicator measures the difference between what a country earns from its exports and what it spends on imports over a given period. If a country produces highly sought after exports then its currency will gain in value purely from the extra demand created from foreign buyers seeking to purchase these goods. Therefore, a positive net Trade Balance strengthens a currency and vice versa for a negative balance.
- Eurozone Manufacturing PMI declined to 44.8 in September, below the 45.6 consensus.
- Bloc’s Services PMI slips to 50.5 in September vs. 52.4 forecast.
- EUR/USD remains in the red near 1.1100 after German, Eurozone PMI data.
The Eurozone manufacturing sector contraction gathered steam while the services sector activity turned south in September, according to the data from the HCOB's latest Purchasing Managers Index (PMI) Survey published on Monday.
The Eurozone Manufacturing Purchasing Managers Index (PMI) dropped from 45.8 in August to 44.8 in September, missing the expected 45.6 figure. The index plunged to a nine-month low.
The bloc’s Services PMI tumbled from 52.9 in August to 50.5 in September. The data came in way below the market forecast of 52.4 and hit a seven-month bottom.
The HCOB Eurozone PMI Composite contracts to 48.9 in September vs. 50.6 expected and August’s 51.0 readout, registering an eight-month low.
EUR/USD reaction to the Eurozone PMIs data
EUR/USD remains under intense selling pressure following the mixed Eurozone PMIs. The pair is losing 0.60% on the day to trade near 1.1100, at the press time.
Euro FAQs
The Euro is the currency for the 20 European Union countries that belong to the Eurozone. It is the second most heavily traded currency in the world behind the US Dollar. In 2022, it accounted for 31% of all foreign exchange transactions, with an average daily turnover of over $2.2 trillion a day. EUR/USD is the most heavily traded currency pair in the world, accounting for an estimated 30% off all transactions, followed by EUR/JPY (4%), EUR/GBP (3%) and EUR/AUD (2%).
The European Central Bank (ECB) in Frankfurt, Germany, is the reserve bank for the Eurozone. The ECB sets interest rates and manages monetary policy. The ECB’s primary mandate is to maintain price stability, which means either controlling inflation or stimulating growth. Its primary tool is the raising or lowering of interest rates. Relatively high interest rates – or the expectation of higher rates – will usually benefit the Euro and vice versa. The ECB Governing Council makes monetary policy decisions at meetings held eight times a year. Decisions are made by heads of the Eurozone national banks and six permanent members, including the President of the ECB, Christine Lagarde.
Eurozone inflation data, measured by the Harmonized Index of Consumer Prices (HICP), is an important econometric for the Euro. If inflation rises more than expected, especially if above the ECB’s 2% target, it obliges the ECB to raise interest rates to bring it back under control. Relatively high interest rates compared to its counterparts will usually benefit the Euro, as it makes the region more attractive as a place for global investors to park their money.
Data releases gauge the health of the economy and can impact on the Euro. Indicators such as GDP, Manufacturing and Services PMIs, employment, and consumer sentiment surveys can all influence the direction of the single currency. A strong economy is good for the Euro. Not only does it attract more foreign investment but it may encourage the ECB to put up interest rates, which will directly strengthen the Euro. Otherwise, if economic data is weak, the Euro is likely to fall. Economic data for the four largest economies in the euro area (Germany, France, Italy and Spain) are especially significant, as they account for 75% of the Eurozone’s economy.
Another significant data release for the Euro is the Trade Balance. This indicator measures the difference between what a country earns from its exports and what it spends on imports over a given period. If a country produces highly sought after exports then its currency will gain in value purely from the extra demand created from foreign buyers seeking to purchase these goods. Therefore, a positive net Trade Balance strengthens a currency and vice versa for a negative balance.
- Germany’s Manufacturing PMI declined to 40.3 in September vs. 42.4 forecast.
- Services PMI for the German economy fell to 50.6 in September vs. 51.0 expected.
- EUR/USD attacks 1.1100 after downbeat German PMIs.
The German manufacturing sector downturn worsened in September while the services sector activity also took a hit, the preliminary business activity report published by the HCOB survey showed Monday.
The HCOB Manufacturing PMI in the Eurozone’s top economy dropped to 40.3 this month, as against August’s 42.4 while missing the estimates of 42.4. The measure hit a yearly low.
Meanwhile, Services PMI declined from 51.2 in August to 50.6 in September, below the market forecast for a 51.0 print in the reported period. The gauge touched a six-month trough.
The HCOB Preliminary German Composite Output Index came in at 47.2 in September vs. 48.2 expected and 48.4 in August. The index was at its weakest in seven months.
FX implications
EUR/USD falls further on the disappointing German data, currently trading 0.42% lower on the day at 1.1112.
Euro PRICE Today
The table below shows the percentage change of Euro (EUR) against listed major currencies today. Euro was the weakest against the Japanese Yen.
| USD | EUR | GBP | JPY | CAD | AUD | NZD | CHF | |
|---|---|---|---|---|---|---|---|---|
| USD | 0.48% | 0.40% | -0.13% | 0.13% | 0.00% | 0.03% | 0.12% | |
| EUR | -0.48% | -0.13% | -0.59% | -0.33% | -0.53% | -0.43% | -0.36% | |
| GBP | -0.40% | 0.13% | -0.40% | -0.20% | -0.41% | -0.30% | -0.23% | |
| JPY | 0.13% | 0.59% | 0.40% | 0.27% | 0.06% | 0.19% | 0.15% | |
| CAD | -0.13% | 0.33% | 0.20% | -0.27% | -0.08% | -0.10% | -0.03% | |
| AUD | 0.00% | 0.53% | 0.41% | -0.06% | 0.08% | 0.12% | 0.17% | |
| NZD | -0.03% | 0.43% | 0.30% | -0.19% | 0.10% | -0.12% | 0.07% | |
| CHF | -0.12% | 0.36% | 0.23% | -0.15% | 0.03% | -0.17% | -0.07% |
The heat map shows percentage changes of major currencies against each other. The base currency is picked from the left column, while the quote currency is picked from the top row. For example, if you pick the Euro from the left column and move along the horizontal line to the US Dollar, the percentage change displayed in the box will represent EUR (base)/USD (quote).
- NZD/USD trades firmer around 0.6250 in Monday’s Asian session.
- Traders expect the Fed to reduce interest rates further in the remainder of the year.
- Deepening growth concerns in New Zealand’s economy might weigh on the Kiwi.
The NZD/USD pair trades on a stronger note near 0.6245 during the early Asian session on Monday. The pair edges higher as investors digest monetary policy decisions from the US Federal Reserve’s (Fed) sharp rate cut last week.
The Fed decided to cut its benchmark interest rate by 50 basis points (bps), marking the first reduction in four years. The half-point move signals that the Fed is acting aggressively to keep the US economy from stalling. Economists believe the rate cut last week will mark the first in a series of reductions this year and into 2025. The markets expect the Fed to cut its benchmark rate again at its November and December meetings, according to FactSet. This, in turn, might continue to undermine the US Dollar (USD) and act as a tailwind for NZD/USD.
Investors will take more cues from the preliminary US Purchasing Managers Index (PMI) data for September, which is due on Monday. The Manufacturing PMI is expected at 48.6 in September versus 47.9 in August, while the Services PMI is estimated at 55.3 in September from 55.7 in the previous reading. Also, the speeches by the Fed’s Austan Goolsbee and Raphael Bostic will be closely watched.
On the other hand, the latest Gross Domestic Product (GDP) figures show the New Zealand economy has contracted again, falling 0.2% in the second quarter (Q2). “Ongoing headwinds, including our expectation for further weakening in the labor market, suggest we are unlikely to see a rapid turnaround in the economy,” said Kim Mundy, economist at ASB Bank in Auckland. The fragile New Zealand economic outlook is likely to cap the upside for the Kiwi in the near term.
New Zealand Dollar FAQs
The New Zealand Dollar (NZD), also known as the Kiwi, is a well-known traded currency among investors. Its value is broadly determined by the health of the New Zealand economy and the country’s central bank policy. Still, there are some unique particularities that also can make NZD move. The performance of the Chinese economy tends to move the Kiwi because China is New Zealand’s biggest trading partner. Bad news for the Chinese economy likely means less New Zealand exports to the country, hitting the economy and thus its currency. Another factor moving NZD is dairy prices as the dairy industry is New Zealand’s main export. High dairy prices boost export income, contributing positively to the economy and thus to the NZD.
The Reserve Bank of New Zealand (RBNZ) aims to achieve and maintain an inflation rate between 1% and 3% over the medium term, with a focus to keep it near the 2% mid-point. To this end, the bank sets an appropriate level of interest rates. When inflation is too high, the RBNZ will increase interest rates to cool the economy, but the move will also make bond yields higher, increasing investors’ appeal to invest in the country and thus boosting NZD. On the contrary, lower interest rates tend to weaken NZD. The so-called rate differential, or how rates in New Zealand are or are expected to be compared to the ones set by the US Federal Reserve, can also play a key role in moving the NZD/USD pair.
Macroeconomic data releases in New Zealand are key to assess the state of the economy and can impact the New Zealand Dollar’s (NZD) valuation. A strong economy, based on high economic growth, low unemployment and high confidence is good for NZD. High economic growth attracts foreign investment and may encourage the Reserve Bank of New Zealand to increase interest rates, if this economic strength comes together with elevated inflation. Conversely, if economic data is weak, NZD is likely to depreciate.
The New Zealand Dollar (NZD) tends to strengthen during risk-on periods, or when investors perceive that broader market risks are low and are optimistic about growth. This tends to lead to a more favorable outlook for commodities and so-called ‘commodity currencies’ such as the Kiwi. Conversely, NZD tends to weaken at times of market turbulence or economic uncertainty as investors tend to sell higher-risk assets and flee to the more-stable safe havens.
- USD/CAD holds ground amid improved US Treasury yields on Monday.
- CME FedWatch Tool suggests a 50% chance of a 50 basis point Fed rate cut by the end of this year.
- The downside of the commodity-linked CAD could be limited due to higher crude Oil prices.
USD/CAD remains in the positive territory, trading around 1.3560 during the Asian session on Monday. However, the US Dollar (USD) may struggle due to rising odds for further rate cuts by the US Federal Reserve (Fed) in 2024. According to the CME FedWatch Tool, markets are pricing in a 50% chance of a 50 basis point rate cut to a range of 4.0-4.25% by the end of this year.
The US Dollar (USD) continues to rise as Treasury yields recover their losses. The US Dollar Index (DXY), which measures the value of the US Dollar, holds ground around 100.80 with 2-year and 10-year yields on US Treasury bonds standing at 3.59% and 3.74%, respectively.
Philadelphia Fed President Patrick Harker stated on Friday that the US central bank has effectively steered through a challenging economic landscape in recent years. Harker compared monetary policy to driving a bus, where it's essential to balance speed.
Canada’s Retail Sales rose by 0.9% month-over-month to $66.4 billion in July, rebounding from a 0.2% decline in June and surpassing the expected 0.6% increase. Sales grew in seven of nine subsectors, with motor vehicle and parts dealers leading the gains. This marked the strongest expansion in Canadian retail turnover since April 2023, countering calls for aggressive rate cuts by the Bank of Canada (BoC).
The downside of the Canadian Dollar (CAD) would be restrained due to higher crude Oil prices. West Texas Intermediate (WTI) Oil price appreciates to near $71.50 at the time of writing. Crude Oil prices are rising due to concerns over potential supply disruptions amid escalating tensions in the Middle East.
Hezbollah and Israel engaged in heavy exchanges of fire on Sunday, with the Lebanese militant group launching missiles deep into northern Israeli territory following intense bombardment—some of the most severe in nearly a year of conflict, according to CNN.
Canadian Dollar FAQs
The key factors driving the Canadian Dollar (CAD) are the level of interest rates set by the Bank of Canada (BoC), the price of Oil, Canada’s largest export, the health of its economy, inflation and the Trade Balance, which is the difference between the value of Canada’s exports versus its imports. Other factors include market sentiment – whether investors are taking on more risky assets (risk-on) or seeking safe-havens (risk-off) – with risk-on being CAD-positive. As its largest trading partner, the health of the US economy is also a key factor influencing the Canadian Dollar.
The Bank of Canada (BoC) has a significant influence on the Canadian Dollar by setting the level of interest rates that banks can lend to one another. This influences the level of interest rates for everyone. The main goal of the BoC is to maintain inflation at 1-3% by adjusting interest rates up or down. Relatively higher interest rates tend to be positive for the CAD. The Bank of Canada can also use quantitative easing and tightening to influence credit conditions, with the former CAD-negative and the latter CAD-positive.
The price of Oil is a key factor impacting the value of the Canadian Dollar. Petroleum is Canada’s biggest export, so Oil price tends to have an immediate impact on the CAD value. Generally, if Oil price rises CAD also goes up, as aggregate demand for the currency increases. The opposite is the case if the price of Oil falls. Higher Oil prices also tend to result in a greater likelihood of a positive Trade Balance, which is also supportive of the CAD.
While inflation had always traditionally been thought of as a negative factor for a currency since it lowers the value of money, the opposite has actually been the case in modern times with the relaxation of cross-border capital controls. Higher inflation tends to lead central banks to put up interest rates which attracts more capital inflows from global investors seeking a lucrative place to keep their money. This increases demand for the local currency, which in Canada’s case is the Canadian Dollar.
Macroeconomic data releases gauge the health of the economy and can have an impact on the Canadian Dollar. Indicators such as GDP, Manufacturing and Services PMIs, employment, and consumer sentiment surveys can all influence the direction of the CAD. A strong economy is good for the Canadian Dollar. Not only does it attract more foreign investment but it may encourage the Bank of Canada to put up interest rates, leading to a stronger currency. If economic data is weak, however, the CAD is likely to fall.
FX option expiries for Sept 23 NY cut at 10:00 Eastern Time, via DTCC, can be found below.
EUR/USD: EUR amounts
- 1.1025 780m
- 1.1150 1.9b
USD/CHF: USD amounts
- 0.8475 1.3b
AUD/USD: AUD amounts
- 0.6780 756m
- 0.6830 507m
NZD/USD: NZD amounts
- 0.6300 1.1b
EUR/GBP: EUR amounts
- 0.8425 536m
- Indian Rupee edges higher in Monday’s Asian session.
- Robust Indian foreign inflow boosts the INR, but higher crude oil prices and a stronger USD could cap its gains.
- Investors will monitor the US PMI data for September on Monday.
The Indian Rupee (INR) extends the rally on Monday, bolstered by positive momentum in Indian equity markets amid a massive inflow of foreign funds. Nonetheless, a further rise in crude oil prices and renewed US Dollar (USD) demand from importers might cap the upside for the local currency.
Moving on, the flash reading of the US Purchasing Managers Index (PMI) data for September is due on Monday. Federal Reserve (Fed) Bank of Chicago President Austan Goolsbee and Fed’s Atlanta President Raphael Bostic are scheduled to speak later in the day. Any signs of weaker US economic data or dovish remarks from the Fed officials could undermine the Greenback.
Daily Digest Market Movers: Indian Rupee gathers strength amid strong foreign portfolio investors (FPIs) inflows
- The HSBC India Manufacturing PMI eased to 56.7 in September from the previous reading of 57.5.
- India's foreign exchange reserves rose by $223 million to a new all-time high of USD 689.458, according to the Reserve Bank of India (RBI) data released on Friday.
- India is estimated to become the world’s third-largest economy by 2030–2031, according to S&P Global India. The country is forecast to grow at an annual rate of 6.7%.
- Philadelphia Fed President Patrick Harker noted on Friday that the US central bank has effectively navigated a challenging economy over the last few years. Harker added that there is a risk that inflation decline could stall and the labor market could soften.
- Fed Governor Michelle Bowman said cutting interest rates by a half percentage point this week risked signaling the Fed was declaring victory over inflation too early, per Bloomberg.
- Fed Governor Christopher Waller stated on Friday that the decision to cut interest rates by an accelerated 50 bps was the right choice, but we can see a lot of room to move down in the next 6 to 12 months, adding that the Fed could even pause, depending on the data.
Technical Analysis: USD/INR is looking oversold in the shorter-term
The Indian Rupee strengthens on the day. The bearish outlook of the USD/INR pair remains in play as the price holds below the key 100-day Exponential Moving Average (EMA) on the daily chart. Further consolidation of the pair cannot be ruled out before positioning for any near-term USD/INR depreciation as the 14-day Relative Strength Index (RSI) stands near 26.40, indicating an oversold condition.
The 100-day EMA at 83.62 acts as the first upside barrier for USD/INR. The 84.00 psychological level appears to be a tough nut to crack for USD/INR bulls.
On the other hand, the low of June 19 at 83.30 acts as an initial support level for the pair. Extended losses could see a drop to the 83.00 round mark.
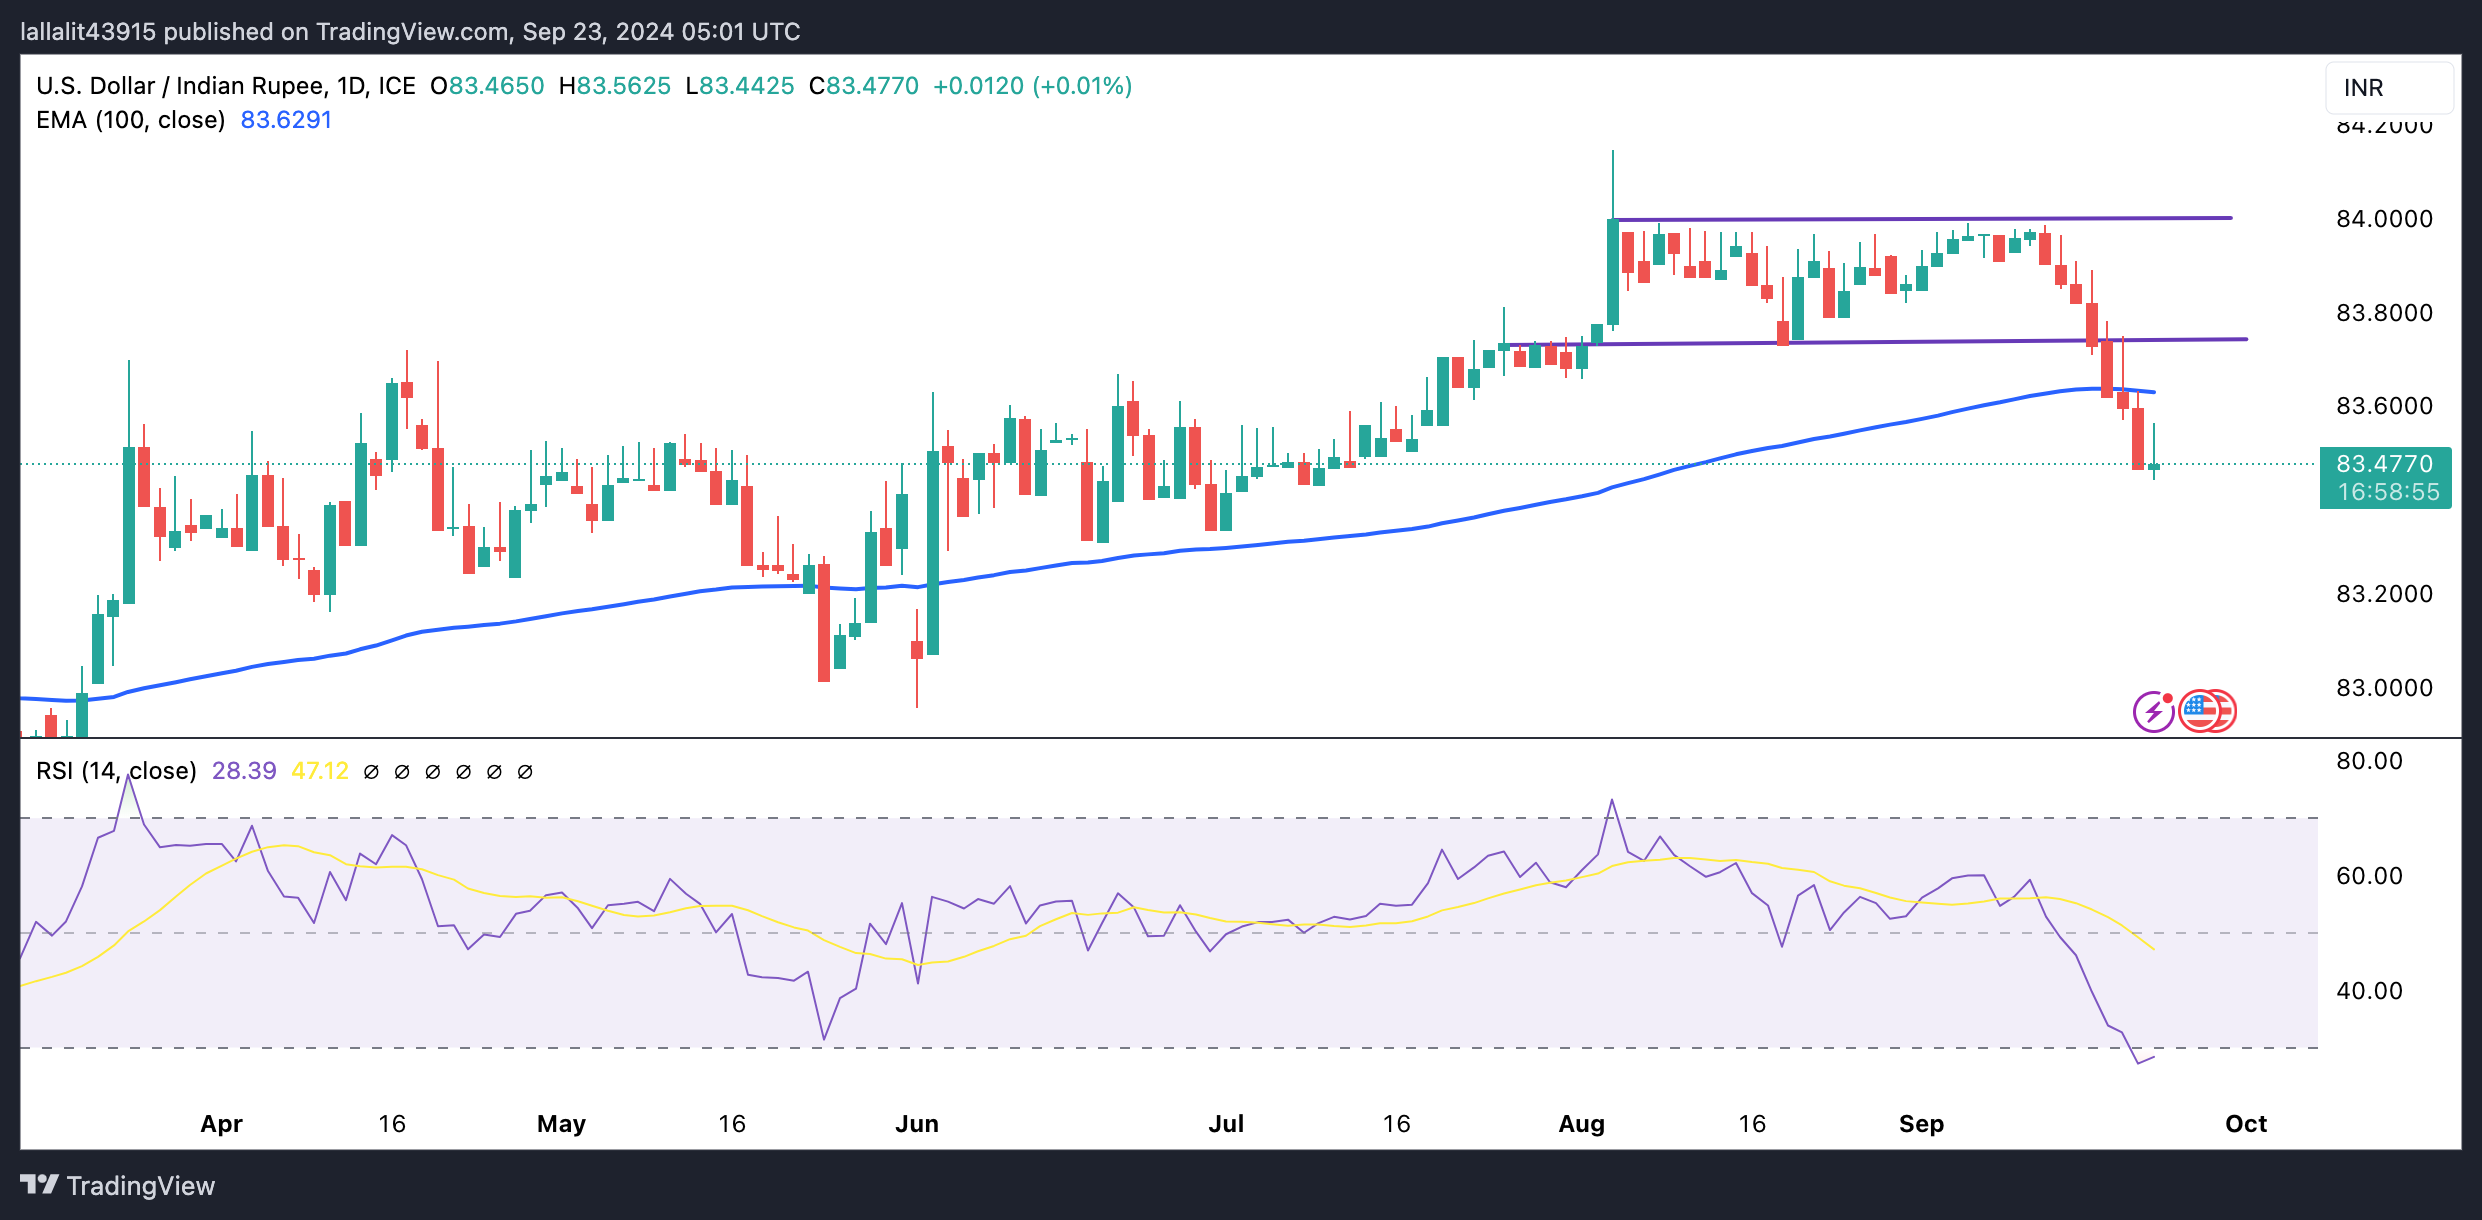
Indian Rupee FAQs
The Indian Rupee (INR) is one of the most sensitive currencies to external factors. The price of Crude Oil (the country is highly dependent on imported Oil), the value of the US Dollar – most trade is conducted in USD – and the level of foreign investment, are all influential. Direct intervention by the Reserve Bank of India (RBI) in FX markets to keep the exchange rate stable, as well as the level of interest rates set by the RBI, are further major influencing factors on the Rupee.
The Reserve Bank of India (RBI) actively intervenes in forex markets to maintain a stable exchange rate, to help facilitate trade. In addition, the RBI tries to maintain the inflation rate at its 4% target by adjusting interest rates. Higher interest rates usually strengthen the Rupee. This is due to the role of the ‘carry trade’ in which investors borrow in countries with lower interest rates so as to place their money in countries’ offering relatively higher interest rates and profit from the difference.
Macroeconomic factors that influence the value of the Rupee include inflation, interest rates, the economic growth rate (GDP), the balance of trade, and inflows from foreign investment. A higher growth rate can lead to more overseas investment, pushing up demand for the Rupee. A less negative balance of trade will eventually lead to a stronger Rupee. Higher interest rates, especially real rates (interest rates less inflation) are also positive for the Rupee. A risk-on environment can lead to greater inflows of Foreign Direct and Indirect Investment (FDI and FII), which also benefit the Rupee.
Higher inflation, particularly, if it is comparatively higher than India’s peers, is generally negative for the currency as it reflects devaluation through oversupply. Inflation also increases the cost of exports, leading to more Rupees being sold to purchase foreign imports, which is Rupee-negative. At the same time, higher inflation usually leads to the Reserve Bank of India (RBI) raising interest rates and this can be positive for the Rupee, due to increased demand from international investors. The opposite effect is true of lower inflation.
Here is what you need to know on Monday, September 23:
It seems like a positive start to the week, as risk sentiment recovers on renewed China optimism after the People’s Bank of China (PBOC) surprised markets by lowering its 14-day repo rate by 10 bps to stimulate the economic turnaround.
Despite a better risk tone, investors remain wary amid escalating tensions between Israel and the Lebanese militant group – Hezbollah. Over the weekend, Hezbollah fired at least 10 missiles into northern towns and cities of Israel's Jezreel Valley, the Times of Israel reported. In response, Israeli Defense Force (IDF) jets carried out a series of retaliatory strikes across southern Lebanon, targetting at least 110 Hezbollah positions.
This comes in response to last week’s pagers and walkie-talkies explosions in Lebonan, with Isreal suspected of these attacks. The US Dollar (USD) finds some safe-haven demand against its major rivals, in the face of looming Mid-East geopolitical risks. Meanwhile, US House Republicans’s declaration to unveil a stopgap spending bill to fund the government through December 20 also offers fresh signs of life to the Greenback.
Increased expectations of another 50 basis points (bps) interest rate cut by the US Federal Reserve in November curbs the USD rebound, despite the modest upswing in the US treasury bond yields.
US Dollar PRICE Today
The table below shows the percentage change of US Dollar (USD) against listed major currencies today. US Dollar was the strongest against the Japanese Yen.
| USD | EUR | GBP | JPY | CAD | AUD | NZD | CHF | |
|---|---|---|---|---|---|---|---|---|
| USD | 0.00% | 0.06% | 0.25% | -0.02% | -0.41% | -0.20% | 0.15% | |
| EUR | -0.00% | 0.00% | 0.26% | -0.02% | -0.45% | -0.15% | 0.13% | |
| GBP | -0.06% | -0.00% | 0.33% | -0.02% | -0.47% | -0.15% | 0.12% | |
| JPY | -0.25% | -0.26% | -0.33% | -0.27% | -0.74% | -0.42% | -0.23% | |
| CAD | 0.02% | 0.02% | 0.02% | 0.27% | -0.33% | -0.15% | 0.13% | |
| AUD | 0.41% | 0.45% | 0.47% | 0.74% | 0.33% | 0.32% | 0.60% | |
| NZD | 0.20% | 0.15% | 0.15% | 0.42% | 0.15% | -0.32% | 0.29% | |
| CHF | -0.15% | -0.13% | -0.12% | 0.23% | -0.13% | -0.60% | -0.29% |
The heat map shows percentage changes of major currencies against each other. The base currency is picked from the left column, while the quote currency is picked from the top row. For example, if you pick the US Dollar from the left column and move along the horizontal line to the Japanese Yen, the percentage change displayed in the box will represent USD (base)/JPY (quote).
All eyes now turn toward the Euro area, the UK and the US S&P Global preliminary Manufacturing and Services PMI data for fresh hints on the state of the global economy, as recession fears loom. Further, speeches from Fed policymakers Raphael Bostic, Austan Goolsbee and Neel Kashkari will also grab attention, as markets brace for Fed Chair Jerome Powell’s speech and the critical US PCE inflation data due later this week.
Within the G10 currency basket, the Australian Dollar emerged as the main performer, driving AUD/USD back toward 0.6850. The pair cheers the PBOC’s easing move, despite weak domestic PMI data. Traders also resort to position readjustments ahead of Tuesday’s Reserve Bank of Australia (RBA) policy announcements.
USD/JPY rebounded firmly above 144.00 but faced rejection near 144.50 before consolating at around 144.25. The pair fails to find fresh impetus amid a public holiday in Japan. The upside, however, remains capped due to the divergent monetary policy outlooks between the Fed and the Bank of Japan (BoJ). The BoJ maintained the short-term rate target in the range of 0.15%-0.25%, as expected, sticking to its cautious stance.
USD/CAD remains on a slippery slope toward 1.3550 as Oil rallies nearly 1% on the Middle East geopolitical escalation and reports of Shell shutting down its production at two oil facilities in the Gulf of Mexico. WTI rises about 1% so far, flirting with $71.50 at the moment.
GBP/USD is keeping its range above 1.3300, consolidating the recent uptrend to over two-year highs before the next push higher. UK Chancellor Rachel Reeves's speech on Monday at the Labour Party conference will be closely eyed alongside the UK PMI data.
EUR/USD is defending 1.1150, extending its side trend into the early European session. The major awaits the German and Eurozone PMI data for fresh trading incentives.
Gold stretches higher and records a new lifetime high above $2,630 on Chinese stimulus optimism and Mid-East concerns. Gold traders turn cautious, as the Relative Strength Index (RSI), a leading indicator, on the daily chart has entered the overbought territory.
- WTI price appreciates due to possible supply disruptions amid mounting tensions in the Middle East.
- Hezbollah and Israel exchanged missile attacks, with the Lebanese militant group launching missiles deep into Israeli territory.
- Shell may shut down production at its two facilities in the Gulf of Mexico.
West Texas Intermediate (WTI) Oil price continues to gain ground, trading around $71.50 during the Asian hours on Monday. Crude Oil prices are rising due to concerns over potential supply disruptions amid escalating tensions in the Middle East.
Hezbollah and Israel engaged in heavy exchanges of fire on Sunday, with the Lebanese militant group launching missiles deep into northern Israeli territory following intense bombardment—some of the most severe in nearly a year of conflict, according to CNN.
On Saturday, Israel conducted approximately 300 strikes on Hezbollah positions, describing the actions as preemptive measures to prevent a planned attack. In response, Hezbollah fired a barrage of rockets and missiles into Israel, asserting that it was retaliating for Israeli strikes in Lebanon.
Expectations that the US Federal interest rate cut last week will support crude Oil demand. Lower borrowing costs may support in growing economic activities in the world’s largest Oil consumer United States (US), which could improve the Oil demand. Federal Reserve (Fed) policymakers predict an additional 75 basis points (bps) of rate cuts in 2024, following an aggressive 50 basis point rate cut to a 4.75-5.00% range last week.
According to a Reuters report on Sunday, Shell plans to shut down production at its Stones and Appomattox facilities in the Gulf of Mexico as a precautionary measure due to a tropical disturbance. Shell stated, "We are in the process of safely pausing some of our drilling operations and currently have no other impact on our production across the Gulf of Mexico."
WTI Oil FAQs
WTI Oil is a type of Crude Oil sold on international markets. The WTI stands for West Texas Intermediate, one of three major types including Brent and Dubai Crude. WTI is also referred to as “light” and “sweet” because of its relatively low gravity and sulfur content respectively. It is considered a high quality Oil that is easily refined. It is sourced in the United States and distributed via the Cushing hub, which is considered “The Pipeline Crossroads of the World”. It is a benchmark for the Oil market and WTI price is frequently quoted in the media.
Like all assets, supply and demand are the key drivers of WTI Oil price. As such, global growth can be a driver of increased demand and vice versa for weak global growth. Political instability, wars, and sanctions can disrupt supply and impact prices. The decisions of OPEC, a group of major Oil-producing countries, is another key driver of price. The value of the US Dollar influences the price of WTI Crude Oil, since Oil is predominantly traded in US Dollars, thus a weaker US Dollar can make Oil more affordable and vice versa.
The weekly Oil inventory reports published by the American Petroleum Institute (API) and the Energy Information Agency (EIA) impact the price of WTI Oil. Changes in inventories reflect fluctuating supply and demand. If the data shows a drop in inventories it can indicate increased demand, pushing up Oil price. Higher inventories can reflect increased supply, pushing down prices. API’s report is published every Tuesday and EIA’s the day after. Their results are usually similar, falling within 1% of each other 75% of the time. The EIA data is considered more reliable, since it is a government agency.
OPEC (Organization of the Petroleum Exporting Countries) is a group of 13 Oil-producing nations who collectively decide production quotas for member countries at twice-yearly meetings. Their decisions often impact WTI Oil prices. When OPEC decides to lower quotas, it can tighten supply, pushing up Oil prices. When OPEC increases production, it has the opposite effect. OPEC+ refers to an expanded group that includes ten extra non-OPEC members, the most notable of which is Russia.
Gold prices rose in India on Monday, according to data compiled by FXStreet.
The price for Gold stood at 7,057.55 Indian Rupees (INR) per gram, up compared with the INR 7,037.26 it cost on Friday.
The price for Gold increased to INR 82,317.82 per tola from INR 82,081.16 per tola on friday.
| Unit measure | Gold Price in INR |
|---|---|
| 1 Gram | 7,057.55 |
| 10 Grams | 70,575.45 |
| Tola | 82,317.82 |
| Troy Ounce | 219,514.30 |
FXStreet calculates Gold prices in India by adapting international prices (USD/INR) to the local currency and measurement units. Prices are updated daily based on the market rates taken at the time of publication. Prices are just for reference and local rates could diverge slightly.
Gold FAQs
Gold has played a key role in human’s history as it has been widely used as a store of value and medium of exchange. Currently, apart from its shine and usage for jewelry, the precious metal is widely seen as a safe-haven asset, meaning that it is considered a good investment during turbulent times. Gold is also widely seen as a hedge against inflation and against depreciating currencies as it doesn’t rely on any specific issuer or government.
Central banks are the biggest Gold holders. In their aim to support their currencies in turbulent times, central banks tend to diversify their reserves and buy Gold to improve the perceived strength of the economy and the currency. High Gold reserves can be a source of trust for a country’s solvency. Central banks added 1,136 tonnes of Gold worth around $70 billion to their reserves in 2022, according to data from the World Gold Council. This is the highest yearly purchase since records began. Central banks from emerging economies such as China, India and Turkey are quickly increasing their Gold reserves.
Gold has an inverse correlation with the US Dollar and US Treasuries, which are both major reserve and safe-haven assets. When the Dollar depreciates, Gold tends to rise, enabling investors and central banks to diversify their assets in turbulent times. Gold is also inversely correlated with risk assets. A rally in the stock market tends to weaken Gold price, while sell-offs in riskier markets tend to favor the precious metal.
The price can move due to a wide range of factors. Geopolitical instability or fears of a deep recession can quickly make Gold price escalate due to its safe-haven status. As a yield-less asset, Gold tends to rise with lower interest rates, while higher cost of money usually weighs down on the yellow metal. Still, most moves depend on how the US Dollar (USD) behaves as the asset is priced in dollars (XAU/USD). A strong Dollar tends to keep the price of Gold controlled, whereas a weaker Dollar is likely to push Gold prices up.
(An automation tool was used in creating this post.)
- The Japanese Yen depreciates, likely due to thin trading conditions stemming from the holiday on Monday.
- BoJ Governor Ueda stated that the central bank will continue to adjust the level of monetary easing as needed.
- The US Dollar receives support as Treasury yields improve.
The Japanese Yen (JPY) extends its losses for the third consecutive session in holiday-thinned trading on Monday. This downward movement may be influenced by growing concerns that the Bank of Japan (BoJ) is not in a rush to raise interest rates.
The Bank of Japan maintained its interest rate target in the range of 0.15-0.25% at Friday’s meeting. BoJ Governor Kazuo Ueda emphasized that the central bank "will continue to adjust the level of monetary easing as needed to achieve our economic and inflation targets." Ueda acknowledged that while Japan's economy is showing moderate recovery, there are still signs of underlying weakness.
The US Dollar (USD) continues to rise as Treasury yields recover their losses. However, the Greenback may encounter challenges due to growing expectations for additional rate cuts by the US Federal Reserve (Fed) in 2024. According to the CME FedWatch Tool, markets are pricing in a 50% chance of a 50 basis point rate cut to a range of 4.0-4.25% by the end of this year.
Daily Digest Market Movers: Japanese Yen depreciates due to concerns of BoJ delaying rate hikes
- Japan's new "top currency diplomat," Atsushi Mimura, stated in an interview with NHK that the Yen carry trades accumulated in the past have likely been mostly unwound. Mimura cautioned that if such trades were to increase again, it could lead to heightened market volatility. "We are always monitoring the markets to ensure that does not happen," he added.
- On Friday, Philadelphia Fed President Patrick Harker stated that the US central bank has effectively steered through a challenging economic landscape in recent years. Harker compared monetary policy to driving a bus, where it's essential to balance speed.
- Japan’s Finance Minister Shunichi Suzuki stated on Friday that he “will continue to monitor and analyze the impact of the latest US rate cut on the Japanese economy and financial markets.” Suzuki added that the Federal Reserve Bank’s (FRB) perspective on the US economy aligns with the Japanese government's view that the US economy is likely to expand.
- Japan's Consumer Price Index (CPI) increased to 3.0% year-on-year in August, up from 2.8% previously, marking the highest level since October 2023. Additionally, the Core National CPI, excluding fresh food, reached a six-month high of 2.8%, rising for the fourth consecutive month and in line with market expectations.
- The Federal Open Market Committee (FOMC) lowered the federal funds rate to a range of 4.75% to 5.0%, marking the Fed’s first rate cut in over four years. Fed policymakers updated their quarterly economic forecasts, increasing the median projection for unemployment to 4.4% by the end of 2024, up from the 4.0% estimate made in June. They also raised their long-term forecast for the federal funds rate from 2.8% to 2.9%.
- Federal Reserve Chair Jerome Powell commented on the aggressive 50 basis point rate cut, saying, “This decision reflects our increased confidence that, with the right adjustments to our policy approach, we can maintain a strong labor market, achieve moderate economic growth, and bring inflation down to a sustainable 2% level.”
- Japan’s Merchandise Trade Balance Total recorded a larger trade deficit of ¥695.30 billion in August, up from ¥628.70 billion the previous month, but well below market expectations of a ¥1,380.0 billion shortfall. Exports increased by 5.6% year-over-year, marking the ninth consecutive month of growth, but fell short of the anticipated 10.0%. Imports rose by just 2.3%, the slowest pace in five months, significantly underperforming the projected 13.4% rise.
Technical Analysis: USD/JPY tests 144.50 near the upper boundary of the descending channel
USD/JPY trades around 144.40 on Monday. The daily chart analysis shows that the pair is moving higher within a descending channel. A break above the upper level of the channel would lead to a momentum shift from bearish to bullish bias. Additionally, the 14-day Relative Strength Index (RSI) is slightly below the 50 level. A break above this threshold could signal the emergence of bullish sentiment.
On the upside, the immediate resistance appears at the upper boundary of the descending channel around the 144.70 level. A breakthrough above this level could support the USD/JPY pair to test the psychological level of the 145.00.
On the downside, the USD/JPY pair could test the 21-day Exponential Moving Average (EMA) at the 143.76 level, followed by the nine-day EMA at the 143.00 level. A break below the latter could push the pair to revisit the 139.58, which is the lowest level since June 2023.
USD/JPY: Daily Chart
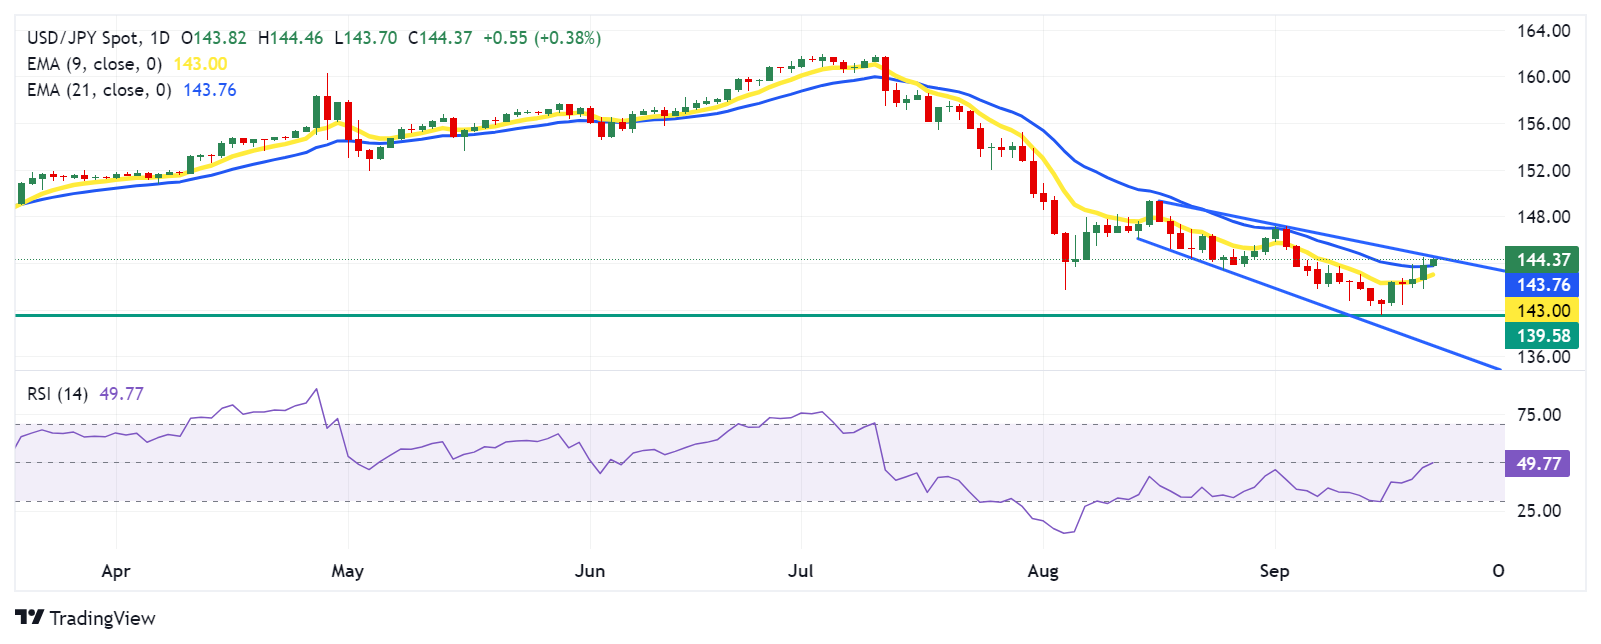
Japanese Yen PRICE Today
The table below shows the percentage change of Japanese Yen (JPY) against listed major currencies today. Japanese Yen was the weakest against the Australian Dollar.
| USD | EUR | GBP | JPY | CAD | AUD | NZD | CHF | |
|---|---|---|---|---|---|---|---|---|
| USD | 0.01% | 0.07% | 0.27% | -0.02% | -0.34% | -0.14% | 0.12% | |
| EUR | -0.01% | 0.00% | 0.27% | -0.01% | -0.42% | -0.15% | 0.10% | |
| GBP | -0.07% | -0.01% | 0.35% | -0.02% | -0.41% | -0.13% | 0.10% | |
| JPY | -0.27% | -0.27% | -0.35% | -0.29% | -0.70% | -0.40% | -0.27% | |
| CAD | 0.02% | 0.01% | 0.02% | 0.29% | -0.27% | -0.12% | 0.12% | |
| AUD | 0.34% | 0.42% | 0.41% | 0.70% | 0.27% | 0.30% | 0.51% | |
| NZD | 0.14% | 0.15% | 0.13% | 0.40% | 0.12% | -0.30% | 0.23% | |
| CHF | -0.12% | -0.10% | -0.10% | 0.27% | -0.12% | -0.51% | -0.23% |
The heat map shows percentage changes of major currencies against each other. The base currency is picked from the left column, while the quote currency is picked from the top row. For example, if you pick the Japanese Yen from the left column and move along the horizontal line to the US Dollar, the percentage change displayed in the box will represent JPY (base)/USD (quote).
Japanese Yen FAQs
The Japanese Yen (JPY) is one of the world’s most traded currencies. Its value is broadly determined by the performance of the Japanese economy, but more specifically by the Bank of Japan’s policy, the differential between Japanese and US bond yields, or risk sentiment among traders, among other factors.
One of the Bank of Japan’s mandates is currency control, so its moves are key for the Yen. The BoJ has directly intervened in currency markets sometimes, generally to lower the value of the Yen, although it refrains from doing it often due to political concerns of its main trading partners. The current BoJ ultra-loose monetary policy, based on massive stimulus to the economy, has caused the Yen to depreciate against its main currency peers. This process has exacerbated more recently due to an increasing policy divergence between the Bank of Japan and other main central banks, which have opted to increase interest rates sharply to fight decades-high levels of inflation.
The BoJ’s stance of sticking to ultra-loose monetary policy has led to a widening policy divergence with other central banks, particularly with the US Federal Reserve. This supports a widening of the differential between the 10-year US and Japanese bonds, which favors the US Dollar against the Japanese Yen.
The Japanese Yen is often seen as a safe-haven investment. This means that in times of market stress, investors are more likely to put their money in the Japanese currency due to its supposed reliability and stability. Turbulent times are likely to strengthen the Yen’s value against other currencies seen as more risky to invest in.
In an interview with NHK Broadcaster on Monday, Atsushi Mimura, Japan’s newly appointed Vice Finance Minister For International Affairs and top foreign exchange official, said that “authorities are always watching markets.”
Additional quotes
Yen carry trades built up in the past are likely to have been mostly unwound ...but if such moves increase again, that could heighten market volatility.
We are always watching markets to ensure that does not happen.
Authorities stand ready to act if currency moves become extremely volatile and deviate from fundamentals in a way that cause problems to firms and households.
Market reaction
USD/JPY is little changed on these comments amid a national holiday-led thin trading. The pair is last seen trading at 144.32, up 0.30% on the day.
- The Australian Dollar receives support from the hawkish sentiment surrounding the upcoming RBA monetary policy decision.
- The AUD could have received support as the PBoC injected liquidity into the banking system.
- The AUD/USD pair remains solid as the RBA is expected to keep Official Cash Rate steady at 4.35% on Tuesday.
The Australian Dollar (AUD) gains ground against the US Dollar (USD) despite the weaker Purchasing Managers Index (PMI) data released on Monday. The AUD/USD pair is likely appreciating due to the People’s Bank of China (PBoC) injecting liquidity into the banking system. As close trade partners, developments in the Chinese economy can have a substantial impact on Australian markets.
The People’s Bank of China (PBoC) injected CNY 74.5 billion in liquidity into the banking system via a 14-day reverse repo, with the rate lowered to 1.85% from 1.95%. Additionally, the Chinese central bank also injected CNY 160.1 billion in liquidity via a 7-day reverse repo, with the rate unchanged at 1.7%.
The AUD could also gain ground due to the hawkish expectations around the Reserve Bank of Australia’s (RBA) upcoming interest rate decision scheduled for Tuesday. The RBA is anticipated to keep the Official Cash Rate (OCR) steady at 4.35%, supported by robust labor market data and ongoing inflationary pressures.
The US Dollar (USD) may depreciate as Federal Reserve (Fed) policymakers predict an additional 75 basis points (bps) of rate cuts in 2024, following an aggressive 50 basis point rate cut to a 4.75-5.00% range last week.
Daily Digest Market Movers: Australian Dollar remains solid due to hawkish sentiment surrounding the RBA
- Australian Treasurer Jim Chalmers is working to establish a new monetary policy board at the Reserve Bank of Australia, but he needs the support of the Greens Party to move forward. The Greens have stated they will only back changes at the RBA if there is a commitment to lowering interest rates.
- Philadelphia Fed President Patrick Harker stated on Friday that the US central bank has effectively steered through a challenging economic landscape in recent years. Harker compared monetary policy to driving a bus, where it's essential to balance speed.
- Australia’s Judo Bank Composite PMI declined to 49.8 in September from 51.7 in August, indicating a contraction in business activity as slower growth in the services sector was unable to counterbalance a deeper slump in manufacturing output. The Services PMI fell to 50.6 in September from 52.5 previously, while the Manufacturing PMI decreased to 46.7 from 48.5 in August.
- On Friday, the People’s Bank of China (PBoC) opted to keep its one-year and five-year Loan Prime Rates (LPRs) unchanged at 3.35% and 3.85%, respectively.
- Commonwealth Bank (CBA) has adjusted its expectation for the first Reserve Bank of Australia rate cut of 25 basis points, moving it from November 2024 to December 2024. This shift follows a robust employment rate and a continued "hawkish" outlook from the central bank, according to Yahoo Finance.
- Australian Employment Change came in at 47.5K in August, down from 48.9K (revised from 58.2K) in July, but well above the consensus forecast of 25.0K. The Unemployment Rate remained steady at 4.2% in August, in line with both expectations and the previous month's figure, according to data released by the Australian Bureau of Statistics (ABS).
- Reserve Bank of Australia (RBA) Governor Michele Bullock emphasized that it is premature to consider rate cuts given the persistently high inflation. Additionally, RBA Assistant Governor Sarah Hunter noted that while the labor market remains tight, wage growth seems to have peaked and is expected to slow further.
Technical Analysis: Australian Dollar remains above 0.6800 as it attempts to return to ascending channel
The AUD/USD pair trades near 0.6820 on Monday. Technical analysis of the daily chart indicates that the pair is testing the lower boundary of the ascending channel pattern, suggesting a weakening bullish bias. However, the 14-day Relative Strength Index (RSI) is still above 50, so further price movement of the area of the contest will provide a clearer indication of the pair’s trend.
With the AUD/USD pair currently testing the lower boundary of the ascending channel near the nine-month high of 0.6839 reached on September 19, a bounce above this level could propel the pair toward the upper boundary of the ascending channel, around the 0.6890 level.
On the downside, the AUD/USD pair may find support around the nine-day Exponential Moving Average (EMA) at 0.6771, with the next key support at the psychological level of 0.6700. A break below the latter could lead the pair toward its six-week low at 0.6622.
AUD/USD: Daily Chart
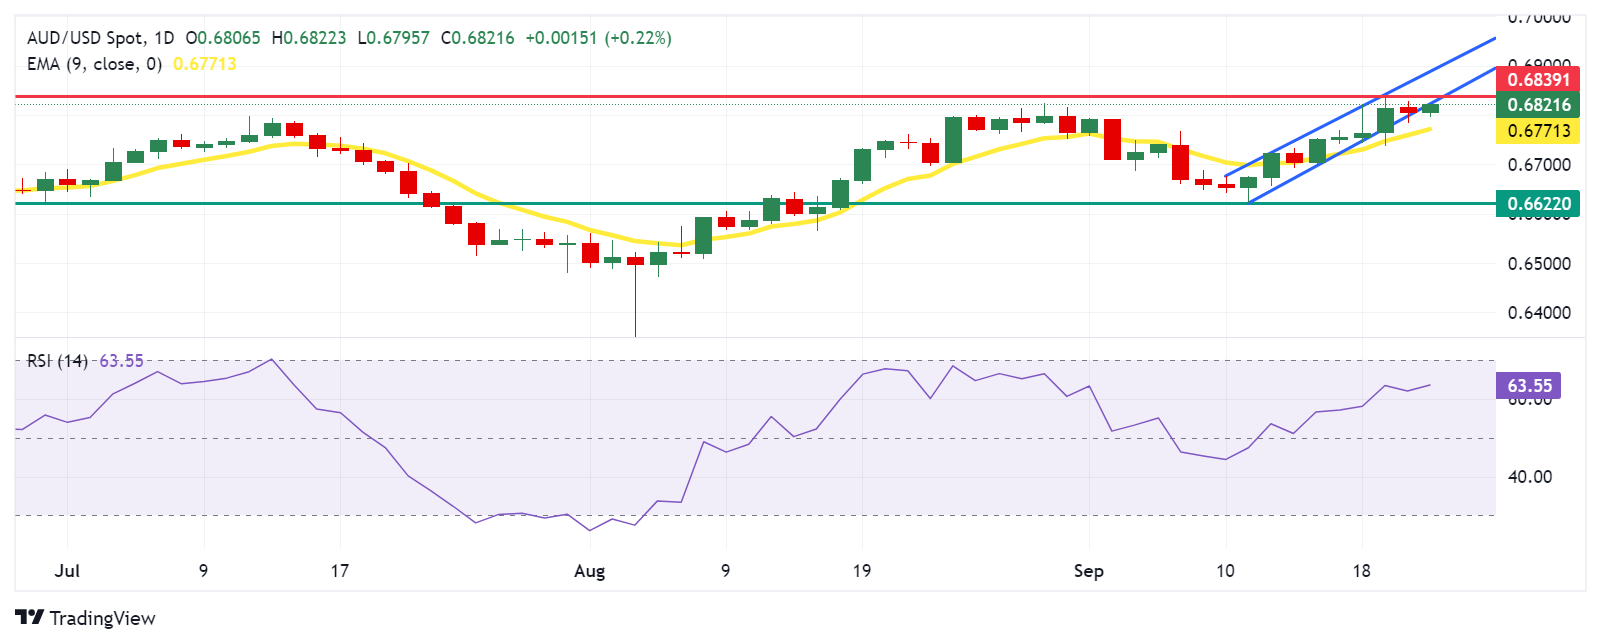
Australian Dollar PRICE Today
The table below shows the percentage change of Australian Dollar (AUD) against listed major currencies today. Australian Dollar was the strongest against the Japanese Yen.
| USD | EUR | GBP | JPY | CAD | AUD | NZD | CHF | |
|---|---|---|---|---|---|---|---|---|
| USD | 0.00% | 0.07% | 0.26% | -0.02% | -0.22% | -0.04% | 0.13% | |
| EUR | -0.01% | 0.01% | 0.26% | -0.02% | -0.29% | -0.03% | 0.11% | |
| GBP | -0.07% | -0.01% | 0.33% | -0.03% | -0.30% | -0.06% | 0.10% | |
| JPY | -0.26% | -0.26% | -0.33% | -0.29% | -0.57% | -0.29% | -0.25% | |
| CAD | 0.02% | 0.02% | 0.03% | 0.29% | -0.15% | -0.01% | 0.13% | |
| AUD | 0.22% | 0.29% | 0.30% | 0.57% | 0.15% | 0.27% | 0.40% | |
| NZD | 0.04% | 0.03% | 0.06% | 0.29% | 0.01% | -0.27% | 0.14% | |
| CHF | -0.13% | -0.11% | -0.10% | 0.25% | -0.13% | -0.40% | -0.14% |
The heat map shows percentage changes of major currencies against each other. The base currency is picked from the left column, while the quote currency is picked from the top row. For example, if you pick the Australian Dollar from the left column and move along the horizontal line to the US Dollar, the percentage change displayed in the box will represent AUD (base)/USD (quote).
Australian Dollar FAQs
One of the most significant factors for the Australian Dollar (AUD) is the level of interest rates set by the Reserve Bank of Australia (RBA). Because Australia is a resource-rich country another key driver is the price of its biggest export, Iron Ore. The health of the Chinese economy, its largest trading partner, is a factor, as well as inflation in Australia, its growth rate and Trade Balance. Market sentiment – whether investors are taking on more risky assets (risk-on) or seeking safe-havens (risk-off) – is also a factor, with risk-on positive for AUD.
The Reserve Bank of Australia (RBA) influences the Australian Dollar (AUD) by setting the level of interest rates that Australian banks can lend to each other. This influences the level of interest rates in the economy as a whole. The main goal of the RBA is to maintain a stable inflation rate of 2-3% by adjusting interest rates up or down. Relatively high interest rates compared to other major central banks support the AUD, and the opposite for relatively low. The RBA can also use quantitative easing and tightening to influence credit conditions, with the former AUD-negative and the latter AUD-positive.
China is Australia’s largest trading partner so the health of the Chinese economy is a major influence on the value of the Australian Dollar (AUD). When the Chinese economy is doing well it purchases more raw materials, goods and services from Australia, lifting demand for the AUD, and pushing up its value. The opposite is the case when the Chinese economy is not growing as fast as expected. Positive or negative surprises in Chinese growth data, therefore, often have a direct impact on the Australian Dollar and its pairs.
Iron Ore is Australia’s largest export, accounting for $118 billion a year according to data from 2021, with China as its primary destination. The price of Iron Ore, therefore, can be a driver of the Australian Dollar. Generally, if the price of Iron Ore rises, AUD also goes up, as aggregate demand for the currency increases. The opposite is the case if the price of Iron Ore falls. Higher Iron Ore prices also tend to result in a greater likelihood of a positive Trade Balance for Australia, which is also positive of the AUD.
The Trade Balance, which is the difference between what a country earns from its exports versus what it pays for its imports, is another factor that can influence the value of the Australian Dollar. If Australia produces highly sought after exports, then its currency will gain in value purely from the surplus demand created from foreign buyers seeking to purchase its exports versus what it spends to purchase imports. Therefore, a positive net Trade Balance strengthens the AUD, with the opposite effect if the Trade Balance is negative.
- Gold price trades in positive territory in Monday’s Asian session.
- The US Fed rate cut and Middle East geopolitical risks continue to underpin the precious metal.
- The renewed US Dollar demand might cap the upside of the XAU/USD.
The Gold price (XAU/USD) reaches a record high on Monday, supported by a softer Greenback. The start of a monetary easing cycle of the Federal Reserve’s (Fed) and the expectation of deeper rate cuts this year might underpin the non-interest-bearing Gold price. Furthermore, the rising geopolitical tensions in the Middle East might lead to fresh allocation towards safe-haven assets like gold.
Looking ahead, traders will keep an eye on the flash reading of the US Purchasing Managers Index (PMI) data, which is due later on Monday. However, the stronger-than-expected outcome could lift the USD and weigh on the USD-denominated Gold price.
Daily Digest Market Movers: Gold price remains stronger amid global factors
- "The forced liquidation of short positions may push the gold price higher into historical highs, as the US dollar generally holds its ground against a basket of major currencies, and rising bond yields create an unfavorable environment for gold," said FxPro analysts.
- Hezbollah and Israel exchanged heavy fire on Sunday, as the Lebanese militant group launched missiles deep into northern Israeli territory after facing some of the most intense bombardment in almost a year of conflict, per CNN.
- Fed Philadelphia President Patrick Harker said on Friday that the US central bank has effectively navigated a challenging economy over the last few years. Harker further stated that "hard" and "soft" data are both important in decision-making.
- Fed Governor Michelle Bowman noted on Friday that it was appropriate to recalibrate the Fed funds rate level, but she preferred a smaller first move as they have not yet achieved the inflation target.
- Fed Governor Christopher Waller noted on Friday that the decision to cut interest rates by an accelerated 50 bps was the right call, but the US central bank could even pause, depending on further data.
Technical Analysis: Gold price holds above $2,600 amid an overbought RSI
The Gold price edges higher on the day. The precious metal keeps a strong bullish trend on the daily timeframe as the price is well-supported above the key 100-day Exponential Moving Average (EMA). However, the 14-day Relative Strength Index (RSI) stands above the midline near 70.50, indicating the overbought RSI condition. This suggests that further consolidation cannot be ruled out before positioning for any near-term Gold price rise.
The yellow metal approaches a major resistance area near the all-time high at $2,625. A decisive break above this level could pave the way to the $2,700 psychological level.
On the flip side, the first downside target emerges at the $2,600 round figure. A breach of this level could see a downward move back towards the resistance-turned-support level at $2,560. The next contention level is located at $2,485, the low of September 6.
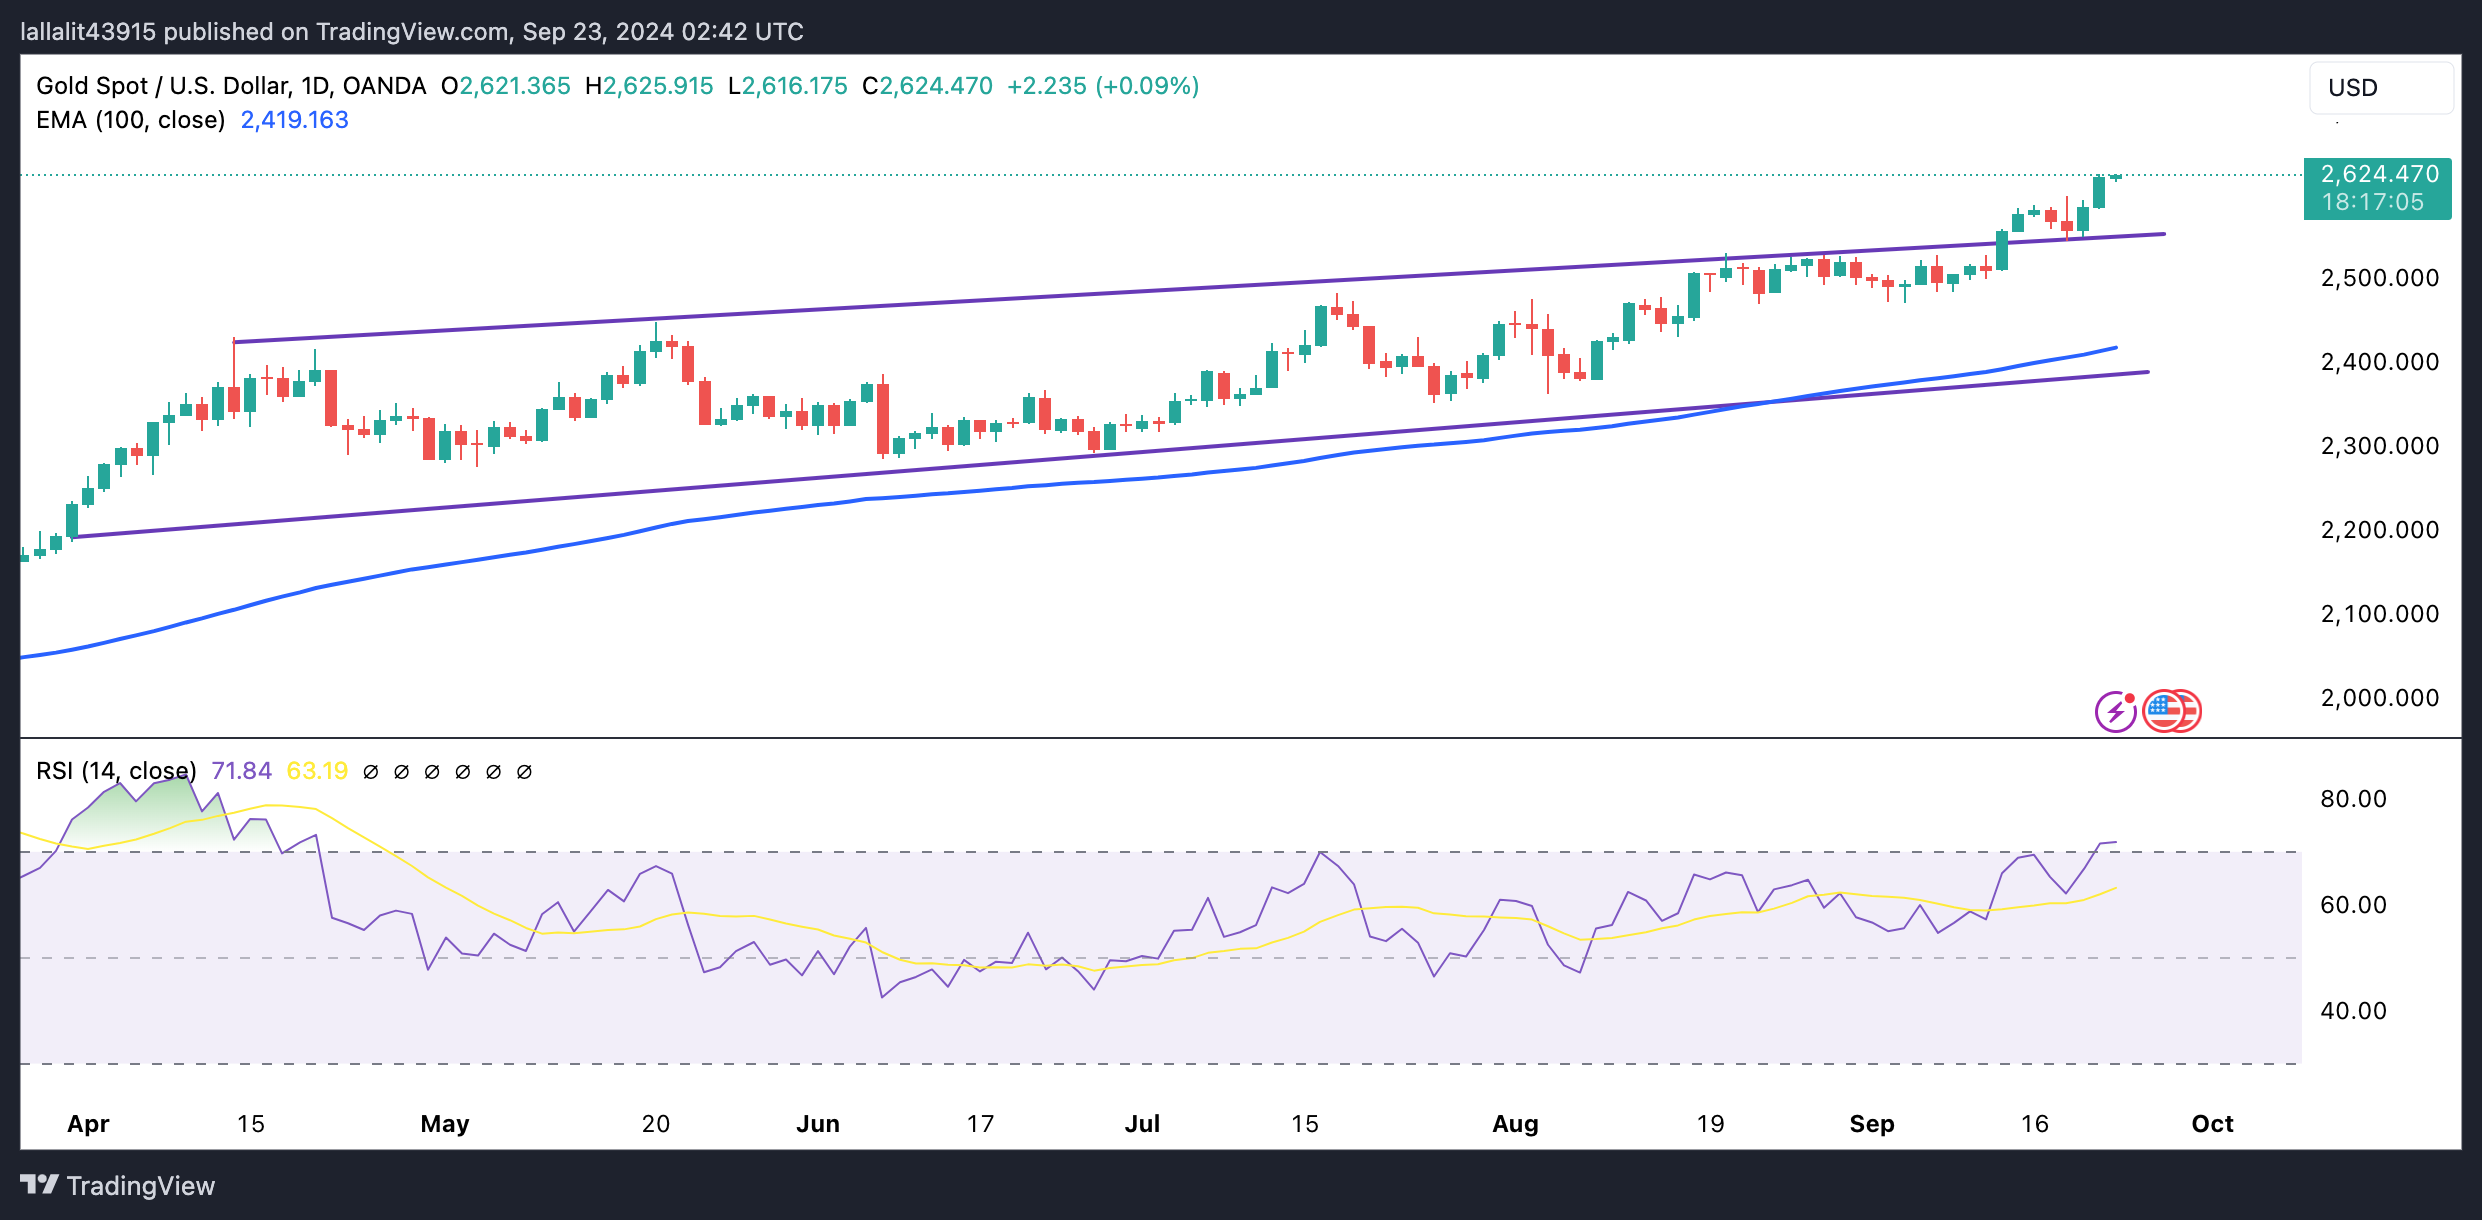
Gold FAQs
Gold has played a key role in human’s history as it has been widely used as a store of value and medium of exchange. Currently, apart from its shine and usage for jewelry, the precious metal is widely seen as a safe-haven asset, meaning that it is considered a good investment during turbulent times. Gold is also widely seen as a hedge against inflation and against depreciating currencies as it doesn’t rely on any specific issuer or government.
Central banks are the biggest Gold holders. In their aim to support their currencies in turbulent times, central banks tend to diversify their reserves and buy Gold to improve the perceived strength of the economy and the currency. High Gold reserves can be a source of trust for a country’s solvency. Central banks added 1,136 tonnes of Gold worth around $70 billion to their reserves in 2022, according to data from the World Gold Council. This is the highest yearly purchase since records began. Central banks from emerging economies such as China, India and Turkey are quickly increasing their Gold reserves.
Gold has an inverse correlation with the US Dollar and US Treasuries, which are both major reserve and safe-haven assets. When the Dollar depreciates, Gold tends to rise, enabling investors and central banks to diversify their assets in turbulent times. Gold is also inversely correlated with risk assets. A rally in the stock market tends to weaken Gold price, while sell-offs in riskier markets tend to favor the precious metal.
The price can move due to a wide range of factors. Geopolitical instability or fears of a deep recession can quickly make Gold price escalate due to its safe-haven status. As a yield-less asset, Gold tends to rise with lower interest rates, while higher cost of money usually weighs down on the yellow metal. Still, most moves depend on how the US Dollar (USD) behaves as the asset is priced in dollars (XAU/USD). A strong Dollar tends to keep the price of Gold controlled, whereas a weaker Dollar is likely to push Gold prices up.
| Raw materials | Closed | Change, % |
|---|---|---|
| Silver | 31.159 | 1.27 |
| Gold | 262.194 | 1.37 |
| Palladium | 1062.76 | -1.82 |
- GBP/USD trades on a softer note near 1.3310 in Monday's Asian session.
- Rising bet on further Fed rate cuts later this year might undermine the US Dollar.
- The preliminary September UK/US PMI data will be in the spotlight on Monday.
The GBP/USD pair edges lower to 1.3310, snapping the three-day winning streak during the early Asian session on Monday. The modest recovery of the US Dollar (USD) weighs on the major pair. Investors will focus on the flash reading of the UK and US Purchasing Managers Index (PMI) data, which are due later on Monday.
The US Federal Reserve (Fed) lowered its key overnight borrowing rate by a half percentage point last week, the first interest rate cut since the early days of the Covid pandemic. The Fed statement noted, “The Committee has gained greater confidence that inflation is moving sustainably toward 2 percent, and judges that the risks to achieving its employment and inflation goals are roughly in balance.”
Fed Chair Jerome Powell was cautious not to declare a victory over inflation as pricing pressures continue to come down. The US Personal Consumption Expenditures (PCE) index, the Fed's preferred inflation gauge, which will be released on Friday, might offer some hints about the progress on inflation and the US interest rate outlook. Meanwhile, the uncertainty surrounding the US economic outlook and rising expectations of the Fed rate cut later this year will continue to drag the USD lower against the Pound Sterling (GBP).
On the other hand, Bank of England (BoE) Governor Andrew Bailey said that it is "vital that inflation stays low," and for that, "we need to be careful not to cut the interest rate too fast or by too much." The BoE decided to hold interest rates at 5.0% in its most recent monetary policy meeting. The decision came one day after the UK's Consumer Price Index (CPI) inflation data held steady at 2.2% YoY in August.
Pound Sterling FAQs
The Pound Sterling (GBP) is the oldest currency in the world (886 AD) and the official currency of the United Kingdom. It is the fourth most traded unit for foreign exchange (FX) in the world, accounting for 12% of all transactions, averaging $630 billion a day, according to 2022 data. Its key trading pairs are GBP/USD, aka ‘Cable’, which accounts for 11% of FX, GBP/JPY, or the ‘Dragon’ as it is known by traders (3%), and EUR/GBP (2%). The Pound Sterling is issued by the Bank of England (BoE).
The single most important factor influencing the value of the Pound Sterling is monetary policy decided by the Bank of England. The BoE bases its decisions on whether it has achieved its primary goal of “price stability” – a steady inflation rate of around 2%. Its primary tool for achieving this is the adjustment of interest rates. When inflation is too high, the BoE will try to rein it in by raising interest rates, making it more expensive for people and businesses to access credit. This is generally positive for GBP, as higher interest rates make the UK a more attractive place for global investors to park their money. When inflation falls too low it is a sign economic growth is slowing. In this scenario, the BoE will consider lowering interest rates to cheapen credit so businesses will borrow more to invest in growth-generating projects.
Data releases gauge the health of the economy and can impact the value of the Pound Sterling. Indicators such as GDP, Manufacturing and Services PMIs, and employment can all influence the direction of the GBP. A strong economy is good for Sterling. Not only does it attract more foreign investment but it may encourage the BoE to put up interest rates, which will directly strengthen GBP. Otherwise, if economic data is weak, the Pound Sterling is likely to fall.
Another significant data release for the Pound Sterling is the Trade Balance. This indicator measures the difference between what a country earns from its exports and what it spends on imports over a given period. If a country produces highly sought-after exports, its currency will benefit purely from the extra demand created from foreign buyers seeking to purchase these goods. Therefore, a positive net Trade Balance strengthens a currency and vice versa for a negative balance.
- EUR/USD remains stable ahead of the Purchasing Managers Index data release from Eurozone and Germany.
- The US Dollar may struggle due to the rising likelihood of more Fed rate cuts by the end of the year.
- ECB President Lagarde emphasized that monetary policy needs to stay adaptable.
EUR/USD maintains its position around 1.1160 during the Asian hours on Monday. The US Dollar (USD) may depreciate following the rising likelihood of further interest rate cuts by the Federal Reserve (Fed) in 2024, which may underpin the EUR/USD pair.
The US Federal Reserve cut interest rates by a larger-than-usual 50 basis points to a 4.75-5.00% range last week. Policymakers also predicted an additional 75 basis points (bps) of rate cuts by the end of the year.
However, Federal Reserve Chair Jerome Powell stated in the post-meeting press conference that the Fed is not in a hurry to ease policy and emphasized that half-percentage point rate cuts are not the "new pace."
On Friday, Philadelphia Fed President Patrick Harker stated that the US central bank has effectively steered through a challenging economic landscape in recent years. Harker compared monetary policy to driving a bus, where it's essential to balance speed. He also emphasized that achieving maximum employment is more than just the number of jobs—it also includes the quality of those jobs.
On the EUR front, European Central Bank (ECB) President Christine Lagarde emphasized in her speech on Friday that monetary policy needs to stay adaptable in a constantly evolving world. Although the core objectives of monetary policy, particularly price stability, remain the same, central banks must maintain flexibility to respond to the challenges of a swiftly changing global economy, according to Euronews.
Traders are expected to closely monitor the Purchasing Managers Index (PMI) data from Eurozone and Germany set to be released later in the day. the monthly PMI serves as a leading indicator of business activity, providing insights into economic health and trends.
Euro FAQs
The Euro is the currency for the 20 European Union countries that belong to the Eurozone. It is the second most heavily traded currency in the world behind the US Dollar. In 2022, it accounted for 31% of all foreign exchange transactions, with an average daily turnover of over $2.2 trillion a day. EUR/USD is the most heavily traded currency pair in the world, accounting for an estimated 30% off all transactions, followed by EUR/JPY (4%), EUR/GBP (3%) and EUR/AUD (2%).
The European Central Bank (ECB) in Frankfurt, Germany, is the reserve bank for the Eurozone. The ECB sets interest rates and manages monetary policy. The ECB’s primary mandate is to maintain price stability, which means either controlling inflation or stimulating growth. Its primary tool is the raising or lowering of interest rates. Relatively high interest rates – or the expectation of higher rates – will usually benefit the Euro and vice versa. The ECB Governing Council makes monetary policy decisions at meetings held eight times a year. Decisions are made by heads of the Eurozone national banks and six permanent members, including the President of the ECB, Christine Lagarde.
Eurozone inflation data, measured by the Harmonized Index of Consumer Prices (HICP), is an important econometric for the Euro. If inflation rises more than expected, especially if above the ECB’s 2% target, it obliges the ECB to raise interest rates to bring it back under control. Relatively high interest rates compared to its counterparts will usually benefit the Euro, as it makes the region more attractive as a place for global investors to park their money.
Data releases gauge the health of the economy and can impact on the Euro. Indicators such as GDP, Manufacturing and Services PMIs, employment, and consumer sentiment surveys can all influence the direction of the single currency. A strong economy is good for the Euro. Not only does it attract more foreign investment but it may encourage the ECB to put up interest rates, which will directly strengthen the Euro. Otherwise, if economic data is weak, the Euro is likely to fall. Economic data for the four largest economies in the euro area (Germany, France, Italy and Spain) are especially significant, as they account for 75% of the Eurozone’s economy.
Another significant data release for the Euro is the Trade Balance. This indicator measures the difference between what a country earns from its exports and what it spends on imports over a given period. If a country produces highly sought after exports then its currency will gain in value purely from the extra demand created from foreign buyers seeking to purchase these goods. Therefore, a positive net Trade Balance strengthens a currency and vice versa for a negative balance.
On Monday, the People’s Bank of China (PBoC) set the USD/CNY central rate for the trading session ahead at 7.0531, as compared to the previous day's fix of 7.0644 and 7.0518 Reuters estimates.
Hezbollah and Israel exchanged heavy fire on Sunday, as the Lebanese militant group launched missiles deep into northern Israeli territory after facing some of the most intense bombardment in almost a year of conflict, per CNN.
On Saturday, Israel launched roughly 300 strikes on Hezbollah sites in what they described as a preemptive action to thwart a planned attack. Meanwhile, Hezbollah has launched a barrage of rockets and other missiles into Israel, claiming it is retaliating for Israeli strikes in Lebanon.
Market reaction
At the time of press, Gold price was down 0.10% on the day at $2,620.
Risk sentiment FAQs
In the world of financial jargon the two widely used terms “risk-on” and “risk off'' refer to the level of risk that investors are willing to stomach during the period referenced. In a “risk-on” market, investors are optimistic about the future and more willing to buy risky assets. In a “risk-off” market investors start to ‘play it safe’ because they are worried about the future, and therefore buy less risky assets that are more certain of bringing a return, even if it is relatively modest.
Typically, during periods of “risk-on”, stock markets will rise, most commodities – except Gold – will also gain in value, since they benefit from a positive growth outlook. The currencies of nations that are heavy commodity exporters strengthen because of increased demand, and Cryptocurrencies rise. In a “risk-off” market, Bonds go up – especially major government Bonds – Gold shines, and safe-haven currencies such as the Japanese Yen, Swiss Franc and US Dollar all benefit.
The Australian Dollar (AUD), the Canadian Dollar (CAD), the New Zealand Dollar (NZD) and minor FX like the Ruble (RUB) and the South African Rand (ZAR), all tend to rise in markets that are “risk-on”. This is because the economies of these currencies are heavily reliant on commodity exports for growth, and commodities tend to rise in price during risk-on periods. This is because investors foresee greater demand for raw materials in the future due to heightened economic activity.
The major currencies that tend to rise during periods of “risk-off” are the US Dollar (USD), the Japanese Yen (JPY) and the Swiss Franc (CHF). The US Dollar, because it is the world’s reserve currency, and because in times of crisis investors buy US government debt, which is seen as safe because the largest economy in the world is unlikely to default. The Yen, from increased demand for Japanese government bonds, because a high proportion are held by domestic investors who are unlikely to dump them – even in a crisis. The Swiss Franc, because strict Swiss banking laws offer investors enhanced capital protection.
| Index | Change, points | Closed | Change, % |
|---|---|---|---|
| NIKKEI 225 | 568.58 | 37723.91 | 1.53 |
| Hang Seng | 245.41 | 18258.57 | 1.36 |
| KOSPI | 12.57 | 2593.37 | 0.49 |
| ASX 200 | 17.6 | 8209.5 | 0.21 |
| DAX | -282.37 | 18720.01 | -1.49 |
| CAC 40 | -115.15 | 7500.26 | -1.51 |
| Dow Jones | 38.17 | 42063.36 | 0.09 |
| S&P 500 | -11.09 | 5702.55 | -0.19 |
| NASDAQ Composite | -65.66 | 17948.32 | -0.36 |
Federal Reserve (Fed) Bank of Philadelphia Patrick Harker said on Friday that the US central bank has efficiently navigated a challenging economy over the past few years.
Key quotes
Monetary policy is likened to driving a bus - need to balance speed.
Maximum employment involves job quality, not just quantity.
Philadelphia Fed conducts research beyond monetary policy.
Importance of both "hard" and "soft" data in decision-making.
Fed plays a crucial role in bank supervision and financial stability.
Fed is exploring AI and quantum computing impacts on finance.
There is a risk that the inflation decline could stall.
There is a risk that the labor market could soften.
Market reaction
The US Dollar Index (DXY) is trading 0.06% higher on the day at 100.80, as of writing.
Fed FAQs
Monetary policy in the US is shaped by the Federal Reserve (Fed). The Fed has two mandates: to achieve price stability and foster full employment. Its primary tool to achieve these goals is by adjusting interest rates. When prices are rising too quickly and inflation is above the Fed’s 2% target, it raises interest rates, increasing borrowing costs throughout the economy. This results in a stronger US Dollar (USD) as it makes the US a more attractive place for international investors to park their money. When inflation falls below 2% or the Unemployment Rate is too high, the Fed may lower interest rates to encourage borrowing, which weighs on the Greenback.
The Federal Reserve (Fed) holds eight policy meetings a year, where the Federal Open Market Committee (FOMC) assesses economic conditions and makes monetary policy decisions. The FOMC is attended by twelve Fed officials – the seven members of the Board of Governors, the president of the Federal Reserve Bank of New York, and four of the remaining eleven regional Reserve Bank presidents, who serve one-year terms on a rotating basis.
In extreme situations, the Federal Reserve may resort to a policy named Quantitative Easing (QE). QE is the process by which the Fed substantially increases the flow of credit in a stuck financial system. It is a non-standard policy measure used during crises or when inflation is extremely low. It was the Fed’s weapon of choice during the Great Financial Crisis in 2008. It involves the Fed printing more Dollars and using them to buy high grade bonds from financial institutions. QE usually weakens the US Dollar.
Quantitative tightening (QT) is the reverse process of QE, whereby the Federal Reserve stops buying bonds from financial institutions and does not reinvest the principal from the bonds it holds maturing, to purchase new bonds. It is usually positive for the value of the US Dollar.
| Pare | Closed | Change, % |
|---|---|---|
| AUDUSD | 0.68064 | -0.1 |
| EURJPY | 160.635 | 0.94 |
| EURUSD | 1.11623 | 0.01 |
| GBPJPY | 191.697 | 1.21 |
| GBPUSD | 1.33208 | 0.3 |
| NZDUSD | 0.62359 | -0.07 |
| USDCAD | 1.35668 | 0.06 |
| USDCHF | 0.85023 | 0.32 |
| USDJPY | 143.891 | 0.9 |
- Gold price posts modest losses around $2,620 in Monday's early Asian session.
- US Fed rate cut and geopolitical risks boost the precious metal.
- The positive view for US growth and stronger US economic data could weigh on the XAU/USD price.
The Gold price (XAU/USD) trades in negative territory around $2,620 but remains near the all-time high on Monday during the early Asian session. An aggressive interest cut by the Federal Reserve (Fed) and rising geopolitical tension in the Middle East lift the Gold price, a traditional safe-haven asset.
The Federal Open Market Committee (FOMC) slashed its interest rates by a surprise 50 basis points (bps) last week following a two-day meeting and signaled that more cuts are likely before the end of 2024. A rate cut by the US Fed is likely to boost the appeal of the non-interest-bearing Gold price.
Additionally, fears of an escalation of tensions in the Middle East after Hezbollah vows retaliation for a pager attack provide some support to the yellow metal price. Hezbollah and Israel exchanged heavy fire on Sunday, as the Lebanese militant group launched missiles deep into northern Israeli territory after facing some of the most intense bombardment in almost a year of conflict, per CNN.
The upside of the precious metal might be capped by the Fed’s broadly positive outlook for US growth. The Fed forecasts that the US economy will expand about 2.0% per year until the end of 2027, suggesting a soft landing profile for the economy. This, in turn, might drag the safe-haven Gold lower.
Looking ahead, Gold traders will closely monitor the development surrounding the Middle East geopolitical risks. Furthermore, the flash reading of the US Purchasing Managers Index (PMI) will be released later on Monday. In case of the stronger-than-expected outcome, this could underpin the Greenback and exert some selling pressure on the USD-denominated Gold price.
Gold FAQs
Gold has played a key role in human’s history as it has been widely used as a store of value and medium of exchange. Currently, apart from its shine and usage for jewelry, the precious metal is widely seen as a safe-haven asset, meaning that it is considered a good investment during turbulent times. Gold is also widely seen as a hedge against inflation and against depreciating currencies as it doesn’t rely on any specific issuer or government.
Central banks are the biggest Gold holders. In their aim to support their currencies in turbulent times, central banks tend to diversify their reserves and buy Gold to improve the perceived strength of the economy and the currency. High Gold reserves can be a source of trust for a country’s solvency. Central banks added 1,136 tonnes of Gold worth around $70 billion to their reserves in 2022, according to data from the World Gold Council. This is the highest yearly purchase since records began. Central banks from emerging economies such as China, India and Turkey are quickly increasing their Gold reserves.
Gold has an inverse correlation with the US Dollar and US Treasuries, which are both major reserve and safe-haven assets. When the Dollar depreciates, Gold tends to rise, enabling investors and central banks to diversify their assets in turbulent times. Gold is also inversely correlated with risk assets. A rally in the stock market tends to weaken Gold price, while sell-offs in riskier markets tend to favor the precious metal.
The price can move due to a wide range of factors. Geopolitical instability or fears of a deep recession can quickly make Gold price escalate due to its safe-haven status. As a yield-less asset, Gold tends to rise with lower interest rates, while higher cost of money usually weighs down on the yellow metal. Still, most moves depend on how the US Dollar (USD) behaves as the asset is priced in dollars (XAU/USD). A strong Dollar tends to keep the price of Gold controlled, whereas a weaker Dollar is likely to push Gold prices up.


© 2000-2026. All rights reserved.
This site is managed by Teletrade D.J. LLC 2351 LLC 2022 (Euro House, Richmond Hill Road, Kingstown, VC0100, St. Vincent and the Grenadines).
The information on this website is for informational purposes only and does not constitute any investment advice.
The company does not serve or provide services to customers who are residents of the US, Canada, Iran, The Democratic People's Republic of Korea, Yemen and FATF blacklisted countries.
Making transactions on financial markets with marginal financial instruments opens up wide possibilities and allows investors who are willing to take risks to earn high profits, carrying a potentially high risk of losses at the same time. Therefore you should responsibly approach the issue of choosing the appropriate investment strategy, taking the available resources into account, before starting trading.
Use of the information: full or partial use of materials from this website must always be referenced to TeleTrade as the source of information. Use of the materials on the Internet must be accompanied by a hyperlink to teletrade.org. Automatic import of materials and information from this website is prohibited.
Please contact our PR department if you have any questions or need assistance at pr@teletrade.global.
transfers