- Analytics
- News and Tools
- Market News
CFD Markets News and Forecasts — 23-07-2024
- EUR/USD grinds down back to 1.0850 as investors huddle ahead of key data prints.
- EU and US PMI figures are due on Wednesday.
- US GDP update and PCE inflation figures due on Thursday and Friday, respectively.
EUR/USD dipped one-third of one percent on Tuesday as investors knuckle down for the wait to a double-header of Purchasing Managers Index (PMI) figures due from both the EU and the US on Wednesday.
Forex Today: Global PMIs take centre stage
Pan-EU PMI figures will kick things off during the early European market session on Wednesday, and markets anticipate a slight uptick in EU Services PMI figures to 53.0 in July after June’s 52.8.
In the US, the Services PMI for July is anticipated to ease slightly to 54.4 from June's 55.3. Global markets are widely anticipating a rate cut from the Federal Reserve (Fed) in September, and investors are closely monitoring US economic indicators for further signs of softening to affirm the rate outlook. Rate traders are currently pricing in nearly 100% odds of at least a quarter-point rate cut from the Federal Open Market Committee (FOMC) during the September 18 rate call.
As the week progresses, the quarterly US Gross Domestic Product figures are scheduled for Thursday, and the US Personal Consumption Expenditure Price Index (PCE) inflation is on the agenda for Friday. It is forecasted that the annualized Q2 US GDP will rise to 1.9% from 1.4%, and Core PCE inflation on Friday is expected to further decrease to 2.5% year-over-year for the year ended in June, compared to the previous month's 2.6%.
Euro PRICE This week
The table below shows the percentage change of Euro (EUR) against listed major currencies this week. Euro was the strongest against the Australian Dollar.
| USD | EUR | GBP | JPY | CAD | AUD | NZD | CHF | |
|---|---|---|---|---|---|---|---|---|
| USD | 0.29% | 0.08% | -1.00% | 0.49% | 1.07% | 1.02% | 0.42% | |
| EUR | -0.29% | -0.21% | -1.30% | 0.16% | 0.83% | 0.68% | 0.06% | |
| GBP | -0.08% | 0.21% | -1.21% | 0.36% | 1.04% | 0.88% | 0.26% | |
| JPY | 1.00% | 1.30% | 1.21% | 1.52% | 2.15% | 1.99% | 1.35% | |
| CAD | -0.49% | -0.16% | -0.36% | -1.52% | 0.68% | 0.53% | -0.09% | |
| AUD | -1.07% | -0.83% | -1.04% | -2.15% | -0.68% | -0.15% | -0.77% | |
| NZD | -1.02% | -0.68% | -0.88% | -1.99% | -0.53% | 0.15% | -0.58% | |
| CHF | -0.42% | -0.06% | -0.26% | -1.35% | 0.09% | 0.77% | 0.58% |
The heat map shows percentage changes of major currencies against each other. The base currency is picked from the left column, while the quote currency is picked from the top row. For example, if you pick the Euro from the left column and move along the horizontal line to the US Dollar, the percentage change displayed in the box will represent EUR (base)/USD (quote).
EUR/USD technical outlook
The Euro’s early decline on Tuesday has sent EUR/USD into fresh lows near 1.0850, and the pair is scrambling to find a foothold ahead of Wednesday’s meaningful trading window. The Fiber has declined nearly a full percent since getting turned around from a near-term high of 1.0948.
Fiber remains on the north side of the 200-day Exponential Moving Average (EMA) at 1.0804, but this week’s downturn leaves the pair exposed to further downside as bids dip back into the wrong side of a rough descending channel.
EUR/USD hourly chart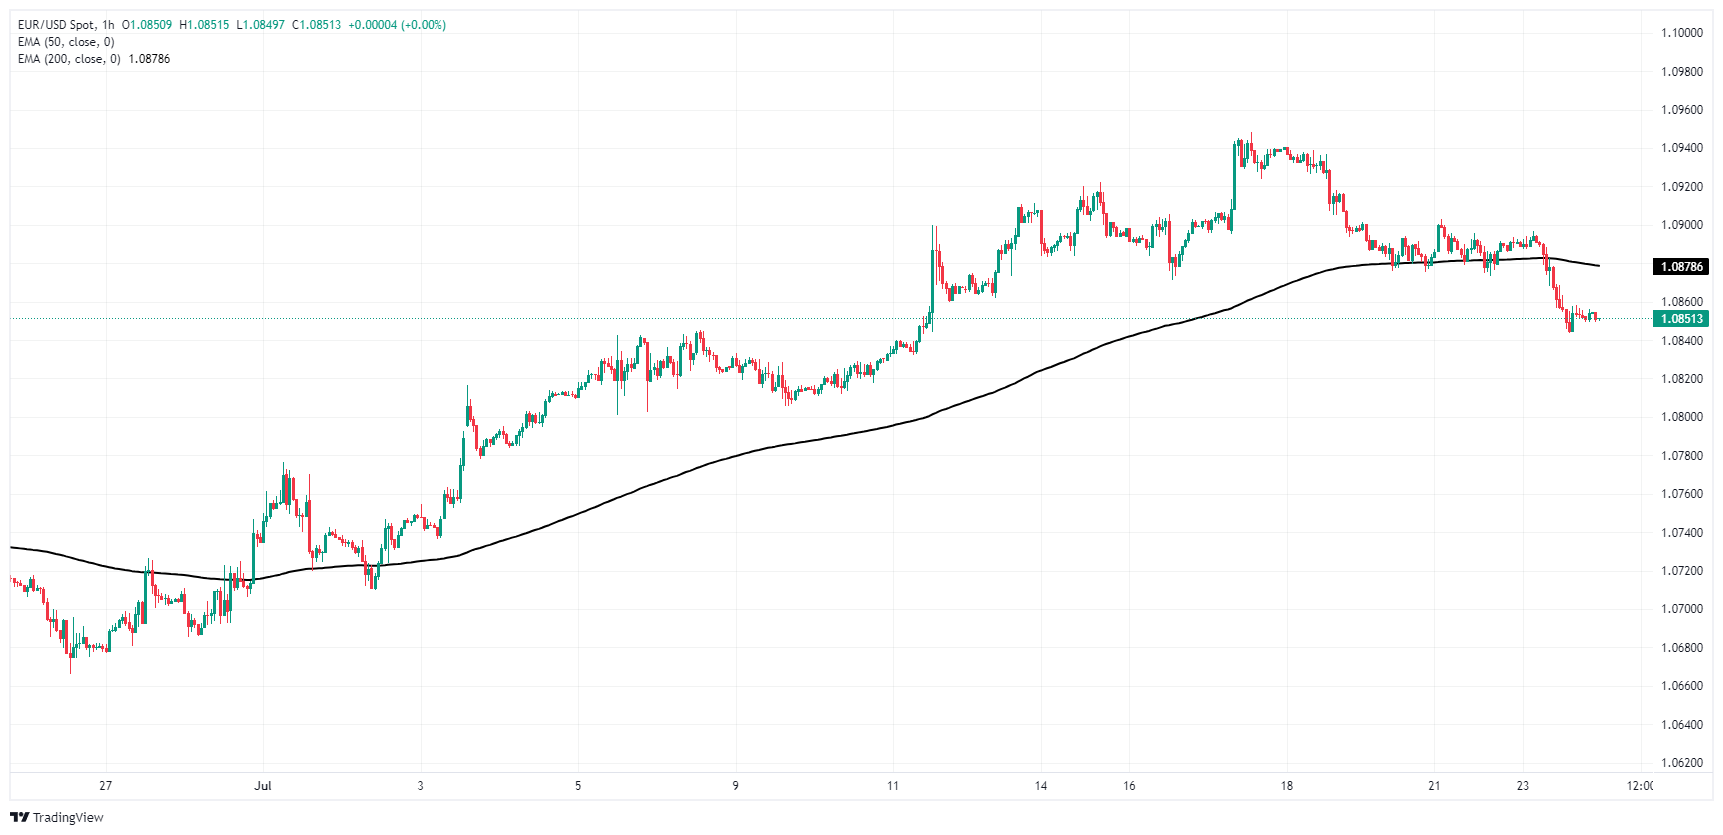
EUR/USD daily chart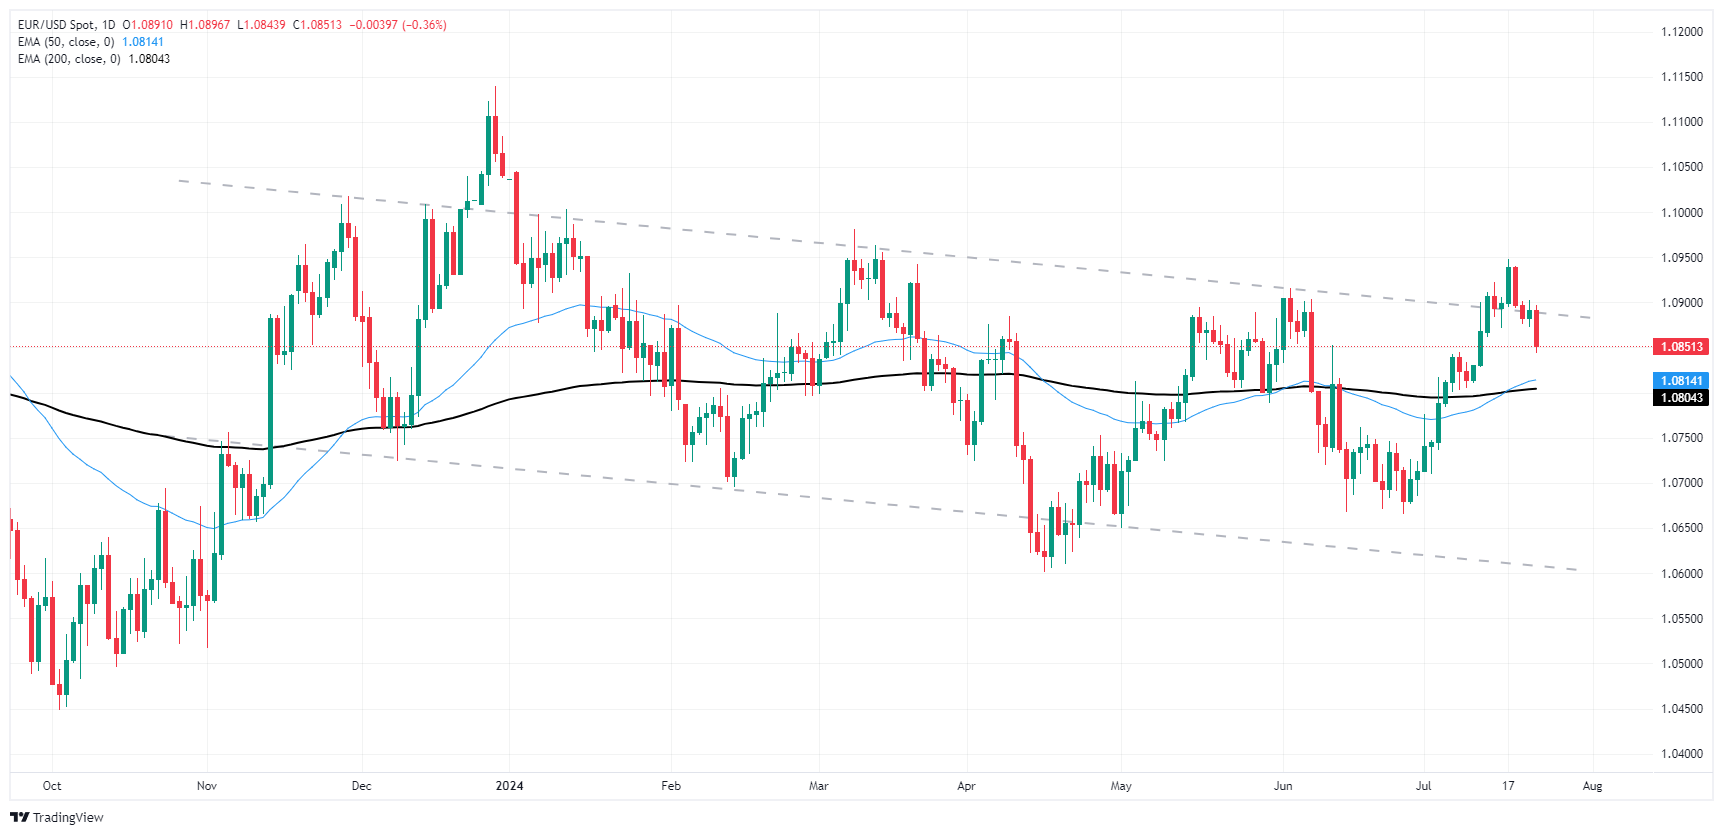
Euro FAQs
The Euro is the currency for the 20 European Union countries that belong to the Eurozone. It is the second most heavily traded currency in the world behind the US Dollar. In 2022, it accounted for 31% of all foreign exchange transactions, with an average daily turnover of over $2.2 trillion a day. EUR/USD is the most heavily traded currency pair in the world, accounting for an estimated 30% off all transactions, followed by EUR/JPY (4%), EUR/GBP (3%) and EUR/AUD (2%).
The European Central Bank (ECB) in Frankfurt, Germany, is the reserve bank for the Eurozone. The ECB sets interest rates and manages monetary policy. The ECB’s primary mandate is to maintain price stability, which means either controlling inflation or stimulating growth. Its primary tool is the raising or lowering of interest rates. Relatively high interest rates – or the expectation of higher rates – will usually benefit the Euro and vice versa. The ECB Governing Council makes monetary policy decisions at meetings held eight times a year. Decisions are made by heads of the Eurozone national banks and six permanent members, including the President of the ECB, Christine Lagarde.
Eurozone inflation data, measured by the Harmonized Index of Consumer Prices (HICP), is an important econometric for the Euro. If inflation rises more than expected, especially if above the ECB’s 2% target, it obliges the ECB to raise interest rates to bring it back under control. Relatively high interest rates compared to its counterparts will usually benefit the Euro, as it makes the region more attractive as a place for global investors to park their money.
Data releases gauge the health of the economy and can impact on the Euro. Indicators such as GDP, Manufacturing and Services PMIs, employment, and consumer sentiment surveys can all influence the direction of the single currency. A strong economy is good for the Euro. Not only does it attract more foreign investment but it may encourage the ECB to put up interest rates, which will directly strengthen the Euro. Otherwise, if economic data is weak, the Euro is likely to fall. Economic data for the four largest economies in the euro area (Germany, France, Italy and Spain) are especially significant, as they account for 75% of the Eurozone’s economy.
Another significant data release for the Euro is the Trade Balance. This indicator measures the difference between what a country earns from its exports and what it spends on imports over a given period. If a country produces highly sought after exports then its currency will gain in value purely from the extra demand created from foreign buyers seeking to purchase these goods. Therefore, a positive net Trade Balance strengthens a currency and vice versa for a negative balance.
- AUD/USD trades on a weaker note near 0.6610 in Wednesday’s early Asian session.
- The mixed Australian Judo Bank PMI and Chinese economic woes continue to undermine the Aussie.
- Rising bets on Fed rate cuts in September might cap the pair’s downside.
The AUD/USD pair trades in negative territory for the seventh consecutive day around 0.6610 on Wednesday during the early Asian session. The mixed flash Australia’s Judo Bank Purchasing Managers Index (PMI) fails to boost the Aussie. Traders await the US preliminary S&P Global PMIs for June for fresh impetus.
Data released by Judo Bank and S&P Global on Wednesday revealed that the first reading of Australia's Judo Bank Manufacturing PMI improved to 47.4 in July from 47.2 in June. Meanwhile, the Services PMI dropped to 50.8 in July from the previous reading of 51.2. The Composite PMI declined to 50.2 in July from 50.7 in June.
Sluggish Chinese economic activity has exerted some selling pressure on the Australian Dollar (AUD) over the past weeks, along with the fall in iron to the lowest since early April. Furthermore, a surprise rate cut by the People's Bank of China (PBoC) on Monday triggered concerns about the weak Chinese economy.
Nonetheless, the growing speculation that the US Federal Reserve (Fed) would start cutting the interest rate in September might weigh on the US Dollar (USD) and cap the downside for AUD/USD. Traders are now pricing in nearly a 96% odds of a Fed rate cut in September, according to the CME FedWatch Tool.
Australian Dollar FAQs
One of the most significant factors for the Australian Dollar (AUD) is the level of interest rates set by the Reserve Bank of Australia (RBA). Because Australia is a resource-rich country another key driver is the price of its biggest export, Iron Ore. The health of the Chinese economy, its largest trading partner, is a factor, as well as inflation in Australia, its growth rate and Trade Balance. Market sentiment – whether investors are taking on more risky assets (risk-on) or seeking safe-havens (risk-off) – is also a factor, with risk-on positive for AUD.
The Reserve Bank of Australia (RBA) influences the Australian Dollar (AUD) by setting the level of interest rates that Australian banks can lend to each other. This influences the level of interest rates in the economy as a whole. The main goal of the RBA is to maintain a stable inflation rate of 2-3% by adjusting interest rates up or down. Relatively high interest rates compared to other major central banks support the AUD, and the opposite for relatively low. The RBA can also use quantitative easing and tightening to influence credit conditions, with the former AUD-negative and the latter AUD-positive.
China is Australia’s largest trading partner so the health of the Chinese economy is a major influence on the value of the Australian Dollar (AUD). When the Chinese economy is doing well it purchases more raw materials, goods and services from Australia, lifting demand for the AUD, and pushing up its value. The opposite is the case when the Chinese economy is not growing as fast as expected. Positive or negative surprises in Chinese growth data, therefore, often have a direct impact on the Australian Dollar and its pairs.
Iron Ore is Australia’s largest export, accounting for $118 billion a year according to data from 2021, with China as its primary destination. The price of Iron Ore, therefore, can be a driver of the Australian Dollar. Generally, if the price of Iron Ore rises, AUD also goes up, as aggregate demand for the currency increases. The opposite is the case if the price of Iron Ore falls. Higher Iron Ore prices also tend to result in a greater likelihood of a positive Trade Balance for Australia, which is also positive of the AUD.
The Trade Balance, which is the difference between what a country earns from its exports versus what it pays for its imports, is another factor that can influence the value of the Australian Dollar. If Australia produces highly sought after exports, then its currency will gain in value purely from the surplus demand created from foreign buyers seeking to purchase its exports versus what it spends to purchase imports. Therefore, a positive net Trade Balance strengthens the AUD, with the opposite effect if the Trade Balance is negative.
- GBP/USD declined one-fifth of one percent on Tuesday.
- A quiet start to the week ends with Wednesday’s double-header PMI data.
- US GDP due on Thursday, PCE inflation on Friday.
GBP/USD eased lower on Tuesday to decline one-fifth of one percent as traders buckle up for a hectic midweek market session after a quiet start to the trading week. S&P Purchasing Managers Index (PMI) activity figures are due on both sides of the Atlantic, and further key US data is due throughout the back half of the trading week.
Forex Today: Global PMIs take centre stage
UK PMI activity survey results will kick off Wednesday’s London market session, and investors are broadly expecting a recovery in July’s UK Services PMI. The UK’s Services PMI dipped to a seven-month low of 52.1 in June, and median market forecasts expect a rebound to 52.5.
On the US side, July’s Services PMI is expected to ease slightly to 54.4 from June’s 55.3. Global markets are broadly forecasting a September rate cut from the Federal Reserve (Fed), and investors are looking for further signs of softening in US economic figures in order to hammer in the rate outlook. Rate traders are pricing in nearly 100% odds of at least a quarter-point rate cut from the Federal Open Market Committee (FOMC) at the September 18 rate call.
Rolling through the week, quarterly US Gross Domestic Product figures are slated for Thursday, with US Personal Consumption Expenditure Price Index (PCE) inflation on the books for Friday. Annualized Q2 US GDP is forecast to tick up to 1.9% from 1.4%, while Core PCE inflation on Friday is expected to cool further on a YoY basis to 2.5% for the year ended in June compared to the previous month’s 2.6%.
British Pound PRICE This week
The table below shows the percentage change of British Pound (GBP) against listed major currencies this week. British Pound was the strongest against the Australian Dollar.
| USD | EUR | GBP | JPY | CAD | AUD | NZD | CHF | |
|---|---|---|---|---|---|---|---|---|
| USD | 0.29% | 0.09% | -1.03% | 0.49% | 1.08% | 1.03% | 0.42% | |
| EUR | -0.29% | -0.21% | -1.35% | 0.16% | 0.83% | 0.68% | 0.06% | |
| GBP | -0.09% | 0.21% | -1.25% | 0.36% | 1.04% | 0.88% | 0.25% | |
| JPY | 1.03% | 1.35% | 1.25% | 1.57% | 2.20% | 2.04% | 1.40% | |
| CAD | -0.49% | -0.16% | -0.36% | -1.57% | 0.68% | 0.54% | -0.09% | |
| AUD | -1.08% | -0.83% | -1.04% | -2.20% | -0.68% | -0.14% | -0.78% | |
| NZD | -1.03% | -0.68% | -0.88% | -2.04% | -0.54% | 0.14% | -0.58% | |
| CHF | -0.42% | -0.06% | -0.25% | -1.40% | 0.09% | 0.78% | 0.58% |
The heat map shows percentage changes of major currencies against each other. The base currency is picked from the left column, while the quote currency is picked from the top row. For example, if you pick the British Pound from the left column and move along the horizontal line to the US Dollar, the percentage change displayed in the box will represent GBP (base)/USD (quote).
GBP/USD technical outlook
GBP/USD extended a near-term decline from 12-month highs, falling back into the 1.2900 handle. Cable is down -1.2% peak-to-trough from 52-week highs near 1.3045, however the pair remains buried deep in bull country, trading well above the 200-day Exponential Moving Average (EMA) at 1.2629.
An extended decline will see the pair dropping through the 50-day EMA at 1.2772, but bidders will be looking for a quick pivot into fresh 52-week highs above 1.3050.
GBP/USD hourly chart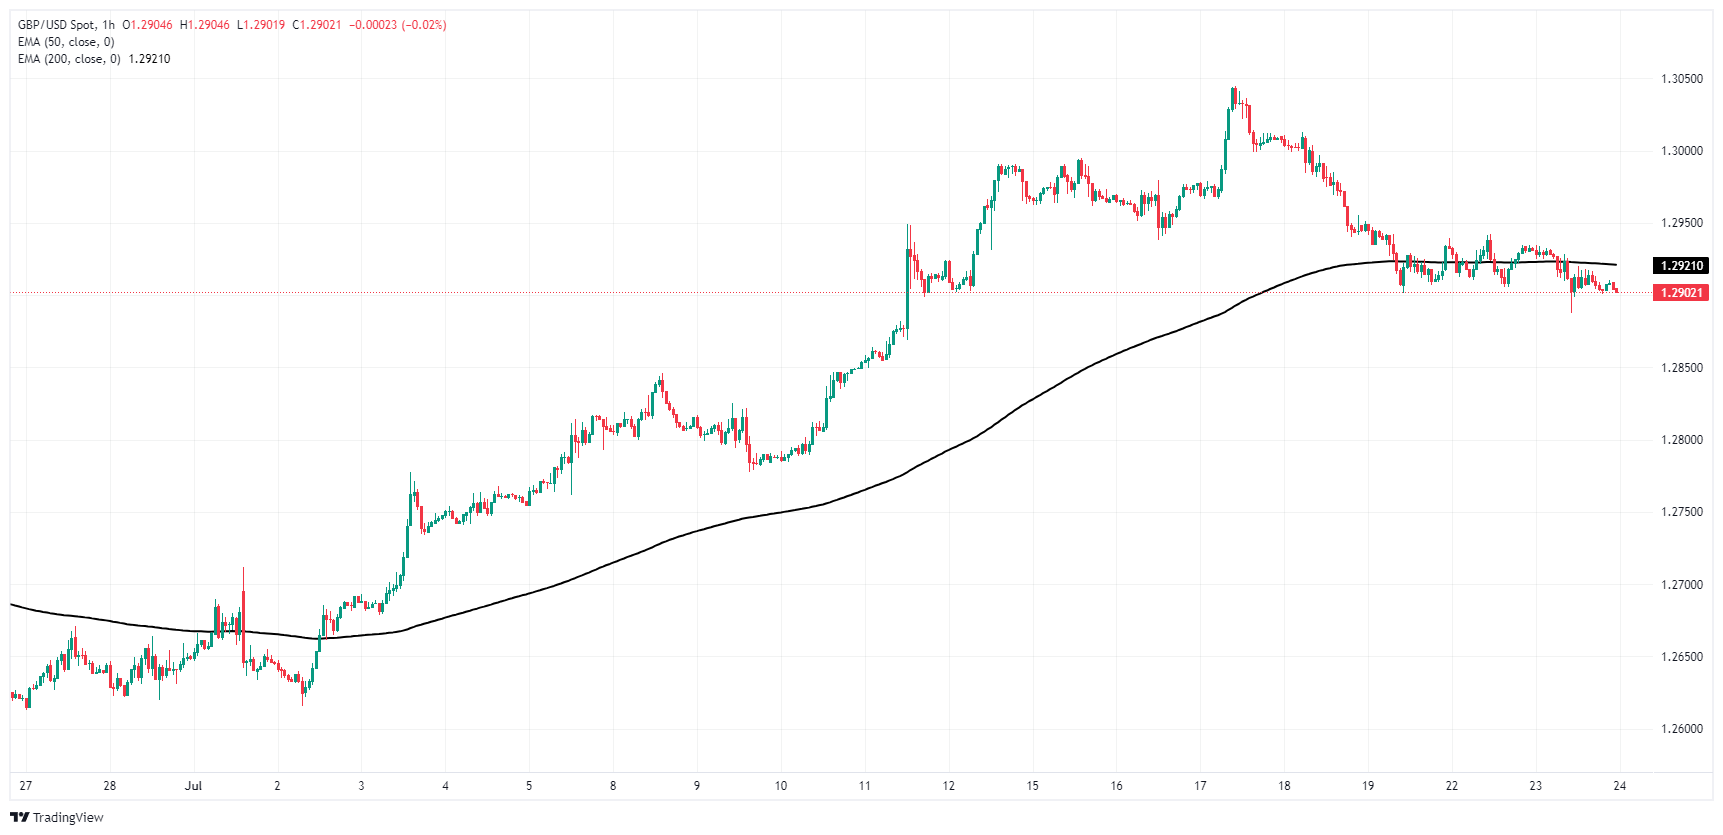
GBP/USD daily chart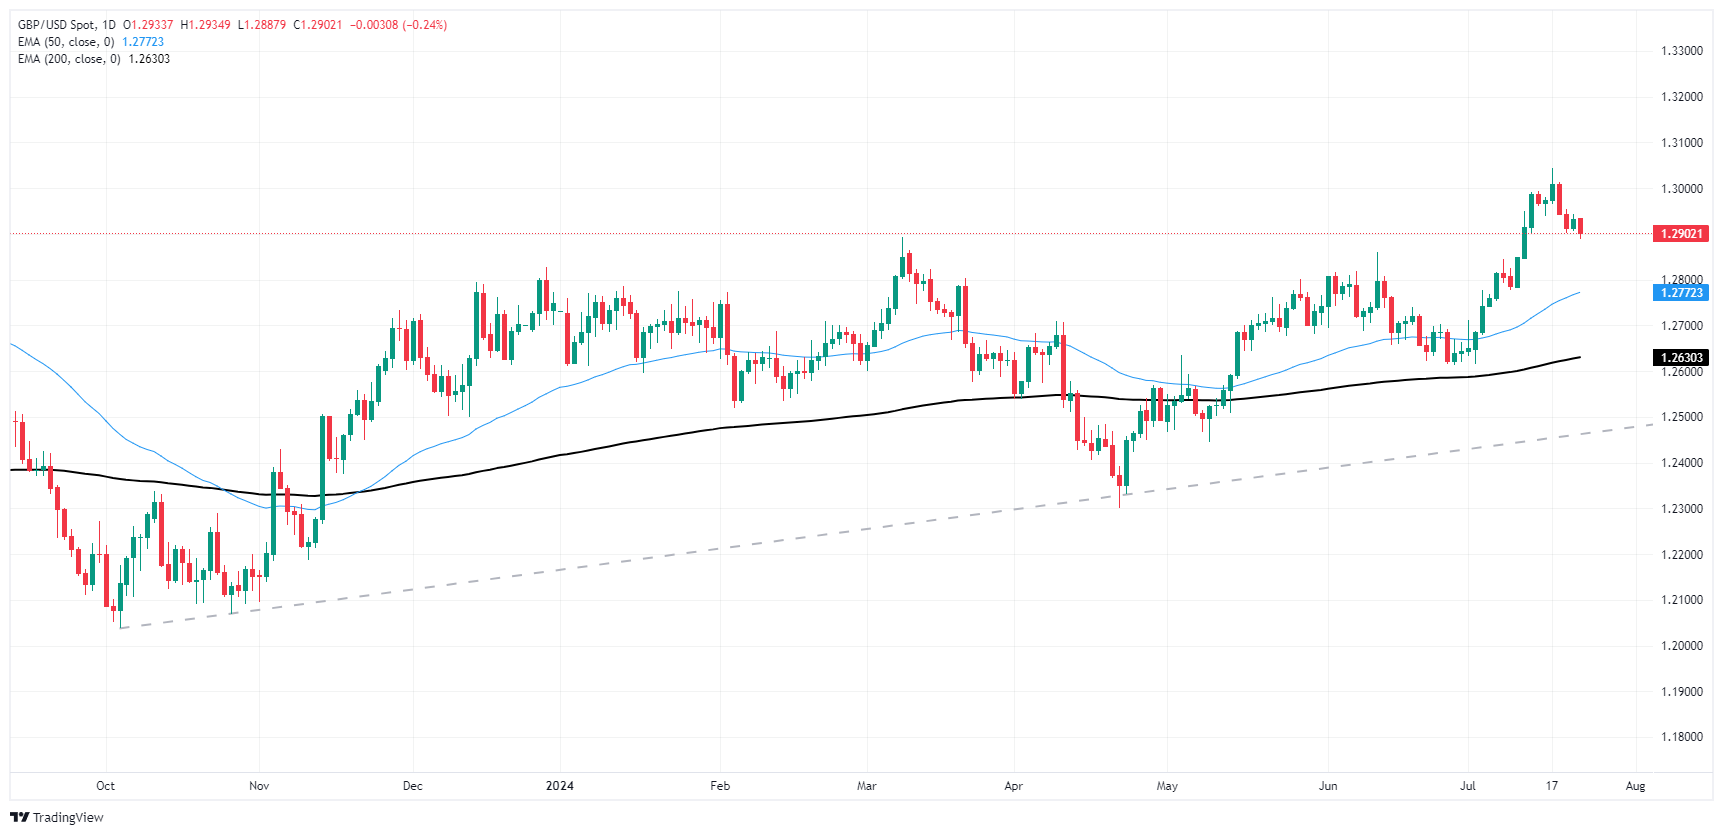
Pound Sterling FAQs
The Pound Sterling (GBP) is the oldest currency in the world (886 AD) and the official currency of the United Kingdom. It is the fourth most traded unit for foreign exchange (FX) in the world, accounting for 12% of all transactions, averaging $630 billion a day, according to 2022 data. Its key trading pairs are GBP/USD, aka ‘Cable’, which accounts for 11% of FX, GBP/JPY, or the ‘Dragon’ as it is known by traders (3%), and EUR/GBP (2%). The Pound Sterling is issued by the Bank of England (BoE).
The single most important factor influencing the value of the Pound Sterling is monetary policy decided by the Bank of England. The BoE bases its decisions on whether it has achieved its primary goal of “price stability” – a steady inflation rate of around 2%. Its primary tool for achieving this is the adjustment of interest rates. When inflation is too high, the BoE will try to rein it in by raising interest rates, making it more expensive for people and businesses to access credit. This is generally positive for GBP, as higher interest rates make the UK a more attractive place for global investors to park their money. When inflation falls too low it is a sign economic growth is slowing. In this scenario, the BoE will consider lowering interest rates to cheapen credit so businesses will borrow more to invest in growth-generating projects.
Data releases gauge the health of the economy and can impact the value of the Pound Sterling. Indicators such as GDP, Manufacturing and Services PMIs, and employment can all influence the direction of the GBP. A strong economy is good for Sterling. Not only does it attract more foreign investment but it may encourage the BoE to put up interest rates, which will directly strengthen GBP. Otherwise, if economic data is weak, the Pound Sterling is likely to fall.
Another significant data release for the Pound Sterling is the Trade Balance. This indicator measures the difference between what a country earns from its exports and what it spends on imports over a given period. If a country produces highly sought-after exports, its currency will benefit purely from the extra demand created from foreign buyers seeking to purchase these goods. Therefore, a positive net Trade Balance strengthens a currency and vice versa for a negative balance.
- USD/CAD trades in positive territory for the sixth consecutive day near 1.3785 in Wednesday’s early Asian session.
- BoC is widely anticipated to cut its benchmark interest rate by 25 bps to 4.50% at its July meeting on Wednesday.
- Economists expect the Fed will cut interest rates twice this year amid the cooler inflation over the past few months.
The USD/CAD pair extends a rally around 1.3785 during the early Asian session on Wednesday. The pair edges higher amid the risk-off mood, which boosts the Greenback broadly. Investors will closely monitor the Bank of Canada (BoC) interest rate decision later in the day, which is expected to cut rates again by 25 basis points (bps) to 4.5%.
After the signs of easing price pressures in June, the financial markets have almost fully priced in a 25 bps rate cut by the BoC that would bring the benchmark rate down to 4.5%. Taylor Schleich, rates strategist at the National Bank of Canada, said, “A rate cut is likely to be delivered,” and the Canadian central bank might reiterate its message that future cuts will be based on incoming data.
Meanwhile, demand concerns from China and easing geopolitical tensions drag crude oil prices lower to six-week lows. This, in turn, undermines the Canadian Dollar (CAD) as Canada is the major crude oil exporter to the United States. The combination of BoC rate cut expectation and lower crude oil prices might lift the USD/CAD pair in the near term.
On the US front, traders see the first rate cut by the US Federal Reserve (Fed) in September, with the possibility of nearly a 96%. A majority of economists in a Reuters poll anticipate the Fed will cut interest rates twice this year amid cooler inflation over the past few months and recent signs of labor market weakness.
Data released on Tuesday showed that US Existing Home Sales dropped by 5.4% MoM in June from 4.11M to 3.89M, worse than expected. Meanwhile, the Richmond Fed Manufacturing Index came in at -17 in July versus -10 prior, highlighting manufacturing weakness around the region. Later on Wednesday, traders will take more cues from the advanced US Goods Trade Balance, seconded by New Home Sales, and the preliminary S&P Global Manufacturing and Services PMIs for June.
Canadian Dollar FAQs
The key factors driving the Canadian Dollar (CAD) are the level of interest rates set by the Bank of Canada (BoC), the price of Oil, Canada’s largest export, the health of its economy, inflation and the Trade Balance, which is the difference between the value of Canada’s exports versus its imports. Other factors include market sentiment – whether investors are taking on more risky assets (risk-on) or seeking safe-havens (risk-off) – with risk-on being CAD-positive. As its largest trading partner, the health of the US economy is also a key factor influencing the Canadian Dollar.
The Bank of Canada (BoC) has a significant influence on the Canadian Dollar by setting the level of interest rates that banks can lend to one another. This influences the level of interest rates for everyone. The main goal of the BoC is to maintain inflation at 1-3% by adjusting interest rates up or down. Relatively higher interest rates tend to be positive for the CAD. The Bank of Canada can also use quantitative easing and tightening to influence credit conditions, with the former CAD-negative and the latter CAD-positive.
The price of Oil is a key factor impacting the value of the Canadian Dollar. Petroleum is Canada’s biggest export, so Oil price tends to have an immediate impact on the CAD value. Generally, if Oil price rises CAD also goes up, as aggregate demand for the currency increases. The opposite is the case if the price of Oil falls. Higher Oil prices also tend to result in a greater likelihood of a positive Trade Balance, which is also supportive of the CAD.
While inflation had always traditionally been thought of as a negative factor for a currency since it lowers the value of money, the opposite has actually been the case in modern times with the relaxation of cross-border capital controls. Higher inflation tends to lead central banks to put up interest rates which attracts more capital inflows from global investors seeking a lucrative place to keep their money. This increases demand for the local currency, which in Canada’s case is the Canadian Dollar.
Macroeconomic data releases gauge the health of the economy and can have an impact on the Canadian Dollar. Indicators such as GDP, Manufacturing and Services PMIs, employment, and consumer sentiment surveys can all influence the direction of the CAD. A strong economy is good for the Canadian Dollar. Not only does it attract more foreign investment but it may encourage the Bank of Canada to put up interest rates, leading to a stronger currency. If economic data is weak, however, the CAD is likely to fall.
The preliminary reading of Australia's Judo Bank Manufacturing Purchasing Managers Index (PMI) rose to 47.4 in July from 47.2 in June, the latest data published by Judo Bank and S&P Global showed on Wednesday.
The Judo Bank Australian Services PMI dropped to 50.8 in July from the previous reading of 51.2 while the Composite PMI eased to 50.2 in July versus 50.7 prior.
Market reaction
At the press time, the AUD/USD pair was down 0.03% on the day to trade at 0.6612.
Australian Dollar FAQs
One of the most significant factors for the Australian Dollar (AUD) is the level of interest rates set by the Reserve Bank of Australia (RBA). Because Australia is a resource-rich country another key driver is the price of its biggest export, Iron Ore. The health of the Chinese economy, its largest trading partner, is a factor, as well as inflation in Australia, its growth rate and Trade Balance. Market sentiment – whether investors are taking on more risky assets (risk-on) or seeking safe-havens (risk-off) – is also a factor, with risk-on positive for AUD.
The Reserve Bank of Australia (RBA) influences the Australian Dollar (AUD) by setting the level of interest rates that Australian banks can lend to each other. This influences the level of interest rates in the economy as a whole. The main goal of the RBA is to maintain a stable inflation rate of 2-3% by adjusting interest rates up or down. Relatively high interest rates compared to other major central banks support the AUD, and the opposite for relatively low. The RBA can also use quantitative easing and tightening to influence credit conditions, with the former AUD-negative and the latter AUD-positive.
China is Australia’s largest trading partner so the health of the Chinese economy is a major influence on the value of the Australian Dollar (AUD). When the Chinese economy is doing well it purchases more raw materials, goods and services from Australia, lifting demand for the AUD, and pushing up its value. The opposite is the case when the Chinese economy is not growing as fast as expected. Positive or negative surprises in Chinese growth data, therefore, often have a direct impact on the Australian Dollar and its pairs.
Iron Ore is Australia’s largest export, accounting for $118 billion a year according to data from 2021, with China as its primary destination. The price of Iron Ore, therefore, can be a driver of the Australian Dollar. Generally, if the price of Iron Ore rises, AUD also goes up, as aggregate demand for the currency increases. The opposite is the case if the price of Iron Ore falls. Higher Iron Ore prices also tend to result in a greater likelihood of a positive Trade Balance for Australia, which is also positive of the AUD.
The Trade Balance, which is the difference between what a country earns from its exports versus what it pays for its imports, is another factor that can influence the value of the Australian Dollar. If Australia produces highly sought after exports, then its currency will gain in value purely from the surplus demand created from foreign buyers seeking to purchase its exports versus what it spends to purchase imports. Therefore, a positive net Trade Balance strengthens the AUD, with the opposite effect if the Trade Balance is negative.
- WTI US Crude Oil found a foothold above $77.00, but bearish pressure remains.
- Crude Oil markets have fallen back as geopolitical risk premiums get priced out.
- Uncertainty in Chinese fossil fuel demand keeps barrel prices pinned low.
West Texas Intermediate (WTI) briefly fell below $77.00 per barrel on Tuesday before a meager recovery that left US Crude Oil markets grappling with a fresh bout of broad-market bearishness.
The American Petroleum Institute (API) noted on Tuesday that its week-on-week Crude Oil Stocks counts contracted again by a further 3.9 million barrels, adding onto the previous week’s -4.44 million barrel decline. The API’s weekly barrel counts contracted even further than the expected -2.47 million barrel contraction as US supplies continue to draw down. The API’s weekly stock counts helped to bolster WTI bids in the late US market session, but overall price momentum remains sluggish and tilted toward the downside.
An increase in Chinese demand for Crude Oil, which was broadly leaned on in the first half of the year in order to prop up barrel bids, has given way to fears of a lopsided Chinese economy in the face of declines in global growth figures. With hopes of a broad recovery in Chinese fuel demand going up in smoke, markets are finding little reason to keep supporting Crude Oil prices as geopolitical tensions in the Middle East continue to sizzle with no foreseeable impact after months of concerns about a possible crimp in global Crude Oil production.
WTI technical outlook
WTI has found a foothold after plunging towards $76.25 on Tuesday, but a bullish bounce failed to recover above the last swing low into $77.50. Intraday price action is leaning into the bearish side, though near-term momentum may have run its course and allow an elastic snap back to the 200-hour Exponential Moving Average (EMA) at $79.80.
Daily candlesticks paint a notable bearish picture, with US Crude Oil prices threatening to backslide to early June’s bottom bids near $72.50 and price action descending almost unimpeded below the 200-day EMA at $79.23.
WTI hourly chart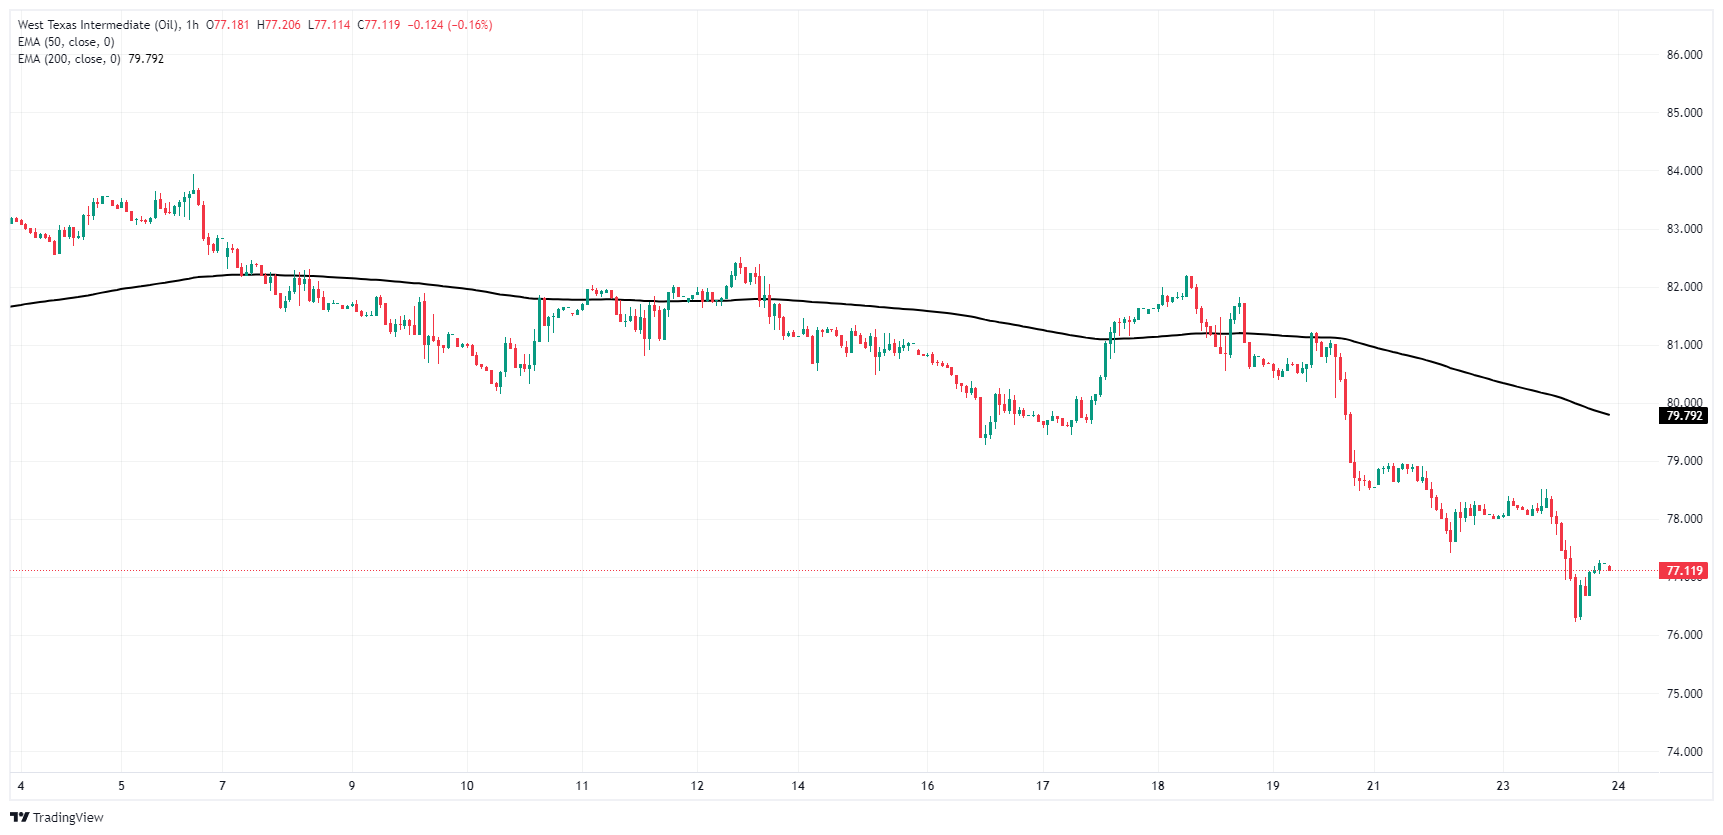
WTI daily chart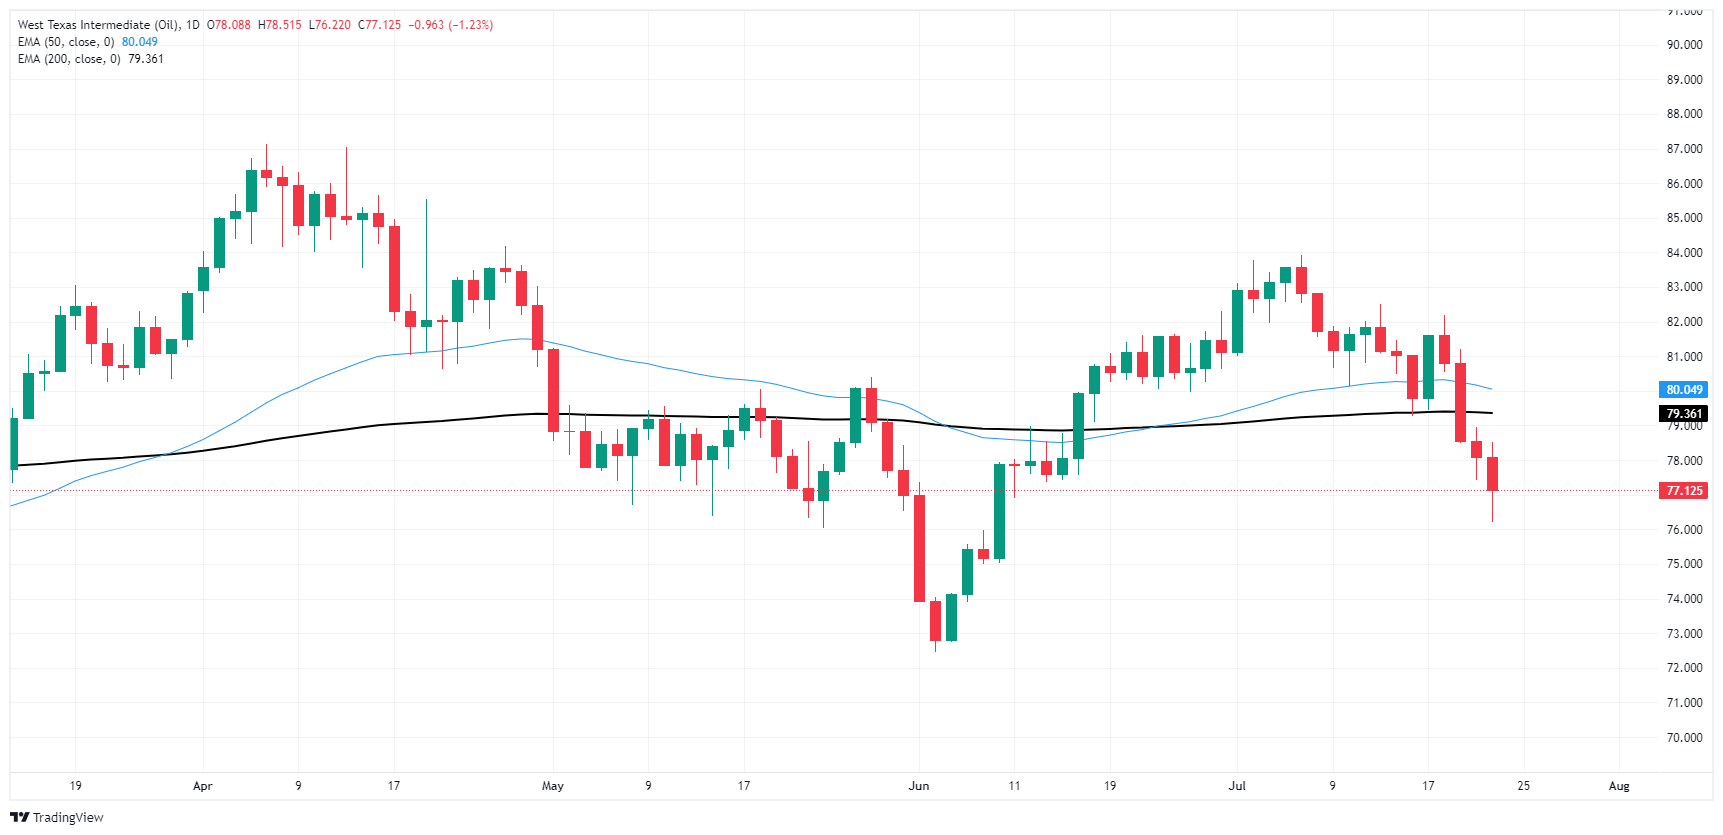
WTI Oil FAQs
WTI Oil is a type of Crude Oil sold on international markets. The WTI stands for West Texas Intermediate, one of three major types including Brent and Dubai Crude. WTI is also referred to as “light” and “sweet” because of its relatively low gravity and sulfur content respectively. It is considered a high quality Oil that is easily refined. It is sourced in the United States and distributed via the Cushing hub, which is considered “The Pipeline Crossroads of the World”. It is a benchmark for the Oil market and WTI price is frequently quoted in the media.
Like all assets, supply and demand are the key drivers of WTI Oil price. As such, global growth can be a driver of increased demand and vice versa for weak global growth. Political instability, wars, and sanctions can disrupt supply and impact prices. The decisions of OPEC, a group of major Oil-producing countries, is another key driver of price. The value of the US Dollar influences the price of WTI Crude Oil, since Oil is predominantly traded in US Dollars, thus a weaker US Dollar can make Oil more affordable and vice versa.
The weekly Oil inventory reports published by the American Petroleum Institute (API) and the Energy Information Agency (EIA) impact the price of WTI Oil. Changes in inventories reflect fluctuating supply and demand. If the data shows a drop in inventories it can indicate increased demand, pushing up Oil price. Higher inventories can reflect increased supply, pushing down prices. API’s report is published every Tuesday and EIA’s the day after. Their results are usually similar, falling within 1% of each other 75% of the time. The EIA data is considered more reliable, since it is a government agency.
OPEC (Organization of the Petroleum Exporting Countries) is a group of 13 Oil-producing nations who collectively decide production quotas for member countries at twice-yearly meetings. Their decisions often impact WTI Oil prices. When OPEC decides to lower quotas, it can tighten supply, pushing up Oil prices. When OPEC increases production, it has the opposite effect. OPEC+ refers to an expanded group that includes ten extra non-OPEC members, the most notable of which is Russia.
- NZD/USD plummets further, breaching the critical 0.6000 mark, exhibiting a consistent bearish path since last week.
- The pair is down by nearly 2% in the last four sessions.
In Tuesday's session, the NZD/USD further extended its downward expedition, decreasing by 0.35% to 0.5960. The bulls' failure to counteract the sellers led to a continuous descent below the 0.6000 level, settling at early May lows, and thereby solidifying the bearish sentiment surrounding the pair. In addition, a confirmed bearish crossover between the 20 and 100-day Simple Moving Averages (SMA) at the 0.6070 area gives more arguments to the bearish narrative.
The daily technical indicators reinforce this declining trend. The Relative Strength Index (RSI) stands near the oversold boundary and has slightly dipped from Monday's position at 30, indicating ongoing selling pressure. In the meantime, the Moving Average Convergence Divergence (MACD) maintains the course with rising red bars, further exacerbating the bearish sentiment. However, as the RSI approaches the oversold threshold, there might be a potential correction in the vicinity.
NZD/USD daily chart
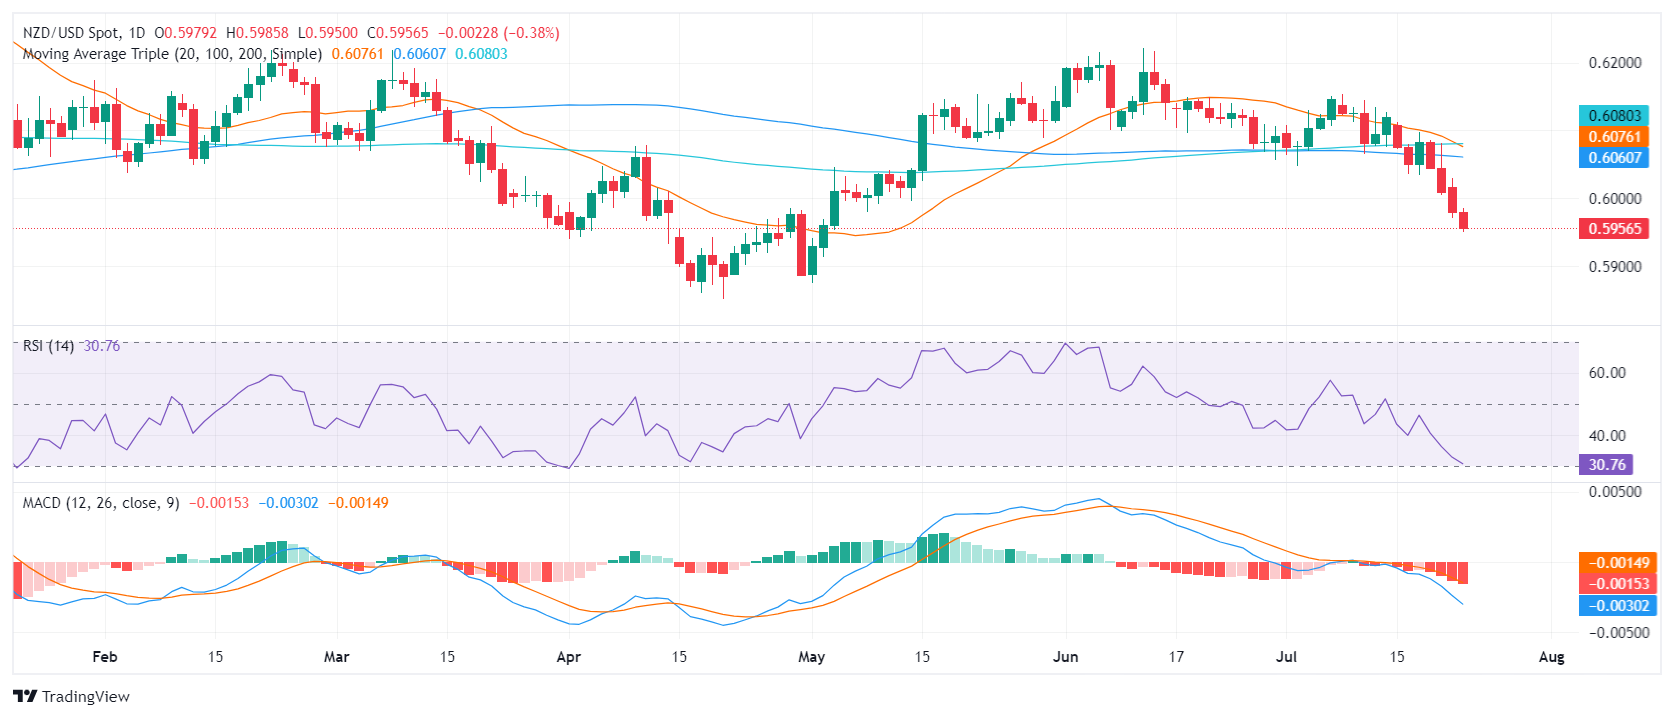 From a daily perspective, strong support is currently detected on the 0.5950 line, and further below within the 0.5930-0.5900 range. Conversely, resistance is now seen at the prior support level of 0.6000 and then at approximately 0.6050.
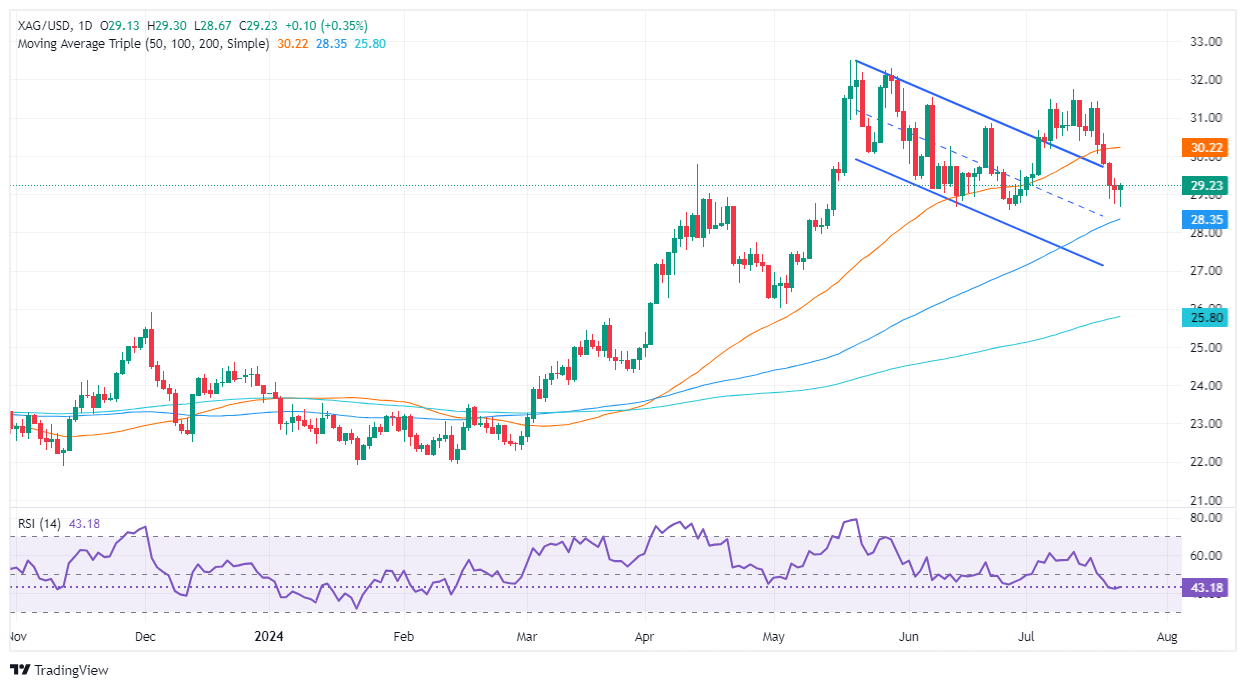
- Silver at $29.22, up 0.40%; 'hammers' suggest strength above $29.00.
- Rising RSI indicates increasing buyer momentum; resistances at $29.42, $29.83, $30.00.
- Downside risks: support at $28.67, with further levels at 100-DMA ($28.34) and $28.00.
Silver's price stages a recovery after diving to four-week lows of $28.67. It climbs back above $29.00, registering gains of more than 0.40%, and trades at $29.22.
XAG/USD Price Analysis: Technical outlook
Technically speaking, XAG/USD has formed a back-to-back session of ‘hammers,’ with sellers unable to push Silver’s price below the $29.00 mark, opening the door for further upside.
Momentum shows that neither buyers nor sellers are in charge, but the recent uptick in the Relative Strength Index (RSI) is a sign that buyers are moving in.
If XAG/USD rallies above the July 22 high of $29.42, it could extend towards the July 19 peak at $29.83. A further upside is seen above that level, with the $30.00 mark lying overhead, before challenging the 50-day moving average (DMA) at $30.12. A breach of the latter will expose the July 17 high at $31.42.
Conversely, if XAG/USD drops below $28.67, that could sponsor a test of the 100-DMA at $28.34. Once surpassed, the next demand zone would be the $28.00 figure.
XAG/USD Price Action – Daily Chart
Silver FAQs
Silver is a precious metal highly traded among investors. It has been historically used as a store of value and a medium of exchange. Although less popular than Gold, traders may turn to Silver to diversify their investment portfolio, for its intrinsic value or as a potential hedge during high-inflation periods. Investors can buy physical Silver, in coins or in bars, or trade it through vehicles such as Exchange Traded Funds, which track its price on international markets.
Silver prices can move due to a wide range of factors. Geopolitical instability or fears of a deep recession can make Silver price escalate due to its safe-haven status, although to a lesser extent than Gold's. As a yieldless asset, Silver tends to rise with lower interest rates. Its moves also depend on how the US Dollar (USD) behaves as the asset is priced in dollars (XAG/USD). A strong Dollar tends to keep the price of Silver at bay, whereas a weaker Dollar is likely to propel prices up. Other factors such as investment demand, mining supply – Silver is much more abundant than Gold – and recycling rates can also affect prices.
Silver is widely used in industry, particularly in sectors such as electronics or solar energy, as it has one of the highest electric conductivity of all metals – more than Copper and Gold. A surge in demand can increase prices, while a decline tends to lower them. Dynamics in the US, Chinese and Indian economies can also contribute to price swings: for the US and particularly China, their big industrial sectors use Silver in various processes; in India, consumers’ demand for the precious metal for jewellery also plays a key role in setting prices.
Silver prices tend to follow Gold's moves. When Gold prices rise, Silver typically follows suit, as their status as safe-haven assets is similar. The Gold/Silver ratio, which shows the number of ounces of Silver needed to equal the value of one ounce of Gold, may help to determine the relative valuation between both metals. Some investors may consider a high ratio as an indicator that Silver is undervalued, or Gold is overvalued. On the contrary, a low ratio might suggest that Gold is undervalued relative to Silver.
- Tuesday's trading session extended the NZD/JPY pair's downward trajectory.
- Losses were recorded in nine out of the past ten sessions, intensifying the bearish momentum.
- Sellers now have the advantage, having descended past the critical 100-day SMA.
In Tuesday's trading session, the NZD/JPY pair continued its fall and dipped to 92.60, marking a 1.30% drop. The pair has seen losses in nine out of the last ten sessions, boosting the bearish momentum significantly. Since the beginning of July, the cross has plunged by a massive 5%, now having dug its claws below the crucial 100-day Simple Moving Average (SMA).
Despite this seemingly relentless journey south, daily technical indicators languishing deep in oversold territory suggest a potential for an incoming correction. The Relative Strength Index (RSI) stands at 23, sinking further into oversold territory. Moreover, the Moving Average Convergence Divergence (MACD) continues to print rising red bars, indicating persistent selling pressure.
NZD/JPY daily chart
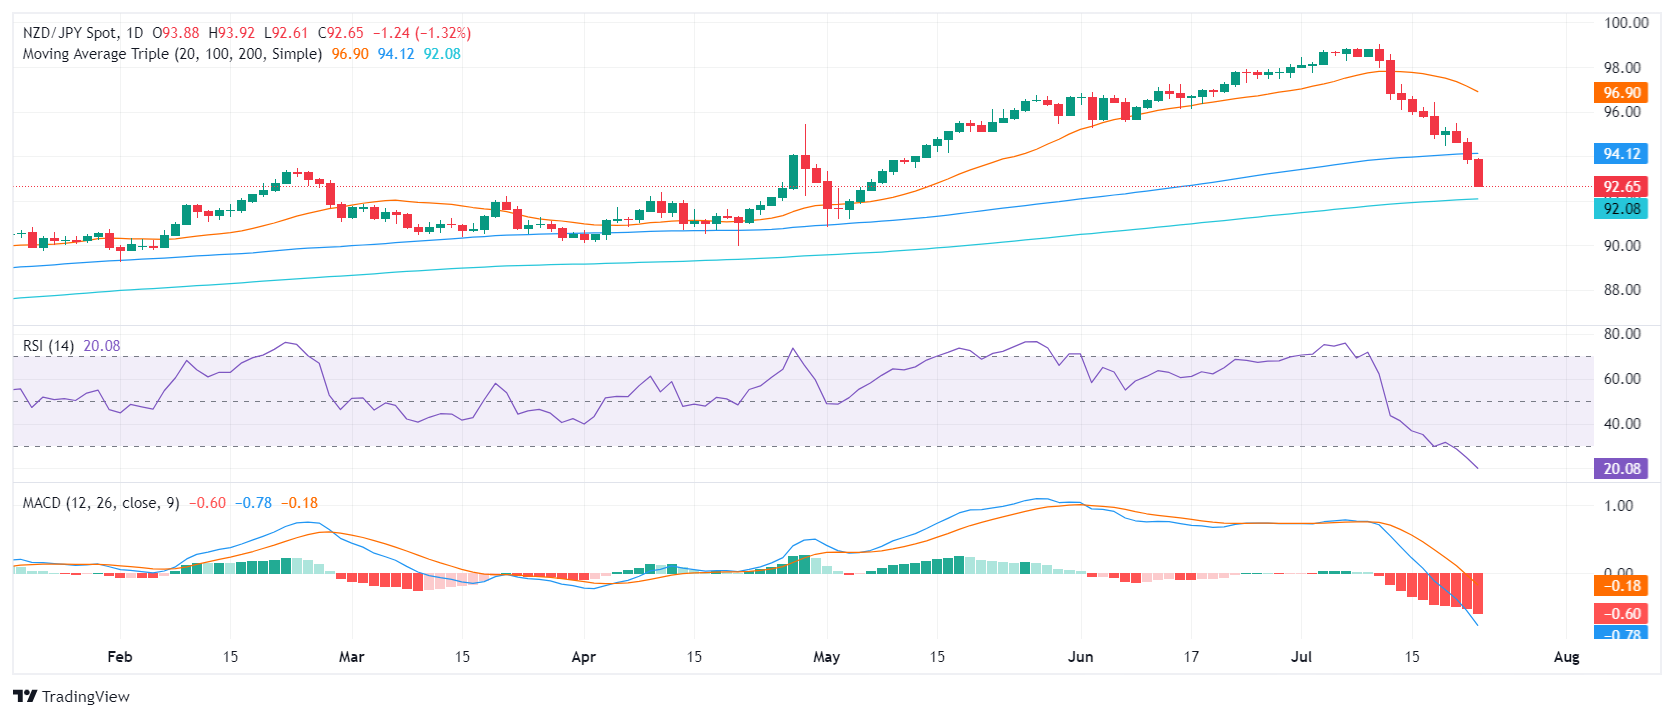
With the pair now below 93.00, bulls must present battle at 92.50 to avoid further losses with the 92.00 area around the 200-day SMA as the final barrier. On the flip side, resistance levels rest at the previous levels of 93.00, 93.50, and 94.00 (former supports).
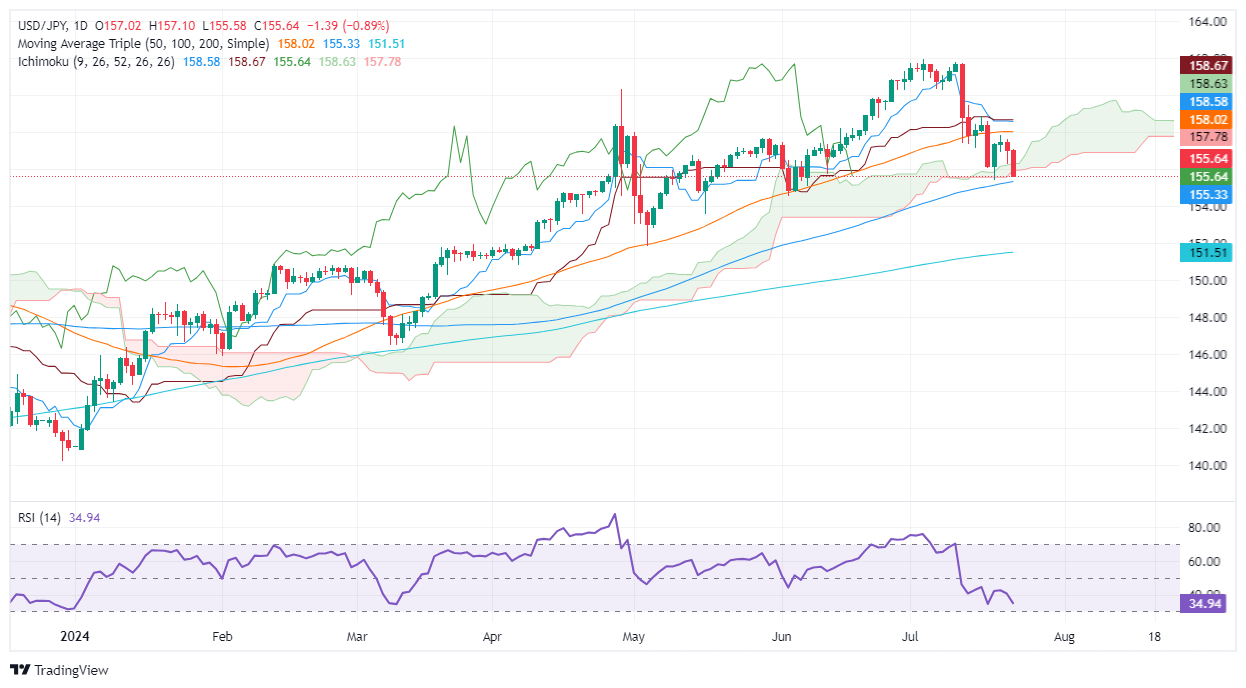
- USD/JPY drops below Ichimoku Cloud, first since January 15, hinting at possible extended downtrend.
- Bearish RSI suggests further falls; supports at 155.00, 154.55, 151.86.
- Resistance at 156.33; breach may push to 157.00, potentially reversing trend.
The USD/JPY plummets over 0.85% and drops below the Ichimoku Cloud (Kumo) for the first time since January 15. This is an important milestone yet pending to be confirmed by a daily close below 155.90. At the time of writing, the pair trades at 155.65 after hitting a daily high of 157.10.
USD/JPY Price Analysis: Technical outlook
The USD/JPY is set to extend its losses if it achieves a daily close below the Kumo. This would be the fifth technical signal using Ichimoku to confirm the downtrend, which could pave the way for a deeper pullback.
Momentum favors sellers as depicted by the Relative Strength Index (RSI) aiming lower beneath the 50-neutral line.
Therefore, the USD/JPY path of least resistance is tilted to the downside. the first support would be the 155.00 figure. A breach of the latter will expose the June 4 low of 154.55, followed by the May 3 bottom at 151.86. Further losses are seen under that level, like the March 8 low at 146.48.
On the other hand, if buyers lift the exchange rate past the top of the Kumo at 156.33, that can open the door for a leg-up. The next resistance would be 157.00.
USD/JPY Price Action – Daily Chart
Japanese Yen FAQs
The Japanese Yen (JPY) is one of the world’s most traded currencies. Its value is broadly determined by the performance of the Japanese economy, but more specifically by the Bank of Japan’s policy, the differential between Japanese and US bond yields, or risk sentiment among traders, among other factors.
One of the Bank of Japan’s mandates is currency control, so its moves are key for the Yen. The BoJ has directly intervened in currency markets sometimes, generally to lower the value of the Yen, although it refrains from doing it often due to political concerns of its main trading partners. The current BoJ ultra-loose monetary policy, based on massive stimulus to the economy, has caused the Yen to depreciate against its main currency peers. This process has exacerbated more recently due to an increasing policy divergence between the Bank of Japan and other main central banks, which have opted to increase interest rates sharply to fight decades-high levels of inflation.
The BoJ’s stance of sticking to ultra-loose monetary policy has led to a widening policy divergence with other central banks, particularly with the US Federal Reserve. This supports a widening of the differential between the 10-year US and Japanese bonds, which favors the US Dollar against the Japanese Yen.
The Japanese Yen is often seen as a safe-haven investment. This means that in times of market stress, investors are more likely to put their money in the Japanese currency due to its supposed reliability and stability. Turbulent times are likely to strengthen the Yen’s value against other currencies seen as more risky to invest in.
- Gold price climbs above $2,400, ending a four-day losing streak amid falling US Treasury yields.
- Traders await crucial economic data, including June’s inflation and Q2 GDP, to gauge the Fed’s next move.
- India’s import tax cut on gold and silver boosts retail demand, supporting bullion prices.
Gold price recovered in the mid-North American session, boosted by a drop in US Treasury bond yields. This pushed the Greenback lower amid a busy Us economic docket in the week, which will feature crucial data. The XAU/USD trades at $2,404, up by 0.33%.
Wall Street trades with gains for the second straight day as market players digest last weekend's political developments in the US. Market players are eyeing the release of June’s inflation data and the preliminary reading of the Gross Domestic Product (GDP) for the second quarter of 2024.
The non-yielding metals are ending a four-day streak of losses as market participants await the Fed's first interest rate cut, according to a Reuters poll. The survey showed that 73 of 100 economists expect Powell and Co. to ease policy by 50 basis points (bps) in 2024, with 13 expecting 25 bps and three expecting no cuts.
Traders speculate the first 25 bps rate cut will be in September, as shown by the CME FedWatch Tool, with odds at 96%.
In the meantime, the US 10-year Treasury bond yield falls one and a half bps to 4.24%, a tailwind for the precious metal.
The Core Personal Consumption Expenditures (PCE) Price Index could be the last piece of the puzzle for Fed officials to begin relaxing policy. Sources cited by Reuters commented, “Anything weaker than expected (PCE data) would be a positive, mainly because it would convince the markets that the U.S. central bank is easing monetary policy in September.”
Bullion was also boosted by India’s slashing import taxes on Gold and Silver, which could lift retail demand.
The US Dollar Index (DXY), which tracks the currency's performance against six other currencies, aims up 0.17% at 104.45. This kept Gold prices glued to the $2,400 mark despite posting gains.
Daily digest market movers: Gold price recovers the $2,400 figure
- Gold traders are focused on the release of key economic data, including Durable Goods Orders, the preliminary Q2 GDP number, and the Core PCE for June.
- Durable Goods Orders are expected to increase from 0.1% to 0.4% month-over-month (MoM).
- The Gross Domestic Product (GDP) for Q2 is projected to rise from 1.4% in Q1 2024 to 1.9% quarter-over-quarter (QoQ), indicating that the economy is accelerating as the year progresses.
- The Fed’s preferred measure of inflation, the Core PCE, is expected to dip from 2.6% to 2.5% year-over-year (YoY).
- The latest Consumer Price Index (CPI) data revealed a continuation of the disinflation process in the United States (US), boosting gold prices and increasing the likelihood that the Fed will cut interest rates starting in September.
- December 2024 fed funds rate futures contract implies that the Fed will ease policy by 50 basis points (bps) toward the end of the year, up from 48 a day ago.
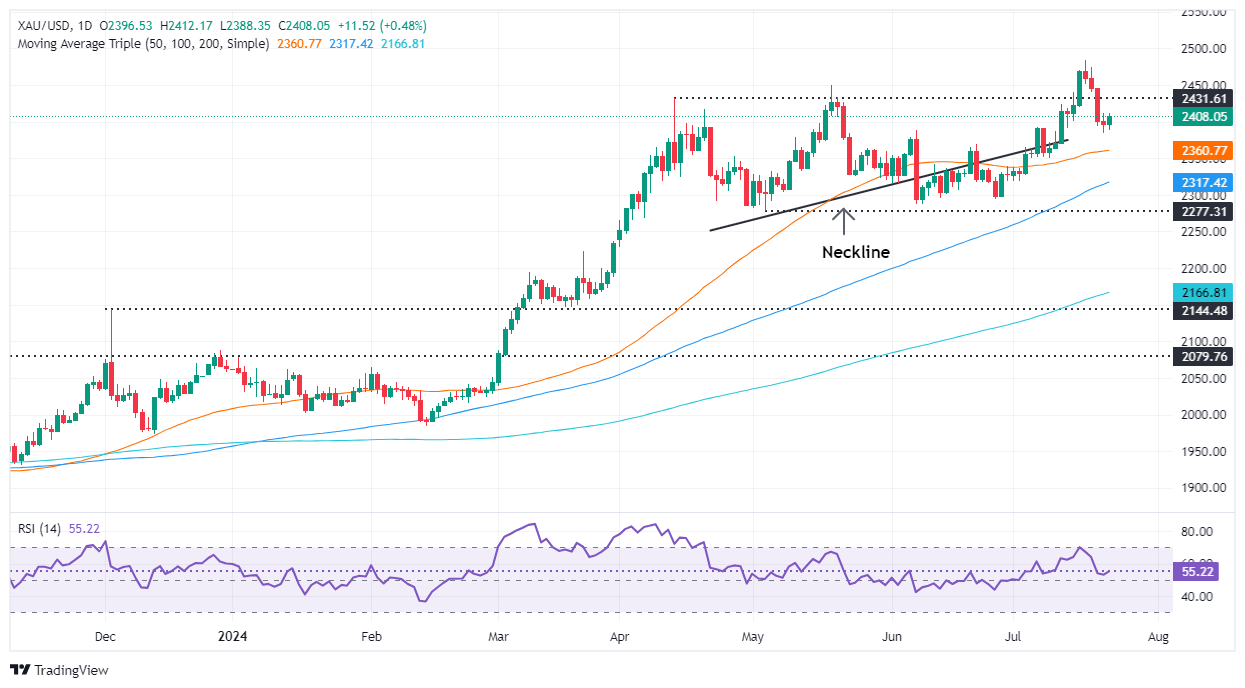
Technical analysis: Gold price contained within Monday’s trading range
Gold price seems to have finished its losing streak, forming a ‘bullish harami,’ a two-candle pattern, hinting the uptrend could continue in the near term.
The Relative Strength Index (RSI) is bullish and indicates that buyers are gathering momentum, which could drive prices higher.
XAU/USD needs to clear Monday’s high at $2,412 for a bullish continuation. Once surpassed, the next resistance would be $2,450 before challenging the all-time high of $2,483. Up next would be the $2,500 figure.
Conversely, if XAU/USD tumbles below the July 22 low of $2,384, a deeper correction is on the cards. The next support would be the 50-day Simple Moving Average (SMA) at $2,359. Once sellers clear the 100-day SMA at $2,315, further losses are seen before falling toward $2,300.
Gold FAQs
Gold has played a key role in human’s history as it has been widely used as a store of value and medium of exchange. Currently, apart from its shine and usage for jewelry, the precious metal is widely seen as a safe-haven asset, meaning that it is considered a good investment during turbulent times. Gold is also widely seen as a hedge against inflation and against depreciating currencies as it doesn’t rely on any specific issuer or government.
Central banks are the biggest Gold holders. In their aim to support their currencies in turbulent times, central banks tend to diversify their reserves and buy Gold to improve the perceived strength of the economy and the currency. High Gold reserves can be a source of trust for a country’s solvency. Central banks added 1,136 tonnes of Gold worth around $70 billion to their reserves in 2022, according to data from the World Gold Council. This is the highest yearly purchase since records began. Central banks from emerging economies such as China, India and Turkey are quickly increasing their Gold reserves.
Gold has an inverse correlation with the US Dollar and US Treasuries, which are both major reserve and safe-haven assets. When the Dollar depreciates, Gold tends to rise, enabling investors and central banks to diversify their assets in turbulent times. Gold is also inversely correlated with risk assets. A rally in the stock market tends to weaken Gold price, while sell-offs in riskier markets tend to favor the precious metal.
The price can move due to a wide range of factors. Geopolitical instability or fears of a deep recession can quickly make Gold price escalate due to its safe-haven status. As a yield-less asset, Gold tends to rise with lower interest rates, while higher cost of money usually weighs down on the yellow metal. Still, most moves depend on how the US Dollar (USD) behaves as the asset is priced in dollars (XAU/USD). A strong Dollar tends to keep the price of Gold controlled, whereas a weaker Dollar is likely to push Gold prices up.
- GBP/JPY followed other Yen pairs lower on Tuesday.
- The Yen is extending a near-term recovery after successive “Yenterventions”.
- Key UK and Japanese economic data due in the back half of the trading week.
GBP/JPY extended into further losses on Tuesday as the Japanese Yen continues a broad-base recovery sparked by a series of “Yenterventions” by the Bank of Japan (BoJ) and Japan’s Ministry of Finance (MoF) to try and prop up the beleaguered Yen. The synthesized Japanese Yen Index (JXY), a basket measure of the Yen’s overall performance against the other major global currencies, has fallen 12.62% peak-to-trough in 2024, and is down a staggering 37.51% since a peak in late 2020.
Guppy traders have eased off of the buy button in the face of increasingly-expensive direct market interventions on behalf of the Yen, but looming key datasets for both the UK and Japan could easily spark fresh moves in either direction. UK S&P Global/CIPS Purchasing Managers Index (PMI) activity figures are due Wednesday, with Japanese Tokyo Consumer Price Index (CPI) inflation figures slated for early Friday.
Markets are expecting a rebound in UK Services PMI figures, forecasting a print of 52.5 in July after easing to a seven-month low of 52.1 in June. On the Japanese data side, Friday’s core Tokyo CPI inflation is expected to tick upward to 2.2% for the year ended in July versus the previous period’s 2.1% YoY. Even if Tokyo CPI inflation rises to meet market expectations, the figure is unlikely to spark any moves from the BoJ on interest rates, which could see the Yen resuming a broad-market decline without further massive cash injections from the MoF.
GBP/JPY technical outlook
GBP/JPY tumbled below the 201.00 handle on Tuesday, testing into 200.80 as the pair extends a backslide from last week’s 16-year peak just north of 208.00. The pair has slipped below the 50-day Exponential Moving Average (EMA) at 201.50, but even a sustained bearish drop will have plenty of ground to cover before reaching the 200-day EMA far below at 192.52.
July is on pace to snap a six-month winning streak for the Guppy that saw the pair rise nearly 16.5% bottom-to-top. However, Yen bulls will still have their work cut out for them as the pair remains buried deep in bull country.
GBP/JPY hourly chart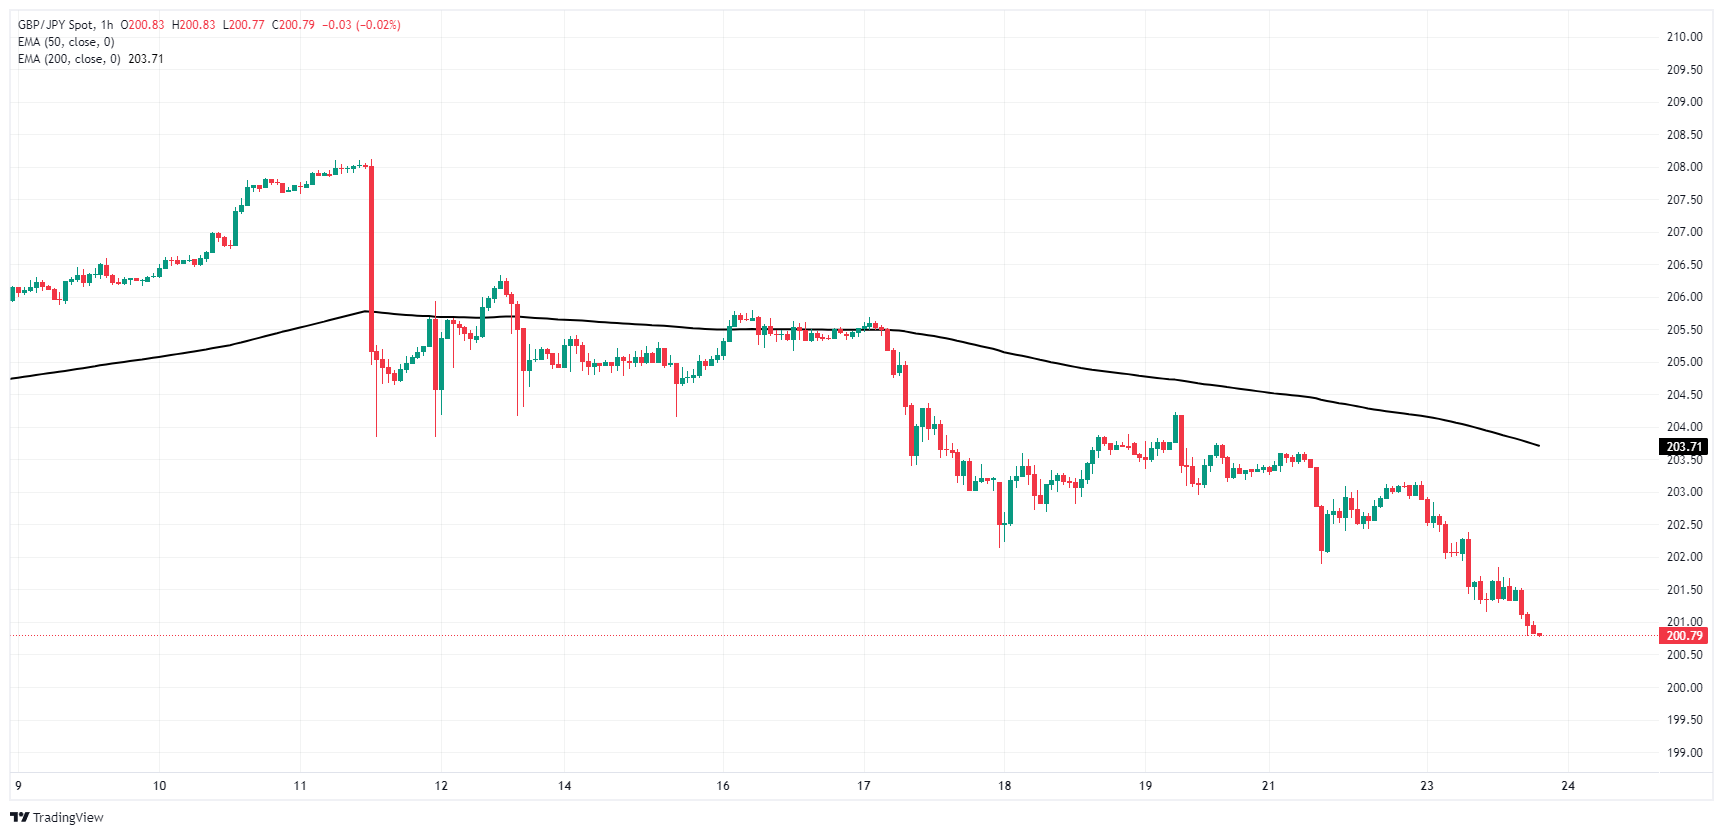
GBP/JPY daily chart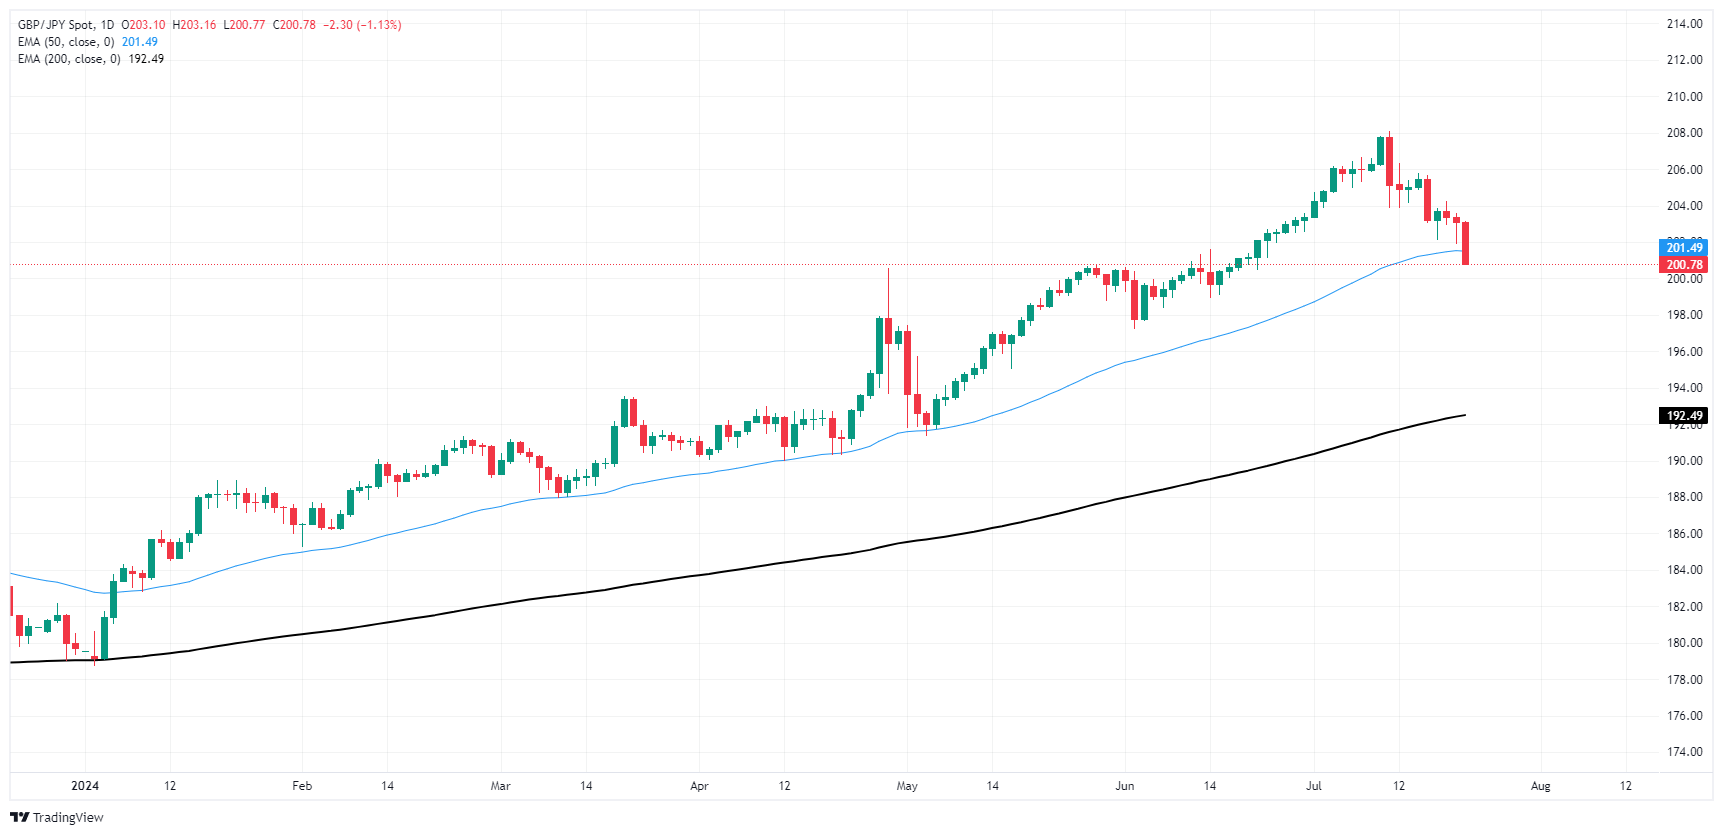
Japanese Yen FAQs
The Japanese Yen (JPY) is one of the world’s most traded currencies. Its value is broadly determined by the performance of the Japanese economy, but more specifically by the Bank of Japan’s policy, the differential between Japanese and US bond yields, or risk sentiment among traders, among other factors.
One of the Bank of Japan’s mandates is currency control, so its moves are key for the Yen. The BoJ has directly intervened in currency markets sometimes, generally to lower the value of the Yen, although it refrains from doing it often due to political concerns of its main trading partners. The current BoJ ultra-loose monetary policy, based on massive stimulus to the economy, has caused the Yen to depreciate against its main currency peers. This process has exacerbated more recently due to an increasing policy divergence between the Bank of Japan and other main central banks, which have opted to increase interest rates sharply to fight decades-high levels of inflation.
The BoJ’s stance of sticking to ultra-loose monetary policy has led to a widening policy divergence with other central banks, particularly with the US Federal Reserve. This supports a widening of the differential between the 10-year US and Japanese bonds, which favors the US Dollar against the Japanese Yen.
The Japanese Yen is often seen as a safe-haven investment. This means that in times of market stress, investors are more likely to put their money in the Japanese currency due to its supposed reliability and stability. Turbulent times are likely to strengthen the Yen’s value against other currencies seen as more risky to invest in.
The risk-off sentiment prevailed on Tuesday, motivating the Greenback to regain some balance despite yields retreated in the global money markets. Moving forward, its PMI-day on Wednesday ahead of key data releases in the US (Q2 GDP and PCE).
Here is what you need to know on Wednesday, July 24:
The USD Index (DXY) posted modest gains and revisited the 104.50 zone despite US yields edged lower. On July 24, advanced Goods Trade Balance is due in the first turn seconded by New Home Sales, and the preliminary S&P Global Manufacturing and Services PMIs.
EUR/USD retreated markedly to multi-day lows near 1.0840 following the broad-based risk aversion theme. The flash HCOB Manufacturing and Services PMIs are expected in Germany and the broader euro bloc on July 24.
GBP/USD pierced the 1.2900 support amidst the better tone in the US dollar and the generalized offered stance in the risk complex. The advanced S&P Global Manufacturing and Services PMIs will be at the centre of the debate in the UK on July 24.
USD/JPY added to Monday’s retracement and flirted with multi-week lows south of the 156.00 level. The preliminary Jibun Bank Manufacturing and Services PMIs are next on tap on July 24.
There was no respite for the downside pressure in AUD/USD, prompting the pair to trade at shouting distance from the 0.6600 region. The flash Judo Bank Manufacturing and Services PMIs are due on July 24.
Persistent demand jitters from China and easing geopolitical concerns dragged WTI prices to six-week lows in the sub-$77.00 region per barrel.
Prices of Gold gathered tepid traction, although it was enough to reverse four consecutive daily pullbacks and regain the $2,400 barrier per ounce troy. Silver advanced modestly past the $29.00 mark per ounce.
- AUD/USD registered significant declines on Tuesday towards 0.6615.
- Slowdown in Chinese economic activity is contributing to the decline in commodity prices.
- Stubbornly high inflation continues to prompt the RBA to delay rate cuts.
In Tuesday's trading session, the Australian Dollar (AUD) suffered further losses against the USD, with AUD/USD falling to 0.6615. This decline is largely attributed to sluggish Chinese economic activity which has resulted in a drop in commodity prices, illustrated by plunges in iron ore future prices to their lowest since early April.
Despite signs of weakness in the Australian economy, the RBA continues to resist rate cuts due to stubbornly high inflation. This could potentially limit any further decline in the AUD. The RBA maintains its position as one of the last central banks within the G10 countries likely to start cutting rates, a stance that might extend the AUD's gains.
Daily digest market movers: Aussie down due to economic concerns in China, markets await new clues on RBA’s stance
- Chinese economic concerns are weighing heavily on the Australian currency as China remains one of Australia's closest trading partners, and the drop in commodity prices is impacting the AUD.
- The CSI 300 stock index in China dropped dramatically by over 2% overnight, and the absence of specific measures in the recent third plenary session of China's central committee to address the country's structural economic disadvantages further added to these concerns.
- Additionally, the unexpected rate cut by the People's Bank of China (PBoC) earlier this week triggered worries about the health of the Chinese economy.
- However, the hawkish stance of the Reserve Bank of Australia (RBA) could limit the downside for the Aussie.
- The market now predicts around 50% likelihood of the RBA implementing a rate hike either in September or November. Australian Judo PMIs will be closely observed during the Asian trading session.
AUD/USD technical analysis: AUD/USD confirms correction following July's sharp gains.
While the AUD/USD pair has entered a correction phase after the sharp gains of early July, the main concern is that they have now fallen below the 20-day Simple Moving Average (SMA) but as long as the pair stays above the 100 and 200-day SMA, any downward adjustments could be considered 'corrective'. If it falls below these lines, that could be a sell signal. The range to watch for AUD/USD is 0.6630-0.6600, as buyers must maintain their orbit around this area to avoid further losses.
Australian Dollar FAQs
One of the most significant factors for the Australian Dollar (AUD) is the level of interest rates set by the Reserve Bank of Australia (RBA). Because Australia is a resource-rich country another key driver is the price of its biggest export, Iron Ore. The health of the Chinese economy, its largest trading partner, is a factor, as well as inflation in Australia, its growth rate and Trade Balance. Market sentiment – whether investors are taking on more risky assets (risk-on) or seeking safe-havens (risk-off) – is also a factor, with risk-on positive for AUD.
The Reserve Bank of Australia (RBA) influences the Australian Dollar (AUD) by setting the level of interest rates that Australian banks can lend to each other. This influences the level of interest rates in the economy as a whole. The main goal of the RBA is to maintain a stable inflation rate of 2-3% by adjusting interest rates up or down. Relatively high interest rates compared to other major central banks support the AUD, and the opposite for relatively low. The RBA can also use quantitative easing and tightening to influence credit conditions, with the former AUD-negative and the latter AUD-positive.
China is Australia’s largest trading partner so the health of the Chinese economy is a major influence on the value of the Australian Dollar (AUD). When the Chinese economy is doing well it purchases more raw materials, goods and services from Australia, lifting demand for the AUD, and pushing up its value. The opposite is the case when the Chinese economy is not growing as fast as expected. Positive or negative surprises in Chinese growth data, therefore, often have a direct impact on the Australian Dollar and its pairs.
Iron Ore is Australia’s largest export, accounting for $118 billion a year according to data from 2021, with China as its primary destination. The price of Iron Ore, therefore, can be a driver of the Australian Dollar. Generally, if the price of Iron Ore rises, AUD also goes up, as aggregate demand for the currency increases. The opposite is the case if the price of Iron Ore falls. Higher Iron Ore prices also tend to result in a greater likelihood of a positive Trade Balance for Australia, which is also positive of the AUD.
The Trade Balance, which is the difference between what a country earns from its exports versus what it pays for its imports, is another factor that can influence the value of the Australian Dollar. If Australia produces highly sought after exports, then its currency will gain in value purely from the surplus demand created from foreign buyers seeking to purchase its exports versus what it spends to purchase imports. Therefore, a positive net Trade Balance strengthens the AUD, with the opposite effect if the Trade Balance is negative.
- Mexican Peso drops sharply, trading at 18.09, with market focus on upcoming inflation and GDP data.
- Mexico's economy decelerates, with retail sales missing expectations, fueling a bleak outlook.
- Banxico expected to cut rates by 25 basis points in August, with economists revising year-end USD/MXN forecast to 18.80.
The Mexican Peso dropped sharply during Tuesday’s North American session, losing more than 1.00% against the Greenback, which registers mild gains amid falling US Treasury bond yields. Market participants expect the release of Mexico’s mid-month inflation figures on Wednesday. This, along with the release of US Gross Domestic Product (GDP) and inflation data, could dictate the path of the Mexican currency. The USD/MXN trades at 18.12 after bouncing off daily lows at 17.90.
Mexico’s economy continued to decelerate in May, according to the Economic Activity Indicator, released by the Instituto Nacional de Estadistica, Geografia e Informatica (INEGI). Retail Sales for the same period missed the mark, creating a gloomy economic outlook.
Meanwhile, the Citi Research Expectations survey showed that all the economists polled expect a 25-basis point rate cut by the Bank of Mexico (Banxico) at the upcoming August meeting.
The consensus revised the USD/MXN exchange rate upward toward the end of the year, from 18.70 to 18.80. For 2025, they estimate the spot price to reach 19.40, unchanged from the last survey.
On the US front, market participants continued to diggest over-the-weekend developments, which saw US President Joe Biden step aside from the Presidential race and endorse Vice President Kamala Harris.
Aside from this, expectations that the US Federal Reserve’s (Fed) preferred gauge for inflation, the Core Personal Consumption Expenditure (PCE) Price Index, will continue to edge lower and increase the odds of a potential September rate cut by the Fed.
Besides that, the US economic docket will feature the release of US GDP data.
Daily digest market movers: Mexican Peso plummets amid strong US Dollar
- Citi Research Expectations survey shows that analysts estimate inflation to end at 4.30% YoY, up from 4.20%, while underlying inflation is foreseen to finish 2024 at 4.0%.
- Regarding growth, Mexico’s economy is expected to grow 1.9%, down from 2.0% in the last poll.
- Fitch Ratings reaffirmed Mexico’s BBB- rating with a stable outlook but noted that the proposed judicial reform could impact the country. The credit rating agency expressed uncertainty about the upcoming administration's ability to narrow the fiscal deficit, anticipated a slight economic downturn in 2025, and mentioned that trade tensions with the US could leave Mexico vulnerable.
- The US Dollar Index (DXY), which tracks the buck’s value against the other six currencies, edges up 0.14%, up at104.42.
- US Existing Home Sales were lower than expected yet failed to trigger a USD/MXN exchange rate reaction.
- The Richmond Fed Manufacturing Index plunged to -17 from -10, underscoring manufacturing weakness around the region.
- The CME FedWatch Tools show that the chances of a quarter-percentage-rate cut to the federal funds rate in September are at 96%.
- June consumer inflation figures were lower than expected in the United States, increasing the chances that the Federal Reserve would lower borrowing costs in 2024 by at least 50 basis points, according to the December 2024 fed funds rate futures contract.
Technical analysis: Mexican Peso tumbles as USD/MXN climbs above 18.00
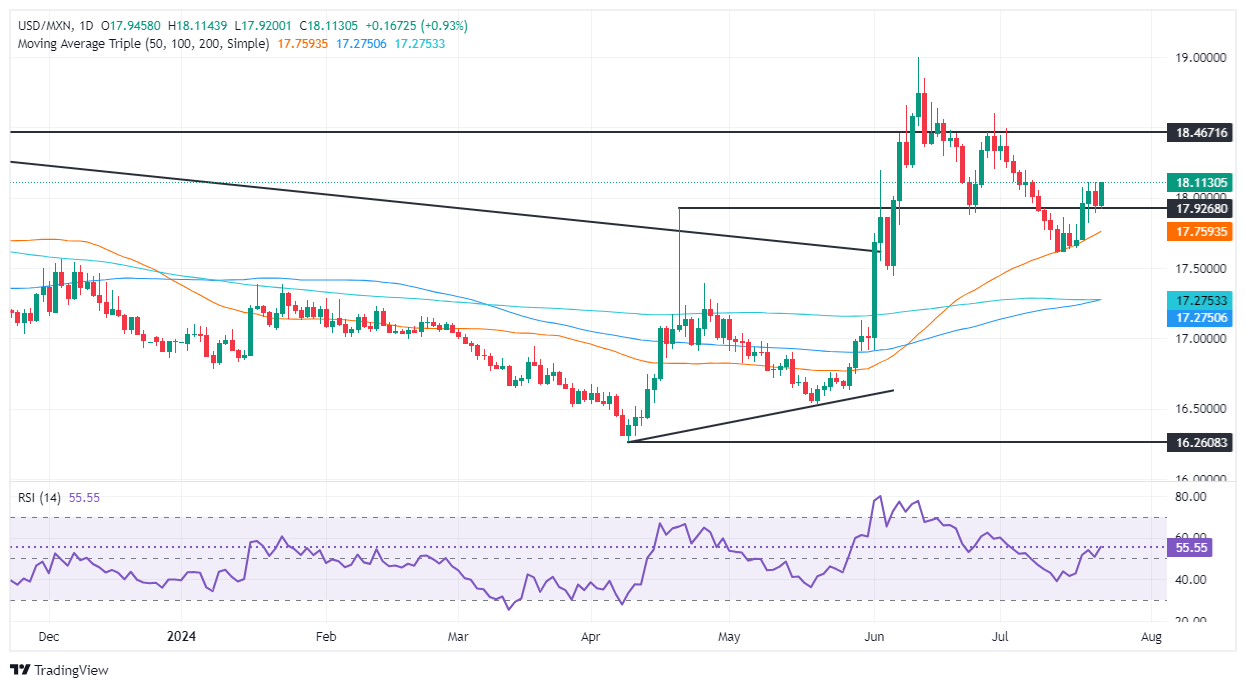
The USD/MXN has reclaimed the 18.00 figure, and it seems to continue to edge higher after posting a ‘shooting star’ bear candle. Seller’s failure to cap spot prices beneath 18.00 could pave the way for a re-test of the June 28 peak at 18.59, but there would be some resistance areas between current levels and the latter.
The USD/MXN first resistance would be 18.50, followed by the aforementioned. In the outcome of a decisive break, the next resistance would be the year-to-date (YTD) high at 18.99.
Conversely, if USD/MXN retreated beneath 18.00, that would pave the way to challenge the 50-day Simple Moving Average (SMA) at 17.74, the first support level. The next support would be the latest cycle low of 17.58; the July 12 high turned support. A breach of the latter will expose the January 23 peak at 17.38.
Mexican Peso FAQs
The Mexican Peso (MXN) is the most traded currency among its Latin American peers. Its value is broadly determined by the performance of the Mexican economy, the country’s central bank’s policy, the amount of foreign investment in the country and even the levels of remittances sent by Mexicans who live abroad, particularly in the United States. Geopolitical trends can also move MXN: for example, the process of nearshoring – or the decision by some firms to relocate manufacturing capacity and supply chains closer to their home countries – is also seen as a catalyst for the Mexican currency as the country is considered a key manufacturing hub in the American continent. Another catalyst for MXN is Oil prices as Mexico is a key exporter of the commodity.
The main objective of Mexico’s central bank, also known as Banxico, is to maintain inflation at low and stable levels (at or close to its target of 3%, the midpoint in a tolerance band of between 2% and 4%). To this end, the bank sets an appropriate level of interest rates. When inflation is too high, Banxico will attempt to tame it by raising interest rates, making it more expensive for households and businesses to borrow money, thus cooling demand and the overall economy. Higher interest rates are generally positive for the Mexican Peso (MXN) as they lead to higher yields, making the country a more attractive place for investors. On the contrary, lower interest rates tend to weaken MXN.
Macroeconomic data releases are key to assess the state of the economy and can have an impact on the Mexican Peso (MXN) valuation. A strong Mexican economy, based on high economic growth, low unemployment and high confidence is good for MXN. Not only does it attract more foreign investment but it may encourage the Bank of Mexico (Banxico) to increase interest rates, particularly if this strength comes together with elevated inflation. However, if economic data is weak, MXN is likely to depreciate.
As an emerging-market currency, the Mexican Peso (MXN) tends to strive during risk-on periods, or when investors perceive that broader market risks are low and thus are eager to engage with investments that carry a higher risk. Conversely, MXN tends to weaken at times of market turbulence or economic uncertainty as investors tend to sell higher-risk assets and flee to the more-stable safe havens.
- The Dow Jones failed to make meaningful headway on Tuesday.
- A trio of US data prints loom overhead throughout the week's back half.
- With hopes of a September rate cut pinned, traders will be hoping for easing data.
The Dow Jones Industrial Average (DJIA) went nowhere fast on Tuesday, sticking close to the day’s opening bids as investors shuffle their feet ahead of a hectic US data schedule in the back half of the trading week. Wednesday will be kicking things off with a fresh print of S&P Global Purchasing Managers Index (PMI) activity survey figures. Markets are expecting a lopsided print with a slight uptick in the Manufacturing PMI and a deceleration in the Services PMI component.
Thursday will follow up with an update to US quarterly Gross Domestic Product (GDP) in Q2. Friday will close out the trading week and the US data docket with Personal Consumption Expenditure Price Index (PCE) inflation figures.
With markets broadly pricing in a September rate cut as a sure thing, investors will be looking for softening data from the US, specifically a continued easing in PCE inflation. According to the CME’s FedWatch Tool, rate markets are pricing in nearly 100% odds of at least a quarter-point rate trim when the Federal Open Market Committee (FOMC) meets on September 18th.
Dow Jones news
Despite trading relatively flat on Tuesday, most of the Dow Jones’ constituent securities are tilted towards the downside, with nearly two-thirds of the index’s listed stocks seeing red. However, steeper gains in key sectors are keeping headline index tickers in the midrange.
Boeing Co. (BA) rallied 3.5% on Tuesday to $185.18 per share, while Amazon.com Inc. (AMZN) climbed 2.67% to $187.41 per share. Walt Disney Co. (DIS) fell -3.8% to $90.53 per share as India’s Competition Commission weighs a move to block Disney’s merging with Reliance. A merger between the two media companies would represent a 40% market share of television advertising in India. Teamsters at Disneyland also voted to authorize a strike in order to force Disney to the negotiating table to improve worker conditions, which could significantly impact Disney’s operations.
Dow Jones technical outlook
The Dow Jones appears to have pumped the brakes on a near-term decline from record highs set at 41,371.38 last week, however it could be a while yet before a bullish rebound takes shape. Price action continues to trade well above the 200-day Exponential Moving Average (EMA) at 37,882.57, while a pullback to the 50-day EMA at 39,449.38 could see a renewed push back into the topend.
Dow Jones daily chart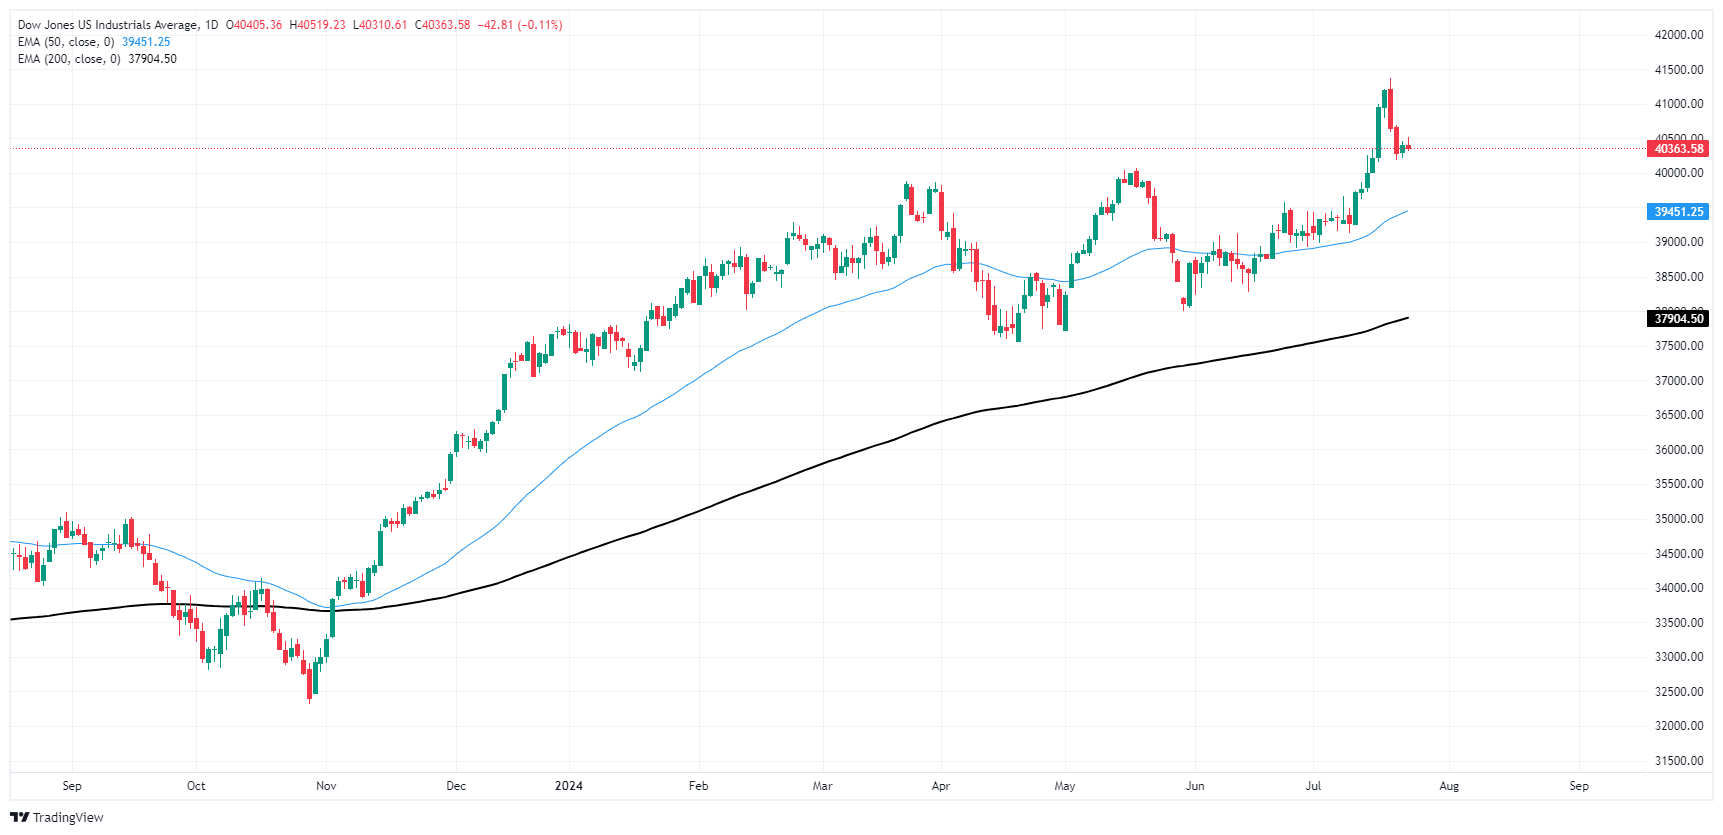
Dow Jones FAQs
The Dow Jones Industrial Average, one of the oldest stock market indices in the world, is compiled of the 30 most traded stocks in the US. The index is price-weighted rather than weighted by capitalization. It is calculated by summing the prices of the constituent stocks and dividing them by a factor, currently 0.152. The index was founded by Charles Dow, who also founded the Wall Street Journal. In later years it has been criticized for not being broadly representative enough because it only tracks 30 conglomerates, unlike broader indices such as the S&P 500.
Many different factors drive the Dow Jones Industrial Average (DJIA). The aggregate performance of the component companies revealed in quarterly company earnings reports is the main one. US and global macroeconomic data also contributes as it impacts on investor sentiment. The level of interest rates, set by the Federal Reserve (Fed), also influences the DJIA as it affects the cost of credit, on which many corporations are heavily reliant. Therefore, inflation can be a major driver as well as other metrics which impact the Fed decisions.
Dow Theory is a method for identifying the primary trend of the stock market developed by Charles Dow. A key step is to compare the direction of the Dow Jones Industrial Average (DJIA) and the Dow Jones Transportation Average (DJTA) and only follow trends where both are moving in the same direction. Volume is a confirmatory criteria. The theory uses elements of peak and trough analysis. Dow’s theory posits three trend phases: accumulation, when smart money starts buying or selling; public participation, when the wider public joins in; and distribution, when the smart money exits.
There are a number of ways to trade the DJIA. One is to use ETFs which allow investors to trade the DJIA as a single security, rather than having to buy shares in all 30 constituent companies. A leading example is the SPDR Dow Jones Industrial Average ETF (DIA). DJIA futures contracts enable traders to speculate on the future value of the index and Options provide the right, but not the obligation, to buy or sell the index at a predetermined price in the future. Mutual funds enable investors to buy a share of a diversified portfolio of DJIA stocks thus providing exposure to the overall index.
- Canadian Dollar finds gains, but remains slightly lower against the Greenback.
- Canada is set to deliver another BoC rate cut despite near-term inflation uptick.
- Key US data due this week will likely overshadow BoC moves.
The Canadian Dollar (CAD) mostly paddled in place on Tuesday, finding thin gains across the board but still struggling to make headway against a mild recovery in US Dollar bidding. A quiet start to the trading week is set to give way to a moderately hectic second half beginning with Wednesday’s expected rate trim from the Bank of Canada (BoC) and a raft of key data prints from the US in a three-day binge.
Canada is all set to deliver another quarter-point rate cut on Wednesday after the BoC boxed itself into a promised series of rate cuts in the latter half of 2024. Despite a near-term uptick in core inflation metrics that would normally worry a major central bank, the BoC is determined to shrug off a data-dependent approach. Instead, the BoC is determined to soothe broad-market demands for cheaper debt financing costs.
Daily digest market movers: Canadian Dollar coils ahead of mid-week rate call
- CAD markets are poised for a broadly-anticipated BoC rate cut. Investors are broadly expecting a 25 bps trim as a follow-up to June’s initial quarter-point cut.
- Too many cuts too fast could easily tip the Canadian economy into an inflation-hot recession with key price growth indicators already flashing warning signs after June’s cut.
- Canada’s housing market already represents an outsized proportion of the Canadian economy, nearly twice the OECD average. Declining rates could spark a fresh flurry in the real estate market, further burdening Canada with long-dated consumer debt and reigniting a run in housing prices.
- The US is poised to kick off a three-day data dump beginning on Wednesday with Purchasing Managers Index (PMI) figures, followed by Thursday’s Gross Domestic Product (GDP) update and Friday’s Personal Consumption Expenditure Price Index (PCE) inflation.
- After last week’s broad-market risk rally and a September rate hike fully priced in, investors will be looking for a continued easing in US data prints to help keep rate cut hopes buoyed.
Canadian Dollar PRICE Today
The table below shows the percentage change of Canadian Dollar (CAD) against listed major currencies today. Canadian Dollar was the strongest against the New Zealand Dollar.
| USD | EUR | GBP | JPY | CAD | AUD | NZD | CHF | |
|---|---|---|---|---|---|---|---|---|
| USD | 0.35% | 0.18% | -0.67% | 0.06% | 0.39% | 0.42% | 0.31% | |
| EUR | -0.35% | -0.17% | -1.00% | -0.28% | 0.02% | 0.06% | -0.04% | |
| GBP | -0.18% | 0.17% | -0.81% | -0.10% | 0.22% | 0.24% | 0.12% | |
| JPY | 0.67% | 1.00% | 0.81% | 0.74% | 1.05% | 1.06% | 0.94% | |
| CAD | -0.06% | 0.28% | 0.10% | -0.74% | 0.32% | 0.34% | 0.23% | |
| AUD | -0.39% | -0.02% | -0.22% | -1.05% | -0.32% | 0.02% | -0.10% | |
| NZD | -0.42% | -0.06% | -0.24% | -1.06% | -0.34% | -0.02% | -0.12% | |
| CHF | -0.31% | 0.04% | -0.12% | -0.94% | -0.23% | 0.10% | 0.12% |
The heat map shows percentage changes of major currencies against each other. The base currency is picked from the left column, while the quote currency is picked from the top row. For example, if you pick the Canadian Dollar from the left column and move along the horizontal line to the US Dollar, the percentage change displayed in the box will represent CAD (base)/USD (quote).
Technical analysis: USD/CAD continues to limp higher as Greenback outperforms CAD on Tuesday
The Canadian Dollar (CAD) found thin gains across the board on Tuesday, gaining ground against nearly all of its major currency peers. However, the CAD was still unable to overcome a mild but determined recovery in US Dollar bidding, keeping USD/CAD testing into near-term highs.
USD/CAD is on pace to chalk in another green daily candle after having closed bullish for all but one of the last eight consecutive trading days. Bidders continue to push the pair back towards the 1.3800 handle, but a heavy supply zone priced in from April’s peaks near 1.3850 are keeping momentum limited. A bearish turnaround would drag price action back to the 200-day Exponential Moving Average (EMA) at 1.3598.
USD/CAD hourly chart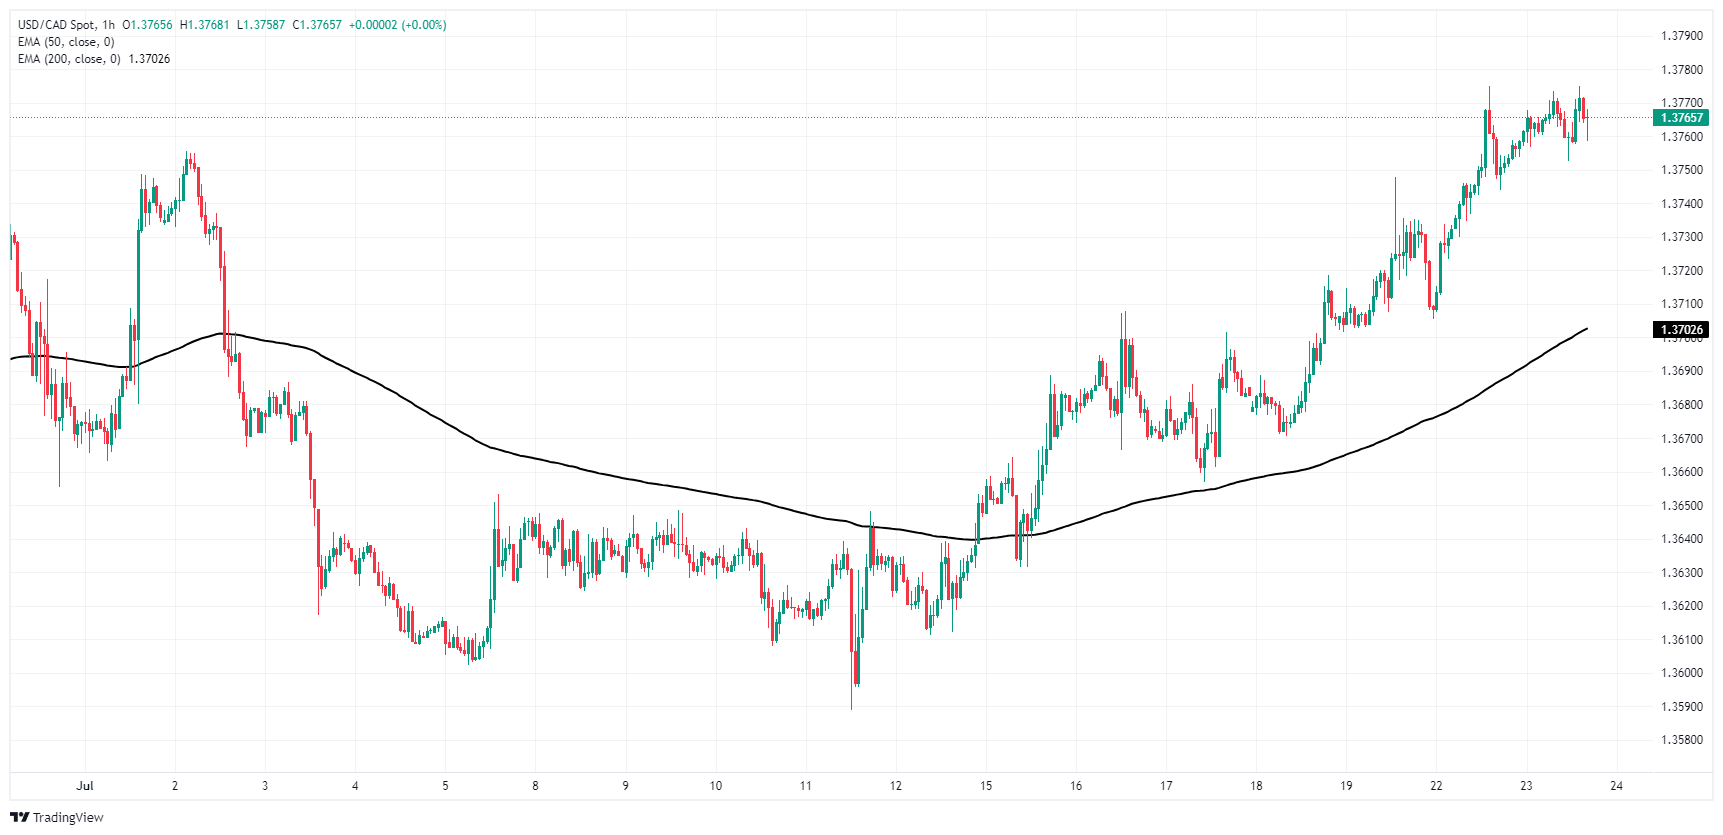
USD/CAD daily chart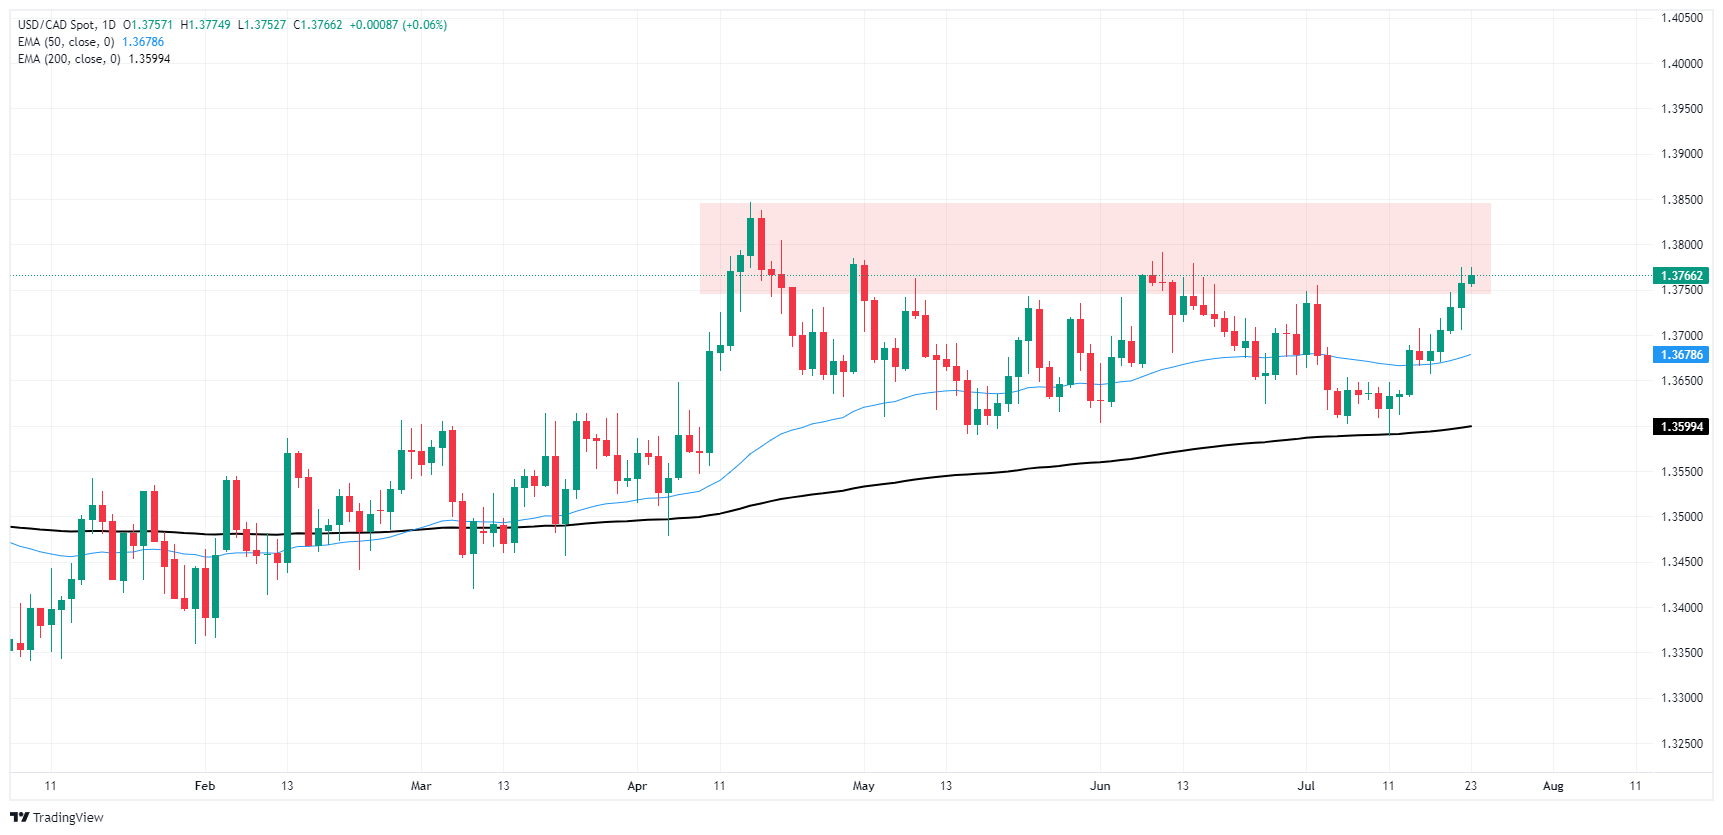
Canadian Dollar FAQs
The key factors driving the Canadian Dollar (CAD) are the level of interest rates set by the Bank of Canada (BoC), the price of Oil, Canada’s largest export, the health of its economy, inflation and the Trade Balance, which is the difference between the value of Canada’s exports versus its imports. Other factors include market sentiment – whether investors are taking on more risky assets (risk-on) or seeking safe-havens (risk-off) – with risk-on being CAD-positive. As its largest trading partner, the health of the US economy is also a key factor influencing the Canadian Dollar.
The Bank of Canada (BoC) has a significant influence on the Canadian Dollar by setting the level of interest rates that banks can lend to one another. This influences the level of interest rates for everyone. The main goal of the BoC is to maintain inflation at 1-3% by adjusting interest rates up or down. Relatively higher interest rates tend to be positive for the CAD. The Bank of Canada can also use quantitative easing and tightening to influence credit conditions, with the former CAD-negative and the latter CAD-positive.
The price of Oil is a key factor impacting the value of the Canadian Dollar. Petroleum is Canada’s biggest export, so Oil price tends to have an immediate impact on the CAD value. Generally, if Oil price rises CAD also goes up, as aggregate demand for the currency increases. The opposite is the case if the price of Oil falls. Higher Oil prices also tend to result in a greater likelihood of a positive Trade Balance, which is also supportive of the CAD.
While inflation had always traditionally been thought of as a negative factor for a currency since it lowers the value of money, the opposite has actually been the case in modern times with the relaxation of cross-border capital controls. Higher inflation tends to lead central banks to put up interest rates which attracts more capital inflows from global investors seeking a lucrative place to keep their money. This increases demand for the local currency, which in Canada’s case is the Canadian Dollar.
Macroeconomic data releases gauge the health of the economy and can have an impact on the Canadian Dollar. Indicators such as GDP, Manufacturing and Services PMIs, employment, and consumer sentiment surveys can all influence the direction of the CAD. A strong economy is good for the Canadian Dollar. Not only does it attract more foreign investment but it may encourage the Bank of Canada to put up interest rates, leading to a stronger currency. If economic data is weak, however, the CAD is likely to fall.
- US Dollar DXY experiences a restricted gain as falling US Treasury yields may pose challenges during the session.
- US political changes continue to influence, and core PCE to be on focus next week.
- Fed officials maintain their data-dependent stance, keeping markets on their toes.
On Tuesday, the US Dollar measured by the DXY, witnessed a slight rise, albeit falling US Treasury yields are expected to pose a significant challenge for the rest of the session. This comes amidst expected shifts in financial markets due to new hints about economic plans from former President Donald Trump after Joe Biden's exit. The focus is still on high-tier data due this week.
Given signs of disinflation in the US, markets express optimism over potential rate adjustments in September. Even with these shifts on the horizon, Federal Reserve officials have reiterated their cautious approach toward deciding on rate changes, hence keeping the markets on their toes. Major indicators to watch out for over the week include Personal Consumption Expenditures (PCE) and Gross Domestic Product (GDP) Q2 revisions.
Daily digest market movers: US Dollar mildly up as focus shifts to PCE
- Mid-tier housing data came in lower than expected with Existing Home Sales posting a higher-than-expected monthly drop in June but didn’t trigger major movements on the USD.
- Weak Richmond Fed manufacturing index didn’t stop the USD bulls from advancing.
- On Friday, forecasts placed the core PCE at a 0.16% MoM increase and the spending is projected at a 0.3% MoM increase.
- The CME FedWatch Tool indicates a highly probable rate cut in September, although GDP and PCE data are set to determine the week's dynamics for the USD.
- US Treasury yields are down with the 2,5 and 10-year rates at 4.51%, 4.16% and 4.23%.
DXY Technical outlook: A slight bullish spree, yet bearish signs linger
Despite the current uplift above the 200-day Simple Moving Average (SMA), the DXY index still carries a neutral to bearish outlook. Bearish signals resurface as the DXY index's indicators are still largely in the negative zone, while a looming bearish crossover between the 20 and 100-day SMAs is evident around the 104.80 area. This, if completed, could give substantial momentum to the sellers.
US Dollar FAQs
The US Dollar (USD) is the official currency of the United States of America, and the ‘de facto’ currency of a significant number of other countries where it is found in circulation alongside local notes. It is the most heavily traded currency in the world, accounting for over 88% of all global foreign exchange turnover, or an average of $6.6 trillion in transactions per day, according to data from 2022. Following the second world war, the USD took over from the British Pound as the world’s reserve currency. For most of its history, the US Dollar was backed by Gold, until the Bretton Woods Agreement in 1971 when the Gold Standard went away.
The most important single factor impacting on the value of the US Dollar is monetary policy, which is shaped by the Federal Reserve (Fed). The Fed has two mandates: to achieve price stability (control inflation) and foster full employment. Its primary tool to achieve these two goals is by adjusting interest rates. When prices are rising too quickly and inflation is above the Fed’s 2% target, the Fed will raise rates, which helps the USD value. When inflation falls below 2% or the Unemployment Rate is too high, the Fed may lower interest rates, which weighs on the Greenback.
In extreme situations, the Federal Reserve can also print more Dollars and enact quantitative easing (QE). QE is the process by which the Fed substantially increases the flow of credit in a stuck financial system. It is a non-standard policy measure used when credit has dried up because banks will not lend to each other (out of the fear of counterparty default). It is a last resort when simply lowering interest rates is unlikely to achieve the necessary result. It was the Fed’s weapon of choice to combat the credit crunch that occurred during the Great Financial Crisis in 2008. It involves the Fed printing more Dollars and using them to buy US government bonds predominantly from financial institutions. QE usually leads to a weaker US Dollar.
Quantitative tightening (QT) is the reverse process whereby the Federal Reserve stops buying bonds from financial institutions and does not reinvest the principal from the bonds it holds maturing in new purchases. It is usually positive for the US Dollar.
AUD/USD peaked at 0.68 on July 11 and fell to 0.6643 on Monday, back inside the 0.6575-0.6700 range seen between mid-May and early July, DBS senior FX strategist Philip Wee.
AUD to rise later in the coming months
“AUD/USD peaked at 0.68 on July 11 and fell to 0.6643 on Monday, back inside the 0.6575-0.6700 range seen between mid-May and early July”
“Apart from China’s uninspiring economy, the Australian Dollar (AUD) has been under pressure alongside commodities over the past week due to uncertainties over the US Presidential elections. For example, Copper fell 17% from the year’s high of USD505/lb.70 (May 21) to 420 on Monday.”
“However, US equities rallied in the overnight market after US President Joe Biden ended his re-election bid with Democrats uniting behind Vice President Kamala Harris as the party’s nomination to take on Donald Trump at the elections. A less one-sided race to the White House coupled with Fed cuts could weaken the USD and support the AUD later in the coming months.”
What began on the Gold market last Thursday as a setback after the strong price increase has now turned into a sharp correction, Commerzbank’s commodity strategist Carsten Fritsch notes.
Gold rises to record highs and falls after that
“The price of Gold has been under pressure for three days and is trading around the $2,400 per troy ounce mark again. The price has now fallen around $100 from the record high reached last Wednesday. This means that all gains since the release of the US inflation data the week before last have been wiped out. These data had led to a significant increase in expectations of interest rate cuts and thus triggered the price rise to the aforementioned record high.”
“The price increase was also supported by a further increase in net long positions on the part of speculative financial investors to the highest level since March 2020. It is quite conceivable that selling pressure has now also emanated from this side. The next CFTC data on Friday may shed light on this. Rate cut expectations have recently been scaled back somewhat.”
“However, according to Fed Funds Futures, a rate cut in September and a total of 2-3 rate cuts by the end of the year are still priced in. The current Gold price of around $2,400 per troy ounce should be more in line with this than a price level of $2,484 per troy ounce. The pressure on the Gold price should therefore ease now and the price should stabilize.”
- GBP/USD trades above 1.2900 down 0.13%, approaching key support at 1.2860.
- Bearish momentum observed as RSI slope turns downward, indicating potential further declines.
- Key support levels: 1.2860 (June 12 high) and 1.2779 (July 10 low), with further downside toward the 100-DMA at 1.2678.
The Pound Sterling extended its losses during the North American session against the US Dollar on Tuesday, clinging to the 1.2900 figure after hitting a 7-day high of 1.2887. Traders eye the next key support level of 1.2860. At the time of writing, the GBP/USD trades at 1.2914, down 0.13%.
GBP/USD Price Analysis: Technical outlook
After a five-day consolidation that witnessed the GBP/USD hitting a yearly peak of 1.3044, followed by a tall bearish candle that sent the pair drifting from around 1.3000s toward the 1.2940 mark before tumbling deeper, toward the 1.2900 figure.
Momentum, as depicted by the Relative Strength Index (RSI), remains bullish, but in the near term, sellers have moved in, as the RSI slope aims downwards.
Therefore, the GBP/USD could continue to edge lower, but first, market participants need to push the exchange rate below 1.2900. In that outcome, the next support could be the June 12 high at 1.2860, followed by July 10 low at 1.2779. A further downside is seen at the 100-day moving average (DMA) at 1.2678.
On the flip side, if buyers lift the exchange rate past 1.2940, the next resistance would be 1.3000.
GBP/USD Price Action – Daily Chart
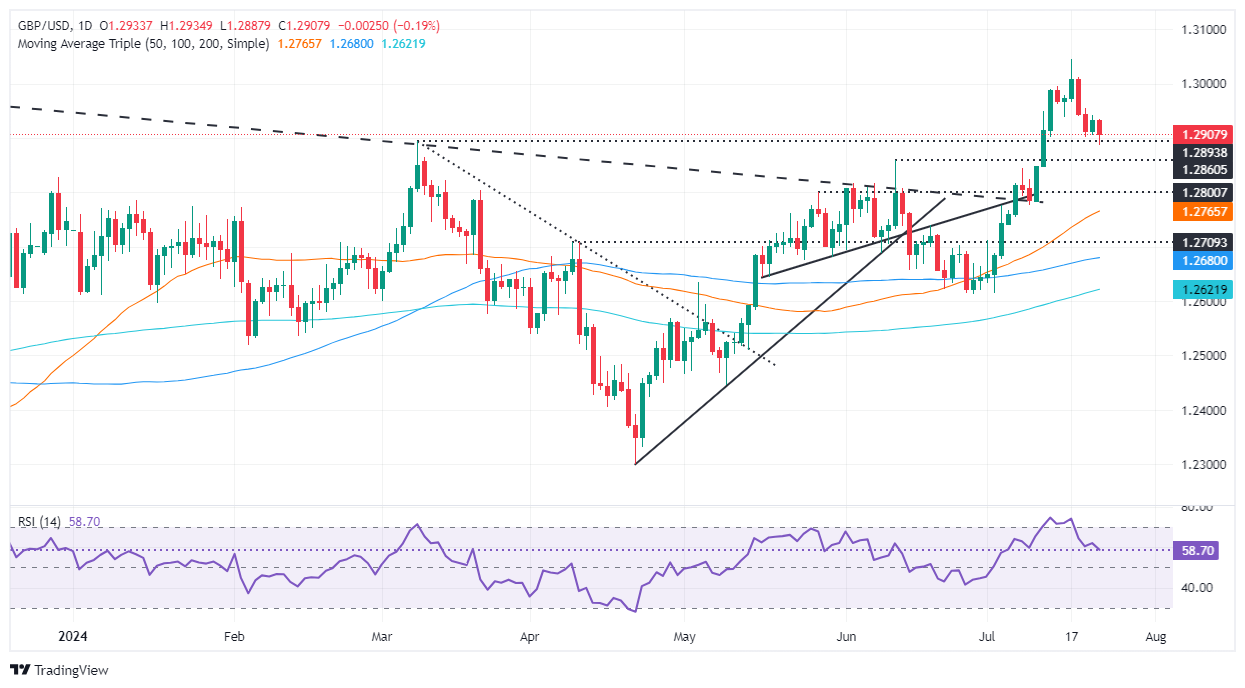
British Pound PRICE Today
The table below shows the percentage change of British Pound (GBP) against listed major currencies today. British Pound was the strongest against the New Zealand Dollar.
| USD | EUR | GBP | JPY | CAD | AUD | NZD | CHF | |
|---|---|---|---|---|---|---|---|---|
| USD | 0.42% | 0.20% | -0.66% | 0.10% | 0.42% | 0.45% | 0.31% | |
| EUR | -0.42% | -0.22% | -1.07% | -0.32% | -0.01% | 0.01% | -0.10% | |
| GBP | -0.20% | 0.22% | -0.85% | -0.09% | 0.23% | 0.24% | 0.10% | |
| JPY | 0.66% | 1.07% | 0.85% | 0.78% | 1.08% | 1.09% | 0.94% | |
| CAD | -0.10% | 0.32% | 0.09% | -0.78% | 0.31% | 0.32% | 0.19% | |
| AUD | -0.42% | 0.01% | -0.23% | -1.08% | -0.31% | 0.02% | -0.13% | |
| NZD | -0.45% | -0.01% | -0.24% | -1.09% | -0.32% | -0.02% | -0.14% | |
| CHF | -0.31% | 0.10% | -0.10% | -0.94% | -0.19% | 0.13% | 0.14% |
The heat map shows percentage changes of major currencies against each other. The base currency is picked from the left column, while the quote currency is picked from the top row. For example, if you pick the British Pound from the left column and move along the horizontal line to the US Dollar, the percentage change displayed in the box will represent GBP (base)/USD (quote).
In May, Copper supply exceeded demand by 65 thousand tons, with the ICSG reporting a supply surplus of 416 thousand tons for the first five months. Even though seasonal effects play a role here and the seasonally adjusted market surplus also reported by the ICSG was ‘only’ 250 thousand tons, Commerzbank’s commodity strategist Barbara Lambrecht notes.
High supply surplus on the Copper market
“The supply and demand figures published yesterday by the International Copper Study Group confirmed an amply supplied market for May and the first five months of the current year: In May, supply exceeded demand by 65 thousand tons, with the ICSG reporting a supply surplus of 416 thousand tons for the first five months.
“Even though seasonal effects play a role here and the seasonally adjusted market surplus also reported by the ICSG was ‘only’ 250 thousand tons, the surplus is still high by historical standards and already exceeds the expected supply surplus of 162 thousand tons that the ICSG had forecast in April for 2024 as a whole.”
“The main reason for this was the sharp rise in Copper refining production: around 6% more was produced worldwide in the first five months than in the previous year, primarily due to China's sharp rise in production, while demand ‘only’ increased by 3.7% during this period. Copper mine production in the period considered was still 4% up on the previous year: the ICSG expects growth of only 0.5% for the year as a whole.”
Silver has recently come under even more pressure than Gold, Commerzbank’s commodity strategist Carsten Fritsch notes.
Silver price loses around 8% since Wednesday
“The Silver price has lost around 8% since Wednesday last week and is trading at less than $29 per troy ounce, its lowest level since the end of June. As a result, the Gold/Silver ratio rose to 83, a level last seen in mid-May. Silver usually follows the price movements of Gold disproportionately. However, this has recently only applied to the downside.”
“The previous upward movement in Gold following the US inflation figures was more or less ignored by Silver. Accordingly, the Gold/Silver ratio was already rising before the recent price slump. The relative weakness in Silver is likely due to the weakness in base metals.”
“This is because industrial applications are expected to account for almost 60% of Silver demand this year, according to the Silver Institute. The largest part of the increase in industrial Silver demand is expected to come from photovoltaics, which is why the negative price reaction in silver seems exaggerated.”
The price of Brent oil falls yesterday to its lowest level since mid-June, Commerzbank’s commodity strategist Carsten Fritsch notes.
Demand concerns move the price lower
“The price of Brent oil fell yesterday to its lowest level since mid-June, but it had already fallen by around 3% on Friday, with most of the price decline occurring in the late afternoon and evening. There is no oil market-specific trigger for the current price weakness. The headwind is therefore very likely to come from the generally negative market sentiment towards cyclical commodities.”
“Oil prices were initially able to withstand this, but this changed abruptly on Friday. Demand concerns have evidently gained the upper hand as a result. The voluntary production cuts by OPEC+ are ensuring that the oil market is undersupplied in the current quarter. This is also shown by the forward curve.”
“The significant decline in US crude oil inventories over the last three weeks also suggests that supply is rather tight. Supply risks do not appear to be playing a role on the market at present. Given the current dominance of demand concerns, oil prices may initially find it difficult to make up lost ground. However, we expect oil prices to rise again in the coming weeks due to the factors mentioned above.”
- Silver price finds cushion near $28.70 as US yields slump.
- The Fed is expected to start cutting interest rates from September.
- Investors await the US Q2 GDP and June’s core PCE inflation data.
Silver price (XAG/USD) discovers interim support near $28.70 in Tuesday’s American session after four-day losing spree. The white metal finds temporary support as US bond yields decline amid firm speculation that the Federal Reserve (Fed) will start reducing interest rates from the September meeting.
10-year US Treasury yields fall to near 4.24%. Lower yields on interest-bearing assets reduces the opportunity cost of holding an investment in non-yielding assets, such as Silver.
Meanwhile, the US Dollar (USD) rises as its safe-haven appeal improves due to uncertainty over United States (US) presidential elections in November. Democrats have nominated Vice President Kamala Harris as their contender against Donald Trump-led Republicans.
The victory of Donald Trump is expected to result in higher inflation as he has pledged to cut corporate taxes and interest rates, which could widen the fiscal budget deficit. Also, he is known for favoring restrictive trade policies.
On Tuesday, Silver price in India nosedives as Prime Minister Narendra Modi-led-NDA proposed to cut custom duty on imports of precious metals. The centre reduces basic custom duty to 6% from 10%.
Going forward, investors will focus on the US Q2 Gross Domestic Product (GDP) and the core Personal Consumption Expenditure Price Index (PCE) data for June, which will be published on Thursday and Friday, respectively.
Silver technical analysis
Silver price trades back and forth in a range between $28.50 and $32.50 for almost two months. The white metal drops below the 20-day Exponential Moving Average (EMA), which trades around $30.00, suggesting uncertainty in near term.
The 14-day Relative Strength Index (RSI) oscillates in the 40.00-60.00 range, indicating indecisiveness among market participants.
Silver daily chart
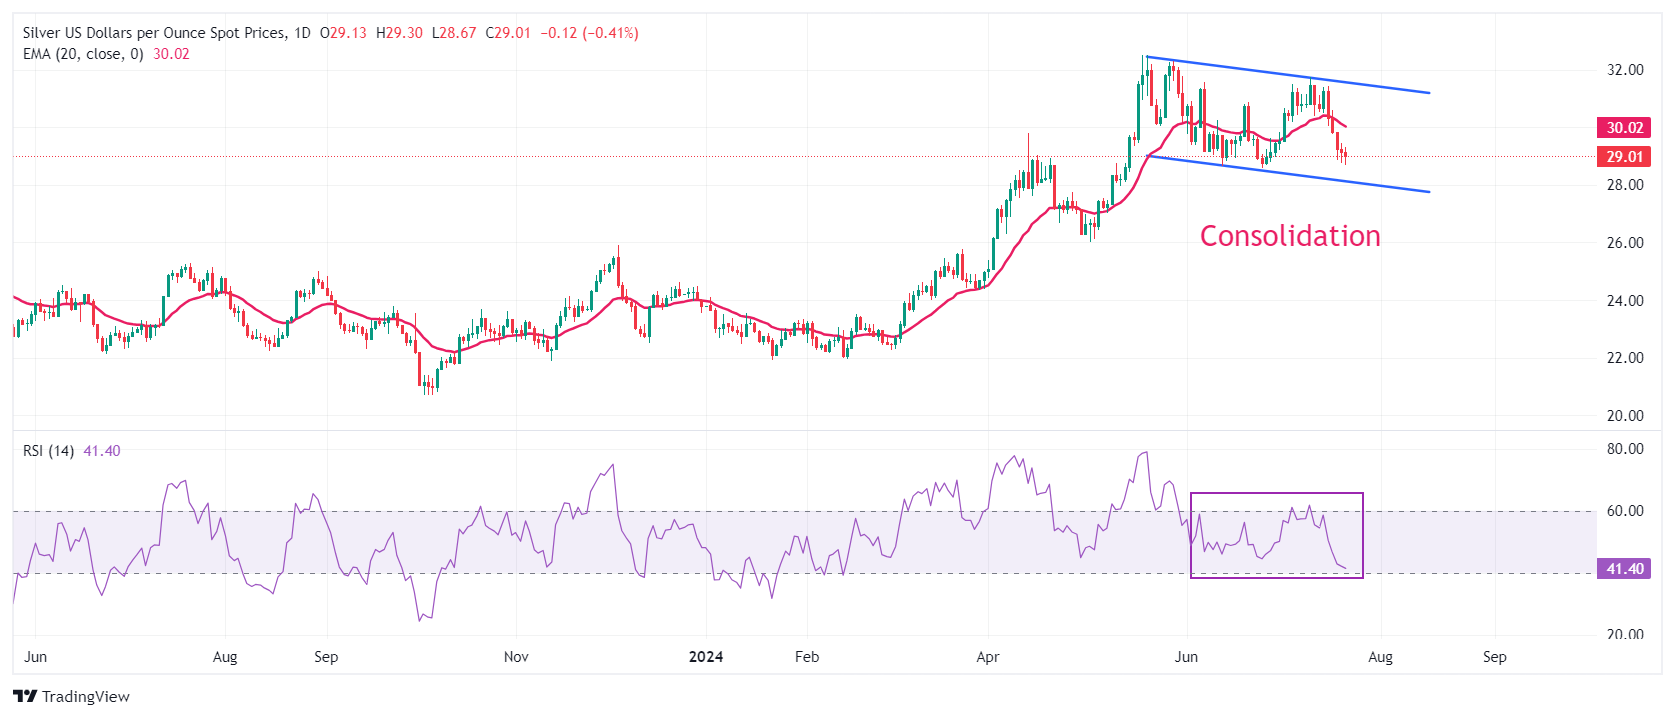
Silver FAQs
Silver is a precious metal highly traded among investors. It has been historically used as a store of value and a medium of exchange. Although less popular than Gold, traders may turn to Silver to diversify their investment portfolio, for its intrinsic value or as a potential hedge during high-inflation periods. Investors can buy physical Silver, in coins or in bars, or trade it through vehicles such as Exchange Traded Funds, which track its price on international markets.
Silver prices can move due to a wide range of factors. Geopolitical instability or fears of a deep recession can make Silver price escalate due to its safe-haven status, although to a lesser extent than Gold's. As a yieldless asset, Silver tends to rise with lower interest rates. Its moves also depend on how the US Dollar (USD) behaves as the asset is priced in dollars (XAG/USD). A strong Dollar tends to keep the price of Silver at bay, whereas a weaker Dollar is likely to propel prices up. Other factors such as investment demand, mining supply – Silver is much more abundant than Gold – and recycling rates can also affect prices.
Silver is widely used in industry, particularly in sectors such as electronics or solar energy, as it has one of the highest electric conductivity of all metals – more than Copper and Gold. A surge in demand can increase prices, while a decline tends to lower them. Dynamics in the US, Chinese and Indian economies can also contribute to price swings: for the US and particularly China, their big industrial sectors use Silver in various processes; in India, consumers’ demand for the precious metal for jewellery also plays a key role in setting prices.
Silver prices tend to follow Gold's moves. When Gold prices rise, Silver typically follows suit, as their status as safe-haven assets is similar. The Gold/Silver ratio, which shows the number of ounces of Silver needed to equal the value of one ounce of Gold, may help to determine the relative valuation between both metals. Some investors may consider a high ratio as an indicator that Silver is undervalued, or Gold is overvalued. On the contrary, a low ratio might suggest that Gold is undervalued relative to Silver.
Base metal prices fell significantly across the board last week and are now all trading at multi-month lows, Commarzbank’s commodity strategist Carsten Fritsch notes.
Base metals slide lower
“The index of the London Metal Exchange (LMEX), which weights the six non-ferrous metals traded on the LME according to production and trading volumes over the last five years, fell by 5.6% week-on-week and slipped below the 4,000 point mark for the first time since the beginning of April.”
“Copper recorded its biggest weekly decline in almost two years at 5.7% and ended the week at around $9,300 per ton, its lowest level in 3½ months. The price decline continued yesterday. At the beginning of the month, the Сopper price was still close to the $10,000 per ton mark.”
“Aluminum hardly fared any better with a weekly decline of more than 5%. As a result, the price of Aluminum fell to its lowest level since the end of March at just over $2,300 per ton, thereby giving up all of its gains since the beginning of the year.”
- USD/JPY weakens to 156.00 as BoJ rate-hike bets surge.
- The BoJ is expected to raise interest rates further by 10 bps as inflation remains above 2%.
- Investors await the US data for fresh guidance on interest rates.
The USD/JPY pair tumbles to near 156.00 in Tuesday’s American session. The asset weakens as the Japanese Yen (JPY) strengthens amid expectations that the Bank of Japan (BoJ) will tighten its monetary policy further in its July monetary policy meeting.
Economists expect that the BoJ will raise interest rates further by 10 basis points (bps). The expectations for the BoJ to hike borrowing rates further are prompted by steady inflation above bank’s target of 2%. In June, annual National Consumer Price Index (CPI) rose steadily by 2.8%.
The core CPI, which excludes volatile food and energy items, accelerated to 2.2% from the former release of 2.1%. National CPI, excluding Fresh Food, grew slower by 2.6% from the estimates of 2.7% but remained higher than the former release of 2.5%.
BoJ policymakers remain worried about rising inflation due to the weak Japanese Yen. Weak yen has resulted in higher exports making them more competitive in global markets.
Meanwhile, the appeal of the US Dollar (USD) improves as a safe haven due to increasing risk aversion. The US Dollar Index (DXY), which tracks the Greenback’s value against six major currencies, rises to near 104.50.
This week, investors will focus on the United States (US) Q2 Gross Domestic Product (GDP) and the Personal Consumption Expenditure Price Index (PCE) data for June. The economic data will provide cues about when the Federal Reserve (Fed) will begin reducing interest rates.
(The story was corrected on July 23 at 13:20 GMT to say in the first bullet that "USD/JPY weakens to 156.00 as BoJ rate-hike bets surge", not rate-cut bets.)
Japanese Yen FAQs
The Japanese Yen (JPY) is one of the world’s most traded currencies. Its value is broadly determined by the performance of the Japanese economy, but more specifically by the Bank of Japan’s policy, the differential between Japanese and US bond yields, or risk sentiment among traders, among other factors.
One of the Bank of Japan’s mandates is currency control, so its moves are key for the Yen. The BoJ has directly intervened in currency markets sometimes, generally to lower the value of the Yen, although it refrains from doing it often due to political concerns of its main trading partners. The current BoJ ultra-loose monetary policy, based on massive stimulus to the economy, has caused the Yen to depreciate against its main currency peers. This process has exacerbated more recently due to an increasing policy divergence between the Bank of Japan and other main central banks, which have opted to increase interest rates sharply to fight decades-high levels of inflation.
The BoJ’s stance of sticking to ultra-loose monetary policy has led to a widening policy divergence with other central banks, particularly with the US Federal Reserve. This supports a widening of the differential between the 10-year US and Japanese bonds, which favors the US Dollar against the Japanese Yen.
The Japanese Yen is often seen as a safe-haven investment. This means that in times of market stress, investors are more likely to put their money in the Japanese currency due to its supposed reliability and stability. Turbulent times are likely to strengthen the Yen’s value against other currencies seen as more risky to invest in.
Encouraging Eurozone disinflationary process leaves the ECB room to cut the policy rate again in September which remains a headwind for the Euro (EUR), BBH analysts note.
ECB to cut the policy rate in September
“EUR/USD fell by about 0.3% during the European trading session to lows around 1.0860.”
“There was no new policy guidance from ECB Vice President Luis de Guindos. Guindos said ‘data-wise, September is a much more convenient month for taking decisions than July was.’ In our view, the encouraging Eurozone disinflationary process leaves the ECB room to cut the policy rate again in September which remains a headwind for EUR.”
“The swaps market implies 80% odds of a 25 bp ECB rate cut to 3.50% on September 12. The Eurozone July consumer confidence index is up next (10:00 New York)”
The Brazilian real has been on a rollercoaster ride in recent weeks, Commerzbank FX analyst Michael Pfister notes.
Trades right below 5.70
“After reaching its highest level in almost two and a half years at 5.70 in early July, the c exchange rate fell sharply in the following days amid pronounced USD weakness. However, the low levels did not last long.”
“One can almost feel sorry for the Brazilian finance minister. For weeks he has been trying to reassure the markets that Brazil is taking concerns seriously and reducing the budget deficit, only for Lula to raise fresh doubts. Friday's announcement of a BRL15bn spending freeze did little to help matters.”
“Granted, this is not even half of the deficit accumulated so far this year, but it was a first step. But as long as the market fears that these efforts will not be sustained, BRL will struggle. Either Lula turns to a more balanced fiscal policy or the USD will have to weaken significantly again — otherwise we are unlikely to see significantly lower USD/BRL levels in the coming weeks.”
Today's meeting of the National Bank of Hungary (NBH) is the main event of the week in the CEE region. Our economists expect rates to remain unchanged, but as we discuss in this NBH preview, the odds of unchanged rates versus a 25bp rate cut are almost even, ING’s FX strategist Frantisek Taborsky notes.
Expect a dovish rhetoric today
“Of course, the downside surprise in inflation, the strongest HUF since late May, and the dovish shift in the global story will make it tempting for the central bank to cut rates. In any case, in this context, our economists have already revised the rate path from flat rates to two 25bp cuts this year.”
“So, regardless of today's decision, we expect dovish rhetoric despite the central bank trying to paint a cautious approach. We see this in market pricing and surveys which are also rather balanced but still favour a 25bp rate cut today. As always, we should see a decision at 1400 local time today and a press conference an hour later.”
“We expect dovish rhetoric today. Given the relatively strong HUF levels, this rhetoric should be negative for the currency. Rates pricing has moved massively down the curve over the past three weeks, most notably across CEE peers, and for some time now the narrower interest rate differential has pointed to a weaker HUF. So, today's meeting could be a trigger and we are bearish on HUF here.”
It is unanimously expected that Turkey’s central bank (CBT) will leave its base rate unchanged at 50.0% at today’s meeting. Even if continuing lira depreciation might have raised some question marks about unchanged rates under other circumstances, now that June CPI surprised to the downside, the likelihood of any other policy change has become remote, Commerzbank FX strategist Tatha Ghose notes.
Inflation below 40% is unlikely
“We, ourselves, have however cautioned in recent days that the CPI improvement was not convincing, while more lira depreciation could follow as it was clear that policymakers were having to intervene to defend the 33.0 USD/TRY level in recent weeks before the exchange rate finally breached it.
“We expect to hear the language that CBT will maintain tight monetary policy for longer as inflation risk still exists. This is what the governor maintained in recent remarks. Of course, it is quite bizarre that, with Turkey’s long history of out-of-control inflation, just after one questionable CPI reading, the central bank even has to explain why it is not cutting rates.”
“The FX market is increasingly nervous that President Tayyip Erdogan may not have patience with high interest rates now that inflation is somehow appearing to moderate. In Turkey, inflation could moderate from current 70% up to 50% or 40% in this manner. But beyond that will be problematic. And today’s policy decision will not constitute a positive step towards solving this problem.”
The story this week in the eurozone could be soft survey data that supports the ECB's contention that short-term economic risks lie to the downside. This may well be most evident in tomorrow's release of the flash PMIs for July, ING’s FX strategist Chris Turner notes.
EUR/USD trades in very narrow ranges under 1.09
“Today, however, we will get some consumer confidence data for July. The Dutch reading has already slipped back a little and the eurozone reading is released at 16:00 CET. Some further improvement is expected in the eurozone aggregate index, but a softer reading suggests fading hopes of positive real wage growth leading to higher consumption.”
“EUR/USD is trading in very narrow ranges at just under 1.09. Traded volatility is exceptionally low – e.g. three-month volatility is just 5.3% – and the market has concluded there is no trend here. Probably the next big input here (after Friday's core PCE figure) is the Fed meeting next Wednesday. That is probably a negative risk to the dollar.”
“Apart from consumer confidence later in the day, the only noteworthy event on the eurozone calendar is a speech from ECB Chief Economist Philip Lane. However, do not expect him to provide many clues of a September ECB rate cut, since the ECB has shifted away from forward guidance.”
Away from US politics, FX markets remain very subdued. Volatility is low and the temptation will be to rotate back into carry even if there are risks associated with the preferred funding currency (Japanese Yen) or the preferred target currency (Mexican Peso), ING’s FX strategist Chris Turner notes.
DXY to continue trading in the 104.00-104.50 range
“On a quiet day, we think investors will take a keen interest in US earnings releases. Two of the Magnificent Seven (a basket of seven tech stocks, lost close to 8% this month) report second-quarter results. With surveys suggesting investors are expecting earnings results to drive the next leg in the equity rally. Tonight's release therefore will have a big say in whether the rally resumes.”
“Higher US equities normally keep traded FX volatility levels low and support the carry trade. Previously, this would have been USD negative, but USD deposit rates at 5.38% for one-week money means that USD is an expensive sell. These conditions do mean, however, that there is a large burden on the Bank of Japan to deliver a rate hike and a sizable reduction in Japanese government bond purchases on 31 July.”
“The US calendar is pretty bare today and there doesn't seem to be a strong reason to take DXY out of a 104.00-104.50 range.”
In addition to the general development linked to its high beta with euro movements, today's interest rate decision by the Hungarian central bank (MNB) is also of interest for the Forint. This is mainly due to the nuances in the statements and less due to the interest rate decision per se, Commerzbank FX analyst Antje Praefcke notes.
A refrain from a cut to be positive for the Forint
“The majority of analysts surveyed by Bloomberg expect the MNB to cut the key interest rate by 25 basis points to 6.75% today anyway, thus continuing the slower pace of its interest rate cut cycle that it has been displaying since June, because the overall inflation rate fell slightly more than expected in June from 4.0% to 3.7%.”
“But, the exponentially smoothed month-on-month change actually accelerated in June to a record 0.5% for ‘tax-adjusted core inflation’ and 0.6% for ‘demand-sensitive inflation’. The FX market is concerned about the fact that the doves in the MNB could push for further interest rate cuts during the year or that the government could push for interest rate cuts in view of the further weakening of the real economy and the need to make savings in the budget.”
“Therefore, the nuances of the MNB meeting today are likely to be important. If the market's concerns are confirmed by the MNB's statements, the Forint could suffer. On the other hand, it would be a positive surprise if the MNB were to take a pause today and refrain from a rate cut. The Forint would benefit from a decision by the MNB to remain restrictive accordingly.”
A look at the data shows that in the UK most of the disinflation in the core rate over the past year has come from goods prices. If inflationary pressures on goods prices had not eased so much, the core rate would not have fallen so much. Services inflation, on the other hand, is much more persistent and is currently almost entirely driving the core rate. It is therefore not surprising that the Bank of England (BoE) has repeatedly emphasised that it wants to see more progress here, Commerzbank FX analyst Michael Pfister notes.
Sometimes the devil is in the detail
“Durable goods peaked first in the current cycle during the pandemic. On the other hand, real incomes have also suffered from the subsequent rise in the other components. The consumption of durable goods is likely to be the first thing that consumers cut back on when incomes become tighter. In addition, supply chains have eased considerably since then, which is likely to put additional downward pressure on prices.”
“This is unlikely to continue forever. Real incomes are now rising again and at some point consumers will need durable goods again. In addition, freight transport has recently become more expensive. The first signs of a turnaround can already be seen in the data, and inflationary pressures are likely to pick up again. This would not be dramatic if inflationary pressures from other sources continued to decline.”
“Services prices would be predestined to do so. However, looking at the first level of the sub-components, price pressures are much more broadly based. If durable goods prices stop falling but services prices remain stubbornly high, there will be little room for lower core UK interest rates. And correspondingly less room for the Bank of England to cut interest rates more sharply.”
- AUD/USD plummets to near 0.6620 as investors worry about China’s economic prospects.
- Firm speculation for RBA to maintain a restrictive interest rate framework for longest fails to support the Australian Dollar.
- The risk-averse market mood improves the US Dollar’s appeal as a safe haven.
The AUD/USD pair extends its losing spell for the seventh trading session on Tuesday. The Aussie asset weakens to near the round-level support of 0.6620 as the Australian Dollar (AUD) has been hit hard, being a liquid proxy of China’s Yuan.
The Chinese economy is going through a vulnerable phase due to weak demand from domestic and the overseas market. The economy expanded at a slower pace of 0.7% in the second quarter than estimates of 1.1% and the prior release of 1.5%.
Meanwhile, concerns over China’s economic prospects deepened after the People’s Bank of China (PBoC) surprisingly came out with a 10 basis points (bps) cut in short-and-long term in Loan Prime Rates (LPRs) on Monday.
China’s poor economic outlook has outweighed the Australian Dollar’s strength that was driven by firm speculation over the Reserve Bank of Australia (RBA) maintaining its monetary policy restrictive for longest among Group of Seven (G-7) economies. Investors also expect that the RBA could hike its Official Cash Rate (OCR) further due to persistent inflationary pressures and stable labor market.
Going forward, investors will focus on preliminary Australian Judo Bank PMI data for July, which will be published on Wednesday.
The market sentiment remains risk-averse amid United States (US) political uncertainty. S&P 500 futures exhibit a subdued performance in European trading hours. The US Dollar Index (DXY), which tracks the Greenback’s value against six major currencies, edges higher to 104.40.
This week, there are plenty of triggers for the US Dollar, which will scrutinize the appropriateness of current market expectations pointing to rate cuts in September.
Australian Dollar FAQs
One of the most significant factors for the Australian Dollar (AUD) is the level of interest rates set by the Reserve Bank of Australia (RBA). Because Australia is a resource-rich country another key driver is the price of its biggest export, Iron Ore. The health of the Chinese economy, its largest trading partner, is a factor, as well as inflation in Australia, its growth rate and Trade Balance. Market sentiment – whether investors are taking on more risky assets (risk-on) or seeking safe-havens (risk-off) – is also a factor, with risk-on positive for AUD.
The Reserve Bank of Australia (RBA) influences the Australian Dollar (AUD) by setting the level of interest rates that Australian banks can lend to each other. This influences the level of interest rates in the economy as a whole. The main goal of the RBA is to maintain a stable inflation rate of 2-3% by adjusting interest rates up or down. Relatively high interest rates compared to other major central banks support the AUD, and the opposite for relatively low. The RBA can also use quantitative easing and tightening to influence credit conditions, with the former AUD-negative and the latter AUD-positive.
China is Australia’s largest trading partner so the health of the Chinese economy is a major influence on the value of the Australian Dollar (AUD). When the Chinese economy is doing well it purchases more raw materials, goods and services from Australia, lifting demand for the AUD, and pushing up its value. The opposite is the case when the Chinese economy is not growing as fast as expected. Positive or negative surprises in Chinese growth data, therefore, often have a direct impact on the Australian Dollar and its pairs.
Iron Ore is Australia’s largest export, accounting for $118 billion a year according to data from 2021, with China as its primary destination. The price of Iron Ore, therefore, can be a driver of the Australian Dollar. Generally, if the price of Iron Ore rises, AUD also goes up, as aggregate demand for the currency increases. The opposite is the case if the price of Iron Ore falls. Higher Iron Ore prices also tend to result in a greater likelihood of a positive Trade Balance for Australia, which is also positive of the AUD.
The Trade Balance, which is the difference between what a country earns from its exports versus what it pays for its imports, is another factor that can influence the value of the Australian Dollar. If Australia produces highly sought after exports, then its currency will gain in value purely from the surplus demand created from foreign buyers seeking to purchase its exports versus what it spends to purchase imports. Therefore, a positive net Trade Balance strengthens the AUD, with the opposite effect if the Trade Balance is negative.
Headline SMEI rebounded to 50.4 in July thanks to a recovery in expectations and credit conditions. Performance sub-index stayed in contractionary territory for a second month due to services drag. Manufacturing activity accelerated, while real estate, construction, finance, retail and catering declined, Standard Chartered economists Hunter Chan and Shuang Ding note.
Services remain the key drag
“Our headline SMEI recovered to 50.4 in July from 49.9 in June, returning to expansionary territory after a single month’s dip, mainly thanks to improved expectations and credit conditions. Meanwhile, the performance sub-index stayed below 50 for a second consecutive month at 49.7. Our growth momentum tracker fell further as the finished product inventory sub-index rebounded more than new orders.”
“Manufacturing SMEs reported faster production activity and an increase in sales and new orders, lifting the manufacturing performance sub-index to 51.3 in July after falling to 49.8 in June. Meanwhile, labour-intensive industrial activity declined. External demand weakened as the new export orders index fell below 50.”
“The services performance sub-index improved by a mere 0.3pts to 49.3 in July as sales fell further. Real estate, construction, retail sales and wholesale remained key drags. Accommodation and catering SMEs reported muted sales and new orders again. Credit and liquidity conditions for SMEs improved modestly as banks remained supportive and cash surplus at SMEs increased.”
The US Dollar (USD) is still trading in a 7.2600/7.3100 range, UOB Group FX analysts Quek Ser Leang and Lee Sue Ann notes.
Wobbles in the 7.2600/7.3100 range continue
24-HOUR VIEW: “We noted yesterday that ‘there has been a slight increase in momentum.’ We expected USD to edge higher, but we highlighted that ‘as upward momentum is not strong, any advance is unlikely to reach 7.2980.’ Our view was not wrong, even though the advance in USD almost reached 7.2980 (high has been 7.2973). Upward momentum has increased further, albeit not much. We continue to expect USD to edge higher, but today, the advance is unlikely to reach 7.3100 (there is another resistance level at 7.3035). Support is at 7.2900, followed by 7.2820.”
1-3 WEEKS VIEW: “Our update from yesterday (22 Jul, spot at 7.2870) still stands. As highlighted, the recent price action suggest that USD is still trading in a 7.2600/7.3100 range.”
Silver prices (XAG/USD) fell on Tuesday, according to FXStreet data. Silver trades at $28.99 per troy ounce, down 0.47% from the $29.13 it cost on Monday.
Silver prices have increased by 21.84% since the beginning of the year.
| Unit measure | Silver Price Today in USD |
|---|---|
| Troy Ounce | 28.99 |
| 1 Gram | 0.93 |
The Gold/Silver ratio, which shows the number of ounces of Silver needed to equal the value of one ounce of Gold, stood at 82.97 on Tuesday, up from 82.27 on Monday.
Silver FAQs
Silver is a precious metal highly traded among investors. It has been historically used as a store of value and a medium of exchange. Although less popular than Gold, traders may turn to Silver to diversify their investment portfolio, for its intrinsic value or as a potential hedge during high-inflation periods. Investors can buy physical Silver, in coins or in bars, or trade it through vehicles such as Exchange Traded Funds, which track its price on international markets.
Silver prices can move due to a wide range of factors. Geopolitical instability or fears of a deep recession can make Silver price escalate due to its safe-haven status, although to a lesser extent than Gold's. As a yieldless asset, Silver tends to rise with lower interest rates. Its moves also depend on how the US Dollar (USD) behaves as the asset is priced in dollars (XAG/USD). A strong Dollar tends to keep the price of Silver at bay, whereas a weaker Dollar is likely to propel prices up. Other factors such as investment demand, mining supply – Silver is much more abundant than Gold – and recycling rates can also affect prices.
Silver is widely used in industry, particularly in sectors such as electronics or solar energy, as it has one of the highest electric conductivity of all metals – more than Copper and Gold. A surge in demand can increase prices, while a decline tends to lower them. Dynamics in the US, Chinese and Indian economies can also contribute to price swings: for the US and particularly China, their big industrial sectors use Silver in various processes; in India, consumers’ demand for the precious metal for jewellery also plays a key role in setting prices.
Silver prices tend to follow Gold's moves. When Gold prices rise, Silver typically follows suit, as their status as safe-haven assets is similar. The Gold/Silver ratio, which shows the number of ounces of Silver needed to equal the value of one ounce of Gold, may help to determine the relative valuation between both metals. Some investors may consider a high ratio as an indicator that Silver is undervalued, or Gold is overvalued. On the contrary, a low ratio might suggest that Gold is undervalued relative to Silver.
(An automation tool was used in creating this post.)
As long as 0.6005 is not breached, the New Zealand Dollar (NZD) could decline further. Impulsive momentum suggests further NZD weakness, but conditions are severely oversold, and it remains to be seen if it can break below 0.5940, UOB Group FX analysts Quek Ser Leang and Lee Sue Ann notes.
A break below 0.5940 is possible
24-HOUR VIEW: “We expected NZD to trade sideways yesterday. Our view was incorrect. Instead of trading sideways, NZD plummeted and closed lower by 0.49% (0.5980). The sharp and swift drop appears to be overdone, but as long as 0.6005 (minor resistance is at 0.5995) is not breached, NZD could decline further. However, any decline is unlikely to reach 0.5940 (there is another support level at 0.5960).”
1-3 WEEKS VIEW: “Last Wednesday (17 Jul), when NZD was trading at 0.6070, we highlighted that ‘downward momentum is building, but not sufficiently enough to suggest the start of a sustained decline.’ After NZD fell sharply on Friday, we indicated yesterday (22 Jul, spot at 0.6025) that ‘as long as 0.6070 (‘strong resistance’ level) is not breached, there is room for NZD to drop to and possibly below 0.6005.’ We added, ‘Looking ahead, the next support below 0.6005 is at 0.5980.’ While our view of NZD declining was correct, we did not quite anticipate the manner in which it plunged to 0.5972 in NY trading. While the impulsive downward momentum suggests further NZD weakness, conditions are severely oversold, and it remains to be seen if NZD can break the next support at 0.5940. On the upside, the ‘strong resistance’ level has moved lower to 0.6030 from 0.6070.”
- Gold price trades with caution in the countdown to a string of US economic data.
- Firm Fed rate cut hopes to keep the upside in the US Dollar limited.
- Gold price in India sinks due to customs duty reduction.
Gold price (XAU/USD) remains on the defensive slightly below the round-level resistance of $2,400 in Tuesday’s European session. The precious metal remains under pressure amid firm speculation that Donald Trump could emerge victorious in the United States (US) presidential elections in November.
The expectations for Donald Trump gaining a second term rose after an assassination attack on him and US President Joe Biden’s withdrawal of his re-election bid from the White House. However, US Vice President Kamala Harris has been chosen as the nominee of Democrats.
Growing speculation for Trump 2.0 has prompted upside risks to consumer inflation expectations. In a note on Monday, Australian investment bank Macquarie said, "Trump 2.0 will be a more inflationary policy regime, given restricted immigration, higher tariffs, and the extension of the Tax Cut and Jobs Act of 2025." The scenario is favorable for the US Dollar (USD). The US Dollar Index (DXY), which tracks the Greenback’s value against six major currencies, edges higher to near 104.40. An appreciation of the US Dollar makes investment in Gold more expensive for investors.
Daily digest market movers: Gold price will be influenced by US data this week
- Gold price struggles to regain ground above the crucial resistance of $2,400. The near-term outlook of the Gold price has become uncertain as investors await a slew of US economic data, which will be published this week.
- Investors will focus on the preliminary US S&P Global PMI for July, Q2 Gross Domestic Product (GDP), and Durable Goods Orders and Personal Consumption Expenditures Price Index (PCE) data for June, which will provide fresh cues about when the US Federal Reserve (Fed) will start reducing interest rates.
- The Manufacturing PMI is estimated to have expanded at a meager pace to 51.7 from June’s reading of 51.6. The Services PMI, a measure of activities in the service sector, is estimated to have expanded at a slower pace of 54.4 from the prior release of 55.3.
- The major trigger will be the Fed’s preferred inflation gauge, the PCE index, which will indicate whether price pressures remain on track to return to the desired rate of 2%. The confidence of Fed officials that inflation has returned to the path of 2% grew after recent inflation readings showed that price pressures rose at a slower-than-expected pace in June.
- According to the CME FedWatch tool, 30-day Federal Fund futures show the central bank beginning to lower its key borrowing rates from their current levels in the September meeting. The Fed is also expected to cut interest rates again in November or December.
- In the Indian region, Multi Commodity Exchange (MCX) Gold price nosedives below Rs. 69,000 after Prime Minister Narendra Modi-led-NDA reduces basic custom duty on precious metals to 6% from 10% in the Fiscal Budget 2024-2025. The decision is expected to boost demand for physical gold.
Technical Analysis: Gold price hovers below $2,400
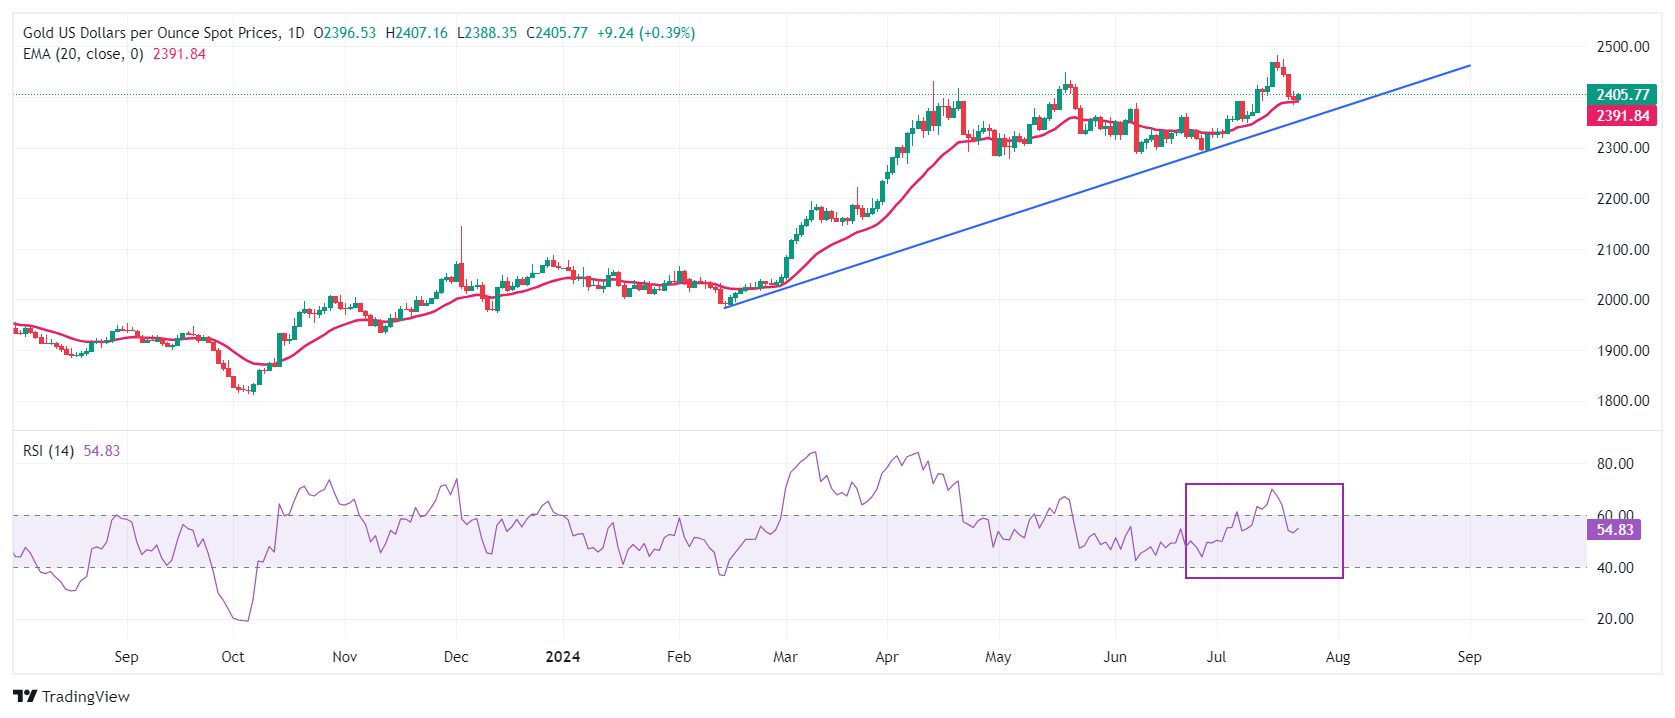
Gold price appears to be vulnerable slightly below $2,400. The precious metal declines to near the 20-day Exponential Moving Average (EMA), which trades around $2,390, suggesting that the near-term outlook has not weakened yet technically.
The advancing trendline plotted from the February 14 low at $1,984.30 will be a major support for Gold bulls.
The 14-day Relative Strength Index (RSI) drops inside the 40.00-60.00 range, suggesting that the upside momentum has stalled. However, the upside bias remains intact.
A fresh upside would appear if the Gold price breaks above all-time highs above $2,480.
Gold FAQs
Gold has played a key role in human’s history as it has been widely used as a store of value and medium of exchange. Currently, apart from its shine and usage for jewelry, the precious metal is widely seen as a safe-haven asset, meaning that it is considered a good investment during turbulent times. Gold is also widely seen as a hedge against inflation and against depreciating currencies as it doesn’t rely on any specific issuer or government.
Central banks are the biggest Gold holders. In their aim to support their currencies in turbulent times, central banks tend to diversify their reserves and buy Gold to improve the perceived strength of the economy and the currency. High Gold reserves can be a source of trust for a country’s solvency. Central banks added 1,136 tonnes of Gold worth around $70 billion to their reserves in 2022, according to data from the World Gold Council. This is the highest yearly purchase since records began. Central banks from emerging economies such as China, India and Turkey are quickly increasing their Gold reserves.
Gold has an inverse correlation with the US Dollar and US Treasuries, which are both major reserve and safe-haven assets. When the Dollar depreciates, Gold tends to rise, enabling investors and central banks to diversify their assets in turbulent times. Gold is also inversely correlated with risk assets. A rally in the stock market tends to weaken Gold price, while sell-offs in riskier markets tend to favor the precious metal.
The price can move due to a wide range of factors. Geopolitical instability or fears of a deep recession can quickly make Gold price escalate due to its safe-haven status. As a yield-less asset, Gold tends to rise with lower interest rates, while higher cost of money usually weighs down on the yellow metal. Still, most moves depend on how the US Dollar (USD) behaves as the asset is priced in dollars (XAU/USD). A strong Dollar tends to keep the price of Gold controlled, whereas a weaker Dollar is likely to push Gold prices up.
- The Indian Rupee weakens against the US Dollar after the announcement of the Indian Fiscal Budget 2024-25.
- Indian government raises capital gains taxes with immediate effect.
- This week, the US Dollar will be influenced by a slew of US economic data.
The Indian Rupee weakens to near 83.70 against the US Dollar (USD) in Tuesday’s European session. The Indian currency faces pressure due to a sharp sell-off in equity markets after the announcement of the Fiscal Budget 2024-25.
Indian Finance Minister Nirmala Sitharaman proposed to hike taxes on Long-term Capital Gains (LTCG) and Short-term Capital Gains (STCG) with immediate effect. The centre has raised taxes on LTCG and STCG from 10% to 12.5% and from 15% to 20%, respectively. While the exemption limit on LTCG has been raised to Rs. 1.25 lakhs from Rs. 1 lakh.
Higher taxes on capital gains are an unfavorable scenario for foreign investors who are keen to invest in India through direct investment or institutional routes. This could have a negative impact on the Indian rupee in near-term.
However, the long-term appeal of the Indian Rupee could strengthen as the administration has reduced fiscal deficit targets for 2024-25 and 2025-26 to 4.9% and 4.5%, respectively.
Meanwhile, the US Dollar exhibits a subdued performance with a focus on a slew of United States (US) economic data, releasing this week. The US Dollar Index (DXY), which tracks the Greenback’s value against six major currencies, trades around 104.30.
The major trigger for the US Dollar will be the core Personal Consumption Expenditure Price Index (PCE) data for June. The core PCE inflation is a Federal Reserve’s (Fed) preferred inflation tool, which provides cues about when the central bank will start reducing interest rates. Currently, financial markets expect the Fed to begin lowering interest rates from the September meeting.
Indian Rupee FAQs
The Indian Rupee (INR) is one of the most sensitive currencies to external factors. The price of Crude Oil (the country is highly dependent on imported Oil), the value of the US Dollar – most trade is conducted in USD – and the level of foreign investment, are all influential. Direct intervention by the Reserve Bank of India (RBI) in FX markets to keep the exchange rate stable, as well as the level of interest rates set by the RBI, are further major influencing factors on the Rupee.
The Reserve Bank of India (RBI) actively intervenes in forex markets to maintain a stable exchange rate, to help facilitate trade. In addition, the RBI tries to maintain the inflation rate at its 4% target by adjusting interest rates. Higher interest rates usually strengthen the Rupee. This is due to the role of the ‘carry trade’ in which investors borrow in countries with lower interest rates so as to place their money in countries’ offering relatively higher interest rates and profit from the difference.
Macroeconomic factors that influence the value of the Rupee include inflation, interest rates, the economic growth rate (GDP), the balance of trade, and inflows from foreign investment. A higher growth rate can lead to more overseas investment, pushing up demand for the Rupee. A less negative balance of trade will eventually lead to a stronger Rupee. Higher interest rates, especially real rates (interest rates less inflation) are also positive for the Rupee. A risk-on environment can lead to greater inflows of Foreign Direct and Indirect Investment (FDI and FII), which also benefit the Rupee.
Higher inflation, particularly, if it is comparatively higher than India’s peers, is generally negative for the currency as it reflects devaluation through oversupply. Inflation also increases the cost of exports, leading to more Rupees being sold to purchase foreign imports, which is Rupee-negative. At the same time, higher inflation usually leads to the Reserve Bank of India (RBI) raising interest rates and this can be positive for the Rupee, due to increased demand from international investors. The opposite effect is true of lower inflation.
Weakness in Australian Dollar (AUD) could extend to 0.6620 before stabilisation can be expected; major support at 0.6590 is unlikely to come under threat. Further AUD weakness is not ruled out, albeit likely at a slower pace. The levels to watch are 0.6420 and 0.6390, UOB Group FX analysts Quek Ser Leang and Lee Sue Ann notes.
A break below 0.6620 to bring 0.6590 into view
24-HOUR VIEW: “The sharp drop in AUD that sent it to a low of 0.6632 was surprising. While the decline appears to be overdone, the weakness in AUD could extend to 0.6620 before stabilisation can be expected. The major support at 0.6590 is unlikely to come under threat. Resistance is at 0.6660; a breach of 0.6675 would mean the weakness has stabilised.”
1-3 WEEKS VIEW: “Last Wednesday (17 Jul), when AUD was trading 0.6730, we indicated that AUD ‘is likely to trade with a downward bias but is unlikely to break below 0.6680.’ On Friday (19 Jul, spot at 0.6700), we indicated that ‘while there is scope for AUD to drop below 0.6680, it is too early to determine if there is enough momentum for it to reach 0.6640.’ Yesterday, AUD plummeted and broke clearly below both 0.6680 and 0.6640, reaching a low of 0.6632. Further AUD weakness is not ruled out, but given that conditions are approaching oversold levels, the pace of any further decline is likely to be slower. The levels to watch are 0.6620 and 0.6590. On the upside, a breach of 0.6705 (‘strong resistance’ level previously at 0.6755) would indicate that AUD is not declining further.”
The Pound Sterling (GBP) is expected to consolidate in a range of 1.2905/1.2955, UOB Group FX analysts Quek Ser Leang and Lee Sue Ann notes.
Rangebound within 1.2905/1.2955
24-HOUR VIEW: “We indicated yesterday that ‘there is scope for GBP to rebound, but any advance is unlikely to reach 1.2980.’ We also indicated that ‘support levels are at 1.2920 and 1.2905.’ Our expectations did not materialise as GBP traded in a relatively quiet manner between 1.2905 and 1.2942, closing slightly higher at 1.2931 (+0.15%). The price action appears to be consolidative, and today, we expect GBP to trade in a range of 1.2905/1.2955.”
1-3 WEEKS VIEW: “We continue to hold the same view as last Friday (19 Jul, spot at 1.2950). As highlighted, the recent advance in GBP has come to an end. GBP appears to have entered a consolidation phase, and it is likely to trade between 1.2850 and 1.3020 for the time being.”
- EUR/USD losses ground ahead of the release of EC Consumer Confidence data due on Tuesday.
- ECB Vice President Luis de Guindos stated that the inflation data is in line with projections.
- Vice President Kamala Harris has secured endorsements as the leading candidate for the presidential nomination.
EUR/USD retraces its recent gains, trading around 1.0870 during the European session on Tuesday. Traders are likely awaiting the release of the leading Consumer Confidence data by the European Commission (EC) later in the day, which is expected to indicate an economic downturn with an expected reading of -13.2 for July, in comparison with the previous -14.0 reading.
In an interview with Europa Press on Tuesday, European Central Bank (ECB) Vice President Luis de Guindos remarked that inflation data is almost exactly as projected. Guindos noted that September is a more suitable month for making decisions compared to July, given the current high level of uncertainty, and emphasized the need for prudence in decision-making.
Most expectations are centered around the possibility of two more cuts by the Federal Reserve (Fed), although scenarios involving one or even three cuts are still in play. Meanwhile, for the European Central Bank (ECB), there is a strong belief that there will be two more reductions in key interest rates by the end of the year.
Read full article: Euro remains on hold below 1.0900 as investors remain cautious
The upside of the US Dollar may be limited as expectations rise for a Federal Reserve (Fed) rate cut in September. Last week, Fed Chair Jerome Powell expressed increased optimism about recent progress on inflation. Additionally, Fed Governor Christopher Waller indicated that the time to lower the policy rate is approaching.
In US politics, Democrats have rallied behind Vice President Kamala Harris as the leading candidate for the presidential nomination. NBC News projected that Harris has secured endorsements from a majority of the Democratic Party’s pledged convention delegates. The threshold for securing the nomination is 1,976 delegates, and NBC estimates that Harris has received support from 1,992 delegates through spoken or written endorsements.
Euro FAQs
The Euro is the currency for the 20 European Union countries that belong to the Eurozone. It is the second most heavily traded currency in the world behind the US Dollar. In 2022, it accounted for 31% of all foreign exchange transactions, with an average daily turnover of over $2.2 trillion a day. EUR/USD is the most heavily traded currency pair in the world, accounting for an estimated 30% off all transactions, followed by EUR/JPY (4%), EUR/GBP (3%) and EUR/AUD (2%).
The European Central Bank (ECB) in Frankfurt, Germany, is the reserve bank for the Eurozone. The ECB sets interest rates and manages monetary policy. The ECB’s primary mandate is to maintain price stability, which means either controlling inflation or stimulating growth. Its primary tool is the raising or lowering of interest rates. Relatively high interest rates – or the expectation of higher rates – will usually benefit the Euro and vice versa. The ECB Governing Council makes monetary policy decisions at meetings held eight times a year. Decisions are made by heads of the Eurozone national banks and six permanent members, including the President of the ECB, Christine Lagarde.
Eurozone inflation data, measured by the Harmonized Index of Consumer Prices (HICP), is an important econometric for the Euro. If inflation rises more than expected, especially if above the ECB’s 2% target, it obliges the ECB to raise interest rates to bring it back under control. Relatively high interest rates compared to its counterparts will usually benefit the Euro, as it makes the region more attractive as a place for global investors to park their money.
Data releases gauge the health of the economy and can impact on the Euro. Indicators such as GDP, Manufacturing and Services PMIs, employment, and consumer sentiment surveys can all influence the direction of the single currency. A strong economy is good for the Euro. Not only does it attract more foreign investment but it may encourage the ECB to put up interest rates, which will directly strengthen the Euro. Otherwise, if economic data is weak, the Euro is likely to fall. Economic data for the four largest economies in the euro area (Germany, France, Italy and Spain) are especially significant, as they account for 75% of the Eurozone’s economy.
Another significant data release for the Euro is the Trade Balance. This indicator measures the difference between what a country earns from its exports and what it spends on imports over a given period. If a country produces highly sought after exports then its currency will gain in value purely from the extra demand created from foreign buyers seeking to purchase these goods. Therefore, a positive net Trade Balance strengthens a currency and vice versa for a negative balance.
Euro (EUR) strength has ended; for the time being, it is likely to trade in a range between 1.0845 and 1.0945, UOB Group FX analysts Quek Ser Leang and Lee Sue Ann notes.
EUR/USD trades towards 1.0845
24-HOUR VIEW: “We indicated yesterday that ‘barring a break below 1.0875, EUR could edge higher.’ We added, ‘given the lackluster momentum, a sustained break above 1.0920 is unlikely.’ However, EUR did not edge higher, as it traded sideways between 1.0871 and 1.0902, closing at 1.0889 (+0.11%). Further sideways trading seems likely today, probably in a range of 1.0875/1.0910.”
1-3 WEEKS VIEW: “There is not much to add to our update from yesterday (22 Jul, spot at 1.0895). As highlighted, the recent EUR strength that started two weeks ago has come to an end. The current price action is likely part of a range trading phase. For the time being, we expect EUR to trade between 1.0845 and 1.0945.”
- USD/MXN gains ground due to risk-off sentiment despite dovish sentiment surrounding the Fed.
- Vice President Kamala Harris had secured endorsements for the leading candidate for the presidential nomination.
- Traders await the release of the first half-month Inflation data for July on Wednesday.
USD/MXN edges higher to near 18.00 during the European session on Tuesday. This upside could be attributed to the increased risk aversion, underpinning the US Dollar (USD). The US Dollar Index (DXY), which measures the value of the US Dollar (USD) against six other major currencies, trades around 104.30 after recovering its daily losses during the early European hours on Tuesday.
However, the US Dollar may limit its upside as expectations rise for a Federal Reserve (Fed) rate cut in September. Last week, Fed Chair Jerome Powell noted that the three US inflation readings this year "add somewhat to confidence" that inflation is on track to meet the Fed’s target sustainably, implying that interest rate cuts might be approaching.
In US politics, Democrats rallied behind Vice President Kamala Harris as the leading candidate for the presidential nomination. NBC News projected that Harris had secured endorsements from a majority of the Democratic party’s pledged convention delegates. The threshold for securing the nomination is 1,976 delegates, and NBC estimates that Harris has received the support of 1,992 delegates, either through spoken or written endorsements.
Traders will likely observe the data releases of the Global Purchasing Managers Index (PMI) and Gross Domestic Product (GDP) later this week. These figures may offer fresh insights into the economic conditions of the United States (US). On the Swiss front, the first half-month Inflation and Core Inflation data for July are scheduled to be released on Wednesday.
On Monday, Mexico’s economic activity expanded by 1.6% year-over-year in May, slowing from the nearly two-year-high increase of 5.4% in the previous month but surpassing market expectations of a 1.4% increase. Additionally, Retail Sales in Mexico grew by 0.3% year-over-year in May, a significant slowdown from the 3.2% increase in the previous month. On a monthly basis, sales grew by 0.1%, down from the prior increase of 0.5%.
Mexican Peso FAQs
The Mexican Peso (MXN) is the most traded currency among its Latin American peers. Its value is broadly determined by the performance of the Mexican economy, the country’s central bank’s policy, the amount of foreign investment in the country and even the levels of remittances sent by Mexicans who live abroad, particularly in the United States. Geopolitical trends can also move MXN: for example, the process of nearshoring – or the decision by some firms to relocate manufacturing capacity and supply chains closer to their home countries – is also seen as a catalyst for the Mexican currency as the country is considered a key manufacturing hub in the American continent. Another catalyst for MXN is Oil prices as Mexico is a key exporter of the commodity.
The main objective of Mexico’s central bank, also known as Banxico, is to maintain inflation at low and stable levels (at or close to its target of 3%, the midpoint in a tolerance band of between 2% and 4%). To this end, the bank sets an appropriate level of interest rates. When inflation is too high, Banxico will attempt to tame it by raising interest rates, making it more expensive for households and businesses to borrow money, thus cooling demand and the overall economy. Higher interest rates are generally positive for the Mexican Peso (MXN) as they lead to higher yields, making the country a more attractive place for investors. On the contrary, lower interest rates tend to weaken MXN.
Macroeconomic data releases are key to assess the state of the economy and can have an impact on the Mexican Peso (MXN) valuation. A strong Mexican economy, based on high economic growth, low unemployment and high confidence is good for MXN. Not only does it attract more foreign investment but it may encourage the Bank of Mexico (Banxico) to increase interest rates, particularly if this strength comes together with elevated inflation. However, if economic data is weak, MXN is likely to depreciate.
As an emerging-market currency, the Mexican Peso (MXN) tends to strive during risk-on periods, or when investors perceive that broader market risks are low and thus are eager to engage with investments that carry a higher risk. Conversely, MXN tends to weaken at times of market turbulence or economic uncertainty as investors tend to sell higher-risk assets and flee to the more-stable safe havens.
- The Pound Sterling falls against the US Dollar as BoE rate-cut bets surge.
- Weak UK Retail Sales lift bets supporting BoE rate cuts in August.
- Investors await the preliminary US/UK S&P Global PMI data for July.
The Pound Sterling (GBP) continues to hold the key support level of 1.2900 against the US Dollar (USD) in Tuesday’s London session. The GBP/USD pair edges down but remains inside the tight range of 1.2900-1.2940 as the recovery move in the US Dollar (USD), driven by growing speculation of Donald Trump winning the United States (US) presidential elections in November, appears to have stalled with focus on a slew of economic data this week.
The US Dollar Index (DXY), which tracks the Greenback’s value, against six major currencies, hovers near 104.30.
This week, investors will focus on the US preliminary S&P Global Purchasing Managers Index (PMI) for July, Q2 Gross Domestic Product (GDP), and Durable Goods Orders and Personal Consumption Expenditures Price Index (PCE) data for June. The economic data could provide fresh cues about when the US Federal Reserve (Fed) will start reducing interest rates this year.
Economists expect the Manufacturing PMI, scheduled on Wednesday, to have expanded at a nominal pace to 51.7 from June’s reading of 51.6. The Services PMI, a measure of activities in the service sector, is estimated to have expanded at a slower pace to 54.4 from the prior release of 55.3.
According to the CME FedWatch tool, 30-day Federal Fund futures show the central bank beginning to lower its key borrowing rates from their current levels in the September meeting. The Fed is also expected to cut interest rates again in November or December.
Daily digest market movers: Pound Sterling drops against its major peers
- The Pound Sterling weakens against its major peers, except the Australian Dollar (AUD) and the New Zealand Dollar (NZD) amid improved speculation that the Bank of England (BoE) will start cutting its key interest rates from the August meeting. Asia-Pacific currencies have been beaten hard due to their strong linkage with China’s economic outlook. Investors have raised concerns over the economic outlook of the world’s second-largest nation due to weaker-than-expected Q2 Gross Domestic Product (GDP) growth.
- The expectations for the BoE to pivot to policy normalization increase as higher interest rates have narrowed pockets of individuals. The recent UK Retail Sales report for June showed that receipts at retail stores unexpectedly contracted by 0.2% year-over-year, which were expected to have grown at a similar pace. Monthly Retail Sales declined at a faster-than-expected pace by 1.2%.
- Meanwhile, expected deceleration in Average Earnings, a key measure of wage growth momentum that prompts inflation in the service sector, has also boosted expectations of BoE rate cuts. Though the wage growth measure has slowed, as expected, in three months ending in May, it is still higher than what needs to be consistent to propel officials’ confidence for rate cuts.
- Going forward, the major trigger for the Pound Sterling will be the UK preliminary S&P Global/CIPS PMI data for July, which will be published on Wednesday. The report is expected to show that the Manufacturing PMI expanded at a faster pace of 51.1 from the former release of 50.9. The Composite PMI is estimated to have increased to 52.6 from 52.3 in May.
Technical Analysis: Pound Sterling hovers near 1.2900
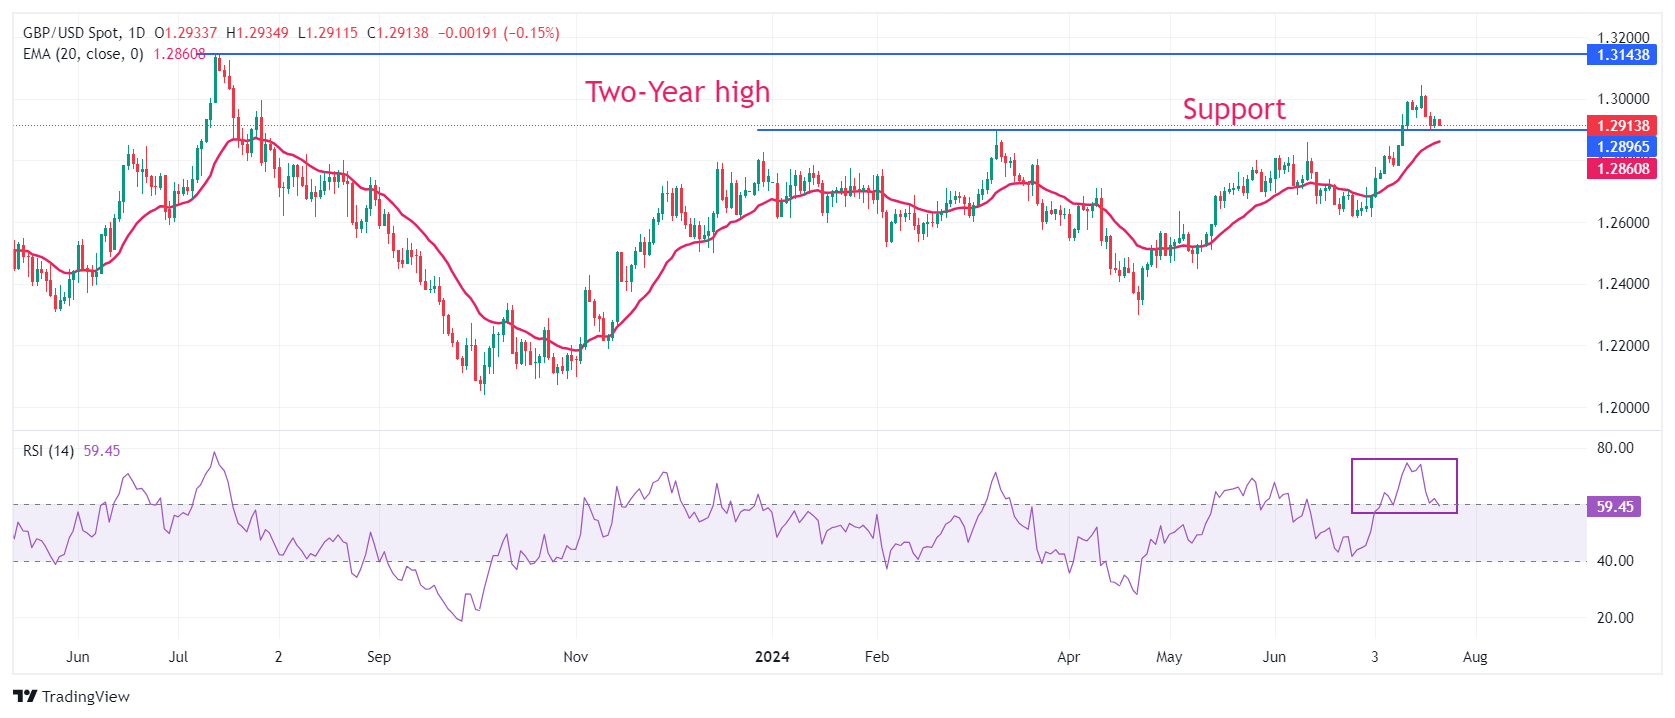
The Pound Sterling oscillates in a tight range above the round-level support of 1.2900 against the US Dollar. The GBP/USD pair weakened after facing a sell-off from a fresh annual high of 1.3044 last Wednesday.
The upward-sloping 20-day Exponential Moving Average (EMA) near 1.2860 suggests that the uptrend is intact. The 14-day Relative Strength Index (RSI) declines after turning slightly overbought and is expected to find a cushion near 60.00.
On the upside, a two-year high near 1.3140 will be a key resistance zone for the Cable. On the other hand, the March 8 high near 1.2900 will be a key support for the Pound Sterling bull.
Pound Sterling FAQs
The Pound Sterling (GBP) is the oldest currency in the world (886 AD) and the official currency of the United Kingdom. It is the fourth most traded unit for foreign exchange (FX) in the world, accounting for 12% of all transactions, averaging $630 billion a day, according to 2022 data. Its key trading pairs are GBP/USD, aka ‘Cable’, which accounts for 11% of FX, GBP/JPY, or the ‘Dragon’ as it is known by traders (3%), and EUR/GBP (2%). The Pound Sterling is issued by the Bank of England (BoE).
The single most important factor influencing the value of the Pound Sterling is monetary policy decided by the Bank of England. The BoE bases its decisions on whether it has achieved its primary goal of “price stability” – a steady inflation rate of around 2%. Its primary tool for achieving this is the adjustment of interest rates. When inflation is too high, the BoE will try to rein it in by raising interest rates, making it more expensive for people and businesses to access credit. This is generally positive for GBP, as higher interest rates make the UK a more attractive place for global investors to park their money. When inflation falls too low it is a sign economic growth is slowing. In this scenario, the BoE will consider lowering interest rates to cheapen credit so businesses will borrow more to invest in growth-generating projects.
Data releases gauge the health of the economy and can impact the value of the Pound Sterling. Indicators such as GDP, Manufacturing and Services PMIs, and employment can all influence the direction of the GBP. A strong economy is good for Sterling. Not only does it attract more foreign investment but it may encourage the BoE to put up interest rates, which will directly strengthen GBP. Otherwise, if economic data is weak, the Pound Sterling is likely to fall.
Another significant data release for the Pound Sterling is the Trade Balance. This indicator measures the difference between what a country earns from its exports and what it spends on imports over a given period. If a country produces highly sought-after exports, its currency will benefit purely from the extra demand created from foreign buyers seeking to purchase these goods. Therefore, a positive net Trade Balance strengthens a currency and vice versa for a negative balance.
Here is what you need to know on Tuesday, July 23:
The action in financial markets turns subdued early Tuesday, following Monday's choppy trading. The US Dollar (USD) holds steady against its major rivals as investors await Existing Home Sales data for June and Richmond Fed Manufacturing Index for July. After Wall Street's closing bell, Google (Alphabet), Tesla and Visa will be among top companies that will report second-quarter earning reports.
US Dollar PRICE This week
The table below shows the percentage change of US Dollar (USD) against listed major currencies this week. US Dollar was the strongest against the Australian Dollar.
| USD | EUR | GBP | JPY | CAD | AUD | NZD | CHF | |
|---|---|---|---|---|---|---|---|---|
| USD | 0.00% | -0.06% | -0.53% | 0.39% | 0.89% | 0.85% | 0.23% | |
| EUR | -0.00% | -0.07% | -0.56% | 0.34% | 0.93% | 0.79% | 0.16% | |
| GBP | 0.06% | 0.07% | -0.59% | 0.40% | 1.00% | 0.84% | 0.21% | |
| JPY | 0.53% | 0.56% | 0.59% | 0.95% | 1.50% | 1.34% | 0.69% | |
| CAD | -0.39% | -0.34% | -0.40% | -0.95% | 0.59% | 0.46% | -0.17% | |
| AUD | -0.89% | -0.93% | -1.00% | -1.50% | -0.59% | -0.14% | -0.78% | |
| NZD | -0.85% | -0.79% | -0.84% | -1.34% | -0.46% | 0.14% | -0.59% | |
| CHF | -0.23% | -0.16% | -0.21% | -0.69% | 0.17% | 0.78% | 0.59% |
The heat map shows percentage changes of major currencies against each other. The base currency is picked from the left column, while the quote currency is picked from the top row. For example, if you pick the US Dollar from the left column and move along the horizontal line to the Japanese Yen, the percentage change displayed in the box will represent USD (base)/JPY (quote).
The USD Index closed the first trading day of the week modestly lower as risk flows dominated the action in the second half of the day. Meanwhile, the benchmark 10-year US Treasury bond yield edged higher above 4.2%, helping the currency limit its losses. Early Tuesday, the USD Index holds above 104.00, US stock index futures trade modestly lower and the 10-year yield fluctuates near 4.25%.
EUR/USD posted small gains on Monday but failed to clear 1.0900. The pair trades in a tight channel below this level in the European morning on Tuesday. Later in the day, the European Commission will publish the preliminary Consumer Confidence Index data for July.
GBP/USD fluctuated in a tight channel above 1.2900 on Monday and closed the day marginally higher. The pair struggles to gather recovery momentum on Tuesday and trades in the red, slightly below 1.2920.
USD/JPY stays on the back foot after registering losses on Monday and was last seen trading in negative territory at around 156.50.
AUD/USD lost more than 0.6% on Monday and extended its slide during the Asian trading hours on Tuesday. At the time of press, the pair was trading at its lowest level in three weeks below 0.6630.
Following a quiet European session, Gold lost its traction during the American trading hours on Monday and dropped below $2,400. XAU/USD finds it difficult to stage a rebound early Tuesday and holds slightly above $2,390.
Risk sentiment FAQs
In the world of financial jargon the two widely used terms “risk-on” and “risk off'' refer to the level of risk that investors are willing to stomach during the period referenced. In a “risk-on” market, investors are optimistic about the future and more willing to buy risky assets. In a “risk-off” market investors start to ‘play it safe’ because they are worried about the future, and therefore buy less risky assets that are more certain of bringing a return, even if it is relatively modest.
Typically, during periods of “risk-on”, stock markets will rise, most commodities – except Gold – will also gain in value, since they benefit from a positive growth outlook. The currencies of nations that are heavy commodity exporters strengthen because of increased demand, and Cryptocurrencies rise. In a “risk-off” market, Bonds go up – especially major government Bonds – Gold shines, and safe-haven currencies such as the Japanese Yen, Swiss Franc and US Dollar all benefit.
The Australian Dollar (AUD), the Canadian Dollar (CAD), the New Zealand Dollar (NZD) and minor FX like the Ruble (RUB) and the South African Rand (ZAR), all tend to rise in markets that are “risk-on”. This is because the economies of these currencies are heavily reliant on commodity exports for growth, and commodities tend to rise in price during risk-on periods. This is because investors foresee greater demand for raw materials in the future due to heightened economic activity.
The major currencies that tend to rise during periods of “risk-off” are the US Dollar (USD), the Japanese Yen (JPY) and the Swiss Franc (CHF). The US Dollar, because it is the world’s reserve currency, and because in times of crisis investors buy US government debt, which is seen as safe because the largest economy in the world is unlikely to default. The Yen, from increased demand for Japanese government bonds, because a high proportion are held by domestic investors who are unlikely to dump them – even in a crisis. The Swiss Franc, because strict Swiss banking laws offer investors enhanced capital protection.
- The US Dollar could gain ground due to increased risk aversion on Tuesday.
- The improvement in US Treasury yields may contribute to support for the Greenback.
- Vice President Kamala Harris had secured endorsements for the leading candidate for the presidential nomination.
The US Dollar Index (DXY), which measures the value of the US Dollar (USD) against six other major currencies, has recovered daily losses, trading around 104.30 during the early European hours on Tuesday. The higher US Treasury yields contribute support for the Greenback, with 2-year and 10-year yields on US Treasury bonds standing at 4.52% and 4.25%, respectively, at the time of writing.
The US Dollar (USD) faces pressure as expectations rise for a Federal Reserve (Fed) rate cut in September. Last week, Fed Chair Jerome Powell noted that the three US inflation readings this year "add somewhat to confidence" that inflation is on track to meet the Fed’s target sustainably, implying that interest rate cuts might be approaching.
Additionally, Federal Reserve Bank of New York President John Williams remarked on Friday that the long-term trends leading to lower neutral interest rates before the pandemic are still in effect. Williams stated, "My own Holston-Laubach-Williams estimates for r-star in the United States, Canada, and the Euro area are about the same level as they were before the pandemic," as reported by Bloomberg.
In US politics, Democrats rallied behind Vice President Kamala Harris as the leading candidate for the presidential nomination. NBC News projected that Harris had secured endorsements from a majority of the Democratic party’s pledged convention delegates. The threshold for securing the nomination is 1,976 delegates, and NBC estimates that Harris has received the support of 1,992 delegates, either through spoken or written endorsements.
Traders will likely observe the data releases of the Global Purchasing Managers Index (PMI) and Gross Domestic Product (GDP) later this week. These figures may offer fresh insights into the economic conditions of the United States (US).
US Dollar FAQs
The US Dollar (USD) is the official currency of the United States of America, and the ‘de facto’ currency of a significant number of other countries where it is found in circulation alongside local notes. It is the most heavily traded currency in the world, accounting for over 88% of all global foreign exchange turnover, or an average of $6.6 trillion in transactions per day, according to data from 2022. Following the second world war, the USD took over from the British Pound as the world’s reserve currency. For most of its history, the US Dollar was backed by Gold, until the Bretton Woods Agreement in 1971 when the Gold Standard went away.
The most important single factor impacting on the value of the US Dollar is monetary policy, which is shaped by the Federal Reserve (Fed). The Fed has two mandates: to achieve price stability (control inflation) and foster full employment. Its primary tool to achieve these two goals is by adjusting interest rates. When prices are rising too quickly and inflation is above the Fed’s 2% target, the Fed will raise rates, which helps the USD value. When inflation falls below 2% or the Unemployment Rate is too high, the Fed may lower interest rates, which weighs on the Greenback.
In extreme situations, the Federal Reserve can also print more Dollars and enact quantitative easing (QE). QE is the process by which the Fed substantially increases the flow of credit in a stuck financial system. It is a non-standard policy measure used when credit has dried up because banks will not lend to each other (out of the fear of counterparty default). It is a last resort when simply lowering interest rates is unlikely to achieve the necessary result. It was the Fed’s weapon of choice to combat the credit crunch that occurred during the Great Financial Crisis in 2008. It involves the Fed printing more Dollars and using them to buy US government bonds predominantly from financial institutions. QE usually leads to a weaker US Dollar.
Quantitative tightening (QT) is the reverse process whereby the Federal Reserve stops buying bonds from financial institutions and does not reinvest the principal from the bonds it holds maturing in new purchases. It is usually positive for the US Dollar.
In an interview with Europa Press on Tuesday, European Central Bank (ECB) Vice President Luis de Guindos said “inflation data practically in line with our projections.”
Additional quotes
Data-wise, September is a much more convenient month for taking decisions than July was.
Current level of uncertainty is huge, so we have to be prudent when taking decisions.
Will look particularly closely at wage developments.
Reelection of Ursula Von der Leyen is a confidence indicator as regards stability.
Outcome of French elections has created additional uncertainty.
Would like to see more cross-border banking M&A transactions because we want to have a single banking market.
Market reaction
At the press time, EUR/USD is grinding lower to near 1.0885, down 0.05% on the day.
- GBP/JPY extends decline near 202.20 in Tuesday’s early European session, down 0.45% on the day.
- The cross keeps the negative stance on the 4-hour chart, with the bearish RSI indicator.
- The key support level emerges at the 202.00 psychological mark; the upside barrier is seen at 203.16.
The GBP/JPY cross remains under some selling pressure around 202.20 on Tuesday during the early European session. The risk-averse environment and growing speculation that the Bank of Japan (BoJ) will hike next week support the Japanese Yen (JPY) and create a headwind for GBP/JPY.
Technically, GBP/JPY maintains the bearish outlook unchanged on the 4-hour chart as it holds above the key 100-period Exponential Moving Average (EMA) as it holds below the key 100-period Exponential Moving Average (EMA). Additionally, the Relative Strength Index (RSI) stands in bearish territory below the 50-midline, suggesting extended losses cannot be ruled out.
The key support level will emerge at the 202.00 psychological mark. A decisive break below this level will pave the way to 201.14, a low of June 24. Further south, the next contention level is located at 200.48, a low of June 21.
On the upside, the immediate resistance level for the cross is seen at 203.16, a high of July 22. The crucial upside barrier to watch is the 204.00-204.10 region, representing the conference of the psychological level, 100-period EMA, and the upper boundary of the Bollinger Band.
GBP/JPY 4-hour chart
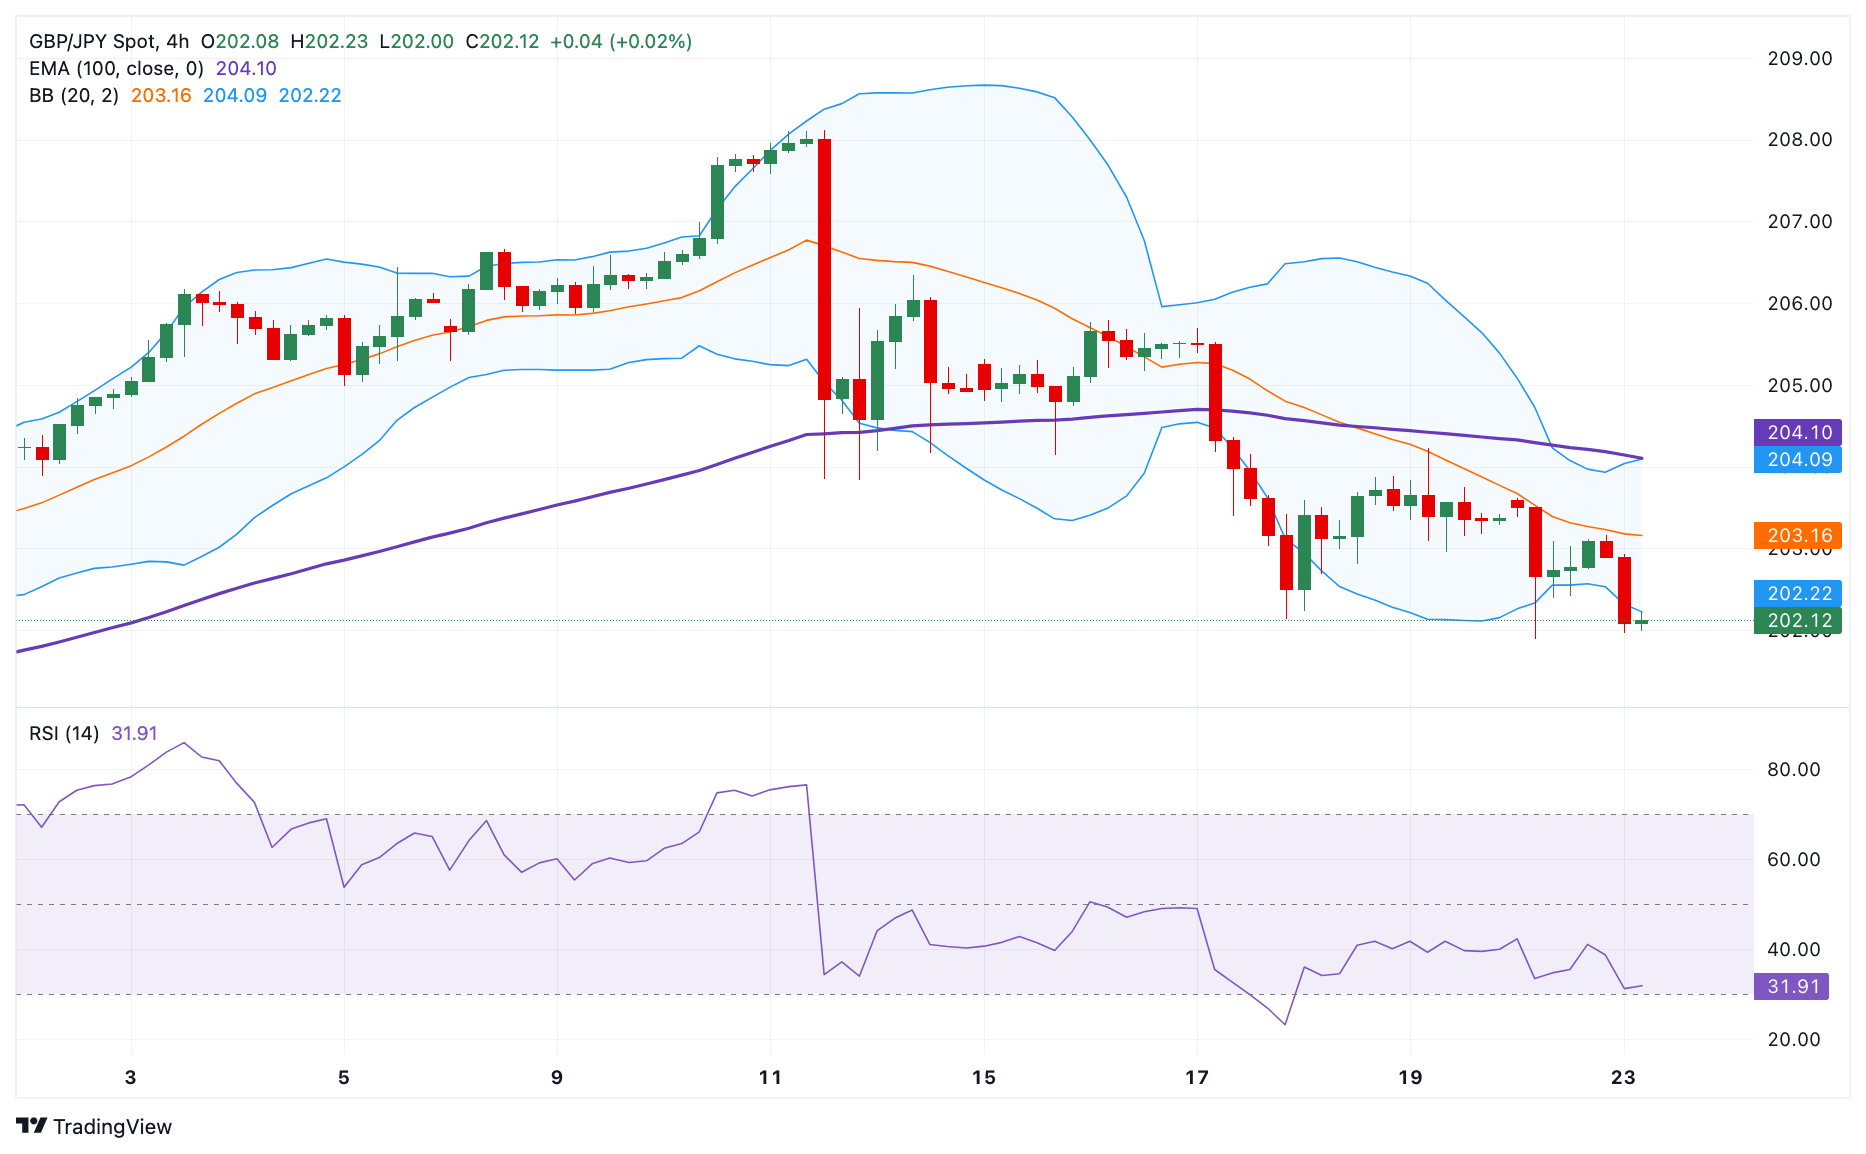
Japanese Yen FAQs
The Japanese Yen (JPY) is one of the world’s most traded currencies. Its value is broadly determined by the performance of the Japanese economy, but more specifically by the Bank of Japan’s policy, the differential between Japanese and US bond yields, or risk sentiment among traders, among other factors.
One of the Bank of Japan’s mandates is currency control, so its moves are key for the Yen. The BoJ has directly intervened in currency markets sometimes, generally to lower the value of the Yen, although it refrains from doing it often due to political concerns of its main trading partners. The current BoJ ultra-loose monetary policy, based on massive stimulus to the economy, has caused the Yen to depreciate against its main currency peers. This process has exacerbated more recently due to an increasing policy divergence between the Bank of Japan and other main central banks, which have opted to increase interest rates sharply to fight decades-high levels of inflation.
The BoJ’s stance of sticking to ultra-loose monetary policy has led to a widening policy divergence with other central banks, particularly with the US Federal Reserve. This supports a widening of the differential between the 10-year US and Japanese bonds, which favors the US Dollar against the Japanese Yen.
The Japanese Yen is often seen as a safe-haven investment. This means that in times of market stress, investors are more likely to put their money in the Japanese currency due to its supposed reliability and stability. Turbulent times are likely to strengthen the Yen’s value against other currencies seen as more risky to invest in.
Gold prices remained broadly unchanged in India on Tuesday, according to data compiled by FXStreet.
The price for Gold stood at 6,439.06 Indian Rupees (INR) per gram, broadly stable compared with the INR 6,444.63 it cost on Monday.
The price for Gold was broadly steady at INR 75,103.98 per tola from INR 75,168.91 per tola a day earlier.
| Unit measure | Gold Price in INR |
|---|---|
| 1 Gram | 6,439.06 |
| 10 Grams | 64,389.83 |
| Tola | 75,103.98 |
| Troy Ounce | 200,277.40 |
FXStreet calculates Gold prices in India by adapting international prices (USD/INR) to the local currency and measurement units. Prices are updated daily based on the market rates taken at the time of publication. Prices are just for reference and local rates could diverge slightly.
Gold FAQs
Gold has played a key role in human’s history as it has been widely used as a store of value and medium of exchange. Currently, apart from its shine and usage for jewelry, the precious metal is widely seen as a safe-haven asset, meaning that it is considered a good investment during turbulent times. Gold is also widely seen as a hedge against inflation and against depreciating currencies as it doesn’t rely on any specific issuer or government.
Central banks are the biggest Gold holders. In their aim to support their currencies in turbulent times, central banks tend to diversify their reserves and buy Gold to improve the perceived strength of the economy and the currency. High Gold reserves can be a source of trust for a country’s solvency. Central banks added 1,136 tonnes of Gold worth around $70 billion to their reserves in 2022, according to data from the World Gold Council. This is the highest yearly purchase since records began. Central banks from emerging economies such as China, India and Turkey are quickly increasing their Gold reserves.
Gold has an inverse correlation with the US Dollar and US Treasuries, which are both major reserve and safe-haven assets. When the Dollar depreciates, Gold tends to rise, enabling investors and central banks to diversify their assets in turbulent times. Gold is also inversely correlated with risk assets. A rally in the stock market tends to weaken Gold price, while sell-offs in riskier markets tend to favor the precious metal.
The price can move due to a wide range of factors. Geopolitical instability or fears of a deep recession can quickly make Gold price escalate due to its safe-haven status. As a yield-less asset, Gold tends to rise with lower interest rates, while higher cost of money usually weighs down on the yellow metal. Still, most moves depend on how the US Dollar (USD) behaves as the asset is priced in dollars (XAU/USD). A strong Dollar tends to keep the price of Gold controlled, whereas a weaker Dollar is likely to push Gold prices up.
(An automation tool was used in creating this post.)
FX option expiries for July 23 NY cut at 10:00 Eastern Time, via DTCC, can be found below.
- EUR/USD: EUR amounts
- 1.0750 1b
- 1.0880 458m
- GBP/USD: GBP amounts
- 1.2650 720m
- USD/JPY: USD amounts
- 155.85 787m
- 157.20 804m
- 157.35 774m
- 158.85 772m
- USD/CHF depreciates as traders expect the Fed to reduce rates in September.
- NBC News projected that Vice President Kamala Harris had secured endorsements from a majority of the Democratic Party’s delegates.
- The Swiss Franc may limit its upside as the SNB could deduct interest rates further.
USD/CHF halts its three-day winning streak, trading around 0.8890 during the Asian session on Tuesday. The US Dollar (USD) faces pressure as expectations rise for a Federal Reserve (Fed) rate cut in September. Last week, Fed Chair Jerome Powell noted that the three US inflation readings this year "add somewhat to confidence" that inflation is on track to meet the Fed’s target sustainably, implying that interest rate cuts might be approaching.
Additionally, Federal Reserve Bank of New York President John Williams remarked on Friday that the long-term trends leading to lower neutral interest rates before the pandemic are still in effect. Williams stated, "My own Holston-Laubach-Williams estimates for r-star in the United States, Canada, and the Euro area are about the same level as they were before the pandemic," as reported by Bloomberg.
On Monday, Democrats rallied behind Vice President Kamala Harris as the leading candidate for the presidential nomination. NBC News projected that Harris had secured endorsements from a majority of the Democratic party’s pledged convention delegates. The threshold for securing the nomination is 1,976 delegates, and NBC estimates that Harris has received the support of 1,992 delegates, either through spoken or written endorsements.
On the CHF front, traders anticipate that the Swiss National Bank (SNB) might further reduce interest rates in September, which could exert downward pressure on the Swiss Franc (CHF). This potential rate cut is driven by subdued inflationary pressures and the resilience of the CHF.
Kyle Chapman, FX markets analyst at Ballinger Group, commented, "I expect the SNB to implement a third rate cut next quarter, with a potential fourth cut in December if there remains strong confidence in the need for restrictive monetary policy."
Swiss Franc FAQs
The Swiss Franc (CHF) is Switzerland’s official currency. It is among the top ten most traded currencies globally, reaching volumes that well exceed the size of the Swiss economy. Its value is determined by the broad market sentiment, the country’s economic health or action taken by the Swiss National Bank (SNB), among other factors. Between 2011 and 2015, the Swiss Franc was pegged to the Euro (EUR). The peg was abruptly removed, resulting in a more than 20% increase in the Franc’s value, causing a turmoil in markets. Even though the peg isn’t in force anymore, CHF fortunes tend to be highly correlated with the Euro ones due to the high dependency of the Swiss economy on the neighboring Eurozone.
The Swiss Franc (CHF) is considered a safe-haven asset, or a currency that investors tend to buy in times of market stress. This is due to the perceived status of Switzerland in the world: a stable economy, a strong export sector, big central bank reserves or a longstanding political stance towards neutrality in global conflicts make the country’s currency a good choice for investors fleeing from risks. Turbulent times are likely to strengthen CHF value against other currencies that are seen as more risky to invest in.
The Swiss National Bank (SNB) meets four times a year – once every quarter, less than other major central banks – to decide on monetary policy. The bank aims for an annual inflation rate of less than 2%. When inflation is above target or forecasted to be above target in the foreseeable future, the bank will attempt to tame price growth by raising its policy rate. Higher interest rates are generally positive for the Swiss Franc (CHF) as they lead to higher yields, making the country a more attractive place for investors. On the contrary, lower interest rates tend to weaken CHF.
Macroeconomic data releases in Switzerland are key to assessing the state of the economy and can impact the Swiss Franc’s (CHF) valuation. The Swiss economy is broadly stable, but any sudden change in economic growth, inflation, current account or the central bank’s currency reserves have the potential to trigger moves in CHF. Generally, high economic growth, low unemployment and high confidence are good for CHF. Conversely, if economic data points to weakening momentum, CHF is likely to depreciate.
As a small and open economy, Switzerland is heavily dependent on the health of the neighboring Eurozone economies. The broader European Union is Switzerland’s main economic partner and a key political ally, so macroeconomic and monetary policy stability in the Eurozone is essential for Switzerland and, thus, for the Swiss Franc (CHF). With such dependency, some models suggest that the correlation between the fortunes of the Euro (EUR) and the CHF is more than 90%, or close to perfect.
- USD/CAD trades with a positive bias for the fifth straight day, closer to a multi-week top.
- The uptick is led by the recent slump in Oil prices and seems unaffected by a weaker USD.
- The technical setup favors bullish traders and supports prospects for a further move up.
The USD/CAD pair attracts some buyers for the fifth successive day on Tuesday and trades above mid-1.3700s during the Asian session, closer to a six-week peak touched the previous day.
The recent slump in Crude Oil prices, to over a one-month low, is seen as a key factor undermining the commodity-linked Loonie and acting as a tailwind for the USD/CAD pair. The uptick, meanwhile, seems rather unaffected by the emergence of some selling around the US Dollar (USD), which continues to be weighed down by bets for an interest rate cut by the Federal Reserve (Fed) in September.
From a technical perspective, the overnight sustained breakout and a close above the 1.3740 supply zone could be seen as a fresh trigger for bullish traders. Moreover, oscillators on the daily chart are holding in positive territory and are still away from being in the overbought zone. This, in turn, validates the positive bias and suggests that the path of least resistance for the USD/CAD pair is to the upside.
Some follow-through buying beyond the 1.3775 area, or the multi-week top set on Monday, will reaffirm the constructive outlook and allow bulls to reclaim the 1.3800 mark. The momentum could extend further and lift the USD/CAD pair back towards the YTD peak, around the 1.3845 region touched on April 16.
On the flip side, weakness below the 1.3740 resistance breakpoint is likely to attract fresh buyers and remain limited near the 1.3700 round figure. A convincing break below the latter might prompt some technical selling and drag the USD/CAD pair to the 100-day Simple Moving Average (SMA) support, currently pegged near the 1.3655 region, which should now act as a key pivotal point.
USD/CAD daily chart
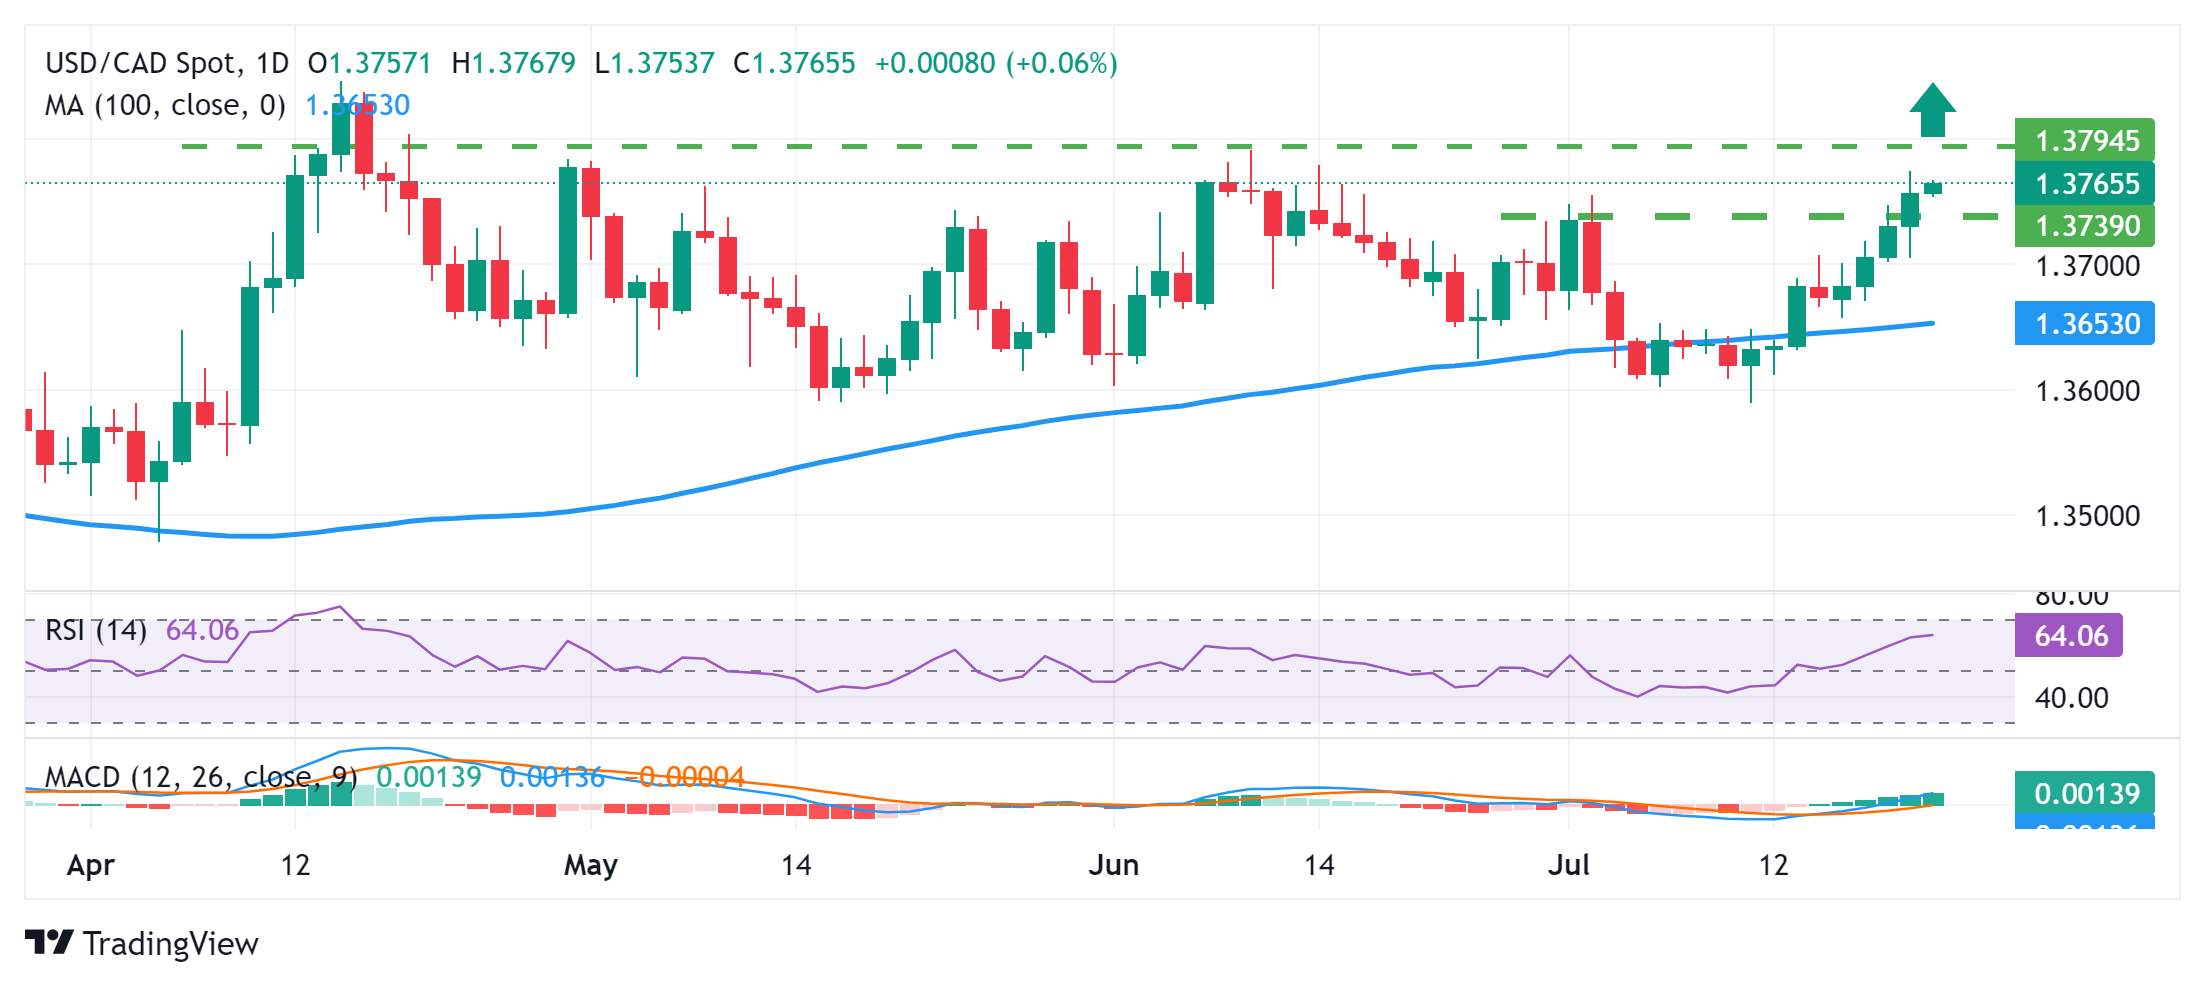
Canadian Dollar FAQs
The key factors driving the Canadian Dollar (CAD) are the level of interest rates set by the Bank of Canada (BoC), the price of Oil, Canada’s largest export, the health of its economy, inflation and the Trade Balance, which is the difference between the value of Canada’s exports versus its imports. Other factors include market sentiment – whether investors are taking on more risky assets (risk-on) or seeking safe-havens (risk-off) – with risk-on being CAD-positive. As its largest trading partner, the health of the US economy is also a key factor influencing the Canadian Dollar.
The Bank of Canada (BoC) has a significant influence on the Canadian Dollar by setting the level of interest rates that banks can lend to one another. This influences the level of interest rates for everyone. The main goal of the BoC is to maintain inflation at 1-3% by adjusting interest rates up or down. Relatively higher interest rates tend to be positive for the CAD. The Bank of Canada can also use quantitative easing and tightening to influence credit conditions, with the former CAD-negative and the latter CAD-positive.
The price of Oil is a key factor impacting the value of the Canadian Dollar. Petroleum is Canada’s biggest export, so Oil price tends to have an immediate impact on the CAD value. Generally, if Oil price rises CAD also goes up, as aggregate demand for the currency increases. The opposite is the case if the price of Oil falls. Higher Oil prices also tend to result in a greater likelihood of a positive Trade Balance, which is also supportive of the CAD.
While inflation had always traditionally been thought of as a negative factor for a currency since it lowers the value of money, the opposite has actually been the case in modern times with the relaxation of cross-border capital controls. Higher inflation tends to lead central banks to put up interest rates which attracts more capital inflows from global investors seeking a lucrative place to keep their money. This increases demand for the local currency, which in Canada’s case is the Canadian Dollar.
Macroeconomic data releases gauge the health of the economy and can have an impact on the Canadian Dollar. Indicators such as GDP, Manufacturing and Services PMIs, employment, and consumer sentiment surveys can all influence the direction of the CAD. A strong economy is good for the Canadian Dollar. Not only does it attract more foreign investment but it may encourage the Bank of Canada to put up interest rates, leading to a stronger currency. If economic data is weak, however, the CAD is likely to fall.
- Silver price trades in the negative territory around $29.00 for the fifth straight day on Tuesday, down 0.35% on the day.
- China’s demand concerns exert some selling pressure on the XAG/USD.
- The Fed's potential interest rate cuts and political uncertainty might cap Silver’s downside.
Silver price (XAG/USD) extends downside near $29.00 during the Asian session on Tuesday. The white metal edges lower amid a slowing Chinese economy. Investors will take more cues from the key US economic data later this week, including the first reading of the US S&P Global Purchasing Managers Index (PMI) for July, Gross Domestic Product (GDP) for the second quarter and the Personal Consumption Expenditures Price Index (PCE) data for June.
Industrial demand concerns from China’s economic slowdown continue to undermine Silver price in the previous sessions. The Chinese GDP for Q2 was weaker-than-expected and Retail Sales increased at the slowest pace since 2022. It’s worth noting that China is a major consumer of industrial metals, and China’s economic slowdown could weigh on the Silver price.
On the other hand, the rising bets on Federal Reserve (Fed) rate cuts in September might lift the white metal. New York Fed President John Williams and Fed Governor Christopher Waller noted that the Fed is getting “closer” to where it wants to be in terms of rate cuts.
According to the CME FedWatch Tool, traders in the Fed Funds Futures markets have fully priced in rate cuts in September, with at least two quarter-point cuts in 2024. Furthermore, political uncertainty after US President Joe Biden’s withdrawal from the 2024 election might support Silver for the time being.
Silver FAQs
Silver is a precious metal highly traded among investors. It has been historically used as a store of value and a medium of exchange. Although less popular than Gold, traders may turn to Silver to diversify their investment portfolio, for its intrinsic value or as a potential hedge during high-inflation periods. Investors can buy physical Silver, in coins or in bars, or trade it through vehicles such as Exchange Traded Funds, which track its price on international markets.
Silver prices can move due to a wide range of factors. Geopolitical instability or fears of a deep recession can make Silver price escalate due to its safe-haven status, although to a lesser extent than Gold's. As a yieldless asset, Silver tends to rise with lower interest rates. Its moves also depend on how the US Dollar (USD) behaves as the asset is priced in dollars (XAG/USD). A strong Dollar tends to keep the price of Silver at bay, whereas a weaker Dollar is likely to propel prices up. Other factors such as investment demand, mining supply – Silver is much more abundant than Gold – and recycling rates can also affect prices.
Silver is widely used in industry, particularly in sectors such as electronics or solar energy, as it has one of the highest electric conductivity of all metals – more than Copper and Gold. A surge in demand can increase prices, while a decline tends to lower them. Dynamics in the US, Chinese and Indian economies can also contribute to price swings: for the US and particularly China, their big industrial sectors use Silver in various processes; in India, consumers’ demand for the precious metal for jewellery also plays a key role in setting prices.
Silver prices tend to follow Gold's moves. When Gold prices rise, Silver typically follows suit, as their status as safe-haven assets is similar. The Gold/Silver ratio, which shows the number of ounces of Silver needed to equal the value of one ounce of Gold, may help to determine the relative valuation between both metals. Some investors may consider a high ratio as an indicator that Silver is undervalued, or Gold is overvalued. On the contrary, a low ratio might suggest that Gold is undervalued relative to Silver.
- EUR/JPY drifts lower for the third straight day amid some follow-through JPY buying.
- A suspected intervention and rising bets for another BoJ rate hike underpin the JPY.
- A weaker USD benefits the Euro and might help limit losses amid a positive risk tone.
The EUR/JPY cross trades with a negative bias for the third successive day on Tuesday, albeit manages to hold above the 170.00 psychological mark, or a nearly one-month low touched last week.
The Japanese Yen (JPY) continues to draw support from expectations the Bank of Japan (BoJ) could hike interest rates again at its upcoming policy meeting and a suspected intervention from authorities to prop up the domestic currency. Adding to this, the US political uncertainty drives some haven flows towards the JPY and turns out to be a key factor exerting downward pressure on the EUR/JPY cross.
Meanwhile, the European Central Bank (ECB) downgraded its view of the Eurozone's economic prospects and predicted that inflation would keep falling, leaving the door for a rate cut in September wide open. This contributes to the shared currency's relative underperformance and the offered tone surrounding the EUR/JPY cross, though a combination of factors could help limit deeper losses.
Dovish Federal Reserve (Fed) expectations keep the US Dollar (USD) bulls on the defensive and benefit the Euro. Furthermore, a generally positive risk tone might cap any further JPY appreciation and offer some support to the EUR/JPY cross. This makes it prudent to wait for acceptance below the 170.00 mark before positioning for an extension of the recent pullback from the highest level since 1992.
The market focus now shifts to the release of flash PMI prints on Wednesday, which will be looked upon for fresh insight into the global economic health. This, along with the broader risk sentiment, will influence demand for the safe-haven JPY and provide some meaningful impetus to the EUR/JPY cross.
Bank of Japan FAQs
The Bank of Japan (BoJ) is the Japanese central bank, which sets monetary policy in the country. Its mandate is to issue banknotes and carry out currency and monetary control to ensure price stability, which means an inflation target of around 2%.
The Bank of Japan has embarked in an ultra-loose monetary policy since 2013 in order to stimulate the economy and fuel inflation amid a low-inflationary environment. The bank’s policy is based on Quantitative and Qualitative Easing (QQE), or printing notes to buy assets such as government or corporate bonds to provide liquidity. In 2016, the bank doubled down on its strategy and further loosened policy by first introducing negative interest rates and then directly controlling the yield of its 10-year government bonds.
The Bank’s massive stimulus has caused the Yen to depreciate against its main currency peers. This process has exacerbated more recently due to an increasing policy divergence between the Bank of Japan and other main central banks, which have opted to increase interest rates sharply to fight decades-high levels of inflation. The BoJ’s policy of holding down rates has led to a widening differential with other currencies, dragging down the value of the Yen.
A weaker Yen and the spike in global energy prices have led to an increase in Japanese inflation, which has exceeded the BoJ’s 2% target. Still, the Bank judges that the sustainable and stable achievement of the 2% target has not yet come in sight, so any sudden change in the current policy looks unlikely.
- EUR/USD may maintain its upward momentum, with a potential return to the ascending channel.
- The pair may encounter key resistance near a four-month high at 1.0922.
- The nine-day EMA at 1.0883 level acts as immediate support.
EUR/USD advances for the second consecutive day, trading around 1.0900 during Tuesday's Asian session. The analysis of the daily chart shows a weakening of a bullish trend, as the pair is positioned below an ascending channel.
Moreover, the 14-day Relative Strength Index (RSI), a momentum indicator, is above the 50 level, further affirming the bullish sentiment for the EUR/USD pair. Further movement will give a clear directional trend.
The EUR/USD pair could retest a potential resistance near a four-month high at 1.0922, observed on July 15, followed by the lower boundary of the ascending channel around the level of 1.0940.
A return to the ascending channel will improve the bullish bias and support the EUR/USD pair to approach the psychological level of 1.1000, followed by the upper boundary of the ascending channel near 1.1100.
On the downside, the nine-day Exponential Moving Average (EMA) at 1.0883 level acts as immediate support. A break below this level could exert downward pressure on the EUR/USD pair to navigate the region around the key level of 1.0670, potentially serving as a throwback support level.
EUR/USD: Daily Chart
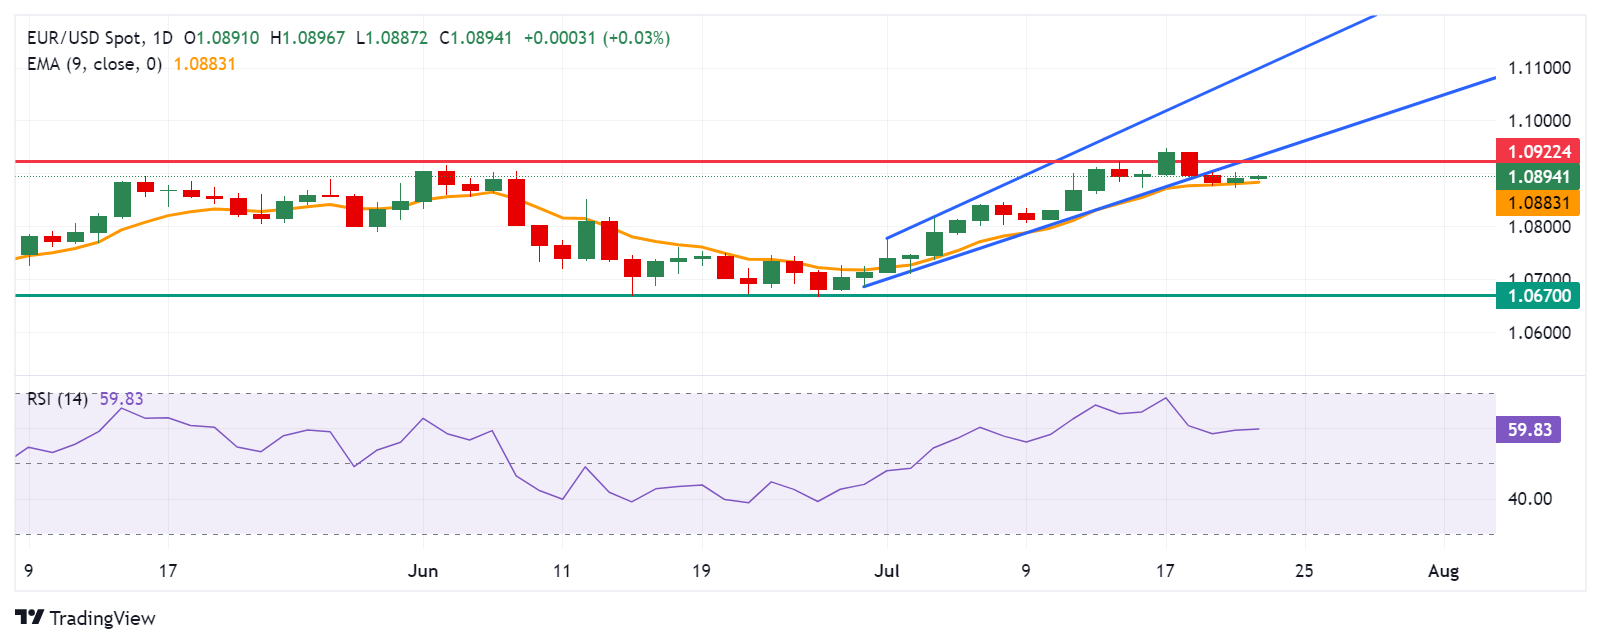
Euro PRICE Today
The table below shows the percentage change of Euro (EUR) against listed major currencies today. Euro was the strongest against the New Zealand Dollar.
| USD | EUR | GBP | JPY | CAD | AUD | NZD | CHF | |
|---|---|---|---|---|---|---|---|---|
| USD | -0.03% | 0.02% | -0.47% | 0.03% | 0.08% | 0.17% | -0.05% | |
| EUR | 0.03% | 0.05% | -0.43% | 0.05% | 0.09% | 0.17% | -0.03% | |
| GBP | -0.02% | -0.05% | -0.46% | 0.01% | 0.07% | 0.14% | -0.08% | |
| JPY | 0.47% | 0.43% | 0.46% | 0.49% | 0.53% | 0.60% | 0.37% | |
| CAD | -0.03% | -0.05% | -0.01% | -0.49% | 0.05% | 0.11% | -0.09% | |
| AUD | -0.08% | -0.09% | -0.07% | -0.53% | -0.05% | 0.08% | -0.15% | |
| NZD | -0.17% | -0.17% | -0.14% | -0.60% | -0.11% | -0.08% | -0.22% | |
| CHF | 0.05% | 0.03% | 0.08% | -0.37% | 0.09% | 0.15% | 0.22% |
The heat map shows percentage changes of major currencies against each other. The base currency is picked from the left column, while the quote currency is picked from the top row. For example, if you pick the Euro from the left column and move along the horizontal line to the US Dollar, the percentage change displayed in the box will represent EUR (base)/USD (quote).
- GBP/USD lacks firm intraday direction and oscillates in a narrow range on Tuesday.
- The fundamental backdrop and the technical setup seem tilted in favor of bulls.
- A convincing break below the 1.2900 mark is needed to negative the positive bias.
The GBP/USD pair struggles to capitalize on the previous day's modest bounce from the 1.2900 neighborhood and oscillates in a narrow trading band during the Asian session on Tuesday. Spot prices currently hover around the 1.2930 area, nearly unchanged for the day, and remain at the mercy of the US Dollar (USD) price dynamics.
Investors have fully priced in an interest rate cut by the Federal Reserve (Fed) at the September policy meeting, which keeps the US Treasury bond yields depressed. This, in turn, prompts some USD selling and turns out to be a key factor acting as a tailwind for the GBP/USD pair. Apart from this, the diminishing odds of an interest rate cut by the Bank of England (BoE) in August offer some support to the currency pair.
From a technical perspective, the recent breakout through the previous YTD peak, around the 1.2895 region, was seen as a fresh trigger for bullish traders. Moreover, the Relative Strength Index (RSI) on the daily chart has eased from the overbought zone and is holding comfortably in positive territory. This validates the positive outlook and suggests that the path of least resistance for the GBP/USD pair is to the upside.
Some follow-through strength beyond the 1.2960-1.2965 immediate hurdle will reaffirm the constructive setup and allow bulls to reclaim the 1.3000 psychological mark. The subsequent move-up has the potential to lift the GBP/USD pair back towards the YTD peak, around the 1.3045 area touched last week. The momentum could extend further towards the 1.3100 mark en route to the July 2023 swing high, around 1.3140 region.
On the flip side, bearish traders need to wait for a sustained break and acceptance below the 1.2900 round-figure mark before placing fresh bets. The said handle should now act as a key pivotal point, below which the GBP/USD pair could decline further towards intermediate support near the 1.2855 zone before eventually dropping to the 1.2820-1.2815 region and the 1.2800 round-figure mark.
GBP/USD daily chart
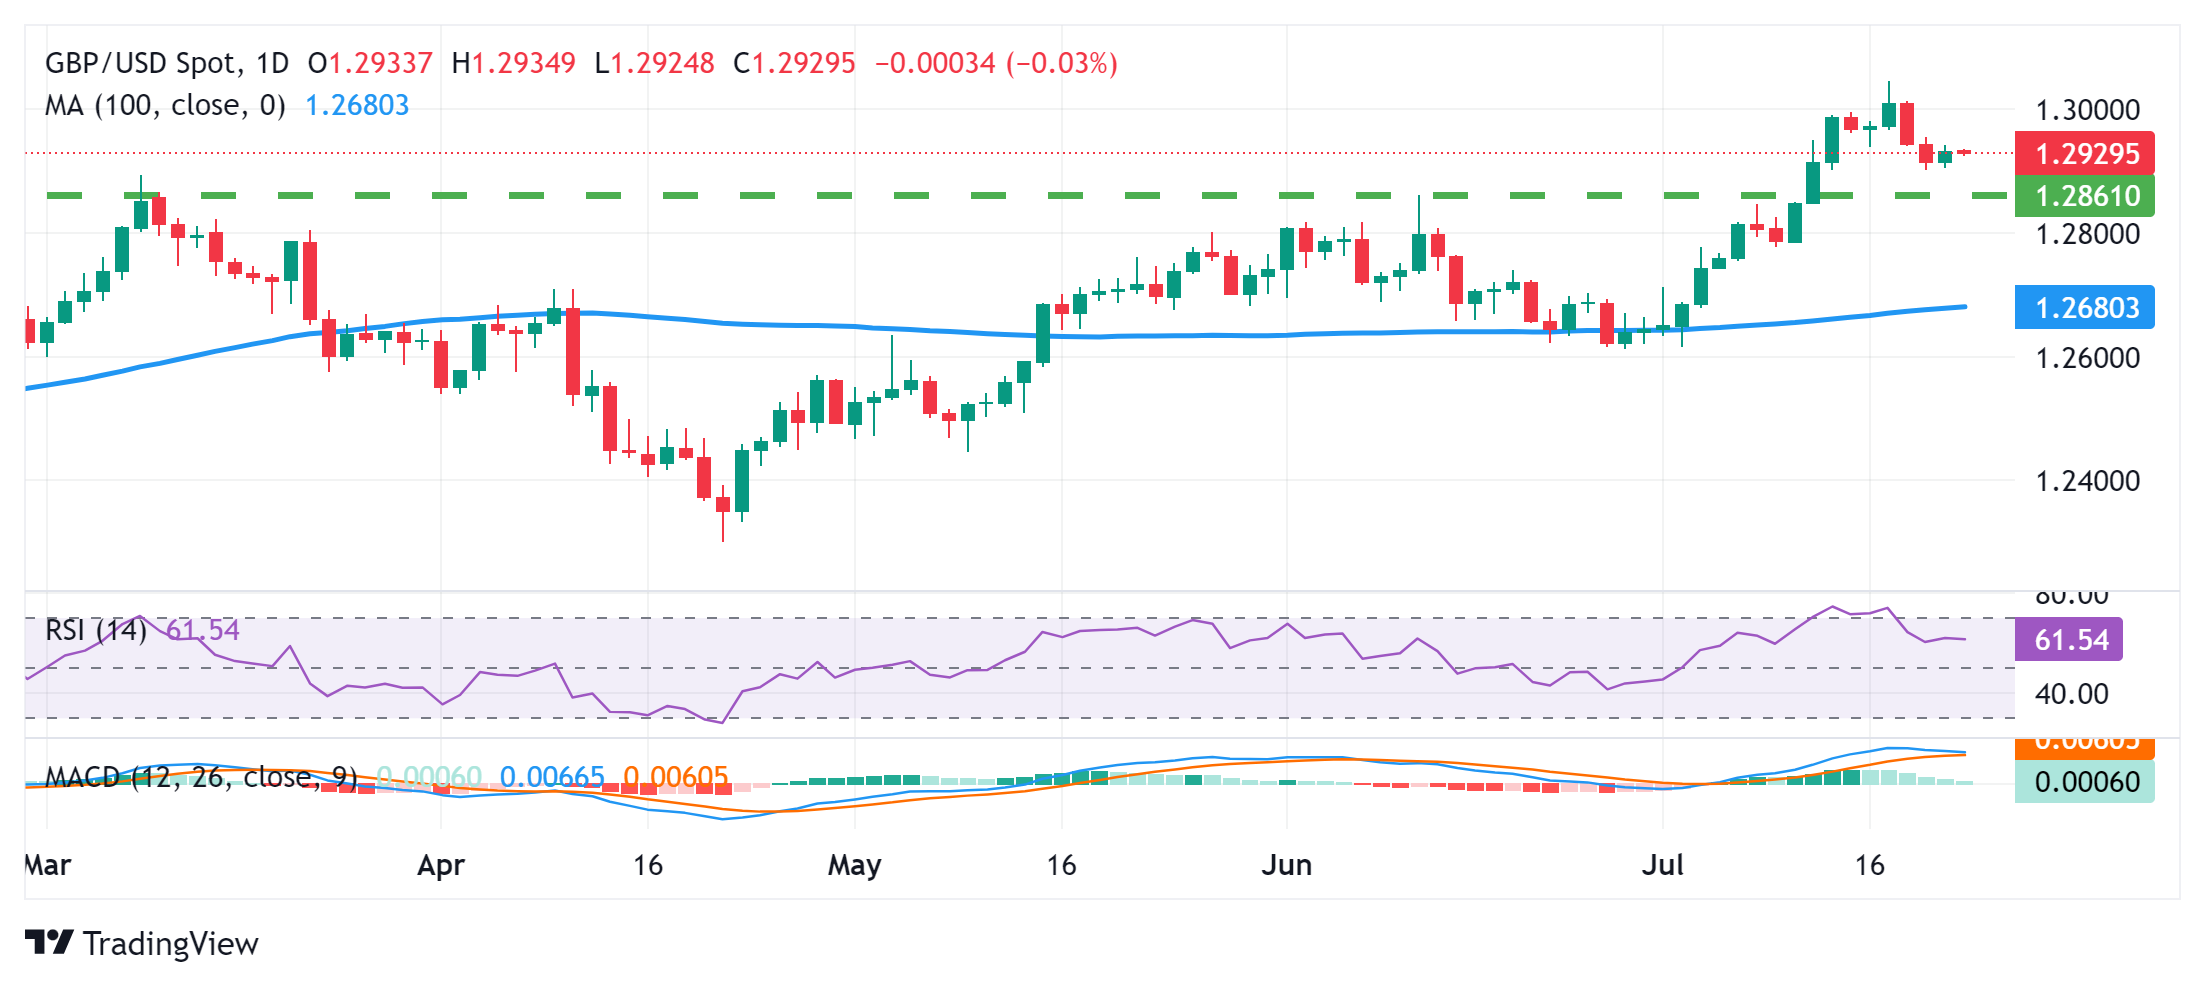
Pound Sterling FAQs
The Pound Sterling (GBP) is the oldest currency in the world (886 AD) and the official currency of the United Kingdom. It is the fourth most traded unit for foreign exchange (FX) in the world, accounting for 12% of all transactions, averaging $630 billion a day, according to 2022 data. Its key trading pairs are GBP/USD, aka ‘Cable’, which accounts for 11% of FX, GBP/JPY, or the ‘Dragon’ as it is known by traders (3%), and EUR/GBP (2%). The Pound Sterling is issued by the Bank of England (BoE).
The single most important factor influencing the value of the Pound Sterling is monetary policy decided by the Bank of England. The BoE bases its decisions on whether it has achieved its primary goal of “price stability” – a steady inflation rate of around 2%. Its primary tool for achieving this is the adjustment of interest rates. When inflation is too high, the BoE will try to rein it in by raising interest rates, making it more expensive for people and businesses to access credit. This is generally positive for GBP, as higher interest rates make the UK a more attractive place for global investors to park their money. When inflation falls too low it is a sign economic growth is slowing. In this scenario, the BoE will consider lowering interest rates to cheapen credit so businesses will borrow more to invest in growth-generating projects.
Data releases gauge the health of the economy and can impact the value of the Pound Sterling. Indicators such as GDP, Manufacturing and Services PMIs, and employment can all influence the direction of the GBP. A strong economy is good for Sterling. Not only does it attract more foreign investment but it may encourage the BoE to put up interest rates, which will directly strengthen GBP. Otherwise, if economic data is weak, the Pound Sterling is likely to fall.
Another significant data release for the Pound Sterling is the Trade Balance. This indicator measures the difference between what a country earns from its exports and what it spends on imports over a given period. If a country produces highly sought-after exports, its currency will benefit purely from the extra demand created from foreign buyers seeking to purchase these goods. Therefore, a positive net Trade Balance strengthens a currency and vice versa for a negative balance.
- The Japanese Yen extends gains as traders expect the BoJ to raise rates next week.
- Toshimitsu Motegi, a senior official in the ruling party, urged the BoJ to communicate its plan to normalize monetary policy.
- Media reports indicate that Vice President Kamala Harris has now surpassed 1,976 Democratic delegates, securing the party's presidential nomination.
The Japanese Yen (JPY) extends its gains for the second successive session on Tuesday, which could be attributed to the increased risk aversion. Traders assess the interest rate decision by the Bank of Japan (BoJ) next week, where an interest rate hike might be on the table to support the JPY.
Toshimitsu Motegi, a senior official in the ruling party, urged the Bank of Japan (BoJ) to more clearly communicate its plan to normalize monetary policy through gradual interest rate hikes, highlighting that excessive Yen declines were adversely affecting the economy, according to Reuters. Prime Minister Fumio Kishida added that normalizing the central bank’s monetary policy would support Japan's transition to a growth-driven economy.
The USD/JPY pair faces challenges as the US Dollar (USD) struggles due to rising bets on a Federal Reserve (Fed) rate cut in September. Federal Reserve (Fed) Chair Jerome Powell noted that he is becoming more hopeful about the progress on inflation in recent months. Meanwhile, Fed Governor Christopher Waller stated that the time to lower the policy rate is drawing closer.
Daily Digest Market Movers: Japanese Yen gains ground due to increased aversion
Media reports say that Vice President Kamala Harris has just passed 1,976 Democratic delegates to secure the party's presidential nomination. Harris is now the Democratic Party’s Presumptive Nominee for November’s Presidential Election.
Federal Reserve Bank of New York President John Williams stated on Friday that the long-term trends that caused declines in neutral interest rates before the pandemic continue to prevail. Williams noted, "My own Holston-Laubach-Williams estimates for r-star in the United States, Canada, and the Euro area are about the same level as they were before the pandemic," according to Bloomberg.
Japan's National Consumer Price Index (CPI) for June held steady at 2.8%, matching the previous month's figure and remaining at the highest level since February. Meanwhile, Core CPI inflation rose to 2.6%, slightly above the previous reading of 2.5% but just below the consensus estimate of 2.7%.
JP Morgan has anticipated no rate hike from the Bank of Japan (BoJ) in July or at any point in 2024. A July rate increase is not their base case, and they do not expect any hikes for the remainder of 2024. They believe it is too early to adopt a bullish stance on the Yen.
Kazushige Kamiyama, a senior Bank of Japan (BoJ) official and the central bank’s Osaka branch manager, said on Thursday that the BoJ wants to maintain an accommodative monetary environment as much as possible, per Jiji News Agency.
During an interview with Bloomberg News on Tuesday, Donald Trump cautioned Fed Chair Jerome Powell against cutting US interest rates before November’s presidential vote. However, Trump also indicated that if re-elected, he would allow Powell to complete his term if he continued to "do the right thing" at the Federal Reserve.
Last week, BoJ data suggested that authorities may have intervened by purchasing nearly ¥6 trillion on July 11-12. Additionally, data revealed that Japan sold approximately $22 billion in US Treasuries in May to raise dollars, bolstering its reserves for potential foreign exchange market operations, according to Reuters.
Technical Analysis: USD/JPY falls to near 156.50
USD/JPY trades around 156.60 on Tuesday. The daily chart analysis shows that the pair is below its nine-day Exponential Moving Average (EMA) of 157.75, suggesting short-term downward momentum. Additionally, the 14-day Relative Strength Index (RSI) is below 50, reinforcing a bearish outlook.
The USD/JPY pair may encounter significant support near June’s low of 154.55. A decline below this level could lead to a further drop toward May’s low of 151.86.
On the upside, immediate resistance is at the nine-day EMA of 157.75. A breakout above this level could push the USD/JPY pair toward the resistance around the psychological level of 162.00.
USD/JPY: Daily Chart
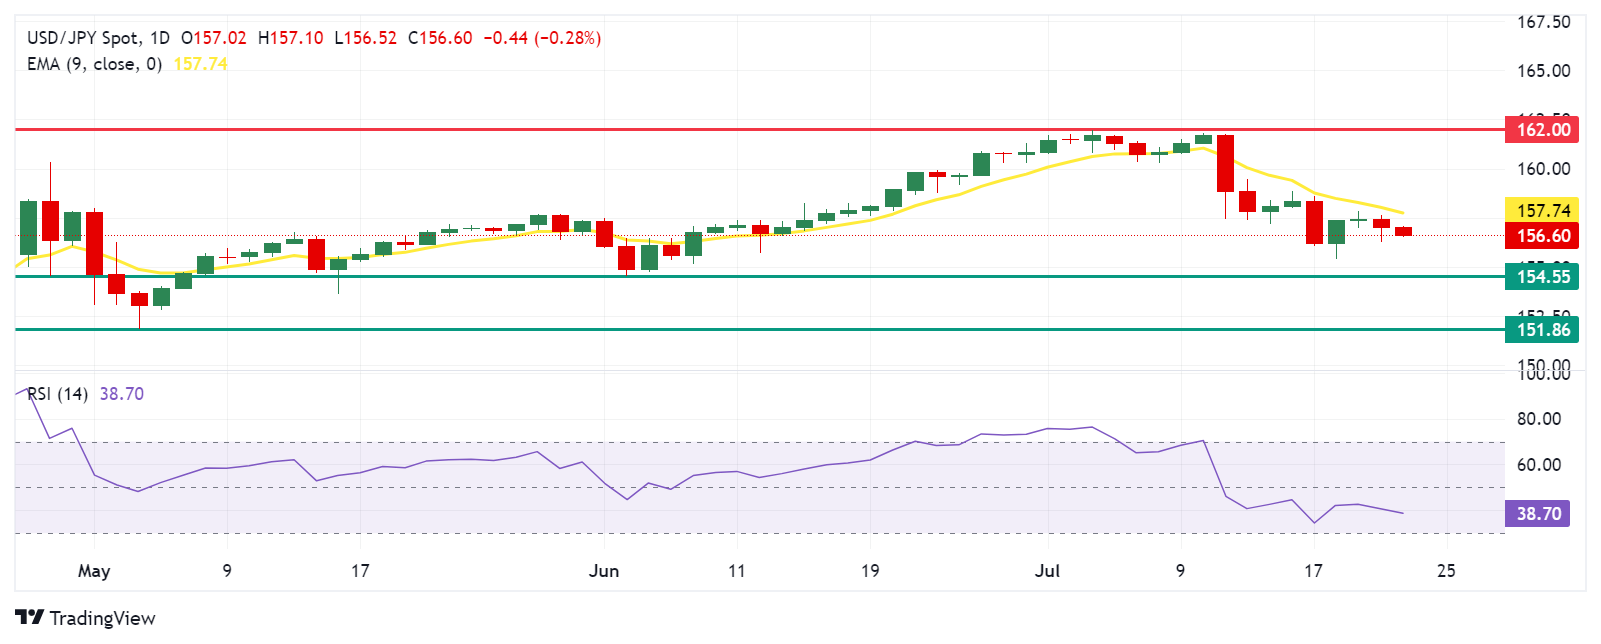
Japanese Yen PRICE Today
The table below shows the percentage change of Japanese Yen (JPY) against listed major currencies today. Japanese Yen was the strongest against the New Zealand Dollar.
| USD | EUR | GBP | JPY | CAD | AUD | NZD | CHF | |
|---|---|---|---|---|---|---|---|---|
| USD | -0.04% | 0.02% | -0.42% | 0.03% | 0.05% | 0.10% | -0.04% | |
| EUR | 0.04% | 0.06% | -0.36% | 0.07% | 0.10% | 0.16% | -0.00% | |
| GBP | -0.02% | -0.06% | -0.42% | 0.02% | 0.03% | 0.10% | -0.06% | |
| JPY | 0.42% | 0.36% | 0.42% | 0.45% | 0.44% | 0.48% | 0.34% | |
| CAD | -0.03% | -0.07% | -0.02% | -0.45% | 0.00% | 0.04% | -0.08% | |
| AUD | -0.05% | -0.10% | -0.03% | -0.44% | -0.00% | 0.04% | -0.10% | |
| NZD | -0.10% | -0.16% | -0.10% | -0.48% | -0.04% | -0.04% | -0.14% | |
| CHF | 0.04% | 0.00% | 0.06% | -0.34% | 0.08% | 0.10% | 0.14% |
The heat map shows percentage changes of major currencies against each other. The base currency is picked from the left column, while the quote currency is picked from the top row. For example, if you pick the Japanese Yen from the left column and move along the horizontal line to the US Dollar, the percentage change displayed in the box will represent JPY (base)/USD (quote).
Japanese Yen FAQs
The Japanese Yen (JPY) is one of the world’s most traded currencies. Its value is broadly determined by the performance of the Japanese economy, but more specifically by the Bank of Japan’s policy, the differential between Japanese and US bond yields, or risk sentiment among traders, among other factors.
One of the Bank of Japan’s mandates is currency control, so its moves are key for the Yen. The BoJ has directly intervened in currency markets sometimes, generally to lower the value of the Yen, although it refrains from doing it often due to political concerns of its main trading partners. The current BoJ ultra-loose monetary policy, based on massive stimulus to the economy, has caused the Yen to depreciate against its main currency peers. This process has exacerbated more recently due to an increasing policy divergence between the Bank of Japan and other main central banks, which have opted to increase interest rates sharply to fight decades-high levels of inflation.
The BoJ’s stance of sticking to ultra-loose monetary policy has led to a widening policy divergence with other central banks, particularly with the US Federal Reserve. This supports a widening of the differential between the 10-year US and Japanese bonds, which favors the US Dollar against the Japanese Yen.
The Japanese Yen is often seen as a safe-haven investment. This means that in times of market stress, investors are more likely to put their money in the Japanese currency due to its supposed reliability and stability. Turbulent times are likely to strengthen the Yen’s value against other currencies seen as more risky to invest in.
- AUD/JPY remains under some selling pressure for the third straight day on Tuesday.
- A combination of factors continues to underpin the JPY and drag spot prices lower.
- China’s economic woes dent demand for the Aussie and contribute to the downfall.
The AUD/JPY cross drifts lower for the third successive day on Tuesday – also marking its ninth day of a negative move in the previous ten – and drops to its lowest level since June 17 during the Asian session. Spot prices slide further below the 104.00 mark in the last hour, with bears looking to extend the recent corrective decline from the highest level since May 1991 touched earlier this month.
Against the backdrop of a suspected intervention by Japanese authorities, expectations the Bank of Japan (BoJ) could hike rates again at its upcoming policy meeting continue to underpin the Japanese Yen (JPY). Apart from this, the US political uncertainty benefits the JPY's relative safe-haven status and exerts some downward pressure on the AUD/JPY cross. Furthermore, worries about a slowdown in the Chinese economy – the world's second-largest economy – seem to weigh on the Australian Dollar (AUD) and contribute to driving flows away from the currency pair.
Bulls, meanwhile, failed to gain respite from unexpected interest rate cuts by the People's Bank of China (PBoC) on Monday. China's central bank lowered the one-year loan prime rate (LPR), the five-year LPR and the seven-day reverse repo rate by 10 basis points (bps) to 3.35%, 3.85% and 1.7%, respectively. This, along with expectations the US equity market could benefit from proposed Trump policies, remains supportive of the prevalent risk-on environment. This could cap any further JPY appreciation and lend some support to the risk-sensitive Aussie.
Furthermore, bets that the Reserve Bank of Australia (RBA) could raise interest rates again, bolstered by the upbeat labor market report for June and higher May inflation print, could act as a tailwind for the Aussie. This, in turn, warrants some caution before placing fresh bearish bets around the AUD/JPY cross. Investors now look to the release of flash global PMIs on Wednesday, which will drive demand for the safe-haven JPY. Apart from this, the broader risk sentiment should contribute to producing short-term trading opportunities around the currency pair.
Japanese Yen FAQs
The Japanese Yen (JPY) is one of the world’s most traded currencies. Its value is broadly determined by the performance of the Japanese economy, but more specifically by the Bank of Japan’s policy, the differential between Japanese and US bond yields, or risk sentiment among traders, among other factors.
One of the Bank of Japan’s mandates is currency control, so its moves are key for the Yen. The BoJ has directly intervened in currency markets sometimes, generally to lower the value of the Yen, although it refrains from doing it often due to political concerns of its main trading partners. The current BoJ ultra-loose monetary policy, based on massive stimulus to the economy, has caused the Yen to depreciate against its main currency peers. This process has exacerbated more recently due to an increasing policy divergence between the Bank of Japan and other main central banks, which have opted to increase interest rates sharply to fight decades-high levels of inflation.
The BoJ’s stance of sticking to ultra-loose monetary policy has led to a widening policy divergence with other central banks, particularly with the US Federal Reserve. This supports a widening of the differential between the 10-year US and Japanese bonds, which favors the US Dollar against the Japanese Yen.
The Japanese Yen is often seen as a safe-haven investment. This means that in times of market stress, investors are more likely to put their money in the Japanese currency due to its supposed reliability and stability. Turbulent times are likely to strengthen the Yen’s value against other currencies seen as more risky to invest in.
- The Indian Rupee edges higher in Tuesday’s Asian session.
- Persistent foreign inflows to India and lower crude oil prices might support the INR in the near term.
- Investors await the Indian Union Budget on Tuesday, which will be announced at 06:00 GMT.
The Indian Rupee (INR) recovers some lost ground on Tuesday after falling to an all-time low in the previous session. A weak Chinese Yuan, and sustained US Dollar (USD) demand from local corporates and oil companies might continue to undermine the INR. Nonetheless, the downside of the Indian Rupee might be limited as the Reserve Bank of India (RBI) is likely to intervene to support the local currency against depreciation. Additionally, strong inflows into the Indian equity markets and a decline in crude oil prices might underpin the INR in the near term.
Market players will closely monitor India’s Federal Budget on Tuesday. On the US docket, Existing Home Sales and Richmond Fed Manufacturing Index will be released. Later this week, the attention will shift to the preliminary US S&P Global Purchasing Managers Index (PMI) for July, Gross Domestic Product (GDP) for the second quarter and the Personal Consumption Expenditures Price Index (PCE) data for June, which will be released on Wednesday, Thursday and Friday, respectively.
Daily Digest Market Movers: Indian Rupee rebounds ahead of Indian Union Budget
- The Indian government is considering lowering personal tax rates for some groups of people, which could help boost consumption in the economy, two government sources told Reuters.
- India’s foreign exchange has risen by nearly $15 billion in the first half of July, reaching a historic high of $667 billion.
- “The upcoming Union Budget is expected to provide a strong outlook for the rupee, as it will outline India's income and expenditure roadmap for the next year. The rupee remains broadly range-bound between Rs 83.25 a dollar and Rs 83.80 per dollar," said Jateen Trivedi, VP Research Analyst - Commodity and Currency, LKP Securities.
- The Indian economy is likely to grow by 6.5% to 7% this year with prospects of clocking 7%-plus growth in coming years, according to the Economic Survey for 2023-24.
- New York Fed President John Williams and Fed Governor Christopher Waller noted that the US central bank is getting “closer” to where it wants to be in terms of rate cuts.
- Traders in Fed Funds Futures markets have fully priced in rate cuts in September, with at least two quarter-point cuts in 2024.
Technical analysis: USD/INR maintains a constructive outlook in the longer term
The Indian Rupee trades with mild gains on the day. The USD/INR pair keeps the bullish vibe on the daily timeframe as it confirms a breakout above the month-long trading range and holds above the key 100-day Exponential Moving Average (EMA). The 14-day Relative Strength Index (RSI) points higher above 60.00, suggesting that some bullish momentum may be in play.
The first upside barrier for the pair is located near the all-time high of 83.77. A break above this level could be enough to spur some buyers to the 84.00 psychological level.
On the other hand, consistent trading below the resistance-turned-support level at 83.65 may draw in enough selling pressure to drag USD/INR lower to 83.51, a low of July 12. Further south, the pair might gain enough downside momentum to revisit 83.40, the 100-day EMA.
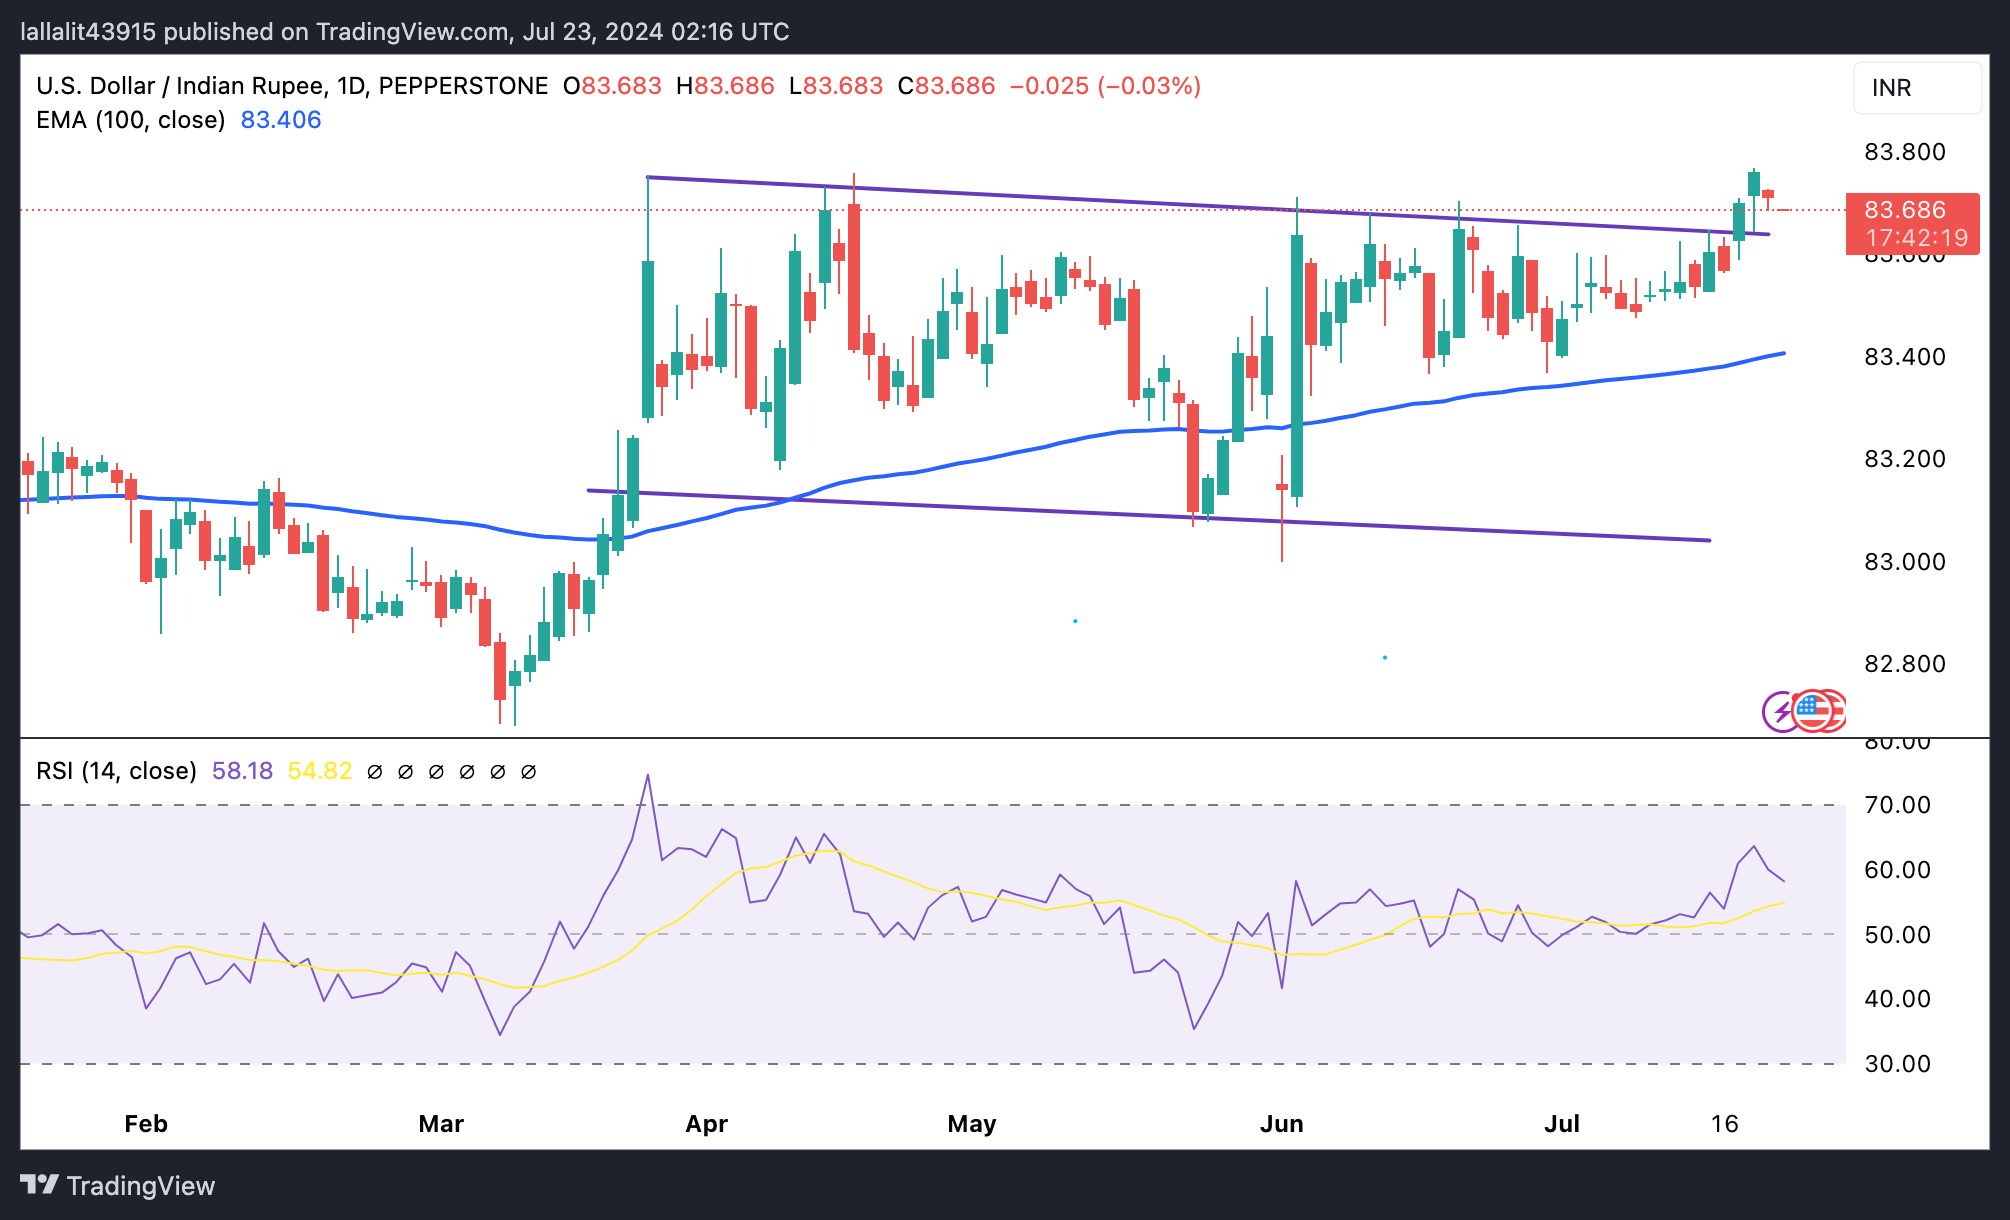
US Dollar price today
The table below shows the percentage change of US Dollar (USD) against listed major currencies today. US Dollar was the weakest against the Japanese Yen.
| USD | EUR | GBP | CAD | AUD | JPY | NZD | CHF | |
| USD | 0.10% | 0.02% | 0.37% | 0.81% | -0.27% | 0.70% | 0.17% | |
| EUR | -0.11% | -0.08% | 0.25% | 0.71% | -0.37% | 0.61% | 0.03% | |
| GBP | 0.00% | 0.07% | 0.33% | 0.78% | -0.31% | 0.67% | 0.13% | |
| CAD | -0.36% | -0.26% | -0.34% | 0.45% | -0.64% | 0.35% | -0.22% | |
| AUD | -0.83% | -0.71% | -0.79% | -0.44% | -1.09% | -0.08% | -0.64% | |
| JPY | 0.27% | 0.41% | 0.30% | 0.65% | 1.05% | 0.98% | 0.43% | |
| NZD | -0.68% | -0.61% | -0.69% | -0.30% | 0.11% | -0.94% | -0.54% | |
| CHF | -0.18% | -0.07% | -0.14% | 0.19% | 0.64% | -0.45% | 0.54% |
The heat map shows percentage changes of major currencies against each other. The base currency is picked from the left column, while the quote currency is picked from the top row. For example, if you pick the Euro from the left column and move along the horizontal line to the Japanese Yen, the percentage change displayed in the box will represent EUR (base)/JPY (quote).
Indian Rupee FAQs
The Indian Rupee (INR) is one of the most sensitive currencies to external factors. The price of Crude Oil (the country is highly dependent on imported Oil), the value of the US Dollar – most trade is conducted in USD – and the level of foreign investment, are all influential. Direct intervention by the Reserve Bank of India (RBI) in FX markets to keep the exchange rate stable, as well as the level of interest rates set by the RBI, are further major influencing factors on the Rupee.
The Reserve Bank of India (RBI) actively intervenes in forex markets to maintain a stable exchange rate, to help facilitate trade. In addition, the RBI tries to maintain the inflation rate at its 4% target by adjusting interest rates. Higher interest rates usually strengthen the Rupee. This is due to the role of the ‘carry trade’ in which investors borrow in countries with lower interest rates so as to place their money in countries’ offering relatively higher interest rates and profit from the difference.
Macroeconomic factors that influence the value of the Rupee include inflation, interest rates, the economic growth rate (GDP), the balance of trade, and inflows from foreign investment. A higher growth rate can lead to more overseas investment, pushing up demand for the Rupee. A less negative balance of trade will eventually lead to a stronger Rupee. Higher interest rates, especially real rates (interest rates less inflation) are also positive for the Rupee. A risk-on environment can lead to greater inflows of Foreign Direct and Indirect Investment (FDI and FII), which also benefit the Rupee.
Higher inflation, particularly, if it is comparatively higher than India’s peers, is generally negative for the currency as it reflects devaluation through oversupply. Inflation also increases the cost of exports, leading to more Rupees being sold to purchase foreign imports, which is Rupee-negative. At the same time, higher inflation usually leads to the Reserve Bank of India (RBI) raising interest rates and this can be positive for the Rupee, due to increased demand from international investors. The opposite effect is true of lower inflation.
| Raw materials | Closed | Change, % |
|---|---|---|
| Silver | 29.107 | -0.55 |
| Gold | 239.588 | -0.33 |
| Palladium | 902.95 | -0.74 |
- A combination of factors dragged the Gold price to over a one-week low on Monday.
- Bets that the Fed will cut rates in September lend some support and help limit losses.
- The US Q2 GDP on Thursday and the US PCE data on Friday will be eyed for fresh impetuses.
Gold price (XAU/USD) extended its recent corrective slide from the record high touched last week and fell to a more than one-week trough on Monday. US President Joe Biden's withdrawal from the 2024 Presidential election increased the chances of Donald Trump becoming the next US President, raising hopes of a looser regulatory environment. This, along with unexpected interest rate cuts by the People's Bank of China (PBoC) on Monday, boosted investors' appetite for riskier assets and weighed heavily on the safe-haven precious metal.
Meanwhile, a second Donald Trump presidency is expected to push up long-term inflation expectations, leading to the overnight rise in the US Treasury bond yields. This acted as a tailwind for the US Dollar (USD) and further contributed to driving flows away from the non-yielding Gold price. That said, growing acceptance that the Federal Reserve (Fed) will start its rate-cutting cycle in September caps gains for the USD and assists the XAU/USD to climb back above the $2,400 mark during the Asian session on Tuesday.
Daily Digest Market Movers: Gold price attracts some buyers as Fed rate cut bets continue to weigh on the USD
- Investors reacted little to US President Joe Biden's decision to end his re-election campaign on Sunday amid expectations that the US equity market would benefit from Trump's proposed policies.
- Adding to this, the People's Bank of China (PBoC) surprised markets by cutting key short and long-term rates and provided an additional boost to the global risk sentiment.
- China's central bank lowered the one-year loan prime rate (LPR), the five-year LPR and the seven-day reverse repo rate by 10 basis points (bps) to 3.35%, 3.85% and 1.7%, respectively.
- The move comes in the wake of a disappointment from the lack of short-term stimulus to support the real economy from the Third Plenum meeting Chinese officials held last week.
- Nevertheless, the combination of factors triggered a fresh wave of the risk-on trade and turned out to be a key factor that led to the overnight downfall in the safe-haven Gold price.
- Moreover, a second Trump presidency is expected to be more inflationary, pushing the US Treasury bond yields higher and contributing to driving flows away from the XAU/USD.
- Meanwhile, money markets have fully priced in a rate cut by the Federal Reserve in September, which keeps the US Dollar bulls on the defensive and lends support to the yellow metal.
- Traders now look to Tuesday's US economic docket, featuring Existing Home Sales and the Richmond Manufacturing Index, for short-term opportunities later during the North American session.
- The market focus, however, will remain glued to Thursday's release of the Advance US Q2 GDP print and the US Personal Consumption Expenditures (PCE) Price Index data on Friday.
- Apart from this, investors, this week will confront the release of flash PMIs, which should provide cues about the health of the global economy and provide some impetus to the commodity.
Technical Analysis: Gold price needs to find acceptance below $2,385 confluence support for bears to seize control
From a technical perspective, the Gold price finds support and attracts some buyers near the $2,385 resistance breakpoint. The said area now coincides with the 100-period Simple Moving Average (SMA) on the 4-hour chart and the 50% retracement level of the June-July rally. This, in turn, should now act as a key pivotal point, which if broken decisively should pave the way for deeper losses. The Gold price might then slide to 61.8% Fibo. level, around the $2,366-2,365 region, en route to the $2,352-2,350 zone before eventually dropping to the 78.6% Fibo. level, near the $2,334-2,334 area, and the $2,300 mark.
On the flip side, any further move up is likely to confront some resistance near the $2,417-2,418 zone, above which a bout of a short-covering has the potential to lift the Gold price to the $2,437-2,438 region. A sustained strength beyond the latter will suggest that the corrective decline has run its course and shift the near-term bias back in favor of bullish traders. The subsequent rally has the potential to lift the XAU/USD back towards the all-time peak, around the $2,482 area touched on July 17, with some intermediate resistance near the $2,458 region.
Gold FAQs
Gold has played a key role in human’s history as it has been widely used as a store of value and medium of exchange. Currently, apart from its shine and usage for jewelry, the precious metal is widely seen as a safe-haven asset, meaning that it is considered a good investment during turbulent times. Gold is also widely seen as a hedge against inflation and against depreciating currencies as it doesn’t rely on any specific issuer or government.
Central banks are the biggest Gold holders. In their aim to support their currencies in turbulent times, central banks tend to diversify their reserves and buy Gold to improve the perceived strength of the economy and the currency. High Gold reserves can be a source of trust for a country’s solvency. Central banks added 1,136 tonnes of Gold worth around $70 billion to their reserves in 2022, according to data from the World Gold Council. This is the highest yearly purchase since records began. Central banks from emerging economies such as China, India and Turkey are quickly increasing their Gold reserves.
Gold has an inverse correlation with the US Dollar and US Treasuries, which are both major reserve and safe-haven assets. When the Dollar depreciates, Gold tends to rise, enabling investors and central banks to diversify their assets in turbulent times. Gold is also inversely correlated with risk assets. A rally in the stock market tends to weaken Gold price, while sell-offs in riskier markets tend to favor the precious metal.
The price can move due to a wide range of factors. Geopolitical instability or fears of a deep recession can quickly make Gold price escalate due to its safe-haven status. As a yield-less asset, Gold tends to rise with lower interest rates, while higher cost of money usually weighs down on the yellow metal. Still, most moves depend on how the US Dollar (USD) behaves as the asset is priced in dollars (XAU/USD). A strong Dollar tends to keep the price of Gold controlled, whereas a weaker Dollar is likely to push Gold prices up.
- The Australian Dollar extends losses due to a sharp drop in energy and metals prices.
- The AUD could limit its downside due to a potential rate hike from the RBA.
- The US Dollar faces challenges due to increasing bets on a Fed rate cut in September.
The Australian Dollar (AUD) weakens for the seventh consecutive session on Tuesday, driven by a steep drop in energy and metals prices. Given Australia's heavy reliance on commodity exports, the AUD is particularly sensitive to fluctuations in these assets.
The AUD could receive support as robust employment data indicate tight labor market conditions and raise concerns about a potential interest rate hike from the Reserve Bank of Australia (RBA). Investors look forward to Australian manufacturing and services PMI figures this week to gauge the economy's health.
The AUD/USD pair could limit its downside as the US Dollar (USD) faces challenges on rising bets on a Federal Reserve (Fed) rate cut in September. Federal Reserve (Fed) Chair Jerome Powell noted that he is becoming more hopeful about the progress on inflation in recent months. Meanwhile, Fed Governor Christopher Waller stated that the time to lower the policy rate is drawing closer.
Daily Digest Market Movers: Australian Dollar declines due to lower energy, metals prices
- Steel rebar futures dropped below CNY 3,250 ($447) per tonne, reaching their lowest level in over seven years. China's economy grew less than anticipated in the second quarter. June saw the steepest decline in home prices in nine years, highlighting the severity of the crisis in the country's real estate sector.
- The People’s Bank of China (PBoC) has cut one- and five-year loan prime rates by ten basis points to 3.35% and 3.85%, respectively. Any change in the Chinese economy could impact the Australian markets as both countries are close trade partners.
- China's $715 billion hedge fund industry braces for increased pressure as new regulations take effect next month. These stricter guidelines will require funds to meet higher asset thresholds and more stringent rules for investments and marketing. As a result, some investment firms are now seeking additional capital, according to a Reuters report.
- US President Joe Biden abandoned his re-election bid on Sunday under growing pressure from his fellow Democrats and endorsed Vice President Kamala Harris as the party's candidate to face Republican Donald Trump in the November election, according to Reuters.
- Federal Reserve Bank of New York President John Williams stated on Friday that the long-term trends that caused declines in neutral interest rates before the pandemic continue to prevail. Williams noted, "My own Holston-Laubach-Williams estimates for r-star in the United States, Canada, and the Euro area are about the same level as they were before the pandemic," according to Bloomberg.
- Australian Bureau of Statistics on Thursday showed that Employment Change increased by 50,200 in June from May, surpassing market forecasts of 20,000, data showed on Thursday.
- Reuters cited Sean Langcake, head of macroeconomic forecasting for Oxford Economics Australia, saying, "The current pace of employment growth suggests demand is resilient and cost pressures will remain. We think the RBA will stay the course and keep rates on hold, but August is certainly a live meeting."
- Fed Chair Powell stated last week that the three US inflation readings from this year "add somewhat to confidence" that inflation is on track to meet the Fed’s target sustainably, suggesting that a shift to interest rate cuts may be imminent.
Technical Analysis: Australian Dollar drops to near 0.6650
The Australian Dollar trades around 0.6650 on Friday. The daily chart analysis shows that the AUD/USD pair depreciates within a descending channel, signaling a bearish bias. Although the 14-day Relative Strength Index (RSI) is below the 50 level, suggesting a confidence of a bearish trend.
The AUD/USD pair might test the lower boundary of the descending channel around the 0.6630 level. A decline below this level could pressure the pair to navigate the throwback support around 0.6590.
The immediate resistance appears at the nine-day Exponential Moving Average (EMA) at 0.6693, followed by the psychological level of 0.6700. A breakthrough above the latter could lead the AUD/USD pair to test the upper boundary of the descending channel around the 0.6760 level, followed by a sixth-month high of 0.6798.
AUD/USD: Daily Char
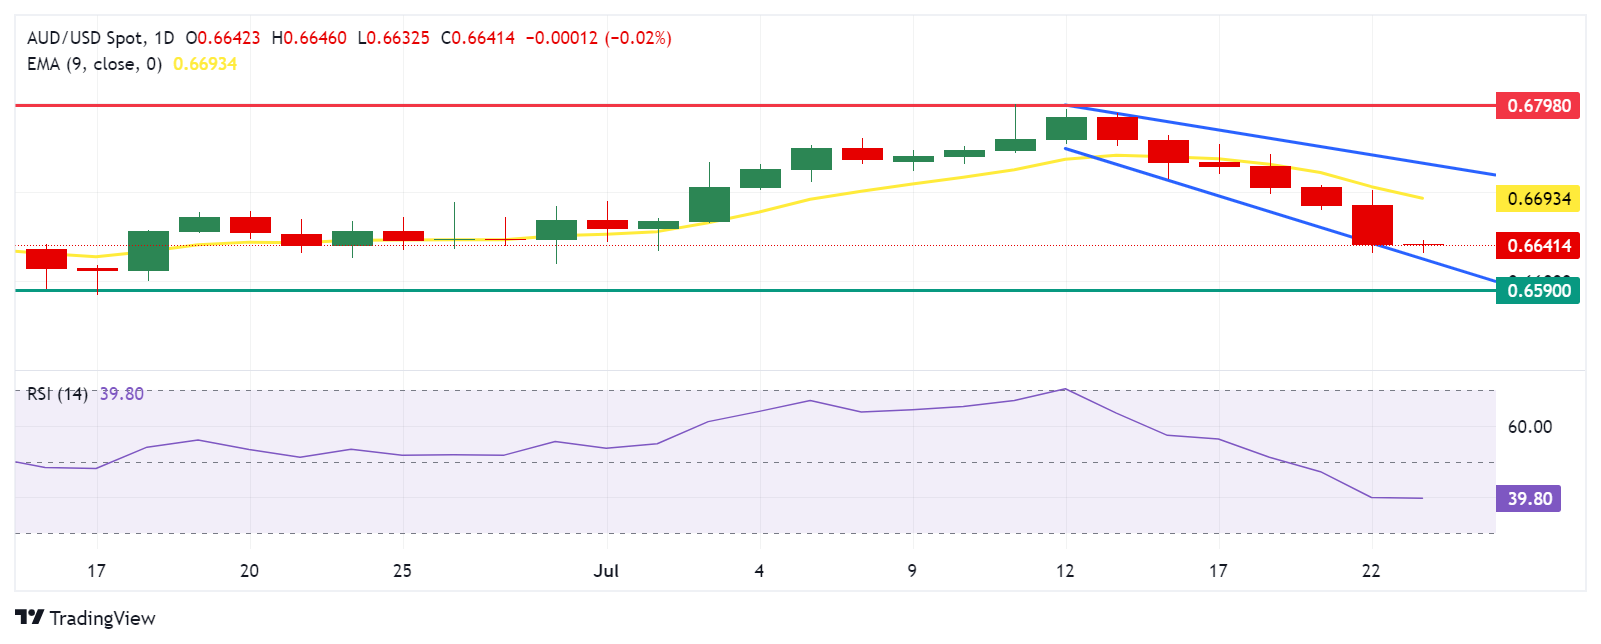
Australian Dollar PRICE Today
The table below shows the percentage change of Australian Dollar (AUD) against listed major currencies today. Australian Dollar was the weakest against the Japanese Yen.
| USD | EUR | GBP | JPY | CAD | AUD | NZD | CHF | |
|---|---|---|---|---|---|---|---|---|
| USD | 0.03% | 0.03% | -0.20% | 0.04% | 0.04% | 0.13% | 0.00% | |
| EUR | -0.03% | 0.00% | -0.20% | 0.00% | -0.00% | 0.09% | -0.03% | |
| GBP | -0.03% | -0.01% | -0.22% | 0.00% | 0.01% | 0.10% | -0.03% | |
| JPY | 0.20% | 0.20% | 0.22% | 0.25% | 0.23% | 0.31% | 0.18% | |
| CAD | -0.04% | -0.01% | -0.01% | -0.25% | -0.01% | 0.07% | -0.04% | |
| AUD | -0.04% | 0.00% | -0.01% | -0.23% | 0.00% | 0.08% | -0.05% | |
| NZD | -0.13% | -0.09% | -0.10% | -0.31% | -0.07% | -0.08% | -0.13% | |
| CHF | -0.01% | 0.03% | 0.03% | -0.18% | 0.04% | 0.05% | 0.13% |
The heat map shows percentage changes of major currencies against each other. The base currency is picked from the left column, while the quote currency is picked from the top row. For example, if you pick the Australian Dollar from the left column and move along the horizontal line to the US Dollar, the percentage change displayed in the box will represent AUD (base)/USD (quote).
Australian Dollar FAQs
One of the most significant factors for the Australian Dollar (AUD) is the level of interest rates set by the Reserve Bank of Australia (RBA). Because Australia is a resource-rich country another key driver is the price of its biggest export, Iron Ore. The health of the Chinese economy, its largest trading partner, is a factor, as well as inflation in Australia, its growth rate and Trade Balance. Market sentiment – whether investors are taking on more risky assets (risk-on) or seeking safe-havens (risk-off) – is also a factor, with risk-on positive for AUD.
The Reserve Bank of Australia (RBA) influences the Australian Dollar (AUD) by setting the level of interest rates that Australian banks can lend to each other. This influences the level of interest rates in the economy as a whole. The main goal of the RBA is to maintain a stable inflation rate of 2-3% by adjusting interest rates up or down. Relatively high interest rates compared to other major central banks support the AUD, and the opposite for relatively low. The RBA can also use quantitative easing and tightening to influence credit conditions, with the former AUD-negative and the latter AUD-positive.
China is Australia’s largest trading partner so the health of the Chinese economy is a major influence on the value of the Australian Dollar (AUD). When the Chinese economy is doing well it purchases more raw materials, goods and services from Australia, lifting demand for the AUD, and pushing up its value. The opposite is the case when the Chinese economy is not growing as fast as expected. Positive or negative surprises in Chinese growth data, therefore, often have a direct impact on the Australian Dollar and its pairs.
Iron Ore is Australia’s largest export, accounting for $118 billion a year according to data from 2021, with China as its primary destination. The price of Iron Ore, therefore, can be a driver of the Australian Dollar. Generally, if the price of Iron Ore rises, AUD also goes up, as aggregate demand for the currency increases. The opposite is the case if the price of Iron Ore falls. Higher Iron Ore prices also tend to result in a greater likelihood of a positive Trade Balance for Australia, which is also positive of the AUD.
The Trade Balance, which is the difference between what a country earns from its exports versus what it pays for its imports, is another factor that can influence the value of the Australian Dollar. If Australia produces highly sought after exports, then its currency will gain in value purely from the surplus demand created from foreign buyers seeking to purchase its exports versus what it spends to purchase imports. Therefore, a positive net Trade Balance strengthens the AUD, with the opposite effect if the Trade Balance is negative.
On Tuesday, the People’s Bank of China (PBOC) set the USD/CNY central rate for the trading session ahead at 7.1334, as against the previous day's fix of 7.1335 and 7.2746 Reuters estimates.
- NZD/USD trades on a softer note near 0.5975 in Tuesday’s early Asian session, down 0.10% on the day.
- The rising bets on RBNZ rate cuts and surprise rate cuts by the Chinese central bank weigh on the Kiwi.
- Fed officials said the time for a US rate cut is drawing closer.
The NZD/USD pair trades in negative territory for the fourth consecutive day around 0.5975 during the early Asian trading hours on Tuesday. The rising expectation that the Reserve Bank of New Zealand (RBNZ) will cut interest rates sooner than later drags the Kiwi lower against the US Dollar (USD).
The softer New Zealand’s Consumer Price Index (CPI) inflation in the second quarter (Q2) fuelled bets that the RBNZ will cut interest rates sooner than expected. This, in turn, weighs on the New Zealand Dollar (NZD) in the near term. The CPI inflation dropped to 0.4% QoQ in Q2 from 0.6% in Q1, while annualized CPI inflation came in at 3.3% YoY compared to the previous period's 4.0%.
Furthermore, surprise rate cuts by the People's Bank of China (PBoC) on Monday have undermined the China-proxy Kiwi as China is New Zealand's largest trade partner for both imports and exports. The Chinese central bank decided to cut the one-year and five-year Loan Prime Rate (LPR), benchmarks for the loans banks make to their customers, by 10 basis points (bps).
On the USD’s front, Federal Reserve (Fed) Chair Jerome Powell noted that he is becoming more hopeful about the progress on inflation in recent months. Meanwhile, Fed Governor Christopher Waller stated that the time to lower the policy rate is drawing closer. Traders are now pricing in the odds of a move at its July meeting less than 5% and pricing in a nearly full rate cut is firmly expected in September, according to the CME FedWatch Tool.
New Zealand Dollar FAQs
The New Zealand Dollar (NZD), also known as the Kiwi, is a well-known traded currency among investors. Its value is broadly determined by the health of the New Zealand economy and the country’s central bank policy. Still, there are some unique particularities that also can make NZD move. The performance of the Chinese economy tends to move the Kiwi because China is New Zealand’s biggest trading partner. Bad news for the Chinese economy likely means less New Zealand exports to the country, hitting the economy and thus its currency. Another factor moving NZD is dairy prices as the dairy industry is New Zealand’s main export. High dairy prices boost export income, contributing positively to the economy and thus to the NZD.
The Reserve Bank of New Zealand (RBNZ) aims to achieve and maintain an inflation rate between 1% and 3% over the medium term, with a focus to keep it near the 2% mid-point. To this end, the bank sets an appropriate level of interest rates. When inflation is too high, the RBNZ will increase interest rates to cool the economy, but the move will also make bond yields higher, increasing investors’ appeal to invest in the country and thus boosting NZD. On the contrary, lower interest rates tend to weaken NZD. The so-called rate differential, or how rates in New Zealand are or are expected to be compared to the ones set by the US Federal Reserve, can also play a key role in moving the NZD/USD pair.
Macroeconomic data releases in New Zealand are key to assess the state of the economy and can impact the New Zealand Dollar’s (NZD) valuation. A strong economy, based on high economic growth, low unemployment and high confidence is good for NZD. High economic growth attracts foreign investment and may encourage the Reserve Bank of New Zealand to increase interest rates, if this economic strength comes together with elevated inflation. Conversely, if economic data is weak, NZD is likely to depreciate.
The New Zealand Dollar (NZD) tends to strengthen during risk-on periods, or when investors perceive that broader market risks are low and are optimistic about growth. This tends to lead to a more favorable outlook for commodities and so-called ‘commodity currencies’ such as the Kiwi. Conversely, NZD tends to weaken at times of market turbulence or economic uncertainty as investors tend to sell higher-risk assets and flee to the more-stable safe havens.
| Index | Change, points | Closed | Change, % |
|---|---|---|---|
| NIKKEI 225 | -464.79 | 39599 | -1.16 |
| Hang Seng | 218.2 | 17635.88 | 1.25 |
| KOSPI | -31.95 | 2763.51 | -1.14 |
| ASX 200 | -39.9 | 7931.7 | -0.5 |
| DAX | 235.14 | 18407.07 | 1.29 |
| CAC 40 | 87.5 | 7622.02 | 1.16 |
| Dow Jones | 127.91 | 40415.44 | 0.32 |
| S&P 500 | 59.41 | 5564.41 | 1.08 |
| NASDAQ Composite | 280.63 | 18007.57 | 1.58 |
| Pare | Closed | Change, % |
|---|---|---|
| AUDUSD | 0.6642 | -0.73 |
| EURJPY | 170.902 | -0.32 |
| EURUSD | 1.08891 | 0.02 |
| GBPJPY | 202.94 | -0.24 |
| GBPUSD | 1.29303 | 0.1 |
| NZDUSD | 0.59784 | -0.62 |
| USDCAD | 1.37556 | 0.27 |
| USDCHF | 0.88944 | 0.07 |
| USDJPY | 156.947 | -0.34 |
- WTI trades in negative territory for the fourth consecutive day $78.00 on Tuesday.
- Oil demand concerns continue to weigh on the WTI price.
- Morgan Stanley expects oil prices to drop to the mid-$70s in 2025 amid a surplus.
West Texas Intermediate (WTI), the US crude oil benchmark, is trading around $79.00 on Tuesday. WTI price edges lower to near lowest level in over a month amid oil demand concerns and rising stockpiles.
The US Federal Reserve (Fed) will hold a policy meeting on July 30-31, with no change in rate expected. However, market players see signs of a possible cut in September. The release of key US economic data this week could offer some hints about the interest rate path in the US. The US Gross Domestic Product (GDP) for the second quarter and the Personal Consumption Expenditures Price Index (PCE) data for June, will be released on Thursday and Friday, respectively. "If we get an indication of a rate cut, the Fed could be positive for risk-sensitive assets like oil," said UBS analyst Giovanni Staunovo.
On the other hand, demand concerns continue to undermine the WTI price. On Monday, the People’s Bank of China (PBOC) surprised markets by cutting the one-year and five-year Loan Prime Rate (LPR), benchmarks for the loans banks make to their customers, by 10 basis points (bps) to boost the economy. However, the Chinese interest rate cut failed to support WTI prices. "The Chinese interest rate cut has been too small to lift overall sentiment for crude oil," said UBS analyst Giovanni Staunovo.
Meanwhile, Morgan Stanley expects Oil prices to drop to the mid-$70s next year amid a surplus on the market from both OPEC+ and non-OPEC+ producer. Morgan Stanley forecasts OPEC and non-OPEC supply to increase by around 2.5 million barrels per day (bpd) in 2025, well outpacing demand growth.
WTI Oil FAQs
WTI Oil is a type of Crude Oil sold on international markets. The WTI stands for West Texas Intermediate, one of three major types including Brent and Dubai Crude. WTI is also referred to as “light” and “sweet” because of its relatively low gravity and sulfur content respectively. It is considered a high quality Oil that is easily refined. It is sourced in the United States and distributed via the Cushing hub, which is considered “The Pipeline Crossroads of the World”. It is a benchmark for the Oil market and WTI price is frequently quoted in the media.
Like all assets, supply and demand are the key drivers of WTI Oil price. As such, global growth can be a driver of increased demand and vice versa for weak global growth. Political instability, wars, and sanctions can disrupt supply and impact prices. The decisions of OPEC, a group of major Oil-producing countries, is another key driver of price. The value of the US Dollar influences the price of WTI Crude Oil, since Oil is predominantly traded in US Dollars, thus a weaker US Dollar can make Oil more affordable and vice versa.
The weekly Oil inventory reports published by the American Petroleum Institute (API) and the Energy Information Agency (EIA) impact the price of WTI Oil. Changes in inventories reflect fluctuating supply and demand. If the data shows a drop in inventories it can indicate increased demand, pushing up Oil price. Higher inventories can reflect increased supply, pushing down prices. API’s report is published every Tuesday and EIA’s the day after. Their results are usually similar, falling within 1% of each other 75% of the time. The EIA data is considered more reliable, since it is a government agency.
OPEC (Organization of the Petroleum Exporting Countries) is a group of 13 Oil-producing nations who collectively decide production quotas for member countries at twice-yearly meetings. Their decisions often impact WTI Oil prices. When OPEC decides to lower quotas, it can tighten supply, pushing up Oil prices. When OPEC increases production, it has the opposite effect. OPEC+ refers to an expanded group that includes ten extra non-OPEC members, the most notable of which is Russia.
- EUR/USD continued to drift near 1.0900 after a quiet start to the new trading week.
- The Euro is poised for a rebound after paring back gains against the US Dollar.
- Key data due later in the week, data-light sessions expected until then.
EUR/USD churned on Monday just below 1.0900 as the new trading week kicks things off on a notably light note. Meaningful data remains limited for the first half of the trading week, leaving Fiber traders to shuffle in place as investors await Wednesday’s key Purchasing Managers Index (PMI) figures for both the EU and the US.
Forex Today: Key US data prompt some caution
Monday and Tuesday are set to keep things roughly on-balance as markets await a kickstart to the week’s meaningful economic data calendar on Wednesday. On Tuesday, mid-tier US Existing Home Sales Change for June will be released. EUR/USD traders will be focusing on Wednesday’s double-header of Purchasing Managers Index (PMI) data prints. The EU’s Manufacturing and Services PMI for July are expected to slightly increase, with MoM Services PMI numbers projected to be at 53.0 compared to the previous month’s 52.8.
On Wednesday, the US will release its own PMI data. Forecasting models predict that July’s US Services PMI will decrease to 54.4 from the previous 55.3. Thursday will continue with high-impact US data trend, featuring annualized Gross Domestic Product (GDP) for the second quarter of 2024. The trading week will conclude with Friday’s US Personal Consumption Expenditure - Price Index (PCE) inflation, which will provide key US inflation data.
Euro PRICE This week
The table below shows the percentage change of Euro (EUR) against listed major currencies this week. Euro was the strongest against the Australian Dollar.
| USD | EUR | GBP | JPY | CAD | AUD | NZD | CHF | |
|---|---|---|---|---|---|---|---|---|
| USD | -0.06% | -0.14% | -0.31% | 0.32% | 0.69% | 0.64% | 0.20% | |
| EUR | 0.06% | -0.09% | -0.29% | 0.34% | 0.79% | 0.65% | 0.20% | |
| GBP | 0.14% | 0.09% | -0.30% | 0.42% | 0.89% | 0.72% | 0.27% | |
| JPY | 0.31% | 0.29% | 0.30% | 0.67% | 1.08% | 0.92% | 0.46% | |
| CAD | -0.32% | -0.34% | -0.42% | -0.67% | 0.46% | 0.32% | -0.12% | |
| AUD | -0.69% | -0.79% | -0.89% | -1.08% | -0.46% | -0.14% | -0.60% | |
| NZD | -0.64% | -0.65% | -0.72% | -0.92% | -0.32% | 0.14% | -0.41% | |
| CHF | -0.20% | -0.20% | -0.27% | -0.46% | 0.12% | 0.60% | 0.41% |
The heat map shows percentage changes of major currencies against each other. The base currency is picked from the left column, while the quote currency is picked from the top row. For example, if you pick the Euro from the left column and move along the horizontal line to the US Dollar, the percentage change displayed in the box will represent EUR (base)/USD (quote).
EUR/USD technical outlook
EUR/USD traded tightly with near-term technical levels on Monday, cycling just north of the 200-hour Exponential Moving Average (EMA) at 1.0882. The Fiber has pulled back from recent highs set just shy of 1.0950 as Greenback bidding eases further back but the top end remains close by.
Daily candlesticks are poised for an extended backslide as price action slips back into the range of a rough descending channel, and a continued bearish reversal could see bids set up to challenge the 200-day EMA at 1.0795.
EUR/USD hourly chart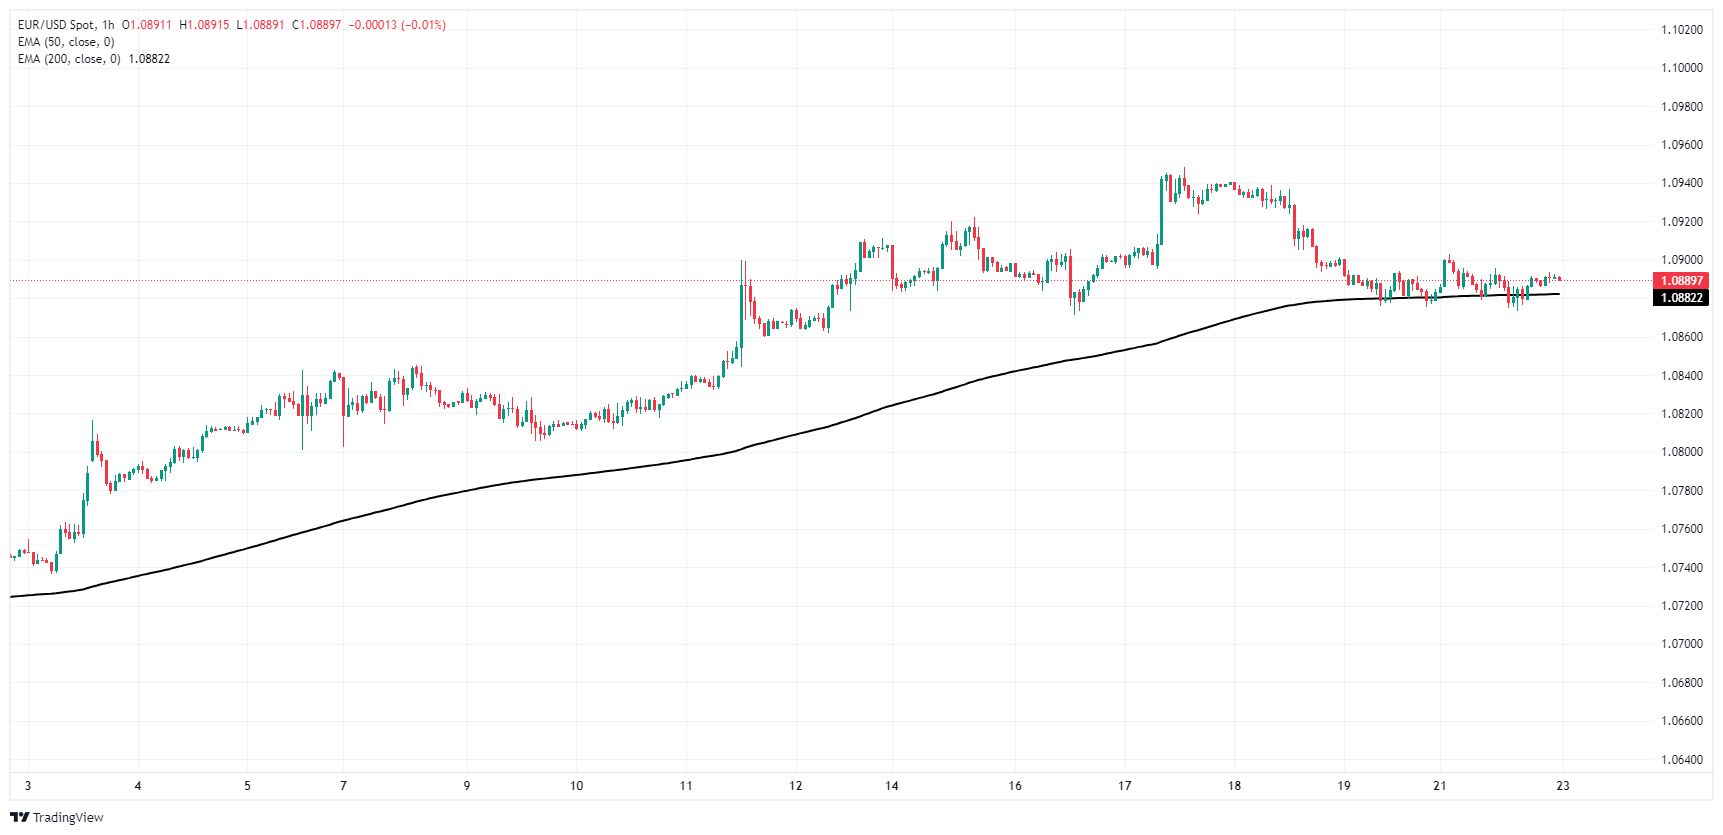
EUR/USD daily chart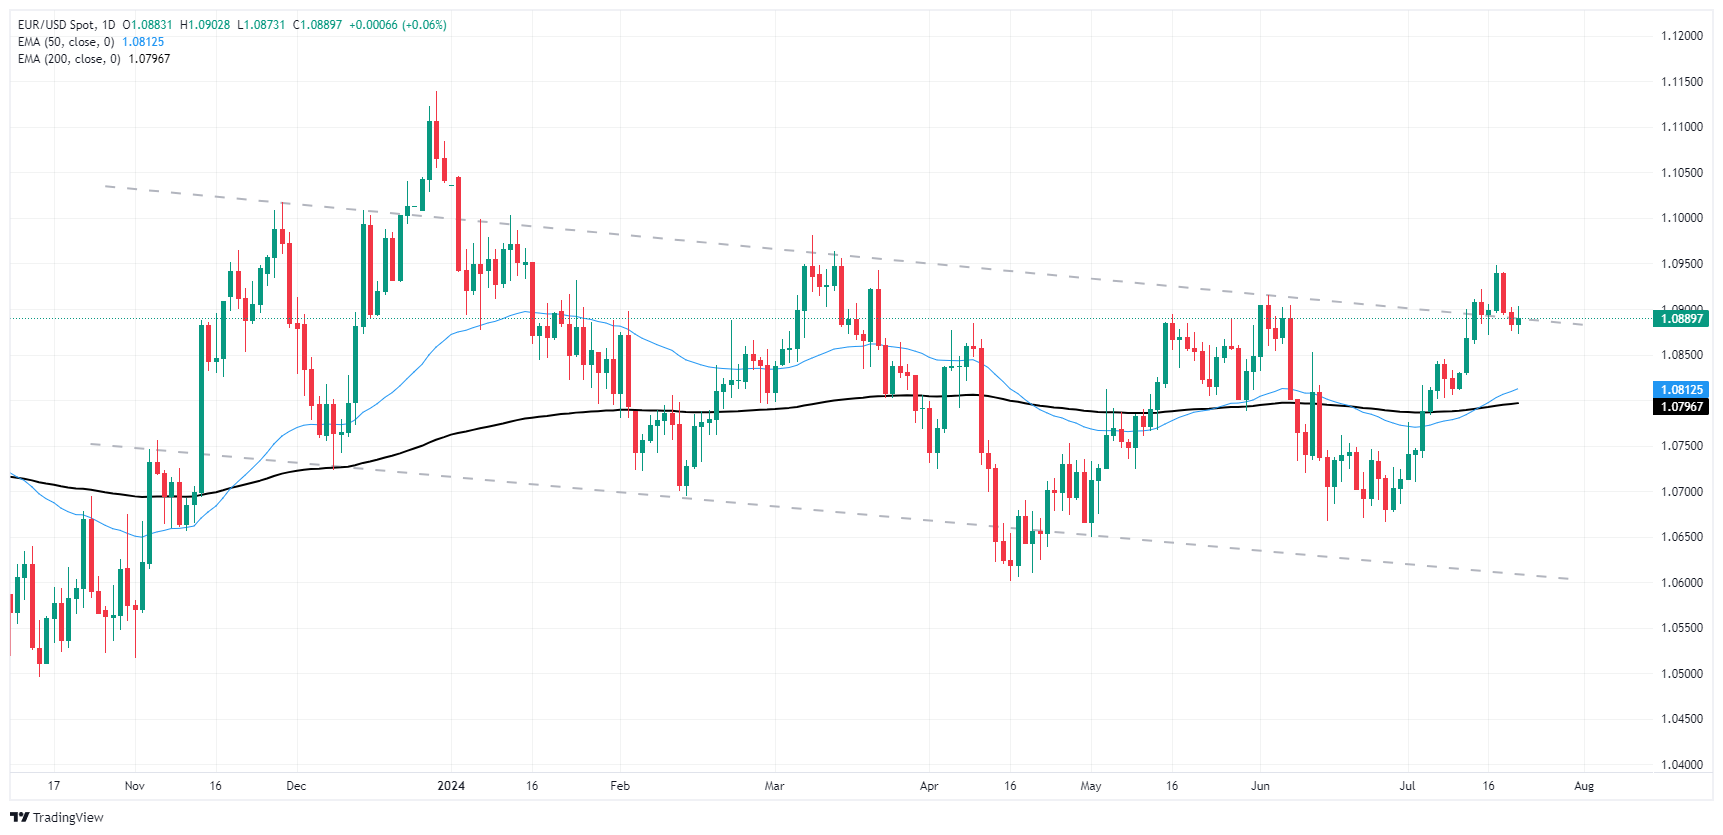
Euro FAQs
The Euro is the currency for the 20 European Union countries that belong to the Eurozone. It is the second most heavily traded currency in the world behind the US Dollar. In 2022, it accounted for 31% of all foreign exchange transactions, with an average daily turnover of over $2.2 trillion a day. EUR/USD is the most heavily traded currency pair in the world, accounting for an estimated 30% off all transactions, followed by EUR/JPY (4%), EUR/GBP (3%) and EUR/AUD (2%).
The European Central Bank (ECB) in Frankfurt, Germany, is the reserve bank for the Eurozone. The ECB sets interest rates and manages monetary policy. The ECB’s primary mandate is to maintain price stability, which means either controlling inflation or stimulating growth. Its primary tool is the raising or lowering of interest rates. Relatively high interest rates – or the expectation of higher rates – will usually benefit the Euro and vice versa. The ECB Governing Council makes monetary policy decisions at meetings held eight times a year. Decisions are made by heads of the Eurozone national banks and six permanent members, including the President of the ECB, Christine Lagarde.
Eurozone inflation data, measured by the Harmonized Index of Consumer Prices (HICP), is an important econometric for the Euro. If inflation rises more than expected, especially if above the ECB’s 2% target, it obliges the ECB to raise interest rates to bring it back under control. Relatively high interest rates compared to its counterparts will usually benefit the Euro, as it makes the region more attractive as a place for global investors to park their money.
Data releases gauge the health of the economy and can impact on the Euro. Indicators such as GDP, Manufacturing and Services PMIs, employment, and consumer sentiment surveys can all influence the direction of the single currency. A strong economy is good for the Euro. Not only does it attract more foreign investment but it may encourage the ECB to put up interest rates, which will directly strengthen the Euro. Otherwise, if economic data is weak, the Euro is likely to fall. Economic data for the four largest economies in the euro area (Germany, France, Italy and Spain) are especially significant, as they account for 75% of the Eurozone’s economy.
Another significant data release for the Euro is the Trade Balance. This indicator measures the difference between what a country earns from its exports and what it spends on imports over a given period. If a country produces highly sought after exports then its currency will gain in value purely from the extra demand created from foreign buyers seeking to purchase these goods. Therefore, a positive net Trade Balance strengthens a currency and vice versa for a negative balance.


© 2000-2026. All rights reserved.
This site is managed by Teletrade D.J. LLC 2351 LLC 2022 (Euro House, Richmond Hill Road, Kingstown, VC0100, St. Vincent and the Grenadines).
The information on this website is for informational purposes only and does not constitute any investment advice.
The company does not serve or provide services to customers who are residents of the US, Canada, Iran, The Democratic People's Republic of Korea, Yemen and FATF blacklisted countries.
Making transactions on financial markets with marginal financial instruments opens up wide possibilities and allows investors who are willing to take risks to earn high profits, carrying a potentially high risk of losses at the same time. Therefore you should responsibly approach the issue of choosing the appropriate investment strategy, taking the available resources into account, before starting trading.
Use of the information: full or partial use of materials from this website must always be referenced to TeleTrade as the source of information. Use of the materials on the Internet must be accompanied by a hyperlink to teletrade.org. Automatic import of materials and information from this website is prohibited.
Please contact our PR department if you have any questions or need assistance at pr@teletrade.global.
transfers