- Analytics
- News and Tools
- Market News
CFD Markets News and Forecasts — 23-02-2023
- GBP/USD observe bids around 1.2000, however, the downside looks imminent amid geopolitical tensions.
- The USD Index could be fueled for more gains if US PCE inflation delivers signs of recovery.
- BoE Mann has favored further policy tightening as she is worried about the extended persistence of inflation
The GBP/USD pair has sensed a buying interest around 1.2000 in the early Asian session. The Cable has shown a minor recovery despite the weak risk appetite of the market participants. The rebound move by the Pound Sterling should be considered a pullback move for now as the downside bias is still intact amid geopolitical tensions.
S&P500 futures have eased some gains as US President Joe Biden looks confident about an arms deal between China and Russia to support Moscow in its battle against Ukraine. The Biden administration is considering releasing intelligence it believes shows that China is weighing whether to supply weapons to support Russia’s war in Ukraine, as reported by Wall Street Journal. Earlier, US Secretary of State Antony Blinken warned, in an interview with CBS News, “China is seriously exploring supplying arms to Russia.”
Global equities could face severe pressure ahead as the central banks are not done with their policy tightening to contain the sticky inflation. Feb 10-22 Reuters poll of more than 150 strategists, analysts, and fund managers covering 17 global stock indices found 56% were expecting a correction in their local market in the next three months. Therefore, investors should brace for sheer volatility ahead.
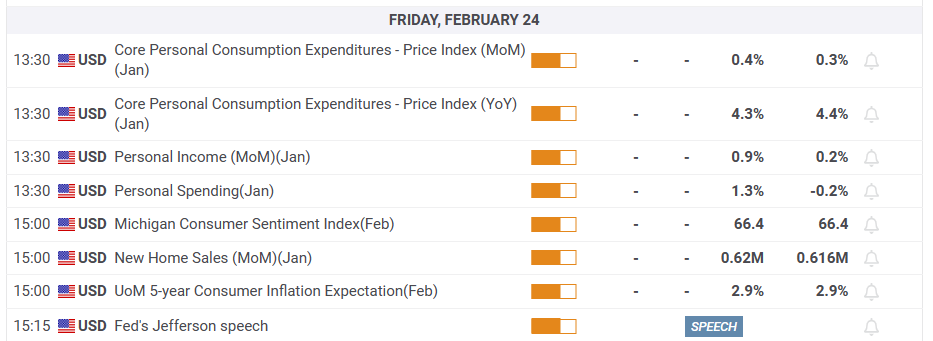
The US Dollar Index (DXY) has surrendered some of its gains and has dropped to near 104.20. The USD Index is likely to remain volatile ahead of the release of the United States Core Personal Consumption Expenditure (PCE) Price Index data. On an annual basis, the economic data is seen higher at 4.3% vs. the former release of 4.4%. The monthly data is expected to escalate by 0.4% against 0.3% released earlier. And, January Personal Spending is expected to increase by 1.3% against a contraction of 0.2%.
On the United Kingdom front, the commentary from Bank of England (BoE) policymaker Catherine Mann indicates that the central bank should not consider the rate peak for now as the inflation figure is still in double digits despite pushing rates to 4%. BoE policymaker is worried about the extended persistence of inflation and sees the need for more tightening and believes that a pivot is not imminent.
- US Dollar Index fades upside momentum after refreshing seven-week top.
- Strong US data amplifies hawkish Fed concerns but yields suggest the moves are already priced in.
- US Core PCE Price Index for January will be crucial for immediate directions, geopolitical headlines are also important to watch.
US Dollar Index (DXY) bulls struggle to keep the reins around mid-104.00s, following a run-up to refresh the seven-week high to 104.78 mark, as traders await the Federal Reserve’s (Fed) favorite inflation number on Friday.
Upbeat US data joined geopolitical fears emanating from China and Russia underpinned the US Dollar’s run-up to refresh multi-day high. However, a pullback in the US Treasury bond yields, mainly on concerns that the strong data are already priced in the latest hawkish Fed moves, as well as in the expectations for the near-future moves, seems to have probed the DXY bulls afterward.
That said, Thursday’s second reading of the US Gross Domestic Product Annualized, better known as Real GDP, eased to 2.7% for the fourth quarter (Q4) versus 2.9% first forecasts. However, the Personal Consumption Expenditure (PCE) Price and Core PCE for the said period rose to 3.7% and 4.3% QoQ versus 3.2% and 3.9% respective first estimations. Additionally, the Chicago Fed National Activity Index improved to 0.23 in January from -0.46 (revised), versus 0.03 analysts’ estimates. On the same line, Initial Jobless Claims also eased to 192K for the week ended on February 17 from 195K (revised) prior, compared to 200K expected.
Elsewhere, the US 10-year Treasury bond yields marked a two-day downtrend near 3.89%, following a run-up to refresh a three-month high.
It should be noted that the absence of a fresh boost to the hawkish Fed concerns, other than what’s already known to the markets, seemed to have triggered the latest DXY retreat, especially ahead of the key US inflation data.
On the same line could be the recently mixed headlines surrounding China. On Thursday, US Treasury Secretary Janet Yellen signaled that the US will resume discussions with China on economic issues 'at an appropriate time' whereas China’s Commerce Ministry urged the US to create good conditions for trade with China. The news managed to trigger the pair’s bounce off a multi-day low on Thursday. On the same line were statements from China’s commerce ministry spokesperson who said, the recovery momentum in the country’s consumer market was strong in January while also adding, “The government will take more measures to revive and expand consumption.”
Elsewhere, the latest headlines suggesting China’s readiness to supply combat drones to Russia and the US Senators’ push to halt Chinese carriers overflying Russia on US flights seem to renew the market fears and put a floor under the US Dollar Index.
Against this backdrop, S&P 500 Futures print mild losses despite Wall Street’s positive closing.
Moving ahead, geopolitical headlines and Japan’s return from holiday may entertain DXY traders ahead of the US Personal Consumption Expenditures (PCE) Price Index data for January. That said, The PCE Price Index is expected to have risen by 4.9% YoY in January, versus 5% prior. Further, the more relevant Core PCE Price Index, known as Fed’s favorite inflation gauge, is likely eased to 4.3% YoY, compared 4.4% prior.
Also read: US PCE Inflation Preview: Can the US Dollar turn bullish for good?
Technical analysis
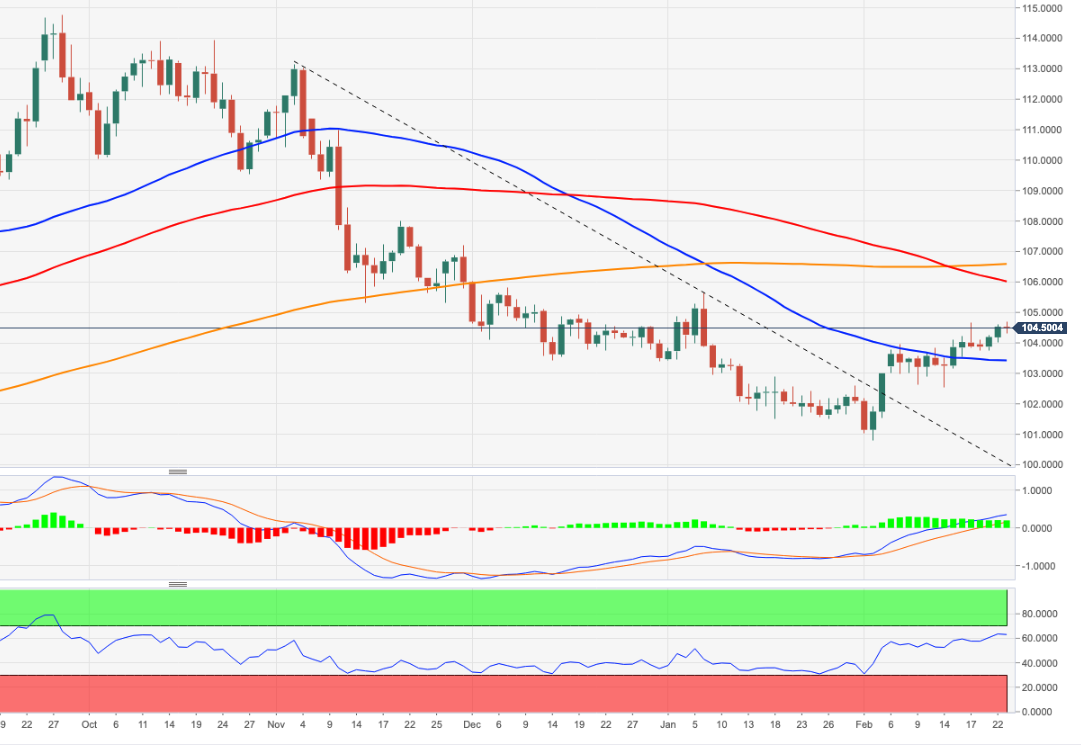
A convergence of the 100-day Exponential Moving Average (EMA) and 200-EMA, around 104.85-90 at the latest, appears a tough nut to crack for the US Dollar Index (DXY) bulls. The pullback moves, however, remain elusive unless breaking a three-week-old support line, close to 104.30 by the press time.
- USD/JPY is under pressure from a move to test key structure.
- The bears eye a break below 134.50 for the day ahead.
USD/JPY is offered at the start of Friday ahead of a busy schedule that will include Kazuo Ueda as the new head of the Bank of Japan speaking in parliament on Friday and key US inflation data. Japan's Consumer Price Index has also been released today but has done little to through the bears off their tracks as they move into longs that have been building over several days.
USD/JPY daily chart
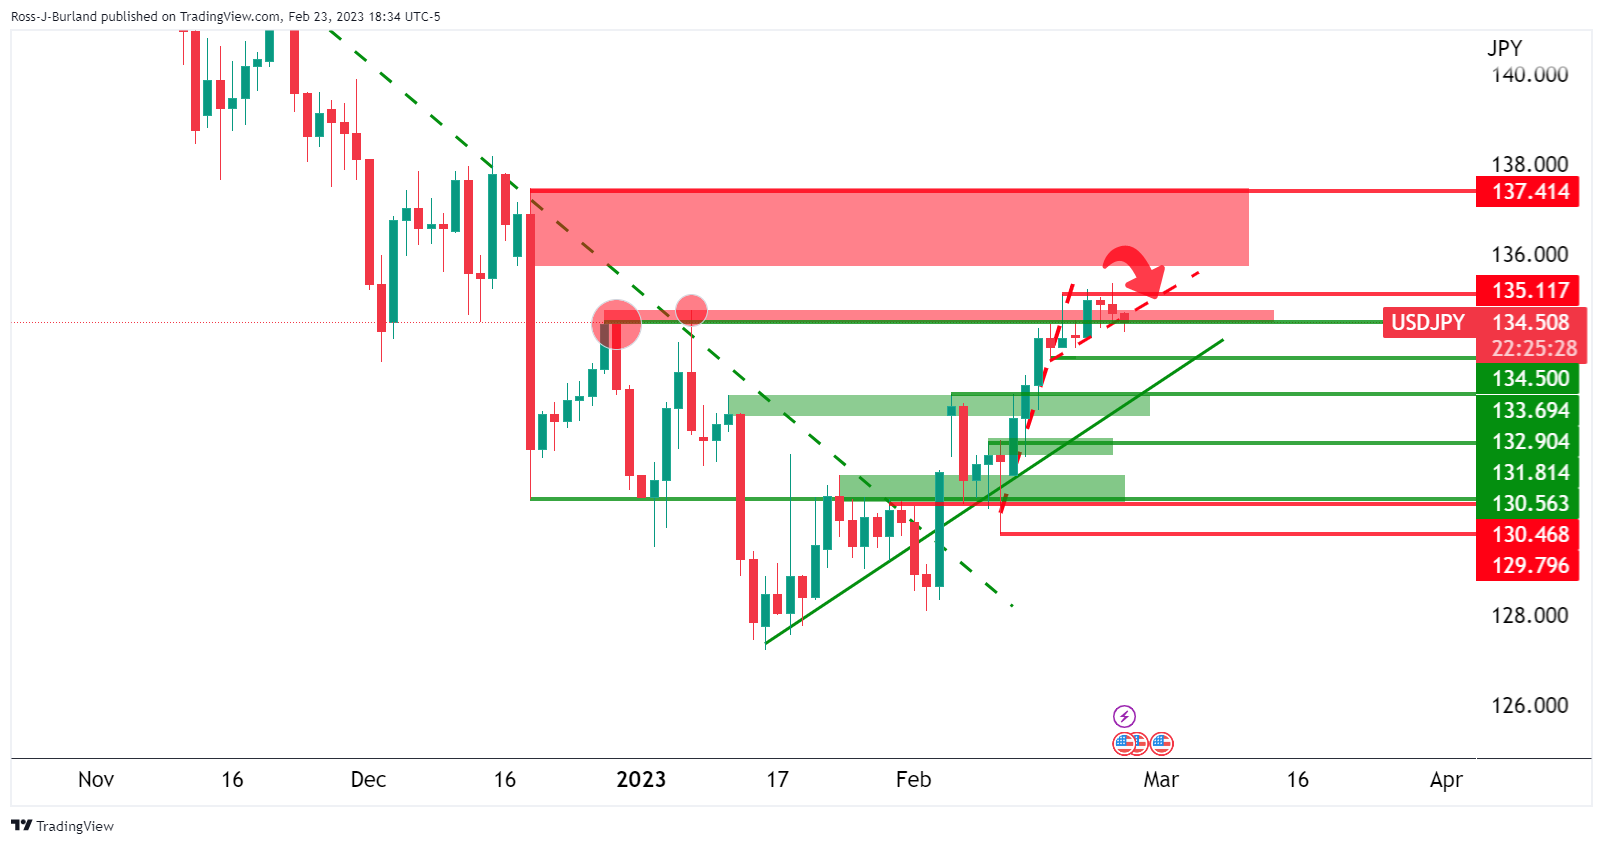
USD/JPY is being capped at what could be the top of an impressive run of late that has lasted over the course of 2023 so far. On a break of 134.50, the bears will be keen on a test to 133.70 and will then eye 132.90.
USD/JPY H1 chart
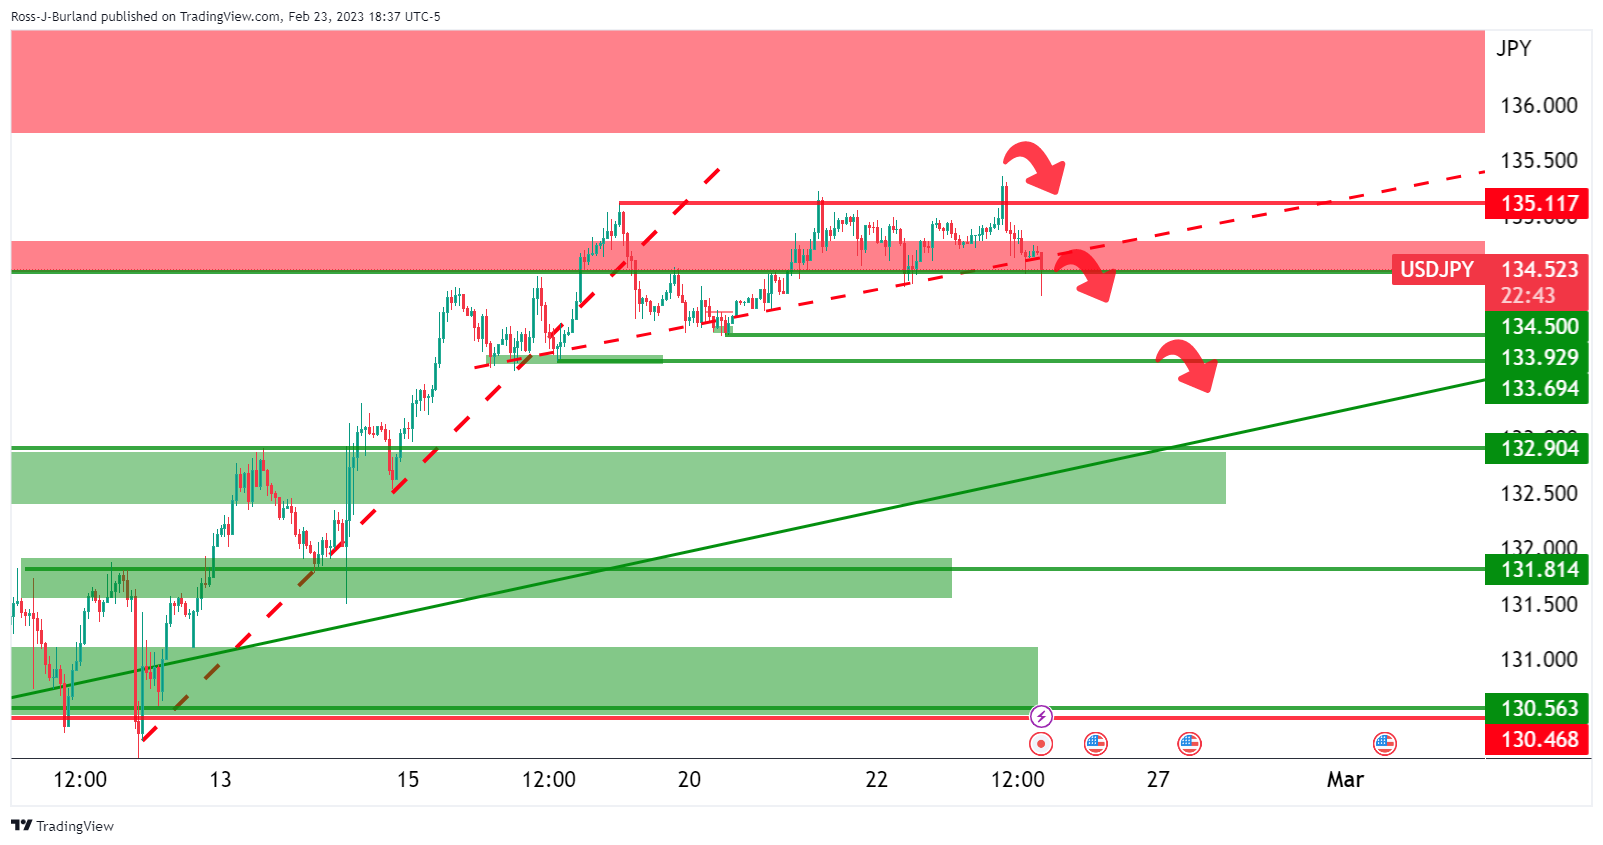
From an hourly perspective, the price needs to get below the 134.50 structure to open 132.90 and 133.70 when it will be on the backside of the micro bullish dynamic trendline. A long squeeze will then be in play and risks of the bull's capitulation on the cards also.
A Reuters poll shows that nearly half of the Japanese firms say that new leadership at the central bank should revise its negative interest rate policies, while more than a quarter say its price target should be changed.
Meanwhile, Kazuo Ueda is the new head of the Bank of Japan and he will be speaking in parliament on Friday and Monday. Traders will be watchful of what he says with regard to the central bank's monetary easing.
We also have Japan’s headline Consumer Price Index which is expected to rise to 4.3% for the year in January from 4.0%. These data expectations are of course well above the BoJ’s 2% target.
Meanwhile, USD/JPY is trading lower by some 0.18% and offered ahead of the above events, moving into a build up of lonmgs from the last number of days.
- Silver price holds lower ground near one-week bottom, down for the third consecutive day.
- Three-month-old ascending trend line, 200-DMA to join nearly oversold RSI to challenge XAG/USD bears.
- Buyers remain off the table unless crossing 100-DMA.
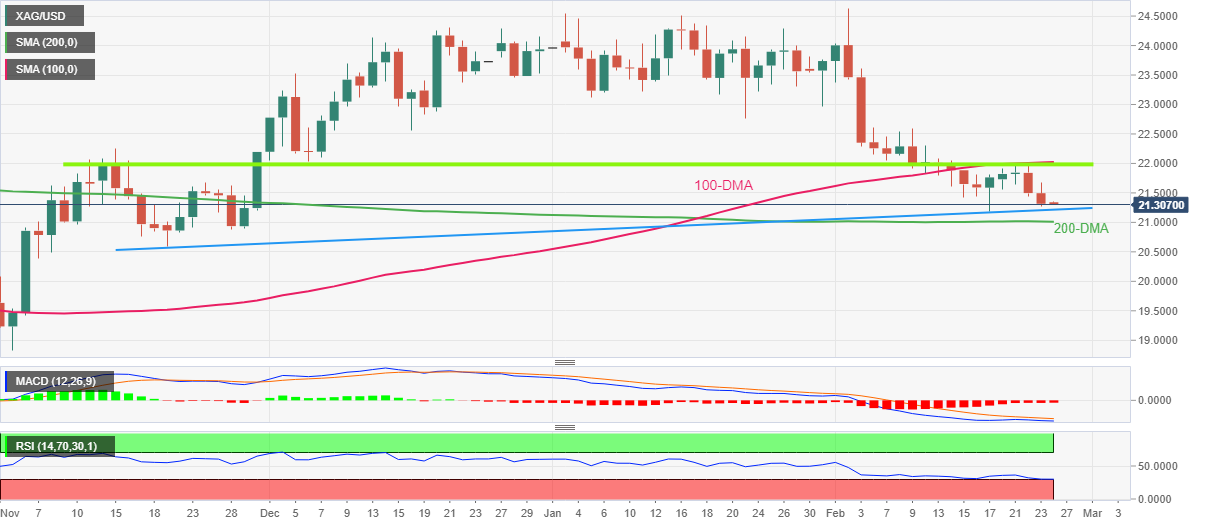
Silver price (XAG/USD) remains on the back foot at the weekly low near $21.30 during early Friday in Asia. In doing so, the bright metal drops for the third consecutive day while extending the early-week pullback from the 100-DMA and a 3.5-month-old horizontal resistance area.
It’s worth noting that the bearish MACD signals keep the XAG/USD sellers hopeful. However, the RSI (14) appears oversold and suggests a pause in the metal’s south run.
As a result, an upward-sloping support line from late November, close to $21.20 by the press time, as well as the 200-DMA level of around $21.00, gain major attention.
Following that, the late November swing low of around $20.60-55 could act as the last defense of the Silver buyers before directing the commodity price towards November 2022 bottom near $18.80.
Meanwhile, recovery moves may initially aim for the $21.50 before jostling with the aforementioned horizontal resistance area and the 100-DMA surrounding $22.00-05.
In a case where the Silver price offers a daily closing beyond $22.05, February 09 high near $22.60 and the previous monthly low near $22.80 will be crucial to watch for the XAG/USD bulls.
Silver price: Daily chart
Trend: Limited downside expected
- GBP/JPY slid below crucial daily EMAs, namely the 200 and the 100-day EMAs.
- The GBP/JPY must crack the 161.00 figure for a bearish continuation.
- On the other hand, GBP/JPY buyers reclaiming 162.00 could pave the way for further upside.
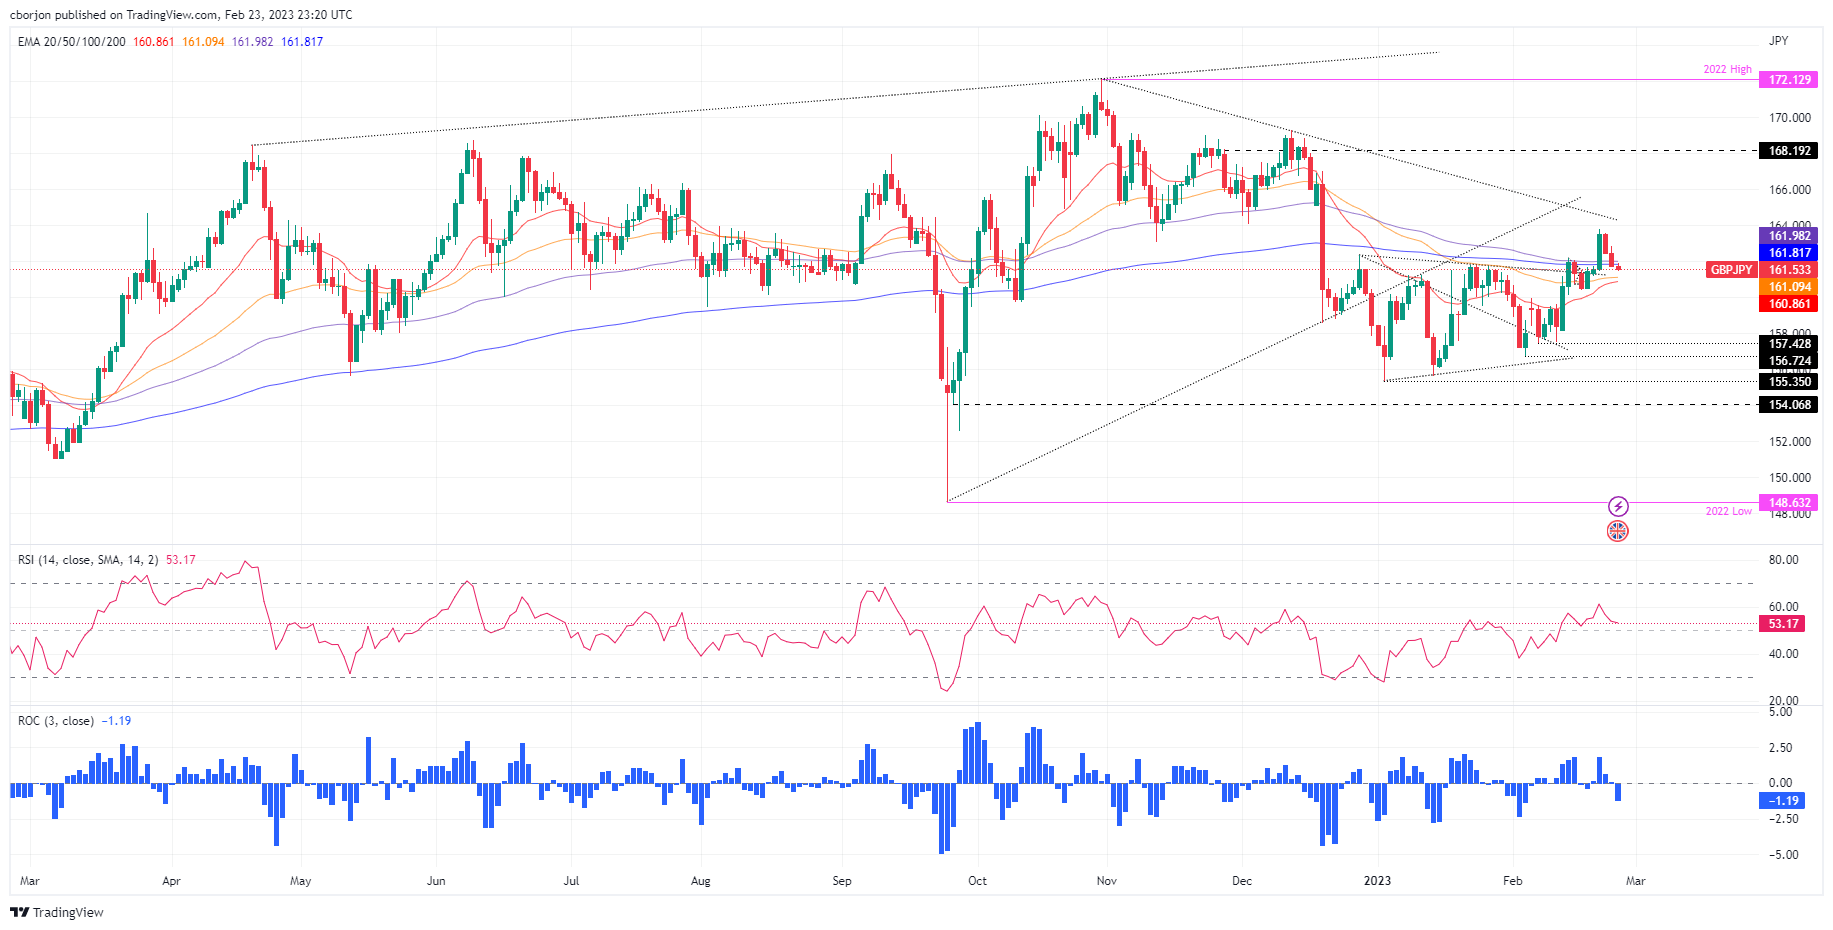
The GBP/JPY registers minuscule gains as Friday’s Asian session begins after tumbling below the 200 and 100-day Exponential Moving Averages (EMAs), at 161.82 and 161.98, respectively. After forming a dark cloud cover and missing to hold to 162.00, the GBP/JPY is trading at around 161.70.
GBP/JPY Thursday’s price action changed the pair’s bias as sellers reclaimed solid support areas, which turned to resistance. Although the Relative Strength Index (RSI) is in bullish territory, its slope aims downwards, suggesting that sellers are gaining momentum. Still, the Rate of Change (RoC) suggests the opposite, that buyers are moving in. Therefore, the GBP/JPY bias is neutral.
For a GBP/JPY bearish continuation, traders must drag prices toward the 50-day EMA at 161.10. Once cleared, the GBP/JPY might test the 20-day EMA at 160.87 before dropping to the 160.00 figure.
As an alternate scenario, if the GBP/JPY reclaims 162.30, that could open the door for further upside. Hence, the GBP/JPY first resistance would be the February 23 daily high at 162.85. The next stop would be the weekly high at 163.75 before testing a major five-month-old downslope trendline that passes around.
GBP/JPY Daily chart
GBP/JPY Key technical levels
- USD/CAD is meeting resistance leaving the 38.2% Fibonacci retracement level towards 1.3500 exposed.
- US data will yet again be front and centre to end the week.
The US Dollar was bolstered by yet further evidence of an inflationary theme in the US economy with the strong economic data that continues to suggest the US Federal Reserve's monetary policy tightening could be extended if it is to bring down the highest inflation in decades. The number of Americans filing new claims for unemployment benefits unexpectedly fell last week, showing a still-tight labor market and a resilient US economy.
Meanwhile, the second estimate of US Q4 Gross Domestic Product being revised down 0.2% to 2.7% saar. The downward revision was driven by weakness in private consumption which was reported at 1.4% vs 2.1% in the preliminary estimate. The GDP deflator rose 4.3%, up from 3.9% in the previous estimate. The personal savings rate was revised to 3.9%, up 0.5pts.
Speaking of deflators, Friday's PCE deflator will be a key red news event. Ahead of the event, the Fed funds futures traders are now pricing for the federal funds rate to reach 5.34% in July, and staying above 5% all year. That rate is currently between 4.50%-4.75% range.
''The market is expecting the January headline data to remain at 5.0% YoY, in line with the previous month,'' analysts at Rabobank said. ''This would strengthen concerns that the downtrend in inflationary indicators may have stalled. Data in line with market expectations would thus add further weight to the view that the Fed will have to work harder to push inflation back to its target level. Currently implied market rates are pointing to a peak in Fed funds close to 5.33%.''
USD/CAD technical analysis
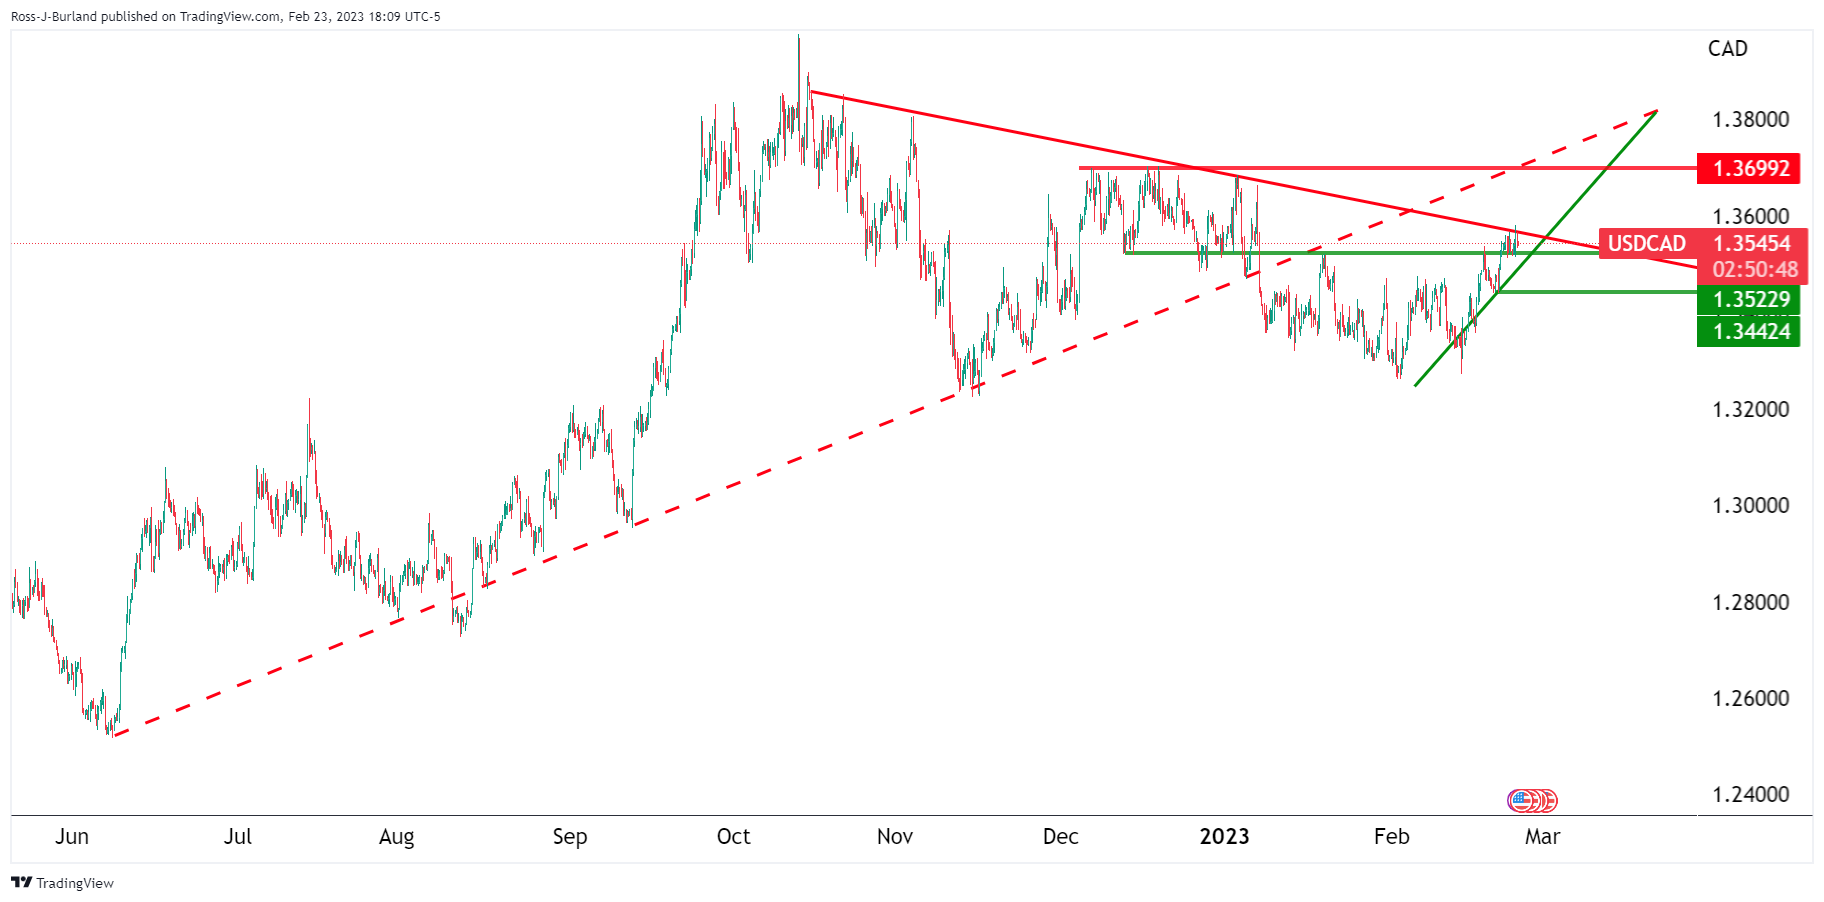
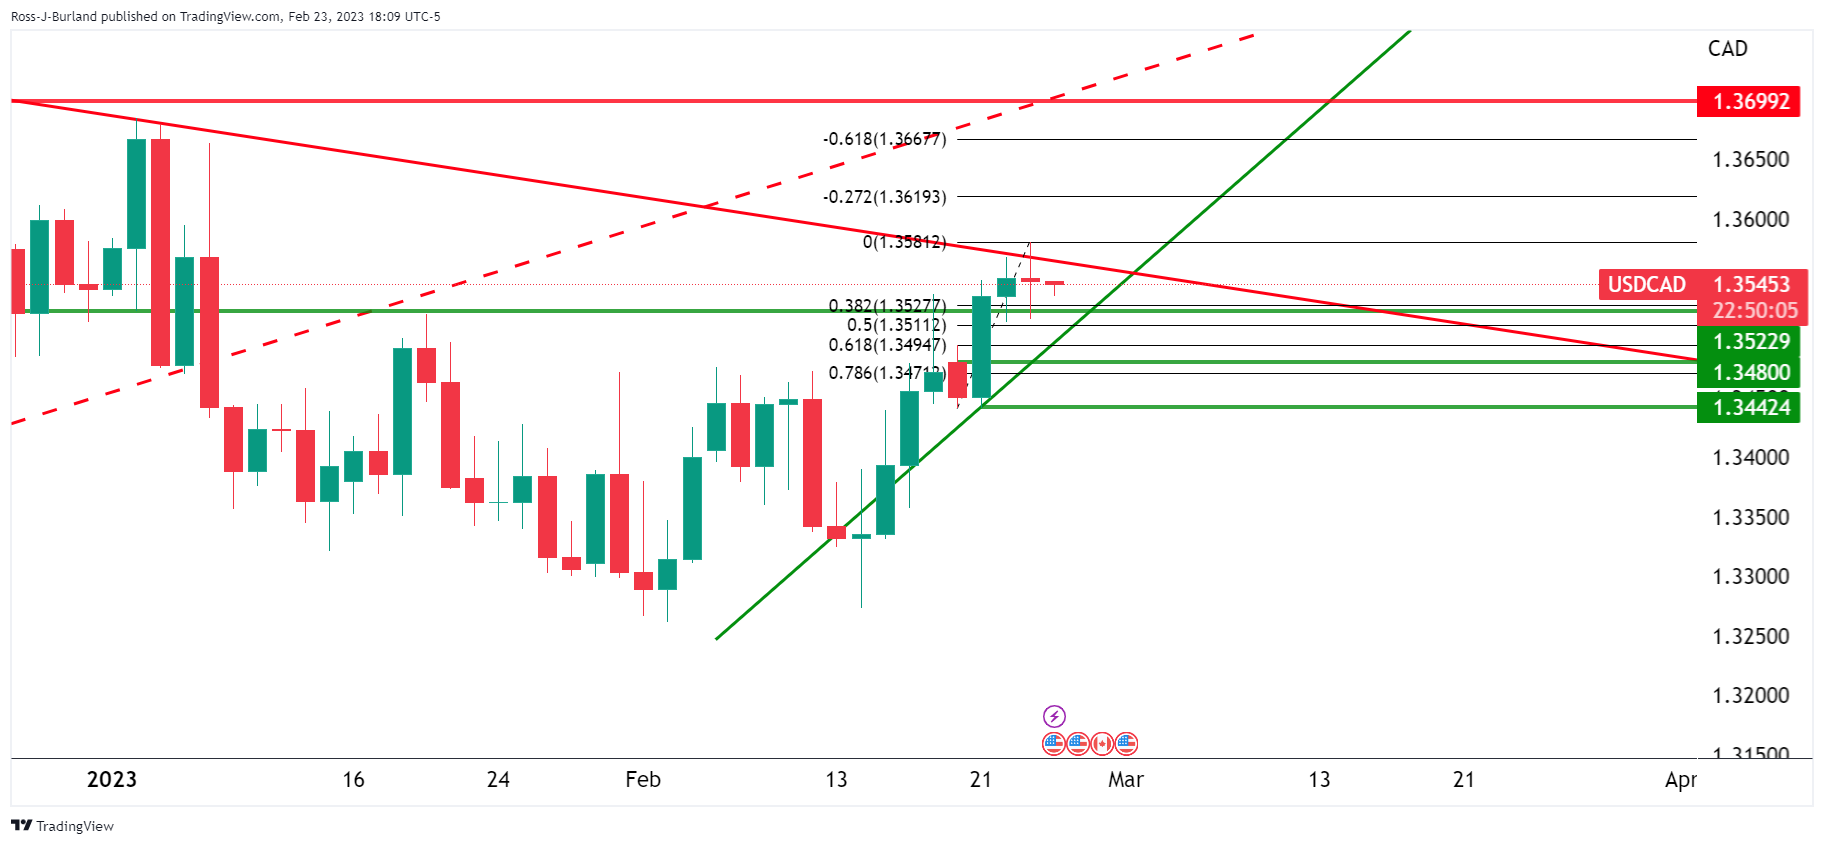
The above charts outline the boundaries for the price in USD/CAD that arrives with a meanwhile bearish bias as the bulls meet resistance following a burst to the upside on US Dollar strength. The bears eye a 38.2% Fibonacci retracement level towards 1.35 the figure for the day ahead.
- WTI has extended its recovery above $75.50 as Russia sets to deepen supply cuts.
- Investors have started ignoring the impact of the huge oil inventory build-up reported by the US EIA.
- Chinese government’s commitment to revive and expand consumption is also providing support to the oil price.
West Texas Intermediate (WTI), futures on NYMEX, have stretched their recovery above $75.50 in the early Tokyo session. Earlier, the oil price displayed a sheer sell-off after the United States American Petroleum Institute (API) announced a huge build-up of oil inventories for the week ending February 17.
Now, the higher build-up of oil stockpiles has been confirmed by the US Energy Information Administration (EIA) at 7.6 million barrels.
However, the oil price has ignored the oil building and has started rising as Russia is expected to deepen oil supply cuts in retaliation to sanctions from Western allies. To restrict funding for arms and ammunition in the battle against Ukraine, Western allies are continuously tightening the price cap on oil provided by Moscow in the international market. This has forced the Kremlin to deepen supply cuts, which might take off the oil price due to a supply glitch.
Russia is considering an oil supply cut at its western ports by up to 25% from March that exceeds its former 500,000 barrels oil supply cut announcement.
Apart from that, an assurance of a demand recovery from China’s commerce ministry has infused fresh blood into the oil bulls. A Chinese commerce ministry spokesperson said at a news conference on Thursday, the recovery momentum in the country’s consumer market was strong in January. He further added, “The government will take more measures to revive and expand consumption.”
Meanwhile, the rising appeal for the US Dollar could spoil the oil bulls’ party. The US Dollar Index (DXY) has shifted its business comfortably above 104.00 as the Federal Reserve (Fed) is dedicated to bringing United States inflation to normalcy by reaching the terminal rate in no time. The expectations of a continuation of policy tightening are supporting the USD Index.
The unfortunate geopolitical tension between Russia and Ukraine has completed one year. The geopolitical issue recently became more vital and weighed on the market sentiment with the participation of the US and China being aggressive, actually in the adverse directions.
That said, Germany’s Der Spiegel came out with the news suggesting, China is negotiating with Russia over supplying 100 Kamikaze combat drones by April.
On the other hand, US Senators pushed for limiting flights and carriers over Russian territory, per Reuters. “The chairman of the Senate Foreign Relations Committee and the committee’s top Republican urged the Biden administration to halt Chinese airlines and other non-American carriers from overflying Russia on US routes,” said the news.
Elsewhere, “Russia still deeply isolated at UN, one year into Ukraine war,” reported Reuters.
The news also said that the United Nations General Assembly overwhelmingly isolated Russia on Thursday, marking one year since Moscow invaded Ukraine by calling for a "comprehensive, just and lasting peace" and again demanding Russia withdraw its troops and stop fighting.
Market implications
The news underpins the US Dollar’s strength amid a risk-off mood, even as the yields allowed Wall Street to close with mild gains.
Also read: Forex Today: US data fueled market concerns ahead of PCE inflation figures
- USD/CHF is looking for recovery after a pullback move amid the risk-off impulse.
- S&P500 futures have ignored the risk-aversion theme amid the upbeat US economic outlook.
- Geopolitical tensions between the US and China have improved the US Dollar appeal.
The USD/CHF pair has corrected marginally to near 0.9330 after printing a fresh six-week high around 0.9350 in the early Asian session. The Swiss franc asset is expected to recover sooner as the risk profile is supporting the safe-haven assets. The US Dollar bulls seem in control as the Federal Reserve (Fed) policymakers are reiterating the requirement of more rates by the central bank to bring down inflation to the 2% target.
The US Dollar Index (DXY) has shown a pullback to near 104.15, however, the upside bias is still favored as rising hawkish Fed bets have dampened the market mood. Contrary to the risk-aversion theme, S&P500 futures displayed recovery as investors are focusing on upbeat demand, recovery in economic activities, and rising labor requirements rather than underpinning the risk associated with higher interest rate projections.
The context that investors have started digesting higher interest rates by the Fed has resulted in a decline in the demand for US government bonds. The yields provided on 10-year US Treasury bonds dropped to near 3.89%.
Meanwhile, geopolitical tensions between the United States and China have improved the US Dollar appeal. US Treasury Secretary Janet Yellen cited on Thursday “Communication between US and China is important for the rest of the world. And, the US will resume discussions with China on economic issues 'at an appropriate time'.
For further guidance, US Core Personal Consumption Expenditure (PCE) Price Index and Personal Spending will be keenly watched. On an annual basis, the economic data is seen higher at 4.3% vs. the former release of 4.4%. The monthly data is expected to escalate by 0.4% against 0.3% released earlier. And, January Personal Spending is expected to increase by 1.3% against a contraction of 0.2%. A recovery in personal spending will accelerate the chances of more rates by the Fed.
On the Swiss Franc front, the rising Consumer Price Index (CPI) is creating troubles for the Swiss National Bank (SNB). Therefore, more rate hike announcements by SNB Chairman Thomas J. Jordan looks warranted to counter “increased inflationary pressure and a further spread of inflation”.
- EUR/USD remains depressed around seven-week low, fades late Thursday’s corrective bounce.
- Chatters that markets priced in higher rates seemed to have triggered rebound from multi-day low.
- Hawkish Fed concerns, geopolitical headlines keep Euro bears hopeful ahead of the key US Core PCE data.
EUR/USD holds lower ground near 1.0600, following a corrective bounce off multi-day bottom that ended up positing the four-day downtrend to early Friday morning in Asia. In doing so, the major currency pair justifies the broad US Dollar strength amid upbeat US data, as well as a pullback in the US Treasury bond yields ahead of the key US inflation clues.
That said, traders’ factoring in the multiple rate hikes seems to underpin the corrective pullback in the US Treasury bond yields and the US Dollar. “US Treasury yields slid in choppy trading on Thursday, with investors already factoring in strong economic data that has supported expectations of a few more interest rate hikes by the Federal Reserve this year,” said Reuters.
Alternatively, comments from US Treasury Secretary Janet Yellen signaled that the US will resume discussions with China on economic issues 'at an appropriate time' whereas China’s Commerce Ministry urged the US to create good conditions for trade with China. The news managed to trigger the pair’s bounce off a multi-day low on Thursday. On the same line were statements from China’s commerce ministry spokesperson who said, the recovery momentum in the country’s consumer market was strong in January while also adding, “The government will take more measures to revive and expand consumption.”
However, the latest headlines suggesting China’s readiness to supply combat drones to Russia and the US Senators’ push to halt Chinese carriers overflying Russia on US flights seem to renew the market fears and weigh on the AUD/USD prices.
Thursday’s US data dump signaled that the second reading of the Gross Domestic Product Annualized, better known as Real GDP, eased to 2.7% for the fourth quarter (Q4) versus 2.9% first forecasts. However, the Personal Consumption Expenditure (PCE) Price and Core PCE for the said period rose to 3.7% and 4.3% QoQ versus 3.2% and 3.9% respective first estimations. Additionally, the Chicago Fed National Activity Index improved to 0.23 in January from -0.46 (revised), versus 0.03 analysts’ estimates. On the same line, Initial Jobless Claims also eased to 192K for the week ended on February 17 from 195K (revised) prior, compared to 200K expected. Hence, the latest set of the US data has been following the upbeat economics released so far in February and has helped the US Dollar to remain firmer, after early Thursday’s retreat.
On the other hand, Eurozone Core Inflation refreshed a record high to 5.3% YoY for January, per the Core Harmonized Index of Consumer Prices measures, versus 5.2% expected and prior.
Against this backdrop, Wall Street closed mildly positive and the US Treasury bond yields retreat from the three-month high but the US Dollar Index (DXY) remains firm ahead of the key data.
Looking forward, a light calendar in the Asia-Pacific zone, as well as in Europe, highlights the US data for fresh impulse. As a result, the Personal Consumption Expenditures (PCE) Price Index will be the key, expected to have risen by 4.9% YoY in January, versus 5% prior. Further, the more relevant Core PCE Price Index, known as Fed’s favorite inflation gauge, is likely eased to 4.3% YoY, compared 4.4% prior.
Also read: US PCE Inflation Preview: Can the US Dollar turn bullish for good?
It should be noted that the second-tier German data will also be important to watch for extra directives.
Technical analysis
A convergence of the 100-day Exponential Moving Average (EMA) and an 11-week-old ascending support line, close to 1.0550 by the press time, appears a tough nut to crack for the EUR/USD bears.
- Gold price is exposed for further downside to near $1,800.00 amid hawkish Fed bets.
- The USD Index is showing signs of reversal as the Fed is expected to continue its policy tightening.
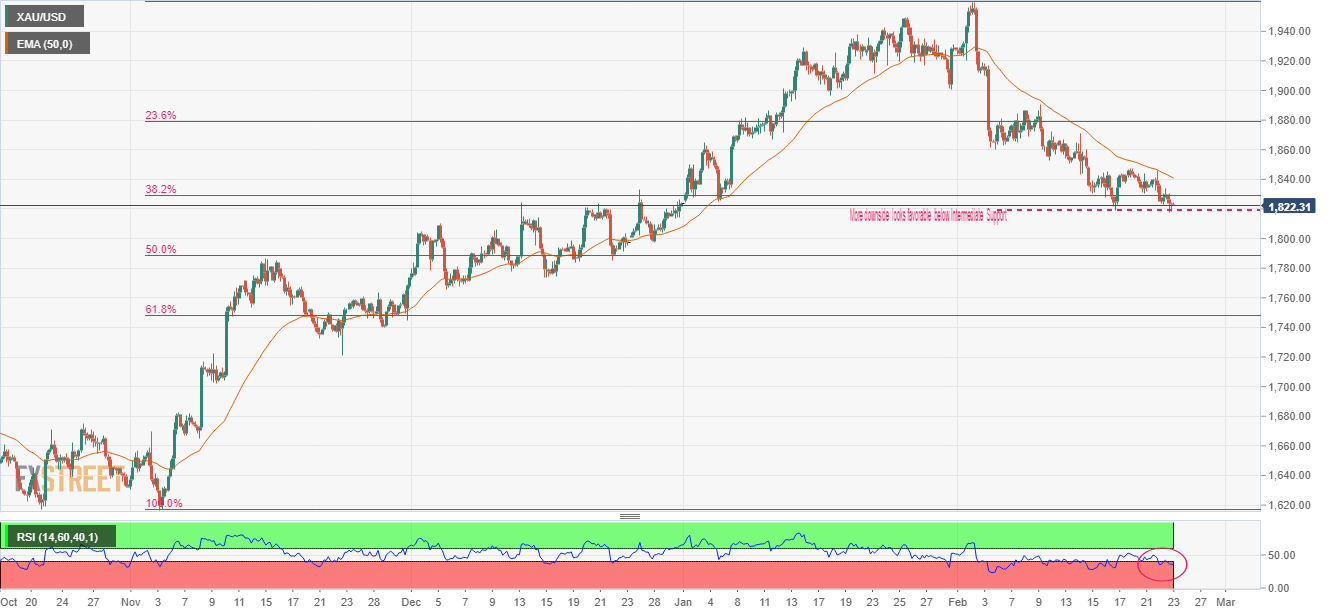
- Gold price has comfortably shifted below the 38.2% Fibonacci retracement at $1,829.45.
Gold price (XAU/USD) has printed a fresh seven-week low of $1,819.00 as the Federal Reserve (Fed) policymakers are favoring reaching the terminal rate as early as possible. The reason behind quickly accessing the terminal rate is the upbeat labor market in the United States, which could underpin the Consumer Price Index (CPI) sooner.
The US Dollar Index (DXY) is showing signs of reversal after a corrective move to near 104.15 as the Fed is expected to continue its policy tightening spell to achieve price stability. This has exposed the Gold price to continue its downside momentum to near the round-level support of $1.800.00.
S&P500 futures recovered on Thursday as investors believe that the US economy is not exposed to recession fears as the economic outlook is steady amid stellar retail demand and robust labor need. Contrary to that, the 10-year US Treasury yields dropped below 3.90%.
On Thursday, the number of people filing for jobless claims for the first time dropped to 192K vs. the consensus of 200K. This has signaled again that the labor market is extremely tight and consumer spending will remain robust ahead.
Economists at TD Securities expect 25 bps rate hikes in March and May, with the Fed settling on a terminal Fed funds target rate range of 5.00%-5.25% by May. And, Fed chair Jerome Powell will keep higher rates for a longer period.
Gold technical analysis
Gold price has comfortably shifted below the 38.2% Fibonacci retracement (placed from November 3 low at $1,616.69 to February 2 high at $1.959.71) at $1,829.45 on a four-hour scale. The precious metal is expected to display more weakness below the immediate support at $1,819.00.
The 50-period Exponential Moving Average (EMA) at $1,840.00 is acting as resistance for the Gold price.
Meanwhile, the Relative Strength Index (RSI) (14) has shifted into the bearish range of 20.00-40.00, which indicates more weakness ahead.
Gold four-hour chart
- EUR/JPY printed losses of 0.27% on Wednesday, but as the Asian session starts, it’s up 0.02%.
- Short term, the EUR/JPY peaked at around 144.00; hence further downside is expected before resuming the uptrend.
The EUR/JPY retraces after hitting a new weekly high at 144.16 on Tuesday but failed to hold to its earlier gains and dropped below 143.00, aiming toward the 20-day Exponential Moving Average (EMA) at 142.24. At the time of writing, the EUR/JPY exchange rate sits at 142.73, below its opening price by 0.22%, ahead of the Asian session beginning.
From a daily chart perspective, the EUR/JPY is still upward biased, even though the EUR/JPY has dived during the last couple of sessions and reached a weekly low of 142.56. Albeit the Relative Strength Index (RSI) aims downward, it still in bullish territory, suggesting that the shared currency could resume its uptrend. However, fundamental news could impact the overall uptrend of the EUR/JPY, and the pair might retreat on safe-haven flows.
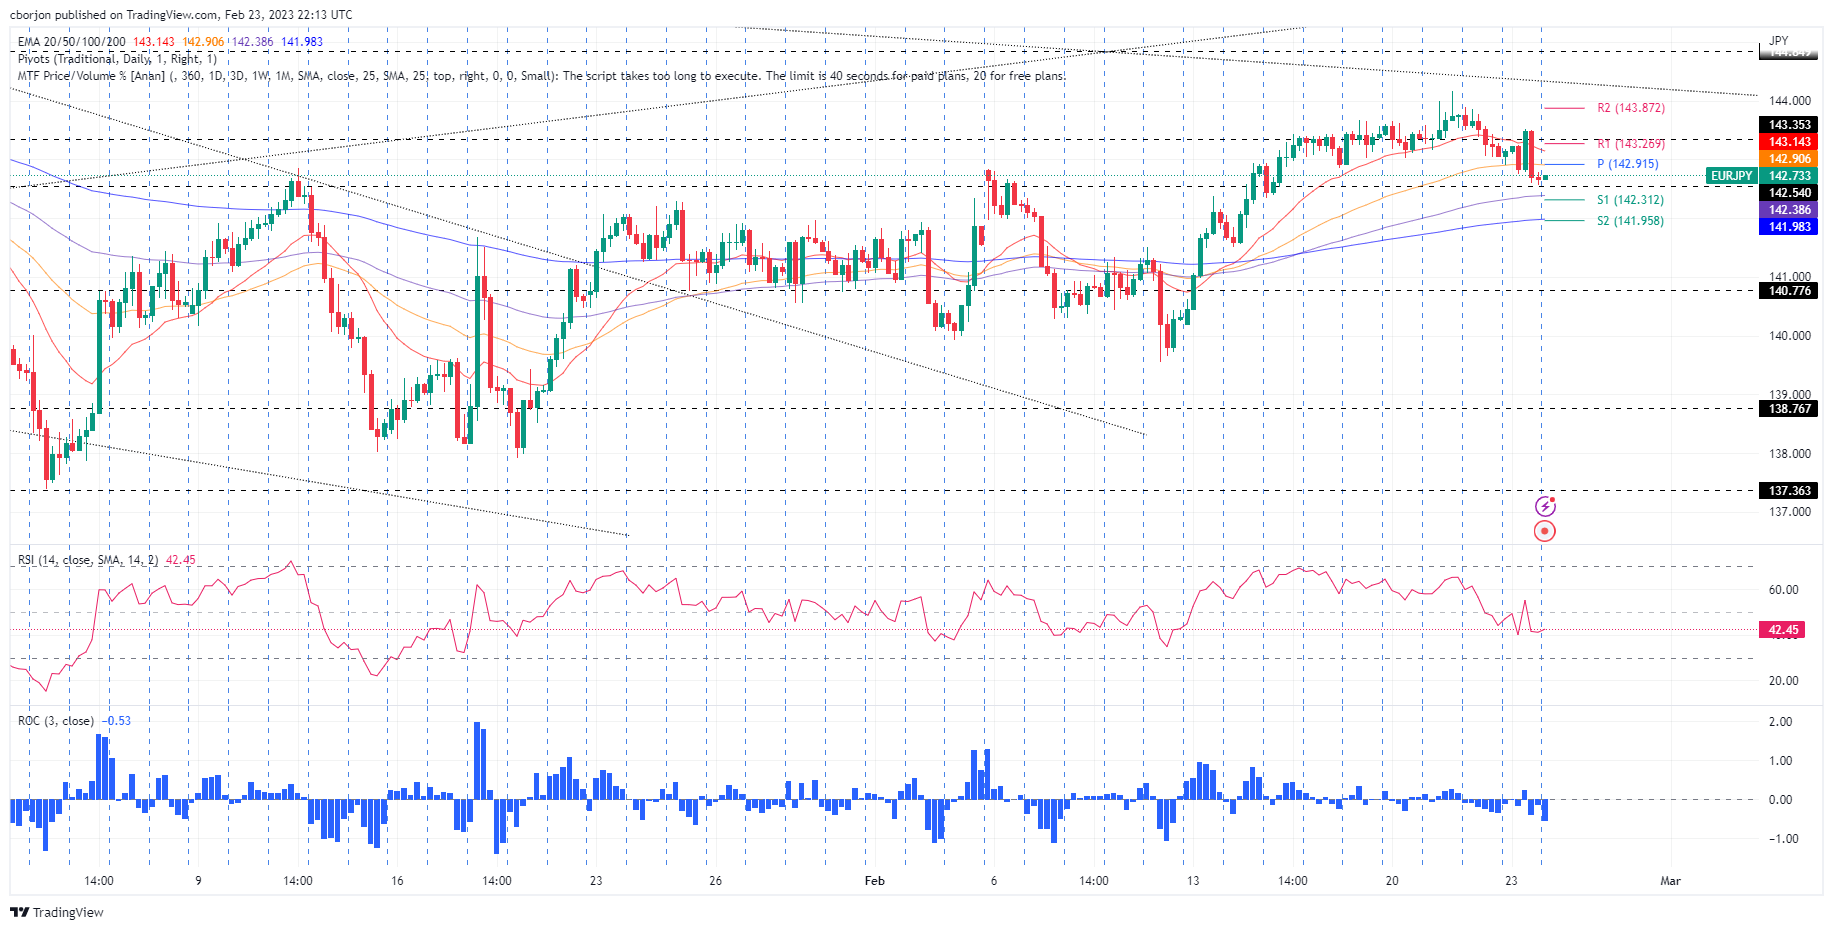
From an intraday perspective, the EUR/JPY is neutral-upward biased, though it appears to have peaked around the 144.00 area. Since then, the EUR/JPY nosedived 150 pips, and at the time of typing, the spot price sits trapped within the daily pivot and the S1 pivot point. Therefore, the EUR/JPY could aim downwards before resuming its uptrend.
The EUR/JPY first support would be the 100-EMA at 142.38, followed by the S1 daily pivot point at 142.31. A breach of the latter and the EUR/JPY next stop would be the intersection of the 200-EMA and the S2 pivot point at around 141.95/98.
EUR/JPY 4-Hour chart
EUR/JPY Key technical levels
“The projected cash rate peak is not set in stone,” Reserve Bank of New Zealand (RBNZ) Assistant Governor, Karen Silk expressed her view Friday.
Additional comments
All rate hike options are on the table for the April meeting.
The RBNZ will do all it takes to control inflation.
There are still concerns on the inflation forecast.
NZD/USD defends corrective bounce
The news allows NZD/USD to remain firmer even as the geopolitical fears join broad US Dollar strength to challenge the bulls. The reason could also be linked to the early week RBNZ rate hike worth 0.25%.
That said, the Kiwi pair holds onto its rebound from the weekly low surrounding 0.6200, picking up bids to 0.6230 by the press time.
Also read: NZD/USD bulls seek a break above 0.6250
- AUD/USD retreats towards multi-day bottom, eyes the biggest loss in three weeks.
- Strong US data bolstered hawkish Fed bets and weighed on the risk barometer pair.
- Hopes of US-China trade negotiations underpinned corrective bounce ahead of latest geopolitical fears-inflicted fall.
- US Core PCE Price Index for January is the key data to watch for fresh impulse.
AUD/USD fails to defend the late Thursday’s corrective bounce off a seven-week low, dropping back to 0.6807 during early Friday in Asia, as markets await the Federal Reserve’s (Fed) preferred inflation gauge. In addition to the pre-data anxiety, hawkish Fed concerns and geopolitical fears surrounding China and Russia also weigh on the risk barometer pair.
As per Thursday’s US data dump, the second reading of the Gross Domestic Product Annualized, better known as Real GDP, eased to 2.7% for the fourth quarter (Q4) versus 2.9% first forecasts. However, the Personal Consumption Expenditure (PCE) Price and Core PCE for the said period rose to 3.7% and 4.3% QoQ versus 3.2% and 3.9% respective first estimations.
Additionally, the Chicago Fed National Activity Index improved to 0.23 in January from -0.46 (revised), versus 0.03 analysts’ estimates. On the same line, Initial Jobless Claims also eased to 192K for the week ended on February 17 from 195K (revised) prior, compared to 200K expected. Hence, the latest set of the US data has been in accordance with the upbeat economics released so far in February and has helped the US Dollar to remain firmer, after early Thursday’s retreat.
On the other hand, comments from US Treasury Secretary Janet Yellen signaled that the US will resume discussions with China on economic issues 'at an appropriate time' whereas China’s Commerce Ministry urged the US to create good conditions for trade with China. The news managed to trigger the pair’s bounce off a multi-day low on Thursday. On the same line were statements from China’s commerce ministry spokesperson who said, the recovery momentum in the country’s consumer market was strong in January while also adding, “The government will take more measures to revive and expand consumption.”
However, the latest headlines suggesting China’s readiness to supply combat drones to Russia and the US Senators’ push to halt Chinese carriers overflying Russia on US flights seem to renew the market fears and weigh on the AUD/USD prices.
Amid these plays, Wall Street closed mildly positive and the US Treasury bond yields retreat from the three-month high but the US Dollar Index (DXY) remains firm ahead of the key data.
Moving on, qualitative headlines may entertain the AUD/USD traders ahead of the key US data. That said, the Personal Consumption Expenditures (PCE) Price Index is expected to have risen by 4.9% YoY in January, versus 5% prior. Further, the more relevant Core PCE Price Index, known as Fed’s favorite inflation gauge, is likely eased to 4.3% YoY, compared 4.4% prior.
Also read: US PCE Inflation Preview: Can the US Dollar turn bullish for good?
Technical analysis
The 200-DMA support, at the 0.6800 threshold by the press time, restricts immediate AUD/USD downside.
- GBP/USD is dropping 0.20% on Thursdays as bears eye 1.2000.
- On its way down, the GBP/USD fell below the 100-day EMA, which exacerbated a test of 1.1991.
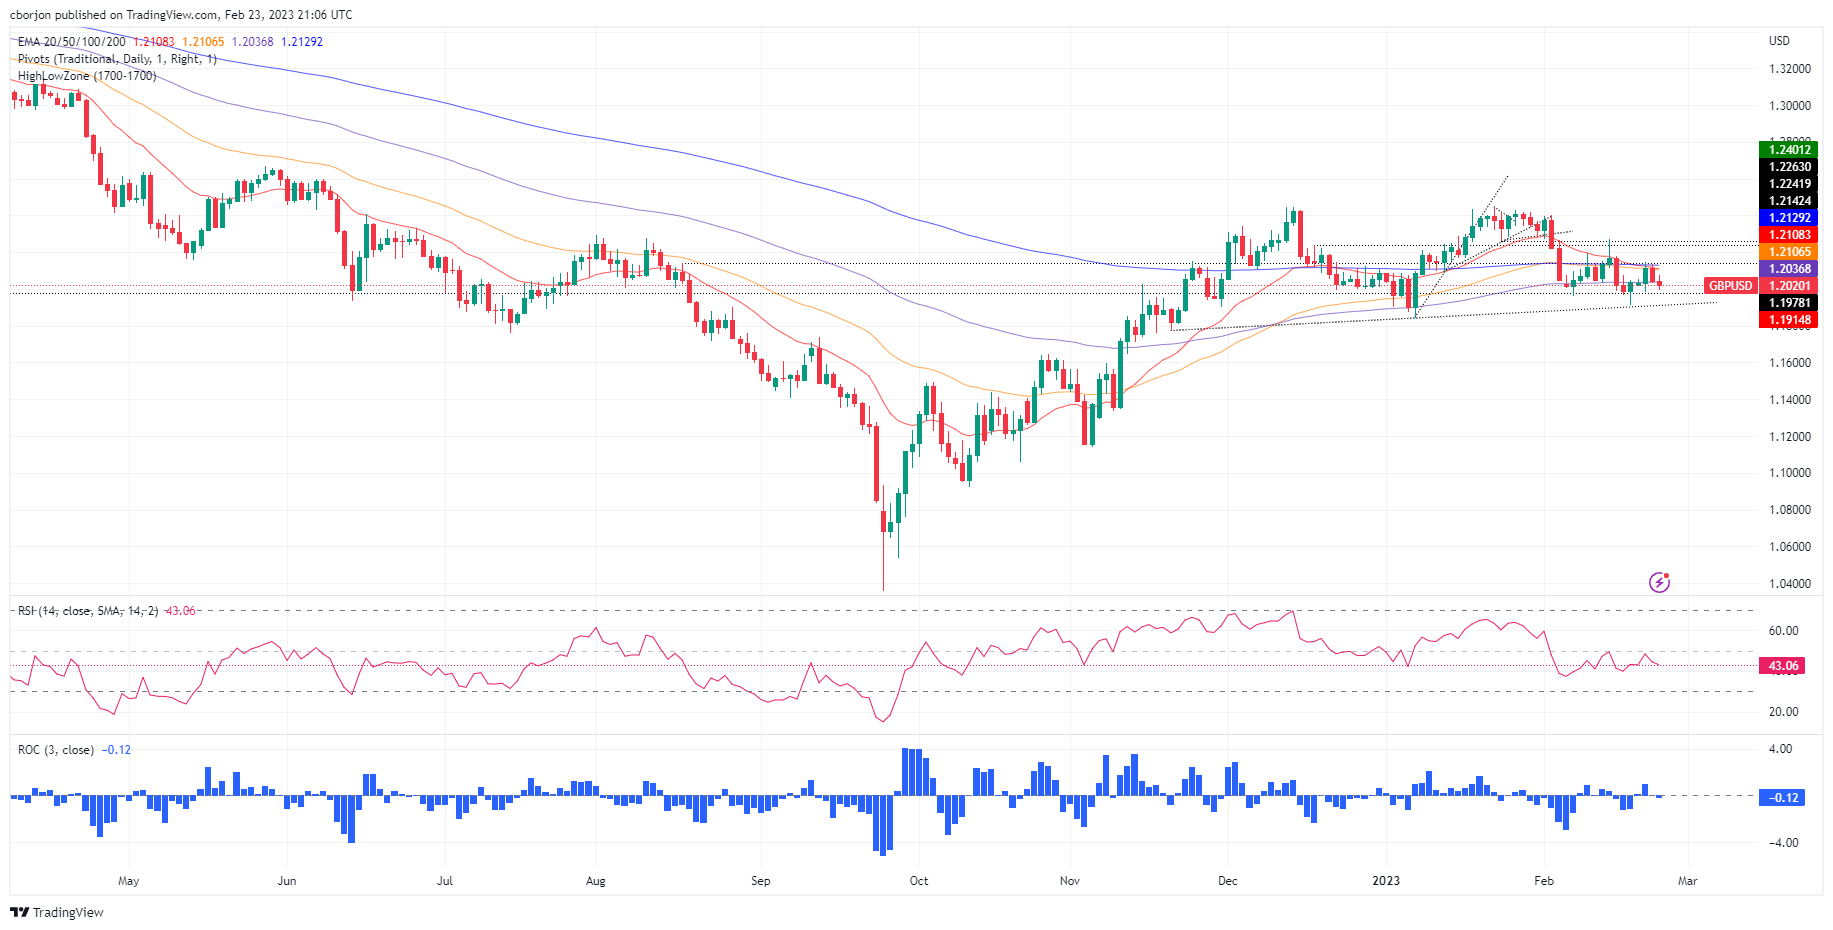
The GBP/USD tumbles below the 100-day Exponential Moving Average (EMA) as Wall Street prepares for Thursday’s close, with decent gains on a risk-on impulse. In the FX space, the US Dollar (USD) exerts pressure on most G8 currency pairs, particularly the Pound Sterling (GBP). At the time of writing, the GBP/USD is trading at 1.2018, below its opening price.
After hitting a daily high of 1.2074, the GBP/USD retreated and broke below 1.2036, the 100-day EMA, on its way to the day’s lows at 1.1991. However, the GBP/USD recovered some ground and reclaimed the 1.2000 figure as the US Dollar softened.
From a daily chart perspective, the GBP/USD is neutral to downward biased, with all the long-term EMAs resting above the spot price. In addition, the Relative Strength Index (RSI) at bearish territory aims south, indicating that sellers are gathering momentum. Therefore, GBP/USD downside is expected.
If the GBP/USD falls below the 1.2000 figure, the next support would be the weekly low of 1.1985. A breach of the latter will expose a support trendline that passes around the February 14 low of 1.1914. That will set the stage for GBP/USD sellers to regain 1.1900.
As an alternate scenario, once the GBP/USD reclaims the 100-day EMA at 1.2036, that would open the door toward 1.2100, where the 20 and 100-day EMAs lie. A rally beyond that supply area and the 200-day EMA will be up for grabs at 1.2129.
GBP/USD Daily chart
GBP/USD Key technical levels
- NZD/USD bears need to get below the consolidation and 0.6200.
- NZD/USD bulls eye a move above 0.6250 for a short squeeze.
NZD/USD is up 0.20% following a move from a low of 0.6202 to a high of 0.6251 wedged between a sideways channel. The bulls need to get above and hold above the 0.6250s and the bears below 0.6200.
Analysts at ANZ Bank explained that having ''succumbed to a gradual firming in the USD DXY in the wake of another round of stronger than expected US data.''
The analysts noted that a ''tight labour markets and sticky inflation remain the key themes. Of course NZ is in that situation too, and alongside the USD, is on track to continue to top global league tables on the bond yield front. That, alongside an expected boost in economic activity post the cyclone has potential to offset what many fear is a fresh wave of USD strength,'' the analysts at ANZ Bank explained. ''But right here, right now, all eyes are on the 0.6200 level amid sluggish price action.''
Indeed, the greenback is firmer on the prospect of further monetary policy tightening after the Minutes of the Jan. 31-Feb. 1 Federal Open Market Committee meeting released Wednesday showed only "a few" participants wanted a larger 50 basis point increase at the meeting.
Looking ahead, Friday's PCE deflator a key red news event. Ahead of the event, the federal funds target rate band stands at 4.50% to 4.75% ''The market is expecting the January headline data to remain at 5.0% YoY, in line with the previous month,'' analysts at Rabobank said.
''This would strengthen concerns that the downtrend in inflationary indicators may have stalled. Data in line with market expectations would thus add further weight to the view that the Fed will have to work harder to push inflation back to its target level. Currently implied market rates are pointing to a peak in Fed funds close to 5.33%.''
NZD/USD technical analysis

The bulls are lurking as the price moves to the backside of the down channel and a break of the 0.650s opens the risk of a move into the shorts that have gathered since breaking below 0.6370. a move below 0.6200 opens the risk of a downward continuation with 0.6150 eyed as a key support base.
- USD/JPY is on the backside of the prior bullish trend.
- The US Dollar remains in favour on hawkish data.
- The price is capped by the 135s so far and a move below 134.50 will be key for the week ahead.
USD/JPY is trading offered in the afternoon on Wall Street and is down some 0.2% within the range of the day between 135.36 and 134.60. The US Dollar rose against its major trading partners on Thursday ahead of the release of an update to Q4 Gross Domestic Product growth (that missed expectations) and Weekly Initial Jobless Claims, (that beat expectations) as well as the Personal Consumption Expenditure (that also beat expectations) and was revised upward to 3.7%, indicating inflation was much stronger than initially thought and helping to stoke bearish sentiment among traders.
Consequently, US Treasury yields edged lower in choppy trading, with those on the 10-year pulling back from three-month highs. This occurred despite investors pricing in the strong economic data of late that commenced with the last Nonfarm Payrolls report at the start of this month.
Benchmark 10-year Treasury notes were down at 3.881%, while the yield curve measuring the gap between the two- and 10-year Treasury notes was still inverted indicating a looming recession. Nevertheless, the US Dollar retained its strength against its major peers. The US Dollar index, which measures the greenback vs. a basket of currencies, DXY
climbed to a high of 104.779 before falling back to the 104.50s. The index is still up from the day's low of 104.308.
The greenback is firmer on the prospect of further monetary policy tightening after the Minutes of the Jan. 31-Feb. 1 Federal Open Market Committee meeting released Wednesday showed only "a few" participants wanted a larger 50 basis point increase at the meeting. All in all, officials favoured a moderation in the pace of rate hikes although they indicated that containing high inflation would be key to how much further rates need to rise which makes Friday's PCE deflator a key red news event. Ahead of the event, the federal funds target rate band stands at 4.50% to 4.75%
Friday will provide the Fed’s favoured inflation measure, the PCE deflator. ''The market is expecting the January headline data to remain at 5.0% YoY, in line with the previous month,'' analysts at Rabobank said. ''This would strengthen concerns that the downtrend in inflationary indicators may have stalled. Data in line with market expectations would thus add further weight to the view that the Fed will have to work harder to push inflation back to its target level. Currently implied market rates are pointing to a peak in Fed funds close to 5.33%.''
USD/JPY technical analysis

USD/JPY is on the backside of the prior bullish trend but remains supported by the hourly bullish trendline. However, the price is capped by the 135s so far and a move below 134.50 will be key for the week ahead.
What you need to take care of on Friday, February 24:
Risk aversion continued underpinning the American Dollar on Thursday, reaching fresh February highs against most major rivals. The Greenback advanced during Asian trading hours on the back of hawkish FOMC Meeting Minutes, picking up momentum during the US session and after mixed United States figures.
On the one hand, the annualized pace of growth in the country was downwardly revised to 2.7% from 2.9% in the last quarter of 2022, according to the second estimate of the Q4 GDP estimate. On the other, inflationary pressures in the same period were higher than previously estimated, as Personal Consumption Expenditure Prices rose by 3.7% QoQ, while the core reading came in at 4.3% higher than the 3.9% gain from the third quarter of 2022. The figures further fueled speculation the US Federal Reserve will continue to hike rates in the upcoming meetings while a potential pivot on monetary policy is farther away.
Wall Street edged lower with the news, with major indexes reaching fresh February lows. US indexes trimmed part of their losses ahead of the close, preventing the US Dollar from advancing further.
EUR/USD fell to 1.0576 and remained below 1.0600 by the US close. GBP/USD trades at around 1.2020, while the USD/JPY settled at around 134.50. Commodity-linked currencies recovered some ground against their American rival ahead of the close, with AUD/USD hovering around 0.6800 and USD/CAD trading at 1.3540.
Market players are now waiting for the US January Personal Consumption Expenditures Price Index, the Federal Reserve’s favorite inflation gauge. The PCE Price Index is expected to have risen by 4.9% YoY in January, easing from the previous 5%, while the more relevant core PCE Price Index is foreseen at 4.3%, after printing 4.4% in December.
Gold maintain its bearish tone and trades at around $1,823 a troy ounce. Crude oil prices, on the other hand, recovered some ground and WTI hovers around $75.30 a barrel.
Like this article? Help us with some feedback by answering this survey:
- USD/CHF resumed its uptrend as the 20-day EMA is about to cross over the 50-DMA.
- USD/CHF Price Analysis: Could shift neutral-upwards once it regains 0.9400.
The USD/CHF climbs above 0.9300, extending its gains after cracking the previous weekly high and reaching a new one at 0.9348 on Thursday. At the time of typing, the USD/CHF exchanges hand at 0.9342.
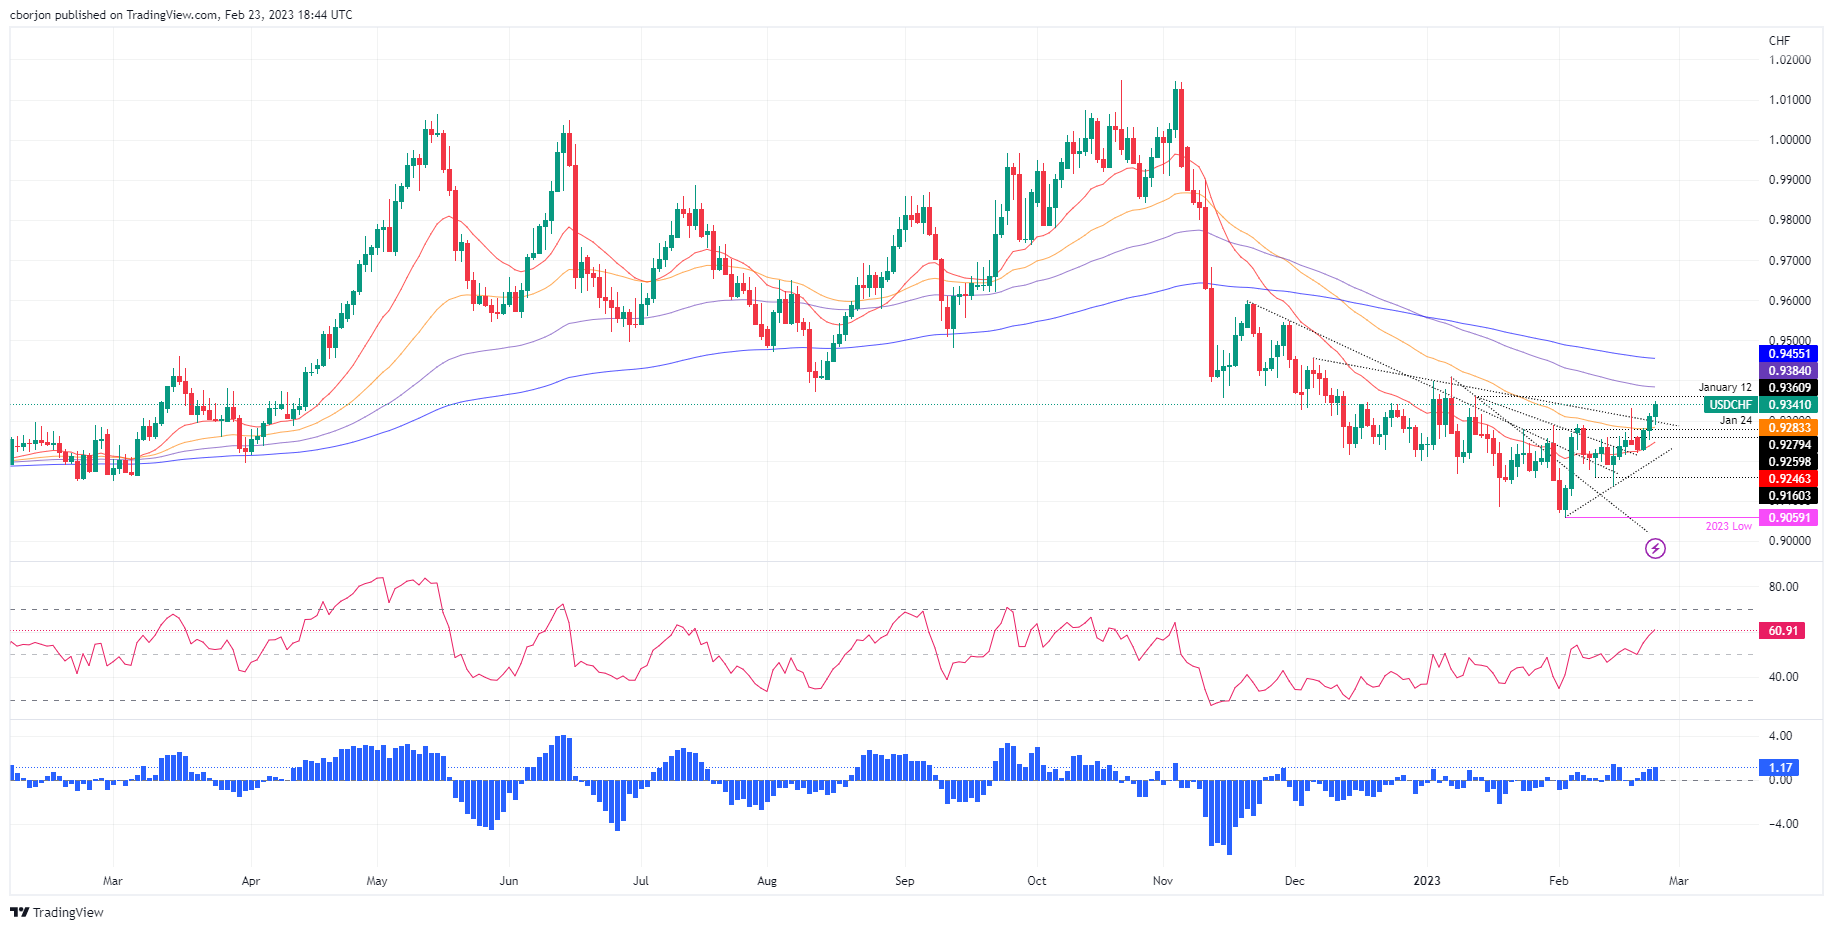
The USD/CHF pair is neutral to downward biased, indicated by the long-term Exponential Moving Averages (EMAs), the 100 and 200-day EMAs, resting above the exchange rate at 0.9384 and 0.9455, respectively. Furthermore, the USD/CHF trades beneath the January 6 daily high of 0.9409, keeping the bearish bias intact. If this rate is surpassed, the USD/CHF can reach the 200-day EMA level.
Even though the USD/CHF bias is tilted to the downside, the pair appears to have bottomed around 0.9059. Also, the Relative Strength Index (RSI) and the Rate of Change (RoC) are bullish, suggesting buyers are moving in.
Therefore, the USD/CHF path of least resistance is upward in the near term. The first resistance would be the January 12 high at 0.9360. A decisive break and the following resistance tested would be the 100-day EMA at 0.9384, ahead of the 0.9400 figure. Once those two resistance areas are broken, buyers will aim toward the 200-day EMA at 0.9454 before posing a threat of the 0.9500 figure.
Contrarily, if the USD/CHF drops below the 50-day EMA at 0.9283, that would exacerbate a fall toward the February 14 daily low at 0.9135.
USD/CHF Daily chart
USD/CHF Key technical levels
- A short squeeze could be in order for the sessions ahead in EUR/USD.
- If the bulls can stay above 1.0550s then buyers will be on the lookout for a move into the 1.0620s.
EUR/USD printed fresh lows on Thursday on the third day of there being shorts in the market which gives rise to the prospects of a move up for the final stages of the week. The following illustrates such a scenario and puts the spotlight on the bearish trendline resistance.
EUR/USD daily charts
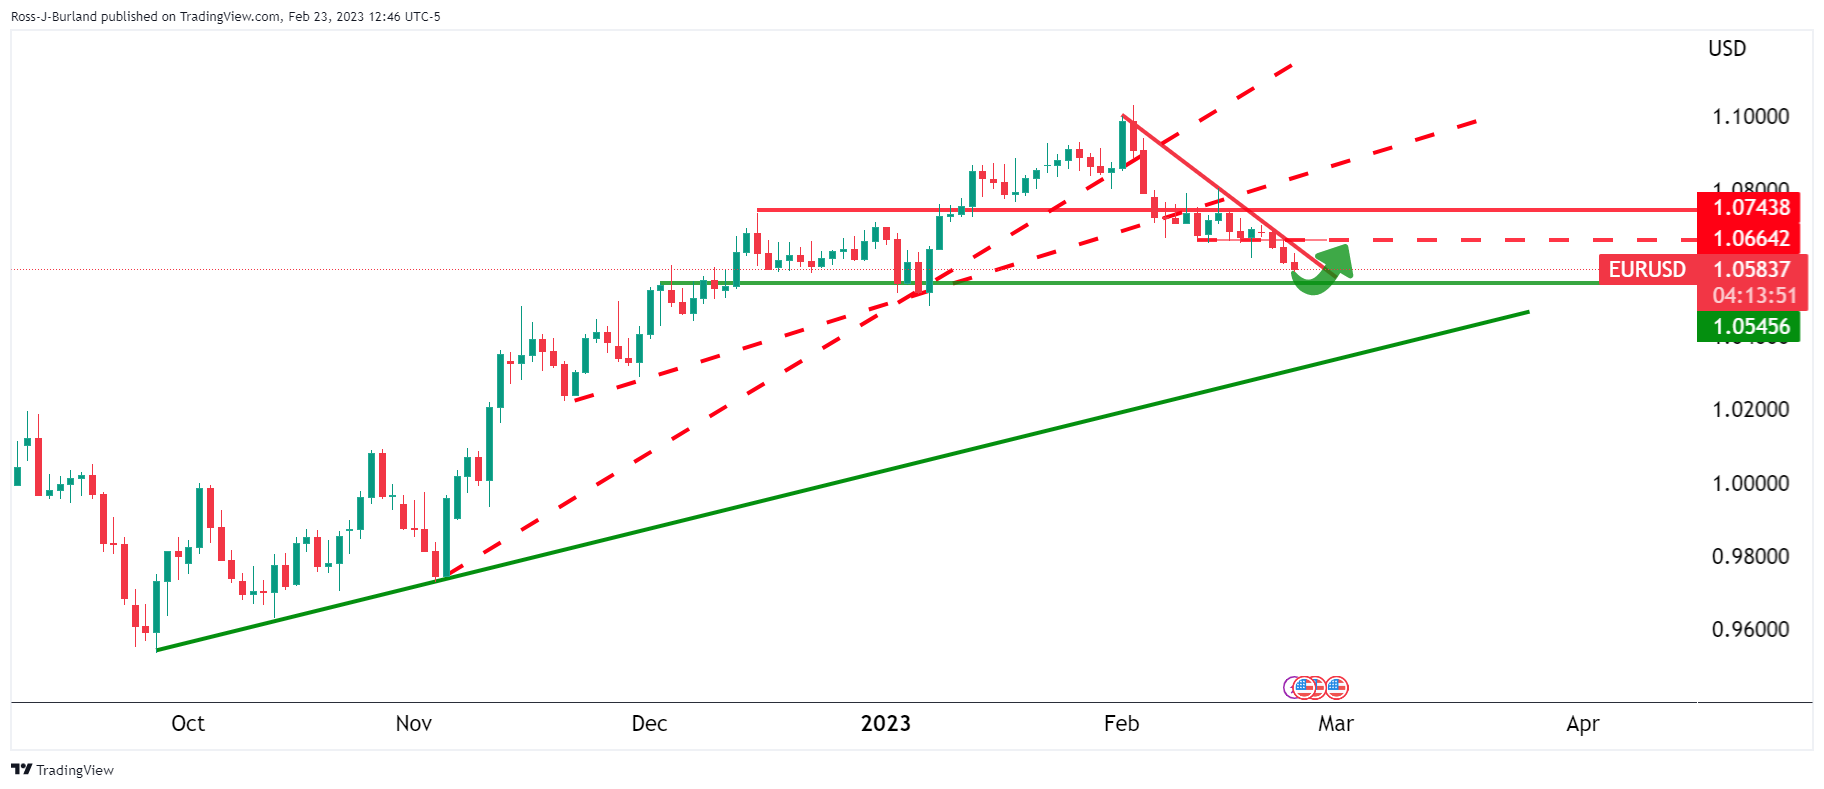
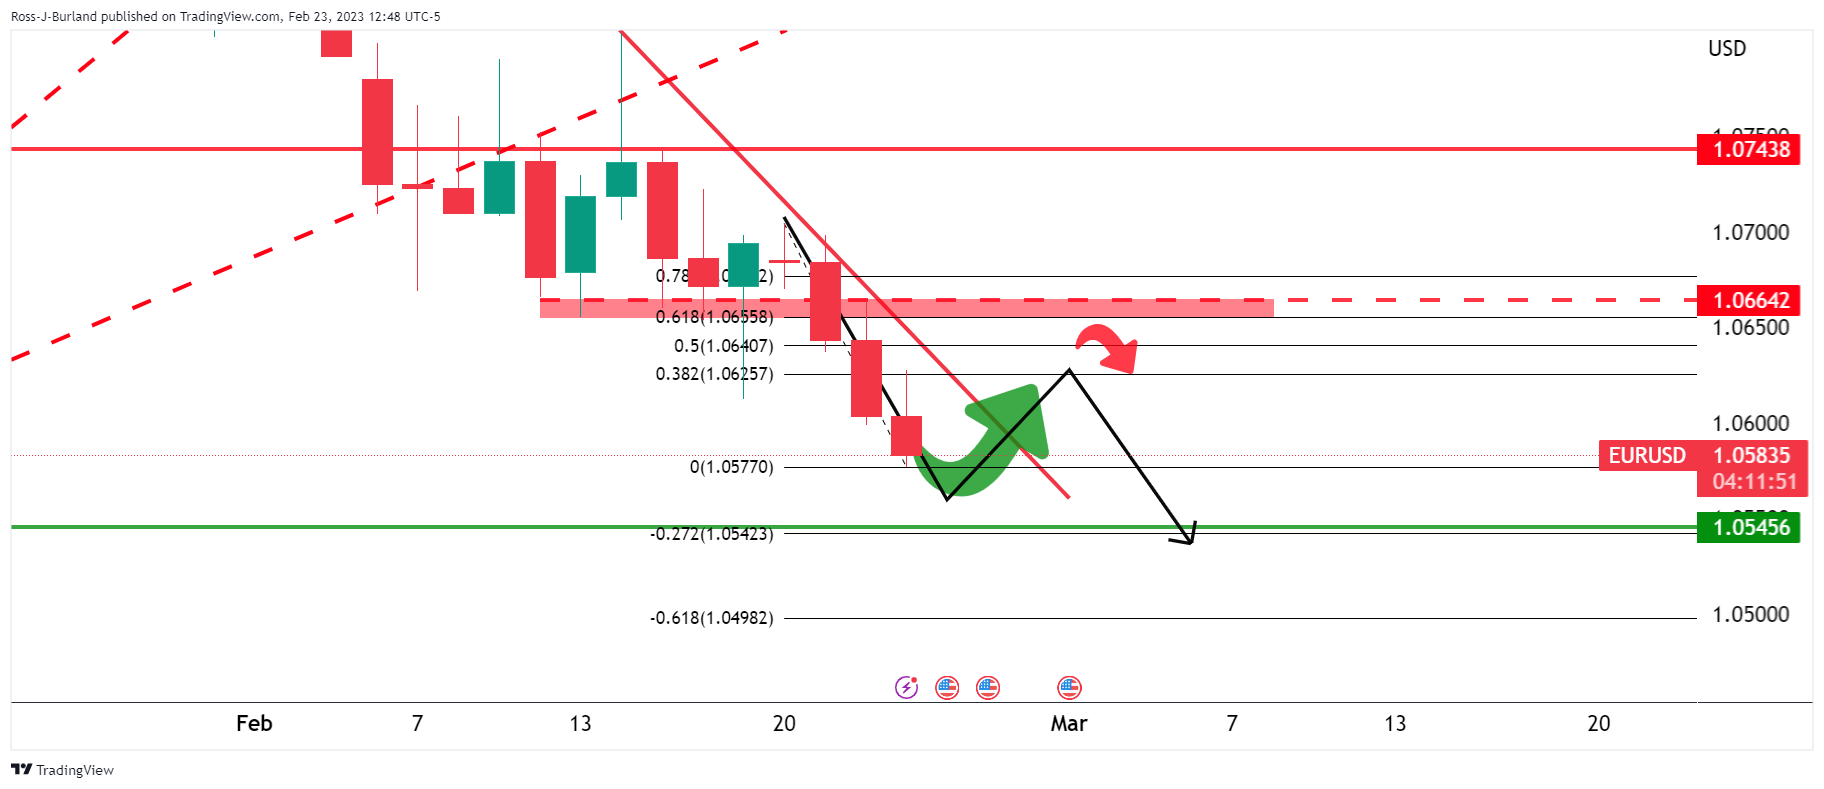
As we can see, the price is jammed in on the front side of the daily trendline still. However, a correction into shorts could be on the agenda for the end of the week to square up some of the books and that exposes the upside fo a short squeeze towards prior shorter-term support structures as follows:
EUR/USD H1 chart
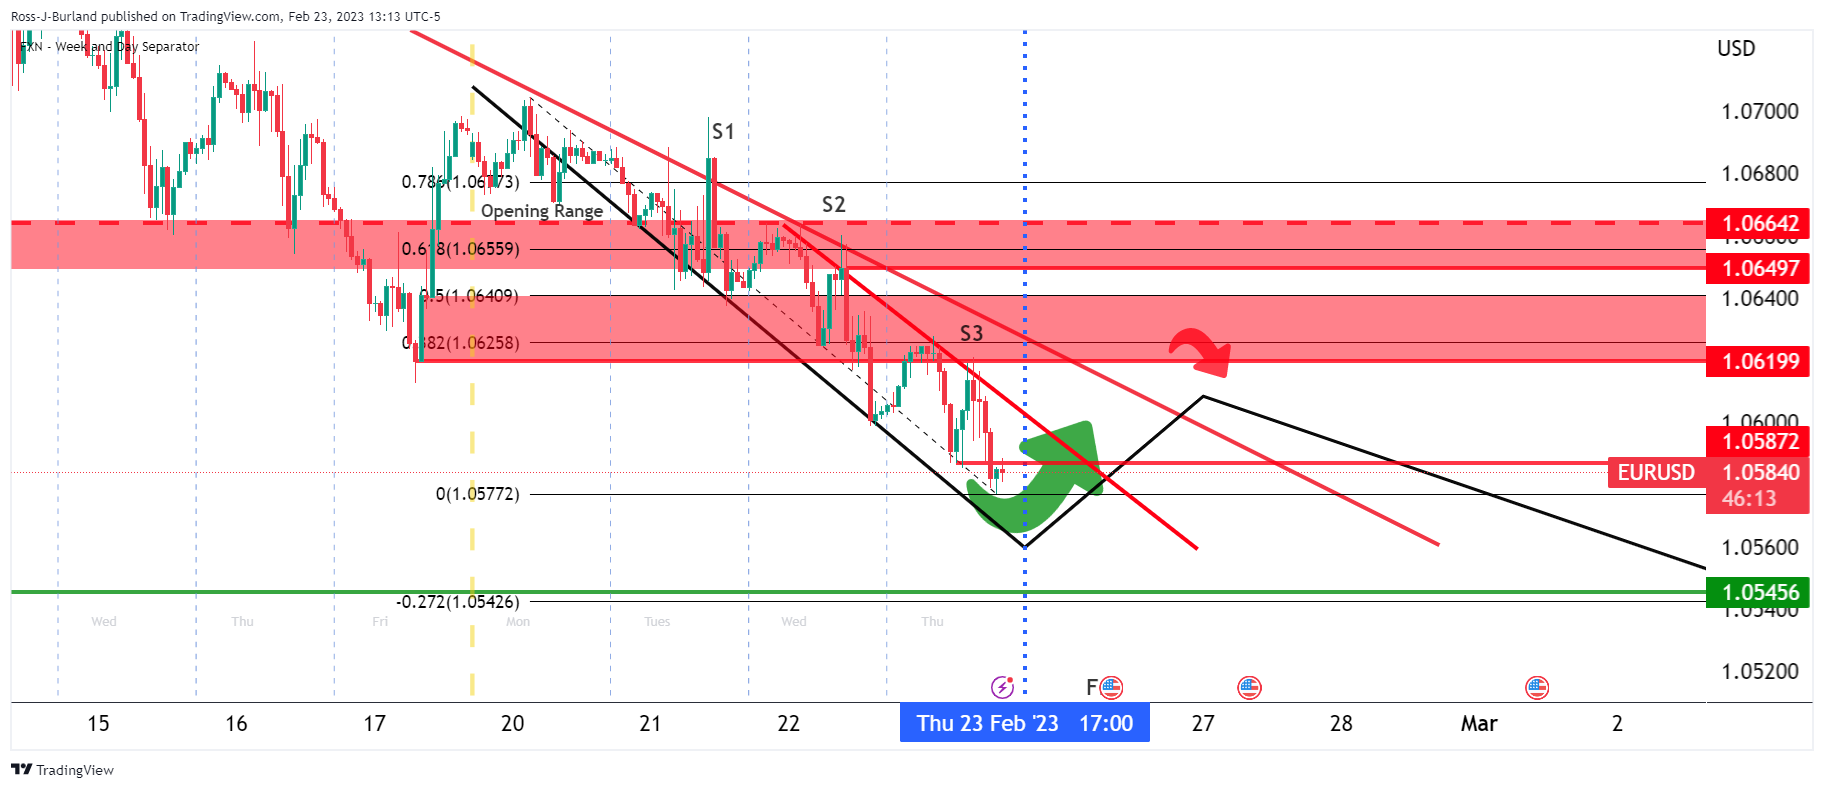
EUR/USD started out the week inside of the prior week's range so on a break of the day's lows on Tuesday,m this confirmed that there were sellers in the market and a continuation to the downside was most probable for the days ahead.
The break of the February lows on Wednesday confirmed that sellers were committed to the downside and Thursday's shorts have taken on fresh lows for the month. However, there is a three-day phenomenon in markets which concludes with a correction and given the timing of the week, a short squeeze could be in order for the sessions ahead. If the bulls can stay above 1.0550s then buyers will be on the lookout for a bullish structure to target a move into the 1.0620s and into at least Thursday's shorts if not higher.
- Western Texas Intermediate prices advance more than 2%, trimming its Wednesday losses.
- US stockpiles have increased the most since 2021, as reported by the US EIA.
- Russia’s plan to cut its oil output supported WTI and oil prices.
Western Texas Intermediate (WTI), the US crude oil benchmark, advances shy of 2% on Thursday, trimming some of its Wednesday’s losses spurred by a strong US Dollar (USD). Nevertheless, WTI is staging a comeback, exchanging hands at $75.78 per barrel.
Sentiment shifted sour as the US Dollar extended its gains, capping oil’s rally. The US Dollar Index (DXY) advances 0.24%, up at 104.752 for the third consecutive day, bolstered by the Fed’s latest monetary policy minutes.
On Wednesday, the Federal Reserve revealed its latest meeting minutes which were tilted hawkish, with policymakers agreeing to raise rates 25 bps, while few members wanted a 50 bps hike. Officials acknowledged the labor market’s tightness and warranted further increases to curb elevated inflation.
Data from the US Energy Information Administration on Thursday showed that oil inventories have risen to their highest level since May 2021. Crude oil stockpiles grew by 7.6 million barrels to 479 in the last week ending February 17, 2023. Meanwhile, inventories in Cushing, Oklahoma, jumped to 40.4 million, the highest level since June 2021.
WTI retreated on the data release, though Russia’s intention to reduce its oil exports from western ports in March by as much as 25% reignited fears of an oil shortage. Consequently, WTI and Brent’s prices have jumped.
In another data, the US Department of Labor revealed that unemployment claims continued downward, while the US economy grew at a 2.7% pace quarterly in Q4 2022, lower than the 2.9% previous reading. The greenback rallied on the data and weighed on WTI, which retreated from daily highs around $75.92.
WTI Key technical levels
- USD/CAD aims higher and tests a significant resistance trendline in the daily chart.
- The latest FOMC minutes suggested that the Fed will continue to hike rates.
- Upbeat US economic data underpinned the US Dollar and bolstered the USD/CAD.
- Rising oil prices capped the USD/CAD rally on Thursday.
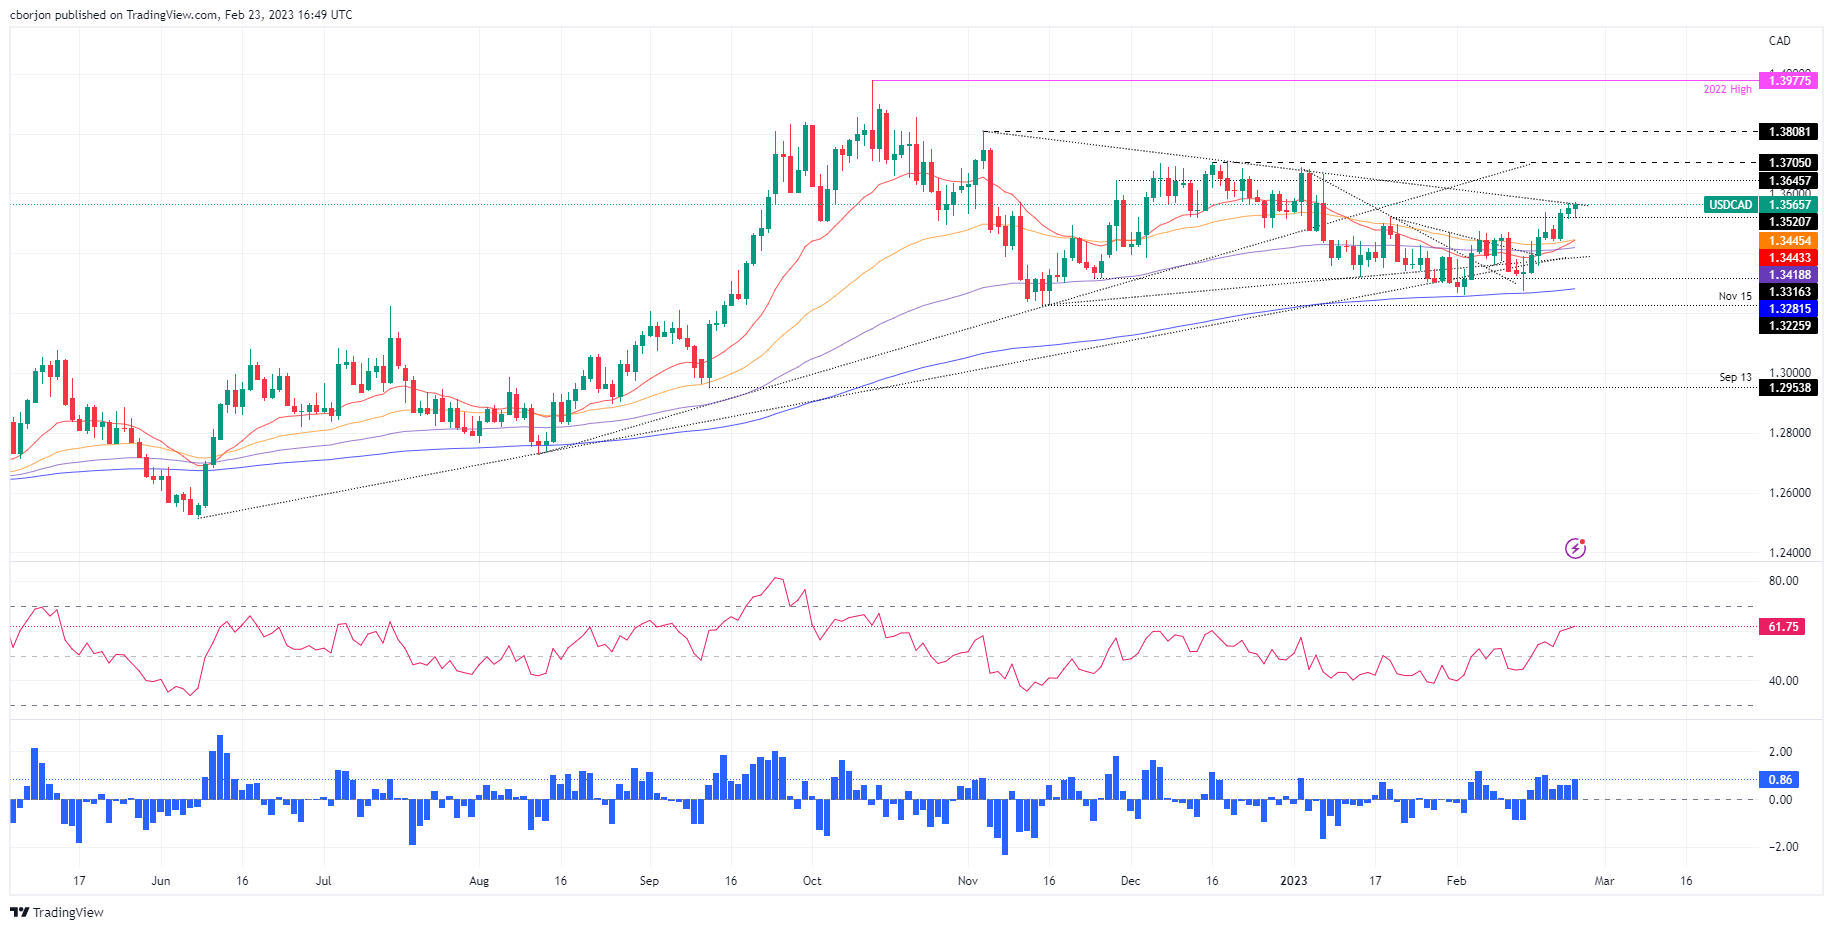
The USD/CAD clash with a four-month-old downslope resistance trendline, gaining 0.15% daily. At the time of writing, the USD/CAD exchanges hands at around 1.3565.
USD/CAD to continue upwards on Fed and BoC policy divergence
Wall Street continues to pare some of its losses. The US Dollar (USD) is gaining some traction as the Federal Reserve is ready to continue tightening monetary conditions, as revealed by the Federal Reserve’s (Fed) last meeting minutes. The minutes showed a slightly hawkish tone as a few officials advocated for a 50 basis point increase in interest rates, but ultimately, they all agreed on a 25 basis point hike. Officials commented that the labor market remains tight and added that growth risks are tilted to the downside.
In the meantime, the US Bureau of Labor Statistics (BLS) revealed that unemployment claims for the week ending on February 18 came at 192K, below last week’s 194K and lower than the 200K expected. Gross Domestic Product (GDP) in the US expanded in the fourth quarter by 2.7%, shy of the first estimate of 2.9%.
The strong growth in the 2022 second half compensated for the 1.1% economic decline during the first six months. Although there was a slowdown in economic activity during the last two months of 2022, it seems the economy has picked up the pace again at the beginning of 2023.
The US Dollar Index (DXY), which tracks the buck’s value vs. six currencies, advances 0.14% at 104.635, the reason for the latest uptick in the USD/CAD pair. Nevertheless, the rally was capped by the jump in oil prices, with WTI’s advancing 2%, trading at $75.32 PB.
On the Canadian front, Average Weekly Earnings eased from 4% to December’s 3.4% YoY. It was the 19th month of growth, with 17 of the 20 sectors reporting gains.
Given the backdrop, the USD/CAD might continue to edge higher. Divergence in monetary policy between the Fed and the Bank of Canada (BoC) warrants further upside in the pair. The BoC announced that it would pause, while Fed officials had stated the need for higher for longer. Therefore, USD/CAD upside is expected.
USD/CAD Technical analysis
The USD/CAD pair is testing a four-month-old resistance trendline, drawn from November highs of 1.3808, which passes at around the 1.3560/80 area. Also, the Relative Strength Index (RSI) is still bullish and aiming north, putting at risk the previously-mentioned trendline. Once cleared, the USD/CAD could test 1.3600, followed by the next resistance at 1.3664, the January 6 high.
- Mexican peso losses momentum versus US Dollar after hitting fresh multi-year highs.
- Dollar gains momentum as Wall Street trims gains.
- Inflations eases modestly in Mexico, Banxico’s minutes point to a smaller rate hike.
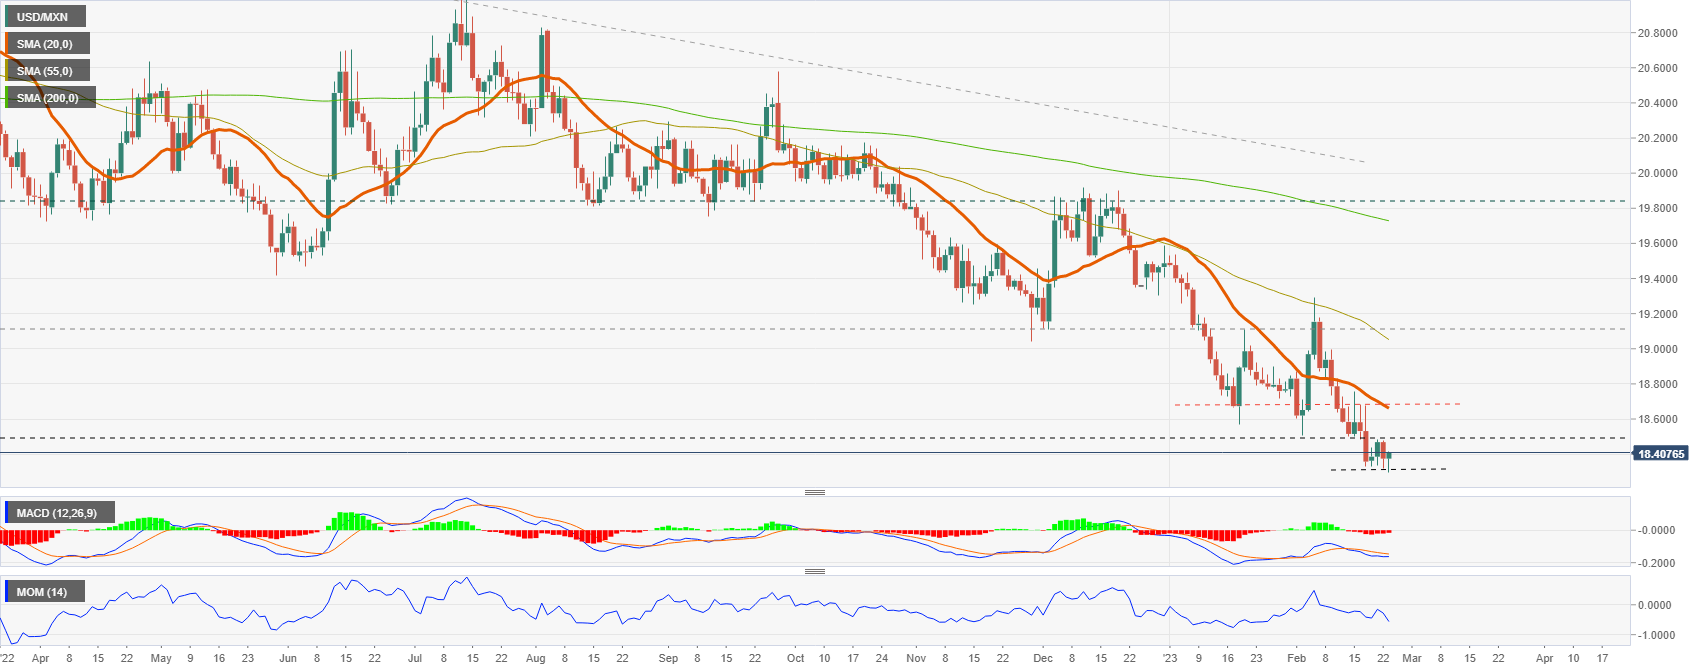
The USD/MXN is trading at daily highs at 18.42, up for the day. Earlier it bottomed at 18.30, the lowest level since April 2018. The rebound took place amid a stronger US Dollar across the board and amid a bearish reversal in US stock markets.
The greenback strengthened following US economic data that included a new revision of Q4 GDP, a decline in jobless claims and a rebound in the Chicago Activity Index.
The USD/MXN is rebounding after testing levels under 18.30. The mentioned level is critical and a consolidation below would point to further weakness. If the current correction extends it would face resistance at the 18.50 area. A recovery above would add support for an extension toward 18.68.
Inflation decelerates slowly in Mexico, Banxico to slow down
The Bank of Mexico released the minutes from its latest Board meeting held on February 9. They surprised market with a 50 basis points rate hike, against expectations of a 25 bps hike. The minutes showed board members considered rate hikes could rise more moderately at the next meeting due on March 30.
The end of the rate hike cycle looks near but inflation is still far from Banxico’s 3% target. Data released on Thursday showed inflation decelerated more than expected during the first half of February. The annual rate dropped from 7.94% to 7.76% while the core index reached 8.38%.
USD/MXN daily chart
Gold is consolidating around the 55-Day Moving Average (DMA). The long-term 200-DMA, currently seen at $1,776, is expected to floor the yellow metal at the very latest, according to strategists at Credit Suisse.
Move above $1,998 can reassert an upward bias
“Gold has been capped at resistance at $1,973/98 as expected and is now consolidating around the 55-DMA, currently seen at $1,858, but so far managed to remain clearly above the long-term 200-DMA, currently seen at $1,776, which we would expect to floor the precious metal at the very latest.”
“Above $1,998 can reassert an upward bias for a test of long-term resistance from the $2,070/72 record highs of 2020 and 2022.”
- US Q4 GDP revised lower, inflation indicators revised higher.
- Jobless Claims, Chicago Fed Activity surpassed expectations.
- Gold’s rebound fails to rise above $1,830.
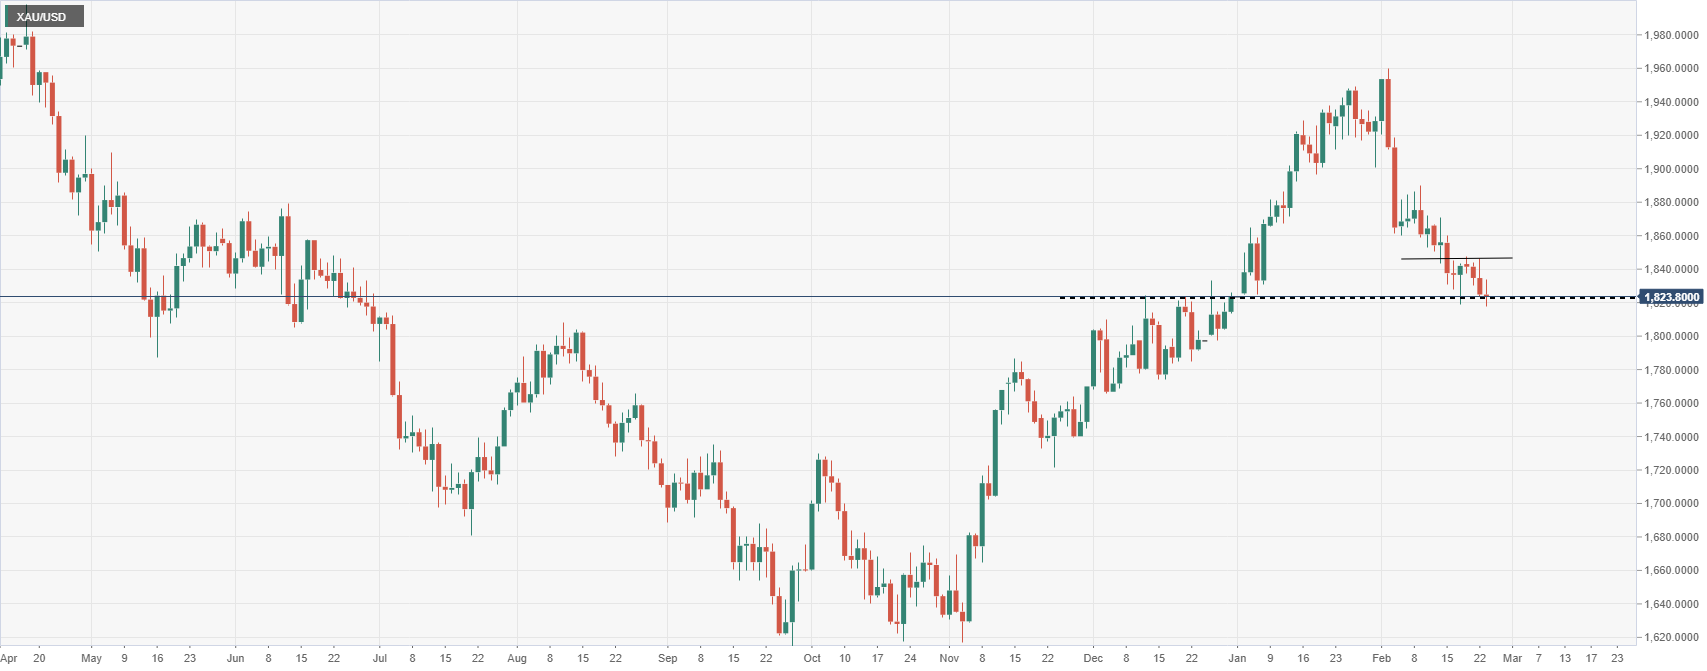
Gold prices rebounded after hitting fresh monthly lows amid risk appetite and an intraday reversal of the US Dollar. XAU/USD bottomed at $1,817 following the release of US economic data, the lowest level since late December and then bounced back toward the $1,830 area.
Data released in the US came in mixed. Initial Jobless Claims dropped to 192K, the lowest level in three weeks. The second reading of Q4 GDP showed a lower annualized growth rate of 2.7% below the 2.9% of the previous estimate. Inflation indicators of the GDP report were revised higher. The Chicago Fed’s National Activity Index rose from -0.43 to 0.23, surpassing expectations.
Investors continue to digest the FOMC minutes and the new economic numbers. The Dow Jones is climbing 0.43% and the Nasdaq is rising 0.50%. US yields are modestly lower, hovering near monthly highs.
The US Dollar peaked after the release of US data while Gold bottomed at $1,817, the lowest since December 30. The yellow metal then rebounded toward $1,830 but it was unable to rise back above that key short-term level.
Following Wall Street’s opening bell the Dollar gained momentum again and pushed XAU/USD back to the downside. XAU/USD is approaching the $1,820 area, which is critical. A consolidation below would open the doors to more weakness, targeting initially $1,812.
XAU/USD daily chart
The FOMC meeting minutes provided additional information about the Committee's decision to hike rates by 25 bps in February. Economists at TD Securities look for a 5.25% terminal rate at the May meeting.
Fed is likely to keep policy restrictive for longer
“The minutes signaled that the FOMC is not done yet in terms of further rate hikes, and it is looking to maintain a restrictive policy stance for the foreseeable future.”
“We expect 25 bps rate hikes in March and May, with the Fed settling on a terminal Fed funds target rate range of 5.00%-5.25% by May. However, we do note a sizable upside risk to our terminal rate projection, where strength in upcoming releases on CPI and PCE inflation, as well as the labor market, could very well sway Fed to continue to hike beyond the May meeting.”
“We continue to like owning 10y Treasuries as the Fed is likely to keep policy restrictive for longer, resulting in weak growth later this year and in 2024.”
- AUD/USD climbs despite upbeat economic data in the United States suggesting further Federal Reserve tightening is needed.
- FOMC’s minutes were hawkish and emphasized the need for higher for longer.
- Initial Jobless Claims dropped in the latest week, while the US economy expanded in Q4 2022.
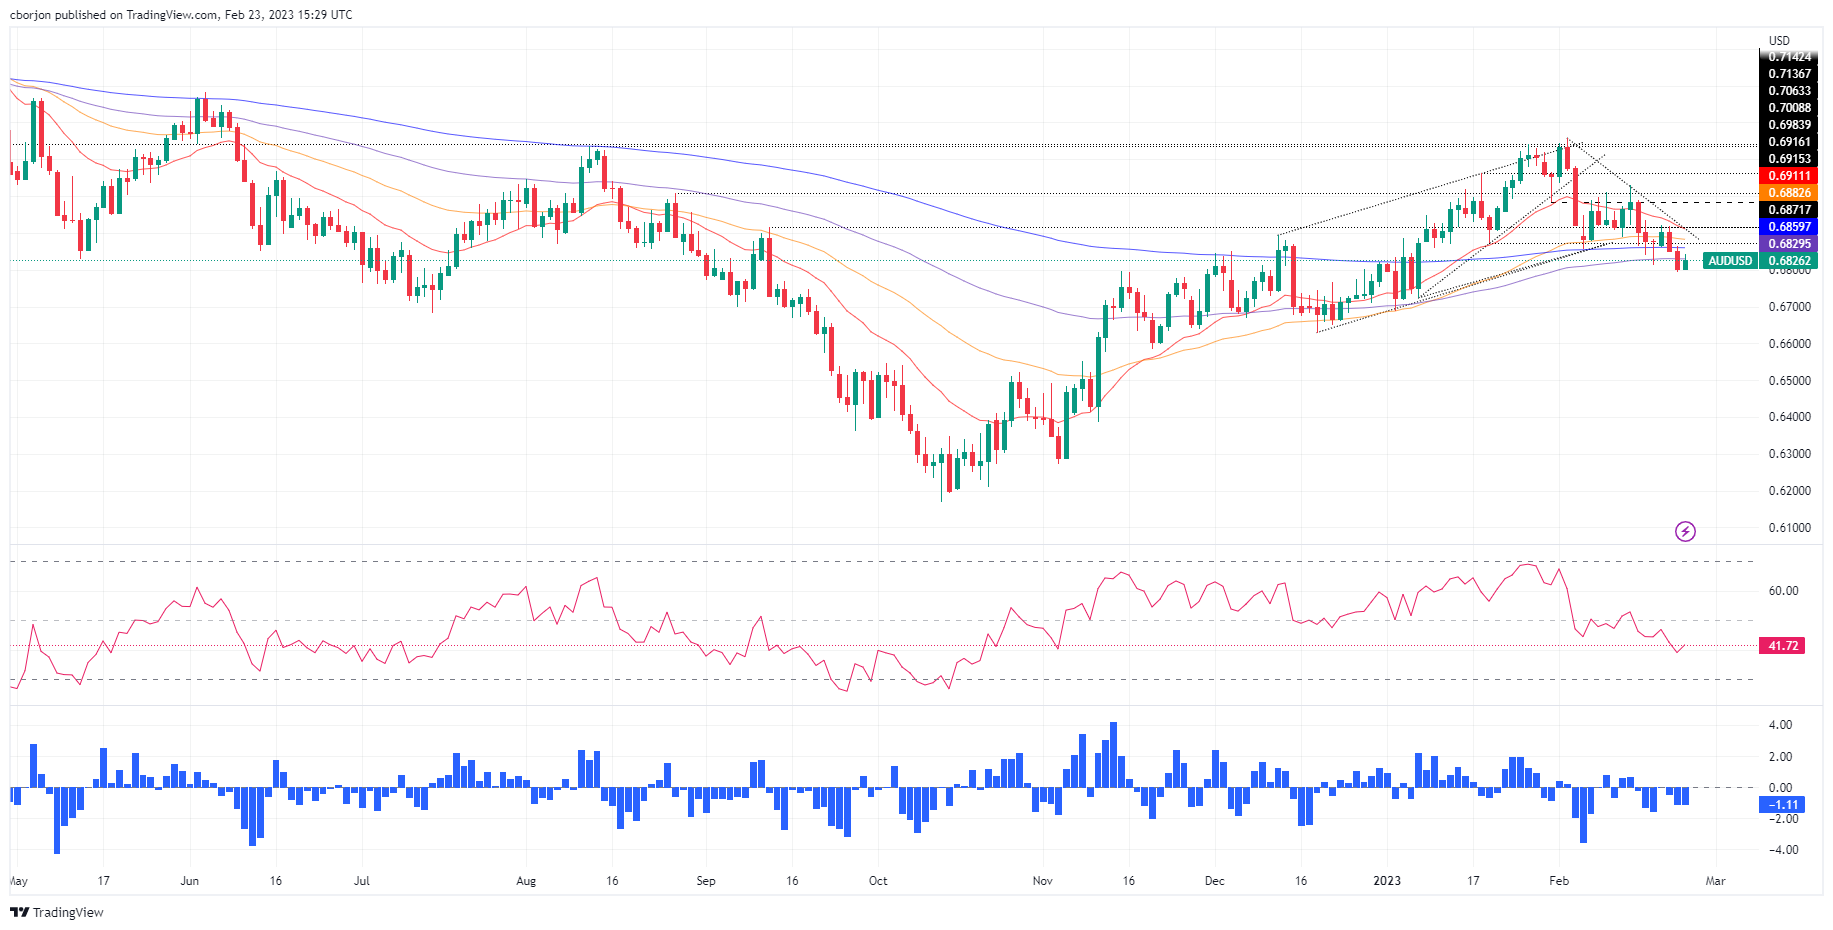
AUD/USD recovered some ground on Thursday after falling to fresh February lows at 0.6803, though it recovered some ground, despite overall US Dollar (USD) strength across the board. A risk-on impulse is another reason that it’s underpinning the Australian Dollar (AUD). At the time of typing, the AUD/USD exchanges hands at 0.6826, above its opening price by 0.39%.
AUD/USD to remain pressured after latest FOMC minutes, US data
US equities have opened in the green after the Federal Reserve Open Market Committee (FOMC) revealed its minutes. The minutes were slightly hawkish, with some officials pushing for a 50 bps rate hike, though all agreed to raise 25 bps. Policymakers remained worrisome about the tightness of the labor market and commented that growth risks are skewed to the downside. Also, they commented on financial conditions for the first time. According to the Chicago Fed National Financial Conditions Index, conditions remained the loosest since February 2022. This could trigger some attention from Fed officials at subsequent meetings.
The US Dollar strengthened after the release of the latest meeting minutes. That sent the AUD/USD to new February lows, though the AUD/USD is erasing some of its Wednesday losses on Thursday.
Data from the United States (US) portrayed the tightness of the labor market after the Department of Labor (DoL), revealed Initial Jobless Claims for the week ending on February 18. The claims rose by 192K, below the 200K estimated and beneath the last week’s 194K. In a separate report, the US Department of Commerce (DoC) featured the US Gross Domestic Product (GDP) for Q4 on its second estimate came at 2.7%, below the prior’s reading of 2.9%.
The US Dollar Index (DXY), which tracks the buck’s value vs. six currencies, slides 0.01% at 104.85, the reason for the latest uptick in the AUD/USD pair.
In the meantime, Private Capital Expenditure in Australia rose 2.2% in Q4 2022, higher than Q3’s data at 0.6% QoQ.
AUD/USD Technical analysis
The AUD/USD is testing the 100-day Exponential Moving Average (EMA) at 0.6829, which, once cleared, will pave the way for further upside toward the 200-day EMA at 0.6859. Nevertheless, the Relative Strength Index (RSI) at bearish territory and the EMA above could cap the AUD/USD rally, which would put into play the 0.6800 figure. Therefore, the AUD/USD downtrend is intact, and it could shift neutral if buyers reclaim the 200-day EMA.
What to watch?
The EUR has corrected lower against the USD so far in February. Economists at MUFG Bank expect the world’s most popular currency pair to continue its decline.
Stronger cyclical outlook for the Eurozone economy is better priced in now
“The EUR’s recent loss of upward momentum could reflect that the stronger cyclical outlook for the Eurozone economy is better priced in now.”
“The EUR would be vulnerable to a further correction lower if core inflation was to fall more quickly as well in the coming months.”
“We see room for EUR/USD to continue correcting lower in the near-term.”
The US Dollar Index (DXY) may see slightly further near-term strength. Nonetheless, analysts at Credit Suisse maintain their broader rangebound outlook.
DXY will eventually resolve its recent range lower
“DXY has edged above the 55-DMA at 103.45. This leaves us mildly biased towards a slightly deeper recovery to 105.63, potentially the 38.2% retracement of the 2022/2023 fall and 200-DMA at 106.15/45. We would expect this to prove the extent of the recovery though, and we would look for this to cap to define the top of a broader range.”
“Post this consolidation phase, our bigger picture view remains that the market will eventually resolve its recent range lower, triggering further weakness later on in the year to test 99.82/37, then the 61.8% retracement at 98.98.”
- Cable continues to vacillate around the mid-1.2000s.
- UK CBI Distributive Trades surprised to the upside in February.
- BoE’s C.Mann favoured extra tightening in the next months.
The inconclusive price action around the dollar seems to be enough to spark a humble advance in GBP/USD to the 1.2050 region on Thursday.
GBP/USD looks to USD, risk trends, BoE
GBP/USD trades slightly in the positive territory at the beginning of the second half of the week, as the quid appears underpinned by another hawkish message from BoE’s Mann as well as some loss of upside momentum in the buck.
Back to the BoE, well-known hawk member C.Mann favoured extra tightening at the upcoming gatherings, at the time when she ruled out any emergence of a pivot in the bank’s monetary stance.
In the UK data space, the CBI Distributive Trades improved to 2 for the current month (from -23) ahead of Friday’s release of the Consumer Confidence gauged by Gfk for the month of February.
News from the money market sees the 10-year Gilt yields in the positive foot near the 3.70% level, or multi-week highs.
What to look for around GBP
Same as with the rest of the risk complex, the British pound is expected to track the dollar’s price action and the policy divergence between the Federal Reserve and the Bank of England when it comes to near-term direction.
Furthermore, the UK economy’s bleak outlook for the remainder of the year in combination with persistent elevated inflation leaves the prospects for further gains in the Sterling somewhat curtailed in the short term, while the BoE approaching its terminal rate does not look helpful for the quid either.
Key events in the UK this week: Gfk Consumer Confidence (Friday).
GBP/USD levels to consider
As of writing, the pair is retreating 0.06% at 1.2038 and faces the next support at 1.1930 (200-day SMA) followed by 1.1914 (monthly low February 17) and finally 1.1841 (2023 low January 6). On the flip side, the breakout of 1.2164 (55-day SMA) would open the door to 1.2269 (weekly high February 14) and then 1.2447 (2023 high January 23).
The Zloty should benefit from a stronger Euro in 2023. However, economists at Commerzbank expect the EUR/PLN to move back higher in 2024.
Rising EUR/PLN rates in 2024
“We forecast the Euro to appreciate further through the rest of 2023 but weaken once again during 2024. Given the Zloty’s high-beta relationship to the Euro, we see EUR/PLN drifting down to around 4.65 by the end of 2023 as inflation moderates globally, which will alter perceptions about Poland’s negative real interest rate.”
“In 2024, we forecast EUR/PLN to rise again towards 4.80 as inflation will likely remain stubbornly above target.”
Source: Commerzbank Research
Economists at TD Securities expect the EUR/USD to move within a 1.05-1.11 range through the second quarter of the year. Thus, the pair is nearing the lower end of the range.
EUR upside this year
“While we continue to see EUR upside this year, we have downshifted our anticipated range versus the USD.”
“We now see EUR/USD in a 1.05-1.11 range through Q2, suggesting we're getting close to buy the dip territory.”
“EUR's drivers are broad-based reflecting the importance of China reopening, the easing terms of trade shock, relative growth and central bank outlooks.”
S&P 500 is set to find a short-term floor at the key cluster of supports around 3984/26, with the infdex expected to trade in a broad range over the medium-term, analysts at Credit Suisse report.
Temporary setback
“We look for the 63 and 200-DMAs and the 38.2% retracement of the 2022/23 upmove at 3984/26 to hold, in line with our view that this a temporary setback, ahead of further strength in due course to test key resistance at the 61.8% retracement of the 2022 fall and summer 2022 high at 4312/4325. We look for this to then prove a tough barrier to define the top of what we believe could be a broad and lengthy range.”
“Below 3886 is needed to suggest we may have seen a ‘false’ break higher and more important downturn within the broad range, with the next support then seen at 3764.”
- Chicago Fed National Activity Index recovered sharply in January.
- The US Dollar stays resilient against its rivals after this data.
The Federal Reserve Bank of Chicago's National Activity Index (CFNAI) rose to 0.23 in January from -0.46 in December. This reading came in much better than the market expectation of 0.03.
"The CFNAI Diffusion Index, which is also a three-month moving average, edged up to –0.10 in January from –0.15 in December," the publication further read. "Fifty-one of the 85 individual indicators made positive contributions to the CFNAI in January, while 34 made negative contributions."
Market reaction
The US Dollar Index clings to modest daily gains at 104.60 after this report.
- USD/JPY regains strong positive traction on Thursday and climbs to a fresh YTD peak.
- The upbeat US macro data reaffirms hawkish Fed expectations and underpin the USD.
- A positive risk tone weighs on the safe-haven JPY and remains supportive of the move.
The USD/JPY pair catches some bids during the early North American session and jumps to a fresh YTD peak, around the 135.35 region in the last hour.
The latest leg of a sudden spike follows the upbeat US data, which showed that Initial Jobless Claims unexpectedly fell to 192K during the week ended February 17. This further points to the underlying strength in the US labour market, which, along with persistently high inflation, should allow the Fed to continue hiking interest rates for longer. This, to a larger extent, offsets a downward revision of the US Q4 GD, which showed that the world's largest economy expanded by a 2.7% annualized pace against the 2.9% rise estimated previously.
Nevertheless, hawkish Fed expectations remain supportive of elevated US Treasury bond yields and continue to lend support to the US Dollar. This, in turn, is seen as a key factor pushing the USD/JPY pair higher. Apart from this, a modest recovery in the global risk sentiment - as depicted by a generally positive tone around the equity markets - undermines the safe-haven Japanese Yen (JPY) and provides an additional boost to the major. The momentum could also be attributed to some technical buying above the 135.00 psychological mark.
It, however, remains to be seen if bulls can capitalize on the move or opt to lighten their bets as the market focus now shifts to the Bank of Japan (BoJ) Governor candidate Kazuo Ueda's testimony on Friday. Investors will closely scrutinize Ueda's view on the future of yield curve control (YCC) and super-easy monetary policy. This, in turn, will play a key role in driving the JPY in the near term and determine the next leg of a directional move for the USD/JPY pair.
Technical levels to watch
- Initial Jobless Claims in the US decreased by 3,000 in the week ending February 18.
- US Dollar Index stays in positive territory above 104.50.
There were 192,000 initial jobless claims in the week ending February 18, the weekly data published by the US Department of Labor (DOL) showed on Thursday. This print followed the previous week's print of 195,000 (revised from 194,000) and came in slightly better than the market expectation of 200,000.
Further details of the publication revealed that the advance seasonally adjusted insured unemployment rate was 1.1% and the 4-week moving average was 191,250, an increase of 1,500 from the previous week's revised average.
"The advance number for seasonally adjusted insured unemployment during the week ending February 11 was 1,654,000, a decrease of 37,000 from the previous week's revised level," the DOL noted.
Market reaction
The US Dollar stays resilient against its rivals after this data with the US Dollar Index clinging to modest daily gains at around 104.60.
- The US BEA revised Q4 GDP lower to 2.7% from 2.9%.
- US Dollar Index clings to modest daily gains above 104.50.
The real Gross Domestic Product (GDP) of the US expanded at an annualized rate of 2.7% in the fourth quarter, the US Bureau of Economic Analysis' (BEA) second estimate showed on Thursday. This reading came in below the initial estimate and the market expectation of 2.9%.
"The updated estimates primarily reflected a downward revision to consumer spending that was partly offset by an upward revision to nonresidential fixed investment," the BEA explained in its publication. "Imports, which are a subtraction in the calculation of GDP, were revised up."
Market reaction
With the initial reaction, the US Dollar Index edged slightly higher and was last seen rising 0.1% on the day at 104.60.
- EUR/USD attempts to bounce off fresh 7-week lows near 1.0580.
- A deeper decline targets the YTD low near 1.0480.
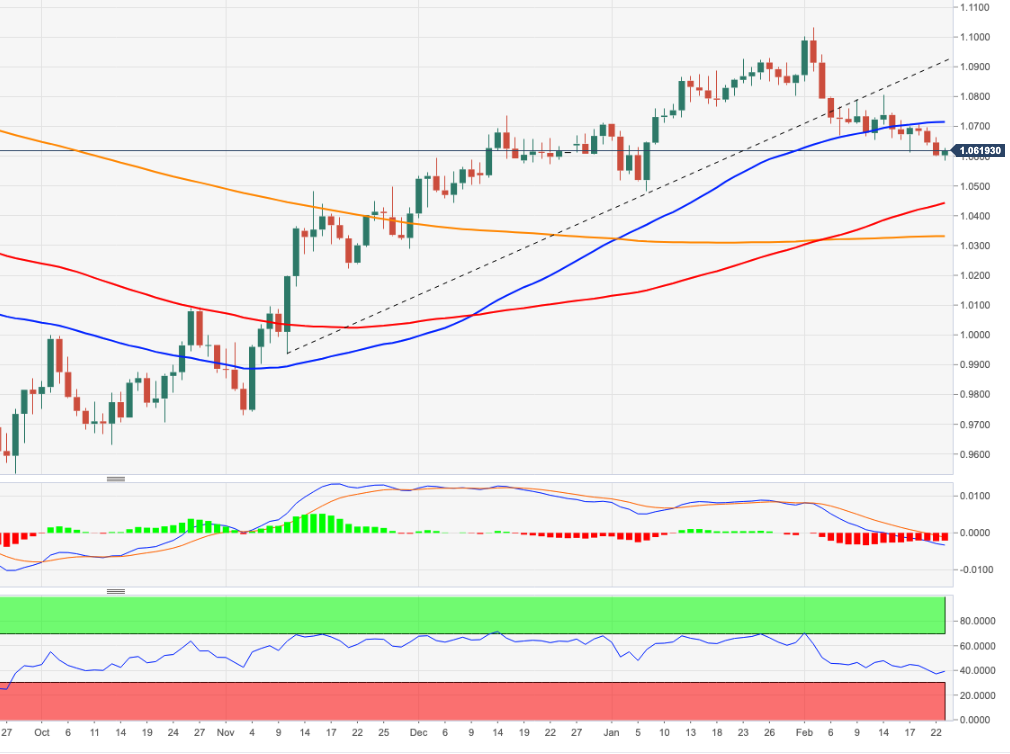
EUR/USD remains under pressure and briefly pierced the 1.0600 support for the first time since early January.
If sellers push harder, spot could extend the downside to the 2023 low at 1.0481 (January 6), an area reinforced by the proximity of the temporary 100-day SMA, today at 1.0441.
In the longer run, the constructive view remains unchanged while above the 200-day SMA, today at 1.0329.
EUR/USD daily chart
Nasdaq 100 is correcting lower, but economists at Credit Suisse look for key supports at 11912/699 to hold.
Break below 11912/699 would open up further weakness again
“Nasdaq 100 setback is likely to extend further to the key 63 and 200-day averages at 11912/699. We view this as a temporary setback as long as the market holds above here, with medium-term MACD momentum very close to turning outright positive”.
“We look for a clear and sustained break above 12856 post this setback and some further consolidation. We would then see resistance next at 13175, ahead of the 50% retracement and summer 2022 highs at 13603/721.”
“Below 11912/699 would open up further weakness again within the Q4 2022 range, with the next level at 11550, then 11252/50.”
- USD/CAD retreats from its highest level since January and is pressured by a combination of factors.
- A goodish rebound in Crude Oil prices underpins the Loonie and weighs on the pair amid a softer USD.
- The technical setup favours bullish traders and supports prospects for the emergence of dip-buying.
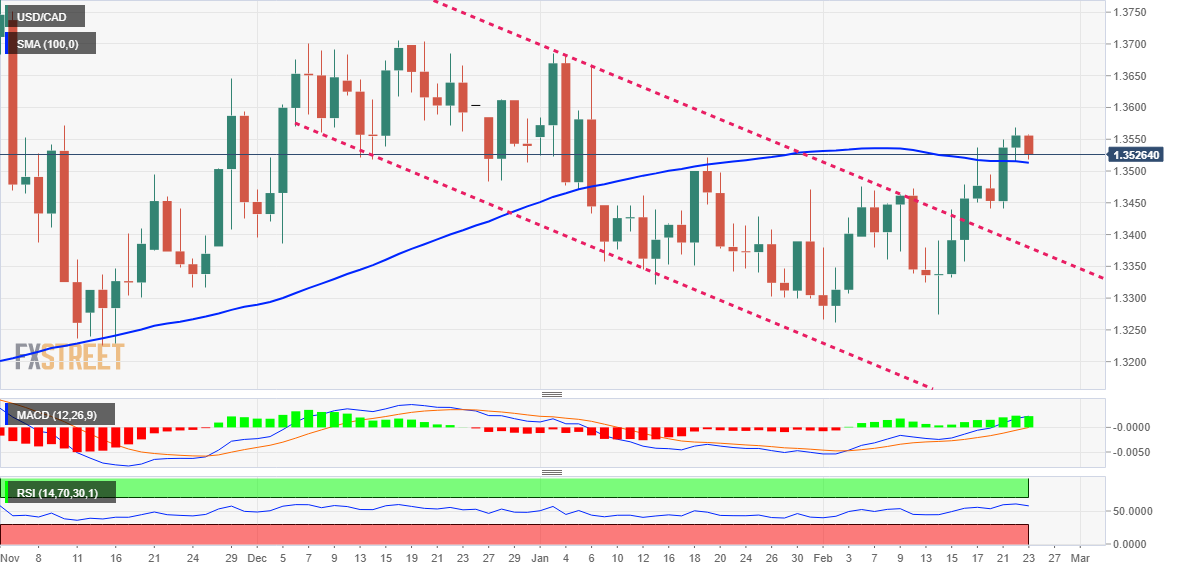
The USD/CAD pair comes under some selling pressure on Thursday and maintains its offered tone heading into the North American session. The pair is currently placed around the 1.3530 region, down less than 0.20% for the day, and so far, has managed to hold its neck above the 100-day Simple Moving Average (SMA).
A goodish recovery in Crude Oil prices underpins the commodity-linked Loonie, which, in turn, is seen as a key factor weighing on the USD/CAD pair. Apart from this, a slight improvement in the global risk sentiment acts as a headwind for the safe-haven US Dollar and exerts additional downward pressure on the major.
That said, elevated US Treasury bond yields, bolstered by the prospects for further policy tightening by the Federal Reserve, should limit any meaningful downside for the Greenback. Furthermore, looming recession risk should cap Oil prices and contribute to limiting the downside for the USD/CAD pair, at least for now.
From a technical perspective, last week's sustained breakout through a downward sloping trend-channel was seen as a fresh trigger for bullish traders. A subsequent move and acceptance above the 100-day SMA adds credence to the constructive setup and supports prospects for a further appreciating move for the USD/CAD pair.
Hence, a further decline below the 1.3500 psychological mark could be seen as a buying opportunity and remain limited near the 50-day SMA, currently around the 1.3460 region. This is followed by the 1.3440 horizontal support, which if broken decisively could drag the USD/CAD pair back towards challenging the 1.3400 mark.
Some follow-through selling will negate any near-term positive outlook and prompt aggressive technical selling. The USD/CAD pair might then accelerate the fall further towards testing the next relevant support near the 1.3330-1.3325 region en route to the 1.3300 mark and last week's swing low, around the 1.3275-1.3270 zone.
On the flip side, the overnight swing high, around the 1.3565-1.3570 area, now seems to act immediate hurdle ahead of the 1.3600 round figure. A sustained strength beyond the latter should allow the USD/CAD bulls to aim back towards retesting the YTD peak, around the 1.3680-1.3685 region touched in January.
USD/CAD daily chart
Key levels to watch
- The upside bias in DXY loses some impetus near 104.50.
- Further upside could revisit the 2023 top around 105.60 near term.
DXY struggles for direction in the upper end of the weekly range around 104.50 on Thursday.
The ongoing price action favours the continuation of the uptrend for the time being. Further bouts of strength should clear the February high at 104.68 (February 23) to allow for a probable challenge of the 2023 top at 105.63 (January 6).
In the longer run, while below the 200-day SMA at 106.45, the outlook for the index remains negative.
DXY daily chart
GBP/USD is trading little changed on the session but has lost a cent or so from yesterday’s peak. Economists at Scotiabank expect the pair to suffer a susbtantial drop to 1.1860 on failure to hold the above the low-1.19s.
Technical undertone for GBP/USD is bearish
“The GBP is tracking a little softer on the short-term charts and the technical undertone for GBP/USD is bearish. But the Pound is still trading above recent lows and key (longer term) support defined by the convergence of the 100 and 200-day MA signals at 1.1930/35.”
“Scope for GBP gains is limited (firm resistance at 1.2140/50 now) and loss of support in the low 1.19s will target a quick drop to major support at 1.1860 (Jan low).”
EUR/USD has eased below 1.06. Economists at Scotiabank expect the pair to extend its fall.
Modest gains are likely to remain well offered
“Short and medium-term trends are tilted bearish for the EUR.”
“EURUSD losses below key support in the upper 1.06s earlier this week increased technical pressure on the EUR and suggest more losses are likely in the short run and perhaps beyond.”
“There is little in terms of support below the market ahead of the mid-1.04 area – 1.0461 is the 38.2% Fib retracement of the 0.95/1.10 rally and looks to be the likely destination for the EUR over the next few weeks.”
“Resistance is 1.0650/75. Modest EUR gains are likely to remain well offered.”
- GBP/USD turns lower for the second successive day, though lacks follow-through selling.
- Hawkish Fed expectations, elevated US bond yields underpin the USD and exert pressure.
- A positive risk tone caps the buck and acts as a tailwind amid bets for more BoE rate hikes.
The GBP/USD pair meets with a fresh supply following an intraday uptick to the 1.2075 region and drops to a fresh daily low during the mid-European session. Spot prices manage to rebound from the vicinity of the 1.2000 psychological mark and now seem to have stabilized in neutral territory, just below the 1.2050 area.
The US Dollar remains pinned near a multi-week high, which, in turn, is seen as a key factor exerting some downward pressure on the GBP/USD pair. The FOMC meeting minutes released on Wednesday reaffirmed market expectations that the US central bank will continue to continue to tighten its monetary policy to tame stubbornly high inflation. Furthermore, the recent upbeat US macro data pointed to an economy that remains resilient despite rising borrowing costs and should allow the Fed to stick to its hawkish stance.
In fact, the markets are now pricing in at least a 25 bps lift-off at the next three FOMC policy meetings. This, in turn, assists the US Treasury bond yields to hold steady near the YTD peak and continues to underpin the Greenback. That said, a modest recovery in the global risk sentiment - as depicted by a generally positive tone around the equity markets - keeps a lid on the safe-haven buck. Apart from this, rising bets for additional interest rate hikes by the Bank of England (BoE) contribute to limiting losses for the GBP/USD pair.
The UK PMIs released on Tuesday indicated that business activity rose more than expected in February and fueled optimism that the country may be able to avoid a steep economic downturn. This, in turn, could persuade the BoE to keep its foot on the accelerator in its race against inflation. Hence, it will be prudent to wait for a sustained break below the 1.2000 mark before confirming that the GBP/USD pair's recent bounce from a technically significant 200-day Simple Moving Average (SMA) has already run out of steam.
Next on tap is the US economic docket, featuring the release of the Prelim (second estimate) Q4 GDP print and the usual Weekly Initial Jobless Claims. Traders will further take cues from comments by influential FOMC members - Atlanta Fed President Raphael Bostic and San Francisco Fed President Mary Daly. This, along with the US bond yields and the broader risk sentiment, will drive the USD and provide some impetus to the GBP/USD pair.
Technical levels to watch
UOB Group’s Economist Lee Sue Ann reviews the latest interest rate decision by the RBNZ.
Key Takeaways
“The Reserve Bank of New Zealand (RBNZ) decided to raise its official cash rate (OCR) by 50bps to 4.75% at its first meeting of the year. Today’s hike follows the 75bps hike at its final meeting of 2022, which was the largest increase since the New Zealand central bank introduced the OCR in 1999. Once again, the RBNZ signaled that the OCR still needs to increase, to ensure inflation returns to within its target range over the medium term.”
“Similar to the Nov Monetary Policy Statement, the RBNZ’s OCR forecasts today show the OCR peaking at 5.5% this year. It reiterated that it expects a recession starting in 2Q23, but the economy is seen rebounding back a little sooner next year. Meanwhile, it now sees inflation accelerating to 7.3% in the current quarter from 7.2% in 4Q22.”
“At this juncture, we are keeping to our forecast of three more 25bps rate hikes at its 5 Apr, 24 May and 12 Jul monetary policy meetings. This should bring the OCR to a peak of 5.50% by 3Q23.”
Economists at Nordea discuss JPY's outlook and maintain a bullish stance.
Turn-around in BoJ monetary policy expected later this year
“We remain fairly optimistic on JPY due to our expectations of a turn-around in BoJ monetary policy later this year.”
“With inflation reaching the highest point in decades and an outlook for higher wage growth ahead, the time should be ripe for a normalisation of BoJ’s stimulative monetary policy.”
“Moreover, JPY’s safe-haven status should come in handy if the negative risk outlook for the global economy and stocks materialise, and/or other G10 central banks are forced to cut rates.”
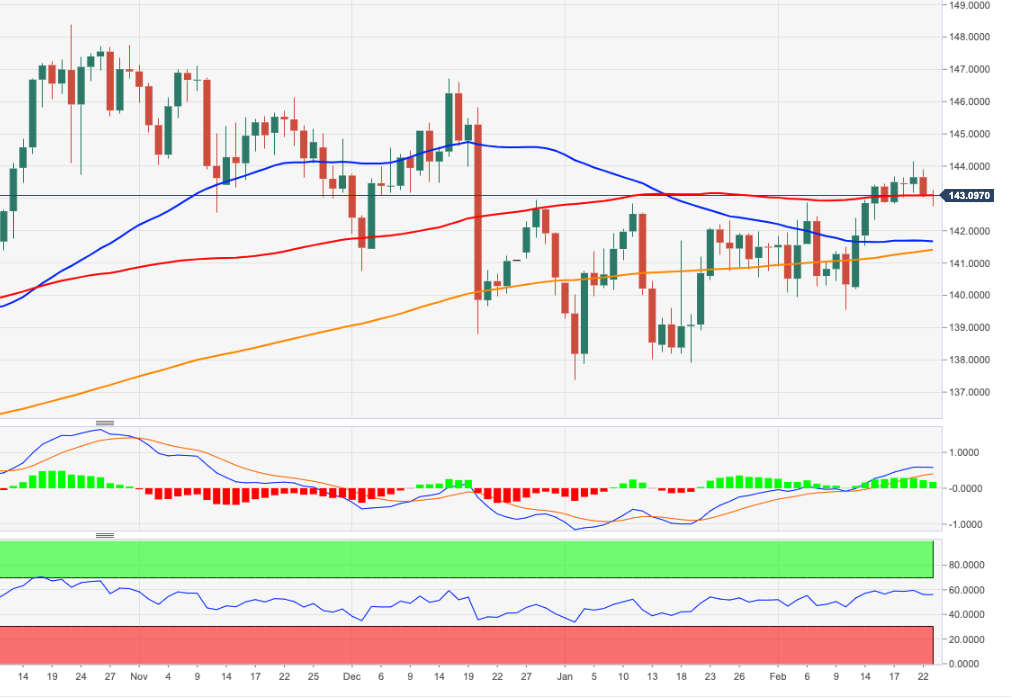
- EUR/JPY treads water around the 143.00 zone on Thursday.
- Extra gains appear on the cards above the 200-day SMA.
EUR/JPY alternates gains with losses in the 143.00 region on Thursday, an area coincident with the temporary 100-day SMA.
While the cross looks somewhat side-lined for the time being, a convincing breakout of the 2023 high at 144.16 (February 21) could spark extra strength to, initially, the December 2022 peak at 146.72 (December 15).
In the meantime, while above the 200-day SMA, today at 141.37, the outlook for the cross is expected to remain positive.
EUR/JPY daily chart
NZD/USD is up on the day. Moving away from the central bank and focusing on technical, economists at OCBC Bank see risks of bounce.
Falling wedge?
“Bearish momentum on daily chart intact while RSI is near oversold conditions. A falling wedge pattern appears to be forming and this is typically associated with a bullish reversal.”
“Support at 0.6170/85 levels (100, 200-DMAs), 0.6130 (38.2% fibo retracement of October low to Jan-Feb double top) and 0.6010 (50% fibo).”
“Resistance at 0.6280 (23.6% fibo), 0.6360 (21, 50-DMAs).”
EUR/USD extended its slide on Wednesday and touched its lowest level since early January at 1.0600. A move towards 1.05 is on the cards, economists at ING report.
EUR/USD remains soggy
“For the short term, EUR/USD remains soggy and it is hard to rule out a break under 1.0600 towards the 1.05 area.”
“Our game plan remains that 1.04/1.05 could now be some of the lowest EUR/USD levels of the year – but it feels like EUR/USD could trade on the offered side for a few weeks yet.”
GBP/USD erased a large portion of gains it recorded on Tuesday but managed to hold comfortably above 1.2000. Economists at OCBC Bank note that the pair needs to clear the 1.2160 to enjoy further gains.
Bullish divergence?
“Bearish momentum on daily chart faded while RSI rose. Potential bullish divergence not ruled out.”
“Key resistance at 1.2160 levels (21, 50-DMAs). A break above this can see GBP gains gather traction but failure to clear could see GBP revert to recent range.”
“Support at 1.1930/50 (23.6% fibo retracement of September low to December high, 100, 200-DMAs).”
Economist at UOB Group Lee Sue Ann assesses the latest set of data releases in the UK economy.
Key Takeaways
“While the UK economy managed to avert a recession at the end of 2022; the fall in Jan’s PMIs shows the manufacturing sector kicking off 2023 on the back foot, in much the same way as it ended 2022. Consumer confidence is below levels seen during the financial crisis, COVID-19 pandemic, and recessions in both the 1980s and 1990s.”
“The latest jobs numbers suggest that the tight labour market will remain a stubborn source of domestic inflationary pressure for some months. Meanwhile, inflation remains in double digits, five times above the Bank of England (BOE)’s target. And there seems to be little signs that UK wage growth is slowing.”
“We are penciling in 25bps hikes at the next 2 meetings on 23 Mar and 11 May, seeing the Bank Rate peak at 4.5%. We recognize, though, the risks to our forecasts given the BOE’s challenge of fighting inflation amid a difficult economic outlook, as reflected by the range of views on the MPC at their last meeting on 2 Feb.”
Bank of England (BoE) policymaker Catherine Mann said on Thursday that her focus on tighter policy reflects concerns about the possible non-linear nature of backward-looking inflation expectations, as reported by Reuters.
"We cannot be comfortable that inflation expectations are consistent with the 2% target," Mann added and noted public expectations for inflation next year are way above 2%. She further elaborated by saying that some businesses expect to raise wages by 6-7% to retain staff.
Market reaction
GBP/USD showed no immediate reaction to these comments and was last seen posting small daily losses at 1.2030.
- AUD/USD struggles to capitalize on its modest intraday gains amid a modest USD uptick.
- Bets for more rate hikes by the Fed push the US bond yields higher and underpin the buck.
- A positive risk tone caps the safe-haven USD and lends support to the risk-sensitive Aussie.
The AUD/USD pair trims a part of its modest intraday gains and retreats to the lower end of the daily range during the first half of the European session. Spot prices, however, manage to hold above the 0.6800 mark, representing a technically significant 200-day Simple Moving Average (SMA), and remain at the mercy of the US Dollar price dynamics.
In fact, the USD Index, which tracks the Greenback against a basket of currencies, stands tall near a multi-week high amid the prospects for further policy tightening by the Fed. The bets were reaffirmed by hawkish FOMC meeting minutes released on Wednesday, showing that policymakers were determined to raise rates further to tame stubbornly high inflation. Furthermore, St. Louis Fed President James Bullard pointed to the need to get inflation on a sustainable path toward the target this year.
It is worth recalling that the US CPI and PPI data indicated last week that inflation isn't coming down quite as fast as hoped. Moreover, the recent upbeat US macro data pointed to an economy that remains resilient despite rising borrowing costs and should allow the US central bank to stick to its hawkish stance. This, in turn, remains supportive of elevated US Treasury bond yields and underpins the buck. That said, a modest recovery in the risk sentiment lends support to the risk-sensitive Aussie.
Even from a technical perspective, the AUD/USD pair has been showing some resilience near the very important 200-day SMA support, currently around the 0.6800 mark. This makes it prudent to wait for a sustained break through the said handle before positioning for an extension of the recent pullback from the highest level since June 2022 touched earlier this month. The focus now shifts to the US economic docket - featuring the Prelim Q4 GDP print and the usual Weekly Initial Jobless Claims data.
Traders will further Apart from this, comments by influential FOMC members - Atlanta Fed President Raphael Bostic and San Francisco Fed President Mary Daly. This, along with the US bond yields and the broader market risk sentiment, will drive the USD demand and provide some meaningful impetus to the AUD/USD pair. Nevertheless, the fundamental backdrop seems tilted in favour of bearish traders and suggests that the path of least resistance for spot prices is to the downside
Technical levels to watch
EUR/USD is offered for fourth day. Economists at Société Générale believe that a move downward to the 1.05 mark is on the cards.
Dollar is unlikely to be sold aggressively
“We remain of the view that the Dollar is expensive longer term but tactically the bounce in February could have further to run if incoming data backs Fed tightening beyond May.”
“PCE inflation tomorrow and the next jobs and CPI prints in March fall before the next FOMC meeting and will decide if the last macro forecasts and dot plot will be revised. Until then, the Dollar is unlikely to be sold aggressively and a return of EUR/USD towards 1.05 cannot be ruled out.”
The release of the February FOMC minutes provided little comfort to Dollar bears. Economists at ING expect the greenback to remain on a solid foot in the near term.
Dollar bears will have to be patient
“The minutes were largely hawkish. The consensus agreed that further rate increases were needed and that inflation remained unacceptably high. There were no hints of a pause and very little to divert market pricing of three more 25 bps hikes from the Fed over the March, May and June meetings. This backdrop can keep the Dollar supported in the near term and potentially into the 22 March FOMC meeting.”
“For Dollar bears, both activity and price data will have to soften over the coming weeks to make an impact on an otherwise hawkish Fed.”
“Our first quarter game plan is that DXY does not hold onto these gains. But for the time being, it looks like DXY wants to probe higher to the 105.00 area with outside risks this quarter to the 106.00/106.50 area.”
Economists at Bank of America Global Research believe that the EUR/USD pair could retest 2022 closing lows around 0.98-1.00.
A bottom in Q1 would reduce the risk of retesting the 0.9800-1.00 area
“We’d be remiss to not mention that when Euro forms a bottom below 1.15 it tends to retest the monthly closing lows at least once. This means the risk of a retest of the 2022 closing lows in 1H23 still can’t be ruled out to form a bigger bottom.”
“If the new downtrend in the daily chart forms a bottom in Q1 then the risk would be reduced. We don’t have that yet. The monthly closing lows is in the 0.9800-1.00 area.”
- USD/JPY is seen oscillating in a narrow trading band and remains below the YTD top.
- Bets for additional interest rate hikes by the Fed underpin the USD and lend support.
- Traders seem reluctant ahead of BoJ Governor candidate Ueda's testimony on Friday.
The USD/JPY pair struggles to gain any meaningful traction on Thursday and oscillates in a narrow band, just below the 135.00 psychological mark through the first half of the European session. Spot prices, meanwhile, remain well within the striking distance of the YTD peak, around the 135.20-135.25 region set earlier this week.
The US Dollar is seen consolidating its recent gains to a multi-week high, which, in turn, acts as a headwind for the USD/JPY pair. The downside, however, remains cushioned, at least for the time being, amid expectations that the Federal Reserve will continue raising interest rates to tame stubbornly high inflation. In fact, the FOMC minutes released on Wednesday showed that a few members favoured raising the target range for the federal funds rate by 50 bps or they could have supported it.
Adding to this, St. Louis Fed President James Bullard noted the need to get inflation on a sustainable path toward the target this year. This comes after the US CPI and PPI data indicated last week that inflation isn't coming down quite as fast as hoped. Moreover, the US data pointed to an economy that remains resilient despite rising borrowing costs, which should allow the Fed to stick to its hawkish stance. This remains supportive of elevated US Treasury bond yields and lends some support to the Greenback.
Furthermore, a modest recovery in the global risk sentiment, which tends to undermine the safe-haven Japanese Yen (JPY), supports prospects for a further appreciating move for the USD/JPY pair. That said, traders seem reluctant to place aggressive bets and prefer to wait for the Bank of Japan (BoJ) Governor candidate Kazuo Ueda's testimony on Friday. Ueda's view on the future of yield curve control (YCC) and super-easy monetary policy should drive the JPY and provide a fresh impetus to the pair.
In the meantime, traders on Thursday will take cues from the US economic docket, featuring the release of the Prelim (second estimate) Q4 GDP print and the usual Weekly Initial Jobless Claims. This, along with the US bond yields, will drive the USD demand. Apart from this, the broader risk sentiment should contribute to producing short-term trading opportunities around the USD/JPY pair. Nevertheless, the fundamental backdrop suggests that the path of least resistance for the major is to the upside.
Technical levels to watch
USD/JPY extends its consolidation from 127.53/27, but analysts at Credit Suisse look for only a temporary floor.
Short-term momentum rising sharply
“USD/JPY has rebounded from our first target of the ‘neckline’ to the multi-year base and 50% retracement of the 2020/2022 uptrend at 127.53/27 and with short-term momentum rising sharply, we expect slightly further short-term strength up to 136.67/95, which we would then expect to cap.”
“Post this recovery, we expect a sustained break below 127.27 and then the 126.36 May 2022 low in due course, which should see weakness extend to the 61.8% retracement at 121.44 later on in the year.”
The prospects for further gains in USD/CNH appear unchanged while the pair trades above the 6.8700 level, suggest Economist Lee Sue Ann and Markets Strategist Quek Ser Leang at UOB Group.
Key Quotes
24-hour view: “Yesterday, we held the view that ‘there is room for USD to break above 6.9000 but the next major resistance level at 6.9300 is unlikely to come under threat’. Our view was not wrong as USD rose to 6.9080. Despite the advance, upward momentum has not improved much. Today, USD could edge higher to 6.9150; the major resistance at 6.9300 is still unlikely to come under threat. Support is at 6.8990, followed by 6.8910.”
Next 1-3 weeks: “We have held a positive USD view since early this month. In our latest narrative from yesterday (22 Feb, spot at 6.8920), we indicated that if USD were to break above 6.9000, the next level to monitor is at 6.9300. While USD took out 6.9000 as expected (high of 6.9080), upward momentum has not improved much. That said, the USD strength is intact as long as it stays above 6.8700 (‘strong support’ level previously at 6.8480). Looking ahead, a breach of 6.9300 will shift the focus to 6.9500.”
Bank of England (BoE) policymaker Catherine Mann is delivering a speech titled "The results of rising rates: Expectations, lags and the transmission of monetary policy" at the Resolution Foundation, in London.
Key quotes
"Failing to do enough on rates now risks the worst of both worlds – higher inflation and lower activity."
"Financial conditions are now looser than what likely will be needed to moderate the embedding of ongoing inflation into the wage- and price-setting paths."
"More tightening is needed, and a pivot is not imminent."
"A preponderance of turning points is not yet in the data."
"I worry about extended persistence of inflation into this year and the next."
"Monetary policy has taken a path which has been historically aggressive but perhaps insufficiently so."
Market reaction
The Pound Sterling received a bit of boost on Mann’s hawkish comments, sending GBP/USD to near 1.2030 from the daily low of 1.2015. The pair is still down 0.12% on the day.
- EUR/USD remains under pressure and breaches 1.0600.
- EMU Final inflation figures next of note in the calendar.
- Q4 GDP takes centre stage in the US docket.
Sellers keep the price action around the European currency subdued and prompt EUR/USD to pierce the 1.0600 support to clock new multi-week lows on Thursday.
EUR/USD focuses on USD, data
EUR/USD puts the 1.0600 neighbourhood to the test amidst the continuation of the gradual decline on Thursday, always against the backdrop of the relentless march north in the greenback.
Indeed, the pair navigates an area last traded during the first week of the new year amidst the equally, albeit in the opposite direction, uptick in the greenback to new multi-week highs in the 104.66/70 band.
No news around the pair leaves the ongoing speculation of the Fed’s tighter-for-longer stance as the exclusive driver of the sentiment around the pair for the time being, while expectations of a 50 bps rate hike by the ECB and a 25 bps raise in the Fed Funds Target Range by the Fed, both due in March, appear firm.
In the domestic calendar, final figures of the inflation during January in the broader Euroland will be the salient event on this side of the Atlantic, while another revision of the Q4 GDP Growth Rate, Initial Claims and the Chicago Fed National Activity Index will be in the limelight later in the NA session.
What to look for around EUR
EUR/USD loses further traction and slips back to the sub-1.0600 region, or multi-week lows, on Thursday.
In the meantime, price action around the European currency should continue to closely follow dollar dynamics, as well as the potential next moves from the ECB after the bank has already anticipated another 50 bps rate raise at the March event.
Back to the euro area, recession concerns now appear to have dwindled, which at the same time remain an important driver sustaining the ongoing recovery in the single currency as well as the hawkish narrative from the ECB.
Key events in the euro area this week: EMU Final Inflation Rate (Thursday) – Germany Final Q4 GDP Growth Rate/GfK Consumer Confidence (Friday).
Eminent issues on the back boiler: Continuation of the ECB hiking cycle amidst dwindling bets for a recession in the region and still elevated inflation. Impact of the Russia-Ukraine war on the growth prospects and inflation outlook in the region. Risks of inflation becoming entrenched.
EUR/USD levels to watch
So far, the pair is retreating 0.09% at 1.0594 and a drop below 1.0590 (monthly low February 17) would target 1.0481 (2023 low January 6) en route to 1.0329 (200-day SMA). On the other hand, the next up barrier emerges at 1.0804 (weekly high February 14) seconded by 1.1032 (2023 high February 2) and finally 1.1100 (round level).
- USD/CAD retreats from its highest level since January and is pressured by a combination of factors.
- A modest recovery in Oil prices undermines the Loonie and prompts some selling amid a softer USD.
- Bets for additional Fed rate hikes, recession fears should help limit the USD losses and lend support.
The USD/CAD pair comes under some selling pressure on Thursday and moves away from its highest level since January 6, around the 1.3565-1.3570 region touched the previous day. Spot prices remain depressed below mid-1.3500s through the first half of the European session, though manage to defend the 100-day Simple Moving Average (SMA) support.
Crude Oil prices edge higher and reverse a part of the previous day's slump to over a two-week low amid reports that Russia's supply cuts will be bigger than previously announced. This, in turn, underpins the commodity-linked Loonie, which, along with a modest US Dollar pullback from a multi-week high, acts as a tailwind for the USD/CAD pair. A slight improvement in the global risk sentiment is seen weighing on the safe-haven Greenback, though the prospects for further policy tightening by the Fed should help limit losses.
In fact, the FOMC minutes released on Wednesday showed that a few participants favoured raising the target range for the federal funds rate by 50 bps or they could have supported it. Adding to this, St. Louis Fed President James Bullard noted the need to get inflation on a sustainable path toward the target this year. This comes after the US CPI and PPI data indicated last week that inflation isn't coming down quite as fast as hoped. Moreover, the US data pointed to an economy that remains resilient despite rising borrowing costs.
This could allow the Fed to stick to its hawkish stance for longer and supports prospects for the emergence of some dip-buying around the USD. Apart from this, looming recession risks should keep a lid on any optimistic move in the markets and seem to act as a headwind for Crude Oil prices. This further contributes to limiting the downside for the USD/CAD pair. Even from a technical perspective, this week's sustained break through the 100-day SMA barrier suggests that the path of least resistance for the major is to the upside.
Traders now look to the US economic docket, featuring the release of the Prelim (second estimate) Q4 GDP print and the usual Weekly Initial Jobless Claims later during the early North American session. This, along with the broader risk sentiment, will drive the USD demand and provide some impetus to the USD/CAD pair. Apart from this, Oil price dynamics should further allow traders to grab short-term opportunities around the major.
Technical levels to watch
The USD upside correction is ending. Economists at Société Générale expect the greenback to weaken again.
The trend has been for the UK and Eurozone to do better than the US
“In relative terms, Europe lagged the US recovery, and the UK lagged the Eurozone, but now, the trend has been for the UK and Eurozone to do better than the US. That’s not reflected in all the data, but it is why the underlying trend has been for the EUR/USD to recover and the EUR/GBP to edge slowly higher.”
“The Dollar may have fallen too fast, and the rate re-think has triggered a recovery. But the underlying trend is for USD weakness to resume.”
Further comments are crossing the wires from US Treasury Secretary Janet Yellen, now speaking about the US-China ties. \
We are working with partners to strengthen sanctions.
We are working with partners to strengthen sanctions on Russia.
We will continue to impose further sanctions on Russia.
Communication between US and China is important for the rest of the world.
Will resume discussions with China on economic issues 'at an appropriate time'.
Does not have a specific time frame in mind for resuming dialogue with China.
Meanwhile, China’s Commerce Ministry urged the US to create good conditions for trade with China.
Related reads
- AUD/USD Forecast: Bearish route continues amid broad US Dollar demand
- China’s Commerce Ministry: Will take more measures to restore and expand consumption
- Gold price triggered another bearish run after FOMC Minutes showed a somewhat hawkish stance.
- US Dollar stays dominant across the board ahead of US Gross Domestic Product second estimate for Q4.
- PCE disinflation should continue, but any surprise could have a notable impact on Gold.
Gold price keeps trending lower after a bearish Wednesday, where the bright metal was weighed down by the release of somewhat hawkish Federal Open Market Committee (FOMC) Minutes. US Dollar made gains across the board, and XAU/USD closed below what had been thick support at $1,830 for the first time since January 3.
Market eyes will turn now to Friday’s US Personal Consumption Expenditures (PCE) Price Index release, the Fed’s preferred measure of inflation.
Gold news: FOMC Minutes hawkish, US Gross Domestic Product second estimate next
The FOMC Minutes showed that all Federal Reserve policymakers agreed more rate hikes would be needed to achieve inflation objectives and even that “a few participants” trend towards raising interest rates by 50 basis points, which would speed up the tightening monetary policy again.
This hawkish tone helped US Treasury bond yields rally, supporting the USD and weighing on the Gold price.
Thursday's economic docket has the publication of the second reading of the US Gross Domestic Product (GDP) numbers for the last quarter of 2022, but the market does not expect any changes to the 2.9% growth printed in the preliminary estimate. The weekly Jobless Claims release and some Fed speakers could bring some action to Gold price.
US PCE disinflation to continue, but how fast?
More important is the economic data to come out on Friday. The US Bureau of Economic Analysis (BEA) will publish the PCE Price Index, the Fed’s preferred gauge of inflation, at 13:30 GMT on Friday. Gold traders and investors will watch the data release closely, as Core PCE inflation is forecast to rise by 0.4% on a monthly basis but the annual figure is expected to decline to 4.1% in January from 4.4% in December. The market reaction should be straightforward, with a softer-than-expected monthly PCE inflation weighing on the US Dollar and vice versa, with Gold price reacting the opposite way.
Considering that the CPI report already revealed that inflation remained sticky in January, it would be surprising to see this data have a long-lasting impact on markets.
Gold price risks skewed to the downside
Dhwani Mehta, Senior Analyst at FXStreet, analyzes Gold price current bearish trend:
“Gold price has finally yielded a downside break, on a daily closing basis, from the critical horizontal trendline support from the January 5 low at $1,825. The breakdown has re-opened floors toward the $1,800 threshold. However, Gold bears will need to take out the seven-week low of $1,819 and the falling trendline support at $1,804 beforehand.”
Gold price in 2023: Up-and-down action
Financial markets have been a two-tale story for the early part of 2023, in which Gold price has reflected in its price action like no other asset. XAU/USD rode an uptrend during all of January with the market optimism about inflation slowing down and constant Federal Reserve dovish talk, only to see a drastic turnaround back to the old dynamics in February after a hot US Nonfarm Payrolls (NFP) report. The US economy adding more than 500K jobs in the month of January shifted the market expectations for the Fed easing its monetary policy, and the US Dollar has come back to the market King throne.
Gold price opened the year at $1,823.76 and reached a year-to-date high of $1,960 on February 2, right in between the first Federal Reserve meeting of the year and the surprising release of the US jobs report for January. Since then, the ongoing downtrend has been relentless, reaching levels close to the yearly open, around $1,830.
-638127390180349323.png)
Gold price daily chart
USD/CNY has strengthened sharply over the past few weeks to the 200-Day Moving Average (DMA), which analysts at Credit Suisse expect to act as the range top.
Key support is seen at 6.6965/10
“The market has now reached key resistance at 6.9022, which is the 200-DMA. We look for a hold below here and a move into a narrow, lower-level range, however we note that a break would open up 6.9982/7.0000, where we would have even more confidence in a cap if reached.”
“Key support is seen at 6.6965/10, then 6.6394, which should act as the range bottom. If this level is broken though, this would trigger a further setback toward 6.5220, where the 78.6% retracement can be identified. This though is not our base case for now.”
In the opinion of Economist Lee Sue Ann and Markets Strategist Quek Ser Leang at UOB Group, USD/JPY is expected to remain bid while above the 134.00 level in the short term.
Key Quotes
24-hour view: “We highlighted yesterday that ‘despite the strong advance, there has been no significant increase in upward momentum and USD is unlikely to strengthen much further’. We expected USD to consolidate between 134.20 and 135.20. Our view of consolidation was not wrong even though USD traded within a narrower range than expected (134.35/135.06). Upward momentum has firmed somewhat and USD is likely to edge higher today. However, any advance is unlikely to break the major resistance at 135.50. Support is at 134.60, a breach of 134.35 would indicate that the build-up in momentum has faded.”
Next 1-3 weeks: “On Monday (20 Feb, spot at 134.35) we highlighted that USD could consolidate for a couple of days before heading higher to the next target at 135.50. It has been a couple of days but there is no sign that USD is ready to head higher to 135.50. However, upward momentum appears to be firm and the risk is still to the upside. Only a break of 134.00 (‘strong support’ level was at 133.60 yesterday) would indicate that the USD strength that started in the middle of last week has come to an end. Looking ahead, if the USD breaks decisively above 135.50, the next level to watch is 137.00.”
- NZD/USD attracts some buying in the vicinity of a technically significant 200-day SMA.
- A positive risk tone undermines the USD and lends support to the risk-sensitive Kiwi.
- Recession fears, bets for more Fed rate hikes limit the USD losses and cap the major.
The NZD/USD pair continues to find support ahead of a technically significant 200-day Simple Moving Average (SMA) and attracts some buyers in the vicinity of the 0.6200 mark on Thursday. The pair sticks to its modest intraday gains through the early European session, albeit lacks bullish conviction and seems to struggle to capitalize on the move beyond the 0.6250 level.
Despite local headwinds from severe flooding and cyclone, the Reserve Bank of New Zealand (RBNZ) raised the official cash rate (OCR) target by 50 bps on Wednesday. Adding to this, RBNZ Governor Adrian Orr said that core inflation is too high and that expectations are elevated. This, in turn, lifts bets for further policy tightening by the central bank and underpins the New Zealand Dollar. Meanwhile, a slight recovery in the global risk sentiment seems to undermine the safe-haven US Dollar and lends support to the NZD/USD pair.
That said, looming recession risks, along with geopolitical tensions, should keep a lid on any optimism in the markets and act as a headwind for the risk-sensitive Kiwi. Furthermore, growing acceptance that the Federal Reserve will continue raising interest rates to control inflation should limit losses for the Greenback and cap the NZD/USD pair. In fact, the FOMC meeting minutes released on Wednesday showed that a few participants favoured raising the target range for the federal funds rate by 50 bps or they could have supported it.
Furthermore, St. Louis Fed President James Bullard noted the need to get inflation on a sustainable path toward the target this year. This comes on the back of the recent robust US macro data, which indicated an economy that remains resilient despite rising borrowing costs and should allow the Fed to stick to its hawkish stance. Moreover, the US CPI and PPI data released last week suggested that inflation isn't coming down quite as fast as hoped. This, in turn, supports prospects for the emergence of some USD dip-buying.
Hence, it will be prudent to wait for a strong follow-through buying around the NZD/USD pair before confirming that the recent pullback from the highest level since June 2022 has run its course. Traders now look forward to the US economic docket, featuring the release of the Prelim (second estimate) Q4 GDP print and the usual Weekly Initial Jobless Claims later during the early North American session. This, along with the broader risk sentiment, will influence the USD price dynamics and provide some impetus to the NZD/USD pair.
Technical levels to watch
US Treasury Secretary Janet Yellen said on Thursday, “sanctions imposed with Western allies are isolating Russia's economy and degrading its productive capacity.”
Additional quotes
US will provide $10 billion in new economic aid to Ukraine in coming months.
Economic aid from US, allies is enabling ukraine's resistance by keeping govt running, funding critical public services.
Critical that IMF move swiftly on a fully financed programme for Ukraine, will promote 'continued robust support' at G20 meetings.
Global economic outlook has improved since last G20 meetings in October, some spillovers from Ukraine war have been mitigated.
Western price caps on Russian oil have helped cut Moscow's oil revenue by 60%.
Will continue to push China, other bilateral creditors for 'meaningful debt treatment' for distressed developing countries.
Will discuss how G20 can advance World Bank reforms to boost finance to fight climate change, other global challenges.
We would like to see strong condemnation of war on Ukraine.
Will express views that russia is in clear violation of international law in its war on Ukraine.
Russia's war in Ukraine is principal factor shaping global economic outlook.
Communique still under negotiation, but past g20 statements have contained strong language on ukraine conflict.
Market reaction
Amidst escalating geopolitical tensions, Yellen’s comments are helping the safe-haven US Dollar recover some ground in the European trading hours. The US Dollar Index is down 0.13% on the day, trading at 104.45 as of writing.
The Bank of Korea stays put for the first time since April 2022. Economists at ING think the BoK may begin its rate cut cycle in the fourth quarter of the year.
BoK puts brakes on rate hike but keeps hawkish tilt
“The BoK’s ‘hold’ decision was widely expected. But one dissenting vote, Governor Rhee Chang-yong's hawkish comments, and growing uncertainty over inflation have hinted that the BoK will leave the door open for further rate hikes for now.”
“We believe that the BoK may enter an easing cycle in the fourth quarter as inflation is expected to fall to the 2% range.”
A Chinese commerce ministry spokesperson said at a news conference on Thursday, the recovery momentum in the country’s consumer market was strong in January.
“The government will take more measures to revive and expand consumption,” the ministry official said.
Market reaction
AUD/USD was last seen trading at 0.6830, adding 0.41% on the day.
Considering advanced prints from CME Group for natural gas futures markets, open interest shrank by nearly 6K contracts on Wednesday after four consecutive daily builds. On the other hand, volume rose for the third session in a row, this time by more than 8K contracts.
Natural Gas: Interim support emerges around $2.00
Prices of natural gas appear to have met some initial and so far decent support around the key $2.00 mark per MMBtu. Wednesday’s bounce, however, was accompanied by decreasing open interest, which hints at the idea that a convincing rebound is not favoured for the time being.
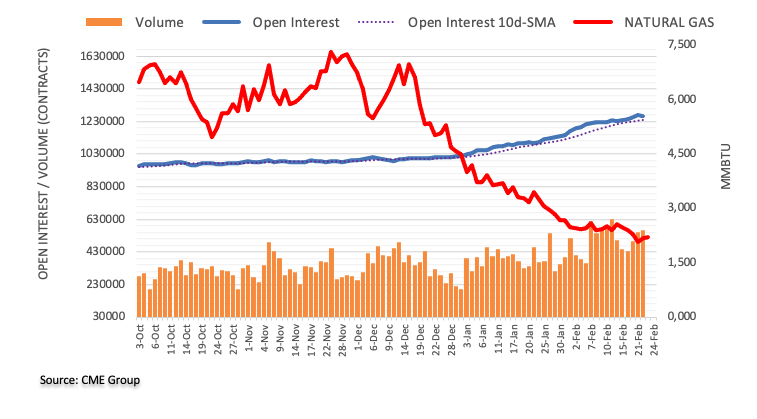
USD/JPY mostly follows US yields. Economists at Société Générale expect the pair to end the year at the 125 level.
US yields are still the Yen’s main driver
“Day to day, the USD/JPY still tracks US yields, but Friday’s parliamentary hearings should give us a chance to gauge Governor-nominee Ueda’s views.”
“We still expect to see 2023 end with the USD/JPY at 125 and 10y Treasury yields significantly lower than today.”
See: USD/JPY to tick down toward 125 over coming months – Rabobank
NZD/USD risks extra losses while below the 0.6285 level, according to Economist Lee Sue Ann and Markets Strategist Quek Ser Leang at UOB Group.
Key Quotes
24-hour view: “We highlighted yesterday that NZD ‘is under mild downward pressure and the bias is to the downside but a break of the major support at 0.6195 is unlikely’. NZD did not quite trade with a downside bias as it gyrated between 0.6206 and 0.6251 before settling at 0.6220 (+0.10%). The price movements appear to be part of a consolidation phase. Today, we expect NZD to trade sideways between 0.6200 and 0.6250.”
Next 1-3 weeks: “Two days ago (20 Feb, spot at 0.6230), we highlighted that NZD has to break below 0.6195 within these 1-2 days or the chance for further weakness will diminish quickly. NZD traded sideways the past few days and did not break 0.6195. Downward momentum is fading quickly but as long as 0.6285 (no change in ‘strong resistance’) is not breached, there is still a slim chance for NZD to break below 0.6195. Looking ahead, if NZD were to break clearly below 0.6195, the next level to monitor is at 0.6150.”
- GBP/USD regains positive traction amid a modest USD pullback from a multi-month top.
- Signs of stability in the equity markets turn out to be a key factor weighing on the buck.
- Bets for additional BoE rate hikes underpin the GBP and remain supportive of the uptick.
- Hawkish Fed expectations, looming recession risks to limit the USD losses and cap the pair.
The GBP/USD pair attracts some dip-buying near the 1.2040-1.2035 area on Thursday and reverses a part of the previous day's downfall. The pair stick to its modest intraday gains through the early European session and is currently placed near the top end of the daily range, around the 1.2065-1.2070 region, through lacks bullish conviction.
Rising bets for additional interest rate hikes by the Bank of England (BoE) act as a tailwind for the British Pound. This, along with a modest US Dollar pullback from a multi-week high, lends some support to the GBP/USD pair. A slight improvement in the global risk sentiment - as depicted by a generally positive tone around the equity markets - undermines the safe-haven buck. That said, a combination of factors should help limit deeper losses for the Greenback and cap the upside for the major.
Investors remain worried about economic headwinds stemming from rapidly rising borrowing costs. This, along with geopolitical tensions, should keep a lid on any optimism in the markets. Apart from this, growing acceptance that the Federal Reserve will continue to raise interest rates to tame persistently high inflation favours the USD bulls. In fact, the FOMC meeting minutes released on Wednesday showed that a few participants favoured raising rates by 50 bps or they could have supported it.
Moreover, the US CPI and PPI data released last week showed that inflation isn't coming down quite as fast as hoped. Adding to this, the recent robust US macro data pointed to an economy that remains resilient despite rising borrowing costs and should allow the Fed to stick to its hawkish stance. In the absence of any relevant UK economic data, the fundamental backdrop makes it prudent to wait for a strong follow-through buying around the GBP/USD pair before positioning for further intraday appreciating move.
Traders now look to the US economic docket, featuring the release of the Prelim (second estimate) Q4 GDP print and the usual Weekly Initial Jobless Claims later during the early North American session. This, along with the broader risk sentiment, will influence the USD price dynamics and provide some impetus to the GBP/USD pair.
Technical levels to watch
- The index meets some initial resistance in the 104.50 region.
- FOMC Minutes noted some members favoured a 50 bps rate hike.
- Another revision of Q4 GDP, Initial Claims next on tap in the docket.
The USD Index (DXY), which gauges the greenback vs. a basket of its main competitors, struggles for direction in the mid-104.00s on Thursday.
USD Index looks to data, Fedspeak
The upside momentum in the index appears to have met some initial resistance in the 104.50 zone so far this week.
In the meantime, the cautious trade appears to prevail on Thursday ahead of the release of the US inflation figures tracked by the PCE on Friday – the Fed’s preferred gauge.
The monthly rally in the dollar remains underpinned by the hawkish narrative from Fed speakers as well as the resilient stance of the US economy, particularly in the labour market.
Furthermore, and despite there were no surprises at the publication of the FOMC Minutes late on Wednesday, participants did reiterate that further evidence is still needed to assess a convincing loss of traction of the inflation pressures.
Moving forward, the US data space will see another revision of the Q4 GDP Growth Rate, usual weekly Claims and the Chicago Fed National Activity Index.
What to look for around USD
The dollar faces an initial up barrier near 104.50 ahead of the release of key US results, particularly the PCE for the month of January (due on Friday).
The probable pivot/impasse in the Fed’s normalization process narrative is expected to remain in the centre of the debate along with the hawkish message from Fed speakers, all after US inflation figures for the month of January showed consumer prices are still elevated, the labour market remains tight and the economy maintains its resilience.
The loss of traction in wage inflation – as per the latest US jobs report - however, seems to lend some support to the view that the Fed’s tightening cycle have started to impact on the still robust US labour markets somewhat.
Key events in the US this week: Advanced Q4 GDP Growth Rate, Initial Jobless Claims, Chicago Fed National Activity Index (Thursday) – PCE, Core PCE, Personal Income/Spending, Final Michigan Consumer Sentiment, New Home Sales (Friday).
Eminent issues on the back boiler: Rising conviction of a soft landing of the US economy. Slower pace of interest rate hikes by the Federal Reserve vs. shrinking odds for a recession in the next months. Fed’s pivot. Geopolitical effervescence vs. Russia and China. US-China trade conflict.
USD Index relevant levels
Now, the index is retreating 0.09% at 104.40 and faces the next hurdle at 104.66 (monthly high February 27) seconded by 105.63 (2023 high January 6) and then 106.45 (200-day SMA). On the other hand, the breach of 102.58 (weekly low February 14) would open the door to 100.82 (2023 low February 2) wand finally 100.00 (psychological level).
EUR/USD has extended its setback. Economists at Credit Suisse expect the pair to trade within a broad 1.05-1-10 range for the time being.
Break above 1.0802/06 needed to clear the way for strength back to test 1.0944
“Near-term momentum stays lower and has now crossed below zero, which suggests a deeper corrective setback to next support at the 38.2% retracement of the 2022/2023 rally and early January YTD low at 1.0483/63. We look for this to prove better support if tested though and to act as the bottom end of a broad ~1.05-1.10 range for now.”
“Above 1.0802/06 is needed to clear the way for strength back to test the 50% retracement of the 2021/2022 fall at 1.0944. This should prove a tough barrier for now, but an eventual weekly close above here should see a move back to the 1.1035 current YTD high and eventually what we look to be tougher resistance at 1.1185/1.1275.”
Eurostat will release the Eurozone Harmonised Index of Consumer Prices (HICP) data for January on Thursday, February 23 at 10:00 GMT and as we get closer to the release time, here are the expectations forecast by the economists and researchers of four major banks regarding the upcoming EU inflation print.
Headline is expected at 8.7% year-on-year vs. 8.5% in December while core is set to remain unchanged at 5.2%. On a monthly basis, the HICP in the old continent is expected to fall by -0.4% in the reported period while the core HICP is also seen down by -0.8%.
Commerzbank
“In the preliminary estimate of the euro area inflation rate for January, Eurostat statisticians apparently assumed a previous month's rate of change in the harmonised consumer price index of -0.1% for Germany. According to a preliminary estimate by the Federal Statistical Office, however, the index rose by 0.5%. This means that the consumer price index for the euro area did not fall by 0.4% in January, but only by 0.2%. The YoY rate of change is thus likely to be revised upwards from 8.5% to 8.6% or possibly even to 8.7%.”
TDS
“While EZ inflation data is rarely revised by much, we look for headline inflation to be revised up by 0.2ppts in Jan – which would mark the biggest revision since 2015. Our forecast (Headline 8.7%, Core 5.2% YoY) is primarily driven by the discrepancy between the actual and Eurostat's estimate of the delayed German inflation data, as Eurostat's estimate did not account for the major energy subsidy changes.”
SocGen
“With the delayed German inflation release printing at 9.2%, which is above the 8.5/8.6% estimate that we believe Eurostat used, the final euro area HICP figure may be revised up from 8.5% to 8.6%. For core and the other major components, there is more uncertainty over whether they will be revised, especially with Germany only releasing data on the headline figure.”
Nomura
“The flash estimate of January euro area HICP inflation printed at 8.5% YoY. This, however, assumed 8.6% YoY inflation for Germany; at the time of publication, German data were unavailable, so it required Eurostat to make an assumption. German headline inflation, meanwhile, subsequently printed at 9.2% YoY. According to our calculations, this should push euro area headline HICP inflation for January up to 8.7% YoY, and push euro area core HICP inflation for January to 5.3% YoY (from 5.2% YoY in the flash estimate).”
CME Group’s flash data for crude oil futures markets noted traders increased their open interest positions by around 28.8K contracts on Wednesday after four straight daily drops. Volume followed suit and went up by around 12.7K contracts, extending the ongoing choppiness.
WTI risks a probable decline to the YTD low
Wednesday’s strong retracement in prices of the WTI came amidst rising open interest and volume and is suggestive that extra weakness could emerge on the horizon in the very near term. Against that, the next support level of relevance is seen at the 2023 low at $72.30 per barrel (February 6).
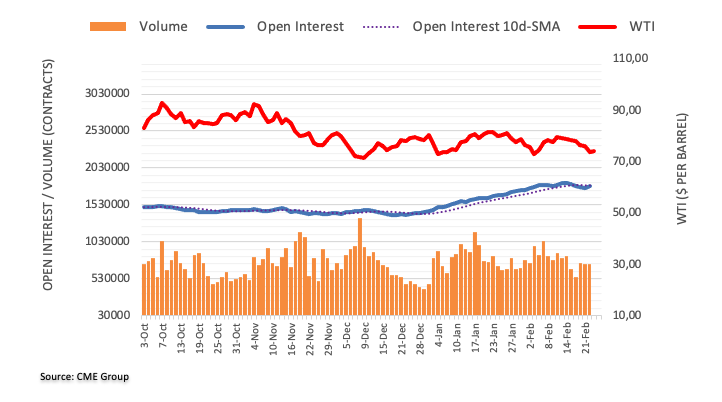
Economist Lee Sue Ann and Markets Strategist Quek Ser Leang at UOB Group note GBP/USD is expected to navigate within the 1.2000-1.2210 range in the next weeks.
Key Quotes
24-hour view: “Our view that the ‘overbought rise in GBP could extend to 1.2165’ was incorrect as it dropped sharply to a low of 1.2035. While there is room for GBP to weaken further, it is unlikely to break the major support at 1.2000. Resistance is 1.2075, followed by 1.2105.”
Next 1-3 weeks: “We continue to hold the same view as yesterday (22 Feb, spot at 1.2115). As highlighted, the current price movements appear to be part of a broad consolidation range and GBP is likely to trade between 1.2000 and 1.2210 for the time being.”
- Silver regains positive traction on Thursday and reverses a part of the overnight slide.
- The formation of a rectangle on the daily chart marks a bearish consolidation phase.
- A sustained break below the 50% Fibo. level will set the stage for a further downfall.
Silver attracts some buyers on Thursday and reverses a part of the previous day's rejection slide from a technically significant 100-day Simple Moving Average (SMA) around the $22.00 mark. The white metal sticks to its gains through the early European session and currently trades around the $21.65-$21.70 area, up around 0.80% for the day.
Looking at the broader picture, the XAG/USD has been oscillating in a familiar range over the past week or so, forming a rectangle on the daily chart. Against the backdrop of the recent pullback from the $24.65 area, or the highest level since April 2022, the rectangle could now be categorized as a bearish consolidation phase. Moreover, oscillators on the daily chart are holding deep in the negative zone and are still far from being in the oversold territory.
The aforementioned technical setup suggests that the path of least resistance for the XAG/USD is to the downside. That said, bearish traders are more likely to wait for a convincing break below the 50% Fibonacci retracement level of the recent rally from October 2022 before placing aggressive bets. Some follow-through selling below the monthly low, around the $22.20-$22.15 area, will reaffirm the negative bias and pave the way for deeper losses.
The XAG/USD might then accelerate the fall towards testing the next relevant support near the $20.60 zone. The downward trajectory could get extended further towards the $20.00 psychological mark and drag the white metal to the $19.75-$19.70 region.
On the flip side, any further move up might continue to confront stiff resistance near the $22.00 mark, or the 100-day SMA. That said, some follow-through buying beyond the 38.2% Fibo. level of the recent rally from October 2022, around the $22.15 zone, could negate the bearish bias. The subsequent short-covering rally might then lift the XAG/USD towards the $22.55-$22.60 supply zone, en route to the 23.6% Fibo. level, around the $23.00 round figure.
Silver daily chart
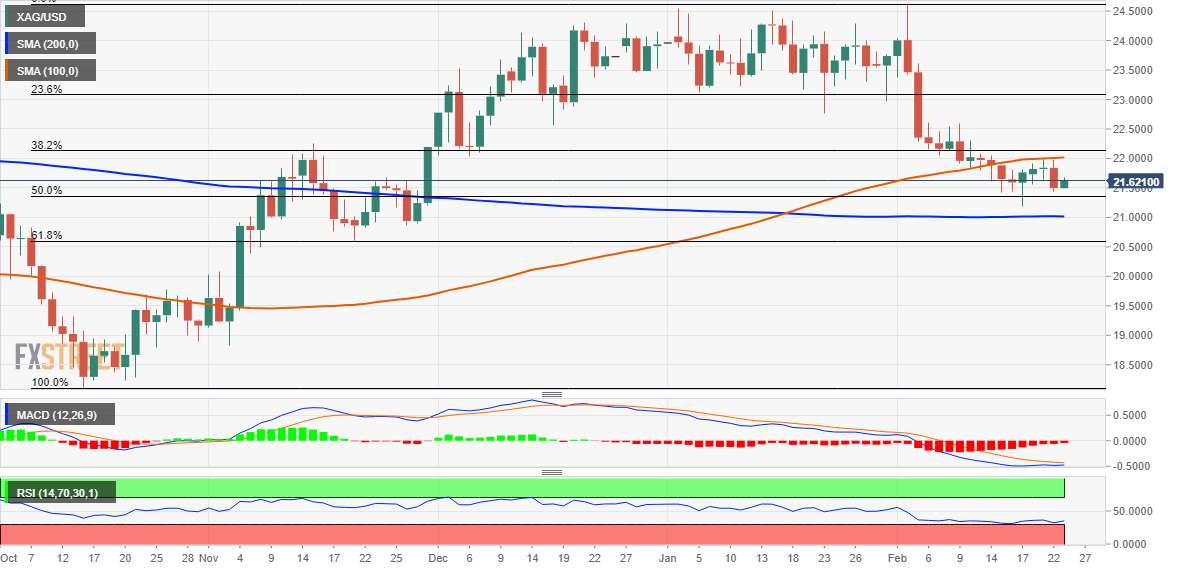
Key levels to watch
Here is what you need to know on Thursday, February 23:
Supported by the FOMC Minutes, the US Dollar Index registered gains for the second straight day on Wednesday but started to edge lower early Thursday amid improving market mood. The US Bureau of Economic Analysis will release its second estimate of the fourth-quarter Gross Domestic Product (GDP) growth later in the day. The US economic docket will also feature the weekly Initial Jobless Claims and the Chicago Fed's National Activity Index. Eurostat will publish its revisions to January inflation figures.
The minutes of the FOMC's first policy meeting of the year revealed that all policymakers agreed more rate hikes will be needed to achieve inflation objectives. The publication also acknowledged that a "few participants" favoured raising rates by 50 basis points but didn't offer any details regarding these discussions. In turn, the benchmark 10-year US Treasury bond yield recovered modestly from daily lows but ended up closing in negative territory. Meanwhile, Wall Street's main indexes ended the day mixed.
In the early European morning, US stock index futures are up between 0.3% and 0.9%, pointing to a positive shift in risk sentiment. The 10-year yield holds steady above 3.9% and the US Dollar Index is down modestly at around 104.30.
While testifying on policy, Reserve Bank of New Zealand Governor Adrian Orr said that core inflation is still too high and that expectations are elevated. "Monetary conditions need to tighten further," Orr added and NZD/USD gained traction during the Asian trading hours. As of writing, the pair was up 0.5% on the day at 0.6250.
EUR/USD extended its slide on Wednesday and touched its lowest level since early January at 1.0600 before staging a modest rebound early Thursday. Citing diplomats, Reuters reported on Wednesday that European Union countries have not reached an agreement about the new sanction package against Russia. Members will have more talks on Thursday.
GBP/USD erased a large portion of the PMI-inspired gains it recorded on Tuesday but managed to hold comfortably above 1.2000. The pair clings to modest recovery gains early Thursday while staying below 1.2100.
USD/JPY failed to stabilize above 135.00 and closed modestly lower on Wednesday. The pair continues to trade in a tight channel below that level in the European morning.
Gold price continued to stretch lower despite retreating US Treasury bond yield and closed below $1,830 for the first time since early January. XAU/USD, however, staged a correction during the Asian trading hours and was last seen trading slightly above $1,830.
Bitcoin lost more than 1% on Wednesday after having failed to stabilize above $25,000. BTC/USD edges higher early Thursday and trades near $24,400. Following a two-day slide, Ethereum rises toward $1,700 and is up more than 1% on the day.
Gold price sees pullback before targeting $1,804 support, FXStreet’s Dhwani Mehra reports.
Risks skewed to the downside
“Gold price has finally yielded a downside break, on a daily closing basis, from the critical horizontal trendline support from the January 5 low at $1,825. The breakdown has re-opened floors toward the $1,800 threshold. However, Gold bears will need to take out the seven-week low of $1,819 and the falling trendline support at $1,804 beforehand.”
“On the flip side, the $1,850 psychological level need to be scaled on a sustained basis to revive the bullish interests. The intraday high at $1,831 and the last Friday’s high at $1,848 could make it a tough road for Gold buyers on a potential recovery attempt.”
See – Gold Price Forecast: XAU/USD starts to look oversold, time to buy? – Standard Chartered
- AUD/USD picks up bids to defend the bounce off key DMA, pokes five-week-old previous support.
- Bearish MACD signals, downbeat RSI keeps sellers hopeful.
- Buyers need to cross 0.6975 to retake control.
AUD/USD holds onto the day-start rebound from a seven-week low as bulls attack the previous support line near 0.6835 during early Thursday morning in Europe. In doing so, the Aussie pair defends the bounce off the 200-DMA to print the first daily gains in three.
It’s worth noting, however, that the recovery remains elusive amid bearish MACD signals and the downbeat RSI (14). Adding strength to the downside bias is the AUD/USD pair’s sustained trading beneath the support-turned-resistance line from late December 2022.
That said, the AUD/USD bears are on the watch and waiting for a clear break of the 200-DMA, around 0.6800 at the latest, to initiate fresh short positions.
Following that, a slump toward the previous monthly low surrounding 0.6685 can’t be ruled out.
However, the last December’s bottom surrounding 0.6630 could challenge the AUD/USD bears afterward.
On the flip side, a daily closing beyond the immediate hurdle, namely the support-turned-resistance line of 0.6835-40, can challenge the weekly high of 0.6920.
Even so, the upside momentum remains unclear before the AUD/USD crosses a bit longer previous support line, close to 0.6970 at the latest.
Also acting as an upside hurdle is the 0.7000 threshold and the mid-February swing high near 0.7030.
Overall, AUD/USD rebound remains unimpressive as bears keep the reins.
AUD/USD: Daily chart
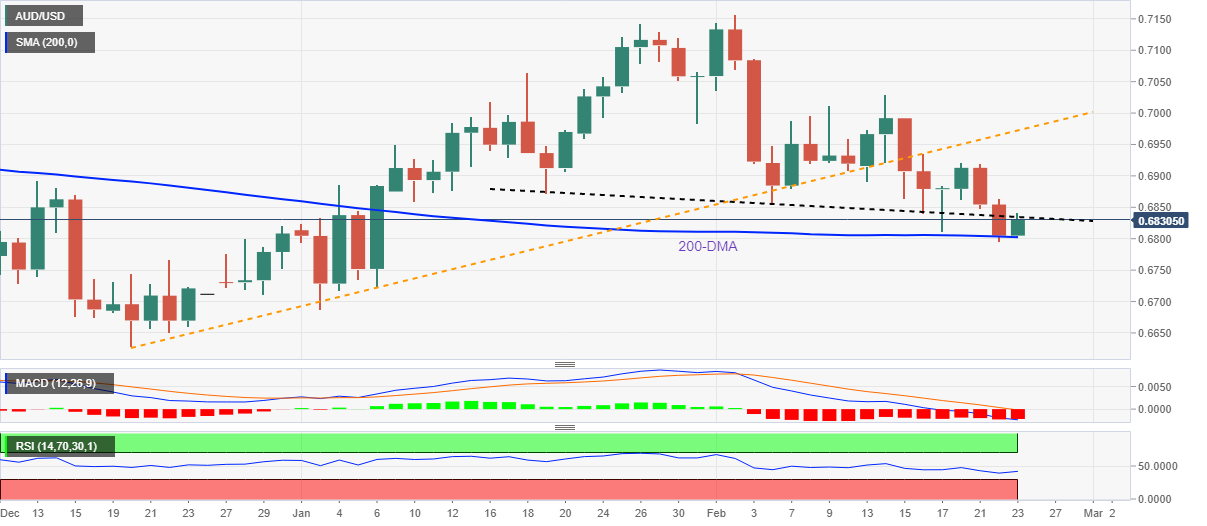
Trend: Bearish
Open interest in gold futures markets rose for the second session in a row on Wednesday, this time by around 3.4K contracts according to preliminary readings from CME Group. Volume, instead, shrank by around 70.3K contracts, reversing the previous daily build.
Gold: Next on the downside comes $1820
Gold prices extended the weekly leg lower on Wednesday. The downtick was on the back of increasing open interest, which is indicative that further decline lies ahead for the yellow metal. Against that, the next support emerges at the 2023 low around $1820 (February 17).
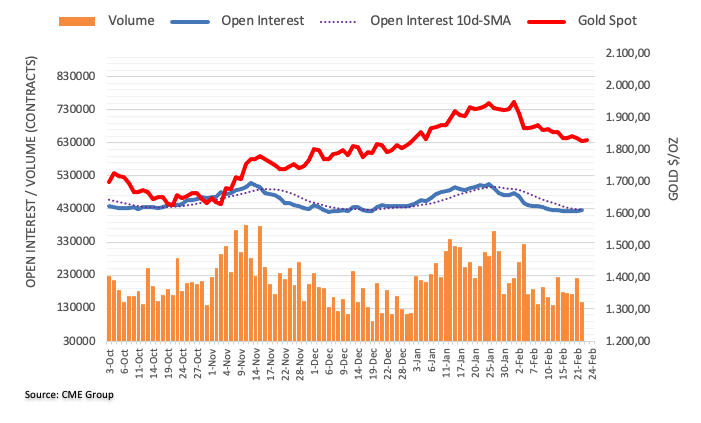
- USD/JPY fades bounce off intraday low, prints mild losses to snap four-day uptrend.
- Treasury bond yields remain lackluster on Japan holiday.
- Retreat in US inflation expectations joins mixed geopolitical, Fed headlines to probe momentum traders.
USD/JPY retreats to 134.80 as bears appear determined to retake control, after a four-day absence, during early Thursday. Even so, Japan’s holiday and hawkish Fed concerns join geopolitical fears to challenge the downside momentum. As a result, the yen pair prints mild losses during the first downbeat day in five.
Starting with the Yen positive headlines, the retreat in the US Treasury bond yields and inflation expectations, per the 10-year and 5-year breakeven inflation rates from the St. Louis Federal Reserve (FRED), seem to exert downside pressure on the USD/JPY price.
On the same line are the receding fears of nuclear war as US President Joe Biden thinks that his Russian counterpart isn’t up to using nuclear arms by backing off an international treaty.
Furthermore, hawkish concerns surrounding the Bank of Japan (BoJ), due to the nearness to the end of Governor Haruhiko Kuroda’s term, also weigh on the USD/JPY pair.
Alternatively, Fed policymakers are all in for further rate lifts, per the latest Federal Open Market Committee’s (FOMC) Monetary Policy Meeting Minutes, which in turn propels the US Dollar demand. Further, the fears surrounding the Ukraine-Russia war are far from over, with the latest edition of the West and China escalating the matter to the worse.
Amid these plays, S&P 500 Futures bounced off the monthly low to print mild gains around 4,010 whereas the Treasury bond yields remain sidelined amid off in Japan. That said, the US Dollar Index (DXY) drops 0.20% to 104.35 by the press time.
Looking ahead, a lack of major data/events could restrict USD/JPY moves but central bankers’ speeches can entertain the pair traders ahead of Friday’s US Core Personal Consumption Expenditures (PCE) Price Index data, the Fed’s favorite inflation gauge. Also important to watch will be the geopolitical headlines surrounding Russia, China and the US.
Technical analysis
Wednesday’s Doji candlestick joins overbought RSI on the daily chart to challenge USD/JPY bulls.
FX option expiries for Feb 23 NY cut at 10:00 Eastern Time, via DTCC, can be found below.
- EUR/USD: EUR amounts
- 1.0800 1.59b
- 1.0500 690.6m
- GBP/USD: GBP amounts
- 1.2000 520m
- USD/JPY: USD amounts
- 135.00 608.5m
- AUD/USD: AUD amounts
- 0.6925 2.08b
- 0.6860 435.6m
- 0.6800 432m
- USD/CAD: USD amounts
- 1.3670 794.1m
- 1.3550 488.8m
- NZD/USD: NZD amounts
- 0.6500 1.33b
- 0.6370 899.3m
- USD/CNY: USD amounts
- 7.0000 345m
In the view of Economist Lee Sue Ann and Markets Strategist Quek Ser Leang at UOB Group, further losses could drag EUR/USD to the sub-1.0500 region in the next few weeks.
Key Quotes
24-hour view: “We expected EUR to weaken yesterday but we were of the view that ‘a sustained decline below 1.0615 is unlikely today’. EUR subsequently edged lower before dropping below 1.0615 in NY trade (low has been 1.0597). Downward momentum has improved, albeit not much. We continue to expect EUR to weaken, even though any decline is expected to encounter solid support at 1.0570. On the upside, a break of 1.0655 (minor resistance is at 1.0625) would indicate that the weakness in EUR has stabilized.”
Next 1-3 weeks: “We have held a negative EUR view since late last week. While our view was not wrong, the decline so far has been patchy. Yesterday (22 Feb, spot at 1.0650), we indicated that while EUR could break below 1.0615, it has to stay below this level before further weakness is likely. EUR took out 1.0615 in NY trade before closing at 1.0601 (-0.42%). The next support is at 1.0570; a clear break of this level could trigger a rapid drop, as the next significant support is some distance away at 1.0485. Overall, only a breach of 1.0690 (‘strong resistance’ level was at 1.0725 yesterday) would indicate EUR is not weakening further.”
- EUR/USD displayed a solid recovery from 1.0600 as investors underpinned the risk-on market mood.
- The USD Index corrected as investors digested the hawkish Federal Reserve minutes.
- European Central Bank is eyeing a continuation of 50 bps rate hike spell.
- EUR/USD is auctioning in a Symmetrical Triangle that conveys volatility contraction.
EUR/USD has stretched its recovery above 1.0620 in the early European session as the risk-taking ability of the market participants has improved firmly. The major currency displayed a confident recovery move from the round-level support of 1.0600 as investors digested the uncertainty associated with the context of policy tightening continuation by the Federal Reserve (Fed) to tame sticky inflation.
S&P500 futures have shown sheer volatility in its recovery move after a rangebound Wednesday, portraying the risk-appetite theme. The positive market sentiment has resulted in a correction in the US Dollar Index (DXY) to near 104.00. At the time of writing, the USD Index is attempting a revival.
The market mood could dampen as geopolitical tensions have not eased yet. China's top diplomat Wang Yi said on Wednesday that they are ready to deepen strategic cooperation with Russia, as reported by Reuters. He further added, "Our relations will not succumb to pressure from third countries." Earlier, the US ambassador to the United Nations, Ambassador Linda Thomas-Greenfield, said China would cross a “red line” if the country decided to provide lethal military aid to Russia for its invasion of Ukraine.
Investors ignore hawkish FOMC minutes
The message from the Federal Open Market Committee (FOMC) minutes that the policy tightening spell will continue as a three-month decline in the United States Consumer Price Index (CPI) is insufficient to infuse confidence among the Federal Reserve policymakers that inflation will come down in an expected manner.
Federal Reserve chair Jerome Powell and other policymakers believe that the upbeat labor market and a recovery in the January Retail Sales data could trigger a revival in the US CPI ahead. The FOMC minutes conveyed that two policymakers Cleveland Fed President Loretta Mester and St. Louis Fed President James Bullard were not in favor of slicing the extent of the interest rate hikes again. In its December monetary policy meeting, the Federal Reserve trimmed the policy tightening pace to 50 basis points (bps) after hiking interest rates four times consecutively by 75 bps.
Talking about the external forces, the Federal Reserve believes that the rollback of pandemic controls by China and the ongoing Russia-Ukraine war could also accelerate the price index in the US.
European Central Bank sets to raise rates by 50 bps in March
In Eurozone, price pressures have fallen at a decent pace in the past few months after the continuous policy tightening by the European Central Bank (ECB). The central bank has already pushed interest rates to 3% in its February monetary policy meeting and further rate hike are on the table. No doubt, the price index is responding effectively to the restrictive monetary policy but a pause at this time could be a premature decision.
European Central Bank President Christine Lagarde in his speech on Tuesday announced that the central bank is ready to hike interest rates further by 50 bps to 3.50% in March. The economy has managed to dodge the recession in CY2022 and now a decent recovery in Eurozone makes the decision of further rate hikes more constructive.
Meanwhile, Goldman Sachs has come forward with an interest rate projection for the European Central Bank. The investment banking firm said in addition to an increase of 50 basis points in March and 25 basis points in May, it was estimating a 25 basis-point hike in June.
EUR/USD technical outlook
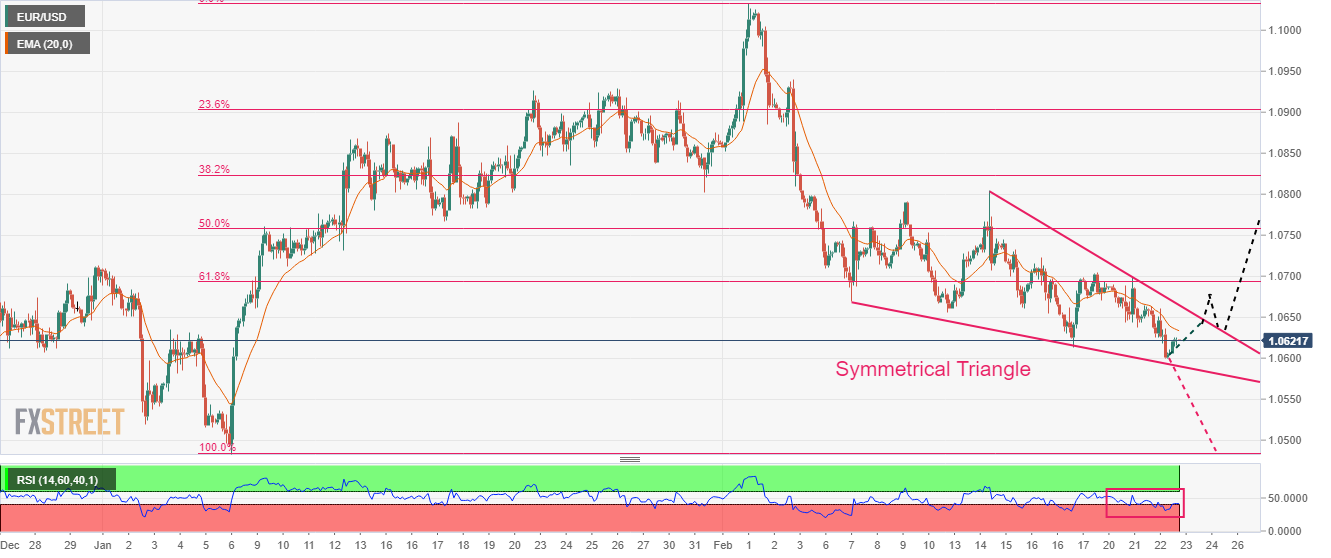
EUR/USD is continuously facing barricades around the 61.8% Fibonacci retracement (placed from January 6 low at 1.0483 to February high at 1.1033) at 1.0693. The formation of the Symmetrical Triangle chart pattern is indicating a volatility contraction in the asset.
The 20-period Exponential Moving Average (EMA) at 1.0633 is overlapping with the asset price, which indicates a rangebound performance ahead.
Meanwhile, the Relative Strength Index (RSI) (14) has not slipped confidently into the bearish range of 20.00-40.00 yet. Therefore, a bearish momentum has not been activated yet.
- WTI prints mild gains at a fortnight low, snaps two-day downtrend.
- Previous support line, 50-DMA guards immediate upside while bearish MACD signals lure sellers.
- RSI conditions suggest limited downside room and highlight seven-week-long horizontal support.
WTI crude oil picks up bids to refresh intraday high near $74.40 during early Thursday. In doing so, the black metal prints the first daily gains in three while bouncing off a two-week low.
Even so, the energy benchmark remains on the bear’s radar as it jostles with fortnight-old previous support near $74.45-50.
Also supporting the downside bias for the Oil price are the bearish MACD signals and the quote’s sustained trading below the 50-DMA, around the $78.00 round figure at the latest.
Even if the WTI crosses the $78.00 hurdle, a downward-sloping resistance line from early November 2022, near $78.50 by the press time, could act as the last defense of the Oil sellers.
It’s worth noting that multiple tops marked during late January around $82.50-70 and the last December’s high of $83.30 could also challenge the WTI bulls.
Meanwhile, the commodity’s fresh downside may aim for the horizontal area comprising multiple lows marked since early January, around $72.65-50.
However, the late 2022 lows of $70.30 and the $70.00 round figure could join the nearly oversold RSI (14) conditions to challenge the Oil bears afterward.
Overall, WTI stays on the bear’s radar unless it crosses the $83.30 hurdle on a daily closing basis.
WTI: Daily chart

Trend: Limited downside expected
- USD/TRY struggles for clear directions after two-day downtrend.
- Turkish government announces economic support for quake-hit areas.
- CBRT expected to leave benchmark rates unchanged for the fourth consecutive month.
- US Dollar struggles to justify hawkish Fed bets, geopolitical fears amid sluggish session.
USD/TRY seesaws around $18.85-90 as Turkish Lira (TRY) traders await the Central Bank of the Republic of Türkiye (CBRT) Interest Rate Decision on early Thursday. The quote’s latest inaction could also be linked to the pullback in the US Dollar and mixed concerns surrounding Türkiye.
As per the latest earthquake updates from Ankara, “The number of people killed in Turkey in this month's devastating earthquakes has risen to 43,556, the country's Interior Minister Suleyman Soylu said overnight,” reported Reuters. The news also quotes the Diplomat as saying to the state broadcaster TRT Haber that there had been 7,930 aftershocks following the first quake on February 6 and that more than 600,000 apartments and 150,000 commercial premises had suffered at least moderate damage.
To battle with the natural calamity, the Turkish government unveiled a temporary wage support scheme on Wednesday and banned layoffs in 10 cities to protect workers and businesses from the financial impact of the massive earthquake that hit the south of the country, per Reuters.
On the other hand, US Dollar Index (DXY) retreats from the weekly high, down 0.16% intraday to 104.35, as the US Treasury bond yields lack momentum during Japan’s holidays. That said, the US 10-year and two-year Treasury bond yields snapped a two-day uptrend the previous day before marking inaction around 3.92% and 4.70%.
It’s worth noting that a retreat in the US inflation expectations, per the 10-year and 5-year breakeven inflation rates from the St. Louis Federal Reserve (FRED), also weighs on the US Dollar.
Meanwhile, hawkish Federal Open Market Committee’s (FOMC) Monetary Policy Meeting Minutes and comments favoring further rate hikes from St. Louis Fed President James Bullard, as well as from Federal Reserve Bank of New York President John Williams, probe DXY bears. On the same line are the US-China tussles over Beijing’s ties with Moscow.
Against this backdrop, S&P 500 Futures bounced off the monthly low to print mild gains around 4,020 whereas the Treasury bond yields remain sidelined amid off in Japan.
Looking forward, CBRT is likely to leave the benchmark rate unchanged at 9.0% for the fourth consecutive time, especially amid the natural calamities. The same can allow the USD/TRY to print some gains ahead of Friday’s US Core Personal Consumption Expenditures (PCE) Price Index data, the Fed’s favorite inflation gauge.
Technical analysis
Although the overbought RSI (14) challenges USD/TRY buyers, the downside remains elusive unless the quote stays firmer past the 50-DMA, near $18.75 by the press time.
- USD/CAD holds lower ground near intraday low, snaps two-day uptrend.
- Bearish MACD signals, downbeat RSI hints at further downside of the Loonie pair.
- Convergence of 100-HMA, support line of two-week-old ascending triangle restricts short-term declines of the USD/CAD pair.
USD/CAD drops 0.25% intraday during the first loss-making day in three heading into Thursday’s European session. In doing so, the Loonie pair drops to 1.3520 by the press time.
That said, the USD/CAD pair’s latest moves appear forming a fortnight-old ascending triangle formation. The same joins downbeat RSI (14) and bearish MACD signals to favor the bearish chart formation.
However, a clear downside break of 1.3500 becomes necessary as the 100-Hour Moving Average (HMA) joins the stated triangle’s lower line to increase the strength of the stated support confluence.
Following that, tops marked during late January and early February, respectively near 1.3520 and 1.3475, could probe the USD/CAD bears before directing them to the theoretical target surrounding 1.3200.
On the contrary, USD/CAD buyers may aim for the latest swing high surrounding 1.3570 before poking the stated triangle’s top line, close to 1.3585 by the press time.
In a case where the Loonie pair remains firmer past 1.3585, the bearish chart formation gets defied as the bulls brace for a late 2022 swing high surrounding 1.3700.
To sum up, USD/CAD slips off bull’s radar but the sellers await clear break of 1.3500 to retake control.
USD/CAD: Hourly chart
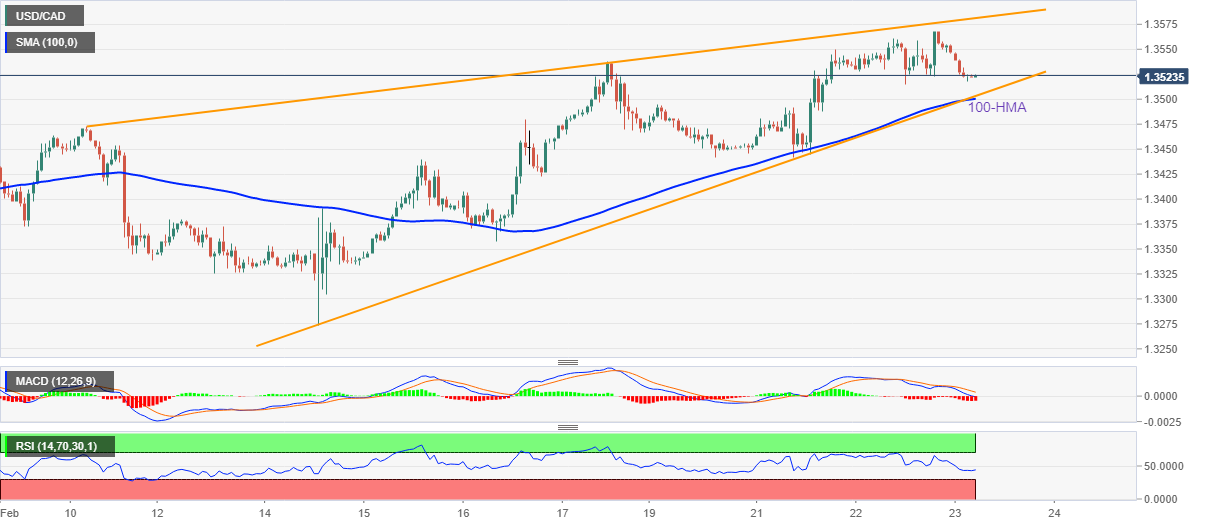
Trend: Limited downside expected
- NZD/USD has displayed a sheer recovery to near 0.6250 as the risk-on mood solidifies.
- The Kiwi asset is attempting to deliver a breakout of the Symmetrical Triangle.
- The RSI (14) is on the verge of delivering a break into the bullish range of 60.00-80.00.
The NZD/USD pair has recovered dramatically after sensing a buying interest around 0.6210 in the Asian session. The Kiwi asset has extended its recovery to near 0.6250 after a responsive buying action and is looking to drive its range extension further as the risk-on impulse has solidified.
Investors have digested the fact that galloping inflation in the United States needs immediate treatment, therefore, the Federal Reserve (Fed) cannot pause the policy tightening spell as it could dampen the efforts yet made to bring it down. The US Dollar Index (DXY) is resisting in continuing the downside further after correcting to near 104.00. However, the positive market sentiment could continue sending pressure on the safe-haven assets.
NZD/USD is attempting to deliver a breakout of the Symmetrical Triangle chart pattern that indicates a sheer volatility contraction on an hourly scale. The downward-sloping trendline of the above-mentioned chart pattern is placed from February 20 high at 0.6262 while the upward-sloping trendline is placed from February 17 low at 0.6204.
The Kiwi asset has successfully shifted its auction above the 50-period Exponential Moving Average (EMA) at 0.6233, which indicates more upside ahead.
Meanwhile, the Relative Strength Index (RSI) (14) is on the verge of delivering a break into the bullish range of 60.00-80.00, which will trigger the upside momentum.
For further upside, the Kiwi asset needs to surpass January 8 low at 0.6272, which will drive the asset towards January 9 low at 0.6320, followed by February 7 high at 0.6363.
Alternatively, a breakdown of January 6 low at 0.6193 will drag the asset toward November 28 low at 0.6155. A slippage below the latter will expose the asset for more downside toward the round-level support at 0.6100.
NZD/USD two-hour chart
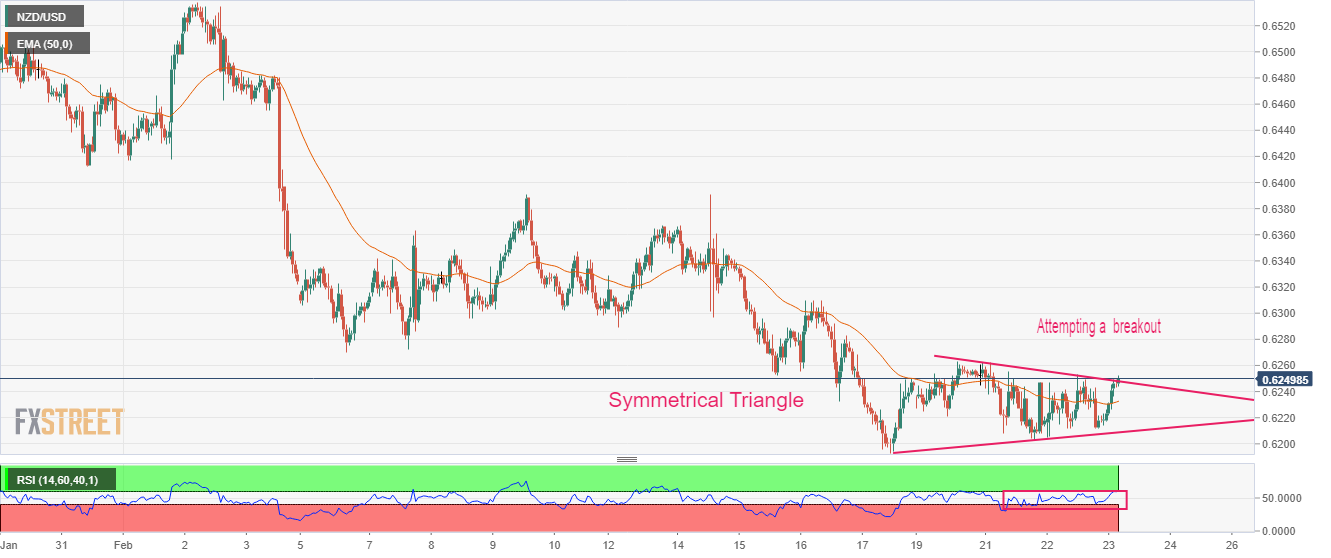
- GBP/USD retreats from intraday high as it pares the biggest weekly gains in five.
- Brexit deal talks stopped amid Tory revolt, UK nurses’ pay negotiations criticized during Sunak’s PMQs.
- Hawkish Fed Minutes, comments from policymakers join geopolitical fears to probe Cable buyers.
- US inflation expectations, absence of nuclear war fears put a floor under GBP/USD price.
GBP/USD witnesses a pullback from intraday high to 1.2060 heading into Thursday’s London open amid political and Brexit fears surrounding the UK. Also challenging the Cable buyers could be the broadly hawkish Federal Open Market Committee’s (FOMC) Monetary Policy Meeting Minutes and geopolitical woes concerning the Ukraine-Russia war. It’s worth noting, however, that the absence of Japanese traders and a light calendar limits the quote’s latest moves.
UK Prime Minister (PM) Rishi Sunak realized how thorny the Brexit issue is when he faced bitter questions in the first PMQs in the parliaments on Wednesday. Not only the Opposition Leader Keir Starmer but the Conservatives were also pushing for no change in the Brexit deal surrounding the Northern Ireland (NI) protocol that was recently opened for discussion. The talks raised fears of a Theresa May-type fall of Sunak’s PM status and challenged the Cable buyers.
In addition to the Brexit call, the UK government’s negotiations with the nurse union also probed the GBP/USD buyers. The Royal College of Nursing (RCN) held “intensive talks” with Health Secretary Stephen Barclay, per The Guardian, but other unions felt left out and the same raises risks of more strikes in the UK moving forward.
Elsewhere, a retreat in the US inflation expectations, per the 10-year and 5-year breakeven inflation rates from the St. Louis Federal Reserve (FRED), joins mixed comments from US President Biden to probe the triggered US Dollar pullback earlier in the day.
That said, inflation expectations gained major attention after Federal Open Market Committee’s (FOMC) Monetary Policy Meeting Minutes signaled that the policymakers discussed going easy on the rate hike trajectory if needed. However, the broad discussion on the need for more rate hikes and hawkish comments from St. Louis Federal Reserve President James Bullard, as well as from Federal Reserve Bank of New York President John Williams, challenge the dovish bias surrounding the Fed.
On the other hand, US President Biden said that he thinks that his Russian counterpart isn’t up to using nuclear arms by backing off an international treaty. However, the fears surrounding the Ukraine-Russia war are far from over, with the latest edition of the West and China escalating the matter to the worse. Previously, the China-Russia ties seemed to have escalated the geopolitical woes as the US strongly criticized such moves and favored the rush towards risk safety.
While portraying the mood, S&P 500 Futures bounced off the monthly low to print mild gains around 4,020 whereas the Treasury bond yields remain sidelined amid off in Japan.
Moving on, a lack of major data/events could restrict GBP/USD moves but central bankers’ speeches can entertain the pair traders ahead of Friday’s US Core Personal Consumption Expenditures (PCE) Price Index data, the Fed’s favorite inflation gauge.
Technical analysis
The RSI (14) prints lower lows but the GBP/USD price prints higher lows, which in turn portrays a hidden bullish divergence and favors the quote’s latest bounce off the one-week-old support line, at 1.2040 by the press time.
- AUD/USD has extended its recovery to near 0.6840 as investors have started ignoring the hawkish Fed minutes' impact.
- The upbeat market mood has resulted in a meaningful correction in the US Dollar Index to near 104.00.
- A decline in the Australian labor cost index might not impact the decision of policy tightening continuation by the RBA.
The AUD/USD pair has stretched its recovery to near 0.6840 in the Asian session. The Aussie asset has picked strength as investors have shrugged-off volatility inspired by the release of the hawkish Federal Open Market Committee (FOMC) minutes released in the late New York session.
A sheer recovery has been observed in the S&P500 futures after a choppy Wednesday, portraying a stellar rebound by the risk-appetite theme. The upbeat market mood has resulted in a meaningful correction in the US Dollar Index (DXY). The USD Index has slipped firmly to near 104.00 despite the Federal Reserve (Fed) policymakers in a hurry to reach the interest rate peak to bring down the inflationary pressures.
Fed chair Jerome Powell and his mates are worried that the strong labor market and a recovery in consumer spending could trigger a revival in the United States Consumer Price Index (CPI). The FOMC minutes conveyed that two policymakers Cleveland Fed President Loretta Mester and St. Louis Fed President James Bullard were not in favor of decelerating the pace of hiking rates again. Investors should be aware that the Fed also trimmed the policy tightening pace in December monetary policy meeting to 50 basis points (bps) after hiking interest rates four times consecutively by 75 bps.
Meanwhile, the absence of meaningful easing signals in the Australian inflation is bolstering the case of policy tightening continuation by the Reserve Bank of Australia (RBA). On Wednesday, Australia’s Wage Price Index (Q4) was escalated by 0.8% lower than the consensus of 1.0% on a quarterly basis. This might have provided relief to the RBA as lower funds with households would result in lower spending. However, more rate hikes cannot be paused as the current inflation is four times more than the desired target.
- Gold price prints mild gains around weekly low, snaps three-day downtrend.
- US Dollar traces a pullback in yields to pare weekly gains as inflation expectations ease.
- Fed Minutes, policymakers’ comments appear hawkish; China, US interference in Russia-Ukraine war escalates geopolitical fears.
- Second-tier US data eyed for fresh impulse ahead of Friday’s US Core PCE Inflation.
Gold price (XAU/USD) picks up bids to pare weekly losses around $1,827 during early Thursday morning in Europe. In doing so, the yellow metal prints the first daily gains in four amid the US Dollar pullback.
US Dollar Index (DXY) retreats from the weekly high, down 0.16% intraday to 104.35, as the US Treasury bond yields lack momentum during Japan’s holidays. Also allowing the DXY to pare recent gains is the pullback in the bond coupons from the multi-day high. That said, the US 10-year and two-year Treasury bond yields snapped a two-day uptrend the previous day before marking inaction around 3.92% and 4.70%.
Behind the moves could be the latest retreat in the US inflation expectations, per the 10-year and 5-year breakeven inflation rates from the St. Louis Federal Reserve (FRED), as both these gauges ease from their recent highs at the latest.
The inflation expectations gained major attention after Federal Open Market Committee’s (FOMC) Monetary Policy Meeting Minutes signaled that the policymakers discussed going easy on the rate hike trajectory if needed. However, the broad discussion on the need for more rate hikes and hawkish comments from St. Louis Federal Reserve President James Bullard, as well as from Federal Reserve Bank of New York President John Williams, challenge the dovish bias surrounding the Fed.
Elsewhere, US President Joe Biden’s comments could also be held responsible for the latest mildly upbeat sentiment and a corrective bounce in the Gold price. As per the latest commentary from US President Joe Biden, he thinks that his Russian counterpart isn’t up to using nuclear arms by backing off an international treaty. However, the fears surrounding the Ukraine-Russia war are far from over, with the latest edition of the West and China escalating the matter to the worse. That said, the Wall Street Journal (WSJ) recently said that the US is considering the release of intelligence on China’s potential arms transfer to Russia. Previously, the China-Russia ties seemed to have escalated the geopolitical woes as the US strongly criticized such moves and favored the rush towards risk safety.
Amid these plays, S&P 500 Futures bounced off the monthly low to print mild gains around 4,020.
Moving on, geopolitical headlines and second-tier data from the US will be important for fresh impulse ahead of Friday’s US Core Personal Consumption Expenditures (PCE) Price Index data, the Fed’s favorite inflation gauge.
Technical analysis
Gold price rebounds from a six-week-old horizontal support zone, around $1,825-23, amid an uptick of the RSI (14) line and sluggish MACD signals. However, the 50-Simple Moving Average (SMA) level surrounding $1,842, guards the immediate upside of the XAU/USD.
Following that, the 61.8% Fibonacci retracement level of the metal’s upside from mid-December 2022 to early February 2023, near $1,846, could test the recovery moves before directing them to February 09 swing high, also including 38.2% Fibonacci retracement, at $1,890.
It’s worth noting that the January 31 swing low of $1,901 could act as the last defense of the Gold sellers before directing them to the monthly peak surrounding $1,960.
Alternatively, a downside break of the $1,825-23 horizontal support could drag the Gold price towards the 78.6% Fibonacci retracement level of $1,813 and then to a three-week-old descending support line, close to $1,803.
In a case where the Gold price remains weak past $1,803, the $1,800 round figure may act as an additional downside filter.
Overall, the Gold price remains on the bear’s radar despite the recent rebound.
Gold price: Four-hour chart
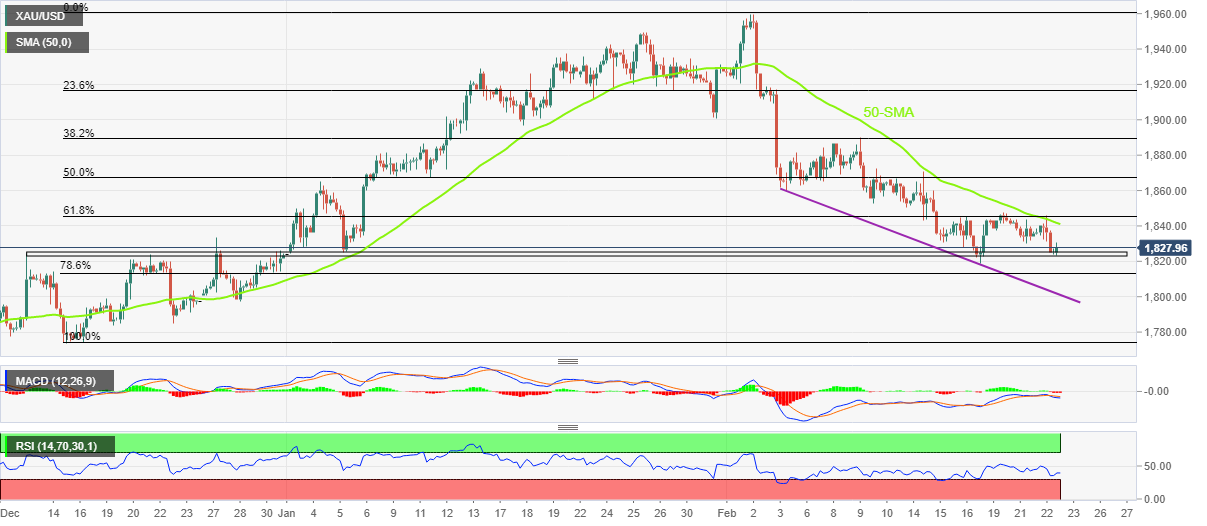
Trend: Further downside expected
- USD/INR is displaying wild moves as investors are discounting the impact of the release of the overnight FOMC minutes.
- Fed policymakers are favoring the continuation of policy tightening to avoid fears of a recovery in US inflation.
- The asset is testing the breakout of the Descending Triangle chart pattern around 82.70.
The USD/INR pair is displaying wild moves in the opening session as investors are discounting the impact of the release of the hawkish Federal Open Market Committee (FOMC) minutes.
According to the FOMC minutes, Federal Reserve (Fed) policymakers were loud and clear that a strong labor market and upbeat January Monthly Sales are posing a threat of pause in the declining trend of the United States Consumer Price Index (CPI). Therefore, the Fed should reach to terminal rate to bring down inflation to the 2% target.
The US Dollar Index (DXY) has dropped to near 104.00 after printing a three-day high of 104.20 as the risk aversion theme has eased. S&P500 futures have added significant gains in the Asian session, portraying a sheer recovery in the risk appetite of the market participants.
USD/INR is testing the breakout of the Descending Triangle chart pattern on an hourly scale. A breakout of the aforementioned chart pattern results in a volatility expansion after a sheer contraction. The downward-sloping trendline of the triangle is plotted from February 14 high at 83.04 while the horizontal support is placed from February 14 low at 82.57.
The mighty 200-period Exponential Moving Average (EMA) at 82.73 is providing support to the US Dollar bulls.
Meanwhile, the Relative Strength Index (RSI) (14) is looking for a cushion around 40.00 after a healthy correction.
Should the asset break above February 22 high at around 83.00, US Dollar bulls will drive the asset toward October 23 high at 83.29. A breach of the latter will expose the asset to unchartered territory. The asset might find further resistance around 83.50, being a round-level number.
On the flip side, a break below February 14 low at 82.57 will drag the asset toward February 10 low at 82.33 followed by January 31 high at 82.07.
USD/INR hourly chart
-638127209690515831.png)
- EUR/GBP looks vulnerable around 0.8800 as hawkish BoE bets soar after a recovery in UK preliminary PMI data.
- UK’s Hunt is facing calls from within his Conservative Party to cut taxes and raise pay for public service workers.
- ECB Lagarde is set to continue its policy tightening spell of 50 bps to March.
The EUR/GBP pair is struggling to find any direction in the Tokyo session amid the absence of a potential trigger. The cross is juggling around 0.8800 and is expected to display more weakness as an economic recovery in the United Kingdom and a shortage of labor is demanding the continuation of policy tightening by the Bank of England (BoE).
Investors were in a dilemma whether the Bank of England (BoE) should pause policy contraction as the economic outlook was expected extremely bleak or continue pushing rates higher to tame stubborn inflation. Shortage of labor and escalating food inflation is continuously maintaining havoc that the inflation could be underpinned anytime to new highs.
No doubt, the UK Consumer Price Index (CPI) has eased in the past few months, however, the headline CPI figure is still in double-digit and sufficient to trouble households.
Meanwhile, a recovery in the economic activities shown by the preliminary S&P Global PMI (Feb) data, released this week, indicates that labor demand could be fueled further and BoE Governor Andrew Bailey should consider continuation of policy tightening. A figure below 50.0 for the preliminary Manufacturing activities indicates contraction, however, the pace of decline in activities has squeezed significantly.
BoE panel sees the interest rate peak around 4.5% and the continuation of the rate hike in the March monetary policy meeting looks warranted.
Meanwhile, UK Finance Minister (FM) Jeremy Hunt is facing calls from within his Conservative Party to cut taxes in his March 15 budget and from trade unions to raise pay for public service workers, as reported by Reuters, which could propel inflationary pressures further.
On the Eurozone front, clarity on the extent of the rate hike by the European Central Bank (ECB) President Christine Lagarde has eased some uncertainty. ECB Lagarde has announced a continuation of 50 bps rate hike spree for March to keep the downside momentum in Eurozone inflation intact.
Bank of Korea (BOK) Governor Rhee Chang-yong said at the press conference following the monetary policy meeting said that “Thursday's decision should not be taken as indicating the tightening cycle is over.”
Earlier on, the South Korean central bank left its policy rate unchanged at 3.50%, as expected. The BOK lowered its inflation forecast from 3.6% to 3.5% for this year.
Additional quotes
Board member Cho Yoon-je dissented to Thursday's rate decision.
Sees recent Won weakening as having little to do with domestic issues.
Five board members wanted to keep chances for terminal rate reaching 3.75%.
Downgrade of inflation forecast mostly due to oil prices.
Short-term money market has mostly returned to stability.
Thursday's decision was based on expectation that inflation will head down from March.
It is time to stop and watch if inflation trend goes along expected path.
No comment on whether herd behaviour is behind Won's recent movement.
Market reaction
USD/KRW is consolidating the latest downswing, triggered by the BOK policy announcement. The pair is trading 0.55% lower at 1,295.78, having tumbled sharply from near the 1,302.50 region.
- USD/JPY takes offers to refresh intraday low, snaps four-day uptrend inside bearish chart formation.
- 100-HMA joins sluggish oscillators to raise barriers for seller’s entry around 134.50.
- Recovery remains elusive below 135.35; bears have a bumpy road to travel.
USD/JPY renews intraday low near 134.70 during early Thursday as it prints the first daily loss in five heading into the European session. In doing so, the Yen pair remains depressed inside a one-week-old rising wedge bearish chart formation.
That said, the latest RSI (14) retreat and multiple failures to remain firmer past 135.00 tease the USD/JPY sellers. However, sluggish RSI and MACD suggest low support for the bears.
It’s worth noting that the 100-Hour Moving Average (HMA) joins the support line of the stated wedge to highlight the 134.50 as the short-term key support.
Following that, the 200-HMA and a fortnight-long horizontal line, respectively near 133.80 and 132.90, could challenge the USD/JPY downside.
In a case where the USD/JPY prices remain weak past 132.90, an ascending support line from February 02, close to 132.35 at the latest, appears as the last defense of the buyers.
On the flip side, recovery moves need to stay successfully beyond the 135.00 round figure to convince USD/JPY buyers.
Even so, the aforementioned wedge’s top line could challenge the upside momentum near 135.35 before giving control to the bulls.
Overall, USD/JPY is likely to decline further but the downside room appears limited.
USD/JPY: Hourly chart
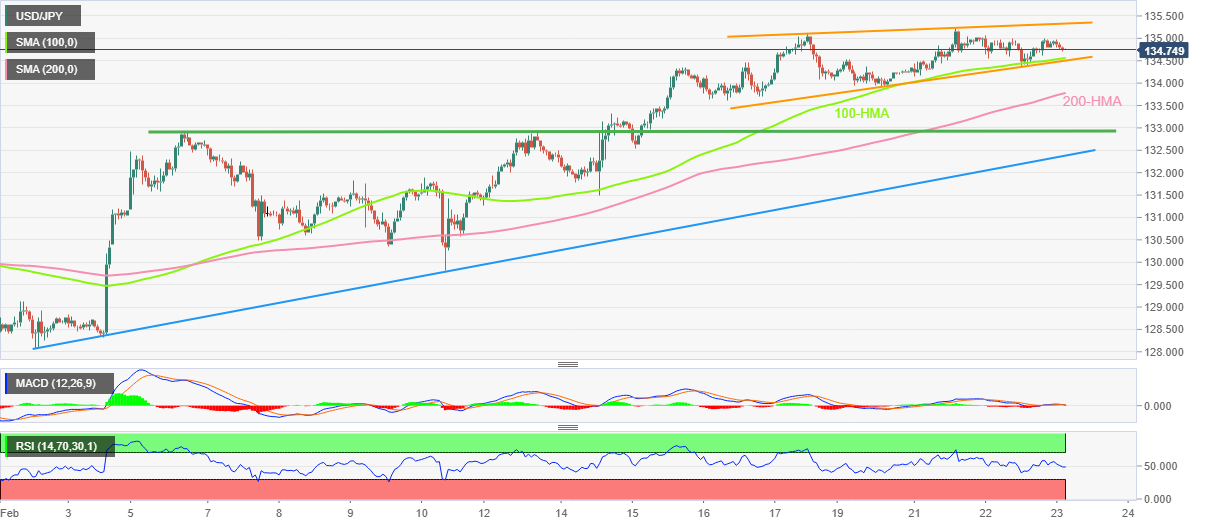
Trend: Limited downside expected
- EUR/USD rebounds from seven-week low, grinds near intraday high.
- Retreat in US inflation expectations, yields jostle with hawkish FOMC Minutes, comments from Fed policymakers to tease buyers.
- Mixed German data, ECB speak fail to gain major attention.
- Receding fears of recession, nuclear war underpin cautious optimism and trigger corrective bounce of the Euro pair.
EUR/USD prints mild gains around 1.0620 as it consolidates recent losses near the lowest levels in seven weeks during early Thursday. In doing so, the Euro pair cheers mildly positive sentiment in the market, as well as a lack of major data/events.
That said, the major currency pair prints the first daily gain in four while bouncing off the lowest level since early January, marked the previous day, amid hopes from the latest economic data. Recently firmer global activity numbers and comments from the key central bank officials, mainly from the West, have raised hopes that the recession is less likely to happen. Even if it does in a certain part of the world, the effects will be mild and short-lived.
Additionally favoring cautious optimism is the recent retreat in the US inflation expectations. That said, the 10-year and 5-year breakeven inflation rates from the St. Louis Federal Reserve (FRED) signal a pullback in the US inflation expectations by retreating from the multi-day top.
Elsewhere, Federal Open Market Committee’s (FOMC) Monetary Policy Meeting Minutes stated that all participants agreed more rate hikes are needed to achieve the inflation target. The same initially triggered the market’s risk-off mood and favored the EUR/USD bears before the details suggested that the policymakers also discussed going easy on the rate hike trajectory. The same highlights softer inflation expectations as the key concern for the recent improvement in mood.
The dual meaning of US President Joe Biden’s comments could also be held responsible for the latest mildly upbeat sentiment. As per the latest commentary from US President Joe Biden, he thinks that his Russian counterpart isn’t up to using nuclear arms by backing off an international treaty. However, the fears surrounding the Ukraine-Russia war are far from over, with the latest edition of the West and China escalating the matter to the worse. That said, the Wall Street Journal (WSJ) recently said that the US is considering the release of intelligence on China’s potential arms transfer to Russia. Previously, the China-Russia ties seemed to have escalated the geopolitical woes as the US strongly criticized such moves and favored the rush towards risk safety.
Talking about the mixed data from Europe, Germany’s IFO Business Climate improved to 91.1 for February versus 91.4 expected and 90.1 prior while the Current Assessment eased to 93.9 from 94.1 previous readings and analysts’ estimations of 95.00. Further, the IFO Expectations gauge rose to 88.5 compared to 88.3 market consensus and 86.4 prior. Following the release of the German IFO Business Survey, the institute’s Economist Klaus Wohlrabe said that the “German economy will not get around recession but it will be mild.” It should be noted that Germany’s inflation gauge, namely Harmonized Index of Consumer Prices (HICP), confirmed 9.2% YoY initial forecasts.
Against this backdrop, S&P 500 Futures bounce off the monthly low to print mild gains around 4,020 while the yields are mostly unchanged amid Japan’s holiday, following a retreat from the three-month high the previous day.
Moving on, final readings of the bloc’s inflation gauge and risk catalysts will be important for the EUR/USD traders to watch ahead of the second readings of the US Personal Consumption Expenditures (PCE) details for the fourth quarter (Q4), as well as the preliminary readings of the US Q4 Gross Domestic Product (GDP).
Technical analysis
Unless bouncing back beyond the three-month-old support-turned-resistance, around 1.0740 by the press time, EUR/USD remains on the bear’s radar.
- USD/MXN grinds near the lowest levels since April 2018.
- Nearly oversold RSI conditions challenge bears on their way to three-month-old support line.
- Two-week-long descending trend line challenges bulls before $18.50 resistance confluence.
- Sustained trading below the key trend line, moving average joins bearish MACD signals to favor sellers.
USD/MXN bears take a breather around $18.40 during early Thursday, following a slump to a nearly five-year low the previous day.
In doing so, the Mexican Peso (MXN) pair takes clues from the RSI (14) conditions to probe the sellers. However, bearish MACD signals and the quote’s sustained trading below the previous support line from early February, as well as the 10-DMA, keep the bears hopeful.
That said, the latest multi-month low near $18.30 appears immediate support for the USD/MXN bears to watch during the quote’s fresh downside.
Following that, a descending support line from late November 2022, close to $18.20 by the press time, will be crucial to challenge the pair’s further declines.
In a case where USD/MXN remains bearish past $18.20, the April 2018 low near the $18.00 threshold should lure the sellers.
On the contrary, recovery moves may initially aim for the fortnight-old resistance line, close to $18.40 by the press time.
Following that, a convergence of the 10-DMA and the support-turned-resistance line from February 02, close to $18.50, will be crucial to watch before welcoming the buyers.
USD/MXN: Daily chart
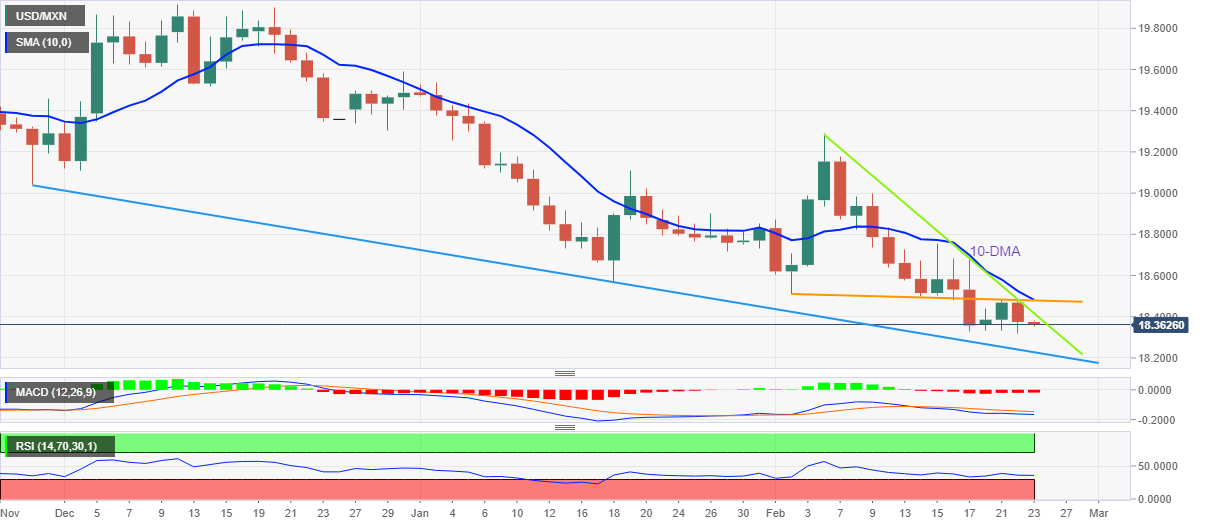
Trend: Further downside expected
| Raw materials | Closed | Change, % |
|---|---|---|
| Silver | 21.518 | -1.51 |
| Gold | 1825.32 | -0.52 |
| Palladium | 1480.76 | -2.74 |
- Market sentiment improves in Asia-Pacific zone despite Japan’s holidays.
- Softer US inflation expectations, upbeat data and US President Joe Biden’s hopes of no imminent nuclear war favors the sentiment.
- Light calendar, mixed closing of Wall Street challenge momentum traders.
Risk appetite improves in the Asia-Pacific zone amid early Thursday, despite being off in Japan, as traders reassess the hawkish Fed concerns and the geopolitical fears amid a quiet session. Also likely to have favored the mildly upbeat sentiment could be the latest retreat in the US inflation expectations and easing fears of recession.
Amid these plays, MSCI’s index of Asia-Pacific shares outside Japan rises half a percent while bouncing off the monthly low. On the same line, shares in Australia, China and New Zealand all print mild gains by the press time.
On a broader front, S&P 500 Futures bounce off the monthly low to print mild gains around 4,020 while the yields are mostly unchanged amid Japan’s holiday, following a retreat from the three-month high the previous day.
It’s worth observing that upbeat Aussie Private Capital Expenditure for the fourth quarter (Q4) and the Bank of Korea’s (BoK) inaction failed to impress the Asia-Pacific share traders.
That said, recently firmer global activity numbers and comments from the key central bank officials, mainly from the West, have raised hopes that the recession is less likely to happen. Even if it does in a certain part of the world, the effects will be mild and short-lived.
Additionally favoring cautious optimism is the recent retreat in the US inflation expectations. That said, the 10-year and 5-year breakeven inflation rates from the St. Louis Federal Reserve (FRED) signal a pullback in the US inflation expectations by retreating from the multi-day top.
It should be noted that the latest Federal Open Market Committee’s (FOMC) Monetary Policy Meeting Minutes stated that all participants agreed more rate hikes are needed to achieve the inflation target. The same initially triggered the market’s risk-off mood before the details suggested that the policymakers also discussed going easy on the rate hike trajectory, which in turn highlights softer inflation expectations as the key concern for the recent improvement in mood.
Elsewhere, comments from US President Joe Biden were also responsible for the latest mildly upbeat sentiment as he thinks that his Russian counterpart isn’t up to using nuclear arms by backing off an international treaty. However, the fears surrounding the Ukraine-Russia war are far from over, with the latest edition of the West and China escalating the matter to the worse. That said, the Wall Street Journal (WSJ) recently said that the US is considering the release of intelligence on China’s potential arms transfer to Russia. Previously, the China-Russia ties seemed to have escalated the geopolitical woes as the US strongly criticized such moves and favored the rush towards risk safety.
Looking ahead, a light calendar and mixed concerns can keep troubling traders but the US Personal Consumption Expenditures (PCE) details for the fourth quarter (Q4), as well as the preliminary readings of the US Q4 Gross Domestic Product (GDP), should entertain them.
Also read: Forex Today: Fed’s hawkishness boosts the US Dollar
South Korea's central bank kept interest rates unchanged on Thursday, matching market expectations and ending an uninterrupted run of hikes for a year.
The Bank of Korea's monetary policy board held its policy interest rate steady at 3.50%, in line with a unanimous call by the 42 economists in a Reuters poll.
Governor Rhee Chang-Yong is making statements as follows:
Economic growth to improve gradually from H2.
Inflation to gradually decrease.
Housing prices continued to decline across country.
Uncertainties surrounding policy decision are high.
Deems it warranted to keep restrictive policy stance for considerable time.
- GBP/USD picks up bids to refresh intraday high, pares biggest daily loss in over a week.
- One-week-old ascending trend line joins hidden bullish RSI divergence to favor Cable buyers.
- 200-EMA appears important challenge for bulls, six-week-old support line can lure bears past 1.2040.
GBP/USD renews its intraday high near 1.2060 as it consolidates the biggest daily loss in more than a during early Thursday. In doing so, the Cable pair rebounds from a one-week-long ascending trend amid hidden bullish RSI divergence.
That said, the RSI (14) prints lower lows but the GBP/USD price prints higher lows, which in turn portrays a hidden bullish divergence and favors the quote’s latest bounce off the short-term key support line.
However, the 61.8% Fibonacci retracement level of the pair’s January 2023 up-moves, near 1.2075, acts as a validation point for the pair’s further upside.
Following that, the 200-bar Exponential Moving Average (EMA) level surrounding 1.2135 could challenge the GBP/USD bulls before directing them to the previous weekly high of near 1.2270.
In a case where the Cable pair remains firmer past 1.2270, January’s top around 1.2450 will be in the spotlight.
Alternatively, a downside break of the immediate support line, close to 1.2040 by the press time, could quickly recall the 1.2000 psychological magnet on the chart.
However, a descending support line from January 12, 2023, around 1.1900 at the latest, could probe the GBP/USD bears afterward.
GBP/USD: Four-hour chart
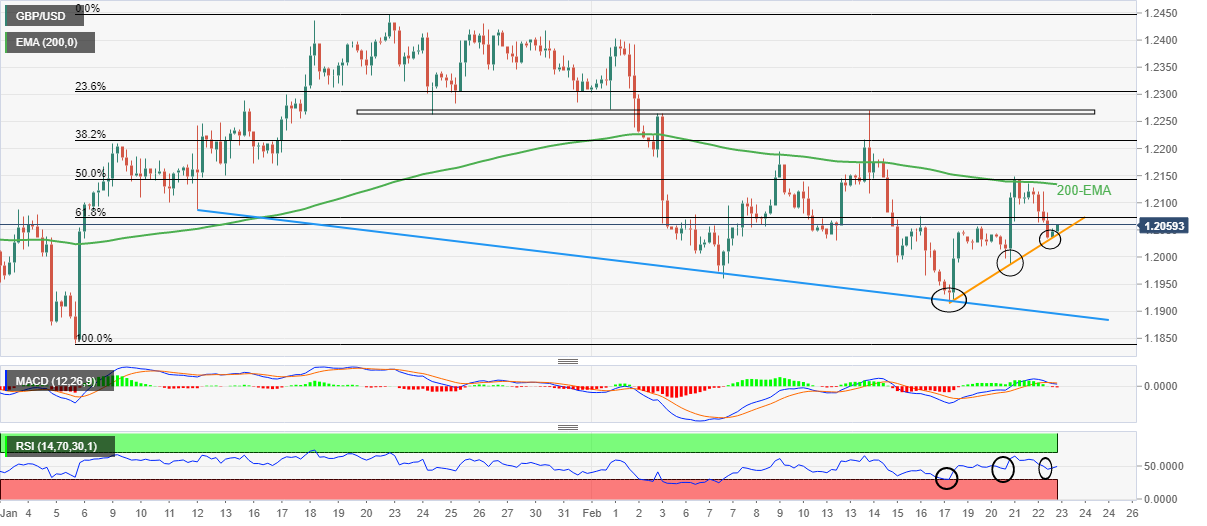
Trend: Further recovery expected
- EUR/JPY is expected to deliver a downside move below 143.00 ahead of BoJ Ueda’s speech.
- Some further yield-widening discussions are expected from BoJ Ueda’s speech.
- ECB Lagarde’s announcement of one more 50 bps rate hike will push rates to 3.5%.
The EUR/JPY is displaying back-and-forth moves around 143.00 in the Asian session. The Japanese Yen bulls are attempting for the third time to push the cross below the immediate support of 143.00 as investors are expecting some discussions related to an exit from the decade-long ultra-loose monetary policy managed by the Bank of Japan (BoJ) in the speech from BoJ Governor nominee Kazuo Ueda.
Japan’s government has been reiterating that the administration will look for a transitioning process in the monetary policy with novel BoJ leadership to major the Japanese Yen more competitive against other FX currencies. Therefore, some further yield-widening discussions are expected from BoJ Ueda’s speech, scheduled for Friday.
Apart from that, Japan’s National Consumer Price Index (CPI) (Jan) data will remain in focus. The headline CPI is seen higher at 4.5% from the former release of 4.0%. And the core CPI that strips off oil and food prices is seen at 3.2%, higher than 3.0%, in the prior release. The Japanese economy is gradually achieving a higher inflation rate by improving wages and consumer spending.
In the view of economists at Commerzbank “Patience is the name of the game”. Only the BoJ decision in early March, still under Kuroda, might provide a first indication as to how monetary policy will develop if Kuroda really was to pave the way for his successor by widening the yield range. Otherwise, we will have to wait patiently until late April when Ueda will be running his first meeting. And even then, it is rather unlikely that Ueda would immediately turn everything in monetary policy inside out.”
Meanwhile, the Euro is struggling to settle its feet despite hawkish commentary from European Central Bank (ECB) President Christine Lagarde. ECB Lagarde states “Headline inflation has begun to slow down but reiterated that they intend to raise the key rates by 50 basis points (bps) at the upcoming policy meeting. She also cited that the central bank is not seeing a wage-price spiral in the Eurozone.
It is worth noting that the ECB has been hiking interest rates by 50 bps from the past two monetary policy meetings and one more 50 bps rate hike will push rates to 3.5%.
- AUD/USD bears are in the market controlling while on the front side of the bear trend.
- Last week's lows are being tested that guard a run to test 0.6750/00.
AUD/USD ended mid-week with the second day of shorts in the market since the price was rejected at last Thursday's highs on Monday's initial balance highs.
AUD/USD daily and H4 charts

We are breaking last week's lows and while being on the front side of the bearish trend, there are prospects of a continuation of a third day of shorts. However, it might be a question of a correction first of all with 0.6850 eyed as resistance:
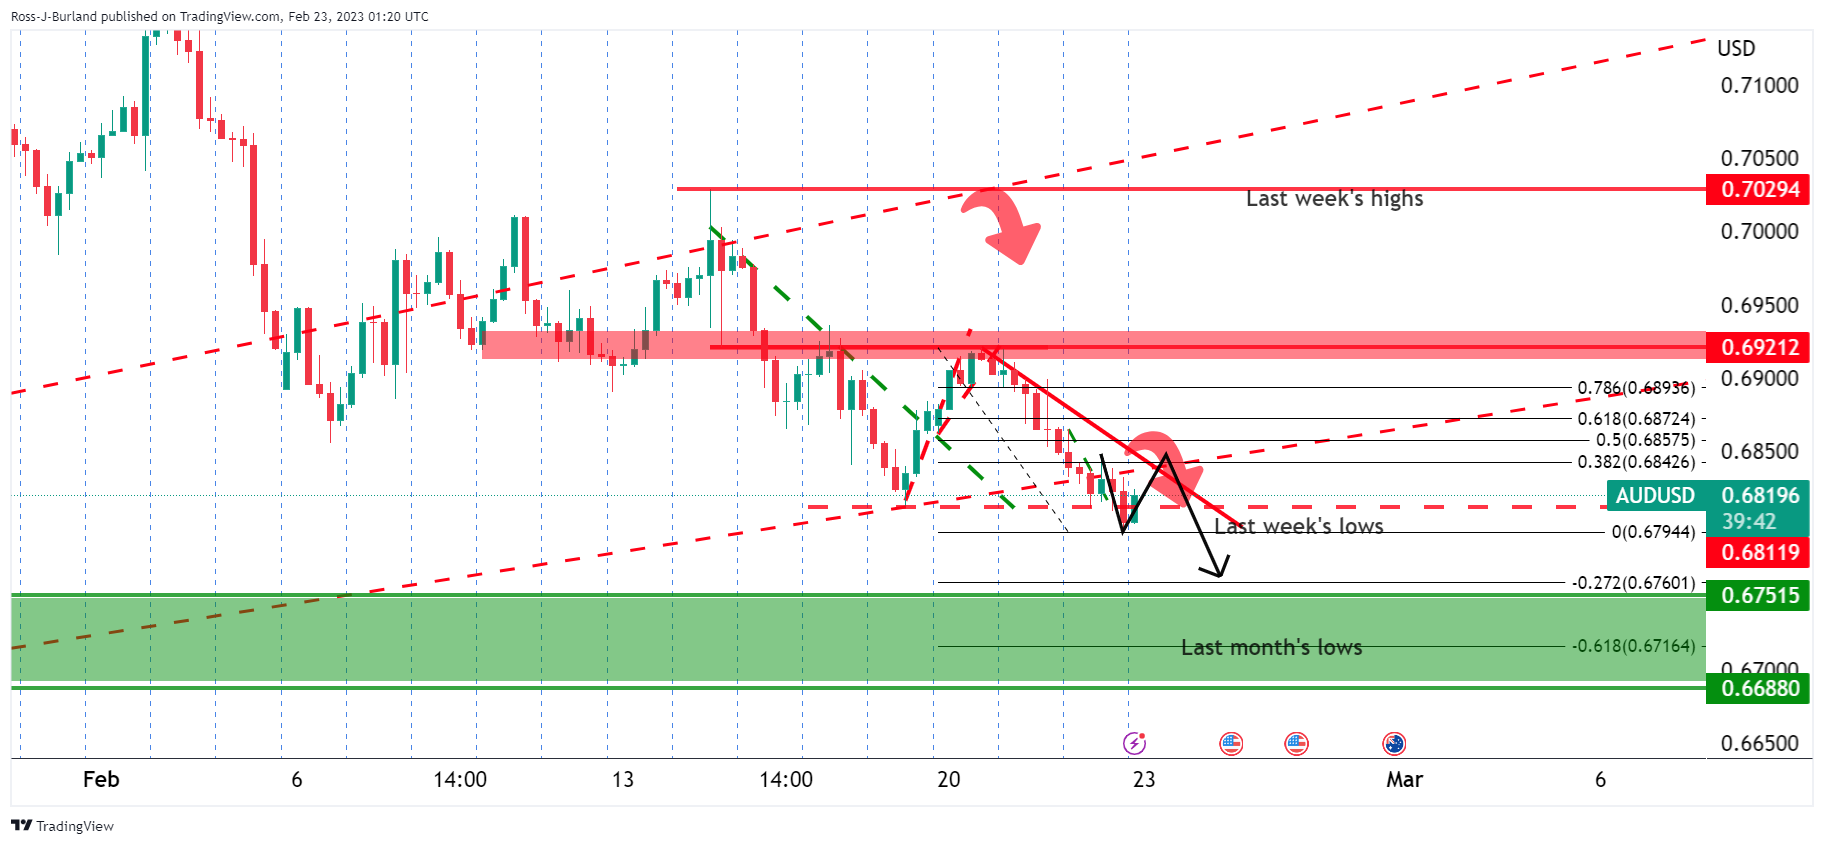
0.6750 is eyed while last month's lows are a downside target on the way to a test of 0.6700 but if we see failures below last week's lows and a firm bullish close above there, then longs will be in the market and the short positions vulnerable for a squeeze whereby 0.6920 will be closely eyed for a restest of bear's commitments.
- USD/CHF retreats from weekly top, snaps two-day winning streak.
- Cautious optimism prevails as US President Biden thinks no imminent fears of nuclear use in Russia-Ukraine war.
- Easing US inflation expectations also favor pullback moves amid off in Japan.
USD/CHF renews its intraday low near 0.9305 as it pares the recent gains around the weekly top during Thursday’s sluggish session. The Swiss currency pair’s latest pullback could be linked to the market’s adjustments of the latest moves amid the Japan holidays and a pullback in the US Treasury bond yields.
The underlying reason could be linked to the comments from US President Joe Biden as he thinks that his Russian counterpart isn’t up to using nuclear arms by backing off an international treaty. However, the fears surrounding the Ukraine-Russia war are far from over, with the latest edition of the West and China escalating the matter to the worse. That said, the Wall Street Journal (WSJ) recently said that the US is considering the release of intelligence on China’s potential arms transfer to Russia. Previously, the China-Russia ties seemed to have escalated the geopolitical woes as the US strongly criticized such moves and favored the rush towards risk safety, which in turn favored the US Dollar.
Also likely to have favored the USD/CHF pullback is the latest retreat in the US inflation expectations. That said, the 10-year and 5-year breakeven inflation rates from the St. Louis Federal Reserve (FRED) signal a pullback in the US inflation expectations by retreating from the multi-day top.
Furthermore, the first daily negative of the US benchmark Treasury bond yields and mixed Wall Street close also allowed the US Dollar Index (DXY) to pare recent gains and weigh on the USD/CHF prices.
It’s worth noting that the latest Federal Open Market Committee’s (FOMC) Monetary Policy Meeting Minutes stated that all participants agreed more rate hikes are needed to achieve the inflation target while also favoring further Fed balance sheet reductions, which in turn favored DXY bulls. On the same line, St. Louis Federal Reserve President James Bullard also mentioned that the Fed will have to go north of 5% to tame inflation, as reported by Reuters. The policymaker also stated that he believes there are good chances they could beat inflation this year without creating a recession. Additionally, Federal Reserve Bank of New York President John Williams highlighted the concerns favoring the Fed’s higher rates by saying, per Reuters, “Fed is absolutely committed to getting inflation back to 2%.”
Looking ahead, second estimations of the US Personal Consumption Expenditures (PCE) details for the fourth quarter (Q4), as well as the preliminary readings of the US Q4 Gross Domestic Product (GDP), will be important for fresh directions to the USD/CHF traders.
Technical analysis
Despite the latest retreat, USD/CHF remains well above the 50-day Exponential Moving Average (EMA) support surrounding 0.9285, which in turn suggests more chances of its further run-up towards the previous monthly high of 0.9410.
In recent trade today, the People’s Bank of China (PBOC) set the yuan at 6.9028 vs. the previous fix of 6.8759 and prior close of 6.8900.
About the fix
China maintains strict control of the yuan’s rate on the mainland.
The onshore yuan (CNY) differs from the offshore one (CNH) in trading restrictions, this last one is not as tightly controlled.
Each morning, the People’s Bank of China (PBOC) sets a so-called daily midpoint fix, based on the yuan’s previous day's closing level and quotations taken from the inter-bank dealer.
- Gold price is eyeing more downside to near $1,820.00 amid hawkish FOMC minutes.
- FOMC minutes state China’s reopening and the Russia-Ukraine war still hold the risk of further escalation in inflation.
- Gold price is auctioning in an Inverted Flag, which is a bearish trend continuation pattern.
Gold price (XAU/USD) is displaying a sideways auction around $1,825.00 in the Asian session. The precious metal has turned sideways after a vertical sell-off and is expected to continue its downside to $1,820.00 as the Federal Open Market Committee (FOMC) minutes are conveying more rates to tame stubborn inflation.
The US Dollar Index (DXY) is aiming to recapture the weekly resistance of 104.33 as further policy restrictions to bring down inflation cannot be ruled out. S&P500 futures are demonstrating some gains in the Tokyo session after a choppy Wednesday, portraying a minor recovery in the risk appetite of the market participants. The return delivered on the 10-year US Treasury yields is marginally dropped to near 3.92%.
The minutes of the Federal Reserve (Fed)’s February monetary policy meeting explain inflation to be persistent as the reopening of China’s economy and the Russia-Ukraine war still hold the risk of further escalation in the price index. Meanwhile, St. Louis Fed President James Bullard has supported an aggressive monetary policy ahead. Fed policymaker sees the terminal rate at around 5.4%.
For further guidance, United States Gross Domestic Product (GDP) (Q4) data will remain in the spotlight. The annualized GDP data is seen unchanged at 2.9%. Economic activities in the US have remained contracting in the past few months. Therefore, the US GDP could deliver a downside surprise.
Gold technical analysis
Gold price is forming an Inverted Flag chart pattern, which is a bearish trend-following pattern. The pattern formation is near the horizontal support plotted from December 13 high at $1,824.55 on a four-hour scale. The chart pattern indicates a sheer consolidation that is followed by a breakdown. Usually, the consolidation phase of the chart pattern serves as an inventory adjustment in which those participants initiate shorts, which prefer to enter an auction after the establishment of a bearish bias.
The 50-period Exponential Moving Average (EMA) at $1,844.00 is acting as a major barricade for the Gold bulls.
Also, the Relative Strength Index (RSI) (14) has slipped into the bearish range of 20.00-40.00, which indicates more weakness ahead.
Gold four-hour chart
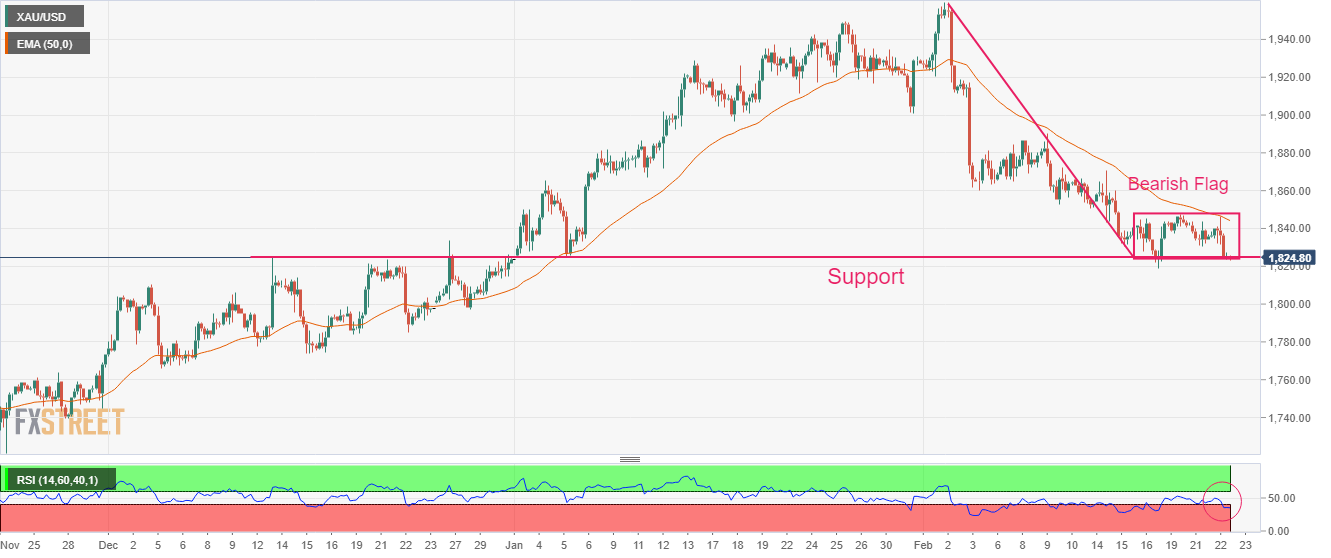
- USD/CAD takes offers to refresh intraday low, snaps two-day uptrend at seven-week high.
- Fresh geopolitical concerns, cautious optimism allow Oil price to lick its wounds.
- Fed hints remain in favor of higher rates, China-Russia ties escalate geopolitical fears.
- Second-tier US data can entertain traders but Japan’s off, retreat in yields may allow further consolidation of gains.
USD/CAD takes offers to refresh the intraday low near 1.3540 as it reverses from a seven-week high marked the previous day during early Thursday. In doing so, the Loonie pair prints the first daily loss in three amid the market’s consolidation, as well as cautious optimism in the market.
That said, the absence of Japanese traders, due to the holiday in Tokyo, joins the previous retreat in the US Treasury bond yields and a pullback in the US inflation expectations to weigh on the latest USD/CAD price. That said, the 10-year and 5-year breakeven inflation rates from the St. Louis Federal Reserve (FRED) signal a pullback in the US inflation expectations by retreating from the multi-day top.
On the same line could be a corrective bounce in Canada’s key export item, namely WTI crude oil. The black gold dropped to the 13-day-low by losing nearly 3.0% the previous day after downbeat US inventories joined the strong US Dollar. That said, the energy benchmark prints mild gains at around $74.00 by the press time.
Despite the latest consolidation in the market, the USD/CAD buyers remain hopeful amid hawkish Federal Reserve (Fed) concerns and geopolitical fears.
Talking about geopolitics, US President Joe Biden thinks that his Russian counterpart isn’t up to using nuclear arms by backing off an international treaty. However, the fears surrounding the Ukraine-Russia war are far from over, with the latest edition of the West and China escalating the matter to the worse. That said, the Wall Street Journal (WSJ) recently said that the US is considering the release of intelligence on China’s potential arms transfer to Russia. Previously, the China-Russia ties seemed to have escalated the geopolitical woes as the US strongly criticized such moves and favored the rush towards risk safety, which in turn favored the US Dollar.
Elsewhere, the latest Federal Open Market Committee’s (FOMC) Monetary Policy Meeting Minutes stated that all participants agreed more rate hikes are needed to achieve the inflation target while also favoring further Fed balance sheet reductions. On the same line, St. Louis Federal Reserve President James Bullard also mentioned that the Fed will have to go north of 5% to tame inflation, as reported by Reuters. The policymaker also stated that he believes there are good chances they could beat inflation this year without creating a recession. Additionally, Federal Reserve Bank of New York President John Williams highlighted the concerns favoring the Fed’s higher rates by saying, per Reuters, “Fed is absolutely committed to getting inflation back to 2%.”
Amid these plays, US Treasury bond yields remain inactive after retreating from the multi-day top while Wall Street closed mixed but the S&P 500 Futures remain mildly bid of late.
Looking ahead, second estimations of the US Personal Consumption Expenditures (PCE) details for the fourth quarter (Q4), as well as the preliminary readings of the US Q4 Gross Domestic Product (GDP), will be important for fresh directions to the USD/CAD traders.
Technical analysis
A daily closing beyond the 100-DMA, around 1.3515 by the press time, directs USD/CAD towards the last January’s peak of 1.3685.
Market sentiment improves during early Thursday, despite looming geopolitical fears and hawkish Federal Reserve (Fed) concerns. The reason could be linked to the recent pullback in the US inflation expectations, per the 10-year and 5-year breakeven inflation rates from the St. Louis Federal Reserve (FRED).
That said, 10-year inflation expectations per the aforementioned measure eased from the highest levels since December 02 to 2.41% by the end of Wednesday’s North American trading session, after refreshing a two-month high the previous day.
On the same line, the five-year US inflation expectations retreated in their latest readings to 2.52%, from the highest levels since November 2022.
It should be noted that the early signals of inflation appear losing upbeat momentum and can push the Fed to ease its hawkish bias, which in turn may weigh on the US Dollar Index (DXY). However, Friday’s Core Personal Consumption Expenditure (PCE) Price Index data for January will be more important as it is considered the Fed’s preferred inflation gauge.
Also read: US Dollar Index: Hawkish Fed signals, geopolitical fears favor DXY bulls near 104.50
| Index | Change, points | Closed | Change, % |
|---|---|---|---|
| NIKKEI 225 | -368.78 | 27104.32 | -1.34 |
| Hang Seng | -105.65 | 20423.84 | -0.51 |
| KOSPI | -41.28 | 2417.68 | -1.68 |
| ASX 200 | -21.8 | 7314.5 | -0.3 |
| FTSE 100 | -47.17 | 7930.63 | -0.59 |
| DAX | 2.27 | 15399.89 | 0.01 |
| CAC 40 | -9.39 | 7299.26 | -0.13 |
| Dow Jones | -84.5 | 33045.09 | -0.26 |
| S&P 500 | -6.29 | 3991.05 | -0.16 |
| NASDAQ Composite | 14.77 | 11507.07 | 0.13 |
- WTI is juggling below $74.00 after a nosedive move due to a huge build-up of US oil stockpiles.
- Hawkish Fed minutes have accelerated the risk of a recession in the United States.
- The oil price might remain on the tenterhooks as a Head and Shoulder pattern is in formation.
West Texas Intermediate (WTI), futures on NYMEX, have been dumped by the market participants after the United States American Petroleum Institute (API) reported a huge build-up of oil inventories for the week ending February 17.
The US API reported a build-up of oil stockpiles by 9.985 million barrels. This signifies exceeding oil supply against the overall demand, which resulted in a nosedive move of around 4%.
Apart from that, hawkish Federal Open Market Committee (FOMC) minutes have bolstered further slowdown in the economic activities in the United States. Firms are still struggling to address higher interest obligations and now further jump in the interest rates will result in more contraction in the scale of activities. Fed policymakers have favored for higher rates for a longer period to bring down inflation meaningfully.
Meanwhile, St. Louis Federal Reserve (Fed) President James Bullard has advocated an aggressive interest rate hike in the March monetary policy meeting to sharpen its tools in the battle against persistent inflation. This might escalate recession fears in the United States and eventually the oil demand. Further, the Fed policymaker sees the terminal rate as around 5.4%.
WTI technical analysis
WTI is forming a Head and Shoulder chart pattern on a four-hour scale that indicates a breakdown of a prolonged consolidation. The right shoulder formation of the aforementioned chart pattern in under process and a complete formation will advocate more shorts on the oil price. The neckline of the chart pattern is plotted from January 5 low at $72.64.
The Relative Strength Index (RSI) (14) has slipped into the bearish range of 20.00-40.00, which indicates that the downside momentum is active.
WTI four-hour chart
-638127088677535289.png)
- EUR/USD short squeeze could be put on in the coming day/sessions.
- However, if the bears commit at a 38.2% or below 1.0625, then there will be prospects of a move into the 1.0580/70s.
EUR/USD is down low with respect to the prior day's range following three days of traders shorting the pair. The bias is bullish USD but a failed break of last week's lows could be a recipe for a sizeable correction to the upside for the days ahead. The following illustrates the week's template and prospects of a short squeeze following three days of shorts (S1, S2 & S3).
EUR/USD H4 chart
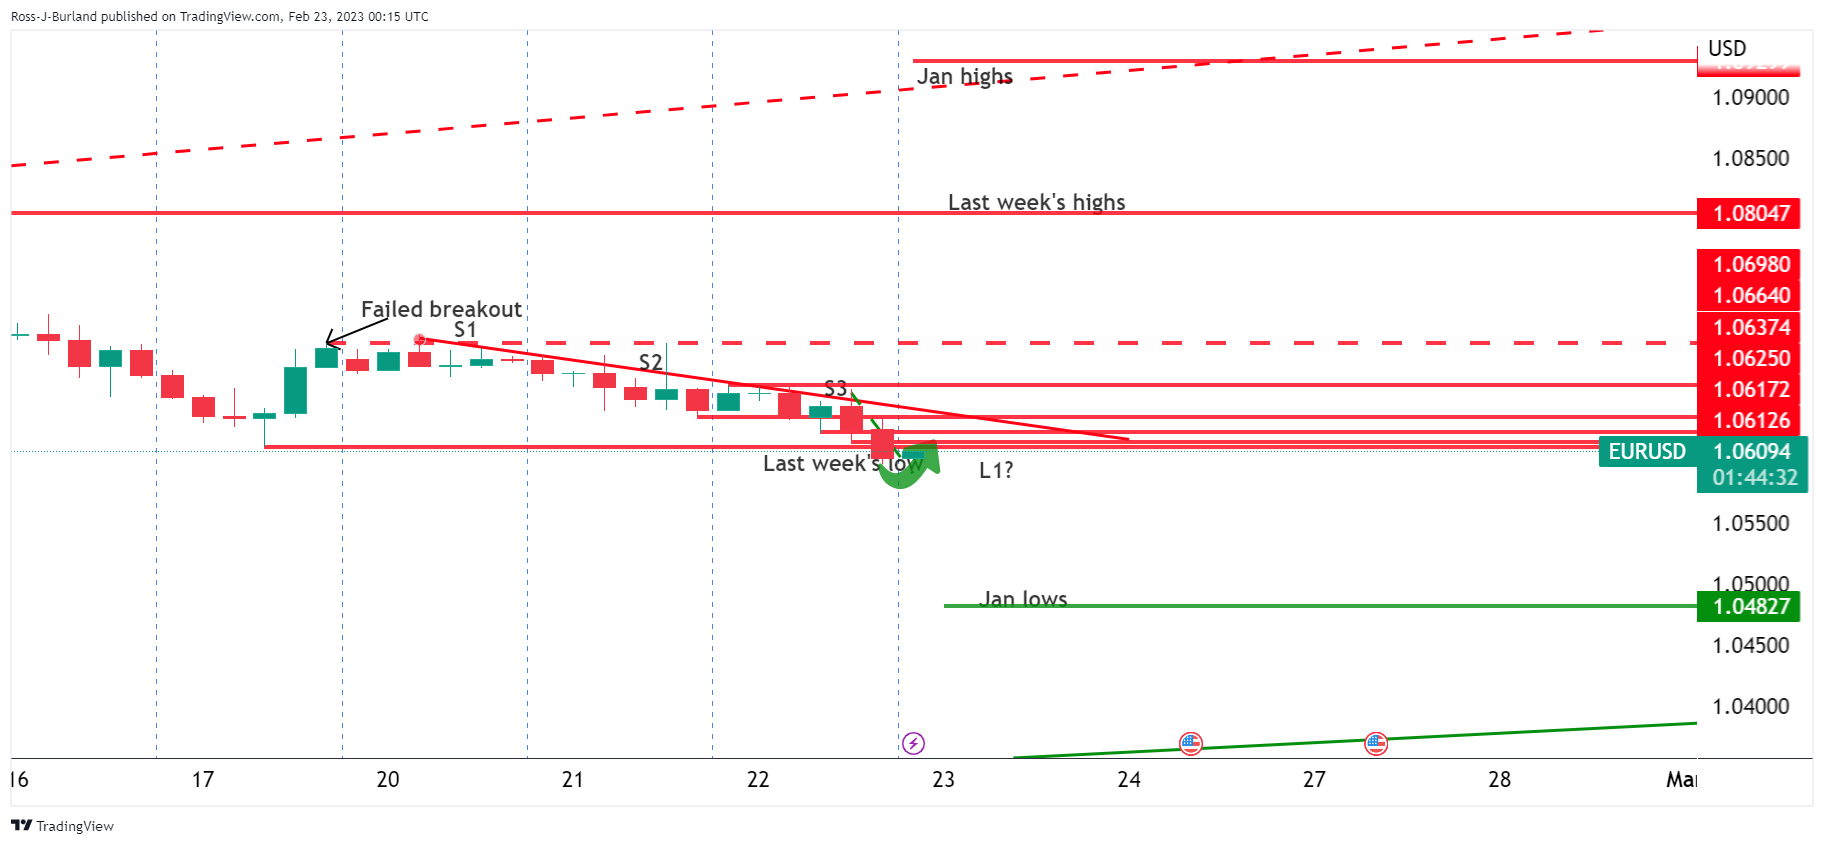
EUR/USD M15 chart
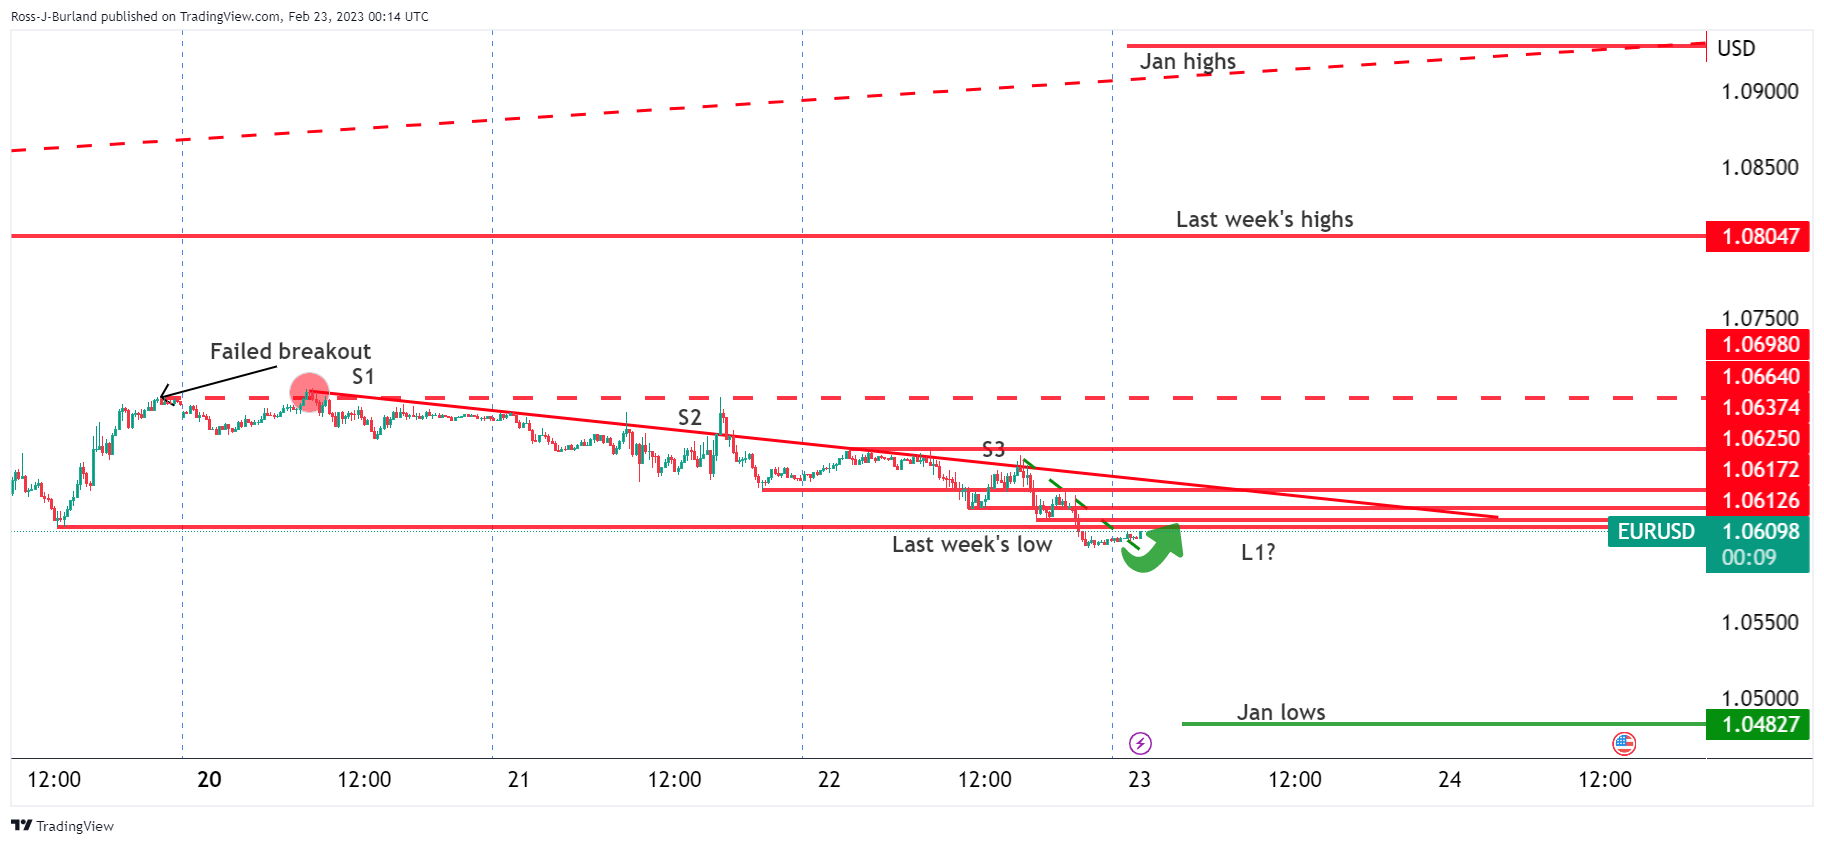
Will Thursday be the first day of longs, a higher close in other words, (L1)?
If so, the thesis for the day ahead would be to buy the dip depending on what session the opportunity comes in, if at all.
For the immediate future, we could see a downside extension as follows:
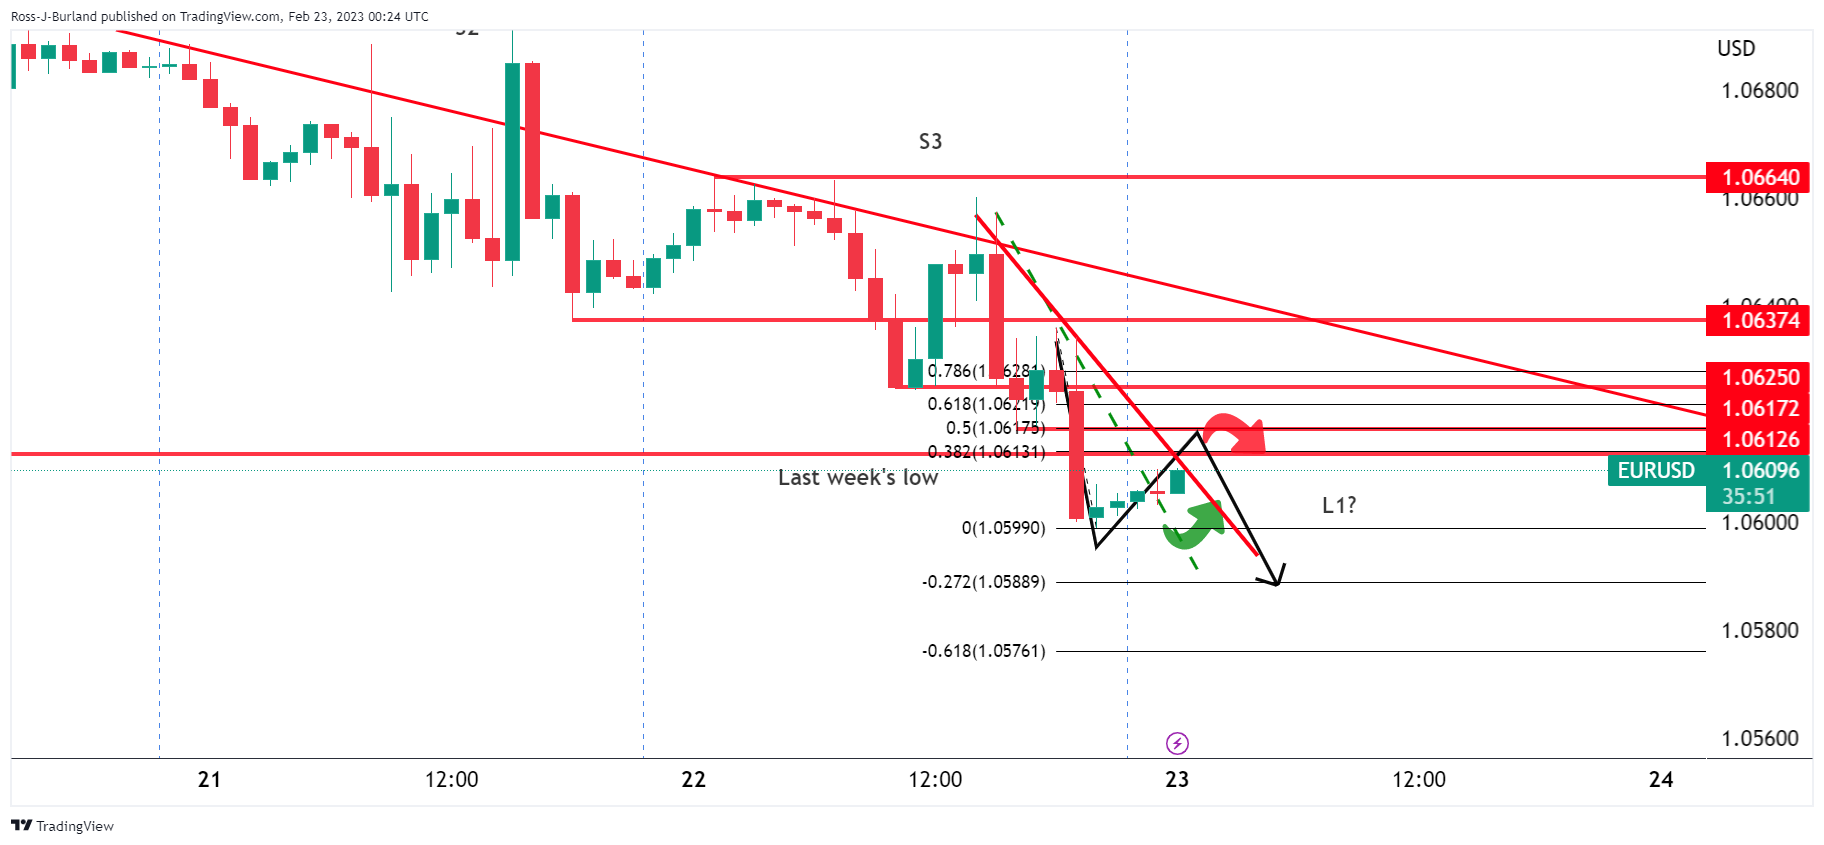
If the bears commit at a 38.2% or below 1.0625, then there will be prospects of a move into the 1.0580/70s for the sessions ahead.
- USD/JPY picks up bids to restore bullish bias, stays sluggish around two-month high.
- Hopes of economic recovery allow yields to retreat from multi-day top.
- Mixed equities, hawkish BoJ concerns also probe USD/JPY bulls.
- FOMC Minutes, Fed talks favor higher rates, geopolitical fears also underpin US Dollar’s haven demand.
USD/JPY grinds higher around 135.00 as bulls struggle to retake control, after a dismal daily close, despite broad US Dollar strength. The reason could be linked to the retreat in the Treasury bond yields ahead of today’s Japan holiday.
It’s worth noting that the receding economic fears, mainly emanating from the recently firmer global economic data, not just from the US, seemed to have pushed back the bond bears. As a result, the US 10-year and two-year Treasury bond yields marked their first negative daily closing in three while retreating from the highest levels since early November, marked recently. That said, the latest prints of the US 10-year and two-year bond coupons are 3.93% and 4.70% respectively.
Elsewhere, doubts about Bank of Japan (BoJ) Governor Haruhiko Kuroda’s ability to play a masterstroke of the dovish league before he retires in April also seemed to have probed the USD/JPY bulls. On the same line could be the recently firmer inflation and activity numbers from Japan.
Above all, hawkish Federal Reserve (Fed) concerns and geopolitical fears keep the USD/JPY bulls hopeful.
US President Joe Biden thinks that his Russian counterpart isn’t up to using nuclear arms by backing off an international treaty. However, the fears surrounding the Ukraine-Russia war are far from over, with the latest edition of the West and China escalating the matter to the worse. That said, the Wall Street Journal (WSJ) recently said that the US is considering the release of intelligence on China’s potential arms transfer to Russia.
Earlier, comments from China's top diplomat Wang Yi and Russian President Putin weigh on the sentiment and underpinned the rush towards risk-safety, which in turn favored the USD/JPY bulls. China’s Diplomat Wang Yi met Russian President Vladimir Putin and said that they are ready to deepen strategic cooperation with Russia on Wednesday, as reported by Reuters. The Chinese policymaker also added that their relations will not succumb to pressure from third countries. Meanwhile, Putin noted that it's very important for them to have a cooperation with China and said he is looking forward to Chinese President Xi Jinping visiting Moscow.
On the other hand, the latest Federal Open Market Committee’s (FOMC) Monetary Policy Meeting Minutes stated that all participants agreed more rate hikes are needed to achieve the inflation target while also favoring further Fed balance sheet reductions. On the same line, St. Louis Federal Reserve President James Bullard also mentioned that the Fed will have to go north of 5% to tame inflation, as reported by Reuters. The policymaker also stated that he believes there are good chances they could beat inflation this year without creating a recession. Additionally, Federal Reserve Bank of New York President John Williams highlighted the concerns favoring the Fed’s higher rates by saying, per Reuters, “Fed is absolutely committed to getting inflation back to 2%.”
Against this backdrop, Wall Street closed mixed whereas the S&P 500 Futures remain mildly bid of late.
Moving on, Japan’s holiday may restrict USD/JPY moves but the second estimations of the US Personal Consumption Expenditures (PCE) details for the fourth quarter (Q4), as well as the preliminary readings of the US Q4 Gross Domestic Product (GDP), will be important for fresh directions.
Technical analysis
Unless dropping back below the 200-day Exponential Moving Average (EMA) level surrounding 133.80, the USD/JPY bulls occupy the driver’s seat.
| Pare | Closed | Change, % |
|---|---|---|
| AUDUSD | 0.68073 | -0.63 |
| EURJPY | 143.097 | -0.42 |
| EURUSD | 1.06048 | -0.4 |
| GBPJPY | 162.513 | -0.52 |
| GBPUSD | 1.20455 | -0.5 |
| NZDUSD | 0.62203 | 0.14 |
| USDCAD | 1.35509 | 0.12 |
| USDCHF | 0.93134 | 0.59 |
| USDJPY | 134.909 | -0.04 |
- US Dollar Index bulls take a breather at weekly top after two-day uptrend.
- FOMC Minutes, Fed talks favor higher rates, China-Russia ties signal amplify geopolitical woes.
- Retreat in yields, mixed equities probe DXY bulls ahead of key data.
US Dollar Index (DXY) seesaws near 104.50, grinding higher around the weekly top, as the greenback bulls cheer hawkish Federal Reserve (Fed) concerns amid geopolitical fears during early Thursday. In doing so, the greenback’s gauge versus the six major currencies seeks fresh directions to extend the two-day uptrend, which in turn highlights today’s data that provides early signals for the US inflation and output conditions.
Although US President Joe Biden thinks that his Russian counterpart isn’t up to using nuclear arms by backing off an international treaty, the fears surrounding the Ukraine-Russia war are far from over, with the latest edition of the West and China escalating the matter to worse. That said, the Wall Street Journal (WSJ) recently said that the US is considering the release of intelligence on China’s potential arms transfer to Russia.
Previously, comments from China's top diplomat Wang Yi and Russian President Putin weigh on the sentiment and propelled the US Dollar Index (DXY). China’s Diplomat Wang Yi met Russian President Vladimir Putin and said that they are ready to deepen strategic cooperation with Russia on Wednesday, as reported by Reuters. The Chinese policymaker also added that their relations will not succumb to pressure from third countries. Meanwhile, Putin noted that it's very important for them to have a cooperation with China and said he is looking forward to Chinese President Xi Jinping visiting Moscow.
On the other hand, hawkish Federal Reserve (Fed) Minutes and statements suggesting higher interest rates from the Fed officials also favor the US Dollar’s demand. As per the latest Federal Open Market Committee’s (FOMC) Monetary Policy Meeting Minutes, all participants agreed more rate hikes are needed to achieve the inflation target while also favoring further Fed balance sheet reductions.
On the same line, St. Louis Federal Reserve President James Bullard also mentioned that the Fed will have to go north of 5% to tame inflation, as reported by Reuters. The policymaker also stated that he believes there are good chances they could beat inflation this year without creating a recession. Additionally, Federal Reserve Bank of New York President John Williams highlighted the concerns favoring the Fed’s higher rates by saying, per Reuters, “Fed is absolutely committed to getting inflation back to 2%.”
It’s worth noting, however, that a retreat in the US Treasury bond yields and mixed performance of equities, amid hopes that the economic slowdown woes are off the table, seemed to have probed the US Dollar Index bulls. That said, the US 10-year and two-year Treasury bond yields retreated from their three-month high as Wall Street closed mixed whereas the S&P 500 Futures remain mildly bid of late.
Looking ahead, the second estimations of the US Personal Consumption Expenditures (PCE) details for the fourth quarter (Q4), as well as the preliminary readings of the US Q4 Gross Domestic Product (GDP), will be important for fresh directions. Although the scheduled figures are likely to confirm the initial forecasts, any surprises won’t be taken lightly and hence should be observed with care for clear directions.
Technical analysis
A sustained trading of the US Dollar Index (DXY) beyond a three-week-old ascending support line, near 104.00 by the press time, directs DXY bulls toward a convergence of the 100-day and 200-day Exponential Moving Average (EMA), around 104.85-90 at the latest.
© 2000-2026. All rights reserved.
This site is managed by Teletrade D.J. LLC 2351 LLC 2022 (Euro House, Richmond Hill Road, Kingstown, VC0100, St. Vincent and the Grenadines).
The information on this website is for informational purposes only and does not constitute any investment advice.
The company does not serve or provide services to customers who are residents of the US, Canada, Iran, The Democratic People's Republic of Korea, Yemen and FATF blacklisted countries.
Making transactions on financial markets with marginal financial instruments opens up wide possibilities and allows investors who are willing to take risks to earn high profits, carrying a potentially high risk of losses at the same time. Therefore you should responsibly approach the issue of choosing the appropriate investment strategy, taking the available resources into account, before starting trading.
Use of the information: full or partial use of materials from this website must always be referenced to TeleTrade as the source of information. Use of the materials on the Internet must be accompanied by a hyperlink to teletrade.org. Automatic import of materials and information from this website is prohibited.
Please contact our PR department if you have any questions or need assistance at pr@teletrade.global.
