- Analytics
- News and Tools
- Market News
CFD Markets News and Forecasts — 23-01-2025
- EUR/USD flattened near 1.0400 on Thursday.
- Investors are riding a tepid wave with a notable lack of data.
- Friday’s global PMI print to cap off an otherwise unremarkable week.
EUR/USD flatlined on Thursday, cycling near the 1.0400 handle as investors grind through a largely unremarkable week despite a strong start on Monday. A lack of meaningful economic docket data isn’t doing already-tepid markets any favors, and political headlines are driving most of what little trading volume exists.
President Donald Trump lashed out about a wide variety of topics during his appearance at the WEF’s annual gathering in Switzerland, colloquially referred to as Davos, the city that hosts the forum every year. President Trump reminded everyone listening that he intended to “obliterate” the US budget deficit, while somehow convincing the US Congress to pass “the largest tax cut in American history” at the same time. Donald Trump also vowed to attempt to subvert the operational independence of the US Federal Reserve (Fed) by demanding lower interest rates.
Fiber traders will have to settle for focusing on Friday’s Purchasing Managers Index (PMI) figures due from both the EU and the US. Both EU and US PMI business activity survey results for January are expected to come in mixed this week. The services components expected to tick down, or in the EU’s case, hold flat, and manufacturing to recover, albeit slightly. PMI figures generally have a limited impact unless figures come in wildly out of sync with forecasts, but survey respondent rates tend to be on the low side, and the overall figures should be taken with a grain of salt.
EUR/USD price forecast
Fiber bulls lost steam just below the 50-day Exponential Moving Average (EMA) around 1.0460, missing the 1.0450 level and pushing bids down into the 1.0400 range. Recent bullish momentum has gradually diminished, even after a 2.75% increase from last week’s drop into fresh two-year lows beneath 1.0200.
While technical indicators have recently shifted to bullish signals after previously suggesting oversold conditions, maintaining sustained momentum remains a challenge. Traders seeking a longer-term bullish correction should wait for price action to affirm a higher low pattern before looking for technical signals to enter the market.
EUR/USD daily chart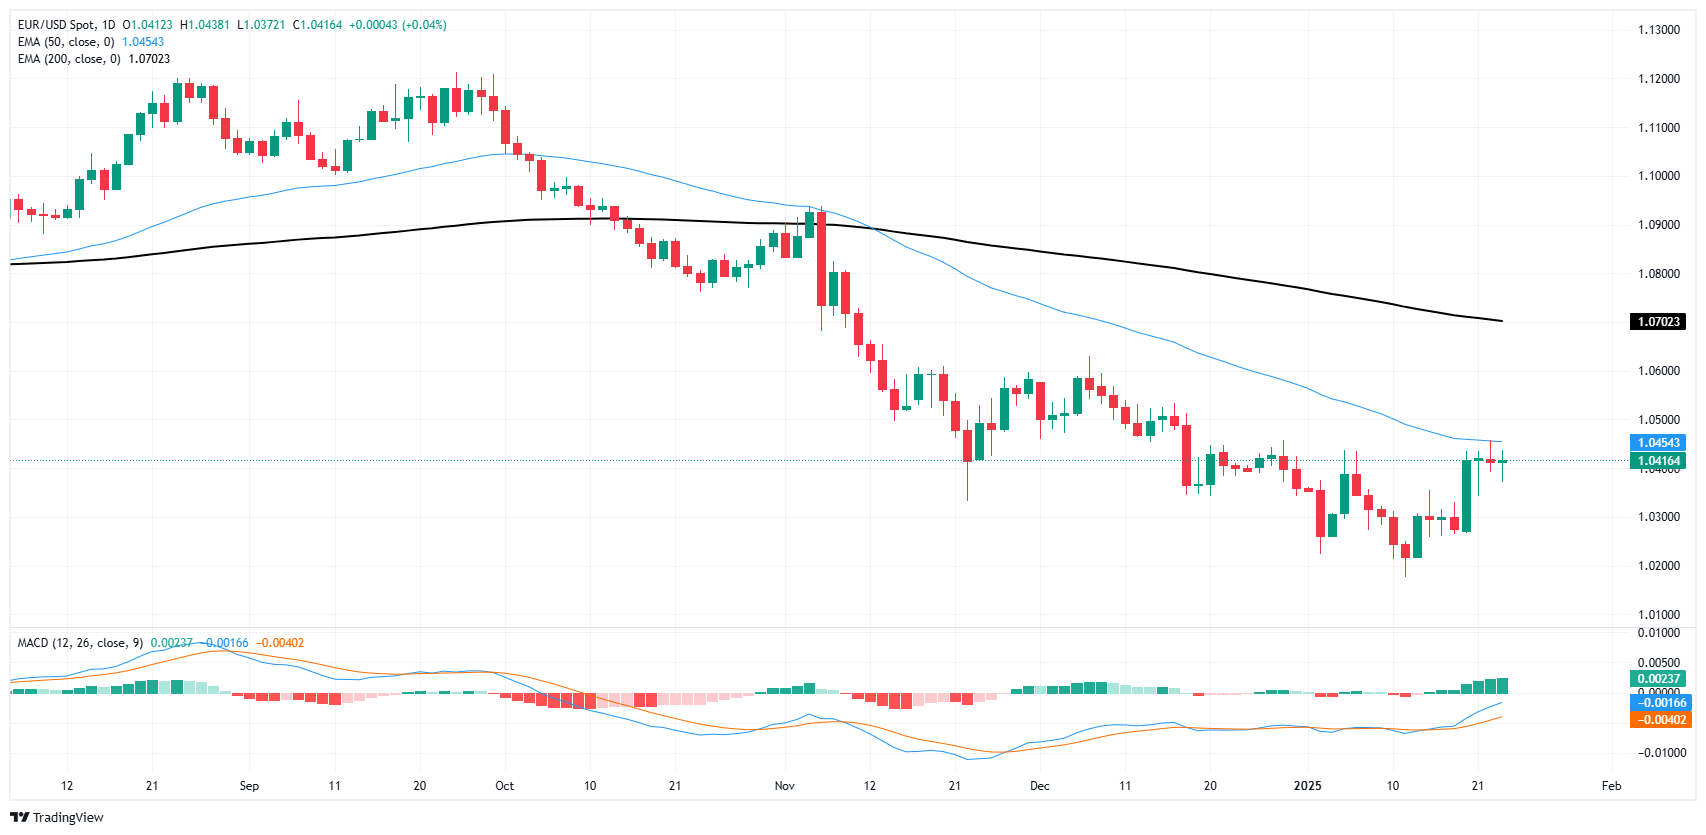
Euro FAQs
The Euro is the currency for the 19 European Union countries that belong to the Eurozone. It is the second most heavily traded currency in the world behind the US Dollar. In 2022, it accounted for 31% of all foreign exchange transactions, with an average daily turnover of over $2.2 trillion a day. EUR/USD is the most heavily traded currency pair in the world, accounting for an estimated 30% off all transactions, followed by EUR/JPY (4%), EUR/GBP (3%) and EUR/AUD (2%).
The European Central Bank (ECB) in Frankfurt, Germany, is the reserve bank for the Eurozone. The ECB sets interest rates and manages monetary policy. The ECB’s primary mandate is to maintain price stability, which means either controlling inflation or stimulating growth. Its primary tool is the raising or lowering of interest rates. Relatively high interest rates – or the expectation of higher rates – will usually benefit the Euro and vice versa. The ECB Governing Council makes monetary policy decisions at meetings held eight times a year. Decisions are made by heads of the Eurozone national banks and six permanent members, including the President of the ECB, Christine Lagarde.
Eurozone inflation data, measured by the Harmonized Index of Consumer Prices (HICP), is an important econometric for the Euro. If inflation rises more than expected, especially if above the ECB’s 2% target, it obliges the ECB to raise interest rates to bring it back under control. Relatively high interest rates compared to its counterparts will usually benefit the Euro, as it makes the region more attractive as a place for global investors to park their money.
Data releases gauge the health of the economy and can impact on the Euro. Indicators such as GDP, Manufacturing and Services PMIs, employment, and consumer sentiment surveys can all influence the direction of the single currency. A strong economy is good for the Euro. Not only does it attract more foreign investment but it may encourage the ECB to put up interest rates, which will directly strengthen the Euro. Otherwise, if economic data is weak, the Euro is likely to fall. Economic data for the four largest economies in the euro area (Germany, France, Italy and Spain) are especially significant, as they account for 75% of the Eurozone’s economy.
Another significant data release for the Euro is the Trade Balance. This indicator measures the difference between what a country earns from its exports and what it spends on imports over a given period. If a country produces highly sought after exports then its currency will gain in value purely from the extra demand created from foreign buyers seeking to purchase these goods. Therefore, a positive net Trade Balance strengthens a currency and vice versa for a negative balance.
- USD/CAD posts modest gains around 1.4375 in Friday’s early Asian session.
- Trump said he wanted the Fed to lower interest rates immediately.
- Canada's Retail Sales were flat in November, weaker than expected.
The USD/CAD pair trades with mild gains near 1.4375 during the early Asian session on Friday. Investors await further clarity on tariff announcements by US President Donald Trump. Later on Friday, the flash US S&P Global Manufacturing and Services Purchasing Managers Index (PMI) for January will be in the spotlight.
Late Thursday, Trump said he wants the US Federal Reserve (Fed) to cut interest rates “immediately,” adding that he understands monetary policy better than those charged with setting it. Trump's remarks came before the Fed's monetary policy meeting scheduled for January 28 and 29, with expectations the US central bank will hold rates steady.
"I think Trump's comments at the World Economic Forum today helped euro-dollar recover and put some pressure on the (U.S.) dollar more broadly," said Silver Gold Bull Erik Bregar, director, FX & precious metals risk management at Silver Gold Bull.
On the Loonie front, Canada’s Retail Sales were flat on a monthly basis in November versus 0.6% prior, Statistics Canada reported on Thursday. This reading came in weaker than the 0.2% expected.
Meanwhile, a fall in crude oil prices might exert some selling pressure on the commodity-linked Canadian Dollar (CAD) and cap the downside for the pair. Canada is the largest oil exporter to the US, and lower crude oil prices tend to have a negative impact on the CAD value.
Canadian Dollar FAQs
The key factors driving the Canadian Dollar (CAD) are the level of interest rates set by the Bank of Canada (BoC), the price of Oil, Canada’s largest export, the health of its economy, inflation and the Trade Balance, which is the difference between the value of Canada’s exports versus its imports. Other factors include market sentiment – whether investors are taking on more risky assets (risk-on) or seeking safe-havens (risk-off) – with risk-on being CAD-positive. As its largest trading partner, the health of the US economy is also a key factor influencing the Canadian Dollar.
The Bank of Canada (BoC) has a significant influence on the Canadian Dollar by setting the level of interest rates that banks can lend to one another. This influences the level of interest rates for everyone. The main goal of the BoC is to maintain inflation at 1-3% by adjusting interest rates up or down. Relatively higher interest rates tend to be positive for the CAD. The Bank of Canada can also use quantitative easing and tightening to influence credit conditions, with the former CAD-negative and the latter CAD-positive.
The price of Oil is a key factor impacting the value of the Canadian Dollar. Petroleum is Canada’s biggest export, so Oil price tends to have an immediate impact on the CAD value. Generally, if Oil price rises CAD also goes up, as aggregate demand for the currency increases. The opposite is the case if the price of Oil falls. Higher Oil prices also tend to result in a greater likelihood of a positive Trade Balance, which is also supportive of the CAD.
While inflation had always traditionally been thought of as a negative factor for a currency since it lowers the value of money, the opposite has actually been the case in modern times with the relaxation of cross-border capital controls. Higher inflation tends to lead central banks to put up interest rates which attracts more capital inflows from global investors seeking a lucrative place to keep their money. This increases demand for the local currency, which in Canada’s case is the Canadian Dollar.
Macroeconomic data releases gauge the health of the economy and can have an impact on the Canadian Dollar. Indicators such as GDP, Manufacturing and Services PMIs, employment, and consumer sentiment surveys can all influence the direction of the CAD. A strong economy is good for the Canadian Dollar. Not only does it attract more foreign investment but it may encourage the Bank of Canada to put up interest rates, leading to a stronger currency. If economic data is weak, however, the CAD is likely to fall.
- The Bank of Japan is set to hike interest rates to 0.50% on Friday.
- All eyes will remain on the language in the policy statement and Governor Ueda’s press conference.
- The Japanese Yen could witness intense volatility on the BoJ policy announcements.
The Bank of Japan (BoJ) is widely expected to raise the short-term interest rate from 0.25% to a 17-year high of 0.50% in January, following the conclusion of its two-day monetary policy review on Friday.
The Japanese Yen (JPY) is set to rock on the BoJ policy announcements as investors seek to find fresh clues on the central bank’s next policy move.
What to expect from the BoJ interest rate decision?
The BoJ will likely begin 2025 with some action as it remains on track to revive its rate-hiking cycle after pausing for three consecutive meetings. In July 2024, the Japanese central bank unexpectedly raised rates by 15 basis points (bps) from 0.1% to 0.25%.
Markets speculated that a slew of hotter-than-expected inflation readings, the ongoing depreciation of the JPY and a fiscal budget strengthened the case for a BoJ rate hike at the January meeting.
Tokyo annual Consumer Price Index (CPI) rose 3% in November, up from 2.6% in October. Core inflation, which excludes food and energy costs, increased by 2.4% in the same period after reporting a 2.2% growth in October. Tokyo’s inflation numbers are widely considered a leading indicator of nationwide trends.
Meanwhile, Japan's annual Producer Price Index (PPI) remained at 3.8% in December, driven primarily by high food prices, particularly a 31.8% increase in agricultural goods costs. Separately, the Japanese Cabinet approved a historic budget of $732 billion for the fiscal year beginning in April while restricting new bond issuance to its lowest level in 17 years, per Reuters.
The recent hawkish commentary from BoJ Governor Kazuo Ueda and Deputy Governor Ryozo Himino also pointed to a likely rate hike this week. Ueda said on January 16 that the board members “will debate at next week's meeting whether to hike rates.” In his speech on January 14, Himino noted: “Japan's inflation expectations have gradually heightened, now around 1.5%. Japan's economy is roughly moving in line with our scenario projecting underlying inflation, inflation expectations to both move around 2%.”
With a rate hike almost a given, the language of the policy statement and Governor Ueda’s post-policy meeting press conference, due at 06:30 GMT, will help determine the path of the Bank’s next policy move.
The BoJ is also set to publish its quarterly Outlook Report and is expected to raise its inflation projections amid the gradual depreciation of the Japanese Yen and a recent surge in the cost of rice, Bloomberg reported, citing people familiar with the matter.
Analysts at BBH said: “Two-day Bank of Japan meeting ends Friday with an expected 25 bp hike to 0.5%. Markets have firmed up the odds of a hike over the past week to around 85% after BOJ officials expressed more confidence on wage growth gathering momentum.”
“In our view, the bar for a hawkish surprise is high because the BoJ will want to avoid unsettling the markets as it did back in July. As such, the Yen is likely to remain under downside pressure as the markets continue to price in the policy rate to peak around 1% over the next two years, the analysts added. “
How could the Bank of Japan's interest rate decision affect USD/JPY?
Reuters reported last week, citing sources familiar with the central bank's thinking, the BoJ is expected to maintain its hawkish stance while raising rates. The hawkish hike could be influenced by global financial market developments, such as United States (US) President Donald Trump’s return to the White House.
If the BoJ struggles to provide consistent guidance on the next policy move, reiterating that it will remain data-dependent and make a decision on a meeting-by-meeting basis, the Japanese Yen is likely to resume its downslide against the US Dollar (USD).
USD/JPY could fall hard if the BoJ hints at a March rate hike while expressing increased concerns over inflation.
Any knee-jerk reaction to the BoJ policy announcements could be temporary heading into Governor Ueda’s presser. Investors will continue to pay close attention to US President Donald Trump’s tariff talks, which trigger a big market reaction.
From a technical perspective, Dhwani Mehta, Asian Session Lead Analyst at FXStreet, notes: “USD/JPY remains confined between the 21-day Simple Moving Average (SMA) and the 50-day variant in the run-up to the BoJ showdown. However, the 14-day Relative Strength Index (RSI) sits just above 50, suggesting that the pair could break the consolidative phase to the upside.”
“A hawkish BoJ hike could revive the USD/JPY correction from six-month highs of 158.88, smashing the pair toward the 200-day SMA at 152.85. The next support is seen at the 100-day SMA of 151.59. Further declines could challenge the 151.00 round level. Alternatively, buyers must yield a sustained break above the 21-day SMA at 157.13 to resume the uptrend toward the multi-month highs of 158.88. Buyers will then target the 160.00 psychological level,” Dhwani adds.
Economic Indicator
BoJ Interest Rate Decision
The Bank of Japan (BoJ) announces its interest rate decision after each of the Bank’s eight scheduled annual meetings. Generally, if the BoJ is hawkish about the inflationary outlook of the economy and raises interest rates it is bullish for the Japanese Yen (JPY). Likewise, if the BoJ has a dovish view on the Japanese economy and keeps interest rates unchanged, or cuts them, it is usually bearish for JPY.
Read more.Next release: Fri Jan 24, 2025 03:00
Frequency: Irregular
Consensus: 0.5%
Previous: 0.25%
Source: Bank of Japan
Central banks FAQs
Central Banks have a key mandate which is making sure that there is price stability in a country or region. Economies are constantly facing inflation or deflation when prices for certain goods and services are fluctuating. Constant rising prices for the same goods means inflation, constant lowered prices for the same goods means deflation. It is the task of the central bank to keep the demand in line by tweaking its policy rate. For the biggest central banks like the US Federal Reserve (Fed), the European Central Bank (ECB) or the Bank of England (BoE), the mandate is to keep inflation close to 2%.
A central bank has one important tool at its disposal to get inflation higher or lower, and that is by tweaking its benchmark policy rate, commonly known as interest rate. On pre-communicated moments, the central bank will issue a statement with its policy rate and provide additional reasoning on why it is either remaining or changing (cutting or hiking) it. Local banks will adjust their savings and lending rates accordingly, which in turn will make it either harder or easier for people to earn on their savings or for companies to take out loans and make investments in their businesses. When the central bank hikes interest rates substantially, this is called monetary tightening. When it is cutting its benchmark rate, it is called monetary easing.
A central bank is often politically independent. Members of the central bank policy board are passing through a series of panels and hearings before being appointed to a policy board seat. Each member in that board often has a certain conviction on how the central bank should control inflation and the subsequent monetary policy. Members that want a very loose monetary policy, with low rates and cheap lending, to boost the economy substantially while being content to see inflation slightly above 2%, are called ‘doves’. Members that rather want to see higher rates to reward savings and want to keep a lit on inflation at all time are called ‘hawks’ and will not rest until inflation is at or just below 2%.
Normally, there is a chairman or president who leads each meeting, needs to create a consensus between the hawks or doves and has his or her final say when it would come down to a vote split to avoid a 50-50 tie on whether the current policy should be adjusted. The chairman will deliver speeches which often can be followed live, where the current monetary stance and outlook is being communicated. A central bank will try to push forward its monetary policy without triggering violent swings in rates, equities, or its currency. All members of the central bank will channel their stance toward the markets in advance of a policy meeting event. A few days before a policy meeting takes place until the new policy has been communicated, members are forbidden to talk publicly. This is called the blackout period.
- GBP/USD spun in a slow circle on Thursday as Cable traders await fresh data.
- It’s been a quiet week on the economic calendar for the Pound Sterling.
- Global PMI data is due on Friday, but mixed prints are expected.
GBP/USD coiled near the 1.3550 level on Thursday as Cable traders functionally ignored a thin economic calendar and a lack of meaningful information to push the pair decisively in either direction. Headlines from US President Donald Trump ruled the roost on most traders’ newsfeeds, but the broader market impact remains limited as Trump struggles to pick an overall objective.
President Donald Trump lashed out about a wide variety of topics during his appearance at the WEF’s annual gathering in Switzerland, colloquially referred to as Davos, the city that hosts the forum every year. President Trump reminded everyone listening that he intended to “obliterate” the US budget deficit, while somehow convincing the US Congress to pass “the largest tax cut in American history” at the same time. Donald Trump also vowed to attempt to subvert the operational independence of the US Federal Reserve (Fed) by demanding lower interest rates.
S&P Global PMI figures are due on both sides of the Atlantic on Friday and show changes in the aggregated respondent results of business operators across the economy. Both UK and US PMI business activity survey results for January are expected to come in mixed this week, with the services components expected to tick down and manufacturing to recover, albeit slightly. PMI figures generally have a limited impact unless figures come in wildly out of sync with forecasts, but survey respondent rates tend to be on the low side, and the overall figures should be taken with a grain of salt.
GBP/USD price forecast
GBP/USD continues to reach for, but fall just shy of, the 1.2400 handle as price action gets swamped out near 1.2350. Bullish momentum is poised to run out of gas with the pair struggling to make further headway, though bids are holding around 2% above the pair’s 15-month low priced in near 1.2100 a couple of weeks ago.
Price action has established strong technical support around the 1.2200 area, but a downward-sloping 50-day Exponential Moving Average (EMA) near 1.2500 is hindering the development of sustained bullish movements.
GBP/USD daily chart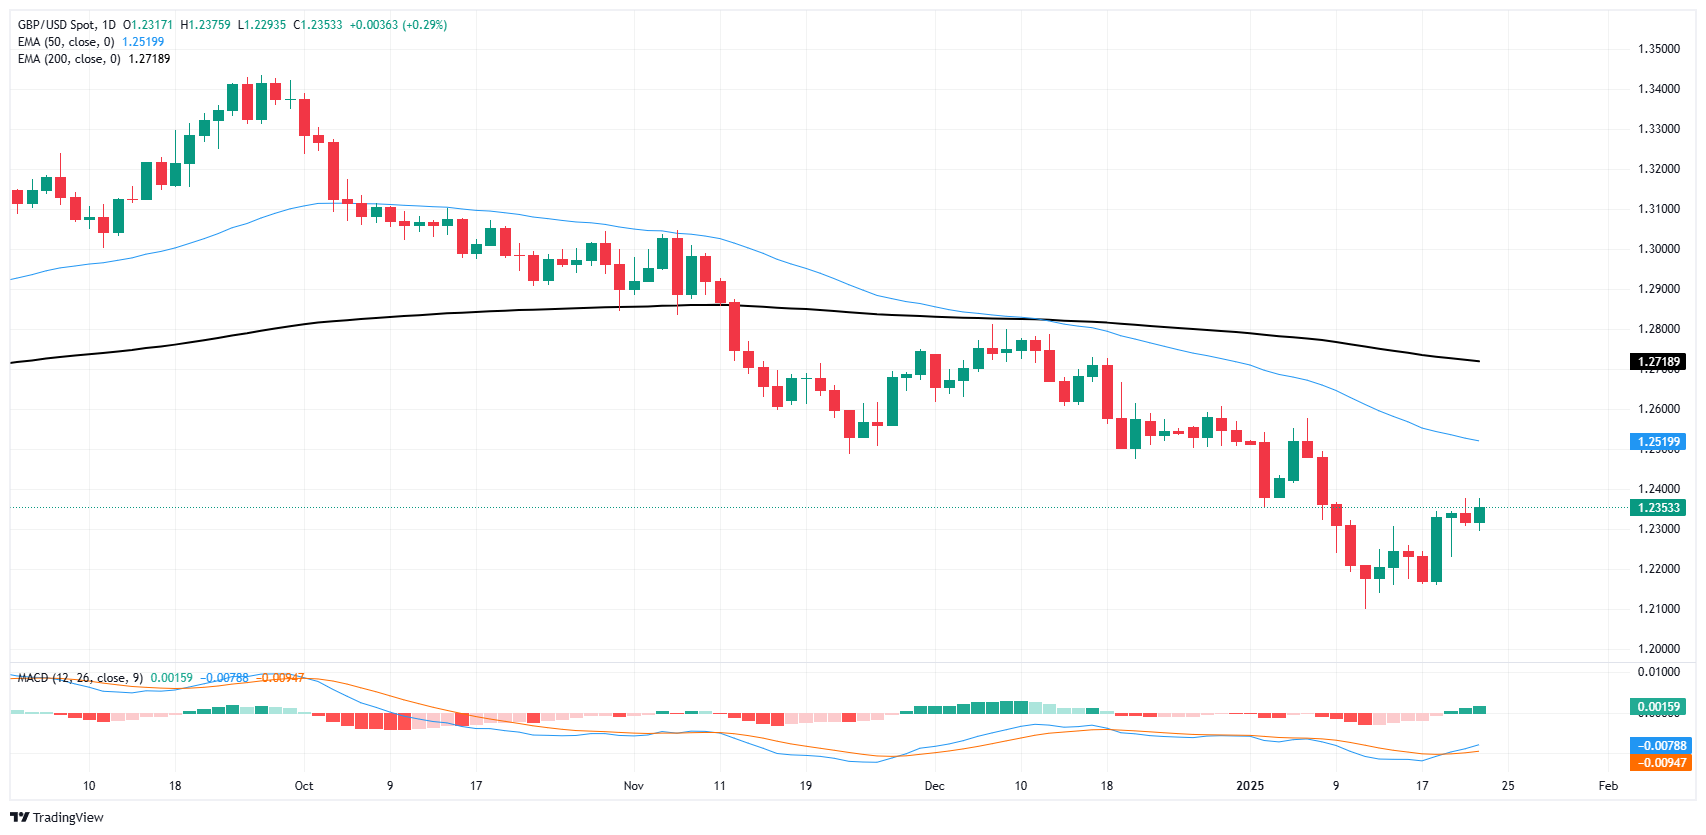
Pound Sterling FAQs
The Pound Sterling (GBP) is the oldest currency in the world (886 AD) and the official currency of the United Kingdom. It is the fourth most traded unit for foreign exchange (FX) in the world, accounting for 12% of all transactions, averaging $630 billion a day, according to 2022 data. Its key trading pairs are GBP/USD, also known as ‘Cable’, which accounts for 11% of FX, GBP/JPY, or the ‘Dragon’ as it is known by traders (3%), and EUR/GBP (2%). The Pound Sterling is issued by the Bank of England (BoE).
The single most important factor influencing the value of the Pound Sterling is monetary policy decided by the Bank of England. The BoE bases its decisions on whether it has achieved its primary goal of “price stability” – a steady inflation rate of around 2%. Its primary tool for achieving this is the adjustment of interest rates. When inflation is too high, the BoE will try to rein it in by raising interest rates, making it more expensive for people and businesses to access credit. This is generally positive for GBP, as higher interest rates make the UK a more attractive place for global investors to park their money. When inflation falls too low it is a sign economic growth is slowing. In this scenario, the BoE will consider lowering interest rates to cheapen credit so businesses will borrow more to invest in growth-generating projects.
Data releases gauge the health of the economy and can impact the value of the Pound Sterling. Indicators such as GDP, Manufacturing and Services PMIs, and employment can all influence the direction of the GBP. A strong economy is good for Sterling. Not only does it attract more foreign investment but it may encourage the BoE to put up interest rates, which will directly strengthen GBP. Otherwise, if economic data is weak, the Pound Sterling is likely to fall.
Another significant data release for the Pound Sterling is the Trade Balance. This indicator measures the difference between what a country earns from its exports and what it spends on imports over a given period. If a country produces highly sought-after exports, its currency will benefit purely from the extra demand created from foreign buyers seeking to purchase these goods. Therefore, a positive net Trade Balance strengthens a currency and vice versa for a negative balance.
- NZD/USD tallies another winning day on Thursday.
- The RSI climbs signaling strengthening bullish sentiment.
- Pair seems to be building support around the 20-day SMA.
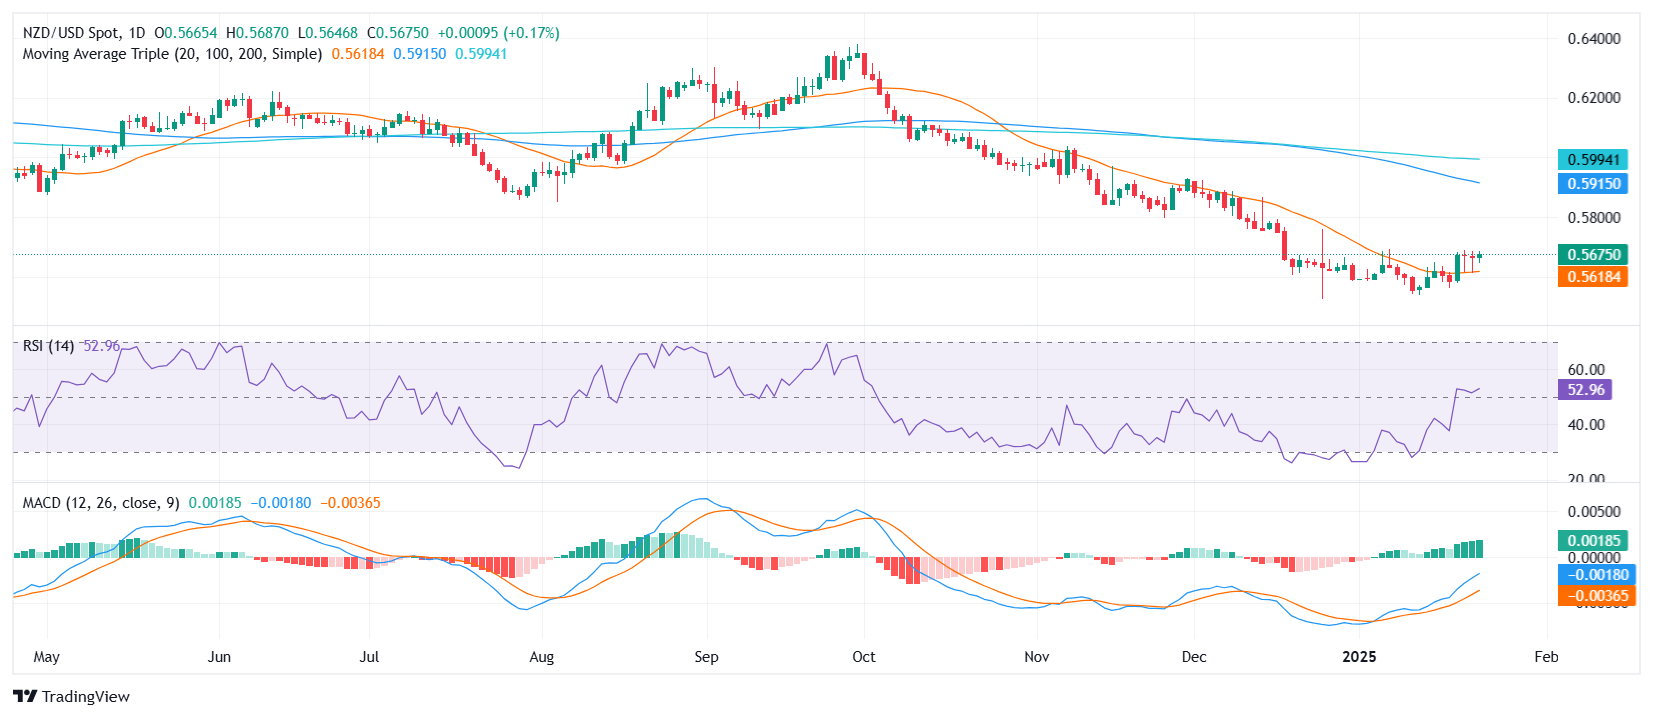
The NZD/USD pair settled at 0.5670, and the price action suggest a period of consolidation near recent highs but bullish momentum remains intact
Technical indicators reinforce the constructive outlook. The Relative Strength Index (RSI) has surged to 52, remaining in positive territory and reflecting increased buying interest. Additionally, the Moving Average Convergence Divergence (MACD) histogram continues to display rising green bars, underscoring sustained upward momentum and hinting at potential further gains in the near term.
From a technical perspective, immediate resistance lies at 0.5685, with a break above this level likely paving the way for a test of 0.5710. On the downside, support is observed at 0.5645, and any sustained drop below this level could trigger a deeper pullback toward 0.5610. Traders will be closely monitoring these levels as the pair seeks to establish a clearer directional bias.
NZD/USD daily chart
- NZD/JPY slips to 88.45 on Thursday, marking a continuation of its recent decline.
- Momentum weakens as the pair fails to extend gains from earlier in the week.
- Market sentiment remains cautious, with the pair trading near short-term support levels.
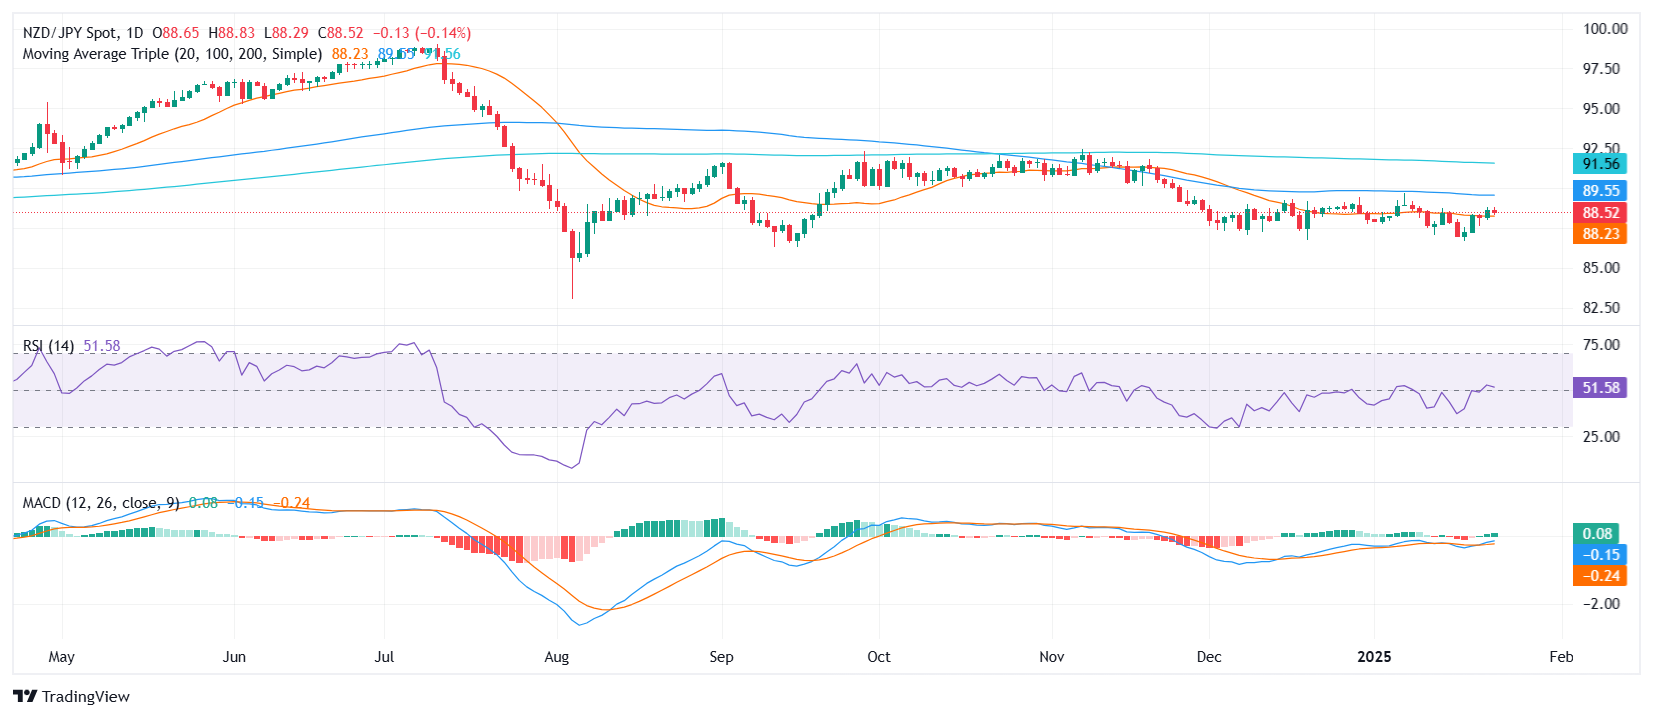
The NZD/JPY pair edged lower on Thursday, closing at 88.45, as the recent decline extended into another session. The pair’s inability to sustain its earlier upward trajectory suggests waning bullish momentum, keeping traders cautious about further upside potential. While the broader trend remains mildly positive, the latest moves point to a more balanced market dynamic.
Technical indicators offer a mixed picture. The Relative Strength Index (RSI) stands at 53, remaining in positive territory but showing a mild decline, indicating reduced buying interest. Meanwhile, the Moving Average Convergence Divergence (MACD) histogram remains flat with green bars, signaling a lack of strong directional momentum. Together, these readings suggest that the pair may struggle to regain its footing without a significant catalyst.
For now, support is seen around the 88.20 level around the 20-day Simple Moving Average (SMA), with a break below this potentially opening the door to 88.00 or lower. On the upside, resistance at 88.75 will be key, and a sustained push above this level could signal renewed bullish interest, targeting the 89.00 psychological mark as the next hurdle.
NZD/JPY daily chart
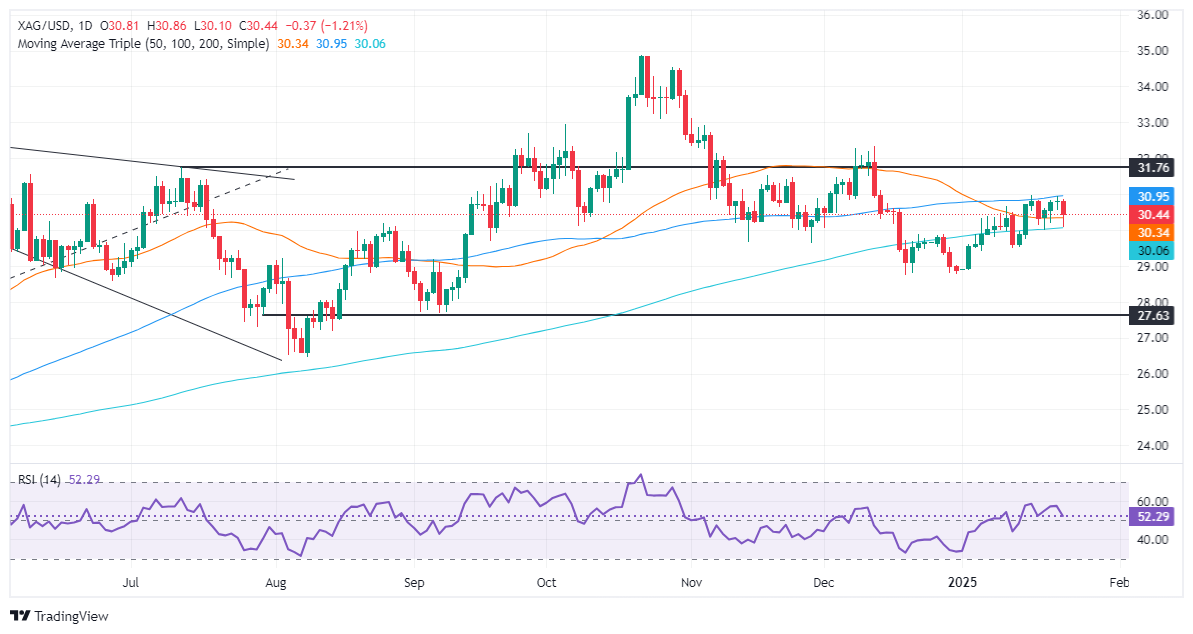
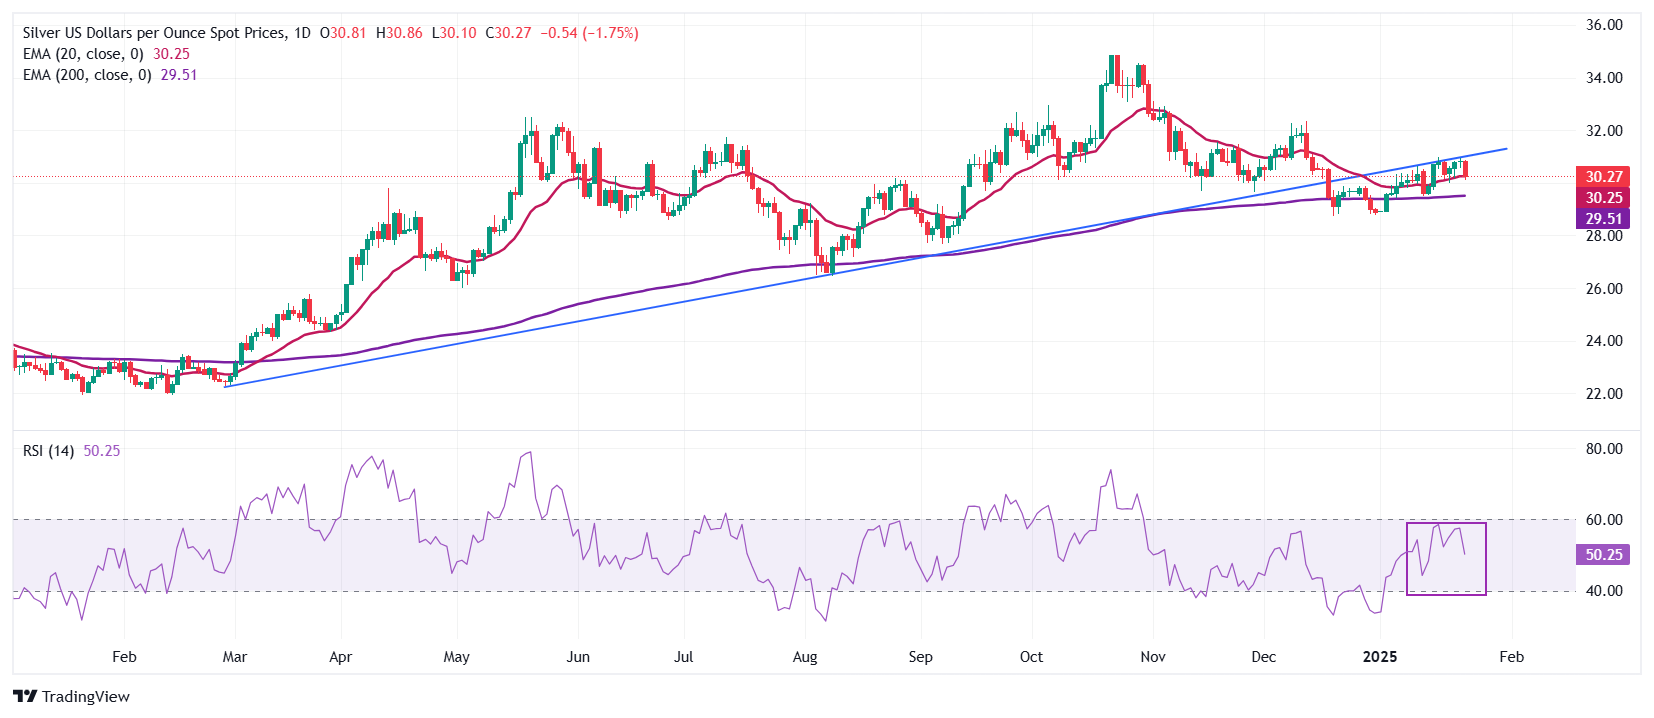
- Silver declines amid profit-taking and high U.S. Treasury yields.
- Bearish momentum as silver tests 50-day SMA at $30.38.
- Recovery possible if silver breaches 100-day SMA at $30.93, aiming for December high of $32.34.
Silver price extended its losses for the second consecutive day amid high US Treasury bond yields and traders booking profits ahead of next week’s Federal Reserve’s monetary policy decision. Nevertheless, Trump’s policies could spark a flight to safety and lift the grey metal higher. The XAG/USD trades at $30.44, down more than 1%.
XAG/USD Price Forecast: Technical outlook
Silver is trading sideways, capped on the upside and the downside, by key resistance and support levels, while the momentum, as measured by the Relative Strength Index (RSI), suggests that sellers are in charge. However, they need to clear the 50-day Simple Moving Average (SMA) at $30.38 so they can challenge the confluence of the 200 and 20-day SMA at $30.03/05. Once those levels are surpassed, the next support will be the January 14 low of $29.48.
Conversely, if buyers lift XAG/USD past the 100-day SMA at $30.93, look for further upside, with the following key resistance at $32.34, the December 12 peak.
XAG/USD Price Chart – Daily
Silver FAQs
Silver is a precious metal highly traded among investors. It has been historically used as a store of value and a medium of exchange. Although less popular than Gold, traders may turn to Silver to diversify their investment portfolio, for its intrinsic value or as a potential hedge during high-inflation periods. Investors can buy physical Silver, in coins or in bars, or trade it through vehicles such as Exchange Traded Funds, which track its price on international markets.
Silver prices can move due to a wide range of factors. Geopolitical instability or fears of a deep recession can make Silver price escalate due to its safe-haven status, although to a lesser extent than Gold's. As a yieldless asset, Silver tends to rise with lower interest rates. Its moves also depend on how the US Dollar (USD) behaves as the asset is priced in dollars (XAG/USD). A strong Dollar tends to keep the price of Silver at bay, whereas a weaker Dollar is likely to propel prices up. Other factors such as investment demand, mining supply – Silver is much more abundant than Gold – and recycling rates can also affect prices.
Silver is widely used in industry, particularly in sectors such as electronics or solar energy, as it has one of the highest electric conductivity of all metals – more than Copper and Gold. A surge in demand can increase prices, while a decline tends to lower them. Dynamics in the US, Chinese and Indian economies can also contribute to price swings: for the US and particularly China, their big industrial sectors use Silver in various processes; in India, consumers’ demand for the precious metal for jewellery also plays a key role in setting prices.
Silver prices tend to follow Gold's moves. When Gold prices rise, Silver typically follows suit, as their status as safe-haven assets is similar. The Gold/Silver ratio, which shows the number of ounces of Silver needed to equal the value of one ounce of Gold, may help to determine the relative valuation between both metals. Some investors may consider a high ratio as an indicator that Silver is undervalued, or Gold is overvalued. On the contrary, a low ratio might suggest that Gold is undervalued relative to Silver.
- Gold recovers from $2,735 dip as US jobless claims rise from temporary factors.
- US Dollar Index falls slightly, bolstering Gold as markets await major central banks' rate decisions.
- Geopolitical events and central bank actions to drive markets; BoJ to expect hike rates, ECB likely to cut.
Gold's price holds firm after sliding to a daily low of $2,735 amid elevated US Treasury bond yields. Economic data from the United States (US) showed the labor market is cooling, while market participants continued to digest US President Trump’s trade policy rhetoric. The XAU/USD trades at $2,755, virtually unchanged.
Bullion prices are set to finish the week with solid gains despite trimming some of their gains on Thursday.
Data from the US Department of Labor revealed that more Americans applied for jobless benefits during the week ending January 18, which usually would signal a weakening labor market. Nevertheless, the report showed that weather distortions and the fire in Los Angeles are the main reasons for this and will likely be reflected in subsequent releases.
The yellow metal’s last leg up was sponsored by the fall of the Greenback. According to the US Dollar Index (DXY), which measures the performance of the Greenback against a basket of six peers and usually correlates inversely to Gold, tumbled 0.08% to 108.06.
On Friday, the central bank bonanza begins with the Bank of Japan (BoJ) expected to hike rates by 25 basis points (bps). Next week, the Federal Reserve (Fed) and the European Central Bank (ECB) are up next with the former projected to keep rates on hold, while the ECB is foreseen cutting borrowing costs by 25 bps.
This week, the US economic docket will feature S&P Global Flash PMIs, housing data and the final release of University of Michigan (UoM) Consumer Sentiment for January.
Daily digest market movers: Gold price consolidates above $2,750 on modest jobs data
- Gold price rose as real yields remained unchanged on Thursday. Measured by the 10-year Treasury Inflation-Protected Securities (TIPS), yield sits at 2.19%.
- The US 10-year Treasury bond yield is up four bps during the day at 4.637%, putting a lid on Gold’s advance.
- US Initial Jobless Claims for the week ending January 18 increased by 223K, up from 217K in the previous release and above estimates of 220K. The Jobless Claims 4-week average rose from 212.75K to 213.5K for the first time in five months.
- A report by Reuters revealed that US President Trump confirmed that universal tariffs on all imports to the US are also under consideration and will come at a later stage.
- Market participants are pricing in near-even odds that the Fed will cut rates twice by the end of 2025 with the first reduction occurring in June.
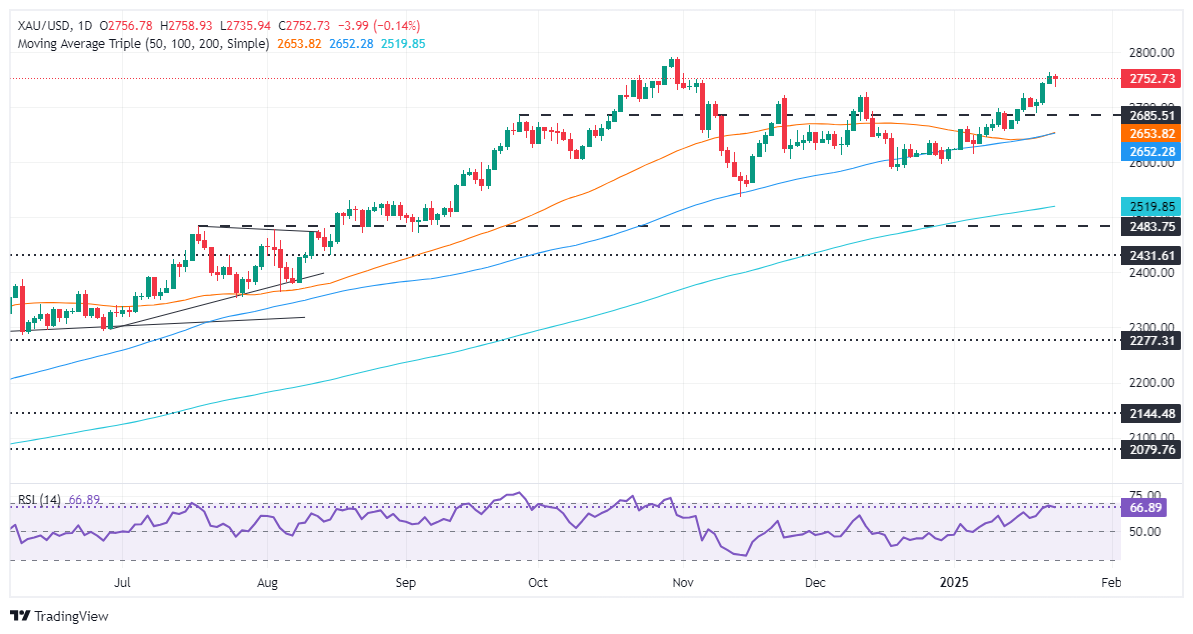
XAU/USD technical outlook: Gold price advance pauses, bulls eye $2,790
Gold prices consolidate near $2,750 as traders book profits ahead of the Fed’s decision next week regarding monetary policy. If the Fed keeps rates unchanged, it would be the first time the bank pauses, which would be detrimental for Bullion buyers.
Despite this, a strong uptick on inflation could spark a buying frenzy into the non-yielding metal, pushing prices higher. In that outcome, if XAU/USD surpasses the all-time high (ATH) at $2,790, up next is the $2,800 mark. Once surpassed, key psychological levels would be exposed at $2,850 and $2,900.
On the downside, if bears drag Bullion prices below the $2,750 figure, the 50 and 100-day Simple Moving Averages (SMAs) emerge as support levels, each at $2,651 and $2,640. If surpassed, up next lies the 200-day SMA at $2,515.
Gold FAQs
Gold has played a key role in human’s history as it has been widely used as a store of value and medium of exchange. Currently, apart from its shine and usage for jewelry, the precious metal is widely seen as a safe-haven asset, meaning that it is considered a good investment during turbulent times. Gold is also widely seen as a hedge against inflation and against depreciating currencies as it doesn’t rely on any specific issuer or government.
Central banks are the biggest Gold holders. In their aim to support their currencies in turbulent times, central banks tend to diversify their reserves and buy Gold to improve the perceived strength of the economy and the currency. High Gold reserves can be a source of trust for a country’s solvency. Central banks added 1,136 tonnes of Gold worth around $70 billion to their reserves in 2022, according to data from the World Gold Council. This is the highest yearly purchase since records began. Central banks from emerging economies such as China, India and Turkey are quickly increasing their Gold reserves.
Gold has an inverse correlation with the US Dollar and US Treasuries, which are both major reserve and safe-haven assets. When the Dollar depreciates, Gold tends to rise, enabling investors and central banks to diversify their assets in turbulent times. Gold is also inversely correlated with risk assets. A rally in the stock market tends to weaken Gold price, while sell-offs in riskier markets tend to favor the precious metal.
The price can move due to a wide range of factors. Geopolitical instability or fears of a deep recession can quickly make Gold price escalate due to its safe-haven status. As a yield-less asset, Gold tends to rise with lower interest rates, while higher cost of money usually weighs down on the yellow metal. Still, most moves depend on how the US Dollar (USD) behaves as the asset is priced in dollars (XAU/USD). A strong Dollar tends to keep the price of Gold controlled, whereas a weaker Dollar is likely to push Gold prices up.
- AUD adds 0.25% against the USD, nearing the 0.6300 barrier on Thursday.
- Surging US yields lend only modest support to the Greenback.
- Traders see a 60% chance of an RBA rate cut next month.
AUD/USD added to Wednesday’s mild rise and advanced toward the 0.6300 region, drawing support from a subdued US Dollar and an upswing in riskier assets. Despite the Greenback attempting to steady itself around the 108.00 zone, market participants continued to parse details from President Donald Trump’s latest statements at the World Economic Forum in Davos, where he criticized trade deficits, pledged more tax cuts, and signaled potential changes in energy and defense policies.
Daily digest market movers: Aussie recovers while markets assess fresh Trump signals
- The Australian Dollar oscillated in the upper end of the weekly range, though it stalled again near the 0.6300 threshold.
- The US Dollar Index (DXY) briefly advanced on Thursday, adding to the prior session’s gains around 108.00, drawing strength from climbing US yields.
- After weeks of a solid USD rally, driven by the so-called “Trump trade,” the Aussie finally recouped some losses, aided by Greenback consolidation.
- On Thursday, US President Donald Trump railed against trade imbalances, specifically singling out Canada’s 4% share of the overall US deficit, reiterated calls for deeper tax cuts, and again pressed OPEC to lower crude oil prices. He also pledged to drastically cut US spending deficits and indicated a desire to influence Federal Reserve policy.
- Regarding the Reserve Bank of Australia, market participants still price in a 60% probability of a rate cut in February, reflecting the country’s muted economic momentum.
- Commodity markets send mixed signals; copper recovers slightly, while iron ore remains at elevated levels but trades sideways.
AUD/USD technical outlook: Bulls hold 20-day average
The AUD/USD rose by 0.25% to 0.6290 on Thursday, staging another attack on the 0.6300 resistance. The Relative Strength Index (RSI) has jumped to 55, firmly in positive territory, while the MACD histogram displays rising green bars, signaling sustained bullish intent.
Notably, buyers are building support around the 20-day Simple Moving Average (SMA). If the pair can consolidate past 0.6300, further recovery may lie ahead, though persistent concerns over China’s economic pace and potential Australian central bank easing could temper any lasting upside.
Australian Dollar FAQs
One of the most significant factors for the Australian Dollar (AUD) is the level of interest rates set by the Reserve Bank of Australia (RBA). Because Australia is a resource-rich country another key driver is the price of its biggest export, Iron Ore. The health of the Chinese economy, its largest trading partner, is a factor, as well as inflation in Australia, its growth rate and Trade Balance. Market sentiment – whether investors are taking on more risky assets (risk-on) or seeking safe-havens (risk-off) – is also a factor, with risk-on positive for AUD.
The Reserve Bank of Australia (RBA) influences the Australian Dollar (AUD) by setting the level of interest rates that Australian banks can lend to each other. This influences the level of interest rates in the economy as a whole. The main goal of the RBA is to maintain a stable inflation rate of 2-3% by adjusting interest rates up or down. Relatively high interest rates compared to other major central banks support the AUD, and the opposite for relatively low. The RBA can also use quantitative easing and tightening to influence credit conditions, with the former AUD-negative and the latter AUD-positive.
China is Australia’s largest trading partner so the health of the Chinese economy is a major influence on the value of the Australian Dollar (AUD). When the Chinese economy is doing well it purchases more raw materials, goods and services from Australia, lifting demand for the AUD, and pushing up its value. The opposite is the case when the Chinese economy is not growing as fast as expected. Positive or negative surprises in Chinese growth data, therefore, often have a direct impact on the Australian Dollar and its pairs.
Iron Ore is Australia’s largest export, accounting for $118 billion a year according to data from 2021, with China as its primary destination. The price of Iron Ore, therefore, can be a driver of the Australian Dollar. Generally, if the price of Iron Ore rises, AUD also goes up, as aggregate demand for the currency increases. The opposite is the case if the price of Iron Ore falls. Higher Iron Ore prices also tend to result in a greater likelihood of a positive Trade Balance for Australia, which is also positive of the AUD.
The Trade Balance, which is the difference between what a country earns from its exports versus what it pays for its imports, is another factor that can influence the value of the Australian Dollar. If Australia produces highly sought after exports, then its currency will gain in value purely from the surplus demand created from foreign buyers seeking to purchase its exports versus what it spends to purchase imports. Therefore, a positive net Trade Balance strengthens the AUD, with the opposite effect if the Trade Balance is negative.
- Mexico's January mid-month inflation drops to below 4%, boosting optimism and supporting Banxico's dovish outlook.
- Unexpected rise in US jobless claims raises due to weather distortions.
- Trump's approving remarks about Mexico at WEF ease trade tensions and strengthen the Peso.
The Mexican Peso (MXN) strengthened against the Greenback during the North American session, hitting a ten-day high on upbeat inflation data from Mexico and a worse-than-expected jobs report from the United States (US). Furthermore, US President Donald Trump's positive comments about Mexico at the World Economic Forum (WEF) were a tailwind for the Mexican currency. The USD/MXN trades at 20.37, down 0.54%.
Inflation in Mexico fared better than expected, as headline mid-month inflation for January dipped to 3.69%, below the 4% mark for the first time in four years, revealed the Instituto Nacional de Estadistica Geografia e Informatica (INEGI). Underlying inflation rose moderately, though both readings remained within Banco de Mexico's (Banxico) 3% plus or minus 1%, justifying Banxico’s intentions to lower borrowing costs on February 6.
In the US, the number of Americans filing unemployment claims rose sharply last week, according to data revealed by the US Department of Labor. The report showed that bad weather, along with fires in Los Angeles, could increase claims in the upcoming weeks.
Meanwhile, the Federal Reserve (Fed) is expected to keep rates unchanged next week. The main reasons behind that decision are the robustness of the US economy, as portrayed by healthy economic growth, a strong labor market and stickier inflation numbers.
On the other hand, Mexico’s economy has continued to cool down and is expected to grow by just 1% in 2025. The slowdown benefited the disinflation process and supports Banxico’s dovish stance.
Recently, US President Donald Trump said he would demand respect from other nations and said that he’s dealing with Mexico “very well.” After these remarks, the USD/MXN pair extended its losses.
This week, Mexico’s economic docket will feature Economic Activity for November, which is expected to improve in monthly figures but not yearly. On the US side, traders are awaiting S&P Global Flash PMIs and Consumer Sentiment.
Daily digest market movers: Mexican Peso appreciates as inflation edges lower
- The Mexican Peso advances versus the US Dollar even though the lowest inflation figures suggest that Banxico will cut rates. Contrarily, the Fed is expected to keep monetary policy unchanged and wait for the March meeting.
- Mexico’s mid-month inflation in January rose by 3.69% YoY, down from 4.44%. Core inflation for the same period increased from 3.62% to 3.72% YoY.
- Citi revealed its Expectations Survey, in which Mexican private economists revised Gross Domestic Product (GDP) figures for 2025 downward to 1%.
- Regarding inflation expectations, analysts estimate headline and core to inflation to dip below 4%, each at 3.91% and 3.68%, while the exchange rate would likely end near 20.95.
- Economists estimate that Banco de Mexico (Banxico) will lower rates by 25 basis points (bps) from 10.00% to 9.75%, though some analysts expect a 50-bps cut at the February 6 meeting.
- The divergence between Banxico and the US Federal Reserve (Fed) favors further upside in the USD/MXN pair.
- US President Trump ordered a comprehensive review of US trade policy, setting an April 1 deadline for recommendations that could significantly transform the country’s trade relations, including the US-Mexico-Canada Agreement (USMCA), set for its first revision in 2026.
- Money market futures have priced in 44 bps of Fed rate cuts in 2025, according to CME FedWatch Tool data.
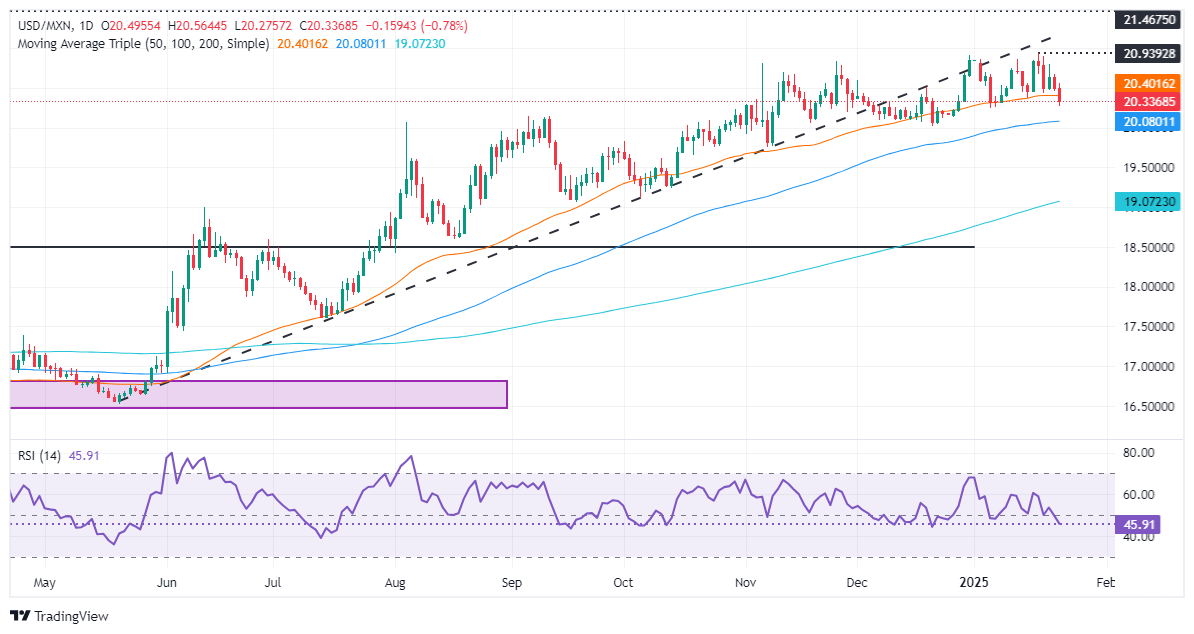
USD/MXN technical outlook: Mexican Peso climbs as USD/MXN tumbles below 20.30
USD/MXN tumbled below 20.50 sponsored by Trump’s friendly rhetoric on Mexico, which has pushed the exchange rate below key support levels like the 20 and 50-day Simple Moving Average (SMA) each at 20.55 and 20.37.
Despite this, the uptrend remains in play.f sellers push the price below the January 6 swing low of 20.22, it will clear the path to challenging the 100-day SMA at 20.05. On further weakness, the exotic pair could test 19.50.
Conversely, for a bullish resumption, the USD/MXN must climb above 20.55 so buyers have a clear path to challenge the year-to-date (YTD) high at 20.90. Once surpassed, the next stop would be 21.00, followed by March 8, 2022, peaking at 21.46 ahead of the 22.00 figure.
Mexican Peso FAQs
The Mexican Peso (MXN) is the most traded currency among its Latin American peers. Its value is broadly determined by the performance of the Mexican economy, the country’s central bank’s policy, the amount of foreign investment in the country and even the levels of remittances sent by Mexicans who live abroad, particularly in the United States. Geopolitical trends can also move MXN: for example, the process of nearshoring – or the decision by some firms to relocate manufacturing capacity and supply chains closer to their home countries – is also seen as a catalyst for the Mexican currency as the country is considered a key manufacturing hub in the American continent. Another catalyst for MXN is Oil prices as Mexico is a key exporter of the commodity.
The main objective of Mexico’s central bank, also known as Banxico, is to maintain inflation at low and stable levels (at or close to its target of 3%, the midpoint in a tolerance band of between 2% and 4%). To this end, the bank sets an appropriate level of interest rates. When inflation is too high, Banxico will attempt to tame it by raising interest rates, making it more expensive for households and businesses to borrow money, thus cooling demand and the overall economy. Higher interest rates are generally positive for the Mexican Peso (MXN) as they lead to higher yields, making the country a more attractive place for investors. On the contrary, lower interest rates tend to weaken MXN.
Macroeconomic data releases are key to assess the state of the economy and can have an impact on the Mexican Peso (MXN) valuation. A strong Mexican economy, based on high economic growth, low unemployment and high confidence is good for MXN. Not only does it attract more foreign investment but it may encourage the Bank of Mexico (Banxico) to increase interest rates, particularly if this strength comes together with elevated inflation. However, if economic data is weak, MXN is likely to depreciate.
As an emerging-market currency, the Mexican Peso (MXN) tends to strive during risk-on periods, or when investors perceive that broader market risks are low and thus are eager to engage with investments that carry a higher risk. Conversely, MXN tends to weaken at times of market turbulence or economic uncertainty as investors tend to sell higher-risk assets and flee to the more-stable safe havens.
- The Dow Jones climbed another 350 points on Thursday, gaining 0.8%.
- Markets are dealing with a lack of meaningful data by hitting the buy button.
- US PMI figures loom ahead on Friday, but Trump headlines dominate.
The Dow Jones Industrial Average (DJIA) continued its steady drift into the high end on Thursday, gaining 0.8% and adding around 350 points to the tally as investors broadly tilt into a risk on stance. United States (US) President Donald Trump took the opportunity to air some of his economic grievances during an appearance at the annual World Economic Forum (WEF) hosted in Davos, Switzerland. Investors brushed off the majority of the President’s structural incongruities, though his statements about demanding lower Crude Oil prices drew some attention from the commodity markets.
The economic data docket on Thursday was thin, giving investors little else to chew on except political headlines from the White House’s newest resident. The US S&P Global Purchasing Managers Index (PMI) figures are due on Friday, and they are expected to be mixed. However, PMI prints are unlikely to have any meaningful impact unless the final figures deviate wildly from market expectations.
President Donald Trump lashed out about a wide variety of topics during his appearance at the WEF’s annual gathering in Switzerland, colloquially referred to as Davos, the city that hosts the forum every year. President Trump reminded everyone listening that he intended to “obliterate” the US budget deficit, while somehow convincing the US Congress to pass “the largest tax cut in American history” at the same time.
Also on President Trump’s docket of things to cover was Crude Oil prices, which he intends to ask the Organization of the Petroleum Exporting Countries (OPEC) to find a way to lower, prompting a quick sell-off in barrel bids. OPEC has historically been known for putting in efforts to raise or stabilize Crude Oil prices, and it remains unclear how the world’s largest Crude Oil cartel would react or even comply with the claim.
President Trump also reiterated his offer for Canada to become a member state of the US, declaring that the US’ current trade deficit with Canada, which currently stands at around 4% of the total US trade overhang, is unsustainable. President Trump also floated a thinly-veiled reminder of possible plans for tariffs on EU goods imported into the US in retaliation for the EU treating the US “very badly”.
Dow Jones news
Most of the Dow Jones’ listed securities are drifting into the high end on Thursday as investors lean into a general improvement in risk appetite. The Travelers Companies (TRV) fell back 1.8% to lead the handful of losers into the red, declining to $242 per share as investors take profits following this week’s surge on better-than-expected revenue reporting. Caterpillar (CAT) rose 2.6%, tapping $408 per share and touching its highest bids since last November.
Dow Jones price forecast
Thursday’s gains put the Dow Jones Industrial Average on pace to close in the green for a fifth straight session, and the major equity index has gained ground in all but one of the last nine straight trading days. Bullish momentum is grinding its way back to record highs just north of 45,000, but first bidders will need to climb back above the 44,800 level.
Price action has extended firmly beyond the 50-day Exponential Moving Average (EMA) near 43,230, and the Dow Jones’ long-run trend of outpacing the 200-day EMA is still firmly in place. A pattern of higher lows is also firmly baked into the chart, and traders hoping for signals to get short will be forced to sit on the sidelines for the time being.
Dow Jones daily chart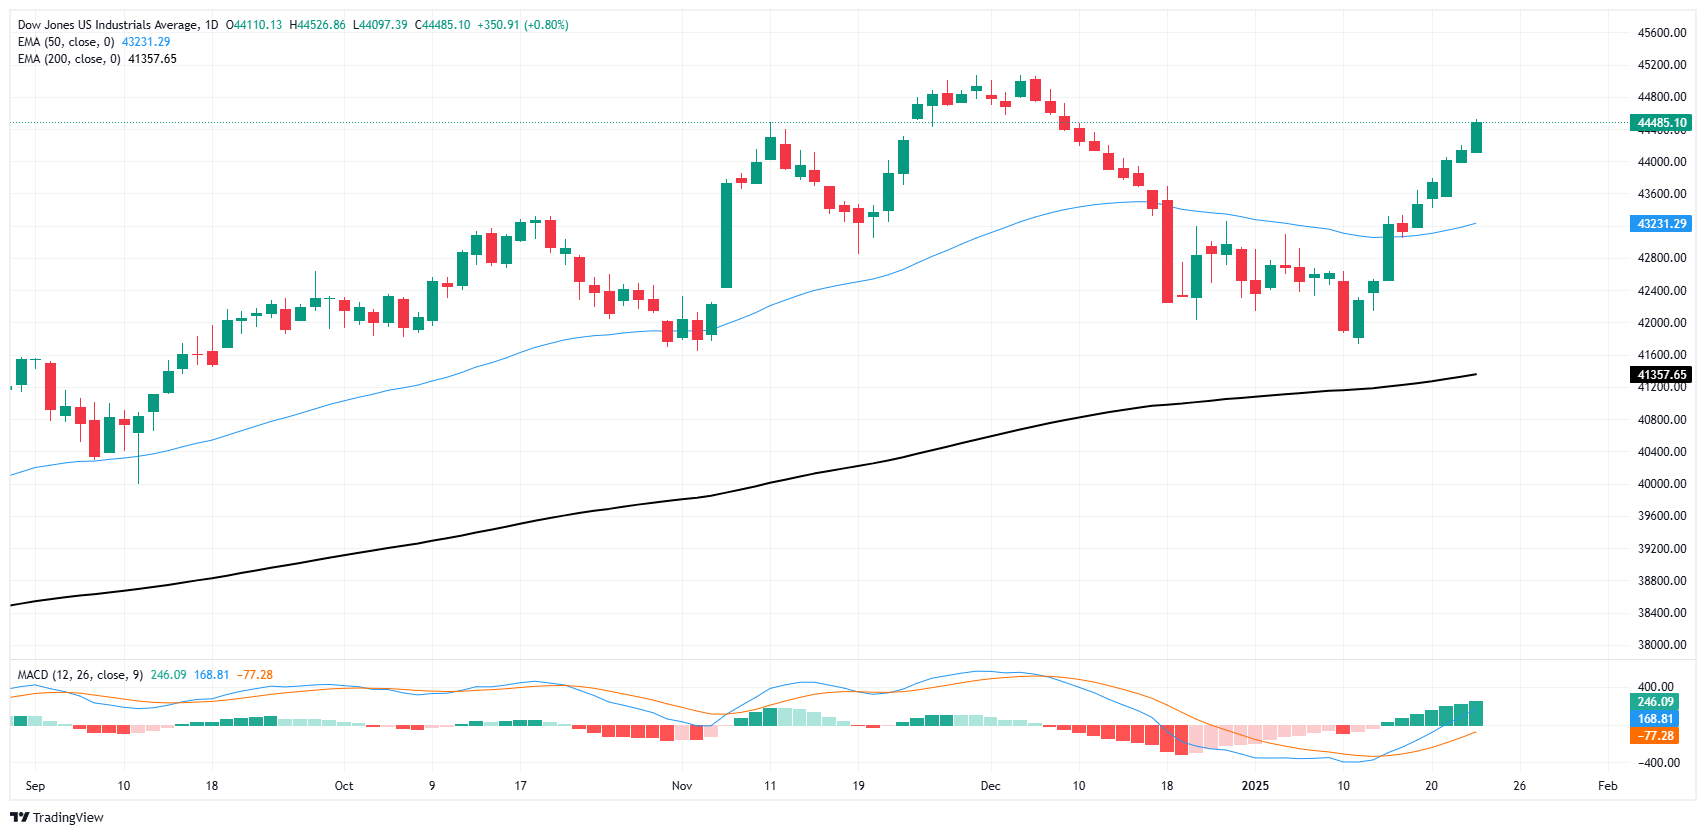
Dow Jones FAQs
The Dow Jones Industrial Average, one of the oldest stock market indices in the world, is compiled of the 30 most traded stocks in the US. The index is price-weighted rather than weighted by capitalization. It is calculated by summing the prices of the constituent stocks and dividing them by a factor, currently 0.152. The index was founded by Charles Dow, who also founded the Wall Street Journal. In later years it has been criticized for not being broadly representative enough because it only tracks 30 conglomerates, unlike broader indices such as the S&P 500.
Many different factors drive the Dow Jones Industrial Average (DJIA). The aggregate performance of the component companies revealed in quarterly company earnings reports is the main one. US and global macroeconomic data also contributes as it impacts on investor sentiment. The level of interest rates, set by the Federal Reserve (Fed), also influences the DJIA as it affects the cost of credit, on which many corporations are heavily reliant. Therefore, inflation can be a major driver as well as other metrics which impact the Fed decisions.
Dow Theory is a method for identifying the primary trend of the stock market developed by Charles Dow. A key step is to compare the direction of the Dow Jones Industrial Average (DJIA) and the Dow Jones Transportation Average (DJTA) and only follow trends where both are moving in the same direction. Volume is a confirmatory criteria. The theory uses elements of peak and trough analysis. Dow’s theory posits three trend phases: accumulation, when smart money starts buying or selling; public participation, when the wider public joins in; and distribution, when the smart money exits.
There are a number of ways to trade the DJIA. One is to use ETFs which allow investors to trade the DJIA as a single security, rather than having to buy shares in all 30 constituent companies. A leading example is the SPDR Dow Jones Industrial Average ETF (DIA). DJIA futures contracts enable traders to speculate on the future value of the index and Options provide the right, but not the obligation, to buy or sell the index at a predetermined price in the future. Mutual funds enable investors to buy a share of a diversified portfolio of DJIA stocks thus providing exposure to the overall index.
The Greenback traded well on the defensive on Thursday as investors continued to wait for further clarity on recent announcements by President Trump, particularly regarding tariffs.
Here is what you need to know on Friday, January 24:
The US Dollar Index (DXY) retreated markedly, revisiting the lower end of the weekly range near 107.60 as investors continued to look at Trump’s announcements. The flash S&P Global Manufacturing and Services PMIs will grab all the attention seconded by Existing Home Sales and the final Michigan Consumer Sentiment print.
EUR/USD resumed its uptrend above the 1.0400 mark, rapidly leaving behind Wednesday’s hiccup. The preliminary HCOB Manufacturing and Services PMIs in Germany and the euro area will be at the centre of the debate along with speeches by the ECB’s Lagarde and Cipollone.
GBP/USD saw a decent recovery to the 1.2380 zone, retesting the area of recent two-week tops. The CBI Distributive Trades, the GfK’s Consumer Confidence, and the advanced S&P Global Manufacturing and Services PMIs will be in the spotlight across the Channel.
USD/JPY resumed its decline and revisited once again the proximity of the 156.00 region. The BoJ meeting will be the salient event, seconded by the publication of Japan’s Inflation Rate and the flash Jibun Bank Manufacturing and Services PMIs.
AUD/USD added to Wednesday’s irresolute price action and revisited the boundaries of the 0.6300 area in response to the weaker tone in the Greenback.
WTI prices extended their bearish trend and approached the $74.00 mark per barrel, challenging at the same time the key 200-day SMA.
After three daily advances in a row, Gold prices traded in a volatile fashion and managed to recoup part of the daily losses towards the end of the day, flirting with the $2,760 zone. Silver prices dropped to weekly lows near the $30.00 mark per ounce, a region also coincident with the key 200-day SMA.
- US traders keep watch on the Federal Reserve’s looming rate decision despite ongoing headlines about cuts.
- President Trump renews criticism of trade imbalances, sparking market chatter about new tax cuts and oil price demands.
- Solid US growth between 2.5% and 3.0% helps underpin the Greenback, though policy ambiguities weigh on sentiment.
- Jobless claims rise slightly, suggesting that labor market conditions remain resilient.
The US Dollar has turned flat during the US trading session on Thursday. US President Trump spoke at the World Economic Forum in Davos. The US Dollar Index (DXY) is back above 108.00, though it is facing some mild selling pressure again.
Daily digest market movers: USD sees red despite Trump hinting at tariffs for Canada and Mexico
- During his World Economic Forum appearance, President Trump restated that the US trade deficit with Canada is unsustainable and underscored his intent to seek deeper tariff measures if deemed necessary.
- He also proclaimed his commitment to slashing business taxes, pressuring OPEC to reduce oil prices and aiming to influence the Federal Reserve’s independence.
- New unemployment filings climbed to 223K for the week ending January 18, slightly above prior forecasts. The insured unemployment rate stands at 1.2% with continuing claims edging higher to nearly 1.9 million.
- Growth in the US economy remains robust at roughly 2.5%–3.0% annualized, powered by hiring gains that support consumption and keep inflation somewhat buoyant. Analysts widely expect the Fed to hold rates steady next week, seeing no compelling argument to cut soon.
- Kansas City Fed Manufacturing data is slated for release with the Services gauge following on Friday. Markets remain attentive to potential headwinds, but leading indicators suggest the US economy retains its underlying strength.
DXY technical outlook: Indicators struggle as the index fails to hold near 108.50
The US Dollar Index continues to fight off selling pressure but has yet to sustain gains beyond 108.50. Momentum signals, such as the Relative Strength Index (RSI), remain below the 50 threshold, indicating a weaker bias. The MACD’s red bars are expanding, hinting at growing bearish momentum.
The DXY stabilized around 108.20, though a lack of follow-through could lead to more downside. Without fresh catalysts to renew buying interest, the Greenback’s rebound may be short-lived, leaving it vulnerable to continued profit-taking.
US Dollar FAQs
The US Dollar (USD) is the official currency of the United States of America, and the ‘de facto’ currency of a significant number of other countries where it is found in circulation alongside local notes. It is the most heavily traded currency in the world, accounting for over 88% of all global foreign exchange turnover, or an average of $6.6 trillion in transactions per day, according to data from 2022. Following the second world war, the USD took over from the British Pound as the world’s reserve currency. For most of its history, the US Dollar was backed by Gold, until the Bretton Woods Agreement in 1971 when the Gold Standard went away.
The most important single factor impacting on the value of the US Dollar is monetary policy, which is shaped by the Federal Reserve (Fed). The Fed has two mandates: to achieve price stability (control inflation) and foster full employment. Its primary tool to achieve these two goals is by adjusting interest rates. When prices are rising too quickly and inflation is above the Fed’s 2% target, the Fed will raise rates, which helps the USD value. When inflation falls below 2% or the Unemployment Rate is too high, the Fed may lower interest rates, which weighs on the Greenback.
In extreme situations, the Federal Reserve can also print more Dollars and enact quantitative easing (QE). QE is the process by which the Fed substantially increases the flow of credit in a stuck financial system. It is a non-standard policy measure used when credit has dried up because banks will not lend to each other (out of the fear of counterparty default). It is a last resort when simply lowering interest rates is unlikely to achieve the necessary result. It was the Fed’s weapon of choice to combat the credit crunch that occurred during the Great Financial Crisis in 2008. It involves the Fed printing more Dollars and using them to buy US government bonds predominantly from financial institutions. QE usually leads to a weaker US Dollar.
Quantitative tightening (QT) is the reverse process whereby the Federal Reserve stops buying bonds from financial institutions and does not reinvest the principal from the bonds it holds maturing in new purchases. It is usually positive for the US Dollar.
United States (US) President Donald Trump ran through a long list of grievances while delivering his remarks during the World Economic Forum hosted in Davos, Switzerland on Thursday. President Trump reiterated his concerns that the US' trade deficit with Canada, which amounts to 4% of the US' total trade imbalance, is unsustainable. President Trump also floated tax cuts for US businesses, asking the Organization of the Petroleum Exporting Countries (OPEC) to lower Crude Oil prices, and re-floated his ongoing threats of ambiguous, sweeping tariffs on US imports from other countries. President Donald Trump also took the opportunity to remind everyone at Davos that he will single-handedly deliver extreme tax cuts while simultaneously shrinking the US spending deficit, and also vowed to attempt to subvert the operational independence of the US Federal Reserve (Fed).
Key highlights
US has largest amount of oil and gas of any country and we are going to use it.
US House and Senate will pass tax-cut measures.
Congress will pass the largest tax cut in American history.
I will ask OPEC to lower oil prices.
I will ask Saudi's MBS for $1 trillion in investments.
I will demand lower interest rates.
I'm asking NATO nations to increase defense spending to 5% of GDP.
EU tariffs make it very difficult to bring products into Europe.
I will do something about the trade deficit with the EU.
We need double the energy we have in the US for AI to be as big as we want it.
I will bring the corporate tax rate to 15% if the product is made in the US.
We can't continue current trade deficit levels with Canada.
I want to obliterate US debt, which will happen rapidly.
I will meet Putin soon to end the war in Ukraine.
I see US-China relationship being very good.
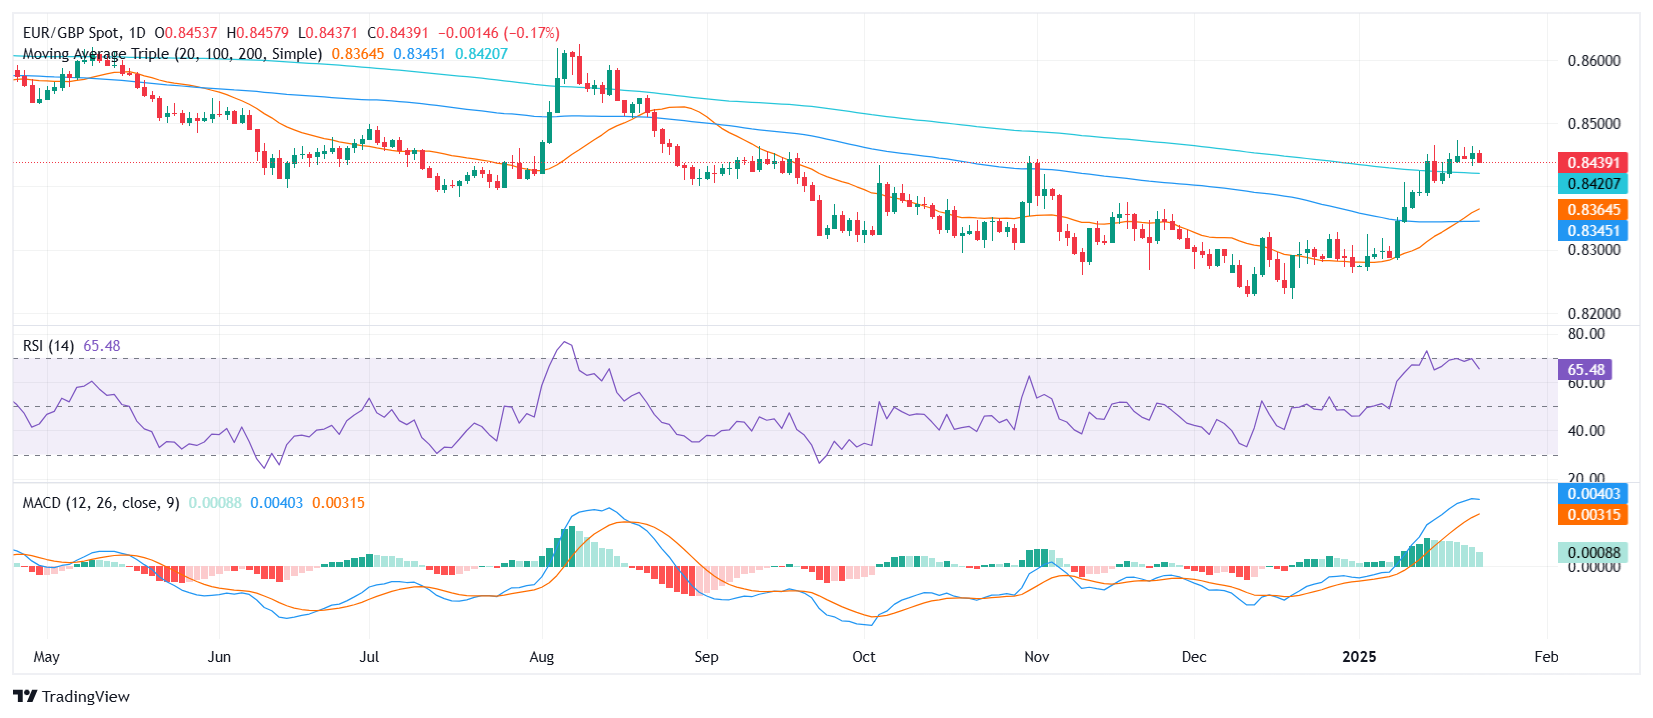
- EUR/GBP edges lower to 0.8445 on Thursday, maintaining a cautious tone near key support levels.
- Momentum wanes as the pair approaches the 200-day SMA at 0.8420.
- Technical signals suggest limited upside unless buyers reclaim the 0.8465 resistance zone.
The EUR/GBP pair edged lower on Thursday, slipping to 0.8445 as it drifts closer to the 200-day Simple Moving Average (SMA), positioned around 0.8420.
Technical indicators reflect a waning bullish bias. The Relative Strength Index (RSI) remains at 65, staying in positive territory but showing no signs of further advancement, pointing to a neutral stance. Meanwhile, the Moving Average Convergence Divergence (MACD) histogram continues to display decreasing green bars, highlighting diminishing upward pressure and raising the possibility of further downside.
In the immediate term, the 200-day SMA at 0.8420 serves as a pivotal support level; a sustained breach below this could open the door for a move toward the 0.8400 mark. On the upside, recovery efforts will need to reclaim 0.8465 to challenge the 0.8500 psychological resistance, which would mark a significant improvement in the pair’s outlook.
EUR/GBP daily chart
November's retail sales report was rather disappointing. Not only did good spending stagnate over the month but, as prices rose, this translated into a 0.4% decline in sales volumes, NBC ecnomists report.
Canada car sales in Q4 hive a major boost to goods spending
"Outlays of items correlated with the housing market continued to fall, as did spending on food. On a more positive note, auto sales saw another solid expansion in November and were on track to grow by no less than 19.1% in annualized terms in the fourth quarter (18.2% in real terms). These good times may not last, however."
"Remember that several subsidy programs for the purchase of electric or hybrid vehicles expired in January, which probably encouraged many car buyers to pull the trigger at the end of last year. We therefore expect a significant slowdown in this category in the first quarter of 2025. But in the meantime, the large increase in spending at dealerships will translate into a significant contribution to Q4 GDP growth from goods consumption."
"Including the December advance reading, we indeed estimate that retail sales volumes rose by no less than 4.9% annualized in Q4, the best performance in a year. Excluding cars, however, sales volumes may have contracted during the quarter, highlighting the extent to which sales were driven by a single category in the final quarter of last year."
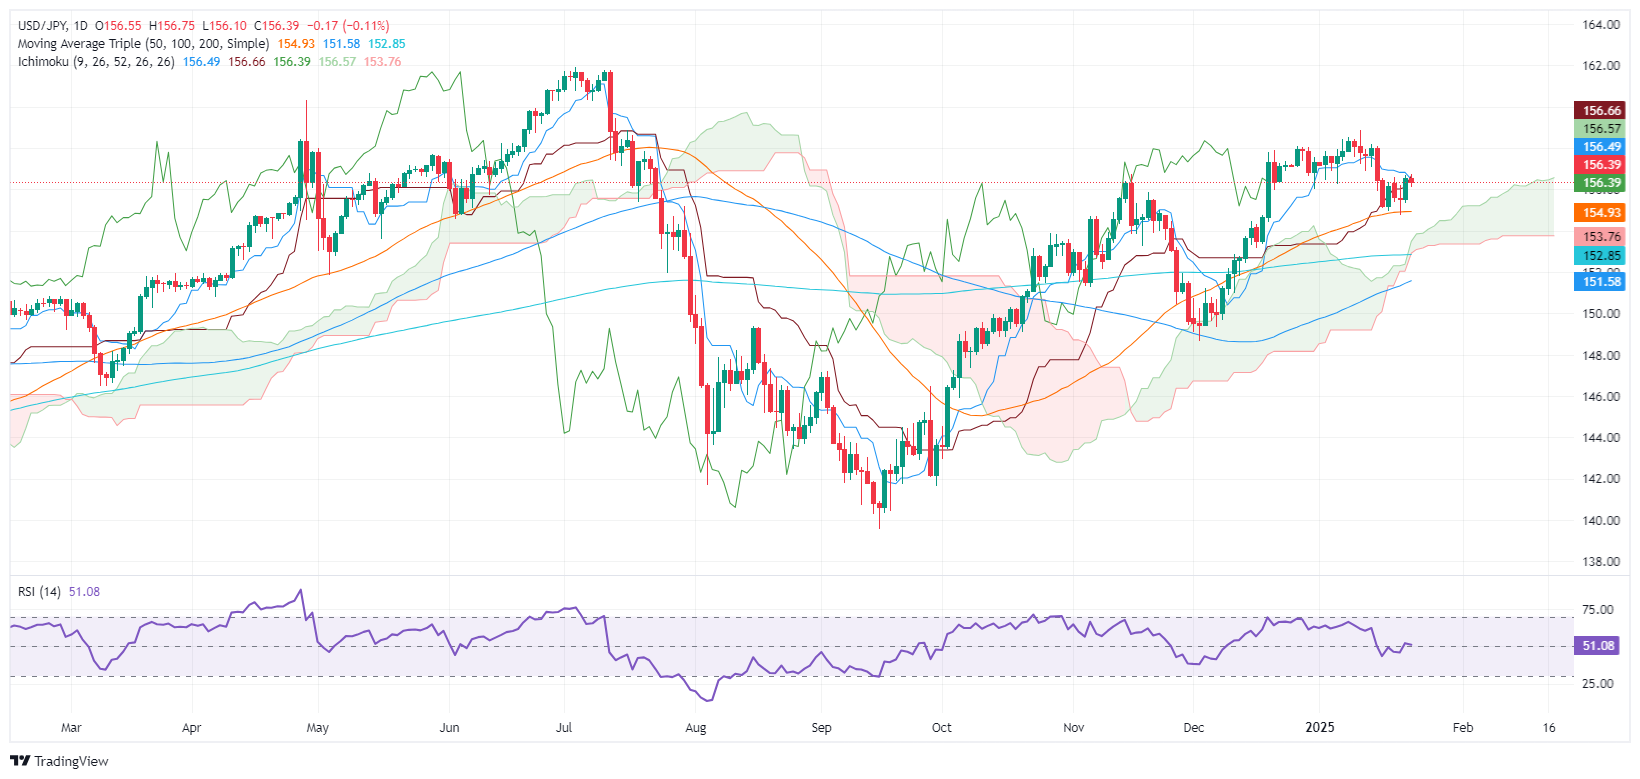
- USD/JPY retreats from six-day high as U.S. Initial Jobless Claims suggest labor market cooling.
- Bank of Japan meeting likely to see 25 basis point rate hike, contrasting with Fed's steady stance.
- Global markets await Trump's Davos comments, with trade policy rhetoric set to influence currencies.
The USD/JPY slides during the North American session after hitting a six-day high of 156.75, as labor market data revealed in the United States (US) came worse than expected. At the time of writing, the pair trades at 156.28, down 0.19%.
Japanese Yen appreciates ahead BoJ’s policy decision
The US Department of Labor revealed that Initial Jobless Claims for the week ended January 18 increased, to 223K, exceeding forecasts of 220K. Labor market strength and rising inflation figures had prompted the Federal Reserve from continuing to easing policy, alongside uncertainty regarding the new fiscal policy applied by the Trump administration.
Even though the Fed is expected to keep rates unchanged at the next week’s meeting, the Bank of Japan (BoJ) most likely raise rates by 25 basis points (bps), which would be the highest since 2007 at the January 23-24 meeting. Several senior BoJ officials expressed confidence on wage growth momentum.
In the meantime, the lack of economic data in the US and Japan would keep traders eyeing the US President Donald Trump appearance at the Davos World Economic Form (WEF). His trade policy rhetoric has sent waves across global financial makers,
USD/JPY Price Forecast: Technical outlook
The USD/JPY has found stir resistance at the 157.00 figure with bulls unable to crack it since sliding below the latter on January 15. Momentum seems to favor sellers, as spot prices lie beneath the confluence of the Tenkan and Kijun-sen at the 156.64-156.48 range, which if broken, could pave the way for further downside. The next key support will be the January 22 low of 155.33, followed by January 21 swing low of 154.75.
Japanese Yen PRICE Today
The table below shows the percentage change of Japanese Yen (JPY) against listed major currencies today. Japanese Yen was the strongest against the Swiss Franc.
| USD | EUR | GBP | JPY | CAD | AUD | NZD | CHF | |
|---|---|---|---|---|---|---|---|---|
| USD | 0.17% | -0.00% | -0.09% | -0.04% | 0.05% | 0.08% | 0.27% | |
| EUR | -0.17% | -0.18% | -0.28% | -0.21% | -0.12% | -0.09% | 0.10% | |
| GBP | 0.00% | 0.18% | -0.10% | -0.03% | 0.06% | 0.09% | 0.28% | |
| JPY | 0.09% | 0.28% | 0.10% | 0.06% | 0.16% | 0.15% | 0.37% | |
| CAD | 0.04% | 0.21% | 0.03% | -0.06% | 0.10% | 0.12% | 0.31% | |
| AUD | -0.05% | 0.12% | -0.06% | -0.16% | -0.10% | 0.03% | 0.21% | |
| NZD | -0.08% | 0.09% | -0.09% | -0.15% | -0.12% | -0.03% | 0.19% | |
| CHF | -0.27% | -0.10% | -0.28% | -0.37% | -0.31% | -0.21% | -0.19% |
The heat map shows percentage changes of major currencies against each other. The base currency is picked from the left column, while the quote currency is picked from the top row. For example, if you pick the Japanese Yen from the left column and move along the horizontal line to the US Dollar, the percentage change displayed in the box will represent JPY (base)/USD (quote).
CTA selling activity in Copper and Aluminum is likely to weigh on these metals, reflecting the downside asymmetry in algo flows resulting from range-bound price action, TDS' Senior Commodity Strategist Daniel Ghali notes.
CTAs to sell +16% and +10% of their max size in Copper and Aluminium
"Ultimately, this trading regime is akin to time-decay for trend signals, resulting in more frequent whipsaws as adversarial pressures build proportionally with CTA positioning."
"This session, CTAs are set to respectively sell up to +16% and +10% of their max size in Copper and Aluminium, but the scope for subsequent purchases remains elevated in aluminium, with more selling in the pipeline over the coming week, even in a flat tape scenario for prices."
- Silver price plunges to near $30.00 as US President Trump delays tariff hikes.
- A delay in Trump tariff plans and hopes of a Russia-Ukraine truce have improved the market mood.
- The Fed is widely anticipated to keep interest rates unchanged on Wednesday.
Silver price (XAG/USD) dives an almost 1.75% to near $30.00 in North American trading hours on Thursday. The white metal has been hit hard as the overall market sentiment has broadly stabilized. The market mood has become favorable for risk-perceived assets as United States (US) President Donald Trump has not imposed tariff hikes yet, while he was anticipated to do the same right on his first day at work.
Donald Trump has commented that he is considering 25% tariff hikes on Mexico and Canada and 10% on China that will come into effect from February 1. His presidential memo also suggested that tariffs are not coming swiftly, and he directed federal agencies to study trade policies and evaluate trade relationships. No concrete announcement of tariff hikes has eased the risk-aversion mood as market participants expect Trump’s tariff policy implementation will be more gradual than feared.
Apart from growing expectations that Russia might have a truce with Ukraine, it has also trimmed the risk premium of precious metals. Trump has threatened to impose sanctions on Russia if he continues the war with Ukraine.
Historically, the safe-haven demand for precious metals, such as Silver, diminishes in a stable risk environment.
Meanwhile, the US Dollar Index (DXY), which tracks the Greenback’s value against six major currencies, trades subduedly after gaining ground post refreshing the two-week low of 107.75. The US Dollar (USD) is expected to remain broadly sideways, with investors awaiting the Federal Reserve’s (Fed) monetary policy decision on Wednesday. The Fed is almost certain to announce a pause to the current policy-easing spell and leave interest rates unchanged in the range of 4.25%-4.50%.
Silver technical analysis
Silver price falls back to near the 20-day Exponential Moving Average (EMA) around $30.25 after failing to break above the upward-sloping trendline around $30.90, which is plotted from 29 February 2024 low of $22.30 on a daily timeframe.
The broader outlook of the Silver price remains firm above the 200-day Exponential Moving Average (EMA), which trades around $29.50.
The 14-day Relative Strength Index (RSI) oscillates in the 40.00-60.00 range, suggesting a sideways trend.
Silver daily chart
Silver FAQs
Silver is a precious metal highly traded among investors. It has been historically used as a store of value and a medium of exchange. Although less popular than Gold, traders may turn to Silver to diversify their investment portfolio, for its intrinsic value or as a potential hedge during high-inflation periods. Investors can buy physical Silver, in coins or in bars, or trade it through vehicles such as Exchange Traded Funds, which track its price on international markets.
Silver prices can move due to a wide range of factors. Geopolitical instability or fears of a deep recession can make Silver price escalate due to its safe-haven status, although to a lesser extent than Gold's. As a yieldless asset, Silver tends to rise with lower interest rates. Its moves also depend on how the US Dollar (USD) behaves as the asset is priced in dollars (XAG/USD). A strong Dollar tends to keep the price of Silver at bay, whereas a weaker Dollar is likely to propel prices up. Other factors such as investment demand, mining supply – Silver is much more abundant than Gold – and recycling rates can also affect prices.
Silver is widely used in industry, particularly in sectors such as electronics or solar energy, as it has one of the highest electric conductivity of all metals – more than Copper and Gold. A surge in demand can increase prices, while a decline tends to lower them. Dynamics in the US, Chinese and Indian economies can also contribute to price swings: for the US and particularly China, their big industrial sectors use Silver in various processes; in India, consumers’ demand for the precious metal for jewellery also plays a key role in setting prices.
Silver prices tend to follow Gold's moves. When Gold prices rise, Silver typically follows suit, as their status as safe-haven assets is similar. The Gold/Silver ratio, which shows the number of ounces of Silver needed to equal the value of one ounce of Gold, may help to determine the relative valuation between both metals. Some investors may consider a high ratio as an indicator that Silver is undervalued, or Gold is overvalued. On the contrary, a low ratio might suggest that Gold is undervalued relative to Silver.
- AUD/USD trades sideways below 0.6300 as investors have been sidelined due to the absence of a full-fledged Trump tariff plan.
- The Fed is expected to leave interest rates unchanged on Wednesday.
- Investors await the Australian Q4 CPI data, which will influence expectations for RBA’s policy decision next month.
The AUD/USD pair trades in a narrow range below the immediate resistance of 0.6300 in Thursday’s North American session. The Aussie pair is stuck in a tight range as investors seek more clarity on United States (US) President Donald Trump’s tariff plan.
Donald Trump has not released his full-fledged tariff plan yet, but market participants were anticipating that he would unveil tariff hikes for all trading partners soon after returning to the White House. He has only signaled that his neighbors, Canada and Mexico, could attract 25% tariffs, and China could face 10%, which will come into effect on February 1.
The release of fewer Trump tariff plans has kept investors on their toes. This has led to caution among investors towards risk-sensitive assets, which has improved the safe-haven demand of the US Dollar (USD). The US Dollar Index (DXY), which tracks the Greenback’s value against six major currencies, gains ground after posting a fresh two-week low near 107.75 but is trading subduedly, at the time of writing.
Meanwhile, investors shift their focus to the Federal Reserve’s (Fed) monetary policy announcement on Wednesday. Investors will mainly focus on the Fed’s monetary policy guidance as it is widely anticipated to keep interest rates unchanged in the range of 4.25%-4.50%.
On the Aussie front, investors await the Q4 Consumer Price Index (CPI) data, which will be released on Wednesday. The inflation data will significantly influence market speculation about whether the Reserve Bank of Australia (RBA) will start reducing interest rates from the monetary policy meeting next month. Currently, traders fully price in a 25-basis points (bps) interest rate reduction by the RBA in February that will push interest rates lower to 4.10%.
US Dollar FAQs
The US Dollar (USD) is the official currency of the United States of America, and the ‘de facto’ currency of a significant number of other countries where it is found in circulation alongside local notes. It is the most heavily traded currency in the world, accounting for over 88% of all global foreign exchange turnover, or an average of $6.6 trillion in transactions per day, according to data from 2022. Following the second world war, the USD took over from the British Pound as the world’s reserve currency. For most of its history, the US Dollar was backed by Gold, until the Bretton Woods Agreement in 1971 when the Gold Standard went away.
The most important single factor impacting on the value of the US Dollar is monetary policy, which is shaped by the Federal Reserve (Fed). The Fed has two mandates: to achieve price stability (control inflation) and foster full employment. Its primary tool to achieve these two goals is by adjusting interest rates. When prices are rising too quickly and inflation is above the Fed’s 2% target, the Fed will raise rates, which helps the USD value. When inflation falls below 2% or the Unemployment Rate is too high, the Fed may lower interest rates, which weighs on the Greenback.
In extreme situations, the Federal Reserve can also print more Dollars and enact quantitative easing (QE). QE is the process by which the Fed substantially increases the flow of credit in a stuck financial system. It is a non-standard policy measure used when credit has dried up because banks will not lend to each other (out of the fear of counterparty default). It is a last resort when simply lowering interest rates is unlikely to achieve the necessary result. It was the Fed’s weapon of choice to combat the credit crunch that occurred during the Great Financial Crisis in 2008. It involves the Fed printing more Dollars and using them to buy US government bonds predominantly from financial institutions. QE usually leads to a weaker US Dollar.
Quantitative tightening (QT) is the reverse process whereby the Federal Reserve stops buying bonds from financial institutions and does not reinvest the principal from the bonds it holds maturing in new purchases. It is usually positive for the US Dollar.
ECB to continue to cut on 30 January with another 25bp reduction in the policy rate to 2.75%, and markets expect the description of the policy stance to be unchanged vs December, Deutsche Bank’s analysts report.
ECB to cut by 25bp at each of the four meetings in H1
“The interpretation between the lines will be consistent with further rate cuts: the policy stance will continue to be described as restrictive and the ECB will remain confident that inflation is on the right track. There will be no pre-determined path for policy and the terminal rate will be above/at/below neutral depending on the data which the ECB will judge meeting-by-meeting. The main risk in January is that the tweaks to the description of the recent data lean a little hawkish relative to December (e.g., higher energy prices, domestic inflation unchanged).”
“In this Preview, we explore the potential tension between the ECB’s growing confidence in the return of inflation to target and the increasing two-sided risks around this central view. These views are consistent with a return to neutral but at a gradual pace. That is, it would require a shock for the ECB to cut by 50bp. We also think about neutral rates and when the ECB might start to “tiptoe” or slow the pace of cuts from the current 2 quarter-point cuts per quarter to one cut per quarter - we think from Q3, the risk is Q2. Finally, we think about the macro data that will be most important to the ECB when making these decisions.”
“Our baseline call on the ECB is unchanged. We expect the ECB to cut by 25bp at each of the four Governing Council meetings in H1, lowering the policy rate to 2.00% by mid-year. In H2, we expect the pace of cuts to slow. We expect one 25bp cut per quarter in H2 – cuts at the September and December meetings – with a terminal rate of 1.50% at year-end, modestly sub-neutral. This view is predicated on the assumption of below-trend growth, moderately below target inflation and risks to inflation that are skewed to the downside.”
The CBI’s January survey of manufacturing was generally morose, Scotiabank’s Chief FX Strategist Shaun Osborne notes.
GBP little changed on the session
“It revealed a small improvement in still weak orders, some improvement in still weak output and a further slide in the quarterly business optimism reading that likely reflects concerns about the government’s fiscal plans and the recent market volatility associated with them. Sterling is holding little changed on the day and over the week so far, however.”
“Cable continues to grind out some gains on the USD on the charts after basing at 1.21 last week but progress is slow towards key resistance (and potential bull trigger) at 1.2415/25—retracement and trend resistance. Support is 1.2325.”
- Initial Jobless Claims surpassed consensus and increased to 223K.
- Continuing Jobless Claims climbed to 1.899M in the week ending January 11.
US citizens filing new applications for unemployment insurance rose to 223K for the week ending January 18, as reported by the US Department of Labor (DoL) on Thursday. This print missed initial estimates and was higher than the previous week's unrevised tally of 217K.
The report also highlighted a seasonally adjusted insured unemployment rate of 1.2%, while the four-week moving average rose to 213.5K, marking an increase of 750 from the prior week’s unrevised average.
Moreover, Continuing Jobless Claims went up by 46K to reach 1.899M for the week ending January 11.
Market reaction
The Greenback keeps the inconclusive price action around 107.80 when tracked by the US Dollar Index (DXY) amid a mixed tone in US yields.
The Euro (EUR) is steady around the 1.04 zone, Scotiabank’s Chief FX Strategist Shaun Osborne notes.
EUR steady around 1.04
“ECB Governor Escriva remarked earlier that the central bank needed to move to a neutral stance in the coming months. However, Governor Holzmann remains cautious on near-term ECB easing, suggesting he needs ‘good arguments’ to support a rate cut next week. President Lagarde commented that the central bank will maintain its ‘measured’ easing steps yesterday.
“Swaps continue to price in a 1/4 point cut for next week’s meeting. The EUR is holding a tight range intraday after another test of —and failure at—retracement resistance at 1.0422 yesterday. The low 1.04 area has been a block on EUR rebounds since December but the level on the chart is a bit more meaningful now as 1.0422 represents the initial (23.6%) retracement of the EUR’s slide from 1.12.”
“A clear push through the low 1.04 zone should see spot gains extend towards 1.05/1.06. Support is 1.0350.”
The Canadian Dollar (CAD) is little changed on the session, Scotiabank’s Chief FX Strategist Shaun Osborne notes.
A potential reversal signal on the cart
“Spot has slipped into a sideways consolidation range after the elevated volatility in spot at the start of the week. Those swings have perhaps discouraged markets from leaning much harder on the CAD for now—at least until there is more clarity on tariff threats. Canada’s November Retail Sales are expected to rise 0.2% in the month. That’s a bit better than the flat preliminary read for November sales Statcan provided with the October data.”
“While USD/CAD is essentially moving sideways, spot is carving out a broadening sideways range around 1.44 after its late 2024 rally. This type of pattern is usually associated with heightened market volatility, participation and emotion and typically develop around major market tops. That shoe seems to fit here.”
“Besides that, spot’s break under three month trend support and price action that is shaping up negatively for the USD on the weekly chart add to some fairly clear USD-negative developments on the charts. Support is 1.4260/80. Resistance is 1.4480/00.”
For some years, there has been a discussion about the decline of the Western style liberalism that has dominated the developed world since WWII. The rise of populism in parts of Europe is part of that discussion as are the protectionist and nationalist style of policies promoted by Trump, Rabobank’s FX analyst Jane Foley notes.
EUR/USD risks parity in Q2 and dipping below that
“Just a few days into his second presidency and Trump has already caused a large degree of disruption. Included in that are his withdrawals from the Paris climate Accord (again) and the WHO. He has also previously raised the threat of the US abandoning Nato, all in the interest of putting ‘America First.’ Trump’s stance, while not wholly surprising, further undermines the liberal principles of cooperation and shared interests.”
“In the same vein, the US Administration’s position on climate change has resulted in US banks leaving the Net Zero Banking Alliance. Canadian banks are reportedly following suit. Given the risks to competitiveness, perhaps it is inevitable that the FT has reported that various European banks may be considering their position. It is against the backdrop of less cooperation that some commentators have been asking whether the World Economic Forum in Davos is now less relevant than it once was.”
“Moreover, against the backdrop of economic malaise in Germany and France, questions are being asked about how Europe can compete with the US given Trump’s low regulation and loose fiscal policies. The rally in both the USD and US stocks since early October reflects the enthusiasm with which investors have embraced Trump’s policies. While the lack of tariffs on day one has allowed the USD to pause for breath this week, the structural nature of Europe’s economic problems and its weak growth outlook suggest that EUR/USD may have further to fall. We maintain our forecast for EUR/USD parity in Q2 and see risk of dips below.”
The US Dollar (USD) continues to consolidate. While broad USD sentiment remains constructive in anticipation of growth-positive policies under President Trump, a lot of good news in priced in to the USD at this point and markets are already positioned very long USDs, Scotiabank’s Chief FX Strategist Shaun Osborne notes.
USD consolidates and investors await more specifics on tariffs
“That may leave the USD prone to position-adjustment in the event of adverse news or market doubts about how quickly Trump can advance his agenda. The key issue for traders in the short run is tariffs—how quickly and how hard they hit those countries that are under immediate threat. The longer the wait goes on for news, the greater the risk of some drift lower in the USD.”
“With little on the data front to move markets today (US weekly claims and the KC Fed Manufacturing Index are the only US releases scheduled), the session ahead may be relatively subdued. The DXY is heading for a second weekly loss, however, with price signals starting to tilt somewhat bearishly on the charts.”
“The JPY has underperformed this week but has a very slight edge on its G10 peers so far today, despite a pickup in US bond yields, as markets anticipate a 25bps hike at the BoJ policy decision (due overnight). Note Japan also releases December CPI data this evening. Australia releases PMIs.”
- The US Dollar stabilizes further on Thursday with traders bracing for US data.
- US President Trump is set to speak at the World Economic Forum in Davos.
- The US Dollar Index (DXY) is back above 108.00, though faces some mild selling pressure again.
The US Dollar Index (DXY), which tracks the Greenback’s value against six major currencies, is further stabilising and trying to recover further towards levels seen last week before US President Donald Trump’s inauguration. Still, there is a long road to recovery, although after a few days with an almost empty US data calendar, traders can brace for a pickup in the next releases. Positive and upbeat data could put inflation concerns back on the agenda, which would fuel higher rates and a stronger US Dollar again.
Meanwhile, the US economic calendar is starting to take shape with the weekly Jobless Claims and the Kansas Fed Manufacturing Activity Index. This all precedes the release of Friday’s S&P Global Purchase Managers Index (PMIs) numbers. Later this Thursday, US President Trump will also appear virtually at the Davos World Economic Forum where he will hold a speech.
Daily digest market movers: Finally some data
- At 13:30 GMT, the weekly Jobless Claims for the week ending on January 17 are due. Expectations are for the initial claims to tick up to 220,000, coming from 217,000 in last week’s count. The Continuing Claims for the week of January 10 are set to head higher to 1.860 million, from 1.859 million previously.
- At 16:00 GMT, the Kansas Fed will release its manufacturing activity survey for January. No forecast is available, with the previous reading at -5.
- In that same timeframe, US President Donald Trump will make a virtual appearance at the World Economic Forum in Davos.
- Equities are looking sluggish this Thursday, facing some profit-taking after its broad rally throughout the week.
- The CME FedWatch tool projects a 57.1% chance that interest rates will remain unchanged at current levels in the May meeting, suggesting a rate cut in June. Expectations are that the Federal Reserve (Fed) will remain data-dependent with uncertainties that could influence inflation during US President Donald Trump’s term.
- The US 10-year yield is trading around 4.619%, off its poor performance seen earlier this week at 4.528% and still has a long way to go back to the more-than-one-year high from last week at 4.807%.
US Dollar Index Technical Analysis: US data could bring back inflation to the agenda
The US Dollar Index (DXY) halts its correction and consolidates around 108.00 on Thursday. Upcoming US economic data this week could fuel inflation concerns again with higher rates and a stronger US Dollar as a result.
If the recovery in the DXY wants to continue its ascent, the pivotal level to gain control of is 109.29 (July 14, 2022, high and rising trendline). Further up, the next big upside level to hit before advancing further remains at 110.79 (September 7, 2022, high). Once beyond there, it is quite a stretch to 113.91, a double top from October 2022.
On the downside, the first area to watch is 107.80-107.90, which held this week’s correction. Further down, the convergence of the high of October 3, 2023, and the 55-day Simple Moving Average (SMA) around 107.50 should act as a double safety feature to catch any falling knives.
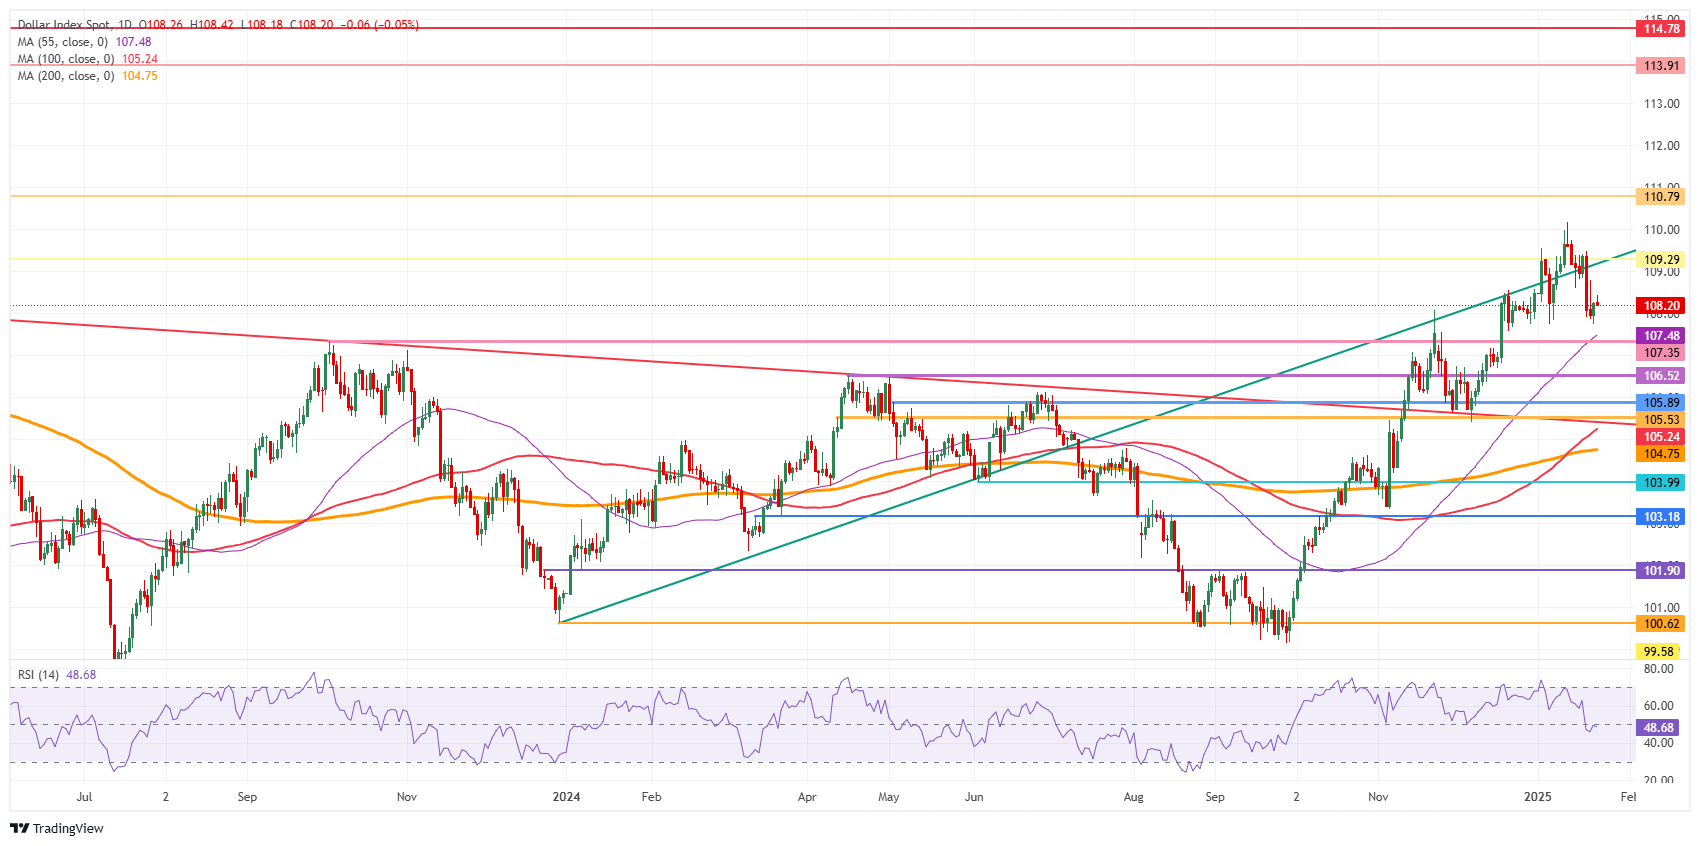
US Dollar Index: Daily Chart
US Dollar FAQs
The US Dollar (USD) is the official currency of the United States of America, and the ‘de facto’ currency of a significant number of other countries where it is found in circulation alongside local notes. It is the most heavily traded currency in the world, accounting for over 88% of all global foreign exchange turnover, or an average of $6.6 trillion in transactions per day, according to data from 2022. Following the second world war, the USD took over from the British Pound as the world’s reserve currency. For most of its history, the US Dollar was backed by Gold, until the Bretton Woods Agreement in 1971 when the Gold Standard went away.
The most important single factor impacting on the value of the US Dollar is monetary policy, which is shaped by the Federal Reserve (Fed). The Fed has two mandates: to achieve price stability (control inflation) and foster full employment. Its primary tool to achieve these two goals is by adjusting interest rates. When prices are rising too quickly and inflation is above the Fed’s 2% target, the Fed will raise rates, which helps the USD value. When inflation falls below 2% or the Unemployment Rate is too high, the Fed may lower interest rates, which weighs on the Greenback.
In extreme situations, the Federal Reserve can also print more Dollars and enact quantitative easing (QE). QE is the process by which the Fed substantially increases the flow of credit in a stuck financial system. It is a non-standard policy measure used when credit has dried up because banks will not lend to each other (out of the fear of counterparty default). It is a last resort when simply lowering interest rates is unlikely to achieve the necessary result. It was the Fed’s weapon of choice to combat the credit crunch that occurred during the Great Financial Crisis in 2008. It involves the Fed printing more Dollars and using them to buy US government bonds predominantly from financial institutions. QE usually leads to a weaker US Dollar.
Quantitative tightening (QT) is the reverse process whereby the Federal Reserve stops buying bonds from financial institutions and does not reinvest the principal from the bonds it holds maturing in new purchases. It is usually positive for the US Dollar.
- Gold faces a first halt for this week in its rally.
- Bond yields are off their lows and starting to grind higher.
- Gold attempted to break above $2,760 on Wednesday and was rejected.
Gold’s price (XAU/USD), $2,747 at the time of writing, is seeing investors start to book some gains after a fierce three-day rally that brought over 2.0% gains. Traders are reducing their exposure to Bullion, with the US economic calendar getting ready for more data releases on Friday. Meanwhile, markets are cautious about what US President Donald Trump will say during his speech at the Davos World Economic Forum (WEF).
The data vacuum suffered lately has been ideal for Gold to rally without any big concern. That sentiment could start to change with the release of the Kansas Fed Manufacturing Activity Survey for January, ahead of the S&P Global Purchase Managers Index (PMIs) numbers on Friday.
Daily digest market movers: US data comes in
- Barrick Gold is exploring the sale of its 50% stake in Chile's Zaldivar Copper mine, according to Bloomberg sources, as the mining giant aims to streamline its portfolio and focus on larger-scale operations, Bloomberg reports.
- At 16:00 GMT, the Kansas Fed Manufacturing Activity Index for January is set to be released. No forecast is available, with the previous number in contraction at -5.
- President Donald Trump is set to speak remotely in Davos.
- US yields are off their lows for this week, with the US 10-year benchmark rate currently trading at 4.619%, off its poor performance seen earlier this week at 4.528%. It still has a long way to go back to the more-than-one-year high from last week at 4.807%.
Technical Analysis: Data to mess with the rally
Gold price stalls its rally on Thursday, and the US economic calendar has something to do with it. It has been a very rare few days, with the US economic calendar having been so empty since US President Donald Trump’s inauguration on Monday. The vacuum in economic data was ideal for traders to enjoy this rally. Though its importance is starting to pick up on Thursday, a correction could hit the precious metal.
Profit-taking could broaden and push Gold’s price back to $2,721, a sort of double top in November and December broken on Tuesday. Just below that, $2,709 (October 23, 2024, low) comes in focus as a second nearby support. In case both abovementioned levels snap, look for a dive back to $2,680 with a full-swing sell-off.
Conversely, Gold is now on its way to the all-time high of $2,790, which is still over 1.4% away from current levels. Once above that, a fresh all-time high will present itself. Meanwhile, some analysts and strategists have penciled in calls for $3,000, but $2,800 looks to be a good starting point as the next resistance on the upside.
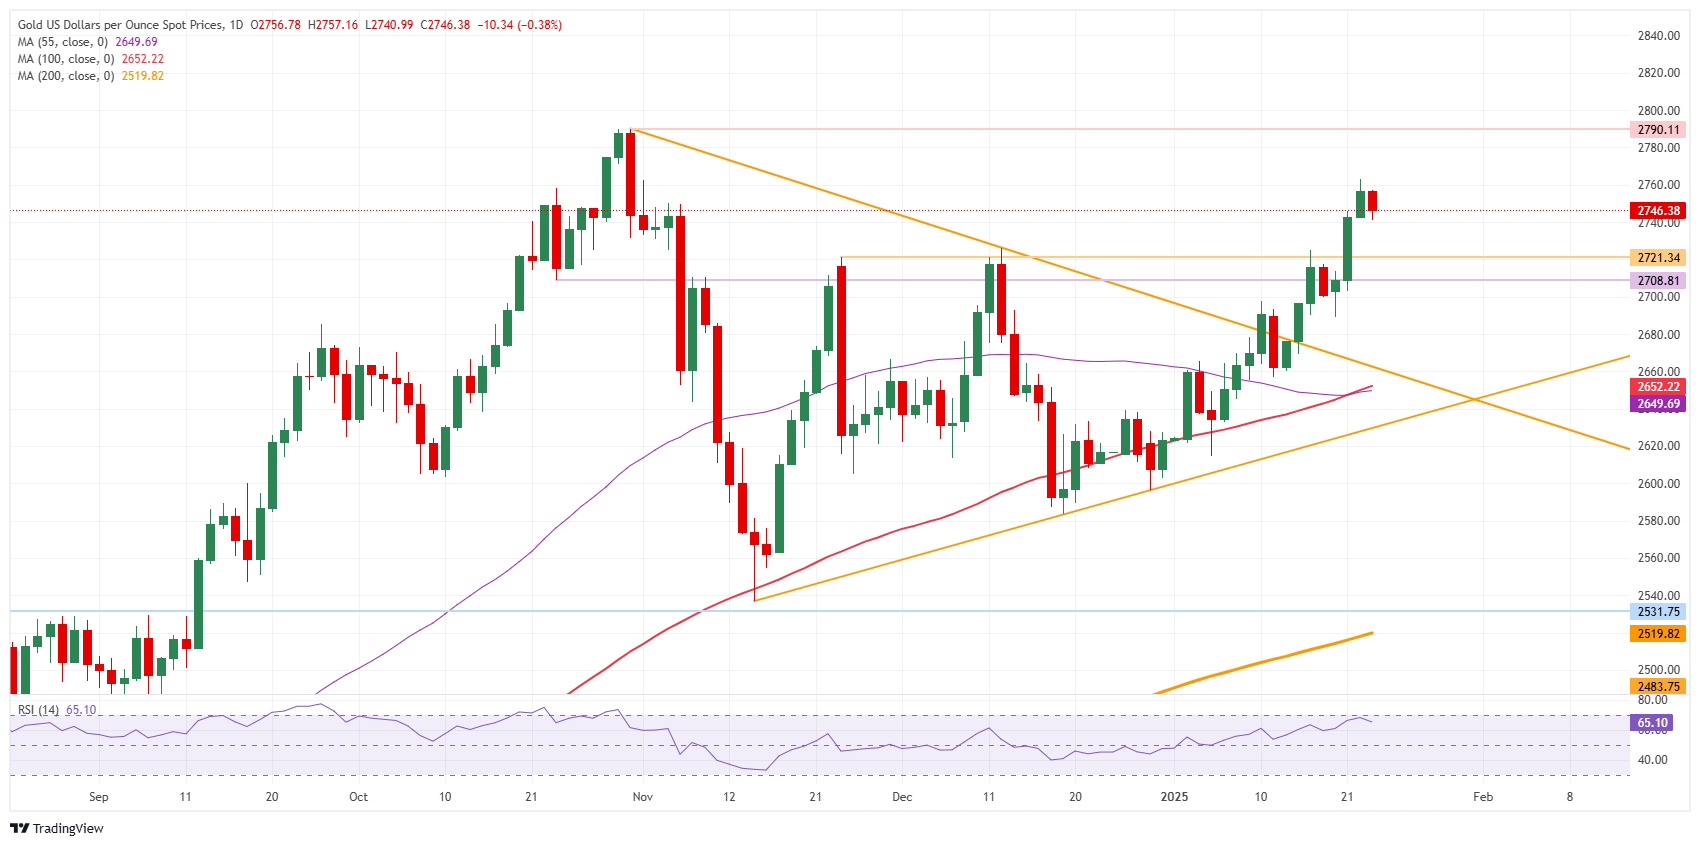
XAU/USD: Daily Chart
Gold FAQs
Gold has played a key role in human’s history as it has been widely used as a store of value and medium of exchange. Currently, apart from its shine and usage for jewelry, the precious metal is widely seen as a safe-haven asset, meaning that it is considered a good investment during turbulent times. Gold is also widely seen as a hedge against inflation and against depreciating currencies as it doesn’t rely on any specific issuer or government.
Central banks are the biggest Gold holders. In their aim to support their currencies in turbulent times, central banks tend to diversify their reserves and buy Gold to improve the perceived strength of the economy and the currency. High Gold reserves can be a source of trust for a country’s solvency. Central banks added 1,136 tonnes of Gold worth around $70 billion to their reserves in 2022, according to data from the World Gold Council. This is the highest yearly purchase since records began. Central banks from emerging economies such as China, India and Turkey are quickly increasing their Gold reserves.
Gold has an inverse correlation with the US Dollar and US Treasuries, which are both major reserve and safe-haven assets. When the Dollar depreciates, Gold tends to rise, enabling investors and central banks to diversify their assets in turbulent times. Gold is also inversely correlated with risk assets. A rally in the stock market tends to weaken Gold price, while sell-offs in riskier markets tend to favor the precious metal.
The price can move due to a wide range of factors. Geopolitical instability or fears of a deep recession can quickly make Gold price escalate due to its safe-haven status. As a yield-less asset, Gold tends to rise with lower interest rates, while higher cost of money usually weighs down on the yellow metal. Still, most moves depend on how the US Dollar (USD) behaves as the asset is priced in dollars (XAU/USD). A strong Dollar tends to keep the price of Gold controlled, whereas a weaker Dollar is likely to push Gold prices up.
- USD/JPY ticks lower as the US Dollar trades subduedly, with investors looking for cues about the likely full-fledged Trump tariff plan.
- Investors expect the Fed to leave interest rates unchanged on Wednesday.
- The BoJ is anticipated to announce its third interest rate hike decision.
The USD/JPY pair ticks lower to near 156.30 in Thursday’s European session. The asset faces slight pressure as the US Dollar (USD) trades subduedly as investors seek clarity over the tariff plan by United States (US) President Donald Trump. The US Dollar Index (DXY), which tracks the Greenback’s value against six major currencies, edges lower but holds the key support of 108.00.
Donald Trump has not yet released a full-fledged tariff plan, while investors anticipated that he will unveil the tariff hike structure for all economies right on his first day of administration. In first three days of Trump administration, he has threatened 25% tariffs on Canada and Mexico and 10% on China, which will come into effect on February 1.
Going forward, investors should brace for significant volatility in the US Dollar as the Federal Reserve (Fed) is going to announce its first monetary policy decision of the year on Wednesday. The Fed is certain to announce a pause in the policy-easing spell, according to the CME FedWatch tool. Therefore, investors will pay more attention to the Fed’s interest rate guidance and the likely impact of Trump’s economic policies on the economy and monetary policy.
But before that, investors will focus on the flash US S&P Global Purchasing Managers’ Index (PMI) data for December, which will be released on Friday.
In the Asia-Pacific side, investors await the Bank of Japan’s (BoJ) monetary policy announcement on Friday. The BoJ is expected to raise interest rates. This would be the third interest rate hike by the BoJ of the current policy-tightening cycle. BoJ hawkish bets accelerated after some officials, including Governor Kazuo Ueda, commented that rate hikes would be discussed in the January meeting. “The central bank is currently analyzing data thoroughly and will compile the findings in the quarterly outlook report, and based on that, the bank will discuss whether to raise interest rates at next week's policy meeting,” Ueda said.
Economic Indicator
BoJ Interest Rate Decision
The Bank of Japan (BoJ) announces its interest rate decision after each of the Bank’s eight scheduled annual meetings. Generally, if the BoJ is hawkish about the inflationary outlook of the economy and raises interest rates it is bullish for the Japanese Yen (JPY). Likewise, if the BoJ has a dovish view on the Japanese economy and keeps interest rates unchanged, or cuts them, it is usually bearish for JPY.
Read more.Next release: Fri Jan 24, 2025 03:00
Frequency: Irregular
Consensus: 0.5%
Previous: 0.25%
Source: Bank of Japan
No immediate tariffs announced on China, signaling a more transactional strategy under Trump 2.0. Tariffs on China are likely to be raised more gradually to allow negotiations on broader issues. US likely to broaden the tariff war to more countries, as the US C/A deficit continues to widen. China’s exports shift towards intermediate goods; global supply chain relocation to accelerate, Standard Chartered's economists Carol Liao and Madhur Jha note.
Tariffs on China held off, for now
"President Trump has pledged to enact 25% additional tariffs on Canada and Mexico as early as February. While he warned of another 10% tariff on China, his reasoning for this seems to centre around fentanyl flows from China. He noted that Europe “treats us very badly”, possibly signaling a different tariff strategy versus his first term – a more gradual approach to tariffs on China to allow for negotiations and concessions, but no longer targeted exceptionally at China."
"We see some low hanging fruit for China in terms of concessions it could make near-term, including curbing fentanyl trafficking more forcefully, increasing imports from the US, opening its services sector further, and allowing negotiations towards a TikTok joint venture with US participation. In addition, ahead of the next tariff hike, the central bank is likely to remain focused on CNY stability, which could delay a domestic policy rate cut. However, these moves may only temporarily ease tensions, with higher tariffs likely to come once the low hanging fruit is picked."
"In the face of the geopolitical challenges, China has prioritized boosting domestic consumption to support growth and lessen its reliance on external demand. Chinese firms are actively adapting by reshuffling their supply chains and investing overseas, with more value added occurring outside China. Under Trump 2.0, we expect the global supply chain reorientation to accelerate."
Slight increase in momentum is likely to lead to a higher trading range of 7.2700/7.2980. In the longer run, decline in US Dollar (USD) seems excessive, but there is potential for a test of 7.2420, UOB Group's FX analysts Quek Ser Leang and Peter Chia note.
Potential for a test of 7.2420
24-HOUR VIEW: "We expected USD to 'trade in a 7.2550/7.2950 range' yesterday. It subsequently traded in a tight range of 7.2666/7.2896, closing at 7.2831 (+0.18%). There has been a slight increase in momentum, but this is likely to lead to a higher trading range of 7.2700/7.2980 instead of sustained advance."
1-3 WEEKS VIEW: "We continue to hold the same view as Tuesday (21 Jan, spot at 7.2720). As indicated previously, while the sharp decline on Monday 'seems excessive, there is potential for USD to test the support at 7.2420.' We will continue to hold the same view, provided that 7.3200 (‘strong resistance’ level was at 7.3230 yesterday) is not breached."
Chance for US Dollar (USD) to retest 156.70 before a more sustained pullback is likely. In the longer run, USD weakness has stabilized; it is likely to consolidate between 155.30 and 157.55 for the time being, UOB Group's FX analysts Quek Ser Leang and Peter Chia note.
USD weakness has stabilized
24-HOUR VIEW: "Two days ago, USD dropped to 154.73 and then rebounded. Yesterday, we pointed out, 'slowing downward momentum suggests the downward pressure is easing,' and we expected USD to 'trade in a range between 155.00 and 156.00.' Instead of trading in a range, USD rebounded strongly, reaching a high of 156.70. Despite the advance, there is no significant increase in upward momentum. That said, there is a chance for USD to retest 156.70 level before a more sustained pullback is likely. The major resistance at 157.55 is unlikely to come under threat. Support is at 156.00; a breach of 155.60 would indicate that the current upward pressure has faded."
1-3 WEEKS VIEW: "We turned negative in USD a week ago. Tracking the decline, we indicated yesterday (21 Jan, spot at 155.55) that 'despite no pickup in downward momentum, there is a chance for USD to drop further to 154.40.' We did not expect USD to rebound strongly to 156.70. The breach of our ‘strong resistance’ at 156.50 indicates that the weakness in USD has stabilized. For the time being, USD is likely to consolidate in a range between 155.30 and 157.55."
Further range trading is likely, probably between 0.5640 and 0.5685. In the longer run, New Zealand Dollar (NZD) is likely to continue to rise, potentially reaching the major resistance at 0.5750, UOB Group's FX analysts Quek Ser Leang and Peter Chia note.
NZD is likely to continue to rise
24-HOUR VIEW: "When NZD was trading at 0.5675 yesterday, we indicated that 'the current price movements are likely part of a range trading phase, probably between 0.5620 and 0.5690.' However, NZD traded in a narrower range of 0.5650/0.5687. Momentum indicators are turning flat, and further range trading is likely, probably between 0.5640 and 0.5685."
1-3 WEEKS VIEW: "Our update from two days ago (21 Jan, spot at 0.5680) remains valid. As highlighted, NZD 'is likely to continue to rise, potentially reaching the major resistance at 0.5750.' Although NZD has not advanced much further, only a break below 0.5620 (‘strong support’ level previously at 0.5600) will invalidate our view."
- USD/CAD oscillates around 1.4400 as investors await key monetary policy decisions by the BoC and the Fed.
- The Fed is expected to leave interest rates at their current levels amid uncertainty over Trump’s economic policies.
- The BoC would reduce interest rates by 25 bps to trim upside risks of price pressures remaining persistently lower.
The USD/CAD pair trades in a tight range around 1.4400 in Thursday’s European session. The Loonie pair consolidates as investors shift their focus to the monetary policy meetings of the Federal Reserve (Fed) and the Bank of Canada (BoC), which are scheduled on Wednesday.
According to the CME FedWatch tool, the Fed is almost certain to keep interest rates unchanged in the range of 4.25%-4.50%. Traders expect the Fed to keep borrowing rates steady on the assumption that United States (US) President Donald Trump’s economic policies will be pro-growth and inflationary for the economy.
Trump has threatened to raise 25% tariffs on China and Mexico and 10% on China. Also, he has signaled plans to impose tariffs on the Eurozone too, but no further details have been provided. Trump mentioned in the inauguration ceremony that funds from tariffs would be utilized to bear the burden of tax cuts on the Treasury. "Instead of taxing our citizens to enrich other countries, we will tariff and tax foreign countries to enrich our citizens,” Trump said.
An inflated-environment with a strong economic outlook would force Fed officials to support keeping interest rates elevated for longer.
Meanwhile, the Bank of Canada (BoC) is expected to unwind its policy restrictiveness further to boost economic growth and absorb growing risks of inflation undershooting the central bank’s target of 2%. The BoC reduced its interest rates by 175 basis points (bps) to 3.25% last year. Next week, the BoC is expected to cut its borrowing rates by 25 bps to 3%.
BoC’s dovish interest rate decision would further dampen the already weak appeal of the Canadian Dollar (CAD). The Canadian currency is already facing pressure as Trump is poised to impose hefty tariffs.
US Dollar FAQs
The US Dollar (USD) is the official currency of the United States of America, and the ‘de facto’ currency of a significant number of other countries where it is found in circulation alongside local notes. It is the most heavily traded currency in the world, accounting for over 88% of all global foreign exchange turnover, or an average of $6.6 trillion in transactions per day, according to data from 2022. Following the second world war, the USD took over from the British Pound as the world’s reserve currency. For most of its history, the US Dollar was backed by Gold, until the Bretton Woods Agreement in 1971 when the Gold Standard went away.
The most important single factor impacting on the value of the US Dollar is monetary policy, which is shaped by the Federal Reserve (Fed). The Fed has two mandates: to achieve price stability (control inflation) and foster full employment. Its primary tool to achieve these two goals is by adjusting interest rates. When prices are rising too quickly and inflation is above the Fed’s 2% target, the Fed will raise rates, which helps the USD value. When inflation falls below 2% or the Unemployment Rate is too high, the Fed may lower interest rates, which weighs on the Greenback.
In extreme situations, the Federal Reserve can also print more Dollars and enact quantitative easing (QE). QE is the process by which the Fed substantially increases the flow of credit in a stuck financial system. It is a non-standard policy measure used when credit has dried up because banks will not lend to each other (out of the fear of counterparty default). It is a last resort when simply lowering interest rates is unlikely to achieve the necessary result. It was the Fed’s weapon of choice to combat the credit crunch that occurred during the Great Financial Crisis in 2008. It involves the Fed printing more Dollars and using them to buy US government bonds predominantly from financial institutions. QE usually leads to a weaker US Dollar.
Quantitative tightening (QT) is the reverse process whereby the Federal Reserve stops buying bonds from financial institutions and does not reinvest the principal from the bonds it holds maturing in new purchases. It is usually positive for the US Dollar.
Silver prices (XAG/USD) fell on Thursday, according to FXStreet data. Silver trades at $30.46 per troy ounce, down 1.14% from the $30.81 it cost on Wednesday.
Silver prices have increased by 5.43% since the beginning of the year.
| Unit measure | Silver Price Today in USD |
|---|---|
| Troy Ounce | 30.46 |
| 1 Gram | 0.98 |
The Gold/Silver ratio, which shows the number of ounces of Silver needed to equal the value of one ounce of Gold, stood at 90.20 on Thursday, up from 89.47 on Wednesday.
Silver FAQs
Silver is a precious metal highly traded among investors. It has been historically used as a store of value and a medium of exchange. Although less popular than Gold, traders may turn to Silver to diversify their investment portfolio, for its intrinsic value or as a potential hedge during high-inflation periods. Investors can buy physical Silver, in coins or in bars, or trade it through vehicles such as Exchange Traded Funds, which track its price on international markets.
Silver prices can move due to a wide range of factors. Geopolitical instability or fears of a deep recession can make Silver price escalate due to its safe-haven status, although to a lesser extent than Gold's. As a yieldless asset, Silver tends to rise with lower interest rates. Its moves also depend on how the US Dollar (USD) behaves as the asset is priced in dollars (XAG/USD). A strong Dollar tends to keep the price of Silver at bay, whereas a weaker Dollar is likely to propel prices up. Other factors such as investment demand, mining supply – Silver is much more abundant than Gold – and recycling rates can also affect prices.
Silver is widely used in industry, particularly in sectors such as electronics or solar energy, as it has one of the highest electric conductivity of all metals – more than Copper and Gold. A surge in demand can increase prices, while a decline tends to lower them. Dynamics in the US, Chinese and Indian economies can also contribute to price swings: for the US and particularly China, their big industrial sectors use Silver in various processes; in India, consumers’ demand for the precious metal for jewellery also plays a key role in setting prices.
Silver prices tend to follow Gold's moves. When Gold prices rise, Silver typically follows suit, as their status as safe-haven assets is similar. The Gold/Silver ratio, which shows the number of ounces of Silver needed to equal the value of one ounce of Gold, may help to determine the relative valuation between both metals. Some investors may consider a high ratio as an indicator that Silver is undervalued, or Gold is overvalued. On the contrary, a low ratio might suggest that Gold is undervalued relative to Silver.
(An automation tool was used in creating this post.)
- EUR/USD falls back to near 1.0400 as the US Dollar gains ground amid concerns over global economic growth with Trump’s tariffs.
- ECB President Lagarde has advised that Europe should be prepared to respond to Trump’s tariff hikes.
- The Fed and the ECB are set to announce their first monetary policy decision of 2025 next week.
EUR/USD ticks lower to near 1.0400 in Thursday’s European session as the US Dollar (USD) gains ground. The US Dollar Index (DXY), which tracks the Greenback’s value against six major currencies, extends its recovery to near 108.40 from the two-week low of 107.75 posted on Wednesday. The Greenback bounces back as the market sentiment turns slightly cautious, with investors assessing the consequences of United States (US) President Donald Trump’s tariffs on economic growth.
Trump has threatened 25% tariff hikes on Canada and Mexico and 10% on China, which will come into effect on February 1. He also plans to impose tariffs on Europe after accusing the bloc of being "very, very bad to us". Trump’s tariff hike approach appears to be more gradual than what market participants had anticipated. However, they would still be unfavorable to global economic growth.
On Wednesday, European Central Bank (ECB) President Christine Lagarde commented on CNBC that Trump’s decision not to swiftly impose tariffs was a "smart approach" because blanket levies don’t necessarily give you the “results that you expect." Lagarde warned that Europe must “anticipate what will happen” and be “prepared in order to respond,” as Trump’s tariffs would be “selective” and “focused.”
Daily digest market movers: EUR/USD ticks lower ahead of Eurozone-US flash PMI for January
- EUR/USD edges lower on Thursday, with investors focusing on flash private Eurozone and the US Purchasing Managers Index (PMI) data for January, which will be published on Friday. Eurozone HCOB PMI report, compiled by S&P Global, is expected to show that overall business activity continued to contract but at a slower pace. The HCOB Composite PMI is estimated to come in slightly higher at 49.7, compared to 49.6 in December.
- On the US front, economists expect overall business activity to have expanded almost at a steady pace. Activities in the manufacturing sector are estimated to have contracted again but at a slower pace. Meanwhile, the service sector activity is expected to expand moderately.
- Investors should also brace for significant volatility in the next week as the Federal Reserve (Fed) and the ECB will announce their first monetary policy decisions this year. The Fed is certain to keep interest rates in the range of 4.25%-4.50%, according to the CME FedWatch tool. Meanwhile, traders have fully priced in a 25-basis points (bps) interest rate reduction by the ECB.
- Traders also expect the ECB to cut its Deposit Facility rate in each of its next four policy meetings. ECB policymaker and Finnish central bank governor Olli Rehn said on Wednesday that he is now confident that “inflation will stabilize at the target as predicted” and monetary policy will “stop being restrictive” in the near future. However, he refrained from endorsing market expectations and argued that policy decisions will be determined meeting by meeting.
Technical Analysis: EUR/USD faces pressure around 1.0460
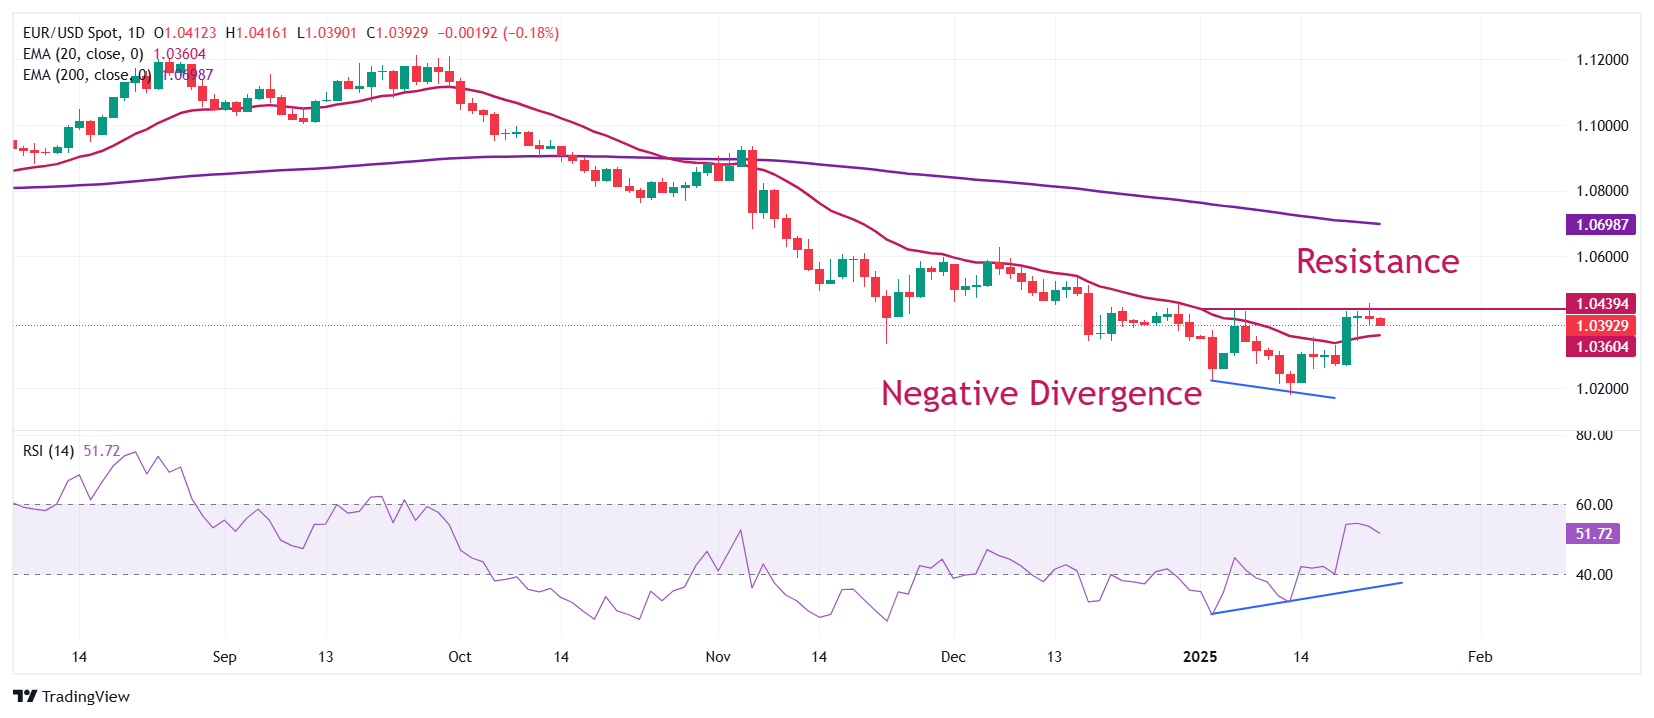
EUR/USD struggles to extend its recovery above the immediate resistance of 1.0460, which was initiated from a two-year low of 1.0175 reached on January 13. The major currency pair bounced back after a divergence in momentum and price action. The 14-day Relative Strength Index (RSI) formed a higher low, while the pair made lower lows.
The near-term outlook of the shared currency pair has improved as it holds above the 20-day Exponential Moving Average (EMA), which trades around 1.0360. Meanwhile, the longer-term outlook is still bearish as the 200-day EMA at 1.0700 is sloping downwards.
Looking down, the January 13 low of 1.0175 will be the key support zone for the pair. Conversely, the psychological resistance of 1.0500 will be the key barrier for the Euro bulls.
Euro FAQs
The Euro is the currency for the 19 European Union countries that belong to the Eurozone. It is the second most heavily traded currency in the world behind the US Dollar. In 2022, it accounted for 31% of all foreign exchange transactions, with an average daily turnover of over $2.2 trillion a day. EUR/USD is the most heavily traded currency pair in the world, accounting for an estimated 30% off all transactions, followed by EUR/JPY (4%), EUR/GBP (3%) and EUR/AUD (2%).
The European Central Bank (ECB) in Frankfurt, Germany, is the reserve bank for the Eurozone. The ECB sets interest rates and manages monetary policy. The ECB’s primary mandate is to maintain price stability, which means either controlling inflation or stimulating growth. Its primary tool is the raising or lowering of interest rates. Relatively high interest rates – or the expectation of higher rates – will usually benefit the Euro and vice versa. The ECB Governing Council makes monetary policy decisions at meetings held eight times a year. Decisions are made by heads of the Eurozone national banks and six permanent members, including the President of the ECB, Christine Lagarde.
Eurozone inflation data, measured by the Harmonized Index of Consumer Prices (HICP), is an important econometric for the Euro. If inflation rises more than expected, especially if above the ECB’s 2% target, it obliges the ECB to raise interest rates to bring it back under control. Relatively high interest rates compared to its counterparts will usually benefit the Euro, as it makes the region more attractive as a place for global investors to park their money.
Data releases gauge the health of the economy and can impact on the Euro. Indicators such as GDP, Manufacturing and Services PMIs, employment, and consumer sentiment surveys can all influence the direction of the single currency. A strong economy is good for the Euro. Not only does it attract more foreign investment but it may encourage the ECB to put up interest rates, which will directly strengthen the Euro. Otherwise, if economic data is weak, the Euro is likely to fall. Economic data for the four largest economies in the euro area (Germany, France, Italy and Spain) are especially significant, as they account for 75% of the Eurozone’s economy.
Another significant data release for the Euro is the Trade Balance. This indicator measures the difference between what a country earns from its exports and what it spends on imports over a given period. If a country produces highly sought after exports then its currency will gain in value purely from the extra demand created from foreign buyers seeking to purchase these goods. Therefore, a positive net Trade Balance strengthens a currency and vice versa for a negative balance.
The Central Bank of Turkey (CBT) is scheduled to meet today, the first time since the start of the cutting cycle in December, ING’s FX analyst Frantisek Taborsky notes.
TRY continues to outperform other emerging market currencies
“We expect the CBT to continue cutting rates by another 250bp to 45% in line with the market consensus, given recent positive signals on the inflation outlook that are likely to further raise the level of real interest rates and lead to tighter financial conditions if the central bank does not act.”
“We anticipate that the forward guidance will stay consistent today, indicating a cautious and data-driven strategy for future rate cuts. The statement is expected to highlight a decrease in the underlying trend of monthly inflation in December, while also noting a temporary increase in January to manage inflation expectations and signal prudence.”
“In FX, the cutting cycle's start in December brought higher USD/TRY volatility but mainly to the downside with the CBT’s hawkish messages and narrower rate corridor. Since the beginning of the year, TRY has resumed its trend of nominal depreciation. Despite the onset of gradual FX carry deterioration, TRY continues to outperform other emerging market currencies and remains our favourite carry trade for this year.”
- Silver faces rejection near the 100-day SMA and descending channel resistance.
- A move beyond the $31.00 is needed to support prospects for additional gains.
- A convincing break below the $30.00 mark could expose the multi-month low.
Silver (XAG/USD) drifts lower on Thursday and for now, seems to have snapped a three-day winning streak to the highest level since December 13, around the $31.00 neighborhood touched the previous day. The white metal retains its negative bias through the first half of the European session on Thursday and currently trades around the $30.55 zone, down over 0.85% for the day.
From a technical perspective, the $31.00 mark represents a confluence hurdle – comprising the 100-day Simple Moving Average (SMA) and the top end of a multi-month-old descending channel. The said barrier should now act as a key pivotal point, which if cleared decisively should pave the way for additional near-term gains. Given that oscillators on the daily chart are holding in positive territory, the XAG/USD could surpass the $31.25 intermediate hurdle and climb to the $31.45-$31.50 resistance. The momentum could extend further towards reclaiming the $32.00 round figure en route to the December swing high, around the $32.25-$32.30 area.
On the flip side, any further decline is likely to find decent support and attract some buyers near the $30.00 psychological mark. A convincing break below could make the XAG/USD vulnerable to accelerate the slide towards the $29.60 region before eventually dropping to test sub-$29.00 levels, or the multi-month low touched in December. Some follow-through selling could expose the descending channel support, currently pegged near the $27.35 region, with some intermediate support near the $28.30 area, $28.00 round figure and the $27.70-$27.65 zone.
Silver daily chart
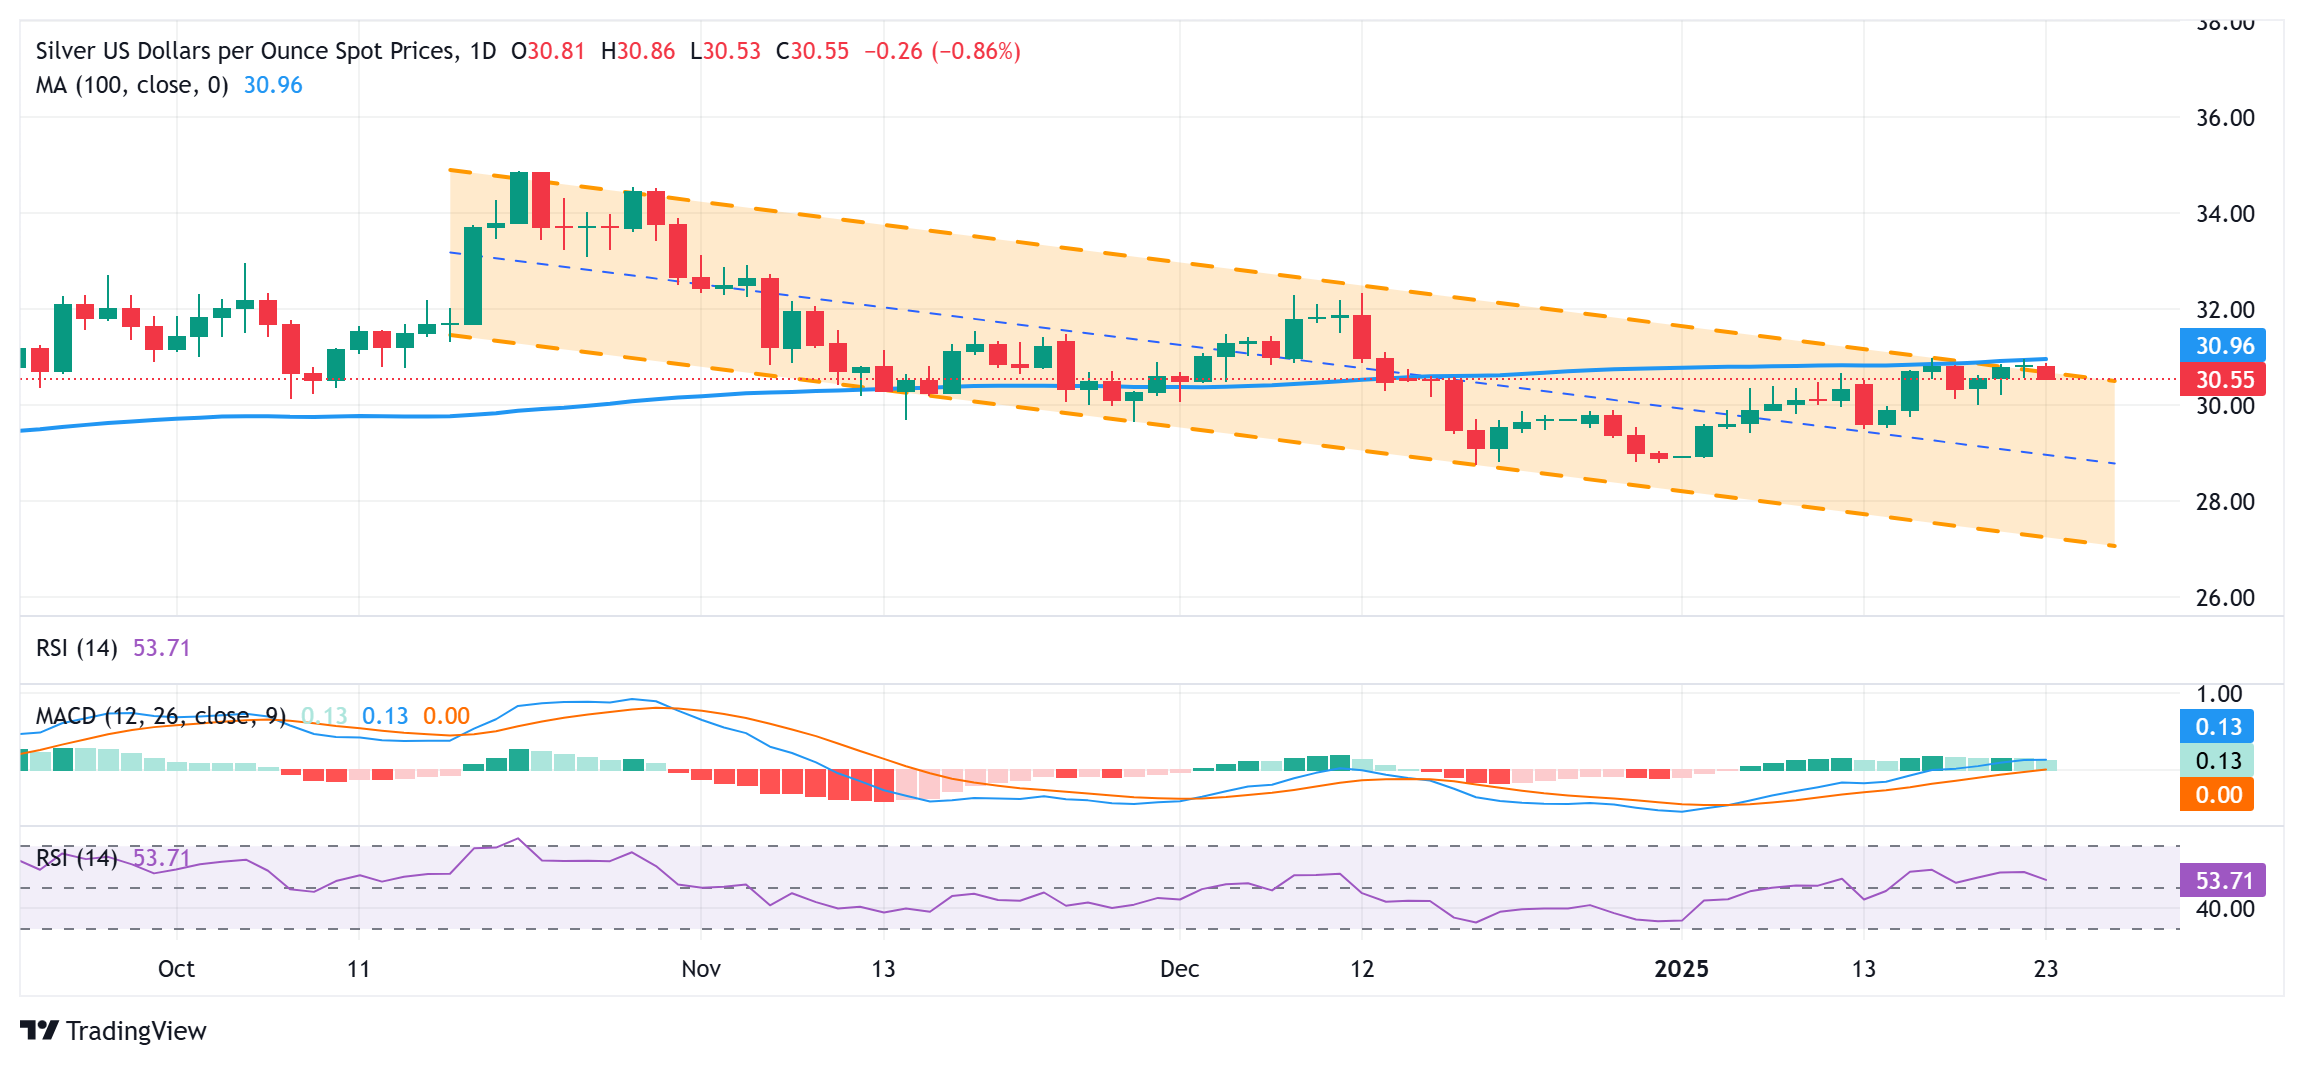
Silver FAQs
Silver is a precious metal highly traded among investors. It has been historically used as a store of value and a medium of exchange. Although less popular than Gold, traders may turn to Silver to diversify their investment portfolio, for its intrinsic value or as a potential hedge during high-inflation periods. Investors can buy physical Silver, in coins or in bars, or trade it through vehicles such as Exchange Traded Funds, which track its price on international markets.
Silver prices can move due to a wide range of factors. Geopolitical instability or fears of a deep recession can make Silver price escalate due to its safe-haven status, although to a lesser extent than Gold's. As a yieldless asset, Silver tends to rise with lower interest rates. Its moves also depend on how the US Dollar (USD) behaves as the asset is priced in dollars (XAG/USD). A strong Dollar tends to keep the price of Silver at bay, whereas a weaker Dollar is likely to propel prices up. Other factors such as investment demand, mining supply – Silver is much more abundant than Gold – and recycling rates can also affect prices.
Silver is widely used in industry, particularly in sectors such as electronics or solar energy, as it has one of the highest electric conductivity of all metals – more than Copper and Gold. A surge in demand can increase prices, while a decline tends to lower them. Dynamics in the US, Chinese and Indian economies can also contribute to price swings: for the US and particularly China, their big industrial sectors use Silver in various processes; in India, consumers’ demand for the precious metal for jewellery also plays a key role in setting prices.
Silver prices tend to follow Gold's moves. When Gold prices rise, Silver typically follows suit, as their status as safe-haven assets is similar. The Gold/Silver ratio, which shows the number of ounces of Silver needed to equal the value of one ounce of Gold, may help to determine the relative valuation between both metals. Some investors may consider a high ratio as an indicator that Silver is undervalued, or Gold is overvalued. On the contrary, a low ratio might suggest that Gold is undervalued relative to Silver.
Further sideways trading appears likely, probably in a 0.6240/0.6295 range. In the longer run, current price action is likely the early stages of a recovery phase that could potentially reach 0.6350, UOB Group’s FX analysts Quek Ser Leang and Lee Sue Ann note.
Price action is the early stages of a recovery phase
24-HOUR VIEW: “Yesterday, we expected AUD to ‘trade sideways between 0.6220 and 0.6290.’ AUD subsequently traded in a narrower range of 0.6253/0.6293. AUD closed largely unchanged at 0.6274 (+0.02%). Further sideways trading appears likely today, probably in a 0.6240/0.6295 range.”
1-3 WEEKS VIEW: “We revised our AUD view to positive on Monday (21 Jan, spot at 0.6275), indicating that ‘the current price action is likely the early stages of a recovery phase that could potentially reach 0.6350.’ Since then, AUD has not been able to make much headway on the upside. However, we will maintain our view as long as 0.6220 (‘strong support’ level previously at 0.6190) is not breached.”
- GBP/JPY depreciates as the Japanese Yen gains ground amid rising expectations of the BoJ hiking interest rates on Friday.
- Japan’s trade surplus rose to ¥130.9 billion in December, against market expectations of a ¥55 billion deficit.
- The Pound Sterling comes under pressure as higher-than-expected UK Public Sector Net Borrowing data for December clouds the economic outlook.
GBP/JPY pauses its four-day rally, trading near 192.50 during Thursday's European session. The GBP/JPY cross faces headwinds as the Japanese Yen (JPY) regains some strength amid rising expectations that the Bank of Japan (BoJ) will announce an interest rate hike after its two-day policy meeting on Friday. Supporting the JPY further is Japan’s better-than-expected Trade Balance data.
Japan reported a trade surplus of ¥130.9 billion in December, significantly outperforming market expectations of a ¥55 billion deficit. This shift was primarily driven by stronger-than-expected export growth, which rose 2.8% year-over-year in December, though it marked a slowdown from the 3.8% increase recorded in November. Meanwhile, imports recovered after contracting by 3.8% YoY in November, growing 1.8% last month. However, this fell short of the anticipated 2.6% growth, reflecting continued weakness in domestic demand.
The Pound Sterling (GBP) faces pressure after higher-than-expected UK Public Sector Net Borrowing data for December dampened the economic outlook. According to the Office for National Statistics (ONS), elevated borrowing costs and a one-time payment for repurchasing military housing contributed to a wider budget deficit.
Adding to the downward momentum, the British Pound is weighed down by recent data including softer-than-expected UK inflation and retail sales data for December, weakening labor demand over the three months to November, and tepid GDP growth. These factors have led traders to anticipate a 25 basis point (bps) rate cut by the Bank of England (BoE) in February. Markets are now pricing in a near-certain reduction in the BoE’s policy rate to 4.5% at its upcoming meeting.
Interest rates FAQs
Interest rates are charged by financial institutions on loans to borrowers and are paid as interest to savers and depositors. They are influenced by base lending rates, which are set by central banks in response to changes in the economy. Central banks normally have a mandate to ensure price stability, which in most cases means targeting a core inflation rate of around 2%. If inflation falls below target the central bank may cut base lending rates, with a view to stimulating lending and boosting the economy. If inflation rises substantially above 2% it normally results in the central bank raising base lending rates in an attempt to lower inflation.
Higher interest rates generally help strengthen a country’s currency as they make it a more attractive place for global investors to park their money.
Higher interest rates overall weigh on the price of Gold because they increase the opportunity cost of holding Gold instead of investing in an interest-bearing asset or placing cash in the bank. If interest rates are high that usually pushes up the price of the US Dollar (USD), and since Gold is priced in Dollars, this has the effect of lowering the price of Gold.
The Fed funds rate is the overnight rate at which US banks lend to each other. It is the oft-quoted headline rate set by the Federal Reserve at its FOMC meetings. It is set as a range, for example 4.75%-5.00%, though the upper limit (in that case 5.00%) is the quoted figure. Market expectations for future Fed funds rate are tracked by the CME FedWatch tool, which shapes how many financial markets behave in anticipation of future Federal Reserve monetary policy decisions.
Monday's correction in the dollar has not run very far at all. That sell-off was premised on Day One not nearly being as aggressive with tariffs as many had feared. Currently, the market’s attention is on two significant upcoming dates, ING’s FX analyst Chris Turner notes.
DXY can trade in a 108.00-108.60 range today
“1 April is a deadline for the US Commerce Department and the US Trade Representative to conduct a root-and-branch review of why the US persistently runs large trade deficits. Large trade deficits are an anathema to the America First agenda. These reviews are due by 1 April and ING's Inga Fechner discusses what's at stake here. This means in theory, substantial tariffs may not come in until after April once the recommendations have been made.”
“The second big date is 1 February. Seemingly in off-the-cuff remarks, President Trump has floated the possibility of 25% tariffs on Mexico and Canada, plus 10% tariffs on China by this date if progress is not made on fentanyl or border issues. This threat is probably preventing the dollar from correcting further. That said we have been seeing a little more stability in some EM currencies, where the Brazilian real is sub 6.00 again after heavy local FX intervention.”
“Today the focus will probably be on Trump's digital dialogue in Davos at 11ET,16GMT/17CET. One new area of interest may be the international tax code, where he could potentially tariff counties trying to enact the OECD's Global Minimum Tax – clearly something on the mind of his tech industry sponsors. Let's see if we hear more about this today, but we would say this dialogue is another positive dollar event risk. DXY could trade a 108.00-108.60 range today and again is very much exposed to Trump headlines.”
Current price movements are likely part of a 1.2280/1.2355 range trading phase. In the longer run, Pound Sterling (GBP) view is positive, anticipating a move to 1.2410, UOB Group’s FX analysts Quek Ser Leang and Lee Sue Ann note.
GBP looks positive mid-term
24-HOUR VIEW: “When GBP was at 1.2330 in early Asian trade yesterday, we highlighted that ‘there is a chance for GBP to test 1.2375.’ We added, ‘the major resistance at 1.2410 is unlikely to come into view.’ Our view was validated, as GBP rose to 1.2376 and then pulled back to close at 1.2328 (-0.25%). The current price movements are likely part of a range trading phase. Today, we expect GBP to trade in a 1.2280/1.2355 range.”
1-3 WEEKS VIEW: “Our update from Tuesday (21 Jan, spot at 1.2330) remains valid. As highlighted, the GBP is positive, and we are anticipating a move to 1.2410. On the downside, a breach of 1.2210 will invalidate our view.”
This week's EUR/USD bounce has been pretty muted so far. As above, there is no way investors can expect to hear an 'all-clear' signal on tariffs. And keeping trading partners off balance/guessing is a tactic that kept the dollar reasonably well bid during Trump's last tariff regime in 2018-19, ING’s FX analyst Chris Turner notes.
EUR/USD may explore the lower end of a 1.0350-1.0450 range
“Another reason traders may not want to reduce their euro short positions is ahead of tomorrow's release of the eurozone flash PMis for January. Another dire set of confidence readings will only encourage the ECB to look through the tick-up in inflation and commit to a 100bp+ easing cycle this year.”
“EUR/USD looks like it might explore the lower end of a 1.0350-1.0450 range today should Trump have something more to say about tariffs. But the next big move may not emerge until the FOMC meeting next Wednesday, the US December core PCE deflator next Friday, and that seemingly 1 February tariff deadline.”
Euro (EUR) is likely to trade in range between 1.0380 and 1.0440. In the longer run, current price action is part of a recovery phase that could extend to 1.0480, UOB Group’s FX analysts Quek Ser Leang and Lee Sue Ann note.
Current price action is part of a recovery phase
24-HOUR VIEW: “Following Tuesday’s price movements, we noted yesterday that ‘there has been no further increase in momentum.’ We were of the view that EUR ‘is likely to trade in a range, probably between 1.0345 and 1.0440.’ However, EUR rose to 1.0457, pulling back swiftly to close at 1.0407 (-0.21%). The price action did not result in any increase in either downward or update momentum. Today, we continue to expect EUR to trade in a range, most likely between 1.0380 and 1.0440.”
1-3 WEEKS VIEW: “We turned positive in EUR two days ago (21 Jan, spot at 1.0415), indicating that ‘the current price action is part of a recovery phase that could extend to 1.0480.’ Yesterday, EUR rose briefly to a three-week high of 1.0457 before pulling back. While there has been no further increase in momentum, we will maintain our view as long as 1.0340 (‘strong support’ level was at 1.0320 yesterday) is intact.”
- NZD/USD extends its losing streak due to the hawkish tone surrounding the Fed’s policy stance.
- US weekly Initial Jobless Claims could show an increase of 220K for the previous week, up from the prior 217K.
- The New Zealand Dollar failed to gain momentum despite the fresh stimulus measures from New Zealand and China.
NZD/USD continues to remain subdued for the third consecutive session, trading around 0.5660 during the European hours on Thursday. The pair’s downside is attributed to the stronger US Dollar (USD) amid hawkish sentiment surrounding the US Federal Reserve’s (Fed) policy stance.
According to the CME FedWatch tool, traders are confident that the Fed will keep its key borrowing rates in the range of 4.25%-4.50% in the upcoming three policy meetings. Moreover, US President Donald Trump’s policies could drive inflationary pressures, potentially limiting the Fed to just one more rate cut in 2025.
President Trump stated that his administration is considering imposing a 10% tariff on Chinese imports starting February 1. However, the proposed tariff is significantly lower than the previously threatened 60% rate, it aligns with the pledge Trump made during his presidential campaign.
Traders will likely monitor Friday's release of the preliminary US S&P Global Purchasing Managers Index (PMI) and the Michigan Consumer Sentiment Index for January. These indicators are likely to provide valuable insights into near-term economic trends.
The New Zealand Dollar (NZD) struggled to gain momentum on Thursday, despite the introduction of fresh stimulus measures from New Zealand and its key trading partner, China. New Zealand’s Prime Minister Christopher Luxon announced plans to ease foreign investment regulations, aiming to attract and support overseas investors. However, the NZD remained under pressure, reflecting broader market concerns and cautious sentiment.
Chinese authorities introduced several measures to stabilize its stock markets, including allowing pension funds to increase investments in domestic equities. A pilot scheme enabling insurers to purchase equities will be launched in the first half of 2025, with an initial scale of at least 100 billion Yuan.
New Zealand Dollar FAQs
The New Zealand Dollar (NZD), also known as the Kiwi, is a well-known traded currency among investors. Its value is broadly determined by the health of the New Zealand economy and the country’s central bank policy. Still, there are some unique particularities that also can make NZD move. The performance of the Chinese economy tends to move the Kiwi because China is New Zealand’s biggest trading partner. Bad news for the Chinese economy likely means less New Zealand exports to the country, hitting the economy and thus its currency. Another factor moving NZD is dairy prices as the dairy industry is New Zealand’s main export. High dairy prices boost export income, contributing positively to the economy and thus to the NZD.
The Reserve Bank of New Zealand (RBNZ) aims to achieve and maintain an inflation rate between 1% and 3% over the medium term, with a focus to keep it near the 2% mid-point. To this end, the bank sets an appropriate level of interest rates. When inflation is too high, the RBNZ will increase interest rates to cool the economy, but the move will also make bond yields higher, increasing investors’ appeal to invest in the country and thus boosting NZD. On the contrary, lower interest rates tend to weaken NZD. The so-called rate differential, or how rates in New Zealand are or are expected to be compared to the ones set by the US Federal Reserve, can also play a key role in moving the NZD/USD pair.
Macroeconomic data releases in New Zealand are key to assess the state of the economy and can impact the New Zealand Dollar’s (NZD) valuation. A strong economy, based on high economic growth, low unemployment and high confidence is good for NZD. High economic growth attracts foreign investment and may encourage the Reserve Bank of New Zealand to increase interest rates, if this economic strength comes together with elevated inflation. Conversely, if economic data is weak, NZD is likely to depreciate.
The New Zealand Dollar (NZD) tends to strengthen during risk-on periods, or when investors perceive that broader market risks are low and are optimistic about growth. This tends to lead to a more favorable outlook for commodities and so-called ‘commodity currencies’ such as the Kiwi. Conversely, NZD tends to weaken at times of market turbulence or economic uncertainty as investors tend to sell higher-risk assets and flee to the more-stable safe havens.
- WTI price depreciates due to uncertainty surrounding the impact of President Trump's proposed tariffs and energy policies.
- API Weekly Crude Oil Stock rose by 1 million barrels in the previous week.
- Trump threatened to impose "high levels" of sanctions and tariffs on Russian imports.
West Texas Intermediate (WTI) Oil price extends its losing streak for the sixth successive session, trading around $74.90 during the early European hours on Thursday. Crude Oil prices decline amid uncertainty surrounding how US President Donald Trump's proposed tariffs and energy policies might affect global economic growth and energy demand.
Traders evaluate the potential impact of Trump's proposed 10% tariff on imports from China, the world's largest Oil importer and a key manufacturing hub. While the 10% tariff is significantly lower than the previously threatened 60%, it has somewhat eased market concerns. However, Trump's additional threats to impose tariffs on the European Union, as well as 25% tariffs on Canada and Mexico, continue to fuel uncertainty in the market.
The American Petroleum Institute (API) report suggested a renewed increase in US crude Oil inventories. According to the API Weekly Crude Oil Stock report, crude stockpiles rose by 1 million barrels during the week ending January 16, marking the first increase after five consecutive weeks of declines.
Crude Oil markets may also face potential supply disruptions as President Donald Trump threatened on Wednesday to impose "high levels" of sanctions on Russia and tariffs on Russian imports. Trump called for a resolution to the war in Ukraine, stating, according to CNBC.
"If we don’t make a ‘deal,’ and soon, I have no other choice but to put high levels of taxes, tariffs, and sanctions on anything being sold by Russia to the United States (US) and various other participating countries," he wrote on Truth Social.
In related news, Saudi Arabia's crude Oil exports reached an eight-month high in November, increasing by 4.7% to 6.2 million barrels per day (bpd), up from 5.9 million bpd in October. However, crude production saw a slight decline, slipping to 8.9 million bpd from 9 million bpd.
Meanwhile, several ports in Texas began reopening on Wednesday following disruptions caused by Winter Storm Enzo earlier this week, which had significantly impacted shipping and energy operations in the region.
WTI Oil FAQs
WTI Oil is a type of Crude Oil sold on international markets. The WTI stands for West Texas Intermediate, one of three major types including Brent and Dubai Crude. WTI is also referred to as “light” and “sweet” because of its relatively low gravity and sulfur content respectively. It is considered a high quality Oil that is easily refined. It is sourced in the United States and distributed via the Cushing hub, which is considered “The Pipeline Crossroads of the World”. It is a benchmark for the Oil market and WTI price is frequently quoted in the media.
Like all assets, supply and demand are the key drivers of WTI Oil price. As such, global growth can be a driver of increased demand and vice versa for weak global growth. Political instability, wars, and sanctions can disrupt supply and impact prices. The decisions of OPEC, a group of major Oil-producing countries, is another key driver of price. The value of the US Dollar influences the price of WTI Crude Oil, since Oil is predominantly traded in US Dollars, thus a weaker US Dollar can make Oil more affordable and vice versa.
The weekly Oil inventory reports published by the American Petroleum Institute (API) and the Energy Information Agency (EIA) impact the price of WTI Oil. Changes in inventories reflect fluctuating supply and demand. If the data shows a drop in inventories it can indicate increased demand, pushing up Oil price. Higher inventories can reflect increased supply, pushing down prices. API’s report is published every Tuesday and EIA’s the day after. Their results are usually similar, falling within 1% of each other 75% of the time. The EIA data is considered more reliable, since it is a government agency.
OPEC (Organization of the Petroleum Exporting Countries) is a group of 12 Oil-producing nations who collectively decide production quotas for member countries at twice-yearly meetings. Their decisions often impact WTI Oil prices. When OPEC decides to lower quotas, it can tighten supply, pushing up Oil prices. When OPEC increases production, it has the opposite effect. OPEC+ refers to an expanded group that includes ten extra non-OPEC members, the most notable of which is Russia.
China’s Commerce Ministry said in a statement on Thursday that they are “willing to work with the US to promote stable and healthy development of economic and trade ties.”
“Tariff measures are not good for China, US, and the rest of the world,” the Ministry said.
These comments came as they responded to US President Donald Trump’s 10% tariff threat on Chinese imports.
Market reaction
AUD/USD remains depressed at around 0.6270 following these comments, down 0.08% on the day.
Australian Dollar FAQs
One of the most significant factors for the Australian Dollar (AUD) is the level of interest rates set by the Reserve Bank of Australia (RBA). Because Australia is a resource-rich country another key driver is the price of its biggest export, Iron Ore. The health of the Chinese economy, its largest trading partner, is a factor, as well as inflation in Australia, its growth rate and Trade Balance. Market sentiment – whether investors are taking on more risky assets (risk-on) or seeking safe-havens (risk-off) – is also a factor, with risk-on positive for AUD.
The Reserve Bank of Australia (RBA) influences the Australian Dollar (AUD) by setting the level of interest rates that Australian banks can lend to each other. This influences the level of interest rates in the economy as a whole. The main goal of the RBA is to maintain a stable inflation rate of 2-3% by adjusting interest rates up or down. Relatively high interest rates compared to other major central banks support the AUD, and the opposite for relatively low. The RBA can also use quantitative easing and tightening to influence credit conditions, with the former AUD-negative and the latter AUD-positive.
China is Australia’s largest trading partner so the health of the Chinese economy is a major influence on the value of the Australian Dollar (AUD). When the Chinese economy is doing well it purchases more raw materials, goods and services from Australia, lifting demand for the AUD, and pushing up its value. The opposite is the case when the Chinese economy is not growing as fast as expected. Positive or negative surprises in Chinese growth data, therefore, often have a direct impact on the Australian Dollar and its pairs.
Iron Ore is Australia’s largest export, accounting for $118 billion a year according to data from 2021, with China as its primary destination. The price of Iron Ore, therefore, can be a driver of the Australian Dollar. Generally, if the price of Iron Ore rises, AUD also goes up, as aggregate demand for the currency increases. The opposite is the case if the price of Iron Ore falls. Higher Iron Ore prices also tend to result in a greater likelihood of a positive Trade Balance for Australia, which is also positive of the AUD.
The Trade Balance, which is the difference between what a country earns from its exports versus what it pays for its imports, is another factor that can influence the value of the Australian Dollar. If Australia produces highly sought after exports, then its currency will gain in value purely from the surplus demand created from foreign buyers seeking to purchase its exports versus what it spends to purchase imports. Therefore, a positive net Trade Balance strengthens the AUD, with the opposite effect if the Trade Balance is negative.
- The Pound Sterling remains on tenterhooks against its major peers as investors are concerned over the UK economic outlook.
- Traderds price in a 25 bps interest rate reduction by the BoE in February.
- Investors seek more clarity on President Trump’s tariff structure to make informed decisions.
The Pound Sterling (GBP) trades cautiously against its major peers on Thursday as the higher-than-expected United Kingdom (UK) Public Sector Net Borrowing in December has weighed on the economic outlook. The Office for National Statistics (ONS) reported on Wednesday that higher borrowing costs and a one-off payment for the repurchase of military accommodation swelled the budget deficit. This scenario could force Chancellor of the Exchequer Rachel Reeves to raise the tax burden on individuals or trim public spending, which could slow down the already moderate growth rate in the UK.
UK government’s borrowing costs have accelerated lately amid concerns that higher tariffs by United States (US) President Donald Trump would dampen growth prospects. This led to a sharp increase in 30-year gilt yields to 5.47% on January 14, the highest level seen in over 26 years.
Meanwhile, investors are shifting their focus to the Bank of England’s (BoE) first monetary policy decision of the year, which will be announced on February 6. Traders have almost fully priced in a 25 basis points (bps) interest rate reduction that will push borrowing rates to 4.5%. BoE dovish bets accelerated due to soft inflation, a decline in Retail Sales in December, and weak labor demand in the three months ending November.
This week, market participants will pay close attention to the flash UK S&P Global/CIPS Purchasing Managers Index (PMI) data for January, which will be published on Friday. The agency is expected to show the overall business activity expanded at a slower pace.
Daily digest market movers: Pound Sterling ranges against US Dollar as investors seek clarity on Trump’s tariff plans
- The Pound Sterling trades sideways above 1.2300 against the US Dollar (USD) in Thursday’s European session. The GBP/USD pair consolidates as investors await US President Donald Trump's concrete tariff plans to build fresh positions. The US Dollar Index (DXY), which tracks the Greenback’s value against six major currencies, oscillates in a tight range above 108.00.
- Until now, Donald Trump has threatened to raise 25% tariffs on his neighbors Mexico and Canada and 10% on China, which could come into effect on February 1. He has also commented that he is considering imposing tariffs on Europe to fix trade imbalances but has not yet provided any explicit details. Before Trump’s inauguration, market participants anticipated he would implement full-scale tariffs universally on his first day at the White House.
- Investors should brace for a sideways trend in the US Dollar until Trump explicitly declares a tariff structure. Also, the Federal Reserve’s (Fed) monetary policy decision on Wednesday is unlikely to stem volatility in the US Dollar, as the central bank is certain to keep interest rates steady in the range of 4.25%- 4.50%, according to the CME FedWatch tool. However, market participants will pay close attention to the Fed’s monetary policy guidance.
Technical Analysis: Pound Sterling aims to break above 20-day EMA
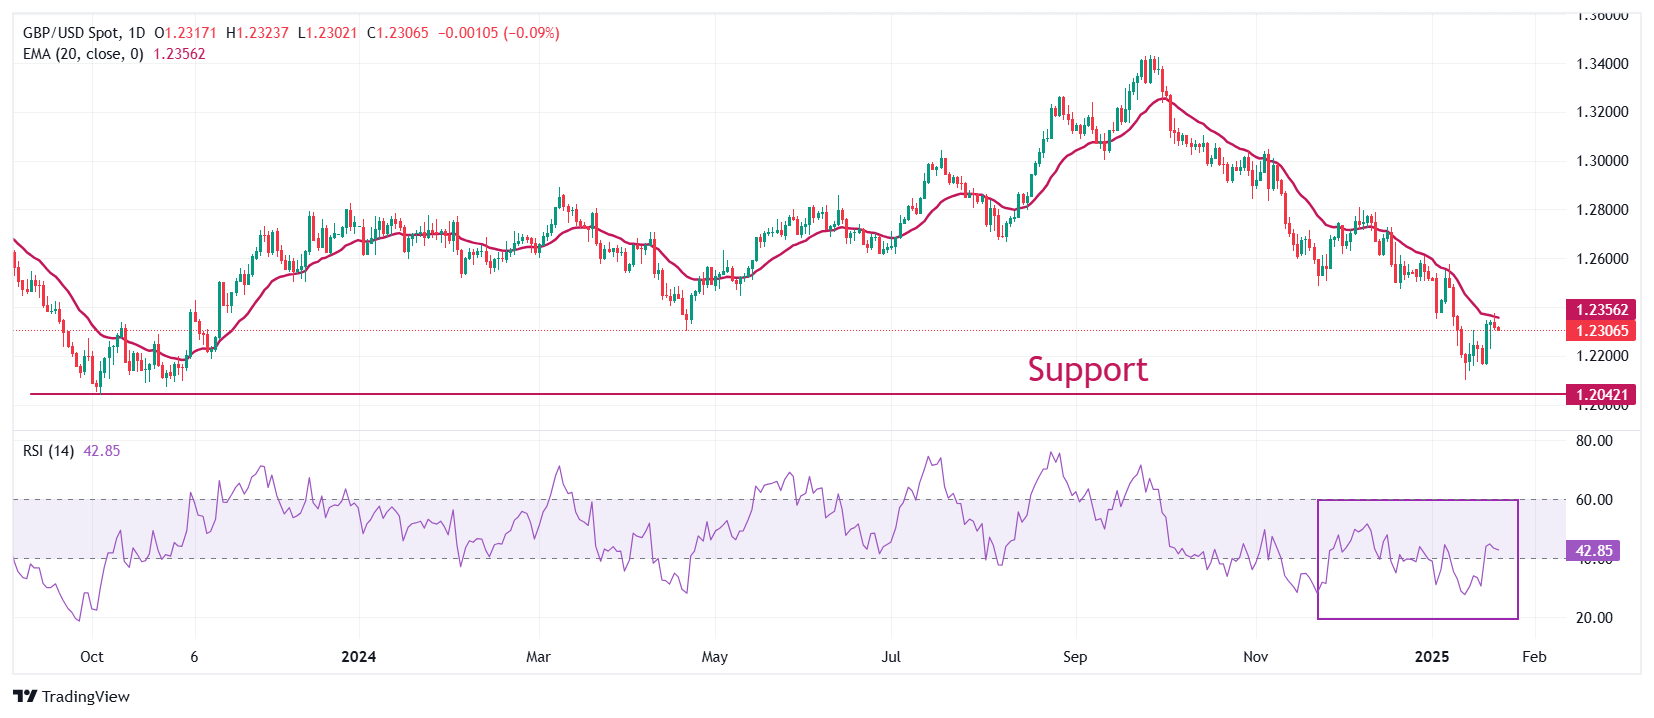
The Pound Sterling strives to break above the 20-day Exponential Moving Average (EMA), which trades around 1.2356, against the US Dollar. The GBP/USD pair rebounded after posting a fresh over-one-year low of 1.2100 on January 13.
The 14-day Relative Strength Index (RSI) rebounds to near 43.50 from the 20.00-40.00 range, suggesting that the bearish momentum has ended, at least for now.
Looking down, the pair is expected to find support near the October 2023 low of 1.2050. On the upside, the 20-day EMA and the round level of 1.2400 will act as key resistances.
Pound Sterling FAQs
The Pound Sterling (GBP) is the oldest currency in the world (886 AD) and the official currency of the United Kingdom. It is the fourth most traded unit for foreign exchange (FX) in the world, accounting for 12% of all transactions, averaging $630 billion a day, according to 2022 data. Its key trading pairs are GBP/USD, also known as ‘Cable’, which accounts for 11% of FX, GBP/JPY, or the ‘Dragon’ as it is known by traders (3%), and EUR/GBP (2%). The Pound Sterling is issued by the Bank of England (BoE).
The single most important factor influencing the value of the Pound Sterling is monetary policy decided by the Bank of England. The BoE bases its decisions on whether it has achieved its primary goal of “price stability” – a steady inflation rate of around 2%. Its primary tool for achieving this is the adjustment of interest rates. When inflation is too high, the BoE will try to rein it in by raising interest rates, making it more expensive for people and businesses to access credit. This is generally positive for GBP, as higher interest rates make the UK a more attractive place for global investors to park their money. When inflation falls too low it is a sign economic growth is slowing. In this scenario, the BoE will consider lowering interest rates to cheapen credit so businesses will borrow more to invest in growth-generating projects.
Data releases gauge the health of the economy and can impact the value of the Pound Sterling. Indicators such as GDP, Manufacturing and Services PMIs, and employment can all influence the direction of the GBP. A strong economy is good for Sterling. Not only does it attract more foreign investment but it may encourage the BoE to put up interest rates, which will directly strengthen GBP. Otherwise, if economic data is weak, the Pound Sterling is likely to fall.
Another significant data release for the Pound Sterling is the Trade Balance. This indicator measures the difference between what a country earns from its exports and what it spends on imports over a given period. If a country produces highly sought-after exports, its currency will benefit purely from the extra demand created from foreign buyers seeking to purchase these goods. Therefore, a positive net Trade Balance strengthens a currency and vice versa for a negative balance.
- EUR/GBP trades in negative territory around 0.8450 in Thursday’s early European session.
- The rising expectation of an ECB further rate cut drags the Euro lower.
- Markets expect one or two more rate reductions from the BOE after February.
The EUR/GBP cross softens to near 0.8450 during the early European trading hours on Thursday. The dovish stance of the European Central Bank (ECB) policymakers weighs on the Euro (EUR) against the Pound Sterling (GBP). The preliminary reading of Eurozone Consumer Confidence for January will be released later on Thursday.
ECB President Christine Lagarde, along with policymaking council members Francois Villeroy de Galhau, Klaas Knot, and Yannis Stournaras, all supported further rate reductions. This, in turn, could undermine the shared currency in the near term. Investors have fully priced a cut in the 3.0% deposit rate on January 30 and expect the benchmark to lower to 2.0% by the end of the year.
ECB Croatian central bank chief Boris Vujcic said earlier this week that market expectations for European Central Bank interest rate cuts are reasonable and risks around the inflation outlook are broadly balanced. Meanwhile, ECB President Christine Lagarde emphasized on Wednesday that the central bank is “not overly concerned” about the risk of inflation from abroad and will continue to reduce interest rates at a gradual pace.
On the GBP’s front, investors anticipate the Bank of England (BoE) to cut its main interest rate by 25 basis points (bps) to 4.5% on February 6, and economists polled by Reuters expect three additional cuts this year, while markets expect one or two more after February. “We still think the Bank of England will cut interest rates at the next meeting in February, from 4.75% to 4.50%, and continue to cut rates gradually thereafter,” noted Capital Economics analysts.
Pound Sterling FAQs
The Pound Sterling (GBP) is the oldest currency in the world (886 AD) and the official currency of the United Kingdom. It is the fourth most traded unit for foreign exchange (FX) in the world, accounting for 12% of all transactions, averaging $630 billion a day, according to 2022 data. Its key trading pairs are GBP/USD, also known as ‘Cable’, which accounts for 11% of FX, GBP/JPY, or the ‘Dragon’ as it is known by traders (3%), and EUR/GBP (2%). The Pound Sterling is issued by the Bank of England (BoE).
The single most important factor influencing the value of the Pound Sterling is monetary policy decided by the Bank of England. The BoE bases its decisions on whether it has achieved its primary goal of “price stability” – a steady inflation rate of around 2%. Its primary tool for achieving this is the adjustment of interest rates. When inflation is too high, the BoE will try to rein it in by raising interest rates, making it more expensive for people and businesses to access credit. This is generally positive for GBP, as higher interest rates make the UK a more attractive place for global investors to park their money. When inflation falls too low it is a sign economic growth is slowing. In this scenario, the BoE will consider lowering interest rates to cheapen credit so businesses will borrow more to invest in growth-generating projects.
Data releases gauge the health of the economy and can impact the value of the Pound Sterling. Indicators such as GDP, Manufacturing and Services PMIs, and employment can all influence the direction of the GBP. A strong economy is good for Sterling. Not only does it attract more foreign investment but it may encourage the BoE to put up interest rates, which will directly strengthen GBP. Otherwise, if economic data is weak, the Pound Sterling is likely to fall.
Another significant data release for the Pound Sterling is the Trade Balance. This indicator measures the difference between what a country earns from its exports and what it spends on imports over a given period. If a country produces highly sought-after exports, its currency will benefit purely from the extra demand created from foreign buyers seeking to purchase these goods. Therefore, a positive net Trade Balance strengthens a currency and vice versa for a negative balance.
Here is what you need to know on Thursday, January 23:
Major currency pairs fluctuate in relatively tight ranges early Thursday as investors await the next fundamental catalyst. The US economic calendar will feature weekly Initial Jobless Claims data and the US Treasury will hold a 10-year Treasury Inflation-Protected Securities (TIPS) auction. Additionally, the European Commission will release the preliminary Consumer Confidence data for January.
US Dollar PRICE This week
The table below shows the percentage change of US Dollar (USD) against listed major currencies this week. US Dollar was the weakest against the Euro.
| USD | EUR | GBP | JPY | CAD | AUD | NZD | CHF | |
|---|---|---|---|---|---|---|---|---|
| USD | -1.30% | -1.19% | 0.19% | -0.55% | -1.25% | -1.30% | -0.74% | |
| EUR | 1.30% | 0.05% | 1.40% | 0.65% | 0.12% | -0.11% | 0.44% | |
| GBP | 1.19% | -0.05% | 1.27% | 0.59% | 0.07% | -0.17% | 0.39% | |
| JPY | -0.19% | -1.40% | -1.27% | -0.73% | -1.37% | -1.57% | -1.09% | |
| CAD | 0.55% | -0.65% | -0.59% | 0.73% | -0.63% | -0.76% | -0.20% | |
| AUD | 1.25% | -0.12% | -0.07% | 1.37% | 0.63% | -0.32% | 0.24% | |
| NZD | 1.30% | 0.11% | 0.17% | 1.57% | 0.76% | 0.32% | 0.38% | |
| CHF | 0.74% | -0.44% | -0.39% | 1.09% | 0.20% | -0.24% | -0.38% |
The heat map shows percentage changes of major currencies against each other. The base currency is picked from the left column, while the quote currency is picked from the top row. For example, if you pick the US Dollar from the left column and move along the horizontal line to the Japanese Yen, the percentage change displayed in the box will represent USD (base)/JPY (quote).
The US Dollar (USD) Index struggled to gain traction on Wednesday as the improving risk mood made it difficult for the USD to find demand. US stock index futures trades marginally lower early Thursday, pointing to a cautious market stance, while the USD Index holds steady above 108.00. US President Donald Trump said late Wednesday that he would impose high levels of sanctions on Russia and tariff imports if they fail to reach a settlement to end its war against Ukraine.
USD/CAD closed in positive territory and continued to stretch higher toward 1.4400 during the Asian trading hours on Thursday. Later in the day, Statistics Canada will publish Retail Sales figures for November.
The data from Japan showed on Thursday that Exports rose by 2.8% on a yearly basis in December, while Imports Expanded by 1.8% in the same period. Early Friday, the Bank of Japan will announce monetary policy decisions and markets foresee a 25 basis points rate increase. Ahead of this key event, USD/JPY trades in a tight range at around 156.50.
EUR/USD continues to move up and down in a narrow channel slightly above 1.0400 after closing marginally lower on Wednesday.
GBP/USD corrected lower on Wednesday but managed to stabilize above 1.2300. The pair was last seen trading flat on the day at around 1.2315.
Gold closed in positive territory for the third consecutive day on Wednesday and touched its highest level since late October above $2,760. XAU/USD stays in a consolidation phase early Thursday and trades slightly above $2,750.
Central banks FAQs
Central Banks have a key mandate which is making sure that there is price stability in a country or region. Economies are constantly facing inflation or deflation when prices for certain goods and services are fluctuating. Constant rising prices for the same goods means inflation, constant lowered prices for the same goods means deflation. It is the task of the central bank to keep the demand in line by tweaking its policy rate. For the biggest central banks like the US Federal Reserve (Fed), the European Central Bank (ECB) or the Bank of England (BoE), the mandate is to keep inflation close to 2%.
A central bank has one important tool at its disposal to get inflation higher or lower, and that is by tweaking its benchmark policy rate, commonly known as interest rate. On pre-communicated moments, the central bank will issue a statement with its policy rate and provide additional reasoning on why it is either remaining or changing (cutting or hiking) it. Local banks will adjust their savings and lending rates accordingly, which in turn will make it either harder or easier for people to earn on their savings or for companies to take out loans and make investments in their businesses. When the central bank hikes interest rates substantially, this is called monetary tightening. When it is cutting its benchmark rate, it is called monetary easing.
A central bank is often politically independent. Members of the central bank policy board are passing through a series of panels and hearings before being appointed to a policy board seat. Each member in that board often has a certain conviction on how the central bank should control inflation and the subsequent monetary policy. Members that want a very loose monetary policy, with low rates and cheap lending, to boost the economy substantially while being content to see inflation slightly above 2%, are called ‘doves’. Members that rather want to see higher rates to reward savings and want to keep a lit on inflation at all time are called ‘hawks’ and will not rest until inflation is at or just below 2%.
Normally, there is a chairman or president who leads each meeting, needs to create a consensus between the hawks or doves and has his or her final say when it would come down to a vote split to avoid a 50-50 tie on whether the current policy should be adjusted. The chairman will deliver speeches which often can be followed live, where the current monetary stance and outlook is being communicated. A central bank will try to push forward its monetary policy without triggering violent swings in rates, equities, or its currency. All members of the central bank will channel their stance toward the markets in advance of a policy meeting event. A few days before a policy meeting takes place until the new policy has been communicated, members are forbidden to talk publicly. This is called the blackout period.
- EUR/JPY extends upside to around 163.05 in Thursday’s early European session.
- The positive outlook of the cross prevails above the 100-period EMA with a bullish RSI indicator.
- The immediate resistance level emerges at 163.55; the first downside target to watch is 162.32.
The EUR/JPY cross extends the rally to near 163.05 during the early European trading hours on Thursday. The uptick of the cross is bolstered by the risk-on mood in the financial markets. Investors will closely monitor the Bank of Japan (BoJ) interest rate decision on Friday for fresh catalysts.
Traders have priced in a nearly 90% possibility that the Japanese central bank will raise interest rates from 0.25% to 0.50% at the end of the January 23-24 meeting, which would be the highest since the 2008 global financial crisis.
Technically, EUR/JPY keeps the bullish vibe on the 4-hour chart as the cross is well-supported above the key 100-period Exponential Moving Average (EMA). The upward momentum is supported by the Relative Strength Index (RSI), which stands above the midline near 58.05, indicating that the further upside looks favorable.
The first upside barrier for EUR/JPY emerges near 163.55, the upper boundary of the Bollinger Band. The next potential resistance level is seen at the 164.00 psychological level. Further north, the next hurdle to watch is 164.55, the high of January 5.
On the flip side, the initial support level for the cross is located at 162.32, the high of January 20. Any follow-through selling below the mentioned level could see a drop to 161.87, the 100-period EMA. The next contention level is seen at 160.96, the low of January 21.
EUR/JPY 4-hour chart
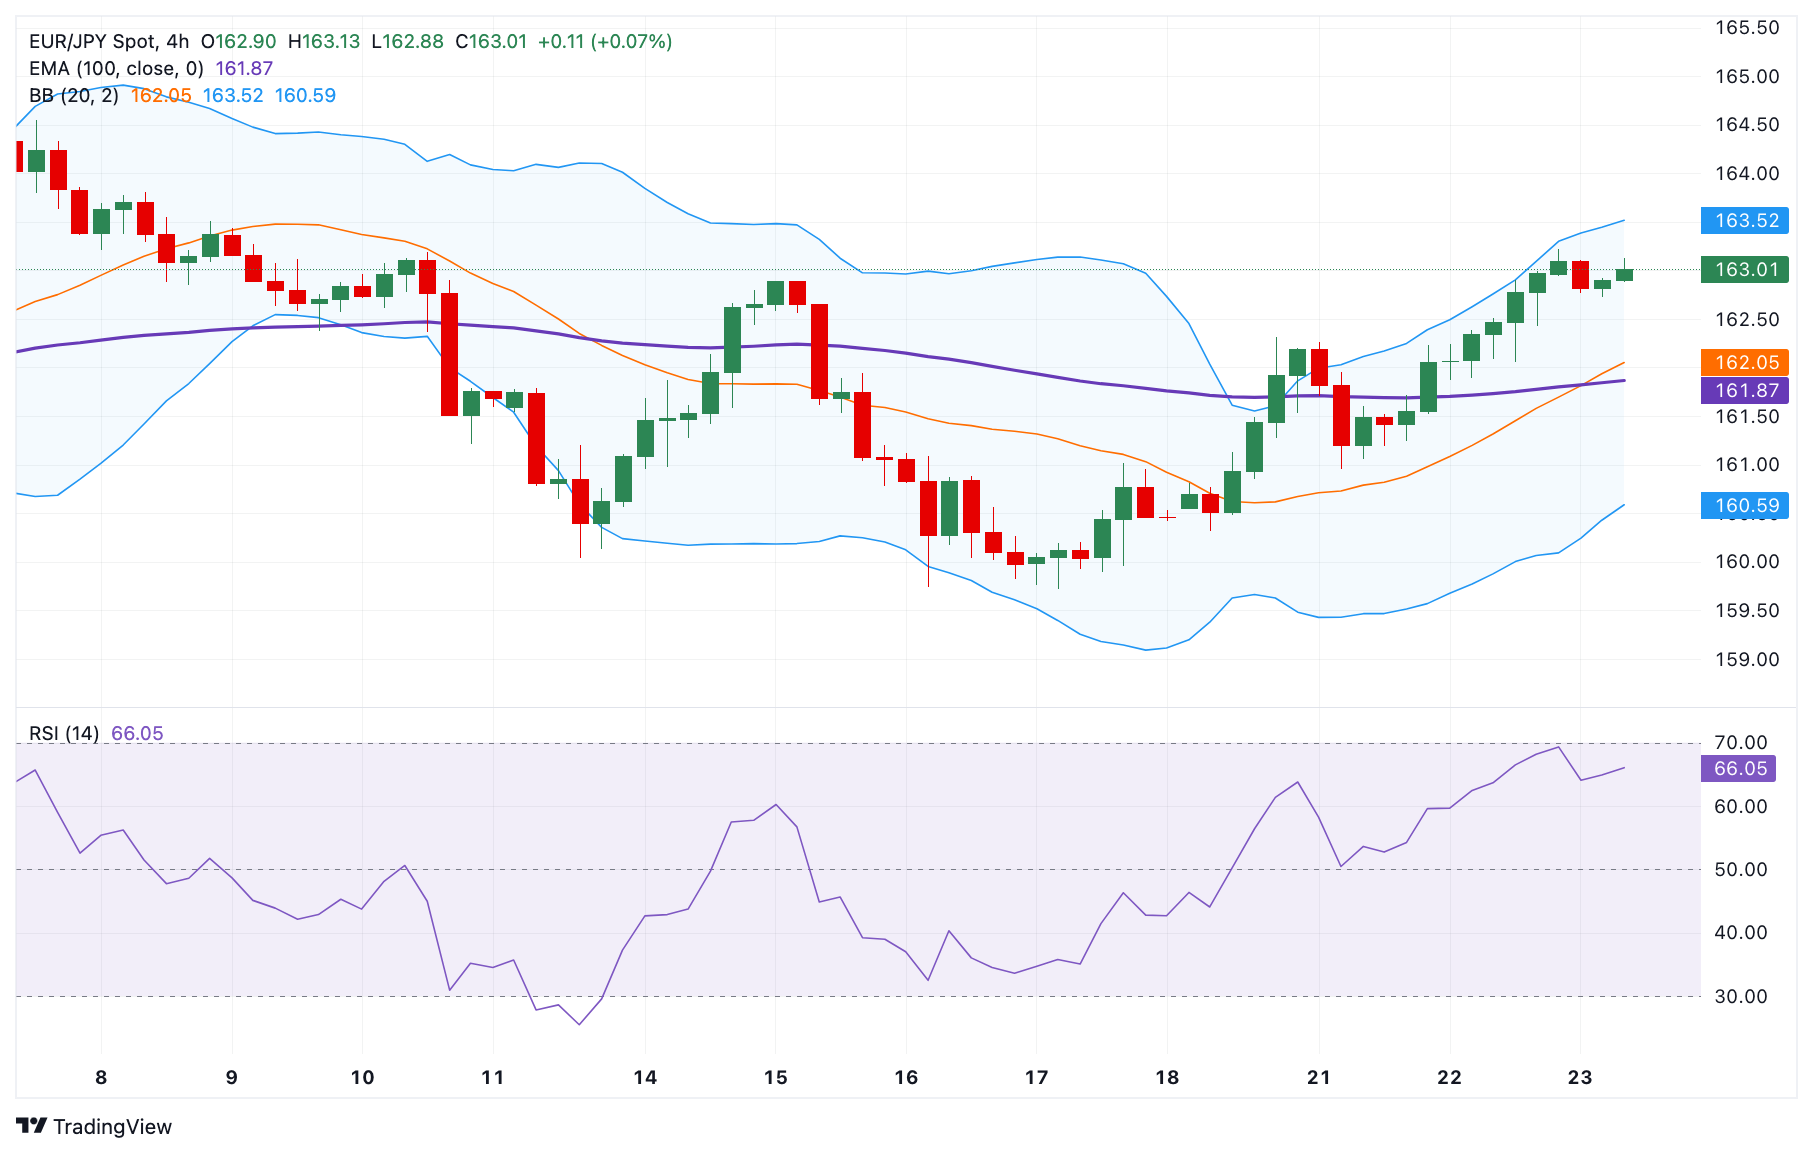
Euro FAQs
The Euro is the currency for the 19 European Union countries that belong to the Eurozone. It is the second most heavily traded currency in the world behind the US Dollar. In 2022, it accounted for 31% of all foreign exchange transactions, with an average daily turnover of over $2.2 trillion a day. EUR/USD is the most heavily traded currency pair in the world, accounting for an estimated 30% off all transactions, followed by EUR/JPY (4%), EUR/GBP (3%) and EUR/AUD (2%).
The European Central Bank (ECB) in Frankfurt, Germany, is the reserve bank for the Eurozone. The ECB sets interest rates and manages monetary policy. The ECB’s primary mandate is to maintain price stability, which means either controlling inflation or stimulating growth. Its primary tool is the raising or lowering of interest rates. Relatively high interest rates – or the expectation of higher rates – will usually benefit the Euro and vice versa. The ECB Governing Council makes monetary policy decisions at meetings held eight times a year. Decisions are made by heads of the Eurozone national banks and six permanent members, including the President of the ECB, Christine Lagarde.
Eurozone inflation data, measured by the Harmonized Index of Consumer Prices (HICP), is an important econometric for the Euro. If inflation rises more than expected, especially if above the ECB’s 2% target, it obliges the ECB to raise interest rates to bring it back under control. Relatively high interest rates compared to its counterparts will usually benefit the Euro, as it makes the region more attractive as a place for global investors to park their money.
Data releases gauge the health of the economy and can impact on the Euro. Indicators such as GDP, Manufacturing and Services PMIs, employment, and consumer sentiment surveys can all influence the direction of the single currency. A strong economy is good for the Euro. Not only does it attract more foreign investment but it may encourage the ECB to put up interest rates, which will directly strengthen the Euro. Otherwise, if economic data is weak, the Euro is likely to fall. Economic data for the four largest economies in the euro area (Germany, France, Italy and Spain) are especially significant, as they account for 75% of the Eurozone’s economy.
Another significant data release for the Euro is the Trade Balance. This indicator measures the difference between what a country earns from its exports and what it spends on imports over a given period. If a country produces highly sought after exports then its currency will gain in value purely from the extra demand created from foreign buyers seeking to purchase these goods. Therefore, a positive net Trade Balance strengthens a currency and vice versa for a negative balance.
FX option expiries for Jan 23 NY cut at 10:00 Eastern Time via DTCC can be found below.
EUR/USD: EUR amounts
- 1.0150 2.7b
- 1.0190 929m
- 1.0200 4.6b
- 1.0295 1.6b
- 1.0300 1.7b
- 1.0320 1.1b
- 1.0400 2.6b
- 1.0460 892m
- 1.0515 1.1b
GBP/USD: GBP amounts
- 1.2400 456m
- 1.2500 961m
USD/JPY: USD amounts
- 153.25 1b
- 155.00 2.3b
- 156.00 1b
- 156.15 732m
- 157.00 712m
AUD/USD: AUD amounts
- 0.6200 1.3b
- 0.6260 705m
- 0.6300 1.3b
USD/CAD: USD amounts
- 1.4375 580m
- 1.4405 796m
- 1.4450 1.2b
- 1.4500 633m
- 1.4600 989m
NZD/USD: NZD amounts
- 0.5660 486m
- 0.5675 796m
- USD/CHF lacks any firm intraday direction, though it manages to hold above a two-week low.
- A further recovery in the US bond yields underpins the USD and lends some support to the pair.
- A positive risk tone weighs on the safe-haven CHF and supports prospects for further gains.
The USD/CHF pair struggles to capitalize on the previous day's modest bounce from the 0.9035-0.9030 area, or over a two-week low and oscillates in a narrow range during the Asian session on Thursday. Spot prices currently trade around the 0.9060 region, nearly unchanged for the day amid subdued US Dollar (USD) price action.
The USD Index (DXY), which tracks the Greenback against a basket of currencies, struggles to capitalize on the overnight bounce from the monthly low amid bets that the Federal Reserve (Fed) will cut interest rates twice this year. That said, an uptick in the US Treasury bond yields acts as a tailwind for the buck, which, in turn, is seen lending support to the USD/CHF pair.
Meanwhile, Swiss National Bank (SNB) Chairman Martin Schlegel's ultra-dovish comments, opening doors for negative interest rates, might continue to weigh on the Swiss Franc. Apart from this, the underlying bullish tone around the equity markets could undermine the safe-haven CHF and further contribute to limiting any meaningful downside for the USD/CHF pair.
Traders also seem reluctant and might opt to wait on the sidelines ahead of US President Donald Trump's speech at the World Economic Forum for more concrete announcements on tariffs. This, in turn, could infuse volatility in the global financial markets and influence the USD price dynamics, which, in turn, should provide some meaningful impetus to the USD/CHF pair.
Traders on Thursday will further take cues from the release of the US Weekly Initial Jobless Claims data, due later during the early North American session. Nevertheless, the aforementioned fundamental backdrop warrants caution before positioning for an extension of the recent pullback from the 0.9200 mark, or the highest level since May 2024 touched earlier this month.
Swiss Franc FAQs
The Swiss Franc (CHF) is Switzerland’s official currency. It is among the top ten most traded currencies globally, reaching volumes that well exceed the size of the Swiss economy. Its value is determined by the broad market sentiment, the country’s economic health or action taken by the Swiss National Bank (SNB), among other factors. Between 2011 and 2015, the Swiss Franc was pegged to the Euro (EUR). The peg was abruptly removed, resulting in a more than 20% increase in the Franc’s value, causing a turmoil in markets. Even though the peg isn’t in force anymore, CHF fortunes tend to be highly correlated with the Euro ones due to the high dependency of the Swiss economy on the neighboring Eurozone.
The Swiss Franc (CHF) is considered a safe-haven asset, or a currency that investors tend to buy in times of market stress. This is due to the perceived status of Switzerland in the world: a stable economy, a strong export sector, big central bank reserves or a longstanding political stance towards neutrality in global conflicts make the country’s currency a good choice for investors fleeing from risks. Turbulent times are likely to strengthen CHF value against other currencies that are seen as more risky to invest in.
The Swiss National Bank (SNB) meets four times a year – once every quarter, less than other major central banks – to decide on monetary policy. The bank aims for an annual inflation rate of less than 2%. When inflation is above target or forecasted to be above target in the foreseeable future, the bank will attempt to tame price growth by raising its policy rate. Higher interest rates are generally positive for the Swiss Franc (CHF) as they lead to higher yields, making the country a more attractive place for investors. On the contrary, lower interest rates tend to weaken CHF.
Macroeconomic data releases in Switzerland are key to assessing the state of the economy and can impact the Swiss Franc’s (CHF) valuation. The Swiss economy is broadly stable, but any sudden change in economic growth, inflation, current account or the central bank’s currency reserves have the potential to trigger moves in CHF. Generally, high economic growth, low unemployment and high confidence are good for CHF. Conversely, if economic data points to weakening momentum, CHF is likely to depreciate.
As a small and open economy, Switzerland is heavily dependent on the health of the neighboring Eurozone economies. The broader European Union is Switzerland’s main economic partner and a key political ally, so macroeconomic and monetary policy stability in the Eurozone is essential for Switzerland and, thus, for the Swiss Franc (CHF). With such dependency, some models suggest that the correlation between the fortunes of the Euro (EUR) and the CHF is more than 90%, or close to perfect.
- USD/CNH maintains its position amid the stable US Dollar and hawkish Fed.
- Trump administration plans to impose a 10% tariff on Chinese imports effective February 1.
- Chinese authorities permit 100 billion Yuan of pension funds to boost investments in domestic equities.
USD/CNH, representing the offshore Chinese Yuan (CNH), extends its gains for the third successive day on Thursday. The pair appreciates as the US Dollar (USD) receives support as traders expect the US Federal Reserve (Fed) to keep its benchmark overnight rate steady in the 4.25%-4.50% range at its January meeting. Moreover, Trump’s policies could drive inflationary pressures, potentially limiting the Fed to just one more rate cut.
US President Donald Trump stated that his administration is considering imposing a 10% tariff on Chinese imports starting February 1. However, the proposed tariff is significantly lower than the previously threatened 60% rate, it aligns with the pledge Trump made during his presidential campaign.
However, Chinese authorities on Thursday introduced several measures to stabilize its stock markets, including allowing pension funds to increase investments in domestic equities. A pilot scheme enabling insurers to purchase equities will be launched in the first half of 2025, with an initial scale of at least 100 billion Yuan. Meanwhile, the People’s Bank of China (PBoC) said that they “will expand the scope and increase the scale of liquidity tools to fund share purchases at the proper time.”
Technical Analysis: USD/CNH could find initial resistance at a nine-day EMA near 7.3100
The USD/CNH pair trades near 7.2820 during Asian hours on Thursday. A review of the daily chart shows the pair remaining below nine- and 14-day Exponential Moving Averages (EMAs), signaling a weaker short-term price momentum.
Additionally, the 14-day Relative Strength Index (RSI), a key momentum indicator, remains below the 50 mark, confirming a persistent bearish momentum.
On the downside, the USD/CNH pair may retest its six-week low at 7.2522, which was recorded on January 21. Further support appears around the psychological support level at 7.2000 level.
The USD/CNH pair may find initial resistance around the nine-day EMA at the 7.3048 level, followed by the 14-day EMA at the 7.3127 level.
USD/CNH: Daily Chart
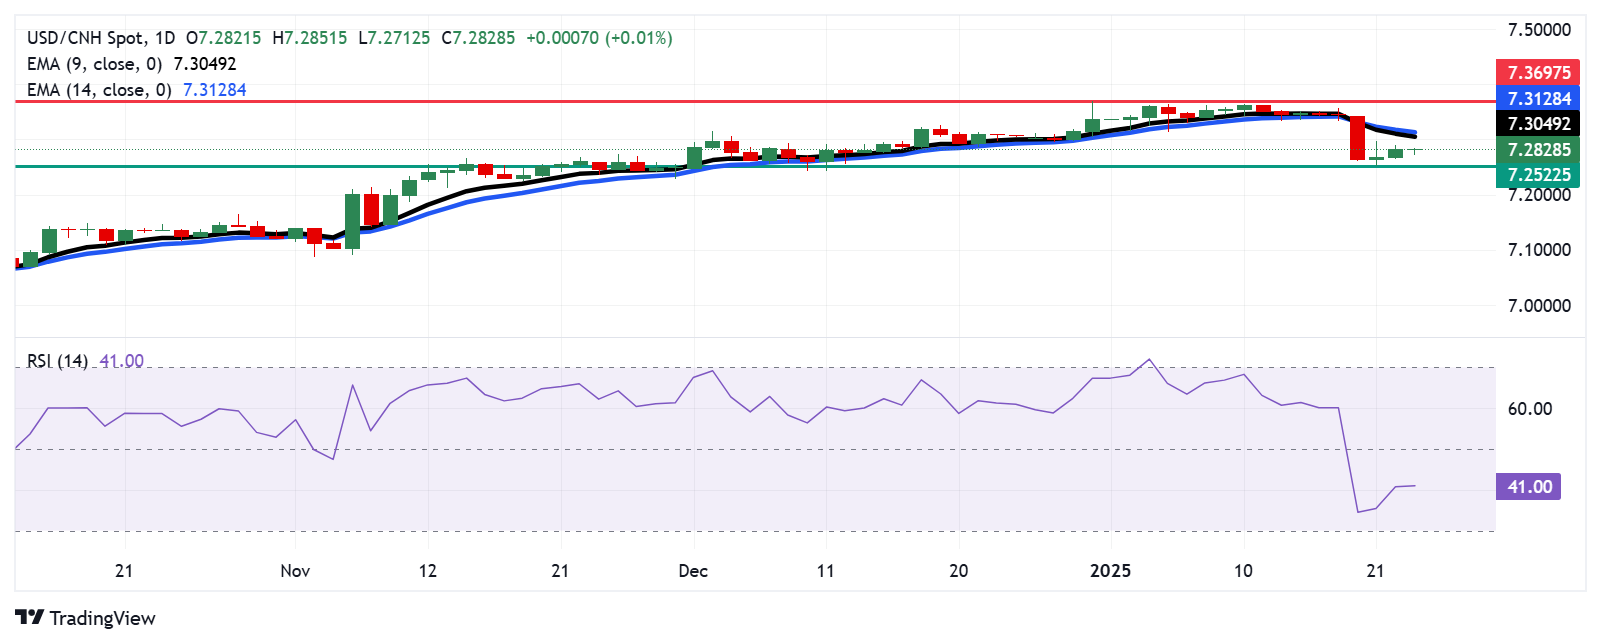
PBOC FAQs
The primary monetary policy objectives of the People's Bank of China (PBoC) are to safeguard price stability, including exchange rate stability, and promote economic growth. China’s central bank also aims to implement financial reforms, such as opening and developing the financial market.
The PBoC is owned by the state of the People's Republic of China (PRC), so it is not considered an autonomous institution. The Chinese Communist Party (CCP) Committee Secretary, nominated by the Chairman of the State Council, has a key influence on the PBoC’s management and direction, not the governor. However, Mr. Pan Gongsheng currently holds both of these posts.
Unlike the Western economies, the PBoC uses a broader set of monetary policy instruments to achieve its objectives. The primary tools include a seven-day Reverse Repo Rate (RRR), Medium-term Lending Facility (MLF), foreign exchange interventions and Reserve Requirement Ratio (RRR). However, The Loan Prime Rate (LPR) is China’s benchmark interest rate. Changes to the LPR directly influence the rates that need to be paid in the market for loans and mortgages and the interest paid on savings. By changing the LPR, China’s central bank can also influence the exchange rates of the Chinese Renminbi.
Yes, China has 19 private banks – a small fraction of the financial system. The largest private banks are digital lenders WeBank and MYbank, which are backed by tech giants Tencent and Ant Group, per The Straits Times. In 2014, China allowed domestic lenders fully capitalized by private funds to operate in the state-dominated financial sector.
- EUR/USD trades with a mild negative bias around 1.0410 in Thursday’s Asian session.
- Trump delivered fresh tariff threats against the EU and China.
- The ECB's dovish bets might weigh on the Euro against the USD.
The EUR/USD pair trades with mild losses around 1.0410 during the Asian trading hours on Thursday. The Euro (EUR) softens as US President Trump has threatened to impose tariffs on the Eurozone. The European Commission will release its advanced Consumer Confidence report for January. On the US docket, the usual weekly Initial Jobless Claims will be published.
Trump on Tuesday said that his administration was discussing 25% tariffs against Canada and Mexico, as well as duties on China and the European Union. The concerns about an economic slowdown in the Eurozone economy and uncertainty surrounding Trump’s tariff threats could drag the shared currency in the near term.
Furthermore, analysts expect Trump’s administration could trigger inflationary pressures, potentially convincing the US Federal Reserve (Fed) to cut rates only once this year. This, in turn, might boost the US Dollar (USD) and act as a headwind for EUR/USD.
Across the pond, the European Central Bank (ECB) is anticipated to deliver 25 basis points (bps) rate cuts in the next four meetings. ECB President Christine Lagarde, along with policymaking council members Francois Villeroy de Galhau, Klaas Knot, and Yannis Stournaras, all supported further policy easing. The dovish expectation from the ECB policymakers is likely to undermine the EUR against the Greenback.
Euro FAQs
The Euro is the currency for the 19 European Union countries that belong to the Eurozone. It is the second most heavily traded currency in the world behind the US Dollar. In 2022, it accounted for 31% of all foreign exchange transactions, with an average daily turnover of over $2.2 trillion a day. EUR/USD is the most heavily traded currency pair in the world, accounting for an estimated 30% off all transactions, followed by EUR/JPY (4%), EUR/GBP (3%) and EUR/AUD (2%).
The European Central Bank (ECB) in Frankfurt, Germany, is the reserve bank for the Eurozone. The ECB sets interest rates and manages monetary policy. The ECB’s primary mandate is to maintain price stability, which means either controlling inflation or stimulating growth. Its primary tool is the raising or lowering of interest rates. Relatively high interest rates – or the expectation of higher rates – will usually benefit the Euro and vice versa. The ECB Governing Council makes monetary policy decisions at meetings held eight times a year. Decisions are made by heads of the Eurozone national banks and six permanent members, including the President of the ECB, Christine Lagarde.
Eurozone inflation data, measured by the Harmonized Index of Consumer Prices (HICP), is an important econometric for the Euro. If inflation rises more than expected, especially if above the ECB’s 2% target, it obliges the ECB to raise interest rates to bring it back under control. Relatively high interest rates compared to its counterparts will usually benefit the Euro, as it makes the region more attractive as a place for global investors to park their money.
Data releases gauge the health of the economy and can impact on the Euro. Indicators such as GDP, Manufacturing and Services PMIs, employment, and consumer sentiment surveys can all influence the direction of the single currency. A strong economy is good for the Euro. Not only does it attract more foreign investment but it may encourage the ECB to put up interest rates, which will directly strengthen the Euro. Otherwise, if economic data is weak, the Euro is likely to fall. Economic data for the four largest economies in the euro area (Germany, France, Italy and Spain) are especially significant, as they account for 75% of the Eurozone’s economy.
Another significant data release for the Euro is the Trade Balance. This indicator measures the difference between what a country earns from its exports and what it spends on imports over a given period. If a country produces highly sought after exports then its currency will gain in value purely from the extra demand created from foreign buyers seeking to purchase these goods. Therefore, a positive net Trade Balance strengthens a currency and vice versa for a negative balance.
Gold prices fell in India on Thursday, according to data compiled by FXStreet.
The price for Gold stood at 7,648.10 Indian Rupees (INR) per gram, down compared with the INR 7,657.10 it cost on Wednesday.
The price for Gold decreased to INR 89,205.98 per tola from INR 89,310.95 per tola a day earlier.
| Unit measure | Gold Price in INR |
|---|---|
| 1 Gram | 7,648.10 |
| 10 Grams | 76,481.04 |
| Tola | 89,205.98 |
| Troy Ounce | 237,882.80 |
FXStreet calculates Gold prices in India by adapting international prices (USD/INR) to the local currency and measurement units. Prices are updated daily based on the market rates taken at the time of publication. Prices are just for reference and local rates could diverge slightly.
Gold FAQs
Gold has played a key role in human’s history as it has been widely used as a store of value and medium of exchange. Currently, apart from its shine and usage for jewelry, the precious metal is widely seen as a safe-haven asset, meaning that it is considered a good investment during turbulent times. Gold is also widely seen as a hedge against inflation and against depreciating currencies as it doesn’t rely on any specific issuer or government.
Central banks are the biggest Gold holders. In their aim to support their currencies in turbulent times, central banks tend to diversify their reserves and buy Gold to improve the perceived strength of the economy and the currency. High Gold reserves can be a source of trust for a country’s solvency. Central banks added 1,136 tonnes of Gold worth around $70 billion to their reserves in 2022, according to data from the World Gold Council. This is the highest yearly purchase since records began. Central banks from emerging economies such as China, India and Turkey are quickly increasing their Gold reserves.
Gold has an inverse correlation with the US Dollar and US Treasuries, which are both major reserve and safe-haven assets. When the Dollar depreciates, Gold tends to rise, enabling investors and central banks to diversify their assets in turbulent times. Gold is also inversely correlated with risk assets. A rally in the stock market tends to weaken Gold price, while sell-offs in riskier markets tend to favor the precious metal.
The price can move due to a wide range of factors. Geopolitical instability or fears of a deep recession can quickly make Gold price escalate due to its safe-haven status. As a yield-less asset, Gold tends to rise with lower interest rates, while higher cost of money usually weighs down on the yellow metal. Still, most moves depend on how the US Dollar (USD) behaves as the asset is priced in dollars (XAU/USD). A strong Dollar tends to keep the price of Gold controlled, whereas a weaker Dollar is likely to push Gold prices up.
(An automation tool was used in creating this post.)
- GBP/USD faces challenges as the US Dollar strengthens, with expectations that the Fed will maintain its rate in January.
- The Pound Sterling struggles as traders anticipate a 25 basis point interest rate cut by the BoE in February.
- Traders expect to closely watch the release of Friday's preliminary S&P Global Purchasing Managers Index for both countries for January.
GBP/USD remains subdued for the second successive session, trading around 1.2320 during the Asian hours on Thursday. The pair faces challenges as the US Dollar (USD) received support as President Donald Trump issued a memorandum instructing federal agencies to investigate and address ongoing trade deficits.
The Greenback could further appreciate as traders expect the US Federal Reserve (Fed) to keep its benchmark overnight rate steady in the 4.25%-4.50% range at its January meeting. Moreover, Trump’s policies could drive inflationary pressures, potentially limiting the Fed to just one more rate cut.
The Pound Sterling (GBP) continues to face pressure following weaker-than-expected UK inflation and retail sales data for December, sluggish labor demand in the three months leading up to November, and modest GDP growth. As a result, traders are anticipating a 25 basis point (bps) interest rate cut by the Bank of England (BoE) in February. It is nearly certain that the BoE will reduce rates to 4.5% during its upcoming policy meeting.
Traders are expected to closely watch the release of Friday's preliminary S&P Global Purchasing Managers Index (PMI) for both the United Kingdom and the United States for January. Additionally, the US Michigan Consumer Sentiment Index will be in focus. These indicators are likely to offer important insights into short-term economic trends.
Pound Sterling FAQs
The Pound Sterling (GBP) is the oldest currency in the world (886 AD) and the official currency of the United Kingdom. It is the fourth most traded unit for foreign exchange (FX) in the world, accounting for 12% of all transactions, averaging $630 billion a day, according to 2022 data. Its key trading pairs are GBP/USD, also known as ‘Cable’, which accounts for 11% of FX, GBP/JPY, or the ‘Dragon’ as it is known by traders (3%), and EUR/GBP (2%). The Pound Sterling is issued by the Bank of England (BoE).
The single most important factor influencing the value of the Pound Sterling is monetary policy decided by the Bank of England. The BoE bases its decisions on whether it has achieved its primary goal of “price stability” – a steady inflation rate of around 2%. Its primary tool for achieving this is the adjustment of interest rates. When inflation is too high, the BoE will try to rein it in by raising interest rates, making it more expensive for people and businesses to access credit. This is generally positive for GBP, as higher interest rates make the UK a more attractive place for global investors to park their money. When inflation falls too low it is a sign economic growth is slowing. In this scenario, the BoE will consider lowering interest rates to cheapen credit so businesses will borrow more to invest in growth-generating projects.
Data releases gauge the health of the economy and can impact the value of the Pound Sterling. Indicators such as GDP, Manufacturing and Services PMIs, and employment can all influence the direction of the GBP. A strong economy is good for Sterling. Not only does it attract more foreign investment but it may encourage the BoE to put up interest rates, which will directly strengthen GBP. Otherwise, if economic data is weak, the Pound Sterling is likely to fall.
Another significant data release for the Pound Sterling is the Trade Balance. This indicator measures the difference between what a country earns from its exports and what it spends on imports over a given period. If a country produces highly sought-after exports, its currency will benefit purely from the extra demand created from foreign buyers seeking to purchase these goods. Therefore, a positive net Trade Balance strengthens a currency and vice versa for a negative balance.
- Gold price retreats from a near three-month top amid an uptick in the US bond yields and the USD.
- Bets for further interest rate cuts by the Fed might hold back the USD bulls from placing fresh bets.
- Concerns about Trump’s tariff plans should further lend support to the safe-haven precious metal.
Gold price (XAU/USD) drifts lower during the Asian session on Thursday and moves away from its highest level since early November, around the $2,763-2,764 area touched the previous day. The US Dollar (USD) looks to build on the overnight bounce from the monthly low amid an uptick in the US Treasury bond yields, which, in turn, is seen exerting some downward pressure on the commodity. Apart from this, the underlying bullish sentiment around the equity markets undermines demand for the safe-haven precious metal.
That said, a combination of factors could act as a tailwind for the Gold price and warrants some caution before confirming that the one-month-old uptrend has run out of steam. Signs of abating inflation in the US revived bets that the Federal Reserve (Fed) will cut rates twice this year. This could act as a headwind for the US bond yields and the USD. Moreover, uncertainty surrounding US President Donald Trump’s tariff plans, which could trigger trade wars and elevate market volatility, should help limit the downside for the XAU/USD.
Gold price ticks lower as rebounding US bond yields underpin the USD; downside seems limited
- The US Dollar holds steady above its lowest level since late December touched on Wednesday amid a modest rebound in the US Treasury bond yields and prompts some selling around the Gold price on Thursday.
- The lack of details about US President Donald Trump's tariff plans and easing geopolitical tensions remain supportive of the risk-on mood, which is seen as another factor undermining the safe-haven precious metal.
- Trump's proposed policies are broadly regarded as inflationary, which, in turn, might compel the Federal Reserve to stick to its hawkish stance and keep interest rates higher for longer to rein in rising price pressures.
- Investors, however, are still pricing in the possibility that the US central bank will lower borrowing costs at least two times by the end of this year. This might cap the upside for the US bond yields and the Greenback.
- Trump's speech at the World Economic Forum will be looked upon for more concrete announcements on tariffs. Apart from this, the release of the US Weekly Jobless Claims should provide some impetus to the XAU/USD.
- The Bank of Japan is scheduled to announce its decision at the end of a two-day policy meeting on Friday and is expected to raise interest rates from 0.25% to 0.50%, or the highest since the 2008 global financial crisis.
- Rate decisions from the Fed and European Central Bank are scheduled for Wednesday and Thursday next week, respectively, which could infuse volatility and provide some impetus to the non-yielding yellow metal.
Gold price seems poised to challenge the all-time top; the $2,725-2,720 area holds the key for bulls
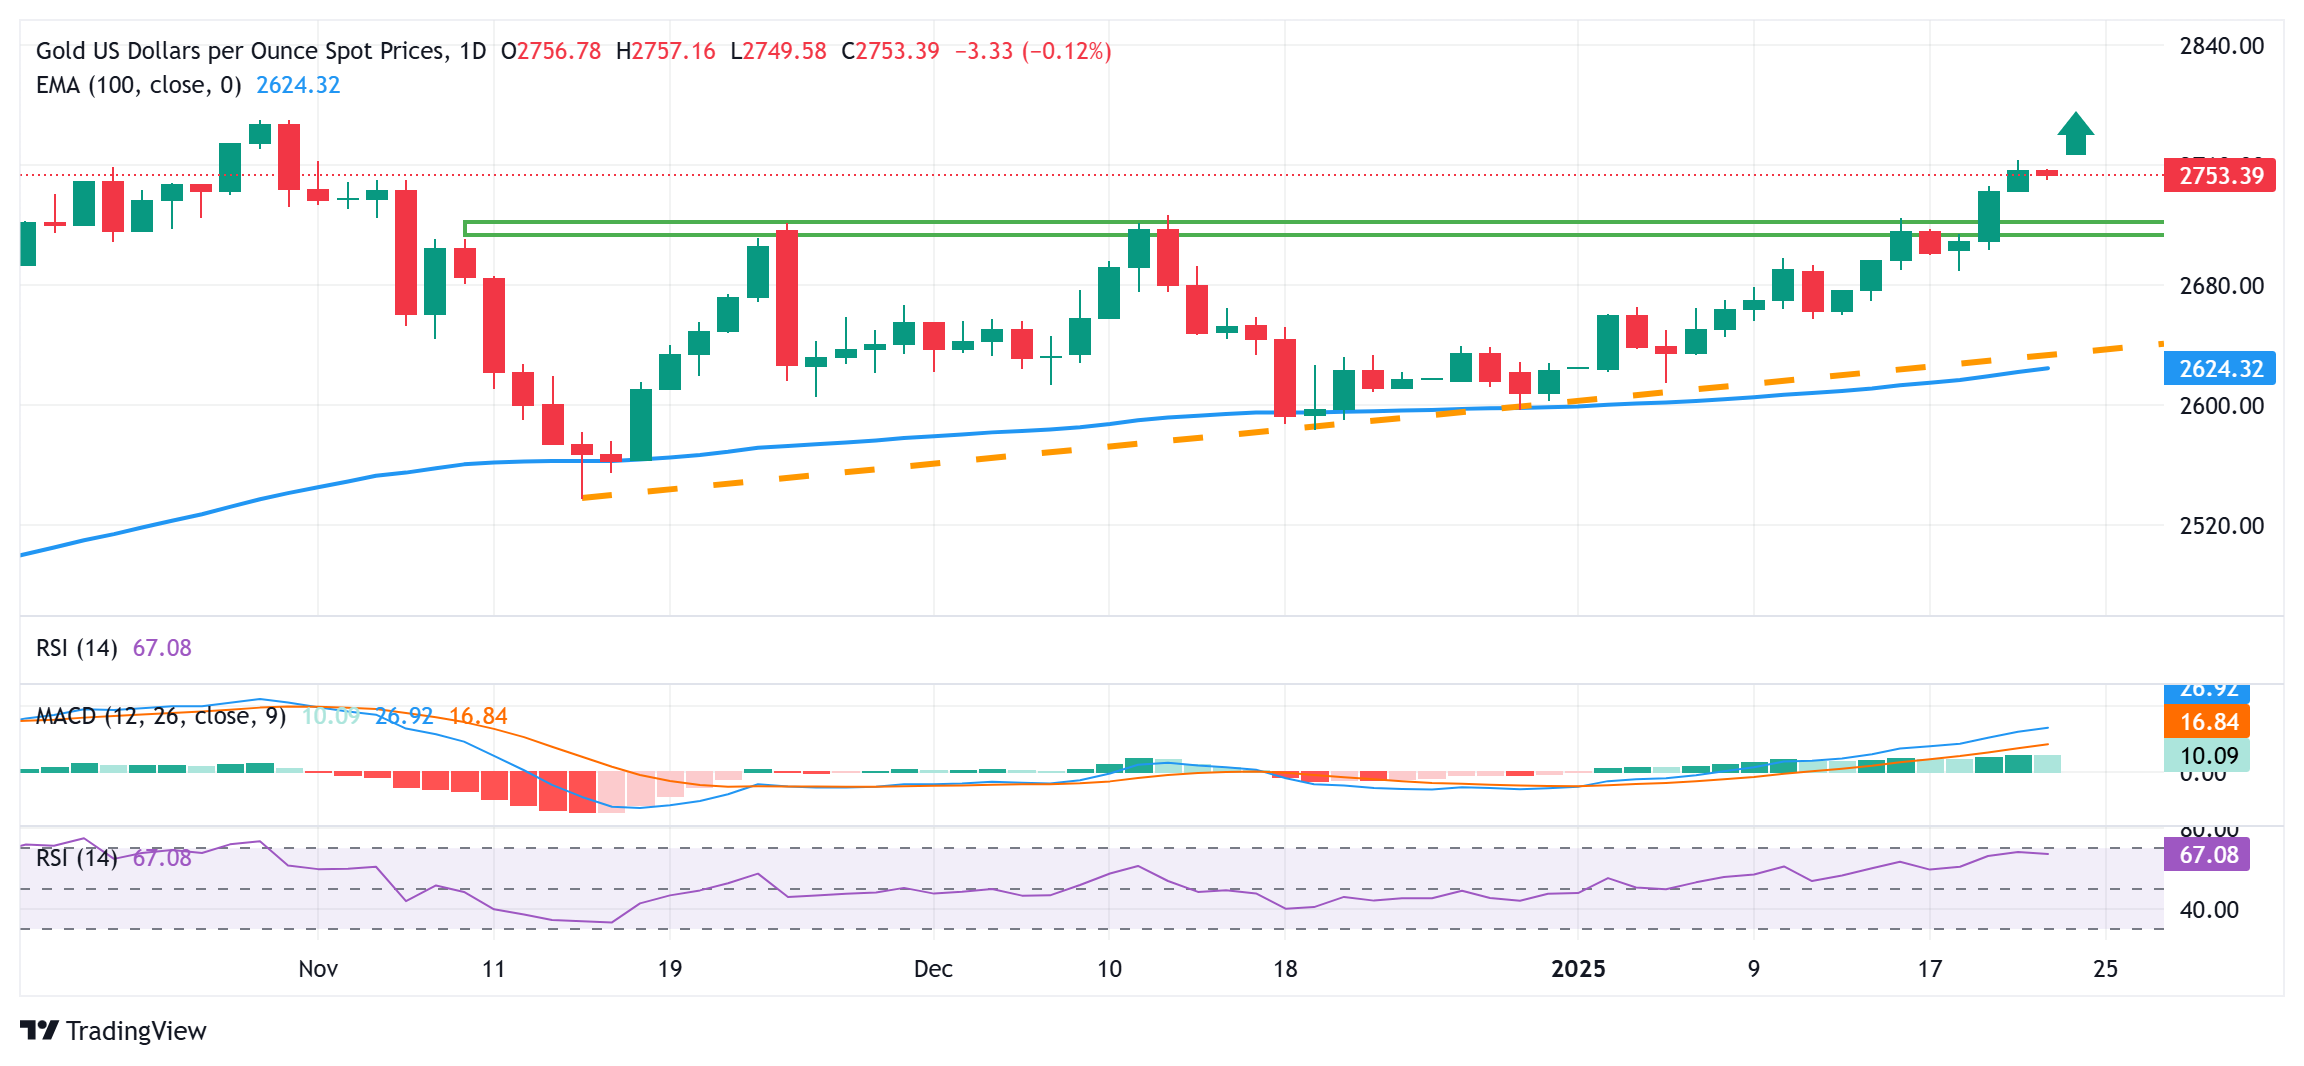
From a technical perspective, any subsequent slide is more likely to find decent support near the $2,625-2,620 strong horizontal resistance breakpoint, now turned support. Some follow-through selling could drag the Gold price to the $2,700 mark, which if broken decisively should pave the way for deeper losses. The XAU/USD might then fall towards the $2,665-2,662 area en route to the 2,627-2,622 confluence. The latter comprises the 100-day Exponential Moving Average (EMA) and a short-term ascending trend line, which, in turn, should act as a key pivotal point for short-term traders.
On the flip side, the overnight swing high, around the $2,763-2,764 area, now seems to offer some resistance, above which the Gold price could aim to challenge the all-time peak, around the $2,790 region touched in October. This is closely followed by the $2,800 mark, which if conquered will be seen as a fresh trigger for bullish trades and set the stage for an extension of the recent well-established uptrend witnessed over the past month or so.
Gold FAQs
Gold has played a key role in human’s history as it has been widely used as a store of value and medium of exchange. Currently, apart from its shine and usage for jewelry, the precious metal is widely seen as a safe-haven asset, meaning that it is considered a good investment during turbulent times. Gold is also widely seen as a hedge against inflation and against depreciating currencies as it doesn’t rely on any specific issuer or government.
Central banks are the biggest Gold holders. In their aim to support their currencies in turbulent times, central banks tend to diversify their reserves and buy Gold to improve the perceived strength of the economy and the currency. High Gold reserves can be a source of trust for a country’s solvency. Central banks added 1,136 tonnes of Gold worth around $70 billion to their reserves in 2022, according to data from the World Gold Council. This is the highest yearly purchase since records began. Central banks from emerging economies such as China, India and Turkey are quickly increasing their Gold reserves.
Gold has an inverse correlation with the US Dollar and US Treasuries, which are both major reserve and safe-haven assets. When the Dollar depreciates, Gold tends to rise, enabling investors and central banks to diversify their assets in turbulent times. Gold is also inversely correlated with risk assets. A rally in the stock market tends to weaken Gold price, while sell-offs in riskier markets tend to favor the precious metal.
The price can move due to a wide range of factors. Geopolitical instability or fears of a deep recession can quickly make Gold price escalate due to its safe-haven status. As a yield-less asset, Gold tends to rise with lower interest rates, while higher cost of money usually weighs down on the yellow metal. Still, most moves depend on how the US Dollar (USD) behaves as the asset is priced in dollars (XAU/USD). A strong Dollar tends to keep the price of Gold controlled, whereas a weaker Dollar is likely to push Gold prices up.
- USD/CAD could test 1.4485, the highest level since March 2020.
- The bullish bias persists, as the 14-day RSI stays above the 50 mark.
- Initial support for the pair is provided by the nine-day EMA at the 1.4377 level.
The USD/CAD pair continues its upward trend for the third consecutive session, hovering around 1.4390 during Thursday’s Asian trading hours. Technically, the daily chart shows the pair moving within an ascending channel, suggesting a prevailing bullish outlook.
The 14-day Relative Strength Index (RSI) remains just above the 50 mark, indicating sustained positive momentum. A sustained RSI above 50 would likely reinforce this bullish sentiment.
Additionally, the USD/CAD pair trades slightly above the nine- and 14-day Exponential Moving Averages (EMAs), further emphasizing the bullish trend and strong short-term price action. This alignment points to robust buying interest and signals the possibility of additional upward movement.
On the upside, the USD/CAD pair tests the psychological level of 1.4400, remaining poised to test 1.4485, its highest point since March 2020, reached on January 20. Further resistance is seen at the upper boundary of the ascending channel, close to the key psychological level of 1.4800.
Initial support is found around the nine-day EMA at 1.4377, followed by the 14-day EMA at 1.4374, which coincides with the lower boundary of the ascending channel.
USD/CAD: Daily Chart
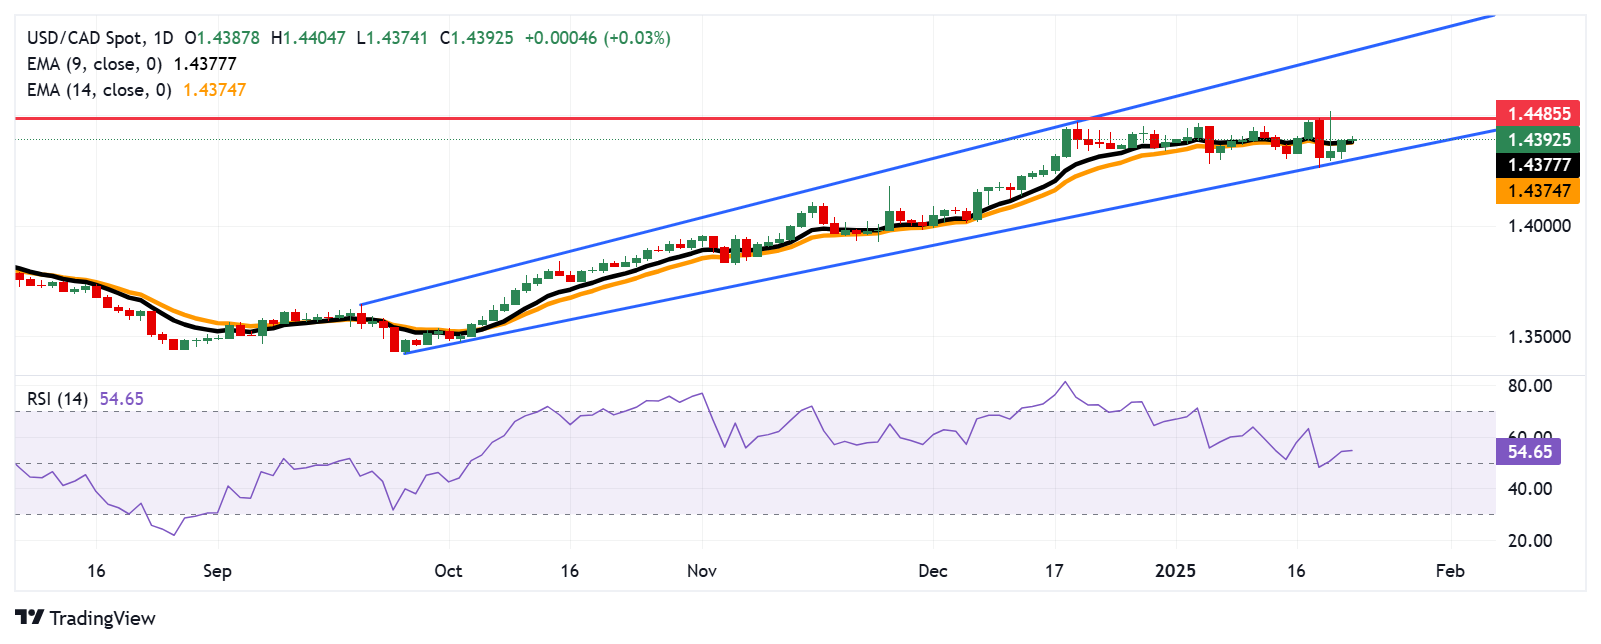
Canadian Dollar PRICE Today
The table below shows the percentage change of Canadian Dollar (CAD) against listed major currencies today. Canadian Dollar was the weakest against the Swiss Franc.
| USD | EUR | GBP | JPY | CAD | AUD | NZD | CHF | |
|---|---|---|---|---|---|---|---|---|
| USD | 0.03% | 0.01% | -0.02% | 0.01% | -0.01% | -0.01% | -0.03% | |
| EUR | -0.03% | -0.02% | -0.08% | -0.02% | -0.05% | -0.05% | -0.07% | |
| GBP | -0.01% | 0.02% | -0.04% | 0.00% | -0.03% | -0.02% | -0.05% | |
| JPY | 0.02% | 0.08% | 0.04% | 0.04% | 0.02% | -0.03% | -0.01% | |
| CAD | -0.01% | 0.02% | -0.00% | -0.04% | -0.02% | -0.03% | -0.05% | |
| AUD | 0.01% | 0.05% | 0.03% | -0.02% | 0.02% | 0.00% | -0.02% | |
| NZD | 0.01% | 0.05% | 0.02% | 0.03% | 0.03% | -0.00% | -0.02% | |
| CHF | 0.03% | 0.07% | 0.05% | 0.01% | 0.05% | 0.02% | 0.02% |
The heat map shows percentage changes of major currencies against each other. The base currency is picked from the left column, while the quote currency is picked from the top row. For example, if you pick the Canadian Dollar from the left column and move along the horizontal line to the US Dollar, the percentage change displayed in the box will represent CAD (base)/USD (quote).
- Silver prices decline as the US Dollar strengthens, with expectations that the Fed will maintain its rate in January.
- Silver demand could rise due to persistent concerns over supply issues, especially in London vaults, coupled with robust industrial demand.
- Silver futures premiums decrease following reports that Trump plans to delay new tariffs.
Silver price (XAG/USD) pauses its three-day rally, trading around $30.60 during the Asian session on Thursday. Dollar-denominated Silver encounters challenges as the US Dollar is likely to strengthen, with traders anticipating that the US Federal Reserve (Fed) will maintain its benchmark overnight rate in the 4.25%-4.50% range during its January meeting.
Additionally, US President Donald Trump’s policies could increase inflationary pressures, potentially limiting the Fed to just one more rate cut. This could bolster the Greenback and reduce demand for commodities like Silver.
However, Silver demand may be strengthened by ongoing concerns about supply issues, particularly in London vaults, along with strong industrial demand, especially in manufacturing, which has supported the grey metal.
Initially, US President Donald Trump’s tariff threats had pushed premiums for Silver futures higher as traders prepared for possible disruptions. However, reports that Trump would postpone new tariffs helped alleviate some of the pressure, leading to a reduction in premiums.
On Tuesday night, President Trump announced plans to impose a 25% tariff on imports from Canada and Mexico, as well as duties on the European Union. He also revealed intentions to implement a 10% tariff on Chinese imports starting February 1, citing concerns over fentanyl shipments from China to Mexico and Canada, according to Reuters.
In reaction, Chinese Vice Premier Ding Xuexiang cautioned on Tuesday about the potential consequences of a trade war, stating that "there are no winners" in such conflicts. His comments come as China prepares for the possibility of new tariffs under the Trump administration, as reported by CNBC.
Silver FAQs
Silver is a precious metal highly traded among investors. It has been historically used as a store of value and a medium of exchange. Although less popular than Gold, traders may turn to Silver to diversify their investment portfolio, for its intrinsic value or as a potential hedge during high-inflation periods. Investors can buy physical Silver, in coins or in bars, or trade it through vehicles such as Exchange Traded Funds, which track its price on international markets.
Silver prices can move due to a wide range of factors. Geopolitical instability or fears of a deep recession can make Silver price escalate due to its safe-haven status, although to a lesser extent than Gold's. As a yieldless asset, Silver tends to rise with lower interest rates. Its moves also depend on how the US Dollar (USD) behaves as the asset is priced in dollars (XAG/USD). A strong Dollar tends to keep the price of Silver at bay, whereas a weaker Dollar is likely to propel prices up. Other factors such as investment demand, mining supply – Silver is much more abundant than Gold – and recycling rates can also affect prices.
Silver is widely used in industry, particularly in sectors such as electronics or solar energy, as it has one of the highest electric conductivity of all metals – more than Copper and Gold. A surge in demand can increase prices, while a decline tends to lower them. Dynamics in the US, Chinese and Indian economies can also contribute to price swings: for the US and particularly China, their big industrial sectors use Silver in various processes; in India, consumers’ demand for the precious metal for jewellery also plays a key role in setting prices.
Silver prices tend to follow Gold's moves. When Gold prices rise, Silver typically follows suit, as their status as safe-haven assets is similar. The Gold/Silver ratio, which shows the number of ounces of Silver needed to equal the value of one ounce of Gold, may help to determine the relative valuation between both metals. Some investors may consider a high ratio as an indicator that Silver is undervalued, or Gold is overvalued. On the contrary, a low ratio might suggest that Gold is undervalued relative to Silver.
- The Indian Rupee softens in Thursday’s Asian trading hours.
- Persistent outflows from foreign investors, renewed USD demand and uncertainties weigh on the INR.
- The US weekly initial Jobless Claims data is due later on Thursday.
The Indian Rupee (INR) edges lower on Thursday. The continued selling by Foreign Institutional Investors (FIIs), US Dollar (USD) demand from importers and global uncertainties continue to undermine the local currency.
Nonetheless, lower crude oil prices might help limit the INR’s losses as India is the world's third-largest oil consumer. The Reserve Bank of India (RBI) likely played a key role by conducting dollar-rupee swaps to manage liquidity and support the Indian Rupee.
Investors brace for the US weekly initial Jobless Claims data, which is due later on Thursday. On Friday, the preliminary reading of HSBC India’s Purchasing Managers Index (PMI) and US S&P PMI data for January will be in the spotlight.
Indian Rupee remains weak amidst persistent global uncertainties
- The Securities and Exchange Board of India (SEBI) has proposed that fund houses launch sachet-sized investment plans. The objective is to "promote financial inclusion, inculcate the habit of systematic saving, and facilitate investment of small savings by investors new to the Mutual Fund space,” noted SEBI.
- India is likely to raise major subsidies by 8% year-on-year to 4.1 trillion rupees ($47.41 billion) in the next fiscal year, government sources said.
- Indian Finance Minister Nirmala Sitharaman will present the national budget on February 1, amid slowing growth in Asia's third-largest economy and rising global uncertainties.
- Foreign investors have sold a net total of about $6.5 billion worth of local equities and bonds in January, the largest monthly outflow since October 2023.
USD/INR keeps the bullish vibe in the longer term
The Indian Rupee trades in negative territory on the day. The constructive outlook of the USD/INR pair remains intact as the price has formed higher highs and higher lows while holding above the key 100-day Exponential Moving Average (EMA) on the daily chart. Furthermore, the 14-day Relative Strength Index (RSI) stands above the midline near 67.30, suggesting that the support is likely to hold rather than break.
The key resistance level for the pair emerges at an all-time high of 86.69. Sustained bullish momentum above this level could pave the way for a rally to the 87.00 psychological mark.
On the other hand, any follow-through selling below 86.18, the low of January 20, could expose 85.85, the low of January 10. The additional downside filter to watch is 85.65, the low of January 7.
Indian Rupee FAQs
The Indian Rupee (INR) is one of the most sensitive currencies to external factors. The price of Crude Oil (the country is highly dependent on imported Oil), the value of the US Dollar – most trade is conducted in USD – and the level of foreign investment, are all influential. Direct intervention by the Reserve Bank of India (RBI) in FX markets to keep the exchange rate stable, as well as the level of interest rates set by the RBI, are further major influencing factors on the Rupee.
The Reserve Bank of India (RBI) actively intervenes in forex markets to maintain a stable exchange rate, to help facilitate trade. In addition, the RBI tries to maintain the inflation rate at its 4% target by adjusting interest rates. Higher interest rates usually strengthen the Rupee. This is due to the role of the ‘carry trade’ in which investors borrow in countries with lower interest rates so as to place their money in countries’ offering relatively higher interest rates and profit from the difference.
Macroeconomic factors that influence the value of the Rupee include inflation, interest rates, the economic growth rate (GDP), the balance of trade, and inflows from foreign investment. A higher growth rate can lead to more overseas investment, pushing up demand for the Rupee. A less negative balance of trade will eventually lead to a stronger Rupee. Higher interest rates, especially real rates (interest rates less inflation) are also positive for the Rupee. A risk-on environment can lead to greater inflows of Foreign Direct and Indirect Investment (FDI and FII), which also benefit the Rupee.
Higher inflation, particularly, if it is comparatively higher than India’s peers, is generally negative for the currency as it reflects devaluation through oversupply. Inflation also increases the cost of exports, leading to more Rupees being sold to purchase foreign imports, which is Rupee-negative. At the same time, higher inflation usually leads to the Reserve Bank of India (RBI) raising interest rates and this can be positive for the Rupee, due to increased demand from international investors. The opposite effect is true of lower inflation.
- The Japanese Yen ticks higher after upbeat domestic data, though it lacks follow-through.
- Concerns about Trump’s tariff plans and the risk-on mood cap gains for the safe-haven JPY.
- Traders look to Trump’s speech for a fresh impetus ahead of the BoJ decision on Friday.
The Japanese Yen (JPY) edges higher during the Asian session on Thursday following the better-than-expected release of Trade Balance data from Japan, though it remains close to a one-week low against its American counterpart touched the previous day. The prospects for an imminent interest rate hike by the Bank of Japan (BoJ) on Friday continue to underpin the JPY. Moreover, subdued US Dollar (USD) price action, amid bets that the Federal Reserve (Fed) will cut interest rates twice this year, cap the USD/JPY pair's recovery from over a one-month low touched on Tuesday.
The JPY bulls, however, seem reluctant and opt to wait on the sidelines ahead of the crucial two-day BoJ policy meeting starting this Thursday. Furthermore, concerns about US President Donald Trump's tariff plans and the risk-on mood might keep a lid on any further JPY appreciation. That said, the divergent BoJ-Fed policy expectations warrant some caution before confirming that the USD/JPY pair has formed a near-term bottom. Traders now look to Trump's speech at the World Economic Forum for some impetus ahead of the highly-anticipated BoJ decision on Friday.
Japanese Yen bulls are not ready to give up amid bets for an imminent BoJ rate hike
- The Japanese Yen ticked higher after government data released this Thursday showed that Japan recorded a trade surplus of ¥130.9 billion in December, compared to expectations for a deficit of ¥55 billion.
- The turnaround was driven chiefly by resilient exports, which grew more than expected, by the 2.8% YoY rate in December. This, however, marked a notable slowdown from the 3.8% rise seen in the prior month.
- Meanwhile, imports picked up after contracting by the 3.8% YoY rate in November and grew 1.8% last month, missing consensus estimates for a 2.6% rise and indicating that local demand remains subdued.
- Annual spring wage negotiations kicked off in Japan on Wednesday, with the leaders of the top business lobby and the biggest labor unions agreeing on the need for pay hikes for more workers amid soaring prices.
- The Bank of Japan, which is scheduled to announce its monetary policy decision on Friday, has repeatedly said that sustained and broad-based wage hikes are a prerequisite to raising short-term interest rates.
- The markets are pricing in over a 90% chance that the BoJ will raise interest rates at the end of the January 23-24 meeting, from 0.25% to 0.50%, which would be the highest since the 2008 global financial crisis.
- This marks a big divergence in comparison to market expectations that the Federal Reserve will lower borrowing costs at least two times by the end of this year amid signs of abating inflationary pressures in the US.
- Some follow-through uptick in the US Treasury bond yields assists the US Dollar in holding steady above the monthly low touched on Wednesday and acts as a tailwind for the USD/JPY pair amid the risk-on mood.
- Investors now look forward to the release of the US Weekly Initial Jobless Claims for some impetus ahead of US President Donald Trump's speech later today and the outcome of a two-day BoJ policy meeting on Friday.
USD/JPY technical setup supports prospects of a move beyond the 157.00 mark
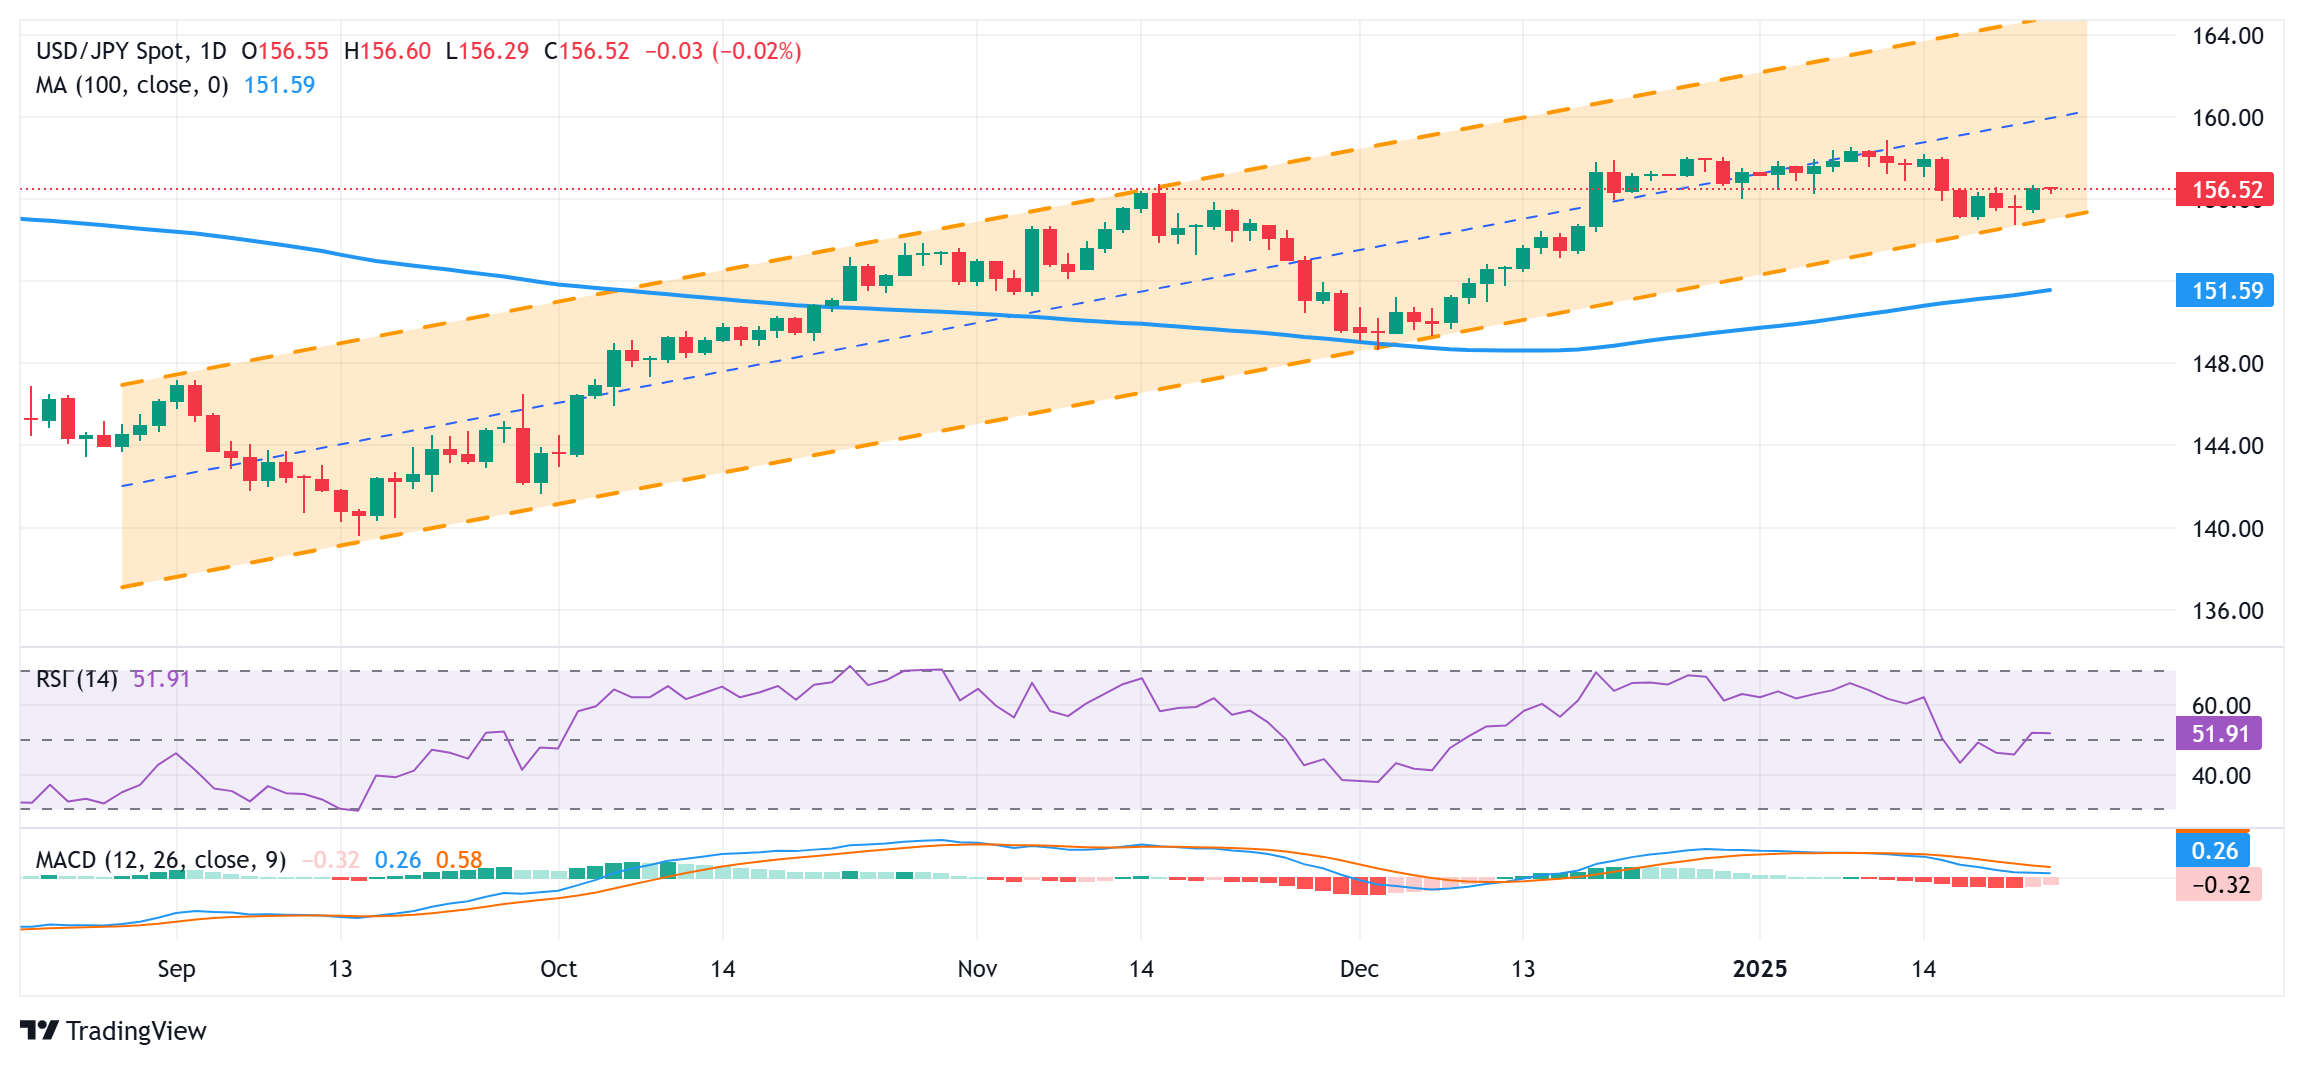
From a technical perspective, spot prices earlier this week found decent support and bounced off the lower end of a multi-month-old ascending channel. The subsequent strength beyond the 156.00 mark and the 156.30-156.35 area favors bullish traders. Moreover, oscillators on the daily chart have again started gaining positive traction and support prospects for further gains. Hence, some follow-through move towards the 156.75-156.80 region, en route to the 157.00 round figure, looks like a distinct possibility. The latter should act as a key pivotal point, which if cleared decisively should pave the way for a further move up towards the 157.55 area, the 158.00 mark, the 158.35-158.40 region and the 159.00 neighborhood, or a multi-month top touched on January 10.
On the flip side, the 156.30-156.25 area now seems to protect the immediate downside ahead of the 156.00 mark. The next relevant support is pegged near the 155.55-155.50 area, below which the USD/JPY pair could accelerate the fall towards the 155.00 psychological mark, which now coincides with the lower boundary of the ascending channel. Some follow-through selling below the 154.80-154.75 region, or over a one-month low touched on Tuesday, will be seen as a fresh trigger for bearish traders and drag spot prices to the 154.00 round figure en route to mid-153.00s and the 153.00 mark.
Japanese Yen FAQs
The Japanese Yen (JPY) is one of the world’s most traded currencies. Its value is broadly determined by the performance of the Japanese economy, but more specifically by the Bank of Japan’s policy, the differential between Japanese and US bond yields, or risk sentiment among traders, among other factors.
One of the Bank of Japan’s mandates is currency control, so its moves are key for the Yen. The BoJ has directly intervened in currency markets sometimes, generally to lower the value of the Yen, although it refrains from doing it often due to political concerns of its main trading partners. The BoJ ultra-loose monetary policy between 2013 and 2024 caused the Yen to depreciate against its main currency peers due to an increasing policy divergence between the Bank of Japan and other main central banks. More recently, the gradually unwinding of this ultra-loose policy has given some support to the Yen.
Over the last decade, the BoJ’s stance of sticking to ultra-loose monetary policy has led to a widening policy divergence with other central banks, particularly with the US Federal Reserve. This supported a widening of the differential between the 10-year US and Japanese bonds, which favored the US Dollar against the Japanese Yen. The BoJ decision in 2024 to gradually abandon the ultra-loose policy, coupled with interest-rate cuts in other major central banks, is narrowing this differential.
The Japanese Yen is often seen as a safe-haven investment. This means that in times of market stress, investors are more likely to put their money in the Japanese currency due to its supposed reliability and stability. Turbulent times are likely to strengthen the Yen’s value against other currencies seen as more risky to invest in.
| Raw materials | Closed | Change, % |
|---|---|---|
| Silver | 30.796 | -0.01 |
| Gold | 2756.07 | 0.45 |
| Palladium | 982.24 | 2.17 |
- The Australian Dollar strengthened as President Trump's revised tariffs on China turned out to be significantly smaller than initially anticipated.
- Trump announced plans to impose a 10% tariff on Chinese imports beginning February 1.
- The S&P/ASX 200 Index declined, driven by a drop in mining stocks as weaker commodity prices put pressure on the sector.
The Australian Dollar (AUD) remains steady against the US Dollar (USD) on Thursday, as market concerns eased following news that the China-specific tariffs proposed under US President Donald Trump’s revised plan are significantly smaller than initially expected. This development helped calm investors' nerves, especially given the strong trade ties between China and Australia, which make Australian markets sensitive to changes in China's economic landscape.
President Trump announced plans to implement a 10% tariff on Chinese imports starting February 1, citing concerns over fentanyl shipments from China to Mexico and Canada, according to Reuters. In response, Chinese Vice Premier Ding Xuexiang warned on Tuesday about the potential trade war fallout, stating that "there are no winners" in such conflicts. His remarks come as China braces for possible tariffs under the Trump administration, as reported by CNBC.
The S&P/ASX 200 Index fell to near 8,400 on Thursday, driven primarily by a decline in mining stocks as weaker commodity prices weighed on the sector. This downturn occurred despite strong gains on Wall Street. Investors remain cautious as they assess the implications of President Trump’s policy changes.
Australian Dollar appreciates as market concerns ease regarding Trump tariffs
- The US Dollar Index (DXY), which tracks the performance of the US Dollar against six major currencies, maintains its position above 108.00 at the time of writing. The Greenback received support as President Donald Trump issued a memorandum instructing federal agencies to investigate and address ongoing trade deficits.
- Traders will likely monitor Friday's release of the preliminary US S&P Global Purchasing Managers Index (PMI) and the Michigan Consumer Sentiment Index for January. These indicators are likely to provide valuable insights into near-term economic trends.
- The US Dollar could appreciate as traders expect the US Federal Reserve (Fed) to keep its benchmark overnight rate steady in the 4.25%-4.50% range at its January meeting. Moreover, Trump’s policies could drive inflationary pressures, potentially limiting the Fed to just one more rate cut.
- US Retail Sales rose by 0.4% MoM in December, reaching $729.2 billion. This reading was weaker than the market expectations of a 0.6% rise and lower than the previous reading of a 0.8% increase (revised from 0.7%).
- The US Consumer Price Index increased by 2.9% year-over-year in December, up from 2.7% in November, aligning with market expectations. Monthly, CPI rose 0.4%, following a 0.3% increase in the previous month. US Core CPI, which excludes volatile food and energy prices, rose 3.2% annually in December, slightly below November's figure and analysts' forecasts of 3.3%.
- Traders are increasingly expecting the Reserve Bank of Australia (RBA) to start cutting interest rates as soon as next month. This outlook is fueled by weaker core inflation data, which has fallen to its lowest level since Q4 2021, nearing the RBA's target range of 2% to 3%. All eyes are now on Australia's upcoming quarterly inflation report, set for release next week, as it could offer additional clues about the future direction of interest rates.
Technical Analysis: Australian Dollar remains below 0.6300, ascending channel’s upper boundary
The AUD/USD pair trades near 0.6270 on Thursday, with a daily chart analysis indicating movement within an ascending channel pattern, suggesting a potential bullish bias. Additionally, the 14-day Relative Strength Index (RSI) is slightly above 50, reinforcing positive market sentiment.
On the upside, the AUD/USD pair could test the psychological resistance level at 0.6300, with the next target near the upper boundary of the ascending channel around 0.6320.
The initial support appears at the nine-day Exponential Moving Average (EMA) at 0.6244, followed by the 14-day EMA at 0.6238. Stronger support is seen at the ascending channel's lower boundary around 0.6220, with further support at the psychological level of 0.6200.
AUD/USD: Daily Chart
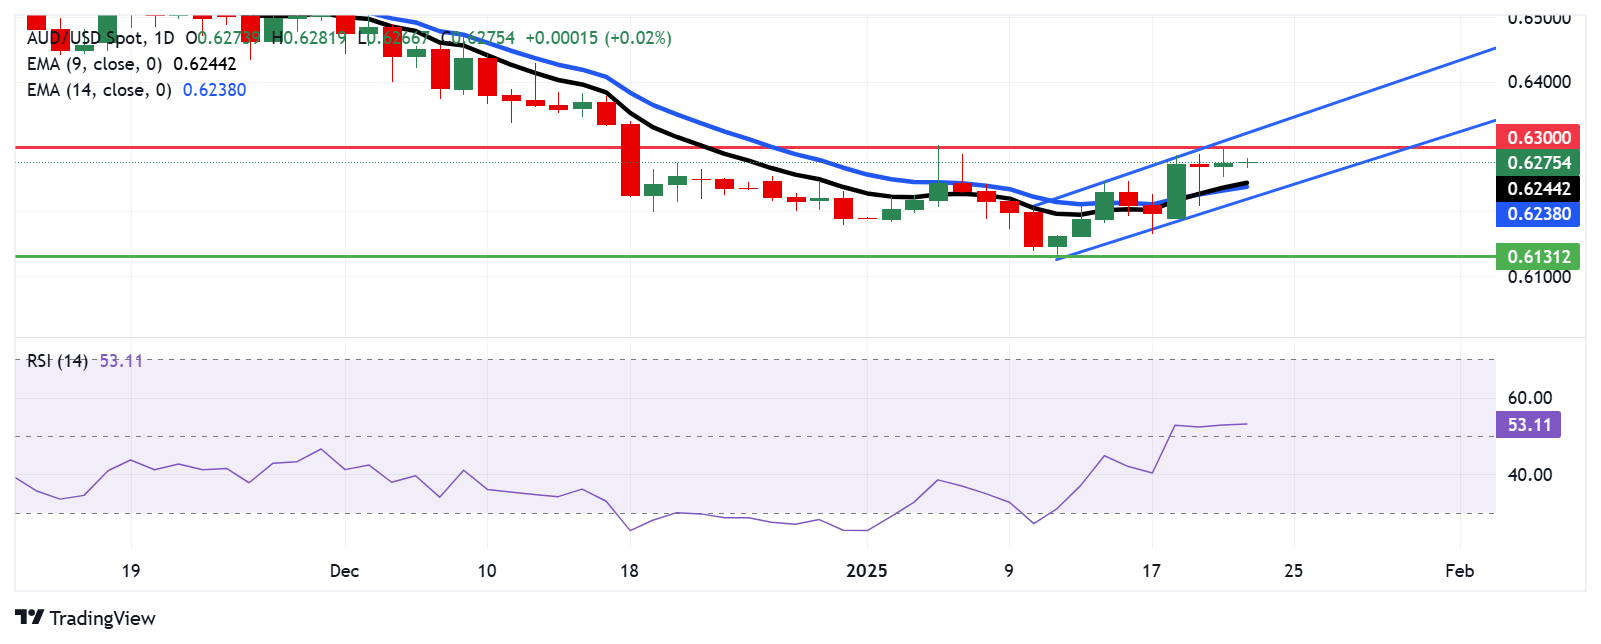
Australian Dollar PRICE Today
The table below shows the percentage change of Australian Dollar (AUD) against listed major currencies today. Australian Dollar was the strongest against the Euro.
| USD | EUR | GBP | JPY | CAD | AUD | NZD | CHF | |
|---|---|---|---|---|---|---|---|---|
| USD | 0.06% | 0.03% | -0.02% | 0.03% | -0.03% | -0.00% | -0.05% | |
| EUR | -0.06% | -0.03% | -0.08% | -0.03% | -0.09% | -0.06% | -0.11% | |
| GBP | -0.03% | 0.03% | -0.06% | 0.00% | -0.06% | -0.02% | -0.08% | |
| JPY | 0.02% | 0.08% | 0.06% | 0.06% | 0.01% | -0.01% | -0.02% | |
| CAD | -0.03% | 0.03% | -0.00% | -0.06% | -0.05% | -0.03% | -0.08% | |
| AUD | 0.03% | 0.09% | 0.06% | -0.01% | 0.05% | 0.04% | -0.01% | |
| NZD | 0.00% | 0.06% | 0.02% | 0.00% | 0.03% | -0.04% | -0.05% | |
| CHF | 0.05% | 0.11% | 0.08% | 0.02% | 0.08% | 0.00% | 0.05% |
The heat map shows percentage changes of major currencies against each other. The base currency is picked from the left column, while the quote currency is picked from the top row. For example, if you pick the Australian Dollar from the left column and move along the horizontal line to the US Dollar, the percentage change displayed in the box will represent AUD (base)/USD (quote).
Australian Dollar FAQs
One of the most significant factors for the Australian Dollar (AUD) is the level of interest rates set by the Reserve Bank of Australia (RBA). Because Australia is a resource-rich country another key driver is the price of its biggest export, Iron Ore. The health of the Chinese economy, its largest trading partner, is a factor, as well as inflation in Australia, its growth rate and Trade Balance. Market sentiment – whether investors are taking on more risky assets (risk-on) or seeking safe-havens (risk-off) – is also a factor, with risk-on positive for AUD.
The Reserve Bank of Australia (RBA) influences the Australian Dollar (AUD) by setting the level of interest rates that Australian banks can lend to each other. This influences the level of interest rates in the economy as a whole. The main goal of the RBA is to maintain a stable inflation rate of 2-3% by adjusting interest rates up or down. Relatively high interest rates compared to other major central banks support the AUD, and the opposite for relatively low. The RBA can also use quantitative easing and tightening to influence credit conditions, with the former AUD-negative and the latter AUD-positive.
China is Australia’s largest trading partner so the health of the Chinese economy is a major influence on the value of the Australian Dollar (AUD). When the Chinese economy is doing well it purchases more raw materials, goods and services from Australia, lifting demand for the AUD, and pushing up its value. The opposite is the case when the Chinese economy is not growing as fast as expected. Positive or negative surprises in Chinese growth data, therefore, often have a direct impact on the Australian Dollar and its pairs.
Iron Ore is Australia’s largest export, accounting for $118 billion a year according to data from 2021, with China as its primary destination. The price of Iron Ore, therefore, can be a driver of the Australian Dollar. Generally, if the price of Iron Ore rises, AUD also goes up, as aggregate demand for the currency increases. The opposite is the case if the price of Iron Ore falls. Higher Iron Ore prices also tend to result in a greater likelihood of a positive Trade Balance for Australia, which is also positive of the AUD.
The Trade Balance, which is the difference between what a country earns from its exports versus what it pays for its imports, is another factor that can influence the value of the Australian Dollar. If Australia produces highly sought after exports, then its currency will gain in value purely from the surplus demand created from foreign buyers seeking to purchase its exports versus what it spends to purchase imports. Therefore, a positive net Trade Balance strengthens the AUD, with the opposite effect if the Trade Balance is negative.
- NZD/USD recovers to around 0.5670 in Thursday’s Asian session.
- Trump tariff threats could weaken the Kiwi in the near term.
- Chinese officials announced fresh measures to boost long-term funds for equity markets.
The NZD/USD pair trades in positive territory around 0.5670 during the early Asian session on Thursday. The New Zealand Dollar (NZD) edges higher following the announcement about fresh stimulus measures from China and New Zealand. Traders will keep an eye on the US weekly initial Jobless Claims data, which is due later on Thursday.
Trump said that the administration was considering imposing a 10% tariff on Chinese-made goods arriving in the US from as early as 1 February. This action came a day after Trump stated that he was thinking about introducing 25% tariffs on imports from Mexico and Canada on February 1. The concerns about the renewed trade war between the US and China, along with the Trump tariff threats, could exert some selling pressure on the China-proxy Kiwi, as China is a major trading partner to New Zealand.
On the other hand, fresh stimulus measures from New Zealand and China might help limit the NZD’s losses. Early Thursday, Prime Minister Christopher Luxon announced that the country will loosen foreign investment regulations to attract and support foreign investors into New Zealand.
Additionally, Chinese officials on Thursday introduced several measures to stabilize its stock markets, including allowing pension funds to increase investments in domestic equities. Chinese authorities said there will be hundreds of billions of Yuan in new long-term capital for A-shares every year from state-owned insurance companies. Large state-owned commercial insurance companies still have room to increase their capital market investment.
New Zealand Dollar FAQs
The New Zealand Dollar (NZD), also known as the Kiwi, is a well-known traded currency among investors. Its value is broadly determined by the health of the New Zealand economy and the country’s central bank policy. Still, there are some unique particularities that also can make NZD move. The performance of the Chinese economy tends to move the Kiwi because China is New Zealand’s biggest trading partner. Bad news for the Chinese economy likely means less New Zealand exports to the country, hitting the economy and thus its currency. Another factor moving NZD is dairy prices as the dairy industry is New Zealand’s main export. High dairy prices boost export income, contributing positively to the economy and thus to the NZD.
The Reserve Bank of New Zealand (RBNZ) aims to achieve and maintain an inflation rate between 1% and 3% over the medium term, with a focus to keep it near the 2% mid-point. To this end, the bank sets an appropriate level of interest rates. When inflation is too high, the RBNZ will increase interest rates to cool the economy, but the move will also make bond yields higher, increasing investors’ appeal to invest in the country and thus boosting NZD. On the contrary, lower interest rates tend to weaken NZD. The so-called rate differential, or how rates in New Zealand are or are expected to be compared to the ones set by the US Federal Reserve, can also play a key role in moving the NZD/USD pair.
Macroeconomic data releases in New Zealand are key to assess the state of the economy and can impact the New Zealand Dollar’s (NZD) valuation. A strong economy, based on high economic growth, low unemployment and high confidence is good for NZD. High economic growth attracts foreign investment and may encourage the Reserve Bank of New Zealand to increase interest rates, if this economic strength comes together with elevated inflation. Conversely, if economic data is weak, NZD is likely to depreciate.
The New Zealand Dollar (NZD) tends to strengthen during risk-on periods, or when investors perceive that broader market risks are low and are optimistic about growth. This tends to lead to a more favorable outlook for commodities and so-called ‘commodity currencies’ such as the Kiwi. Conversely, NZD tends to weaken at times of market turbulence or economic uncertainty as investors tend to sell higher-risk assets and flee to the more-stable safe havens.
Chinese authorities on Thursday introduced several measures to stabilize its stock markets, including allowing pension funds to increase investments in domestic equities.
Chinese officials said there will be hundreds of billions of Yuan in new long-term capital for A-shares every year from state-owned insurance companies. A pilot scheme enabling insurers to purchase equities will be launched in the first half of 2025, with an initial scale of at least 100 billion Yuan.
This action came after Chinese equities had their worst start to the year in over a decade, following a volatile 2024 due to property market woes and weak consumer demand.
Market reaction
At the press time, the NZD/USD pair is up 0.03% on the day to trade at 0.6275.
Australian Dollar FAQs
One of the most significant factors for the Australian Dollar (AUD) is the level of interest rates set by the Reserve Bank of Australia (RBA). Because Australia is a resource-rich country another key driver is the price of its biggest export, Iron Ore. The health of the Chinese economy, its largest trading partner, is a factor, as well as inflation in Australia, its growth rate and Trade Balance. Market sentiment – whether investors are taking on more risky assets (risk-on) or seeking safe-havens (risk-off) – is also a factor, with risk-on positive for AUD.
The Reserve Bank of Australia (RBA) influences the Australian Dollar (AUD) by setting the level of interest rates that Australian banks can lend to each other. This influences the level of interest rates in the economy as a whole. The main goal of the RBA is to maintain a stable inflation rate of 2-3% by adjusting interest rates up or down. Relatively high interest rates compared to other major central banks support the AUD, and the opposite for relatively low. The RBA can also use quantitative easing and tightening to influence credit conditions, with the former AUD-negative and the latter AUD-positive.
China is Australia’s largest trading partner so the health of the Chinese economy is a major influence on the value of the Australian Dollar (AUD). When the Chinese economy is doing well it purchases more raw materials, goods and services from Australia, lifting demand for the AUD, and pushing up its value. The opposite is the case when the Chinese economy is not growing as fast as expected. Positive or negative surprises in Chinese growth data, therefore, often have a direct impact on the Australian Dollar and its pairs.
Iron Ore is Australia’s largest export, accounting for $118 billion a year according to data from 2021, with China as its primary destination. The price of Iron Ore, therefore, can be a driver of the Australian Dollar. Generally, if the price of Iron Ore rises, AUD also goes up, as aggregate demand for the currency increases. The opposite is the case if the price of Iron Ore falls. Higher Iron Ore prices also tend to result in a greater likelihood of a positive Trade Balance for Australia, which is also positive of the AUD.
The Trade Balance, which is the difference between what a country earns from its exports versus what it pays for its imports, is another factor that can influence the value of the Australian Dollar. If Australia produces highly sought after exports, then its currency will gain in value purely from the surplus demand created from foreign buyers seeking to purchase its exports versus what it spends to purchase imports. Therefore, a positive net Trade Balance strengthens the AUD, with the opposite effect if the Trade Balance is negative.
New Zealand’s Prime Minister Christopher Luxon said early Thursday that he will take any action necessary to improve competition in critical sectors such as banking, energy, and groceries.
Luxon further stated that the country will loosen foreign investment regulations to attract and support foreign investors into New Zealand.
Market reaction
At the press time, the NZD/USD pair is up 0.06% on the day to trade at 0.5668.
New Zealand Dollar FAQs
The New Zealand Dollar (NZD), also known as the Kiwi, is a well-known traded currency among investors. Its value is broadly determined by the health of the New Zealand economy and the country’s central bank policy. Still, there are some unique particularities that also can make NZD move. The performance of the Chinese economy tends to move the Kiwi because China is New Zealand’s biggest trading partner. Bad news for the Chinese economy likely means less New Zealand exports to the country, hitting the economy and thus its currency. Another factor moving NZD is dairy prices as the dairy industry is New Zealand’s main export. High dairy prices boost export income, contributing positively to the economy and thus to the NZD.
The Reserve Bank of New Zealand (RBNZ) aims to achieve and maintain an inflation rate between 1% and 3% over the medium term, with a focus to keep it near the 2% mid-point. To this end, the bank sets an appropriate level of interest rates. When inflation is too high, the RBNZ will increase interest rates to cool the economy, but the move will also make bond yields higher, increasing investors’ appeal to invest in the country and thus boosting NZD. On the contrary, lower interest rates tend to weaken NZD. The so-called rate differential, or how rates in New Zealand are or are expected to be compared to the ones set by the US Federal Reserve, can also play a key role in moving the NZD/USD pair.
Macroeconomic data releases in New Zealand are key to assess the state of the economy and can impact the New Zealand Dollar’s (NZD) valuation. A strong economy, based on high economic growth, low unemployment and high confidence is good for NZD. High economic growth attracts foreign investment and may encourage the Reserve Bank of New Zealand to increase interest rates, if this economic strength comes together with elevated inflation. Conversely, if economic data is weak, NZD is likely to depreciate.
The New Zealand Dollar (NZD) tends to strengthen during risk-on periods, or when investors perceive that broader market risks are low and are optimistic about growth. This tends to lead to a more favorable outlook for commodities and so-called ‘commodity currencies’ such as the Kiwi. Conversely, NZD tends to weaken at times of market turbulence or economic uncertainty as investors tend to sell higher-risk assets and flee to the more-stable safe havens.
The People’s Bank of China (PBOC) set the USD/CNY central rate for the trading session ahead on Thursday at 7.1708 as compared to the previous day's fix of 7.1696 and 7.2896 Reuters estimates.
PBOC FAQs
The primary monetary policy objectives of the People's Bank of China (PBoC) are to safeguard price stability, including exchange rate stability, and promote economic growth. China’s central bank also aims to implement financial reforms, such as opening and developing the financial market.
The PBoC is owned by the state of the People's Republic of China (PRC), so it is not considered an autonomous institution. The Chinese Communist Party (CCP) Committee Secretary, nominated by the Chairman of the State Council, has a key influence on the PBoC’s management and direction, not the governor. However, Mr. Pan Gongsheng currently holds both of these posts.
Unlike the Western economies, the PBoC uses a broader set of monetary policy instruments to achieve its objectives. The primary tools include a seven-day Reverse Repo Rate (RRR), Medium-term Lending Facility (MLF), foreign exchange interventions and Reserve Requirement Ratio (RRR). However, The Loan Prime Rate (LPR) is China’s benchmark interest rate. Changes to the LPR directly influence the rates that need to be paid in the market for loans and mortgages and the interest paid on savings. By changing the LPR, China’s central bank can also influence the exchange rates of the Chinese Renminbi.
Yes, China has 19 private banks – a small fraction of the financial system. The largest private banks are digital lenders WeBank and MYbank, which are backed by tech giants Tencent and Ant Group, per The Straits Times. In 2014, China allowed domestic lenders fully capitalized by private funds to operate in the state-dominated financial sector.
| Index | Change, points | Closed | Change, % |
|---|---|---|---|
| NIKKEI 225 | 618.27 | 39646.25 | 1.58 |
| Hang Seng | -327.78 | 19778.77 | -1.63 |
| KOSPI | 29.03 | 2547.06 | 1.15 |
| ASX 200 | 27.4 | 8429.8 | 0.33 |
| DAX | 212.27 | 21254.27 | 1.01 |
| CAC 40 | 66.45 | 7837.4 | 0.86 |
| Dow Jones | 130.92 | 44156.73 | 0.3 |
| S&P 500 | 37.13 | 6086.37 | 0.61 |
| NASDAQ Composite | 252.56 | 20009.34 | 1.28 |
- WTI price edges lower to around $75.00 in Thursday’s early Asian session.
- Trump tariff threats weigh on the WTI price.
- API reported an unexpected crude oil inventory build last week.
West Texas Intermediate (WTI), the US crude oil benchmark, is trading around $75.00 on Thursday. The WTI price extends its decline to a fresh one-week low as traders assess how US President Donald Trump’s proposed tariffs could affect the global energy demand and economy.
Trump said on Monday that he was considering imposing 25% tariffs on Canada and Mexico while discussing imposing a 10% tariff on goods imported from China on February 1. Tariffs could potentially slow economic growth and drag the black gold lower.
"Possible sanctions under the new Trump administration remain unclear, with possible tariffs related to Canada and Mexico now seemingly at the forefront of trader uncertainties," said analysts at energy advisory firm Ritterbusch and Associates.
The American Petroleum Institute (API) weekly report showed crude oil stockpiles in the United States for the week ending January 16 increased by a million barrels, compared to a decline of 2.6 million barrels in the previous week.
Crude oil inventories dropped by more than 12 million barrels in 2024, according to the API, with the downward trend continuing beyond the new year.
On Tuesday, the US Energy Information Administration (EIA) suggested that Oil prices are expected to decline this year and next as weak economic activity and energy transition efforts weighed heavily on the US and China. "Strong global growth in production of petroleum and other liquids and slower demand growth put downward pressure on prices," according to EIA economists.
WTI Oil FAQs
WTI Oil is a type of Crude Oil sold on international markets. The WTI stands for West Texas Intermediate, one of three major types including Brent and Dubai Crude. WTI is also referred to as “light” and “sweet” because of its relatively low gravity and sulfur content respectively. It is considered a high quality Oil that is easily refined. It is sourced in the United States and distributed via the Cushing hub, which is considered “The Pipeline Crossroads of the World”. It is a benchmark for the Oil market and WTI price is frequently quoted in the media.
Like all assets, supply and demand are the key drivers of WTI Oil price. As such, global growth can be a driver of increased demand and vice versa for weak global growth. Political instability, wars, and sanctions can disrupt supply and impact prices. The decisions of OPEC, a group of major Oil-producing countries, is another key driver of price. The value of the US Dollar influences the price of WTI Crude Oil, since Oil is predominantly traded in US Dollars, thus a weaker US Dollar can make Oil more affordable and vice versa.
The weekly Oil inventory reports published by the American Petroleum Institute (API) and the Energy Information Agency (EIA) impact the price of WTI Oil. Changes in inventories reflect fluctuating supply and demand. If the data shows a drop in inventories it can indicate increased demand, pushing up Oil price. Higher inventories can reflect increased supply, pushing down prices. API’s report is published every Tuesday and EIA’s the day after. Their results are usually similar, falling within 1% of each other 75% of the time. The EIA data is considered more reliable, since it is a government agency.
OPEC (Organization of the Petroleum Exporting Countries) is a group of 12 Oil-producing nations who collectively decide production quotas for member countries at twice-yearly meetings. Their decisions often impact WTI Oil prices. When OPEC decides to lower quotas, it can tighten supply, pushing up Oil prices. When OPEC increases production, it has the opposite effect. OPEC+ refers to an expanded group that includes ten extra non-OPEC members, the most notable of which is Russia.
| Pare | Closed | Change, % |
|---|---|---|
| AUDUSD | 0.62731 | 0.02 |
| EURJPY | 162.969 | 0.55 |
| EURUSD | 1.04098 | -0.16 |
| GBPJPY | 192.782 | 0.47 |
| GBPUSD | 1.23156 | -0.21 |
| NZDUSD | 0.56645 | -0.15 |
| USDCAD | 1.43795 | 0.43 |
| USDCHF | 0.90655 | 0.08 |
| USDJPY | 156.535 | 0.7 |


© 2000-2026. All rights reserved.
This site is managed by Teletrade D.J. LLC 2351 LLC 2022 (Euro House, Richmond Hill Road, Kingstown, VC0100, St. Vincent and the Grenadines).
The information on this website is for informational purposes only and does not constitute any investment advice.
The company does not serve or provide services to customers who are residents of the US, Canada, Iran, The Democratic People's Republic of Korea, Yemen and FATF blacklisted countries.
Making transactions on financial markets with marginal financial instruments opens up wide possibilities and allows investors who are willing to take risks to earn high profits, carrying a potentially high risk of losses at the same time. Therefore you should responsibly approach the issue of choosing the appropriate investment strategy, taking the available resources into account, before starting trading.
Use of the information: full or partial use of materials from this website must always be referenced to TeleTrade as the source of information. Use of the materials on the Internet must be accompanied by a hyperlink to teletrade.org. Automatic import of materials and information from this website is prohibited.
Please contact our PR department if you have any questions or need assistance at pr@teletrade.global.
transfers