- Analytics
- News and Tools
- Market News
CFD Markets News and Forecasts — 21-06-2024
- Kiwi tallies a three-day losing streak, end the week on a negative note with the pair stabilizing at 0.6115.
- NZD/USD outlook continues to skew bearish as bulls fail to maintain upward traction.
- Bucking the bearish trend, a break above 0.6150, the position of the 20-day SMA, is vital.
On Friday, the NZD/USD extended its losing streak to three days. Despite an attempt to rally which took the pair to a high of 0.6140, the bulls were unable to return to the positive side and the pair stabilized at 0.6115 The unsuccessful attempt to maintain gains solidifies the increasing bearish sentiment for the Kiwi. The currency pair must climb past the 20-day Simple Moving Average (SMA) situated at 0.6150 to brighten the otherwise negative outlook.
The Relative Strength Index (RSI) for the NZD/USD pair on the daily chart locates at 49, hinting at a shift of momentum towards more bearishness. Despite this downward shift, the RSI remains near the neutral zone. Furthermore, the Moving Average Convergence Divergence (MACD) continues to increase its red bars, indicating an amplified seller presence in the market.
NZD/USD daily chart
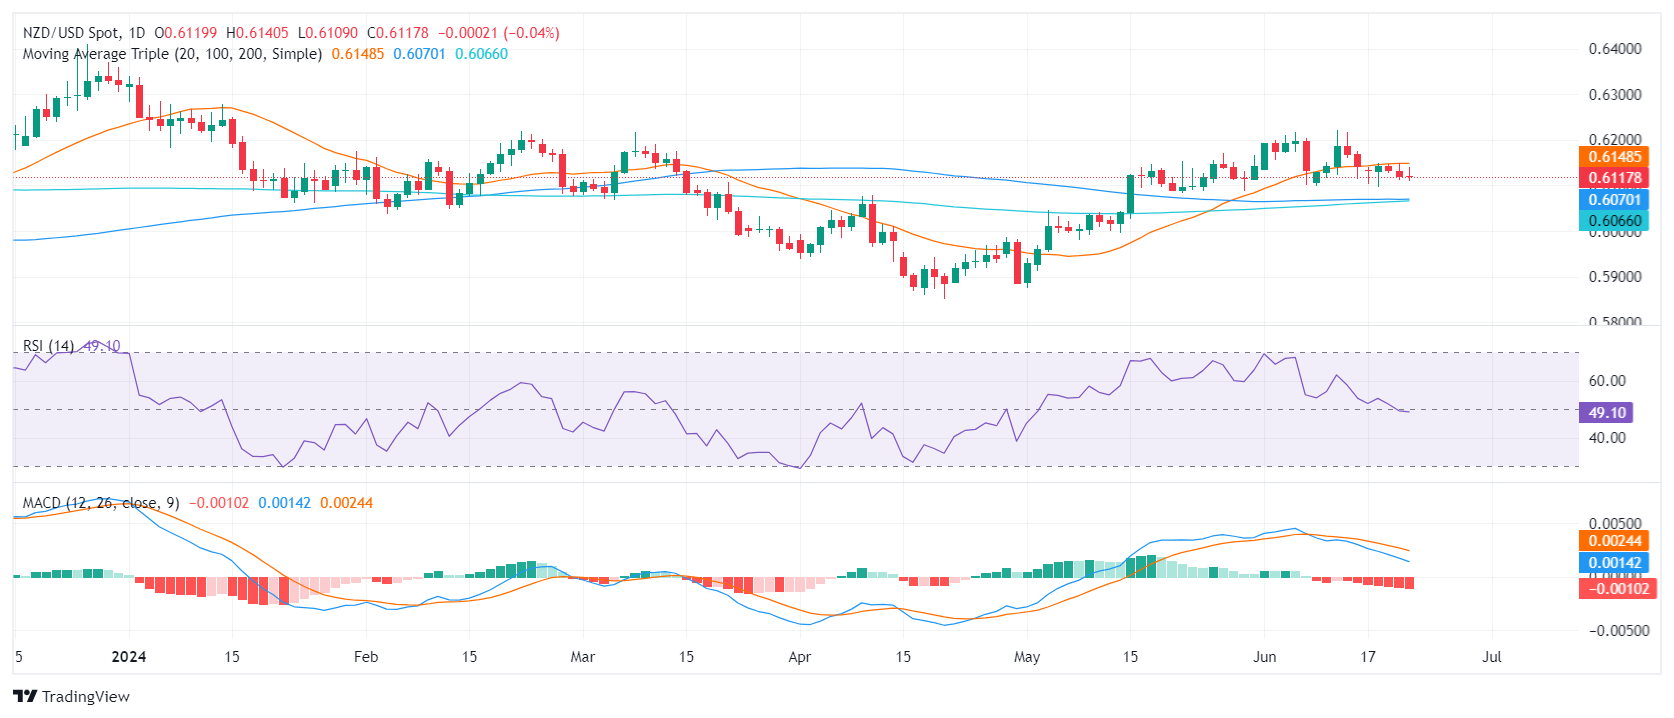
The NZD/USD finds immediate support near the 0.6100 level. Beneath that, additional support resides at the 100-day SMA at 0.6070 and the 200-day SMA at 0.6060. These levels could offer a robust defense should the pair extend its downside. A breach below these SMA convergence points might signal an intensifying sell-off scenario.
Conversely, the first resistance remains around the 20-day SMA level at 0.6150. Higher resistances are found at the 0.6170 and 0.6200 levels. A decisive breakout above these levels could possibly indicate an end to the current bearish market sentiment and start to favor the bulls.
- Silver declines 3.86% sparked by firm US Treasury yields and a strong US Dollar.
- Technical outlook shows a bearish engulfing pattern with RSI turning bearish, indicating potential further losses.
- Key support levels: 50-DMA at $29.09, $29.00, and MTD low of $28.66, with deeper support at 100-DMA of $26.60.
- Key resistance levels: June 7 high at $31.54, $32.00, and YTD high of $32.51.
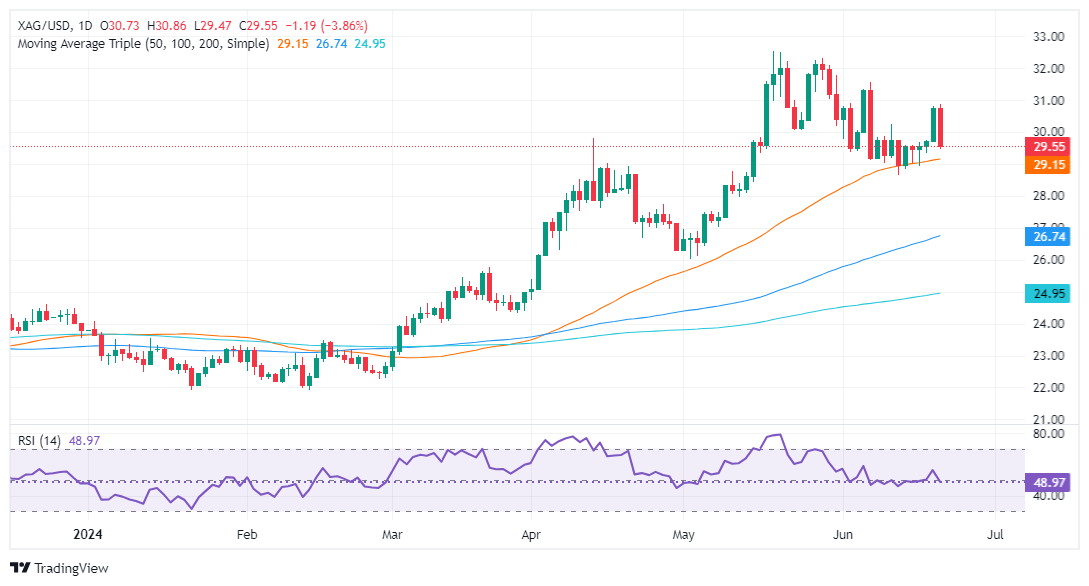
Silver price dropped sharply and snapped two days of gains amid firm US Treasury bond yields and a strong US Dollar. The grey metal trades at $29.53 , down 3.86%
XAG/USD Price Analysis: Technical outlook
Silver is still bullish biased though joining today and yesterday price action completed a ‘bearish engulfing,’ chart pattern. Momentum shifted in sellers’ favor as the Relative Strength Index (RSI) turned bearish and opened the door for further losses.
That said, XAG/USD's first support would be the 50-day moving average (DMA) at $29.09; it will expose $29.00. Breaching this level could lead to the MTD low of $28.66, ahead of a potential drop towards the 100-DMA at $26.60.
On the flip side, if XAG/USD resumes its uptrend, the next resistance level is the June 7 high of $31.54. Clearing this level would target $32.00 before challenging the year-to-date (YTD) high of $32.51.
XAG/USD Price Action – Daily Chart
- GBP/USD hit fresh lows on Friday as Cable extended declines.
- Upbeat US PMIs drive off risk appetite, bolster Greenback.
- GBP traders buckle down for a long wait to next Friday’s GDP.
GBP/USD closed Friday at a fresh five-week low of 1.2622, marking the Cable's third straight down week. The Bank of England’s (BoE) midweek rate hold did little to spark confidence in the GBP, and a late-week upswing in US Purchasing Managers Index (PMI) kicked broad-market risk appetite lower, lifting the US Dollar heading into the trading week’s close.
UK Retail Sales lurched higher to 2.9% MoM in May, snubbing the forecast move down to 1.5% from the previous month’s revised -1.8% contraction. UK PMIs also came in mixed, with the S&P Global/CIPS Manufacturing PMI for June rising to 51.4 against the forecast 51.3 and the previous month’s 51.2. The Services PMI contracted sharply to a seven–month low of 51.2, entirely missing the forecast uptick to 53.0 from 52.9.
Forecasting the Coming Week: The US PCE will unlikely move the Fed’s dial
On the US side, the S&P Global Manufacturing PMI for June rose to 51.7 versus the forecast downtick to 51.0 from the previous 51.3. The Services PMI also thumped expectations, rising to almost a two-year high of 55.1 versus the expected softening to 53.7 from 54.8.
With upbeat US economic data crimping odds of an early rate cut from the Federal Reserve (Fed), market sentiment backed up into the safe haven Greenback on Friday.
UK economic remains thin heading into next week, leaving Sterling traders to wait for next Friday’s Gross Domestic Product (GDP) print. US economic data prints are also relegated to mid-tier releases early next week, with the US’ own GDP update slated for next Thursday.
GBP/USD technical outlook
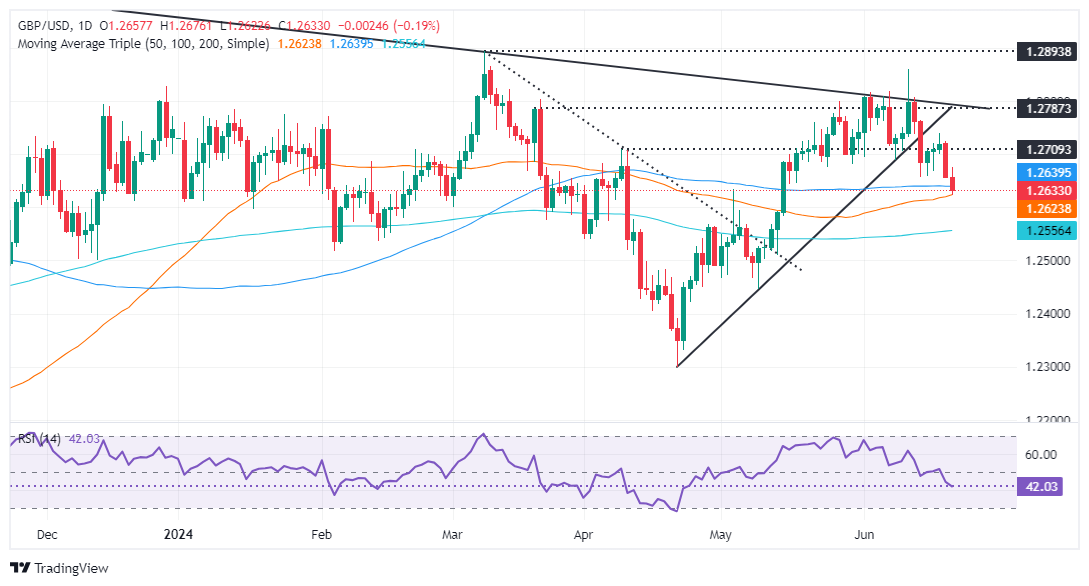
GBP/USD has locked in a third straight down week as the Sterling extends a slump against the Greenback. The pair fell to a five-week low, setting a fresh low for the week early Friday at 1.2622. Cable tumbled -0.92% peak-to-trough from the week’s peak bids near 1.2740.
Daily candlesticks are facing a steepening bearish decline after a rejection from a supply zone near the 1.2800 handle. Candles are on pace to fall back to the 200-day Exponential Moving Average (EMA) at 1.2586.
GBP/USD hourly chart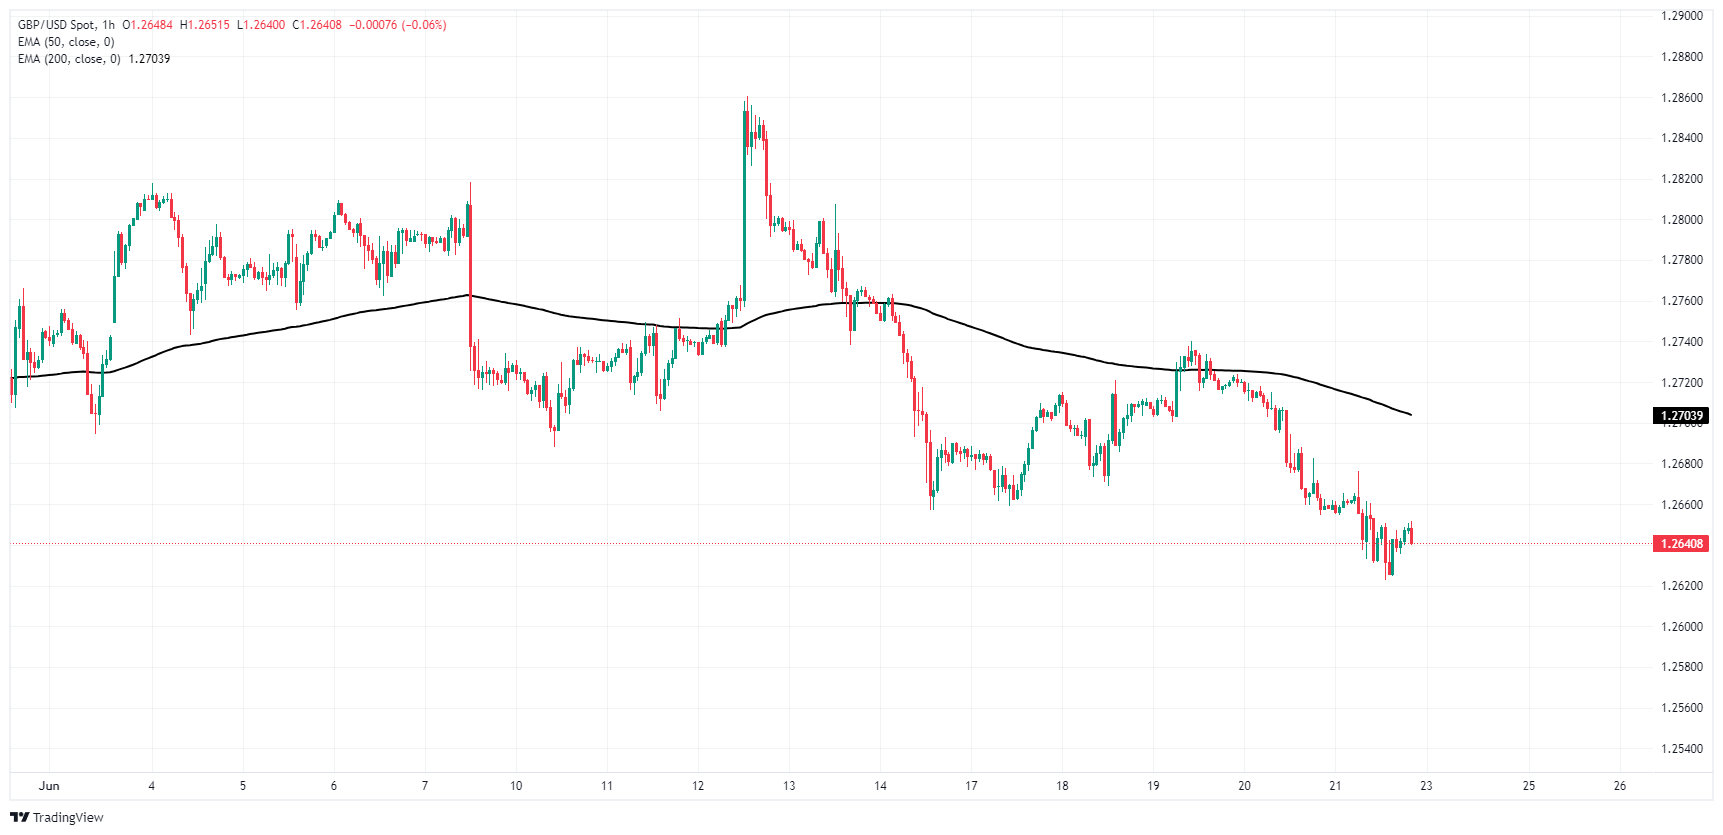
GBP/USD daily chart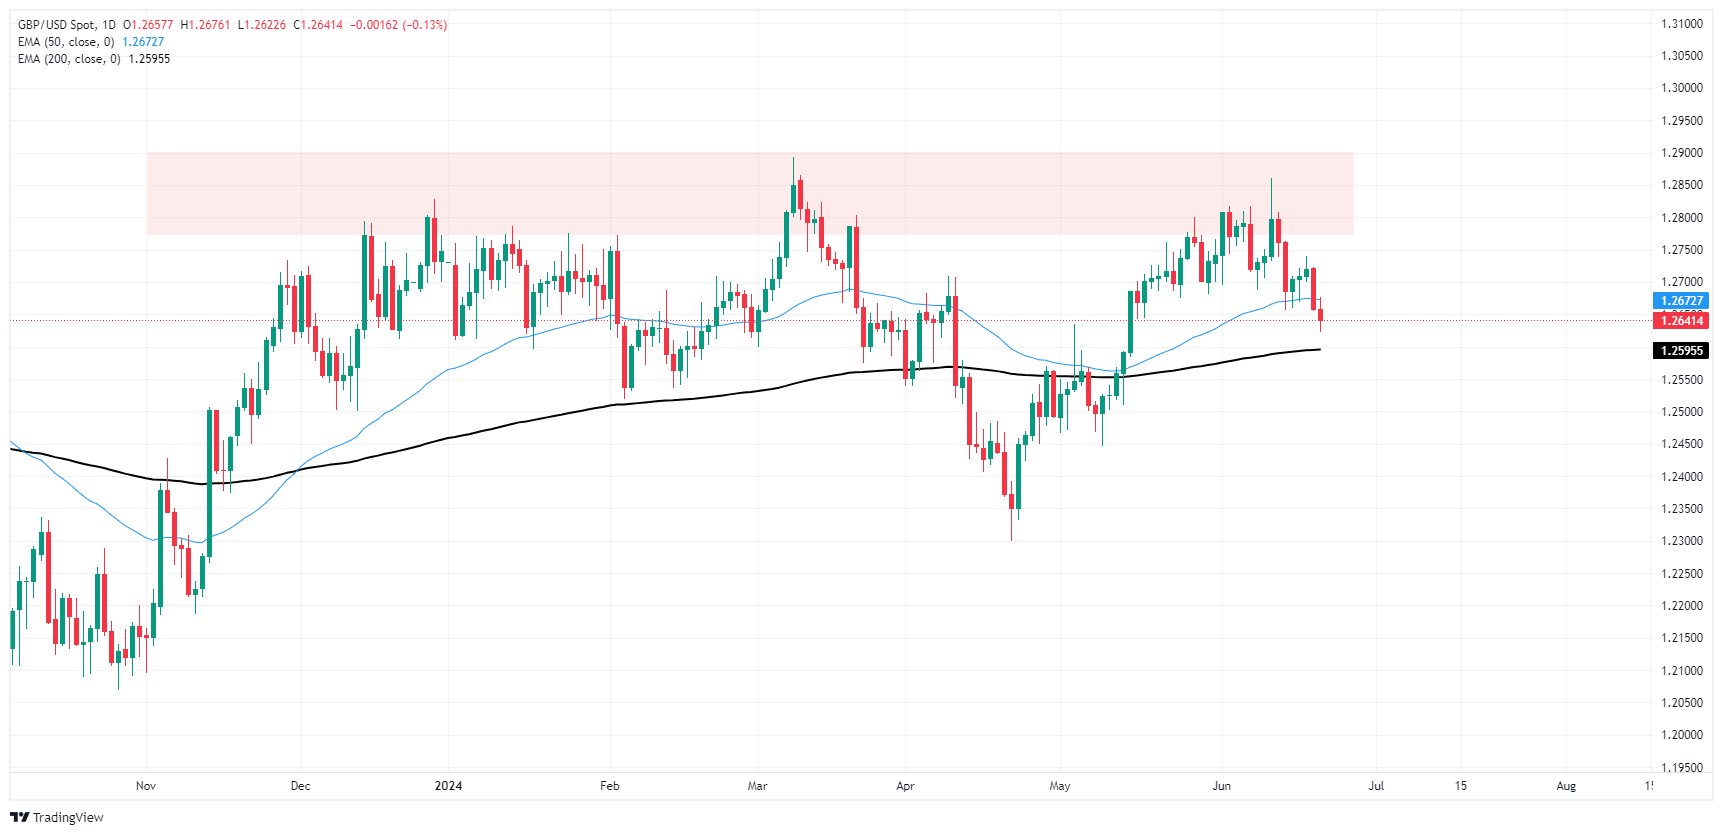
Pound Sterling FAQs
The Pound Sterling (GBP) is the oldest currency in the world (886 AD) and the official currency of the United Kingdom. It is the fourth most traded unit for foreign exchange (FX) in the world, accounting for 12% of all transactions, averaging $630 billion a day, according to 2022 data. Its key trading pairs are GBP/USD, aka ‘Cable’, which accounts for 11% of FX, GBP/JPY, or the ‘Dragon’ as it is known by traders (3%), and EUR/GBP (2%). The Pound Sterling is issued by the Bank of England (BoE).
The single most important factor influencing the value of the Pound Sterling is monetary policy decided by the Bank of England. The BoE bases its decisions on whether it has achieved its primary goal of “price stability” – a steady inflation rate of around 2%. Its primary tool for achieving this is the adjustment of interest rates. When inflation is too high, the BoE will try to rein it in by raising interest rates, making it more expensive for people and businesses to access credit. This is generally positive for GBP, as higher interest rates make the UK a more attractive place for global investors to park their money. When inflation falls too low it is a sign economic growth is slowing. In this scenario, the BoE will consider lowering interest rates to cheapen credit so businesses will borrow more to invest in growth-generating projects.
Data releases gauge the health of the economy and can impact the value of the Pound Sterling. Indicators such as GDP, Manufacturing and Services PMIs, and employment can all influence the direction of the GBP. A strong economy is good for Sterling. Not only does it attract more foreign investment but it may encourage the BoE to put up interest rates, which will directly strengthen GBP. Otherwise, if economic data is weak, the Pound Sterling is likely to fall.
Another significant data release for the Pound Sterling is the Trade Balance. This indicator measures the difference between what a country earns from its exports and what it spends on imports over a given period. If a country produces highly sought-after exports, its currency will benefit purely from the extra demand created from foreign buyers seeking to purchase these goods. Therefore, a positive net Trade Balance strengthens a currency and vice versa for a negative balance.
- The cross continued its upward journey, reaching new cycle highs above 97.50, levels not seen since July 2007.
- The daily chart shows intense bullish sentiment, with the Yen weakening against its peers.
- Indicators are approaching overbought conditions which might limit the upside.
On Friday, the NZD/JPY cross extended advances and established multi-year highs above 97.50. The 20-day Simple Moving Average (SMA), now at 96.60 continued as firm support at the beginning of the week, where buyers ward off sellers' strivings to breach this level.
The daily Relative Strength Index (RSI) for NZD/JPY is currently at 68, indicating an increase from Thursday's value and overall upward momentum. Meanwhile, the Moving Average Convergence Divergence (MACD) for today shows decreasing red bars, implying decreased selling pressure. The RSI near 70 should flash caution to investors as it approaches the overbought threshold.
NZD/JPY daily chart
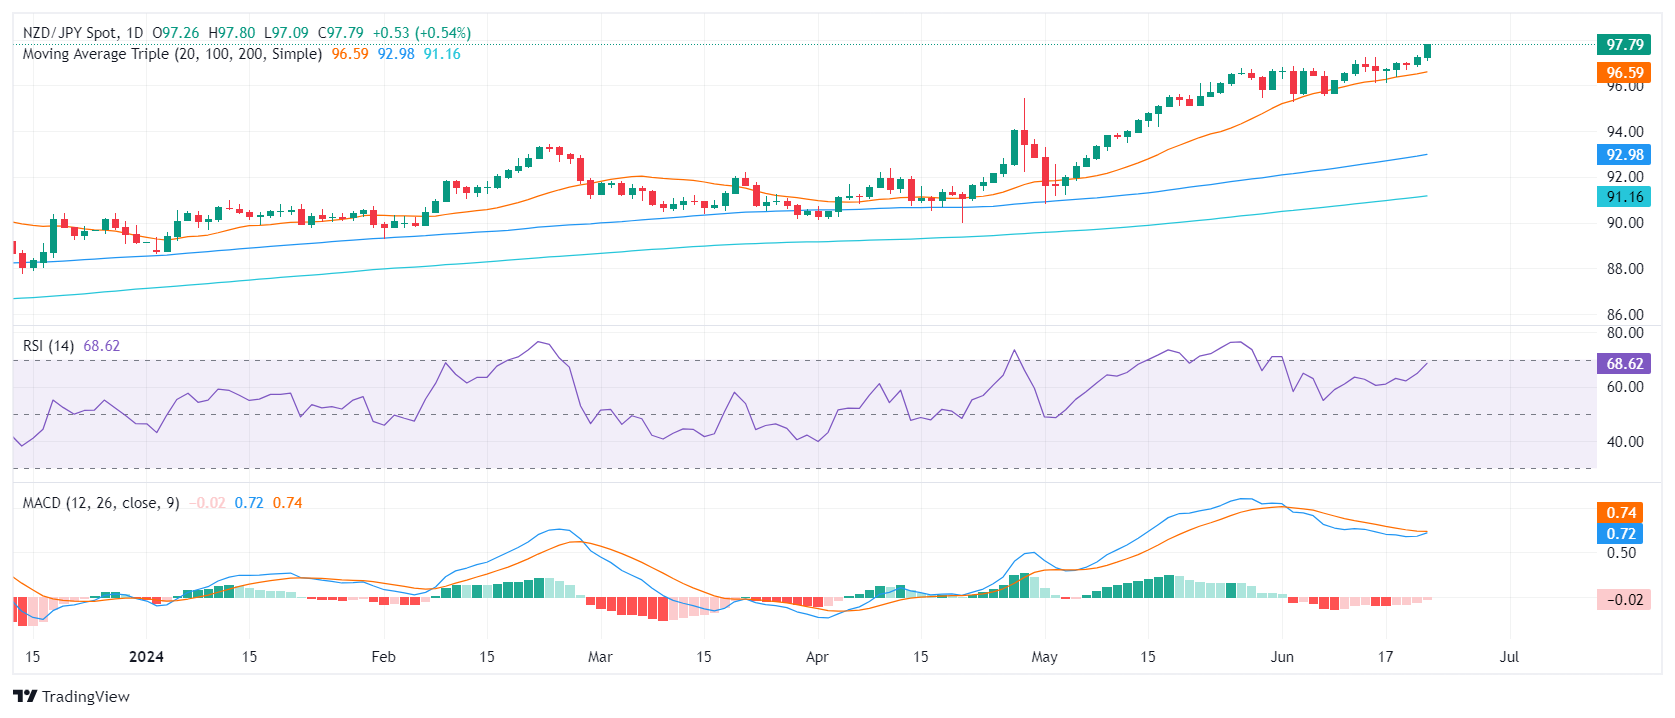
The bulls' tenacity to sustain their positions above the 20-day SMA remains unshaken. This, combined with the near-overbought daily technical indicators, reinforces the superior technical vim of the Kiwi against the Yen. The consecutive failed attempts from the sellers to breach the 96.30 point, a strong support, led to the bulls' momentum which catalyzed the surge to fresh highs.
For the following trading sessions, the cross may oscillate between the immediate support at 97.00 and the resistance target at 98.00. Investors need to keep an eye on a possible break above the mentioned range or a fall below the 20-day SMA mark which could signal a deeper correction.
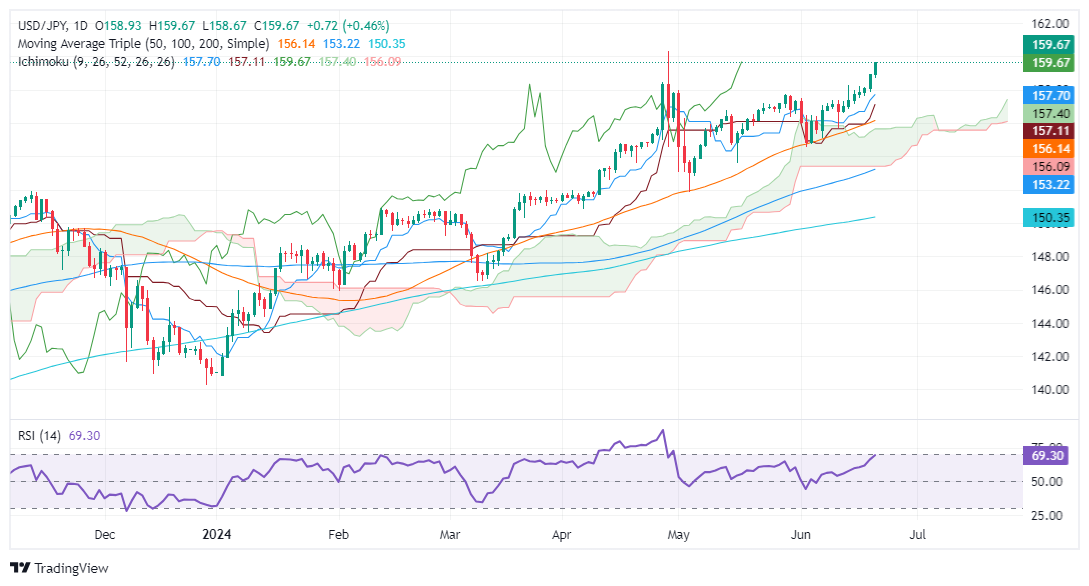
- USD/JPY rises to 159.59, nearing the pivotal 160.00 mark, propelled by robust US PMI data.
- Key resistance at 160.00 and YTD high of 160.32; potential for Bank of Japan intervention looms.
- Support found at 159.00, June 14 high of 158.25, 158.00, with additional support at Tenkan-Sen (157.69) and Senkou Span A (157.40).
The US Dollar climbs against the Japanese Yen on Friday and approaches intervention levels ahead of the weekend. Stronger than expected US S&P Global Flash PMIs overshadowed weaker housing data and weighed the JPY. Therefore, the USD/JPY trades at 159.59, gains 0.42%.
USD/JPY Price Analysis: Technical outlook
The major has finally broken the barrier of 159.00 and closes to intervention levels reached on April 29, when the USD/JPY cleared the 160.00 figure. This triggered a reaction by the Bank of Japan, which intervened in the FX space, sending the pair tumbling 400 pips to 156.06 after hitting a daily high of 160.32.
Despite that, the USD/JPY remains upward biased, and the next resistance would be 160.00. Once cleared up, next would be the year-to-date (YTD) high of 160.32.
Conversely, the most likely scenario due to intervention threats is the USD/JPY first support of 159.00. Once cleared, the next support would be the June 14 high at 158.25, followed by 158.00. Further losses are seen at the Tenkan-Sen at 157.69, followed by Senkou Span A at 157.40, ahead of the Kijun-Sen at 157.11
USD/JPY Price Action – Daily Chart
- WTI tumbled back below $81.00 on Friday, tested $81.50.
- The EIA reported a surprise buildup in natural gas reserves, clipping drawdown hopes.
- US Crude Oil productivity remains close to all-time highs.
West Texas Intermediate (WTI) US Crude Oil hit a fresh high for the week early Friday before slumping back into negative territory for the day after the Energy Information Administration (EIA) noted that US Crude Oil production remains near all-time peaks and a larger-than-expected buildup in Natural Gas reserves.
The EIA reported a 71 billion cubic feet (Bcf) increase in the amount of available working natural gas in storage, bringing US reserves to a multi-month high of 3,045 Bcf for the week ended June 14. The previous week’s increase of 74 Bcf was expected to a steeper drop in buildup to only 69 Bcf.
With natural gas reserves filling up ahead of peak summertime cooling demand, Crude Oil is less likely to see meaningful increases in demand, trimming hopes of a steeper drawdown during the summer.
US Purchasing Managers Index (PMI) figures for June also beat the street on Friday, pressing down on broad-market hopes for rate cuts. With the Federal Reserve (Fed) unlikely to get forced into an accelerated pace of rate cuts in 2024, Crude Oil markets are second-guessing near-term bullishness as investors lean deeply into rate trim hopes to ease lending and financing costs.
WTI technical outlook
Hesitating bulls have crimped topside momentum in WTI on Friday, dragging intraday price action back into range of near-term rising trendlines. Firmer technical support is sitting at the 200-hour Exponential Moving Average (EMA) at $79.35. Despite a hesitation in the second-half of Friday’s US market session, US Crude Oil managed to etch out a fresh seven-week high above $81.60 before settling lower.
Daily candlesticks are beginning to show signs of exhaustion as WTI’s technical recovery above the 200-day EMA at $78.87 begins to run out of steam. Barring a resurgence in firm bidding, WTI could be primed for a tumble back to the last swing low near $72.50.
WTI hourly chart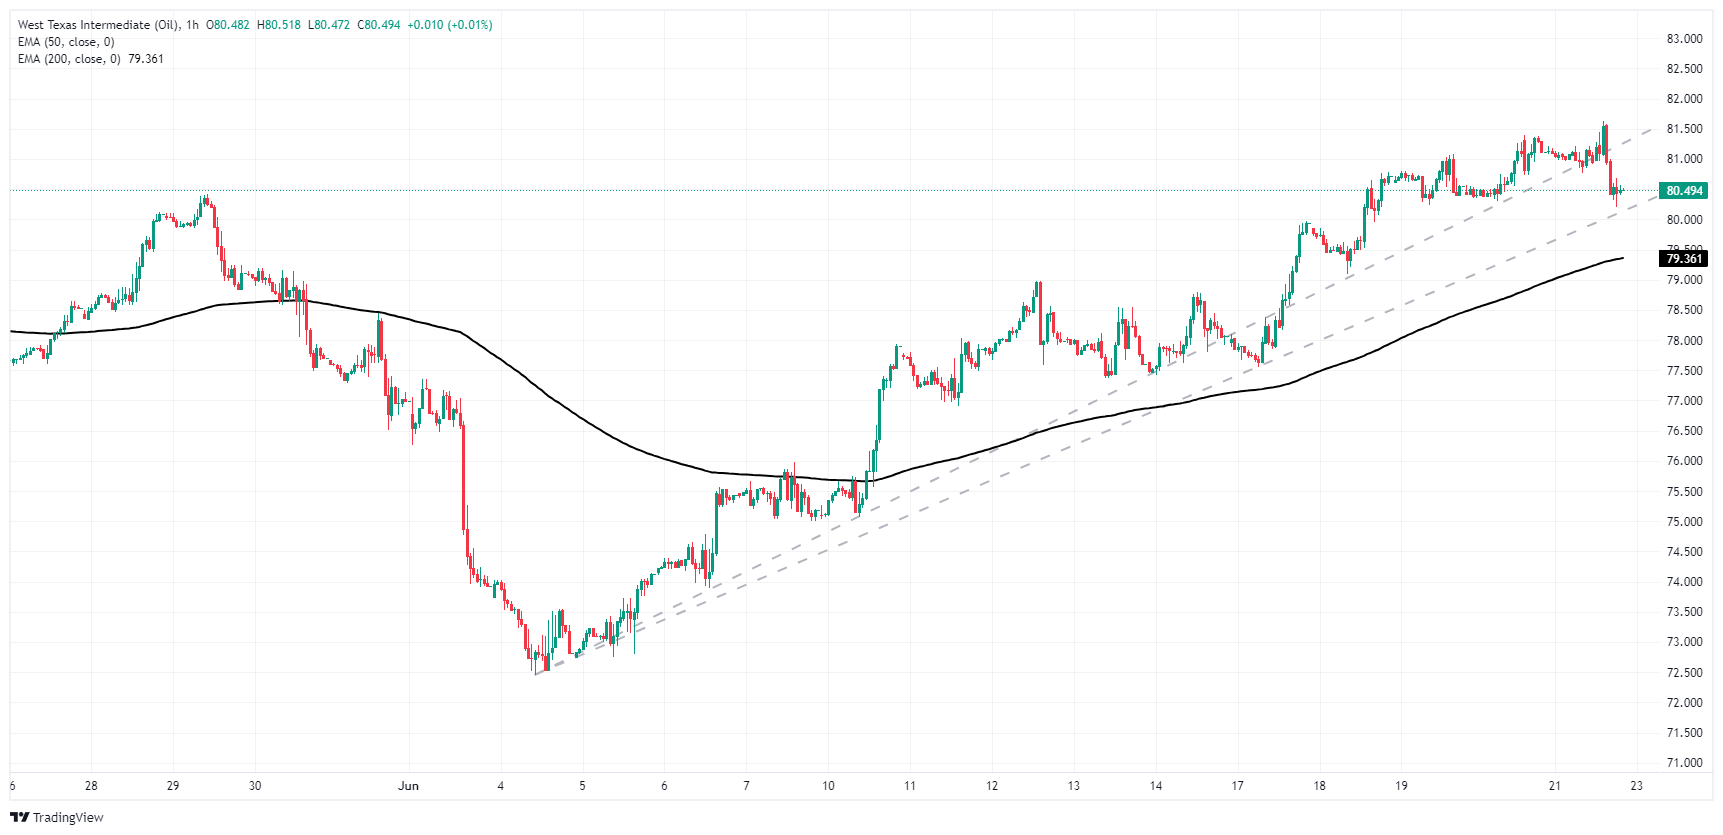
WTI daily chart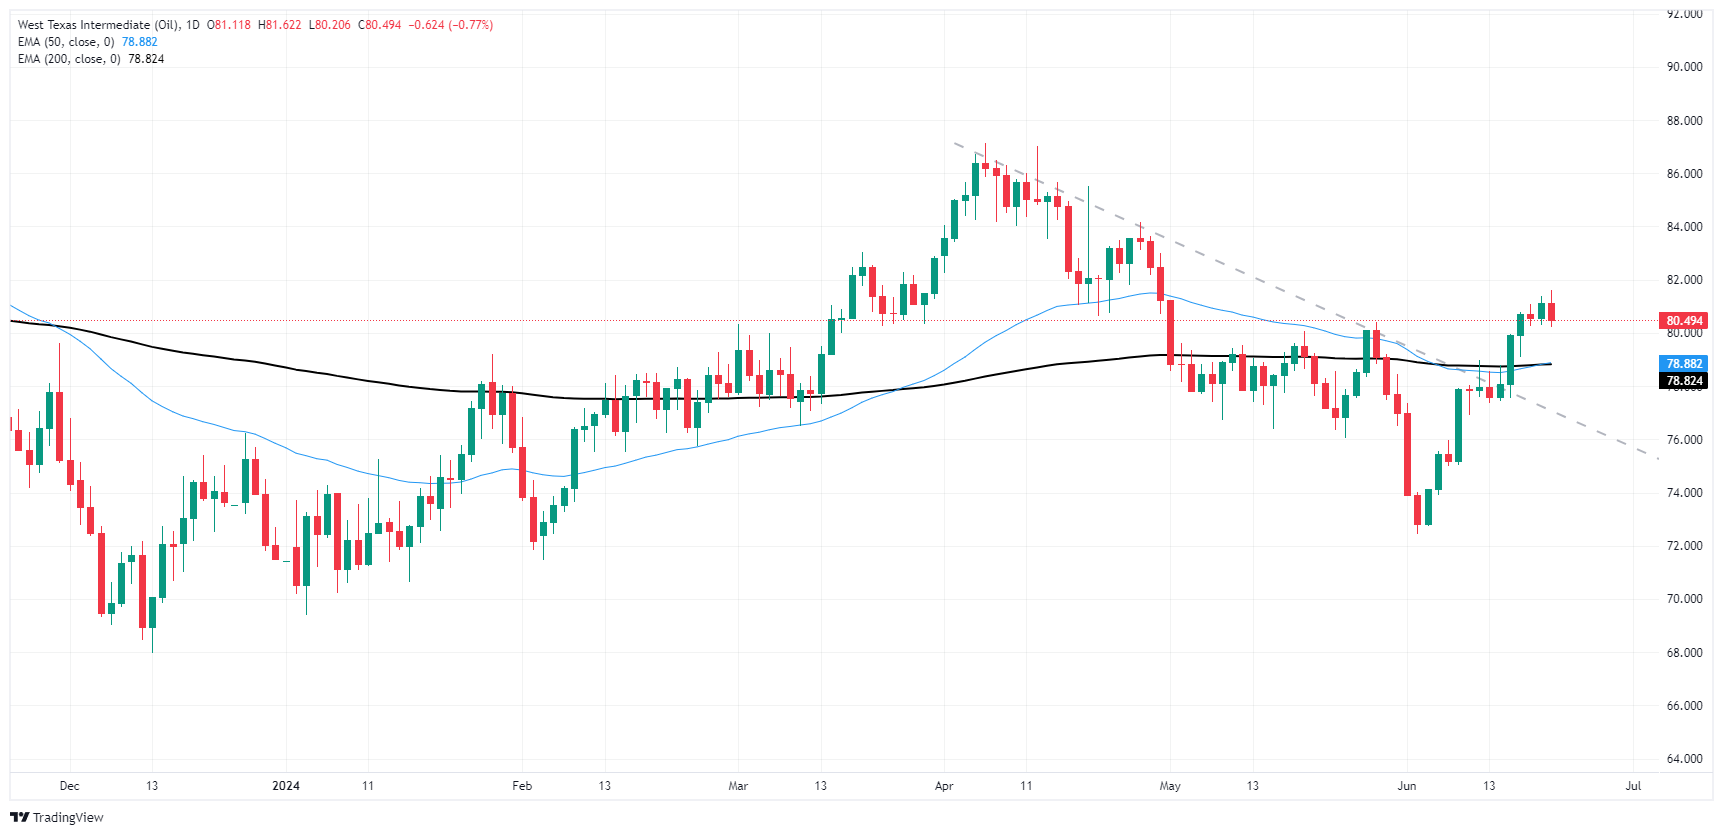
WTI Oil FAQs
WTI Oil is a type of Crude Oil sold on international markets. The WTI stands for West Texas Intermediate, one of three major types including Brent and Dubai Crude. WTI is also referred to as “light” and “sweet” because of its relatively low gravity and sulfur content respectively. It is considered a high quality Oil that is easily refined. It is sourced in the United States and distributed via the Cushing hub, which is considered “The Pipeline Crossroads of the World”. It is a benchmark for the Oil market and WTI price is frequently quoted in the media.
Like all assets, supply and demand are the key drivers of WTI Oil price. As such, global growth can be a driver of increased demand and vice versa for weak global growth. Political instability, wars, and sanctions can disrupt supply and impact prices. The decisions of OPEC, a group of major Oil-producing countries, is another key driver of price. The value of the US Dollar influences the price of WTI Crude Oil, since Oil is predominantly traded in US Dollars, thus a weaker US Dollar can make Oil more affordable and vice versa.
The weekly Oil inventory reports published by the American Petroleum Institute (API) and the Energy Information Agency (EIA) impact the price of WTI Oil. Changes in inventories reflect fluctuating supply and demand. If the data shows a drop in inventories it can indicate increased demand, pushing up Oil price. Higher inventories can reflect increased supply, pushing down prices. API’s report is published every Tuesday and EIA’s the day after. Their results are usually similar, falling within 1% of each other 75% of the time. The EIA data is considered more reliable, since it is a government agency.
OPEC (Organization of the Petroleum Exporting Countries) is a group of 13 Oil-producing nations who collectively decide production quotas for member countries at twice-yearly meetings. Their decisions often impact WTI Oil prices. When OPEC decides to lower quotas, it can tighten supply, pushing up Oil prices. When OPEC increases production, it has the opposite effect. OPEC+ refers to an expanded group that includes ten extra non-OPEC members, the most notable of which is Russia.
- Australian Dollar has suffered extended declines in recent sessions as RBA gains slowly fade.
- PMI figures from Australia reveal weaker-than-expected data.
- Fragility in the Australian economy seems to be driving demand off the Aussie.
In Friday's session, the Australian Dollar (AUD) intensified its losses against its peers. The AUD/USD duo has been testing its notable support at the 0.6640 threshold, the 20-day Simple Moving Average (SMA). Selling pressure emerged from the Asian markets in light of soft June preliminary PMIs from Judo Bank in Australia. This weakness has been compounded by high US Treasury yields and optimistic PMI data from S&P in the US, lifting the USD.
Notwithstanding certain signs of frailty in Australia’s economic scene, the stubbornly high inflation continues to prompt the Reserve Bank of Australia (RBA) to delay potential rate cuts, potentially offsetting the Aussie's losses. The RBA is primed to be among the last G10 nation central banks to initiate rate cuts, which might perpetuate the Aussie's gains.
Daily digest market movers: Australian Dollar grapples with weakened data, awaits further cues
- Australia reported weaker preliminary data from the June Purchasing Managers Index (PMI) set, with Manufacturing at 47.5 versus May's 49.7, Services at 51.0 against 52.5, and the Composite rate falling for a third consecutive month to 50.6, from 52.1 in May.
- In contrast, US business activity in the private sector continued to showcase solid growth, with the S&P Global Composite PMI improving slightly to 54.6.
- Governor Bullock, during her latest press conference, confirmed that the Board discussed potential rate hikes, dismissing considerations of rate cuts in the near term.
- Bullock maintained, “Inflation remains above target and is proving persistent,” specifying that "the Board expects that it will be some time yet before inflation is sustainably in the target range."
- RBA affirmed its readiness to do "what is necessary" to guide inflation back within target parameters.
- Market anticipates nearly 50 bps of easing by December 2025, while rate hikes in August and September are yet to be ruled out on the RBA’s side.
- Fed signals only one cut in 2024, while markets continue to hope for a September cut.
Technical analysis: Signs of bullish strength waning, bears time now
The technical front reveals weakened momentum, with the Relative Strength Index (RSI) remaining above 50 but tilting downwards and the Moving Average Convergence Divergence (MACD) continuing to chart red bars. For further confirmation of a more solid buying stance, the AUD/USD pair needs to firmly support itself beyond the 20-day Simple Moving Average (SMA). Sellers might extend trials of the mentioned SMA support in ensuing sessions to test its resilience.
Australian Dollar FAQs
One of the most significant factors for the Australian Dollar (AUD) is the level of interest rates set by the Reserve Bank of Australia (RBA). Because Australia is a resource-rich country another key driver is the price of its biggest export, Iron Ore. The health of the Chinese economy, its largest trading partner, is a factor, as well as inflation in Australia, its growth rate and Trade Balance. Market sentiment – whether investors are taking on more risky assets (risk-on) or seeking safe-havens (risk-off) – is also a factor, with risk-on positive for AUD.
The Reserve Bank of Australia (RBA) influences the Australian Dollar (AUD) by setting the level of interest rates that Australian banks can lend to each other. This influences the level of interest rates in the economy as a whole. The main goal of the RBA is to maintain a stable inflation rate of 2-3% by adjusting interest rates up or down. Relatively high interest rates compared to other major central banks support the AUD, and the opposite for relatively low. The RBA can also use quantitative easing and tightening to influence credit conditions, with the former AUD-negative and the latter AUD-positive.
China is Australia’s largest trading partner so the health of the Chinese economy is a major influence on the value of the Australian Dollar (AUD). When the Chinese economy is doing well it purchases more raw materials, goods and services from Australia, lifting demand for the AUD, and pushing up its value. The opposite is the case when the Chinese economy is not growing as fast as expected. Positive or negative surprises in Chinese growth data, therefore, often have a direct impact on the Australian Dollar and its pairs.
Iron Ore is Australia’s largest export, accounting for $118 billion a year according to data from 2021, with China as its primary destination. The price of Iron Ore, therefore, can be a driver of the Australian Dollar. Generally, if the price of Iron Ore rises, AUD also goes up, as aggregate demand for the currency increases. The opposite is the case if the price of Iron Ore falls. Higher Iron Ore prices also tend to result in a greater likelihood of a positive Trade Balance for Australia, which is also positive of the AUD.
The Trade Balance, which is the difference between what a country earns from its exports versus what it pays for its imports, is another factor that can influence the value of the Australian Dollar. If Australia produces highly sought after exports, then its currency will gain in value purely from the surplus demand created from foreign buyers seeking to purchase its exports versus what it spends to purchase imports. Therefore, a positive net Trade Balance strengthens the AUD, with the opposite effect if the Trade Balance is negative.
- Gold reverses gains after hitting daily high of $2,368, down more than 1.70%.
- Strong US S&P Global PMI data boosts the US Dollar, with the DXY rising 0.14% to 105.80.
- Mixed US economic data keeps Fed rate cut speculation alive.
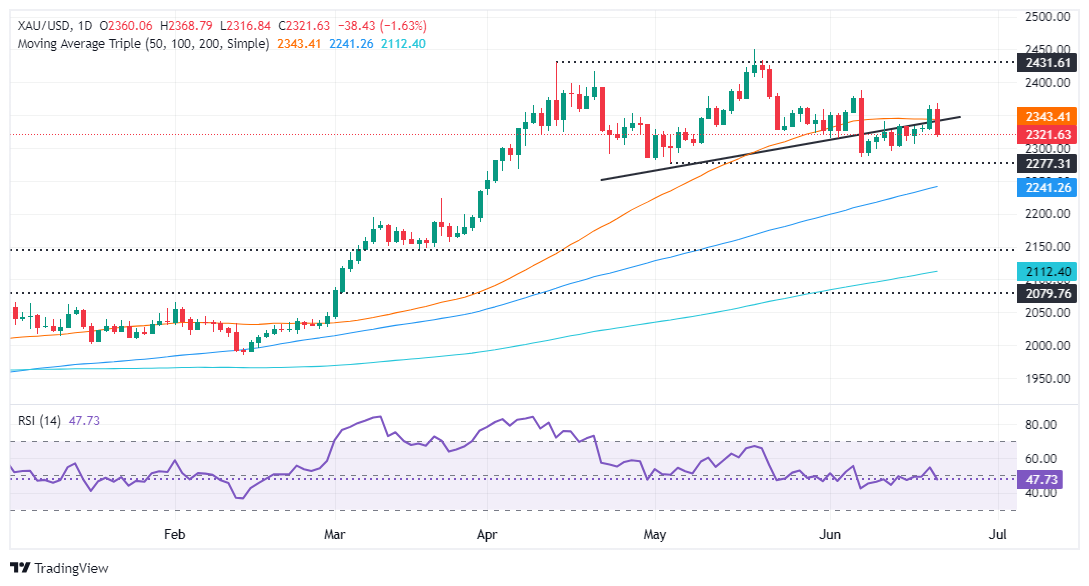
Gold prices reversed course on Friday, moving down more than 1.70%. Economic data from the United States (US) spurred investors' reaction to pricing out fewer interest rate cuts by the Federal Reserve (Fed) due to the solid state of the economy. The XAU/USD trades at $2,317, below its opening price after hitting a daily high of $2,368.
The US economy continued to give mixed signals regarding its robustness. S&P Global revealed June’s Purchasing Managers Index (PMI) readings, which exceeded estimates and topped May’s data. However, the US housing sector continued to deteriorate after Existing Home Sales for May missed the mark and fell compared to April’s data.
On the PMI release, investors ditched Gold and bought the Greenback, which, according to the US Dollar Index (DXY), rose 0.14% at 105.80.
US data revealed during the week highlights uncertainty as some economic indicators reiterate that the economy is still solid. On the positive side, Industrial Production, S&P Flash PMIs, and Retail Sales advanced, though the latter were lower than the previous month.
Conversely, housing continued to deteriorate, while the jobs market, as measured by Americans filing unemployment claims, came in worse than expected. The data kept investors' chances of a September Fed rate cut alive.
Given the backdrop, Gold prices continued to drop, along with technical indicators, pointing to a correction following a three-month rally that began in March and lifted XAU/USD to its all-time high of $2,450.
The CME FedWatch Tool shows odds for a 25-basis-point Fed rate cut in September at 59.5%, up from 57.5% on Thursday. In the meantime, the December 2024 fed funds rate futures contract implies the Fed will cut 36 bps toward the end of the year.
Daily digest market movers: Gold price drops due to strong US Dollar
- US Treasury bond yields are firm, with the 10-year Treasury note yield flat at 4.261%.
- S&P Global Manufacturing and Services Flash PMIs in June expanded above estimates. The Manufacturing PMI rose to 51.7, up from 51.3 and exceeding the estimate of 51. The Services PMI increased from 54.8 to 55.1, surpassing the forecast of 53.7.
- US Existing Home Sales in May were lower than expected, falling to 4.11 million from 4.14 million in April, representing a contraction of -0.7%.
- Fed officials advised patience regarding interest rate cuts, emphasizing that their decisions would remain data-dependent. Despite last week's positive CPI report, policymakers reiterated the need to see more data similar to May's before considering any changes.
- Despite the US CPI report showing that the disinflation process continues, Fed Chair Jerome Powell commented that they remain “less confident” about the progress on inflation.
Technical analysis: Gold price drops below Head-and-Shoulders neckline, eyes $2,300
Gold’s downtrend resumed on Friday after buyers tested the Head-and-Shoulders pattern, dragging the XAU/USD price above the pattern’s neckline. Despite achieving a daily close above the latter, sellers defended the neckline and pushed the spot price to a new three-day low of $2,316.
That said, the path of least resistance is to the downside. The next support would be $2,300. Once cleared, XAU/USD would fall to $2,277, the May 3 low, followed by the March 21 high of $2,222. Further losses lie underneath, with sellers eyeing the Head-and-Shoulders chart pattern objective from $2,170 to $2,160.
Conversely, if Gold reclaims $2,350, that will expose additional key resistance levels like the June 7 cycle high of $2,387, ahead of challenging the $2,400 figure.
Gold FAQs
Gold has played a key role in human’s history as it has been widely used as a store of value and medium of exchange. Currently, apart from its shine and usage for jewelry, the precious metal is widely seen as a safe-haven asset, meaning that it is considered a good investment during turbulent times. Gold is also widely seen as a hedge against inflation and against depreciating currencies as it doesn’t rely on any specific issuer or government.
Central banks are the biggest Gold holders. In their aim to support their currencies in turbulent times, central banks tend to diversify their reserves and buy Gold to improve the perceived strength of the economy and the currency. High Gold reserves can be a source of trust for a country’s solvency. Central banks added 1,136 tonnes of Gold worth around $70 billion to their reserves in 2022, according to data from the World Gold Council. This is the highest yearly purchase since records began. Central banks from emerging economies such as China, India and Turkey are quickly increasing their Gold reserves.
Gold has an inverse correlation with the US Dollar and US Treasuries, which are both major reserve and safe-haven assets. When the Dollar depreciates, Gold tends to rise, enabling investors and central banks to diversify their assets in turbulent times. Gold is also inversely correlated with risk assets. A rally in the stock market tends to weaken Gold price, while sell-offs in riskier markets tend to favor the precious metal.
The price can move due to a wide range of factors. Geopolitical instability or fears of a deep recession can quickly make Gold price escalate due to its safe-haven status. As a yield-less asset, Gold tends to rise with lower interest rates, while higher cost of money usually weighs down on the yellow metal. Still, most moves depend on how the US Dollar (USD) behaves as the asset is priced in dollars (XAU/USD). A strong Dollar tends to keep the price of Gold controlled, whereas a weaker Dollar is likely to push Gold prices up.
- Dow Jones struggles in flat territory as investors roil at upbeat US data.
- Rate-cut-hungry markets balk as US economic figures continue to beat the street.
- US PMIs rose in June as business activity expectations turn upbeat.
The Dow Jones Industrial Average (DJIA) is stubbornly flat on Friday, treading water after US equity markets were disappointed by a better-than-expected print in June’s US Purchasing Managers Index (PMI) figures. Markets hoping for a not-too-steep decline in US economic data to push the Federal Reserve (Fed) towards rate cuts were disappointed by upbeat activity survey results, leaning into the “bad news is good news” narrative driving financial markets singularly focused on achieving cheaper lending and financing rates from the Fed.
US PMIs broadly beat Wall Street forecasts in June, with the S&P Global Manufacturing PMI rising to 51.7 from the previous month’s 51.3, snubbing a forecast decline to 51.0. The Services component also increased, climbing to 55.1, it’s highest print since May 2022. The previous month had printed at 54.8, and markets had forecast a decline to 53.7.
On the downside, US Existing Home Sales eased back to 4.11 million units MoM in May, a -0.7% slip from the previous 4.14 million, but still a smaller decline than the forecast 4.10 million. Despite Friday’s mildly higher print in PMIs, markets continue to pin hopes on a September rate cut from the Fed. According to the CME’s FedWatch Tool, rate traders are still pricing in around 65% odds of at least a quarter-point rate trim at the Federal Open Market Committee’s (FOMC) September 18 rate decision.
Dow Jones news
On Friday, about two-thirds of the Dow Jones’ constituent securities were in the green, but gains remained tepid. McDonald’s Corp. (MCD) is leading the gainers, climbing 2.4% to $260.00 per share as the fast food chain wades into the social consciousness surrounding inflation pressures with competitive pricing on strategic menu offerings. The food chain also announced it was ditching AI integration after its bespoke “Automated Order Taker” proved woefully ill-equipped to handle real-world operations at scale.
On the downside, the banking sector is waffling as interest rate hopes battle upbeat US data; JPMorgan Chase & Co. (JPM) fell back 1.25% to $196.20 per share with Goldman Sachs Group Inc. (GS) falling around the same to $452.50 per share.
Dow Jones technical outlook
The Dow Jones is flat on Friday, trading in a tight range in intraday action as the index struggles to find the momentum to reclaim 39,200.00. The DJIA briefly set a fresh peak for the week near 39,260.00 before returning to the day’s opening range.
Daily candlesticks have lept back over the 50-day Exponential Moving Average (EMA) at 38,825.00, extending a recovery from a recent plunge to the 38,000.00 region.
Dow Jones five minute chart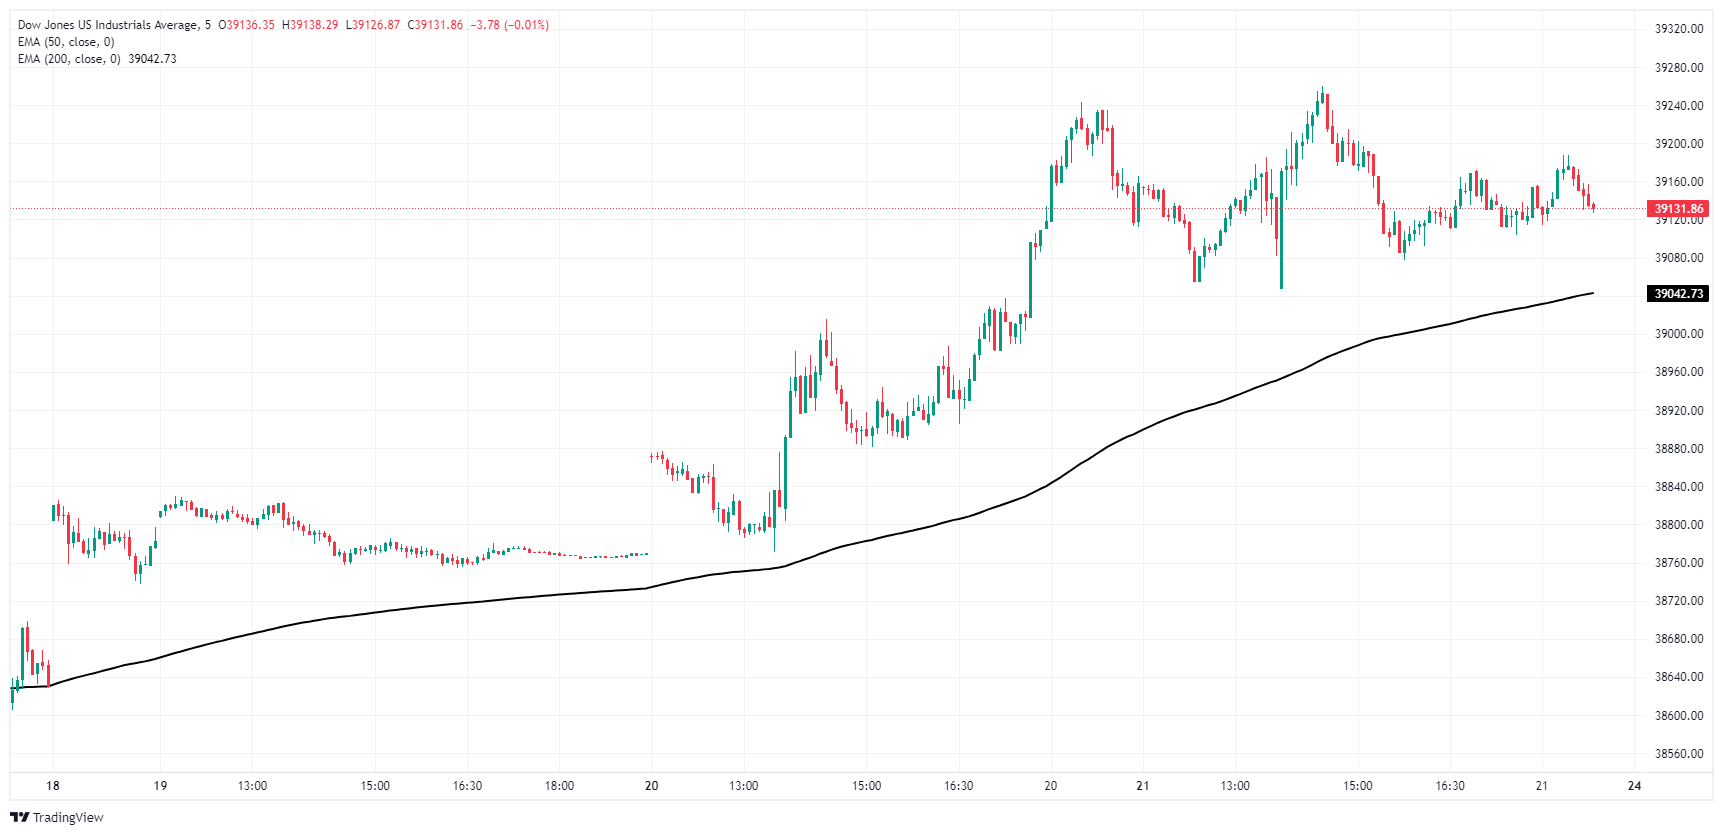
Dow Jones daily chart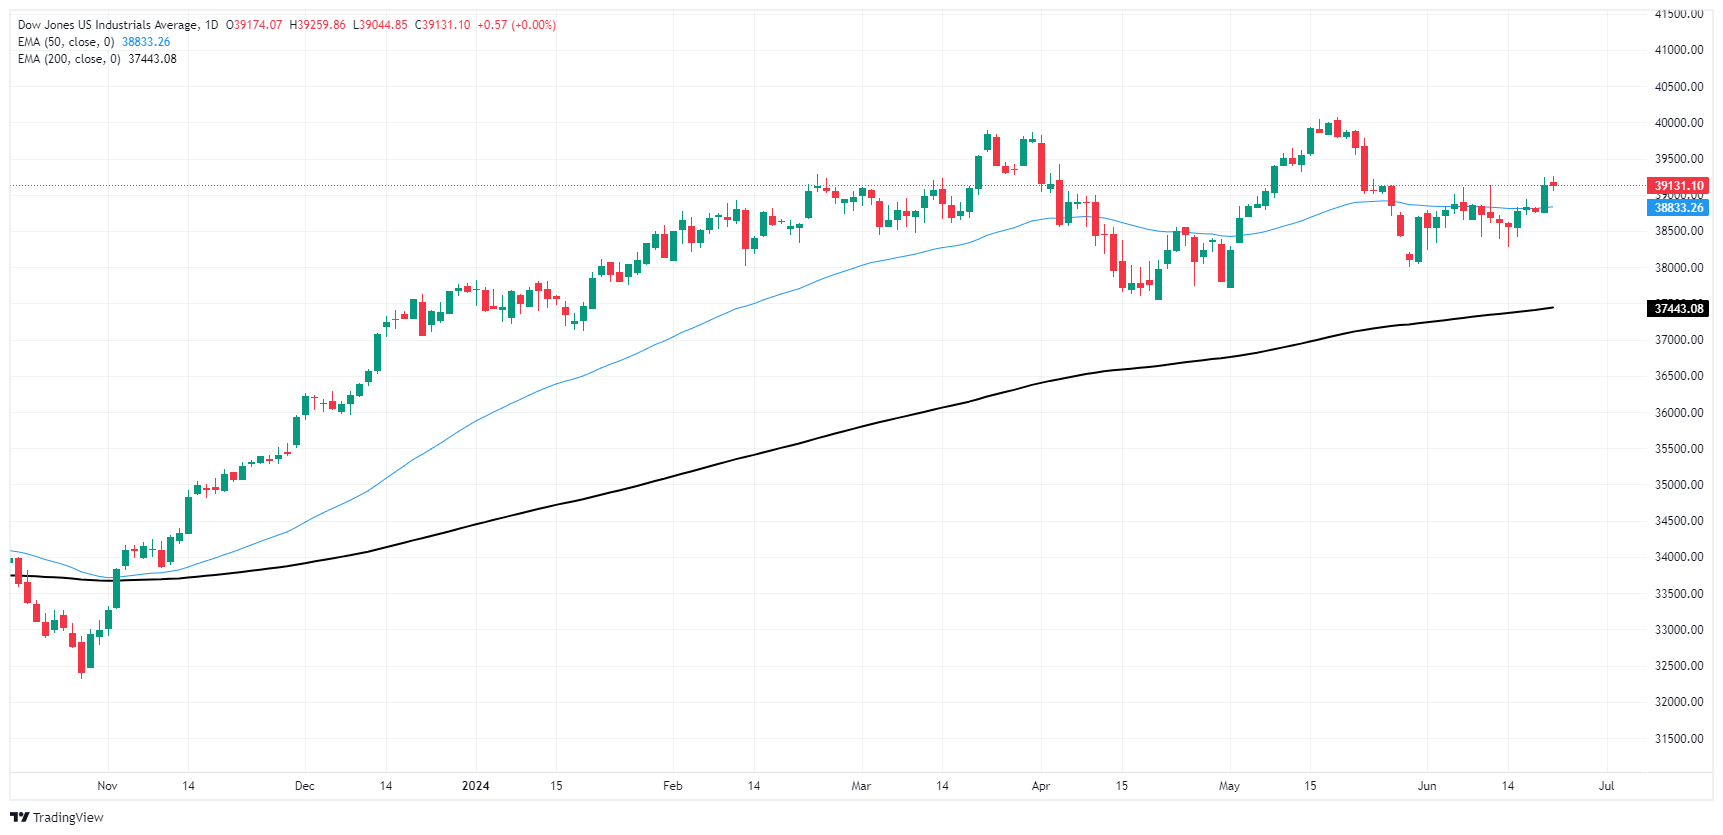
Dow Jones FAQs
The Dow Jones Industrial Average, one of the oldest stock market indices in the world, is compiled of the 30 most traded stocks in the US. The index is price-weighted rather than weighted by capitalization. It is calculated by summing the prices of the constituent stocks and dividing them by a factor, currently 0.152. The index was founded by Charles Dow, who also founded the Wall Street Journal. In later years it has been criticized for not being broadly representative enough because it only tracks 30 conglomerates, unlike broader indices such as the S&P 500.
Many different factors drive the Dow Jones Industrial Average (DJIA). The aggregate performance of the component companies revealed in quarterly company earnings reports is the main one. US and global macroeconomic data also contributes as it impacts on investor sentiment. The level of interest rates, set by the Federal Reserve (Fed), also influences the DJIA as it affects the cost of credit, on which many corporations are heavily reliant. Therefore, inflation can be a major driver as well as other metrics which impact the Fed decisions.
Dow Theory is a method for identifying the primary trend of the stock market developed by Charles Dow. A key step is to compare the direction of the Dow Jones Industrial Average (DJIA) and the Dow Jones Transportation Average (DJTA) and only follow trends where both are moving in the same direction. Volume is a confirmatory criteria. The theory uses elements of peak and trough analysis. Dow’s theory posits three trend phases: accumulation, when smart money starts buying or selling; public participation, when the wider public joins in; and distribution, when the smart money exits.
There are a number of ways to trade the DJIA. One is to use ETFs which allow investors to trade the DJIA as a single security, rather than having to buy shares in all 30 constituent companies. A leading example is the SPDR Dow Jones Industrial Average ETF (DIA). DJIA futures contracts enable traders to speculate on the future value of the index and Options provide the right, but not the obligation, to buy or sell the index at a predetermined price in the future. Mutual funds enable investors to buy a share of a diversified portfolio of DJIA stocks thus providing exposure to the overall index.
- US Dollar soars on back of robust PMI figures for June.
- Markets continue to exercise caution as Fed officials maintain a wary stance on easing cycles.
- Investors continue to leave the door open for a September cut.
On Friday, the US Dollar, benchmarked by the US Dollar Index (DXY), extended its gains, stemming primarily from robust Purchasing Managers Index (PMI) figures for June released by S&P.
Regarding the US economic outlook, there exist signs of some disinflation. Furthermore, Federal Reserve (Fed) officials' cautious comments regarding embracing easing cycles serve to keep market expectations in balance. Should the mixed signals from the economy continue, these could potentially impede any further gains in the USD.
Daily digest market movers: US Dollar rides high on strong PMIs
- US S&P Global Composite PMI for June rose slightly from 54.5 in May to a flash estimate of 54.6, indicating a healthy expansion in business activity within the private sector of the United States.
- Similarly, the S&P Global Manufacturing PMI rose from 51.3 to 51.7 within the same time frame, while Services PMI witnessed an increase to 55.1 from 54.8 in May. This data beat the estimates done by analysts.
- Probability of a rate cut as per CME Group's FedWatch Tool continues to stand around 65% for the meeting on September 18.
DXY technical analysis: Bullish momentum continues, technicals pave the way for more upside
Technical indicators for Friday's session demonstrated renewed bullish momentum backed by robust PMI figures. The Relative Strength Index (RSI) stood above 50, with the Moving Average Convergence Divergence (MACD) presenting green bars, pointing toward sustained bullish sentiment.
Additionally, the DXY Index maintains its footing above the 20-day, 100-day and 200-day Simple Moving Averages (SMAs). Coupled with the rising indicators, the US Dollar seems to be poised for additional gains.
Fed FAQs
Monetary policy in the US is shaped by the Federal Reserve (Fed). The Fed has two mandates: to achieve price stability and foster full employment. Its primary tool to achieve these goals is by adjusting interest rates. When prices are rising too quickly and inflation is above the Fed’s 2% target, it raises interest rates, increasing borrowing costs throughout the economy. This results in a stronger US Dollar (USD) as it makes the US a more attractive place for international investors to park their money. When inflation falls below 2% or the Unemployment Rate is too high, the Fed may lower interest rates to encourage borrowing, which weighs on the Greenback.
The Federal Reserve (Fed) holds eight policy meetings a year, where the Federal Open Market Committee (FOMC) assesses economic conditions and makes monetary policy decisions. The FOMC is attended by twelve Fed officials – the seven members of the Board of Governors, the president of the Federal Reserve Bank of New York, and four of the remaining eleven regional Reserve Bank presidents, who serve one-year terms on a rotating basis.
In extreme situations, the Federal Reserve may resort to a policy named Quantitative Easing (QE). QE is the process by which the Fed substantially increases the flow of credit in a stuck financial system. It is a non-standard policy measure used during crises or when inflation is extremely low. It was the Fed’s weapon of choice during the Great Financial Crisis in 2008. It involves the Fed printing more Dollars and using them to buy high grade bonds from financial institutions. QE usually weakens the US Dollar.
Quantitative tightening (QT) is the reverse process of QE, whereby the Federal Reserve stops buying bonds from financial institutions and does not reinvest the principal from the bonds it holds maturing, to purchase new bonds. It is usually positive for the value of the US Dollar.
- Mexican Peso strengthens for second consecutive day as USD/MXN drops close to 1%.
- Positive market reaction comes in response to choice of Marcelo Ebrard as economy minister.
- Banxico expected to hold rates unchanged amid inflation concerns and recent Peso depreciation.
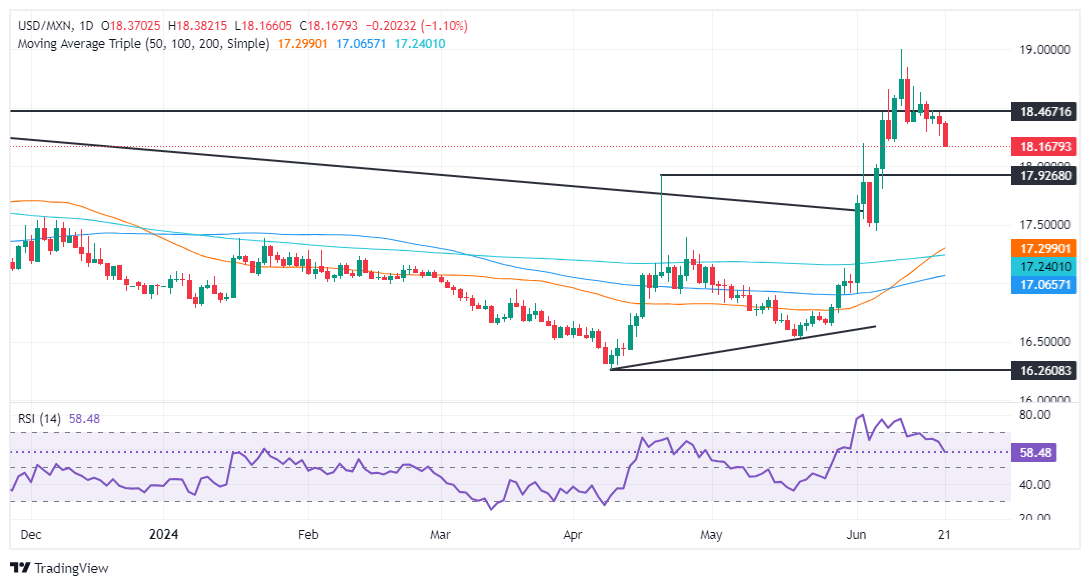
The Mexican Peso rallied for the second straight day against the US Dollar on Friday after President-elect Claudia Sheinbaum revealed the first members of the cabinet on Thursday, which were cheered by investors. In the meantime, traders brace for next week’s Bank of Mexico (Banxico) monetary policy decision, which is expected to hold rates unchanged. The USD/MXN trades at 18.21, down 0.80%.
Mexico’s President-elect Sheinbaum revealed on Thursday the first six cabinet members to take office on October 1. She named Marcelo Ebrard as economy minister and Juan Ramon de la Fuente as foreign minister. Traders saw these appointments as positive since Ebrard will oversee the USMCA free trade agreement review.
Data-wise, the Mexican economic docket featured Economic Activity, which plunged in April, as shown by monthly figures. In the twelve months to April, it exceeded estimates.
In the meantime, most analysts estimate Banxico will keep rates unchanged after the 6.95% depreciation of the Mexican Peso following the June 2 general election. The consensus was expecting a 25-basis-point cut on June 27, though not unanimously, as Deputy Governors Jonathan Heath and Irene Espinosa expressed that inflation risks were skewed to the upside.
Across the border, June S&P Global Flash PMIs exceeded estimates, a sign of economic robustness. Nevertheless, the latest Existing Home Sales data suggests the housing market continues to cool down.
Daily digest market movers: Mexican Peso advances after mixed economic activity data
- Mexico’s April Economic Activity plunged -0.6% MoM, deeper than the expected -0.3% contraction. On an annual basis, Economic Activity expanded by 5.4%, up from -1.3%, and exceeded the consensus of 3.8%.
- Citibanamex Survey showed that most analysts estimate Banxico’s next rate cut will come at the August 8 meeting and that interest rates will be lowered from 11.00% to 10.25%, up from 10%.
- According to the poll, economists estimate inflation to finish 2024 down at 4.27%, core inflation at 4.02%, and the USD/MXN exchange rate at 18.70.
- USD/MXN stabilizes following last week’s verbal intervention by Banxico Governor Victoria Rodriguez Ceja, who said the central bank is attentive to volatility in the Mexican currency exchange rate and could act to restore “order” in markets.
- S&P Global Manufacturing and Services Flash PMIs in June expanded above estimates. Manufacturing PMI came at 51.7, up from 51.3 and the estimate of 51. The Services PMI jumped from 54.8 to 55.1 and was above forecasts of 53.7.
- US Existing Home Sales in May were lower than expected at 4.11 million from 4.14 million in April, a contraction of -0.7%.
- CME FedWatch Tool shows odds for a 25-basis-point Fed rate cut at 59.5%, up from 57.5% on Thursday.
Technical analysis: Mexican Peso climbs as USD/MXN falls below 18.30
The USD/MXN is upwardly biased as a Golden Cross emerged two days ago, but today’s dip below 18.30 has opened the door for a pullback with bears eyeing the 18.00 psychological level. At the time of writing, momentum favors sellers as the Relative Strength Index (RSI) almost vertically falls toward the 50-neutral line.
That said, the USD/MXN first support would be the 18.00 figure. Once cleared, the next stop would be the 50-day Simple Moving Average (SMA) at 17.29, ahead of the 200-day SMA at 17.23.
For a bullish continuation, the USD/MXN must clear 18.50 if buyers want to retest the year-to-date high of 18.99. A breach of the latter will expose the March 20, 2023, high of 19.23. If that price is cleared, this will sponsor an uptick to 19.50.
Mexican Peso FAQs
The Mexican Peso (MXN) is the most traded currency among its Latin American peers. Its value is broadly determined by the performance of the Mexican economy, the country’s central bank’s policy, the amount of foreign investment in the country and even the levels of remittances sent by Mexicans who live abroad, particularly in the United States. Geopolitical trends can also move MXN: for example, the process of nearshoring – or the decision by some firms to relocate manufacturing capacity and supply chains closer to their home countries – is also seen as a catalyst for the Mexican currency as the country is considered a key manufacturing hub in the American continent. Another catalyst for MXN is Oil prices as Mexico is a key exporter of the commodity.
The main objective of Mexico’s central bank, also known as Banxico, is to maintain inflation at low and stable levels (at or close to its target of 3%, the midpoint in a tolerance band of between 2% and 4%). To this end, the bank sets an appropriate level of interest rates. When inflation is too high, Banxico will attempt to tame it by raising interest rates, making it more expensive for households and businesses to borrow money, thus cooling demand and the overall economy. Higher interest rates are generally positive for the Mexican Peso (MXN) as they lead to higher yields, making the country a more attractive place for investors. On the contrary, lower interest rates tend to weaken MXN.
Macroeconomic data releases are key to assess the state of the economy and can have an impact on the Mexican Peso (MXN) valuation. A strong Mexican economy, based on high economic growth, low unemployment and high confidence is good for MXN. Not only does it attract more foreign investment but it may encourage the Bank of Mexico (Banxico) to increase interest rates, particularly if this strength comes together with elevated inflation. However, if economic data is weak, MXN is likely to depreciate.
As an emerging-market currency, the Mexican Peso (MXN) tends to strive during risk-on periods, or when investors perceive that broader market risks are low and thus are eager to engage with investments that carry a higher risk. Conversely, MXN tends to weaken at times of market turbulence or economic uncertainty as investors tend to sell higher-risk assets and flee to the more-stable safe havens.
- Canadian Dollar sheds a fifth of a percent against Greenback.
- Canada saw an upswing in core Retail Sales, but industrial prices cooled.
- US PMIs beat the street, snubbing forecasts and ticking higher in June.
The Canadian Dollar (CAD) is struggling to overtake the US Dollar (USD) on Friday, buckling under the weight of a thin, five-day win streak against the Greenback after the US Purchasing Managers Index (PMI) firmly beat forecasts, bolstering the Greenback and leaving the CAD to compete for second place.
Canada saw a better-than-expected print in core Retail Sales in April, but floundering industrial and raw materials prices in May limited the Canadian Dollar's upside moves on Friday. US PMIs lurched higher in June, pushing the US Dollar higher across the board. The CAD is still broadly higher on the week, holding onto a fifth of a percent against the USD from Monday’s opening bids.
Daily digest market movers: Mixed Canadian data flubs broad beats from US
- Canadian core Retail Sales surged 1.8% MoM in April, the highest MoM gain since July 2022. Markets had expected a print of 0.7% compared to the previous month’s revised -0.8%.
- Canadian Raw Material Price Index fell a full 1.0% in May, a steeper decline than the expected -0.6% contraction and falling back from the previous 5.3% (revised from 5.5%).
- Canadian Industrial Produce Prices came in flat in May, below the 0.5% forecast and clipping the previous month’s revised 1.4% as inflation continues to seep out of the Canadian economy at the industrial level.
- US S&P Global Manufacturing PMIs broadly beat forecasts with the Manufacturing PMI printing at 51.7 versus the forecast decline to 51.0 from the previous 51.3.
- US Services PMI also stepped higher, clipping into 55.1 compared to the median market forecast of 53.7 against the previous month’s 54.8.
- Coming up next week, Bank of Canada (BoC) Governor Tiff Macklem will be making a public appearance on Monday; Tuesday will follow up with Canada’s Consumer Price Index (CPI) inflation alongside the BoC’s own CPI core print.
Canadian Dollar PRICE Today
The table below shows the percentage change of Canadian Dollar (CAD) against listed major currencies today. Canadian Dollar was the strongest against the Japanese Yen.
| USD | EUR | GBP | JPY | CAD | AUD | NZD | CHF | |
|---|---|---|---|---|---|---|---|---|
| USD | 0.09% | 0.13% | 0.33% | 0.11% | 0.18% | -0.00% | 0.31% | |
| EUR | -0.09% | 0.03% | 0.26% | 0.04% | 0.11% | -0.07% | 0.22% | |
| GBP | -0.13% | -0.03% | 0.22% | -0.01% | 0.08% | -0.10% | 0.20% | |
| JPY | -0.33% | -0.26% | -0.22% | -0.23% | -0.17% | -0.34% | -0.00% | |
| CAD | -0.11% | -0.04% | 0.01% | 0.23% | 0.05% | -0.12% | 0.20% | |
| AUD | -0.18% | -0.11% | -0.08% | 0.17% | -0.05% | -0.21% | 0.12% | |
| NZD | 0.00% | 0.07% | 0.10% | 0.34% | 0.12% | 0.21% | 0.32% | |
| CHF | -0.31% | -0.22% | -0.20% | 0.00% | -0.20% | -0.12% | -0.32% |
The heat map shows percentage changes of major currencies against each other. The base currency is picked from the left column, while the quote currency is picked from the top row. For example, if you pick the Canadian Dollar from the left column and move along the horizontal line to the US Dollar, the percentage change displayed in the box will represent CAD (base)/USD (quote).
Technical analysis: Canadian Dollar gives mixed performance on Friday
The Canadian Dollar (USD) is trading tightly on Friday with gains and losses equally balanced. The CAD is up around a fifth of a percent against the Australian Dollar (AUD) and Japanese Yen (JPY), but struggling to limit losses against the US Dollar to one-fifth of one percent.
USD/CAD bumped higher on Friday, bouncing from a fresh weekly low of 1.3675 to briefly test back above the 1.3700 handle before running into intraday technical resistance at the 200-hour Exponential Moving Average (EMA) at 1.3715.
Daily candlesticks are on pace to chalk in a first green candle after soft declines for five straight trading days, rebounding from near-term support at the 50-day EMA near 1.3675. USD/CAD is mired in rough consolidation as traders grapple with a rough rising trendline, and long-term technical support continues to bolster bids as the 200-day EMA rises into 1.3600.
USD/CAD hourly chart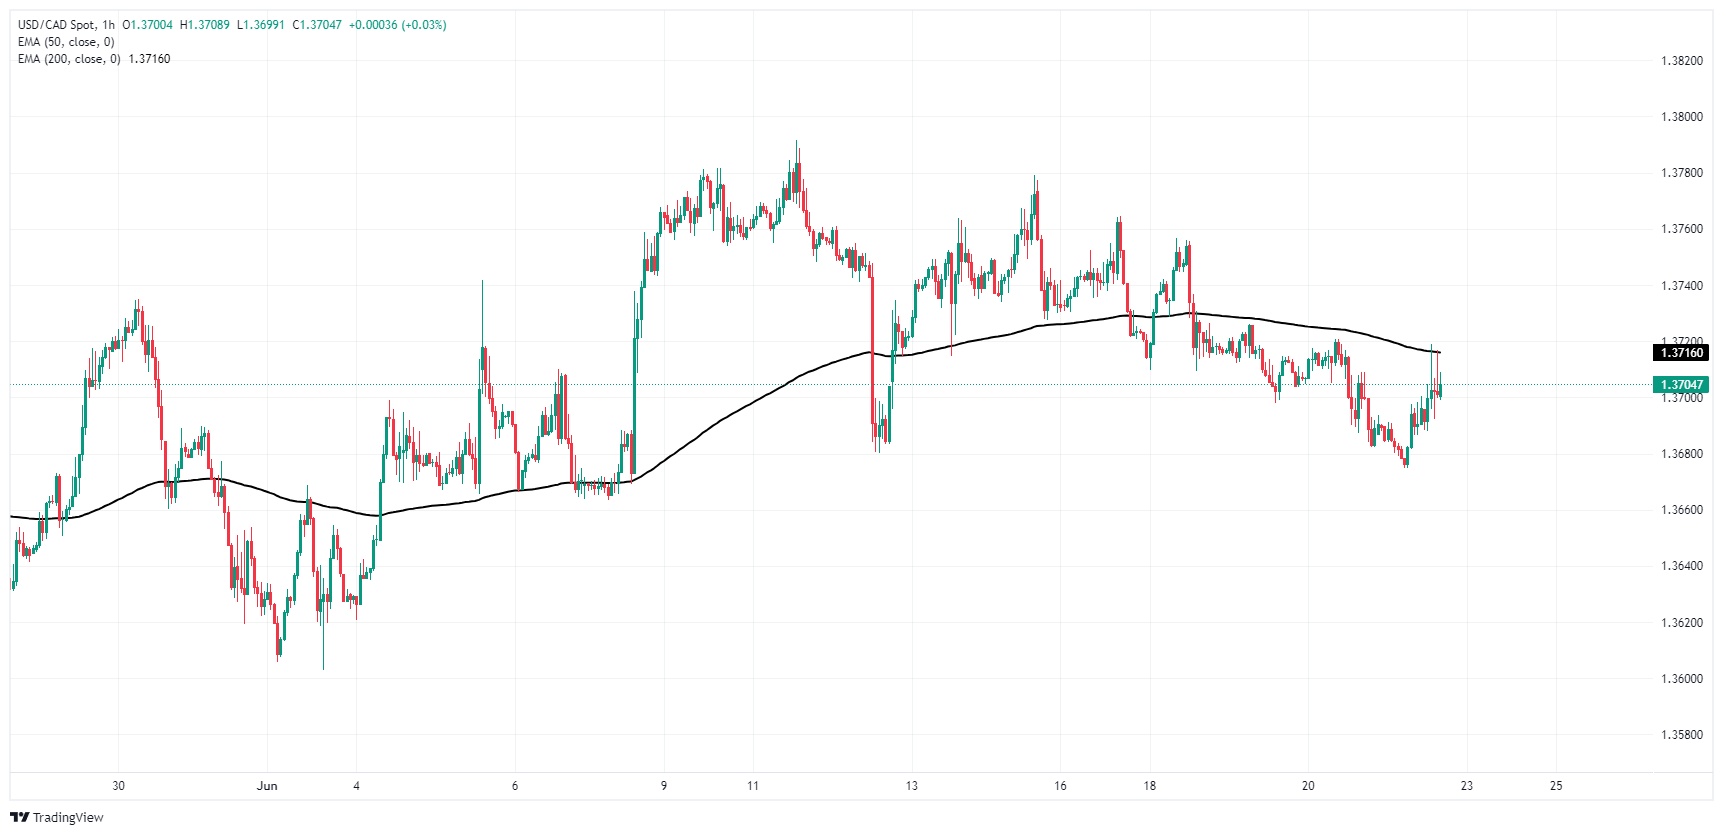
USD/CAD daily chart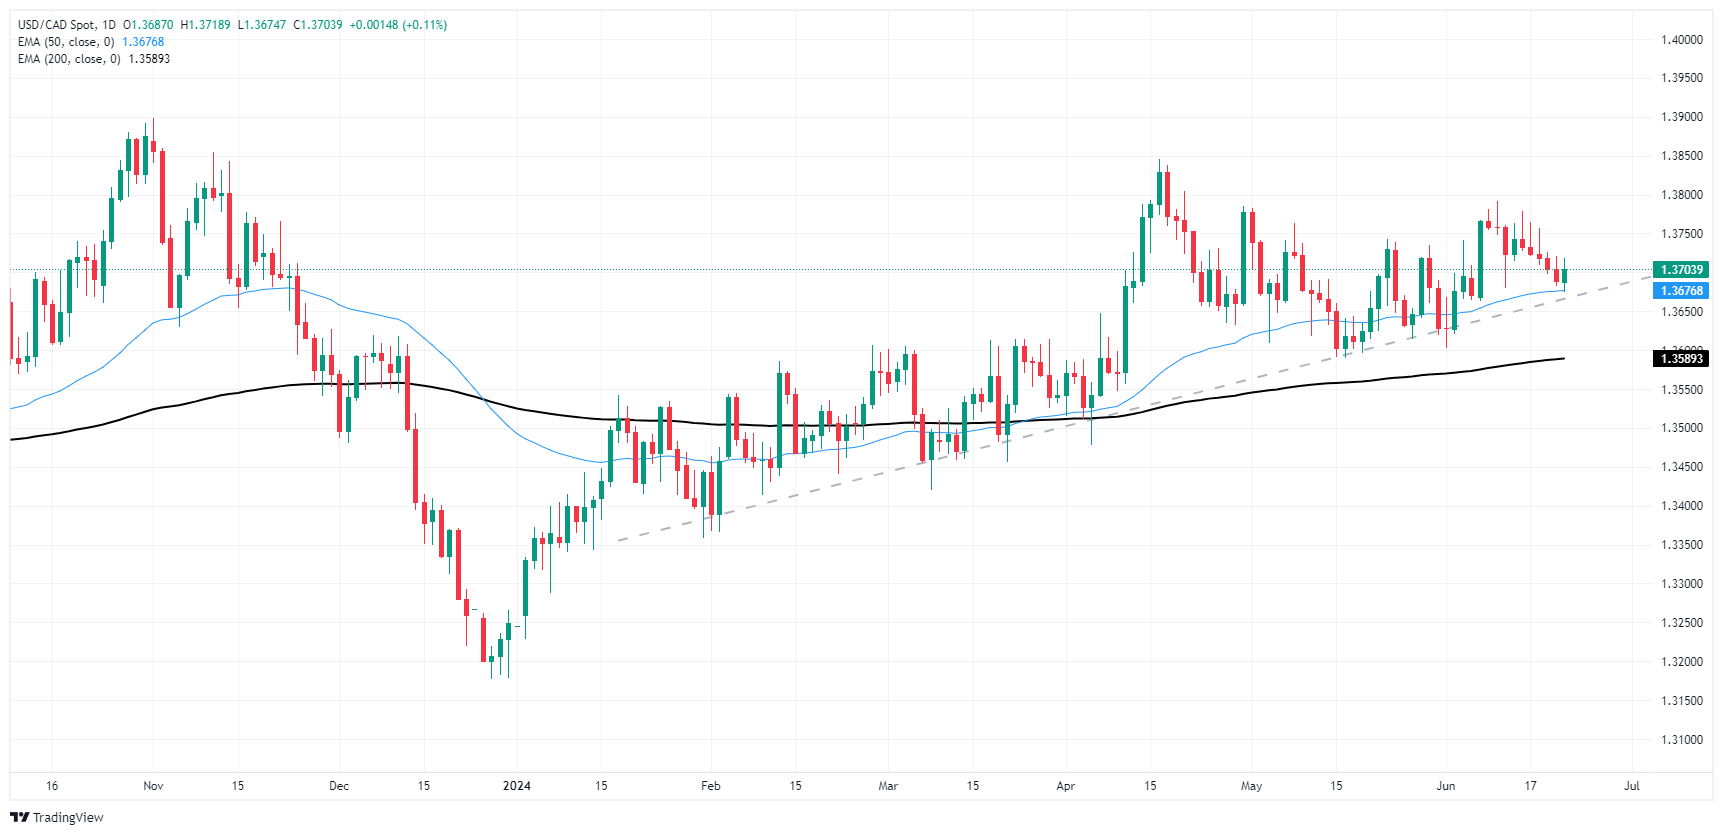
Canadian Dollar FAQs
The key factors driving the Canadian Dollar (CAD) are the level of interest rates set by the Bank of Canada (BoC), the price of Oil, Canada’s largest export, the health of its economy, inflation and the Trade Balance, which is the difference between the value of Canada’s exports versus its imports. Other factors include market sentiment – whether investors are taking on more risky assets (risk-on) or seeking safe-havens (risk-off) – with risk-on being CAD-positive. As its largest trading partner, the health of the US economy is also a key factor influencing the Canadian Dollar.
The Bank of Canada (BoC) has a significant influence on the Canadian Dollar by setting the level of interest rates that banks can lend to one another. This influences the level of interest rates for everyone. The main goal of the BoC is to maintain inflation at 1-3% by adjusting interest rates up or down. Relatively higher interest rates tend to be positive for the CAD. The Bank of Canada can also use quantitative easing and tightening to influence credit conditions, with the former CAD-negative and the latter CAD-positive.
The price of Oil is a key factor impacting the value of the Canadian Dollar. Petroleum is Canada’s biggest export, so Oil price tends to have an immediate impact on the CAD value. Generally, if Oil price rises CAD also goes up, as aggregate demand for the currency increases. The opposite is the case if the price of Oil falls. Higher Oil prices also tend to result in a greater likelihood of a positive Trade Balance, which is also supportive of the CAD.
While inflation had always traditionally been thought of as a negative factor for a currency since it lowers the value of money, the opposite has actually been the case in modern times with the relaxation of cross-border capital controls. Higher inflation tends to lead central banks to put up interest rates which attracts more capital inflows from global investors seeking a lucrative place to keep their money. This increases demand for the local currency, which in Canada’s case is the Canadian Dollar.
Macroeconomic data releases gauge the health of the economy and can have an impact on the Canadian Dollar. Indicators such as GDP, Manufacturing and Services PMIs, employment, and consumer sentiment surveys can all influence the direction of the CAD. A strong economy is good for the Canadian Dollar. Not only does it attract more foreign investment but it may encourage the Bank of Canada to put up interest rates, leading to a stronger currency. If economic data is weak, however, the CAD is likely to fall.
- Norges Bank kept rates steady at 4.5%, as expected.
- The bank is delaying the easing to Q1 of 2025.
- As long as the NB policy diverges with its peers the NOK might see further upside.
On Friday, the USD/NOK recovered towards 10.575 and cleared most of Thursday's losses. That being said, the NOK is holding strong against its peers as the Norges Bank will likely start the easing in Q1 of 2025.
The Norges Bank announced on Thursday that it will maintain its interest rate at 4.5%, a decision that was widely anticipated. This move is considered hawkish as the bank has delayed its initial rate cut projection to the first quarter of 2025, previously set for the third quarter of 2024. According to the new forecast, the policy rate will stay at 4.50% until the end of the year and will then begin to decrease gradually. This contrasts with the more aggressive rate-cutting strategies of neighboring central banks, which are grappling with different economic challenges.
Regarding the economic outlook, Norges Bank expressed concerns that reducing the rate too soon could lead to prolonged inflation above the target level despite the latest economic challenges. As a result, market expectations for a rate cut within the next six months have nearly vanished, with approximately 50 basis points of easing anticipated over the following half-year which fueled a rise of the Krone against its peers.
USD/NOK technical analysis
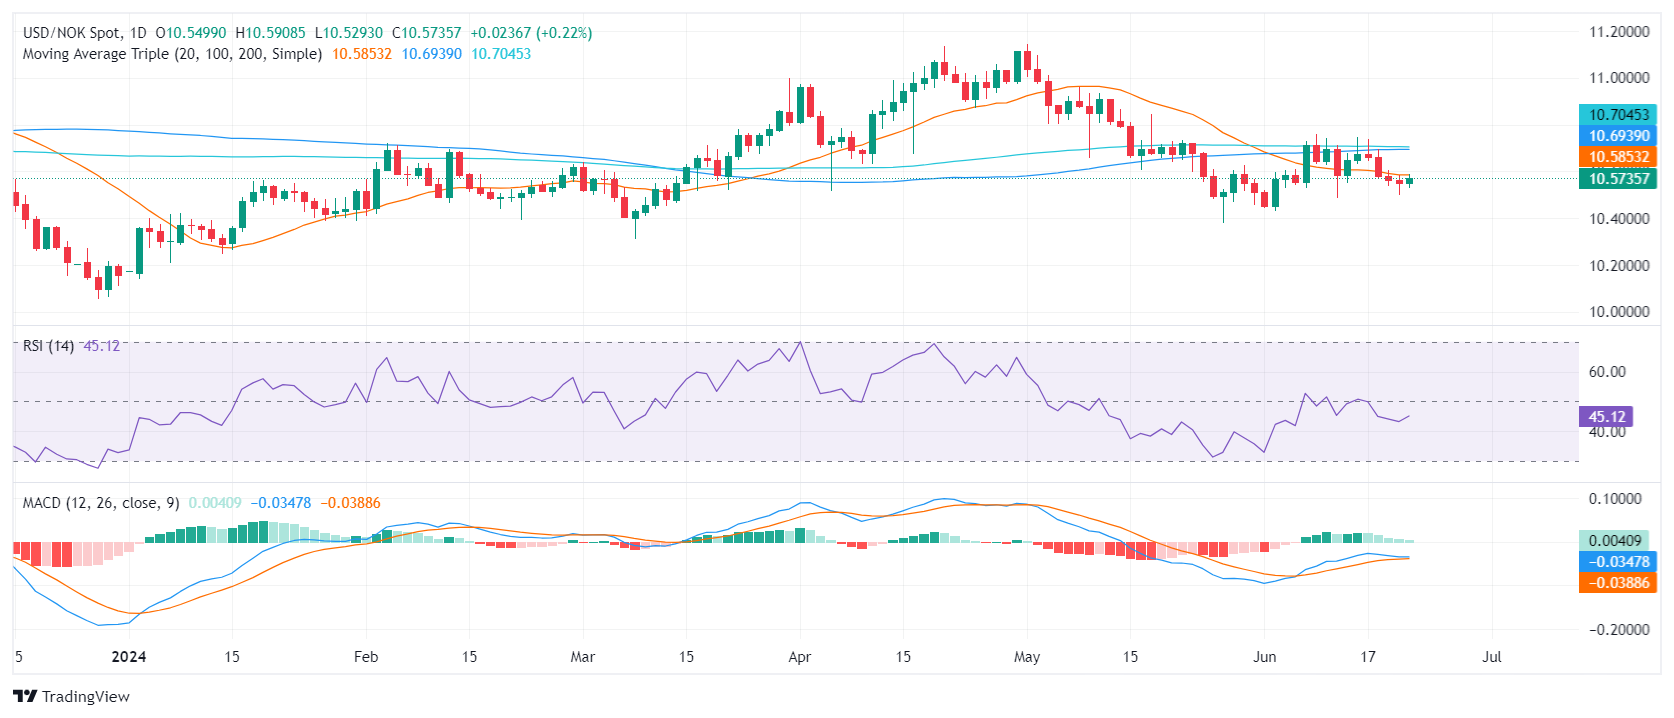
According to the daily chart, the outlook of the pair remains bearish with indicators flashing bearish signals. The Relative Strength Index (RSI) stands below 50 while the Moving Average Divergence Convergence (MACD) prints steady red bars.
The most clear of the bearish signals is that the pair has recently dipped below the 20,100 and 200-day Simple Moving Averages (SMA) as lost over 1% in the last four sessions.
USD/NOK daily chart
Thursday’s Bank of England (BoE) statement and minutes suggested officials are getting closer to cutting interest rates, ING’s FX Strategist Francesco Pesole notes.
August cut is a must, GBP/USD set to fall under 1.25
“The recent upside surprises in services inflation (5.7%) are attributed to volatility related to annual price hikes, not a significant trend, and while the BoE isn’t pre-committing to anything, an August rate cut is likely if the next inflation report doesn’t contain surprises.”
“Three rate cuts in 2024 starting from August remain ING’s base case, which is more dovish than the two cuts priced in by the market. An August move is only 60% priced in at the moment.”
“This makes us lean on the bearish side of sterling, although the political events in the eurozone mean that a EUR/GBP rebound may be delayed further. We expect most of Pund Sterling’s weakness to be channeled via GBP/USD, which we expect to trade back under 1.25.”
With dovish signals from the European Central Bank’s (ECB) major European counterparts (the Bank of England and Swiss National Bank) and investors' nerves still quite jittery on EU fiscal and political developments, the Euro is understandably under some pressure in the latter half of this week, Francesco Pesole, FX Strategist at ING argues.
EU activity indicators proved favorable for the Euro
“What had come to the help of the common currency in some instances recently was decent activity indicators, and PMIs are released today. It will be interesting to see whether political uncertainty in France has already taken a toll on French business sentiment at all: consensus doesn’t believe so.”
“We’ll hear from two ECB members today – Gediminas Simkus and the hawk Joachim Nagel – who could move the market on comments about the current turmoil in EU bond markets.”
“We still think EUR/USD can trade a bit lower into the US core PCE/French election events in late June. Risks of multiple days of trading below 1.07 are tangible.”
Central bank events in Europe gave the Dollar some support on Thursday, Francesco Pesole, FX Strategist at ING argues.
DXY may trade closer to 106.00
“The surprise rate cut by the Swiss National Bank and a dovish hold by the Bank of England reinforced the notion that central banks in Europe are way ahead of the Federal Reserve with rate cuts, a dollar-positive development. The hawkish revision in guidance by Norway’s Norges Bank went in the other direction.”
“A further softening in inflation and/or activity data in the US is now needed to close the rate gap between the Fed and other central banks, and ultimately fuel a new dollar downtrend. The next top-tier data for markets is the PCE May release on 28 June, but some activity indicators before then can steer rate expectations to a smaller extent.”
“The comparison between PMIs in Europe and the US should drive some market moves today, but we doubt there is enough to take the dollar meaningfully lower at this stage, also considering the lingering political risk in the EU. DXY may trade closer to 106.0 than 105.0 in the next few days.”
Crude Oil continues to prove resilient, with inventory draws offering modest support to the complex, TDS strategists say.
Crude Oil stays strong amid CTA buying
"We still argue that the rally could start to fade as Commodity Trading Advisors (CTA) buying flows taper off. Prices below $81.73/bbl and $85.46/bbl for WTI and Brent crude respectively, would see CTAs ease up on their buying and liquidate a portion of the recently acquired length."
"Aside from the resurgent CTA flows, there is still more relative concern about Q4 balances and beyond, which should serve as a resistance to major upside."
Precious metals have held gains despite the uncertainty surrounding Federal Reserve (Fed) policy. Top traders on the Shanghai Futures Exchange (SHFE) continue to hold large positions in Gold (XAU/USD) and Silver (XAG/USD), while inflows continue into Chinese Gold ETFs, TDS strategists say.
Gold turns lower, Palladium faces short covering
“Macro investors have remained underpositioned in the Yellow Metal relative to a typical cutting cycle and macro traders seem to be happy waiting on the sidelines until there is more certainty on the timing of the coming Fed cuts. Ater a brief period of slight gains in Gold ETF holdings, the trend has started to ease lower once again.”
“Elsewhere, a bout of tightness and concern on sanction risk has sparked some likely short covering from the bloated money manager shorts in Palladium. Today's price action though is making short covering from this cohort more likely, with a handful of key triggers within the $968/oz - $973/oz range.”
- USD/CHF might be beginning a new short-term uptrend.
- The evidence is building and includes a break above the last lower high, a trendline and the 50 Simple Moving Average.
- A break above 0.8989 would provide greater confirmation.
USD/CHF trades in the 0.8930s on Friday, after rising on the back of positive US Purchasing Manager Index (PMI) data, which showed a healthy expansion in the manufacturing and services sectors in June.
The direction of the short-term trend is unclear. Recent gains have brought into question the dominance of the down trend since the pair broke out of the rising channel it was in at the beginning of the year.
USD/CHF 4-hour Chart
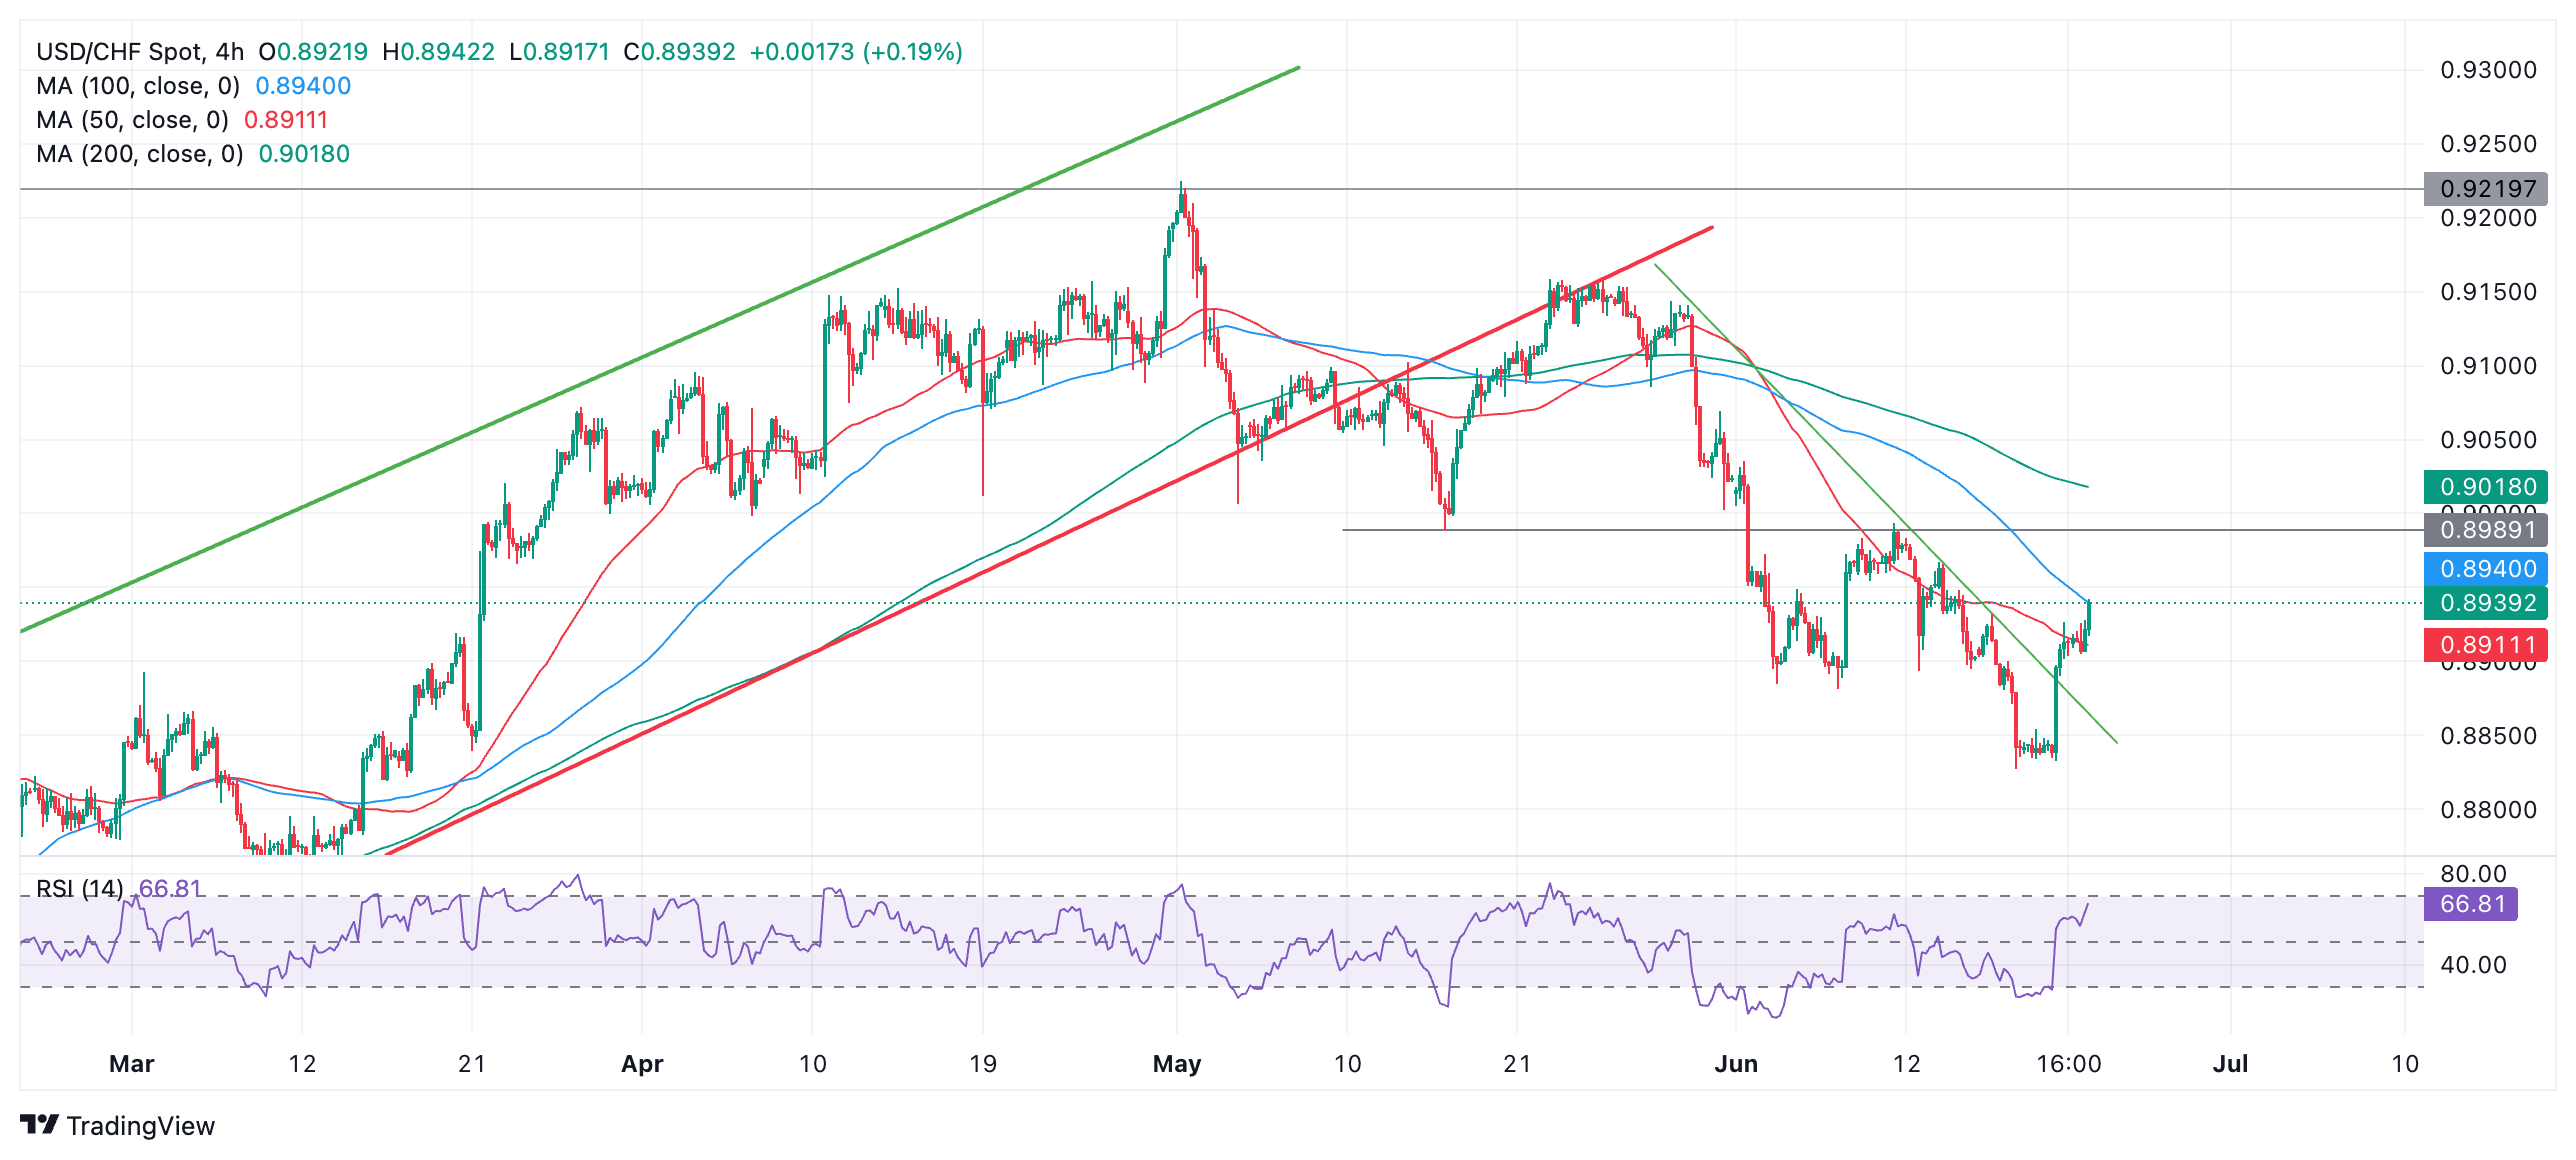
Thursday’s rally off the 0.8827 lows was strong, indicating it could be the start of a reversal. The Relative Strength Index (RSI) exited oversold at the same time and rose up equally steeply, showing strong upside momentum, and further supporting a bullish reversal hypothesis.
USD/CHF has broken above the last lower higher of the prior downtrend at 0.8932 (June 17 high), the 50 Simple Moving Average (SMA) and the green down-trend line, adding further evidence a new uptrend might be evolving.
It could be argued USD/CHF is now in a very young short-term uptrend which, going by the saying “the trend is your friend”, is more likely than not to extend. However, for stronger confirmation it would need to break above major support and resistance at 0.8989.
Our gauge of commodity demand continues to weaken amid a precarious global macro landscape, TD Securities analysts note.
Base metal complex shifts lower
“Our return decomposition framework across the complex confirms the demand side is finally starting to weigh heavy on base metals as the early summer euphoria fades.”
“Inflows into broad commodity ETFs throughout May had lifted the complex, but an easing of inflows and modest outflows have also started to weigh on the base metal complex. In this sense, AUM for base metal specific ETFs have also notably declined.”
“For Copper, our return decomposition framework is also showing a major drag from idiosyncratic factors, such as positioning, which suggests that the Red Metal could still be prone to additional downside in the near-term as bloated positions are cut.”
- GBP/USD remains heavy as BoE delivers ‘dovish’ hold.
- UK Retail Sales crushed estimates, but PMIs were softer.
- Tested 50-DMA, bounced but remains above 100-DMA, sitting at 1.2638.
The Pound Sterling prolonged its agony and fell for the second straight day after the Bank of England’s decision to hold rates unchanged, signaling that the beginning of the easing cycle is coming. Additionally, mixed UK economic data, with Retail Sales exceeding estimates but flash PMIs softening, hints the economy might be slowing. The GBP/USD trades at 1.2636, down 0.16%.
GBP/USD Price Analysis: Technical outlook
After diving to its lowest level since May 15 at 1.2621, the GBP/USD trimmed some of its earlier losses yet remains beneath its opening price. Momentum favors sellers, with the Relative Strength Index (RSI) aiming downwards and below its 50-neutral line.
That said, a daily close below the May 3 high turned support at 1.2634 would pave the way to test 1.2600. A breach of the latter will expose the 200-day moving average (DMA) at 1.2552. Conversely, further upside would be seen once buyers lift the exchange rate above 1.2700.
GBP/USD Price Action – Daily Chart
British Pound PRICE Today
The table below shows the percentage change of British Pound (GBP) against listed major currencies today. British Pound was the strongest against the Japanese Yen.
| USD | EUR | GBP | JPY | CAD | AUD | NZD | CHF | |
|---|---|---|---|---|---|---|---|---|
| USD | 0.14% | 0.19% | 0.32% | 0.09% | 0.23% | 0.10% | 0.25% | |
| EUR | -0.14% | 0.05% | 0.22% | -0.04% | 0.12% | -0.02% | 0.10% | |
| GBP | -0.19% | -0.05% | 0.14% | -0.11% | 0.05% | -0.10% | 0.07% | |
| JPY | -0.32% | -0.22% | -0.14% | -0.24% | -0.09% | -0.23% | -0.04% | |
| CAD | -0.09% | 0.04% | 0.11% | 0.24% | 0.13% | -0.00% | 0.17% | |
| AUD | -0.23% | -0.12% | -0.05% | 0.09% | -0.13% | -0.16% | 0.03% | |
| NZD | -0.10% | 0.02% | 0.10% | 0.23% | 0.00% | 0.16% | 0.16% | |
| CHF | -0.25% | -0.10% | -0.07% | 0.04% | -0.17% | -0.03% | -0.16% |
The heat map shows percentage changes of major currencies against each other. The base currency is picked from the left column, while the quote currency is picked from the top row. For example, if you pick the British Pound from the left column and move along the horizontal line to the US Dollar, the percentage change displayed in the box will represent GBP (base)/USD (quote).
Data from the United Kingdom reflects a mixed picture of the economy. The Pound Sterling (GBP) has underperformed on the week relative to most of its core peers, Scotiabank’s Chief FX Strategist Shaun Osborne says.
GBP struggles to find foothold
“UK Retail Sales rose a stronger than expected 2.9% in May, reflecting a rebound in activity after a depressed April (revised slightly higher to 1.8%). PMI data reflected slightly stronger than expected Manufacturing (51.4) but the Services and Composite data were below consensus estimates.”
“Sterling’s technical tone has weakened in the past few sessions. Recall that the GBP closed bearishly on the week last Friday. Loss of support in the upper 1.26s leaves the Pound struggling for a foothold amid some clear deterioration in the intraday and daily trend strength oscillators.”
“Support is 1.2580 (50% retracement of the April/June rebound). Look for resistance on minor rebounds to the upper 1.26s from here.”
- USD/CAD bounces back strongly after upbeat US preliminary S&P Global PMI report for June.
- Canadian Retail Sales grew expectedly by 0.7%.
- The Fed is expected to deliver two rate cuts this year.
The USD/CAD pair recovers strongly from 11-day low near 1.3670 in Friday’s American session. The Loonie asset bounces back as the US Dollar (USD) extends its upside after the US S&P Global PMI data for June shows that the Composite PMI surprisingly outperformed expectations that were pointing to slowdown in activity.
The US Dollar Index (DXY), which tracks the Greenback’s value against six major currencies, jumps to six-week high near 105.90.
However, investors are still uncertain about the US Dollar’s outlook as investors expect that the Federal Reserve (Fed) will start reducing interest rates from the September meeting. Market participants expect that the Fed will cut interest rates twice this year. On the contrary, Fed policymakers continue to argue in favor of reducing interest rates only once this year.
Meanwhile, the Canadian Dollar barely moved as Canada’s Retail Sales for April grew in line with expectations of 0.7% month-on-month. The Retail Sales data comes out positive after contracting for straight three months.
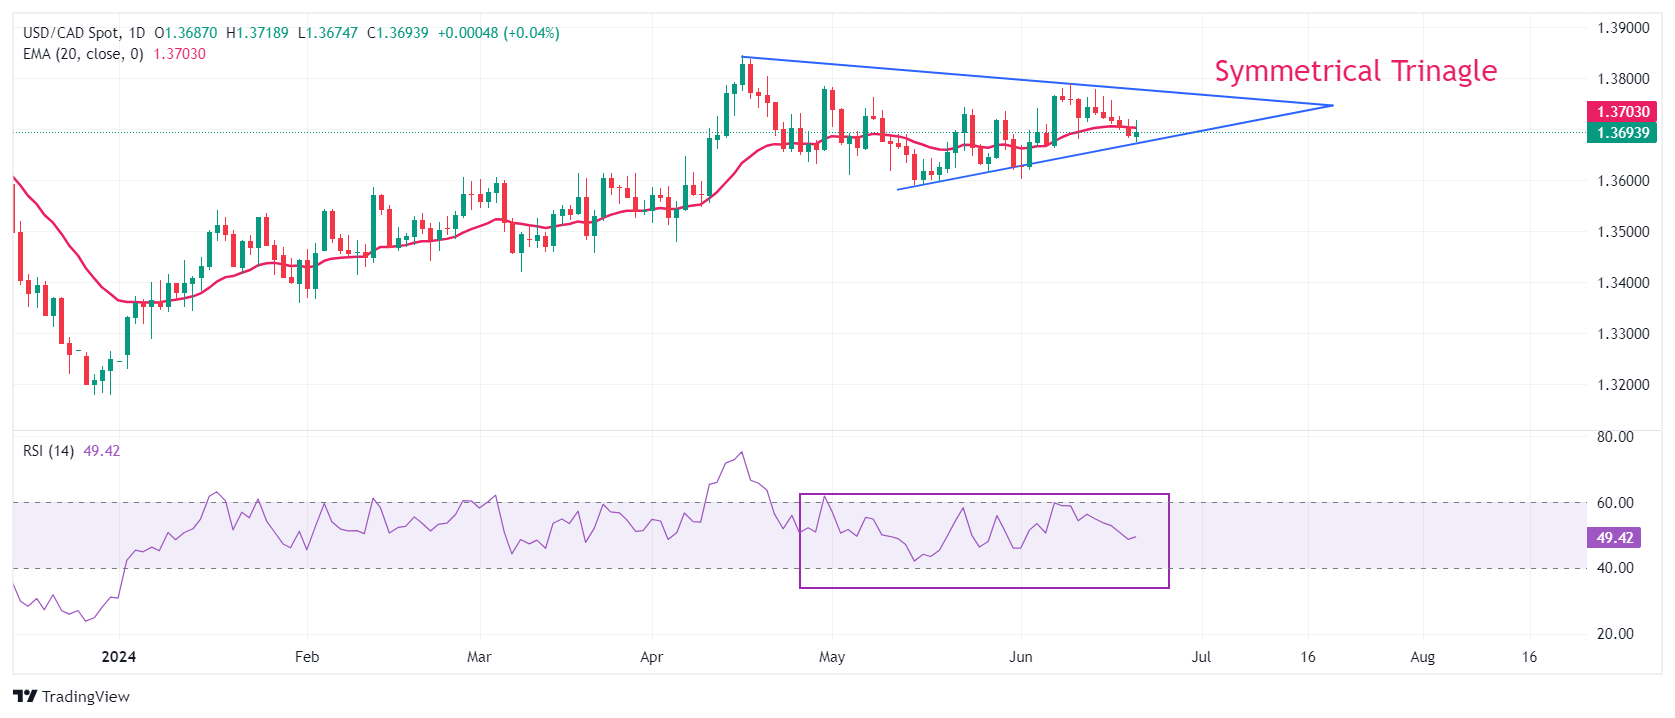
USD/CAD trades in a Symmetrical Triangle chart pattern, which indicates a sharp volatility contraction. Spot prices remain sticky to the 20-day Exponential Moving Average (EMA) near 1.3700, indicating a sideways trend.
The 14-period Relative Strength Index (RSI) oscillates in the 40.00-60.00 range, suggesting indecisiveness among market participants.
Fresh buying opportunity would emerge if the asset breaks above April 17 high at 1.3838. This would drive the asset towards 1 November 2023 high at 1.3900, followed by the psychological resistance of 1.4000.
In an alternate scenario, a breakdown below June 7 low at 1.3663 will expose the asset to May 3 low around 1.3600 and April 9 low around 1.3547.
USD/CAD daily chart
EUR/USD dipped to retest the mid-June low at 1.0675 earlier after preliminary Eurozone PMI data reports reflected an unexpected softening in activity, Scotiabank’s Chief FX Strategist Shaun Osborne argues.
Spot may stabilize after quickly regaining 1.0750
“Focus fell on the French data, associating weakness with the French snap election, but German Manufacturing dropped two points to 43.4, instead of gaining one point as expected.”
“Preliminary Eurozone data for Manufacturing, Services and the Composite index were all weaker than expected but the Composite and Services readings held above 50 (52.6 and 50.8 respectively). French survey data reflected steady Business Confidence in June, meanwhile, but May Retail Sales plunged 1.4%.”
“Hefty losses over the latter part of the week leave the EUR testing key support again at 1.0675. Weakness below here leaves spot exposed to 1.06, or possibly lower. A strong, positive reaction to the upper 1.06s last week suggests the EUR may be able to stabilize but it needs to regain 1.0750 quickly in order to do that.”
The Canadian Dollar (CAD) is little changed on the session after edging through the upper 1.3600s in overnight trade, but it is having a decent week relatively speaking, Scotiabank’s Chief FX Strategist Shaun Osborne notes.
Gains may be capped by 1.3720-1.3725 area
“A second consecutive weekly gain is on the cards, something it has not achieved since the middle of April. There is no clear reason for the CAD’s relatively firm performance this week and overnight movement leaves spot drifting the furthest from fair value (1.3784 today) since March.”
“The explanation may come from the Commodity Futures Trading Commission (CFTC) positioning data which show record net CAD shorts have accumulated in recent weeks. CAD bears have been persistent in recent months but positioning has not always been rewarded and has sometimes coincided with CAD rebounds, forcing CAD shorts to lightened up.”
“Steady USD losses this week may be finding a base in the upper 1.36 area. Intraday price signals suggest a USD rebound may be developing after spot based around 1.3675/80 in overnight. Gains may be capped by intraday resistance at 1.3720/25 with intraday trend momentum bearish and the daily DMI slipping into neutral now.”
- Silver price declines to $30.30 amid firm US Dollar.
- Investors await the preliminary US S&P Global PMI report for June.
- The Fed is expected to cut interest rates twice this year.
Silver price (XAG/USD) falls sharply to near $30.30 in Friday’s American session. The white metal is under pressure as the US Dollar (USD) clings to gains ahead of the preliminary United States (US) S&P PMI data for June, which will be published at 13:45 GMT.
The US Dollar Index (DXY) rises to a six-week high around 105.90 as global PMI figures have failed to meet market estimates, resulting in a dismal market sentiment. The USD Index could face pressure if the US PMI data also fails to match expectations.
Economists expect that the PMI report will show a slower growth in the Manufacturing as well as in Services activity.
Meanwhile, the overall appeal of the Silver price remains upbeat as investors expect that the Fed will start reducing interest rates from the September meeting. Financial markets expect that the Fed will deliver two rate cuts this year instead of one as signaled by policymakers in their latest interest rate projections report.
The expectations for the Fed reducing rates twice this year were prompted by soft US inflation report and slower than-expected growth in Retail Sales data for May. On the inflation outlook, Minneapolis Fed Bank President Neel Kashkari said on Thursday that inflation would return to bank’s target of 2% in up to two years. However, Kashkari remained concerned about high wage growth.
Silver technical analysis
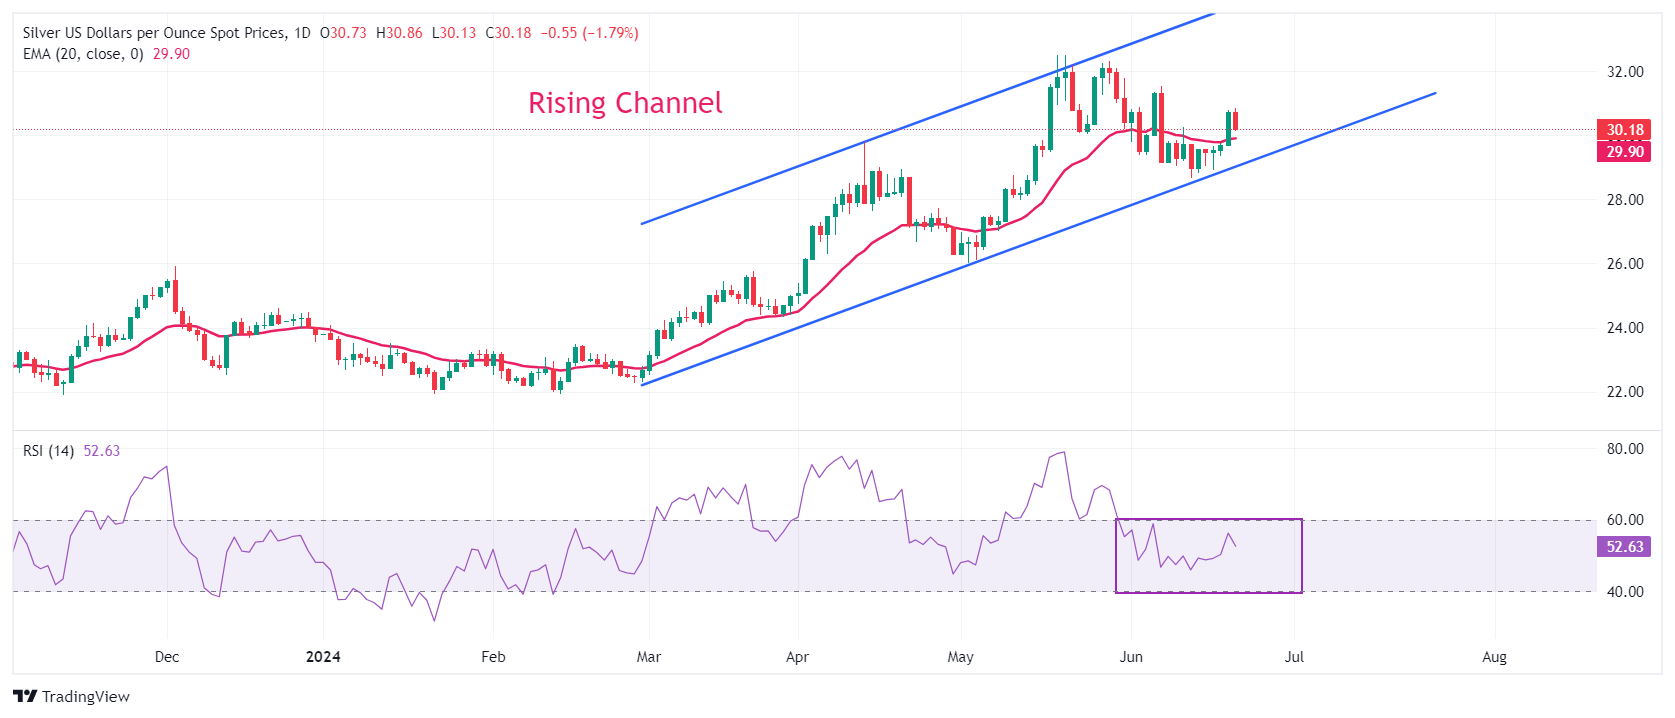
Silver price rebounds after discovering buying interest near the lower border of the Rising Channel chart pattern formed on a daily timeframe. The white metal rises above the 20-day Exponential Moving Average (EMA) near $29.90, suggesting that the near-term trend has turned bullish.
The 14-period Relative Strength Index (RSI) oscillates in the 40.00-60.00 range, indicating indecisiveness among investors.
Silver daily chart
- USD/JPY rallies to over 159 as US Dollar gains on hawkish Fedspeak and weakening Yen.
- Slide in Japanese underlying inflation suggests BoJ will not be able to raise rates much to support JPY.
- USD/JPY reenters intervention territory increasing chances authorities could intervene to push it lower.
USD/JPY continues its relentless climb, reaching the 159s on Friday – only one big figure away from the April highs of 160.32, where the Japanese authorities finally stepped in to prevent a further depreciation of their currency.
The pair is rallying off the back of a strengthening US Dollar (USD) due to rising US Treasury yields, as Federal Reserve (Fed) officials continue to spout hawkish commentary, playing down any market eagerness to see them cut interest rates any time soon.
USD/JPY gets further support from a weakening Japanese Yen (JPY), after the release of Japanese inflation data for May showed a fall in core inflation, and what gains there were, were mostly put down to rises in energy prices.
USD/JPY pushes higher on back of rising US Treasury yields
USD/JPY’s recent gains have been driven by the US Dollar due to “Higher (US) bond yields” which are highly correlated to USD, according to Westpac’s Pat Bustamante in his Friday morning report.
“The 2-year bond yield increased 3 basis points to 4.74%. The 10-year treasury yield increased 4 basis points to 4.26%,” says the Senior Economist, putting the gains down to, “some hawkish talk from a Fed official.”
The Fed official in question was Federal Reserve’s (Fed) Bank of Richmond President Tom Barkin, who urged patience as Fed rate cuts would “hit in time” but that the Fed needed “clearer inflation signals before a rate cut,” and reiterated that the bank would be taking a data-dependent approach.
According to Westpac’s Bustamente, “Interest-rate markets are pricing in just under two 25 basis points rate cuts this year, one in November and the other in December.”
The estimate is something of a backwards step from previous expectations that the Fed would make a cut in September as was the case immediately after US Retail Sales bombed earlier in the week.
Japanese underlying inflation continues to cool
Experts say the only way to reverse the long-term depreciation in the Yen is to increase interest rates, however, in order to do that, the Bank of Japan (BoJ) needs to to see inflation rising. Japanese Consumer Price Index (CPI) data for May released overnight will likely make them less inclined to begin raising interest rates, according to economists at Capital Economics.
Despite the headline rate of inflation rising to 2.8% from 2.5% previously, these gains were put mainly down to a 10% rise in utility bills after the government withdrew its subsidies for energy companies.
National CPI ex Food and Energy, however, cooled to 2.1% from 2.4% previously and showed underlying inflation continuing “to slow rapidly” according to Marcel Thieliant, Head of Asia-Pacific at Capital Economics.
“The upshot is that inflation excluding fresh food could already fall below the Bank of Japan’s 2% target in June and we still expect it to slow more sharply over coming months than the Bank has been anticipating. While that probably won’t forestall a rate hike at the Bank’s July meeting, it should convince the Bank to leave rates unchanged thereafter,” he concludes.
USD/JPY enters “intervention zone”
USD/JPY is now back on the edge of a cloudy “intervention zone” (red shaded area) where the Japanese authorities made direct purchases of Japanese Yen in the open market in late April and early May, to counteract its devaluation. The result was a deep correction in USD/JPY from 160 to 152.
USD/JPY Daily Chart
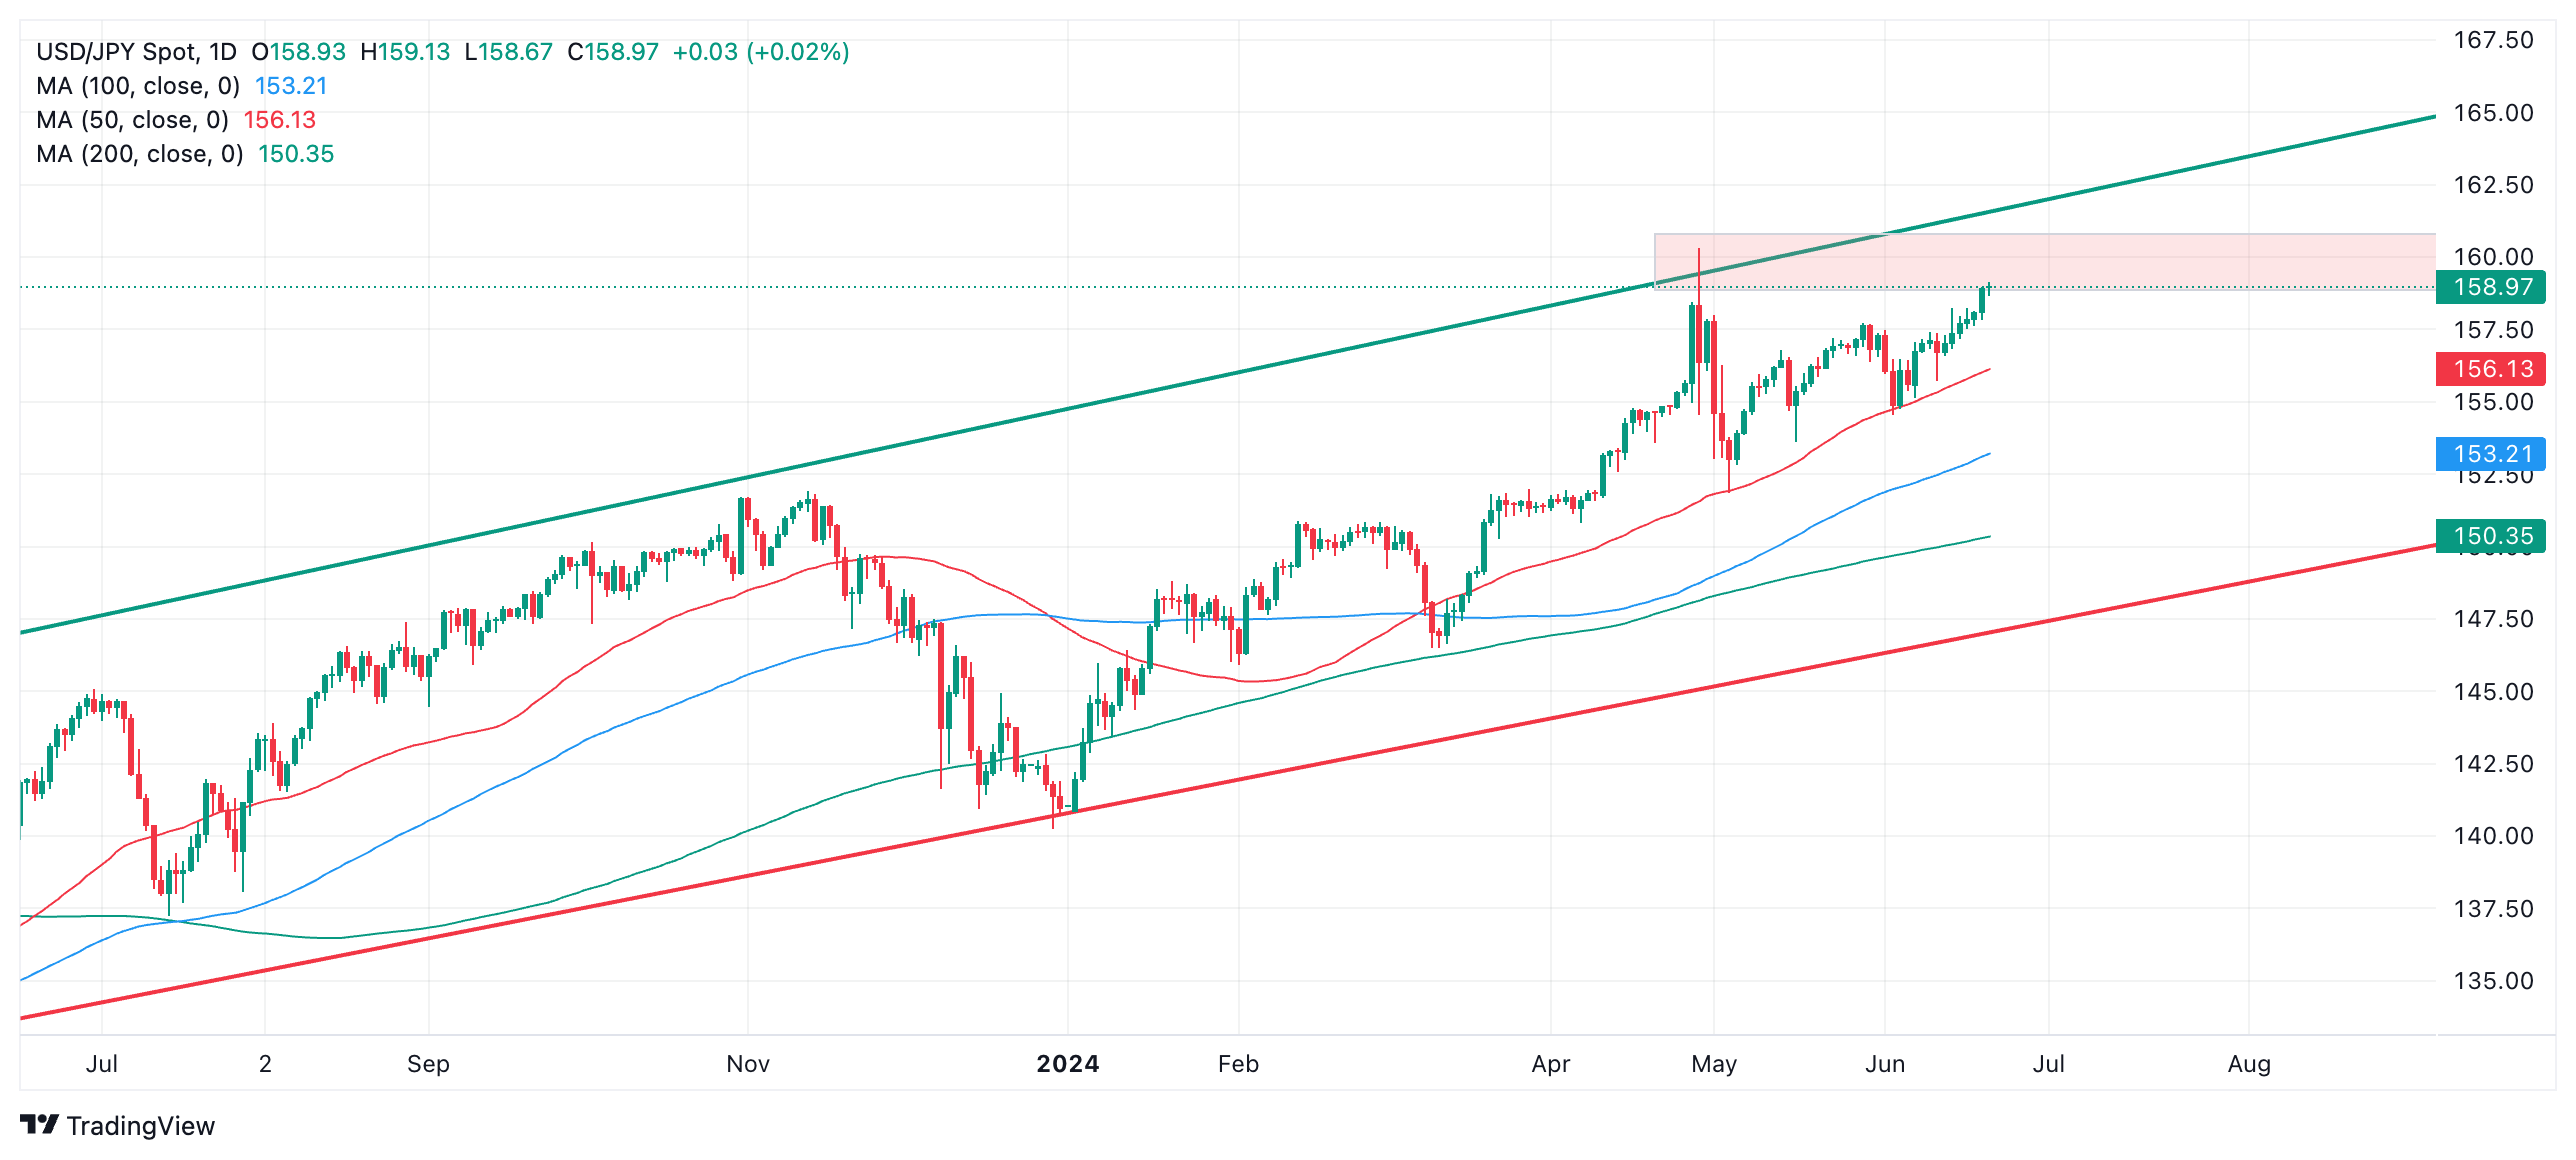
Given the increasing frequency of warnings from currency officials that further weakness will be countered by direct intervention, the chances of the same thing happening again has drastically increased. This, in turn, suggests a pullback may be in the offing.
- The US Dollar trades firmly higher for the week after late price action.
- Markets will focus on the US S&P Global PMI data for June on Friday.
- The US Dollar index trades in the green and could lock in a third consecutive week of gains.
The US Dollar (USD) continued edging higher on Friday ahead of the preliminary US S&P Global Purchasing Managers Index (PMI) report for June. The US Dollar shot higher in the last hours, with the Greenback outpacing the Japanese Yen (JPY) again, hitting 159.00 at USD/JPY, whilst tech wale Nvidia dove over 3% and lost $91 billion at the US closing bell.
On the economic data front, earlier in the day, S&P Global and Hamburg Commercial Bank (HCOB) released the Eurozone PMI data for June, showing lower-than-expected numbers. Manufacturing data further deepened into contraction at 45.6, while the services sector index fell to 52.6 from 53.2 in May. On the US side, traders will especially focus on the services component, as it accounts for two-thirds of the economy. Expectations for the US S&P Global Services PMI range from 55.00 to 52.00, with the previous month’s number at 54.8.
Daily digest market movers: Asia moving markets
- Masato Kanda, vice-minister for international affairs at Japan's Ministry of Finance, said that Japan is ready to take proper action on FX when needed. This comment sent the US Dollar back up to 159 against the Japanese Yen.
- Preliminary S&P Global/HCOB PMI data for France, Germany, and the Eurozone showed worst-than-expected numbers. As a result, the Euro retreats further against the US Dollar, falling below 1.07.
- At 13:45 GMT, S&P Global will release the June’s PMI preliminary reading per sector:
- Services sector is expected to ease to 53.7 from 54.8 in May.
- Manufacturing should remain rather stable, t showing 51.00 in June from 51.3 the previous month.
- The Composite Index was at 54.5 in May, with no consensus view available.
- At 14:00 GMT, in the slipstream of the US PMI release, Existing Home Sales data for May will be released. The expected number is 4.10 million in May, down from the 4.14 million seen in April.
- Equities are still trying to recover from the massive punch they received from the $91 billion value evaporating in Nvidia. There are red numbers across the board and across the globe for all major indices.
- The CME Fedwatch futures for September are backing a rate cut, with odds now standing at 57.9% for a 25 basis point cut. A rate pause stands at a 35.9% chance, while a 50-basis-point rate cut has a slim 6.2% possibility.
- The US 10-year benchmark rate is trading at 4.24%, right in the middle of this week’s range after briefly hitting 4.29% on Thursday.
US Dollar Index Technical Analysis: Gaining while not doing anything
The US Dollar Index (DXY) is breaking higher and has good odds to lock in a third consecutive week of gains. Although refraining from any soccer analogies, looking at the chart, it is quite clear that the Greenback has not played a good game this week. However, what counts is the end result, and that looks to be a win for the Greenback with a big thank you to the weaker Japanese Yen, France’s political turmoil, and the further contracting PMIs in Europe as main drivers.
On the upside, there are no big changes to the levels traders need to watch out for. The first level to watch is 105.88, which triggered a rejection at the start of May and will likely play its role as resistance again. Further up, the biggest challenge remains at 106.51, the year-to-date high from April 16.
On the downside, that 105.52 level is first support ahead of the trifecta of Simple Moving Averages (SMA) is still playing as support. First is the 55-day SMA at 105.14, safeguarding the 105.00 figure. A touch lower, near 104.61 and 104.48, both the 100-day and the 200-day SMA are forming a double layer of protection to support any declines. Should this area be broken, look for 104.00 to salvage the situation.
US Dollar FAQs
The US Dollar (USD) is the official currency of the United States of America, and the ‘de facto’ currency of a significant number of other countries where it is found in circulation alongside local notes. It is the most heavily traded currency in the world, accounting for over 88% of all global foreign exchange turnover, or an average of $6.6 trillion in transactions per day, according to data from 2022. Following the second world war, the USD took over from the British Pound as the world’s reserve currency. For most of its history, the US Dollar was backed by Gold, until the Bretton Woods Agreement in 1971 when the Gold Standard went away.
The most important single factor impacting on the value of the US Dollar is monetary policy, which is shaped by the Federal Reserve (Fed). The Fed has two mandates: to achieve price stability (control inflation) and foster full employment. Its primary tool to achieve these two goals is by adjusting interest rates. When prices are rising too quickly and inflation is above the Fed’s 2% target, the Fed will raise rates, which helps the USD value. When inflation falls below 2% or the Unemployment Rate is too high, the Fed may lower interest rates, which weighs on the Greenback.
In extreme situations, the Federal Reserve can also print more Dollars and enact quantitative easing (QE). QE is the process by which the Fed substantially increases the flow of credit in a stuck financial system. It is a non-standard policy measure used when credit has dried up because banks will not lend to each other (out of the fear of counterparty default). It is a last resort when simply lowering interest rates is unlikely to achieve the necessary result. It was the Fed’s weapon of choice to combat the credit crunch that occurred during the Great Financial Crisis in 2008. It involves the Fed printing more Dollars and using them to buy US government bonds predominantly from financial institutions. QE usually leads to a weaker US Dollar.
Quantitative tightening (QT) is the reverse process whereby the Federal Reserve stops buying bonds from financial institutions and does not reinvest the principal from the bonds it holds maturing in new purchases. It is usually positive for the US Dollar.
- USD/CAD witnesses buying interest below 1.3700 as the US Dollar rises further.
- The Fed is expected to begin lowering interest rates in September.
- Investors see the Canadian Retail Sales coming out of contraction trajectory.
The USD/CAD pair rebounds strongly after sliding slightly below the crucial support of 1.3700 in Friday’s European session. The Loonie asset recovers as the US Dollar (USD) exhibits strength on prospects that the Federal Reserve (Fed) will lag behind its peers in an attempt to commence its policy-easing process.
Market sentiment remains uncertain as global PMIs have underperformed against expectations. S&P 500 futures have posted some losses in the London session. The US Dollar Index (DXY), which tracks the Greenback’s value against six major currencies, jumps to six-week high near 105.90.
Currently, financial markets expect that the Fed will start reducing interest rates from the September. On the contrary, various central banks including the Bank of Canada (BoC) has already pivoted to policy normalization.
Meanwhile, investors await the preliminary United States (US) S&P Global PMI data for June, which will be published at 13:45 GMT. The Manufacturing and Services PMI are expected to have expanded at a slower pace. The PMI data will indicate the economic health of the economy, which investors expect is off from a strong outlook amid deepening consequences of higher interest rates by the Fed.
On the Loonie front, the Canadian Dollar will dance to the tunes of the Canada’s Retail Sales data for April, which will be published at 12:30 GMT. On month, the Retail Sales are expected to have risen by 0.7% after contracting straight for three months. The Retail Sales data is a measure to consumer spending, which provide cues about the inflation outlook.
- Gold trades higher on Friday on the back of continued expectations global interest rates will decline.
- As a non-interest-bearing asset, lower interest rates increase the attractiveness of Gold.
- XAU/USD’s break above key resistance invalidates the bearish Head-and-Shoulders pattern that formed on the daily chart.
Gold (XAU/USD) has broken back above its 50-day Simple Moving Average (SMA) and trades in the $2,360s on Friday as investors continue to bet on the US Federal Reserve (Fed) lowering interest rates, a key determinant of Gold price. Lower interest rates are positive for the yellow metal as they reduce the opportunity cost of holding Gold, which is non-coupon paying, compared to other assets like bonds.
Gold breaks higher as bargain hunters enter market
Gold trades higher at the end of the week on expectations that interest rates in the US – and other major economies – are set to fall. Lower-than-expected Retail Sales data for May out of the US and a rise in Jobless Claims on Thursday suggest economic momentum in the US may be slowing. This, in turn, is likely to lead to a cooling off in inflation and a greater possibility the Fed will move to cut interest rates. Such a chain of events would be positive for Gold.
Further afield, the Swiss National Bank’s (SNB) decision to cut interest rates by 0.25% to 1.25% on Thursday; the Bank of England’s (BoE) mildly dovish hold at its meeting; and the People’s Bank of China’s (PBoC) decision to hold its 1-year and 5-year prime loan rates at 3.45% and 3.95%, respectively, point to a flat-to-negative trajectory for interest rates which is positive for Gold, according to Kitco’s Jim Wyckoff.
Gold also benefits from strong central bank buying, according to a survey of international central bank reserve managers conducted by the World Gold Council (WGC). The survey’s findings found that 81% of respondents thought central banks would increase their holdings in 2024 – the highest percentage since the survey began in 2019.
A large share of the central-bank buying has been by Asian central banks hoarding Gold as a hedge against a strengthening US Dollar. With the Fed dialing back expectations of interest-rate cuts from three to one in 2024, according to the latest Fed dot-plot, the year has seen many Asian currencies depreciate significantly versus the Greenback.
The trend of using Gold as a buffer against the strength of the US Dollar has been magnified by the increasingly partisan division of world trade between BRICS nations and the West. A major policy plank of the BRICS and their allies is to break the dominance of the US Dollar so that it cannot be used as a weapon against their members (which include Russia and now Iran) in sanctions. One of the few realistic replacements to the Dollar would be conducting trade in Gold-denominated financial assets.
The split between the BRICS and the West, moreover, has been accelerated by Russia’s invasion of Ukraine and Israel’s war against Hammas, which has divided the world along ideological and political lines. Given these conflicts are not set to end any time soon, they are likely to continue providing a backdraught of demand for Gold, both as a potential medium of exchange and a safe-haven.
Technical Analysis: Gold break higher invalidates Head-and-Shoulders pattern
Gold decisively breaks above a key resistance level at the 50-day Simple Moving Average (SMA) and a trendline connecting the May 7 and June 20 highs.
The break is critical as it invalidates the bearish Head-and-Shoulders (H&S) pattern that had been forming on the daily chart.
XAU/USD Daily Chart
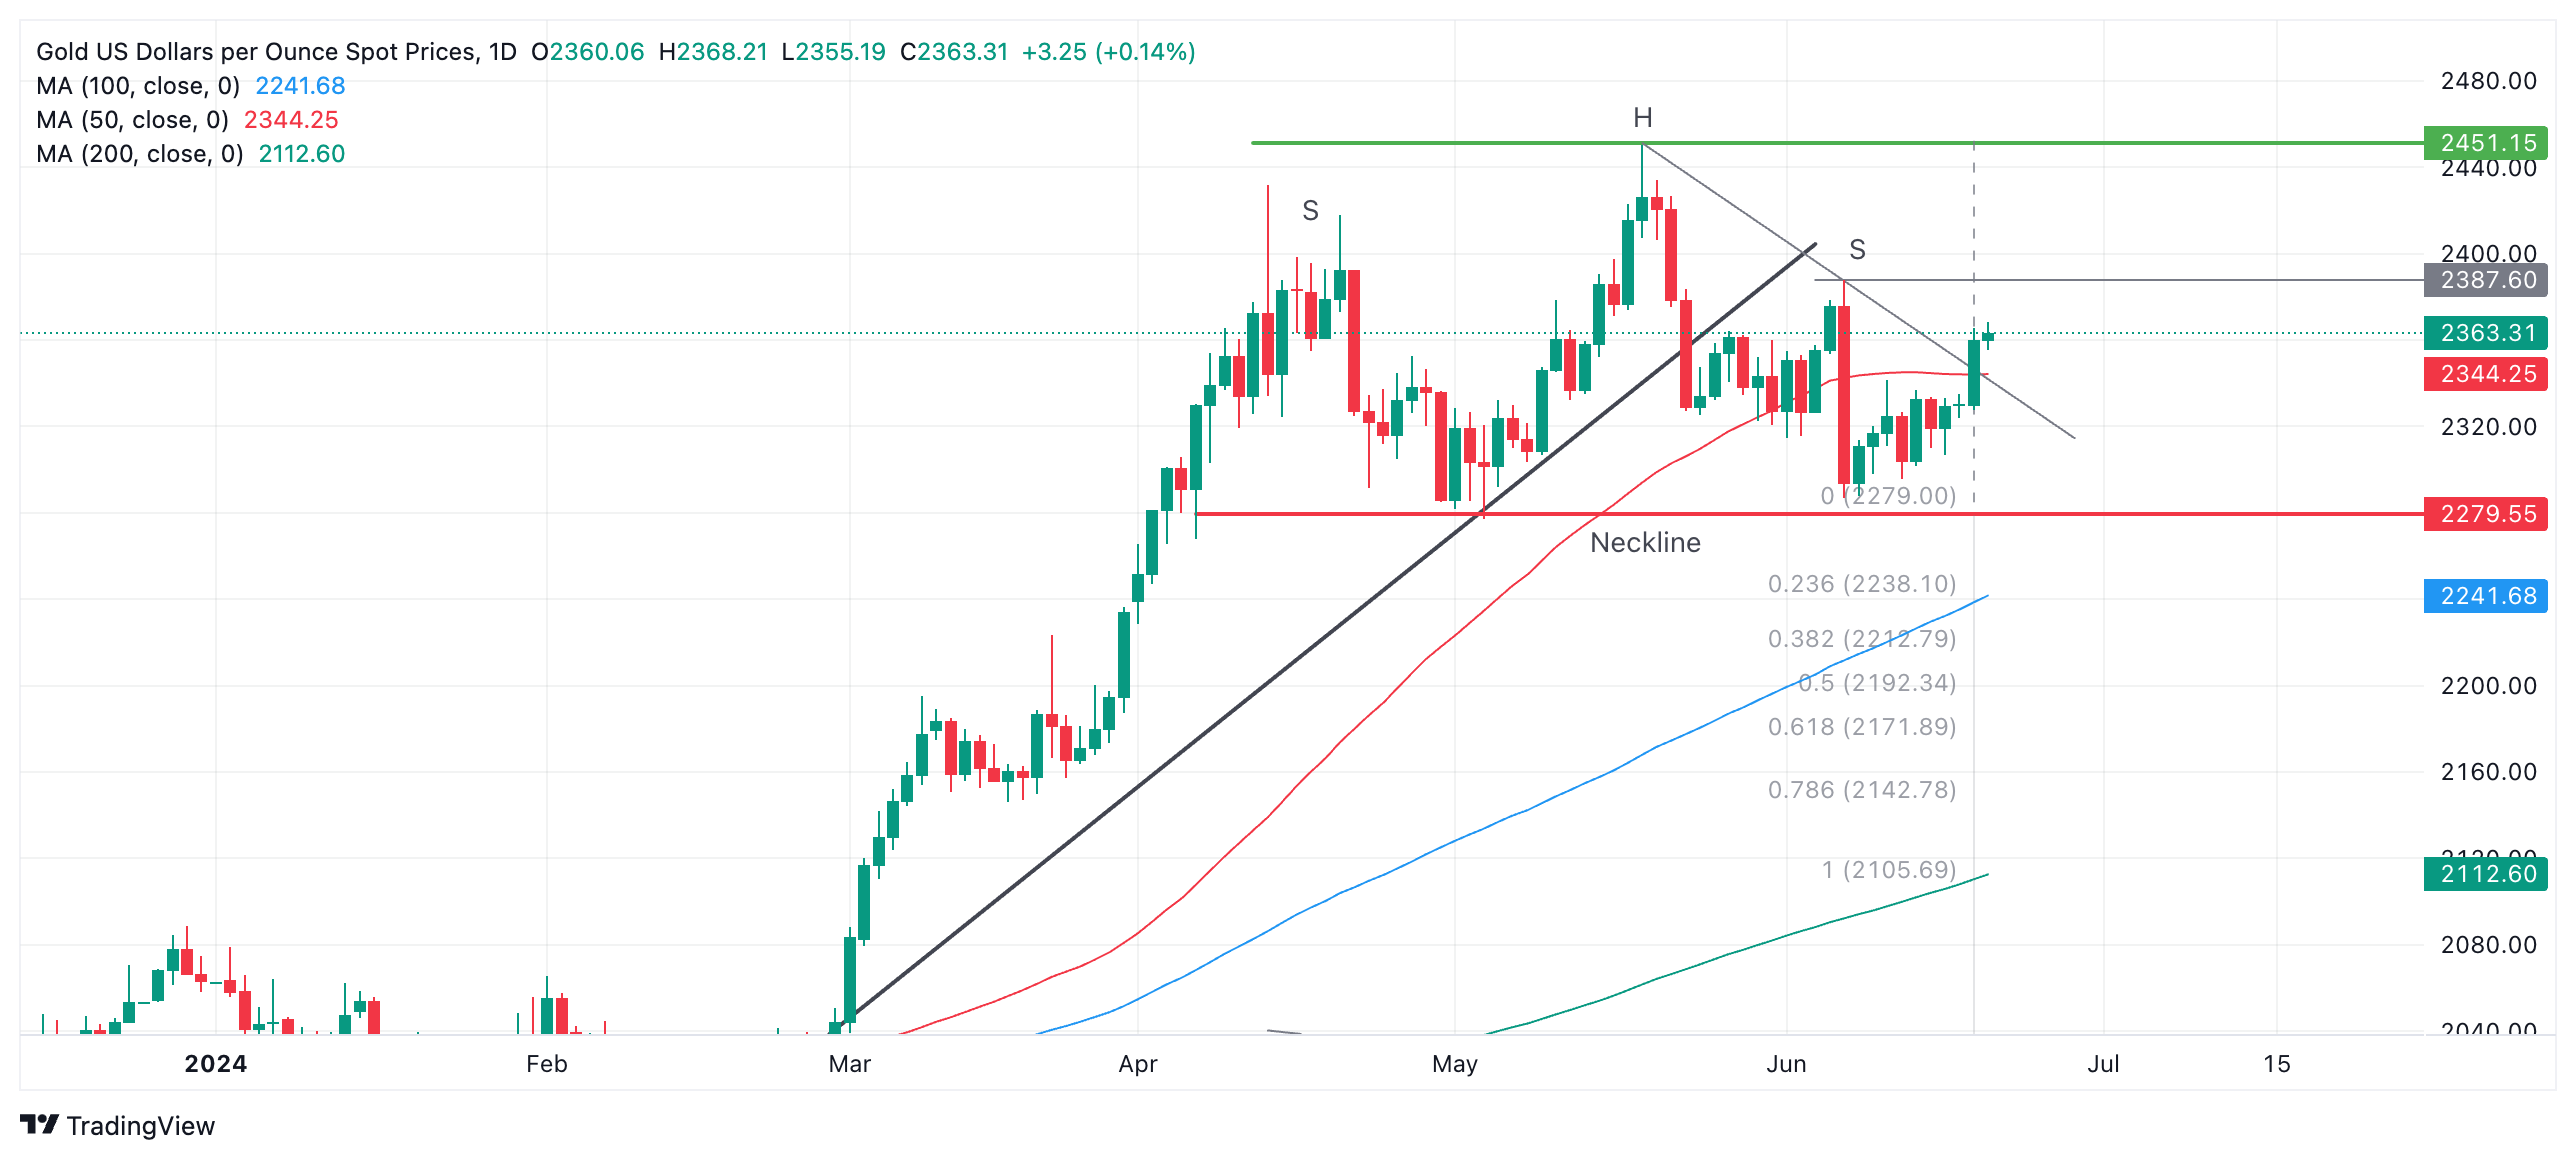
Gold’s follow-through higher after the break is likely to reach an initial target in the mid $2,380s (June 7 high).
A break above the June 7 high would indicate a probable continuation up to the May – and all-time – high at $2,450.
A break above that would confirm a resumption of the broader uptrend.
Economic Indicator
Retail Sales (MoM)
The Retail Sales data, released by the US Census Bureau on a monthly basis, measures the value in total receipts of retail and food stores in the United States. Monthly percent changes reflect the rate of changes in such sales. A stratified random sampling method is used to select approximately 4,800 retail and food services firms whose sales are then weighted and benchmarked to represent the complete universe of over three million retail and food services firms across the country. The data is adjusted for seasonal variations as well as holiday and trading-day differences, but not for price changes. Retail Sales data is widely followed as an indicator of consumer spending, which is a major driver of the US economy. Generally, a high reading is seen as bullish for the US Dollar (USD), while a low reading is seen as bearish.
Read more.Last release: Tue Jun 18, 2024 12:30
Frequency: Monthly
Actual: 0.1%
Consensus: 0.2%
Previous: 0%
Source: US Census Bureau
Retail Sales data published by the US Census Bureau is a leading indicator that gives important information about consumer spending, which has a significant impact on the GDP. Although strong sales figures are likely to boost the USD, external factors, such as weather conditions, could distort the data and paint a misleading picture. In addition to the headline data, changes in the Retail Sales Control Group could trigger a market reaction as it is used to prepare the estimates of Personal Consumption Expenditures for most goods.
- Oil prices are set for a second consecutive week of gains despite facing a bit of profit-taking on Friday.
- Traders see a rosy outlook for US demand in the short term while inventories fell more than expected last week.
- The US Dollar Index trades firmly above 105.50, with help from the Japanese Yen and Euro.
Oil prices retreat slightly on Friday but look set to close in the green for the second week in a row, adding over 7% of gains in two weeks. The drawdown in US stockpiles, together with the Southern belt in the US getting ready for the first tropical storms to hit, could mean some short-term supply hiccups.
Meanwhile, the US Dollar Index (DXY), which tracks the performance of the US Dollar against six major currencies, is comfortably up in the higher 105.00 area, nearing 106.00. The move was initiated overnight when Nvidia (NVDA) shredded $91 billion in market value in just one trading session, triggering a massive move into the safe-haven Greenback. On Friday, European Purchasing Managers Index (PMI) numbers signaled the Eurozone economy is losing momentum, ahead of the US PMIs later this Friday.
At the time of writing, Crude Oil (WTI) trades at $81.00 and Brent Crude at $84.56.
Oil news and market movers: Drawdowns ahead of hurricane season
- The US Energy Information Administration reported on Thursday that crude stockpiles fell by more than 2.5 million barrels this week, more than the 2 million drawdown expected , triggering another leg up for Crude prices to pop above $80.00, Bloomberg reported.
- Due to bad weather, the Corpus Christi area in Texas suspended most activities in Oil drilling and exporting. Mexico will shut down as well some fuel-importing terminals, according to Reuters.
- Reuters reports that Mexican State Oil company Pemex will begin processing crude at its Dos Bocas refinery in the second half of 2024.
- Baker Hughes US Oil Rig Count will start to gain importance as a number as the hurricane season gets underway. Yhe number for this week will be released at 17:00 GMT, with the previous count at 488.
Oil Technical Analysis: US market throwing in its weight
Oil price has managed to jump above a key level by hitting $81.00. It will be vital from here to see first if Crude can withstand profit-taking and manage a daily and weekly close above this level. When that is the case, more upside could come into play towards the 2024 high at $87.12
On the upside, the red descending trend line near $81.00 has been broken and now needs to prove its resilience as support with both a daily and weekly close above it. More room to move higher towards $87.12, the year-to-date high (April 5). Previously, a relatively small pivotal level would act as resistance near $84.00.
On the downside, the big belt of Simple Moving Averages (SMA) should work now as support and no longer allow to see moves below it. That means the 55-day SMA at $79.79, the 100-day SMA at $79.47, and the 200-day SMA at $78.99 should avoid any dips below $79.00. Should those levels not hold, another drop back to $75 could occur.
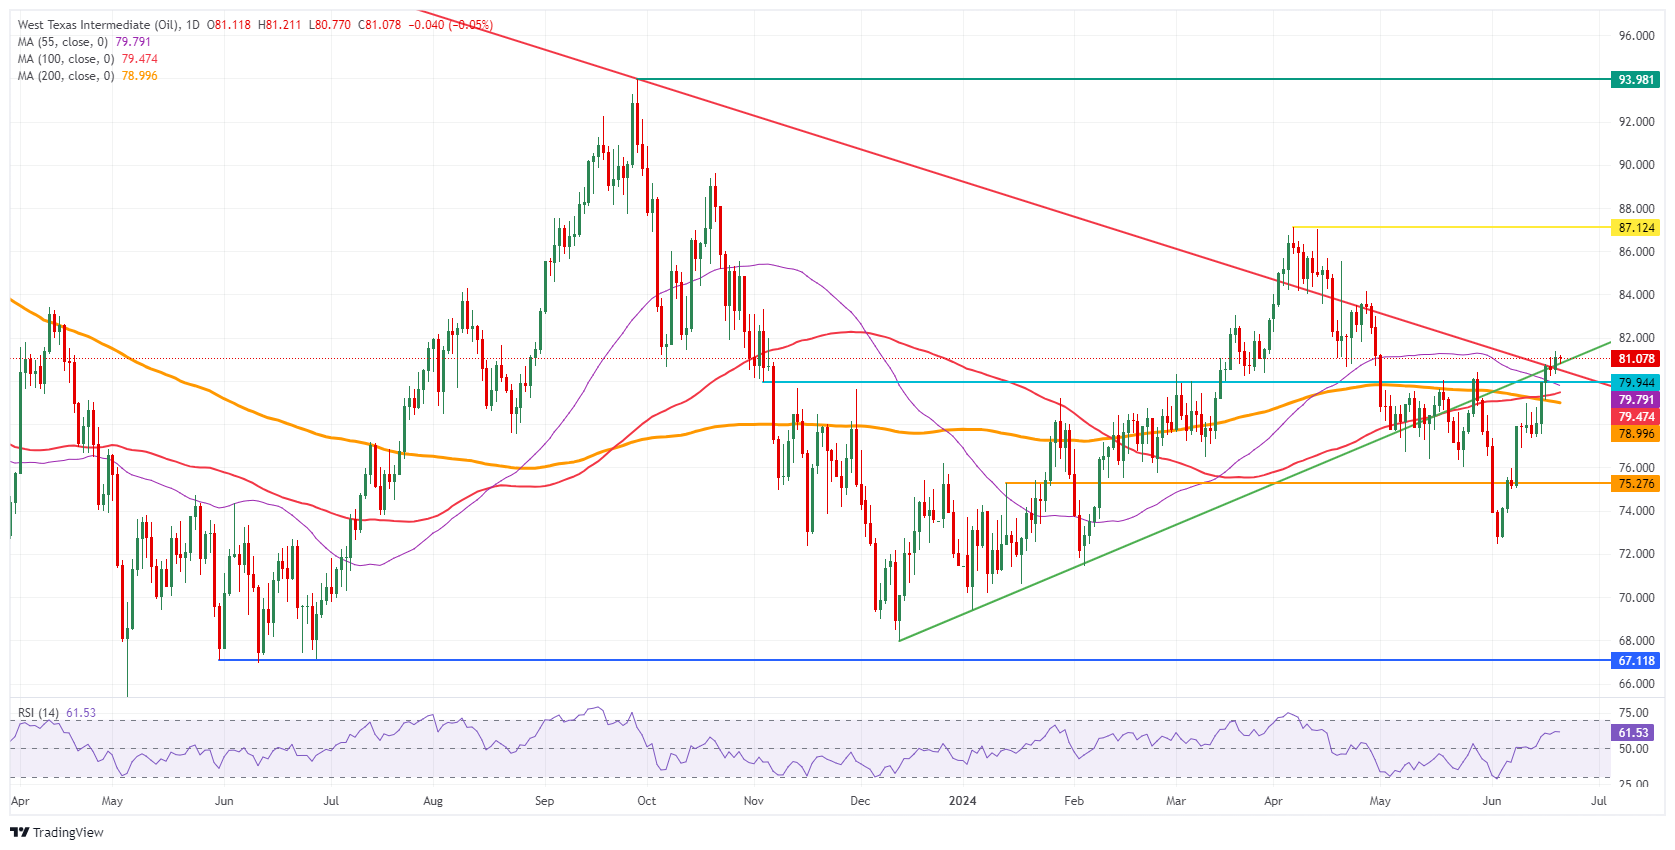
US WTI Crude Oil: Daily Chart
WTI Oil FAQs
WTI Oil is a type of Crude Oil sold on international markets. The WTI stands for West Texas Intermediate, one of three major types including Brent and Dubai Crude. WTI is also referred to as “light” and “sweet” because of its relatively low gravity and sulfur content respectively. It is considered a high quality Oil that is easily refined. It is sourced in the United States and distributed via the Cushing hub, which is considered “The Pipeline Crossroads of the World”. It is a benchmark for the Oil market and WTI price is frequently quoted in the media.
Like all assets, supply and demand are the key drivers of WTI Oil price. As such, global growth can be a driver of increased demand and vice versa for weak global growth. Political instability, wars, and sanctions can disrupt supply and impact prices. The decisions of OPEC, a group of major Oil-producing countries, is another key driver of price. The value of the US Dollar influences the price of WTI Crude Oil, since Oil is predominantly traded in US Dollars, thus a weaker US Dollar can make Oil more affordable and vice versa.
The weekly Oil inventory reports published by the American Petroleum Institute (API) and the Energy Information Agency (EIA) impact the price of WTI Oil. Changes in inventories reflect fluctuating supply and demand. If the data shows a drop in inventories it can indicate increased demand, pushing up Oil price. Higher inventories can reflect increased supply, pushing down prices. API’s report is published every Tuesday and EIA’s the day after. Their results are usually similar, falling within 1% of each other 75% of the time. The EIA data is considered more reliable, since it is a government agency.
OPEC (Organization of the Petroleum Exporting Countries) is a group of 13 Oil-producing nations who collectively decide production quotas for member countries at twice-yearly meetings. Their decisions often impact WTI Oil prices. When OPEC decides to lower quotas, it can tighten supply, pushing up Oil prices. When OPEC increases production, it has the opposite effect. OPEC+ refers to an expanded group that includes ten extra non-OPEC members, the most notable of which is Russia.
- AUD/USD drops to near 0.6650 as the US Dollar extends its upside.
- The Fed is expected to begin reducing interest rates in September.
- Investors await the preliminary US S&P Global PMI data for June.
The AUD/USD pair falls back to the crucial support of 0.6650 in Friday’s European session. The Aussie asset surrenders its entire intraday gains and turns negative as the US Dollar (USD) rises further due to expectations that the Federal Reserve (Fed) will hold its current restrictive interest rate framework for longer than other central banks.
The market sentiment remains cautious as global preliminary PMI figures for June have underperformed estimates in major economies such as the Eurozone, the United Kingdom (UK), Japan, and Australia. Also, the US PMI is expected to weaken against the prior release. Economists expect that the Composite PMI will decline due to poor activity in manufacturing and service sectors.
S&P 500 futures have posted some losses in the European session. Asian and European markets have witnessed a sheer sell-off. The US Dollar Index (DXY), which tracks the Greenback’s value against six major currencies, approaches the crucial resistance of 106.00 as investors rush for safe-haven assets.
According to the CME FedWatch tool, 30-day Federal Funds pricing data shows that interest rates will start declining from September. While other central banks from G-7 nations have already initiated the policy-easing phase such as the European Central Bank (ECB), the Bank of Canada (BoC). The Swiss National Bank (SNB) has delivered subsequent rate cuts on Thursday.
Meanwhile, the Australian Dollar is under pressure across the FX domain even though the Reserve Bank of Australia (RBA) is not expected to deliver rate cuts anytime soon. The RBA is expected to hold its Official Cash Rate (OCR) steady at 4.35% this year as price pressures in Australia are significantly higher than the desired rate of 2%.
Silver prices (XAG/USD) fell on Friday, according to FXStreet data. Silver trades at $30.49 per troy ounce, down 0.81% from the $30.73 it cost on Thursday.
Silver prices have increased by 28.12% since the beginning of the year.
| Unit measure | Silver Price Today in USD |
|---|---|
| Troy Ounce | 30.49 |
| 1 Gram | 0.98 |
The Gold/Silver ratio, which shows the number of ounces of Silver needed to equal the value of one ounce of Gold, stood at 77.64 on Friday, up from 76.79 on Thursday.
Silver FAQs
Silver is a precious metal highly traded among investors. It has been historically used as a store of value and a medium of exchange. Although less popular than Gold, traders may turn to Silver to diversify their investment portfolio, for its intrinsic value or as a potential hedge during high-inflation periods. Investors can buy physical Silver, in coins or in bars, or trade it through vehicles such as Exchange Traded Funds, which track its price on international markets.
Silver prices can move due to a wide range of factors. Geopolitical instability or fears of a deep recession can make Silver price escalate due to its safe-haven status, although to a lesser extent than Gold's. As a yieldless asset, Silver tends to rise with lower interest rates. Its moves also depend on how the US Dollar (USD) behaves as the asset is priced in dollars (XAG/USD). A strong Dollar tends to keep the price of Silver at bay, whereas a weaker Dollar is likely to propel prices up. Other factors such as investment demand, mining supply – Silver is much more abundant than Gold – and recycling rates can also affect prices.
Silver is widely used in industry, particularly in sectors such as electronics or solar energy, as it has one of the highest electric conductivity of all metals – more than Copper and Gold. A surge in demand can increase prices, while a decline tends to lower them. Dynamics in the US, Chinese and Indian economies can also contribute to price swings: for the US and particularly China, their big industrial sectors use Silver in various processes; in India, consumers’ demand for the precious metal for jewellery also plays a key role in setting prices.
Silver prices tend to follow Gold's moves. When Gold prices rise, Silver typically follows suit, as their status as safe-haven assets is similar. The Gold/Silver ratio, which shows the number of ounces of Silver needed to equal the value of one ounce of Gold, may help to determine the relative valuation between both metals. Some investors may consider a high ratio as an indicator that Silver is undervalued, or Gold is overvalued. On the contrary, a low ratio might suggest that Gold is undervalued relative to Silver.
(An automation tool was used in creating this post.)
- EUR/USD drops sharply to 1.0670 due to weak preliminary Eurozone PMI for June and sheer strength in the US Dollar.
- ECB's Klaas Knot sees one or two more rate cuts this year.
- The US Dollar strengthens amid firm expectations of widening policy divergence between the Fed and other central banks.
EUR/USD faces selling pressure in Friday’s European session due to multiple headwinds. The major currency pair declines to a six-week low near 1.0670 as the Euro weakens after downbeat Eurozone’s preliminary PMIs data that suggested the economy is losing momentum.
The HCOB PMP report, produced by S&P Global, shows that the Composite PMI unexpectedly declined to 50.8 in June from the prior release of 52.2 but managed to hold above the 50.0 threshold that separates expansion from contraction. Investors expected the Composite PMI to increase to 52.5. The Manufacturing PMI fell further into contraction territory while the Service PMI continued to suggest expansion, although at a slower pace than the previous month.
“New orders decreased for the first time in four months, feeding through to softer expansions in business activity and employment. Meanwhile, business confidence dipped to the lowest since February,” the report said.
Meanwhile, political uncertainty in France, the Eurozone’s second-largest economy, has been keeping the Euro on the back foot. Investors worry that the formation of Marine Le Pen's-led-National Rally’s (RN) government after legislative elections would trigger financial woes in France. The RN has promised a lower retirement age, energy price cuts, more public spending and "France first" economic policies in its manifesto.
On the monetary policy front, investors evaluate how many times the European Central Bank (ECB) will cut interest rates again this year. ECB Governing Council member and President of De Nederlandsche Bank Klaas Knot said on Thursday that he is comfortable with market expectations of one or two more rate cuts this year. The ECB cut interest rates for the first time in seven years at its June meeting.
Daily digest market movers: EUR/USD declines as US Dollar jumps to almost seven-week high
- EUR/USD weakens as the US Dollar exhibits a strong performance due to the increasing policy divergence between the Federal Reserve (Fed) with other central banks from G7 nations. The US Dollar Index (DXY), which tracks the Greenback’s value against six major currencies, rises to almost seven-week high near 105.85.
- Prospects for further policy divergence have strengthened as investors expect that the Fed will start reducing interest rates from the September meeting and will deliver one more rate cut in the November or December. On the contrary, the ECB, the Bank of Canada (BoC), and the Swiss National Bank (SNB) have already entered a policy-easing phase. The SNB delivered its second consecutive rate cut in its meeting on Thursday. The Bank of England (BoE) is expected to start lowering interest rates from August.
- Fed policymakers emphasize keeping interest rates at their current levels until they see inflation declining for months. In latest interest-rate projections, Fed officials signaled only one rate cut this year.
- Market speculation of two Fed rate cuts this year was prompted by a higher-than-expected decline in the United States (US) inflation and slower growth in Retail Sales. On the inflation outlook, Minneapolis Fed Bank President Neel Kashkari said on Thursday that inflation would return to the bank’s target of 2% in up to two years. Kashkari remained concerned about high wage growth and acknowledged it is a key barrier to achieve price stability.
- In Friday’s session, investors will pay close attention to the US S&P Global PMIs data for June, which will be published at 13:45 GMT. The Composite PMI is expected to decline, although staying above the 50 level, signaling slowing growth in manufacturing and the services sector.
Technical Analysis: EUR/USD corrects below 1.0700
EUR/USD extends its correction below the crucial support of 1.0700. The major currency pair declines toward the upward-sloping border of the Symmetrical Triangle pattern formed on a daily time frame. The long-term outlook has become uncertain as the pair establishes below the 200-day Exponential Moving Average (EMA), which trades around 1.0800.
The 14-period Relative Strength Index (RSI) declines below 40.00 for the first time in almost two months, suggesting that the momentum has leaned towards the downside.
Euro FAQs
The Euro is the currency for the 20 European Union countries that belong to the Eurozone. It is the second most heavily traded currency in the world behind the US Dollar. In 2022, it accounted for 31% of all foreign exchange transactions, with an average daily turnover of over $2.2 trillion a day. EUR/USD is the most heavily traded currency pair in the world, accounting for an estimated 30% off all transactions, followed by EUR/JPY (4%), EUR/GBP (3%) and EUR/AUD (2%).
The European Central Bank (ECB) in Frankfurt, Germany, is the reserve bank for the Eurozone. The ECB sets interest rates and manages monetary policy. The ECB’s primary mandate is to maintain price stability, which means either controlling inflation or stimulating growth. Its primary tool is the raising or lowering of interest rates. Relatively high interest rates – or the expectation of higher rates – will usually benefit the Euro and vice versa. The ECB Governing Council makes monetary policy decisions at meetings held eight times a year. Decisions are made by heads of the Eurozone national banks and six permanent members, including the President of the ECB, Christine Lagarde.
Eurozone inflation data, measured by the Harmonized Index of Consumer Prices (HICP), is an important econometric for the Euro. If inflation rises more than expected, especially if above the ECB’s 2% target, it obliges the ECB to raise interest rates to bring it back under control. Relatively high interest rates compared to its counterparts will usually benefit the Euro, as it makes the region more attractive as a place for global investors to park their money.
Data releases gauge the health of the economy and can impact on the Euro. Indicators such as GDP, Manufacturing and Services PMIs, employment, and consumer sentiment surveys can all influence the direction of the single currency. A strong economy is good for the Euro. Not only does it attract more foreign investment but it may encourage the ECB to put up interest rates, which will directly strengthen the Euro. Otherwise, if economic data is weak, the Euro is likely to fall. Economic data for the four largest economies in the euro area (Germany, France, Italy and Spain) are especially significant, as they account for 75% of the Eurozone’s economy.
Another significant data release for the Euro is the Trade Balance. This indicator measures the difference between what a country earns from its exports and what it spends on imports over a given period. If a country produces highly sought after exports then its currency will gain in value purely from the extra demand created from foreign buyers seeking to purchase these goods. Therefore, a positive net Trade Balance strengthens a currency and vice versa for a negative balance.
- The Mexican Peso finds support after investors welcome incoming-President Sheinbaum’s cabinet picks.
- Marcelo Luis Ebrard Casaubón will take the Economy portfolio.
- High interest rates and a low probability of an interest-rate cut in June keep the Peso supported, analysts say.
The Mexican Peso (MXN) continues recovering on Friday on the back of optimism regarding incoming-President Claudia Sheinbaum’s top cabinet picks and the expectations that higher interest rates in Mexico will continue attracting foreign capital to its shores.
As a currency that tends to rise during periods of risk-on, however, the Peso’s gains are capped by an overall subdued market mood. US stock indexes closed lower on Thursday as the rally in tech fizzled out after higher US Jobless Claims stoked labor market concerns. Asian bourses traded mixed into Friday, with the Shanghai Composite posting its sixth weekly decline on uneven Chinese economic data.
At the time of writing, one US Dollar (USD) buys 18.33 Mexican Pesos, EUR/MXN is trading at 19.56 and GBP/MXN at 23.17.
Mexican Peso regains investors confidence after cabinet choices
The Mexican Peso strengthened on Thursday after Claudia Sheinbaum’s announcement of six of her cabinet ministers was well received by markets. The list includes several leading academics and public servants who served with her during her time as Mayor of Mexico City.
Heading up the Economy Ministry will be Marcelo Luis Ebrard Casaubón, the former head of Foreign Affairs under President Andres Manuel López Obrador (AMLO). Ebrard Casaubón left the ministry in 2023 to run against Sheinbaum for the Morena party nomination. He has a long background in government administration and was President of the United Nations Global Network on Safer Cities, which focuses on fostering sustainable development. He thus shares Sheinbaum’s concerns about climate change.
“Ebrard will have to take on the renewal of a free trade agreement with the United States and Canada and increase foreign investment, another well-received announcement,” said Gabriela Siller, Director of Economic Analysis at Banco Base, to Associated Press (AP) News. Siller added that despite the appointment, market concerns had “not disappeared” following the election.
For the other roles, Sheinbaum chose Juan Ramón de la Fuente, former rector of her alma mater the National Autonomous University of Mexico (UNAM), as Secretary of Foreign Affairs.
Alicia Bárcena will serve as Secretary of Environment and Natural Resources.
Rosaura Ruiz Gutiérrez, a biologist who worked at UNAM and under Sheinbaum when she was Mayor of Mexico City, was chosen as head of a new ministry overseeing science, humanities, technology and innovation.
Ernestina Godoy, the Chief Prosecutor for Mexico City, was chosen as Sheinbaum’s legal adviser and Julio Berdegué Sacristán, an agronomist with a long academic trajectory, was her choice for the Secretary of Agriculture and Rural Development, reported Associated Press News.
High interest rates have Peso’s back – Rabobank
The Mexican Peso is likely to remain supported by the relatively high interest rates in Mexico (11.00%) which make it one of the most attractive currencies to buy in the carry trade, according to Christian Lawrence, Senior Strategist at Rabobank.
The “carry trade” is a type of investment in which investors borrow in a currency with low interest rates, like the Japanese Yen (JPY), and buy a currency with a high interest rate like the Mexican Peso.
“The main driver of MXN outperformance has been its position as the world’s most attractive carry currency and that remains true and will remain true in the coming months,” Lawrence told FXStreet.
This also makes it expensive for most traders to hold shorts positions in the Mexican Peso for long periods of time, he adds, reducing the chances of a long-term bearish change in trend.
Banxico to leave rates unchanged in July – Standard Chartered
The Mexican Peso is likely to continue benefiting from its relatively high interest-rate differentials as the Bank of Mexico (Banxico) will probably not make a further interest-rate cut at its June 27 meeting – as had previously been expected – analysts at Standard Chartered (SC) say in a note on Thursday.
“We now expect Banco de México (Banxico) to stay on hold instead of cutting by 25bps at its 27 June meeting, amid sharp currency depreciation driven by elevated political noise and fiscal uncertainty,” says the bank.
Currency depreciation will lead to imported inflation, according to SC, which will add to existing stubborn inflation in Mexico. This, in turn, will prevent the Banxico from pressing the trigger on rate cuts, supporting the Peso in the process.
Technical Analysis: USD/MXN continues correcting
USD/MXN continues leaking lower after rolling over from its 18.99 peak reached on June 12.
Whilst it is possible the correction could have further to run, the short and medium-term trends are still bullish, suggesting price will eventually turn around and start rising again. The next target higher is situated at 19.22 (March 2023 high).
USD/MXN Daily Chart
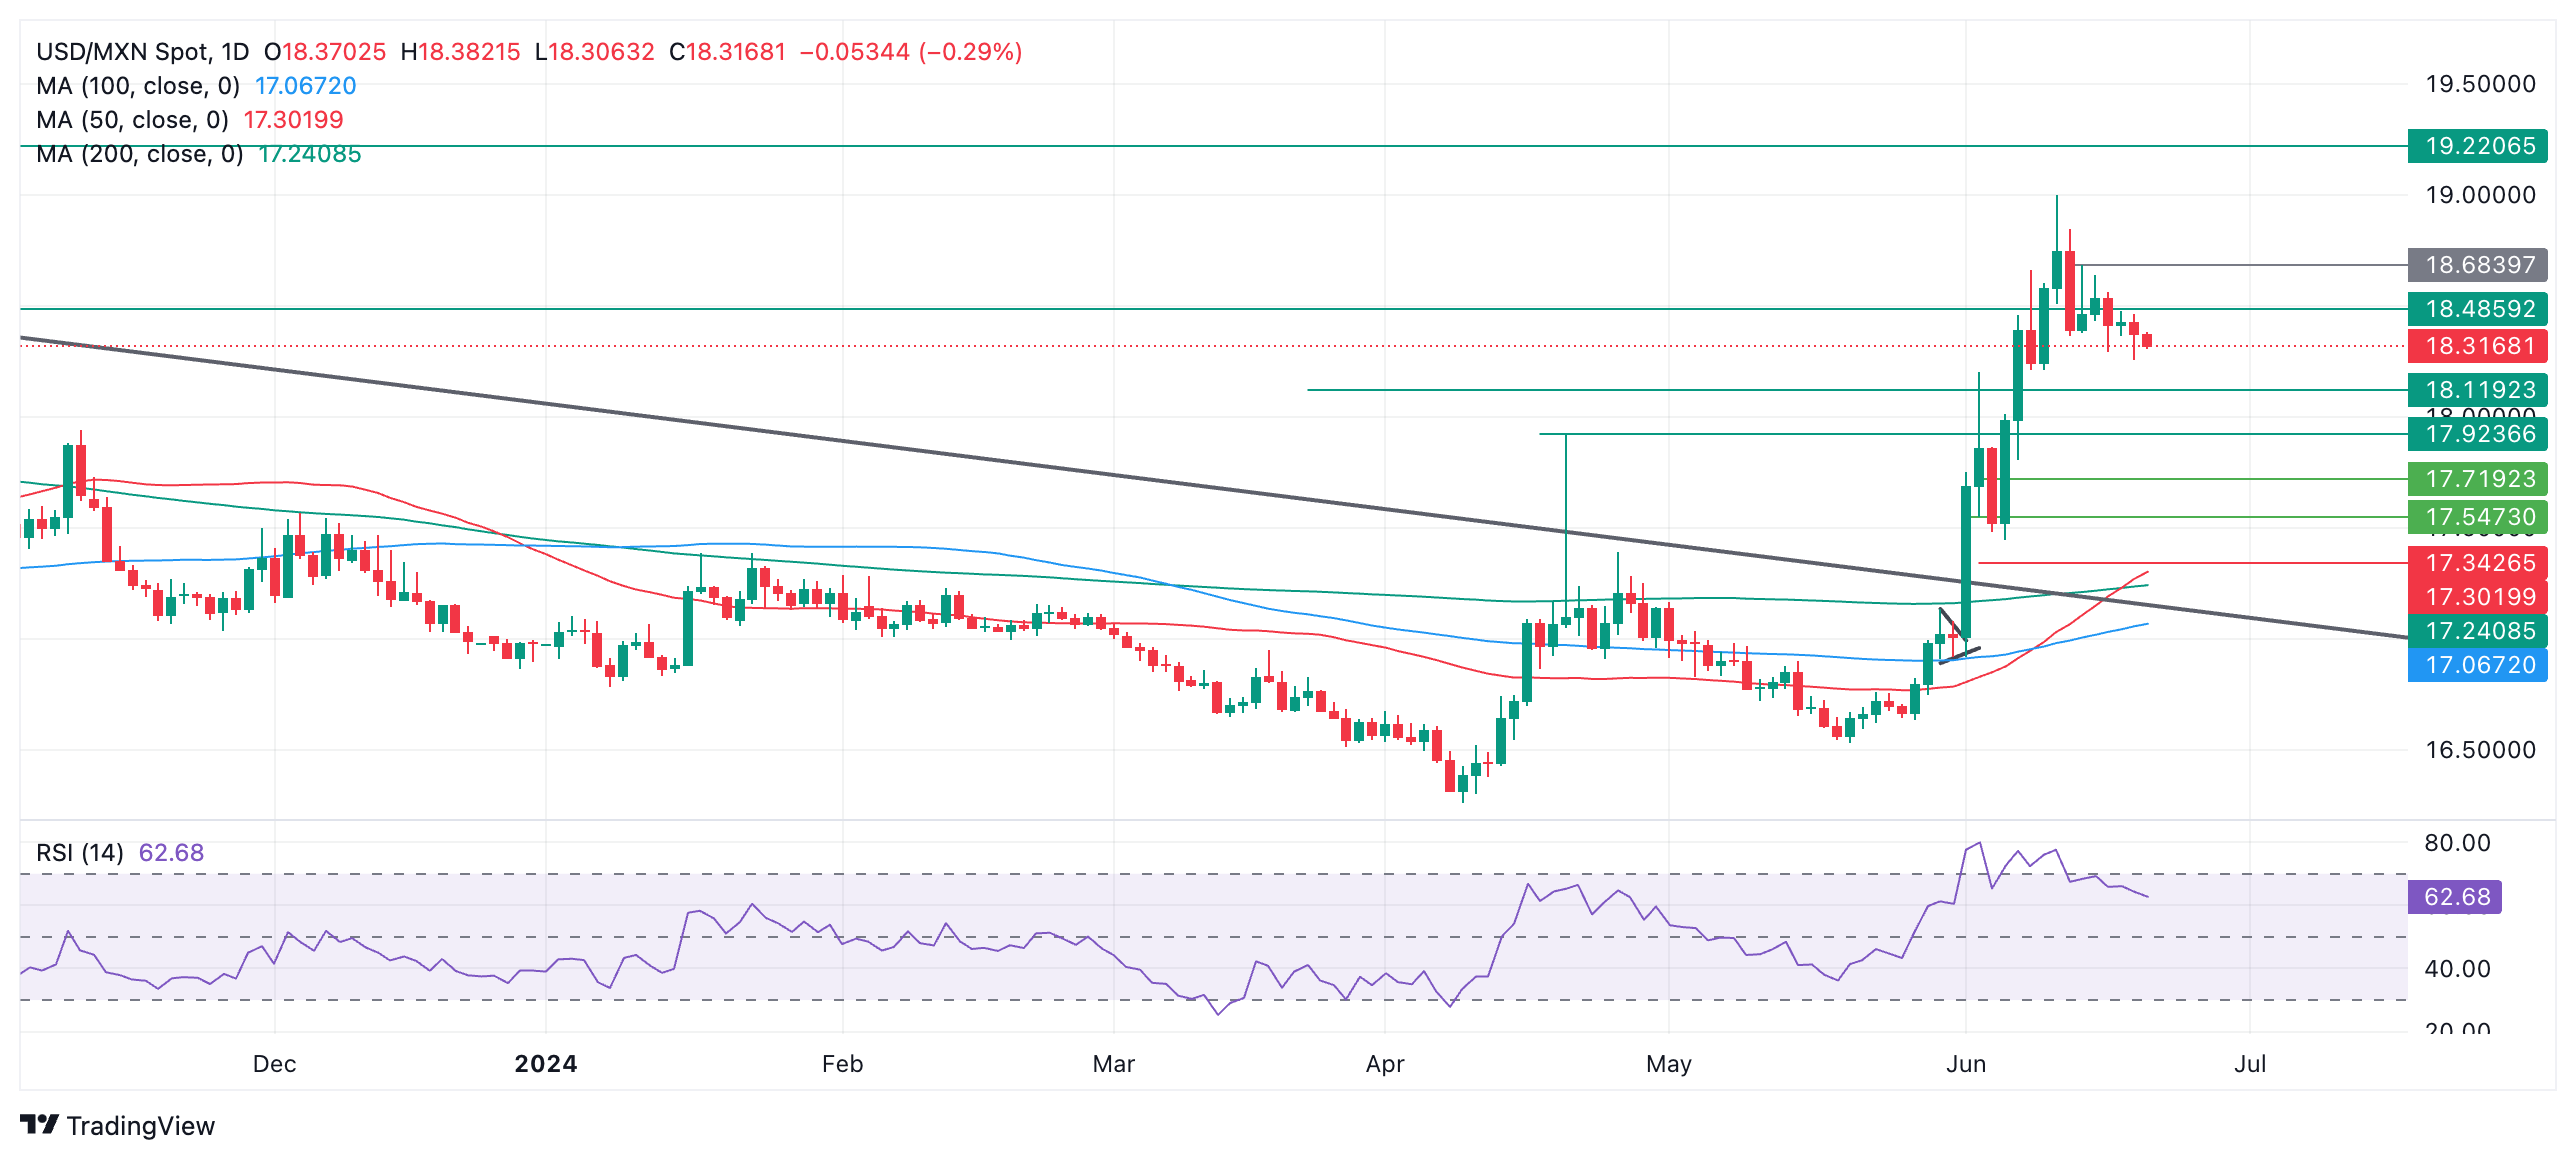
A break above June 14 high at 18.68 would provide additional confirmation of more upside towards the target at 19.22.
A break below 18.20 (June 10 low), however, would change the tone of the chart to one that is more bearish in the short-term. From there the next stop down could be 18.11.
The direction of the long-term trend remains in doubt after the break above the October 2023 high. Previous to that, it was bearish.
Mexican Peso FAQs
The Mexican Peso (MXN) is the most traded currency among its Latin American peers. Its value is broadly determined by the performance of the Mexican economy, the country’s central bank’s policy, the amount of foreign investment in the country and even the levels of remittances sent by Mexicans who live abroad, particularly in the United States. Geopolitical trends can also move MXN: for example, the process of nearshoring – or the decision by some firms to relocate manufacturing capacity and supply chains closer to their home countries – is also seen as a catalyst for the Mexican currency as the country is considered a key manufacturing hub in the American continent. Another catalyst for MXN is Oil prices as Mexico is a key exporter of the commodity.
The main objective of Mexico’s central bank, also known as Banxico, is to maintain inflation at low and stable levels (at or close to its target of 3%, the midpoint in a tolerance band of between 2% and 4%). To this end, the bank sets an appropriate level of interest rates. When inflation is too high, Banxico will attempt to tame it by raising interest rates, making it more expensive for households and businesses to borrow money, thus cooling demand and the overall economy. Higher interest rates are generally positive for the Mexican Peso (MXN) as they lead to higher yields, making the country a more attractive place for investors. On the contrary, lower interest rates tend to weaken MXN.
Macroeconomic data releases are key to assess the state of the economy and can have an impact on the Mexican Peso (MXN) valuation. A strong Mexican economy, based on high economic growth, low unemployment and high confidence is good for MXN. Not only does it attract more foreign investment but it may encourage the Bank of Mexico (Banxico) to increase interest rates, particularly if this strength comes together with elevated inflation. However, if economic data is weak, MXN is likely to depreciate.
As an emerging-market currency, the Mexican Peso (MXN) tends to strive during risk-on periods, or when investors perceive that broader market risks are low and thus are eager to engage with investments that carry a higher risk. Conversely, MXN tends to weaken at times of market turbulence or economic uncertainty as investors tend to sell higher-risk assets and flee to the more-stable safe havens.
- UK Services PMI unexpectedly declines to 51.2 in June.
- Manufacturing PMI in the UK rises to 51.4 in June.
- GBP/USD holds lower ground near 1.2650 after mixed UK business PMIs.
The seasonally adjusted S&P Global/CIPS UK Manufacturing Purchasing Managers’ Index (PMI) increased from 51.2 in May to 51.4 in June, beating the market consensus of 51.3.
Meanwhile, the Preliminary UK Services Business Activity Index fell to 51.2 in June, missing the market consensus of 53.0. The previous figure stood at 52.9.
Commenting on the flash PMI data, Chris Williamson, Chief Business Economist at S&P Global Market Intelligence said: “Flash PMI survey data for June signal a slowing in the pace of economic growth, indicating that GDP is now growing at a sluggish quarterly rate of just over 0.1%.”
“The slowdown in part reflects uncertainty around the business environment in the lead-up to the general election, with many firms seeing a hiatus in decision-making pending clarity on various policies,” Chris added.
FX implications
GBP/USD remains on the back foot near 1.2650 after mixed UK PMI data. The pair is trading flat on the day, as of writing.
British Pound PRICE Today
The table below shows the percentage change of British Pound (GBP) against listed major currencies today. British Pound was the strongest against the Euro.
| USD | EUR | GBP | JPY | CAD | AUD | NZD | CHF | |
|---|---|---|---|---|---|---|---|---|
| USD | 0.14% | 0.06% | -0.11% | 0.01% | 0.00% | -0.10% | -0.01% | |
| EUR | -0.14% | -0.09% | -0.22% | -0.13% | -0.10% | -0.24% | -0.16% | |
| GBP | -0.06% | 0.09% | -0.16% | -0.02% | -0.02% | -0.17% | -0.05% | |
| JPY | 0.11% | 0.22% | 0.16% | 0.12% | 0.12% | -0.00% | 0.13% | |
| CAD | -0.01% | 0.13% | 0.02% | -0.12% | -0.02% | -0.13% | -0.01% | |
| AUD | -0.01% | 0.10% | 0.02% | -0.12% | 0.02% | -0.16% | -0.02% | |
| NZD | 0.10% | 0.24% | 0.17% | 0.00% | 0.13% | 0.16% | 0.11% | |
| CHF | 0.00% | 0.16% | 0.05% | -0.13% | 0.01% | 0.02% | -0.11% |
The heat map shows percentage changes of major currencies against each other. The base currency is picked from the left column, while the quote currency is picked from the top row. For example, if you pick the British Pound from the left column and move along the horizontal line to the US Dollar, the percentage change displayed in the box will represent GBP (base)/USD (quote).
- Eurozone Manufacturing PMI dropped to 45.6 in June, missing 47.9 estimate.
- Bloc’s Services PMI dipped to 52.2 in June vs. 53.5 anticipated.
- EUR/USD keeps losses below 1.0700 after German, Eurozone PMI data.
The Eurozone manufacturing sector downturn gathered momentum again while the services sector activity deteriorated in June, according to the data from the HCOB's latest purchasing managers index survey published on Friday.
The Eurozone Manufacturing Purchasing Managers Index (PMI) dropped from 47.3 in May to 45.6 in June, missing the market forecast of 47.9. The index tumbled to a six-month trough.
The bloc’s Services PMI dropped from 53.2 in May to 52.2 June. The data fell short of the market expectations of 53.5 and hit a three-month low.
The HCOB Eurozone PMI Composite fell sharply to 50.8 in June vs. 52.5 expected and May’s 52.2 reading. The index reached a three-month low.
EUR/USD reaction to the Eurozone PMIs data
EUR/USD is keeping losses near 1.0675 following the downbeat Eurozone PMIs. The spot is losing 0.20% on the day, at the press time.
Euro FAQs
The Euro is the currency for the 20 European Union countries that belong to the Eurozone. It is the second most heavily traded currency in the world behind the US Dollar. In 2022, it accounted for 31% of all foreign exchange transactions, with an average daily turnover of over $2.2 trillion a day. EUR/USD is the most heavily traded currency pair in the world, accounting for an estimated 30% off all transactions, followed by EUR/JPY (4%), EUR/GBP (3%) and EUR/AUD (2%).
The European Central Bank (ECB) in Frankfurt, Germany, is the reserve bank for the Eurozone. The ECB sets interest rates and manages monetary policy. The ECB’s primary mandate is to maintain price stability, which means either controlling inflation or stimulating growth. Its primary tool is the raising or lowering of interest rates. Relatively high interest rates – or the expectation of higher rates – will usually benefit the Euro and vice versa. The ECB Governing Council makes monetary policy decisions at meetings held eight times a year. Decisions are made by heads of the Eurozone national banks and six permanent members, including the President of the ECB, Christine Lagarde.
Eurozone inflation data, measured by the Harmonized Index of Consumer Prices (HICP), is an important econometric for the Euro. If inflation rises more than expected, especially if above the ECB’s 2% target, it obliges the ECB to raise interest rates to bring it back under control. Relatively high interest rates compared to its counterparts will usually benefit the Euro, as it makes the region more attractive as a place for global investors to park their money.
Data releases gauge the health of the economy and can impact on the Euro. Indicators such as GDP, Manufacturing and Services PMIs, employment, and consumer sentiment surveys can all influence the direction of the single currency. A strong economy is good for the Euro. Not only does it attract more foreign investment but it may encourage the ECB to put up interest rates, which will directly strengthen the Euro. Otherwise, if economic data is weak, the Euro is likely to fall. Economic data for the four largest economies in the euro area (Germany, France, Italy and Spain) are especially significant, as they account for 75% of the Eurozone’s economy.
Another significant data release for the Euro is the Trade Balance. This indicator measures the difference between what a country earns from its exports and what it spends on imports over a given period. If a country produces highly sought after exports then its currency will gain in value purely from the extra demand created from foreign buyers seeking to purchase these goods. Therefore, a positive net Trade Balance strengthens a currency and vice versa for a negative balance.
- S&P Global preliminary PMIs are expected to confirm ongoing expansion in the US private sector’s business activity in June.
- Survey details on inflation and employment will be scrutinized by market participants.
- EUR/USD needs to clear 1.0790-1.0800 to attract buyers.
S&P Global will issue flash estimates of the United States (US) Purchasing Managers Indexes (PMIs) for June, a monthly survey of business activity, on Friday. The survey is expected to show that the economic activity in the private sector continued to expand at a moderate pace.
In May, S&P Global Composite PMI improved to 54.5 from 51.3 in April. The Manufacturing PMI edged higher to 51.3 from 50.0, while the Services PMI climbed to 54.8 from 51.3. Assessing the survey’s findings, “the US economic upturn has accelerated again after two months of slower growth, with the early PMI data signaling the fastest expansion for just over two years in May,” Chris Williamson, Chief Business Economist at S&P Global Market Intelligence, said.
Regarding the inflation dynamics, Williamson noted that selling price inflation ticked higher in May. “The main inflationary impetus is now coming from manufacturing rather than services, meaning rates of inflation for costs and selling prices are now somewhat elevated by pre-pandemic standards in both sectors to suggest that the final mile down to the Fed’s 2% target still seems elusive,” he elaborated further.
What to expect from the next S&P Global PMI report?
PMI surveys are widely accepted as forward-looking or leading indicators. As the Federal Reserve (Fed) clings to a data-dependent approach to policymaking, investors will pay close attention to PMI data heading into the weekend.
The S&P Global Manufacturing PMI is forecast to edge lower to 51.0 from 51.3 in May, and the Services PMI is expected to retreat to 53.7 from 54.8. A reading above 50.0 presents an expansion in the sector’s business activity.
When will June flash US S&P Global PMIs be released and how could they affect EUR/USD?
The S&P Global Manufacturing, Services and Composite PMI reports will be issued on Friday, June 21, at 13:45 GMT.
In case either the Manufacturing or the Services PMI unexpectedly falls below 50.0 and points to contraction, the initial market reaction could make it difficult for the US Dollar (USD) to find demand and help EUR/USD edge higher. On the other hand, the USD could gather strength if there is a positive surprise in either PMI print.
Focus will shift to the underlying details on employment and inflation developments if PMIs come in near analysts’ estimates. In case surveys highlight higher input inflation, investors could refrain from pricing in a Federal Reserve rate cut in September and trigger a leg lower in EUR/USD. A significant negative contribution to either PMI from employment could cause the USD to come under selling pressure and provide a boost to the pair.
FXStreet Analyst Yohay Elam thinks that upbeat PMI data would hurt Gold and support the US Dollar, while soft figures would have the opposite impact. “Stocks might follow the US Dollar if the data is weak – I expect investors to take profits off the table ahead of the weekend,” he adds.
In the meantime, Eren Sengezer, European Session Lead analyst at FXStreet, shares a brief technical outlook for EUR/USD:
“EUR/USD needs to climb above 1.0790-1.0800, where the 100-day and the 200-day Simple Moving Averages are located, and confirm that area as support to attract technical buyers. In this scenario, the pair could target 1.0900 (static level, psychological level) and 1.0950 (static level from March).”
“On the downside, sellers could take action with a drop below 1.0670 (Fibonacci 78.6% retracement of the uptrend from mid-April) and cause EUR/USD to slide toward 1.0600 (static level).”
Economic Indicator
S&P Global Composite PMI
The S&P Global Composite Purchasing Managers Index (PMI), released on a monthly basis, is a leading indicator gauging US private-business activity in the manufacturing and services sector. The data is derived from surveys to senior executives. Each response is weighted according to the size of the company and its contribution to total manufacturing or services output accounted for by the sub-sector to which that company belongs. Survey responses reflect the change, if any, in the current month compared to the previous month and can anticipate changing trends in official data series such as Gross Domestic Product (GDP), industrial production, employment and inflation. The index varies between 0 and 100, with levels of 50.0 signaling no change over the previous month. A reading above 50 indicates that the private economy is generally expanding, a bullish sign for the US Dollar (USD). Meanwhile, a reading below 50 signals that activity is generally declining, which is seen as bearish for USD.
Read more.Next release: Fri Jun 21, 2024 13:45 (Prel)
Frequency: Monthly
Consensus: -
Previous: 54.5
Source: S&P Global
Fed FAQs
Monetary policy in the US is shaped by the Federal Reserve (Fed). The Fed has two mandates: to achieve price stability and foster full employment. Its primary tool to achieve these goals is by adjusting interest rates. When prices are rising too quickly and inflation is above the Fed’s 2% target, it raises interest rates, increasing borrowing costs throughout the economy. This results in a stronger US Dollar (USD) as it makes the US a more attractive place for international investors to park their money. When inflation falls below 2% or the Unemployment Rate is too high, the Fed may lower interest rates to encourage borrowing, which weighs on the Greenback.
The Federal Reserve (Fed) holds eight policy meetings a year, where the Federal Open Market Committee (FOMC) assesses economic conditions and makes monetary policy decisions. The FOMC is attended by twelve Fed officials – the seven members of the Board of Governors, the president of the Federal Reserve Bank of New York, and four of the remaining eleven regional Reserve Bank presidents, who serve one-year terms on a rotating basis.
In extreme situations, the Federal Reserve may resort to a policy named Quantitative Easing (QE). QE is the process by which the Fed substantially increases the flow of credit in a stuck financial system. It is a non-standard policy measure used during crises or when inflation is extremely low. It was the Fed’s weapon of choice during the Great Financial Crisis in 2008. It involves the Fed printing more Dollars and using them to buy high grade bonds from financial institutions. QE usually weakens the US Dollar.
Quantitative tightening (QT) is the reverse process of QE, whereby the Federal Reserve stops buying bonds from financial institutions and does not reinvest the principal from the bonds it holds maturing, to purchase new bonds. It is usually positive for the value of the US Dollar.
Gold prices remained broadly unchanged in India on Friday, according to data compiled by FXStreet.
The price for Gold stood at 6,339.72 Indian Rupees (INR) per gram, broadly stable compared with the INR 6,342.35 it cost on Thursday.
The price for Gold was broadly steady at INR 73,945.29 per tola from INR 73,976.31 per tola a day earlier.
| Unit measure | Gold Price in INR |
|---|---|
| 1 Gram | 6,339.72 |
| 10 Grams | 63,397.23 |
| Tola | 73,945.29 |
| Troy Ounce | 197,186.40 |
FXStreet calculates Gold prices in India by adapting international prices (USD/INR) to the local currency and measurement units. Prices are updated daily based on the market rates taken at the time of publication. Prices are just for reference and local rates could diverge slightly.
Gold FAQs
Gold has played a key role in human’s history as it has been widely used as a store of value and medium of exchange. Currently, apart from its shine and usage for jewelry, the precious metal is widely seen as a safe-haven asset, meaning that it is considered a good investment during turbulent times. Gold is also widely seen as a hedge against inflation and against depreciating currencies as it doesn’t rely on any specific issuer or government.
Central banks are the biggest Gold holders. In their aim to support their currencies in turbulent times, central banks tend to diversify their reserves and buy Gold to improve the perceived strength of the economy and the currency. High Gold reserves can be a source of trust for a country’s solvency. Central banks added 1,136 tonnes of Gold worth around $70 billion to their reserves in 2022, according to data from the World Gold Council. This is the highest yearly purchase since records began. Central banks from emerging economies such as China, India and Turkey are quickly increasing their Gold reserves.
Gold has an inverse correlation with the US Dollar and US Treasuries, which are both major reserve and safe-haven assets. When the Dollar depreciates, Gold tends to rise, enabling investors and central banks to diversify their assets in turbulent times. Gold is also inversely correlated with risk assets. A rally in the stock market tends to weaken Gold price, while sell-offs in riskier markets tend to favor the precious metal.
The price can move due to a wide range of factors. Geopolitical instability or fears of a deep recession can quickly make Gold price escalate due to its safe-haven status. As a yield-less asset, Gold tends to rise with lower interest rates, while higher cost of money usually weighs down on the yellow metal. Still, most moves depend on how the US Dollar (USD) behaves as the asset is priced in dollars (XAU/USD). A strong Dollar tends to keep the price of Gold controlled, whereas a weaker Dollar is likely to push Gold prices up.
(An automation tool was used in creating this post.)
- Germany’s Manufacturing PMI dipped to 43.4 in June vs. 46.4 estimate.
- Services PMI for the German economy fell to 53.5 in June vs. 54.4 forecast.
- EUR/USD falls further below 1.0700 after weak German PMIs.
The German manufacturing sector contraction unexpectedly deepened in June while the services sector also lost its expansionary momentum, the preliminary business activity report published by the HCOB survey showed Friday.
The HCOB Manufacturing PMI in the Eurozone’s economic powerhouse arrived at 43.4 this month, deteriorating from May’s 45.4 while much below the expected 46.4 readout. The index tripped to the lowest level in two months.
Meanwhile, Services PMI fell from 54.2 in May to 53.5 in June, missing the market expectations of 54.4 in the reported period. The measure also hit a two-month low.
The HCOB Preliminary German Composite Output Index came in at 50.6 in June vs. 52.7 estimated and 52.4 reported in May. The gauge was at its weakest in two months.
FX implications
EUR/USD has come under renewed selling pressure on the disappointing German data, currently trading 0.22% lower on the day at 1.0675.
Euro PRICE Today
The table below shows the percentage change of Euro (EUR) against listed major currencies today. Euro was the weakest against the Swiss Franc.
| USD | EUR | GBP | JPY | CAD | AUD | NZD | CHF | |
|---|---|---|---|---|---|---|---|---|
| USD | 0.25% | 0.11% | -0.08% | 0.02% | 0.04% | -0.03% | -0.04% | |
| EUR | -0.25% | -0.15% | -0.29% | -0.22% | -0.19% | -0.26% | -0.33% | |
| GBP | -0.11% | 0.15% | -0.18% | -0.09% | -0.06% | -0.14% | -0.17% | |
| JPY | 0.08% | 0.29% | 0.18% | 0.11% | 0.13% | 0.06% | 0.05% | |
| CAD | -0.02% | 0.22% | 0.09% | -0.11% | 0.00% | -0.06% | -0.08% | |
| AUD | -0.04% | 0.19% | 0.06% | -0.13% | 0.00% | -0.09% | -0.10% | |
| NZD | 0.03% | 0.26% | 0.14% | -0.06% | 0.06% | 0.09% | -0.03% | |
| CHF | 0.04% | 0.33% | 0.17% | -0.05% | 0.08% | 0.10% | 0.03% |
The heat map shows percentage changes of major currencies against each other. The base currency is picked from the left column, while the quote currency is picked from the top row. For example, if you pick the Euro from the left column and move along the horizontal line to the US Dollar, the percentage change displayed in the box will represent EUR (base)/USD (quote).
- The Pound Sterling strengthens after UK Retail Sales grew more than expected in May.
- Strong UK Retail Sales could weigh on BoE rate-cut hopes for August.
- Investors will keenly focus on the preliminary PMIs for June for both the UK and the US.
The Pound Sterling (GBP) edges higher in Friday’s London session as the United Kingdom (UK) Office for National Statistics (ONS) has reported stronger-than-expected Retail Sales data for May. The report showed that monthly Retail Sales rebounded, growing at a robust 2.9%, more than the 1.5% expected. On year, Retail Sales surprisingly rose by 1.3% while investors expected them to have declined by 0.9%.
Retail Sales are an indicator measuring consumer spending, which accounts for a major part of economic growth. A significant improvement in sales at retail stores despite the Bank of England's (BoE) maintaining higher interest rates indicates strong demand but also increasing price pressures in the pipeline. This, if sustained, could be a headache for the BoE, which is focusing on achieving price stability.
On Thursday, the BoE kept interest rates steady at 5.25% in a 7-2 vote split, as expected. BoE policymakers acknowledged the return of headline inflation to the bank’s target of 2% in three years but said that won’t be enough as price pressures in the service sector are still too high. Currently, financial markets expect that the BoE will start reducing interest rates in August, which means there will be no rate cuts before parliamentary elections. Pre-election polls show the Conservative Party of Prime Minister Rishi Sunak is behind the opposition Labour Party by around 20 points, Reuters reports.
Going forward, investors will focus on the preliminary UK's S&P Global/CIPS PMI data for June, which will be published at 08:30 GMT. The PMI report is expected to show that the Composite PMI barely rises.
Daily digest market movers: Pound Sterling edges higher against US Dollar
- The Pound Sterling rises to 1.2670 against the US Dollar (USD) in Friday’s London session. The GBP/USD pair rises due to strong UK Retail Sales data and a modest correction in the US Dollar. The US Dollar drops as a recent decline in the United States (US) inflation and Retail Sales data for May has led to rising bets that the Federal Reserve (Fed) will start reducing interest rates in September.
- According to the CME FedWatch tool, 30-day Fed Fund Futures pricing data shows a 64% chance for rate cuts in September. The CME FedWatch tool also shows that there will be two rate cuts this year against one signaled by policymakers in their latest projections.
- Contrary to market expectations, Fed policymakers continue to argue in favor of one rate cut this year. Officials say they want to see inflation declining for months before lowering interest rates.
- In Friday’s session, the US Dollar will dance to the tunes of the US S&P Global PMIs data for June, which will be published at 13:45 GMT. The Composite PMI is expected to decline, although remaining above the 50 mark that separates expansion from contraction, due to slowing growth in manufacturing and the service sector. As the PMI data gives clues about the economic health and overall demand, a weak number would indicate that the economy is off from boil, boosting Fed rate cuts bets for September.
Technical Analysis: Pound Sterling remains below 20-day and 50-day EMAs
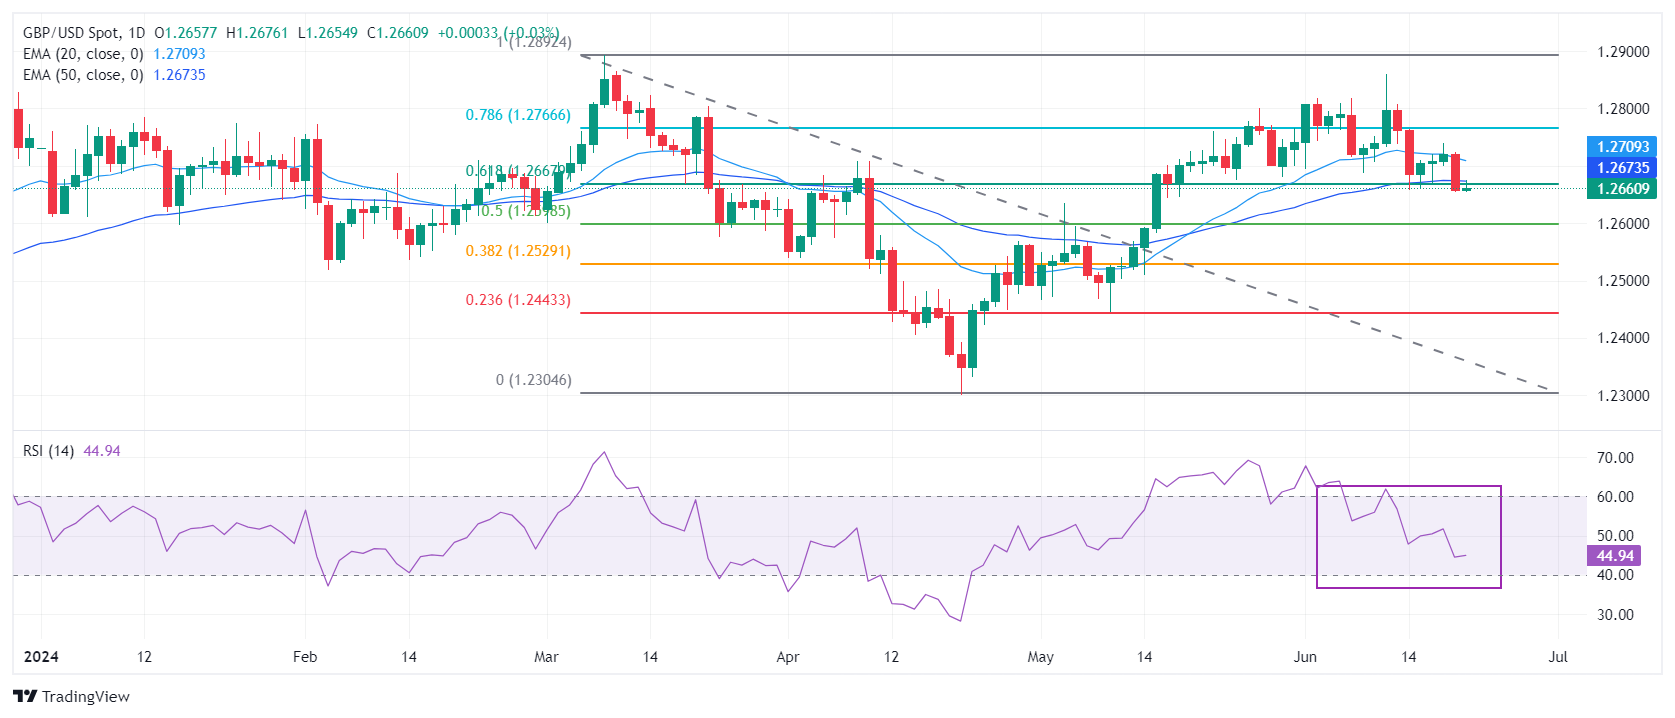
The Pound Sterling finds a temporary cushion near 1.2670 after the release of the upbeat UK Retail Sales data for May. However, the near-term appeal is uncertain as the GBP/USD pair is below the 20-day and 50-day Exponential Moving Averages (EMAs), which trade around 1.2700 and 1.2670, respectively.
The Cable struggles to hold the 61.8% Fibonacci retracement support at 1.2667, plotted from the March 8 high of 1.2900 to the April 22 low at 1.2300.
The 14-period Relative Strength Index (RSI) falls back into the 40.00-60.00 range, indicating that the upside momentum has faded.
Pound Sterling FAQs
The Pound Sterling (GBP) is the oldest currency in the world (886 AD) and the official currency of the United Kingdom. It is the fourth most traded unit for foreign exchange (FX) in the world, accounting for 12% of all transactions, averaging $630 billion a day, according to 2022 data. Its key trading pairs are GBP/USD, aka ‘Cable’, which accounts for 11% of FX, GBP/JPY, or the ‘Dragon’ as it is known by traders (3%), and EUR/GBP (2%). The Pound Sterling is issued by the Bank of England (BoE).
The single most important factor influencing the value of the Pound Sterling is monetary policy decided by the Bank of England. The BoE bases its decisions on whether it has achieved its primary goal of “price stability” – a steady inflation rate of around 2%. Its primary tool for achieving this is the adjustment of interest rates. When inflation is too high, the BoE will try to rein it in by raising interest rates, making it more expensive for people and businesses to access credit. This is generally positive for GBP, as higher interest rates make the UK a more attractive place for global investors to park their money. When inflation falls too low it is a sign economic growth is slowing. In this scenario, the BoE will consider lowering interest rates to cheapen credit so businesses will borrow more to invest in growth-generating projects.
Data releases gauge the health of the economy and can impact the value of the Pound Sterling. Indicators such as GDP, Manufacturing and Services PMIs, and employment can all influence the direction of the GBP. A strong economy is good for Sterling. Not only does it attract more foreign investment but it may encourage the BoE to put up interest rates, which will directly strengthen GBP. Otherwise, if economic data is weak, the Pound Sterling is likely to fall.
Another significant data release for the Pound Sterling is the Trade Balance. This indicator measures the difference between what a country earns from its exports and what it spends on imports over a given period. If a country produces highly sought-after exports, its currency will benefit purely from the extra demand created from foreign buyers seeking to purchase these goods. Therefore, a positive net Trade Balance strengthens a currency and vice versa for a negative balance.
Here is what you need to know on Friday, June 21:
The US Dollar (USD) stays resilient early Friday after posting gains against its major rivals on Thursday. S&P Global will release preliminary June Manufacturing and Services PMI reports for Germany, the UK, the Eurozone and the US later in the day. May Existing Home Sales from the US and May Retail Sales data from Canada will also be watched closely by market participants ahead of the weekend.
The negative shift seen in risk mood helped the USD gather strength in the American session on Thursday. After edging lower in the first three days of the week, the USD Index gained 0.4% on Thursday and erased all of this week's losses. In the European morning, the USD Index holds steady slightly above 105.50. Meanwhile, US stock index futures trade marginally higher and the benchmark 10-year US Treasury bond yield continues to fluctuate above 4.2%.
US Dollar PRICE This week
The table below shows the percentage change of US Dollar (USD) against listed major currencies this week. US Dollar was the strongest against the Japanese Yen.
| USD | EUR | GBP | JPY | CAD | AUD | NZD | CHF | |
|---|---|---|---|---|---|---|---|---|
| USD | -0.07% | 0.23% | 1.02% | -0.45% | -0.69% | 0.13% | 0.13% | |
| EUR | 0.07% | 0.32% | 1.11% | -0.38% | -0.72% | 0.25% | 0.20% | |
| GBP | -0.23% | -0.32% | 0.87% | -0.70% | -1.05% | -0.10% | -0.09% | |
| JPY | -1.02% | -1.11% | -0.87% | -1.35% | -1.69% | -0.73% | -0.82% | |
| CAD | 0.45% | 0.38% | 0.70% | 1.35% | -0.31% | 0.59% | 0.60% | |
| AUD | 0.69% | 0.72% | 1.05% | 1.69% | 0.31% | 1.03% | 0.96% | |
| NZD | -0.13% | -0.25% | 0.10% | 0.73% | -0.59% | -1.03% | 0.00% | |
| CHF | -0.13% | -0.20% | 0.09% | 0.82% | -0.60% | -0.96% | -0.01% |
The heat map shows percentage changes of major currencies against each other. The base currency is picked from the left column, while the quote currency is picked from the top row. For example, if you pick the US Dollar from the left column and move along the horizontal line to the Japanese Yen, the percentage change displayed in the box will represent USD (base)/JPY (quote).
The Bank of England (BoE) left its monetary policy settings unchanged following the June meeting, as expected. The optimistic tone on inflation outlook, however, made it difficult for Pound Sterling to find demand. GBP/USD broke below 1.2700 and closed the day deep in negative territory on Thursday. Early Friday, the pair consolidates its losses slightly above 1.2650. In the meantime, the UK's Office for National Statistics reported that Retail Sales rose 2.9% on a monthly basis in May. This reading surpassed the market expectation for a 1.5% increase by a wide margin.
During the Asian trading hours, the data from Japan showed that the National Consumer Price Index (CPI) rose 2.8% on a yearly basis in May, following the 2.5% increase recorded in April. USD/JPY gained more than 0.5% on Thursday and continued to stretch higher in the Asian session on Friday. At the time of press, the pair was trading at its highest level since April 29, when the Bank of Japan (BoJ) intervened in foreign exchange (FX) markets, at around 159.00. Japanese Finance Minister Shunichi Suzuki said on Friday that he will work with colleagues to mitigate damage to economies from FX fluctuations, adding excessive and disorderly FX moves could hurt economies.
Judo Bank Manufacturing PMI in Australia declined to 47.5 in June's flash estimate from 49.7 in May. Services PMI edged lower to 51.0 from 52.5. These readings failed to trigger a noticeable reaction in AUD/USD and the pair was last seen trading in a tight range slightly above 0.6650.
EUR/USD closed in negative territory on Thursday but managed to stabilize above 1.0700 in the European morning on Friday.
Gold benefited from escalating geopolitical tensions and gained more than 1% on Thursday to reach a fresh two-week high above $2,360. Early Friday, XAU/USD stays in a consolidation phase at around $2,360.
US Dollar FAQs
The US Dollar (USD) is the official currency of the United States of America, and the ‘de facto’ currency of a significant number of other countries where it is found in circulation alongside local notes. It is the most heavily traded currency in the world, accounting for over 88% of all global foreign exchange turnover, or an average of $6.6 trillion in transactions per day, according to data from 2022. Following the second world war, the USD took over from the British Pound as the world’s reserve currency. For most of its history, the US Dollar was backed by Gold, until the Bretton Woods Agreement in 1971 when the Gold Standard went away.
The most important single factor impacting on the value of the US Dollar is monetary policy, which is shaped by the Federal Reserve (Fed). The Fed has two mandates: to achieve price stability (control inflation) and foster full employment. Its primary tool to achieve these two goals is by adjusting interest rates. When prices are rising too quickly and inflation is above the Fed’s 2% target, the Fed will raise rates, which helps the USD value. When inflation falls below 2% or the Unemployment Rate is too high, the Fed may lower interest rates, which weighs on the Greenback.
In extreme situations, the Federal Reserve can also print more Dollars and enact quantitative easing (QE). QE is the process by which the Fed substantially increases the flow of credit in a stuck financial system. It is a non-standard policy measure used when credit has dried up because banks will not lend to each other (out of the fear of counterparty default). It is a last resort when simply lowering interest rates is unlikely to achieve the necessary result. It was the Fed’s weapon of choice to combat the credit crunch that occurred during the Great Financial Crisis in 2008. It involves the Fed printing more Dollars and using them to buy US government bonds predominantly from financial institutions. QE usually leads to a weaker US Dollar.
Quantitative tightening (QT) is the reverse process whereby the Federal Reserve stops buying bonds from financial institutions and does not reinvest the principal from the bonds it holds maturing in new purchases. It is usually positive for the US Dollar.
Bank of Japan (BoJ) Deputy Governor Shinichi Uchida said on Friday that “Japan's economy recovering moderately albeit with some weak signs.”
Additional quotes
Underlying inflation likely to gradually accelerate.
Uncertainty surrounding Japan's economic, price outlook remains high.
Must be vigilant to financial, FX market developments and their impact on Japan’s economy, prices.
BoJ will decide specifics on bond tapering plan, size of reducting in bond buying will likely be significant.
Japan's financial system remains stable as a whole.
BoJ will adjust degree of monetary easing if economy, prices move in line with our forecasts.
Market reaction
At the time of writing, USD/JPY is adding 0.04% on the day to trade near 159.00.
- Silver price edges lower to $30.60 amid the firmer US Dollar on Friday.
- The weaker US data boosted bets for rate cuts from the Fed this year, weighing on the Silver price.
- Traders will take more cues from the advanced reading of US S&P Global PMI data for June.
Silver price (XAG/USD) attracts some sellers near $30.60 on Friday during the early European trading hours. The white metal edges lower amid the stronger US Dollar (USD). However, the downside might be limited as the weaker US economic data have triggered the expectation of the Federal Reserve's (Fed) rate-cutting cycle later this year. Later on Friday, the first reading of the US S&P Global Purchasing Managers Index (PMI) reports for June will be published.
Data released by the US Department of Labour showed that US citizens who applied for unemployment insurance benefits rose by 238,000 for the week ending June 15. This figure was below the market consensus of 235,000 and lower than 243,000 in the previous week. This figure indicated a moderation in the labour market and raised the speculation for a Fed rate cut, following the weaker Retail Sales data last week.
Traders have priced in nearly 64% odds of a Fed rate cut in September, according to CME FedWatch Tool. A lower interest rate generally lifts the Silver price as it reduces the opportunity cost of holding non-yielding assets. “The market is starting to increasingly expect the U.S. central bank to start its easing program. I suspect we might be getting some long positions getting installed into the market,” said Bart Melek, head of commodity strategies at TD Securities.
The advanced reading of the US S&P Global Purchasing Managers Index (PMI) reports for June might offer some hints about economic activity in the United States. Any signs of improvement could lift the Greenback and create a headwind for the USD-denominated Silver.
FX option expiries for June 21 NY cut at 10:00 Eastern Time, via DTCC, can be found below
- EUR/USD: EUR amounts
- 1.0600 1.4b
- 1.0650 1.3b
- 1.0660 2.8b
- 1.0695 667m
- 1.0720 712m
- 1.0775 925m
- GBP/USD: GBP amounts
- 1.2740 2b
- 1.2780 1.1b
- USD/JPY: USD amounts
- 156.00 1b
- 156.75 800m
- 157.00 1b
- 157.25 830m
- 157.50 1.5b
- 158.25 736m
- 159.00 1b
- USD/CHF: USD amounts
- 0.8900 1.4b
- 0.8980 500m
- USD/CAD: USD amounts
- 1.3650 1b
- 1.3675 738m
- 1.3710 716m
- 1.3740 605m
- 1.3800 1.5b
- EUR/GBP: EUR amounts
- 0.8400 630m
- 0.8475 898m
- The UK Retail Sales rebounded 2.9% MoM in May, a big beat.
- Monthly Core Retail Sales for the UK jumped 2.9% in May.
- GBP/USD holds gains above 1.2650 after upbeat UK data.
The United Kingdom (UK) Retail Sales rebounded 2.9% over the month in May after falling 1.8% in April, the latest data published by the Office for National Statistics (ONS) showed Friday. Markets predicted a 1.5% uptick in the reported month.
The Core Retail Sales, stripping the auto motor fuel sales, rose 2.9% MoM, against the previous decline of 1.4% and the market forecast of 1.3%.
The annual Retail Sales in the UK rose 1.3% in May versus April’s 2.3% drop while the Core Retail Sales increased by 1.2% in the same month versus -2.5% previous. Both figures outpaced expectations.
Market reaction to UK Retail Sales report
GBP/USD picks up fresh bids on strong UK data release, up 0.10% on the day to trade near 1.2670, as of writing.
- USD/JPY moves toward 160.00 on multiple tailwinds.
- The BoJ could further delay plans to trim bond-buying as core inflation decelerates.
- The US Dollar will be guided by the preliminary US S&P Global PMIs for June.
The USD/JPY pair clings to gains near 159.00 in Friday’s Asian session after a winning spell for six trading sessions. The asset is expected to extend its upside towards a multi-year high near 160.00 as investors expect that the Bank of Japan (BoJ) could further delay plans of reducing the amount of bond-buying beyond the July meeting.
In the latest monetary policy meeting, BoJ Governor Kazuo Ueda said that policymakers decided to delay plans to trim bond-buying and hike interest rates further to the July meeting. Policymakers also communicated their concerns toward inflation expectations due to sheer weakness in the Japanese Yen, which has made Japanese exports competitive in the global market and has increased import costs. The consequences of a weak Japanese Yen could result in high inflation in the economy.
However, the National Consumer Price Index (CPI) numbers for May appear to narrate a different story. The core CPI, which excludes food and energy prices, decelerated to 2.1% from the former reading of 2.4%. The report showed that National CPI, excluding Fresh Food, grew at a slower pace of 2.5% from expectations of 2.6% but was higher than the prior release of 2.2%.
Meanwhile, the US Dollar (USD) edges down to 105.50 but remains broadly firm as investors expect that the Federal Reserve (Fed) will lag behind other central banks in an attempt to pivot to the policy-normalization process. Fed policymakers have already signaled that there will be only one rate cut this year, which is supposed to be announced in the last quarter. Contrary to the Fed’s latest interest rate projections, financial markets expect there will be two rate cuts, and the policy expansion process will start from the September meeting.
Going forward, investors will focus on the US S&P Global PMIs data for June, which will be published at 13:45 GMT. The agency is expected to show a decline in the Composite PMI due to weakness in manufacturing as well as the service sector.
- GBP/USD struggles to register any meaningful recovery and hangs near a one-month trough.
- Bets for an early rate cut by the BoE undermine the GBP and act as a headwind for the major.
- September Fed rate cut bets cap the upside for the USD and help limit losses for spot prices.
- A break below 100-day SMA is needed to support prospects for a further depreciating move.
The GBP/USD pair is seen oscillating in a range during the Asian session on Friday and consolidating the previous day's post-Bank of England (BoE) decline to over a one-month low. Spot prices currently trade just above mid-1.2600s and seem vulnerable to prolonging the recent retracement slide from a multi-month peak, around the 1.2860 region touched last week.
The markets started pricing in a greater chance of a rate cut in August after the BoE Governor Andrew Bailey said on Thursday that it was "good news" that official figures had shown inflation was back at its 2% target. This might continue to undermine the British Pound (GBP) ahead of the UK election on July 4 and validate the negative outlook for the GBP/USD pair. The US Dollar (USD), on the other hand, struggles to capitalize on the previous day's strong move up amid expectations for an imminent start of the Federal Reserve's (Fed) rate-cutting cycle in September. This, in turn, is seen lending some support to the currency pair.
From a technical perspective, bearish traders need to wait for some follow-through selling below the 100-day Simple Moving Average (SMA) support, currently pegged near the 1.2640-1.2635 region, before placing fresh bets. Given that oscillators on the daily chart have just started gaining negative traction, the GBP/USD pair might then accelerate the fall towards the 1.2600 mark. The downward trajectory could extend further towards challenging the very important 200-day SMA, around the 1.2560-1.2555 region en route to the 1.2500 psychological mark and the May monthly swing low, around the 1.2445 area.
On the flip side, any attempted recovery might now confront immediate resistance near the 1.2685 region ahead of the 1.2700 mark and the 1.2715-1.2720 supply zone. This is closely followed by the weekly top, around the 1.2740 area, which if cleared could trigger a short-covering rally and lift the GBP/USD pair to the 1.2800 round figure. The subsequent strength should pave the way for a move towards retesting the monthly swing high, around the 1.2860 zone, en route to the YTD peak, around the 1.2900 neighborhood touched in March.
GBP/USD daily chart
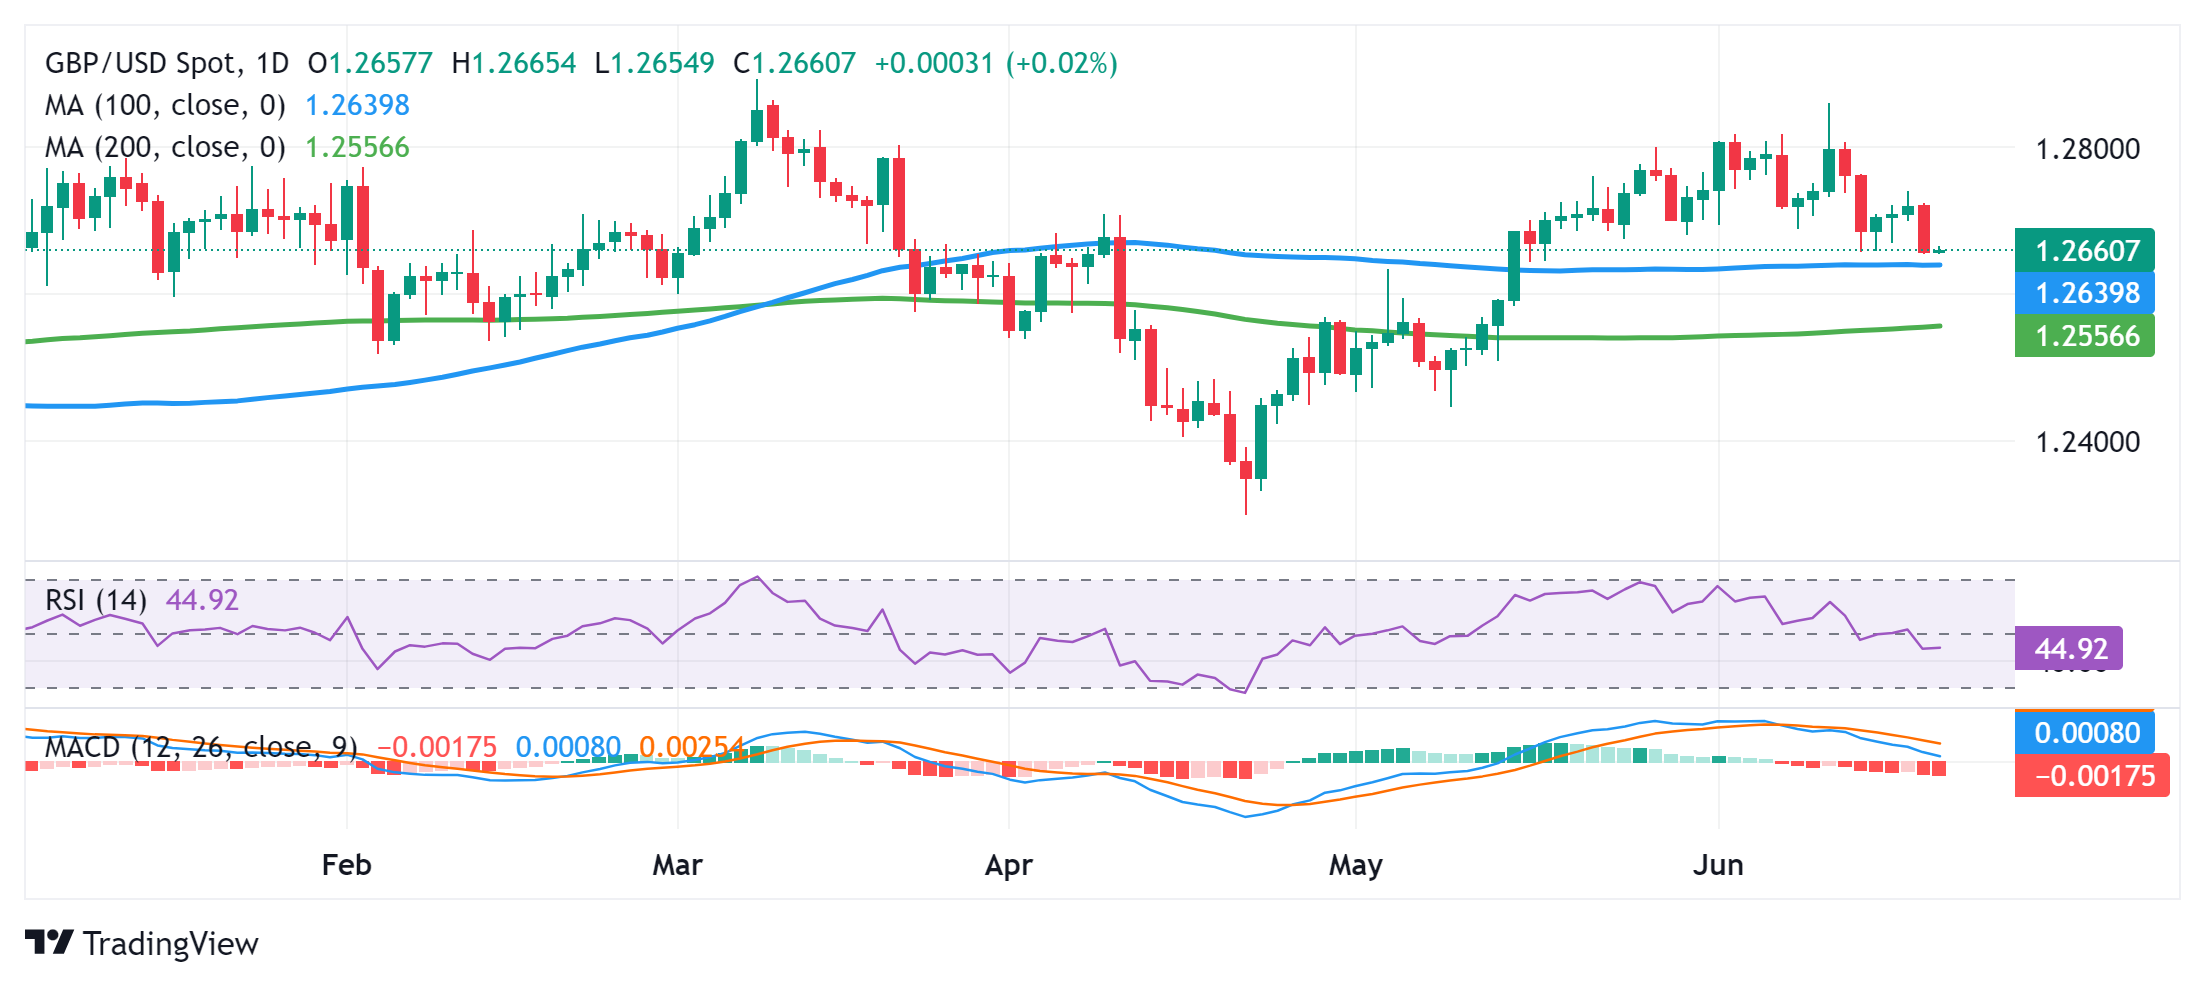
- WTI edges lower amid a modest USD strength, albeit lacks follow-through selling.
- Expectations about tightening global supply and geopolitical tensions lend support.
- Rising bets for a September rate cut by the Fed contribute to limiting the downside.
West Texas Intermediate (WTI) US crude Oil prices tick lower during the Asian session on Friday, albeit lack follow-through and remain well within the striking distance of the highest level since late April touched the previous day. The commodity currently trades around the $81.00/barrel mark and seems poised to register strong gains for the second successive week.
Data published by the Energy Information Administration (EIA) on Thursday showed a larger-than-expected drawdown in US crude stockpiles and reaffirmed expectations about a tighter market in the second half of the year. This, along with concerns that a wider Middle East conflict will lead to potential disruption to global supplies from the key producing region, continues to act as a tailwind for Crude Oil prices and validates the near-term positive outlook.
Meanwhile, investors have been pricing in a greater chance that the Federal Reserve (Fed) will begin its rate-cutting cycle in September and the bets were further reinforced by Thursday's softer US macro data. This turns out to be another factor lending some support to Crude Oil prices, though a modest US Dollar (USD) strength, bolstered by the overnight sharp rise in the US Treasury bond yields, might cap further gains for the USD-denominated commodity.
Nevertheless, the aforementioned fundamental backdrop seems tilted in favor of bullish traders. Moreover, the recent breakout through technically important 100-day and 200-day Simple Moving Averages (SMA) suggests that the path of least resistance for Crude Oil prices is to the upside. Hence, any meaningful slide is more likely to attract fresh buyers and remain limited. Traders now look forward to the release of the flash global PMIs for short-term opportunities.
- The Indian Rupee edges higher on the modest decline of the US Dollar on Friday.
- Foreign inflows into Indian bonds could lift the INR, while higher crude oil prices might weigh on it.
- The first reading of June’s PMI data from both India and the US is due on Friday.
The Indian Rupee (INR) gains ground on Friday due to the modest decline of the US Dollar (USD). The significant inflows into the Indian bond market ahead of India’s inclusion in the JPMorgan Emerging Market bond index at the end of this month are likely to boost the local currency in the near term.
On the other hand, the renewed Greenback demand from local importers, likely capital outflows, and the weakening in the Chinese Yuan might exert some selling pressure on the INR. Additionally, the rally in crude oil prices might drag the INR lower as India is the third-largest consumer of crude oil in the world. Investors will keep an eye on the first reading of the Indian HSBC Purchasing Managers Index (PMI) on Friday. Also, the US S&P Global PMI reports for June will be released.
Daily Digest Market Movers: Indian Rupee edges higher amid foreign inflows into Indian markets
- Foreign investors have sold a net of US$2.6 billion of local equities so far this calendar year, while US Dollar inflows into the debt markets have been strong at US$7.5 billion ahead of India’s inclusion in the JPMorgan Emerging Market bond index.
- Foreign inflows into Indian bonds could reach a decade-high of $2 billion around June 28, when they will be included in a widely-tracked JPMorgan index, although the RBI will lap up most of the USD to avoid the volatility in the INR, bankers said.
- The preliminary India’s HSBC Services PMI is expected to drop to 60.0 in June from 60.2 in May.
- US citizens who applied for unemployment insurance benefits increased by 238K in the week ending June 15. This figure was lower than the previous weekly gain of 243K and below the market consensus of 235K.
- US Building Permits declined by 3.6% MoM in May from 1.44 million to 1.386 million, while Housing Starts for the same period dropped by 5.5% from 1.352 million to 1.277 million.
- Fed Bank of Richmond President Tom Barkin said on Thursday that the central bank is well-positioned with the necessary firepower for the job, but will learn a lot more over the next several months.
Technical analysis: USD/INR holds bullish bias in the longer term
The Indian Rupee trades stronger on the day. The USD/INR pair keeps the constructive vibe unchanged as it holds above the key 100-day Exponential Moving Average (EMA) on the daily timeframe. The bullish momentum is also supported by the 14-day Relative Strength Index (RSI), which remains above the 50-midline, supporting the buyers for the time being.
Any follow-through buying will attract some buyers to the all-time high of 83.75. The next barrier will emerge at the 84.00 psychological level.
On the downside, the initial support level for the pair is seen near 83.60, a low of June 20. The potential contention level to watch is the 83.30-83.35 region, the resistance-turned-support level, and the 100-day EMA. Extended losses will expose the 83.00 round figure.
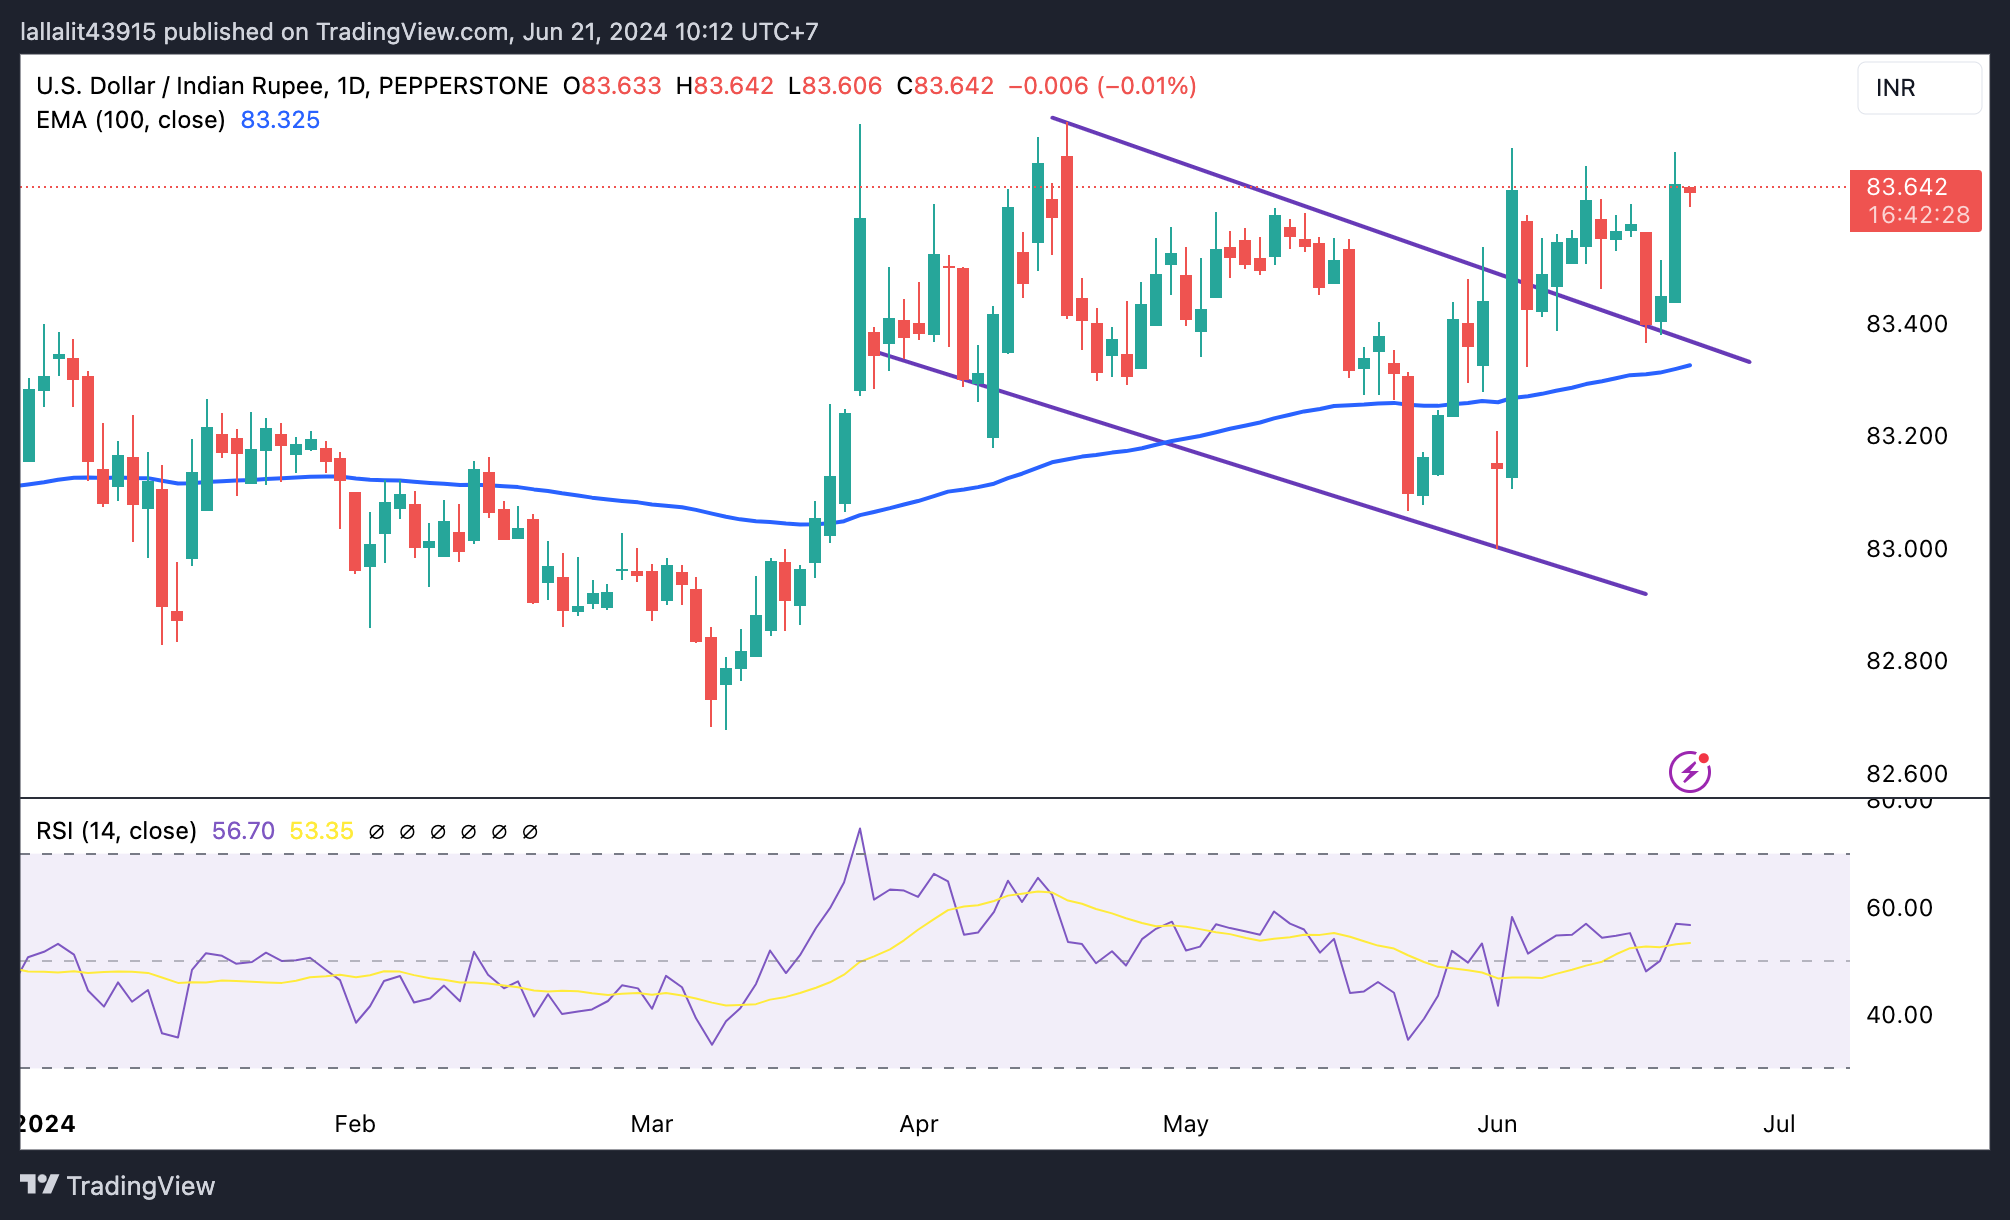
US Dollar price today
The table below shows the percentage change of US Dollar (USD) against listed major currencies today. US Dollar was the weakest against the Euro.
| USD | EUR | GBP | CAD | AUD | JPY | NZD | CHF | |
| USD | -0.07% | -0.01% | -0.01% | 0.03% | 0.02% | 0.04% | 0.03% | |
| EUR | 0.07% | 0.07% | 0.06% | 0.10% | 0.09% | 0.11% | 0.09% | |
| GBP | -0.01% | -0.07% | -0.01% | 0.03% | 0.04% | 0.05% | 0.03% | |
| CAD | 0.01% | -0.05% | 0.01% | 0.04% | 0.04% | 0.05% | 0.01% | |
| AUD | -0.03% | -0.09% | -0.04% | -0.04% | 0.01% | 0.00% | 0.00% | |
| JPY | -0.02% | -0.11% | -0.04% | -0.03% | 0.02% | 0.04% | 0.01% | |
| NZD | -0.04% | -0.11% | -0.05% | -0.05% | -0.02% | 0.00% | -0.01% | |
| CHF | -0.03% | -0.10% | -0.03% | -0.04% | -0.01% | 0.01% | 0.01% |
The heat map shows percentage changes of major currencies against each other. The base currency is picked from the left column, while the quote currency is picked from the top row. For example, if you pick the Euro from the left column and move along the horizontal line to the Japanese Yen, the percentage change displayed in the box will represent EUR (base)/JPY (quote).
Indian Rupee FAQs
The Indian Rupee (INR) is one of the most sensitive currencies to external factors. The price of Crude Oil (the country is highly dependent on imported Oil), the value of the US Dollar – most trade is conducted in USD – and the level of foreign investment, are all influential. Direct intervention by the Reserve Bank of India (RBI) in FX markets to keep the exchange rate stable, as well as the level of interest rates set by the RBI, are further major influencing factors on the Rupee.
The Reserve Bank of India (RBI) actively intervenes in forex markets to maintain a stable exchange rate, to help facilitate trade. In addition, the RBI tries to maintain the inflation rate at its 4% target by adjusting interest rates. Higher interest rates usually strengthen the Rupee. This is due to the role of the ‘carry trade’ in which investors borrow in countries with lower interest rates so as to place their money in countries’ offering relatively higher interest rates and profit from the difference.
Macroeconomic factors that influence the value of the Rupee include inflation, interest rates, the economic growth rate (GDP), the balance of trade, and inflows from foreign investment. A higher growth rate can lead to more overseas investment, pushing up demand for the Rupee. A less negative balance of trade will eventually lead to a stronger Rupee. Higher interest rates, especially real rates (interest rates less inflation) are also positive for the Rupee. A risk-on environment can lead to greater inflows of Foreign Direct and Indirect Investment (FDI and FII), which also benefit the Rupee.
Higher inflation, particularly, if it is comparatively higher than India’s peers, is generally negative for the currency as it reflects devaluation through oversupply. Inflation also increases the cost of exports, leading to more Rupees being sold to purchase foreign imports, which is Rupee-negative. At the same time, higher inflation usually leads to the Reserve Bank of India (RBI) raising interest rates and this can be positive for the Rupee, due to increased demand from international investors. The opposite effect is true of lower inflation.
- Gold price consolidates the previous day’s strong move up to a two-week high.
- Bets for a September rate cut by the Fed continue to lend support to the XAU/USD.
- The overnight rise in the US bond yields underpins the USD and caps the upside.
Gold price (XAU/USD) oscillates in a range during the Asian session on Friday and consolidates the previous day's strong move up to a two-week high, around the $2,360-2,365 area. The near-term bias, meanwhile, seems tilted in favor of bulls amid the case for interest rate cuts from the Federal Reserve (Fed) this year. The expectations were reaffirmed by softer US economic data released on Thursday, which added to the recent signs of a slowing economy. This, along with a convincing breakout through the 50-day Simple Moving Average (SMA), favors bullish traders and suggests that the path of least resistance for the commodity is to the upside.
Meanwhile, the Bank of England's (BoE) dovish outlook on Thursday lifted bets for an interest rate cut in August. Furthermore, the European Central Bank's (ECB) decision to start cutting interest rates earlier this month and the Swiss National Bank's (SNB) second rate cut of 2024 on Thursday further validate the near-term positive outlook for the non-yielding Gold price. That said, an uptick in the US Treasury bond yields and the underlying bullish tone across the global equity markets turn out to be key factors acting as a headwind for the safe-haven precious metal. Nevertheless, the XAU/USD remains on track to register gains for the second straight week.
Daily Digest Market Movers: Gold price could benefit from bets for two Fed rate cuts in 2024
- Disappointing US economic data released on Thursday reinforced market expectations that the Federal Reserve will start its easing program soon and lifted the Gold price to a two-week high.
- The US Department of Labor (DoL) reported that the number of Americans applying for unemployment insurance fell to 238K in the week ending June 15 compared to the 235K expected.
- Moreover, the Commerce Department's Census Bureau said Housing Starts declined 5.2% to a seasonally adjusted annual rate of 982K units in May, and Building Permits fell 2.9% to 949K units.
- Adding to this, the Philadelphia Fed Manufacturing Index unexpectedly declined to 1.3 in June from 4.5 in the previous month, though it remained in positive territory for a fifth successive month.
- This comes on top of tepid US Retail Sales figures for May and signs of easing inflation, which keeps a September rate cut on the table and should lend support to the non-yielding yellow metal.
- The markets are also pricing in the possibility of another interest rate cut at the December policy meeting despite the Fed policymakers' hawkish outlook, indicating only one rate cut this year.
- Minneapolis Fed President Neel Kashkari argued that the US economy has proven to be remarkably resilient and that it will probably take a year or two to get inflation back to the 2% target.
- Richmond Fed President Tom Barkin noted that the US central bank has sufficient firepower to address policy issues, but it will have to maintain a strict data-dependent approach.
- The US Treasury bond yields shook off softer US data and rose on Thursday in anticipation of new supply next week, pushing the US Dollar to the weekly top and capping gains for the XAU/USD.
- Investors now look forward to the release of flash PMI prints for cues about the health of the global economy, which should provide some impetus ahead of the US Existing Home Sales data.
Technical Analysis: Gold price seems poised to climb further, 50-day SMA breakout in play
From a technical perspective, the overnight sustained close above the 50-day SMA could be seen as a fresh trigger for bullish traders. This, along with the fact that oscillators on the daily chart have again started gaining positive traction, supports prospects for a further appreciating move. Hence, a subsequent move towards testing the next relevant hurdle, near the $2,378-2380 region, looks like a distinct possibility. The Gold price could eventually aim to reclaim the $2,400 round-figure mark.
On the flip side, the 50-day SMA, currently pegged near the $2,345-2,344 area, now seems to protect the immediate downside ahead of the $2,336-2,335 region. A convincing break below the latter might expose the $2,300 round figure and the $2,285 horizontal support. Some follow-through selling will set the stage for the resumption of the recent retracement slide from the all-time peak touched in May and drag the Gold price further towards the $2,254-2,253 zone.
Gold FAQs
Gold has played a key role in human’s history as it has been widely used as a store of value and medium of exchange. Currently, apart from its shine and usage for jewelry, the precious metal is widely seen as a safe-haven asset, meaning that it is considered a good investment during turbulent times. Gold is also widely seen as a hedge against inflation and against depreciating currencies as it doesn’t rely on any specific issuer or government.
Central banks are the biggest Gold holders. In their aim to support their currencies in turbulent times, central banks tend to diversify their reserves and buy Gold to improve the perceived strength of the economy and the currency. High Gold reserves can be a source of trust for a country’s solvency. Central banks added 1,136 tonnes of Gold worth around $70 billion to their reserves in 2022, according to data from the World Gold Council. This is the highest yearly purchase since records began. Central banks from emerging economies such as China, India and Turkey are quickly increasing their Gold reserves.
Gold has an inverse correlation with the US Dollar and US Treasuries, which are both major reserve and safe-haven assets. When the Dollar depreciates, Gold tends to rise, enabling investors and central banks to diversify their assets in turbulent times. Gold is also inversely correlated with risk assets. A rally in the stock market tends to weaken Gold price, while sell-offs in riskier markets tend to favor the precious metal.
The price can move due to a wide range of factors. Geopolitical instability or fears of a deep recession can quickly make Gold price escalate due to its safe-haven status. As a yield-less asset, Gold tends to rise with lower interest rates, while higher cost of money usually weighs down on the yellow metal. Still, most moves depend on how the US Dollar (USD) behaves as the asset is priced in dollars (XAU/USD). A strong Dollar tends to keep the price of Gold controlled, whereas a weaker Dollar is likely to push Gold prices up.
| Raw materials | Closed | Change, % |
|---|---|---|
| Silver | 30.716 | 3.26 |
| Gold | 2359.1 | 1.28 |
| Palladium | 925.43 | 2.71 |
The People’s Bank of China (PBoC) set the USD/CNY central rate for the trading session ahead on Friday at 7.1196, as against the previous day's fix of 7.1192 and 7.2698 Reuters estimates.
Japanese Finance Minister Shunichi Suzuki said on Friday that he will work with colleagues to mitigate damage to economies from foreign exchange (FX) fluctuations, adding excessive and disorderly FX moves could hurt economies
Key quotes
To visit Seoul on June 25 to meet with South Korean counterpart.
Will communicate closely with the US, and other countries on FX based on G7 agreement that excessive, disorderly FX moves could hurt economies.
Collaborates with colleagues to mitigate damage to economies from foreign exchange fluctuations.
Don't think the US sees Japan's FX policy as problematic.
Market reaction
The Japanese Yen remains near a seven-month low against the US Dollar following the verbal intervention. At the time of writing, USD/JPY is trading 0.04% higher on the day at 159.00.
Japan Chief Cabinet Secretary Yoshimasa Hayashi said on Friday that stable foreign change (FX) levels are desirable. Hayashi emphasized the importance of maintaining strong confidence in the Japanese Yen (JPY).
Key quotes
The addition of Japan to the US currency monitoring list does not mean that Japan's foreign exchange policy is a problem
Stable Forex levels are desirable
Important that forex rates reflect fundamentals
Will continue to closely monitor moves in the forex market
Emphasizes the importance of maintaining strong confidence in the yen.
Emphasizes the importance of stable forex movements
Market reaction
The Japanese Yen hits a seven-month low against the US Dollar. At the time of writing, USD/JPY is trading 0.07% higher on the day at 159.05.
Japanese Yen FAQs
The Japanese Yen (JPY) is one of the world’s most traded currencies. Its value is broadly determined by the performance of the Japanese economy, but more specifically by the Bank of Japan’s policy, the differential between Japanese and US bond yields, or risk sentiment among traders, among other factors.
One of the Bank of Japan’s mandates is currency control, so its moves are key for the Yen. The BoJ has directly intervened in currency markets sometimes, generally to lower the value of the Yen, although it refrains from doing it often due to political concerns of its main trading partners. The current BoJ ultra-loose monetary policy, based on massive stimulus to the economy, has caused the Yen to depreciate against its main currency peers. This process has exacerbated more recently due to an increasing policy divergence between the Bank of Japan and other main central banks, which have opted to increase interest rates sharply to fight decades-high levels of inflation.
The BoJ’s stance of sticking to ultra-loose monetary policy has led to a widening policy divergence with other central banks, particularly with the US Federal Reserve. This supports a widening of the differential between the 10-year US and Japanese bonds, which favors the US Dollar against the Japanese Yen.
The Japanese Yen is often seen as a safe-haven investment. This means that in times of market stress, investors are more likely to put their money in the Japanese currency due to its supposed reliability and stability. Turbulent times are likely to strengthen the Yen’s value against other currencies seen as more risky to invest in.
- The Australian Dollar holds positive ground on Thursday.
- The Aussie edges higher as Australian PMI reading has maintained expansion in June.
- Investors await the advanced US S&P Global PMI data, which is due on Friday.
The Australian Dollar (AUD) trades with mild gains in Thursday’s early Asian session. The Aussie edges higher after the recent Australian Judo Bank PMI report suggested that business activity is still growing despite a slower pace than in March and April. Furthermore, the Reserve Bank of Australia’s (RBA) hawkish hold on Tuesday is likely to underpin the AUD in the near term.
However, the escalating geopolitical tensions in the Middle East after Israeli officials reiterated that the country is ready for an all-out war against Hezbollah, might boost safe-haven currencies like the US Dollar (USD). The advanced US S&P Global Manufacturing and Services PMI will take center stage on Friday. If the US business activity showed an improvement in June, this could further support the Greenback and act as a headwind for the pair.
Daily Digest Market Movers: Australian Dollar remains firm after the country’s PMI data
- Advanced Australia's Judo Bank Composite PMI declined in June to 50.6 from 52.1 in May. The Manufacturing PMI dropped to 47.5 in June from 49.7 in the previous reading, weaker than the 50.6 expected. The Services PMI fell to a five-month low of 51.0 in June compared to 51.2 prior, according to the Judo Bank and S&P Global.
- US Initial Jobless Claims for the week ending June 15 rose to 238K from the previous reading of 243K, above the market consensus of 235K.
- US Building Permits dropped by 3.6% MoM in May from 1.44 million to 1.386 million, while Housing Starts for the same period fell by 5.5% from 1.352 million to 1.277 million.
- Richmond Fed President Tom Barkin said on Thursday that the central bank is well-positioned with necessary firepower for job, but will have to maintain a strict data-dependent approach before considering cutting rates.
- Minneapolis Fed President Neel Kashkari noted that it could take one to two years for inflation to return to the Fed’s 2% target, per Reuters.
Technical Analysis: AUD/USD’s constructive bias remains in place
The Australian Dollar trades on a stronger note on the day. The AUD/USD pair has remained stuck within a descending trend channel since May 14. The pair maintains a positive outlook beyond the 100-day Exponential Moving Average (EMA) on the daily chart. The 14-day Relative Strength Index (RSI) continues to show bullish momentum, suggesting resistance is more likely to hold than to break.
A decisive break above 0.6675 (the upper boundary of the descending trend channel) could send the pair up to the 0.6700 round mark en route to 0.6760 (high of January 4).
In the bearish case, the key contention level for AUD/USD is seen at 0.6592 (100-day EMA) A breach of the mentioned level will see more loss to 0.6565 (the lower limit of the channel). The additional downside filter to watch is 0.6510, a low of March 22, followed by 0.6465, a low of May 1.
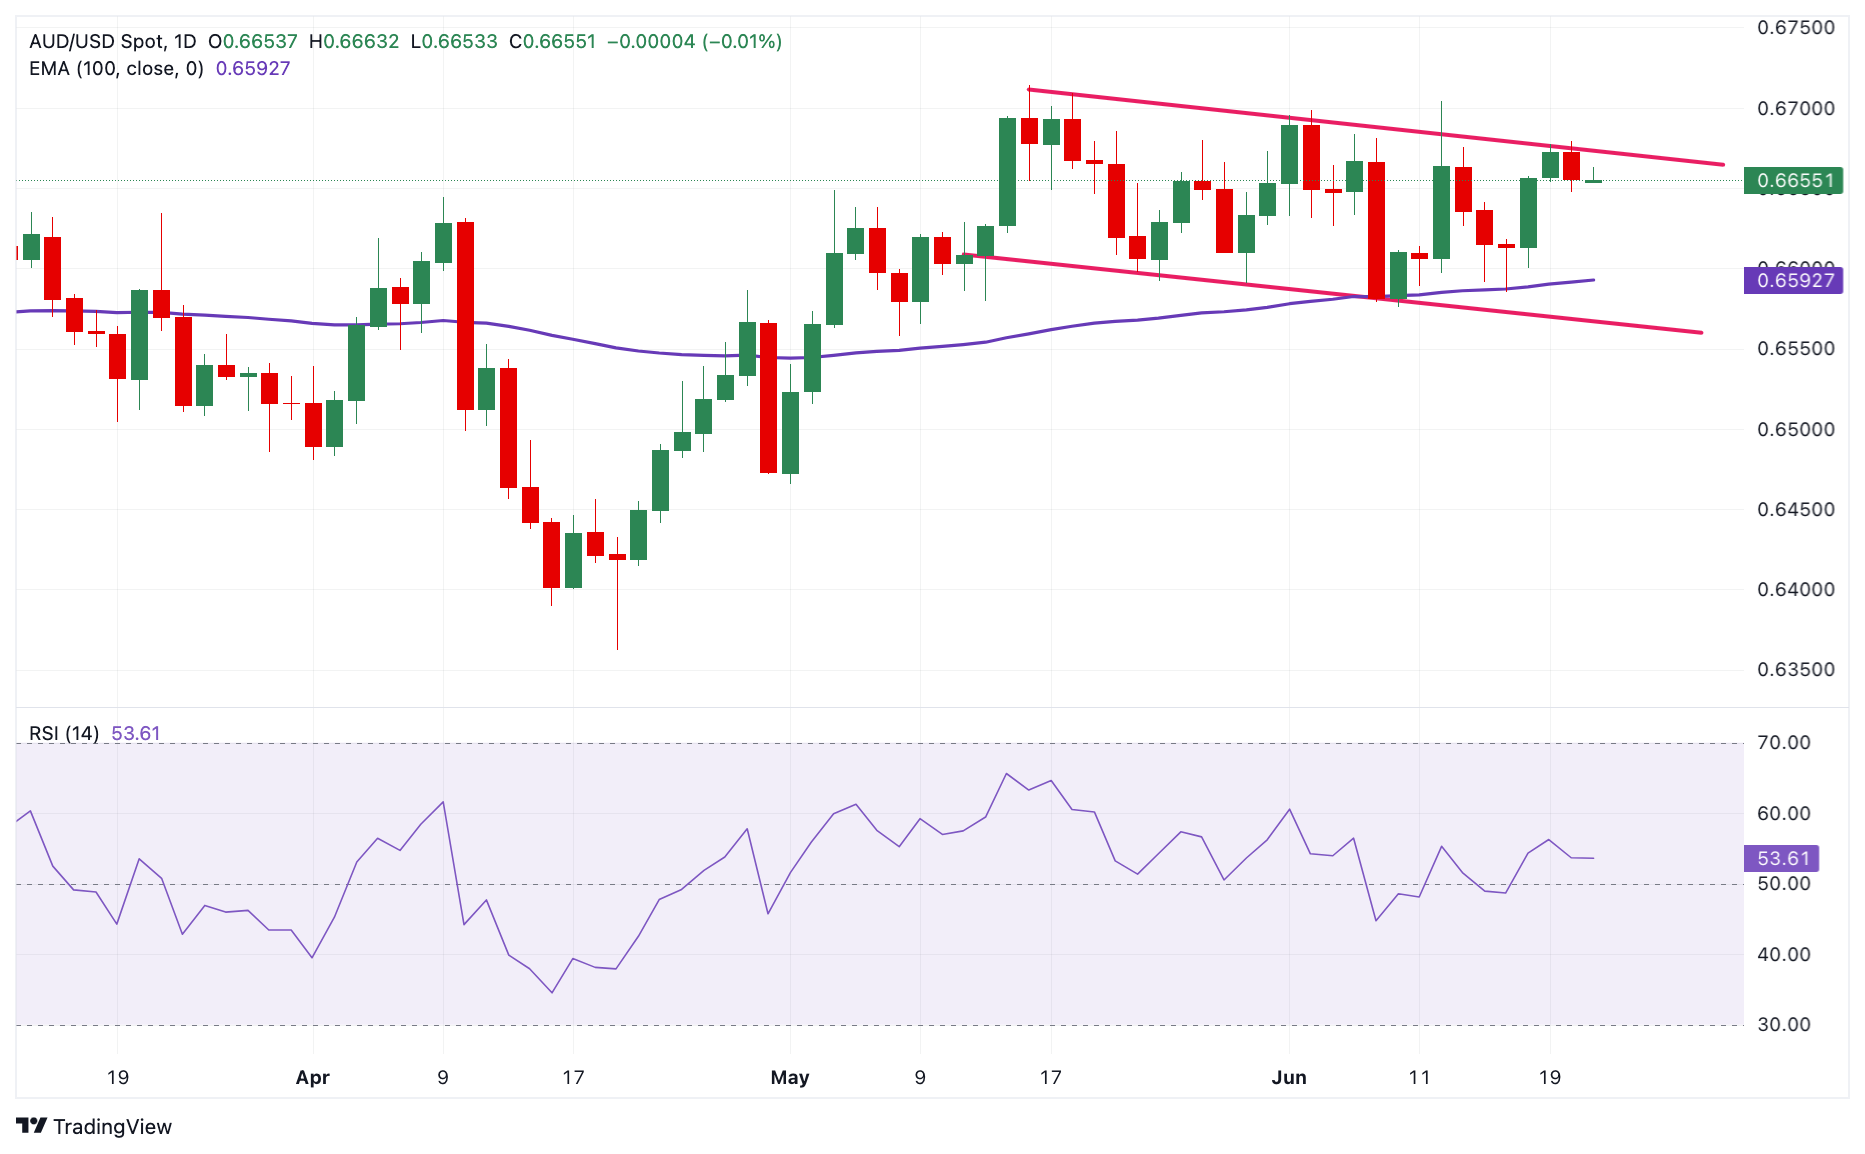
Australian Dollar FAQs
One of the most significant factors for the Australian Dollar (AUD) is the level of interest rates set by the Reserve Bank of Australia (RBA). Because Australia is a resource-rich country another key driver is the price of its biggest export, Iron Ore. The health of the Chinese economy, its largest trading partner, is a factor, as well as inflation in Australia, its growth rate and Trade Balance. Market sentiment – whether investors are taking on more risky assets (risk-on) or seeking safe-havens (risk-off) – is also a factor, with risk-on positive for AUD.
The Reserve Bank of Australia (RBA) influences the Australian Dollar (AUD) by setting the level of interest rates that Australian banks can lend to each other. This influences the level of interest rates in the economy as a whole. The main goal of the RBA is to maintain a stable inflation rate of 2-3% by adjusting interest rates up or down. Relatively high interest rates compared to other major central banks support the AUD, and the opposite for relatively low. The RBA can also use quantitative easing and tightening to influence credit conditions, with the former AUD-negative and the latter AUD-positive.
China is Australia’s largest trading partner so the health of the Chinese economy is a major influence on the value of the Australian Dollar (AUD). When the Chinese economy is doing well it purchases more raw materials, goods and services from Australia, lifting demand for the AUD, and pushing up its value. The opposite is the case when the Chinese economy is not growing as fast as expected. Positive or negative surprises in Chinese growth data, therefore, often have a direct impact on the Australian Dollar and its pairs.
Iron Ore is Australia’s largest export, accounting for $118 billion a year according to data from 2021, with China as its primary destination. The price of Iron Ore, therefore, can be a driver of the Australian Dollar. Generally, if the price of Iron Ore rises, AUD also goes up, as aggregate demand for the currency increases. The opposite is the case if the price of Iron Ore falls. Higher Iron Ore prices also tend to result in a greater likelihood of a positive Trade Balance for Australia, which is also positive of the AUD.
The Trade Balance, which is the difference between what a country earns from its exports versus what it pays for its imports, is another factor that can influence the value of the Australian Dollar. If Australia produces highly sought after exports, then its currency will gain in value purely from the surplus demand created from foreign buyers seeking to purchase its exports versus what it spends to purchase imports. Therefore, a positive net Trade Balance strengthens the AUD, with the opposite effect if the Trade Balance is negative.
- USD/JPY remains supported near its highest level since April touched earlier this Friday.
- The BoJ rate-hike uncertainty and mixed National CPI from Japan undermine the JPY.
- September Fed rate cut bets cap gains for the USD and the pair amid intervention fears.
The USD/JPY pair oscillates in a narrow range during the Asian session on Friday and consolidates its recent gains to the 159.00 neighborhood, or the highest level since late April touched the last hour. The fundamental backdrop supports prospects for a further near-term appreciating move for the currency pair, though intervention fears might cap the upside.
The Japanese Yen (JPY) continues to be undermined by the disappointment led by the Bank of Japan's (BoJ) lack of commitment to hiking interest rates in the near term. Furthermore, data released earlier this Friday showed that Japan's core-core Consumer Price Index (CPI), which excludes food and energy prices, slowed for the ninth straight month and eased to the 2.1% yearly rate from the 2.4% previous. This adds to uncertainty if the BoJ will hike interest rates in July or later in the year, which, along with the underlying bullish sentiment across the global equity markets, dents demand for the safe-haven JPY and acts as a tailwind for the USD/JPY pair.
The US Dollar (USD), on the other hand, stands tall near the top end of its weekly trading range in the wake of the overnight sharp rise in the US Treasury bond yields. This results in the further widening of the US-Japan rate differential, which is seen as another factor weighing on the JPY and lending support to the USD/JPY pair. Investors, meanwhile, remain on alert amid speculations that Japanese authorities will intervene to prop up the domestic currency. Moreover, rising bets for an imminent start of the Federal Reserve's (Fed) rate-cutting cycle in September might keep a lid on the Greenback and any further gains for the currency pair.
Nevertheless, the USD/JPY pair remains on track to end in positive territory for the second straight week as investors now look forward to the release of the global flash PMI prints for some meaningful impetus. Apart from this, the release of Existing Home Sales data from the US, along with the US bond yields and the broader market risk sentiment, might further contribute to producing short-term trading opportunities on the last day of the week.
| Index | Change, points | Closed | Change, % |
|---|---|---|---|
| NIKKEI 225 | 62.26 | 38633.02 | 0.16 |
| Hang Seng | -95.07 | 18335.32 | -0.52 |
| KOSPI | 10.3 | 2807.63 | 0.37 |
| ASX 200 | -0.3 | 7769.4 | -0 |
| DAX | 186.27 | 18254.18 | 1.03 |
| CAC 40 | 101.14 | 7671.34 | 1.34 |
| Dow Jones | 299.9 | 39134.76 | 0.77 |
| S&P 500 | -13.86 | 5473.17 | -0.25 |
| NASDAQ Composite | -140.64 | 17721.59 | -0.79 |
| Pare | Closed | Change, % |
|---|---|---|
| AUDUSD | 0.66551 | -0.26 |
| EURJPY | 170.112 | 0.21 |
| EURUSD | 1.07042 | -0.38 |
| GBPJPY | 201.157 | 0.09 |
| GBPUSD | 1.26579 | -0.51 |
| NZDUSD | 0.61193 | -0.21 |
| USDCAD | 1.36884 | -0.14 |
| USDCHF | 0.89122 | 0.8 |
| USDJPY | 158.914 | 0.6 |


© 2000-2026. All rights reserved.
This site is managed by Teletrade D.J. LLC 2351 LLC 2022 (Euro House, Richmond Hill Road, Kingstown, VC0100, St. Vincent and the Grenadines).
The information on this website is for informational purposes only and does not constitute any investment advice.
The company does not serve or provide services to customers who are residents of the US, Canada, Iran, The Democratic People's Republic of Korea, Yemen and FATF blacklisted countries.
Making transactions on financial markets with marginal financial instruments opens up wide possibilities and allows investors who are willing to take risks to earn high profits, carrying a potentially high risk of losses at the same time. Therefore you should responsibly approach the issue of choosing the appropriate investment strategy, taking the available resources into account, before starting trading.
Use of the information: full or partial use of materials from this website must always be referenced to TeleTrade as the source of information. Use of the materials on the Internet must be accompanied by a hyperlink to teletrade.org. Automatic import of materials and information from this website is prohibited.
Please contact our PR department if you have any questions or need assistance at pr@teletrade.global.
transfers