- Analytics
- News and Tools
- Market News
CFD Markets News and Forecasts — 21-01-2025
US President Donald Trump said on Tuesday that his administration is discussing imposing a 10% tariff on goods imported from China on February 1 because fentanyl is being sent from China to Mexico and Canada, per Reuters.
Market reaction
At the press time, the AUD/USD pair is down 0.12% on the day to trade at 0.6262.
Australian Dollar FAQs
One of the most significant factors for the Australian Dollar (AUD) is the level of interest rates set by the Reserve Bank of Australia (RBA). Because Australia is a resource-rich country another key driver is the price of its biggest export, Iron Ore. The health of the Chinese economy, its largest trading partner, is a factor, as well as inflation in Australia, its growth rate and Trade Balance. Market sentiment – whether investors are taking on more risky assets (risk-on) or seeking safe-havens (risk-off) – is also a factor, with risk-on positive for AUD.
The Reserve Bank of Australia (RBA) influences the Australian Dollar (AUD) by setting the level of interest rates that Australian banks can lend to each other. This influences the level of interest rates in the economy as a whole. The main goal of the RBA is to maintain a stable inflation rate of 2-3% by adjusting interest rates up or down. Relatively high interest rates compared to other major central banks support the AUD, and the opposite for relatively low. The RBA can also use quantitative easing and tightening to influence credit conditions, with the former AUD-negative and the latter AUD-positive.
China is Australia’s largest trading partner so the health of the Chinese economy is a major influence on the value of the Australian Dollar (AUD). When the Chinese economy is doing well it purchases more raw materials, goods and services from Australia, lifting demand for the AUD, and pushing up its value. The opposite is the case when the Chinese economy is not growing as fast as expected. Positive or negative surprises in Chinese growth data, therefore, often have a direct impact on the Australian Dollar and its pairs.
Iron Ore is Australia’s largest export, accounting for $118 billion a year according to data from 2021, with China as its primary destination. The price of Iron Ore, therefore, can be a driver of the Australian Dollar. Generally, if the price of Iron Ore rises, AUD also goes up, as aggregate demand for the currency increases. The opposite is the case if the price of Iron Ore falls. Higher Iron Ore prices also tend to result in a greater likelihood of a positive Trade Balance for Australia, which is also positive of the AUD.
The Trade Balance, which is the difference between what a country earns from its exports versus what it pays for its imports, is another factor that can influence the value of the Australian Dollar. If Australia produces highly sought after exports, then its currency will gain in value purely from the surplus demand created from foreign buyers seeking to purchase its exports versus what it spends to purchase imports. Therefore, a positive net Trade Balance strengthens the AUD, with the opposite effect if the Trade Balance is negative.
- GBP/USD roiled on Tuesday, finding support from 1.2300.
- UK labor data came in mixed, flubbing forecasts in both directions.
- With low-tier data on the docket for Wednesday, trade headlines will rule the roost.
GBP/USD spun in a circle on Tuesday, falling and then climbing in lockstep with global money flows into and out of the US Dollar. The Pound Sterling saw mixed labor data results from the UK, but the UK’s own labor department takes the numbers with a grain of salt. On the American side, US President Donald Trump brushed off his own campaign trail promises of instituting sweeping day-one tariffs on all of the US’ trading partners, focusing newer, more refined tariff threats on the US’ North American trade partners Canada and Mexico.
Markets have whipsawed as investors race to catch up with the newest headline generator on the block, President Trump. Investors have been betting big that the newly-minted US President wouldn’t impose day-one tariffs as he had long threatened, however a fresh round of updated trade rhetoric is keeping market sentiment tangled in the midrange.
Only low-tier data is on the offering for Wednesday, leaving Cable traders to focus on developing headlines likely to be concentrated during the US trading hours. Pound Sterling traders will be on the lookout for Friday’s S&P Global Purchasing Managers Index (PMI) figures due on both sides of the Atlantic.
GBP/USD price forecast
GBP/USD continues to grind its way into a half-hearted technical recovery, with bidders struggling to lock their grip on the 1.2300 level convincingly. Price action is tilted into the bullish side with technical oscillators pivoting into buy signals, but the pair remains steeply off of recent highs after knocking into a 15-month low last week.
Topside momentum is set to face firm technical barriers at the 50-day Exponential Moving Average (EMA) falling into 1.2500, the same level that the pair’s last major swing low clocked in late November.
GBP/USD daily chart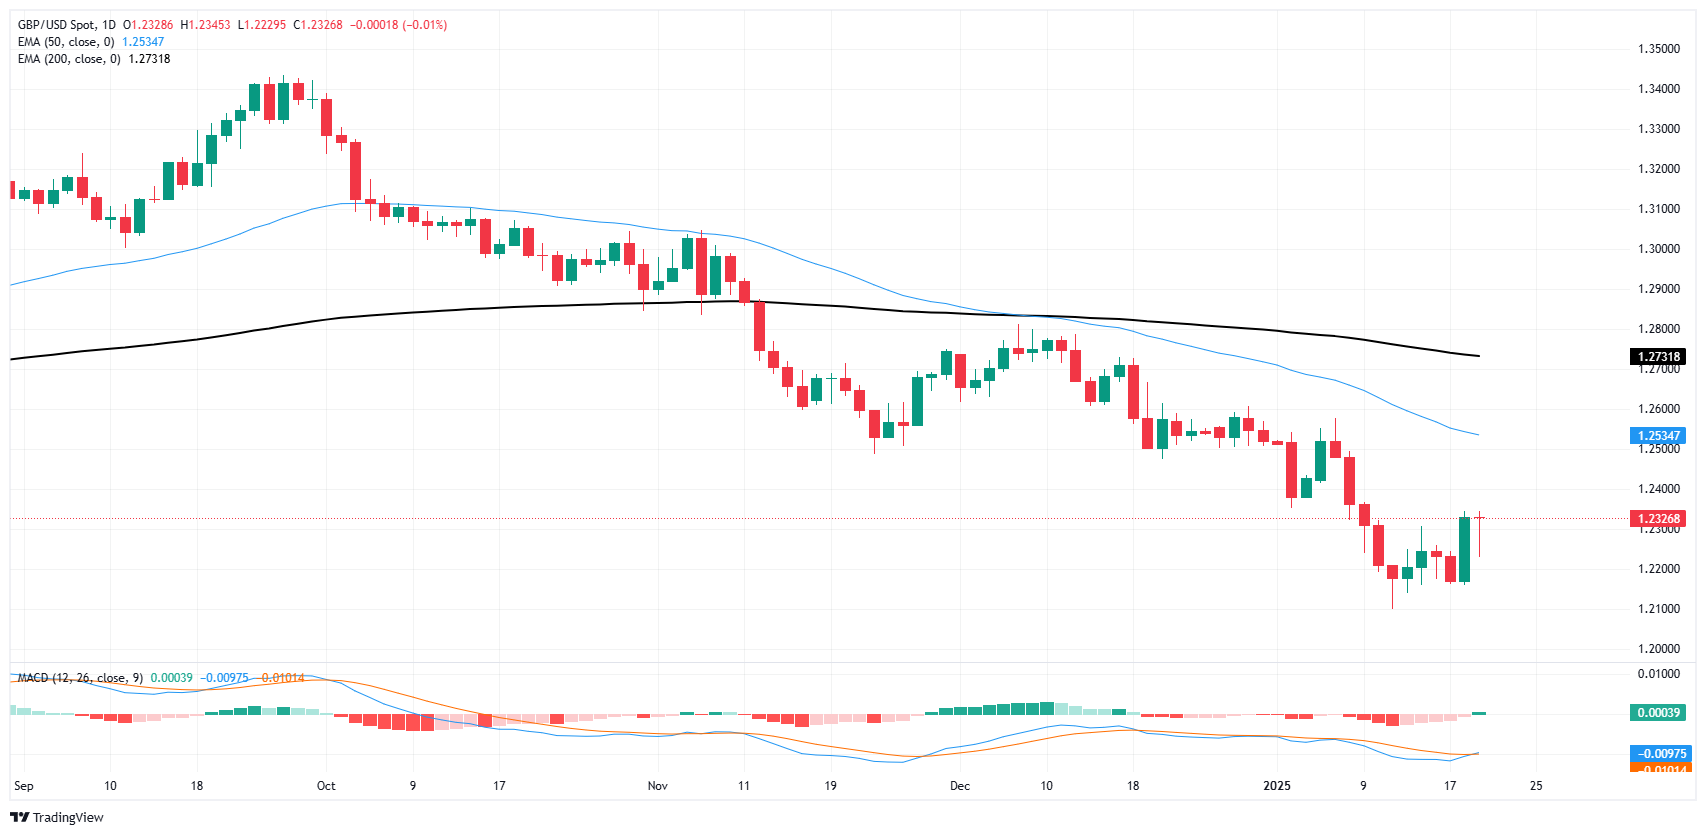
Pound Sterling FAQs
The Pound Sterling (GBP) is the oldest currency in the world (886 AD) and the official currency of the United Kingdom. It is the fourth most traded unit for foreign exchange (FX) in the world, accounting for 12% of all transactions, averaging $630 billion a day, according to 2022 data. Its key trading pairs are GBP/USD, also known as ‘Cable’, which accounts for 11% of FX, GBP/JPY, or the ‘Dragon’ as it is known by traders (3%), and EUR/GBP (2%). The Pound Sterling is issued by the Bank of England (BoE).
The single most important factor influencing the value of the Pound Sterling is monetary policy decided by the Bank of England. The BoE bases its decisions on whether it has achieved its primary goal of “price stability” – a steady inflation rate of around 2%. Its primary tool for achieving this is the adjustment of interest rates. When inflation is too high, the BoE will try to rein it in by raising interest rates, making it more expensive for people and businesses to access credit. This is generally positive for GBP, as higher interest rates make the UK a more attractive place for global investors to park their money. When inflation falls too low it is a sign economic growth is slowing. In this scenario, the BoE will consider lowering interest rates to cheapen credit so businesses will borrow more to invest in growth-generating projects.
Data releases gauge the health of the economy and can impact the value of the Pound Sterling. Indicators such as GDP, Manufacturing and Services PMIs, and employment can all influence the direction of the GBP. A strong economy is good for Sterling. Not only does it attract more foreign investment but it may encourage the BoE to put up interest rates, which will directly strengthen GBP. Otherwise, if economic data is weak, the Pound Sterling is likely to fall.
Another significant data release for the Pound Sterling is the Trade Balance. This indicator measures the difference between what a country earns from its exports and what it spends on imports over a given period. If a country produces highly sought-after exports, its currency will benefit purely from the extra demand created from foreign buyers seeking to purchase these goods. Therefore, a positive net Trade Balance strengthens a currency and vice versa for a negative balance.
- USD/CAD posts modest gains around 1.4340 in Wednesday’s early Asian session.
- Trump threatened 25% tariffs on Mexico and Canada on February 1, weighing on the CAD.
- Canadian headline CPI rose below consensus in December.
The USD/CAD pair trades with mild gains around 1.4340 during the early Asian session on Wednesday. The Canadian Dollar (CAD) weakens amid softer Canada’s December Consumer Price Index (CPI) inflation data and concerns about a trade war between the United States and Canada.
On Monday, US President Donald Trump said that he was thinking of imposing 25% tariffs on imports from Canada and Mexico on February 1 as both countries were allowing many people to cross the border as well as fentanyl. Trump’s remarks exert some selling pressure on the Loonie as Canada is highly dependent on trade with the US, with roughly 75% of its exports heading south.
Canadian Prime Minister Justin Trudeau stated that his government is ready to respond to any scenario if Trump implements tariffs on Canada. Trudeau added that Trump's promised prosperity for the United States would need Canadian resources to fuel it.
Canada’s CPI report has opened the door to the Bank of Canada (BoC) rate cut in January. Data released by Statistics Canada on Tuesday showed that the country’s CPI inflation eased to 1.8% YoY in December from 1.9% in November. This reading was slightly below the 1.9% expected.
“We believe that the Bank of Canada should continue to ease monetary policy by cutting its policy rate by 25 basis points next week. This would give us a little more hope of seeing economic growth above potential assuming Canada is able to avoid a tariff war with our largest trading partner,” said Matthieu Arseneau, economist at the National Bank of Canada.
Canadian Dollar FAQs
The key factors driving the Canadian Dollar (CAD) are the level of interest rates set by the Bank of Canada (BoC), the price of Oil, Canada’s largest export, the health of its economy, inflation and the Trade Balance, which is the difference between the value of Canada’s exports versus its imports. Other factors include market sentiment – whether investors are taking on more risky assets (risk-on) or seeking safe-havens (risk-off) – with risk-on being CAD-positive. As its largest trading partner, the health of the US economy is also a key factor influencing the Canadian Dollar.
The Bank of Canada (BoC) has a significant influence on the Canadian Dollar by setting the level of interest rates that banks can lend to one another. This influences the level of interest rates for everyone. The main goal of the BoC is to maintain inflation at 1-3% by adjusting interest rates up or down. Relatively higher interest rates tend to be positive for the CAD. The Bank of Canada can also use quantitative easing and tightening to influence credit conditions, with the former CAD-negative and the latter CAD-positive.
The price of Oil is a key factor impacting the value of the Canadian Dollar. Petroleum is Canada’s biggest export, so Oil price tends to have an immediate impact on the CAD value. Generally, if Oil price rises CAD also goes up, as aggregate demand for the currency increases. The opposite is the case if the price of Oil falls. Higher Oil prices also tend to result in a greater likelihood of a positive Trade Balance, which is also supportive of the CAD.
While inflation had always traditionally been thought of as a negative factor for a currency since it lowers the value of money, the opposite has actually been the case in modern times with the relaxation of cross-border capital controls. Higher inflation tends to lead central banks to put up interest rates which attracts more capital inflows from global investors seeking a lucrative place to keep their money. This increases demand for the local currency, which in Canada’s case is the Canadian Dollar.
Macroeconomic data releases gauge the health of the economy and can have an impact on the Canadian Dollar. Indicators such as GDP, Manufacturing and Services PMIs, employment, and consumer sentiment surveys can all influence the direction of the CAD. A strong economy is good for the Canadian Dollar. Not only does it attract more foreign investment but it may encourage the Bank of Canada to put up interest rates, leading to a stronger currency. If economic data is weak, however, the CAD is likely to fall.
New Zealand’s Consumer Price Index (CPI) rose 2.2% YoY in the fourth quarter (Q4) of 2024, compared with the 2.2% increase seen in the third quarter, according to the latest data published by Statistics New Zealand on Wednesday. The market consensus was for a growth of 2.1% in the reported period.
The quarterly CPI inflation eased to 0.5% in Q4 from the previous print of 0.6% and in line with the market consensus of 0.5%.
Market reaction
At the time of writing, the NZD/USD pair is trading 0.04% higher on the day to trade at 0.5674.
New Zealand Dollar FAQs
The New Zealand Dollar (NZD), also known as the Kiwi, is a well-known traded currency among investors. Its value is broadly determined by the health of the New Zealand economy and the country’s central bank policy. Still, there are some unique particularities that also can make NZD move. The performance of the Chinese economy tends to move the Kiwi because China is New Zealand’s biggest trading partner. Bad news for the Chinese economy likely means less New Zealand exports to the country, hitting the economy and thus its currency. Another factor moving NZD is dairy prices as the dairy industry is New Zealand’s main export. High dairy prices boost export income, contributing positively to the economy and thus to the NZD.
The Reserve Bank of New Zealand (RBNZ) aims to achieve and maintain an inflation rate between 1% and 3% over the medium term, with a focus to keep it near the 2% mid-point. To this end, the bank sets an appropriate level of interest rates. When inflation is too high, the RBNZ will increase interest rates to cool the economy, but the move will also make bond yields higher, increasing investors’ appeal to invest in the country and thus boosting NZD. On the contrary, lower interest rates tend to weaken NZD. The so-called rate differential, or how rates in New Zealand are or are expected to be compared to the ones set by the US Federal Reserve, can also play a key role in moving the NZD/USD pair.
Macroeconomic data releases in New Zealand are key to assess the state of the economy and can impact the New Zealand Dollar’s (NZD) valuation. A strong economy, based on high economic growth, low unemployment and high confidence is good for NZD. High economic growth attracts foreign investment and may encourage the Reserve Bank of New Zealand to increase interest rates, if this economic strength comes together with elevated inflation. Conversely, if economic data is weak, NZD is likely to depreciate.
The New Zealand Dollar (NZD) tends to strengthen during risk-on periods, or when investors perceive that broader market risks are low and are optimistic about growth. This tends to lead to a more favorable outlook for commodities and so-called ‘commodity currencies’ such as the Kiwi. Conversely, NZD tends to weaken at times of market turbulence or economic uncertainty as investors tend to sell higher-risk assets and flee to the more-stable safe havens.
- NZD/USD dips on Tuesday, hovering near 0.5670 amid a sideways pattern.
- RSI stands at 54, hinting at positive momentum yet showing signs of a pullback.
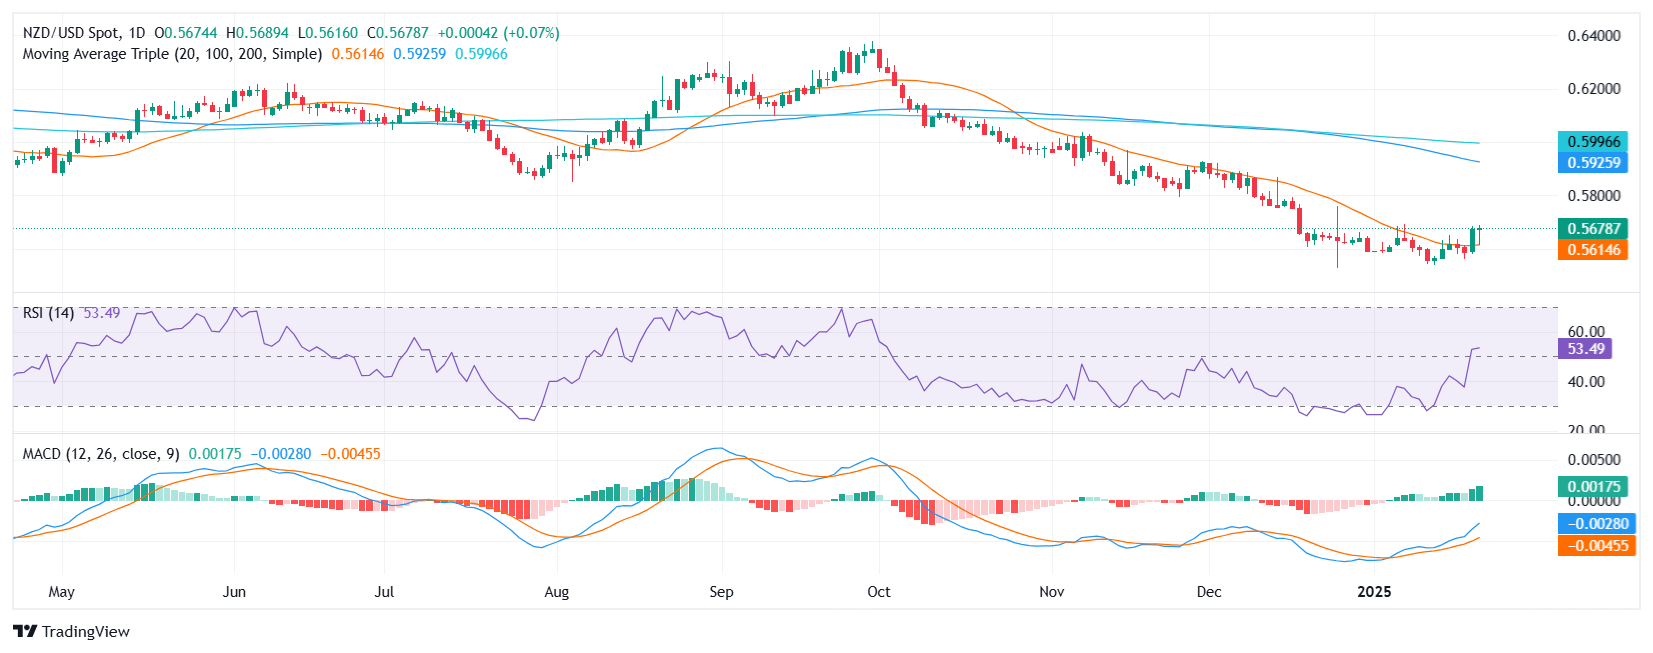
NZD/USD edged lower to 0.5670 on Tuesday, extending its recent stretch of range-bound action between 0.5690 and 0.5565. The pair’s inability to sustain a decisive move outside this corridor highlights traders’ indecision, with buyers and sellers each awaiting a clearer catalyst. Despite slipping slightly, NZD/USD remains close to the upper band of its established consolidation zone.
Technical readings offer a mixed outlook. Although the Relative Strength Index (RSI) stands at 54 in positive territory, it has shown signs of moderating from previous levels, suggesting that upward momentum may be losing steam. In contrast, the Moving Average Convergence Divergence (MACD) histogram is displaying rising green bars—often taken as an indication that buyers have not completely bowed out. As a result, the pair appears to be at a crossroads, needing a stronger push from either side.
Looking ahead, an upside break above 0.5690 would signal a potential bullish extension, possibly targeting 0.5720 or higher if momentum holds. On the downside, failure to maintain current levels could see bears aiming for 0.5565, which has served as a reliable floor throughout the recent consolidation.
NZD/USD daily chart
- USD/CHF fluctuates sharply, soaring then retracting to open levels after Trump proposes tariffs.
- Mixed technical outlook; pair rebounds from key support but can't sustain above 20-day SMA.
- Future hinges on breaking 20-day SMA to revisit January highs, with risks below 0.9040.
The USD/CHF whipsawed during Tuesday's session after US President Donald Trump hinted that he could impose tariffs on Mexico and Canada as he was signing a tranche of executive orders on day 1. Therefore, the pair rose sharply towards its daily peak of 0.9114, before reversing course near its opening price at 0.9062, and is virtually unchanged.
USD/CHF Price Forecast: Technical outlook
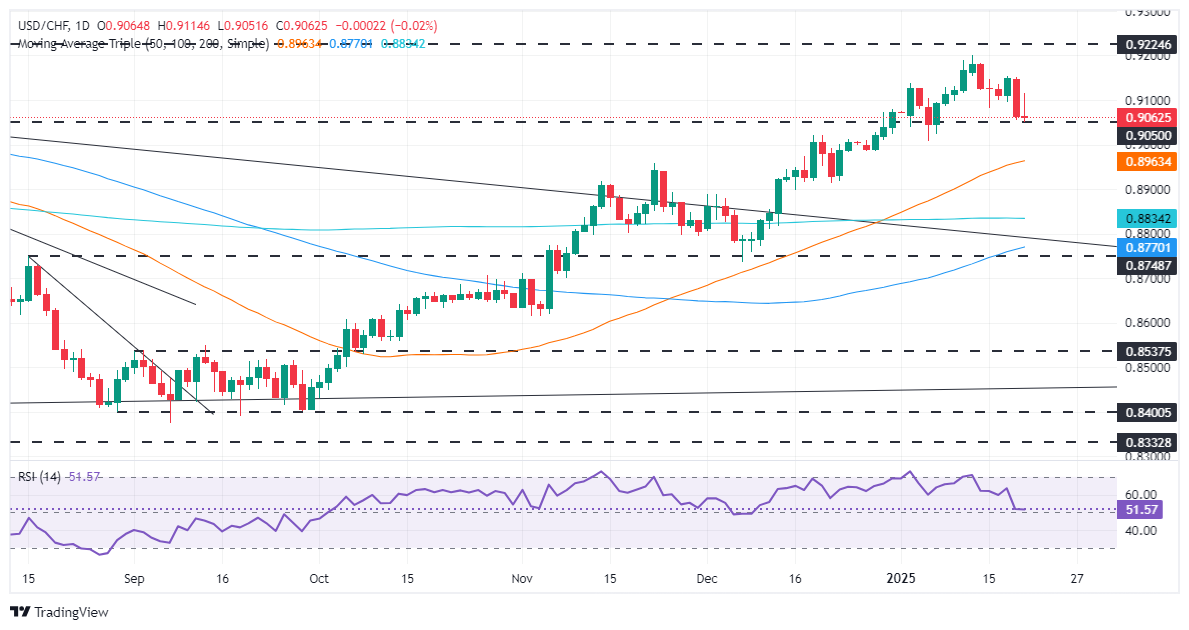
The USD/CHF dipped towards a three-month-old support trendline near 0.9049 before buyers moved in, pushing the exchange rate past the 20-day Simple Moving Average (SMA) of 0.9085 and the 0.9100 figure. Nevertheless, the pair retreated below the former, near its opening price.
If USD/CHF resumes its uptrend and clears the 20-day SMA, the bulls will remain hopeful of pushing the exchange rate toward the January 13 high at 0.9200. A decisive break would signal that bullish momentum is growing, opening the door to testing last year’s peak of 0.9224.
Conversely, if USD/CHF dips below 0.9040, sellers could test the 100-day SMA at 0.9000. A decisive break will expose the 50-day SMA at 0.8960.
USD/CHF Price Chart – Daily
Swiss Franc FAQs
The Swiss Franc (CHF) is Switzerland’s official currency. It is among the top ten most traded currencies globally, reaching volumes that well exceed the size of the Swiss economy. Its value is determined by the broad market sentiment, the country’s economic health or action taken by the Swiss National Bank (SNB), among other factors. Between 2011 and 2015, the Swiss Franc was pegged to the Euro (EUR). The peg was abruptly removed, resulting in a more than 20% increase in the Franc’s value, causing a turmoil in markets. Even though the peg isn’t in force anymore, CHF fortunes tend to be highly correlated with the Euro ones due to the high dependency of the Swiss economy on the neighboring Eurozone.
The Swiss Franc (CHF) is considered a safe-haven asset, or a currency that investors tend to buy in times of market stress. This is due to the perceived status of Switzerland in the world: a stable economy, a strong export sector, big central bank reserves or a longstanding political stance towards neutrality in global conflicts make the country’s currency a good choice for investors fleeing from risks. Turbulent times are likely to strengthen CHF value against other currencies that are seen as more risky to invest in.
The Swiss National Bank (SNB) meets four times a year – once every quarter, less than other major central banks – to decide on monetary policy. The bank aims for an annual inflation rate of less than 2%. When inflation is above target or forecasted to be above target in the foreseeable future, the bank will attempt to tame price growth by raising its policy rate. Higher interest rates are generally positive for the Swiss Franc (CHF) as they lead to higher yields, making the country a more attractive place for investors. On the contrary, lower interest rates tend to weaken CHF.
Macroeconomic data releases in Switzerland are key to assessing the state of the economy and can impact the Swiss Franc’s (CHF) valuation. The Swiss economy is broadly stable, but any sudden change in economic growth, inflation, current account or the central bank’s currency reserves have the potential to trigger moves in CHF. Generally, high economic growth, low unemployment and high confidence are good for CHF. Conversely, if economic data points to weakening momentum, CHF is likely to depreciate.
As a small and open economy, Switzerland is heavily dependent on the health of the neighboring Eurozone economies. The broader European Union is Switzerland’s main economic partner and a key political ally, so macroeconomic and monetary policy stability in the Eurozone is essential for Switzerland and, thus, for the Swiss Franc (CHF). With such dependency, some models suggest that the correlation between the fortunes of the Euro (EUR) and the CHF is more than 90%, or close to perfect.
- Pair inches up after dipping to the 0.6220 zone on Tuesday.
- Trump’s hinted tariffs on China weigh on risk assets, tempering AUD gains.
- RBA is likely to cut rates in February, keeping the Aussie on the defensive.
The Australian Dollar (AUD) mildly rose to 0.6270 on Tuesday, recovering after briefly falling near 0.6220 when United States (US) President Donald Trump reiterated plans to impose tariffs on China. Although the Reserve Bank of Australia (RBA) is widely expected to initiate a rate cut in February, the currency found modest footing in a calmer market atmosphere. Investors, however, remain cautious as the US Dollar (USD) climbs on revived tariff concerns.
Daily digest market movers: Aussie recovers mainly as markets await US tariffs directions
- In the wake of President Trump’s inauguration, the administration directed agencies to probe ongoing trade imbalances and currency manipulation, especially targeting China, Canada and Mexico.
- Despite uncertainties over Trump’s early trade agenda, a softer US Dollar provided a lift to stock markets in Europe and the US, as well as risk-driven currencies such as the Aussie.
- The CME FedWatch tool suggests a 55.6% chance the Federal Reserve (Fed) will hold rates steady at its May gathering, with rising chatter about a potential rate decrease by June.
- US 10-year yields hover around 4.60%, while US bond markets are calm following Martin Luther King Jr. Day. Traders brace for possible updates on tariffs policies in the days ahead.
- On the local front, markets are gearing up for a cut by the Reserve Bank of Australia as early as next month which might prevent any upside.
AUD/USD technical outlook: Indicators hint at choppy momentum amid bullish undercurrents
The AUD/USD pair’s price action remains volatile, briefly sliding toward 0.6220 before rebounding to 0.6275. The Relative Strength Index (RSI) currently sits around 52—still in positive territory but sharp, indicating a potential waning of bullish momentum. Meanwhile, the Moving Average Convergence Divergence (MACD) histogram exhibits rising green bars, supporting a constructive near-term view.
Although the Aussie’s short-lived dip underscores lingering downside risks, a sustained break above recent highs near 0.6300 could reinforce the pair’s recovery if trade policy anxieties recede.
Australian Dollar FAQs
One of the most significant factors for the Australian Dollar (AUD) is the level of interest rates set by the Reserve Bank of Australia (RBA). Because Australia is a resource-rich country another key driver is the price of its biggest export, Iron Ore. The health of the Chinese economy, its largest trading partner, is a factor, as well as inflation in Australia, its growth rate and Trade Balance. Market sentiment – whether investors are taking on more risky assets (risk-on) or seeking safe-havens (risk-off) – is also a factor, with risk-on positive for AUD.
The Reserve Bank of Australia (RBA) influences the Australian Dollar (AUD) by setting the level of interest rates that Australian banks can lend to each other. This influences the level of interest rates in the economy as a whole. The main goal of the RBA is to maintain a stable inflation rate of 2-3% by adjusting interest rates up or down. Relatively high interest rates compared to other major central banks support the AUD, and the opposite for relatively low. The RBA can also use quantitative easing and tightening to influence credit conditions, with the former AUD-negative and the latter AUD-positive.
China is Australia’s largest trading partner so the health of the Chinese economy is a major influence on the value of the Australian Dollar (AUD). When the Chinese economy is doing well it purchases more raw materials, goods and services from Australia, lifting demand for the AUD, and pushing up its value. The opposite is the case when the Chinese economy is not growing as fast as expected. Positive or negative surprises in Chinese growth data, therefore, often have a direct impact on the Australian Dollar and its pairs.
Iron Ore is Australia’s largest export, accounting for $118 billion a year according to data from 2021, with China as its primary destination. The price of Iron Ore, therefore, can be a driver of the Australian Dollar. Generally, if the price of Iron Ore rises, AUD also goes up, as aggregate demand for the currency increases. The opposite is the case if the price of Iron Ore falls. Higher Iron Ore prices also tend to result in a greater likelihood of a positive Trade Balance for Australia, which is also positive of the AUD.
The Trade Balance, which is the difference between what a country earns from its exports versus what it pays for its imports, is another factor that can influence the value of the Australian Dollar. If Australia produces highly sought after exports, then its currency will gain in value purely from the surplus demand created from foreign buyers seeking to purchase its exports versus what it spends to purchase imports. Therefore, a positive net Trade Balance strengthens the AUD, with the opposite effect if the Trade Balance is negative.
- Gold spikes as investors seek safety after Trump's day-one tariff threats.
- US Dollar Index drops, Treasury yields fall, both tailwinds for Bullion prices.
- Escalating Middle East tensions increases global uncertainty, boosting Gold's safe-haven status.
Gold rallied more than 1% and hit a two-month high of $2,745 on Tuesday as investors seeking safety bought the non-yielding metal following US President Donald Trump's remarks on tariffs. The Greenback, which initially advanced, has turned negative as depicted by the US Dollar Index (DXY), a tailwind for Bullion prices. The XAU/USD trades at $2,742 at the time of writing.
Trump’s first day in office improved risk appetite, only to suddenly turn risk-averse after he hinted at imposing tariffs on Canada and Mexico as he signed a tranche of executive orders. The Canadian Dollar (CAD) and the Mexican Peso (MXN) tumbled, consequently sending the Greenback to a daily high of 108.79, according to the DXY.
Despite this, the precious metal continued to trend higher, clearing key resistance at $2,730. In addition, US Treasury bond yields are dropping in the belly and long end of the curve, bolstering Gold prices. The US 10-year T-note yield tumbled five-and-a-half basis points (bps) to 4.572%.
In the Middle East, the ceasefire agreement between Israel and Hamas was set aside as Israeli forces began an operation in the West Bank city of Jenin. In response, Hamas called for escalating the fighting against Israel.
This week, the US economic docket will feature Initial Jobless Claims data, S&P Global Flash PMIs, and housing data.
Daily digest market movers: Gold price soars as US yields retreat
- Gold price rises as real yields tumbled three basis points. Measured by the 10-year Treasury Inflation-Protected Securities (TIPS) yield sits at 2.17%.
- President Trump confirmed that universal tariffs on all imports to the US are under consideration as well and will come at a later stage, Reuters reports.
- Market participants are pricing in near-even odds that the Fed will cut rates twice by the end of 2025, with the first reduction occurring in June.
XAU/USD technical outlook: Gold price breaks higher toward $2,750
The uptrend in Gold prices resumed after bulls had failed to clear the December 12 daily peak of $2,725. This opened the door for challenging the psychological $2,750 figure, and the record high at $2,790 ahead of $2,800.
Conversely, if sellers drive XAU/USD below $2,700, the first support would be the January 13 swing low of $2,656, followed by the confluence of the 50 and 100-day Simple Moving Averages (SMAs) at $2,642 to $2,644.

Gold FAQs
Gold has played a key role in human’s history as it has been widely used as a store of value and medium of exchange. Currently, apart from its shine and usage for jewelry, the precious metal is widely seen as a safe-haven asset, meaning that it is considered a good investment during turbulent times. Gold is also widely seen as a hedge against inflation and against depreciating currencies as it doesn’t rely on any specific issuer or government.
Central banks are the biggest Gold holders. In their aim to support their currencies in turbulent times, central banks tend to diversify their reserves and buy Gold to improve the perceived strength of the economy and the currency. High Gold reserves can be a source of trust for a country’s solvency. Central banks added 1,136 tonnes of Gold worth around $70 billion to their reserves in 2022, according to data from the World Gold Council. This is the highest yearly purchase since records began. Central banks from emerging economies such as China, India and Turkey are quickly increasing their Gold reserves.
Gold has an inverse correlation with the US Dollar and US Treasuries, which are both major reserve and safe-haven assets. When the Dollar depreciates, Gold tends to rise, enabling investors and central banks to diversify their assets in turbulent times. Gold is also inversely correlated with risk assets. A rally in the stock market tends to weaken Gold price, while sell-offs in riskier markets tend to favor the precious metal.
The price can move due to a wide range of factors. Geopolitical instability or fears of a deep recession can quickly make Gold price escalate due to its safe-haven status. As a yield-less asset, Gold tends to rise with lower interest rates, while higher cost of money usually weighs down on the yellow metal. Still, most moves depend on how the US Dollar (USD) behaves as the asset is priced in dollars (XAU/USD). A strong Dollar tends to keep the price of Gold controlled, whereas a weaker Dollar is likely to push Gold prices up.
- The Canadian Dollar roiled on Tuesday, hitting multi-year lows before recovering.
- The Bank of Canada is expected to continue trimming interest rates this month.
- Canadian CPI inflation figures ticked down, but core measures accelerated.
The Canadian Dollar (CAD) went end-over-end on Tuesday, whipsawing as Loonie traders grapple with a mixed bag of political headlines and inflation data that strongly implies more rate cuts are on the table. Tariff talk is slowly absorbing most of the market’s available attention span, but a still-widening rate differential poses significant risks for the CAD.
US President Donald Trump held off on deploying his long-threatened package of day one tariffs on nearly all of the US’ largest trading partners, including Canada. Most market participants assumed (apparently rightly) that the talk of immediate tariffs via executive order were largely bluster for the campaign trail, but Donald Trump is still chasing the high of threatening global nations with self-imposed import taxes that would derail the financial well-being of his own citizens.
Daily digest market movers: Canadian Dollar goes parabolic on tariff Tuesday
- Canadian Consumer Price Index (CPI) inflation ticked down in December, falling to 1.8% YoY versus the expected hold at 1.9%. On a monthly basis, Canadian headline CPI contracted -0.4% MoM, in-line with expectations.
- Cooling headline inflation figures will be more than enough to push the Bank of Canada (BoC) into a fresh batch of rate cuts; interest rate futures traders are now pricing in 83% odds of a 25 bps rate trim from the BoC next week, up slightly from the previous 78%.
- Core inflation metrics, the BoC’s own CPI core measure, accelerated to 1.8% YoY versus the last print of 1.6%, but again the monthly figure contracted by -0.3% MoM.
- Donald Trump made a point of leaving the door open to a sweeping 25% tariff on all Canadian exports to the US, possibly in February.
- Mid-tier Canadian Retail Sales figures are due on Thursday, but no drastic swings or changes are expected on that front.
Canadian Dollar price forecast
Tuesday’s wide swing sent the Canadian Dollar spiralling into a fresh five-year low, pushing USD/CAD into the 1.4500 handle for the first time since March of 2020. Markets quickly recovered their footing to keep the pair under pressure and staring at a technical floor near 1.4300, but the damage was done and the Loonie is set to continue fighting a losing battle.
USD/CAD daily chart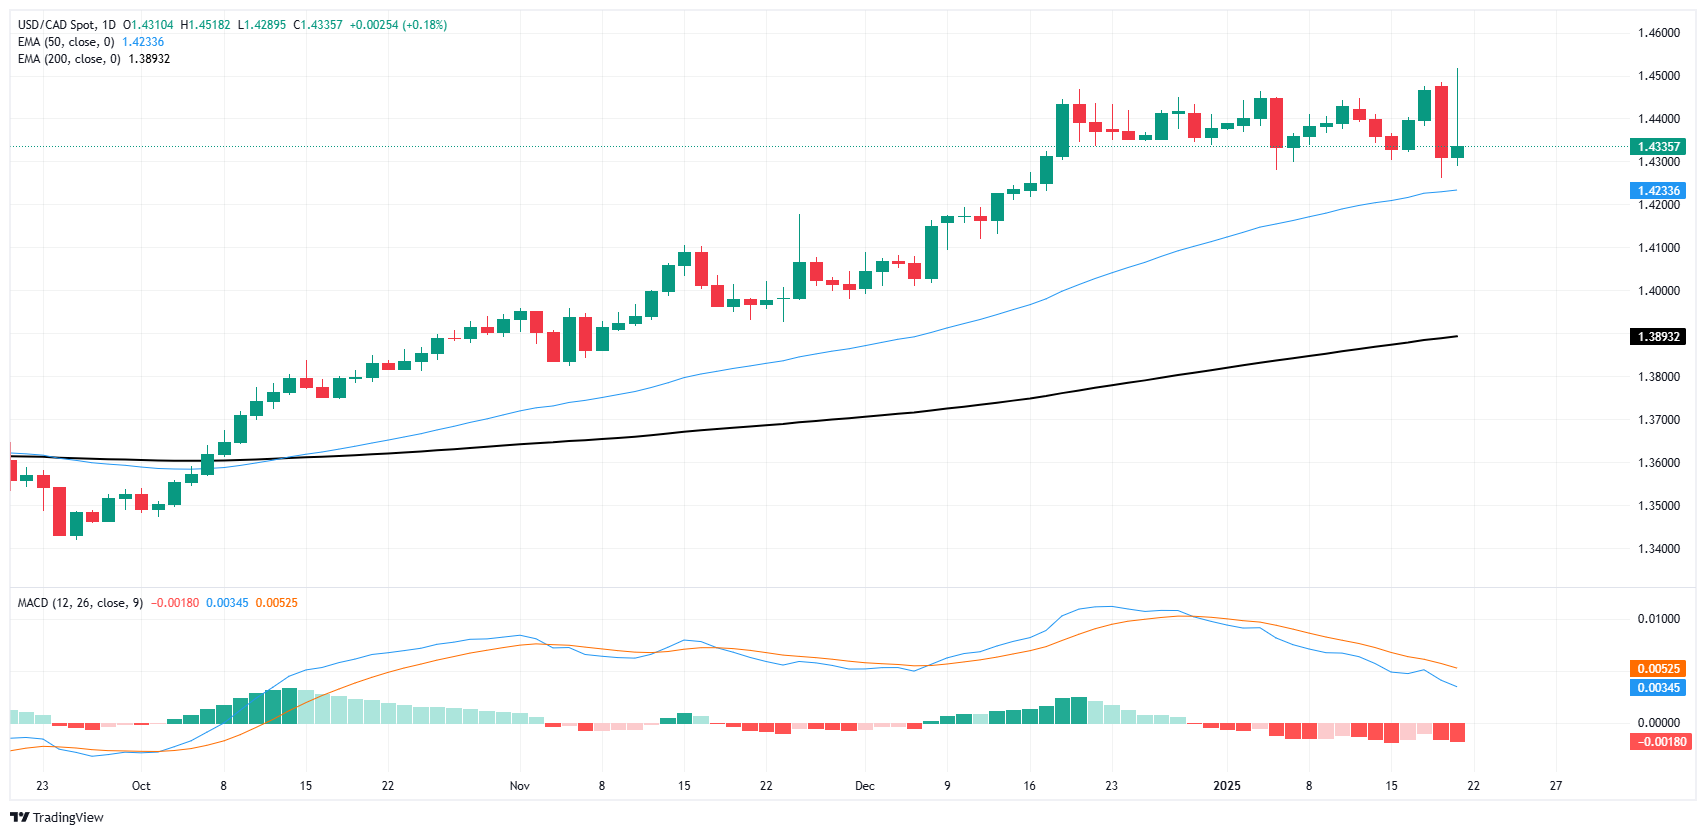
Canadian Dollar FAQs
The key factors driving the Canadian Dollar (CAD) are the level of interest rates set by the Bank of Canada (BoC), the price of Oil, Canada’s largest export, the health of its economy, inflation and the Trade Balance, which is the difference between the value of Canada’s exports versus its imports. Other factors include market sentiment – whether investors are taking on more risky assets (risk-on) or seeking safe-havens (risk-off) – with risk-on being CAD-positive. As its largest trading partner, the health of the US economy is also a key factor influencing the Canadian Dollar.
The Bank of Canada (BoC) has a significant influence on the Canadian Dollar by setting the level of interest rates that banks can lend to one another. This influences the level of interest rates for everyone. The main goal of the BoC is to maintain inflation at 1-3% by adjusting interest rates up or down. Relatively higher interest rates tend to be positive for the CAD. The Bank of Canada can also use quantitative easing and tightening to influence credit conditions, with the former CAD-negative and the latter CAD-positive.
The price of Oil is a key factor impacting the value of the Canadian Dollar. Petroleum is Canada’s biggest export, so Oil price tends to have an immediate impact on the CAD value. Generally, if Oil price rises CAD also goes up, as aggregate demand for the currency increases. The opposite is the case if the price of Oil falls. Higher Oil prices also tend to result in a greater likelihood of a positive Trade Balance, which is also supportive of the CAD.
While inflation had always traditionally been thought of as a negative factor for a currency since it lowers the value of money, the opposite has actually been the case in modern times with the relaxation of cross-border capital controls. Higher inflation tends to lead central banks to put up interest rates which attracts more capital inflows from global investors seeking a lucrative place to keep their money. This increases demand for the local currency, which in Canada’s case is the Canadian Dollar.
Macroeconomic data releases gauge the health of the economy and can have an impact on the Canadian Dollar. Indicators such as GDP, Manufacturing and Services PMIs, employment, and consumer sentiment surveys can all influence the direction of the CAD. A strong economy is good for the Canadian Dollar. Not only does it attract more foreign investment but it may encourage the Bank of Canada to put up interest rates, leading to a stronger currency. If economic data is weak, however, the CAD is likely to fall.
The US Dollar remained on the defensive, adding to Monday’s pullback as further market chatter around US tariffs failed to underpin the initial bullish bias in the currency.
Here is what you need to know on Wednesday, January 22:
The US Dollar Index (DXY) retreated marginally and closed around the 107.60 zone following mixed US yields and rising uncertainty around Trump’s trade policies. The usual weekly Mortgage Applications by MBA are due along with the CB Leading Index, and the API report on US crude oil supplies.
EUR/USD extended its advance following extra USD selling, revisiting the area beyond the 1.0400 barrier on quite a convincing mood. The ECB’s C. Lagarde will speak on Wednesday.
GBP/USD remained well bid above 1.2300 the figure on the back of the persistent downward bias in the Greenback. The UK’s Public Sector Net Borrowing figures will be on the docket.
USD/JPY traded in a volatile fashion around the 155.50 zone as investors remained cautious in light of the upcoming BoJ meeting. Japan’s Balance of Trade is next on tap on January 23 followed by weekly Foreign Bond Investment.
Contrasting with its risky peers, AUD/USD charted humble losses on Tuesday, partially reversing an auspicious start to the week. The Westpac Leading Index is next on tap on the Australian calendar.
WTI prices declined further and approached the $75.00 mark per barrel on the back of the stronger Dollar and investors’ assessment of Trump’s tariffs.
Gold prices rose to two-month peaks past the $2,740 mark per ounce troy in response to rising uncertainty surrounding potential announcements by President Trump. Silver prices added to the positive start to the week and traded closer to the $31.00 mark per ounce.
- Traders respond to fresh tariffs comments from President Trump, overshadowing improved investor sentiment in equities.
- The Federal Reserve’s data-dependent stance remains intact, with market consensus leaning toward a possible June rate cut.
- Bond yields hover around 4.60%, a sharp reduction from last week's highs, reflecting changing risk appetite.
- US economic outperformance persists, yet abrupt policy shifts could dent the Dollar’s near-term recovery efforts.
The US Dollar Index (DXY) trades just above 108.00 and flips into losses if more selling pressure arises. Tuesday’s trading was quiet as markets are responding to late-Monday comments from United States (US) President Donald Trump about tariffs on its North American neighbours.
Daily digest market movers: USD sees red despite Trump proposing tariffs on Canada and Mexico
- Equities push modestly higher on Tuesday, with European stocks largely unchanged and US futures up around 0.50%.
- US yields sit near 4.60%, well below last week’s levels; however, President Trump’s sudden trade policy announcements have sparked reversals in currency pairs and risk assets.
- Tariff chatter points to a 25% levy on imports from Canada and Mexico by early February, which immediately pressured the Canadian Dollar (CAD) and Mexican Peso (MXN).
- Strong Dollar narrative endures and many analysts view these trade moves as noise, believing the ongoing rally’s core drivers including the US economic dominance and steady Fed policy as major drivers to the upside for the Buck.
- The Federal Reserve (Fed) media blackout precedes Chair Powell’s press conference on January 29; the market prices July as the earliest date for a single rate cut, contingent on forthcoming data.
- CME FedWatch Tool suggests a near 55% probability of unchanged rates in May, implying a June rate cut if inflation moderates.
DXY technical outlook: Sellers repel attempt to reclaim 20-day SMA
The US Dollar Index broke beneath its 20-day Simple Moving Average near 108.50 and buyers’ efforts to retake that threshold proved unsuccessful. With DXY still hovering around 108.00, a fresh rejection at the 20-day SMA suggests building downside risk. If sellers maintain control, the Greenback could face a deeper pullback despite broader fundamentals pointing to US economic resilience. However, any signs of supportive trade or a shift in Fed expectations might rapidly ignite renewed Dollar demand.
US Dollar FAQs
The US Dollar (USD) is the official currency of the United States of America, and the ‘de facto’ currency of a significant number of other countries where it is found in circulation alongside local notes. It is the most heavily traded currency in the world, accounting for over 88% of all global foreign exchange turnover, or an average of $6.6 trillion in transactions per day, according to data from 2022. Following the second world war, the USD took over from the British Pound as the world’s reserve currency. For most of its history, the US Dollar was backed by Gold, until the Bretton Woods Agreement in 1971 when the Gold Standard went away.
The most important single factor impacting on the value of the US Dollar is monetary policy, which is shaped by the Federal Reserve (Fed). The Fed has two mandates: to achieve price stability (control inflation) and foster full employment. Its primary tool to achieve these two goals is by adjusting interest rates. When prices are rising too quickly and inflation is above the Fed’s 2% target, the Fed will raise rates, which helps the USD value. When inflation falls below 2% or the Unemployment Rate is too high, the Fed may lower interest rates, which weighs on the Greenback.
In extreme situations, the Federal Reserve can also print more Dollars and enact quantitative easing (QE). QE is the process by which the Fed substantially increases the flow of credit in a stuck financial system. It is a non-standard policy measure used when credit has dried up because banks will not lend to each other (out of the fear of counterparty default). It is a last resort when simply lowering interest rates is unlikely to achieve the necessary result. It was the Fed’s weapon of choice to combat the credit crunch that occurred during the Great Financial Crisis in 2008. It involves the Fed printing more Dollars and using them to buy US government bonds predominantly from financial institutions. QE usually leads to a weaker US Dollar.
Quantitative tightening (QT) is the reverse process whereby the Federal Reserve stops buying bonds from financial institutions and does not reinvest the principal from the bonds it holds maturing in new purchases. It is usually positive for the US Dollar.
- The Dow Jones climbed 450 points on Tuesday as investors brush off tariff fears.
- President Donald Trump pivoted on his threats of day-one tariffs.
- Tariff threats from the White House are still leaking through, now for February.
The Dow Jones Industrial Average (DJIA) absorbed newly-minted President Donald Trump’s last-minute pivot away from enacting sweeping tariffs on his first day in office with jubilation. The major equity index climbed over 400 points and is now testing the 44,000 handle for the first time since mid-December.
Equity markets caught a firm bid after incoming President Donald Trump failed to enact a package of tariffs that would have levied significant fees across the board on most imported goods on his first day in office. Donald Trump is still pushing his threats of enacting stiff import taxes on some of his closest allies, including Canada and Mexico, but investors are willing to call his bluff now that tariffs have fallen into the usual cycle of eternally coming “in a couple of weeks”, a common box that many of Donald Trump’s bespoke campaign promises tend to fall into.
Economic data remains limited throughout the rest of the week, at least until Friday’s S&P Global Purchasing Managers Index (PMI) print, leaving investors to grapple with political headlines as traders readjust to life under the ‘Trump two-step’. After a four-year hiatus, traders will have to get comfortable with Presidential musings delivered via social media apps and inconsistent policy claims that clash with previous statements, often sent only hours apart.
Dow Jones news
All but five of the Dow Jones’ listed securities are gaining ground on Tuesday, with gains being led by 3M (MMM) leading the charge higher after a firm beat of Q4 earnings forecasts. 3M’s fourth-quarter performance outpaced analyst expectations enough to earn a 5% upswing to $148 per share, although the company’s annualized performance came in slightly softer than expected.
Dow Jones price forecast
The Dow Jones gained further ground on Tuesday as investors bid the index back into the high end, keeping their eyes locked on record peaks set in late November just above 45,000. Despite a recent slow grind into the low end, price action has pivoted firmly bullish in the near-term, with all but one of the last six straight trading sessions closing higher.
More patient technical traders will be waiting for a fresh stop and a pullback to confirm a higher low before reloading on fresh bids. Despite a firm bounce, the Dow’s strong plunge from record highs dragged the index worryingly close to the 200-day Exponential Moving Average (EMA) near 41,300.
Dow Jones daily chart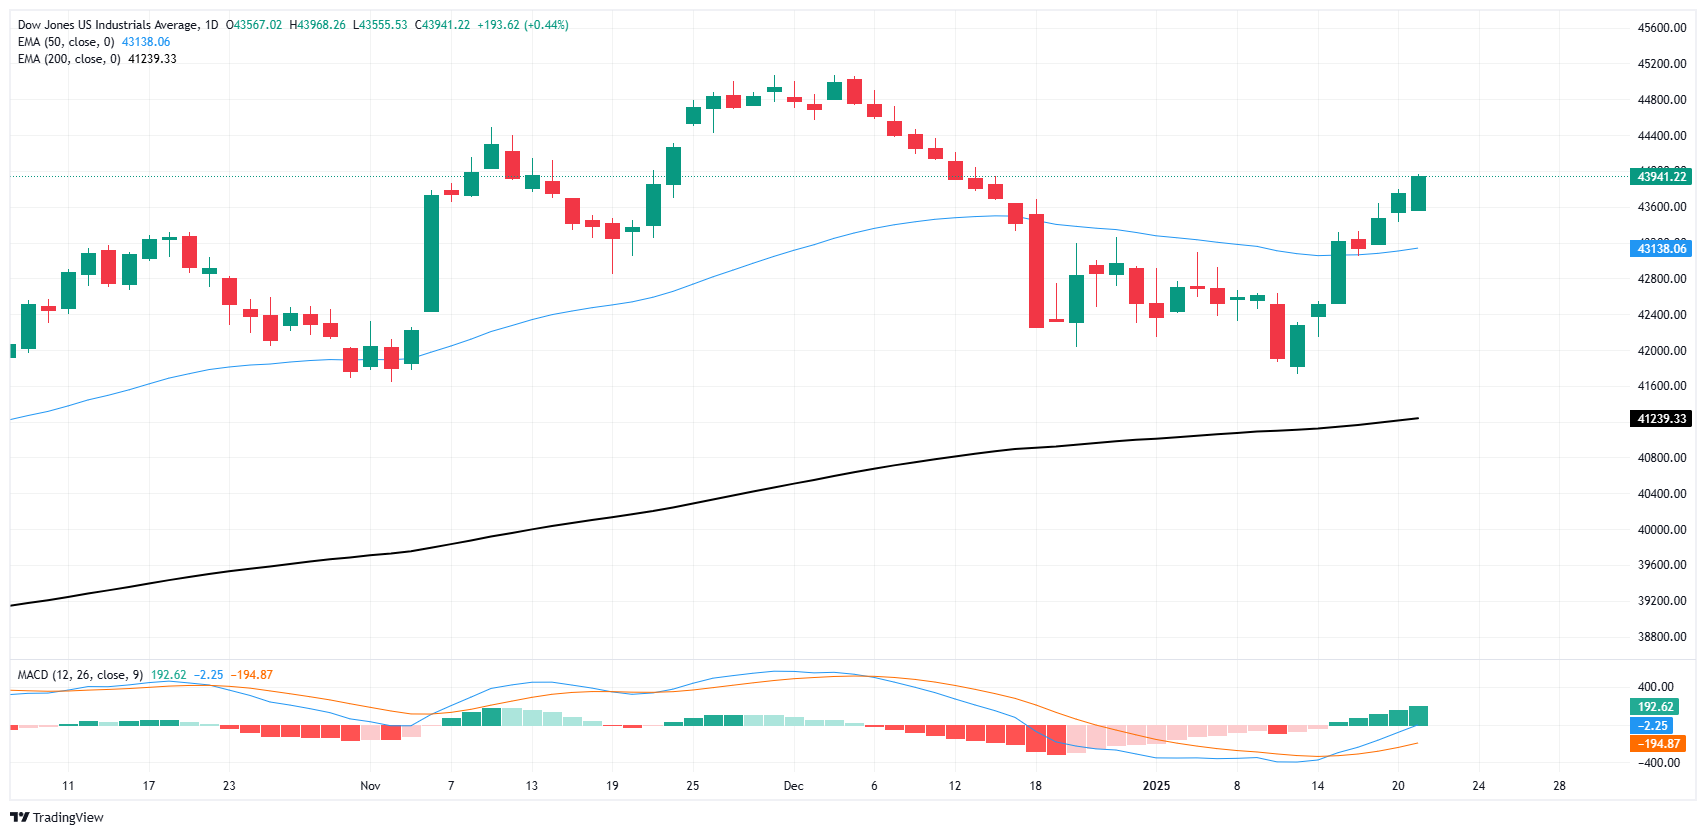
Dow Jones FAQs
The Dow Jones Industrial Average, one of the oldest stock market indices in the world, is compiled of the 30 most traded stocks in the US. The index is price-weighted rather than weighted by capitalization. It is calculated by summing the prices of the constituent stocks and dividing them by a factor, currently 0.152. The index was founded by Charles Dow, who also founded the Wall Street Journal. In later years it has been criticized for not being broadly representative enough because it only tracks 30 conglomerates, unlike broader indices such as the S&P 500.
Many different factors drive the Dow Jones Industrial Average (DJIA). The aggregate performance of the component companies revealed in quarterly company earnings reports is the main one. US and global macroeconomic data also contributes as it impacts on investor sentiment. The level of interest rates, set by the Federal Reserve (Fed), also influences the DJIA as it affects the cost of credit, on which many corporations are heavily reliant. Therefore, inflation can be a major driver as well as other metrics which impact the Fed decisions.
Dow Theory is a method for identifying the primary trend of the stock market developed by Charles Dow. A key step is to compare the direction of the Dow Jones Industrial Average (DJIA) and the Dow Jones Transportation Average (DJTA) and only follow trends where both are moving in the same direction. Volume is a confirmatory criteria. The theory uses elements of peak and trough analysis. Dow’s theory posits three trend phases: accumulation, when smart money starts buying or selling; public participation, when the wider public joins in; and distribution, when the smart money exits.
There are a number of ways to trade the DJIA. One is to use ETFs which allow investors to trade the DJIA as a single security, rather than having to buy shares in all 30 constituent companies. A leading example is the SPDR Dow Jones Industrial Average ETF (DIA). DJIA futures contracts enable traders to speculate on the future value of the index and Options provide the right, but not the obligation, to buy or sell the index at a predetermined price in the future. Mutual funds enable investors to buy a share of a diversified portfolio of DJIA stocks thus providing exposure to the overall index.
- Mexican Peso trims gains post-Trump inauguration amid tariff threats against Mexico and Canada.
- President Sheinbaum commits to defend Mexico's sovereignty, seeks dialogue with heightened US tensions.
- Mexico's Retail Sales show resilience in November; key inflation and economic activity data expected this week.
The Mexican Peso erased some of Monday’s gains on US President Donald Trump’s inauguration day after the latter threatened to impose 25% tariffs on Mexico and Canada as soon as February 1. Therefore, the USD/MXN jumped to a daily high of 20.79, before stabilizing at current exchange rates, trading at 20.59, up 0.60%.
Tariff rhetoric is back following last night Trump’s remarks, sending the currencies of the country’s neighbors plunging versus the US Dollar. However, as Tuesday’s session evolves, the emerging market currency has recovered as fears dissipated.
Tensions between the US and Mexico heightened as Mexican President Claudia Sheinbaum emphasized that she will defend the country’s sovereignty and independence but stressed that she will pursue dialogue with Trump.
Mexico’s Retail Sales in November shrank less than foreseen in monthly figures. In the 12 months through November, sales disappointed investors as the economy continued to show deterioration in consumer spending.
Ahead in the docket, Mexico will feature January’s Mid-Month Inflation figures, and the Economic Activity Indicator for November. Across the north of the border, Initial Jobless Claims for the week ending January 18 and Flash PMIs would update the status of the economy.
Daily digest market movers: Mexican Peso depreciates after two days of gains
- The Mexican Peso main driver of Tuesday’s session was Trump’s tariff rhetoric.
- Mexico’s Retail Sales dropped 0.1% MoM in November, yet improved compared to the 0.3% contraction expected by the consensus. On an annual basis, sales plummeted 1.9%, worse than the 1.2% decrease projected by economists.
- Banxico Deputy Governor Jonathan Heath was dovish, saying that headline and core inflation figures may hit 4% in January, adding that the central bank “does not need to exaggerate a restrictive posture.”
- Divergence between Banxico and the US Federal Reserve favors further upside in the USD/MXN pair.
- Economists polled by Reuters revealed that they foresee Banxico cutting interest rates by at least 150 basis points to 8.50% by the end of the year.
- In the Fed’s latest Summary of Economic Projections, officials estimate they will cut interest rates by 50 basis points.
- Mid-Month Inflation in January is foreseen dropping from 4.44% to 3.93%. Underlying inflation is expected to rise modestly from 3.62% to 3.69%.
- Money market futures have priced in 41.5 bps of Fed rate cuts in 2025, according to CME FedWatch Tool data.
USD/MXN technical outlook: Mexican Peso falls as USD/MXN climbs past 20.50
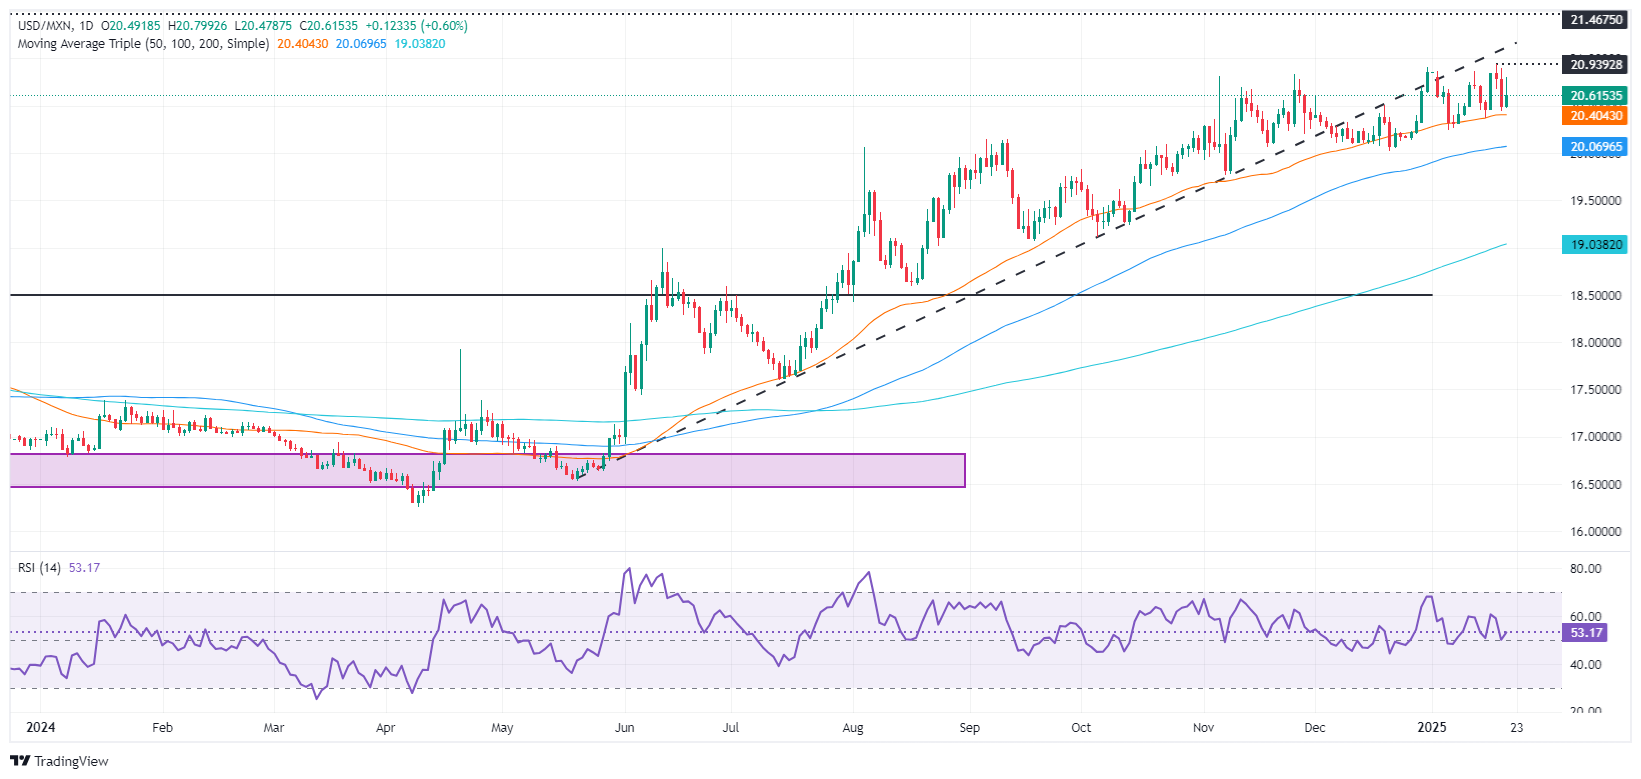
The USD/MXN has consolidated somewhat near the 20.50 to 20.90 area during the last four trading days, a sign that neither buyers nor sellers are sure about the direction of the pair.
Nevertheless, the reduction of the interest rate differential despite the Greenback being extremely overbought suggests the exotic pair could challenge the 21.00 level. If surpassed, the next stop would be the March 8, 2022 peak at 21.46, followed by 21.50 and the 22.00 psychological level.
Conversely, if the pair tumbles below the 50-day SMA, the next support would be the 100-day SMA at 20.04, which is ahead of the 20.00 mark.
Mexican Peso FAQs
The Mexican Peso (MXN) is the most traded currency among its Latin American peers. Its value is broadly determined by the performance of the Mexican economy, the country’s central bank’s policy, the amount of foreign investment in the country and even the levels of remittances sent by Mexicans who live abroad, particularly in the United States. Geopolitical trends can also move MXN: for example, the process of nearshoring – or the decision by some firms to relocate manufacturing capacity and supply chains closer to their home countries – is also seen as a catalyst for the Mexican currency as the country is considered a key manufacturing hub in the American continent. Another catalyst for MXN is Oil prices as Mexico is a key exporter of the commodity.
The main objective of Mexico’s central bank, also known as Banxico, is to maintain inflation at low and stable levels (at or close to its target of 3%, the midpoint in a tolerance band of between 2% and 4%). To this end, the bank sets an appropriate level of interest rates. When inflation is too high, Banxico will attempt to tame it by raising interest rates, making it more expensive for households and businesses to borrow money, thus cooling demand and the overall economy. Higher interest rates are generally positive for the Mexican Peso (MXN) as they lead to higher yields, making the country a more attractive place for investors. On the contrary, lower interest rates tend to weaken MXN.
Macroeconomic data releases are key to assess the state of the economy and can have an impact on the Mexican Peso (MXN) valuation. A strong Mexican economy, based on high economic growth, low unemployment and high confidence is good for MXN. Not only does it attract more foreign investment but it may encourage the Bank of Mexico (Banxico) to increase interest rates, particularly if this strength comes together with elevated inflation. However, if economic data is weak, MXN is likely to depreciate.
As an emerging-market currency, the Mexican Peso (MXN) tends to strive during risk-on periods, or when investors perceive that broader market risks are low and thus are eager to engage with investments that carry a higher risk. Conversely, MXN tends to weaken at times of market turbulence or economic uncertainty as investors tend to sell higher-risk assets and flee to the more-stable safe havens.
The tick lower in inflation in December to 1.8% was above our own assumption for a 1.5% increase, but largely due to a smaller than assumed reduction in prices from the temporary GST/HST holiday in December, and was still slightly below market expectations for a 1.9% reading, RBC Economics' Assistant Chief Economist Nathan Janzen notes.
Risks on price growth tilted to the downside
"Controlling for the tax distortion, price growth was mixed but is still consistent with further signs of underlying easing in price growth."
"The CPI data will be impacted by the tax holiday into February, but a weakened Canadian GDP and elevated unemployment rate (with the potential for protectionist U.S. trade policy to make both worse) is pushing inflation expectations from businesses and households lower."
"That leaves the risks on price growth tilted to the downside and argue for further BoC interest rate cuts."
USD/CNH fell sharply below 7.26 at one point after Trump announced there was no immediate plans for tariffs and calls for further study. USD/CNH was last seen at 7.2712 levels, OCBC's FX analysts Frances Cheung and Christopher Wong note.
Tariff situation remains highly uncertain
"That said, tariff development remains highly uncertain in terms of timing, magnitude and scope of products, hence its implication on markets can be binary for now. A longer delay in tariff announcement may provide an extended breather for risk proxies, and USD/CNH could trade lower. However, a swift implementation of tariff is expected to undermine sentiments and provide a boost to USD/CNH."
"For now, it appears that Trump is in the midst of trying to cut a deal, threatening with 25% tariffs on Mexico and Canada today and setting a deadline of 1 Feb. For China, tariff concerns should restrain the offshore yuan from strengthening too much, though it’s also unlikely to see CNH trade weaker until there’s greater clarity on the US’s trade policies. In the interim, stale CNH shorts could be forced to unwind if there is a longer delay in announcing tariffs on China."
"Daily momentum is bearish bias while RSI fell. Risks are skewed to the downside. Support at 7.2540 and 7.22 levels. Resistance at 7.2950 (50 DMA), 7.33 (21 DMA)."
- EUR/USD drops to a low 1.0355 on Tuesday, shedding part of its weekly gains.
- RSI stands at 52 in positive territory, yet its rapid decline raises concern over near-term resilience.
- MACD histogram features rising green bars, hinting at underlying buyer interest despite the downward slope.
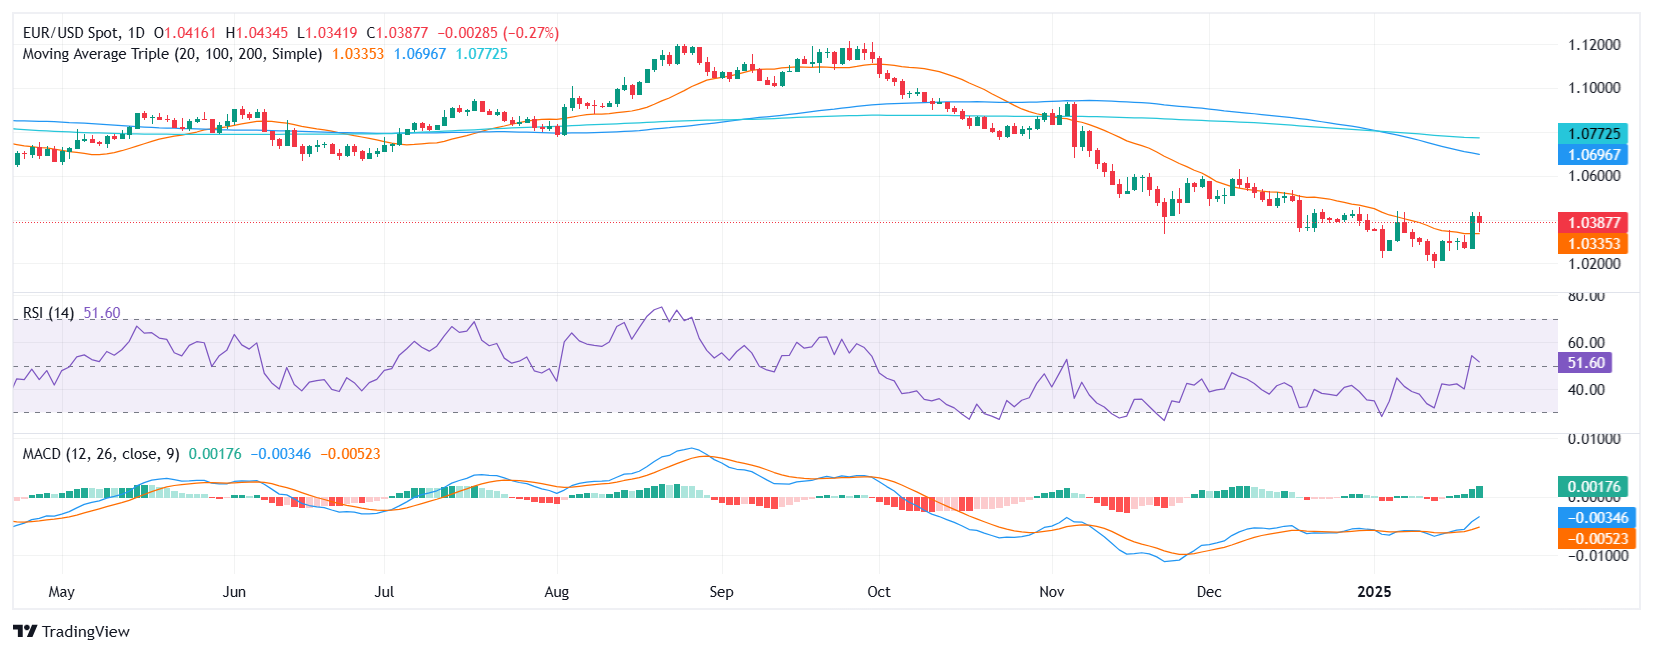
The EUR/USD sits around 1.0380, indicating a dip of 0.30% on Tuesday’s trade but managed to clear part of its daily losses. Despite occasional attempts at recovery, the pair has failed to generate sustained momentum on the upside, suggesting sellers remain firmly in control in the bigger picture.
Technically, the Relative Strength Index (RSI) is perched at 52 but declining swiftly, undermining confidence in an immediate rebound. Meanwhile, the Moving Average Convergence Divergence (MACD) histogram continues to show rising green bars, a signal that some degree of bullish sentiment still lurks beneath the current price action. This contrast between a softening RSI and a firming MACD underscores the market’s indecision at present levels.
Looking forward, traders will keep an eye on whether EUR/USD can find a stable footing above the 1.0300 region or if further selling could push it back toward this month’s trough near 1.0240. On the flipside, any sustained push above 1.0400 would draw attention to the pair’s recent peak at 1.0435, potentially shifting short-term prospects back in favor of the bulls.
EUR/USD daily chart
USD/JPY fell, tracking the gap lower in UST yields. Focus next on BoJ MPC (Fri). We are looking for 25bp hike on Friday. USDJPY last seen at 155.46 levels, OCBC's FX analysts Frances Cheung and Christopher Wong note.
Daily momentum is bearish
"Economic data has been supportive. Jobless rate easing, trade unions calling for another 5-6% wage increase. Fast Retailing (Uniqlo) announced it will raise starting pay for new employees by 10% and 5% for other employees. Meiji Yasuda announced raising wages by an average of 5% for all 47k staff starting April."
"Elsewhere, JP CPI, PPI were all higher, paving the way for BoJ policy normalization. Divergence in Fed-BoJ policies should bring about further narrowing of UST-JGB yield differentials and this should underpin the broader direction of travel for USD/JPY to the downside. The risk is a dovish hike, as this may suggest that USDJPY’s move lower may be more constrained."
"Daily momentum is bearish while RSI fell. Risks skewed to the downside. Next support at 154.30 (23.6% fibo retracement of Sep low to Jan high) and 152.80 (200 DMA). Resistance at 157.15 (21 DMA), 158.80 (recent high)."
- USD/JPY stable despite volatility after Trump announces possible 25% tariffs on neighboring countries.
- US Dollar Index (DXY) gains 0.29%, reaching 108.30, amid positive market sentiment.
- Focus on upcoming Bank of Japan meeting; potential for 25 basis point rate hike expected.
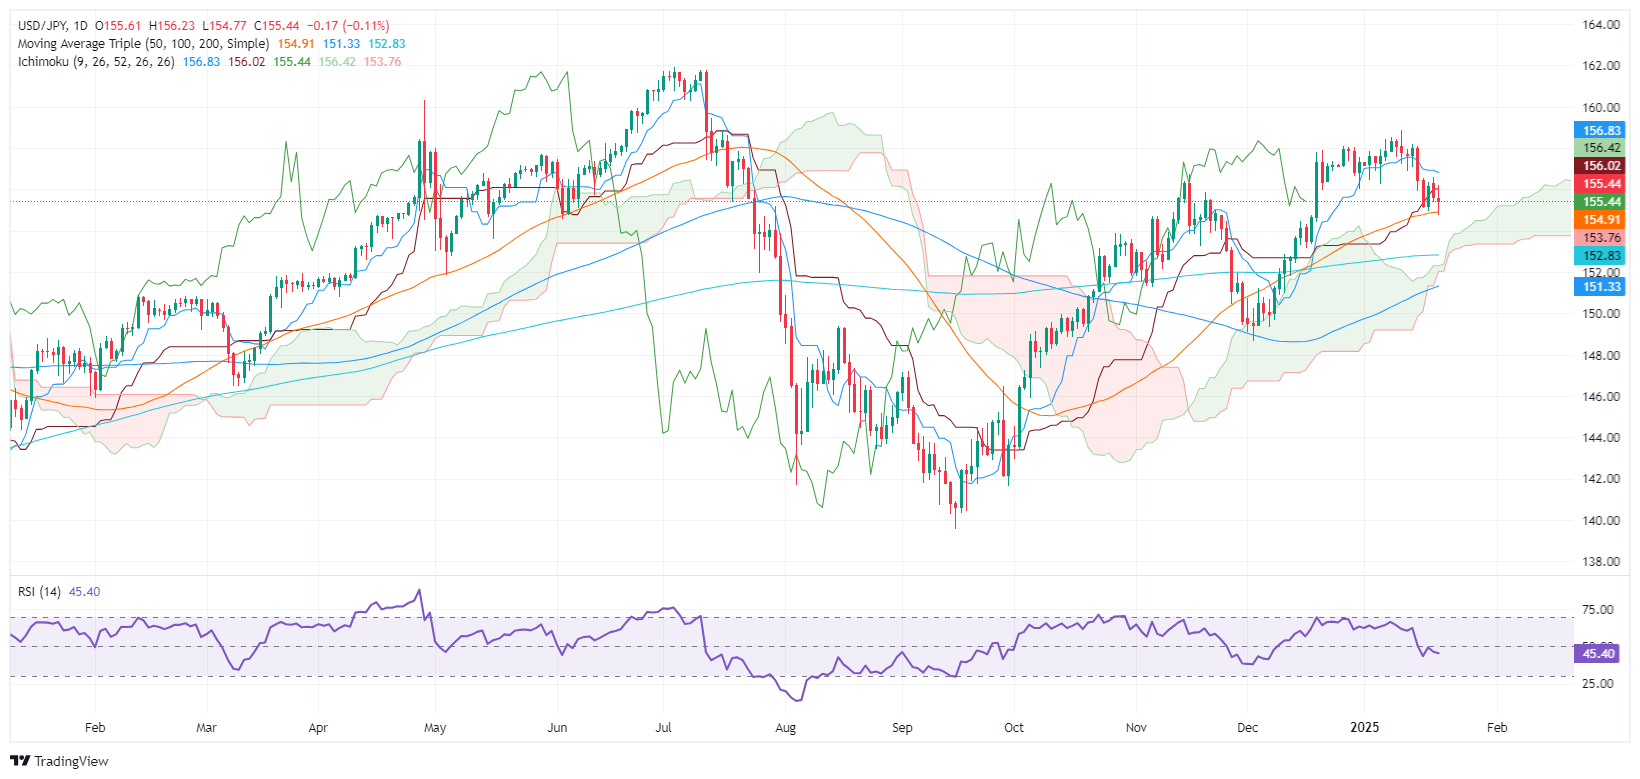
The USD/JPY was virtually unchanged during the North American session on Tuesday, as traders assessed US President Donald Trump’s threats to impose 25% tariffs on Canada and Mexico as soon as February 1. The Greenback recovered as the major hit a daily high of 156.20. However, fears faded as the pair traded near 155.54, virtually unchanged.
USD/JPY consolidates near 155.50 on President Trump's proposed tariffs on Canada and Mexico
Market sentiment remains upbeat, and the US Dollar climbs, as depicted by the US Dollar Index (DXY), which tracks the basket of six currencies against the buck, rising 0.29% to 108.30.
Meanwhile, traders in the FX markets would continue to be attentive to Trump’s rhetoric, which sent ripples late Monday in the US as he signed a tranche of executive orders, including illegal immigration and naming cartels as global terrorist organizations.
In addition, USD/JPY traders are focused on the Bank of Japan's (BoJ) next monetary policy meeting. Interest rate probabilities suggest the BoJ would likely raise rates by 25 basis points to 0.50% for the first time since July last year.
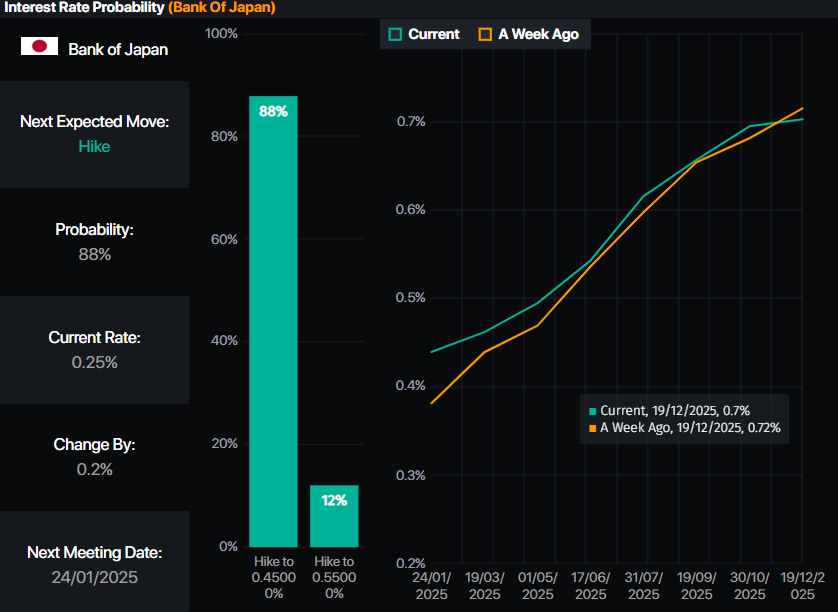
Source: Prime Market Terminal
This week, the US economic schedule remains absent until Thursday, when the Initial Jobless Claims data will be released, followed by Friday’s S&P Flash PMIs. In Japan, the docket will feature Trade Balance data and foreign Investment figures ahead of the BoJ meeting.
USD/JPY Price Forecast: Technical outlook
The USD/JPY uptrend remains intact, but recently, sellers stepped in and dragged spot prices from around 158.80 to the current level. Despite this, bears failed to clear a support trendline drawn from September 2024 lows near 154.50. Nevertheless, if USD/JPY holds below 156.00, further downside is seen once 155.00 is cleared. The next support would be the 154.50, followed by the 154.00 mark.
On the other hand, if USD/JPY rises past the Senkou-span A at 156.41, a test of 157.00 is on the cards. If surpassed, a jump toward the January 15 high of 158.03 is likely.
Japanese Yen PRICE Today
The table below shows the percentage change of Japanese Yen (JPY) against listed major currencies today. Japanese Yen was the strongest against the Canadian Dollar.
| USD | EUR | GBP | JPY | CAD | AUD | NZD | CHF | |
|---|---|---|---|---|---|---|---|---|
| USD | 0.25% | 0.30% | -0.06% | 0.56% | 0.33% | 0.45% | 0.20% | |
| EUR | -0.25% | 0.06% | -0.24% | 0.30% | 0.08% | 0.21% | -0.07% | |
| GBP | -0.30% | -0.06% | -0.34% | 0.24% | 0.01% | 0.14% | -0.12% | |
| JPY | 0.06% | 0.24% | 0.34% | 0.61% | 0.37% | 0.48% | 0.23% | |
| CAD | -0.56% | -0.30% | -0.24% | -0.61% | -0.23% | -0.10% | -0.37% | |
| AUD | -0.33% | -0.08% | -0.01% | -0.37% | 0.23% | 0.12% | -0.14% | |
| NZD | -0.45% | -0.21% | -0.14% | -0.48% | 0.10% | -0.12% | -0.27% | |
| CHF | -0.20% | 0.07% | 0.12% | -0.23% | 0.37% | 0.14% | 0.27% |
The heat map shows percentage changes of major currencies against each other. The base currency is picked from the left column, while the quote currency is picked from the top row. For example, if you pick the Japanese Yen from the left column and move along the horizontal line to the US Dollar, the percentage change displayed in the box will represent JPY (base)/USD (quote).
- AUD/USD slumps to near 0.6220 as Trump threatens to impose tariffs on China.
- The RBA is expected to start reducing interest rates in February.
- The US Dollar recovers sharply as Trump confirms that the tariff plan is on track.
The AUD/USD pair falls sharply to near 0.6220 in Tuesday’s North American session after a couple of failed attempts to revisit the key resistance of 0.6300. The Aussie pair slumps as United States (US) President Donald Trump threatens to raise tariffs on China, a move that would also hurt the Australian export sector, being the leading trading partner of China.
Trump’s presidential memo showed that he directed federal agencies to evaluate trade relationships with China and other North American economies.
Meanwhile, growing expectations that the Reserve Bank of Australia (RBA) could pivot to policy-easing in the policy meeting in February. RBA's dovish bets swelled after the board said in the December meeting that it gained some confidence that inflation is moving sustainably towards the target.
The US Dollar (USD) rebounds sharply and recovers most of Monday’s losses as Trump confirms that the tariff plan is still on. The US Dollar Index (DXY), which gauges the Greenback’s value against six major currencies, bounces back from an almost two-week low of 108.00.
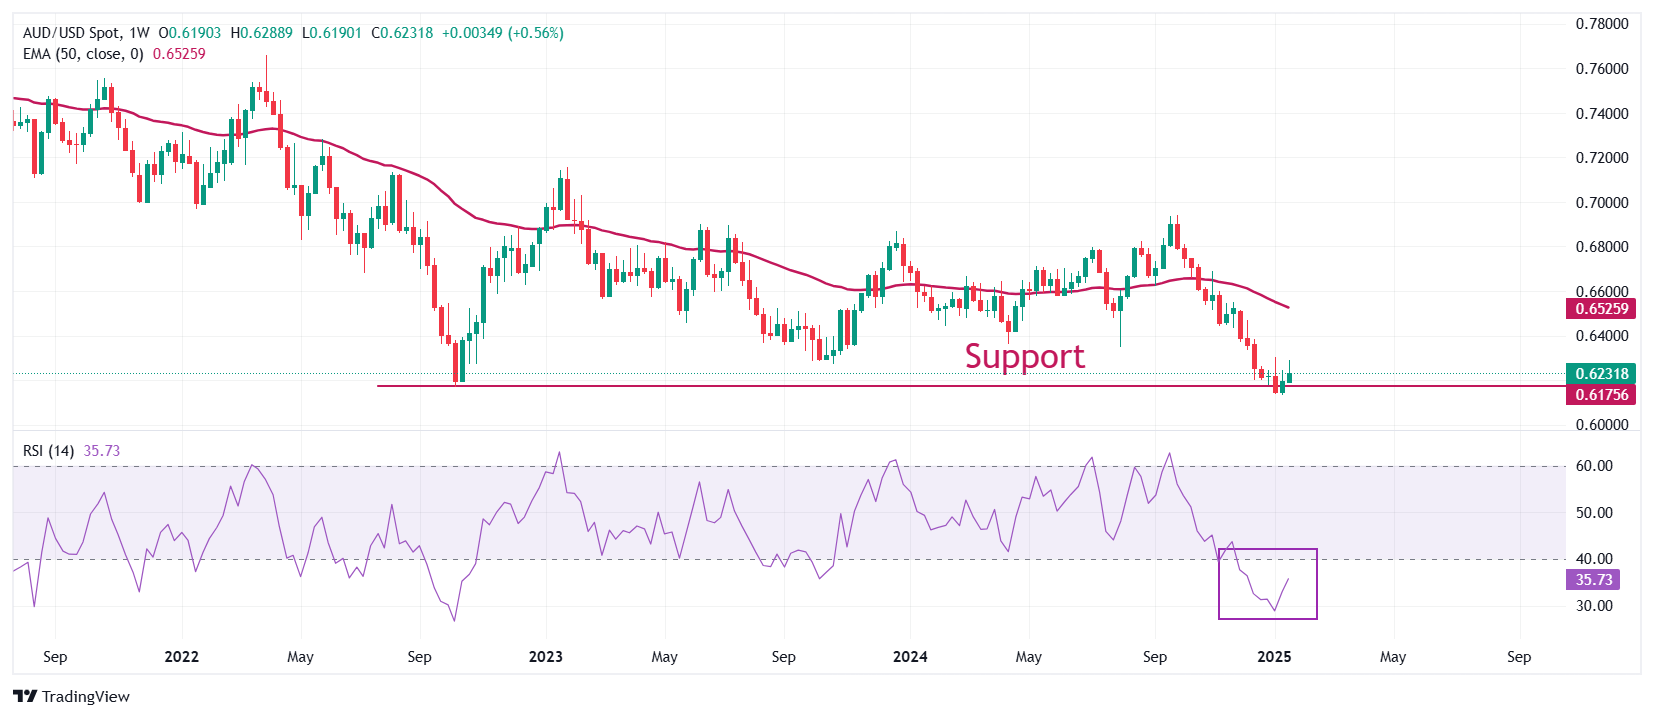
AUD/USD discovers buying interest after revisiting an over four-year low of 0.6170. However, the outlook of the pair is still bearish as the 50-week Exponential Moving Average (EMA) near 0.6526 is sloping downwards.
The 14-week Relative Strength Index (RSI) bounces back after turning oversold near 30.00. However, the overall momentum will remain bearish until it stays inside the 20.00-40.00 range.
Going forward, the pair would face more downside if it fails to hold the January 13 low of 0.6131. This will push it lower to the round-level support of 0.6100 and the April 2020 low of 0.5990.
On the flip side, a decisive breakout above the January 6 high of 0.6302 will open doors to the December 18 high of 0.6340 and the round-level resistance of 0.6400.
AUD/USD weekly chart
Australian Dollar FAQs
One of the most significant factors for the Australian Dollar (AUD) is the level of interest rates set by the Reserve Bank of Australia (RBA). Because Australia is a resource-rich country another key driver is the price of its biggest export, Iron Ore. The health of the Chinese economy, its largest trading partner, is a factor, as well as inflation in Australia, its growth rate and Trade Balance. Market sentiment – whether investors are taking on more risky assets (risk-on) or seeking safe-havens (risk-off) – is also a factor, with risk-on positive for AUD.
The Reserve Bank of Australia (RBA) influences the Australian Dollar (AUD) by setting the level of interest rates that Australian banks can lend to each other. This influences the level of interest rates in the economy as a whole. The main goal of the RBA is to maintain a stable inflation rate of 2-3% by adjusting interest rates up or down. Relatively high interest rates compared to other major central banks support the AUD, and the opposite for relatively low. The RBA can also use quantitative easing and tightening to influence credit conditions, with the former AUD-negative and the latter AUD-positive.
China is Australia’s largest trading partner so the health of the Chinese economy is a major influence on the value of the Australian Dollar (AUD). When the Chinese economy is doing well it purchases more raw materials, goods and services from Australia, lifting demand for the AUD, and pushing up its value. The opposite is the case when the Chinese economy is not growing as fast as expected. Positive or negative surprises in Chinese growth data, therefore, often have a direct impact on the Australian Dollar and its pairs.
Iron Ore is Australia’s largest export, accounting for $118 billion a year according to data from 2021, with China as its primary destination. The price of Iron Ore, therefore, can be a driver of the Australian Dollar. Generally, if the price of Iron Ore rises, AUD also goes up, as aggregate demand for the currency increases. The opposite is the case if the price of Iron Ore falls. Higher Iron Ore prices also tend to result in a greater likelihood of a positive Trade Balance for Australia, which is also positive of the AUD.
The Trade Balance, which is the difference between what a country earns from its exports versus what it pays for its imports, is another factor that can influence the value of the Australian Dollar. If Australia produces highly sought after exports, then its currency will gain in value purely from the surplus demand created from foreign buyers seeking to purchase its exports versus what it spends to purchase imports. Therefore, a positive net Trade Balance strengthens the AUD, with the opposite effect if the Trade Balance is negative.
The Pound Sterling (GBP) has softened in line with the EUR through the overnight session, Scotiabank’s Chief FX Strategist Shaun Osborne notes.
GBP slips back from Monday’s peak
“UK data reports were mixed—wage growth picked up again in November but the 5.6% increase in Average Weekly Earnings was a bit below consensus. Payrolls fell a larger than expected 47k in December, however, which may be the data point the BoE homes in on at the February 6th policy decision.”
“GBP has slipped back from yesterday’s intraday peak near 1.2345 but is maintaining a minor uptrend on the USD that has developed over the past week. Support is 1.2220 and 1.2185 (firmer).”
The Euro (EUR) has slipped back to the mid-1.03 area after failing to hold gains through the low 1.04s yesterday, Scotiabank’s Chief FX Strategist Shaun Osborne notes.
EUR weakens after failing to hold 1.04+ gains
“It’s all headline-driven movement, with little regard for fundamental developments, however limited. The German ZEW investor survey for January showed a minor improvement in sentiment but weaker expectations amid sluggish domestic growth.”
“The EUR is maintaining some of yesterday’s rally. While the failure to hold gains through the low 1.04 area (initial retracement resistance from the EUR’s Sep/Jan decline in the EUR sits at 1.0422) looks a little disappointing, the EUR is holding the break above trend resistance, now support, at 1.0318. A clear move through 1.0420/25 should add to corrective momentum.”
Euro (EUR) jumped overnight on headlines that Trump is not planning to impose new tariffs yet, Scotiabank’s Chief FX Strategist Shaun Osborne notes.
Headlines to drive 2-way trades in the near term
“In the near term, we may see further unwinding of EUR shorts should Trump leave universal tariffs alone in the interim. EUR may even have a good chance of trading higher should ZEW survey expectations come in better than expected later today.”
“Daily momentum is mild bullish while RSI rose. Risks remain skewed to the upside. Key resistance at 1.0440 (50 DMA). Break out exposes the pair to 1.05, 1.0570 levels (38.2% fibo retracement of Sep high to Jan low). Support at 1.0340 (21 DMA), 1.0240, 1.02 (recent low). Expect headlines to drive 2-way trades in the near term.”
- USD/CAD finds bids as the Canadian headline CPI decelerated in December on year. Month-on-month CPI deflated.
- Soft Canadian inflation data stokes hopes that the BoC would continue reducing interest rates by 50 bps.
- US Trump prepares to impose 25% tariffs on Canada and Mexico on Feb 1.
The USD/CAD pair witnesses buying interest near 1.4430 in Tuesday’s North American session as Statistics Canada reported that soft inflation data for December. The agency showed that the headline inflation rose at a slower pace of 1.8%, compared to estimates and the former release of 1.9% on year.
Month-on-month headline CPI deflated by 0.4%, as expected, against a flat reading in November. Soft CPI data has deepened risks of inflation undershooting the Bank of Canada’s (BoC) target of 2%. This scenario would force the BoC to continue unwinding the policy restrictiveness at an ongoing pace. The BoC has been reducing its interest rates at a larger-than-usual pace of 50 basis points (bps) from its last two policy meetings.
However, the Reuters poll in the January 10-16 period showed that the BoC is almost certain to cut interest rates by 25 basis points (bps) to 3% in the policy meeting later this month.
The outlook of the Canadian Dollar was already vulnerable as US President Donald Trump confirmed that he would impose 25% tariffs on Canada and Mexico on February 1. Also, Trump’s plan to accelerate strategic oil reserves weighed on the Loonie, given that Canada is the leading exporter of Oil to the US and resulting lower Oil prices from higher production would lead to lower foreign inflows.
Meanwhile, the US Dollar (USD) has rebounded strongly on Tuesday after plummeting on Monday as Trump has not denied the imposition of tariffs, though have delayed, citing that “We are not ready for that yet.” The US Dollar Index (DXY), which tracks the Greenback’s value against six major currencies, climbs above 108.50.
US Dollar (USD) saw a sharp drop after Trump announced no immediate tariffs on China. USD/CNH saw a sharp move below 7.26 overnight before rebounding. DXY was last at 108.50 levels, OCBC FX analysts Frances Cheung and Christopher Wong note.
Risks skewed to the downside
“Subsequent headlines came by quoting Trump imposing a 1 February deadline and tariff of as much as 25% on Mexico and Canada. Not surprisingly, MXN and CAD came under pressure. An absence of immediate tariffs but a 1 February deadline suggests that this is a strong call for Mexicans and Canadians to come back to the negotiating table quickly. Nevertheless, this underscores the fluidity of tariff developments. Tariff uncertainty remains in terms of timing, magnitude and scope of products.”
“And we continue to hold to the view that the implications on markets can be very much 2-way. On one hand, a longer delay on tariff announcement will continue to provide a breather for risk proxies while consensus trade (long USD) unwinds. On the other hand, a swift implementation of tariff would undermine sentiments and boost the USD. We do not expect a one-way trade in Trump regime.”
“Daily momentum is bearish while RSI fell. Risks skewed to the downside. Support at 108, 107.50 (50DMA). Resistance at 108.75 (21 DMA), 110.10 levels. With Trump inauguration done and dusted, next few days will be closely watched with regards to executive orders, executive actions he will sign.”
Markets generally and high beta FX in particular breathed a sigh of relief yesterday when the WSJ reported that President Trump would not impose aggressive tariffs immediately on returning to the White House. Rather, the incoming administration will take a more considered approach to tariff action after reviewing existing arrangements, Scotiabank’s Chief FX Strategist Shaun Osborne notes.
USD reverses some of Monday’s drop
“The US Dollar (USD) tumbled but losses partially reversed late yesterday after Trump wheeled out the 25% tariff threat on Canada and Mexico (and additional tariffs on China) from February 1, citing border issues (drugs, illegal immigrants). The USD is trading higher on the session so far today, with the CAD and MXN predictably underperforming, but the DXY remains well below Monday’s opening levels.”
“Trade tariffs are still coming in some form but the apparent capriciousness of policymaking means anticipating the president’s decisions gets all the harder. That’s probably deliberate but higher uncertainty means higher volatility for markets broadly. The JPY and Asia FX are relative out-performers on the session, limiting losses to the USD to around –0.2/0.3%.”
“Assuming the 25% tariff threat is just that (while very harmful for Canada and Mexico, the negative repercussions for the US economy would be significant as well), a more considered approach to trade tariffs that yesterday’s WSJ report hinted at may still be a drag on the USD’s near-term outlook, given sentiment and positioning that was geared around (aggressive) ‘tariffs from day one’.”
- The US Dollar enters the second day of choppy trading with a firm recovery.
- Markets trembled after US President Trump confirmed upcoming tariffs on Canada and Mexico in February.
- The US Dollar Index (DXY) trades higher again with 109.00 in focus.
The US Dollar Index (DXY), which tracks the Greenback’s value against six major currencies, got knocked on Monday when tariffs were not part of the executive orders signed by Donald Trump in his first hours as US President. Markets got wrong footed thinking the stance on tariffs got eased and would face broad delay. However, a surprise comment from US President Trump late Monday night triggered a turnaround with reversals in all major pairs, including the US Dollar. President Trump said the application of 25% tariffs on imports from Canada (CAD) and Mexico (MXN) is due at the start of February, with Canadian Dollar (CAD) and Mexican Peso (MXN)devaluing as an immediate reaction. Overall, reversals are taking place on Tuesday from Monday’s losses on nearly all fronts and asset classes impacted by those comments.
Daily digest market movers: Fundamentals to drive this week
- The US Treasury will publish some data this Tuesday in an otherwise very empty economic calendar ahead. At 16:30 GMT, 3-month, 6-month and 52-week Bills will be allocated in the markets.
- Equities are tying up with gains on Tuesday. European equities are flat, while US futures are up near 0.50%.
- The CME FedWatch tool projects a 54.2% chance that interest rates will remain unchanged at current levels in the May meeting, suggesting a rate cut in June. Expectations are that the Federal Reserve (Fed) will remain data-dependent with uncertainties that could influence inflation during US President Donald Trump’s term.
- The US 10-year yield is trading around 4.56% and has a long road to recover if it wants to head back to last week’s levels near 4.75%.
US Dollar Index Technical Analysis: Recovery could get dangerous
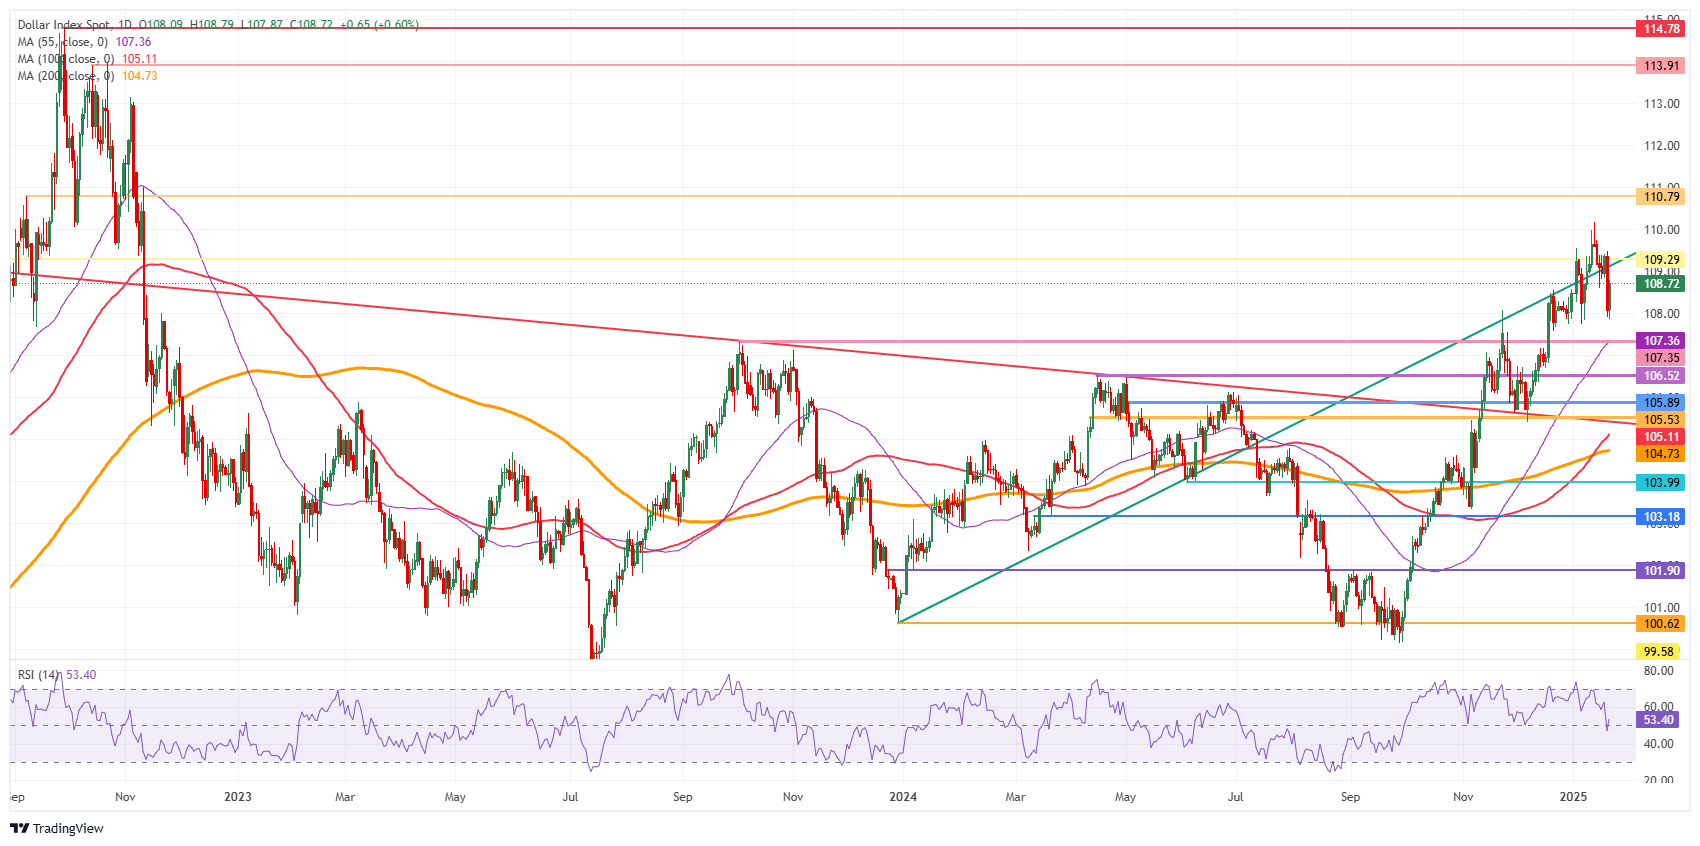
The US Dollar Index (DXY) fell in the hands of the bears on Monday, with the bulls taking over again on Tuesday. However, traders need to be aware of some potholes in the road ahead should the DXY head back to 109.00 and higher. With the ongoing recovery on Tuesday, some pivotal upside levels could cause a heavy rejection, resulting in a dead-cat-bounce, trapping US Dollar bulls and squeezing them out towards 107.00 and lower.
If this recovery wants to continue its ascent, the pivotal level to gain control of is 109.29 (July 14, 2022, high and rising trendline). Further up, the next big upside level to hit before advancing further remains at 110.79 (September 7, 2022, high). Once beyond there, it is quite a stretch to 113.91, a double top from October 2022.
On the downside, the first area to watch is 107.85-107.90, which held Monday’s correction. Further down, the convergence of the high of October 3, 2023, and the 55-day Simple Moving Average (SMA) around 107.35 should act as a double safety feature to catch any falling knive.
US Dollar Index: Daily Chart
US Dollar FAQs
The US Dollar (USD) is the official currency of the United States of America, and the ‘de facto’ currency of a significant number of other countries where it is found in circulation alongside local notes. It is the most heavily traded currency in the world, accounting for over 88% of all global foreign exchange turnover, or an average of $6.6 trillion in transactions per day, according to data from 2022. Following the second world war, the USD took over from the British Pound as the world’s reserve currency. For most of its history, the US Dollar was backed by Gold, until the Bretton Woods Agreement in 1971 when the Gold Standard went away.
The most important single factor impacting on the value of the US Dollar is monetary policy, which is shaped by the Federal Reserve (Fed). The Fed has two mandates: to achieve price stability (control inflation) and foster full employment. Its primary tool to achieve these two goals is by adjusting interest rates. When prices are rising too quickly and inflation is above the Fed’s 2% target, the Fed will raise rates, which helps the USD value. When inflation falls below 2% or the Unemployment Rate is too high, the Fed may lower interest rates, which weighs on the Greenback.
In extreme situations, the Federal Reserve can also print more Dollars and enact quantitative easing (QE). QE is the process by which the Fed substantially increases the flow of credit in a stuck financial system. It is a non-standard policy measure used when credit has dried up because banks will not lend to each other (out of the fear of counterparty default). It is a last resort when simply lowering interest rates is unlikely to achieve the necessary result. It was the Fed’s weapon of choice to combat the credit crunch that occurred during the Great Financial Crisis in 2008. It involves the Fed printing more Dollars and using them to buy US government bonds predominantly from financial institutions. QE usually leads to a weaker US Dollar.
Quantitative tightening (QT) is the reverse process whereby the Federal Reserve stops buying bonds from financial institutions and does not reinvest the principal from the bonds it holds maturing in new purchases. It is usually positive for the US Dollar.
- EUR/CAD gives up a majority of intraday gains and falls back below 1.0500.
- Trump mentioned that he planning to announce 25% tariffs on Canada and Mexico.
- The ECB is expected to cut its Deposit Facility rate gradually in each of its next four policy meetings.
The EUR/CAD pair surrenders a majority of its intraday gains after failing to extend its four-day run-up above the key resistance of 1.5050 in Tuesday’s European session. However, the outlook of the asset remains firm as the Canadian economy is expected to face hefty tariff hikes from the United States (US).
US President Donald Trump indicated in his inauguration ceremony on Monday that he is planning to slap 25% tariff hikes on Canada and Mexico on February 1. This scenario will result in a significant weakness in Canadian exports. Also, Trump’s plans to raise strategic oil reserves dampened Canada’s export sector, being a leading oil exporter to the US.
Meanwhile, investors await the Canadian Consumer Price Index (CPI) data for December, which will be published at 13:30 GMT. The CPI report is expected to show that inflation rose steadily by 1.9% on a year-on-year basis. On month, price pressures are estimated to have deflated by 0.4% after remaining flat in November.
Soft US inflation data and uncertainty over Trump’s tariff plan would prompt expectations that the Bank of Canada (BoC) will continue reducing interest rates at a larger-than-usual pace of 50 basis points (bps). While, the Reuters poll in January 10-16 period showed that the BoC is almost certain to cut interest rates by 25 basis points (bps) to 3%.
On the other side of the Atlantic, the Euro (EUR) is also expected to face pressure from Trump’s tariff agenda as he mentioned on Monday that he would remedy the trade imbalance with Europe either by “raising tariffs or forcing them to buy more US oil and gas”. Trump’s tariff hikes on the Eurozone would weigh on an already weak economic outlook, due to which traders expect the European Central Bank (ECB) to cut interest rates gradually in the coming four policy meetings.
- Gold price rallies over 0.50% on Tuesday as Trump enters his first day in office.
- President Trump said he will keep his tariff hike plans
- Gold prints a new over two-month high at $2,732 and enters the area with $2,790 as firm resistance ahead.
Gold’s price (XAU/USD) rallies for a second straight day this week after US President Donald Trump confirmed he intends to impose 25% tariffs on Canada and Mexico as early as February, as well as g tariffs on Silver and Gold. China was left out of the immediate levies being imposed, Bloomberg reported.
The possibility of Trump applying tariffs on Silver and Gold has caused market uncertainty, driving premiums for futures to elevated levels. President Trump's domestic agenda is the second main driver, which could extend Gold’s bullish momentum further and increase demand for haven assets. Meanwhile, bond yields took a nosedive to 4.527% in Asian trading on Tuesday after remaining closed on Monday for Martin Luther King Day.
Daily digest market movers: Dropping the ball already
- Comments by President Donald Trump during the signing session of his first executive orders caught traders by surprise. During the session, Trump said tariffs for Canada and Mexico will already be implemented as soon as February. The market reaction was a knee-jerk fall in the Canadian Dollar (CAD) and Mexican Peso (MXN) due to the unexpected decision, as the Wall Street Journal had already published a story on Monday where tariffs were postponed until a task force was formed first, Bloomberg reports.
- President Trump confirmed that universal tariffs on all imports to the US are under consideration as well and will come at a later stage, Reuters reports.
- Saudi Arabia’s investment mining fund is set to buy a stake in Pakistan’s Reko Diq project, which will be one of the world’s largest Copper mines once complete, as the kingdom accelerates its expansion into the precious metal sector, the Financial Times reports.
- US yields are catching up with Monday’s turn of events after remaining closed on that same day due to Martin Luther King Day. The US 10-year benchmark sank to 4.527% before rebounding at the start of the European session. The 10-year bond is still trading 5% lower from its peak performance last week at 4.788%
Technical Analysis: Watch out for repercussions
Gold’s price edges higher for the second consecutive day on Tuesday and profits from US President Donald Trump’s selective measures to single out Mexico and Canada and postpone China’s levies. While tariffs are normally seen as a negative element for precious metals, in this case, the possibility of tariffs on Gold and Silver is ramping up prices. It looks like the Gold story is not worn out just yet.
Profit-taking could emerge and push Gold’s price back to $2,700, with the downward-slopping trendline of the broken pennant chart pattern last week at $2,668 as the next support. In case more downside occurs, the 55-day Simple Moving Average (SMA) and the 100-day SMA converging at around $2,646 is the next level to watch.
At the time of writing, $2,721, a sort of double top in November and December, is being tested. In case Bullion powers through that level, the all-time high of $2,790 is the key upside barrier.
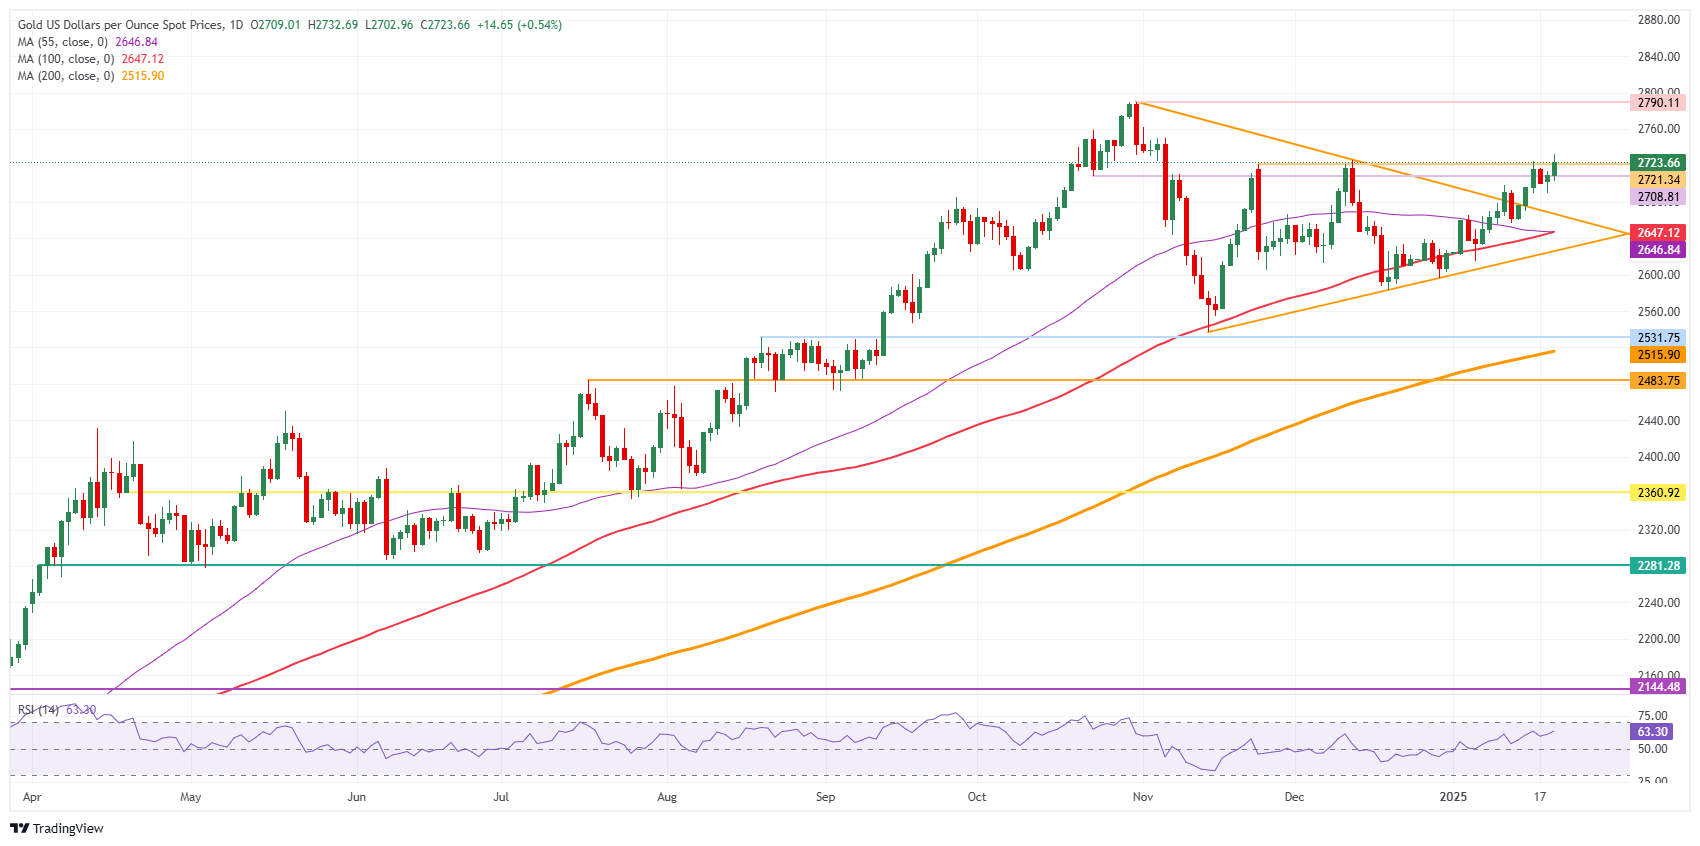
XAU/USD: Daily Chart
Gold FAQs
Gold has played a key role in human’s history as it has been widely used as a store of value and medium of exchange. Currently, apart from its shine and usage for jewelry, the precious metal is widely seen as a safe-haven asset, meaning that it is considered a good investment during turbulent times. Gold is also widely seen as a hedge against inflation and against depreciating currencies as it doesn’t rely on any specific issuer or government.
Central banks are the biggest Gold holders. In their aim to support their currencies in turbulent times, central banks tend to diversify their reserves and buy Gold to improve the perceived strength of the economy and the currency. High Gold reserves can be a source of trust for a country’s solvency. Central banks added 1,136 tonnes of Gold worth around $70 billion to their reserves in 2022, according to data from the World Gold Council. This is the highest yearly purchase since records began. Central banks from emerging economies such as China, India and Turkey are quickly increasing their Gold reserves.
Gold has an inverse correlation with the US Dollar and US Treasuries, which are both major reserve and safe-haven assets. When the Dollar depreciates, Gold tends to rise, enabling investors and central banks to diversify their assets in turbulent times. Gold is also inversely correlated with risk assets. A rally in the stock market tends to weaken Gold price, while sell-offs in riskier markets tend to favor the precious metal.
The price can move due to a wide range of factors. Geopolitical instability or fears of a deep recession can quickly make Gold price escalate due to its safe-haven status. As a yield-less asset, Gold tends to rise with lower interest rates, while higher cost of money usually weighs down on the yellow metal. Still, most moves depend on how the US Dollar (USD) behaves as the asset is priced in dollars (XAU/USD). A strong Dollar tends to keep the price of Gold controlled, whereas a weaker Dollar is likely to push Gold prices up.
- Silver price ticks lower as the US Dollar recovers sharply, with Trump keeping the tariff hike plan intact.
- Trump directed federal agencies to scrutinize trade relations with neighbors and China.
- Traders have raised dovish bets for the Fed’s May policy meeting.
Silver price (XAG/USD) drops slightly to near $30.50 in Tuesday’s European session. The white metal faces pressures as the US Dollar (USD) rebounds strongly after President Donald Trump confirmed that the plan of tariff hikes on foreign countries is delayed not denied. On his first day at the White House, Trump mentioned that the proposal of universal tariff hikes is on the table, but “We are not ready for that yet”.
The US Dollar Index (DXY), which tracks the Greenback’s value against six major currencies, rebounds sharply from its almost two-week low around 108.00, which it posted on Monday. Historically, a higher US Dollar weighs on precious metals, such as Silver, by making them expensive for investors.
The Greenback plummeted on Tuesday after reports from the Wall Street Journal (WSJ) showed that tariff hikes were absent in a presidential memo. However, the memo indicated that Trump has directed federal agencies to study trade policies and evaluate trade relationships with China and other North American economies.
Meanwhile, the downside in the Silver price has been limited by falling bond yields. Lower yields on interest-bearing assets reduce the opportunity cost of non-yielding assets, such as Silver, which improves their appeal. 10-year US Treasury yields decline to 4.56%. US Treasury yields have slumped as trader expect that the Federal Reserve (Fed) could cut interest rates in the policy meeting in May.
According to the CME FedWatch tool, the probability for the Fed to reduce interest rates in May has eased to 53% from 63% a week ago.
Silver technical analysis
Silver price struggles near the upward-sloping trendline around $30.80, which is plotted from 29 February 2024 low of $22.30 on a daily timeframe.
The white metal discovered strong buying interest near the 200-day Exponential Moving Average (EMA) around $29.45 and but struggles to sustain above the 50-day EMA, which is around $30.30.
The 14-day Relative Strength Index (RSI) faces pressure near 60.00. A fresh bullish momentum would trigger if it manages to break above 60.00.
Silver daily chart
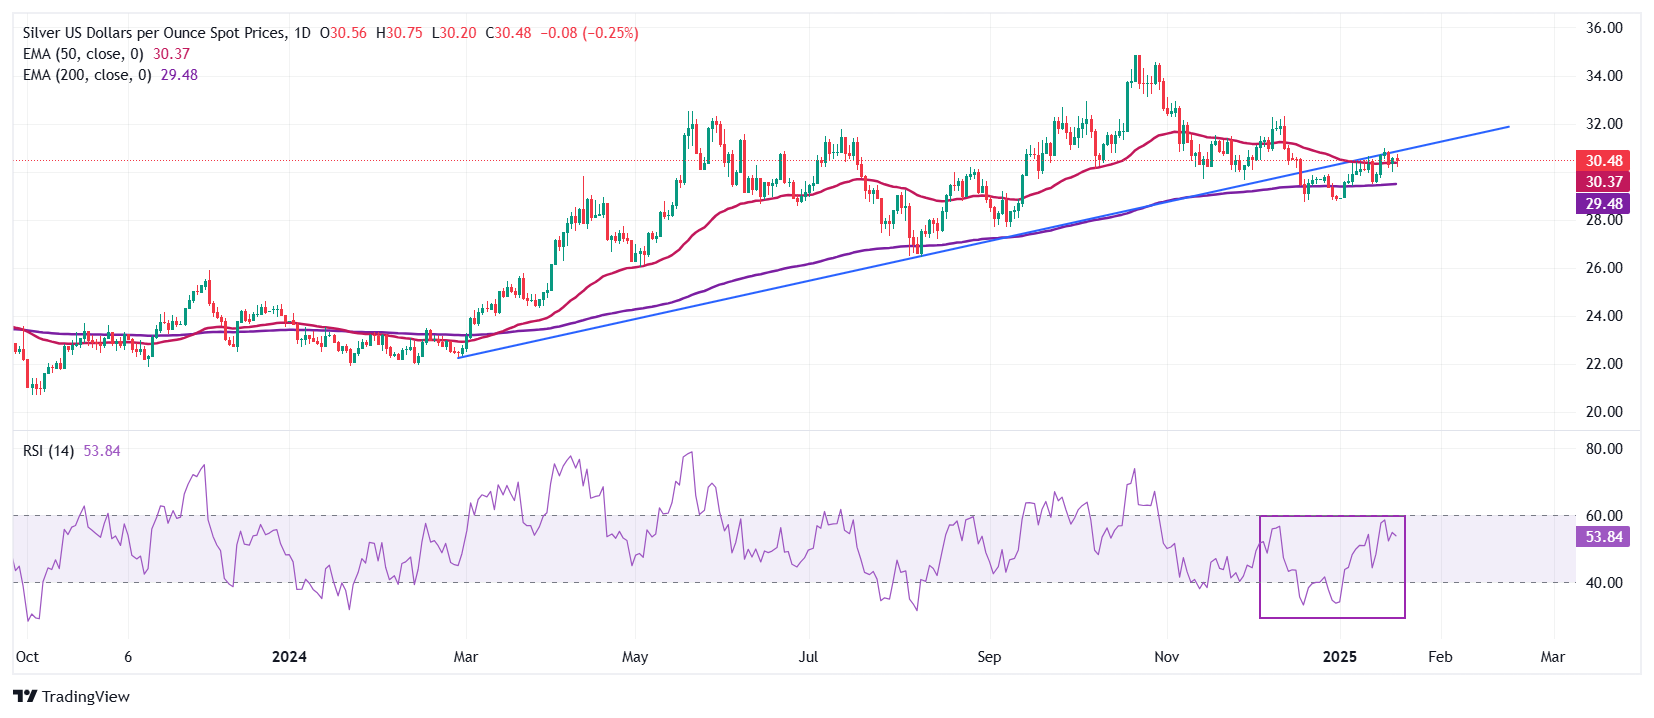
Silver FAQs
Silver is a precious metal highly traded among investors. It has been historically used as a store of value and a medium of exchange. Although less popular than Gold, traders may turn to Silver to diversify their investment portfolio, for its intrinsic value or as a potential hedge during high-inflation periods. Investors can buy physical Silver, in coins or in bars, or trade it through vehicles such as Exchange Traded Funds, which track its price on international markets.
Silver prices can move due to a wide range of factors. Geopolitical instability or fears of a deep recession can make Silver price escalate due to its safe-haven status, although to a lesser extent than Gold's. As a yieldless asset, Silver tends to rise with lower interest rates. Its moves also depend on how the US Dollar (USD) behaves as the asset is priced in dollars (XAG/USD). A strong Dollar tends to keep the price of Silver at bay, whereas a weaker Dollar is likely to propel prices up. Other factors such as investment demand, mining supply – Silver is much more abundant than Gold – and recycling rates can also affect prices.
Silver is widely used in industry, particularly in sectors such as electronics or solar energy, as it has one of the highest electric conductivity of all metals – more than Copper and Gold. A surge in demand can increase prices, while a decline tends to lower them. Dynamics in the US, Chinese and Indian economies can also contribute to price swings: for the US and particularly China, their big industrial sectors use Silver in various processes; in India, consumers’ demand for the precious metal for jewellery also plays a key role in setting prices.
Silver prices tend to follow Gold's moves. When Gold prices rise, Silver typically follows suit, as their status as safe-haven assets is similar. The Gold/Silver ratio, which shows the number of ounces of Silver needed to equal the value of one ounce of Gold, may help to determine the relative valuation between both metals. Some investors may consider a high ratio as an indicator that Silver is undervalued, or Gold is overvalued. On the contrary, a low ratio might suggest that Gold is undervalued relative to Silver.
Further US Dollar (USD) weakness is not ruled out; the major support at 7.2420 is likely out of reach for now. In the longer run, decline in USD seems excessive, but there is potential for a test of 7.2420, UOB Group’s FX analysts Quek Ser Leang and Lee Sue Ann note.
Decline in USD seems excessive
24-HOUR VIEW: “While we noted yesterday that ‘downward momentum is building,’ we were of the view that ‘this will likely lead to a lower trading range of 7.3200/7.3500 instead of a sustained decline.’ Instead of trading in a lower range, USD plunged, reaching a low of 7.2600. While further weakness is not ruled out, given the deeply oversold conditions, the major support at 7.2420 is likely out of reach (there is another support level at 7.2500). Resistance levels are at 7.3000 and 7.3140.”
1-3 WEEKS VIEW: “We revised our view to neutral yesterday (20 Jan, spot at 7.3360), we indicated that ‘upward momentum has dissipated.’ We pointed out that ‘there has been a slight increase in downward momentum, but it is not sufficient to indicate a sustained decline.’ We did not expect USD to plunge by 1.04% (7.2650), its biggest 1-day drop in 5-1/2 months. While the decline seems excessive, there is potential for USD to test the support at 7.2420. For the time being, the significant support at 7.2290 is unlikely to come into view. To keep the momentum going, USD must remain below 7.3380.”
US Dollar (USD) could break 154.90; the next major support at 154.40 is likely out of reach for now. In the longer run, USD remains weak; if it breaks below 154.90, the next objective will be at 154.40, UOB Group’s FX analysts Quek Ser Leang and Lee Sue Ann note.
USD remains weak
24-HOUR VIEW: “Last Friday, USD dropped to 154.96 and then rebounded strongly. Yesterday, when USD was at 156.20, we indicated that ‘the sharp bounce has room to extend, but overbought conditions indicate that any advance is unlikely to threaten the strong resistance at 156.70.’ USD subsequently rose to 156.58 and then pulled back, closing at 155.59 (-0.45%). It traded on a soft note in early Asian trade today, and downward momentum is building. It could break below 154.90, but the next major support at 154.40 is likely out of reach for now. Resistance levels are at 155.75 and 156.25.”
1-3 WEEKS VIEW: “In our update from last Friday (17 Jan, spot at 156.20), we indicated that USD ‘remains weak.’ We also indicated that ‘if it breaks below 154.90, the next objective will be at 154.40.’ There is no change in our view. Overall, only a breach of 156.70 (no change in ‘strong resistance’ would mean that USD weakness has stabilised.”
- Germany’s ZEW Economic Sentiment Index dropped to 10.3 in January.
- EUR/USD holds losses near 1.0350 after German and Eurozone ZEW surveys.
The headline German ZEW Economic Sentiment Index declined to 10.3 in January from 15.7 in December, missing the market consensus of 15.3.
The Current Situation Index improved to -90.4 in the same period, as against December’s -93.1 figure. Data beat the expected -93.1 reading.
The Eurozone ZEW Economic Sentiment Index arrived at 18 in January versus 17 in December. The market forecast was 16.9.
Key points
The second consecutive year of recession caused economic expectations in Germany to fall.
A lack of private household spending and subdued demand in the construction sector continue to stall the German economy.
If these trends continue in the current year, Germany will fall further behind the other countries of the Eurozone.
There is also greater political uncertainty, driven by coalition-building process in Germany and unpredictability of Trump economic policy.
Market reaction
The EUR/USD pair remains heavy after the mixed German and Eurozone ZEW surveys. The pair is losing 0.58% on the day to trade near 1.0350, at the press time.
Euro PRICE Today
The table below shows the percentage change of Euro (EUR) against listed major currencies today. Euro was the weakest against the US Dollar.
| USD | EUR | GBP | JPY | CAD | AUD | NZD | CHF | |
|---|---|---|---|---|---|---|---|---|
| USD | 0.61% | 0.63% | 0.23% | 0.77% | 0.67% | 0.76% | 0.47% | |
| EUR | -0.61% | 0.01% | -0.40% | 0.16% | 0.06% | 0.15% | -0.14% | |
| GBP | -0.63% | -0.01% | -0.46% | 0.15% | 0.05% | 0.13% | -0.17% | |
| JPY | -0.23% | 0.40% | 0.46% | 0.58% | 0.48% | 0.56% | 0.26% | |
| CAD | -0.77% | -0.16% | -0.15% | -0.58% | -0.10% | -0.01% | -0.31% | |
| AUD | -0.67% | -0.06% | -0.05% | -0.48% | 0.10% | 0.08% | -0.20% | |
| NZD | -0.76% | -0.15% | -0.13% | -0.56% | 0.01% | -0.08% | -0.31% | |
| CHF | -0.47% | 0.14% | 0.17% | -0.26% | 0.31% | 0.20% | 0.31% |
The heat map shows percentage changes of major currencies against each other. The base currency is picked from the left column, while the quote currency is picked from the top row. For example, if you pick the Euro from the left column and move along the horizontal line to the US Dollar, the percentage change displayed in the box will represent EUR (base)/USD (quote).
- EUR/USD corrects lower after revisiting a two-week high of 1.0430 as the US Dollar pares some of Monday’s losses.
- The US Dollar rebounds as Donald Trump confirms that the tariff hike plan remains afloat.
- Trump aims to fix the trade imbalance with Europe, which would keep the Euro on the backfoot.
EUR/USD corrects lower to near 1.0350 in Tuesday’s European session after surging to 1.0430 on Monday. The major currency pair faces pressure on Tuesday as the US Dollar (USD) pares some of Monday’s losses. The US Dollar Index (DXY), which tracks the Greenback’s value against six major currencies, bounces back around 108.50 from its almost two-week low slightly below 108.00.
The Greenback dived vertically on Monday as Donald Trump’s presidential memo lacked immediate tariff imposition on foreign countries. The memo was directing federal agencies to study trade policies and evaluate US trade relationships with China and America’s continental neighbors, the Wall Street Journal (WSJ) reported.
Donald Trump clarified that the proposal of universal tariff hikes is on the table but “we are not ready for that yet”. However, he highlighted the sizeable trade deficit issue with the Eurozone. Trump said that he would remedy the trade imbalance either by “raising tariffs or Europe buying more US oil and gas”, Reuters reported.
The absence of tariff hikes by in Trump's comments on his first day at the White House led to a strong buying in risk-sensitive currencies. The Euro (EUR) rallied almost 1.3% against the US Dollar despite fears of higher tariffs remaining intact.
Daily digest market movers: EUR/USD falls back below 1.0400 amid firm ECB dovish bets
- EUR/USD fails to sustain above the key level of 1.0400 due to a slight recovery in the US Dollar. Market participants are divided over US Dollar’s outlook as Trump has delayed tariff orders. The Greenback had a strong run-up in the last three months as investors feared that Trump would probably slap hefty tariffs soon after returning to the White House.
- Firm expectations that the Federal Reserve (Fed) will follow a more gradual policy-easing approach this year are expected to limit the downside in the US Dollar. According to the CME FedWatch tool, traders are confident that the Fed will not cut interest rates in the coming policy meetings later this month and in March.
- On the contrary, solid European Central Bank (ECB) dovish bets would continue weighing on the Euro. Market participants expect the ECB to keep easing its Deposit Facility rate at a gradual pace of 25 basis points (bps) for the next four policy meetings. Also, a string of ECB officials are comfortable with dovish bets.
- On Monday, ECB policymaker and Croatian central bank chief Boris Vujčić said, "I don't feel uncomfortable with the current market pricing.". Vujčić added that risks to the inflation outlook are broadly balanced.
Technical Analysis: EUR/USD corrects lower from a two-week high of 1.0430
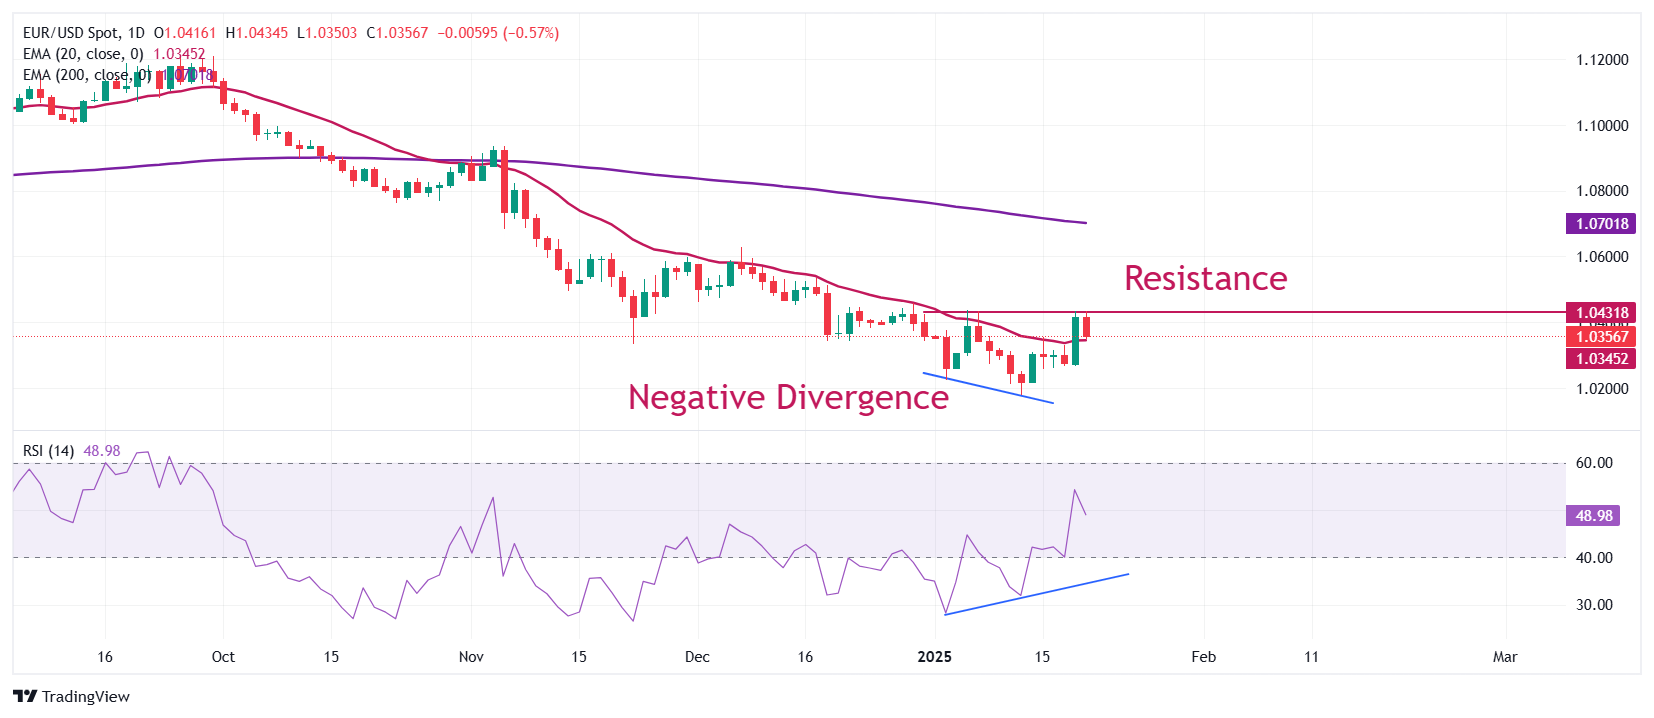
EUR/USD drops after revisiting a two-week high of 1.0430 in Tuesday’s European session. The major currency pair rebounds after a divergence in momentum and price action. The 14-day Relative Strength Index (RSI) formed a higher low, while the pair made lower lows.
The near-term outlook has improved as EUR/USD climbs above the 20-day Exponential Moving Average (EMA), which trades around 1.0346. However, the longer-term outlook remains bearish as the 200-day EMA at 1.0702 points downwards.
Looking down, the January 13 low of 1.0177 will be the key support zone for the pair. Conversely, the psychological resistance of 1.0500 will be the key barrier for the Euro bulls.
Euro FAQs
The Euro is the currency for the 19 European Union countries that belong to the Eurozone. It is the second most heavily traded currency in the world behind the US Dollar. In 2022, it accounted for 31% of all foreign exchange transactions, with an average daily turnover of over $2.2 trillion a day. EUR/USD is the most heavily traded currency pair in the world, accounting for an estimated 30% off all transactions, followed by EUR/JPY (4%), EUR/GBP (3%) and EUR/AUD (2%).
The European Central Bank (ECB) in Frankfurt, Germany, is the reserve bank for the Eurozone. The ECB sets interest rates and manages monetary policy. The ECB’s primary mandate is to maintain price stability, which means either controlling inflation or stimulating growth. Its primary tool is the raising or lowering of interest rates. Relatively high interest rates – or the expectation of higher rates – will usually benefit the Euro and vice versa. The ECB Governing Council makes monetary policy decisions at meetings held eight times a year. Decisions are made by heads of the Eurozone national banks and six permanent members, including the President of the ECB, Christine Lagarde.
Eurozone inflation data, measured by the Harmonized Index of Consumer Prices (HICP), is an important econometric for the Euro. If inflation rises more than expected, especially if above the ECB’s 2% target, it obliges the ECB to raise interest rates to bring it back under control. Relatively high interest rates compared to its counterparts will usually benefit the Euro, as it makes the region more attractive as a place for global investors to park their money.
Data releases gauge the health of the economy and can impact on the Euro. Indicators such as GDP, Manufacturing and Services PMIs, employment, and consumer sentiment surveys can all influence the direction of the single currency. A strong economy is good for the Euro. Not only does it attract more foreign investment but it may encourage the ECB to put up interest rates, which will directly strengthen the Euro. Otherwise, if economic data is weak, the Euro is likely to fall. Economic data for the four largest economies in the euro area (Germany, France, Italy and Spain) are especially significant, as they account for 75% of the Eurozone’s economy.
Another significant data release for the Euro is the Trade Balance. This indicator measures the difference between what a country earns from its exports and what it spends on imports over a given period. If a country produces highly sought after exports then its currency will gain in value purely from the extra demand created from foreign buyers seeking to purchase these goods. Therefore, a positive net Trade Balance strengthens a currency and vice versa for a negative balance.
Robust momentum indicates New Zealand Dollar (NZD) could break above 0.5700, but it might not be able to maintain a foothold above this level. In the longer run, NZD is likely to continue to rise, potentially reaching the major resistance at 0.5750, UOB Group’s FX analysts Quek Ser Leang and Lee Sue Ann note.
NZD is likely to continue to rise
24-HOUR VIEW: “The sharp surge in NZD that sent it to a high of 0.5682 was surprising (we were expecting sideways trading). While the advance is overbought, robust momentum indicates NZD could break above 0.5700. Given the overbought conditions, it might not be able to maintain a foothold above this level. The next major resistance at 0.5750 is also unlikely to come into view for now. Support is at 0.5620; a breach of 0.5630 would indicate that the current strong upward pressure has eased.”
1-3 WEEKS VIEW: “We indicated yesterday (20 Jan, spot at 0.5585) that the recent ‘upward momentum has largely faded, and from here, we expect NZD to trade in a 0.5540/0.5650 range.’ We did not anticipate the resurgence in momentum, as NZD soared above 0.5650, reaching a high of 0.5682. NZD is likely to continue to rise, potentially reaching the major resistance at 0.5750. We will maintain our positive NZD view as long as 0.5600 is not breached.”
EUR/GBP was unfazed this morning by the release of UK labour figures. Wage growth excluding bonuses was slightly higher than expected. However, the month-on-month increase in private sector pay, which the Bank of England (BoE) closely monitors, was more subdued, ING’s FX analyst Francesco Pesole notes.
EUR/GBP is looking at some upside risks
“This figure has been fluctuating and follows a stronger reading previously. Unemployment figures have been rather unreliable, but there are still broad indications that the jobs market is cooling enough to reduce wage growth over the year ahead. The BoE’s recent CFO survey shows expected wage growth dropping below 4% in recent months. This doesn’t significantly alter the BoE’s outlook, with a February rate cut still our base case.”
“EUR/GBP is looking at some upside risks in the short term as markets can still price in more Bank of England easing and continue to embed idiosyncratic GBP risks related to higher borrowing rates. At the same time, as discussed above, the euro could see some tentative relief on Trump not targeting the EU with tariffs for now.”
European Central Bank (ECB) policymaker Francois Villeroy de Galhau said on Tuesday that “there is a plausible consensus that we will act at each meeting.”
Additional quotes
We are not on a pre-set course on rates.
Among major central banks, ECB has the simplest course.
Our view on inflation is quite assured.
Staying vigilant but not worried about inflation.
Progress towards victory against inflation is on track.
If we are decisive about the pace of rate cuts, we don't need larger ones.
But would not rule out larger rate cuts in the future.
Market reaction
EUR/USD extends losses below 1.0350 following these comments, down 0.64% on the day at press time.
Australian Dollar (AUD) could break above 0.6305; the next major resistance at 0.6350 is likely out of reach for now. In the longer run, current price action is likely the early stages of a recovery phase that could potentially reach 0.6350, UOB Group’s FX analysts Quek Ser Leang and Lee Sue Ann note.
Below 0.6190, the current momentum is going to fade
24-HOUR VIEW: “When AUD was at 0.6195 yesterday, we expected it to ‘trade in a 0.6165/0.6220 range.’ Instead of trading in a range, AUD jumped, surging to a high of 0.6287. The impulsive momentum is likely to outweigh the overbought conditions. Today, provided that 0.6205 (minor support is at 0.6240) is not breached, AUD could break above 0.6305. The next major resistance at 0.6350 is likely out of reach for now.”
1-3 WEEKS VIEW: “We noted yesterday (20 Jan, spot at 0.6195) that the recent ‘buildup in upward momentum seems to have faded.’ We indicated that AUD ‘for the time being, AUD is likely to trade in a 0.6140/0.6245 range.’ Our shift to a neutral stance was ill-timed, as AUD lifted and broke the significant resistance at 0.6245. The current price action is likely the early stages of a recovery phase that could potentially reach 0.6350. To keep the momentum going, AUD must not break below 0.6190.”
Silver prices (XAG/USD) fell on Tuesday, according to FXStreet data. Silver trades at $30.38 per troy ounce, down 0.58% from the $30.56 it cost on Monday.
Silver prices have increased by 5.15% since the beginning of the year.
| Unit measure | Silver Price Today in USD |
|---|---|
| Troy Ounce | 30.38 |
| 1 Gram | 0.98 |
The Gold/Silver ratio, which shows the number of ounces of Silver needed to equal the value of one ounce of Gold, stood at 89.51 on Tuesday, up from 88.65 on Monday.
Silver FAQs
Silver is a precious metal highly traded among investors. It has been historically used as a store of value and a medium of exchange. Although less popular than Gold, traders may turn to Silver to diversify their investment portfolio, for its intrinsic value or as a potential hedge during high-inflation periods. Investors can buy physical Silver, in coins or in bars, or trade it through vehicles such as Exchange Traded Funds, which track its price on international markets.
Silver prices can move due to a wide range of factors. Geopolitical instability or fears of a deep recession can make Silver price escalate due to its safe-haven status, although to a lesser extent than Gold's. As a yieldless asset, Silver tends to rise with lower interest rates. Its moves also depend on how the US Dollar (USD) behaves as the asset is priced in dollars (XAG/USD). A strong Dollar tends to keep the price of Silver at bay, whereas a weaker Dollar is likely to propel prices up. Other factors such as investment demand, mining supply – Silver is much more abundant than Gold – and recycling rates can also affect prices.
Silver is widely used in industry, particularly in sectors such as electronics or solar energy, as it has one of the highest electric conductivity of all metals – more than Copper and Gold. A surge in demand can increase prices, while a decline tends to lower them. Dynamics in the US, Chinese and Indian economies can also contribute to price swings: for the US and particularly China, their big industrial sectors use Silver in various processes; in India, consumers’ demand for the precious metal for jewellery also plays a key role in setting prices.
Silver prices tend to follow Gold's moves. When Gold prices rise, Silver typically follows suit, as their status as safe-haven assets is similar. The Gold/Silver ratio, which shows the number of ounces of Silver needed to equal the value of one ounce of Gold, may help to determine the relative valuation between both metals. Some investors may consider a high ratio as an indicator that Silver is undervalued, or Gold is overvalued. On the contrary, a low ratio might suggest that Gold is undervalued relative to Silver.
(An automation tool was used in creating this post.)
- GBP/JPY received downward pressure after the UK employment data released on Tuesday.
- The ILO Unemployment Rate (3M) rose to 4.4% in November, exceeding expectations and the previous rate of 4.3%.
- Japan's Kato remarked that the BoJ is anticipated to adjust its monetary policies appropriately to meet the 2% inflation target.
GBP/JPY experiences a decline after two consecutive days of gains, trading around 190.90 during the European session on Tuesday. The Pound Sterling (GBP) faces pressure following the release of labor market data from the United Kingdom (UK).
The ILO Unemployment Rate increased to 4.4% from September to November 2024, surpassing market expectations and the previous rate of 4.3%. This marks the highest level since the three months ending in May 2024.
The Employment Change rose by 35,000 in the three months to November, a sharp slowdown from the 173,000 increase in the prior period. Nonetheless, this marks the eighth consecutive three-month period of job growth.
On a positive note, UK Average Earnings Excluding Bonus, a key indicator of wage growth, rose by a solid 5.6%, beating estimates of 5.5% and the prior 5.2%. Average Earnings Including Bonus also grew by 5.6%, in line with expectations and surpassing the 5.2% growth seen in the three months ending October.
On Tuesday, Japan’s Finance Minister Katsunobu Kato stated that the BoJ is expected to implement monetary policies appropriately to achieve its 2% inflation target. Kato also added that Japan will respond accordingly after evaluating the new US President’s policies and will closely monitor the impact of US policies on both the global economy and Japan.
Recent hawkish comments from Bank of Japan Governor Kazuo Ueda and Deputy Governor Ryozo Himino, coupled with growing inflationary pressures in Japan, have increased expectations for an imminent rate hike by the Bank of Japan (BoJ). The markets are now pricing in an 80% chance of a rate hike later this week.
Economic Indicator
ILO Unemployment Rate (3M)
The ILO Unemployment Rate released by the UK Office for National Statistics is the number of unemployed workers divided by the total civilian labor force. It is a leading indicator for the UK Economy. If the rate goes up, it indicates a lack of expansion within the UK labor market. As a result, a rise leads to a weakening of the UK economy. Generally, a decrease of the figure is seen as bullish for the Pound Sterling (GBP), while an increase is seen as bearish.
Read more.Last release: Tue Jan 21, 2025 07:00
Frequency: Monthly
Actual: 4.4%
Consensus: 4.3%
Previous: 4.3%
Source: Office for National Statistics
The Unemployment Rate is the broadest indicator of Britain’s labor market. The figure is highlighted by the broad media, beyond the financial sector, giving the publication a more significant impact despite its late publication. It is released around six weeks after the month ends. While the Bank of England is tasked with maintaining price stability, there is a substantial inverse correlation between unemployment and inflation. A higher than expected figure tends to be GBP-bearish.
The first day of Donald Trump's presidency was a volatile one for FX markets. The US Dollar (USD) tumbled before the inauguration as markets got tipped off by media reports that Trump would not impose tariffs on day one. The large dollar long positioning into the event and potentially some thinner liquidity due to US holiday may have exacerbated the move. In the slew of day-one executive orders, Trump confirmed the establishment of the External Revenue Service tasked with collecting tariff and duties, ING’s FX analyst Francesco Pesole notes.
Markets are at least cautiously optimistic
Other executive orders declared a national emergency at the border and on energy, and unwinding some of former president Joe Biden’s green energy measures. However, later in the day, Trump said he would likely impose 25% tariffs on Canada and Mexico by 1 February. That generated a rebound in the dollar – with CAD and MXN erasing daily gains. Still, DXY is trading around 0.7% off Friday’s close, as markets are at least cautiously optimistic that indiscriminate universal tariffs won’t be delivered all in one go. Understandably, European currencies and those exposed to China are receiving the most support. At this point, there is more downside room for CAD and MXN to fall should Trump follow through with the tariff threat.”
“Canada is currently led by outgoing prime minister Justin Trudeau, about to face a Liberal Party leadership contest for his replacement, and likely to face early elections. It was reported that Canadian officials had already laid out plans to retaliate against US tariffs targeting products that would asymmetrically damage US producers compared to the domestic impact on consumers. We estimate USD/CAD is embedding just above 2% in risk premium. That is less than in previous weeks, signalling markets may still not fully price in the 25% tariff risk and opening up more upside potential for the pair. Canada will also release CPI data today, but that will likely have limited impact on the currency. We expect a USD/CAD rally north of the 1.45 area for now.”
“Despite yesterday's positioning readjustments, dollar net longs likely remain stretched. For reference, we calculate that CFTC net dollar positioning versus reported G10 currencies was at +24% a week ago, the highest since June 2019. With that in mind, European currencies and China proxies can hang on to gains for a little longer. Data will play a secondary role this week as all the attention will be on Trump’s first executive orders. Incidentally, the Federal Reserve is in the quiet period ahead of next Wednesday’s meeting. Expect a lot of ‘headline trading’ and short-term noise, with risks still skewed for a stronger dollar.”
- The Canadian Consumer Price Index is seen advancing by 1.8% YoY in December.
- The Bank of Canada has lowered its interest rate by 175 basis points in 2024.
- The Canadian Dollar navigates multi-year lows against its American peer.
Statistics Canada is set to release its latest inflation report for December, based on the Consumer Price Index (CPI), this Tuesday. Early forecasts suggest headline inflation may have risen by 1.8% compared to the same month of the previous year.
In addition to the headline figures, the Bank of Canada (BoC) will publish its core CPI data, which excludes more unpredictable items like food and energy. For context, November’s core CPI showed a 0.1% contraction compared to the previous month but showed a 1.6% increase from a year earlier. Meanwhile, headline inflation for November rose just 1.9% annually and actually came in flat on a monthly basis.
These inflation numbers are under a microscope, particularly because of their potential impact on the Canadian Dollar (CAD). The BoC’s approach to interest rates plays a critical role here. The central bank has already reduced its policy rate by 175 basis points since it began easing in June 2024, bringing it down to 3.25% on December 11.
On the currency front, the CAD has faced significant challenges, losing value steadily. This has pushed the USD/CAD exchange rate to its highest levels since May 2020, breaching the 1.4400 mark. Markets will be paying close attention to Tuesday’s data to gauge what might come next for the Canadian economy and its currency.
What can we expect from Canada’s inflation rate?
The Bank of Canada’s decision to cut rates by 50 basis points on December 11 to 3.25% was a close call, according to the meeting Minutes published on December 23. Some council members favoured a smaller 25 basis point reduction, leading to significant debate. Governor Tiff Macklem signalled that future cuts would likely be more gradual, marking a shift from earlier messaging about the need for steady easing. Proponents of the larger cut cited concerns about weaker growth and downside inflation risks, though not all recent data supported such an aggressive move. The decision highlights the central bank’s careful navigation of economic uncertainties.
Previewing the data release, analysts at TD Securities note: “We look for CPI to edge higher to 2.0% YoY as prices fall by 0.2% MoM. Seasonal headwinds to core goods will weigh heavily on a MoM basis, while food prices and a softer Loonie provide a source of strength. Core inflation should slow by 0.2pp to 2.45% YoY on average as CPI-trim/median overshoot BoC projections for Q4, but we expect the BoC to look through this in January.”
When is the Canada CPI data due, and how could it affect USD/CAD?
Canada's inflation report for December is set to be released on Tuesday at 13:30 GMT, but the Canadian Dollar's reaction will likely depend on whether the data delivers any major surprises. If the figures align with expectations, they are unlikely to influence the Bank of Canada’s current rate outlook.
Meanwhile, USD/CAD has been navigating a consolidative range since mid-December, reaching multi-year highs just beyond the 1.4500 hurdle. This rise has been primarily driven by a robust rebound in the US Dollar (USD), largely attributed to the so-called “Trump trade,” which continues to exert significant pressure on risk-sensitive currencies like the Canadian Dollar.
Pablo Piovano, Senior Analyst at FXStreet, suggests that given the current scenario of persistent gains in the Greenback and heightened volatility in crude oil prices, further weakness in the Canadian Dollar should remain in the pipeline for the time being.
“Bullish attempts should lead USD/CAD to another potential visit to the 2024 peak of 1.4485 (January 20), ahead of the highest level reached in 2020 at 1.4667 (March 19),” Piovano adds.
On the downside, there is an initial support zone at the 2025 low of 1.4278 (January 6), prior to the provisional 55-day SMA at 1.4177 and the psychological 1.4000 threshold. Down from here comes the November low of 1.3823 (November 6), closely followed by the more significant 200-day SMA at 1.3816. Should USD/CAD break below this level, it could trigger additional selling pressure, initially targeting the September low of 1.3418 (September 25), Piovano notes.
Economic Indicator
BoC Consumer Price Index Core (MoM)
The BoC Consumer Price Index Core, released by the Bank of Canada (BoC) on a monthly basis, represents changes in prices for Canadian consumers by comparing the cost of a fixed basket of goods and services. It is considered a measure of underlying inflation as it excludes eight of the most-volatile components: fruits, vegetables, gasoline, fuel oil, natural gas, mortgage interest, intercity transportation and tobacco products. The MoM figure compares the prices of goods in the reference month to the previous month. Generally, a high reading is seen as bullish for the Canadian Dollar (CAD), while a low reading is seen as bearish.
Read more.Next release: Tue Jan 21, 2025 13:30
Frequency: Monthly
Consensus: -
Previous: -0.1%
Source: Statistics Canada
Inflation FAQs
Inflation measures the rise in the price of a representative basket of goods and services. Headline inflation is usually expressed as a percentage change on a month-on-month (MoM) and year-on-year (YoY) basis. Core inflation excludes more volatile elements such as food and fuel which can fluctuate because of geopolitical and seasonal factors. Core inflation is the figure economists focus on and is the level targeted by central banks, which are mandated to keep inflation at a manageable level, usually around 2%.
The Consumer Price Index (CPI) measures the change in prices of a basket of goods and services over a period of time. It is usually expressed as a percentage change on a month-on-month (MoM) and year-on-year (YoY) basis. Core CPI is the figure targeted by central banks as it excludes volatile food and fuel inputs. When Core CPI rises above 2% it usually results in higher interest rates and vice versa when it falls below 2%. Since higher interest rates are positive for a currency, higher inflation usually results in a stronger currency. The opposite is true when inflation falls.
Although it may seem counter-intuitive, high inflation in a country pushes up the value of its currency and vice versa for lower inflation. This is because the central bank will normally raise interest rates to combat the higher inflation, which attract more global capital inflows from investors looking for a lucrative place to park their money.
Formerly, Gold was the asset investors turned to in times of high inflation because it preserved its value, and whilst investors will often still buy Gold for its safe-haven properties in times of extreme market turmoil, this is not the case most of the time. This is because when inflation is high, central banks will put up interest rates to combat it. Higher interest rates are negative for Gold because they increase the opportunity-cost of holding Gold vis-a-vis an interest-bearing asset or placing the money in a cash deposit account. On the flipside, lower inflation tends to be positive for Gold as it brings interest rates down, making the bright metal a more viable investment alternative.
Pound Sterling (GBP) is expected to continue to advance; the significant resistance at 1.2410 is probably out of reach today. In the longer run, GBP view is positive, anticipating a move to 1.2410, UOB Group’s FX analysts Quek Ser Leang and Lee Sue Ann note.
GBP view is positive
24-HOUR VIEW: “Our view for GBP to ‘trade with a downward bias’ yesterday was incorrect. GBP surged, blowing past several resistance levels with ease (high has been 1.2344). Although we expect GBP to continue to advance today, the significant resistance at 1.2410 is probably out of reach today. Note that there is another resistance level at 1.2380. On the downside, any pullback is likely to remain above 1.2240.”
1-3 WEEKS VIEW: “Yesterday (20 Jan, spot at 1.2170), we highlighted, “there has been a tentative buildup in momentum, but GBP must break clearly below 1.2100/1.2130 support zone before further weakness can be expected.” The tentative buildup in momentum fizzled out quickly, as GBP surged above our ‘strong resistance’ level at 1.2305. From here, we are revising our view for GBP to positive, anticipating a move to 1.2410. We will maintain our view as long as the ‘strong support’ level, currently at 1.2210, is not breached. The ‘strong support’ level is set to move higher in the coming days.”
EUR/USD remains cheap and oversold despite yesterday’s rebound. We estimate that the pair is still trading around 1.5% below its short-term fair value, signalling some tariff related risk remains in the price, ING’s FX analyst Francesco Pesole notes.
Any rebound may well fall short of 1.050 in EUR/USD
“The euro could fare well in the crosses if more days pass without Europe being explicitly mentioned in Trump’s tariff comments. That support may, however, prove rather short-lived as things can – as we learned yesterday with Canada and Mexico – change abruptly on protectionism, and the euro remains generally unappealing from a number of macro fundamentals. This means any rebound may well fall short of 1.050 in EUR/USD.”
“On the data side, today’s ZEW surveys out of Germany will tell us whether there is any glimmer of hope in the otherwise gloomy activity picture. Expectations are for broadly unchanged reads since December, which would confirm the recessionary mood.”
- WTI Oil price experiences significant volatility as traders evaluate a series of executive orders issued by President Trump.
- Trump plans to impose 25% tariffs on Canadian imports, raising higher cost risks for the majority of Canada’s Oil exports.
- US President Donald Trump repealed actions taken by former President Joe Biden to restrict Oil drilling.
West Texas Intermediate (WTI) Oil price ended a three-day losing streak, holding steady near $76.20 during European trading hours on Tuesday. Crude Oil markets experienced significant volatility as traders assessed a series of executive orders issued by US President Donald Trump shortly after his inauguration.
One of the key measures included a plan to impose 25% tariffs on imports from Canada and Mexico starting February 1, disappointing investors who had hoped for a delay in implementation. Crude Oil prices gained momentum as the proposed duties on Canadian crude imports were seen as a potential driver for higher market prices.
Canada exports nearly all of its crude Oil to the United States (US), often at a discount to WTI. "US sanctions therefore raise the risk of higher costs for most of Canada's Oil exports," Commonwealth Bank analyst Vivek Dhar noted in a report, according to Reuters.
Former President Donald Trump refrained from announcing specific tariffs on China, the world's largest Oil importer, leaving markets uncertain. Traders are keeping a close eye on developments in tariff policies, as Trump previously threatened China with tariffs of up to 60% in December.
At the same time, concerns about a potential surge in US oil production loomed large, fueled by Trump’s “drill, baby, drill” agenda. On Monday, Trump unveiled an ambitious plan to expedite the permitting process for Oil, gas, and power projects, aiming to boost already record-high US energy production.
One of Trump’s executive orders on his first day in office repealed actions taken by former President Joe Biden to restrict Oil drilling. Trump reversed Biden’s ban on Oil drilling in the Arctic and along extensive areas of the US coastline.
According to the White House, Trump also nullified a 2023 memo that had prohibited Oil drilling across 16 million acres (6.5 million hectares) in the Arctic. These moves signaled a sharp policy shift and highlighted the administration's commitment to maximizing domestic energy output.
WTI Oil FAQs
WTI Oil is a type of Crude Oil sold on international markets. The WTI stands for West Texas Intermediate, one of three major types including Brent and Dubai Crude. WTI is also referred to as “light” and “sweet” because of its relatively low gravity and sulfur content respectively. It is considered a high quality Oil that is easily refined. It is sourced in the United States and distributed via the Cushing hub, which is considered “The Pipeline Crossroads of the World”. It is a benchmark for the Oil market and WTI price is frequently quoted in the media.
Like all assets, supply and demand are the key drivers of WTI Oil price. As such, global growth can be a driver of increased demand and vice versa for weak global growth. Political instability, wars, and sanctions can disrupt supply and impact prices. The decisions of OPEC, a group of major Oil-producing countries, is another key driver of price. The value of the US Dollar influences the price of WTI Crude Oil, since Oil is predominantly traded in US Dollars, thus a weaker US Dollar can make Oil more affordable and vice versa.
The weekly Oil inventory reports published by the American Petroleum Institute (API) and the Energy Information Agency (EIA) impact the price of WTI Oil. Changes in inventories reflect fluctuating supply and demand. If the data shows a drop in inventories it can indicate increased demand, pushing up Oil price. Higher inventories can reflect increased supply, pushing down prices. API’s report is published every Tuesday and EIA’s the day after. Their results are usually similar, falling within 1% of each other 75% of the time. The EIA data is considered more reliable, since it is a government agency.
OPEC (Organization of the Petroleum Exporting Countries) is a group of 12 Oil-producing nations who collectively decide production quotas for member countries at twice-yearly meetings. Their decisions often impact WTI Oil prices. When OPEC decides to lower quotas, it can tighten supply, pushing up Oil prices. When OPEC increases production, it has the opposite effect. OPEC+ refers to an expanded group that includes ten extra non-OPEC members, the most notable of which is Russia.
Potential for Euro (EUR) to rise above 1.0440; the significant resistance at 1.0480 is unlikely to come under threat for now. Current price action is part of a recovery phase that could extend to 1.0480, UOB Group’s FX analysts Quek Ser Leang and Lee Sue Ann note.
Current price action is part of a recovery phase
24-HOUR VIEW: “After trading in a range for a few days, EUR lifted off during NY session, surging to a high of 1.0434. While the impulsive momentum suggests further EUR strength, any advance could be relatively limited due to deeply overbought conditions. Overall, there is potential for EUR to rise above 1.0440, but the significant resistance at 1.0480 is unlikely to come under threat for now. Support levels are at 1.0385 and 1.0350.”
1-3 WEEKS VIEW: “We revised our view to neutral last Wednesday (15 Jan, spot at 1.0300), indicating that EUR ‘has likely entered a range trading phase, and it is likely to trade between 1.0220 and 1.0400 for the time being.’ EUR subsequently traded in a range, and yesterday (20 Jan, spot at 1.0275), we indicated that ‘further range is likely, but given the decreasing volatility, we expect price movements to be confined to a narrower range of 1.0220/1.0365 for now.’ We did not expect EUR to lift off and blew past 1.0365. EUR closed sharply higher by 1.39% (1.0414). The current price action is likely part of a recovery stage that could extend to 1.0480. Should EUR break above 1.0480, it could lead to a more sustained and sizeable advance. We will view EUR favourably from here, as long as 1.0305 (‘strong support’ level) is not breached.”
US President Trump pledged to put America’s interests first to return the country to ‘a golden age’, reversing the US decline while taking on ‘a radical and corrupt establishment’ and ‘stop the weaponization of law enforcement’, UOB Group’s Senior Economist Alvin Liew notes.
Tariffs on hold for now but for how long
“Trump also lived up to his promise, kicking off his presidency right at the start with a flurry of executive orders, memoranda and proclamations, repealing many of the Biden administration mandates and executing his ‘America First’ policies.”
“Energy policies and immigration (border security) featured prominently on Trump’s Day 1, with markets relieved for now that there was an absence of concrete tariff measures. But a delay does not imply no tariffs.”
|We maintain our base case scenario (55%) for more measured imposition of tariffs (Additional 25% tariff on China, instead of the claimed 60%, 10% tariffs on economies that recorded increase in trade surplus with US due to trade diversion from China, and no blanket tariff on all US imports), with a staggered implementation pace from as early as 2Q 2025 and fully completed by 1H 2026.”
- The Pound Sterling remains steady against its major peers on Tuesday after the UK labor market data showed that wage growth accelerated.
- UK labor demand remained weak as employers dissented from the government’s decision to direct them to higher NI contributions.
- Traders see the Fed keeping interest rates steady in the next two policy meetings.
The Pound Sterling (GBP) remains steady against its major peers on Tuesday after the United Kingdom (UK) Office for National Statistics (ONS) showed that Average Earnings accelerated in three months ending November. The agency reported that Average Earnings Excluding Bonus, a key measure of wage growth, rose at a robust pace of 5.6%, faster than estimates of 5.5% and the former 5.2%.
Average Earnings Including Bonus also rose by 5.6%, as expected, faster than the 5.2% growth in three months ending October.
Meanwhile, labor growth remained significantly weak, with a fresh addition of 35K workers against the former reading of 173K. The ILO Unemployment Rate rose to 4.4%, higher than estimates and the prior release of 4.3%. Weak labor growth clearly shows employers’ discontent with the government’s decision to increase their contribution to National Insurance (NI).
Bank of England (BoE) officials closely track wage growth data when deciding on interest rates, as wage growth is a major contributor to inflationary pressures in the UK service sector. Technically, stronger-than-expected UK wage growth should have jeopardized recent growing expectations that the BoE will reduce interest rates by 25 basis points (bps) to 4.5% in the policy meeting on February 6. However, soft labor demand would offset this.
Daily digest market movers: Pound Sterling struggles to hold recovery against US Dollar
- The Pound Sterling corrects against the US Dollar (USD) on Tuesday after failing to sustain the recovery move to near a 10-day high of 1.2344. The GBP/USD pair declines as the US Dollar (USD) bounces back after President Donald Trump confirms that the universal tariff hikes proposal remains afloat, but “We are not ready for that yet”.
- A delay in the tariff hike plan has jeopardized the US Dollar’s outlook as market participants anticipated that the imposition of hefty tariffs would be one of the initial decisions by Trump soon after returning to the White House. The assumption of higher tariffs also forced traders to raise bets supporting the Federal Reserve (Fed) to keep interest rates at their current levels for longer.
- Meanwhile, market speculation that the Fed will not announce an interest rate cut decision in the next two monetary policy meetings remains intact. Still, traders are divided over the May policy meeting decision. According to the CME FedWatch tool, traders see an almost 50% chance that the Fed will keep interest rates in the current range of 4.25%-4.50% in May.
- On the economic front, investors will pay close attention to the preliminary US S&P Global Purchasing Managers Index (PMI) data for January, which will be published on Friday.
Technical Analysis: Pound Sterling aims to recapture 20-day EMA
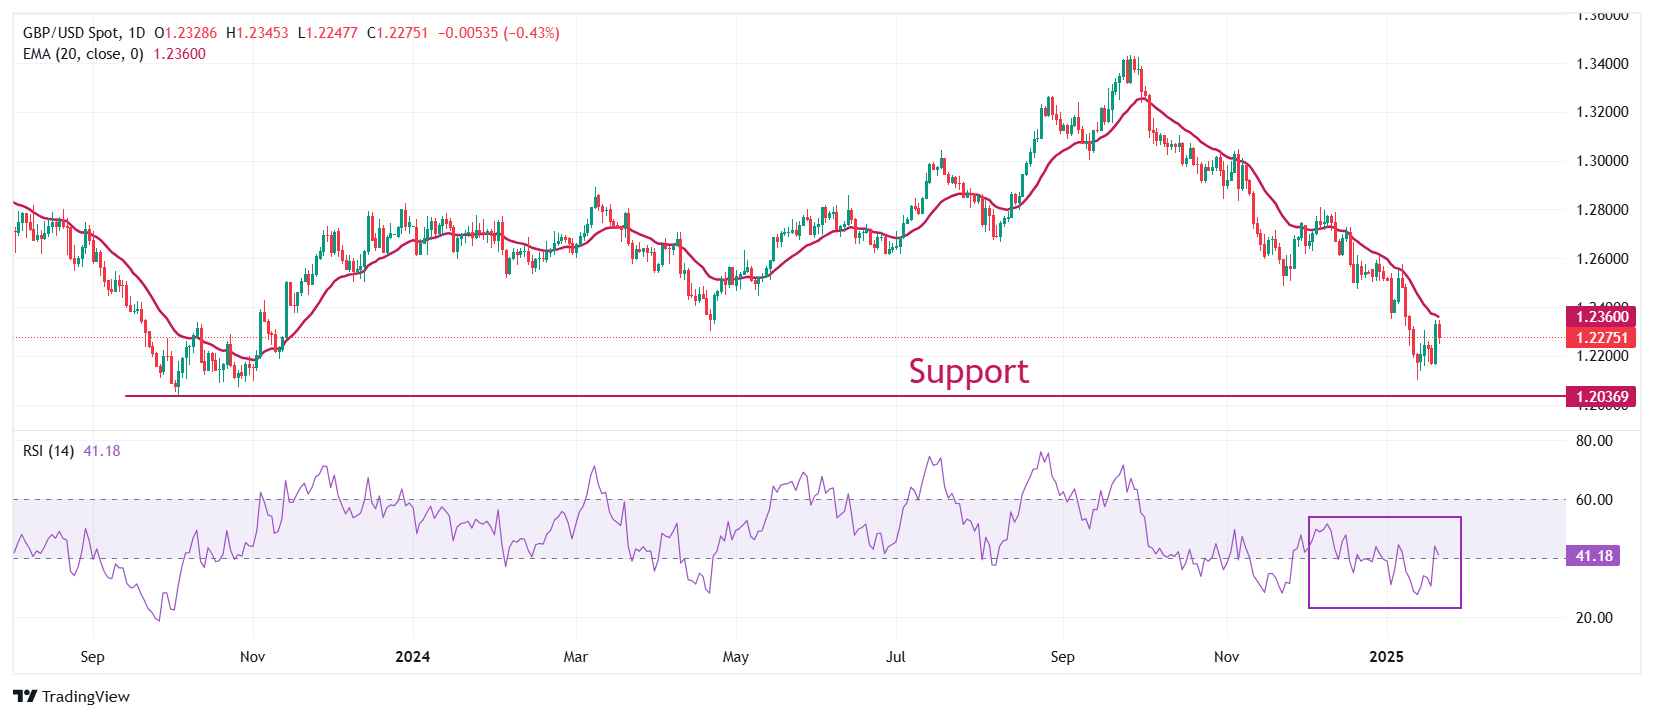
The Pound Sterling declines to near 1.2275 against the US Dollar on Tuesday after posting a fresh 10-day high near 1.2345 earlier in the day. The GBP/USD pair rebounded but failed to reclaim the 20-day Exponential Moving Average (EMA), which trades around 1.2360.
The 14-day Relative Strength Index (RSI) rebounds above 40.00. The bearish momentum would end if the RSI manages to sustain above that level.
Looking down, the pair is expected to find support near the October 2023 low of 1.2050. On the upside, the round-level resistance of 1.2400 will act as key resistance.
Pound Sterling FAQs
The Pound Sterling (GBP) is the oldest currency in the world (886 AD) and the official currency of the United Kingdom. It is the fourth most traded unit for foreign exchange (FX) in the world, accounting for 12% of all transactions, averaging $630 billion a day, according to 2022 data. Its key trading pairs are GBP/USD, also known as ‘Cable’, which accounts for 11% of FX, GBP/JPY, or the ‘Dragon’ as it is known by traders (3%), and EUR/GBP (2%). The Pound Sterling is issued by the Bank of England (BoE).
The single most important factor influencing the value of the Pound Sterling is monetary policy decided by the Bank of England. The BoE bases its decisions on whether it has achieved its primary goal of “price stability” – a steady inflation rate of around 2%. Its primary tool for achieving this is the adjustment of interest rates. When inflation is too high, the BoE will try to rein it in by raising interest rates, making it more expensive for people and businesses to access credit. This is generally positive for GBP, as higher interest rates make the UK a more attractive place for global investors to park their money. When inflation falls too low it is a sign economic growth is slowing. In this scenario, the BoE will consider lowering interest rates to cheapen credit so businesses will borrow more to invest in growth-generating projects.
Data releases gauge the health of the economy and can impact the value of the Pound Sterling. Indicators such as GDP, Manufacturing and Services PMIs, and employment can all influence the direction of the GBP. A strong economy is good for Sterling. Not only does it attract more foreign investment but it may encourage the BoE to put up interest rates, which will directly strengthen GBP. Otherwise, if economic data is weak, the Pound Sterling is likely to fall.
Another significant data release for the Pound Sterling is the Trade Balance. This indicator measures the difference between what a country earns from its exports and what it spends on imports over a given period. If a country produces highly sought-after exports, its currency will benefit purely from the extra demand created from foreign buyers seeking to purchase these goods. Therefore, a positive net Trade Balance strengthens a currency and vice versa for a negative balance.
- NZD/USD weakened as President Trump announced plans to direct federal agencies to review tariff policies.
- Traders speculate that Trump’s policies could drive inflationary pressures, potentially limiting the Fed to just one additional rate cut.
- Business NZ PSI fell to 47.9 in December from 49.5 in November, extending its contraction streak to ten consecutive months.
NZD/USD retraces its recent gains from the previous session, trading near 0.5650 during early European hours on Tuesday. The pair experienced volatility as US President Donald Trump's inauguration day created ripples in the markets.
The US Dollar (USD) appreciated following reports that Trump plans to direct federal agencies to review tariff policies and reassess the United States' trade relationships with Canada, Mexico, and China.
However, the NZD/USD gained some footing as the Greenback came under pressure. This was driven by Trump's apparent efforts to strengthen ties with Chinese President Xi Jinping, the TikTok deal, and hints of a potentially softer stance on tariffs.
US President Donald Trump stated, "If we make a TikTok deal and China doesn’t approve it, we could maybe put tariffs on China." This comment came after he signed an executive order delaying the enforcement of the TikTok ban by 75 days. Given the close trade relationship between China and New Zealand, any changes in China's economy could influence New Zealand's markets.
Meanwhile, the New Zealand Dollar (NZD) faced downward pressure as Business NZ's data reported a decline in the country’s Performance of Services Index (PSI). The PSI dropped to 47.9 in December from 49.5 in November, marking ten consecutive months of contraction.
Traders will closely monitor Wednesday’s Consumer Price Index (CPI) data, as the annual inflation rate is anticipated to drop to its lowest level since 2021. Markets are currently pricing in an 80% probability that the Reserve Bank of New Zealand (RBNZ) will cut its cash rate from 4.25% to 3.75% next month.
New Zealand Dollar FAQs
The New Zealand Dollar (NZD), also known as the Kiwi, is a well-known traded currency among investors. Its value is broadly determined by the health of the New Zealand economy and the country’s central bank policy. Still, there are some unique particularities that also can make NZD move. The performance of the Chinese economy tends to move the Kiwi because China is New Zealand’s biggest trading partner. Bad news for the Chinese economy likely means less New Zealand exports to the country, hitting the economy and thus its currency. Another factor moving NZD is dairy prices as the dairy industry is New Zealand’s main export. High dairy prices boost export income, contributing positively to the economy and thus to the NZD.
The Reserve Bank of New Zealand (RBNZ) aims to achieve and maintain an inflation rate between 1% and 3% over the medium term, with a focus to keep it near the 2% mid-point. To this end, the bank sets an appropriate level of interest rates. When inflation is too high, the RBNZ will increase interest rates to cool the economy, but the move will also make bond yields higher, increasing investors’ appeal to invest in the country and thus boosting NZD. On the contrary, lower interest rates tend to weaken NZD. The so-called rate differential, or how rates in New Zealand are or are expected to be compared to the ones set by the US Federal Reserve, can also play a key role in moving the NZD/USD pair.
Macroeconomic data releases in New Zealand are key to assess the state of the economy and can impact the New Zealand Dollar’s (NZD) valuation. A strong economy, based on high economic growth, low unemployment and high confidence is good for NZD. High economic growth attracts foreign investment and may encourage the Reserve Bank of New Zealand to increase interest rates, if this economic strength comes together with elevated inflation. Conversely, if economic data is weak, NZD is likely to depreciate.
The New Zealand Dollar (NZD) tends to strengthen during risk-on periods, or when investors perceive that broader market risks are low and are optimistic about growth. This tends to lead to a more favorable outlook for commodities and so-called ‘commodity currencies’ such as the Kiwi. Conversely, NZD tends to weaken at times of market turbulence or economic uncertainty as investors tend to sell higher-risk assets and flee to the more-stable safe havens.
- EUR/GBP trades in positive territory near 0.8450 in Tuesday’s early European session.
- UK Unemployment Rate climbed to 4.4% in three months to November; Claimant Count Change came in at 0.7K in December.
- The dovish remarks from the ECB could weigh on the shared currency.
The EUR/GBP cross extends its upside to near 0.8450 during the early European session on Tuesday. The Pound Sterling (GBP) weakens after the UK employment report. Later on Tuesday, traders will keep an eye on Germany’s ZEW Survey for January for fresh impetus.
Data released by the UK Office for National Statistics on Tuesday showed that the country’s ILO Unemployment Rate ticked higher to 4.4% in the three months to November. This figure missed the expectations of 4.3% during the reported period. Meanwhile, the Claimant Count Change increased by 0.7K in December versus -25.1K (revised from 0.3K) prior, beating the expected 10.3K figure. The GBP remains weak in an immediate reaction to the mixed UK employment report.
Additionally, an unexpected decline in the UK Retail Sales data has prompted the Bank of England's (BoE) dovish bets, which weigh on the GBP. The UK central bank is widely anticipated to cut the interest rate by 25 bps at its February meeting. The markets have priced in a total of more than 75 basis points (bps) total rate cuts throughout 2025, up from around 65 bps before the data.
On the other hand, more aggressive market bets on the European Central Bank (ECB) rate cuts could exert some selling pressure on the Euro (EUR). UBS analysts expect at least 150 bps of rate cuts from the ECB over the next 12 months. The ECB policymakers agreed in the December meeting that interest rate cuts should be approached cautiously and gradually, but they also noted that more rate cuts were likely coming given weakening price pressures.
Pound Sterling FAQs
The Pound Sterling (GBP) is the oldest currency in the world (886 AD) and the official currency of the United Kingdom. It is the fourth most traded unit for foreign exchange (FX) in the world, accounting for 12% of all transactions, averaging $630 billion a day, according to 2022 data. Its key trading pairs are GBP/USD, also known as ‘Cable’, which accounts for 11% of FX, GBP/JPY, or the ‘Dragon’ as it is known by traders (3%), and EUR/GBP (2%). The Pound Sterling is issued by the Bank of England (BoE).
The single most important factor influencing the value of the Pound Sterling is monetary policy decided by the Bank of England. The BoE bases its decisions on whether it has achieved its primary goal of “price stability” – a steady inflation rate of around 2%. Its primary tool for achieving this is the adjustment of interest rates. When inflation is too high, the BoE will try to rein it in by raising interest rates, making it more expensive for people and businesses to access credit. This is generally positive for GBP, as higher interest rates make the UK a more attractive place for global investors to park their money. When inflation falls too low it is a sign economic growth is slowing. In this scenario, the BoE will consider lowering interest rates to cheapen credit so businesses will borrow more to invest in growth-generating projects.
Data releases gauge the health of the economy and can impact the value of the Pound Sterling. Indicators such as GDP, Manufacturing and Services PMIs, and employment can all influence the direction of the GBP. A strong economy is good for Sterling. Not only does it attract more foreign investment but it may encourage the BoE to put up interest rates, which will directly strengthen GBP. Otherwise, if economic data is weak, the Pound Sterling is likely to fall.
Another significant data release for the Pound Sterling is the Trade Balance. This indicator measures the difference between what a country earns from its exports and what it spends on imports over a given period. If a country produces highly sought-after exports, its currency will benefit purely from the extra demand created from foreign buyers seeking to purchase these goods. Therefore, a positive net Trade Balance strengthens a currency and vice versa for a negative balance.
Here is what you need to know on Tuesday, January 21:
After declining sharply on the first trading day of the week, the US Dollar (USD) Index benefits from the souring risk mood and gathers bullish momentum on Tuesday. The European economic docket will feature ZEW Survey - Economic Sentiment data for Germany and the Eurozone. Later in the day, December Consumer Price Index (CPI) data from Canada will be watched closely by investors.
US Dollar PRICE Today
The table below shows the percentage change of US Dollar (USD) against listed major currencies today. US Dollar was the strongest against the Canadian Dollar.
| USD | EUR | GBP | JPY | CAD | AUD | NZD | CHF | |
|---|---|---|---|---|---|---|---|---|
| USD | 0.38% | 0.42% | -0.09% | 0.91% | 0.57% | 0.61% | 0.21% | |
| EUR | -0.38% | 0.04% | -0.42% | 0.52% | 0.20% | 0.23% | -0.19% | |
| GBP | -0.42% | -0.04% | -0.50% | 0.48% | 0.15% | 0.19% | -0.22% | |
| JPY | 0.09% | 0.42% | 0.50% | 0.97% | 0.64% | 0.66% | 0.27% | |
| CAD | -0.91% | -0.52% | -0.48% | -0.97% | -0.33% | -0.29% | -0.70% | |
| AUD | -0.57% | -0.20% | -0.15% | -0.64% | 0.33% | 0.03% | -0.37% | |
| NZD | -0.61% | -0.23% | -0.19% | -0.66% | 0.29% | -0.03% | -0.41% | |
| CHF | -0.21% | 0.19% | 0.22% | -0.27% | 0.70% | 0.37% | 0.41% |
The heat map shows percentage changes of major currencies against each other. The base currency is picked from the left column, while the quote currency is picked from the top row. For example, if you pick the US Dollar from the left column and move along the horizontal line to the Japanese Yen, the percentage change displayed in the box will represent USD (base)/JPY (quote).
During the early trading hours of the American session on Monday, reports of US President Donald Trump refraining from announcing day-one tariffs at his inauguration ceremony caused the USD to come under selling pressure. Later in the day, Trump said they could impose tariffs on China if they make a TikTok deal and China doesn't approve it. Additionally, he noted that they are thinking about putting a 25% tariff on imports from Mexico and Canada, triggering a USD rally in the Asian trading hours on Tuesday.
The UK's Office for National Statistics reported on Tuesday that the ILO Unemployment Rate edged higher to 4.4% in the three months to November from 4.3%. Other details of the jobs report showed that Employment Change was +35K in the same period. Finally, wage inflation, as measured by the change in the Average Earnings Including Bonus, climbed to 5.6% from 5.2%, as expected. GBP/USD showed no immediate reaction to these figures and was last seen trading deep in negative territory below 1.2300.
After losing more than 1% on Monday, USD/CAD reversed its direction and touched its highest level since March 2020 above 1.4500 in the Asian session on Tuesday before correcting lower toward 1.4450. On a yearly basis, the CPI in Canada is forecast to rise 1.8% in December, down slightly from the 1.9% increase recorded in November.
USD/MXN turned north as Trump's tariff comments weighed heavily on the Mexican Peso. The pair was last seen gaining more than 1% on a daily basis at 20.7640.
EUR/USD registered strong gains on Monday but lost its traction early Tuesday. At the time of press, the pair was down about 0.4% on the day at 1.0375.
Gold closed marginally higher on Monday and gathered bullish momentum early Tuesday. XAU/USD was last seen trading at its strongest level since early November above $2,725.
Risk sentiment FAQs
In the world of financial jargon the two widely used terms “risk-on” and “risk off'' refer to the level of risk that investors are willing to stomach during the period referenced. In a “risk-on” market, investors are optimistic about the future and more willing to buy risky assets. In a “risk-off” market investors start to ‘play it safe’ because they are worried about the future, and therefore buy less risky assets that are more certain of bringing a return, even if it is relatively modest.
Typically, during periods of “risk-on”, stock markets will rise, most commodities – except Gold – will also gain in value, since they benefit from a positive growth outlook. The currencies of nations that are heavy commodity exporters strengthen because of increased demand, and Cryptocurrencies rise. In a “risk-off” market, Bonds go up – especially major government Bonds – Gold shines, and safe-haven currencies such as the Japanese Yen, Swiss Franc and US Dollar all benefit.
The Australian Dollar (AUD), the Canadian Dollar (CAD), the New Zealand Dollar (NZD) and minor FX like the Ruble (RUB) and the South African Rand (ZAR), all tend to rise in markets that are “risk-on”. This is because the economies of these currencies are heavily reliant on commodity exports for growth, and commodities tend to rise in price during risk-on periods. This is because investors foresee greater demand for raw materials in the future due to heightened economic activity.
The major currencies that tend to rise during periods of “risk-off” are the US Dollar (USD), the Japanese Yen (JPY) and the Swiss Franc (CHF). The US Dollar, because it is the world’s reserve currency, and because in times of crisis investors buy US government debt, which is seen as safe because the largest economy in the world is unlikely to default. The Yen, from increased demand for Japanese government bonds, because a high proportion are held by domestic investors who are unlikely to dump them – even in a crisis. The Swiss Franc, because strict Swiss banking laws offer investors enhanced capital protection.
- USD/CAD spikes to a fresh multi-year peak in reaction to Trump’s tariff remarks.
- A modest USD recovery from a two-week low contributes to the strong move up.
- Declining US bond yields caps the USD and the pair amid an uptick in Oil prices.
- Traders also seem reluctant and opt to wait for the crucial Canadian CPI report.
The USD/CAD pair trims a part of strong intraday gains to the highest level since March 2020 and trades around the 1.4440-1.4435 area during the early European session on Tuesday, still up 0.90% for the day.
The Canadian Dollar (CAD) came under heavy selling pressure after US President Donald Trump indicated plans to impose 25% tariffs on imports from Canada and Mexico as soon as early February. The US Dollar (USD), on the other hand, stages a modest recovery after the overnight slump to a two-week low amid expectations that Trump's protectionist policies would boost inflation and force the Federal Reserve (Fed) to stick to its hawkish stance. This, in turn, lifts the USD/CAD pair beyond the 1.4500 psychological mark, though a combination of factors keeps a lid on any further gains.
Investors are betting that the Fed will lower borrowing costs twice by the end of this year amid signs of abating inflation in the US. This leads to a further steep decline in the US Treasury bond yields, which, along with a generally positive tone around the equity markets, caps gains for the safe-haven buck. Apart from this, the emergence of some buying around Crude Oil prices underpins the commodity-linked Loonie and contributes to keeping a lid on the USD/CAD pair. Traders also seem reluctant and opt to wait for the release of the latest consumer inflation figures from Canada later today.
The crucial Canadian Consumer Price Index (CPI) report will play a key role in influencing the Bank of Canada's (BoC) interest rate outlook, which, in turn, will drive the domestic currency and provide some meaningful impetus to the USD/CAD pair. Meanwhile, there isn't any relevant market-moving economic data due for release from the US, leaving the USD at the mercy of the US bond yields and the broader risk sentiment.
Economic Indicator
Consumer Price Index (YoY)
The Consumer Price Index (CPI), released by Statistics Canada on a monthly basis, represents changes in prices for Canadian consumers by comparing the cost of a fixed basket of goods and services. The YoY reading compares prices in the reference month to the same month a year earlier. Generally, a high reading is seen as bullish for the Canadian Dollar (CAD), while a low reading is seen as bearish.
Read more.Next release: Tue Jan 21, 2025 13:30
Frequency: Monthly
Consensus: 1.8%
Previous: 1.9%
Source: Statistics Canada
- The UK Unemployment Rate rose to 4.4% in three months to November.
- The Claimant Count Change for Britain arrived at 0.7K in December.
- GBP/USD drops further toward 1.2250 after mixed UK employment data.
The United Kingdom’s (UK) ILO Unemployment Rate edged higher to 4.4% in the three months to November, the data published by the Office for National Statistics (ONS) showed on Tuesday. The reading missed the expectations of 4.3% in the reported period.
Additional details of the report showed that the number of people claiming jobless benefits increased by only 0.7K in December, compared with a revised drop of 25.1K in November, beating the expected 10.3K figure.
The Employment Change data for November came in at 35K versus October’s 173K.
Meanwhile, Average Earnings, excluding Bonus, in the UK increased by 5.6% 3M YoY in November versus a 5.2% growth in October. Markets estimated a 5.5% print.
Another measure of wage inflation, Average Earnings, including Bonus, rose 5.6% in the same period after growing by 5.2% in the quarter through October. The data met the expected 5.6% growth.
GBP/USD reaction to the UK employment report
GBP/USD meets fresh supply on the release of the UK employment data. The pair is trading 0.49% lower on the day at 1.2265, as of writing.
British Pound PRICE Today
The table below shows the percentage change of British Pound (GBP) against listed major currencies today. British Pound was the weakest against the Japanese Yen.
| USD | EUR | GBP | JPY | CAD | AUD | NZD | CHF | |
|---|---|---|---|---|---|---|---|---|
| USD | 0.46% | 0.52% | -0.06% | 0.97% | 0.65% | 0.67% | 0.26% | |
| EUR | -0.46% | 0.07% | -0.48% | 0.51% | 0.19% | 0.22% | -0.20% | |
| GBP | -0.52% | -0.07% | -0.57% | 0.44% | 0.12% | 0.15% | -0.26% | |
| JPY | 0.06% | 0.48% | 0.57% | 1.00% | 0.67% | 0.69% | 0.29% | |
| CAD | -0.97% | -0.51% | -0.44% | -1.00% | -0.32% | -0.29% | -0.70% | |
| AUD | -0.65% | -0.19% | -0.12% | -0.67% | 0.32% | 0.02% | -0.38% | |
| NZD | -0.67% | -0.22% | -0.15% | -0.69% | 0.29% | -0.02% | -0.42% | |
| CHF | -0.26% | 0.20% | 0.26% | -0.29% | 0.70% | 0.38% | 0.42% |
The heat map shows percentage changes of major currencies against each other. The base currency is picked from the left column, while the quote currency is picked from the top row. For example, if you pick the British Pound from the left column and move along the horizontal line to the US Dollar, the percentage change displayed in the box will represent GBP (base)/USD (quote).
- USD/CHF appreciated following news that President Trump intends to direct federal agencies to review tariff policies.
- Traders speculate that Trump’s policies could lead to inflationary pressures, possibly restricting the Fed to just one more rate cut.
- The Swiss Franc remains generally weak as investors expect the Swiss National Bank to continue lowering interest rates.
USD/CHF holds ground after experiencing volatility, trading around 0.9070 during the Asian session on Tuesday. The US Dollar saw volatility as US President Donald Trump's inauguration day made waves. However, the USD faced downward pressure as Trump appeared to strengthen his relationship with Chinese President Xi Jinping, with the TikTok deal and a potentially softer approach to tariffs contributing to the shift.
The US Dollar (USD) regained ground following news that President Donald Trump intends to direct federal agencies to review tariff policies and evaluate the United States' trade relationships with Canada, Mexico, and China.
The US Dollar Index (DXY), which tracks the performance of the US Dollar against six major currencies, trades around 108.30 after trimming recent gains. The US Dollar receives downward pressure as the US Treasury yields on 2-year and 10-year bonds remain subdued at 4.23% and 4.54%, respectively, at the time of writing.
According to the CME FedWatch tool, traders anticipate that the US Federal Reserve (Fed) will maintain borrowing rates within the current range of 4.25%-4.50% over the next three policy meetings. However, investors speculate that policies under Trump’s administration could trigger inflationary pressures, potentially limiting the Fed to only one additional rate cut.
The Swiss Franc (CHF) remains broadly weak as investors anticipate that the Swiss National Bank (SNB) could continue to reduce interest rates. Swiss interest rates have already been lowered to 0.5% due to concerns over inflation remaining below the central bank’s target.
The traditionally safe-haven Swiss Franc (CHF) may face challenges as geopolitical tensions in the Middle East ease. Traders are closely watching developments related to a long-delayed ceasefire agreement and a hostage release deal between Israel and Hamas.
Swiss Franc FAQs
The Swiss Franc (CHF) is Switzerland’s official currency. It is among the top ten most traded currencies globally, reaching volumes that well exceed the size of the Swiss economy. Its value is determined by the broad market sentiment, the country’s economic health or action taken by the Swiss National Bank (SNB), among other factors. Between 2011 and 2015, the Swiss Franc was pegged to the Euro (EUR). The peg was abruptly removed, resulting in a more than 20% increase in the Franc’s value, causing a turmoil in markets. Even though the peg isn’t in force anymore, CHF fortunes tend to be highly correlated with the Euro ones due to the high dependency of the Swiss economy on the neighboring Eurozone.
The Swiss Franc (CHF) is considered a safe-haven asset, or a currency that investors tend to buy in times of market stress. This is due to the perceived status of Switzerland in the world: a stable economy, a strong export sector, big central bank reserves or a longstanding political stance towards neutrality in global conflicts make the country’s currency a good choice for investors fleeing from risks. Turbulent times are likely to strengthen CHF value against other currencies that are seen as more risky to invest in.
The Swiss National Bank (SNB) meets four times a year – once every quarter, less than other major central banks – to decide on monetary policy. The bank aims for an annual inflation rate of less than 2%. When inflation is above target or forecasted to be above target in the foreseeable future, the bank will attempt to tame price growth by raising its policy rate. Higher interest rates are generally positive for the Swiss Franc (CHF) as they lead to higher yields, making the country a more attractive place for investors. On the contrary, lower interest rates tend to weaken CHF.
Macroeconomic data releases in Switzerland are key to assessing the state of the economy and can impact the Swiss Franc’s (CHF) valuation. The Swiss economy is broadly stable, but any sudden change in economic growth, inflation, current account or the central bank’s currency reserves have the potential to trigger moves in CHF. Generally, high economic growth, low unemployment and high confidence are good for CHF. Conversely, if economic data points to weakening momentum, CHF is likely to depreciate.
As a small and open economy, Switzerland is heavily dependent on the health of the neighboring Eurozone economies. The broader European Union is Switzerland’s main economic partner and a key political ally, so macroeconomic and monetary policy stability in the Eurozone is essential for Switzerland and, thus, for the Swiss Franc (CHF). With such dependency, some models suggest that the correlation between the fortunes of the Euro (EUR) and the CHF is more than 90%, or close to perfect.
- EUR/JPY loses traction to around 161.10 in Tuesday’s early European session, losing 0.62% on the day.
- The BoJ is anticipated to raise rates to the highest in 17 years.
- The ECB's dovish bets weigh on the shared currency.
The EUR/JPY cross falls to near 161.10 during the early European session on Tuesday. The Japanese Yen strengthens against the US Dollar (USD) due to the rising speculation that the Bank of Japan (BoJ) will raise interest rates at its policy meeting on Friday. Later on Tuesday, Germany’s ZEW Survey for January will be released.
The BoJ is anticipated to hike interest rates in the upcoming monetary policy meeting, with the markets pricing in nearly a 92% odds of a move by the conclusion of the January 23-24 policy meeting. This would lift short-term borrowing costs to levels unseen since the 2008 global financial crisis.
On Tuesday, Japan’s Vice Finance Minister for International Affairs and top foreign exchange official, Atsushi Mimura, said, “The US economy outlook’s up to Trump’s macroeconomic policies.” Meanwhile, Japan’s Finance minister, Katsunobu Kato, stated that the officials will closely watch the impact of US policies on Japan and the world economy, adding that he expects the Japanese central bank to conduct monetary policies appropriately to achieve the 2% inflation goal.
On the other hand, the dovish expectations for the European Central Bank (ECB) could drag the Euro (EUR) lower against the JPY. According to the ECB Monetary Policy Meeting Accounts released on Thursday, policymakers agreed in the December meeting that interest rate cuts should be approached cautiously and gradually, but they also noted that further rate cuts were likely coming given weakening price pressures. Traders expect the ECB will deliver a 25 basis point (bps) rate cut at each of the next four ECB policy meetings, driven by concerns over the Eurozone’s economic outlook and the belief that inflationary pressures will remain subdued.
Bank of Japan FAQs
The Bank of Japan (BoJ) is the Japanese central bank, which sets monetary policy in the country. Its mandate is to issue banknotes and carry out currency and monetary control to ensure price stability, which means an inflation target of around 2%.
The Bank of Japan embarked in an ultra-loose monetary policy in 2013 in order to stimulate the economy and fuel inflation amid a low-inflationary environment. The bank’s policy is based on Quantitative and Qualitative Easing (QQE), or printing notes to buy assets such as government or corporate bonds to provide liquidity. In 2016, the bank doubled down on its strategy and further loosened policy by first introducing negative interest rates and then directly controlling the yield of its 10-year government bonds. In March 2024, the BoJ lifted interest rates, effectively retreating from the ultra-loose monetary policy stance.
The Bank’s massive stimulus caused the Yen to depreciate against its main currency peers. This process exacerbated in 2022 and 2023 due to an increasing policy divergence between the Bank of Japan and other main central banks, which opted to increase interest rates sharply to fight decades-high levels of inflation. The BoJ’s policy led to a widening differential with other currencies, dragging down the value of the Yen. This trend partly reversed in 2024, when the BoJ decided to abandon its ultra-loose policy stance.
A weaker Yen and the spike in global energy prices led to an increase in Japanese inflation, which exceeded the BoJ’s 2% target. The prospect of rising salaries in the country – a key element fuelling inflation – also contributed to the move.
FX option expiries for Jan 21 NY cut at 10:00 Eastern Time via DTCC can be found below.
EUR/USD: EUR amounts
- 1.0150 1.7b
- 1.0220 1.2b
- 1.0300 2b
- 1.0325 5.3b
- 1.0350 1.5b
- 1.0400 4b
- 1.0420 1.7b
- 1.0450 1.9b
- 1.0500 1.8b
USD/JPY: USD amounts
- 153.00 1.4b
- 156.00 1.6b
- 156.50 1.1b
AUD/USD: AUD amounts
- 0.6200 779m
- 0.6245 633m
- 0.6300 569m
USD/CAD: USD amounts
- 1.4285 703m
- 1.4500 538m
NZD/USD: NZD amounts
- 0.5600 478m
EUR/GBP: EUR amounts
- 0.8350 441m
- GBP/USD depreciates following news that President Trump intends to direct federal agencies to review tariff policies.
- Traders speculate that Trump’s policies could lead to inflationary pressures, possibly restricting the Fed to just one more rate cut.
- UK gilts demand rose following weaker-than-expected Retail Sales data for December.
GBP/USD loses ground after registering more than 1% gains in the previous session, trading around 1.2300 during the Asian hours on Tuesday. The pair faced challenges as the US Dollar (USD) regained ground after recent losses in the previous session, supported by news that President Donald Trump intends to direct federal agencies to review tariff policies and evaluate the United States' trade relationships with Canada, Mexico, and China.
The US Dollar Index (DXY), which tracks the performance of the US Dollar against six major currencies, trades around 108.30 after trimming recent gains. The US Dollar receives downward pressure as the US Treasury yields on 2-year and 10-year bonds remain subdued at 4.23% and 4.54%, respectively, at the time of writing.
According to the CME FedWatch tool, traders anticipate that the US Federal Reserve (Fed) will maintain borrowing rates within the current range of 4.25%-4.50% over the next three policy meetings. However, investors speculate that policies under Trump’s administration could trigger inflationary pressures, potentially limiting the Fed to only one additional rate cut.
The Pound Sterling (GBP) strengthened as demand for United Kingdom (UK) gilts increased following weaker-than-expected UK Retail Sales data for December. Monthly Retail Sales contracted by 0.3%, contrary to expectations of a 0.4% growth, which was anticipated to follow the 0.1% increase in November.
The unexpected drop in UK Retail Sales has reinforced dovish expectations for the Bank of England (BoE). Analysts at Oxford Economics forecast that the BoE may reduce interest rates by 100 basis points (bps), bringing them down to 3.75% by the end of the year.
British Pound PRICE Today
The table below shows the percentage change of British Pound (GBP) against listed major currencies today. British Pound was the weakest against the Japanese Yen.
| USD | EUR | GBP | JPY | CAD | AUD | NZD | CHF | |
|---|---|---|---|---|---|---|---|---|
| USD | 0.25% | 0.25% | -0.33% | 0.77% | 0.40% | 0.36% | 0.05% | |
| EUR | -0.25% | 0.00% | -0.50% | 0.52% | 0.15% | 0.11% | -0.20% | |
| GBP | -0.25% | -0.01% | -0.57% | 0.51% | 0.14% | 0.11% | -0.20% | |
| JPY | 0.33% | 0.50% | 0.57% | 1.08% | 0.71% | 0.66% | 0.36% | |
| CAD | -0.77% | -0.52% | -0.51% | -1.08% | -0.36% | -0.40% | -0.71% | |
| AUD | -0.40% | -0.15% | -0.14% | -0.71% | 0.36% | -0.04% | -0.34% | |
| NZD | -0.36% | -0.11% | -0.11% | -0.66% | 0.40% | 0.04% | -0.31% | |
| CHF | -0.05% | 0.20% | 0.20% | -0.36% | 0.71% | 0.34% | 0.31% |
The heat map shows percentage changes of major currencies against each other. The base currency is picked from the left column, while the quote currency is picked from the top row. For example, if you pick the British Pound from the left column and move along the horizontal line to the US Dollar, the percentage change displayed in the box will represent GBP (base)/USD (quote).
- Silver reverses an Asian session dip and turns positive for the second straight day.
- The technical setup favors bulls and supports prospects for further appreciation.
- Any meaningful dips could be seen as a buying opportunity near the $30.00 mark.
Silver (XAG/USD) attracts some dip-buying near the $30.20 area during the Asian session on Tuesday and looks to build on the overnight bounce from the vicinity of the 100-period Exponential Moving Average (EMA) on the 4-hour chart. The white metal, however, eases from a two-day high touched in the last hour and currently trades around the $30.60-$30.55 region, up 0.25% for the day.
Looking at the broader picture, the recent move up witnessed over the past four weeks or so, from the $28.75-$28.70 region or a multi-month low touched in December, has been along an upward-sloping channel. This, along with the fact that oscillators on the daily chart have just started gaining positive traction, favors the XAG/USD bulls and supports prospects for a further near-term appreciating move towards the $31.00 mark.
A subsequent move up is likely to confront resistance near the top boundary of the aforementioned channel, currently pegged near the $31.25 region. A sustained breakout above the said barrier has the potential to lift the XAG/USD towards the $32.00 mark, with some intermediate hurdle near the $31.45-$31.50 region. The momentum could extend further towards the December swing high, around the $32.25-$32.30 area.
On the flip side, the $30.00 psychological mark – comprising the 100-period EMA on the 4-hour chart and the lower end of the ascending channel – might continue to act as immediate support. A convincing break below might shift the bias in favor of bearish traders and make the XAG/USD vulnerable to accelerate the fall towards the $29.50 region en route to the $29.00 mark and the $28.75-$28.70 region, or the multi-month low.
XAG/USD 4-hour chart
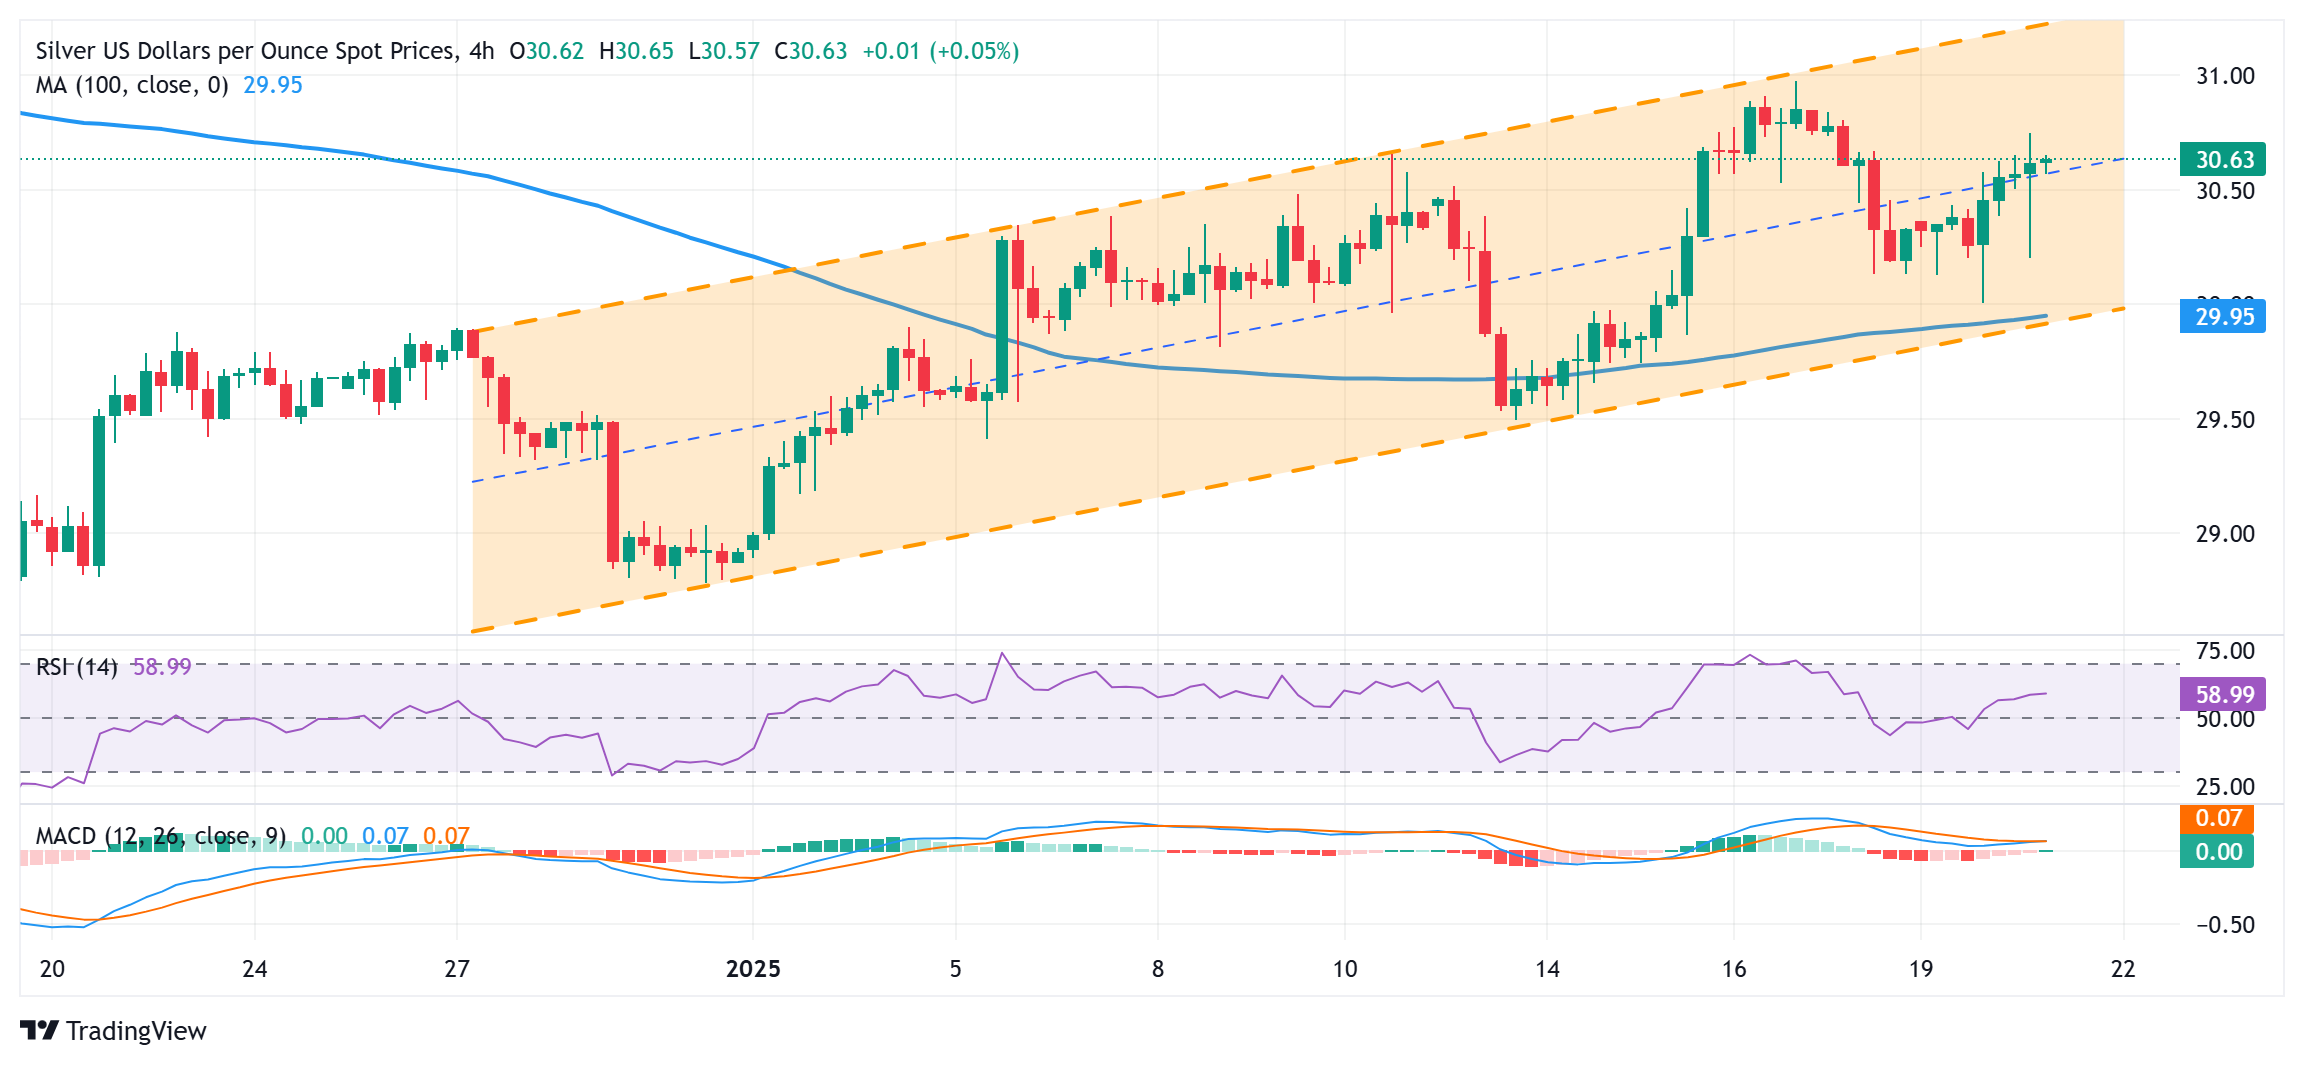
Silver FAQs
Silver is a precious metal highly traded among investors. It has been historically used as a store of value and a medium of exchange. Although less popular than Gold, traders may turn to Silver to diversify their investment portfolio, for its intrinsic value or as a potential hedge during high-inflation periods. Investors can buy physical Silver, in coins or in bars, or trade it through vehicles such as Exchange Traded Funds, which track its price on international markets.
Silver prices can move due to a wide range of factors. Geopolitical instability or fears of a deep recession can make Silver price escalate due to its safe-haven status, although to a lesser extent than Gold's. As a yieldless asset, Silver tends to rise with lower interest rates. Its moves also depend on how the US Dollar (USD) behaves as the asset is priced in dollars (XAG/USD). A strong Dollar tends to keep the price of Silver at bay, whereas a weaker Dollar is likely to propel prices up. Other factors such as investment demand, mining supply – Silver is much more abundant than Gold – and recycling rates can also affect prices.
Silver is widely used in industry, particularly in sectors such as electronics or solar energy, as it has one of the highest electric conductivity of all metals – more than Copper and Gold. A surge in demand can increase prices, while a decline tends to lower them. Dynamics in the US, Chinese and Indian economies can also contribute to price swings: for the US and particularly China, their big industrial sectors use Silver in various processes; in India, consumers’ demand for the precious metal for jewellery also plays a key role in setting prices.
Silver prices tend to follow Gold's moves. When Gold prices rise, Silver typically follows suit, as their status as safe-haven assets is similar. The Gold/Silver ratio, which shows the number of ounces of Silver needed to equal the value of one ounce of Gold, may help to determine the relative valuation between both metals. Some investors may consider a high ratio as an indicator that Silver is undervalued, or Gold is overvalued. On the contrary, a low ratio might suggest that Gold is undervalued relative to Silver.
Gold prices rose in India on Tuesday, according to data compiled by FXStreet.
The price for Gold stood at 7,572.02 Indian Rupees (INR) per gram, up compared with the INR 7,524.58 it cost on Monday.
The price for Gold increased to INR 88,319.59 per tola from INR 87,765.26 per tola a day earlier.
| Unit measure | Gold Price in INR |
|---|---|
| 1 Gram | 7,572.02 |
| 10 Grams | 75,723.30 |
| Tola | 88,319.59 |
| Troy Ounce | 235,516.50 |
FXStreet calculates Gold prices in India by adapting international prices (USD/INR) to the local currency and measurement units. Prices are updated daily based on the market rates taken at the time of publication. Prices are just for reference and local rates could diverge slightly. Related news
Gold FAQs
Gold has played a key role in human’s history as it has been widely used as a store of value and medium of exchange. Currently, apart from its shine and usage for jewelry, the precious metal is widely seen as a safe-haven asset, meaning that it is considered a good investment during turbulent times. Gold is also widely seen as a hedge against inflation and against depreciating currencies as it doesn’t rely on any specific issuer or government.
Central banks are the biggest Gold holders. In their aim to support their currencies in turbulent times, central banks tend to diversify their reserves and buy Gold to improve the perceived strength of the economy and the currency. High Gold reserves can be a source of trust for a country’s solvency. Central banks added 1,136 tonnes of Gold worth around $70 billion to their reserves in 2022, according to data from the World Gold Council. This is the highest yearly purchase since records began. Central banks from emerging economies such as China, India and Turkey are quickly increasing their Gold reserves.
Gold has an inverse correlation with the US Dollar and US Treasuries, which are both major reserve and safe-haven assets. When the Dollar depreciates, Gold tends to rise, enabling investors and central banks to diversify their assets in turbulent times. Gold is also inversely correlated with risk assets. A rally in the stock market tends to weaken Gold price, while sell-offs in riskier markets tend to favor the precious metal.
The price can move due to a wide range of factors. Geopolitical instability or fears of a deep recession can quickly make Gold price escalate due to its safe-haven status. As a yield-less asset, Gold tends to rise with lower interest rates, while higher cost of money usually weighs down on the yellow metal. Still, most moves depend on how the US Dollar (USD) behaves as the asset is priced in dollars (XAU/USD). A strong Dollar tends to keep the price of Gold controlled, whereas a weaker Dollar is likely to push Gold prices up.
(An automation tool was used in creating this post.)
- Gold price gains a strong positive traction amid the flight to safety after Trump’s tariff remarks.
- Bets for more Fed rate cuts drag the US bond yields and further underpin the yellow metal.
- A modest USD recovery, along with a positive risk tone, might cap gains for the commodity.
Gold price (XAU/USD) attracts some follow-through buying for the second successive day and climbs to its highest level since November 6, around the $2,726 region during the Asian session on Tuesday. US President Donald Trump suggested imposing tariffs on Canada and Mexico in the near future, reviving trade war fears and boosting demand for the traditional safe-haven precious metal. Apart from this, declining US Treasury bond yields, led by bets that the Federal Reserve (Fed) will cut interest rates twice this year amid signs of abating inflation in the US, further drive flows towards the non-yielding yellow metal.
Meanwhile, expectations that Trump's protectionist policies would reignite inflationary pressures and force the Fed to stick to its hawkish stance help the US Dollar (USD) to stage a goodish recovery from a two-week low touched on Monday. This, along with a generally positive tone around the equity markets, caps the upside for the Gold price. Nevertheless, the fundamental backdrop suggests that the path of least resistance for the XAU/USD is to the upside. There isn't any relevant US economic data due for release on Tuesday, leaving the commodity at the mercy of the broader risk sentiment and the USD price dynamics.
Gold price draws support from trade war fears, bets for two rate cuts by the Fed in 2025
- US President Donald Trump said this Tuesday that he intends 25% tariffs on Canada and Mexico, and the target date for tariffs would be as soon as early February. Trump further threatened that we could put tariffs on China if it doesn't approve a TikTok deal, underpinning demand for the safe-haven Gold price.
- The US Producer Price Index (PPI) and Consumer Price Index (CPI) released last week pointed to signs of abating inflation. This suggests that the Fed may not exclude the possibility of rate cuts by the end of this year and drags the yield on the benchmark 10-year US government bond to a nearly three-week low.
- The US Dollar (USD) regains positive traction following the overnight slump to a two-week low amid expectations that Trump's protectionist policies could boost inflation and force the Federal Reserve to stick to its hawkish stance. This, in turn, might cap any further gains for the non-yielding yellow metal.
- The Israel-Hamas ceasefire deal, along with hopes that Trump might relax curbs on Russia in exchange for a deal to end the Ukraine war, remains supportive of the positive risk tone. This might further hold back bulls from placing fresh bets around the XAU/USD in the absence of any relevant US economic data.
- The market focus will remain glued to the crucial Bank of Japan policy meeting on January 23-24 on Friday. Apart from this, the release of the flash PMI prints, which will be looked upon for fresh insight into the global economic health, should infuse volatility around the commodity during the latter half of the week.
Gold price seems poised to appreciate further, towards the $2,746-2,748 resistance zone
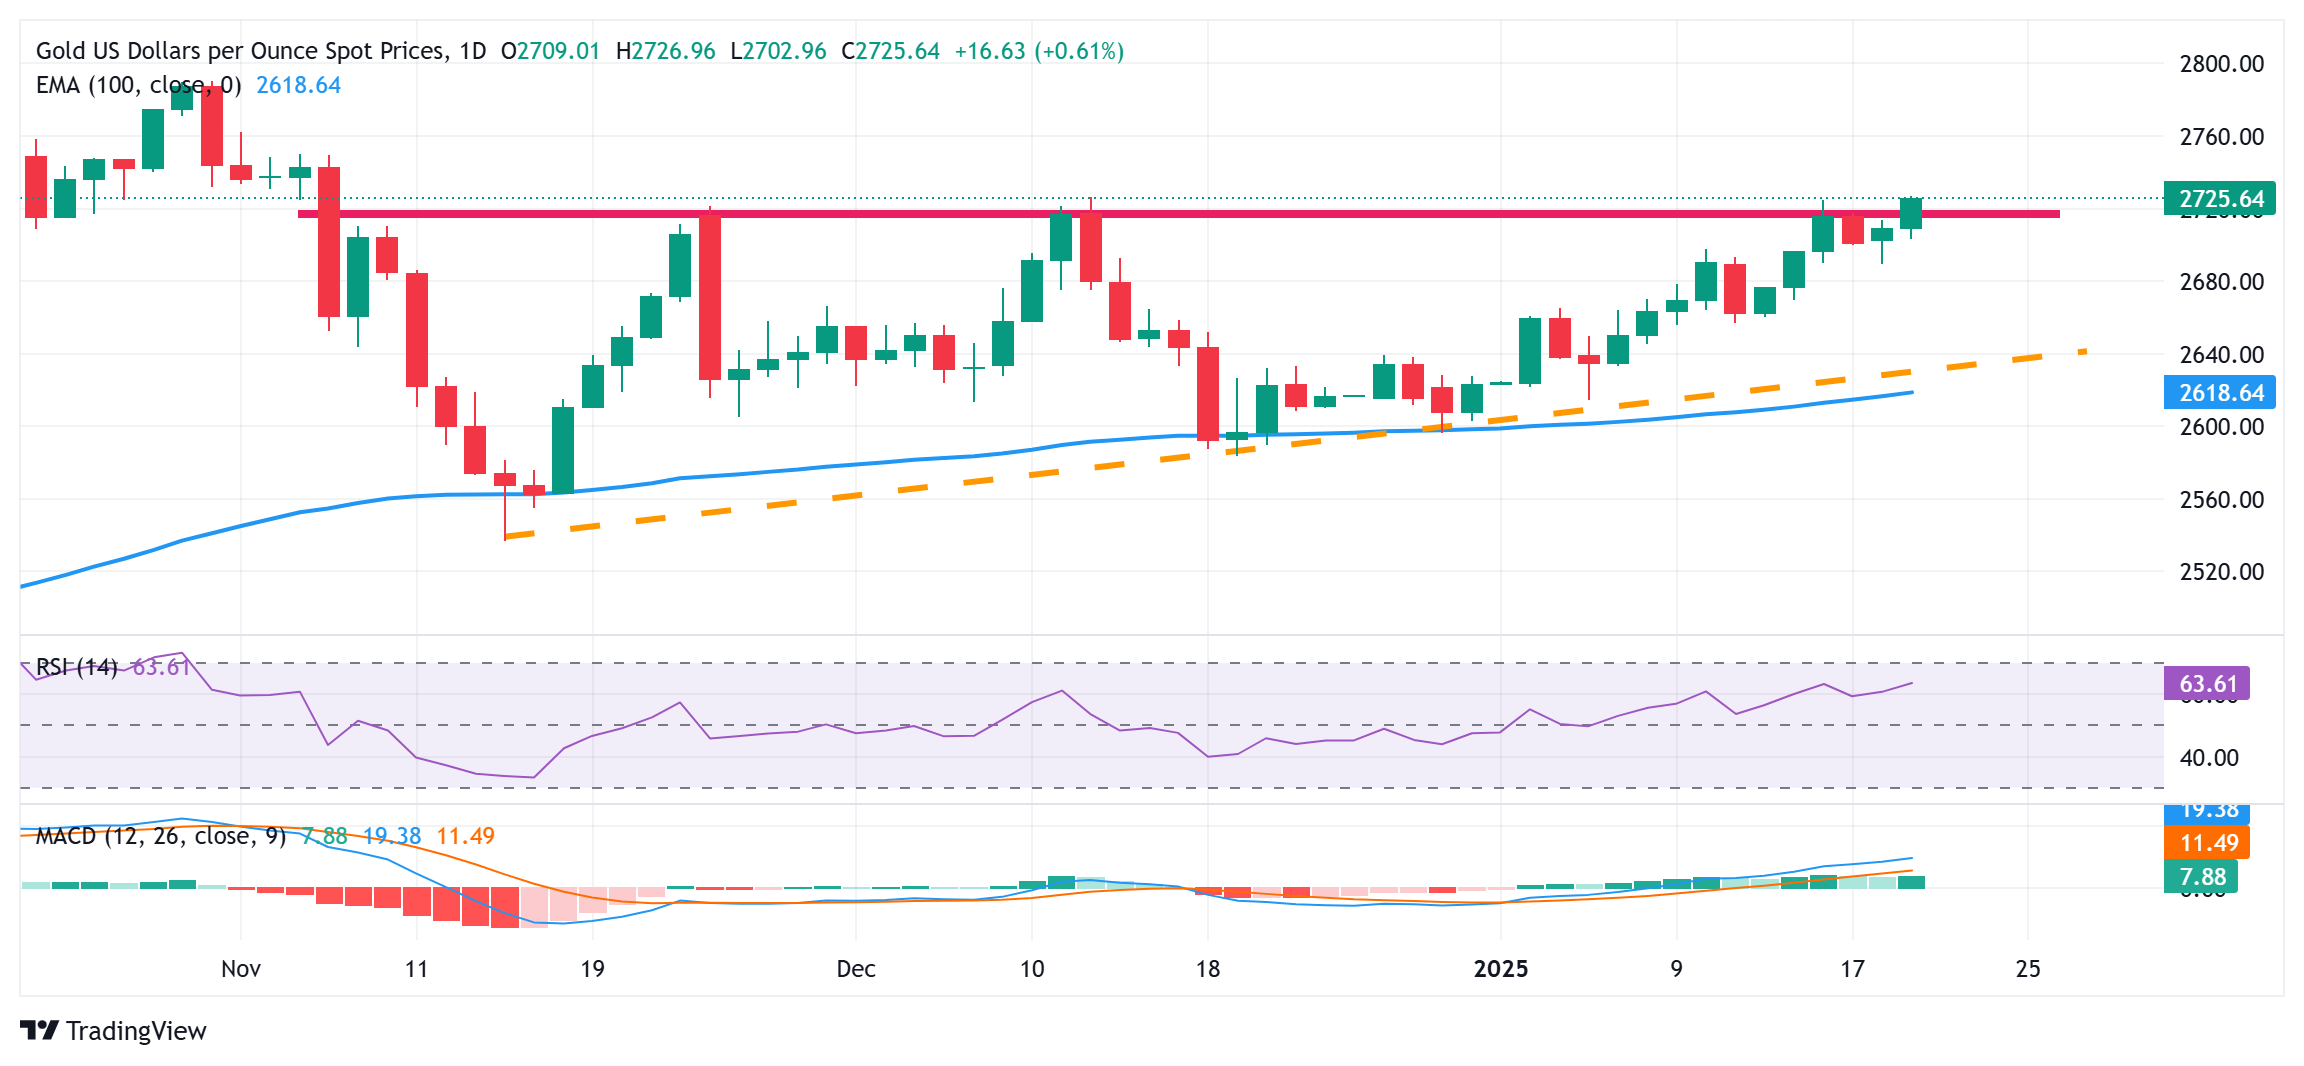
From a technical perspective, the Gold price now seems to have found acceptance above the $2,720 supply zone. Moreover, oscillators on the daily chart have been gaining positive traction and are still away from being in the overbought territory. This, in turn, favors bullish traders and suggests that the path of least resistance for the XAU/USD is to the upside. Hence, some follow-through strength towards the next relevant hurdle near the $2,735 horizontal zone, en route to the $2,746-2,748 region, looks like a distinct possibility. The momentum could extend further towards challenging the all-time peak, around the $2,790 area touched in October 2024.
On the flip side, any corrective pullback now seems to find decent support near the $2,700 mark. A subsequent slide below the overnight swing low, around the $2,689 region, could prompt some technical selling and drag the Gold price further towards the $2,662-2,660 region. The latter should act as a pivotal point, below which the XAU/USD could fall to the $2,635 zone en route to the $2,622-2,618 confluence – comprising a short-term ascending trend-line extending from the November low and the 100-day Exponential Moving Average (EMA).
Gold FAQs
Gold has played a key role in human’s history as it has been widely used as a store of value and medium of exchange. Currently, apart from its shine and usage for jewelry, the precious metal is widely seen as a safe-haven asset, meaning that it is considered a good investment during turbulent times. Gold is also widely seen as a hedge against inflation and against depreciating currencies as it doesn’t rely on any specific issuer or government.
Central banks are the biggest Gold holders. In their aim to support their currencies in turbulent times, central banks tend to diversify their reserves and buy Gold to improve the perceived strength of the economy and the currency. High Gold reserves can be a source of trust for a country’s solvency. Central banks added 1,136 tonnes of Gold worth around $70 billion to their reserves in 2022, according to data from the World Gold Council. This is the highest yearly purchase since records began. Central banks from emerging economies such as China, India and Turkey are quickly increasing their Gold reserves.
Gold has an inverse correlation with the US Dollar and US Treasuries, which are both major reserve and safe-haven assets. When the Dollar depreciates, Gold tends to rise, enabling investors and central banks to diversify their assets in turbulent times. Gold is also inversely correlated with risk assets. A rally in the stock market tends to weaken Gold price, while sell-offs in riskier markets tend to favor the precious metal.
The price can move due to a wide range of factors. Geopolitical instability or fears of a deep recession can quickly make Gold price escalate due to its safe-haven status. As a yield-less asset, Gold tends to rise with lower interest rates, while higher cost of money usually weighs down on the yellow metal. Still, most moves depend on how the US Dollar (USD) behaves as the asset is priced in dollars (XAU/USD). A strong Dollar tends to keep the price of Gold controlled, whereas a weaker Dollar is likely to push Gold prices up.
- AUD/JPY may approach the psychological support level at 96.00.
- The bearish sentiment persists as the 14-day RSI continues to stay below the 50 mark.
- The currency cross could retest the nine-day EMA at the 97.26 level.
The AUD/JPY cross halts its two-day winning streak, trading around 97.00 during the Asian hours on Tuesday. The 14-day Relative Strength Index (RSI) remains slightly below the 50 level, indicating a bearish momentum is still in play. If the RSI rises above 50, it would signal an emergence of a bullish bias.
Additionally, a review of the daily chart indicates that the AUD/JPY cross remains below nine- and 14-day Exponential Moving Averages (EMAs). This suggests that short-term price momentum is weaker compared to the longer-term trend, signaling the potential for continued price weakness.
The initial support for the AUD/JPY cross is located at the psychological level of 96.00, followed by the four-month low at 95.52. A break below this level could strengthen the bearish bias and push the currency cross to navigate the area around its five-month low at 93.59, which was recorded on September 11.
On the upside, the AUD/JPY cross could test its primary resistance at the nine-day EMA of 97.26, followed by the 50-day EMA at the 98.05 level. A decisive break above this level would signal strengthening short-term price momentum, potentially driving the currency cross toward the six-month high of 102.41, last reached on November 7.
AUD/JPY: Daily Chart
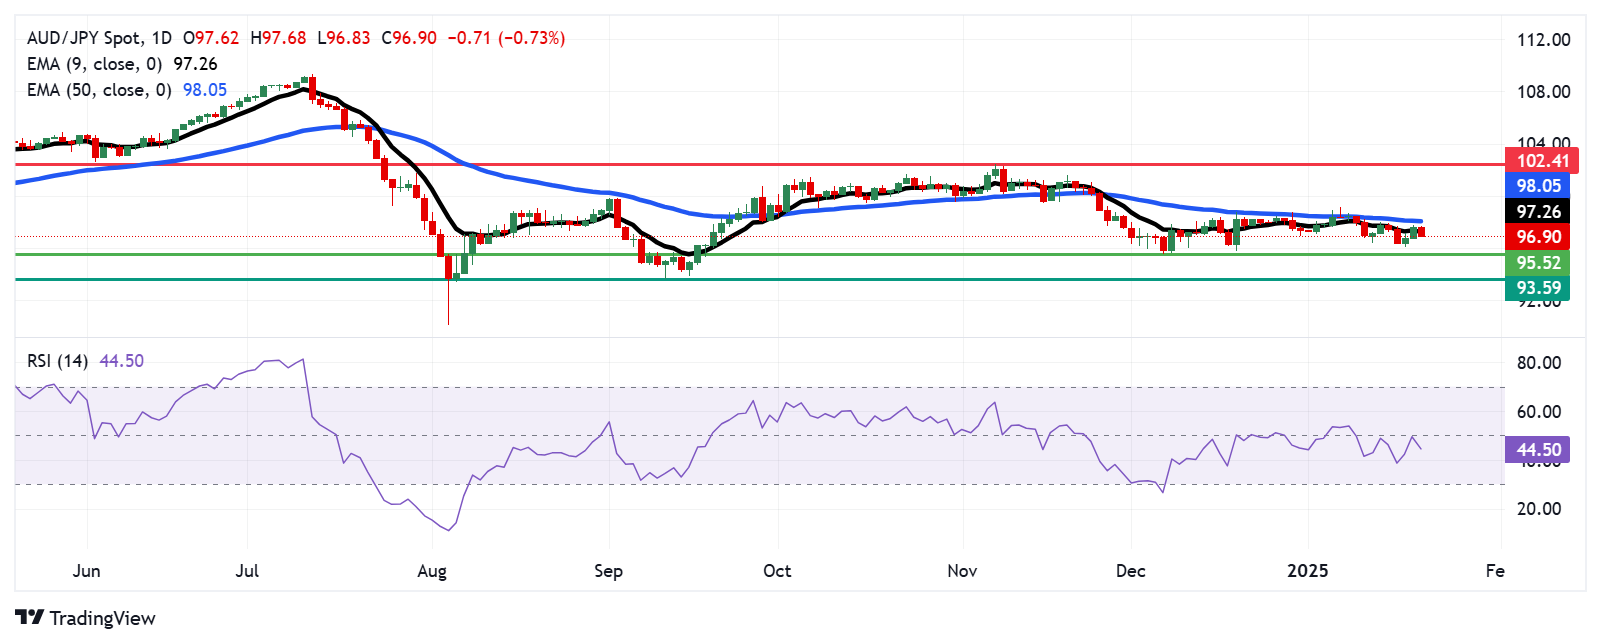
Australian Dollar PRICE Today
The table below shows the percentage change of Australian Dollar (AUD) against listed major currencies today. Australian Dollar was the weakest against the Japanese Yen.
| USD | EUR | GBP | JPY | CAD | AUD | NZD | CHF | |
|---|---|---|---|---|---|---|---|---|
| USD | 0.27% | 0.26% | -0.37% | 0.76% | 0.36% | 0.30% | 0.08% | |
| EUR | -0.27% | -0.01% | -0.60% | 0.49% | 0.09% | 0.03% | -0.20% | |
| GBP | -0.26% | 0.00% | -0.63% | 0.50% | 0.09% | 0.04% | -0.18% | |
| JPY | 0.37% | 0.60% | 0.63% | 1.12% | 0.71% | 0.64% | 0.43% | |
| CAD | -0.76% | -0.49% | -0.50% | -1.12% | -0.40% | -0.46% | -0.68% | |
| AUD | -0.36% | -0.09% | -0.09% | -0.71% | 0.40% | -0.06% | -0.27% | |
| NZD | -0.30% | -0.03% | -0.04% | -0.64% | 0.46% | 0.06% | -0.23% | |
| CHF | -0.08% | 0.20% | 0.18% | -0.43% | 0.68% | 0.27% | 0.23% |
The heat map shows percentage changes of major currencies against each other. The base currency is picked from the left column, while the quote currency is picked from the top row. For example, if you pick the Australian Dollar from the left column and move along the horizontal line to the US Dollar, the percentage change displayed in the box will represent AUD (base)/USD (quote).
Atsushi Mimura, Japan’s Vice Finance Minister For International Affairs and top foreign exchange official, said on Tuesday, “US economy outlook’s up to Trump’s macroeconomic policies.”
Further comments
Need to closely watch if China’s recent export strength will continue.
Inclined not to comment on individual cases, when asked about Nippon Steel-US.
Japan's economy beyond April appears "not that bad," supported by business investments.
Japan's real consumption appears weak.
Must closely watch the next US administration's moves, when asked about forex.
No comment on BoJ's monetary policies.
Market reaction
USD/JPY is flirting with 155.00, falling hard on these comments. The pair is losing 0.35% on the day, as of writing.
- The Indian Rupee loses momentum in Tuesday’s Asian session.
- Renewed USD demand could weigh on the INR, but routine RBI intervention and lower crude oil prices might cap its downside.
- Investors will take more cues from Trump’s policy announcements this week.
The Indian Rupee (INR) tumbles on Tuesday after reaching a one-week high in the previous session. The US Dollar (USD) might continue its upward trajectory due to demand from importers and a reversal of global financial flows toward the United States. Nonetheless, the Reserve Bank of India (RBI) could prevent the local currency from significantly depreciating through active interventions in the foreign exchange markets. Additionally, the decline in crude oil prices supports the INR as India is the world's third-largest oil consumer.
Investors will closely watch the development surrounding policy announcements this week, which might offer fresh catalysts for the pair. On Friday, the preliminary reading of HSBC India’s Purchasing Managers Index (PMI) for January will be in the spotlight. On the US docket, the flash estimate of S&P PMI data will be released.
Indian Rupee remains weak amid multiple global cues
- The Indian Rupee is likely to make a strong comeback once the euphoria over Donald Trump’s assuming the US presidency settles, according to the State Bank of India (SBI) on Monday.
- “There will be the risk of a correction in the dollar should it look like Trump will be more selective on tariffs after all – but that should probably come at a later stage,” noted ING Bank.
- Foreign investors have sold a net total of about $6.5 billion of local stocks and bonds in January so far, the steepest monthly outflow since October 2023.
- Trump stated on Monday that he is thinking of imposing 25% tariffs on Canada and Mexico as soon as early February, per CNBC.
- Trump said on Monday that he would immediately declare a national energy emergency, promising to fill up strategic reserves and use the authority to rapidly approve new oil, gas, and electricity projects that would normally take years to get permits.
USD/INR maintains bullish trend in the longer term
The Indian Rupee trades on a stronger note on the day. The USD/INR pair keeps the bullish vibe on the daily timeframe as the price has formed higher highs and higher lows while holding above the key 100-day Exponential Moving Average (EMA). The upward momentum is supported by the 14-day Relative Strength Index (RSI), which stands above the midline near 65.40, suggesting that further upside looks favorable.
The key upside barrier for USD/INR emerges at an all-time high of 86.69. A sustained move above this level could see a rally to the 87.00 psychological level.
On the downside, the low of January 20 at 86.18 acts as an initial support level for the pair. Extended losses could expose 85.85, the low of January 10. Further south, the next contention level to watch is 85.65, the low of January 7.
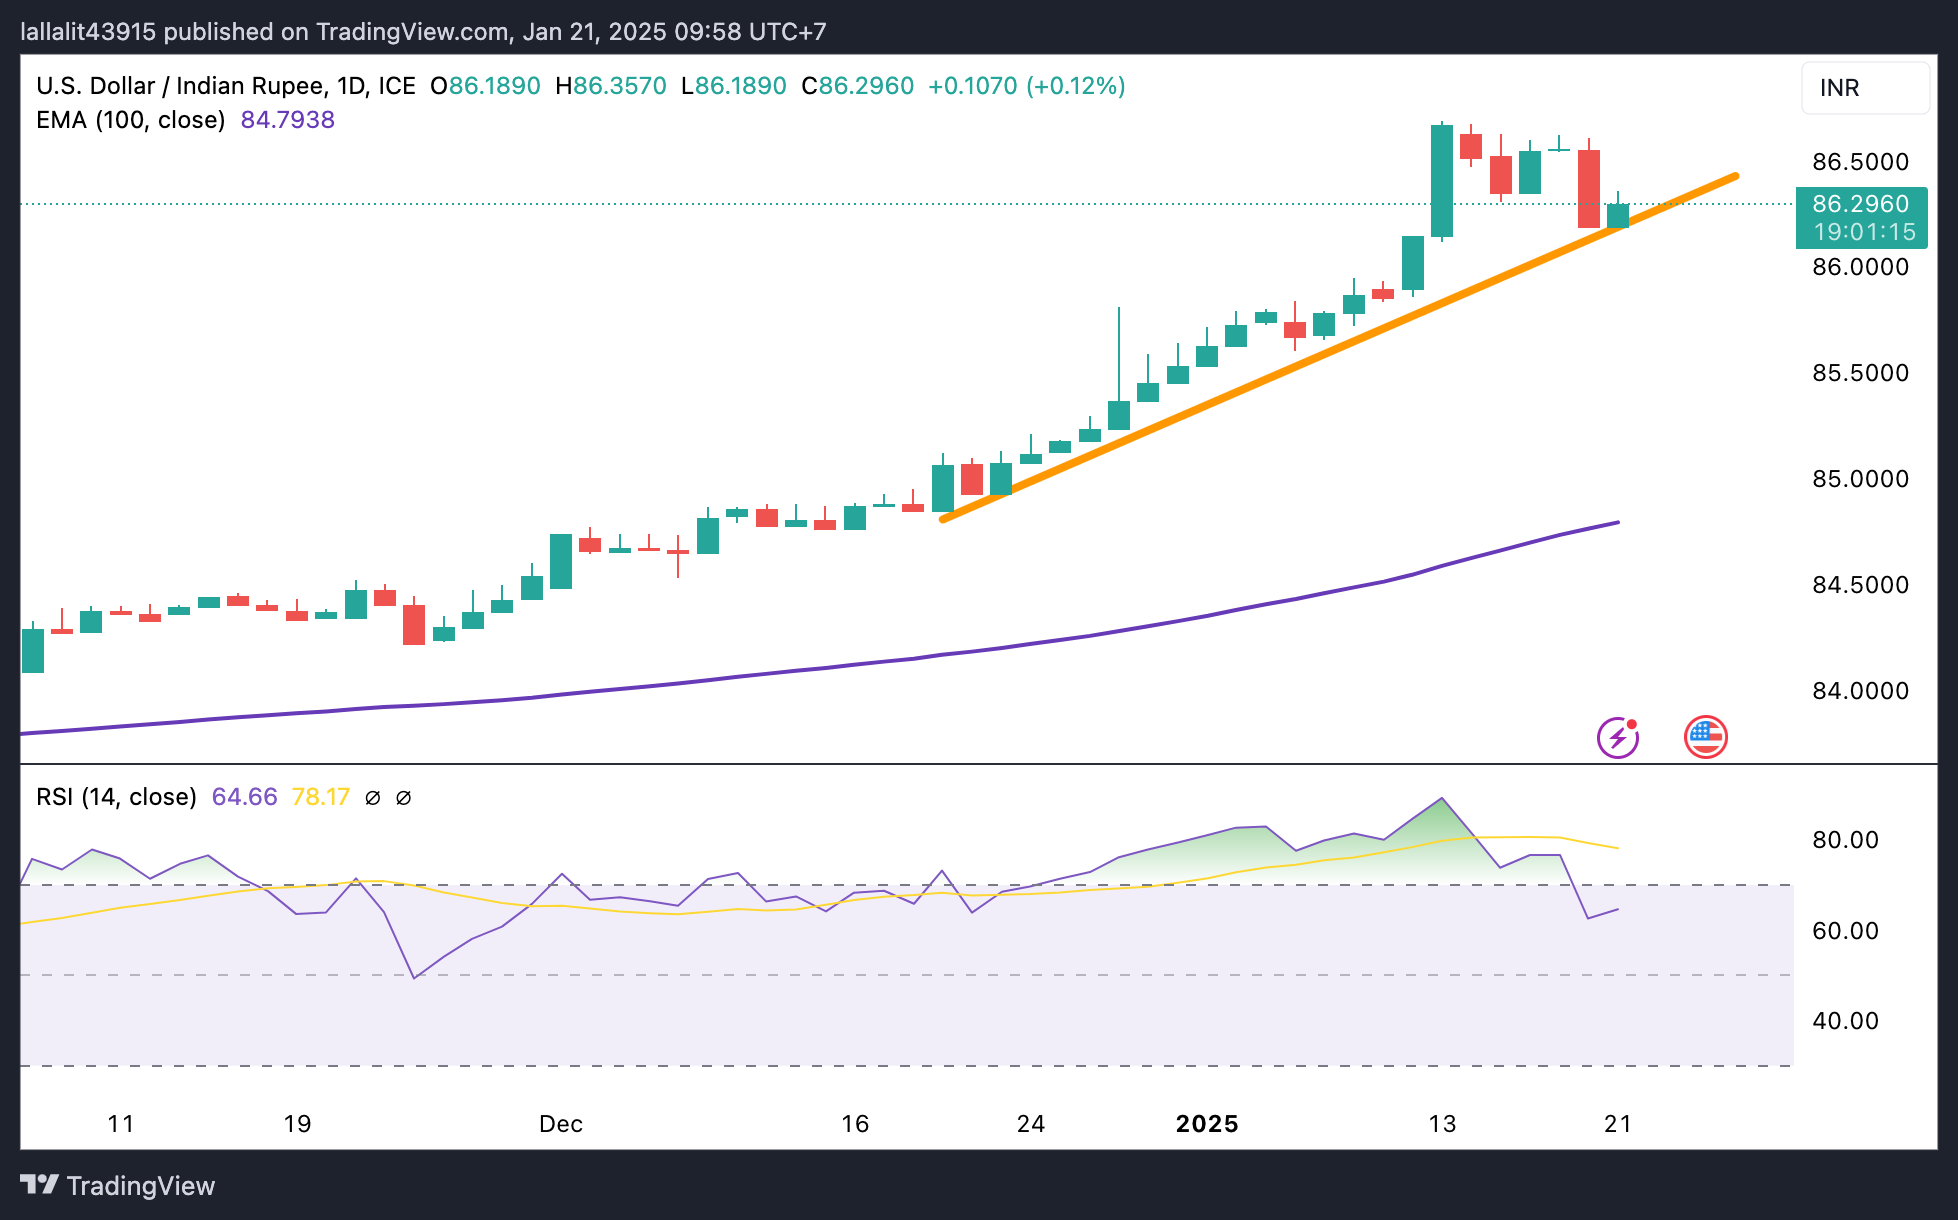
Indian Rupee FAQs
The Indian Rupee (INR) is one of the most sensitive currencies to external factors. The price of Crude Oil (the country is highly dependent on imported Oil), the value of the US Dollar – most trade is conducted in USD – and the level of foreign investment, are all influential. Direct intervention by the Reserve Bank of India (RBI) in FX markets to keep the exchange rate stable, as well as the level of interest rates set by the RBI, are further major influencing factors on the Rupee.
The Reserve Bank of India (RBI) actively intervenes in forex markets to maintain a stable exchange rate, to help facilitate trade. In addition, the RBI tries to maintain the inflation rate at its 4% target by adjusting interest rates. Higher interest rates usually strengthen the Rupee. This is due to the role of the ‘carry trade’ in which investors borrow in countries with lower interest rates so as to place their money in countries’ offering relatively higher interest rates and profit from the difference.
Macroeconomic factors that influence the value of the Rupee include inflation, interest rates, the economic growth rate (GDP), the balance of trade, and inflows from foreign investment. A higher growth rate can lead to more overseas investment, pushing up demand for the Rupee. A less negative balance of trade will eventually lead to a stronger Rupee. Higher interest rates, especially real rates (interest rates less inflation) are also positive for the Rupee. A risk-on environment can lead to greater inflows of Foreign Direct and Indirect Investment (FDI and FII), which also benefit the Rupee.
Higher inflation, particularly, if it is comparatively higher than India’s peers, is generally negative for the currency as it reflects devaluation through oversupply. Inflation also increases the cost of exports, leading to more Rupees being sold to purchase foreign imports, which is Rupee-negative. At the same time, higher inflation usually leads to the Reserve Bank of India (RBI) raising interest rates and this can be positive for the Rupee, due to increased demand from international investors. The opposite effect is true of lower inflation.
- EUR/USD struggles due to rising dovish sentiment surrounding the ECB’s policy outlook.
- The US Dollar appreciates following news that President Trump intends to direct federal agencies to review tariff policies.
- Traders expect the Fed to keep its benchmark overnight rate steady in the 4.25%-4.50% range at its January meeting.
EUR/USD remains in the negative territory after trimming its recent losses, trading around 1.0380 during the Asian hours on Tuesday. The Euro (EUR) remains under pressure as dovish expectations for the European Central Bank (ECB) continue to dominate. Markets are anticipating a 25 basis point (bps) rate cut at each of the next four ECB policy meetings, driven by concerns over the Eurozone’s economic outlook and the belief that inflationary pressures will remain subdued.
These dovish bets have intensified due to rising confidence that Eurozone inflation will sustainably return to the ECB’s 2% target, coupled with heightened uncertainty surrounding potential tariff policies from the United States (US).
The US Dollar Index (DXY), which tracks the performance of the US Dollar against six major currencies, rises to around 108.30 at the time of writing. The Greenback regained ground after recent losses in the previous session, supported by news that President Donald Trump intends to direct federal agencies to review tariff policies and evaluate the United States' trade relationships with Canada, Mexico, and China.
However, the Greenback faced headwinds following a Bloomberg report indicating that President Donald Trump will not immediately announce new tariffs after his inauguration on Monday. The US Federal Reserve (Fed) is expected to keep its benchmark overnight rate steady in the 4.25%-4.50% range at its January meeting. However, investors believe Trump’s policies could drive inflationary pressures, potentially limiting the Fed to just one more rate cut.
Euro FAQs
The Euro is the currency for the 19 European Union countries that belong to the Eurozone. It is the second most heavily traded currency in the world behind the US Dollar. In 2022, it accounted for 31% of all foreign exchange transactions, with an average daily turnover of over $2.2 trillion a day. EUR/USD is the most heavily traded currency pair in the world, accounting for an estimated 30% off all transactions, followed by EUR/JPY (4%), EUR/GBP (3%) and EUR/AUD (2%).
The European Central Bank (ECB) in Frankfurt, Germany, is the reserve bank for the Eurozone. The ECB sets interest rates and manages monetary policy. The ECB’s primary mandate is to maintain price stability, which means either controlling inflation or stimulating growth. Its primary tool is the raising or lowering of interest rates. Relatively high interest rates – or the expectation of higher rates – will usually benefit the Euro and vice versa. The ECB Governing Council makes monetary policy decisions at meetings held eight times a year. Decisions are made by heads of the Eurozone national banks and six permanent members, including the President of the ECB, Christine Lagarde.
Eurozone inflation data, measured by the Harmonized Index of Consumer Prices (HICP), is an important econometric for the Euro. If inflation rises more than expected, especially if above the ECB’s 2% target, it obliges the ECB to raise interest rates to bring it back under control. Relatively high interest rates compared to its counterparts will usually benefit the Euro, as it makes the region more attractive as a place for global investors to park their money.
Data releases gauge the health of the economy and can impact on the Euro. Indicators such as GDP, Manufacturing and Services PMIs, employment, and consumer sentiment surveys can all influence the direction of the single currency. A strong economy is good for the Euro. Not only does it attract more foreign investment but it may encourage the ECB to put up interest rates, which will directly strengthen the Euro. Otherwise, if economic data is weak, the Euro is likely to fall. Economic data for the four largest economies in the euro area (Germany, France, Italy and Spain) are especially significant, as they account for 75% of the Eurozone’s economy.
Another significant data release for the Euro is the Trade Balance. This indicator measures the difference between what a country earns from its exports and what it spends on imports over a given period. If a country produces highly sought after exports then its currency will gain in value purely from the extra demand created from foreign buyers seeking to purchase these goods. Therefore, a positive net Trade Balance strengthens a currency and vice versa for a negative balance.
US President Donald Trump said on Tuesday, “if we make a TikTok deal and China doesn’t approve it, we could maybe put tariffs on China.”
This comment comes as Trump signed an executive action that delays enforcement of the TikTok ban for 75 days.
Additional comments
The delay will help the Trump administration attempt to “determine the appropriate course forward in an orderly way that protects national security while avoiding an abrupt shutdown of a communications platform used by millions of Americans.”
TikTok is largely about kids, young kids ... If China is going to get information about young kids out of it, to be honest, I think we have bigger problems than that.
If I do a TikTok deal, we should get half.
Market reaction
AUD/USD has paused its recovery on these comments, currently losing 0.46% on the day to trade near 0.6250.
Australian Dollar FAQs
One of the most significant factors for the Australian Dollar (AUD) is the level of interest rates set by the Reserve Bank of Australia (RBA). Because Australia is a resource-rich country another key driver is the price of its biggest export, Iron Ore. The health of the Chinese economy, its largest trading partner, is a factor, as well as inflation in Australia, its growth rate and Trade Balance. Market sentiment – whether investors are taking on more risky assets (risk-on) or seeking safe-havens (risk-off) – is also a factor, with risk-on positive for AUD.
The Reserve Bank of Australia (RBA) influences the Australian Dollar (AUD) by setting the level of interest rates that Australian banks can lend to each other. This influences the level of interest rates in the economy as a whole. The main goal of the RBA is to maintain a stable inflation rate of 2-3% by adjusting interest rates up or down. Relatively high interest rates compared to other major central banks support the AUD, and the opposite for relatively low. The RBA can also use quantitative easing and tightening to influence credit conditions, with the former AUD-negative and the latter AUD-positive.
China is Australia’s largest trading partner so the health of the Chinese economy is a major influence on the value of the Australian Dollar (AUD). When the Chinese economy is doing well it purchases more raw materials, goods and services from Australia, lifting demand for the AUD, and pushing up its value. The opposite is the case when the Chinese economy is not growing as fast as expected. Positive or negative surprises in Chinese growth data, therefore, often have a direct impact on the Australian Dollar and its pairs.
Iron Ore is Australia’s largest export, accounting for $118 billion a year according to data from 2021, with China as its primary destination. The price of Iron Ore, therefore, can be a driver of the Australian Dollar. Generally, if the price of Iron Ore rises, AUD also goes up, as aggregate demand for the currency increases. The opposite is the case if the price of Iron Ore falls. Higher Iron Ore prices also tend to result in a greater likelihood of a positive Trade Balance for Australia, which is also positive of the AUD.
The Trade Balance, which is the difference between what a country earns from its exports versus what it pays for its imports, is another factor that can influence the value of the Australian Dollar. If Australia produces highly sought after exports, then its currency will gain in value purely from the surplus demand created from foreign buyers seeking to purchase its exports versus what it spends to purchase imports. Therefore, a positive net Trade Balance strengthens the AUD, with the opposite effect if the Trade Balance is negative.
- UZD/MXN catches aggressive bids on Tuesday in reaction to Trump’s tariff remarks.
- A goodish USD recovery from a two-week low lends additional support to the pair.
- Bets that the Fed will cut rates twice in 2025 caps gains for the buck and the major.
The USD/MXN pair regains positive traction during the Asian session on Tuesday and remains close to its highest level since July 2022 touched last week. Spot prices currently trade around the 20.70-20.75 area, up over 1.0% for the day, in the wake of US President Donald Trump's tariff remarks and resurgent US Dollar (USD) demand.
The Mexican Peso (MXN) weakens after Trump said this Tuesday that he intends 25% tariffs on Canada and Mexico, and the target date for tariffs would be as soon as early February. This comes on top of overnight dovish comments from Banco de Mexico (Banxico) Deputy Governor Jonathan Heath, saying that headline and core inflation rates will likely land below 4% in January. Heath added that the bank does not need to exaggerate a restrictive posture, which, along with the emergence of some USD buying provides a goodish lift to the USD/MXN pair.
The USD Index, which tracks the Greenback against a basket of currencies, rebounds swiftly from a two-week low touched on Monday amid worries that Trump's protectionist policies would reignite inflationary pressures. Furthermore, Trump's comments revived trade war fears and further benefits the safe-haven buck. That said, the recent signs of abating inflation in the US lifted market bets that the Federal Reserve (Fed) will cut interest rates twice this year. This, in turn, caps any further appreciating move for the buck and the USD/MXN pair.
Mexican Peso FAQs
The Mexican Peso (MXN) is the most traded currency among its Latin American peers. Its value is broadly determined by the performance of the Mexican economy, the country’s central bank’s policy, the amount of foreign investment in the country and even the levels of remittances sent by Mexicans who live abroad, particularly in the United States. Geopolitical trends can also move MXN: for example, the process of nearshoring – or the decision by some firms to relocate manufacturing capacity and supply chains closer to their home countries – is also seen as a catalyst for the Mexican currency as the country is considered a key manufacturing hub in the American continent. Another catalyst for MXN is Oil prices as Mexico is a key exporter of the commodity.
The main objective of Mexico’s central bank, also known as Banxico, is to maintain inflation at low and stable levels (at or close to its target of 3%, the midpoint in a tolerance band of between 2% and 4%). To this end, the bank sets an appropriate level of interest rates. When inflation is too high, Banxico will attempt to tame it by raising interest rates, making it more expensive for households and businesses to borrow money, thus cooling demand and the overall economy. Higher interest rates are generally positive for the Mexican Peso (MXN) as they lead to higher yields, making the country a more attractive place for investors. On the contrary, lower interest rates tend to weaken MXN.
Macroeconomic data releases are key to assess the state of the economy and can have an impact on the Mexican Peso (MXN) valuation. A strong Mexican economy, based on high economic growth, low unemployment and high confidence is good for MXN. Not only does it attract more foreign investment but it may encourage the Bank of Mexico (Banxico) to increase interest rates, particularly if this strength comes together with elevated inflation. However, if economic data is weak, MXN is likely to depreciate.
As an emerging-market currency, the Mexican Peso (MXN) tends to strive during risk-on periods, or when investors perceive that broader market risks are low and thus are eager to engage with investments that carry a higher risk. Conversely, MXN tends to weaken at times of market turbulence or economic uncertainty as investors tend to sell higher-risk assets and flee to the more-stable safe havens.
| Raw materials | Closed | Change, % |
|---|---|---|
| Silver | 30.474 | 0.62 |
| Gold | 2707.68 | 0.22 |
| Palladium | 952.49 | 0.44 |
- The Australian Dollar loses ground due to increased risk aversion as traders focus on Trump’s economic policies, including tariffs.
- The S&P/ASX 200 Index rose to nearly 8,400, reaching its highest level in six weeks.
- President Trump intends to instruct federal agencies to review tariff policies and assess the relationships with Canada, Mexico, and China.
The Australian Dollar (AUD) pares back its recent gains on Tuesday after a strong performance in the previous session. Despite this, the AUD/USD pair advanced as the US Dollar (USD) weakened, with traders closely watching for updates on US President Donald Trump’s economic policies, particularly regarding tariffs.
The S&P/ASX 200 Index climbed to nearly 8,400 on Tuesday, reaching its highest level in six weeks. This rally came in the wake of Donald Trump’s second-term inauguration, as markets reacted positively to his decision not to announce any new tariffs.
Traders increasingly anticipate that the Reserve Bank of Australia (RBA) could begin cutting interest rates as early as next month. This sentiment is driven by softer core inflation data, which has dropped to its lowest level since the fourth quarter of 2021, approaching the RBA’s target range of 2% to 3%. Attention is now turning to Australia’s upcoming quarterly inflation report, scheduled for release next week, as it may provide further insights into the likely path of interest rates.
The People’s Bank of China (PBOC) announced on Monday that it would keep its Loan Prime Rates (LPRs) unchanged. The one-year Loan Prime Rate (LPR) remains at 3.10%, while the five-year LPR stands at 3.60%. Since China and Australia are close trading partners, any shifts in China’s economy could have an impact on Australian markets.
Australian Dollar could appreciate as Trump refrains from announcing new tariffs
- The US Dollar Index (DXY), which tracks the performance of the US Dollar against six major currencies, rises to around 108.50 at the time of writing. However, the Greenback faced headwinds following a Bloomberg report indicating that President Donald Trump will not immediately announce new tariffs after his inauguration on Monday. Instead, Trump plans to direct federal agencies to review tariff policies and the United States' trade relationships with Canada, Mexico, and China.
- The US Federal Reserve (Fed) is expected to keep its benchmark overnight rate steady in the 4.25%-4.50% range at its January meeting. However, investors believe Trump’s policies could drive inflationary pressures, potentially limiting the Fed to just one more rate cut. This could help cushion the USD against significant losses in the near term.
- US Retail Sales rose by 0.4% MoM in December, reaching $729.2 billion. This reading was weaker than the market expectations of a 0.6% rise and lower than the previous reading of a 0.8% increase (revised from 0.7%).
- The US Consumer Price Index increased by 2.9% year-over-year in December, up from 2.7% in November, aligning with market expectations. Monthly, CPI rose 0.4%, following a 0.3% increase in the previous month. US Core CPI, which excludes volatile food and energy prices, rose 3.2% annually in December, slightly below November's figure and analysts' forecasts of 3.3%.
- On Thursday, Chicago Federal Reserve Bank President Austan Goolsbee stated that he has grown increasingly confident over the past several months that the job market is stabilizing at a level resembling full employment, rather than deteriorating into something worse, according to Reuters.
- Scott Bessent, Donald Trump’s nominee for Treasury Secretary, emphasized the importance of maintaining the US Dollar as the world’s reserve currency for the nation's economic stability and future prosperity. Bessent stated “Productive investment that grows the economy must be prioritized over wasteful spending that drives inflation,” per Bloomberg.
- The Federal Reserve reported in its latest Beige Book survey, released last week, that economic activity saw slight to moderate growth across the twelve Federal Reserve Districts in late November and December. Consumer spending increased moderately, driven by strong holiday sales that surpassed expectations. However, manufacturing activity experienced a slight decline overall, as some manufacturers stockpiled inventories in anticipation of higher tariffs.
Technical Analysis: Australian Dollar falls back below 0.6250 toward nine-day EMA
The AUD/USD pair trades near 0.6230 on Tuesday, attempting to fall back to the descending channel on the daily chart. A successful return would suggest that prevailing bearish bias is still in play. The 14-day Relative Strength Index (RSI) remains below the 50 level, signaling bearish bias is intact.
The AUD/USD pair tests the nine-day Exponential Moving Average (EMA) at 0.6220. A more substantial support level is located near the recent low at 0.6131 level. A break below this level could lead the AUD/USD pair to navigate the region around the lower boundary of the descending channel, around the 0.5890 mark.
On the upside, the AUD/USD pair could approach the psychological level of 0.6300.
AUD/USD: Daily Chart
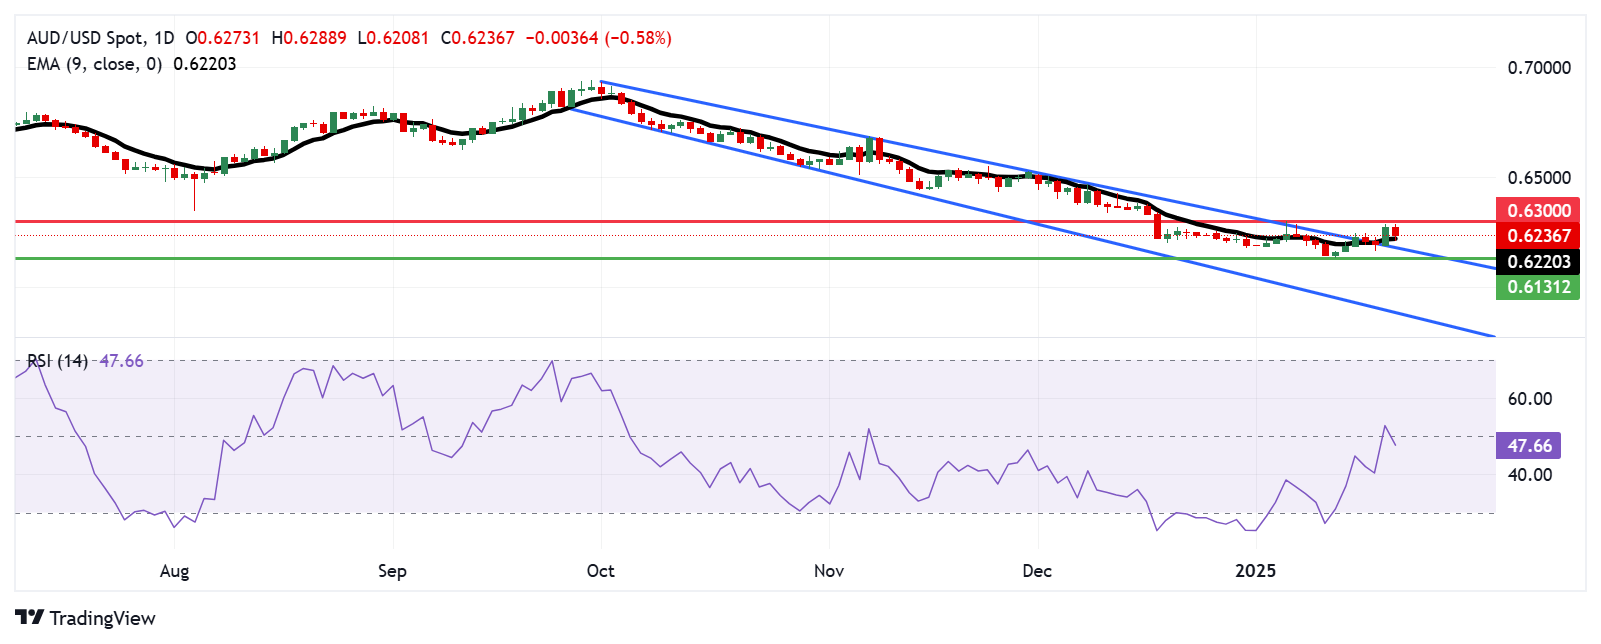
Australian Dollar PRICE Today
The table below shows the percentage change of Australian Dollar (AUD) against listed major currencies today. Australian Dollar was the weakest against the Japanese Yen.
| USD | EUR | GBP | JPY | CAD | AUD | NZD | CHF | |
|---|---|---|---|---|---|---|---|---|
| USD | 0.34% | 0.33% | -0.23% | 0.79% | 0.45% | 0.45% | 0.13% | |
| EUR | -0.34% | 0.00% | -0.60% | 0.46% | 0.11% | 0.12% | -0.20% | |
| GBP | -0.33% | -0.00% | -0.63% | 0.46% | 0.11% | 0.12% | -0.20% | |
| JPY | 0.23% | 0.60% | 0.63% | 1.08% | 0.73% | 0.72% | 0.42% | |
| CAD | -0.79% | -0.46% | -0.46% | -1.08% | -0.35% | -0.34% | -0.65% | |
| AUD | -0.45% | -0.11% | -0.11% | -0.73% | 0.35% | 0.00% | -0.30% | |
| NZD | -0.45% | -0.12% | -0.12% | -0.72% | 0.34% | -0.00% | -0.32% | |
| CHF | -0.13% | 0.20% | 0.20% | -0.42% | 0.65% | 0.30% | 0.32% |
The heat map shows percentage changes of major currencies against each other. The base currency is picked from the left column, while the quote currency is picked from the top row. For example, if you pick the Australian Dollar from the left column and move along the horizontal line to the US Dollar, the percentage change displayed in the box will represent AUD (base)/USD (quote).
Australian Dollar FAQs
One of the most significant factors for the Australian Dollar (AUD) is the level of interest rates set by the Reserve Bank of Australia (RBA). Because Australia is a resource-rich country another key driver is the price of its biggest export, Iron Ore. The health of the Chinese economy, its largest trading partner, is a factor, as well as inflation in Australia, its growth rate and Trade Balance. Market sentiment – whether investors are taking on more risky assets (risk-on) or seeking safe-havens (risk-off) – is also a factor, with risk-on positive for AUD.
The Reserve Bank of Australia (RBA) influences the Australian Dollar (AUD) by setting the level of interest rates that Australian banks can lend to each other. This influences the level of interest rates in the economy as a whole. The main goal of the RBA is to maintain a stable inflation rate of 2-3% by adjusting interest rates up or down. Relatively high interest rates compared to other major central banks support the AUD, and the opposite for relatively low. The RBA can also use quantitative easing and tightening to influence credit conditions, with the former AUD-negative and the latter AUD-positive.
China is Australia’s largest trading partner so the health of the Chinese economy is a major influence on the value of the Australian Dollar (AUD). When the Chinese economy is doing well it purchases more raw materials, goods and services from Australia, lifting demand for the AUD, and pushing up its value. The opposite is the case when the Chinese economy is not growing as fast as expected. Positive or negative surprises in Chinese growth data, therefore, often have a direct impact on the Australian Dollar and its pairs.
Iron Ore is Australia’s largest export, accounting for $118 billion a year according to data from 2021, with China as its primary destination. The price of Iron Ore, therefore, can be a driver of the Australian Dollar. Generally, if the price of Iron Ore rises, AUD also goes up, as aggregate demand for the currency increases. The opposite is the case if the price of Iron Ore falls. Higher Iron Ore prices also tend to result in a greater likelihood of a positive Trade Balance for Australia, which is also positive of the AUD.
The Trade Balance, which is the difference between what a country earns from its exports versus what it pays for its imports, is another factor that can influence the value of the Australian Dollar. If Australia produces highly sought after exports, then its currency will gain in value purely from the surplus demand created from foreign buyers seeking to purchase its exports versus what it spends to purchase imports. Therefore, a positive net Trade Balance strengthens the AUD, with the opposite effect if the Trade Balance is negative.
- The Japanese Yen weakened against the USD after Trump’s tariff remarks.
- The divergent BoJ-Fed expectations helped limit any further losses for the JPY.
- The narrowing US-Japan yield differential warrants caution for the JPY bears.
The Japanese Yen (JPY) retreats sharply after touching a five-week top against its American counterpart during the Asian session on Tuesday, with the USD/JPY pair rallying over 100 pips from levels below the 155.00 psychological mark in the last hour. US President Donald Trump's tariff remarks triggered a sharp US Dollar (USD) recovery from a two-week low touched on Monday and turned out to be a key factor behind the intraday JPY downfall. That said, a turnaround in the global risk sentiment offers some support to the safe-haven JPY.
Furthermore, firming expectations that the Bank of Japan (BoJ) will hike interest rates at its monetary policy meeting later this week contribute to limiting any meaningful JPY depreciation. Meanwhile, rising bets that the Federal Reserve (Fed) will lower borrowing costs twice this year led to the recent decline in the US Treasury bond yields. The resultant narrowing of the US-Japan rate differential is holding back traders from placing aggressive bearish bets around the JPY and keeping a lid on the intraday USD/JPY pair's positive move.
Japanese Yen bulls have the upper hand amid BoJ rate hike bets
- The recent hawkish comments from Bank of Japan Governor Kazuo Ueda and Deputy Governor Ryozo Himino, along with the broadening inflationary pressure in Japan, raised the odds for an imminent rate hike by the Japanese central bank. The markets are pricing in an 80% chance of a rate hike later this week.
- According to people familiar with the matter, BoJ will reach the final conclusion after examining economic data, markets and the implications of US economic policies. The view among the officials is that US President Donald Trump could ruffle markets or change expectations about the global economy.
- Trump said this Tuesday that he intends to impose 25% tariffs on Canada and Mexico, and the target date for tariffs would be as soon as early February. Trump's remarks revive inflation concerns, which could force the Federal Reserve to stick to its hawkish stance and prompt a sharp US Dollar recovery from a two-week low.
- The US Producer Price Index (PPI) and Consumer Price Index (CPI) released last week pointed to signs of abating inflation. This suggests that the Fed may not exclude the possibility of rate cuts by the end of this year, which keeps the US Treasury bond yields depressed and acts as a headwind for the Greenback.
- There isn't any relevant market-moving economic data due for release on Tuesday, either from Japan or the US. Moreover, the focus remains glued to the highly-anticipated two-day BoJ policy meeting starting on Thursday, which will play a key role in determining the near-term trajectory for the Japanese Yen.
USD/JPY bears await sustained break below ascending channel support
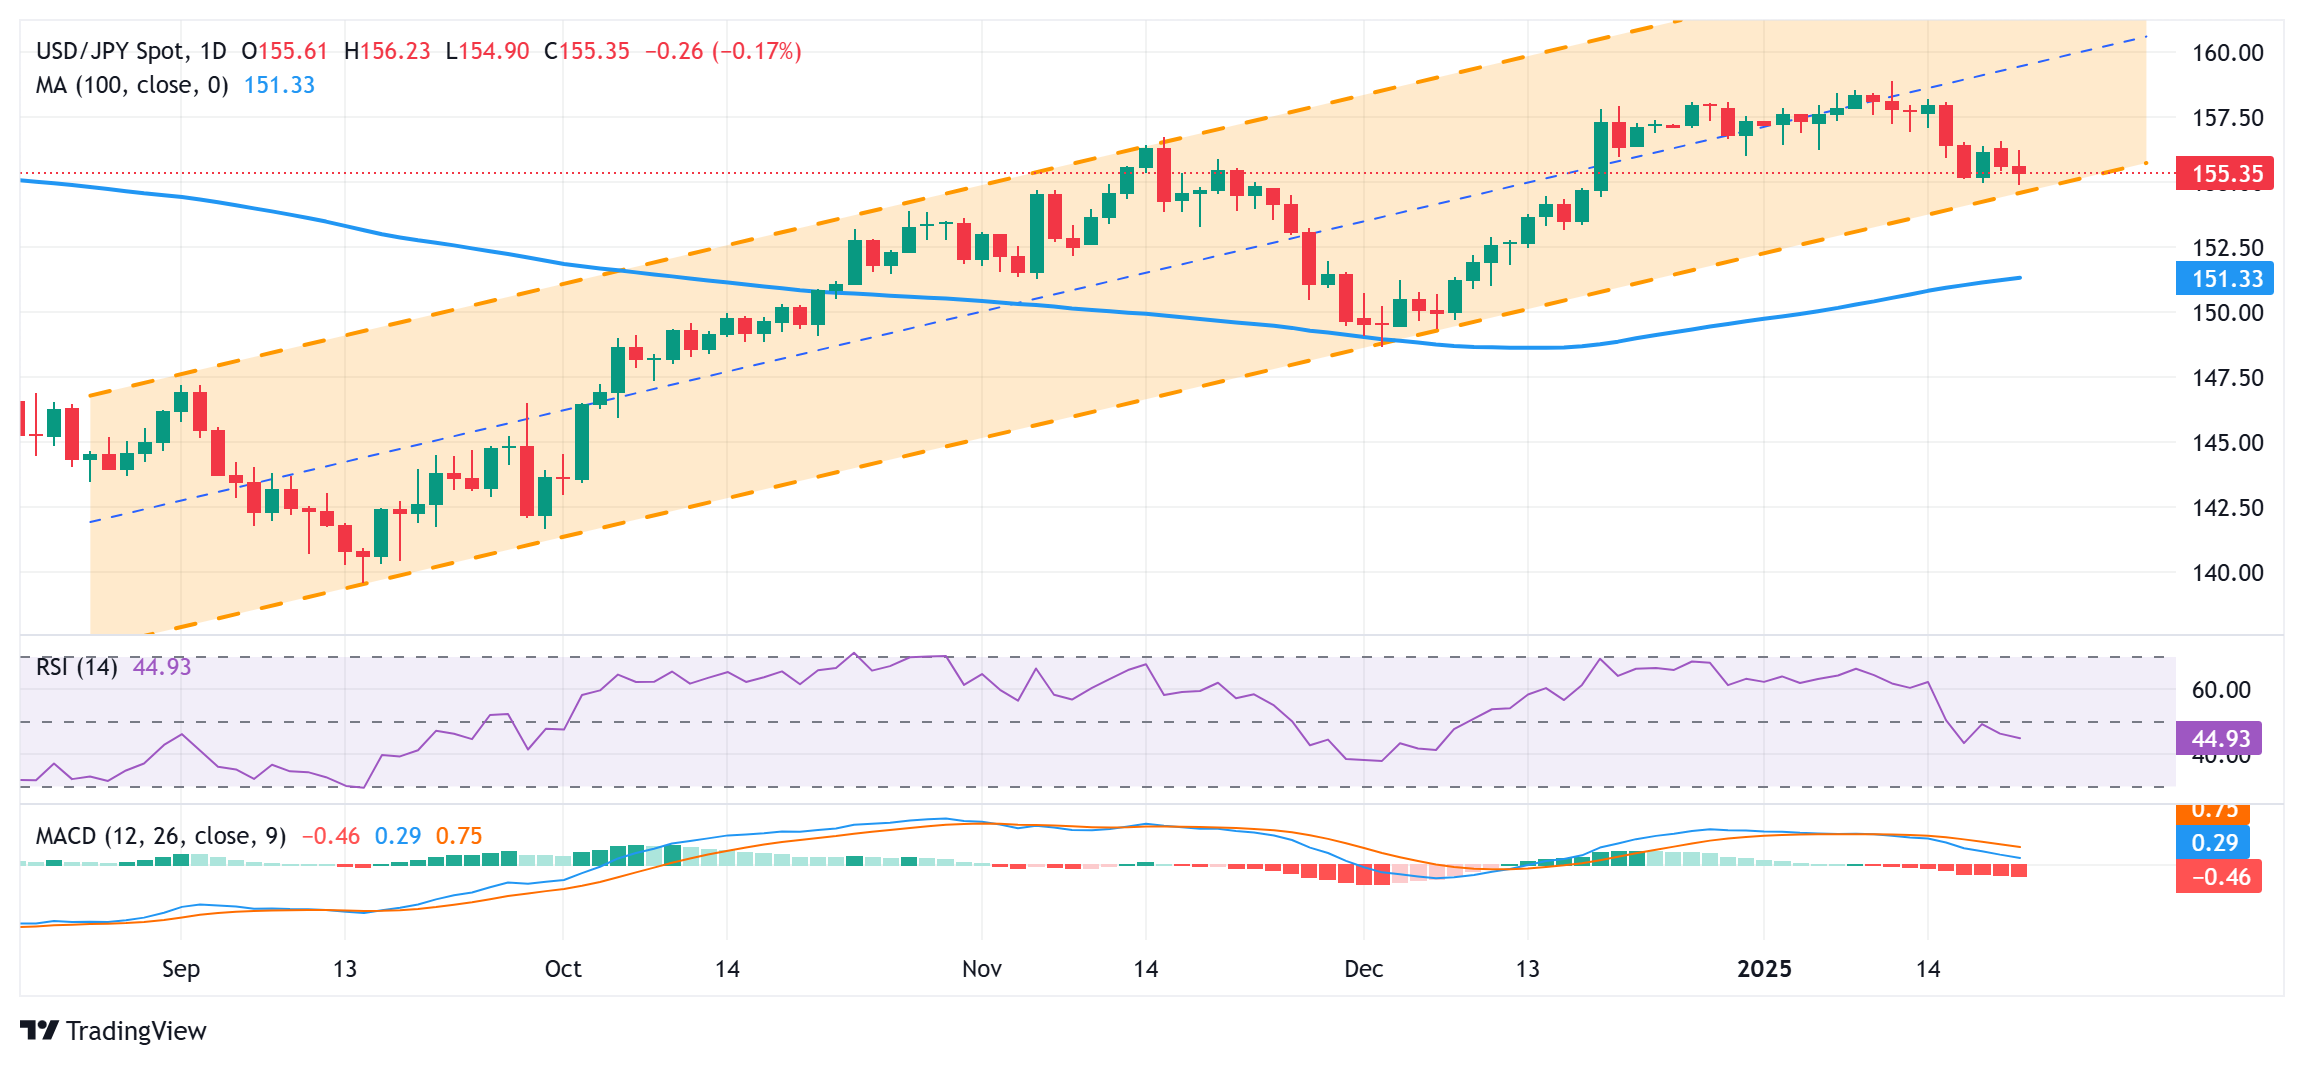
From a technical perspective, the USD/JPY pair continues to show some resilience below the 155.00 mark and so far, has managed to defend a support representing the lower boundary of a multi-month-old ascending channel. This makes it prudent to wait for a convincing breakdown and acceptance below the said support levels before positioning for an extension of the recent downfall from a multi-month top. Spot prices might then accelerate the slide towards the 154.50-154.45 intermediate support en route to the 154.00 round figure, the mid-153.00s, and the 153.00 mark.
On the flip side, the Asian session peak, around the 156.25 region, now seems to act as an immediate hurdle. Some follow-through buying beyond the overnight swing high, around the 156.58-156.60 area, could allow the USD/JPY pair to reclaim the 157.00 mark. The recovery momentum could extend further towards the 157.25-157.30 area en route to the 157.60 region and the 158.00 round figure. A sustained strength beyond the latter could set the stage for a move towards retesting the multi-month peak, around the 159.00 neighborhood touched on January 10.
Japanese Yen FAQs
The Japanese Yen (JPY) is one of the world’s most traded currencies. Its value is broadly determined by the performance of the Japanese economy, but more specifically by the Bank of Japan’s policy, the differential between Japanese and US bond yields, or risk sentiment among traders, among other factors.
One of the Bank of Japan’s mandates is currency control, so its moves are key for the Yen. The BoJ has directly intervened in currency markets sometimes, generally to lower the value of the Yen, although it refrains from doing it often due to political concerns of its main trading partners. The BoJ ultra-loose monetary policy between 2013 and 2024 caused the Yen to depreciate against its main currency peers due to an increasing policy divergence between the Bank of Japan and other main central banks. More recently, the gradually unwinding of this ultra-loose policy has given some support to the Yen.
Over the last decade, the BoJ’s stance of sticking to ultra-loose monetary policy has led to a widening policy divergence with other central banks, particularly with the US Federal Reserve. This supported a widening of the differential between the 10-year US and Japanese bonds, which favored the US Dollar against the Japanese Yen. The BoJ decision in 2024 to gradually abandon the ultra-loose policy, coupled with interest-rate cuts in other major central banks, is narrowing this differential.
The Japanese Yen is often seen as a safe-haven investment. This means that in times of market stress, investors are more likely to put their money in the Japanese currency due to its supposed reliability and stability. Turbulent times are likely to strengthen the Yen’s value against other currencies seen as more risky to invest in.
Japan’s Finance Minister Katsunobu Kato on Tuesday that “Japan to respond appropriately after examining new US President’s policies.”
Additional quotes
Will closely monitor impact of US policies on world economy, Japan.
Expect the BoJ to conduct monetary policies appropriately to achieve 2% inflation target.
Market reaction
USD/JPY is back under 155.50 following these above comments, losing 0.15% on the day.
- USD/CAD holds positive ground near 1.4445 in Tuesday’s Asian session, up 0.94% on the day.
- Trump said he considered imposing 25% tariffs on Canada and Mexico in February.
- Canada’s December CPI inflation will be the highlight later on Tuesday.
The USD/CAD pair jumps to 1.4518 before pulling back sharply to 1.4445 during the Asian trading hours on Tuesday. The Canadian Dollar (CAD) weakens on US President Donald Trump's remarks on tariffs on Canada. Later on Tuesday, the Canadian December Consumer Price Index (CPI) inflation data will be in the spotlight.
On Monday, Trump said that he was thinking of imposing 25% tariffs on imports from Canada and Mexico, as both countries were allowing many people to cross the border as well as fentanyl. Trump added that the action could come as soon as early February. “We’re thinking in terms of 25% (levies) on Mexico and Canada because they’re allowing cast number of people” over the border, Trump said.
Furthermore, the Bank of Canada’s (BoC) Business Outlook Survey suggested that overall economic sentiment in Canada remains subdued. Canadian firms see improved demand and sales in the coming year, fueled by rate cuts, but are concerned about the potential risks from promised US trade policies from Trump’s administration.
Investors will keep an eye on Canada’s December CPI inflation data, which is due later on Tuesday. The CPI is estimated to see an increase of 1.8% YoY in December versus 1.9% prior. If the report shows an unexpected upside in inflation, this could lift the Canadian Dollar and cap the upside for the pair.
Canadian Dollar FAQs
The key factors driving the Canadian Dollar (CAD) are the level of interest rates set by the Bank of Canada (BoC), the price of Oil, Canada’s largest export, the health of its economy, inflation and the Trade Balance, which is the difference between the value of Canada’s exports versus its imports. Other factors include market sentiment – whether investors are taking on more risky assets (risk-on) or seeking safe-havens (risk-off) – with risk-on being CAD-positive. As its largest trading partner, the health of the US economy is also a key factor influencing the Canadian Dollar.
The Bank of Canada (BoC) has a significant influence on the Canadian Dollar by setting the level of interest rates that banks can lend to one another. This influences the level of interest rates for everyone. The main goal of the BoC is to maintain inflation at 1-3% by adjusting interest rates up or down. Relatively higher interest rates tend to be positive for the CAD. The Bank of Canada can also use quantitative easing and tightening to influence credit conditions, with the former CAD-negative and the latter CAD-positive.
The price of Oil is a key factor impacting the value of the Canadian Dollar. Petroleum is Canada’s biggest export, so Oil price tends to have an immediate impact on the CAD value. Generally, if Oil price rises CAD also goes up, as aggregate demand for the currency increases. The opposite is the case if the price of Oil falls. Higher Oil prices also tend to result in a greater likelihood of a positive Trade Balance, which is also supportive of the CAD.
While inflation had always traditionally been thought of as a negative factor for a currency since it lowers the value of money, the opposite has actually been the case in modern times with the relaxation of cross-border capital controls. Higher inflation tends to lead central banks to put up interest rates which attracts more capital inflows from global investors seeking a lucrative place to keep their money. This increases demand for the local currency, which in Canada’s case is the Canadian Dollar.
Macroeconomic data releases gauge the health of the economy and can have an impact on the Canadian Dollar. Indicators such as GDP, Manufacturing and Services PMIs, employment, and consumer sentiment surveys can all influence the direction of the CAD. A strong economy is good for the Canadian Dollar. Not only does it attract more foreign investment but it may encourage the Bank of Canada to put up interest rates, leading to a stronger currency. If economic data is weak, however, the CAD is likely to fall.
- NZD/USD remains under selling pressure around 0.5645, down 0.53% on the day.
- Trump said he is thinking in terms of 25% tariffs on Mexico and Canada next week.
- New Zealand’s PSI declined to 47.9 in December vs. 49.5 prior.
The NZD/USD pair slumps to around 0.5645 during the Asian trading hours on Tuesday. The US Dollar (USD) rebounds after US President Donald Trump said that he intends to impose 25% tariffs on Canada and Mexico on February 1.
Trump stated on Monday that tariffs could be levied against Mexico and Canada as soon as early February, per CNBC. “We’re thinking in terms of 25% (levies) on Mexico and Canada because they’re allowing cast number of people” over the border, Trump said. The Greenback recovers some lost ground following this report.
Meanwhile, the US dollar Index (DXY), a measure of the USD's value relative to its most significant trading partners' currencies, bounced off the two-week low and edges higher above 108.50, gaining 0.40% on the day.
Investors will closely monitor the development surrounding tariff policies, as Trump had also threatened China with tariffs of up to 60% in December. If he imposes any tariffs on China, this could weigh on the Kiwi, as China is a major trading partner to New Zealand.
Data released by Business NZ on Tuesday showed that New Zealand’s Performance of Services Index (PSI) eased to 47.9 in December from 49.5 in November. This figure has now been in contraction for ten consecutive months. The downbeat report contributes to the New Zealand Dollar’s (NZD) downside.
New Zealand Dollar FAQs
The New Zealand Dollar (NZD), also known as the Kiwi, is a well-known traded currency among investors. Its value is broadly determined by the health of the New Zealand economy and the country’s central bank policy. Still, there are some unique particularities that also can make NZD move. The performance of the Chinese economy tends to move the Kiwi because China is New Zealand’s biggest trading partner. Bad news for the Chinese economy likely means less New Zealand exports to the country, hitting the economy and thus its currency. Another factor moving NZD is dairy prices as the dairy industry is New Zealand’s main export. High dairy prices boost export income, contributing positively to the economy and thus to the NZD.
The Reserve Bank of New Zealand (RBNZ) aims to achieve and maintain an inflation rate between 1% and 3% over the medium term, with a focus to keep it near the 2% mid-point. To this end, the bank sets an appropriate level of interest rates. When inflation is too high, the RBNZ will increase interest rates to cool the economy, but the move will also make bond yields higher, increasing investors’ appeal to invest in the country and thus boosting NZD. On the contrary, lower interest rates tend to weaken NZD. The so-called rate differential, or how rates in New Zealand are or are expected to be compared to the ones set by the US Federal Reserve, can also play a key role in moving the NZD/USD pair.
Macroeconomic data releases in New Zealand are key to assess the state of the economy and can impact the New Zealand Dollar’s (NZD) valuation. A strong economy, based on high economic growth, low unemployment and high confidence is good for NZD. High economic growth attracts foreign investment and may encourage the Reserve Bank of New Zealand to increase interest rates, if this economic strength comes together with elevated inflation. Conversely, if economic data is weak, NZD is likely to depreciate.
The New Zealand Dollar (NZD) tends to strengthen during risk-on periods, or when investors perceive that broader market risks are low and are optimistic about growth. This tends to lead to a more favorable outlook for commodities and so-called ‘commodity currencies’ such as the Kiwi. Conversely, NZD tends to weaken at times of market turbulence or economic uncertainty as investors tend to sell higher-risk assets and flee to the more-stable safe havens.
The People’s Bank of China (PBOC) set the USD/CNY central rate for the trading session ahead on Tuesday at 7.1703 as compared to the previous day's fix of 7.1886 and 7.2888 Reuters estimates.
US President Donald Trump said on Tuesday that he intends to impose 25% tariffs on Canada and Mexico next week.
Key quotes
“We’re thinking in terms of 25% on Mexico and Canada.”
“I think February 1.”
“I think we’ll do it Feb. 1. On each.”
Market reaction
The US Dollar Index (DXY) is trading 0.49% higher on the day at 108.60 as of writing.
US Dollar FAQs
The US Dollar (USD) is the official currency of the United States of America, and the ‘de facto’ currency of a significant number of other countries where it is found in circulation alongside local notes. It is the most heavily traded currency in the world, accounting for over 88% of all global foreign exchange turnover, or an average of $6.6 trillion in transactions per day, according to data from 2022. Following the second world war, the USD took over from the British Pound as the world’s reserve currency. For most of its history, the US Dollar was backed by Gold, until the Bretton Woods Agreement in 1971 when the Gold Standard went away.
The most important single factor impacting on the value of the US Dollar is monetary policy, which is shaped by the Federal Reserve (Fed). The Fed has two mandates: to achieve price stability (control inflation) and foster full employment. Its primary tool to achieve these two goals is by adjusting interest rates. When prices are rising too quickly and inflation is above the Fed’s 2% target, the Fed will raise rates, which helps the USD value. When inflation falls below 2% or the Unemployment Rate is too high, the Fed may lower interest rates, which weighs on the Greenback.
In extreme situations, the Federal Reserve can also print more Dollars and enact quantitative easing (QE). QE is the process by which the Fed substantially increases the flow of credit in a stuck financial system. It is a non-standard policy measure used when credit has dried up because banks will not lend to each other (out of the fear of counterparty default). It is a last resort when simply lowering interest rates is unlikely to achieve the necessary result. It was the Fed’s weapon of choice to combat the credit crunch that occurred during the Great Financial Crisis in 2008. It involves the Fed printing more Dollars and using them to buy US government bonds predominantly from financial institutions. QE usually leads to a weaker US Dollar.
Quantitative tightening (QT) is the reverse process whereby the Federal Reserve stops buying bonds from financial institutions and does not reinvest the principal from the bonds it holds maturing in new purchases. It is usually positive for the US Dollar.
| Index | Change, points | Closed | Change, % |
|---|---|---|---|
| NIKKEI 225 | 451.04 | 38902.5 | 1.17 |
| Hang Seng | 341.75 | 19925.81 | 1.75 |
| KOSPI | -3.5 | 2520.05 | -0.14 |
| ASX 200 | 37 | 8347.4 | 0.45 |
| DAX | 86.92 | 20990.31 | 0.42 |
| CAC 40 | 23.75 | 7733.5 | 0.31 |
- WTI price trades in negative territory near $76.15 in Tuesday's early Asian session.
- US President Donald Trump promised to boost US crude production, weighing on the WTI price.
- The upbeat Chinese economic data could cap the downside for the black gold.
West Texas Intermediate (WTI), the US crude oil benchmark, is trading around $76.15 on Tuesday. The WTI price attracts some sellers as traders await a flurry of executive orders from US President Donald Trump following his inauguration.
Trump announced on Monday that he would immediately declare a national energy emergency, promising to fill up strategic reserves and use the authority to rapidly approve new oil, gas, and electricity projects that would normally take years to get permits.
Trump’s administration will push for more oil and gas production as well as consumption in the United States, which might drag the WTI price lower. “The inflation crisis (in the US) was caused by massive overspending and escalating energy prices, and that is why today I will also declare a national energy emergency. We will drill, baby, drill. America will be a manufacturing nation once again,” Trump said.
The upside for the WTI price might be capped amid the easing tension in the Middle East. On Sunday, Hamas and Israel swapped hostages and inmates, marking the start of a truce after 15 months of conflict.
On the other hand, the encouraging Chinese economic data could support black gold, as China is the world's biggest crude importer. China’s economy grew 5.4% YoY in the fourth quarter (Q4) of 2024, compared to a 4.6% expansion in Q3. This reading came in stronger than the 5% expected by a wide margin.
WTI Oil FAQs
WTI Oil is a type of Crude Oil sold on international markets. The WTI stands for West Texas Intermediate, one of three major types including Brent and Dubai Crude. WTI is also referred to as “light” and “sweet” because of its relatively low gravity and sulfur content respectively. It is considered a high quality Oil that is easily refined. It is sourced in the United States and distributed via the Cushing hub, which is considered “The Pipeline Crossroads of the World”. It is a benchmark for the Oil market and WTI price is frequently quoted in the media.
Like all assets, supply and demand are the key drivers of WTI Oil price. As such, global growth can be a driver of increased demand and vice versa for weak global growth. Political instability, wars, and sanctions can disrupt supply and impact prices. The decisions of OPEC, a group of major Oil-producing countries, is another key driver of price. The value of the US Dollar influences the price of WTI Crude Oil, since Oil is predominantly traded in US Dollars, thus a weaker US Dollar can make Oil more affordable and vice versa.
The weekly Oil inventory reports published by the American Petroleum Institute (API) and the Energy Information Agency (EIA) impact the price of WTI Oil. Changes in inventories reflect fluctuating supply and demand. If the data shows a drop in inventories it can indicate increased demand, pushing up Oil price. Higher inventories can reflect increased supply, pushing down prices. API’s report is published every Tuesday and EIA’s the day after. Their results are usually similar, falling within 1% of each other 75% of the time. The EIA data is considered more reliable, since it is a government agency.
OPEC (Organization of the Petroleum Exporting Countries) is a group of 12 Oil-producing nations who collectively decide production quotas for member countries at twice-yearly meetings. Their decisions often impact WTI Oil prices. When OPEC decides to lower quotas, it can tighten supply, pushing up Oil prices. When OPEC increases production, it has the opposite effect. OPEC+ refers to an expanded group that includes ten extra non-OPEC members, the most notable of which is Russia.
| Pare | Closed | Change, % |
|---|---|---|
| AUDUSD | 0.6272 | 1.19 |
| EURJPY | 162.029 | 0.94 |
| EURUSD | 1.04133 | 1.34 |
| GBPJPY | 191.735 | 0.85 |
| GBPUSD | 1.23231 | 1.27 |
| NZDUSD | 0.56715 | 1.43 |
| USDCAD | 1.43111 | -1.03 |
| USDCHF | 0.90672 | -0.69 |
| USDJPY | 155.592 | -0.38 |


© 2000-2026. All rights reserved.
This site is managed by Teletrade D.J. LLC 2351 LLC 2022 (Euro House, Richmond Hill Road, Kingstown, VC0100, St. Vincent and the Grenadines).
The information on this website is for informational purposes only and does not constitute any investment advice.
The company does not serve or provide services to customers who are residents of the US, Canada, Iran, The Democratic People's Republic of Korea, Yemen and FATF blacklisted countries.
Making transactions on financial markets with marginal financial instruments opens up wide possibilities and allows investors who are willing to take risks to earn high profits, carrying a potentially high risk of losses at the same time. Therefore you should responsibly approach the issue of choosing the appropriate investment strategy, taking the available resources into account, before starting trading.
Use of the information: full or partial use of materials from this website must always be referenced to TeleTrade as the source of information. Use of the materials on the Internet must be accompanied by a hyperlink to teletrade.org. Automatic import of materials and information from this website is prohibited.
Please contact our PR department if you have any questions or need assistance at pr@teletrade.global.
transfers