- Analytics
- News and Tools
- Market News
CFD Markets News and Forecasts — 20-09-2024
- The NZD/USD upside seems to be limited as buying and selling forces struggle for dominance.
- The RSI suggests a neutral outlook, while the MACD indicates declining selling pressure.
- A crossover between the 100 and 200-day SMA might propel the pair upwards.
The NZD/USD traded mostly flat on Friday’s session and failed to hold gain which took it to a high around 0.6260 as it then retreated to 0.6240.
The Relative Strength Index (RSI) is at 61, in positive territory with a flat slope. This indicates a neutral outlook for the pair, as buying pressure is flat. The Moving Average Convergence Divergence (MACD) histogram is red and decreasing, suggesting that selling pressure is declining.
NZD/USD daily chart
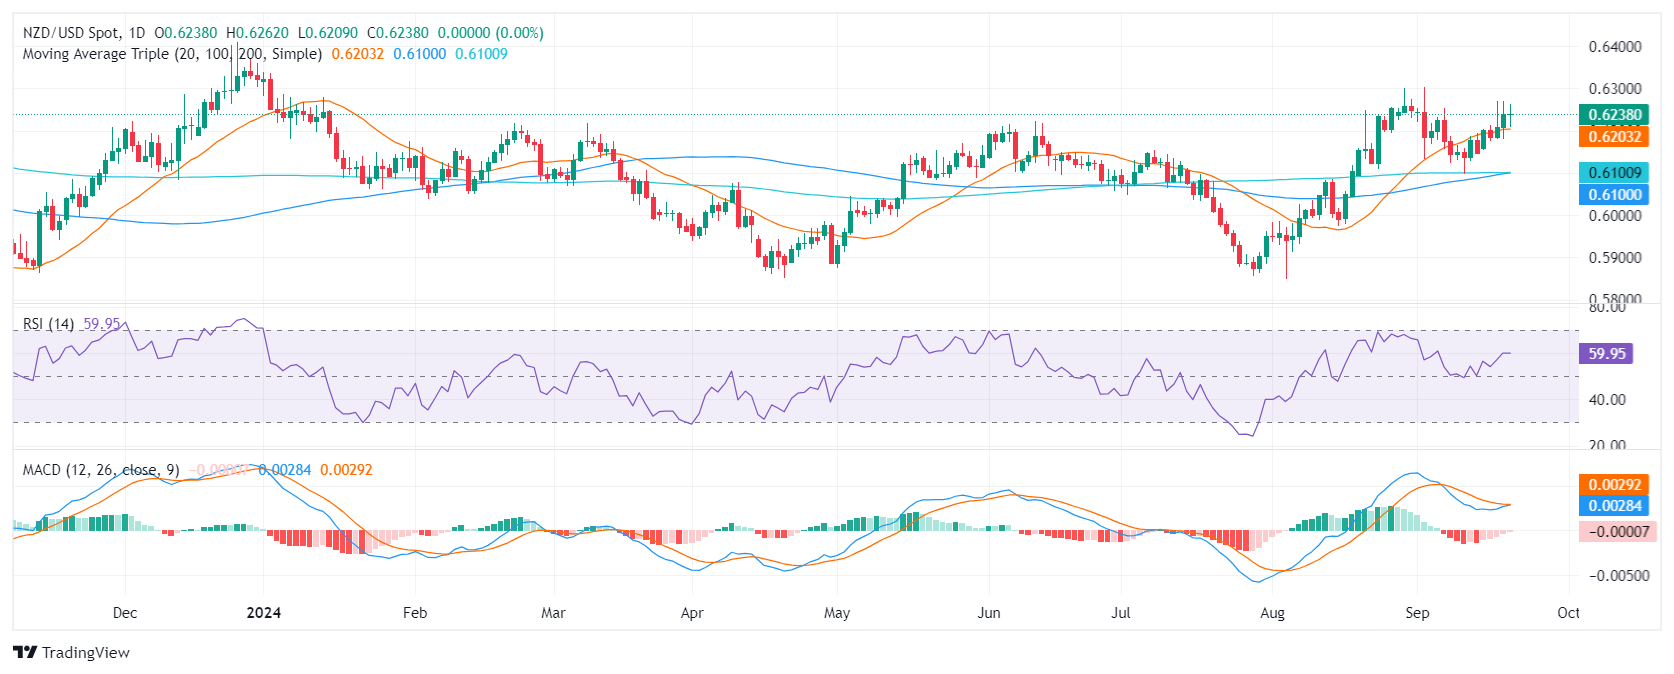
Key support levels include 0.6150, 0.6120, and 0.6100, while resistance levels are 0.6190, 0.6200, and 0.6230. A close above the 20-day SMA, currently at 0.6200, could signal further upward movement with the next target being at early September highs near 0.6300. In addition, traders should monitor the 0.6100 area as the 100 and 200-day SMAs are about to perform a bullish crossover. That could serve as a bullish confirmation and might trigger another upwards leg.
- The NZD/JPY rose by nearly 0.90% to 89.80 on Friday.
- The RSI is in positive territory and rising, indicating buying pressure.
- The MACD is showing rising green bars, suggesting increasing bullish momentum.
In Friday's session, the NZD/JPY continued its climb, propelled by a 0.90% rise to 89.80. This upward trajectory indicates that the pair is gaining strength following the recent consolidation above the 89.00 level. The pair is also riding a substantial winning streak and exhibiting signs of technical strength, amplifying the possibility of further advancements.
Examining the Relative Strength Index (RSI), it is currently positioned at 54, suggesting that buying pressure is elevated and remains a driving force behind the pair's momentum. Additionally, the Moving Average Convergence Divergence (MACD) is painting a bullish picture, with rising green bars indicating increasing bullish momentum.
NZD/JPY daily chart
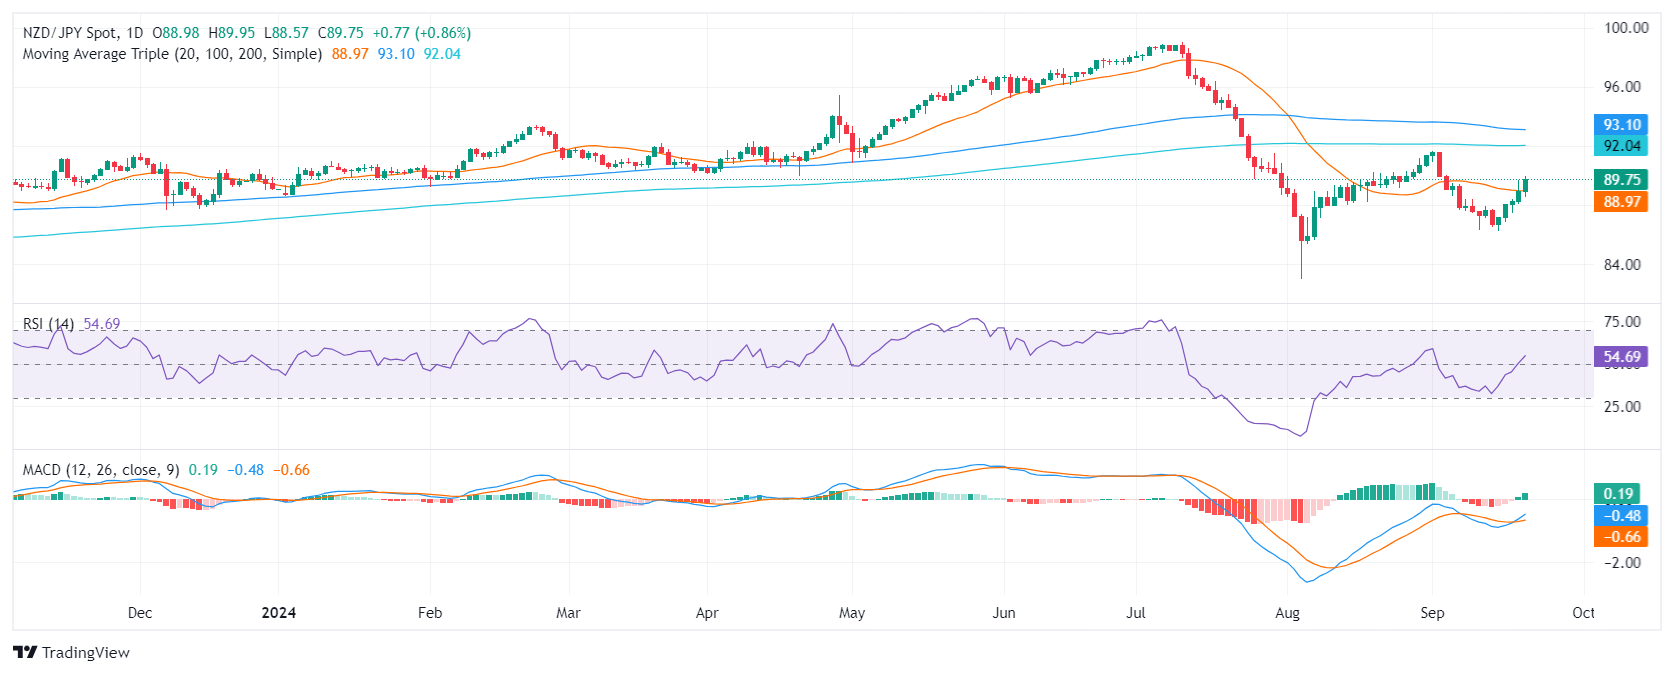
As for notable support and resistance levels, round support levels can be identified at 87.00, 86.50, and 86.00. Meanwhile, resistance levels can be found at 89.50, 90.00, and 90.50. The pair's breach past the 89.00 level has provided further confirmation of its bullish momentum, and sustained trading above this level could pave the way for a continued ascent..
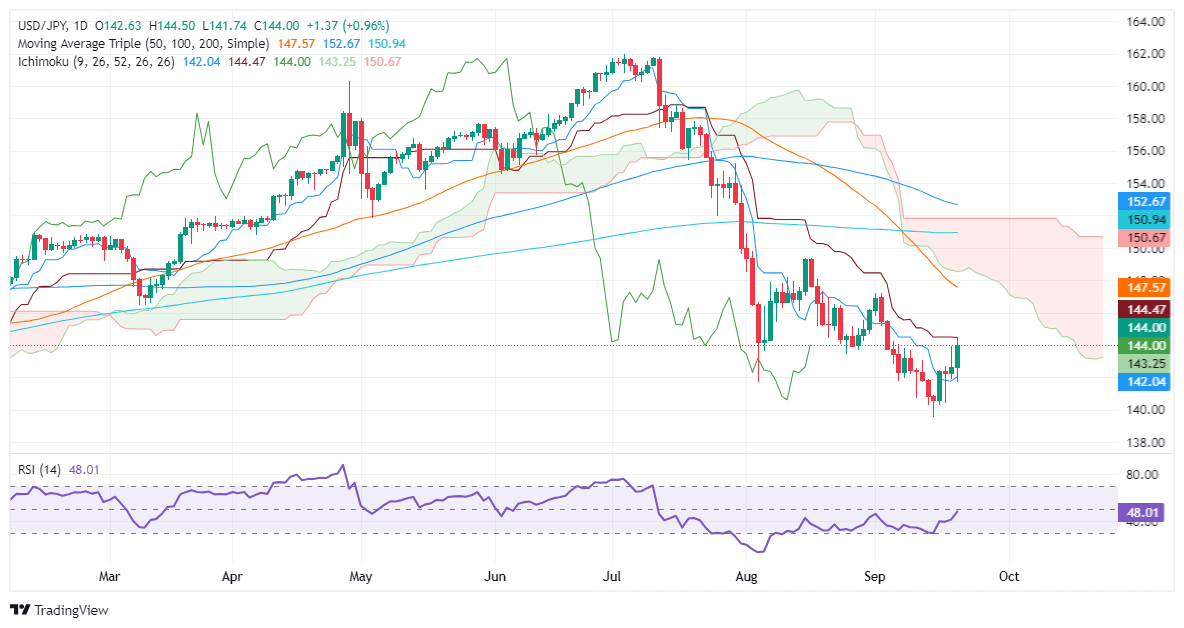
- USD/JPY on track for a positive weekly close, yet still under key resistances, maintaining the downtrend.
- Resistance challenges include Kijun-Sen at 144.40 and Ichimoku Cloud; 50-DMA approaching a bearish cross with 100 and 200-DMAs.
- Buyer momentum builds with RSI rising, though remains below the critical 60 mark needed to overturn the downtrend.
- Potential upside targets 145.00 and the September 3 high at 147.21; a drop below 143.00 could test support at 142.04 (Tenkan-Sen).
The USD/JPY registers gain for back-to-back days, yet it remains shy of decisively cracking the 144.00 figure despite registering a weekly high of 144.49. At the time of writing, the pair exchanged hands at 143.96, up by 0.93%.
USD/JPY Price Forecast: Technical outlook
The pair is set to end the week positively, but the downtrend remains. The USD/JPY has failed to reclaim the Kijun-Sen at 144.46, and price action remains below the Ichimoku Cloud (Kumo).
In fact, the trend could accelerate as the 50-day moving average (DMA) crosses below the 100 and 200-DMAs, with the former closing the gap with the latter.
Momentum favors buyers as the Relative Strength Index (RSI) aims upward. However, it remains far from testing the 60 level, which is usually sought as a crucial break to change the USD/JPY ongoing downtrend.
Short-term, the USD/JPY could extend its gains, with the Kijun-Sen seen as first resistance at 144.40. A breach of the latter will expose the 145.00 figure, followed by the September 3 high at 147.21, followed by the 50-DMA at 147.56.
Conversely, if USD/JPY extends its losses past the 143.00 figure, the next support would be the Tenkan-Sen at 142.04.
USD/JPY Price Action – Daily Chart
Japanese Yen PRICE Today
The table below shows the percentage change of Japanese Yen (JPY) against listed major currencies today. Japanese Yen was the strongest against the Swiss Franc.
| USD | EUR | GBP | JPY | CAD | AUD | NZD | CHF | |
|---|---|---|---|---|---|---|---|---|
| USD | 0.02% | -0.23% | 0.95% | 0.07% | 0.13% | -0.02% | 0.31% | |
| EUR | -0.02% | -0.26% | 0.95% | 0.03% | 0.10% | -0.03% | 0.29% | |
| GBP | 0.23% | 0.26% | 1.21% | 0.31% | 0.38% | 0.24% | 0.58% | |
| JPY | -0.95% | -0.95% | -1.21% | -0.86% | -0.82% | -0.96% | -0.61% | |
| CAD | -0.07% | -0.03% | -0.31% | 0.86% | 0.05% | -0.08% | 0.26% | |
| AUD | -0.13% | -0.10% | -0.38% | 0.82% | -0.05% | -0.12% | 0.22% | |
| NZD | 0.02% | 0.03% | -0.24% | 0.96% | 0.08% | 0.12% | 0.34% | |
| CHF | -0.31% | -0.29% | -0.58% | 0.61% | -0.26% | -0.22% | -0.34% |
The heat map shows percentage changes of major currencies against each other. The base currency is picked from the left column, while the quote currency is picked from the top row. For example, if you pick the Japanese Yen from the left column and move along the horizontal line to the US Dollar, the percentage change displayed in the box will represent JPY (base)/USD (quote).
- Upbeat Aussie Employment data strengthens case for RBA to maintain its current interest rate policy.
- Aussie shows little reaction to PBoC's decision to leave interest rates unchanged.
- Fed dovish bets might limit the downside.
The AUD/USD declined by 0.40% to 0.6790 in Friday's session, pressured by growing expectations of interest rate cuts by the Federal Reserve (Fed). The Fed's focus on preventing labor market deterioration has led traders to anticipate a 75-basis-point (bps) decrease in the remaining two Fed policy meetings. The Australian Dollar remained stable despite the People's Bank of China's (PBoC) decision to maintain interest rates unchanged.
Despite the mixed Australian economic outlook, the Reserve Bank of Australia's (RBA) hawkish stance on inflation has led to market expectations of a modest 25-basis-point rate cut in 2024. This signals a shift away from the previously anticipated more aggressive easing cycle due to the persistent inflationary pressures.
Daily digest market movers: Australian Dollar declines, Fed rate cut expectations limit downside
- Fed cut interest rates by 50 bps, signaling further cuts due to labor market concerns.
- Traders anticipate 75 bps of rate cuts in November and December, with a 43% probability of a 50 bps cut in November.
- Australian Dollar remains firm on strong employment data, dampening expectations for RBA rate cuts.
- Australia's August employment report showed a gain of 47.5K jobs, exceeding estimates and supporting the currency.
- China's PBoC left interest rates unchanged with no significant impact on AUD/USD.
AUD/USD technical outlook: Indicators turn flat but outlook remains positive
Around the 0.6800 mark, the AUD/USD indicators turned flat as buyers seem to be locking in gains from the previous session’s upwards movements. With the pair near yearly highs, it may be set to trade sideways in the next several sessions before the next upward leg. In the meantime, indicators turned flat but remain deep in positive terrain with the Relative Strength Index (RSI) near 62.
Australian Dollar FAQs
One of the most significant factors for the Australian Dollar (AUD) is the level of interest rates set by the Reserve Bank of Australia (RBA). Because Australia is a resource-rich country another key driver is the price of its biggest export, Iron Ore. The health of the Chinese economy, its largest trading partner, is a factor, as well as inflation in Australia, its growth rate and Trade Balance. Market sentiment – whether investors are taking on more risky assets (risk-on) or seeking safe-havens (risk-off) – is also a factor, with risk-on positive for AUD.
The Reserve Bank of Australia (RBA) influences the Australian Dollar (AUD) by setting the level of interest rates that Australian banks can lend to each other. This influences the level of interest rates in the economy as a whole. The main goal of the RBA is to maintain a stable inflation rate of 2-3% by adjusting interest rates up or down. Relatively high interest rates compared to other major central banks support the AUD, and the opposite for relatively low. The RBA can also use quantitative easing and tightening to influence credit conditions, with the former AUD-negative and the latter AUD-positive.
China is Australia’s largest trading partner so the health of the Chinese economy is a major influence on the value of the Australian Dollar (AUD). When the Chinese economy is doing well it purchases more raw materials, goods and services from Australia, lifting demand for the AUD, and pushing up its value. The opposite is the case when the Chinese economy is not growing as fast as expected. Positive or negative surprises in Chinese growth data, therefore, often have a direct impact on the Australian Dollar and its pairs.
Iron Ore is Australia’s largest export, accounting for $118 billion a year according to data from 2021, with China as its primary destination. The price of Iron Ore, therefore, can be a driver of the Australian Dollar. Generally, if the price of Iron Ore rises, AUD also goes up, as aggregate demand for the currency increases. The opposite is the case if the price of Iron Ore falls. Higher Iron Ore prices also tend to result in a greater likelihood of a positive Trade Balance for Australia, which is also positive of the AUD.
The Trade Balance, which is the difference between what a country earns from its exports versus what it pays for its imports, is another factor that can influence the value of the Australian Dollar. If Australia produces highly sought after exports, then its currency will gain in value purely from the surplus demand created from foreign buyers seeking to purchase its exports versus what it spends to purchase imports. Therefore, a positive net Trade Balance strengthens the AUD, with the opposite effect if the Trade Balance is negative.
- Gold surges to new all-time high above $2,600, fueled by expectations of further Fed rate cuts.
- Safe-haven demand spikes due to escalating tension between Israel and Hezbollah.
- Fed Governor Waller backs 50 bps rate cut; however, dissenting Fed member Michelle Bowman prefers a smaller cut to guard against declaring an early win on inflation.
Gold prices climbed past $2,600, recording new all-time highs amid increasing speculation that the Federal Reserve (Fed) will continue to lower borrowing costs and heightened tensions between Israel and Hezbollah in the Middle East. The XAU/USD trades at $2,621, up 1.37%.
Risk aversion is the game's name, which is portrayed by Wall Street’s three leading indices all posting losses between 0.26% and 0.31%. Fed Governor Christopher Waller stated that cutting 50 basis points was appropriate, citing expectations that the August Personal Consumption Expenditures (PCE) Price Index would be very low.
Waller added that inflation is softening more rapidly than anticipated, which is concerning to him. He also noted that the Fed could take further action if the labor market deteriorates or inflation data soften quickly.
Meanwhile, correlations are not playing a huge role as US Treasury yields rise with Gold prices and the Greenback. The US 10-year Treasury note yields 3.726%, up by one and a half basis points. The US Dollar Index (DXY), which tracks the American currency’s value against the other six, advanced some 0.08% to 100.71.
A scarce economic schedule in the US left Gold’s direction on the shoulders of additional Fed speakers. Michelle Bowman dissented to a 50 bps cut. Although it was appropriate to adjust the policy, she preferred a smaller cut, as risks on the decision could be interpreted as a “declaration of victory on inflation.”
Looking ahead into the next week, the Fed parade begins with Atlanta Fed’s Raphael Bostic, Chicago’s Austan Goolsbee, and Minnesota’s Neel Kashkari. On the data front, S&P Global Flash PMIs, along with housing data and the Fed’s preferred inflation gauge, the Core Personal Consumption Expenditures (PCE) Price Index, will dictate the XAU/USD forward path.
Daily digest market movers: Gold price traders eye next week’s busy US schedule
- Overall weakness on the US Dollar and elevated tensions in the Middle East kept Gold’s rally underway.
- Bullion prices had risen over 27% in 2024, the biggest annual rise since 2010.
- China and India's physical demand for Gold has overshadowed anemic inflows into Gold-backed ETFs.
- The Summary of Economic Projections indicates the Fed projects interest rates to end at 4.4% in 2024 and 3.4% in 2025.
- Inflation, as measured by the Core Personal Consumption Expenditures Price Index, is estimated to reach its 2% target by 2026, with forecasts of 2.6% in 2024 and 2.2% in 2025.
- US economy will likely grow at a 2% pace in 2024 with the Unemployment Rate rising to 4.4% by the end of the year.
- December 2024 fed funds rate futures contracting suggests that the Fed might lower rates by at least 53 basis points, implying that in the following two meetings this year the market expects one 25 bps cut in November and December.
XAU/USD technical outlook: Gold price hits record highs above $2,600
Gold’s uptrend continues after hitting a new all-time high (ATH) at $2,625. Even though all the signs point upwards, the rally of the golden metal seems overextended, opening the door for a pullback before aiming to new record highs.
Momentum favors buyers. The Relative Strength Index (RSI) aims upwards in bullish territory and not in overbought territory. Therefore, the path of least resistance is tilted to the upside.
XAU/USD's first resistance would be $2,650, followed by the psychological $2,700 figure. In the event of a pullback, the first support would be the $2,600 mark, followed by the September 18 swing low of $2,546. A breach of the latter will expose the August 20 high, which turned into support at $2,531, before aiming toward the September 6 low of $2,485.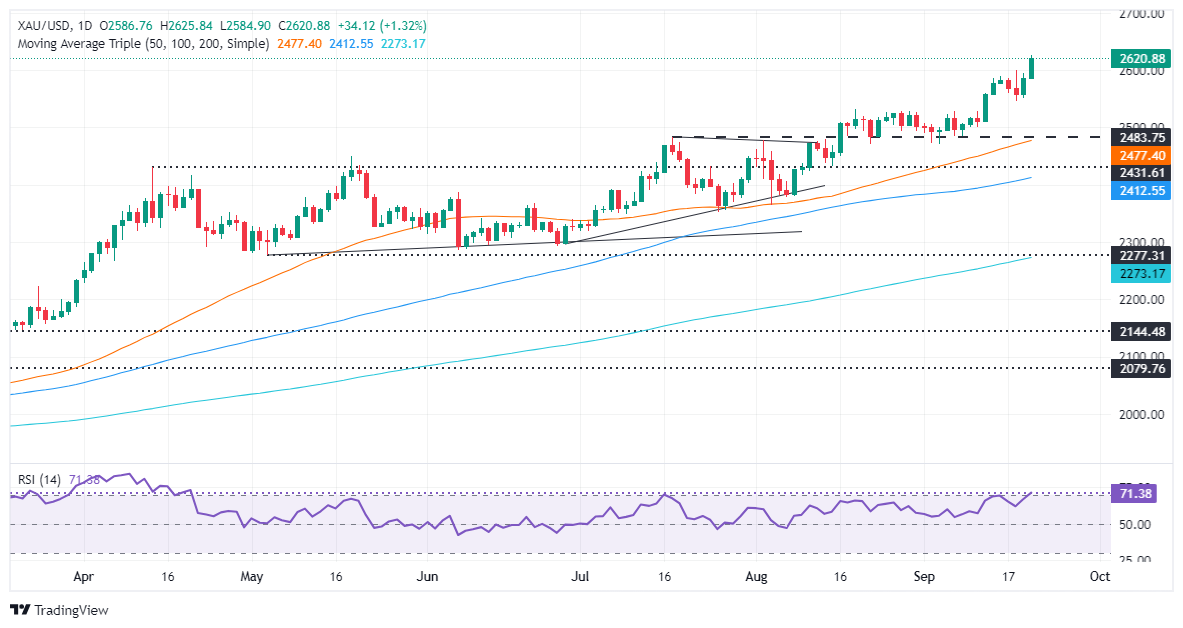
Gold FAQs
Gold has played a key role in human’s history as it has been widely used as a store of value and medium of exchange. Currently, apart from its shine and usage for jewelry, the precious metal is widely seen as a safe-haven asset, meaning that it is considered a good investment during turbulent times. Gold is also widely seen as a hedge against inflation and against depreciating currencies as it doesn’t rely on any specific issuer or government.
Central banks are the biggest Gold holders. In their aim to support their currencies in turbulent times, central banks tend to diversify their reserves and buy Gold to improve the perceived strength of the economy and the currency. High Gold reserves can be a source of trust for a country’s solvency. Central banks added 1,136 tonnes of Gold worth around $70 billion to their reserves in 2022, according to data from the World Gold Council. This is the highest yearly purchase since records began. Central banks from emerging economies such as China, India and Turkey are quickly increasing their Gold reserves.
Gold has an inverse correlation with the US Dollar and US Treasuries, which are both major reserve and safe-haven assets. When the Dollar depreciates, Gold tends to rise, enabling investors and central banks to diversify their assets in turbulent times. Gold is also inversely correlated with risk assets. A rally in the stock market tends to weaken Gold price, while sell-offs in riskier markets tend to favor the precious metal.
The price can move due to a wide range of factors. Geopolitical instability or fears of a deep recession can quickly make Gold price escalate due to its safe-haven status. As a yield-less asset, Gold tends to rise with lower interest rates, while higher cost of money usually weighs down on the yellow metal. Still, most moves depend on how the US Dollar (USD) behaves as the asset is priced in dollars (XAU/USD). A strong Dollar tends to keep the price of Gold controlled, whereas a weaker Dollar is likely to push Gold prices up.
- The Canadian Dollar continues to churn in the midrange.
- Canada remains on the back burner after CPI inflation fizzled this week.
- CAD traders are facing a slim data calendar next week.
The Canadian Dollar (CAD) found little underpinning momentum on Friday, and the CAD is poised to wrap up the end of the trading week close to where it started. The Canadian Dollar fell to a three-week low of 1.3650 against the US Dollar (USD), but broad-market Greenback weakness has USD/CAD stumped near 1.3550.
An appearance from Bank of Canada (BoC) Governor Tiff Macklem fizzled on Friday, failing to jumpstart CAD flows as the BoC Governor focused on non-monetary policy musings. Looking ahead to next week, CAD traders are facing down another quiet week with strictly mid-tier data on offer.
Daily digest market movers
- The CAD is cycling familiar territory on Friday, with little directional momentum on either side.
- BoC Governor Macklem made a public appearance, but focused on AI tech and its limited intersectionality with central banking.
- BoC head Macklem will get another kick at the can next week when he speaks at the Institute of International Finance and Canadian Bankers Association Canada Forum in Toronto next Tuesday.
- Markets are still exhausted after splurging in the wake of the Federal Reserve’s jumbo 50 bps rate cut on Wednesday.
- Canadian economic data is thin next week, with only mid-tier data on the docket.
Canadian Dollar price forecast
The Canadian Dollar (CAD) continues to plumb familiar territory on Friday, with little meaningful momentum underpinning the currency. USD/CAD is still cycling just south of the 200-day Exponential Moving Average (EMA) near the 1.3600 handle.
USD/CAD daily chart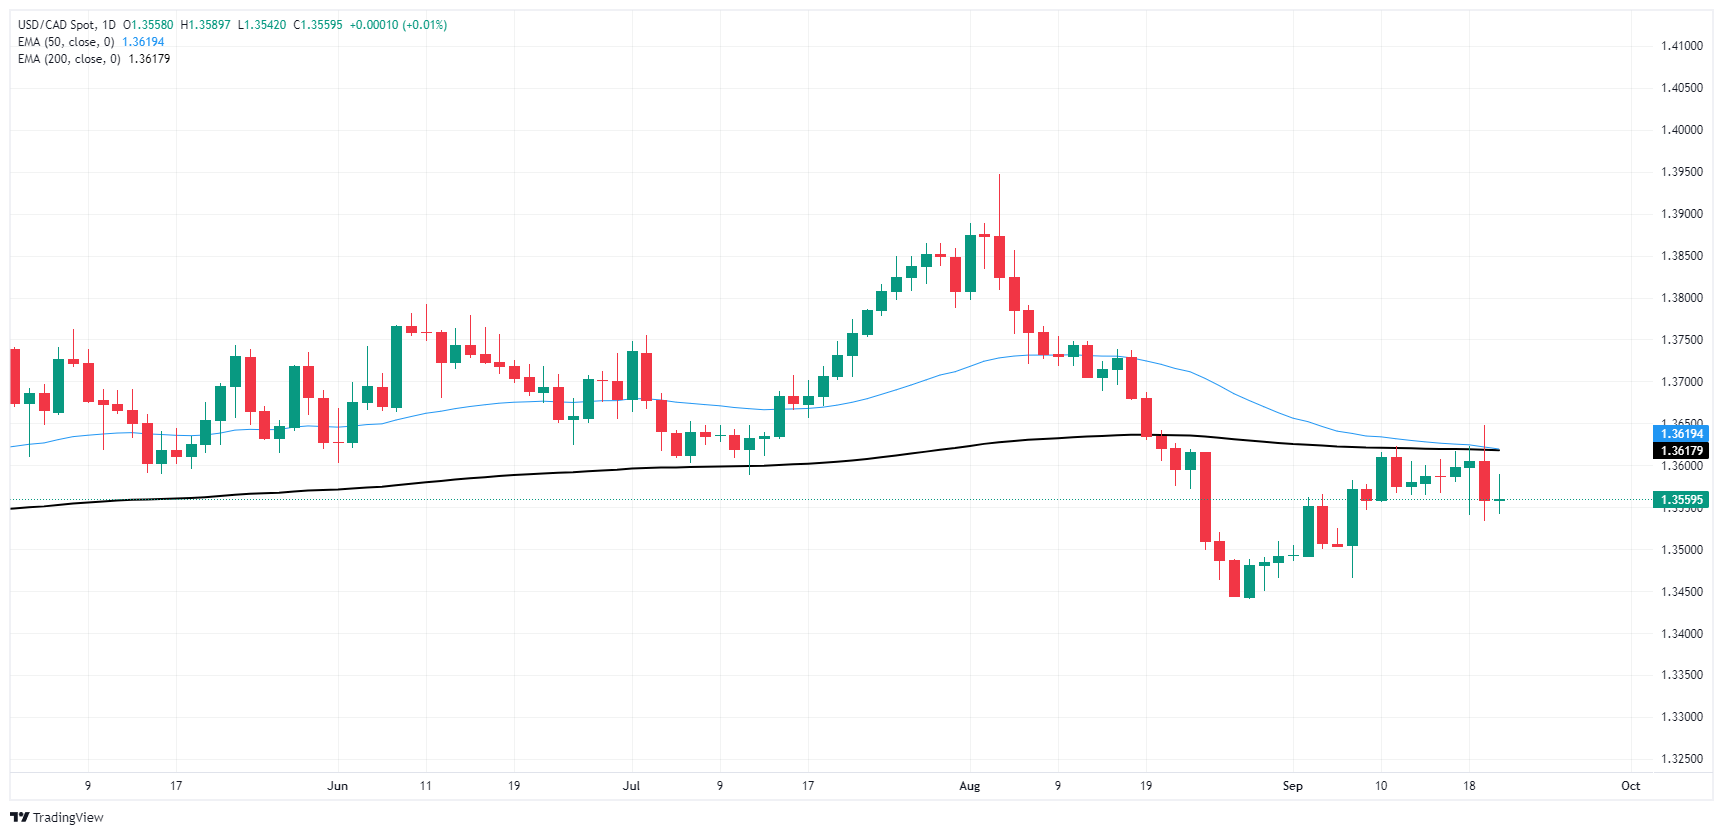
Canadian Dollar FAQs
The key factors driving the Canadian Dollar (CAD) are the level of interest rates set by the Bank of Canada (BoC), the price of Oil, Canada’s largest export, the health of its economy, inflation and the Trade Balance, which is the difference between the value of Canada’s exports versus its imports. Other factors include market sentiment – whether investors are taking on more risky assets (risk-on) or seeking safe-havens (risk-off) – with risk-on being CAD-positive. As its largest trading partner, the health of the US economy is also a key factor influencing the Canadian Dollar.
The Bank of Canada (BoC) has a significant influence on the Canadian Dollar by setting the level of interest rates that banks can lend to one another. This influences the level of interest rates for everyone. The main goal of the BoC is to maintain inflation at 1-3% by adjusting interest rates up or down. Relatively higher interest rates tend to be positive for the CAD. The Bank of Canada can also use quantitative easing and tightening to influence credit conditions, with the former CAD-negative and the latter CAD-positive.
The price of Oil is a key factor impacting the value of the Canadian Dollar. Petroleum is Canada’s biggest export, so Oil price tends to have an immediate impact on the CAD value. Generally, if Oil price rises CAD also goes up, as aggregate demand for the currency increases. The opposite is the case if the price of Oil falls. Higher Oil prices also tend to result in a greater likelihood of a positive Trade Balance, which is also supportive of the CAD.
While inflation had always traditionally been thought of as a negative factor for a currency since it lowers the value of money, the opposite has actually been the case in modern times with the relaxation of cross-border capital controls. Higher inflation tends to lead central banks to put up interest rates which attracts more capital inflows from global investors seeking a lucrative place to keep their money. This increases demand for the local currency, which in Canada’s case is the Canadian Dollar.
Macroeconomic data releases gauge the health of the economy and can have an impact on the Canadian Dollar. Indicators such as GDP, Manufacturing and Services PMIs, employment, and consumer sentiment surveys can all influence the direction of the CAD. A strong economy is good for the Canadian Dollar. Not only does it attract more foreign investment but it may encourage the Bank of Canada to put up interest rates, leading to a stronger currency. If economic data is weak, however, the CAD is likely to fall.
- US Dollar is gaining strength after Fed decision volatility.
- New York Fed's Nowcast model predicts robust economic growth in third and fourth quarters.
- Fed expects financial conditions to remain loose, supporting economy.
The US economy is experiencing a moderate slowdown, but indicators suggest that economic activity remains robust overall. The Federal Reserve (Fed) has indicated that the pace of its interest rate increases will be determined by economic data.
The upcoming US election will have wide ranging impacts across financial markets, but for now the US Dollar is holding its ground. However, dovish bets on the Fed remain steady and might limit the USD.
Daily digest market movers: US Dollar rises ahead of the weekend on market optimism
- Market optimism is driving the US Dollar higher ahead of the weekend.
- The market is expecting robust growth in Q3, with the New York Fed's Nowcast model tracking Q3 growth at 2.6% SAAR and Q4 growth at 2.2% SAAR.
- Fed is likely pleased that the market is helping to keep financial conditions loose, which should help the economy avoid a hard landing.
- Despite the Fed's efforts to push back against market easing expectations, they have intensified.
- After initially lowering its expectations following the decision, the market is now factoring in an additional 75 basis points of rate cuts by the end of the year.
- Even more unexpected is that the market anticipates close to 250 basis points of further cuts over the next year, which would bring the fed funds rate significantly below the neutral level.
DXY technical outlook: DXY bullish momentum waning, technicals remain bearish
The DXY index has gained some upside momentum, but technical indicators remain bearish.
The Relative Strength Index (RSI) is at 40, near oversold conditions, while the Moving Average Convergence Divergence (MACD) is printing decreasing green bars, implying weak buying pressure.
These indicators suggest that bears are in control and that the index is likely to continue its downtrend.Supports: 100.50, 100.30, and 100.00Resistances: 101.00, 101.30, and 101.60
US Dollar FAQs
The US Dollar (USD) is the official currency of the United States of America, and the ‘de facto’ currency of a significant number of other countries where it is found in circulation alongside local notes. It is the most heavily traded currency in the world, accounting for over 88% of all global foreign exchange turnover, or an average of $6.6 trillion in transactions per day, according to data from 2022. Following the second world war, the USD took over from the British Pound as the world’s reserve currency. For most of its history, the US Dollar was backed by Gold, until the Bretton Woods Agreement in 1971 when the Gold Standard went away.
The most important single factor impacting on the value of the US Dollar is monetary policy, which is shaped by the Federal Reserve (Fed). The Fed has two mandates: to achieve price stability (control inflation) and foster full employment. Its primary tool to achieve these two goals is by adjusting interest rates. When prices are rising too quickly and inflation is above the Fed’s 2% target, the Fed will raise rates, which helps the USD value. When inflation falls below 2% or the Unemployment Rate is too high, the Fed may lower interest rates, which weighs on the Greenback.
In extreme situations, the Federal Reserve can also print more Dollars and enact quantitative easing (QE). QE is the process by which the Fed substantially increases the flow of credit in a stuck financial system. It is a non-standard policy measure used when credit has dried up because banks will not lend to each other (out of the fear of counterparty default). It is a last resort when simply lowering interest rates is unlikely to achieve the necessary result. It was the Fed’s weapon of choice to combat the credit crunch that occurred during the Great Financial Crisis in 2008. It involves the Fed printing more Dollars and using them to buy US government bonds predominantly from financial institutions. QE usually leads to a weaker US Dollar.
Quantitative tightening (QT) is the reverse process whereby the Federal Reserve stops buying bonds from financial institutions and does not reinvest the principal from the bonds it holds maturing in new purchases. It is usually positive for the US Dollar.
- The Dow Jones is inching back into record highs on Friday.
- The index continues to find play above 42,000 in the post-Fed glut.
- The Dow Jones stock index rose up to 100 points, or 0.25%, during Friday trading.
The Dow Jones Industrial Average (DJIA) edged back into the top end during the Friday market session, keeping bids north of 42,000 and sticking close to this week’s all-time record peaks. Equities pivoted firmly into the bullish side after the Federal Reserve (Fed) cut interest rates for the first time in over four years, delivering an outsized 50 bps rate cut.
Federal Reserve (Fed) Chair Jerome Powell delivered a jumbo 50 bps rate cut this week, pivoting the narrative as a “re-calibration of policy” to shore up the US labor market rather than an outright snap reaction to decaying economic indicators. Markets, for their part, scooped up the Fed Chair’s bid full-parcel, bolstering equities across the board in a rate-cut splurge and sending the US Dollar Index (DXY) to a 14-month low.
With the Fed’s first rate cut in over four years finally out of the way, investors are now ready to pivot to the next immediate task: betting on whether the Fed’s November rate cut will be a 25 bps follow-up or another 50 bps slash. According to the CME’s FedWatch Tool, rate traders have fully priced in another rate cut from the Fed on November 7, with bets evenly split between 25 and 50 bps. Rate markets are so confident the Fed will deliver a follow-up rate cut in a little over six weeks there is currently a 0% chance priced in of the Fed holding rates steady in November.
Dow Jones news
A little under half of the Dow Jones equity index is underwater on Friday, with losses being led by Intel (INTC) which has backslid -3.5% and tumbled below $20.50 per share. Intel recently announced multiple plans to spin the vessel back keel-side down, including axing around 10% of their global workforce, spinning off their foundry business into an independent subsidiary, and inking a fresh deal with Amazon to produce exclusive AI-based chipsets for Amazon Web Services. Despite all of the planned pivots, investors are still balking at the silicon company’s expected $25 to $27 billion in capital expenditures over the next year.
The Dow Chemical Company (DOW) is also chasing the bottom of the barrel on Friday, despite a recent announcement that the manufacturing company was tapped to receive $100 million in subsidy funding from the Department of Energy to establish or expand US-based battery manufacturing.
Dow Jones price forecast
Despite an absolutely stellar performance on the charts recently, bidding pressure is beginning to show signs of exhaustion, with the Dow Jones struggling to continue chalking in subsequent record highs with little to no pullback. The major equity index rose nearly 5.5% from the last swing low into the 40,000 major price handle, and price action is set to dig into the 42,000 level for the time being.
Dow Jones daily chart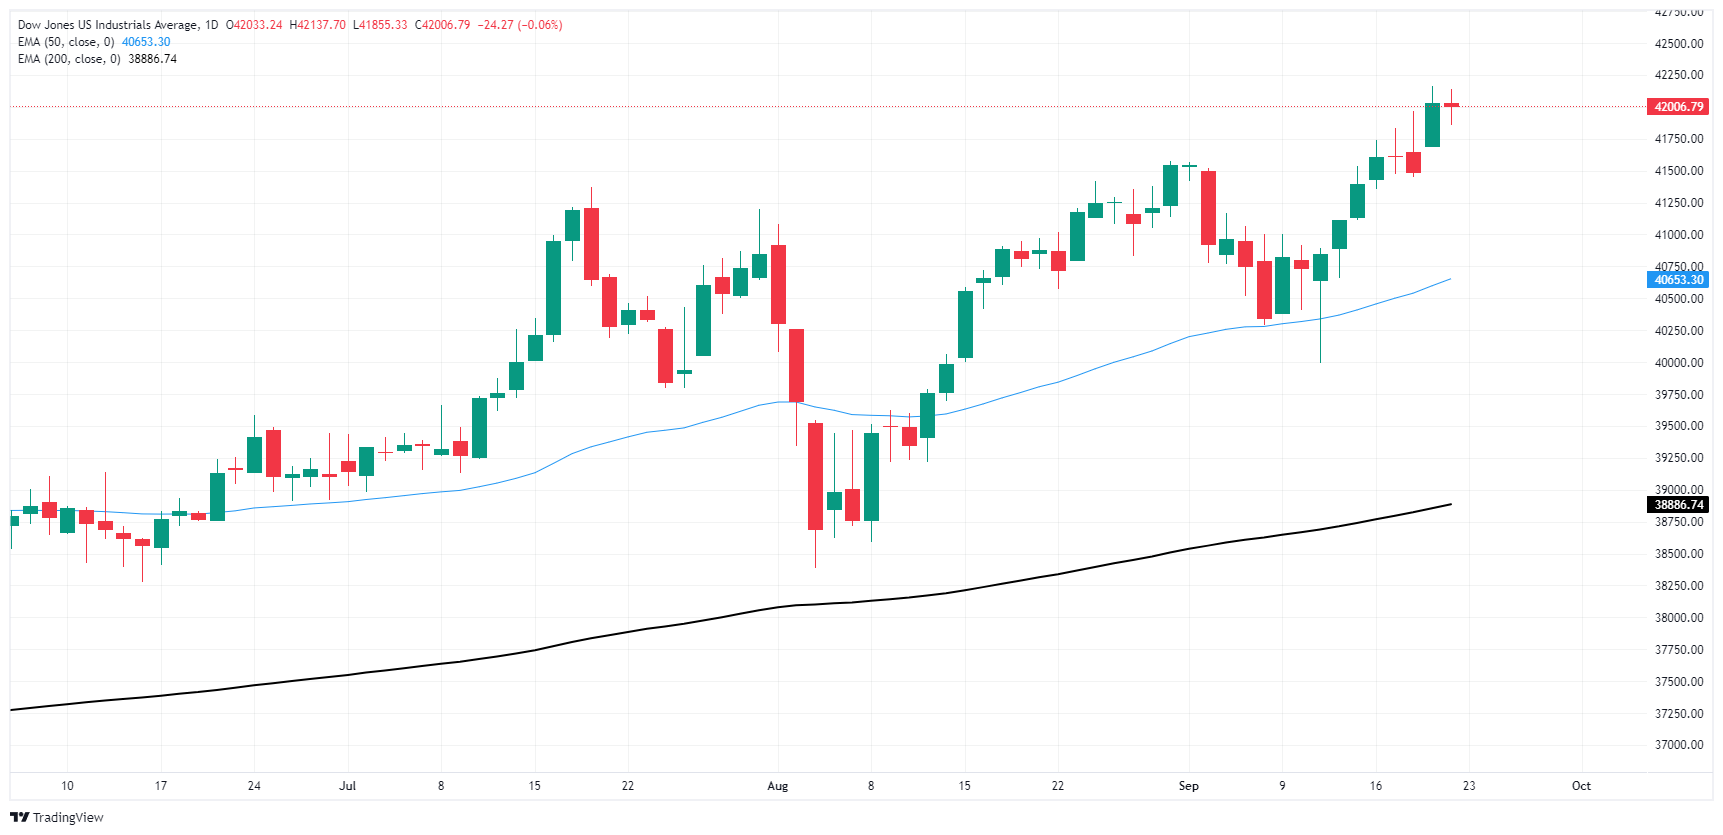
Dow Jones FAQs
The Dow Jones Industrial Average, one of the oldest stock market indices in the world, is compiled of the 30 most traded stocks in the US. The index is price-weighted rather than weighted by capitalization. It is calculated by summing the prices of the constituent stocks and dividing them by a factor, currently 0.152. The index was founded by Charles Dow, who also founded the Wall Street Journal. In later years it has been criticized for not being broadly representative enough because it only tracks 30 conglomerates, unlike broader indices such as the S&P 500.
Many different factors drive the Dow Jones Industrial Average (DJIA). The aggregate performance of the component companies revealed in quarterly company earnings reports is the main one. US and global macroeconomic data also contributes as it impacts on investor sentiment. The level of interest rates, set by the Federal Reserve (Fed), also influences the DJIA as it affects the cost of credit, on which many corporations are heavily reliant. Therefore, inflation can be a major driver as well as other metrics which impact the Fed decisions.
Dow Theory is a method for identifying the primary trend of the stock market developed by Charles Dow. A key step is to compare the direction of the Dow Jones Industrial Average (DJIA) and the Dow Jones Transportation Average (DJTA) and only follow trends where both are moving in the same direction. Volume is a confirmatory criteria. The theory uses elements of peak and trough analysis. Dow’s theory posits three trend phases: accumulation, when smart money starts buying or selling; public participation, when the wider public joins in; and distribution, when the smart money exits.
There are a number of ways to trade the DJIA. One is to use ETFs which allow investors to trade the DJIA as a single security, rather than having to buy shares in all 30 constituent companies. A leading example is the SPDR Dow Jones Industrial Average ETF (DIA). DJIA futures contracts enable traders to speculate on the future value of the index and Options provide the right, but not the obligation, to buy or sell the index at a predetermined price in the future. Mutual funds enable investors to buy a share of a diversified portfolio of DJIA stocks thus providing exposure to the overall index.
- Mexican Peso continues to weaken, recording losses for three consecutive days amid increasing risk aversion.
- Fed Governor Waller supports the recent 50 bps rate cut, pointing to easing inflation and hinting at further cuts if labor conditions deteriorate.
- Banxico anticipated to lower rates by 25 bps next week, potentially sustaining an appealing interest rate differential to support the Peso.
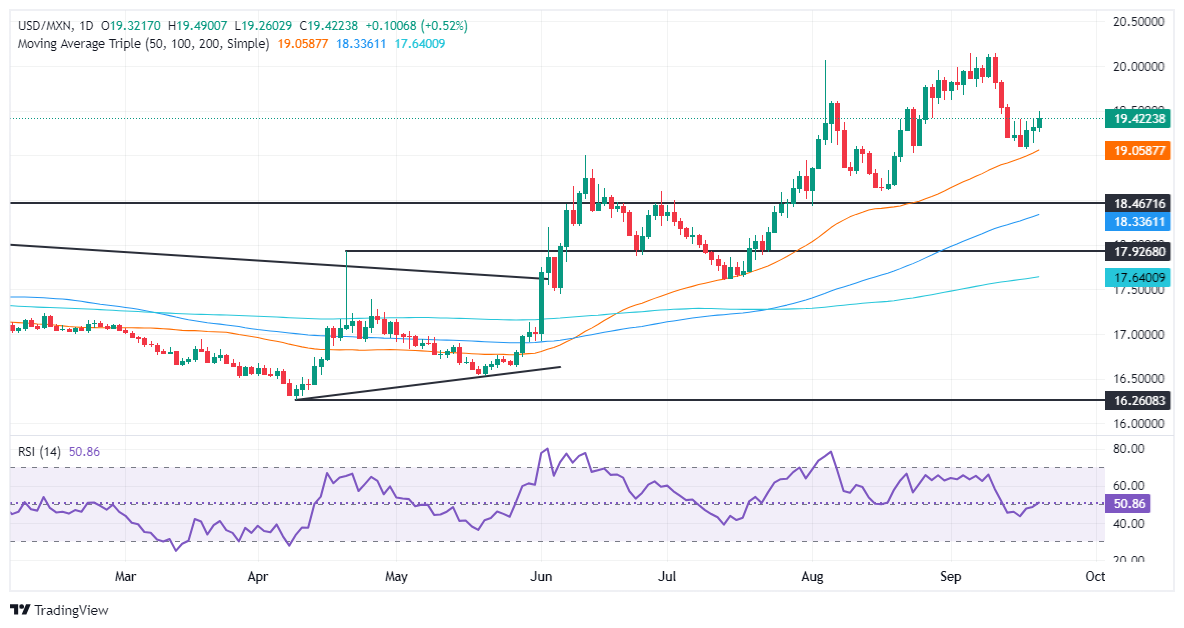
The Mexican Peso extended its losing streak against the Greenback to three consecutive days, with the currency set to sustain weekly losses. Risk aversion hurts the Peso's prospects, which hasn’t been able to capitalize on the Federal Reserve’s (Fed) decision to lower rates for the first time in four years. This exerts pressure on the US Dollar, but the USD/MXN remains firm and trades at 19.38, printing gains of over 0.42%.
Wall Street reversed course on Friday as traders digested the decisions of three major central banks, particularly the Fed. Fed Governor Christopher Waller said on CNBC that cutting 50 basis points was right, justifying its decision based on estimates that the August Personal Consumption Expenditures Price Index (PCE) will be very low.
Waller added that inflation is softening faster than he thought and is concerned about that. He stated that they could do more if the labor market worsens and if the inflation data softens quickly.
South of the border, Mexico’s economic docket is scarce, and traders are eyeing next week with the release of Economic Activity, Retail Sales, inflation data, and the Bank of Mexico (Banxico) monetary policy decision.
Regarding the political turmoil, the week has been calm since the signing into law of the judicial reform.
Meanwhile, traders are eyeing Banxico’s decision. Most analysts estimate a rate cut of at least 25 basis points from 10.75% to 10.50%, which would reduce the interest rate differential slightly. It should, however, will remain attractive to investors and boost the Mexican currency.
Daily digest market movers: Mexican Peso falls, awaiting next week’s data
- According to different banks and rating agencies, the impact of overhauling the judicial system remains far from being felt. The lack of a state of law and transparency could be factors in adjusting Mexico’s creditworthiness over the longer term.
- On Wednesday, the Fed cut rates by 50 bps, justifying its decision on the progress on inflation, which is sustainably moving toward its 2% goal. The US central bank focus shifted onto the labor market.
- The Fed expects inflation to condense to 2.6% in 2024, 2.2% in 2025, and 2% by 2026, according to the Core Personal Consumption Expenditures Price Index.
- Fed officials estimate the US economy will grow at a 2% pace in 2024, with the Unemployment Rate rising to 4.4% by the end of the year.
- December 2024 fed funds rate futures contracting suggests that the Fed might lower rates by at least 53 basis points, implying that in the following two meetings, the market expects two 25 bps rate cuts left in 2024.
USD/MXN technical outlook: Mexican Peso tumbles as USD/MXN rallies above 19.35
From a technical standpoint, the USD/MXN is upwardly biased despite retreating from around 20.00 toward the September 18 swing low of 19.06. Next week, Banxico is expected to lower rates, which could push the exchange rate out of the 19.00-19.50 range.
Momentum shifted bullishly as the Relative Strength Index (RSI) crossed above its neutral line, while aiming upward.
If the USD/MXN climbs above 19.50, the next resistance would be the 20.00 psychological level. Further upside emerges at the yearly peak at 20.22, followed by the 20.50 mark.
Conversely, if the USD/MXN drops below the September 18 low of 19.06, the psychological 19.00 figure will be exposed. Further losses lie underneath, with buyers' next line of defense being the 50-day Simple Moving Average (SMA) at 18.99, followed by the last cycle low of 18.59, the August 19 daily low.
Mexican Peso FAQs
The Mexican Peso (MXN) is the most traded currency among its Latin American peers. Its value is broadly determined by the performance of the Mexican economy, the country’s central bank’s policy, the amount of foreign investment in the country and even the levels of remittances sent by Mexicans who live abroad, particularly in the United States. Geopolitical trends can also move MXN: for example, the process of nearshoring – or the decision by some firms to relocate manufacturing capacity and supply chains closer to their home countries – is also seen as a catalyst for the Mexican currency as the country is considered a key manufacturing hub in the American continent. Another catalyst for MXN is Oil prices as Mexico is a key exporter of the commodity.
The main objective of Mexico’s central bank, also known as Banxico, is to maintain inflation at low and stable levels (at or close to its target of 3%, the midpoint in a tolerance band of between 2% and 4%). To this end, the bank sets an appropriate level of interest rates. When inflation is too high, Banxico will attempt to tame it by raising interest rates, making it more expensive for households and businesses to borrow money, thus cooling demand and the overall economy. Higher interest rates are generally positive for the Mexican Peso (MXN) as they lead to higher yields, making the country a more attractive place for investors. On the contrary, lower interest rates tend to weaken MXN.
Macroeconomic data releases are key to assess the state of the economy and can have an impact on the Mexican Peso (MXN) valuation. A strong Mexican economy, based on high economic growth, low unemployment and high confidence is good for MXN. Not only does it attract more foreign investment but it may encourage the Bank of Mexico (Banxico) to increase interest rates, particularly if this strength comes together with elevated inflation. However, if economic data is weak, MXN is likely to depreciate.
As an emerging-market currency, the Mexican Peso (MXN) tends to strive during risk-on periods, or when investors perceive that broader market risks are low and thus are eager to engage with investments that carry a higher risk. Conversely, MXN tends to weaken at times of market turbulence or economic uncertainty as investors tend to sell higher-risk assets and flee to the more-stable safe havens.
Federal Reserve (Fed) Board of Governors member Michelle Bowman clarified on Friday why the policymaker voted against the Fed's 50 bps jumbo rate cut this week. Fed Governor Waller goes down in the books as the first Fed Governor to vote against both the consensus and the Fed Chair since 2005.
Key highlights
I agreed it was appropriate at this meeting to recalibrate the Fed funds rate level, but I preferred a smaller first move.
We have not yet achieved the inflation goal.
I see risk that the FOMC's larger policy action could be interpreted as a premature declaration of victory on inflation.
Such an approach would avoid unnecessarily stoking demand.
The economy remains strong and labor market remains near full employment.
I believe moving at a measured pace toward a more neutral policy stance will ensure further progress is made in returning inflation to 2% goal.
My reading of labor market data has become more uncertain because of measurement challenges, difficulty assessing immigration impact.
I respect and appreciate that colleagues preferred to go with a larger reduction, and remain committed to working with them to ensure policy is appropriately positioned to achieve dual mandate goals.
Federal Reserve (Fed) Board of Governors member Christopher Waller noted on Friday that while the Fed's decision to cut interest rates by an accelerated 50 bps, the Fed's data-dependent approach could mean that the next meeting will be a pause as policymakers await further data.
Key highlights
(50 bps rate cut) whas the right call.
We are at the point that the economy is strong, we want to keep it that way, 50 bps right policy action to do that.
In terms of 25 bps vs 50 bps, my speech two weeks ago said 25 bps was a good idea but open to 50. The inflation data during the blackout pushed me to a 50 bps cut.
CPI report and PPI report flowing into PCE inflation was my consideration.
Inflation is softening much faster than I thought it was going to.
If data comes in fine, you could imagine going 25 next meeting or two.
If labor market worsens and inflation data softens quicker, we could do more.
We could even pause, depending on the data.
We see a lot of room to move down in next 6-12 months.
Inflation is potentially on a lower path than we were expecting.
I am a bit more concerned about inflation running softer.
- EUR/GBP weakens further, and buying pressure continues to retreat.
- The RSI is moving dangerously near the oversold threshold.
- The 0.8380 presents a strong barrier against the sellers.
In Friday's session, the EUR/GBP pair continued to decline, losing 0.15% to close at 0.8385. The bearish outlook persists, as selling pressure intensifies and technical indicators signal a negative trend.
Looking at the technical outlook, the Relative Strength Index (RSI) has fallen to 35, moving deeper into the negative area. This sharp decline indicates that selling pressure is rising. Furthermore, the Moving Average Convergence Divergence (MACD) histogram remains red and rising, also suggesting increasing bearish momentum.
EUR/GBP daily chart
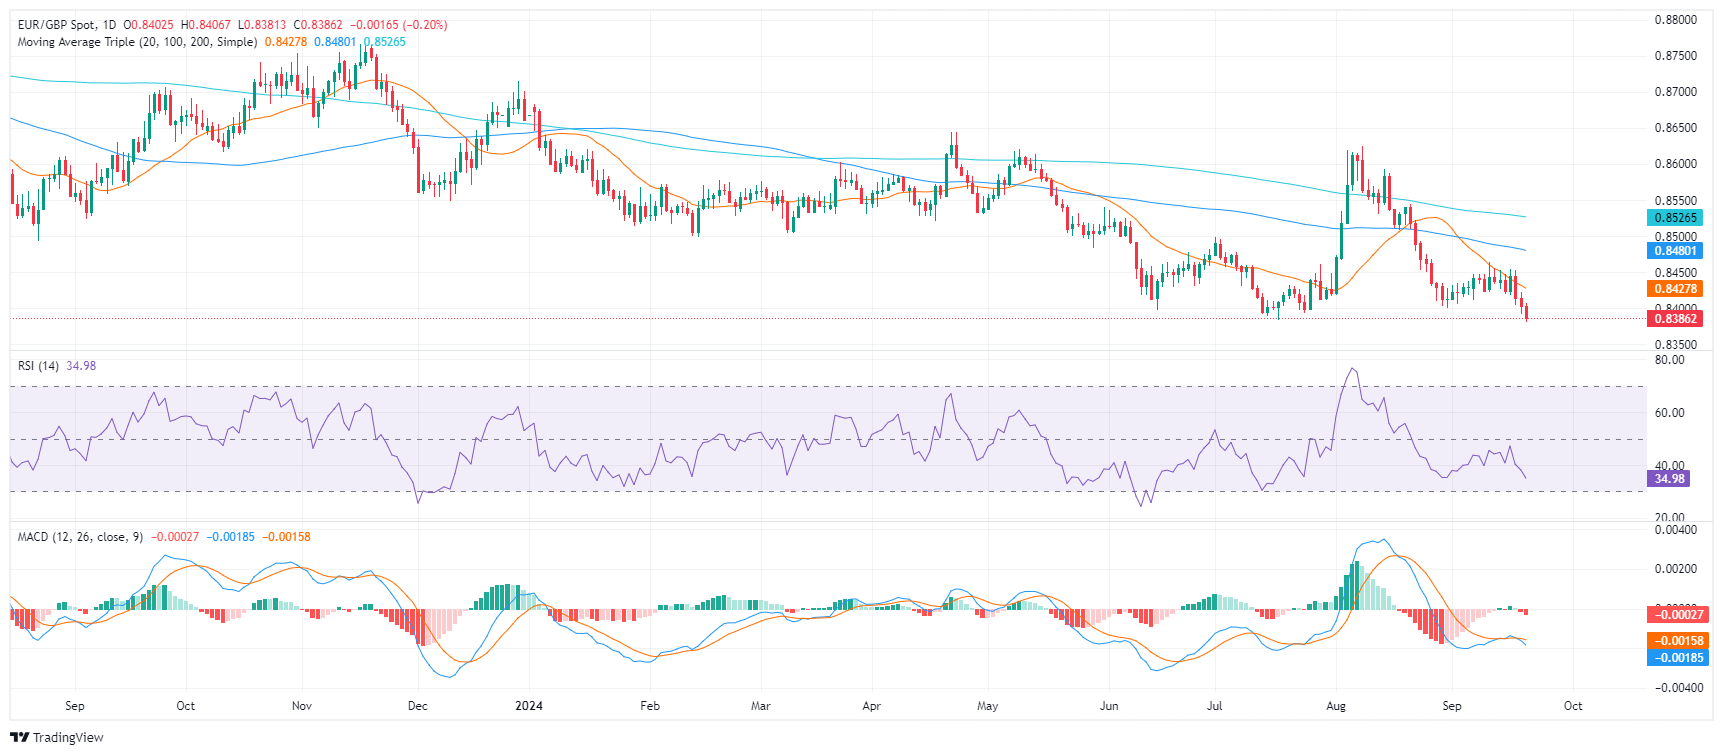
Based on the current technical picture, the EUR/GBP pair is likely to continue its downward trajectory. Support levels can be found at 0.8380, 0.8350, and 0.8330. If the pair breaks below 0.8380, it could signal a deeper decline toward 0.8350. Resistance levels can be found at 0.8420 (20-day Simple Moving Average (SMA)), 0.8430, and 0.8440. A break above 0.8440 could indicate a potential trend reversal.
Overall, the technical indicators and recent price action suggest that the bearish momentum is likely to continue in the short term. As bears point their cannons towards 0.8380, a break below would mark a fresh yearly low, which would confirm a bearish outlook.
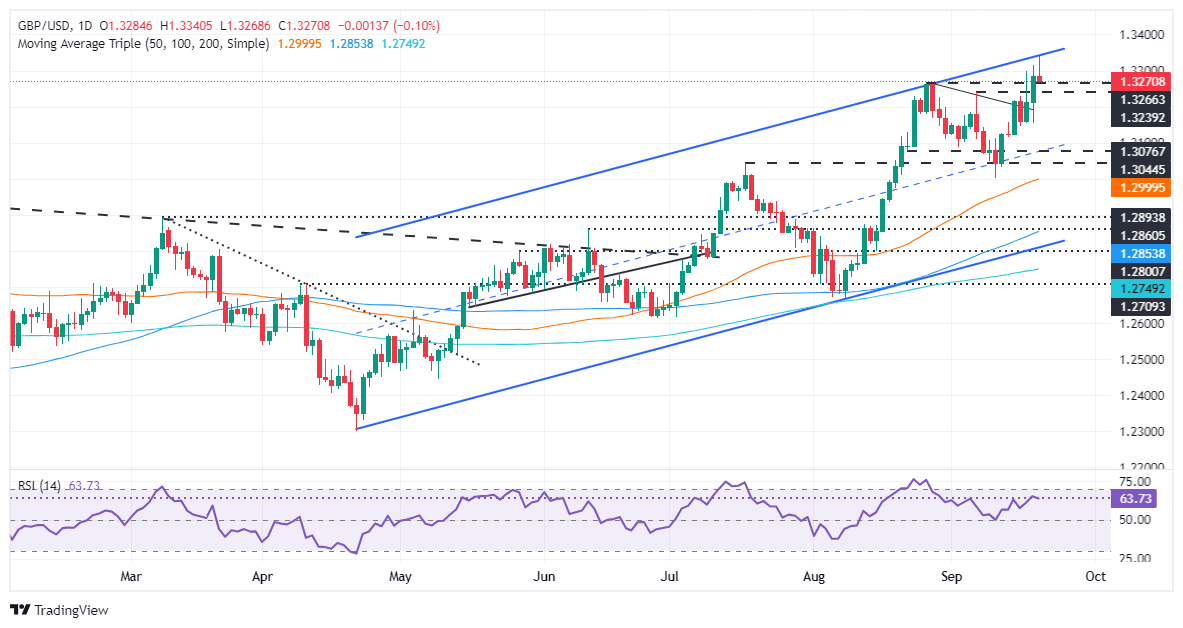
- GBP/USD hits resistance at 1.3340 and forms a potential ‘shooting star’ candlestick, signaling possible further losses.
- Key support lies at 1.3250, with additional levels at 1.3239, 1.3200, and the July 14 peak at 1.3142.
- On the upside, GBP/USD must reclaim 1.3300 to retest the YTD high of 1.3340, with further resistance at 1.3437.
The Pound Sterling registered minimal gains versus the US Dollar during the North American session after reaching a two-and-a-half-year high of 1.3340 on an upbeat retail sales report in the UK. At the time of writing, the GBP/USD trades at 1.3282, a gain of 0.03%.
GBP/USD Price Forecast: Technical outlook
From a technical standpoint, the GBP/USD clashed with solid resistance as the pair reached the top of an ascending channel shy of testing 1.3350. Since then, the pair erased those gains, about to form a ‘shooting star’ candle, which opens the door for further losses.
Momentum remains bullish according to the Relative Strength Index (RSI). However, a negative divergence looms, which could spur a pullback in the pair.
If GBP/USD tumbles below 1.3250, further downside is seen. Once cleared, the next stop would be the September 6 peak at 1.3239, ahead of 1.3200. If surpassed, key support levels will be exposed, like the July 14, 2023, peak at 1.3142, followed by the September 11 low of 1.3001.
Conversely, if GBP/USD reclaims 1.3300, the first resistance would be the year-to-date (YTD) high of 1.3340 ahead of the March 1, 2022, pivot high at 1.3437.
GBP/USD Price Action – Daily Chart
British Pound PRICE Today
The table below shows the percentage change of British Pound (GBP) against listed major currencies today. British Pound was the strongest against the Japanese Yen.
| USD | EUR | GBP | JPY | CAD | AUD | NZD | CHF | |
|---|---|---|---|---|---|---|---|---|
| USD | 0.20% | 0.10% | 1.21% | 0.19% | 0.45% | 0.40% | 0.39% | |
| EUR | -0.20% | -0.11% | 1.05% | -0.03% | 0.23% | 0.21% | 0.20% | |
| GBP | -0.10% | 0.11% | 1.15% | 0.10% | 0.36% | 0.33% | 0.32% | |
| JPY | -1.21% | -1.05% | -1.15% | -1.01% | -0.77% | -0.81% | -0.80% | |
| CAD | -0.19% | 0.03% | -0.10% | 1.01% | 0.25% | 0.22% | 0.22% | |
| AUD | -0.45% | -0.23% | -0.36% | 0.77% | -0.25% | -0.01% | -0.02% | |
| NZD | -0.40% | -0.21% | -0.33% | 0.81% | -0.22% | 0.01% | -0.00% | |
| CHF | -0.39% | -0.20% | -0.32% | 0.80% | -0.22% | 0.02% | 0.00% |
The heat map shows percentage changes of major currencies against each other. The base currency is picked from the left column, while the quote currency is picked from the top row. For example, if you pick the British Pound from the left column and move along the horizontal line to the US Dollar, the percentage change displayed in the box will represent GBP (base)/USD (quote).
Gold prices continue to melt into new all-time highs in the overnight, TDS Senior Commodity Strategist Daniel Ghali notes.
Shanghai trader positioning has edged off its record highs
“Clearly, some buying activity is hitting the tapes, but the source remains off of our radar for now. In fact, visible flows point to modest outflows from broad commodity funds and a continued trend of outflows Chinese Gold ETFs. Shanghai trader positioning has edged off its record highs, with aggregate net positioning for the top traders remaining fairly stable.”
“Certainly, participants feel comfortable knowing that central banks are on the bid, but on a six-month moving average basis, official global central bank flows are now trending towards their lowest levels in five years. In Comex Gold, non-commercial 'directional short' positioning, which accounts for EFP positioning, points to nearly no shorts remaining following recent short covering.”
“Our latest gauge of macro fund positioning remained just a nudge below its maximum historical levels, and CTAs are effectively max long. We only note marginal inflows into popular Western Gold ETFs, and perhaps most notable, signs of risk parity and vol-targeting funds' releveraging.”
- NZD/USD drops from 0.6250 as the market sentiment turns cautious.
- The US Dollar bounces back ahead of Fed Harker’s policy announcement.
- Traders expect the Fed to reduce interest rates further by 75 bps in the remainder of the year.
The NZD/USD pair faces selling pressure above the crucial resistance of 0.6250 in Friday’s North American trading hours. The Kiwi asset drops as the US Dollar (USD) attempts to gain ground above the annual low. The US Dollar Index (DXY), which tracks the Greenback’s value against six major currencies, bounces back from the annual low of 100.20 to near 100.90.
Market sentiment turns cautious as investors shift focus to global PMI data, which will be published on Monday. The S&P 500 opens on a bearish note, indicating a decline in investors’ risk appetite. The cautious market mood has also weighed on risk-perceived currencies, such as the New Zealand Dollar (NZD).
Growing uncertainty over the Federal Reserve’s (Fed) interest rate outlook has made market sentiment cautious. The Fed delivered its first interest rate cut decision in more than four years on Wednesday, in which it reduced its key borrowing rates by 50 basis points (bps) to 4.75%-5.00%. Fed policymakers projected the federal fund rate to decline to 4.4% by year-end. Also, comments from Fed Chair Jerome Powell at the press conference signaled that the policy-easing cycle wouldn’t be aggressive.
On the contrary, traders expect that the Fed’s rate-cut cycle will be more aggressive than other central bankers. The CME FedWatch tool shows that the Fed will cut borrowing rates further by 75 bps in the remaining two meetings this year, suggesting that there will be one more 50 bps rate cut.
Meanwhile, the NZ Dollar could face selling pressure due to deepening growth concerns. The NZ economy contracted by 0.2% in the second quarter of the year and its economic outlook is also vulnerable. However, the pace at which the economy contracted was slower than the expected pace of 0.4%.
Risk sentiment FAQs
In the world of financial jargon the two widely used terms “risk-on” and “risk off'' refer to the level of risk that investors are willing to stomach during the period referenced. In a “risk-on” market, investors are optimistic about the future and more willing to buy risky assets. In a “risk-off” market investors start to ‘play it safe’ because they are worried about the future, and therefore buy less risky assets that are more certain of bringing a return, even if it is relatively modest.
Typically, during periods of “risk-on”, stock markets will rise, most commodities – except Gold – will also gain in value, since they benefit from a positive growth outlook. The currencies of nations that are heavy commodity exporters strengthen because of increased demand, and Cryptocurrencies rise. In a “risk-off” market, Bonds go up – especially major government Bonds – Gold shines, and safe-haven currencies such as the Japanese Yen, Swiss Franc and US Dollar all benefit.
The Australian Dollar (AUD), the Canadian Dollar (CAD), the New Zealand Dollar (NZD) and minor FX like the Ruble (RUB) and the South African Rand (ZAR), all tend to rise in markets that are “risk-on”. This is because the economies of these currencies are heavily reliant on commodity exports for growth, and commodities tend to rise in price during risk-on periods. This is because investors foresee greater demand for raw materials in the future due to heightened economic activity.
The major currencies that tend to rise during periods of “risk-off” are the US Dollar (USD), the Japanese Yen (JPY) and the Swiss Franc (CHF). The US Dollar, because it is the world’s reserve currency, and because in times of crisis investors buy US government debt, which is seen as safe because the largest economy in the world is unlikely to default. The Yen, from increased demand for Japanese government bonds, because a high proportion are held by domestic investors who are unlikely to dump them – even in a crisis. The Swiss Franc, because strict Swiss banking laws offer investors enhanced capital protection.
- USD/CAD consolidates below 1.3600 ahead of Fed Harker’s speech.
- The Fed is expected to cut interest rates further by 75 bps this year.
- The BoC may likely continue easing interest rates further.
The USD/CAD pair trades sideways below the crucial resistance of 1.3600 in Friday’s North American session. The Loonie asset consolidates as investors look for fresh cues about Federal Reserve’s (Fed) likely monetary policy action in the remaining policy meetings this year.
The market sentiment turns slightly cautious on a light United States (US) economic calendar day. The S&P 500 has opened on a weak note, exhibiting uncertainty over investors’ risk appetite. The US Dollar Index (DXY), which tracks the Greenback’s value against six major currencies, attempts to gain ground above the annual low of 100.20.
Investors expect that the Fed will cut interest rates further by a total of 75 basis points (bps) in the November and December meetings, suggesting that there will be atleast one 50 bps interest rate cut decision. However, the central bank projected the federal fund rate at 4.4% by year-end. Also, Fed Chair Jerome Powell cleared in his press conference that the 50 bps will not new normal.
For fresh interest rate guidance, investors will focus on Philadelphia Fed Bank President Patrick Harker’s speech at 18:00 GMT for fresh guidance on interest rates.
On the Loonie front, growing speculation for more interest rate cuts by the Bank of Canada (BoC) will keep the Canadian Dollar (CAD) under pressure. Market expectations for BoC rate cuts rose after Canada’s headline inflation decelerated to 2% in August.
Canadian Dollar FAQs
The key factors driving the Canadian Dollar (CAD) are the level of interest rates set by the Bank of Canada (BoC), the price of Oil, Canada’s largest export, the health of its economy, inflation and the Trade Balance, which is the difference between the value of Canada’s exports versus its imports. Other factors include market sentiment – whether investors are taking on more risky assets (risk-on) or seeking safe-havens (risk-off) – with risk-on being CAD-positive. As its largest trading partner, the health of the US economy is also a key factor influencing the Canadian Dollar.
The Bank of Canada (BoC) has a significant influence on the Canadian Dollar by setting the level of interest rates that banks can lend to one another. This influences the level of interest rates for everyone. The main goal of the BoC is to maintain inflation at 1-3% by adjusting interest rates up or down. Relatively higher interest rates tend to be positive for the CAD. The Bank of Canada can also use quantitative easing and tightening to influence credit conditions, with the former CAD-negative and the latter CAD-positive.
The price of Oil is a key factor impacting the value of the Canadian Dollar. Petroleum is Canada’s biggest export, so Oil price tends to have an immediate impact on the CAD value. Generally, if Oil price rises CAD also goes up, as aggregate demand for the currency increases. The opposite is the case if the price of Oil falls. Higher Oil prices also tend to result in a greater likelihood of a positive Trade Balance, which is also supportive of the CAD.
While inflation had always traditionally been thought of as a negative factor for a currency since it lowers the value of money, the opposite has actually been the case in modern times with the relaxation of cross-border capital controls. Higher inflation tends to lead central banks to put up interest rates which attracts more capital inflows from global investors seeking a lucrative place to keep their money. This increases demand for the local currency, which in Canada’s case is the Canadian Dollar.
Macroeconomic data releases gauge the health of the economy and can have an impact on the Canadian Dollar. Indicators such as GDP, Manufacturing and Services PMIs, employment, and consumer sentiment surveys can all influence the direction of the CAD. A strong economy is good for the Canadian Dollar. Not only does it attract more foreign investment but it may encourage the Bank of Canada to put up interest rates, leading to a stronger currency. If economic data is weak, however, the CAD is likely to fall.
- GBP/CAD has rallied up to resistance at the upper channel line of a rising channel.
- It is at an important crossroads. The uptrend holds but price is diverging bearishly with MACD.
GBP/CAD has rallied up to a new high for 2024 and reached the top trendline of a long-term rising channel. Although it is in a strong uptrend the top of the channel is likely to exert tough resistance and there is a risk of a pullback and countertrend correction unfolding. The pair has reached a critical level.
GBP/CAD Daily Chart
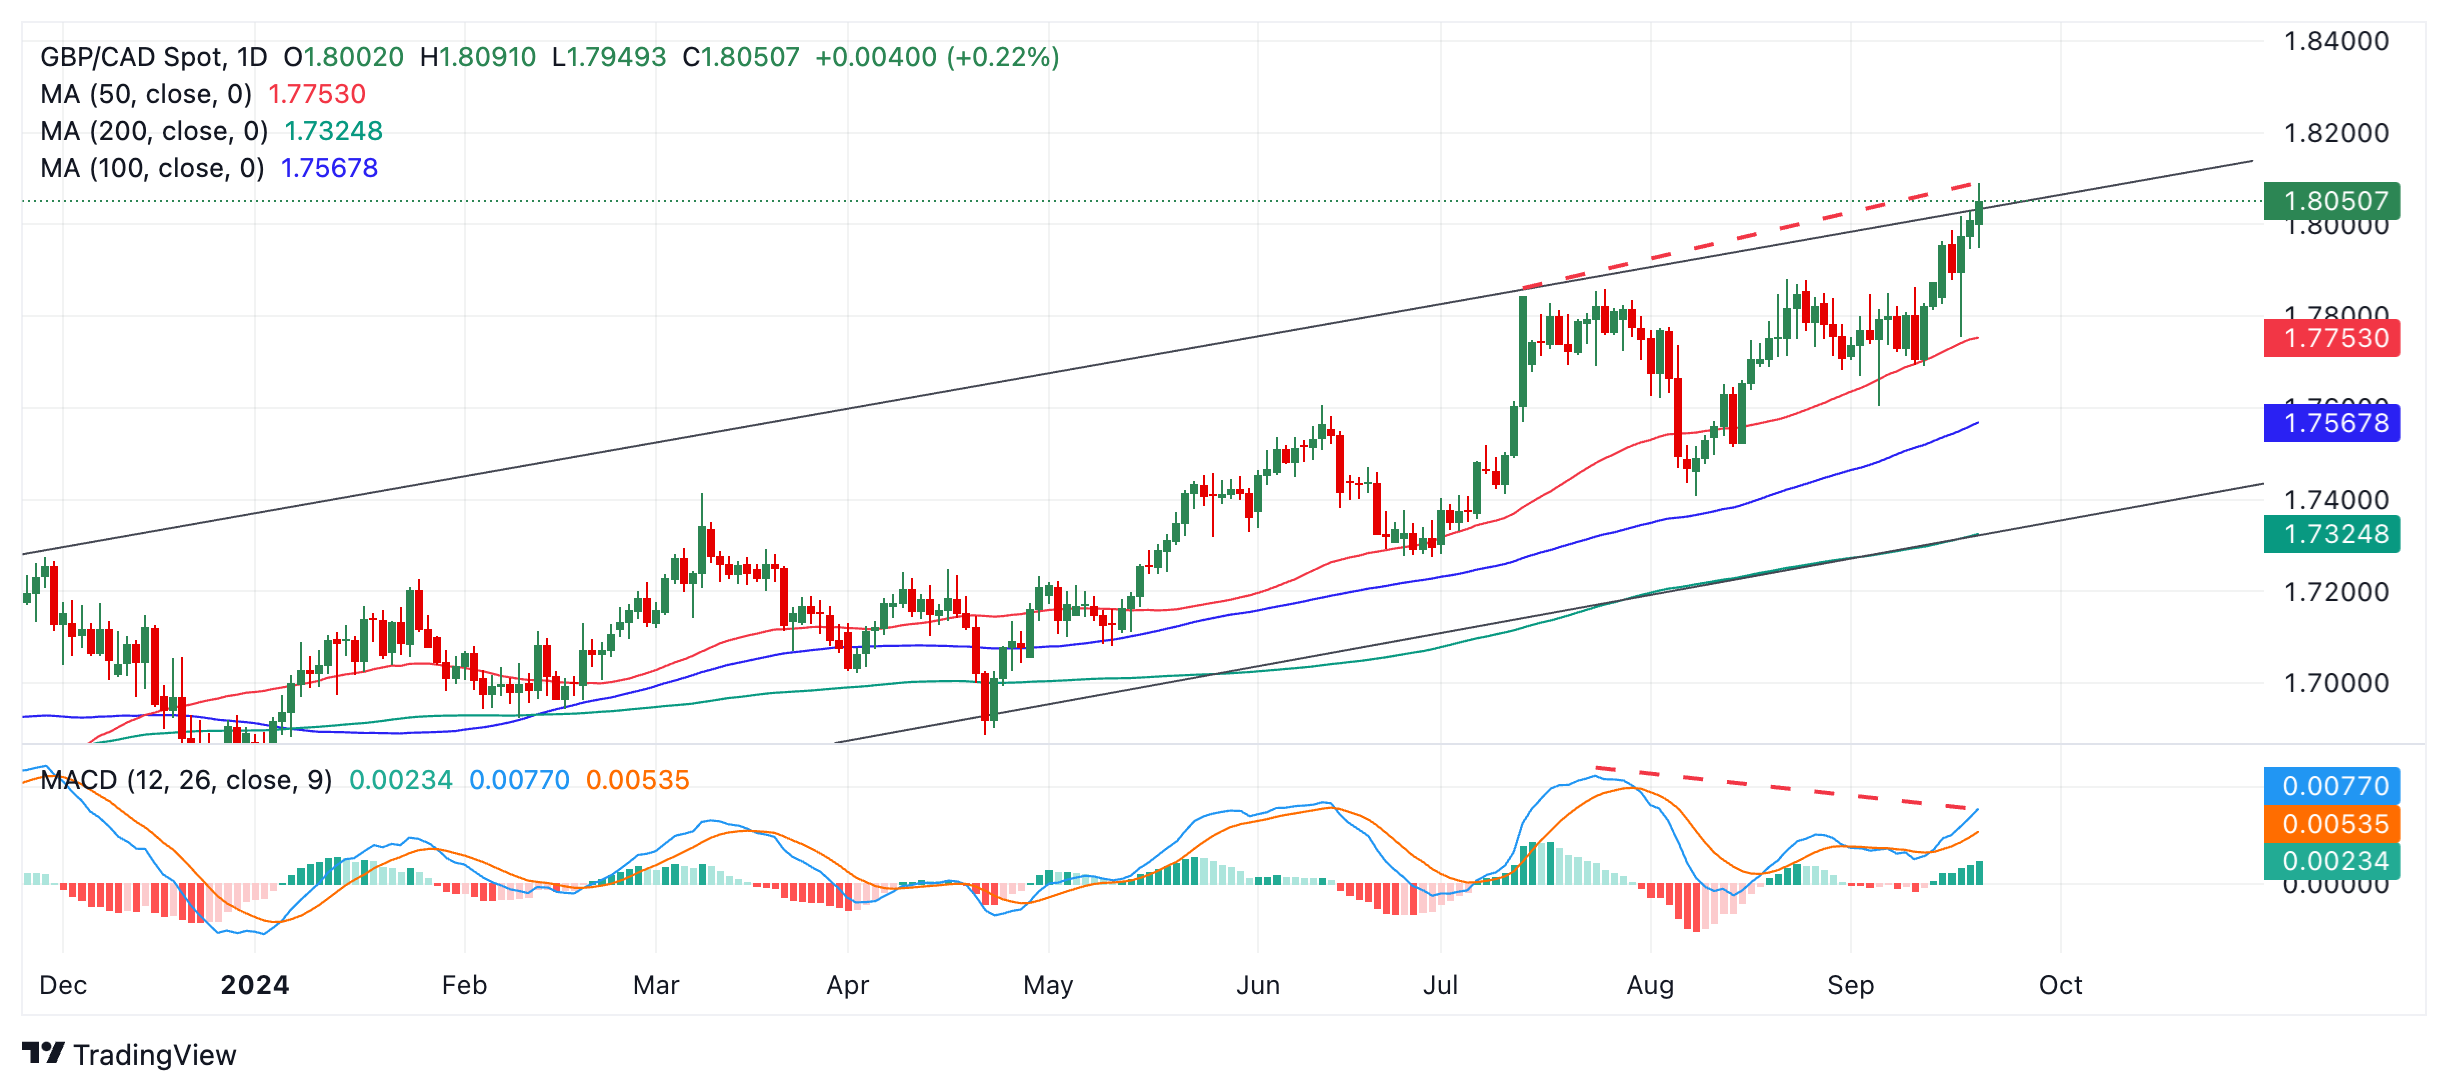
GBP/CAD is showing bearish divergence with the Moving Average Convergence Divergence (MACD) momentum indicator (red dashed lines). Although price has risen to a higher high compared to July 12, the MACD is actually lower than the level it was at on July 12. This is a bearish sign and suggests a higher chance of a pull back evolving.
An initial target for such a pull back might be the 50-day Simple Moving Average (SMA) at 1.7753.
That said, price itself has not formed any kind of reversal pattern yet. It is also in an uptrend on all three major time frames – the short, medium and long-term. This suggests that overall the current is flowing north. Given it is a principle of technical analysis that “the trend is your friend” the odds favor more upside.
Given the resistance above, however, price would have to decisively break above the upper channel line to confirm a continuation.
A decisive break would be one accompanied by a long green candlestick that closed near its high well above the channel line, or three green candlesticks in a row that close well above the trendline. A close above the 1.8091 yearly high would confirm such a breakout, for example.
Such a breakout might reach a target at 1.8278 the 61.8% extrapolation of the prior move higher.
Stronger than expected August Retail Sales (up 1.0% in headline terms versus a 0.4% rise expected) drove the pound to its highest in 2 1/2 years against the USD and the highest in 2 years against the EUR, Scotiabank’s Chief FX Strategist Shaun Osborne notes.
GBP drives gains to test major resistance
“Swaps have pared a little more BoE easing risk for November but continue to reflect a little more than 25bps of anticipated cuts.”
“The Pound Sterling (GBP) has failed to hold early gains and movement off the intraday peak is starting to look somewhat negative on the intraday chart (via a bearish “shooting star” candle signal). Daily price action looks—potentially—similar. This may be important as I noted 1.3330 as major, longterm resistance in yesterday’s comments.”
“For now, I note that broader trends are GBP-bullish, with solid-looking trend momentum developing on the intraday, daily and weekly charts. While off its best today, the pound will still (likely) close out the week strongly overall. Look for firm sterling support on dips to the low/mid 1.32s.”
- AUD/USD edges higher towards the top of a long-term range.
- Momentum is diverging bearishly with price, however, suggesting a risk of a pullback evolving.
AUD/USD keeps posting green candlesticks as it steadily creeps higher. The pair hit a new 2024 high of 0.6839 on Thursday and although there is not much spare room left above until it touches the long-term range high at 0.6870, the trend is short-term bullish, so it’s quite possible it could continue higher.
AUD/USD Daily Chart
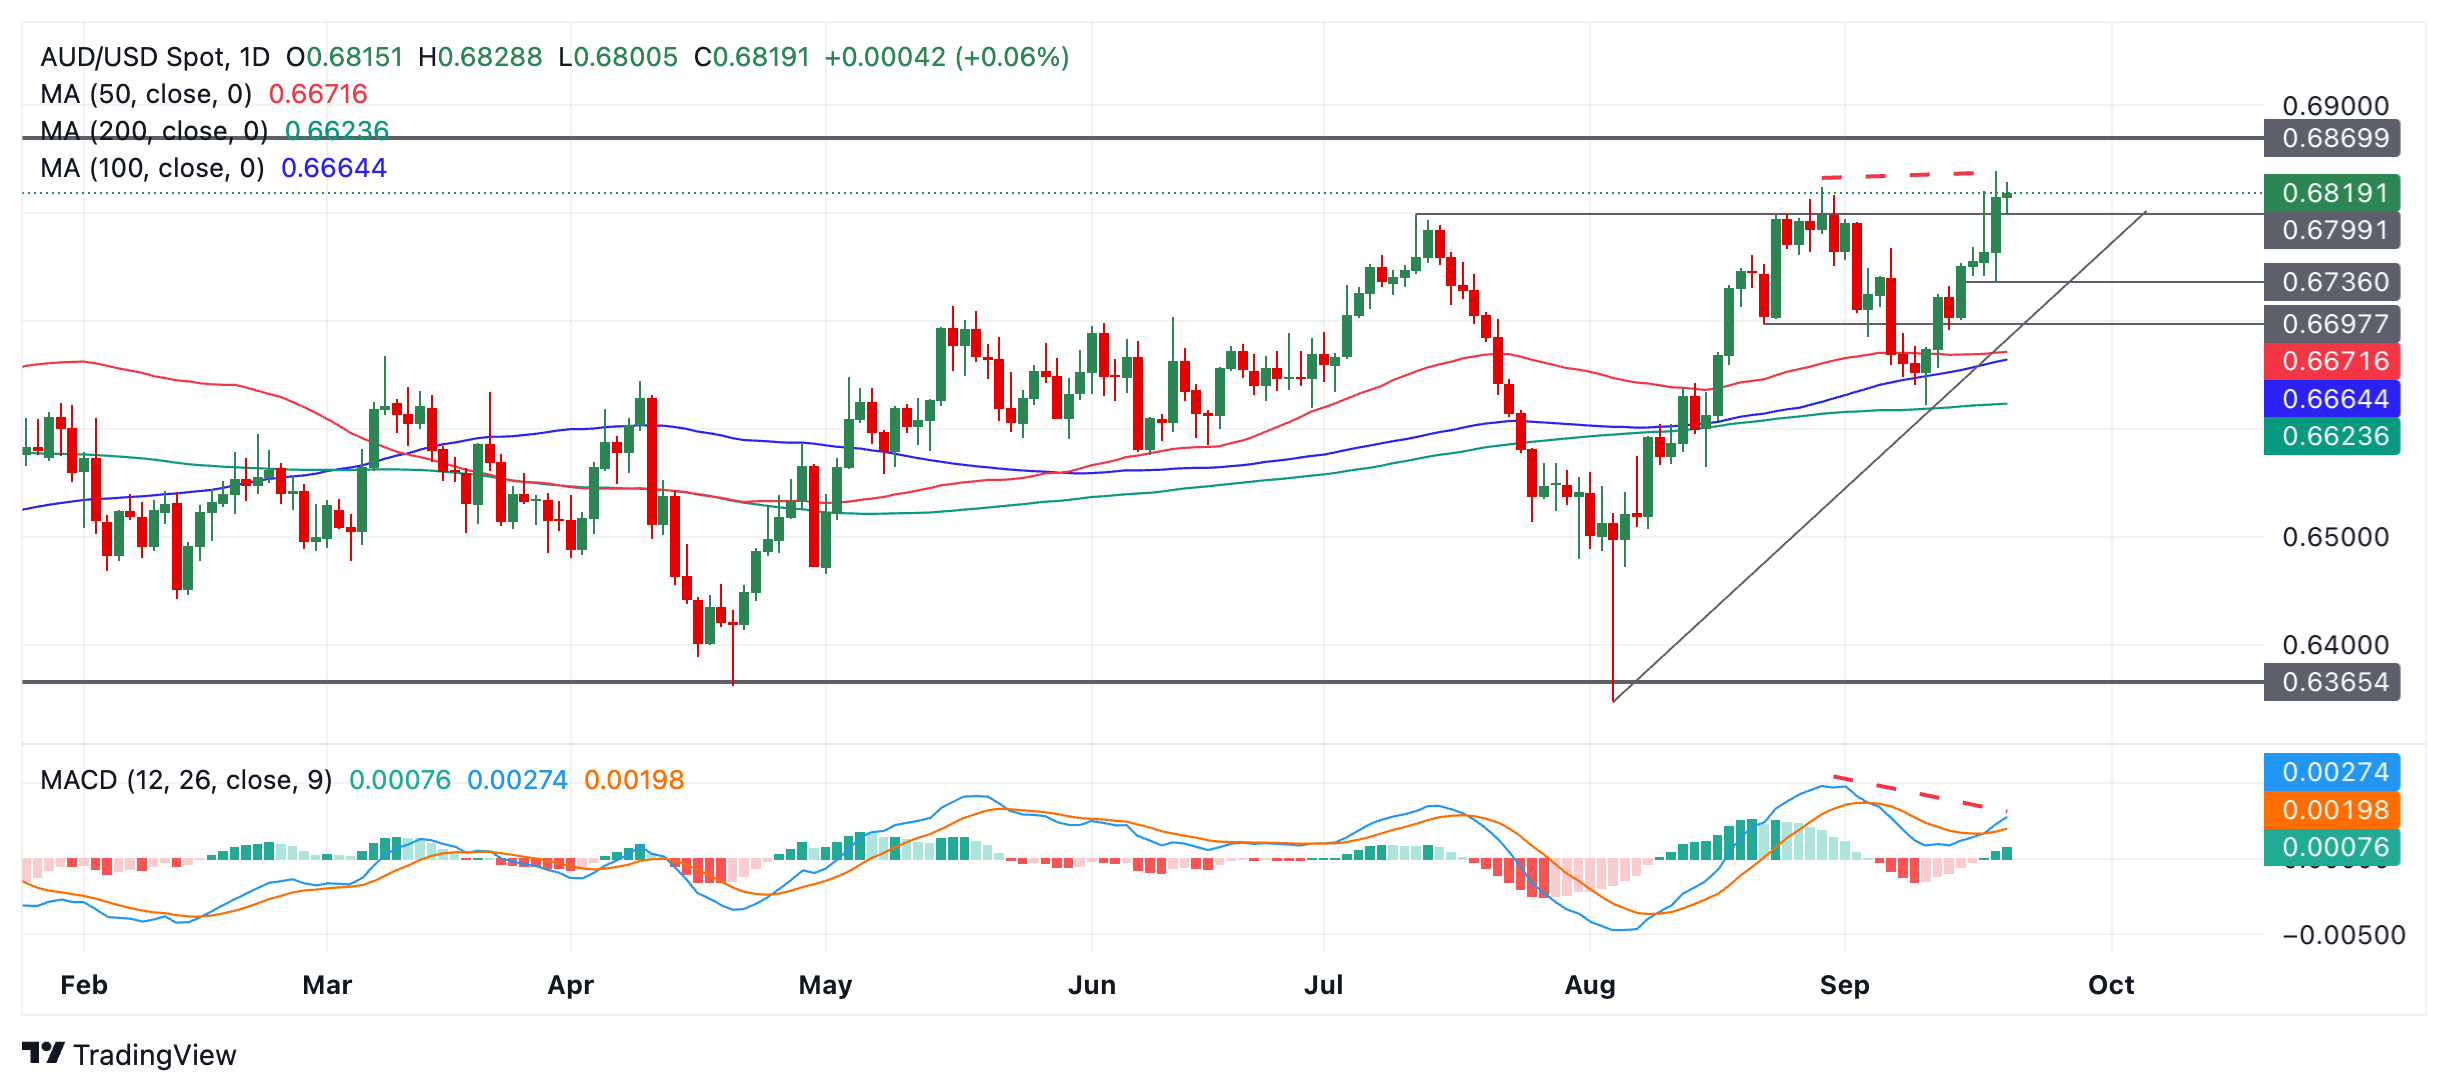
The Aussie is showing mild bearish divergence with the Relative Strength Index (RSI) momentum indicator (red dashed lines on chart above). This occurs when the price reaches a new high but the RSI fails to. The non confirmation is a bearish sign and indicates mild underlying weakness. It suggests AUD/USD is at risk of pulling back.
If a correction evolves it is likely to find support at around 0.6800 (July high), followed by 0.6736.
AUD/USD is in a short-term uptrend since the September 11 low and given it is a principle of technical analysis that “the trend is your friend” the odds favor a continuation higher eventually – despite the bearish divergence with RSI.
A break above the 0.6839 (September 19 and yearly high) would confirm a continuation of the uptrend to a target at the 0.6870 level (December 2023 high).
EUR/USD retains a firm undertone but EUR has drifted off its best levels of the week as short-term yield spreads correct slightly from the peak seen earlier this week, Scotiabank’s Chief FX Strategist Shaun Osborne notes.
Price action is neutral on the intraday chart
“Narrower EZ/US yield spreads overall (the narrowest in more than a year) remain a prime driver of EUR gains and suggest limited scope for EUR losses in the short run at least.”
“The intraday chart reflects better selling pressure developing in the upper 1.11s over the past day or so as investors book profits on EUR longs. Price action is neutral on the intraday chart but broader trends are positive, backed by bullishly-aligned trend strength signals on the short-, medium– and long-term oscillators.”
“Minor EUR dips to the upper 1.10s/low 1.11s should remain well-supported.”
The Swiss customs authority published data on Gold exports on Thursday. Swiss Gold exports in August show no supplies to China for the first time since January 2021, Commerzbank’s commodity analyst Carsten Fritsch notes.
Demand for physical Gold is low due to high price
“It was noteworthy that there were no shipments to China and only minimal shipments to Hong Kong. The last time this happened was in January 2021. Almost no Gold was shipped to the US either. There was a decline of almost 60% in shipments to the UK.”
“Net inflows into Gold ETFs in August, with US-registered Gold ETFs recording inflows of almost 12 tons and UK-registered inflows of just over 4 tons according to the WGC, would have indicated higher deliveries. On the other hand, Gold exports to India were up almost 40 percent. The significant reduction of the Gold import tax in India may have played a role here.”
“Nevertheless, the Swiss data clearly show that the high price level is having a dampening effect on the demand for physical Gold.”
Gold rises to new highs after the Fed's 50-basis-point interest rate cut. According to Fed Funds Futures, a further interest rate cut of 50 basis points is to happen in either November or December. As long as markets expect it to happen in December, the upswing in Gold should continue, Commerzbank’s commodity analyst Carsten Fritsch notes.
Gold on the new highs following latest FOMC
“The Gold price rose to a new record high of more than $2,600 per troy ounce today, having reached this level for the first time on Wednesday following the Fed's 50-basis-point interest rate cut. Even though Fed Chairman Powell tried to emphasize at the press conference that such a rate cut should be the exception rather than the rule, the market is apparently not convinced.”
“According to Fed Funds Futures, a further 75 basis points of interest rate cuts are priced in by the end of the year. With two meetings remaining, this means a further interest rate cut of 50 basis points in either November or December. The market currently sees a slightly greater probability for December.”
“As long as these expectations persist, the upswing in Gold should continue. However, we expect only interest rate cuts of 25 basis points at each of the two meetings, which is why the rally in Gold should not go on forever.”
Bank of Canada Governor Tiff Macklem said on Friday that the adoption of artificial intelligence (AI) could add to inflationary pressures in the near term, per Reuters.
Key takeaways
"AI, combined with a more shock-prone world, means inflation could be more volatile than it was in the 25 years before the pandemic."
"Central banks need to be closely attuned to how AI is affecting inflation, both indirectly and directly."
"AI is expected to boost productivity; when labor productivity is rising, the economy can grow more quickly without causing inflation."
"AI could destroy more jobs than it creates, and people may struggle to find new opportunities; this is a concern for us all."
"We don’t have much evidence that labor is being displaced by AI at rates that would lead to declines in total employment."
"AI adoption could also lead to financial stability issues; operational risks could become concentrated in a few third-party service providers."
"There is huge potential for central banks to use AI to understand how consumers and businesses are behaving."
Market reaction
These comments failed to trigger a noticeable market reaction. At the time of press, USD/CAD was virtually unchanged on the day at 1.3565.
The upside potential in the Gold market may have been largely exhausted after the new record high of $2,600 per troy ounce, Commerzbank’s commodity analyst Barbara Lambrecht notes.
Gold posts another all-time high
“The price of Gold celebrated the Fed's large interest rate move with a new record high, touching $2,600 per troy ounce for the first time. After all, high prices also leave their mark on physical demand.”
“This was reflected, among other things, in the recent sharp fall in China's Gold imports, which fell to 44.6 tons in July, the lowest level in two years. Imports had already fallen sharply in the previous month.”
“New import quotas were allocated to Chinese banks in August, but buying interest is still unlikely to be too strong: jewelry demand is weakening, and only investment demand is intact. The fact that the Chinese central bank did not buy any Gold in August also suggests that Gold imports from Hong Kong will be low.”
- GBP/JPY rallies by more than a percent at the end of a strong week.
- UK Retail Sales beat expectations and past prints adding fuel to the rally.
- BoJ strikes dovish tone at meeting but Japanese inflation data hits ten-month high, limiting JPY losses.
GBP/JPY rises over one-and-a-quarter percentage points on Friday, to trade in the 191.80s, as it builds on considerable gains made throughout the week. The pair extends its bullish run following major macroeconomic releases and events affecting both currencies.
The Pound Sterling (GBP) is strengthening overall against the Japanese Yen (JPY), after the release of UK Retail Sales showed shoppers loosening their purse strings in August, data from the Office of National Statistics (ONS) showed on Friday. Retail Sales rose 1.0% MoM in August accelerating the 0.5% rise of July and roundly beating expectations of 0.4%.
The data suggests that shoppers in the UK are unphased by higher borrowing costs and are continuing to spend liberally. This is likely to cause upward pressure on prices and keep inflation elevated. This, in turn, is likely to keep the Bank of England (BoE) from cutting interest rates. By maintaining them at a relatively high level (5.0%) it will help the Pound to strengthen because higher interest rates increase foreign capital inflows.
The Pound gained a leg up on Thursday after the board of the BoE voted eight to one to keep interest rates unchanged at its September meeting. The stance stands in contrast to most other central banks which are lowering interest rates as global inflationary pressures ebb. Sterling probably gained a further boost from the words of BoE policymaker Catherine Mann, who said about policy on Friday, that “it is better to remain restrictive for longer.”
GBP/JPY upside could be limited, however, after inflation data from Japan showed an uptick in consumer prices.
The National Consumer Price Index (CPI) for Japan rose 3.0% YoY in August, according to data from the Statistics Bureau of Japan (SBJ) released overnight. This was higher than the 2.8% of July, and represented a ten-month high for the metric.
National CPI ex Food, Energy, meanwhile, showed a 2.0% YoY rise from 1.9% previously, and National CPI ex Fresh Food a 2.8% YoY rise in August, in line with expectations but higher than the 2.7% of July. The data is likely to keep alive hopes the Bank of Japan (BoJ) will normalize policy by raising interest rates from their relatively low (0.25%) level. With such a move, in turn, helping to strengthen the JPY.
The BoJ concluded its September policy meeting on Friday, and although it left interest rates unchanged – as widely expected – and BoJ Governor Kazuo Ueda struck a cautious tone, citing “high uncertainties surrounding Japan’s economic activity and prices”, the higher inflation readings released at the same time supported the Yen.
Norges Bank ultimately did what was perceived reasonable by the markets. It maintained its position that the key interest rate will not be lowered until next year, Commerzbank’s FX analyst Antje Praefcke notes.
Weak krone remains a concern for Norges Bank
“Although inflation has fallen somewhat more strongly than expected, the weak krone remains a concern for Norges Bank, which is why it does not want to lower the key rate prematurely.”
“Norges Bank removed the reference to possible interest rate hikes from the statement. “We believe that there is a need to keep the policy rate at today’s level for a period ahead but that the time to ease monetary policy is approaching,” said the central bank’s Governor.”
“In short, Norges Bank is still restrictive as it continues to see risks to inflation. However, it is preparing the rate cut cycle by no longer citing the possibility of a rate increase. The market is likely to view the prospect of a rising real interest rate positively, which is why the krone was able to appreciate moderately even after the decision.”
The Canadian Dollar (CAD) is drifting back to very familiar ranges this morning. Spot is finding it hard to break away from the upper 1.35 area and, with trading looking relatively subdued today, that may not change in the short run, Scotiabank’s Chief FX Strategist Shaun Osborne notes.
Technicals lean USD-bearish
“Extended periods of narrow range trading eventually give way to more directionally dynamic trading but there is simply no catalyst to drive movement at the moment. Spot remains close to estimated equilibrium (1.3548 today).”
“Canadian Retail Sales are expected to rise 0.6% in the July month (Scotia at 0.5%), with ex-auto sales rising 0.3%. Retail activity was weak in June, although volume sales advanced marginally. Statcan’s ‘flash’ estimate for July sales, released with the June data, pointed to a 0.6% rise.”
“A weak close on day Thursday for the USD developed a large, bearish outside range signal on the daily chart which tilts near term risks to the downside and should reinforce USD resistance in the mid-1.36 zone from here. Minor gains for the USD today look consolidative ahead of renewed softness. Loss of short-term support at 1.3535/45 should see USD weakness extend a little more.”
The Bank of Japan maintains its monetary policy unchanged, but removes its forwards guidance, to the sheer surprise of the markets, UOB Group Senior Economist Alvin Liew notes.
No change to monetary policy guideline as expected
“The Bank of Japan (BOJ) at its scheduled Monetary Policy Meeting (MPM) on Fri (20 Sep), took a unanimous decision to maintain its current monetary policy guidelines for money market operations, in line with market expectations.”
“The surprise in Sep MPM statement was the absence of any monetary policy forward guidance, unlike the Jul MPM. BOJ’s positive economic outlook and expectations of gradually rising inflation in the Sep MPM was largely unchanged from Jul.”
“We expect BOJ to resume normalisation in 4Q 24 (likely the Oct MPM), with a 25-bps hike to 0.50% which we believe will be the terminal rate. This path will also be subject to further CPI forecasts changes in the subsequent MPMs.”
- The US Dollar consolidates on Friday after weakening further on Thursday..
- Traders have repriced the US Dollar amidst the Bank of Japan and Bank of England’s decisions to keep rates on hold.
- The US Dollar Index falls outside its tight bandwidth, a sign that could dive lower next week.
The US Dollar (USD) trades broadly steady on Friday after Thursday’s sharp decline, when traders revalued the Greenback after the US Federal Reserve (Fed) joined the European Central Bank (ECB) and several others by starting its interest-rate cutting cycle. Quite a different picture comes from the Bank of England (BoE) and the Bank of Japan (BoJ), which decided to keep interest rates steady, causing the US Dollar to struggle against the British Pound (GBP) and the Japanese Yen (JPY).
On the economic data front, the US economic calendar is quite empty, which is ideal for traders to let the dust settle after a volatile week. Next week, a lot of US data is set to be released. The main elements include the final US Gross Domestic Product (GDP) data for Q2 and the Personal Consumption Expenditures (PCE) Price Index, the Fed’s preferred inflation gauge.
Daily digest market movers: You can’t always get what you want
- The Bank of Japan (BoJ) has kept its interest rate stable at 0.25%. BoJ Governor Kazuo Ueda mentioned that inflation came in a little softer than anticipated, that the BoJ is keeping a close eye on the economic data, and that it is ready to hike at any moment when needed.
- Federal Reserve Bank of Philadelphia President Patrick Harker delivers a speech titled "The Federal Reserve: it's more than just interest rates" at the Tulane University Freeman School of Business Lecture in New Orleans at around 18:00 GMT.
- Equity markets are facing some profit taking after the steep rallies that took place in the aftermath of the Fed rate decision. Both European equities and US Futures are in red numbers. Still, losses are rather contained, by no more than 0.5% on average.
- The CME Fedwatch Tool shows a 59.3% chance of a 25-basis-point rate cut at the next Fed meeting on November 7. The remaining 40.7% is pricing in another 50-basis-point rate cut.
- The US 10-year benchmark rate trades at 3.71%, rather in the middle of this week’s range between 3.60% and 3.76%.
US Dollar Index Technical Analysis: Where do we close this week?
The US Dollar Index (DXY) is in a precarious situation. A weekly close below that line in the sand of 100.62 could point to further weakness ahead. A further depreciation could take place next week if US data eases further, opening the door to another big rate cut in November.
The upper level of the recent range remains 101.90, with the DXY still possible to recover above 100.62 first. Further up, the index could go to 103.18, with the 55-day Simple Moving Average (SMA) at 102.66 on the way. The next tranche up is very misty, with the 200-day SMA and the 100-day SMA at 103.76, just ahead of the big 104.00 round level.
On the downside, 100.62 (the low from December 28, 2023) is being broken again and could point to more weakness ahead. Should that take place next week, the low from July 14, 2023, at 99.58, will be the next level to look out for. If that level gives way, early levels from 2023 are coming in near 97.73.
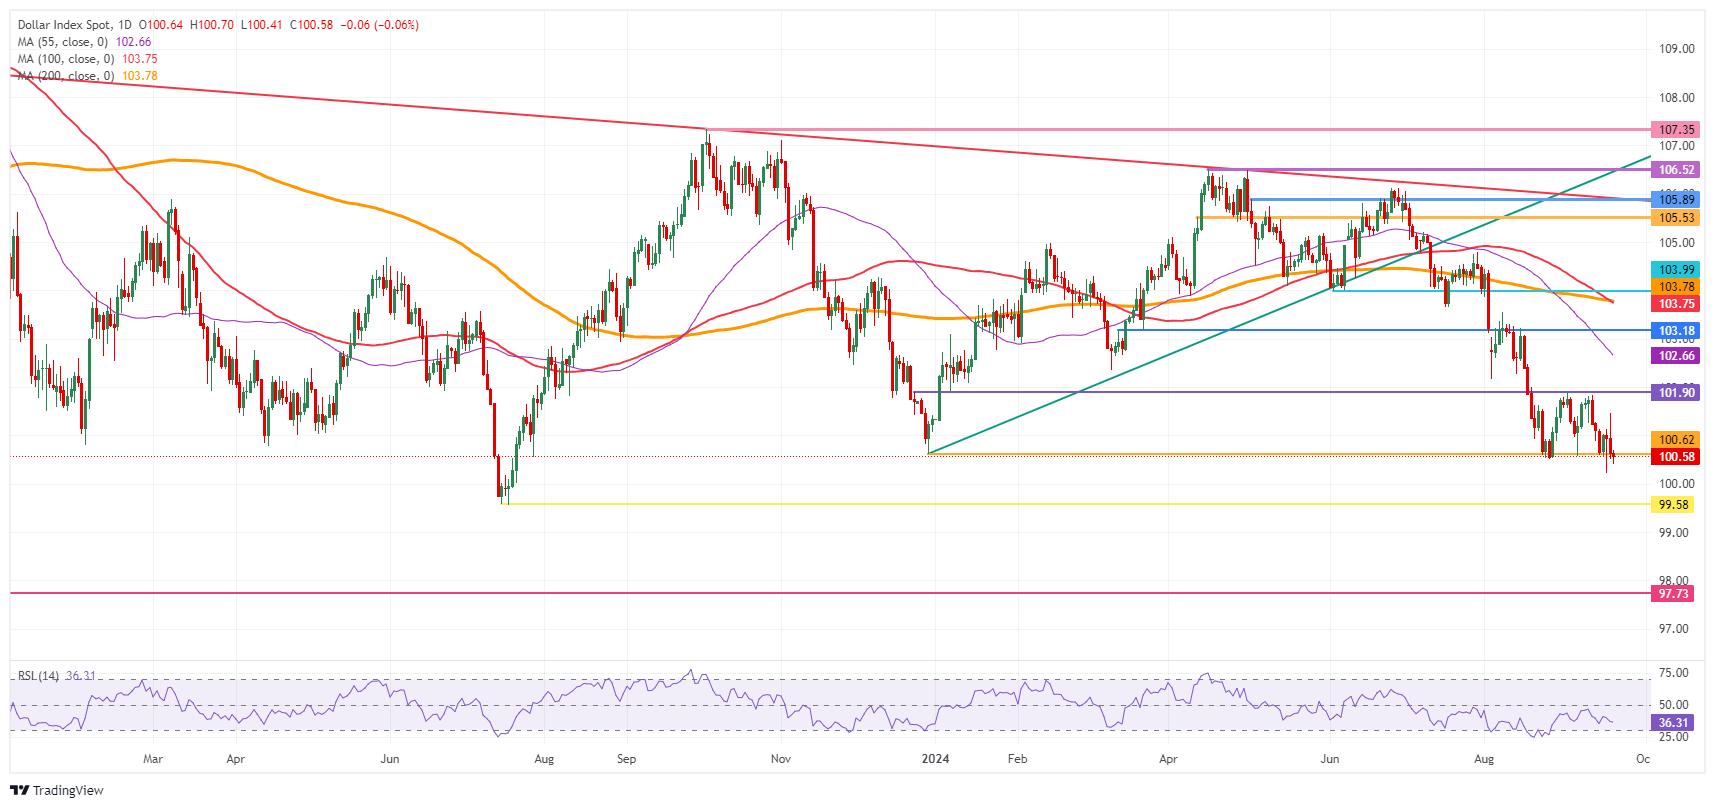
US Dollar Index: Daily Chart
US Dollar FAQs
The US Dollar (USD) is the official currency of the United States of America, and the ‘de facto’ currency of a significant number of other countries where it is found in circulation alongside local notes. It is the most heavily traded currency in the world, accounting for over 88% of all global foreign exchange turnover, or an average of $6.6 trillion in transactions per day, according to data from 2022. Following the second world war, the USD took over from the British Pound as the world’s reserve currency. For most of its history, the US Dollar was backed by Gold, until the Bretton Woods Agreement in 1971 when the Gold Standard went away.
The most important single factor impacting on the value of the US Dollar is monetary policy, which is shaped by the Federal Reserve (Fed). The Fed has two mandates: to achieve price stability (control inflation) and foster full employment. Its primary tool to achieve these two goals is by adjusting interest rates. When prices are rising too quickly and inflation is above the Fed’s 2% target, the Fed will raise rates, which helps the USD value. When inflation falls below 2% or the Unemployment Rate is too high, the Fed may lower interest rates, which weighs on the Greenback.
In extreme situations, the Federal Reserve can also print more Dollars and enact quantitative easing (QE). QE is the process by which the Fed substantially increases the flow of credit in a stuck financial system. It is a non-standard policy measure used when credit has dried up because banks will not lend to each other (out of the fear of counterparty default). It is a last resort when simply lowering interest rates is unlikely to achieve the necessary result. It was the Fed’s weapon of choice to combat the credit crunch that occurred during the Great Financial Crisis in 2008. It involves the Fed printing more Dollars and using them to buy US government bonds predominantly from financial institutions. QE usually leads to a weaker US Dollar.
Quantitative tightening (QT) is the reverse process whereby the Federal Reserve stops buying bonds from financial institutions and does not reinvest the principal from the bonds it holds maturing in new purchases. It is usually positive for the US Dollar.
Yesterday, members of the Monetary Policy Committee voted eight to one to leave the Bank Rate unchanged at 5.0%, Commerzbank’s FX Analyst Volkmar Baur notes.
GBP to remain broadly unchanged against the euro
“The Bank of England remained somewhat hawkish in its language, which is also in line with our expectation that the Bank of England will be very cautious. Only Swati Dhingra voted in favor of another rate cut, living up to her reputation as a monetary dove. She has voted for a cut at each of the last five meetings and was the lone dissenter at the last rate hike in August last year.”
“We therefore think that Governor Andrew Bailey has a broad majority in favor of his monetary policy, and we expect three more rate cuts, one per quarter, which should bring the key rate down to 4.25% by the middle of next year. This means that in the upcoming meetings, the Bank of England will continue to take a pause in the cutting cycle from time to time.”
“This cautious approach, which is also appropriate given the stubbornness of inflation, should support GBP and allow GBP/USD to rise slightly, while we expect the GBP to remain broadly unchanged against the Euro over the next few months.”
- Crude Oil popped higher on Thursday after intense attacks from Israel on Lebanon.
- Saudi Arabia has cut its crude oil exports in July to an almost one-year low.
- The US Dollar Index remains under pressure, trading near the yearly lows.
Crude Oil consolidates at around $71 on Friday after popping higher by nearly 3% the previous day as a peace or ceasefire deal in the Middle East seems further away than ever. Israel stepped up its offensive after the rare pager and walkie-talkie explosion with bombardments on Libanon on Thursday. The offensive is a big setback for any negotiation and puts the region back on high alert.
Meanwhile, the US Dollar Index (DXY), which tracks the performance of the Greenback against six other currencies, is under pressure near the yearly lows and could break lower now that the US Federal Reserve (Fed) has joined other countries by starting its interest rate cutting cycle. This triggered a devaluation in the DXY that could have more room to go in the coming weeks.
At the time of writing, Crude Oil (WTI) trades at $70.65 and Brent Crude at $73.74.
Oil news and market movers: Escalations drive Crude higher
- The next step up in Israel attacking Lebanon is adding to more tensions in the Middle East.
- Reuters reports that Saudi Arabia saw its oil exports drop to a one-year low in July. The country exported 5.741 million barrels per day (bpd) in July, their lowest level since August 2023.
- Declining global crude stockpiles should support Oil prices going forward, pushing Brent back above $80 in the coming months, UBS analysts said in a note to clients, Reuters reports.
- The above argument was supported on Wednesday during the weekly Energy Information Administration (EIA) release, which saw inventories fall to a one-year low last week.
Oil Technical Analysis: Not the Fed, but the Middle East
Crude Oil price consolidates recent gains on Friday. With tensions in the Middle East back on the forefront while US strategic reserves are running lower, a surge in prices looks granted. Going forward, it will be key to see how demand will hold up with the heating season underway.
The first level to watch on the upside is $71.46 (the February 5 low), which returns to the table as the next level to look out for. Ultimately, a return to $75.27 (the January 12 high) is still possible but would likely come if a seismic shift in current balances occurs.
On the downside, the initial support remains at $67.11, a triple bottom in the summer of 2023. Further down, the next level in line is $64.38, the low from March and May 2023. Should that level face a second test and snap, $61.65 becomes a target, with $60.00 as a psychologically big figure just below it, at least tempting to be tested.
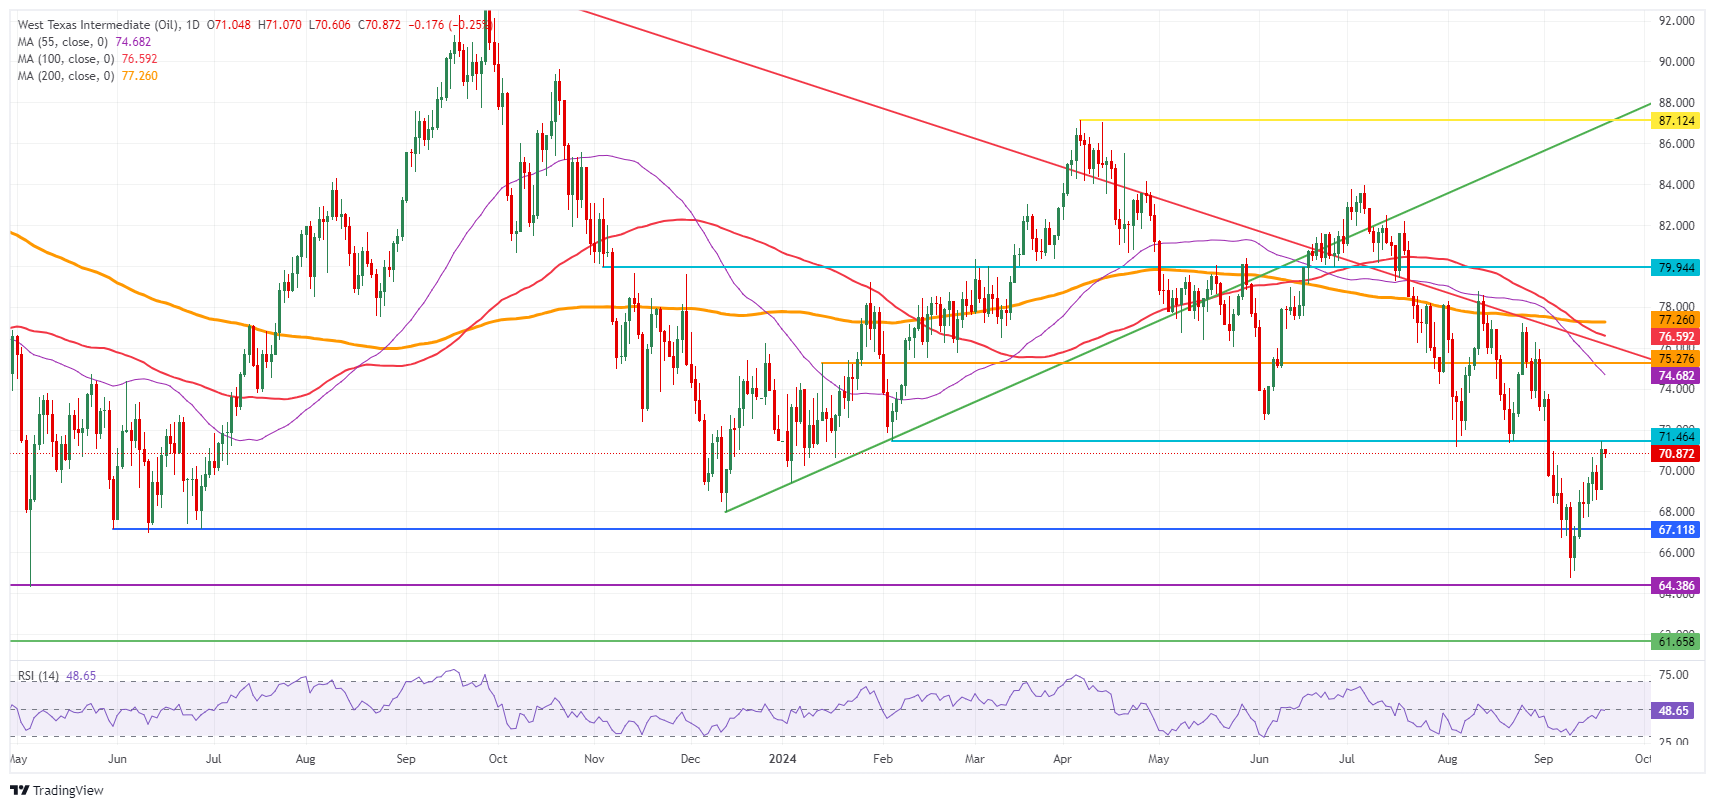
US WTI Crude Oil: Daily Chart
WTI Oil FAQs
WTI Oil is a type of Crude Oil sold on international markets. The WTI stands for West Texas Intermediate, one of three major types including Brent and Dubai Crude. WTI is also referred to as “light” and “sweet” because of its relatively low gravity and sulfur content respectively. It is considered a high quality Oil that is easily refined. It is sourced in the United States and distributed via the Cushing hub, which is considered “The Pipeline Crossroads of the World”. It is a benchmark for the Oil market and WTI price is frequently quoted in the media.
Like all assets, supply and demand are the key drivers of WTI Oil price. As such, global growth can be a driver of increased demand and vice versa for weak global growth. Political instability, wars, and sanctions can disrupt supply and impact prices. The decisions of OPEC, a group of major Oil-producing countries, is another key driver of price. The value of the US Dollar influences the price of WTI Crude Oil, since Oil is predominantly traded in US Dollars, thus a weaker US Dollar can make Oil more affordable and vice versa.
The weekly Oil inventory reports published by the American Petroleum Institute (API) and the Energy Information Agency (EIA) impact the price of WTI Oil. Changes in inventories reflect fluctuating supply and demand. If the data shows a drop in inventories it can indicate increased demand, pushing up Oil price. Higher inventories can reflect increased supply, pushing down prices. API’s report is published every Tuesday and EIA’s the day after. Their results are usually similar, falling within 1% of each other 75% of the time. The EIA data is considered more reliable, since it is a government agency.
OPEC (Organization of the Petroleum Exporting Countries) is a group of 13 Oil-producing nations who collectively decide production quotas for member countries at twice-yearly meetings. Their decisions often impact WTI Oil prices. When OPEC decides to lower quotas, it can tighten supply, pushing up Oil prices. When OPEC increases production, it has the opposite effect. OPEC+ refers to an expanded group that includes ten extra non-OPEC members, the most notable of which is Russia.
The US Dollar (USD) is likely to trade with a downward bias towards 7.0500, UOB Group FX analysts Quek Ser Leang and Lee Sue Ann note.
USD to trade towards 7.0500
24-HOUR VIEW: “Our view for USD to trade in a 7.0850/7.1150 range was incorrect, as it rose to 7.1133 and then plummeted to 7.0601. While the sharp drop appears to be running ahead of itself, there is scope for USD to break below 7.0600 today. The next support 7.0500 is unlikely to come into view. Resistance levels are at 7.0800 and 7.0970.”
1-3 WEEKS VIEW: “On Tuesday (17 Sep, spot at 7.1005), we indicated that USD ‘is likely to trade in a sideways range of 7.0700/7.1300.’ Yesterday, USD fell and broke below 7.0700, reaching a low of 7.0601. Downward momentum has increased, albeit not much. From here, provided that USD remain 7.1100, we expect USD to trade with a downward bias towards 7.0500.”
- USD/JPY surges above 144.00 as BoJ refrains from committing pre-defined rate hikes in this year.
- Japan’s National CPI rose to 3% in August.
- Traders see the Fed cutting interest rates further by 75 bps to 4.00%-4.25%.
The USD/JPY delivers a sharp rally to near 144.00 in Friday’s European session. The asset strengthens as the Japanese Yen (JPY) weakens after the Bank of Japan’s (BoJ) monetary policy announcement. The BoJ kept interest rates in the range of 0.15%-0.25%, as expected, but did not endorse the need of more hikes in the remaining year, which was widely anticipated by market participants.
BoJ Governor Kazuo Ueda said, "Our decision on monetary policy will depend on economic, price and financial developments at the time. Japan's real interest rates remain extremely low. If our economic and price forecasts are achieved, we will raise interest rates and adjust the degree of monetary support accordingly," at the press conference.
Going forward, market speculation for more BoJ rate hikes is expected to remain firm as the Japan’s National Consumer Price Index (CPI) data for August came in higher at 3% than 2.8% in July. The National CPI data excluding fresh food grew expectedly by 2.8%, faster than the prior release of 2.7%.
Meanwhile, a mild recovery in the US Dollar (USD) has also pushed the asset higher. The US Dollar Index (DXY), which tracks the Greenback’s value against six major currencies, bounces back to near 100.85 from the intraday low of 100.40.
The near-term outlook of the US Dollar is expected to remain uncertain as traders expect the Federal Reserve (Fed) to continue with an aggressive policy-easing cycle. The CME FedWatch tool shows that the central bank will reduce interest rates further by 75 basis points (bps) in the remaining two policy meetings this year.
The Fed delivered its first interest rate cut decision in more than four years on Wednesday in which it cut its key borrowing rates by 50 bps to 4.75%-5.00%.
Japanese Yen FAQs
The Japanese Yen (JPY) is one of the world’s most traded currencies. Its value is broadly determined by the performance of the Japanese economy, but more specifically by the Bank of Japan’s policy, the differential between Japanese and US bond yields, or risk sentiment among traders, among other factors.
One of the Bank of Japan’s mandates is currency control, so its moves are key for the Yen. The BoJ has directly intervened in currency markets sometimes, generally to lower the value of the Yen, although it refrains from doing it often due to political concerns of its main trading partners. The current BoJ ultra-loose monetary policy, based on massive stimulus to the economy, has caused the Yen to depreciate against its main currency peers. This process has exacerbated more recently due to an increasing policy divergence between the Bank of Japan and other main central banks, which have opted to increase interest rates sharply to fight decades-high levels of inflation.
The BoJ’s stance of sticking to ultra-loose monetary policy has led to a widening policy divergence with other central banks, particularly with the US Federal Reserve. This supports a widening of the differential between the 10-year US and Japanese bonds, which favors the US Dollar against the Japanese Yen.
The Japanese Yen is often seen as a safe-haven investment. This means that in times of market stress, investors are more likely to put their money in the Japanese currency due to its supposed reliability and stability. Turbulent times are likely to strengthen the Yen’s value against other currencies seen as more risky to invest in.
- USD/CHF has been oscillating since late August.
- It is currently unfolding a bullish leg within that sideways trend.
USD/CHF is trading within a range which began forming after the August lows. It is currently rising up within that range in a bullish leg which has reached about the midpoint of the consolidation.
USD/CHF 4-hour Chart
USD/CHF is not in a bullish or bearish trend in the short-term but rather probably a sideways trend. Since it is a principle of technical analysis that “the trend is your friend” the odds favor a continuation of this trend. This suggests the current move up will probably continue until it reaches the range highs before rotating down and continuing the sideways oscillation.
The Moving Average Convergence Divergence (MACD) momentum indicator has risen above zero which is a bullish sign and suggests a continuation of the up move.
A break above 0.8515 (September 19 high) would probably provide confirmation of a continuation higher towards the range high at 0.8541.
The Bank of Japan avoided another market surprise at its September meeting, following economists' and markets' expectations, leaving the key rate unchanged, Commerzbank’s FX Analyst Volkmar Baur notes.
BoJ intends to maintain its hawkish tone
“Although Governor Ueda will not speak to the press until 7:30 (UTC+1), the statement already indicated that the BoJ intends to maintain its hawkish tone and continue to raise interest rates. This is based on a positive economic outlook, with the economy expected to grow above potential in the coming quarters and an improvement in consumer spending and inflation expectations.”
“The Bank of Japan believes that inflation will continue to rise gradually, paving the way for further hikes. What is striking, however, is the lack of explicit forward guidance in today's statement. This confirms our view that the situation in Japan is not quite as clear-cut as the Bank of Japan would sometimes like us to believe. A look at today's inflation figures also supports this view.”
“We continue to believe that the Bank of Japan will find it difficult to raise interest rates significantly and expect only one more rate hike in December, which will lead to a weaker JPY in the coming months.”
The last day of the week should be quiet with an empty calendar in the CEE region. However, the FX market has a lot to absorb, ING’s FX strategist Frantisek Taborsky notes.
Markets are bullish ahead of central bank events
“Overall, we remain bullish on the CEE region, just like at the start of the week. The most attractive at the moment seems to be Hungary's forint, which in the rates market repriced up significantly for no visible reason, while EUR rates fell slightly. Thus, at the end of the day, the interest rate differential moved to the highest level in weeks, adding support to FX.”
“Moreover, EUR/USD is still testing higher levels favouring CEE currencies in general. Thus, we think EUR/HUF should move into the 392-393 range by Tuesday's National Bank of Hungary meeting, supporting a 25bp rate cut, which is our economist's call.”
“Another currency preparing for next week's central bank meeting is the Czech koruna, which has been enjoying stronger values in recent days and is slowly approaching 25.00 per euro. As we mentioned earlier, the market pricing is still on the very dovish side, but given the core story, it makes no sense to go against the received market.”
Upward momentum is building; if the US Dollar (USD) can break above 144.00, it could trigger a stronger recovery towards 145.50, UOB Group FX analysts Quek Ser Leang and Lee Sue Ann note.
Bulls can push above 144.00 and towards 145.50
24-HOUR VIEW: “We indicated yesterday that USD ‘has potential to test the major resistance at 144.00.’ USD subsequently rose to 143.94, closing at 142.62 (+0.25%). Slowing momentum, combined with overbought conditions suggests USD is unlikely to rise further. Today, we expect USD to trade in a range of 141.50/143.80.”
1-3 WEEKS VIEW: “Our update from yesterday (19 Sep, spot at 143.00) remains valid. As highlighted, if USD can break clearly above 144.00, it could trigger a stronger recovery towards 145.50. The likelihood of USD breaking clearly above 144.00 will remain intact, provided that the ‘strong support’ level at 141.00 is not breached.”
- EUR/GBP has touched down on support from the bottom of a range.
- It is converging with momentum and could be about to pullback.
EUR/GBP has extended its break out of a rising channel and fallen to the major support level at 0.8385, which lies at the bottom of a broader range for the pair.
EUR/GBP Daily Chart
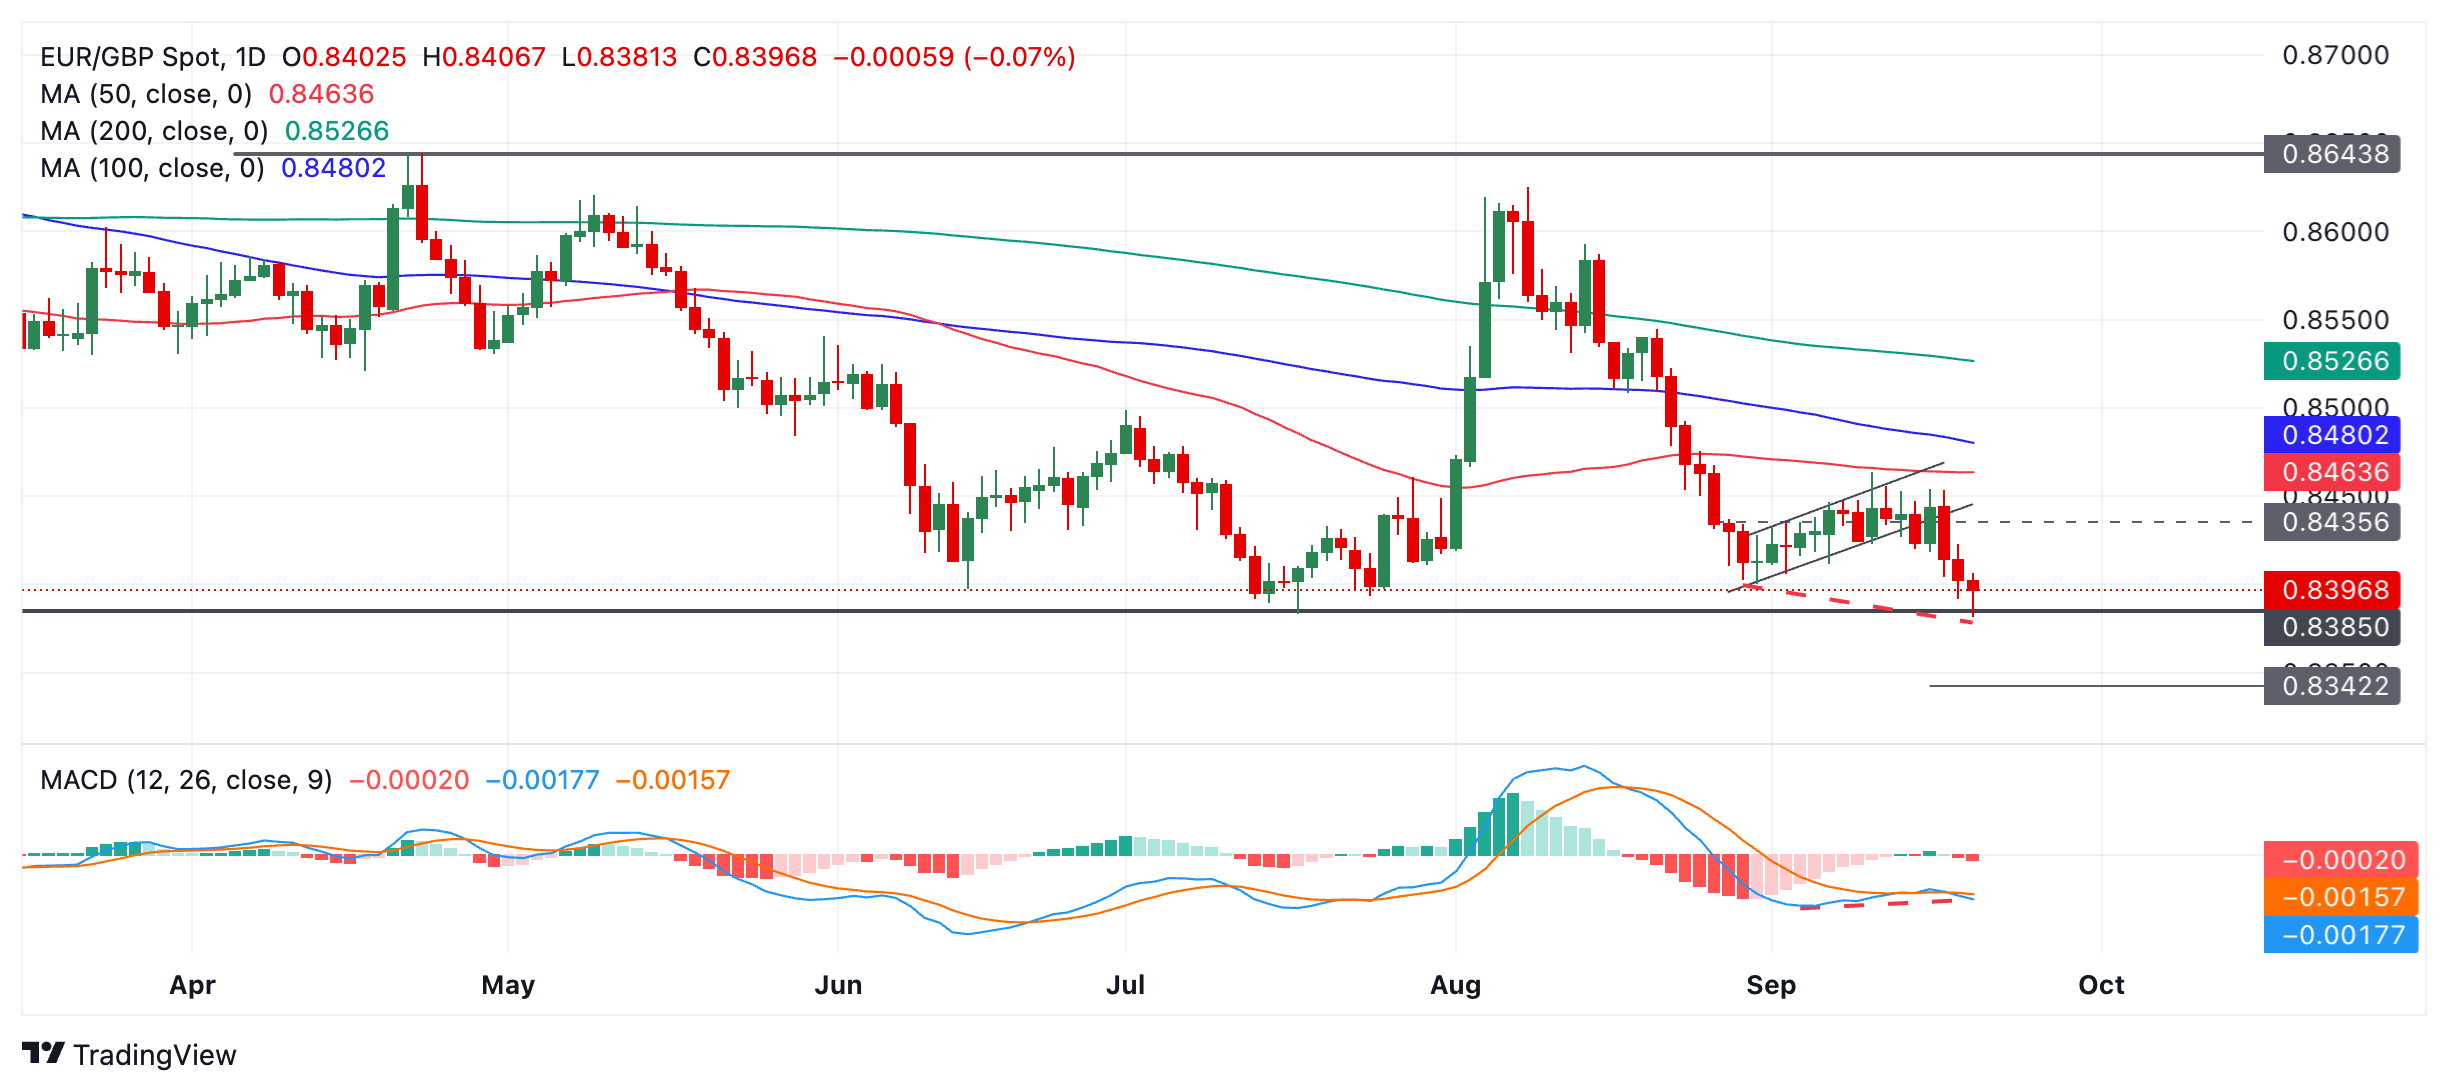
The trend is bearish both in the short and medium-term and given the principle that “the trend is your friend” this means the odds favor more downside. A close below 0.8380 would provide confirmation of a continuation lower to a probable target at 0.8342, the 61.8% Fibonacci extrapolation of the prior down move.
At the same time bears should be cautious. There are growing signs the EUR/GBP might be bottoming.
Firstly the pair has reached a solid level of historic support at the base of its range.
Secondly, the most recent move down over the last few days has been accompanied by relatively weak momentum. Price is now showing bullish convergence with the Moving Average Convergence Divergence (MACD) momentum indicator (red dashed lines). This happens when price falls to a new low but momentum does not match. This is so if the MACD level at the August 29 bottom is compared to the MACD at the September 20 bottom. The price has declined over time but the MACD has not. The convergence is a sign a pullback higher might form.
Thirdly, EUR/GBP is forming a bullish hammer candlestick on September 20 (today) and this could also suggest a near-term reversal is in the offing, however, this is provisional and depends on the final level of the day’s close.
The New Zealand Dollar (NZD) is expected to trade in a 0.6200/0.6270 range. In the longer run, NZD must break and remain above 0.6270 before an advance to 0.6310 can be expected, UOB Group FX analysts Quek Ser Leang and Lee Sue Ann note.
NZD trading in a 0.6200/0.6270 range for now
24-HOUR VIEW: “Our view for NZD to trade in a 0.6180/0.6230 range was incorrect. NZD dropped to 0.6183, soared to 0.6269, closing at 0.6242 (+0.55%). The price action has resulted in a mixed outlook. We continue to expect NZD to trade in a range, albeit a narrower one of 0.6200/0.6270.”
1-3 WEEKS VIEW: “In our most recent narrative from Tuesday (17 Sep, spot at 0.6185), we indicated that NZD is likely to trade in a 0.6135/0.6235 range for now. Yesterday, NZD rose and reached a high of 0.6269 before pulling back to close at 0.6242 (+0.55%). Upward momentum has increased, but not enough to suggest the start of a sustained advance. NZD must break and remain above 0.6270 before an advance to 0.6310 can be expected. The chance of NZD breaking clearly above 0.6270 will remain intact provided that the ‘strong support’ level at 0.6180 is not breached.”
The Pound Sterling's (GBP) rally on yesterday's Bank of England communication looks fully justified. It’s hard to rule out GBP/USD pushing to the 1.35 area, and EUR/GBP could extend to 0.8340, ING’s FX strategist Chris Turner notes.
GBP seems on the rise
“UK short-dated yields rose relative to their eurozone counterparts as the BoE stuck to the new script of 'gradual' easing.”
“The BoE does genuinely seem to be questioning whether inflation will come down as much as elsewhere in the world and continues to present three scenarios. The BoE certainly does not seem to be in the Fed camp of signalling the 'all-clear' on inflation.”
“Thus, it's hard to rule out GBP/USD making a push to the 1.35 area, while EUR/GBP could extend to 0.8340. August UK retail sales have helped sterling today, but leading indicators for consumer confidence warn that consumers are starting to become fearful of the 30 October UK budget.”
- AUD/USD grips gains above 0.6800 as investors see one more large Fed interest rate cut.
- Investors await Fed Harker’s speech for fresh guidance on interest rates.
- The RBA is unlikely to cut interest rates this year.
The AUD/USD pair clings to gains above the round-level support of 0.6800 in Friday’s European session. The Aussie asset remains broadly firm amid growing speculation that the Federal Reserve (Fed) could deliver one more bumper interest rate cut in its monetary policy meeting in November.
The Fed pivoted to policy normalization on Wednesday when he announced a 50 basis points (bps) rate cut decision, pushing interest rates to 4.75%-5.00%. The signal was clear that the Fed is focused in preventing further deterioration in the labor market conditions. On the interest rate guidance, the Fed dot plot shows that policymakers see the federal fund rate heading to 4.4% by the year-end, which indicates the central bank will cut rates further by at least 25 basis bps.
However, traders see a 75-bps decline in the remaining two policy meetings in November and December, in which one interest rate decision would be a 50-bps rate cut. According to the CME FedWatch tool, the likelihood of the Fed reducing interest rates by 50 bps to 4.25%-4.50% in November is 43%, higher than the 37% recorded on Thursday.
In today’s session, investors will keenly focus on the speech from Philadelphia Fed Bank President Patrick Harker’s speech at 18:00 GMT for fresh interest rate guidance.
In the Asia-Pacific region, the Australian Dollar (AUD) remains firm as upbeat Aussie Employment data weigh on market expectations for the Reserve Bank of Australia (RBA) to start reducing interest rates this year. The Australian Employment report for August showed that employers hired 47.5K fresh workers, higher than estimates of 25K but almost similar to the prior release of 48.9K, downwardly revised from 58.2K.
Meanwhile, the Australian Dollar didn’t react much to People’s Bank of China’s (PBoC) interest rate decision announced in the Asian session in which the central bank left its one-year and five-year Loan Prime Rates (LPRs) unchanged at 3.35% and 3.85%, respectively, as expected. Historically, any economic development in China influences the Australian Dollar significantly being close trading partners.
Australian Dollar FAQs
One of the most significant factors for the Australian Dollar (AUD) is the level of interest rates set by the Reserve Bank of Australia (RBA). Because Australia is a resource-rich country another key driver is the price of its biggest export, Iron Ore. The health of the Chinese economy, its largest trading partner, is a factor, as well as inflation in Australia, its growth rate and Trade Balance. Market sentiment – whether investors are taking on more risky assets (risk-on) or seeking safe-havens (risk-off) – is also a factor, with risk-on positive for AUD.
The Reserve Bank of Australia (RBA) influences the Australian Dollar (AUD) by setting the level of interest rates that Australian banks can lend to each other. This influences the level of interest rates in the economy as a whole. The main goal of the RBA is to maintain a stable inflation rate of 2-3% by adjusting interest rates up or down. Relatively high interest rates compared to other major central banks support the AUD, and the opposite for relatively low. The RBA can also use quantitative easing and tightening to influence credit conditions, with the former AUD-negative and the latter AUD-positive.
China is Australia’s largest trading partner so the health of the Chinese economy is a major influence on the value of the Australian Dollar (AUD). When the Chinese economy is doing well it purchases more raw materials, goods and services from Australia, lifting demand for the AUD, and pushing up its value. The opposite is the case when the Chinese economy is not growing as fast as expected. Positive or negative surprises in Chinese growth data, therefore, often have a direct impact on the Australian Dollar and its pairs.
Iron Ore is Australia’s largest export, accounting for $118 billion a year according to data from 2021, with China as its primary destination. The price of Iron Ore, therefore, can be a driver of the Australian Dollar. Generally, if the price of Iron Ore rises, AUD also goes up, as aggregate demand for the currency increases. The opposite is the case if the price of Iron Ore falls. Higher Iron Ore prices also tend to result in a greater likelihood of a positive Trade Balance for Australia, which is also positive of the AUD.
The Trade Balance, which is the difference between what a country earns from its exports versus what it pays for its imports, is another factor that can influence the value of the Australian Dollar. If Australia produces highly sought after exports, then its currency will gain in value purely from the surplus demand created from foreign buyers seeking to purchase its exports versus what it spends to purchase imports. Therefore, a positive net Trade Balance strengthens the AUD, with the opposite effect if the Trade Balance is negative.
The Australian Dollar (AUD) is likely to trade in a sideways range of 0.6780/0.6840. In the longer run, there is still room for AUD to rise further, but there may not be enough momentum for it to challenge 0.6870, UOB Group FX analysts Quek Ser Leang and Lee Sue Ann note.
AUD rangebound between 0.6780 and 0.6840
24-HOUR VIEW: “Yesterday, we held the view that AUD ‘could trade in a range between 0.6735 and 0.6800.’ We did not anticipate the subsequent volatility, as after dipping to 0.6738, AUD soared and broke above the solid resistance zone of 0.6820/0.6825 (high of 0.6839). AUD pulled back from the high, closing at 0.6815 (+0.75%). The pullback in overbought conditions suggests AUD is unlikely to weaken much further. Today, AUD is more likely to trade in a sideways range of 0.6780/0.6840.”
1-3 WEEKS VIEW: “We indicated yesterday (19 Sep, spot at 0.6770) that ‘there is room for AUD to rise further, but the 0.6820/0.6825 solid resistance zone may be difficult to break.’ However, AUD easily took out the resistance zone, as it soared to a high of 0.6839. While there is still room for AUD to continue to rise, at this time, it may not have enough momentum to challenge to significant resistance at 0.6870. On the downside, a breach of 0.6740 (‘strong support’ level was at 0.6715 yesterday) would mean that the current upward momentum has faded.”
Having bounced around on yesterday's US initial claims data, EUR/USD is back below the recent highs at 1.1180, ING’s FX strategist Chris Turner notes.
EUR/USD may trade in a 1.1150-1.1200 range today
“We have mentioned this before, but EUR/USD looks to be on the verge of breaking out of a low volatility range. For example, a weekly close above 1.1160 (the upper twenty-month Bollinger Band) warns of a sizable upside breakout. At this stage in the US cycle, we believe an upside EUR/USD breakout is entirely possible.”
“There seem no immediate catalysts for that upside breakout today given the lack of US data and only second-tier eurozone releases. Let's look out for a speech from Christine Lagarde at 17CET today.”
“The market still has 6bp of an October ECB cut priced - which should come out of the market at some point. A 1.1150-1.1200 EUR/USD range may well be seen today, though we retain an upside bias.”
The Pound Sterling (GBP) appears to have enough momentum to test 1.3320 before leveling off. In the longer run, price action continues to suggest GBP strength; overbought conditions could limit gains, UOB Group FX analysts Quek Ser Leang and Lee Sue Ann note.
Bullish momentum leads towards 1.3320
24-HOUR VIEW: “We expected GBP to trade in a sideways range of 1.3150/1.3250 yesterday. However, after dropping to 1.3155, GBP soared, breaking above 1.3300 (high of 1.3314). GBP closed on a firm note at 1.3286 (+0.54%). While the rapid rise appears to be overextended, GBP seems to have enough momentum to test 1.3320 before leveling off. The next resistance at 1.3350 is unlikely to come under threat. Support is at 1.3255; a breach of 1.3230 would suggest that the current upward pressure has faded.”
1-3 WEEKS VIEW: “The next level to watch is 1.3350. On Tuesday (17 Sep, spot at 1.3210), we indicated that GBP ‘could potentially break above this year’s high, near 1.3270.’ After GBP rose to 1.3298, we indicated yesterday (19 Sep, spot at 1.3200) that ‘further GBP strength is not ruled out, but any advance is expected to face significant resistance at 1.3300.’ The ease with which GBP took out 1.3300 was surprising (GBP rose to 1.3314 in NY trade). While the price action continues to suggest GBP strength, overbought conditions could potentially limit any further advance. The next level to watch is 1.3350. On the downside, should GBP break below 1.3160 (‘strong support’ level previously at 1.3120), it would mean that GBP is not strengthening further.”
Amid much intra-day volatility, the Dollar Index (DXY) is down around 0.5% on the week. That's not much, but DXY is now just a whisker away from the lowest levels in two years, ING’s FX strategist Chris Turner notes.
USD may be ready to break below its two-year range
“It seems obvious now that US labour market data will be the key macro driver of the USD story into year-end. That's why the USD saw a decent intra-day bounce yesterday on the lower-than-expected weekly initial jobless claims data. The USD is also moving in line with the US yield curve.”
“But the big question for the market right now is whether the USD is ready to break out of its two-year range. We think it may well do because of some of the factors outlined above, but the timing remains uncertain.”
“There seems nothing on the agenda today to justify a breakout, but suffice to say we are in the camp looking for some strong follow-through selling should DXY support levels at 99.50/100 give way.”
Silver prices (XAG/USD) rose on Friday, according to FXStreet data. Silver trades at $31.21 per troy ounce, up 1.38% from the $30.79 it cost on Thursday.
Silver prices have increased by 31.17% since the beginning of the year.
| Unit measure | Silver Price Today in USD |
|---|---|
| Troy Ounce | 31.21 |
| 1 Gram | 1.00 |
The Gold/Silver ratio, which shows the number of ounces of Silver needed to equal the value of one ounce of Gold, stood at 83.55 on Friday, down from 84.02 on Thursday.
Silver FAQs
Silver is a precious metal highly traded among investors. It has been historically used as a store of value and a medium of exchange. Although less popular than Gold, traders may turn to Silver to diversify their investment portfolio, for its intrinsic value or as a potential hedge during high-inflation periods. Investors can buy physical Silver, in coins or in bars, or trade it through vehicles such as Exchange Traded Funds, which track its price on international markets.
Silver prices can move due to a wide range of factors. Geopolitical instability or fears of a deep recession can make Silver price escalate due to its safe-haven status, although to a lesser extent than Gold's. As a yieldless asset, Silver tends to rise with lower interest rates. Its moves also depend on how the US Dollar (USD) behaves as the asset is priced in dollars (XAG/USD). A strong Dollar tends to keep the price of Silver at bay, whereas a weaker Dollar is likely to propel prices up. Other factors such as investment demand, mining supply – Silver is much more abundant than Gold – and recycling rates can also affect prices.
Silver is widely used in industry, particularly in sectors such as electronics or solar energy, as it has one of the highest electric conductivity of all metals – more than Copper and Gold. A surge in demand can increase prices, while a decline tends to lower them. Dynamics in the US, Chinese and Indian economies can also contribute to price swings: for the US and particularly China, their big industrial sectors use Silver in various processes; in India, consumers’ demand for the precious metal for jewellery also plays a key role in setting prices.
Silver prices tend to follow Gold's moves. When Gold prices rise, Silver typically follows suit, as their status as safe-haven assets is similar. The Gold/Silver ratio, which shows the number of ounces of Silver needed to equal the value of one ounce of Gold, may help to determine the relative valuation between both metals. Some investors may consider a high ratio as an indicator that Silver is undervalued, or Gold is overvalued. On the contrary, a low ratio might suggest that Gold is undervalued relative to Silver.
(An automation tool was used in creating this post.)
There is room for the Euro (EUR) to edge higher, but it is unlikely to be able the break the major resistance at 1.1200. In the longer run, the likelihood of EUR breaking above 1.1200 has increased, UOB Group FX analysts Quek Ser Leang and Lee Sue Ann note.
Bulls may target 1.1200 in the longer run
24-HOUR VIEW: “EUR traded choppily two days ago. Yesterday, we indicated that ‘despite the choppy price action, the underlying tone seems to have softened somewhat,’ and we expected it to ‘trade in a lower range of 1.1080/1.1140.’ The subsequent price movements did not turn out as we anticipated. EUR dropped briefly to 1.1067 and then soared to 1.1178, closing on a firm note at 1.1161 (+0.39%). Upward momentum has increased slightly. Today, there is room for EUR to edge higher, but it is unlikely to be able to break the major resistance at 1.1200. Support levels are at 1.1130 and 1.1110.”
1-3 WEEKS VIEW: “Two days ago (17 Sep, spot at 1.1125), we highlighted that EUR ‘is likely to continue to rise, but it is unclear at this time if it has sufficient momentum to break above the year-to-date high, near 1.1200.’ After EUR popped briefly to 1.1189, we indicated yesterday (19 Sep, spot at 1.1125) that ‘it is still unclear for now if EUR can break above 1.1200.’ We added, ‘only a breach of 1.1060 (‘strong support’ level) would indicate that the potential for EUR to rise above 1.1200 has dissipated.’ EUR dropped to 1.1067 in Asian trading and then rebounded, reaching a high of 1.1178. There has been a slight increase in momentum, and the likelihood of EUR breaking above 1.1200 has increased as well. However, it remains to be seen if EUR has enough momentum to reach the next resistance at 1.1230. On the downside, the ‘strong support’ level remains unchanged at 1.1060 for now.”
- EUR/USD clings to gains above 1.1150 as more ECB policymakers show concerns over price pressures remaining persistent.
- Investors await ECB Lagarde’s speech for fresh interest-rate guidance.
- The US Dollar remains under pressure on escalating Fed dovish bets.
EUR/USD gathers strength, aiming to reclaim the key resistance of 1.1200 in Friday’s European session. The major currency pair strengthens as the Euro (EUR) performs strongly on growing speculation that the European Central Bank (ECB) will leave its Deposit Facility rate unchanged at 3.5% in its October monetary policy meeting.
A few ECB policymakers have voiced their willingness to follow a gradual policy-easing approach as they want to see more evidence pointing to a slowdown in inflationary pressures. This week, ECB policymakers such as Governing Council member Peter Kazimir, Executive Board Member Isabel Schnabel, and President of Deutsche Bundesbank Joachim Nagel said that price pressures are still higher than where the bank wants them.
Specifically, ECB Isabel Schnabel said on Thursday that sticky services inflation is keeping headline inflation at an elevated level.
For fresh guidance on interest rates, investors will focus on ECB President Christine Lagarde’s speech, which is scheduled at 15:00 GMT. In her latest comments at ECB policy’s press conference on September 12, Lagarde refrained from proving a pre-defined interest rate cut path.
"The interest rate decisions will be based on its assessment of inflation outlook in light of incoming economic and financial data, dynamics of underlying inflation, and strength of monetary policy transmission," she said.
Daily digest market movers: EUR/USD gains as market bets for ECB rate cuts in October wane
- EUR/USD remains firm above the crucial support of 1.1150 in Friday’s European trading hours. Lately, the major currency pair has performed strongly due to weakness in the US Dollar (USD). The US Dollar Index (DXY), which gauges the Greenback’s value against six major peers, hovers above the year-to-date low of 100.21.
- The Greenback has weakened following the Fed’s bumper interest rate cut decision and increasing market expectations that the US central bank will continue with an aggressive policy-easing cycle. The Fed reduced interest rates by 50 basis points (bps) as policymakers seem to focus on reviving labor market strength as inflation is declining to the bank’s target of 2%.
- On the interest rate guidance, Fed policymakers see the federal fund rate heading to 4.4% by year-end, according to the latest dot plot. However, traders expect interest rates to decline further, by 75 bps to 4.00%-4.25%, according to the CME FedWatch tool.
- The preliminary consumer confidence reading for the Eurozone will be published at 14:00 GMT. Expectations are for a slight improvement of the index, to -13 in September from -13.5 in August.
- In Friday’s New York session, US investors will focus on Philadelphia Fed Bank President Patrick Harker’s speech at 18:00 GMT for fresh guidance on interest rates.
Technical Analysis: EUR/USD stays above 1.1150
EUR/USD holds trade above 1.1150 in European trading hours. The near-term outlook of the shared currency pair is upbeat on the upward-sloping 20-day Exponential Moving Average (EMA) near 1.1088.
The major currency pair remains firm as it has confidently recovered after retesting the breakout of the Rising Channel chart pattern formed on a daily time frame near the psychological support of 1.1000.
The 14-day Relative Strength Index (RSI) moves higher above 60.00. A bullish momentum would trigger if it sustains above the aforementioned level.
Looking up, the round-level resistance of 1.1200 will act as a major barricade for the Euro bulls. A decisive break above the same would drive the asset toward July 2023 high of 1.1276. On the downside, the psychological level of 1.1000 and the July 17 high near 1.0950 will be major support zones.
Euro FAQs
The Euro is the currency for the 20 European Union countries that belong to the Eurozone. It is the second most heavily traded currency in the world behind the US Dollar. In 2022, it accounted for 31% of all foreign exchange transactions, with an average daily turnover of over $2.2 trillion a day. EUR/USD is the most heavily traded currency pair in the world, accounting for an estimated 30% off all transactions, followed by EUR/JPY (4%), EUR/GBP (3%) and EUR/AUD (2%).
The European Central Bank (ECB) in Frankfurt, Germany, is the reserve bank for the Eurozone. The ECB sets interest rates and manages monetary policy. The ECB’s primary mandate is to maintain price stability, which means either controlling inflation or stimulating growth. Its primary tool is the raising or lowering of interest rates. Relatively high interest rates – or the expectation of higher rates – will usually benefit the Euro and vice versa. The ECB Governing Council makes monetary policy decisions at meetings held eight times a year. Decisions are made by heads of the Eurozone national banks and six permanent members, including the President of the ECB, Christine Lagarde.
Eurozone inflation data, measured by the Harmonized Index of Consumer Prices (HICP), is an important econometric for the Euro. If inflation rises more than expected, especially if above the ECB’s 2% target, it obliges the ECB to raise interest rates to bring it back under control. Relatively high interest rates compared to its counterparts will usually benefit the Euro, as it makes the region more attractive as a place for global investors to park their money.
Data releases gauge the health of the economy and can impact on the Euro. Indicators such as GDP, Manufacturing and Services PMIs, employment, and consumer sentiment surveys can all influence the direction of the single currency. A strong economy is good for the Euro. Not only does it attract more foreign investment but it may encourage the ECB to put up interest rates, which will directly strengthen the Euro. Otherwise, if economic data is weak, the Euro is likely to fall. Economic data for the four largest economies in the euro area (Germany, France, Italy and Spain) are especially significant, as they account for 75% of the Eurozone’s economy.
Another significant data release for the Euro is the Trade Balance. This indicator measures the difference between what a country earns from its exports and what it spends on imports over a given period. If a country produces highly sought after exports then its currency will gain in value purely from the extra demand created from foreign buyers seeking to purchase these goods. Therefore, a positive net Trade Balance strengthens a currency and vice versa for a negative balance.
Bank of England (BoE) policymaker Catherine Mann said on Friday that “it is better to remain restrictive for longer.”
Additional quotes
We can cut more aggressively later once inflation risk is contained.
There appears to be more upside risks to inflation in the UK..
UK has seen more of an impact on services prices.
Contemplated to vote to cut rates in August but wanted to avoid "boogie-dance" on rates.
Market reaction
Despite the hawkish remarks from the BoE official, GBP/USD struggles at around 1.3300, up 0.12% on the day.
- USD/CAD formed a Japanese candlestick reversal pattern on Wednesday.
- Price could be about to fall in a large ABC or Measured Move price pattern.
USD/CAD formed a Hanging Man candlestick reversal pattern (blue rectangle on chart below) on Wednesday which suggests more downside is likely for the pair in the near-term. The pattern gained confirmation after Thursday ended as a long, red, down day.
USD/CAD Daily Chart
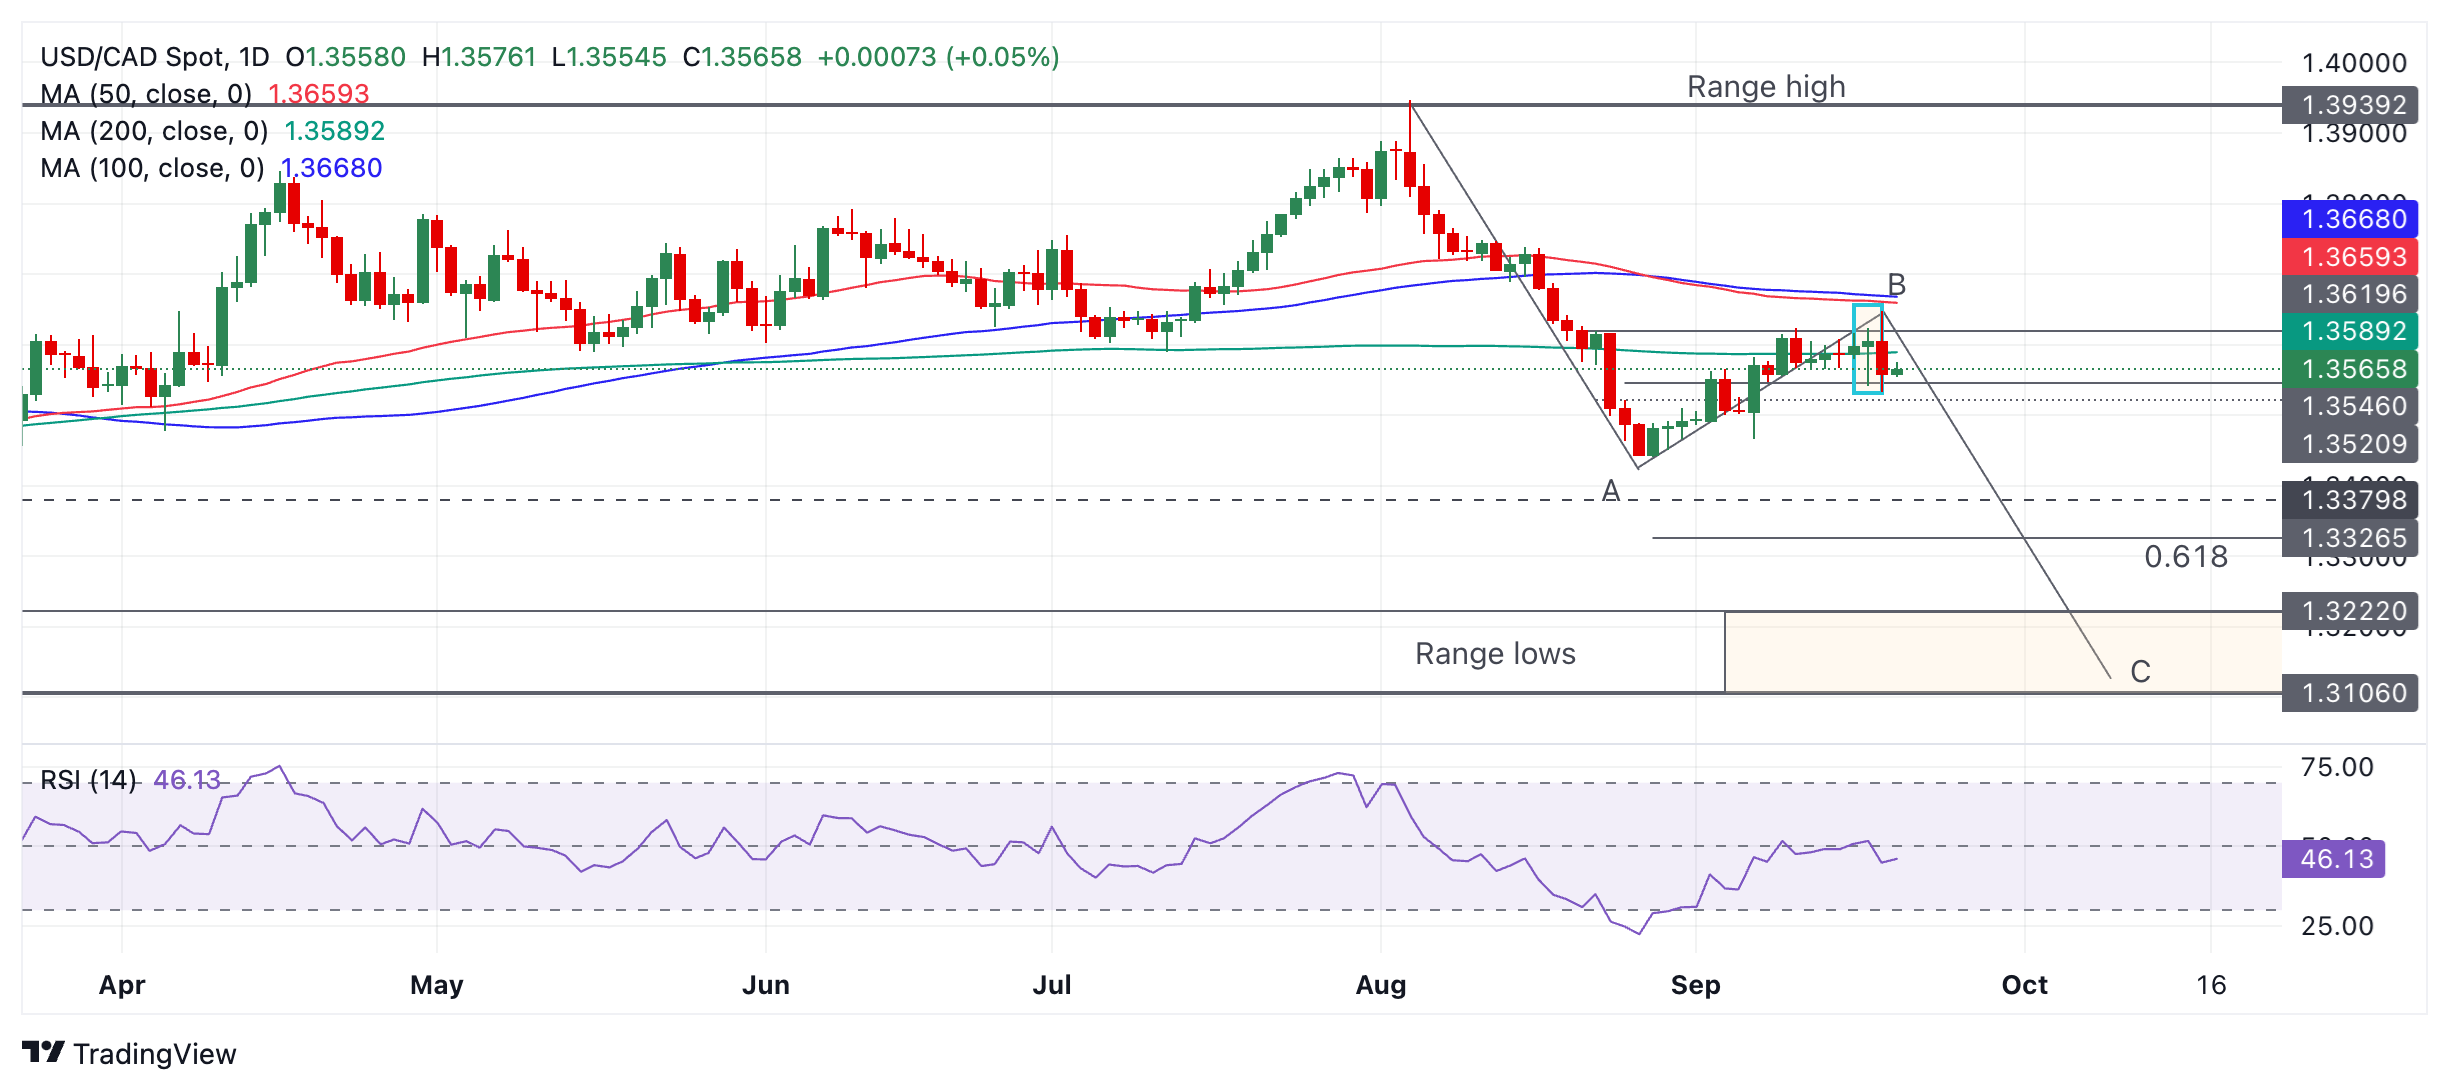
The Hanging Man forms when price rises to a new higher high, pulls back down during the same day, then recovers again and closes the day close to where it opened. If it is followed by a red down day – as was the case with USD/CAD – a short-term bearish reversal is heralded.
USD/CAD’s move down from the range high looks like it is conforming to an ABC pattern, or “Measured Move” (see labels on chart above). Such patterns are like large zig-zags. The wave C usually reaches a similar length to wave A or at a minimum is a Fibonacci 61.8% of A.
If USD/CAD is really forming an ABC pattern then wave C is probably about to unfold and go substantially lower. Such a down leg would probably fall to the zone of the range lows (orange shaded rectangle on chart above). The 61.8% target, meanwhile, lies at 1.3326.
It is still a little early to be sure that USD/CAD has reversed and will fall further. A break below 1.3533 (September 19 low) would provide added bearish confirmation, and a break below 1.3466 (September 6) even more solid confirmation.
- Silver gains positive traction for the second straight day and stands tall near a two-month high.
- The technical setup favors bullish traders and supports prospects for a further appreciating move.
- Any meaningful corrective decline might still be seen as a buying opportunity and remain limited.
Silver (XAG/USD) attracts buyers for the second straight day on Friday and sticks to its gains above the $31.00 mark, near a two-month peak through the first half of the European session.
From a technical perspective, the recent breakout through a short-term descending trend-line resistance, around the $29.35 area, which coincided with the 100-day Simple Moving Average (SMA), was seen as a fresh trigger for bullish traders. Adding to this, the emergence of some dip-buying on Thursday, along with positive oscillators on the daily chart, suggest that the path of least resistance for the XAG/USD is to the upside.
The positive outlook is validated by the fact that the white metal now seems to have found acceptance above the $31.00 mark. Hence, a subsequent move up beyond the $31.45 intermediate hurdle, en route to the July swing high around the $31.75 zone and the $32.00 mark, looks like a distinct possibility. The momentum could extend further and allow the XAG/USD to challenge a one-decade high, around mid-$32.00s touched in May.
On the flip side, weakness below the $31.00 mark now seems to find decent support near the $30.70 horizontal zone. Any further decline might still be seen as a buying opportunity and remain limited near the $30.00 psychological mark. Some follow-through selling could expose the $29.35 confluence resistance breakpoint, now turned support, which should now act as a strong near-term and a key pivotal point for the commodity.
A convincing break below could accelerate the downfall and drag the XAG/USD below the $29.00 mark, towards testing the next relevant support near the $28.20-$28.15 zone. This is followed by the $28.00 mark and strong horizontal support near the $27.70 area, or the monthly low, which if broken might shift the near-term bias back in favor of bearish traders.
Silver daily chart
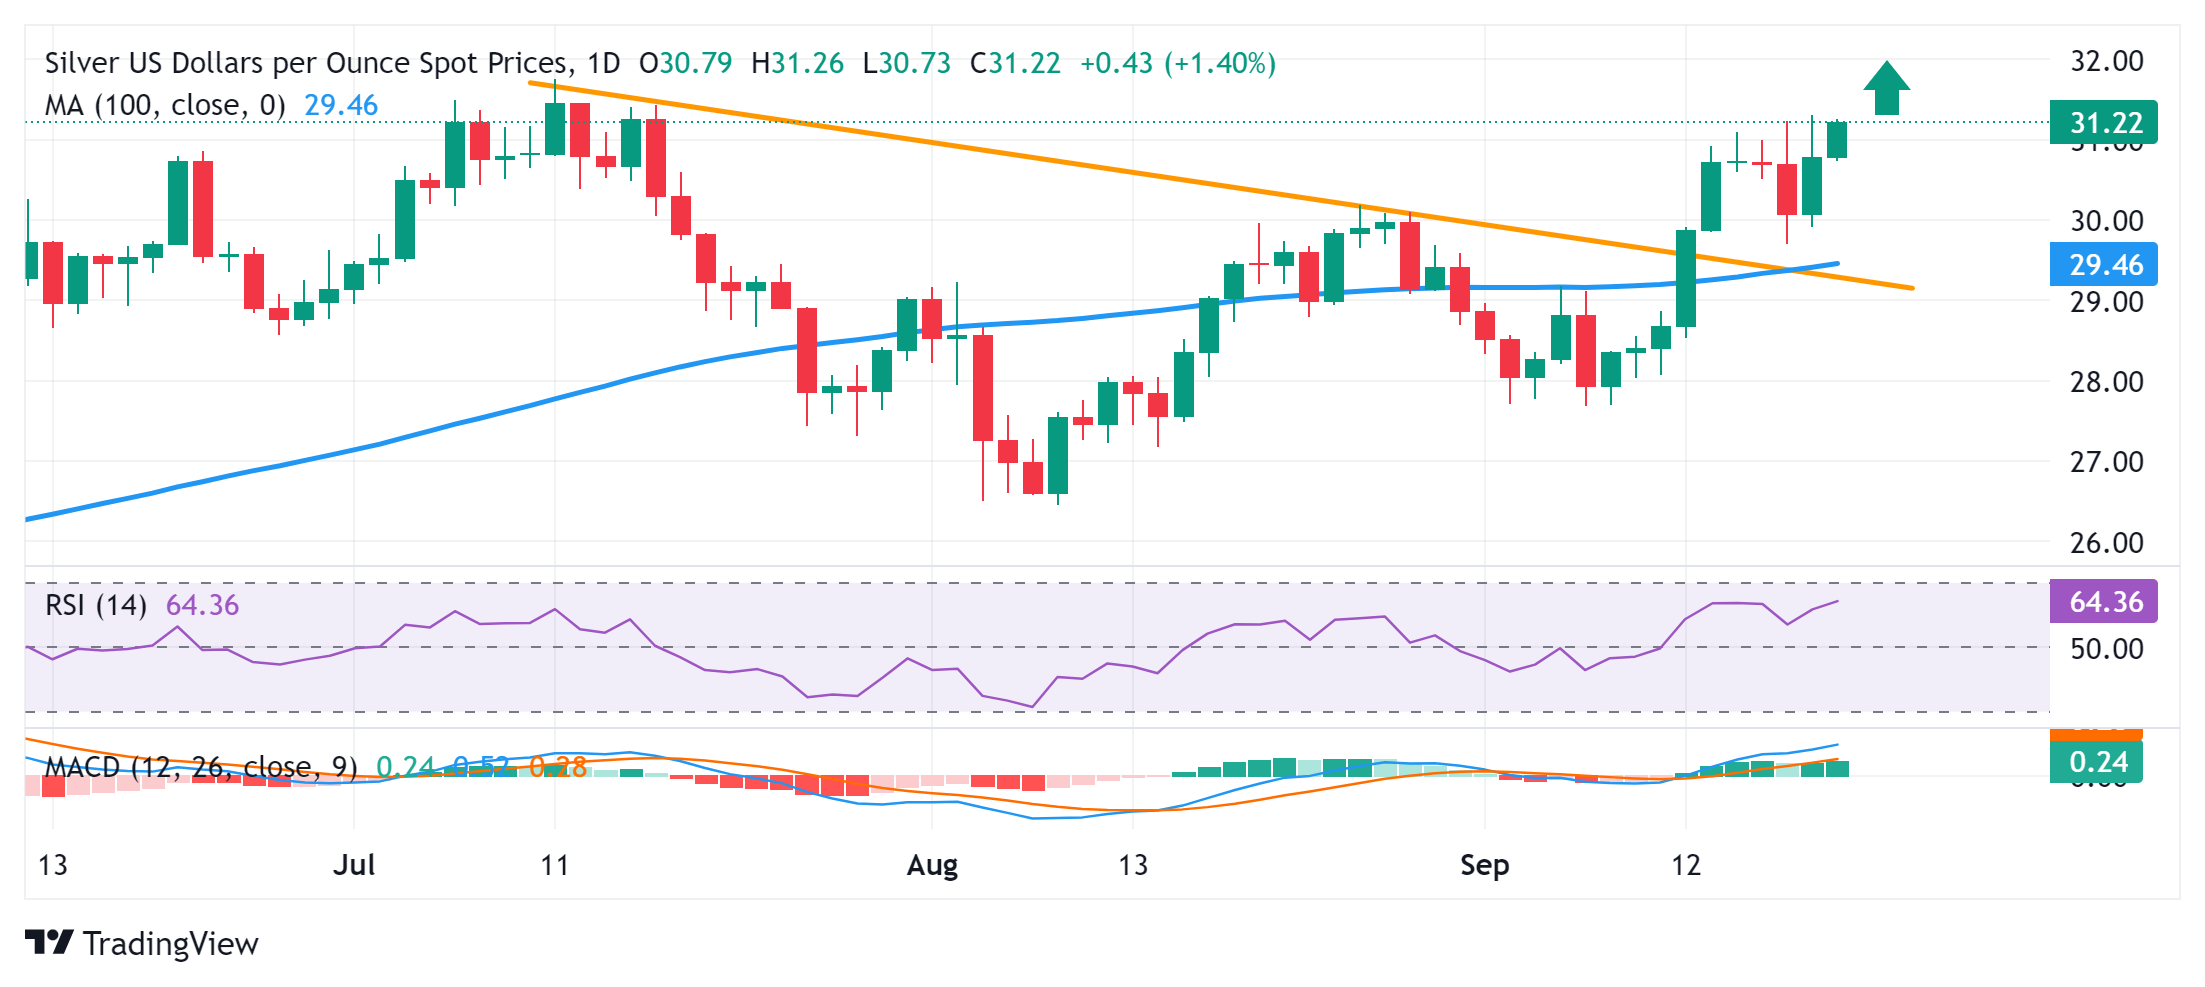
Silver FAQs
Silver is a precious metal highly traded among investors. It has been historically used as a store of value and a medium of exchange. Although less popular than Gold, traders may turn to Silver to diversify their investment portfolio, for its intrinsic value or as a potential hedge during high-inflation periods. Investors can buy physical Silver, in coins or in bars, or trade it through vehicles such as Exchange Traded Funds, which track its price on international markets.
Silver prices can move due to a wide range of factors. Geopolitical instability or fears of a deep recession can make Silver price escalate due to its safe-haven status, although to a lesser extent than Gold's. As a yieldless asset, Silver tends to rise with lower interest rates. Its moves also depend on how the US Dollar (USD) behaves as the asset is priced in dollars (XAG/USD). A strong Dollar tends to keep the price of Silver at bay, whereas a weaker Dollar is likely to propel prices up. Other factors such as investment demand, mining supply – Silver is much more abundant than Gold – and recycling rates can also affect prices.
Silver is widely used in industry, particularly in sectors such as electronics or solar energy, as it has one of the highest electric conductivity of all metals – more than Copper and Gold. A surge in demand can increase prices, while a decline tends to lower them. Dynamics in the US, Chinese and Indian economies can also contribute to price swings: for the US and particularly China, their big industrial sectors use Silver in various processes; in India, consumers’ demand for the precious metal for jewellery also plays a key role in setting prices.
Silver prices tend to follow Gold's moves. When Gold prices rise, Silver typically follows suit, as their status as safe-haven assets is similar. The Gold/Silver ratio, which shows the number of ounces of Silver needed to equal the value of one ounce of Gold, may help to determine the relative valuation between both metals. Some investors may consider a high ratio as an indicator that Silver is undervalued, or Gold is overvalued. On the contrary, a low ratio might suggest that Gold is undervalued relative to Silver.
- Gold breaks to new record highs on Friday as central banks worldwide are expected to follow the Fed’s example.
- The precious metal shot to a new high after the Fed’s decision to slash borrowing costs by 0.50% on Wednesday.
- As traders say, the “trend is your friend,” and technically, Gold is in a strong uptrend in all time frames.
Gold (XAU/USD) breaks to a new record high near $2,610 on Friday on heightened expectations that global central banks will follow the Federal Reserve (Fed) in easing policy and slashing interest rates. Lower interest rates are positive for Gold, as they reduce the opportunity cost of holding the non-interest-paying asset, making it more attractive to investors.
Following Wednesday’s Fed decision, the South African Reserve Bank (SARB) cut its key interest rate by 25 basis points (bps) on Thursday – the first cut since the Covid pandemic in 2020. The Central Bank of the Philippines cut interest rates by 250 bps to 7.0% at its meeting on Friday. The Reserve Bank of India (RBI) is now also widely expected to slash interest rates in sympathy with the Fed when it next meets.
Although the People’s Bank of China (PboC) kept its key lending rates unchanged at the September fixing on Friday, the one and five-year loan prime rates lie at record lows of 3.35% and 3.85%, respectively, after the bank made a surprise cut in July. The Bank of Japan (BoJ), meanwhile, left rates unchanged at its meeting on Friday, despite some speculation of a rate hike in the offing.
Gold breaks above previous record highs
Gold is breaking above the previous record highs set on Wednesday of $2,600 following the Fed’s decision. At this meeting, the US central bank decided to cut interest rates by a double-dose of 50 pbs (0.50%).
The upside for the yellow metal was capped, however, by the Fed’s broadly positive outlook for US growth, which the central bank saw remaining stable at about 2.0% per year until the end of 2027. This suggested a “soft landing” profile for the economy, which is broadly positive for sentiment. However, this was probably negative for the safe-haven Gold. Thus, the precious metal quickly fell after peaking.
At the same time, increased geopolitical risk aversion might be generating supportive safe-haven flows. Israel’s use of exploding pagers and walkie-talkies to eliminate and injure Hezbollah agents in Lebanon has increased the risk of an escalation in the Middle East conflict, potentially supporting the precious metal.
Technical Analysis: Gold makes new high as uptrend extends
Gold has broken through to new highs on Friday, above the previous record high of $2,600 set after the Fed meeting on Wednesday.
The technical analysis dictum says that “the trend is your friend,” which means the odds favor more upside for the yellow metal in line with the dominant long, medium, and short-term uptrends.
XAU/USD Daily Chart
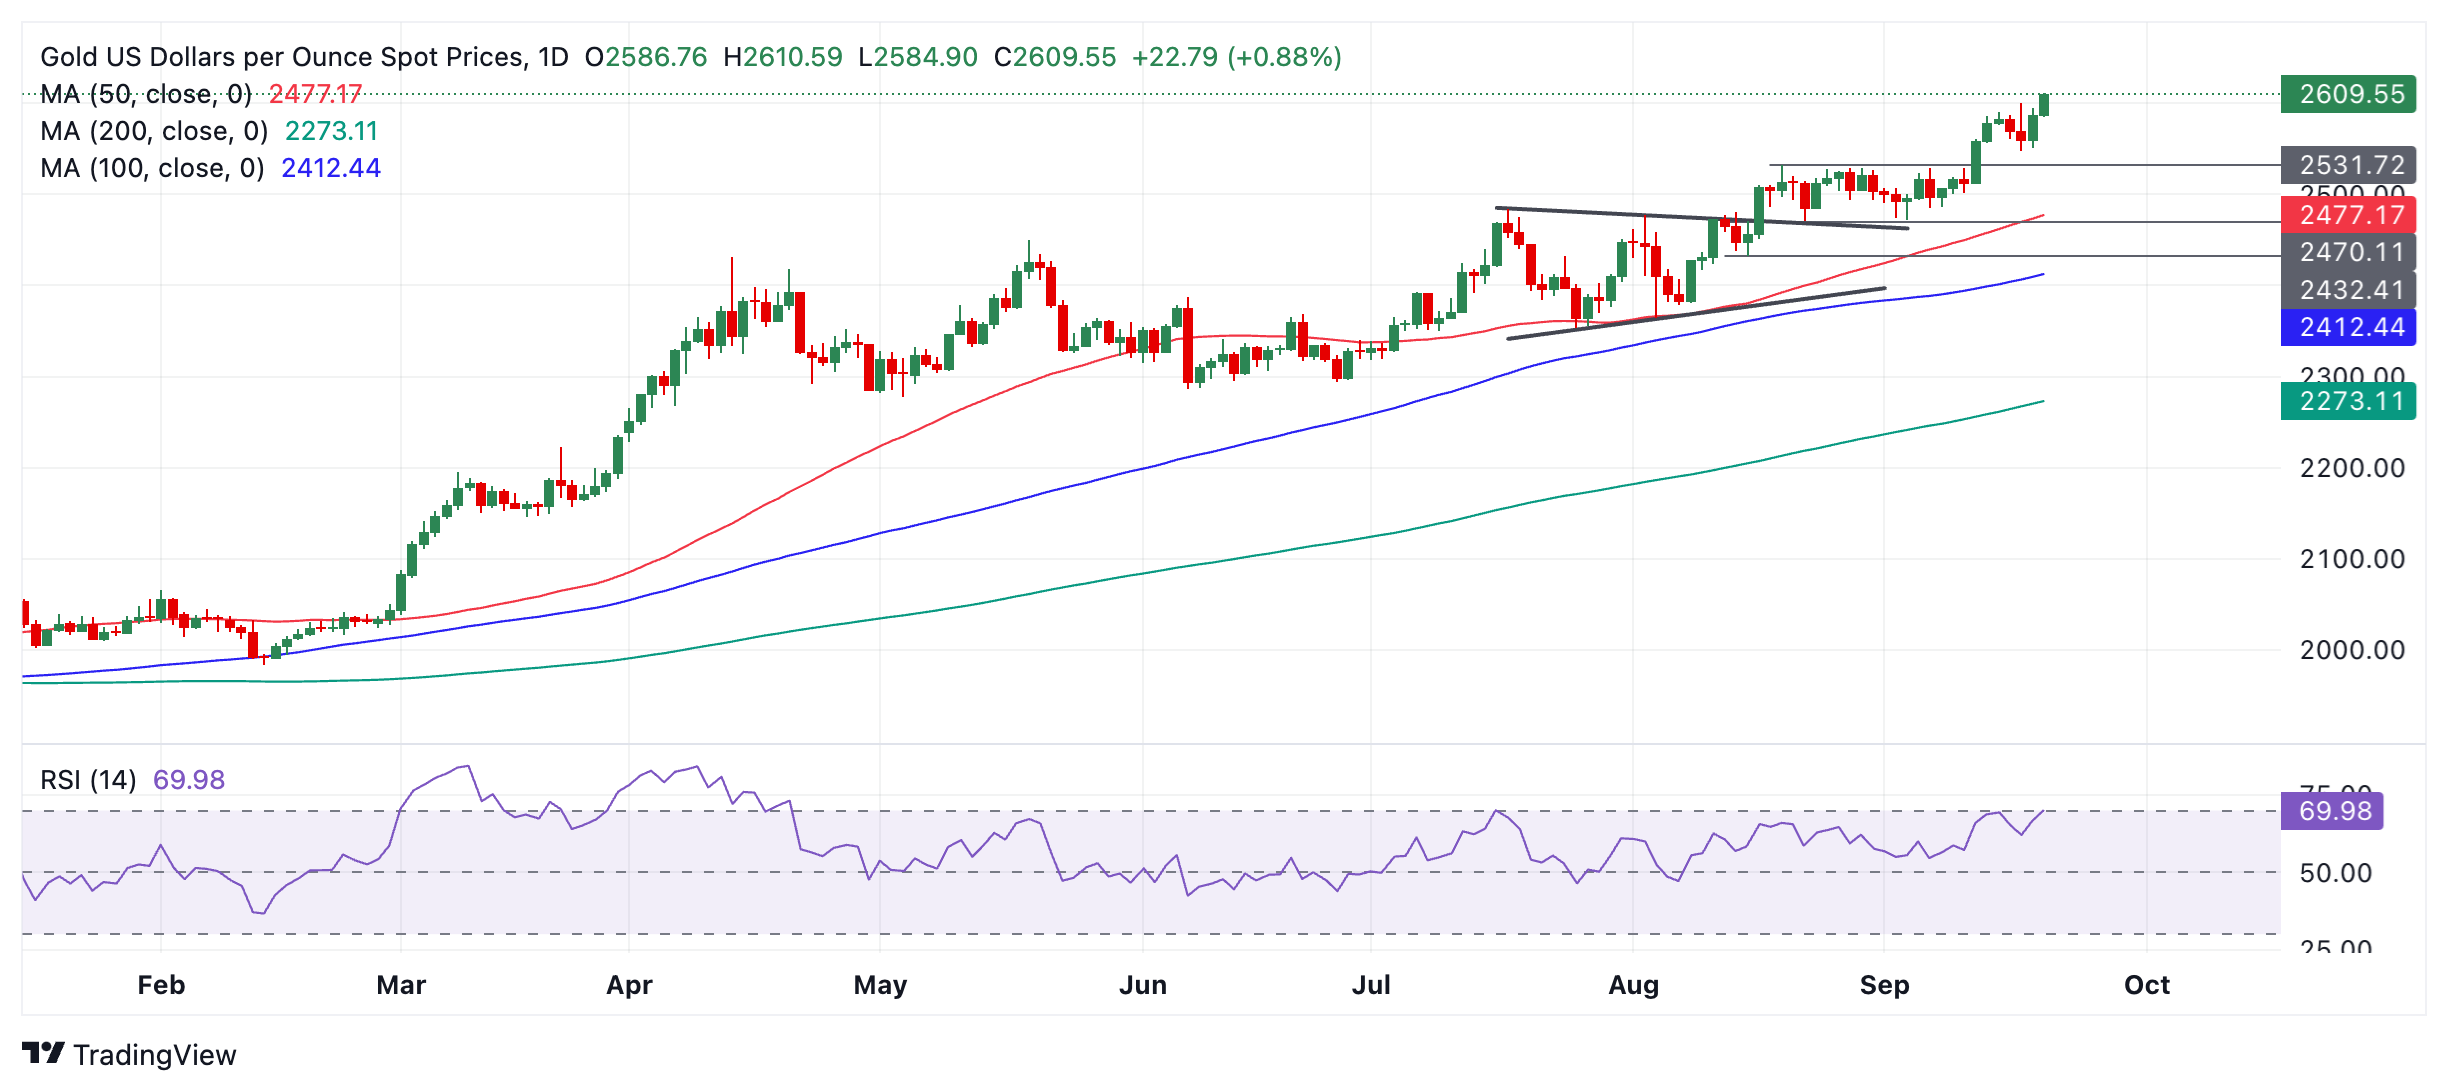
The next targets to the upside are the round numbers: $2,650 first and then $2,700.
Gold is still not quite overbought, according to the Relative Strength Index (RSI) in the daily chart above, which also leaves room for more upside.
In the event that Gold’s RSI enters the overbought zone on a closing basis, however, it will advise traders not to add to their long positions.
If it enters and then exits overbought, it will be a sign to close longs and sell, as it would suggest a deeper correction is in the process of unfolding.
If a correction evolves, firm supports lies at $2,550, $2,544 (0.382 Fibonacci retracement of the September rally), and $2,530 (former range high).
Economic Indicator
Fed Interest Rate Decision
The Federal Reserve (Fed) deliberates on monetary policy and makes a decision on interest rates at eight pre-scheduled meetings per year. It has two mandates: to keep inflation at 2%, and to maintain full employment. Its main tool for achieving this is by setting interest rates – both at which it lends to banks and banks lend to each other. If it decides to hike rates, the US Dollar (USD) tends to strengthen as it attracts more foreign capital inflows. If it cuts rates, it tends to weaken the USD as capital drains out to countries offering higher returns. If rates are left unchanged, attention turns to the tone of the Federal Open Market Committee (FOMC) statement, and whether it is hawkish (expectant of higher future interest rates), or dovish (expectant of lower future rates).
Read more.Last release: Wed Sep 18, 2024 18:00
Frequency: Irregular
Actual: 5%
Consensus: 5.25%
Previous: 5.5%
Source: Federal Reserve
- The Mexican Peso continues weakening on Friday.
- Continued domestic woes and technical trading may be weighing on MXN.
- Technically, USD/MXN finds a firm bedrock of support at the base of a channel and recovers.
The Mexican Peso (MXN) is falling in its key pairs on Friday as the currency suffers from political risk premia, the outlook for the domestic economy and as chart technicals favor short-positioning.
Mexican Peso depreciates amid political concerns
The Mexican Peso depreciated for the second day in a row in its most heavily traded pairs on Thursday as domestic headwinds continued to weigh on investor confidence. Reforms to the judiciary, the abolition of autonomous regulatory bodies and the perilous state of the public finances, including those of public-owned companies such as the Mexican state-owned Oil company Pemex, are all taking a toll.
The Bank of Mexico is widely expected to cut interest rates by 25 basis points (bps), from 10.75% to 10.50%, at its meeting on Thursday. Although this is less than the Fed’s 50 bps cut, the expectation of lower interest rates is still generally negative for a currency since it lessens foreign capital inflows.
The Peso lost the most ground against the Pound Sterling (GBP) and the Euro (EUR) on Thursday as both these currencies’ central banks are likely to take a more measured approach to cutting interest rates compared to the Fed.
In fact, the Bank of England (BoE), which had its meeting on Thursday, decided to keep interest rates unchanged amid still-high core inflation. For the Euro, wage inflation is expected to remain inflationary until the end of the year, preventing the European Central Bank (ECB) from slashing interest rates aggressively in the Eurozone.
Technical Analysis: USD/MXN extends recovery from base of channel
USD/MXN is finding technical support at the base of a long-term rising channel and recovering slowly.
Although the pair declined sharply last week it found key support from the base of a long-term rising channel and the 50-day Simple Moving Average at just above 19.00, which has so far prevented a deeper slide.
USD/MXN Daily Chart
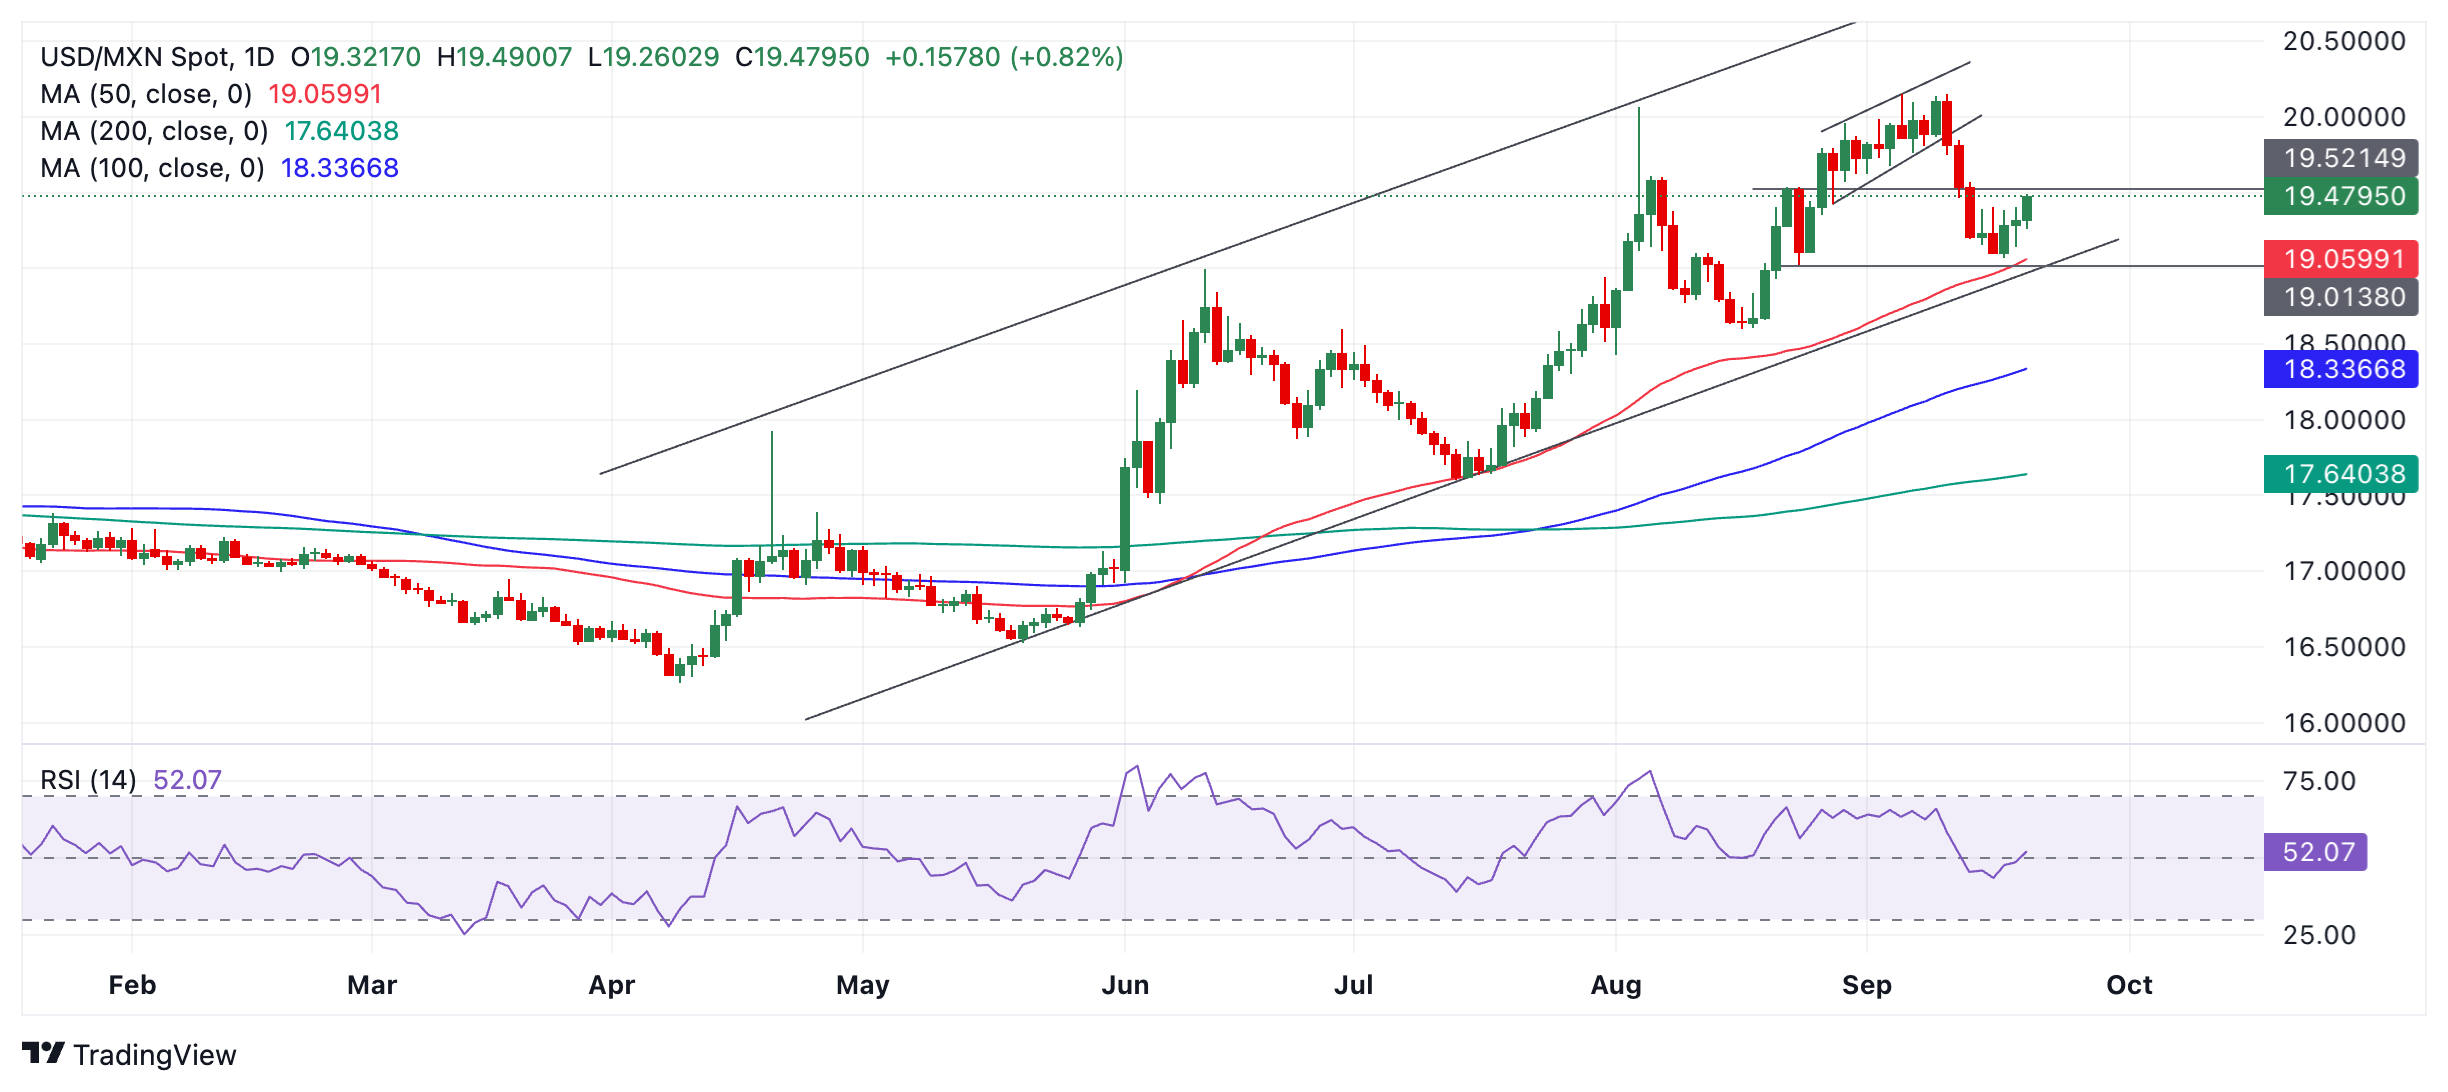
There is a possibility now that USD/MXN has found stability at these support levels and is launching a recovery leg back up within the channel, thereby extending the medium and long-term uptrends.
USD/MXN formed a Bullish Engulfing candlestick pattern (albeit small) on Wednesday and followed through higher on Thursday, thus providing confirmation. This is another possible sign the short-term trend could be reversing. A close above 19.53 (August 23 swing high), however, would be required to shift the diagnosis to bullish in the short-term.
Alternatively, a decisive break below the lower channel line and 50-day SMA could still be possible, although less likely now. Such a move would alter the outlook and indicate a continuation of the near-term downtrend.
A decisive break would be one accompanied by a long red candle that pierced well below the channel line and closed near its low, or three down days in a row that broke clearly below the line.
Mexican Peso FAQs
The Mexican Peso (MXN) is the most traded currency among its Latin American peers. Its value is broadly determined by the performance of the Mexican economy, the country’s central bank’s policy, the amount of foreign investment in the country and even the levels of remittances sent by Mexicans who live abroad, particularly in the United States. Geopolitical trends can also move MXN: for example, the process of nearshoring – or the decision by some firms to relocate manufacturing capacity and supply chains closer to their home countries – is also seen as a catalyst for the Mexican currency as the country is considered a key manufacturing hub in the American continent. Another catalyst for MXN is Oil prices as Mexico is a key exporter of the commodity.
The main objective of Mexico’s central bank, also known as Banxico, is to maintain inflation at low and stable levels (at or close to its target of 3%, the midpoint in a tolerance band of between 2% and 4%). To this end, the bank sets an appropriate level of interest rates. When inflation is too high, Banxico will attempt to tame it by raising interest rates, making it more expensive for households and businesses to borrow money, thus cooling demand and the overall economy. Higher interest rates are generally positive for the Mexican Peso (MXN) as they lead to higher yields, making the country a more attractive place for investors. On the contrary, lower interest rates tend to weaken MXN.
Macroeconomic data releases are key to assess the state of the economy and can have an impact on the Mexican Peso (MXN) valuation. A strong Mexican economy, based on high economic growth, low unemployment and high confidence is good for MXN. Not only does it attract more foreign investment but it may encourage the Bank of Mexico (Banxico) to increase interest rates, particularly if this strength comes together with elevated inflation. However, if economic data is weak, MXN is likely to depreciate.
As an emerging-market currency, the Mexican Peso (MXN) tends to strive during risk-on periods, or when investors perceive that broader market risks are low and thus are eager to engage with investments that carry a higher risk. Conversely, MXN tends to weaken at times of market turbulence or economic uncertainty as investors tend to sell higher-risk assets and flee to the more-stable safe havens.
- GBP/JPY turns positive for the fifth straight day and climbs to a nearly three-week top.
- BoJ Governor Ueda’s cautious remarks weigh on the JPY and lend support to the cross.
- The formation of a ‘Death Cross’ on the daily chart warrants caution for bullish traders.
The GBP/JPY cross turns positive for the fifth successive day following an intraday dip to the 188.70 area and jumps to a nearly three-week top during the first half of the European session on Friday. Spot prices reclaim the 191.00 mark in the last hour amid the emergence of some selling around the Japanese Yen (JPY), triggered by the Bank of Japan (BoJ) Governor Kazuo Ueda's less hawkish remarks during the post-meeting press conference.
In fact, Ueda noted that uncertainties surrounding Japan's economy, and prices remain high and that risks of inflation overshoot have diminished to some extent in the wake of the recent FX moves. This, along with the underlying bullish sentiment across the global financial markets, undermines the safe-haven JPY. Meanwhile, the British Pound (GBP) draws support from the Bank of England's (BoE) decision on Thursday to keep rates unchanged and run down its stock of government bonds by another £100 billion over the coming 12 months. This, in turn, provides an additional boost to the GBP/JPY cross and contributes to the move up.
From a technical perspective, oscillators on the daily chart have been gaining positive traction and support prospects for a further appreciating move. That said, the 50-day Simple Moving Average (SMA) has fallen below the 200-day SMA, forming the 'Death Cross' pattern on the daily chart and warranting some caution for bullish traders. Hence, any subsequent move up might confront stiff resistance near the 50-day SMA, currently near the 191.75 region. This is followed by the 192.00 mark, above which the GBP/JPY cross could climb further, though is likely to remain capped near the 200-day SMA barrier near the 192.35-192.40 region.
On the flip side, the 190.40-190.35 zone now seems to protect the immediate downside ahead of the 190.00 psychological mark and the 189.45 horizontal support. Some follow-through selling could drag the GBP/JPY cross towards the 189.00 mark en route to the daily swing low, around the 188.70-188.65 region. Failure to defend the said support levels will suggest that this week's goodish rebound from the vicinity of the monthly low has run its course and pave the way for deeper losses. Spot prices might then accelerate the fall towards the 188.00 round figure before eventually dropping to the 187.35 support zone and the 187.00 mark.
GBP/JPY daily chart
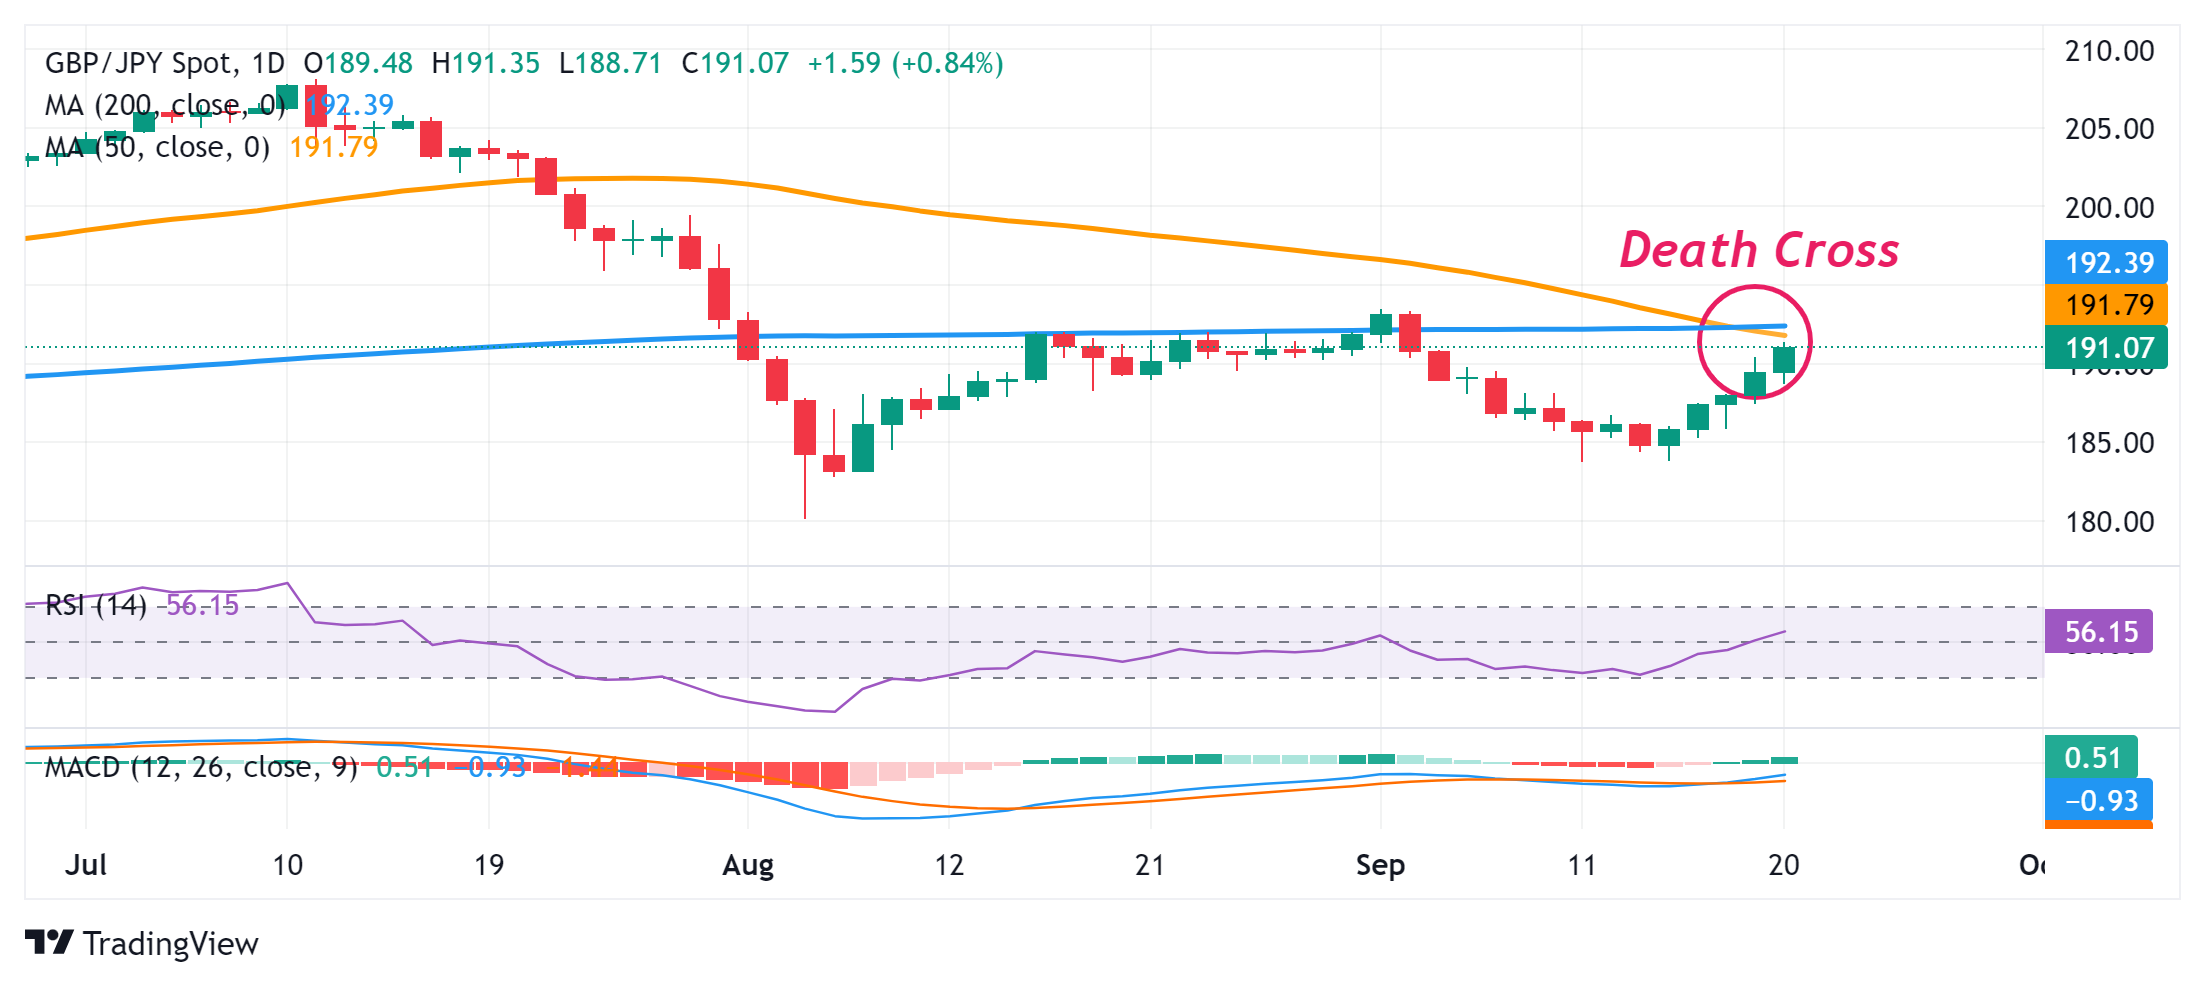
Economic Indicator
BoJ Press Conference
The Bank of Japan (BoJ) holds a press conference at the end of each one of its eight scheduled policy meetings. At the press conference the Governor of the BoJ communicates with media representatives and investors regarding monetary policy. The Governor talks about the factors that affect the most recent interest rate decision, the overall economic outlook, inflation, and clues regarding future monetary policy. Hawkish comments tend to boost the Japanese Yen (JPY), while a dovish message tends to weaken it.
Read more.Last release: Fri Sep 20, 2024 06:00
Frequency: Irregular
Actual: -
Consensus: -
Previous: -
Source: Bank of Japan
Speaking at the post-policy meeting press conference on Friday, Bank of Japan (BoJ) Governor Kazuo Ueda said that the Bank “will analyze the impact of whether Yen's strengthening since August will impact prices by the same degree as previous Yen weakness had on prices.”
The BoJ left the benchmark interest rate at 0.15%-0.25% following its September policy meeting.
Additional quotes
Today's CPI data was slightly stronger than what we had forecast a short while ago.
There was evidence in today's data that wage hikes are being reflected in service prices.
Closely looking at whether wage growth momentum will continue, service prices will continue to reflect wage growth, and consumption will remain strong in autumn and beyond.
Will analyse how the US economy will impact next wage negotiations next spring..
US economy soft landing is our main scenario.
But risk against the US soft landing is higher.
Our stance has been that we will not use monetary policy to control forex rates.
We do not react directly to forex rates but their impact on inflation outlook.
Want to take some time to see how heightened uncertainties affect our outlook in deciding next policy step.
- NZD/USD extends its upside following the PBoC’s interest rates decision on Friday.
- The PBoC holds its current one-year and five-year Loan Prime Rates (LPRs) at 3.35% and 3.85%, respectively.
- The US Dollar struggles amid growing expectations of further Federal Reserve rate cuts in 2024.
NZD/USD continues its winning streak for the third successive day, trading around 0.6250 during the early European hours on Friday. The New Zealand Dollar (NZD) gains ground following the interest rate decision by the People’s Bank of China (PBoC).
The PBoC opted to keep its one-year and five-year Loan Prime Rates (LPRs) unchanged at 3.35% and 3.85%, respectively. As close trade partners, any developments in the Chinese economy can significantly impact Kiwi markets.
In New Zealand, recent data showed that the Gross Domestic Product (GDP) shrank by 0.2% quarter-on-quarter in the second quarter, bringing the economy close to recession. This decline was smaller than the anticipated 0.4% contraction. Year-on-year, the economy contracted by 0.5%, as expected. Markets have already fully priced in another 25 basis point rate cut for October.
The US Dollar remains under pressure as expectations grow for additional rate cuts by the US Federal Reserve by the end of 2024. The latest dot plot projections indicate a gradual easing cycle, with the median rate for 2024 revised down to 4.375% from the June forecast of 5.125%.
US Treasury Secretary Janet Yellen stated on Friday that the recent interest rate cut by the Federal Reserve is a very positive indicator for the US economy. According to Yellen, it demonstrates the Fed's confidence that inflation has significantly decreased and is moving toward the 2% target. Meanwhile, the job market continues to show strength.
New Zealand Dollar FAQs
The New Zealand Dollar (NZD), also known as the Kiwi, is a well-known traded currency among investors. Its value is broadly determined by the health of the New Zealand economy and the country’s central bank policy. Still, there are some unique particularities that also can make NZD move. The performance of the Chinese economy tends to move the Kiwi because China is New Zealand’s biggest trading partner. Bad news for the Chinese economy likely means less New Zealand exports to the country, hitting the economy and thus its currency. Another factor moving NZD is dairy prices as the dairy industry is New Zealand’s main export. High dairy prices boost export income, contributing positively to the economy and thus to the NZD.
The Reserve Bank of New Zealand (RBNZ) aims to achieve and maintain an inflation rate between 1% and 3% over the medium term, with a focus to keep it near the 2% mid-point. To this end, the bank sets an appropriate level of interest rates. When inflation is too high, the RBNZ will increase interest rates to cool the economy, but the move will also make bond yields higher, increasing investors’ appeal to invest in the country and thus boosting NZD. On the contrary, lower interest rates tend to weaken NZD. The so-called rate differential, or how rates in New Zealand are or are expected to be compared to the ones set by the US Federal Reserve, can also play a key role in moving the NZD/USD pair.
Macroeconomic data releases in New Zealand are key to assess the state of the economy and can impact the New Zealand Dollar’s (NZD) valuation. A strong economy, based on high economic growth, low unemployment and high confidence is good for NZD. High economic growth attracts foreign investment and may encourage the Reserve Bank of New Zealand to increase interest rates, if this economic strength comes together with elevated inflation. Conversely, if economic data is weak, NZD is likely to depreciate.
The New Zealand Dollar (NZD) tends to strengthen during risk-on periods, or when investors perceive that broader market risks are low and are optimistic about growth. This tends to lead to a more favorable outlook for commodities and so-called ‘commodity currencies’ such as the Kiwi. Conversely, NZD tends to weaken at times of market turbulence or economic uncertainty as investors tend to sell higher-risk assets and flee to the more-stable safe havens.
European Central Bank (ECB) Vice President Luis de Guindos said on Friday, “we will have more information in December than in October.”
“We have left the door totally open,” he said.
Market reaction
At the press time, EUR/USD is grinding higher to near 1.1180, up 0.16% on the day.
Euro PRICE Today
The table below shows the percentage change of Euro (EUR) against listed major currencies today. Euro was the strongest against the Japanese Yen.
| USD | EUR | GBP | JPY | CAD | AUD | NZD | CHF | |
|---|---|---|---|---|---|---|---|---|
| USD | -0.17% | -0.40% | 0.20% | 0.00% | -0.10% | -0.25% | -0.15% | |
| EUR | 0.17% | -0.25% | 0.37% | 0.15% | 0.06% | -0.07% | 0.02% | |
| GBP | 0.40% | 0.25% | 0.61% | 0.43% | 0.33% | 0.18% | 0.29% | |
| JPY | -0.20% | -0.37% | -0.61% | -0.17% | -0.29% | -0.43% | -0.30% | |
| CAD | -0.01% | -0.15% | -0.43% | 0.17% | -0.12% | -0.24% | -0.14% | |
| AUD | 0.10% | -0.06% | -0.33% | 0.29% | 0.12% | -0.12% | -0.01% | |
| NZD | 0.25% | 0.07% | -0.18% | 0.43% | 0.24% | 0.12% | 0.10% | |
| CHF | 0.15% | -0.02% | -0.29% | 0.30% | 0.14% | 0.01% | -0.10% |
The heat map shows percentage changes of major currencies against each other. The base currency is picked from the left column, while the quote currency is picked from the top row. For example, if you pick the Euro from the left column and move along the horizontal line to the US Dollar, the percentage change displayed in the box will represent EUR (base)/USD (quote).
- EUR/JPY recovers to near 160.00 in Friday’s early European session, gaining 0.45% on the day.
- BoJ’s Ueda said central bank will keep adjusting the degree of easing if our economic, price outlooks are to be realised.
- Investors await the ECB’s Lagarde speech for fresh impetus.
The EUR/JPY cross gains momentum around 160.00 during the early European session on Friday. The Bank of Japan (BoJ) decided to keep its policy rate unchanged, as widely expected. However, the uncertain outlook of the BoJ monetary policy is likely to cap the upside of the Japanese Yen (JPY) for the time being.
The BoJ kept its benchmark interest rate steady at around 0.25%, the highest level since 2008, at the conclusion of a two-day meeting on Friday. “The central bank is expected to hike rates in October, and “further dial back monetary support this year despite a poor run of economic data,” noted Stefan Angrick, associate director at Moody’s Analytics.
BoJ Governor Kazuo Ueda said during the press conference that the Japanese central bank “will keep adjusting the degree of easing if our economic and price outlooks are to be realized." Ueda added that uncertainties surrounding Japan's economy and prices remain high, and he will monitor the economy and market trends with an extremely high sense of urgency.
However, he affirmed there is no change to his thinking that the BoJ will keep raising rates if the economy moves in line with the outlook. The rising expectation that the BoJ will raise the interest rate later this year could lift the JPY against the Euro (EUR).
On the other hand, the European Central Bank (ECB) reduced its interest rates last week during its September meeting. Investors will take more cues from ECB President Christine Lagarde's speech later on Friday. Any dovish remarks from Lagarde could weigh on the shared currency in the near term, while the hawkish tone might lift the EUR.
Bank of Japan FAQs
The Bank of Japan (BoJ) is the Japanese central bank, which sets monetary policy in the country. Its mandate is to issue banknotes and carry out currency and monetary control to ensure price stability, which means an inflation target of around 2%.
The Bank of Japan has embarked in an ultra-loose monetary policy since 2013 in order to stimulate the economy and fuel inflation amid a low-inflationary environment. The bank’s policy is based on Quantitative and Qualitative Easing (QQE), or printing notes to buy assets such as government or corporate bonds to provide liquidity. In 2016, the bank doubled down on its strategy and further loosened policy by first introducing negative interest rates and then directly controlling the yield of its 10-year government bonds.
The Bank’s massive stimulus has caused the Yen to depreciate against its main currency peers. This process has exacerbated more recently due to an increasing policy divergence between the Bank of Japan and other main central banks, which have opted to increase interest rates sharply to fight decades-high levels of inflation. The BoJ’s policy of holding down rates has led to a widening differential with other currencies, dragging down the value of the Yen.
A weaker Yen and the spike in global energy prices have led to an increase in Japanese inflation, which has exceeded the BoJ’s 2% target. With wage inflation becoming a cause of concern, the BoJ looks to move away from ultra loose policy, while trying to avoid slowing the activity too much.
- The Pound Sterling outperforms its major peers as UK Retail Sales grew at a faster-than-expected pace in August
- Fears of UK inflation remaining persistent have deepened after an acceleration in price pressures coming from the services sector.
- The Fed is expected to continue an aggressive policy-easing cycle.
The Pound Sterling (GBP) performs strongly against its major peers on Friday. The British currency strengthens as the United Kingdom (UK) Retail Sales data for August came in stronger than expected. The Retail Sales data, a key measure of consumer spending, rose at a robust pace of 2.5% on year, higher than the estimates of 1.4% and July’s print of 1.5%. On month, Retail Sales grew by 1% against expectations of 0.4% and the 0.5% advance registered in July.
The report showed that households spent heavily on textile clothing and footwear stores and food stores, while sales receipts at other non-food stores declined. Signs of robust demand for durable items could further fuel price pressures, a potential concern after core inflation already came in hotter-than-expected in August. The persistence of high price growth in certain parts of the economy guided the Bank of England (BoE) to leave interest rates unchanged at 5% in Thursday’s policy meeting.
The BoE kept its borrowing rates steady, with an 8-1 vote split. BoE external policy member Swati Dhingra was the only one among the Monetary Policy Committee who voted to cut interest rates by 25 basis points (bps) for the second time in a row. Investors were expecting that Deputy Governor Dave Ramsden would also vote for a cut, but he didn't.
Also, BoE members unanimously voted to trim their government bonds holdings by 100 billion pounds over the coming 12 months.
Daily digest market movers: Pound Sterling strengthens against US Dollar on dovish Fed bets
- The Pound Sterling refreshes a two-year high above the crucial resistance of 1.3300 against the US Dollar (USD) in Friday’s London session. The GBP/USD pair strengthens as the US Dollar faces severe selling pressure amid growing speculation that the Federal Reserve’s (Fed) policy-easing cycle will continue in the last quarter of the year. The US Dollar Index (DXY), which tracks the Greenback’s value against six major currencies, slides below the crucial support of 100.50 and is declining towards a year-to-date low of 100.21.
- The Fed kicked off its policy easing cycle on Wednesday with a larger-than-usual rate cut of 50 basis points (bps), pushing borrowing rates lower to 4.75%-5.00%. This bumper rate cut from the Fed was a clear signal that policymakers are more focused on restoring labor market health and are confident about inflation returning to the bank’s target of 2%.
- According to the CME FedWatch tool, the Fed is expected to cut borrowing rates further by 75 bps in the remaining two meetings this year, suggesting that there will be one more 50 bps rate cut. The tool also shows that the likelihood of the Fed reducing interest rates by 50 bps in November is at 43%, higher than the 37% recorded on Thursday. On the contrary, Fed policymakers see the federal fund rates heading to 4.4% by the year-end, a smaller reduction than the one that markets are pricing in.
- Going forward, the next trigger for the Pound Sterling and the US Dollar will be preliminary S&P Global PMI data for September, which will be published on Monday.
Technical Analysis: Pound Sterling rises above 1.3300
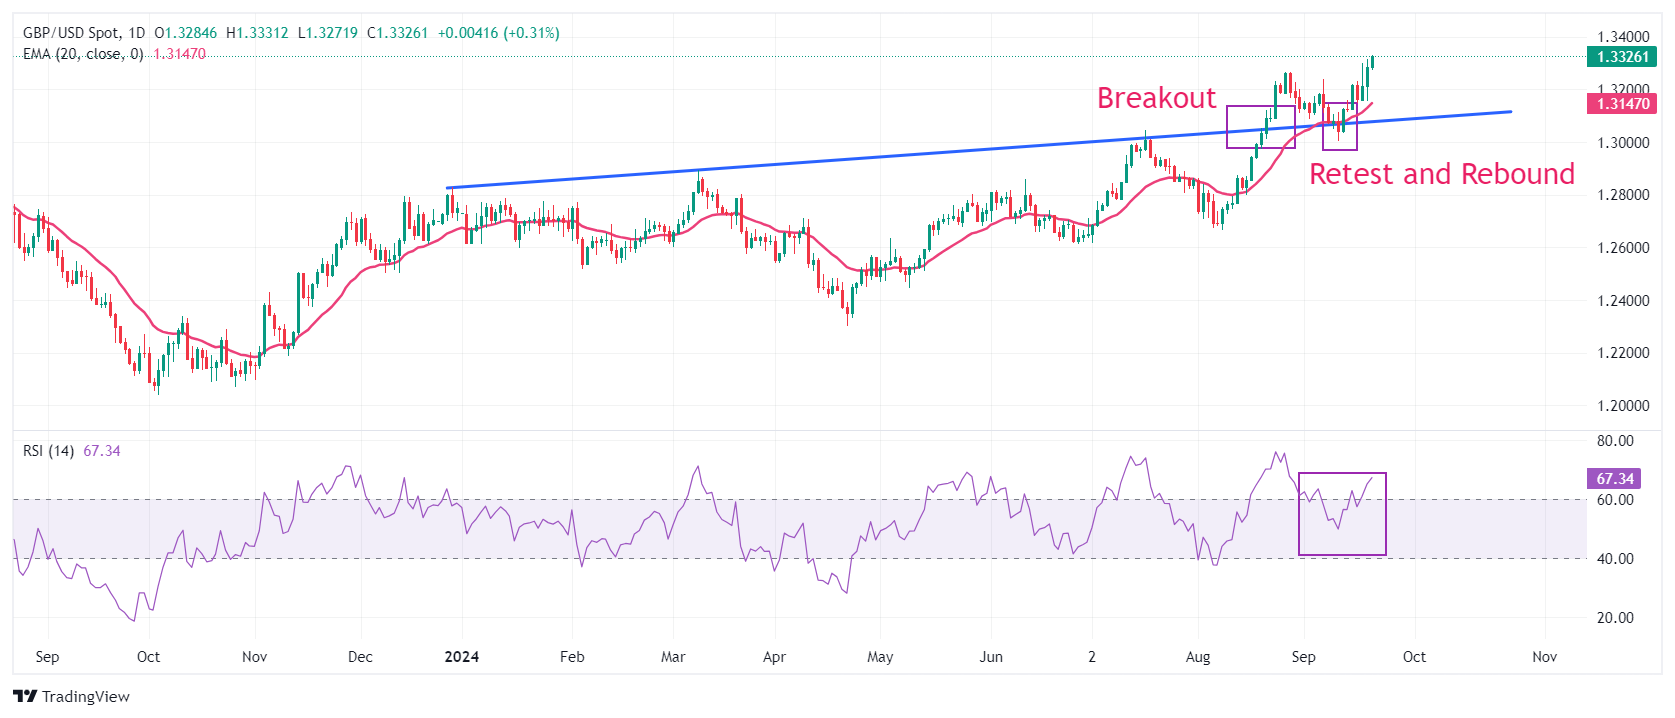
The Pound Sterling aims to gain firm-footing above 1.3300 against the US Dollar in European trading hours. The near-term outlook of the GBP/USD pair remains firm as it holds above the 20-day Exponential Moving Average (EMA) near 1.3150. Earlier, the Cable strengthened after recovering from a corrective move to near the trendline plotted from the December 28, 2023, high of 1.2828, from where it delivered a sharp increase after a breakout on August 21.
The 14-day Relative Strength Index (RSI) shifts above 60.00, suggesting an active bullish momentum
Looking up, the Cable will face resistance near the psychological level of 1.3500. On the downside, the psychological level of 1.3000 emerges as crucial support.
Pound Sterling FAQs
The Pound Sterling (GBP) is the oldest currency in the world (886 AD) and the official currency of the United Kingdom. It is the fourth most traded unit for foreign exchange (FX) in the world, accounting for 12% of all transactions, averaging $630 billion a day, according to 2022 data. Its key trading pairs are GBP/USD, aka ‘Cable’, which accounts for 11% of FX, GBP/JPY, or the ‘Dragon’ as it is known by traders (3%), and EUR/GBP (2%). The Pound Sterling is issued by the Bank of England (BoE).
The single most important factor influencing the value of the Pound Sterling is monetary policy decided by the Bank of England. The BoE bases its decisions on whether it has achieved its primary goal of “price stability” – a steady inflation rate of around 2%. Its primary tool for achieving this is the adjustment of interest rates. When inflation is too high, the BoE will try to rein it in by raising interest rates, making it more expensive for people and businesses to access credit. This is generally positive for GBP, as higher interest rates make the UK a more attractive place for global investors to park their money. When inflation falls too low it is a sign economic growth is slowing. In this scenario, the BoE will consider lowering interest rates to cheapen credit so businesses will borrow more to invest in growth-generating projects.
Data releases gauge the health of the economy and can impact the value of the Pound Sterling. Indicators such as GDP, Manufacturing and Services PMIs, and employment can all influence the direction of the GBP. A strong economy is good for Sterling. Not only does it attract more foreign investment but it may encourage the BoE to put up interest rates, which will directly strengthen GBP. Otherwise, if economic data is weak, the Pound Sterling is likely to fall.
Another significant data release for the Pound Sterling is the Trade Balance. This indicator measures the difference between what a country earns from its exports and what it spends on imports over a given period. If a country produces highly sought-after exports, its currency will benefit purely from the extra demand created from foreign buyers seeking to purchase these goods. Therefore, a positive net Trade Balance strengthens a currency and vice versa for a negative balance.
Speaking at the post-policy meeting press conference on Friday, Bank of Japan (BoJ) Governor Kazuo Ueda said that the Bank “will keep adjusting the degree of easing if our economic and price outlooks are to be realized.”
The BoJ left the benchmark interest rate at 0.15%-0.25% following its September policy meeting.
Additional quotes
Japan's economy is recovering moderately, although some weakness has been seen.
Uncertainties surrounding Japan's economy, prices remain high.
Must pay due attention to financial, FX markets, impact on Japan's economy, prices.
Outlook of overseas economies, including the US economy, markets remain unstable.
Markets remain unstable, when asked about deputy governor uchida's remarks.
Will monitor economy, market trends with extremely high sense of urgency.
Important to check overseas economic trends including the US when making policy decisions.
Risks of inflation overshoot have diminished to some extent.
Will check how overseas economic trends would impact corporate activities, earnings.
Uncertainties around the US and overseas economy are behind recent market moves.
Need to closely watch if the US economy would achieve soft landing or harder correction.
Real interest rates remain at very low levels.
There is some time to make decision on monetary policy because upside price risks have decreased given recent FX moves.
There is no specific time schedule for how long it would take to confirm impact of overseas economy on BoJ’s outlook.
Raised assessment on private consumption because wages are growing.
Recent data confirmed economy was moving in line with our outlook.
Recent data suggest we may be able to raise our outlook on underlying inflation, but overseas trends raise uncertainties.
No change to our thinking that we will keep raising interest rates if economy moves in line with our outlook.
Not yet able to narrow down Japan's estimated neutral interest rates.
We're in phase of deepening understanding on neutral rates while we check impact of rate hikes on economy.
Interested in how updated minimum wages would impact part-time workers' wages.
Will continue to aim to carefully communicate BoJ’s thinking behind policy decision with markets.
Market reaction
USD/JPY is little changed following these comments. The pair was last seen trading 0.13% lower on the day at 142.48.
Bank of Japan FAQs
The Bank of Japan (BoJ) is the Japanese central bank, which sets monetary policy in the country. Its mandate is to issue banknotes and carry out currency and monetary control to ensure price stability, which means an inflation target of around 2%.
The Bank of Japan has embarked in an ultra-loose monetary policy since 2013 in order to stimulate the economy and fuel inflation amid a low-inflationary environment. The bank’s policy is based on Quantitative and Qualitative Easing (QQE), or printing notes to buy assets such as government or corporate bonds to provide liquidity. In 2016, the bank doubled down on its strategy and further loosened policy by first introducing negative interest rates and then directly controlling the yield of its 10-year government bonds.
The Bank’s massive stimulus has caused the Yen to depreciate against its main currency peers. This process has exacerbated more recently due to an increasing policy divergence between the Bank of Japan and other main central banks, which have opted to increase interest rates sharply to fight decades-high levels of inflation. The BoJ’s policy of holding down rates has led to a widening differential with other currencies, dragging down the value of the Yen.
A weaker Yen and the spike in global energy prices have led to an increase in Japanese inflation, which has exceeded the BoJ’s 2% target. With wage inflation becoming a cause of concern, the BoJ looks to move away from ultra loose policy, while trying to avoid slowing the activity too much.
- EUR/GBP extends its decline as the Pound Sterling gains support from the BoE’s decision to maintain its interest rate.
- UK Retail Sales rose by 1.0% MoM in August, rebounding from a prior decline of 0.5%.
- Germany's Producer Price Index (MoM) recorded a consistent increase of 0.2% for August.
EUR/GBP continues to lose ground, trading around 0.8390 during Friday’s Asian hours, following the release of UK Retail Sales data for August. Retail Sales rose by 1.0% month-over-month, rebounding from a prior decline of 0.5% and surpassing the expected increase of 0.4%. Meanwhile, the annualized rate increased to 2.5%, up from the previous 1.5% rise.
The Pound Sterling (GBP) received support from the Bank of England’s (BoE) decision to maintain its interest rate at 5% on Thursday, as widely anticipated. The BoE had previously signaled the possibility of rate cuts earlier in the summer with a quarter-point reduction at the last meeting, but this move may have been premature.
Out of the nine Monetary Policy Committee (MPC) members, BoE external member Swati Dhingra voted for cutting interest rates for the second consecutive time, while the remaining members supported maintaining rates at their current levels. Investors had anticipated that two MPC members would back a dovish policy decision.
On the euro side, Germany's Producer Price Index (PPI) showed a consistent month-over-month increase of 0.2%. However, the annual PPI declined by 0.8%, lower than the expected 1.0%. Traders are likely to focus on European Central Bank (ECB) President Christine Lagarde’s speech at the Michel Camdessus Central Banking Lecture in Washington, DC, on Friday.
European Central Bank (ECB) policymakers are divided on the pace of policy easing due to differing views on the inflation outlook. ECB Governing Council member Peter Kazimir and Deutsche Bundesbank President Joachim Nagel have expressed a desire to see more evidence that inflation will return to the levels the bank aims for, according to Reuters.
Economic Indicator
Retail Sales (MoM)
The Retail Sales data, released by the Office for National Statistics on a monthly basis, measures the volume of sales of goods by retailers in Great Britain directly to end customers. Changes in Retail Sales are widely followed as an indicator of consumer spending. Percent changes reflect the rate of changes in such sales, with the MoM reading comparing sales volumes in the reference month with the previous month. Generally, a high reading is seen as bullish for the Pound Sterling (GBP), while a low reading is seen as bearish.
Read more.Last release: Fri Sep 20, 2024 06:00
Frequency: Monthly
Actual: 1%
Consensus: 0.4%
Previous: 0.5%
Source: Office for National Statistics
FX option expiries for Sept 20 NY cut at 10:00 Eastern Time, via DTCC, can be found below.
EUR/USD: EUR amounts
- 1.1000 776m
- 1.1100 2.7b
- 1.1150 3.1b
- 1.1175 1.4b
- 1.1200 2b
- 1.1225 1.2b
GBP/USD: GBP amounts
- 1.3150 890m
- 1.3250 1.7b
- 1.3300 859m
USD/JPY: USD amounts
- 141.00 890m
- 142.00 665m
USD/CHF: USD amounts
- 0.8475 1.3b
AUD/USD: AUD amounts
- 0.6675 550m
- 0.6790 851m
USD/CAD: USD amounts
- 1.3400 1.4b
- 1.3580 1.1b
- 1.3590 954m
NZD/USD: NZD amounts
- 0.6105 520m
EUR/GBP: EUR amounts
- 0.8375 700m
- 0.8425 850m
Here is what you need to know on Friday, September 20:
Investors digest the latest central bank announcements to start the last trading day of a critical week for markets. In the second half of the day, the European Commission will release the preliminary Consumer Confidence data for September and Statistics Canada will publish Retail Sales figures for July. Ahead of the weekend, market participants will also pay close attention to comments from central bank officials.
US Dollar PRICE This week
The table below shows the percentage change of US Dollar (USD) against listed major currencies this week. US Dollar was the weakest against the Australian Dollar.
| USD | EUR | GBP | JPY | CAD | AUD | NZD | CHF | |
|---|---|---|---|---|---|---|---|---|
| USD | -0.87% | -1.48% | 0.95% | -0.30% | -1.75% | -1.52% | -0.18% | |
| EUR | 0.87% | -0.68% | 1.81% | 0.53% | -0.95% | -0.67% | 0.65% | |
| GBP | 1.48% | 0.68% | 2.40% | 1.21% | -0.26% | -0.02% | 1.34% | |
| JPY | -0.95% | -1.81% | -2.40% | -1.24% | -2.62% | -2.42% | -1.19% | |
| CAD | 0.30% | -0.53% | -1.21% | 1.24% | -1.54% | -1.22% | 0.02% | |
| AUD | 1.75% | 0.95% | 0.26% | 2.62% | 1.54% | 0.25% | 1.60% | |
| NZD | 1.52% | 0.67% | 0.02% | 2.42% | 1.22% | -0.25% | 1.37% | |
| CHF | 0.18% | -0.65% | -1.34% | 1.19% | -0.02% | -1.60% | -1.37% |
The heat map shows percentage changes of major currencies against each other. The base currency is picked from the left column, while the quote currency is picked from the top row. For example, if you pick the US Dollar from the left column and move along the horizontal line to the Japanese Yen, the percentage change displayed in the box will represent USD (base)/JPY (quote).
The Bank of Japan (BoJ) announced on Friday that it maintained the short-term rate target in the range of 0.15%-0.25%, as expected. In its policy statement, the BoJ noted that it expect inflation to be at a level generally consistent with the BoJ’s price target in the second half of the 3-year projection period, through the fiscal year 2026. USD/JPY edged slightly lower with the immediate reaction and was last seen trading slightly above 142.00.
Meanwhile, the People’s Bank of China (PBOC), China's central bank, left its Loan Prime Rates (LPRs) unchanged on Friday. With this decision, the one-year and five-year LPRs stood at 3.35% and 3.85%, respectively. Following Thursday's upsurge, AUD/USD stays relatively quiet on Friday and consolidates its weekly gains above 0.6800.
On Thursday, the Bank of England (BoE) maintained its bank rate at 5% as forecast. Early Friday, the UK's Office for National Statistics reported that Retail Sales rose 1% on a monthly basis in August. This reading followed the 0.5% increase recorded in July and came in better than the market expectation of 0.4%. After closing in positive territory on Thursday, GBP/USD continues to push higher in the European morning and was last seen trading at its highest level since March 2022 above 1.3300.
Following a recovery attempt in the early American session on Thursday, the US Dollar (USD) Index turned south and closed deep in negative territory as risk flows dominated the action in financial markets. Early Friday, the USD Index edges lower and was last seen fluctuating near 100.50. Federal Reserve Bank of Philadelphia President Patrick Harker is scheduled to deliver a speech later in the day.
EUR/USD gathered bullish momentum in the late American session and registered gains on Thursday. The pair holds steady and trades in a narrow channel above 1.1150.
After making a technical correction, Gold gained traction and closed above $2,580 on Thursday. XAU/USD continues to push higher early Friday and was last seen trading within a touching distance of the all-time high it set at $2,600 on Wednesday.
Central banks FAQs
Central Banks have a key mandate which is making sure that there is price stability in a country or region. Economies are constantly facing inflation or deflation when prices for certain goods and services are fluctuating. Constant rising prices for the same goods means inflation, constant lowered prices for the same goods means deflation. It is the task of the central bank to keep the demand in line by tweaking its policy rate. For the biggest central banks like the US Federal Reserve (Fed), the European Central Bank (ECB) or the Bank of England (BoE), the mandate is to keep inflation close to 2%.
A central bank has one important tool at its disposal to get inflation higher or lower, and that is by tweaking its benchmark policy rate, commonly known as interest rate. On pre-communicated moments, the central bank will issue a statement with its policy rate and provide additional reasoning on why it is either remaining or changing (cutting or hiking) it. Local banks will adjust their savings and lending rates accordingly, which in turn will make it either harder or easier for people to earn on their savings or for companies to take out loans and make investments in their businesses. When the central bank hikes interest rates substantially, this is called monetary tightening. When it is cutting its benchmark rate, it is called monetary easing.
A central bank is often politically independent. Members of the central bank policy board are passing through a series of panels and hearings before being appointed to a policy board seat. Each member in that board often has a certain conviction on how the central bank should control inflation and the subsequent monetary policy. Members that want a very loose monetary policy, with low rates and cheap lending, to boost the economy substantially while being content to see inflation slightly above 2%, are called ‘doves’. Members that rather want to see higher rates to reward savings and want to keep a lit on inflation at all time are called ‘hawks’ and will not rest until inflation is at or just below 2%.
Normally, there is a chairman or president who leads each meeting, needs to create a consensus between the hawks or doves and has his or her final say when it would come down to a vote split to avoid a 50-50 tie on whether the current policy should be adjusted. The chairman will deliver speeches which often can be followed live, where the current monetary stance and outlook is being communicated. A central bank will try to push forward its monetary policy without triggering violent swings in rates, equities, or its currency. All members of the central bank will channel their stance toward the markets in advance of a policy meeting event. A few days before a policy meeting takes place until the new policy has been communicated, members are forbidden to talk publicly. This is called the blackout period.
- USD/CHF softens near 0.8465 in Friday’s early European session.
- Expectations of more rate cuts by the Fed continue to undermine the US Dollar.
- Switzerland's trade surplus came in at 4.578 billion Swiss Francs in August.
The USD/CHF pair trades on a softer note around 0.8465 on Friday during the early European session. The Greenback remains under some selling pressure after the Federal Reserve's (Fed) oversized interest rate cut on Wednesday. Traders will take more cues from the Fed’s Patrick Harker speech later on Friday.
The Fed decided to cut its key lending rate by 50 basis points (bps) on Wednesday, the first reduction since the COVID-19 pandemic. Fed Chair Jerome Powell noted after the rate announcement that the US central bank "It is time to recalibrate our policy to something that is more appropriate given the progress on inflation, and on employment moving to a more sustainable level.”
The Fed officials also penciled in an additional half-point of cuts before the end of this year. This, in turn, might exert some selling pressure on the US Dollar (USD).
On the Swiss front, Switzerland's trade surplus came in at 4.578 billion Swiss Francs in August, according to the Federal Customs Office on Thursday. Additionally, the country’s Exports fell to 20.491 billion Swiss Francs in August and Imports declined to 15.912 billion Swiss Francs in the same reported period.
Israeli warplanes and artillery attacked Hezbollah in southern Lebanon on Thursday. The action came after the militia's pagers and walkie-talkies exploded last week, killing scores and injuring thousands across Lebanon, according to CNBC. Any signs of escalating geopolitical risks in the region could boost the safe-haven flows, benefiting the Swiss Franc (CHF).
Swiss Franc FAQs
The Swiss Franc (CHF) is Switzerland’s official currency. It is among the top ten most traded currencies globally, reaching volumes that well exceed the size of the Swiss economy. Its value is determined by the broad market sentiment, the country’s economic health or action taken by the Swiss National Bank (SNB), among other factors. Between 2011 and 2015, the Swiss Franc was pegged to the Euro (EUR). The peg was abruptly removed, resulting in a more than 20% increase in the Franc’s value, causing a turmoil in markets. Even though the peg isn’t in force anymore, CHF fortunes tend to be highly correlated with the Euro ones due to the high dependency of the Swiss economy on the neighboring Eurozone.
The Swiss Franc (CHF) is considered a safe-haven asset, or a currency that investors tend to buy in times of market stress. This is due to the perceived status of Switzerland in the world: a stable economy, a strong export sector, big central bank reserves or a longstanding political stance towards neutrality in global conflicts make the country’s currency a good choice for investors fleeing from risks. Turbulent times are likely to strengthen CHF value against other currencies that are seen as more risky to invest in.
The Swiss National Bank (SNB) meets four times a year – once every quarter, less than other major central banks – to decide on monetary policy. The bank aims for an annual inflation rate of less than 2%. When inflation is above target or forecasted to be above target in the foreseeable future, the bank will attempt to tame price growth by raising its policy rate. Higher interest rates are generally positive for the Swiss Franc (CHF) as they lead to higher yields, making the country a more attractive place for investors. On the contrary, lower interest rates tend to weaken CHF.
Macroeconomic data releases in Switzerland are key to assessing the state of the economy and can impact the Swiss Franc’s (CHF) valuation. The Swiss economy is broadly stable, but any sudden change in economic growth, inflation, current account or the central bank’s currency reserves have the potential to trigger moves in CHF. Generally, high economic growth, low unemployment and high confidence are good for CHF. Conversely, if economic data points to weakening momentum, CHF is likely to depreciate.
As a small and open economy, Switzerland is heavily dependent on the health of the neighboring Eurozone economies. The broader European Union is Switzerland’s main economic partner and a key political ally, so macroeconomic and monetary policy stability in the Eurozone is essential for Switzerland and, thus, for the Swiss Franc (CHF). With such dependency, some models suggest that the correlation between the fortunes of the Euro (EUR) and the CHF is more than 90%, or close to perfect.
- The UK Retail Sales rose 1.0% MoM in August, beat estimates.
- Monthly Core Retail Sales for the UK advanced 1.1% in August.
- GBP/USD regains 1.3300 after upbeat UK data.
The United Kingdom (UK) Retail Sales increased 1.0% over the month in August after rebounding 0.5% in July, the latest data published by the Office for National Statistics (ONS) showed Friday. Markets expected a 0.4% growth in the reported month.
The Core Retail Sales, stripping the auto motor fuel sales, rose 1.1% MoM, against the previous jump of 0.7% and the forecast of 0.5%.
The annual Retail Sales in the UK edged higher by 2.5% in August versus July’s 1.5% rise while the Core Retail Sales advanced 2.3% in the same month versus 1.4% previous. Both figures outpaced market expectations.
Market reaction to UK Retail Sales report
GBP/USD is picking up fresh bids following the encouraging UK data release, 0.18% higher on the day near 1.3310, as of writing.
British Pound PRICE Today
The table below shows the percentage change of British Pound (GBP) against listed major currencies today. British Pound was the strongest against the Canadian Dollar.
| USD | EUR | GBP | JPY | CAD | AUD | NZD | CHF | |
|---|---|---|---|---|---|---|---|---|
| USD | -0.05% | -0.17% | -0.31% | 0.00% | -0.04% | -0.12% | -0.20% | |
| EUR | 0.05% | -0.13% | -0.24% | 0.04% | -0.00% | -0.06% | -0.15% | |
| GBP | 0.17% | 0.13% | -0.09% | 0.20% | 0.15% | 0.08% | 0.00% | |
| JPY | 0.31% | 0.24% | 0.09% | 0.32% | 0.26% | 0.18% | 0.12% | |
| CAD | -0.01% | -0.04% | -0.20% | -0.32% | -0.06% | -0.12% | -0.19% | |
| AUD | 0.04% | 0.00% | -0.15% | -0.26% | 0.06% | -0.05% | -0.13% | |
| NZD | 0.12% | 0.06% | -0.08% | -0.18% | 0.12% | 0.05% | -0.07% | |
| CHF | 0.20% | 0.15% | -0.01% | -0.12% | 0.19% | 0.13% | 0.07% |
The heat map shows percentage changes of major currencies against each other. The base currency is picked from the left column, while the quote currency is picked from the top row. For example, if you pick the British Pound from the left column and move along the horizontal line to the US Dollar, the percentage change displayed in the box will represent GBP (base)/USD (quote).
- EUR/USD holds positive ground around 1.1165 in Friday’s Asian session.
- The pair keeps the positive stance above the key 100-period EMA, with the bullish RSI indicator.
- The first upside barrier emerges at 1.1172; the initial support level is located at 1.1130.
The EUR/USD pair trades in positive for the third consecutive day near 1.1165 during the Asian trading hours on Friday. The bearish US Dollar (USD) after the US Federal Reserve (Fed) began its easing cycle with an unexpected 50 basis point (bps) rate cut at its September meeting underpins the major pair.
The bullish outlook of EUR/USD remains intact as the major pair is well supported above the key 100-period Exponential Moving Averages (EMA) on the 4-hour chart. Furthermore, the upward momentum is reinforced by the Relative Strength Index (RSI), which is above the midline near 67.45, suggesting the further upside looks favorable.
A decisive break above the upper boundary of Bollinger Band of 1.1172 could see a rally to the 1.1190-1.1200 region. The mentioned level is the confluence of the psychological mark and the high of September 18. Further north, the next hurdle emerges at 1.1240, the high of July 19.
In the bearish event, the low of September 19 near 1.1130 acts as an initial support level for the major pair. Any follow-through selling below this level will see a drop to the 1.1100 psychological figure. The additional downside filter to watch is 1.1088, the 100-period EMA.
EUR/USD 4-hour chart
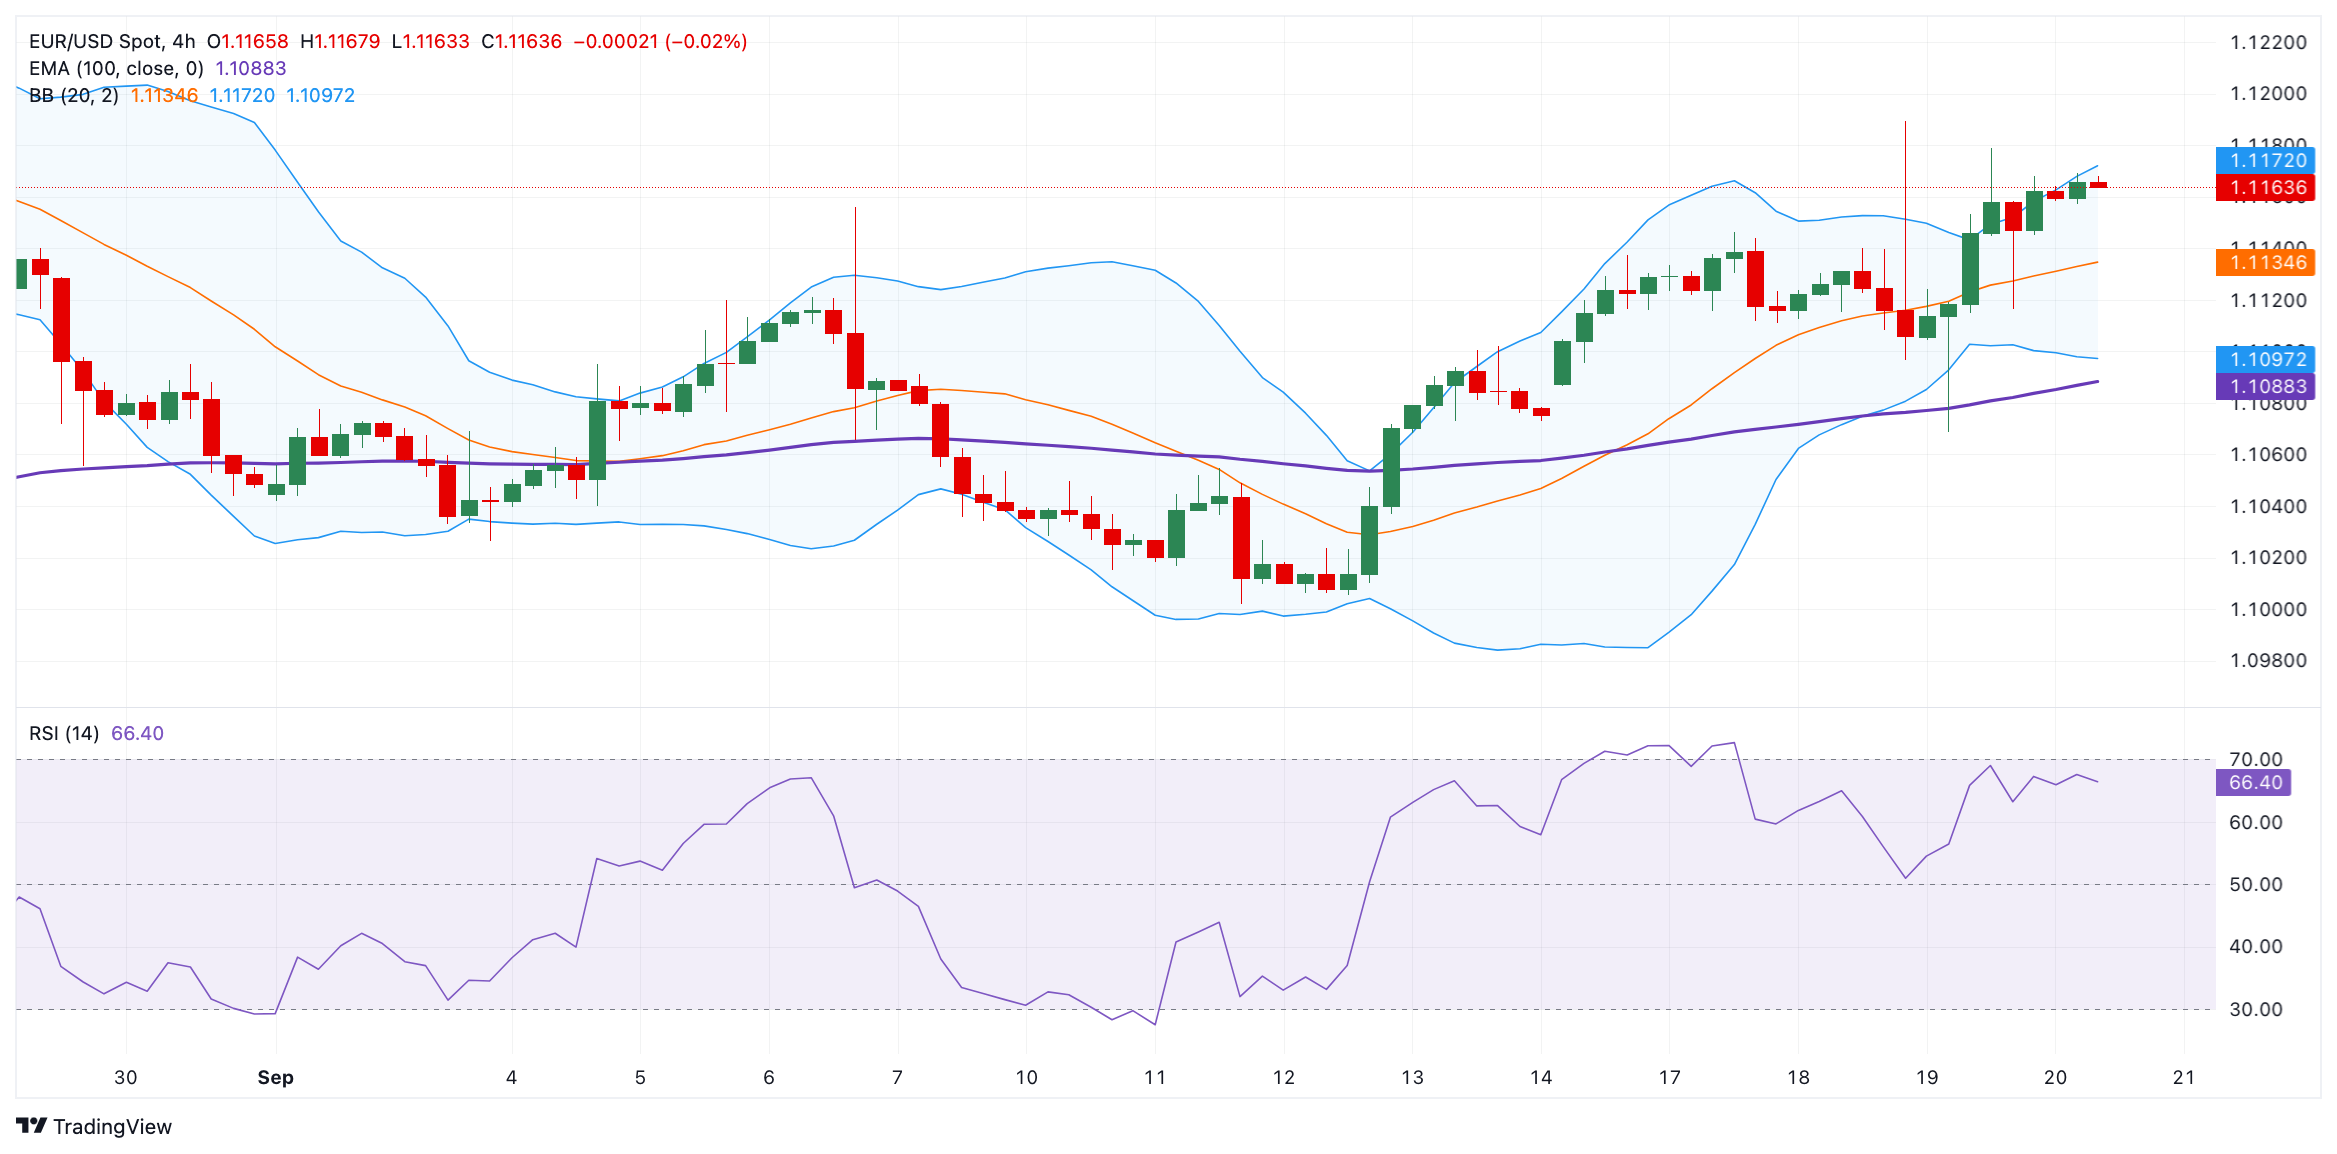
Euro FAQs
The Euro is the currency for the 20 European Union countries that belong to the Eurozone. It is the second most heavily traded currency in the world behind the US Dollar. In 2022, it accounted for 31% of all foreign exchange transactions, with an average daily turnover of over $2.2 trillion a day. EUR/USD is the most heavily traded currency pair in the world, accounting for an estimated 30% off all transactions, followed by EUR/JPY (4%), EUR/GBP (3%) and EUR/AUD (2%).
The European Central Bank (ECB) in Frankfurt, Germany, is the reserve bank for the Eurozone. The ECB sets interest rates and manages monetary policy. The ECB’s primary mandate is to maintain price stability, which means either controlling inflation or stimulating growth. Its primary tool is the raising or lowering of interest rates. Relatively high interest rates – or the expectation of higher rates – will usually benefit the Euro and vice versa. The ECB Governing Council makes monetary policy decisions at meetings held eight times a year. Decisions are made by heads of the Eurozone national banks and six permanent members, including the President of the ECB, Christine Lagarde.
Eurozone inflation data, measured by the Harmonized Index of Consumer Prices (HICP), is an important econometric for the Euro. If inflation rises more than expected, especially if above the ECB’s 2% target, it obliges the ECB to raise interest rates to bring it back under control. Relatively high interest rates compared to its counterparts will usually benefit the Euro, as it makes the region more attractive as a place for global investors to park their money.
Data releases gauge the health of the economy and can impact on the Euro. Indicators such as GDP, Manufacturing and Services PMIs, employment, and consumer sentiment surveys can all influence the direction of the single currency. A strong economy is good for the Euro. Not only does it attract more foreign investment but it may encourage the ECB to put up interest rates, which will directly strengthen the Euro. Otherwise, if economic data is weak, the Euro is likely to fall. Economic data for the four largest economies in the euro area (Germany, France, Italy and Spain) are especially significant, as they account for 75% of the Eurozone’s economy.
Another significant data release for the Euro is the Trade Balance. This indicator measures the difference between what a country earns from its exports and what it spends on imports over a given period. If a country produces highly sought after exports then its currency will gain in value purely from the extra demand created from foreign buyers seeking to purchase these goods. Therefore, a positive net Trade Balance strengthens a currency and vice versa for a negative balance.
- Silver price appreciates as the non-yielding asset becomes more appealing after the bumper 50 basis point Fed rate cut.
- BoE, PBoC, and BoJ all decided to keep their interest rates unchanged in September.
- The safe-haven Silver receives support from escalating tensions in the Middle East, as Israeli warplanes conducted intense strikes on southern Lebanon.
Silver price (XAG/USD) extends its gains for the second successive day, trading around $31.10 per troy ounce on Friday. The non-yielding Silver receives support following the bumper 50 basis point rate cut by the US Federal Reserve (Fed) on Wednesday.
Additionally, increasing expectations for further rate cuts by the US Federal Reserve by the end of 2024 are putting pressure on Silver demand. The latest dot plot projections indicate a gradual easing cycle, with the median rate for 2024 revised down to 4.375% from the previous forecast of 5.125% in June.
As a non-yielding commodity asset, the precious metal becomes more appealing to investors in a lower interest rate environment, as the opportunity cost of holding it decreases. This can make Silver potentially offer better returns compared to other assets.
Meanwhile, the People’s Bank of China (PBoC) decided to keep its one-year Loan Prime Rate (LPR) unchanged at 3.35%, while the Bank of Japan (BoJ) maintained its interest rate at 0.15% on Friday. Additionally, on Thursday, the Bank of England (BoE) opted to hold its interest rate at 5%, as widely expected.
The safe-haven demand for Silver was bolstered by escalating tensions in the Middle East, as Israeli warplanes conducted their most intense strikes on southern Lebanon in nearly a year of conflict late Thursday. The White House stated that a diplomatic solution was both achievable and urgent, while Britain called for an immediate ceasefire between Israel and Hezbollah, according to Reuters.
Silver FAQs
Silver is a precious metal highly traded among investors. It has been historically used as a store of value and a medium of exchange. Although less popular than Gold, traders may turn to Silver to diversify their investment portfolio, for its intrinsic value or as a potential hedge during high-inflation periods. Investors can buy physical Silver, in coins or in bars, or trade it through vehicles such as Exchange Traded Funds, which track its price on international markets.
Silver prices can move due to a wide range of factors. Geopolitical instability or fears of a deep recession can make Silver price escalate due to its safe-haven status, although to a lesser extent than Gold's. As a yieldless asset, Silver tends to rise with lower interest rates. Its moves also depend on how the US Dollar (USD) behaves as the asset is priced in dollars (XAG/USD). A strong Dollar tends to keep the price of Silver at bay, whereas a weaker Dollar is likely to propel prices up. Other factors such as investment demand, mining supply – Silver is much more abundant than Gold – and recycling rates can also affect prices.
Silver is widely used in industry, particularly in sectors such as electronics or solar energy, as it has one of the highest electric conductivity of all metals – more than Copper and Gold. A surge in demand can increase prices, while a decline tends to lower them. Dynamics in the US, Chinese and Indian economies can also contribute to price swings: for the US and particularly China, their big industrial sectors use Silver in various processes; in India, consumers’ demand for the precious metal for jewellery also plays a key role in setting prices.
Silver prices tend to follow Gold's moves. When Gold prices rise, Silver typically follows suit, as their status as safe-haven assets is similar. The Gold/Silver ratio, which shows the number of ounces of Silver needed to equal the value of one ounce of Gold, may help to determine the relative valuation between both metals. Some investors may consider a high ratio as an indicator that Silver is undervalued, or Gold is overvalued. On the contrary, a low ratio might suggest that Gold is undervalued relative to Silver.
Gold prices rose in India on Friday, according to data compiled by FXStreet.
The price for Gold stood at 6,968.89 Indian Rupees (INR) per gram, up compared with the INR 6,949.19 it cost on Thursday.
The price for Gold increased to INR 81,283.71 per tola from INR 81,054.03 per tola a day earlier.
| Unit measure | Gold Price in INR |
|---|---|
| 1 Gram | 6,968.89 |
| 10 Grams | 69,688.85 |
| Tola | 81,283.71 |
| Troy Ounce | 216,756.70 |
FXStreet calculates Gold prices in India by adapting international prices (USD/INR) to the local currency and measurement units. Prices are updated daily based on the market rates taken at the time of publication. Prices are just for reference and local rates could diverge slightly.
Gold FAQs
Gold has played a key role in human’s history as it has been widely used as a store of value and medium of exchange. Currently, apart from its shine and usage for jewelry, the precious metal is widely seen as a safe-haven asset, meaning that it is considered a good investment during turbulent times. Gold is also widely seen as a hedge against inflation and against depreciating currencies as it doesn’t rely on any specific issuer or government.
Central banks are the biggest Gold holders. In their aim to support their currencies in turbulent times, central banks tend to diversify their reserves and buy Gold to improve the perceived strength of the economy and the currency. High Gold reserves can be a source of trust for a country’s solvency. Central banks added 1,136 tonnes of Gold worth around $70 billion to their reserves in 2022, according to data from the World Gold Council. This is the highest yearly purchase since records began. Central banks from emerging economies such as China, India and Turkey are quickly increasing their Gold reserves.
Gold has an inverse correlation with the US Dollar and US Treasuries, which are both major reserve and safe-haven assets. When the Dollar depreciates, Gold tends to rise, enabling investors and central banks to diversify their assets in turbulent times. Gold is also inversely correlated with risk assets. A rally in the stock market tends to weaken Gold price, while sell-offs in riskier markets tend to favor the precious metal.
The price can move due to a wide range of factors. Geopolitical instability or fears of a deep recession can quickly make Gold price escalate due to its safe-haven status. As a yield-less asset, Gold tends to rise with lower interest rates, while higher cost of money usually weighs down on the yellow metal. Still, most moves depend on how the US Dollar (USD) behaves as the asset is priced in dollars (XAU/USD). A strong Dollar tends to keep the price of Gold controlled, whereas a weaker Dollar is likely to push Gold prices up.
(An automation tool was used in creating this post.)
- USD/CAD hangs near a two-week low touched amid a dovish Fed-inspired USD downtick.
- The recent rally in Oil prices underpins the Loonie and contributes to capping the major.
- Bets for a larger interest rate cut by BoC act as a headwind for the CAD and limit losses.
The USD/CAD pair struggles to gain any meaningful traction during the Asian session on Friday and currently trades around the 1.3555 region, well within the striking distance of a nearly two-week low touched the previous day.
The US Dollar (USD) remains under some selling pressure for the second straight day and languishes near its lowest level since July 2023 touched in reaction to the Federal Reserve's (Fed) oversized interest rate cut on Wednesday. Moreover, Fed members projected another 50 basis points fall in borrowing costs by the end of this year, which, along with the prevalent risk-on mood, weighs on the safe-haven Greenback and acts as a headwind for the USD/CAD pair.
Meanwhile, Crude Oil prices consolidate the recent strong move up to over a two-week high and remain on track to register gains for the second straight week amid worries about declining global stockpiles. Apart from this, rising tensions in the Middle East offer some support to the black liquid, which underpins the commodity-linked Loonie and contributes to capping the USD/CAD pair, though dovish Bank of Canada (BoC) expectations help limit the downside.
The markets started pricing in the possibility of a larger, 50 bps BoC rate cut move next month after data published this week showed that Canada's CPI posted its smallest increase since February 2021 and the core measures fell to the lowest level in 40 months. This, in turn, is holding back bulls from placing aggressive bets around the Canadian Dollar (CAD) and lending some support to the USD/CAD pair ahead of Friday's release of Retail Sales data from Canada.
Apart from this, traders will take cues from BoC Governor Tiff Macklem's speech later during the early North American session, which, along with Oil price dynamics, should influence the CAD. Furthermore, Philadelphia Fed President Patrick Harker's remarks and the broader risk sentiment will drive the USD demand, which should provide some impetus to the USD/CAD pair. Nevertheless, spot prices seem poised to register losses for the first week in the previous three.
Fed FAQs
Monetary policy in the US is shaped by the Federal Reserve (Fed). The Fed has two mandates: to achieve price stability and foster full employment. Its primary tool to achieve these goals is by adjusting interest rates. When prices are rising too quickly and inflation is above the Fed’s 2% target, it raises interest rates, increasing borrowing costs throughout the economy. This results in a stronger US Dollar (USD) as it makes the US a more attractive place for international investors to park their money. When inflation falls below 2% or the Unemployment Rate is too high, the Fed may lower interest rates to encourage borrowing, which weighs on the Greenback.
The Federal Reserve (Fed) holds eight policy meetings a year, where the Federal Open Market Committee (FOMC) assesses economic conditions and makes monetary policy decisions. The FOMC is attended by twelve Fed officials – the seven members of the Board of Governors, the president of the Federal Reserve Bank of New York, and four of the remaining eleven regional Reserve Bank presidents, who serve one-year terms on a rotating basis.
In extreme situations, the Federal Reserve may resort to a policy named Quantitative Easing (QE). QE is the process by which the Fed substantially increases the flow of credit in a stuck financial system. It is a non-standard policy measure used during crises or when inflation is extremely low. It was the Fed’s weapon of choice during the Great Financial Crisis in 2008. It involves the Fed printing more Dollars and using them to buy high grade bonds from financial institutions. QE usually weakens the US Dollar.
Quantitative tightening (QT) is the reverse process of QE, whereby the Federal Reserve stops buying bonds from financial institutions and does not reinvest the principal from the bonds it holds maturing, to purchase new bonds. It is usually positive for the value of the US Dollar.
- AUD/JPY weakens around 97.05 in Friday’s Asian session, down 0.22% on the day.
- The BoJ kept the interest rate unchanged in September, as widely expected.
- CBA analysts expect the RBA to cut its Official Cash Rate (OCR) in December.
The AUD/JPY cross loses ground around 97.05, snapping the four-day winning streak during the Asian trading hours on Friday. The cross drifts lower after the Bank of Japan (BoJ) announced its policy decision.
As widely anticipated, the BoJ decided to keep the short-term rate target in the range of 0.15%-0.25% after the conclusion of its two-day monetary policy review meeting on Friday. The Japanese BoJ remains cautious about hiking further as it could harm economic activity and hinder the demand-driven inflation that it tries to support.
However, Japanese officials will meet again in October and December, leaving the door open for more rate hikes after recent economic data revealed that inflation in Japan has come hotter than estimated. The rising speculation that the Japanese central bank will raise the interest rate again by the end of this year provides some support to the Japanese Yen (JPY) and acts as a headwind for AUD/JPY.
Data released by the Japan Statistics Bureau showed on Friday that the National Consumer Price Index (CPI) rose 3.0% YoY in August, compared to 2.8% in July. Meanwhile, the core CPI, which excludes volatile fresh food costs, climbed 2.8% YoY in August versus 2.7% prior, matching the market expectation of 2.8%.
On the Aussie front, Commonwealth Bank of Australia (CBA) analysts moved their expected timing of the first RBA rate cut from November 2024 to December 2024, with a 25 basis points (bps) rate cut expected. This, in turn, might weigh the Australian Dollar (AUD) against the JPY in the near term.
Bank of Japan FAQs
The Bank of Japan (BoJ) is the Japanese central bank, which sets monetary policy in the country. Its mandate is to issue banknotes and carry out currency and monetary control to ensure price stability, which means an inflation target of around 2%.
The Bank of Japan has embarked in an ultra-loose monetary policy since 2013 in order to stimulate the economy and fuel inflation amid a low-inflationary environment. The bank’s policy is based on Quantitative and Qualitative Easing (QQE), or printing notes to buy assets such as government or corporate bonds to provide liquidity. In 2016, the bank doubled down on its strategy and further loosened policy by first introducing negative interest rates and then directly controlling the yield of its 10-year government bonds.
The Bank’s massive stimulus has caused the Yen to depreciate against its main currency peers. This process has exacerbated more recently due to an increasing policy divergence between the Bank of Japan and other main central banks, which have opted to increase interest rates sharply to fight decades-high levels of inflation. The BoJ’s policy of holding down rates has led to a widening differential with other currencies, dragging down the value of the Yen.
A weaker Yen and the spike in global energy prices have led to an increase in Japanese inflation, which has exceeded the BoJ’s 2% target. With wage inflation becoming a cause of concern, the BoJ looks to move away from ultra loose policy, while trying to avoid slowing the activity too much.
- GBP/JPY halts its winning streak after the release of the BoJ interest rates decision.
- The Bank of Japan decided to hold its current interest rate at 0.15% at Friday's meeting.
- Policymakers await August’s UK Retail Sales data to gather more insights into the developments in the UK economy.
GBP/JPY breaks its four-day winning streak, trading around 189.00 during the Asian session on Friday. The GBP/JPY cross faces challenges as the Japanese Yen (JPY) gains ground following the Bank of Japan (BoJ) policy decision on Friday, keeping its interest rate at 0.15%, as highly expected.
Additionally, Japan's Consumer Price Index (CPI) increased to 3.0% year-on-year in August, up from 2.8% previously, marking the highest level since October 2023. Additionally, the Core National CPI, excluding fresh food, reached a six-month high of 2.8%, rising for the fourth consecutive month and in line with market expectations.
Japan’s Finance Minister Shunichi Suzuki stated on Friday that he “will continue to monitor and analyze the impact of the latest US rate cut on the Japanese economy and financial markets.” Suzuki added that the Federal Reserve Bank’s (FRB) perspective on the US economy aligns with the Japanese government's view that the US economy is likely to expand.
In the United Kingdom (UK), the Bank of England (BoE) decided to maintain its interest rate at 5% on Thursday, as widely anticipated. The BoE had previously signaled the possibility of rate cuts earlier in the summer with a quarter-point reduction at the last meeting, but this move may have been premature.
Policymakers are now awaiting further developments in the UK economy before considering additional rate adjustments. On Friday, UK Retail Sales data for August will be closely watched, with expectations for the monthly rate to decline to 0.4% from 0.5%, while the annualized figure is anticipated to remain steady at 1.4%.
Out of the nine Monetary Policy Committee (MPC) members, BoE external member Swati Dhingra voted for cutting interest rates for the second consecutive time, while the remaining members supported maintaining rates at their current levels. Investors had anticipated that two MPC members would back a dovish policy decision.
Economic Indicator
BoJ Interest Rate Decision
The Bank of Japan (BoJ) announces its interest rate decision after each of the Bank’s eight scheduled annual meetings. Generally, if the BoJ is hawkish about the inflationary outlook of the economy and raises interest rates it is bullish for the Japanese Yen (JPY). Likewise, if the BoJ has a dovish view on the Japanese economy and keeps interest rates unchanged, or cuts them, it is usually bearish for JPY.
Read more.Last release: Fri Sep 20, 2024 02:52
Frequency: Irregular
Actual: 0.15%
Consensus: -
Previous: 0.15%
Source: Bank of Japan
- GBP/USD attracts buyers for the third straight day and draws support from a combination of factors.
- The BoE’s decision to keep rates unchanged acts as a tailwind amid dovish Fed-inspired USD decline.
- The technical setup remains tilted in favor of bulls and supports prospects for further near-term gains.
The GBP/USD pair trades with a positive bias for the third straight day on Friday and hovers around the 1.3300 mark during the Asian session, just below its highest level since March 2022 touched the previous day.
The British Pound (GBP) continues to draw support from the Bank of England's (BoE) decision on Thursday to keep interest rates unchanged and run down its stock of government bonds by another £100 billion over the coming 12 months. In contrast, the US Dollar (USD) languishes near its lowest level since July 2023 amid bets for more interest rate cuts by the Federal Reserve (Fed) and turns out to be a key factor acting as a tailwind for the GBP/USD pair.
From a technical perspective, the overnight sustained breakout through a short-term descending trend-line extending from the late August swing high was seen as a fresh trigger for bullish traders. Moreover, oscillators on the daily chart are holding in positive territory and suggest that the path of least resistance for the GBP/USD pair is to the upside. That said, the Relative Strength Index (RSI) on the daily chart is flashing slightly overbought conditions.
This makes it prudent to wait for some intraday consolidation or a modest pullback before traders start positioning for the next leg of a positive move. Nevertheless, the GBP/USD pair seems poised to climb further towards the next relevant hurdle near the 1.3365 region before aiming to reclaim the 1.3400 mark and test the March 2022 swing high, around the 1.3435-1.3440 region.
On the flip side, the 1.3265-1.3260 area, or the previous YTD peak, now seems to protect the immediate downside. Any further decline is more likely to attract fresh buyers and remain cushioned near the aforementioned descending trend-line resistance, now turned support near the 1.3200 mark. The latter should act as a key pivotal point, which if broken decisively could accelerate the corrective decline towards testing the 1.3150 strong horizontal support.
GBP/USD 4-hour chart
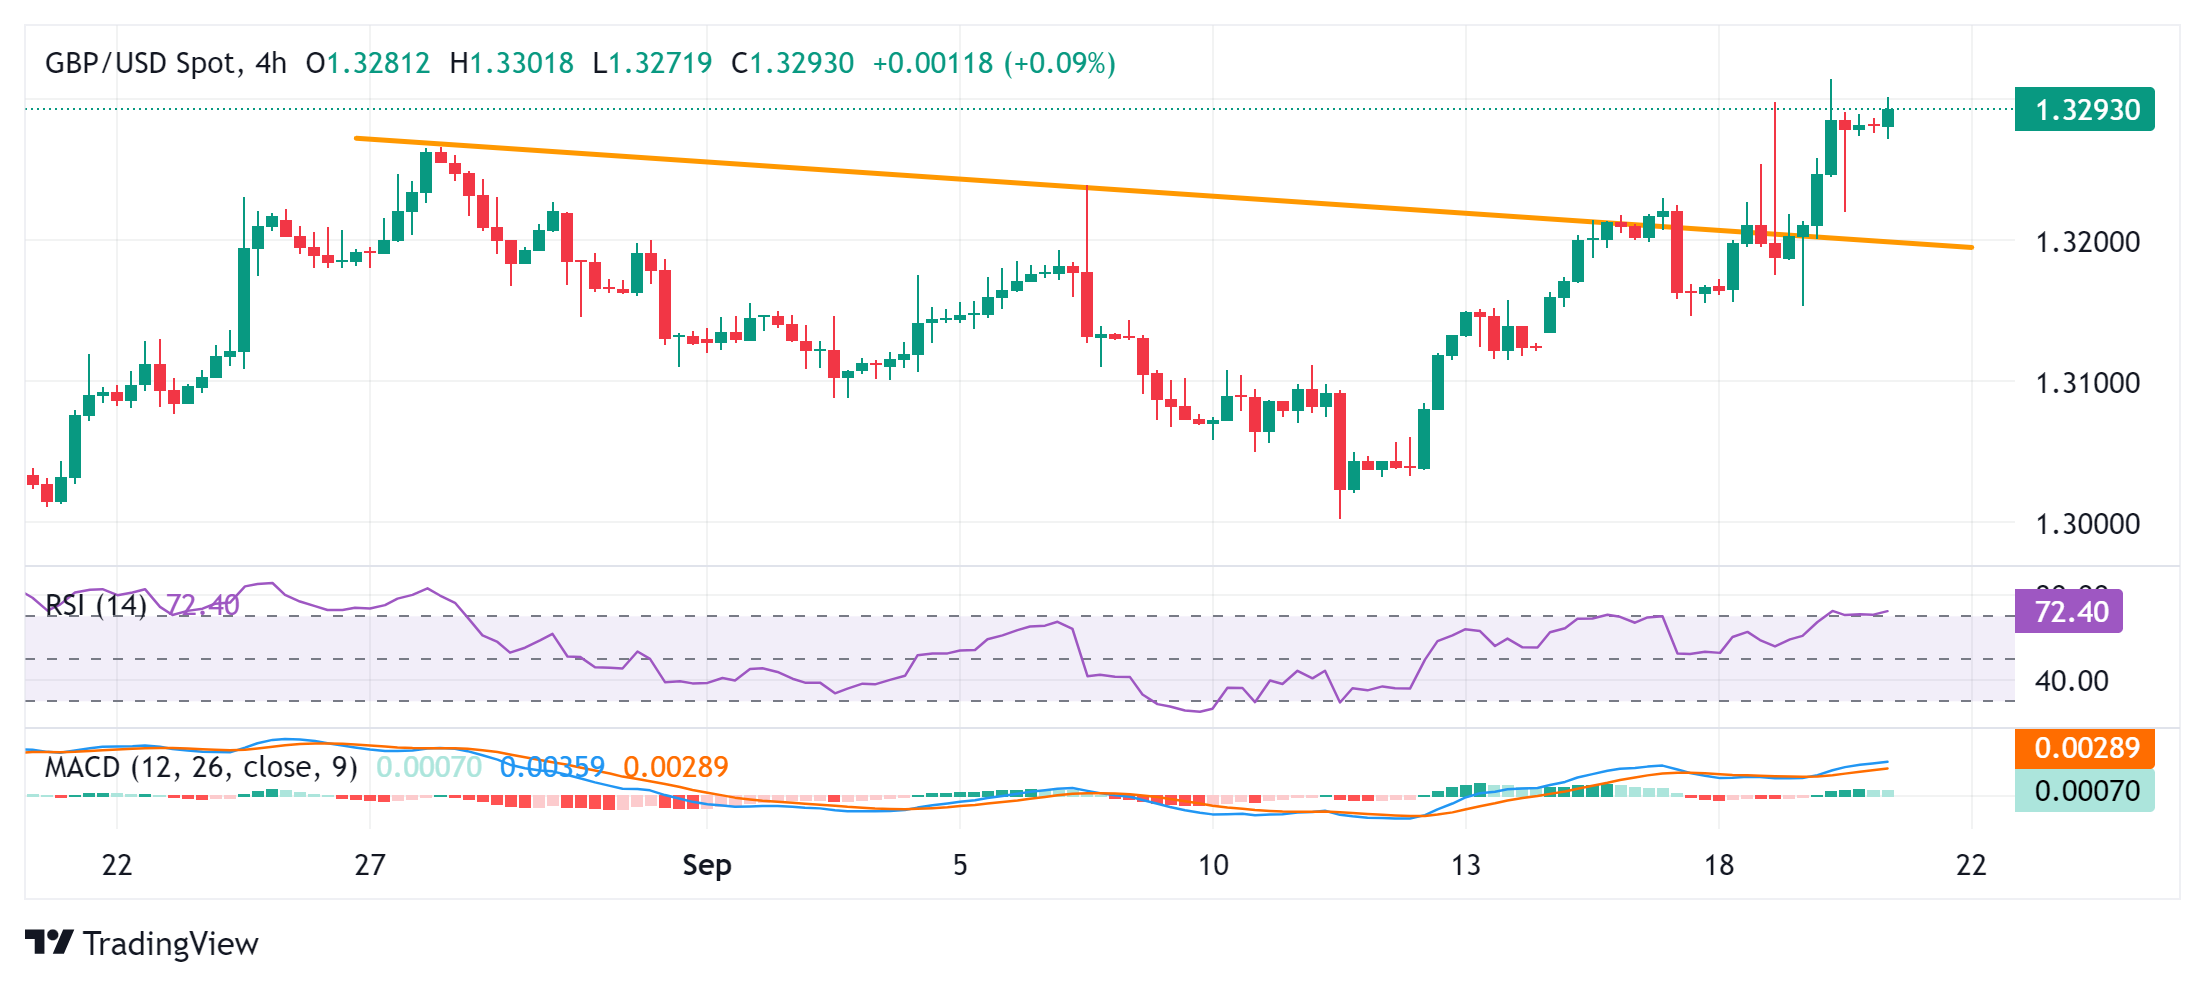
US Dollar PRICE Today
The table below shows the percentage change of US Dollar (USD) against listed major currencies today. US Dollar was the strongest against the Canadian Dollar.
| USD | EUR | GBP | JPY | CAD | AUD | NZD | CHF | |
|---|---|---|---|---|---|---|---|---|
| USD | -0.03% | -0.06% | -0.33% | 0.00% | -0.07% | -0.09% | -0.21% | |
| EUR | 0.03% | -0.04% | -0.27% | 0.01% | -0.05% | -0.05% | -0.18% | |
| GBP | 0.06% | 0.04% | -0.23% | 0.08% | 0.01% | -0.00% | -0.12% | |
| JPY | 0.33% | 0.27% | 0.23% | 0.32% | 0.23% | 0.22% | 0.12% | |
| CAD | -0.00% | -0.01% | -0.08% | -0.32% | -0.08% | -0.08% | -0.20% | |
| AUD | 0.07% | 0.05% | -0.01% | -0.23% | 0.08% | 0.01% | -0.10% | |
| NZD | 0.09% | 0.05% | 0.00% | -0.22% | 0.08% | -0.01% | -0.11% | |
| CHF | 0.21% | 0.18% | 0.12% | -0.12% | 0.20% | 0.10% | 0.11% |
The heat map shows percentage changes of major currencies against each other. The base currency is picked from the left column, while the quote currency is picked from the top row. For example, if you pick the US Dollar from the left column and move along the horizontal line to the Japanese Yen, the percentage change displayed in the box will represent USD (base)/JPY (quote).
- The Australian Dollar receives support against the US Dollar on central banks’ policy divergence.
- The PBoC decided to keep its one-year and five-year Loan Prime Rates unchanged at 3.35% and 3.85%, respectively.
- The US Dollar struggles amid the rising likelihood of further rate cuts by the Federal Reserve in 2024.
The Australian Dollar (AUD) recovers its daily losses and extends its winning streak against the US Dollar (USD) following the interest rate decision by the People’s Bank of China (PBoC) on Friday. The PBoC opted to keep its one-year and five-year Loan Prime Rates (LPRs) unchanged at 3.35% and 3.85%, respectively. As close trade partners, any developments in the Chinese economy can significantly impact Australian markets.
The AUD/USD pair received support following Thursday’s labor market report and the Federal Reserve’s (Fed) 50 basis points (bps) interest rate cut on Wednesday. The divergence in monetary policy between the Reserve Bank of Australia’s (RBA) commitment to maintaining higher rates for longer and the Fed’s easing cycle is expected to impact the pair’s movement in the near term.
The US Dollar faces challenges amid growing expectations for further rate cuts by the US Federal Reserve by the end of 2024. The latest dot plot projections suggest a gradual easing cycle, with the median rate for 2024 revised down to 4.375% from the 5.125% forecast in June.
Fed Chair Jerome Powell commented on the aggressive rate cut, saying, “This decision reflects our growing confidence that, with the appropriate adjustments to our policy, we can maintain a strong labor market, support moderate economic growth, and bring inflation down to a sustainable 2% level.”
Daily Digest Market Movers: Australian Dollar rises against US Dollar on central banks’ policy divergence
- US Treasury Secretary Janet Yellen stated on Friday that the recent interest rate cut by the Federal Reserve is a very positive indicator for the US economy. According to Yellen, it demonstrates the Fed's confidence that inflation has significantly decreased and is moving toward the 2% target. Meanwhile, the job market continues to show strength.
- Australian Employment Change came in at 47.5K in August, down from 58.2K in July, but well above the consensus forecast of 25.0K. The Unemployment Rate remained steady at 4.2% in August, in line with both expectations and the previous month's figure, according to data released by the Australian Bureau of Statistics (ABS).
- The Federal Open Market Committee (FOMC) lowered the federal funds rate to a range of 4.75% to 5.0%, marking the Fed’s first rate cut in over four years. This move signals the Fed’s commitment to safeguarding the labor market and steering the economy away from any signs of recession.
- Fed policymakers updated their quarterly economic forecasts, increasing the median projection for unemployment to 4.4% by the end of 2024, up from the 4% estimate made in June. They also raised their long-term forecast for the federal funds rate from 2.8% to 2.9%.
- Economists at Goldman Sachs and Citi have lowered their 2024 GDP growth forecasts for China to 4.7%, below Beijing's target of approximately 5.0%. SocGen describes the scenario as a "downward spiral," while Barclays refers to it as "from bad to worse" and a "vicious cycle." Morgan Stanley has also warned that "things could get worse before they get better," according to a Reuters report.
- China's economy showed signs of weakness in August, characterized by a continued slowdown in industrial activity and falling real estate prices. This situation has prompted increasing pressure on Beijing to enhance spending to stimulate demand, as reported by the National Bureau of Statistics on Saturday, according to Business Standard.
- Reserve Bank of Australia (RBA) Governor Michele Bullock emphasized that it is premature to consider rate cuts given the persistently high inflation. Additionally, RBA Assistant Governor Sarah Hunter noted that while the labor market remains tight, wage growth seems to have peaked and is expected to slow further.
Technical Analysis: Australian Dollar holds a position within the rising wedge near 0.6800
The AUD/USD pair trades near 0.6810 on Friday. Technical analysis of the daily chart shows that the pair is moving upward within the rising wedge pattern, signaling a strengthening of a bullish bias. Additionally, the 14-day Relative Strength Index (RSI) moves toward the 70 mark, indicating an ongoing bullish trend for the pair.
Regarding the upside, the AUD/USD pair may explore the region around the upper boundary of the rising wedge at the 0.6870 level. A breakthrough above the rising wedge could support the pair to test the psychological level of 0.6900.
On the downside, the AUD/USD pair is testing the lower boundary of the rising wedge around the level of 0.6800. A break below this level could pressure the pair to test the nine-day Exponential Moving Average (EMA) at 0.6760, with the next support at the psychological level of 0.6700.
AUD/USD: Daily Chart
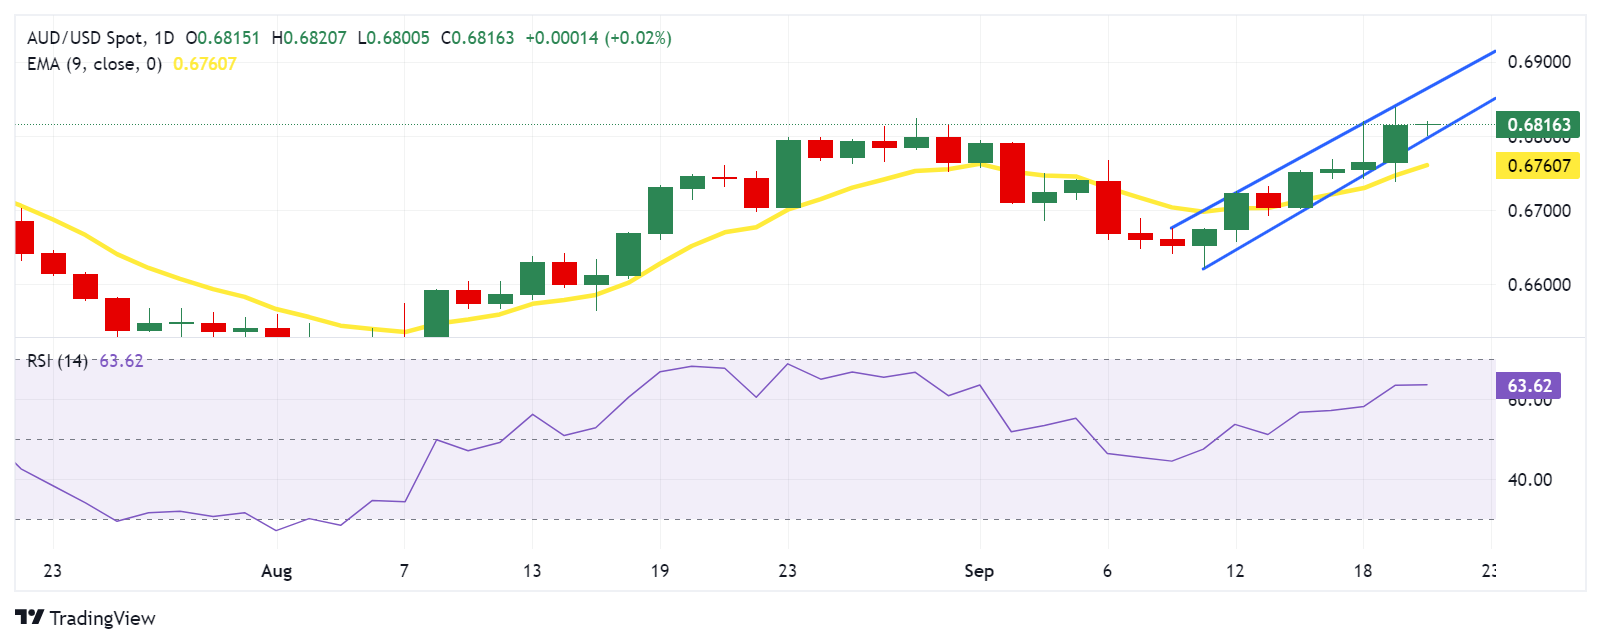
Australian Dollar PRICE Today
The table below shows the percentage change of Australian Dollar (AUD) against listed major currencies today. Australian Dollar was the strongest against the Canadian Dollar.
| USD | EUR | GBP | JPY | CAD | AUD | NZD | CHF | |
|---|---|---|---|---|---|---|---|---|
| USD | -0.03% | -0.05% | -0.31% | 0.00% | -0.04% | -0.08% | -0.16% | |
| EUR | 0.03% | -0.03% | -0.27% | 0.01% | -0.02% | -0.04% | -0.13% | |
| GBP | 0.05% | 0.03% | -0.25% | 0.07% | 0.03% | -0.01% | -0.08% | |
| JPY | 0.31% | 0.27% | 0.25% | 0.31% | 0.25% | 0.22% | 0.16% | |
| CAD | -0.01% | -0.01% | -0.07% | -0.31% | -0.05% | -0.08% | -0.15% | |
| AUD | 0.04% | 0.02% | -0.03% | -0.25% | 0.05% | -0.01% | -0.12% | |
| NZD | 0.08% | 0.04% | 0.00% | -0.22% | 0.08% | 0.01% | -0.07% | |
| CHF | 0.16% | 0.13% | 0.08% | -0.16% | 0.15% | 0.12% | 0.07% |
The heat map shows percentage changes of major currencies against each other. The base currency is picked from the left column, while the quote currency is picked from the top row. For example, if you pick the Australian Dollar from the left column and move along the horizontal line to the US Dollar, the percentage change displayed in the box will represent AUD (base)/USD (quote).
Australian Dollar FAQs
One of the most significant factors for the Australian Dollar (AUD) is the level of interest rates set by the Reserve Bank of Australia (RBA). Because Australia is a resource-rich country another key driver is the price of its biggest export, Iron Ore. The health of the Chinese economy, its largest trading partner, is a factor, as well as inflation in Australia, its growth rate and Trade Balance. Market sentiment – whether investors are taking on more risky assets (risk-on) or seeking safe-havens (risk-off) – is also a factor, with risk-on positive for AUD.
The Reserve Bank of Australia (RBA) influences the Australian Dollar (AUD) by setting the level of interest rates that Australian banks can lend to each other. This influences the level of interest rates in the economy as a whole. The main goal of the RBA is to maintain a stable inflation rate of 2-3% by adjusting interest rates up or down. Relatively high interest rates compared to other major central banks support the AUD, and the opposite for relatively low. The RBA can also use quantitative easing and tightening to influence credit conditions, with the former AUD-negative and the latter AUD-positive.
China is Australia’s largest trading partner so the health of the Chinese economy is a major influence on the value of the Australian Dollar (AUD). When the Chinese economy is doing well it purchases more raw materials, goods and services from Australia, lifting demand for the AUD, and pushing up its value. The opposite is the case when the Chinese economy is not growing as fast as expected. Positive or negative surprises in Chinese growth data, therefore, often have a direct impact on the Australian Dollar and its pairs.
Iron Ore is Australia’s largest export, accounting for $118 billion a year according to data from 2021, with China as its primary destination. The price of Iron Ore, therefore, can be a driver of the Australian Dollar. Generally, if the price of Iron Ore rises, AUD also goes up, as aggregate demand for the currency increases. The opposite is the case if the price of Iron Ore falls. Higher Iron Ore prices also tend to result in a greater likelihood of a positive Trade Balance for Australia, which is also positive of the AUD.
The Trade Balance, which is the difference between what a country earns from its exports versus what it pays for its imports, is another factor that can influence the value of the Australian Dollar. If Australia produces highly sought after exports, then its currency will gain in value purely from the surplus demand created from foreign buyers seeking to purchase its exports versus what it spends to purchase imports. Therefore, a positive net Trade Balance strengthens the AUD, with the opposite effect if the Trade Balance is negative.
- EUR/JPY attracts some sellers after the BoJ announced its policy decision this Friday.
- The Japanese central bank decided to leave interest rates unchanged, as anticipated.
- Traders still expect the BoJ to hike again in 2024, which lends some support to the JPY.
The EUR/JPY cross ticks lower after the Bank of Japan (BoJ) announced its policy decision this Friday and moves away from over a two-week high, around the 160.00 psychological mark touched the previous day. Spot prices drop closer to mid-158.00s in the last hour, though remain confined in the previous day's broader range.
As was widely anticipated, the Japanese central bank maintained the short-term interest rate target in the range of 0.15%-0.25% at the end of a two-day monetary policy review meeting. In the accompanying policy statement, the BoJ noted that Japan's economy will achieve growth above potential and that inflation is likely to be at a level generally consistent with the price target. This, however, fails to provide any meaningful impetus to the Japanese Yen (JPY), though hawkish BoJ expectations continue to act as a headwind for the EUR/JPY cross.
In fact, the recent comments by a slew of BoJ officials suggested that the Japanese central bank will hike interest rates again by the end of this year. The bets were reaffirmed by the latest consumer inflation figures released earlier this Friday, which showed that Japan's headline CPI rose from 2.8% in the prior month to the 3% YoY rate in August, hitting a 10-month high. Adding to this, the Core CPI, which excludes volatile fresh food prices, edged higher to 2.8%, or a 10-month high amid a sustained pick-up in consumption on the back of higher wages.
In contrast, the European Central Bank (ECB) last week indicated a declining path for borrowing costs in the months ahead after cutting interest rates for the second time this cycle. However, reports that the ECB policymakers see an interest rate cut in October as unlikely, barring a major deterioration in the outlook for growth, along with a bearish US Dollar (USD), lends some support to the shared currency. This, in turn, should limit losses for the EUR/JPY cross, which remains on track to register weekly gains for the first time in the previous three.
Economic Indicator
BoJ Interest Rate Decision
The Bank of Japan (BoJ) announces its interest rate decision after each of the Bank’s eight scheduled annual meetings. Generally, if the BoJ is hawkish about the inflationary outlook of the economy and raises interest rates it is bullish for the Japanese Yen (JPY). Likewise, if the BoJ has a dovish view on the Japanese economy and keeps interest rates unchanged, or cuts them, it is usually bearish for JPY.
Read more.Last release: Fri Sep 20, 2024 02:52
Frequency: Irregular
Actual: 0.15%
Consensus: -
Previous: 0.15%
Source: Bank of Japan
- NZD/USD struggles to gain any meaningful traction amid mixed fundamental cues.
- The Fed’s signal for more rate cuts and a positive risk tone undermines the USD.
- China’s economic woes seem to cap antipodean currencies, including the Kiwi.
The NZD/USD pair seesaws between tepid gains/minor losses through the Asian session on Friday and currently trades around the 0.6235-0.6240 region, well within the striking distance of the monthly peak touched the previous day.
The US Dollar (USD) struggles to attract buyers and languishes near the YTD low touched on Wednesday amid bets for more interest rate cuts by the Federal Reserve (Fed), which, in turn, is seen lending some support to the NZD/USD pair. In fact, Fed members forecasted another 50 basis points fall in borrowing costs by the end of this year and projected the benchmark rates to fall to 3.4% in 2025, down from a prior forecast of 4.1%, before declining to 2.9% in 2026.
Apart from this, the risk-on rally across the global equity markets turns out to be another factor undermining demand for the safe-haven Greenback and benefiting the risk-sensitive Kiwi. That said, persistent worries about an economic slowdown in China act as a headwind for antipodean currencies, including the New Zealand Dollar (NZD). That said, hopes for additional stimulus should continue to lend support to the NZD/USD pair and limit any meaningful decline.
The National Development and Reform Commission of the People's Republic of China (NDRC), during a news conference on Thursday, promised that it will roll out a batch of incremental measures with good effects in a timely manner. China's state planner sounded confident of achieving full-year economic and social development goals. This, however, failed to impress bulls, warranting caution before positioning for an extension of the NZD/USD pair's one-week-old uptrend.
There isn't any relevant market-moving economic data due for release from the US on Friday. That said, a scheduled speech by Philadelphia Fed President Patrick Harker might influence the USD price dynamics. Apart from this, the broader risk sentiment should contribute to producing short-term trading opportunities around the NZD/USD pair. Nevertheless, spot prices remain on track to register strong weekly gains for the first time in the previous three.
New Zealand Dollar FAQs
The New Zealand Dollar (NZD), also known as the Kiwi, is a well-known traded currency among investors. Its value is broadly determined by the health of the New Zealand economy and the country’s central bank policy. Still, there are some unique particularities that also can make NZD move. The performance of the Chinese economy tends to move the Kiwi because China is New Zealand’s biggest trading partner. Bad news for the Chinese economy likely means less New Zealand exports to the country, hitting the economy and thus its currency. Another factor moving NZD is dairy prices as the dairy industry is New Zealand’s main export. High dairy prices boost export income, contributing positively to the economy and thus to the NZD.
The Reserve Bank of New Zealand (RBNZ) aims to achieve and maintain an inflation rate between 1% and 3% over the medium term, with a focus to keep it near the 2% mid-point. To this end, the bank sets an appropriate level of interest rates. When inflation is too high, the RBNZ will increase interest rates to cool the economy, but the move will also make bond yields higher, increasing investors’ appeal to invest in the country and thus boosting NZD. On the contrary, lower interest rates tend to weaken NZD. The so-called rate differential, or how rates in New Zealand are or are expected to be compared to the ones set by the US Federal Reserve, can also play a key role in moving the NZD/USD pair.
Macroeconomic data releases in New Zealand are key to assess the state of the economy and can impact the New Zealand Dollar’s (NZD) valuation. A strong economy, based on high economic growth, low unemployment and high confidence is good for NZD. High economic growth attracts foreign investment and may encourage the Reserve Bank of New Zealand to increase interest rates, if this economic strength comes together with elevated inflation. Conversely, if economic data is weak, NZD is likely to depreciate.
The New Zealand Dollar (NZD) tends to strengthen during risk-on periods, or when investors perceive that broader market risks are low and are optimistic about growth. This tends to lead to a more favorable outlook for commodities and so-called ‘commodity currencies’ such as the Kiwi. Conversely, NZD tends to weaken at times of market turbulence or economic uncertainty as investors tend to sell higher-risk assets and flee to the more-stable safe havens.
Japan’s Finance Minister Shunichi Suzuki said on Friday that he “will continue to monitor and analyze the impact of the latest US rate cut on the Japanese economy and financial markets.”
“Federal Reserve Bank’s (FRB) view on the US economy is in line with the Japanese government's view that the US economy is likely to expand,” he added.
Market reaction
USD/JPY was last seen trading 0.13% lower on the day at 142.45, awaiting the Bank of Japan (BoJ) policy decision.
| Raw materials | Closed | Change, % |
|---|---|---|
| Silver | 30.784 | 2.39 |
| Gold | 258.594 | 1.06 |
| Palladium | 1082 | 2.95 |
- Indian Rupee gains traction in Friday’s Asian session.
- Softer USD and portfolio inflows support the INR, while higher crude oil prices might cap its upside.
- Investors await the Fed’s Harker speech on Friday.
The Indian Rupee (INR) extends its upside on the weaker US Dollar (USD) on Friday. The INR trades near the two-month highs, bolstered by likely portfolio inflows and an appreciation in the Chinese Yuan after the US Federal Reserve (Fed) began its easing cycle with an unexpected 50 basis point rate cut at its September meeting. Additionally, the USD sales likely from large foreign banks on behalf of custodial clients contribute to the local currency’s upside.
However, the further rise in crude oil prices might limit the upside for the INR as India is the third-largest oil consumer after the United States (US) and China. The Fed Philadelphia President Patrick Harker is scheduled to speak later on Friday.
Daily Digest Market Movers: Indian Rupee trades firmer amid favorable economic factors
- According to the Reserve Bank of India (RBI), the foreign exchange reserves have grown by USD 66 billion in 2024, reaching a total of USD 689.235 billion.
- “The rupee’s recent rally reflects favorable domestic conditions and the impact of global monetary policy shifts. As the Fed's decisions continue to sway markets, all eyes will be on the Reserve Bank of India’s response and whether the rupee can maintain its upward trajectory. For now, 84 will serve as a strong resistance level, while 83.50 will act as robust support,” said Amit Pabari, managing director at CR Forex.
- The US weekly Initial Jobless Claims came in at 219K for the week ending September 14, the US Department of Labor (DoL) showed Thursday. This figure was below the market consensus of 230K and lower than the previous week of 231K (revised from 230K).
- US Existing Home Sales dropped 2.5% MoM in August to 3.86 million from 3.96 million in July.
- The Philadelphia Fed Manufacturing index unexpectedly rose to 1.7 in September, compared to a fall of 7 in the previous reading, better than the estimation of -1.
Technical Analysis: USD/INR resumes its broader bearish trend
The Indian Rupee trades stronger on the day. The downtrend of the USD/INR pair resumes as the pair broke below the rectangle and the key 100-day Exponential Moving Average (EMA) on the daily chart. The downward momentum is supported by the 14-day Relative Strength Index (RSI), which stands below the midline near 32.40, supporting the sellers for the time being.
The initial support level for the pair emerges at 83.50, the low of July 17. Sustained bearish momentum could pave the way to 83.31, the low of June 18. The next cushion level is seen at the 83.00 psychological mark.
On the bright side, the 100-day EMA at 83.64 will be the immediate resistance level for USD/INR, followed by 83.75, the lower limit of the rectangle. The key upside barrier to watch is the 83.90-84.00 zone.
Indian Rupee FAQs
The Indian Rupee (INR) is one of the most sensitive currencies to external factors. The price of Crude Oil (the country is highly dependent on imported Oil), the value of the US Dollar – most trade is conducted in USD – and the level of foreign investment, are all influential. Direct intervention by the Reserve Bank of India (RBI) in FX markets to keep the exchange rate stable, as well as the level of interest rates set by the RBI, are further major influencing factors on the Rupee.
The Reserve Bank of India (RBI) actively intervenes in forex markets to maintain a stable exchange rate, to help facilitate trade. In addition, the RBI tries to maintain the inflation rate at its 4% target by adjusting interest rates. Higher interest rates usually strengthen the Rupee. This is due to the role of the ‘carry trade’ in which investors borrow in countries with lower interest rates so as to place their money in countries’ offering relatively higher interest rates and profit from the difference.
Macroeconomic factors that influence the value of the Rupee include inflation, interest rates, the economic growth rate (GDP), the balance of trade, and inflows from foreign investment. A higher growth rate can lead to more overseas investment, pushing up demand for the Rupee. A less negative balance of trade will eventually lead to a stronger Rupee. Higher interest rates, especially real rates (interest rates less inflation) are also positive for the Rupee. A risk-on environment can lead to greater inflows of Foreign Direct and Indirect Investment (FDI and FII), which also benefit the Rupee.
Higher inflation, particularly, if it is comparatively higher than India’s peers, is generally negative for the currency as it reflects devaluation through oversupply. Inflation also increases the cost of exports, leading to more Rupees being sold to purchase foreign imports, which is Rupee-negative. At the same time, higher inflation usually leads to the Reserve Bank of India (RBI) raising interest rates and this can be positive for the Rupee, due to increased demand from international investors. The opposite effect is true of lower inflation.
- Gold price enters a bullish consolidation phase near the all-time peak touched on Wednesday.
- Bets for more Fed rate cuts keep the USD bulls on the defensive and underpin the commodity.
- Concerns over the US/China economic outlook and geopolitical risks also benefit the XAU/USD.
Gold price (XAU/USD) regained positive traction on Thursday and rallied back closer to the all-time peak touched the previous day in reaction to the Federal Reserve's (Fed) decision to start the policy easing cycle with an oversized rate cut. Expectations of further rate cuts by the US central bank attracted fresh US Dollar (USD) selling and turned out to be a key factor that benefited the non-yielding yellow metal.
Apart from this, concerns over a slowdown in the United States (US) and China – the world's two largest economies – and persistent geopolitical risks provided an additional boost to the Gold price. That said, the risk-on rally across the global equity markets keeps a lid on any further upside for the safe-haven XAU/USD and leads to subdued range-bound price action during the Asian session on Friday.
Nevertheless, Gold price, at current levels, remains on track to end in the green for the second straight week. Moreover, the fundamental backdrop seems tilted in favor of bullish traders and supports prospects for an extension of the commodity's well-established uptrend. Traders now look to the crucial Bank of Japan (BoJ) policy update, which might infuse volatility and provide some impetus to the XAU/USD.
Daily Digest Market Movers: Gold price draws support from bearish USD and persistent geopolitical risks
- The Federal Reserve's jumbo rate cut on Wednesday and forecast for another 50 basis points fall in borrowing costs by the end of this year failed to assist the US Dollar to capitalize on the post-FOMC recovery from the YTD low.
- Moreover, Fed policymakers projected rates falling to 3.4% in 2025, down from a prior forecast of 4.1%, and declining to 2.9% in 2026, down from a prior forecast of 3.1%, which revived demand for the Gold price on Thursday.
- The USD bulls seem unimpressed by the upbeat US macro data, showing that Weekly Initial Jobless Claims fell to 219K in the week ending September 14, marking the lowest since May and pointing to a resilient labor market.
- Adding to this, the Philadelphia Fed's survey revealed that the current general activity index for manufacturing jumped from a seven-month low of -7.0 in August to 1.7 in September, surpassing consensus estimates.
- Meanwhile, the Fed's oversized rate cut fueled concerns over economic growth, which, along with persistent worries about a slowdown in China, turned out to be another factor that benefited the safe-haven XAU/USD.
- Furthermore, geopolitical risks stemming from tensions in the Middle East and the Russia-Ukraine war act as a tailwind for the precious metal amid the US political uncertainty ahead of the November presidential election.
- Apart from this, the fact that several Asian central banks and Russia are buying gold to reduce their reliance on the USD favors bullish traders and supports prospects for a further near-term appreciating move.
Technical Outlook: Gold price might confront resistance near the top end of a short-term ascending channel
From a technical perspective, the $2,600 round-figure mark, or the all-time peak set on Wednesday could offer some resistance ahead of the $2,613-2,615 region. The latter represents the top boundary of a short-term ascending trend channel extending from June and should act as a key pivotal point. With oscillators on the daily chart holding comfortably in positive territory and still far from being in the overbought zone, a sustained strength beyond the said barrier will be seen as a fresh trigger for bulls and pave the way for a further near-term appreciating move for the Gold price.
On the flip side, the $2,551-2,550 area now seems to protect the immediate downside ahead of the $2,532-2,530 horizontal resistance breakpoint. Some follow-through selling might expose the $2,500 psychological mark, below which Gold price could accelerate the slide towards the $2,476 confluence – comprising the 50-day Simple Moving Average (SMA) and the lower boundary of the channel. A convincing break below will suggest that the XAU/USD has topped out in the near term, setting the stage for a slide to the 100-day SMA, around the $2,412 region, en route to the $2,400 mark.
Gold FAQs
Gold has played a key role in human’s history as it has been widely used as a store of value and medium of exchange. Currently, apart from its shine and usage for jewelry, the precious metal is widely seen as a safe-haven asset, meaning that it is considered a good investment during turbulent times. Gold is also widely seen as a hedge against inflation and against depreciating currencies as it doesn’t rely on any specific issuer or government.
Central banks are the biggest Gold holders. In their aim to support their currencies in turbulent times, central banks tend to diversify their reserves and buy Gold to improve the perceived strength of the economy and the currency. High Gold reserves can be a source of trust for a country’s solvency. Central banks added 1,136 tonnes of Gold worth around $70 billion to their reserves in 2022, according to data from the World Gold Council. This is the highest yearly purchase since records began. Central banks from emerging economies such as China, India and Turkey are quickly increasing their Gold reserves.
Gold has an inverse correlation with the US Dollar and US Treasuries, which are both major reserve and safe-haven assets. When the Dollar depreciates, Gold tends to rise, enabling investors and central banks to diversify their assets in turbulent times. Gold is also inversely correlated with risk assets. A rally in the stock market tends to weaken Gold price, while sell-offs in riskier markets tend to favor the precious metal.
The price can move due to a wide range of factors. Geopolitical instability or fears of a deep recession can quickly make Gold price escalate due to its safe-haven status. As a yield-less asset, Gold tends to rise with lower interest rates, while higher cost of money usually weighs down on the yellow metal. Still, most moves depend on how the US Dollar (USD) behaves as the asset is priced in dollars (XAU/USD). A strong Dollar tends to keep the price of Gold controlled, whereas a weaker Dollar is likely to push Gold prices up.
- The Japanese Yen appreciates as traders expect the BoJ to keep interest rates unchanged on Friday.
- Japan's Consumer Price Index rose to 3.0% YoY in August, reaching its highest level since October 2023.
- The US Dollar faces challenges due to rising odds for additional Fed rate cuts in 2024.
The Japanese Yen (JPY) edges lower against the US Dollar (USD) following the National Consumer Price Index (CPI) data released on Friday. Traders are now focusing on the Bank of Japan (BoJ) policy decision later in the day, with expectations of keeping its short-term interest rate target between 0.15% and 0.25%.
Japan's Consumer Price Index (CPI) increased to 3.0% year-on-year in August, up from 2.8% previously, marking the highest level since October 2023. Additionally, the Core National CPI, excluding fresh food, reached a six-month high of 2.8%, rising for the fourth consecutive month and in line with market expectations.
The downside of the USD/JPY pair is supported by a weaker US Dollar (USD) as expectations grow for additional rate cuts by the US Federal Reserve (Fed) by the end of 2024. The latest dot plot projections indicate a gradual easing cycle, with the 2024 median rate revised to 4.375%, down from the 5.125% forecast in June.
However, Federal Reserve Chair Jerome Powell stated in the post-meeting press conference that the Fed is not in a hurry to ease policy and emphasized that half-percentage point rate cuts are not the "new pace."
Daily Digest Market Movers: Japanese Yen appreciates due to hawkish BoJ
- US Treasury Secretary Janet Yellen stated on Friday that the recent interest rate cut by the Federal Reserve is a very positive indicator for the US economy. According to Yellen, it demonstrates the Fed's confidence that inflation has significantly decreased and is moving toward the 2% target. Meanwhile, the job market continues to show strength.
- The Federal Open Market Committee (FOMC) lowered the federal funds rate to a range of 4.75% to 5.0%, marking the Fed’s first rate cut in over four years. Fed policymakers updated their quarterly economic forecasts, increasing the median projection for unemployment to 4.4% by the end of 2024, up from the 4.0% estimate made in June. They also raised their long-term projection for the federal funds rate from 2.8% to 2.9%.
- Federal Reserve Chair Jerome Powell commented on the aggressive 50 basis point rate cut, saying, “This decision reflects our increased confidence that, with the right adjustments to our policy approach, we can maintain a strong labor market, achieve moderate economic growth, and bring inflation down to a sustainable 2% level.”
- Japan’s Merchandise Trade Balance Total recorded a larger trade deficit of ¥695.30 billion in August, up from ¥628.70 billion the previous month, but well below market expectations of a ¥1,380.0 billion shortfall. Exports increased by 5.6% year-over-year, marking the ninth consecutive month of growth, but fell short of the anticipated 10.0%. Imports rose by just 2.3%, the slowest pace in five months, significantly underperforming the projected 13.4% rise.
- Japanese Finance Minister Shunichi Suzuki stated on Tuesday that rapid foreign exchange (FX) fluctuations are undesirable. Suzuki emphasized that officials will closely monitor how FX movements affect the Japanese economy and people's livelihoods. The government will continue to assess the impact of a stronger Japanese Yen and respond accordingly, according to Reuters.
- Commerzbank FX analyst Volkmar Baur anticipated that the Bank of Japan will remain on the sidelines this week. Baur noted that the Federal Reserve's actions are likely to have a greater impact on the USD/JPY pair, suggesting that the JPY could have a strong chance of falling below 140.00 per USD even without a rate hike from the BoJ.
Technical Analysis: USD/JPY falls toward 142.00; further downside seems possible due to bearish bias
USD/JPY trades around 142.30 on Friday. Analysis of the daily chart indicates that the pair is consolidating within a descending channel, which supports a bearish bias. However, the 14-day Relative Strength Index (RSI) remains below the 50 level, confirming an ongoing bearish outlook.
On the downside, the USD/JPY pair might find immediate support at 139.58, which is the lowest level since June 2023, followed by the lower boundary of the descending channel near 137.50.
On the resistance side, the 21-day Exponential Moving Average (EMA) at the 143.56 level acts as an initial barrier, followed by the upper boundary of the descending channel around the 144.80 level.
USD/JPY: Daily Chart
Japanese Yen PRICE Today
The table below shows the percentage change of Japanese Yen (JPY) against listed major currencies today. Japanese Yen was the strongest against the Australian Dollar.
| USD | EUR | GBP | JPY | CAD | AUD | NZD | CHF | |
|---|---|---|---|---|---|---|---|---|
| USD | 0.02% | 0.05% | -0.16% | 0.06% | 0.17% | 0.12% | -0.13% | |
| EUR | -0.02% | 0.02% | -0.17% | 0.02% | 0.15% | 0.10% | -0.16% | |
| GBP | -0.05% | -0.02% | -0.19% | 0.03% | 0.14% | 0.08% | -0.15% | |
| JPY | 0.16% | 0.17% | 0.19% | 0.24% | 0.34% | 0.29% | 0.06% | |
| CAD | -0.06% | -0.02% | -0.03% | -0.24% | 0.10% | 0.07% | -0.17% | |
| AUD | -0.17% | -0.15% | -0.14% | -0.34% | -0.10% | -0.02% | -0.27% | |
| NZD | -0.12% | -0.10% | -0.08% | -0.29% | -0.07% | 0.02% | -0.25% | |
| CHF | 0.13% | 0.16% | 0.15% | -0.06% | 0.17% | 0.27% | 0.25% |
The heat map shows percentage changes of major currencies against each other. The base currency is picked from the left column, while the quote currency is picked from the top row. For example, if you pick the Japanese Yen from the left column and move along the horizontal line to the US Dollar, the percentage change displayed in the box will represent JPY (base)/USD (quote).
Japanese Yen FAQs
The Japanese Yen (JPY) is one of the world’s most traded currencies. Its value is broadly determined by the performance of the Japanese economy, but more specifically by the Bank of Japan’s policy, the differential between Japanese and US bond yields, or risk sentiment among traders, among other factors.
One of the Bank of Japan’s mandates is currency control, so its moves are key for the Yen. The BoJ has directly intervened in currency markets sometimes, generally to lower the value of the Yen, although it refrains from doing it often due to political concerns of its main trading partners. The current BoJ ultra-loose monetary policy, based on massive stimulus to the economy, has caused the Yen to depreciate against its main currency peers. This process has exacerbated more recently due to an increasing policy divergence between the Bank of Japan and other main central banks, which have opted to increase interest rates sharply to fight decades-high levels of inflation.
The BoJ’s stance of sticking to ultra-loose monetary policy has led to a widening policy divergence with other central banks, particularly with the US Federal Reserve. This supports a widening of the differential between the 10-year US and Japanese bonds, which favors the US Dollar against the Japanese Yen.
The Japanese Yen is often seen as a safe-haven investment. This means that in times of market stress, investors are more likely to put their money in the Japanese currency due to its supposed reliability and stability. Turbulent times are likely to strengthen the Yen’s value against other currencies seen as more risky to invest in.
On Friday, the People’s Bank of China (PBoC) set the USD/CNY central rate for the trading session ahead at 7.0644, as compared to the previous day's fix of 7.0983 and 7.0637 Reuters estimates.
- WTI price drifts lower to near $70.80 in Friday’s Asian session.
- Ongoing Middle East geopolitical tensions, prospects of further Fed rate cuts this year could support the WTI price.
- The weaker oil demand in China might weigh on the WTI.
West Texas Intermediate (WTI), the US crude Oil benchmark, is trading around $70.80 on Friday. WTI price edges lower amid some profit-taking. However, the downside of the WTI price might be limited as geopolitical tensions in the Middle East continue to escalate and the Federal Reserve (Fed) is likely to cut more interest rates in the months to come.
Israeli warplanes and artillery attacked Hezbollah in southern Lebanon on Thursday. The action came after the militia's pagers and walkie-talkies exploded last week, killing scores and injuring thousands across Lebanon, according to CNBC. “We continue to highlight Lebanon as the main pathway to oil disruption through direct Iranian involvement in a wider regional war,” said Helima Croft, head of global commodity strategy at RBC Capital Markets.
The US Fed decided to cut its interest rates by half a percentage point at its September meeting on Wednesday. The new "dot plots" suggest a gradual easing cycle, with the 2024 median revised to 4.375% versus the 5.125% projection in June. Lower interest rates generally support the WTI price as it reduces the cost of borrowing, which can boost economic activity and oil demand.
Declining US crude stockpiles might support oil prices in the near term. According to the US Energy Information Administration (EIA), crude oil stockpiles in the United States for the week ending September 13 decreased by 1.63 million barrels, compared to a decline of 0.833 million barrels in the previous week. The market consensus estimated that stocks would decline by just 0.1 million barrels.
On the other hand, the concerns about weaker oil demand and the economic slowdown in China might cap the black gold’s upside. Statistics Bureau data showed Chinese Industrial Production growth slowed to a five-month low in August and Retail Sales weakened further.
WTI Oil FAQs
WTI Oil is a type of Crude Oil sold on international markets. The WTI stands for West Texas Intermediate, one of three major types including Brent and Dubai Crude. WTI is also referred to as “light” and “sweet” because of its relatively low gravity and sulfur content respectively. It is considered a high quality Oil that is easily refined. It is sourced in the United States and distributed via the Cushing hub, which is considered “The Pipeline Crossroads of the World”. It is a benchmark for the Oil market and WTI price is frequently quoted in the media.
Like all assets, supply and demand are the key drivers of WTI Oil price. As such, global growth can be a driver of increased demand and vice versa for weak global growth. Political instability, wars, and sanctions can disrupt supply and impact prices. The decisions of OPEC, a group of major Oil-producing countries, is another key driver of price. The value of the US Dollar influences the price of WTI Crude Oil, since Oil is predominantly traded in US Dollars, thus a weaker US Dollar can make Oil more affordable and vice versa.
The weekly Oil inventory reports published by the American Petroleum Institute (API) and the Energy Information Agency (EIA) impact the price of WTI Oil. Changes in inventories reflect fluctuating supply and demand. If the data shows a drop in inventories it can indicate increased demand, pushing up Oil price. Higher inventories can reflect increased supply, pushing down prices. API’s report is published every Tuesday and EIA’s the day after. Their results are usually similar, falling within 1% of each other 75% of the time. The EIA data is considered more reliable, since it is a government agency.
OPEC (Organization of the Petroleum Exporting Countries) is a group of 13 Oil-producing nations who collectively decide production quotas for member countries at twice-yearly meetings. Their decisions often impact WTI Oil prices. When OPEC decides to lower quotas, it can tighten supply, pushing up Oil prices. When OPEC increases production, it has the opposite effect. OPEC+ refers to an expanded group that includes ten extra non-OPEC members, the most notable of which is Russia.
The People’s Bank of China (PBOC), China's central bank, announced to leave its Loan Prime Rates (LPRs) unchanged on Friday. The one-year and five-year LPRs were at 3.35% and 3.85%, respectively.
Market reaction
At the time of writing, AUD/USD is holding lower ground near 0.6803, down 0.15% on the day.
Australian Dollar FAQs
One of the most significant factors for the Australian Dollar (AUD) is the level of interest rates set by the Reserve Bank of Australia (RBA). Because Australia is a resource-rich country another key driver is the price of its biggest export, Iron Ore. The health of the Chinese economy, its largest trading partner, is a factor, as well as inflation in Australia, its growth rate and Trade Balance. Market sentiment – whether investors are taking on more risky assets (risk-on) or seeking safe-havens (risk-off) – is also a factor, with risk-on positive for AUD.
The Reserve Bank of Australia (RBA) influences the Australian Dollar (AUD) by setting the level of interest rates that Australian banks can lend to each other. This influences the level of interest rates in the economy as a whole. The main goal of the RBA is to maintain a stable inflation rate of 2-3% by adjusting interest rates up or down. Relatively high interest rates compared to other major central banks support the AUD, and the opposite for relatively low. The RBA can also use quantitative easing and tightening to influence credit conditions, with the former AUD-negative and the latter AUD-positive.
China is Australia’s largest trading partner so the health of the Chinese economy is a major influence on the value of the Australian Dollar (AUD). When the Chinese economy is doing well it purchases more raw materials, goods and services from Australia, lifting demand for the AUD, and pushing up its value. The opposite is the case when the Chinese economy is not growing as fast as expected. Positive or negative surprises in Chinese growth data, therefore, often have a direct impact on the Australian Dollar and its pairs.
Iron Ore is Australia’s largest export, accounting for $118 billion a year according to data from 2021, with China as its primary destination. The price of Iron Ore, therefore, can be a driver of the Australian Dollar. Generally, if the price of Iron Ore rises, AUD also goes up, as aggregate demand for the currency increases. The opposite is the case if the price of Iron Ore falls. Higher Iron Ore prices also tend to result in a greater likelihood of a positive Trade Balance for Australia, which is also positive of the AUD.
The Trade Balance, which is the difference between what a country earns from its exports versus what it pays for its imports, is another factor that can influence the value of the Australian Dollar. If Australia produces highly sought after exports, then its currency will gain in value purely from the surplus demand created from foreign buyers seeking to purchase its exports versus what it spends to purchase imports. Therefore, a positive net Trade Balance strengthens the AUD, with the opposite effect if the Trade Balance is negative.
| Index | Change, points | Closed | Change, % |
|---|---|---|---|
| NIKKEI 225 | 775.16 | 37155.33 | 2.13 |
| Hang Seng | 353.14 | 18013.16 | 2 |
| ASX 200 | 49.8 | 8191.9 | 0.61 |
| DAX | 290.89 | 19002.38 | 1.55 |
| CAC 40 | 170.51 | 7615.41 | 2.29 |
| Dow Jones | 522.09 | 42025.19 | 1.26 |
| S&P 500 | 95.38 | 5713.64 | 1.7 |
| NASDAQ Composite | 440.68 | 18013.98 | 2.51 |
| Pare | Closed | Change, % |
|---|---|---|
| AUDUSD | 0.68132 | 0.75 |
| EURJPY | 159.194 | 0.8 |
| EURUSD | 1.11614 | 0.41 |
| GBPJPY | 189.438 | 0.96 |
| GBPUSD | 1.3281 | 0.56 |
| NZDUSD | 0.62393 | 0.53 |
| USDCAD | 1.35563 | -0.36 |
| USDCHF | 0.84721 | 0.11 |
| USDJPY | 142.622 | 0.39 |
- AUD/USD trades firmer around 0.6810 in Friday’s early Asian session.
- Fed officials pencilled in more rate cuts by year-end in their latest economic projections.
- Investors will monitor the PBoC interest rate decision, Fed’s Harker speech on Friday.
The AUD/USD pair trades on a stronger note near 0.6810 during the early Asian session on Friday. The uptick of the pair is bolstered by the softer US Dollar (USD) amid the prospects of further rate cuts by the US Federal Reserve (Fed) this year. Later on Friday, the Fed’s Patrick Harker is set to speak.
The divergence of monetary policy between the Reserve Bank of Australia’s (RBA) higher for longer rate narrative and the Fed’s easing cycle is likely to influence the major pair in the near term. The two-day Fed meeting ended with an unexpected 50 basis points (bps) rate cut. The new dot-plots suggest a gradual easing cycle, with the 2024 median revised to 4.375% versus the 5.125% projection in June. Market expectations of the Fed rate cut might continue to undermine the Greenback and act as a tailwind for AUD/USD for the time being.
On the other hand, investors see the RBA keep its Official Cash Rate (OCR) unchanged at the upcoming meeting, but expect the rate cut later this year. Commonwealth Bank of Australia (CBA) analysts moved their expected timing of the first RBA rate cut from November 2024 to December 2024, with 25bp cut expected. “Recent strength in employment growth coupled with still relatively hawkish rhetoric from the RBA Governor means we now see December as the more likely month for the start of normalising the cash rate,” said CBA analysts.
The People’s Bank of China’s (PBoC) will announce its interest rate decision on Friday. Meanwhile, any development surrounding the weakness in the Chinese economy could weigh on the China-proxy Australian Dollar (AUD) as China is Australia's largest trading partner.
Australian Dollar FAQs
One of the most significant factors for the Australian Dollar (AUD) is the level of interest rates set by the Reserve Bank of Australia (RBA). Because Australia is a resource-rich country another key driver is the price of its biggest export, Iron Ore. The health of the Chinese economy, its largest trading partner, is a factor, as well as inflation in Australia, its growth rate and Trade Balance. Market sentiment – whether investors are taking on more risky assets (risk-on) or seeking safe-havens (risk-off) – is also a factor, with risk-on positive for AUD.
The Reserve Bank of Australia (RBA) influences the Australian Dollar (AUD) by setting the level of interest rates that Australian banks can lend to each other. This influences the level of interest rates in the economy as a whole. The main goal of the RBA is to maintain a stable inflation rate of 2-3% by adjusting interest rates up or down. Relatively high interest rates compared to other major central banks support the AUD, and the opposite for relatively low. The RBA can also use quantitative easing and tightening to influence credit conditions, with the former AUD-negative and the latter AUD-positive.
China is Australia’s largest trading partner so the health of the Chinese economy is a major influence on the value of the Australian Dollar (AUD). When the Chinese economy is doing well it purchases more raw materials, goods and services from Australia, lifting demand for the AUD, and pushing up its value. The opposite is the case when the Chinese economy is not growing as fast as expected. Positive or negative surprises in Chinese growth data, therefore, often have a direct impact on the Australian Dollar and its pairs.
Iron Ore is Australia’s largest export, accounting for $118 billion a year according to data from 2021, with China as its primary destination. The price of Iron Ore, therefore, can be a driver of the Australian Dollar. Generally, if the price of Iron Ore rises, AUD also goes up, as aggregate demand for the currency increases. The opposite is the case if the price of Iron Ore falls. Higher Iron Ore prices also tend to result in a greater likelihood of a positive Trade Balance for Australia, which is also positive of the AUD.
The Trade Balance, which is the difference between what a country earns from its exports versus what it pays for its imports, is another factor that can influence the value of the Australian Dollar. If Australia produces highly sought after exports, then its currency will gain in value purely from the surplus demand created from foreign buyers seeking to purchase its exports versus what it spends to purchase imports. Therefore, a positive net Trade Balance strengthens the AUD, with the opposite effect if the Trade Balance is negative.


© 2000-2026. All rights reserved.
This site is managed by Teletrade D.J. LLC 2351 LLC 2022 (Euro House, Richmond Hill Road, Kingstown, VC0100, St. Vincent and the Grenadines).
The information on this website is for informational purposes only and does not constitute any investment advice.
The company does not serve or provide services to customers who are residents of the US, Canada, Iran, The Democratic People's Republic of Korea, Yemen and FATF blacklisted countries.
Making transactions on financial markets with marginal financial instruments opens up wide possibilities and allows investors who are willing to take risks to earn high profits, carrying a potentially high risk of losses at the same time. Therefore you should responsibly approach the issue of choosing the appropriate investment strategy, taking the available resources into account, before starting trading.
Use of the information: full or partial use of materials from this website must always be referenced to TeleTrade as the source of information. Use of the materials on the Internet must be accompanied by a hyperlink to teletrade.org. Automatic import of materials and information from this website is prohibited.
Please contact our PR department if you have any questions or need assistance at pr@teletrade.global.
transfers