- Analytics
- News and Tools
- Market News
CFD Markets News and Forecasts — 20-05-2024
The New Zealand Treasury's Economic Update issued late last week showed that there is no near-term turning point seen for the economy and the consensus expects the Reserve Bank of New Zealand (RBNZ) to hold interest rate on Wednesday.
Key quotes
“Weak housing market, lower food prices and expected inflation highlight low demand.”
“No turning point in sight amid lower retail spending and sector-wide business activity.”
“Weaker-than-expected credit data, along with soft inflation, easing sentiment in manufacturing and services surveys and persistent housing market weakness confirm subdued domestic demand amidst weak consumer confidence.”
“Indicators continue to point to low demand heading into the second quarter, affecting consumers and businesses alike.”
“A convincing drop in inflation expectations, discretionary spending and normalising patterns of migration will be welcome news to the Reserve Bank but a rate cut at week’s Monetary Policy Statement is unlikely.”
“Furthermore, business sentiment across all sectors show no sign of a turning point in the near term painting a bleak picture at least in the domestic economy.”
Market reaction
The NZD/USD pair is trading higher by 0.02% on the day to trade at 0.6107, as of writing.
New Zealand Dollar FAQs
The New Zealand Dollar (NZD), also known as the Kiwi, is a well-known traded currency among investors. Its value is broadly determined by the health of the New Zealand economy and the country’s central bank policy. Still, there are some unique particularities that also can make NZD move. The performance of the Chinese economy tends to move the Kiwi because China is New Zealand’s biggest trading partner. Bad news for the Chinese economy likely means less New Zealand exports to the country, hitting the economy and thus its currency. Another factor moving NZD is dairy prices as the dairy industry is New Zealand’s main export. High dairy prices boost export income, contributing positively to the economy and thus to the NZD.
The Reserve Bank of New Zealand (RBNZ) aims to achieve and maintain an inflation rate between 1% and 3% over the medium term, with a focus to keep it near the 2% mid-point. To this end, the bank sets an appropriate level of interest rates. When inflation is too high, the RBNZ will increase interest rates to cool the economy, but the move will also make bond yields higher, increasing investors’ appeal to invest in the country and thus boosting NZD. On the contrary, lower interest rates tend to weaken NZD. The so-called rate differential, or how rates in New Zealand are or are expected to be compared to the ones set by the US Federal Reserve, can also play a key role in moving the NZD/USD pair.
Macroeconomic data releases in New Zealand are key to assess the state of the economy and can impact the New Zealand Dollar’s (NZD) valuation. A strong economy, based on high economic growth, low unemployment and high confidence is good for NZD. High economic growth attracts foreign investment and may encourage the Reserve Bank of New Zealand to increase interest rates, if this economic strength comes together with elevated inflation. Conversely, if economic data is weak, NZD is likely to depreciate.
The New Zealand Dollar (NZD) tends to strengthen during risk-on periods, or when investors perceive that broader market risks are low and are optimistic about growth. This tends to lead to a more favorable outlook for commodities and so-called ‘commodity currencies’ such as the Kiwi. Conversely, NZD tends to weaken at times of market turbulence or economic uncertainty as investors tend to sell higher-risk assets and flee to the more-stable safe havens.
- GBP/USD holds positive ground around 1.2710 in Tuesday’s early Asian session.
- Fed officials remain cautious about the timing of rate cuts, emphasizing the need to hold rates higher for longer.
- The UK CPI inflation is expected to ease to 2.1% YoY in April from 3.2% prior.
The GBP/USD pair extends the rally near 1.2710 on Tuesday during the early Asian session. Investors await fresh catalysts, with different Federal Reserve (Fed) speakers set to speak later in the day. On Wednesday, the UK Consumer Price Index (CPI) inflation data and FOMC Minutes will be closely watched.
The Greenback trades steady on Tuesday amid the absence of top-tier economic data releases from the US and the UK. The Fed officials remain cautious about the timing of its easing cycle and emphasize the need to hold rates higher for longer to gain confidence that inflation is on course toward the target. The upcoming FOMC minutes on Wednesday will take center stage as they might offer some clues about the future interest rate path.
On Monday, Fed Vice Chair Michael Barr said that the central bank “will need to allow our restrictive policy some further time to continue to do its work.” Meanwhile, Fed policymaker Philip Jefferson, another permanent voting member of the Fed's rate-setting committee, said inflation was still easing, although nowhere near as quickly as he expected. The Fed is widely expected to leave rates unchanged when they meet again in June. Financial markets see a 76% chance of rate cuts by 25 basis points (bps) in September and two cuts by the end of the year, according to the CME FedWatch Tool. The wait-and-see mode of the US Fed is likely to lift the US dollar (USD) and might cap the pair’s upside in the near term.
On the other hand, an interest rate cut from the Bank of England (BoE) at its June meeting has not been ruled out. The BoE governor Andrew Bailey noted that the bank will be led by data such as UK wage growth and consumer price inflation. The UK CPI inflation is expected to ease to 2.1% YoY in April from 3.2% in March, while the core CPI inflation is estimated to drop to 3.6% YoY in April from 4.2% in the previous reading. The softer reading might trigger the expectation of rate cuts and weigh on the Pound Sterling (GBP).
- EUR/USD drifts down as Greenback bids mix with ECB cut expectations.
- Fedspeak talks down Fed cut hopes, but stubborn markets continue to hope.
- ECB geared for a summer rate cut, but mismatched talking points muddy the waters.
EUR/USD eased back from 1.0880 on Monday as talking points from Federal Reserve (Fed) officials weighed on otherwise quiet market flows. Broader markets are keenly anxious for signs of a rate cut from the Fed, but central planners continue to force down expectations with a tricky inflation outlook hobbling the Fed’s options on rate moves.
Read more: Fed officials lean into cautious stance as inflation concerns weigh on central planners
Tuesday promises more of the same, with a raft of Fed officials due to provide speeches throughout the day, while European traders will be looking ahead to an appearance from the European Central Bank (ECB) President Christine Lagarde. European Purchasing Managers Index (PMI) figures are due later in the week, with US Home Sales, PMIs, and Durable Goods Orders all due in the back half of the trading week.
ECB’s Kazaks: It's quite likely June will be when we start to cut rates
Market expectations of an ECB rate cut are on the high side on Monday after the ECB’s Martins Kazaks declared that June would be a good time to begin cutting rates. The Euro is easing against firmer currencies as investors price in an increasing likelihood of a widening differential between the EUR and the USD.
EUR/USD technical outlook
EUR/USD has fallen back from last week’s peak near 1.0895, but it is still staunchly bullish in the near term. The pair holds above the 200-hour Exponential Moving Average (EMA) at 1.0826.
EUR/USD pushed into the bullish side of the 200-day EMA near the 1.0800 handle last week, but stalled progress could pull the pair back down to the last swing low near 1.0600.
EUR/USD hourly chart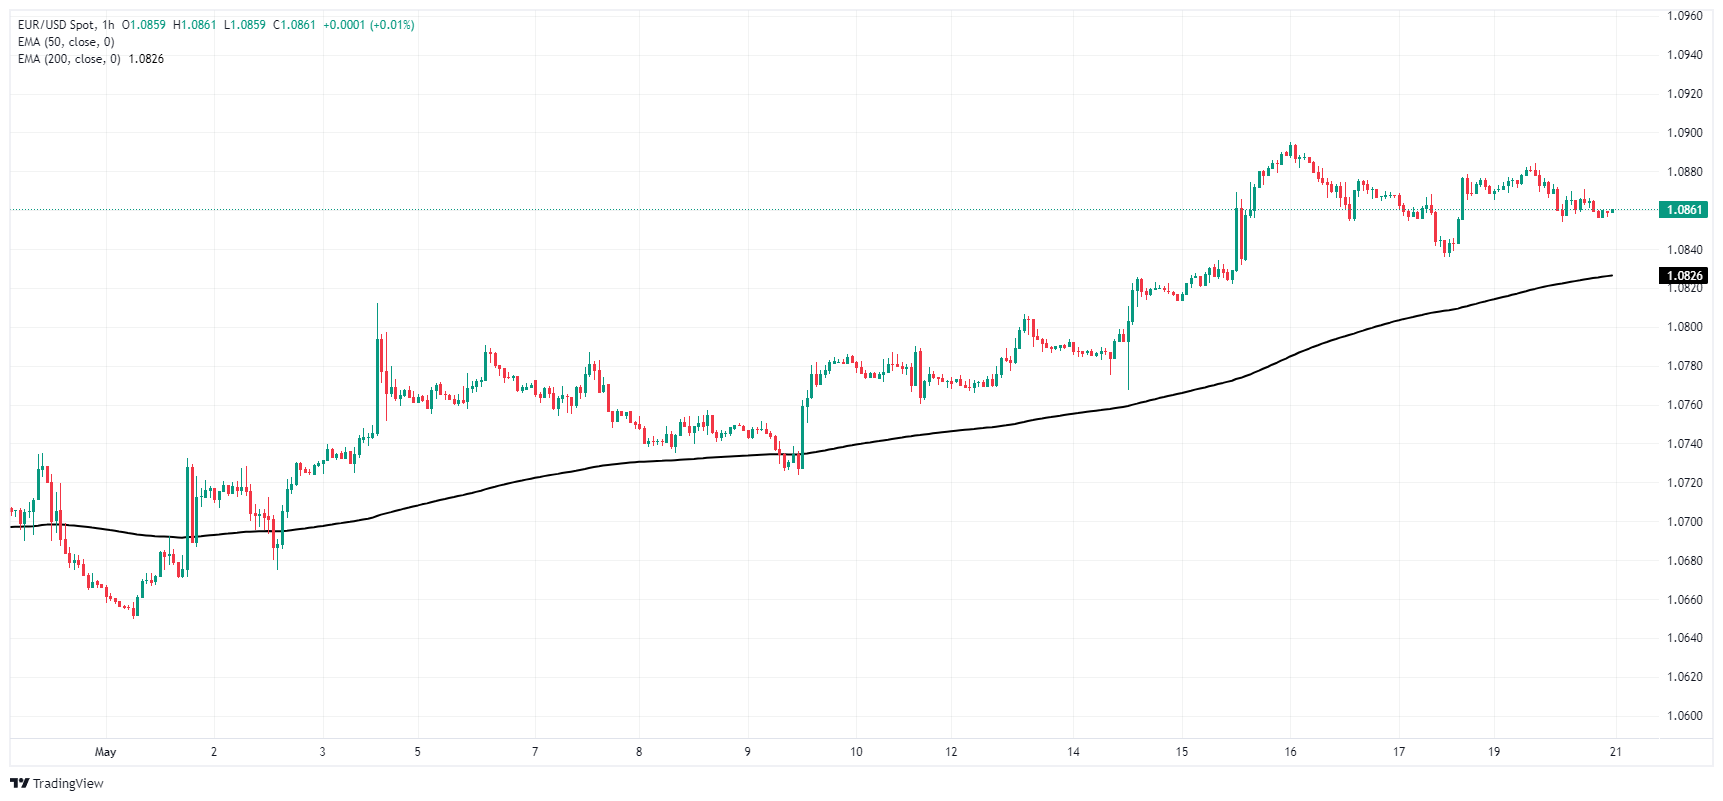
EUR/USD daily chart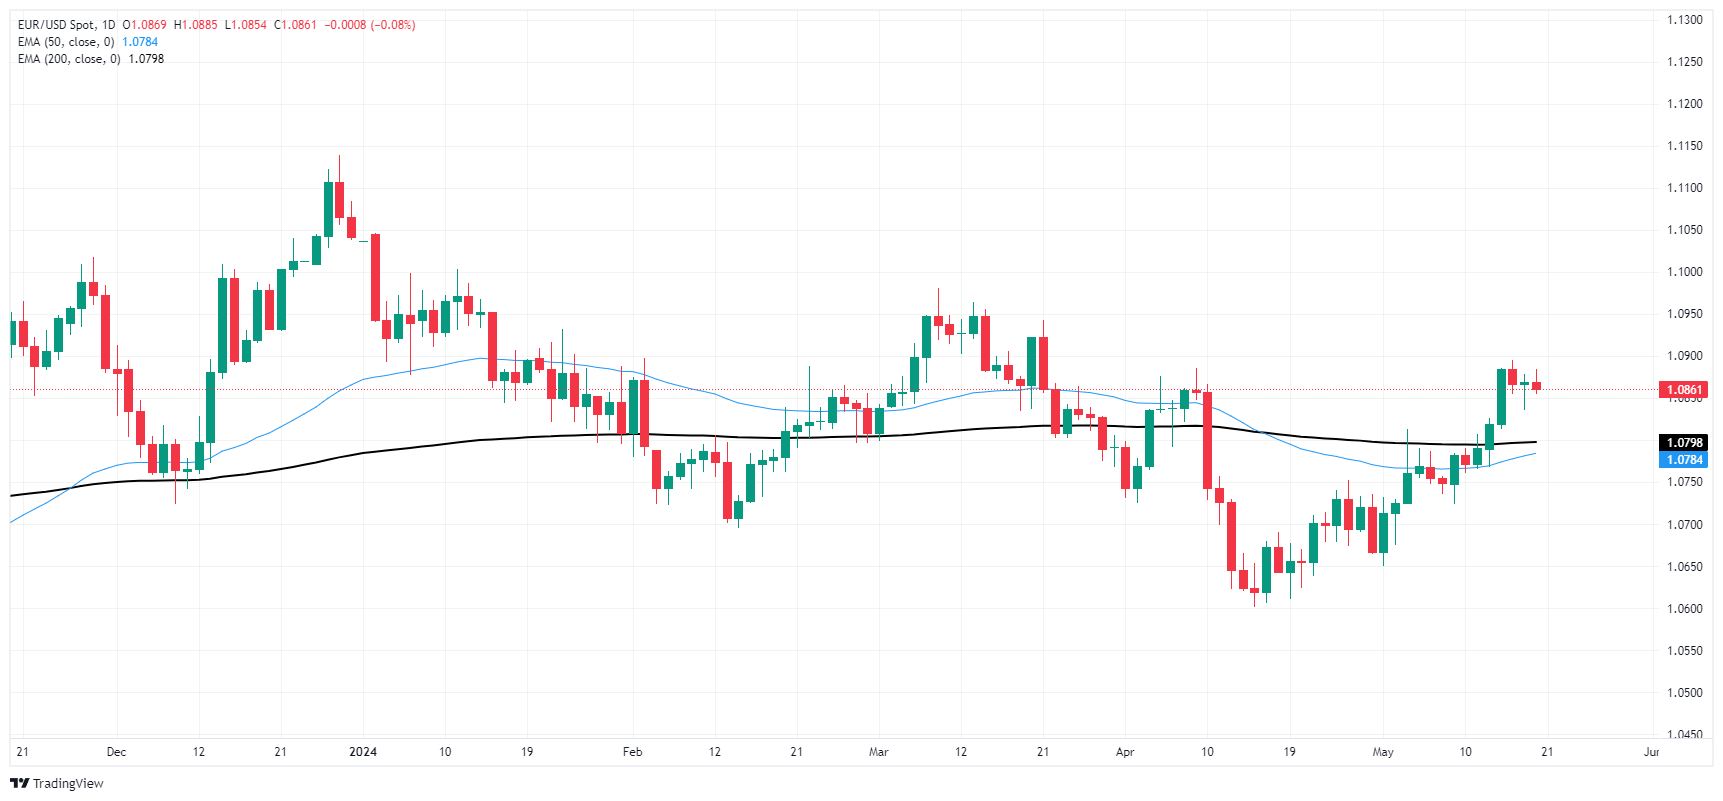
- Australian Dollar drops 0.37% against the US Dollar, trading at 0.6668.
- US Treasury yields rise, overshadowing upbeat market sentiment and pressuring AUD.
- Focus shifts to RBA meeting minutes and upcoming Fed speakers and minutes release.
The Australian Dollar registered losses of 0.37% against the US Dollar on Monday, amid rising US Treasury yields that underpinned the Greenback. An upbeat market sentiment could not boost the high-beta Aussie Dollar, which tumbled below the 0.6700 figure. As the Tuesday Asian session begins, the AUD/USD trades at 0.6668, virtually unchanged.
AUD/USD dips below 0.6700 as high US Treasury yields bolster the Greenback
Data-wise, the US economy was empty, though several Fed officials crossed the wires. Following April's data, vice-Chair Philip Jefferson stated that it is too early to tell if the inflation slowdown will last. Michael Barr, the Vice-Chair of Supervision, said that restrictive policy needs more time to do its work, while Atlanta’s Fed President Raphael Bostic stated he expects rates to remain steady.
In the meantime, the Australian docket would feature the release of the minutes of the Reserve Bank of Australia (RBA) monetary policy meeting. ANZ analysts wrote, “We suspect the decision to keep rates on hold was not a close one, given the tone of the post-meeting statement.”
On the US front, Tuesday’s economic docket will feature additional Fed speakers ahead of the release of the last meeting minutes on Wednesday.
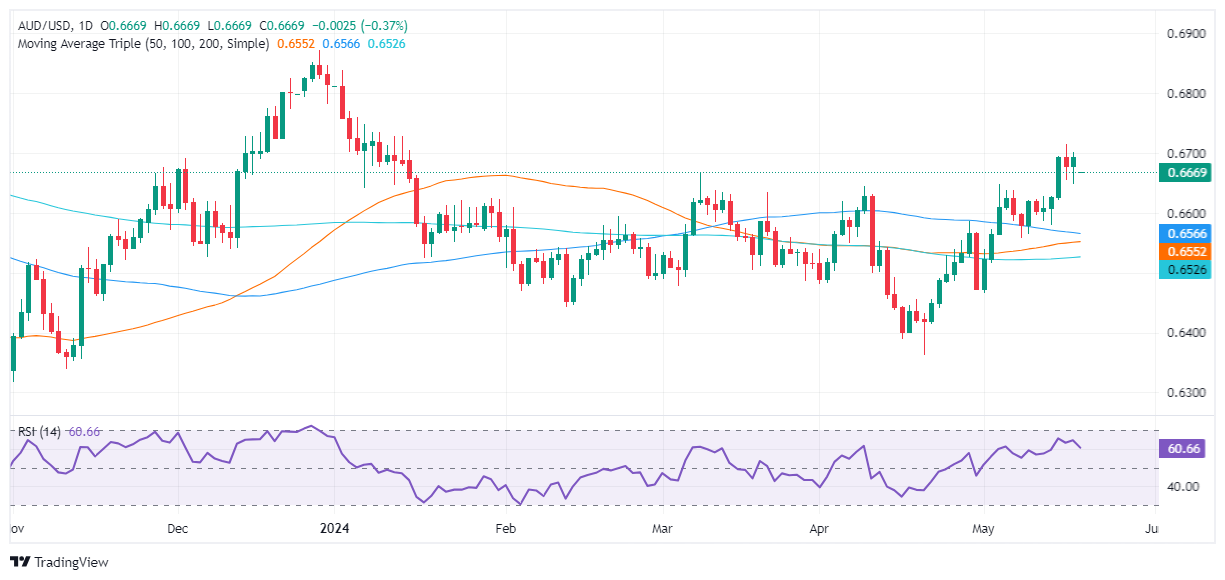
AUD/USD Price Analysis: Technical outlook
The AUD/USD is neutral to upward bias, but the dip below the March 8 high of 0.6667 could pave the way for a deeper pullback. The next support would be the 0.6600 mark, followed by the 100-day moving average (DMA) at 0.6564 and the 50-DMA at 0.6552. Once surpassed, the next stop would be the 200-DMA at 0.6525.
- EUR/GBP fell to a 20-day low, dips below 0.8550.
- ECB summer rate cuts increasingly expected.
- Key UK data due this week, UK inflation and PMIs on the cards.
EUR/GBP dropped further on Monday, receding below 0.8550 as the Euro (EUR) sheds weight against the Pound Sterling (GBP) with the European Central Bank (ECB) stepping closer towards making a first rate cut in June or July. Talking points from ECB officials are giving mixed signals to markets, deflating the Euro as investors grapple with inconsistent messaging from central planners.
Rate doves from the ECB have stepped to the forefront recently, led by comments from ECB policymaker Martins Kazaks. Kazaks noted on Monday that June is a likely starting point for rate cuts. ECB Kazak’s comments muddy the waters on ECB messaging in recent weeks, which have run the gamut from advising further caution on rate moves, to some policymakers floating a possible start to rate cuts in July.
With the ECB increasingly likely to trim rates as soon as July, the rate differential between the ECB and the Bank of England (BoE) threatens to widen, softening the Euro against the Pound.
Key UK inflation data due this week will help traders gauge the BoE’s rate outlook. UK COnsumer Price Index (CPI) inflation is due on Wednesday, and is expected to ease to 2.1% YoY in April from the previous 3.2%. Later in the week, Purchasing Managers Index (PMI) results are expected from both the EU and the UK. UK Retail Sales will round out the trading week on Friday.
EUR/GBP technical outlook
EUR/GBP is accelerating a downside tumble below the 200-hour Exponential Moving Average (EMA) after dropping through the key technical indicator near 0.8590. The 200-hour EMA is turning bearish into 0.8577, and the pair is bidding further into bear country below 0.8550.
Despite a near-term downturn, EUR/GBP remains trapped in familiar consolidation. The pair is chewing on volatility-plagued chart paper as the EUR/GBP battles with repeated technical rejections from the 200-day EMA near the 0.8600 handle.
EUR/GBP hourly chart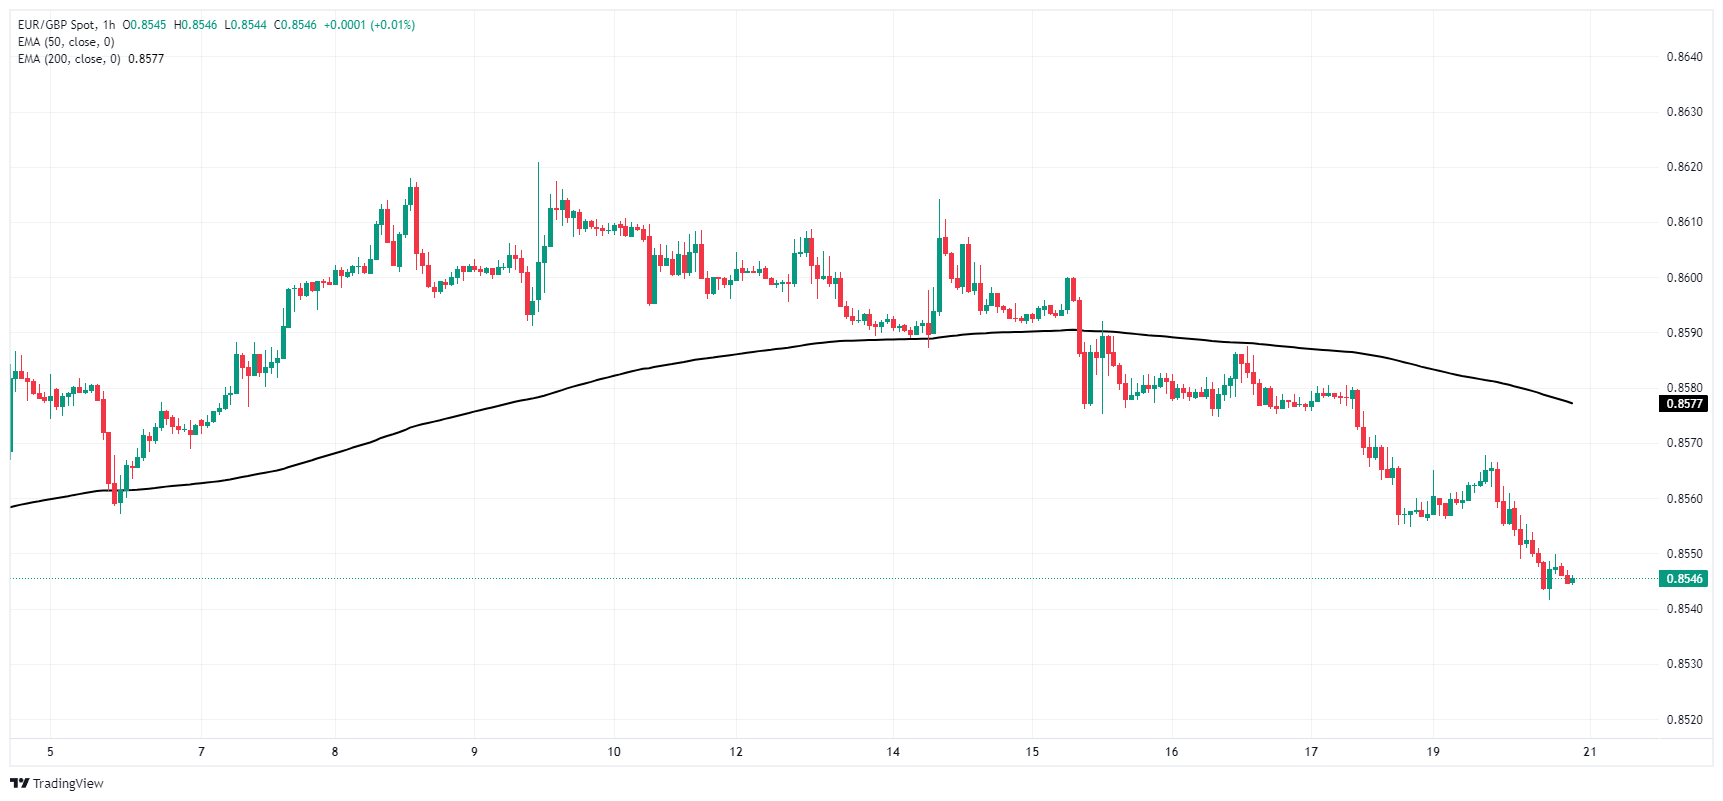
EUR/GBP daily chart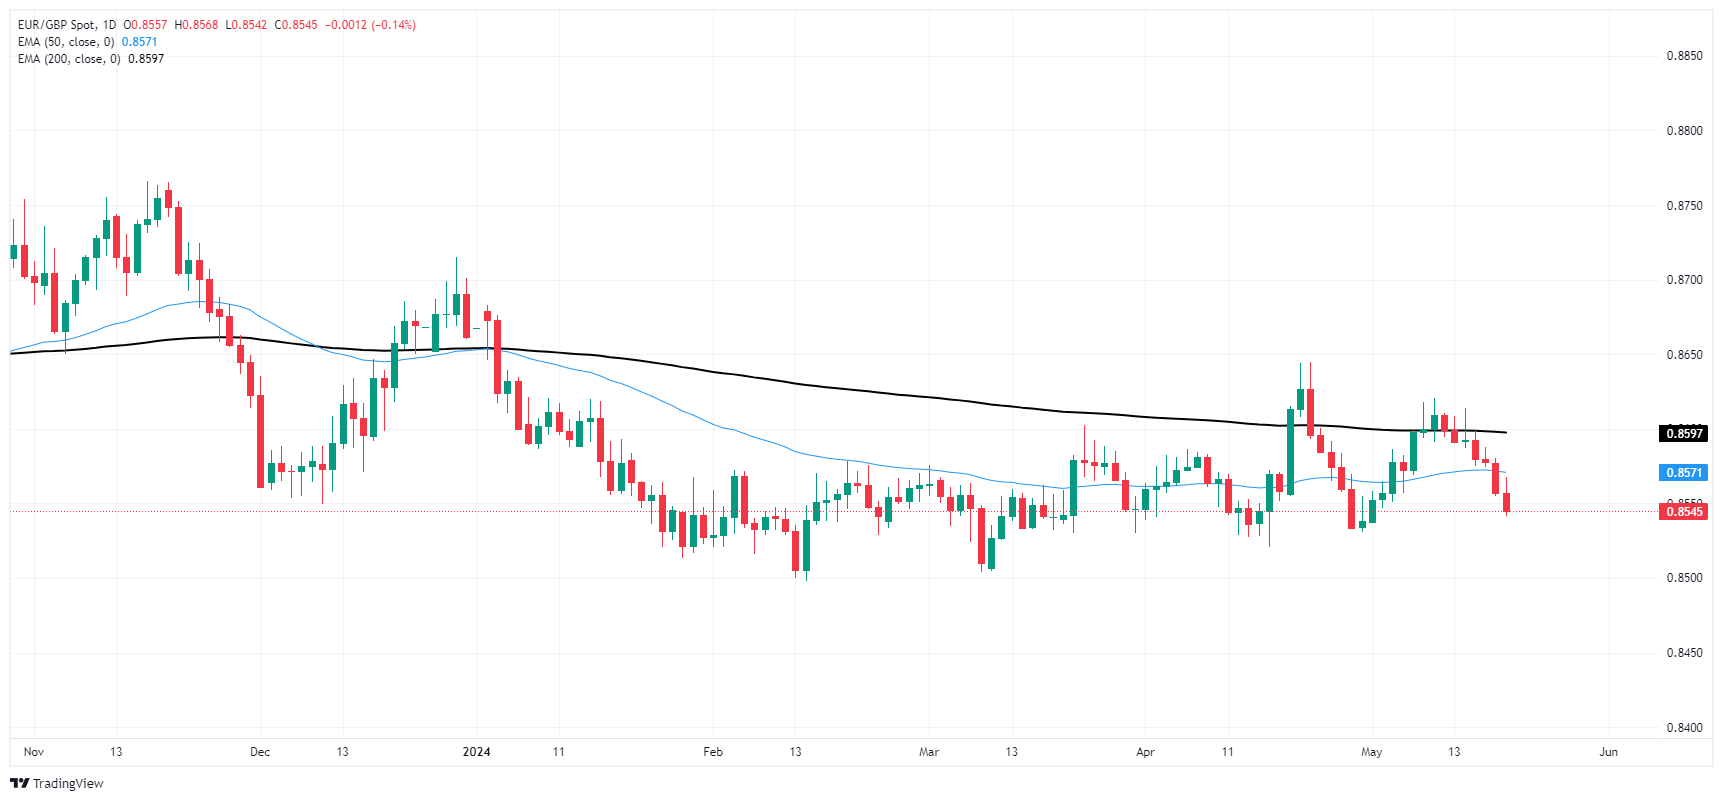
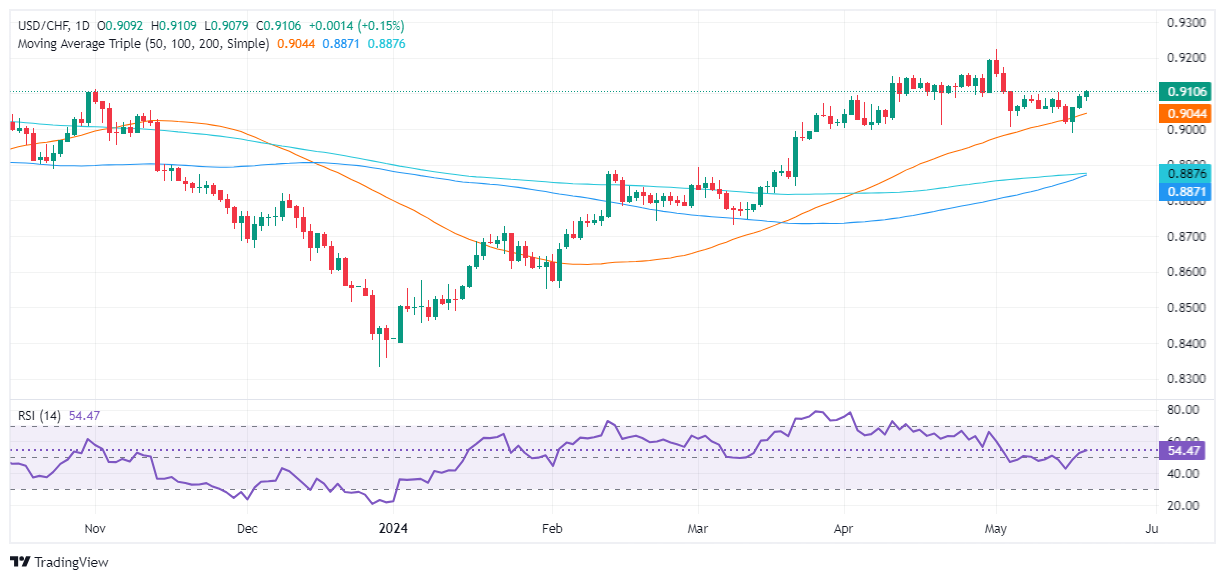
- USD/CHF up over 0.20%, closing above 0.9100 on Monday.
- Potential for further gains if pair surpasses 0.9150, targeting 0.9200 and YTD high of 0.9224.
- Key supports at 0.9100, 50-DMA (0.9049), and 0.8988 in case of bearish momentum.
On Monday, the USD/CHF registered more than 0.20% gains, with buyers regaining control and achieving a daily close above 0.9100. This was sponsored by high US yields, which underpinned the Greenback, though it posted modest gains. As the Tuesday Asian session begins, the major trades at 0.9104, virtually unchanged.
USD/CHF Price Analysis: Technical outlook
From a technical perspective, the pair has reversed its course after diving to a multi-week low of 0.8988, though buyers lifted the USD/CHF and achieved a daily close above 0.9060. That opened the door for a bullish continuation. But momentum has faded so far, as shown by the Relative Strength Index (RSI), which remains bullish but has a flat slope.
If bulls lift the USD/CHF above 0.9150, that will exacerbate a rally to 0.9200. Once surpassed, the next stop would be the year-to-date (YTD) high at 0.9224.
Conversely, if sellers moved in and dragged the USD/CHF exchange rate below 0.9100, that would pave the way to test the 50-day moving average (DMA) at 0.9049. Further losses lie at 0.9000 and 0.8988.
USD/CHF Price Action – Daily Chart
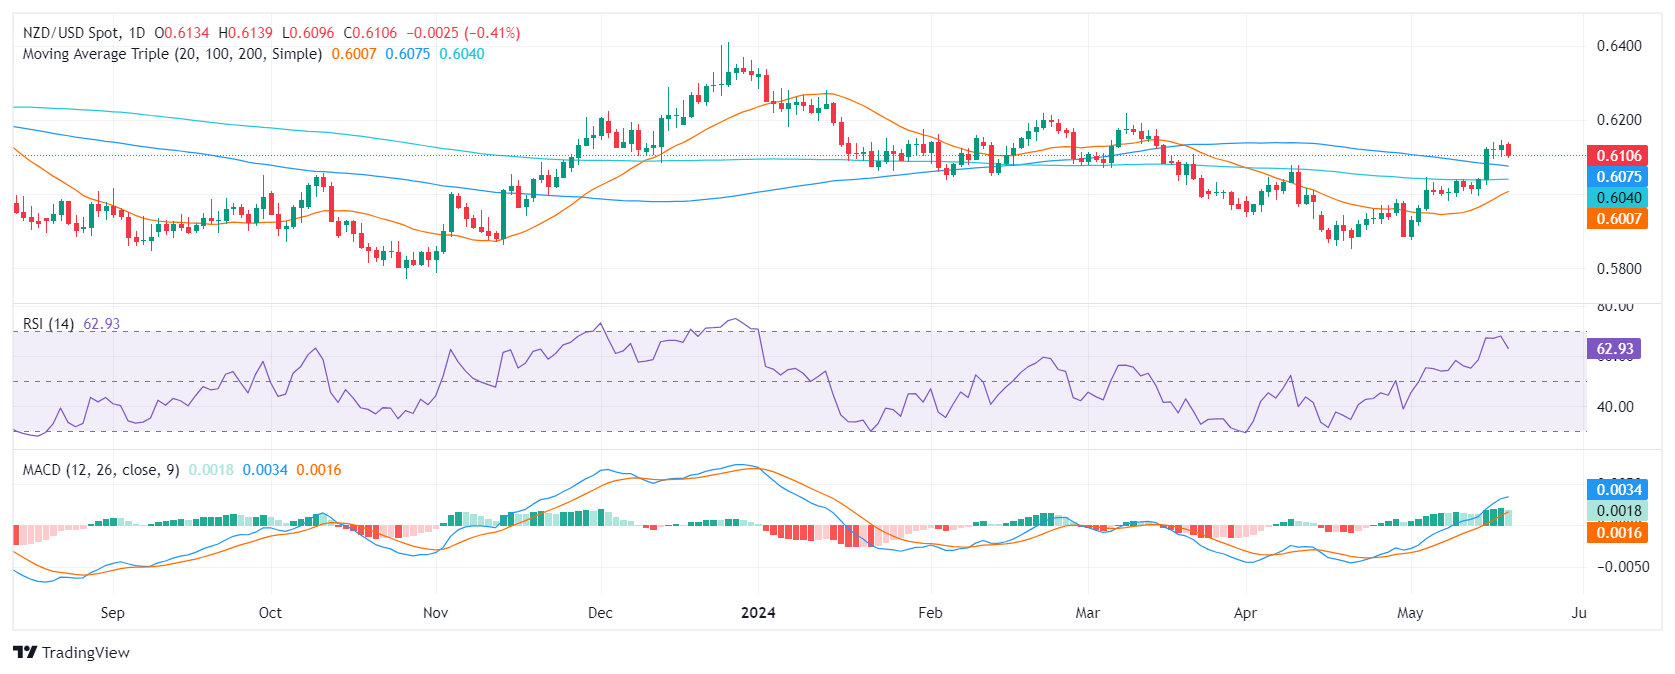
- The daily RSI and MACD signal a slowdown in positive momentum.
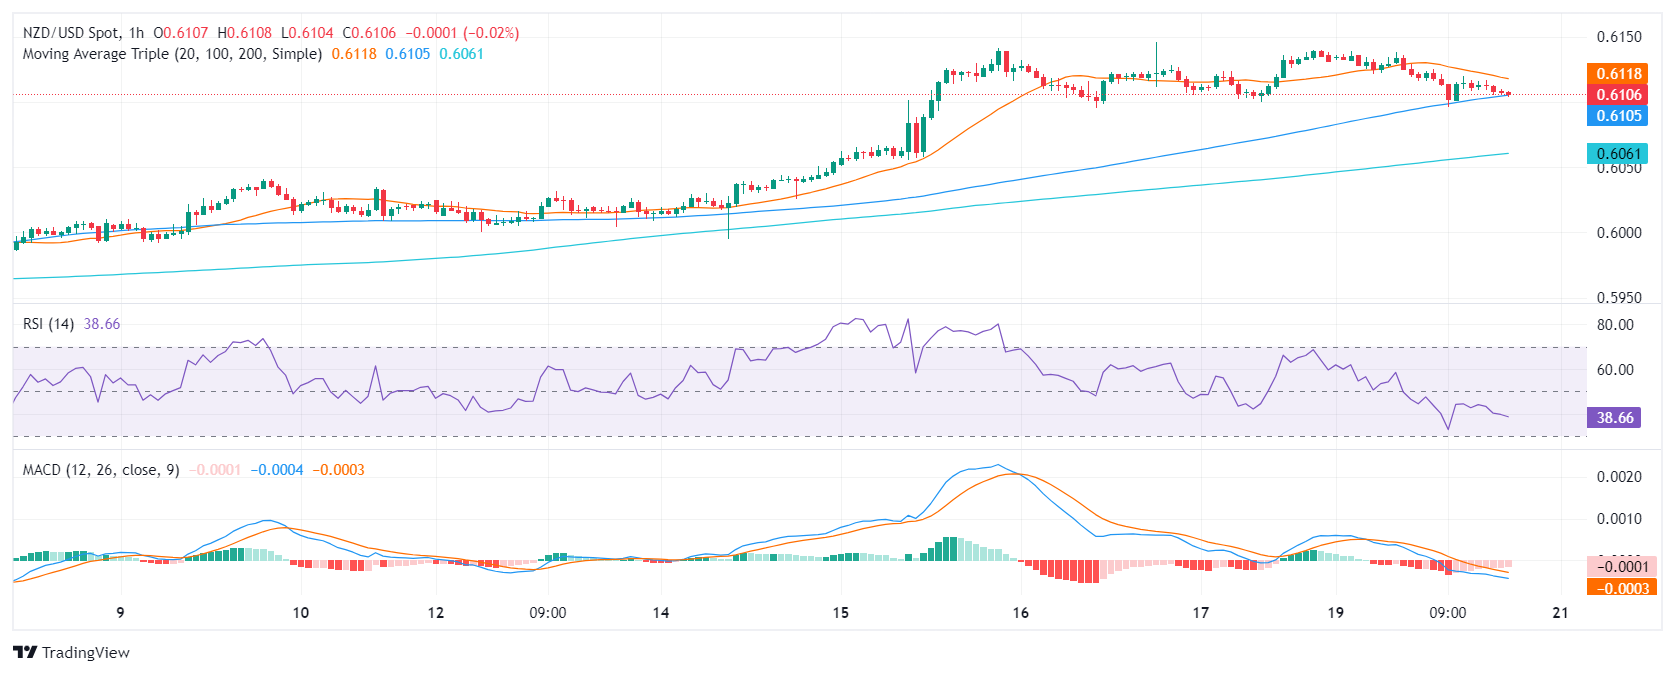
- On the hourly chart, indicators also show that the buyers are losing grip.
- Downward movements which keep the pair above the 100 and 200-day SMAs, should be viewed as healthy corrections.
In Monday's session, the NZD/USD stands at 0.6107, revealing a dip of 0.40%. However, the market continues under the dominant control of the bulls. Occasional losses in positive momentum do not indicate a sway of power to the bears and may validate healthy market corrections after a 1.45% weekly gain.
In the daily timeframe, the Relative Strength Index (RSI) is mainly in the positive territory, with a recent reading at 62. This implies a moderate bullish momentum. Nevertheless, the tapering down of the index from its peak nearing overbought conditions may suggest a slowdown in the upward thrust. The Moving Average Convergence Divergence (MACD) complements this, revealing decreasing green bars indicative of a shrinking positive momentum.
NZD/USD daily chart
Contrarily, an examination of the hourly chart reveals a negative territory dominance for the RSI. The recent value stands at 39, revealing the presence of more sellers in the last session. The MACD for the same period manifests flat red bars, subsequently confirming the negative momentum.
NZD/USD hourly chart
Deep diving into the broader landscape, the NZD/USD is appealing due to its position above the 20, 100, and 200-day Simple Moving Averages (SMAs). Such positioning confirms a positive bias for the pair, forecasting stable reliability for short-term and long-term investors.
The current scenario, where investors are taking profits while holding above the recently conquered 100 and 200-day SMAs, indicates that any downward movement should not be considered as a selling signal. Instead, it can be viewed as a healthy correction within the overall bullish context. Therefore, despite short-term volatility, the long-term prospects remain in favor of the bulls.
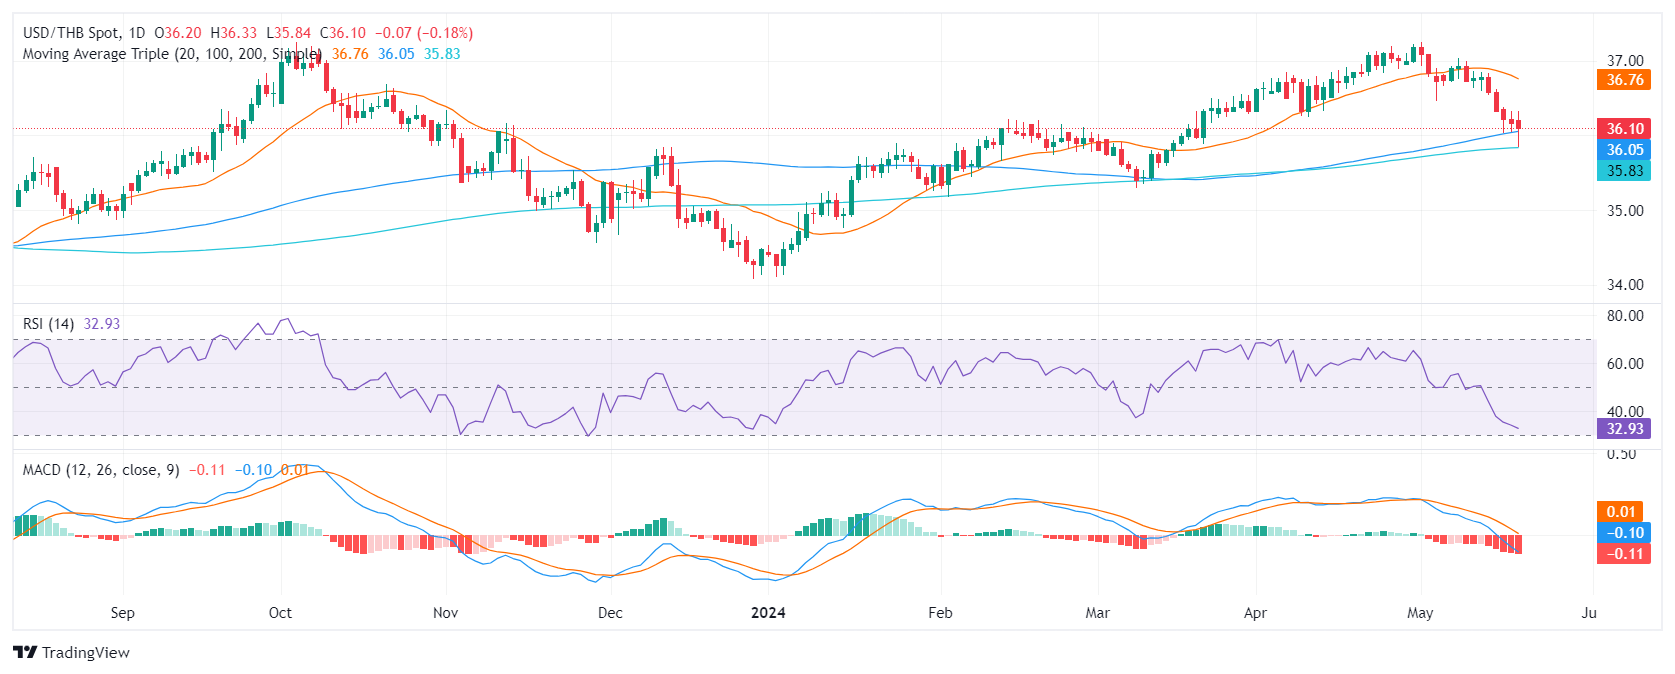
- USD/THB trades at around 36.11, marking a 0.15% decrease in Monday's session.
- Fed officials ask for caution on premature easing, despite some recent data weakness.
- May’s FOMC minutes, April’s S&P PMIs, and Durable Goods figures from May will be the highlights this week.
The USD/THB pair is trading mildly down on Monday after falling to a low of 36.05 earlier in the session and managed to clear most of the daily losses. The USD is holding its ground, driven by cautious comments from the Federal Reserve (Fed) officials who are reluctant to loosen monetary policy prematurely.
Fed policymakers reiterated their reluctance towards premature easing on Monday, referencing that it is too soon to consider as evidence of disinflation the recent soft inflation data. The odds of a cut by the Fed until September is bookmarked at around 35% but officials and mid-tier data this week may change those odds.
Investors seem to be waiting for additional delivery of Fed speeches this week and for May's Federal Open Market Committee (FOMC) minutes slated for release this Wednesday, hoping for greater clarity on the direction of the Fed’s outlook. On Thursday, May’s S&P readings and weekly Jobless Claims will be looked upon as well as Friday’s Durable Goods figures from April.
USD/THB technical analysis
Examining the daily graph, the Relative Strength Index (RSI) of the USD/THB is hovering in the negative territory, suggesting a hint of bearish momentum. Simultaneously, the Moving Average Convergence Divergence (MACD) histogram is displaying red bars, indicating a negative momentum. Yet, as the histogram bars are flat, these suggest a decreasing selling pressure and the potential for a lessening in the current bearish bias.
USD/THB daily chart
Regarding the Simple Moving Average (SMA), the pair is below the 20, 100-day SMAs. However, it is noteworthy that in Monday's session, buyers defended the 200-day SMA at the 35.83 mark. This reveals resilience, potentially impeding the bearish narrative and may trigger a bullish sentiment if sustained. This combination reveals that the pair is in a bearish trend but if the bulls remain resilient, the losses might be limited.
What you need to take care of on Tuesday, May 21:
Metals grabbed all of the attention on Monday, as Gold and Copper traded at record highs at the beginning of the day, although shed some ground in a quiet European morning, as most local markets were closed due to the celebration of Whit Monday.
The American session provided little to work with, as the macroeconomic calendar only featured different Federal Reserve speakers, which anyway, repeated well-known messages and fell short of triggering action across the FX board.
The Greenback took clues from metals, recovering just modestly with Gold slide but resuming its slide ahead of Wall Street’s close as XAU/USD pressures the $2,430 price zone.
The EUR/USD pair held around 1.0860, while the GBP/USD stood at around 1.2700. Commodity-linked currencies were the most volatile, with AUD and CAD ending the day with losses vs the US Dollar.
Wall Street closed mixed, also failing to provide clues. The DJIA lost 200 points, although the S&P500 and the Nasdaq Composite managed to post uneven gains.
The upcoming Asian session will bring Australian Westpac Consumer Confidence and the Reserve Bank of Australia (RBA) meeting Minutes. There won’t be any relevant release throughout Tuesday.
US Dollar PRICE Today
The table below shows the percentage change of US Dollar (USD) against listed major currencies today. US Dollar was the strongest against the New Zealand Dollar.
| USD | EUR | GBP | JPY | CAD | AUD | NZD | CHF | |
|---|---|---|---|---|---|---|---|---|
| USD | 0.09% | -0.05% | 0.44% | 0.06% | 0.37% | 0.44% | 0.15% | |
| EUR | -0.09% | -0.16% | 0.41% | -0.01% | 0.33% | 0.37% | 0.07% | |
| GBP | 0.05% | 0.16% | 0.42% | 0.13% | 0.48% | 0.52% | 0.22% | |
| JPY | -0.44% | -0.41% | -0.42% | -0.41% | -0.06% | 0.04% | -0.28% | |
| CAD | -0.06% | 0.01% | -0.13% | 0.41% | 0.29% | 0.40% | 0.10% | |
| AUD | -0.37% | -0.33% | -0.48% | 0.06% | -0.29% | 0.03% | -0.25% | |
| NZD | -0.44% | -0.37% | -0.52% | -0.04% | -0.40% | -0.03% | -0.28% | |
| CHF | -0.15% | -0.07% | -0.22% | 0.28% | -0.10% | 0.25% | 0.28% |
The heat map shows percentage changes of major currencies against each other. The base currency is picked from the left column, while the quote currency is picked from the top row. For example, if you pick the US Dollar from the left column and move along the horizontal line to the Japanese Yen, the percentage change displayed in the box will represent USD (base)/JPY (quote).
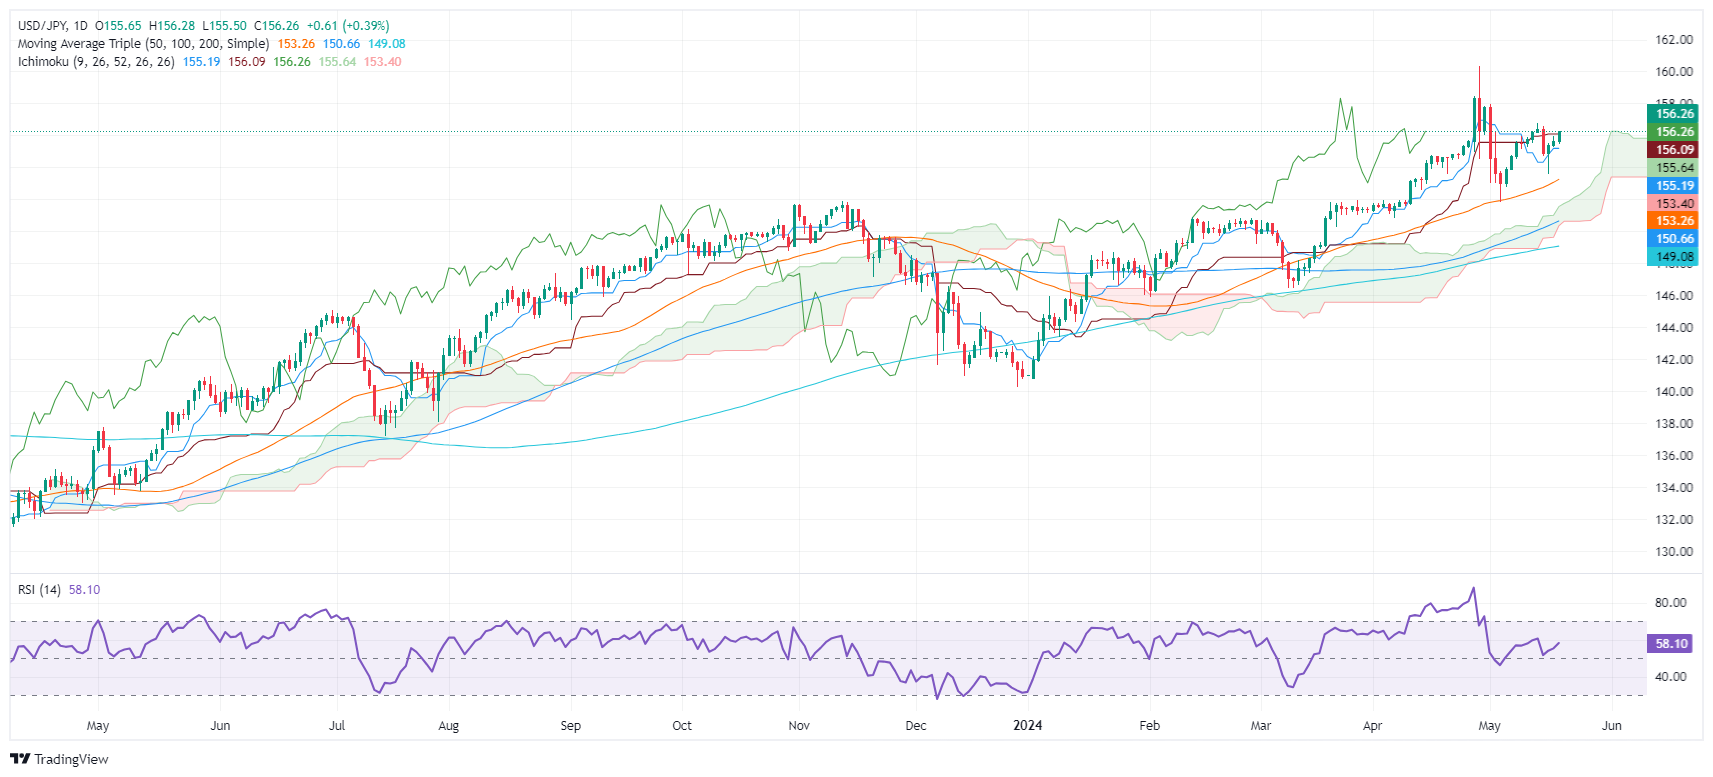
- USD/JPY rises 0.38% after bouncing off a daily low of 155.49.
- Buyers favored in technical outlook; key resistance at 156.76 with potential to reach 157.99 and YTD high of 160.32.
- Bearish scenario could see support at 153.61, 153.25, and Ichimoku Cloud top at 151.94.
The US Dollar gains ground against the Japanese Yen (JPY) and climbs 0.38% in an upbeat market mood. US Treasury bond yields advance, particularly the 10-year Treasury note yield, which correlates positively to the USD/JPY pair. Therefore, the pair trades at 156.25 after hitting a daily low of 155.49.
USD/JPY Price Analysis: Technical outlook
The USD/JPY daily chart shows the pair remains tilted to the upside, yet it’s far from testing the latest cycle high. Nevertheless, the Relative Strength Index (RSI) shows momentum favors the buyers, which could open the door for further gains.
For a bullish continuation, the USD/JPY must clear the May 14 high of 156.76. Once done, buyers must surpass the May month-to-date (MTD) high of 157.99. A breach of the latter could expose the year-to-date (YTD) high of 160.32.
Conversely, if bears stepped in and dragged prices below the Senkou Span A at 156.25, that could sponsor a leg-down toward the May 16 low of 153.61. Further losses lie beneath, with the next support seen at the Senkou Span B at 153.25 before sliding toward the top of the Ichimoku Cloud at around 151.94.
USD/JPY Price Action – Daily Chart
Japanese Yen PRICE Today
The table below shows the percentage change of Japanese Yen (JPY) against listed major currencies today. Japanese Yen was the strongest against the New Zealand Dollar.
| USD | EUR | GBP | JPY | CAD | AUD | NZD | CHF | |
|---|---|---|---|---|---|---|---|---|
| USD | 0.07% | -0.04% | 0.42% | 0.04% | 0.38% | 0.42% | 0.12% | |
| EUR | -0.07% | -0.14% | 0.39% | -0.02% | 0.34% | 0.38% | 0.05% | |
| GBP | 0.04% | 0.14% | 0.40% | 0.12% | 0.48% | 0.51% | 0.19% | |
| JPY | -0.42% | -0.39% | -0.40% | -0.39% | -0.03% | 0.06% | -0.29% | |
| CAD | -0.04% | 0.02% | -0.12% | 0.39% | 0.29% | 0.40% | 0.07% | |
| AUD | -0.38% | -0.34% | -0.48% | 0.03% | -0.29% | 0.03% | -0.29% | |
| NZD | -0.42% | -0.38% | -0.51% | -0.06% | -0.40% | -0.03% | -0.33% | |
| CHF | -0.12% | -0.05% | -0.19% | 0.29% | -0.07% | 0.29% | 0.33% |
The heat map shows percentage changes of major currencies against each other. The base currency is picked from the left column, while the quote currency is picked from the top row. For example, if you pick the Japanese Yen from the left column and move along the horizontal line to the US Dollar, the percentage change displayed in the box will represent JPY (base)/USD (quote).
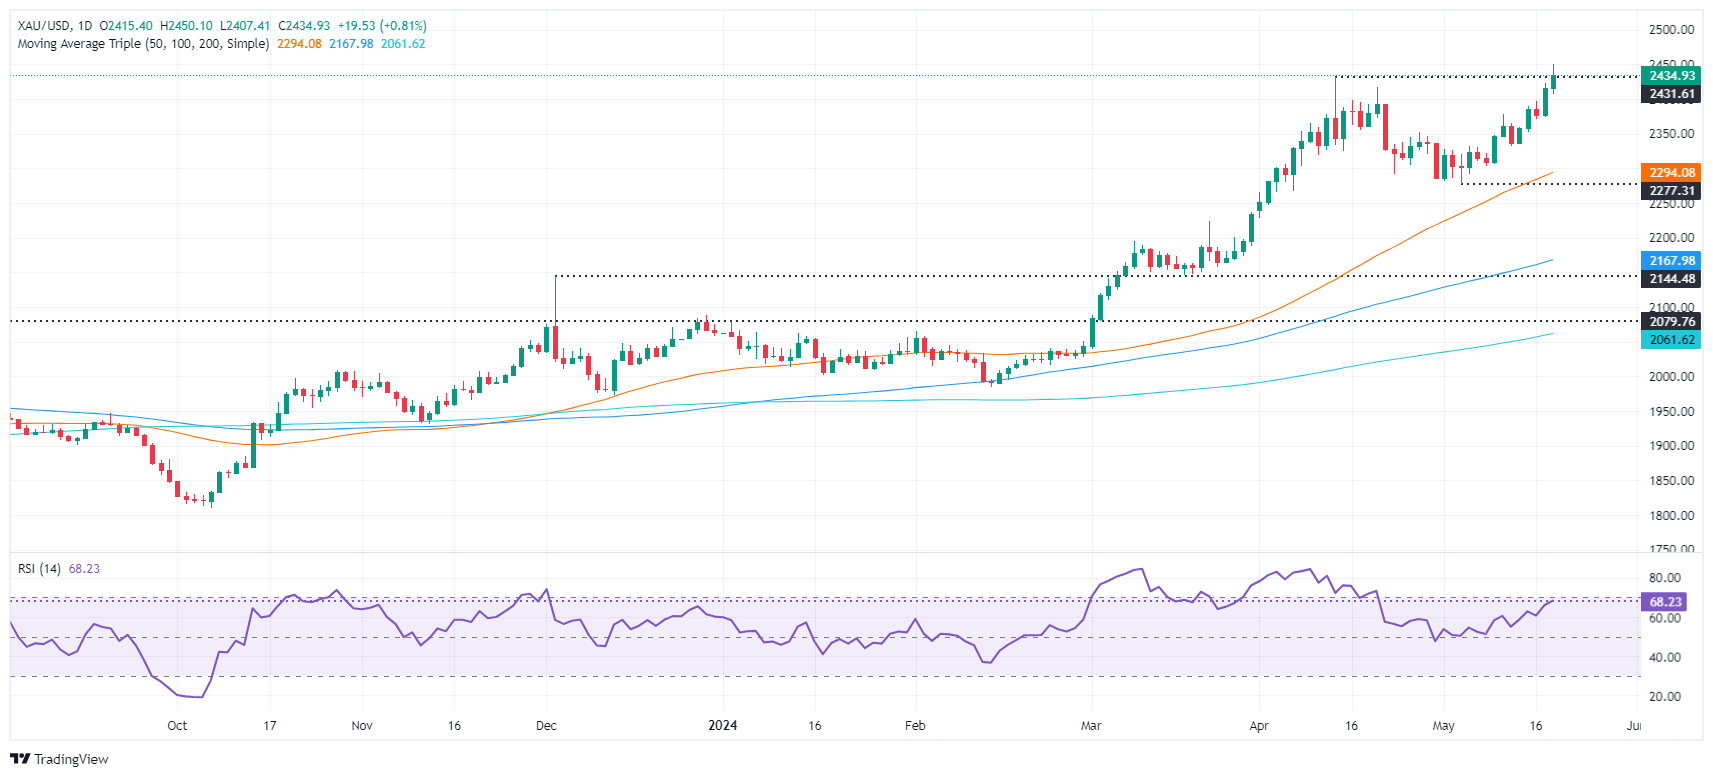
- Gold extends gains, trading at $2,433, just below the all-time high of $2,450.
- Softer US inflation report boosts bets on Fed rate cuts with 76% odds for a September reduction.
- Investors anticipate two rate cuts by year-end, potentially lowering the Federal funds rate to 4.75%-5.00%.
Gold price extended its gains on Monday, yet it trades slightly below the all-time high of $2,450 reached during the Asian session amid increasing expectations that major central banks, including the Federal Reserve, might ease policy during 2024. The XAU/USD trades at $2,433, up 0.80%.
Market sentiment is a mixed bag, though slightly positive, with the S&P 500 and NASDAQ 100 gaining, while the Dow Jones is almost flat. This and last week’s softer-than-expected consumer inflation report in the United States (US) boosted bets that the Fed could slash borrowing costs as soon as September, according to CME FedWatch Tool data.
Odds that the Fed would cut rates by 25 bps in September are at 76%. Investors have begun to price in two cuts toward the end of the year, which would leave the fed funds rate at 4.75%-5.00%.
In the meantime, Federal Reserve (Fed) speakers would dominate the US economic docket during the week before the latest Fed meeting minutes were released on Wednesday. On Thursday, US Initial Jobless Claims are expected to show the labor market is cooling, along with the Chicago Fed National Activity Index.
Daily digest market movers: Gold price trends higher despite hawkish Fed commentary
- Gold price advances despite higher US Treasury yields and a weaker US Dollar. The US 10-year Treasury note yields 4.437% and is up one-and-a-half basis points (bps) from its opening level. DXY gains 0.06% to 104.55.
- Last week’s inflation data showed that underlying prices are easing. That reignited traders' expectations that the US central bank would resume easing policy. However, they must be cautious as Fed officials pushed back against just one reading that inflation is moderating.
- Earlier, Fed speakers grabbed the headlines. First, Atlanta Fed President Raphael Bostic said that policy is restrictive and that it would take a while before they could be certain that inflation is headed to 2%. Vice-Chair Michel Barr echoed his words, noting the Fed will need to keep rates higher to “allow tight policy” to continue to do its work.
- Recently, Vice-Chair Philip Jefferson said it’s too easy to tell when the disinflation process will resume while stating that the policy rate is restrictive.
- As of writing, Cleveland Fed President Loretta Mester approved the latest CPI data and added that the risks of being “too restrictive” had gone down, while inflation risks are tilted to the upside.
Technical analysis: Gold price hits $2,450 as bulls target $2,500
Gold prices remain set to test higher prices after hitting a new all-time high of $2,450, which could open the door to further gains. Traders should know that momentum supports buyers as the Relative Strength Index (RSI) continues to aim higher but is not yet at overbought readings.
If XAU/USD breaches the all-time high, the next stop would be $2,475, followed by the $2,500 mark.
Conversely, if XAU/USD retreats below $2,400, that could expose the May 13 low at $2,332, followed by the May 8 low of $2,303. Once those levels are surpassed, the 50-day Simple Moving Average (SMA) at $2,284 will be up next.
Gold FAQs
Gold has played a key role in human’s history as it has been widely used as a store of value and medium of exchange. Currently, apart from its shine and usage for jewelry, the precious metal is widely seen as a safe-haven asset, meaning that it is considered a good investment during turbulent times. Gold is also widely seen as a hedge against inflation and against depreciating currencies as it doesn’t rely on any specific issuer or government.
Central banks are the biggest Gold holders. In their aim to support their currencies in turbulent times, central banks tend to diversify their reserves and buy Gold to improve the perceived strength of the economy and the currency. High Gold reserves can be a source of trust for a country’s solvency. Central banks added 1,136 tonnes of Gold worth around $70 billion to their reserves in 2022, according to data from the World Gold Council. This is the highest yearly purchase since records began. Central banks from emerging economies such as China, India and Turkey are quickly increasing their Gold reserves.
Gold has an inverse correlation with the US Dollar and US Treasuries, which are both major reserve and safe-haven assets. When the Dollar depreciates, Gold tends to rise, enabling investors and central banks to diversify their assets in turbulent times. Gold is also inversely correlated with risk assets. A rally in the stock market tends to weaken Gold price, while sell-offs in riskier markets tend to favor the precious metal.
The price can move due to a wide range of factors. Geopolitical instability or fears of a deep recession can quickly make Gold price escalate due to its safe-haven status. As a yield-less asset, Gold tends to rise with lower interest rates, while higher cost of money usually weighs down on the yellow metal. Still, most moves depend on how the US Dollar (USD) behaves as the asset is priced in dollars (XAU/USD). A strong Dollar tends to keep the price of Gold controlled, whereas a weaker Dollar is likely to push Gold prices up.
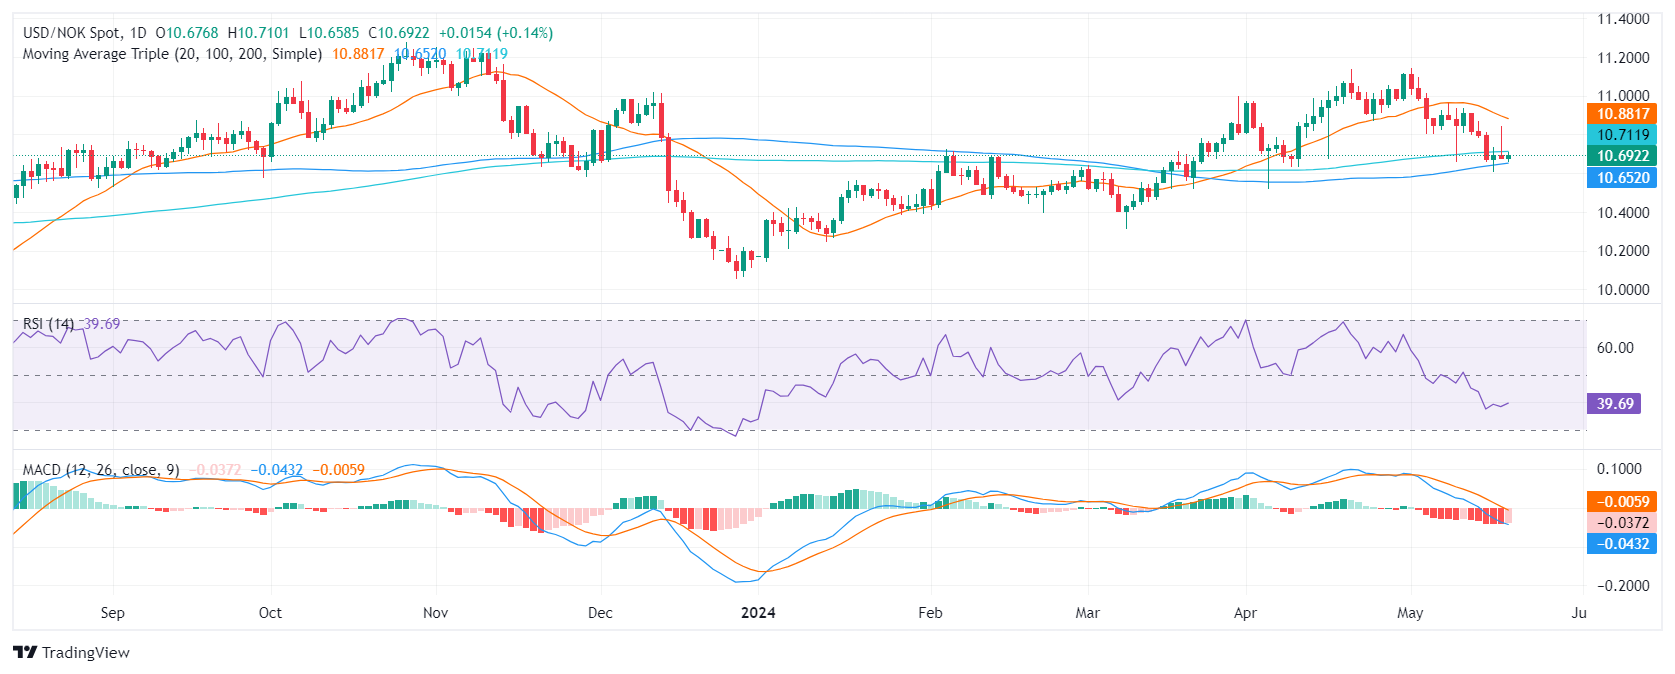
- USD/NOK registers a slight uptick in Monday's session, settling at 10.693, with buyers making measured strides.
- With the Fed displaying resistance against premature easing, the USD finds solid support.
- Markets will look for further clues on the Fed’s stance on Wednesday’s FOMC minutes.
The USD/NOK pair is trading with mild gains, with the USD holding its ground against its peers. The Federal Reserve (Fed) continues to send cautious messages about future policy decisions, causing traders to wait for the release of the Federal Open Market Committee (FOMC) minutes scheduled for Wednesday to gain further insights into the bank's stance.
The Fed's unified voice cautioning on easing, despite a softening in recent data, remains one of the influential factors of the pair which is limiting the downside of the pair. The views are aligned with the market bets of a 10% possibility of a rate cut in June which rises to 30% and 80% in July and September according to the CME FedWatch tool.
On the data front, the economic calendar remained empty on Monday, and the week’s highlights include the FOMC minutes from May’s meeting on Wednesday, S&P PMI readings from May on Thursday, and Durable Goods figures from April on Friday.
USD/NOK technical analysis
Examining the daily graph, the Relative Strength Index (RSI) resides within negative territory, increasing slightly to 43, indicating a sluggish recovery from a negative trend. Concurrently, the Moving Average Convergence Divergence (MACD) reveals a flat tendency with persistent red bars, suggesting that negative momentum is still prevalent among investors.
USD/NOK daily chart
From the broader perspective, the USD/NOK is at a critical juncture, positioned below the 20 and 200-day Simple Moving Average (SMA) suggesting a negative outlook. Still, the losses will be limited if the pair holds above the 100-day average at 10.652.
- WTI briefly rose to $80.00 per barrel before falling back.
- US Crude Oil found its highest bids since the start of the month.
- Risk appetite struggles to push broad asset categories firmly higher.
West Texas Intermediate (WTI) US Crude Oil rose briefly above $80.00 per barrel on Monday as risk appetite remains close to the surface, but topside momentum remains thin. WTI fell back into range near $78.80 as appearances from Federal Reserve (Fed) officials crimp risk appetite, limiting buying pressure to kick off the new trading week.
Read more: Fed officials lean into cautious stance as inflation concerns weigh on central planners
Upside pressure is cooking in the background of global Crude Oil markets after a helicopter carrying Iranian President Ebrahim Raisi and Iranian Foreign Minister Hossein Amir-Abdollahian crashed over the weekend. As Iran prepares to rush to the polls to elect a new president, energy investors will be keeping one eye on developments. A federal election in Iran is expected within the next 50 days.
A broadly-expected increase in Crude Oil markets from refineries has failed to materialize, meaning supply chains are at risk of getting overrun by production that continues to outpace overall demand. A lopsided number of refineries went offline for spring maintenance in 2024, and energy traders had been banking on an uptick in Crude Oil demand after those facilities came back online. Price-pressured and cost-hobbled consumers have been cutting back spending on liquid fuels, leaving production chains fuller than investors had anticipated.
Barrel counts from the American Petroleum Institute (API) and Energy Information Administration (EIA) eased more than expected last week, helping to bolster barrel bids in the short-term. Crude Oil traders will be keeping an eye out for this week’s Crude Oil stocks updates to gauge just how far a supply overhang could be looming.
WTI technical outlook
US Crude Oil is hobbled by technical consolidation between $80.00 and $79.00 as energy traders get hung up on a support/resistance band around $79.50. Price have recovered from multi-month lows near $76.40, but topside momentum remains limited.
WTI hourly chart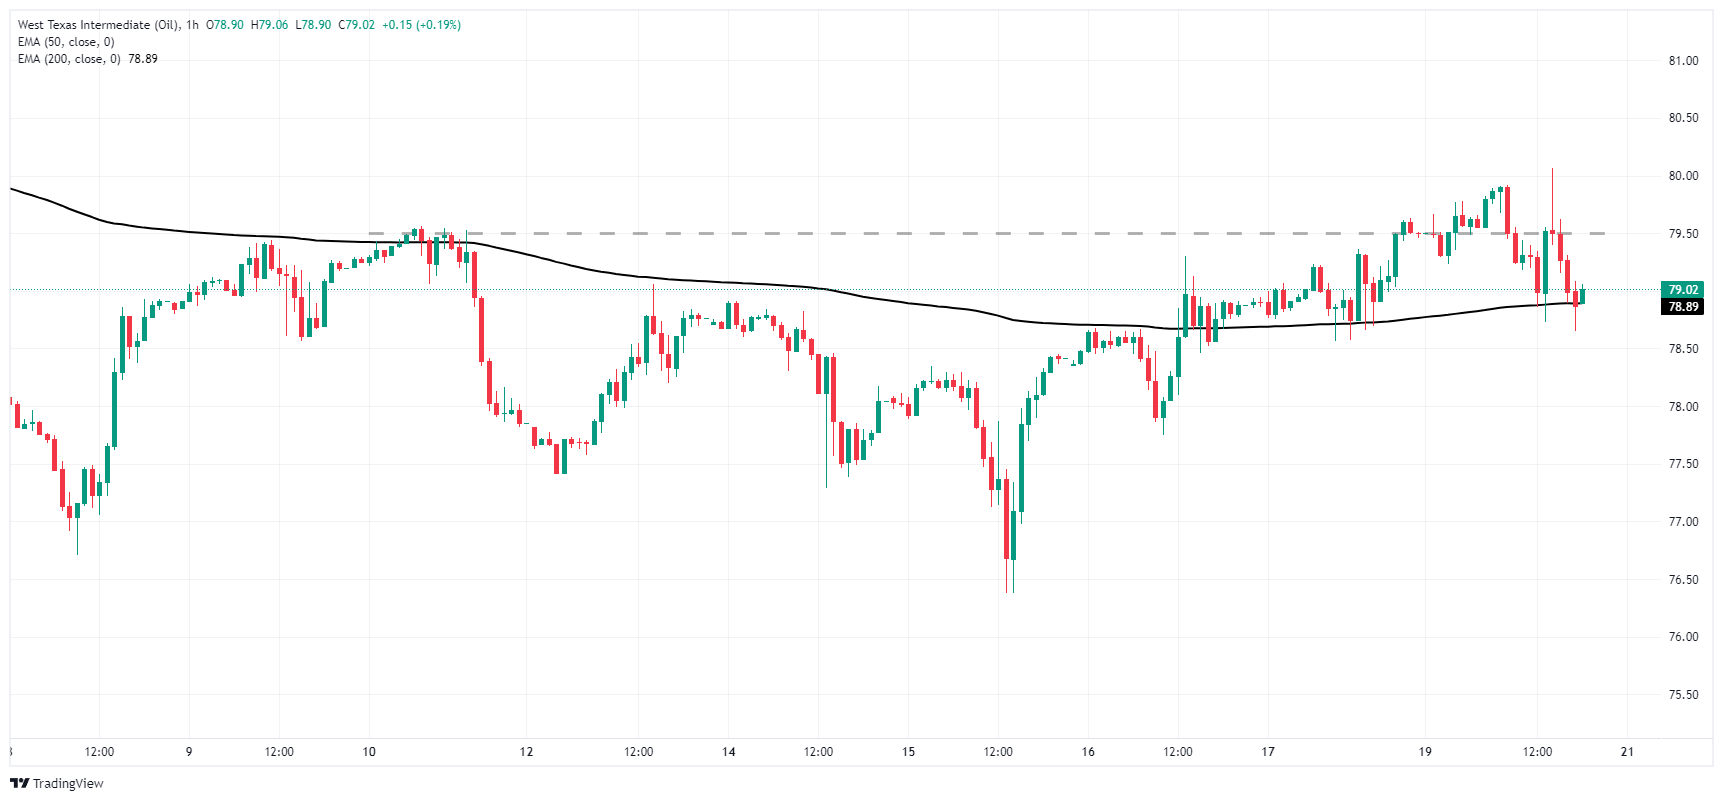
WTI daily chart

- Dow Jones briefly tipped into a new record high, but cautious tones remain.
- Fedspeak dominates headlines on quiet Monday, risk appetite hesitates.
- Rate markets still bet on September rate cut, but odds are easing.
The Dow Jones Industrial Average (DJIA) tested into a new all-time record high on Monday, but price action is getting pushed into the middle near the 40,000.00 handle. Federal Reserve (Fed) officials are appearing in force to kick off the new week, with a slew of policymakers giving cautious comments on Monday. Further comments from Fed officials are expected on Tuesday.
Key inflation data eased slightly below expectations last week, pinning broad-market hopes for Fed rate cuts higher. Despite a better-than-expected inflation print last week, price growth remains well above the Fed’s 2% annualized target. Key Fed members remain concerned that progress on inflation may be stalling out.
Read more: Fed officials speak cautiously on policy outlook after April inflation report
The latest Meeting Minutes from the Fed’s Federal Open Market Committee (FOMC) will be published this week, followed by US Purchasing Managers Index (PMI) figures. New and used Home Sales as well as Durable Goods are due later in the week.
The CME’s FedWatch Tool shows rate markets are still pricing in at least 25 basis points in rate cuts from the September Fed rate meeting, but odds are slipping back. At current cut, rate traders are pricing in around 63% odds of a quarter-point cut in September.
Dow Jones news
Over half of the constituent equities that make up the Dow Jones are in the red on Monday, with JPMorgan Chase & Co. (JPM) leading the losers lower, backsliding -2.7% and falling below $200 per share. JPM is pulling back after hitting a new 52-week high near $205.00 recently.
On the high side, Caterpillar Inc. (CAD) rose 1.7% to $362.40 per share. Caterpillar was closely followed by Boeing Co. (BA), which rose 1.45% to $362.50 per share.
Dow Jones technical outlook
The Dow Jones clipped into a fresh all-time high of 40,070.82 on Monday before cautious investors dragged the mega cap index back down to 39,900.00. Despite softening bids to kick off the new trading week, the DJIA remains firmly-planted in bull country.
The Dow Jones is still up nearly 6% in 2024, and is trading well above the 200-day Exponential Moving Average (EMA) at 37,090.37.
Dow Jones five-minute chart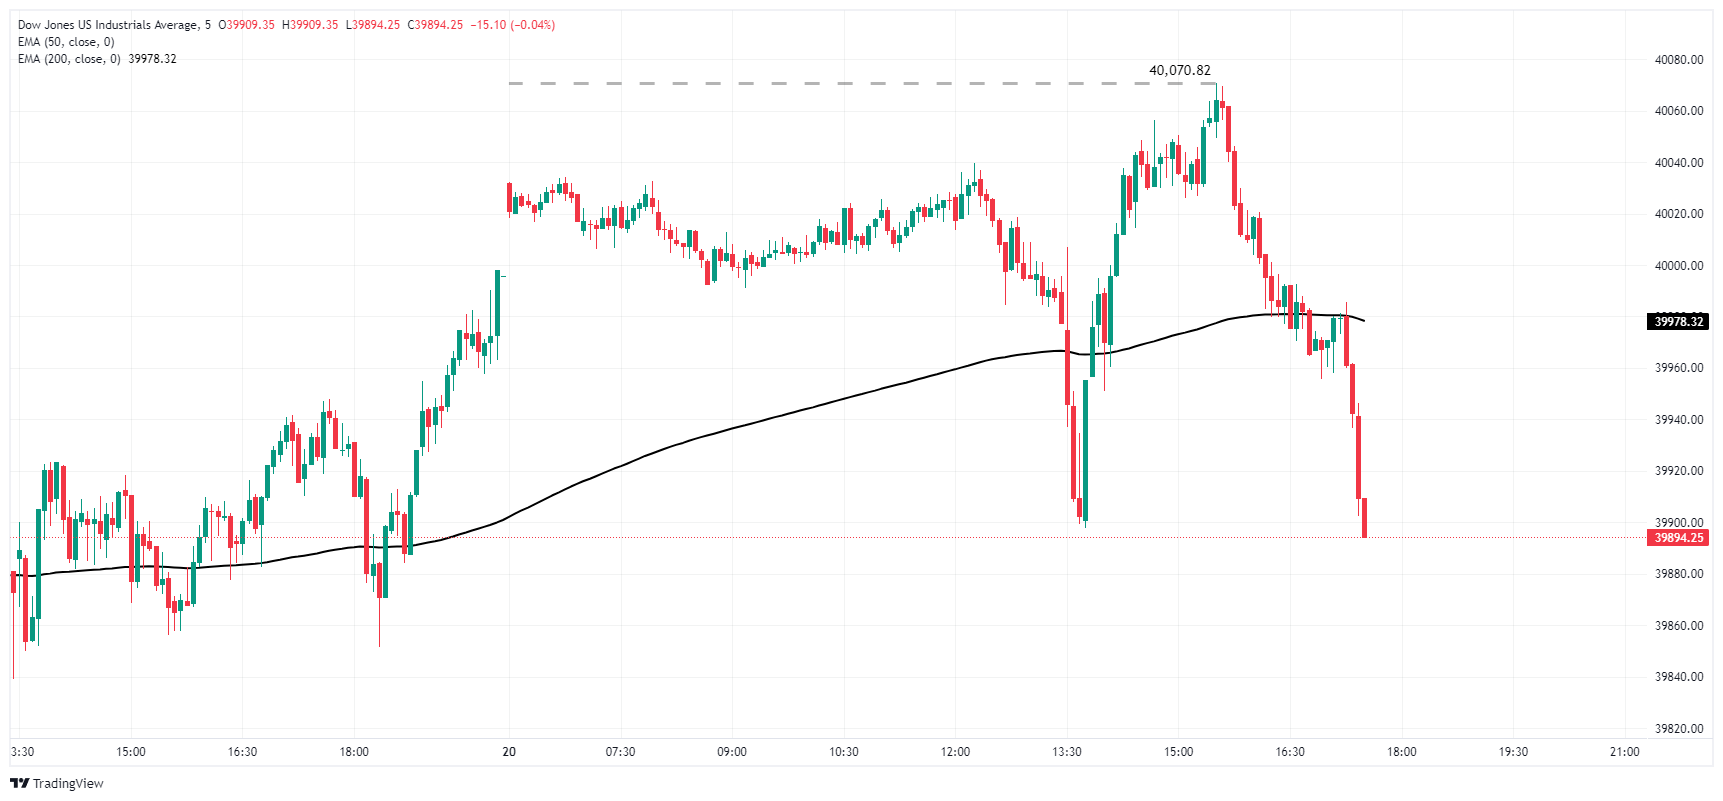
Dow Jones daily chart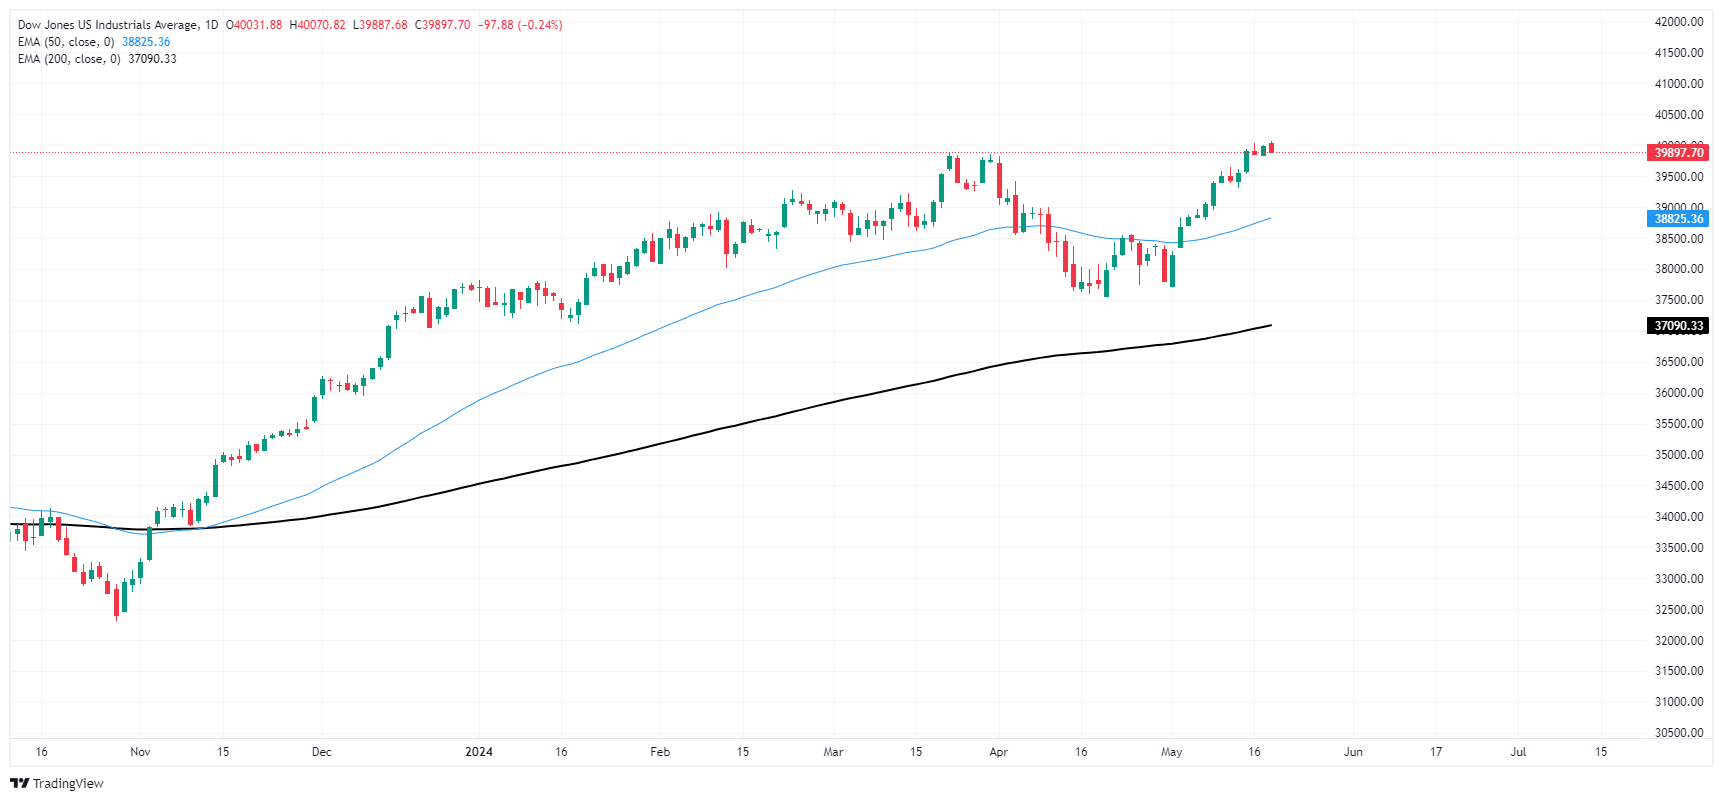
Dow Jones FAQs
The Dow Jones Industrial Average, one of the oldest stock market indices in the world, is compiled of the 30 most traded stocks in the US. The index is price-weighted rather than weighted by capitalization. It is calculated by summing the prices of the constituent stocks and dividing them by a factor, currently 0.152. The index was founded by Charles Dow, who also founded the Wall Street Journal. In later years it has been criticized for not being broadly representative enough because it only tracks 30 conglomerates, unlike broader indices such as the S&P 500.
Many different factors drive the Dow Jones Industrial Average (DJIA). The aggregate performance of the component companies revealed in quarterly company earnings reports is the main one. US and global macroeconomic data also contributes as it impacts on investor sentiment. The level of interest rates, set by the Federal Reserve (Fed), also influences the DJIA as it affects the cost of credit, on which many corporations are heavily reliant. Therefore, inflation can be a major driver as well as other metrics which impact the Fed decisions.
Dow Theory is a method for identifying the primary trend of the stock market developed by Charles Dow. A key step is to compare the direction of the Dow Jones Industrial Average (DJIA) and the Dow Jones Transportation Average (DJTA) and only follow trends where both are moving in the same direction. Volume is a confirmatory criteria. The theory uses elements of peak and trough analysis. Dow’s theory posits three trend phases: accumulation, when smart money starts buying or selling; public participation, when the wider public joins in; and distribution, when the smart money exits.
There are a number of ways to trade the DJIA. One is to use ETFs which allow investors to trade the DJIA as a single security, rather than having to buy shares in all 30 constituent companies. A leading example is the SPDR Dow Jones Industrial Average ETF (DIA). DJIA futures contracts enable traders to speculate on the future value of the index and Options provide the right, but not the obligation, to buy or sell the index at a predetermined price in the future. Mutual funds enable investors to buy a share of a diversified portfolio of DJIA stocks thus providing exposure to the overall index.
- Canadian Dollar mostly higher but flat against Greenback again.
- Canada brings BoC CPI inflation to the table on Tuesday.
- Fedspeak dominates headlines, CAD volumes thin on holiday Monday.
The Canadian Dollar (CAD) is broadly higher on Monday, though momentum remains limited with Canadian markets shuttered for the Victoria Day holiday. CAD traders will officially kick the trading week off on Tuesday, just in time for the Bank of Canada’s (BoC) latest Consumer Price Index (CPI) inflation.
Canada is taking the day off, leaving Fedspeak the key market force on Monday as Federal Reserve (Fed) officials make a slew of appearances. Fed policymakers are walking a fine line between hawkish and bullish as the US central bank tries to balance sky-high market expectations for rate cuts with a mixed data outlook. The Fed remains concerned that inflation could remain a tricky problem to solve, but investors are adamant that the Fed is due for a first rate cut in September.
Daily digest market movers: Canadian Dollar finds room to grow, but limited against Greenback
- Canadian Dollar recovers ground, but Greenback takes top spot on Monday, climbing higher and further.
- Fed speakers flood the newswires on Monday, stressing the need for patience on rate moves with inflation expected by Fed staff to remain too high for too long.
- Canada’s CPI inflation for the year ended April is expected to tick down to 2.7% from 2.9%.
- The BoC’s own Core CPI inflation tracker last came in at 2.0% YoY.
- Tuesday will feature even more Fed appearances, filling investors’ viewports.
- Fed officials speak cautiously on policy outlook after April inflation report
Canadian Dollar PRICE Today
The table below shows the percentage change of Canadian Dollar (CAD) against listed major currencies today. Canadian Dollar was the strongest against the New Zealand Dollar.
| USD | EUR | GBP | JPY | CAD | AUD | NZD | CHF | |
|---|---|---|---|---|---|---|---|---|
| USD | 0.03% | -0.12% | 0.31% | 0.01% | 0.27% | 0.33% | 0.03% | |
| EUR | -0.03% | -0.18% | 0.32% | -0.01% | 0.28% | 0.31% | 0.00% | |
| GBP | 0.12% | 0.18% | 0.36% | 0.17% | 0.45% | 0.48% | 0.18% | |
| JPY | -0.31% | -0.32% | -0.36% | -0.32% | -0.04% | 0.04% | -0.27% | |
| CAD | -0.01% | 0.01% | -0.17% | 0.32% | 0.22% | 0.32% | 0.02% | |
| AUD | -0.27% | -0.28% | -0.45% | 0.04% | -0.22% | 0.02% | -0.27% | |
| NZD | -0.33% | -0.31% | -0.48% | -0.04% | -0.32% | -0.02% | -0.30% | |
| CHF | -0.03% | -0.01% | -0.18% | 0.27% | -0.02% | 0.27% | 0.30% |
The heat map shows percentage changes of major currencies against each other. The base currency is picked from the left column, while the quote currency is picked from the top row. For example, if you pick the Canadian Dollar from the left column and move along the horizontal line to the US Dollar, the percentage change displayed in the box will represent CAD (base)/USD (quote).
Technical analysis: Canadian Dollar high, but Greenback even higher
The Canadian Dollar (CAD) is gaining ground against nearly all of its major currency peers, climbing a third of a percent against the Antipodeans and around a sixth of a percent against the Japanese Yen (JPY). On the low side, the CAD is shedding around a tenth of a percent against the market’s top performers on Monday, the Pound Sterling (GBP) and the US Dollar (USD).
USD/CAD continues to go sideways in the near term, treading choppy water between 1.3640 and the 1.3600 handle. Intraday price action remains hampered by the 200-hour Exponential Moving Average (EMA) at 1.3646.
Middling technical action threatens to bake into USD/CAD with daily candlesticks stuck between the 50-day and 200-day EMAs at 1.3635 and 1.3548, respectively. The 1.3600 handle remains a key technical barrier, acting as a magnet pulling down bullish momentum and a price floor hobbling further shortside progress.
USD/CAD hourly chart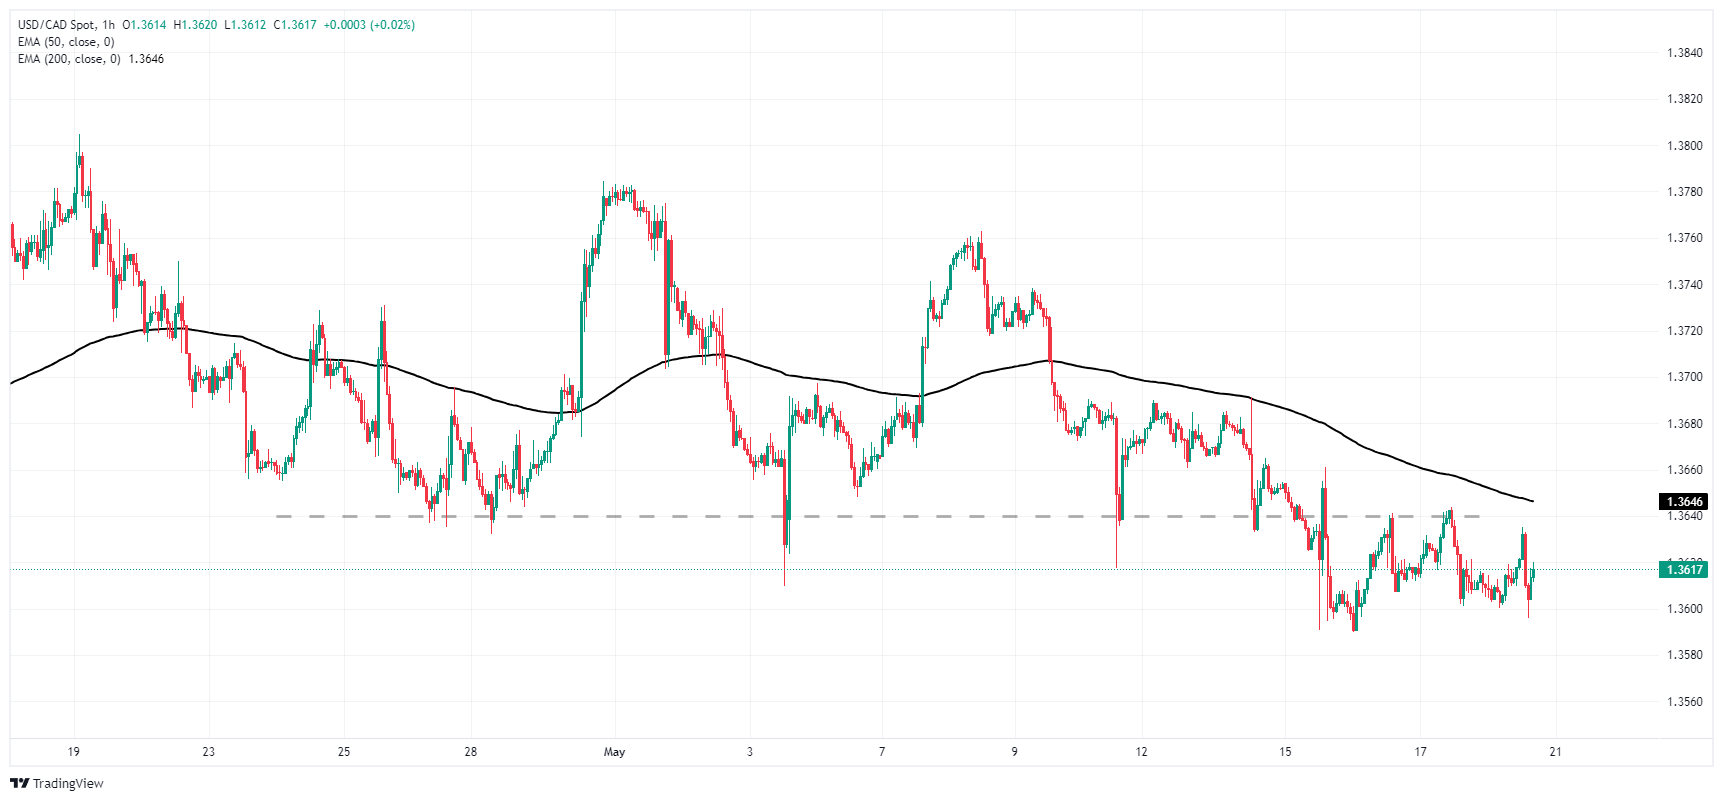
USD/CAD daily chart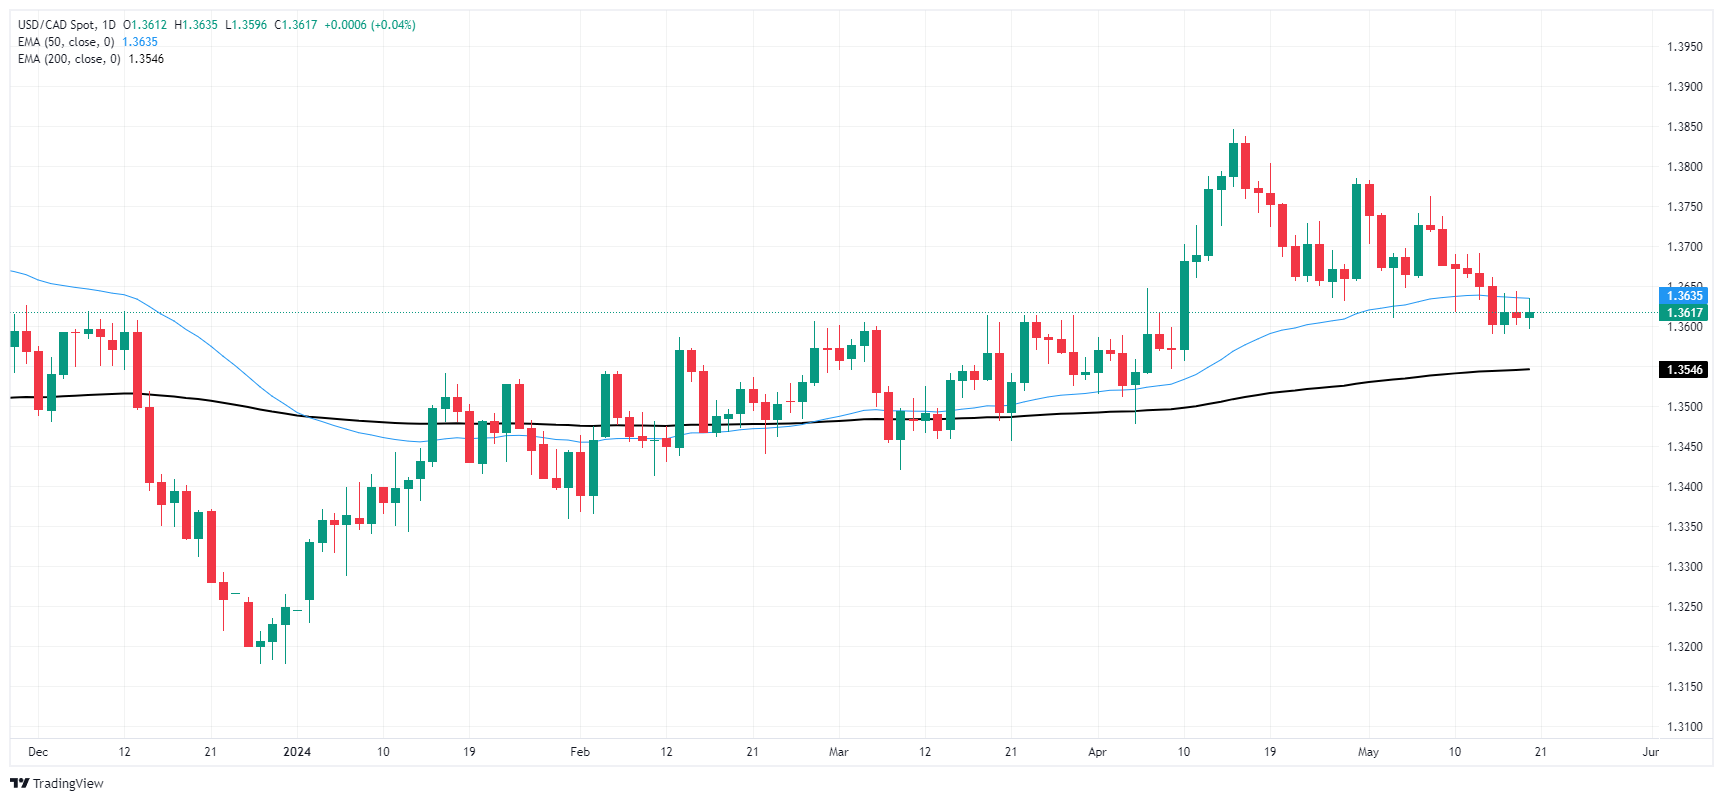
Canadian Dollar FAQs
The key factors driving the Canadian Dollar (CAD) are the level of interest rates set by the Bank of Canada (BoC), the price of Oil, Canada’s largest export, the health of its economy, inflation and the Trade Balance, which is the difference between the value of Canada’s exports versus its imports. Other factors include market sentiment – whether investors are taking on more risky assets (risk-on) or seeking safe-havens (risk-off) – with risk-on being CAD-positive. As its largest trading partner, the health of the US economy is also a key factor influencing the Canadian Dollar.
The Bank of Canada (BoC) has a significant influence on the Canadian Dollar by setting the level of interest rates that banks can lend to one another. This influences the level of interest rates for everyone. The main goal of the BoC is to maintain inflation at 1-3% by adjusting interest rates up or down. Relatively higher interest rates tend to be positive for the CAD. The Bank of Canada can also use quantitative easing and tightening to influence credit conditions, with the former CAD-negative and the latter CAD-positive.
The price of Oil is a key factor impacting the value of the Canadian Dollar. Petroleum is Canada’s biggest export, so Oil price tends to have an immediate impact on the CAD value. Generally, if Oil price rises CAD also goes up, as aggregate demand for the currency increases. The opposite is the case if the price of Oil falls. Higher Oil prices also tend to result in a greater likelihood of a positive Trade Balance, which is also supportive of the CAD.
While inflation had always traditionally been thought of as a negative factor for a currency since it lowers the value of money, the opposite has actually been the case in modern times with the relaxation of cross-border capital controls. Higher inflation tends to lead central banks to put up interest rates which attracts more capital inflows from global investors seeking a lucrative place to keep their money. This increases demand for the local currency, which in Canada’s case is the Canadian Dollar.
Macroeconomic data releases gauge the health of the economy and can have an impact on the Canadian Dollar. Indicators such as GDP, Manufacturing and Services PMIs, employment, and consumer sentiment surveys can all influence the direction of the CAD. A strong economy is good for the Canadian Dollar. Not only does it attract more foreign investment but it may encourage the Bank of Canada to put up interest rates, leading to a stronger currency. If economic data is weak, however, the CAD is likely to fall.
- DXY Index is neutral, trading at 104.25, setting up for a quiet weekly start.
- Weaker data drives Fed officials' cautious stance, and financial conditions are improving.
- Markets continue to bet on an easing cycle starting in September, FOMC minutes on Wednesday will be key.
The US Dollar Index (DXY) begins the week on a quiet note, trading at 104.25, registering negligible changes despite the recent soft performances in data. The Federal Reserve (Fed) still showcases caution regarding premature easing as financial conditions continue to loosen.
The US economy exhibits signs of unyielding stability, despite recent data revealing some underperformance. The Fed, nonetheless, remains vigilant, hesitant to resort to premature easing as the financial conditions persistently ease. Inflation and Retail sales data from April disappointed last week, and markets will set their sight on S&P data later this week to gain more insights into the US economy’s health.
Daily digest market movers: US Dollar holds its ground, markets await drivers
- Fed officials remain cautious in terms of a timeline for cutting interest rates, incoming data will set the timing of the easing cycle.
- Odds of a cut in June and July still remain low, so investors are delaying the first cut to September.
- Treasury bond yields are rising with the 2-year yield seen at 4.83%, the 5-year yield at 4.44%, and the 10-year yield at 4.42%.
DXY technical analysis: DXY wrestles with momentum as both bulls and bears battle for dominance
The indicators on the daily chart reflect an undecided market that awaits drivers. The flat position of the Relative Strength Index (RSI) in negative territory discloses the conflict within the market, detailing the struggle between buyers and sellers. Moreover, the Moving Average Convergence Divergence (MACD) histogram displaying flat red bars supports this idea of bears trying to wrest control over the short term. However, the stalled nature shows a lack of decisive momentum in either direction, reflecting a market awaiting firm direction.
The Simple Moving Averages (SMAs) partially tell a similar tale. The index trading below the 20-day SMA indicates that bears have recently gained some ground. However, the fact that DXY remains above both the 100 and 200-day SMAs suggests that the longer-term bullish momentum cannot be entirely dismissed.
US Dollar FAQs
The US Dollar (USD) is the official currency of the United States of America, and the ‘de facto’ currency of a significant number of other countries where it is found in circulation alongside local notes. It is the most heavily traded currency in the world, accounting for over 88% of all global foreign exchange turnover, or an average of $6.6 trillion in transactions per day, according to data from 2022. Following the second world war, the USD took over from the British Pound as the world’s reserve currency. For most of its history, the US Dollar was backed by Gold, until the Bretton Woods Agreement in 1971 when the Gold Standard went away.
The most important single factor impacting on the value of the US Dollar is monetary policy, which is shaped by the Federal Reserve (Fed). The Fed has two mandates: to achieve price stability (control inflation) and foster full employment. Its primary tool to achieve these two goals is by adjusting interest rates. When prices are rising too quickly and inflation is above the Fed’s 2% target, the Fed will raise rates, which helps the USD value. When inflation falls below 2% or the Unemployment Rate is too high, the Fed may lower interest rates, which weighs on the Greenback.
In extreme situations, the Federal Reserve can also print more Dollars and enact quantitative easing (QE). QE is the process by which the Fed substantially increases the flow of credit in a stuck financial system. It is a non-standard policy measure used when credit has dried up because banks will not lend to each other (out of the fear of counterparty default). It is a last resort when simply lowering interest rates is unlikely to achieve the necessary result. It was the Fed’s weapon of choice to combat the credit crunch that occurred during the Great Financial Crisis in 2008. It involves the Fed printing more Dollars and using them to buy US government bonds predominantly from financial institutions. QE usually leads to a weaker US Dollar.
Quantitative tightening (QT) is the reverse process whereby the Federal Reserve stops buying bonds from financial institutions and does not reinvest the principal from the bonds it holds maturing in new purchases. It is usually positive for the US Dollar.
- Mexican Peso rises 0.26% against US Dollar and dives below 16.60.
- Weak March Retail Sales data from INEGI ahead of Q1 GDP release and Banxico minutes.
- Banxico Deputy Governor Espinosa's hawkish stance contrasts with US Fed's cautious optimism on disinflation.
The Mexican Peso posted solid gains against the US Dollar in early Monday trading during the North American session. Although Mexican Retail Sales data plunged, the Mexican currency edged up on Deputy Governor Irene Espinosa's hawkish comments last Friday. The USD/MXN trades at 16.56, down 0.26%.
Mexico’s economic docket should be busier than last week. On Monday, the Instituto Nacional de Estadística Geografía e Informática (INEGI) revealed that Retail Sales in March missed the mark in monthly and yearly figures.
The data comes ahead of the release of Gross Domestic Product (GDP) figures for the first quarter of 2024 on May 23. These figures are expected to show that the Mexican economy is slowing amid higher borrowing costs of 11.00% set by the Bank of Mexico (Banxico) on fears of higher inflation and a depreciation of the Peso.
Later that day, Banxico would release the minutes of its latest monetary policy meeting, followed on Friday by the announcement of the Balance of Trade and the Current Account.
Last Friday, Banxico’s Deputy Governor Irene Espinosa, the dissenter of the latest meeting, made hawkish comments stating that March’s rate cut was premature and that it would hinder inflation convergence to the bank’s goal.
Across the border, the Vice-Chair of the Federal Reserve, Philipp Jefferson, said that the policy rate is restrictive, adding that April’s reading is encouraging. However, it’s too early to tell if the disinflationary process will last.
Daily digest market movers: Mexican Peso soars on Espinosa’s hawkish stance
- Retail Sales in March plunged -0.2% MoM, below February’s 0.5% increase. On a yearly basis, sales plummeted -1.7%, missed estimates of 0%, and trailed the previous month's 3% growth.
- Diverging views surface in Banxico. Governor Victoria Rodriguez Ceja said last Monday that the bank would discuss lowering rates in the upcoming meeting on June 29. Conversely, Deputy Governor Espinosa commented that lowering rates in March might have delayed inflation convergence toward the central bank’s target by two quarters.
- According to Bloomberg, leveraged funds increased its net long Peso positions by 3,780 contracts between May 7 and May 14 via CFTC data. Institutional asset managers, which hold the biggest bullish position in the peso with 146,975 contracts, also added to positive momentum with 2,558 long peso contracts in the same week. That has propelled the Mexican Peso to be the best-performing currency in the world so far.
- Atlanta’ Fed President Raphael Bostic commented that interest rates are likely to remain higher than last decade, adding that Fed is open to all possibilities amid many economic scenarios.
- Data from the Chicago Board of Trade shows investors are expecting 33 basis points (bps) of the Fed’s easing toward the end of the year, down from Friday’s 35 bps.
Technical analysis: Mexican Peso extends its gains as USD/MXN falls below 16.60
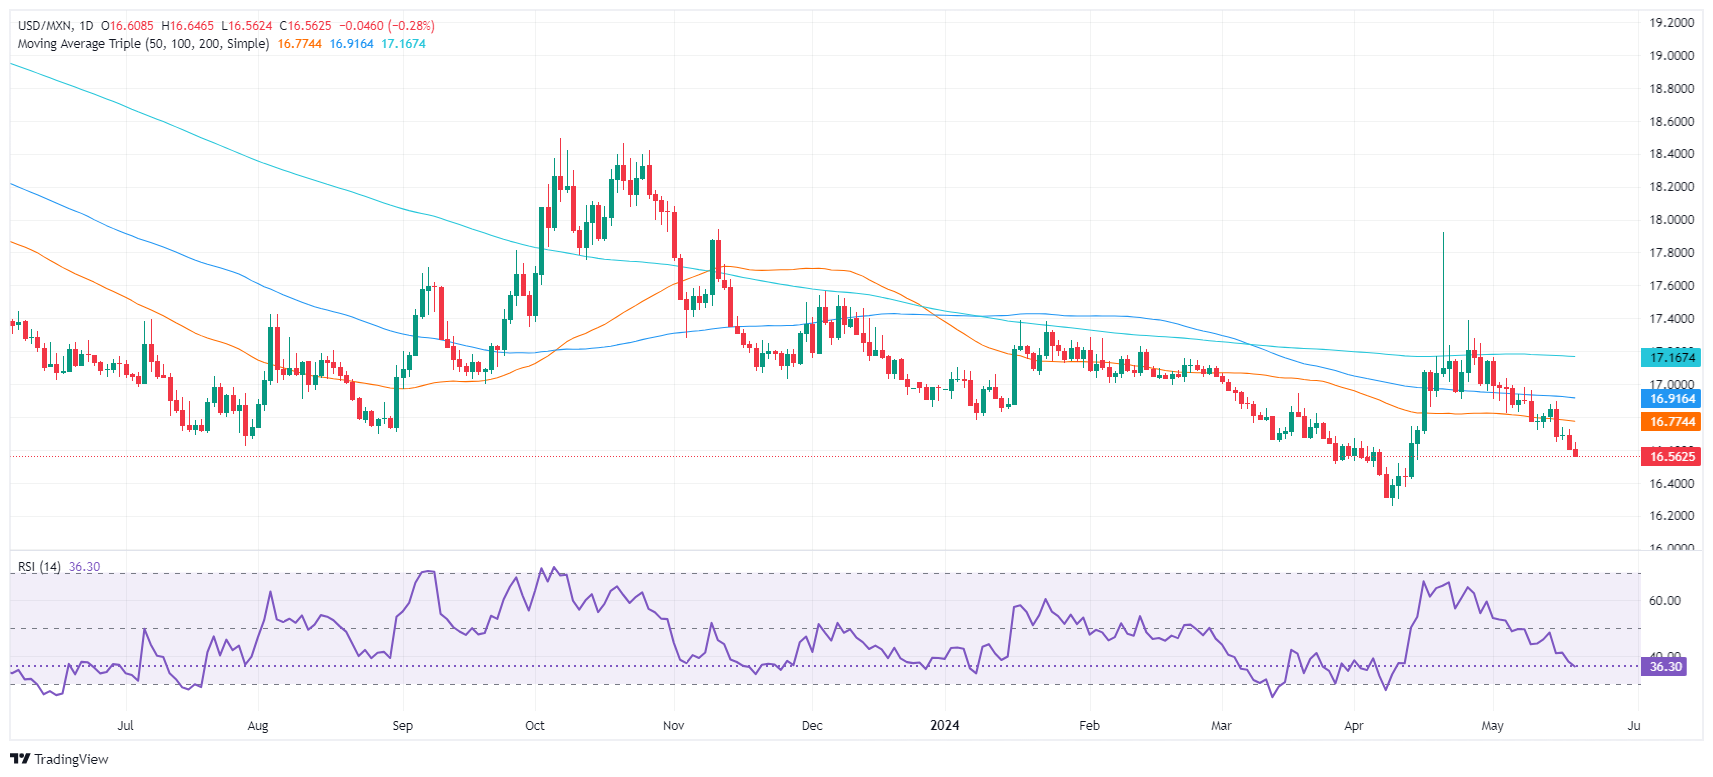
The Mexican Peso continues to rally sharply as the USD/MXN downtrend extends, likely to test the psychological 16.50 figure. Momentum, as depicted by the Relative Strength Index (RSI), favors sellers, yet they seem to take a breather as the downward move stalled.
Once the USD/MXN falls below 16.50, the next stop would be the current year-to-date low of 16.25.
Conversely, if buyers reclaim the 50-day SMA at 16.76, it could exacerbate a rally toward the 100-day SMA at 16.91. Once cleared, the next supply zone would be the 17.00 psychological level. In that event, the next stop would be the 200-day SMA at 17.17.
Mexican Peso FAQs
The Mexican Peso (MXN) is the most traded currency among its Latin American peers. Its value is broadly determined by the performance of the Mexican economy, the country’s central bank’s policy, the amount of foreign investment in the country and even the levels of remittances sent by Mexicans who live abroad, particularly in the United States. Geopolitical trends can also move MXN: for example, the process of nearshoring – or the decision by some firms to relocate manufacturing capacity and supply chains closer to their home countries – is also seen as a catalyst for the Mexican currency as the country is considered a key manufacturing hub in the American continent. Another catalyst for MXN is Oil prices as Mexico is a key exporter of the commodity.
The main objective of Mexico’s central bank, also known as Banxico, is to maintain inflation at low and stable levels (at or close to its target of 3%, the midpoint in a tolerance band of between 2% and 4%). To this end, the bank sets an appropriate level of interest rates. When inflation is too high, Banxico will attempt to tame it by raising interest rates, making it more expensive for households and businesses to borrow money, thus cooling demand and the overall economy. Higher interest rates are generally positive for the Mexican Peso (MXN) as they lead to higher yields, making the country a more attractive place for investors. On the contrary, lower interest rates tend to weaken MXN.
Macroeconomic data releases are key to assess the state of the economy and can have an impact on the Mexican Peso (MXN) valuation. A strong Mexican economy, based on high economic growth, low unemployment and high confidence is good for MXN. Not only does it attract more foreign investment but it may encourage the Bank of Mexico (Banxico) to increase interest rates, particularly if this strength comes together with elevated inflation. However, if economic data is weak, MXN is likely to depreciate.
As an emerging-market currency, the Mexican Peso (MXN) tends to strive during risk-on periods, or when investors perceive that broader market risks are low and thus are eager to engage with investments that carry a higher risk. Conversely, MXN tends to weaken at times of market turbulence or economic uncertainty as investors tend to sell higher-risk assets and flee to the more-stable safe havens.
- EUR/JPY extends its uptrend as the Euro outperforms the Japanese Yen due to the higher interest rates in the Eurozone.
- After suspected direct intervention by the Japanese authorities to strengthen the Yen in early May there have been no follow ups.
- Weak data from Japan has lowered expectations the BoJ will be in a position to continue raising interest rates, further weakening JPY.
EUR/JPY extends its uptrend on Monday, clocking up gains of over two-tenths of a percent to reach 169.50s, as the wide interest-rate differential between the Eurozone and Japan continues to favor the Euro (EUR) over the Japanese Yen (JPY) – relatively higher interest rates attract greater foreign capital inflows.
Additionally, in the absence of recent direct intervention in currency markets by the Japanese authorities to strengthen the JPY, the pair has been allowed to creep higher. The last time a suspected intervention took place was in late April and early May when EUR/JPY experienced sharp declines for no apparent reason leading to unconfirmed speculations of intervention.
The Bank of Japan’s (BoJ) decision to not repeat a reduction in its bond buying operations on May 17 despite doing so on May 13 further led the JPY to weaken. Reductions to bond buying are seen as a form of policy tightening – like raising interest rates – thus the decision not to go ahead was seen as a slight shift to an easier stance.
A string of weak data releases in Japan, including a surprise 2.0% annualized drop in Q1 GDP, Tokyo CPI coming out lower than expected, and weak wage growth data in Q1 further suggest the BoJ will probably delay its next interest rate hike, after a one-off raise in March, giving EUR/JPY a back wind.
The Euro, meanwhile, is strengthening as positive data for the region suggests the European Central Bank (ECB) will not need to cut interest rates as quickly as previously thought, in order to stimulate economic growth. Q1 GDP data showed a 0.3% rise after two quarters of contraction and the strongest quarter of growth since Q3 of 2022. The Euro was also supported by relatively strong Eurozone PMI data for April.
The ECB is widely expected to cut interest rates in June but recent comments from ECB board member Isabel Schnabel suggested the governing council might not follow up the cut in June with a cut in July. On Monday ECB policymaker Martin Kazaks gave the go ahead for rate cuts, saying inflation was gradually falling to the ECB’s 2.0% target, however, he added “the process (of cutting interest rates) needs to be gradual and we must not rush it.”
Federal Reserve (Fed) Vice Chair of the Board of Governors Phillip Jefferson said on Monday that they will assess incoming data, evolving outlook and balance of risks to set appropriate stance of policy rate, per Reuters.
Fed officials take on cautious tone on policy after April inflation report.
Key quotes
"Policy rate is in restrictive territory."
"We continue to see the labor market come into better balance, and inflation decline, though nowhere near as quickly as would have liked."
"Expecting consumer spending growth to slow later this year."
"Too early to tell if recent slowdown in disinflationary process will be long-lasting."
"April's better inflation reading is encouraging."
"Fed staff estimate core PCE prices rose at an annual 4.1% in the first four months of 2024, with 12-month change at 2.75%."
"Long-term inflation expectations show Americans believe the Fed will make good on 2% inflation goal."
"Restrictive monetary policy has weighed on the housing market."
Market reaction
These comments don't seem to be having a noticeable impact on the US Dollar's valuation. At the time of press, the US Dollar Index was unchanged on the day at 104.50.
- GBP/USD extends its gains to two straight days, climbing above 1.2700.
- Despite remaining bullish, bears loom as daily close below 1.2700 could reignite selling pressure.
- Buyers are in charge, and need the GBP/USD staying above 1.2700, to challenge 1.2800 near term.
The Pound Sterling begins the week solidly against the US Dollar, registering modest gains of 0.04% after hitting a daily low of 1.2681. At the time of writing, the GBP/USD trades at 1.2703.
GBP/USD Price Analysis: Technical outlook
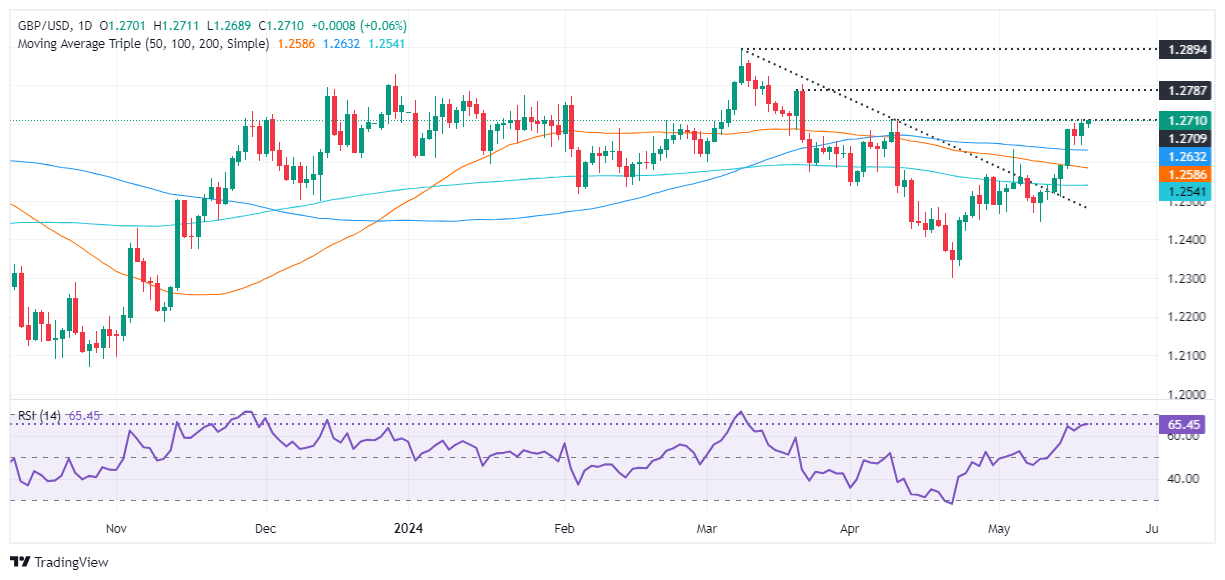
Last week, the GBP/USD edged toward the current exchange rate, clearing stir resistance levels like the 50 and 100-day moving averages (DMAs), which opened the door for further gains. Although momentum backs buyers, as depicted by the Relative Strength Index (RSI), downside risks remain.
For a bullish continuation, the GBP/USD must remain above 1.2700. In that event, the first resistance would be the March 21 cycle high at 1.2803. Once surpassed, sellers’ next line of defense would be the year-to-date (YTD) high at 1.2893, ahead of 1.2900, followed by the psychological 1.3000 mark.
Conversely, if sellers drag the GBP/USD spot price below 1.2700, that could exacerbate a retest of the confluence of the 100-DMA and the May 3 high at 1.2634. Further losses lie below the latter, which would expose 1.2594 and the 50-DMA at 1.2584 before dipping to the 200-DMA at 1.2539.
GBP/USD Price Action – Daily Chart
British Pound PRICE Today
The table below shows the percentage change of British Pound (GBP) against listed major currencies today. British Pound was the strongest against the New Zealand Dollar.
| USD | EUR | GBP | JPY | CAD | AUD | NZD | CHF | |
|---|---|---|---|---|---|---|---|---|
| USD | 0.00% | -0.06% | 0.33% | -0.10% | 0.22% | 0.31% | -0.07% | |
| EUR | -0.01% | -0.10% | 0.36% | -0.10% | 0.25% | 0.30% | -0.07% | |
| GBP | 0.06% | 0.10% | 0.32% | 0.00% | 0.34% | 0.39% | 0.02% | |
| JPY | -0.33% | -0.36% | -0.32% | -0.45% | -0.10% | -0.01% | -0.39% | |
| CAD | 0.10% | 0.10% | 0.00% | 0.45% | 0.28% | 0.41% | 0.03% | |
| AUD | -0.22% | -0.25% | -0.34% | 0.10% | -0.28% | 0.05% | -0.32% | |
| NZD | -0.31% | -0.30% | -0.39% | 0.00% | -0.41% | -0.05% | -0.38% | |
| CHF | 0.07% | 0.07% | -0.02% | 0.39% | -0.03% | 0.32% | 0.38% |
The heat map shows percentage changes of major currencies against each other. The base currency is picked from the left column, while the quote currency is picked from the top row. For example, if you pick the British Pound from the left column and move along the horizontal line to the US Dollar, the percentage change displayed in the box will represent GBP (base)/USD (quote).
- NZD/USD slumps to 0.6100 ahead of RBNZ monetary policy decision.
- The US Dollar steadies as investors shift focus to FOMC minutes.
- US yields rise as Fed maintains a hawkish guidance on the interest rate outlook.
The NZD/USD pair faces selling pressure and drops to the round-level support of 0.6100 in Monday’s New York session. The Kiwi asset drops comes under pressure as the New Zealand Dollar weakens ahead of the Reserve Bank of New Zealand’s (RBNZ) interest rate decision, which will be announced on Wednesday.
Investors expect that the RBNZ will keep its Official Cash Rate (OCR) steady at 5.5%. Therefore, market participants will focus on cues about when the RBNZ will start reducing interest rates. Currently, financial markets see the RBNZ shifting to policy-normalization next year.
Meanwhile, the US Dollar Index (DXY) rises to 104.60 as investors turn slightly cautious ahead of the Federal Open Market Committee (FOMC) minutes for the May meeting, which will be published on Wednesday. The FOMC minutes will indicate policymakers’ view on the interest rate outlook.
10-year US Treasury yields rise to 4.44% as Fed policymakers emphasize keeping interest rates higher for a longer period despite an expected decline in the US Consumer Price Index (CPI) data for April. The annual headline and core CPI declined to 3.4% and 3.6%, respectively.
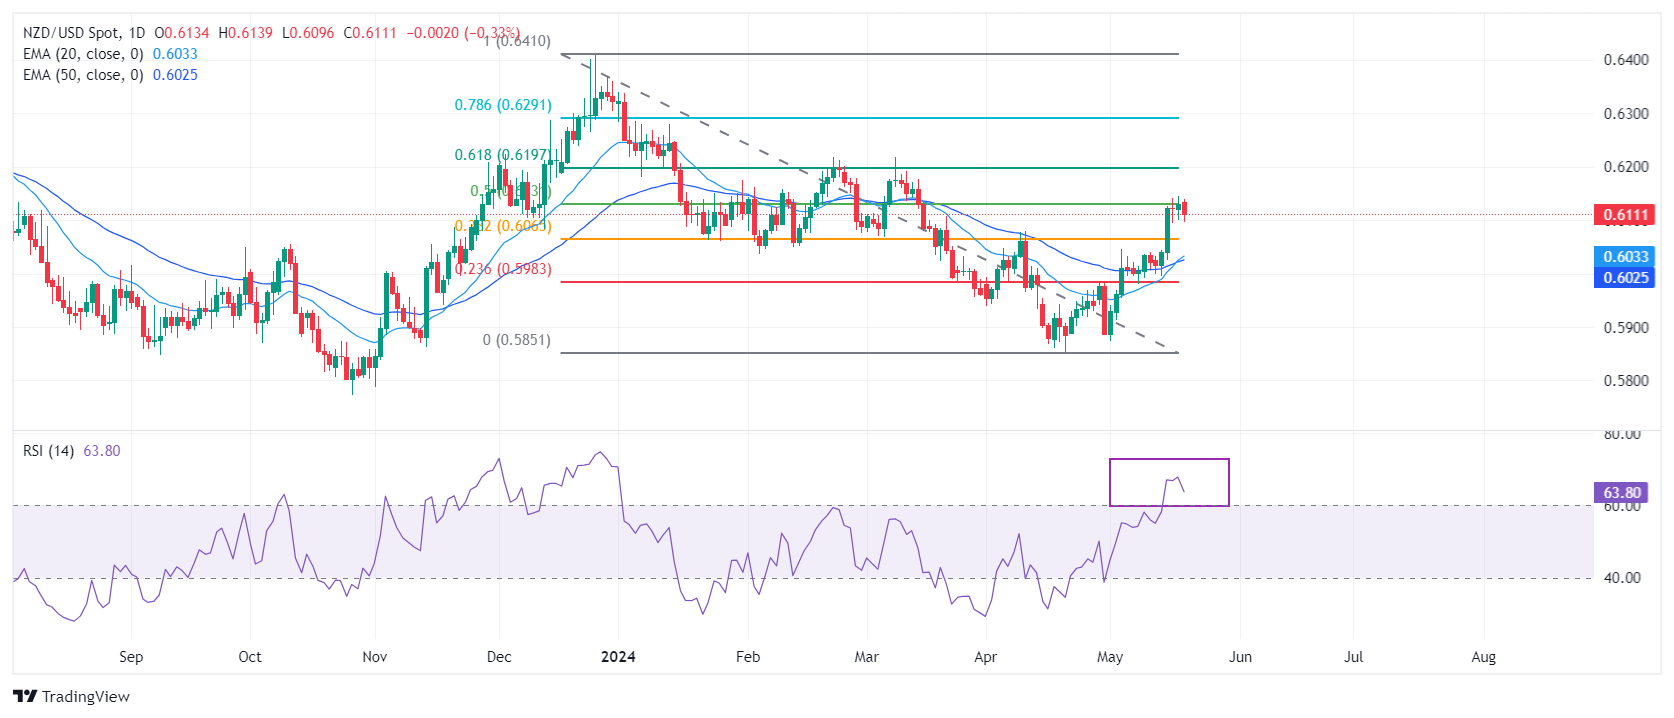
NZD/USD extends recovery to 50% Fibonacci retracement (plotted from December 26 high at 0.6410 to April 19 low around 0.5850) at 0.6130 on a daily timeframe. The near-term outlook of the Kiwi asset has improved as the 20-and 50-day Exponential Moving Averages (EMAs) around 0.6017. The 14-period Relative Strength Index (RSI) has shifted comfortably into the bullish range of 60.00-80.00, suggesting that the momentum has leaned toward the upside.
An upside move above February 9 high of 0.6160 will drive the asset towards 61.8% Fibo retracement at 0.6200, followed by January 15 high near 0.6250
On the contrary, fresh downside would appear if the asset breaks below April 4 high around 0.6050 This would drag the asset towards the psychological support of 0.6000 and April 25 high at 0.5969.
NZD/USD daily chart
New Zealand Dollar PRICE TodaY
The table below shows the percentage change of New Zealand Dollar (NZD) against listed major currencies today. New Zealand Dollar was the strongest against the Australian Dollar.
| USD | EUR | GBP | JPY | CAD | AUD | NZD | CHF | |
|---|---|---|---|---|---|---|---|---|
| USD | 0.03% | -0.02% | 0.28% | -0.03% | 0.24% | 0.33% | -0.06% | |
| EUR | -0.03% | -0.09% | 0.29% | -0.06% | 0.25% | 0.31% | -0.08% | |
| GBP | 0.02% | 0.09% | 0.24% | 0.03% | 0.33% | 0.38% | -0.01% | |
| JPY | -0.28% | -0.29% | -0.24% | -0.34% | -0.03% | 0.06% | -0.33% | |
| CAD | 0.03% | 0.06% | -0.03% | 0.34% | 0.23% | 0.36% | -0.02% | |
| AUD | -0.24% | -0.25% | -0.33% | 0.03% | -0.23% | 0.04% | -0.33% | |
| NZD | -0.33% | -0.31% | -0.38% | -0.06% | -0.36% | -0.04% | -0.39% | |
| CHF | 0.06% | 0.08% | 0.00% | 0.33% | 0.02% | 0.33% | 0.39% |
The heat map shows percentage changes of major currencies against each other. The base currency is picked from the left column, while the quote currency is picked from the top row. For example, if you pick the New Zealand Dollar from the left column and move along the horizontal line to the US Dollar, the percentage change displayed in the box will represent NZD (base)/USD (quote).
Federal Reserve Vice Chair for Supervision Michael Barr said on Monday that the Fed is in a good position to hold the policy steady and watch the economy, per Reuters.
Fed officials adopt cautious tone speaking on policy outlook after inflation data.
Key takeaways
"Q1 inflation was disappointing, did not provide the confidence needed to ease monetary policy."
"Fed will need to allow tight policy further time to continue to do its work."
"Vigilant to the risks to both inflation and employment mandates."
"Current approach is prudent to manage both sets of risks."
Market reaction
The US Dollar Index edged slightly higher and was last seen gaining 0.1% on the day at 104.60.
- USD/CAD rises on Monday as geopolitical tensions drive safe-haven demand to the Greenback.
- Canadian CPI data out on Tuesday could impact BoC decision making on interest rates and USD/CAD.
- A roll-call of Fed officials are scheduled to speak on Monday with implications for USD pairs.
USD/CAD trades a beat higher on Monday, rising into the 1.3620s, as the US Dollar (USD) strengthens in most pairs, on the back of safe-haven demand as markets are put on edge by reports the President of Iran, Ebrahim Raisi, died in a freak helicopter accident in Northern Iran over the weekend, according to Reuters.
Additionally, Russia’s decision to open a second front in the Kharkiv region has intensified that hotspot. Russian President Putin’s visit to Beijing and the bonhomie expressed between himself and Chinese President Xi, highlights geopolitical divisions and the growing fault lines between the West and BRICS countries, with implications for world peace and free trade.
Canadian Dollar (CAD) traders, meanwhile, await the release of critical Canadian Consumer Price Index (CPI) data for April, on Tuesday, which will inform Bank of Canada (BoC) future policy on interest rates, a key driver of FX.
Markets expect the BoC to begin cutting its policy interest rate from the current 5.0% in June, with a 40% probability, according to FXStreet Editor Lallalit Srijandorn. Tuesday’s CPI release could change the probability.
If CPI comes out higher than the 2.8% expected YoY, it will probably convince the BoC to delay, resulting in strength for the CAD since the maintenance of higher interest rates is positive for currencies, since it attracts greater foreign capital inflows. Such an outcome would be negative for USD/CAD which measures the buying power of one US Dollar in Canadian Dollars. If CPI comes out lower, the opposite effect is likely to be observed.
The probabilities of the Fed cutting interest rates in June, meanwhile, have fallen from over 50% at the start of the year to only 3.5% at the time of writing, according to the CME FedWatch tool which calculates the odds from interest-rate futures markets. The fall in probabilities was due to higher-than-expected inflation and growth in Q1. For a while markets even questioned whether the Fed would cut at all in 2024. This has been favorable for the USD and put a backwind behind USD/CAD for most of 2024.
Data out last Wednesday, however, showed an unexpected cooling in US inflation and Retail Sales in April which led to a revival of bets that the Fed would start cutting interest rates. The probability of the fed funds rates being lower by September now stands at 65%. This had the effect of undermining the US Dollar last week, which weighed on USD/CAD.
On Monday US Dollar traders await comments from several Fed officials which could impact expectations of the future path of interest rates. During the US session, Atlanta Fed President Raphael Bostic, Fed Vice Chair for Supervision Michael Barr, Fed Governor Christopher Waller and Fed Vice Chair Phillip Jefferson are all scheduled to deliver speeches, and their words will be analyzed for insights on Fed policy going forward.
In an interview with Bloomberg on Monday, Atlanta Federal Reserve Bank President Raphael Bostic said that it is going to take a while before they are certain that inflation is going back down to 2%.
Key takeaways
"Data for first part of years on inflation have been very bumpy."
"Business leaders tell me things are slowing down, but very slowly."
"Momentum in the economy will take a while to play through."
"Pricing power is weakening."
"My outlook is inflation will continue to fall this year and into 2025."
"Our new steady state on interest rates is likely to be higher than what people have been used to for past decade."
"Fed is open to all possibilities on path of the economy."
"Risks are really balanced right now."
"Firms tell me labor market weaker than last year, but not soft."
"Our policy stance is restrictive."
Market reaction
The US Dollar Index showed no reaction to these comments and was last seen posting small gains at 104.55.
- AUD/USD has continued trending higher and almost retested the highs of May.
- A clear break above 0.6714 would confirm a continuation of the short-term uptrend.
- Only a break below the red trendline would bring into question the dominant uptrend.
AUD/USD was pulling back but it found support and rallied back up to within a few pips of the May 16 high at 0.6714.
The Aussie is in a short-term uptrend indicated by the rising peaks and troughs on the four-hour chart since the April 19 lows. Given the old saying that “the trend is your friend” the odds favor an extension of the uptrend.
A break above the May 16 high will create a higher high and confirm an extension of the short-term uptrend.
AUD/USD 4-hour Chart
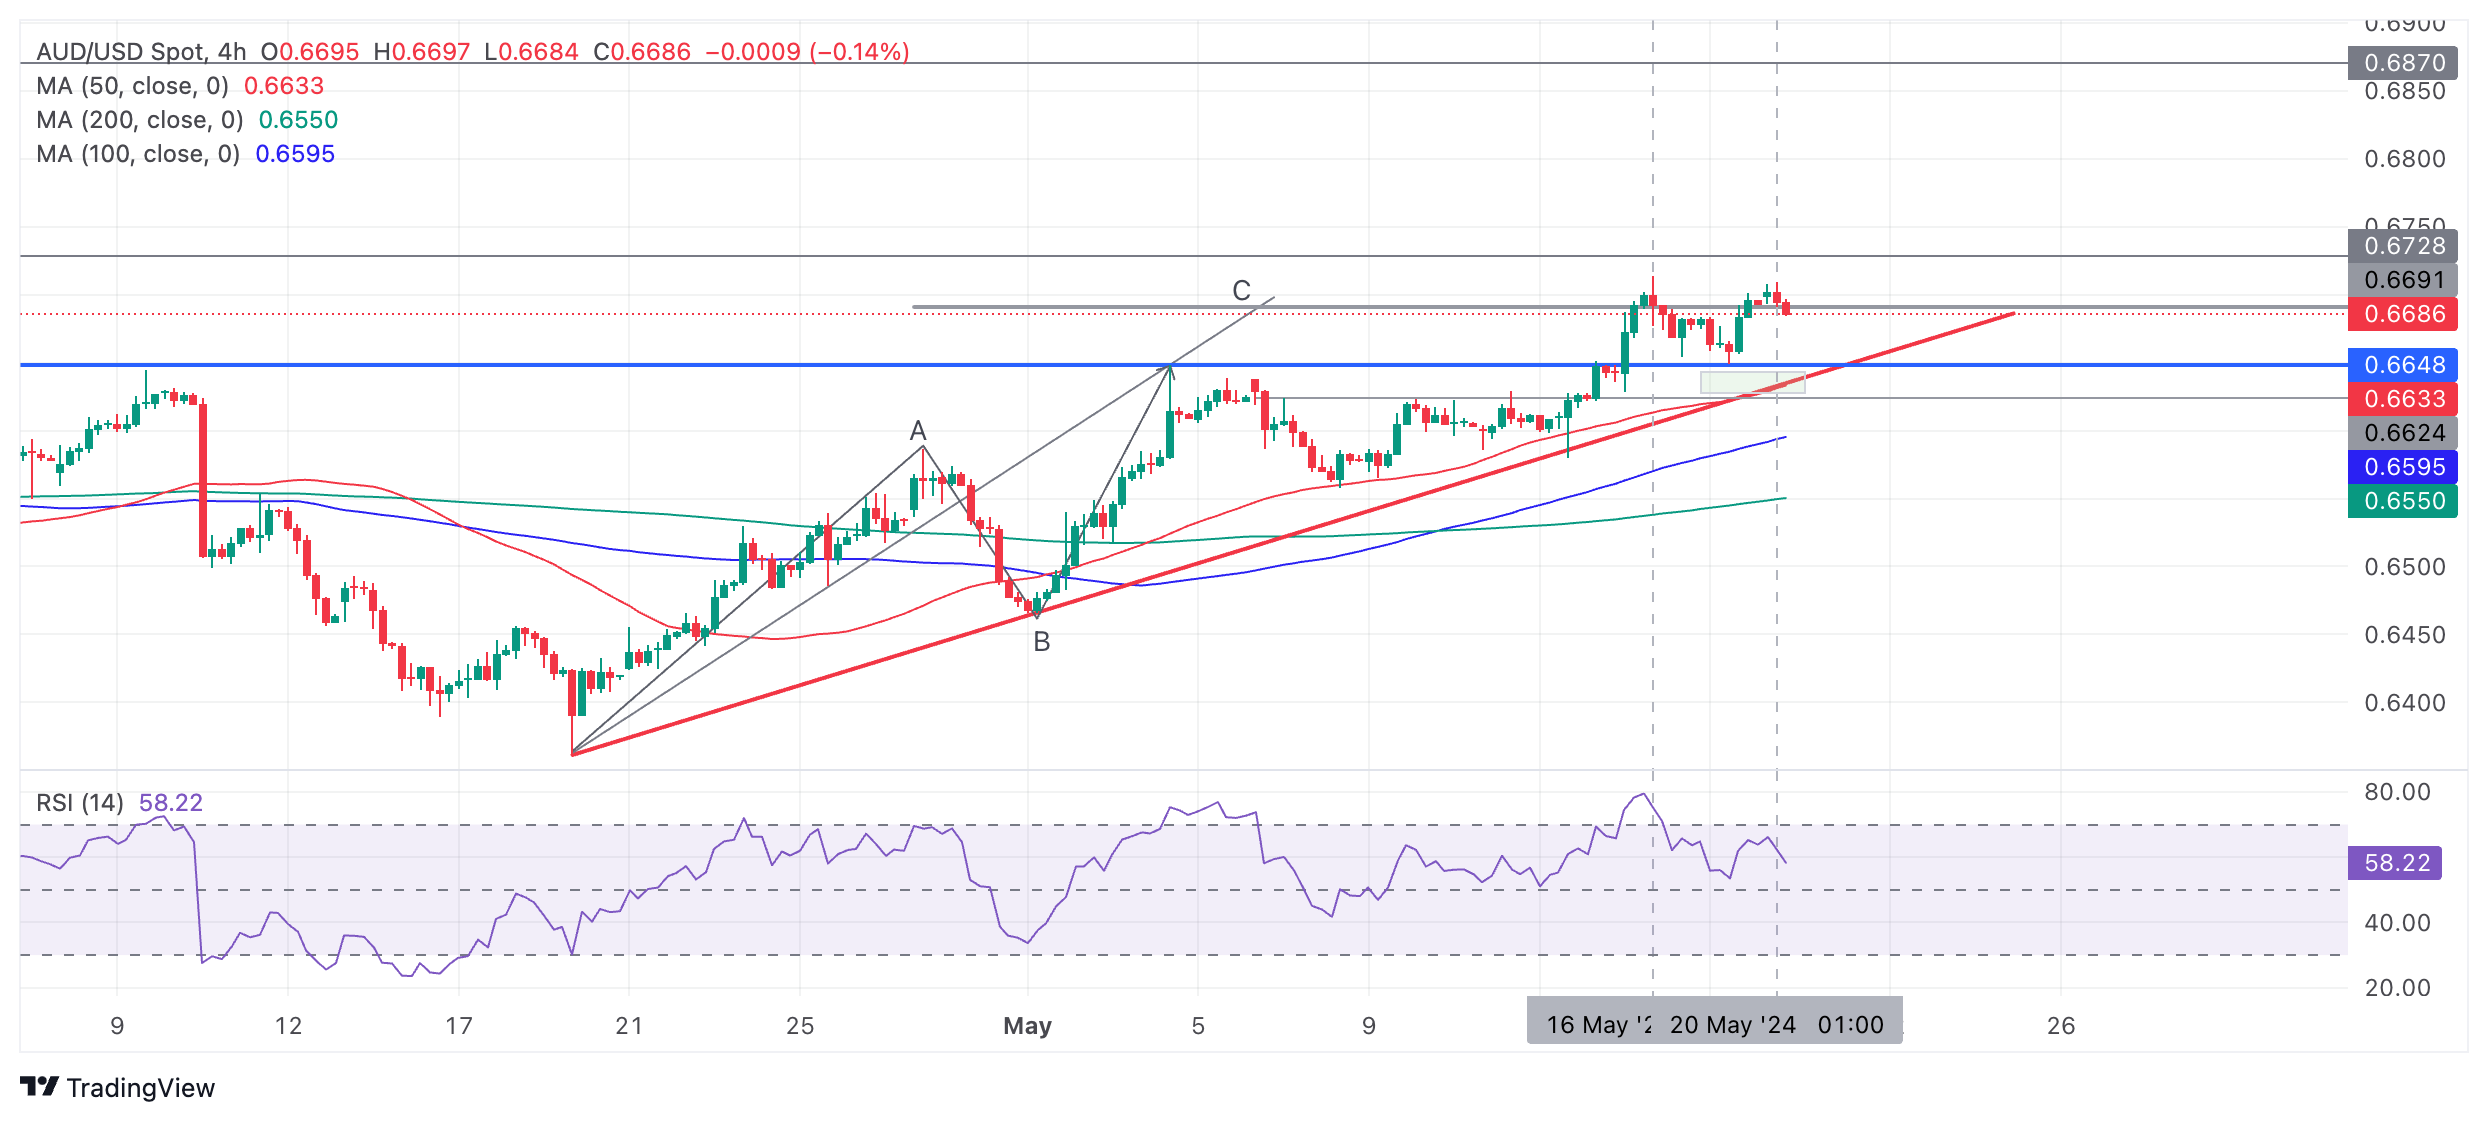
The next target to the upside would be 0.6728, a previous high, followed by 0.6870, an old resistance level.
AUD/USD achieved the target for the Measured Move pattern it formed from the April 19 lows at the May 16 highs of the month. Measured moves are zig-zag like patterns composed of three waves, usually labeled A, B and C. The general expectation is that wave C will reach either the same length as A (or a Fibonacci ratio of A) which it succeeded in doing when it peaked at 0.6714.
The Relative Strength Index (RSI) is much lower at the May 20 high compared to the May 16 high. The difference is a soft divergence but because price has not made a higher high on May 20 yet, it cannot be counted as pure divergence. Nevertheless, it is a mildly bullish sign that suggests an increased possibility of a pull back.
It would require a clear break below the 0.6649 May 17 lows to indicate the trend was weakening.
A decisive break below the red trendline would be a much more bearish sign which could denote a change of the short-term trend.
Decisive would be characterized as a break that was accompanied by a long red candle that closed near its low or three red candles in a row that broke through the trendline.
- EUR/GBP finds an intermediate cushion near 0.8550, downside remains favored.
- The pace for unwinding the policy-tightening by the ECB is expected to be more aggressive than the BoE.
- Investors await the UK Inflation data for fresh guidance.
The EUR/GBP pair finds a temporary cushion near 0.8550 in Monday’s European session. The cross remains on the back foot as investors expect that the pace at which the European Central Bank (ECB) will roll back its restrictive monetary policy stance will be more aggressive than the Bank of England (BoE).
A rate-cut move by the ECB in the June meeting is widely anticipated. ECB policymakers see that inflation is on course to return to the desired rate of 2%. In late Asian session, ECB policymaker Martins Kazaks said, “it's quite likely June will be when we start to cut rates,” Bloomberg reported. However, he cautioned over aggressively reducing interest rates and advised to follow a gradual approach.
ECB Kazaks cautioned about reducing borrowing rates aggressively as it could revamp price pressures again. While a few policymakers still hope that the ECB has room to cut interest rates in the July meeting too.
On the United Kingdom front, investors shift focus to the Consumer Price Index (CPI) data for April, which will be published on Wednesday. The UK Office for National Statistics (ONS) is expected to show that the annual headline declined to 2.1% from the prior reading of 3.2%. The core CPI that strips off volatile items is estimated to have softened to 3.7% from 4.2% in April.
A sharp decline in the UK inflation data will boost prospects of rate cuts by the BoE, which traders expect that the central bank could start from the June or August meeting. Meanwhile, BoE Deputy Governor Ben Broadbent said in his commentary in Monday’s London session that he sees rate cuts likely in the summer. Broadbent added that rates will be less restrictive at some point.
- EUR/USD remains firm near 1.0900 due to multiple tailwinds.
- ECB’s Schnabel remains uncertain over the central bank extending rate cuts beyond June.
- Fed policymakers emphasize keeping interest rates higher for longer.
EUR/USD clings to gains near 1.0900 in Monday’s European session. The major currency pair remains in bullish territory due to investors’ higher risk appetite. The Euro has performed strongly in the past few trading sessions as market participants turn slightly cautious about whether the European Central Bank (ECB) will extend the policy-tightening spell beyond the June meeting.
The ECB is widely anticipated to start reducing interest rates from the June meeting. However, ECB policymakers remain divided over the rate-cut move in the July meeting. A few policymakers remain worried that an aggressive rate-cut cycle could revamp price pressures and offset the impact yet made on inflation.
Last week, ECB board member Isabel Schnabel said that depending on incoming data, a rate cut in June may be appropriate but the path beyond June is much more uncertain. Schnabel added that she cannot pre-commit to any particular rate path due to very high uncertainty.
On the economic data front, investors will shift focus to the Eurozone and the United States preliminary Purchasing Managers Index (PMI) data for May, which will be published on Thursday. The PMI data will indicate their economic outlook.
Daily digest market movers: EUR/USD will dance to the tunes of the Eurozone/US preliminary PMI
- EUR/USD trades in a tight range below the round-level resistance of 1.0900. The shared currency pair is expected to remain quiet as investors shift focus to the Federal Open Market Committee (FOMC) minutes for the May meeting, which will be published on Wednesday. The FOMC minutes will provide a detailed explanation behind interest rates remaining steady and policymakers’ views about the interest rate outlook.
- The communication from Fed policymakers on the interest rate outlook is expected to have remained hawkish as inflationary pressures in the first three months of this year accelerated. However, the Consumer Price Index (CPI) data for April declined as expected due to lower prices of utility gas piped services, and used car and trucks. Fed policymakers are expected to have avoided supporting for further policy-tightening.
- Though the decline in price pressures has provided some relief that the progress in the disinflation process has not stalled, Fed policymakers remain leaned towards a restrictive policy stance for a longer period to build confidence that inflation will sustainably return to the desired rate of 2%.
- Last week, New York Fed Bank President John Williams said the monetary policy is restrictive and is in a good place. He doesn’t see any economic indicator suggesting the need to change the stance of monetary policy now. When asked about the inflation outlook, Williams said: “In the very near term, I don't expect to get that greater confidence that we need to see on inflation progress towards a 2% goal," Reuters reported.
Technical Analysis: EUR/USD holds gains inspired by triangle breakout
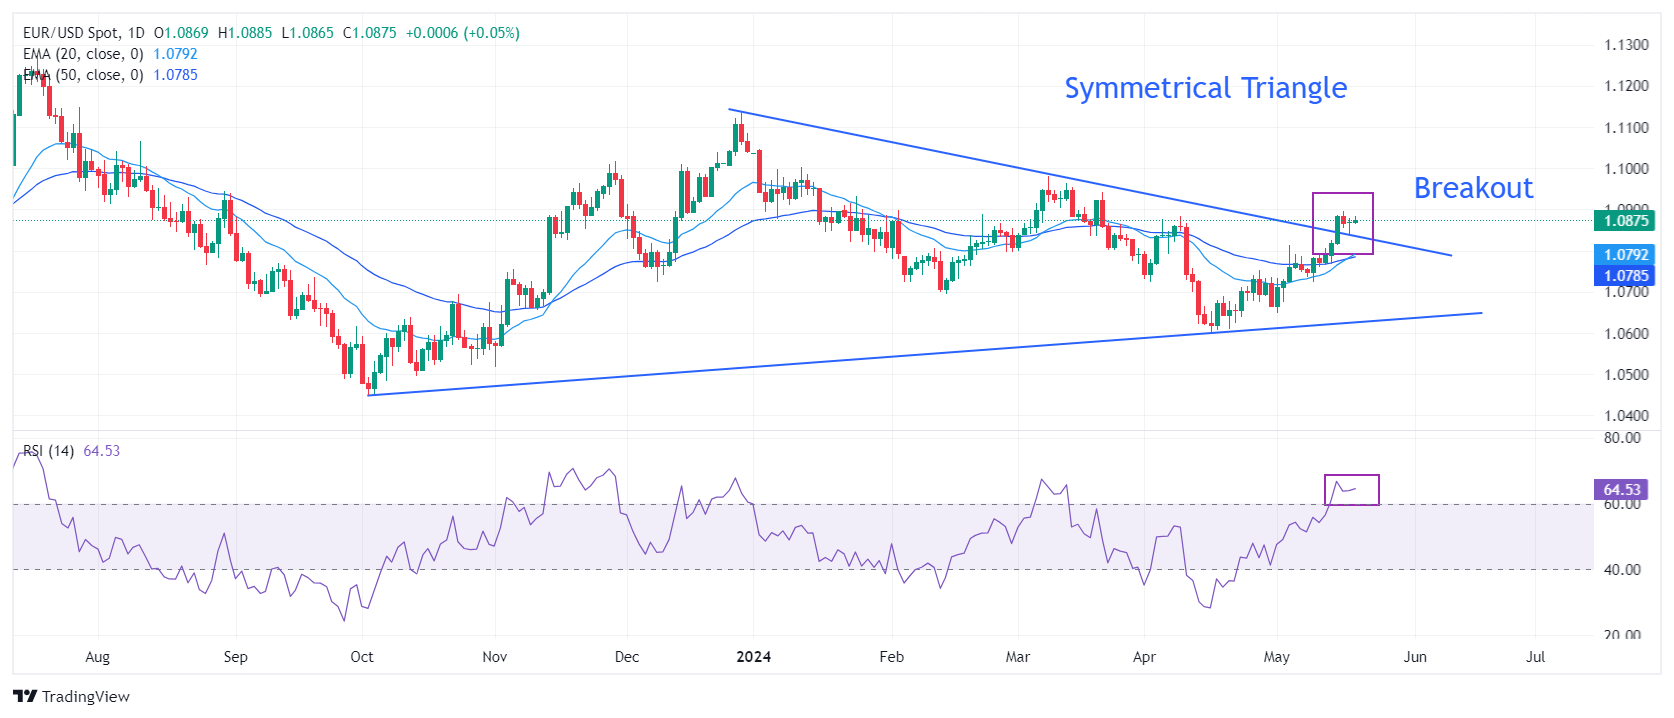
EUR/USD holds the breakout of the Symmetrical Triangle chart pattern seen on a daily timeframe. The stabilization of the major currency pair above the breakout region suggests that the asset is quite bullish. Also, a bullish crossover of the 20-day and 50-day Exponential Moving Averages (EMAs) around 1.0780 has improved the near-term outlook of the pair.
The 14-period Relative Strength Index (RSI) has shifted comfortably into the bullish range of 60.00-80.00, suggesting that the momentum has leaned toward the upside.
Euro FAQs
The Euro is the currency for the 20 European Union countries that belong to the Eurozone. It is the second most heavily traded currency in the world behind the US Dollar. In 2022, it accounted for 31% of all foreign exchange transactions, with an average daily turnover of over $2.2 trillion a day. EUR/USD is the most heavily traded currency pair in the world, accounting for an estimated 30% off all transactions, followed by EUR/JPY (4%), EUR/GBP (3%) and EUR/AUD (2%).
The European Central Bank (ECB) in Frankfurt, Germany, is the reserve bank for the Eurozone. The ECB sets interest rates and manages monetary policy. The ECB’s primary mandate is to maintain price stability, which means either controlling inflation or stimulating growth. Its primary tool is the raising or lowering of interest rates. Relatively high interest rates – or the expectation of higher rates – will usually benefit the Euro and vice versa. The ECB Governing Council makes monetary policy decisions at meetings held eight times a year. Decisions are made by heads of the Eurozone national banks and six permanent members, including the President of the ECB, Christine Lagarde.
Eurozone inflation data, measured by the Harmonized Index of Consumer Prices (HICP), is an important econometric for the Euro. If inflation rises more than expected, especially if above the ECB’s 2% target, it obliges the ECB to raise interest rates to bring it back under control. Relatively high interest rates compared to its counterparts will usually benefit the Euro, as it makes the region more attractive as a place for global investors to park their money.
Data releases gauge the health of the economy and can impact on the Euro. Indicators such as GDP, Manufacturing and Services PMIs, employment, and consumer sentiment surveys can all influence the direction of the single currency. A strong economy is good for the Euro. Not only does it attract more foreign investment but it may encourage the ECB to put up interest rates, which will directly strengthen the Euro. Otherwise, if economic data is weak, the Euro is likely to fall. Economic data for the four largest economies in the euro area (Germany, France, Italy and Spain) are especially significant, as they account for 75% of the Eurozone’s economy.
Another significant data release for the Euro is the Trade Balance. This indicator measures the difference between what a country earns from its exports and what it spends on imports over a given period. If a country produces highly sought after exports then its currency will gain in value purely from the extra demand created from foreign buyers seeking to purchase these goods. Therefore, a positive net Trade Balance strengthens a currency and vice versa for a negative balance.
- Gold price rises on safe-haven demand after news of the President of Iran’s death ignites tensions in the region.
- Gold rises as a general fracturing of the world order drives central banks to stock up on the precious metal.
- A shift in expectations of when the Federal Reserve might cut interest rates further helps non-yielding Gold.
Gold price (XAU/USD) rallies to record highs in the $2,440s on Monday due to its safe-haven qualities as the geopolitical risk barometer rises a notch due to increased tensions in the Middle East.
The precious metal also gains from rising expectations that the Federal Reserve (Fed) will move to cut interest rates earlier than was previously thought following tepid US economic data out last week.
Gold price rises on geopolitics, Fed expectations
Gold price rises to a new all-time high after the news that the President of Iran, Ebrahim Raisi, as well as other high-profile political figures from Iran, died in a helicopter crash in the North of the country over the weekend, according to Reuters. This increased uncertainty in a region already simmering with tensions from the Israel-Hammas conflict.
Russia’s opening up of a second front in the Kharkiv region and the bonding on display between Russian President Putin and Chinese President Xi during Putin’s recent visit to Beijing are further adding to a picture of a fracturing world order, with serious implications for world peace and free trade. All of which is supportive of Gold.
Gold demand from BRICS countries and emerging economy central banks has increased substantially over recent years as a hedge against the threat of Western sanctions, according to the IMF. The trend is only likely to continue in light of recent events on the world stage.
US Federal Reserve more likely to cut interest rates
Gold is also seeing demand as a result of a general lowering of expectations that the Federal Reserve (Fed) will maintain interest rates at their current relatively high level for much longer.
Increasing expectations that interest rates will fall is positive for Gold as it lowers the opportunity cost of holding the non-yielding asset vis-a-vis cash or bonds.
The change in outlook comes on the back of cooler inflation and retail sales data for April released last week. Although members of the Federal Reserve have been evasive about when the Fed might actually move to cut interest rates, the market sees a 65% chance that the fed fund rates will be lower than the current level in September, based on the CME FedWatch tool, which tracks the price of interest-rate futures.
Speeches from a roll-call of Fed speakers on Monday could further clarify the stance of many rate-setters at the Washington institution. Atlanta Fed President Raphael Bostic, Fed Vice Chair for Supervision Michael Barr, Fed Governor Christopher Waller and Fed Vice Chair Phillip Jefferson will all be delivering speeches during the American session.
Technical Analysis: Gold price climbs parabolically
Gold price (XAU/USD) rallies to new all-time highs above $2,440 on Monday, breaking out of the rising channel it has been in since May 2.
The precious metal’s short-term trend is bullish, and more upside is expected given the old saying that “the trend is your friend.”
XAU/USD 4-hour Chart
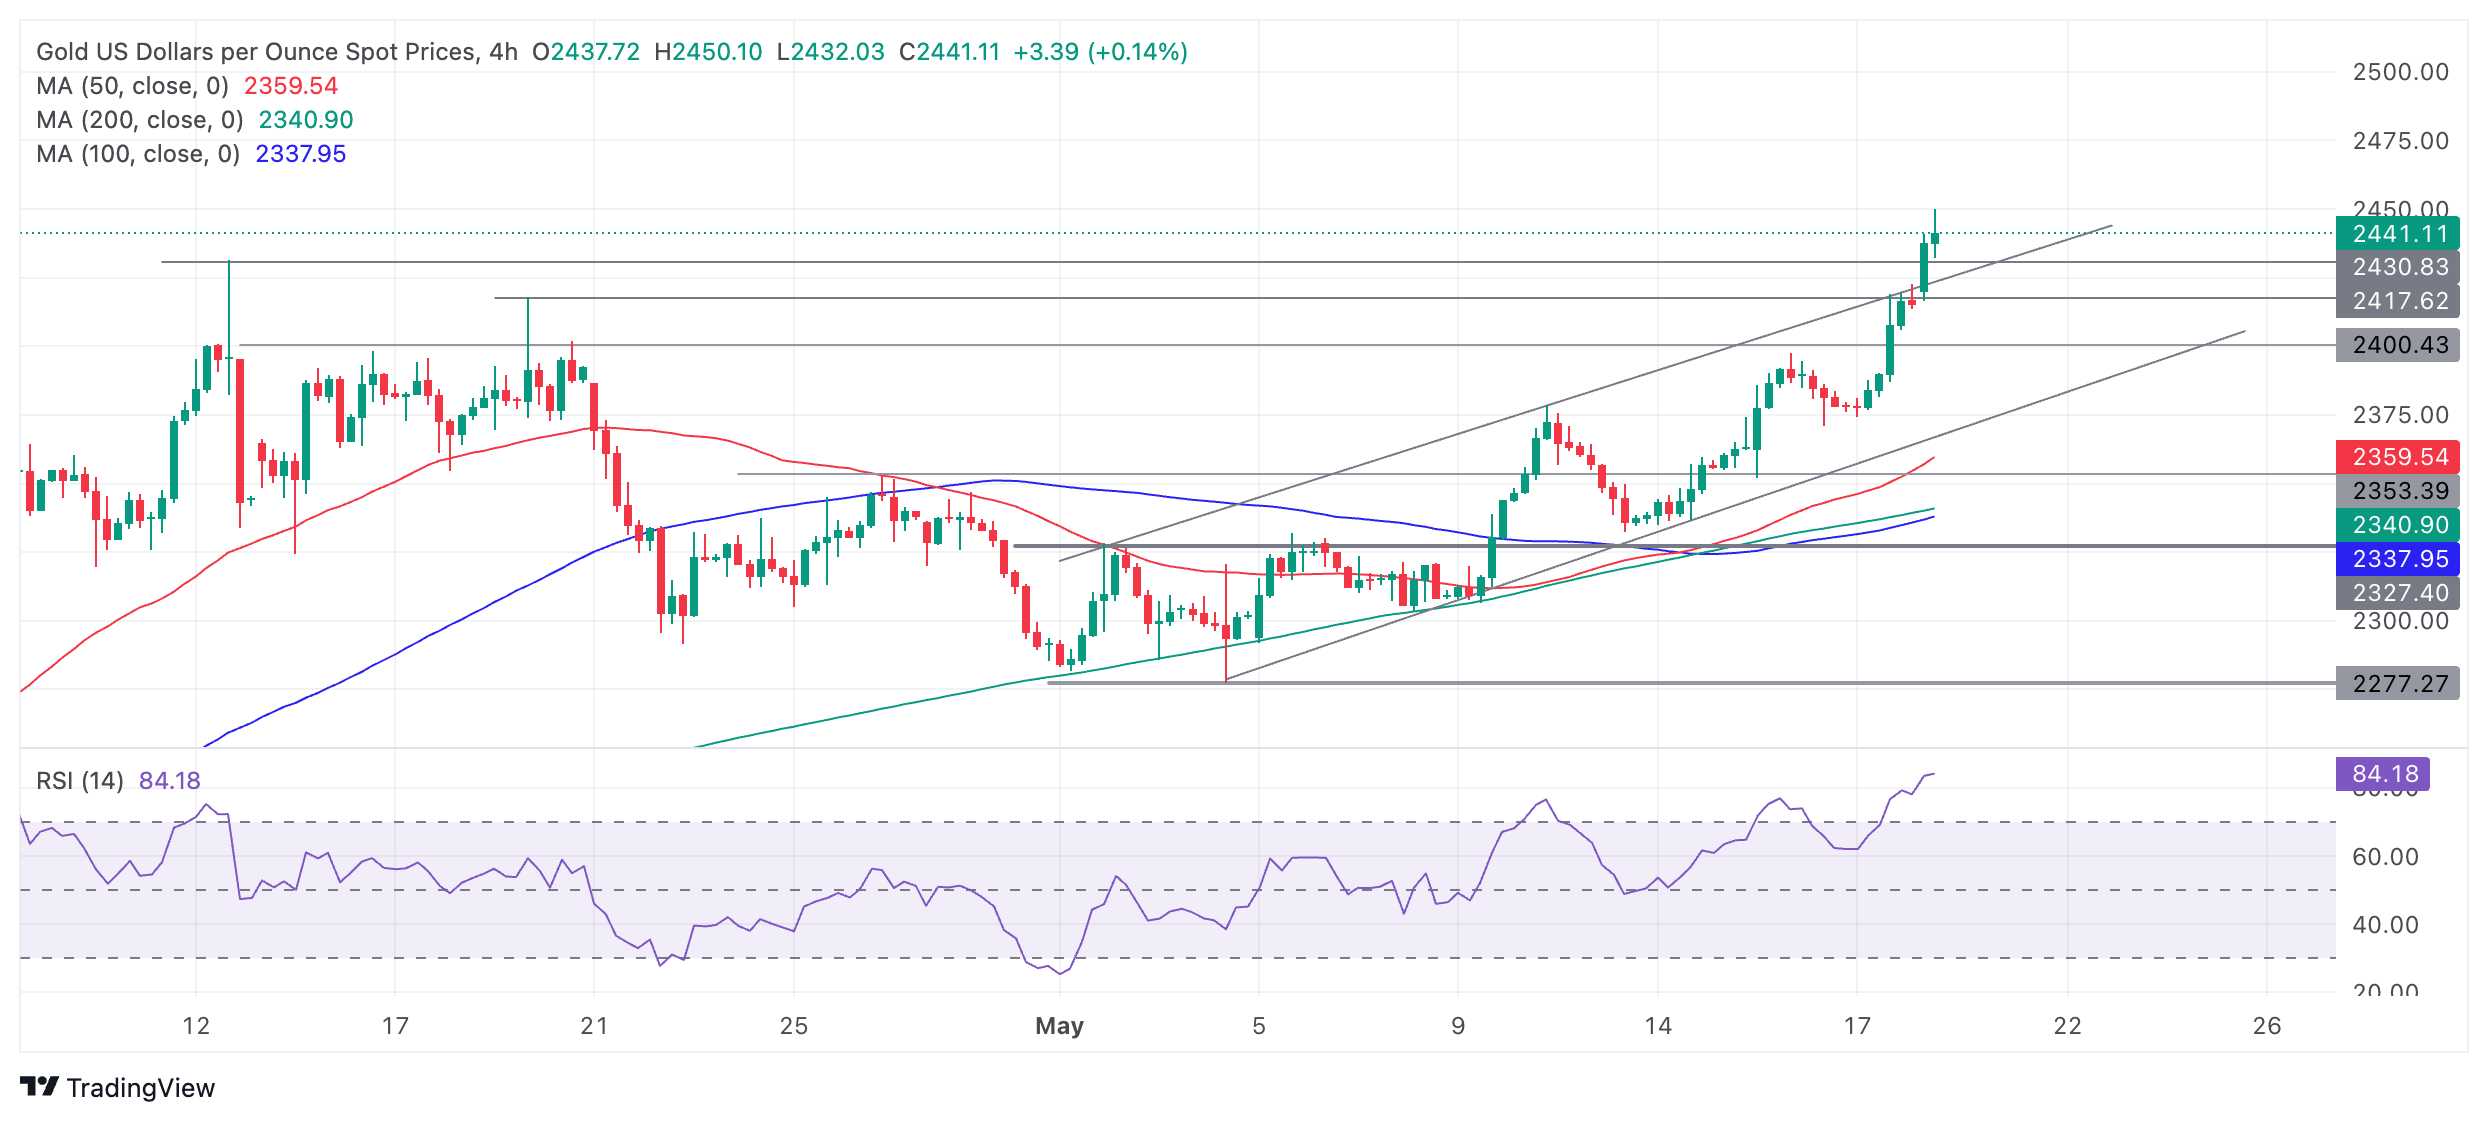
The Relative Strength Index (RSI) is overbought, however, indicating long-holders should not add to their positions. When the RSI falls back into the neutral zone (below 70), it will signal to close long-positions and that Gold price is undergoing a correction. Any such corrections are likely to find support at the upper channel line and former highs at $2,430.
A break above the new $2,450 all-time high would likely continue the rally to the next target at the psychologically significant $2,500 level.
The medium and long-term charts (daily and weekly) are also bullish, adding a supportive backdrop for Gold.
Gold FAQs
Gold has played a key role in human’s history as it has been widely used as a store of value and medium of exchange. Currently, apart from its shine and usage for jewelry, the precious metal is widely seen as a safe-haven asset, meaning that it is considered a good investment during turbulent times. Gold is also widely seen as a hedge against inflation and against depreciating currencies as it doesn’t rely on any specific issuer or government.
Central banks are the biggest Gold holders. In their aim to support their currencies in turbulent times, central banks tend to diversify their reserves and buy Gold to improve the perceived strength of the economy and the currency. High Gold reserves can be a source of trust for a country’s solvency. Central banks added 1,136 tonnes of Gold worth around $70 billion to their reserves in 2022, according to data from the World Gold Council. This is the highest yearly purchase since records began. Central banks from emerging economies such as China, India and Turkey are quickly increasing their Gold reserves.
Gold has an inverse correlation with the US Dollar and US Treasuries, which are both major reserve and safe-haven assets. When the Dollar depreciates, Gold tends to rise, enabling investors and central banks to diversify their assets in turbulent times. Gold is also inversely correlated with risk assets. A rally in the stock market tends to weaken Gold price, while sell-offs in riskier markets tend to favor the precious metal.
The price can move due to a wide range of factors. Geopolitical instability or fears of a deep recession can quickly make Gold price escalate due to its safe-haven status. As a yield-less asset, Gold tends to rise with lower interest rates, while higher cost of money usually weighs down on the yellow metal. Still, most moves depend on how the US Dollar (USD) behaves as the asset is priced in dollars (XAU/USD). A strong Dollar tends to keep the price of Gold controlled, whereas a weaker Dollar is likely to push Gold prices up.
- The US Dollar eases further at the start of a fresh week.
- The Greenback pulls back with risk on sentiment taking over.
- The US Dollar Index hovers around 104.50 and retreats further below.
The US Dollar (USD) is starting the week as it closed off the previous week: with some easing. Equities are on the front foot this Monday while commodities are trading higher, pushing the Greenback into some easing. Market volumes though might be a bit lighter than normal in the European trading hours with European markets closed for a bank holiday.
On the economic data front, traders are bracing for the Fed Minutes from the latest Federal Open Market Committee (FOMC) policy rate decision. Markets will be looking for clues or further confirmation on ‘how long’ steady for longer actually means. Ahead of the Minutes later this week, traders can brace for no less than five Fed speakers lined up for this Monday.
Daily digest market movers: Fed not putting a timestamp
- Market volume in European hours can be a big lighter with European markets closed for a bank holiday. Canada and India are closed for business as well.
- Markets are facing a slew of Fed officials for this Monday:
- At 12:15 GMT, Federal Reserve Bank of Atlanta President Raphael Bostic delivers welcome remarks at the Atlanta Fed's Financial Market Conference.
- Federal Reserve Vice Chair for Supervision Michael Bar delivers a keynote speech at the Atlanta Fed's Financial Market Conference at 13:00 GMT.
- Federal Reserve Governor Christopher Waller delivers welcoming remarks at the Third Conference on the International Roles of the US Dollar in Washington, DC, as well near 13:00 GMT.
- Near 14:30 Federal Reserve Vice Chair Phillip Jefferson delivers a speech about the US economic outlook and housing price dynamics at the Mortgage Bankers Association (MBA) Secondary and Capital Markets Conference in New York.
- To close off this Monday near 23:00 GMT, Federal Reserve Bank of Atlanta President Raphael Bostic (2024 voting member) delivers a keynote speech at the Atlanta Fed's Financial Market Conference dinner.
- Equities are shooting higher on Monday, with green numbers across the board and across the globe. Most Asian indices are even flirting with 1% gains for this Monday. US equity futures are rather mildly in the green, overall by less than 0.25%.
- The CME Fedwatch Tool suggests a 91.1% probability that June will still see no change to the Federal Reserve's fed fund rate. Odds have changed for September, with the tool showing a 49.0% chance that rates will be 25 basis points lower than current levels.
- The benchmark 10-year US Treasury Note trades around 4.41%.
US Dollar Index Technical Analysis: Can Fed officials support the DXY
The US Dollar Index (DXY) is easing at the start of this week, with markets picking up where they left off last week. Some more Dollar selling is taking place with traders heading out of safe havens and into risk assets, with equities and commodities sprinting higher. With a rather light economic data calendar ahead for this week, room for more risk on is present and could mean that the DXY slides below the 104.00 marker.
On the upside, several levels need to be regained again after Wednesday’s firm correction. The first is the 55-day Simple Moving Average (SMA) at 104.68, together with a pivotal level at 104.60. The next step up will be 105.12 and 105.52.
On the downside, the 100-day SMA around 104.11 is the last man standing to support the decline. Once that snaps, an air pocket is placed between 104.11 and 103.00. Should US Dollar outflows persist, the low of March at 102.35 and the low from January at 100.61 are levels to keep into consideration.
US Dollar FAQs
The US Dollar (USD) is the official currency of the United States of America, and the ‘de facto’ currency of a significant number of other countries where it is found in circulation alongside local notes. It is the most heavily traded currency in the world, accounting for over 88% of all global foreign exchange turnover, or an average of $6.6 trillion in transactions per day, according to data from 2022. Following the second world war, the USD took over from the British Pound as the world’s reserve currency. For most of its history, the US Dollar was backed by Gold, until the Bretton Woods Agreement in 1971 when the Gold Standard went away.
The most important single factor impacting on the value of the US Dollar is monetary policy, which is shaped by the Federal Reserve (Fed). The Fed has two mandates: to achieve price stability (control inflation) and foster full employment. Its primary tool to achieve these two goals is by adjusting interest rates. When prices are rising too quickly and inflation is above the Fed’s 2% target, the Fed will raise rates, which helps the USD value. When inflation falls below 2% or the Unemployment Rate is too high, the Fed may lower interest rates, which weighs on the Greenback.
In extreme situations, the Federal Reserve can also print more Dollars and enact quantitative easing (QE). QE is the process by which the Fed substantially increases the flow of credit in a stuck financial system. It is a non-standard policy measure used when credit has dried up because banks will not lend to each other (out of the fear of counterparty default). It is a last resort when simply lowering interest rates is unlikely to achieve the necessary result. It was the Fed’s weapon of choice to combat the credit crunch that occurred during the Great Financial Crisis in 2008. It involves the Fed printing more Dollars and using them to buy US government bonds predominantly from financial institutions. QE usually leads to a weaker US Dollar.
Quantitative tightening (QT) is the reverse process whereby the Federal Reserve stops buying bonds from financial institutions and does not reinvest the principal from the bonds it holds maturing in new purchases. It is usually positive for the US Dollar.
- USD/JPY is stuck in a tight range as the US Dollar consolidates.
- The US Dollar stays on the sidelines despite Fed officials maintaining hawkish guidance on interest rates.
- Investors await the US S&P Global PMI and Japan’s National CPI data.
The USD/JPY pair displays a sharp volatility contraction near 155.60 in Monday’s European session. The asset struggles for direction as investors shift focus to the Federal Open Market Committee (FOMC) minutes for the May meeting and commentaries from Federal Reserve (Fed) policymakers that will provide fresh guidance of the interest rate outlook.
S&P 500 futures have posted decent gains in the European session, exhibiting an increase in investors’ risk-appetite. The US Dollar Index (DXY), which tracks the Greenback’s value against six major currencies, consolidates in a tight range around 104.50.
Fed policymakers are expected to have used a hawkish tone on interest rates in the May’s policy meeting. The United States (US) Consumer Price Index (CPI) data disappointed Fed policymakers in the first three months, forced them to emphasize keeping interest rates at their current levels.
For the April month, US inflation has declined as expected and the labor demand remained soft, suggesting that the progress in inflation declining to the 2% target is on track. This has strengthened expectations for the Fed to begin reducing interest rates from the September meeting.
On the economic data front, investors will look to US S&P Global PMI data for May, which will be published on Thursday. The economic data will indicate whether the economy is effectively coping with the consequences of the Fed's higher interest rates.
Meanwhile, the Japanese Yen is under pressure as investors worry about the limited scope of policy tightening by the Bank of Japan (BoJ). Th Japanese economy was contracted at a faster pace in the first quarter of this year. Going forward, the National CPI data will provide fresh guidance on interest rates, which will be published on Friday. The National CPI excluding fresh goods is estimated to have declined to 2.2% from the prior reading of 2.6%.
Bank of England (BoE) Deputy Governor Ben Broadbent said on Monday that it was possible that the BoE could cut the policy rate this summer, per Reuters.
"If things continue to evolve with its forecasts - forecasts that suggest policy will have to become less restrictive at some point - then it's possible Bank Rate could be cut some time over the summer," Broadbent noted.
Key takeaways
"We are not on a knife-edge where any rate cut would produce above-trend growth, policy would still be restrictive."
"Experience of past 2-3 years has made MPC members wary about cutting rates."
"Signs of inflation pressures easing is reassuring."
"It is a matter of individual opinion on MPC how much evidence needed for rate cut."
Market reaction
GBP/USD showed no immediate reaction to these comments and was last seen moving sideways at around 1.2700.
- Silver price breaks out of a four-year consolidation zone and rallies strongly.
- The precious metal could still go higher once the current pull back ends and the uptrend resumes.
Silver (XAG/USD) price has broken decisively above key resistance at $30.00 and risen parabolically, hitting its first upside target at $32.28.
The precious metal has since pulled back to trade just above $32.00 at the time of writing, but it is firmly in an uptrend which – given the old saying that “the trend is your friend” – is expected to continue.
4-hour Chart
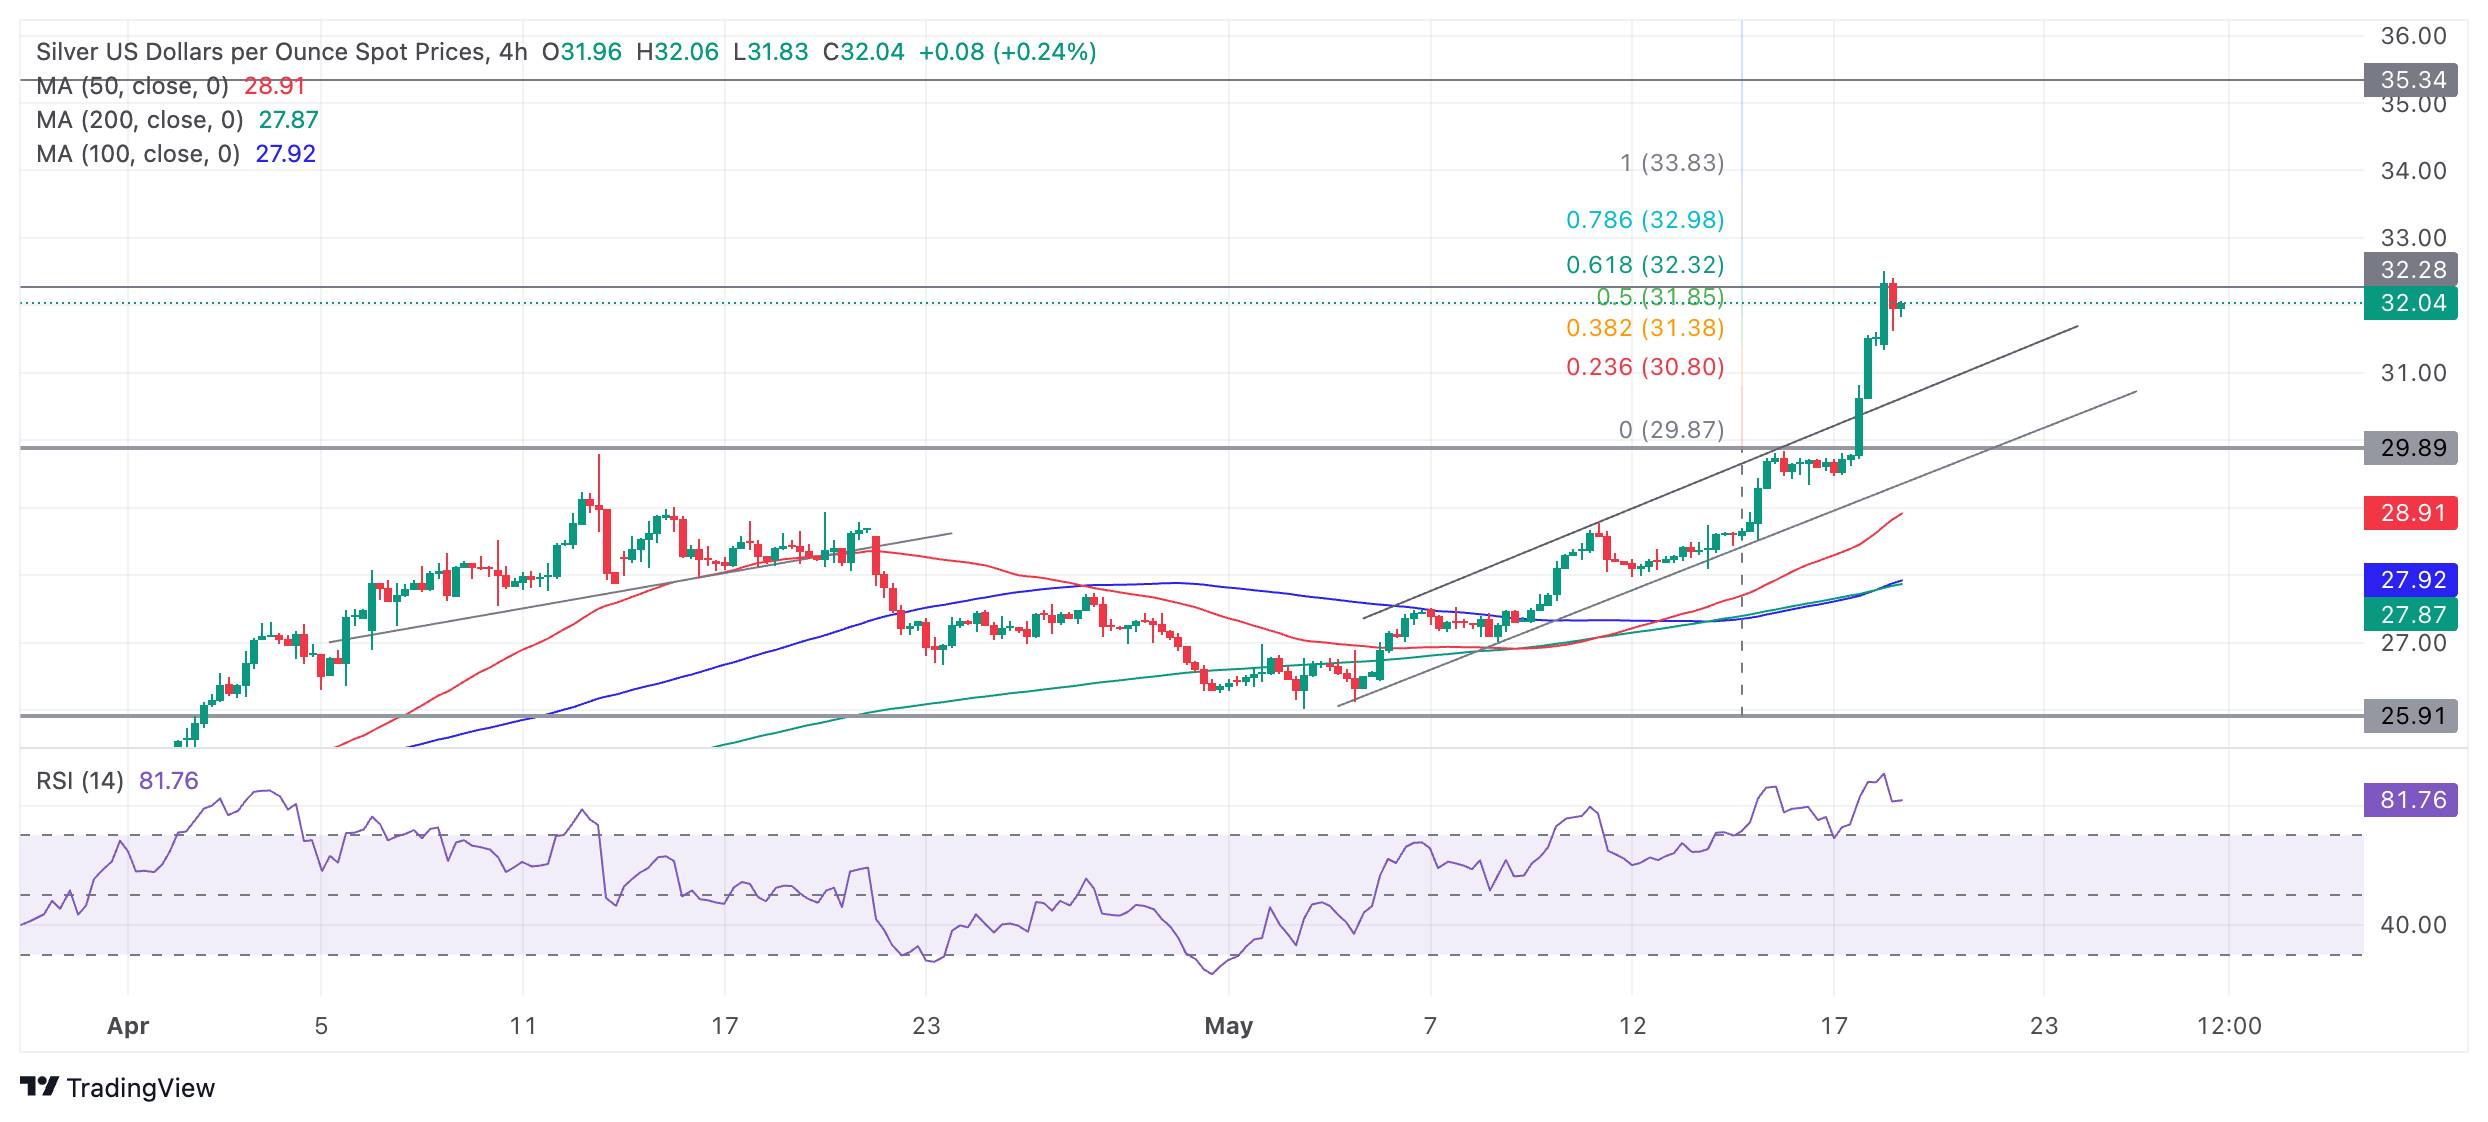
The Relative Strength Index (RSI) is in the overbought zone, suggesting traders should not add to their long holdings. If the RSI exits overbought on a closing basis it will signal a deeper correction is taking place.
Any correction is likely to meet initial support at the top of the rising channel, at around $31.20. Given the trend is bullish, Silver is likely to resume rallying after its correction finalizes.
The decisive break above $30.00 resulted in a steep upside move as it represents the ceiling of a four-year consolidation range. The rally rapidly met the first target at $32.28, the Fibonacci 0.618 extension of the upper part of the consolidation range higher.
Silver could still go much higher, however, as the break above $30.00 was an important milestone for price and increased confidence could draw more bulls to the trade. The next target to the upside is $33.83, the full height of the range extrapolated higher, followed by $35.34, a key former high.
It would require a decisive break below the rising channel lows in the $29.00s to bring the short-term uptrend into doubt.
A decisive break would be one accompanied by a long red candlestick that closed near its lows or three red candlesticks in a row.
- AUD/JPY lost ground due to possible risk aversion sentiment.
- The Australian Dollar pared its gains after China's interest rate decision.
- PBOC maintained the one-year and five-year LPR at 3.45% and 3.95%, respectively.
AUD/JPY has trimmed its intraday gains, trading around 104.20 during the European session on Monday, amid a risk aversion sentiment. Earlier in the day, the Australian Dollar (AUD) appreciated but later pared its gains following China's interest rate decision. The People's Bank of China (PBOC) maintained the one-year and five-year Loan Prime Rates (LPR) at 3.45% and 3.95%, respectively. Traders are now awaiting the Reserve Bank of Australia's (RBA) Meeting Minutes, which are set to be released on Tuesday.
The Australian Dollar could encounter obstacles as the yield on Australia's 10-year government bond hovers around 4.2% at its lowest level in a month. This decline in bond yields comes in the wake of a softer domestic jobs report for the first quarter. Sluggish wage growth has led markets to diminish the likelihood of any interest rate hikes by the Reserve Bank of Australia (RBA).
On the JPY front, the significant interest rate differential between Japan and other countries exerts selling pressure on the Japanese Yen (JPY) and boosts the AUD/JPY cross. The Bank of Japan (BoJ) abandoned the negative interest rate policy in March. Moreover, traders speculate that the BoJ might reduce bond purchases at the June policy meeting. BOJ Governor Kazuo Ueda also indicated that there are no immediate plans to sell the central bank’s ETF holdings.
The findings of a survey conducted by the Bank of Japan (BoJ) to evaluate its past monetary easing measures showed that Japan is on the brink of witnessing significant changes in corporate activity. Many firms stated that they are unable to hire enough workers if they cut wages. Additionally, more firms are beginning to pass on rising labor costs to sales prices. Manufacturers identified FX stability as the most crucial factor they desired from the BoJ’s monetary policy.
- The Mexican Peso extends its uptrend after comments from the Deputy Governor of the Bank of Mexico.
- Irene Espinosa said she advocated for interest rates remaining high as inflation continued to be a problem.
- USD/MXN forms a bearish channel while it continues to descend.
The Mexican Peso (MXN) edges higher, continuing the steep rally witnessed in most MXN pairs on Friday, after the Deputy Governor of the Bank of Mexico (Banxico), Irene Espinosa, said she thought the Banxico should keep interest rates at their current high level (11.0%) as the battle with inflation was not yet over.
Her comments were positive for the Mexican Peso as higher interest rates attract more foreign capital inflows. They also contrast with the outlook for many of the Peso’s major peers where earlier interest rate cuts are now either expected or likely.
At the time of writing, USD/MXN is trading at 16.60, EUR/MXN at 18.05 and GBP/MXN at 21.07.
Mexican Peso boosted by Espinosa comments
The Mexican Peso continued its short-term uptrend in most pairs on Friday after Irene Espinosa said she did not see any “urgency in cutting interest rates”, according to Milenio.com. She further added that the Banxico’s decision to cut interest rates in March had been “premature”, according to Christian Borjan Valencia, Editor at FXStreet.
Espinosa's views are consistent with her stance at the Banxico March meeting when she was the only member of the Banxico board not to vote for the decision to cut interest rates by 0.25% from 11.25%. They also contrast with the views of the Governor of the Banxico Victoria Rodriguez Ceja, according to Milenio.com.
Divergence with major central banks
Espinosa’s stance diverges from the market’s expectations of monetary policy for the central banks of the Peso’s key counterparts – the US Dollar (USD), Euro (EUR) and Pound (GBP).
Officials at the European Central Bank (ECB) have as good as committed to implementing interest rates cut in June; the Bank of England (BoE) is widely expected to cut rates in August; and whilst officials at the Federal Reserve (Fed) have not been as vocal about wanting to cut interest rates amid persistent inflation, recent lower-than-expected CPI data as well as flat Retail Sales for April, increased bets by futures traders of the Fed cutting rates in September, which currently stand at around 65%, according to the CME FedWatch tool.
On the economic-data front, the Mexican Peso could experience some volatility after the release of Mexican Retail Sales for March at 12:00 GMT on Monday.
Technical Analysis: USD/MXN continues descent
USD/MXN – the value of one US Dollar in Mexican Pesos – edges lower on Monday after the steep sell-off at the end of the previous week, as traders continue exerting bearish pressure on the pair.
USD/MXN 4-hour Chart

The USD/MXN is falling in a short-term downtrend within a descending channel that favors short bets over longs.
The next downside target is the conservative price objective calculated for the breakout of the mid-April to May range. This is situated at 16.54, the 0.618 Fibonacci ratio of the range's height extrapolated lower. Further bearishness could even see USD/MXN reach 16.34, the full height of the range extrapolated lower.
The pair is meeting support at the lower base of the channel and could pull back before its next descent.
The Relative Strength Index (RSI) momentum indicator is signaling oversold conditions, which indicates traders should not add to their short positions. If the RSI exits oversold and returns to neutral territory above 30, it would be a signal to close those positions as a correction is probably underway. Once the correction ends, however, the descending channel is expected to continue taking prices lower.
Given the medium and long-term trends are also bearish, the odds further favor more downside.
Economic Indicator
Retail Sales (MoM)
The Retail Sales released by INEGI measures the total receipts of retail stores. Monthly percent changues reflect the rate of changes of such sales. Changes in retail sales are widely followed as an indicator of consumer spending. Generally speaking, a high reading is seen as positive or bullish for the Mexican peso, while a low reading is seen as negative or bearish.
Read more.
- USD/CHF appreciates as the US Dollar recovers its daily losses amid improved US Treasury yields.
- Softer US inflation and employment data have fueled speculation about potential rate cuts by the Fed in 2024.
- 10-year Swiss yield inched higher, indicating expectations of SNB maintaining current interest rates.
USD/CHF continues its winning streak for the third day, trading around 0.9100 during the early European hours on Monday. The upside of the USD/CHF pair could be attributed to the improved US Dollar (USD). It is worth noting that Swiss markets are closed due to the Whit Monday bank holiday.
However, the easing of the US consumer inflation and labor market data has fueled speculation about potential rate cuts by the Federal Reserve (Fed) in 2024. According to the CME FedWatch Tool, the likelihood of the Federal Reserve delivering a 25 basis-point rate cut in September has slightly increased to 49.0%, up from 48.6% a week ago. This potential easing of monetary policy by the central bank could undermine the US Dollar and limit the advance of the USD/CHF pair.
Fed officials maintained a cautious stance regarding interest rates, emphasizing that a one-time decline in inflation is insufficient to build confidence that price pressures will sustainably return to the desired 2% rate. Investors await the Federal Open Market Committee (FOMC) minutes due on Wednesday. The FOMC minutes are expected to show that policymakers stressed the need to keep higher interest rates for longer.
On the Swiss side, the yield on the 10-year Swiss government bond inched higher to around 0.7%. This increase in Swiss yield typically indicates the Swiss National Bank (SNB) to maintain current interest rates, which could strengthen the CHF. SNB unexpectedly cut interest rates for the first time in nine years in March, reducing the key interest rate by 25 basis points to 1.50%, making it the first major central bank to ease its monetary policy.
For further cues on the Swiss economy, traders will likely observe the Employment Level released by the Swiss Statistics later in the week. Also, the Swiss National Bank (SNB) Chairman Thomas Jordan will deliver a speech about communication, monetary policy, and public impact at the Swiss Media Forum in Lucerne, Switzerland on Friday.
- The Pound Sterling holds strength near 1.2700 as investors turn risk-averse on firm Fed rate-cut hopes.
- April’s UK headline inflation is expected to return to near 2%.
- This week, investors will focus on the UK inflation for April and the FOMC minutes.
The Pound Sterling (GBP) trades close to an almost two-month high around 1.2700 in Monday’s European session. The GBP/USD pair strengthens as the US Dollar (USD) is on the back foot as financial markets remain confident that the Federal Reserve (Fed) will start lowering interest rates from the September meeting.
Investor confidence in Fed rate cuts has strengthened due to a decline in the United States Consumer Price Index (CPI) data and easing labor market conditions as suggested by recent Employment and Initial Jobless Claims data.
In spite of unsupportive economic indicators, Fed policymakers remain leaning towards a restrictive interest rate stance as a one-time decline in inflation is insufficient to build confidence that price pressures will sustainably return to the desired rate of 2%.Going forward, investors will focus on the Federal Open Market Committee (FOMC) minutes, which will be published on Wednesday. The FOMC minutes are expected to show that policymakers emphasized keeping interest rates restrictive for a longer period.
Daily digest market movers: Pound Sterling strengthens while US Dollar is on the back foot
- The Pound Sterling exhibits strength near the round-level resistance of 1.2700 against the US Dollar. The GBP/USD pair remains upbeat as the appeal for risk-perceived assets has improved amid firm speculation that the Federal Reserve will start reducing interest rates from the September meeting. S&P 500 futures have posted decent gains in the European session.
- This week, the strength of the Pound Sterling will be tested on the grounds of the United Kingdom (UK) inflation data for April, which will be published on Wednesday. The UK Office for National Statistics (ONS) is expected to show that annual headline CPI declined to 2.1% in April from the prior reading of 3.2%. The core CPI, which excludes volatile items such as food and energy prices, is estimated to have softened to 3.7% in April from 4.2% a motnh earlier.
- The expected decline in inflationary pressures will boost expectations of rate cuts by the Bank of England (BoE). Investors expect that the BoE will start reducing interest rates from the June meeting. The scenario would be unfavorable for the Pound Sterling as policymakers will cut interest rates for the first time since March 2020. Historically, higher interest rates by the nation’s central bank reduce liquidity inflows into the economy, which strengthens the currency’s appeal.
- Before the inflation data is released, investors will focus on the commentaries from BoE Deputy Governor Ben Broadbent and BoE Governor Andrew Bailey on the interest rate outlook, which are scheduled for Monday and Tuesday, respectively.
Technical Analysis: Pound Sterling rises to 1.2700
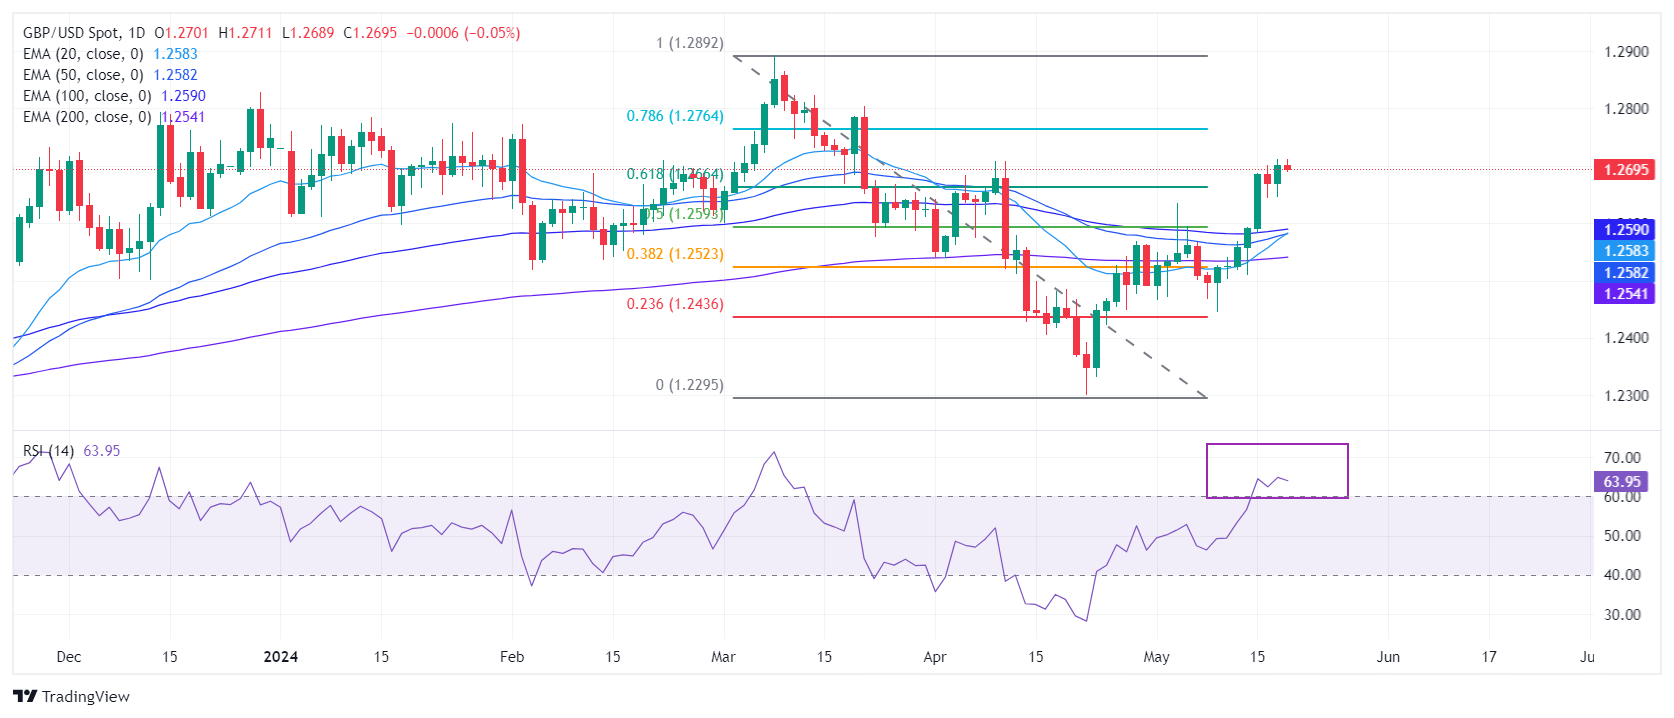
The Pound Sterling advances to an almost two-month high near 1.2700. The GBP/USD pair is expected to remain in the bullish trajectory as all short-to-long-term Exponential Moving Averages (EMAs) are sloping higher, suggesting a strong uptrend. The Cable has retraced 61.8% of losses from March’s high of around 1.2900.
The 14-period Relative Strength Index (RSI) has shifted into the bullish range of 60.00-80.00, suggesting that the momentum has leaned toward the upside.
Pound Sterling FAQs
The Pound Sterling (GBP) is the oldest currency in the world (886 AD) and the official currency of the United Kingdom. It is the fourth most traded unit for foreign exchange (FX) in the world, accounting for 12% of all transactions, averaging $630 billion a day, according to 2022 data. Its key trading pairs are GBP/USD, aka ‘Cable’, which accounts for 11% of FX, GBP/JPY, or the ‘Dragon’ as it is known by traders (3%), and EUR/GBP (2%). The Pound Sterling is issued by the Bank of England (BoE).
The single most important factor influencing the value of the Pound Sterling is monetary policy decided by the Bank of England. The BoE bases its decisions on whether it has achieved its primary goal of “price stability” – a steady inflation rate of around 2%. Its primary tool for achieving this is the adjustment of interest rates. When inflation is too high, the BoE will try to rein it in by raising interest rates, making it more expensive for people and businesses to access credit. This is generally positive for GBP, as higher interest rates make the UK a more attractive place for global investors to park their money. When inflation falls too low it is a sign economic growth is slowing. In this scenario, the BoE will consider lowering interest rates to cheapen credit so businesses will borrow more to invest in growth-generating projects.
Data releases gauge the health of the economy and can impact the value of the Pound Sterling. Indicators such as GDP, Manufacturing and Services PMIs, and employment can all influence the direction of the GBP. A strong economy is good for Sterling. Not only does it attract more foreign investment but it may encourage the BoE to put up interest rates, which will directly strengthen GBP. Otherwise, if economic data is weak, the Pound Sterling is likely to fall.
Another significant data release for the Pound Sterling is the Trade Balance. This indicator measures the difference between what a country earns from its exports and what it spends on imports over a given period. If a country produces highly sought-after exports, its currency will benefit purely from the extra demand created from foreign buyers seeking to purchase these goods. Therefore, a positive net Trade Balance strengthens a currency and vice versa for a negative balance.
Silver prices (XAG/USD) rose on Monday, according to FXStreet data. Silver trades at $31.97 per troy ounce, up 1.46% from the $31.51 it cost on Friday.
Silver prices have increased by 25.52% since the beginning of the year.
| Unit measure | Today Price |
|---|---|
| Silver price per troy ounce | $31.97 |
| Silver price per gram | $1.03 |
The Gold/Silver ratio, which shows the number of troy ounces of Silver needed to equal the value of one troy ounce of Gold, stood at 76.36 on Monday, down from 76.66 on Friday.
Investors might use this ratio to determine the relative valuation of Gold and Silver. Some may consider a high ratio as an indicator that Silver is undervalued – or Gold is overvalued – and might buy Silver or sell Gold accordingly. Conversely, a low ratio might suggest that Gold is undervalued relative to Silver.
(An automation tool was used in creating this post.)
Silver FAQs
Silver is a precious metal highly traded among investors. It has been historically used as a store of value and a medium of exchange. Although less popular than Gold, traders may turn to Silver to diversify their investment portfolio, for its intrinsic value or as a potential hedge during high-inflation periods. Investors can buy physical Silver, in coins or in bars, or trade it through vehicles such as Exchange Traded Funds, which track its price on international markets.
Silver prices can move due to a wide range of factors. Geopolitical instability or fears of a deep recession can make Silver price escalate due to its safe-haven status, although to a lesser extent than Gold's. As a yieldless asset, Silver tends to rise with lower interest rates. Its moves also depend on how the US Dollar (USD) behaves as the asset is priced in dollars (XAG/USD). A strong Dollar tends to keep the price of Silver at bay, whereas a weaker Dollar is likely to propel prices up. Other factors such as investment demand, mining supply – Silver is much more abundant than Gold – and recycling rates can also affect prices.
Silver is widely used in industry, particularly in sectors such as electronics or solar energy, as it has one of the highest electric conductivity of all metals – more than Copper and Gold. A surge in demand can increase prices, while a decline tends to lower them. Dynamics in the US, Chinese and Indian economies can also contribute to price swings: for the US and particularly China, their big industrial sectors use Silver in various processes; in India, consumers’ demand for the precious metal for jewellery also plays a key role in setting prices.
Silver prices tend to follow Gold's moves. When Gold prices rise, Silver typically follows suit, as their status as safe-haven assets is similar. The Gold/Silver ratio, which shows the number of ounces of Silver needed to equal the value of one ounce of Gold, may help to determine the relative valuation between both metals. Some investors may consider a high ratio as an indicator that Silver is undervalued, or Gold is overvalued. On the contrary, a low ratio might suggest that Gold is undervalued relative to Silver.
- USD/INR continues to lose ground due to the improved risk appetite on Monday.
- The US Dollar faced a challenge as softer US inflation sparked speculation about the Fed’s rate cuts in this year.
- Indian markets are closed as general elections are held in the financial capital, Mumbai.
USD/INR edges lower due to improved risk appetite, trading around 83.20 during the early European trading hours on Monday. The subdued US Dollar (USD) has exerted downward pressure on the pair. This weakness in the Greenback is attributed to softer US consumer inflation data for April, which has fueled speculation about potential rate cuts by the Federal Reserve (Fed) in 2024.
According to the CME FedWatch Tool, the likelihood of the Federal Reserve delivering a 25 basis-point rate cut in September has slightly increased to 49.0%, up from 48.6% a week ago. This potential easing of monetary policy by the central bank could undermine the US Dollar and weaken the USD/INR pair.
However, the Fed remains cautious about inflation and the possibility of rate adjustments this year. On Friday, Federal Reserve Board of Governors member Michelle Bowman made headlines by noting that the progress on inflation might not be as steady as many had hoped. Bowman indicated that the decline in inflation observed in the latter half of last year was temporary and that there has been no further progress on inflation this year.
In India, markets are closed as voting is held in general elections in the financial capital Mumbai, and other states on Monday. This leaves limited room for the Reserve Bank of India (RBI) to intervene in currency markets to influence the Indian National Rupee (INR).
A resilient Indian economy and hawkish expectations for the Reserve Bank of India (RBI) have helped mitigate a sharper downturn of INR. In its latest meeting, RBI highlighted that higher food prices could drive inflation higher, necessitating a prolonged period of elevated interest rates.
(This story was corrected on May 20 at 08:00 GMT to say, in the second paragraph, that the central bank could undermine the US Dollar and weaken the USD/INR pair, not the NZD/USD pair)
European Central Bank (ECB) policymaker Martins Kazaks, in a Bloomberg interview on Monday, said that “it's quite likely June will be when we start to cut rates.”
Additional quotes
The data-dependent approach has been an appropriate one so far.
Forward guidance is still not a good policy solution given high uncertainty.
Baseline scenario is that we are gradually approaching 2% inflation target.
This means we can start to cut rates.
But process needs to be gradual and we should not rush it.
Market reaction
EUR/USD keeps its range at around 1.0875 on these above comments, marginally higher on the day.
- EUR/JPY attracts some buyers around 169.50 in Monday’s early European session.
- The positive outlook of the cross remains intact above the key EMA, with a bullish RSI indicator.
- The first upside target will emerge at 169.82; the initial support level is seen at 168.78.
The EUR/JPY cross gains traction near 169.50 during the early European trading hours on Monday. The weakened Japanese Yen (JPY) is driven by the weaker-than-expected Japan GDP growth numbers for Q1, challenging the Bank of Japan's (BoJ) push to get interest rates further away from near zero.
EUR/JPY keeps the bullish vibe unchanged as the cross holds above the 100-period Exponential Moving Averages (EMA) on the four-hour chart. Furthermore, the path of least resistance level for the cross is to the upside, with the Relative Strength Index (RSI) standing in bullish territory near 64.50.
The first upside barrier for EUR/JPY will emerge near the upper boundary of the Bollinger Band at 169.82. The next hurdle is seen at the 170.00 psychological round mark. A break above the latter will expose an all-time high of 171.60, en route to the 172.00 level.
On the other hand, a low of May 17 at 168.78 acts as an initial support level for the cross. The additional downside filter to watch is the lower limit of the Bollinger Band at 167.79, followed by the 100-period EMA at 167.50, and then a low of May 16 at 167.33. A breach of this level will see a drop to a low of April 29 at 165.66.
EUR/JPY four-hour chart
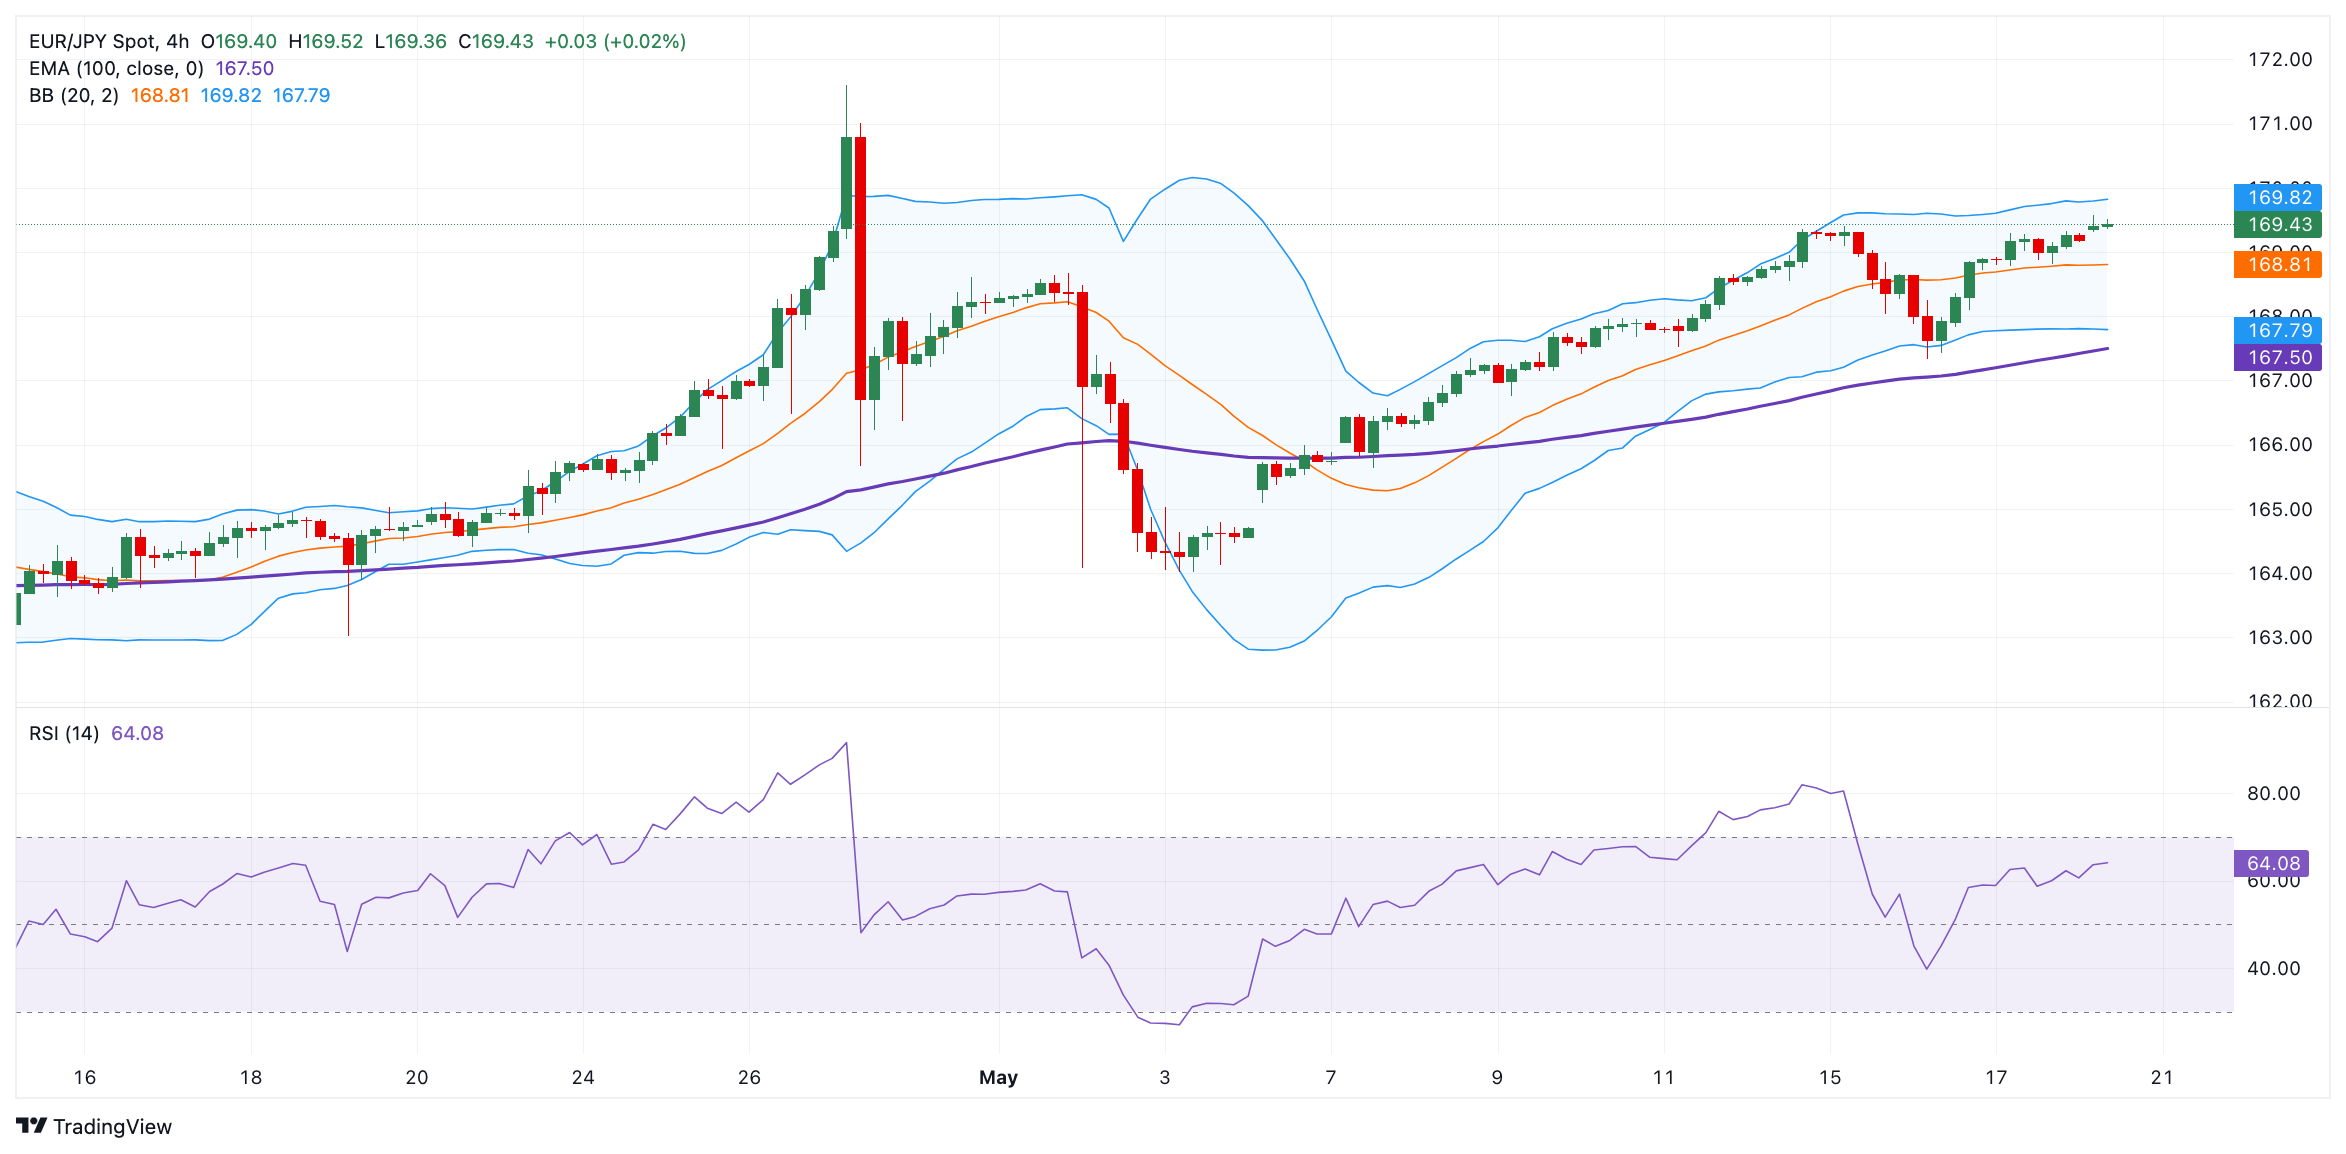
- USD/CAD trades on a softer note near 1.3605 in Monday’s early Asian session.
- Canada’s CPI inflation data is estimated to ease to 2.8% YoY in April from 2.9% YoY in the previous reading.
- The Fed is expected to keep the rate on hold until September, despite cooler-than-expected US inflation data.
The USD/CAD pair extended its downside around 1.3605 during the early European session on Monday. The weaker US Dollar (USD) on the prospect of a Federal Reserve (Fed) rate cut weighs on the pair. Investors await the Canadian Consumer Price Index (CPI) inflation data for fresh impetus, which is expected to ease to 2.8% YoY in April from 2.9% YoY in the previous reading.
The markets expect the Bank of Canada (BoC) to begin rate cuts in June or July, ahead of the Fed's first move. However, Canada’s CPI inflation report on Tuesday will be in the spotlight, which could provide some hints about the next rate decision. The central bank might need to see easing inflation to be convinced to cut interest rates next month. Investors are currently pricing in nearly 40% odds of a BoC rate cut in June. This, in turn, might exert some pressure on the Loonie and cap the pair’s downside.
On the other hand, the US Fed is anticipated to keep the rate on hold until September, despite cooler-than-expected US inflation data. Cleveland Fed President Loretta Mester, one of the FOMC’s more hawkish members, said that the Fed's current monetary policy stance is appropriate as it continues to assess incoming economic data. Additionally, Fed Governor Michelle Bowman said the policy is restrictive, but she is willing to hike rates if inflation stalls or reverses. The wait-and-see mode of Fed officials is likely to support the USD.
Here is what you need to know on Monday, May 20:
Gold price surged higher and reached a new record peak near $2,450 at the beginning of the week. The European economic docket will not feature any data releases and major markets will be on holiday in observance of Whit Monday. In the second half of the day, several Federal Reserve (Fed) policymakers are scheduled to deliver speeches.
Reports of Iran’s President Ebrahim Raisi and Foreign Minister Hossein Amirabdollahian dying in a helicopter crash in Iran's East Azerbaijan province triggered a flight to safety in the early trading hours of the Asian session on Monday. After gaining more than 2% in the previous week, XAU/USD shot higher and was last seen rising more than 1% on the day above $2,440.
Gold price rises to a record high, escalating geopolitical tensions in focus.
Earlier in the day, the People's Bank of China (PBOC) announced that it held the Loan Prime Rates (LPR) unchanged across the time horizons. The Chinese central bank maintained the one-year and five-year LPRs steady at 3.45% and 3.95%, respectively.
PBOC keeps Loan Prime Rates steady, as expected.
After losing nearly 1% in the previous week, the US Dollar (USD) Index fluctuates in a tight channel at around 104.50 early Monday. The benchmark 10-year US Treasury bond yield stays flat slightly above 4.4% and US stock index futures trade modestly higher. Atlanta Fed President Raphael Bostic, Fed Vice Chair for Supervision Michael Barr, Fed Governor Christopher Waller and Fed Vice Chair Phillip Jefferson will be delivering speeches during the American session on Monday.
US Dollar PRICE Today
The table below shows the percentage change of US Dollar (USD) against listed major currencies today. US Dollar was the weakest against the Australian Dollar.
| USD | EUR | GBP | JPY | CAD | AUD | NZD | CHF | |
|---|---|---|---|---|---|---|---|---|
| USD | -0.14% | -0.06% | 0.06% | -0.09% | -0.15% | 0.02% | -0.03% | |
| EUR | 0.14% | 0.05% | 0.24% | 0.05% | 0.03% | 0.16% | 0.11% | |
| GBP | 0.06% | -0.05% | 0.04% | 0.01% | -0.03% | 0.10% | 0.06% | |
| JPY | -0.06% | -0.24% | -0.04% | -0.17% | -0.21% | -0.03% | -0.08% | |
| CAD | 0.09% | -0.05% | -0.01% | 0.17% | -0.11% | 0.10% | 0.06% | |
| AUD | 0.15% | -0.03% | 0.03% | 0.21% | 0.11% | 0.13% | 0.06% | |
| NZD | -0.02% | -0.16% | -0.10% | 0.03% | -0.10% | -0.13% | -0.05% | |
| CHF | 0.03% | -0.11% | -0.06% | 0.08% | -0.06% | -0.06% | 0.05% |
The heat map shows percentage changes of major currencies against each other. The base currency is picked from the left column, while the quote currency is picked from the top row. For example, if you pick the US Dollar from the left column and move along the horizontal line to the Japanese Yen, the percentage change displayed in the box will represent USD (base)/JPY (quote).
EUR/USD struggled to find direction and closed flat on Friday. Nevertheless, the pair registered gains for the fifth consecutive week. In the European morning, EUR/USD trades marginally higher on the day slightly below 1.0900.
GBP/USD rose nearly 1.5% last week and reached its highest level in nearly two months above 1.2700. The pair stays relatively quiet a few pips above 1.2700 early Monday.
USD/JPY moves up and down in a very narrow channel above 155.50 to start the new week. The findings of a survey, conducted by the Bank of Japan (BoJ) to assess its past monetary easing measures, showed that Japan is on the cusp of seeing big changes in corporate activity. "Many firms said they can no longer hire enough workers if they curb wages," the BoJ said and noted that more firms are starting to pass on rising labour costs to sales prices.
Risk sentiment FAQs
In the world of financial jargon the two widely used terms “risk-on” and “risk off'' refer to the level of risk that investors are willing to stomach during the period referenced. In a “risk-on” market, investors are optimistic about the future and more willing to buy risky assets. In a “risk-off” market investors start to ‘play it safe’ because they are worried about the future, and therefore buy less risky assets that are more certain of bringing a return, even if it is relatively modest.
Typically, during periods of “risk-on”, stock markets will rise, most commodities – except Gold – will also gain in value, since they benefit from a positive growth outlook. The currencies of nations that are heavy commodity exporters strengthen because of increased demand, and Cryptocurrencies rise. In a “risk-off” market, Bonds go up – especially major government Bonds – Gold shines, and safe-haven currencies such as the Japanese Yen, Swiss Franc and US Dollar all benefit.
The Australian Dollar (AUD), the Canadian Dollar (CAD), the New Zealand Dollar (NZD) and minor FX like the Ruble (RUB) and the South African Rand (ZAR), all tend to rise in markets that are “risk-on”. This is because the economies of these currencies are heavily reliant on commodity exports for growth, and commodities tend to rise in price during risk-on periods. This is because investors foresee greater demand for raw materials in the future due to heightened economic activity.
The major currencies that tend to rise during periods of “risk-off” are the US Dollar (USD), the Japanese Yen (JPY) and the Swiss Franc (CHF). The US Dollar, because it is the world’s reserve currency, and because in times of crisis investors buy US government debt, which is seen as safe because the largest economy in the world is unlikely to default. The Yen, from increased demand for Japanese government bonds, because a high proportion are held by domestic investors who are unlikely to dump them – even in a crisis. The Swiss Franc, because strict Swiss banking laws offer investors enhanced capital protection.
FX option expiries for May 20 NY cut at 10:00 Eastern Time, via DTCC, can be found below
- EUR/USD: EUR amounts
- 1.0850 991m
- 1.0860 731m
- 1.0875 1.2b
- 1.0890 907m
- 1.0900 1.4b
- GBP/USD: GBP amounts
- 1.2645 459m
- USD/JPY: USD amounts
- 154.00 1.8b
- 155.00 789m
- 156.00 597m
- 156.45 807m
- 156.50 590m
- USD/CHF: USD amounts
- 0.9050 811m
- AUD/USD: AUD amounts
- 0.6590 913m
- 0.6605 550m
- 0.6780 1b
- 0.6800 462m
- USD/CAD: USD amounts
- 1.3535 721m
- 1.3730 735m
- NZD/USD: NZD amounts
- 0.6100 1.3b
- NZD/USD holds ground after NZIER Monetary Policy Shadow Board advised the RBNZ to keep the OCR unchanged at 5.5%.
- The US Dollar faces a challenge as softer US inflation sparked speculation about the Fed’s rate cuts in 2024.
- Fed’s Michelle Bowman suggested that the inflation decline last year was temporary and denied any further progress on this in 2024.
The NZD/USD pair trades around 0.6130 during Asian trading hours on Monday as investors anticipate the Reserve Bank of New Zealand's (RBNZ) policy meeting on Wednesday. The RBNZ is expected to maintain its Official Cash Rate at 5.5% for the seventh consecutive meeting. Policymakers are likely to emphasize the importance of keeping the policy restrictive for an extended period to bring inflation back to the 1-3% target range.
Additionally, on Monday, the New Zealand Institute of Economic Research (NZIER) Monetary Policy Shadow Board advised the RBNZ to keep the Official Cash Rate unchanged in the forthcoming Monetary Policy Statement, citing ongoing concerns about persistent high inflation.
On the other side, US consumer inflation eased to 0.3% in April, sparking speculation about potential rate cuts by the Federal Reserve (Fed) in 2024. However, the Fed remains cautious about inflation and the prospect of rate adjustments this year.
According to the CME FedWatch Tool, the likelihood of the Federal Reserve delivering a 25 basis-point rate cut in September has slightly increased to 49.0%, up from 48.6% a week ago. This potential easing of monetary policy by the central bank could undermine the US Dollar and bolster the NZD/USD pair.
Federal Reserve Board of Governors member Michelle Bowman made waves on Friday by suggesting that progress on inflation may not be as steady as anticipated. Bowman indicated that last year's observed inflation decline was temporary and that there hasn't been further progress this year. Additionally, Richmond Fed President Thomas Barkin noted that while inflation is moderating, achieving the Fed's 2% target will require more time.
The findings of a survey, conducted by the Bank of Japan (BoJ) to assess its past monetary easing measures, showed that Japan is on the cusp of seeing big changes in corporate activity.
Additional takeaways
Many firms said they can no longer hire enough workers if they curb wages.
More firms starting to pass on rising labour costs to sales prices.
Many firms regardless of size, sector, said an economy where wages and prices both rise is favourable for their business than that where wages, prices barely move.
BoJ’s monetary easing has underpinnned capex, corporate business activity by keeping borrowing costs low, improving availability of funds.
Some firms said they saw difficulty of hiring people, intensifying price competition as among side-effects of BoJ’s monetary easing.
Many big manufacturers cited FX moves as among effects that BoJ’s monetary easing had on their businesses.
Big manufacturers saw FX stability as biggest factor they wanted out of BoJ’s monetary policy.
Whether such changes in corporate activity broaden, become sustained would be crucial to Japan's economic, price outlook.
Market reaction
USD/JPY is unfazed by the above findings, trading modestly flat at around 155.75, as of writing.
Bank of Japan FAQs
The Bank of Japan (BoJ) is the Japanese central bank, which sets monetary policy in the country. Its mandate is to issue banknotes and carry out currency and monetary control to ensure price stability, which means an inflation target of around 2%.
The Bank of Japan has embarked in an ultra-loose monetary policy since 2013 in order to stimulate the economy and fuel inflation amid a low-inflationary environment. The bank’s policy is based on Quantitative and Qualitative Easing (QQE), or printing notes to buy assets such as government or corporate bonds to provide liquidity. In 2016, the bank doubled down on its strategy and further loosened policy by first introducing negative interest rates and then directly controlling the yield of its 10-year government bonds.
The Bank’s massive stimulus has caused the Yen to depreciate against its main currency peers. This process has exacerbated more recently due to an increasing policy divergence between the Bank of Japan and other main central banks, which have opted to increase interest rates sharply to fight decades-high levels of inflation. The BoJ’s policy of holding down rates has led to a widening differential with other currencies, dragging down the value of the Yen.
A weaker Yen and the spike in global energy prices have led to an increase in Japanese inflation, which has exceeded the BoJ’s 2% target. Still, the Bank judges that the sustainable and stable achievement of the 2% target has not yet come in sight, so any sudden change in the current policy looks unlikely.
- GBP/USD extends gains as softer US inflation raises expectations for Fed rate cuts in 2024.
- The US Dollar faces a challenge as US Treasury yields inch lower.
- The Pound Sterling may face a challenge as the BoE is expected to deliver 60 basis points rate cuts in 2024.
The GBP/USD pair extends its gains for the second consecutive session, trading around 1.2710 during the Asian hours on Monday. A weaker US Dollar (USD) supports the GBP/USD pair. April data indicated that US consumer inflation had slowed to 0.3%, raising expectations for potential Federal Reserve (Fed) rate reductions in 2024. However, the US Fed maintains a cautious stance regarding inflation and the possibility of rate cuts in 2024.
According to the CME FedWatch Tool, the likelihood of the Federal Reserve delivering a 25 basis-point rate cut in September has slightly increased to 49.0%, up from 48.6% a week ago. This potential easing of monetary policy by the central bank could undermine the US Dollar and bolster the GBP/USD pair.
On Friday, Federal Reserve Board of Governors member Michelle Bowman made headlines by noting that the progress on inflation might not be as steady as many had hoped. Bowman indicated that the decline in inflation observed in the latter half of last year was temporary and that there has been no further progress on inflation this year. Moreover, Richmond Fed President Thomas Barkin noted that inflation is easing but highlighted that it will "take more time" to reach the Fed’s 2% target.
In the United Kingdom (UK), investors expect a potential 60 basis points (bps) interest rate cut by the Bank of England (BoE) in 2024, with the initial cut expected in August. The UK Consumer Price Index (CPI) data for April, set to be published on Wednesday, is forecasted to show an annual rise of 2.7%, according to FactSet estimates. This data is expected to significantly influence the Pound Sterling (GBP).
BoE Governor Andrew Bailey remarked after the release of March’s CPI data, “Inflation in the UK will fall near its 2% target next month,” noting that inflation has declined roughly in line with the BoE’s February forecast.
- Gold price gains ground after reaching a record high on Monday.
- The hopes for Fed rate cuts and escalating Middle East tensions boost safe-haven assets like gold.
- Federal Reserve officials Bostic, Barr, Waller, Jefferson, and Mester are set to speak on Monday.
The gold price (XAU/USD) gains momentum on Monday. The yellow metal hit a record high near $2,441 during the Asian session on Monday amid renewed hopes for interest rate cuts from the US Federal Reserve (Fed) and rising geopolitical tensions in the Middle East. Meanwhile, heightened tensions between Russia and Ukraine also bolstered safe-haven demand, with both nations launching attacks against each other over the weekend.
Later on Monday, gold traders will focus on the Federal Reserve’s (Fed) Bostic, Barr, Waller, Jefferson, and Mester speeches, which might offer some insight into the future path of monetary policy. The cautious approach or hawkish comments from Fed officials could limit the precious metal’s upside.
Daily Digest Market Movers: Gold price edges higher amid geopolitical risks and uncertainties in the Middle East
- Iranian state television is reporting that there is “no sign of life” at the crash site of the helicopter carrying Iran's President Ebrahim Raisi, according to Reuters.
- Richmond Fed President Thomas Barkin noted that inflation is easing but highlighted that it will "take more time" to reach the Fed’s 2% target.
- Cleveland Fed President Loretta Mester said that the Fed's current monetary policy stance is appropriate as it continues to assess incoming economic data.
- Fed Governor Michelle Bowman said the policy is restrictive, but she is willing to hike rates if inflation stalls or reverses.
- Financial markets have priced in 10% odds of a cut in June and a nearly 80% chance in September, according to the CME FedWatch tool.
- The People's Bank of China (PBoC) added 60,000 troy ounces of gold to its stash in April, marking the 18th straight month of gold purchases, according to official data released Tuesday.
Technical Analysis: Gold price keeps the bullish vibes, eyes on overbought RSI condition
Gold price trades with a positive bias on the day. The precious metal breaks above an ascending trend channel that has formed since May 2. Technically, the yellow metal maintains the bullish outlook unchanged on the four-hour chart as it is above the 100-period Exponential Moving Average (EMA), with the Relative Strength Index (RSI) holding above the midline around 82.50. Nonetheless, the overbought RSI condition indicates that further consolidation cannot be ruled out before positioning for any near-term gold upside.
An all-time high of $2,440 acts as an immediate resistance level for XAU/USD. A decisive break above this level will see a rally to the potential upside barrier at the $2,500 psychological level.
On the flip side, the resistance-turned support level at $2,415 will be the first downside target for the yellow metal. The crucial contention level is located at the $2,400 round number, followed by a low of May 16 at $2,370.

US Dollar price today
The table below shows the percentage change of US Dollar (USD) against listed major currencies today. US Dollar was the weakest against the Euro.
| USD | EUR | GBP | CAD | AUD | JPY | NZD | CHF | |
| USD | -0.04% | 0.00% | 0.00% | -0.01% | -0.02% | 0.14% | 0.03% | |
| EUR | 0.03% | 0.05% | 0.05% | 0.04% | 0.03% | 0.18% | 0.09% | |
| GBP | -0.01% | -0.06% | -0.01% | -0.01% | -0.02% | 0.13% | 0.03% | |
| CAD | 0.00% | -0.05% | 0.03% | 0.01% | -0.01% | 0.14% | 0.04% | |
| AUD | 0.01% | -0.06% | 0.01% | 0.00% | -0.02% | 0.13% | 0.04% | |
| JPY | 0.02% | 0.00% | 0.04% | 0.02% | 0.01% | 0.16% | 0.07% | |
| NZD | -0.14% | -0.18% | -0.13% | -0.14% | -0.13% | -0.16% | -0.10% | |
| CHF | -0.05% | -0.09% | -0.04% | -0.04% | -0.04% | -0.07% | 0.09% |
The heat map shows percentage changes of major currencies against each other. The base currency is picked from the left column, while the quote currency is picked from the top row. For example, if you pick the Euro from the left column and move along the horizontal line to the Japanese Yen, the percentage change displayed in the box will represent EUR (base)/JPY (quote).
Gold FAQs
Gold has played a key role in human’s history as it has been widely used as a store of value and medium of exchange. Currently, apart from its shine and usage for jewelry, the precious metal is widely seen as a safe-haven asset, meaning that it is considered a good investment during turbulent times. Gold is also widely seen as a hedge against inflation and against depreciating currencies as it doesn’t rely on any specific issuer or government.
Central banks are the biggest Gold holders. In their aim to support their currencies in turbulent times, central banks tend to diversify their reserves and buy Gold to improve the perceived strength of the economy and the currency. High Gold reserves can be a source of trust for a country’s solvency. Central banks added 1,136 tonnes of Gold worth around $70 billion to their reserves in 2022, according to data from the World Gold Council. This is the highest yearly purchase since records began. Central banks from emerging economies such as China, India and Turkey are quickly increasing their Gold reserves.
Gold has an inverse correlation with the US Dollar and US Treasuries, which are both major reserve and safe-haven assets. When the Dollar depreciates, Gold tends to rise, enabling investors and central banks to diversify their assets in turbulent times. Gold is also inversely correlated with risk assets. A rally in the stock market tends to weaken Gold price, while sell-offs in riskier markets tend to favor the precious metal.
The price can move due to a wide range of factors. Geopolitical instability or fears of a deep recession can quickly make Gold price escalate due to its safe-haven status. As a yield-less asset, Gold tends to rise with lower interest rates, while higher cost of money usually weighs down on the yellow metal. Still, most moves depend on how the US Dollar (USD) behaves as the asset is priced in dollars (XAU/USD). A strong Dollar tends to keep the price of Gold controlled, whereas a weaker Dollar is likely to push Gold prices up.
- The Australian Dollar appreciates due to improved risk appetite on Monday.
- The Australian Dollar may struggle as Australia’s 10-year bond has dropped to its monthly lows.
- The US Dollar faces a challegne as US Treasury yields inch lower.
The Australian Dollar (AUD) extends gains for the second consecutive session on Monday. The weaker US Dollar (USD) supports to underpin the AUS/USD pair. However, the Aussie Dollar trims gains after the interest rate decision from China. The People's Bank of China (PBOC) kept the one-year and five-year Loan Prime Rates (LPR) steady at 3.45% and 3.95%, respectively.
The Australian Dollar may face challenges as the yield on Australia's 10-year government bond hovers around 4.2%, its lowest level in a month. This decline in bond yields follows a softer domestic jobs report for the first quarter. Slowing wage growth has led markets to discount the likelihood of any interest rate hikes by the Reserve Bank of Australia (RBA). Australia’s Wage Price Index (QoQ) increased by 0.8% in the first quarter, falling short of the market's forecast of a 0.9% rise. This quarter's increase is the smallest since late 2022.
The US Federal Reserve (Fed) maintains a cautious stance regarding inflation and the potential for rate cuts in 2024. On Friday, Federal Reserve Board of Governors member Michelle Bowman made headlines by noting that the progress on inflation might not be as steady as many had hoped. Bowman indicated that the decline in inflation observed in the latter half of last year was temporary and that there has been no further progress on inflation this year.
Daily Digest Market Movers: Australian Dollar advances due to risk-on mood
- On Monday, the Chinese Commerce Ministry announced a prohibition on General Atomics Aeronautical Systems, a US company, from engaging in import and export activities related to China. This decision comes amid ongoing trade tensions between the United States and China. Any economic change in the Chinese economy could catalyze the Australian market as both nations are close trade partners.
- On Friday, data showed that China's Retail Sales increased 2.3% YoY in April, down from March's 3.1% and falling short of the expected 3.8%. This marks the 15th consecutive month of growth in retail activity but represents the slowest uptick in this trend. Meanwhile, Industrial Production improved 6.7% YoY, surpassing the anticipated 5.5% and the previous recording of 4.5%.
- The US Department of Labor released the US Initial Jobless Claims on Thursday. The number of Americans filing new claims for jobless benefits rose to 222,000 for the week ending May 10, surpassing the market consensus of 220,000 but below the previous week's figure of 232,000.
- Sarah Hunter, Chief Economist and Assistant Governor (Economic) at the Reserve Bank of Australia (RBA), delivered a speech at the REIA Centennial Congress on Thursday. During her address, Hunter explored various potential strategies to address the imbalance between housing supply and demand growth. This issue looms large in Australia, with escalating prices, rents, and homelessness posing significant challenges.
- US Consumer Price Index (CPI) decelerated to 0.3% month-over-month in April and came in at a lower-than-expected 0.4% reading. While Retail Sales flattened, falling short of the expected increase of 0.4%.
Technical Analysis: Australian Dollar hovers around the psychological level of 0.6700
The Australian Dollar trades around 0.6700 on Monday. Observing the daily chart for AUD/USD showed an ascending triangle formation. Additionally, the 14-day Relative Strength Index (RSI) suggests a bullish sentiment, holding above the 50 mark.
The AUD/USD pair could test the upper limit of the ascending triangle, resting near the four-month peak of 0.6714. A breach above this level might prompt the pair to explore the area around the significant barrier at 0.6750.
On the downside, potential support stands at the nine-day Exponential Moving Average (EMA) at 0.6653, aligned with the major level of 0.6650. A break below the latter could lead the AUD/USD pair to navigate the region around the lower boundary of the ascending triangle around 0.6610 and the psychological level of 0.6600. A breakdown below this level could exert downward pressure, directing attention toward the throwback support at 0.6550.
AUD/USD: Daily Chart
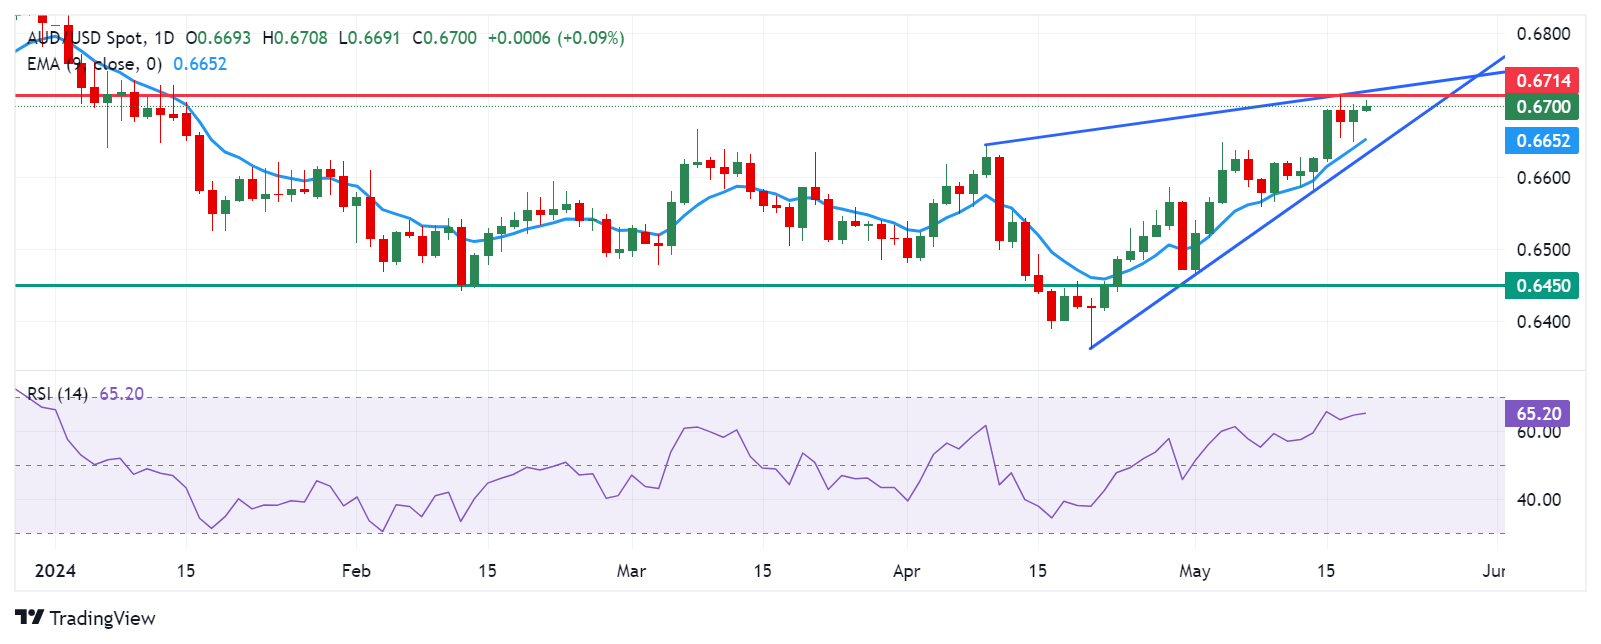
Australian Dollar price today
The table below shows the percentage change of the Australian Dollar (AUD) against listed major currencies today. The Australian Dollar was the strongest against the New Zealand Dollar.
| USD | EUR | GBP | CAD | AUD | JPY | NZD | CHF | |
| USD | 0.00% | 0.02% | 0.01% | 0.02% | 0.04% | 0.18% | 0.05% | |
| EUR | 0.00% | 0.03% | 0.02% | 0.04% | 0.06% | 0.19% | 0.08% | |
| GBP | -0.02% | -0.03% | -0.01% | 0.01% | 0.03% | 0.17% | 0.04% | |
| CAD | -0.01% | -0.02% | 0.03% | 0.02% | 0.04% | 0.17% | 0.05% | |
| AUD | -0.02% | -0.03% | -0.01% | -0.01% | 0.01% | 0.16% | 0.03% | |
| JPY | -0.03% | -0.05% | -0.02% | -0.01% | -0.03% | 0.12% | 0.01% | |
| NZD | -0.18% | -0.20% | -0.17% | -0.17% | -0.16% | -0.15% | -0.12% | |
| CHF | -0.08% | -0.08% | -0.05% | -0.05% | -0.03% | -0.02% | 0.12% |
The heat map shows percentage changes of major currencies against each other. The base currency is picked from the left column, while the quote currency is picked from the top row. For example, if you pick the Euro from the left column and move along the horizontal line to the Japanese Yen, the percentage change displayed in the box will represent EUR (base)/JPY (quote).
Australian Dollar FAQs
One of the most significant factors for the Australian Dollar (AUD) is the level of interest rates set by the Reserve Bank of Australia (RBA). Because Australia is a resource-rich country another key driver is the price of its biggest export, Iron Ore. The health of the Chinese economy, its largest trading partner, is a factor, as well as inflation in Australia, its growth rate and Trade Balance. Market sentiment – whether investors are taking on more risky assets (risk-on) or seeking safe-havens (risk-off) – is also a factor, with risk-on positive for AUD.
The Reserve Bank of Australia (RBA) influences the Australian Dollar (AUD) by setting the level of interest rates that Australian banks can lend to each other. This influences the level of interest rates in the economy as a whole. The main goal of the RBA is to maintain a stable inflation rate of 2-3% by adjusting interest rates up or down. Relatively high interest rates compared to other major central banks support the AUD, and the opposite for relatively low. The RBA can also use quantitative easing and tightening to influence credit conditions, with the former AUD-negative and the latter AUD-positive.
China is Australia’s largest trading partner so the health of the Chinese economy is a major influence on the value of the Australian Dollar (AUD). When the Chinese economy is doing well it purchases more raw materials, goods and services from Australia, lifting demand for the AUD, and pushing up its value. The opposite is the case when the Chinese economy is not growing as fast as expected. Positive or negative surprises in Chinese growth data, therefore, often have a direct impact on the Australian Dollar and its pairs.
Iron Ore is Australia’s largest export, accounting for $118 billion a year according to data from 2021, with China as its primary destination. The price of Iron Ore, therefore, can be a driver of the Australian Dollar. Generally, if the price of Iron Ore rises, AUD also goes up, as aggregate demand for the currency increases. The opposite is the case if the price of Iron Ore falls. Higher Iron Ore prices also tend to result in a greater likelihood of a positive Trade Balance for Australia, which is also positive of the AUD.
The Trade Balance, which is the difference between what a country earns from its exports versus what it pays for its imports, is another factor that can influence the value of the Australian Dollar. If Australia produces highly sought after exports, then its currency will gain in value purely from the surplus demand created from foreign buyers seeking to purchase its exports versus what it spends to purchase imports. Therefore, a positive net Trade Balance strengthens the AUD, with the opposite effect if the Trade Balance is negative.
| Raw materials | Closed | Change, % |
|---|---|---|
| Silver | 31.416 | 6.13 |
| Gold | 2414.42 | 1.53 |
| Palladium | 1004.06 | 2.25 |
- USD/JPY holds positive ground near 155.80 on Monday,
- Fed’s Bostic said he saw signs of cooling inflation, but he prefers to watch more data before cutting rates.
- The divergence in interest rates between the US and Japan weighs on the JPY and creates a tailwind for the pair.
The USD/JPY pair trades in positive territory for the third consecutive trading day around 155.80 during the early Asian session on Monday. The downtick of the pair is supported by weaker Japan’s GDP data in the first quarter (Q1). The Fed’s Bostic, Barr, Waller, Jefferson, and Mester are set to speak later in the day. The FOMC Minutes will be due on Wednesday. On Friday, the Japanese National Consumer Price Index (CPI) will be in the spotlight.
Atlanta Fed President Raphael Bostic stated on Friday that he saw signs of cooling inflation in the recent CPI report, but he prefers to watch the May and June data to make sure that the inflation doesn’t turn back the other way. Meanwhile, Richmond Fed President Tom Barkin noted the central bank needs to keep borrowing costs high for longer to ensure inflation is on track with its target.
Cleveland Fed President Loretta Mester said policy was well positioned, and it was too early to say progress on inflation had stalled. Richmond Fed President Tom Barkin noted the central bank needs to keep borrowing costs high for longer to ensure inflation is on track with its target.
The wide interest rate differential between the US and Japan exerts some selling pressure on the Japanese Yen (JPY) and lifts the USD/JPY. The BoJ abandoned the world's only negative interest policy in March. It underlined that financial conditions would be kept easy and interest rates would slowly increase.
- WTI Oil price gains ground after PBoC keeps interest rates unchanged on Monday.
- Oil prices may struggle possibly due to the hawkish remarks from the Fed officials.
- Crude prices may strengthen due to the optimism for increased demand from the US and China.
West Texas Intermediate (WTI) Oil price continues to gain ground after an interest rate decision from China, trading around $79.70 per barrel during the Asian session on Monday. The People's Bank of China (PBOC) kept the one-year and five-year Loan Prime Rates (LPR) steady at 3.45% and 3.95%, respectively. However, crude Oil prices may struggle following the hawkish remarks made by Federal Reserve (Fed) officials last week. Furthermore, Fed members Bostic, Barr, Waller, Jefferson, and Mester are scheduled to speak on Monday.
On Friday, Federal Reserve Board of Governors member Michelle Bowman made headlines by noting that the progress on inflation might not be as steady as many had hoped. Bowman indicated that the decline in inflation observed in the latter half of last year was temporary and that there has been no further progress on inflation this year.
Last week, WTI Oil price rose by around 2%, driven by optimism for increased demand from the United States (US), the world's largest oil consumer. April data indicated that US consumer inflation had slowed to 0.3%, raising expectations for potential Federal Reserve rate reductions in 2024. Such rate cuts could stimulate economic growth and energy demand. Additionally, lower US interest rates could weaken the US Dollar (USD), making Oil more affordable for buyer countries using other currencies.
Data from the US Energy Information Administration (EIA) showed that US crude stockpiles fell by 2.508 million barrels for the week ending on May 10, marking the second consecutive week of decline and surpassing the expected decline of 1.350 million barrels.
In China, industrial output increased by 6.7% year-on-year in April, indicating a robust recovery in its manufacturing sector and suggesting potential for stronger future demand. Additionally, Reuters reported that on Friday, China announced "historic" measures to stabilize its crisis-hit property sector. The central bank is providing 1 trillion yuan ($138 billion) in additional funding and easing mortgage rules. Additionally, local governments are set to purchase "some" apartments to support the sector.
Gold prices (XAU/USD) climbs to a record high near $2,441 during the early Asian trading hours on Monday.
The bullish move of the precious metal is bolstered by the renewed hopes for interest rate cuts from the US Federal Reserve (Fed). Traders anticipated nearly two quarter-point cuts from the Fed this year, with November being the most likely starting point
Furthermore, the People's Bank of China (PBoC) purchased gold for the 18th straight month in April, adding 60,000 troy ounces of gold to its stash in April. Chinese investors have shifted to gold as a safe-haven asset to hedge against economic uncertainties, boosting yellow metal price to record highs. The recent data showed that Turkey and many countries in Middle East are also buying bullion.
Gold FAQs
Gold has played a key role in human’s history as it has been widely used as a store of value and medium of exchange. Currently, apart from its shine and usage for jewelry, the precious metal is widely seen as a safe-haven asset, meaning that it is considered a good investment during turbulent times. Gold is also widely seen as a hedge against inflation and against depreciating currencies as it doesn’t rely on any specific issuer or government.
Central banks are the biggest Gold holders. In their aim to support their currencies in turbulent times, central banks tend to diversify their reserves and buy Gold to improve the perceived strength of the economy and the currency. High Gold reserves can be a source of trust for a country’s solvency. Central banks added 1,136 tonnes of Gold worth around $70 billion to their reserves in 2022, according to data from the World Gold Council. This is the highest yearly purchase since records began. Central banks from emerging economies such as China, India and Turkey are quickly increasing their Gold reserves.
Gold has an inverse correlation with the US Dollar and US Treasuries, which are both major reserve and safe-haven assets. When the Dollar depreciates, Gold tends to rise, enabling investors and central banks to diversify their assets in turbulent times. Gold is also inversely correlated with risk assets. A rally in the stock market tends to weaken Gold price, while sell-offs in riskier markets tend to favor the precious metal.
The price can move due to a wide range of factors. Geopolitical instability or fears of a deep recession can quickly make Gold price escalate due to its safe-haven status. As a yield-less asset, Gold tends to rise with lower interest rates, while higher cost of money usually weighs down on the yellow metal. Still, most moves depend on how the US Dollar (USD) behaves as the asset is priced in dollars (XAU/USD). A strong Dollar tends to keep the price of Gold controlled, whereas a weaker Dollar is likely to push Gold prices up.
Amid simmering trade tensions between the United States (US) and China, the Chinese Commerce Ministry announced on Monday that the country prohibits general atomics aeronautical systems of the US from engaging in import and export activities related to China.
This comes after US Trade Representative (USTR) Katherine Tai announced last Tuesday that "further action required beyond tariff changes to address China's unfair policies."
Market reaction
AUD/USD has paused its upside near 0.7010 on the above headlines, still up 0.19% on the day.
The People’s Bank of China (PBoC) set the USD/CNY central rate for the trading session ahead on Monday at 7.1042 as compared to the previous day's fix of 7.1045 and 7.2162 Reuters estimates.
On Monday, the People's Bank of China (PBOC) held the Loan Prime Rates (LPR) steady across the time horizons.
The Chinese central bank maintained the one-year and five-year LPRs steady at 3.45% and 3.95%, respectively.
The decision was in line with the market expectations.
In February, the PBOC lowered the five-year LPR by 25 basis points (bps) from 4.20% to 3.95.
Market reaction
At the time of writing, AUD/USD is holding gains near the 0.7000 level, up 0.18% on the day.
Australian Dollar FAQs
One of the most significant factors for the Australian Dollar (AUD) is the level of interest rates set by the Reserve Bank of Australia (RBA). Because Australia is a resource-rich country another key driver is the price of its biggest export, Iron Ore. The health of the Chinese economy, its largest trading partner, is a factor, as well as inflation in Australia, its growth rate and Trade Balance. Market sentiment – whether investors are taking on more risky assets (risk-on) or seeking safe-havens (risk-off) – is also a factor, with risk-on positive for AUD.
The Reserve Bank of Australia (RBA) influences the Australian Dollar (AUD) by setting the level of interest rates that Australian banks can lend to each other. This influences the level of interest rates in the economy as a whole. The main goal of the RBA is to maintain a stable inflation rate of 2-3% by adjusting interest rates up or down. Relatively high interest rates compared to other major central banks support the AUD, and the opposite for relatively low. The RBA can also use quantitative easing and tightening to influence credit conditions, with the former AUD-negative and the latter AUD-positive.
China is Australia’s largest trading partner so the health of the Chinese economy is a major influence on the value of the Australian Dollar (AUD). When the Chinese economy is doing well it purchases more raw materials, goods and services from Australia, lifting demand for the AUD, and pushing up its value. The opposite is the case when the Chinese economy is not growing as fast as expected. Positive or negative surprises in Chinese growth data, therefore, often have a direct impact on the Australian Dollar and its pairs.
Iron Ore is Australia’s largest export, accounting for $118 billion a year according to data from 2021, with China as its primary destination. The price of Iron Ore, therefore, can be a driver of the Australian Dollar. Generally, if the price of Iron Ore rises, AUD also goes up, as aggregate demand for the currency increases. The opposite is the case if the price of Iron Ore falls. Higher Iron Ore prices also tend to result in a greater likelihood of a positive Trade Balance for Australia, which is also positive of the AUD.
The Trade Balance, which is the difference between what a country earns from its exports versus what it pays for its imports, is another factor that can influence the value of the Australian Dollar. If Australia produces highly sought after exports, then its currency will gain in value purely from the surplus demand created from foreign buyers seeking to purchase its exports versus what it spends to purchase imports. Therefore, a positive net Trade Balance strengthens the AUD, with the opposite effect if the Trade Balance is negative.
- Gold price kicks off the new week on a positive note near $2,415.
- The softer US inflation data has prompted the Fed’s rate cut expectation, lifting the yellow metal.
- The hawkish comments from Fed officials might cap the precious metal’s upside.
Gold price (XAU/USD) gathers strength around $2,415 during the early Asian session on Monday. The softer US inflation data in April provides some support to the yellow metal. Meanwhile, the USD Index (DXY), the value of the US dollar measured against a group of six foreign currencies, edges lower to 104.50, losing 0.03% on the day. Investors will take more cues from the Fed’s Bostic, Barr, Waller, Jefferson, and Mester on Monday.
The growing speculation that the US Federal Reserve (Fed) could lower rates in 2024 provides some support to XAU/USD as the lower rate increases the attractiveness of non-yielding Gold to investors. Both US CPI inflations for April dropped to 0.3% MoM from a 0.4% rise in the previous reading. Both the headline and Core CPI printed lower but in line with market expectations.
On the other hand, the cautious approach from the Fed might cap the upside of the precious metal, as higher interest rates might well reduce overall investment demand for non-yielding gold. Last week, Fed Chair Jerome Powell said that he thinks the US central bank will need more data to gain confidence on whether inflation is steadily falling towards 2%. Also, many Fed officials emphasised the need to hold the rate higher for longer, which boosts the Greenback broadly.
| Index | Change, points | Closed | Change, % |
|---|---|---|---|
| NIKKEI 225 | -132.88 | 38787.38 | -0.34 |
| Hang Seng | 177.08 | 19553.61 | 0.91 |
| KOSPI | -28.38 | 2724.62 | -1.03 |
| ASX 200 | -66.9 | 7814.4 | -0.85 |
| DAX | -34.39 | 18704.42 | -0.18 |
| CAC 40 | -20.99 | 8167.5 | -0.26 |
| Dow Jones | 134.21 | 40003.59 | 0.34 |
| S&P 500 | 6.17 | 5303.27 | 0.12 |
| NASDAQ Composite | -12.35 | 16685.97 | -0.07 |
| Pare | Closed | Change, % |
|---|---|---|
| AUDUSD | 0.66947 | 0.22 |
| EURJPY | 169.252 | 0.24 |
| EURUSD | 1.08701 | 0.02 |
| GBPJPY | 197.751 | 0.45 |
| GBPUSD | 1.27004 | 0.23 |
| NZDUSD | 0.61346 | 0.21 |
| USDCAD | 1.36107 | -0.01 |
| USDCHF | 0.90906 | 0.34 |
| USDJPY | 155.704 | 0.22 |


© 2000-2026. All rights reserved.
This site is managed by Teletrade D.J. LLC 2351 LLC 2022 (Euro House, Richmond Hill Road, Kingstown, VC0100, St. Vincent and the Grenadines).
The information on this website is for informational purposes only and does not constitute any investment advice.
The company does not serve or provide services to customers who are residents of the US, Canada, Iran, The Democratic People's Republic of Korea, Yemen and FATF blacklisted countries.
Making transactions on financial markets with marginal financial instruments opens up wide possibilities and allows investors who are willing to take risks to earn high profits, carrying a potentially high risk of losses at the same time. Therefore you should responsibly approach the issue of choosing the appropriate investment strategy, taking the available resources into account, before starting trading.
Use of the information: full or partial use of materials from this website must always be referenced to TeleTrade as the source of information. Use of the materials on the Internet must be accompanied by a hyperlink to teletrade.org. Automatic import of materials and information from this website is prohibited.
Please contact our PR department if you have any questions or need assistance at pr@teletrade.global.
transfers