- Analytics
- News and Tools
- Market News
CFD Markets News and Forecasts — 20-02-2023
- GBP/JPY is aiming to deliver a breakout above 161.70 after multiple failed attempts.
- BoJ Amamiya believes that the current situation is not ripe for an exit from easy policy.
- The BoE could consider a pause in further policy tightening to avoid slowdown fears.
The GBP/JPY pair is looking to surpass the immediate resistance of 161.70 in the early Tokyo session. The cross has tried multiple times to deliver an upside break of 161.70, however, the Pound Sterling was not getting the required strength.
Mixed views from Bank of Japan (BoJ) officials are triggering volatility for the Japanese Yen. BoJ Deputy Governor Masayoshi Amamiya said on Monday, “The BoJ has already shifted to a sustainable monetary easing framework, so it is appropriate to maintain current policy given underlying price moves.” He further added, “What is more difficult is to decide whether conditions have been met to exit easy policy, and how to communicate BoJ’s intentions.”
The official sounds dovish despite the Japanese administration looking for a quick transition from the decade-long expansionary policy to make the Japanese Yen a strong contender against rival currencies.
Meanwhile, escalating signs of a slowdown in the United Kingdom economy due to higher interest rates by the Bank of England (BoE) has strengthened the case of pausing further hikes. The UK economy has been a laggard in demonstrating inflation softening. Despite a string of interest rate hikes, the BoE has failed in easing inflation from the double-digit figure led by higher food inflation and strong labor demand.
For further guidance, investors' focus will be on the fresh talks between UK Foreign Secretary James Cleverly and Conservative rebels for a post-Brexit deal on Northern Ireland. Earlier, UK Prime Minister Rishi Sunak was forced to pause the deal after a backlash from Senior Tories.
- WTI grinds within immediate bullish channel after snapping five-day downtrend.
- Key moving averages, monthly resistance line challenge buyers.
- Bears need to conquer $72.70 to retake control, $76.70 acts as immediate support.
WTI pares the week-start gains as it prints mild losses around $77.30 during Tuesday’s Asian session. In doing so, the black gold trades inside a two-day-old ascending trend channel.
Adding strength to the recovery moves could be the looming bull cross on the MACD, as well as a clear bounce off the six-week-old horizontal support zone, near $72.50-70.
It’s worth noting, however, that the quote’s upside break of the stated channel’s top, around $78.10 at the latest, could find it difficult to lure the Oil buyers as a convergence of the 50-SMA and the 200-SMA might restrict the black gold’s further upside near $78.40.
Even if the quote rises past $78.40, a downward-sloping resistance line from January 27 and the multiple tops marked since late January, respectively near $79.15 and $82.60-65 by the press time, will be crucial to watch for WTI traders past $78.40.
Meanwhile, pullback moves remain elusive unless staying inside the stated bullish channel, currently between $76.65 and $78.10.
Following that, $75.10 and $74.30 may entertain WTI crude oil bears before directing them to the “doubt bottom” marked around $72.50-65.
Overall, WTI is likely to remain firmer inside the $72.50 and $82.65 trading range.
WTI: Four-hour chart

Trend: Limited upside expected
- USD/CHF is struggling to find direction as volatility has squeezed amid a long weekend in the United States.
- Fed minutes will provide a detailed explanation behind an interest rate hike of 25bps.
- The Swiss Franc asset is testing the breakout of the downward-sloping trendline plotted from 0.9600.
The USD/CHF pair is oscillating in a narrow range around 0.9230 in the early Asian session. The Swiss Franc asset has turned sideways following the footprints of the US Dollar Index (DXY). The USD Index failed to gauge a decisive movement amid less trading activity due to an elongated weekend in the United States amid a holiday on Monday due to Presidents’ Day.
Investors are shifting their focus towards the release of the preliminary S&P PMI (Feb) figures and the Federal Reserve (Fed) minutes. The minutes from the Fed will provide a detailed explanation of hiking interest rates by 25 basis points (bps) in the February monetary policy meeting.
Meanwhile, the commentary from Swiss National Bank (SNB) Vice Chairman Martin Schlegel failed to provide strength to the Swiss franc. SNB Schlegel cited the central bank is "still willing" to be active in the foreign currency markets in pursuing its goal of price stability.
USD/CHF is testing the breakout of the downward-sloping trendline placed from November 21 high around 0.9600 on a four-hour scale. Usually, a test of a trendline breakout with an absence of solid downside pressure indicates the strength of bulls and prepares a platform for a confident upside move ahead.
The Swiss Franc asset is employing efforts to shift its auction above the 200-period Exponential Moving Average (EMA) at 0.9245.
Meanwhile, the Relative Strength Index (RSI) (14) has failed to sustain in the bullish range of 60.00-80.00. A bullish momentum will be triggered if the momentum oscillator manages to reclaim the 60.00-80.00 range.
For a fresh upside, the Swiss Franc asset needs to deliver a confident break above February 6 high around 0.9290, which will drive the asset towards January 12 high at 0.9363 followed by January 6 high at 0.9410.
In an alternate scenario, a breakdown below February 9 low at 0.9161 will drag the asset towards the round-level support at 0.9100. A slippage below the latter will drag the asset towards February low at 0.9059.
USD/CHF four-hour chart
-638125313959687125.png)
- EUR/USD picks up bids to pare week-start losses, remains range-bound though.
- ECB’s Rehn signals rate hikes beyond March, EU Consumer Confidence improved in February.
- US holiday, mixed comments from the latest Fed talks and pullback in US Treasury bond yields weigh on US Dollar.
- Preliminary readings of EU, German and US PMIs for February will be eyed for clear directions.
EUR/USD struggles to overcome the week-start losses as it rises to 1.0690 during the early hours of Tuesday’s sluggish Asian session. Even so, the major currency pair remains tight-lipped within a small trading range ahead of the key Purchasing Managers Indexes (PMIs) for February.
The quote’s latest pick-up could be linked to the hawkish comments from the European Central Bank (ECB) official. That said, ECB governing council member and Finnish central bank Chief Olli Rehn recently said, per Reuters, “ECB should keep raising interest rates beyond March and the rate peak, which should be stuck to for some time, could be reached over the summer.” "With inflation so high, further rate hikes beyond March seem likely, logical and appropriate," Rehn told Germany’s Börsen-Zeitung newspaper.
Also underpinning the recovery moves could be the upbeat prints of Eurozone Consumer Confidence. That said, the first readings of the bloc’s Consumer Confidence for February matched market forecasts of -19 versus -20.9 prior.
Earlier on Monday, Germany's Bundesbank released its monthly report and noted that the economic outlook was somewhat brighter with the short-term outlook turning more favorable than seen just a few months ago. The report also mentioned, “High inflationary pressures remain in place as the second round impact of quick wage growth is expected to keep Eurozone inflation above its target for an extended period of time.” On the same line were comments from France’s Finance Minister Bruno Le Maire who expected positive economic growth in 2023 and also believed that inflation should ease off from the middle of this year.
On the other hand, the latest comments from the Federal Reserve (Fed) officials, published on Friday, failed to reiterate the hawkish bias and hence joined a retreat in the US Treasury bond yields to weigh on the US Dollar.
Alternatively, challenges to the sentiment, especially emanating from geopolitical fears surrounding China, Russia and North Korea, seemed to have put a floor under the prices. On the same line could be the last round of the US data showing higher inflation and the Fed’s readiness for further rate lifts.
Against this backdrop, Wall Street was closed and US Treasury yields eased, which in turn weighed on the US Dollar Index (DXY) and allowed the EUR/USD to remain firmer, defending Friday’s rebound from the six-week low.
Moving on, the return of full markets may highlight the geopolitical fears surrounding the US-China tussles over Taiwan and balloon shooting, not to forget the North Korean missile firing, to weigh on the sentiment and the EUR/USD prices.
Additionally, flash readings of German, Eurozone and the US S&P Global PMIs for February will be important to watch for the pair traders. Should the activity data suggest further improvement in the respective economies, the latest hawkish comments from the ECB could gain validation and might help the quote to remain firmer, unless the Fed policymakers sound hawkish too.
Technical analysis
EUR/USD remains on the bear’s radar unless crossing a three-month-old previous support line, close to 1.0725 by the press time.
- Silver spot price climbed on Monday, though the 200-DMA capped its uptrend.
- XAG/USD Price Analysis: The most likely scenario is downwards, with solid resistance from $21.90 and beyond.
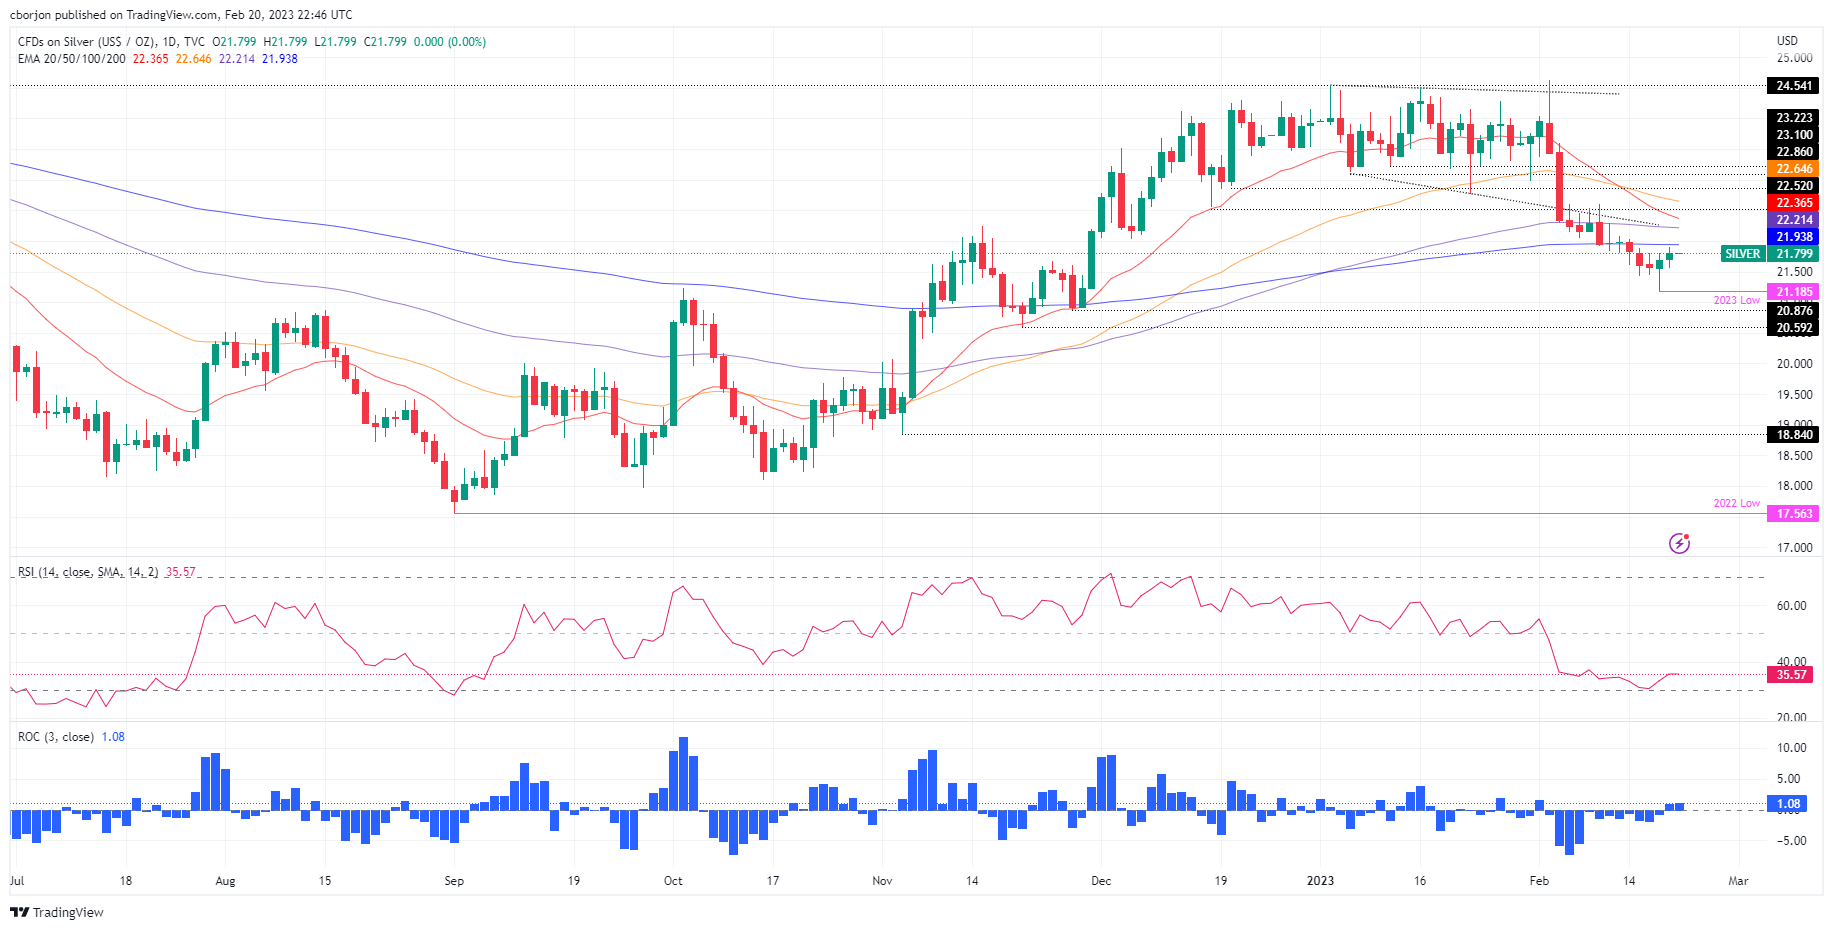
Silver price registered gains on Monday amidst thin liquidity conditions due to a US holiday. However, its rally was capped at a technical juncture, with the important 200-day Exponential Moving Average (EMA) rejecting higher prices for the white metal. Consequently, the XAG/USD retreated and settled at around $21.79 a troy ounce at the time of typing.
The XAG/USD daily chart portrays a large area of resistance resting above Silver’s spot price, led by the 200-day EMA at $21.93, followed by the 100, 20, and 50-day EMAs, each at $22.21, $22.36, and $22.64, respectively. Hence, the XAG/USD path of least resistance is downward biased. Still, the Relative Strength Index (RSI) turning flat at bearish territory, and the Rate of Change (RoC) almost neutral, suggests that bears are taking a respite before attacking the year’s lows.
Therefore, the XAG/USD first support would be the YTD low at $21.18. Once the white metal crosses the latter, it will expose the $21.00 figure, followed by the November 22 swing low at $20.87, and then the November 21 low at $20.59, ahead of the psychological $20.00 figure.
As an alternate scenario, if XAG’s bulls reclaim the 200-day EMA and the $22.00 mark, that would pave the way to retest the 100-day EMA.
XAG/USD Daily chart
XAG/USD Key technical levels
- USD/CAD is displaying a rangebound auction ahead of Canada’s CPI and Retail Sales data.
- The market mood is extremely quiet despite escalating geopolitical tensions.
- Higher consumer spending could force the BoC ahead to reassess the monetary policy.
The USD/CAD pair is demonstrating a rangebound performance around 1.3450 in the early Tokyo session. The Loonie asset has turned sideways as investors are awaiting the release of Canada’s Consumer Price Index (CPI) and the Retail Sales data for fresh cues.
The sideways auction in the Loonie asset is also backed by the lackluster US Dollar Index (DXY). The USD Index remained topsy-turvy as United States markets were closed on Monday due to Presidents’ Day. An elongated weekend pushed investors to the sidelines before making a significant move. The market mood was extremely quiet despite escalating geopolitical tensions. S&P500 futures displayed sheer volatility as US-China tensions escalated after the US ambassador warned China for providing lethal support to Russia in the invasion of Ukraine.
Going forward, the release of Canada’s Inflation and Retail Sales data will keep the Canadian Dollar in action. As per the consensus, Canada’s core CPI that excludes oil and food prices is seen higher at 5.5% vs. the former release of 5.4% on an annual basis. While the annual headline inflation is seen lower at 6.1% against 6.3% released earlier.
It is worth noting that the Bank of Canada (BoC) has announced a pause in the continuation of policy tightening after pushing interest rates to 4.5%. BoC Governor Tiff Macklem believes that the monetary policy is restrictive enough to tame the stubborn inflation for now.
Apart from the inflation figures, monthly Retail Sales will remain in focus, which is seen at 0.2% against a contraction of 0.1% released in the prior period. This indicates that consumer spending is coming back despite higher interest rates by the BoC. It could force the BoC ahead to reassess the monetary policy as higher consumer spending could propel wholesale inflation ahead.
Meanwhile, oil prices are aiming to reclaim the $78.00 resistance after Saudi Arabian Energy Minister Prince Abdulaziz bin Salman said on Monday, “OPEC+ is flexible enough to change decisions whenever required.” It is worth noting that Canada is a leading exporter of oil to the United States and higher oil prices would support the Canadian Dollar ahead.
- GBP/USD struggles for clear directions after tepid week-start, fails to extend Friday’s bounce off multi-day low.
- Sluggish oscillators, key HMAs challenge bulls ahead of 13-day-old resistance line.
- Bears need sustained trading below 1.1920-15 to retake control.
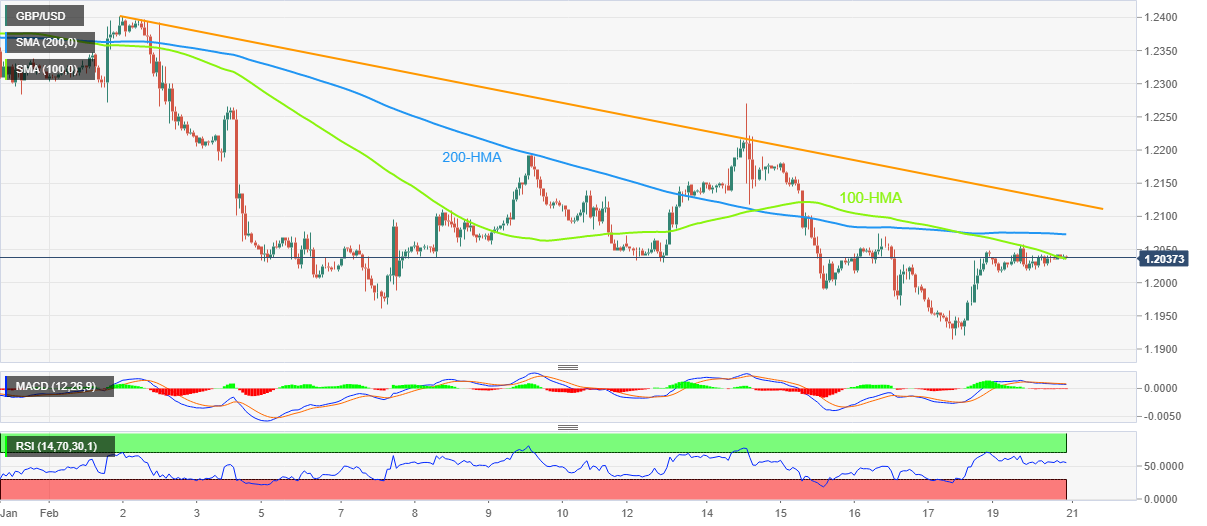
GBP/USD remains sidelined near 1.2040 during the early hours of Tuesday’s Asian session, extending Monday’s inaction.
In doing so, the Cable pair seesaws around the 100-Hour Moving Average (HMA) amid the trader’s cautious mood ahead of the first readings of the UK Purchasing Managers Indexes (PMI) for February.
Not only the 100-HMA level surrounding 1.2040 but the 200-HMA level surrounding 1.2075 also challenges the GBP/USD pair buyers.
Following that, a downward-sloping resistance line from February 02, close to 1.2125 at the latest, will be important to watch as a break of which could convince GBP/USD buyers to challenge the monthly high surrounding the 1.2400 threshold. During the run-up, the previous weekly high near 1.2270 may act as an intermediate halt.
Meanwhile, the 1.2000 psychological maget precedes the 1.1960 support to restrict short-term GBP/USD downside.
However, the recent low near 1.1920-15 joins an upward-sloping support line from mid-November 2022 to act as a tough nut to crack for the GBP/USD bears to conquer.
To sum up, GBP/USD remains tight-lipped ahead of the key UK data. However, the sluggish oscillators and multiple hurdles to the north keep sellers hopeful.
GBP/USD: Hourly chart
Trend: Further downside expected
“Cyclone reconstruction will boost economic activity,” said New Zealand (NZ) Treasury on late Monday, early Tuesday in Asia.
More to come
- AUD/JPY clears a downslope resistance trendline around 92.50, with bulls eyeing 93.00.
- Consolidation within the 92.00-93.40 area would keep AUD/JPY traders entertained, nearby last week’s highs.
- AUD/JPY Analysis: Once it clears 93.50, a rally toward 95.00 is on the cards.
The Australian dollar (AUD) is recovering against the Japanese Yen (JPY) despite market sentiment shifting sour as US equity futures turned red, except for the Dow Jones. As the North American session fades, the AUD/JPY is advancing 0.63%, trading at 92.82.
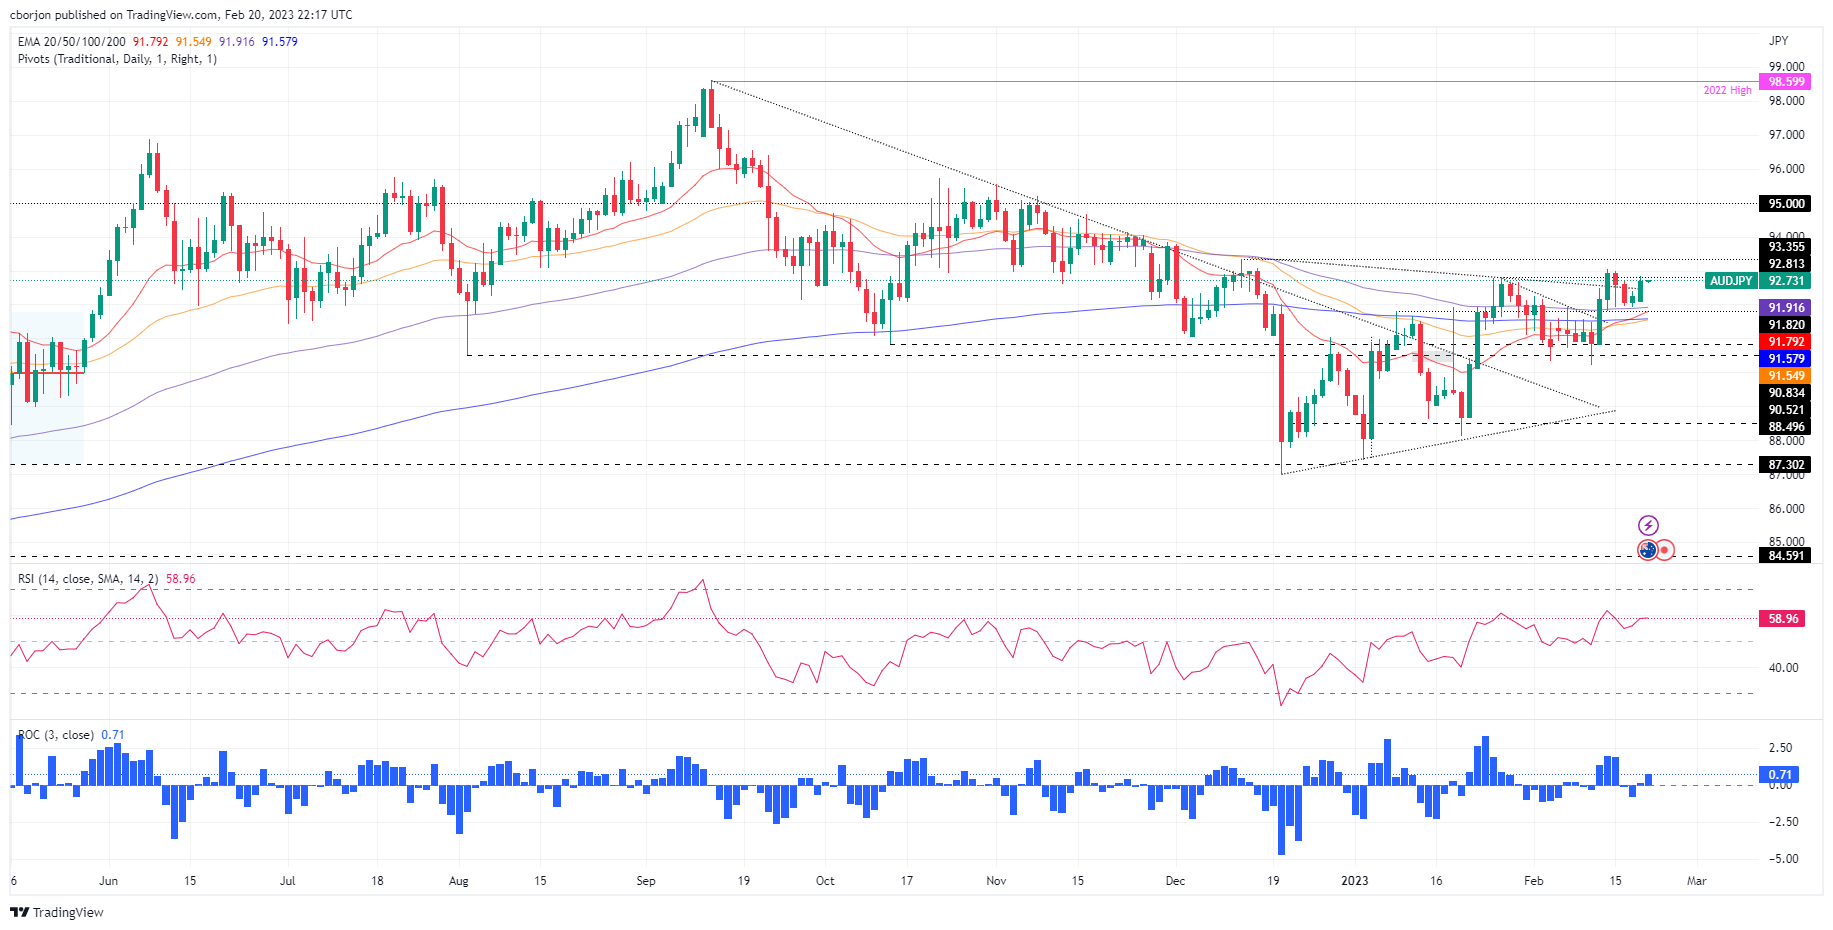
From a daily chart perspective, the AUD/JPY is still neutral-biased, though trading within the 92.00-93.40 range, nearby the highs of the last week. AUD/JPY price action distanced from the daily Exponential Moving Averages (EMAs), suggesting that the uptrend is accelerating. Also, the Relative Strength Index (RSI) shifted upward in bullish territory. Therefore, the AUD/JPY could be testing the 93.00 figure in the near term, followed by the November 30 daily high at 93.84 and the psychological 94.00 figure.
As an alternate scenario, it is less likely that the AUD/JPY shifts gears and turns bearish, though it would face a solid support area below 92.00. Firstly, the 100-day EMA at 91.91, followed by the 91.50-60 area, a confluence of the 20/200/50-day EMAs, and then the 91.00 figure.
AUD/JPY Daily chart
AUD/JPY Key technical levels
- Gold price is looking to recapture the $1,850.00 resistance despite quiet market mood.
- The USD Index failed to capitalize on escalating geopolitical tensions.
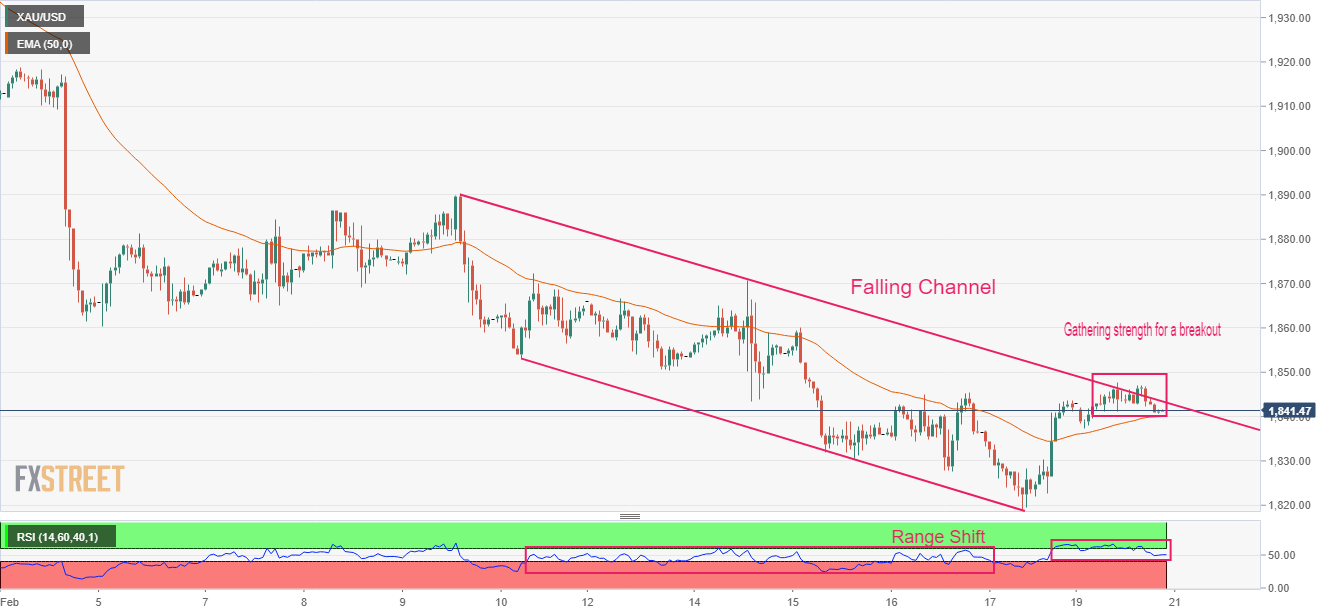
- Gold price is gathering strength to deliver a breakout of the Falling Channel.
Gold price (XAU/USD) has displayed a back-and-forth action in a narrow range above $1,840.00 on Monday’s session. The precious metal is expected to hit the critical resistance of $1,850.00 as investors have digested the fact that the United States inflation could display a surprise rebound after declining consecutively for the past six months.
Last week, the release of the higher-than-anticipated Producer Price Index (PPI) indicated that firms believe that consumer spending is still solid and that wholesale inflation should not be declined extensively. Robust demand from households due to the upbeat labor market is going to keep the expectations of a rebound in the Consumer Price Index (CPI) alive ahead.
Meanwhile, the US Dollar Index (DXY) managed to safeguard the critical support of 103.50. The USD Index didn’t pick strength despite rising geopolitical tensions. The market mood was quiet as the US markets were closed on account of Presidents’ Day. S&P500 futures displayed a volatile session amid uncertainty inspired by an elongated weekend.
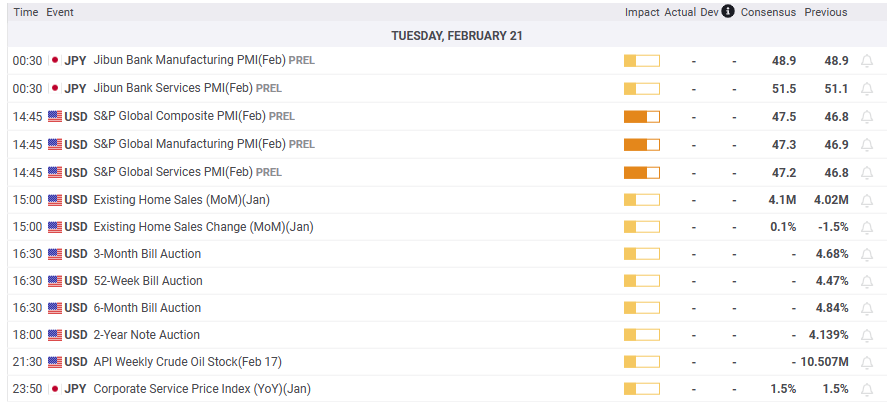
For further guidance, investors will focus on the preliminary S&P PMI (Feb) data, which will release on Tuesday. The preliminary Manufacturing PMI (Feb) is seen lower at 46.8 vs. the prior release of 46.9. And the Services PMI is seen at 46.6 against the former release of 46.8.
Gold technical analysis
Gold price is oscillating near the upper end of the Falling Channel chart pattern on an hourly scale. The precious metal is gathering strength to deliver a breakout for a fresh upside. A breakout of the aforementioned chart pattern indicates a bullish reversal. The 50-period Exponential Moving Average (EMA) at $1,840.00 is acting as major support for the Gold bulls.
Meanwhile, the Relative Strength Index (RSI) (14) has demonstrated a range shift structure. The RSI (14) has shifted its structure from the bearish segment of 20.00-60.00 to the bullish arena of 40.00-60.00, in which the 40.00 will act as a support for the US Dollar bulls.
Gold hourly chart
- AUD/USD struggles to hold recovery from multi-day low after Australia activity data.
- Preliminary readings of S&P Global PMIs for Australia improved in February.
- US holidays, sluggish markets allowed buyers to keep the reins despite geopolitical challenges.
- RBA Minutes should justify hawkish bias to keep the buyers in the driver’s seat, US PMIs will be eyed too.
AUD/USD fades the week-start optimism even as Australian activity data for February came in firmer during early Tuesday. Adding strength to the pullback moves could be the return of the full markets, as well as the geopolitical fears. Furthermore, the cautious mood ahead of the Reserve Bank of Australia’s (RBA) Monetary Policy Meeting Minutes also weakens the risk-barometer pair. That said, the Aussie pair retreats to 0.6910 at the latest, following the previous day’s run-up to 0.6920.
Australia’s preliminary readings of the S&P Global PMIs for February came in firmer as Manufacturing PMI rose to 50.1, versus 49.9 expected and 50.0 prior while the Services PMI increased to 49.2 from 48.6 previous readings and 48.4 market forecasts. Further, the S&P Global Composite PMI also improved to 49.2 from 48.5.
Even so, the AUD/USD pair failed to cheer the upbeat data and retreated to 0.6910 following the release.
The Aussie pair’s latest pullback could be linked to the return of the full markets as well as the latest challenges to the sentiment, especially emanating from geopolitical fears surrounding China, Russia and North Korea. On the same line could be the hopes of witnessing dovish remarks of the RBA policymakers from today’s RBA Monetary Policy Meeting Minutes.
On Monday, AUD/USD managed to remain firmer amid hopes of more stimulus from China, after the People’s Bank of China (PBOC) left its monetary policy unchanged. Also seemed to have helped the pair buyers could be the last round of Federal Reserve (Fed) talks that came in slightly offbeat, not to forget the President’s Day holiday in the US.
Amid these plays, Wall Street was closed and US Treasury yields eased, which in turn weighed on the US Dollar Index (DXY) and allowed the AUD/USD to remain firmer, extending Friday’s rebound from the six-week low.
Moving on, the return of full markets may highlight the geopolitical fears surrounding the US-China tussles over Taiwan and balloon shooting, not to forget the North Korean missile firing, to weigh on the sentiment and the AUD/USD prices.
However, major attention will be given to the RBA Minutes and the US S&P Global PMIs for clear directions. Should the RBA fails to defend its hawkish bias, as well as the US PMIs appear firmer, the AUD/USD could reverse the recent gains.
Technical analysis
A clear rebound from the 200-DMA, around 0.6800 by the press time, directs AUD/USD towards a 13-day-old resistance line, close to 0.6950 at the latest.
- US Dollar on the backfoot ahead of key data and Fed minutes.
- The bears have pressured the greenback into bearish territories.
The US Dollar continues to take its cues from US Treasuries that are pressured in a more hawkish environment. Recent Fed speakers have been advocating for higher for longer. this has encouraged the Fed Funds futures market to start pricing in a 50bp rate hike in March.
Last week, comments from Loretta Mester and James Bullard (both currently non-voting Fed officials) separately indicated that they saw a case for a 50-bps rate hike earlier this month. However, the Federal Reserve opted for a 25 bps move at the February 1 FOMC meeting.
But with markets expecting the Fed funds rate to peak just under 5.3% by July, the move in the greenback may have run its course and it is sinking at the start of the week.
As measured by the DXY index, it fell in light trade on Monday, losing territory to a low of 103.76. However, it is still up almost 1.8% for the month, on track for its first monthly gain since September. It hit a six-week high of 104.67 on Friday and while below there, the pressures are on.
There will be crucial events, however, from, the US economic calendar. The Federal Reserve's preferred measure of inflation in the Personal Consumption Expenditure deflator will be key. The market is expecting the January headline data to remain at 5.0% YoY, in line with the previous month, in stark contrast to the presumption that a downtrend in inflationary indicators would continue.
''Data in line with market expectations would thus add further weight to the view that the Fed will have to work harder to push inflation back to its target level,'' analysts at Rabobank explained. ''Currently implied market rates are pointing to a peak in Fed funds close to 5.33%.''
On February 22, the release of the minutes of this meeting will come out and may well indicate if a 50-bps move was seriously considered, and if so, the US Dollar could attract further demand, potentially enough to keep it above 104.50 for the foreseeable future in DXY.
US Dollar H4 chart
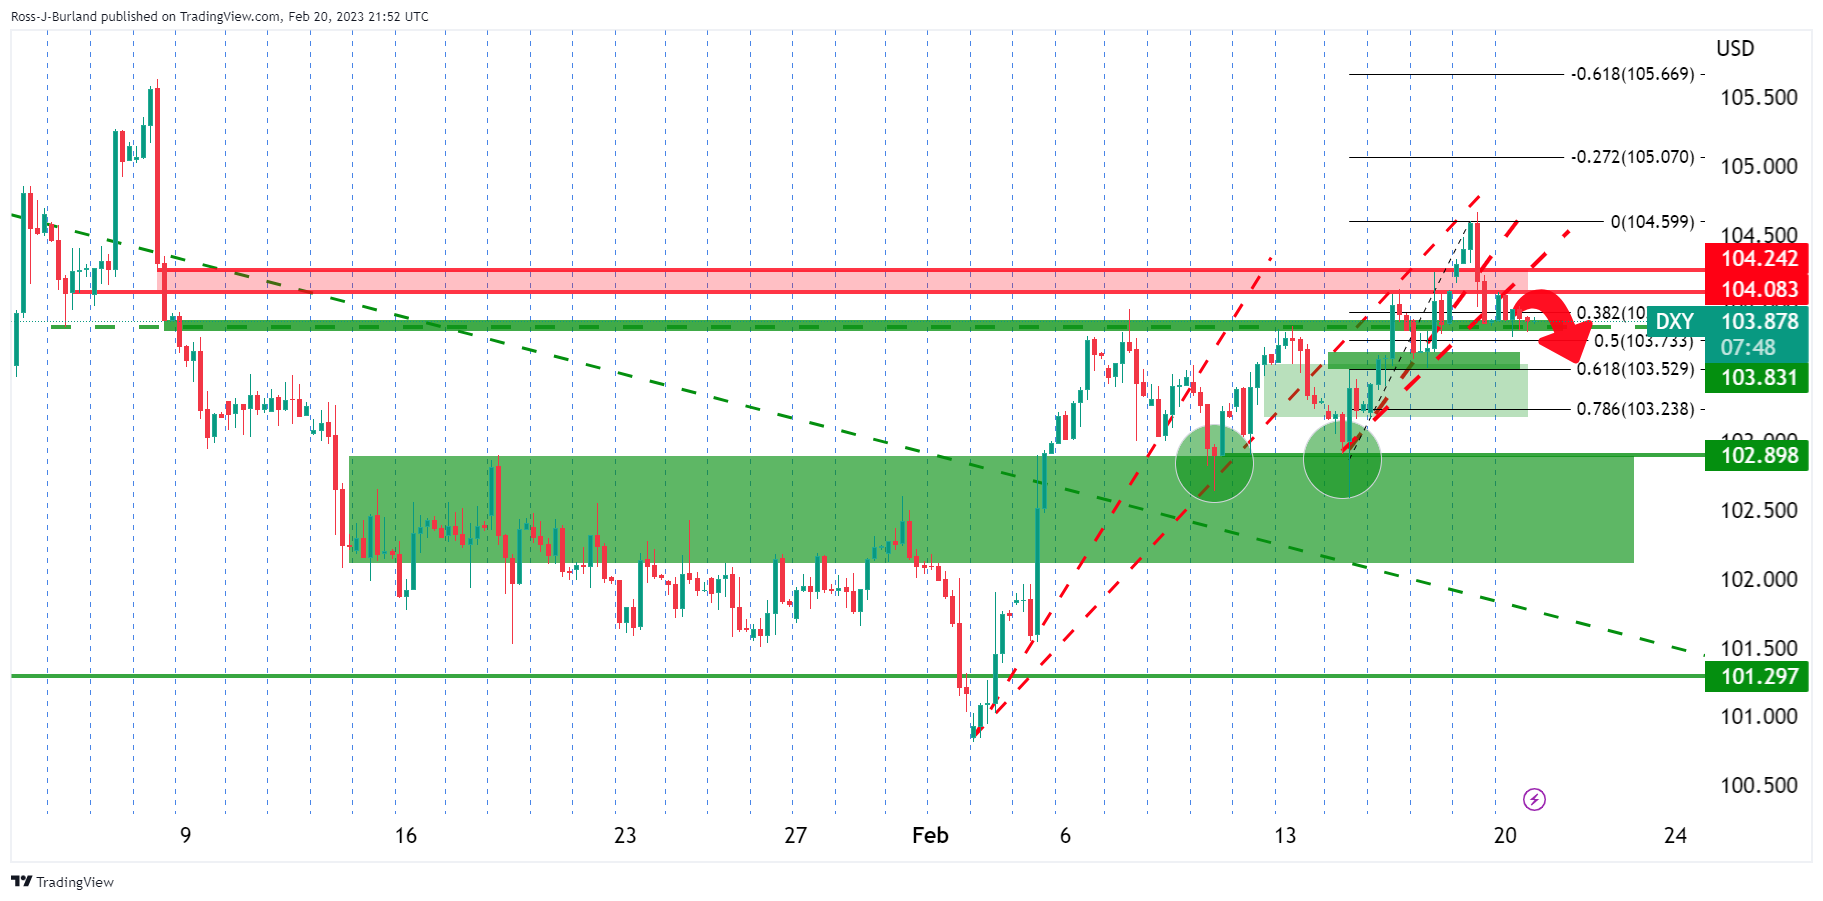
A move lower, in the meantime, would appear to be the bias with the price on the back side of the prior bullish trend. A move to test 103.50 and a break thereof opens the risk to below 102.00.
- USD/JPY is still underpinned by the US 10-year Treasury bond yield and the market mood.
- The latest US inflation data triggered the last week’s USD/JPY rally from 131.50 to 135.00.
- USD/JPY Technical analysis: To remain consolidated, slightly tilted upwards.
The USD/JPY fluctuated in Monday’s session as US financial markets remained closed during President’s Day. US equity futures are negative, except for the Dow Jones Industrial Average. The US Dollar continued to trend lower, while US Treasury bond yields capped the USD/JPY fall. The USD/JPY is trading at 134.23, above its opening price by 0.07%.
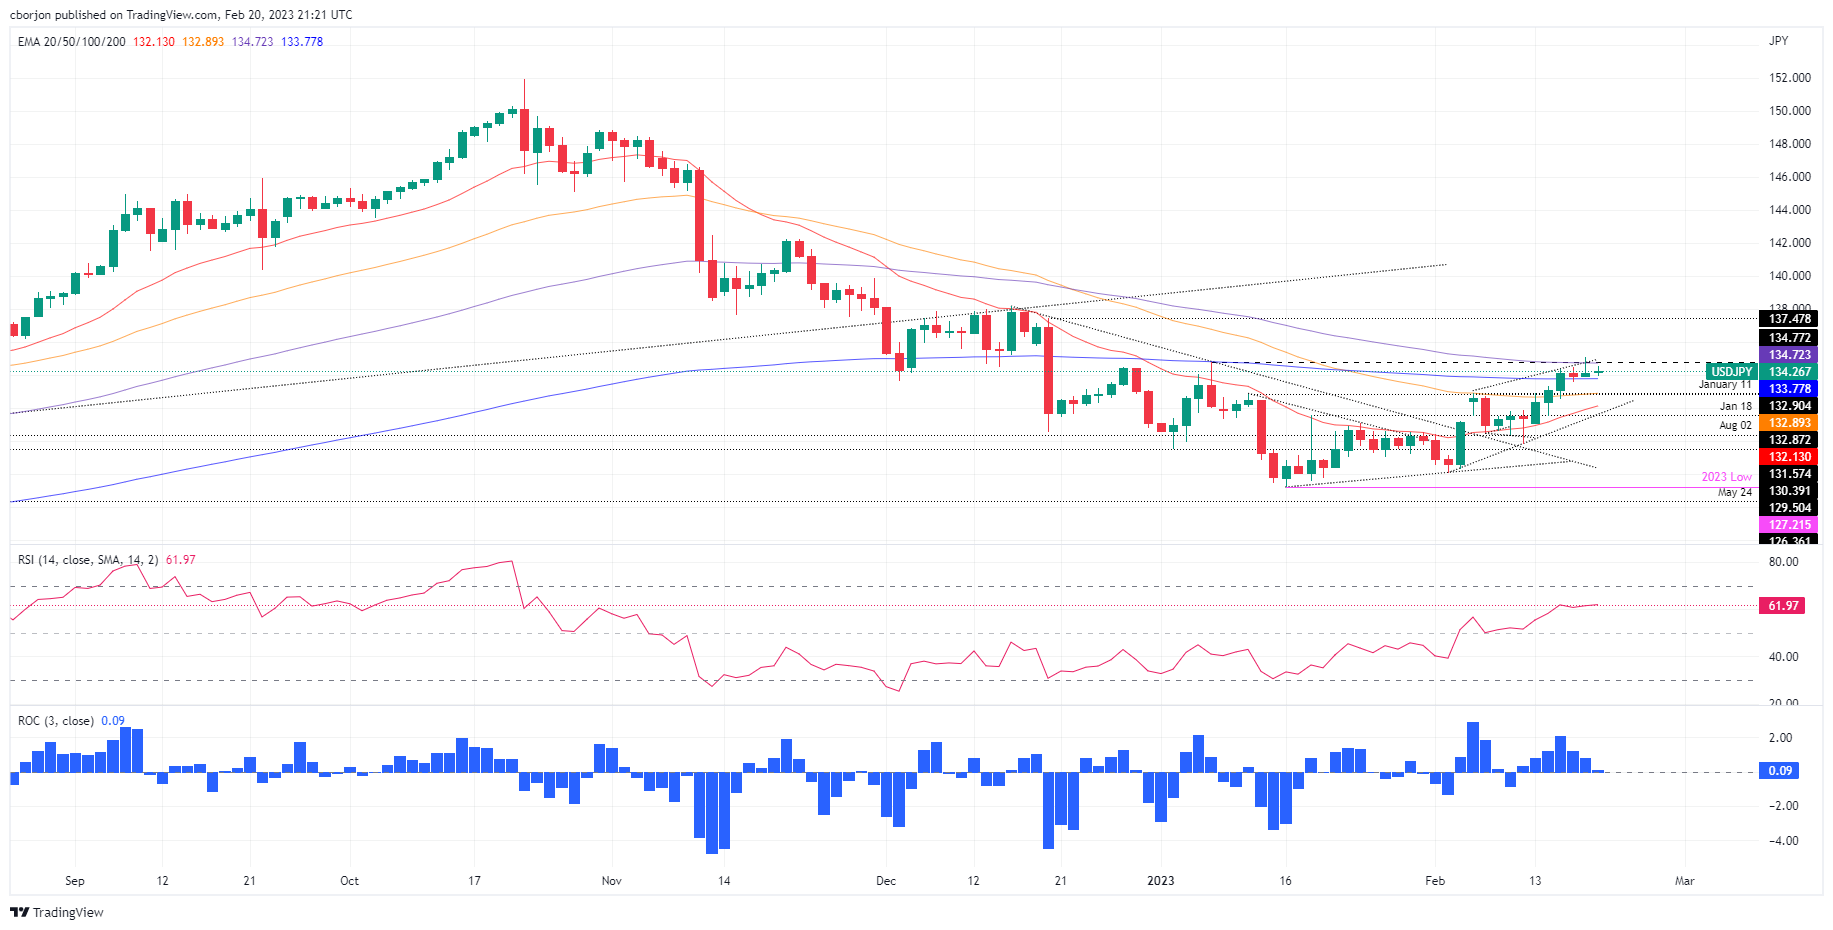
After reclaiming the 50-day Exponential Moving Average (EMA) at 132.73, the USD/JPY enjoyed a rally that peaked at around 135.11. Bull’s failure to hold gains above the latter exacerbated a fall to the 134.20s area, mainly driven by the fall in the US 10-year benchmark note rate, which finished last Friday’s session on a lower note.
Last week’s US inflation data in the consumer segment showed some slowing down. Prices paid by producers, also known as PPI, rose above estimates and the previous month’s reading on a monthly basis. Therefore, traders shifted from a risk-on to a risk-off environment, as traders expect a more hawkish than estimated US Federal Reserve (Fed).
In the meantime, changes in the Bank of Japan (BoJ) are increasing volatility in the pair. Given that Kazuo Ueda remains the leader to become the new BoJ Governor, investors are positioning toward a more hawkish BoJ stance. On early Monday in the Asian session, the current BoJ Deputy Governor Amamiya said that the BoJ has the necessary tools to exit from ultra-loose monetary conditions.
What to watch?
USD/JPY Technical analysis
The USD/JPY uptrend lost steam as it formed an inverted hammer near the peak at around 135.00. Buyers’ failure to hold to the latter exacerbated a retracement below the 100-day EMA at 134.72, opening the door to consolidate within the important 200-day EMA at 133.77 and 134.70, a 100 pip range. The Relative Strength Index (RSI) shifted falt though at bullish territory, signals that buyers are taking a respite, while the Rate of Change (RoC), is almost unchanged. Break above the 100-day EMA, and the USD/JPY might re-test 135.00. On the downside, a break below 134.00 would challenge the 200-day EMA.
- NZD/USD has been perking up from the failed breakout on Friday with eyes on RBNZ.
- NZD/USD longs are in the market with the 0.6270s eyed that safeguard a move to test 0.63 territories.
NZD/USD is getting set for the Reserve Bank of New Zealand tomorrow and has been tucked up in a tight range due to a slow start this week with the United States out on holiday for Presidents’ Day.
''The Kiwi’s immediate future will depend on what the RBNZ do, but as markets contemplate the cost of rebuilding and the impact that’s likely to have on inflation, insurance flows and infrastructure spending, it’s quickly becoming a potential driver of sustained NZD strength – more than we thought just a few days ago,'' analysts at ANZ Bank wrote in a note on Tuesday, adding, ''market expectations seem to have swung slightly away from arguments to go easy post-cyclone and back toward the economic arguments to press ahead with hikes.''
The US Dollar dynamic
Meanwhile, the US Dollar is being guided by US Treasuries that are pressured in a more hawkish environment. However, further significant US Dollar strength might need the Fed Funds futures market to start pricing in a 50bp rate hike in March. But with markets expecting the Fed funds rate to peak just under 5.3% by July, the move in the greenback may have run its course.
As measured by the DXY index, it fell in light trade on Monday, losing territory to a low of 103.76. However, it is still up almost 1.8% for the month, on track for its first monthly gain since September. It hit a six-week high of 104.67 on Friday and while below there, the pressures are on.
NZD/USD technical analysis
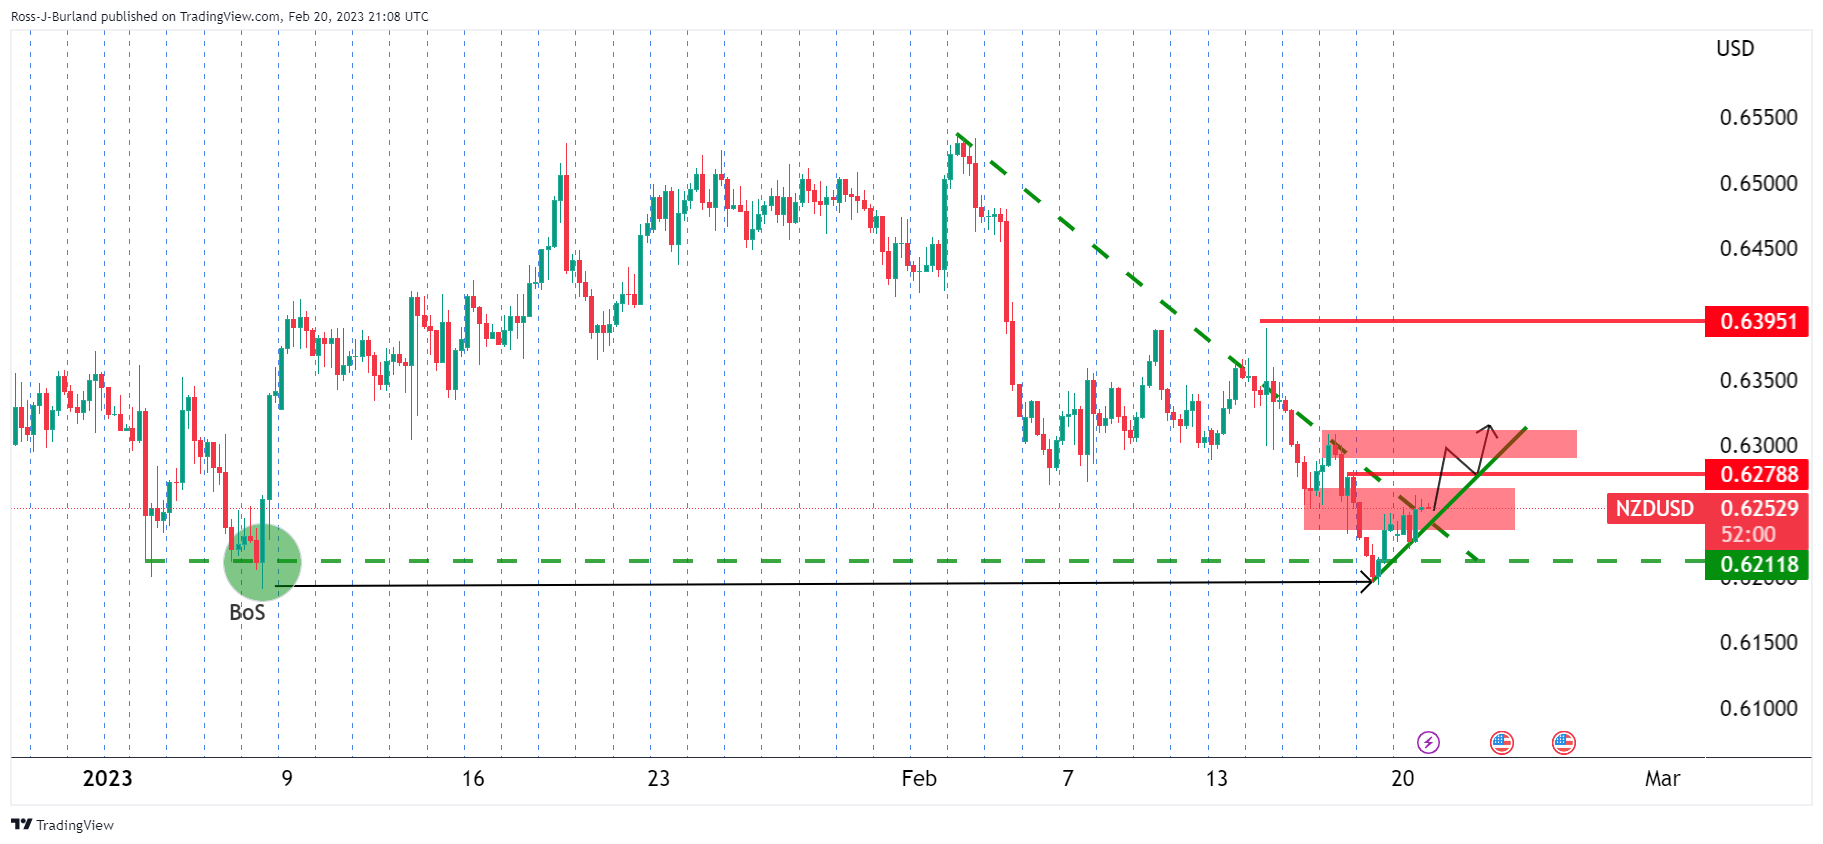
NZD/USD has been perking up from the failed breakout on Friday and longs are in the market with the 0.6270s eyed that safeguard a move to test 0.63 territories.
- EUR/USD stuck in a range and awaits major data this week.
- Traders will have both Eurozone and US economic data to potentially kickstart some major moves in EUR/USD.
EUR/USD is moving sideways during a US holiday parked inside of Friday's range at the upper end of it. The Euro has travelled a small distance between 1.0670 and 1.0704 vs. the US Dollar so far on the day.
Liquidity is expected to remain thin for the remainder of the day with US markets closed for Presidents' Day. However, there is plenty at stake this week and from a technical standpoint, big moves are on the horizon.
A flurry of recent data from the United States reinforced market expectations of tighter monetary policy from the Federal Reserve over the last several days, fuelling a firm recovery in the US Dollar last week. The DXY index, which measures the greenback vs. six other major currencies, rallied from a double-bottom low in the 102.50s last week and reached a high of 104.67, a six-week high. However, the squaring of that run has left the US dollar vulnerable while below 104.00 as it is today which is offering the Euro bulls some relief, albeit possibly only temporary.
The US Dollar is still up almost 1.8% for the month, on track for its first monthly gain since September and the fundamentals will continue to flow this week with the minutes of the February FOMC meeting released on February 22. ''Strong inflation and labour market data since then have turned Fed speak more hawkish,'' analysts at TD Securities said. ''Overall, the minutes are likely to be too outdated to impact markets meaningfully.''
We will also have the Core Personal Consumption Expenditure data that is known for capturing inflation (or deflation) across a wide range of consumer expenses and reflecting changes in consumer behaviour. It is the Federal Reserve's preferred measure for inflation which makes this week a crucial one for the US Dollar and market sentiment surrounding the central bank.
''We expect core PCE prices to accelerate in January to its strongest m/m pace in five months, also outpacing the core CPI's 0.4% MoM gain,'' analysts at TD Securities said.
''The YoY rate likely stayed unchanged at 4.5%, suggesting price gains remain elevated. The report is also expected to confirm that the consumer remains alive and kicking, posting an increase that is likely to more than makeup for recent weakness.''
This data will come out on February 24, but on February 23, the Eurozone will release the Final HICP Inflation reading for January year over year that could be revised up, cementing the inevitably of a 50 basis point rate hike by the Europen Central Bank next month. However, it will also potentially play into the sentiment that the ECB will not be done in March and will need to do more. The governor of the ECB, Christine Lagarde signalled at the prior meeting that March will not mark the final hike.
All in all, there could be something for both the EUR/SD bears and the bulls this week in terms of the data, but the technicals are so far aligning bullish following the failed breakout on Friday:
EUR/USD technical analysis
At the start of the week's analysis, EUR/USD Price Analysis: US Dollar's failures above 104.20 DXY opens risk to 1.0720s, it was noted that the price was entering correction territory and we have seen a test already to the prior week's lows that have acted as support on Monday:
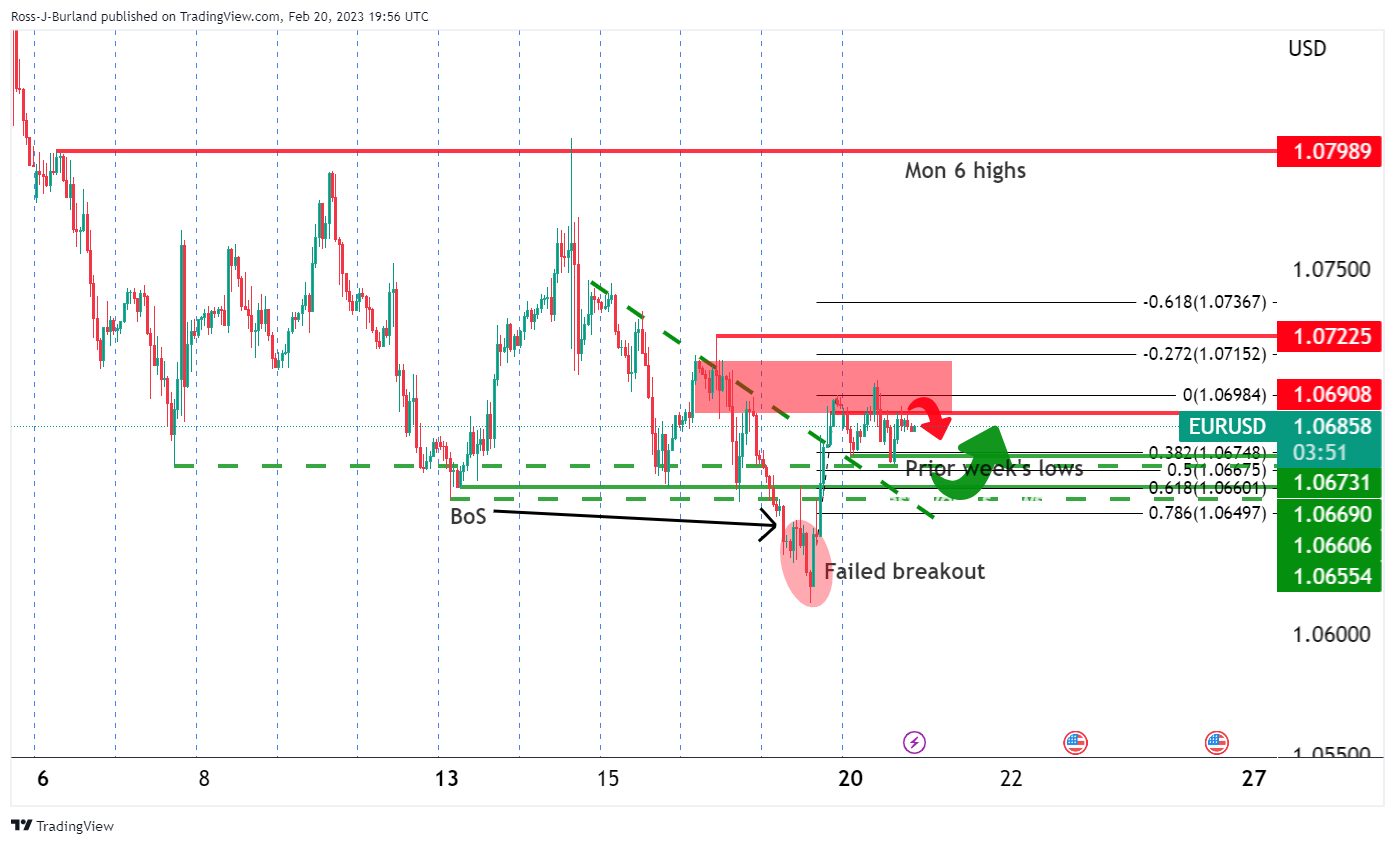
That is not to say that we cannot see more downside. After all, there is money below 1.0670 from Friday's long positions towards 1.0650. However, with the Euro being on the back side of the trend and there being untapped territory above 1.0720, the focus is bullish until a break below Friday's lows near 1.0612.
What you need to take care of on Tuesday, February 21:
The week started in slow motion amid the United States celebrating President’s Day. The absence of relevant macroeconomic releases helped majors to trade within tight intraday ranges.
In the meantime, the market sentiment is sour. Tensions between the United States and China over the balloons shots earlier this month continue as US top diplomat Anthony Blinken said Beijing's actions were irresponsible, while Chinese officials responded US reaction was "hysterical." Meanwhile, North Korea fired an intercontinental ballistic missile on Saturday that landed in the Sea of Japan. Finally, US President Joe Biden unexpectedly visited Kyiv to announce additional weapons supplies.
EUR/USD trades around 1.0680, limited by softer-than-anticipated EU data. GBP/USD hovers around 1.2040, unchanged for the day.
Commodity-linked currencies advanced vs their American rival. AUD/USD trades around 0.6910, while USD/CAD is down to 1.3450. The USD/JPY pair is ending the day unchanged at 134.20.
Crude oil prices posted a modest intraday advance, with WTI currently trading at $77.70 a barrel. Gold peaked at $1,847.45, but finished the day around $1,841.
On Tuesday, the focus will be on the preliminary estimates of the February S&P Global PMIs for major economies.
FTT explodes by nearly 28% following FTX Japan's announcement of crypto withdrawal resumption
Like this article? Help us with some feedback by answering this survey:
The Swiss National Bank is "still willing" to be active on the foreign currency markets in pursuing its goal of price stability, Vice Chairman Martin Schlegel said on Monday.
"If the Swiss franc depreciates we are ready to sell foreign exchange, if the Swiss franc appreciates strongly we are willing to buy foreign exchange," Schlegel told an event in Warsaw.
Key notes from SNB Vice Chairman
''We are still willing to be active on the forex markets.''
''If the swiss franc depreciates, we are ready to sell forex. if it appreciates strongly we are willing to buy forex.''
USD/CHF technical analysis
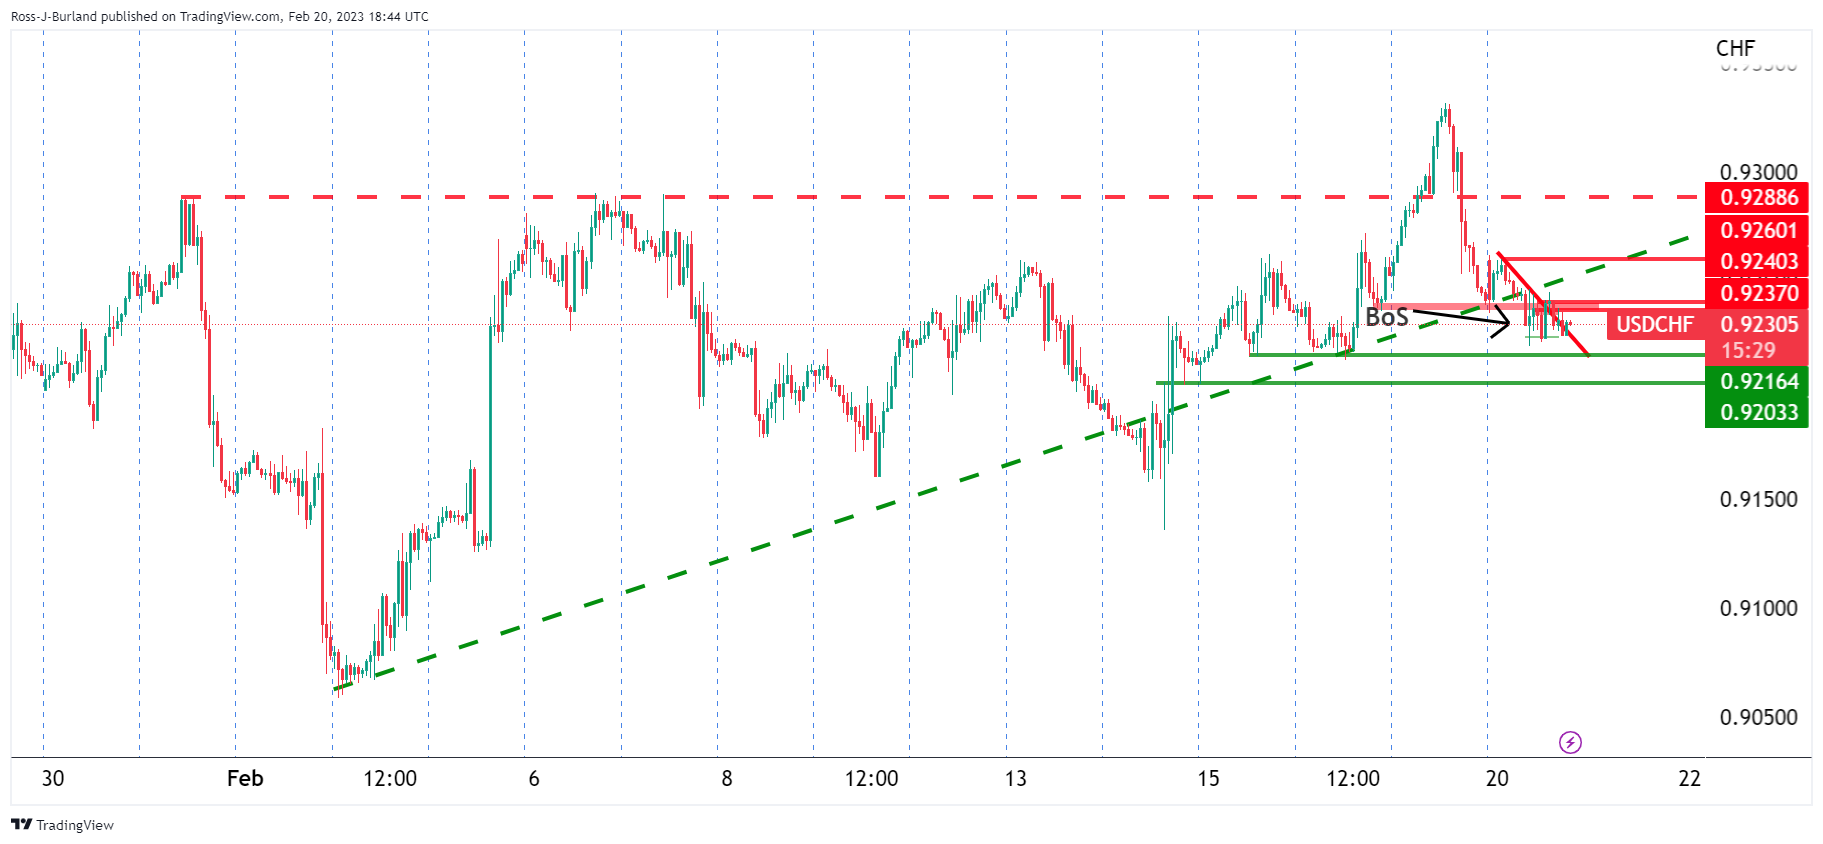
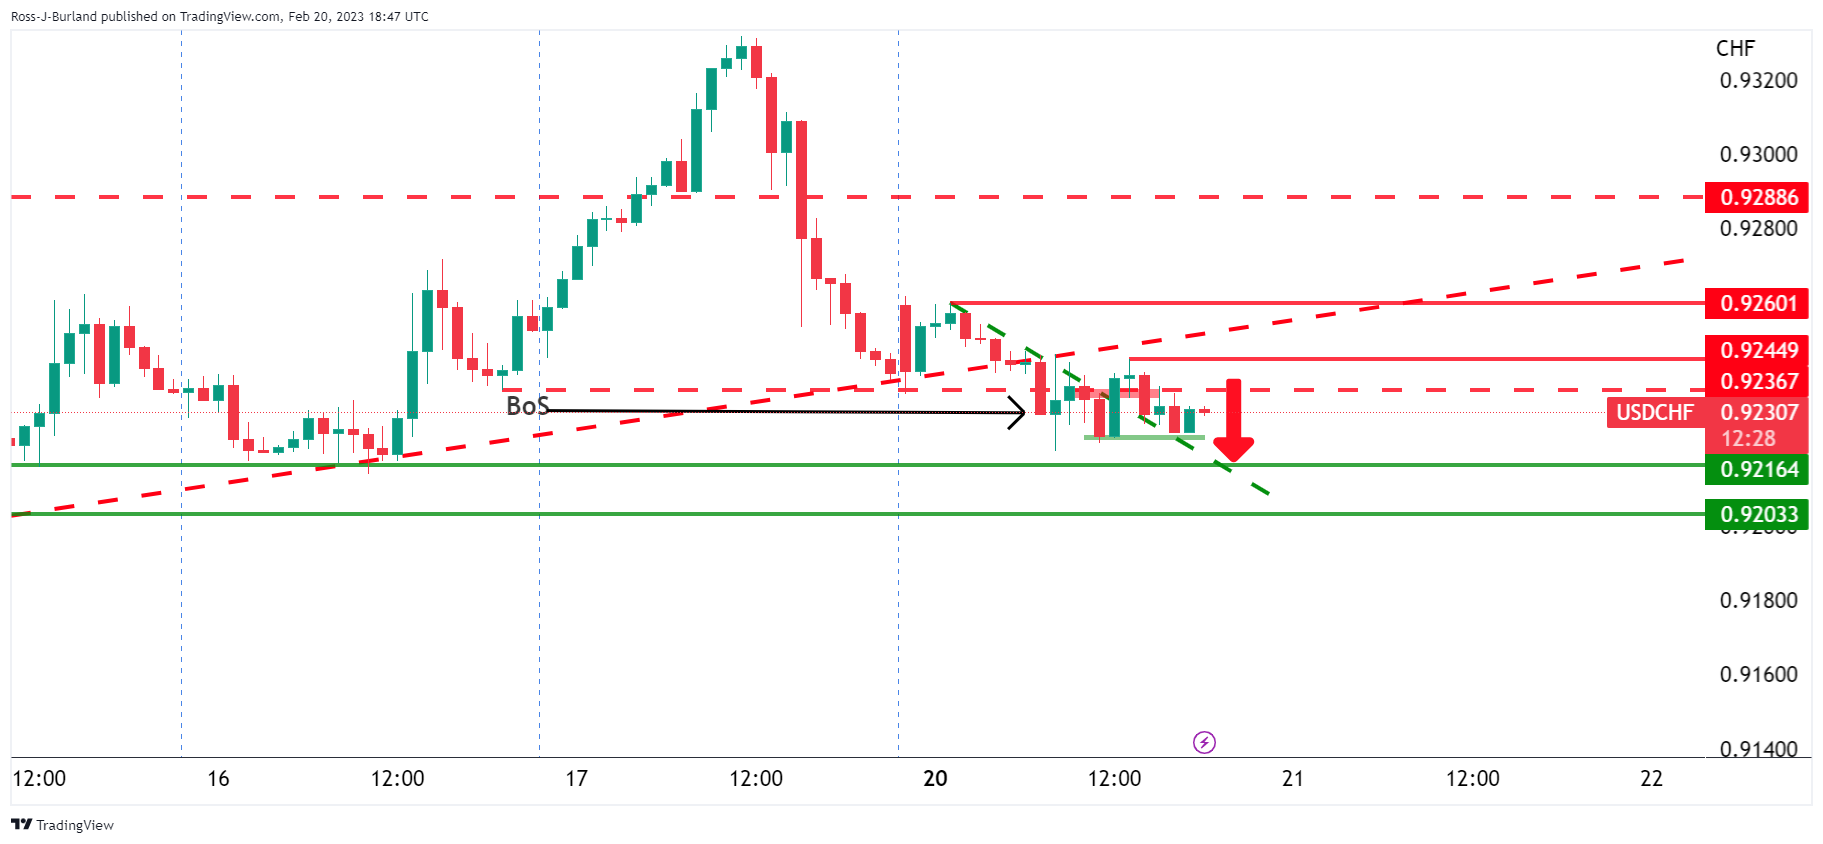
There has been a break in the structure, BoS, below 0.9250 and should the bears commit, a move to test 0.9200 could be in order for the coming sessions.
- USD/CHF retraced some of the last week’s gains after struggling at the 50-day EMA.
- USD/CHF Price Analysis: It is still neutral-to-downward biased, but it could increase once 0.9300 is reclaimed.
The USD/CHF is subdued amidst a thin liquidity trading session sponsored by a holiday in the United States (US), with traders enjoying a long weekend in the observation of President’s Day. At the time of writing, the USD/CHF is trading at 0.9230, below its opening price by 0.12%.
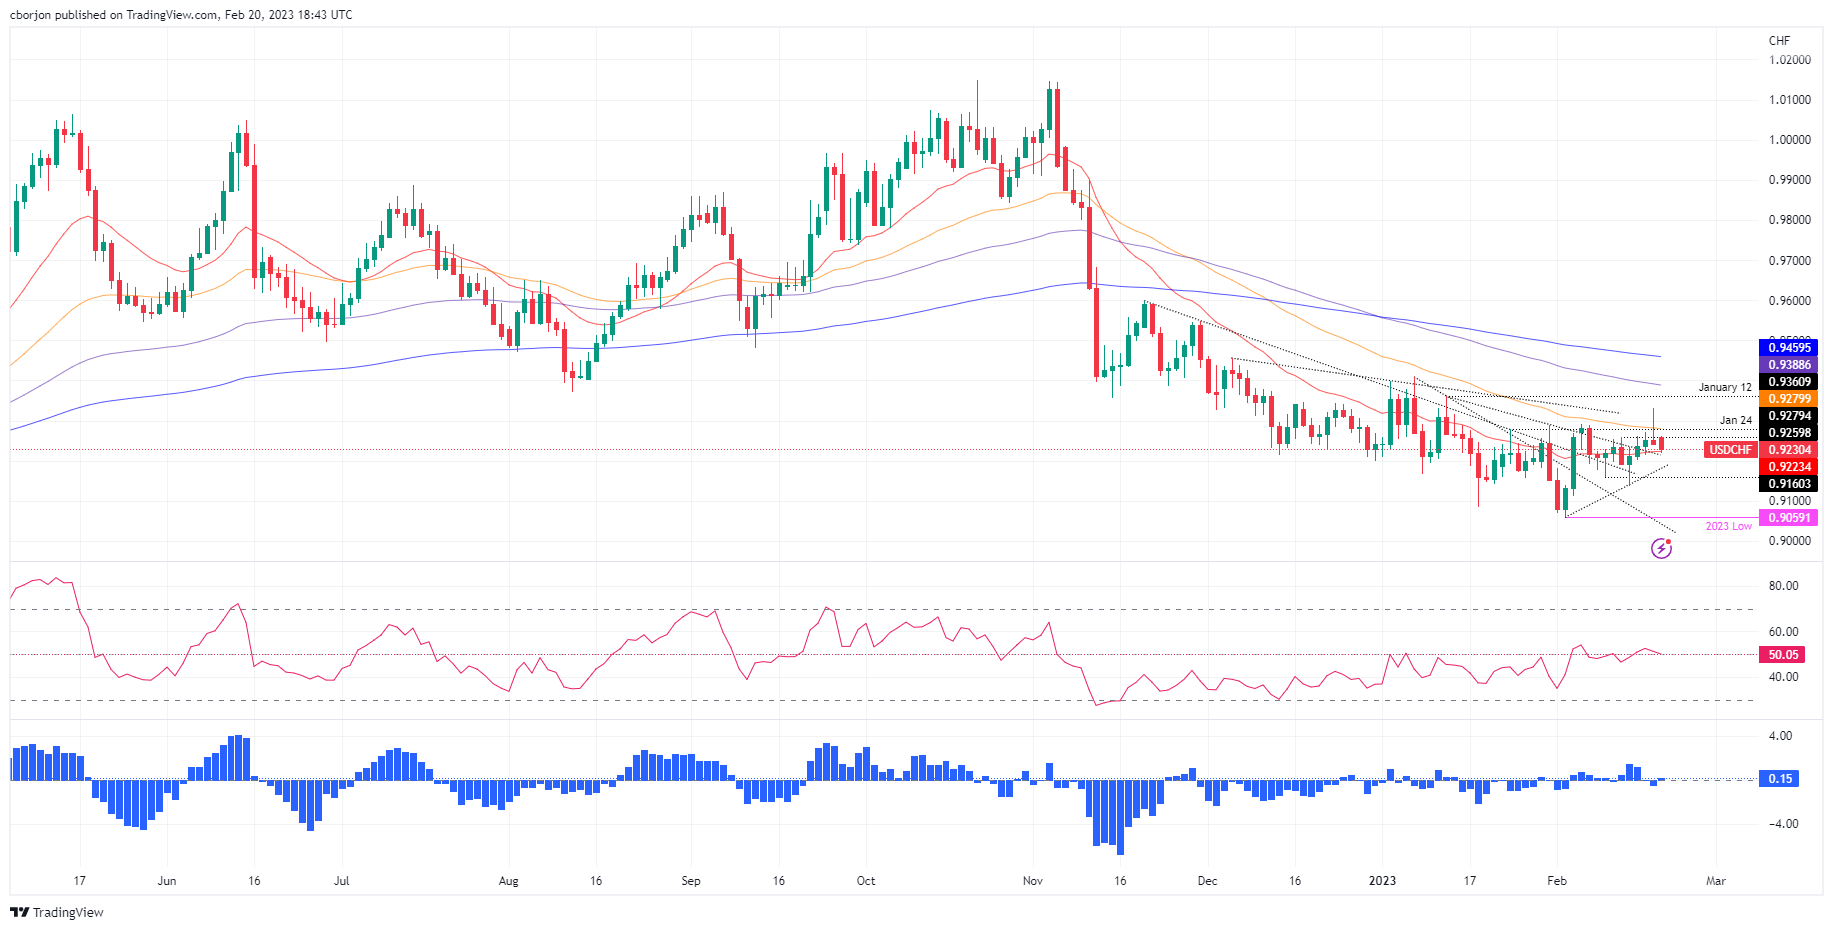
From a daily chart perspective, the USD/CHF remains neutral to downward biased. On Friday, the USD/CHF reached a new multi-week high but reversed its course and finished with losses of 0.12%. The bearish continuation extended today, though it was capped by the 20-day Exponential Moving Average (EMA) at 0.9223.
For a bearish resumption, the USD/CHF must clear the 20-day EMA, followed by the psychological 0.9200 mark. A breach of the latter will expose the February 9 swing low at 0.9160, followed by the February 14 daily low of 0.9135, ahead of the 0.9100 psychological level.
Conversely, the USD/CHF first resistance would be the 50-day EMA At 0.9279, followed by the 0.9300 figure. A decisive break and the buyers could send the USD/CHF aiming towards the 100-day EMA At 0.9388, ahead of the 0.9400 mark.
USD/CHF Daily chart
USD/CHF Key technical levels
- GBP/USD bears could be about to make a move.
- The multi-time frame structures are dominating the technicals and make for a bias to the downside.
GBP/USD corrected from the low 1.19s on Friday, denting the bear's dominance ahead of a US holiday on Monday as traders squared up into the long weekend. At the time of writing, GBP/USD is trading near 1.2050 and remains in consolidation between the day's low of 1.2014 and 1.2056.
For some background, the pair has been capped where equal highs were put in near 1.2450 between mid-December and late January whereby the price corrected a strong monthly bearish impulse to a 61.8% Fibonacci of the range:
GBP/USD monthly chart
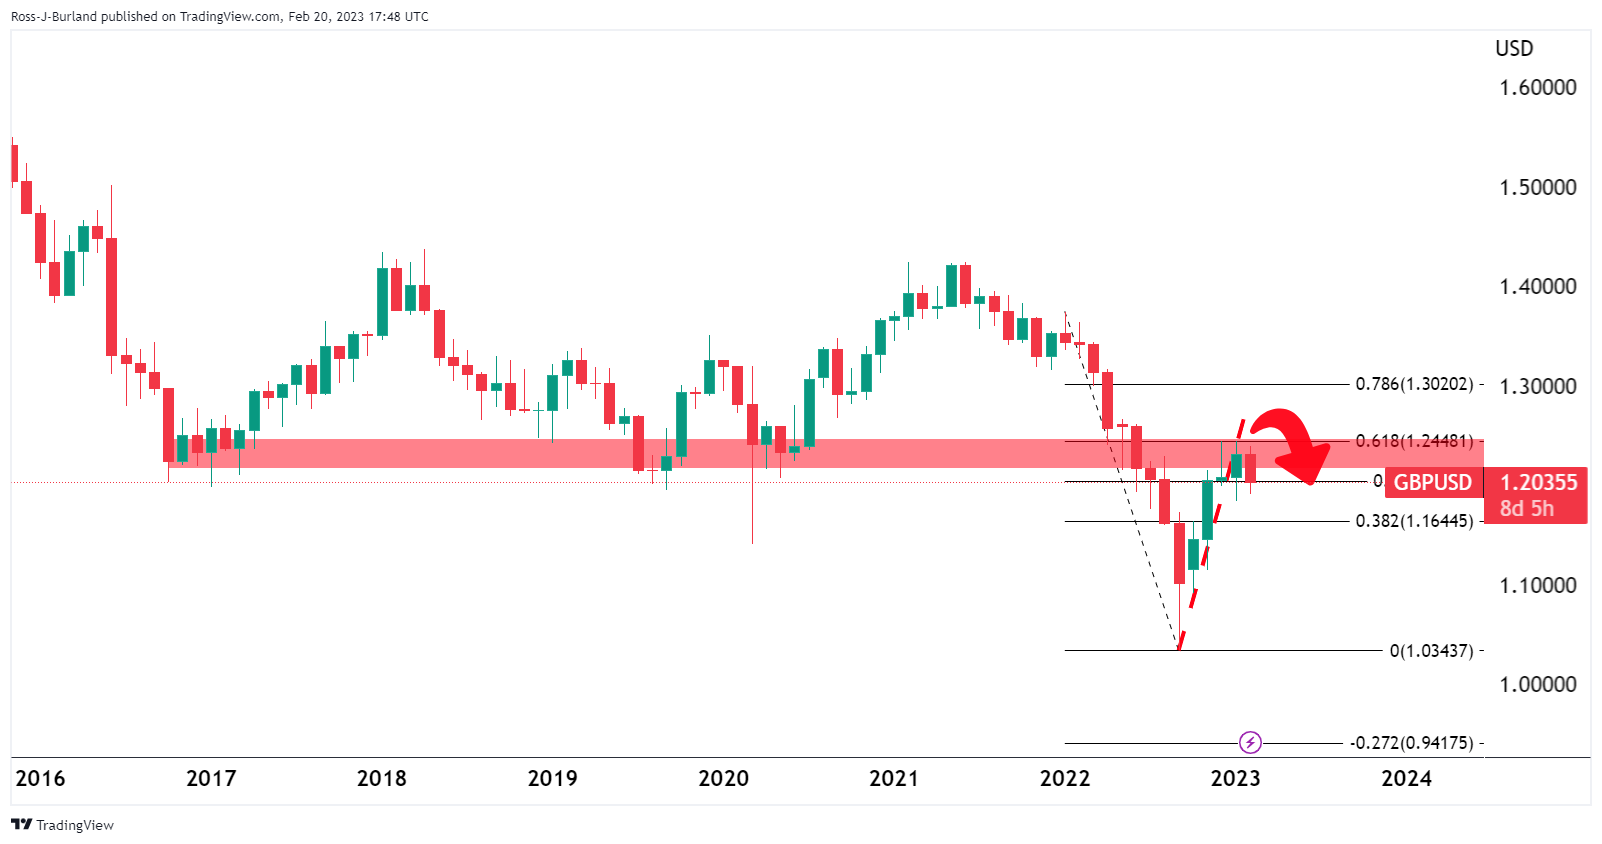
Given the steepness of the correction, while the downside bias is coming to the fore, a gradual decline could be in order and the bears have already made their first move, breaking the old monthly support:
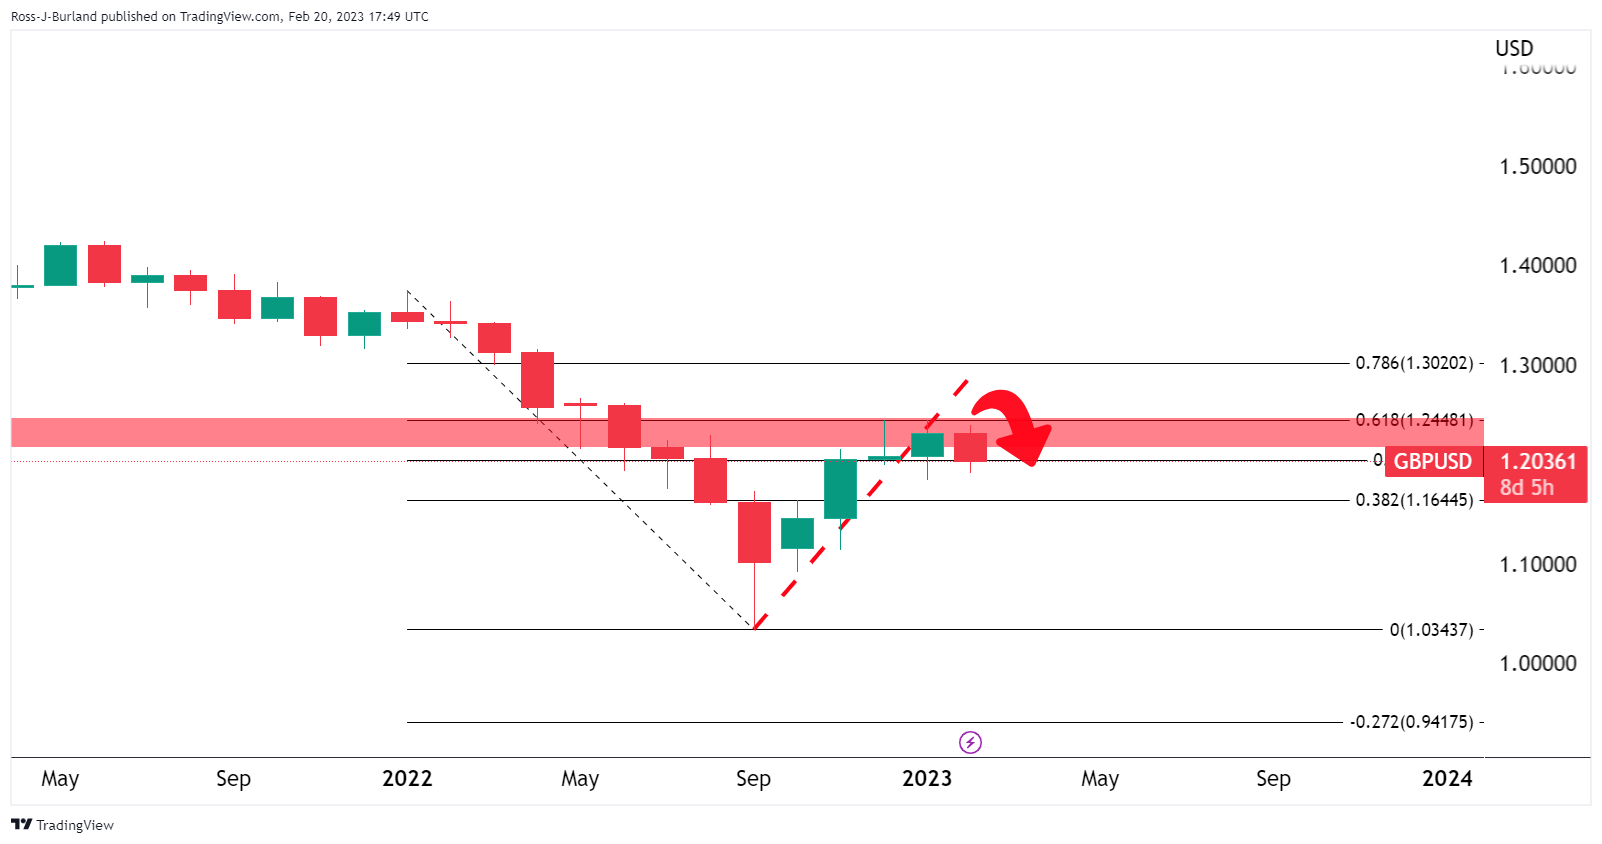
GBP/USD weekly chart
From a weekly perspective, a bearish head and shoulders could be forming:
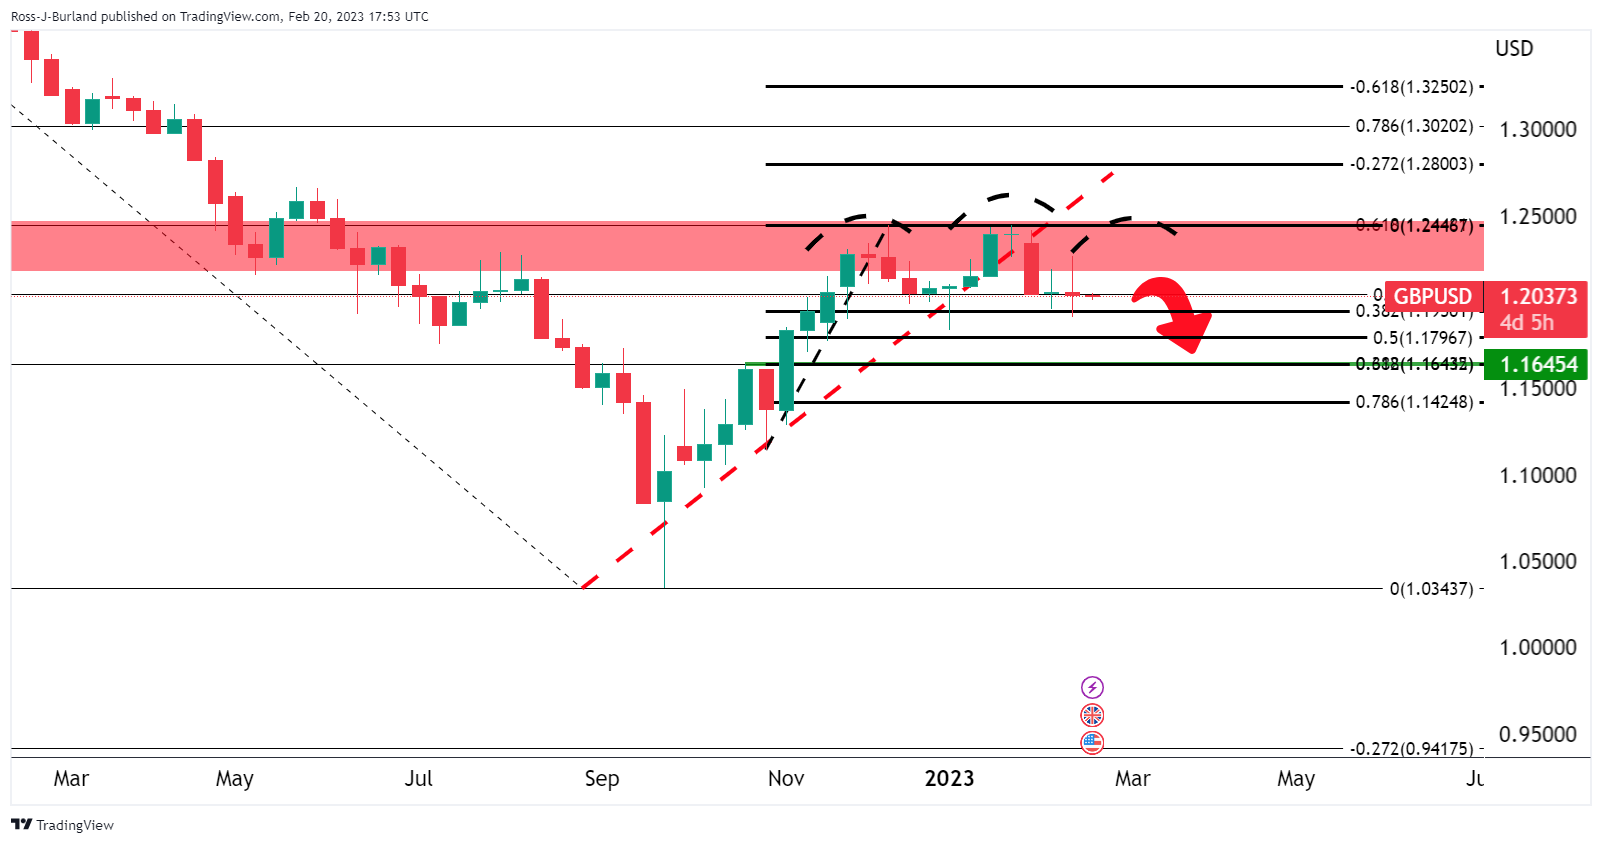
While on the backside of the prior bullish trend's support line, the bears will be looking for a solid structure to lean against for a move to target the prior resistance in the bullish leg that has the confluence with the 61.8% Fibonacci retracement near 1.1650.
GBP/USD daily chart
For structure, the bears can look to the lower time frames:
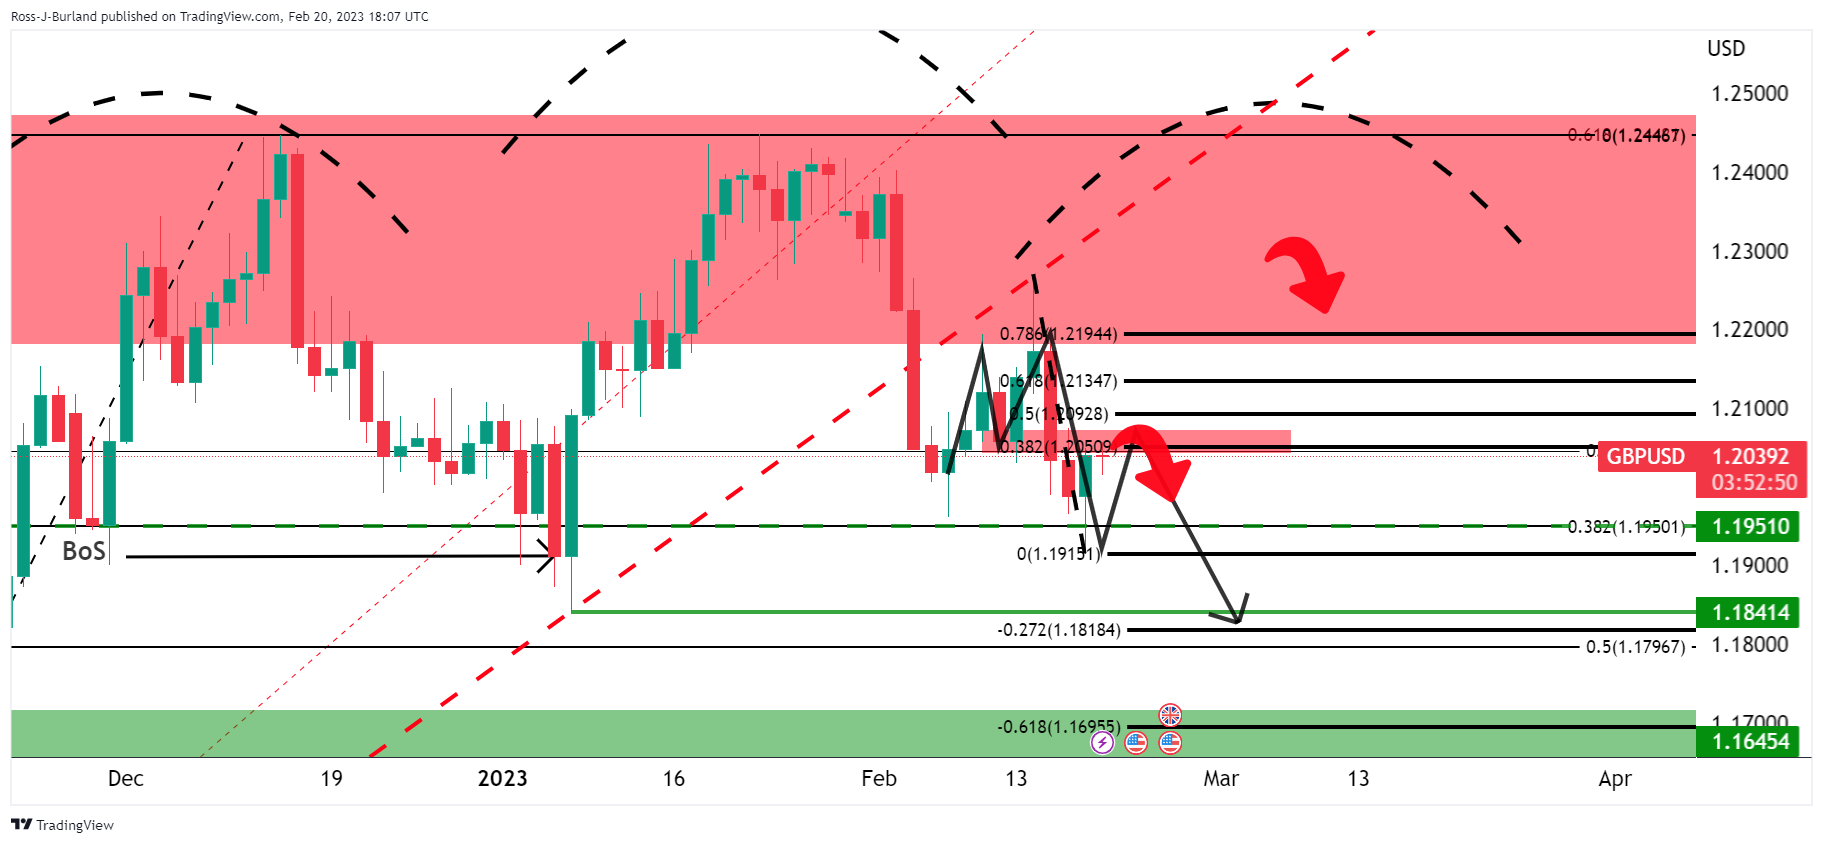
While it is too early in the right-hand shoulder's formation phase, a move lower could still be in order for the meantime as the price discovery plays out.
Currently, within the right-hand shoulder's formation, there is an M-pattern on the daily chart that is formed above where there was a break of structure, BoS, at the start of the year. The price has corrected the bearish leg of the pattern to a 38.2% Fibonacci level near 1.2050 and should this hold as resistance, at the neckline of the pattern, then a downside extension would be in order for a run to test 1.1850 territory for the days ahead.
GBP/USD H1 chart
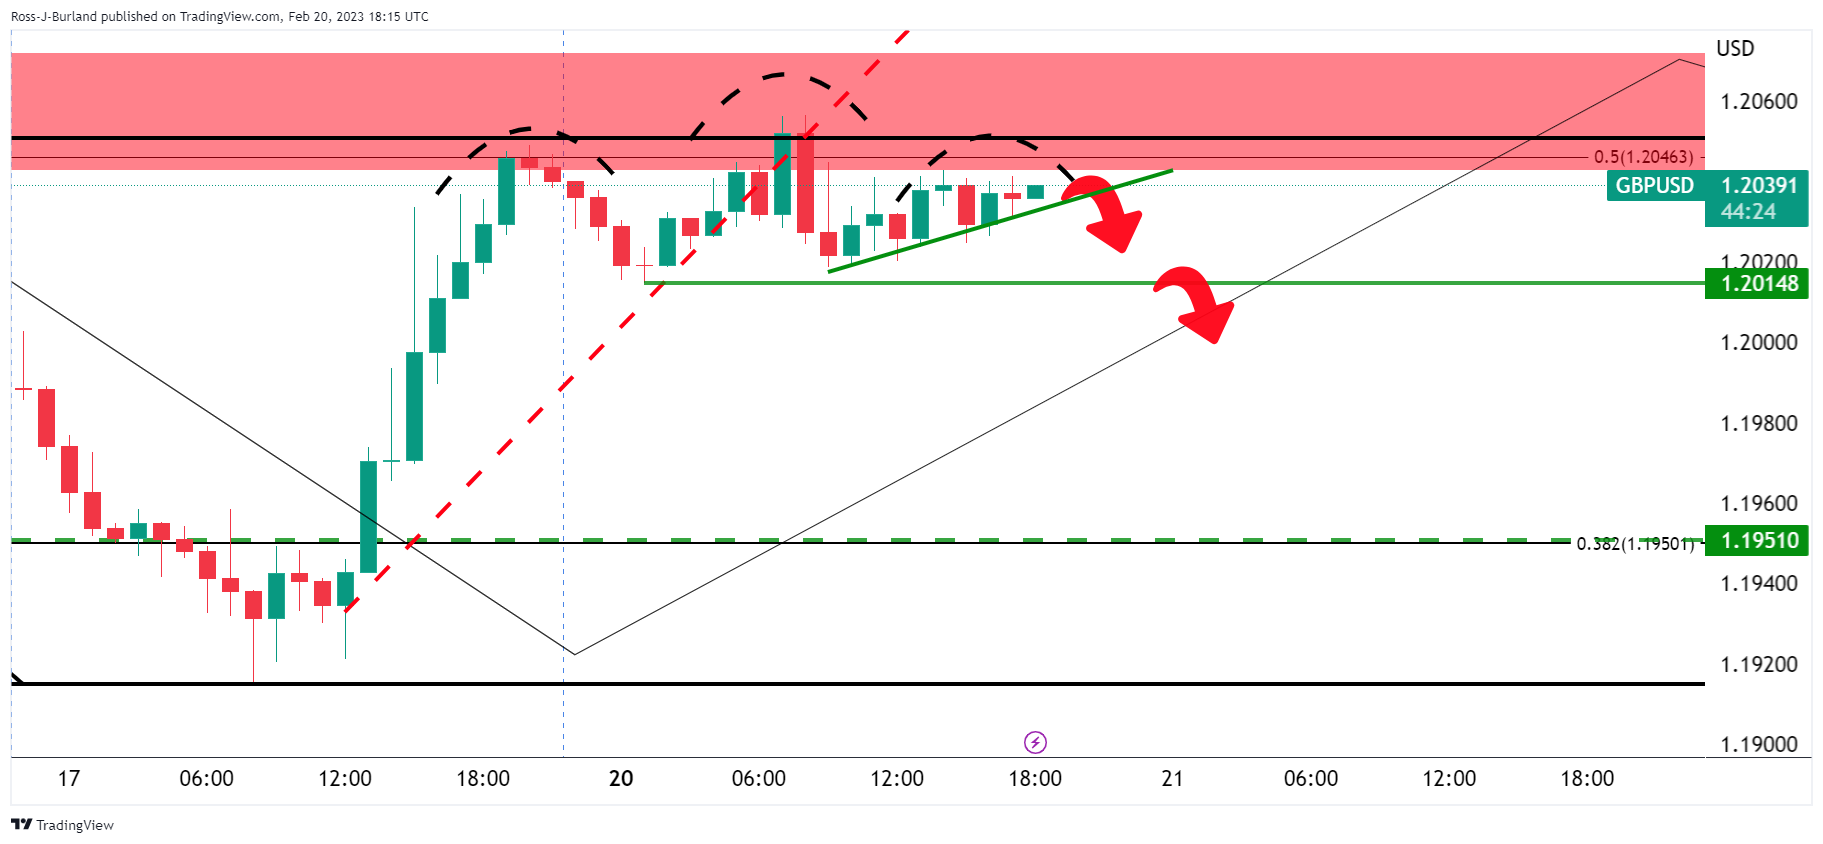
From a 1-hour perspective, the bears could be active on a break of the 1.2015 level and prior support which is a neckline of the current hourly head and shoulders:
- AUD/USD climbs and hovers above the 50-day EMA, eyeing the 20-day EMA on the upside.
- US last week’s inflation data failed to bolster the USD, as the AUD/USD snapped three days of losses.
- AUD/USD traders are eyeing the RBA and the FOMC minutes, each revealed Tuesday and Wednesday.
AUD/USD has managed to stage a recovery after dropping to a new YTD low at 0.6811, which, consequently, cracked the 50, 100, and 200-day Exponential Moving Averages (EMAs). However, the AUD/USD pair reclaimed the 0.6900 figure and is trading at 0.6912, above its opening price by 0.53%.
A soft US Dollar, a tailwind for the AUD/USD amidst a lack of data
The New York trading session remains quiet in observance of US President Day. US equity futures reflect risk aversion, though the AUD/USD pair portrayed the opposite, with renewed demand for the Aussie Dollar (AUD).
Even though last week’s data from the United States (US) showed that inflationary pressures remain tilted to the upside, the greenback has not found its floor on Monday, undermined by falling US Treasury bond yields. The US Dollar Index (DXY), a gauge of the buck’s value vs. a basket of six currencies, is pairing some of its earlier losses but remains down by 0.02%, at 103.864
Speculations that the People’s Bank of China (PboC) would continue to propel the economy increased flows toward the second-largest economy in the world. According to Bloomberg, Goldman Sachs raised its bet on Chinese equities, as its reopening would underpin global growth. Therefore, flows to the AUD/USD boosted the Aussie Dollar (AUD), despite the Federal Reserve’s (Fed) resolution to tackle high inflation in the US.
Another reason that has underpinned the AUD/USD is that the Reserve Bank of New Zealand (RBNZ) will raise rates on Wednesday, a headwind for the US Dollar (USD). Even though the Reserve Bank of Australia (RBA) raised rates during the last week, a dismal employment report triggered a reversal, which weighed on the AUD/USD.
What to watch?
The Australian economic docket will feature Tuesday’s S&P Global PMI figures alongside the RBA’s last meeting minutes. On the US side, S&P Global PMIs find reading numbers would be released, and also the FOMC minutes.
AUD/USD Key technical levels
- USD/MXN jumps from YTD lows around $18.33 and climbs to 18.40.
- USD/MXN Price Analysis: Positive divergence remains, which could pave the way for a recovery.
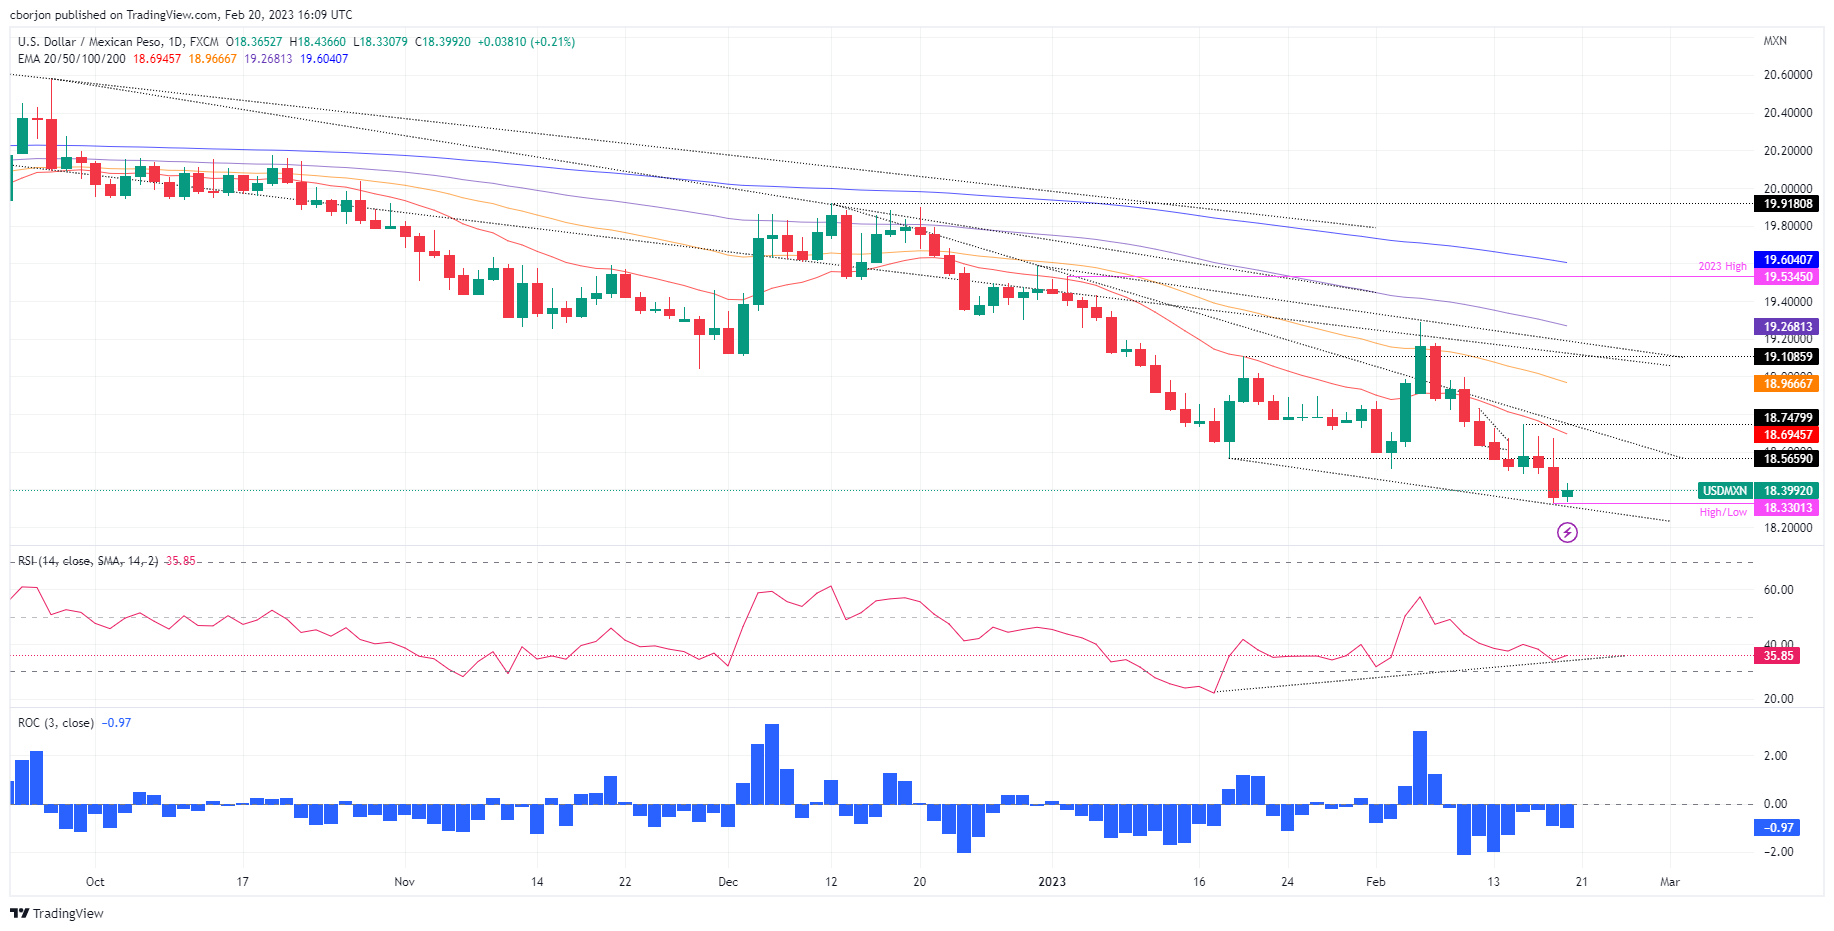
The USD/MXN bounces after hitting multi-year lows around 18.3301, snapping three days of consecutive losses. Nevertheless, the USD/MXN would remain pressured after a strong downtrend dragged prices from the last year's $21.05 peak toward the above-mentioned $18.33 area. At the time of writing, the USD/MXN exchanges hand at 18.4076, above its opening price by 0.25%.
Technically speaking, the USD/MXN daily chart portrays a bearish continuation as the most likely scenario. However, the divergence between the USD/MXN price action and the Relative Strength Index (RSI) remains intact, which would spur a reversal that might open the door for the USD/MXN buyers to reclaim the $19.00 psychological level. This means as price action registered lower lows, the RSI has not. Therefore, risks for a reversal remain, which would open the door for further USD/MXN upside.
For that scenario to play out, the USD/MXN needs to crack the confluence of a downslope-resistance trendline and the 20-day Exponential Moving Average (EMA) at 18.6951, followed by the February 15 daily high at 18.7479, followed by the 50-day EMA At 18.9669, ahead of the 19.0000 psychological price level.
The USD/MXN must conquer the 18.4000 mark for a bearish continuation. Once cleared, that will expose the YTD low at 18.3301, followed by the psychological $18.00.
USD/MXN Daily chart
USD/MXN Key technical levels
The Forint rallied strongly over the past month. Economists at Commerzbank see the HUF staying strong during 2023 but once again in 2024, they forecast a weaker Forint when the Euro resumes depreciating.
HUF underperformance will likely resume during 2024
“HUF’s rally might extend modestly further in the near-term as inflation begins to moderate – in this window, we see EUR/HUF in the 380 range.”
“We forecast a weaker Forint subsequently in 2024 when inflation proves stubborn globally, and the Euro resumes depreciating.”
Source: Commerzbank Research
In the opinion of Kit Juckes, Chief Global FX Strategist at Société Générale, the Dollar’s bounce is fading, unless the Fed starts talking tough.
EUR/USD is stuck
“Presidents’ Day has delivered a slow morning for markets, albeit one with a slight positive bias to Asian and European equities, that helps risk sentiment more broadly and in so doing, has prevented the Dollar from rising any further today.”
“In terms of EUR/USD, there are two reasons why the dollar’s bounce is getting stuck. The first is that 2023 growth forecasts are still converging on the back of European optimism. The second is that the move in relative EU-US rates that triggered the Dollar’s bounce at the start of this month, has petered out.”
“I suspect that further significant Dollar strength will require the Fed Funds futures market to start pricing in a 50 bps rate hike in March. After all, the market currently prices a very high probability of a 50 bps hike by the ECB in March.”
It would be appropriate for the European Central Bank to raise rates beyond March and reach the terminal rate this summer, European Central Bank (ECB) Governing Council member Olli Rehn told Börsen-Zeitung on Monday, per Reuters.
Additional takeaways
"Rates need to stay in restrictive level for some time, should not rush to discuss cuts."
"Rate hikes should not stop while core inflation is rising and is so high."
"Eurozone recession likely avoided, 2023 growth could be around 1%."
Market reaction
These comments don't seem to be having a significant impact on the Euro's performance against its rivals. As of writing, EUR/USD was flat on the day at 1.0690.
GBP/USD recovered from below 200-Day Moving Average at 1.1938. However, economists at Société Générale believe that the pair is unlikely to stage a sustainable rise.
Modes UK PMI improvement may not be enough to lift GBP/USD
“The Pound fought back from below 1.20/USD and the 200-DMA (1.1938) on Friday but conviction for a return to 1.2450 is low based on the outlook for a widening in US/UK rate differentials. Based on implied market rates, the Fed/BoE spread could widen to almost 100 bps in 2Q, keeping GBP/USD in check.”
“The PMI for February is the pick of the UK data calendar tomorrow. We forecast a modest improvement to 49.2. This may not be enough to lift GBP/USD with investors instead bracing for the FOMC minutes and US PCE inflation.”
- Gold price stages a recovery, reclaiming the $1840 area as it aims north.
- Last week’s US economic data and hawkish commentary continue to dampen market sentiment.
- Gold Price Forecast: It will face the 50-DMA as resistance, followed by the 20-DMA; otherwise, it could fall to $1800.
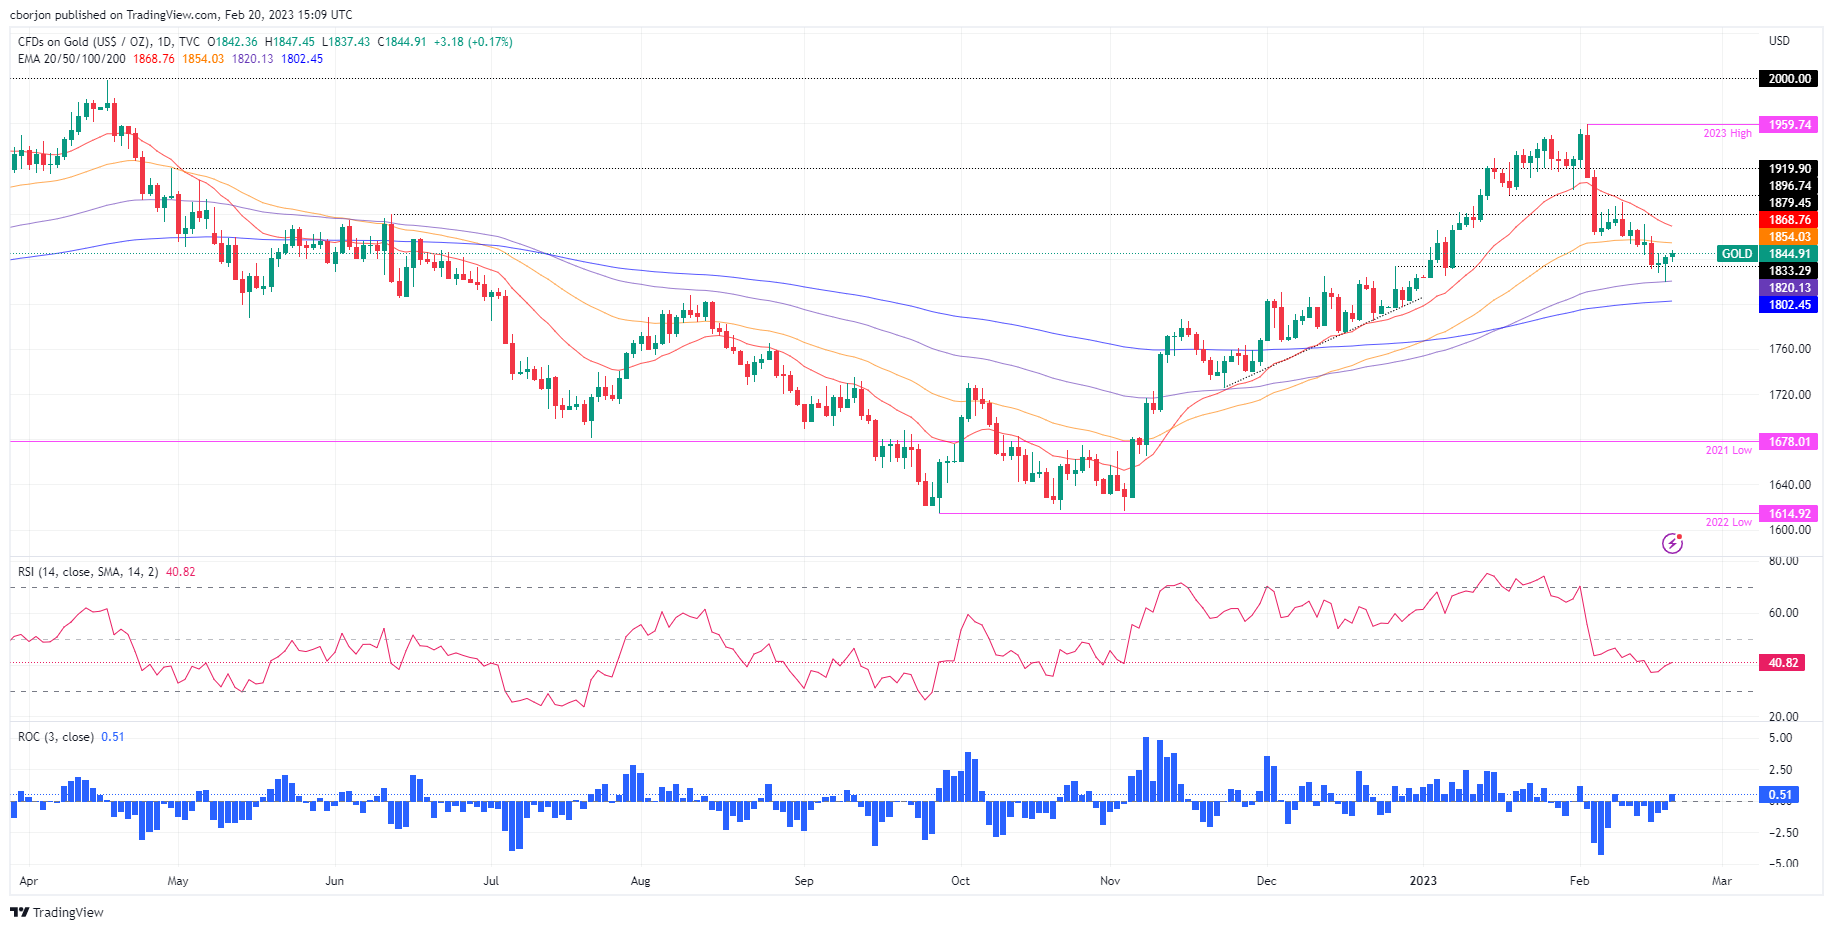
Gold price advances after hitting a six-week low at around $1819 and aims toward the 50-day Exponential Moving Average (EMA), above its opening price by 0.30%. At the time of writing, the XAU/USD is at $1845.82, bolstered by a soft US Dollar (USD) undermined by falling US Treasury bond yields.
Gold climbs to the $1840 mark on a US holiday
As the North American session begins, US equity futures are trading in the red, except for the Dow Jones. Monday’s trading session would be dull due to thin liquidity conditions, as the US remains a holiday in observance of President’s Day.
Last week’s economic data revealed in the United States (US) keeps traders nervous, as they had begun to price in a more aggressive Fed. Uncertainty of where the Federal Funds Rate (FFR) will peak triggered the second consecutive week in which US equities finished with losses. In addition, Fed Governor Bowman and Christopher Waller were the latest policymakers to emphasize the need to raise higher rates for longer as the US central bank battles to tame inflation.
Last Tuesday, the US economic calendar revealed that the Consumer Price Index (CPI) slowed faster than estimated. However, two days later, prices paid by producers, also known as PPI, came above estimates and the prior’s month data in the month-over-month figure, reigniting speculations that the Fed would continue to tighten monetary policy as rate cuts speculations begin to fade.
Reflection of this was the jump in US Treasury bond yields, which closed the last week at 3.822%, eight basis points (bps) above the previous week and underpinned the greenback. The US Dollar Index (DXY), a gauge of the buck’s value vs. a basket of six currencies, climbed above the 104.000 mark. Nevertheless, in the session, the DXY it’s sliding 0.03%, at 103.849.
What to watch?
The US economic docket will feature in the week Existing Home Sales, S&P Global PMIs on its final readings, the Fed’s preferred gauge for inflation, the core PCE and the University of Michigan (UoM) Consumer Sentiment.
Gold technical analysis
From a technical perspective, the XAU/USD jumped from the 100-day EMA at $1820 and climbed above the $1840 area as buyers prepared to assault the 50-day EMA at $1854.08. On the upside, the XAU/USD first resistance would be the 50-day EMA, followed by the 20-day EMA at $1868.83, ahead of the February 9 daily high at $1890.21. Downwards, the XAU/USD first support would be the 100-day EMA, followed by the 200-day EMA at $1802.46, ahead of $1800.
- Eurozone Consumer Confidence Index edged slightly higher in February's flash estimate.
- EUR/USD continues to trade in a tight range at around 1.0700.
Consumer sentiment in the Euro area improved modestly in February with the European Commission's Consumer Confidence Indicator rising to -19 (flash estimate) from -20.9 in January.
For the EU, the Consumer Confidence Indicator rose by 1.5 points to -20.6.
"Despite this fourth consecutive monthly improvement, at -20.6 (EU) and ‑19.0 (EA) pps., consumer confidence remains well below its long-term average," the European Commission noted in its publication.
Market reaction
This data failed to trigger a noticeable reaction in EUR/USD. As of writing, the pair was virtually unchanged on a daily basis at 1.0692.
Value outperformance should resume amid rates uncertainty, in the opinion of economists at UBS.
Price pressures remain, despite an easing of headline inflation
“Based on data going back to the 1970s, value stocks have outpaced growth when inflation is over 3%. The latest US consumer price index release for January has reinforced our view that inflation is only likely to fall below this level later this year.”
Fed officials have stressed that further rate hikes are essential, a greater potential drag for growth sectors
“Growth sectors tend to suffer more from higher rates since this reduces the current value of more distant profits. So, the recent hawkish tone of comments from top Fed officials could also tilt the balance between growth and value sectors.”
Tech, the largest growth sector, faces additional headwinds beyond rate worries
“The MSCI World IT sector trades on a 12-month forward price-to-earnings multiple of 22 times, 20% above the sector’s 10-year average, as of 13 February. By contrast, value sectors are generally more moderately priced. In addition, we expect global tech sector earnings growth to slow further due to a weaker enterprise outlook and lukewarm consumer demand.”
Economist Enrico Tanuwidjaja at UOB Group reviews the latest GDP figures in Thailand.
Key Takeaways
“The Thai economy’s pace of growth decelerated to 1.4% y/y in 4Q22 following a strong, upwardly revised growth of 4.6% y/y in 3Q22. Still, 2H22 accelerated to 3.0% from an average of 2.4% in 1H22. On a sequential basis, the economy contracted by 1.5% q/q sa in 4Q22 (3Q22: +1.1%).”
“Growth in the last quarter was primarily driven by higher private consumption expenditures, investment, and most notably the export of services (tourism revenue). However, export of goods slowed down, while government expenditure, including its public investment decreased.”
“Based on today’s 4Q22 GDP data, the Thai economy grew well below expectation at just 2.6% in 2022 (Bank of Thailand – BOT, consensus, and UOB forecast all were projecting 3.2% for 2022), though it is still much higher than 2021’s tepid 1.6% growth. Given the downside surprise, we revise our 2023 growth forecast lower to 3.1% as the strength of domestic economic recovery appears to be more modest than expected. Nevertheless, we continue to expect higher and steadier tourism income amidst China’s reopening to bode well for services exports performance. Less robust growth recovery will also render BOT less room to embark on an even tighter monetary policy in 2023.”
- EUR/USD keeps the current side-lined trade unchanged.
- Immediately to the downside appears the monthly low near 1.0610.
EUR/USD trades without direction in the sub-1.0700 region at the beginning of the week.
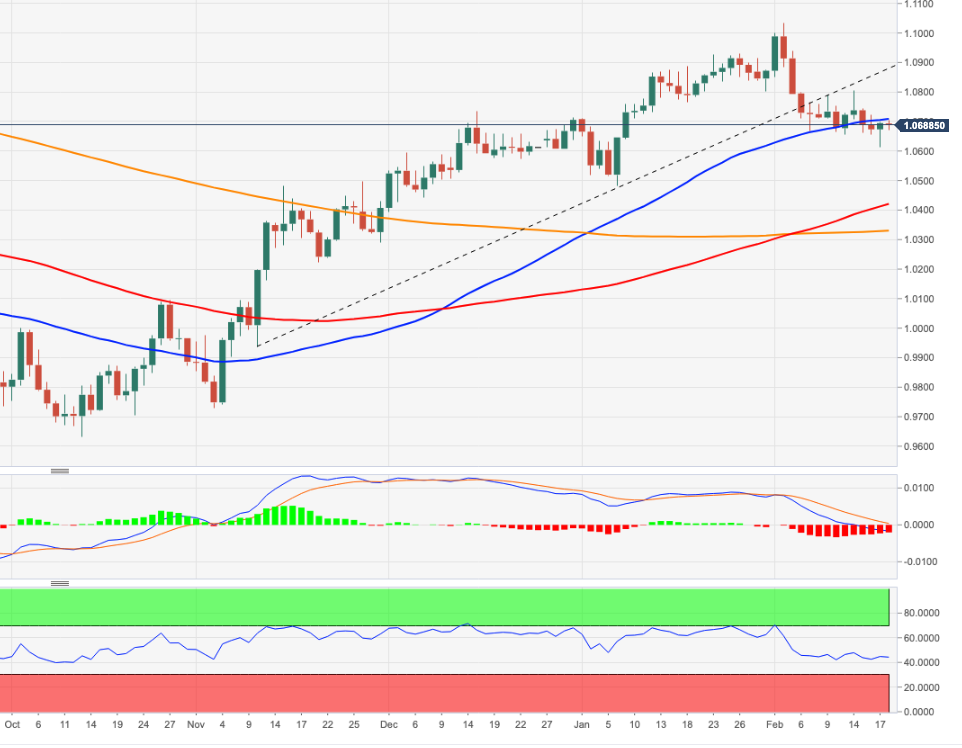
If sellers regain the upper hand, pair could slip back to the February low at 1.0612 (February 17) in the near term. The breach of this level could see a potential test of the 2023 low at 1.0481 (January 6) emerge on the horizon.
So far, the bearish sentiment is expected to persist as long as the 3-month resistance line, today near 1.0890, caps the upside.
In the longer run, the constructive view remains unchanged while above the 200-day SMA, today at 1.0328.
EUR/USD daily chart
EUR/USD currently stands only slightly above the levels traded at the start of the year. Economists at Rabobank expect the 1.06 level to offer psychological support
Scope for the USD to remain well supported into the middle of the year
“In terms of USD sentiment, February has clearly offered something of a sea-change relative to last month. It is our expectation that this has further to run.”
“Given our expectation that the FOMC is likely to take the top of the target range for the Fed Funds to 5.5%, we see scope for the USD to remain well supported into the middle of the year.”
“1.06 can be expected to offer psychological support. Below this the year’s low at 1.0484 is likely to offer strong support.”
Extra gains in USD/IDR look likely, although a sustained advance beyond 15,245 seems off the table suggests UOB Group’s Market Strategist Quek Ser Leang.
Key Quotes
“Our expectations for USD/IDR to ‘advance further’ last week did not materialize as it traded in a relatively narrow range of 15,139/15,225. The underlying tone still appears to be a tad firm and USD/IDR is likely to edge higher to 15,245.”
“Barring a sudden surge in momentum, a sustained rise above 15,245 is unlikely (next resistance is at 15,270). Support is at 15,130, followed by 15,000.”
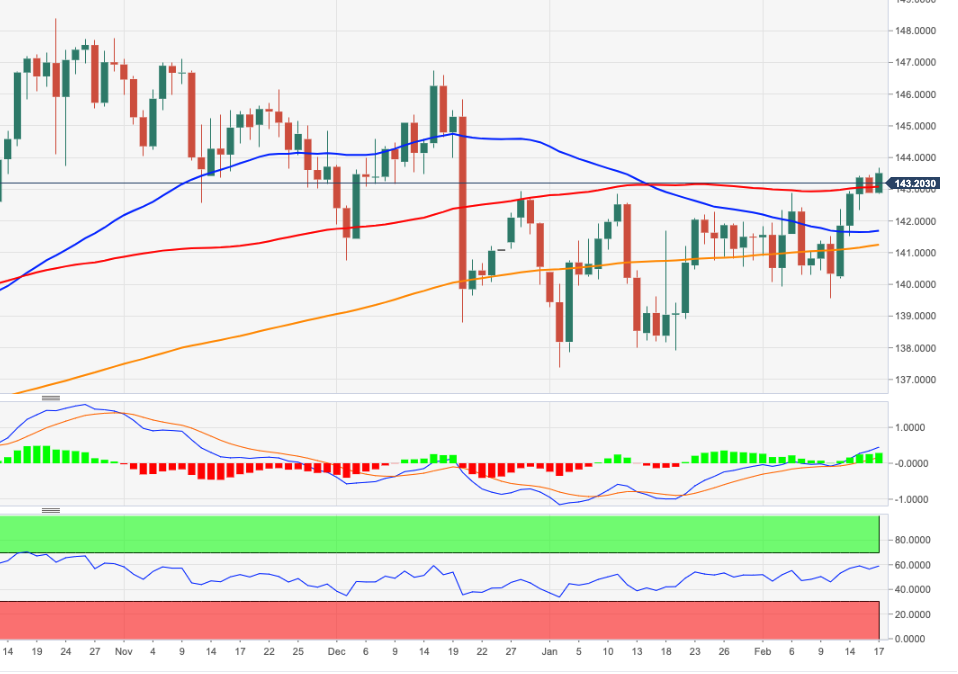
- The index treads water around the 104.00 region on Monday.
- Further advance could revisit the 2023 high near 105.60.
DXY trades within a tight range near Friday’s closing levels in the sub-104.00 zone.
The ongoing price action favours the continuation of the uptrend for the time being. Further bouts of strength are now expected to put a potential test of the 2023 top at 105.63 (January 6) back on the investors’ radar in the not-so-distant future.
In the longer run, while below the 200-day SMA at 106.44, the outlook for the index remains negative.
DXY daily chart
Recently released US activity data was stronger than expected. But HSBC’s conviction remains the same, the broader USD is seen weakening in the longer run.
Markets continue to debate how best to respond to US data
“Markets are currently debating what the recent run of better-than-expected US data means for risk sentiment: The ‘risk off’ and USD bullish angle is that a strong US labour market is supporting consumption, keeping inflation levels elevated , which will force the Fed to act more aggressively than what the rate market has priced in. The ‘risk on’ and USD bearish angle is that both inflation and wages growth are decelerating in the US, ensuring the Fed’s tightening is nearly done without needing to induce a US recession. This also helps to allay concerns of a weaker global growth backdrop and subsequent hard landing.”
“We believe this debate will continue over the near term, meaning that the USD is likely to remain choppy. We also expect further deceleration in inflation and measured increases in the unemployment rate to decisively favour the ‘risk on’ narrative and USD weakness, as the year progresses.”
- USD/JPY remains on the defensive on Monday, though the downside remains cushioned.
- Hawkish Fed expectations continue to underpin the USD and lend support to the major.
- The technical setup favours bulls and supports prospects for the emergence of dip-buying.
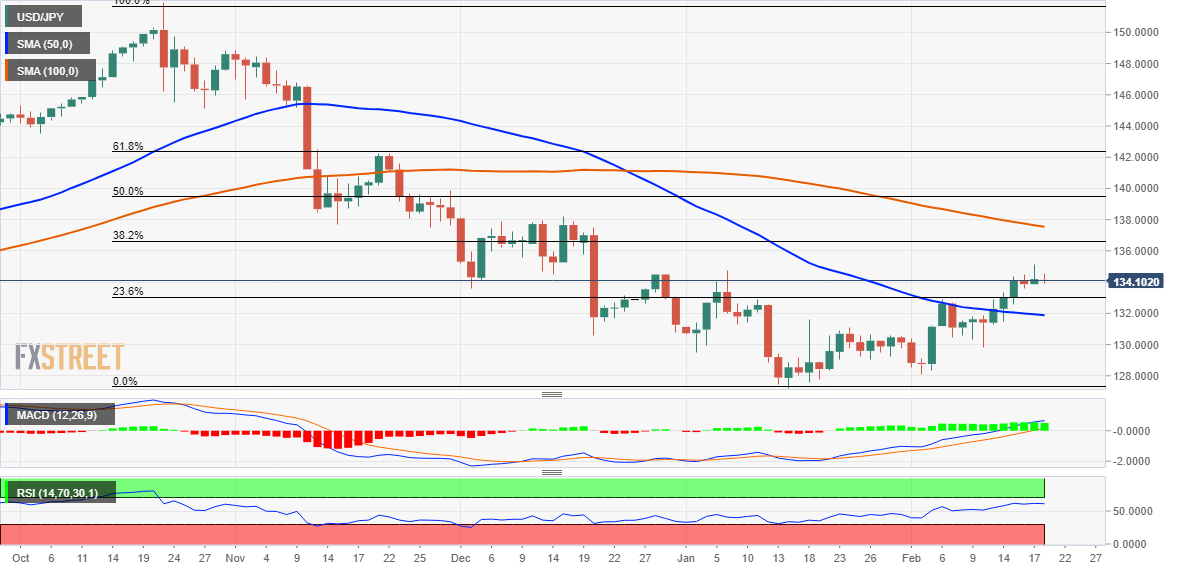
The USD/JPY pair edges lower on the first day of a new week and remains on the defensive through the early North American session. The pair is currently placed around the 134.00 mark, though the setup warrants some caution before positioning for an extension of Friday's pullback from a nearly two-month high.
The cautious market mood, amid looming recession risks and geopolitical tensions, underpins the safe-haven Japanese Yen (JPY) and acts as a headwind for the USD/JPY pair. That said, the underlying bullish sentiment surrounding the US Dollar, bolstered by expectations that the Fed will stick to its hawkish stance to tame inflation, should continue to lend support to the major.
From a technical perspective, last week's sustained break through the 50-day SMA, for the first time since September 2022, and a subsequent move beyond the 132.90-133.00 supply zone was seen as a key trigger for bulls. The latter also marks the 38.2% Fibonacci retracement level of the pullback from over a three-decade high touched in October and should act as a pivotal point.
Moreover, oscillators on the daily chart have just started gaining traction and support prospects for the emergence of some dip-buying. Hence, any further pullback is more likely to find decent support and remain limited near the aforementioned 133.00 strong resistance breakpoint. A convincing break below, however, will negate the positive outlook and prompt some technical selling.
On the flip side, the 134.45-134.50 area now seems to act as an immediate barrier ahead of the 135.00 psychological mark. Some follow-through buying beyond the monthly peak, around the 135.10 zone touched on Friday, should allow the USD/JPY pair to climb further towards the 135.55-135.60 horizontal zone and eventually aim to reclaim the 136.00 round-figure mark.
The momentum could get extended further towards the 136.75-136.85 confluence resistance, comprising the 38.2% Fibo. level and a technically significant 200-day SMA. A sustained strength beyond will suggest that spot prices have bottomed out and pave the way for an extension of the recent recovery move from the 127.20 area, or the lowest level since May 2022.
USD/JPY daily chart
Key levels to watch
According to UOB Group’s Market Strategist Quek Ser Leang, further upside could motivate USD/MYR to revisit the 4.4550 level in the near term.
Key Quotes
“Last Monday (13 Feb, spot at 4.3510), we held a bullish USD/MYR view. We indicated that ‘the risk for USD/MYR is still on the upside’. We added, ‘a break of the strong resistance at 4.3660 could potentially trigger a rapid rise to 4.4000’. Our bullish view was correct even though the anticipated ‘rapid rise’ exceeded our expectations as USD/MYR surged to a high of 4.4320 before closing higher by a whopping 2.23% (Friday’s close of 4.4300), its largest 1-week advance since Mar 2020.”
“While deeply overbought, the advance has room to extend to 4.4550. The next major resistance level at 4.5000 is unlikely to be tested this week. Support is at 4.4000, but only a breach of 4.3750 would indicate that the current strong upward pressure has eased.”
- EUR/JPY gives away part of Friday’s move to YTD highs.
- Extra gains should retarget the December 2022 peak near 146.70.
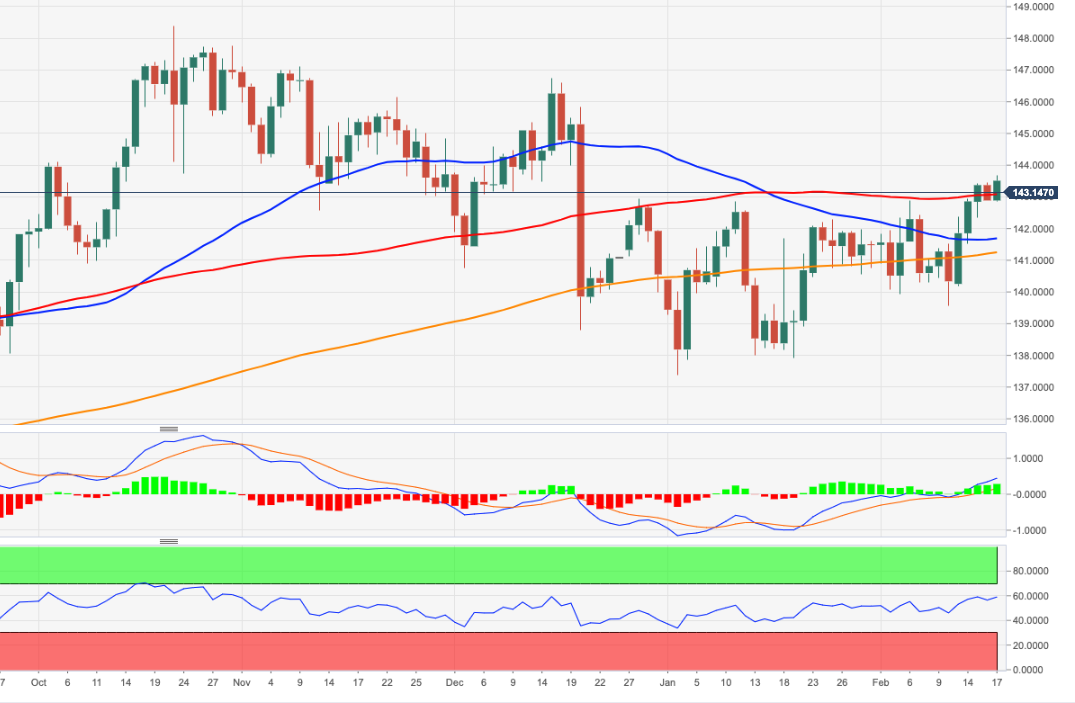
EUR/JPY faces some downside pressure following Friday’s yearly highs in the 143.65/70 band.
While the cross looks somewhat side-lined for the time being, a convincing breakout of the 2023 high at 143.67 (February 17) could trigger a move higher to, initially, the December 2022 top at 146.72 (December 15).
In the meantime, while above the 200-day SMA, today at 141.25, the outlook for the cross is expected to remain positive.
EUR/JPY daily chart
- NZD/USD gains some positive traction on Monday, albeit lacks any follow-through buying.
- A combination of factors continues to underpin the USD and acts as a headwind for the pair.
- Traders seem reluctant ahead of the RBNZ decision and the FOMC minutes on Wednesday.
The NZD/USD pair attracts some buyers near the 0.6220 area on Monday and snaps a four-day losing streak to its lowest level since January 6. The pair sticks to its modest gains around the mid-0.6200s through the mid-European session, though seems to struggle to build on Friday's bounce from the very important 200-day SMA.
A combination of supporting factors assists the US Dollar to hold steady just below a six-week high set on Friday, which, in turn, caps the upside for the NZD/USD pair. The prospects for further policy tightening by the Fed continue to act as a tailwind for the US Dollar. Apart from this, a generally weaker tone around the equity markets further benefits the Greenback's relative safe-haven status and keeps a lid on the risk-sensitive Kiwi.
In fact, the markets seem convinced that the US central bank will stick to its hawkish stance and have been pricing in at least a 25 bps lift-off at the next two FOMC meetings in March and May. The bets were reaffirmed by the US CPI and PPI data last week, which showed that inflation isn't coming down quite as fast as hoped. Moreover, several FOMC officials recently stressed the need to keep lifting rates gradually to fully gain control of inflation.
Meanwhile, worries about economic headwinds stemming from rapidly rising borrowing costs, along with geopolitical tensions, take a toll on the global risk sentiment. In fact, North Korea launched two more ballistic missiles off its east coast on Monday after firing an intercontinental ballistic missile (ICBM) into the sea off Japan's west coast over the weekend. Adding to this, talks of Russia ramping up attacks in Ukraine weigh on investors' sentiment.
Traders also seem reluctant to place aggressive bets amid relatively thin volumes on the back of the President Day's holiday in the US and ahead of this week's key event risks. The Reserve Bank of New Zealand (RBNZ) is scheduled to announce its monetary policy decision ahead of the release of the FOMC meeting minutes on Wednesday. This will play a key role in influencing the NZD/USD pair and help investors determine the next leg of a directional move.
Technical levels to watch
The Canadian Dollar is poised to retain a soft undertone, in the opinion of economists at Scotiabank.
The Loonie has little chance of strengthening
“Seasonal pressures which are typically adverse for the Canadian Dollar through Q1.”
“We look for the USD to retain a firm undertone in the short run.”
“Trend signals are aligning bullishly across short, medium and long-term DMI oscillators.”
“The USD/CAD pair is poised to remain firm in the upper 1.34s between a potential range base of 1.3320 and a ceiling of 1.3630.”
- Silver struggles to capitalize on its modest intraday gains to the $22.00 neighbourhood.
- The recent breakdown through key technical levels supports prospects for further losses.
- A sustained move above the $22.55-$22.60 area is needed to negate the bearish outlook.
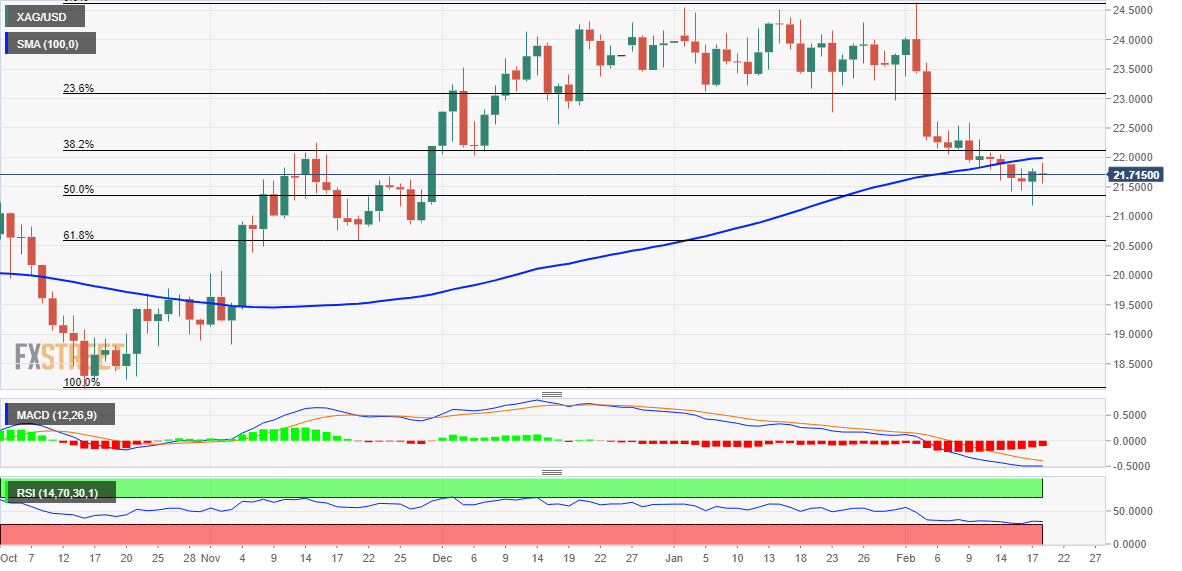
Silver builds on Friday's modest bounce from the $21.20-$21.15 area, or its lowest level since November 29 and attracts some buyers on the first day of a new week. The intraday uptick, however, lacks bullish conviction and fails just ahead of the $22.00 round-figure mark.
From a technical perspective, the said handle represents the 100-day Simple Moving Average (SMA) support breakpoint. This is followed by the 38.2% Fibonacci retracement level of the recent rally from October 2022, around the $22.15 region. Any subsequent move up is more likely to meet with a fresh supply and remain capped near the $22.55-$22.60 resistance zone.
The latter should act as a pivotal point, which if cleared decisively will negate any near-term bearish bias. The subsequent move up has the potential to lift the XAG/USD towards the $24.00 round-figure mark
en route to the $24.50 supply zone. Some follow-through buying will shift the bias back in favour of bullish traders and pave the way for additional gains.
On the flip side, the 50% Fibo. level, around the $21.35 area, seems to protect the immediate downside. This is followed by Friday's swing low, around the $21.20-$20.15 region, nearing the 50% Fibo. level. A convincing break below the latter will be seen as a fresh trigger for bearish traders and make the XAG/USD vulnerable to weaken further below the $21.00 mark.
Given that technical indicators on the daily chart are holding deep in the negative territory, the white metal could eventually drop to 61.8% Fibo., around the $20.60 region. The downward trajectory could get extended further towards challenging the $20.00 psychological mark en route to the next relevant support near the $19.75-$19.70 horizontal zone.
Silver daily chart
Key levels to watch
In its monthly report published on Monday, Germany's Bundesbank noted that the economic outlook was somewhat brighter with the short-term outlook turning more favorable than seen just a few months ago.
"At the turn of the year, sentiment among entrepreneurs and consumers worldwide brightened slightly, with recessionary fears receding somewhat," the publication read.
Bundesbank further noted that high inflationary pressures remain in place as the second round impact of quick wage growth is expected to keep Eurozone inflation above its target for an extended period of time.
Market reaction
EUR/USD continues to fluctuate in a very narrow range at around 1.0700 following this publication.
A USD rebound is now underway as it reverses losses from the start of the year. Economists at MUFG Bank see room for the USD rebound to run further in near-term.
Break above 105.00 for the DXY to open up the 200-DMA at just below 106.50
“The upcoming releases of the latest FOMC minutes and PCE deflator report are unlikely to derail the USD’s rebound in the week ahead.”
“We believe the USD’s recent rebound has room to run further in the near-term.”
“A break above the 105.00 level for the DXY would open up a retest of the year to date high at 105.63 and then the 200-Day Moving Average at just below 106.50.”
UOB Group’s Market Strategist Quek Ser Leang suggests USD/THB could now navigate within the 33.90-34.65 range in the short-term horizon.
Key Quotes
“We highlighted that last Monday (13 Feb, spot at 33.75) that ‘short-term upward momentum is beginning to build and the bias for USD/THB this week is tilted to the upside’. We added, ‘Looking ahead, the next resistance above 34.00 is at 34.20’.”
“The anticipated USD/THB exceeded our expectations as it took out both 34.00 and 34.20 and surged to a high of 34.64. The sharp and rapid rise in a short time suggests the advance is likely overdone. In other words, USD/THB is unlikely to strengthen much. This week, USD/THB is more likely to consolidate between 33.90 and 34.65.”
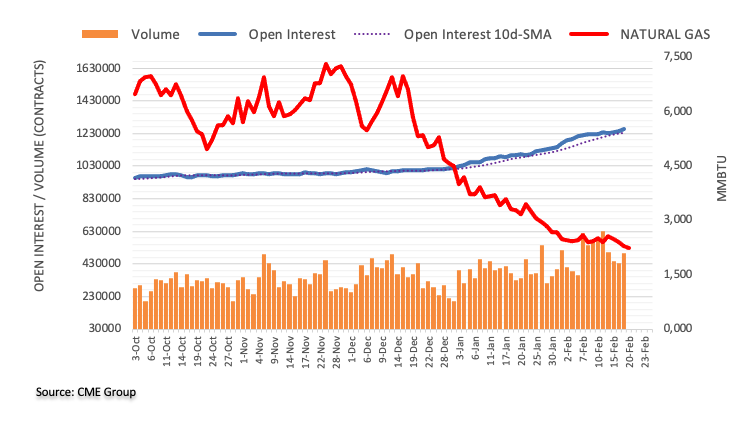
Considering advanced prints from CME Group for natural gas futures markets, open interest rose for the third session in a row on Friday, this time by around 12.5K contracts. Volume followed suit and went up by around 60.2K contracts after three consecutive daily drops.
Natural Gas keeps targeting the $2.00 region
Friday’s decline in prices of the naturas gas was once again amidst rising open interest and volume, opening the door at the same time to the continuation of the current downtrend for the time being. Against that, the next contention of note is expected at the key $2.00 mark per MMBtu.
FX markets start the week on a quiet footing. Is the Dollar rally getting tired? In the view of economists at ING, February's Dollar rally is a correction.
February's hawkish re-pricing of the Fed story might have come far enough
“Friday's price action suggested that February's hawkish re-pricing of the Fed story might have come far enough for the time being. US yields reversed from highs seen in early Europe on Friday and DXY dropped quickly from a high of 104.60. On Friday, we had said that this DXY rally could extend to 105.00 or, with outside risk, to 106.50. Yet Friday's price action suggests those levels could be out of reach.”
“Overall our base case is that February's Dollar rally is a correction – but this week will determine whether it runs out of steam or has a little further to go.”
Economist Lee Sue Ann and Markets Strategist Quek Ser Leang at UOB Group note USD/CNH keeps targeting the 6.9000/6.9300 region in the next weeks.
Key Quotes
24-hour view: “We expected ‘further USD gains’ last Friday but we held the view that ‘the major resistance at 6.9000 is likely out of reach today’. Our view was correct as USD rose to 6.8966 before staging a sharp and swift pullback (low has been 6.8682). The price movements are likely part of a consolidation and we expect USD to trade sideways between 6.8650 and 6.8880 today.”
Next 1-3 weeks: “Last Friday (17 Feb, spot at 6.8780), we indicated that ‘the outlook for USD remains positive and the focus is at 6.9000’. USD subsequently rose to 6.8966 before pulling back. There is no change in our view but overbought short-term conditions could lead to 1-2 days of consolidation. Overall, only a break of 6.8480 (‘strong support’ level was at 6.8360 last Friday) would indicate that the USD strength that started earlier this month has come to an end.”
The Riksbank delivered a hawkish decision in February. The restrictive monetary policy should cause the Krona to appreciate in the course of the year, according to economists at Commerzbank.
Riksbank the hawk in the far north
“Everything all told the Riksbank has proven itself determined in its fight against inflation. The bank itself puts it very well: It is ‘important for monetary policy to act when inflation is too high’.”
“I stick to my view that the market is trading SEK at excessively low levels and that it should appreciate over the course of the year due to the restrictive monetary policy.”
Source: Commerzbank Research
USD/INR remains below the 83 mark. Economists at Société Générale highlight the key technical levels to watch.
Overcoming resistance zone at 82.95/83.30 essential to affirm an extended uptrend
“USD/INR has evolved within a large sideways consolidation resembling an ascending triangle after facing resistance near 83.30 last October; a clear direction has been lacking.”
“Overcoming the resistance zone at 82.95/83.30 would be essential for affirming an extended uptrend.”
“Recent bullish gap at 82.30 is first layer of support. In case this gets violated, a short-term pullback is likely.”
“Below 82.30, next potential support is located at 81.40, the 76.4% retracement of recent bounce.”
USD/CNY trended higher last week to close almost 550 pips higher at around 6.87. Rising US-China tensions are set to keep the pair well supported for now, economists at Commerzbank report.
Loan prime rates on hold
“The banks’ loan prime rates (LPRs) for February remained unchanged at 3.65% and 4.3%, respectively.”
“We think the PBoC may cut the MLF rate and banks will subsequently reduce the LPRs as early as March following the annual session of the National People’s Congress which is scheduled to begin on 5 March.”
“Macro policy stimulus will likely be announced during the annual session, and it will be a good timing for the PBoC to cut rates and signals that it stands ready to support the economic recovery.”
“Heightened US-China tensions could keep USD/CNY well supported near term.”
- GBP/USD struggles to capitalize on its modest intraday uptick to levels just above mid-1.2000s.
- Hawkish Fed expectations, recession fears underpin the USD and cap the upside for the major.
- Expectations that the BoE’s rate-hiking cycle is nearing the end act as a headwind for the GBP.
The GBP/USD pair attracts some sellers near the 1.2055 area on Monday and stalls its recovery move from the lowest level since January 6 touched on Friday. The pair retreats to the lower end of its daily range during the first half of the European session, though manages to hold above the 1.2000 psychological mark.
A combination of supporting factors assists the US Dollar to regain some positive traction, which, in turn, acts as a headwind for the GBP/USD pair. Against the backdrop of looming recession risks, fresh geopolitical tensions continue to weigh on investors' sentiment and benefit the Greenback's relative safe-haven status. Adding to this, firming expectations that the Fed will stick to its hawkish stance provide a modest lift to the USD.
In fact, the markets are now pricing in at least a 25 bps lift-off at each of the next two FOMC policy meetings in March and May. The bets were reaffirmed by the US CPI and PPI data last week, which showed that inflation isn't coming down quite as fast as hoped. In contrast, the softer-than-expected UK consumer inflation figures fueled speculations that the Bank of England's (BoE) current rate-hiking cycle might be nearing the end.
The divergent Fed-BoE policy expectations also contribute to capping the upside for the GBP/USD pair. The downside, however, seems cushioned, at least for the time being, amid relatively thin trading volumes in the wake of the President Day's holiday in the US. Traders also seem reluctant and might refrain from placing aggressive bets ahead of the latest FOMC monetary policy meeting minutes, scheduled for release on Wednesday.
Several Fed officials, including Chairman Jerome Powell, recently stressed the need to keep raising rates gradually to fully gain control of inflation. Hence, investors will look for fresh cues about the Fed's policy tightening path, which will play a key role in influencing the USD price dynamics and help determine the near-term trajectory for the GBP/USD pair.
Technical levels to watch
Sterling enjoyed a modest recovery on Friday. Nonetheless, economists at ING expect EUR/GBP to remain stuck in a range while GBP/USD will be drive by Dollar’s movements.
Sunak struggles to make progress
“We doubt Sterling strength owes much to PM Rishi Sunak trying to make progress on revisions to the Northern Ireland protocol. It will probably continue to be monetary policy that drives FX trends. We think BoE rates will peak at 4.25% in March – not that far from market pricing of a peak at 4.35%.
“Expect EUR/GBP to stay range-bound and GBP/USD to be bounced around by the Dollar trend.”
USD/JPY could now move into some consolidative phase prior to a potential advance to 135.50, suggest Economist Lee Sue Ann and Markets Strategist Quek Ser Leang at UOB Group.
Key Quotes
24-hour view: “Last Friday, we highlighted that ‘the bias for USD remains on the upside’ but we were of the view that ‘any advance is unlikely to break the major resistance at 135.00 today’. Our view for USD to strengthen was correct even though it rose above 135.00 (high of 135.04) before pulling back sharply. The pullback amid overbought conditions suggests USD has likely moved into a consolidation phase. Today, we expect USD to trade sideways, likely within a range of 133.80/134.80.”
Next 1-3 weeks: “We turned positive USD last Wednesday (15 Feb, spot at 132.90. As USD rose, in our latest narrative from Thursday (16 Feb, spot at 133.85), we indicated that ‘upward momentum has improved further and USD is likely to continue to advance’. We noted, ‘The next level to watch is at 135.00, followed by 135.50’. Our target level of 135.00 was met as USD rose to a high of 135.04 on Friday. From here, overbought short -term conditions could lead to a couple of days of consolidation. As long as 133.10 (‘strong support’ level was at 132.80 last Friday) is not breached, there is still chance for USD to head higher to the next target at 135.50 later on.”
- USD/CAD comes under some selling pressure on Monday and extends Frida’s retracement slide.
- Rebounding oil prices underpins the Loonie and exerts pressure amid subdued USD price action.
- Recession fears, hawkish Fed expectations could limit the USD losses and lend support to the pair.
The USD/CAD pair attracts some sellers in the vicinity of the 1.3500 psychological mark on Monday and extends its steady descent through the first half of the European session. Spot prices retreat further from the highest level since January 6 touched on Friday and drop to the 1.3455 area, or a fresh daily low in the last hour.
Crude oil prices gain some positive traction and for now, seem to have snapped a five-day losing streak to over a one-week low touched on Friday. This, in turn, underpins the commodity-linked Loonie and acts as a headwind for the USD/CAD pair amid subdued US Dollar price action. That said, a combination of factors supports prospects for the emergence of some dip-buying at lower levels and warrants caution before positioning for deeper losses.
Worries that rapidly rising borrowing costs will dampen economic growth and dent fuel demand should keep a lid on any further upside for the black liquid. Apart from this, firming expectations that the Fed will stick to its hawkish stance favours the USD bulls. In fact, the markets are now pricing in at least a 25 bps lift-off at the next two FOMC meetings in March and May. This, in turn, validates the positive outlook for the USD/CAD pair.
Traders also seem reluctant amid relatively thin trading volumes on the back of a holiday in the US and Canada. Furthermore, investors are more likely to wait for the latest FOMC meeting minutes, due for release on Wednesday, before placing fresh directional bets. Hence, strong follow-through selling is needed to confirm that the USD/CAD pair's recent positive move witnessed over the past week or so has run its course.
Technical levels to watch
There is room for the USD rebound to extend further. Therefore, economists at MUFG Bank expect the EUR/USD pair to challenge the 200-Day Moving Average (DMA) at around 1.0330.
Improving cyclical outlook better priced into EUR
“There is room for the reversal lower to extend further in the near-term.”
“We are expecting the EUR/USD pair to fall back towards support from the 200-DMA that comes in at around 1.0330.”
“The price action highlights that the Eurozone rate market and EUR have already moved along way at the start of this year to better reflect the improving cyclical outlook.”
Saudi Arabian Energy Minister Prince Abdulaziz bin Salman said on Monday, “OPEC+ is flexible enough to change decisions whenever required.”
Last week, Saudi Arabian Energy Minister said the current OPEC+ deal on oil output would be locked in until the end of the year, adding the oil group can't increase output based solely on initial signals.
Market reaction
WTI is keeping its upbeat momentum intact on the above comments, rallying 1.08% on the day to trade at $77.35, as of writing.
USD/JPY gained nearly 300 pips last week. On Friday, BoJ Governor nominee Ueda speaks. Hints of change to the BoJ's ultra-dovish monetary policy could pummel the USD/JPY pair, economists at ING r eport.
Hearings for the new BoJ governor
“On Friday, nomination hearings will take place for new Bank of Japan Governor, Kazuo Ueda. He is seen as more of a pragmatic academic than the ultra-dove of his predecessor, Haruhiko Kuroda.”
“Any hints of a change to the BoJ's ultra-dovish monetary policy could see USD/JPY sell off again – dragging the broader Dollar with it.”
Bank of Japan (BoJ) Deputy Governor Masayoshi Amamiya said on Monday, “the BoJ has already shifted to a sustainable monetary easing framework, so it is appropriate to maintain current policy given underlying price moves.”
Additional comments
BoJ has operational tools to achieve exit from ultra-loose monetary policy.
What is more difficult is to decide whether conditions have met to exit easy policy, and how to communicate BoJ’s intentions.
- AUD/USD gains some traction on Monday and recovers further from a nearly two-month low,
- Rising Copper prices seem to benefit the resources-linked Aussie amid subdued USD demand.
- Recession fears, hawkish Fed expectations favour the USD bulls and seem to cap the upside.
- Traders now look to the RBA meeting minutes for some impetus ahead of the FOMC minutes.
The AUD/USD pair builds on Friday's goodish rebound from the vicinity of the 0.6800 mark, or its lowest level since January 6, and gains strong follow-through traction on the first day of a new week. The pair maintains its bid tone through the early part of the European session and is currently placed around the 0.6900 mark, just a few pips below the daily high.
Some optimism over a potential recovery in China, along with supply disruptions in Panama, lend support to Copper prices and benefit the resources-linked Australian Dollar. Apart from this, subdued US Dollar price action turns out to be a key factor acting as a tailwind for the AUD/USD pair. That said, the fundamental backdrop still seems tilted in favour of bearish traders and warrants caution before positioning for any meaningful upside.
Against the backdrop of looming recession risks, geopolitical tensions weigh on investors' sentiment and should cap the AUD/USD pair. In fact, North Korea launched two more ballistic missiles off its east coast on Monday after firing an intercontinental ballistic missile (ICBM) into the sea off Japan's west coast over the weekend. Adding to this, talks of Russia ramping up attacks in Ukraine should keep a lid on the risk-sensitive Aussie.
Moreover, firming expectations that the Federal Reserve (Fed) will stick to its hawkish stance in the wake of stubbornly high inflation favours the USD bulls. Traders also seem reluctant ahead of the release of the policy meeting minutes from the Reserve Bank of Australia (RBA) on Tuesday and the Fed on Wednesday. This further makes it prudent to wait for strong follow-through buying before confirming that the AUD/USD pair has formed a bottom.
Technical levels to watch
- EUR/USD looks side-lined near 1.0700 on Monday.
- The pair looks to extend the bounce of Friday’s monthly lows.
- Flash EMU Consumer Confidence next of note in the docket.
The single currency clings to the recent bullish move and encourages EUR/USD to return to the 1.0700 neighbourhood at the beginning of the week.
EUR/USD looks to USD, data
EUR/USD alternates gains with losses amidst the equally vacillating mood in the global markets on Monday and attempts to extend the bounce off February lows near 1.0600 the figure recorded on Friday.
So far, it seems cautiousness has started to dominate the markets’ mood ahead of the release of the FOMC Minutes and the Fed’s preferred inflation gauge – the PCE – on Wednesday and Friday, respectively.
The recent pullback in spot, in the meantime, came against the backdrop of further hawkish remarks from Fed’s policy makers vs. some doubts regarding the rate path that emerged amidst ECB’s rate setters past the March gathering.
Absent releases in the US data space, the focus of attention will be on the publication of the advanced Consumer Confidence in the euro bloc tracked by the European Commission (EC).
What to look for around EUR
EUR/USD regains some traction on Monday, although it appears to have met quite a solid hurdle around the 1.0700 mark.
In the meantime, price action around the European currency should continue to closely follow dollar dynamics, as well as the potential next moves from the ECB after the bank has already anticipated another 50 bps rate raise at the March event.
Back to the euro area, recession concerns now appear to have dwindled, which at the same time remain an important driver sustaining the ongoing recovery in the single currency as well as the hawkish narrative from the ECB.
Key events in the euro area this week: EMU Flash Consumer Confidence (Monday) – EMU New Car Registrations, EMU/Germany/France Advanced PMIs, Germany ZEW Economic Sentiment (Tuesday) – Germany Final Inflation Rate/IFO Business Climate, France Business Confidence (Wednesday) – EMU Final Inflation Rate (Thursday) – Germany Final Q4 GDP Growth Rate/GfK Consumer Confidence (Friday).
Eminent issues on the back boiler: Continuation of the ECB hiking cycle amidst dwindling bets for a recession in the region and still elevated inflation. Impact of the Russia-Ukraine war on the growth prospects and inflation outlook in the region. Risks of inflation becoming entrenched.
EUR/USD levels to watch
So far, the pair is retreating 0.05% at 1.0689 and a drop below 1.0612 (monthly low February 17) would target 1.0481 (2023 low January 6) en route to 1.0328 (200-day SMA). On the other hand, the next up barrier emerges at 1.0804 (weekly high February 14) seconded by 1.1032 (2023 high February 2) and finally 1.1100 (round level).
NZD/USD ended the week back above 0.62. This week is all about the RBNZ and the impact of cyclone Gabrielle, economists at ANZ Bank report.
Fall in the USD cannot be taken for granted
“Even though some of the special factors (other central banks going slow, a global risk-off vibe) behind 2022’s USD rally have faded, if nothing else, last week’s bounce is a timely reminder that a fall in the USD can’t be taken for granted, especially if the Fed continues to take leadership on tackling inflation.”
“But this week is all about the RBNZ and the debate re whether cyclone Gabrielle will or should change their OCR decision (analysts’ consensus and market pricing still say a 50 bps hike). NZD will be hypersensitive to the RBNZ’s decision and tone.”
Open interest in crude oil futures markets shrank for the third session in a row on Friday, now by more than 14K contracts according to preliminary readings from CME Group. On the flip side, volume reversed two daily drops in a row and went up by around 189.7K contracts.
WTI: Initial up barrier comes near $80.60
WTI prices extended the leg lower for yet another session on Friday. The daily decline, however, was in tandem with declining open interest, which hints at the view that probable rebound could be in the offing. The next target of note on the upside emerges at the February high at $80.57 (February 13).
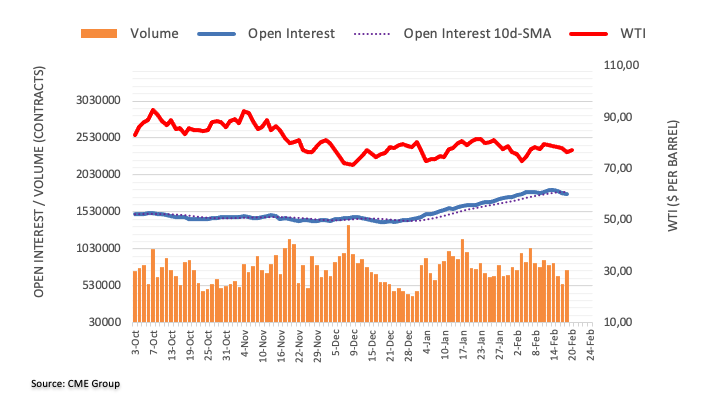
France’s Finance Minister Bruno Le Maire made some comments on the French economic and inflation outlook on Monday.
Key quotes
I expect positive economic growth in 2023.
Inflation should ease off from the middle of this year.
Inflation should ease off from this summer onwards.
I also expect even more positive economic growth in 2024.
Market reaction
EUR/USD was last seen trading at around 1.0700, up 0.05% on the day.
In the opinion of Economist Lee Sue Ann and Markets Strategist Quek Ser Leang at UOB Group, the idea of further downside in AUD/USD seems to be losing momentum in the short term.
Key Quotes
24-hour view: “Last Friday, we highlighted that AUD ‘is likely to weaken further but the likelihood of a sustained decline below the major support at 0.6820 is low’. While our view was not wrong as AUD dropped to 0.6817, we did quite anticipate the sharp rebound from the low as AUD closed little changed at 0.6879 (-0.01%). Not surprisingly, downward pressure has eased. We view the current movement as part of a consolidation and expect AUD to trade sideways between 0.6850 and 0.6915.”
Next 1-3 weeks: “We highlighted last Friday (17 Feb, spot at 0.6865) that ‘downward momentum has improved further and AUD is likely to weaken to 0.6820’. Our view was not wrong as AUD dropped to 0.6817 but we did not expect the rapid rebound from the low. Downward momentum is beginning to wane and the chance for AUD to drop below 0.6820 in a sustained manner has decreased. However, only a breach of 0.6950 (no change in ‘strong resistance’ level from last Friday) would indicate that the risk of a sustained drop below 0.6820 has fizzled out.”
- Gold price gains some follow-through traction on Monday and moves away from the YTD low.
- Recession fears, along with geopolitical tensions, lend some support to the safe-haven XAU/USD.
- Hawkish Federal Reserve expectations underpin the US Dollar and might cap gains for Gold price.
Gold price edges higher on the first day of a new week and looks to build on Friday's bounce from the $1,819-$1,818 area, or the YTD low. The XAU/USD sticks to its modest intraday gains through the early European session and is currently placed just above the $1,845 region, albeit seems to lack bullish conviction.
Reviving safe-haven demand lends support to Gold price
Against the backdrop of looming recession risks, geopolitical tensions turn out to be a key factor that offers some support to the safe-haven Gold price. In fact, North Korea launched two more ballistic missiles off its east coast on Monday after firing an intercontinental ballistic missile (ICBM) into the sea off Japan's west coast over the weekend. Adding to this, talks of Russia ramping up attacks in Ukraine drive some haven flows towards the XAU/USD.
Bets for more rate hikes by Federal Reserve cap Gold price
The upside for the Gold price, meanwhile, remains capped amid the prospects for further policy tightening by the Federal Reserve (Fed). In fact, the markets are pricing in at least a 25 basis points (bps) lift-off at the next two Federal Open Market Committee (FOMC) meetings in March and May. The bets were lifted by the United States (US) Consumer Price Index (CPI) and the Producer Price Index (PPI), which showed that inflation isn't coming down quite as fast as hoped.
Stronger US Dollar further acts as a headwind for Gold price
Furthermore, several FOMC policymakers, including Fed Chair Jerome Powell, recently stressed the need to keep raising rates gradually to fully gain control of inflation. This, in turn, keeps a lid on the non-yielding Gold price amid the underlying bullish sentiment surrounding the US Dollar (USD). Hence, it will be prudent to wait for strong follow-through buying before placing bullish bets around the US Dollar-denominated XAU/USD and positioning for any further gains.
Investors now eye FOMC minutes for fresh directional impetus
Traders might also prefer to move to the sidelines ahead of the FOMC monetary policy meeting minutes, due for release on Wednesday. Investors will look for fresh clues about the Fed's rate-hike path, which will play a key role in influencing the USD price dynamics and provide a fresh directional impetus to Gold price. In the meantime, the XAU/USD is likely to oscillate in a range amid thin trading volumes on the back of the President's Day holiday in the US.
Gold price technical outlook
From a technical perspective, any subsequent move up is likely to confront stiff resistance near the 50-day Simple Moving Average (SMA) support breakpoint, currently around the $1,862 area. This is followed by the $1,872-$1,873 supply zone, above which Gold price could aim to test the $1,890 hurdle and reclaim the $1,900 round-figure mark.
On the flip side, the $1,835 horizontal zone now seems to protect the immediate downside for Gold price ahead of Friday’s swing low, around the $1,819-$1,818 region. Some follow-through selling could make the XAU/USD vulnerable to accelerate the slide towards the $1,800 mark en route to the 100-day SMA support, currently around the $1,785 zone.
Key levels to watch
EUR/USD bounced off a low at 1.0613 on Friday. Economists at ING believe that a hawkish set of FOMC minutes is needed to drag the pair down toward 1.05.
PMIs in focus this week
“This week, the Eurozone focus will be on business confidence in the form of PMIs and the German Ifo. The PMI readings are seen hovering around the 50 area and the market may take more notice of the Chinese February PMI readings which come out later next week.”
“The Dollar rally might have come far enough for the time being and EUR/USD found good demand ahead of 1.06. It will probably require quite a hawkish set of FOMC minutes on Wednesday for EUR/USD to break towards 1.05 – where we expect to see good demand ahead of a EUR/USD rally in the second quarter.”
Inflationary pressures push the peak cash rate higher. According to ANZ Bank economists, a higher terminal rate of 4.1% looks likely to be required.
RBA will hold the cash rate at 4.1% until late 2024
“We now have the RBA cash rate target peaking at 4.1% in May 2023, up 25 bps from our previous peak of 3.85%.”
“Persistence in inflation pressures suggests that the cash rate will remain in restrictive territory for some time. We do not expect the RBA to start easing until a 25 bps cut in November 2024.”
“Given that price pressures are intense and look to remain stronger for longer, we have lifted our 2023 inflation and wage growth forecasts and see the higher cash rate as necessary to return inflation to the top of the target band by late-2024.”
“Our revised rate path has the RBA tightening by 25 bps in March, April and May.”
- USD/JPY lacks any firm directional bias and oscillates in a narrow trading band on Monday.
- Geopolitical tensions, recession fears benefit the safe-haven JPY and cap gains for the pair.
- Hawkish Fed expectations continue to underpin the USD and should help limit any downfall.
The USD/JPY pair struggles to gain any traction on Monday and seesaws between tepid gains/minor losses through the early European session. The pair is currently placed just above the 134.00 round figure and for now, seems to have stalled Friday's modest pullback from a nearly two-month high.
Against the backdrop of looming recession risks, geopolitical tensions drive some haven flows towards the Japanese Yen (JPY) and acts as a headwind for the USD/JPY pair. After firing an intercontinental ballistic missile (ICBM) into the sea off Japan's west coast over the weekend, North Korea launched two more ballistic missiles off its east coast on Monday. This comes amid talk of Russia ramping up attacks in Ukraine and lending some support to traditional safe-haven assets, including the JPY.
The downside for the USD/JPY pair, however, remains cushioned amid the underlying bullish sentiment surrounding the US Dollar, bolstered by the prospects for further policy tightening by the Fed. The markets are pricing in at least a 25 bps lift-off at each of the next two FOMC policy meetings in March and May. The bets were reaffirmed last week after the US CPI and PPI data showed that inflation isn't coming down quite as fast as hoped, and hawkish comments by several Fed policymakers.
This, in turn, is holding back traders from placing aggressive bets around the USD/JPY pair ahead of the FOMC monetary policy meeting minutes, due for release on Wednesday. Investors also await Friday's testimony from the newly nominated head of the Bank of Japan (BoJ) Governor Kazuo Ueda for his view on the future of yield curve control (YCC) and super-easy monetary policy. This, in turn, will play a key role in influencing the USD/JPY pair and help determine the next leg of a directional move.
In the meantime, relatively lighter trading volumes on the back of the Presidents' Day holiday in the US, could lead to an extension of the USD/JPY pair's range-bound price action on Monday. From a technical perspective, last week's breakout through the 132.90-133.00 resistance zone favours bullish traders, suggesting that any meaningful pullback could be seen as a buying opportunity.
Technical levels to watch
CME Group’s flash data for gold futures markets noted traders added just 812 contracts to their open interest positions at the end of last week, adding to the previous daily build. Volume, instead, dropped for the third consecutive session, this time by around 1.4K contracts.
Gold: Interim hurdle comes at the 55-day SMA
Friday’s continuation of the recovery in gold prices was in tandem with a small uptick in open interest, which indicates that extra rebound could still be in store for the yellow metal in the very near term. That said, the next up barrier of note comes at the 55-day SMA, today at $1855 per ounce troy.
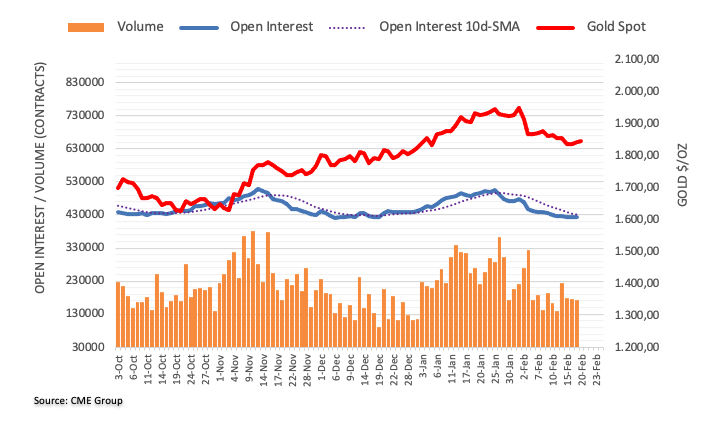
GBP/USD still risks a deeper pullback as well as 1.2100 caps the upside, note Economist Lee Sue Ann and Markets Strategist Quek Ser Leang at UOB Group.
Key Quotes
24-hour view: “We highlighted last Friday that GBP ‘is likely to break 1.1960 but it is unlikely to threaten the next support at 1.1900’. Our view turned out to be correct as GBP dropped to 1.1915. However, we did not anticipate the sharp bounce from the low as GBP closed higher by 0.46% (1.2043). The sharp and rapid rebound in GBP has room to extend but any advance is viewed as part of a higher trading range of 1.1990/1.2075. In other words, a sustained rise above 1.2075 is unlikely.”
Next 1-3 weeks: “Last Friday (17 Feb, spot at 1.1985), we highlighted that ‘downward momentum has improved, albeit not much’. We added, ‘GBP is likely to break 1.1960 and the next support is at 1.1900’. GBP subsequently dropped close to 1.1900 (low of 1.1915) before rebounding strongly. With the strong rebound, downward momentum has waned, but as long as the ‘strong resistance’ at 1.2100 (level is unchanged from last Friday) is not breached within the next few days, there is still a slim chance for GBP to break below 1.1900.”
Gold price is trading around a flatline at the start of the week. XAU/USD is set to range between two key barriers amid light trading, FXStreet’s Dhwani Mehta reports.
Thursday’s high of $1,845 could challenge bearish commitments
“Gold price settled the previous week above the critical horizontal trendline support from the January 5 low at $1,825.
Therefore, Gold bulls could gather some courage to retest the previous support now turned resistance at the flattish 50-Daily Moving Average (DMA), currently pegged at $1,853. Ahead of that, Thursday’s high of $1,845 could challenge the bearish commitments.”
“On the downside, daily closing below the key support at $1,825 is needed to retest the previous day’s low at $1,819. Additional selling will call for a fresh downswing toward the $1,800 barrier.”
- USD/CHF holds lower ground after reversing from five-week high.
- Sluggish markets, off in US, Canada restrict immediate moves.
- Risk-negative headlines, hawkish Fed challenges the bearish bias.
USD/CHF flirts with the intraday low surrounding 0.9240 amid early Monday in Europe. In doing so, the major currency pair remains pressured toward the previous resistance line from late November 2022. However, a light calendar and holiday in the US, as well as in Canada, restrict immediate moves of the Swiss Franc (CHF) pair.
Better-than-forecast prints of the US Consumer Price Index (CPI) and Retail Sales followed the previously flashed upbeat readings of employment and output data and propelled the US Treasury bond yields, as well as the US Dollar. On the same line could be the hawkish Federal Reserve (Fed) comments and the risk-negative catalysts surrounding China, North Korea and Russia.
However, Friday’s mixed comments from the Fed officials seemed to have probed the US Dollar bulls and triggered the USD/CHF pair’s U-turn from the multi-day high. That said, Fed Governor Michelle Bowman recently said, “We are seeing a lot of inconsistent data in economic conditions,” as reported by Reuters. On the contrary, Richmond Fed President Thomas Barkin said that they are seeing some progress on inflation with demand normalizing, as reported by Reuters.
Elsewhere, North Korea fired two ballistic missiles toward Japan and renewed the fears that the hermit kingdom is up to something serious that can endanger the global economy, mainly due to the nature of the missiles fired as they both were termed as tactical nuclear attack weapons. However, both the missiles were down ahead of Japanese boundaries and allowed traders to take a sigh of relief even as Japan PM Fumio Kishida calls for the United Nations Security Council meeting to discuss the issues.
On the same line, the latest meeting between US Secretary of State Antony Blinken and China's top diplomat Wang Yi seemed to have failed in restoring the US-China ties. The reason could be linked to a Chinese diplomat’s comments saying that the US must change course and repair the damage done to Sino-US ties by indiscriminate use of force. On the same line, US ambassador to the United Nations, Ambassador Linda Thomas-Greenfield, said Sunday that China would cross a “red line” if the country decided to provide lethal military aid to Russia for its invasion of Ukraine.
Against this backdrop, the S&P 500 Futures print mild losses even as Wall Street closed mixed. It’s worth noting that the US 10-year Treasury bond yields rose to the highest levels since early November in the last week and helped the US Dollar Index (DXY) to print a three-week uptrend, before retreating to 103.90 as of late.
Moving ahead, light calendar and holidays in the key markets may offer a sluggish trading session ahead of Wednesday’s key Minutes of the latest Federal Open Market Committee (FOMC) Monetary Policy Meeting. Following that, the second reading of the US fourth quarter (Q4) Gross Domestic Product (GDP) will be important to forecast the USD/CHF moves.
Technical analysis
USD/CHF remains on the bull’s radar unless breaking below the three-month-old descending resistance line, now support line near 0.9230 at the latest.
Here is what you need to know on Monday, February 20:
Stock and bond markets in the US will be closed on Monday in observance of the Presidents' Day holiday and the trading action is expected to remain subdued, especially in the second half of the day. The Bundesbank will release its monthly report and the European Commission will publish the preliminary Consumer Confidence Index for February.
Developments over the weekend seem to have caused the geopolitical tensions to escalate but the impact on risk sentiment remains muted in the European morning.
Reports claim that the US and Taiwan may sign a bilateral trade agreement earlier than expected this year following the 'not very encouraging' meeting between China’s Director of the Office of the Central Foreign Affairs Commission Wang Yi and US Secretary of State Antony Blinken in Germany. Meanwhile, Japan's Defense Ministry of Defense said North Korea fired two ballistic missiles and Japan's Prime Minister Fumio Kishida requested a meeting of the United Nations Security Council.
During the Asian trading hours, New Zealand (NZ) Deputy Prime Minister and Finance Minister Grant Robertson reiterated that the Reserve Bank of New Zealand (RBNZ) has a responsibility to address inflation. The RBNZ will announce its policy decisions on Wednesday and is expected to raise its policy rate by 50 basis points to 4.75%. Meanwhile, NZD/USD trades in a tight range at around 0.6250 early Monday after having registered losses for the third straight week last week.
USD/JPY, which gained nearly 300 pips last week, stays in a consolidation phase near 134.00 in the European morning.
Following the decline witnessed last week, AUD/USD trades modestly higher on the day at around 0.6900. In the early Asian session on Tuesday, S&P Global Manufacturing and Services PMI data will be featured in the Australian economic docket and the Reserve Bank of Australia will release the Meeting Minutes.
EUR/USD staged a rebound late Friday and ended up closing the previous week virtually unchanged. The pair fluctuates in a tight range early Monday and trades within a touching distance of 1.0700.
GBP/USD managed to end the week slightly above the key 1.2000 level. The pair holds steady at around 1.2050 at the beginning of the week. In the absence of high-impact data releases, markets will keep a close eye on Brexit-related headlines.
Gold price lost more than 1% last week pressured by rising US Treasury bond yields. XAU/USD stays quiet early Monday and trades above $1,840.
Bitcoin failed to make a decisive move in either direction over the weekend but registered its highest weekly close since June above $24,000. BTC/USD edges higher early Monday and was last seen trading near $24,500, where it was up 1% on the day. Ethereum closed in negative territory on Saturday and Sunday but managed to regain its traction to start the week. At the time of press, ETH/USD was up 1% on the day, trading withing a touching distance of $1,700.
FX option expiries for Feb 20 NY cut at 10:00 Eastern Time, via DTCC, can be found below.
- GBP/USD: GBP amounts
- 1.1000 400m
- The index struggles for direction just below 104.00.
- There is no clear direction in the global markets so far.
- The FOMC Minutes and PCE readings will take centre stage this week.
The greenback, in terms of the USD Index (DXY), treads water just below the 104.00 zone ahead of the opening bell in the old continent on Monday.
USD Index: Upside capped near 104.70
The index appears somewhat stable in the sub-104.00 region following Friday’s U-turn after climbing to fresh multi-week highs in the 104.65/70 band.
In the meantime, the recent bull run in the dollar was underpinned by better-than-expected results in US fundamentals as well as the persevering hawkish narrative from Fed’s rate setters. So far the probability of a 25 bps rate hike at the Fed’s March 22 meeting is nearly 85% according to CME Group’s FedWatch Tool.
Moving forward, the publication of the FOMC Minutes of the February gathering (Wednesday) and inflation figures tracked by the PCE (Friday) are expected to take centre stage in the US docket this week.
What to look for around USD
The dollar faces some profit taking mood following Friday’s sharp advance (and subsequent drop) to new 6-week peaks near 104.70.
The probable pivot/impasse in the Fed’s normalization process narrative is expected to remain in the centre of the debate along with the hawkish message from Fed speakers, all after US inflation figures for the month of January showed consumer prices are still elevated, the labour market remains tight and the economy maintains its resilience.
The loss of traction in wage inflation – as per the latest US jobs report - however, seems to lend some support to the view that the Fed’s tightening cycle have started to impact on the still robust US labour markets somewhat.
Key events in the US this week: Flash Manufacturing/Services PMI, Existing Home Sales (Tuesday) – MAB Mortgage Applications, FOMC Minutes (Wednesday) – Advanced Q4 GDP Growth Rate, Initial Jobless Claims, Chicago Fed National Activity Index (Thursday) – PCE, Core PCE, Personal Income/Spending, Final Michigan Consumer Sentiment, New Home Sales (Friday).
Eminent issues on the back boiler: Rising conviction of a soft landing of the US economy. Slower pace of interest rate hikes by the Federal Reserve vs. shrinking odds for a recession in the next months. Fed’s pivot. Geopolitical effervescence vs. Russia and China. US-China trade conflict.
USD Index relevant levels
Now, the index is gaining 0.02% at 103.89 and faces the next hurdle at 104.66 (monthly high February 27) seconded by 105.63 (2023 high January 6) and then 106.44 (200-day SMA). On the other hand, the breach of 102.58 (weekly low February 14) would open the door to 100.82 (2023 low February 2) wand finally 100.00 (psychological level).
- EUR/GBP fades bounce off immediate horizontal support, 200-HMA.
- Sluggish oscillators suggest limited downside room but bulls need validation from 0.8930.
- Monthly low lures bears past 200-HMA buyers have a bumpy road to the north to track.
EUR/GBP holds lower ground near 0.8880 during the early Monday morning in Europe.
In doing so, the cross-currency pair fades bounce off the 200-HMA and eight-day-old horizontal support. Also teasing the pair sellers is the lower high formation, marked since February 07.
However, the aforementioned support line, close to 0.8875 at the latest, precedes the 200-Hour Moving Average (HMA) level surrounding 0.8865, to put a floor under the EUR/GBP prices.
In a case where the EUR/GBP pair drops below 0.8865, the odds of witnessing a slump toward the monthly low near the 0.8800 round figure can’t be ruled out.
It’s worth noting, though, that January’s low near 0.8720 could challenge the pair sellers afterward.
Meanwhile, the 50% and 61.8% Fibonacci retracement levels of the EUR/GBP pair’s fall between February 03 and 14, near 0.8890 and 0.8910 in that order, could challenge the short-term upside of the pair.
Following that, a downward-sloping resistance line from February 07, close to 0.8930 by the press time, will be the key as a clear break of the same towards the north might endanger the monthly peak of 0.8978.
Overall, EUR/GBP is likely to grind lower amid mixed catalysts and sluggish prints of the MACD and RSI. Though, the downside room appears limited.
EUR/GBP: Hourly chart
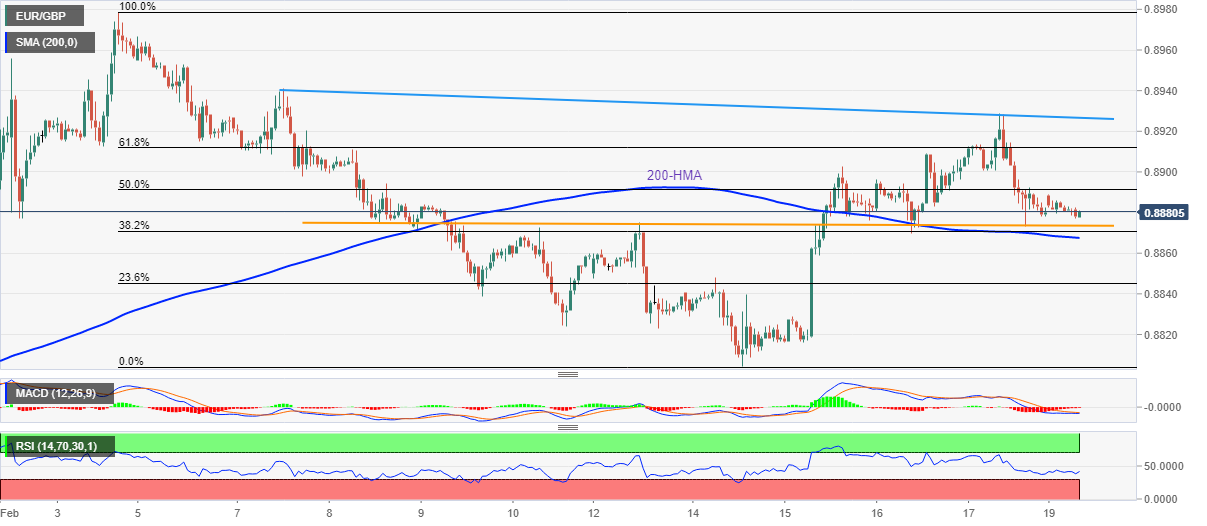
Trend: Limited downside expected
New Zealand Prime Minister (PM) Chris Hipkins on Monday called cyclone Gabrielle New Zealand's biggest natural disaster this century at a news conference announcing an emergency NZ$300 million ($187.08 million) cyclone relief package.
PM Hipkins said: "The required investment to reconnect our communities and future-proof our nation's infrastructure is going to be significant and it will require hard decisions.”
Earlier on, the country’s Finance Minister Grant Robertson said the total cost to the government could be similar to the NZ$13.5 billion (USD8.42 billion) it spent rebuilding Christchurch after the devastating 2011 earthquake, per Reuters.
Market reaction
At the time of writing, the NZD/USD pair is trading flat at 0.6242, having recovered from lows of 0.6227.
- GBP/USD is marching towards 1.2050 as the risk-off market mood has lost traction.
- The FOMC minutes will provide detailed guidance on the interest rate policy.
- Preliminary US/UK PMIs are expected to scale down due to higher interest rates.
The GBP/USD pair has printed a fresh day high at 1.2045 in the early London session. The Cable is looking to extend its gains to 1.2050 as the risk-off impulse has faded away despite no negative development on the US-China tensions and three missiles launched by North Korea near Japan’s region.
The US Dollar Index (DXY) has refreshed its day low at 103.52 as investors ignored the fears of persistent inflation and a robust labor market in the United States. S&P500 futures have recovered their entire losses and are looking to shift into a positive trajectory amid the risk appetite theme.
No doubt, the declining trend in the US inflation is still intact as the figures have dropped from their prior numbers. However, the releases of the Consumer Price Index (CPI) and Producer Price Index (PPI) above its estimates have cleared that the battle against inflation is far from over yet. And, the release of the upbeat monthly Retail Sales indicates that consumer spending has recovered vigorously.
Going forward, the release of the Federal Open Market Committee (FOMC) minutes will provide detailed guidance on the interest rate policy ahead.
But before that, the release of the US S&P PMI data will be keenly watched. The preliminary Manufacturing PMI (Feb) is seen lower at 46.8 vs. the prior release of 46.9. And the Services PMI is seen at 46.6 against the former release of 46.8.
Meanwhile, the Pound Sterling remained in action after the United Kingdom's Telegraph reported that UK Prime Minister (PM) Rishi Sunak has been forced to “pause” his Northern Ireland protocol deal amid a backlash from senior Tories and unionists.
Going forward, Tuesday’s S&P PMI (Feb) data will remain in the spotlight. The preliminary Manufacturing PMI is seen lower at 46.8 while the Services PMI is expected to decline to 48.3.
According to Economist Lee Sue Ann and Markets Strategist Quek Ser Leang at UOB Group, the prospects for a sustained drop below 1.0615 in EUR/USD appear diminished for the time being.
Key Quotes
24-hour view: “We expected EUR to weaken last Friday but we were of the view that it ‘is unlikely to challenge the major support at 1.0615’. While EUR cracked 1.0615 (low of 1.0611) in London trade, it rebounded strongly to end the day higher by 0.24% (1.0694). The rebound amid oversold conditions suggests EUR is unlikely to weaken further. Today, EUR is more likely to consolidate within a range of 1.0650/1.0720.”
Next 1-3 weeks: “Our most recent narrative was from last Thursday (16 Feb, spot at 1.0690) where ‘downward momentum is building again but EUR has to break and stay below 1.0655 before a sustained decline is likely’. We indicated, ‘a clear break of 1.0655 will shift the focus to 1.0615, followed by 1.0535’. While EUR subsequently took out both 1.0655 and 1.0615, it rebounded strongly from 1.0611 to end the day higher by 0.24% (1.0694). Downward momentum has waned somewhat with the strong rebound and the likelihood of a sustained decline in EUR below 1.0615 is not high. That said, only a breach of 1.0740 (‘strong resistance’ level was at 1.0760 last Friday) would indicate that the current downward pressure.”
- NZD/USD struggles to extend the corrective bounce off six-week low.
- Sluggish sentiment, mixed headlines and US holiday challenge Kiwi pair buyers.
- RBNZ Shadow Board expects 0.50% rate hike but NZ FinMin cites inflation as the key catalysts.
- Fed hawks need confirmation from FOMC Minutes, second-tier data.
NZD/USD seesaws around 0.6240 as it struggles to push back the bearish bias after a four-day losing streak, keeping the bounce off a six-week low during early Monday morning in Europe. In doing so, the Kiwi pair portrays the traders’ cautious mood ahead of the key Reserve Bank of New Zealand (RBNZ) monetary policy meeting and the Minutes of the latest Federal Open Market Committee (FOMC) Monetary Policy Meeting.
Earlier in Asia, the RBNZ's Shadow Board recommended 50 basis points (bps) of an increase in the benchmark cash rate by citing strong inflationary pressures. On the same line could be the latest comments from New Zealand (NZ) Deputy Prime Minister and Finance Minister (FinMin) Grant Robertson who said that the RBNZ has a responsibility to address inflation while also adding, “RBNZ needs to look through current events.”
It’s worth noting that the flood in New Zealand joins recent downside economic indicators for the Pacific nation to probe the RBNZ hawks.
Also challenging the NZD/USD bulls are the geopolitical fears emanating from the US-China tussles, recently about the Taiwan trade deal with Washington and Beijing’s ties with Russia.
On a different page, upbeat US data and mixed comments from the Federal Reserve (Fed) officials seemed to have triggered the NZD/USD pair’s corrective bounce off the multi-day low. Also allowing the Kiwi pair traders to push back the bears is the US holiday.
Looking forward, natural calamities and the recent weakness in Auckland’s data may probe the RBNZ hawks. However, this week’s 0.50% rate hike is almost given and may not impress the NZD/USD bulls unless offering hints for further strong rate increases.
Following the RBNZ meeting, the Fed Minutes will also be crucial for clear directions as the US central bank officials have recently praised the upbeat data surrounding inflation, Retail Sales and jobs.
Technical analysis
Sustained downside break of the 200-day Exponential Moving Average (EMA), around 0.6275 by the press time, keeps NZD/USD bears hopeful of breaking the three-month-old support line, close to 0.6220 at the latest.
- AUD/USD has touched a high of 0.6900 as the USD Index has surrendered its morning gains.
- Persistent inflation in the United States has bolstered the odds of more interest rate hikes by the Federal Reserve ahead.
- The minutes from the Reserve Bank of Australia might remain hawkish for further guidance as inflation has still not peaked yet.
- AUD/USD has negated the downside break of the H&S pattern and has shifted into a bullish trajectory.
AUD/USD touched the round-level resistance of 0.6900 in the early European session. The Aussie asset has been strengthened as investors have shrugged-off uncertainty associated with US-China tensions and the launch of three projectiles from North Korea near Japan’s Exclusive Economic Zone (EEZ).
The US Dollar Index (DXY) has surrendered its entire gains added in the Asian session and is looking to continue its downside journey ahead. Meanwhile, the risk appetite theme has regained traction, which is supporting the risk-perceived assets. S&P500 futures have turned volatile ahead of the market holiday on account of Presidents’ Day.
People’s Bank of China maintains the status quo on interest rates
The Australian Dollar remained in action after the People’s Bank of China (PBoC) kept its monetary policy unchanged. An interest rate decision of unchanged policy was widely anticipated as the Chinese economy is focusing on accelerating the economic recovery after remaining bound by pandemic controls.
The People’s Bank of China has kept one-year and five-year Loan Prime Rates (LPR) unchanged at 3.65% and 4.30% respectively. It is worth noting that Australia is a leading trading partner of China and the continuation of expansionary monetary policy by the People’s Bank of China will strengthen the Australian Dollar ahead.
Fresh concerns for higher US Inflation call for more rates by the Fed
Last week, a majority of economic indicators cleared that it would be early for the Federal Reserve to announce a win in the battle against stubborn inflation as it is set to surprise the market ahead. The United States Consumer Price Index (CPI) landed higher at 6.4% than the projections of 6.2%, Producer Price Index (PPI) released at 6.0% higher than the consensus of 5.4%. And, the release of the monthly Retail Sales data at 3.0% against the consensus of 1.8% was the last nail in the coffin, which cleared that consumer spending is gaining traction.
A note from Goldman Sachs states the investment banking firm expects the U.S. Federal Reserve to raise interest rates three more times this year, lifting their estimates after data pointed to persistent inflation and a resilient labor market, as reported by Reuters.
Spotlight shifts to Reserve Bank of Australia and Federal Reserve’s minutes
This week, the release of the minutes from the Reserve Bank of Australia and Federal Reserve’s and Federal Reserve will lead from the front for the power-pack action in the Aussie asset. Federal Reserve policymakers are aware of the persistent nature of the US inflation, which is why hawkish guidance is expected on interest rates.
The minutes from the Reserve Bank of Australia policy announced in the first week of February resulted in a ninth consecutive interest rate hike to 3.35%. Inflationary pressures in the Australian economy have not softened yet amid solid consumer spending, which is bolstering the case of hawkish guidance on the monetary policy.
Later this week, Australia’s Labor Cost Index (Q4) data will remain in focus. The economic data is seen at 3.4% vs. the prior release of 3.1% on an annual basis. And, the quarterly data is seen lower at 0.7% against the prior release of 1.0%.
AUD/USD technical outlook
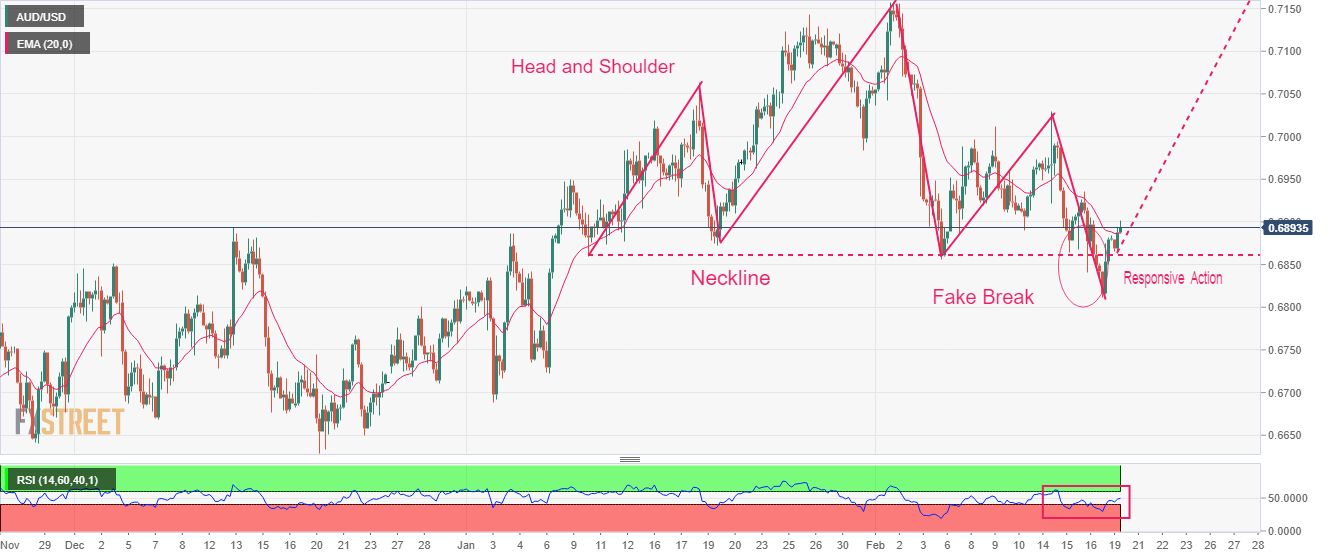
AUD/USD has negated the downside break of the Head and Shoulder chart pattern formed on a four-hour scale. The responsive buying active from the market participants has pushed the Aussie asset above the neckline of the aforementioned chart pattern plotted from January 10 low at 0.6860. The asset has scaled above the 20-period Exponential Moving Average (EMA) at 0.6888, which indicates that the short-term trend is bullish now.
The Relative Strength Index (RSI) (14) has rebounded into the 40.00-60.00 range, which indicates that the asset is no more bearish now.
- USD/CAD remains pressured after retreating from six-week high.
- Upbeat oscillators, sustained trading beyond 50-DMA keep buyers hopeful.
- Convergence of 100-DMA, four-month-old descending resistance line challenge buyers.
USD/CAD bulls take a breather around 1.3480, following the run-up to refresh the monthly high, as the upside momentum failed to cross the key resistance confluence the previous day.
Even so, the Loonie pair remains on the buyer’s radar on early Monday as it defends the previous week’s upside break of the 50-DMA, close to 1.3465 at the latest.
It’s worth mentioning that the 50-DMA breakout joins the bullish MACD signals, as well as the upbeat RSI (14), not overbought, to keep the USD/CAD buyers hopeful.
That said, a one-week-old ascending support line, near 1.3440 by the press time, adds to the short-term downside filters for the USD/CAD pair traders to watch on the break of the 50-DMA.
Following that, a three-month-old ascending support line, around 1.3280 as we write, becomes crucial to follow as it holds the key to the Loonie pair’s slump towards the 1.3000 psychological magnet.
Meanwhile, an upside clearance of the 1.3520 resistance confluence enables the USD/CAD buyers to aim for the previous monthly high of 1.3685.
In case where the quote remains firmer past 1.3685, the last December’s peak of 1.3705 may act as an extra check for the USD/CAD bulls before directing them to the October 2022 high surrounding 1.3980, as well as the 1.4000 round figure.
To sum up, USD/CAD remains on the bull’s radar unless breaking 1.3440 support.
USD/CAD: Daily chart
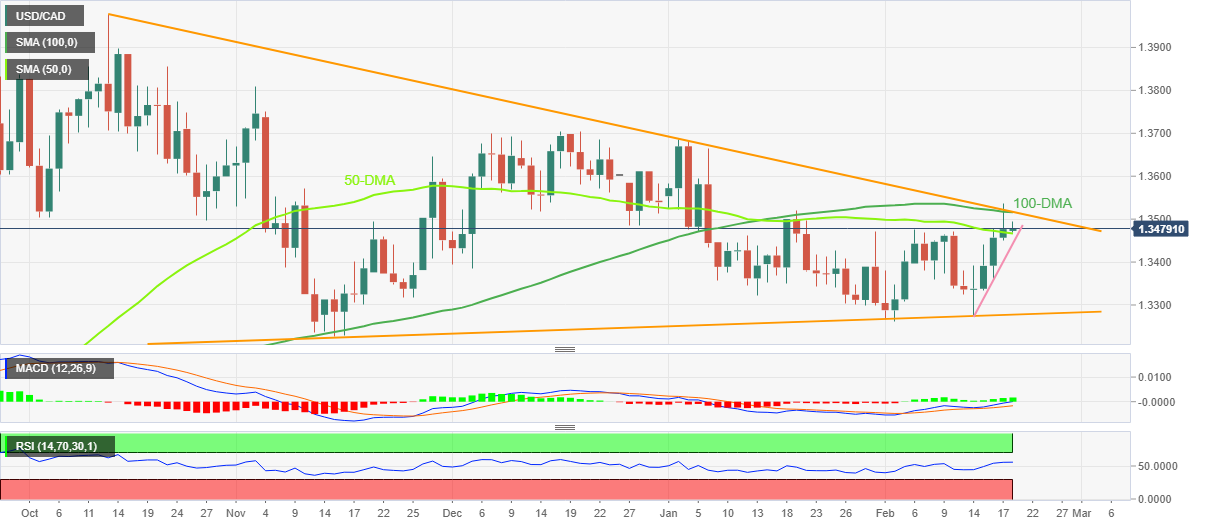
Trend: Further upside expected
New Zealand (NZ) Deputy Prime Minister and Finance Minister Grant Robertson said on Monday that the “Reserve Bank of New Zealand (RBNZ) has a responsibility to address inflation.”
“RBNZ needs to look through current events,” Roberston added.
The RBNZ is scheduled to meet this Wednesday for its policy decision, with uncertainty around a 50 bps or 25 bps rate hike looming, in the face of the recent flooding and cyclone disasters.
Market reaction
Amidst a mixed market mood, NZD/USD remains depressed below 0.6250 so far this Monday. The spot is down 0.07% on the day.
- USD/MXN takes offers to refresh intraday low, mildly offered near the lowest levels since April 2018.
- US Dollar retreat adds strength to the bearish bias amid sluggish session.
- Risk-off mood, downbeat Oil prices put a floor under the Mexican Peso price.
- FOMC Meeting Minutes, Mexican Q4 GDP eyed for fresh impulse.
USD/MXN remains pressured around the lowest level in nearly five years as it drops to $18.33 during early Monday, keeping Friday’s fall to the multi-day bottom during a three-day downtrend.
In doing so, the Mexican Peso (MXN) pair cheers the retreat in the US Dollar amid a light calendar and the US holidays. Adding strength to the lackluster moves could be the cautious mood ahead of this week’s top-tier data from the US and Mexico, as well as mixed headlines surrounding the geopolitical risks emanating from Russia, China and North Korea.
Market sentiment dwindles as the Federal Reserve (Fed) hawks take a breather ahead of Wednesday’s Federal Open Market Committee (FOMC) Meeting Minutes. Also, Japan’s calling of the United Nations (UN) Security Council meeting to address the threats issued by North Korea joins the recent tension between the US and China over Taiwan seems to weigh on the risk profile and put a floor under the US Dollar.
On the other hand, an absence of US and Canadian traders allows the bond bears to take a breather and hence trigger the USD/MXN weakness.
It’s worth noting that Banxico’s surprise 0.50% rate hike propelled the USD/MXN moves earlier in February. However, the USD/MXN traders will look for this week’s fourth quarter (Q4) Mexican Gross Domestic Product (GDP) data, up for publishing on Friday, for clear directions. Should the Mexican economy marks welcome growth figures, the odds of witnessing the pair’s slump towards $18.00 can’t be ruled out.
Also important to note is that the Mexican economy relies on Oil exports and the hopes of higher economic recovery in China keep energy buyers hopeful, which in turn weighs on the USD/MXN prices.
Elsewhere, better-than-forecast prints of the US Consumer Price Index (CPI) and Retail Sales followed the previously flashed upbeat readings of employment and output data and propelled the US Treasury bond yields, as well as the US Dollar. On the same line could be the hawkish Federal Reserve (Fed) comments and the risk-negative catalysts mentioned above. However, the Fed’s pivot discussions aren’t off the table, which in turn highlights Wednesday’s Fed Minutes for clear directions.
Technical analysis
Unless providing a daily close beyond a 6.5-month-old descending resistance line, around $18.45 by the press time, USD/MXN buyers remain off the table.
- EUR/USD is looking to reclaim 1.0700 amid a recovery in the market mood.
- The USD Index has refreshed its day’s low at 103.58 as the geopolitical tensions-inspired volatility has faded away.
- Goldman Sachs expects the Fed to raise interest rates three more times this year.
The EUR/USD pair has attempted a recovery after dropping to near 1.0673 in the early European session. The major currency pair is looking to reclaim the round-level resistance of 1.0700 as the risk aversion theme has lost its traction. Investors have ignored the US-China tensions and North Korea’s missile attacks near Japan’s Exclusive Economic Zone (EEZ) region. However, the United States (UN) Securities Council is holding a meeting to discuss North Korea’s action after Japan urged the former.
S&P500 futures have recovered their entire losses despite volatility ahead of Monday’s holiday on account of Presidents’ Day. The 500-US stocks basket ended the week on a mixed note as investors digested renewed fears of inflation recovery. Meanwhile, the US Dollar Index (DXY) has refreshed its day’s low at 103.58 as the geopolitical tensions-inspired volatility has faded away. The USD Index is looking to test Friday’s low around 103.50.
For further guidance, investors have shifted their focus toward the release of the Federal Open Market Committee (FOMC) minutes, which will release on Wednesday. The market participants will keenly watch for the inflation projections and cues related to March’s monetary policy.
Considering the fresh rise in January’s Retail Sales data, the Federal Reserve (Fed) is expected to remain hawkish ahead and might push interest rates to 5% region. A recovery in consumer spending could be offset by restrictive monetary policy. A note from Goldman Sachs states the investment banking firm expects the U.S. Federal Reserve to raise interest rates three more times this year, lifting their estimates after data pointed to persistent inflation and a resilient labor market, as reported by Reuters.
On the Eurozone front, investors are focusing on the S&P Global PMI numbers, which will release on Tuesday. The Manufacturing PMI is seen higher at 49.3 against the former release of 48.8. While the Services PMI is expected to improve to 51.1 from the prior release of 50.8.
- USD/INR renews intraday low, after four-week uptrend, on technical breakdown.
- Downbeat oscillators add strength to the fall targeting 100-SMA, 200-SMA.
- Weekly descending trend line adds to the upside filters.
USD/INR takes offers to refresh intraday low near 82.65 during the initial Indian trading session on Monday.
In doing so, the Indian Rupee (INR) pair justifies the early day’s downside break of a one-month-old ascending trend line to print the first daily loss after witnessing four consecutive weeks of a run-up.
Not only the trend line breakdown but the bearish MACD signals and the downbeat RSI (14), not oversold, also signals the INR pair’s further downside towards the 100-SMA, close to 82.40 by the press time.
However, the 200-SMA level surrounding the 82.00 round figure could challenge the USD/INR bears afterward.
In a case where the USD/INR pair remains bearish past the 82.00 threshold, the late January’s swing high near 81.80 could act as the last defense of the pair buyers.
On the flip side, recovery moves need to cross the previous support line from January 23, close to 82.75, to recall the USD/INR buyers.
Even so, a one-week-old descending trend line could challenge the recovery moves near the 82.85 hurdle.
Should the USD/INR bulls remain dominant past 82.85, an upward-sloping resistance line from February 07, close to 83.15 at the latest, may lure the pair buyers.
Overall, USD/INR is likely to decline further but the downside room appears limited.
USD/INR: Four-hour chart
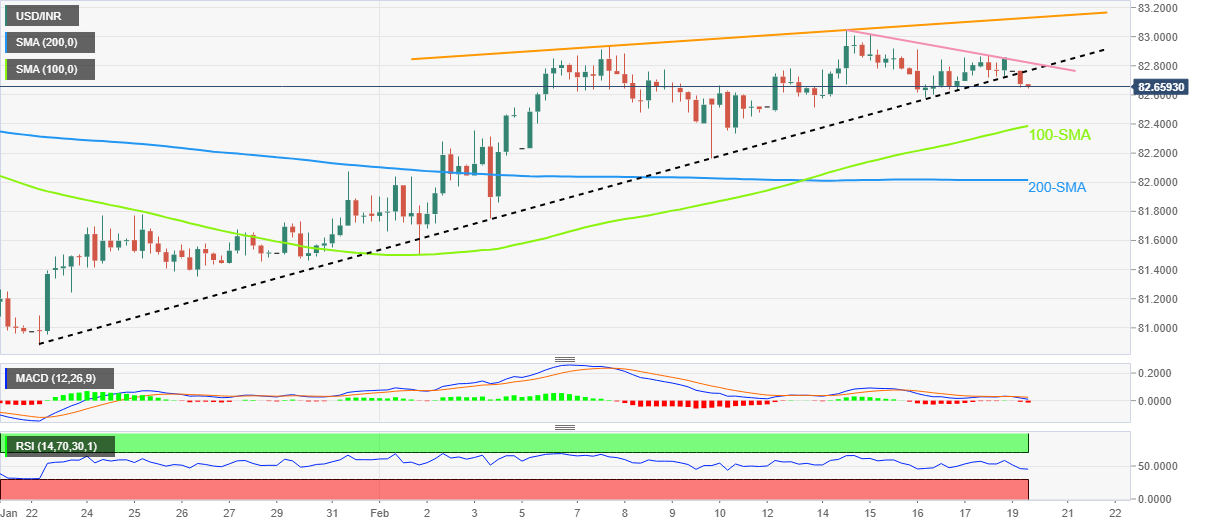
Trend: Further downside expected
- USD/JPY is looking to hold its feet as USD Index struggles to extend recovery.
- The US Dollar is not getting enough strength despite the risk-off market mood.
- The asset has comfortably established above the mighty 200-period EMA, which indicates more upside ahead.
The USD/JPY pair has sensed barricades while extending its recovery above the critical resistance of 134.50 in the Asian session. The asset is expected to display a range extension towards the north as the overall market mood is quite downbeat amid the US-China geopolitical tensions and three missile launches near Japan’s Exclusive Economic Zone (EEZ) region. In response to that, the United States (UN) Security Council is scheduled to hold a meeting on North Korean missile launches.
S&P500 futures have recovered the majority of losses, however, investors are unable to build confidence in channelizing funds into risk-perceived assets. The US Dollar Index (DXY) has slipped after struggling to sustain above 103.70.
The novel leadership of the Bank of Japan (BoJ) provided to academician Kazuo Ueda is equipped full of challenges as Japan’s government is expecting a transition in the decade-long expansionary monetary policy. Bloomberg reported that BoJ watchers are flagging the outside risk that Governor Haruhiko Kuroda may surprise international markets one last time next month with adjustments to smooth the transition process for his nominated successor Kazuo Ueda.
USD/JPY has sensed selling interest while attempting to surpass the horizontal resistance plotted from January 6 high at 134.77. A confident test of the aforementioned resistance is indicating that the asset is in a transition process and is highly expected to deliver a bullish reversal.
The asset has comfortably established above the mighty 200-period Exponential Moving Average (EMA) at 132.00, which indicates more upside ahead.
Meanwhile, the Relative Strength Index (RSI) (14) has demonstrated a range shift structure. The RSI (14) has shifted its structure from the bearish segment of 20.00-60.00 to the bullish arena of 40.00-60.00, in which the 40.00 will act as a support for the US Dollar bulls.
A confident break above Friday’s high at 134.90 will drive the asset toward December 16 low at 135.90. A break above the same will expose the asset to December 13 high around 138.00.
On a contrary, if the asset breaks February 2 low around 128.08, Japanese Yen bulls will drag the asset toward January 16 low at 127.27 followed by May 24 low at 126.36.
USD/JPY four-hour chart
-638124624864921669.png)
- Gold price remains sidelined after three-week downtrend, picking up bids of late.
- Geopolitical fears fail to weigh on XAU/USD price amid absence of US, Canadian traders.
- Headlines surrounding North Korea, China will be crucial for fresh impulse, Fed Minutes become the key.
Gold price (XAU/USD) grinds higher around the intraday top, reversing the early-day losses, as the US Dollar bulls take a breather amid the US holiday on Monday. In doing so, the yellow metal snaps a three-week downtrend amid the inactive markets heading into the European session.
US Dollar Index (DXY) retreats from its intraday high but stays mildly bid near 104.00 following a three-week winning streak. The greenback’s gauge versus six major currencies previously cheered upbeat US Treasury bond yields and upbeat US data but mixed comments from the Federal Reserve (Fed) officials seemed to have weighed on the Gold price on Friday.
Recently, Japanese Prime Minister (PM) Fumio Kishida pushes for an emergency United Nations (UN) Security Council meeting amid growing fears from North Korea after the hermit kingdom fired two ballistic missiles towards Tokyo, both of which landed outside Japan's EEZ.
On the same line is the failure of the latest meeting between US Secretary of State Antony Blinken and China's top diplomat Wang Yi seemed to restore US-China ties. The reason could be linked to a Chinese diplomat’s comments saying that the US must change course and repair the damage done to Sino-US ties by indiscriminate use of force.
It should be noted that the People’s Bank of China’s (PBOC) inaction joins the holidays in the US and Canada to restrict XAU/USD moves.
Amid these plays, the S&P 500 Futures print mild losses even as Wall Street closed mixed. It’s worth noting that the US 10-year Treasury bond yields rose to the highest levels since early November in the last week and helped the DXY to print a three-week uptrend.
Moving ahead, a light calendar and the absence of the key players can keep restricting immediate XAU/USD momentum. Even so, headlines surrounding Russia, China and North Korea will be crucial for intraday directions. Following that, Wednesday’s Federal Open Market Committee (FOMC) Meeting Minutes will be crucial to watch.
Gold price technical analysis
Gold price grinds near the top line of the two-week-old falling wedge bullish chart formation, following a successful bounce off a two-month-old horizontal support area.
The corrective bounce also takes clues from the bullish MACD signals and firmer RSI (14), not overbought.
As a result, confirmation of the bullish pattern, with an upside break of $1,845 hurdle, appears more likely an outcome. Following that, the 200-SMA level surrounding $1, 892 and the $1,900 threshold could challenge the XAU/USD bulls during the theoretical run-up toward $1,945.
Alternatively, the aforementioned horizontal support area near $1,823-22 precedes the stated falling wedge’s lower line, close to $1,819, to restrict the short-term downside of the Gold price.
In a case where the XAU/USD remains weak past $1,819, the odds of witnessing a slump toward $1,819 can’t be ruled out.
Gold: Four-hour chart
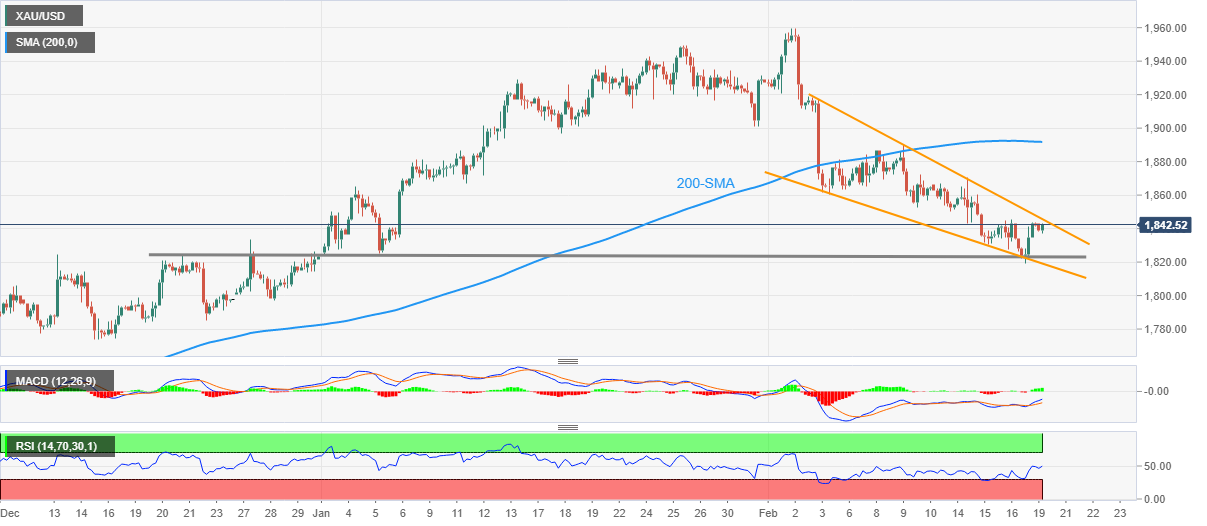
Trend: Further downside expected
Analysts at Citigroup recommended selling the USD/JPY pair on rallies above the 135.00 level amidst expectations of a hawkish Bank of Japan (BoJ) policy pivot.
Key quotes
"With the likelihood of a BoJ policy adjustment in April now lessening, US interest rates are rising and the USD are rebounding across the board, especially after the strong employment statistics released earlier this month. We expect the recovery in USDJPY to continue in the near term somewhat beyond the 135 level, for instance to around 137, largely a 38.2% Fibonacci retracement of the decline since October.”
"However, there will be the ongoing potential for downward pressure on USDJPY as long as the market remains wary of the risk of an eventual policy adjustment under the new BoJ troika. Once the US market finishes repricing the Fed's terminal interest rate at that time, the pair will turn downwards again and a new downtrend to start. On a timeline through around June, we expect a decline to about 125.”
- Asian indices are surviving the high-altitude geopolitical tensions-inspired tides.
- S&P500 futures have recovered a majority of the losses reported in the Asian session, portraying a recovery in the risk appetite theme.
- Chinese equities are solid after the PBoC kept the monetary policy unchanged.
Markets in the Asian domain have revived mildly after facing severe heat on Monday. S&P500 futures have recovered firmly after displaying significant losses in the Asian session, indicating the risk appetite of the market participants has recovered firmly. Asian indices were uneasy The warning from the US ambassador to the United Nations, Ambassador Linda Thomas-Greenfield, on Sunday that China would cross a “red line” if the country decides to provide lethal military aid to Russia for its invasion of Ukraine, is turning investors risk averse.
Things got quite volatile after the headlines of launching three projectiles from North Korea near Japan’s Exclusive Economic Zone (EEZ). Meanwhile, the United States (UN) Security Council is scheduled to hold a meeting on North Korean missile launches at 20:00 GMT this Monday, as reported by a Japanese media outlet, Jiji Press. This has come after Japanese Prime Minister Fumio Kishida urged the UN Security Council to hold a meeting on North Korean missiles.
At the press time, Japan’s Nikkei225 dropped 0.52%, Shanghai jumped 0.88%, Hang Seng added 0.37%, and KOSPI added 0.44%.
Chinese stocks have gained firmly after the People’s Bank of China (PBoC) left the interest rate policy unchanged. The one-year LPR was kept stable at 3.65% and the five-year LPR remained unchanged at 4.30%. The decision was widely anticipated by the market participants as the Chinese economy needs an expansion of stimulus to fuel the economic recovery after dismantling the pandemic controls.
On the oil front, oil prices have advanced to near $77.00 as the US Dollar Index (DXY) failed to extend recovery above 103.70 in the Tokyo session. Concerns for the downside pressure remain elevated as a fresh increase in the US inflation indicators is favoring more interest rate hikes by the Federal Reserve (Fed).
The Bank of Japan (BoJ) announced on Monday that it offers to purchase JPY1.75 trillion worth of Japanese government bonds (JGBs).
Key details
JPY425Bln 1-3 year.
JPY500 billion 3-5 year.
JPY675 billion 5-10 year.
JPY150 billion 25+ year.
According to the Japanese media outlet, Jiji Press, the United States (UN) Security Council is scheduled to hold a meeting on North Korean missile launches at 20:00 GMT this Monday.
This comes after Japanese Prime Minister Fumio Kishida urged the UN Security Council to hold a meeting on North Korean missiles.
South Korea’s military said on Monday, North Korea fired two ballistic missiles off its east coast, as the powerful sister of the North’s leader, Kim Jong-un, warned the isolated and nuclear-armed state could turn the Pacific into a “firing range”.
In response, the US geared up for their annual military exercises as part of efforts to ward off the growing nuclear and missile threat that the North poses.
Market reaction
The US S&P 500 futures are down 0.10% on the day while the Asian stocks are recovering ground after a negative open to the week. The US Dollar Index has paused its recovery, although defends 104.00 so far this Monday.
- GBP/JPY remains mildly bid during sluggish session, retreats from intraday high.
- Fresh Brexit woes join fears emanating from China, North Korea to weigh on GBP/JPY price.
- Upbeat yields, easing hawkish concerns surrounding BoJ propel prices.
GBP/JPY grinds higher around 161.60 during early Monday, struggles to extend intraday gains amid dicey markets. In addition to the sluggish sentiment, geopolitical fears emanating from China and North Korea, as well as Brexit woes, also probe the cross-currency buyers. Even so, upbeat US Treasury bond yields and easing hawkish bias about the Bank of Japan (BoJ) seem to put a floor under the Yen price.
Japanese Prime Minister (PM) Fumio Kishida pushes for an emergency United Nations (UN) Security Council meeting amid growing fears from North Korea after the hermit kingdom fired two ballistic missiles towards Tokyo, both of which landed outside Japan's EEZ.
Elsewhere, the failure of the latest meeting between US Secretary of State Antony Blinken and China's top diplomat Wang Yi seemed to restore US-China ties. The reason could be linked to a Chinese diplomat’s comments saying that the US must change course and repair the damage done to Sino-US ties by indiscriminate use of force. On the same line, US ambassador to the United Nations, Ambassador Linda Thomas-Greenfield, said Sunday that China would cross a “red line” if the country decided to provide lethal military aid to Russia for its invasion of Ukraine.
It should be noted that the US 10-year Treasury bond yields rose to the highest levels since early November in the last week, before retreating to 3.82%, as hawkish concerns surrounding the US Federal Reserve’s (Fed) next move underpin recession woes.
On the contrary, hawkish bias from the Bank of Japan’s (BoJ) new policy board seemed to have faded of late as the key diplomat from Tokyo, including Japan PM Kishida, indirectly unveiled their expectations of BoJ’s easy money policy’s extension.
Additionally, the Telegraph came out with the news suggesting a fresh Brexit blow as it said, “UK PM Rishi Sunak forced to ‘pause’ protocol deal amid backlash from senior Tories and DUP.” It should be noted that the British media previously raised expectations of the much-awaited Brexit deal in Northern Ireland. On the same line, EU Commissioner for Interinstitutional Relations and Foresight Maroš Šefčovič said on Friday that they made good progress in Brexit talks with British Foreign Secretary James cleverly, as reported by Reuters.
Given the off in the US and Canada and a light calendar, the GBP/JPY pair may witness further hardships in trading ahead of the first readings of the UK’s February month PMIs, up for publishing on Tuesday.
Technical analysis
GBP/JPY remains bullish between the 21-day and 200-day Exponential Moving Average (EMA), currently around 160.30 and 161.85 at the latest.
| Raw materials | Closed | Change, % |
|---|---|---|
| Silver | 21.759 | 0.96 |
| Gold | 1842.07 | 0.37 |
| Palladium | 1498.45 | -0.58 |
Amidst reports that the weekend meeting between China’s Director of the Office of the Central Foreign Affairs Commission Wang Yi and US Secretary of State Antony Blinken in Germany was not very encouraging, there are chatters doing the rounds that the US and Taiwan may sign a bilateral trade agreement earlier than expected this year.
There is no official statement about the same.
Over the weekend, Blinken said the US has information that China is considering sending weapons to Russia for the war in Ukraine.
Market reaction
The market remains on tenterhooks but AUD/USD shows resilience by trading 0.17% higher on the day at 0.6890, as of writing.
- GBP/USD takes offer to refresh intraday low, fades bounce off six-week low.
- Bearish MACD signals, sustained trading below the previous key support lines keep sellers hopeful.
- 200-DMA, 100-DMA restrict Cable pair’s short-term downside ahead of January’s low.
GBP/USD bears return to the desk, after the previous day’s absence, as they approach the 1.2000 psychological manget, down 0.20% intraday near 1.2020 during early Monday.
In doing so, the Cable pair retreats from the previous support line stretched from early January amid the bearish MACD signals. it’s worth noting that the quote’s failure to cross the support-turned-resistance line from November 09, 2022, adds strength to the downside bias.
With this, the GBP/USD bears are all set to revisit the 200-DMA support surrounding 1.1940. However, the 1.2000 psychological magnet could act as immediate downside support.
Following that, the 100-DMA, close to the 1.1900 round figure, may become the last defense of the GBP/USD bulls before giving control to the bears, who can aim for January’s low of 1.1840 during the further downside.
Meanwhile, the GBP/USD pair’s run-up beyond the immediate resistance line, previous support near 1.2055, isn’t the confirmation of further advances as a 3.5-month-old previous support line, close to 1.2300, could challenge the buyers afterward.
Should the quote remains firmer past 1.2300, the monthly high near 1.2400 and the double tops marked around 1.2450 will be crucial to watch.
GBP/USD: Daily chart
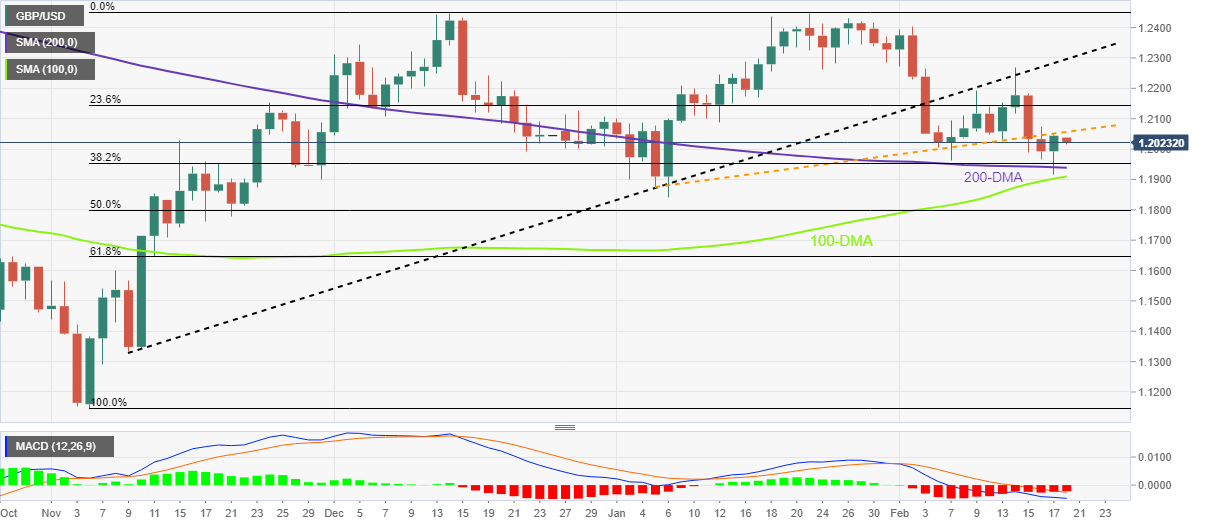
Trend: Further downside expected
- USD/CAD reverses the previous day’s pullback from seven-week high despite US, Canada holidays.
- Geopolitical tension weighs on sentiment and underpins the US Dollar’s haven demand.
- Hawkish Fed versus dovish BoC talks add strength to the upside momentum.
USD/CAD picks up bids to reverse Friday’s corrective move from a 1.5-month high, up 0.08% intraday near 1.3490 during the five-day uptrend to early Monday.
The Loonie pair’s latest gains could be linked to the downbeat prices of Canada’s main export item, namely WTI Crude Oil, as well as the market’s risk-off mood that favors the US Dollar’s demand. It’s worth noting, however, that the holiday in the US and Canada restricts immediate moves of the quote amid a sluggish Asian session.
That said, WTI crude oil prints a six-day downtrend near $76.50 as the US Dollar’s strength joins an increase in the US crude oil stockpile and growing fears of faster Fed rate hikes.
Elsewhere, Japanese Prime Minister (PM) Fumio Kishida pushes for an emergency United Nations (UN) Security Council meeting amid growing fears from North Korea after the hermit kingdom fired two ballistic missiles towards Tokyo, both of which landed outside Japan's EEZ. On the same line is the failure of the latest meeting between US Secretary of State Antony Blinken and China's top diplomat Wang Yi seemed to restore US-China ties. The reason could be linked to a Chinese diplomat’s comments saying that the US must change course and repair the damage done to Sino-US ties by indiscriminate use of force. On the same line, US ambassador to the United Nations, Ambassador Linda Thomas-Greenfield, said Sunday that China would cross a “red line” if the country decided to provide lethal military aid to Russia for its invasion of Ukraine.
Talking about the central banks, the better-than-forecast prints of the US Consumer Price Index (CPI) and Retail Sales followed the previously flashed upbeat readings of employment and output data helped the Federal Reserve (Fed) policymakers to remain hawkish. On the other hand, the Bank of Canada (BoC) officials showed readiness to pause the rate hikes by citing the negative implications for the economy.
Against this backdrop, the S&P 500 Futures print mild losses even as Wall Street closed mixed. It’s worth noting that the US 10-year Treasury bond yields rose to the highest levels since early November in the last week and helped the DXY to print a three-week uptrend.
Moving on, a light calendar and off in the US, as well as Canada, could restrict immediate moves ahead of Tuesday’s BoC CPI and Wednesday’s Federal Open Market Committee (FOMC) Meeting Minutes. Should the Fed policymakers remain hawkish and the Canada inflation number slows, the USD/CAD can witness further upside.
Technical analysis
A daily closing beyond the four-month-old resistance line, close to 1.3515 by the press time, becomes necessary for the USD/CAD bulls to keep the reins.
Japan's Prime Minister Fumio Kishida has stated that he is requesting a meeting of the United Nations Security Council on North Korean missiles.
This follows the earlier news of It was the first intercontinental ballistic missile test by North Korea since the beginning of the year.
The US responded on Sunday by flying bombers in a joint exercise with South Korea.
That North Korea said its latest missile test was meant to bolster Pyongyang’s “fatal” nuclear attack capabilities after US officials denounced the tests and announced joint military exercises with South Korea and Japan, as reported by The Hill.
“This launch needlessly raises tensions and risks destabilizing the security situation in the region,” US National Security Council spokesperson Adrienne Watson said.
“It only demonstrates that the DPRK continues to prioritize its unlawful weapons of mass destruction and ballistic missile programs over the well-being of its people,'' she added.
- NZD/USD is now in the corrective territory around 0.6200/50.
- The price has made a 61.8% Fibonacci retracement of the 4-hour bearish impulse.
- If the bulls keep control, then a breach of 0.6280 opens the risk of a run through 0.6300.
As per prior analysis, NZD/USD bears are waiting to move in to keep pressures on below 0.6300, the price dropped as per the forecast following the speculated trajectory as follows:
NZD/USD prior analysis
''Meanwhile, there are prospects of a move lower:
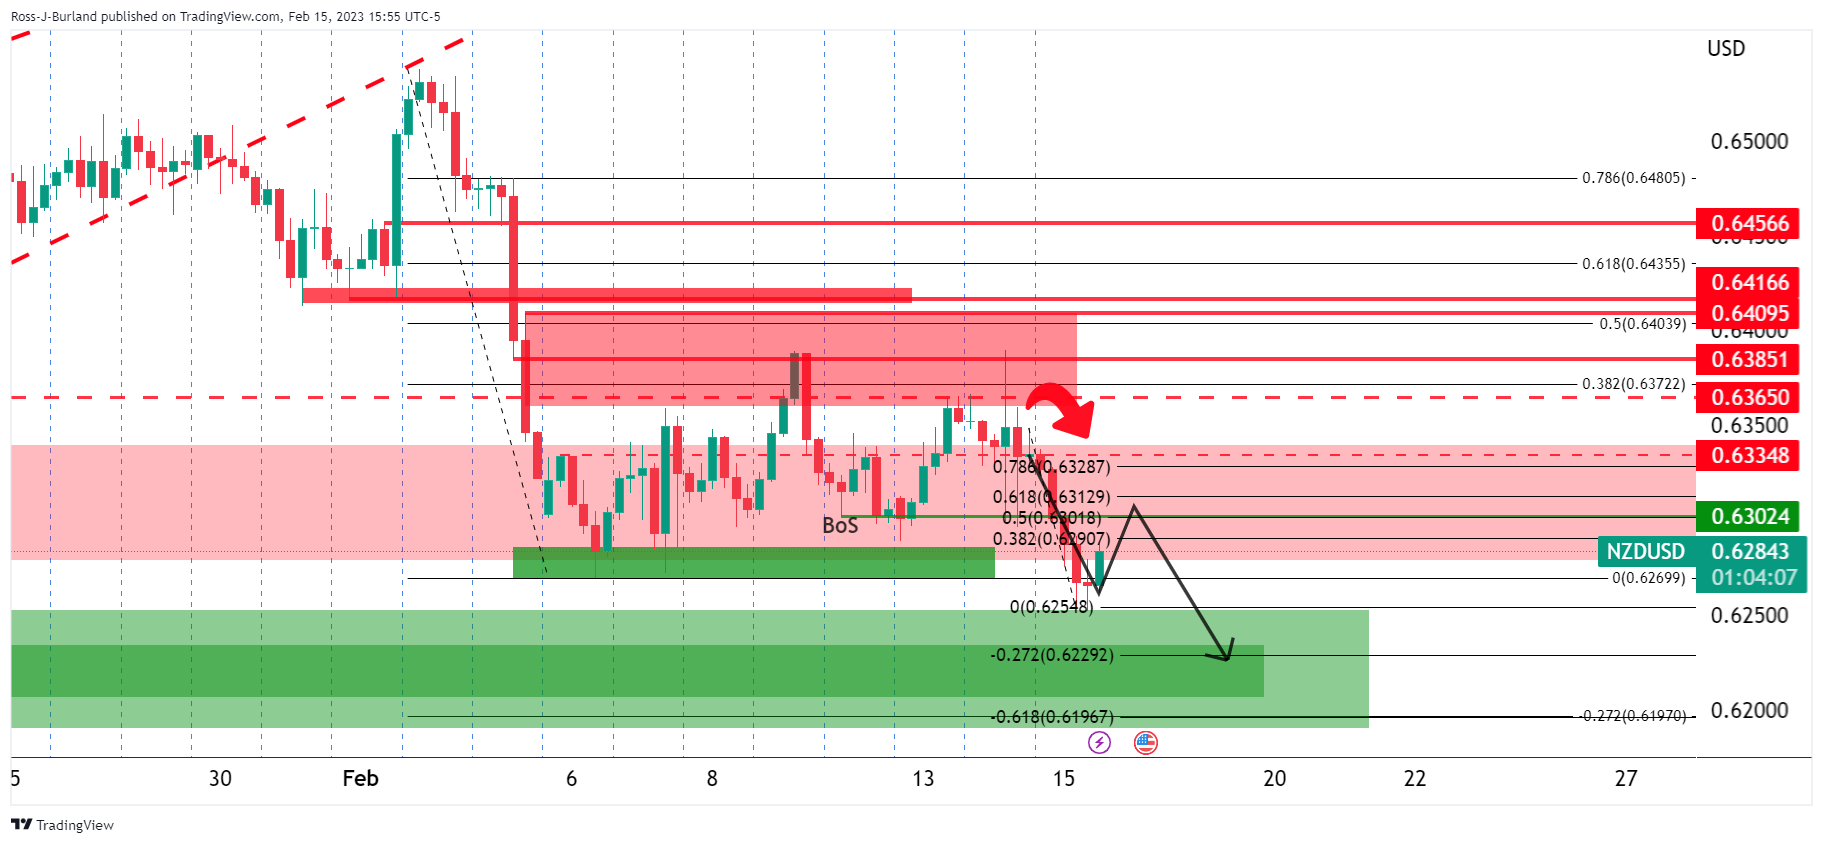
While below resistance, the odds are for a move into the low 0.62s following the break of structure. a correction is in process currently, but if bears commit, say below 0.6300, then a sell-off from the region of a 50%, 61.8% ratio could be on the cards for the day ahead.''
NZD/USD update
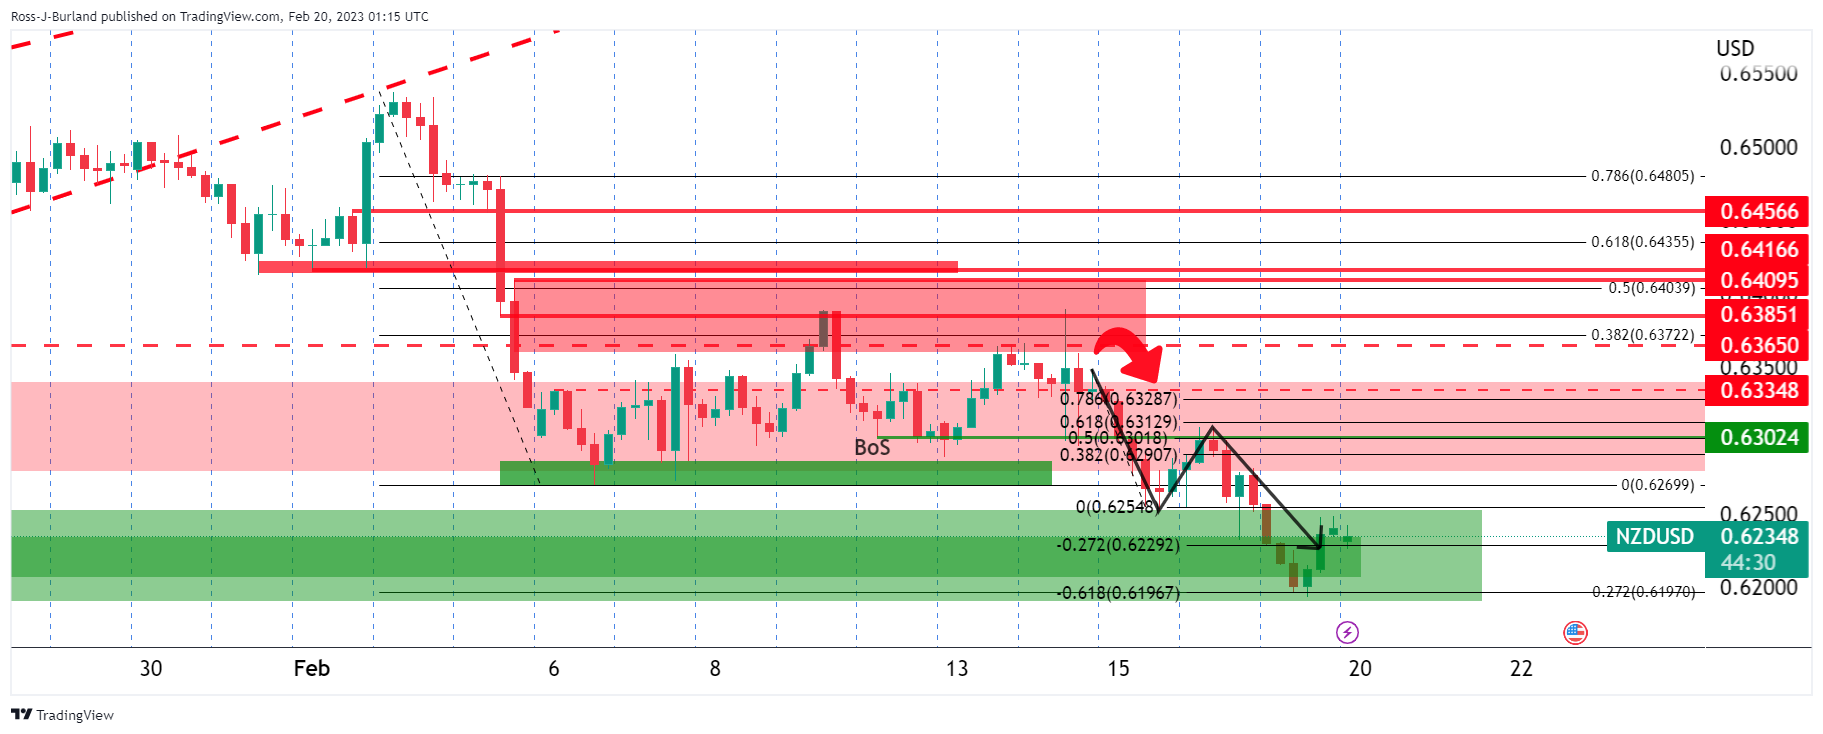
NZD/USD is now in the corrective territory around 0.6200/50 after reaching the -0.618% Fibonacci target area.
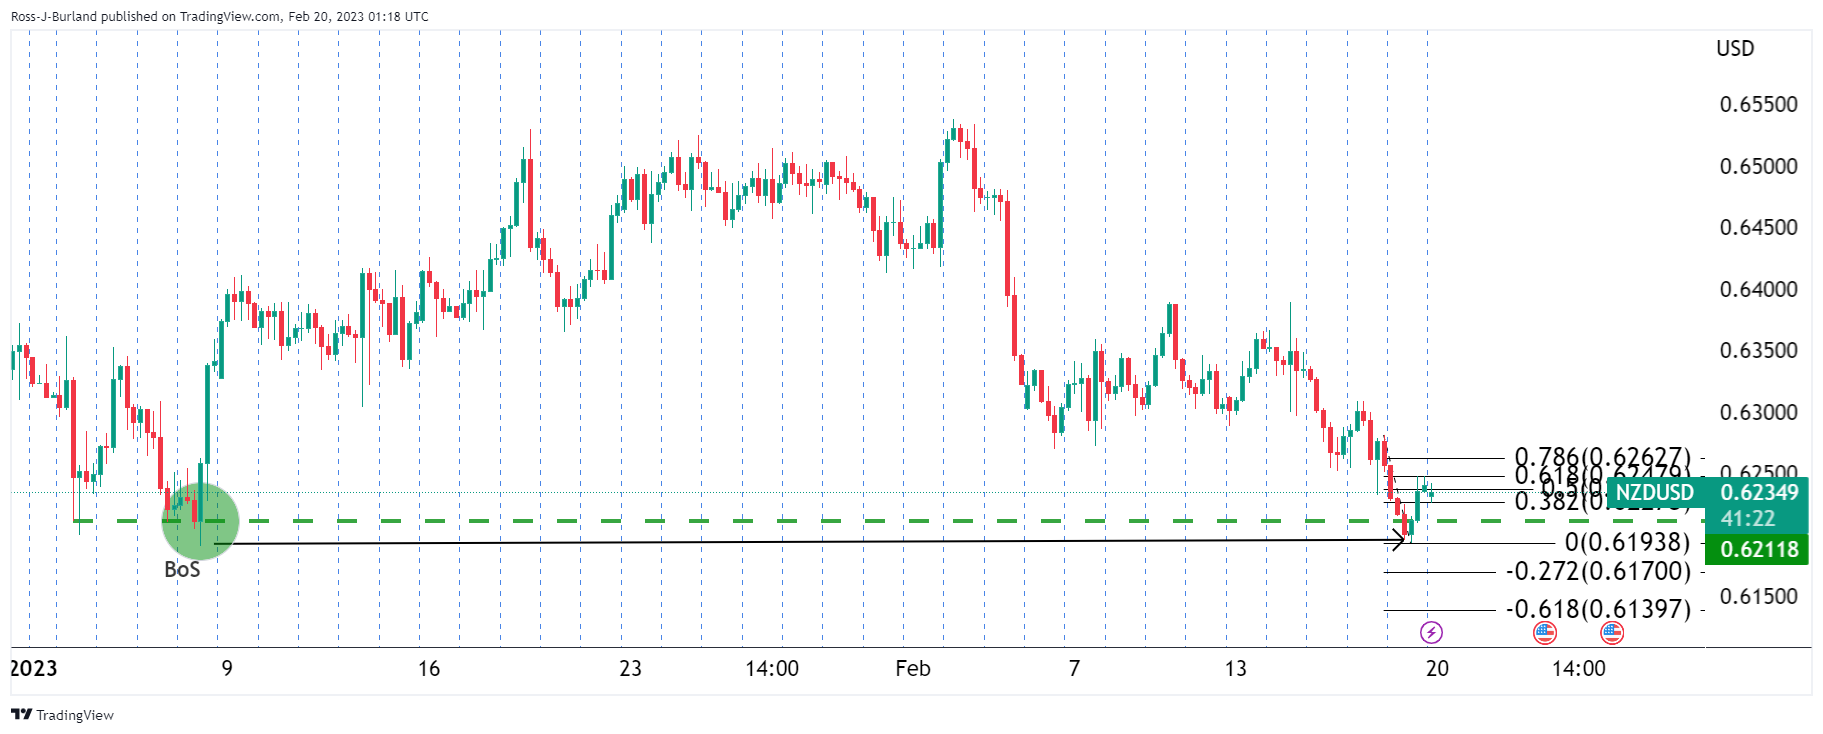
The price has made a 61.8% Fibonacci retracement of the 4-hour bearish impulse but has since started to decelerate. However, given the momentum in the correction, if the downside is to play out, it could be a staggard and slow process as the bears and bulls go head to head in a barroom brawl between the lows and 0.6250. If the bulls keep control, then a breach of 0.6280 opens the risk of a run through 0.6300 and from that point, things will start to look bullish towards 0.6400:
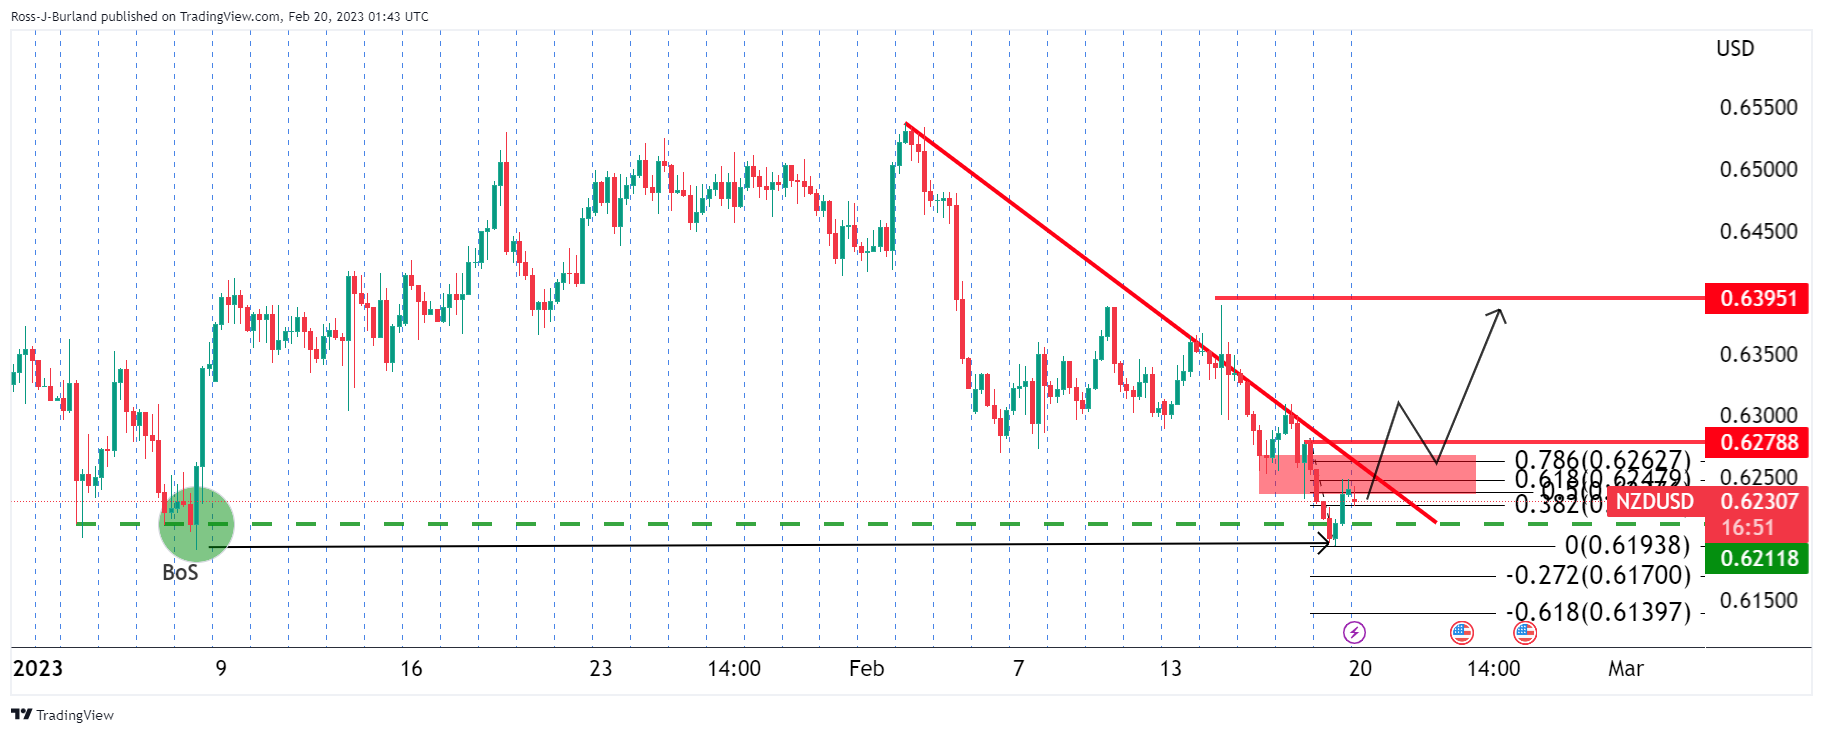
- EUR/USD fades bounce off seven-week-old horizontal support, retreats from 61.8% Fibonacci retracement level.
- RSI pullback favors the latest U-turn in Euro prices, suggesting further downside.
- Convergence of 50-SMA, monthly resistance line challenges buyers.
EUR/USD stays depressed around 1.0680-75 as it reverses the previous day’s corrective bounce during early Monday.
In doing so, the Euro pair retreats from the 61.8% Fibonacci retracement level of its January-February upside moves. The pullback also takes clues from the RSI’s (14) hesitance in rising further to favor sellers.
With this, the EUR/USD bears are all set to revisit the 1.0630-15 support area comprising multiple levels marked since early January 2023.
Following that, the 1.0600 and 1.0500 may entertain the EUR/USD sellers before directing them to the previous monthly low surrounding 1.0480. It should be noted that November’s top adds strength to the 1.0480 support.
Meanwhile, recovery moves may initially aim for the 61.8% Fibonacci retracement level surrounding 1.0700, also known as the golden Fibonacci retracement.
However, major attention will be given to a convergence of the 50-SMA and a downward-sloping resistance line from February 01, close to 1.0705-10.
In a case where EUR/USD remains firmer past 1.0710, the odds of witnessing a north-run towards the monthly high of 1.1033 can’t be ruled out.
That said, the previous weekly top of near 1.0800 acts as an extra filter to the north.
Overall, EUR/USD is likely to decline further, even as the downside room appears limited.
EUR/USD: Four-hour chart
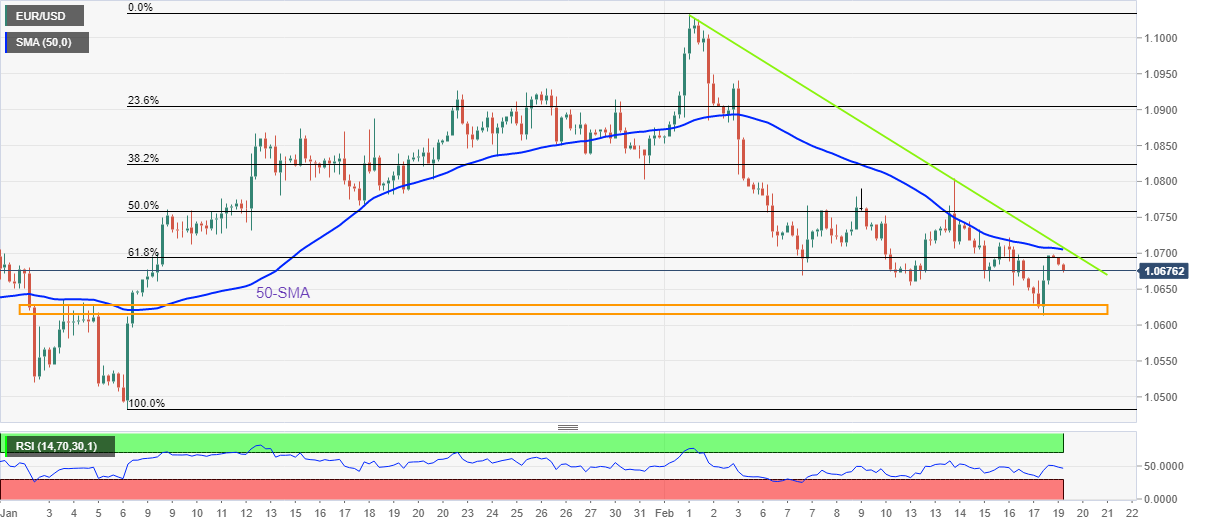
Trend: Further downside expected
- AUD/USD has printed a fresh daily high above 0.6880 as the PBoC has maintained the status quo.
- A higher Australian Labor Cost Index might create more troubles for the RBA ahead.
- The upside bias for the USD Index looks solid amid anxiety among the market participants due to US-China geopolitical tensions.
The AUD/USD pair has refreshed its day’s high above 0.6880 in the Asian session as the People’s Bank of China (PBoC) has kept the Loan Prime Rate (LPR) unchanged. The one-year LPR has kept stable at 3.65% and the five-year LPR is unchanged at 4.30%.
The PBoC was expected to maintain the status quo as the Chinese economy is on a path of recovery after rolling back the lockdown controls. Bloomberg reported, Goldman Sachs sees the potential for the MSCI China Index to reach 85 by the end of 2023, an increase of about 24% from current levels as the nation’s economic reopening delivers windfall profits for businesses.
It is worth noting that Australia is a leading trading partner of China and accelerating economic activities in China will support the Australian Dollar.
For further guidance, the Australian Dollar will focus on the release of the Labor Cost Index (Q4) data, which will release on Wednesday. The economic data is seen at 3.4% vs. the prior release of 3.1% on an annual basis. And the quarterly data is seen lower at 0.7% against the prior release of 1.0%. An increase in the employment cost data could strengthen the odds of a further interest rate hike by the Reserve Bank of Australia (RBA). Higher funds equipped by households would result in more consumer spending, which could accelerate Australian Consumer Price Index (CPI) further.
Meanwhile, the US Dollar Index (DXY) is struggling to stabilize above the 103.70 hurdle. The upside bias for the USD Index looks solid amid anxiety among the market participants due to US-China geopolitical tensions.
For the sixth month in a row, the People's Bank of China set the one- and five-year Loan Prime Rate (LPR) unchanged:
- 3.65% for the one-year.
- 4.30% for the five-year.
More to come..
In recent trade today, the People’s Bank of China (PBOC) set the yuan at 6.8643 compared with the last close of 6.8661.
The PBoC also set the LPR 1-year and 5-year both as unchanged and sold 270b Yuan in a 7-day reverse repo at 2% while injecting a net 224b Yuan.
About the fix
China maintains strict control of the yuan’s rate on the mainland.
The onshore yuan (CNY) differs from the offshore one (CNH) in trading restrictions, this last one is not as tightly controlled.
Each morning, the People’s Bank of China (PBOC) sets a so-called daily midpoint fix, based on the yuan’s previous day's closing level and quotations taken from the inter-bank dealer.
- Gold price has slipped below $1,840.00 amid the risk-off market mood.
- Escalating US-China tensions and the launch of projectiles from North Korea near Japan’s EEZ have supported the USD Index.
- Fed Bowman believes that the central bank has a long way to scale down inflation to 2%.
Gold price (XAU/USD) has slipped to near $1,837.90 after delivering a downside break of the consolidation formed in a narrow range of around $1,844.00 in the Asian session. The precious metal has been offered amid escalating geopolitical tensions between the United States and China and the launch of projectiles from North Korea near Japan’s Exclusive Economic Zone (EEZ).
Investors should brace for sheer volatility as the equity markets in the United States will remain closed on Monday due to Presidents’ Day. Meanwhile, S&P500 futures have slipped further amid rising expectations of the continuation of the restrictive policy stance by the Federal Reserve (Fed), portraying a decline in the risk-aversion theme.
The US Dollar Index (DXY) has scaled above 103.70 as investors are getting nervous that the higher-than-anticipated US Consumer Price Index (CPI), Producers Price Index (PPI), and monthly Retail Sales data have triggered the risk of a revival in the inflationary pressures.
Fed Governor Michelle Bowman said on Friday that they are seeing a lot of inconsistent data in economic conditions. He further added, the Fed has “A long way to go to get inflation back down to our goal."
Gold technical analysis
Gold price has rebounded after sensing a loss in the downside momentum on an hourly scale. The precious metal was continuously making lower lows while the Relative Strength Index (RSI) (14) made a higher low. The negative bullish divergence bolstered the case of a bullish reversal.
The Gold price has comfortably shifted its business above the 50-period Exponential Moving Average (EMA) at $1,836.42, which indicates that the short-term trend is bullish now.
Broadly, the Gold price is oscillating in a Falling Channel chart pattern. For a fresh upside, the Gold price needs to deliver a breakout of the chart pattern ahead.
Gold hourly chart
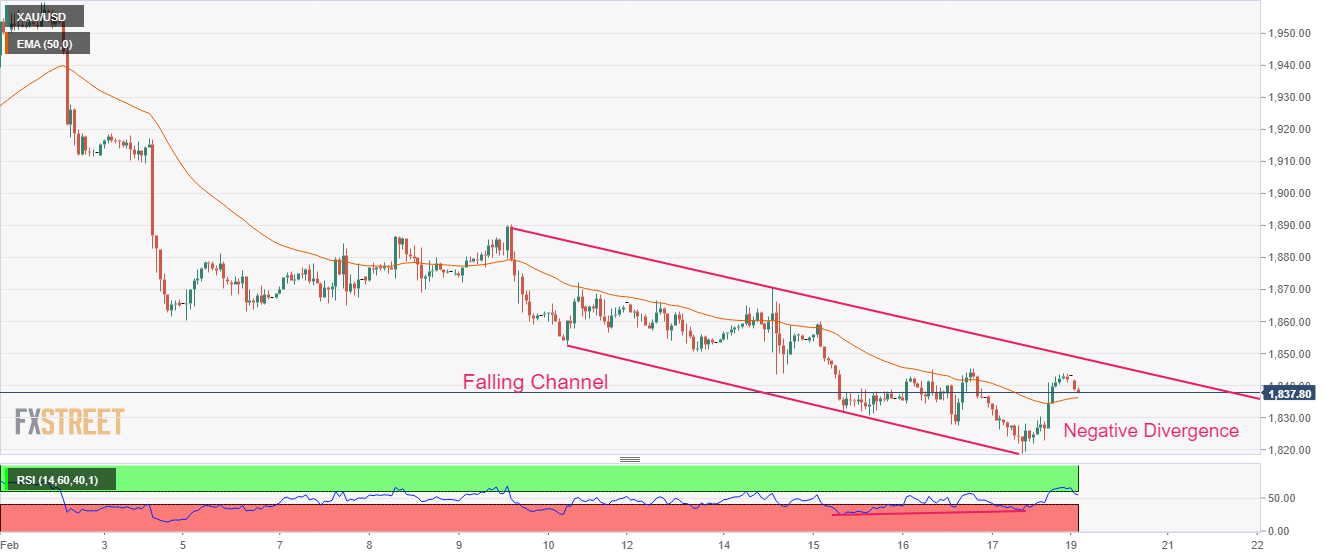
The Bank of America (BofA) recently added one more rate hike in its expectations from the Federal Reserve (Fed).
The investment bank cites the lack of a quick US economic slowdown, as most expected, as the key catalyst for expecting the third rate lift from the Fed during 2023.
Resurgent inflation and solid employment gains are other catalysts that helped BofA to signal the hawkish move.
It should be noted that the BofA sees the peak for Fed funds at 5.25 - 5.5% and a pause in the rate hike trajectory during July 2023 Federal Open Market Committee (FOMC) Meeting.
More importantly, the US bank sees the first rate cut in March of 2024.
Also read: US Dollar Index grinds near 104.00 amid US holiday, Fed Minutes, US GDP eyed
- USD/JPY picks up bids to refresh intraday high, reverses the pullback from nine-week top.
- Yields rally to two-month high as upbeat US data joins firmer Fed speak.
- Geopolitical concerns about China, Russia and North Korea recently weigh on sentiment.
- Off in the US, Canada restrict immediate moves amid a light calendar.
USD/JPY refreshes intraday high near the mid-134.00s as it picks up bids to reverse the previous day’s pullback from a multi-day high during early Monday. In doing so, the Yen pair portrays the broad US Dollar strength amid mildly downbeat sentiment and the holidays in the US and Canada.
That said, geopolitical concerns about China, North Korea and Russia have recently weighed on the market sentiment, even if the light calendar and absence of US/Canadian traders restrict the momentum.
During the weekend, North Korea fired two ballistic missiles toward Japan and renewed the fears that the hermit kingdom is up to something serious that can endanger the global economy, mainly due to the nature of the missiles fired as they both were termed as tactical nuclear attack weapons.
On the same line, the latest meeting between US Secretary of State Antony Blinken and China's top diplomat Wang Yi seemed to have failed in restoring the US-China ties. The reason could be linked to a Chinese diplomat’s comments saying that the US must change course and repair the damage done to Sino-US ties by indiscriminate use of force. On the same line, US ambassador to the United Nations, Ambassador Linda Thomas-Greenfield, said Sunday that China would cross a “red line” if the country decided to provide lethal military aid to Russia for its invasion of Ukraine.
Elsewhere, better-than-forecast prints of the US Consumer Price Index (CPI) and Retail Sales followed the previously flashed upbeat readings of employment and output data and propelled the US Treasury bond yields, as well as the US Dollar. On the same line could be the hawkish Federal Reserve (Fed) comments and the risk-negative catalysts mentioned above.
That said, Fed Governor Michelle Bowman recently said, “We are seeing a lot of inconsistent data in economic conditions,” as reported by Reuters. On the contrary, Richmond Fed President Thomas Barkin said that they are seeing some progress on inflation with demand normalizing, as reported by Reuters.
It should be noted that the mixed bias for the Bank of Japan’s (BoJ) new monetary policy board and chatters of higher inflation in Japan seem to put a floor under the Yen.
Amid these plays, the S&P 500 Futures print mild losses even as Wall Street closed mixed. It’s worth noting that the US 10-year Treasury bond yields rose to the highest levels since early November in the last week and helped the DXY to print a three-week uptrend.
Looking forward, Japan’s National Core Inflation numbers will join the second reading of the US fourth quarter (Q4) Gross Domestic Product to direct immediate USD/JPY moves. However, major attention will be given to the Federal Open Market Committee (FOMC) Meeting Minutes.
Technical analysis
USD/JPY pair’s successful trading above the 200-day Exponential Moving Average (EMA), around 133.80 by the press time, keeps USD/JPY buyers to aim for December 2022 peak surrounding 138.20.
- EUR/JPY m,oves in on the countertrendline bneat 143.500.
- Bears below 143.70. could see a move to target 143.20 142.90/00 thereafter.
EUR/JPY is correcting firmly on the bid to restest resistance structure near 143.50 but there is a bearish bias while the bears commit to this area for the days ahead as the following illustrates:
EUR/JPY M15 charts
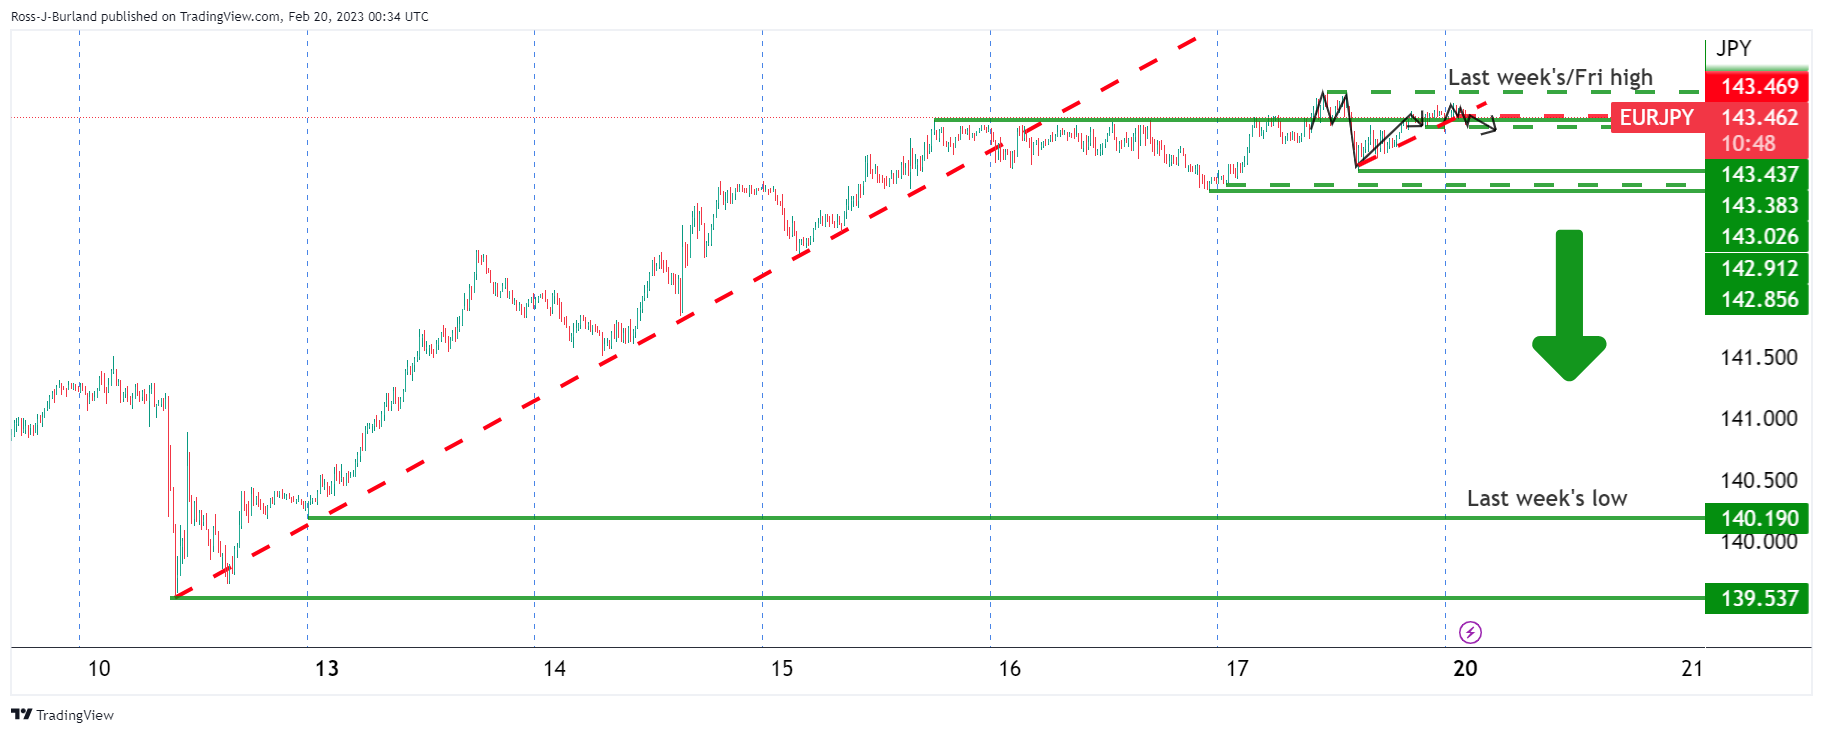
EUR/JPY was driven out of the bull trend last week but failed to break any significant structure to the downside so has moved sideways above the 142.80s, trapping both shorts and longs in the process. This trapped volume has the potential to result in a breakout one way or the other week.
Zoomed in...
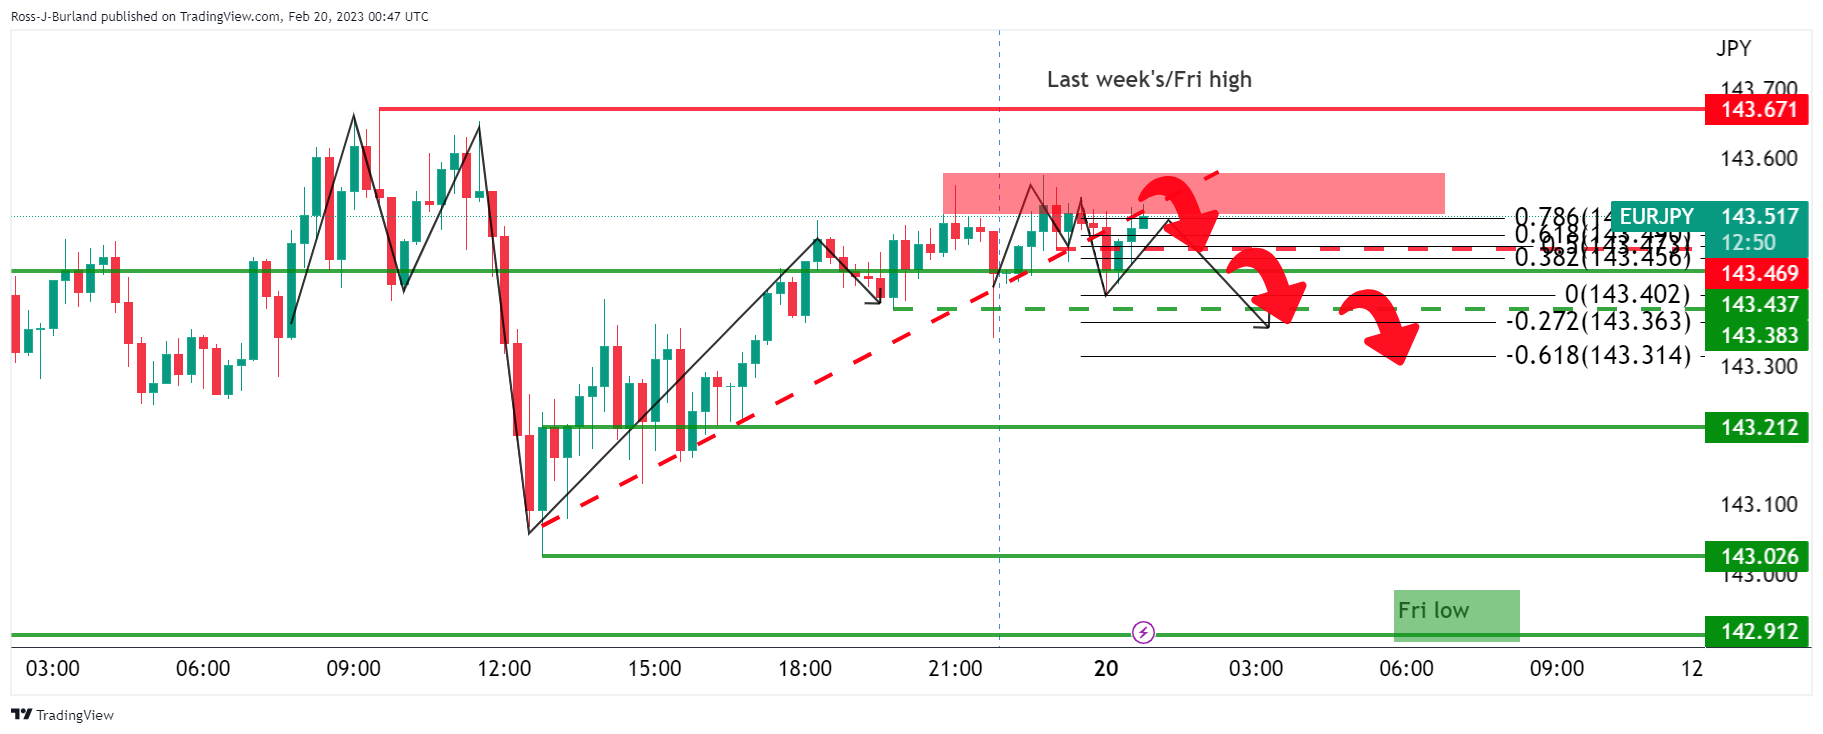
If we zoom down to the microstructure in a new week's template, we see that the initial balance is tilted to the upside, taking the price towards potential buy orders above 143.50. However, bears could be lurking around here as well if not higher up near 143.70. 142.90 is eyed on the downside.
- Silver price has slipped below $21.60 as the dismal market mood has improved the safe-haven’s appeal.
- S&P500 futures have extended their losses further amid the renewal of US inflation fears.
- The preliminary annualized GDP for the fourth quarter is expected to remain steady at 2.9%.
Silver price (XAG/USD) has delivered a vertical fall to near $21.55 in the Tokyo session. The white metal tumbled like a house of cards as the escalating geopolitical tensions strengthened the risk aversion theme. Silver price is expected to continue its downside momentum as the fears of a recovery in the United States inflation have joined the US-China tensions.
The US Dollar Index (DXY) has rebounded firmly to near 103.70 as the geopolitical tensions-inspired volatility has forced investors to hide behind safe-haven assets. Warning signals from US Ambassador to China if it decides to provide lethal military aid to Russia for its invasion of Ukraine has dampened the market mood. Also, three projectiles from North Korea on Japan’s Exclusive Economic Zone (EEZ) have added fuel to the fire.
S&P500 futures have extended their losses further as the renewal of US inflation fears has raised red flags for economic recovery ahead. The Federal Reserve (Fed) might continue hiking interest rates after a rebound in the prices of goods and services at the factory gates and a revival in consumer spending, conveyed by upbeat Retail Sales data. Investors should be aware that the US markets will remain closed on Monday on account of Presidents’ Day.
For further guidance, investors will focus on the Gross Domestic Product (GDP) data, which is scheduled for Thursday. The preliminary annualized GDP for the fourth quarter is expected to remain steady at 2.9%.
Silver technical analysis
Silver price is demonstrating an extended correction after a breakout of the Falling Channel chart pattern placed on an hourly scale. The asset is required to rebound above the chart pattern to negate the downside bias.
The 20-period Exponential Moving Average (EMA) at $21.57 is providing support to the Silver asset.
Meanwhile, the Relative Strength Index (RSI) (14) has failed to sustain in the bullish range of 60.00-80.00. A bullish momentum will be triggered if the momentum oscillator manages to reclaim the 60.00-80.00 range.
Silver price hourly chart
- AUD/USD fades bounce off 200-DMA, retreats from 50-DMA.
- Three-month-old ascending trend line adds strength to 0.6800 support.
- Bearish MACD signals, failure to cross 50-DMA keep sellers hopeful.
- 12-day-old resistance line adds to the upside filters, bears can aim for January’s low on breaking 0.6800.
AUD/USD takes offers to reverse the previous day’s corrective bounce off a six-week low, down 0.20% intraday near 0.6865 during early Monday. In doing so, the Aussie pair retreats from the 50-DMA amid bearish MACD signals.
While the quote’s failure to cross the short-term DMA join downbeat oscillators, a convergence of the 200-DMA and an upward-sloping support line appears a tough nut to crack for the AUD/USD bears around 0.6800.
Following that, a slump toward the previous monthly low surrounding 0.6685 seems imminent.
In a case where the AUD/USD price remains bearish past 0.6685, lows marked during the last December and late November, respectively near 0.6630 and 0.6585, will gain major attention.
Alternatively, the Aussie pair’s recovery beyond the 50-DMA hurdle surrounding 0.6890 isn’t an open invitation to the bulls as the 0.6900 round figure and a downward-sloping resistance line from February 02, close to 0.6965 at the latest could challenge the upside momentum.
Even if the AUD/USD price remains firmer past 0.6965, the previous weekly high of around 0.7030, will act as the last defense of the bears.
Overall, AUD/USD remains on the bear’s radar even if the 0.6800 key support challenges the short-term downside.
AUD/USD: Daily chart
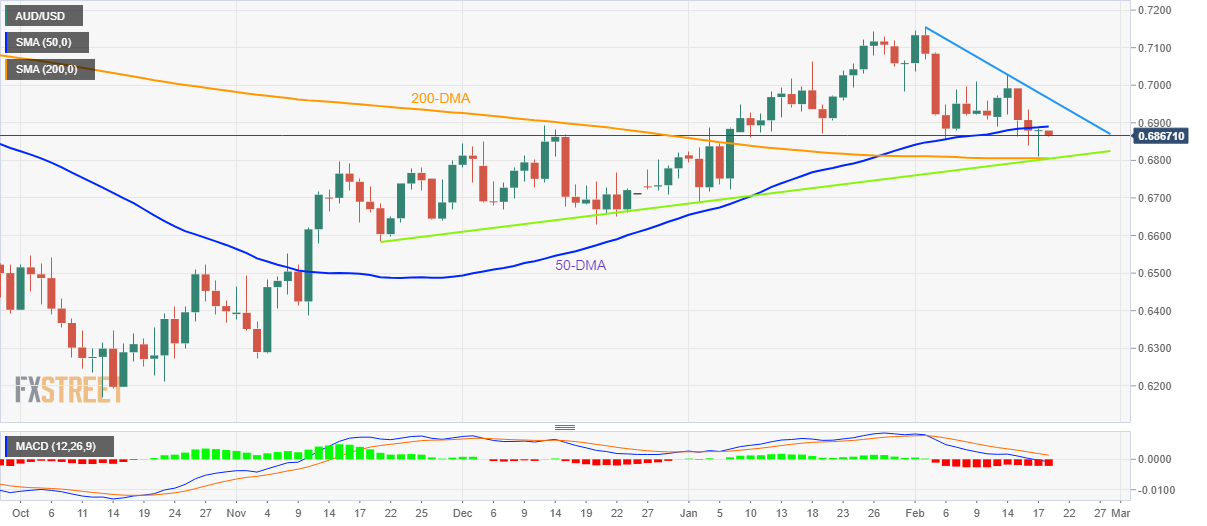
Trend: Further downside expected
| Index | Change, points | Closed | Change, % |
|---|---|---|---|
| NIKKEI 225 | -183.31 | 27513.13 | -0.66 |
| Hang Seng | -267.86 | 20719.81 | -1.28 |
| KOSPI | -24.27 | 2451.21 | -0.98 |
| ASX 200 | -63.5 | 7346.8 | -0.86 |
| FTSE 100 | -8.1 | 8004.4 | -0.1 |
| DAX | -51.64 | 15482 | -0.33 |
| CAC 40 | -18.44 | 7347.72 | -0.25 |
| Dow Jones | 129.84 | 33826.69 | 0.39 |
| S&P 500 | -11.32 | 4079.09 | -0.28 |
| NASDAQ Composite | -68.56 | 11787.27 | -0.58 |
| Pare | Closed | Change, % |
|---|---|---|
| AUDUSD | 0.68793 | 0.12 |
| EURJPY | 143.48 | 0.38 |
| EURUSD | 1.06942 | 0.22 |
| GBPJPY | 161.562 | 0.62 |
| GBPUSD | 1.20418 | 0.46 |
| NZDUSD | 0.62438 | -0.18 |
| USDCAD | 1.34762 | 0.18 |
| USDCHF | 0.92462 | -0.06 |
| USDJPY | 134.167 | 0.16 |
- US Dollar Index reverses the previous day’s pullback from six-week high.
- Hawkish Fed bias, geopolitical fears underpin the US Dollar amid sluggish session.
- US, Canada holidays restrict immediate moves ahead of FOMC Minutes, US GDP.
US Dollar Index (DXY) picks up bids to regain 104.00, after the previous day’s reversal from a 1.5-month high, as market players struggle for clear directions during early Monday. In doing so, the greenback’s gauge versus the six major currencies cheers the market’s risk-off mood, as well as the hawkish bias for the Federal Reserve (Fed), amid an inactive week-start due to the holidays in the US and Canada.
The sour sentiment could be linked to the fresh geopolitical tension surrounding North Korea, China and Russia.
During the weekend, North Korea fired two ballistic missiles toward Japan and renewed the fears that the hermit kingdom is up to something serious that can endanger the global economy, mainly due to the nature of the missiles fired as they both were termed as tactical nuclear attack weapons.
On the other hand, the US-China tensions are back on the table as the latest meeting between US Secretary of State Antony Blinken and China's top diplomat Wang Yi seemed to have failed in restoring the US-China ties. The reason could be linked to a Chinese diplomat’s comments saying that the US must change course and repair the damage done to Sino-US ties by indiscriminate use of force. On the same line, US ambassador to the United Nations, Ambassador Linda Thomas-Greenfield, said Sunday that China would cross a “red line” if the country decided to provide lethal military aid to Russia for its invasion of Ukraine.
Elsewhere, the firmer prints of the US Consumer Price Index (CPI) and Retail Sales followed the previously flashed upbeat readings of employment and output data and propelled the odds of the US economy witnessing more inflation ahead. The same joins hawkish Federal Reserve comments to underpin the firmer US Treasury bond yields and the US Dollar.
As per the latest Federal Reserve (Fed) talks, Fed Governor Michelle Bowman said, “We are seeing a lot of inconsistent data in economic conditions,” as reported by Reuters. On the contrary, Richmond Fed President Thomas Barkin said that they are seeing some progress on inflation with demand normalizing, as reported by Reuters.
While portraying the sentiment, the S&P 500 Futures print mild losses even as Wall Street closed mixed. It’s worth noting that the US 10-year Treasury bond yields rose to the highest levels since early November in the last week and helped the DXY to print a three-week uptrend.
Moving on, the monetary policy meeting minutes by the Federal Reserve (Fed), up for publishing on Wednesday, will precede Thursday’s second reading of the US fourth quarter (Q4) Gross Domestic Product to direct immediate DXY moves.
Technical analysis
Unless declining back below the previous resistance line from late November 2022, now support near 103.30, the US Dollar Index (DXY) remains on the bull’s radar.
- AUD/JPY is struggling to extend recovery above 92.30 amid geopolitical tensions.
- The People’s Bank of China is expected to leave the Loan Prime Rate unchanged at 3.65%.
- Japan’s Manufacturing PMI is seen unchanged at 48.9 and the Services PMI higher at 51.5.
The AUD/JPY pair has picked strength after a weak open around 92.10 in the Tokyo session. The risk barometer has recovered to near 92.30 and is looking to extend its rebound move ahead. However, the risk profile seems not to support the risk-perceived assets after the US ambassador to the United Nations, Ambassador Linda Thomas-Greenfield, said Sunday that China would cross a “red line” if the country decided to provide lethal military aid to Russia for its invasion of Ukraine.
Meanwhile, fresh headlines from public broadcaster NHK that Japan's Coast Guard said North Korea launched three projectiles that could be ballistic missiles, as reported by Reuters, has dampened the already negative market mood further.
North Korean leader Kim's sister, Kim Yo Jong has warned against the rising presence of U.S. strategic assets on the Korean peninsula after the United States held joint air exercises bilaterally with South Korea and Japan on Sunday in response to the North's ICBM launch.
For further guidance, investors are awaiting the interest rate decision by the People’s Bank of China (PBoC). A Reuters poll published on February 17 showed that 8 out of 10 economists expect the PBoC to leave the Loan Prime Rate (LPR) unchanged at 3.65%. The Chinese economy is subjected to keeping monetary policy expansionary to spurt economic growth after dismantling pandemic controls.
Bloomberg reported Goldman Sachs sees potential for the MSCI China Index to reach 85 by the end of 2023, an increase of about 24% from current levels as the nation’s economic reopening delivers windfall profits for businesses.
It is worth noting that Australia is a leading trading partner of China and accelerating economic activities in China will support the Australian Dollar.
On the Japanese Yen front, investors will focus on the preliminary Jibun Bank PMI (Feb) data, which will release on Tuesday. The Manufacturing PMI is seen stable at 48.9 while the Services PMI is expected to increase to 51.5 from the former release of 51.1.
© 2000-2026. All rights reserved.
This site is managed by Teletrade D.J. LLC 2351 LLC 2022 (Euro House, Richmond Hill Road, Kingstown, VC0100, St. Vincent and the Grenadines).
The information on this website is for informational purposes only and does not constitute any investment advice.
The company does not serve or provide services to customers who are residents of the US, Canada, Iran, The Democratic People's Republic of Korea, Yemen and FATF blacklisted countries.
Making transactions on financial markets with marginal financial instruments opens up wide possibilities and allows investors who are willing to take risks to earn high profits, carrying a potentially high risk of losses at the same time. Therefore you should responsibly approach the issue of choosing the appropriate investment strategy, taking the available resources into account, before starting trading.
Use of the information: full or partial use of materials from this website must always be referenced to TeleTrade as the source of information. Use of the materials on the Internet must be accompanied by a hyperlink to teletrade.org. Automatic import of materials and information from this website is prohibited.
Please contact our PR department if you have any questions or need assistance at pr@teletrade.global.


-638124502322800730.png)


