- Analytics
- News and Tools
- Market News
CFD Markets News and Forecasts — 20-02-2022
- Silver grinds higher around one-month high, stays inside bearish chart pattern.
- 200-DMA, 14-week-old resistance line challenge immediate upside, bullish MACD favor buyers.
- Bears need validation from $23.70 while 50% Fibonacci retracement acts as another strong support.
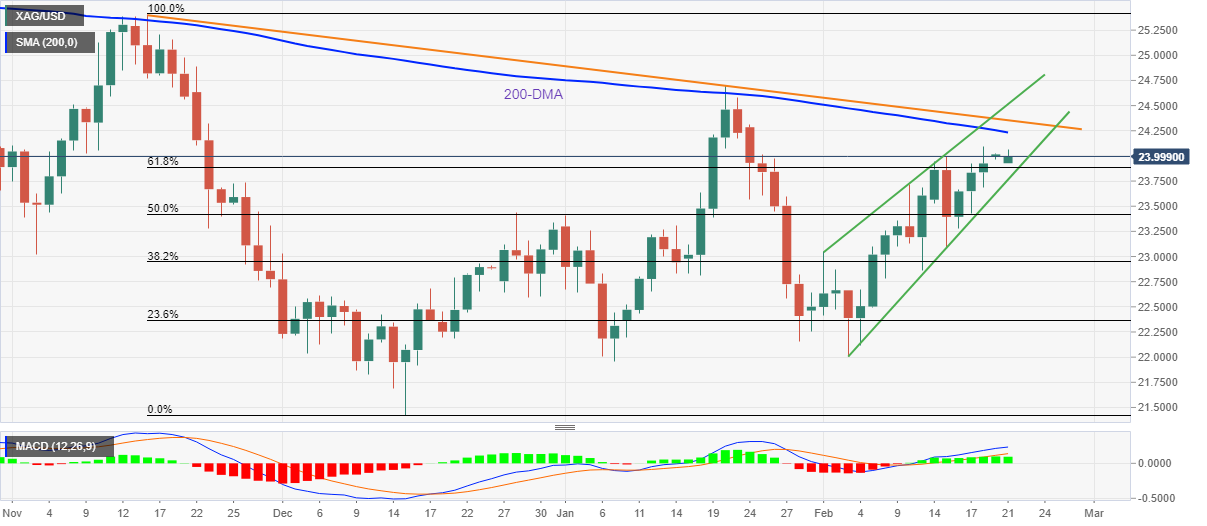
After rising for three consecutive weeks, silver (XAG/USD) prices remain on the front foot around $24.00 during Monday’s Asian session.
In doing so, the bright metal pokes the highest levels last seen on January 24 while taking rounds to 61.8% Fibonacci retracement of November-December 2021 downside.
It should be noted, however, that the bullish MACD signals keep silver buyers hopeful to refresh monthly top.
That said, the 200-DMA and a descending trend line from late November, respectively around $24.25 and $24.35, become tough nuts to crack for the XAG/USD bulls.
Following that, the upper line of a three-week-old rising wedge bearish chart pattern and January’s peak, near $24.50 and $24.70 in that order, will challenge the commodity buyers.
Alternatively, a clear downside break of the 61.8% Fibo. level near $23.90 will attack the wedge’s lower line, near $23.70 at the latest.
Also acting as the key support is the $23.40 level comprising highs marked during late December and early January, as well as 50% Fibonacci retracement.
Should the silver bears manage to keep reins past $23.40, the 2022 bottom surrounding $21.95 will be in focus.
Silver: Daily chart
Trend: Pullback expected
- GBP/USD finds a decent opening despite the escalation of the Russia-Ukraine tussle.
- The risk-aversion tone set by the geopolitical tensions may underpin bears to the cable.
- The UK’s Market Service PMI may add volatility amid an already uncertain market.
The GBP/USD pair has attracted significant bids near 1.3580 despite the negative developments in the Russia-Ukraine tensions over the weekend. The build-up of troops by Moscow and separatists near the eastern region of Ukraine has raised the expectations of a potential invasion of Russia to Ukraine.
The continuous warnings from NATO that Russia could strike on Ukraine have created havoc on market sentiment. Meanwhile, the extension of drills by Russia and Belarus despite its agreed termination on Sunday has escalated the tensions.
On one side, where Ukraine’s President Volodymer Zelensky is demanding security guarantees against the Kremlin from the Western leaders, which aspires to accompany NATO and the EU, Moscow is demanding assurance that the North Atlantic Alliance will not accept Ukraine as it may pose threat to the Putin’s area.
Investors are unable to find a suitable asset to be added due to the obscurity over the geopolitical picture, which seems to display wide range ticks but in a capped range. Therefore, follow-up of a risk aversion theme by the investors will be witnessed.
Meanwhile, the rising bets over an aggressive monetary policy from the Federal Reserve (Fed) are going to make it difficult for the cable to find some grounds.
Although the headlines along the Russia-Ukraine tensions will remain the major driver Britain’s Purchasing Managers Index (PMI) service to be released by both the Chartered Institute of Purchasing & Supply and the Markit Economics will hold the nerves of the investors. As per the market estimates, the UK’s Markit Services PMI will land at 55.2, above the previous print of 54.1.
US inflation expectations, as measured by the 10-year breakeven inflation rate per the St. Louis Federal Reserve (FRED) data, add to the market’s anxiety ahead of the Fed’s preferred inflation measure, namely the Core Personal Consumption Expenditures - Price Index for January.
Read: CPI vs. PCE Price Index – Which is a better measure of inflation in US?
That said, the inflation precursor dropped during the last three days to 2.41% at the latest, testing the lowest levels last seen on February 07. In doing so, the key number fades the rebound from late September levels, triggered on January 20.
The same could have been the reason behind the market’s recently softer bets on the 0.50-0.75% rate hikes during March Federal Open Market Committee (FOMC) meeting.
As per the CME FedWatch Tool, there are 78% probabilities for a 0.25-50% rate hike in March versus 22% for a 50-75 basis points (bps) of a lift to the Fed rate. The stated tool previously showed around 0.80% odds for a 0.50% rate hike in March.
It should be noted, however, that Friday’s Core PCE Price Index becomes the Fed’s preferred measure of inflation and may propel the hawkish odds should it manage to cross 4.8% YoY forecasts and 4.9% prior.
Read: The Week Ahead: US Q4 GDP, PCE, HSBC, Barclays, Lloyds, Rolls Royce results and more
According to CBS News, ''the US has intelligence that Russian commanders have received orders to proceed with an invasion of Ukraine, with commanders on the ground making specific plans for how they would manoeuvre in their sectors of the battlefield.''
Russia has denied that the nation plans to invade its neighbour, but US Secretary of State Antony Blinken said the extension of military exercises shows the world is on the brink of war.
Transcript: Secretary of State Antony Blinken on "Face the Nation"
"Everything we're seeing tells us that the decision we believe President Putin has made to invade is moving forward," Blinken said. "We've seen that with provocations created by the Russians or separatist forces over the weekend, false flag operations, now the news just this morning that the 'exercises' Russia was engaged in in Belarus with 30,000 Russian forces that was supposed to end this weekend will now continue because of tensions in eastern Ukraine, tensions created by Russia and the separatist forces it backs there."
"My job as a diplomat is to leave absolutely no stone unturned and see if we can prevent war, and if there's anything I can do to do that, I'm going to do it," Blinken said Sunday.
"President Biden has made very clear that he's prepared to meet President Putin at any time in any format if that can help prevent a war. Even if the die is cast, until it's settled, until we know that the tanks are rolling, the planes are flying, and the aggression has fully begin, we're going to do everything we can to prevent it but we're prepared either way."
"We are calling not only on [the] aggressor, which is Russia but also on all of our friends and allies to get together and use every opportunity to still deter Russia from invading," she told "Face the Nation."
US Secretary of State Antony Blinken was scheduled to meet Russian Foreign Minister Sergei Lavrov this week, according to a report from the Guardian.
The markets are starting the week around the closing price of Friday, but concerns about a possible Russian invasion of Ukraine have boosted demand for safe-haven bonds, with Treasury yields dropping on Friday, gold and continued has weighed on global stocks.
- USD/CAD grinds higher after Friday’s bounce off monthly support line.
- Bull cross, firmer RSI also keep buyers hopeful, 1.2700 is a tough nut to crack for bears.
- Descending trend line from early January holds the key to further upside.
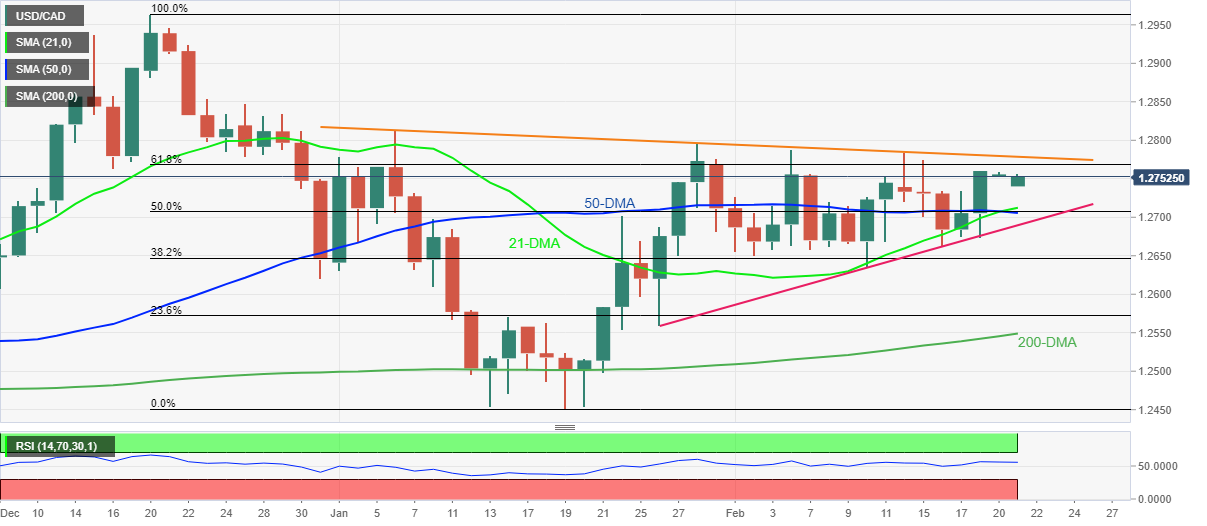
USD/CAD remains on the front foot around 1.2750 during Monday’s initial Asian session, after posting the heaviest daily gains in over a week the previous day.
With Friday’s upbeat performance, the quote not only bounced off an upward sloping trend line from January 26 but also portrayed a bull cross on the daily chart. That said, the 21-DMA pierces the 50-DMA from below, which in turn suggests the pair’s further upside.
Also adding to the bullish bias is the firmer RSI line, recently around 55.00.
That said, the 61.8% Fibonacci retracement (Fibo.) of December 2021 to January 2022 downside, near 1.2770, restricts the immediate upside of the USD/CAD prices.
However, major attention is given to a downward sloping resistance line from January 06, around 1.2780 at the latest.
Should the pair rise past-1.2780, the January 2021 peak of 1.2813 will lure the USD/CAD bulls.
On the contrary, pullback moves remain elusive beyond 1.2700 as the 21-DMA, the 50-DMA and the 50% Fibo. offer strong support around the stated level.
Even if the USD/CAD bears manage to conquer the 1.2700 mark, a one-month-long support line near 1.2690, will be important to watch before eyeing further downside.
USD/CAD: Daily chart
Trend: Further upside expected
- 1.1350 old support now turns to new resistance in EUR/USD.
- There is a bias to the downside with 1.1250 in focus.
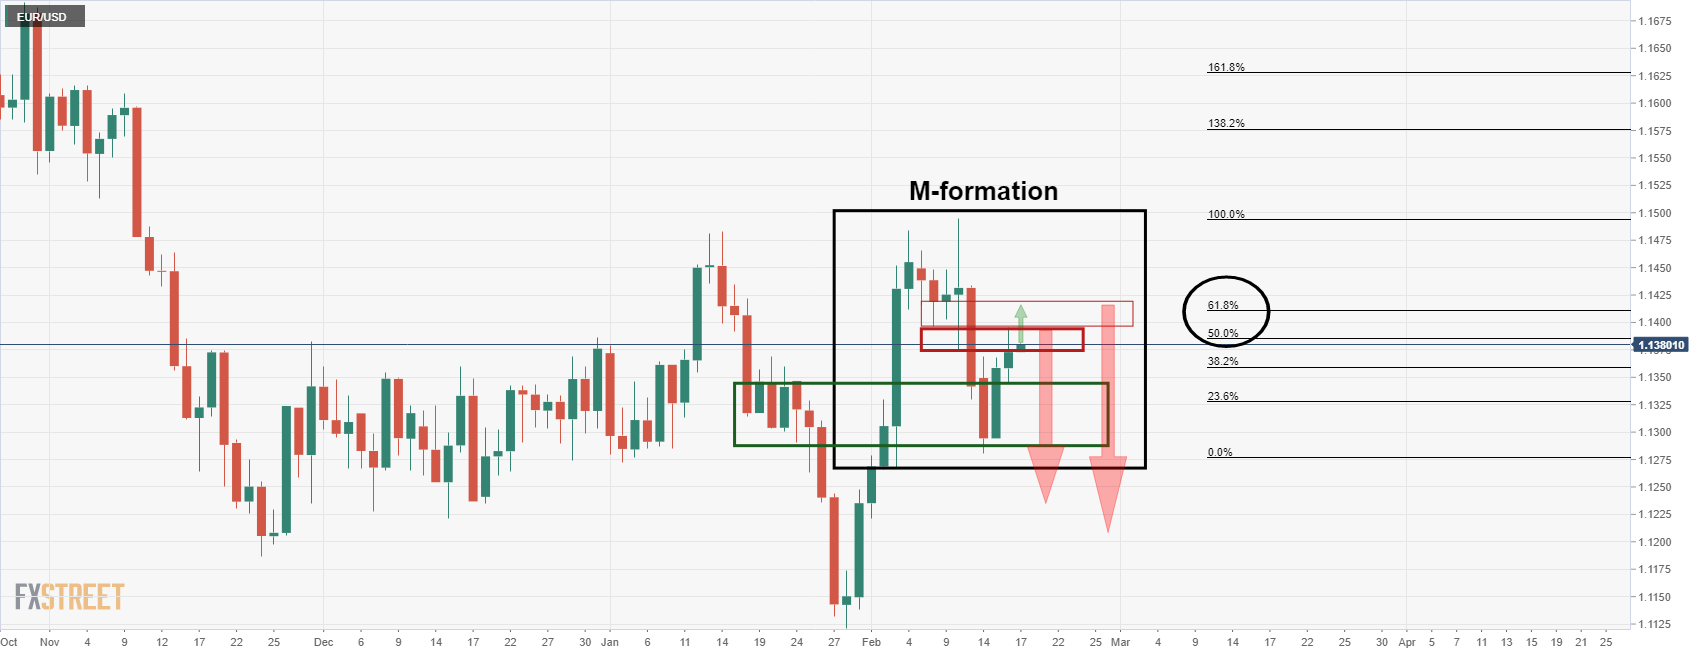
EUR/USD fell from 1.1377 to 1.1315 on Friday and there could be more in store from this pair to the downside for the opening sessions this week. According to the daily chart's market structure, 1.1250 could come under pressure on a breakout below 1.1310.
As per the prior analysis, EUR/USD Price Analysis: Bears looking for a downside extension for the week ahead, if was stated that ''the price was testing daily resistance and if this holds, the focus should have been on the downside.''
EUR/USD price analysis
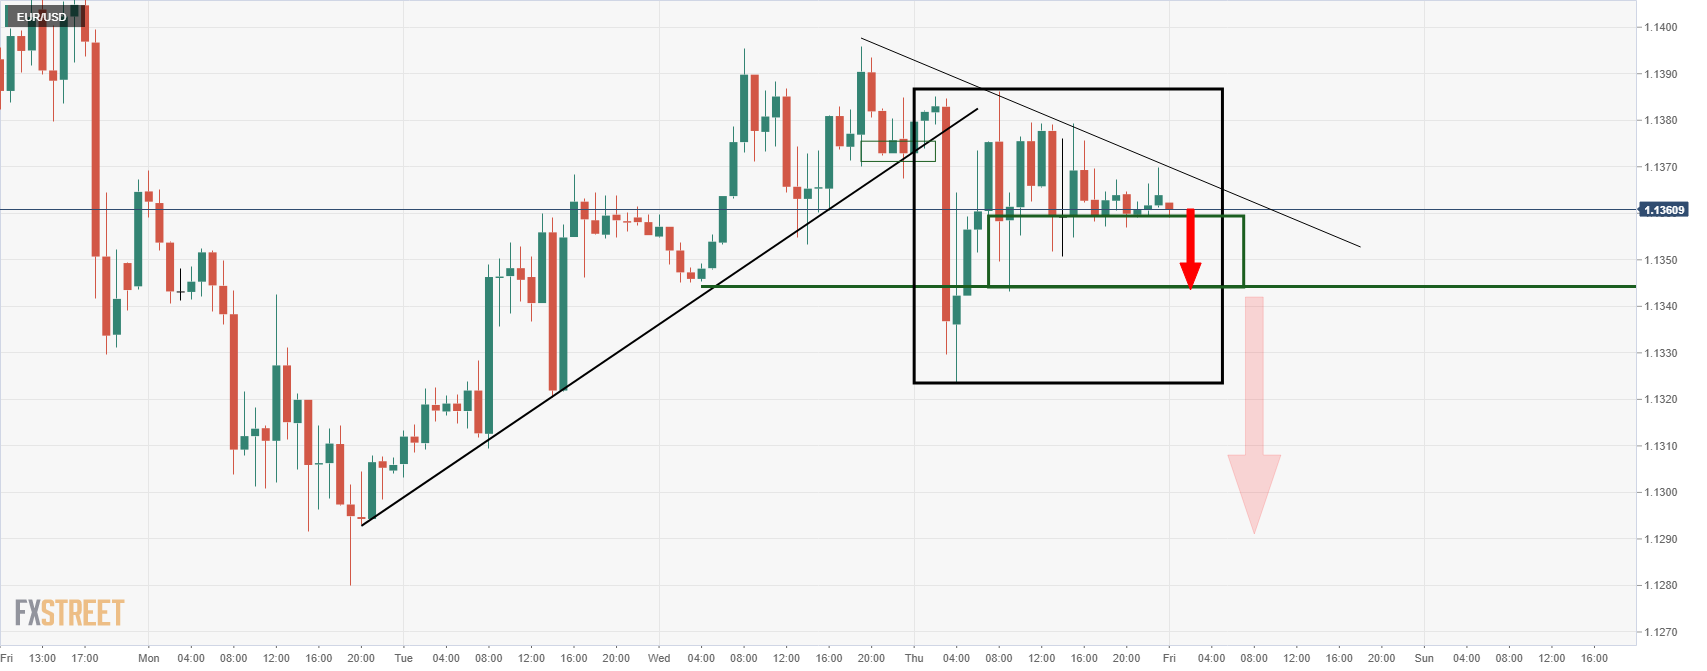
EUR/USD live market
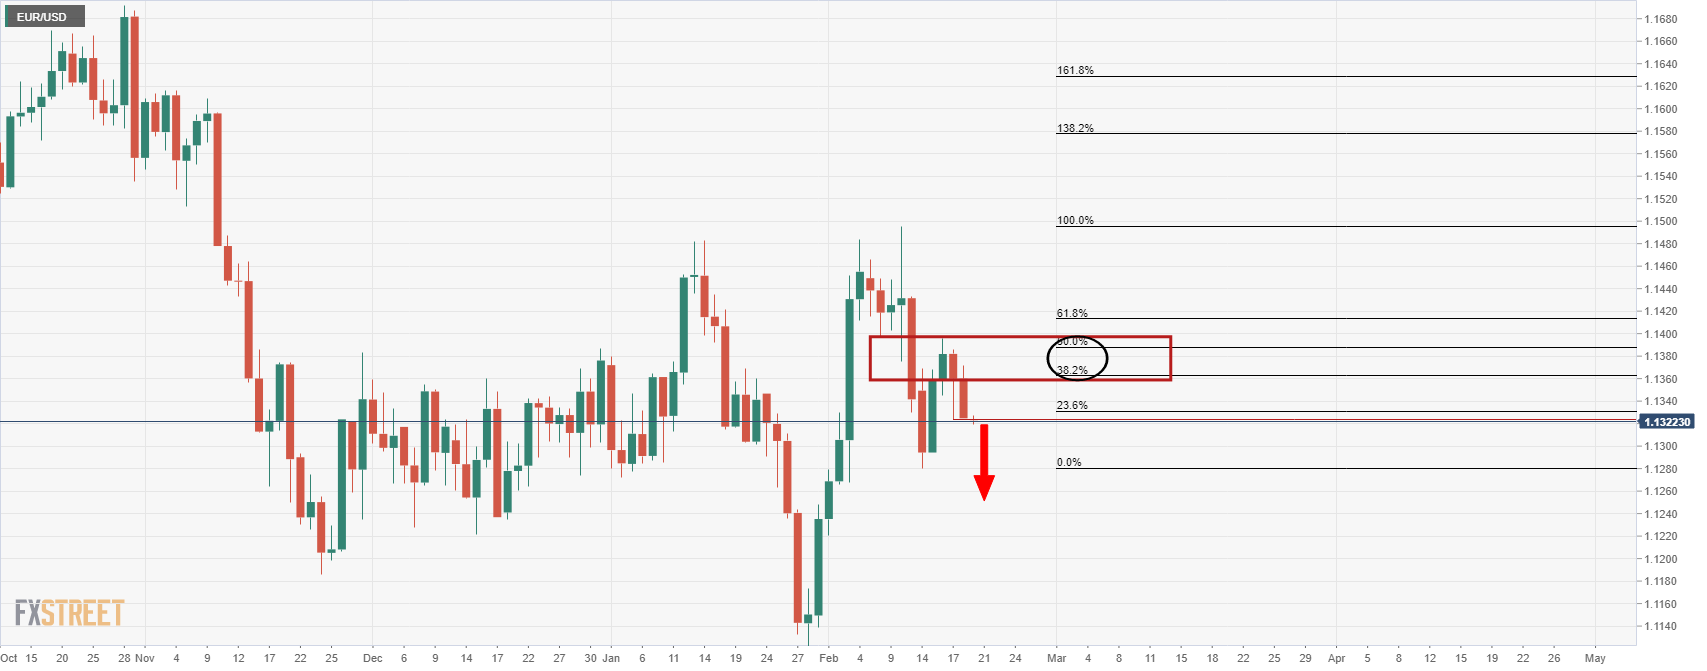
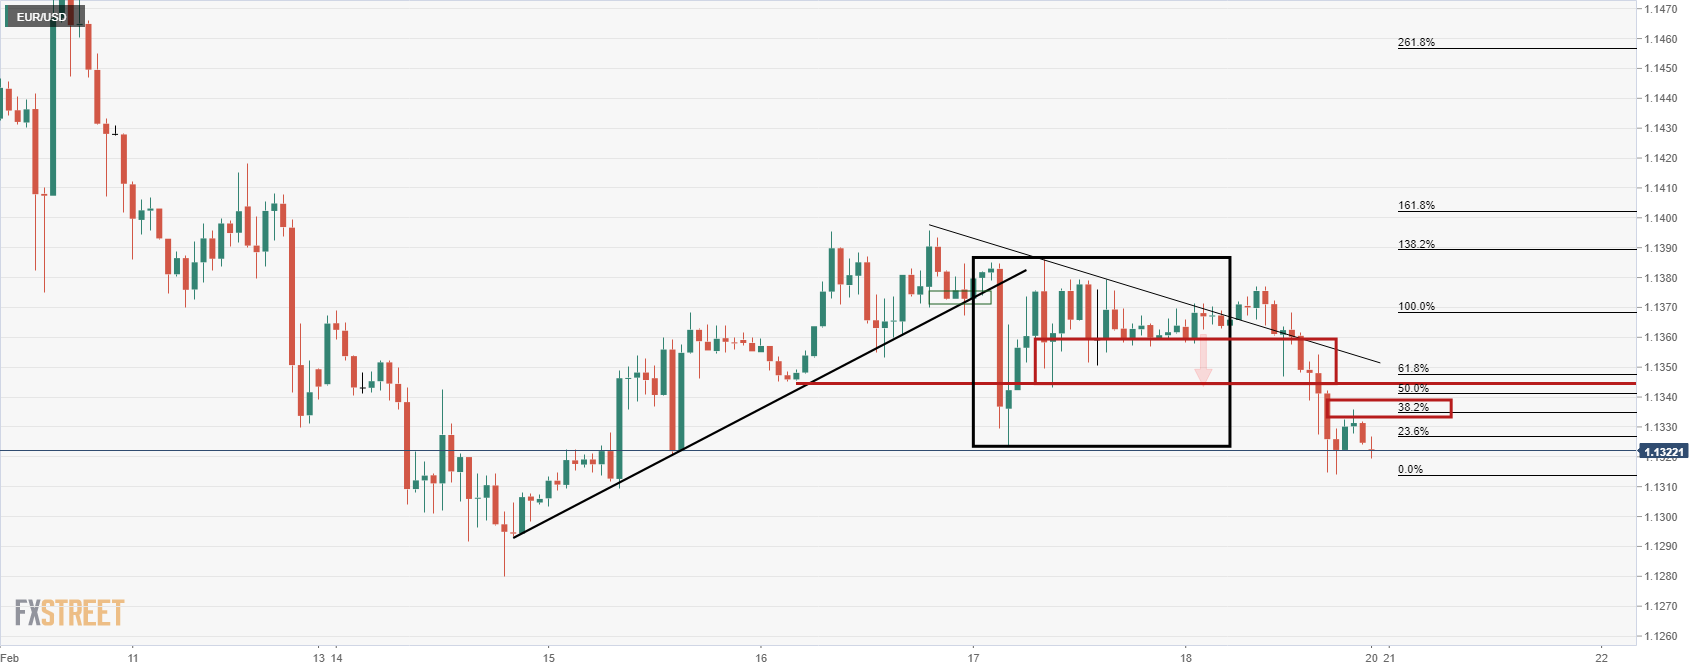
As seen, the price is moving in accordance with the forecasted price trajectory. 1.1350 old support now turns to new resistance and while below there, the bias is to the downside with 1.1250 in focus.
- NZD/USD portrayed three-week uptrend even as bulls slowed down near monthly top.
- NZ government bond’s inclusion to global bond index, hopes of hawkish RBNZ keep Kiwi pair buyers in command.
- Pre-RBNZ caution, geopolitical fears surrounding Russia, Ukraine challenge Antipodeans.
- PBOC Interest Rate Decision, Fedspeak will decorate calendar, risk catalysts are the key for fresh impulse.
NZD/USD justifies Friday’s gravestone Doji around the monthly top, as it struggles to regain 0.6700 during the early hours of Monday’s Asian session. Even so, the kiwi pair seesaws near the monthly peak after posting three consecutive weekly gains.
That being said, the quote’s recent pullback could be linked to the broad fears of the Russian invasion of Ukraine, as well as worsening covid conditions in New Zealand.
The West warns of an imminent Russian attack over Kyiv and many other cities even as Moscow denies the allegations. As per the latest updates from a Reuters’ witness, an explosion was heard in the center of rebel-held city of Donetsk in eastern Ukraine. It’s worth noting that a diplomatic meeting between US Secretary of State Antony Blinken and Russian Foreign Minister Sergei Lavrov is the ray of hope to witness de-escalation of the geopolitical fears and hence keep NZD/USD bears in check.
Elsewhere, New Zealand’s record covid cases also weigh on the NZD/USD prices. As per the latest covid update from NZ Herald, “Some 1799 of yesterday's 2522 new cases were in Auckland, but cases are growing rapidly in other areas.” The news also mentioned, “But despite a record number of cases and hospitalizations yesterday, Prime Minister Jacinda Ardern will this afternoon shed some light on what public health measures could look like in the future once the country has got through the Omicron peak.”
Other than the geopolitical and covid, cautious mood ahead of Wednesday’s Reserve Bank of New Zealand (RBNZ) monetary policy meeting also challenge NZD/USD traders as some in the market have hopes of a 0.50% rate hike, versus a general view of 25 basis points (bps) of a lift.
Alternatively, a pullback in the US Treasury yields from multi-day high and New Zealand government bond’s inclusion to FTSE Russell World Government Bond Index keep NZD/USD buyers hopeful, not to forget hawkish hopes from the RBNZ. “Now that the local market is in the benchmark global index, New Zealand fixed income securities are expected to enjoy higher prices and greater liquidity as fund managers who track the index (with trillions of dollars) buy NZ government bonds,” said analysts at ANZ.
Given the cautious mood and a lack of major data/events on Monday, NZD/USD prices may consolidate recent gains based on chart and candlestick patterns if the risk aversion wave extends.
Technical analysis
NZD/USD portrayed a gravestone Doji bearish candlestick formation on the daily chart. Also adding to the odds of a pullback is the quote’s U-turn from the 50-DMA, around 0.6730 by the press time. However, an upward sloping trend line from January 28, close to 0.6630, will be a tough nut to crack for the pair sellers.
- AUD/USD has to safeguard 0.7150 as bears are hopeful around it.
- The escalation of the Russia-Ukraine tensions on weekend has underpinned the risk-off impulse.
- The headlines from the Russia-Ukraine tussle will remain the major driver for the AUD/USD.
The AUD/USD pair is set to attract significant offers from the market participants as the geopolitical tensions amid the Russia-Ukraine tussle escalated on the weekend, which may keep the investors on their toes.
The extension of drills by Russia and Belarus in the eastern part of Ukraine, which was due to end on Sunday, had poised AUD/USD to start on a cautious note on Monday.
On Sunday, explosions operated by separatists in the eastern Donbas region, specifically in the centre of Donetsk city, forced Ukraine President Volodymyr Zelenskiy to call for an immediate ceasefire in eastern Ukraine. He also said Ukraine supports peace talks within the Trilateral Contact Group, where Ukraine participates along with Russia amid the Organisation for Security and Co-Operation in Europe (OSCE), as per Reuters.
Russia's potential build-up of troops in eastern Ukraine in the Donetsk and Luhansk regions has underpinned the risk-off impulse for Monday opening.
Meanwhile, the headlines from the western leaders to put sanctions on Russia are intensifying and poising a potential threat for the global markets.
The European Union (EU) is ready to initiate massive sanctions on Russia despite the associated risk of harming its own economy if it would be required to encounter the kremlin on the buildup of troops in eastern Ukraine, said by the European Council President Charles Michael.
On the contrary, the US dollar index is likely to be held by the bulls as the rising geopolitical tensions may improve the appeal for the safe-haven assets.
Meanwhile, the Manufacturing Purchasing Managers Index (PMI) will be released by both the Commonwealth Bank of Australia and the Markit Economics on Monday, which will also impact the Aussie against the greenback.
- Gold bulls are meeting critical resistance, all eyes on Fed speakers and Russian diplomacy.
- A break of $1,890 could be on the cards for the opening sessions.
Gold, XAU/USD, was little changed on Friday, but the trend followers are still engaged with traders seeking safe-haven assets. Stocks slid in Europe and on Wall Street while safe-haven government debt prices rose due to increased shelling in Ukraine's East and a tough stance from Russia is unsettling financial markets.
XAU/USD ranged between $1,886.66 and $1,902.54 on Friday ending flat on the day while more warnings from the US that a Russian invasion is imminent continued to put pressure on risk sentiment on Friday night, with developments likely to be a key driver of markets this week, analysts at ANZ Bank said. ''The US has warned that multiple cities could come under attack, causing significant civilian casualties, while Russia continues to deny any plans to invade.''
Meanwhile, the Federal Reserve hangs over prices like a knife on a string. ''Looking forward, however, the crushing weight of a hawkish Fed will ultimately sap appetite for precious metals,'' analysts at TD securities argued. ''Without sustained buying behaviour, gold prices are unlikely to remain in an uptrend, particularly as real rates rise sharply amid dual tightening via hikes and quantitative tightening. However, if gold prices are going to succumb to this macro regime as we expect, then CTAs are accumulating at the top.''
For the week ahead, there is plenty going on from the economic calendar. We will have a chorus of Fed speakers and the PCE report as well as Markit PMIs. ''Fed officials will remain occupied this week trying to guide the market ahead of the March FOMC meeting and following signs of persistent data strength in Q1, particularly on inflation,'' analysts at TD Securities said. ''Most focus will be centred on Governor Waller, who will be discussing the US economic outlook on 24 February. Presidents Bostic, Barkin and Mester are also scheduled to deliver remarks.''
Gold technical analysis
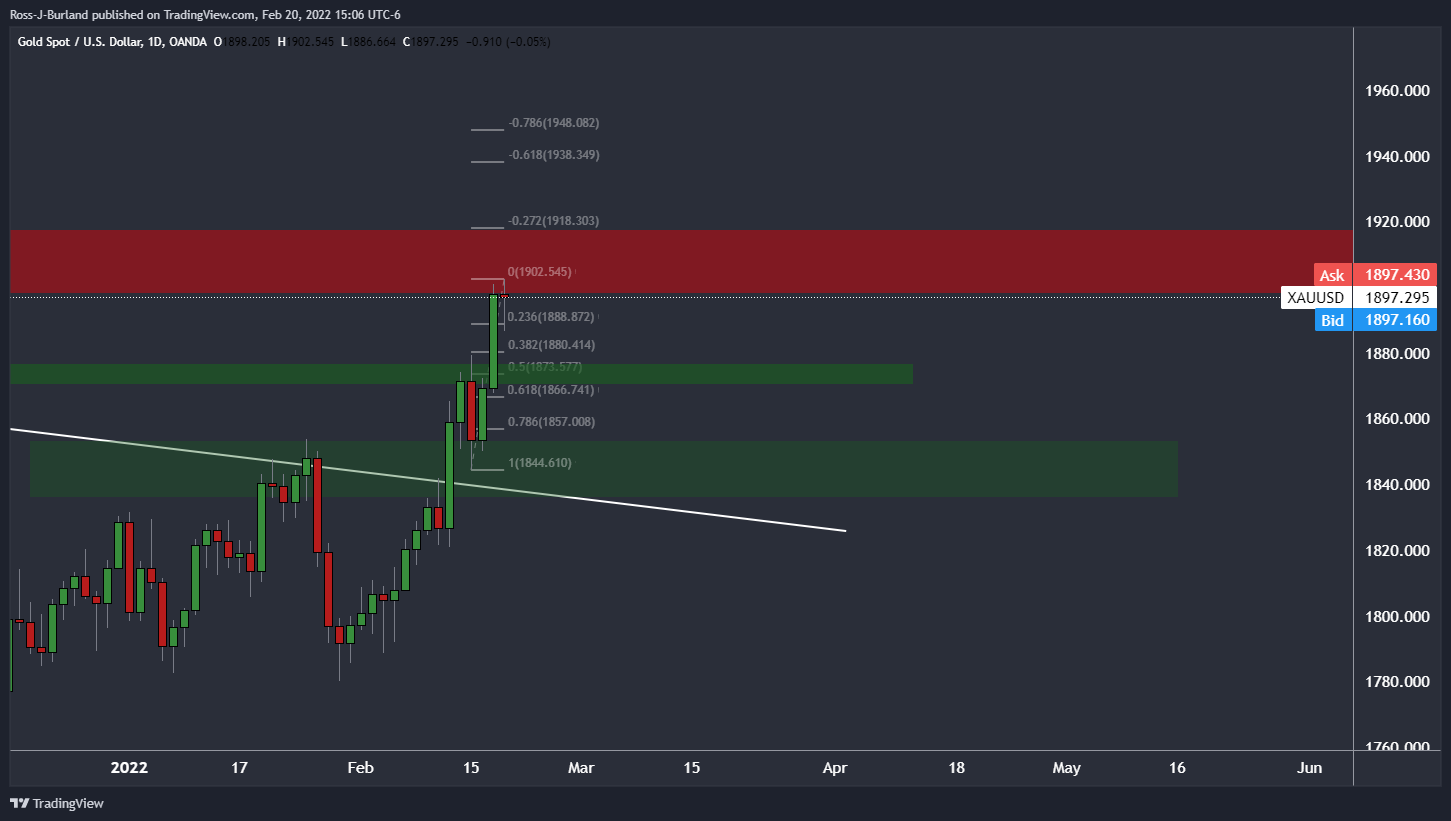
The bulls have squeezed the bears to a weekly resistance and the daily chart's Fibonacci scale of ratios is compelling at this juncture.
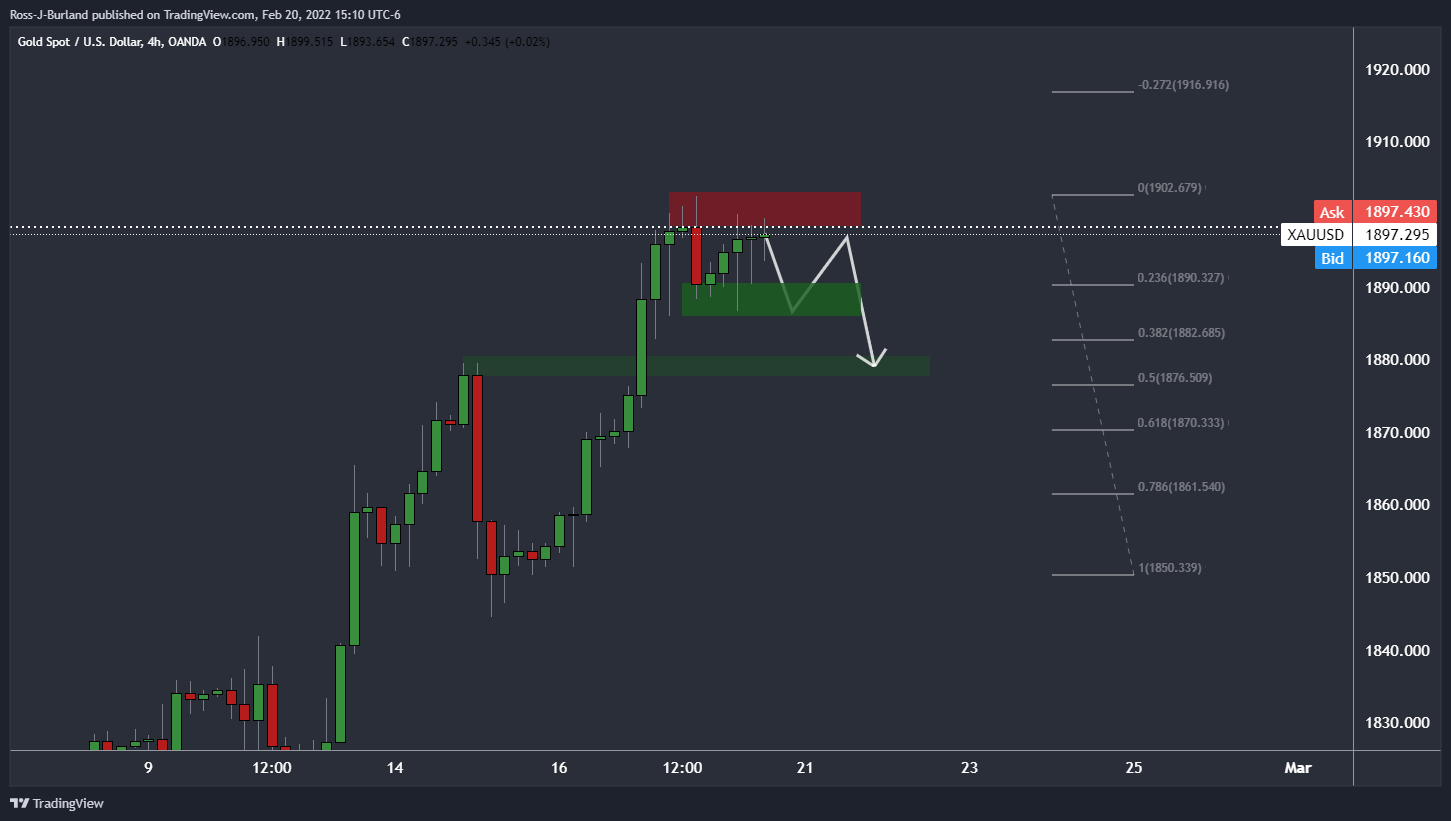
The 4-hour chart shows that the price is poised for a possible break to the downside considering the deceleration of the correction. A break of $1,890 could be on the cards for the opening sessions to open the way to the daily chart's 38.2% Fibo near $1,880.
© 2000-2026. All rights reserved.
This site is managed by Teletrade D.J. LLC 2351 LLC 2022 (Euro House, Richmond Hill Road, Kingstown, VC0100, St. Vincent and the Grenadines).
The information on this website is for informational purposes only and does not constitute any investment advice.
The company does not serve or provide services to customers who are residents of the US, Canada, Iran, The Democratic People's Republic of Korea, Yemen and FATF blacklisted countries.
Making transactions on financial markets with marginal financial instruments opens up wide possibilities and allows investors who are willing to take risks to earn high profits, carrying a potentially high risk of losses at the same time. Therefore you should responsibly approach the issue of choosing the appropriate investment strategy, taking the available resources into account, before starting trading.
Use of the information: full or partial use of materials from this website must always be referenced to TeleTrade as the source of information. Use of the materials on the Internet must be accompanied by a hyperlink to teletrade.org. Automatic import of materials and information from this website is prohibited.
Please contact our PR department if you have any questions or need assistance at pr@teletrade.global.


