- Analytics
- News and Tools
- Market News
CFD Markets News and Forecasts — 19-02-2021
On Monday, at 09:00 GMT, Germany will present the IFO Business Environment indicator, the IFO assessment of the current situation indicator, and the IFO economic expectations indicator for February. At 11: 00 GMT, in Germany, the Bundesbank's monthly report will be released. At 14:00 GMT, Belgium will present the business sentiment index for February. At 15:00 GMT, the US will publish the index of leading indicators for January. At 21:45 GMT, New Zealand will report the change in retail trade for the 4th quarter.
On Tuesday, at 00:30 GMT, Australia will announce the change in the trade balance for January. At 07:00 GMT, Britain will report changes in the number of applications for unemployment benefits for January, as well as the unemployment rate and average earnings for December. At 07:30 GMT, Switzerland will release the producer and import price index for January. At 10:00 GMT, the euro zone will publish the consumer price index for January. At 11:00 GMT, in the UK, CBI retail sales volume balance for February will be released. At 14:00 GMT, the US will announce the change in the S&P/Case-Shiller housing price index for December. At 15:00 GMT, the US will present the consumer confidence indicator and the Fed-Richmond manufacturing index for February. Also at 15:00 GMT, Fed Chairman Powell will make a speech. At 17:30 GMT, in Canada, the head of the Bank of Canada Macklem will make a speech.
On Wednesday, at 00:30 GMT, Australia will report the change in the construction work done for the 4th quarter and will release the labor cost index for the 4th quarter. At 01:00 GMT in New Zealand, the RBNZ interest rate decision will be announced, and at 02:00 GMT, the RBNZ press conference will be held. At 07:00 GMT, Germany will announce the change in GDP for the 4th quarter. At 09:00 GMT, Switzerland will release the index of expectations of Swiss investors, according to ZEW and Credit Suisse for February. At 15:00 GMT, the US will report the change in new home sales for January. Also at 15:00 GMT, Fed Chairman Powell will make a speech. At 15:30 GMT, the United States will announce changes in oil reserves according to the Department of Energy.
On Thursday, at 00:00 GMT, New Zealand will release the ANZ Business Confidence indicator for February. At 00:30 GMT, Australia will announce a change in the volume of capital expenditures in the private sector for the 4th quarter. At 07:00 GMT, Germany will present the GFK consumer Climate index for March. At 09:00 GMT, the euro zone will report on the change in the M3 aggregate of money supply and private sector lending for January. At 10:00 GMT, the euro zone will present the index of business optimism in industry, the index of sentiment in the economy and the index of consumer confidence for February. At 13:30 GMT, the US will announce changes in GDP for the 4th quarter, the volume of orders for long-term goods for January and the number of initial applications for unemployment benefits. At 15:00 GMT, the US will announce a change in the volume of pending home sales for January. At 21:45 GMT, New Zealand will report a change in the foreign trade balance for January. At 23:30 GMT, Japan will present the Tokyo consumer price index for February, and at 23:50 GMT, it will announce changes in industrial production and retail trade volume for January.
On Friday, at 00:30 GMT, Australia will report a change in private sector lending for January. At 05:00 GMT, Japan will announce a change in the housing starts for January. At 06:45 GMT, Switzerland will announce a change in the volume of GDP for the 4th quarter. At 07:00 GMT, Britain will release the Nationwide house price index for February. At 07:30 GMT, Switzerland will report the change in real retail trade volume for January. At 07:45 GMT, France will announce changes in consumer spending for January and GDP for the 4th quarter. At 08:00 GMT, Switzerland will present the KOF index of leading economic indicators for February. At 13:30 GMT, Canada will release the producer price index for January. Also at 13: 30 GMT, the US will publish the main index of personal consumption expenditures for January, and will announce changes in personal income and expenses for January. At 14:45 GMT, the US will present the Chicago Purchasing Managers ' Index for February, and at 15:00 GMT, the University of Michigan Consumer sentiment index for February. At 18:00 GMT, in the United States, the Baker Hughes report on the number of active oil drilling rigs will be released.
On Sunday at 01:00 GMT, China will publish the PMI index for the manufacturing sector and the index of activity in the non-manufacturing sector for February. At 21:30 GMT, Australia will release the AiG manufacturing activity index for February.
- We will make 2021 a turning point for multilateralism and to shape a recovery that promotes the health and prosperity of our people and planet
- We will intensify cooperation on the health response to COVID-19
- We reaffirm our support to the most vulnerable countries
- We will engage with others, especially G20 countries, including large economies such as China
- We will put our global ambitions on climate change and the reversal of biodiversity loss
- Recovery from Covid-19 must build back better for all
- We will consult with each other on collective approaches to address non-market oriented policies and practices
- Want to deliver a green energy transformation no later than 2050
- Strive to reach a consensus-based solution on international taxation by mid-2021 within OECD framework
- Sees robust recovery underway by H2
- Says monetary policy is quite accommodative
- Both monetary and fiscal policy responses have been quite appropriate, given the severity of the economic crisis
- Savings built up during pandemic could ultimately lead to significant increases in demand for activities limited by social distancing
- Repeats that Fed expects to keep rates at near-zero levels until 2% inflation target has been reached
- Fed will continue purchases until there is substantially more progress in lowering unemployment rate and raising inflation
The National Association
of Realtors (NAR) announced on Friday that the U.S. existing home sales rose 0.6
percent m-o-m to a seasonally adjusted rate of 6.69 million in January 2021 from 6.65
million in December 2020.
Economists had
forecast home resales decreasing to a 6.61 million-unit pace last month.
In y-o-y terms,
existing-home sales surged 23.7 percent in January
According to
the report, two of the four major regions recorded m-o-m gains in existing-home
sales in January but all four regions rose at double-digit rates from one year
ago. The median existing-home price for all housing types in January was $303,900,
up 14.1 percent from January 2020. Single-family home sales stood at a
seasonally-adjusted annual rate of 5.93 million in January, up 0.2 percent from
December and up 23.0 percent from one year ago. The median existing
single-family home price was $308,300 in January, up 14.8 percent from January 2020. Meanwhile,
existing condominium and co-op sales were recorded at a seasonally-adjusted
annual rate of 760,000 units in January, up 4.1 percent from December and up
28.8 percent from one year ago. The median existing condo price was $269,600 in
January, an advance of 8.6 percent from a year ago.
"Home
sales continue to ascend in the first month of the year, as buyers quickly
snatched up virtually every new listing coming on the market," noted
Lawrence Yun, NAR's chief economist. "Sales easily could have been even
20% higher if there had been more inventory and more choices," he added.
Preliminary
data released by IHS Markit on Friday revealed that U.S. private sector business
activity recorded its strongest monthly expansion for almost six years in February.
According to
the report, the Markit flash manufacturing purchasing manager's index (PMI)
came in at 58.5 in January, down slightly from 59.2 in January. Economists had
expected the reading to drop to 58.5. A reading above 50 signals an expansion
in activity, while a reading below this level signals a contraction. The
headline index reading was buoyed in part due to a substantial deterioration in
vendor performance. Expansions in production and new orders weakened, but the rates
of growth were still steep overall, supported by strong client demand. In
addition, the rate of job creation was the quickest since December 2017.
The Markit
flash services purchasing manager's index (PMI) rose to 58.9 in February, up
from 58.3 in the previous month. The rate of expansion was the steepest since
March 2015, as service sector firms saw greater client demand. Economists had
expected the reading to decrease to 57.6. The new business rose at the sharpest
pace for three months, despite
a decrease in new export orders, while employment rose only marginally amid
efforts to control outgoings.
Overall, IHS
Markit Flash U.S. Composite PMI Output Index came in at 58.8 in February, up
slightly from 58.7 in January, indicating the sharpest expansion since March
2015.
Chris
Williamson, Chief Business Economist at HIS Markit noted: “Despite headwinds of
COVID-19, extreme weather and record supply chain delays, US businesses reported
the fastest output growth for almost six years in February. The data add to
signs that the economy is enjoying a strong opening quarter to 2021, buoyed by additional
stimulus and the partial reopening of the economy as virus-related restrictions
were eased on average across the country."
U.S. stock-index futures traded higher on Friday, as technology stocks rose after being sold off for most parts of the week, while investors awaited preliminary February U.S. manufacturing/services PMIs and continued to digest the comments by Treasury Secretary Janet Yellen, who said that a large coronavirus relief package is needed for a full economic recovery in the U.S.
Global Stocks:
Index/commodity | Last | Today's Change, points | Today's Change, % |
Nikkei | 30,017.92 | -218.17 | -0.72% |
Hang Seng | 30,644.73 | +49.46 | +0.16% |
Shanghai | 3,696.17 | +20.81 | +0.57% |
S&P/ASX | 6,793.80 | -92.10 | -1.34% |
FTSE | 6,637.91 | +20.76 | +0.31% |
CAC | 5,778.92 | +50.59 | +0.88% |
DAX | 14,022.05 | +135.12 | +0.97% |
Crude oil | $59.69 | -1.37% | |
Gold | $1,776.20 | +0.07% |
- Says inflation is "not in the numbers"
- Warmer weather, spreading immunity will mean fewer constraints on consumers and businesses
- Individual hesitance to receive coronavirus vaccine is potential barrier to herd immunity but the economy may not require it
- Hopes combination of easy policy, savings and fiscal help can return U.S. economy to health "in short order"
- Fundamental challenge for U.S. growth right now is how to increase the workforce
- Raising labor force participation is on ground battle that will hinge on social supports, training, wages and other incentives to attract workers
- Infrastructure program could face constrained supply of construction, manufacturing workers
- Imbalance between housing demand and supply is likely multi-year problem
(company / ticker / price / change ($/%) / volume)
ALCOA INC. | AA | 21.53 | 0.41(1.94%) | 23803 |
ALTRIA GROUP INC. | MO | 43.78 | 0.15(0.34%) | 12240 |
Amazon.com Inc., NASDAQ | AMZN | 3,338.00 | 9.77(0.29%) | 20728 |
American Express Co | AXP | 128.89 | 0.40(0.31%) | 393 |
AMERICAN INTERNATIONAL GROUP | AIG | 42.24 | 0.13(0.31%) | 730 |
Apple Inc. | AAPL | 130.68 | 0.97(0.75%) | 893246 |
AT&T Inc | T | 29.29 | 0.06(0.21%) | 63028 |
Boeing Co | BA | 210.3 | 1.82(0.87%) | 72622 |
Caterpillar Inc | CAT | 202.68 | 2.76(1.38%) | 21263 |
Chevron Corp | CVX | 94.94 | -0.06(-0.06%) | 26890 |
Cisco Systems Inc | CSCO | 46.49 | 0.15(0.32%) | 10524 |
Citigroup Inc., NYSE | C | 63.95 | 0.47(0.74%) | 42178 |
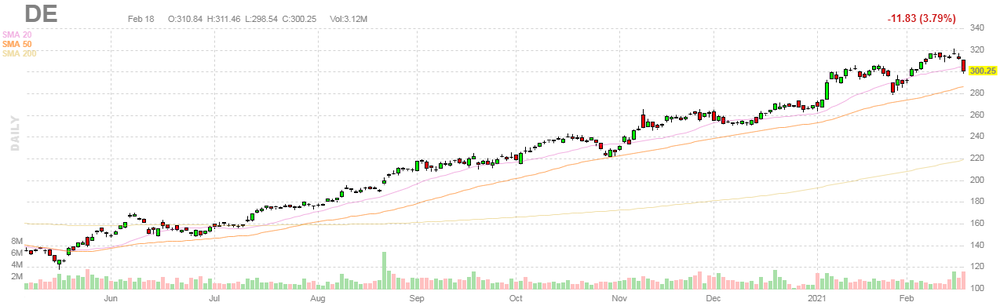
Deere & Company, NYSE | DE | 319 | 18.75(6.24%) | 70134 |
E. I. du Pont de Nemours and Co | DD | 69.2 | 0.36(0.52%) | 3248 |
Exxon Mobil Corp | XOM | 52.06 | 0.04(0.08%) | 179572 |
Facebook, Inc. | FB | 270.6 | 1.21(0.45%) | 66790 |
FedEx Corporation, NYSE | FDX | 256.65 | 1.02(0.40%) | 3418 |
Ford Motor Co. | F | 11.51 | 0.08(0.70%) | 393293 |
Freeport-McMoRan Copper & Gold Inc., NYSE | FCX | 35.1 | 0.96(2.81%) | 301759 |
General Electric Co | GE | 11.72 | 0.09(0.77%) | 342708 |
General Motors Company, NYSE | GM | 52.6 | 0.44(0.84%) | 95181 |
Goldman Sachs | GS | 312.02 | 2.12(0.68%) | 74909 |
Google Inc. | GOOG | 2,126.10 | 8.90(0.42%) | 1658 |
Hewlett-Packard Co. | HPQ | 26.46 | 0.05(0.19%) | 1650 |
Home Depot Inc | HD | 283.55 | 0.50(0.18%) | 4325 |
Intel Corp | INTC | 61.86 | 0.25(0.41%) | 35797 |
International Business Machines Co... | IBM | 121.1 | 0.37(0.31%) | 20009 |
International Paper Company | IP | 48 | 0.16(0.33%) | 1029 |
Johnson & Johnson | JNJ | 166.15 | 0.41(0.25%) | 19555 |
JPMorgan Chase and Co | JPM | 146.49 | 0.90(0.62%) | 10167 |
McDonald's Corp | MCD | 215.45 | 0.02(0.01%) | 1740 |
Merck & Co Inc | MRK | 75.74 | 0.33(0.44%) | 17877 |
Microsoft Corp | MSFT | 244.65 | 0.86(0.35%) | 55281 |
Nike | NKE | 145.69 | 0.60(0.41%) | 3904 |
Pfizer Inc | PFE | 34.69 | 0.13(0.38%) | 296831 |
Tesla Motors, Inc., NASDAQ | TSLA | 795.73 | 8.35(1.06%) | 297674 |
The Coca-Cola Co | KO | 50.85 | 0.08(0.16%) | 31860 |
Twitter, Inc., NYSE | TWTR | 72.7 | 0.44(0.61%) | 47641 |
Verizon Communications Inc | VZ | 57.26 | 0.28(0.49%) | 63454 |
Visa | V | 209.85 | 0.50(0.24%) | 6792 |
Wal-Mart Stores Inc | WMT | 138.19 | 0.53(0.39%) | 146796 |
Walt Disney Co | DIS | 184.5 | 1.50(0.82%) | 31894 |
Yandex N.V., NASDAQ | YNDX | 69.51 | 1.91(2.83%) | 20966 |
Statistics
Canada announced on Friday that the Canadian retail sales fell 3.4 percent
m-o-m to CAD53.38 billion in December, following an unrevised 1.3 percent m-o-m
advance in November.
Economists had
forecast a 2.5 percent m-o-m decline for December.
According to
the report, sales decreased in 9 of 11 subsectors in December, accounting for 83.6
percent of total retail sales. Sales at motor vehicle and parts dealers
declined 1.4 percent m-o-m, recording their largest decline since April.
Meanwhile, sales at gasoline stations rose 0.3 percent m-o-m in December,
recording their first increase in four months. Excluding motor vehicle and
parts dealers, retail sales fell 4.1 percent m-o-m in December compared to a 2.1
percent m-o-m gain in November and economists’ forecast for a 2.0 percent m-o-m
decrease. Core retail sales, which excludes gasoline stations and motor vehicle
and parts dealers, decreased 4.6 percent m-o-m in December, hurt by
lower sales at sales at general merchandise stores (-7.6 percent m-o-m) and
clothing and clothing accessories stores (-17.0 percent m-o-m), as well as
sporting goods, hobby, book and music stores (-22.5 percent m-o-m).
In y-o-y terms,
Canadian retail sales climbed 3.3 percent in December, following an unrevised 7.5
percent surge in November.
In 2020,
Canadian retail sales declined 1.4 percent y-o-y to CAD606 billion. This was
the largest annual decline since the 2009 recession.
| Time | Country | Event | Period | Previous value | Forecast | Actual |
|---|---|---|---|---|---|---|
| 07:00 | Germany | Producer Price Index (YoY) | January | 0.2% | 0.3% | 0.9% |
| 07:00 | Germany | Producer Price Index (MoM) | January | 0.8% | 0.8% | 1.4% |
| 07:00 | United Kingdom | Retail Sales (YoY) | January | 3.1% | -1.3% | -5.9% |
| 07:00 | United Kingdom | Retail Sales (MoM) | January | 0.4% | -2.5% | -8.2% |
| 07:30 | Switzerland | Industrial Production (YoY) | Quarter IV | -4.4% | -3.8% | |
| 07:45 | France | CPI, y/y | January | 0% | 0.6% | 0.6% |
| 07:45 | France | CPI, m/m | January | 0.2% | 0.2% | 0.2% |
| 08:15 | France | Manufacturing PMI | February | 51.6 | 51.4 | 55 |
| 08:15 | France | Services PMI | February | 47.3 | 47 | 43.6 |
| 08:30 | Germany | Services PMI | February | 46.7 | 46.5 | 45.9 |
| 08:30 | Germany | Manufacturing PMI | February | 57.1 | 56.5 | 60.6 |
| 09:00 | Eurozone | Current account, unadjusted, bln | December | 27.3 | 51.9 | |
| 09:00 | Eurozone | Manufacturing PMI | February | 54.8 | 54.3 | 57.7 |
| 09:00 | Eurozone | Services PMI | February | 45.4 | 45.9 | 44.7 |
| 09:30 | United Kingdom | Purchasing Manager Index Services | February | 39.5 | 41 | 49.7 |
| 09:30 | United Kingdom | Purchasing Manager Index Manufacturing | February | 54.1 | 53.2 | 54.9 |
| 11:00 | United Kingdom | CBI industrial order books balance | February | -38 | -35 | -24 |
| 13:00 | U.S. | Fed Barkin Speech | ||||
| 13:30 | Canada | Retail Sales, m/m | December | 1.3% | -2.5% | -3.4% |
| 13:30 | Canada | Retail Sales YoY | December | 7.5% | 3.3% | |
| 13:30 | Canada | Retail Sales ex Autos, m/m | December | 2.1% | -2% | -4.1% |
GBP traded mixed against its major rivals in the European session on Friday as investors assessed a slew of mixed economic data from the UK, while the country’s successful Covid-19 vaccination rollout continued to support the pound. It rose against USD, EUR, JPY and CHF, but fell against AUD, NZD and CAD.
Data from the Office for National Statistics (ONS) showed British retail sales fell much more than forecast in January as non-essential shops went back into nationwide coronavirus lockdown. According to the report, retail sales in the UK slumped 8.2 percent m/m in January 2021 (the most since a record 18 percent m/m plunge in April 2020), following a 0.4 percent m/m advance seen in December 2020. Economists had forecast a 2.5 percent m/m decline. In y/y terms, retail sales decreased 5.9 percent in contrast to a 3.1 percent gain in the previous month. This was the biggest fall since May 2020. Economists had expected a drop of 1.3 percent.
Flash readings of business activity data indicated only a fractional decrease in the UK private-sector output in February, largely reflecting a near-stabilization in service activity amid continuing growth in manufacturing. According to IHS Markit’s report, the IHS Markit/Chartered Institute of Procurement & Supply (CIPS) UK Composite PMI climbed to 49.8 in February from 41.2 in January, approaching close to a 50.0 no-change threshold. The score was predicted to increase only to 42.2. The IHS Markit/CIPS UK Services PMI rose to 49.7 in February from 39.5 in the previous month, exceeding economists' expectations of 41.0. The reading signaled the softest rate of decline since the current phase of contraction began in November 2020. At the same time, the IHS Markit/CIPS UK Manufacturing PMI rose to 54.9 in February from 54.1 in January, also beating economists’ forecasts of 53.2.
Meanwhile, the latest survey by the Confederation of British Industry (CBI) revealed that the UK manufacturers' order books improved in February to a similar position as in December 2020. According to the report, the CBI's monthly factory order book balance increased to -24 in February from -38 in the previous month but remained well below the long-run average of -14. Economists had forecast the reading to come in at -35.
Market participants also digested the remarks of the Bank of England's (BoE) policymaker Gertjan Vlieghe, who suggested that the BoE might need negative rates later this year or in 2022 if Britain’s economic recovery disappoints. However, if the economy evolves broadly in line with BoE’s latest projections, it is likely that no further monetary stimulus is required, he said.
FXStreet reports that UOB Group’s Economist Lee Sue Ann reviews the latest revision of the Q4 GDP figures in Euroland.
“The Eurozone’s GDP fell by 0.6% q/q in 4Q20, less than the 0.7% q/q contraction of the first estimate. This contraction follows a strong rebound of 12.4% q/q in 3Q20, when COVID19 pandemic restrictions were eased. In the second quarter of the year, the Eurozone economy had suffered a historic contraction of 11.7% q/q. Compared with the same quarter of the previous year, GDP, however, decreased by 5.0% y/y. This compares with a 5.1% y/y drop expected. For 2020, the Eurozone economy shrank by 6.8%.”
“The European Commission, last week, cut its Euro Area economic outlook for this year to 3.8% from 4.2%, and said developments largely depend on the success of the region’s immunization efforts.”
“Indeed, the success and distribution of vaccines, and how the COVID-19 pandemic evolves will drive both upside and downside risks to our Eurozone growth outlook of 5.2% in 2021."
FXStreet notes that the EUR/JPY pair remains well supported and despite a bearish “reversal day” analysts at Credit Suisse look for support at 127.33/30 to ideally hold for strength to 128.67/70 and eventually 130.16.
“EUR/JPY weakness has been contained at 127.33/30 and despite the recent “reversal day” weakness stays seen as a temporary pullback prior to the rally resuming in due course. Above 127.98 remains needed to add weight to this view to clear the way for a move back to 128.37/47, then the ‘measured base objective’ and 61.8% retracement of the 2018/2020 bear trend at 128.67/70. Whilst we would look for a cap here at first, above in due course should see the ‘measured triangle objective’ at 130.13/16.”
- If the economy evolves broadly in line with our central projection, in my view, it is likely that no further monetary stimulus is required
- My preferred path for policy would be to keep current monetary stimulus in place until well into 2023 or 2024
- We are clearly not experiencing a V-shaped recovery
- There is also the possibility of weaker scenario, and my own view is that risks remain skewed in this direction
- Even small amount of persistent labour market slack would be enough to keep wage pressure too low
- In such a scenario, I judge more monetary stimulus would be appropriate; I would favour a negative bank rate as tool to implement the stimulus
- No evidence that negative rates have been counterproductive
- Possible that we have short period of pent up demand, after which demand eases back again
- It would be a policy error to respond to such circumstances with early monetary tightening
- Even if the economy recovers more strongly than in our central projection, I think the removal of monetary stimulus is unlikely to become appropriate until well into 2022
FXStreet reports that Senior Economist at UOB Group Alvin Liew evaluates the latest publication of the FOMC Minutes of the January meeting.
“The main takeaway from the Federal Reserve’s release of the January 2021 FOMC minutes (18 Feb) was the central bank’s reassurance that the Fed is keeping its easy monetary policies in place for some time.”
“While the FOMC participants broadly agreed that the medium-term outlook for US real GDP growth and employment had improved, they continued to see the uncertainty surrounding that outlook as elevated and that the progress on vaccinations was essential for supporting further gains in consumer spending and economic recovery more generally.”
“With the expectations that it would be “some time” before conditions to scale back their massive bond purchases were met, the latest FOMC minutes left markets wondering whether any tapering could start before 2022. Going forward, our base case remains for the Fed to stay on hold for most of 2021, at least and the taper discussion will only start in late 2021/early 2022.”
Deere (DE) reported Q1 FY 2021 earnings of $3.87 per share (versus $1.63 per share in Q1 FY 2020), beating analysts’ consensus estimate of $2.17 per share.
The company’s quarterly revenues amounted to $8.051 bln (+23.3% y/y), beating analysts’ consensus estimate of $7.120 bln.
DE rose to $308.00 (+2.58%) in pre-market trading.
FXStreet reports that the Credit Suisse analyst team notes that the NZD/USD pair found support at the 55-day average at 0.7167 and is poised for a fresh test of the crucial range highs at 0.7254/69.
“Our bias is still to look for a move higher from here, in line with the broader medium-term uptrend and a sustained close above the aforementioned 0.7254/69 would confirm this. Thereafter, we see resistance at 0.7281/86, ahead of the psychological inflection point at 0.7300.”
“Support is seen initially at 0.7204, then 0.7176, ahead of 0.7167/58, which ideally holds once more to keep the risk higher. Removal of here though would expose the early February lows at 0.7136/35, where we would expect to see another attempt to hold.”
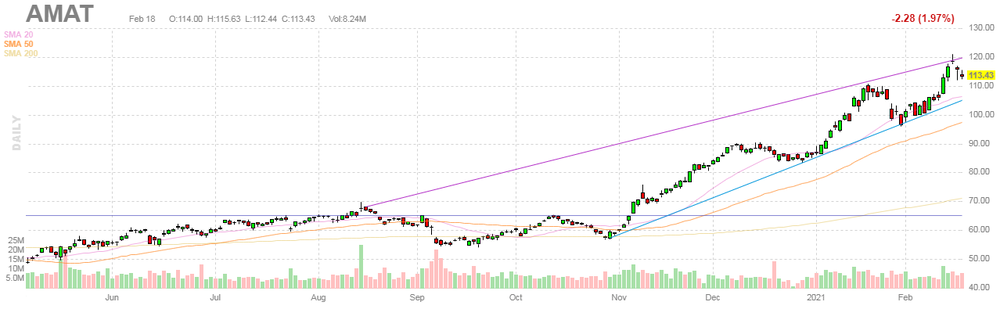
Applied Materials (AMAT) reported Q1 FY 2021 earnings of $1.39 per share (versus $0.98 per share in Q1 FY 2020), beating analysts’ consensus estimate of $1.28 per share.
The company’s quarterly revenues amounted to $5.162 bln (+24.0% y/y), beating analysts’ consensus estimate of $4.967 bln.
The company also issued upside guidance for Q2 FY 2021, projecting EPS of $1.44-1.56 versus analysts’ consensus estimate of $1.28 and revenues of $5.37-5.41 bln versus analysts’ consensus estimate of $4.97 bln.
AMAT rose to $119.00 (+4.91%) in pre-market trading.
The latest
survey by the Confederation of British Industry (CBI) revealed on Friday the UK
manufacturers' order books improved in February to a similar position as in December 2020, but remained far
below their long-run average.
According to
the report, the CBI's monthly factory order book balance increased to -24 in February
from -38 in the previous month, but remained well below the long-run average of
-14. Economists had forecast the reading to come in at -35. Meanwhile, export order
books (-39) worsened somewhat on January (-33), remaining far weaker than their
long-run average (-18).
The CBI also
reported that output volumes in the three months to February declined at a
modest pace (-8 from -2 in January 2021). It was also expected that output would
be roughly flat in the next three months (-2), marking a notable improvement in
expectations from January (-24).
In other survey
results, output prices were seen to be broadly steady in the next three months
(+3 compared to +4 in January). This was in line with the long-run average (+3).
“Manufacturing
activity remains patchy, but so far appears to have taken a smaller hit than in
previous lockdowns. However, a stubbornly mixed picture persists among the
different manufacturing sub-sectors, pointing to the asymmetric impact of
restrictions,” noted Alpesh Paleja, CBI Lead Economist. “With some much-needed
clarity coming down the track in the Government’s roadmap for easing lockdown,
it is vital that manufacturers are supported beyond April, in line with the restrictions
that will remain.”
Meanwhile, Tom
Crotty, Group Director at INEOS and Chair of the CBI Manufacturing Council,
said: “The start of 2021 has been tough for manufacturers as firms acclimatize
to life outside the EU and grapple with the challenges of lockdown. As we look
ahead to the future, there is an incredibly exciting opportunity for the
government to work with firms to help shape a manufacturing sector that is
capable of driving the UK’s post-COVID economic recovery. In the meantime,
however, it’s important that the sector continues to have access to the support
it needs to get through the next few difficult months.”
CNBC reports that JPMorgan says crude prices could see further upside ahead as oil continues to see strong gains so far this year.
“I think there’s room for oil prices to move a little bit higher in this environment but, you know, not thinking about a price of $80 or $90 a barrel. Maybe it goes up by $5 or $10 more from here,” Kerry Craig, global market strategist at JPMorgan Asset Management, told CNBC.
There are two things that will likely drive oil prices going forward, according to Craig.
Firstly, demand for oil is expected to pick up as the global economy recovers from the hit of the coronavirus pandemic, he said. However, that will be “curtailed to a certain extent” due to the low likelihood of international travel coming back in a big way soon. Travel is an “important source of demand,” he added.
On the supply side, he said: “We’re still relying on those OPEC+ members to keep that supply relatively curtailed and I think there’s still a question about that in terms of the amount of supply coming on relative to demand.”
FXStreet reports that MUFG Bank said that the GBP against an equally-weighted basket of the EUR and USD is now only around 1.5% below the post Brexit referendum high from April 2018 which is likely to prove an important juncture for pound performance.
“A break above the post-referendum highs would encourage speculation for further near-term pound gains now that Brexit uncertainty has eased. Whereas if those highs remain in place, market participants could start to more seriously question whether recent pound gains have gone too far.”
“The UK government will set out its plans to begin easing COVID restrictions on Monday. Press reports have been suggesting that the UK government will adopt a very cautious approach. A slower paring back of restrictions could dampen some of the recent optimism over the faster roll out of vaccines in the UK.”
Reuters reports that the State Administration of Foreign Exchange (SAFE) said that China will allow more outbound investment by appropriately raising the quota on its Qualified Domestic Institutional Investor (QDII) scheme in 2021.
China will push forward with the opening up of its financial derivative market in 2021, Ye Haisheng, the head of capital account management department at the State Administration of Foreign Exchange (SAFE), wrote.
It will also study the impact of unconventional foreign stimulus policies on its balance of payments, yuan exchange rates and its financial markets, the official said.
The SAFE will prevent disorderly cross-border capital flows and step up its monitoring of foreign capital flows in and out of China's stock and bond markets, in order to head off systemic financial risks, Ye added.
According to the report from IHS Markit / CIPS, February data indicated only a fractional decline in UK private sector output, which contrasted with the sharp reduction seen at the start of the national lockdown in January. This largely reflected a near-stabilisation in service activity during the latest survey period. Manufacturing production continued to expand in February, but the rate of growth was only marginal and the weakest since the recovery began in June 2020. Manufacturing companies often cited severe supply chain disruptions as a factor holding back production volumes. This was attributed to international shipping delays, strong worldwide demand for raw materials and Brexit-related trade frictions. Around 58% of the survey panel reported longer delivery times from suppliers, while only 2% saw an improvement in February. The scale of the downturn in vendor performance was the second-largest since the survey began in 1992 (exceeded only by those seen in April 2020).
At 49.8 in February, up from 41.2 in January, the headline seasonally adjusted UK Composite Output Index was close to the 50.0 no-change threshold. As a result, the flash reading in February – which is based on approximately 85% of usual monthly replies – signalled broadly stable levels of UK private sector output in comparison to those seen during January.
Service sector activity remained severely impacted by the coronavirus disease 2019 (COVID-19) pandemic in February, with output levels suppressed due to tight restrictions on travel, leisure and hospitality. Moreover, some manufacturers commented on weaker sales volumes due to temporary closures among clients in the consumer services sector, especially hospitality businesses.
According to the report from IHS Markit, eurozone business activity fell for a fourth successive month in February, driven lower by a further slump in the service sector as virus-related restrictions continued to affect many businesses. The service sector downturn was offset, however, by faster manufacturing growth, led by Germany. Business expectations also improved to the highest for nearly three years as companies looked ahead to vaccine roll-outs allowing an easing of restrictions. Rising price pressures were evident, however, as surging demand for raw materials led to near record supply constraints, driving manufacturing input prices up at a rate not seen for almost ten years.
The headline flash Eurozone Composite PMI edged higher from 47.8 in January to 48.1 in February. By remaining below 50.0, the latest reading indicated a fourth consecutive monthly contraction of business activity, but also registered a slight easing in the rate of decline c ompared to January. Despite the rise in the PMI, the average reading of 47.9 for the first quarter so far is marginally lower than the average of 48.1 seen in the fourth quarter of last year. The sustained downturn therefore hints at a further deterioration in the economy as measures to control the coronavirus disease 2019 (COVID-19) pandemic continue to disrupt business activity across the region.
The deterioration in output was driven by the service sector, where activity fell at the fastest rate since November, registering the second steepest fall since last May largely in response to COVID-19 related restrictions. In contrast to the further weakening of service sector activity, manufacturing output growth accelerated to the fastest since October, and the second-fastest in three years, buoyed by surging inflows of news business.
According to the report from IHS Markit, latest data showed a further divergence in the performances of Germany’s manufacturing and service sectors in February. While coronavirus disease 2019 (COVID 19) lockdown measures continued to weigh on activity across large parts of the services economy, factories saw strong and accelerated growth due in part to surging export orders.
The positive manufacturing performance came despite a backdrop of increasing supply-side pressures. February saw record reports of delays in the delivery of inputs amid raw material shortages and squeezed transport capacity, as well an associated spike in costs.
The headline Flash Germany PMI Composite Output Index registered 51.3 in February. This was up slightly from January’s seven-month low of 50.8, though still lower than at any other time since the start of the recovery last July. The slight rise in the headline index was driven by stronger growth in manufacturing output which, having eased to the slowest for five months in January, reaccelerated to the quickest since last November. This contrasted with the fastest decline in services activity since May last year, albeit one still much slower than at the depths of the initial COVID-19 shutdowns. Inflows of new business fell across the service sector for the fifth month in a row in February, and at the quickest rate in this sequence. Surveyed businesses highlighted slow decision-making among clients as well as disruption from forced closures and travel restrictions. Manufacturing order book volumes, on the other hand, remained robust, supported by the strongest growth in factory export orders in over three years. As was the case for output and new orders, overall backlogs of work showed a modest increase in February, with the result masking varied trends at the sector level. The volume of outstanding business at services firms was down for the nineteenth month in a row, while backorders at manufacturers continued to rise steeply.
| Time | Country | Event | Period | Previous value | Forecast | Actual |
|---|---|---|---|---|---|---|
| 00:01 | United Kingdom | Gfk Consumer Confidence | February | -28 | -23 | |
| 00:30 | Australia | Retail Sales, M/M | January | -4.1% | 2% | 0.6% |
| 00:30 | Japan | Nikkei Services PMI | February | 46.1 | 45.8 | |
| 00:30 | Japan | Manufacturing PMI | February | 49.8 | 50.6 | |
| 07:00 | Germany | Producer Price Index (YoY) | January | 0.2% | 0.3% | 0.9% |
| 07:00 | Germany | Producer Price Index (MoM) | January | 0.8% | 0.8% | 1.4% |
| 07:00 | United Kingdom | Retail Sales (YoY) | January | 3.1% | -1.3% | -5.9% |
| 07:00 | United Kingdom | Retail Sales (MoM) | January | 0.4% | -2.5% | -8.2% |
| 07:30 | Switzerland | Industrial Production (YoY) | Quarter IV | -5.1% | -3.8% | |
| 07:45 | France | CPI, y/y | January | 0% | 0.6% | 0.6% |
| 07:45 | France | CPI, m/m | January | 0.2% | 0.2% | 0.2% |
During today's Asian trading, the US dollar fell against the euro and declined slightly against the yen.
The ICE Dollar index, which shows the value of the dollar against six major world currencies, fell by 0.11%. However, at the end of this week, the dollar index may show a slight increase. The US currency received support on the back of higher yields on US government bonds.
However, the difficult situation in the labor market and the soft monetary policy of the US Federal Reserve System largely limited the dollar's rise. In addition, the prospects for a global economic recovery due to the adoption of large-scale stimulus packages by countries and the gradual introduction of coronavirus vaccines lead to a decrease in the demand of traders for safe assets.
According to data released yesterday by the US Department of Labor, the number of Americans who applied for unemployment benefits for the first time increased by 13 thousand last week - to 861 thousand people. A week earlier, the number of requests was 848 thousand, and not 793 thousand, as previously reported. Analysts on average expected a decline in the number of applications to 765 thousand.
The pound continued its gains against the US dollar after hitting a two-and-a-half-year high earlier this week amid hopes of an early easing of quarantine restrictions in the UK thanks to mass vaccination against COVID-19.
According to the report from the INSEE, in January 2021, the Consumer Price Index (CPI) rose by 0.2% over one month, as in December 2020. The food prices rebounded (+0.4% after –0.4%) and those of tobacco rose by 0.3% after being stable in the previous month. The service prices slowed down (+0.1% after +0.5%). The prices of energy increased at the same rate as in the last month (+1.7%) and those of manufactured goods decreased as in December (–0.4%).
Seasonally adjusted, consumer prices rose by 0.7%, after being stable in December.
Year on year, consumer prices rose by 0.6% after being stable in December. The service prices (+0.8% after +0.7%) and those of tobacco (+12.7% after +12.5%) accelerated. The prices of manufactured goods rebounded sharply (+0.8% after –0.9%), due to the offset of winter sales. The decrease in the energy prices softened (–5.8% after –7.0%) in the wake of petroleum product prices. The food prices grew, year on year, at the same rate as in the last month (+1.0%).
Year on year, core inflation rose, in January, up to +1.0% after +0.2% in December. The Harmonised Index of Consumer Prices (HICP) rose by 0.3% over one month after +0.2% in the previous month; year on year, it increased by 0.8% after being stable in December.
EUR/USD
Resistance levels (open interest**, contracts)
$1.2217 (2929)
$1.2180 (2481)
$1.2150 (4006)
Price at time of writing this review: $1.2104
Support levels (open interest**, contracts):
$1.2074 (390)
$1.2061 (1717)
$1.2041 (2309)
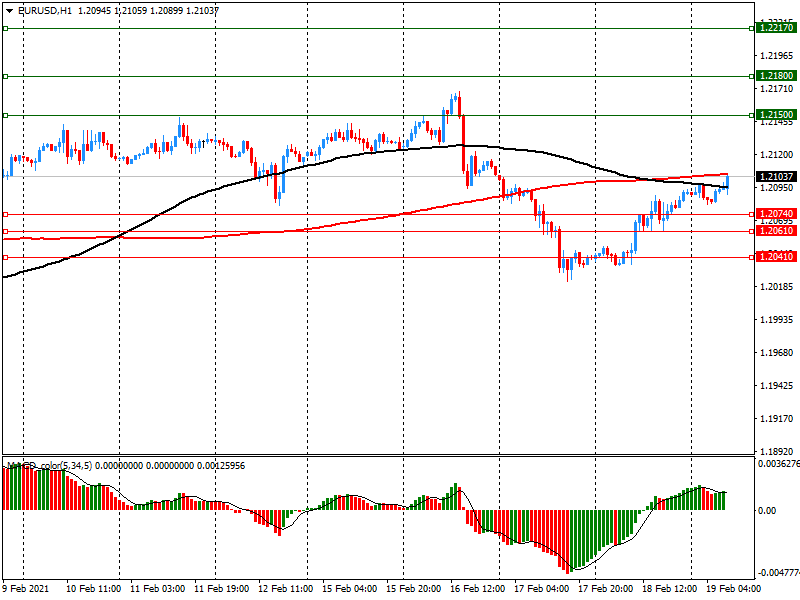
Comments:
- Overall open interest on the CALL options and PUT options with the expiration date March, 5 is 89956 contracts (according to data from February, 18) with the maximum number of contracts with strike price $1,1950 (5990);
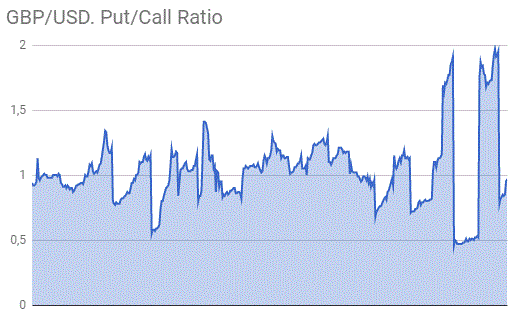
GBP/USD
Resistance levels (open interest**, contracts)
$1.4067 (2136)
$1.4024 (618)
$1.4000 (1843)
Price at time of writing this review: $1.3976
Support levels (open interest**, contracts):
$1.3816 (253)
$1.3776 (404)
$1.3733 (211)
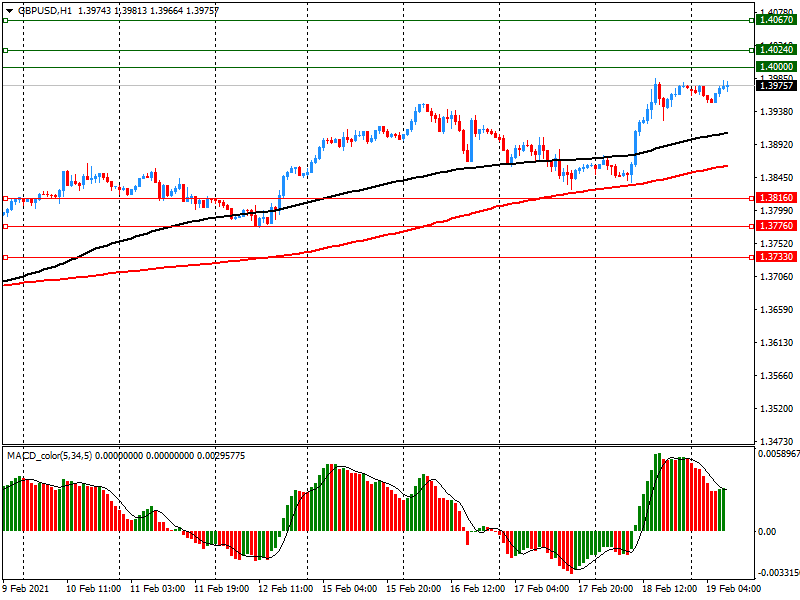
Comments:
- Overall open interest on the CALL options with the expiration date March, 5 is 16732 contracts, with the maximum number of contracts with strike price $1,4200 (2219);
- Overall open interest on the PUT options with the expiration date March, 5 is 15027 contracts, with the maximum number of contracts with strike price $1,3100 (1225);
- The ratio of PUT/CALL was 0.90 versus 0.97 from the previous trading day according to data from February, 18
* - The Chicago Mercantile Exchange bulletin (CME) is used for the calculation.
** - Open interest takes into account the total number of option contracts that are open at the moment.
According to the report from the Federal Statistical Office (Destatis), in January 2021, the index of producer prices for industrial products increased by 0.9% compared with the corresponding month of the preceding year. Economists had expected a 0.3% increase. In December 2020 the annual rate of change all over had been +0.2%. Compared with the preceding month December 2020 the overall index increased by 1.4% in January 2021 (+0.8% in December 2020). Economists had expected a 0.8% increase.
Prices of intermediate goods increased by 2.4% compared to January 2020 and by 2.0% compared to the previous month December 2020. Prices of durable consumer goods increased by 1.5% compared to January 2020, capital goods, such as machines and vehicles, by 0.7%.
Energy prices as a whole increased by 0.7% compared to January 2020 and by 2.7% compared to December 2020. The price increase from December 2020 to January 2021 in parts is due to the national CO2-pricing that has been introduced in January 2021.
The overall index disregarding energy was 0.9% up on January 2020.
Prices of non-durable consumer goods decreased by 1.8% compared to January 2020. Food prices decreased by 3.3%.
According to the report from Office for National Statistics, in January 2021, retail sales volumes decreased by 8.2% when compared with December 2020 as tighter nationwide coronavirus (COVID-19) restrictions affected sales. Economists had expected a 2.5% increase.
Retail sales volumes were 5.5% lower than before the pandemic in February 2020 indicating that the impact of restrictions on the retail sector was not as large as that seen in April 2020 during the first full month of retail restrictions when sales fell by 22.2% when compared with levels before the pandemic.
All sectors saw a monthly decline in volume sales in January 2021 except for non-store retailers and food stores, who reported growth of 3.7% and 1.4% respectively when compared with December 2020.
In the three months to January 2021, retail sales volume fell by 4.9% when compared with the previous three months, with strong declines in both clothing stores and automotive fuel.
The proportion spent online soared to 35.2% in January 2021, the highest on record; this compares with 29.6% in December 2020 and 19.5% reported in January 2020.
All store types reported an increase in their proportion of online spending in January 2021 when compared with December 2020; with food stores reaching an historic high of 12.2% of sales conducted online.
| Raw materials | Closed | Change, % |
|---|---|---|
| Brent | 63.5 | -2.67 |
| Silver | 27 | -1.36 |
| Gold | 1775.387 | -0.07 |
| Palladium | 2345.73 | -1.1 |
| Time | Country | Event | Period | Previous value | Forecast |
|---|---|---|---|---|---|
| 00:01 (GMT) | United Kingdom | Gfk Consumer Confidence | February | -28 | |
| 00:30 (GMT) | Australia | Leading Index | January | 0.1% | |
| 00:30 (GMT) | Australia | Retail Sales, M/M | January | -4.2% | 2% |
| 00:30 (GMT) | Australia | Wage Price Index, y/y | Quarter IV | 1.4% | |
| 00:30 (GMT) | Australia | Wage Price Index, q/q | Quarter IV | 0.1% | |
| 00:30 (GMT) | Japan | Nikkei Services PMI | February | 46.1 | |
| 00:30 (GMT) | Japan | Manufacturing PMI | February | 49.8 | |
| 07:00 (GMT) | Germany | Producer Price Index (YoY) | January | 0.2% | |
| 07:00 (GMT) | Germany | Producer Price Index (MoM) | January | 0.8% | |
| 07:00 (GMT) | United Kingdom | Retail Sales (YoY) | January | 2.9% | |
| 07:00 (GMT) | United Kingdom | Retail Sales (MoM) | January | 0.3% | |
| 07:30 (GMT) | Switzerland | Industrial Production (YoY) | Quarter IV | -5.1% | |
| 07:45 (GMT) | France | CPI, y/y | January | 0% | 0.6% |
| 07:45 (GMT) | France | CPI, m/m | January | 0.2% | 0.2% |
| 08:15 (GMT) | France | Services PMI | February | 47.3 | |
| 08:15 (GMT) | France | Manufacturing PMI | February | 51.6 | |
| 08:30 (GMT) | Germany | Services PMI | February | 46.7 | |
| 08:30 (GMT) | Germany | Manufacturing PMI | February | 57.1 | |
| 09:00 (GMT) | Eurozone | Current account, unadjusted, bln | December | 26.8 | |
| 09:00 (GMT) | Eurozone | Manufacturing PMI | February | 54.8 | |
| 09:00 (GMT) | Eurozone | Services PMI | February | 45.4 | |
| 09:30 (GMT) | United Kingdom | PSNB, bln | January | -34.1 | |
| 09:30 (GMT) | United Kingdom | Purchasing Manager Index Services | February | 39.5 | |
| 09:30 (GMT) | United Kingdom | Purchasing Manager Index Manufacturing | February | 54.1 | |
| 11:00 (GMT) | United Kingdom | CBI industrial order books balance | February | -38 | |
| 13:00 (GMT) | U.S. | Fed Barkin Speech | |||
| 13:30 (GMT) | Canada | Retail Sales, m/m | December | 1.3% | |
| 13:30 (GMT) | Canada | Retail Sales YoY | December | 7.5% | |
| 13:30 (GMT) | Canada | Retail Sales ex Autos, m/m | December | 2.1% | |
| 14:45 (GMT) | U.S. | Manufacturing PMI | February | 59.2 | |
| 14:45 (GMT) | U.S. | Services PMI | February | 58.3 | |
| 15:00 (GMT) | U.S. | Existing Home Sales | January | 6.76 | 6.55 |
| 16:00 (GMT) | U.S. | FOMC Member Rosengren Speaks | |||
| 18:00 (GMT) | U.S. | Baker Hughes Oil Rig Count | February |
| Pare | Closed | Change, % |
|---|---|---|
| AUDUSD | 0.77693 | 0.26 |
| EURJPY | 127.773 | 0.27 |
| EURUSD | 1.20915 | 0.45 |
| GBPJPY | 147.643 | 0.64 |
| GBPUSD | 1.39721 | 0.82 |
| NZDUSD | 0.72203 | 0.43 |
| USDCAD | 1.26757 | -0.16 |
| USDCHF | 0.89583 | -0.26 |
| USDJPY | 105.664 | -0.18 |


© 2000-2026. All rights reserved.
This site is managed by Teletrade D.J. LLC 2351 LLC 2022 (Euro House, Richmond Hill Road, Kingstown, VC0100, St. Vincent and the Grenadines).
The information on this website is for informational purposes only and does not constitute any investment advice.
The company does not serve or provide services to customers who are residents of the US, Canada, Iran, The Democratic People's Republic of Korea, Yemen and FATF blacklisted countries.
Making transactions on financial markets with marginal financial instruments opens up wide possibilities and allows investors who are willing to take risks to earn high profits, carrying a potentially high risk of losses at the same time. Therefore you should responsibly approach the issue of choosing the appropriate investment strategy, taking the available resources into account, before starting trading.
Use of the information: full or partial use of materials from this website must always be referenced to TeleTrade as the source of information. Use of the materials on the Internet must be accompanied by a hyperlink to teletrade.org. Automatic import of materials and information from this website is prohibited.
Please contact our PR department if you have any questions or need assistance at pr@teletrade.global.
transfers