- Analytics
- News and Tools
- Market News
CFD Markets News and Forecasts — 18-10-2021
In an article recently published by Bloomberg, the IK's PM Boris Johnson has been quoted saying "we'll fix" Brexit’s Northern Ireland Protocol, in a sign that a compromise will be reached with the E.
''UK Prime Minister Boris Johnson promised to find a solution to Brexit’s Northern Ireland Protocol, a sign that a compromise will be reached with the European Union in a dispute that had threatened to spiral into a trade war,'' the article read, quoting further comments as follows:
“Is there a problem with the Northern Irish protocol? Yes there is -- but we’ll fix that,” Johnson said in an interview with Bloomberg News’s editor-in-chief, John Micklethwait, on Monday. “I don’t think that’s going to be the end of the world.”
Market implications
GBP price action is far more centred around the Bank of England at the moment.
GBP steadied near a 20-month high versus the euro on Monday after Bank of England Governor Andrew Bailey sent a fresh signal that the central bank is gearing up to raise interest rates as inflation risks mount.
GBP/AUD has added around 5.5% this year as traders price in the BoE and the prospects that the Old lady will be one of the first central banks to raise rates as a major factor supporting the pound.
However, there are concerns that the BoE will be cutting off the nose despite the face as the British economy has struggled with a shortage of labour, an energy crisis and rising COVID-19 cases of late. Some of these factors have been leading to inflation but the concern is for stagflation. With that being said, it's a dilemma for global central banks in general as supply chain disruptions sweeping major economies have reawakened an old nemesis for them.
- USD/CAD trades cautiously on Tuesday in the early Asian session.
- Bulls remain hopeful to catch a bid around 1.2400 for more gains.
- Momentum oscillator holds onto oversold zone, warns caution against aggressive bids.
USD/CAD remains muted on Tuesday in the early Asian trading hours. The pair trades in a very narrow price band of 1.2340 and 1.2400 for the past two sessions with no meaningful traction. At the time of writing, USD/CAD is trading at 1.2380, up 0.01% for the day.
USD/CAD daily chart
-637701962244299181.png)
On the daily chart, after testing the high of 1.2896 on September 20, the USD/CAD pair came under selling pressure. The pair then took solace at 50-day Simple Moving Average (SMA) at 1.2616 and moved back to the high made on September 29, at 1.2774. Once again a break of the mentioned SMA resulted in a downside movement for the pair toward the multi-month support near 1.2330.
If the price sustains the intraday high it could easily test the 1.2450 horizontal resistance level followed by the psychological 1.2500 mark. The Moving Average Convergence Divergence (MACD) trades in the oversold zone. Any uptick in the MACD would trigger a fresh round of buying opportunities for the pair. USD/CAD bulls would look out for October 8 high at 1.2562.
Alternatively, a break of multi-month support will bring more pain to the pair with the first downside target at a low of July 6 at 1.2303 followed by the 1.2270 horizontal support level. Next, the market participant will test the low made on June 16 at 1.2157.
USD/CAD additional levels
- AUD/NZD is making a fresh low in the Asian session, expended the bearish trend.
- Bears should be aware and take precautions against a significant bullish correction, however.
AUD/NZD is on the verge of a downside breakout below the recent phase of accumitlaiton. However, there is a caveat to such a forecast —The daily M-formation.
The following is a top-down analysis between the daily and hourly chart and goes as a reminder that when trading lower time frames, it is always prudent to zoom out to the higher time frames for the bigger picture.
AUD/NZD hourly chart
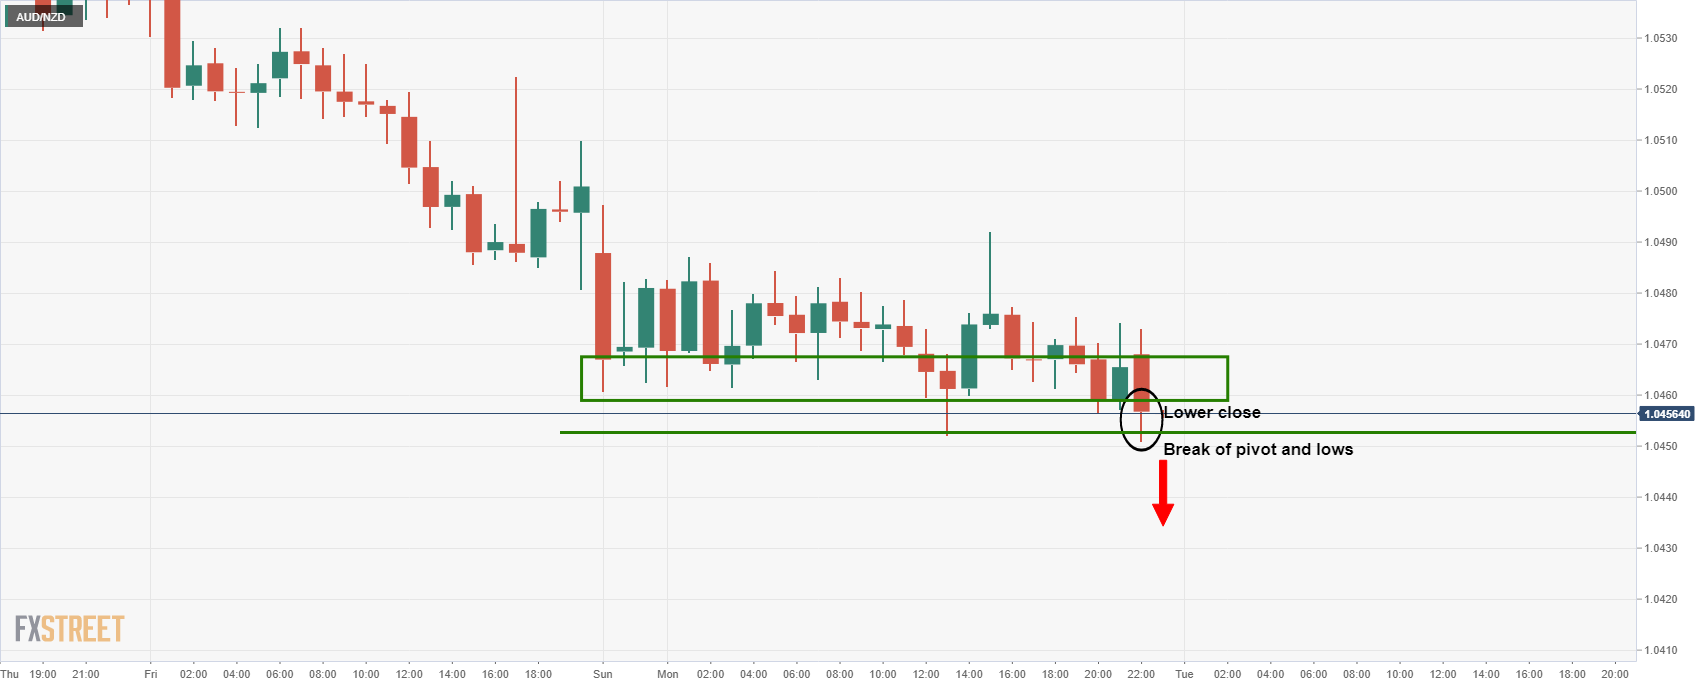
Despite the fresh low, lower close and bearish tendency of the trend, the price could be faking out here according to the daily chart's analysis below.
AUD/NZD daily chart
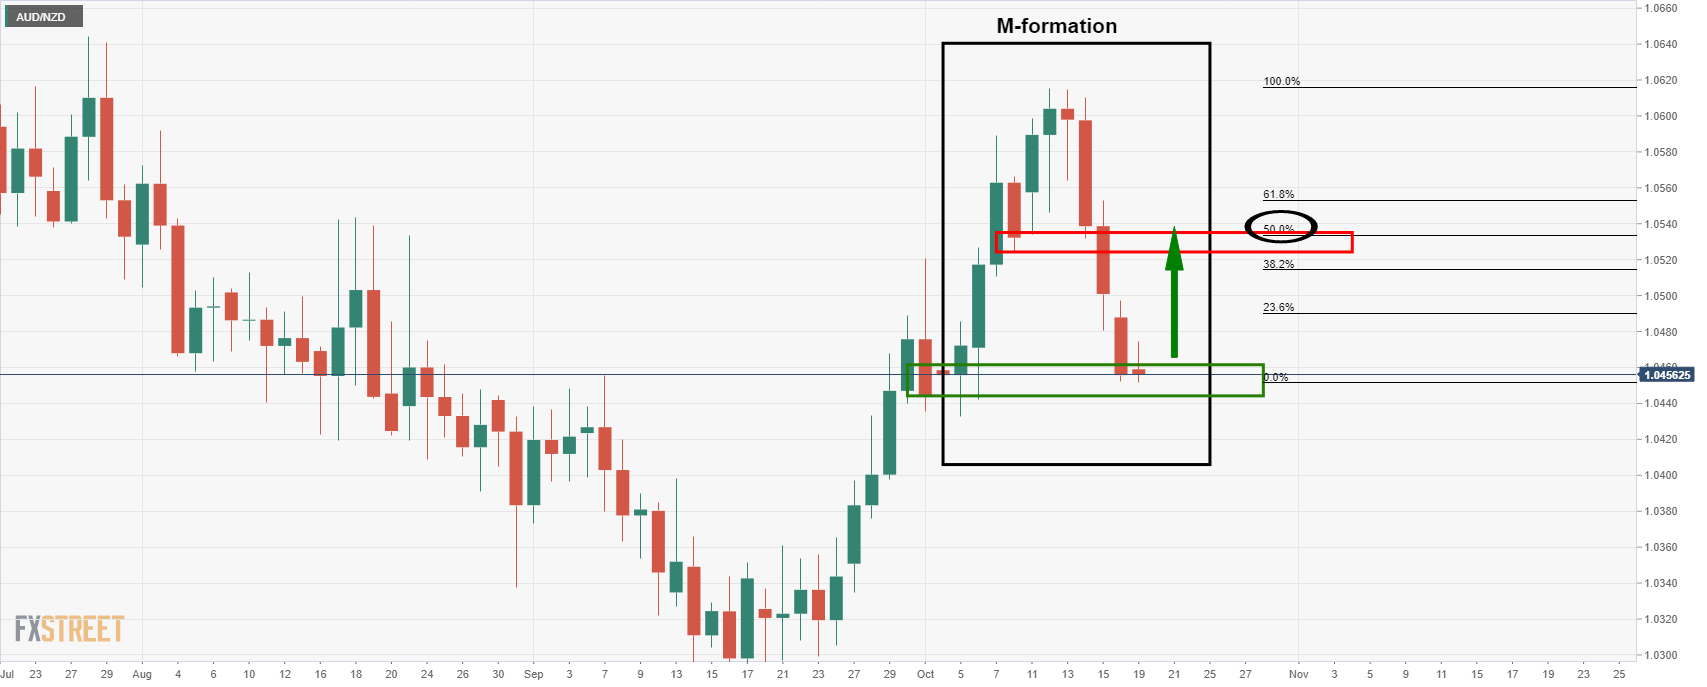
The M-formation is a bullish reversion pattern that would be expected to draw in the price for a test of the formation's neckline. In this case, that level is the 8 Oct low at 1.0524.
AUD/NZD hourly chart
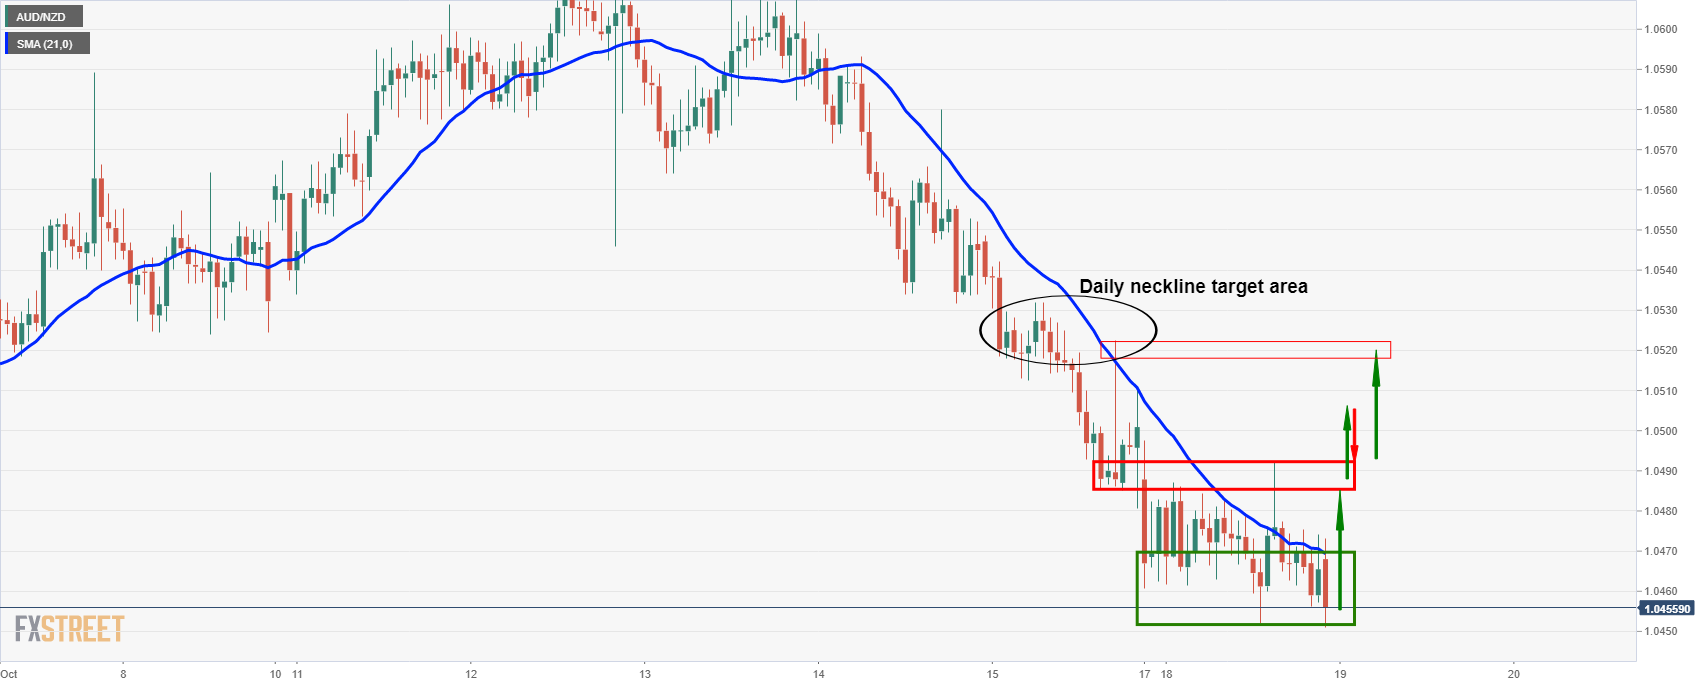
So, instead of looking for an immediate downside extension, the bulls could be accumulating here and on a break of near term resistance, the bulls can target the M-formation's neckline near 1.0520.
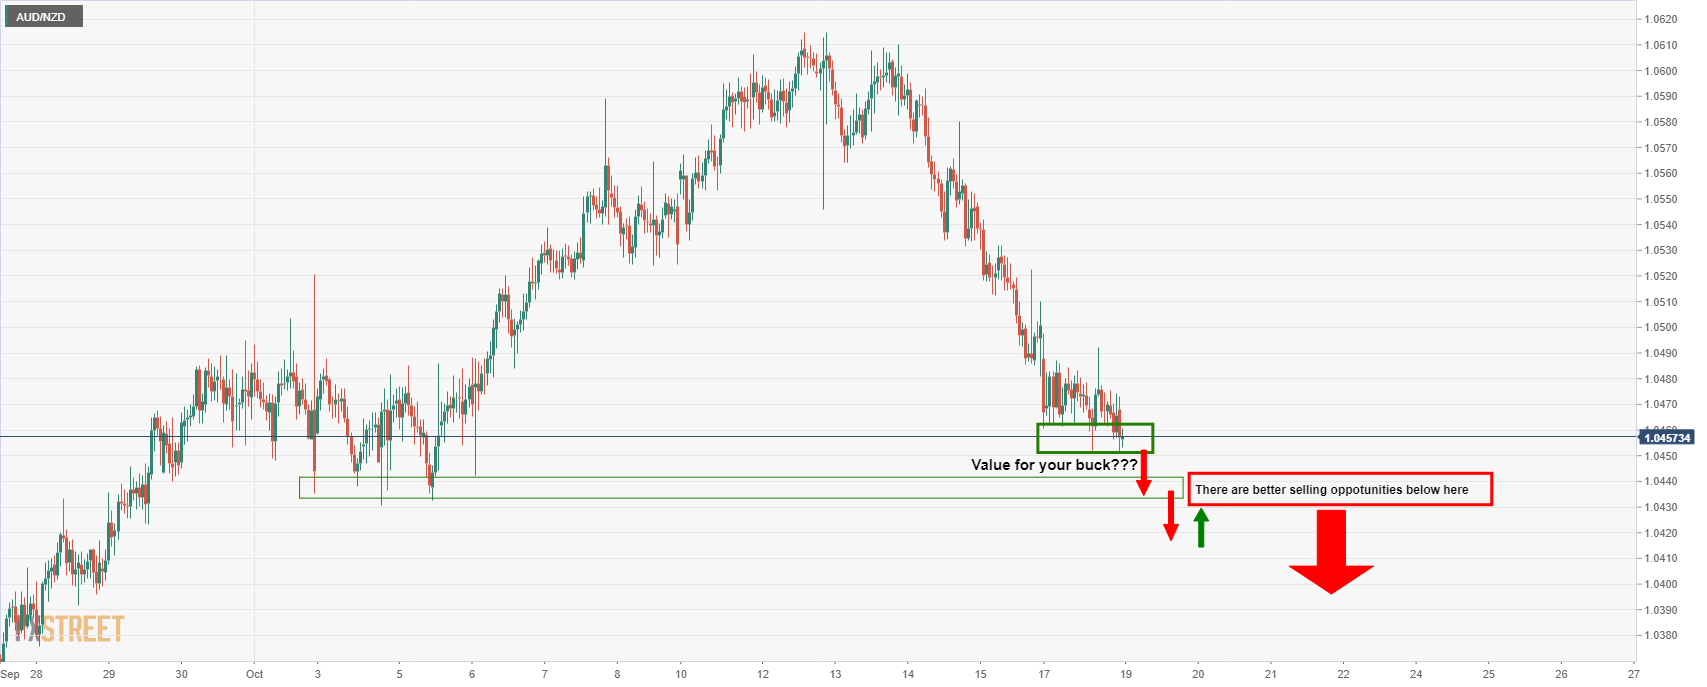
With all this being said, there is still every chance that the price will melt to fresh lows from here. But how far can it go before meeting an old demand area and expected support?
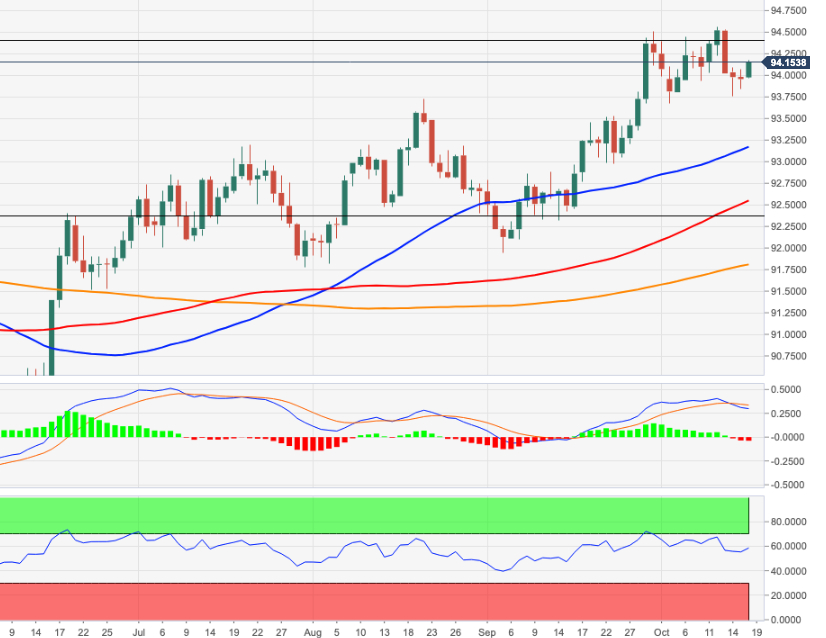
- USD/JPY accumulates minor losses on Tuesday in the initial Asia session.
- US dollar remains steady near 94.00 on firmer US T-bonds yields.
- US debt limit, inflationary pressure, higher Wall Street Index contains the movement in the greenback.
USD/JPY extends the previous session’s declines on Tuesday in the early Asian trading session. The pair stays in a relatively narrow price band, after hovering near the daily highs in the US session. At the time of writing, USD/JPY is trading at 114.27, down 0.02% for the day.
The US benchmark 10-year Treasury bond yields trade at 1.59% after rising trading near 1.61% on Monday, levels are last seen in early June. As the recent, Retail Sales and Initial Jobless Claims suggest ongoing economic recovery despite persistent pricing pressure. The greenback remains steady around 94.00.
The US Treasury Secretary Janet Yellen said that Congress needs to act to protect US credit. In addition to that, US President Joe Biden will speak to US Senator Joe Manchin, the centrist Democrat from coal-rich West Virginia whose vote is critical to the passage of the budget reconciliation bill pending in Congress.
On the other hand, the Japanese yen gained on its safe-haven appeal amid higher pricing pressure due to soaring energy prices. It is worth noting that, S&P 500 Future is trading at 4,473.50, down 0.09% for the day.
As for now, traders are waiting for the US Housing Starts, and Building Permits data to gauge the market sentiment.
USD/JPY additional levels
- Despite a strong upside move in US stocks, the market mood is a mixed bag, as Asian equity futures are mixed.
- AUD/JPY: The prevailing trend still tilted to the upside on the back of the interest rate differentials.
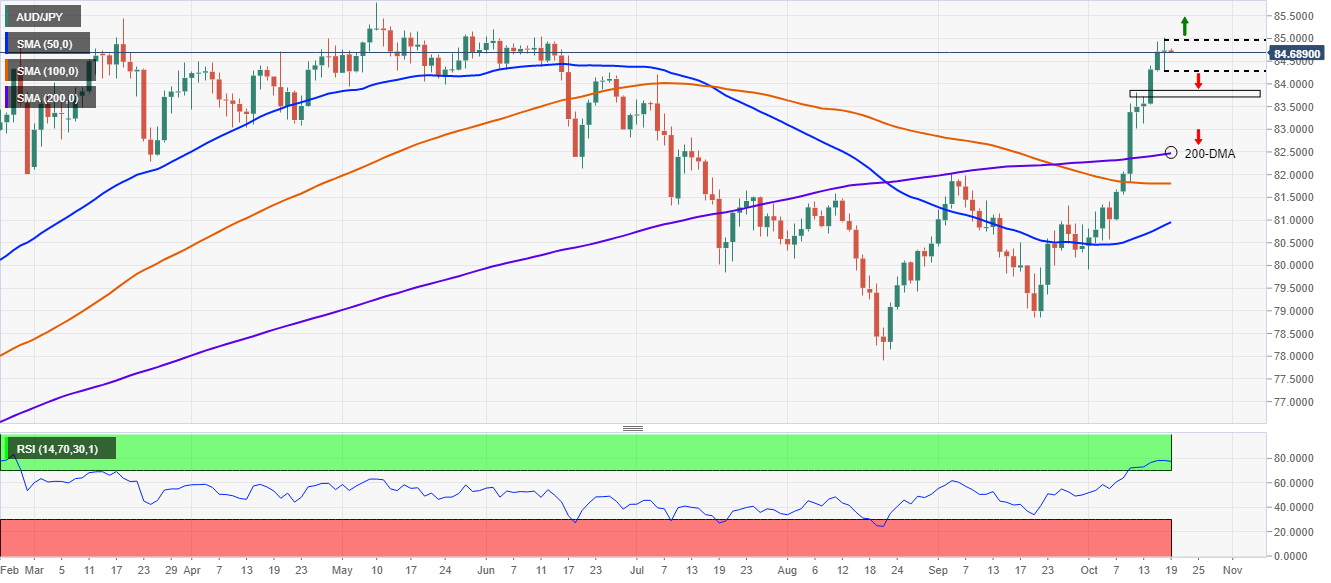
- AUD/JPY: Doji on Monday’s price action and RSI in overbought levels could spur a corrective leg-down.
- AUD/JPY: An upside break opens the door to 2018 highs around 89.00.
The AUD/JPY pair is down 0.02% as the Asian session begins, trading at 84.69 at the time of writing. On Monday, the pair traded within the 84.27-90 range.
The market sentiment is upbeat, even though China’s third-quarter GDP and Industrial production have grown below expectations. Also, heightened inflationary pressures and central banks’ monetary policy tightening weighed on investors’ mood at one time on Monday.
At press time, Asian equity futures are mixed. The Hang-Seng and the Nikkei 225 print gains between 0.01% and 0.32%, while the Australian S&P/ASX 200, the Japanese Topix, and the Chinese China A50 record losses of 0.36%, 0.44%, and 1.83%, respectively.
AUD/JPY Price Forecast: Technical outlook
In the last couple of weeks, the AUD/JPY rallied from 81.00 to 85.00, on the back of risk appetite in the financial markets and the interest rate differential between both countries. From a technical perspective, the daily chart portrays an overextended upside move, which shows that Monday’s price action formed a doji, meaning that indecision surrounds the pair, so it could consolidate before resuming the prevailing upward trend. Furthermore, the Relative Strength Index (RSI), close to 79, in overbought levels, confirms the abovementioned.
A daily break below the 84.27 prices could lead to a downward move towards the before resistance-now support area around 83.80. A breach of the latter would expose the 200-day moving average (DMA) at 82.47.
On the flip side, a clear break above the 84.90 level might see the pair rally towards the May 10 high at 85.80. If buyers could break that supply zone, a test to the 2018’s highs around 89.00 is on the books.
Treasury Secretary Janet Yellen in a letter to Congress said that the Treasury must use extraordinary measures before Dec. 3 to meet all its obligations. She urges a long term debt ceiling increase.
Reuters reported that Yellen said the extended “debt issuance suspension period” would mean that Treasury would continue its suspensions of investments in the Civil Service Retirement and Disability Fund and the Postal Service Retiree Health Benefits Fund. It will also extend a suspension of the sale of State and Local Government Series (SLGS) securities.
"It is imperative that Congress act to increase or suspend the debt limit in a way that provides longer-term certainty that the government will satisfy all of its obligations," Yellen wrote in a letter to House Speaker Nancy Pelosi and other congressional leaders.
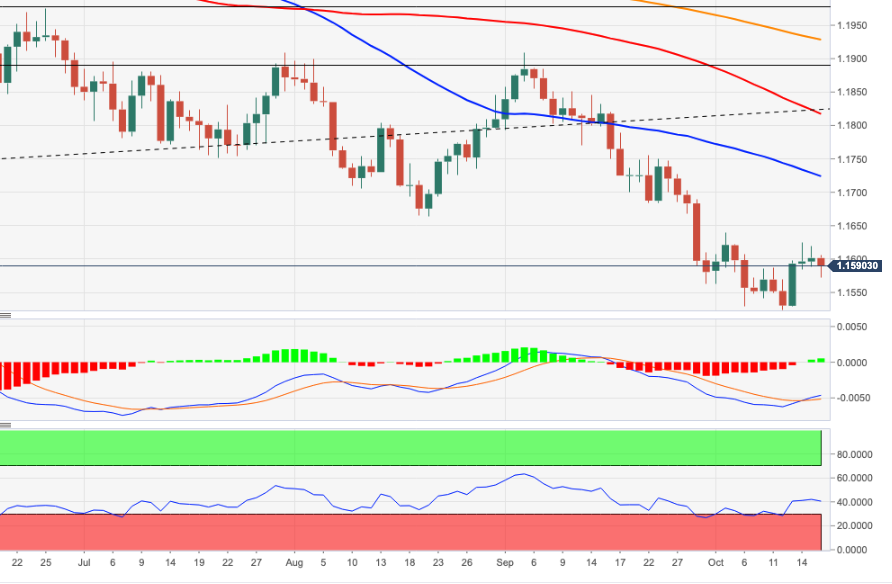
- The shared currency stages a recovery reclaims 1.1600.
- China’s weaker than expected GDP dented the market sentiment.
- At press, the market sentiment is upbeat, despite US dollar strength.
- ECB Christine Lagarde insists that “inflation is largely transitory.”
- EUR/USD: Range-bound within the 1.1560 – 1.1620 area, RSI is at 44 flat.
The EUR/USD advances during the New York session, up 0.07%, trading at 1.1610 at the time of writing. During the session, market sentiment conditions improved despite a weaker than expected third-quarter GDP print out of China, rising inflationary pressures, and central bank tightening monetary conditions expectations.
In the Asian session, China’s GDP for the third quarter rose by 4.9% (YoY), lower than the 5.0% expected, which trailed the 7.9% increase of the second quarter. The ongoing energy crisis that hit the Asian dragon forced factories to curb output. Furthermore, Industrial Production for September also came short of expectations with a 3.1% (YoY) increase versus 3.8% (YoY) estimated.
That said, investors flew through safe-haven assets, mainly towards the US dollar, but as the market improved, the EUR/USD pair reclaimed the 1.1600.
Meanwhile, the US Dollar Index that tracks the buck’s performance against a basket of six currencies is gaining 0.02%, sits at 93.97, whereas the US T-bond 10-year yield is up to one a half basis points currently at 1.591%.
On Saturday, October 16, ECB’s President Christine Lagarde said that the ECB is paying “very close attention” to wage negotiations and other effects that could permanently drive prices higher after delivering 2021 Per Jacobsson Lecture at the IMF. She added that “inflation is largely transitory.”
The European economic docket is absent. Across the pond, the US Industrial Production for September on a monthly reading shrank 1.3%, versus an expansion of 0.2% estimated by investors, while Capacity Utilization expanded 75.2% worse than the 76.5% expected.
EUR/USD Price Forecast: Technical outlook
The EUR/USD daily chart shows the pair is range-bound within the 1.1560 – 1.1620 area. The Relative Strength Index at 44, trendless, depicts the pair is in consolidation. However, recent price action illustrates that an inverse head-and-shoulders pattern is forming, but a daily close above the neckline around 1.1625 is needed to confirm its validity. In that outcome, a move towards the 1.1700 figure is on the cards.
On the other hand, failure at 1.1625 would resume the downward trend of the EUR/USD pair. The first support would be the September 30 low at 1.1562, immediately followed by the October 12 low at 1.1524
What you need to know on Tuesday, October 19:
The greenback shed some ground on Monday, although it ended the day mixed across the FX board and within familiar levels. A light macroeconomic calendar keeps investors depending on the sentiment for direction, the latter following US government bond yields. Speaking of which, the yield on the 10-year US Treasury note peaked at 1.627% but finished the day at around 1.58%.
Asian indexes edged lower after softer-than-anticipated Chinese macroeconomic figures. European indexes followed the negative lead, while US traders fought back, with Wall Street ended the day around its opening levels.
The dollar edged lower against most of its major rivals. The EUR/USD pair trades around 1.1610, while GBP/USD stands at 1.3730. The AUD/USD pair and USD/JPY finished the day unchanged while USD/CAD ticked lower, despite weakening crude oil prices.
Crude oil prices hit fresh multi-year highs before retreating. WTI settled at $81.50 a barrel. Gold ended the day with modest losses at around $1,764.60 a troy ounce.
Attention shifts now to the UK inflation data, as the Bank of England has hinted at a possible rate hike as the first move in the case inflation keeps rising above the desired levels.
Cardano price weakens as ADA targets $1.8
Like this article? Help us with some feedback by answering this survey:
- Gold is consolidating above critical dynamic daily support.
- Markets are weighing the prospects of stagflation in surging energy costs.
- Gold is renowned as the perfect hedge for stagflation risks.
The price of gold is currently trading at $1,765.25 into the Wall Street close and is down some 0.12% after falling from a high of $1,772.10 to a low of $1,760.37. While the US dollar fell out of the wrong side of the bed in New York morning, it has moved slightly higher overnight. Treasury yields rose on expectations the Federal Reserve will need to hike interest rates sooner than previously expected to quell rising price pressures.
Trades are looking ahead to next month's Fed meeting where they expect the US central bank to act as inflation looks to be stubbornly persistent and unlikely to fade anytime soon. However, the Fed is not the only central bank on course to start raising rates which potentially strips the greenback of some of the demand that it has enjoyed more recently in 2021. For instance, New Zealand faced its highest inflation pressures in a decade in data revealed on Tuesday and the Bank of England Governor Andrew Bailey has also been wires with hawkish rhetoric.
Gold is the stagflation hedge
The price of oil on Tuesday gave back some gains following a move into seven-year highs, as seen in the following chart of WTI:
However, the correction to the daily support might entice more demand from strong bullish hands in the energy complex, which leads to the risk of stagflation.
''The prospect of a prolonged period of higher inflation is spooking global central banks, and the fears of central bank tightening is weighing on precious metals,'' analysts at TD Securities explained. ''But market pricing for Fed hikes fails to consider that inflation due to a potential energy shock would be unlikely to elicit a Fed response, considering that it is growth-negative,'' the analysts added.
''In turn, market pricing for Fed hikes is too hawkish relative to TD Securities' expectations, notwithstanding the potential for the global energy crisis to intensify. This suggests gold is an ideal hedge against rising stagflationary winds, and reasons to own the yellow metal are growing more compelling.''
The analysts warned further that ''a cold winter could send energy prices astronomically higher, potentially pricing-out industries and fueling price asymmetries in markets — which translates into a fat right tail for gold prices...In the near-term, gold's failure to hold onto positive momentum has prompted yet another whipsaw for CTA trend followers, with marginal selling underway.''
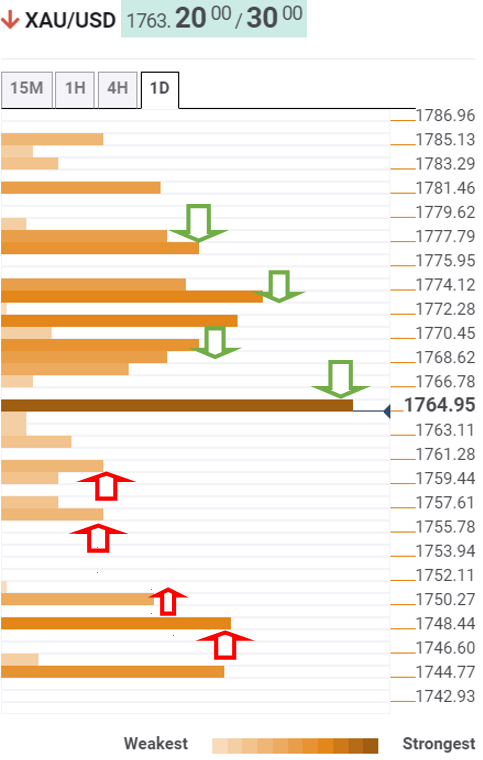
Gold technical analysis
For the latest in-depth technical analysis of gold, see here: Gold Chart of the Week: XAU hit the $1,800 target, now what?
However, at a snapshot, we are likely to see some consolidation to continue to play out:
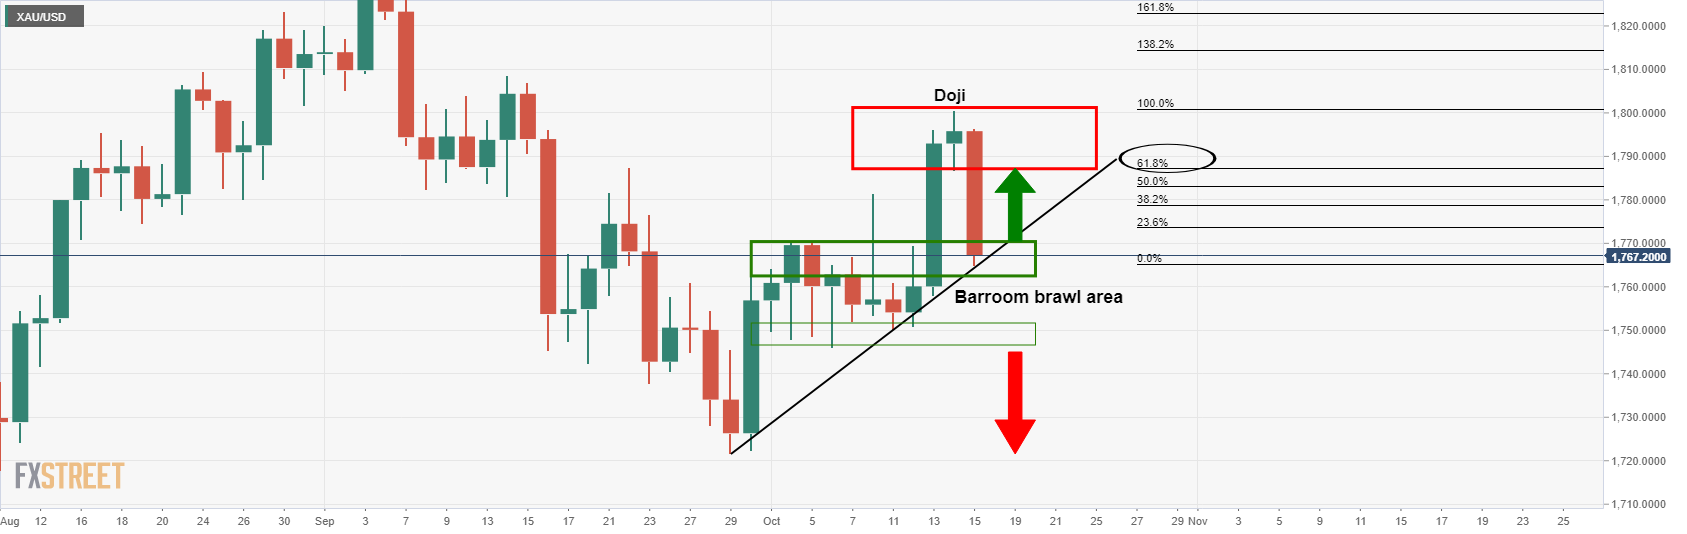
''As illustrated above, the price is testing not only dynamic support but horizontal also. This would be expected to hold initial tests and potentially lead to a restest of the prior day's lows of the Doji candle which has a confluence with the 61.8% Fibonacci retracement level near 1,786.''
''If gold does manage to break the dynamic trendline support, there is still going to be room into the 1,750s where price could find itself stuck in a range, aka, the ''barroom brawl''.
If, on the other hand, the price holds and moves up beyond 1,770 again, that would be bullish.''
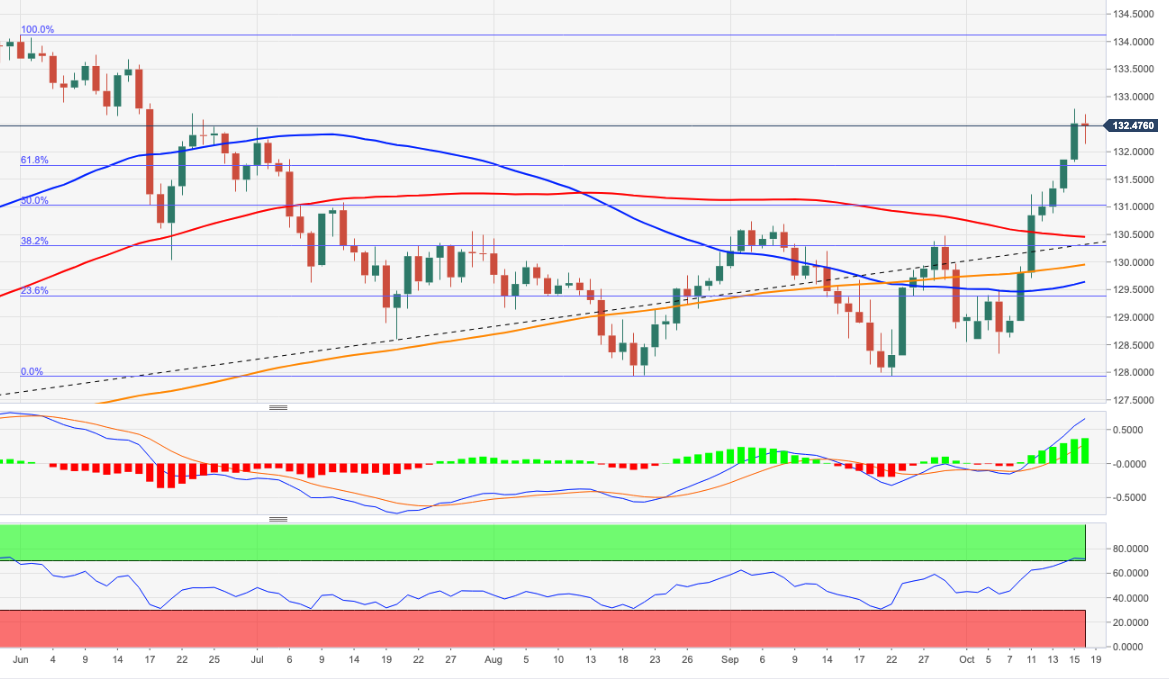
- The euro is steady at four-month highs above 132.15.
- Higher US T-bonds is crushing demand for the yen.
- EUR/JPY: Seen appreciating towards 137.50 – Commerzbank.
The euro has ticked up against the Japanese yen, for the eighth consecutive session, although it has failed to advance beyond the four-month high at 132.75 hit on Friday. The pair, however, maintains its positive bias intact, with bearish attempts contained above 132.15.
The euro remains strong against an ailing yen
The common currency has remained bid against the Japanese yen, in spite of the sour market mood observed during the Asian and the European morning sessions. The weaker than expected Chinese GDP and industrial production figures have revived concerns about a slowdown in the world’s second economy that could reverberate in the whole globe.
Furthermore, crude prices jumped to fresh multi-year highs earlier today, with the US benchmark WTI reaching prices past $83, bringing back inflation pressures to the spotlight and crushing appetite for risk. This has reflected on negative equity markets in Asia and Europe until a moderate pullback on oil prices brightened the mood somewhat and allowed US stocks to post a moderate recovery.
The safe-haven yen, however, has failed to take advantage of the risk-averse sentiment. The JPY remains close to four-year lows against the US dollar weighed by a solid rally on US T-Bond yields amid a widening the monetary policy differential between the Fed and the Bank of Japan, with the investors positioning QE tapering and starting to speculate about interest rate hikes in 2022
EUR/JPY: Likely to extend rally to 137.51 – Commerzbank
From a technical perspective, Karen Jones, Team Head FICC Technical Analysis Research at Commerzbank, sees scope on the pair to reach levels beyond 137.00: “EUR/JPY has maintained its gains. We look for a move to 132.69/80, the 23rd June high, and 78.6% retracement. This is regarded as the last defense for the 134.12 June peak (…) Longer-term, a break above here is favored and will introduce scope to 137.51.”
Technical levels to watch
- NZD/USD bears are lurking from the daily resistance.
- Weekly bulls are backing a test of the weekly resistance line.
NZD/USD has enjoyed a burst of life from the bulls since the New Zealand inflation readings from the Asian session. This has seen the price rally parabolically but at some point, there needs to be a pullback. The following illustrates where that might come from in a daily perspective. However, there are bullish tendencies on the weekly chart that is conflicting, to some extent.
NZD/USD daily chart
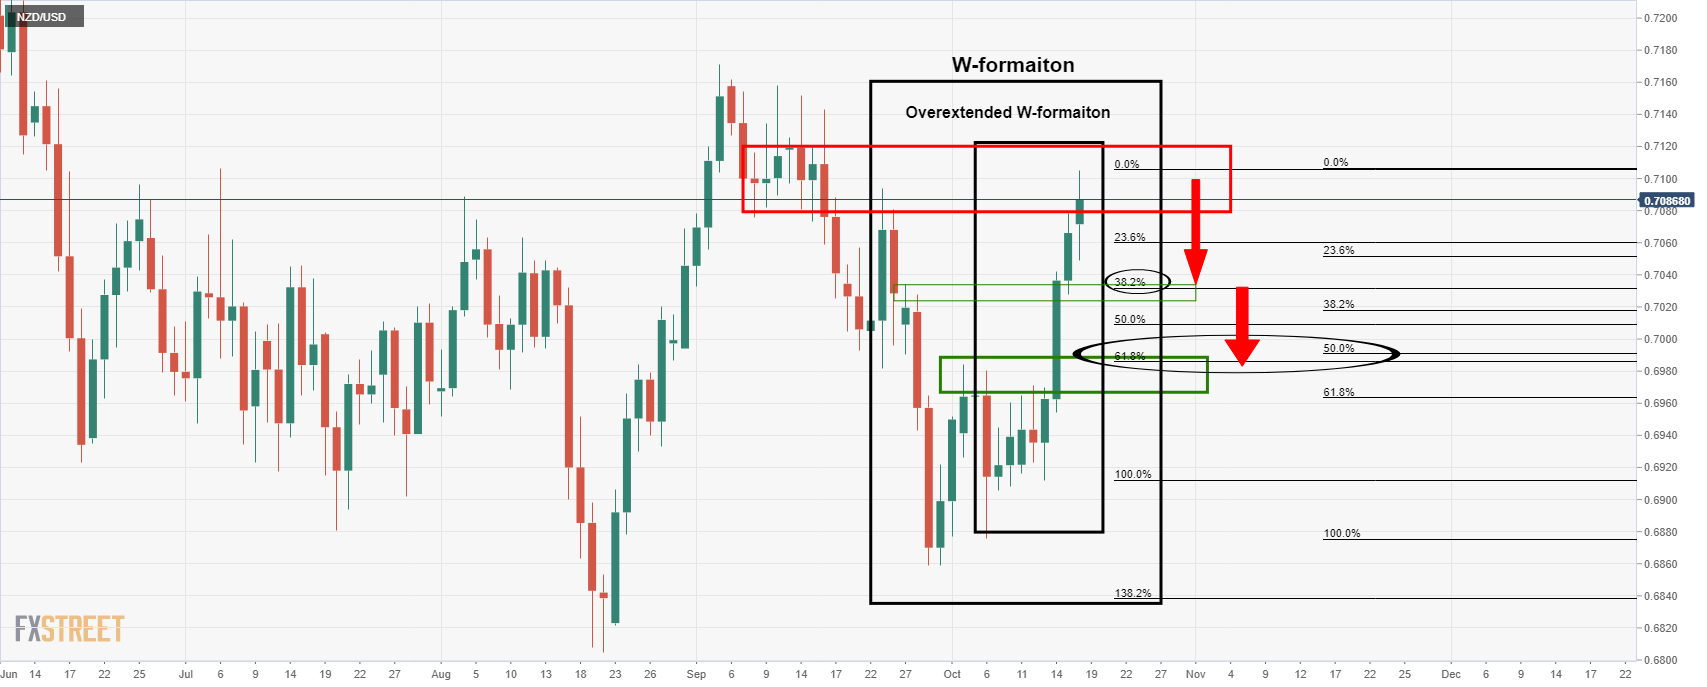
We have not one but two W-formations on the daily chart. The w-formations are a reversion pattern that has a high completion rate of the price reverting back to test the neckline of the formation. The smallest of the W-formations is highly overextended, so the price is more likely to correct only some of the recent rallies and fall short of the neckline. However, the confluence of the 50% and 61.8% Fibos is compelling as a firm area of technical demand of the price were to correct all the way to the neckline of the larger of the two W-formations (the W that is not over extended, containing the overextended within its ranges).
NZD/USD weekly chart
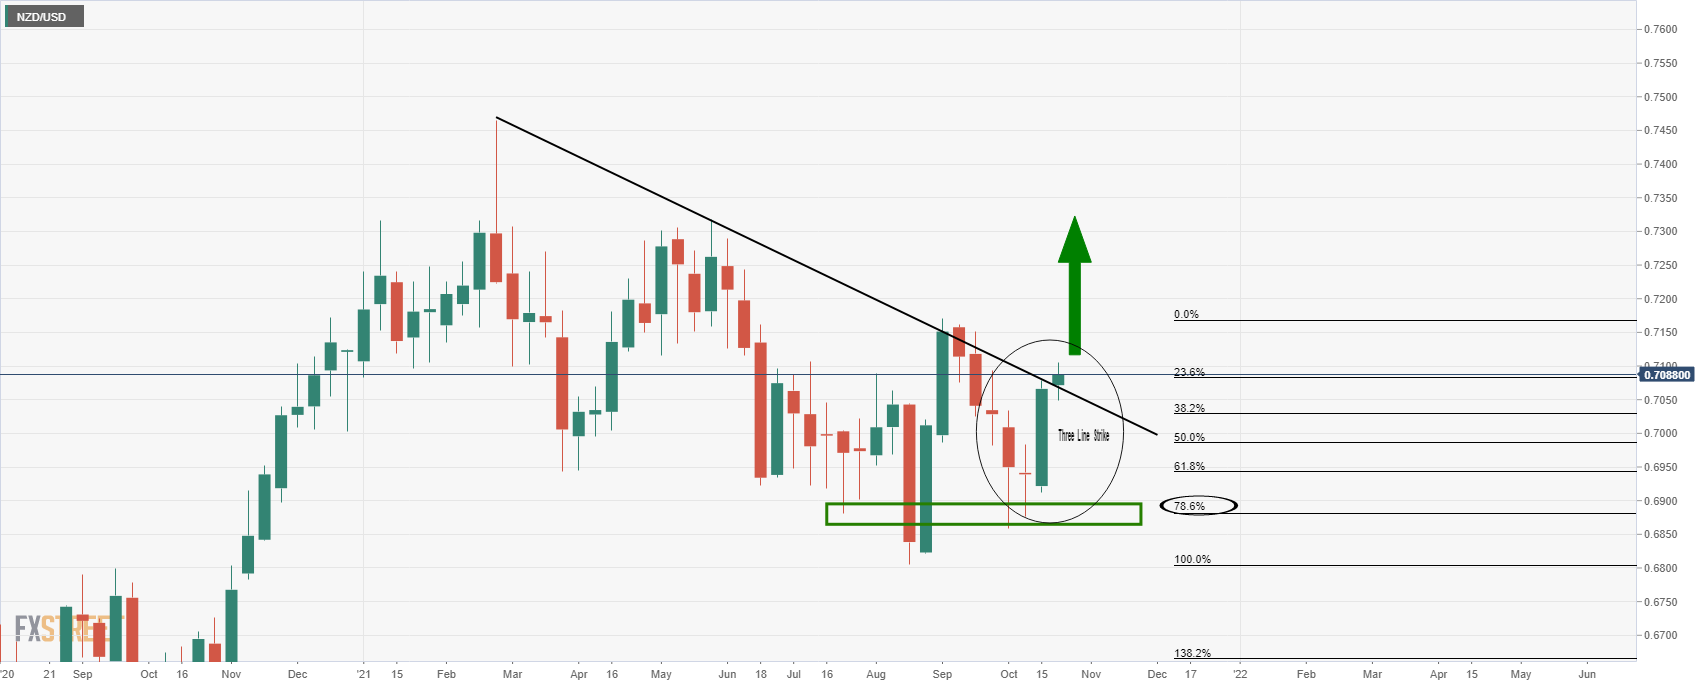
Meanwhile, from a weekly perspective, the price has corrected deeply to a 78.6% Fibonacci from trendline resistance. It then shot higher in a three-line strike as pe the bodies of the candles. In any case, the bullish engulfing rally has penetrated the resistance line so there are prospects of a breakout, in contrast to the daily chart's W-formations.
- USD/JPY steady around 114.20, waits for a fresh catalyst.
- USD/JPY clings to gains, despite the greenback’s weakness across the board.
- From a technical perspective, the USD/JPY is consolidating before printing a leg-up towards 115.00.
- USD/JPY to push above the 115.00 level amid the energy crisis – ING
The USD/JPY barely advances during the New York session, up some 0.02%, trading at 114.22 at the time of writing. Despite slower than expected economic growth in China, expectations of higher inflation, and central banks reducing the COVID-19 stimulus plan, the market mood is in risk-on mode.
Despite a weaker US dollar, the USD/JPY holds above the 114.00 threshold
The US 10-yeat Treasury yield is flat at press time, clings to 1.581%, whereas the US Dollar Index, which tracks the greenback’s performance against a basket of rivals, slides 0.02%, sits at 93.943. The Japanese yen is close to four-year lows versus the greenback, as higher US T-bond yields, which have been rising lately, have a strong positive correlation with the pair, spurred a rally from 110.00 to 114.46.
The US economic docket featured September Industrial Production data, which contracted 1.3% versus a 0.2% expansion foreseen by analysts. Invertors could largely ignore it, as market sentiment and US T-bond yields remain the main drivers for the pair.
USD/JPY Price Forecast: Technical outlook
The daily chart shows that the USD/JPY pair could consolidate. The Relative Strength Index, a momentum indicator at 75, is in oversold levels and has been there since October 10. Despite the abovementioned, the pair rallied 150 pips towards the 2021 year high at 114.46, but at press time, retraced the move 30 pips, waiting for a fresh catalyst.
The USD/JPY is range-bound within the 114.00 – 114.46 area. A break above the top could pave the way for further gains, with 115.00 as the first supply zone.
USD/JPY: To push above the 115.00 level amid the energy crisis – ING
According to ING analysts: “the USD/JPY pair will also find support from US yields, where our rates team still expect a further rise as market tightening expectations move towards those of the Fed.”
“Japan’s monthly trade balance is expected to widen towards the JPY500 B area. Any wider deficit could provide USD/JPY with the nudge through 115.00 as the market sinks its teeth into the energy dependence story.”
- Silver futures, trading flat near one-month highs at $23.55.
- Precious metals remain weighed amid higher US T-Bond yields.
- XAG/USD: Positive while above $23.00.
Silver futures have been trading without a clear direction on Monday, steady above $23.00, and a short distance to one-month highs at $23.55. Upside attempts, however, have been capped below $23.45, as the US dollar remains firm amid higher US T-Bond yields.
Fed tapering expectations weigh on metal prices
Silver and other precious metals have opened the week on a slightly negative tone, with the US dollar supported by higher US Treasury bond yields. Investors’ expectations of an upcoming announcement of QE tapering, and rising speculation about higher interest rates in 2022 are pushing US bond yields higher, making the US dollar a more attractive hedge from inflation than precious metals.
The US 10-year yield has ticked up to 1.57% from 1.55% on Friday, while shorter-term notes, such as the 5-year yield surging to 20-month highs at 1.19% after having rallied for the last two weeks.
XAG/USD: remains positive while above $23.00
From a technical perspective, the pair remains positive above previous highs, at $23.00, with the focus on the September 14 and 15 highs, at $23.55 September 16 high at $24.00.
On the downside, a reversal below $23.00 (September 22, October 8 highs) might ease bullish pressure, and open the path towards 22.20/35 (October 6 and 12 lows) ahead of year-to-date lows at $21.40.
Technical levels to watch
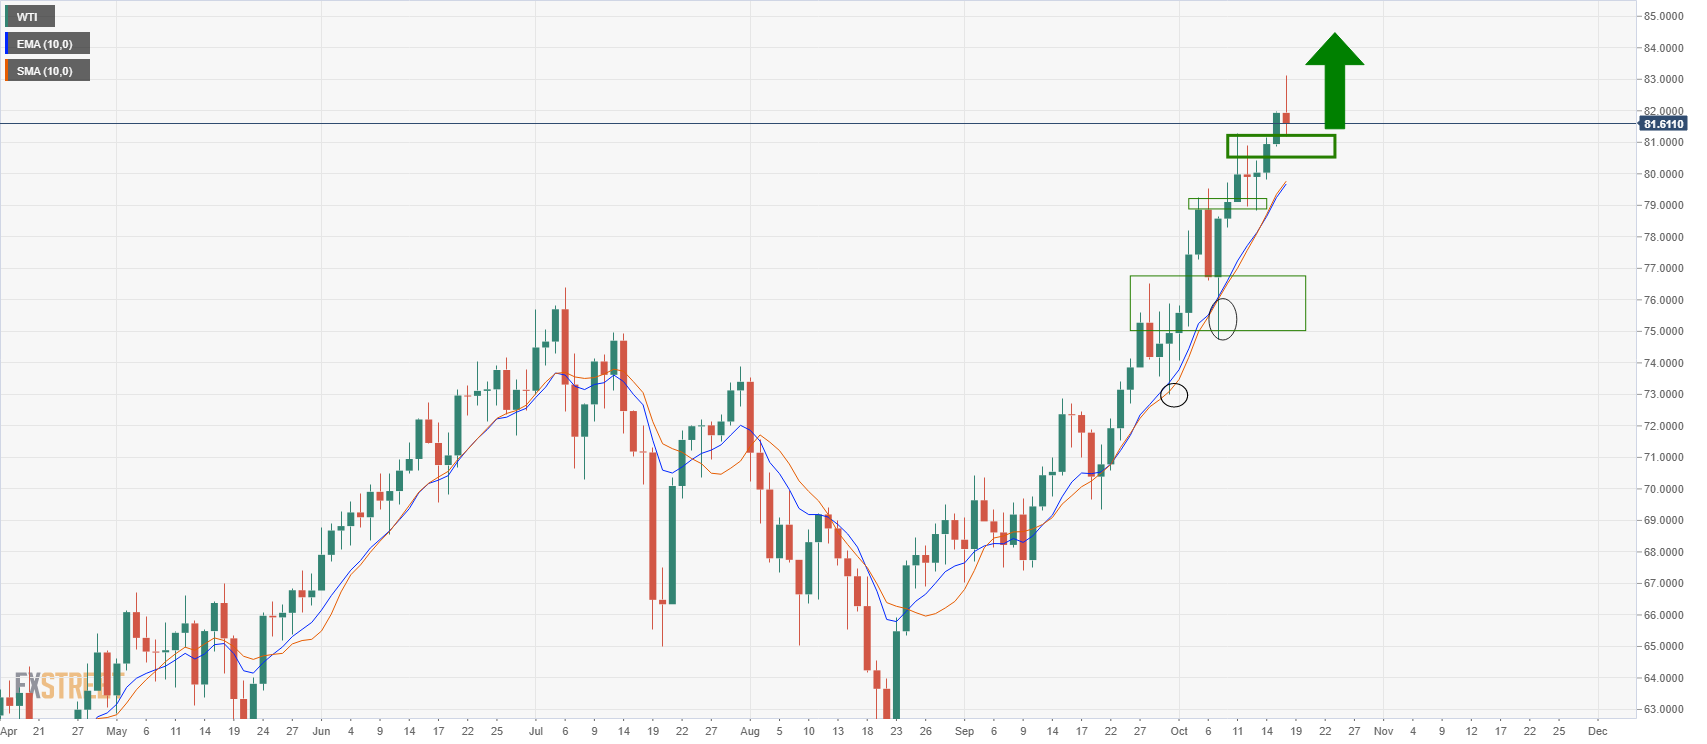
- WTI falls on supposed profit-taking as it reaches towards the psychological $85 figure.
- Bears are trying to keep control but have run into daily support which is now critical.
- Supply vs demand plays out but the right tail remains the fattest.
The price of the West Texas Intermediate crude spot has morphed into a bearish trend on the lower time frames in New York following a sell-off from higher highs that were made just ahead of the North American open today. At the time of writing, WTI is trading at $81.93 and has fallen from a cycle higher of $83.85 to print a low of $81.90.
A seven-year high was made in London trade which likely encouraged weaker hands to take profits in what has been a parabolic rally since Sep 30 and then Oct 7 following a retest of the 10 day-MAs. More on that below. There have been concerns that demand is outstripping supply as the global economic recovery from the pandemic continues. This has fuelled the demand and taken speculative positions longer while investors at the same time reduced shorts according to the latest weekly COT report.
Global oil inventories falling
Meanwhile, the fresh highs same on the back of the International Energy Agency last week saying that global oil inventories were falling by 0.7-million barrels per day. There has been a shortage of natural gas and coal in Europe and Asia which has encouraged fuel switching amid a higher call on supply from economies recovering from the pandemic. The price of oil was even climbing despite the weak economic data from China at the start of the week. China's Gross Domestic Product rose 4.9% in the third quarter, down from 7.9% in the prior period.
However, as analysts at TD Securities note, ''two-way risks remain elevated, but the right tail remains the fattest suggesting speculators will be happy to hold on to length in the short-term.''
The analysts also explained that the ''oil markets are also benefiting as delta-variant risks have proved benign while growing departure levels suggest air traffic will continue to support jet fuel demand across both APAC and the US. This supports a tight supply-demand outlook that is particularly fueling upside momentum in Brent crude and heating oil, which can be exacerbated by up to 1 million bpd of incremental winter demand due to natural gas switching for crude and fuel oils. This informs our long-short heating oil-gasoline trade.''
WTI technical analysis
From a technical perspective, the price has been bid ever since the test of the 10-day moving averages:
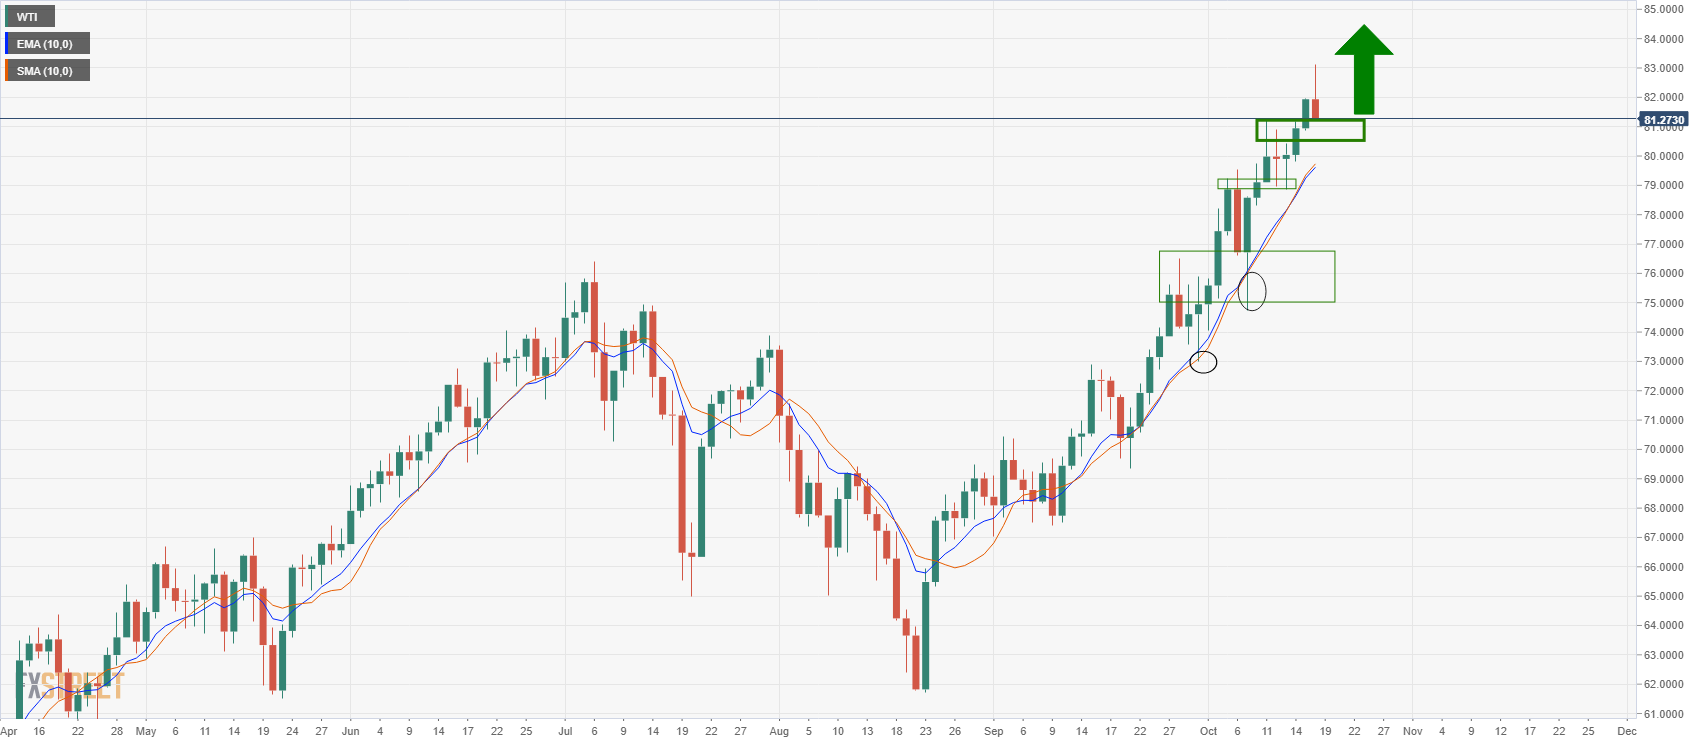
As illustrated, there has been a series of restest of support and this could well just be another one of those. If that is the case, then there are still blue skies for the price to come with the $85 psychological figure in close range.
- The pound consolidates gains near multi-year highs at 157.40.
- Sterling remains strong against an ailing yen.
- GBP/USD steady above 156.60; upside bias, intact.
The British pound is taking a breather on Monday, consolidating gains at five-year highs after having rallied nearly 5% over the last two weeks. The pair remains supported right above the February 2018 peak, at 156.60 with five-year highs at 157.40 on sight.
The pound remains strong against a weaker yen
The sterling remains firm across the board, supported by increasing expectations of interest rate hikes by the Bank of England next year. With energy prices surging and consumer inflation at levels almost twice the BoE’s target for price stability, some Bank officials are openly suggesting the possibility of accelerating the monetary policy normalization plan.
The BoE President, Andrew Bailey, has confirmed those speculations earlier today. Bailey has warned that the Bank of England "will have to act" over rising inflation, although he gave no hint about the bank’s calendar to increase interest rates.
On the other end, the Japanese yen is on the defensive, unable to take advantage of the risk-averse sentiment, triggered by poor Chinese data and revived concerns about inflation. The yen remains close to four-year lows against the US dollar, crushed by higher US T-bond yields, amid a widening monetary policy differential, with the market positioning for the tapering of the Federal Reserve’s monetary stimulus measures.
GBP/JPY: Immediate support lies at 156.60
From a technical point of view, the support level at 1.5660 (intra-day level) maintains the pair’s bullish bias intact. Below here, 156.05 (May 27 and 28 highs) and 154.00 (Jul 7 high) might be the next targets.
On the upside further rally above October 15 high at 157.40, the path seems clear until 159.95 (50% Fibonacci retracement of the 2015-16 decline) and April 2016 high at 162.80.
Technical levels to watch
- The single currency trims two consecutive days’ losses, despite BoE’s prospects of a hike rate.
- ECB Christine Lagarde reinforces that “inflation is largely transitory.”
- ECB and BoE divergence could benefit the British pound versus the single currency.
- EUR/GBP: To extend its slump towards the 0.8385 mark – SocGen.
The EUR/GBP recovers from two days in a row loss, climb 0.27%, trading at 0.8457 during the New York session at the time of writing. Despite rising inflationary pressures, downbeat macroeconomic data from China, and tightening central banks’ monetary policy, the market sentiment is upbeat. The most significant US stock indexes record gains between 0.16% and 0.76%, except for the Dow Jones Industrial, down 0.15%.
European Central Bank and Bank of England divergence boosts the GBP versus the EUR
On Saturday, October 16, the President of the ECB, Christine Lagarde, said that “inflation is largely transitory” after delivering the 2021 Per Jacobsson Lecture at the IMF. Lagarde added that the ECB pays “very close attention” to wage negotiations and other effects that could permanently drive prices.
Meanwhile, over the weekend, the Bank of England Governor Andrew Bailey reiterated that the Bank of England “Will have to act” to curb inflationary pressures.
The UK economic docket featured the Rightmove House Price Index for October, which expanded 1.8% and 6.5% monthly and annual, respectively, higher than the previous reading.
That said, the central bank policy divergence seems to favor the British pound. Portrayed by the move from the October 10 high at 0.8517 towards the October 15 low at 0.8422, it suggests that downward pressures are mounting on the pair, on the expectations of a Bank of England interest rate hike, that could boost the GBP against the shared currency.
EUR/GBP: To extend its slump towards the 0.8385 mark – SocGen
According to analysts at Société Générale, a close below 0.8450 on Friday suggests that downward momentum persists at the EUR/GBP pair: “Holding below 0.8550, EUR/GBP could head lower towards projections of 0.8385.”
“Lower band of the consolidation zone since 2016 at 0.8300/0.8270 and 0.8200 are next significant support levels.”
- Gold treads water below $1,770.
- Bullion remains weak, weighed by higher US bond yields.
- XAU/USD: Dangerously close to $1,725 support area.
Gold futures remain on the defensive on Monday, unable to regain the $1,770 level after a $30 sell-off seen on Monday. The XAU/USD bounced at $1,760 lows earlier today although the ensuing recovery attempt has lacked follow-through, leaving the pair practically flat on the day.
Gold, on the defensive amid higher US T-Bond yields
Bullion has opened the week on a soft note, in spite of the negative market mood seen during the Asian and the European sessions. Weak Chinese data and fresh highs on oil prices, which have revived concerns about inflationary pressures, have hammered risk appetite, triggering losses in equity markets.
The increase on US Treasury bonds, however, fuelled by increasing expectations that Fed tapering is around the corner, has made the US dollar a more attractive refuge for inflation than gold. The US 10-year yield has ticked up to 1.57% from 1.55% on Friday, while shorter-term notes, like the 5-year yield, surging to 20-month highs at 1.19% as investors start speculating about the possibility of higher interest rates for 2022.
XAU/USD remains close to $1,745 and $1,725 support levels
From a technical perspective, XAU/USD remains steady above $1.760 area, consolidating after Friday’s 1.8% decline. If that level is broken, the focus might shift towards t $1,745 (October 6 low) and then a key support area at $1,725 (September 29, 30 low).
On the upside, immediate resistance lies at intra-day highs $1,770, which should be breached to aim toward $1,807 (Sept. 15 high) ahead of $1.830, July and September’s peak.
Technical levels to watch
- The market mood is upbeat as the US stocks indexes are in the green.
- Falling crude oil prices boost the US dollar prospects versus the Loonie.
- BoC’s Tim Macklem: Global supply chain bottlenecks are not easing, which means inflation might not be temporary as expected.
The USD/CAD is flat during the New York session is trading at 1.2362 at the time of writing. Earlier the market sentiment was downbeat due to higher inflationary pressures and central banks reducing the pandemic-era stimulus programs. However, the market mood has improved, witnessed by US stock indexes, recording gains of 0.24% and 52%, except for the Dow Jones Industrial, which is flat at press time.
Crude oil prices falls for the first time in eight days
In the meantime, crude oil prices are falling. The US benchmark crude oil Western Texas Intermediate (WTI) is losing half percent, trades at $81.55 per barrel, exerting additional pressure on the commodity-oil-linked Canadian dollar.
The US Dollar Index, a basket that measures the performance of the US dollar against six peers, declines 0.04%, sits at 93.94, whereas the US T-bond yields rise, with the 10-year note up two and a half basis points, at 1.60%.
On October 14, the Bank of Canada Governor, Tim Macklem, said that global supply chain bottlenecks “are not easing as quickly as expected,” meaning that inflation in Canada and IMF members will probably take longer than foreseen to come down.
On the macroeconomic front, the Bank of Canada’s (BoC) Business Outlook Survey (BoS) for the Q3 unveiled on Monday that the business sentiment continued to improve, with the BoS indicator hitting a record high of 4.73, compared to 3.96 in the second quarter.
According to the report, “Many businesses face supply constraints that will limit their sales and put upward pressure on their costs.” Furthermore, 45% of the companies interviewed on the survey expect the Consumer Price Index to rise above 3% over the next two years. However, half of those firms say that “drivers of higher inflation are temporary.”
In the US economic docket, the Industrial Production shrank 1.3%, worse than the 0.2% increment expected by analysts. Moreover, Capacity Utilization fell from 76.2% in August to 75.2% in September.
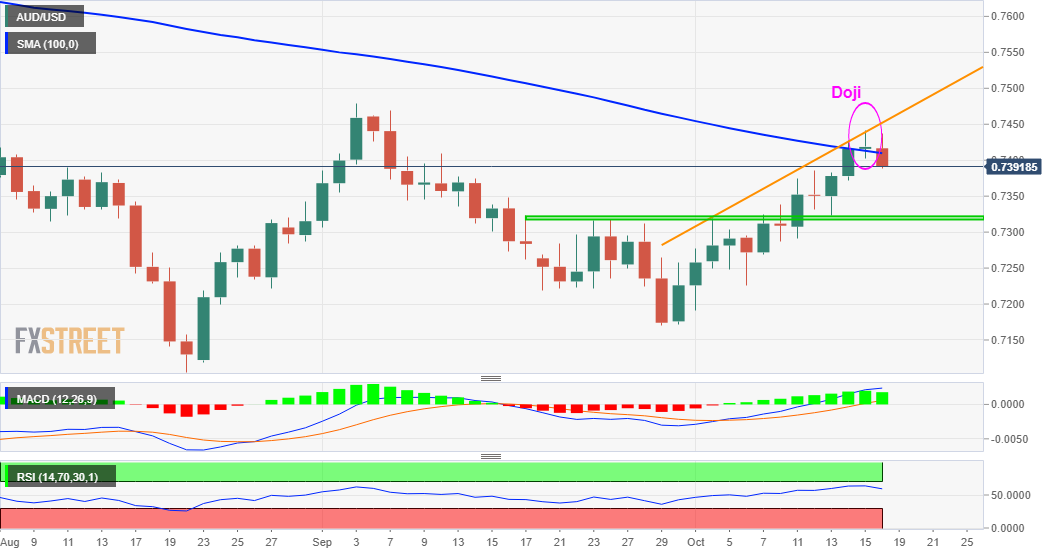
- Australian dollar bounces at 0.7380 lows to regain the 0.7400 level.
- Risk aversion eases with energy prices pulling back from highs.
- AUD/USD: Consolidation before further appreciation towards 0.7450 – UOB.
The Australian dollar is shrugging off the weakness observed during Monday’s Asian and European sessions. The pair has bounced at 0.7380 lows to reach 0.715 area at the time of writing, turning positive on the day.
The AUD picks up as risk appetite improves
The risk-sensitive Aussie has regained lost ground, favored by a somewhat improved market sentiment during the American trading session. The main Wall Street indexes have turned positive after having opened in the red, as the decline in oil prices has eased concerns about the consequences of surging inflation.
Crude prices are pulling back from another multi-year high hit earlier today, which has revived fears about inflationary pressures thwarting the global economic recovery. WTI prices have retreated to $82.11 after having hit $83.85 earlier today, with Brent prices trading at $84.40 at the time of writing, down from fresh three-year highs above $86.00 earlier today.
Furthermore, disappointing figures from China, one of Australia’s major trading partners, have increased doubts about the world’s second economy, adding bearish pressure on the AUD. According to the Chinese GDP, the country’s economy grew at a 4.9% pace in the third quarter, missing expectations of a 5.2% increment, while Industrial production increased 3.1%, against market expectations of a 4.5% reading.
AUD/USD: Consolidation before heading towards 0.7450 – UOB
According to the FX analysis team at UOB, technical indicators suggest that the pair could consolidate before resuming the uptrend: “We detected the build-up in upward momentum last Friday (08 Oct, spot 0.7310) and has held a positive view in AUD since then. As AUD rose strongly, we highlighted yesterday (14 Oct, spot at 0.7380) that ‘0.7405 appears to be within reach and a break of this level would open up the way for further AUD gains towards 0.7450’.
Technical levels to watch
- The euro remains capped below 1.1600, close to long-term lows at 1.1525.
- The sour market sentiment has weighed on the euro's recovery attempt.
- EUR/USD seen extending decline to 1.1400 – Scotiabank.
The common currency has attempted to pick up from the 1.1575 low hit earlier on Monday, before failing at 1.1610 and returning to levels below 1.1600. On a broader picture, the EUR/USD remains unable to return above1.1600 and put some distance from the year-to-date- ows at 1.1525 hit last week.
Risk aversion weighs on the euro
The risk-off market mood seen on Monday, with the major European stock indexes in the red and Wall Street mixed, has weighed on the Eurodollar’s upside attempts. Inflation fears, which have returned to the spotlight, combined with downbeat macroeconomic data from China have curbed appetite for risky currencies.
The third quarter's Chinese GDP has disappointed earlier today, showing a 4.9% growth and missing expectations of a 5.2% increment. Beyond that, industrial production increased 3.1%, against market expectations of a 4.5% reading. These figures have increased concerns about a slowdown on the Chinese economy, hit by high inflation and supply chain disruptions, that could send shockwaves through the whole world.
Furthermore, the global increase in inflation keeps adding negative pressure in the euro which has been one of the worst G10 performances over the last weeks. The surging energy prices have pushed consumer inflation to 13-year highs in the Euro Area and are threatening to derail the post-pandemic recovery.
EUR/USD: Expected to extend losses towards 1.1400 – Scotiabank
According to the FX Analysis team at Scotiabank, the technical EUR/USD picture suggests a further decline towards 1.1400: “Spot’s drift back to the 1.1575/85 zone today leaves it vulnerable to renewed pressure on the low 1.15 area (…) We think broader technical pointers continue to indicate scope for EUR/USD losses to extend to the low 1.14s in the near-term (2-4 weeks) while medium-term pointers suggest losses to the 1.11 area.”
Technical levels to watch
- The British pound declines despite BoE’s Governor Bailey hawkish comments.
- The market sentiment is downbeat, as European stocks print losses, like US stocks, except for the Nasdaq.
- BoE’s Andrew Bailey said that central banks need to prevent higher inflation expectations from becoming permanent.
The British pound is sliding during the New York session, down some 0.23%, is trading at 1.3712 at the 2time of writing. Surging energy prices, higher inflationary pressures witnessed on the last CPI readings in developed country’s economies, and central banks tightening monetary policy dented the market sentiment.
Significant European equity indexes record losses between 0.45% and 0.85%, while in the US, most of the indexes, except for the heavy-tech Nasdaq, edge lower between 0.02% and 0.22%.
In the meantime, the US Dollar Index, a basket that measures the performance of the US dollar against six peers, advances 0.04%, sits at 93.99, underpinned by US T-bond yields rising, with the 10-year note up one basis point, at 1.586%.
Bank of England Governor Andrew Bailey reinforces that the central bank will take measures to tackle inflation
Over the weekend on a panel organized by the Group of 30, Bank of England (BoE) Governor Andrew Bailey said that while the central banks don’t have the tools to counter supply disruptions, officials need to prevent higher inflations expectations from becoming permanent.
Furthermore, Bailey added that rising energy prices mean inflation will be last longer than expected. Additionally said that “we, at the Bank of England, have signaled, and this is another signal, that we will have to act. But of course, that action comes in our monetary policy meetings.”
That said, since October 9, when BoE’s members Michael Saunders and Andrew Bailey expressed concerns about inflation and the central bank reaction, the British pound rallied from 1.3567 to 1.3772, on investors’ expectations, that an interest rate hike is on the cards.
Putting this aside for a moment, in the UK, the economic docket featured the Rightmove House Price Index for October, which expanded 1.8% and 6.5% on a monthly and annual basis, respectively, higher than the previous reading. On the US front, Industrial Production (IP) contracted 1.3%, worse than the 0.2% expansion estimated by economists. Further, Capacity Utilization followed the IP footsteps, falling from 76.2% in August to 75.2% in September.
The Bank of Canada's (BoC) Business Outlook Survey (BoS) for the third quarter revealed on Monday that the business sentiment continued to improve with the BoS indicator hitting a record high of 4.73, compared to 3.96 in the second quarter.
Key takeaways as summarized by Reuters
"Most firms continue to anticipate healthy growth in both domestic and foreign demand, especially from the US."
"Many businesses face supply constraints that will limit their sales and put upward pressure on their costs."
"Demand pressures and supply challenges are driving widespread plans to invest, hire staff and increase prices."
"Labor shortages are frequent and have intensified from last year; employment intentions remain at record-high levels."
"Supply chain disruptions are more prevalent and have worsened since Q2; many businesses anticipate they will persist until H2-2022."
Growing number of respondents plan to increase wages to attract and retain labor; firms intend to continue passing increased input costs on to their customers."
"Compared to Q1 and Q2, greater share of firms plan to invest more in machinery and equipment; this is especially true among large companies."
"45% of firms expect total CPI to be above 3% over next two years; half of those firms say drivers of higher inflation are temporary."
"Expectations for 1-year ahead inflation increase to a record high 3.72%; spike seen as temporary."
"Most respondents plan to increase their spending significantly but remain cautious because of the delta variant."
Market reaction
The USD/CAD pair edged slightly higher from the session lows after this publication and was last seen trading flat on the day near 1.2370.
- Wall Street's main indexes are pushing lower on Monday.
- Rising crude oil prices continue to boost energy stocks.
- Industrial shares start the new week on the back foot.
Following last week's upsurge, major equity indexes in the US opened in the negative territory on Monday as the safe-haven flows dominate the financial markets. Reflecting the souring market mood, the CBOE Volatility Index is rising more than 8% on a daily basis at 17.72.
As of writing, the S&P 500 Index was down 0.5% on the day at 4,448, the Dow Jones Industrial Average was losing 0.7% at 35,035 and the Nasdaq Composite was falling 0.33% at 14,848.
Among the 11 major S&P 500 sectors, the Energy Index is up nearly 1% supported by rising crude oil prices. On the other hand, the Industrials Index is down 0.9%.
Earlier in the day, the data released by the US Federal Reserve showed that Industrial Production in the US contracted by 1.3% on a monthly basis in September. "The production of motor vehicles and parts fell 7.2%, as shortages of semiconductors continued to hobble operations," the Fed noted in its publication.
S&P 500 chart (daily)
- USD/TRY extends the upside above 9.3000 on Monday.
- Turkey 10-year bond yields surpass 19.00%, highest since May 2019.
- The dollar remains bid and pushes the pair higher.
The lira remains well on the defensive and now helps USD/TRY recording a new all-time high just above the 9.3000 yardstick at the beginning of the week.
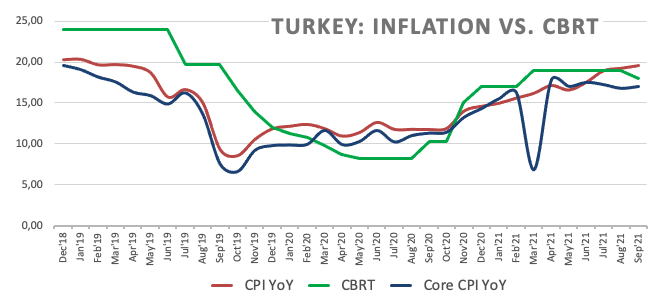
USD/TRY looks fragile ahead of CBRT event
USD/TRY entered its third consecutive week of gains on Monday on the back of extra depreciation in the Turkish currency and the moderate recovery in the greenback. Indeed, the pair advanced in six out of the last seven weeks since the beginning of September and was (once again) the worst performer EM currency during last week.
The depreciation of the Turkish currency intensified in past sessions after President Erdogan dismissed three CBRT officials who were against the latest decision by the Turkish central bank (CBRT) to reduce the One-Week Repo Rate by 100 bps at the September event.
Still in Turkey, it is worth recalling that the IMF revised up its GDP forecast for the country and now expects the economy to expand 9% this year and 3.3% in 2022.
Later in the week, Turkey’s Consumer Confidence is due on Thursday ahead of the key CBRT monetary policy meeting. Consensus among investors now expect the central bank to reduce further the policy rate by another 100 bps to 17%.
USD/TRY key levels
So far, the pair is gaining 0.33% at 9.2864 and a drop below 9.0379 (10-day SMA) would aim for 8.9221 (20-day SMA) and finally 8.8317 (monthly low Oct.4). On the other hand, the next up barrier lines up at 9.3060 (all-time high Oct.18) followed by 10.0000 (round level).
The EUR/USD’s gains through the low 1.16s last week have faded. From a technical point of view, the pair points to a slump to the low 1.14s, economists at Scotiabank report.
See: ECB to leave the euro sluggish as its policy has sequence limitations – TDS
Yield differentials to pressure the euro
“With ECB officials remaining generally dovish in their policy outlook, we think yield differentials will continue to weigh on the EUR in the short-to-medium term.”
“Spot’s drift back to the 1.1575/85 zone today leaves it vulnerable to renewed pressure on the low 1.15 area.”
“We think broader technical pointers continue to indicate scope for EUR/USD losses to extend to the low 1.14s in the near-term (2-4 weeks) while medium-term pointers suggest losses to the 1.11 area.”
- Industrial Production in US fell sharply in September.
- US Dollar Index continues to fluctuate near 94.00.
Industrial Production in the United States declined by 1.3% on a monthly basis in September, the data published by the US Federal Reserve revealed on Monday. This reading followed August's expansion of 0.4% and came in worse than the market expectation for an increase of 0.2%.
"The production of motor vehicles and parts fell 7.2%, as shortages of semiconductors continued to hobble operations, while factory output elsewhere declined 0.3%," the publication further read. "Capacity utilization for the industrial sector fell 1.0 percentage point in September to 75.2%, a rate that is 4.4 percentage points below its long-run (1972–2020) average."
Market reaction
This report doesn't seem to be having a significant impact on the dollar's performance against its rivals. As of writing, the US Dollar Index was up 0.06% on the day at 94.02.
- XAU/USD struggles to stage a convincing rebound on Monday.
- US 10-year US T-bond yield is closing in on multi-month highs.
- XAU/USD eyes $1756 and $1750 as the next bearish targets.
Gold lost its traction after testing $1,800 on Thursday and ended up closing the week with small gains at $1,767. With the US Treasury bond yields continuing to push higher on Monday, XAU/USD is having a difficult time recovering its losses in a convincing way. As of writing, the pair was down 0.15% on the day at $1,765.
The benchmark 10-year US Treasury bond yield, which gained 4% and caused XAU/USD to fall sharply on Friday, is currently rising 2.85% on a daily basis at 1.619%. On October 11, the 10-year yield reached its strongest level since June at 1.636% and staged a deep correction in the first half of the previous week. With a daily close above that level, another leg higher could be witnessed and gold could come under renewed bearish pressure.
Meanwhile, the US Dollar Index, which tracks the greenback's performance against a basket of six major currencies, is moving sideways around 94.00 and limiting XAU/USD's downside for the time being.
Moreover, the negative shift witnessed in risk sentiment following the disappointing third-quarter growth data from China earlier in the day seems to be allowing the precious metal to find some demand as a safe haven.
Nevertheless, investors are likely to continue to react to fluctuations in the US T-bond yields as the US economic docket will not be offering any high-tier data releases in the remainder of the day.
Gold near-term technical outlook
"The sellers eye the next support at $1760, where the SMA100 four-hour merges with the Bollinger Band one-day Middle," notes FXStreet Senior Analyst Dhwani Mehta. "If the bearish momentum accelerates, then the pivot point one-day S1 at $1756 will get challenged."
According to Mehta, $1765 is critical for gold buyers to initiate a meaningful recovery towards $1768, where the one-week Fibonacci 61.8% retracement is located.
Additional levels to watch for
There are some regions where earlier tightening is more plausible than others. In the view of strategists at TD Securities, the Bank of England (BoE) is certainly one of them. The Bank of Canada (BoC) also has some risk of earlier tightening. Then there are some central banks where the hawkish repricing in curves looks more unreasonable. This includes the European Central Bank (ECB).
BoE and BoC in the first place to tighten
“We think there are some central banks that are more at risk of acting ‘early’ than expected. The BoE is certainly one of them.”
“CAD outperformance has been broadly based and even stretched in some places. That could create some pullback risk at next week's BoC meeting if the meeting is not hawkish enough.”
“Then there are some regions where there have been holdouts within the central bank community and hence, make it ripe for the market to call out their bluff. The RBA is the standout, since the central bank has been rather steadfast in keeping policy rates unchanged for the foreseeable future.”
“Then there are some central banks that are not quite there in terms of delivering on market expectations. Here, the ECB comes to mind. The reality is that in a reasonably hawkish scenario, the ECB won't be in a position to end QE until late next year, which puts 2023 (likely the latter half) as the risk scenario for tightening. Ultimately, this central bank backdrop leaves EUR rather sluggish overall.”
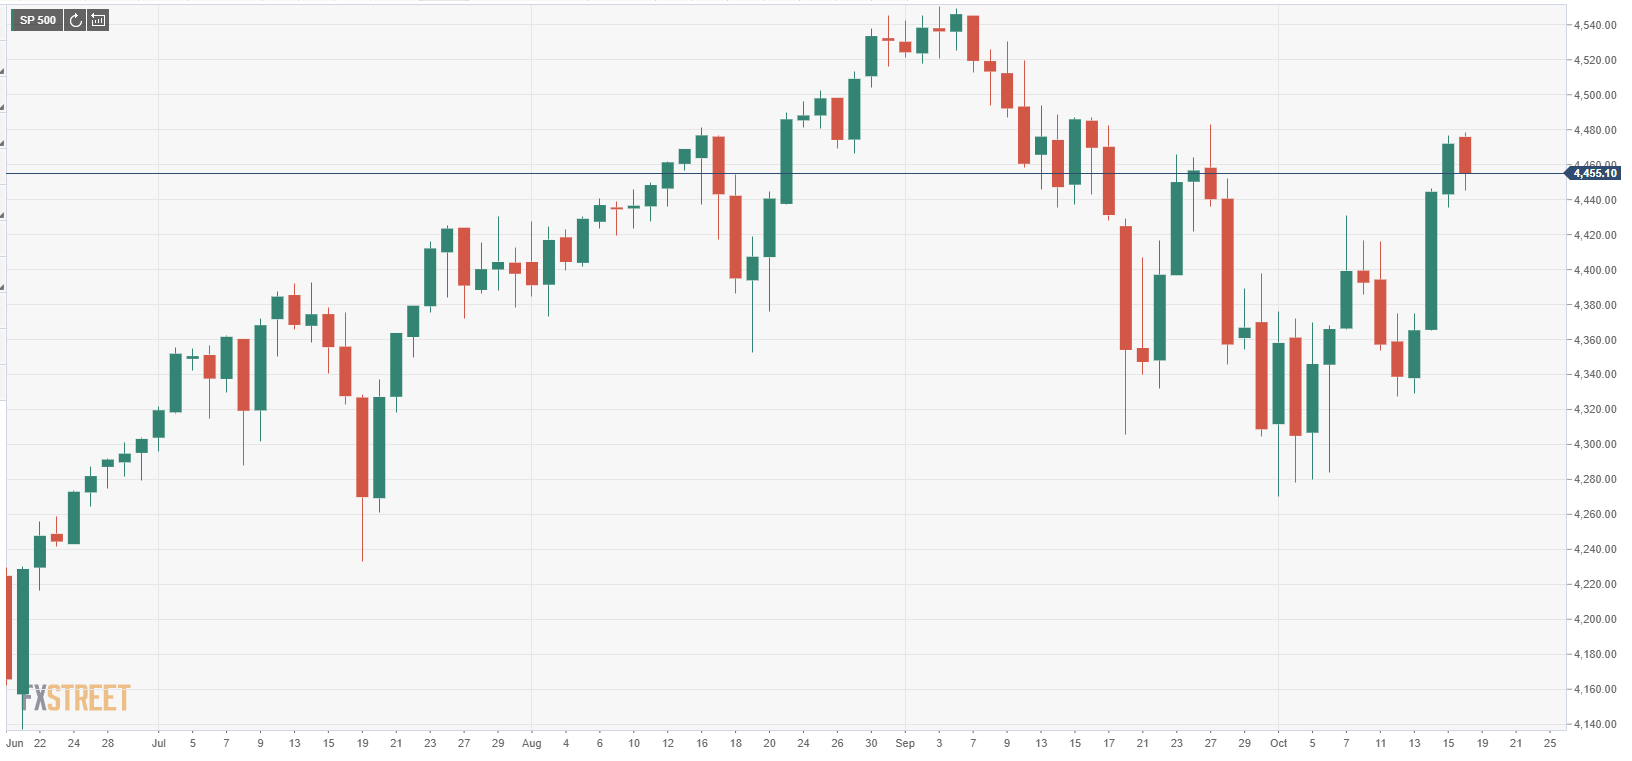
S&P 500 has seen a clear break and close above key resistance from its 63-day average at 4448/28. With daily momentum turning higher again this suggests the correction lower is over, with resistance seen at 4486/89 next and eventually back at the high at 4546, analysts at Credit Suisse report.
Support at 4448/28 holding to keep the immediate risk higher
“The S&P 500 maintains the strong tone after closing above key resistance from its 63-day average and price gap from late September at 4423/43 and with daily RSI momentum holding a base and with daily MACD momentum having crossed higher this suggests the worst of the corrective setback may already be over.”
“Resistance is seen next at the 78.6% retracement of the September/October fall and price resistance at 4486/87. An initial pause/pullback from here should be allowed for, but with a break in due course expected for a move to 4520/30 next and eventually a retest of the 4546 record high.”
“Support from the price gap from Friday morning and 63-day average at 4448/28 holding can keep the immediate risk higher. A closing break can see a deeper setback to the 13-day exponential average at 4395, but with fresh buyers expected here.”
EUR/GBP has broken below the lower end of the gentle seven-month downtrend channel and prior low for the year at 0.8449/37. This suggests the downtrend is accelerating for a test of the key lows of 2019 and 2020 at 0.8281/39, the Credit Suisse analyst team reports.
Resistance is seen at 0.8515/20
“We are now seeing an acceleration in the downtrend and we look for the risk to stay directly lower. Support is seen next at 0.8417 ahead of 0.8355 and then 0.8332 and then eventually and more importantly the key lows of 2019 and 2020 at 0.8281/39.”
“Whilst we would look for an attempt to hold at the key lows of 2019 and 2020 at 0.8281/39, a sustained break below would mark the completion of a large and important top.”
“Resistance moves to 0.8446/54 initially, with the immediate risk seen lower whilst below 0.8489. Above can see a recovery back 0.8500/02, potentially 0.8515/20, but with this now ideally capping further strength.”
- USD/JPY is fluctuating in a tight range above 114.00 on Monday.
- 10-year US T-bond yield is up more than 1%.
- Wall Street's main indexes look to open in the negative territory.
Following last week's impressive rally, the USD/JPY pair stays relatively quiet on Monday and stays in a consolidation phase below the multi-year high it set at 114.47 on Friday. As of writing, the pair was up 0.1% on the day at 114.32.
Rising US Treasury bond yields continue to fuel USD/JPY's upside. The benchmark 10-year US T-bond yield, which gained nearly 4% on Friday, is currently up 1.8% on a daily basis at 1.602%.
However, the cautious market mood is helping the safe-haven JPY stay resilient against its rivals and limiting USD/JPY's downside. Reflecting the souring sentiment, Wall Street's main indexes remain on track to open in the negative territory with US stock index futures losing between 0.2% and 0.3%.
The only data featured in the US economic docket will be September Industrial Production data. Nevertheless, investors are likely to ignore this report and remain focused on the US T-bond yields. Currently, the US Dollar Index is posting modest daily gains at 94.05.
USD/JPY near-term outlook
UOB Group analysts think that the pair could target 114.55 as long as it stays above the strong support level that is located at 113.00.
USD/JPY: Further strength remains in the pipeline – UOB.
Technical levels to watch for
GBP/USD has broken above its 55-day average (DMA) at 1.3731. Analysts at Credit Suisse see scope for a test of the downtrend from June at 1.3808.
Initial support is seen at 1.3690
“We see scope for the recovery to extend further yet with resistance above 1.3774 seen next at the downtrend from the June peak, now seen at 1.3808/16. With the key 200-day average seen not far above at 1.3847, we look for a better cap here.”
“A close above 1.3845 though would reassert a broader sideways range, with resistance then seen next at 1.3914.”
“Support is seen at 1.3690 initially, with a break below 1.3667 needed to ease the immediate upside bias for a fall back to 1.3589, then 1.3544. Beneath this latter level though is needed to clear the way for a retest of the 1.3411 recent low.”
Refined metal prices have continued higher amid continuing production shortages and power outages. At the same time, final demand outlook from the largest metal consumer China has faded. Longer-term outlook supports moderating metal prices, but in the near-term, low metal supply could continue to contribute to global inflationary pressures, economists at Danske Bank report.
Power crunch supports metal prices despite fading demand outlook
“We do expect metal prices to moderate over the longer term on the back of both fading Chinese demand outlook as well as recovering supply.”
“In the near-term, the looming energy crisis is unlikely to fade quickly ahead of the winter’s heating season in developed economies and China.”
“Both the limited supply and elevated prices of metals are likely to continue to contribute to global supply chain challenges and inflationary pressure over the coming months even if the longer-term outlook is for lower prices.”
NZD/USD spiked higher on the back of today’s strong CPI inflation release to test the 200 day-average at 0.7102 before pulling back. Accordingly, economists at Rabobank have upgraded their NZD/USD one-month forecast to 0.70 from 0.69.
NZ CPI inflation a lot higher than predicted
“This morning’s release of New Zealand Q3 CPI inflation data at a much faster than expected 4.9% YoY has been the trigger for the latest spate of fears around RBNZ policy. The market is assuming that a 25 bps rate hike at the November 24 policy meeting is a done deal. This implies that the key element for markets in the coming weeks surrounds the risk of a larger move.”
“On the assumption that the RBA maintains more dovish credentials we expect AUD/NZD to continue moving back towards its recent lows around the 1.03 area.”
“We have raised our one-month NZD/USD forecast to 0.70 from 0.69.”
- EUR/USD stays on the defensive and adds to Friday’s losses.
- Immediately to the upside emerges the weekly top at 1.1624.
EUR/USD extends the leg lower and recedes to the 1.1570 region at the beginning of the week.
While the weekly top at 1.1624 (October 14) caps the upside, then the door remains open to another visit to the YTD low at 1.1524 (October 12). If the pair manages to surpass 1.1624 and the monthly peak at 1.1640 (October 4), then the selling pressure is expected to mitigate somewhat.
In the meantime, the near-term outlook for EUR/USD is seen on the negative side below the key 200-day SMA, today at 1.1926.
EUR/USD daily chart
- EUR/GBP staged a modest bounce from 18-month lows touched earlier this Monday.
- The attempted recovery lacked any obvious fundament catalyst and follow-through.
- Positive Brexit development, hawkish BoE might underpin the GBP and cap gains.
The EUR/GBP cross extended its sideways consolidative price action and remained confined in a range below mid-0.8400s through the first half of the European session.
The cross stalled its recent downward trajectory to the lowest level since February 2020 and staged a modest bounce from the 0.8425-20 region on the first day of a new trading week. The uptick lacked any obvious fundamental catalyst and was solely led by some profit-taking by bearish traders amid slightly oversold conditions.
However, a combination of factors, so far, have failed to assist the EUR/GBP cross to register any meaningful recovery. Resurgent US dollar demand acted as a headwind for the shared currency. Apart from this, positive Brexit development and hawkish signals by the Bank of England collaborated to cap the upside for the cross.
After days of rising tensions, the European Union agreed to scrap most checks on goods and medicines arriving into Northern Ireland from the rest of the UK. Adding to this, the BoE Governor Andrew Bailey warned that rising energy prices means inflation will last longer and that monetary policy cannot solve supply-side problems.
Bailey further added that the BoE will have to act and must do so if we see a risk, particularly to medium-term inflation expectations. This, in turn, acted as a tailwind for the British pound and kept a lid on any meaningful recovery for the EUR/GBP cross amid absent market-moving economic data, either from the UK or the Eurozone.
From a technical perspective, the lack of any strong follow-through buying and the range-bound price action might still be categorized as a consolidation phase. This, in turn, suggests that the recent bearish trend might still be far from being over and warrants some caution before positioning for any meaningful appreciating move.
Technical levels to watch
- USD/CAD gained positive traction on Monday and snapped four days of the losing streak.
- A strong pickup in the USD demand was seen as a key factor that provided a modest lift.
- Bullish crude oil prices underpinned the loonie and kept a lid on any meaningful upside.
The USD/CAD pair held on to its modest intraday gains through the first half of the European session, albeit seemed struggling to capitalize on the move beyond the 1.2400 mark.
A strong pickup in the US dollar demand assisted the USD/CAD pair to attracted some dip-buying near the 1.2350 region on Monday and snap four successive days of the losing streak. The uptick assisted the major to move away from over three-month lows touched on Friday, though lacked any bullish conviction.
The prospects for an early policy tightening by the Fed pushed the yield on the benchmark 10-year US government bond shot back above the 1.60% threshold. This, along with a softer risk tone – as depicted a generally negative trading sentiment around the equity markets – acted as a tailwind for the safe-haven greenback.
The supporting factor, to some extent, was offset by bullish crude oil prices, which continued underpinning the commodity-linked loonie and capped any meaningful recovery for the USD/CAD pair. Hence, it will be prudent to wait for a strong follow-through buying before confirming that the pair has bottomed out in the near term.
Market participants now look forward to the release of US Industrial Production data for some impetus. This, along with the US bond yields and the broader market risk sentiment, will influence the USD. Traders will further take cues from the BoC's Business Outlook Survey report and oil price dynamics for some short-term opportunities.
Technical levels to watch
- DXY reverses the recent weakness and retakes the 94.20 area.
- Further upside is expected to re-visit the YTD peak at 94.56.
DXY so far posts gains for the first time after three consecutive daily pullbacks, including new weekly lows around 93.75 (October 14).
The corrective downside appears so far contained near 93.70. If the incipient recovery gathers traction, then there are no significant hurdles until the 2021 high at 94.56 recorded on October 12 ahead of the round level at the 95.00 barrier.
Looking at the broader picture, the constructive stance on the index is seen unchanged above the 200-day SMA at 91.80.
DXY daily chart
The Russian rouble still appreciates. As Axel Rudolph, Senior FICC Technical Analyst, notes, USD/RUB is within reach of the September 2018 high at 70.64 around which its descent may pause.
USD/RUB to slip back towards the September 2018 high at 70.64
“USD/RUB continues its descent towards the September 2018 high at 70.64 around which it may short-term pause. Slightly further down lies the December 2018 high at 69.78. Still further down the 2014-2021 uptrend line can be spotted at 69.52.”
“Minor resistance above the 72.13 mid-October high and the 72.22 September low sits between the August and early September lows as well as the three month resistance line at 72.55/73. Further resistance comes in along the seven month resistance line at 73.18.”
“For any kind of (unexpected) bullish reversal to gain traction, a rise and daily chart close above the September 20 high at 73.62 would need to be seen. This scenario is highly unlikely, though, and instead further weakness is probably on the cards.”
- EUR/JPY keeps the intense rally well and sound on Monday.
- Further upside could see the Fibo level at 132.79 retested.
EUR/JPY navigates quite a volatile session so far and alternates gains with losses in the mid-132.00s on Monday.
The intense move higher in the cross remains well and sound and points to extra gains in the very near term at least. That said, there is an interim hurdle at the Fibo level at 132.79 ahead of the round level at 133.00 the figure and early-June peaks around 133.70/75.
In the broader scenario, while above the 200-day SMA at 129.91, the outlook for the cross is expected to remain constructive.
EUR/JPY daily chart
- AUD/USD witnessed a modest pullback on Monday from the vicinity of multi-week tops.
- Resurgent USD demand, a softer risk tone exerted pressure on the perceived riskier aussie.
- A mixed technical setup warrants some caution before placing aggressive directional bets.
The AUD/USD pair struggled to capitalize on its early modest gains to the 0.7435 region and witnessed an intraday turnaround from the vicinity of five-week tops touched on Friday. The corrective pullback extended through the early part of the European session and dragged the pair further below the 0.7400 round-figure mark.
The downfall was sponsored by a goodish pickup in the US dollar demand, bolstered by a fresh leg up in the US Treasury bond yields. This, along with a softer risk tone and disappointing Chinese GDP print, further benefitted the greenback's relative safe-haven status and contributed to driving flows away from the perceived riskier aussie.
Looking at the technical picture, the AUD/USD pair struggled to find acceptance or build on the momentum beyond 100-day SMA. This comes on the back of the formation of an indecisive Doji candlestick on Friday and suggests that the recent strong positive move from September monthly swing lows might have run out of steam.
The outlook is reinforced by the fact that technical indicators on the 1-hour chart have been gaining positive traction. That said, oscillators on daily/4-hour charts – though have lost some traction – are still holding in the bullish territory. This, in turn, warrants some caution for aggressive bearish traders.
Hence, it will be prudent to wait for a strong follow-through selling before confirming that the AUD/USD pair has topped out in the near term and positioning for any meaningful depreciating move. Hence, any subsequent downfall is more likely to find decent support near the lower boundary of a short-term ascending channel.
The latter is currently pegged near the 0.7370 region, which if broken decisively could accelerate the fall towards the 0.7320-15 strong horizontal resistance breakpoint. Some follow-through selling, leading to a subsequent weakness below the 0.7300 mark will set the stage for deeper losses and turn the AUD/USD pair vulnerable.
On the flip side, any meaningful move back above the 0.7400 mark might continue to confront stiff resistance near the 0.7435-40 region. A sustained strength beyond should push the AUD/USD pair back towards September monthly swing highs, around the 0.7475-80 region, before bulls aim to reclaim the key 0.7500 psychological mark.
AUD/USD daily chart
Technical levels to watch
The Chinese authorities are capable of containing the risks that could emerge out of the troubled China Evergrande Group on the country’s financial system, the People’s Bank of China (PBOC) Governor Yi Gang said at a virtual meeting of the Group of 30 on Sunday.
Key quotes
The property developer’s trouble “casts a little bit of concern.”
“Overall, we can contain the Evergrande risk.”
Evergrande’s liabilities were spread across “hundreds” of entities in the financial system so that there is “not much concentration.”
“The rights and interests of creditors and shareholders will be fully respected in strict accordance with the law. And also the law has clearly indicated the seniority of those liabilities.”
“The growth momentum has moderated somewhat.”
“Economic growth has been slowed down a little, but the trajectory of the economic recovery remains unchanged.”
“The Chinese economy is doing well in general, but we still face some challenges.”
“We are keeping a close eye on all these problems.”
Related reads
- China’s GDP grows 4.9% YoY in Q3 2021 vs. 5.2% expected
- PBOC unlikely to alter the RRR this year – Goldman Sachs
Turkish lira trades in new all-time lows. According to Axel Rudolph, Senior FICC Technical Analyst at Commerzbank, the USD/TRY pair may rise all the way to the 10.00 level.
USD/TRY trades in new all-time highs above 9.00
“USD/TRY’s advance has reached our daily 0.1 x 3 vertical Point & Figure upside target at 9.1000 and so far risen to 9.2959. Further up lies the 10.0000 mark.”
“We will stay immediately bullish while the cross remains above the two month support line at 9.0330 below which the early October low can be spotted at 8.8037. While remaining above the latter level, overall upside pressure should retain the upper hand.”
“Key support remains to be seen between the June-to-September lows at 8.2925/2605.”
- Gold price extends Friday’s decline amid firmer yields and the US dollar.
- Hawkish Fed’s expectations and higher inflation continue to weigh on gold.
- Gold: Sellers defend $1,800, all eyes on US T-bond yields.
Gold price is looking to extend Friday’s $30 slide on Monday, as the underlying narrative of sooner than expected Fed’s monetary policy normalization to counter inflationary risks continues to play out. An upside surprise to the US Retail Sales data bolstered the hawkish Fed’s bets, leading to an extended rally in the US Treasury yields across the curve. Meanwhile, the buying resurgence in the US dollar, in the face of firmer yields and China slowdown worries-led risk-aversion, also exerts the additional downside pressure on gold price. Looking ahead, gold traders will continue to closely follow the dynamics in the yields and the greenback amid a lack of top-tier US events this week.
Read: Gold Price Forecast: XAU/USD eyes $1750 after rejection at 200-DMA, focus on yields
Gold Price: Key levels to watch
According to the Technical Confluences Detector, gold has breached the critical support at $1765, which is the convergence of the previous day’s low and Fibonacci 38.2% one-month.
Therefore, the sellers eye the next support at $1760, where the SMA100 four-hour merges with the Bollinger Band one-day Middle.
If the bearish momentum accelerates, then the pivot point one-day S1 at $1756 will get challenged.
The additional downside will then open up towards $1750, the previous week’s low, below which the bears will look out for the Fibonacci 23.6% one-month at $1748.
Alternatively, recapturing the abovementioned support-turned-resistance at $1765 is critical for gold buyers to initiate a meaningful recovery towards $1768, the Fibonacci 61.8% one-week.
Up next, the bulls will aim for the $1770 figure, followed by the intersection of the SMA5 one-day, Fibonacci 23.6% one-day and SMA200 four-hour around $1773.
Further up, the level to beat for gold bulls is seen around $1777, where the SMA50 one-day, Fibonacci 38.2% one-day and SMA10 four-hour coincide.
Here is how it looks on the tool
About Technical Confluences Detector
The TCD (Technical Confluences Detector) is a tool to locate and point out those price levels where there is a congestion of indicators, moving averages, Fibonacci levels, Pivot Points, etc. If you are a short-term trader, you will find entry points for counter-trend strategies and hunt a few points at a time. If you are a medium-to-long-term trader, this tool will allow you to know in advance the price levels where a medium-to-long-term trend may stop and rest, where to unwind positions, or where to increase your position size.
- NZD/USD witnessed an intraday pullback from one-month tops touched earlier this Monday.
- Hawkish Fed expectations, rallying US bond yields helped revive demand for the greenback.
- A softer risk tone further benefitted the USD’s safe-haven status and exerted some pressure.
The NZD/USD pair extended its corrective pullback from one-month tops and dropped to fresh daily lows, around mid-0.7000s during the early part of the European session.
The pair gained some positive traction on the first day of a new trading week and shot to the highest level since September 16 in reaction to a hotter-than-expected New Zealand CPI report. Bulls, however, struggled to capitalize on the move, or find acceptance above the 0.7100 mark amid a strong pickup in the US dollar demand.
The prospects for an early policy tightening by the Fed pushed the yield on the benchmark 10-year US government bond back above the 1.60% threshold on Monday. This, along with a generally softer risk tone, benefitted the greenback's relative safe-haven status and acted as a headwind for the perceived riskier kiwi.
The FOMC meeting minutes released last Wednesday reaffirmed that the Fed remains on track to begin rolling back its massive pandemic-era stimulus as soon as November. The markets have also started pricing in the possibility of a rate hike in 2022 amid worries that the recent rally in commodity prices will stoke inflation.
Meanwhile, fears about a faster than expected rise in inflation and a sharp deceleration in the Chinese economic growth fueled concerns about the return of stagflation. In fact, the world's second-largest economy recorded a modest 0.2% growth during the third quarter and the yearly rate fell to 4.9% from 7.9% previous.
From a technical perspective, the early uptick faltered near a confluence resistance comprising of the very important 200-day SMA and a downward sloping trend-line extending from YTD tops. With the latest leg down, the NZD/USD pair has now snapped three consecutive days of the winning streak, though the pullback lacked bearish conviction.
Hence, it will be prudent to wait for a strong follow-through selling before confirming that the NZD/USD pair has topped out in the near term and placing aggressive bearish bets. Market participants now look forward to the release of US Industrial Production data for some impetus later during the early North American session.
Technical levels to watch
2-year British government bold yield surged to its strongest level since May 2019 at 0.74% on Monday as investors continue to price the expectation for a Bank of England (BoE) rate hike amid surging energy prices.
Currently, the yield on the 2-year UK gilt is up nearly 25% on a daily basis at 0.7255. According to Reuters, a 15 basis points rate increase by the end of this year is now fully priced in.
Market reaction
The British pound remains on the back foot during the European trading hours on Monday and the GBP/USD pair was last seen losing 0.2% on a daily basis at 1.3723.
EUR/USD is moving back below 1.16 this morning. Economists at Société Générale expect the 1.1650 level to cap any attempts to rebound.
See: EUR/USD to trade within a 1.1550-1.1650 range this week – ING
1.1530 holds the downside
“So long as the 1.1530 area holds, it’s difficult to envisage the pair having a go below 1.15. It’s a similar story to the upside with 1.1625/65 barring the road to 1.17.”
“Without a re-flattening of the US front-end – FF futures are pricing 68% odds of a rate increase by June next year, it will be tricky for the tactical recovery in EUR/USD to broaden beyond 1.1650.”
The CAD is having a good October as it has posted a solid 2.5% gain on the USD so far. Economists at Scotiabank see USD/CAD downside potential to the low 1.22s.
Rallies to run out of steam around the mid-1.24s
“If the USD manages to steady around 1.2365/70 into this week, a modest correction could develop. We expect USD gains to remain limited to the low/mid 1.24s, however, with daily and weekly trend momentum signals aligned bearishly for the USD.”
“We think USD/CAD can print a 1.22 handle ahead of year end.”
- Silver attracted some dip-buying on the first day of a new trading week.
- Acceptance above the head & shoulders neckline favours bullish traders.
- A sustained move beyond the 61.8% Fibo. will reaffirm the positive bias.
Silver managed to find some support near the $23.00 round-figure mark on Friday and attracted some dip-buying on the first day of a new trading week. The commodity edged higher through the early European session and was last seen hovering near daily highs, around the $23.40-45 region.
Looking at the technical picture, last week's sustained move beyond the $23.15-20 barrier marked a bullish breakout through an inverted head and shoulders neckline. The emergence of fresh buying near the mentioned resistance breakpoint–turned–support, adds credence to the positive bias.
The constructive setup is reinforced by the fact that technical indicators on the daily chart have been gaining positive traction and are still far from being in the overbought territory. A sustained move beyond the 61.8% Fibonacci level of the $24.87-$21.42 downfall will reaffirm the outlook.
The XAG/USD might then aim to reclaim the $24.00 mark en-route the next relevant hurdle near the $24.25-30 region. The momentum could further get extended towards September monthly swing highs, near the $24.75-80 zone, before bulls eventually aim to reclaim the key $25.00 psychological mark.
On the flip side, the $23.20-$23.00 neckline resistance breakpoint should protect the immediate downside. The mentioned region coincides with 200-period SMA on the 4-hour chart and the 50% Fibo. level, which, in turn, should act as a strong near-term base for the XAG/USD.
A convincing break below will negate the bullish outlook and prompt aggressive technical selling. The XAG/USD might then accelerate the fall towards the 38.2% Fibo. level, around the $22.75-70 region before dropping further towards mid-$22.00s and the $22.25 region (23.6% Fibo.).
Silver 4-hour chart
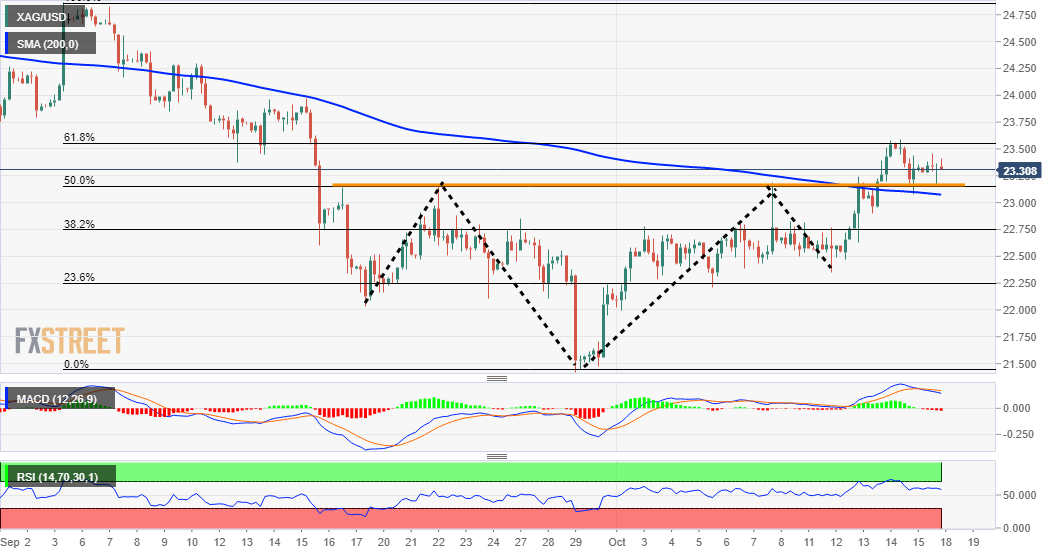
Technical levels to watch
European Central Bank (ECB) Governing Council member Ignazio Visco told Bloomberg TV on Monday that market expectations are not that consistent with the ECB's guidance.
Additional takeaways
"ECB has not discussed raising the limit on international bond-buying."
"We may end up rising limits but nothing has been discussed."
"Monetary policy will remain accommodative, will look through price pressures if something remains."
"Price pressures may last some months, even into next year but we are not seeing second-round effects."
"There should be a level of flexibility in ECB's toolbox."
Market reaction
The common currency struggles to find demand after these comments and the EUR/USD pair was last seen losing 0.1% on the day at 1.1587.
For EUR/GBP, the close below 0.8450 on Friday is technically significant. Economists at Société Générale are pointing towards persistence of downward momentum with next support seen at 0.8385.
EUR/GBP to edge lower towards projections of 0.8385
“Holding below 0.8550, EUR/GBP could head lower towards projections of 0.8385.”
“Lower band of the consolidation zone since 2016 at 0.8300/0.8270 and 0.8200 are next significant support levels.”
The US dollar has been transitioning from a weaker to stronger state this year. In the view of economists at HSBC, the USD will likely remain resilient, amid slowing global growth and the Fed’s forward guidance on rate hikes.
The USD’s modest strength looks set to persist in 2022
“Yet, there is clearly some concern about the poor mix of slowing global growth with stickier inflation.”
“In our view, ‘stagflation lite’ – a lighter version of the 1970s stagflation – is occurring. We believe that this still plays to the advantage of the USD – one of the ‘hardest’ currencies.”
“A more serious form of stagflation is not our base case; however, if the markets increasingly fear this scenario, the USD should also be primed to benefit.”
EUR/RUB is dashing towards 82.0 after a 1.5% drop in the last two sessions. Economists at Société Générale expect the pair to see a rebound towards the 83.65 level, which is set to cap the upside.
Support 80.60 and resistance 83.65
“EUR/RUB is now in proximity to the lower limit of a multi month channel near 81.90. An initial rebound can’t be ruled out, however last week's peak of 83.65 is likely to contain.”
“Failure to cross above the 83.65 mark can result in continuation of the down move towards next projections at 80.60. This could be an important support near-term.”
- EUR/USD starts the week on the back footing.
- Risk-on sentiment dented after mixed Chinese data.
- US Industrial Production figures next on tap in the docket.
The European currency remains under pressure and now drags EUR/USD to the 1.1570 region at the beginning of the week.
EUR/USD remains capped above 1.1600
EUR/USD loses ground for the second session in a row on Monday on the back of the continuation of the recovery in the greenback.
In fact, higher US yields sustain the upside move in the buck and encourages the US Dollar Index (DXY) to retake the 94.00 yardstick and above at the beginning of the week. Same path follows yields of the German 10-year Bund, which add to Friday’s advance and reach the -0.12% region.
The pair looks offered against a weak backdrop in the risk complex after Chinese GDP figures showed the economy expanded 4.9% YoY in Q3 and 0.2% inter-quarter, both prints coming in short of estimates. In addition, the jobless rate ticked lower to 4.9%, Retail Sales expanded more than expected 4.4% in the year to September and Industrial Production expanded below forecast at an annualized 3.1% also in September.
Nothing scheduled in the euro calendar on Monday should leave all the attention to the US docket, where Industrial Production figures and the NAHB Index will be in the centre of the debate.
What to look for around EUR
Despite EUR/USD managed to regain the key barrier at 1.1600 the figure and beyond during last week, it was unable to close any session at/above it. As usual in past weeks, dollar dynamics are expected to keep dictating the price action around spot for the time being, where tapering chatter remains well in centre stage. In the meantime, the idea that elevated inflation could last longer coupled with the loss of momentum in the economic recovery in the region, as per some weakness observed in key fundamentals, are seen pouring cold water over investors’ optimism as well as bullish attempts in the European currency.
Key events in the euro area this week: Final EMU CPI (Wednesday) – Preliminary PMIs in the euro zone (Friday).
Eminent issues on the back boiler: Asymmetric economic recovery post-pandemic in the region. Sustainability of the pick-up in inflation figures. Probable political effervescence around the EU Recovery Fund. Investors’ shift to European equities in the wake of the pandemic could lend extra oxygen to the euro. ECB tapering speculations.
EUR/USD levels to watch
So far, spot is losing 0.02% at 1.1592 and faces the next up barrier at 1.1624 (weekly high Oct.14) followed by 1.1640 (weekly high Oct.4) and finally 1.1722 (55-day SMA). On the other hand, a break below 1.1571 (low Oct.18) would target 1.1524 (2021 low Oct.12) en route to 1.1495 (high Mar.9 2020).
- GBP/JPY attracted some dip-buying on Monday and shot back closer to multi-year tops.
- Positive Brexit headlines, hawkish BoE underpinned the GBP and remained supportive.
- A softer risk tone benefitted the safe-haven JPY and capped the upside for the cross.
The GBP/JPY cross shot to fresh daily tops, around the 157.35 region during the early European session, albeit lacked any follow-through buying. The cross was last seen hovering around the 157.00 mark, nearly unchanged for the day.
The cross attracted some dip-buying near the 156.60 region on the first day of a new trading week and inched back closer to over five-year tops touched on Friday. The GBP/JPY cross bounced over 50 pips from the daily swing lows, though the uptick lacked bullish conviction.
The British pound continued drawing some support from the fact that the EU agreed to scrap most checks on goods and medicines arriving into Northern Ireland from the rest of the UK. This, along with rising bets for a BoE rate hike this year, acted as a tailwind for the sterling.
Adding to the recent hawkish rhetoric, the BoE Governor Andrew Bailey warned that rising energy prices means inflation will last longer and that monetary policy cannot solve supply-side problems. He added that the BoE will have to act if we see a risk to medium-term inflation expectations.
That said, fears that the UK will reject the EU's new proposal for the Northern Ireland protocol held traders from placing fresh bullish bets around the GBP. Moreover, a softer risk tone benefitted the Japanese yen's safe-haven status and collaborated to cap the upside for the GBP/JPY cross.
Against the backdrop of fears about a faster-than-expected rise in inflation, signs of a global economic slowdown have been fueling concerns about the return of stagflation. Adding to this, disappointing Chinese GDP print tempered investors' appetite for perceived riskier assets.
In the absence of any major market-moving economic releases from the UK, traders seemed reluctant amid extremely overbought RSI on the daily chart. This further makes it prudent to wait for some near-term consolidation or a modest pullback before the GBP/JPY cross resumes its bullish trend.
Technical levels to watch
GBP/USD has been boosted by Brexit calm and clearer Fed path. The Bank of England's (BoE) next decision will be influenced by UK inflation. Elevated numbers are key to more sterling gains, Yohay Elam, an Analyst at FXStreet, reports.
UK inflation stands out, as it could determine the BoE's next decision
“Market observers seem resigned to accept that the Brexit topic will linger for a long time – but there is a difference between making the headlines and being a side story. If quiet negotiations replace pompous speeches, sterling could shine. On the other hand, ongoing clashes could pressure the pound.”
“Contrary to the continent, COVID-19 infections refuse to fall in Britain, but the disease's impact on markets is diminished. Any seasonal change in cases or hospitalizations could weigh on the pound.”
“UK inflation is critical for the BoE's upcoming decision. Headline inflation shot to 3.2% YoY in August, above the bank's 1-3% range. If price rises remain elevated, there is room for substantial gains for sterling, as a rate hike in November would seem imminent. A drop below 3% would provide relief to the BoE and could take some of the hot air out of the pound.”
- A goodish pickup in the USD demand assisted USD/CHF to regain positive traction on Monday.
- Hawkish Fed expectations, a fresh leg up in the US bond yields acted as a tailwind for the USD.
- A softer risk tone might underpin the safe-haven CHF and cap any further gains for the major.
The USD/CHF pair built on its stead intraday ascent and climbed to fresh daily tops, around the 0.9260 region during the early European session.
The pair managed to regain some positive traction on the first day of a new trading week and inched back closer to Friday's swing high amid a goodish pickup in the US dollar demand. The prospects for an early policy tightening by the Fed pushed the yield on the benchmark 10-year US government bond back closer to the 1.60% threshold. This, in turn, was seen as a key factor that acted as a tailwind for the greenback.
The FOMC meeting minutes released last Wednesday reaffirmed that the Fed remains on track to begin rolling back its massive pandemic-era stimulus by the end of 2021. The markets also seem to have started pricing in the possibility of an interest rate hike in 2022 amid worries that the recent widespread rally in commodity prices will stoke inflation. This further contributed to the spike in the bond yields.
Meanwhile, fears about a faster than expected rise in inflation, along with signs of a global economic slowdown have been fueling concerns about the return of stagflation. Adding to this, Monday's disappointing Chinese macro data weighed on investors' sentiment. This was evident from a generally softer tone around the equity markets, which could benefit the safe-haven Swiss franc and cap gains for the USD/CHF pair.
Market participants now look forward to the release of US Industrial Production data for some impetus later during the early North American session. This, along with US bond yields, might influence the USD price dynamics. Traders will further take cues from the broader market risk sentiment for some meaningful opportunities around the USD/CHF pair.
Technical levels to watch
CAD’s rally continued this week, with USD/CAD breaking decisively below 1.24. Economists at ING believe USD/CAD downside potential should be more contained in the week ahead.
Inflation set to confirm the need for tapering
“We think that a headline rate around 4.0% should allow markets to further reinforce their view around the prospect of the Bank of Canada ending QE by year-end. Any above-consensus read may fuel speculation that the Bank will start tightening earlier in 2H22 and add support to CAD. Still, we don’t think the USD correction has long legs, so USD/CAD downside potential should be more contained in the week ahead.”
“One topic that should attract increasing market interest is the BoC mandate, which is due for renewal by the end of this year. We are inclined to think the current inflation target (2%, with a +/- 1% tolerance band) will be renewed, although there is some speculation it could be made more flexible, like in the US.”
According to FX Strategists at UOB Group, losses in USD/CNH could accelerate on a break below 6.4240.
Key Quotes
24-hour view: “We highlighted yesterday that the weakness in USD could ‘retest the 6.4240 level before stabilization can be expected’. However, USD traded between 6.4273 and 6.4391 before closing at 6.4350 (+0.10%). The quiet price actions are viewed as part of a consolidation and USD is likely to trade sideways for today, expected to be within a range of 6.4280/6.4480.”
Next 1-3 weeks: “There is not much to add to our update from yesterday (14 Oct, spot at 6.4340). As highlighted, downward momentum is beginning to build but USD has to close below 6.4240 before a sustained decline can be expected (next support is at 6.4100). The chance for USD to close below 6.4240 is quite high as long as it does not move above the ‘strong resistance’ level (currently at 6.4540) within these few days.”
WTI and Brent are over $82/bbl and 84/bbl, respectively. How much higher can oil go? Howie Lee, Economist at OCBC Bank, remains highly sceptical about $100 oil.
Pre-shale days are far away
“Many are looking at oil’s price chart and pointing out the lack of notable resistance levels from here to $100 for their $100-oil justification. But to do that demonstrates a lack of understanding of the oil market structure. The era of $100 oil was before the US shale boom and stocks were way tighter than what they are now.”
“Despite the current stock tightness, stocks are still not as tight as the pre-shale era – hence, it does seem ambitious to suggest prices return to pre-shale days.”
“If implied gasoline consumption increases from 9,750kbpd to 10,500kbpd on a sustained basis (+8%), or commercial oil inventories fall by 70mn barrels to 350mn barrels (-17%) then that $100 theory may have a chance – but these are huge hurdles that I am not particularly optimistic about. On that lack of optimism, it appears that this is as high as the oil market may go – Brent at $85, WTI at $80 – with the potential for a slight overshoot by $3- $5/bbl.”
- DXY starts the week on a positive note above 94.00.
- US 10-year yields cling to gains around 1.60% on Monday.
- Industrial Production, NAHB Index, Fedspeak come up next.
The US Dollar Index (DXY), which gauges the greenback vs. a bundle of its main competitors, begins Monday’s session on a positive footing around 94.20.
US Dollar Index looks to data, yields
The index regains composure and upside traction after three consecutive daily pullbacks, including the corrective downside from new 2021 highs past 94.50 recorded on October 12.
The move higher in the index comes in tandem with the recovery in US yields, where the front end of the curve flirts with the 0.42% level and the belly surpasses the 1.60% yardstick so far on Monday.
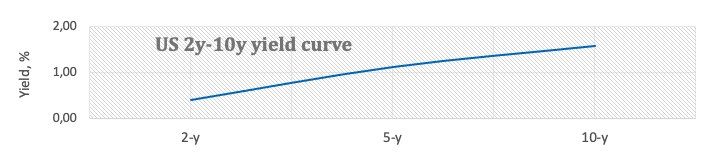
The dollar, in the meantime, appears well supported by solid prospects for a tapering announcement as early as at the November meeting, while Fed speakers have been also intensifying their support to this view particularly since the September FOMC event.
In the US data sphere, Industrial and Manufacturing Production figures are due later in the NA session seconded by Capacity Utilization, the NAHB Index and TIC Flows.
What to look for around USD
The index corrected lower following new 2021 highs past 94.50 on October 12, although the bearish move has so far met decent contention near 93.70. Supportive Fedspeak, an anticipated start of the tapering process, higher yields and the rising probability that high inflation could linger for longer continue to prop up the sentiment around the buck for the time being and keep sustaining the case for the resumption of the uptrend in DXY in the relatively short-term horizon.
Key events in the US this week: industrial Production, NAHB Index (Monday) – Building Permits, Housing Starts (Tuesday) – Initial Claims, Philly Fed Index, CB Leading Index, Existing Home Sales (Thursday) – Flash Manufacturing PMI (Friday).
Eminent issues on the back boiler: Persistent uncertainty around Biden’s multi-billion Build Back Better plan. US-China trade conflict under the Biden’s administration. Tapering speculation vs. economic recovery. Debt ceiling debate. Geopolitical risks stemming from Afghanistan.
US Dollar Index relevant levels
Now, the index is gaining 0.10% at 94.16 and a break above 94.56 (2021 high Oct.12) would open the door to 94.74 (monthly high Sep.25 2020) and then 94.76 (200-week SMA). On the flip side, the next down barrier emerges at 93.75 (weekly low October 14) followed by 93.67 (monthly low Oct.4) and finally 92.98 (weekly low Sep.23).
- GBP/USD snaps three-day uptrend, as 1.3768 remains a tough nut to crack.
- Firmer yields, US dollar recall cable sellers, as Bailey’s comments ignored.
- Will GBP/USD yield a symmetrical triangle breakout on the 1D chart?
GBP/USD has faced rejection once again near the 1.3770 region, with the bears now fighting back control, dragging the rates lower towards 1.3700.
In doing so, the cable turns into the red zone for the first time in four trading sessions, retreating from four-week highs reached last Friday.
The latest leg down in the spot could be mainly associated with the rebound in the US dollar across the board, as the Treasury yields extend the American Retail Sales blowout-inspired rally amid increasing hawkish Fed’s expectations.
Further, adding to the downside in the spot is the looming Brexit concerns, with the European Union (EU) states growing weary of the Northern Ireland (NI) Protocol, Brexit and the UK bad faith.
The dynamics in the yields and the greenback will continue to have a significant bearing on the cable ahead, in absence of relevant UK/US macro data.
From a near-term technical perspective, the price has stalled the upside at the symmetrical triangle resistance of 1.3768.
A daily closing above the latter will confirm the upside break from the triangle, calling for a fresh run towards 1.3800. The next bullish target is seen at the downward-sloping 100-Daily Moving Average (DMA) at 1.3814.
The 14-day Relative Strength Index (RSI) holds above the midline, keeping the buyers hopeful.
GBP/USD: Daily chart
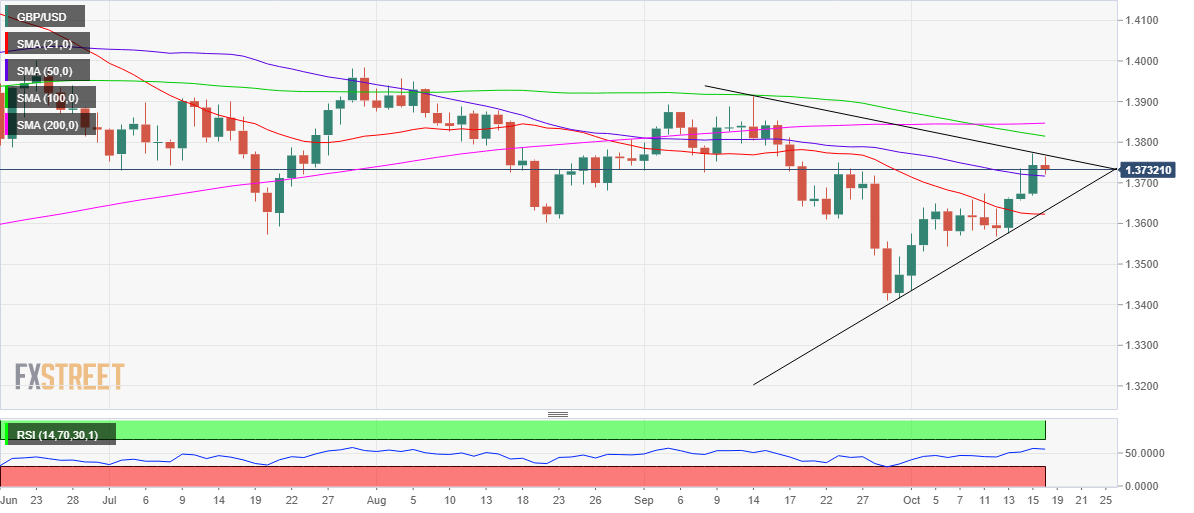
Alternatively, 50-DMA at 1.3716 offers immediate support to the pair, below which a sharp drop towards 1.3625 cannot be ruled out.
That level is the confluence of the 21-DMA and rising trendline (triangle) support.
GBP/USD: Additional levels to consider
The kiwi continued its march higher into the end of the week, closing the New York session at highs for the week just shy of 0.7075. Higher interest rates and a weaker USD are set to propel the NZD/USD pair, economists at ANZ Bank report.
Improved technical picture
“A good chunk of the strength appears simply to be USD weakness, but NZ interest rates are also rising as markets start to question whether the OCR might just keep rising as inflation fears percolate. The implications of that for the domestic economy aren’t necessarily great given high levels of debt, but for now, markets are trading the NZD like all other late-cycle assets, where buyers remain the dominant force.”
“Technically, the picture is certainly way more upbeat than it was a week ago.”
“Support 0.6805/0.6860 – Resistance 0.7170/0.7215/0.7310”
USD/JPY stays relatively calm after posting its strongest weekly close since March 2017 at 114.20. The energy crisis has left the JPY vulnerable and a test of major resistance at 115.00 beckons for USD/JPY, economists at ING report.
Rising US yields continue to fuel the pair's upside
“The USD/JPY pair will also find support from US yields, where our rates team still expect a further rise as market tightening expectations move towards those of the Fed.”
“Japan’s monthly trade balance is expected to widen towards the JPY500 B area. Any wider deficit could provide USD/JPY with the nudge through 115.00 as the market sinks its teeth into the energy dependence story.”
The pound has now crept to its highest levels versus the euro since spring 2020. Plenty of market commentators are concerned about the impact of early Bank of England rate hikes on UK growth prospects though the most relevant question is ‘could’ the BoE hike rates soon, not ‘should’ it, in the opinion of economists at Rabobank. They forecast EUR/GBP at 0.85 on a three-month view.
Headwinds are coming
“Fears around the medium-term outlook for the UK economy could hinder the prospects for the pound next year and beyond.”
“Tensions with French fishermen and disagreements about the Northern Ireland protocol have brought warnings of a trade war between the UK and the EU. Neither had had a significant impact on the pound to date. That said, this is a risk that the differences between the UK and the EU won’t be resolved easily and, on the margin, this news-flow provides an additional disincentive to GBP investors.”
“We are not expecting the BoE to raise rates in the coming months and see scope for GBP to edge lower on disappointment.”
“We are forecasting EUR/GBP at 0.85 on a three-month view. We expect USD strength to push cable back to the 1.36 area on a three-month view.”
On Monday, EUR/USD is trading in the negative territory below 1.1600. The European Central Bank's dovish outlook remains intact and makes it difficult for the common currency to find demand. Economists at ING expect the pair to see a period of consolidation.
PMIs to start show the impact of the gas crisis?
“EUR/USD has shown no interest in wanting to break big support at 1.1500 and a further period of consolidation looks likely.”
“The top of the range should be the 1.1650/70 area.”
“On the data front, the highlight of the week will be the flash October PMIs. Confidence in the manufacturing sector has been softening a little, but we could get to see the first impact of the gas crisis that is hitting the European industrial base.”
“ We have quite a few ECB speakers over the coming week, but not until the likes of Lagarde or Lane change their tune will there be a re-rating of the EUR. In fact, our rates team feel that the ECB cycle is already over-priced (10bp ECB rate hike priced for late 2022) while the Fed cycle is under-priced.”
EUR/GBP is in new 18 month lows. The pair fell below the key support at 0.8471/49 on Friday and is set to target the 0.8239 2019 low, Karen Jones, Team Head FICC Technical Analysis Research at Commerzbank, reports.
Rallies to find initial resistance at the previous 0.8471
“EUR/GBP on Friday eroded key support at 0.8471/49, which represented the recent low and lows since 2019. This was an extremely negative price action. The break of this support leaves attention on the 0.8239 2019 low.”
“The 200-month ma lies at 0.8159.”
“Rallies will find initial resistance at the previous low at 0.8471 and the 55-day ma at 0.8538 and will need to regain this to challenge the 0.8659/73 highs since May.”
USD/JPY keeps well and sound a probable visit to the 114.20 level in the next weeks, commented FX Strategists at UOB Group.
Key Quotes
24-hour view: “USD traded between 113.20 and 113.71 yesterday, narrower than our expected sideway-trading range of 113.10/113.75. USD traded on a firm note during early Asian hours as it rose above 113.80. Upward momentum has improved, albeit not by much and USD could rise but the major resistance at 114.20 is likely out of reach for today (minor resistance is at 114.00). Support is at 113.60 followed by 113.40.”
Next 1-3 weeks: “Our view from Tuesday (12 Oct, spot at 113.40) still stands. As highlighted, the recent impulsive surge suggests that further USD strength would not be surprising and the next resistance is at 114.20. The USD strength is deemed intact as long as it does not breach 113.00 (‘strong support’ level was at 112.80 previously). Looking ahead, the next resistance above 114.20 is at 114.55.”
- Asian stocks kickstart the fresh trading week on a lower note.
- China reports the weakest Q3 GDP data in a year, oil prices soar.
- New Zealand prints higher CPI data, RBNZ says more aggressive hiking cycle ahead.
Asian stocks edge lower following the release of key Chinese economic data. Further Investors remain concerned about the rising energy prices, which exacerbate the global inflationary concerns.
MSCI’s broadest index of Asia-pacific shares outside Japan falls 0.07%.
The Shanghai Composite Index is trading down 0.6%, following the disappointing third-quarter Gross Domestic Product (GDP), which expands 4.9% YoY basis, below the market expectations of 5.2%.
The Nikkei 225 index declines 0.2%, following Japan’s Prime Minister comments that there will be no change in sales tax. He further said that the country must issue government bonds to fund policies aimed at helping the public defence from the coronavirus pandemic.
The ASX 200 trades higher 0.4% on Monday, after a strong closing on Wall Street last week, led by the energy and financial sectors. Meanwhile, Australia secured additional COVID-19 treatments as the country gradually reopens to the international level.
Oil prices surge more than 1% on Monday, hitting the seven-year high near $83.00.
Here is what you need to know on Monday, October 18:
The greenback is gathering strength in the early hours of the European session on Monday as investors stay focused on the US Treasury bond yields in the absence of significant fundamental drivers and high-tier data releases. September Industrial Production data will be featured in the US economic docket in the second half of the day but the market mood alongside the performance of US T-bond yields is likely to continue to impact the USD's valuation.
Earlier in the day, the data from China revealed that the Gross Domestic Product (GDP) expanded by 0.2% on a quarterly basis in the second quarter after growing by 1.3% in the second quarter. This reading missed the market expectation of 0.5% and caused risk sentiment to sour during the Asian trading hours.
The US stocks futures are down between 0.1% and 0.3%, suggesting that Wall Street's main indexes are likely to open not too far away from Friday's closing level. On a weekly basis, the S&P 500 and the Dow Jones Industrial Average rose 1.8% and 1.6%, respectively. In the meantime, the benchmark 10-year US Treasury bond yield is up nearly 2% at 1.605%.
Gold suffered heavy losses in the second half of the previous week as the precious metal remains extremely sensitive to movements in the US T-bond yields. XAU/USD is currently moving sideways in a relatively tight range around $1,770 but the pair could feel renewed bearish pressure when trading volume rises with European and American traders entering the market.
EUR/USD's recovery attempt failed to convince investors that the pair was about to reverse its direction. The European Central Bank's dovish outlook remains intact and makes it difficult for the common currency to find demand. On Monday, the pair is trading in the negative territory below 1.1600.
USD/JPY stays relatively calm after posting its strongest weekly close since March 2017 at 114.20. Rising US T-bond yields continue to fuel the pair's upside.
GBP/USD managed to close the second straight week in the positive territory and seems to have gone into a consolidation phase above 1.3700. The Bank of England's hawkish policy outlook and renewed Brexit optimism help the British pound stay resilient against the dollar.
Despite rising copper prices, the AUD/USD pair edges lower on Monday pressured by the disappointing Chinese growth data.
Cryptocurrencies: Bitcoin continues to trade above $60,000 as crypto investors wait for the first Bitcoin ETF to debut in the US either on Monday or Tuesday. Ethereum stays within a touching distance of $4,000 and Ripple is fluctuating around $1.1.
In light of preliminary readings from CME Group for natural gas futures markets, open interest dropped by around 1.7K contracts and reversed two daily builds in a row on Friday. On the flip side, volume went up by nearly 70K contracts after two consecutive daily pullbacks.
Natural Gas faces solid support around $4.70
Natural gas prices receded further at the end of last week. The downtick was on the back of shrinking open interest, however, playing against a deeper move lower at least in the very near term. The commodity, in the meantime, is seen facing decent contention in the $4.70 region per MMBtu for the time being.
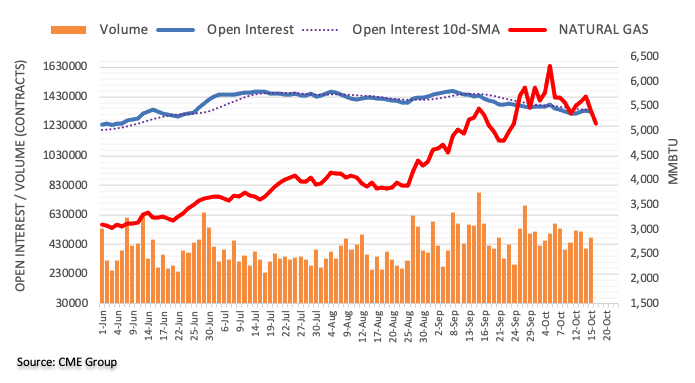
FX option expiries for October 18 NY cut at 10:00 Eastern Time, via DTCC, can be found below.
- EUR/USD: EUR amounts
- 1.1525 644m
- 1.1575 556m
- 1.1600-05 652m
- 1.1655 551m
- USD/JPY: USD amounts
- 112.50 542m
- 114.00 303m
- AUD/USD: AUD amounts
- 0.7425 640m
- 0.762 620m
- USD/CAD: USD amounts
- 1.2450 740m
Gold price is pressuring lows near $1765. As FXStreet’s Dhwani Mehta notes, XAU/USD eyes $1750 after rejection at the critical 200-Daily Moving Average (DMA) at $1796.
Dynamics in the yields and dollar will be closely followed by gold traders
“The rising inflationary concerns-led earlier Fed’s tightening calls keep the buoyant tone intact around the Treasury yields, which limits the upside attempts in XAU/USD.”
“Gold is looking to extend Friday’s decline towards the horizontal 21-DMA support at $1761. A sustained break below the latter could bring the last week’s demand area at $1750-$1745 back into play. Further south, the multi-week lows of $1722 could be on the sellers’ radars.”
“Gold bulls will need to recapture the 50-DMA at $1778 to revive the bullish interests. The next relevant target awaits at $1795, the confluence of the 100 and 200-DMAs. Buyers will then aim for the $1800 round number.”
AUD/USD faces some consolidative mood in the near term ahead of a potential advance to the mid-0.7400s in the next weeks, suggested FX Strategists at UOB Group.
Key Quotes
24-hour view: “Yesterday, we highlighted that AUD ‘is likely to advance even though it may not be able to maintain a foothold above the major resistance at 0.7405’. We added, ‘the next resistance at 0.7450 is not expected to come into the picture’. AUD subsequently rose to 0.7427 before closing on a firm note at 0.7416 (+0.48%). The advance is deeply overbought and AUD is unlikely to strengthen much further. For today, AUD is more likely to trade between 0.7385 and 0.7430.”
Next 1-3 weeks: “We detected the build-up in upward momentum last Friday (08 Oct, spot 0.7310) and has held a positive view in AUD since then. As AUD rose strongly, we highlighted yesterday (14 Oct, spot at 0.7380) that ‘0.7405 appears to be within reach and a break of this level would open up the way for further AUD gains towards 0.7450’. AUD subsequently rose to a high of 0.7427. There is no change in our view even though AUD could consolidate for a couple of days first before heading towards 0.7450. On the downside, a break of the ‘strong support’ at 0.7350 (level was at 0.7325 yesterday) would indicate that the current positive phase has come to an end.”
- USD/JPY stalls the upside amid risk-off mood, awaits US data.
- US Treasury yields retreat from highs, DXY remains broadly underpinned.
- USD/JPY remains bid amid a quiet start to the week, Fed sentiment to lead the way.
Having tested three-year highs of 114.46 in early Asia, USD/JPY is consolidating above 114.00, as the bulls take a breather before resuming the upside momentum.
The major closely follow the price action in the US Treasury yields, tagging alongwith the benchmark 10-year rates. The renewed uptick in the yields drove the currency pair back towards the multi-year tops reached on Friday.
However, the 10-year rates seem to lack follow-through upside bias above 1.60%, capping USD/JPY’s effort to refresh three-year tops.
The downside in the major remains cushioned by the strengthening US dollar, as the risk tone remains softer heading into early European trading.
China’s Q3 GDP disappointed with 4.9% YoY vs. 5.2% expected, hitting a fresh yearly low. The re-emergence of the China slowdown worries combined with surging oil prices tempered the market mood and supported the dollar bulls.
Meanwhile, Japanese Prime Minister Fumio Kishida said that he has no plans to change the sales tax. The pair is likely to get influenced by the broader market sentiment and the yields’ price action, as the US data docket is relatively scarce.
Fedspeak will draw some attention, however, amid rising Fed’s hawkish expectations.
USD/JPY: Technical outlook
“The USD/JPY first resistance level is October 4, 2018, high at 114.54, which is a crucial price level, unsuccessfully tested four times in four years. A break above the latter can clear the way for further gains, exposing key resistance levels like January 27, 2017, high at 115.37, followed by January 9, 2017, high at 117.52. On the other hand, failure at 114.00 could open the door for a leg-down in confluence with the current RSI oversold conditions,” explains FXStreet’s Analyst Christian Borjon Valencia.
USD/JPY: Additional levels to consider
CME Group’s advanced figures for crude oil futures markets noted open interest resumed the upside and increased by around 20.6K contracts on Friday. On the other hand, volume shrank for the fourth consecutive session, this time by around 102.5K contracts.
WTI: Rally looks unabated, but a correction looks likely
There seems to be no respite for the upside momentum in prices of the WTI. Friday’s uptick was in tandem with rising open interest allowing for the continuation of the move in the very near term at least. However, the current overbought condition of the commodity hints at the likelihood of a corrective decline in the not-so-distant future. On the upside, the $85.00 mark per barrel already emerges on the horizon.
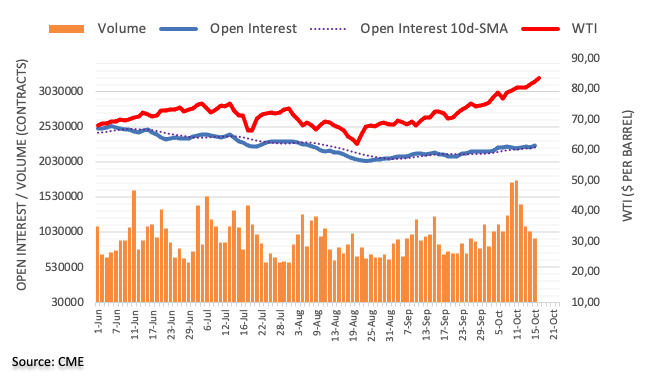
Cable is predicted to move into a consolidative phase in the next weeks, noted FX Strategists at UOB Group.
Key Quotes
24-hour view: “We highlighted yesterday that ‘there is room for GBP to advance to 1.3695, possibly 1.3715’. The subsequent advance exceeded our expectations as GBP rose to 1.3734. However, GBP pulled back sharply from the high. The pullback has room to extend but any weakness is likely limited to a test of 1.3645. The strong support at 1.3595 is not expected to come into the picture. Resistance is at 1.3695 followed by 1.3715.”
Next 1-3 weeks: “Yesterday, we highlighted that GBP ‘is likely to head higher to 1.3715’. We added, ‘a break of 1.3715 would shift the focus to 1.3750’. We did not quite expect the rapid manner by which GBP moved above 1.3715 as it popped to 1.3734 during London hours before retreating. There is no change in our view for now but GBP could consolidate for a couple of days first before heading higher. Only a break of the ‘strong support’ at 1.3595 (no change in level) would indicate that 1.3750 is out of reach.”
Open interest in gold futures markets reversed two daily builds in a row and went down by around 13.2K contracts at the end of last week considering flash data from CME Group. Volume, instead, went up by around 39.2K contracts.
Gold remains capped by $1,800
Friday’s sharp pullback in gold prices was amidst decreasing open interest, which is indicative that further losses appear out of favour for the time being. In the meantime, intermittent bullish attempts are seen facing solid resistance around the $1,800 mark per ounce troy.
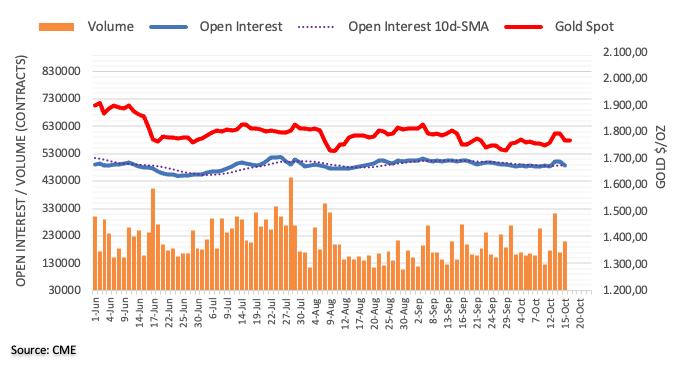
- Gold extends the previous session’s decline on Monday below $1,770.
- Higher US Treasury yields underpin the demand for the US dollar.
- Higher inflation worries and China’s dismal Gross Domestic data strike investors risk-sentiment.
After testing the $1,800 mark in a month on Thursday, the gold prices track lower. Gold is posting a fall for the second straight day as the fresh trading week begins. The US benchmark 10-year Treasury yields rise above 1.60%, reducing non-yielding bullion’s opportunity cost.
The US Dollar Index, which tracks the performance of the greenback against the basket of six major currencies trades higher above 94.10 with 0.19% gains, making gold expansive for other currencies holders.
The US Retail Sales, which jumps 0.7% in September, beating the market estimates of a 0.2% decline bolster expectations for sooner-than-expected interest rate hikes from the US Federal Reserve. In addition to that, the Bank of England (BOE) Governor Andrew Bailey also hints that the British central bank is gearing up to raise interest rates in December or early 2022 as inflation risk mounts.
Gold is generally considered a hedge against inflation and currency volatility. A Hawkish move by the major central banks would diminish gold’s appeal. In addition to that, the SPDR Gold Trust, the world’s largest physically-backed gold exchange-traded fund (ETF) said its holding falls 0.3% to 980.1 tons on Friday from 982.72 tons a day earlier.
Nevertheless, the lower prices get support from the fall in global equities and concerns on the patchy global growth recovery. Asian stock market and US futures slid amid surging energy prices boosting worries about inflation and as Chinese growth falters. China’s economy stumbles in the third quarter, hurt by power shortages, supply chain bottlenecks, and major disruptions in the property market. The Gross Domestic Product (GDP) expands 4.9% in July-September, much below the market forecast.
Technical levels
XAG/USD daily chart
-637701313860557806.png)
Gold prices fell nearly 40 points on Friday after testing the $1,800 mark on Thursday for the first time since September, 15. The downside is being confirmed as the prices trade below the crucial 100-day and 50-day Simple Moving Averages (SMA) confluence.
The Moving Average Convergence Divergence (MACD) holds below the midline with a bearish crossover. Any downtick in the MACD indicator would amplify the selling pressure and the prices would approach Tuesday’s low of $1,750.81. A daily close below the mentioned level would entice bears to retest the $1,740 horizontal support level. XAU/USD bears could meet the September, 29 low at $1,7217.
Alternatively, if the prices sustain the intraday high, it could retrace back to the $1,780 horizontal resistance level, above the 50-day SMA at $1,777.66. Next, the XAU/USD bulls would again test the 100-day SMA at $1,782.21. A daily close above the mentioned level would see the $1,820 horizontal resistance level for the bulls.
XAU/USD additional levels
In opinion of FX Strategists at UOB Group, EUR/USD is stil expected to attempt s move to 1.1640 in the next weeks.
Key Quotes
24-hour view: “Yesterday, we held the view that ‘further gains are not ruled out but the major resistance at 1.1640 is unlikely to come into the picture’. Our view was not wrong as EUR rose to 1.1624 before pulling back. Upward pressure has eased and EUR is unlikely to strengthen much further. For today, EUR is more likely to trade sideways within a range of 1.1570/1.1620.”
Next 1-3 weeks: “There is no change in our view from yesterday (14 Oct, spot at 1.1595). As highlighted, the recent weak phase has ended. The rapid rebound has gained momentum and EUR is likely trade with an upward bias towards 1.1640. Further advance is not ruled out but 1.1640 may not be easy to crack. The upward bias is deemed intact as long as EUR does not move below 1.1540 within these few days.”
These are the main highlights for the CFTC Positioning Report for the week ended on October 12.
- Speculators remained on the bearish side regarding the euro for the second consecutive week, although net shorts eased from the previous week as well as the net position to open interest to -2.65% (from -3.22%). Higher yields following the debt ceiling truce and rising cautiousness ahead of the release of the Nonfarm Payrolls kept the risk complex under pressure and forced EUR/USD to drift lower to new 2021 lows.
- USD net longs climbed to levels last seen around 3 years ago just past the 35K contracts, while the net position to open interest stayed near 55%. US yields advanced after the federal government extended the funding at least until early December while Fedspeak continued to support a November tapering announcement, all sponsoring a fresh YTD peak in the US Dollar Index (DXY) past the 94.50 level.
- In the safe haven galaxy, net shorts in CHF receded to 2-week lows and net shorts in JPY climbed to levels last seen in early May 2019. The Japanese yen accelerated its losses and pushed USD/JPY to new 2021 highs well past 113.00 the figure.
- Net longs in crude oil move higher to levels last seen in early August around 405K contracts. The continuation of the rally in crude oil prices remained propped up by the relentless energy crunch as well as the steady hand from the OPEC+ at its meeting on October 4.
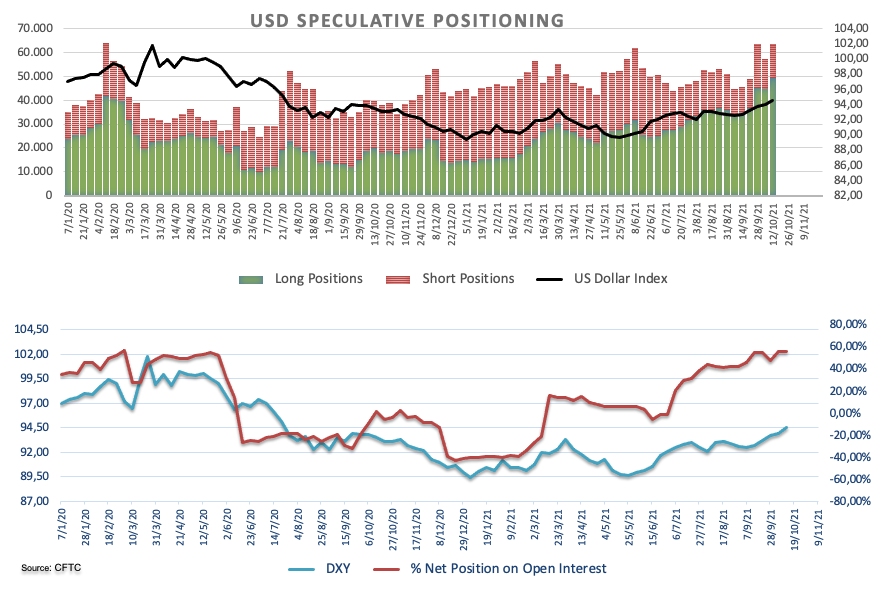
Japanese Prime Minister Fumio Kishida said in a statement on Monday, he has no plans to change the sales tax.
“Climate change is a big theme, but must maintain stability in energy prices and supply,” he added.
Market reaction
USD/JPY caught a fresh bid wave in sync with the Treasury yields, having tested the multi-year highs at 114.46 earlier this Monday.
The spit was last seen trading at 114.34, up 0.10% so far.
- GBP/JPY accumulates mild gains on Monday in the initial European session.
- Bulls fear the formation of a Doji candlestick near five-year highs.
- Momentum oscillators hold onto the overbought zone throw caution for aggressive bids.
The GBP/JPY cross-currency pair posts gains for the eight-straight session. The pair seems exhaustive near the five-year highs around 157.40. At the time of writing, GBP/JPY is trading at 157.04, up 0.02% for the day.
GBP/JPY daily chart
-637701273228640776.png)
On the daily chart, the GBP/JPY cross currency pair has risen sharply after breaking the strong long-time resistance barrier near the 152.90-153.00 zone, which coincides with the 21-day and the 50-day Simple Moving Average’s (SMA) confluence. The pair embarks above the 157.00 mark for the first time since 2016. Now, the upside seems exhaustive as the formation of a Doji candlestick suggests indecisiveness among traders.
If the price breaks the intraday’s low, it could fall back to the psychological 156.00 mark. Furthermore, the overbought Moving Average Convergence and Divergence (MACD) hints at more downside toward the 155.10 horizontal support level. The Relative Strength Index (RSI ) reads above 70, which suggests the stretched buying conditions. Next, the GBP/JPY bears could approach the 154.00 horizontal support level.
Alternatively, if the price continues to move higher, the bulls would first meet the previous day’s high of 157.41. A daily close above this level would open the gates for the June ,2016 high near 160.67.
GBP/JPY additional levels
New Zealand Prime Minister Jacinda Ardern announced on Monday, the lockdown in the country’s largest city of Auckland will be extended by two weeks.
Earlier on, the local media reported that the government is considering tightening restrictions in Auckland again, on the lines of a 'circuit breaker' lockdown.
This comes as the South Pacific Island nation reports a rise in the covid cases, with 2.5% of its population having managed to vaccinate in a single day.
Market reaction
NZD/USD is retreating on these headlines, as it trades at 0.7073, up 0.14% on the day, as of writing. The spot jumped to five-month highs of 0.7105 after NZ CPI upside surprise, which brought the RBNZ rate hike expectations back into play.
- EUR/USD starts the fresh trading week on a lower note.
- US Dollar Index regains 94.00 amid risk aversion, firmer yields
- Dovish ECB, Fed tapering, mixed Eurozone data back the euro underperformance.
The EUR/USD pair remains subdued in the Asian session on Monday. The pair opens up near 1.1600 but fails to preserve the upside momentum. At the time of writing, EUR/USD is trading at 1.1587, down 0.09%.
The greenback rises above 94.00, following the higher US 10-year benchmark Treasury yields. Higher inflation worries over rising energy prices and upbeat US Retail sales data puss bond yields on the higher side.
Investors are bracing up for the Fed’s tapering as soon as November whereas the European Central Bank (ECB) dovish stance weighs on the shared currency. The risk sentiment deteriorates following the disappointing Chinese GDP data. It is worth noting that, S&P 500 Futures are trading at 4,461, down 0.03% for the day.
The ECB President Christine Lagarde said that the central bank will continue to aid the eurozone economy as the fallout from the pandemic lingers, adding to her previous comments on the inflation as “ largely transitory”. In addition to that, ECB Governing Council member Klass Knot shrugged off the inflationary fear and the prospects of the near-term interest rate hike scenario.
On the economic data front, the \Eurozone Industrial Output declined by 1.6% in August, following a revised 1.4% growth in July.
As for now, traders are waiting for the US Industrial Production Data, US Fed’s Quarles Speech for fresh trading impetus.
EUR/USD technical levels
- A modest USD strength assisted USD/CAD to stage a modest bounce from over three-month lows.
- Hawkish Fed expectations elevated US bond yields, the cautious marked mood benefitted the USD.
- Bullish crude oil prices might underpin the loonie and keep a lid on any meaningful gains for the pair.
The USD/CAD pair bounced around 40 pips from the Asian session lows and was last seen hovering near the top end of its intraday trading range, around the 1.2385-90 region.
Having shown some resilience below mid-1.2300s, the USD/CAD pair attracted some buying on the first day of a new week and for now, seems to have snapped four successive days of the losing streak. The uptick allowed the pair to move away from over three-month lows touched on Friday and was sponsored by a modest US dollar strength.
The USD drew some support from elevated US Treasury bond yields, which remained well supported by the prospects for an early policy tightening by the Fed. The market expectations were reaffirmed by Friday's upbeat US monthly Retail Sales figures, while unexpectedly rose 0.7% in September as against a 0.2% decline anticipated.
The markets also seem to have started pricing in the possibility of an interest rate hike in 2022 amid worries that the recent widespread rally in commodity prices will stoke inflation. Apart from this, the prevalent cautious mood around the equity markets was seen as another factor that benefitted the greenback's safe-haven status.
Against the backdrop of fears about a faster than expected rise in inflation, a sharp deceleration in the Chinese economic growth fueled concerns about the return of stagflation. In fact, the world's second-largest economy recorded a modest 0.2% growth during the third quarter and the yearly rate fell to 4.9% from 7.9% previous.
This, in turn, kept a lid on the optimism and dented investors' appetite for perceived riskier assets. That said, an extension of the recent bullish run in crude oil prices to fresh multi-year tops might continue to underpin the commodity-linked loonie. This, in turn, should keep a lid on any strong gains for the USD/CAD pair.
Market participants now look forward to the release of US Industrial Production data for some impetus later during the early North American session. This, along with US bond yields, might influence the greenback. Traders will further take cues from oil price dynamics for some short-term opportunities around the USD/CAD pair.
Technical levels to watch
The Reserve Bank of New Zealand (RBNZ) released its Sectoral Factor Model Inflation gauge for the third quarter of 2021 after the publication of the official consumer price index (CPI) by the NZ Stats early Monday.
The gauge accelerated 2.7% QoQ in Q3 vs. 2.2% prior.
The inflation measures are closely watched by the RBNZ, which has a monetary policy goal of achieving 1% to 3% inflation.
FX Implications
The Kiwi dollar consolidates on the RBNZ’s inflation gauge, as NZD/USD hovers below 0.7100. The spot is currently trading at 0.7084, higher by 0.24% on the day.
About the RBNZ Sectoral Factor Model Inflation
The Reserve Bank of New Zealand has a set of models that produce core inflation estimates. The sectoral factor model estimates a measure of core inflation based on co-movements - the extent to which individual price series move together. It takes a sectoral approach, estimating core inflation based on two sets of prices: prices of tradable items, which are those either imported or exposed to international competition, and prices of non-tradable items, which are those produced domestically and not facing competition from imports.
- NZD/USD struggled to capitalize on the post-NZ GDP gains to over one month tops.
- Overbought RSI on 4-hourly charts seemed to be the only factor that capped gains.
- A sustained strength beyond the 0.7100 mark is needed to confirm a bullish bias.
The NZD/USD pair surrendered a major part of its upbeat NZ GDP-led gains to one-month tops and was last seen trading in the neutral territory, around the 0.7075-80 region.
A cautious mood around the equity markets was seen as a key factor that acted as a headwind for the perceived riskier kiwi amid a subdued US dollar price action. This, along with disappointing Chinese macro data, weighed on antipodean currencies and contributed to the intraday decline.
From a technical perspective, the uptick faltered near a resistance marked by a descending trend-line extending from YTD tops touched in February. The mentioned barrier coincides with the very important 200-day SMA, around the 0.7100 mark and should act as a pivotal point for short-term traders.
Meanwhile, technical indicators on the daily chart are holding comfortably in the bullish territory and support prospects for an extension of last week's strong move up. That said, slightly overbought RSI on hourly charts seemed to be the only factor that prompted some profit-taking.
Nevertheless, the near-term bias remains tilted in favour of bullish traders. Hence, any meaningful pullback might be seen as a buying opportunity. This should help limit the downside near 100-day SMA, around the 0.7020-15 area, which is followed by 50-day SMA near the 0.7000 psychological mark.
That said, bulls are likely to wait for a sustained strength beyond the 0.7100 confluence hurdle before placing aggressive bets. The NZD/USD pair might then climb to September monthly swing highs, around the 0.7155-60 region, before aiming to reclaim the 0.7200 round-figure mark.
NZD/USD daily chart
-637701217372653760.png)
Technical levels to watch
| Raw materials | Closed | Change, % |
|---|---|---|
| Brent | 84.8 | 0.43 |
| Silver | 23.297 | -0.89 |
| Gold | 1767.178 | -1.6 |
| Palladium | 2060.1 | -3.24 |
- USD/INR bulls are tiring following the recent daily bullish impulse.
- The supply area achieved is critical and bulls need to move higher from here for a break of the upside.
USD/INR is consolidating the recent move to the upside and the subsequent correction in critical daily support as follows:
USD/INR daily chart
-637701201381854707.png)
The price of USD/INR met the daily support zone and is now in the process of consolidation at a critical juncture. If the price fails to move higher from here, there is an argument for a long term consolidation with 74.50 eyed as a downside target.
Following the release of the September activity numbers, China’s National Bureau of Statistics (NBS) released a statement, via Reuters, expressing their take on the economy.
China's economy maintained recovery trend in Jan-Sept.
China's economy faces rising international uncertainties, recovery still not solid, not balanced.
Will keep economic operations within reasonable range, will achieve full-year targets.
-
AUD/USD remains confined in a range, around mid-0.7400s post-Chinese macro data
- AUD/USD witnessed a subdued/range-bound price action on the first day of the week.
- A cautious mood in the equity markets acted as a headwind for the perceived riskier aussie.
- Mostly disappointing Chinese macro data did little to impress bulls or provide any impetus.
The AUD/USD pair extended its sideways consolidative price action and remained confined in a narrow trading band, around the 0.7400 mark post-Chinese data dump.
The pair struggled to capitalize on its early uptick back closer to over one-month tops touched on Friday and witnessed a modest pullback from the 0.7435 region on the first day of a new week. The prevalent cautious mood around the equity markets was seen as a key factor that acted as a headwind for the perceived riskier aussie amid a subdued US dollar price action.
This, along with weaker than expected Chinese macro releases, collaborated to cap the upside for the China-proxy Australian dollar. The National Bureau of Statistics of China reported this Monday that the economic growth in the world's second-largest economy decelerated to 0.2% and 4.9% YoY rate during the third quarter, as against the previous quarter's 1.3% and 7.9%, respectively.
Adding to this, China's Industrial Production also fell short of market expectations and increased by a 3.1% YoY rate in September, down from 5.3%. This, to a larger extent, offset a better than expected monthly Retail Sales figures, which recorded a growth of 4.4% in September. This comes amid fears of a faster than expected rise in inflation and added to worries about stagflation.
That said, the market reaction, so far, has been limited and warrants some caution for aggressive traders. The recent widespread rally in commodity prices turned out to be a key factor that continued lending some support to the resources-linked aussie. Hence, it will be prudent to wait for a strong follow-through selling before confirming that the AUD/USD pair has topped out in the near term.
Technical levels to watch
China's annualized GDP figures for the third quarter of 2021 arrived at 4.9% vs. 5.2% expected and 7.9% previous, with the QoQ reading coming in at 0.2% vs. 0.5% expected and 1.3% last.
With regard to Retail Sales YoY, the number was 4.4% vs. 3.3% exp and 2.5% previous while Industrial Output YoY came in at 3.1% and 4.5% exp and 5.3% prior.
Meanwhile, the Fixed Asset Investment YoY stood at 7.3% vs 7.9% expected and 8.9% last.
Additional details
China Jan-Sept GDP +9.8% YoY.
China Sept power generation up 4.9% y/y at 675.1 bln KWH.
Market reaction
The mixed data had a limited impact on the Australian Dollar, with the AUD/USD pair keeping its recovery mode intact from daily lows of 0.7409
The spot was last seen trading at 0.7418, still down 0.07% on the day.
Analysts at Goldman Sachs predict that China’s central bank will refrain from cutting the Reserve Ratio Requirement (RRR) this year.
Key quotes
“Instead, the People's Bank of China might rely on: Open market operations, its medium-term lending facility and targeted tools to keep liquidity supply and demand relatively stable.”
“Amid tight regulations on property financing, shadow banking, and local government borrowing, as well as increased supervision on anti-corruption, credit demand has remained soft.”
-
USD/CNY fix: 6.4300 vs the estimated 6.4295
- Western Texas Intermediate (WTI ) starts the new trading session with stronger gains.
- Crude oil approaches a new 7-year high near $83.00 amid a shortage of gas and coal.
- OPEC launches price war against US shale producers.
Western Texas Intermediate (WTI) is scaling higher in the Asian session on Monday. The supply crunch and global demand upsurge boost the demand for black gold. At the time of writing, WTI is trading at $82.60, up 0.83% for the day.
Crude oil prices hit a fresh seven-year high as shortages of natural gas in Europe and Asia continue to boost demand for oil amid supply-side bottlenecks.
According to the International Energy Agency (IEA), the energy crunch is expected to uplift oil demand by 500,000 barrels per day (bpd). This, in turn, will results in a supply gap of around 700,000 bpd through the end of the year.
In addition to that, the Organization of the Petroleum Exporting Countries (OPEC) begins a price war against the US shale producers. Furthermore, the demand has picked up with the recovery from the COVID-19 pandemic amid the easing of coronavirus-related travel restrictions.
As for now, the US dollar dynamics and the demand-supply constraint continue to influence WTI prices.
WTI additional levels
The main event of the session is due at the top of the hour with the Chinese data dump that will include Gross Domestic Product readings for the third quarter. With the nation's property sector and energy crisis, the economy is under scrutiny for fears of global contagion. This makes the reading an important one for forex today, specifically, the Australian dollar which has enjoyed a surge in Aussie yields at the start of the week following the New Zealand Consumer Price Index upside surprise.
GDP is expected to only edge 0.4% higher, seeing the annual rate drop sharply from 7.9% in Q2 to around 5.0%. Analysts at Westpac explained that the underlying this result will be the proactive approach taken by authorities to stop delta’s spread within China, which hit consumption hard, and weaker momentum in construction and investment.
Meanwhile, in a note on Friday, analysts at TD Securities stressed that the ''supply constraints, extreme weather, regulatory measures, and environmental policies likely led to a further slowing in manufacturing activity in Sep.''
Also out today is September data for Retail Sales (f/c 3.5%yr), Industrial Production (f/c 3.8%yr) and fixed asset investment. ''Retail spending is likely to fare better given the rebound in the services PMI, as activity restrictions were lifted in many provinces and domestic tourism picked up. However, a high base last year will limit gains,'' analysts at TD Securities argued.
How might the data affect AUD/USD?
AUD is a trade-off between external factors for the near-term directly impacting the economic landscape for the now and medium-term and risk-sentiment on the flipside. Risk sentiment, when elevated, such as what we saw on Friday, owing to US Retail Sales and strong earnings results, is supportive of the Aussie.
With that being said, Australia stands to lose a great deal in the face of a Chinese economic collapse as its main source of export income. Data today will reflect the state of the Chinese economy vs projections that have been dialled back in recent weeks owing to the Evergrande Gray Rhino event that has sent shivers down the spine of the financial markets.
In technical analysis, we are seeing hidden bearish divergence again from a daily perspective as follows:
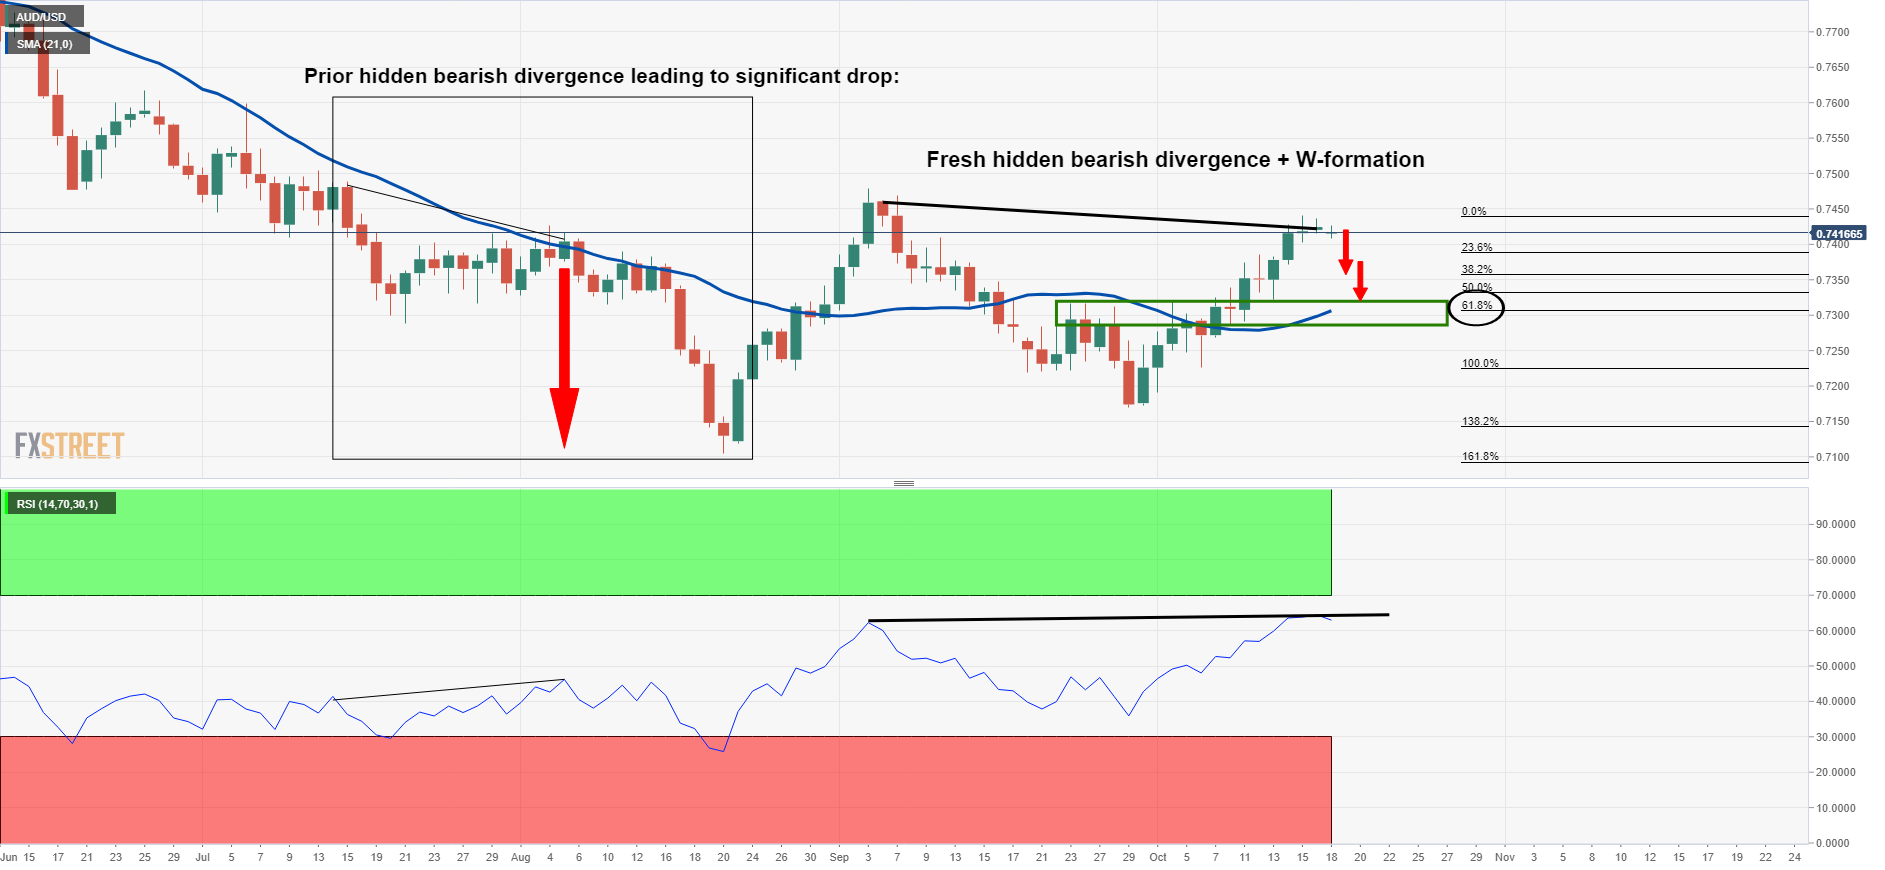
Should the Chinese data really disappoint, there is a probability that it will be the catalyst to send the Aussie lower on its way towards a test of the W-formation's neckline for the days ahead. There is a confluence of the W-formation, as a reversion pattern and bearish, the 61.8% golden ratio target that meets the 21-day moving average at the neckline near 0.73 the figure.
For the very near term, 0.7390 will be eyed on a poor outcome from an hourly basis:
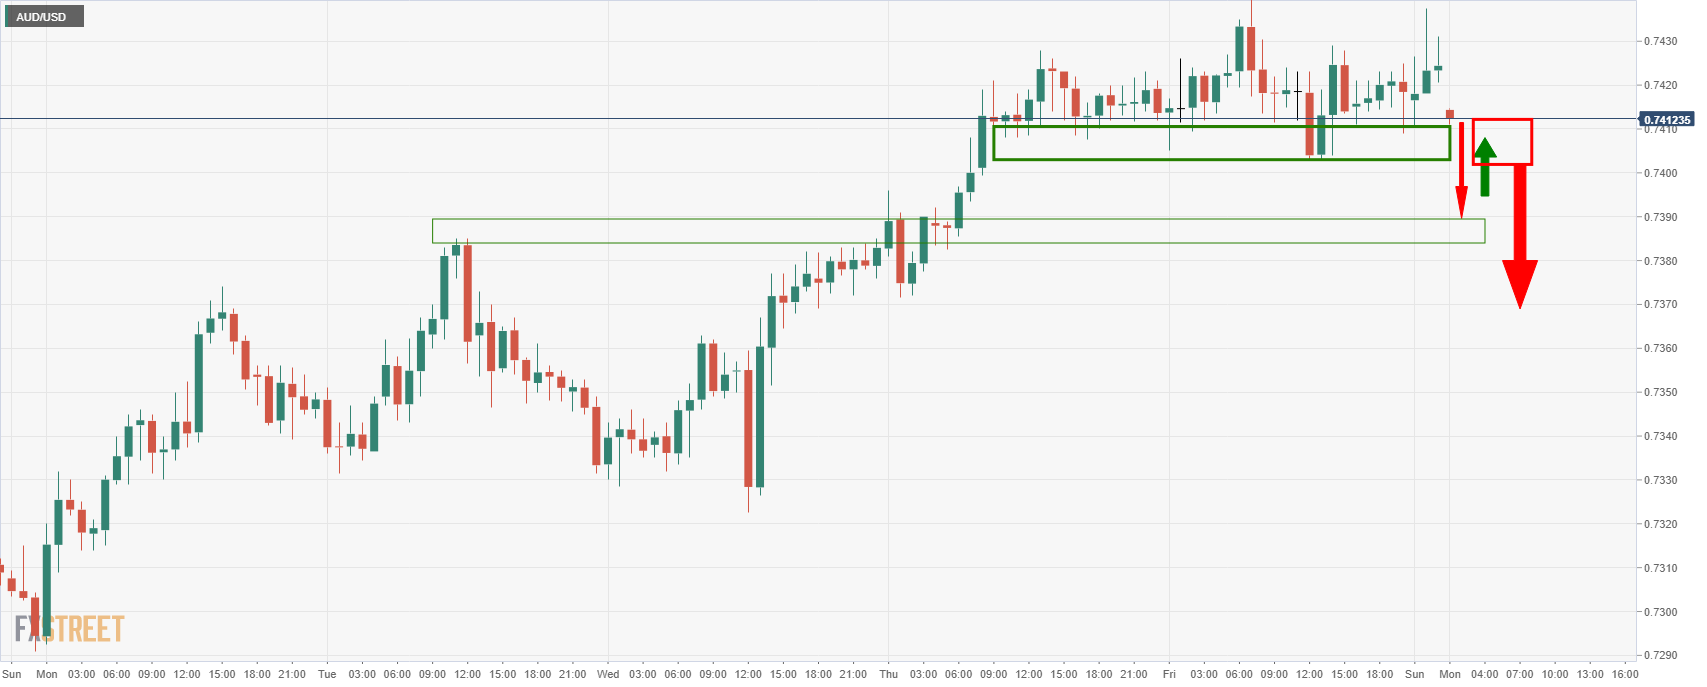
If the data surprises on the upside, then the recent spike in Aussie yields should help to elevate the currency higher towards 0.7480 and the daily highs of August.
About GDP
The Gross Domestic Product (GDP) released by the National Bureau of Statistics of China studies the gross value of all goods and services produced by China. The indicator presents the pace at which the Chinese economy is growing or decreasing.
As the Chinese economy has an influence on the global economy, this economic event would have an impact on the Forex market. Generally speaking, a high reading is seen as positive (or bullish) for the CNY, while a low reading is seen as negative (or Bearish).
In recent trade today, the People’s Bank of China (PBOC) set the yuan (CNY) at 6.4300 vs the estimated 6.4295 and prior 6.4386.
About the fix
China maintains strict control of the yuan’s rate on the mainland.
The onshore yuan (CNY) differs from the offshore one (CNH) in trading restrictions, this last one is not as tightly controlled.
Each morning, the People’s Bank of China (PBOC) sets a so-called daily midpoint fix, based on the yuan’s previous day closing level and quotations taken from the inter-bank dealer.
- Gold is firming at a critical level of support on the daily chart.
- Stagflation risks are being weighed as a driver for gold.
- Oil prices are parabolic and supply chain disruption supports the bullish outlook for gold.
The price of gold on Friday plummetted following signs that the US economy may not be declining at a rate that could spark stagflation in 2022. Data at the end of the week was surprisingly strong in US Retail Sales which, coupled with strong earnings on Wall Street, pressured the remaining bulls on the day to cash in and step aside. XAU/USD fell from a high of $1,796.49 to a low of $1,764.86 on Friday.
At the open of the week, the price is 0.14% higher as bulls look to protect a strategic layer of support, as illustrated below, and trades near $1,770. The high of the day so far has been $1,772 and the lows were $1,764.
The week ahead will have plenty of Federal Reserve speakers, and the Fed’s Beige Book could give further insight into the breadth and depth of bottlenecks facing US industry. Depending on the Fed's rhetoric, gold prices will likely be caught in conflicting sentiment with regards to inflation, stagflation, timings for tapering and final liftoff.
Oil risks are higher still
In this regard, the oil price will be closely monitored which has been at the crux of the recent concerns for stagflation:
-637701131428474499.png)
In the above monthly chart of the world's benchmark for oil prices, Brent, the price is moving parabolic and towards the 2018 highs. They temporarily broke through $85/bbl as the global energy crisis escalates and this spells stagflation risk to the gold markets.
''A tight supply-demand outlook that is particularly fueling upside momentum in Brent crude and heating oil, which can be exacerbated by up to 1 million bpd of incremental winter demand due to natural gas switching for crude and fuel oils,'' analysts at TD Securities explained.
Meanwhile, looking at positioning data, the analysts also noted that ''speculators continued to increase exposure to WTI crude, adding longs and cutting shorts as the ongoing energy crisis remains a substantial risk. With supply risks remaining extremely elevated, OPEC did not offer much to cool the price action.''
''Two-way risks remain elevated,'' the analysts said, ''but the right tail remains the fattest suggesting speculators will be happy to hold on to length in the short-term.''
Arguments against stagflation risks
For the week ahead, it will really be a matter of what side of the argument the markets want to fall on. There are plenty of arguments against stagflation risks brewing just as fast as the arguments for it have risen in recent weeks. For one, analysts at ANZ bank argued that ''activity and price data for September out last week ran counter to the stagflation narrative – there was broad-based strength in retail sales while a range of inflation measures, though still elevated, came in softer than expected.''
Additionally, the analysts noted that ''the Atlanta Fed Wage Growth Tracker, a measure we follow closely, jumped to 4.2% y/y in September up from 3% in May. The increase is largely owing to a sharp rise in wages for low-skilled workers in leisure and hospitality.''
Moreover, the analysts explained that ''President Biden is working with ports on the west coast to ease backlogs. In addition, a number of large logistic and retailing companies are set to expand the use of non-peak hours to ease supply-chain logjams.''
Gold technical analysis
For the latest in-depth technical analysis of gold, see here: Gold Chart of the Week: XAU hit the $1,800 target, now what?
However, at a snapshot, we are likely to see some consolidation to start the week off.
''As illustrated above, the price is testing not only dynamic support but horizontal also. This would be expected to hold initial tests and potentially lead to a restest of the prior day's lows of the Doji candle which has a confluence with the 61.8% Fibonacci retracement level near 1,786.''
''If gold does manage to break the dynamic trendline support, there is still going to be room into the 1,750s where price could find itself stuck in a range, aka, the ''barroom brawl''.
If, on the other hand, the price holds and moves up beyond 1,770 again, that would be bullish.''
| Time | Country | Event | Period | Previous value | Forecast |
|---|---|---|---|---|---|
| 02:00 (GMT) | China | Fixed Asset Investment | September | 8.9% | 7.9% |
| 02:00 (GMT) | China | Industrial Production y/y | September | 5.3% | 4.5% |
| 02:00 (GMT) | China | Retail Sales y/y | September | 2.5% | 3.3% |
| 02:00 (GMT) | China | GDP y/y | Quarter III | 7.9% | 5.2% |
| 12:15 (GMT) | Canada | Housing Starts | September | 260.2 | 255 |
| 12:30 (GMT) | Canada | Foreign Securities Purchases | August | 14.19 | |
| 13:15 (GMT) | U.S. | Capacity Utilization | September | 76.4% | 76.5% |
| 13:15 (GMT) | U.S. | Industrial Production YoY | September | 5.9% | |
| 13:15 (GMT) | U.S. | Industrial Production (MoM) | September | 0.4% | 0.2% |
| 14:00 (GMT) | U.S. | NAHB Housing Market Index | October | 76 | 76 |
| 14:30 (GMT) | Canada | Bank of Canada Business Outlook Survey | |||
| 18:00 (GMT) | U.S. | Federal budget | September | -171 | |
| 20:00 (GMT) | U.S. | Net Long-term TIC Flows | August | 2 | |
| 20:00 (GMT) | U.S. | Total Net TIC Flows | August | 126 |
| Pare | Closed | Change, % |
|---|---|---|
| AUDUSD | 0.74188 | 0.05 |
| EURJPY | 132.507 | 0.53 |
| EURUSD | 1.15976 | 0 |
| GBPJPY | 157.013 | 1.04 |
| GBPUSD | 1.37429 | 0.53 |
| NZDUSD | 0.70634 | 0.49 |
| USDCAD | 1.23599 | -0.06 |
| USDCHF | 0.92285 | -0.02 |
| USDJPY | 114.243 | 0.53 |
- EUR/USD remains muted in the early Asian session on Monday.
- The pair consolidates for the third-straight session.
- MACD trades in the oversold zone with the underlying bullish sentiment.
EUR/USD edges lower in a quiet session on Monday The pair confides in a narrow trade band with no meaningful traction. At the time of writing, EUR/USD is trading at 1.1599, down 0.02% for the day.
EUR/USD daily chart
-637701118605909126.png)
On the daily chart, the EUR/USD pair has started the October series on a lower note below 1.1600 while testing the yearly lows around 1.1524 on Tuesday. The spot already trades below the 21-day and the 50-day Simple Moving Average (SMA), indicating a downside risk.
Now, if the price crosses the 21-day SMA at 1.1618, it could register fresh daily gains. In doing so, the first upside target would be the 1.1650 horizontal resistance level followed by the high of September 29 at 1.1690. The Moving Average Convergence Divergence (MACD) indicator trades in the oversold zone, any uptick could mean the 1.1750 horizontal resistance zone for the EUR/USD bulls.
Alternatively, if the price breaks the session’s low, the EUR/USD bears would once again dominate the trend with their eyes on the 1.1555 horizontal support level. Next, the market participants would test Wednesday’’s low at 1.1528. A break below the mentioned level would open the gates for the lows last seen in 2018.
EUR/USD additional level


© 2000-2026. All rights reserved.
This site is managed by Teletrade D.J. LLC 2351 LLC 2022 (Euro House, Richmond Hill Road, Kingstown, VC0100, St. Vincent and the Grenadines).
The information on this website is for informational purposes only and does not constitute any investment advice.
The company does not serve or provide services to customers who are residents of the US, Canada, Iran, The Democratic People's Republic of Korea, Yemen and FATF blacklisted countries.
Making transactions on financial markets with marginal financial instruments opens up wide possibilities and allows investors who are willing to take risks to earn high profits, carrying a potentially high risk of losses at the same time. Therefore you should responsibly approach the issue of choosing the appropriate investment strategy, taking the available resources into account, before starting trading.
Use of the information: full or partial use of materials from this website must always be referenced to TeleTrade as the source of information. Use of the materials on the Internet must be accompanied by a hyperlink to teletrade.org. Automatic import of materials and information from this website is prohibited.
Please contact our PR department if you have any questions or need assistance at pr@teletrade.global.
transfers