- Analytics
- News and Tools
- Market News
CFD Markets News and Forecasts — 18-09-2024
According to the Bank of Canada's (BoC) minutes from a recent meeting that was released Wednesday, some governing council members were more concerned about downside risks to inflation.
Key quotes
- Some Governing Council members were more concerned about downside risks to inflation.
- Concern about downside risks was linked to the potential further weakening of the economy and labor market.
- Other members took the view that risks to the inflation outlook were balanced.
- Members discussed whether weakness in Canadian consumption and housing could partly be due to caution on the part of households.
- Members felt consumers could be waiting for lower rates to make large purchases or enter the housing market.
- Discussed scenario where the economy could weaken and it might be appropriate to speed the pace of cuts.
- Labor market softening, wage growth still elevated.
- Housing market subdued.
- No pre-determined path for rates, decisions to be made meeting-by-meeting.
- Council puzzled by successive upside surprises in US household spending.
- Felt low US saving rate was a possible indicator of weakness going forward.
- In China, continued weakness in domestic demand had increased the downside risk to the growth outlook.
- The Bank of Canada cut rates by 25 bps at the meeting.
- Macklem signalled a willingness to cut more-quickly after the decision.
Market reaction to the BoC Minutes
At the time of writing, USD/CAD was up 0.06% on the day at 1.3612.
Bank of Canada FAQs
The Bank of Canada (BoC), based in Ottawa, is the institution that sets interest rates and manages monetary policy for Canada. It does so at eight scheduled meetings a year and ad hoc emergency meetings that are held as required. The BoC primary mandate is to maintain price stability, which means keeping inflation at between 1-3%. Its main tool for achieving this is by raising or lowering interest rates. Relatively high interest rates will usually result in a stronger Canadian Dollar (CAD) and vice versa. Other tools used include quantitative easing and tightening.
In extreme situations, the Bank of Canada can enact a policy tool called Quantitative Easing. QE is the process by which the BoC prints Canadian Dollars for the purpose of buying assets – usually government or corporate bonds – from financial institutions. QE usually results in a weaker CAD. QE is a last resort when simply lowering interest rates is unlikely to achieve the objective of price stability. The Bank of Canada used the measure during the Great Financial Crisis of 2009-11 when credit froze after banks lost faith in each other’s ability to repay debts.
Quantitative tightening (QT) is the reverse of QE. It is undertaken after QE when an economic recovery is underway and inflation starts rising. Whilst in QE the Bank of Canada purchases government and corporate bonds from financial institutions to provide them with liquidity, in QT the BoC stops buying more assets, and stops reinvesting the principal maturing on the bonds it already holds. It is usually positive (or bullish) for the Canadian Dollar.
- USD/CAD trades in positive territory near 1.3605 in Thursday’s early Asian session.
- The Fed lowered its benchmark interest rate by a half percentage point at its September meeting on Wednesday.
- Both faster rate cuts and slower cuts are on the table, noted the BoC deliberations.
The USD/CAD pair posts modest gains around 1.3605 during the early Asian session on Thursday. Traders continue to assess the Federal Reserve’s (Fed) 50 basis points (bps) interest rate cut in quite a volatile session on Wednesday. Investors will keep an eye on the US weekly Initial Jobless Claims, the Philly Fed Manufacturing Index and Existing Home Sales, which are due later in the day.
The Federal Open Market Committee (FOMC) decided to lower the federal funds rate to a range of 4.75% to 5%, the Fed’s first rate cut in more than four years. Fed Chair Jerome Powell said in a press conference following the monetary policy meeting, “This decision reflects our growing confidence that with an appropriate recalibration of our policy stance, strength in the labor market can be maintained in a context of moderate growth and inflation moving sustainably down to 2%.”
The US Dollar (USD) initially edged lower after the Fed decision, but pared losses after Chair Jerome Powell finished his press conference. Furthermore, Fed policymakers revised their quarterly economic forecasts, raising the median projection for unemployment by the end of 2024 to 4.4% from the 4% projection in June. Officials again raised their projection for the long-run federal funds rate to 2.9% from 2.8%.
According to a summary of its deliberations, the Bank of Canada (BoC) is carefully assessing both upside and negative risks to the economy in order to determine the pace of interest rate reduction. The deliberations that led to the BoC's September rate cut came several weeks before Tuesday’s inflation data, which showed that the Canadian Consumer Price Index (CPI) rose at an annualised rate of under 2% in August, meeting the central bank target.
Money markets see almost 46% odds of a 50 bps rate cut in October. Softer inflation and rising speculation of additional rate cuts by the BoC are likely to weigh on the Canadian Dollar (CAD) and support the USD/CAD pair in the near term.
Canadian Dollar FAQs
The key factors driving the Canadian Dollar (CAD) are the level of interest rates set by the Bank of Canada (BoC), the price of Oil, Canada’s largest export, the health of its economy, inflation and the Trade Balance, which is the difference between the value of Canada’s exports versus its imports. Other factors include market sentiment – whether investors are taking on more risky assets (risk-on) or seeking safe-havens (risk-off) – with risk-on being CAD-positive. As its largest trading partner, the health of the US economy is also a key factor influencing the Canadian Dollar.
The Bank of Canada (BoC) has a significant influence on the Canadian Dollar by setting the level of interest rates that banks can lend to one another. This influences the level of interest rates for everyone. The main goal of the BoC is to maintain inflation at 1-3% by adjusting interest rates up or down. Relatively higher interest rates tend to be positive for the CAD. The Bank of Canada can also use quantitative easing and tightening to influence credit conditions, with the former CAD-negative and the latter CAD-positive.
The price of Oil is a key factor impacting the value of the Canadian Dollar. Petroleum is Canada’s biggest export, so Oil price tends to have an immediate impact on the CAD value. Generally, if Oil price rises CAD also goes up, as aggregate demand for the currency increases. The opposite is the case if the price of Oil falls. Higher Oil prices also tend to result in a greater likelihood of a positive Trade Balance, which is also supportive of the CAD.
While inflation had always traditionally been thought of as a negative factor for a currency since it lowers the value of money, the opposite has actually been the case in modern times with the relaxation of cross-border capital controls. Higher inflation tends to lead central banks to put up interest rates which attracts more capital inflows from global investors seeking a lucrative place to keep their money. This increases demand for the local currency, which in Canada’s case is the Canadian Dollar.
Macroeconomic data releases gauge the health of the economy and can have an impact on the Canadian Dollar. Indicators such as GDP, Manufacturing and Services PMIs, employment, and consumer sentiment surveys can all influence the direction of the CAD. A strong economy is good for the Canadian Dollar. Not only does it attract more foreign investment but it may encourage the Bank of Canada to put up interest rates, leading to a stronger currency. If economic data is weak, however, the CAD is likely to fall.
New Zealand's Gross Domestic Product (GDP) growth in the second quarter contracted by 0.2% QoQ, falling back from the previous quarter's revised 0.1% (from 0.2%), but still held above the median market forecast of -0.4%.
YoY NZ GDP growth fell by a steeper 0.5% on an annualized basis, matching forecasts and reversing the previous period's 0.5% uptick, which was also revised slightly higher from the initial print of 0.3%.
According to Stats NZ, near-term declines in NZ GDP growth were driven primarily in spending declines in retail trade and accomodation, specifically motor vehicles and food services. Forestry and logging also saw declines in growth, as did materials wholesaling.
Economic Indicator
Gross Domestic Product (QoQ)
The Gross Domestic Product (GDP), released by Statistics New Zealand on a quarterly basis, is a measure of the total value of all goods and services produced in New Zealand during a given period. The GDP is considered as the main measure of New Zealand’s economic activity. The QoQ reading compares economic activity in the reference quarter to the previous quarter. Generally, a high reading is seen as bullish for the New Zealand Dollar (NZD), while a low reading is seen as bearish.
Read more.Last release: Wed Sep 18, 2024 22:45
Frequency: Quarterly
Actual: -0.2%
Consensus: -0.4%
Previous: 0.2%
Source: Stats NZ
The Gross Domestic Product (GDP), released by Statistics New Zealand, highlights the overall economic performance on a quarterly basis. The gauge has a significant influence on the Reserve Bank of New Zealand’s (RBNZ) monetary policy decision, in turn affecting the New Zealand dollar. A rise in the GDP rate signifies improvement in the economic conditions, which calls for tighter monetary policy, while a drop suggests deterioration in the activity. An above-forecast GDP reading is seen as NZD bullish.
New Zealand Dollar FAQs
The New Zealand Dollar (NZD), also known as the Kiwi, is a well-known traded currency among investors. Its value is broadly determined by the health of the New Zealand economy and the country’s central bank policy. Still, there are some unique particularities that also can make NZD move. The performance of the Chinese economy tends to move the Kiwi because China is New Zealand’s biggest trading partner. Bad news for the Chinese economy likely means less New Zealand exports to the country, hitting the economy and thus its currency. Another factor moving NZD is dairy prices as the dairy industry is New Zealand’s main export. High dairy prices boost export income, contributing positively to the economy and thus to the NZD.
The Reserve Bank of New Zealand (RBNZ) aims to achieve and maintain an inflation rate between 1% and 3% over the medium term, with a focus to keep it near the 2% mid-point. To this end, the bank sets an appropriate level of interest rates. When inflation is too high, the RBNZ will increase interest rates to cool the economy, but the move will also make bond yields higher, increasing investors’ appeal to invest in the country and thus boosting NZD. On the contrary, lower interest rates tend to weaken NZD. The so-called rate differential, or how rates in New Zealand are or are expected to be compared to the ones set by the US Federal Reserve, can also play a key role in moving the NZD/USD pair.
Macroeconomic data releases in New Zealand are key to assess the state of the economy and can impact the New Zealand Dollar’s (NZD) valuation. A strong economy, based on high economic growth, low unemployment and high confidence is good for NZD. High economic growth attracts foreign investment and may encourage the Reserve Bank of New Zealand to increase interest rates, if this economic strength comes together with elevated inflation. Conversely, if economic data is weak, NZD is likely to depreciate.
The New Zealand Dollar (NZD) tends to strengthen during risk-on periods, or when investors perceive that broader market risks are low and are optimistic about growth. This tends to lead to a more favorable outlook for commodities and so-called ‘commodity currencies’ such as the Kiwi. Conversely, NZD tends to weaken at times of market turbulence or economic uncertainty as investors tend to sell higher-risk assets and flee to the more-stable safe havens.
- GBP/USD has a fresh 30-month high in the bag after Fed rate cut.
- BoE rate call is in the barrel for Thursday, but no moves are expected.
- UK Retail Sales set to wrap up the week on Friday.
GBP/USD hit a fresh 30-month high on Wednesday, pushed within inches of the 1.3300 handle after the US Federal Reserve (Fed) trimmed interest rates by a jumbo 50 bps and chalking in the US central bank’s first rate cut in over four years. The UK’s Bank of England (BoE) is set to deliver its own September rate call early Thursday, but no moves are expected from the BoE after already cutting reference rates earlier this summer.
Forex Today: Investors’ attention now shifts to the US economic health
The BoE is expected to hold interest rates steady at 5.0% in a seven-to-two vote. The BoE’s Monetary Policy Committee (MPC) previously voted five-to-four to reduce interest rates by 25 bps from 5.25%, and markets are expecting the BoE to hold steady for this meeting.
The Fed's dot plot of the Federal Open Market Committee's (FOMC) Summary of Economic Projections was also revised downward from the central bank's previous rate outlook. The median policy expectations from the Fed now see the Fed Funds rate at 4.4% by year-end 2024 and 3.4% by year-end 2025, down from 5.1% and 4.1%, respectively.
Going deeper into the Fed's notes, Fed policymakers now see US Gross Domestic Product (GDP) growth of 2.0% flat through 2024, down from the previous print of 2.1% in June. Fed officials also expected the US Unemployment Rate to settle around 4.4% by the end of 2024.
Fed Chair Jerome Powell did his best to soothe markets during his ensuing press conference following the Fed's bumper 50 bps rate trim, highlighting that the Fed will resume its wait-and-see approach to incoming economic data in the weeks to come before deciding on further rate cuts. The Fed head's measured approach to explaining the Fed's policy adjustment helped to keep market flows on-balance, and rate markets are pricing in 65% chance of no further action at the FOMC's next rate call on November 7.
GBP/USD price forecast
Despite rallying into a fresh 30-month high near 1.3300 on Wednesday, markets quickly pared back the day’s volatility to keep Cable pinned near familiar levels around the 1.3200 handle. A firm bullish trend is still baked into daily candlesticks with the pair climbing above the 50–day Exponential Moving Average (EMA) near 1.3000.
GBP/USD daily chart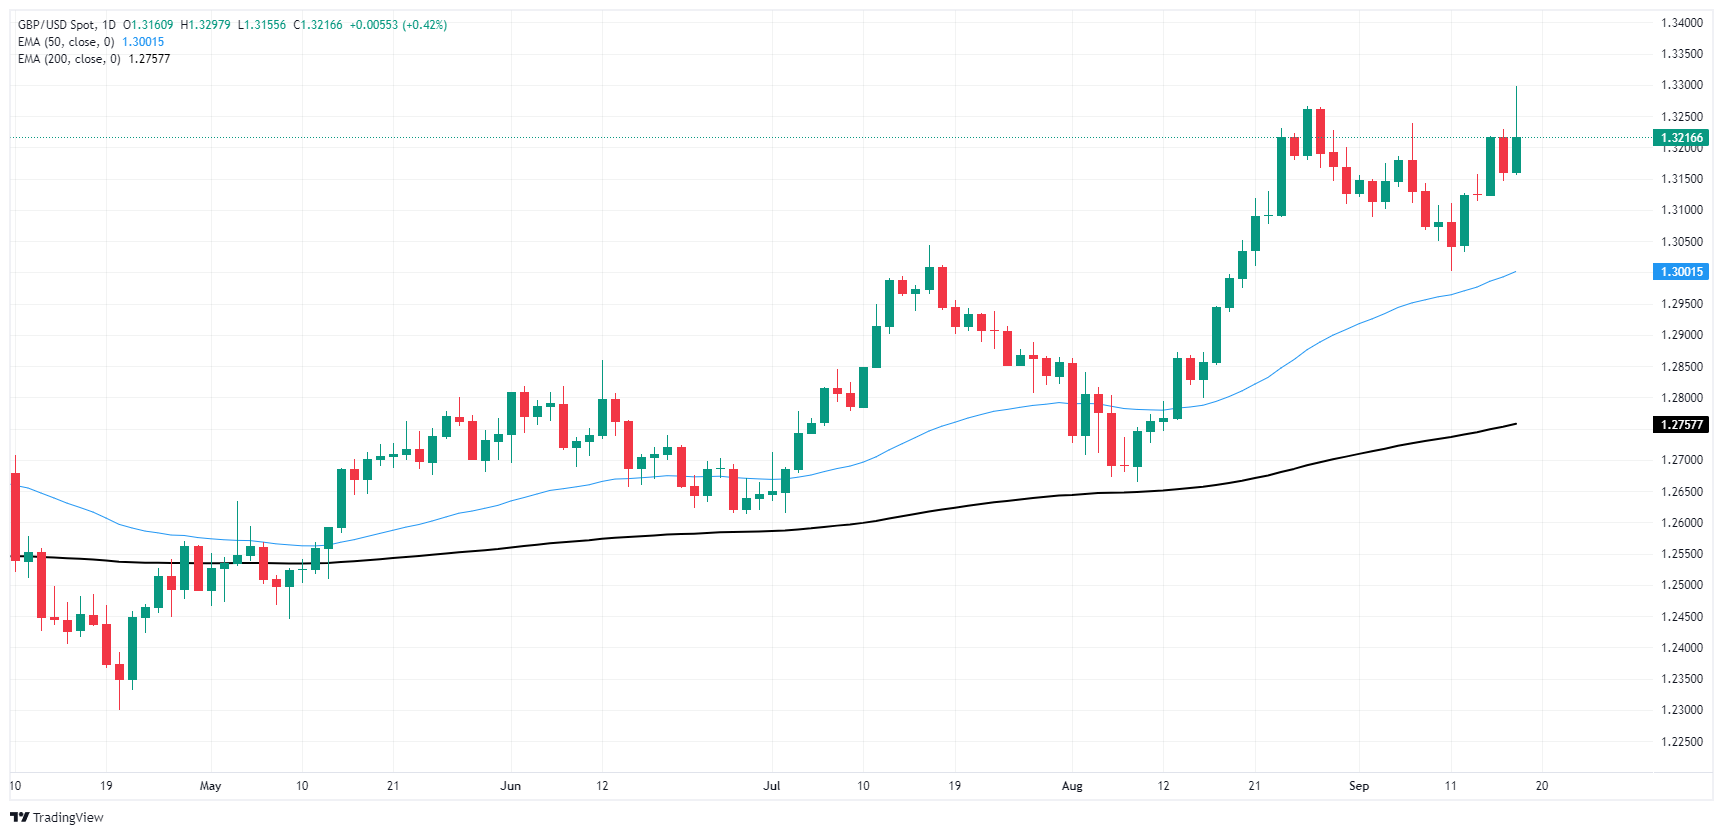
Pound Sterling FAQs
The Pound Sterling (GBP) is the oldest currency in the world (886 AD) and the official currency of the United Kingdom. It is the fourth most traded unit for foreign exchange (FX) in the world, accounting for 12% of all transactions, averaging $630 billion a day, according to 2022 data. Its key trading pairs are GBP/USD, aka ‘Cable’, which accounts for 11% of FX, GBP/JPY, or the ‘Dragon’ as it is known by traders (3%), and EUR/GBP (2%). The Pound Sterling is issued by the Bank of England (BoE).
The single most important factor influencing the value of the Pound Sterling is monetary policy decided by the Bank of England. The BoE bases its decisions on whether it has achieved its primary goal of “price stability” – a steady inflation rate of around 2%. Its primary tool for achieving this is the adjustment of interest rates. When inflation is too high, the BoE will try to rein it in by raising interest rates, making it more expensive for people and businesses to access credit. This is generally positive for GBP, as higher interest rates make the UK a more attractive place for global investors to park their money. When inflation falls too low it is a sign economic growth is slowing. In this scenario, the BoE will consider lowering interest rates to cheapen credit so businesses will borrow more to invest in growth-generating projects.
Data releases gauge the health of the economy and can impact the value of the Pound Sterling. Indicators such as GDP, Manufacturing and Services PMIs, and employment can all influence the direction of the GBP. A strong economy is good for Sterling. Not only does it attract more foreign investment but it may encourage the BoE to put up interest rates, which will directly strengthen GBP. Otherwise, if economic data is weak, the Pound Sterling is likely to fall.
Another significant data release for the Pound Sterling is the Trade Balance. This indicator measures the difference between what a country earns from its exports and what it spends on imports over a given period. If a country produces highly sought-after exports, its currency will benefit purely from the extra demand created from foreign buyers seeking to purchase these goods. Therefore, a positive net Trade Balance strengthens a currency and vice versa for a negative balance.
- The NZD/JPY pair is on a three-day winning streak, with Wednesday's session adding to those gains, rising to 88.25.
- RSI is still negative but shows a rising slope, indicating recovering buying pressure.
- Decreasing red bars in the MACD confirms that selling pressure is weakening.
In Wednesday's session, the NZD/JPY pair rose by to 88.25. Considering the fresh gains and the latest technical outlook, the possibility of a reversal of last week's losses is growing.
The Relative Strength Index (RSI) is currently at 46, which is still in negative area. However, the slope of the RSI is sharply rising, indicating that buying pressure is recovering. The Moving Average Convergence Divergence (MACD) is also red, but the histogram is decreasing, suggesting that selling pressure is declining. With the cross accumulating gains and tallying a three-day winning streak the bulls are making an argument for a reversal.
NZD/JPY daily chart
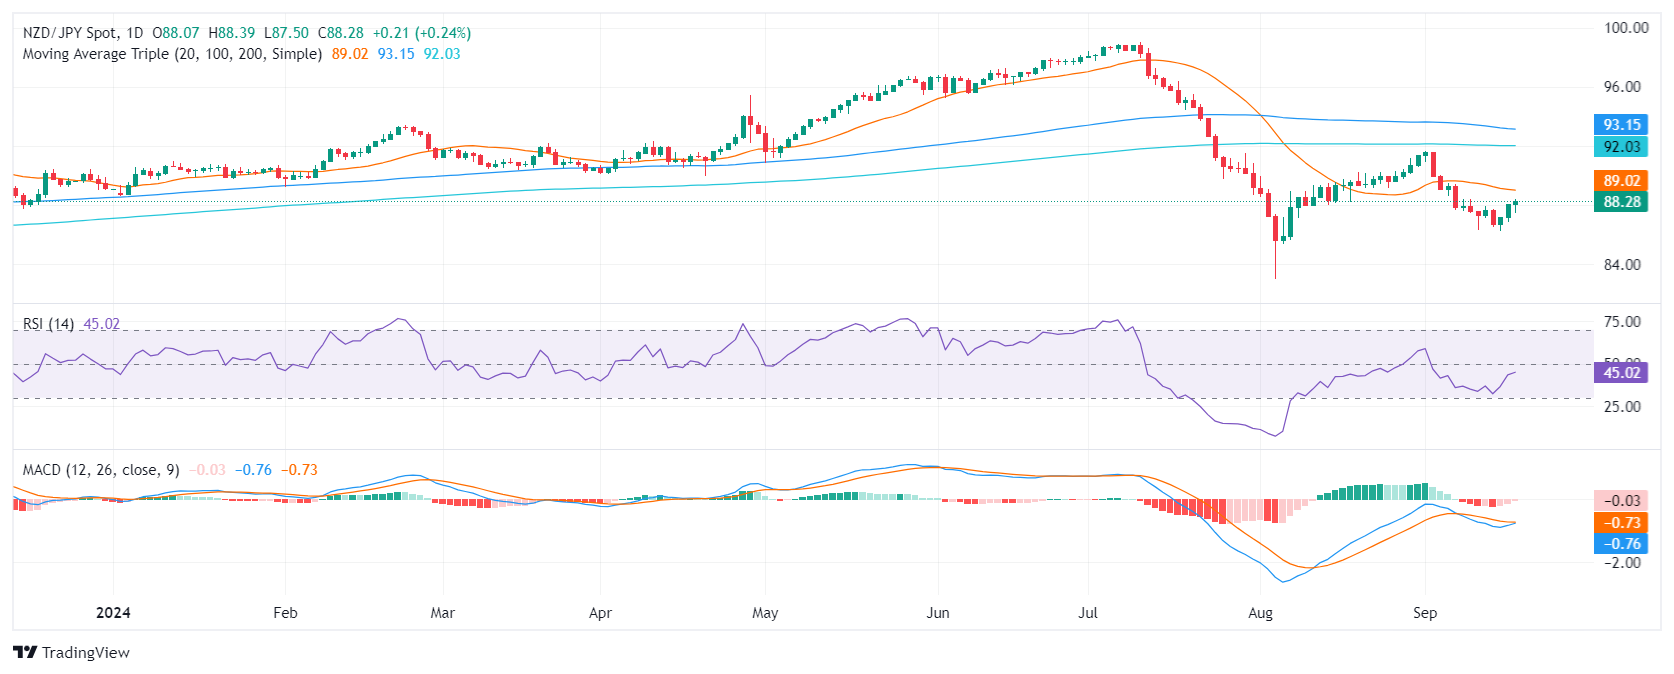
Key support levels are at 87.00, 86.50, and 86.00, while resistance points are at 88.00, 88.50, and 89.00 (20-day SMA). A break above the latter would confirm a recovery and further upside movements could be expected if the bulls complete it.
- The Australian Unemployment Rate is foreseen unchanged at 4.2% in August.
- Employment Change is expected at 25K, more than halving the 58.2K posted in July.
- AUD/USD stands below 0.6800, with a bullish bias in the Federal Reserve’s aftermath.
The Australian Bureau of Statistics (ABS) will release the monthly employment report at 1:30 GMT on Thursday. The country is expected to have added 25K new positions in August, while the Unemployment Rate is foreseen to remain steady at 4.2%. The Australian Dollar (AUD) heads into the event with a firmer tone against its United States (US) rival, with AUD/USD hovering around the 06770 level.
The ABS reports Employment Change separating full-time from part-time positions. According to its own definitions, full-time jobs imply working 38 hours per week or more and usually include additional benefits, but they mostly represent consistent income. On the other hand, part-time employment generally means higher hourly rates but lacks consistency and benefits. That’s why full-time jobs have more weight than part-time ones when setting an AUD directional path.
Back in July, the monthly employment report showed that Australia managed to create 60.5K full-time jobs while losing 2.3K part-time positions, resulting in a net Employment Change of 58.2K. The Unemployment Rate, in the meantime, rose to 4.2% from 4.1% prior.
Australian Unemployment Rate seen stable, but high in August
As previously noted, financial markets anticipate the Unemployment Rate to be at 4.2%, unchanged on a monthly basis. Job creation is expected to continue, albeit at a slower pace.
The Australian Unemployment rate jumped to 4.2% in July, which seems good news from the Reserve Bank of Australia (RBA) as it’s a sign of a loosening labor market, which eventually will back up an interest rate cut.
The RBA has maintained the Official Cash Rate (OCR) at 4.35% since lifting it to such a level in November 2023, being among those central banks that show no interest in trimming interest rates.
And there is a good reason: The Australian inflation rate rose to 3.8% year-on-year (YoY) in the second quarter of the year, matching expectations yet higher than the 3.6% posted in Q1. It was the first acceleration in the annual Consumer Price Index (CPI) since 2022 amid higher inflation for both goods and services.
Indeed, growth remains sluggish in the country. According to the latest Gross Domestic Product (GDP) release, the economy grew a modest 1% YoY in the second quarter of the year. Taking the 2023-24 financial year as a whole, the economy expanded 1.5%, the weakest since the 1991-92 year, excluding the 0.3% contraction during the pandemic-disrupted year, the ABS stated.
Finally, it is worth noting that RBA Governor Michele Bullock said that market expectations for an interest rate cut “don’t align” with the Board’s thinking. Even further, Bullock noted she is doing her job, which is to tame inflation, suggesting policymakers are not putting economic performance above their mandate.
“If the economy evolves broadly as anticipated, the Board does not expect that it will be in a position to cut rates in the near term,” Bullock added.
When will the Australian employment report be released, and how could it affect AUD/USD?
The ABS will publish the August employment report early on Thursday. As previously stated, Australia is expected to have added 25K new job positions in the month, while the Unemployment Rate is foreseen at 4.2%. Finally, the Participation Rate is expected to hold at 67.1%.
The AUD/USD pair trades near the 0.6800 price zone ahead of the event and following the Federal Reserve’s (Fed) monetary policy decision. The US central bank went for an aggressive 50 basis points (bps) interest rate cut, with the overall decision being more dovish than anticipated. Financial markets welcomed the news and sold the Greenback, while stock markets rose, underpinning AUD/USD.
After the dust settled, stocks trimmed Fed-inspired gains and helped the US Dollar to recover against its major rivals. From a technical perspective, Valeria Bednarik, Chief Analyst at FXStreet, notes: “The AUD/USD pair is bullish and trades near its recent highs at 0.6823. The pair can reach the level on a better-than-anticipated August employment report. December high at 0.6870 is the next level to watch and a potential bullish target, although the figures really have to rock markets to spur such a rally.”
Bednarik adds: “AUD/USD will likely trade on mood. DIscouraging employment figures may have a negative effect on the AUD/USD pair. Support can be found in the 0.6740 region ahead of the 0.6700 threshold.”
Employment FAQs
Labor market conditions are a key element in assessing the health of an economy and thus a key driver for currency valuation. High employment, or low unemployment, has positive implications for consumer spending and economic growth, boosting the value of the local currency. Moreover, a very tight labor market – a situation in which there is a shortage of workers to fill open positions – can also have implications on inflation levels because low labor supply and high demand leads to higher wages.
The pace at which salaries are growing in an economy is key for policymakers. High wage growth means that households have more money to spend, usually leading to price increases in consumer goods. In contrast to more volatile sources of inflation such as energy prices, wage growth is seen as a key component of underlying and persisting inflation as salary increases are unlikely to be undone. Central banks around the world pay close attention to wage growth data when deciding on monetary policy.
The weight that each central bank assigns to labor market conditions depends on its objectives. Some central banks explicitly have mandates related to the labor market beyond controlling inflation levels. The US Federal Reserve (Fed), for example, has the dual mandate of promoting maximum employment and stable prices. Meanwhile, the European Central Bank’s (ECB) sole mandate is to keep inflation under control. Still, and despite whatever mandates they have, labor market conditions are an important factor for policymakers given their significance as a gauge of the health of the economy and their direct relationship to inflation.
RBA FAQs
The Reserve Bank of Australia (RBA) sets interest rates and manages monetary policy for Australia. Decisions are made by a board of governors at 11 meetings a year and ad hoc emergency meetings as required. The RBA’s primary mandate is to maintain price stability, which means an inflation rate of 2-3%, but also “..to contribute to the stability of the currency, full employment, and the economic prosperity and welfare of the Australian people.” Its main tool for achieving this is by raising or lowering interest rates. Relatively high interest rates will strengthen the Australian Dollar (AUD) and vice versa. Other RBA tools include quantitative easing and tightening.
While inflation had always traditionally been thought of as a negative factor for currencies since it lowers the value of money in general, the opposite has actually been the case in modern times with the relaxation of cross-border capital controls. Moderately higher inflation now tends to lead central banks to put up their interest rates, which in turn has the effect of attracting more capital inflows from global investors seeking a lucrative place to keep their money. This increases demand for the local currency, which in the case of Australia is the Aussie Dollar.
Macroeconomic data gauges the health of an economy and can have an impact on the value of its currency. Investors prefer to invest their capital in economies that are safe and growing rather than precarious and shrinking. Greater capital inflows increase the aggregate demand and value of the domestic currency. Classic indicators, such as GDP, Manufacturing and Services PMIs, employment, and consumer sentiment surveys can influence AUD. A strong economy may encourage the Reserve Bank of Australia to put up interest rates, also supporting AUD.
Quantitative Easing (QE) is a tool used in extreme situations when lowering interest rates is not enough to restore the flow of credit in the economy. QE is the process by which the Reserve Bank of Australia (RBA) prints Australian Dollars (AUD) for the purpose of buying assets – usually government or corporate bonds – from financial institutions, thereby providing them with much-needed liquidity. QE usually results in a weaker AUD.
Quantitative tightening (QT) is the reverse of QE. It is undertaken after QE when an economic recovery is underway and inflation starts rising. Whilst in QE the Reserve Bank of Australia (RBA) purchases government and corporate bonds from financial institutions to provide them with liquidity, in QT the RBA stops buying more assets, and stops reinvesting the principal maturing on the bonds it already holds. It would be positive (or bullish) for the Australian Dollar.
- USD/CHF recovers slightly post-Fed decision, yet buyers struggle to significantly elevate the rate.
- Fed enacts a 50 bps rate cut, forecasts a 4.4% federal funds rate by 2024, and maintains a data-driven policy stance.
- Jerome Powell notes reduced inflation risks, with flexibility for adjusting the pace of future rate cuts as necessary.
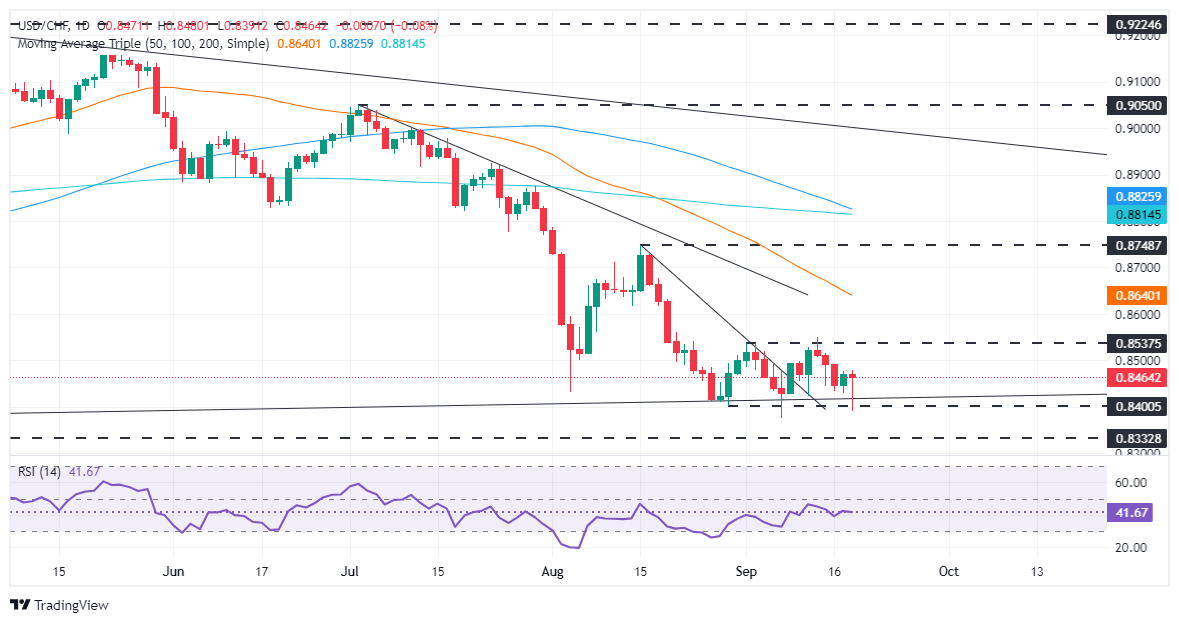
The USD/CHF recovered after whipsawing after the Federal Reserve lowered borrowing costs by 50 basis points (bps), though it reaffirmed its data-dependent stance, according to Chairman Jerome Powell. At the time of writing, the major trades were at 0.8459, slightly down to some 0.14%.
USD/CHF falls as Fed signals confidence in inflation control but leaves room for flexible policy adjustments
The Fed began its easing cycle, which will take the federal funds rate to 4.4% in 2024, according to the median in the Summary of Economic Projections (SEP). In its monetary policy statement, officials hinted that they had grown confident that inflation is on a “sustainable” path to the central bank’s 2% goal and that dual mandate risk had “roughly” balanced.
Policymakers estimate the US economy to grow at a 2% pace during the 2024-2027 period, and project inflation to edge down to 2.6% in 2024 and 2.2% in 2025 and reach the 2% target in 2026.
The Unemployment Rate, seen as the main driver for Fed Chair Powell’s decision to slash rates by 0.50%, is expected to climb to 4.4% toward the end of the year.
After the Fed’s statement, Fed Chair Jerome Powell commented that inflation risks had diminished, and the economy remained strong. He added that if higher prices persist, the Fed can adjust policy more slowly while keeping its options open to “go quicker, slower or pause on rate cuts if it is appropriate.” Powell said that the Committee is not in a rush to normalize policy.
Meanwhile, the USD/CHF erased some of its losses, though buyers could not increase the exchange rate.
USD/CHF Price Forecast: Technical outlook
The USD/CHF daily chart hints an ‘inverted head and shoulders’ could be emerging at the lows at around0.8400,
Momentum remains bearishly biased, as the Relative Strength Index (RSI) portrays. Still, the latter's failure to print another trough could pave the way for a leg-up in the USD/CHF pair.
If the major edges above the September 12 high of 0.8549, that could pave the way for a confirmation of the ‘inverted head-and-shoulders.’ The next resistance would be the August 15 peak at 0.8748. Conversely, if USD/CHF drops below 0.8400, look for a re-test of the year-to-date (YTD) low of 0.8373.
Swiss economy FAQs
Switzerland is the ninth-largest economy measured by nominal Gross Domestic Product (GDP) in the European continent. Measured by GDP per capita – a broad measure of average living standards –, the country ranks among the highest in the world, meaning that it is one the richest countries globally. Switzerland tends to be in the top spots in global rankings about living standards, development indexes, competitiveness or innovation.
Switzerland is an open, free-market economy mainly based on the services sector. The Swiss economy has a strong export sector, and the neighboring European Union (EU) is its main trading partner. Switzerland is a leading exporter of watches and clocks, and hosts leading firms in the food, chemicals and pharmaceutical industries. The country is considered to be an international tax haven, with significantly low corporate and income tax rates compared with its European neighbors.
As a high-income country, the growth rate of the Swiss economy has diminished over the last decades. Still, its political and economic stability, its high education levels, top-tier firms in several industries and its tax-haven status have made it a preferred destination for foreign investment. This has generally benefited the Swiss Franc (CHF), which has historically kept relatively strong against its main currency peers. Generally, a good performance of the Swiss economy – based on high growth, low unemployment and stable prices – tends to appreciate CHF. Conversely, if economic data points to weakening momentum, CHF is likely to depreciate.
Switzerland isn’t a commodity exporter, so in general commodity prices aren’t a key driver of the Swiss Franc (CHF). However, there is a slight correlation with both Gold and Oil prices. With Gold, CHF’s status as a safe-haven and the fact that the currency used to be backed by the precious metal means that both assets tend to move in the same direction. With Oil, a paper released by the Swiss National Bank (SNB) suggests that the rise in Oil prices could negatively influence CHF valuation, as Switzerland is a net importer of fuel.
- AUD/USD fell as the US Dollar recovered following Powell’s words.
- The Fed reduced rates by 50 bps to 5%.
- Federal policymakers foresee lower GDP development, higher unemployment, and easing inflation in the coming years.
The AUD/USD reached a high of 0.6800 before falling back toward the 0.6760 level in the wake of the Federal Reserve's (Fed) decision to cut interest rates by 50 basis points to 5%. Fed Chair Jerome Powell’s cautious words seem to have made the USD clear most of its daily losses.
On the Aussie’s front, the Australian economy faces an uncertain future with mixed signals from various economic indicators. Despite high inflation, the Reserve Bank of Australia (RBA) has maintained a hawkish stance, indicating a commitment to combating inflation through interest rate increases. As a result, markets now anticipate only a modest easing of monetary policy in 2024, with a potential rate cut of just 0.25%.
Daily digest market movers: Australian Dollar clears gains as markets digest Powell’s words
- The Australian Dollar cleared gains against the US Dollar following the 50 basis point rate cut by the Fed.
- The Fed lowered its GDP growth projection for 2024 to 2%, down from 2.1% previously and increased its Unemployment Rate forecast for 2024 and 2025 to 4.4%, up from 4.2%.
- Inflation expectations eased, with PCE inflation forecast to reach 2.3% by the end of 2024, down from the previous estimate of 2.6%, while core inflation is expected to settle at 2.6%.
- The Fed cut rates by 50 basis points to a range of 4.75-5.00% in an effort to balance economic conditions.
- Fed Chair Powell stated that the rate cut was not a signal of a new pace of reductions and that the Fed had been patient and is moving at an appropriate pace.
AUD/USD technical outlook: Pair rejected above 0.6800 resistance
The AUD/USD climbed significantly, approaching 0.6800 after the Fed's surprising decision. After cleaning all of its daily gains indicators flattened somewhat, but the overall outlook remains positive. For that to remain, the bulls must defend the 20-day Simple Moving Average (SMA) at 0.6730.
Fed FAQs
Monetary policy in the US is shaped by the Federal Reserve (Fed). The Fed has two mandates: to achieve price stability and foster full employment. Its primary tool to achieve these goals is by adjusting interest rates. When prices are rising too quickly and inflation is above the Fed’s 2% target, it raises interest rates, increasing borrowing costs throughout the economy. This results in a stronger US Dollar (USD) as it makes the US a more attractive place for international investors to park their money. When inflation falls below 2% or the Unemployment Rate is too high, the Fed may lower interest rates to encourage borrowing, which weighs on the Greenback.
The Federal Reserve (Fed) holds eight policy meetings a year, where the Federal Open Market Committee (FOMC) assesses economic conditions and makes monetary policy decisions. The FOMC is attended by twelve Fed officials – the seven members of the Board of Governors, the president of the Federal Reserve Bank of New York, and four of the remaining eleven regional Reserve Bank presidents, who serve one-year terms on a rotating basis.
In extreme situations, the Federal Reserve may resort to a policy named Quantitative Easing (QE). QE is the process by which the Fed substantially increases the flow of credit in a stuck financial system. It is a non-standard policy measure used during crises or when inflation is extremely low. It was the Fed’s weapon of choice during the Great Financial Crisis in 2008. It involves the Fed printing more Dollars and using them to buy high grade bonds from financial institutions. QE usually weakens the US Dollar.
Quantitative tightening (QT) is the reverse process of QE, whereby the Federal Reserve stops buying bonds from financial institutions and does not reinvest the principal from the bonds it holds maturing, to purchase new bonds. It is usually positive for the value of the US Dollar.
What just happened?
The US Federal Reserve (Fed), easily the largest and most powerful central bank in the world, just decreased its Federal Funds Interest Rate by 50 basis points (bps) to a reference range of 4.75-5.0% percent. This is the first time that the US interest rate has been cut since March of 2020 and represents a major policy shift for the Fed.
Why did the Fed cut interest rates?
The US Fed, headed by Fed Chairman Jerome Powell, cut interest rates for the first time in four years in order to alleviate pressure underpinning the US economy and help keep the largest economic region in the world healthy. Interest rates impact a wide range of economic aspects, including how much it costs to borrow money to finance business operations. With interest rates easing, businesses may be more inclined to step up their pace of borrowing and explore more hiring and production activities. Also, consumers may be more inclined to increase their level of spending on a credit basis, both because it will be slightly easier to obtain bank-funded credit, and also because saving their money will have a slightly less-attractive rate of return versus going ahead and spending it. In this way, central banks can discourage consumers from actively saving more money than they otherwise would have by making the rate of return on savings less attractive, pushing more money into the domestic economy.
As the US central bank, the Federal Reserve has a dual mandate: control the rate of domestic inflation using a variety of policy tools, and also maintain stable employment numbers within the US. Since falling interest rates tend to have an immediately inflationary effect, the Fed needs to be careful about how fast and how much they raise or lower interset rates. September's rate cut implies that the Fed believes it has successfully tamed US consumer inflation, and expects headline price growth figures to continue easing back toward the Fed's internal goal of 2% YoY inflation. US employment figures also play a role in Fed decision-making on interest rates, as too high of a reference rate for too long could discourage business activity to the point that a wide sweep of layoffs could force a hiccup into the economy, increasing the likelihood of a recession.
What happens next?
With the Fed’s first rate cut in four years finally out of the way, investors will be immediately pivoting to guess whether the Fed will cut rates again when the central bank gathers on November 7 to deliver another rate call. It is still too early to tell what the Fed’s next move is going to be, and policymakers will want to wait and see what the next few batches of economic data say before making any decisions a little under two months from now.
Fed FAQs
Monetary policy in the US is shaped by the Federal Reserve (Fed). The Fed has two mandates: to achieve price stability and foster full employment. Its primary tool to achieve these goals is by adjusting interest rates. When prices are rising too quickly and inflation is above the Fed’s 2% target, it raises interest rates, increasing borrowing costs throughout the economy. This results in a stronger US Dollar (USD) as it makes the US a more attractive place for international investors to park their money. When inflation falls below 2% or the Unemployment Rate is too high, the Fed may lower interest rates to encourage borrowing, which weighs on the Greenback.
The Federal Reserve (Fed) holds eight policy meetings a year, where the Federal Open Market Committee (FOMC) assesses economic conditions and makes monetary policy decisions. The FOMC is attended by twelve Fed officials – the seven members of the Board of Governors, the president of the Federal Reserve Bank of New York, and four of the remaining eleven regional Reserve Bank presidents, who serve one-year terms on a rotating basis.
In extreme situations, the Federal Reserve may resort to a policy named Quantitative Easing (QE). QE is the process by which the Fed substantially increases the flow of credit in a stuck financial system. It is a non-standard policy measure used during crises or when inflation is extremely low. It was the Fed’s weapon of choice during the Great Financial Crisis in 2008. It involves the Fed printing more Dollars and using them to buy high grade bonds from financial institutions. QE usually weakens the US Dollar.
Quantitative tightening (QT) is the reverse process of QE, whereby the Federal Reserve stops buying bonds from financial institutions and does not reinvest the principal from the bonds it holds maturing, to purchase new bonds. It is usually positive for the value of the US Dollar.
The Greenback regained composure and bounced off multi-month lows as traders continued to assess the Fed’s 50-bps interest rate cut in quite a volatile session on Wednesday.
Here is what you need to know on Thursday, September 19:
The US Dollar Index (DXY) weakened to the 100.20 region, just to rebound afterwards and reclaim the 101.00 hurdle and beyond in the wake of the FOMC event. The usual weekly Initial Jobless Claims are due on September 19, seconded by the Philly Fed Manufacturing Index, the CB Leading Index, and Existing Home Sales.
EUR/USD faded the initial uptick to multi-week tops in the 1.1190 zone, coming under pressure and briefly piercing the 1.1100 support late on Wednesday. On September 19, the Current Account results in the broader euro bloc are due, along with a speech by the ECB’s Schnabel.
GBP/USD advanced to yearly highs near the 1.3300 barrier on the back of the downward bias in the US Dollar and mixed UK CPI data. The BoE meets on September 19 and is expected to leave its policy rate unchanged.
USD/JPY resumed its downtrend and partially faded Tuesday’s pullback following the Fed meeting. The weekly Foreign Bond Investment figures are only due on September 19.
AUD/USD could not sustain a move to the 0.6800 area, relinquishing gains and eventually receding to the 0.6750 zone. The release of the Australian labour market report takes centre stage early on September 19.
WTI prices added to losses recorded in the previous day despite the weak dollar and the resurgence of geopolitical effervescence in the Middle East.
Prices of Gold rose to record tops around the $2,600 per ounce troy, although prices lost momentum and eventually ended with marked losses. Silver prices, on the other hand, tumbled to four-day lows in the sub-$30.00 region per ounce.
- Gold prices fall following a 50 bps Fed rate cut; officials project fed funds rate to reach 4.4% by 2024.
- Fed expresses confidence in nearing 2% inflation target, despite economic uncertainties and balanced mandates.
- US Treasury yields climb to 3.67%; US Dollar Index dips 0.54% to 100.49, hitting new yearly low of 100.24.
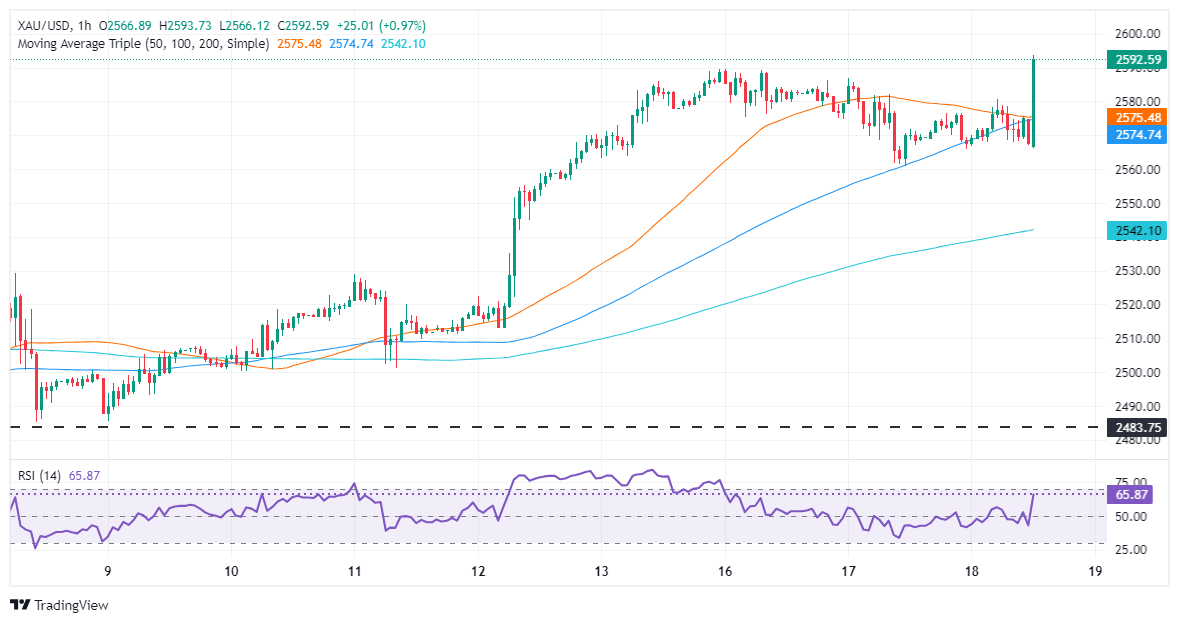
Gold prices fluctuated within the $2,565-$2,600 range during the North American session after the Federal Reserve (Fed) cut rates by 50 bps. The Fed also projected that the fed funds rate would end 2024 around 4.4%, according to the median estimate. At the time of writing, XAU/USD had erased its previous gains and is down by over 0.20%.
Fed policymakers decided to lower borrowing costs as they grew confident that inflation is moving “sustainably” toward the bank’s 2% goal. However, they acknowledged that the dual mandate on price stability and maximum employment are roughly balanced while noting that the economic outlook is uncertain.
It is worth noting that there was a dissenter in the vote as Governor Michelle Bowman voted to lower rates by a quarter of a percentage point.
The Summary of Economic Projections (SEP) shows officials estimate interest rates to end at 4.4% in 2024 and 3.4% in 2025. Meantime, inflation as measured by the Core Personal Consumption Expenditures Price Index (PCE) is foreseen reaching its target in 2026, though it’s projected to end at 2.6% in 2024 and 2.2% in 2025.
Fed officials project that the economy will grow at a 2% pace in 2024 and the Unemployment Rate to edge up to 4.4% by the end of the year.
In the meantime, Fed Chair Jerome Powell’s press conference is underway. He said that risks to inflation have diminished and reaffirmed that the economy is strong. Powell added that if inflation persists, “we can dial back policy more slowly,” and he added that, according to the SEP, the Committee is not in a rush to normalize policy.
In the meantime, US Treasury yields are rising two-and-a-half basis points at 3.67%, while the Greenback plunges. The US Dollar Index (DXY), which tracks the buck’s performance against six currencies, tumbles 0.54% to 100.49 after reaching a new yearly low of 100.24.
Daily digest market movers: Gold price drops on volatile session
- December 2024 fed funds rate futures contract suggests that the Fed might lower rates by at least 108 basis points, implying that in the following two meetings, they expect two 25 bps rate cuts left in 2024.
- US Building Permits in August grew by 4.9% MoM from 1.406 million to 1.475 million.
- Housing Starts expanded by 9.6% and rose from 1.237 million to 1.356 million.
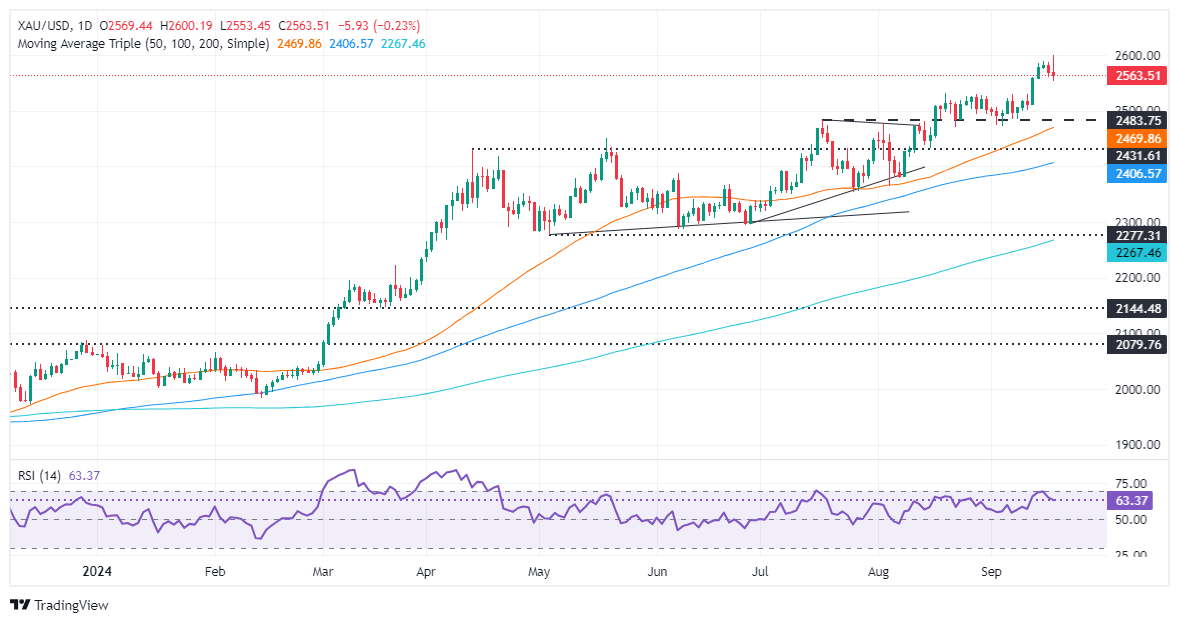
XAU/USD technical outlook: Gold price hits $2,600, then retreats amid Powell’s press conference
Gold price remains volatile during the North American session, but it remains bullish after hitting a new all-time high of $2,600. However, buyers failed at the latter, which could pave the way for a pullback.
Momentum favors buyers, though short-term sellers are in control, as the Relative Strength Index (RSI) aims lower.
If XAU/USD drops below the September 13 low of $2,556, the next support would be $2,550. Once cleared, the next stop would be the August 20 high, which turned into support at $2,531, before aiming toward the September 6 low of $2,485.
On the upside, if Gold continues to rally, the first resistance would be $2,600. A breach of the latter will expose the psychological levels $2,650 and $2,700.
Gold FAQs
Gold has played a key role in human’s history as it has been widely used as a store of value and medium of exchange. Currently, apart from its shine and usage for jewelry, the precious metal is widely seen as a safe-haven asset, meaning that it is considered a good investment during turbulent times. Gold is also widely seen as a hedge against inflation and against depreciating currencies as it doesn’t rely on any specific issuer or government.
Central banks are the biggest Gold holders. In their aim to support their currencies in turbulent times, central banks tend to diversify their reserves and buy Gold to improve the perceived strength of the economy and the currency. High Gold reserves can be a source of trust for a country’s solvency. Central banks added 1,136 tonnes of Gold worth around $70 billion to their reserves in 2022, according to data from the World Gold Council. This is the highest yearly purchase since records began. Central banks from emerging economies such as China, India and Turkey are quickly increasing their Gold reserves.
Gold has an inverse correlation with the US Dollar and US Treasuries, which are both major reserve and safe-haven assets. When the Dollar depreciates, Gold tends to rise, enabling investors and central banks to diversify their assets in turbulent times. Gold is also inversely correlated with risk assets. A rally in the stock market tends to weaken Gold price, while sell-offs in riskier markets tend to favor the precious metal.
The price can move due to a wide range of factors. Geopolitical instability or fears of a deep recession can quickly make Gold price escalate due to its safe-haven status. As a yield-less asset, Gold tends to rise with lower interest rates, while higher cost of money usually weighs down on the yellow metal. Still, most moves depend on how the US Dollar (USD) behaves as the asset is priced in dollars (XAU/USD). A strong Dollar tends to keep the price of Gold controlled, whereas a weaker Dollar is likely to push Gold prices up.
Federal Reserve Chairman Jerome Powell explains the decision to cut the policy rate, federal funds rate, by 50 basis points to the range of 4.75%-5% after the September meeting and responds to questions in the post-meeting press conference.
Key quotes
"Housing market is frozen in part due to higher rates."
"As rates come home, people will start to move more, and that's already happening."
"As rates come down, people will sell more."
"Real issue with housing is lack of supply."
"Fed can not fix issues with housing supply constraints."
"As we normalize rates, we do think housing market will normalize."
"Supply question is for the market and for government to solve."
"Our 50 bps move today is a commitment to us not falling behind."
"We might well have cut in July if we had the jobs data at that point."
"Hard to say how much more mortgage rates will fall; that will depend on economy."
Fed FAQs
Monetary policy in the US is shaped by the Federal Reserve (Fed). The Fed has two mandates: to achieve price stability and foster full employment. Its primary tool to achieve these goals is by adjusting interest rates. When prices are rising too quickly and inflation is above the Fed’s 2% target, it raises interest rates, increasing borrowing costs throughout the economy. This results in a stronger US Dollar (USD) as it makes the US a more attractive place for international investors to park their money. When inflation falls below 2% or the Unemployment Rate is too high, the Fed may lower interest rates to encourage borrowing, which weighs on the Greenback.
The Federal Reserve (Fed) holds eight policy meetings a year, where the Federal Open Market Committee (FOMC) assesses economic conditions and makes monetary policy decisions. The FOMC is attended by twelve Fed officials – the seven members of the Board of Governors, the president of the Federal Reserve Bank of New York, and four of the remaining eleven regional Reserve Bank presidents, who serve one-year terms on a rotating basis.
In extreme situations, the Federal Reserve may resort to a policy named Quantitative Easing (QE). QE is the process by which the Fed substantially increases the flow of credit in a stuck financial system. It is a non-standard policy measure used during crises or when inflation is extremely low. It was the Fed’s weapon of choice during the Great Financial Crisis in 2008. It involves the Fed printing more Dollars and using them to buy high grade bonds from financial institutions. QE usually weakens the US Dollar.
Quantitative tightening (QT) is the reverse process of QE, whereby the Federal Reserve stops buying bonds from financial institutions and does not reinvest the principal from the bonds it holds maturing, to purchase new bonds. It is usually positive for the value of the US Dollar.
Federal Reserve Chairman Jerome Powell explains the decision to cut the policy rate, federal funds rate, by 50 basis points to the range of 4.75%-5% after the September meeting and responds to questions in the post-meeting press conference.
Key quotes
"Immigration is one of the things that has allowed unemployment rate to rise."
"Further declines in job openings will translate more directly into unemployment."
"My own sense is we are not going back to negative rates for long-term bonds; it feels neutral rate is higher than it was."
"It feels to me that neutral rate is probably significantly higher than it was pre-pandemic."
"Fed makes decisions based on its service to American people."
"Our decisions are never about politics or anything else."
"Our job is to support the economy on behalf of the American people."
"If we get it right, will benefit the American people."
Interest rates FAQs
Interest rates are charged by financial institutions on loans to borrowers and are paid as interest to savers and depositors. They are influenced by base lending rates, which are set by central banks in response to changes in the economy. Central banks normally have a mandate to ensure price stability, which in most cases means targeting a core inflation rate of around 2%. If inflation falls below target the central bank may cut base lending rates, with a view to stimulating lending and boosting the economy. If inflation rises substantially above 2% it normally results in the central bank raising base lending rates in an attempt to lower inflation.
Higher interest rates generally help strengthen a country’s currency as they make it a more attractive place for global investors to park their money.
Higher interest rates overall weigh on the price of Gold because they increase the opportunity cost of holding Gold instead of investing in an interest-bearing asset or placing cash in the bank. If interest rates are high that usually pushes up the price of the US Dollar (USD), and since Gold is priced in Dollars, this has the effect of lowering the price of Gold.
The Fed funds rate is the overnight rate at which US banks lend to each other. It is the oft-quoted headline rate set by the Federal Reserve at its FOMC meetings. It is set as a range, for example 4.75%-5.00%, though the upper limit (in that case 5.00%) is the quoted figure. Market expectations for future Fed funds rate are tracked by the CME FedWatch tool, which shapes how many financial markets behave in anticipation of future Federal Reserve monetary policy decisions.
Federal Reserve Chairman Jerome Powell explains the decision to cut the policy rate, federal funds rate, by 50 basis points to the range of 4.75%-5% after the September meeting and responds to questions in the post-meeting press conference.
Key quotes
"Labor market bears close watching."
"But we think policy adjustments will support the labor market."
"Retail sales data, Q2 GDP indicates economy growing at solid pace."
"We are not seeing rising layoffs from our business contacts."
"We are not waiting for that."
"Our policy is still restrictive."
"We don't think we need to see further loosening of labor market to get inflation down to 2%."
"Unemployment rate is still a healthy level."
"Participation in job market is at high levels, wage increases still a bit above being consistent with 2% inflation."
"Vacancies still at a pretty strong level."
"Quits have come back down to normal levels."
"Together, they all say it is a solid labor market."
"Downside risks to employment have increased."
"So now, we manage the risks to both of our goals."
Fed FAQs
Monetary policy in the US is shaped by the Federal Reserve (Fed). The Fed has two mandates: to achieve price stability and foster full employment. Its primary tool to achieve these goals is by adjusting interest rates. When prices are rising too quickly and inflation is above the Fed’s 2% target, it raises interest rates, increasing borrowing costs throughout the economy. This results in a stronger US Dollar (USD) as it makes the US a more attractive place for international investors to park their money. When inflation falls below 2% or the Unemployment Rate is too high, the Fed may lower interest rates to encourage borrowing, which weighs on the Greenback.
The Federal Reserve (Fed) holds eight policy meetings a year, where the Federal Open Market Committee (FOMC) assesses economic conditions and makes monetary policy decisions. The FOMC is attended by twelve Fed officials – the seven members of the Board of Governors, the president of the Federal Reserve Bank of New York, and four of the remaining eleven regional Reserve Bank presidents, who serve one-year terms on a rotating basis.
In extreme situations, the Federal Reserve may resort to a policy named Quantitative Easing (QE). QE is the process by which the Fed substantially increases the flow of credit in a stuck financial system. It is a non-standard policy measure used during crises or when inflation is extremely low. It was the Fed’s weapon of choice during the Great Financial Crisis in 2008. It involves the Fed printing more Dollars and using them to buy high grade bonds from financial institutions. QE usually weakens the US Dollar.
Quantitative tightening (QT) is the reverse process of QE, whereby the Federal Reserve stops buying bonds from financial institutions and does not reinvest the principal from the bonds it holds maturing, to purchase new bonds. It is usually positive for the value of the US Dollar.
Federal Reserve Chairman Jerome Powell explains the decision to cut the policy rate, federal funds rate, by 50 basis points to the range of 4.75%-5% after the September meeting and responds to questions in the post-meeting press conference.
Key quotes
"We've been very patient about reducing policy rate, others have cut."
"Our patience has paid dividends in our confidence on inflation."
"No one should look at today and think this is the new pace."
"We have waited as other central banks have cut."
"We are moving at the base that we think is appropriate."
Interest rates FAQs
Interest rates are charged by financial institutions on loans to borrowers and are paid as interest to savers and depositors. They are influenced by base lending rates, which are set by central banks in response to changes in the economy. Central banks normally have a mandate to ensure price stability, which in most cases means targeting a core inflation rate of around 2%. If inflation falls below target the central bank may cut base lending rates, with a view to stimulating lending and boosting the economy. If inflation rises substantially above 2% it normally results in the central bank raising base lending rates in an attempt to lower inflation.
Higher interest rates generally help strengthen a country’s currency as they make it a more attractive place for global investors to park their money.
Higher interest rates overall weigh on the price of Gold because they increase the opportunity cost of holding Gold instead of investing in an interest-bearing asset or placing cash in the bank. If interest rates are high that usually pushes up the price of the US Dollar (USD), and since Gold is priced in Dollars, this has the effect of lowering the price of Gold.
The Fed funds rate is the overnight rate at which US banks lend to each other. It is the oft-quoted headline rate set by the Federal Reserve at its FOMC meetings. It is set as a range, for example 4.75%-5.00%, though the upper limit (in that case 5.00%) is the quoted figure. Market expectations for future Fed funds rate are tracked by the CME FedWatch tool, which shapes how many financial markets behave in anticipation of future Federal Reserve monetary policy decisions.
Federal Reserve Chairman Jerome Powell explains the decision to cut the policy rate, federal funds rate, by 50 basis points to the range of 4.75%-5% after the September meeting and responds to questions in the post-meeting press conference.
Key quotes
"It is time to calibrate our policy to something that is more appropriate given progress on inflation and on employment."
"The direction of our process is toward a sense of neutral."
"We'll move as fast or as slow as we think appropriate."
"We left open size of rate cut as we entered blackout."
"Broad support for a 50 bps cut today."
"There is a dissent and a range of views but also a lot of common ground."
"There's no sense that the Committee feels it is in a rush."
"We have made a good strong start today on cuts."
"I am very pleased that we did 50 bps."
Fed FAQs
Monetary policy in the US is shaped by the Federal Reserve (Fed). The Fed has two mandates: to achieve price stability and foster full employment. Its primary tool to achieve these goals is by adjusting interest rates. When prices are rising too quickly and inflation is above the Fed’s 2% target, it raises interest rates, increasing borrowing costs throughout the economy. This results in a stronger US Dollar (USD) as it makes the US a more attractive place for international investors to park their money. When inflation falls below 2% or the Unemployment Rate is too high, the Fed may lower interest rates to encourage borrowing, which weighs on the Greenback.
The Federal Reserve (Fed) holds eight policy meetings a year, where the Federal Open Market Committee (FOMC) assesses economic conditions and makes monetary policy decisions. The FOMC is attended by twelve Fed officials – the seven members of the Board of Governors, the president of the Federal Reserve Bank of New York, and four of the remaining eleven regional Reserve Bank presidents, who serve one-year terms on a rotating basis.
In extreme situations, the Federal Reserve may resort to a policy named Quantitative Easing (QE). QE is the process by which the Fed substantially increases the flow of credit in a stuck financial system. It is a non-standard policy measure used during crises or when inflation is extremely low. It was the Fed’s weapon of choice during the Great Financial Crisis in 2008. It involves the Fed printing more Dollars and using them to buy high grade bonds from financial institutions. QE usually weakens the US Dollar.
Quantitative tightening (QT) is the reverse process of QE, whereby the Federal Reserve stops buying bonds from financial institutions and does not reinvest the principal from the bonds it holds maturing, to purchase new bonds. It is usually positive for the value of the US Dollar.
Federal Reserve Chairman Jerome Powell explains the decision to cut the policy rate, federal funds rate, by 50 basis points to the range of 4.75%-5% after the September meeting and responds to questions in the post-meeting press conference.
Key quotes
"Since the last meeting, there has been a lot of data."
"Benchmark revisions showed payrolls may be revised down."
"We concluded that 50 bps cut was the right thing."
"We will make future decisions based meeting by meeting."
"We are recalibrating our policy stance."
"Nothing in our projections that suggest we are in a rush."
Fed FAQs
Monetary policy in the US is shaped by the Federal Reserve (Fed). The Fed has two mandates: to achieve price stability and foster full employment. Its primary tool to achieve these goals is by adjusting interest rates. When prices are rising too quickly and inflation is above the Fed’s 2% target, it raises interest rates, increasing borrowing costs throughout the economy. This results in a stronger US Dollar (USD) as it makes the US a more attractive place for international investors to park their money. When inflation falls below 2% or the Unemployment Rate is too high, the Fed may lower interest rates to encourage borrowing, which weighs on the Greenback.
The Federal Reserve (Fed) holds eight policy meetings a year, where the Federal Open Market Committee (FOMC) assesses economic conditions and makes monetary policy decisions. The FOMC is attended by twelve Fed officials – the seven members of the Board of Governors, the president of the Federal Reserve Bank of New York, and four of the remaining eleven regional Reserve Bank presidents, who serve one-year terms on a rotating basis.
In extreme situations, the Federal Reserve may resort to a policy named Quantitative Easing (QE). QE is the process by which the Fed substantially increases the flow of credit in a stuck financial system. It is a non-standard policy measure used during crises or when inflation is extremely low. It was the Fed’s weapon of choice during the Great Financial Crisis in 2008. It involves the Fed printing more Dollars and using them to buy high grade bonds from financial institutions. QE usually weakens the US Dollar.
Quantitative tightening (QT) is the reverse process of QE, whereby the Federal Reserve stops buying bonds from financial institutions and does not reinvest the principal from the bonds it holds maturing, to purchase new bonds. It is usually positive for the value of the US Dollar.
Federal Reserve Chairman Jerome Powell explains the decision to cut the policy rate, federal funds rate, by 50 basis points to the range of 4.75%-5% after the September meeting and responds to questions in the post-meeting press conference.
Key quotes
"Our projections are not a plan or decision."
"We will adjust policy as necessary."
"If the economy remains solid, we can dial back the pace of cuts; equally, if the labor market deteriorates, we can respond."
Interest rates FAQs
Interest rates are charged by financial institutions on loans to borrowers and are paid as interest to savers and depositors. They are influenced by base lending rates, which are set by central banks in response to changes in the economy. Central banks normally have a mandate to ensure price stability, which in most cases means targeting a core inflation rate of around 2%. If inflation falls below target the central bank may cut base lending rates, with a view to stimulating lending and boosting the economy. If inflation rises substantially above 2% it normally results in the central bank raising base lending rates in an attempt to lower inflation.
Higher interest rates generally help strengthen a country’s currency as they make it a more attractive place for global investors to park their money.
Higher interest rates overall weigh on the price of Gold because they increase the opportunity cost of holding Gold instead of investing in an interest-bearing asset or placing cash in the bank. If interest rates are high that usually pushes up the price of the US Dollar (USD), and since Gold is priced in Dollars, this has the effect of lowering the price of Gold.
The Fed funds rate is the overnight rate at which US banks lend to each other. It is the oft-quoted headline rate set by the Federal Reserve at its FOMC meetings. It is set as a range, for example 4.75%-5.00%, though the upper limit (in that case 5.00%) is the quoted figure. Market expectations for future Fed funds rate are tracked by the CME FedWatch tool, which shapes how many financial markets behave in anticipation of future Federal Reserve monetary policy decisions.
Federal Reserve Chairman Jerome Powell explains the decision to cut the policy rate, federal funds rate, by 50 basis points to the range of 4.75%-5% after the September meeting and responds to questions in the post-meeting press conference.
Key quotes
"Squarely focused on our goals."
"Economy is strong overall."
"Committed to maintaining economy's strength."
"Fed reduced amount of policy restraint today."
"Our decision today reflects growing confidence that strength in labor market can be maintained."
"Consumer spending has remained resilient."
"Housing sector investment fell back in Q2."
Improving supply conditions have supported demand over past year."
"Our projections show we expect GDP growth to remain solid."
"Labor market has continued to cool."
"Conditions in labor market are less tight than pre-pandemic."
"Indicators suggest labor market is now less tight than just before pandemic."
"Labor market not a source of elevated inflationary pressures."
"Inflation has eased notably but remains above our goal."
"Longer term inflation expectations appear well anchored."
"Our primary focus had been on bringing down inflation, which imposes significant hardship."
"Our patient approach has paid dividends."
"Inflation is much closer to our goal."
"Upside risks to inflation have diminished and downside risks to labor market have risen."
"We are attentive to risks on both sides of mandate."
Fed FAQs
Monetary policy in the US is shaped by the Federal Reserve (Fed). The Fed has two mandates: to achieve price stability and foster full employment. Its primary tool to achieve these goals is by adjusting interest rates. When prices are rising too quickly and inflation is above the Fed’s 2% target, it raises interest rates, increasing borrowing costs throughout the economy. This results in a stronger US Dollar (USD) as it makes the US a more attractive place for international investors to park their money. When inflation falls below 2% or the Unemployment Rate is too high, the Fed may lower interest rates to encourage borrowing, which weighs on the Greenback.
The Federal Reserve (Fed) holds eight policy meetings a year, where the Federal Open Market Committee (FOMC) assesses economic conditions and makes monetary policy decisions. The FOMC is attended by twelve Fed officials – the seven members of the Board of Governors, the president of the Federal Reserve Bank of New York, and four of the remaining eleven regional Reserve Bank presidents, who serve one-year terms on a rotating basis.
In extreme situations, the Federal Reserve may resort to a policy named Quantitative Easing (QE). QE is the process by which the Fed substantially increases the flow of credit in a stuck financial system. It is a non-standard policy measure used during crises or when inflation is extremely low. It was the Fed’s weapon of choice during the Great Financial Crisis in 2008. It involves the Fed printing more Dollars and using them to buy high grade bonds from financial institutions. QE usually weakens the US Dollar.
Quantitative tightening (QT) is the reverse process of QE, whereby the Federal Reserve stops buying bonds from financial institutions and does not reinvest the principal from the bonds it holds maturing, to purchase new bonds. It is usually positive for the value of the US Dollar.
- GBP/USD registers gains of over 0.80% following Fed’s cut.
- The Fed delivers a 50 bps rate cut as it grows confident that inflation will reach its 2% target.
- The Fed's dot-plot projects the fed funds rate to end 2024 at approximately 4.4%.
The GBP/USD hit a new yearly high of 1.3286 during the North American session after the Fed surprised the markets with a 50 bps rate cut. At the time of writing, the pair trades volatile within the 1.3200-1.3300 range as traders await Fed Chair Jerome Powell's press conference.
Fed cuts rates by 50 bps, not unanimously, as Bowman dissents
In their monetary policy statement, Fed policymakers acknowledged that economic activity continues to expand solidly, though the unemployment rate has "moved up." They also noted that while inflation "remains somewhat elevated," the Committee "has gained greater confidence that inflation is moving sustainably toward 2 percent" and believes that the risks to achieving its employment and inflation goals are now roughly balanced. The Federal Open Market Committee (FOMC) highlighted that the economic outlook remains uncertain.
The Fed's decision was not unanimous, as Governor Michelle Bowman favored a 25-basis point (bps) rate cut.
Regarding the Summary of Economic Projections (SEP), Fed officials anticipate another 50 bps of rate cuts by the end of 2024 and an additional 100 bps of cuts projected for 2025.
GBP/USD reaction to Fed’s cut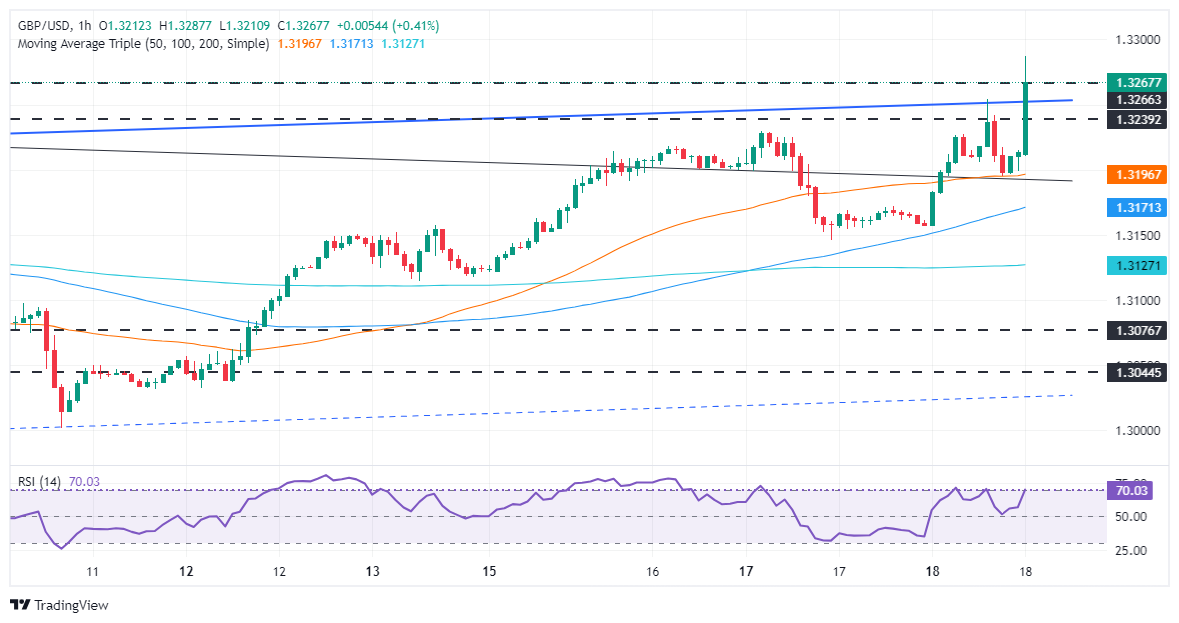
The GBP/USD extended its gains above the previous yearly peak at 1.3266, with traders eyeing 1.3300. Further upside is seen once cleared, with the next resistance lying at the March 1, 2022, high at 1.3437.
Pound Sterling FAQs
The Pound Sterling (GBP) is the oldest currency in the world (886 AD) and the official currency of the United Kingdom. It is the fourth most traded unit for foreign exchange (FX) in the world, accounting for 12% of all transactions, averaging $630 billion a day, according to 2022 data. Its key trading pairs are GBP/USD, aka ‘Cable’, which accounts for 11% of FX, GBP/JPY, or the ‘Dragon’ as it is known by traders (3%), and EUR/GBP (2%). The Pound Sterling is issued by the Bank of England (BoE).
The single most important factor influencing the value of the Pound Sterling is monetary policy decided by the Bank of England. The BoE bases its decisions on whether it has achieved its primary goal of “price stability” – a steady inflation rate of around 2%. Its primary tool for achieving this is the adjustment of interest rates. When inflation is too high, the BoE will try to rein it in by raising interest rates, making it more expensive for people and businesses to access credit. This is generally positive for GBP, as higher interest rates make the UK a more attractive place for global investors to park their money. When inflation falls too low it is a sign economic growth is slowing. In this scenario, the BoE will consider lowering interest rates to cheapen credit so businesses will borrow more to invest in growth-generating projects.
Data releases gauge the health of the economy and can impact the value of the Pound Sterling. Indicators such as GDP, Manufacturing and Services PMIs, and employment can all influence the direction of the GBP. A strong economy is good for Sterling. Not only does it attract more foreign investment but it may encourage the BoE to put up interest rates, which will directly strengthen GBP. Otherwise, if economic data is weak, the Pound Sterling is likely to fall.
Another significant data release for the Pound Sterling is the Trade Balance. This indicator measures the difference between what a country earns from its exports and what it spends on imports over a given period. If a country produces highly sought-after exports, its currency will benefit purely from the extra demand created from foreign buyers seeking to purchase these goods. Therefore, a positive net Trade Balance strengthens a currency and vice versa for a negative balance.
- USD/JPY dips on reaction to 50 bps Fed rate cut.
- Fed's dot plot on rate outlook also declined.
- Markets await Fed Chair Powell's press conference appearance.
USD/JPY plumbed the depths of 140.80 on Wednesday after the Federal Reserve (Fed) dropped a 50 bps rate cut on markets. This marks the Fed's first rate cut in over four years as US central bank policymakers race to catch up to market expectations. Investors had initially hoped for a first rate cut from the Fed in March.
The Federal Reserve's dot plot, part of the Federal Open Market Committee's (FOMC) Summary of Economic Projections, has been revised downward from the central bank's previous rate outlook. The median policy expectations from the Fed now indicate that the Fed Funds rate is projected to be 4.4% by the end of 2024 and 3.4% by the end of 2025, down from 5.1% and 4.1% respectively.
Digging deeper into the Fed's notes, Fed policymakers now anticipate US Gross Domestic Product (GDP) growth to remain at 2.0% through 2024, down from the previous projection of 2.1% in June. Fed officials also expect the US Unemployment Rate to settle around 4.4% by the end of 2024.
With the Fed aligning with market expectations for rate cuts, global markets are now turning their attention to Fed Chair Jerome Powell's press conference scheduled to take place shortly.
More to come...
USD/JPY 15-minute chart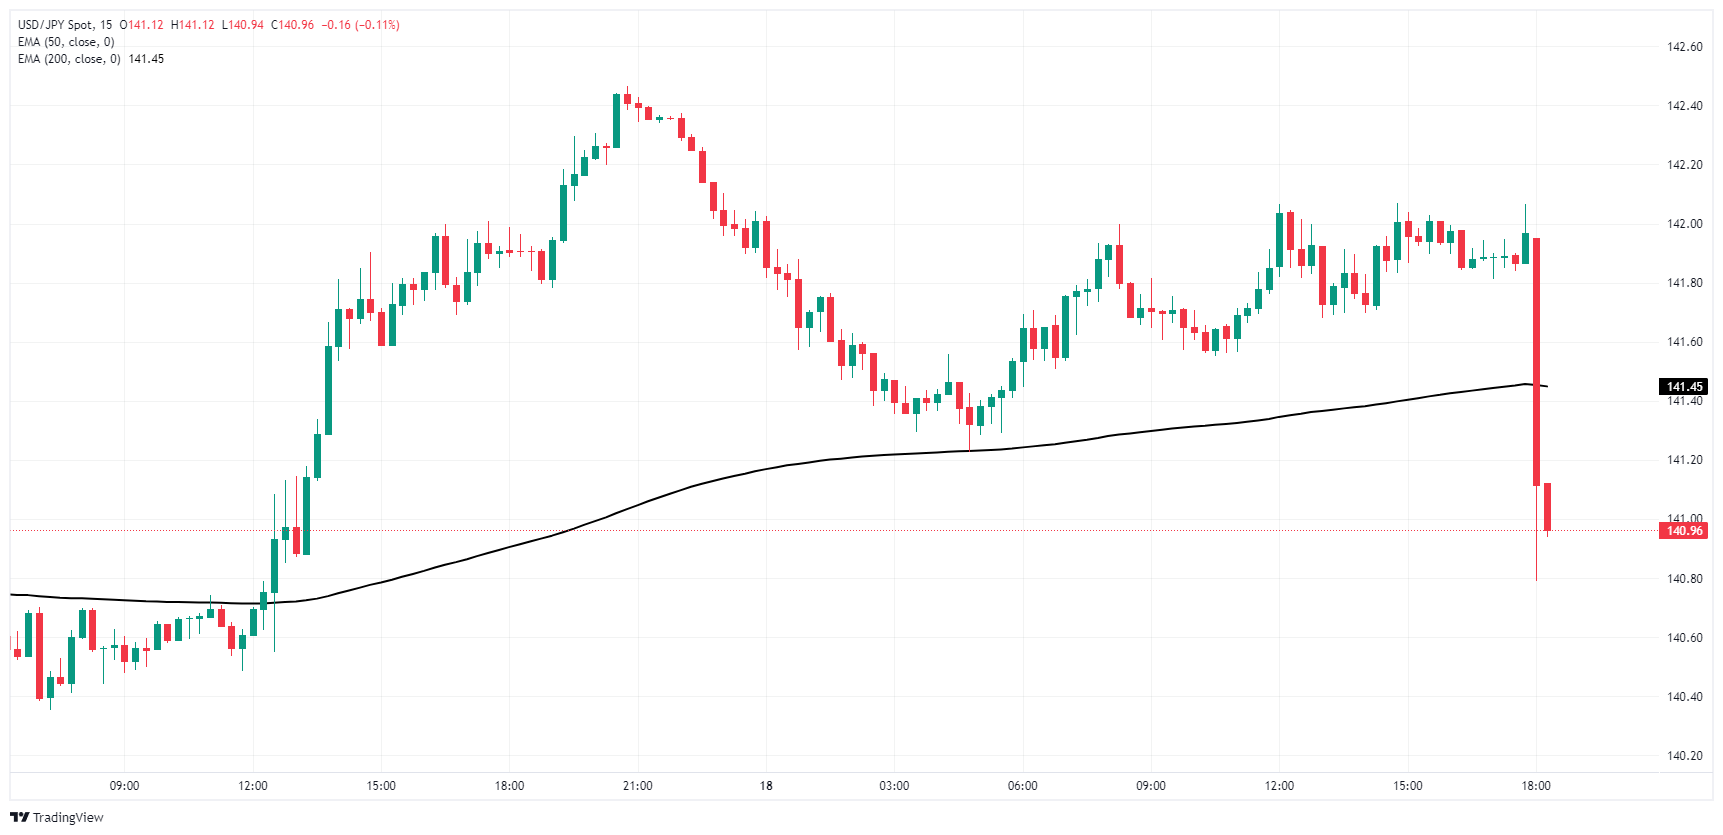
Japanese Yen FAQs
The Japanese Yen (JPY) is one of the world’s most traded currencies. Its value is broadly determined by the performance of the Japanese economy, but more specifically by the Bank of Japan’s policy, the differential between Japanese and US bond yields, or risk sentiment among traders, among other factors.
One of the Bank of Japan’s mandates is currency control, so its moves are key for the Yen. The BoJ has directly intervened in currency markets sometimes, generally to lower the value of the Yen, although it refrains from doing it often due to political concerns of its main trading partners. The current BoJ ultra-loose monetary policy, based on massive stimulus to the economy, has caused the Yen to depreciate against its main currency peers. This process has exacerbated more recently due to an increasing policy divergence between the Bank of Japan and other main central banks, which have opted to increase interest rates sharply to fight decades-high levels of inflation.
The BoJ’s stance of sticking to ultra-loose monetary policy has led to a widening policy divergence with other central banks, particularly with the US Federal Reserve. This supports a widening of the differential between the 10-year US and Japanese bonds, which favors the US Dollar against the Japanese Yen.
The Japanese Yen is often seen as a safe-haven investment. This means that in times of market stress, investors are more likely to put their money in the Japanese currency due to its supposed reliability and stability. Turbulent times are likely to strengthen the Yen’s value against other currencies seen as more risky to invest in.
- Gold reached all-time high at $2,591 post Fed decision.
- Fed delivers a 50 bps as it grows confident that inflation will get to 2% goal.
- Fed dot-plot estimates the fed funds rate to end 2024 at around 4.4%
Gold price trades volatile within the $2,565-$2,587 range during the North American session after the Federal Reserve cut rates by 50 bps while expecting the fed funds rates to end in 2024 at around 4.4%, according to the median. At the time of writing, XAU/USD trades post gains of over 0.50%.
Summary of Fed’s monetary policy statement
In their monetary policy statement, Fed officials acknowledge that economic activity continues to expand solidly, though the unemployment rate has “moved up.” They added that although inflation “remains somewhat elevated,” the Committee “has gained greater confidence that inflation is moving sustainably toward 2 percent, and judges that the risks to achieving its employment and inflation goals are roughly in balance.” The FOMC noted that the economic outlook is uncertain.
The Fed’s decision was not unanimous as Governor Michell Bowman voted for a 25 bps rate cut.
Regarding the Summary of Economic Projections (SEP), officials are already expecting another 50 bps of cuts toward the end of 2024 and 100 bps of cuts in 2025.
Gold’s reaction to the Fed’s decision
On the Fed's decision, the gold price reached a new all-time high of $2,591, yet traders prepared for the Fed Chair Powell press conference.
Gold FAQs
Gold has played a key role in human’s history as it has been widely used as a store of value and medium of exchange. Currently, apart from its shine and usage for jewelry, the precious metal is widely seen as a safe-haven asset, meaning that it is considered a good investment during turbulent times. Gold is also widely seen as a hedge against inflation and against depreciating currencies as it doesn’t rely on any specific issuer or government.
Central banks are the biggest Gold holders. In their aim to support their currencies in turbulent times, central banks tend to diversify their reserves and buy Gold to improve the perceived strength of the economy and the currency. High Gold reserves can be a source of trust for a country’s solvency. Central banks added 1,136 tonnes of Gold worth around $70 billion to their reserves in 2022, according to data from the World Gold Council. This is the highest yearly purchase since records began. Central banks from emerging economies such as China, India and Turkey are quickly increasing their Gold reserves.
Gold has an inverse correlation with the US Dollar and US Treasuries, which are both major reserve and safe-haven assets. When the Dollar depreciates, Gold tends to rise, enabling investors and central banks to diversify their assets in turbulent times. Gold is also inversely correlated with risk assets. A rally in the stock market tends to weaken Gold price, while sell-offs in riskier markets tend to favor the precious metal.
The price can move due to a wide range of factors. Geopolitical instability or fears of a deep recession can quickly make Gold price escalate due to its safe-haven status. As a yield-less asset, Gold tends to rise with lower interest rates, while higher cost of money usually weighs down on the yellow metal. Still, most moves depend on how the US Dollar (USD) behaves as the asset is priced in dollars (XAU/USD). A strong Dollar tends to keep the price of Gold controlled, whereas a weaker Dollar is likely to push Gold prices up.
- AUD/USD soared near 0.6800 after the Fed's larger than expected cut.
- The Fed signalled three additional cuts in 2024.
- Unemployment projections where revised higher
The AUD/USD pair surged towards the 0.6800 level following the Federal Reserve's unexpected decision to cut interest rates by 50 basis points, surpassing the anticipated 25 basis points reduction. This aggressive monetary easing reflects the Fed's strengthened confidence in achieving its 2% inflation target, as the Federal Open Market Committee (FOMC) acknowledges that inflation is making substantial progress while remaining somewhat elevated.
Looking ahead, the Fed has indicated the possibility of two to three additional 25 basis point rate cuts in the upcoming meetings of 2024, underscoring the committee's cautious stance amidst an uncertain economic outlook. The FOMC remains vigilant to risks on both sides of its dual mandate, carefully assessing incoming data and the evolving balance of risks before making further adjustments.
While unemployment projections have slightly risen, the overall message from the FOMC is one of confidence and careful optimism, as they strive to maintain economic stability and ensure that inflation trends sustainably towards their long-term objective.
Fed FAQs
Monetary policy in the US is shaped by the Federal Reserve (Fed). The Fed has two mandates: to achieve price stability and foster full employment. Its primary tool to achieve these goals is by adjusting interest rates. When prices are rising too quickly and inflation is above the Fed’s 2% target, it raises interest rates, increasing borrowing costs throughout the economy. This results in a stronger US Dollar (USD) as it makes the US a more attractive place for international investors to park their money. When inflation falls below 2% or the Unemployment Rate is too high, the Fed may lower interest rates to encourage borrowing, which weighs on the Greenback.
The Federal Reserve (Fed) holds eight policy meetings a year, where the Federal Open Market Committee (FOMC) assesses economic conditions and makes monetary policy decisions. The FOMC is attended by twelve Fed officials – the seven members of the Board of Governors, the president of the Federal Reserve Bank of New York, and four of the remaining eleven regional Reserve Bank presidents, who serve one-year terms on a rotating basis.
In extreme situations, the Federal Reserve may resort to a policy named Quantitative Easing (QE). QE is the process by which the Fed substantially increases the flow of credit in a stuck financial system. It is a non-standard policy measure used during crises or when inflation is extremely low. It was the Fed’s weapon of choice during the Great Financial Crisis in 2008. It involves the Fed printing more Dollars and using them to buy high grade bonds from financial institutions. QE usually weakens the US Dollar.
Quantitative tightening (QT) is the reverse process of QE, whereby the Federal Reserve stops buying bonds from financial institutions and does not reinvest the principal from the bonds it holds maturing, to purchase new bonds. It is usually positive for the value of the US Dollar.
- EUR/USD climbs on reaction to first Fed rate cut since March of 2020.
- Fed delivers a surprising 50 bps rate cut out of the gate.
- Fed dot plot eases lower in September, unemployment forecast ticks slightly higher.
EUR/USD soared into a fresh high for September after the Federal Reserve (Fed) surprised markets with a full 50 bps rate cut on Wednesday, pushing risk appetite into the high side and sending traders scrambling for the buy button. This marks the first Fed rate cut in over four years.
The Fed's dot plot of the Federal Open Market Committee's (FOMC) Summary of Economic Projections was also revised downward from the central bank's previous rate outlook. The median policy expectations from the Fed now see the Fed Funds rate at 4.4% by year-end 2024 and 3.4% by year-end 2025, down from 5.1% and 4.1%, respectively.
Going deeper into the Fed's notes, Fed policymakers now see US Gross Domestic Product (GDP) growth of 2.0% flat through 2024, down from the previous print of 2.1% in June. Fed officials also expected the US Unemployment Rate to settle around 4.4% by the end of 2024.
With the Fed finally catching up to market expectations that have been clamoring for rate cuts since the beginning of the year, global markets are pivoting to catch Fed Chair Jerome Powell's press conference due at the bottom of the hour.
More to come...
EUR/USD 15-minute chart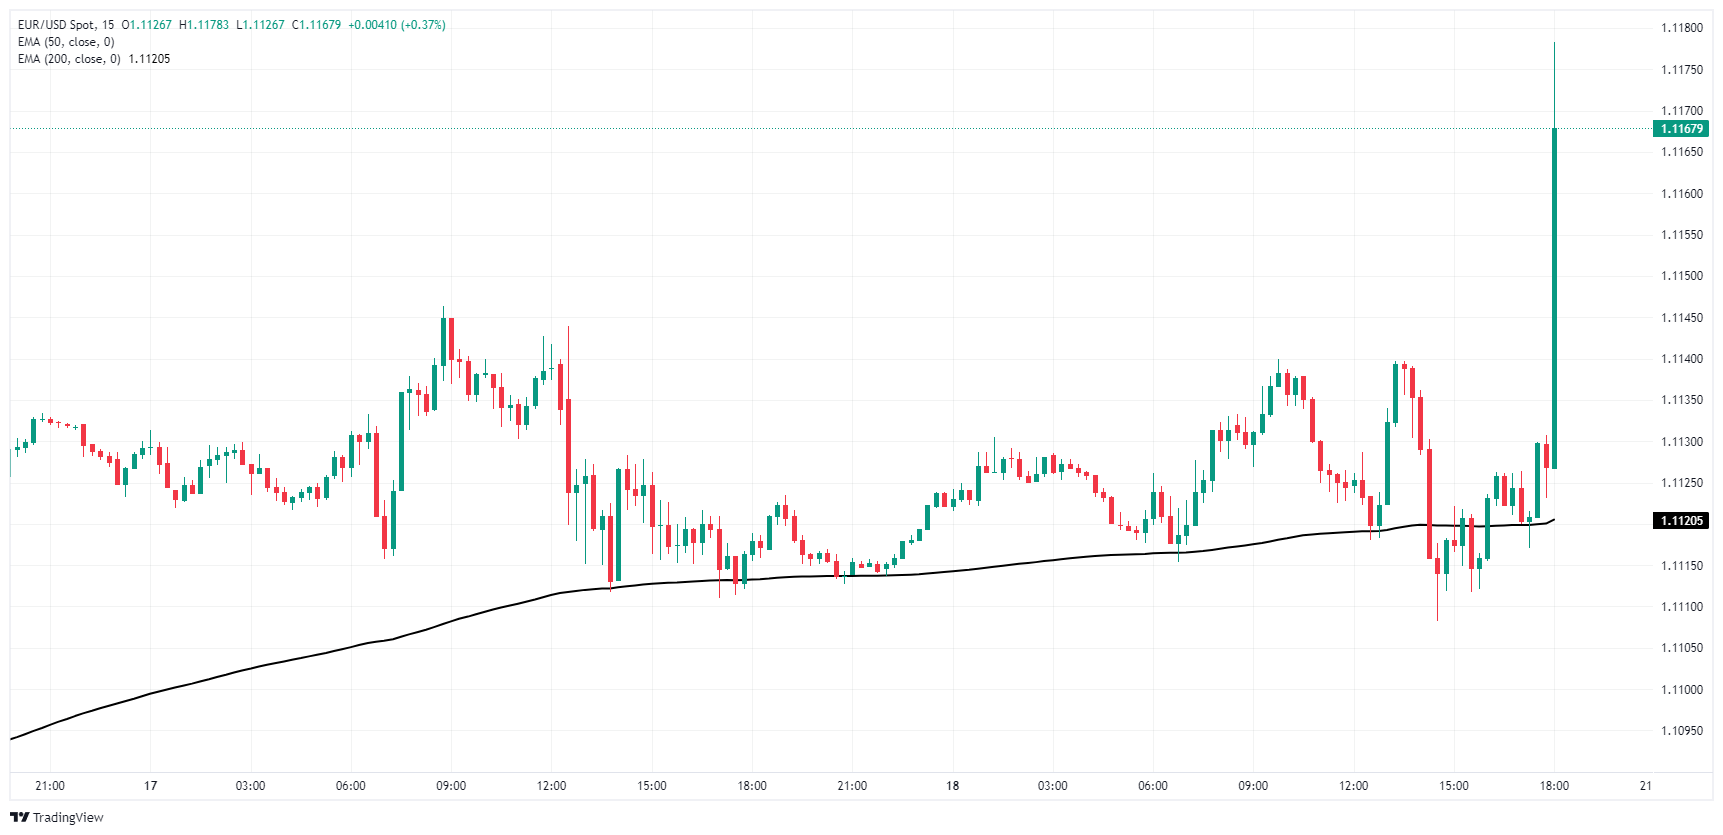
Euro FAQs
The Euro is the currency for the 20 European Union countries that belong to the Eurozone. It is the second most heavily traded currency in the world behind the US Dollar. In 2022, it accounted for 31% of all foreign exchange transactions, with an average daily turnover of over $2.2 trillion a day. EUR/USD is the most heavily traded currency pair in the world, accounting for an estimated 30% off all transactions, followed by EUR/JPY (4%), EUR/GBP (3%) and EUR/AUD (2%).
The European Central Bank (ECB) in Frankfurt, Germany, is the reserve bank for the Eurozone. The ECB sets interest rates and manages monetary policy. The ECB’s primary mandate is to maintain price stability, which means either controlling inflation or stimulating growth. Its primary tool is the raising or lowering of interest rates. Relatively high interest rates – or the expectation of higher rates – will usually benefit the Euro and vice versa. The ECB Governing Council makes monetary policy decisions at meetings held eight times a year. Decisions are made by heads of the Eurozone national banks and six permanent members, including the President of the ECB, Christine Lagarde.
Eurozone inflation data, measured by the Harmonized Index of Consumer Prices (HICP), is an important econometric for the Euro. If inflation rises more than expected, especially if above the ECB’s 2% target, it obliges the ECB to raise interest rates to bring it back under control. Relatively high interest rates compared to its counterparts will usually benefit the Euro, as it makes the region more attractive as a place for global investors to park their money.
Data releases gauge the health of the economy and can impact on the Euro. Indicators such as GDP, Manufacturing and Services PMIs, employment, and consumer sentiment surveys can all influence the direction of the single currency. A strong economy is good for the Euro. Not only does it attract more foreign investment but it may encourage the ECB to put up interest rates, which will directly strengthen the Euro. Otherwise, if economic data is weak, the Euro is likely to fall. Economic data for the four largest economies in the euro area (Germany, France, Italy and Spain) are especially significant, as they account for 75% of the Eurozone’s economy.
Another significant data release for the Euro is the Trade Balance. This indicator measures the difference between what a country earns from its exports and what it spends on imports over a given period. If a country produces highly sought after exports then its currency will gain in value purely from the extra demand created from foreign buyers seeking to purchase these goods. Therefore, a positive net Trade Balance strengthens a currency and vice versa for a negative balance.
- US Dollar has declined ahead of today's FOMC decision.
- Consensus expects a 25 bps cut, but some analysts predict a larger 50 bps cut.
- Fed's Dot Plot will be closely watched, as they are expected to show a dovish shift.
The US Dollar Index (DXY), which measures the value of the USD against a basket of six currencies, has declined ahead of today's Federal Open Market Committee (FOMC) decision. Market consensus anticipates a 25-basis-point (bps) rate cut, although some analysts predict a larger 50 bps reduction. The Fed's Dot Plot, which outlines the FOMC members' projections for future interest rate movements, will be closely scrutinized for any signs of a dovish shift.
The pricing of the markets of a 50 bps cut seems unrealistic as, despite weakness in the labor market, the overall economy is showing resilience.
Daily digest market movers: US Dollar remains soft ahead of FOMC
- US Dollar remained weak ahead of the FOMC meeting, with the market pricing in a nearly 70% chance of a 50 bps rate cut.
- FOMC is expected to cut rates by 25 bp, but a 50 bp cut is also possible.
- New Dot Plot will be closely watched for signs of a dovish shift in the Fed's policy outlook.
- US Dollar is likely to weaken if the Fed cuts rates by 50 bps and signals a more dovish stance.
- Powell’s presser will also be closely followed for further clues.
DXY technical outlook: DXY indicators suggest a negative outlook
Technical analysis of the DXY index suggests a negative outlook, with indicators remaining in negative territory. In addition, the loss of the 20-day Simple Moving Average (SMA) indicates a fading buying momentum.
The Relative Strength Index (RSI) is pointing downwards and remains below 50, indicating bearish sentiment. The Moving Average Convergence Divergence (MACD) is printing lower green bars, further supporting the bearish trend. Supports are identified at 100.50, 100.30 and 100.00, while resistance levels lie at 101.00, 101.30 and 101.60.
US Dollar FAQs
The US Dollar (USD) is the official currency of the United States of America, and the ‘de facto’ currency of a significant number of other countries where it is found in circulation alongside local notes. It is the most heavily traded currency in the world, accounting for over 88% of all global foreign exchange turnover, or an average of $6.6 trillion in transactions per day, according to data from 2022. Following the second world war, the USD took over from the British Pound as the world’s reserve currency. For most of its history, the US Dollar was backed by Gold, until the Bretton Woods Agreement in 1971 when the Gold Standard went away.
The most important single factor impacting on the value of the US Dollar is monetary policy, which is shaped by the Federal Reserve (Fed). The Fed has two mandates: to achieve price stability (control inflation) and foster full employment. Its primary tool to achieve these two goals is by adjusting interest rates. When prices are rising too quickly and inflation is above the Fed’s 2% target, the Fed will raise rates, which helps the USD value. When inflation falls below 2% or the Unemployment Rate is too high, the Fed may lower interest rates, which weighs on the Greenback.
In extreme situations, the Federal Reserve can also print more Dollars and enact quantitative easing (QE). QE is the process by which the Fed substantially increases the flow of credit in a stuck financial system. It is a non-standard policy measure used when credit has dried up because banks will not lend to each other (out of the fear of counterparty default). It is a last resort when simply lowering interest rates is unlikely to achieve the necessary result. It was the Fed’s weapon of choice to combat the credit crunch that occurred during the Great Financial Crisis in 2008. It involves the Fed printing more Dollars and using them to buy US government bonds predominantly from financial institutions. QE usually leads to a weaker US Dollar.
Quantitative tightening (QT) is the reverse process whereby the Federal Reserve stops buying bonds from financial institutions and does not reinvest the principal from the bonds it holds maturing in new purchases. It is usually positive for the US Dollar.
- The Dow Jones is cycling near 41,500 as markets await the appearance of Powell.
- The Fed is set to begin a new rate cutting cycle on Wednesday.
- Markets are grappling with whether to expect a 50 or 25 bps cut.
The Dow Jones Industrial Average (DJIA) has pulled into Wednesday’s midrange near 41,500 as investors await the Federal Reserve's (Fed) first rate cut in over four years. Markets kicked off 2024 hoping for an initial rate cut in March, but have thus far been battled all the way back to Q3. Now it finally looks like the Fed is ready to play ball.
Read more: Federal Reserve set to cut interest rates in pivotal meeting for markets
Talking points from Fed officials, including Fed Chair Jerome Powell, pivoted toward finally delivering a rate cut within the past month, delivering hope to markets that have been leaning into expectations of rate moves for most of the year. The Fed is now widely expected to kick off a new rate-cutting cycle on Wednesday, and markets have already blown past the actual event to play tug-of-war with expectations of the depth of an initial cut, as well as the number of cuts expected to happen for the rest of the year.
According to the CME’s FedWatch Tool, rate markets are roughly on-balance with bets how deep the Fed’s first cut in four years will be. Rate traders have priced in 55% odds that the Fed will kick things off with a 50 bps cut right out of the gate, with the remaining 45% expecting a steadier 25 bps initial cut. The Fed drops their latest rate decision at around 2:00 pm EST/9:00 pm GMT.
Dow Jones news
The Dow Jones is roughly on-balance heading into the Fed’s rate call window, with about half of the index’s listed securities in the green in early Wednesday trading. Intel (INTC) is pulling back from a recent recovery, declining -2.3% and falling below $21 per share, while Apple (AAPL) is rebounding 2% to $221 per share. Apple is recovering after disappointing presales of their latest flagship iPhone disappointed investors, forcing the tech stock lower earlier this week.
Elsewhere in stocks, Honeywell (HON) is declining ahead of Wednesday’s Fed rate call, despite a recent announcement of a partnership with Samsung to produce carbon capture devices.
Dow Jones price forecast
Despite a tight pre-Fed pattern on Wednesday, the Dow Jones is still holding close to record highs set earlier this week. The DJIA could still make a break for higher ground above Tuesday’s record peak bid of 41,832.
However, near-term price action is playing out at the top end of a recent four-day bull run that dragged the Dow Jones up nearly 4.5% bottom-to-top. An exhaustion play on Fed expectations could see the major equity index rotate back into the low side and dip back toward the 50-day Exponential Moving Average (EMA) near 40,538.
Dow Jones daily chart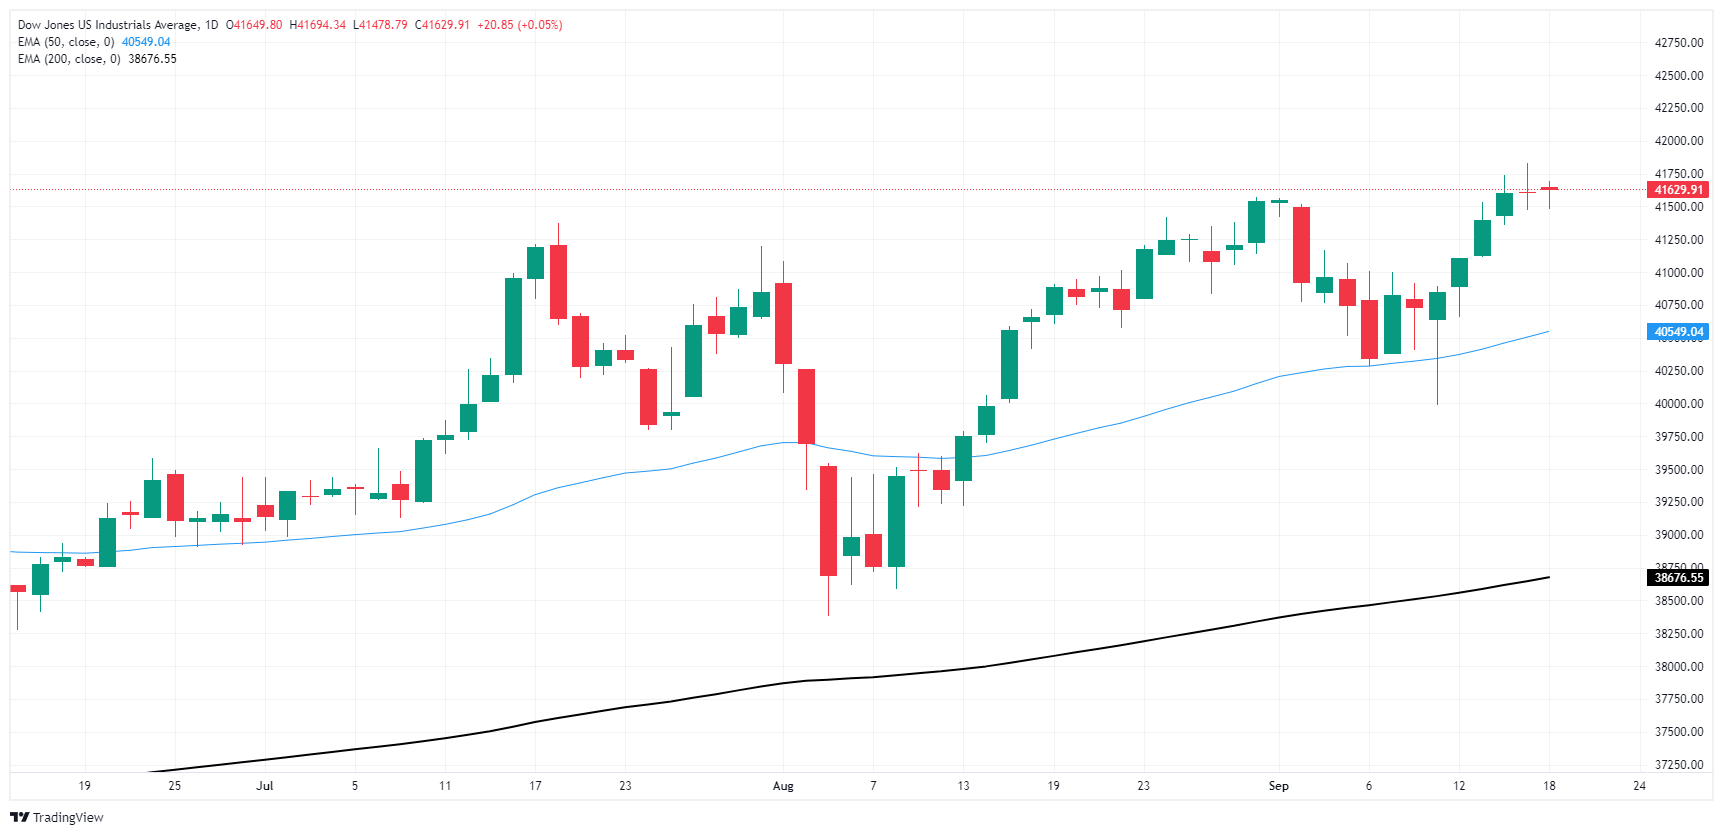
Dow Jones FAQs
The Dow Jones Industrial Average, one of the oldest stock market indices in the world, is compiled of the 30 most traded stocks in the US. The index is price-weighted rather than weighted by capitalization. It is calculated by summing the prices of the constituent stocks and dividing them by a factor, currently 0.152. The index was founded by Charles Dow, who also founded the Wall Street Journal. In later years it has been criticized for not being broadly representative enough because it only tracks 30 conglomerates, unlike broader indices such as the S&P 500.
Many different factors drive the Dow Jones Industrial Average (DJIA). The aggregate performance of the component companies revealed in quarterly company earnings reports is the main one. US and global macroeconomic data also contributes as it impacts on investor sentiment. The level of interest rates, set by the Federal Reserve (Fed), also influences the DJIA as it affects the cost of credit, on which many corporations are heavily reliant. Therefore, inflation can be a major driver as well as other metrics which impact the Fed decisions.
Dow Theory is a method for identifying the primary trend of the stock market developed by Charles Dow. A key step is to compare the direction of the Dow Jones Industrial Average (DJIA) and the Dow Jones Transportation Average (DJTA) and only follow trends where both are moving in the same direction. Volume is a confirmatory criteria. The theory uses elements of peak and trough analysis. Dow’s theory posits three trend phases: accumulation, when smart money starts buying or selling; public participation, when the wider public joins in; and distribution, when the smart money exits.
There are a number of ways to trade the DJIA. One is to use ETFs which allow investors to trade the DJIA as a single security, rather than having to buy shares in all 30 constituent companies. A leading example is the SPDR Dow Jones Industrial Average ETF (DIA). DJIA futures contracts enable traders to speculate on the future value of the index and Options provide the right, but not the obligation, to buy or sell the index at a predetermined price in the future. Mutual funds enable investors to buy a share of a diversified portfolio of DJIA stocks thus providing exposure to the overall index.
- Mexican Peso depreciates over 0.80% as traders eye Fed’s first rate cut in four years.
- Fed is expected to lower rates by at least 108 basis points by the end of 2024, potentially pressuring the US Dollar.
- Mixed Q2 data in Mexico and concerns over judicial reform may reduce investment attractiveness, adding to Peso volatility.
The Mexican Peso edged lower against the US Dollar during the North American session on Wednesday, dropping over 0.80% as traders prepared for the Federal Open Market Committee (FOMC) decision on interest rates. Data from Mexico was mixed, though it failed to boost the Mexican currency. At the time of writing, the USD/MXN trades at 19.26 after hitting a low of 19.06.
Investors are focused on the FOMC meeting as expectations for a 50-basis-point (bps) rate cut had been trimmed from 63% a day ago to 55% as of writing, according to the CME FedWatch Tool. Consequently, the odds of easing 25 bps increased to 45%.
The December 2024 fed funds rate futures contract suggests that the Fed might lower rates by at least 108 basis points, implying that in one of the three meetings left in 2024, they will cut 50 bps.
This would likely keep the USD/MXN downwardly pressured as the interest-rate differential between Mexico and the US will widen again. However, it could be short-lived, as the Bank of Mexico (Banxico) is expected to lower rates by 0.25% at the September 26 monetary policy meeting decision.
Aggregate Demand and Private Spending in Mexico in Q2 contracted every quarter, though they expanded in YoY figures.
In the meantime, Victor Manuel Herrera, President of Instituto Mexicano de Ejecutivos de Finanzas (IMEF), commented that the judicial reform and the disappearance of autonomous organizations might affect the economy in Mexico and reduce investment attractiveness, given the phenomenon of companies relocating from the US.
Daily digest market movers: Mexican Peso weighed down by weak Mexican data, Fed decision
- USD/MXN would continue to be driven by market mood and expectations for a bigger Fed rate cut.
- Mexico’s Aggregate Demand in Q2 shrank -0.4%, below the previous reading of 1.2%. Private Spending in the second quarter plunged by 0.6% and trailed Q1’s expansion by 1.8%.
- US Building Permits in August grew by 4.9% MoM from 1.406 million to 1.475 million.
- Housing Starts expanded by 9.6% and rose from 1.237 million to 1.356 million.
USD/MXN technical outlook: Mexican Peso falls as USD/MXN holds gains above 19.30
The USD/MXN uptrend remains intact, though the FOMC’s decision could rock the boat sharply and increase volatility. Momentum hints that bulls are gathering steam, as shown by the Relative Strength Index (RSI).
If USD/MXN climbs above 19.50, the next resistance would be the 20.00 psychological level. Further upside emerges at the yearly peak at 20.22, followed by the 20.50 mark.
Conversely, if USD/MXN drops below 19.15, key support levels emerge, like the August 23 daily low of 19.02, ahead of the 50-day Simple Moving Average (SMA) at 18.99.
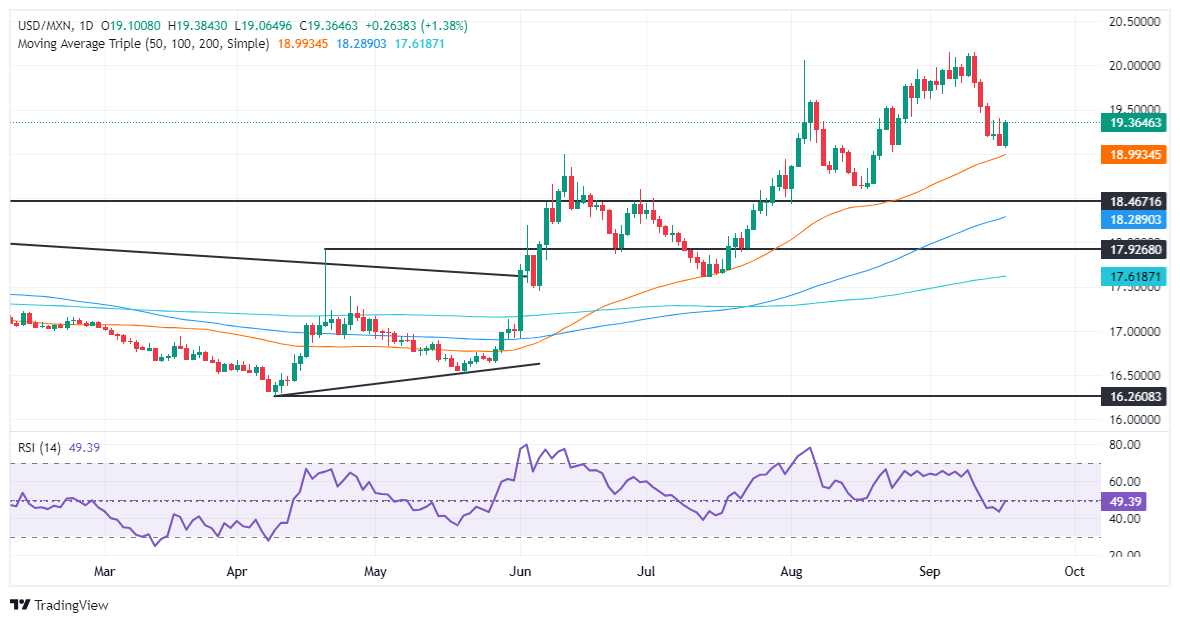
Mexican Peso FAQs
The Mexican Peso (MXN) is the most traded currency among its Latin American peers. Its value is broadly determined by the performance of the Mexican economy, the country’s central bank’s policy, the amount of foreign investment in the country and even the levels of remittances sent by Mexicans who live abroad, particularly in the United States. Geopolitical trends can also move MXN: for example, the process of nearshoring – or the decision by some firms to relocate manufacturing capacity and supply chains closer to their home countries – is also seen as a catalyst for the Mexican currency as the country is considered a key manufacturing hub in the American continent. Another catalyst for MXN is Oil prices as Mexico is a key exporter of the commodity.
The main objective of Mexico’s central bank, also known as Banxico, is to maintain inflation at low and stable levels (at or close to its target of 3%, the midpoint in a tolerance band of between 2% and 4%). To this end, the bank sets an appropriate level of interest rates. When inflation is too high, Banxico will attempt to tame it by raising interest rates, making it more expensive for households and businesses to borrow money, thus cooling demand and the overall economy. Higher interest rates are generally positive for the Mexican Peso (MXN) as they lead to higher yields, making the country a more attractive place for investors. On the contrary, lower interest rates tend to weaken MXN.
Macroeconomic data releases are key to assess the state of the economy and can have an impact on the Mexican Peso (MXN) valuation. A strong Mexican economy, based on high economic growth, low unemployment and high confidence is good for MXN. Not only does it attract more foreign investment but it may encourage the Bank of Mexico (Banxico) to increase interest rates, particularly if this strength comes together with elevated inflation. However, if economic data is weak, MXN is likely to depreciate.
As an emerging-market currency, the Mexican Peso (MXN) tends to strive during risk-on periods, or when investors perceive that broader market risks are low and thus are eager to engage with investments that carry a higher risk. Conversely, MXN tends to weaken at times of market turbulence or economic uncertainty as investors tend to sell higher-risk assets and flee to the more-stable safe havens.
- The RSI and MACD indicate a decline in buying pressure.
- The pair remains locked in a sideways range between 0.8420-0.8460.
- The cross cleared most of Tuesday’s gains.
Tuesday's 0.28% rise to 0.8450 in the EUR/GBP has retraced due to the 0.49% decline on Wednesday. The latest price action and technical indicators paint a mixed technical outlook.
The EUR/GBP's price movements have fluctuated within a narrow range in the last sessions. Yet, Wednesday's signal ongoing selling pressure. The Relative Strength Index (RSI), which currently stands at 43, suggests that selling pressure is rising. The RSI's negative terrain and descending slope further reinforce this view. Furthermore, the Moving Average Convergence Divergence (MACD) histogram, while still green, is showing a decrease, suggesting that the recently gained buying pressure is easing.
EUR/GBP daily chart
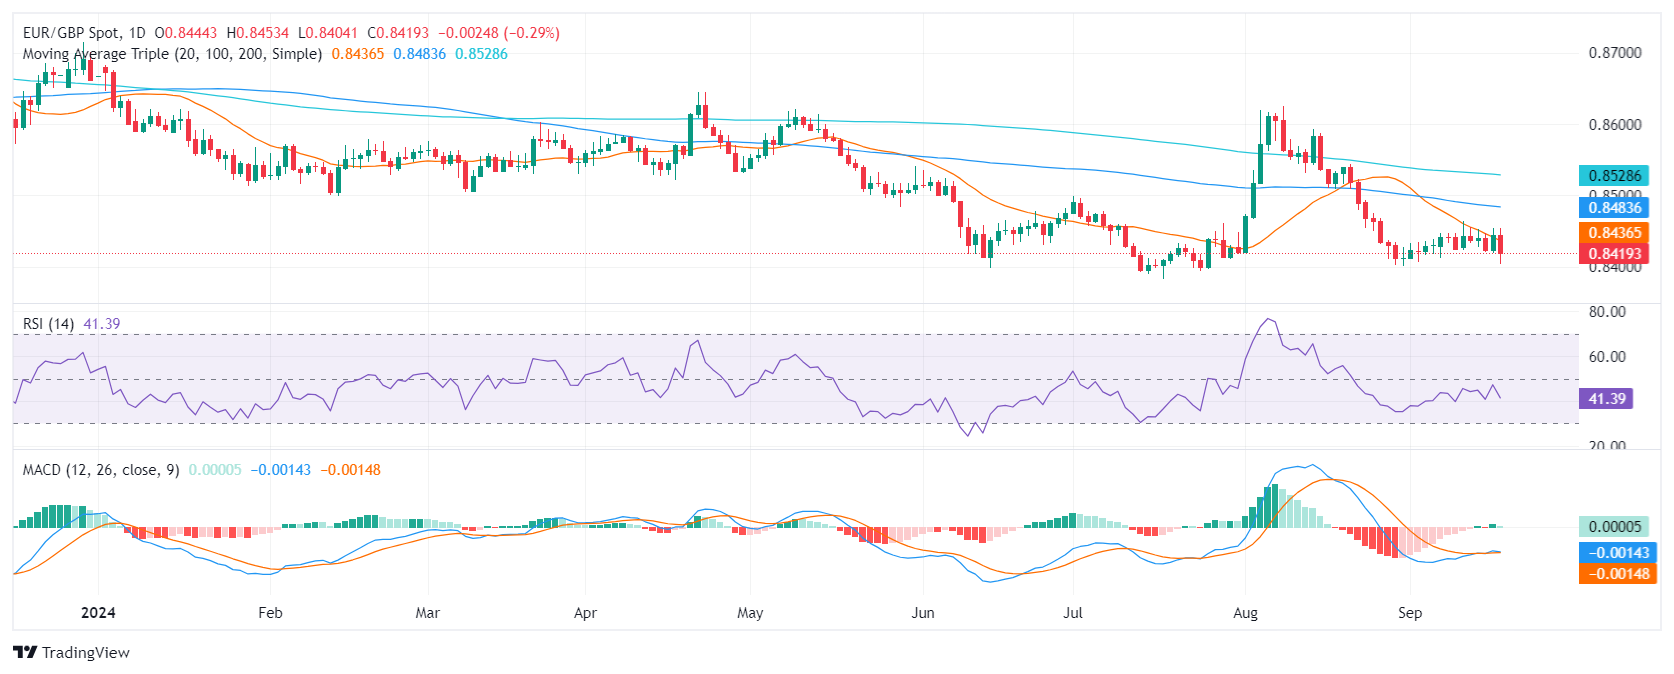
Based on the mixed technical outlook, the EUR/GBP's future direction is uncertain. A break above the immediate resistance level of 0.8460 could potentially target 0.8480 and 0.8500. Conversely, a break below 0.8420 could open up further downside potential toward 0.8400 and 0.8380.
- USD/JPY downtrend persists, with the RSI favoring sellers ahead of the Fed's rate cut decision.
- A 25-bps Fed rate cut could push USD/JPY higher toward 142.47, with potential to target the 143.00 figure.
- A 50-bps cut could lead to a retest of 140.32, with further downside aiming for the YTD low of 139.58.
The USD/JPY dropped after reaching a four-day high of 142.47, yet it remains range-bound during the North American session. The rise in US Treasury yields and a soft US Dollar keeps the pair trapped within the September 17 trading range. Therefore, the major trades at 141.88, losses 0.36%
USD/JPY Price Forecast: Technical outlook
The USD/JPY downtrend remains in place, but the Federal Reserve’s decision to cut rates by a smaller or larger size could trigger different reactions. The Relative Strength Index (RSI) favors sellers, hence further downside.
If the Fed lowers rates by 25 basis points, this could be bullish for the USD/JPY and push prices toward the September 17 high at 142.47, which, if cleared, will expose the 143.00 figure.
On the other hand, a 50 bps rate cut could allow the September 17 low of 140.32 to be retested and pave the way for the challenge of the year-to-date (YTD) low of 139.58.
USD/JPY Price Action – Daily Chart
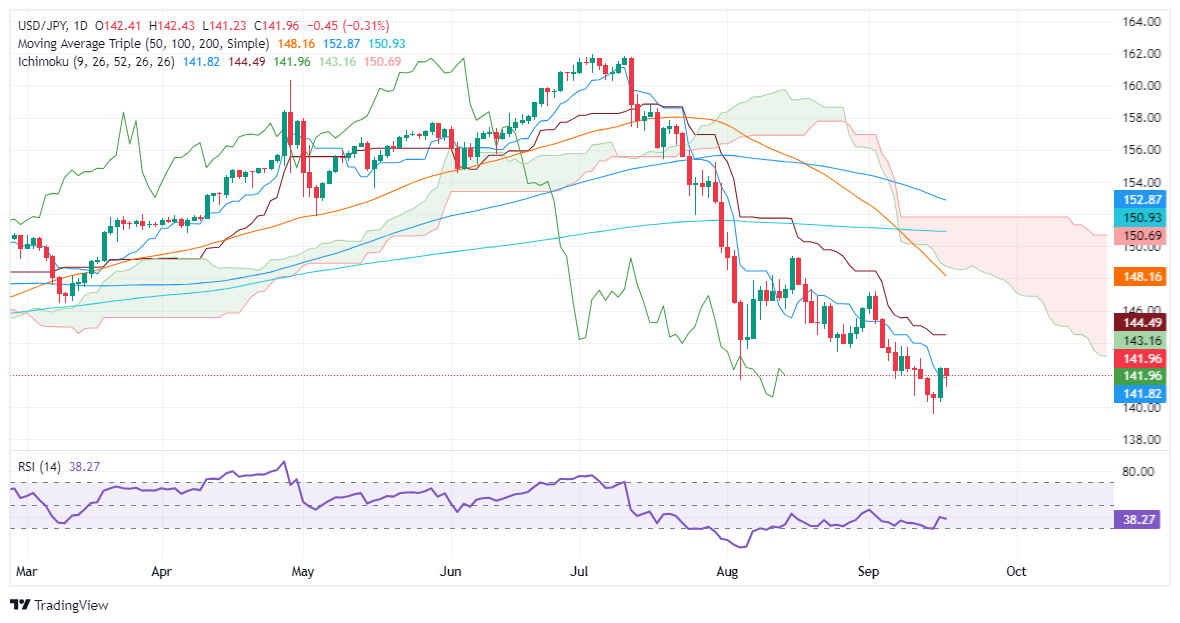
Japanese Yen PRICE Today
The table below shows the percentage change of Japanese Yen (JPY) against listed major currencies today. Japanese Yen was the strongest against the US Dollar.
| USD | EUR | GBP | JPY | CAD | AUD | NZD | CHF | |
|---|---|---|---|---|---|---|---|---|
| USD | -0.04% | -0.32% | -0.31% | -0.04% | -0.16% | -0.37% | -0.19% | |
| EUR | 0.04% | -0.29% | -0.30% | -0.01% | -0.12% | -0.35% | -0.15% | |
| GBP | 0.32% | 0.29% | 0.00% | 0.28% | 0.18% | -0.07% | 0.17% | |
| JPY | 0.31% | 0.30% | 0.00% | 0.27% | 0.16% | -0.05% | 0.17% | |
| CAD | 0.04% | 0.01% | -0.28% | -0.27% | -0.12% | -0.34% | -0.11% | |
| AUD | 0.16% | 0.12% | -0.18% | -0.16% | 0.12% | -0.21% | 0.00% | |
| NZD | 0.37% | 0.35% | 0.07% | 0.05% | 0.34% | 0.21% | 0.21% | |
| CHF | 0.19% | 0.15% | -0.17% | -0.17% | 0.11% | -0.01% | -0.21% |
The heat map shows percentage changes of major currencies against each other. The base currency is picked from the left column, while the quote currency is picked from the top row. For example, if you pick the Japanese Yen from the left column and move along the horizontal line to the US Dollar, the percentage change displayed in the box will represent JPY (base)/USD (quote).
- GBP/USD bias remains bullish, with the RSI favoring buyers, though profit-taking ahead of the Fed decision limits further gains.
- A 25-bps Fed rate cut could see GBP/USD fall toward support at 1.3200, 1.3151, and 1.3100, with a potential retest of 1.3001.
- A 50-bps cut could push GBP/USD above 1.3300, targeting the March 2022 high of 1.3437.
The Pound Sterling posted modest gains during the North American session, hitting a three-week high of 1.3254, but failed to gain traction as traders braced for the Federal Reserve’s monetary policy decision. Therefore, GBP/USD traders dragged the exchange rate toward 1.3205, still above its opening price by 0.30%.
GBP/USD Price Forecast: Technical outlook
The GBP/USD bias is bullish, though it has failed to break to new yearly highs due to a possible change of scenario. At the time of writing, the Relative Strength Index (RSI) favors buyers, while price action hints they-‘re booking profits ahead of the Fed.
If Powell and Co. decide to cut rates by 25 basis points (bps), further downsides will be seen in the GBP/USD. This will put into play the 1.3200 figure and the daily low of 1.3151. If those levels are taken out, the next support would be 1.3100 ahead of the latest cycle low at 1.3001, the September 11 low.
On the other hand, a 50-bps cut could cause the GBP/USD to climb past 1.3300, opening the door to testing the March 1, 2022 peak at 1.3437.
GBP/USD Price Action – Daily Chart
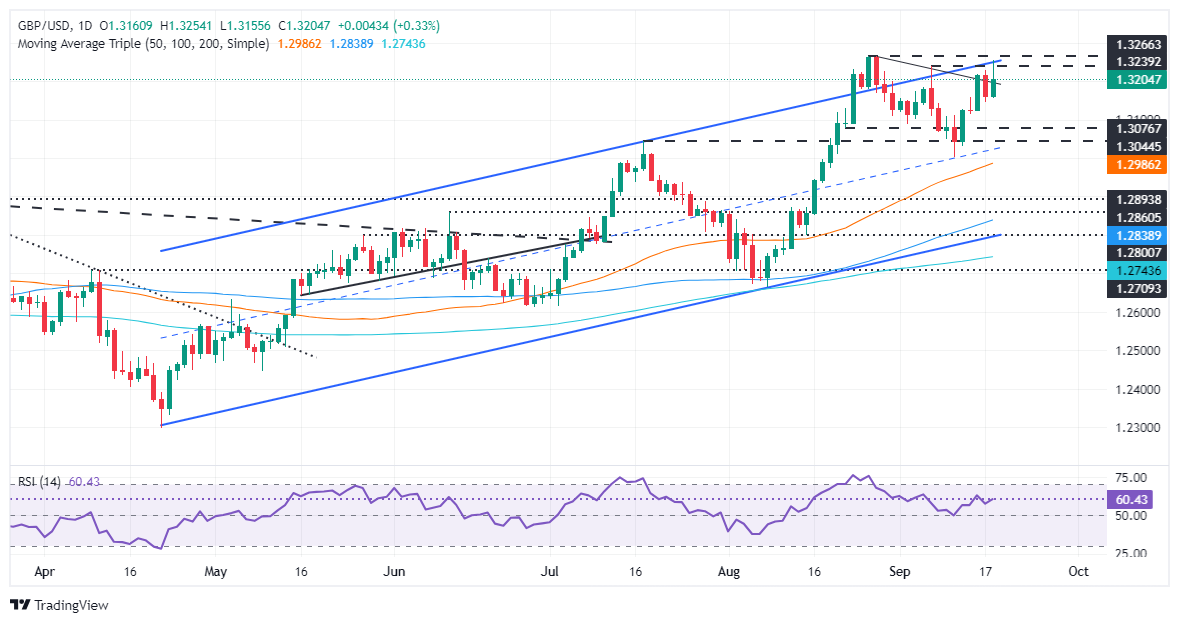
British Pound PRICE Today
The table below shows the percentage change of British Pound (GBP) against listed major currencies today. British Pound was the strongest against the US Dollar.
| USD | EUR | GBP | JPY | CAD | AUD | NZD | CHF | |
|---|---|---|---|---|---|---|---|---|
| USD | -0.04% | -0.34% | -0.31% | -0.05% | -0.18% | -0.39% | -0.20% | |
| EUR | 0.04% | -0.32% | -0.28% | -0.01% | -0.14% | -0.36% | -0.16% | |
| GBP | 0.34% | 0.32% | 0.02% | 0.30% | 0.18% | -0.05% | 0.18% | |
| JPY | 0.31% | 0.28% | -0.02% | 0.28% | 0.15% | -0.05% | 0.16% | |
| CAD | 0.05% | 0.00% | -0.30% | -0.28% | -0.13% | -0.35% | -0.12% | |
| AUD | 0.18% | 0.14% | -0.18% | -0.15% | 0.13% | -0.20% | 0.03% | |
| NZD | 0.39% | 0.36% | 0.05% | 0.05% | 0.35% | 0.20% | 0.20% | |
| CHF | 0.20% | 0.16% | -0.18% | -0.16% | 0.12% | -0.03% | -0.20% |
The heat map shows percentage changes of major currencies against each other. The base currency is picked from the left column, while the quote currency is picked from the top row. For example, if you pick the British Pound from the left column and move along the horizontal line to the US Dollar, the percentage change displayed in the box will represent GBP (base)/USD (quote).
Gold price is waiting for the Fed interest rate decision. The price is off its all-time highs for now. For Gold to rise back and, probably, above the all-tine high price, interest rates would have to be cut by 50 basis points, Commerzbank’s commodity analyst Carsten Fritsch notes.
Further interest rate cuts need to be signaled very clearly
“The Gold price has retreated somewhat from its record high of $2,590 per troy ounce recorded at the beginning of the week, and is currently trading around $20 lower. The price increase to the aforementioned record high was largely driven by expectations that the US Federal Reserve would cut interest rates by 50 basis points at its meeting that started yesterday.”
“According to the Fed Funds Futures, the probability of this is around 60 percent. Should the Fed, as we expect, cut interest rates ‘only’ by 25 basis points, this is likely to cause disappointment in the market and thus weigh on the Gold price.”
“If these do not deviate too much from current market expectations, the downside potential for Gold should be limited. For Gold to rise and mark new all-time highs following the Fed meeting, interest rates would have to be cut by 50 basis points today and, in addition, further substantial interest rate cuts would have to be signaled very clearly.”
The upcoming FOMC meeting is going to be quite contentious, but not for the Gold market, TDS commodity analyst Daniel Ghali notes.
The pain trade is to the downside
“Rates traders are divided on the outlook for Fed cuts for the next several meetings. One market where we do not see such division: Gold. Consensus is unanimously bullish, macro fund positions are at extremes and levered participants have scarcely held this bloated of a position.”
“A dry-powder analysis of Comex non-commercial positioning suggests that this froth is not associated with the breadth of traders long, but rather with the position size held by these traders. And given that the scale of macro fund positioning has reached extreme levels that have historically marked local tops, bloated position sizes argue for additional pain on a hawkish disappointment.”
“Shanghai traders have unwound some length in recent weeks from record highs, and Asian physical markets remain on a buyer's strike. Central banks are still buying, but the pace has significantly slowed and the latest data suggests it's now at its lowest levels of the last five years on a 6-month moving average basis. Hate it or love it, the pain trade is to the downside.”
- NZD/USD surges to near 0.6230 as the Kiwi dollar performs strongly.
- Investors await the Fed’s interest rate decision, which is expected to be dovish.
- Traders lean towards Fed 50 bps rate cut prospects.
The NZD/USD pair delivers a sharp upside move to near 0.6230 in Wednesday’s North American session. The kiwi asset rallies as the New Zealand Dollar (NZD) strengthens despite the Reserve Bank of New Zealand (RBNZ) is expected to soften its Official Cash Rate (OCR) further due to weak economic performance and the US Dollar (USD) is down ahead of Federal Reserve’s (Fed) monetary policy decision.
For fresh insights on NZ’s economic health, investors will focus on the Q2 Gross Domestic Product (GDP) data, which will be published on Thursday. The NZ economy is estimated to have contracted by 0.5% on an annualized basis after growing by 0.3% in the second quarter of the last fiscal year.
Meanwhile, the major trigger for the Kiwi asset will be the Fed’s policy announcement at 18:00 GMT. The Fed is poised to deliver its first interest rate cut decision in more than four years. Investors will keenly focus on the Fed’s likely interest rate cut size and the dot plot.
According to the CME FedWatch tool, 30-day Federal Funds Futures pricing data shows that the probability of the central bank cutting rates by 50 basis points (bps) to 4.75%-5.00% is 61% and the rest favors a 25-bps rate cut.
NZD/USD extends its recovery above 23.6% Fibonacci retracement (plotted from the August 5 low of 0.5850 to the August 29 high of 0.6300) near 0.6200. Earlier, the asset rebounded strongly after retracing 38.2% from the August 29 high of 0.6300 to near 0.6130. The 20-period Exponential Moving Average (EMA) near 0.6200 continues to provide support to the New Zealand Dollar bulls.
The 14-period Relative Strength Index (RSI) stands above 60.00. A fresh round of bullish momentum could occur if the oscillator sustains around this level.
Further upside above the September 6 high of 0.6250 would drive the asset towards the September 2 high of 0.6300, followed by this year's high of 0.6330.
In an alternate scenario, a downside move would appear if the asset decisively breaks the July 17 high near 0.6100. This would push the asset lower to the May 3 high at 0.6046 and the psychological support of 0.6000.
NZD/USD four-hour chart
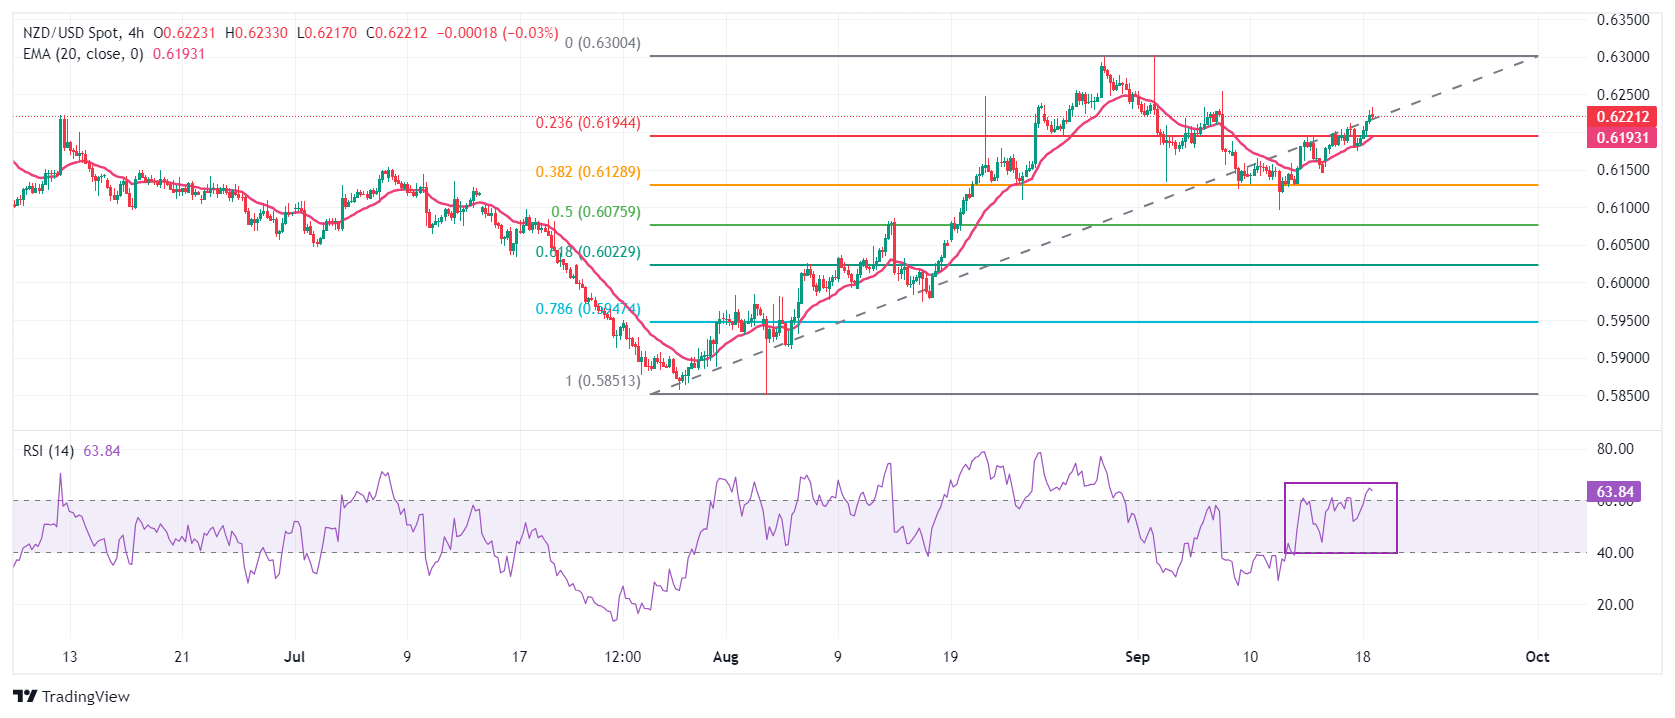
New Zealand Dollar FAQs
The New Zealand Dollar (NZD), also known as the Kiwi, is a well-known traded currency among investors. Its value is broadly determined by the health of the New Zealand economy and the country’s central bank policy. Still, there are some unique particularities that also can make NZD move. The performance of the Chinese economy tends to move the Kiwi because China is New Zealand’s biggest trading partner. Bad news for the Chinese economy likely means less New Zealand exports to the country, hitting the economy and thus its currency. Another factor moving NZD is dairy prices as the dairy industry is New Zealand’s main export. High dairy prices boost export income, contributing positively to the economy and thus to the NZD.
The Reserve Bank of New Zealand (RBNZ) aims to achieve and maintain an inflation rate between 1% and 3% over the medium term, with a focus to keep it near the 2% mid-point. To this end, the bank sets an appropriate level of interest rates. When inflation is too high, the RBNZ will increase interest rates to cool the economy, but the move will also make bond yields higher, increasing investors’ appeal to invest in the country and thus boosting NZD. On the contrary, lower interest rates tend to weaken NZD. The so-called rate differential, or how rates in New Zealand are or are expected to be compared to the ones set by the US Federal Reserve, can also play a key role in moving the NZD/USD pair.
Macroeconomic data releases in New Zealand are key to assess the state of the economy and can impact the New Zealand Dollar’s (NZD) valuation. A strong economy, based on high economic growth, low unemployment and high confidence is good for NZD. High economic growth attracts foreign investment and may encourage the Reserve Bank of New Zealand to increase interest rates, if this economic strength comes together with elevated inflation. Conversely, if economic data is weak, NZD is likely to depreciate.
The New Zealand Dollar (NZD) tends to strengthen during risk-on periods, or when investors perceive that broader market risks are low and are optimistic about growth. This tends to lead to a more favorable outlook for commodities and so-called ‘commodity currencies’ such as the Kiwi. Conversely, NZD tends to weaken at times of market turbulence or economic uncertainty as investors tend to sell higher-risk assets and flee to the more-stable safe havens.
- Eurozone’s HICP rose 2.2% YoY in August, aligning with expectations but capping the Euro's recovery.
- ECB official Francois Villeroy signals potential rate cuts, while Bundesbank’s Joachim Nael warns inflation isn’t yet at target levels.
- BoJ’s policy decision looms, with concerns about Yen strength potentially reducing chances for further rate hikes.
The Euro edged lower against the Japanese Yen in early trading during the North American session, down by 0.29%, after the Eurozone’s (EU) inflation approaches the European Central Bank’s (ECB) 2% goal. The EUR/JPY trades at 157.74 after hitting a high of 158.25.
EUR/JPY drops on dovish ECB comments, as traders eye BoJ’s policy decision
Eurostat revealed that the Harmonized Index of Consumer Prices (HICP) rose by 2.2% YoY in August, as estimated and aligned with the previous month's reading. The data underpinned the EUR/JPY, which was trading near daily lows of 157.04.
The Euro’s recovery was capped by ECB official Francois Villeroy's dovish comments, reaffirming that the ECB will likely continue lowering borrowing costs.
Conversely, Bundesbank President and ECB member Joachim Nael stated, “Inflation is currently not where we want it to be,” pushing back against a possible rate cut in October.
The Bank of Japan will host its monetary policy decision on Friday. Although BoJ officials leaned hawkish, some members had grown wary of the rise in the Yen, which may hinder BoJ’s chances for additional hikes, as a stronger currency would lower import costs and slow inflation.
EUR/JPY Price Forecast: Technical outlook
From a technical standpoint, the EUR/JPY is downward biased, though it could consolidate within the Tenkan-Sen (157.35) and Kijun Sen (159.51). The Relative Strength Index (RSI) favors sellers, though it shifted flat, while price action suggests that a leg-up may be underway.
Nevertheless, buyers must push prices above September's 17 high of 158.32. Once surpassed, this will expose 159.00, followed by the Kijun-Sen at 159.51. On further strength, the 160.00 mark is up for grabs. Otherwise, a drop below 158.00 will expose the Tenkan-Sen at 157.35, followed by the September 17 low of 156.04.
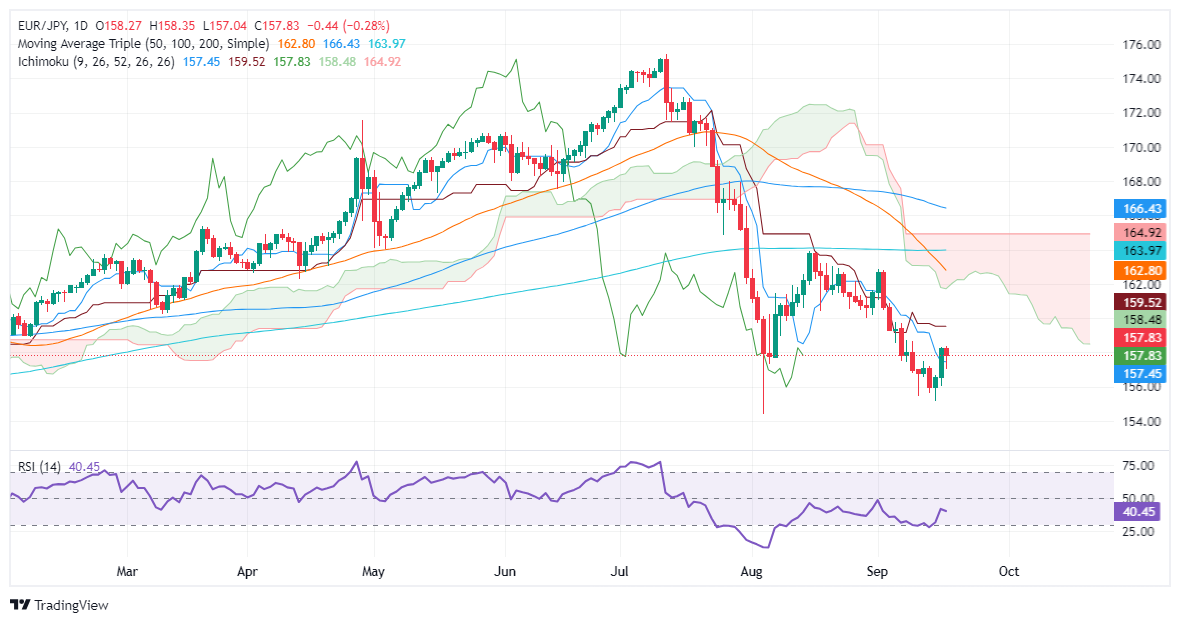
Euro FAQs
The Euro is the currency for the 20 European Union countries that belong to the Eurozone. It is the second most heavily traded currency in the world behind the US Dollar. In 2022, it accounted for 31% of all foreign exchange transactions, with an average daily turnover of over $2.2 trillion a day. EUR/USD is the most heavily traded currency pair in the world, accounting for an estimated 30% off all transactions, followed by EUR/JPY (4%), EUR/GBP (3%) and EUR/AUD (2%).
The European Central Bank (ECB) in Frankfurt, Germany, is the reserve bank for the Eurozone. The ECB sets interest rates and manages monetary policy. The ECB’s primary mandate is to maintain price stability, which means either controlling inflation or stimulating growth. Its primary tool is the raising or lowering of interest rates. Relatively high interest rates – or the expectation of higher rates – will usually benefit the Euro and vice versa. The ECB Governing Council makes monetary policy decisions at meetings held eight times a year. Decisions are made by heads of the Eurozone national banks and six permanent members, including the President of the ECB, Christine Lagarde.
Eurozone inflation data, measured by the Harmonized Index of Consumer Prices (HICP), is an important econometric for the Euro. If inflation rises more than expected, especially if above the ECB’s 2% target, it obliges the ECB to raise interest rates to bring it back under control. Relatively high interest rates compared to its counterparts will usually benefit the Euro, as it makes the region more attractive as a place for global investors to park their money.
Data releases gauge the health of the economy and can impact on the Euro. Indicators such as GDP, Manufacturing and Services PMIs, employment, and consumer sentiment surveys can all influence the direction of the single currency. A strong economy is good for the Euro. Not only does it attract more foreign investment but it may encourage the ECB to put up interest rates, which will directly strengthen the Euro. Otherwise, if economic data is weak, the Euro is likely to fall. Economic data for the four largest economies in the euro area (Germany, France, Italy and Spain) are especially significant, as they account for 75% of the Eurozone’s economy.
Another significant data release for the Euro is the Trade Balance. This indicator measures the difference between what a country earns from its exports and what it spends on imports over a given period. If a country produces highly sought after exports then its currency will gain in value purely from the extra demand created from foreign buyers seeking to purchase these goods. Therefore, a positive net Trade Balance strengthens a currency and vice versa for a negative balance.
- EUR/CHF has unfolded a correction over the last four days.
- This move now looks almost complete and the bullish prior move is likely to resume.
EUR/CHF pulls back in the middle of a recovery rally. Despite the overall bearish medium-term trend the pair is showing signs it could press higher in the short-term.
EUR/CHF Daily Chart
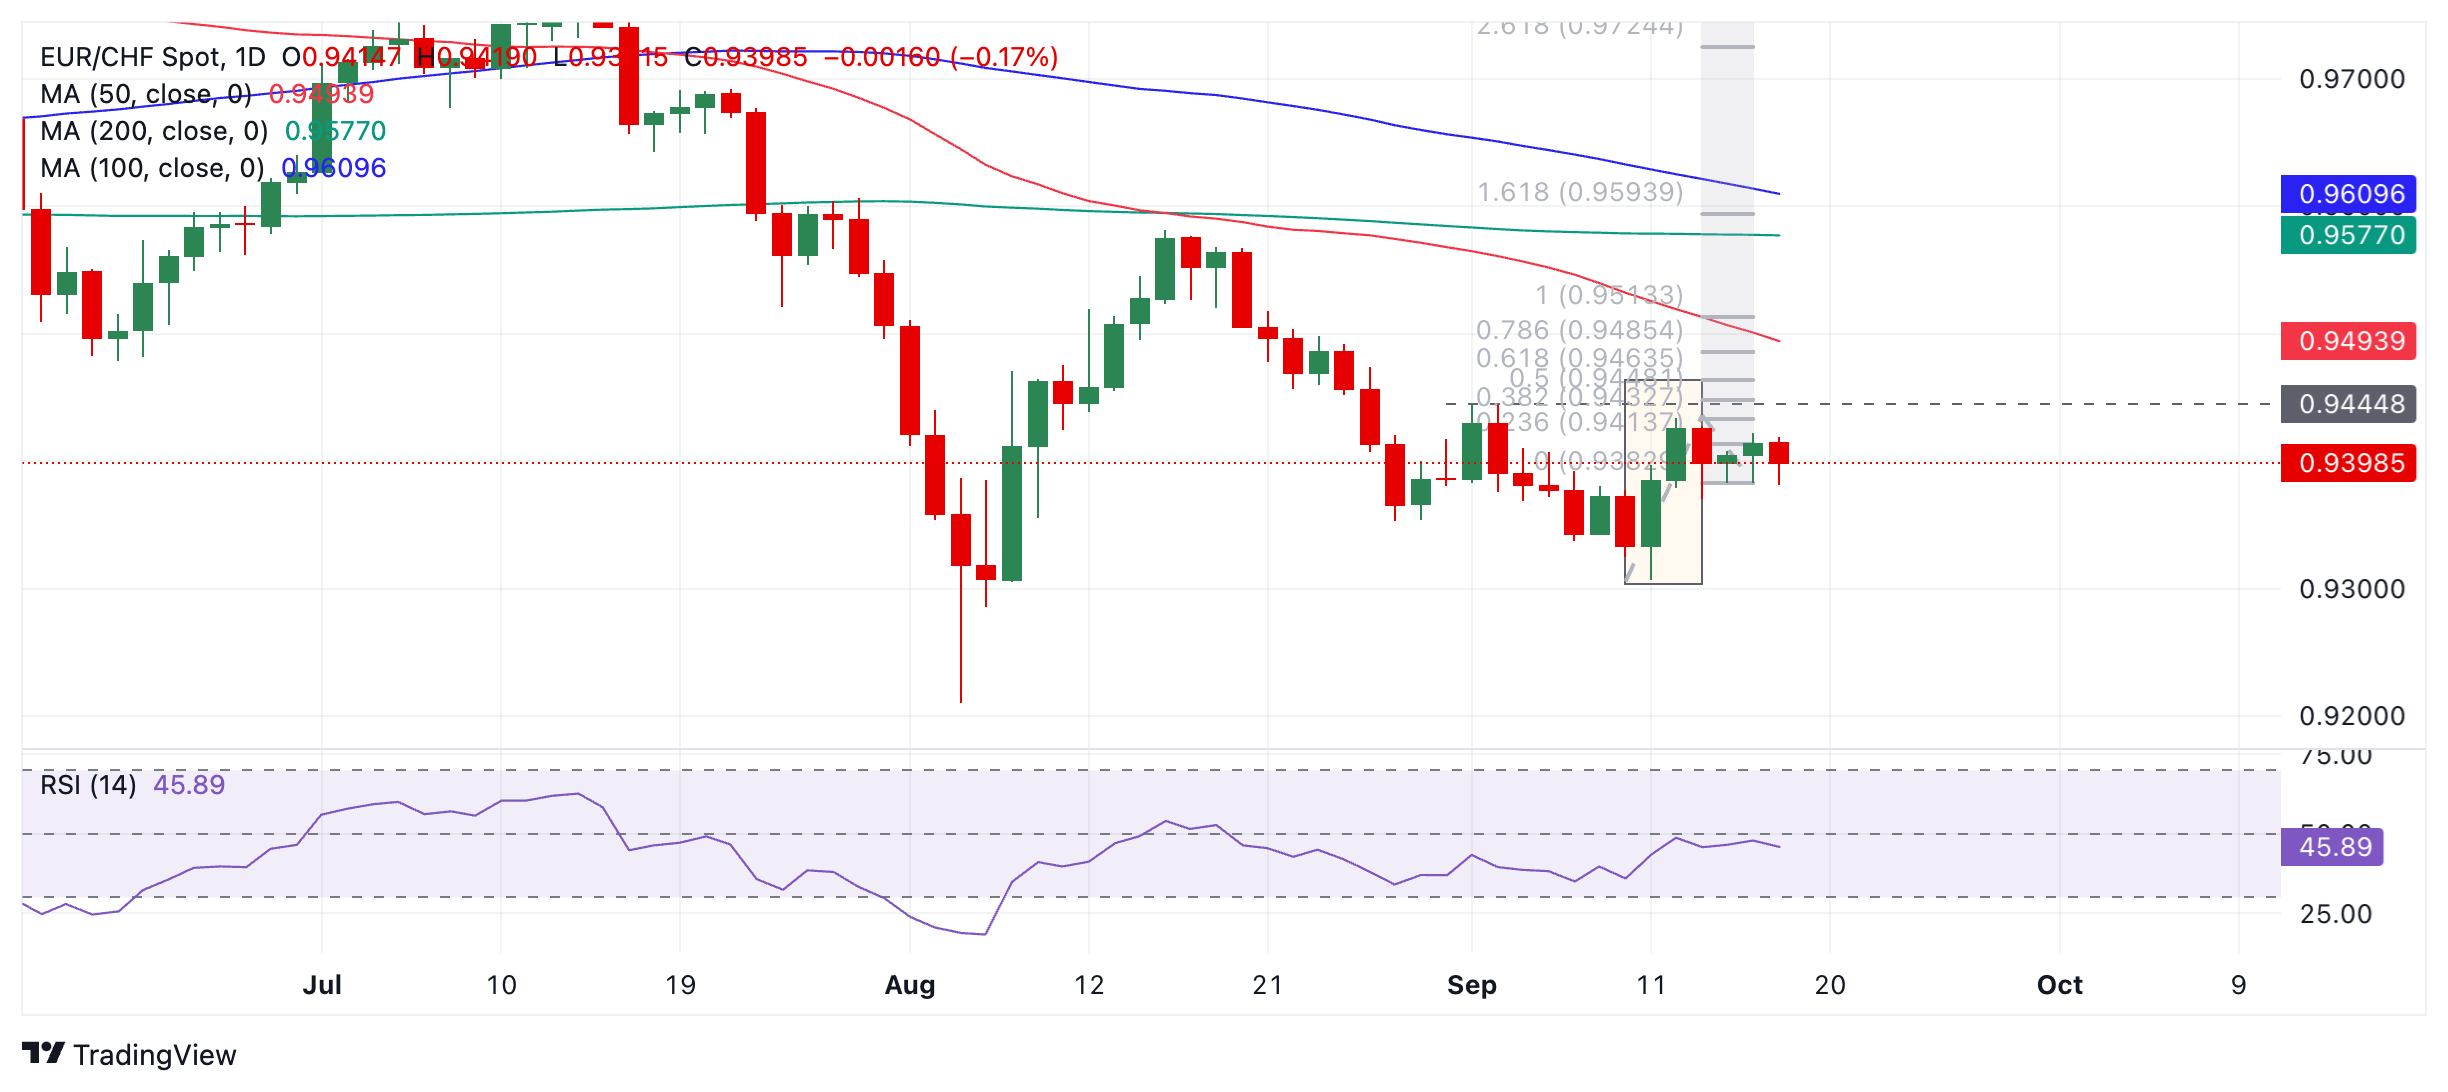
EUR/CHF formed a Bullish Engulfing Japanese candlestick pattern on the day it bottomed on September 11 (shaded rectangle). This happens when price reaches a new low in a downtrend, reverses during the same day and closes higher. When the body of the recovery candle encompasses – or “engulfs” – the whole of the previous day’s body it is known in technical analysis as a Bullish Engulfing. The following day was a green up day adding confirmation to the Bullish Engulfing. The whole pattern is a short-term bullish signal.
Not long after the recovery, the pair pulled back on September 12, however, the correction has been shallow and seems to have traced out a vague three-wave corrective pattern. This suggests the bullish rebound will probably resume. The correction also looks close to completion.
A break above 0.9434 (September 12 high) would confirm a continuation higher, with the next target at 0.9464, followed by 0.9513 in the case of a particularly bullish move.
A break below 0.9369 would probably invalidate the bullish hypothesis and suggest a more neutral or bearish outlook.
UK CPI data that came earlier dampened already low BoE easing expectations for the upcoming meeting, while the Pound Sterling (GPB) pushed higher on the data to retest yesterday’s highs in the low 1.32s, Scotiabank’s Chief FX Strategist Shaun Osborne notes.
Core and services CPI gain, dousing BoE bets
“UK CPI data were in line with expectations. The data dampened already low BoE easing expectations for tomorrow’s meeting even further. Sterling pushed higher on the data to retest yesterday’s highs in the low 1.32s.”
“A solid intraday rebound from the mid 1.31 zone puts a positive spin on short-term GBP price action but gains have stalled around 1.3225/30, near yesterday’s high. Broader price patterns and solidly bullish trend signals suggest a bias towards GBP gains and firm support on minor dips.”
“Resistance is 1.3255/65 and 1.3330. Support is 1.3150.”
- USD/CAD performs weakly below 1.3600 with Fed policy on the horizon.
- Investors will keenly focus on the Fed rate cut size and dot plot.
- The BoC is expected to cut interest rates again in October.
The USD/CAD pair remains below the crucial resistance of 1.3600 in Wednesday’s North American session. The Loonie asset faces selling pressure as the US Dollar (USD) performs weakly against its major peers ahead of the Federal Reserve’s (Fed) monetary policy decision at 18:00 GMT.
Market sentiment appear to be cheerful as risk-perceived assets are performing strongly, with growing confidence that the Fed will deliver a 50-basis points (bps) interest rate cut. The US Dollar Index (DXY), which tracks the Greenback’s value against six major currencies, declines to near 100.70.
The message from the Fed would be clear that officials are highly concerned over deteriorating labor market conditions, if it starts the policy-easing cycle with an outsize interest rate cut. This could result in more downside in the US Dollar and will pave way for foreign flows to emerging economies.
Apart from the Fed’s likely interest rate cut size, investors will focus on the dot plot and economic projections. The Fed dot plot indicates where policymakers see Federal Fund Rates heading in the short and long term.
Meanwhile, the Canadian Dollar (CAD) remains under pressure as the Bank of Canada (BoC) is expected to extend its monetary policy further. The BoC has already cut interest rates by 75 basis points (bps) this year to 4.25%. Market expectations for more BoC rate cuts rose after Tuesday’s Consumer Price Index (CPI) data for August, which came in softer-than-expected. The Canadian CPI report showed that the headline inflation returns to bank’s target of 2%, grew slower than the estimates of 2.1% and the former release of 2.5%. The Bank of Canada’s (BoC) core CPI measure decelerated further to 1.5% from 1.7% in July.
Economic Indicator
Fed Interest Rate Decision
The Federal Reserve (Fed) deliberates on monetary policy and makes a decision on interest rates at eight pre-scheduled meetings per year. It has two mandates: to keep inflation at 2%, and to maintain full employment. Its main tool for achieving this is by setting interest rates – both at which it lends to banks and banks lend to each other. If it decides to hike rates, the US Dollar (USD) tends to strengthen as it attracts more foreign capital inflows. If it cuts rates, it tends to weaken the USD as capital drains out to countries offering higher returns. If rates are left unchanged, attention turns to the tone of the Federal Open Market Committee (FOMC) statement, and whether it is hawkish (expectant of higher future interest rates), or dovish (expectant of lower future rates).
Read more.Next release: Wed Sep 18, 2024 18:00
Frequency: Irregular
Consensus: 5.25%
Previous: 5.5%
Source: Federal Reserve
- Silver has met resistance at a trendline and is pausing after a bull run.
- It would need to make a decisive break above the trendline to continue its uptrend.
Silver (XAG/USD) has reached a key trendline in the $30s and stalled. It has posted several Doji-like candlestick patterns over the last few days. Dojis are days where the price closes very near to the level where it opened. This is a sign of market indecision.
Silver Daily Chart
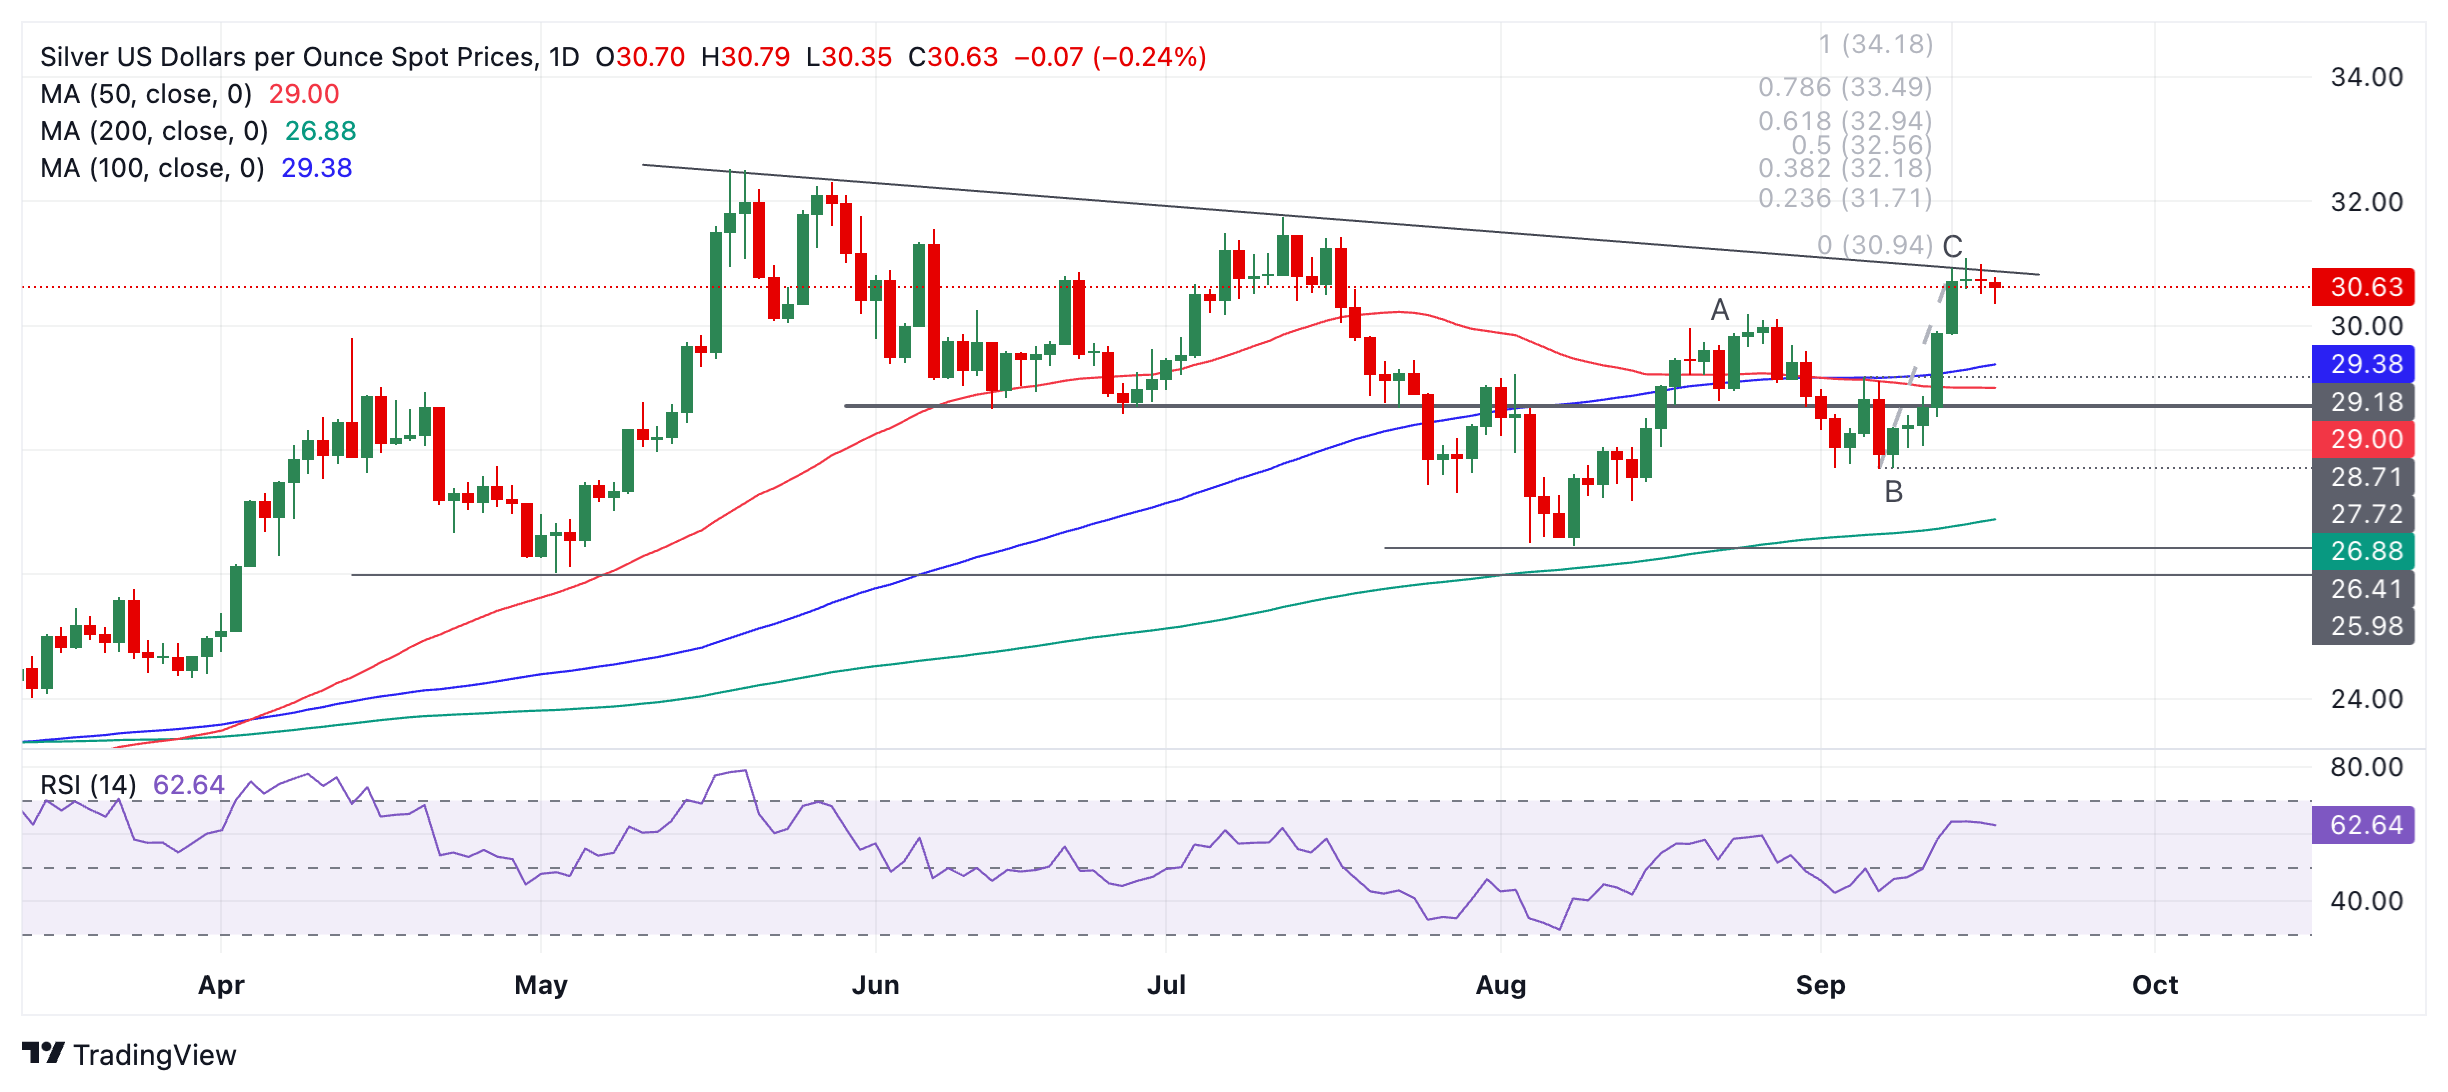
Silver has been in an uptrend ever since the early August lows, even though it also corrected back during the second half of the month. As it is a principle of technical analysis that “the trend is your friend” the uptrend in Silver is more likely than not to extend. Therefore, it could go higher. A decisive break above the trendline would confirm a breakout and a follow-through to $32.94, the 0.618 Fibonacci ratio of C leg extended higher.
A decisive break would be one accompanied by a long green candlestick that broke clearly above the level and closed near its high, or three candlesticks in a row that broke above the level.
Although price action has formed several Doji Japanese candles over recent days it has not formed a reversal candlestick pattern such as a Shooting Star, Bearish Engulfing or Hanging Man, for example. As such it is still too early to say the precious metal will correct back lower.
Silver has probably completed a Measured Move price pattern from the August 8 low. Such patterns consist of three waves in a zig-zag. It is another characteristic of these patterns that waves A and C are usually of a similar length. In the case of Silver, A and C reached a similar length. This further suggests prices will pause and take a rest for a while, or even pull back.
EUR/USD remains little changed on the day. Spot is trading flat and holding within yesterday’s range in the wait of the upcoming FOMC, Scotiabank’s Chief FX Strategist Shaun Osborne notes.
Technicals lean bullish
“Markets are awaiting for the FOMC and there was no incentive to push spot one way or the other. Final Eurozone August inflation was revised marginally lower to 0.1% M/M (from 0.2%) while the Y/Y measure was unrevised at 2.2% (down from 2.6%).”
“Spot is holding its bullish break out from its August/September consolidation range (bull flag) on the daily chart. Trend momentum signals are aligned bullishly on the intraday, daily and weekly DMI studies, tilting technical risks clearly towards EUR gains.”
“Resistance is 1.12 and 1.1275 in the short run. Support is 1.1100/10 and 1.1050. Sustained gains above 1.1110 through the end of the week will tilt medium term risks higher.”
- AUD/USD is extending its recovery move from the September 11 lows.
- It will probably go a little higher until it reaches the July or August highs.
AUD/USD continues rallying as it climbs from the bottom it formed on September 11. The new up leg has broken above a key trendline for the correction of the August rally. This is a bullish sign and suggests it is now in a short-term uptrend.
AUD/USD Daily Chart
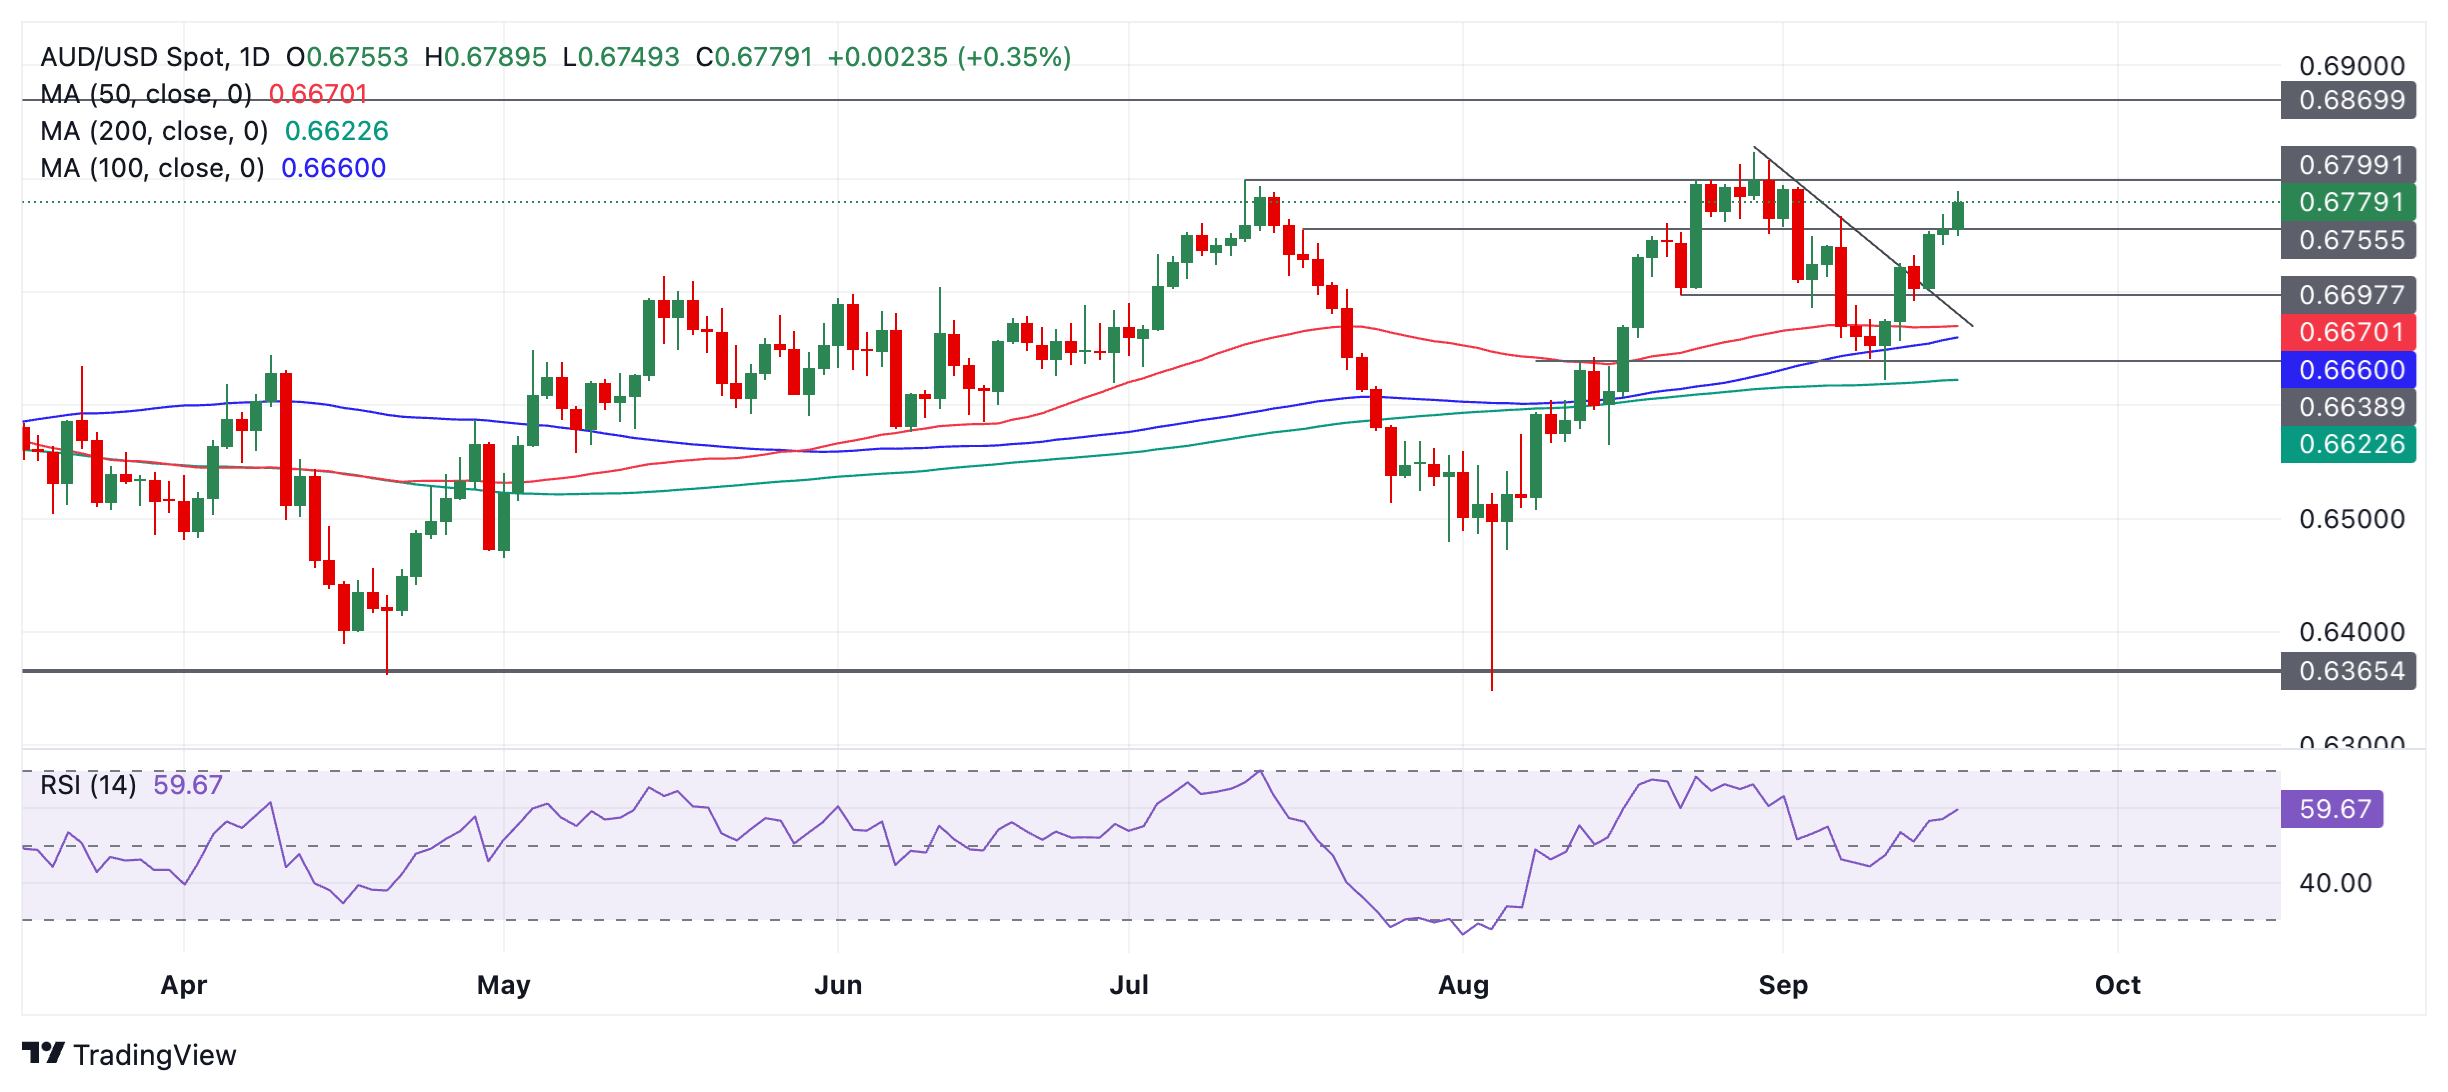
Given it is a principle of technical analysis that “the trend is your friend” the Aussie is likely to continue going higher. It could match or almost match the 0.6824 August 29 high. The resistance level at 0.6799 ( July high) is another potential target and could provide firm resistance to bulls.
Momentum, as measured by the Relative Strength Index (RSI) is slacking off a little and suggests some caution before adopting an overly bullish stance, however, it is broadly mirroring price, a fact that is supportive of the current mini-rally.
- Housing Starts and Building Permits in the US rose sharply in August.
- The US Dollar Index stays in negative territory below 101.00.
Housing Starts in the US rose 9.6% in August to 1.356 million units, the monthly data published by the US Census Bureau showed on Wednesday. This reading followed the 6.8% decline recorded in July.
In the same period, Building Permits increased 4.9% after falling 3.3% in July.
Market reaction
The US Dollar Index showed no reaction to these figures and was last seen staying in negative territory below 101.00.
- UK inflation data released on Wednesday quashes hopes the BoE will cut interest rates on Thursday.
- Whilst this is bad news for UK mortgage holders the Pound Sterling rose on the news.
- Eurozone revisions of flash estimates to its inflation showed a downwards revision, weighing on the Euro.
EUR/GBP is trading lower on Thursday, exchanging hands in the 0.8420s as it continues falling after breaking out of the shallow channel it had been rising in since the end-of-August lows.
The pair is down by over a quarter of a percent on the day as the Euro (EUR) loses ground against the Pound Sterling (GBP) following the release of UK inflation data early Wednesday. The data wiped out any hope of the Bank of England (BoE) cutting interest rates at its meeting on Thursday. With interest rates expected to remain elevated Sterling gained because relatively higher interest rates attract foreign investors, resulting in higher inflows of capital.
Although headline inflation in the UK, as measured by the Consumer Price Index (CPI) remained unchanged at 2.2% in August YoY – as expected – core CPI rose above expectations, registering a 3.6% increase YoY. This was well above the 3.3% of July and the 3.5% expected. In addition, services inflation also rose, and this particular component of inflation has been a major reason holding back the BoE from cutting interest rates before.
“..but the rise in services inflation 5.2% to 5.6% suggests the Bank of England will almost certainly press the pause button on interest rate cuts on Thursday. We continue to expect the next 25 basis point rate cut to take place in November," said Ruth Gregory, Deputy Chief UK Economist at Capital Economics.
The Euro, meanwhile, experienced mild weakness after the Eurozone’s gauge of inflation, the Harmonized Index of Consumer Prices (HICP) was revised down to 0.1% MoM in August from a flash estimate of 0.2%, when no change was expected. Lower inflation suggests the European Central Bank (ECB) will be more likely to cut interest rates in the future, given its officially data-dependent stance. Lower interest rates are negative for currencies as they attract comparatively less inflows of foreign capital.
EUR/GBP may have lost further ground after European Central Bank (ECB) Governing Council member and Bank of France President, François Villeroy de Galhau, confirmed more cuts were on their way, saying that the “ECB is likely to continue to cut rates.”
His comments mark a change in tone and follow more cautious statements from colleagues. ECB Governing Council member Gediminas Šimkus said on Tuesday, “the likelihood of an October rate cut is very small.” His colleague ECB Chief Economist Philip Lane said on Monday that the ECB should retain optionality about the speed of policy adjustments, and added that wages were rising “as expected” and likely to “remain high and volatile” during the second half of 2024, indicating he expected inflation to remain relatively high over the period and therefore advocating a cautious approach to cutting interest rates.
- Crude Oil dips lower with nervousness picking up towards the crucial Fed meeting.
- Overnight API data was a surprise build against all expectations.
- The US Dollar Index remains under pressure, trading at the lower boundary of September’s bandwidth.
Crude Oil drops lower this Wednesday in a very calm market which is looking ahead to the US Federal Reserve (Fed) meeting later this Wednesday. Meanwhile India’s government has removed the windfall tax on crude oil Bloomberg reports. Despite expectations for a drawdown on the back of tropical storm Francine whipping out large portions of production in the Gulf, the overnight stockpile number from the American Petroleum Institute was a build of 1.96 million barrels.
The US Dollar Index (DXY), which measures the performance of the Greenback against a basket of six different currencies, is trading on the downside again. Market expectations are very split over the size of the initial rate cut. The outcome later this Wednesday could be a volatile event.
At the time of writing, Crude Oil (WTI) trades at $69.14 and Brent Crude at $72.32.
Oil news and market movers: Support is needed for the sector
- Bloomberg reported that India has removed the windfall tax on crude oil effective Wednesday, according to a government notification. This comes after several producers already signalled having financial issues, with on Tuesday two major refiners filing for bankruptcy in China for example.
- Saipem has been awarded a new offshore contract worth approximately $2 billion for the development of the Marjan field in Saudi Arabia, according to a statement, Reuters reports.
- Near 14:30 GMT, the Energy Information Administration will release its weekly Crude stockpile report. Expectation is for a drawdown by 0.1 million barrels against the previous build of 0.833 million barrels.
Economic Indicator
EIA Crude Oil Stocks Change
The EIA Crude Oil stockpiles report is a weekly measure of the change in the number of barrels in stock of crude oil and its derivates, and it's released by the Energy Information Administration. This report tends to generate large price volatility, as oil prices impact on worldwide economies, affecting the most, commodity related currencies such as the Canadian dollar. Despite it has a limited impact among currencies, this report tends to affect the price of oil itself, and, therefore, had a more notorious impact on WTI crude futures.
Read more.Next release: Wed Sep 18, 2024 14:30
Frequency: Weekly
Consensus: -0.1M
Previous: 0.833M
Oil Technical Analysis: All hopes that the Fed delivers
Crude Oil price will have several traders crossing their fingers in the hope the Fed later this evening will deliver a dovish message. A bigger than expected rate cut and further rate cut projections down the line will be perceived as oxygen for the much battered Crude Oil price. Expect to see Crude Oil rallying in the assumption that demand and growth will pick up again if the Fed delivers that ultra-dovish message without spooking the markets.
First level to watch on the upside remains $70.00 after it was tested on Tuesday but did not hold. Once there has been a daily close above it, $71.46 gets back on the table as the next level to look out for. Ultimately, a return to $75.27 is still possible, but would likely come after a seismic shift in current balances.
Support should be very close by at $68.19, which was the triple bottom back in the summer of 2023. The next level further down the line is $64.38, the low from March and May 2023. Should that level face a second test and snap, $61.65 becomes a target, with of course $60.00 as a psychologically big figure just below it, at least tempting to be tested.
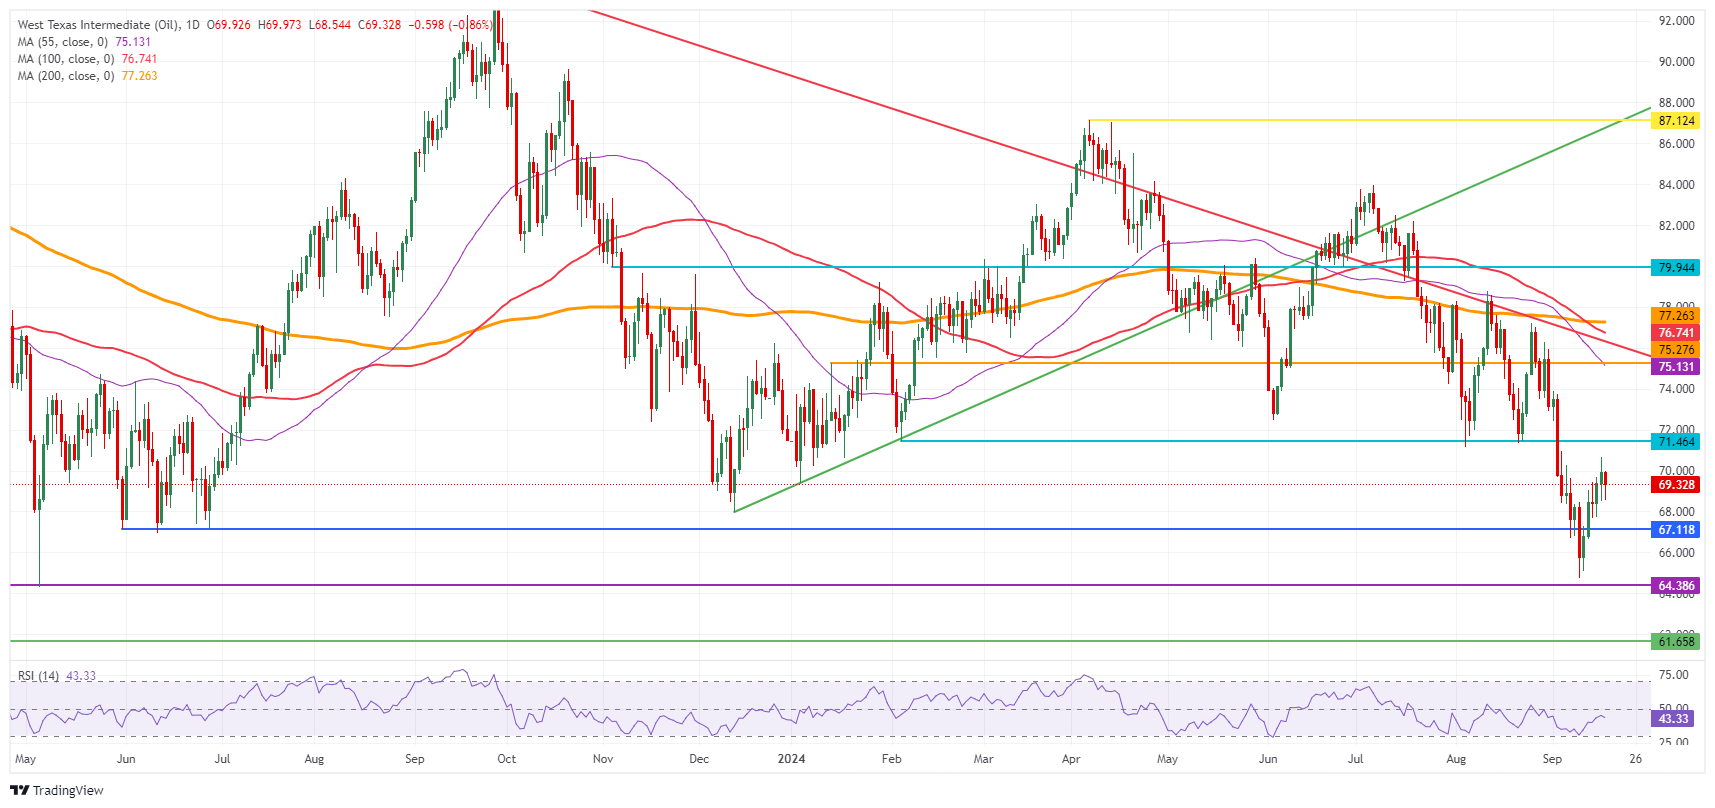
US WTI Crude Oil: Daily Chart
WTI Oil FAQs
WTI Oil is a type of Crude Oil sold on international markets. The WTI stands for West Texas Intermediate, one of three major types including Brent and Dubai Crude. WTI is also referred to as “light” and “sweet” because of its relatively low gravity and sulfur content respectively. It is considered a high quality Oil that is easily refined. It is sourced in the United States and distributed via the Cushing hub, which is considered “The Pipeline Crossroads of the World”. It is a benchmark for the Oil market and WTI price is frequently quoted in the media.
Like all assets, supply and demand are the key drivers of WTI Oil price. As such, global growth can be a driver of increased demand and vice versa for weak global growth. Political instability, wars, and sanctions can disrupt supply and impact prices. The decisions of OPEC, a group of major Oil-producing countries, is another key driver of price. The value of the US Dollar influences the price of WTI Crude Oil, since Oil is predominantly traded in US Dollars, thus a weaker US Dollar can make Oil more affordable and vice versa.
The weekly Oil inventory reports published by the American Petroleum Institute (API) and the Energy Information Agency (EIA) impact the price of WTI Oil. Changes in inventories reflect fluctuating supply and demand. If the data shows a drop in inventories it can indicate increased demand, pushing up Oil price. Higher inventories can reflect increased supply, pushing down prices. API’s report is published every Tuesday and EIA’s the day after. Their results are usually similar, falling within 1% of each other 75% of the time. The EIA data is considered more reliable, since it is a government agency.
OPEC (Organization of the Petroleum Exporting Countries) is a group of 13 Oil-producing nations who collectively decide production quotas for member countries at twice-yearly meetings. Their decisions often impact WTI Oil prices. When OPEC decides to lower quotas, it can tighten supply, pushing up Oil prices. When OPEC increases production, it has the opposite effect. OPEC+ refers to an expanded group that includes ten extra non-OPEC members, the most notable of which is Russia.
For BoE Bank Rate, the upcoming decision will be a decisive pause, with a 7-2 vote expected and with the key uncertainty surrounding the size of balance sheet reduction over the next year. The BoE is widely expected to stay on hold, so the Pound Sterling (GBP) will remain driven by market sentiment post-Fed. TDS FX analysts give note scenarios of how the BoE can proceed.
BoE is likely to stay on hold
“Hawkish (20%, Hold, Faster QT): As in the base case, the MPC votes decisively to hold rates, without ruling out further cuts. QT is more aggressive, maintaining another £50bn of active gilt sales over the next year, on top of the £87bn in maturing debt, making for a total of around £137bn in balance sheet reduction.”
“Base Case (70%, Hold, £100bn QT): The MPC votes 7-2 (+/- 1) to keep rates on hold at this meeting. Nothing changes materially enough in the Summary/Minutes to suggest a rate cut in November is off the table, but the MPC does continue to sound quite cautious around easing given strong wage growth and services inflation. QT is announced at another £100bn for the next year, unchanged from last year, but consisting of a much higher share of maturing debt, and lower active Gilt sales.”
“Dovish (10%, Hold, No Active Gilt Sales): The MPC leaves rates on hold in a close 5-4 vote, and ends active gilt sales, leaving QT at £87bn for the next 12 months. Importantly, the MPC notes that while it has left policy on hold, it explicitly says that it expects further reductions to Bank Rate in the future, leaving November firmly on the table, and implying that sequential cuts are possible from there.”
The Canadian Dollar (CAD) is trading just below the 1.36 mark as traders await the Fed, Scotiabank’s Chief FX Strategist Shaun Osborne notes.
CAD is little changed ahead of FOMC
“The BoC’s meeting minutes may not provide a lot more insight into the policy outlook than we know already. Inflation is slowing in line with BoC forecasts and while Q3 growth is likely to be well short of the Bank’s high expectations, the rationale for more aggressive policy moves is not clear to me at this point.”
“There is no change in USD/CAD’s technical condition. Spot continues to pivot narrowly around the 200-day MA (1.3587), with the USD finding it impossible to translate positive momentum on the intraday and daily charts into more obvious progress.”
“Short-term technical resistance remains 1.3635 (38.2% retracement of the USD’s August decline) and 1.3695 (50% Fibonacci). Support is 1.3550 (minor, last Monday’s low) and 1.3465.”
The USD is trading lower. All other major currencies are posting gains, while global stocks are mixed and bonds are generally softer as markets ponder this afternoon’s FOMC outcome, Scotiabank’s Chief FX Strategist Shaun Osborne notes.
Markets wait on Fed decision
“Beyond the rate decision itself, the FX reaction will be shaped by a range of factors—the policy statement, the Fed’s latest economic forecasts and dot plot and Chair Powell’s press conference.”
“There is likely to be some—limited—scope for short-term USD gains in the event of a 25bps ease while a 50bps cut will maintain broader pressure on it. Either way, the charts are reflecting a generally negative tone in the DXY across short-, medium– and long-term studies.”
“Loss of support in the index at 100.55 targets a 1-1.5% drop in the index in the short run (and sets up a 3% or so fall potentially). Note the DXY’s estimated fair value (based solely on weighted spreads) sits at 99.6 today.”
- The US Dollar is under pressure as markets are still divided over the size of the Fed rate cut.
- Traders will sit on their hands until the decision is out, followed by the Fed’s Chair Powell press conference.
- The US Dollar Index retraces on Wednesday after the prior day’s small bounce.
The US Dollar (USD) retraces and trades below 101.00, as measured by the US Dollar Index (DXY), ahead of the US Federal Reserve (Fed) interest rate decision on Wednesday. The DXY is under pressure near the yearly lows and faces a key moment, with the Federal Open Market Committee (FOMC) ready to answer how much the Fed needs to cut interest rates. Besides Fed Chairman Jerome Powell’s speech and press conference, the focus will be on the Summary of Economic Projections (SEP), or the Fed’s Dot Plot or Philips curve, where every FOMC member gets a chance to communicate where they see the Fed policy rate move to in the near future. The number of projected rate cuts could be vital in guiding markets in their expectations.
On the economic data front, some relatively light data points are not set to move the needle ahead of the Fed decision on Wednesday. Markets are still split between a 25 or 50 basis points interest rate cut, so guidance from Fed Chairman Jerome Powell during his speech could shed a completely different light on the matter and might result in a knee-jerk reaction.
Daily digest market movers: It will be painful
- The main set of economic data on Wednesday will be out at 12:30 GMT, with monthly Building Permits and Housing Starts data. Monthly Building Permits are expected to jump to 1.410 million in August from 1.406 million in July. Monthly Housing Starts are also expected to head higher, with 1.310 million expected in August against 1.238 million previously.
- At 18:00 GMT, the Fed will release its Interest Rate Decision, the Monetary Policy Statement, and the Summary of Economic Projections.
- At 18:30 GMT, Fed Chairman Jerome Powell will take the stage with a statement followed by a Q&A session.
- Asian equities are doing fine on Wednesday, while European equities are marginally in the red. US Futures are flat ahead of the Fed rate decision.
- The CME Fedwatch Tool shows it will be a very close call this Wednesday with a 25 basis points (bps) interest rate cut probability at 37.0%. Meanwhile, the chances of a 50 bps cut are at 63%. For the November 7 meeting, another 25 bps cut (if this Wednesday is a 25 bps cut) is expected by 22.4%, while there is a 51.6% chance that rates will be 75 bps (25 bps + 50 bps) and a 26.0% probability of rates being 100 (25 bps + 75 bps) basis points lower compared to current levels.
- The US 10-year benchmark rate trades at 3.66%, bounces off the 15-month low of 3.60%.
Economic Indicator
Fed Interest Rate Decision
The Federal Reserve (Fed) deliberates on monetary policy and makes a decision on interest rates at eight pre-scheduled meetings per year. It has two mandates: to keep inflation at 2%, and to maintain full employment. Its main tool for achieving this is by setting interest rates – both at which it lends to banks and banks lend to each other. If it decides to hike rates, the US Dollar (USD) tends to strengthen as it attracts more foreign capital inflows. If it cuts rates, it tends to weaken the USD as capital drains out to countries offering higher returns. If rates are left unchanged, attention turns to the tone of the Federal Open Market Committee (FOMC) statement, and whether it is hawkish (expectant of higher future interest rates), or dovish (expectant of lower future rates).
Read more.Next release: Wed Sep 18, 2024 18:00
Frequency: Irregular
Consensus: 5.25%
Previous: 5.5%
Source: Federal Reserve
US Dollar Index Technical Analysis: Stuck or broken?
The US Dollar Index (DXY) is set to either stick to its range for quite a time longer or finally break out of this rud it has been for nearly a month. The Fed rate decision on Wednesday is the catalyst that markets seek to finally break out of a certain consolidation phase. With the split conviction on the size of the interest rate cut, the risk is that a knee-jerk reaction could end up with the DXY opening Thursday still in the same tight range between 100.62 and 101.90.
The upper level of the recent range is 101.90. Further up, a steep 1.2% uprising would be needed to get the index to 103.18, with the 55-day Simple Moving Average (SMA) at 102.82 on the way. The next tranche up is very misty, with the 200-day SMA at 103.80 and the 100-day SMA at 103.84, just ahead of the big 104.00 round level.
On the downside, 100.62 (the low from December 28, 2023) holds strong and has already made the DXY rebound two times in recent weeks. Should it break, the low from July 14, 2023, at 99.58, will be the next level to look out for. If that level gives way, early levels from 2023 are coming in near 97.73.
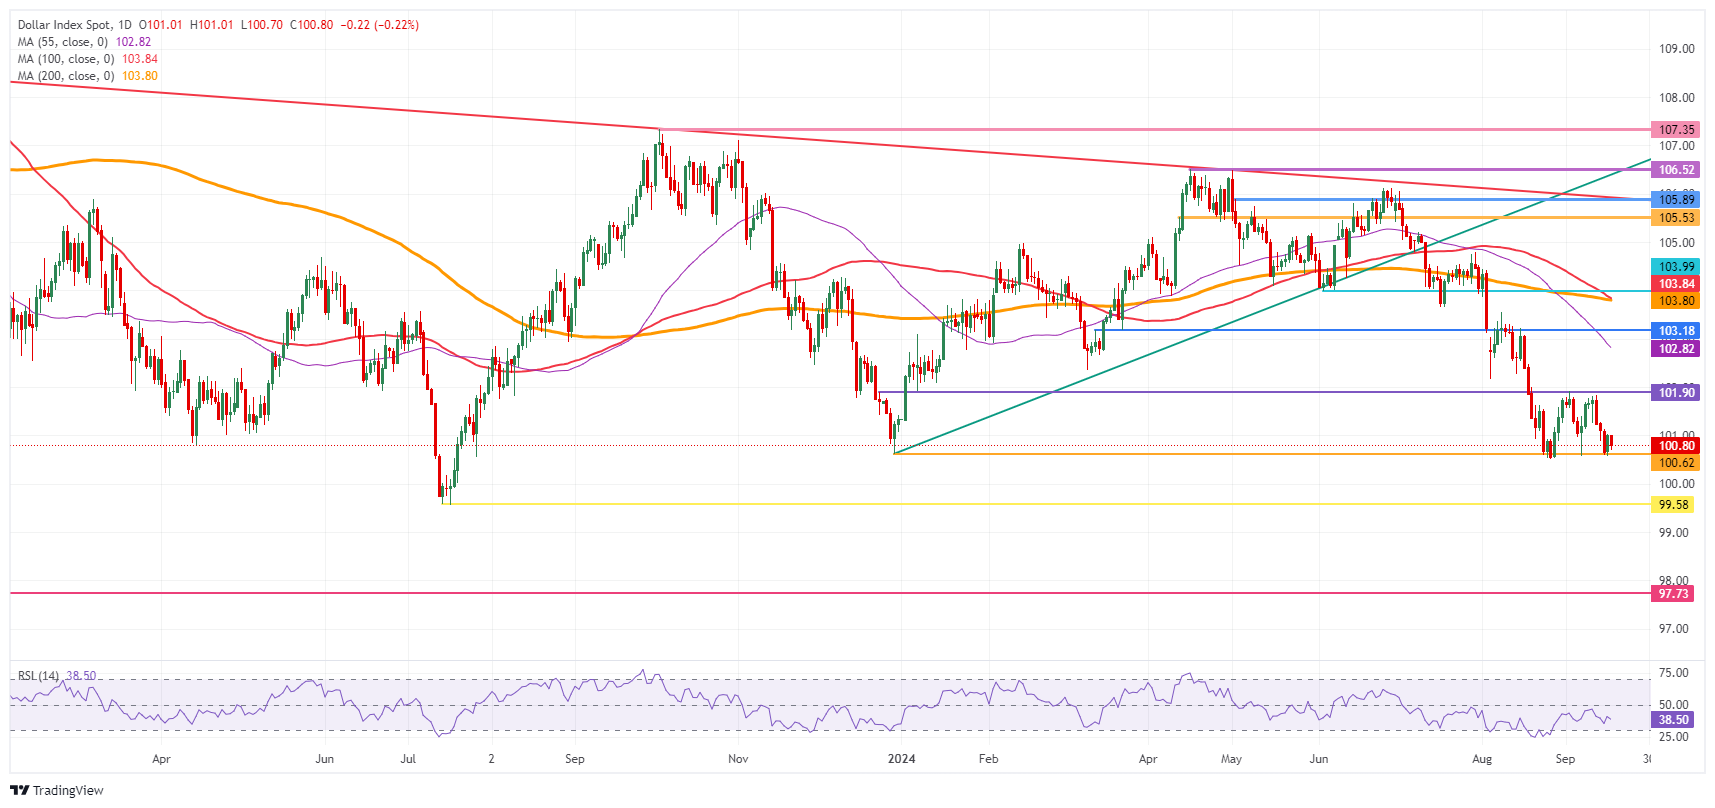
US Dollar Index: Daily Chart
US Dollar FAQs
The US Dollar (USD) is the official currency of the United States of America, and the ‘de facto’ currency of a significant number of other countries where it is found in circulation alongside local notes. It is the most heavily traded currency in the world, accounting for over 88% of all global foreign exchange turnover, or an average of $6.6 trillion in transactions per day, according to data from 2022. Following the second world war, the USD took over from the British Pound as the world’s reserve currency. For most of its history, the US Dollar was backed by Gold, until the Bretton Woods Agreement in 1971 when the Gold Standard went away.
The most important single factor impacting on the value of the US Dollar is monetary policy, which is shaped by the Federal Reserve (Fed). The Fed has two mandates: to achieve price stability (control inflation) and foster full employment. Its primary tool to achieve these two goals is by adjusting interest rates. When prices are rising too quickly and inflation is above the Fed’s 2% target, the Fed will raise rates, which helps the USD value. When inflation falls below 2% or the Unemployment Rate is too high, the Fed may lower interest rates, which weighs on the Greenback.
In extreme situations, the Federal Reserve can also print more Dollars and enact quantitative easing (QE). QE is the process by which the Fed substantially increases the flow of credit in a stuck financial system. It is a non-standard policy measure used when credit has dried up because banks will not lend to each other (out of the fear of counterparty default). It is a last resort when simply lowering interest rates is unlikely to achieve the necessary result. It was the Fed’s weapon of choice to combat the credit crunch that occurred during the Great Financial Crisis in 2008. It involves the Fed printing more Dollars and using them to buy US government bonds predominantly from financial institutions. QE usually leads to a weaker US Dollar.
Quantitative tightening (QT) is the reverse process whereby the Federal Reserve stops buying bonds from financial institutions and does not reinvest the principal from the bonds it holds maturing in new purchases. It is usually positive for the US Dollar.
A 50-basis point interest rate cut, if it were to come from the Fed tonight, would be negative for the US Dollar (USD). The Fed's reaction function is more aggressive than previously thought, and not just for today, but possibly for the future, which is USD-negative, Commerzbank’s FX analyst Antje Praefcke notes.
USD gains on a 25 b.p. move are set to be short-lived
“Since the majority has already settled on 50 basis points, a 25 basis point move would probably be the bigger surprise and a disappointment, so the SUD could recover some of its losses in an initial reaction. It will depend on how concerned Fed Chairman Jerome Powell is about the economic situation.”
“If he is clearly concerned that a recession is looming, the market could quickly revert to its expectation of a fairly aggressive rate cut cycle in the coming months, putting the dollar under pressure again. Only if Powell appears confident that the economy will hold up fairly well, the USD is likely to defend its position or even strengthen a little.”
“I am not very confident that Powell would even be able to dispel the market's concerns. To do that, he would have to sound very positive, which at this point in time and given the data dependency of further interest rate decisions, he can hardly be. All in all, I therefore expect that any gains made by the dollar after a 25 basis point move will probably only be short-lived.”
- USD/CHF falls to near 0.8430 as traders’ big bets on Fed large rate cuts weigh on the US Dollar.
- The Fed is poised to deliver its first interest rate cut decision in more than four years.
- Investors expect the SNB to cut interest rates further in its policy meeting later this month.
The USD/CHF pair posts a fresh weekly low near 0.8430 in Wednesday’s European session. The Swiss Franc asset weakens as the US Dollar (USD) falls back after a short-lived pullback move. The US Dollar Index (DXY), which tracks the Greenback’s value against six major currencies, declines to near 100.70.
The Greenback faces selling pressure ahead of the Federal Reserve’s (Fed) monetary policy announcement at 18:00 GMT in which the central bank is widely anticipated to cut interest rates. This would be the Fed’s first dovish decision in more than four years. However, investors will pay close attention to the interest rate cut size and the Fed’s dot plot, which shows where policymakers see Federal Fund rates heading in the short and long term.
Market participants are curious about the Fed's likely rate cut to size to understand how bad the current labor market’s health is due to the long maintenance of a restrictive monetary policy stance. According to the CME FedWatch tool, the likelihood of the Fed reducing interest rates by 50 basis points (bps) to 4.75%-5.00% has increased to 63% from 14% a week ago.
Ahead of the Fed’s policy decision, the risk appetite of investors is high. S&P 500 futures have posted decent gains in European trading hours.
Meanwhile, the Swiss Franc (CHF) performs strongly against the US Dollar despite growing speculation that the Swiss National Bank (SNB) will extend the policy-easing cycle in September’s monetary policy. The SNB is expected to deliver a third straight interest rate cut as the Swiss inflation has softened significantly. Annual Swiss Consumer Price Index (CPI) decelerated to 1.1% in August, the lowest level since March of this year.
Economic Indicator
Fed Interest Rate Decision
The Federal Reserve (Fed) deliberates on monetary policy and makes a decision on interest rates at eight pre-scheduled meetings per year. It has two mandates: to keep inflation at 2%, and to maintain full employment. Its main tool for achieving this is by setting interest rates – both at which it lends to banks and banks lend to each other. If it decides to hike rates, the US Dollar (USD) tends to strengthen as it attracts more foreign capital inflows. If it cuts rates, it tends to weaken the USD as capital drains out to countries offering higher returns. If rates are left unchanged, attention turns to the tone of the Federal Open Market Committee (FOMC) statement, and whether it is hawkish (expectant of higher future interest rates), or dovish (expectant of lower future rates).
Read more.Next release: Wed Sep 18, 2024 18:00
Frequency: Irregular
Consensus: 5.25%
Previous: 5.5%
Source: Federal Reserve
The US Dollar (USD) is likely to trade in a sideways range of 7.0700/7.1300, UOB Group FX analysts Quek Ser Leang and Lee Sue Ann note.
Rangebound for the time being
24-HOUR VIEW: “Yesterday, we expected USD to trade in a range between 7.0900 and 7.1100 USD subsequently traded in a slightly higher range of 7.0928/7.1118. The price movements did not result in any increase in either downward or upward momentum. Today, we continue to expect USD to trade in a range, likely between 7.0910 and 7.1110.”
1-3 WEEKS VIEW: “Our update from yesterday (17 Sep, spot at 7.1005) remains valid. As highlighted, momentum indicators are mostly neutral, and USD is likely to trade in a sideways range of 7.0700/7.1300.”
USD/JPY was last seen at 141.63 levels. The pair rebounded, alongside higher UST yields after better-than-expected US data. FOMC decision should see USD/JPY more volatile, OCBC FX analysts Frances Cheung and Christopher Wong note.
FOMC to trigger USD/JPY volatility
“USD/JPY rebounded, alongside higher UST yields after US data came in better than expected.”
“Daily momentum is not showing a clear bias while RSI rose. Bias to the downside but still cautious of near term rebound risks. Resistance at 143.67 (21 DMA), 144.60 (23.6% fibo retracement of 2023 low to 2024 high). Support at 140.50, 139.60 and 138 levels.”
“FOMC decision should see USD/JPY trade wild into and post-decision, press conference.”
- USD/JPY slides below 142.00 as firm speculation for Fed large interest rate cuts weighs on the US Dollar.
- Market participants expect the Fed to cut interest rates by 100 bps this year.
- Investors expect the BoJ to maintain interest rates steady at 0.25% on Friday.
The USD/JPY pair drops below 142.00 in Wednesday’s European session. The asset faces selling pressure after a recovery move to near 142.47 as the US Dollar (USD) slumps ahead of the Federal Reserve’s (Fed) monetary policy announcement at 18:00 GMT.
The market sentiment remains cheerful as the Fed is almost certain to start reducing interest rates. S&P 500 futures have posted decent gains in European trading hours. The US Dollar Index (DXY), which tracks the greenback’s value against six major currencies, falls back to near 100.70 from Tuesday’s pullback move to 101.00. However, 10-year US Treasury yields jump above 3.67%.
While the Fed is poised to cut interest rates, investors will keenly focus on the potential rate cut size and the dot plot, which shows where policymakers see Federal Fund rates heading in short and long term.
According to the CME FedWatch tool, the likelihood of the Fed reducing interest rates by 50 basis points (bps) to 4.75%-5.00% has increased to 63% from 14% a week ago. For the year-end, traders expect that the Fed will cut interest rates by 100 bps. This suggests that the Fed will cut interest rates by 50 bps in one of its three meetings remaining this year.
In Asia, the Japanese Yen (JPY) will be influenced by the Bank of Japan’s (BoJ) monetary policy decision on Friday. The BoJ is widely anticipated to leave interest rates unchanged at 0.25%, with a hawkish guidance due to steady economic growth and the stability of inflation above 2% for the straight 21 months.
Last week, BoJ policymaker Naoki Tamura projected interest rates to rise at least 1% as early as the second half of the next fiscal year.
Meanwhile, Japan’s economic assessment report for September, released on Wednesday, showed that the economy is recovering moderately although it is still pausing in parts, Reuters reported.
Japanese Yen FAQs
The Japanese Yen (JPY) is one of the world’s most traded currencies. Its value is broadly determined by the performance of the Japanese economy, but more specifically by the Bank of Japan’s policy, the differential between Japanese and US bond yields, or risk sentiment among traders, among other factors.
One of the Bank of Japan’s mandates is currency control, so its moves are key for the Yen. The BoJ has directly intervened in currency markets sometimes, generally to lower the value of the Yen, although it refrains from doing it often due to political concerns of its main trading partners. The current BoJ ultra-loose monetary policy, based on massive stimulus to the economy, has caused the Yen to depreciate against its main currency peers. This process has exacerbated more recently due to an increasing policy divergence between the Bank of Japan and other main central banks, which have opted to increase interest rates sharply to fight decades-high levels of inflation.
The BoJ’s stance of sticking to ultra-loose monetary policy has led to a widening policy divergence with other central banks, particularly with the US Federal Reserve. This supports a widening of the differential between the 10-year US and Japanese bonds, which favors the US Dollar against the Japanese Yen.
The Japanese Yen is often seen as a safe-haven investment. This means that in times of market stress, investors are more likely to put their money in the Japanese currency due to its supposed reliability and stability. Turbulent times are likely to strengthen the Yen’s value against other currencies seen as more risky to invest in.
As long as the US Dollar (USD) remains above 140.90, it could test 142.80 before leveling off. In the longer run, the USD weakness seems to have stabilised; it is expected to trade in a range between 140.00 and 144.00 for now, UOB Group FX analysts Quek Ser Leang and Lee Sue Ann note.
USD/JPY to trade 140.00 and 144.00 long term
24-HOUR VIEW: “On Monday, USD fell sharply to 139.56, then rebounded. Yesterday, we indicated that ‘the rebound in severely oversold conditions and slowing momentum indicates that instead of continuing to weaken, USD is more likely to trade in a sideways range of 140.10/141.40.’ However, after dipping to a low of 140.30, USD lifted off and soared to 142.47, closing on a strong note at 142.40 (+1.28%). The rapid rise appears to be running ahead of itself. That said, as long as USD remains above 140.90 (minor support is at 141.40), USD could test 142.80 before leveling off. The next resistance at 144.00 is not expected to come into view.”
1-3 WEEKS VIEW: “While USD fell and broke below the round-number support of 140.00 two days (low of 139.56), we pointed out yesterday (17 Sep, spot at 140.70) that ‘downward momentum has not increased much.’ However, we indicated that ‘the weakness has not stabilised, and USD could continue to weaken even though it remains to be seen if 139.00 is within reach this time round.’ We added, ‘a breach of 142.20 would indicate that the weakness has stabilised.’ We did not anticipate USD to rise strongly as it soared to a high of 142.47. The recent USD weakness seems to have stabilised. For the time being, we expect USD to trade in a range between 140.00 and 144.00.”
- The Federal Reserve is widely expected to lower the policy rate after the September meeting.
- The revised Summary of Economic Projections and Fed Chairman Powell’s remarks could provide important clues about the rate outlook.
- The US Dollar faces a two-way risk depending on the size of the interest rate cut.
The US Federal Reserve (Fed) will announce monetary policy decisions following the September policy meeting and release the revised Summary of Economic Projections (SEP), the so-called dot plot, on Wednesday. Market participants widely anticipate that the US central bank will lower the policy rate, but the size of the cut is up in the air.
The CME FedWatch Tool shows that markets are currently pricing in a nearly 60% probability of a 50 basis points (bps) rate cut against a nearly 40% chance of a 25 bps reduction. The market positioning suggests that the US Dollar (USD) faces a two-way risk heading into the event.
The US Bureau of Labor Statistics reported last week that the core Consumer Price Index (CPI), which excludes volatile food and energy prices, rose 0.3% on a monthly basis in August. This reading followed the 0.2% increase recorded in July and came in above the market expectation of 0.2%. Following this report, investors saw a diminishing chance of a large rate cut.
In an article published a day later, on September 12, The Wall Street Journal reporter Nick Timiraos, who is widely seen as a “Fed insider,” wrote that the size of the Fed’s rate cut at the September meeting will be a close call. Additionally, the annual producer inflation, as measured by the change in the Producer Price Index (PPI), declined to 1.7% in August from 2.1% a month before. Markets shifted their view toward a 50 bps cut, which caused the US Dollar to come under renewed selling pressure.
Previewing the Fed meeting, “the FOMC is widely expected to start its easing cycle next week, with the Committee reducing rates by 25bp. The decision to cut between 25bp vs 50bp will be close,” TD Securities analysts said in a recently published report and added:
“In our view, the dot plot will be the most prominent part of the Fed's guidance next week, along with Chair Powell's post-meeting presser. We expect the Fed's forward guidance to lean broadly dovish.”
Dot Plot FAQs
The “Dot Plot” is the popular name of the interest-rate projections by the Federal Open Market Committee (FOMC) of the US Federal Reserve (Fed), which implements monetary policy. These are published in the Summary of Economic Projections, a report in which FOMC members also release their individual projections on economic growth, the unemployment rate and inflation for the current year and the next few ones. The document consists of a chart plotting interest-rate projections, with each FOMC member’s forecast represented by a dot. The Fed also adds a table summarizing the range of forecasts and the median for each indicator. This makes it easier for market participants to see how policymakers expect the US economy to perform in the near, medium and long term.
The US Federal Reserve publishes the “Dot Plot” once every other meeting, or in four of the eight yearly scheduled meetings. The Summary of Economic Projections report is published along with the monetary policy decision.
The “Dot Plot” gives a comprehensive insight into the expectations from Federal Reserve (Fed) policymakers. As projections reflect each official’s projection for interest rates at the end of each year, it is considered a key forward-looking indicator. By looking at the “Dot Plot” and comparing the data to current interest-rate levels, market participants can see where policymakers expect rates to head to and the overall direction of monetary policy. As projections are released quarterly, the “Dot Plot” is widely used as a guide to figure out the terminal rate and the possible timing of a policy pivot.
The most market-moving data in the “Dot Plot” is the projection of the federal funds rate. Any change compared with previous projections is likely to influence the US Dollar (USD) valuation. Generally, if the “Dot Plot” shows that policymakers expect higher interest rates in the near term, this tends to be bullish for USD. Likewise, if projections point to lower rates ahead, the USD is likely to weaken.
When will the Fed announce its interest rate decision and how could it affect EUR/USD?
The US Federal Reserve is scheduled to announce its interest rate decision and publish the monetary policy statement alongside the SEP on Wednesday, September 18, at 18:00 GMT. This will be followed by Fed Chairman Jerome Powell's press conference starting at 18:30 GMT.
The interest rate decision is likely to trigger the immediate market reaction. A 25 bps rate cut is likely to provide a boost to the USD, while a 50 bps reduction would have the opposite effect on the currency’s valuation. Following a knee-jerk reaction, the revised SEP could have a more lasting impact on the USD.
June’s dot-lot showed that 4 of 19 officials saw no rate cuts in 2024, 7 projected a 25 bps rate reduction, while 8 marked down a 50 bps cut in the policy rate. In case the new dot-plot shows that policymakers see the policy rate 100 bps below the current rate of 5.25%-5.5% at the end of the year, the USD could still come under pressure even if the Fed opts for a 25 bps cut because that would imply three consecutive rate reductions in the last three meetings of the year, including September, and one of them being a 50 bps cut. If the Fed opts for a 25 bps cut and the dot-plot points to two more 25 bps cuts in November and December, the USD could gather further strength.
Investors will also pay close attention to comments from Chair Powell in the post-meeting press conference. In case the Fed goes for a 25 bps cut but Powell says in the presser that it was a close call with some policymakers arguing in favor of a large cut, the USD could struggle to preserve its strength. Powell’s remarks on the growth outlook could also influence the risk perception and the USD’s performance. If Powell adopts a pessimistic tone about the economic outlook and notes a risk of recession, risk-off flows could dominate the markets. In this scenario, the USD is likely to find demand as a safe haven.
In summary, the September Fed event will have too many moving parts and surely ramp up market volatility. It could be too risky for investors to take large positions in the immediate aftermath of the Fed and they could opt to wait until the dust settles.
Eren Sengezer, European Session Lead Analyst at FXStreet, provides a short-term technical outlook for EUR/USD:
“Following the pullback seen in the first half of September, EUR/USD has turned bullish, with the Relative Strength Index (RSI) on the daily chart rising toward 60. Additionally, the pair recovered back above the 20-day Simple Moving Average (SMA) after closing below it for five consecutive days, reflecting growing buyer interest.”
On the upside, 1.1200 (static level, end-point of July-August uptrend) aligns as the first resistance before 1.1275 (July 18, 2023, high) and 1.1360 (static level from January 2022). In case the pair returns below 1.1090-1.1080 (20-day SMA, Fibonacci 23.6% retracement) and starts using this area as resistance, technical sellers could take action. In this scenario, the next support could be spotted at 1.1000-1.0980 (Fibonacci 38.2% retracement, 50-day SMA) before 1.0940 (Fibonacci 50% retracement).
US Dollar FAQs
The US Dollar (USD) is the official currency of the United States of America, and the ‘de facto’ currency of a significant number of other countries where it is found in circulation alongside local notes. It is the most heavily traded currency in the world, accounting for over 88% of all global foreign exchange turnover, or an average of $6.6 trillion in transactions per day, according to data from 2022. Following the second world war, the USD took over from the British Pound as the world’s reserve currency. For most of its history, the US Dollar was backed by Gold, until the Bretton Woods Agreement in 1971 when the Gold Standard went away.
The most important single factor impacting on the value of the US Dollar is monetary policy, which is shaped by the Federal Reserve (Fed). The Fed has two mandates: to achieve price stability (control inflation) and foster full employment. Its primary tool to achieve these two goals is by adjusting interest rates. When prices are rising too quickly and inflation is above the Fed’s 2% target, the Fed will raise rates, which helps the USD value. When inflation falls below 2% or the Unemployment Rate is too high, the Fed may lower interest rates, which weighs on the Greenback.
In extreme situations, the Federal Reserve can also print more Dollars and enact quantitative easing (QE). QE is the process by which the Fed substantially increases the flow of credit in a stuck financial system. It is a non-standard policy measure used when credit has dried up because banks will not lend to each other (out of the fear of counterparty default). It is a last resort when simply lowering interest rates is unlikely to achieve the necessary result. It was the Fed’s weapon of choice to combat the credit crunch that occurred during the Great Financial Crisis in 2008. It involves the Fed printing more Dollars and using them to buy US government bonds predominantly from financial institutions. QE usually leads to a weaker US Dollar.
Quantitative tightening (QT) is the reverse process whereby the Federal Reserve stops buying bonds from financial institutions and does not reinvest the principal from the bonds it holds maturing in new purchases. It is usually positive for the US Dollar.
USD/CHF’s decline of late was largely due to the USD leg as markets re-priced for larger than expected magnitude of Fed cut, and, if the broad USD trend is for further depreciation bias, then USD/CHF may still be broadly skewed to the downside, OCBC FX analysts Frances Cheung and Christopher Wong note.
SNB to support exporters by curbing the strength of CHF
“The revival in market confidence to re-price for 50bp Fed cut can be attributed to initial jobless claims data (which rose again) and the WSJ article on Fed’s rate cut dilemma. We are still of the view that recent CHF strength should slow as SNB pursues a neutral monetary policy and is likely to lower policy rate (by 25bp) to 1% at its upcoming MPC on 26 Sep, for the 3rd consecutive time this year.’
“Swiss inflation is also well under control at 1.1% in line with SNB’s expectations and a benign inflation profile allows for SNB to ease policy. In addition, industry lobby groups including watchmakers, technology manufacturers’ association have urged SNB and the government to support exporters by curbing the strength of CHF.”
“Mild bullish momentum on daily chart intact while RSI eased. 2-way trades likely but a scenario of less dovish Fed may aid a rebound in USD/CHF. Key resistance at 0.8780 (21 DMA). Breakout puts next resistance at 0.8575 (23.6% fibo retracement of May high to Sep low), 0.8640 (50 DMA). Support at 0.84, 0.8375 levels.”
The New Zealand Dollar (NZD) is likely to trade in a 0.6135/0.6235 range, UOB Group FX analysts Quek Ser Leang and Lee Sue Ann note.
Rangebound within the 0.6135/0.6235 range
24-HOUR VIEW: “We expected NZD to trade in range between 0.6160 and 0.6205 yesterday. NZD then traded in a 0.6179/0.6211 range, closing at 0.6187 (-0.23%). The price movements did not result in any increase in either downward or upward momentum. Today, we continue to expect NZD to trade in a range, probably between 0.6170 and 0.6210.”
1-3 WEEKS VIEW: “Yesterday (17 Sep, spot at 0.6185), we indicated that NZD is likely to trade in a 0.6135/0.6235 range for now. We continue to hold the same for now.”
Silver prices (XAG/USD) fell on Wednesday, according to FXStreet data. Silver trades at $30.56 per troy ounce, down 0.46% from the $30.70 it cost on Tuesday.
Silver prices have increased by 28.42% since the beginning of the year.
| Unit measure | Silver Price Today in USD |
|---|---|
| Troy Ounce | 30.56 |
| 1 Gram | 0.98 |
The Gold/Silver ratio, which shows the number of ounces of Silver needed to equal the value of one ounce of Gold, stood at 84.07 on Wednesday, up from 83.70 on Tuesday.
Silver FAQs
Silver is a precious metal highly traded among investors. It has been historically used as a store of value and a medium of exchange. Although less popular than Gold, traders may turn to Silver to diversify their investment portfolio, for its intrinsic value or as a potential hedge during high-inflation periods. Investors can buy physical Silver, in coins or in bars, or trade it through vehicles such as Exchange Traded Funds, which track its price on international markets.
Silver prices can move due to a wide range of factors. Geopolitical instability or fears of a deep recession can make Silver price escalate due to its safe-haven status, although to a lesser extent than Gold's. As a yieldless asset, Silver tends to rise with lower interest rates. Its moves also depend on how the US Dollar (USD) behaves as the asset is priced in dollars (XAG/USD). A strong Dollar tends to keep the price of Silver at bay, whereas a weaker Dollar is likely to propel prices up. Other factors such as investment demand, mining supply – Silver is much more abundant than Gold – and recycling rates can also affect prices.
Silver is widely used in industry, particularly in sectors such as electronics or solar energy, as it has one of the highest electric conductivity of all metals – more than Copper and Gold. A surge in demand can increase prices, while a decline tends to lower them. Dynamics in the US, Chinese and Indian economies can also contribute to price swings: for the US and particularly China, their big industrial sectors use Silver in various processes; in India, consumers’ demand for the precious metal for jewellery also plays a key role in setting prices.
Silver prices tend to follow Gold's moves. When Gold prices rise, Silver typically follows suit, as their status as safe-haven assets is similar. The Gold/Silver ratio, which shows the number of ounces of Silver needed to equal the value of one ounce of Gold, may help to determine the relative valuation between both metals. Some investors may consider a high ratio as an indicator that Silver is undervalued, or Gold is overvalued. On the contrary, a low ratio might suggest that Gold is undervalued relative to Silver.
(An automation tool was used in creating this post.)
The Japanese Cabinet Office said in its monthly report published on Wednesday, the government maintained its economic assessment after the previous month’s upgrade.
Additional takeaways
The Japanese government sees the economy as recovering at a moderate pace, although it remains pausing in part.
Private consumption shows movements of picking up recently.
Business investment shows movements of picking up.
Industrial production shows movements of picking up.
The employment situation shows movements of improvement.
Exports are almost flat.
Consumer prices have been rising moderately.
UK inflation for August came in perfectly in line with consensus this morning. The numbers confirm that the Bank of England should keep rates on hold tomorrow, ING’s FX analyst Francesco Pesole notes.
CPI numbers confirm BoE to keep on hold
“This morning’s numbers all but confirm that the Bank of England should keep rates on hold tomorrow. There is a residual 6bp of easing priced though for the meeting, suggesting a bit more room for short-dated Sonia swap rates to readjust higher, after falling throughout September.”
“The GBP is trading on the front foot after CPI data and may find a bit more support tomorrow.”
“The FOMC event today may be a bigger event for GBP markets. A 25bp cut can send GBP/USD back below 1.3100, but if Powell is as dovish as we expect, Cable may well find good support before touching the recent 1.3015 lows.”
- Silver price trades sideways below $31.00 with Fed policy on the horizon.
- The Fed is widely anticipated to pivot to policy normalization.
- The likelihood for the Fed to reduce interest rates by 50 bps is higher.
Silver price (XAG/USD) oscillates below the crucial resistance of $31.00 in Wednesday’s European session. The white metal stays on the sidelines as investors await the Federal Reserve’s (Fed) monetary policy, which will be announced at 18:00 GMT.
The Fed is poised to deliver its first interest rate cut decision in more than four years as officials are worried about deteriorating labor market conditions. However, policymakers remain confident that price pressures are on track to return to the bank’s target of 2%.
With firm speculation that the Fed will pivot to policy normalization, investors will focus on the likely interest rate cut size. According to the CME FedWatch tool, 30-day Federal Funds Futures pricing data shows that the probability of the central bank cutting rates by 50 basis points (bps) to 4.75%-5.00% is 65% and the rest favors a 25-bps rate cut. Apart from the Fed’s policy decision, investors will also focus on the Fed’s dot plot and economic projections.
Ahead of the Fed policy, the US Dollar Index (DXY), which tracks the Greenback’s value against six major currencies, drops to near 100.80. On the contrary, 10-year US Treasury yields jump to near 3.67%. The announcement of the Fed's large rate cut would weigh heavily on the US Dollar and bond yields.
Silver technical analysis
Silver price trades cautiously ahead of the Fed’s interest rate decision. The white metal could a fresh upside if it manages to break above September 16 high of $31.10. The near-term outlook of the Silver price remains firm as the asset holds above the 20-day Exponential Moving Average (EMA), which trades around $29.40.
The 14-day Relative Strength Index (RSI) rises above 60.00. A fresh round of bullish momentum could occur if the oscillator sustains about this level.
Silver daily chart
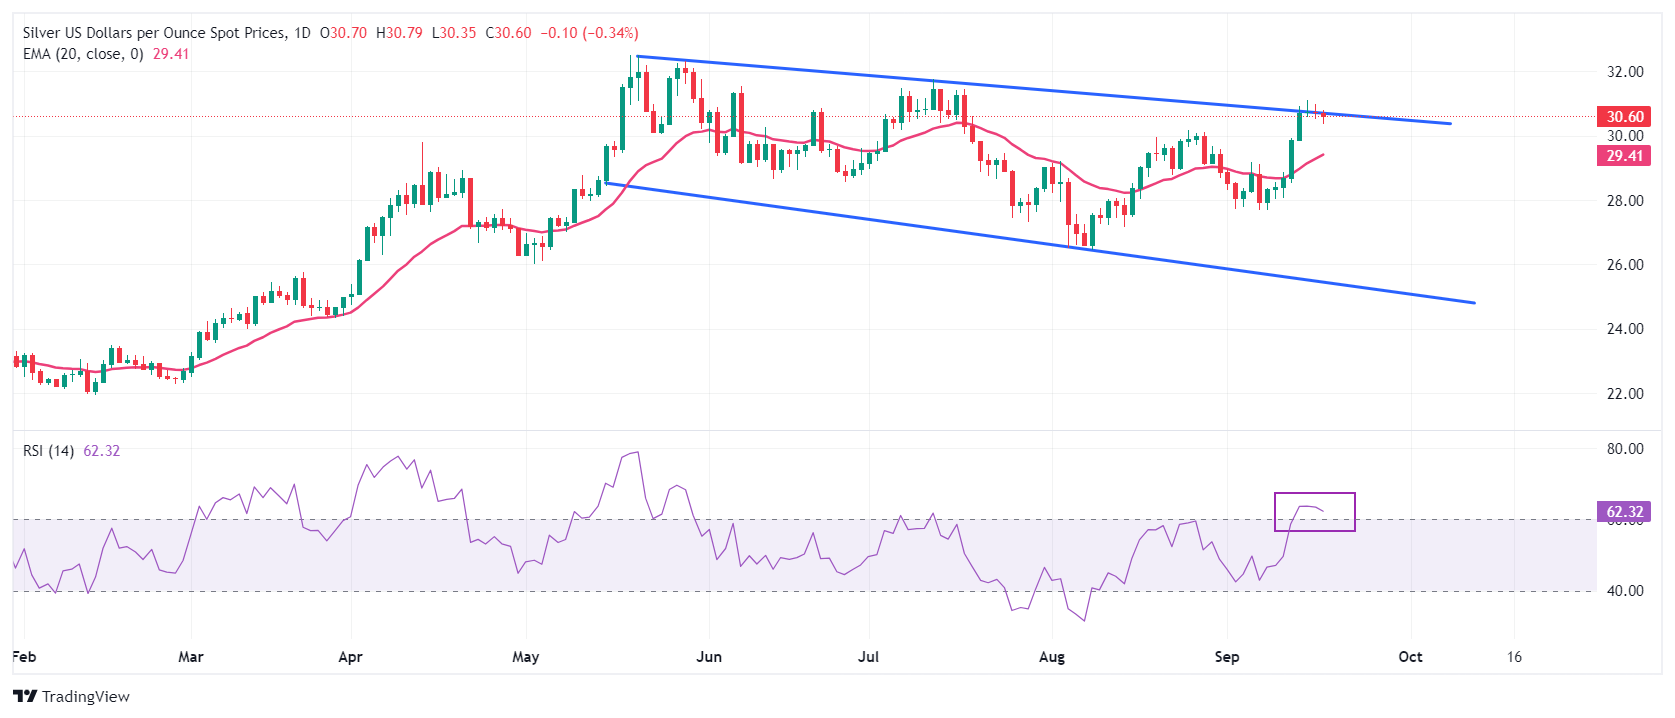
Silver FAQs
Silver is a precious metal highly traded among investors. It has been historically used as a store of value and a medium of exchange. Although less popular than Gold, traders may turn to Silver to diversify their investment portfolio, for its intrinsic value or as a potential hedge during high-inflation periods. Investors can buy physical Silver, in coins or in bars, or trade it through vehicles such as Exchange Traded Funds, which track its price on international markets.
Silver prices can move due to a wide range of factors. Geopolitical instability or fears of a deep recession can make Silver price escalate due to its safe-haven status, although to a lesser extent than Gold's. As a yieldless asset, Silver tends to rise with lower interest rates. Its moves also depend on how the US Dollar (USD) behaves as the asset is priced in dollars (XAG/USD). A strong Dollar tends to keep the price of Silver at bay, whereas a weaker Dollar is likely to propel prices up. Other factors such as investment demand, mining supply – Silver is much more abundant than Gold – and recycling rates can also affect prices.
Silver is widely used in industry, particularly in sectors such as electronics or solar energy, as it has one of the highest electric conductivity of all metals – more than Copper and Gold. A surge in demand can increase prices, while a decline tends to lower them. Dynamics in the US, Chinese and Indian economies can also contribute to price swings: for the US and particularly China, their big industrial sectors use Silver in various processes; in India, consumers’ demand for the precious metal for jewellery also plays a key role in setting prices.
Silver prices tend to follow Gold's moves. When Gold prices rise, Silver typically follows suit, as their status as safe-haven assets is similar. The Gold/Silver ratio, which shows the number of ounces of Silver needed to equal the value of one ounce of Gold, may help to determine the relative valuation between both metals. Some investors may consider a high ratio as an indicator that Silver is undervalued, or Gold is overvalued. On the contrary, a low ratio might suggest that Gold is undervalued relative to Silver.
- Gold has pulled back down ahead of the Federal Reserve policy meeting announcement on Wednesday.
- Better-than-expected US Retail Sales data released on Tuesday caused the backslide in the precious metal.
- Bridgewater Associates CIO Ray Dalio considers a 25 basis points rate cut as more appropriate in the current context.
Gold (XAU/USD) trades in the $2,570s on Wednesday, ahead of the main financial-market event of the week: the Federal Reserve (Fed) policy meeting announcement at 18:00 GMT.
Gold surges as bets the Fed will double cut increase
Gold hit a record high of $2,589 at the start of the week after market bets that the Fed would make a double-dose 0.50% cut to interest rates at its meeting later today rose sharply.
A bigger rate cut from the Fed would be positive for Gold because it lowers the opportunity cost of holding the yellow metal, which is a non-interest-paying asset. This makes it more attractive to investors.
Gold pulls back after Retail Sales data
Gold slid lower on Tuesday after US Retail Sales rose 0.1% in August, compared to the 1.0% advance registered in July. However, this was still better than the consensus expectations (revised down at the last minute from a 0.2% gain to a 0.2% decline).
A 50 bps cut highly probable, according to futures markets
The probability of a larger 0.50% cut stands at 61%, according to the CME FedWatch tool, which bases its calculation on the price of 30-day fed funds futures. The probability of a smaller 0.25% cut, meanwhile, is at 39%. The probability of a cut of any size is therefore 100%.
In an interview with Bloomberg News on Wednesday, Ray Dalio, CIO of Bridgewater Associates said that the Fed would be looking to balance the needs of creditors to earn a real yield (the gain from debt interest after inflation) with the desire to lower interest repayments for debtors.
“[A] 25 pbs [interest-rate cut] would be the right thing to do if you are looking at the whole picture. If you are looking at the mortgage situation, which is worse – and affects more people – then it’s probably 50 bps,” Dalio said.
Based on the economic data alone, he said the “[US] economy is very close to an equilibrium level, except for the debt situation.” Significant socio-economic and political factors, including political polarization were further variables to consider, added Dalio.
Another factor that could influence financial markets and the price of Gold is the Fed’s Summary of Economic Projections (SEP), which is published along with its accompanying policy statement.
The SEP shows the projected path of interest rates in the future based on officials’ views, as well as growth and inflation forecasts for the US economy. Any revisions from past SEP projections could cause volatility.
Technical Analysis: Gold undertakes modest pullback
Gold pulls back to the $2,570-$2,560s after rallying higher. At the same time, the trend remains bullish in the short, medium, and long-term.
Based on the technical analysis dictum that “the trend is your friend,” this means the odds favor more upside in line with the trend. If there is a correction, therefore, it is likely to be short-lived before Gold resumes its broader uptrend.
XAU/USD Daily Chart
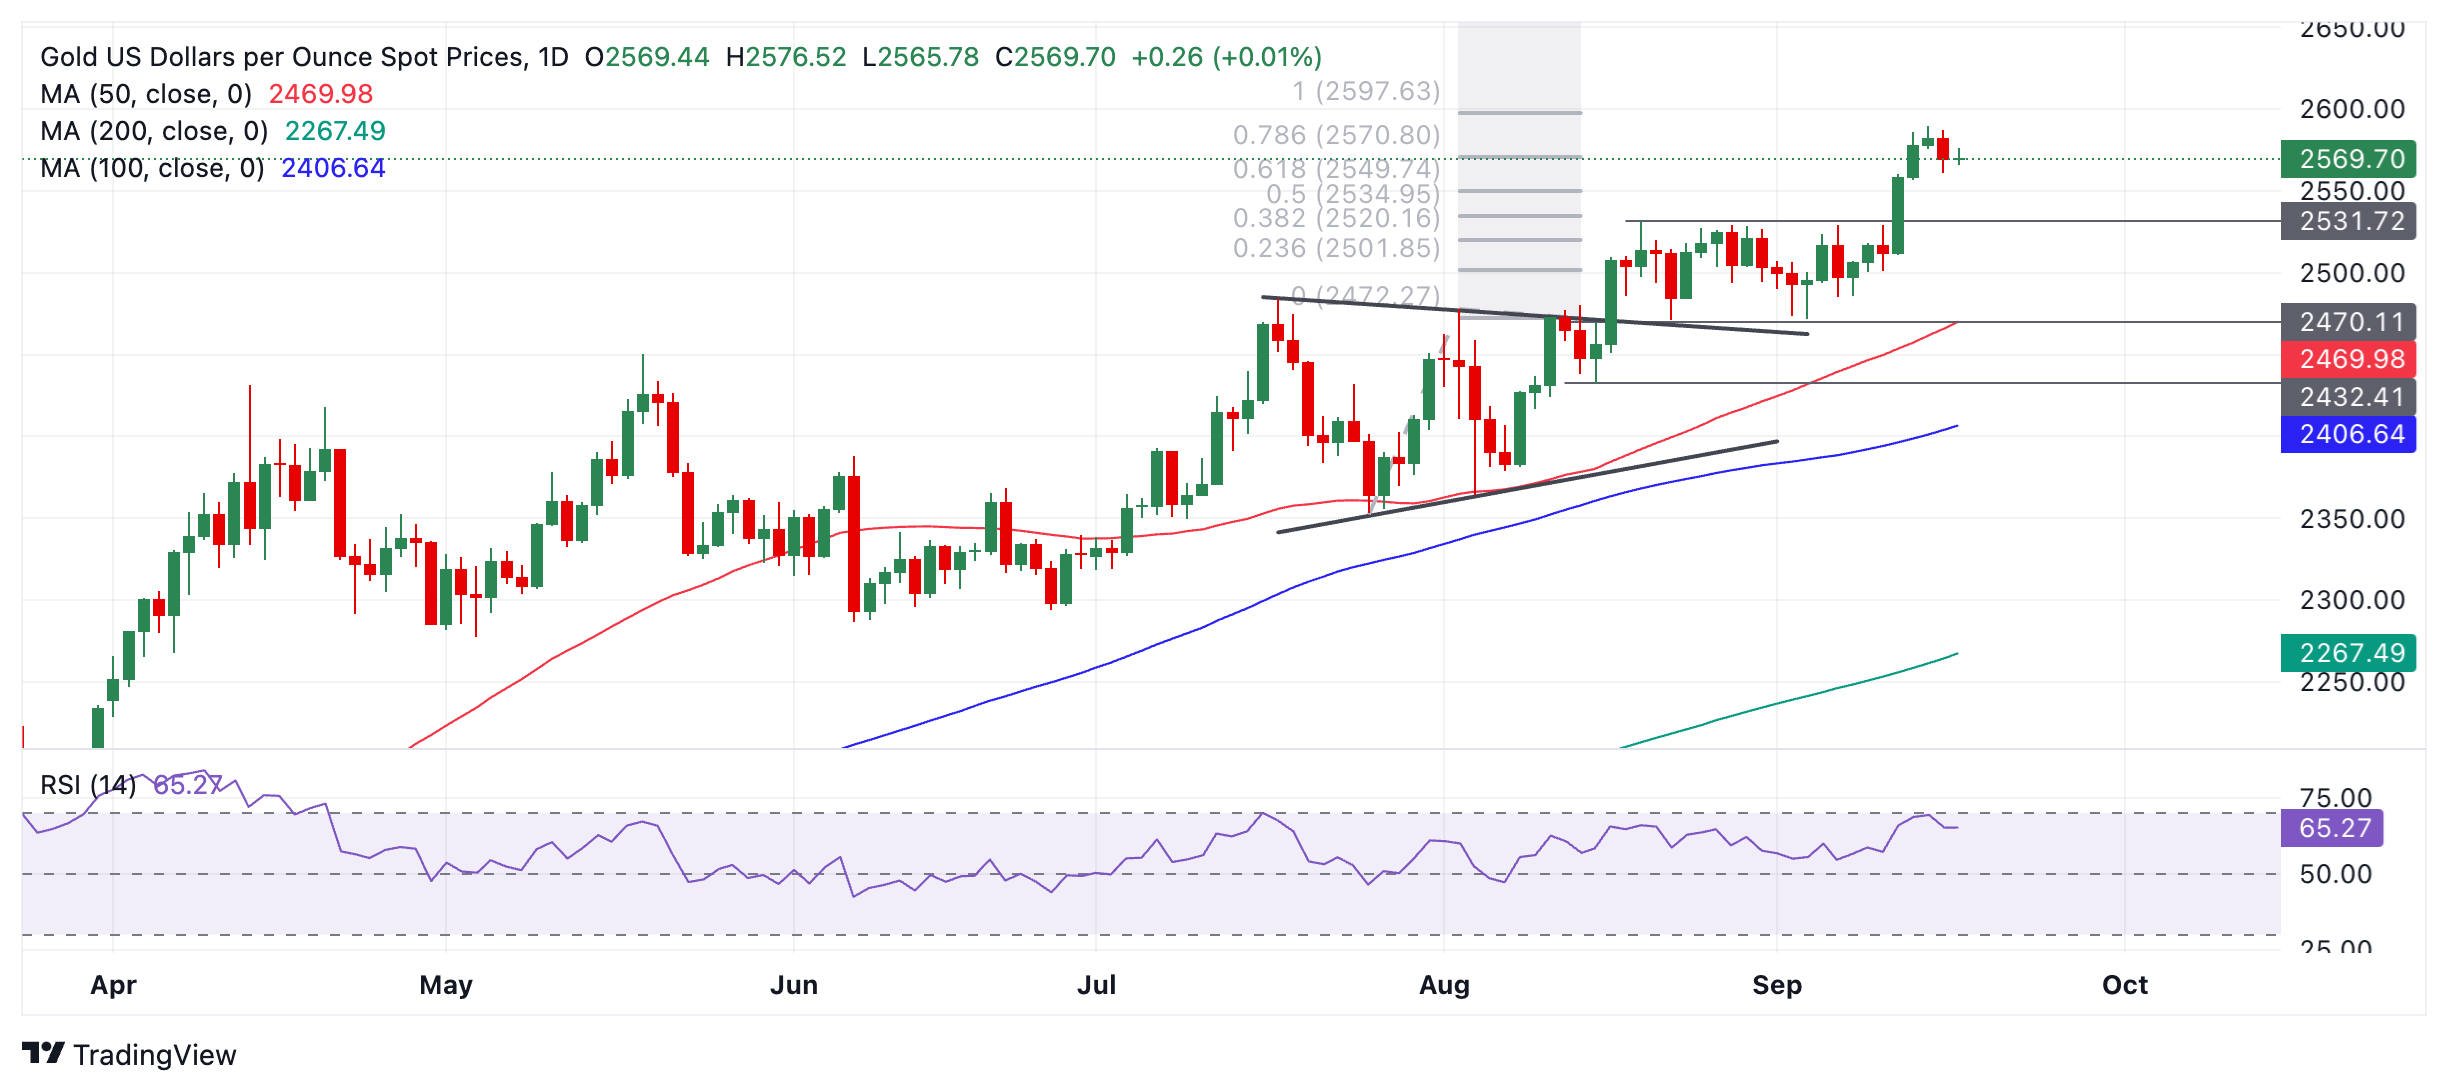
Gold is not overbought, according to the Relative Strength Index (RSI), leaving room for more upside.
If Gold does enter the overbought zone on a closing basis, however, it will advise traders not to add to their long positions.
If it enters and then exits overbought, it will be a sign to close longs and sell as it would suggest a deeper correction is in the process of unfolding.
In the event of a correction, firm support lies at $2,550, $2,544 (0.382 Fibonacci retracement of the September rally), and $2,530 (former range high).
Given prices are into uncharted territory when it comes to further upside, traders may target whole numbers, with $2,600 as an obvious first target for profit-taking if the rally continues.
Economic Indicator
Retail Sales (MoM)
The Retail Sales data, released by the US Census Bureau on a monthly basis, measures the value in total receipts of retail and food stores in the United States. Monthly percent changes reflect the rate of changes in such sales. A stratified random sampling method is used to select approximately 4,800 retail and food services firms whose sales are then weighted and benchmarked to represent the complete universe of over three million retail and food services firms across the country. The data is adjusted for seasonal variations as well as holiday and trading-day differences, but not for price changes. Retail Sales data is widely followed as an indicator of consumer spending, which is a major driver of the US economy. Generally, a high reading is seen as bullish for the US Dollar (USD), while a low reading is seen as bearish.
Read more.Last release: Tue Sep 17, 2024 12:30
Frequency: Monthly
Actual: 0.1%
Consensus: -0.2%
Previous: 1%
Source: US Census Bureau
Retail Sales data published by the US Census Bureau is a leading indicator that gives important information about consumer spending, which has a significant impact on the GDP. Although strong sales figures are likely to boost the USD, external factors, such as weather conditions, could distort the data and paint a misleading picture. In addition to the headline data, changes in the Retail Sales Control Group could trigger a market reaction as it is used to prepare the estimates of Personal Consumption Expenditures for most goods.
The Australian Dollar (AUD) is set to advance towards 0.6825, UOB Group FX analysts Quek Ser Leang and Lee Sue Ann note.
AUD to move towards 0.6825
24-HOUR VIEW: “Although AUD rose sharply on Monday, we indicated yesterday (Tuesday) that ‘upward momentum has not increased much.’ However, we were of the view that it ‘could continue to rise, but any advance is likely part of a higher range of 0.6725/0.6765.’ AUD then traded in a 0.6742/0.6769 range, closing largely unchanged at 0.6756 (+0.06%). Further range trading still seems likely today, expected to be in a range of 0.6725/0.6775.”
1-3 WEEKS VIEW: “We continue to hold the same view as yesterday (17 Sep, spot at 0.6745). As highlighted, the recent price action has resulted in a tentative buildup in upward momentum. However, AUD must break and remain above 0.6765 before an advance to 0.6825 can be expected. The likelihood of AUD breaking clearly above 0.6765 will increase in the next few days as long as 0.6700 is not breached.”
Focus today on FOMC (2am SGT) – whether its 25 or 50bp cut and admittedly, this remains a close call. USD saw a modest rebound, alongside UST yields overnight after retail sales and industrial production came in better than expected. The better print in activity data somewhat still suggests that US economy is still likely to be on a path to soft landing. DXY was last at 100.79, OCBC FX analysts Frances Cheung and Christopher Wong note.
Clean break below 100.50 puts 99.60 in focus
“Given that markets have priced in a much dovish Fed (70% probability for 50bp cut), the scenario where Fed only cuts 25bp may force a nasty USD short squeeze. While the magnitude of Fed cut is highly in focus and may impact USD moves in the short term, we opined that Fed’s commentary and dot plot guidance should play a slightly more lasting effect than a 25 or 50bp first cut itself.”
“And beyond this rate cut hype, markets' focus should shift back to watching global growth momentum. We emphasized that it is important to consider what the market environment is when rate cut cycle gets going. If Fed cut is non-recessionary driven and that growth outside-US continues to manage ok in a not-hot-not cold setting, then the USD can remain back footed.”
“Mild bullish momentum on daily chart is fading while decline in RSI moderated. 2-way trade intra-day with a good chance we see choppy price action around policy decision and press conference. Support at 100.50 levels. Clean break puts 99.60 in focus. Resistance at 101.20 (21 DMA), 102.20 (23.6% fibo retracement of 2023 high to 2024 low), 102.60 (50 DMA).”
- USD/CAD tests the lower boundary of the ascending channel, which suggests a potential weakening of the bullish bias.
- The pair’s price remains above both the nine-day and 14-day EMAs, indicating that bullish momentum is still in play.
- The 1.3590 level, where "throwback support turns into pullback resistance," serves as the immediate barrier.
USD/CAD trades around 1.3590 during Wednesday’s European hours. Analysis of the daily chart suggests a potential weakening of the bullish bias for the USD/CAD pair, as it is testing the lower boundary of the ascending channel pattern.
Additionally, the 14-day Relative Strength Index (RSI) is slightly below the 50 level. Further movement in the RSI will provide a clearer indication of the directional trend for the USD/CAD pair.
However, the nine-day Exponential Moving Average (EMA) is positioned slightly above the 14-day EMA, indicating that the short-term trend is stronger than the longer-term trend. The price of the USD/CAD pair remains above both the nine-day and 14-day EMAs, suggesting that bullish momentum is still in play.
On the downside, a break below the lower boundary of the ascending channel would weaken the bullish bias and lead the USD/CAD pair to test the nine-day EMA at the 1.3578 level, which aligns closely with the 14-day EMA at 1.3575. A breach below these EMAs could trigger a bearish trend, potentially pressuring the pair to move toward the six-month low of 1.3441, recorded on August 28.
Regarding the upside, the immediate barrier is at the "throwback support turns into a pullback resistance" level of 1.3590, followed by the psychological level of 1.3600. Additional resistance may emerge at the upper boundary of the ascending channel, around the 1.3700 level.
USD/CAD: Daily Chart
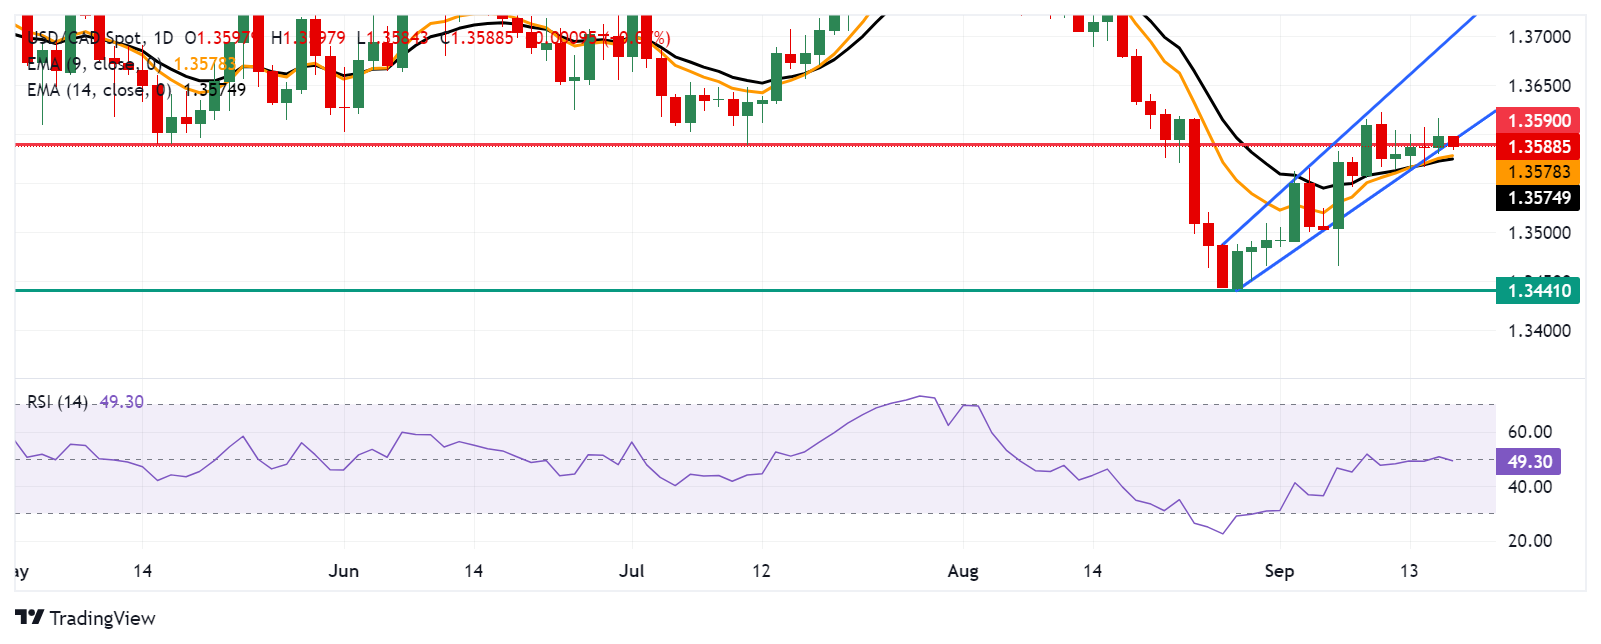
Canadian Dollar PRICE Today
The table below shows the percentage change of Canadian Dollar (CAD) against listed major currencies today. Canadian Dollar was the strongest against the US Dollar.
| USD | EUR | GBP | JPY | CAD | AUD | NZD | CHF | |
|---|---|---|---|---|---|---|---|---|
| USD | -0.14% | -0.34% | -0.45% | -0.06% | -0.32% | -0.54% | -0.40% | |
| EUR | 0.14% | -0.21% | -0.33% | 0.08% | -0.17% | -0.42% | -0.26% | |
| GBP | 0.34% | 0.21% | -0.09% | 0.29% | 0.04% | -0.21% | -0.03% | |
| JPY | 0.45% | 0.33% | 0.09% | 0.39% | 0.13% | -0.07% | 0.08% | |
| CAD | 0.06% | -0.08% | -0.29% | -0.39% | -0.27% | -0.48% | -0.32% | |
| AUD | 0.32% | 0.17% | -0.04% | -0.13% | 0.27% | -0.21% | -0.06% | |
| NZD | 0.54% | 0.42% | 0.21% | 0.07% | 0.48% | 0.21% | 0.15% | |
| CHF | 0.40% | 0.26% | 0.03% | -0.08% | 0.32% | 0.06% | -0.15% |
The heat map shows percentage changes of major currencies against each other. The base currency is picked from the left column, while the quote currency is picked from the top row. For example, if you pick the Canadian Dollar from the left column and move along the horizontal line to the US Dollar, the percentage change displayed in the box will represent CAD (base)/USD (quote).
There are no major data releases in the eurozone today, and EUR/USD should trade in tight ranges until the FOMC announcement this evening,
ECB to cut rates if Fed delivers 50bp today
“The transmission channels from the Fed cut to EUR/USD are the USD short-term rate impact first, and the equity reaction second. If the Fed cuts by 50bp and markets read that as a panic move, USD weakness may be channelled via EUR, JPY and CHF, while higher-beta currencies (like NOK and SEK) may take a hit.”
“In our base case (dovish 25bp cut), EUR/USD moves back below 1.110, but gradually recovers ground in the coming days. By the time the next big things happen in markets (US PCE, US jobs report), EUR/USD may be back at 1.11-1.12.”
“On the ECB side, another hawkish-leaning Governing Council member, Gediminas Simkus, said that an October cut is unlikely. Markets are only pricing in 7bp, and we also expect the next reduction in December. That said, if the Fed cuts by 50bp today, there will be growing pressure on the ECB to frontload some easing as well.”
- GBP/JPY recovers early lost ground following the release of the UK consumer inflation figures.
- The headline UK CPI held steady at 2.2%, while the core CPI accelerated to the 3.6% YoY rate.
- The upside remains capped as traders await the BoE and the BoJ monetary policy meetings.
The GBP/JPY cross attracts some dip-buyers following an intraday slide to the 185.80 area and climbs to the top end of its daily range during the first half of the European session on Wednesday. Spot prices currently trade around the 187.25-187.30 region, just below a one-week high touched on Tuesday, though the fundamental backdrop warrants caution before positioning for an extension of this week's bounce from the vicinity of the monthly low.
The British Pound (GBP) rallies across the board following the release of the UK Consumer Price Index (CPI) report, which fueled expectations that the Bank of England (BoE) would hold rates steady and acted as a tailwind for the GBP/JPY cross. In fact, the UK Office for National Statistics (ONS) reported that the core CPI (excluding volatile food and energy items) accelerated to the 3.6% YoY rate in August from 3.3% previous.
Adding to this, the UK August Services CPI inflation climbed 5.6% during the reported period as compared to the 5.2% in July and the headline print held steady at 2.2%. This, in turn, raises hopes that the BoE's rate-cutting cycle is more likely to be slower than in the United States (US) and the Eurozone. The upside for the GBP/JPY cross, however, remains capped as traders seem reluctant ahead of the key central bank event risks.
The BoE is scheduled to announce its decision on Wednesday and the market pricing suggests a little chance of an interest rate cut, though the possibility of a reduction in November remains on the table. The focus will then shift to the Bank of Japan (BoJ) policy update on Friday, which will play a key role in influencing demand for the Japanese Yen (JPY) and help in determining the next leg of a directional move for the GBP/JPY cross.
Hence, a strong follow-through buying is needed to confirm that spot prices have formed a near-term bottom around the 183.70-183.75 region, or a one-month low touched last Wednesday. Nevertheless, the GBP/JPY cross, for now, seems to have snapped a two-day winning streak ahead of the BoE and the BoJ meetings. In the meantime, the critical Fed decision might infuse some volatility and produce short-term opportunities.
Economic Indicator
Core Consumer Price Index (YoY)
The United Kingdom (UK) Core Consumer Price Index (CPI), released by the Office for National Statistics on a monthly basis, is a measure of consumer price inflation – the rate at which the prices of goods and services bought by households rise or fall – produced to international standards. The YoY reading compares prices in the reference month to a year earlier. Core CPI excludes the volatile components of food, energy, alcohol and tobacco. The Core CPI is a key indicator to measure inflation and changes in purchasing trends. Generally, a high reading is seen as bullish for the Pound Sterling (GBP), while a low reading is seen as bearish.
Read more.Last release: Wed Sep 18, 2024 06:00
Frequency: Monthly
Actual: 3.6%
Consensus: 3.5%
Previous: 3.3%
Source: Office for National Statistics
The Bank of England is tasked with keeping inflation, as measured by the headline Consumer Price Index (CPI) at around 2%, giving the monthly release its importance. An increase in inflation implies a quicker and sooner increase of interest rates or the reduction of bond-buying by the BOE, which means squeezing the supply of pounds. Conversely, a drop in the pace of price rises indicates looser monetary policy. A higher-than-expected result tends to be GBP bullish.
The Pound Sterling (GBP) is likely to trade sideways between 1.3120 and 1.3210. In the longer run, increase in momentum is likely to lead to further GBP strength, potentially breaking this year’s high, near 1.3270, UOB Group FX analysts Quek Ser Leang and Lee Sue Ann note.
GBP rangebound for now
24-HOUR VIEW: “After GBP soared two days ago, we indicated yesterday that ‘while the sharp advance seems to be overdone, there is room for GBP to rise 1.3240 before levelling off.’ GBP subsequently rose less than expected to 1.3229, staging a surprisingly sharp pullback to 1.3147. The pullback appears to be running ahead of itself, and GBP is unlikely to weaken much further. Today, GBP is more likely to trade sideways between 1.3120 and 1.3210.”
1-3 WEEKS VIEW: “Two days ago, GBP rose sharply. Yesterday (17 Sep, spot at 1.3210), we highlighted that ‘the increase in momentum is likely to lead to further GBP strength, potentially breaking above this year’s high, near 1.3270.’ We added, ‘should GBP break below 1.3120, it would mean that the buildup in momentum has faded.’ GBP then rose to 1.3229 before falling sharply to 1.3163. While upward momentum has slowed, we continue to hold the same view for now.”
- EUR/USD holds gains above 1.1100 as the US Dollar remains under pressure ahead of the Fed’s policy decision at 18:00 GMT.
- Traders seem more confident that the Fed will reduce interest rates by 50 basis points.
- ECB’s Villeroy sees the policy-easing cycle continuing further.
EUR/USD steadies above 1.1100 in Wednesday’s European session ahead of the Federal Reserve’s (Fed) monetary policy announcement at 18:00 GMT. The major currency pair gains as the US Dollar (USD) remains under pressure as the Fed is poised to deliver its first interest rate cut in more than four years.
The US Dollar Index (DXY), which tracks the Greenback’s value against six major currencies, struggles to hold its recovery to near 101.00, a rebound fuelled by better-than-expected United States (US) monthly Retail Sales data for August.
The confidence of market participants that the Fed will start the policy-easing cycle aggressively has increased as officials said they remain concerned over a slowdown in job growth. Also, they are confident that inflation is declining towards the bank’s target of 2%.
According to the CME FedWatch tool, 30-day Federal Funds Futures pricing data shows that the probability of the central bank cutting rates by 50 basis points (bps) to 4.75%-5.00% is at 65%, while the rest favors a 25-bps rate cut.
In addition to the Fed’s decision itself, the US Dollar will also be influenced by the Fed’s dot plot, economic projections, and the press conference of Fed Chair Jerome Powell, which will provide fresh guidance on interest rates. The Fed’s dot plot indicates where policymakers see the federal fund rate heading in the medium and long term.
Daily digest market movers: EUR/USD gains even though Euro struggles
- EUR/USD remains firm at the US Dollar’s expense as the Euro (EUR) is underperforming against other major peers on Wednesday. The Euro faces pressure amid growing uncertainty over the European Central Bank’s (ECB) interest-rate path and the Eurozone’s economic performance.
- ECB officials seem split over the interest rate-cut path due to diverging opinions over the inflation outlook. On Friday, the comments from ECB Governing Council member and Bank of France President, François Villeroy de Galhau indicated that more rate cuts are needed to avoid the risk of inflation coming in too low despite a dovish decision on Thursday. In Wednesday’s Asian session, Villeroy said the ECB “is likely to continue to cut rates.”
- On the contrary, ECB Governing Council member Peter Kazimir said on Monday in a blog post: "We will almost surely need to wait until December for a clearer picture before making our next move," Reuters reported. Kazimir emphasized the need to be certain that price pressures continue to decline as projected, “otherwise policymakers might regret rushing to cut borrowing costs before inflation has been sustainably defeated”, he said.
- Financial market participants expect that the ECB will deliver one more interest rate cut in one of its remaining meetings of the year, either in October or December.
- In the Eurozone calendar, Eurostat will publish at 09:00 GMT the final reading of the Harmonized Index of Consumer Prices (HICP) for August. Economists expect the figures to be aligned with the preliminary estimates, with annual headline inflation at 2.2% and core inflation at 2.8%.
Technical Analysis: EUR/USD holds gains above 1.1100
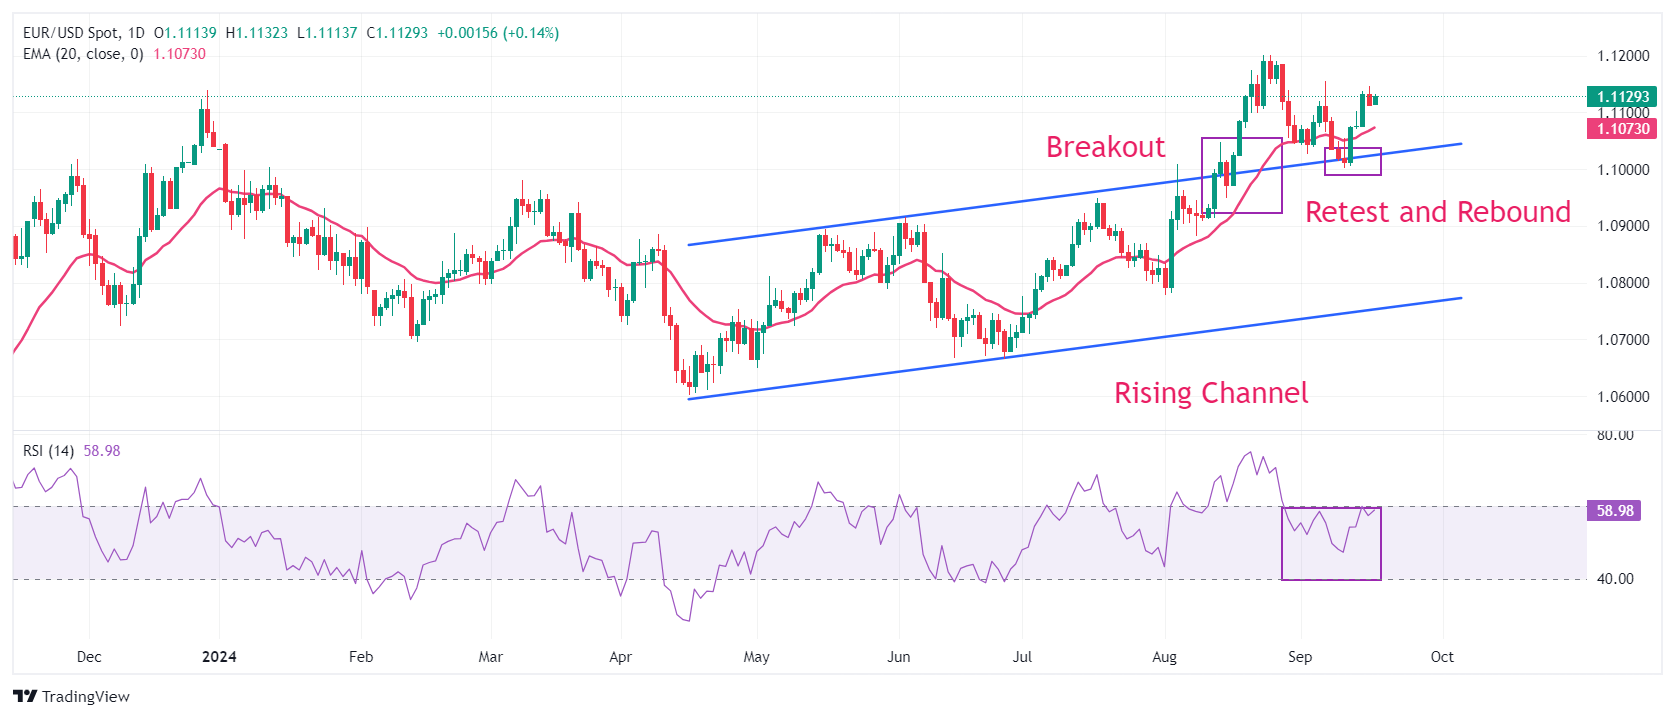
EUR/USD steadies above 1.1100 in European trading hours. The major currency pair strengthened after retesting the breakout of the Rising Channel chart pattern formed on a daily time frame near the psychological support of 1.1000. The near-term outlook of the major currency pair has strengthened as the asset steadies above the 20-day Exponential Moving Average (EMA), which trades around 1.1060.
The 14-day Relative Strength Index (RSI) moves higher to near 60.00. A bullish momentum would trigger if it sustains above the aforementioned level.
Looking up, the high of 1.1155 from September 6 and the round-level resistance of 1.1200 will act as major barricades for the Euro bulls. On the downside, the psychological level of 1.1000 and the July 17 high near 1.0950 will be major support zones.
Euro FAQs
The Euro is the currency for the 20 European Union countries that belong to the Eurozone. It is the second most heavily traded currency in the world behind the US Dollar. In 2022, it accounted for 31% of all foreign exchange transactions, with an average daily turnover of over $2.2 trillion a day. EUR/USD is the most heavily traded currency pair in the world, accounting for an estimated 30% off all transactions, followed by EUR/JPY (4%), EUR/GBP (3%) and EUR/AUD (2%).
The European Central Bank (ECB) in Frankfurt, Germany, is the reserve bank for the Eurozone. The ECB sets interest rates and manages monetary policy. The ECB’s primary mandate is to maintain price stability, which means either controlling inflation or stimulating growth. Its primary tool is the raising or lowering of interest rates. Relatively high interest rates – or the expectation of higher rates – will usually benefit the Euro and vice versa. The ECB Governing Council makes monetary policy decisions at meetings held eight times a year. Decisions are made by heads of the Eurozone national banks and six permanent members, including the President of the ECB, Christine Lagarde.
Eurozone inflation data, measured by the Harmonized Index of Consumer Prices (HICP), is an important econometric for the Euro. If inflation rises more than expected, especially if above the ECB’s 2% target, it obliges the ECB to raise interest rates to bring it back under control. Relatively high interest rates compared to its counterparts will usually benefit the Euro, as it makes the region more attractive as a place for global investors to park their money.
Data releases gauge the health of the economy and can impact on the Euro. Indicators such as GDP, Manufacturing and Services PMIs, employment, and consumer sentiment surveys can all influence the direction of the single currency. A strong economy is good for the Euro. Not only does it attract more foreign investment but it may encourage the ECB to put up interest rates, which will directly strengthen the Euro. Otherwise, if economic data is weak, the Euro is likely to fall. Economic data for the four largest economies in the euro area (Germany, France, Italy and Spain) are especially significant, as they account for 75% of the Eurozone’s economy.
Another significant data release for the Euro is the Trade Balance. This indicator measures the difference between what a country earns from its exports and what it spends on imports over a given period. If a country produces highly sought after exports then its currency will gain in value purely from the extra demand created from foreign buyers seeking to purchase these goods. Therefore, a positive net Trade Balance strengthens a currency and vice versa for a negative balance.
- The Mexican Peso is trading marginally lower in its key pairs on Wednesday.
- It is weakening especially against the Pound Sterling after the release of UK inflation data.
- USD/MXN falls close to major support from a lower channel line and 50-day SMA.
The Mexican Peso (MXN) notes a modest weakness in its most heavily-traded pairs during the European session on Wednesday, falling in particular against the Pound Sterling (GBP), which broadly appreciates after the release of UK inflation data.
Mexican Peso down against the Pound
The Mexican Peso is currently down by over a third of a percent against the Pound Sterling after the release of higher-than-expected UK services and core inflation data for August, which wiped out any hopes of the Bank of England (BoE) cutting interest rates on Thursday. A rate cut had been speculated, which would have put a lid on GBP strength since lower interest rates generally attract less foreign capital inflows. Given that it is now highly unlikely, Sterling is appreciating.
UK headline Consumer Price Index (CPI) in August met expectations of 2.2% year-over-year (YoY) and remained unchanged from the previous month, whilst core CPI rose 3.6% YoY when 3.5% had been expected from 3.3% in July. A rise in Services inflation, which has been a key issue for the BoE, was the final nail in the coffin for hopes of a rate cut.
“..but the rise in services inflation 5.2% to 5.6% suggests the Bank of England will almost certainly press the pause button on interest rate cuts on Thursday. We continue to expect the next 25 basis point rate cut to take place in November," said Ruth Gregory, Deputy Chief UK Economist at Capital Economics.
Big day for the US Dollar as Fed set to announce rate cut
The hot topic for markets is still whether the Federal Reserve (Fed) will cut interest rates by a bigger 50 basis points (0.50%) at the conclusion of its meeting on Wednesday or opt for a standard 25 basis point (bps) cut – 0.25% in percentage terms.
The outcome is likely to cause volatility in the US Dollar (USD) and its pairs, US stocks, and broader global financial markets. A larger rate cut will weaken the USD, leading to a fall in USD/MXN. A smaller cut is probably already priced in.
The Fed’s accompanying Statement of Economic Projections (SEP), with its projected path for interest rates in the future based on officials’ views, as well as growth and inflation forecasts, could also impact markets and FX.
Dalio weighs in on 25-or-50 debate
In an interview with Bloomberg News on Wednesday, Ray Dalio, CIO of Bridgewater Associates, said that the Fed would be looking to balance the needs of creditors to earn a real yield (the gain from debt interest after inflation) with the desire to lower interest repayments for debtors.
“25 pbs would be the right thing to do if you are looking at the whole picture. If you are looking at the mortgage situation, which is worse – and affects more people – then it’s probably 50 bps,” Dalio said.
Based on the economic data alone, he said the “(US) economy is very close to an equilibrium level, except for the debt situation.” “Significant socio-economic and political factors, including polarization in both, were further variables to consider,” added Dalio.
The probability of a larger 0.50% cut stands at 61%, as implied by 30-day Fed Funds futures prices according to the CME FedWatch tool, whilst the probability of a smaller 0.25% cut stands at 39%.
Technical Analysis: USD/MXN nears bottom of channel
USD/MXN has declined within a broad rising channel, forming a Three Black Crows Japanese candlestick pattern on the way down (shaded rectangle) last week. The pattern indicates the probability that prices will fall even lower in the short term. That said, they are already nearing key support at the base of the channel.
USD/MXN Daily Chart
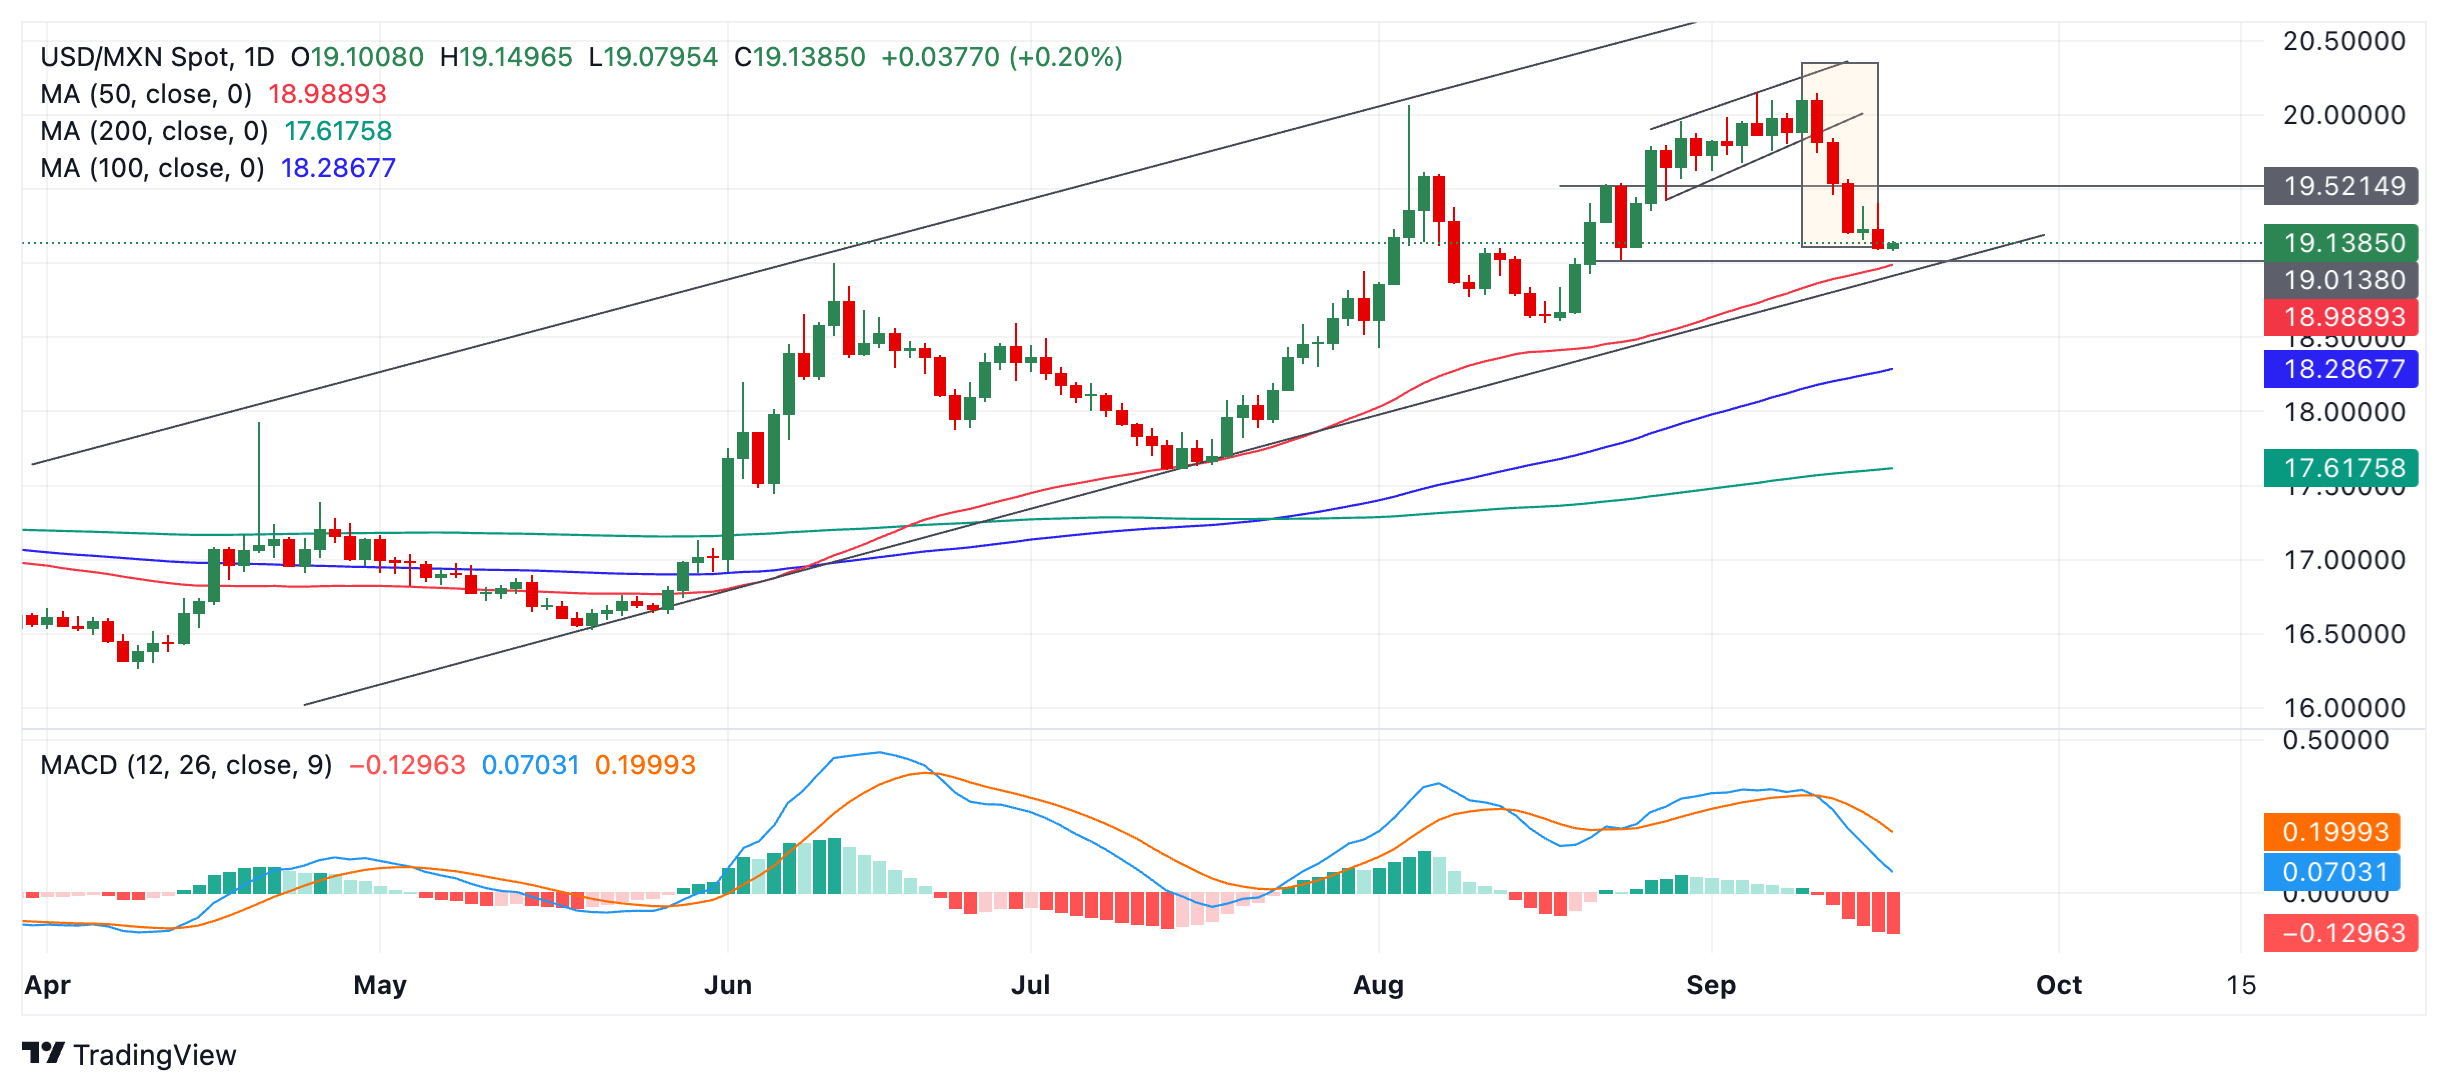
Although USD/MXN has fallen quite far already, the odds favor more weakness to the next downside target and support level at 19.01 (August 23 low), followed perhaps by further weakness to the 50-day Simple Moving Average (SMA) at 18.99 and then the lower trendline of the larger channel a few pips below. At that level, the price will likely find firm support to stabilize and perhaps recover in line with the broader medium and long-term trend.
A decisive break below the lower channel line would indicate a reversal in the medium-term trend. This is a possibility given the risk of volatility on the horizon from the Fed’s announcement and the speed and steepness of the decline so far.
A decisive break would be one accompanied by a long red candle that pierced well below the channel line and closed near its low, or three down days in a row that broke clearly below the line.
Economic Indicator
Core Consumer Price Index (YoY)
The United Kingdom (UK) Core Consumer Price Index (CPI), released by the Office for National Statistics on a monthly basis, is a measure of consumer price inflation – the rate at which the prices of goods and services bought by households rise or fall – produced to international standards. The YoY reading compares prices in the reference month to a year earlier. Core CPI excludes the volatile components of food, energy, alcohol and tobacco. The Core CPI is a key indicator to measure inflation and changes in purchasing trends. Generally, a high reading is seen as bullish for the Pound Sterling (GBP), while a low reading is seen as bearish.
Read more.Last release: Wed Sep 18, 2024 06:00
Frequency: Monthly
Actual: 3.6%
Consensus: 3.5%
Previous: 3.3%
Source: Office for National Statistics
The Bank of England is tasked with keeping inflation, as measured by the headline Consumer Price Index (CPI) at around 2%, giving the monthly release its importance. An increase in inflation implies a quicker and sooner increase of interest rates or the reduction of bond-buying by the BOE, which means squeezing the supply of pounds. Conversely, a drop in the pace of price rises indicates looser monetary policy. A higher-than-expected result tends to be GBP bullish.
Today’s Fed rate decision (1900 BST) is approaching. Markets have recently leaned narrowly in favour of a 50bp cut rather than 25bp, and ING’s FX analyst Francesco Pesole thinks that the September FOMC will deliver a 25bp cut, and this may be an exceptionally close call, he notes.
Powell to open the door to larger cuts ahead
“The key risk for the Fed here: Chair Jerome Powell would need to provide solid macro justifications for a half-point move to avoid sounding too sensitive to market rate expectations. Incidentally, Powell would need to show the 50bp cut isn’t a ‘panic’ move: i.e. the Fed is not overly worried about recession and the jobs market.”
“We see 25bp as slightly more likely. However, we believe the Fed would accompany a more cautious cut with dovish messaging. That could include a few members voting for 50bp and Powell opening the door to larger cuts ahead.”
“A 25bp cut will likely lead to a dollar rally due to a mechanical shift higher in the OIS curve. However, if we are right with our expectations of a dovish press conference by Powell, the dollar may well struggle to hold on to gains beyond the very short-term.”
The Euro (EUR) is likely to trade in a range, probably between 1.1085 and 1.1145. In the longer run, EUR is likely to continue to rise, but it is unclear if it has sufficient momentum to break above the y-t-d high, near 1.1200, UOB Group FX analysts Quek Ser Leang and Lee Sue Ann note.
EUR to continue to rise in the longer run
24-HOUR VIEW: “We indicated yesterday that ‘there is scope for EUR to test 1.1155, but sustained break above this level seems unlikely.’ Our view did not materialise as EUR rose to 1.1146, pulling back to close at 1.1113 (-0.17%). The price action is likely part of a range trading phase, probably between 1.1085 and 1.1145.”
1-3 WEEKS VIEW: “Yesterday (17 Sep, spot at 1.1125), we highlighted that EUR “is likely to continue to rise, but it is unclear at this time if it has sufficient momentum to break above the year-to-date high, near 1.1200.” We will continue to hold the same view as long as 1.1040 (no change in ‘strong support’ level) remains intact.”
- AUD/USD gains positive traction for the third straight day amid modest USD weakness.
- Bets for a 50 bps Fed rate cut and a positive risk tone undermine the safe-haven buck.
- China’s economic woes warrant caution for bulls ahead of the crucial Fed policy decision.
The AUD/USD pair scales higher for the third straight day – also marking the fifth day of a positive move in the previous six – and climbs to over a two-week high, around the 0.6775-0.6780 region during the early European session on Wednesday. The momentum is sponsored by the emergence of fresh US Dollar (USD) selling, which continues to be weighed down by dovish Federal Reserve (Fed) expectations.
In fact, the markets are currently pricing in a greater chance of an oversized 50 basis points (bps) Fed rate cut move at the end of a two-day policy meeting later today. This keeps a lid on the overnight recovery in the US Treasury bond yields, led by the upbeat US Retail Sales figures. Apart from this, a generally positive tone around the equity markets caps the USD recovery from its lowest level since July 2023 and acts as a tailwind for the AUD/USD pair.
The Australian Dollar (AUD), on the other hand, continues to draw support from the Reserve Bank of Australia's (RBA) hawkish stance. The RBA Governor Michele Bullock reiterated last Thursday that bringing inflation down to the target band of 2-3% remains the central bank's highest priority and it was premature to contemplate near-term rate cuts as inflation remained too high. This further contributes to the bid tone surrounding the AUD/USD pair.
That said, persistent worries about a slowdown in China – the world's second-largest economy – might hold back traders from placing aggressive bullish bets around the China-proxy Aussie. Investors might also prefer to move to the sidelines and wait for the highly-anticipated FOMC monetary policy decision before positioning for an extension of the AUD/USD pair's recent goodish rebound from the 200-day Simple Moving Average (SMA) support.
Dot Plot FAQs
The “Dot Plot” is the popular name of the interest-rate projections by the Federal Open Market Committee (FOMC) of the US Federal Reserve (Fed), which implements monetary policy. These are published in the Summary of Economic Projections, a report in which FOMC members also release their individual projections on economic growth, the unemployment rate and inflation for the current year and the next few ones. The document consists of a chart plotting interest-rate projections, with each FOMC member’s forecast represented by a dot. The Fed also adds a table summarizing the range of forecasts and the median for each indicator. This makes it easier for market participants to see how policymakers expect the US economy to perform in the near, medium and long term.
The US Federal Reserve publishes the “Dot Plot” once every other meeting, or in four of the eight yearly scheduled meetings. The Summary of Economic Projections report is published along with the monetary policy decision.
The “Dot Plot” gives a comprehensive insight into the expectations from Federal Reserve (Fed) policymakers. As projections reflect each official’s projection for interest rates at the end of each year, it is considered a key forward-looking indicator. By looking at the “Dot Plot” and comparing the data to current interest-rate levels, market participants can see where policymakers expect rates to head to and the overall direction of monetary policy. As projections are released quarterly, the “Dot Plot” is widely used as a guide to figure out the terminal rate and the possible timing of a policy pivot.
The most market-moving data in the “Dot Plot” is the projection of the federal funds rate. Any change compared with previous projections is likely to influence the US Dollar (USD) valuation. Generally, if the “Dot Plot” shows that policymakers expect higher interest rates in the near term, this tends to be bullish for USD. Likewise, if projections point to lower rates ahead, the USD is likely to weaken.
- AUD/JPY recovers its daily losses, possibly driven by a risk-on mood amid the expected Federal Reserve interest rate cut.
- The Japanese Yen receives support from the hawkish sentiment surrounding the BoJ’s policy outlook.
- The Australian Dollar may appreciate due to the Reserve Bank of Australia’s aggressive monetary policy approach.
AUD/JPY trims its intraday losses, trading around 96.10 during the European hours on Wednesday. However, the AUD/JPY cross may hold losses as the Japanese Yen (JPY) receives support from the hawkish sentiment surrounding the Bank of Japan’s (BoJ) policy outlook.
Traders await the US Federal Reserve’s (Fed) interest rate decision scheduled to be released later in the North American session. The focus will shift toward the BoJ policy decision on Friday, with expectations of keeping rates unchanged while leaving the possibility open for further rate hikes.
Japanese Finance Minister Shunichi Suzuki stated on Tuesday that rapid foreign exchange (FX) fluctuations are undesirable. Suzuki emphasized that officials will closely monitor how FX movements affect the Japanese economy and people's livelihoods. The government will continue to assess the impact of a stronger Japanese Yen and respond accordingly, according to Reuters.
The downside of the AUD/JPY cross could be restrained as the Australian Dollar (AUD) receives support from the Reserve Bank of Australia's (RBA) hawkish stance on monetary policy outlook. RBA Governor Michele Bullock stated that it is premature to consider rate cuts due to persistently high inflation. Additionally, RBA Assistant Governor Sarah Hunter noted that while the labor market remains tight, wage growth appears to have peaked and is expected to slow further.
Investors are now awaiting Australia's jobs data, including Employment Change and the Unemployment Rate for August, set to be released on Thursday. This report may provide insights into the health of the labor market and may influence expectations regarding the future direction of domestic monetary policy.
Interest rates FAQs
Interest rates are charged by financial institutions on loans to borrowers and are paid as interest to savers and depositors. They are influenced by base lending rates, which are set by central banks in response to changes in the economy. Central banks normally have a mandate to ensure price stability, which in most cases means targeting a core inflation rate of around 2%. If inflation falls below target the central bank may cut base lending rates, with a view to stimulating lending and boosting the economy. If inflation rises substantially above 2% it normally results in the central bank raising base lending rates in an attempt to lower inflation.
Higher interest rates generally help strengthen a country’s currency as they make it a more attractive place for global investors to park their money.
Higher interest rates overall weigh on the price of Gold because they increase the opportunity cost of holding Gold instead of investing in an interest-bearing asset or placing cash in the bank. If interest rates are high that usually pushes up the price of the US Dollar (USD), and since Gold is priced in Dollars, this has the effect of lowering the price of Gold.
The Fed funds rate is the overnight rate at which US banks lend to each other. It is the oft-quoted headline rate set by the Federal Reserve at its FOMC meetings. It is set as a range, for example 4.75%-5.00%, though the upper limit (in that case 5.00%) is the quoted figure. Market expectations for future Fed funds rate are tracked by the CME FedWatch tool, which shapes how many financial markets behave in anticipation of future Federal Reserve monetary policy decisions.
Here is what you need to know on Wednesday, September 18:
The US Federal Reserve (Fed) will conclude its two-day policy meeting and announce the interest rate decision on Wednesday. For the first time in a very long time, markets are unsure about what the Fed will do and they will finally see whether policymakers will opt for a 25 or a 50 basis points (bps) rate cut. The US central Bank will also release the revised Summary of Economic Projections (SEP), also known as the dot-plot, and Chairman Jerome Powell will respond to questions in a press conference.
US Dollar PRICE This week
The table below shows the percentage change of US Dollar (USD) against listed major currencies this week. US Dollar was the weakest against the Australian Dollar.
| USD | EUR | GBP | JPY | CAD | AUD | NZD | CHF | |
|---|---|---|---|---|---|---|---|---|
| USD | -0.44% | -0.49% | 0.71% | -0.06% | -1.00% | -0.83% | -0.35% | |
| EUR | 0.44% | -0.10% | 1.10% | 0.35% | -0.62% | -0.44% | 0.04% | |
| GBP | 0.49% | 0.10% | 1.12% | 0.44% | -0.53% | -0.33% | 0.14% | |
| JPY | -0.71% | -1.10% | -1.12% | -0.74% | -1.63% | -1.49% | -1.10% | |
| CAD | 0.06% | -0.35% | -0.44% | 0.74% | -1.03% | -0.77% | -0.41% | |
| AUD | 1.00% | 0.62% | 0.53% | 1.63% | 1.03% | 0.18% | 0.65% | |
| NZD | 0.83% | 0.44% | 0.33% | 1.49% | 0.77% | -0.18% | 0.48% | |
| CHF | 0.35% | -0.04% | -0.14% | 1.10% | 0.41% | -0.65% | -0.48% |
The heat map shows percentage changes of major currencies against each other. The base currency is picked from the left column, while the quote currency is picked from the top row. For example, if you pick the US Dollar from the left column and move along the horizontal line to the Japanese Yen, the percentage change displayed in the box will represent USD (base)/JPY (quote).
Following a bearish start to the week, the US Dollar (USD) Index recovered and closed in positive territory on Tuesday, supported by the upbeat August Retail Sales data and the cautious market mood. Early Wednesday, the index holds steady slightly below 101.00. In the meantime, US stock index futures trade marginally higher after Wall Street's main indexes closed virtually unchanged on Tuesday and the benchmark 10-year US Treasury bond yield fluctuates at around 3.65%. According to the CME FedWatch Tool, markets currently see a 61% probability of the Fed reducing the policy rate by 50 bps to the range of 4.75%-5%.
The UK's Office for National Statistics reported early Wednesday that the annual inflation, as measured by the change in the Consumer Price Index (CPI), held steady at 2.2% in August, matching the market expectation. On a monthly basis, the CPI rose 0.3% following the 0.2% decline recorded in July. The core CPI, which excludes volatile food and energy prices, rose 3.6% on a yearly basis, up from 3.3% in July. GBP/USD gained traction following these data and advanced toward 1.3200.
EUR/USD closed modestly lower on Tuesday but managed to stabilize above 1.1100. Eurostat will publish revisions to August Harmonized Index of Consumer Prices data later in the session.
USD/JPY gathered bullish momentum and snapped a five-day losing streak on Tuesday. The pair stays on the back foot in the European morning on Wednesday and trades below 142.00.
Gold reversed its direction after setting a new record-high on Monday and lost 0.5% on Tuesday. XAU/USD stays relatively quiet early Wednesday and fluctuates near $2,570.
Fed FAQs
Monetary policy in the US is shaped by the Federal Reserve (Fed). The Fed has two mandates: to achieve price stability and foster full employment. Its primary tool to achieve these goals is by adjusting interest rates. When prices are rising too quickly and inflation is above the Fed’s 2% target, it raises interest rates, increasing borrowing costs throughout the economy. This results in a stronger US Dollar (USD) as it makes the US a more attractive place for international investors to park their money. When inflation falls below 2% or the Unemployment Rate is too high, the Fed may lower interest rates to encourage borrowing, which weighs on the Greenback.
The Federal Reserve (Fed) holds eight policy meetings a year, where the Federal Open Market Committee (FOMC) assesses economic conditions and makes monetary policy decisions. The FOMC is attended by twelve Fed officials – the seven members of the Board of Governors, the president of the Federal Reserve Bank of New York, and four of the remaining eleven regional Reserve Bank presidents, who serve one-year terms on a rotating basis.
In extreme situations, the Federal Reserve may resort to a policy named Quantitative Easing (QE). QE is the process by which the Fed substantially increases the flow of credit in a stuck financial system. It is a non-standard policy measure used during crises or when inflation is extremely low. It was the Fed’s weapon of choice during the Great Financial Crisis in 2008. It involves the Fed printing more Dollars and using them to buy high grade bonds from financial institutions. QE usually weakens the US Dollar.
Quantitative tightening (QT) is the reverse process of QE, whereby the Federal Reserve stops buying bonds from financial institutions and does not reinvest the principal from the bonds it holds maturing, to purchase new bonds. It is usually positive for the value of the US Dollar.
- NZD/USD appreciates due to improved risk sentiment ahead of the Federal Reserve's anticipated interest rate cut on Wednesday.
- Lower US Treasury yields added to the downward pressure on the US Dollar.
- New Zealand's Current Account deficit expanded to NZD 4.826 billion in Q2, from the previous deficit of NZD 3.825 billion.
NZD/USD edges higher to near 0.6200 during the early European hours on Wednesday. The upside of the NZD/USD pair could be attributed to the improved risk sentiment ahead of the Federal Open Market Committee’s (FOMC) monetary policy meeting scheduled for Wednesday.
The US Dollar (USD) loses ground amid rising expectations that the US Federal Reserve (Fed) may announce a substantial 50 basis point rate cut on Wednesday. The CME FedWatch Tool indicates that markets are assigning a 37.0% probability to a 25-basis-point interest rate cut, while the likelihood of a 50 basis point cut has risen to 63.0%, up from 62.0% just the previous day.
Additionally, lower US Treasury yields contribute to the downward pressure for the Greenback. The US Dollar Index (DXY), which measures the value of the US Dollar (USD) against other six major currencies, retraces its recent gains from the previous session. The DXY trades around 100.80 with 2-year and 10-year yields on US government bonds standing at 3.60% and 3.64%, respectively, at the time of writing.
UOB Group FX strategists Quek Ser Leang and Lee Sue Ann highlighted that the New Zealand Dollar (NZD) is unlikely to see significant further gains in the short term. Instead, they expect the NZD to trade within a range of 0.6160 to 0.6205. Over the longer term, they anticipate a broader trading range between 0.6135 and 0.6235.
On Wednesday, New Zealand's Current Account deficit expanded to NZD 4.826 billion in the second quarter, up from a deficit of NZD 3.825 billion in the previous quarter. The Q2 deficit exceeded market expectations, which had predicted a trade deficit of NZD 4.0 billion.
Additionally, traders will be closely monitoring New Zealand's Gross Domestic Product (GDP) data for the second quarter, set to be released on Thursday. The GDP is expected to contract by 0.4% quarter-on-quarter in Q2, following a 0.2% expansion in Q1. On an annual basis, economic growth is projected to decline by 0.5%, compared to the previous 0.3% growth.
New Zealand Dollar FAQs
The New Zealand Dollar (NZD), also known as the Kiwi, is a well-known traded currency among investors. Its value is broadly determined by the health of the New Zealand economy and the country’s central bank policy. Still, there are some unique particularities that also can make NZD move. The performance of the Chinese economy tends to move the Kiwi because China is New Zealand’s biggest trading partner. Bad news for the Chinese economy likely means less New Zealand exports to the country, hitting the economy and thus its currency. Another factor moving NZD is dairy prices as the dairy industry is New Zealand’s main export. High dairy prices boost export income, contributing positively to the economy and thus to the NZD.
The Reserve Bank of New Zealand (RBNZ) aims to achieve and maintain an inflation rate between 1% and 3% over the medium term, with a focus to keep it near the 2% mid-point. To this end, the bank sets an appropriate level of interest rates. When inflation is too high, the RBNZ will increase interest rates to cool the economy, but the move will also make bond yields higher, increasing investors’ appeal to invest in the country and thus boosting NZD. On the contrary, lower interest rates tend to weaken NZD. The so-called rate differential, or how rates in New Zealand are or are expected to be compared to the ones set by the US Federal Reserve, can also play a key role in moving the NZD/USD pair.
Macroeconomic data releases in New Zealand are key to assess the state of the economy and can impact the New Zealand Dollar’s (NZD) valuation. A strong economy, based on high economic growth, low unemployment and high confidence is good for NZD. High economic growth attracts foreign investment and may encourage the Reserve Bank of New Zealand to increase interest rates, if this economic strength comes together with elevated inflation. Conversely, if economic data is weak, NZD is likely to depreciate.
The New Zealand Dollar (NZD) tends to strengthen during risk-on periods, or when investors perceive that broader market risks are low and are optimistic about growth. This tends to lead to a more favorable outlook for commodities and so-called ‘commodity currencies’ such as the Kiwi. Conversely, NZD tends to weaken at times of market turbulence or economic uncertainty as investors tend to sell higher-risk assets and flee to the more-stable safe havens.
- The Pound Sterling jumps to near 1.3180 against the US Dollar as UK core inflation rose faster than expected in August.
- UK core CPI grew by 3.6%, while the headline inflation was stable at 2.2% as expected.
- The Fed seems prepared to announce its first interest-rate cut in more than four years.
The Pound Sterling (GBP) gains against its major peers in Wednesday’s London session as the United Kingdom (UK) inflation data for August came in hotter than expected. The Office for National Statistics (ONS) reported that the core Consumer Price Index (CPI) – which excludes volatile items such as food, energy, oil and tobacco – rose by 3.6%, more than the 3.5% estimated and accelerating from 3.3% in July.
Services inflation, a closely watched indicator by Bank of England (BoE) officials, rose sharply to 5.6% from 5.2% in July. This acceleration in inflation could force traders to pare back bets supporting one more interest rate cut by the Bank of England (BoE) in the remainder of the year.
Headline inflation, meanwhile, rose by 0.3% and 2.2% on a monthly and annual basis, respectively, meeting analysts' expectations.
Going forward, investors will focus on the BoE’s monetary policy announcement on Thursday. Before inflation data came out, markets were already expecting the BoE to leave interest rates unchanged at 5%. With August data signaling that inflation remains stubborn, market expectations for rates remaining at their current levels by the year-end may increase.
Daily digest market movers: Pound Sterling outperforms US Dollar ahead of Fed meeting
- The Pound Sterling jumps to near 1.3170 against the US Dollar (US) after the release of the hot UK inflation data for August. The GBP/USD pair aims to reclaim the immediate resistance of 1.3200. The Cable is expected to face volatility as the Federal Reserve’s (Fed) monetary policy decision will be announced at 18:00 GMT.
- According to the CME FedWatch tool, the central bank is certain to start reducing interest rates. This will be the first interest rate cut decision by the Fed in over four years. However, the debate is over the pace by which key borrowing rates will be reduced. 30-day Federal Funds Futures pricing data shows that the probability of the central bank cutting rates by 50 basis points (bps) to 4.75%-5.00% is at 65%, while the rest favors a 25-bps rate cut.
- The Fed will pivot to policy normalization as the latest commentaries from officials indicated that the central bank is more concerned about deteriorating labor demand rather than inflation.
- Apart from the Fed’s policy decision, investors will also focus on the Fed’s dot plot, economic projections and the press conference of Fed Chair Jerome Powell after the interest rate decision. The Fed dot plot indicates the collective forecast for the federal fund rate by all policymakers in the medium and long term.
Technical Analysis: Pound Sterling aims to reclaim 1.3200
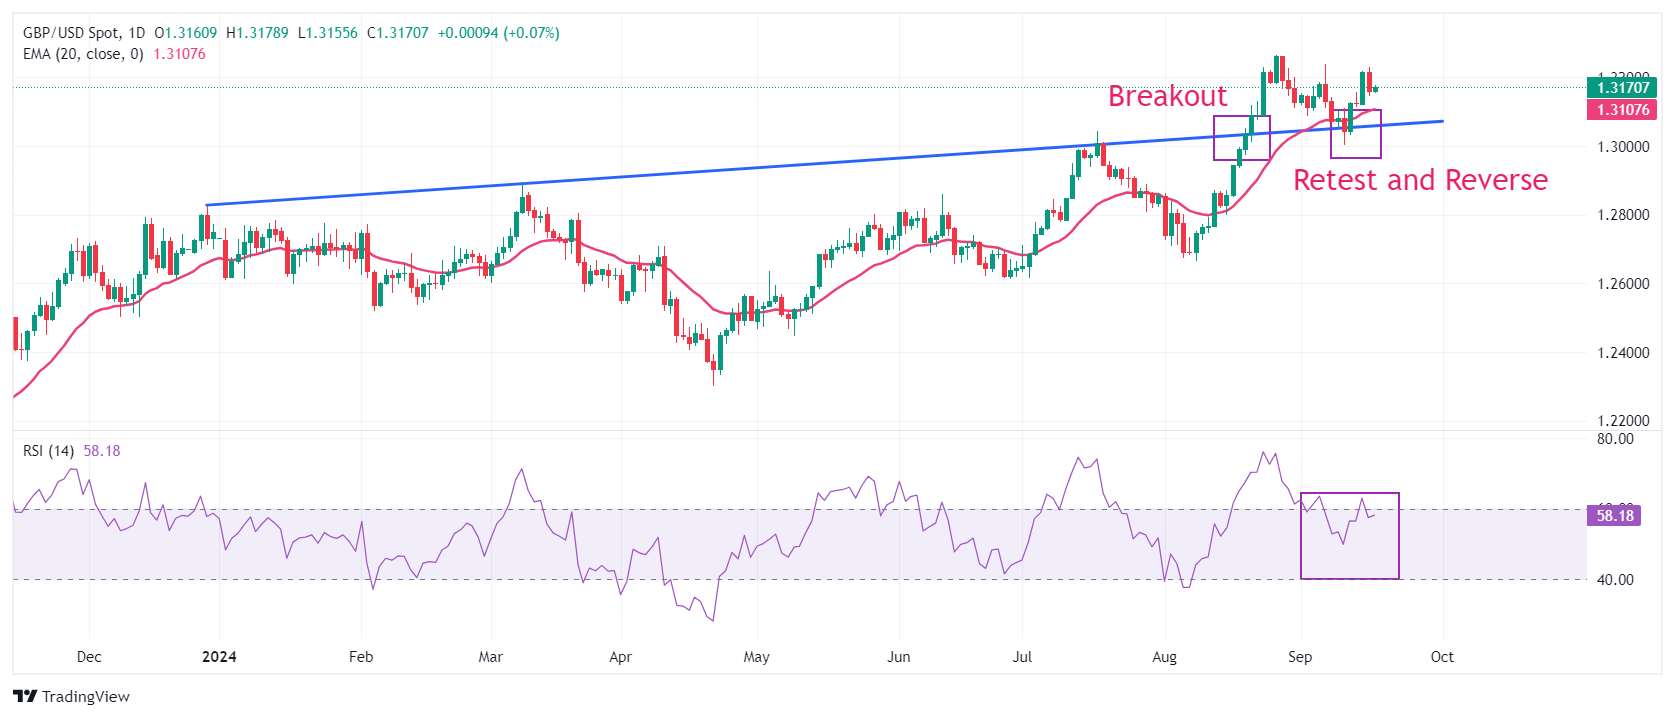
The Pound Sterling approaches 1.3200 against the US Dollar in European trading hours. The near-term outlook of the GBP/USD pair remains firm as it holds above the 20-day Exponential Moving Average (EMA) near 1.3100. Earlier, the Cable strengthened after recovering from a corrective move to near the trendline plotted from the December 28, 2023, high of 1.2828, from where it delivered a sharp increase after a breakout on August 21.
The 14-day Relative Strength Index (RSI) stands around 60.00. A fresh round of bullish momentum could occur if the oscillator sustains around this level.
Looking up, the Cable will face resistance near the August 27 high of 1.3266 and the psychological level of 1.3500. On the downside, the psychological level of 1.3000 emerges as crucial support.
Pound Sterling FAQs
The Pound Sterling (GBP) is the oldest currency in the world (886 AD) and the official currency of the United Kingdom. It is the fourth most traded unit for foreign exchange (FX) in the world, accounting for 12% of all transactions, averaging $630 billion a day, according to 2022 data. Its key trading pairs are GBP/USD, aka ‘Cable’, which accounts for 11% of FX, GBP/JPY, or the ‘Dragon’ as it is known by traders (3%), and EUR/GBP (2%). The Pound Sterling is issued by the Bank of England (BoE).
The single most important factor influencing the value of the Pound Sterling is monetary policy decided by the Bank of England. The BoE bases its decisions on whether it has achieved its primary goal of “price stability” – a steady inflation rate of around 2%. Its primary tool for achieving this is the adjustment of interest rates. When inflation is too high, the BoE will try to rein it in by raising interest rates, making it more expensive for people and businesses to access credit. This is generally positive for GBP, as higher interest rates make the UK a more attractive place for global investors to park their money. When inflation falls too low it is a sign economic growth is slowing. In this scenario, the BoE will consider lowering interest rates to cheapen credit so businesses will borrow more to invest in growth-generating projects.
Data releases gauge the health of the economy and can impact the value of the Pound Sterling. Indicators such as GDP, Manufacturing and Services PMIs, and employment can all influence the direction of the GBP. A strong economy is good for Sterling. Not only does it attract more foreign investment but it may encourage the BoE to put up interest rates, which will directly strengthen GBP. Otherwise, if economic data is weak, the Pound Sterling is likely to fall.
Another significant data release for the Pound Sterling is the Trade Balance. This indicator measures the difference between what a country earns from its exports and what it spends on imports over a given period. If a country produces highly sought-after exports, its currency will benefit purely from the extra demand created from foreign buyers seeking to purchase these goods. Therefore, a positive net Trade Balance strengthens a currency and vice versa for a negative balance.
European Central Bank (ECB) Governing Council member and Bank of France President, François Villeroy de Galhau, commented on the interest rate outlook on Wednesday.
Villeroy said that the “ECB is likely to continue to cut rates.”
Further comments
My European colleagues express astonishment at current french political situation.
Need to raise taxes.
- EUR/GBP weakens around 0.8445 in Wednesday’s early European session.
- The UK annual CPI climbed 2.2% in August vs. 2.2% expected.
- Investors will shift their focus to the Eurozone HICP inflation for August, which is due on Wednesday.
The EUR/GBP cross loses its recovery momentum near 0.8445 during the early European session on Wednesday. The Pound Sterling (GBP) edges higher after the UK inflation data. The attention will shift to the Eurozone Harmonized Index of Consumer Prices (HICP) data, wishes to you later in the day.
Data released by the Office for National Statistics showed on Wednesday that the UK CPI rose at an annual pace of 2.2% in August. The figure was in line with the market consensus and the previous reading of 2.2%. Meanwhile, core CPI, excluding volatile food and energy items, climbed 3.6% YoY in August versus 3.3% in July, hotter than the 3.5% expected. The GBP attracts some buyers in an immediate reaction to the UK CPI inflation data.
The Bank of England (BoE) interest rate decision will be in the spotlight on Thursday. The UK central bank is anticipated to keep rates on hold before adopting a more aggressive stance from November. The odds of another 25 basis points (bps) rate cut in September increased but remain relatively low nearly 35%, according to LSEG data.
On the Euro front, the European Central Bank (ECB) Governing Council member Martins Kazaks said on Monday that the central bank will ease monetary policy further, though it shouldn’t do so too hastily due to lingering inflation risks. Less dovish interest rate guidance from European Central Bank (ECB) officials might help limit the Euro’s losses against the GBP.
The Eurozone HICP inflation might offer some hints about the inflation trajectory in the Eurozone and influence the ECB about the next move. The HICP is estimated to show an increase of 2.2% YoY in August, while the core HICP is forecasted to show a rise of 2.8% in the same period.
Inflation FAQs
Inflation measures the rise in the price of a representative basket of goods and services. Headline inflation is usually expressed as a percentage change on a month-on-month (MoM) and year-on-year (YoY) basis. Core inflation excludes more volatile elements such as food and fuel which can fluctuate because of geopolitical and seasonal factors. Core inflation is the figure economists focus on and is the level targeted by central banks, which are mandated to keep inflation at a manageable level, usually around 2%.
The Consumer Price Index (CPI) measures the change in prices of a basket of goods and services over a period of time. It is usually expressed as a percentage change on a month-on-month (MoM) and year-on-year (YoY) basis. Core CPI is the figure targeted by central banks as it excludes volatile food and fuel inputs. When Core CPI rises above 2% it usually results in higher interest rates and vice versa when it falls below 2%. Since higher interest rates are positive for a currency, higher inflation usually results in a stronger currency. The opposite is true when inflation falls.
Although it may seem counter-intuitive, high inflation in a country pushes up the value of its currency and vice versa for lower inflation. This is because the central bank will normally raise interest rates to combat the higher inflation, which attract more global capital inflows from investors looking for a lucrative place to park their money.
Formerly, Gold was the asset investors turned to in times of high inflation because it preserved its value, and whilst investors will often still buy Gold for its safe-haven properties in times of extreme market turmoil, this is not the case most of the time. This is because when inflation is high, central banks will put up interest rates to combat it. Higher interest rates are negative for Gold because they increase the opportunity-cost of holding Gold vis-a-vis an interest-bearing asset or placing the money in a cash deposit account. On the flipside, lower inflation tends to be positive for Gold as it brings interest rates down, making the bright metal a more viable investment alternative.
- The US Dollar Index faces downward pressure ahead of the Federal Reserve's anticipated interest rate cut on Wednesday.
- The CME FedWatch Tool indicates the likelihood of a 50 basis point cut has risen to 63.0%.
- JP Morgan CEO Jamie Dimon commented that a Fed interest rate cut would be "not earth-shattering."
The US Dollar Index (DXY), which measures the value of the US Dollar (USD) against other six major currencies, retraces its recent gains from the previous session. The DXY trades around 100.80 during Asian hours ahead of the Federal Open Market Committee’s (FOMC) monetary policy meeting scheduled for Wednesday.
This downside of the US Dollar could be attributed to the improved risk sentiment amid the increasing likelihood of the US Federal Reserve (Fed) announcing a bumper 50 basis point rate cut at September’s meeting scheduled later in the North American session.
The CME FedWatch Tool indicates that markets are assigning a 37.0% probability to a 25-basis-point rate cut, while the likelihood of a 50 basis points cut has risen to 63.0%, up from 62.0% just the previous day.
However, the US Dollar Index (DXY) gained upward momentum following the release of stronger-than-expected US Retail Sales data on Tuesday. Retail sales increased by 0.1% month-over-month in August, following a revised 1.1% growth in July, beating expectations of a 0.2% decline. This data points to resilient consumer spending. Meanwhile, the Retail Sales Control Group rose by 0.3%, slightly below the previous month's 0.4% increase.
On Tuesday, JP Morgan CEO Jamie Dimon remarked that whether the Fed cuts interest rates by 25 or 50 basis points, the impact will be “not earth-shattering.” Dimon emphasized that while the Fed needs to make these adjustments, such rate changes are relatively minor in the broader context, as "there's a real economy" operating beyond the Fed’s rate modifications, according to Bloomberg.
US Dollar FAQs
The US Dollar (USD) is the official currency of the United States of America, and the ‘de facto’ currency of a significant number of other countries where it is found in circulation alongside local notes. It is the most heavily traded currency in the world, accounting for over 88% of all global foreign exchange turnover, or an average of $6.6 trillion in transactions per day, according to data from 2022. Following the second world war, the USD took over from the British Pound as the world’s reserve currency. For most of its history, the US Dollar was backed by Gold, until the Bretton Woods Agreement in 1971 when the Gold Standard went away.
The most important single factor impacting on the value of the US Dollar is monetary policy, which is shaped by the Federal Reserve (Fed). The Fed has two mandates: to achieve price stability (control inflation) and foster full employment. Its primary tool to achieve these two goals is by adjusting interest rates. When prices are rising too quickly and inflation is above the Fed’s 2% target, the Fed will raise rates, which helps the USD value. When inflation falls below 2% or the Unemployment Rate is too high, the Fed may lower interest rates, which weighs on the Greenback.
In extreme situations, the Federal Reserve can also print more Dollars and enact quantitative easing (QE). QE is the process by which the Fed substantially increases the flow of credit in a stuck financial system. It is a non-standard policy measure used when credit has dried up because banks will not lend to each other (out of the fear of counterparty default). It is a last resort when simply lowering interest rates is unlikely to achieve the necessary result. It was the Fed’s weapon of choice to combat the credit crunch that occurred during the Great Financial Crisis in 2008. It involves the Fed printing more Dollars and using them to buy US government bonds predominantly from financial institutions. QE usually leads to a weaker US Dollar.
Quantitative tightening (QT) is the reverse process whereby the Federal Reserve stops buying bonds from financial institutions and does not reinvest the principal from the bonds it holds maturing in new purchases. It is usually positive for the US Dollar.
FX option expiries for Sept 18 NY cut at 10:00 Eastern Time, via DTCC, can be found below.
EUR/USD: EUR amounts
- 1.1000 1.8b
- 1.1025 443m
- 1.1100 721m
- 1.1125 882m
- 1.1200 1.3b
- 1.1250 839m
GBP/USD: GBP amounts
- 1.3000 2.1b
- 1.3050 706m
USD/JPY: USD amounts
- 139.75 1.6b
- 141.00 1.1b
- 142.00 682m
- 142.25 918m
- 143.00 1.5b
AUD/USD: AUD amounts
- 0.6750 443m
NZD/USD: NZD amounts
- 0.5950 565m
EUR/GBP: EUR amounts
- 0.8380 1b
- EUR/JPY edges lower to 157.20 in Wednesday’s early European session, down 0.72% on the day.
- Japan’s trade balance shrank less than expected in August, but Imports and Exports were worse than estimated.
- Market players will keep an eye on the Eurozone HICP inflation data on Wednesday.
The EUR/JPY cross weakens near 157.20, snapping to a two-day winning streak during the early European session on Wednesday. The Japanese weaker Imports and Exports reading raises some doubts over demand in Japan on the back of strong wages, which weighs on the Japanese Yen (JPY). The Bank of Japan (BoC) interest rate decision on Friday will be closely watched.
Japan’s Trade Balance shrank less than expected in August, although Imports and Exports missed estimations. Japan’s trade deficit widens to 695.3 billion yen in August from 628.7 billion yen in July, better than expectations for a deficit of 1.38 trillion yen. Meanwhile, Exports grew 5.6% YoY in August versus 10.2% prior, weaker than the 10.0% expected. Imports rose 2.3% in the same period from a 16.6% jump in July, below the consensus of a 13.4% rise.
Economists from the Reuters poll expect the BoJ to leave the interest rate unchanged on Friday, but will likely raise interest rates again before the year ends. BoJ Governor Kazuo Ueda said that the central bank will continue to raise rates if the economy moves in line with its forecasts. BoJ policymaker Naoki Tamura stated on Thursday that the central bank should raise interest rates to at least 1% as early as the second half of the next fiscal year. The hawkish stance from the Japanese central bank might lift the JPY and create a headwind for EUR/JPY in the near term.
On the Euro front, the Eurozone Harmonized Index of Consumer Prices (HICP) data is due on Wednesday. The headline HICP is projected to show an increase of 2.2% YoY in August, while the core HICP is forecasted to show a rise of 2.8% in the same period. If the inflation data shows a hotter than expected outcome, this could cap the downside for the shared currency.
Bank of Japan FAQs
The Bank of Japan (BoJ) is the Japanese central bank, which sets monetary policy in the country. Its mandate is to issue banknotes and carry out currency and monetary control to ensure price stability, which means an inflation target of around 2%.
The Bank of Japan has embarked in an ultra-loose monetary policy since 2013 in order to stimulate the economy and fuel inflation amid a low-inflationary environment. The bank’s policy is based on Quantitative and Qualitative Easing (QQE), or printing notes to buy assets such as government or corporate bonds to provide liquidity. In 2016, the bank doubled down on its strategy and further loosened policy by first introducing negative interest rates and then directly controlling the yield of its 10-year government bonds.
The Bank’s massive stimulus has caused the Yen to depreciate against its main currency peers. This process has exacerbated more recently due to an increasing policy divergence between the Bank of Japan and other main central banks, which have opted to increase interest rates sharply to fight decades-high levels of inflation. The BoJ’s policy of holding down rates has led to a widening differential with other currencies, dragging down the value of the Yen.
A weaker Yen and the spike in global energy prices have led to an increase in Japanese inflation, which has exceeded the BoJ’s 2% target. With wage inflation becoming a cause of concern, the BoJ looks to move away from ultra loose policy, while trying to avoid slowing the activity too much.
- USD/CAD meets with a fresh supply on Wednesday amid a dovish Fed-inspired USD downtick.
- Bets for a larger BoC rate cut, retreating Oil prices to undermine the Loonie and lend support.
- Traders might also prefer to wait on the sidelines ahead of the crucial FOMC policy decision.
The USD/CAD pair attracts fresh sellers during the Asian session on Wednesday and currently trades below the 1.3600 mark, down less than 0.10% for the day. Spot prices, meanwhile, remain confined in a familiar range held over the past week or so as traders keenly await the key central bank event risk before positioning for the next leg of a directional move.
The US Federal Reserve (Fed) is scheduled to announce its policy decision at the end of a two-day meeting later today and is universally expected to start its rate-cutting cycle. Apart from this, the market focus will be on the upbeat economic projections, including the so-called 'dot plot', which will play a key role in influencing the near-term US Dollar (USD) price dynamics and provide some meaningful impetus to the USD/CAD pair.
In the meantime, rising bets for an oversized, 50 basis points (bps) interest rate cut by the Fed overshadow Tuesday's upbeat US Retail Sales and cap the USD recovery from its lowest level since July 2023, which, in turn, is seen weighing on the USD/CAD pair. An unexpected rise in the US Retail Sales eased concerns about a broader economic slowdown, though the market reaction turned out to be short-lived amid dovish Fed expectations.
The downside for the USD/CAD pair, meanwhile, seems cushioned in the wake of hopes for a larger rate cut by the Bank of Canada (BoC) next month, bolstered by Tuesday data that Canada's inflation reached the central bank's 2% target in August. This, along with a modest downtick in Crude Oil prices, could undermine the commodity-linked Loonie and offer some support to the USD/CAD pair, warranting caution for bearish traders.
Canadian Dollar FAQs
The key factors driving the Canadian Dollar (CAD) are the level of interest rates set by the Bank of Canada (BoC), the price of Oil, Canada’s largest export, the health of its economy, inflation and the Trade Balance, which is the difference between the value of Canada’s exports versus its imports. Other factors include market sentiment – whether investors are taking on more risky assets (risk-on) or seeking safe-havens (risk-off) – with risk-on being CAD-positive. As its largest trading partner, the health of the US economy is also a key factor influencing the Canadian Dollar.
The Bank of Canada (BoC) has a significant influence on the Canadian Dollar by setting the level of interest rates that banks can lend to one another. This influences the level of interest rates for everyone. The main goal of the BoC is to maintain inflation at 1-3% by adjusting interest rates up or down. Relatively higher interest rates tend to be positive for the CAD. The Bank of Canada can also use quantitative easing and tightening to influence credit conditions, with the former CAD-negative and the latter CAD-positive.
The price of Oil is a key factor impacting the value of the Canadian Dollar. Petroleum is Canada’s biggest export, so Oil price tends to have an immediate impact on the CAD value. Generally, if Oil price rises CAD also goes up, as aggregate demand for the currency increases. The opposite is the case if the price of Oil falls. Higher Oil prices also tend to result in a greater likelihood of a positive Trade Balance, which is also supportive of the CAD.
While inflation had always traditionally been thought of as a negative factor for a currency since it lowers the value of money, the opposite has actually been the case in modern times with the relaxation of cross-border capital controls. Higher inflation tends to lead central banks to put up interest rates which attracts more capital inflows from global investors seeking a lucrative place to keep their money. This increases demand for the local currency, which in Canada’s case is the Canadian Dollar.
Macroeconomic data releases gauge the health of the economy and can have an impact on the Canadian Dollar. Indicators such as GDP, Manufacturing and Services PMIs, employment, and consumer sentiment surveys can all influence the direction of the CAD. A strong economy is good for the Canadian Dollar. Not only does it attract more foreign investment but it may encourage the Bank of Canada to put up interest rates, leading to a stronger currency. If economic data is weak, however, the CAD is likely to fall.
- EUR/USD gains traction near 1.1125 in Wednesday’s Asian session.
- The Fed is widely expected to reduce the benchmark overnight interest rate on Wednesday.
- Investors await the Eurozone HICP data, which is expected to show an increase of 2.2% YoY in August.
The EUR/USD pair trades on a stronger note around 1.1125 during the Asian trading hours on Wednesday. The rising expectation of the US Federal Reserve (Fed) deeper rate cut provides some support to the major pair. The Eurozone Harmonized Index of Consumer Prices (HICP) data and the Fed monetary policy meeting will be the highlights on Wednesday.
The markets have remained split on whether the Fed should cut interest rates by 25 or 50 basis points (bps). Futures on the Fed funds rate have priced in nearly 60% odds of a 50 bps rate cut by the Fed at its September meeting on Wednesday, up from 45% last Friday, according to the LSEG.
Boris Kovacevic, global macro strategist at Convera in Vienna, said, "If they go 50, there is a chance that the Fed has some information that investors don't have and that recession risks are more likely than currently anticipated and priced in."
The US Retail Sales unexpectedly rose 0.1% MoM in August versus 1.1% prior, better than the expectation of -0.2%, the US Census Bureau showed Tuesday. Meanwhile, Industrial Production jumped 0.8% MoM in August, compared to a decline of 0.6% in July, above the consensus of 0.2%.
Less dovish interest rate guidance from European Central Bank (ECB) officials underpins the Euro (EUR) against the USD. ECB policymakers emphasized that the central bank will remain data-dependent when it comes to making future monetary policy decisions.
Investors will monitor the Eurozone HICP inflation data, which is due later on Wednesday. The headline HICP is expected to show an increase of 2.2% YoY in August, while the core HICP is estimated to show a rise of 2.8% in the same period.
Euro FAQs
The Euro is the currency for the 20 European Union countries that belong to the Eurozone. It is the second most heavily traded currency in the world behind the US Dollar. In 2022, it accounted for 31% of all foreign exchange transactions, with an average daily turnover of over $2.2 trillion a day. EUR/USD is the most heavily traded currency pair in the world, accounting for an estimated 30% off all transactions, followed by EUR/JPY (4%), EUR/GBP (3%) and EUR/AUD (2%).
The European Central Bank (ECB) in Frankfurt, Germany, is the reserve bank for the Eurozone. The ECB sets interest rates and manages monetary policy. The ECB’s primary mandate is to maintain price stability, which means either controlling inflation or stimulating growth. Its primary tool is the raising or lowering of interest rates. Relatively high interest rates – or the expectation of higher rates – will usually benefit the Euro and vice versa. The ECB Governing Council makes monetary policy decisions at meetings held eight times a year. Decisions are made by heads of the Eurozone national banks and six permanent members, including the President of the ECB, Christine Lagarde.
Eurozone inflation data, measured by the Harmonized Index of Consumer Prices (HICP), is an important econometric for the Euro. If inflation rises more than expected, especially if above the ECB’s 2% target, it obliges the ECB to raise interest rates to bring it back under control. Relatively high interest rates compared to its counterparts will usually benefit the Euro, as it makes the region more attractive as a place for global investors to park their money.
Data releases gauge the health of the economy and can impact on the Euro. Indicators such as GDP, Manufacturing and Services PMIs, employment, and consumer sentiment surveys can all influence the direction of the single currency. A strong economy is good for the Euro. Not only does it attract more foreign investment but it may encourage the ECB to put up interest rates, which will directly strengthen the Euro. Otherwise, if economic data is weak, the Euro is likely to fall. Economic data for the four largest economies in the euro area (Germany, France, Italy and Spain) are especially significant, as they account for 75% of the Eurozone’s economy.
Another significant data release for the Euro is the Trade Balance. This indicator measures the difference between what a country earns from its exports and what it spends on imports over a given period. If a country produces highly sought after exports then its currency will gain in value purely from the extra demand created from foreign buyers seeking to purchase these goods. Therefore, a positive net Trade Balance strengthens a currency and vice versa for a negative balance.
Gold prices rose in India on Wednesday, according to data compiled by FXStreet.
The price for Gold stood at 6,927.79 Indian Rupees (INR) per gram, up compared with the INR 6,920.08 it cost on Tuesday.
The price for Gold increased to INR 80,803.39 per tola from INR 80,714.48 per tola a day earlier.
| Unit measure | Gold Price in INR |
|---|---|
| 1 Gram | 6,927.79 |
| 10 Grams | 69,279.20 |
| Tola | 80,803.39 |
| Troy Ounce | 215,478.40 |
FXStreet calculates Gold prices in India by adapting international prices (USD/INR) to the local currency and measurement units. Prices are updated daily based on the market rates taken at the time of publication. Prices are just for reference and local rates could diverge slightly.
Gold FAQs
Gold has played a key role in human’s history as it has been widely used as a store of value and medium of exchange. Currently, apart from its shine and usage for jewelry, the precious metal is widely seen as a safe-haven asset, meaning that it is considered a good investment during turbulent times. Gold is also widely seen as a hedge against inflation and against depreciating currencies as it doesn’t rely on any specific issuer or government.
Central banks are the biggest Gold holders. In their aim to support their currencies in turbulent times, central banks tend to diversify their reserves and buy Gold to improve the perceived strength of the economy and the currency. High Gold reserves can be a source of trust for a country’s solvency. Central banks added 1,136 tonnes of Gold worth around $70 billion to their reserves in 2022, according to data from the World Gold Council. This is the highest yearly purchase since records began. Central banks from emerging economies such as China, India and Turkey are quickly increasing their Gold reserves.
Gold has an inverse correlation with the US Dollar and US Treasuries, which are both major reserve and safe-haven assets. When the Dollar depreciates, Gold tends to rise, enabling investors and central banks to diversify their assets in turbulent times. Gold is also inversely correlated with risk assets. A rally in the stock market tends to weaken Gold price, while sell-offs in riskier markets tend to favor the precious metal.
The price can move due to a wide range of factors. Geopolitical instability or fears of a deep recession can quickly make Gold price escalate due to its safe-haven status. As a yield-less asset, Gold tends to rise with lower interest rates, while higher cost of money usually weighs down on the yellow metal. Still, most moves depend on how the US Dollar (USD) behaves as the asset is priced in dollars (XAU/USD). A strong Dollar tends to keep the price of Gold controlled, whereas a weaker Dollar is likely to push Gold prices up.
(An automation tool was used in creating this post.)
- USD/CHF depreciates as traders expect the Federal Reserve to implement a 50 basis point rate cut.
- The CME FedWatch Tool indicates the likelihood of a 50 basis point cut has risen to 67.0%.
- The Swiss National Bank is expected to deliver a 25 basis point rate cut at its September meeting.
USD/CHF retraces its recent gains, trading around 0.8450 during the Asian hours on Wednesday. The US Dollar (USD) faces challenges amid rising expectations that the US Federal Reserve (Fed) may announce a substantial 50 basis point rate cut at September’s meeting scheduled later in the North American session.
The CME FedWatch Tool indicates that markets are assigning a 33.0% probability to a 25-basis-point rate cut, while the likelihood of a 50 basis point cut has risen to 67.0%, up from 62.0% just the previous day.
On Tuesday, JP Morgan CEO Jamie Dimon remarked that whether the Fed cuts interest rates by 25 or 50 basis points, the impact will be “not earth-shattering.” Dimon emphasized that while the Fed needs to make these adjustments, such rate changes are relatively minor in the broader context, as "there's a real economy" operating beyond the Fed’s rate modifications, according to Bloomberg.
On Tuesday, US Retail Sales increased by 0.1% MoM in August, following a revised 1.1% growth in July, surpassing expectations of a 0.2% decline and indicating resilient consumer spending. Meanwhile, the Retail Sales Control Group rose by 0.3%, slightly below the previous month's 0.4% increase.
On the CHF front, traders are likely to pay close attention to the Trade Balance data scheduled for release on Thursday. This report could provide valuable insights into the Swiss economic conditions. Moreover, the solid Swiss Franc (CHF) is leading to speculation that the Swiss National Bank (SNB) could be the first major central bank to implement a significant rate cut this year. Economists are forecasting that the Swiss National Bank (SNB) might announce a 25 basis point rate cut at its September meeting.
Swiss Franc FAQs
The Swiss Franc (CHF) is Switzerland’s official currency. It is among the top ten most traded currencies globally, reaching volumes that well exceed the size of the Swiss economy. Its value is determined by the broad market sentiment, the country’s economic health or action taken by the Swiss National Bank (SNB), among other factors. Between 2011 and 2015, the Swiss Franc was pegged to the Euro (EUR). The peg was abruptly removed, resulting in a more than 20% increase in the Franc’s value, causing a turmoil in markets. Even though the peg isn’t in force anymore, CHF fortunes tend to be highly correlated with the Euro ones due to the high dependency of the Swiss economy on the neighboring Eurozone.
The Swiss Franc (CHF) is considered a safe-haven asset, or a currency that investors tend to buy in times of market stress. This is due to the perceived status of Switzerland in the world: a stable economy, a strong export sector, big central bank reserves or a longstanding political stance towards neutrality in global conflicts make the country’s currency a good choice for investors fleeing from risks. Turbulent times are likely to strengthen CHF value against other currencies that are seen as more risky to invest in.
The Swiss National Bank (SNB) meets four times a year – once every quarter, less than other major central banks – to decide on monetary policy. The bank aims for an annual inflation rate of less than 2%. When inflation is above target or forecasted to be above target in the foreseeable future, the bank will attempt to tame price growth by raising its policy rate. Higher interest rates are generally positive for the Swiss Franc (CHF) as they lead to higher yields, making the country a more attractive place for investors. On the contrary, lower interest rates tend to weaken CHF.
Macroeconomic data releases in Switzerland are key to assessing the state of the economy and can impact the Swiss Franc’s (CHF) valuation. The Swiss economy is broadly stable, but any sudden change in economic growth, inflation, current account or the central bank’s currency reserves have the potential to trigger moves in CHF. Generally, high economic growth, low unemployment and high confidence are good for CHF. Conversely, if economic data points to weakening momentum, CHF is likely to depreciate.
As a small and open economy, Switzerland is heavily dependent on the health of the neighboring Eurozone economies. The broader European Union is Switzerland’s main economic partner and a key political ally, so macroeconomic and monetary policy stability in the Eurozone is essential for Switzerland and, thus, for the Swiss Franc (CHF). With such dependency, some models suggest that the correlation between the fortunes of the Euro (EUR) and the CHF is more than 90%, or close to perfect.
- Silver attracts some sellers and drops to a fresh weekly low on Wednesday.
- Any further slide could be seen as a buying opportunity and remain limited.
- The $29.40 confluence resistance breakpoint might now act as a strong base.
Silver (XAG/USD) drifts lower during the Asian session on Wednesday and moves away from a one-month peak, around the $31.10 region touched earlier this week. The white metal currently trades around mid-$30.00s, or the weekly low and down nearly 0.70% for the day, though the technical setup supports prospects for the emergence of some dip-buying.
The recent breakout through a short-term descending trend-line resistance, around the $29.40 area, which coincided with the 100-day Simple Moving Average (SMA) validates the near-term positive outlook. Moreover, oscillators on the daily chart are holding in positive territory and are still far from being in the overbought zone, suggesting that the path of least resistance for the XAG/USD is to the upside.
From current levels, any subsequent decline is likely to attract fresh buyers near the $30.00 psychological mark. This should help limit the downside near the $29.40 confluence resistance breakpoint, now turned support. The latter should act as a pivotal point, which if broken could drag the XAG/USD below the $29.00 round figure, towards the $28.45-$28.40 intermediate support en route to the $28.00 mark.
On the flip side, the $30.80 region now seems to act as an immediate hurdle ahead of the $31.00 mark, above which the white metal could prolong its appreciating move. The XAG/USD might then climb to the $31.45 region and retest the July swing high, around the $31.75 zone, before aiming to reclaim the $32.00 round-figure mark and challenge a one-decade high, around mid-$32.00s touched in May.
Silver daily chart
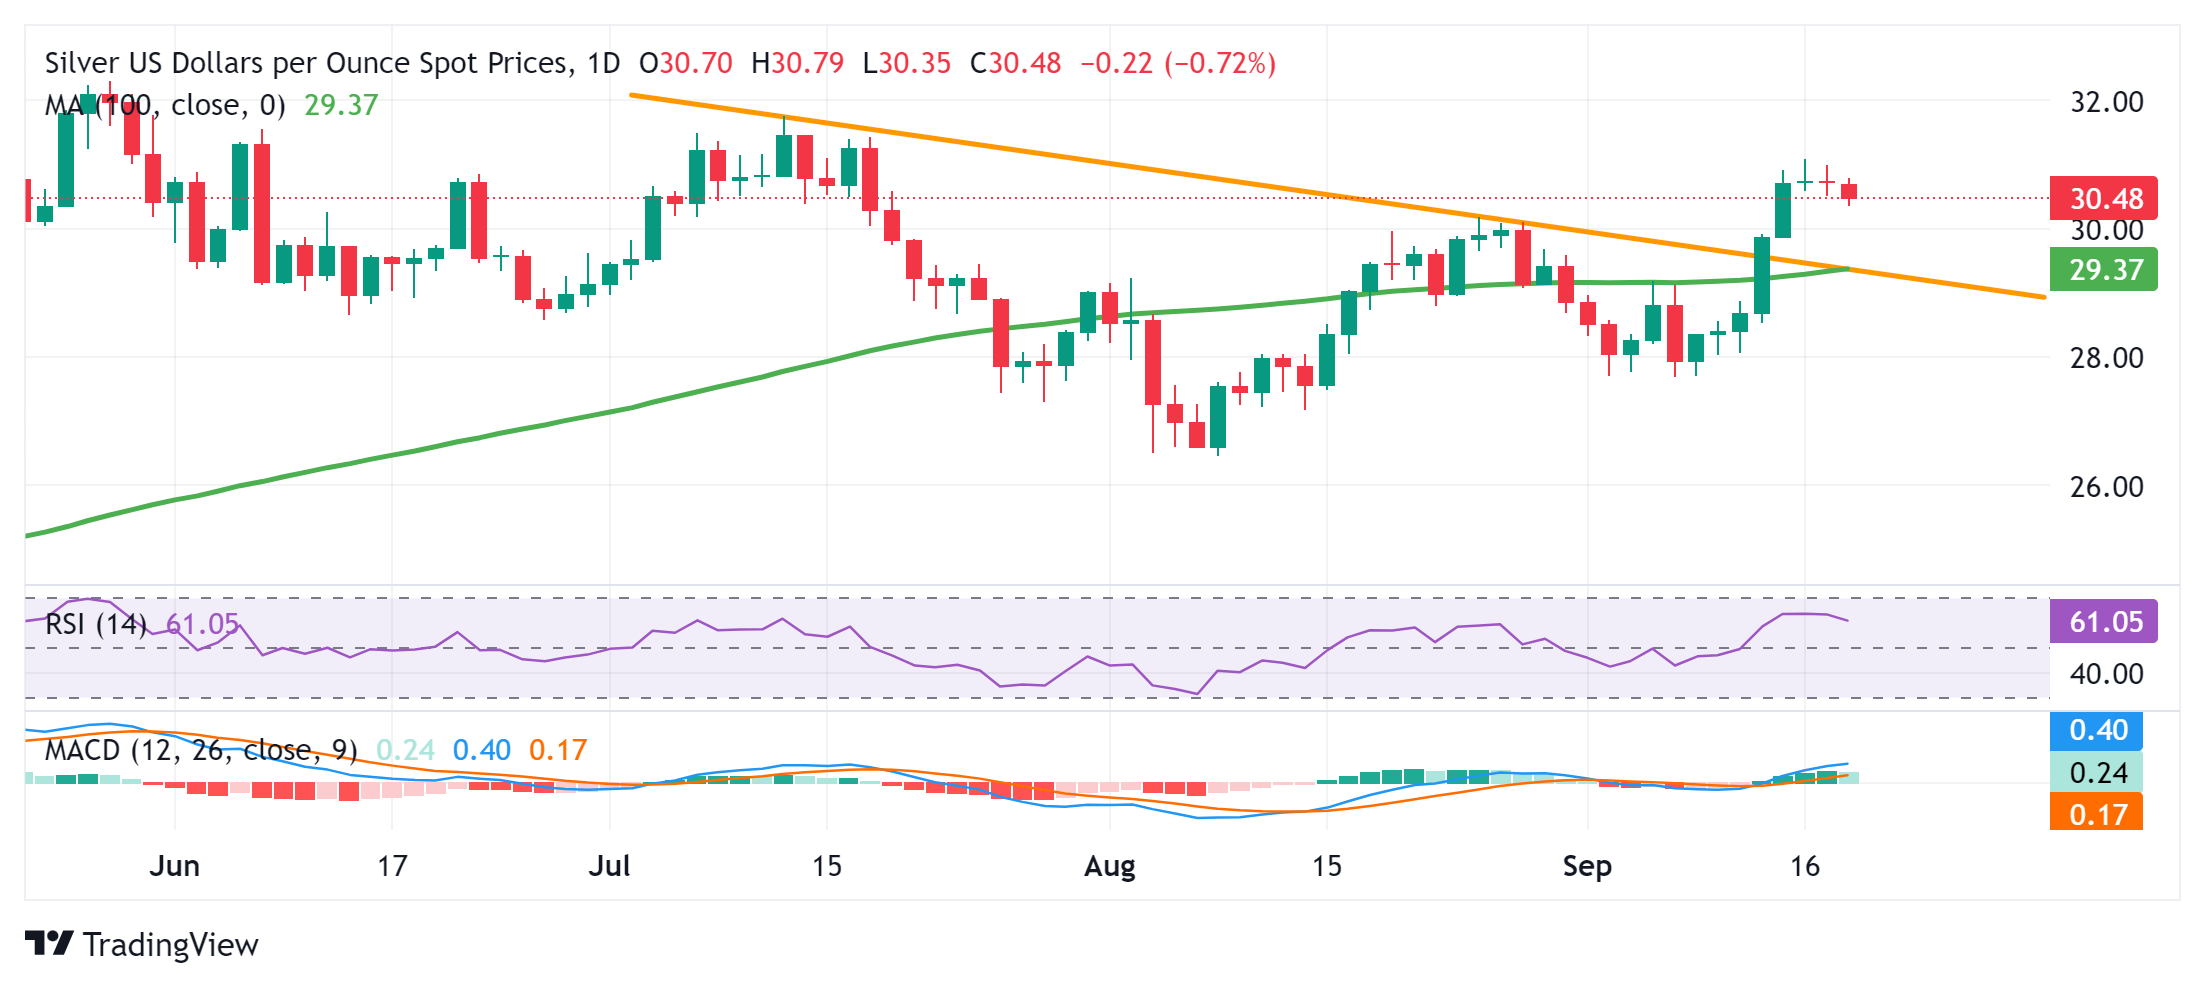
Silver FAQs
Silver is a precious metal highly traded among investors. It has been historically used as a store of value and a medium of exchange. Although less popular than Gold, traders may turn to Silver to diversify their investment portfolio, for its intrinsic value or as a potential hedge during high-inflation periods. Investors can buy physical Silver, in coins or in bars, or trade it through vehicles such as Exchange Traded Funds, which track its price on international markets.
Silver prices can move due to a wide range of factors. Geopolitical instability or fears of a deep recession can make Silver price escalate due to its safe-haven status, although to a lesser extent than Gold's. As a yieldless asset, Silver tends to rise with lower interest rates. Its moves also depend on how the US Dollar (USD) behaves as the asset is priced in dollars (XAG/USD). A strong Dollar tends to keep the price of Silver at bay, whereas a weaker Dollar is likely to propel prices up. Other factors such as investment demand, mining supply – Silver is much more abundant than Gold – and recycling rates can also affect prices.
Silver is widely used in industry, particularly in sectors such as electronics or solar energy, as it has one of the highest electric conductivity of all metals – more than Copper and Gold. A surge in demand can increase prices, while a decline tends to lower them. Dynamics in the US, Chinese and Indian economies can also contribute to price swings: for the US and particularly China, their big industrial sectors use Silver in various processes; in India, consumers’ demand for the precious metal for jewellery also plays a key role in setting prices.
Silver prices tend to follow Gold's moves. When Gold prices rise, Silver typically follows suit, as their status as safe-haven assets is similar. The Gold/Silver ratio, which shows the number of ounces of Silver needed to equal the value of one ounce of Gold, may help to determine the relative valuation between both metals. Some investors may consider a high ratio as an indicator that Silver is undervalued, or Gold is overvalued. On the contrary, a low ratio might suggest that Gold is undervalued relative to Silver.
- GBP/USD appreciates ahead of the release of UK inflation data on Wednesday.
- The UK Consumer Price Index might have risen by 2.2% YoY in August, matching the rate observed in July.
- The US Dollar struggles due to rising odds of the FOMC opting for a bumper 50 basis point rate cut in September.
GBP/USD inches higher to near 1.3160 during the Asian hours on Wednesday. Traders await the release of August Consumer Price Index (CPI) figures from the United Kingdom (UK). Traders will shift their focus on the Federal Reserve (Fed) interest rate decision scheduled later in the North American session.
The UK CPI is anticipated to have increased at an annual rate of 2.2% in August, consistent with the July figure. The core annual CPI is expected to rise to 3.5%, up from the previous 3.3%. Additionally, monthly inflation is projected to grow by 0.3%, following a decline of 0.2% in July.
The Bank of England is set to announce its monetary policy on Thursday, with inflation levels potentially influencing their decision. Financial markets expect the BoE to maintain its current interest rate at 5%, with a more aggressive approach anticipated starting in November. The BoE forecasts inflation could rise to 2.75% in the coming months before gradually declining and potentially falling below the 2.0% target by 2025.
The US Dollar faces challenges amid rising expectations that the Federal Open Market Committee (FOMC) may announce a substantial 50 basis point rate cut on Wednesday. The CME FedWatch Tool indicates that markets are assigning a 33.0% probability to a 25-basis-point rate cut, while the likelihood of a 50-basis-point cut has risen to 67.0%, up from 62.0% just the previous day.
On Tuesday, US Retail Sales rose by 0.1% month-over-month in August, following a revised 1.1% increase in July, surpassing expectations of a 0.2% decline and indicating resilient consumer spending. Meanwhile, the Retail Sales Control Group increased by 0.3%, slightly below the previous month's 0.4% rise.
Pound Sterling FAQs
The Pound Sterling (GBP) is the oldest currency in the world (886 AD) and the official currency of the United Kingdom. It is the fourth most traded unit for foreign exchange (FX) in the world, accounting for 12% of all transactions, averaging $630 billion a day, according to 2022 data. Its key trading pairs are GBP/USD, aka ‘Cable’, which accounts for 11% of FX, GBP/JPY, or the ‘Dragon’ as it is known by traders (3%), and EUR/GBP (2%). The Pound Sterling is issued by the Bank of England (BoE).
The single most important factor influencing the value of the Pound Sterling is monetary policy decided by the Bank of England. The BoE bases its decisions on whether it has achieved its primary goal of “price stability” – a steady inflation rate of around 2%. Its primary tool for achieving this is the adjustment of interest rates. When inflation is too high, the BoE will try to rein it in by raising interest rates, making it more expensive for people and businesses to access credit. This is generally positive for GBP, as higher interest rates make the UK a more attractive place for global investors to park their money. When inflation falls too low it is a sign economic growth is slowing. In this scenario, the BoE will consider lowering interest rates to cheapen credit so businesses will borrow more to invest in growth-generating projects.
Data releases gauge the health of the economy and can impact the value of the Pound Sterling. Indicators such as GDP, Manufacturing and Services PMIs, and employment can all influence the direction of the GBP. A strong economy is good for Sterling. Not only does it attract more foreign investment but it may encourage the BoE to put up interest rates, which will directly strengthen GBP. Otherwise, if economic data is weak, the Pound Sterling is likely to fall.
Another significant data release for the Pound Sterling is the Trade Balance. This indicator measures the difference between what a country earns from its exports and what it spends on imports over a given period. If a country produces highly sought-after exports, its currency will benefit purely from the extra demand created from foreign buyers seeking to purchase these goods. Therefore, a positive net Trade Balance strengthens a currency and vice versa for a negative balance.
- The Japanese Yen appreciates due to ongoing hawkish sentiment surrounding the BoJ interest rate outlook.
- Japan's Merchandise Trade Balance Total recorded a trade deficit of ¥695.3 billion in August, below the expected ¥1,380.0 billion shortfall.
- The US Dollar receives downward pressure from rising odds of a 50 basis point cut by the Fed on Wednesday.
The Japanese Yen (JPY) retraces its losses against the US Dollar due to rising expectations of a 50 basis point Federal Reserve (Fed) rate cut on Wednesday. Traders will shift their focus on the BoJ policy decision on Friday, with expectations of keeping rates unchanged while leaving the possibility open for further rate hikes.
Japan’s Merchandise Trade Balance Total recorded a larger trade deficit of ¥695.30 billion in August, up from ¥628.70 billion the previous month, but well below market expectations of a ¥1,380.0 billion shortfall. Exports increased by 5.6% year-over-year, marking the ninth consecutive month of growth, but fell short of the anticipated 10.0%. Imports rose by just 2.3%, the slowest pace in five months, significantly underperforming the projected 13.4% rise.
The US Dollar remains under pressure amid rising expectations that the Federal Open Market Committee (FOMC) may announce a substantial 50 basis point rate cut on Wednesday. The CME FedWatch Tool indicates that markets are assigning a 33.0% probability to a 25-basis-point rate cut, while the likelihood of a 50-basis-point cut has risen to 67.0%, up from 62.0% just the previous day.
Daily Digest Market Movers: Japanese Yen appreciates due to the dovish Fed policy outlook
- Japanese Finance Minister Shunichi Suzuki stated on Tuesday that rapid foreign exchange (FX) fluctuations are undesirable. Suzuki emphasized that officials will closely monitor how FX movements affect the Japanese economy and people's livelihoods. The government will continue to assess the impact of a stronger Japanese Yen and respond accordingly, according to Reuters.
- Rabobank economists Jane Foley and Molly Schwartz highlighted on Monday that JPY net long positions were at their highest level since October 2016. While there is minimal expectation for a rate hike by the Bank of Japan at its policy meeting on September 20, traders will be closely watching for any hints that October could potentially be a more active meeting.
- Commerzbank FX analyst Volkmar Baur anticipated that the Bank of Japan will remain on the sidelines this week. Baur noted that the Federal Reserve's actions are likely to have a greater impact on the USD/JPY pair, suggesting that the JPY could have a strong chance of falling below 140.00 per USD even without a rate hike from the BoJ.
- On Friday, Fitch Ratings' latest report on the Bank of Japan's policy outlook suggests that the BoJ might raise rates to 0.5% by the end of 2024, 0.75% in 2025, and 1.0% by the end of 2026.
- The University of Michigan’s Consumer Sentiment Index rose to 69.0 in September, exceeding the market expectations of 68.0 reading and marking a four-month high. This increase reflects a gradual improvement in consumers' outlook on the US economy after months of declining economic expectations.
- The hawkish BoJ policymaker Naoki Tamura stated on Thursday that the central bank should raise interest rates to at least 1% as early as the second half of the next fiscal year. This comment reinforces the BoJ's commitment to ongoing monetary tightening.
- The US Producer Price Index (PPI) rose to 0.2% month-on-month in August, exceeding the forecasted 0.1% increase and the previous 0.0%. Meanwhile, core PPI accelerated to 0.3% MoM, against the expected 0.2% rise and July’s 0.2% decline.
Technical Analysis: USD/JPY falls to near 141.50; next support at 14-month lows
USD/JPY trades around 141.40 on Wednesday. Analysis of the daily chart shows that the pair is trending downward within a descending channel, confirming a bearish outlook. The 14-day Relative Strength Index (RSI), a momentum indicator, has risen above the 30 level, suggesting the potential for an upward correction in the near future.
In terms of support, the USD/JPY pair may encounter immediate support at 139.58, the lowest level since June 2023. This is followed by the lower boundary of the descending channel around 138.20.
On the upside, the USD/JPY pair may first face resistance at the nine-day EMA near the 142.14 level, followed by the 21-day EMA around 143.72. A break above these EMAs could weaken the bearish sentiment, potentially driving the pair to test the upper boundary of the descending channel at 145.10.
USD/JPY: Daily Chart
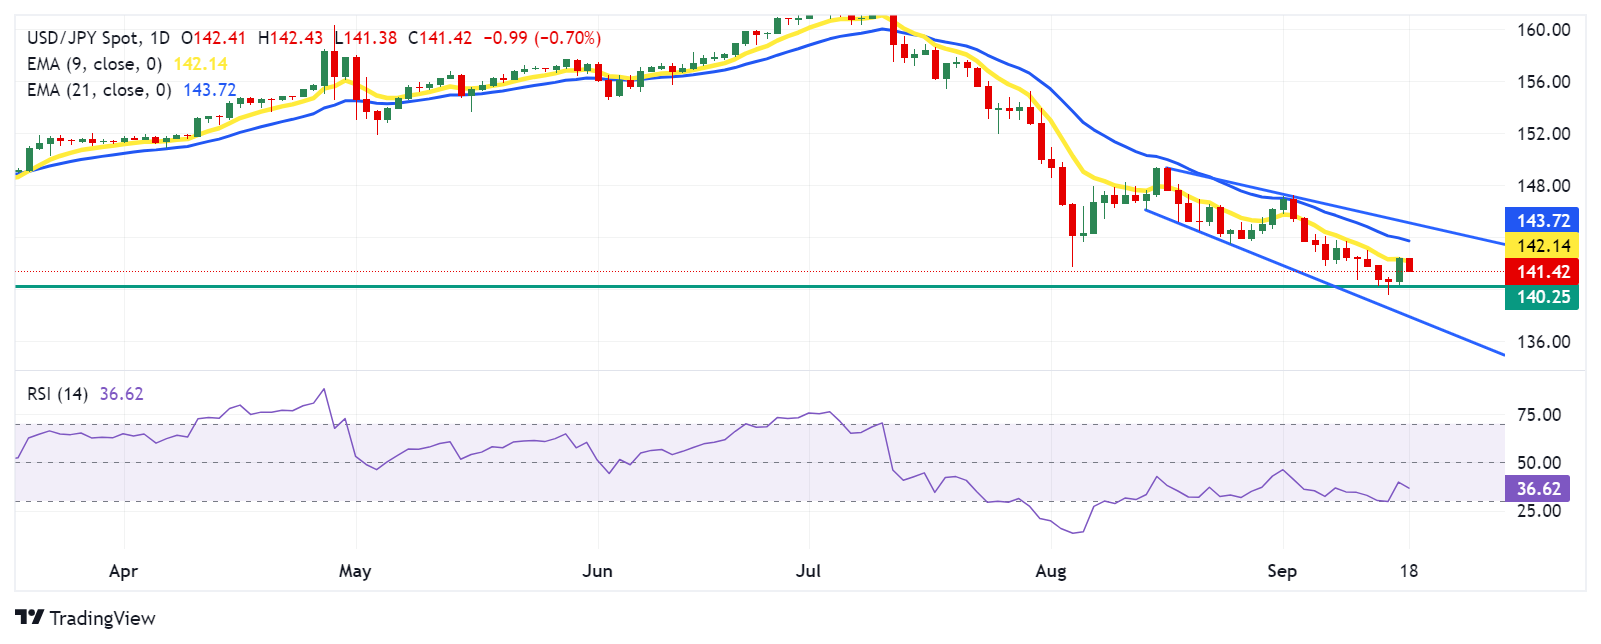
Japanese Yen PRICE Today
The table below shows the percentage change of Japanese Yen (JPY) against listed major currencies today. Japanese Yen was the strongest against the US Dollar.
| USD | EUR | GBP | JPY | CAD | AUD | NZD | CHF | |
|---|---|---|---|---|---|---|---|---|
| USD | -0.12% | -0.04% | -0.74% | -0.07% | -0.16% | -0.33% | -0.27% | |
| EUR | 0.12% | 0.07% | -0.63% | 0.05% | -0.03% | -0.23% | -0.14% | |
| GBP | 0.04% | -0.07% | -0.69% | -0.03% | -0.10% | -0.31% | -0.19% | |
| JPY | 0.74% | 0.63% | 0.69% | 0.66% | 0.59% | 0.42% | 0.51% | |
| CAD | 0.07% | -0.05% | 0.03% | -0.66% | -0.09% | -0.28% | -0.17% | |
| AUD | 0.16% | 0.03% | 0.10% | -0.59% | 0.09% | -0.17% | -0.09% | |
| NZD | 0.33% | 0.23% | 0.31% | -0.42% | 0.28% | 0.17% | 0.08% | |
| CHF | 0.27% | 0.14% | 0.19% | -0.51% | 0.17% | 0.09% | -0.08% |
The heat map shows percentage changes of major currencies against each other. The base currency is picked from the left column, while the quote currency is picked from the top row. For example, if you pick the Japanese Yen from the left column and move along the horizontal line to the US Dollar, the percentage change displayed in the box will represent JPY (base)/USD (quote).
Japanese Yen FAQs
The Japanese Yen (JPY) is one of the world’s most traded currencies. Its value is broadly determined by the performance of the Japanese economy, but more specifically by the Bank of Japan’s policy, the differential between Japanese and US bond yields, or risk sentiment among traders, among other factors.
One of the Bank of Japan’s mandates is currency control, so its moves are key for the Yen. The BoJ has directly intervened in currency markets sometimes, generally to lower the value of the Yen, although it refrains from doing it often due to political concerns of its main trading partners. The current BoJ ultra-loose monetary policy, based on massive stimulus to the economy, has caused the Yen to depreciate against its main currency peers. This process has exacerbated more recently due to an increasing policy divergence between the Bank of Japan and other main central banks, which have opted to increase interest rates sharply to fight decades-high levels of inflation.
The BoJ’s stance of sticking to ultra-loose monetary policy has led to a widening policy divergence with other central banks, particularly with the US Federal Reserve. This supports a widening of the differential between the 10-year US and Japanese bonds, which favors the US Dollar against the Japanese Yen.
The Japanese Yen is often seen as a safe-haven investment. This means that in times of market stress, investors are more likely to put their money in the Japanese currency due to its supposed reliability and stability. Turbulent times are likely to strengthen the Yen’s value against other currencies seen as more risky to invest in.
- GBP/JPY comes under some renewed selling pressure amid broad-based JPY strength.
- Hawkish BoJ expectations, along with the cautious market mood, underpin the JPY.
- Traders now look to the UK CPI for short-term impetus ahead of the BoE and the BoJ.
The GBP/JPY cross struggles to capitalize on a two-day-old recovery from the vicinity of a one-month low retested earlier this week and meets with a fresh supply during the Asian session on Wednesday. Spot prices drop back closer to the 186.00 mark in the last hour amid the emergence of fresh buying around the Japanese Yen (JPY), though the downside seems limited ahead of the release of the UK consumer inflation figures.
The headline UK Consumer Price Index (CPI) is expected to rise 0.3% in August following a 0.2% fall in the previous month and the yearly rate is seen holding steady at 2.2%. Meanwhile, the core CPI – excluding the volatile components of food, energy, alcohol and tobacco – is anticipated to climb to the 3.5% YoY rate from 3.3 in July. Against the backdrop of a slowdown in the UK wage growth and a flat GDP print for the second straight month in July, a softer CPI print will lift bets for more interest rate cuts by the Bank of England (BoE) and undermine the British Pound (GBP).
Conversely, the market reaction to a stronger report is more likely to be short-lived amid the hawkish Bank of Japan (BoJ)-led JPY strength. The recent comments by a slew of BoJ officials suggested that the Japanese central bank will hike interest rates again by the end of this year. This, along with the market nervousness ahead of this week's key central bank event risks, is seen benefiting the JPY's safe-haven status and exerting downward pressure on the GBP/JPY cross. This, in turn, favors bearish traders and supports prospects for a further intraday depreciating move.
Meanwhile, the market focus remains on the BoE decision on Thursday, which will be followed by the latest BoJ policy update on Friday. This will play a key role in influencing the GBP/JPY cross and help in determining the next leg of a directional move. Hence, it will be prudent to wait for a sustained break and acceptance below the 184.50 horizontal support before positioning for the resumption of the prior downtrend witnessed over the past two weeks or so.
Economic Indicator
Consumer Price Index (YoY)
The United Kingdom (UK) Consumer Price Index (CPI), released by the Office for National Statistics on a monthly basis, is a measure of consumer price inflation – the rate at which the prices of goods and services bought by households rise or fall – produced to international standards. It is the inflation measure used in the government’s target. The YoY reading compares prices in the reference month to a year earlier. Generally, a high reading is seen as bullish for the Pound Sterling (GBP), while a low reading is seen as bearish.
Read more.Next release: Wed Sep 18, 2024 06:00
Frequency: Monthly
Consensus: 2.2%
Previous: 2.2%
Source: Office for National Statistics
The Bank of England is tasked with keeping inflation, as measured by the headline Consumer Price Index (CPI) at around 2%, giving the monthly release its importance. An increase in inflation implies a quicker and sooner increase of interest rates or the reduction of bond-buying by the BOE, which means squeezing the supply of pounds. Conversely, a drop in the pace of price rises indicates looser monetary policy. A higher-than-expected result tends to be GBP bullish.
- Gold price attracts some dip-buying and reverses a part of the overnight corrective slide.
- Bets for a 50 bps Fed rate cut keep a lid on the attempted USD recovery and lends support.
- Bulls seem reluctant to place aggressive bets ahead of the key central bank event risks.
Gold price (XAU/USD) witnessed a modest pullback from the vicinity of the record high, around the $2,589-2,590 area touched the previous day, and ended in the red for the first time in the last four days on Tuesday. The downtick was led by some profit-taking, albeit lacking any follow-through as traders opted to wait on the sidelines ahead of this week's key central bank event risks before placing fresh directional bets. The Federal Reserve (Fed) will announce its decision at the end of a two-day meeting later this Wednesday, which will be followed by the Bank of England (BoE) meeting on Thursday and the Bank of Japan (BoJ) policy update on Friday.
In the meantime, the extensive pricing for an oversized interest rate cut by the Fed fails to assist the US Dollar (USD) in capitalizing on the overnight bounce from its lowest level since July 2023 and revives demand for the non-yielding Gold price. However, a 25 basis points (bps) rate cut could bode well for the USD and weigh on the commodity. That said, the risk of a further escalation of conflict in the Middle East, along with the US political uncertainty ahead of the November presidential election, could offer support to the precious metal and limit the downside. This, in turn, suggests that any corrective pullback might still be seen as a buying opportunity.
Daily Digest Market Movers: Gold price continues to draw support from a combination of factors ahead of Fed
- Bets for a more aggressive policy easing by the Federal Reserve will assist the gold price in attracting some dip-buyers on Wednesday and stall the overnight modest pullback from the vicinity of the all-time peak.
- According to CME Group's FedWatch Tool, the markets are currently pricing in a 65% chance that the US central bank will lower borrowing costs by 50-basis points at the end of a two-day meeting later today.
- The yield on the benchmark 10-year US government bond bounced from a 16-month low following the release of US Retail Sales data on Tuesday, albeit lacks follow-through and caps the US Dollar recovery.
- The US Census Bureau reported that Retail Sales in the US rose 0.1% in August as compared to a decline of 0.2% expected, while sales excluding Autos missed consensus estimates and expanded by 0.1%.
- The upbeat data prompted some intraday USD short-covering move and pushed it away from the lowest level since July 2023, though the positive move runs out of steam amid dovish Fed expectations.
- At least nine people were killed in simultaneous explosions of handheld pagers used by Hezbollah members in Lebanon, raising the risk of a broader Middle East war and underpinning the safe-haven metal.
- Meanwhile, North Korea, days after offering a view into a facility built to enrich uranium for nuclear bombs, test-fired multiple ballistic missiles toward the South Korean and Japanese eastern seas on Wednesday.
- The market focus remains glued to the critical FOMC policy decision, which, along with updated economic projections, including the so-called 'dot plot', should provide a fresh impetus to the XAU/USD.
Technical Outlook: Gold price seems poised to climb further, could aim to test ascending channel resistance near $2,610
From a technical perspective, bulls might now wait for a move beyond the $2,589-2,590 region, or the all-time peak touched on Monday, before placing fresh bets. The subsequent move up has the potential to lift the Gold price above the $2,600 mark, towards testing the top boundary of a short-term ascending channel extending from sub-$2,400 levels touched late June. The said barrier is currently pegged near the $2,609-2,610 area, which if cleared decisively will confirm a fresh breakout and set the stage for an extension of the recent well-established uptrend.
On the flip side, some follow-through selling below the overnight swing low, around the $2,561-2,560 area, could pave the way for deeper losses towards the $2,530-2,525 strong horizontal resistance breakpoint. Any further decline is more likely to attract fresh buyers and remain limited near the $2,500 psychological mark. The latter should act as a key pivotal point, which if broken decisively could drag the Gold price to the $2,475-2,470 confluence – comprising the 50-day Simple Moving Average and the lower boundary of the aforementioned trend channel.
Gold FAQs
Gold has played a key role in human’s history as it has been widely used as a store of value and medium of exchange. Currently, apart from its shine and usage for jewelry, the precious metal is widely seen as a safe-haven asset, meaning that it is considered a good investment during turbulent times. Gold is also widely seen as a hedge against inflation and against depreciating currencies as it doesn’t rely on any specific issuer or government.
Central banks are the biggest Gold holders. In their aim to support their currencies in turbulent times, central banks tend to diversify their reserves and buy Gold to improve the perceived strength of the economy and the currency. High Gold reserves can be a source of trust for a country’s solvency. Central banks added 1,136 tonnes of Gold worth around $70 billion to their reserves in 2022, according to data from the World Gold Council. This is the highest yearly purchase since records began. Central banks from emerging economies such as China, India and Turkey are quickly increasing their Gold reserves.
Gold has an inverse correlation with the US Dollar and US Treasuries, which are both major reserve and safe-haven assets. When the Dollar depreciates, Gold tends to rise, enabling investors and central banks to diversify their assets in turbulent times. Gold is also inversely correlated with risk assets. A rally in the stock market tends to weaken Gold price, while sell-offs in riskier markets tend to favor the precious metal.
The price can move due to a wide range of factors. Geopolitical instability or fears of a deep recession can quickly make Gold price escalate due to its safe-haven status. As a yield-less asset, Gold tends to rise with lower interest rates, while higher cost of money usually weighs down on the yellow metal. Still, most moves depend on how the US Dollar (USD) behaves as the asset is priced in dollars (XAU/USD). A strong Dollar tends to keep the price of Gold controlled, whereas a weaker Dollar is likely to push Gold prices up.
- Indian Rupee holds steady in Wednesday’s Asian session.
- Firmer Fed rate cuts bets and robust USD sales weigh on the pair, but higher oil prices might cap its downside.
- The Fed rate decision will be in the spotlight on Wednesday.
The Indian Rupee (INR) trades on a flat note on Wednesday after climbing to a month-high of 83.75 in the previous session. The downtick of the pair is pressured by the rising expectations of a deeper Federal Reserve (Fed) rate cut and robust US Dollar sales. Nonetheless, the extended recovery of crude oil prices might undermine the local currency and help limit USD/INR losses.
Later on Wednesday, all eyes will be on the Fed interest rate decision, which is widely expected to cut the rate in its September meeting. Fed officials will also release a Summary of Economic Projections, or ‘dot-plot’ after the policy meeting, which could give insight into just how much the US central bank plans to cut over the next year. The expectation of the jumbo rate cuts might exert some selling pressure on the Greenback in the near term.
Daily Digest Market Movers: Indian Rupee flatlines ahead of US key event
- India's Wholesale Price Index (WPI)-based inflation declined to a four-month low of 1.31% YoY in August from 2.04% in the previous reading. This figure came in below the market consensus of 1.80%.
- India’s merchandise trade deficit stood at $29.65 billion in August compared with $23.5 billion in July, according to Ministry of Commerce and Industry data released on Tuesday.
- India's foreign exchange reserves rose to a record high of $689.2 billion as of September 6, according to the Reserve Bank of India (RBI).
- The US Retail Sales unexpectedly rose 0.1% MoM in August versus 1.1% prior, above the market consensus of -0.2%. Industrial Production climbed 0.8% MoM in August, compared to a decline of 0.6% in the previous reading, better than the estimation of 0.2%.
- According to the CME Fedwatch Tool, Fed funds futures have priced in nearly 63% probability of a 50 basis points (bps) rate cut, up from 30% a week ago, while the chance of a 25 bps cut was at 37%.
Technical Analysis: USD/INR’s positive outlook prevails in the longer term
The Indian Rupee trades flat on the day. The USD/INR pair oscillates within the rectangle on the daily chart. However, in the longer term, the pair keeps the bullish vibe as the price holds above the key 100-day Exponential Moving Average (EMA). Further downside cannot be ruled out as the 14-day Relative Strength Index (RSI) stands in the bearish zone below the midline, supporting the sellers for the time being.
The 83.90-84.00 zone appears to be a tough nut to crack for USD/INR buyers. This region portrays the upper boundary of the rectangle and psychological mark. A break above the mentioned level will see the next upside barrier at 84.50.
On the flip side, the initial support level is located at the low of September 17 at 83.70. A breach of this level will pave the way to the 100-day EMA at 83.64.
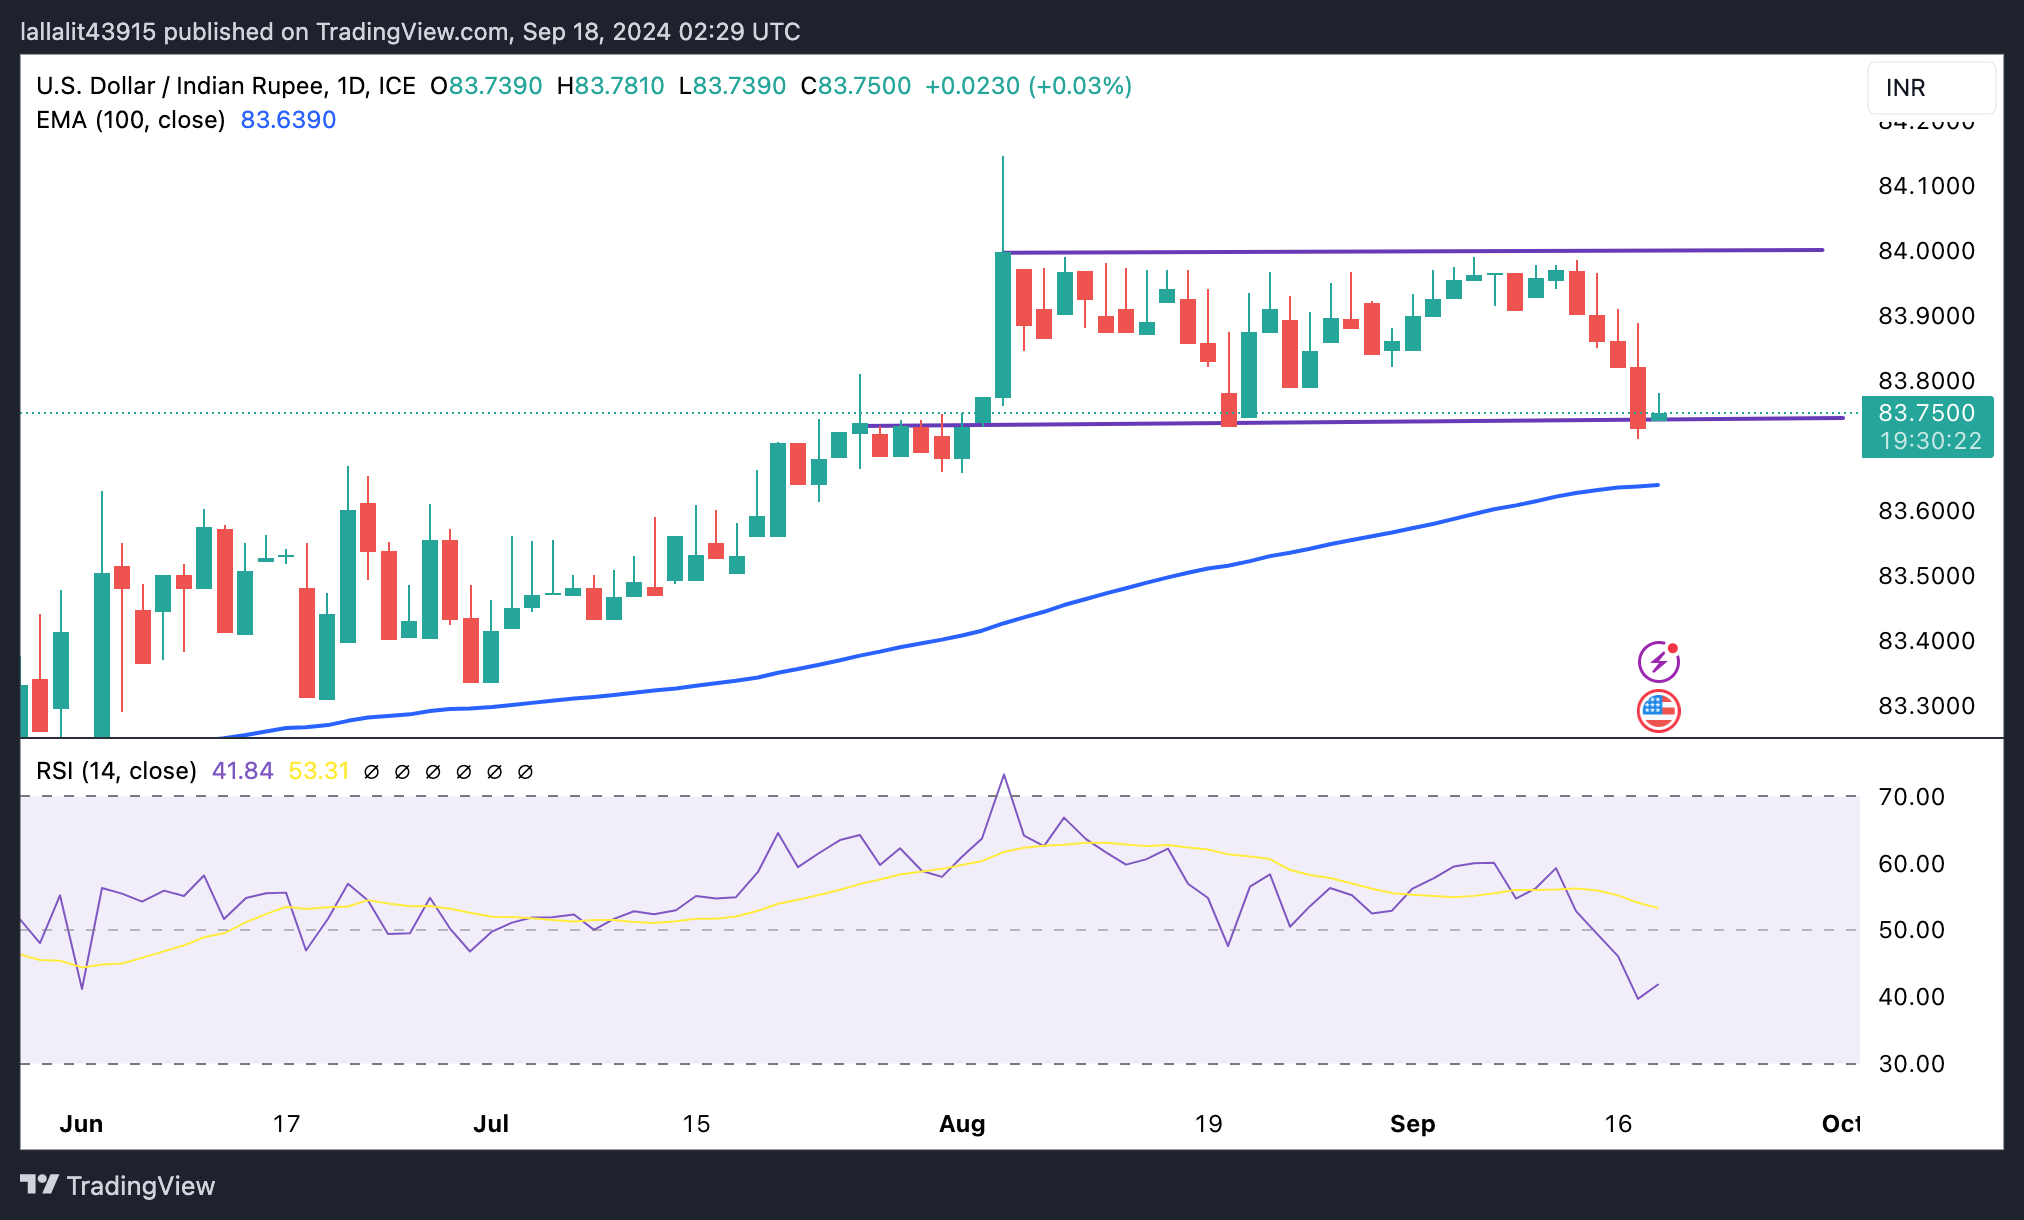
Indian Rupee FAQs
The Indian Rupee (INR) is one of the most sensitive currencies to external factors. The price of Crude Oil (the country is highly dependent on imported Oil), the value of the US Dollar – most trade is conducted in USD – and the level of foreign investment, are all influential. Direct intervention by the Reserve Bank of India (RBI) in FX markets to keep the exchange rate stable, as well as the level of interest rates set by the RBI, are further major influencing factors on the Rupee.
The Reserve Bank of India (RBI) actively intervenes in forex markets to maintain a stable exchange rate, to help facilitate trade. In addition, the RBI tries to maintain the inflation rate at its 4% target by adjusting interest rates. Higher interest rates usually strengthen the Rupee. This is due to the role of the ‘carry trade’ in which investors borrow in countries with lower interest rates so as to place their money in countries’ offering relatively higher interest rates and profit from the difference.
Macroeconomic factors that influence the value of the Rupee include inflation, interest rates, the economic growth rate (GDP), the balance of trade, and inflows from foreign investment. A higher growth rate can lead to more overseas investment, pushing up demand for the Rupee. A less negative balance of trade will eventually lead to a stronger Rupee. Higher interest rates, especially real rates (interest rates less inflation) are also positive for the Rupee. A risk-on environment can lead to greater inflows of Foreign Direct and Indirect Investment (FDI and FII), which also benefit the Rupee.
Higher inflation, particularly, if it is comparatively higher than India’s peers, is generally negative for the currency as it reflects devaluation through oversupply. Inflation also increases the cost of exports, leading to more Rupees being sold to purchase foreign imports, which is Rupee-negative. At the same time, higher inflation usually leads to the Reserve Bank of India (RBI) raising interest rates and this can be positive for the Rupee, due to increased demand from international investors. The opposite effect is true of lower inflation.
| Raw materials | Closed | Change, % |
|---|---|---|
| Silver | 30.689 | -0.13 |
| Gold | 257 | -0.49 |
| Palladium | 1116.84 | 3.59 |
- The United Kingdom’s CPI is foreseen to grow at stable pace of 2.2% in the year to August.
- The Bank of England will announce its monetary policy decision on Thursday.
- The Pound Sterling is technically bullish and could surpass the 1.3300 mark.
The United Kingdom (UK) Office for National Statistics (ONS) will release August Consumer Price Index (CPI) figures on Wednesday. Inflation, as measured by the CPI, is one of the main factors on which the Bank of England (BoE) bases its monetary policy decision, meaning the data is considered a major mover of the Pound Sterling (GBP).
The BoE met in August and decided to trim the benchmark interest rate by 25 basis points (bps) to 5%, a decision supported by a slim majority of 5 out of the 9 voting members of the Monetary Policy Committee (MPC). The widely anticipated announcement had a negative impact on the GBP, which entered a selling spiral against the US Dollar, resulting in the GBP/USD pair bottoming at 1.2664 a couple of days after the event.
What to expect from the next UK inflation report?
The UK CPI is expected to have risen at an annual pace of 2.2% in August, matching the July print. The core annual reading is foreseen at 3.5%, higher than the previous 3.3%. Finally, the monthly index is expected to grow by 0.3% after falling by 0.2% in July.
It is worth adding that the BoE will announce its monetary policy on Thursday and that inflation levels could affect policymakers' decision. Ahead of the announcement, financial markets anticipate officials will keep rates on hold before adopting a more aggressive stance from November on. The central bank anticipated that inflation could reach 2.75% in the upcoming months before gradually declining and even falling below the 2% goal in 2025.
Meanwhile, the BoE released a quarterly survey on public inflation expectations last week, which showed that inflation for the next 12 months is expected to fall to 2.7%, the lowest in three years. However, the 5-year perspective ticked higher, to 3.2% from 3.1% in May. The figures support the case for on-hold rates, and so will the expected CPI outcome.
Finally, it is worth noting that the UK entered a technical recession in the last quarter of 2023. Ever since the economy has recovered, but growth is sluggish, and the risk of another setback remains.
In such a scenario, a mild deviation from the expected figures could have a limited impact on Pound Sterling. Higher than-anticipated readings could cool down hopes for aggressive rate cuts, but the path is clear. The BoE will reduce interest rates and there is no room for hikes. Even further, market participants don’t expect the BoE to deliver a cut when it meets later this week, which would likely reduce the potential impact on the currency.
When will the UK Consumer Price Index report be released and how could it affect GBP/USD?
The UK Office for National Statistics will release August CPI data figures on Wednesday at 06:00 GMT. Before analysing potential scenarios, there’s still one more thing to consider: Despite headline inflation hovering around the central bank’s goal, services inflation has remained quite hot and above 5% for most of the year, more than doubling the headline one.
As said, a modest uptick in inflation could be seen as modest rate cuts coming, but it will not surprise investors enough to consider the opposite scenario. On the contrary, a lower-than-anticipated outcome with easing services inflation should fuel hopes for more aggressive rate cuts and put the Pound Sterling under strong selling pressure.
Valeria Bednarik, FXStreet's Chief Analyst, notes: “The GBP/USD pair is heading into the event trading above the 1.3200 mark, and not far from the multi-month high at 1.3265 posted in August. Most of the pair’s strength is the result of the broad US Dollar’s weakness, as the Federal Reserve (Fed) is expected to deliver its first rate cut on Wednesday. The Fed’s event is likely to overshadow UK CPI release, as market players would wait until after the US central bank announcement to take positions.”
Technically speaking, Bednarik adds: “GBP/USD is bullish according to technical readings in the daily chart. A break through the aforementioned August high could lead to a quick test of the 1.3300 mark, while once beyond the latter, the rally can continue towards 1.3360. A daily close above the 1.3300 threshold would support the case for a steady advance in the days to come. On the other hand, the pair would need to slip below the 1.3140 region to put the bullish case at risk. In that case, the next level to watch and the potential bearish target comes at 1.3000.”
BoE FAQs
The Bank of England (BoE) decides monetary policy for the United Kingdom. Its primary goal is to achieve ‘price stability’, or a steady inflation rate of 2%. Its tool for achieving this is via the adjustment of base lending rates. The BoE sets the rate at which it lends to commercial banks and banks lend to each other, determining the level of interest rates in the economy overall. This also impacts the value of the Pound Sterling (GBP).
When inflation is above the Bank of England’s target it responds by raising interest rates, making it more expensive for people and businesses to access credit. This is positive for the Pound Sterling because higher interest rates make the UK a more attractive place for global investors to park their money. When inflation falls below target, it is a sign economic growth is slowing, and the BoE will consider lowering interest rates to cheapen credit in the hope businesses will borrow to invest in growth-generating projects – a negative for the Pound Sterling.
In extreme situations, the Bank of England can enact a policy called Quantitative Easing (QE). QE is the process by which the BoE substantially increases the flow of credit in a stuck financial system. QE is a last resort policy when lowering interest rates will not achieve the necessary result. The process of QE involves the BoE printing money to buy assets – usually government or AAA-rated corporate bonds – from banks and other financial institutions. QE usually results in a weaker Pound Sterling.
Quantitative tightening (QT) is the reverse of QE, enacted when the economy is strengthening and inflation starts rising. Whilst in QE the Bank of England (BoE) purchases government and corporate bonds from financial institutions to encourage them to lend; in QT, the BoE stops buying more bonds, and stops reinvesting the principal maturing on the bonds it already holds. It is usually positive for the Pound Sterling.
Economic Indicator
Consumer Price Index (YoY)
The United Kingdom (UK) Consumer Price Index (CPI), released by the Office for National Statistics on a monthly basis, is a measure of consumer price inflation – the rate at which the prices of goods and services bought by households rise or fall – produced to international standards. It is the inflation measure used in the government’s target. The YoY reading compares prices in the reference month to a year earlier. Generally, a high reading is seen as bullish for the Pound Sterling (GBP), while a low reading is seen as bearish.
Read more.Next release: Wed Sep 18, 2024 06:00
Frequency: Monthly
Consensus: 2.2%
Previous: 2.2%
Source: Office for National Statistics
The Bank of England is tasked with keeping inflation, as measured by the headline Consumer Price Index (CPI) at around 2%, giving the monthly release its importance. An increase in inflation implies a quicker and sooner increase of interest rates or the reduction of bond-buying by the BOE, which means squeezing the supply of pounds. Conversely, a drop in the pace of price rises indicates looser monetary policy. A higher-than-expected result tends to be GBP bullish.
- The Australian Dollar extends its upside due to improved risk sentiment ahead of the Fed decision.
- The Reserve Bank of Australia’s hawkish stance supports the Aussie Dollar.
- The US Dollar struggles due to rising odds of a 50 basis points Fed interest rate cut on Wednesday.
The Australian Dollar (AUD) extends its upside for the third successive day against the US Dollar (USD) on Wednesday. Investors await the Federal Reserve (Fed) interest rate decision later in the day, although rising expectations of a 50 basis points cut should support risk-sensitive currencies like AUD.
The AUD/USD pair may advance further as the Australian Dollar remains supported by the Reserve Bank of Australia's (RBA) hawkish stance. RBA Governor Michele Bullock stated that it is premature to consider rate cuts due to persistently high inflation. Additionally, RBA Assistant Governor Sarah Hunter noted that while the labor market remains tight, wage growth appears to have peaked and is expected to slow further.
The Federal Reserve is expected to lower interest rates at its September meeting, following a steady rate range of 5.25% to 5.5% since July 2023. The CME FedWatch Tool indicates that markets are assigning a 33.0% probability to a 25-basis-point rate cut, while the likelihood of a 50-basis-point cut has risen to 67.0%, up from 62.0% just the previous day.
Daily Digest Market Movers: Australian Dollar gains ground due to dovish Fed policy outlook
- JP Morgan CEO Jamie Dimon stated on Tuesday that whether the Federal Reserve cuts interest rates by 25 or 50 basis points, the impact will be “not earth-shattering.” Dimon emphasized, “They need to do it,” but noted that such moves are relatively minor in the grand scheme of things, as "there's a real economy" operating beneath the Fed’s rate changes, according to Bloomberg.
- US Retail Sales rose by 0.1% month-over-month in August, following a revised 1.1% increase in July, surpassing expectations of a 0.2% decline and indicating resilient consumer spending. Meanwhile, the Retail Sales Control Group increased by 0.3%, slightly below the previous month's 0.4% rise.
- ANZ-Roy Morgan Consumer Confidence climbed 1.8 points, reaching an eight-week high of 84.1. While ANZ notes that the rise was broad-based, confidence remains firmly in pessimistic territory.
- Economists at Goldman Sachs and Citi have reduced their 2024 GDP growth forecasts for China to 4.7%, falling short of Beijing's target of around 5.0%. SocGen describes the situation as a "downward spiral," while Barclays calls it "from bad to worse" and a "vicious cycle." Morgan Stanley also cautions that "things could get worse before they get better," according to a Reuters report.
- The University of Michigan’s Consumer Sentiment Index rose to 69.0 in September, exceeding the market expectations of 68.0 reading and marking a four-month high. This increase reflects a gradual improvement in consumers' outlook on the US economy after months of declining economic expectations.
- China's economy weakened in August, with a continued slowdown in industrial activity and declining real estate prices, as Beijing faces growing pressure to increase spending to boost demand. According to Business Standard, this was reported by the National Bureau of Statistics on Saturday.
- Australia’s Consumer Inflation Expectations eased to 4.4% in September, down slightly from August's four-month high of 4.5%. This decline highlights the central bank's efforts to balance bringing inflation down within a reasonable timeframe and maintaining gains in the labor market.
Technical Analysis: Australian Dollar remains above 0.6750; next barrier appears at seven-month highs
The AUD/USD pair trades near 0.6760 on Wednesday. Technical analysis of the daily chart indicates that the pair is positioned below the lower boundary of the rising wedge pattern, indicating a potential bearish reversal. However, the 14-day Relative Strength Index (RSI) remains above the 50 level, suggesting an ongoing bullish trend.
Regarding the upside, a return to the rising wedge would reinforce the bullish bias and push the AUD/USD pair to test a seven-month high of 0.6798, followed by the 0.6800 level. Further resistance appears at the upper boundary of the rising wedge at the 0.6820 level.
On the downside, the AUD/USD pair could find immediate support around the nine-day Exponential Moving Average (EMA) at the 0.6730 level, followed by the psychological level of 0.6700. A break below the latte could lead the pair to navigate the region around the throwback support zone near 0.6575.
AUD/USD: Daily Chart
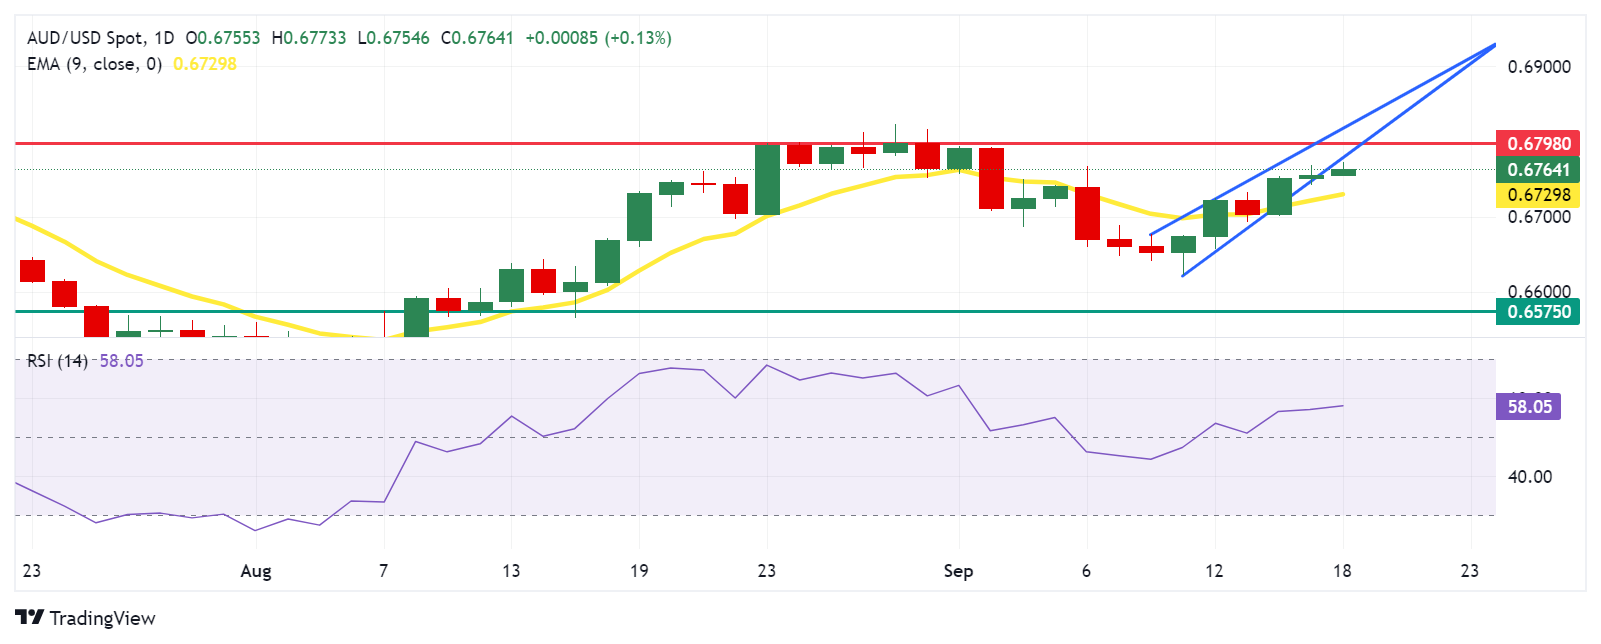
Australian Dollar PRICE Today
The table below shows the percentage change of Australian Dollar (AUD) against listed major currencies today. Australian Dollar was the strongest against the US Dollar.
| USD | EUR | GBP | JPY | CAD | AUD | NZD | CHF | |
|---|---|---|---|---|---|---|---|---|
| USD | -0.12% | -0.05% | -0.58% | -0.06% | -0.16% | -0.32% | -0.23% | |
| EUR | 0.12% | 0.06% | -0.46% | 0.05% | -0.03% | -0.22% | -0.10% | |
| GBP | 0.05% | -0.06% | -0.50% | -0.02% | -0.09% | -0.28% | -0.15% | |
| JPY | 0.58% | 0.46% | 0.50% | 0.51% | 0.42% | 0.26% | 0.38% | |
| CAD | 0.06% | -0.05% | 0.02% | -0.51% | -0.10% | -0.26% | -0.13% | |
| AUD | 0.16% | 0.03% | 0.09% | -0.42% | 0.10% | -0.16% | -0.05% | |
| NZD | 0.32% | 0.22% | 0.28% | -0.26% | 0.26% | 0.16% | 0.11% | |
| CHF | 0.23% | 0.10% | 0.15% | -0.38% | 0.13% | 0.05% | -0.11% |
The heat map shows percentage changes of major currencies against each other. The base currency is picked from the left column, while the quote currency is picked from the top row. For example, if you pick the Australian Dollar from the left column and move along the horizontal line to the US Dollar, the percentage change displayed in the box will represent AUD (base)/USD (quote).
Australian Dollar FAQs
One of the most significant factors for the Australian Dollar (AUD) is the level of interest rates set by the Reserve Bank of Australia (RBA). Because Australia is a resource-rich country another key driver is the price of its biggest export, Iron Ore. The health of the Chinese economy, its largest trading partner, is a factor, as well as inflation in Australia, its growth rate and Trade Balance. Market sentiment – whether investors are taking on more risky assets (risk-on) or seeking safe-havens (risk-off) – is also a factor, with risk-on positive for AUD.
The Reserve Bank of Australia (RBA) influences the Australian Dollar (AUD) by setting the level of interest rates that Australian banks can lend to each other. This influences the level of interest rates in the economy as a whole. The main goal of the RBA is to maintain a stable inflation rate of 2-3% by adjusting interest rates up or down. Relatively high interest rates compared to other major central banks support the AUD, and the opposite for relatively low. The RBA can also use quantitative easing and tightening to influence credit conditions, with the former AUD-negative and the latter AUD-positive.
China is Australia’s largest trading partner so the health of the Chinese economy is a major influence on the value of the Australian Dollar (AUD). When the Chinese economy is doing well it purchases more raw materials, goods and services from Australia, lifting demand for the AUD, and pushing up its value. The opposite is the case when the Chinese economy is not growing as fast as expected. Positive or negative surprises in Chinese growth data, therefore, often have a direct impact on the Australian Dollar and its pairs.
Iron Ore is Australia’s largest export, accounting for $118 billion a year according to data from 2021, with China as its primary destination. The price of Iron Ore, therefore, can be a driver of the Australian Dollar. Generally, if the price of Iron Ore rises, AUD also goes up, as aggregate demand for the currency increases. The opposite is the case if the price of Iron Ore falls. Higher Iron Ore prices also tend to result in a greater likelihood of a positive Trade Balance for Australia, which is also positive of the AUD.
The Trade Balance, which is the difference between what a country earns from its exports versus what it pays for its imports, is another factor that can influence the value of the Australian Dollar. If Australia produces highly sought after exports, then its currency will gain in value purely from the surplus demand created from foreign buyers seeking to purchase its exports versus what it spends to purchase imports. Therefore, a positive net Trade Balance strengthens the AUD, with the opposite effect if the Trade Balance is negative.
- WTI extends the rally to nearly $70.85 in Wednesday’s early Asian session.
- Rising Fed rate cut bets and oil supply disruptions underpin the WTI price.
- China's demand worries might limit the black gold’s upside.
West Texas Intermediate (WTI), the US crude Oil benchmark, is trading around $70.85 on Wednesday. WTI price edges higher amid supply disruptions in the Gulf of Mexico and the hope that the Federal Reserve (Fed) will cut interest rates on Wednesday.
The Bureau of Safety and Environmental Enforcement reported that US crude oil around 100,000 barrels per day, remained offline in the Gulf as of Tuesday due to Hurricane Francine. Additionally, the supply disruption in Libya amid a rift between rival factions over control of the central bank has led to lower oil output and lifted the WTI price.
“Supply disruptions are making their mark, including Hurricane Francine’s impact on US Gulf of Mexico infrastructure,” said Svetlana Tretyakova, senior analyst at Rystad Energy.
Expectations of a Fed rate cut could revitalize demand in the top oil-consuming nation. The market ramps up expectations for a jumbo 50 basis points (bps) cut at the September Fed meeting on Wednesday, with nearly 67% odds pricing in, up from 30% a week ago.
The US crude inventories climbed last week. According to the American Petroleum Institute (API), crude oil stockpiles in the United States for the week ending September 13 increased by 1.96 million barrels, compared to a decrease of 2.79 million barrels in the previous week. The market consensus estimated that stocks would decline by just 0.1 million barrels.
On the other hand, IG market strategist Yeap Jun Rong noted that the recent weaker-than-expected Chinese economic data dampened market sentiment, with the low-for-longer growth outlook in the world's second-largest economy reinforcing doubts over oil demand. The concerns about oil demand in China are likely to limit the WTI’s upside for the time being.
WTI Oil FAQs
WTI Oil is a type of Crude Oil sold on international markets. The WTI stands for West Texas Intermediate, one of three major types including Brent and Dubai Crude. WTI is also referred to as “light” and “sweet” because of its relatively low gravity and sulfur content respectively. It is considered a high quality Oil that is easily refined. It is sourced in the United States and distributed via the Cushing hub, which is considered “The Pipeline Crossroads of the World”. It is a benchmark for the Oil market and WTI price is frequently quoted in the media.
Like all assets, supply and demand are the key drivers of WTI Oil price. As such, global growth can be a driver of increased demand and vice versa for weak global growth. Political instability, wars, and sanctions can disrupt supply and impact prices. The decisions of OPEC, a group of major Oil-producing countries, is another key driver of price. The value of the US Dollar influences the price of WTI Crude Oil, since Oil is predominantly traded in US Dollars, thus a weaker US Dollar can make Oil more affordable and vice versa.
The weekly Oil inventory reports published by the American Petroleum Institute (API) and the Energy Information Agency (EIA) impact the price of WTI Oil. Changes in inventories reflect fluctuating supply and demand. If the data shows a drop in inventories it can indicate increased demand, pushing up Oil price. Higher inventories can reflect increased supply, pushing down prices. API’s report is published every Tuesday and EIA’s the day after. Their results are usually similar, falling within 1% of each other 75% of the time. The EIA data is considered more reliable, since it is a government agency.
OPEC (Organization of the Petroleum Exporting Countries) is a group of 13 Oil-producing nations who collectively decide production quotas for member countries at twice-yearly meetings. Their decisions often impact WTI Oil prices. When OPEC decides to lower quotas, it can tighten supply, pushing up Oil prices. When OPEC increases production, it has the opposite effect. OPEC+ refers to an expanded group that includes ten extra non-OPEC members, the most notable of which is Russia.
- USD/JPY meets with a fresh supply and reverses a part of the overnight recovery gains.
- The divergent Fed-BoJ policy expectations underpin the JPY and exert some pressure.
- Investors look to the critical Fed decision ahead of the key BoJ policy update on Friday.
The USD/JPY pair attracts fresh sellers during the Asian session on Wednesday and slides back below the 142.00 mark in the last hour, eroding a part of the overnight gains and stalling its recovery from the lowest level since July 2023 touched earlier this week. Meanwhile, the fundamental backdrop suggests that the path of least resistance for spot prices is to the downside, though traders might refrain from placing aggressive bets ahead of the key central bank event risks.
The Federal Reserve (Fed) is scheduled to announce its decision at the end of a two-day meeting later this Wednesday and is universally expected to kick start its policy easing cycle. The market attention will then shift to the Bank of Japan (BoJ) policy update on Friday, which will play a key role in influencing the Japanese Yen (JPY) and provide a fresh directional impetus to the USD/JPY pair. In the meantime, the cautious market mood, along with the divergent Fed-BoJ policy expectations, drives some haven flows towards the JPY and turns out to be a key factor exerting downward pressure on the USD/JPY pair.
The markets have been pricing in a greater chance of an oversized, 50 basis points (bps) interest rate cut by the Fed amid signs of easing inflationary pressures. This overshadows Tuesday's better-than-expected release of the US Retail Sales data and fails to assist the US Dollar (USD) to build on the overnight bounce from the 2024 low. In contrast, the recent hawkish signals from BoJ officials suggest that the Japanese central bank will hike rates again by the end of this year. This has been a key factor behind the JPY's recent relative outperformance and contributes to the offered tone surrounding the USD/JPY pair.
The JPY bulls, meanwhile, seem rather unaffected by Japan's August trade data, which showed a big miss for both exports and imports. According to the official data, Japan's exports rose for a ninth straight month, by the 5.6% YoY rate in August, but at a much slower-than-expected pace. This was accompanied by a substantially smaller-than-expected growth of 2.3% in imports, albeit did little to dent the underlying bullish sentiment surrounding the JPY. This, in turn, validates the near-term negative outlook for the USD/JPY pair and supports prospects for an extension of the recent well-established downtrend.
Economic Indicator
Fed Interest Rate Decision
The Federal Reserve (Fed) deliberates on monetary policy and makes a decision on interest rates at eight pre-scheduled meetings per year. It has two mandates: to keep inflation at 2%, and to maintain full employment. Its main tool for achieving this is by setting interest rates – both at which it lends to banks and banks lend to each other. If it decides to hike rates, the US Dollar (USD) tends to strengthen as it attracts more foreign capital inflows. If it cuts rates, it tends to weaken the USD as capital drains out to countries offering higher returns. If rates are left unchanged, attention turns to the tone of the Federal Open Market Committee (FOMC) statement, and whether it is hawkish (expectant of higher future interest rates), or dovish (expectant of lower future rates).
Read more.Next release: Wed Sep 18, 2024 18:00
Frequency: Irregular
Consensus: 5.25%
Previous: 5.5%
Source: Federal Reserve
On Wednesday, the People’s Bank of China (PBoC) set the USD/CNY central rate for the trading session ahead at 7.0870, as against last Friday's fix of 7.1030 and 7.0828 Reuters estimates.
- NZD/USD gains ground near 0.6190 in Wednesday’s early Asian session.
- The Fed is anticipated to reduce its borrowing costs on Wednesday.
- New Zealand’s GDP will be released on Thursday, and it is projected to contract by 0.4% QoQ in Q2.
The NZD/USD pair attracts some buyers around 0.6190 on Wednesday during the early Asian session. The resumption of the US Dollar (USD) weakness amid firmer bets of the Federal Reserve (Fed) rate cut provides some support to the pair. Investors will closely monitor the Fed interest rate decision on Wednesday.
The Fed will likely cut interest rates at its September meeting on Wednesday after holding the rate steady within a target of 5.25% and 5.5% since July 2023. Fed Chair Jerome Powell said at Jackson Hole, “The time has come for policy to adjust.” He further stated that “the direction of travel is clear, and the timing and pace of rate cuts will depend on incoming data, the evolving outlook and the balance of risks.”
Fed officials will also release a Summary of Economic Projections, or ‘dot-plot’ after the policy meeting, which could give insight into just how much the US central bank plans to cut over the next year. The expectation of the jumbo rate cuts might exert some selling pressure on the Greenback in the near term.
On the Kiwi front, a bleak outlook in the Chinese economy after the disappointing economic data might cap the upside for the China-proxy New Zealand Dollar (NZD). Investors will take more cues from New Zealand's Gross Domestic Product (GDP) for the second quarter (Q2), which is due on Thursday. The GDP number is estimated to contract by 0.4% quarter-on-quarter in Q2 following a 0.2% expansion in Q1. However, a surprise upside in GDP reading could boost the NZD against the USD.
New Zealand Dollar FAQs
The New Zealand Dollar (NZD), also known as the Kiwi, is a well-known traded currency among investors. Its value is broadly determined by the health of the New Zealand economy and the country’s central bank policy. Still, there are some unique particularities that also can make NZD move. The performance of the Chinese economy tends to move the Kiwi because China is New Zealand’s biggest trading partner. Bad news for the Chinese economy likely means less New Zealand exports to the country, hitting the economy and thus its currency. Another factor moving NZD is dairy prices as the dairy industry is New Zealand’s main export. High dairy prices boost export income, contributing positively to the economy and thus to the NZD.
The Reserve Bank of New Zealand (RBNZ) aims to achieve and maintain an inflation rate between 1% and 3% over the medium term, with a focus to keep it near the 2% mid-point. To this end, the bank sets an appropriate level of interest rates. When inflation is too high, the RBNZ will increase interest rates to cool the economy, but the move will also make bond yields higher, increasing investors’ appeal to invest in the country and thus boosting NZD. On the contrary, lower interest rates tend to weaken NZD. The so-called rate differential, or how rates in New Zealand are or are expected to be compared to the ones set by the US Federal Reserve, can also play a key role in moving the NZD/USD pair.
Macroeconomic data releases in New Zealand are key to assess the state of the economy and can impact the New Zealand Dollar’s (NZD) valuation. A strong economy, based on high economic growth, low unemployment and high confidence is good for NZD. High economic growth attracts foreign investment and may encourage the Reserve Bank of New Zealand to increase interest rates, if this economic strength comes together with elevated inflation. Conversely, if economic data is weak, NZD is likely to depreciate.
The New Zealand Dollar (NZD) tends to strengthen during risk-on periods, or when investors perceive that broader market risks are low and are optimistic about growth. This tends to lead to a more favorable outlook for commodities and so-called ‘commodity currencies’ such as the Kiwi. Conversely, NZD tends to weaken at times of market turbulence or economic uncertainty as investors tend to sell higher-risk assets and flee to the more-stable safe havens.
| Index | Change, points | Closed | Change, % |
|---|---|---|---|
| NIKKEI 225 | -378.54 | 36203.22 | -1.03 |
| Hang Seng | 237.9 | 17660.02 | 1.37 |
| ASX 200 | 19.3 | 8140.9 | 0.24 |
| DAX | 92.97 | 18726.08 | 0.5 |
| CAC 40 | 37.98 | 7487.42 | 0.51 |
| Dow Jones | -15.9 | 41606.18 | -0.04 |
| S&P 500 | 1.49 | 5634.58 | 0.03 |
| NASDAQ Composite | 35.93 | 17628.06 | 0.2 |
| Pare | Closed | Change, % |
|---|---|---|
| AUDUSD | 0.67555 | 0.08 |
| EURJPY | 158.182 | 1.02 |
| EURUSD | 1.11138 | -0.12 |
| GBPJPY | 187.295 | 0.76 |
| GBPUSD | 1.31542 | -0.42 |
| NZDUSD | 0.61822 | -0.25 |
| USDCAD | 1.35944 | 0.05 |
| USDCHF | 0.84667 | 0.22 |
| USDJPY | 142.331 | 1.15 |


© 2000-2026. All rights reserved.
This site is managed by Teletrade D.J. LLC 2351 LLC 2022 (Euro House, Richmond Hill Road, Kingstown, VC0100, St. Vincent and the Grenadines).
The information on this website is for informational purposes only and does not constitute any investment advice.
The company does not serve or provide services to customers who are residents of the US, Canada, Iran, The Democratic People's Republic of Korea, Yemen and FATF blacklisted countries.
Making transactions on financial markets with marginal financial instruments opens up wide possibilities and allows investors who are willing to take risks to earn high profits, carrying a potentially high risk of losses at the same time. Therefore you should responsibly approach the issue of choosing the appropriate investment strategy, taking the available resources into account, before starting trading.
Use of the information: full or partial use of materials from this website must always be referenced to TeleTrade as the source of information. Use of the materials on the Internet must be accompanied by a hyperlink to teletrade.org. Automatic import of materials and information from this website is prohibited.
Please contact our PR department if you have any questions or need assistance at pr@teletrade.global.
transfers