- Analytics
- News and Tools
- Market News
CFD Markets News and Forecasts — 17-02-2023
- AUD/USD finished the week with losses, on a sentiment shift, and speculations for an aggressive Federal Reserve.
- During the last week, US inflation data sponsored a recovery for the greenback as US Treasury bond yields aimed north.
- AUD/USD are eyeing the busy economic calendar in Australia and the US next week.
The Australian dollar (AUD) finished the week on a lower note, after hitting a daily high of 0.6884, dropped on a risk-off impulse, as Wall Street ended the session with losses between 0.26% and 0.58%, while the Dow Jones was the outlier, finishing 0.39% above its opening price. At the time of writing, the AUD/USD exchanges hands at 0.6877
Global stocks finished on a lower note as investors increased their bets that the US Federal Reserve (Fed) will tighten policy above earlier expectations. Last week’s January inflation reports in the United States (US), namely the Consumer Price Index (CPI) and the Producer Price Index (PPI), were lower compared to December’s data but above estimates. In fact, the highlight of the week was PPI on a monthly basis, exceeding the consensus and the prior month’s figure, which justified Fed officials’ hawkish commentary during the week.
On Thursday, Cleveland and St. Louis Fed Presidents Loretta Mester and James Bullard commented that they’re seeing compelling evidence to raise rates by 50 bps in upcoming meetings.
Today, Fed Governor Michell Bowman stated that the US central bank has not finished tightening monetary conditions and reiterated that “we haven’t beaten inflation.” Meanwhile, Richmond’s Fed President Thomas Barkin said that getting inflation back to the Fed’s 2% goal “will require more rate increases,” said reporters following an event in Rosslyn, Virginia. “How many of those I think we’ll have to see ... what you see is progress, but slow progress, you don’t see victory.”
Elsewhere, in the Asian session, the Reserve Bank of Australia (RBA) Governor Philipe Lowe said that based on incoming data, the RBA board estimates that additional rate increases will be needed “over the months ahead to ensure that inflation returns to target and that this period of high inflation is only temporary.”
“If we don’t get on top of inflation and bring it down in a timely way, the end result will be even higher interest rates and more unemployment in the future,” Lowe said.
Given the backdrop and worse than estimates Australian labor market date revealed on Wednesday, the US Dollar (USD) regained composure and weighed on the Australian dollar. The AUD/USD pair tumbled from around 0.6989 toward the week’s lows at 0.6811.
What to watch?
The Australian economic docket will feature Manufacturing, Services, and Composite PMIs, the Composite Leading Index, and the Wage Price Index. On the US front, the calendar will reveal Q4’s GDP estimates, Initial Jobless Claims, the Fed’s preferred inflation gauge, and the University of Michigan Consumer Sentiment final reading.
AUD/USD Key technical levels
- The EUR/JPY is registering gains of 2.22% in the week after facing solid resistance around 143.60.
- EUR/JPY Price Analysis: In consolidation within a 130 pip range circa the 143.00 psychological barriers.
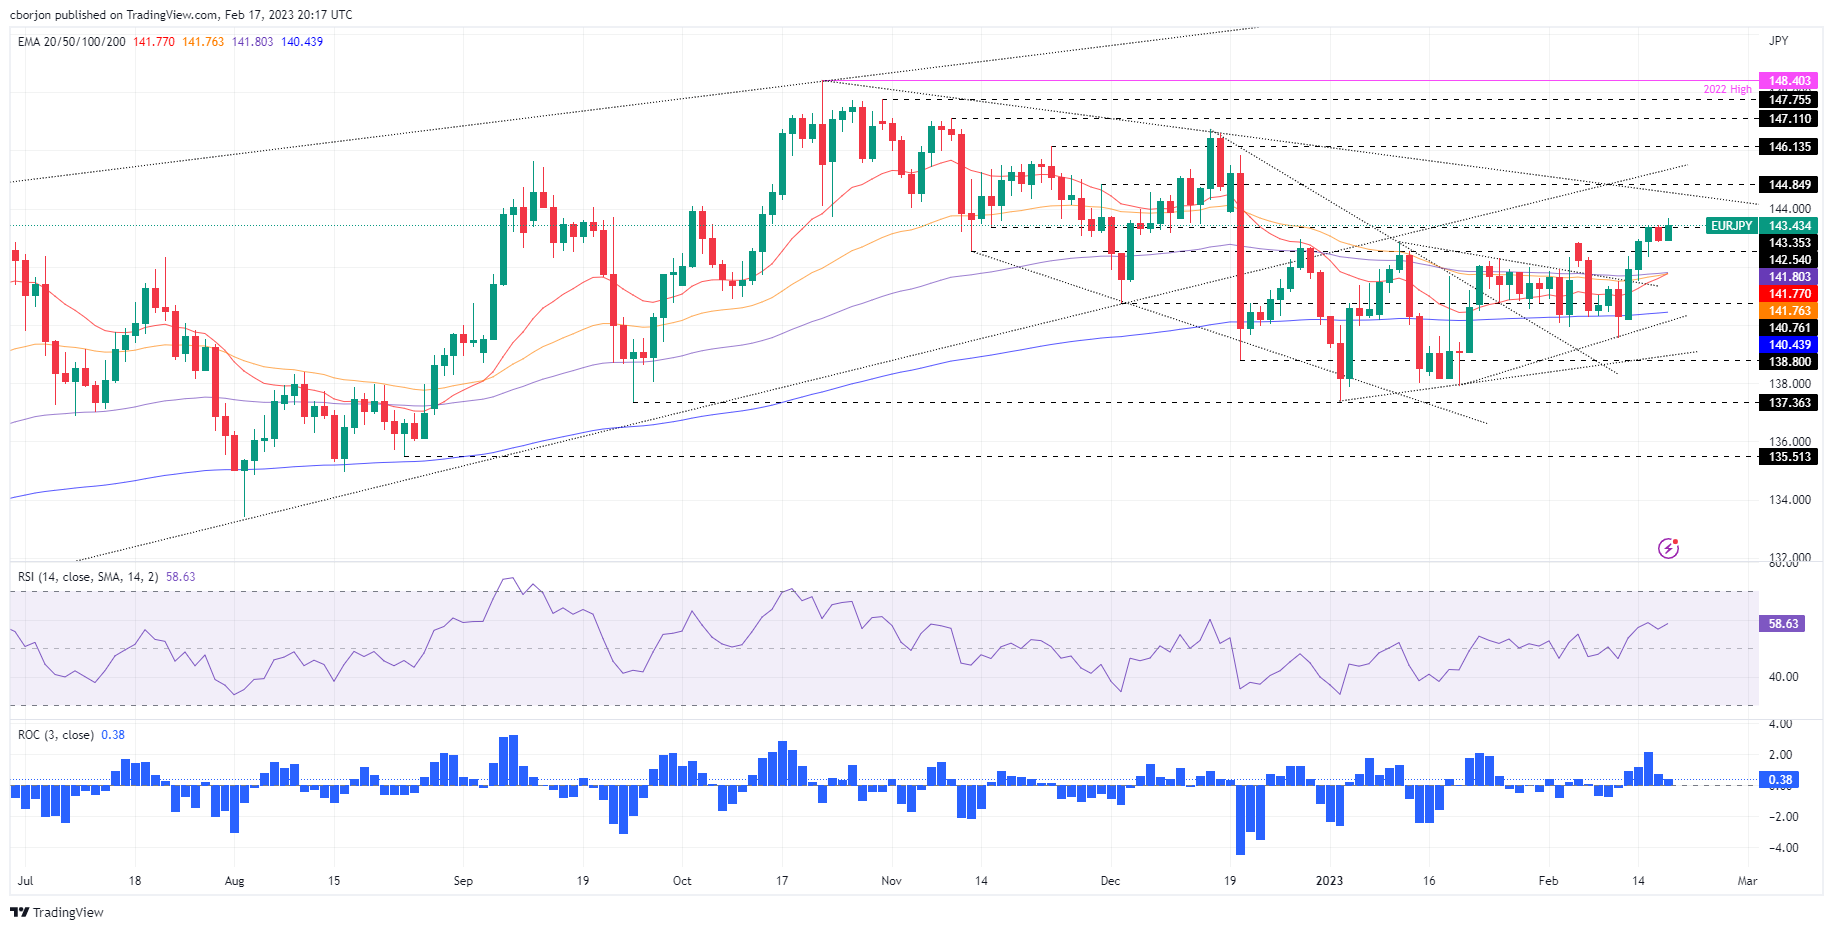
The EUR/JPY hit a fresh weekly high at 143.67 but reversed some of those gains, resting comfortably above Thursday’s high ahead of the weekend. Therefore, the EUR/JPY exchanges hands at 143.40 after dropping to a low of 142.91.
EUR/JPY began the week at around the 200-day Exponential Moving Average (EMA) at 140.32 before rallying sharply towards the 142.38 Tuesday high. Since that day, the EUR/JPY consolidated at around the 142.35-143.65 area, unable to crack either side of the range.
On Friday, the EUR/JPY pierced the top of the range, but buyers unable to hold to its gains, caused a retracement in the pair. Therefore, the EUR/JPY neutral-to-upward bias remains intact.
If the EUR/JPY breaks the top of the range, the next supply area will be 144.00. Once broken, the EUR/JPY might rally and test a five-month-old downslope resistance trendline passing nearby 144.50/60. That could propel EUR/JPY bulls toward the psychological 145.00 barrier.
Contrarily a EUR/JPY fall below 142.30, and the pair might test the 142.00 figure. A breach of the latter will open the door for a move lower to the 141.70/80 area, with the 20, 50, and 100-day EMAs resting inside the range, followed by a fall to the 200*day EMA at 140.44.
EUR/JPY Daily chart
EUR/JPY Key technical levels
- GBP/USD is set to finish the week with losses of 0.16%.
- Softer UK’s inflation data warrant further action by the BoE but in smaller steps.
- Hotter-than-expected January US CPI and PPI figures justify Fed official’s calls for a 50 bps increase in upcoming meetings.
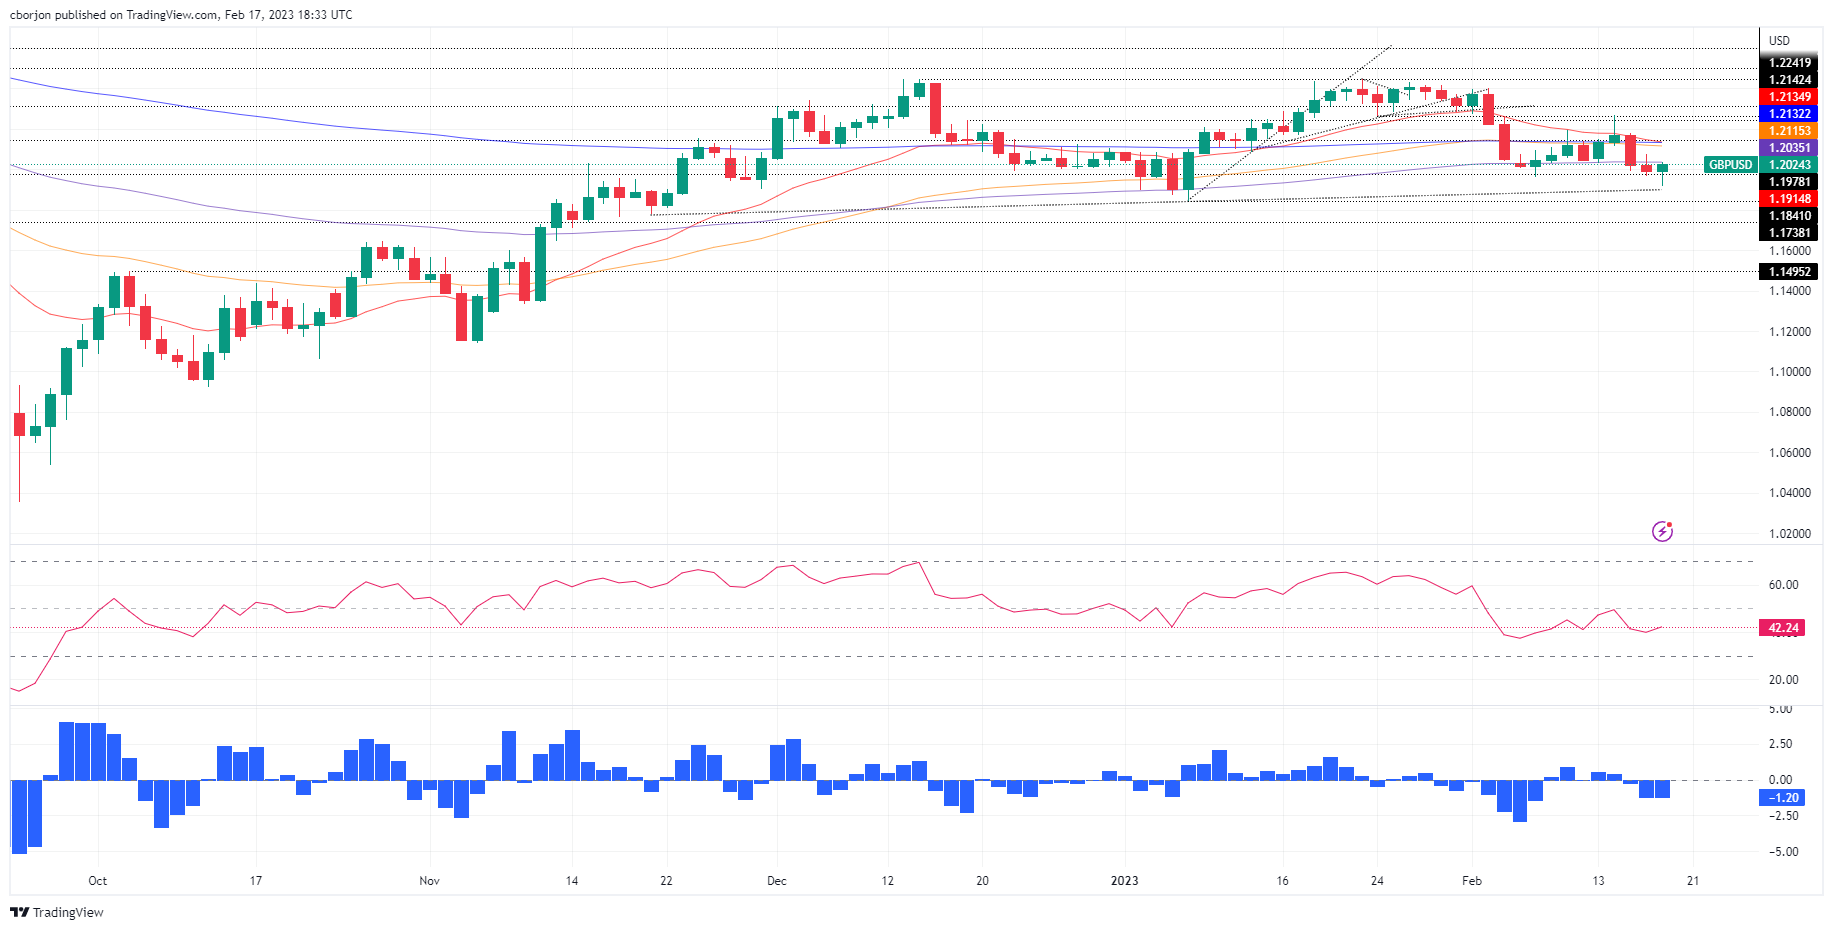
The GBP/USD is staging a recovery after diving to fresh February lows around 1.1914 in the mid-North American session, bolstered by overall US Dollar (USD) weakness. Nevertheless, it remains trading below the important 200-day Exponential Moving Average (EMA) at 1.2132, keeping the downtrend intact. At the time of writing, the GBP/USD is exchanging hands above the 1.2020 figure, above its opening price by 0.30%.
GBP/USD pressured by an expected Fed aggressive path, compared to the BoE
Data from both sides of the Atlantic kept the GBP/USD pressured, which finally dropped below the 200-day EMA. A UK inflation report on Tuesday contributed to speculations that the Bank of England (BoE) would not hike rates as aggressively as expected. That, alongside softer than expected Consumer Price Index (CPI) for January in the US, which exceeded estimates by bank analysts, incremented the likelihood of further tightening by the US Federal Reserve (Fed).
The last piece of the puzzle that propelled US Treasury bond yields and the US Dollar (USD) was the Producer Price Index (PPI) for January, with data coming higher than estimates on a monthly basis. That spurred hawkish commentary by two Federal Reserve (Fed) officials, who said that rates need to be higher for longer, foreseeing them above the 5.0% threshold.
Another factor that influenced investors’ reaction was the Philadelphia Fed Manufacturing Index, which collapsed, but comments in the poll by business executives commented that input prices jumped for the first time in 10 months. Given the backdrop, money market futures are pricing in a more hawkish Federal Reserve.
Therefore, the GBP/USD extended its losses on Thursday, dropping 0.26%. But as the New York session progresses, the Pound Sterling (GBP) has gained traction against the US Dollar (USD), setting the stage to challenge the 100-day EMA.
GBP/USD Technical analysis
The GBP/USD pair daily chart portrays the pair as downward biased, even though it’s recovering from falling for two straight days. The major found buyers around the 1.1900 area, which triggered an uptick to the day’s high at 1.2037, the 100-day EMA, where the GBP/USD was quickly rejected.
If the GBP/USD achieves a daily close above the 100-day EMA, the pair will rally toward the confluence of the 200 and 20-day EMAs, each at 1.2132/35, respectively. On the other hand, a bearish resumption could happen once the GBP/USD tumbles below 1.1914, followed by the 1.1900 figure.
- USD/MXN drops below last Thursday’s low, extending its losses to a fresh multi-year low of around $18.40.
- USD/MXN Price Analysis: A break below $18.40 would pave the way toward $18.00.
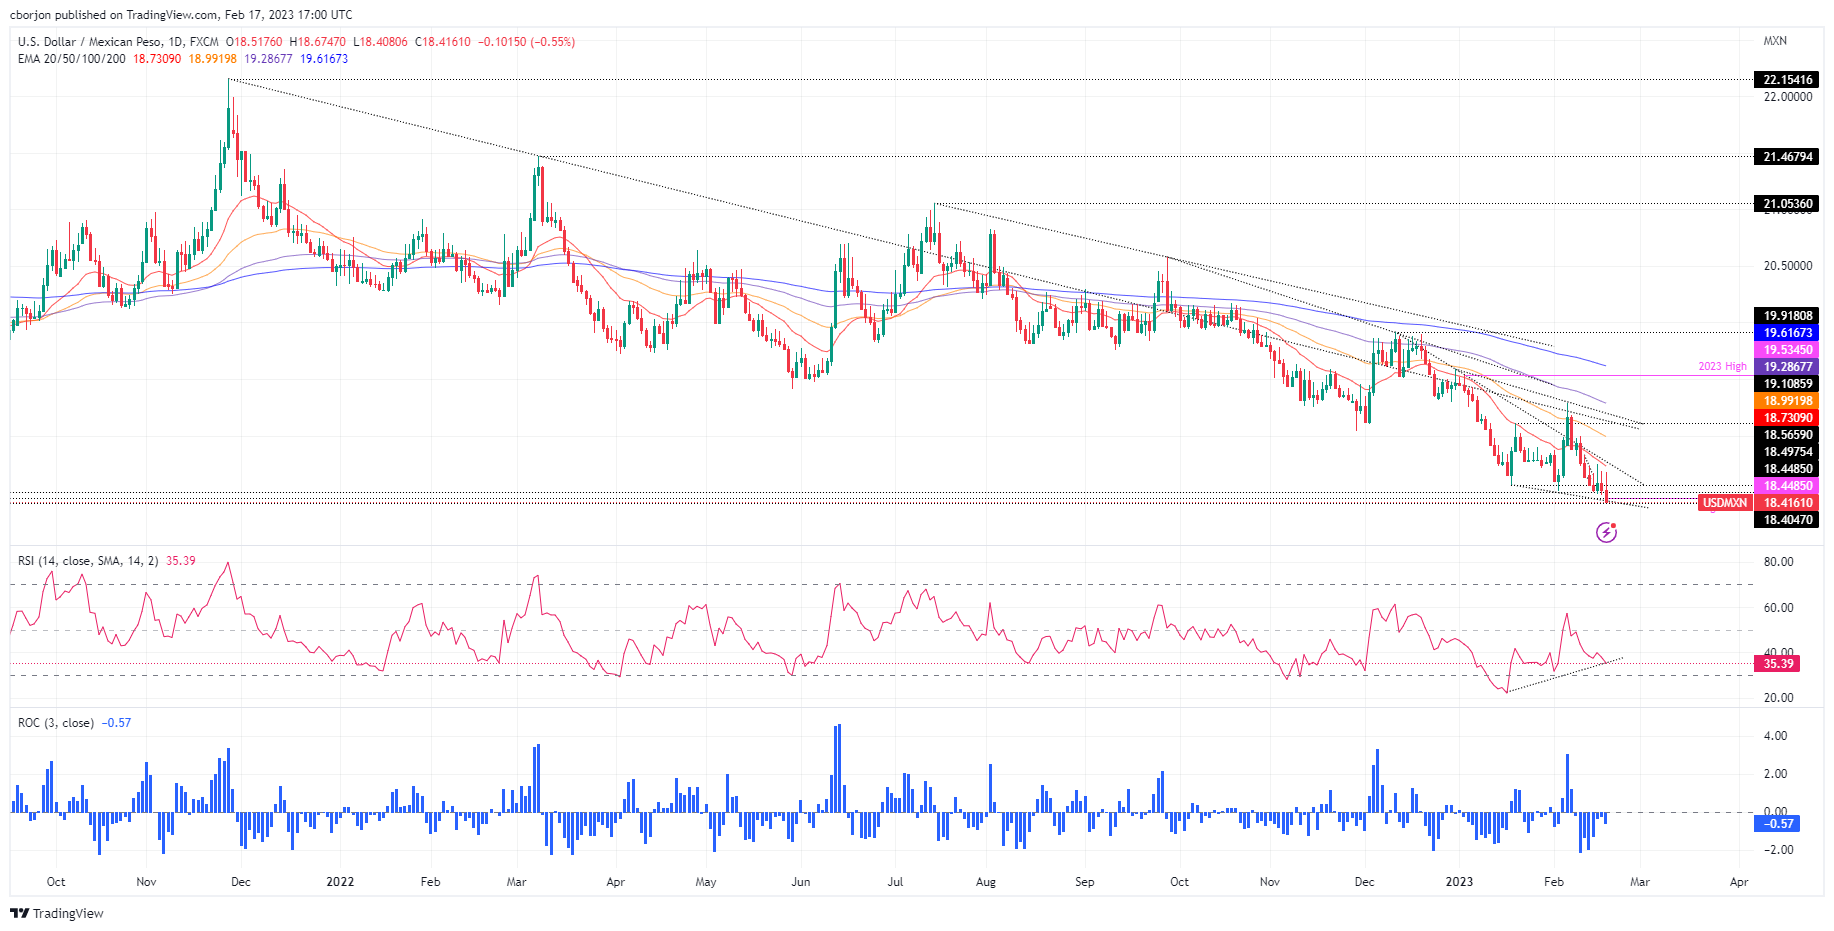
The USD/MXN hit an almost 4-year-and-a-half month low around 18.4485, a level last seen in October 2018, extending its losses by 0.89% in the week. At the time of writing, the USD/MXN exchanges hands at 18.4161.
Since the beginning of the week, the Mexican Peso (MXN) has shown resilience to register a daily loss vs. the greenback (USD). Even though the USD/MXN Tuesday’s session finished in the green, prices were reluctant to break solid resistance around the 20-day Exponential Moving Average (EMA) at 18.7999 that day. Albeit the USD/MXN closed with gains of 0.31%, analyzing price action, the large wick on top of Tuesday’s candle’s body was a forecast of what was upcoming in the rest of the week.
Hence, the USD/MXN dropped for two consecutive days, and it’s on its way toward the 18.00 psychological level, as it has decisively broken the $18.50 mark.
The USD/MXN’s next support would be August 7, 2018, daily low at 18.4047. Breach of the latter and the next support would be the psychological $18.00 barrier. Once cleared, the USD/MXN would dip to April 17, 2018, swing low at 17.9388, which would be up for grabs.
Contrarily, if the USD/MXN reconquers $18.50, that could open the door for recovery. Therefore, the USD/MXN first resistance would be the 20-day EMA At 18.7312, followed by the confluence of the February 9 daily high and the 50-day EMA around 18.9922. Once cleared, the next stop will be the 100-day EMA at 19.2869.
USD/MXN Daily chart
USD/MXN Key technical levels
The correction of the Gold price has been pronounced. In the opinion of strategists at Commerzbank, investors on the Gold market are likely to remain hesitant after the price dip.
Forecast of the mid-year Gold price lowered to $1,800
“Hopes of an end to the rate hike cycle in the near future in the US have turned out to be premature. Currently, a troy ounce of Gold costs a good $130 less than it did at the beginning of the month. Presumably, a number of investors have had their fingers burnt.”
“In response to the Fed’s steeper rate hikes – we now expect rates to peak at 5.5% – we have lowered our forecast of the mid-year Gold price to $1,800 (previously $1,850).”
“A lasting recovery should ensue in the second half of the year, however, as the US economy is then likely to experience a dip that will probably spark renewed expectations of rate cuts. We are therefore sticking with our year-end forecast of $1,950.”
- Gold price is set to finish the week with losses of around 1.60%, below $1850.
- US CPI and PPI figures reignited investors' worries about a hawkish Federal Reserve.
- Solid Retail Sales and Jobless Claims data showed the robustness of the US economy.
- Investors estimate the Federal Fund Rates will be above the 5.0% threshold by July 2023.
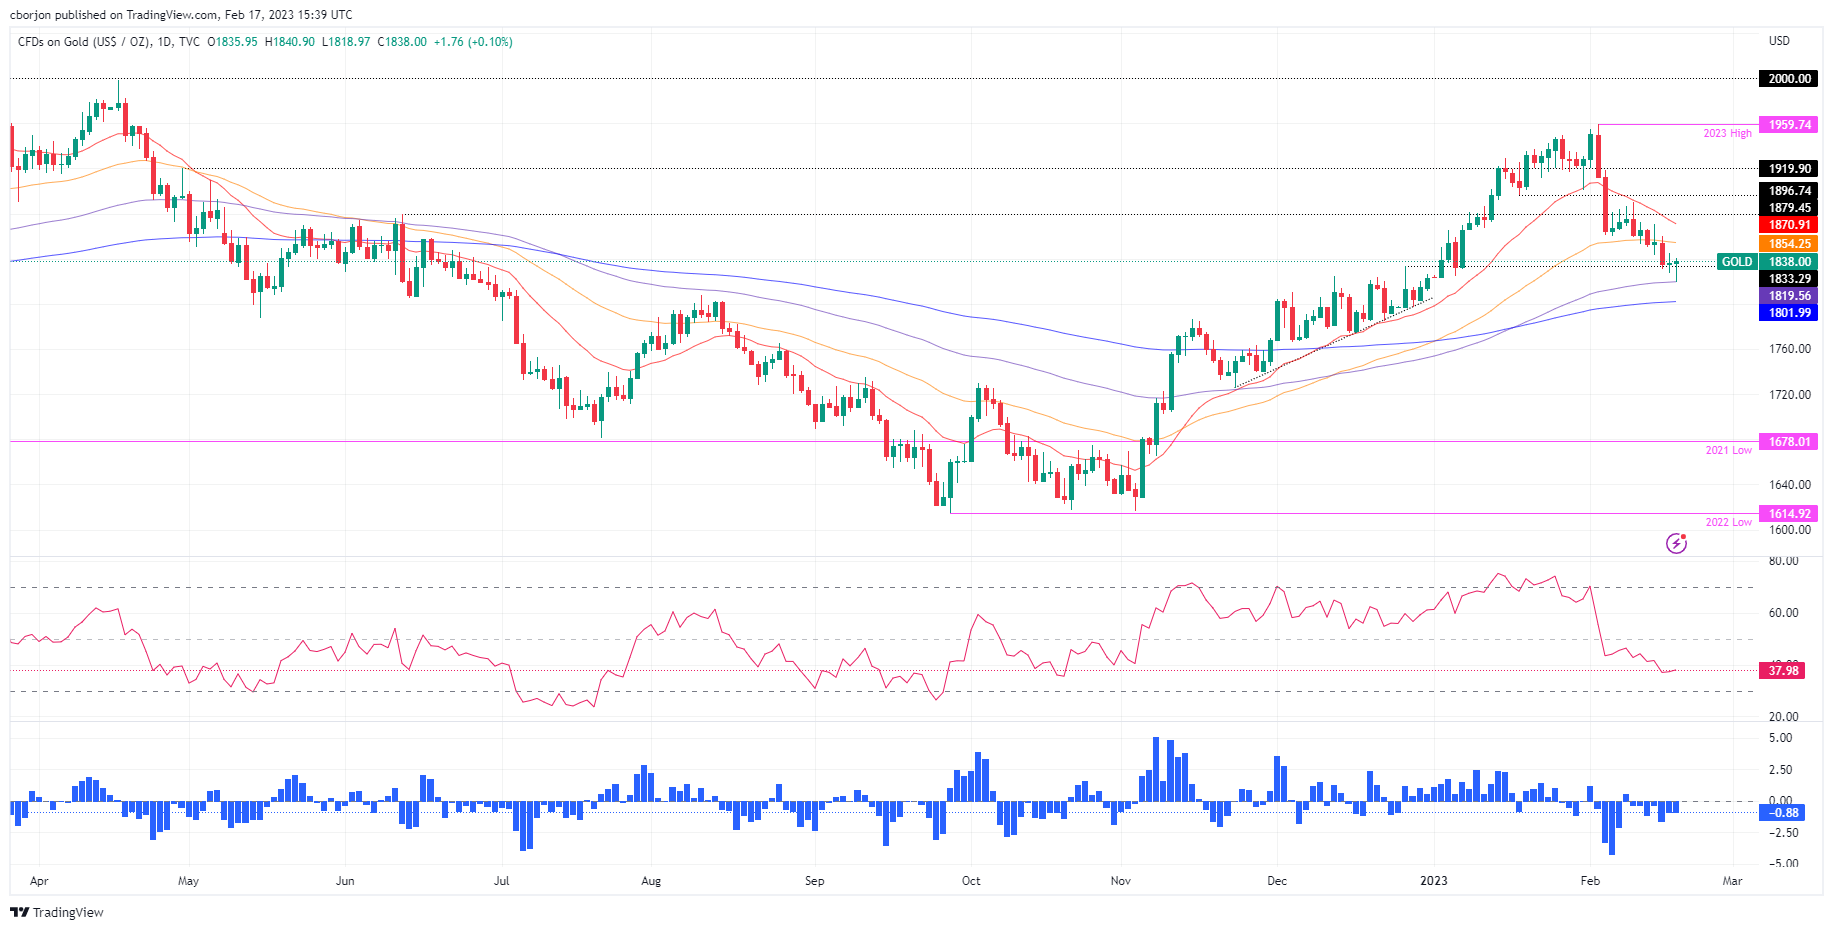
Gold spot price tumbled for the third day In the week, down almost 0.65% in the aftermath of incoming US economic data throughout the week, turning sentiment sour on speculations that further Federal Reserve (Fed) tightening is coming. At the time of writing, the XAU/USD is trading at $1838.70.
Inflation in the United States justifies Federal Reserve officials’ hawkish comments
US equities are trading with losses on risk aversion. Economic data revealed earlier this week witnessed inflationary pressures in the United States (US) uptick. Although the US Consumer Price Index for January came short compared to the previous month’s readings, data exceeded forecasts. Standing in the inflationary theme, last Thursday’s PPI data jumped in the monthly readings in the headline and core PPI. Given the backdrop, the US Federal Reserve’s (Fed) job on inflation is not done, as mentioned by Fed officials on Thursday, Cleveland’s Fed President Loretta Mester and St. Louis Fed James Bullard crossed newswires.
American consumers are still spending, bolstered by the labor market
Additional data pointed to a robust economy in the US, as Retail Sales surprisingly jumped 3.0%, vs. estimates of 1.8%, following two months of contraction. The US Bureau of Labor Statistics (BLS) revealed that Initial Jobless Claims for the week ending February 11 increased by 194K, below the prior’s week 196K and well short of the 200K foreseen by economists.
Investors estimate the Fed will lift rates above 5.30%
Meanwhile, investors had begun to reprice how far the Fed will raise rates as the tightening cycle continues. Money market futures show Federal Fund Rates (FFR) climbing above 5.3% in July vs. 4.9% a couple of weeks ago. Therefore, US Treasury bond yields, particularly the US 10-year benchmark note rate, although falling during the session, jumped ten bps, at 3.838%. The greenback benefited from the jump in yields, with the US Dollar Index (DXY) back above the 104.00 mark, up in the week by 0.44%.
Gold technical analysis
Of late, XAU/USD found a respite after hitting a low of $1818.97, around the 100-day Exponential Moving Average (EMA) at $1819.49, with buyers entering in and dragging prices higher. Even though the XAU/USD remains neutral to upward biased, sellers could step in around the 50-day EMA at $1854.27 as a solid resistance area. Still, a daily close above the December 27 daily high-turned-support at $1833.29 could pave the way for consolidation in the $1830-$1850 area. Otherwise, a bearish continuation toward the 100-day EMA is on the cards.
Economists at BNP Paribas Research revise their targets on EUR/USD and USD/JPY as they expect the Dollar to embark on a bearish trend.
A multi-year bearish trend in the USD is underway
“We expect USD strength to ultimately prove short-lived. Indeed, we believe a multi-year bearish trend in the USD is underway, with portfolio flows turning increasingly negative for the currency.”
“Yields turning positive in Europe and Japan could spur repatriation by local investors; we note they have accumulated significant US fixed income exposure since 2014. With evidence of these repatriation flows appearing, we revise our USD forecasts lower and now project EUR/USD to rise to 1.14 by end-2023 and USD/JPY to decline to 121.”
Federal Reserve (Fed) Governor Michelle Bowman said on Friday that they are seeing a lot of inconsistent data in economic conditions, as reported by Reuters.
Key takeaways
"Your guess as good as mine as to what happens next in the economy."
"Unusually low unemployment a great sign."
"We are not seeing what we need to on inflation, numbers are jumping around a bit."
"Recent numbers not consistent with us bringing down inflation to our goal."
"A long way to go to get inflation back down to our goal."
Market reaction
The US Dollar Index showed no immediate reaction to these comments and was last seen rising 0.3% on the day at 104.40.
NZD/USD stays on the back foot and declines toward 0.6200. Nevertheless, economists at ING expect the pair to bounce back higher toward the 0.67-68 zone in the second half of the year.
NZD strength relies on external factors
“Our bullish view on NZD/USD for the remainder of the year is primarily a function of global factors: improved risk sentiment, positive exposure to the China reopening story, a benign USD decline.”
“We target 0.67-0.68 in the second half of 2023.”
See: NZD/USD to advance nicely over the course of the year – ANZ
Economist at UOB Group Loke Siew Ting reviews the latest BSP monetary policy meeting.
Key Takeaways
“Bangko Sentral ng Pilipinas (BSP) raised its overnight reverse repurchase (RRP) rate by 50bps to 6.00%, marking the eighth straight meeting of increases since May last year. It wasn’t a surprised move as we have highlighted in our Jan CPI report that both stronger-than-expected Jan inflation and 4Q22 GDP outturns have cemented the case for a more restrictive monetary policy setting. Cumulatively, BSP has tightened its monetary policy by 400bps, the most aggressive since 2000.”
“The Monetary Board (MB) judged a strong follow-through monetary policy response today (16 Feb) as necessary (i) to reduce the risk of a breach in the inflation target in 2024 after consumer price inflation is projected to hit an average 6.1% this year (which is an upward revision from BSP’s previous forecast of 4.5% in Dec 2022, UOB est: 6.0%); (ii) to prevent inflation expectations from drifting further away from the 2.0%-4.0% target band; and (iii) to contain demand-side pressures and second-round effects without unduly hindering the sustained momentum of economic growth.”
“We now expect BSP to jack up its RRP rate to 6.75% by the middle of this year (from a previous estimate of 6.00% by 1Q23). Our new BSP outlook is mainly to reflect an upward revision in inflation projection last week (7 Feb) for the Philippines this year and a revised timeline for US Fed rate to hit its peak in 2Q23. After that, we believe that a consistent gradual slowdown in inflation following the most aggressive interest rate hikes since last year and moderate growth prospects would allow BSP to take a long pause on its rate hikes in 2H23, keeping the RRP rate at 6.75% until year-end.”
GBP/USD is trading at a new low since January 6 and is vulnerable to more losses, according to economists at Scotiabank.
Minor rebounds are a sell
“Sterling looks technically weak and prone to more losses but the chart situation is not yet definitively bearish from a longer run point of view, with Cable still trading within its recent, broad range. The danger is clear, however; losses below 1.1845 will trigger a 1.2450 double top and signal scope for a sizeable move lower in the next 1-3 months (towards 1.12 potentially).”
“Trend signals are aligned bearishly for the GBP across short, medium and longer run oscillators.”
“Minor rebounds are a sell.”
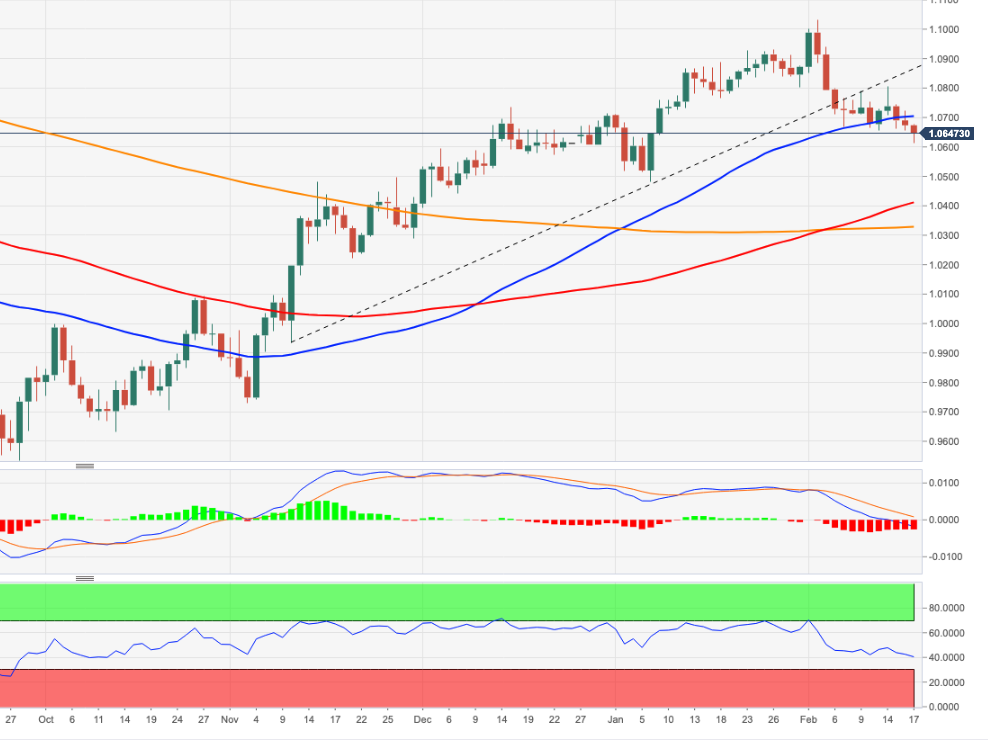
- EUR/USD accelerates losses to the vicinity of the 1.0600 support.
- A sustained loss of momentum exposes a visit to the 2023 low.
EUR/USD drops to multi-week lows in the 1.0610 region at the end of the week.
If the selling pressure gathers extra impulse, the pair could put the round level at 1.0600 to the test in the short term. The breach of this level could see a potential test of the YTD low at 1.0481 (January 6) emerge on the horizon.
So far, the bearish sentiment is expected to persist as long as the 3-month resistance line, today near 1.0880, caps the upside.
In the longer run, the constructive view remains unchanged while above the 200-day SMA, today at 1.0326.
EUR/USD daily chart
Richmond Fed President Thomas Barkin said on Friday that they are seeing some progress on inflation with demand normalizing, as reported by Reuters.
Barkin further added that the US labor market is still "quite hot" and noted that the labor demand continues to run ahead of labor supply, causing businesses to remain reluctant to shed employees. "It seems as if shortages in labor supply will continue," he said.
Market reaction
The US Dollar Index edged slightly lower following these comments and was last seen rising 0.27% on the day at 104.37.
Economist Enrico Tanuwidjaja at UOB Group assesses the latest decision by the Bank Indonesia (BI).
Key Takeaways
“Bank Indonesia (BI) kept its benchmark policy rate (7-Day Reverse Repo) unchanged at 5.75% in Feb MPC meeting, in line with consensus expectation.”
“BI remains of the view that inflation expectations is anchored while continues to view that rupiah stability is here to stay. Specifically, BI is of the view that headline and core inflation have trended back to BI’s target range of 2-4% faster than expected.”
“Today’s MPC decision marks the end of the current hiking cycle, which was started in Aug 2022. Therefore, we revised our BI rate forecast to remain unchanged at 5.75% for the rest of this year and for BI to potentially embark on an asymmetric rate cut cycle in 1H24. At the current level, BI rate still gives a positive but at much tighter spread historically with our expected terminal rate of the Fed funds rate of 5.25% by 2Q23.”
- USD/CAD climbs to its highest level since January and draws support from a combination of factors.
- Sliding crude oil prices undermines the Loonie and provides a goodish lift amid sustained USD buying.
- The overbought RSI on hourly charts fails to assist bulls to find acceptance above the 100-day SMA.
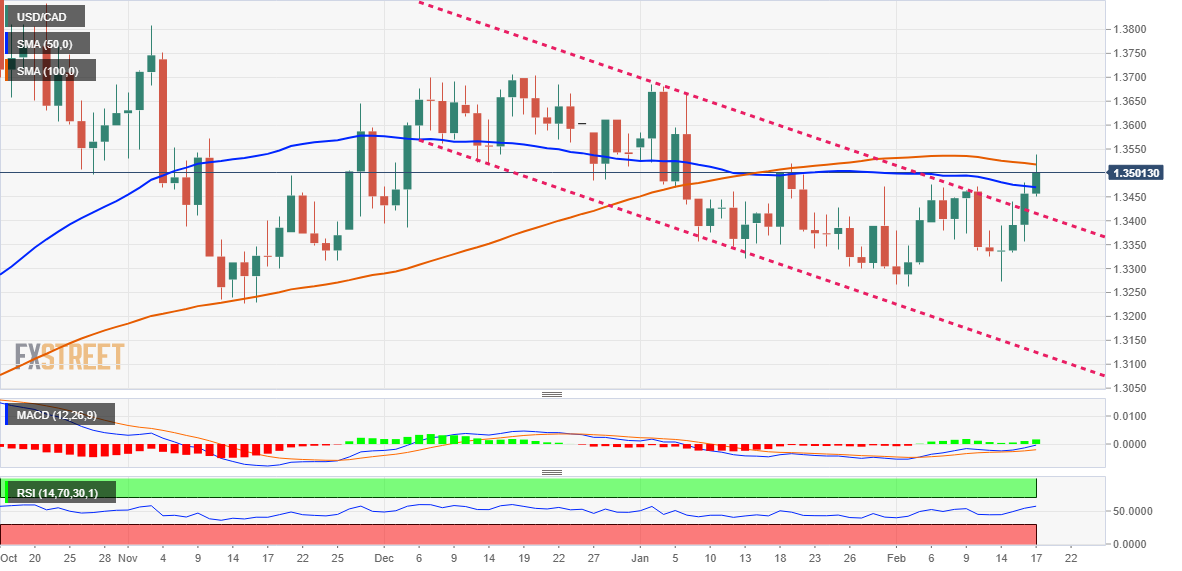
The USD/CAD pair builds on this week's goodish rebound from the vicinity of the monthly low and gains strong follow-through traction on Friday. The momentum lifts spot prices to the 1.3535-1.3540 region, or the highest level since January 6, and is sponsored by a combination of factors.
Crude oil prices tumble to a one-and-half-week low amid worries that rising borrowing costs will dampen economic growth and dent fuel demand. This, in turn, undermines the commodity-linked Loonie, which, along with relentless US Dollar buying, acts as a tailwind for the USD/CAD pair.
From a technical perspective, the overnight sustained strength above the 1.3400 mark, representing the top end of over a two-month-old descending channel, was seen as a fresh trigger for bulls. A subsequent move beyond the 50-day SMA supports prospects for a further appreciating move.
Spot prices, however, struggle to find acceptance above the 100-day SMA amid overbought RSI (14) on hourly charts. Hence, it will be prudent to wait for a convincing break through the said barrier, currently around the 1.3520 region, before placing fresh bullish around the USD/CAD pair.
The subsequent positive momentum should allow bulls to surpass an intermediate barrier near the 1.3570 area and aim to reclaim the 1.3600 round-figure mark. The upward trajectory could get extended further towards retesting the YTD peak, around the 1.3680-1.3685 region touched in January.
On the flip side, any subsequent pullback below the 1.3475-1.3470 horizontal resistance breakpoint, coinciding with the 50-day SMA, could be seen as a buying opportunity and remain limited near the 1.3400 mark. The latter should act as a strong base for the USD/CAD pair, which if broken might negate the positive outlook.
USD/CAD daily chart
Key levels to watch
Strategists at TD Securities analyze Gold, Platinum and Silver technical outlook.
Extreme uptrend in Silver is showing signs of turning over
“From a technical lens, Gold now screens most overbought in the precious metals complex with 51% of mean-reversion signals pointing to further downside, but the combined breadth of trend and mean-reversion signals is sending mixed signals for Gold after a boom in physical buying activity supported trend signals higher.”
“Today, the breadth of uptrend signals in Platinum continues to deteriorate, and overbought signals still suggest the consolidation lower has some room to run before prices find a bottom.”
“The extreme uptrend in Silver is showing signs of turning over, with trend signals deteriorating in favor of mean-reversion signals pointing to additional downside.”
- AUD/USD continues drifting lower for the third straight day and drops to a fresh multi-week low.
- Hawkish Fed expectations, the risk-off mood lifts the USD and weighs on the risk-sensitive Aussie.
- The technical setup favours bearish traders and supports prospects for a further near-term decline.
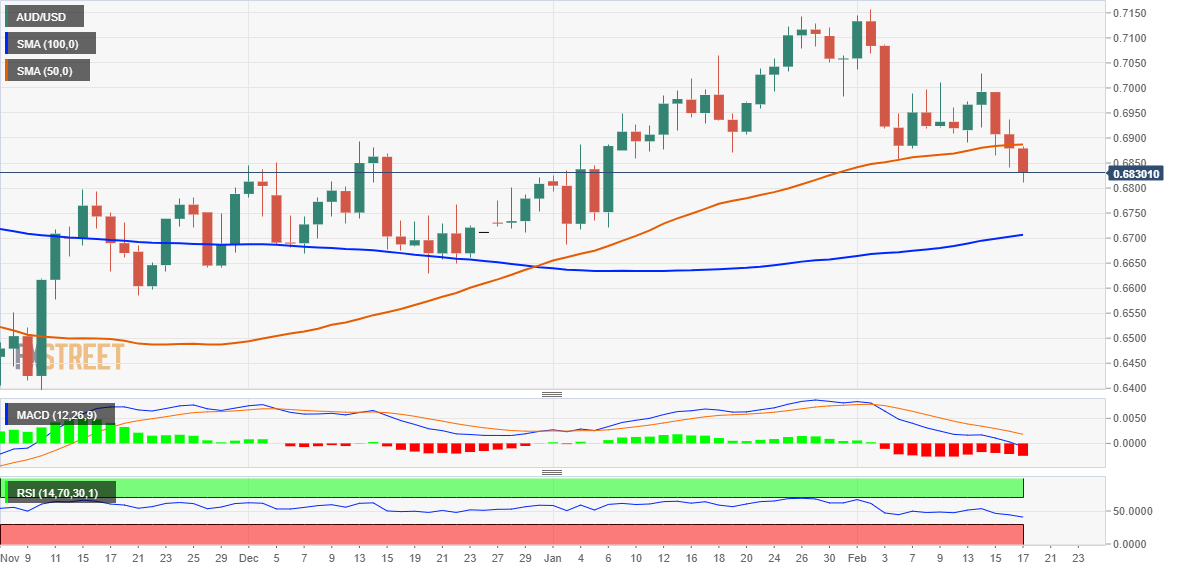
The AUD/USD pair remains under heavy selling pressure for the third successive day and drops to its lowest level since January 6 heading into the North American session on Friday. The pair is currently placed around the 0.6825 region, down over 0.70% for the day, and seems vulnerable to decline further.
The US Dollar climbs to a fresh six-week high amid expectations that the Federal Reserve will continue to raise interest rates and turns out to be a key factor weighing on the AUD/USD pair. Apart from this, the prevalent risk-off environment further benefits the Greenback's relative safe-haven status and contributes to driving flows away from the risk-sensitive Aussie.
From a technical perspective, the overnight breakdown below the 50-day Simple Moving Average (SMA) for the first time since November 2022 was seen as a fresh trigger for bears. Moreover, oscillators on the daily chart have just started drifting into negative territory and support prospects for an extension of the recent sharp pullback from the highest level since June 2022.
Spot prices seem poised to weaken further below the 0.6800 round-figure mark and accelerate the fall towards the next relevant support near the 0.6740-0.6735 region. This is followed by the 100-day SMA, currently around the 0.6715-0.6710 zone, which if broken decisively should set the stage for a further near-term depreciating move for the AUD/USD pair.
On the flip side, the 50-day SMA support breakpoint, currently pegged just ahead of the 0.6900 mark, now seems to act as an immediate strong hurdle. Some follow-through buying could lift the AUD/USD pair towards the 0.6945-0.6950 horizontal resistance, above which a fresh bout of a short-covering move should allow bulls to aim to conquer the 0.7000 psychological mark.
AUD/USD daily chart
Key levels to watch
EUR’s slide continues. Economists at Scotiabank note that the EUR/USD pair could dive as low as 1.0460.
More declines ahead for EUR/USD
“A third consecutive lower weekly close and losses, if rather limited so far, below key short-term support at 1.0660 target more declines ahead for EUR/USD from a technical point of view.”
“The break-out from the Feb range implies downside risks extending to the low 1.05 area over the next 2-4 weeks. An overshoot to retracement support at 1.0460 (38.2% Fib of the 0.95/1.10 rally) cannot be excluded as a risk.”
EU Commissioner for Interinstitutional Relations and Foresight Maroš Šefčovič said on Friday that they made good progress in Brexit talks with British Foreign Secretary James cleverly, as reported by Reuters.
Šefčovič added that their shared objective is to find joint solutions responding to the everyday concerns of people in Northern Ireland.
Market reaction
These comments don't seem to be having a noticeable impact on the Pound Sterling's performance against its major rivals. At the time of press, GBP/USD was down 0.5% on the day at 1.1932.
European Central Bank (ECB) policymaker Francois Villeroy de Galhau argued on Friday that the ECB needs to aim to be more predictable with its communication and added that they could give short-term perspectives on policy, per Reuters.
Regarding the inflation outlook, Villeroy noted but that the Eurozone inflation may half by mid-2023 but acknowledged that it was currently "too fast and possibly persistent."
Market reaction
EUR/USD showed no immediate reaction to these comments. As of writing, the pair was trading at 1.0623, where it was down 0.44% on a daily basis.
The Bank of Canada (BoC) seems to be prepared to raise the policy rate further. In that case, the Loonie could appreciate, albeit just moderately, economists at Commerzbank report.
Will the BoC have to backpaddle?
“After the labor market data surprised clearly to the upside last Friday the question increasingly arises whether the BoC might have to adjust its rates once again after all. The BoC had left the door open for such a step in view of the high uncertainty.”
“If future data publications were to point towards further monetary policy tightening being required by the BoC imminently, CAD might benefit moderately. In view of the US central bank’s hawkish approach, we consider the appreciation potential of the Loonie against the greenback to be limited though.”
- USD/JPY prolongs its weekly uptrend and climbs to a fresh YTD top on Friday.
- Sustained USD buying lends support amid uncertainty over BoJ’s policy path.
- The technical setup supports prospects for an extension of the positive move.
The USD/JPY pair gains strong positive traction on the last day of the week and climbs to a nearly two-month high heading into the North American session. The pair is currently placed around the 135.00 psychological mark and seems poised to build on the recent appreciating move witnessed over the past two weeks or so.
The Japanese Yen (JPY) weakens across the board amid the uncertainty over the path of monetary policy under new Bank of Japan (BoJ) Governor Kazuo Ueda. The US Dollar, on the other hand, hits a fresh six-week high amid expectations that the Federal Reserve will stick to its hawkish stance in the wake of stubbornly high inflation. This turns out to be a key factor pushing the USD/JPY pair higher.
From a technical perspective, this week's sustained break through the 50-day SMA and a subsequent move beyond the 132.90-133.00 supply zone was seen as a key trigger for bullish traders. The latter marks the 38.2% Fibonacci retracement level of the recent sharp pullback from over a three-decade higher touched in October and should now act as a strong near-term base for the USD/JPY pair.
In the meantime, any meaningful slide below the 134.80-134.75 immediate support is likely to attract fresh buyers near the 134.40 region. This, in turn, should help limit the downside for the USD/JPY pair near the 134.00 round-figure mark. That said, a convincing break below might prompt some technical selling and pave the way for a slide back towards the 133.00 strong resistance breakpoint.
On the flip side, the USD/JPY pair seems poised to climb towards the 135.55-135.60 horizontal zone and eventually aim to reclaim the 136.00 mark. The momentum could get extended further towards the 136.75-136.85 confluence resistance, comprising the 38.2% Fibo. level and a technically significant 200-day SMA. A sustained strength beyond will suggest that spot prices have bottomed out.
USD/JPY daily chart
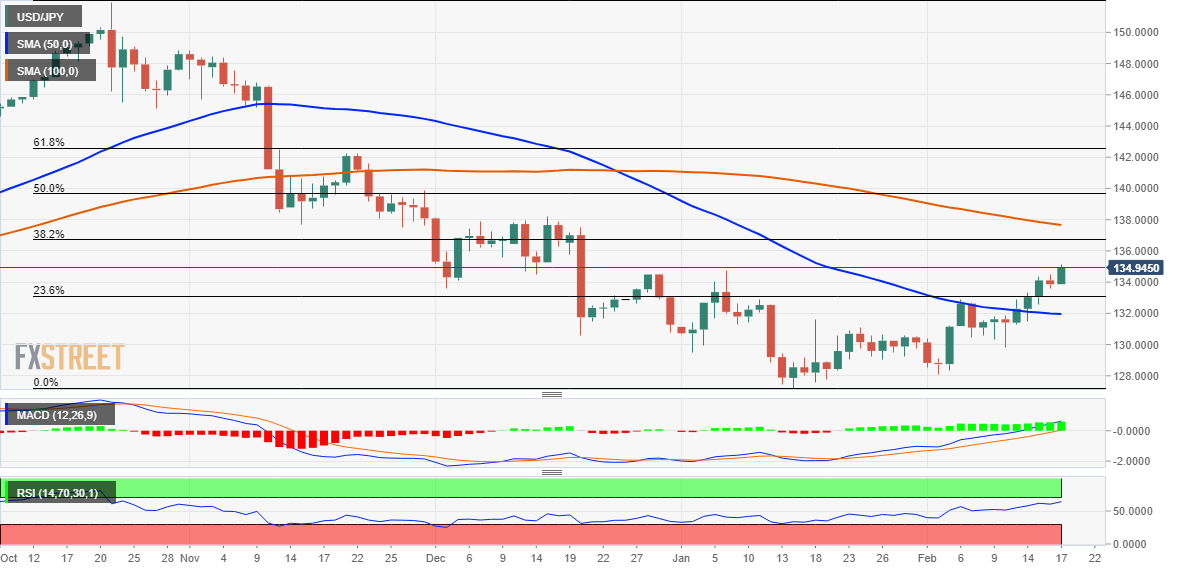
Key levels to watch
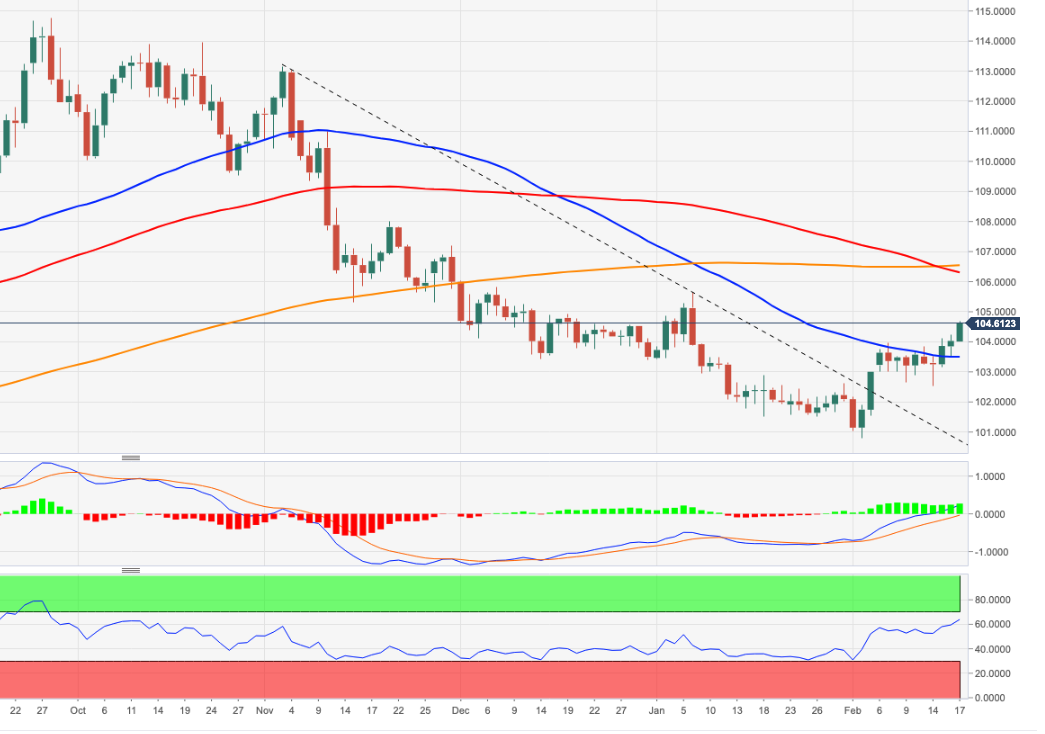
- The index extends the advance well past the 104.00 mark.
- Extras gains now target the YTD high at 105.63.
The upside momentum gathers extra impulse and lifts DXY to new monthly highs near 104.70 on Friday.
The ongoing price action favours the continuation of the uptrend for the time being. Further bouts of strength are now expected to put a potential test of the 2023 top at 105.63 (January 6) back on the investors’ radar in the not-so-distant future.
In the longer run, while below the 200-day SMA at 106.44, the outlook for the index remains negative.
DXY daily chart
- EUR/JPY resumes the upside and clocks a new 2023 high.
- Further advances seem likely in the short-term horizon.
EUR/JPY regains the smile and climbs to fresh YTD highs in the 143.65/70 band at the end of the week.
While the cross looks somewhat side-lined for the time being, a convincing breakout of the 2023 high at 143.67 (February 17) could trigger a move higher to, initially, the December 2022 top at 146.72 (December 15).
In the meantime, while above the 200-day SMA, today at 141.21, the outlook for the cross is expected to remain positive.
EUR/JPY daily chart
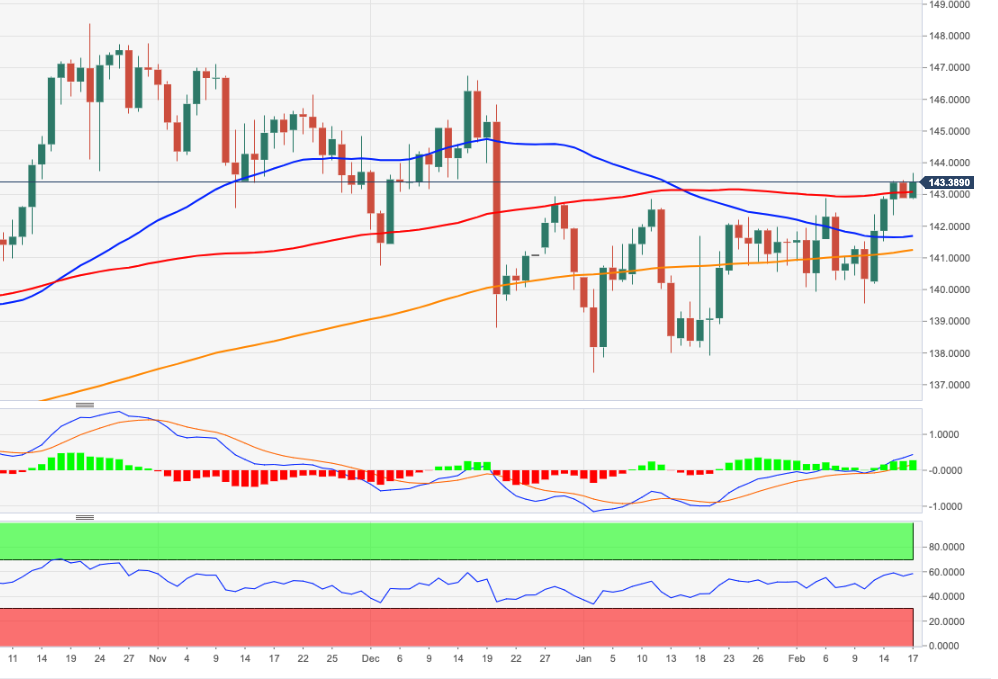
EUR/USD traded lower amid USD strength and dovish ECB speaks. Economists at OCBC Bank expect the Euro to remain under downside pressure.
Bearish momentum on daily chart
“Known dove, Panetta warned about possible overtightening and that he favours smaller rate hikes. Another ECB-dove, Stournaras said ‘there’s been a visible slowdown in inflation and a slight strengthening in economic activity, fuelling hope that the new round of quarterly forecasts will be better’. That said, other usual hawks reiterate their stance. Nagel said he does not think interest rates are at restrictive levels yet and it is a mistake to ease monetary policy too quickly.”
“Bearish momentum on daily chart intact while RSI fell. Risks are skewed to the downside.”
“Support at 1.05, 1.0460 (38.2% fibo retracement of Sep low to Feb high).” “Resistance at 1.0675 (23.6% fibo), 1.0720 (50 DMA) and 1.08 (21 DMA).”
Senior Economist at UOB Group Alvin Liew gives his views on the latest releases of US inflation figures for the month of January.
Key Takeaways
“US headline consumer price index (CPI) inflation re-accelerated by 0.5% m/m in Jan 2023, exactly in line with Bloomberg’s survey and more importantly, the original 0.1% m/m decline in Dec was eventually revised to a 0.1% m/m increase. Despite the sequential increases, headline inflation in Jan eased off tad lower to 6.4% y/y (from 6.5% y/y in Dec). Core CPI (which excludes food and energy) also rose sequentially in Jan, at 0.4% m/m, same pace as Dec. Despite the m/m increase, core CPI decelerated on a y/y basis slightly to 5.6% (from 5.7% in Dec). This is the smallest y/y rise since Dec 2021.”
“The m/m increase in the shelter cost index was the main inflation driver, accounting for nearly half of the 0.5% m/m overall CPI rise. The indices for gasoline prices, food and utility (piped) gas services (i.e. natural gas) also contributed. And within the core CPI, the shelter cost was the main contributor in Jan, followed by the indices of household furnishings and operations, motor vehicle insurance, recreation, and apparel. From the y/y overall CPI perspective, housing component (which includes shelter and household furnishings and operations) remained the main contributor, accounting for more than half of the y/y increase.”
“US Inflation Outlook – For the full year, we still expect both headline and core inflation to average 3.0% in 2023, above the Fed’s 2% objective. But at the start of this year, they showed that the balance of risk for US inflation remains on the upside as reflected by the persistent rise of food and shelter costs, and that services inflation remains elevated amidst ample demand while the unexpected rebound in goods and energy inflation in Jan gives caution that these factors may continue to play a part in price developments this year.”
Gold fell to a six-week low. Economists at Commerzbank believe that the yellow metal could remain under pressure for the time being.
Weak demand in the key market of India
“Market participants are likely to proceed with caution, especially given that Swiss Gold exports will probably confirm weak demand in the key market of India.”
“Even though gold exports to China may prove more robust – either due to coronavirus restrictions being lifted, inventories being replenished ahead of the New Year festivities or the central bank making further purchases – we see potential for setbacks if anything on the Gold market in the short term.”
In India, the much-awaited “decisive” fall in inflation is unlikely to occur anytime soon. Thus, economists at ANZ Bank expect the Reserve Bank of India (RBI) to deliver another 25 basis points rate hike.
Pencilling in another hike
“January’s CPI inflation at 6.5% was much above the monetary policy committee’s tolerance limit, jeopardising the RBI’s near-term inflation projections.”
“Inflation built up in the food basket and stayed elevated in the core CPI basket. Among food items, higher inflation in more heavily weighted components such as staple cereals and proteins was worrying.”
“We see a 20-30 bps upside to the central bank’s inflation projection of 5.7% for Q1 2023.”
“Since a ‘decisive’ fall in inflation is unlikely in the next few months, we now expect another 25 bps hike in April, and a change of stance to ‘neutral’ only in June.”
Supported by hawkish comments from Fed officials, the US Dollar continued to gather strength against its rivals. Economists at Commerzbank expect the greenback to remain resilient for the time being.
USD remains supported for now
“Cleveland Fed president Loretta Mester stated that she had already seen convincing arguments in favour of a 50 bps rate hike at the January meeting. St. Louis Fed president James Bullard made similar comments. Of course, both these FOMC members (non-voting members this year) are known for their hawkish stance and in view of the aggressive rate hikes over the past quarters a slightly more cautious approach remains plausible to us, in particular since consumer price inflation has fallen recently.”
“If the data from the US should continue to surprise on the upside, it cannot be excluded that other FOMC members might join Mester and Bullard, which is likely to benefit USD.”
Economist at UOB Group Enrico Tanuwidjaja reviews the latest trade balance results in Indonesia.
Key Takeaways
“Mining-related exports surged 121.5% m/m to drive Jan’s exports to reach USD22.3bn (16.4% y/y gain). Oil & gas (OG) exports also surged 65.0%, driven mainly by raw and processed oil exports as well as gas exports. Meanwhile, non-oil imports’ contraction of 2.8% y/y pushed for a more subdued total imports growth of just 1.3% in Jan as OG imports continued to grow robustly at 30.4%. Trade balance in Jan continued to remain high at USD3.9bn, virtually unchanged from Dec’s level and beating consensus of USD3.3bn.”
“Key non-oil exports destination are China, US, and Japan with the export values at USD5,3bn, USD1.9bn, and USD1.9bn respectively while key imports origins are from China (USD5.3bn), Japan (USD1.4bn), and Thailand (USD0.9bn).”
“Today’s trade figures mark a strong start for 2023 performance whereby trade surplus continued to remain at an elevated level. Against a record year in 2022 where annual trade surplus stood at historic high of USD54.5bn (monthly average of USD4.5bn), this year’s annual performance may relatively be lower as we expect easing global commodity prices to weigh down on the overall non-OG and in turn, total exports.”
The last month has been characterised by a stall in the EUR rally. Economists at Danske Bank lower their downward sloping profile slightly but maintain a bottom above parity.
Tide is turning
“We have long argued the strategic case for a lower EUR/USD based on relative terms of trade, real rates (growth prospects) and relative unit labour costs. Meanwhile, we increasingly think there is a potential for the cross to also head lower on a short-term horizon driven by the market realisation that financial conditions need to tighten, relative rates as well as relative asset demand.”
“As a difference to the period from September to early January, Eurozone equities are now underperforming peers, which could be an indication that EUR/USD has peaked.”
“We lower our downward sloping profile slightly but maintain a bottom above parity, as we believe new energy/real rate shocks are required for a return to the September lows.”
“Forecast: 1.06 (1M), 1.04 (3M), 1.02 (6M), 1.02 (12M)”
The Bank of England (BoE) might soon reach the end of its rate hike cycle. Thus, economists at Commerzbank maintain a bearish GBP view.
Sceptical view towards Sterling
“The BoE is clearly concerned that the significant rate hikes might slow the economy excessively. In view of the painfully slow fall in inflation rates, the question nonetheless arises whether concerns of this nature may be a little premature. It is important to avoid second-round effects right now, and inflation expectations need anchoring. In this context, any doubts in the BoE’s ability to fight inflation in a determined manner would be counterproductive.”
“It is of little use that the BoE warns inflation might be more stubborn and that the BoE should therefore remain vigilant if it points out at the same time that it would like to end its rate hike cycle sooner rather than later and that any small improvement of the data might be sufficient reason to do so. Against this background, we stick to our sceptical view towards Sterling.”
- Gold price drops to its lowest level since January amid sustained US Dollar buying.
- Bets for additional rate hikes by the Federal Reserve continue to underpin the buck.
- The fundamental/technical setup supports prospects a slide below the $1,800 mark.
Gold price comes under some renewed selling pressure on Friday and drops to a fresh YTD low during the first half of the European session. The XAU/USD is currently trading around the $1,824 region, down over 1% for the day, and seems vulnerable to prolong the recent downward trajectory witnessed over the past two weeks or so.
Bets for more aggressive Federal Reserve weigh on Gold price
Growing acceptance that the Federal Reserve (Fed) will stick to its hawkish stance and that rates are going to remain higher for longer continue to drive flows away from the non-yielding Gold price. In fact, the markets are now pricing in at least a 25 bps lift-off at each of the next two Federal Open Market Committee (FOMC) meetings in March and May. The bets were lifted by the US Consumer Price Index (CPI) data on Tuesday, which showed that inflation remained stubbornly high in January.
Higher inflation and hawkish Fed officials reinforce expectations
Adding to this, the US Producer Price Index (PPI) too surprised to the upside on Thursday and rose by 0.7% in January. On an annualized basis, the PPI decelerated from 6.5% in December to 6.0%, though was above market expectations. Moreover, the incoming positive US economic data pointed to an economy that remains resilient despite rising borrowing costs. Furthermore, two Fed officials raised the prospect of a 50 bps hike in March, which, in turn, continues to exert pressure on Gold price.
St. Louis Fed President James Bullard said that the central bank could return to raising interest rates at a sharper pace. Separately, Cleveland Fed President Loretta Mester said that interest rates will likely rise above 5% and that the central bank should have hiked rates by more than 25 bps at the February meeting. This, in turn, pushes the yield on the benchmark 10-year US government bond to its highest level since late December and provides a strong boost to the US Dollar (USD) whilst weighing on non-yielding Gold.
Stronger US Dollar exerts additional pressure on Gold price
The USD Index, which tracks the Greenback against a basket of currencies, climbs to a fresh six-week high and is seen as another factor weighing on the US Dollar-denominated Gold price.
The risk-off mood - amid worries about economic headwinds stemming from rapidly rising borrowing costs - lends some support to the safe-haven precious metal and helps limit losses.
Nevertheless, the XAU/USD remains on track to register heavy losses for the second week in the previous three.
Gold price technical outlook
From a technical perspective, this week's breakdown below the 50-day Simple Moving Average (SMA) was seen as a fresh trigger for bearish traders. The subsequent fall supports prospects for a further near-term depreciating move. Hence, some follow-through weakness towards the $1,800 mark, en route to the 100-day SMA, currently around the $1,783 region, looks like a distinct possibility.
On the flip side, the $1,835-$1,836 area seems to act as an immediate hurdle ahead of the $1,850 level and the 50-day SMA support breakpoint, around the $1,861 region.
This is followed by resistance near the $1,875 area, above which a bout of a short-covering could provide an additional lift to the Gold price, though is more likely to remain capped ahead of the $1,900 round-figure mark.
Key levels to watch
NZD/USD has come a long way since it bottomed out just above 0.55 in mid-October. Economists at ANZ Bank expect to see further moderate NZD/USD strength over 2023.
Further NZD strength expected in 2023
“Looking ahead, we expect to see further moderate NZD/USD strength over 2023, and we have recently upgraded our forecasts accordingly. As with the past four months, this is expected to occur via a combination of both NZD strength and USD weakness.”
“AUD strength is also expected to be a driver, but logically, that also poses downside risks to NZD/AUD, and that was a factor in our downgraded forecasts for that cross.”
“NZD/USD 0.640 Mar-23 0.650 Jun-23 0.660 Sep-23 0.660 Dec-23 0.670 Mar-24 0.670 Jun-24”
Economists at Commerzbank have adjusted their EUR/USD forecast a little. They expect higher EUR/USD levels over the course of the year.
EUR/USD is likely to trend upwards over the coming months
“As both the market and our economists expect the US central bank to start cutting its key rate again following a reasonably short break whereas the ECB will leave everything on hold for longer, EUR/USD is likely to trend upwards over the coming months.”
“However, due to the delayed start of the Fed’s rate cut cycle, we only expect EUR/USD to peak in Q1 2024 rather than in Q4 2023 as we did before. After that, EUR/USD is likely to weaken again though.”
“Inflation in the US and the Eurozone is likely to remain above inflation targets, but the USD is likely to benefit from the fact that the US central bank is seen as the more determined in the fight against inflation whereas there is likely to be a certain amount of scepticism towards the ECB.”
- GBP/USD continues losing round for the third straight day and slides below the 200-day SMA.
- Expectations that the BoE’s rate-hiking cycle is nearing the end continue to weigh on the GBP.
- Bets for additional rate hikes by the Fed boost the USD and contribute to the ongoing decline.
The GBP/USD pair remains under heavy selling pressure for the third straight day on Friday and drops to its lowest level since January 6 during the first half of the European session. The pair currently trades around the 1.1930-1.1925 region, just below the very important 200-day SMA, and seems vulnerable to decline further.
The British Pound continues to be weighed down by expectations that the Bank of England's (BoE) current policy-tightening cycle might be nearing the end. The speculations were fueled by softer-than-expected UK consumer inflation figures released on Tuesday, which seem to have eased pressure on the UK central bank to deliver aggressive rate hikes going forward. This, along with strong follow-through US Dollar buying, is seen dragging the GBP/USD pair lower on the last day of the week.
Growing acceptance that the Federal Reserve will stick to its hawkish stance in the wake of stubbornly high inflation lifts the USD to a fresh six-week high. In fact, the markets are now pricing in at least a 25 bps lift-off at each of the next two FOMC policy meetings in March and May. This, in turn, pushes the yield on the benchmark 10-year US government bond to the highest level since late December. Apart from this, the prevalent risk-off mood further underpins the safe-haven buck.
The GBP/USD pair, meanwhile, fails to benefit from the better-than-expected UK Retail Sales figures for January. This, along with a sustained break below the 1.2000 psychological mark and a technically significant 200-day SMA, suggests that the path of least resistance for spot prices is to the downside. Hence, some follow-through weakness back towards retesting the YTD low, around the 1.1840 area set in January, looks like a distinct possibility in the absence of any relevant US macro data.
Technical levels to watch
The Dollar continues to quietly reclaim some of the heavy losses seen since last October. Economists at ING believe that the USD Index (DXY) can hold gains.
First quarter of 2023 is proving to be the push-back quarter
“We think the current Dollar rally is probably a correction to an underlying bear trend in 2023. This 1Q23 dollar correction may have a little further to run, however.”
“We see a scenario where DXY continues to edge up to 105.00, with outside risk this quarter to strong resistance at 106.50 (about 1.8% above current levels), which may then prove the best Dollar levels of the year.”
- EUR/USD drops to multi-week lows in the 1.0630/25 band.
- The dollar remains strong well north of the 104.00 barrier.
- CB Leading Index and Fed’s Barking come next in the US docket.
The bearish sentiment remains well and sound around the European currency and motivates EUR/USD to slip back to the 1.0630 region for the first time since early January.
EUR/USD remains weak on USD recovery
EUR/USD loses ground for the third session in a row at the end of the week amidst the so far unabated recovery in the greenback, which motivates the USD Index (DXY) to extend the recent breakout of the 104.00 barrier.
The pair saw its losses accelerate in past hours in response to the persistent hawkish narrative from Fed speakers – this time Mester and Bullard – while the firmer-than-expected results from the US docket also added to the renewed strength in the buck.
Data wise in the Euroland, Producer Prices in Germany contracted at a monthly 1.0% in January and rose 17.8% over the last twelve months. In addition, France’s final figures saw the CPI rise 0.4% MoM in January and 6.0% vs. the same month of 2022. Later in the session, EMU’s Current Account results are also due.
In the US, the CB Leading Index will be the sole release seconded by the speech by Richmond Fed T.Barkin.
What to look for around EUR
EUR/USD appears well on the offered side and probes the area of multi-week lows near 1.0630 at the end of the week.
In the meantime, price action around the European currency should continue to closely follow dollar dynamics, as well as the potential next moves from the ECB after the bank has already anticipated another 50 bps rate raise at the March event.
Back to the euro area, recession concerns now appear to have dwindled, which at the same time remain an important driver sustaining the ongoing recovery in the single currency as well as the hawkish narrative from the ECB.
Eminent issues on the back boiler: Continuation of the ECB hiking cycle amidst dwindling bets for a recession in the region and still elevated inflation. Impact of the Russia-Ukraine war on the growth prospects and inflation outlook in the region. Risks of inflation becoming entrenched.
EUR/USD levels to watch
So far, the pair is retreating 0.29% at 1.0640 and a drop below 1.0629 (monthly low February 17) would target 1.0481 (2023 low January 6) en route to 1.0326 (200-day SMA). On the other hand, the next up barrier emerges at 1.0804 (weekly high February 14) seconded by 1.1032 (2023 high February 2) and finally 1.1100 (round level).
Economists at Westpac updated their forecasts for the USD/CNY and USD/INR pairs by the end of 2023 and 2024.
CNY and INR have great promise
“The USD/CNY pair is expected to see a large sustained move to 6.50 end-2023 and Y6.10 end-2024.”
“India’s Rupee is also poised to be appreciated at a rapid pace. USD/INR at 75 and USD/INR at 72 are the forecast levels for the end-2023 and 2024.”
See – USD/CNY: Resumption of Dollar’s strength to drive a small rebound – Danske Bank
According to UOB Group’s Economist Lee Sue Ann and Markets Strategist Quek Ser Leang, USD/CNH is expected to meet a solid up barrier at the 6.9300 level in the near term.
Key Quotes
24-hour view: “Yesterday, we highlighted that USD could continue to advance but we indicated, ‘overbought conditions suggest a break of 6.8800 is unlikely’. Our view was not wrong as USD rose to 6.8800. USD traded on a firm note in early Asian trade and edged above 6.8800. Further USD gains are likely but the next major resistance at 6.9000 may be out of reach today. Support is at 6.8650, a breach of 6.8570 would indicate that USD is not advancing further.
Next 1-3 weeks: “We highlighted yesterday that ‘the outlook for USD is still positive’. We added, ‘a break of 6.8800 will shift the focus to 6.9000’. USD edged above 6.8800 in early Asian trade. Not surprisingly, the outlook for USD remains positive and the focus now is at 6.9000. Looking ahead, the next major level above 6.9000 is at 6.9300. Overall, only a break of 6.8360 (‘strong support’ level was at 6.8250 yesterday) would indicate that the USD strength that started earlier this month has come to an end.”
CME Group’s flash data for natural gas futures markets noted traders added around 4.5K contracts to their open interest positions on Thursday, reaching the second consecutive daily build. Volume, on the other hand, dropped for the third session in a row, now by around 8.1K contracts.
Natural Gas: Extra losses target the $2.00 mark
Prices of natural gas accelerated the decline on Thursday amidst rising open interest, which leaves the door open to the continuation of this trend for the time being. A test of the key $2.00 mark per MMBtu seems more an issue of‘when’ rather than ‘if’.
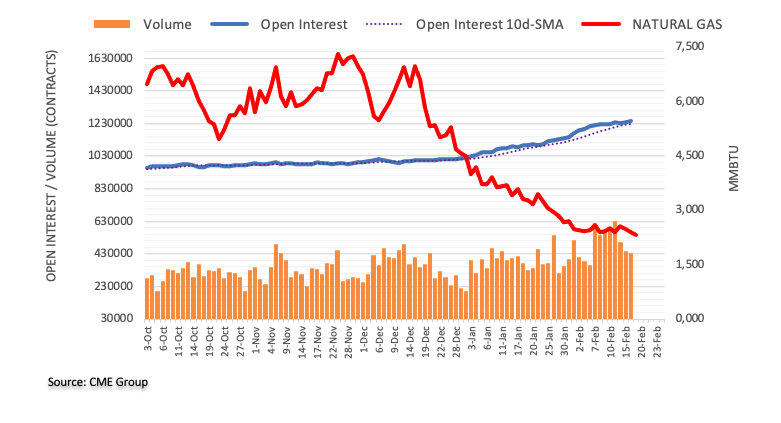
- USD/CAD spikes to its highest level since January and is supported by a combination of factors.
- Declining oil prices undermines the Loonie and acts as a tailwind amid sustained USD buying.
- A sustained move beyond the 1.3500 mark might have already set the stage for further gains.
The USD/CAD pair is prolonging the strong weekly uptrend and gaining strong follow-through traction for the fourth successive day on Friday. The momentum remains uninterrupted through the early part of the European session and lifts spot prices to levels beyond the 1.3500 psychological mark, or its highest level since January 6.
Crude oil prices extend this week's rejection slide from the 100-day SMA and remain depressed for the fifth straight day, hitting over a one-week low. Investors seem worried that rapidly rising borrowing costs will dampen economic growth and dent fuel demand. This, in turn, weighs on the black liquid, which is seen undermining the commodity-linked Loonie. Apart from this, broad-based US Dollar strength turns out to be another factor providing a goodish lift to the USD/CAD pair.
In fact, the USD Index, which tracks the Greenback against a basket of currencies, touches a fresh six-week peak amid expectations for further policy tightening by the Fed. The markets seem convinced that the US central bank will stick to its hawkish stance and have been pricing in at least a 25 bps lift-off at the next two FOMC meetings in March and May. This pushes the yield on the benchmark 10-year US government bond to its highest level since late December and boosts the USD.
Apart from this, a fresh leg down in the global equity markets - amid looming recession risks - further benefits the safe-haven buck. The USD/CAD pair's rally could further be attributed to some technical buying following the overnight breakout through over a two-month-old descending channel. A subsequent move above the 1.3470-1.3475 region and the 1.3500 mark could be seen as a fresh trigger for bullish traders. This might have already set the stage for a further appreciative move.
Technical levels to watch
Extra gains in USD/JPY looks likely and with the next target at the 135.00 level and beyond, comment UOB Group’s Economist Lee Sue Ann and Markets Strategist Quek Ser Leang.
Key Quotes
24-hour view: “We highlighted yesterday that ‘there is room for USD to rise above 134.35’. However, we were of the view that ‘135.00 is likely out of reach’. Our view was not wrong as USD rose to 134.49 in NY trade. While upward momentum has not improved much, the bias for USD remains on the upside. That said, barring a surge in momentum, any advance is unlikely to break the major resistance at 135.00 today. Support is at 133.90, followed by 133.60.”
Next 1-3 weeks: “Our update from yesterday (16 Feb, spot at 133.85) still stands. As highlighted, upward momentum has improved further and USD is likely to continue to advance. The next level to watch is at 135.00, followed by 135.50. On the downside, a break of 132.80 (‘strong support’ level was at 132.40 yesterday) would indicate that the current upward pressure has eased.”
Considering advanced prints from CME Group for crude oil futures markets, open interest went down for the second straight session on Thursday, now by nearly 19K contracts. Volume followed suit and dropped by more than 119K contracts.
WTI: Next on the downside comes the 2023 low
Thursday’s continuation of the leg lower in prices of the WTI was in tandem with increasing open interest and volume. That said, while a deeper retracement in the commodity seems not favoured, there should be decent contention around the 2023 low near the $72.00 mark per barrel for the time being.
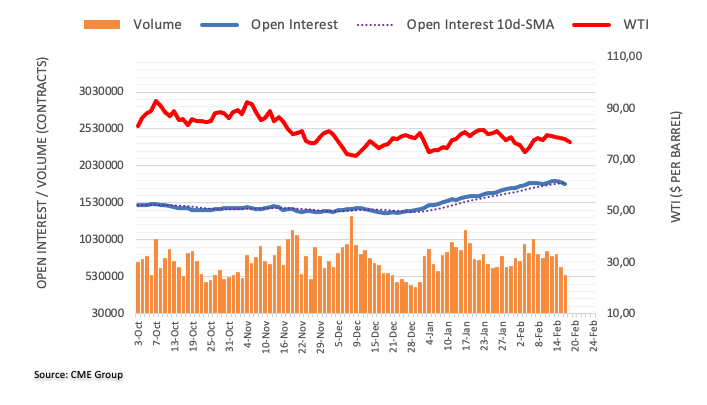
The continuation of the downtrend could force AUD/USD to slip back to the 0.6820 region in the short term, suggest UOB Group’s Economist Lee Sue Ann and Markets Strategist Quek Ser Leang.
Key Quotes
24-hour view: “We expected AUD to trade sideways between 0.6865 and 0.6940 yesterday. AUD rose to 0.6937 before dropping to a low of 0.6841 in early NY trade. Downward momentum has increased and AUD is likely to weaken further. However, the likelihood of a sustained decline below the major support at 0.6820 is low. Resistance is at 0.6895 but only a break of 0.6920 would indicate that AUD is not weakening further.”
Next 1-3 weeks: “Yesterday (16 Feb, spot at 0.6910), we highlighted that ‘downward momentum is building but AUD has to break below 0.6865 before a sustained decline is likely’. In NY trade, AUD fell below 0.6865 to 0.6841. Downward momentum has improved further and AUD is likely to weaken to 0.6820. Looking ahead, the next support below 0.6820 is at 0.6750. Overall, only a breach of 0.6950 (‘strong resistance’ level was at 0.6970) would indicate that the build-up in downward momentum has faded.”
GBP/USD is expected to remain trapped in the approximate 1.1850-1.2450 range still, according to economists at Credit Suisse.
Break below 1.1841 January low to signal a much deeper sell-off
“GBP/USD has held support at 1.1951/44 as looked for, never mind the key 1.1841 January low, and we continue to look for this to hold to keep the market trapped in a range. However, we stress that a break below here would complete a bearish ‘double top’ to signal a much deeper sell-off, and likely a stronger USD rally more broadly, with support seen next at 1.1646.”
“Post this rangebound phase, we are still biased towards an eventual break above 1.2447/49 to target the May high and 61.8% retracement of the 2021/2022 fall at 1.2668/1.2758.”
- GBP/JPY regains positive traction on Friday and snaps a two-day losing streak.
- The uncertainty over the BoJ’s policy path weighs on the JPY and lends support.
- Speculations that the BoE’s rate hiking cycle is nearing the end caps the upside.
The GBP/JPY cross attracts some buying near the 160.50 area on Friday and stalls this week's pullback from the YTD peak. The cross sticks to its gains around the 161.00 mark through the early European session and for now, seems to have snapped a two-day losing streak.
The Japanese Yen (JPY) weakens across the board amid the uncertainty over the path of monetary policy under new Bank of Japan (BoJ) Governor Kazuo Ueda, which, in turn, lends support to the GBP/JPY cross. Investors have been speculating that Ueda will dismantle the yield curve control easing mechanism. That said, data released this week showed the world’s third-largest economy grew at a slower-than-expected pace in the fourth quarter and making it prudent for the BoJ to stick to its ultra-lose monetary policy stance.
That said, any meaningful upside for the GBP/JPY cross seems elusive, at least for the time being, amid expectations that the Bank of England's (BoE) current rate-hiking cycle might be nearing the end. The bets were lifted by softer-than-expected UK consumer inflation figures on Wednesday, which might have eased pressure on the UK central bank to tighten its monetary policy more aggressively. This, to a larger extent, offsets the better-than-expected UK Retail Sales figures for January and might hold back bulls from placing fresh bets.
Apart from this, a generally weaker tone around the equity markets - amid looming recession risks - benefits the safe-haven JPY and further contributes to capping the GBP/JPY cross. Hence, it will be prudent to wait for some follow-through buying before positioning for the resumption of the recent positive trend witnessed over the past two weeks or so. Nevertheless, spot prices remain on track to register first weekly gains in the previous three.
Technical levels to watch
EUR/USD closed below 1.0700 on Thursday. Economists at ING believe that the pair could plummet to the 1.0450/1.0500 zone.
Temporary downside to EUR/USD
“The two-year EUR/USD swap differential has widened back out to levels last seen in mid-December. This now stands at -150 bps having narrowed to -110 bps at the start of this month. Arguably this spread should not narrow in too much more (unless the market thinks that Fed Funds will end the year near 5.50%), meaning that EUR/USD may not have to fall too much more. We would, however, say the direction of travel is to the 1.0450/1.0500 area, which may be the strongest Dollar level of the year for Eurozone corporates.”
“There is not too much on the Eurozone calendar today apart from the December current account figure and the market seems to be ignoring yesterday's comments from ECB dove, Fabio Panetta, favouring the ECB to move in 25 bps rather than 50 bps increments.”
European Central Bank (ECB) Governing Council member Isabel Schnabel said on Friday that another 50 basis points (bps) rate hike in March will be needed under virtually all scenarios.
Schnabel further added that quantitative tightening could be sped-up after June and noted that she sees risk that markets will underestimate inflation.
Market reaction
These comments don't seem to be helping the Euro gather strength against its major rivals. As of writing, the EUR/USD pair was down 0.25% on a daily basis at 1.0640.
Economists at Danske Bank expect the USD/JPY to fall and reach the 125 level in three months.
BoJ’s monetary policy stance is still important to follow regarding USD/JPY +3M
“The development in BoJ’s monetary policy stance is still important to follow regarding USD/JPY +3M; however, it is difficult to imagine any changes in the monetary policy until at least April 28th, when the new governor will have his first monetary policy meeting.”
“The main drivers for the USD/JPY in the next 3M are developments in US Treasury yields and the oil price.”
“We expect USD/JPY to drop to 125 in 3M following more tightening of monetary policy.”
“Forecast: 129 (1M), 125 (3M), 125 (6M), 125 (12M).”
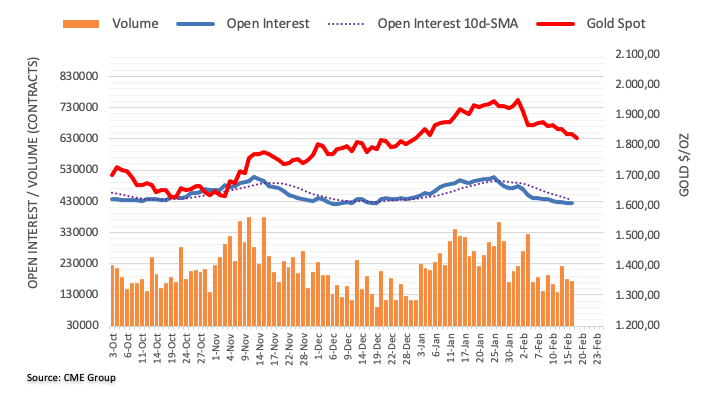
Open interest in gold futures markets increased by just 544 contracts on Thursday, snapping a downtrend in place since February 2 at the same time, according to preliminary readings from CME Group. Volume, instead, shrank for the second session in a row, this time by around 5.4K contracts.
Gold: En route to $1800?
Gold’s price action was inconclusive on Thursday amidst a small increase in open interest. Against that, some near-term consolidation is not ruled out ahead of the probable continuation of the decline. The next contention area, in the meantime, remains at the key $1800 region per ounce troy.
- EUR/GBP gains positive traction for the third straight day and climbs to over a one-week high.
- The upbeat UK Retail Sales for January fail to impress the GBP bulls or provide any impetus.
- Bets for additional jumbo rate hikes by the ECB support prospects for further near-term gains.
The EUR/GBP cross builds on this week's goodish bounce from the 0.8800 mark and edges higher for the third successive day on Friday. Spot prices hold steady above the 0.8900 round figure through the early European session and react little to the latest UK macro data.
The UK Office for National Statistics reported that domestic Retail Sales grew 0.5% in January against consensus estimates for a 0.3% fall. Furthermore, sales excluding fuel also surpassed market expectations and rose by 0.4% during the reported month. The better-than-expected prints, however, were offset by a downward revision of the previous month's already weaker readings. This, in turn, fails to provide any meaningful impetus to the British Pound or move the EUR/GBP cross.
That said, the softer UK consumer inflation figures released earlier this week fueled expectations that the Bank of England's (BoE) current rate-hiking cycle might be nearing the end. This continues to weigh on the Sterling and acts as a tailwind for the EUR/GBP cross. That said, broad-based US Dollar strength exerts some follow-through downward pressure on the shared currency. This, in turn, holds back bulls from placing aggressive bets and caps the upside for the cross, at least for now.
Meanwhile, bets for additional jumbo rate hikes by the European Central Bank (ECB) might contribute to the Euro's relative outperformance against its British counterpart. This, in turn, supports prospects for a further near-term appreciating move for the EUR/GBP cross. Hence, some follow-through strength back towards the 0.8975-0.8980 region, or the highest level since September 2022 touched earlier this month, looks like a distinct possibility.
Technical levels to watch
In the opinion of UOB Group’s Economist Lee Sue Ann and Markets Strategist Quek Ser Leang, GBP/USD could extend the decline to the 1.1900 region in the next weeks.
Key Quotes
24-hour view: “We highlighted yesterday that ‘as long as 1.2100 is not breached, GBP could continue to decline’. However, we were of the view that ‘a break of the major support at 1.1960 is unlikely today’. Our view turned out to be correct as GBP rose to 1.2075 in early London trade before dropping to a low of 1.1966. Downward has improved a tad and GBP is likely to break below 1.1960 today. As downward momentum is not strong for now, any decline is unlikely to threaten 1.1900. Overall, only a breach of 1.2045 (minor resistance is at 1.2010) would indicate that the downward pressure has eased.”
Next 1-3 weeks: “Yesterday (16 Feb, spot at 1.2040), we highlighted that ‘the risk for GBP has shifted to the downside’ but we held the view that ‘any decline is expected to face solid support at 1.1960’. GBP subsequently dropped to a low of 1.1966 in NY trade before settling at 1.1987 (-0.42%). Downward momentum has improved, albeit not much. In view of the increased downward momentum, a break of 1.1960 would not be surprising. The next support is at 1.1900. On the upside, a breach of 1.2100 (‘strong resistance’ level was at 1.2150 yesterday) would indicate that the downside risk has faded.”
Here is what you need to know on Friday, February 17:
Supported by upbeat macroeconomic data releases and hawkish comments from Fed officials, the US Dollar continued to gather strength against its rivals and the US Dollar Index (USD) reached its highest level since early January above 104.00 on Friday. In the absence of high-impact data releases, markets will pay close attention to central bank speak ahead of the weekend.
The European Central Bank will release the December Current Account numbers. Export and Import Price indexes data for January will be featured in the US economic docket. Statistics Canada will publish January Industrial Product Price and Raw Material Price Index figures.
The US Bureau of Labor Statistics reported on Thursday that the Core Producer Price Index edged slightly lower to 5.4% in January from 5.5% but this reading came in much higher than the market expectation of 4.9%.0Additionally, the US Department of Labor's report revealed that there were less than 200,000 Initial Jobless Claims for the fifth straight week.
Meanwhile, Cleveland Fed President Loretta Mester said the Fed will need to go above 5% and stay there for a while as it has more work to do to control inflation. Similarly, St. Louis Fed President James Bullard noted that continued policy rate increases can help lock in a 'disinflationary trend' during 2023. The benchmark 10-year US Treasury bond yield gained more than 1% for the third straight day on Thursday and continued to stretch higher toward 3.9% early Friday, helping the USD outperform its rivals.
In the second day of his testimony, Reserve Bank of Australia (RBA) Governor Philip Lowe reiterated on Friday that the board expects that further increases will be needed over the months ahead. This comment failed to help the Aussie find demand during the Asian trading hours and AUD/USD was last seen trading at its lowest level in five weeks below 0.6850.
"If evidence begins to accumulate to show that inflation is not declining in line with forecast, we are prepared to raise policy rate further, Bank of Canada Governor Tiff Macklem said while testifying before the Standing Committee on Finance on Thursday. USD/CAD showed no immediate reaction to Macklem's remarks and registered strong gains for the second straight day on Thursday. The pair preserves its bullish momentum and rises toward 1.3500 early Friday.
NZD/USD stays on the back foot and declines toward 0.6200 on Friday. New Zealand Financial Minister Robertson said earlier in the day there was evidence that inflation has peaked.
EUR/USD closed below 1.0700 on Thursday and failed to stage a rebound, pressured by the broad US Dollar strength. The pair trades below 1.0650 early Friday. PPI in Germany declined to 17.8% on a yearly basis in January from 21.6% in December, compared to the market expectation of 16.4%.
GBP/USD broke below 1.2000 and touched its weakest level since January 6 at 1.1930 early Friday. Reports suggesting that there was a growing speculation that a deal between the UK and the US on the Northern Ireland Protocol was imminent failed to help the Pound Sterling stay resilient against the USD. The UK's Office for National Statistics reported on Friday that Retail Sales rose by 0.5% on a monthly basis in January. This reading came in better than the market expectation for a decrease of 0.3% but failed to trigger a bullish reaction in the pair.
USD/JPY extended its rally in the Asian session and reached its highest level since late December above 134.50.
Although XAU/USD managed to close flat on Thursday, it came in under renewed bearish pressure amid rising US T-bond yields early Friday. Gold price was last seen losing more than 0.5% on the day at $1,825.
Bitcoin advanced above $25,000 for the first time since August on Thursday but made a sharp U-turn during the American trading hours to post a daily loss of nearly 4%. BTC/USD was last seen moving up and down in a narrow channel above $23,500. Ethereum failed to build on Wednesday's impressive gains on Thursday and closed below $1,700. In the early European morning, ETH/USD is up nearly 1% at around $1,650.
- GBP/USD portrays corrective bounce off six-week low on strong UK Retail Sales.
- UK Retail Sales grew 0.5% MoM versus -0.3% expected, -1.0% prior.
- Broad US Dollar strength on hawkish Fed concerns, upbeat US data keep bears hopeful.
- Fed Minutes, preliminary PMIs for February eyed for clear directions.
GBP/USD bounces off a 1.5-month low to 1.1950 as UK Retail Sales for January offered a positive surprise. Adding strength to the rebound could be the Brexit optimism. However, broad US Dollar strength weighs on the Cable pair.
UK Retail Sales grew 0.5% MoM versus -0.3% market forecast and -1.0% previous readings. That said, the YoY figures came in as -5.1% compared to -5.5% consensus and -5.8% prior.
Also read: UK Retail Sales jump 0.5% MoM in January vs. -0.3% expected
Late on Thursday, BBC News came out with the headlines suggesting an imminent deal between the UK and the EU on the Northern Ireland Protocol. “Prime Minister Rishi Sunak has arrived in Northern Ireland to hold talks with Stormont party leaders,” said BBC News.
It’s worth noting that the latest improvement in UK Retail Sales remains insufficient to overcome the dovish Bank of England (BoE) bias that takes clues from the downbeat British employment and inflation data, published earlier in the week. Additionally, the Northern Ireland trade deal is the gemstone of Brexit and hence the European Union (EU) may not easily give up on it, which in turn raises doubts about the latest optimism triggered through the BBC news.
Furthermore, a slew of clues for the US inflation, employment and output conditions push back the Fed’s policy pivot talks and help the Federal Reserve (Fed) officials to suggest higher rates. The same could be witnessed in the latest read of the FEDWATCH tool, observed via Reuters, which suggests more market bets on the higher Fed rate than earlier signaled by the US central bank in December. That said, Cleveland Fed President Loretta Mester and St. Louis Federal Reserve's James Bullard were the latest to sound the hawkish alarm.
It should be observed that the fears surrounding China also weigh on the sentiment, in addition to the high Fed rate concerns, which in turn allow the US Dollar to cheer its haven status and drown the GBP/USD pair.
Against this backdrop, S&P 500 Futures dropped half a percent intraday to 4,086 while poking the weekly low after falling the most in a month on Thursday. Additionally, the US 10-year Treasury bond yields rise to a fresh high since December 30, 2022, whereas the two-year US Treasury bond also renews its highest levels since November 2022.
Having witnessed the initial reaction to the UK data, GBP/USD is likely to remain pressured amid a lack of major data/events and comparatively stronger market belief over the Fed’s next moves, versus the pessimism surrounding the BoE.
Technical analysis
A sustained downside break of a 1.5-month-old ascending trend line joins bearish MACD signals to keep GBP/USD bears hopeful of breaking an upward-sloping support line from November 17, 2022, around 1.1920 by the press time, becomes an important support to watch.
- The UK Retail Sales came in at 0.5% MoM in January, an upside surprise.
- Core Retail Sales for the UK rose by 0.4% MoM in January.
- The Cable keeps losses near 1.1950 on the upbeat UK data.
The UK Retail Sales arrived at 0.5% over the month in January vs. -0.3% expected and -1.2% previous. The Core Retail Sales, stripping the auto motor fuel sales, rose by 0.4% MoM vs. 0% expected and -1.4% previous.
Gold price is extending its three-day bearish momentum on Friday. XAU/USD needs a weekly closing below $1,825 to target $1,800, FXStreet’s Dhwani Mehta reports.
Gold sellers look to extend control below $1,825
“Daily closing below the horizontal trendline support from the January 5 low at $1,825 is needed to extend the downtrend toward the $1,800 threshold.”
“Gold bulls need to find a strong foothold back above the descending trendline support-turned-resistance at $1,836. The previous day’s high at $1,845 will be next on buyers’ radars on their way to the $1,850 psychological level. Further up, the critical 50-Daily Moving Average (DMA) at $1,862 will be a tough nut to crack for Gold optimists.”
- The index extends the advance past the 104.00 barrier.
- US yields climb to fresh highs following data, hawkish Fedspeak.
- Fed’s Barkin, CB Leading Index next on tap in the docket.
The greenback pushes higher and prints fresh 6-week tops north of the 104.00 hurdle when gauged by the USD Index (DXY) at the end of the week.
USD Index remains strong on Fedspeak, firm data
The index extends the weekly recovery and climbs to 6-week peaks past the 104.00 barrier on Friday, as investors continue to assess the recent firmer results from the US docket and hawkish Fedspeak.
On the latter, Cleveland Fed L.Mester and St.Louis Fed J.Bullard left the door open to a 50 bps rate hike at the March event on the back of the still elevated inflation, tightness of the labour market and resilience of the US economy.
So far, and according to CME Group’s FedWatch Tool, the probability of a 25 bps rate hike at the March 22 meeting hovers around the 87% (from nearly 91% a week ago).
In the US data space, the CB Leading Index for the month of January will be the sole release on Friday along with the speech by Richmond Fed T.Barkin (2024 voter, centrist).
What to look for around USD
The dollar seems to have broken above the multi-session consolidative phase and keeps the relentless recovery further north of the 104.00 level, always against the backdrop of the renewed hawkish message from Fed’s rate setters.
The probable pivot/impasse in the Fed’s normalization process narrative is expected to remain in the centre of the debate along with the hawkish message from Fed speakers, all after US inflation figures for the month of January showed consumer prices are still elevated, the labour market remains tight and the economy maintains its resilience.
Key events in the US this week: CB Leading Index (Friday).
Eminent issues on the back boiler: Rising conviction of a soft landing of the US economy. Slower pace of interest rate hikes by the Federal Reserve vs. shrinking odds for a recession in the next months. Fed’s pivot. Geopolitical effervescence vs. Russia and China. US-China trade conflict.
USD Index relevant levels
Now, the index is gaining 0.35% at 104.45 and faces the next hurdle at 104.45 (monthly high February 17) seconded by 105.63 (2023 high January 6) and then 106.44 (200-day SMA). On the other hand, the breach of 102.58 (weekly low February 14) would open the door to 100.82 (2023 low February 2) wand finally 100.00 (psychological level).
- NZD/USD drops for the fourth consecutive day as bears poke January’s low.
- Fears of inflation peak in New Zealand, geopolitical concerns probe RBNZ hawks.
- US data, yields join upbeat Fed talks to keep rate hike concerns on the table and propel US Dollar.
- Risk catalysts can entertain traders ahead of next week’s FOMC Minutes, RBNZ.
NZD/USD bears keep the reins for the fourth consecutive day as the quote drops to the lowest level since early January, following a U-turn from the weekly top on Tuesday. That said, the Kiwi pair sellers attack 0.6220-15 support during early Friday in Europe.
Earlier in Asia, New Zealand Financial Minister Robertson said events will exacerbate a slowdown in the economy and that is evidence that inflation has peaked. The same challenges the hawkish bias surrounding the Reserve Bank of New Zealand (RBNZ) ahead of the next week’s monetary policy meeting.
On the other hand, a slew of US statistics concerning inflation, employment and output push back the Fed’s policy pivot talks and help the Federal Reserve (Fed) officials to suggest higher rates. The fashion could be witnessed in the latest comments from the Fed officials and the FEDWATCH tool, observed via Reuters. That said, Cleveland Fed President Loretta Mester and St. Louis Federal Reserve's James Bullard were the latest to sound the hawkish alarm.
It should be noted that the recent fears of more US-China tussles over the spy balloon and Taiwan also bolster the US Dollar’s safe-haven demand, which in turn weighs on the NZD/USD price. The geopolitical fears have a double impact on the Kiwi pair due to New Zealand’s trade ties with China.
Amid these plays, S&P 500 Futures dropped half a percent intraday to 4,086 while poking the weekly low after falling the most in a month on Thursday. Additionally, the US 10-year Treasury bond yields rise to a fresh high since December 30, 2022, whereas the two-year US Treasury bond also renews its highest levels since November 2022.
Moving ahead, the next week’s monetary policy meeting minutes of the Federal Open Market Committee (FOMC) and the RBNZ Interest Rate Decision will be crucial for the NZD/USD traders to watch for clear directions. Market forecasts suggest another 0.50% rate hike from the RBNZ before teasing the policy pivot.
Technical analysis
NZD/USD pair’s sustained downside break of the previous support line from mid-November 2022, now resistance around 0.6300, keeps the pair bears hopeful. Adding strength to the downside bias are the bearish MACD signals and the lower high formation on the daily chart.
However, a daily closing below a 2.5-month-long support line, currently around 0.6220-15, becomes necessary for the bears to keep the reins, a break of which can highlight the 200-DMA of around 0.6175.
FX option expiries for Feb 17 NY cut at 10:00 Eastern Time, via DTCC, can be found below.
- EUR/USD: EUR amounts
- 1.0800 455m
- GBP/USD: GBP amounts
- 1.1300 607m
- 1.1400 304m
- 1.2415 403m
- USD/JPY: USD amounts
- 134.40 395m
- AUD/USD: AUD amounts
- 0.6740 365m
NZD/USD: NZD amounts
- 0.6630 468m
UOB Group’s Economist Lee Sue Ann and Markets Strategist Quek Ser Leang note EUR/USD risks a deeper retracement below the 1.0655 level in the near term.
Key Quotes
24-hour view: “Yesterday, we held the view that EUR ‘could test the 1.0655 level before a more sustained recovery is likely’. While our view was not wrong as EUR rebounded from a low of 1.0653, the recovery did not gain much traction. Today, the risk still appears to be tilted to the downside but while EUR could drop below 1.0655 again, it is unlikely to challenge the major support at 1.0615. Resistance is at 1.0715, followed by 1.0730.”
Next 1-3 weeks: “We continue to hold the same view as yesterday (16 Feb, spot at 1.0690). As highlighted, downward momentum is building again but EUR has to break and stay below 1.0655 before a sustained decline is likely. The chance of a sustained decline will increase as long as EUR does not move above 1.0760 (no change in ‘strong resistance’ level) within the next couple of days. Looking ahead, a clear break of 1.0655 will shift the focus to 1.0615, followed by 1.0535.”
- Silver price refreshes 11-week low during five-day losing streak.
- 100-DMA breakdown, bearish MACD signals favor sellers around multi-day low.
- Oversold RSI hints at corrective bounce, highlights 200-DMA, $20.00 as key supports.
Silver price (XAG/USD) holds lower ground at the 2.5-month bottom surrounding $21.45 amid the early hours of Friday morning in Europe.
The bright metal refreshed the multi-day low on breaking the 100-DMA, as well as taking clues from the bearish MACD signals. However, the oversold RSI (14) conditions suggest limited downside room for the XAG/USD.
As a result, the 200-DMA level surrounding $21.00 appears putting a short-term floor under the Silver price.
In a case where the XAG/USD drops below $21.00, a convergence of the previous resistance line from March 2022 and an ascending trend line from the last September, close to the $20.00 psychological magnet, will be a tough nut to crack for the Silver sellers.
It should be noted that the quote’s weakness past $20.00 makes it vulnerable to test the previous yearly bottom marked in September at around $17.55.
Alternatively, XAG/USD rebound remains elusive unless crossing the 100-DMA level near the $22.00 round figure.
Following that, the 50% and 61.8% Fibonacci retracements of the metal’s fall between March and September of 2022, respectively near $22.30 and $23.35, could act as additional upside filters for the Silver buyers to watch. Above all, the monthly high of $24.63 acts as the last defense of the XAG/USD bears.
Silver price: Daily chart
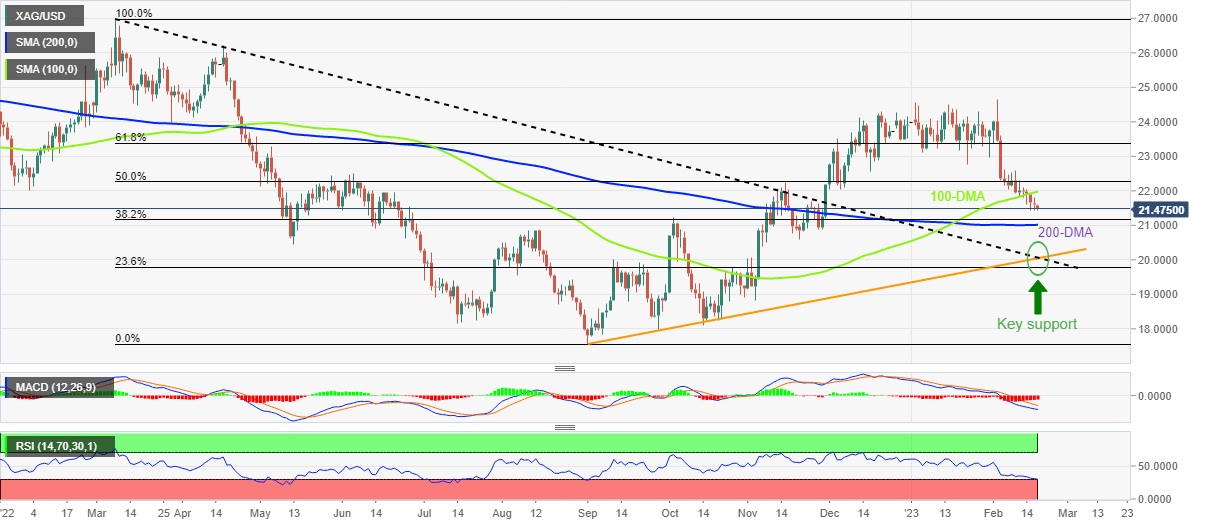
Trend: Limited downside expected
- EUR/USD extends three-day losing streak to refresh six-week low.
- Strong US data, hawkish Fed talks favor upside momentum of US Dollar, Treasury bond yields.
- ECB Minutes, policymakers’ statements appear less hawkish and probe Euro bulls.
- Geopolitical fears add strength to the greenback’s haven demand and weigh on EUR/USD amid light calendar.
EUR/USD bears keep the reins around 1.0630, the lowest level in six weeks while portraying a three-day downtrend during early Friday.
The major currency pair’s latest fall seems akin to the broad US Dollar run-up and mixed clues from the European Central Bank (ECB) officials.
While printing the greenback’s run-up, the US Dollar Index (DXY) grinds near the 1.5-month top surrounding 104.30, marked earlier in Asia. In doing so, the US Dollar’s gauge versus the six major currencies cheers the hawkish concerns about the Federal Reserve’s (Fed) next move amid strong US data and upbeat comments from the Fed policymakers.
A slew of US statistics concerning inflation, employment and output underpin the force that pushes back the Fed’s policy pivot talks. The fashion could be witnessed in the latest comments from the Fed officials and the FEDWATCH tool, observed via Reuters.
At home, the ECB’s monthly bulletin and the latest comments from the policymakers, including executive board member Fabio Panetta and Chief Economist Philip Lane, signal the need for a cautious monetary policy move amid economic jitters.
Elsewhere, the recent fears of more US-China tussles over the spy balloon and Taiwan also bolster the US Dollar’s safe-haven demand, which in turn weighs on the EUR/USD price.
Against this backdrop, S&P 500 Futures mark 0.30% intraday losses to 4,086 while poking the weekly low after falling the most in a month on Thursday. Additionally, the US 10-year Treasury bond yields rise to a fresh high since December 30, 2022, whereas the two-year US Treasury bond also renews the highest levels since November 2022, making rounds to 3.88% and 4.68% in that order.
Moving on, a light calendar and the well-set hawkish Fed concerns, versus doubts over the ECB’s future rate hikes, the EUR/USD is likely to remain bearish ahead of next week’s monetary policy meeting minutes of the Federal Open Market Committee (FOMC).
Technical analysis
A clear downside break of the three-month-old support line, now resistance around 1.0710, joins the 50-day Exponential Moving Average (EMA) breakdown, close to 1.0675 at the latest, to keep EUR/USD bears hopeful of meeting the previous monthly low of 1.0483.
- AUD/USD remains under some selling pressure for the third successive day on Friday.
- Hawkish Fed expectations, recession fears underpin the buck and weigh on the major.
- Technical selling below the 50-day SMA further contributes to the ongoing downfall.
The AUD/USD pair extends this week's retracement slide from the 0.7030 area and continues losing ground for the third successive day on Friday. The downward trajectory drags spot prices to the lowest level since January 6 during the Asian session and is sponsored by broad-based US Dollar strength.
In fact, the USD Index, which tracks the Greenback against a basket of currencies, hits a fresh six-week high amid firming expectations for further policy tightening by the Fed. Investors seem convinced that the US central bank will stick to its hawkish stance in the wake of stubbornly high inflation. Moreover, the incoming upbeat US macro data points to an economy that remains resilient despite rising borrowing costs. This, along with the recent hawkish remarks by several FOMC members, suggests that the Fed will continue to hike interest rates.
The markets are now pricing in at least a 25 bps lift-off at each of the next two FOMC policy meetings in March and May. This, in turn, pushes the yield on the benchmark 10-year US Treasury note to its highest level since late December and is seen underpinning the buck. Meanwhile, worries about economic headwinds stemming from rapidly rising interest rates weigh on investors' sentiment. This is evident from a weaker tone around the equity markets, which further benefits the safe-haven USD and drives flows away from the risk-sensitive Aussie.
Apart from the aforementioned fundamental factors, the AUD/USD pair's downfall could also be attributed to some technical selling following the overnight break below the 50-day SMA. This comes on the back of the recent repeated failures to find acceptance above the 0.7000 psychological mark and might have already set the stage for further losses. Moreover, bearish oscillators on the daily chart add credence to the near-term negative outlook.
This, in turn, suggests that the path of least resistance for the AUD/USD pair is to the downside. In the absence of any relevant market-moving economic data, any attempted bounce will now be seen as a selling opportunity and remain capped near the 50-day SMA support breakpoint.
Technical levels to watch
- USD/CAD rises to the highest level in a month, braces for the biggest weekly gains since early December.
- Successful break of short-term key resistance lines, 200-SMA directs bulls towards 61.8% Fibonacci ratio.
- Sellers should remain cautious beyond four-day-old support line.
USD/CAD takes the bids to a fresh monthly high near 1.3490 during early Friday. In doing so, the Loonie pair rises for the fourth consecutive day while preparing for the biggest weekly run-up since early December 2022.
That said, the USD/CAD bulls cheer the upside break of a 12-day-old ascending trend line and one-month-old resistance line, now support, to keep buyers hopeful. Also favoring the USD/CAD bulls is the quote’s successful trading above the 200-SMA.
Given the aforementioned technical breakouts and bullish MACD signals, the USD/CAD pair is well-set to poke the mid-January swing high surrounding 1.3520. The same encompasses the 61.8% Fibonacci retracement level of the pair’s January-February downturn.
In a case where the USD/CAD remains firmer past 1.3520, the 1.3600 round figure may act as an intermediate halt before highlighting the previous monthly high of 1.3685 for the pair buyers.
On the flip side, the 12-day-old previous resistance line and a downward-sloping trend line from January 19 put a floor under the USD/CAD prices of around 1.3480 and 1.3455 in that order.
Following that, the 200-SMA and an ascending support line from Tuesday, respectively near 1.3400 and 1.3390, could act as the last defense of the USD/CAD buyers.
USD/CAD: Four-hour chart
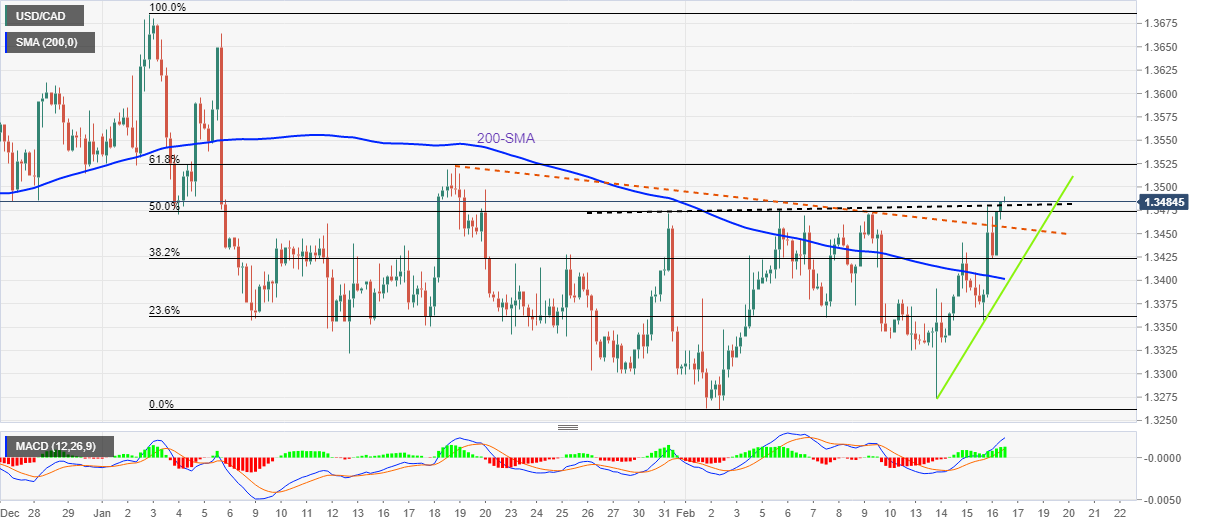
Trend: Further upside expected
- Gold price remains below the key $1,830 support confluence as hawkish Fed bets fuel US Dollar.
- Upbeat US Treasury bond yields, strong US data and risk-negative macros from China weigh on XAU/USD.
- Light calendar ahead of next week’s Fed Minutes keep Gold bears in the driver’s seat.
Gold price (XAU/USD) renews a six-week low as concerns surrounding the US Federal Reserve’s (Fed) higher interest rates propel the US Dollar. Adding strength to the greenback’s run-up, which ultimately weighs on the XAU/USD, are the upbeat US Treasury bond yields and challenges to the market sentiment, not to forget upbeat US data.
A slew of US statistics concerning inflation, employment and output have been positive of late, which in turn push back the Fed’s policy pivot talks. The same could be witnessed in the latest comments from the Fed officials and the FEDWATCH tool, observed via Reuters. The same joins the recent fears of more US-China tussles over the spy balloon and Taiwan to bolster the US Dollar’s safe-haven demand, which in turn allows the US Dollar Index (DXY) to renew a 1.5-month high and drown the Gold price.
Moving on, a light calendar and cautious mood, not to forget the multi-day high Treasury bond yields, can keep the XAU/USD buyers hopeful ahead of next week’s monetary policy meeting minutes of the Federal Open Market Committee (FOMC).
Also read: Gold Price Forecast: XAU/USD stays depressed as upbeat United States data propel US Dollar
Gold Price: Key levels to watch
The Technical Confluence Detector shows that the Gold price has broken the key $1,830 support confluence comprising Pivot Point one week S1 and Fibonacci 23.6% on one day, which in turn opens the door for the metal’s further downside.
However, the road towards the south appears bumpy as XAU/USD flirts with the $1,825 support confluence by the press time, which encompasses the previous low on daily and Pivot Point one day S1.
Following that, the previous monthly low surrounding $1,822 may test the Gold bears before directing them to the $1,820 support including the Bollinger bank one day lower and Pivot Point one day S2.
It’s worth noting that the Pivot Point S3 on Daily and Weekly formations highlight $1,810 as the short-term key support for the Gold traders to watch during the metal’s further downside.
On the flip side, a successful run-up beyond $1,830 can aim for a 50-HMA level near $1,840 before emphasizing the $1,850 upside hurdle, including Pivot Point one week S1.
Here is how it looks on the tool
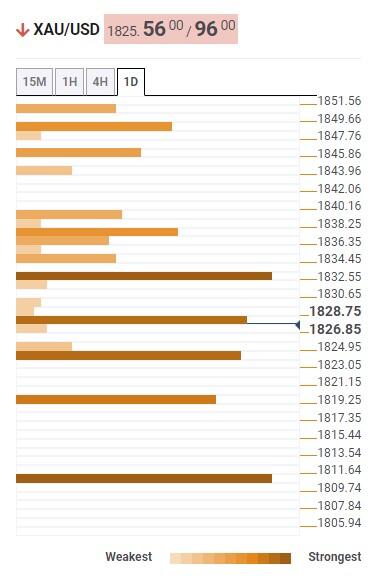
About Technical Confluences Detector
The TCD (Technical Confluences Detector) is a tool to locate and point out those price levels where there is a congestion of indicators, moving averages, Fibonacci levels, Pivot Points, etc. If you are a short-term trader, you will find entry points for counter-trend strategies and hunt a few points at a time. If you are a medium-to-long-term trader, this tool will allow you to know in advance the price levels where a medium-to-long-term trend may stop and rest, where to unwind positions, or where to increase your position size.
- USD/JPY catches fresh bids on Friday and challenges the YTD top amid sustained USD buying.
- Hawkish Fed expectations push the US bond yields higher and continue to underpin the buck.
- Recession fears, hopes for a hawkish BoJ shift could benefit the JPY and cap any further gains.
The USD/JPY pair regains positive traction following the previous day's modest downtick and rallies back closer to the YTD peak during the Asian session on Friday. The pair currently trades around the 134.70-134.75 region and seems poised to prolong its uptrend witnessed since the beginning of this month.
The US Dollar buying remains unabated on the last day of the week amid firming expectations that the Fed will stick to its hawkish stance, which, in turn, acts as a tailwind for the USD/JPY pair. In fact, the USD Index, which tracks the Greenback against a basket of currencies, hits a fresh six-week low as investors now seem convinced that interest rates are going to remain elevated for longer.
The bets were lifted by the incoming positive US macro data, which point to a resilient economy despite rising borrowing costs and stubbornly high inflation. Adding to this, hawkish remarks by a slew of FOMC members suggest that the US central bank will continue to tighten its monetary policy. This, in turn, pushes the US Treasury bond yields higher across the board and underpins the Greenback.
In fact, the yield on the benchmark 10-year US government bond climbs to the highest level since late December. This results in the widening of the US-Japan rate differential, which is seen driving flows away from the Japanese Yen (JPY) and providing an additional boost to the USD/JPY pair. That said, a combination of factors could limit losses for the JPY and cap the upside for the major.
Worries about economic headwinds stemming from rapidly rising borrowing costs continue to weigh on investors' sentiment, which is evident from a generally weaker tone around the equity markets. Adding to this, speculations that the Bank of Japan (BoJ) governor candidate Kazuo Ueda will dismantle the yield curve control easing mechanism could lend some support to the safe-haven JPY.
Nevertheless, the USD/JPY pair remains on track to post strong weekly gains. From a technical perspective, this week's sustained move beyond the 132.90-133.00 region could be seen as a fresh trigger for bullish traders and add credence to the positive outlook. Hence, some follow-through strength, towards reclaiming the 135.00 psychological mark, looks like a distinct possibility.
Technical levels to watch
- USD/INR clings to mild gains during the first positive daily performance in three.
- Upbeat US data, hawkish Fed talks propel Treasury bond yields and the US Dollar.
- Sluggish Oil price, mixed sentiment in Asia fail to help Indian Rupee in extending previous gains.
- Light calendar ahead of next week’s FOMC Minutes can keep buyers hopeful.
USD/INR remains mildly bid around 82.75-80, after a gap-up opening to 82.80, amid the broad US Dollar strength during early Friday. In doing so, the Indian Rupee (INR) pair snaps a two-day losing streak amid mostly downbeat sentiment.
US Dollar Index (DXY) grinds near the six-week top surrounding 104.30, marked earlier in Asia, as it cheers the hawkish concerns about the Federal Reserve’s (Fed) next move amid strong US data and upbeat comments from the Fed policymakers.
Producer Price Index (PPI) for January gained major attention by rising the most since June with 0.7% MoM figure. Also positive for the USD/INR pair was the improvement in the US Initial Jobless Claims for the week ended on February 10, 194K versus 200K expected and 195K prior. On the contrary, a slump in the Housing Starts for January and the Philadelphia Fed Manufacturing Survey for February seemed to have gained a little attention.
Following the data, the FEDWATCH tool, observed via Reuters, suggests that the interest rate futures market shows US rates could peak close to 5.25% by July before dropping to 5.0% by the end of the year. The same signals a higher policy pivot than the 5.10% peak conveyed by the Fed in the December meeting, which in turn hints at a few more rate hikes from the US central bank and favors the US Dollar.
It should be noted that Cleveland Fed President Loretta Mester recently teased the recession woes while repeating the previous defense of the highest rates. Before that, St. Louis Federal Reserve's James Bullard bolstered the hawkish Fed bias while saying, “Continued policy rate increases can help lock in a disinflationary trend during 2023, even with ongoing growth and strong labor markets, by keeping inflation expectations low.”
Other than the Upbeat US data, Fed bets and hawkish comments from the Fed policymakers, the fears emanating from China also weigh on the sentiment and underpin the USD/INR rebound. That said, US President Joe Biden fired shots at his Chinese counterpart while conveying the expectations for a talk with the Chinese leader, during an interview with NBC News. “I think the last thing that Xi wants is to fundamentally rip the relationship with the United States and with me," said US President Biden per Reuters.
Amid these plays, S&P 500 Futures mark 0.30% intraday losses to 4,086 while poking the weekly low after falling the most in a month on Thursday. Additionally, the US 10-year Treasury bond yields rise to a fresh high since December 30, 2022, whereas the two-year US Treasury bond also renews the highest levels since November 2022, making rounds to 3.88% and 4.68% in that order.
It’s worth mentioning that the Oil price weakness and the Reserve Bank of India’s (RBI) hawkish concerns seem challenging the USD/INR bulls amid a light calendar ahead of the next week’s Federal Open Market Committee (FOMC) monetary policy meeting minutes.
Technical analysis
A sustained bounce off the 10-day Exponential Moving Average (EMA), around 82.60 by the press time, keeps USD/INR buyers hopeful of crossing the four-month-old resistance line near the 83.00 round figure.
Economists at Goldman Sachs said in their latest note that they are now forecasting the US Federal Reserve (Fed) to hike rates by 25 basis points (bps) each at the March, May and June meetings.
Goldman Sachs previously projected two rate hikes ahead.
Stronger economic growth and firmer inflation news seem to be the main reasons behind adding another rate hike by the Federal Reserve in the second quarter of this year.
The US banking giant projects the peak Fed Funds rate at 5.25%-5.50%.
- WTI picks up bids to snap four-day downtrend, stays within one-week-old symmetrical triangle.
- 50-SMA, bearish MACD signals probe buyers, steady RSI line suggests further grinding of Oil price.
- Weekly high near $80.75 appers the last defense of Oil sellers.
WTI crude oil licks its wounds around $78.30 during early Friday morning in Europe. In doing so, the black gold prices pare the weekly loss while positing the first daily gains in five while staying inside a one-week-old symmetrical triangle formation.
That said, the quote’s latest rebound pokes the 50-SMA hurdle surrounding $78.50. Also challenging the Oil buyers are the bearish MACD signals.
It’s worth noting, however, that the stated symmetrical triangle limited the energy benchmark’s short-term moves between $79.60 and $77.70 by the press time.
Should the commodity prices rally beyond $79.60, the $80.00 round figure and the weekly top of $80.75 could act as additional upside filters for the WTI bulls to watch.
On the contrary, a downside break of the stated triangle’s lower line, close to $77.70 at the latest, could trigger a fresh fall in the Oil price.
In that case, $76.70 holds the key to the commodity’s downside towards the previous weekly low surrounding $72.50.
If at all the WTI crude oil bears keep the reins past $72.50, January’s bottom of $70.27 and the $70.00 round figure should act as the final stops for the buyers before leaving the train.
WTI: Four-hour chart
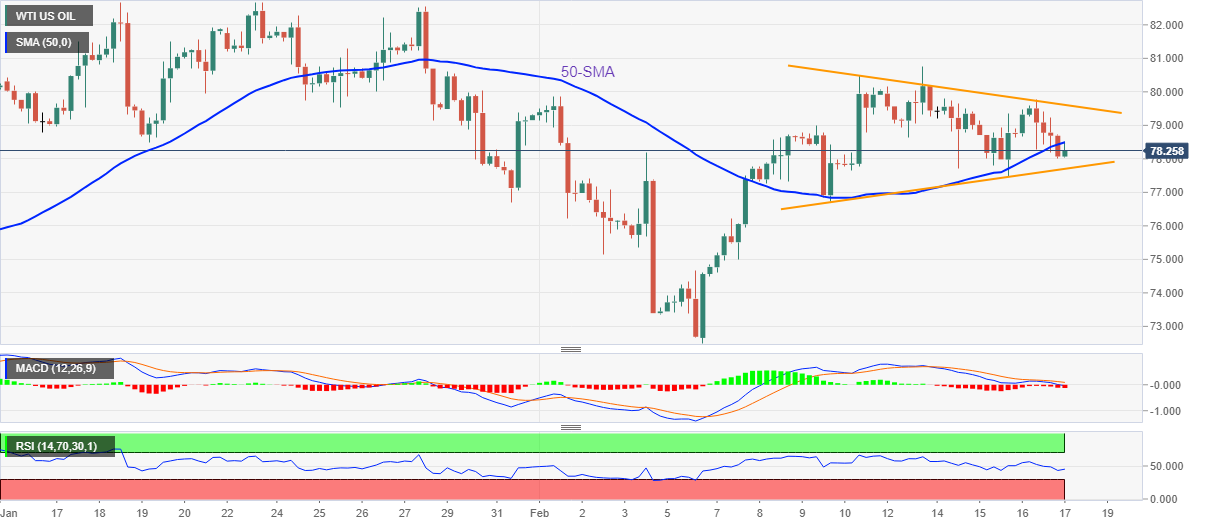
Trend: Further downside expected
- EUR/USD bears move in for the attack as US Dollar takes off.
- The bulls could be waiting at a confluence area near 1.0640.
EUR/USD is under pressure while the US Dollar rides US Treasury yields higher in Asia which is seeing the greenback head for a third straight week of gains. At the time of writing, EUR/USD is trading at 1.06552 and has made a low of 1.0649 so far, sliding from 1.0675.
Resilient economic data out of the United States accompanied wit fresh hawkish rhetoric from Federal Reserve speakers since the Nonfarm Payrolls blowout last Friday has turned the screw on risk sentiment and has given the US Dollar a shot in the arm to 104.31 so far. US Treasury yields have also surged on the back of further hawkish rate repricing, with the two-year yields last hitting 4.679%the high. Markets are now expecting rates to peak just below 5.3% by July.
EUR/USD technical analysis
EUR/USD Price Analysis: Bears are putting up their resistances, eye 1.0650
In a prior analysis made in the the New York session, it was stated that in a ''late session surge from the bears is underway and that could leave prospects of a bearish close for another day and the downside bias underpinned:
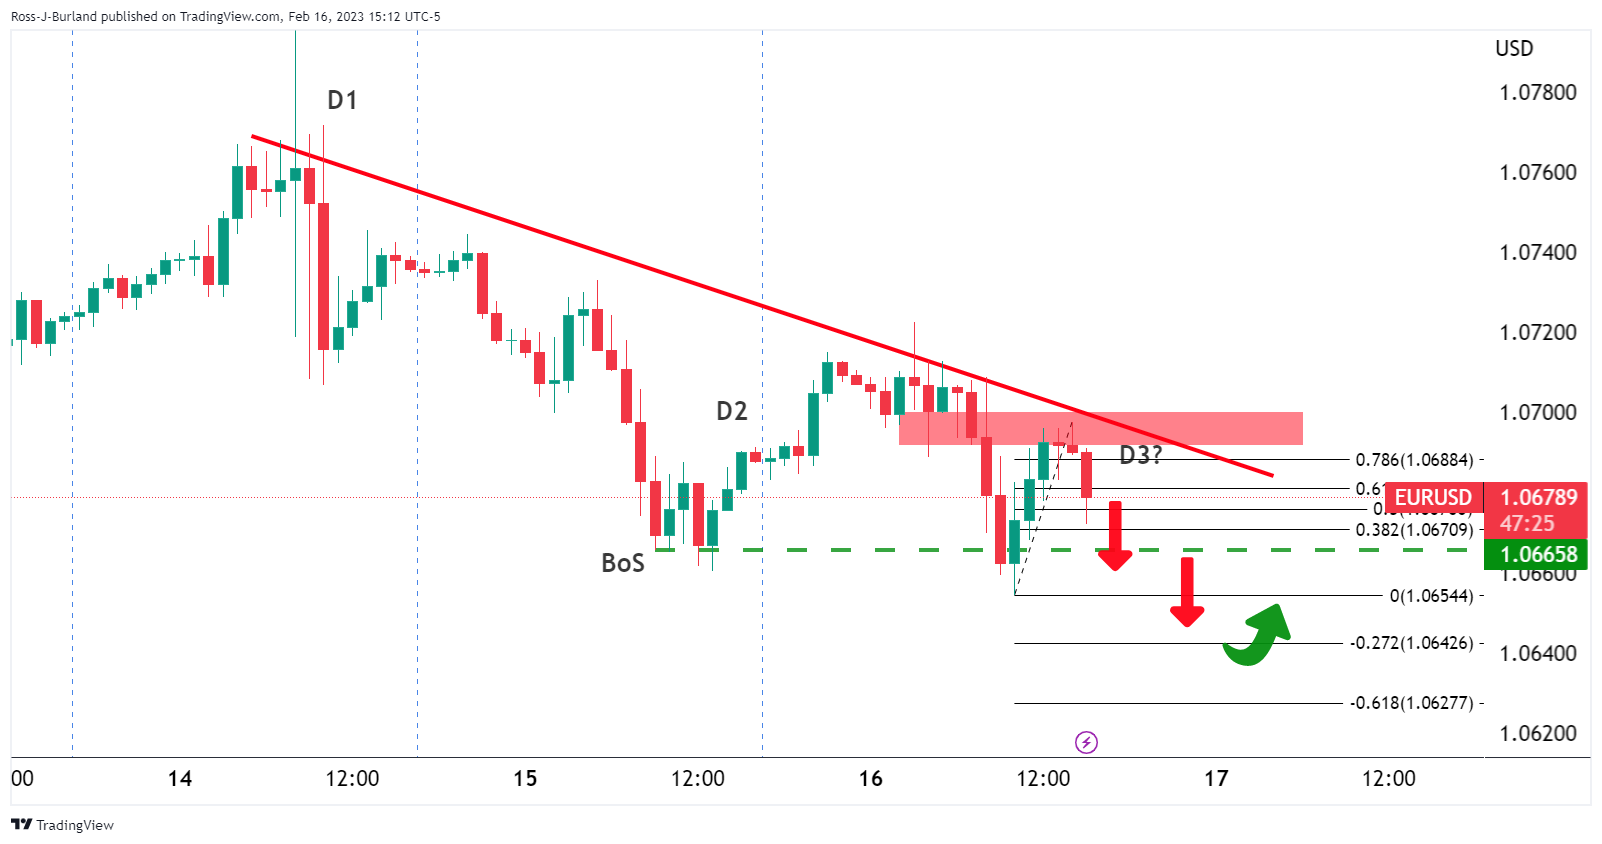
''As illustrated, there have been three days of shorts, old and new, with the latest coming in the last hours on Wall Street.1.0650 is on the bear's radar but given the build-up of shorts, a big squeeze could come into play to end the week and to balance the books:
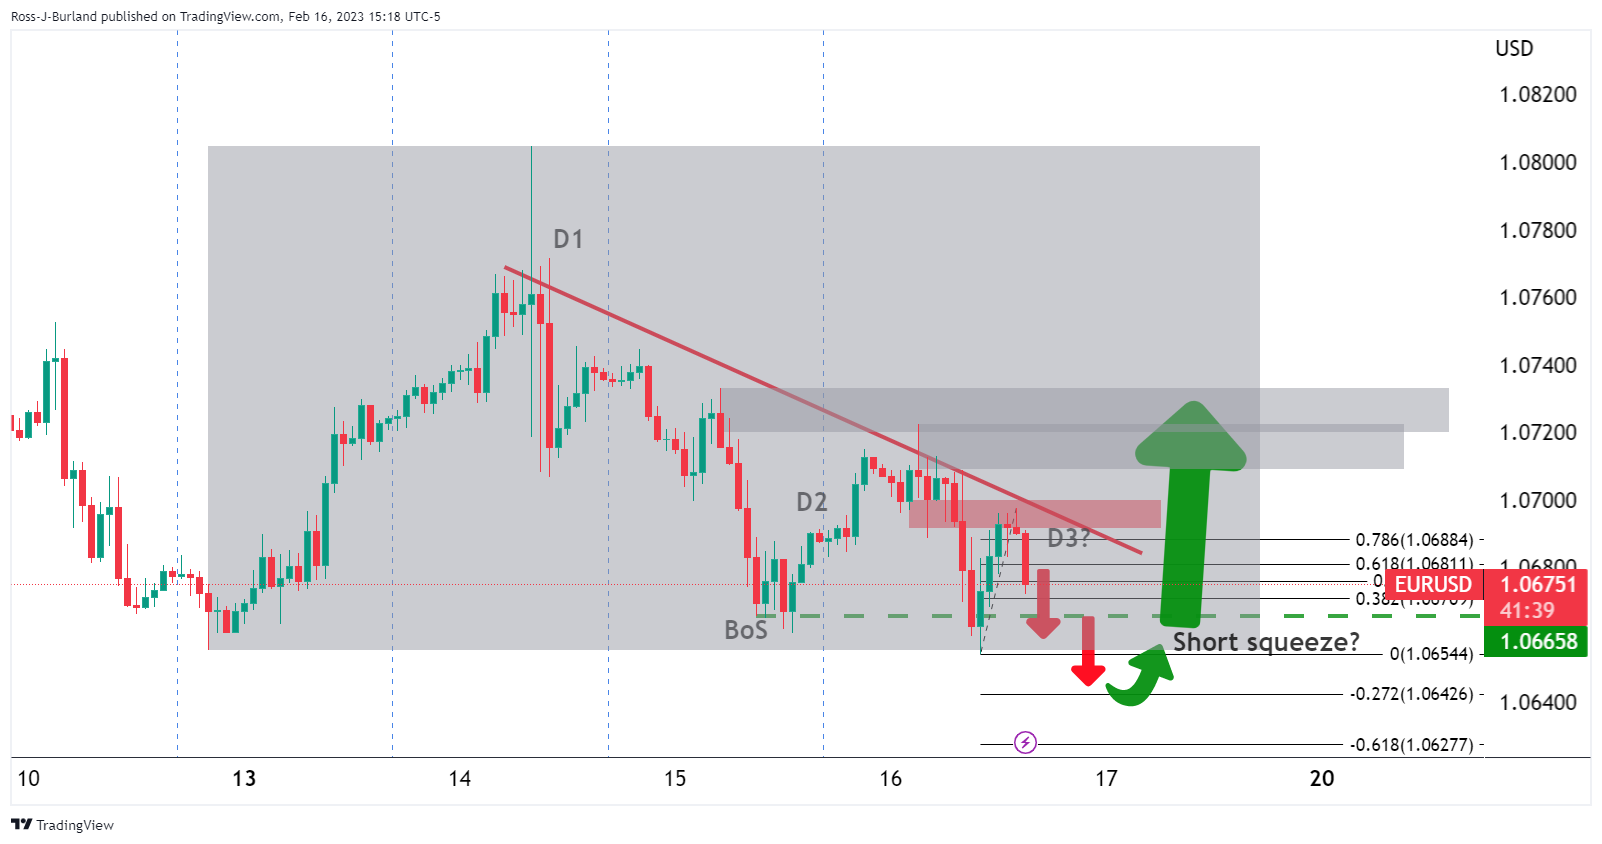
EUR/USD update
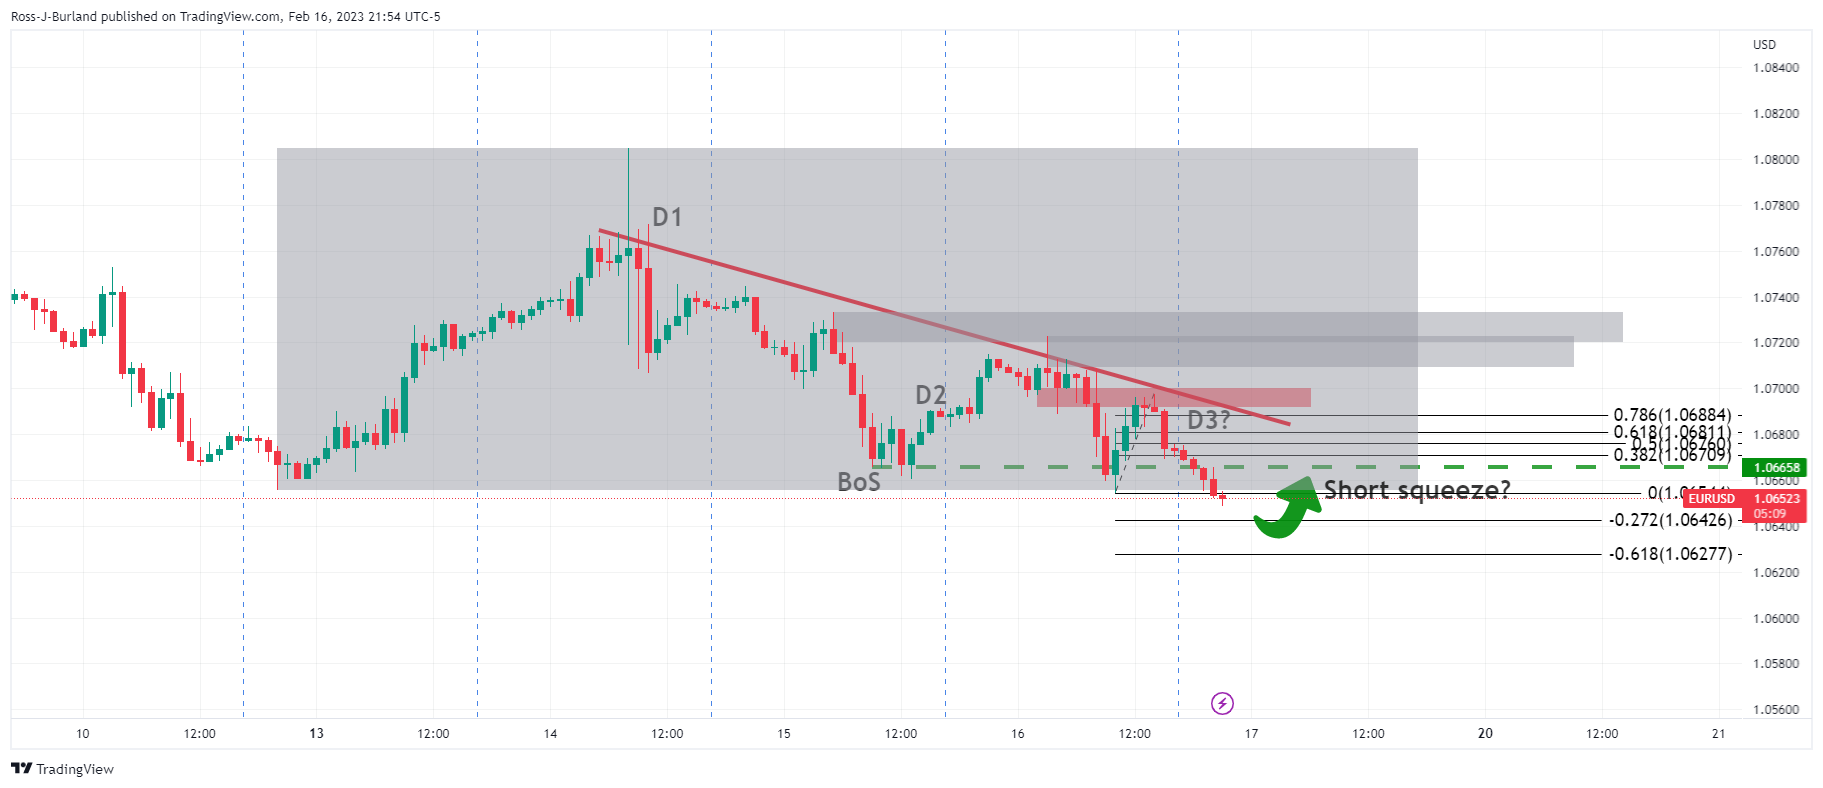
The -272% Fibonacci target is eyed as where the bulls could look to emerge from:
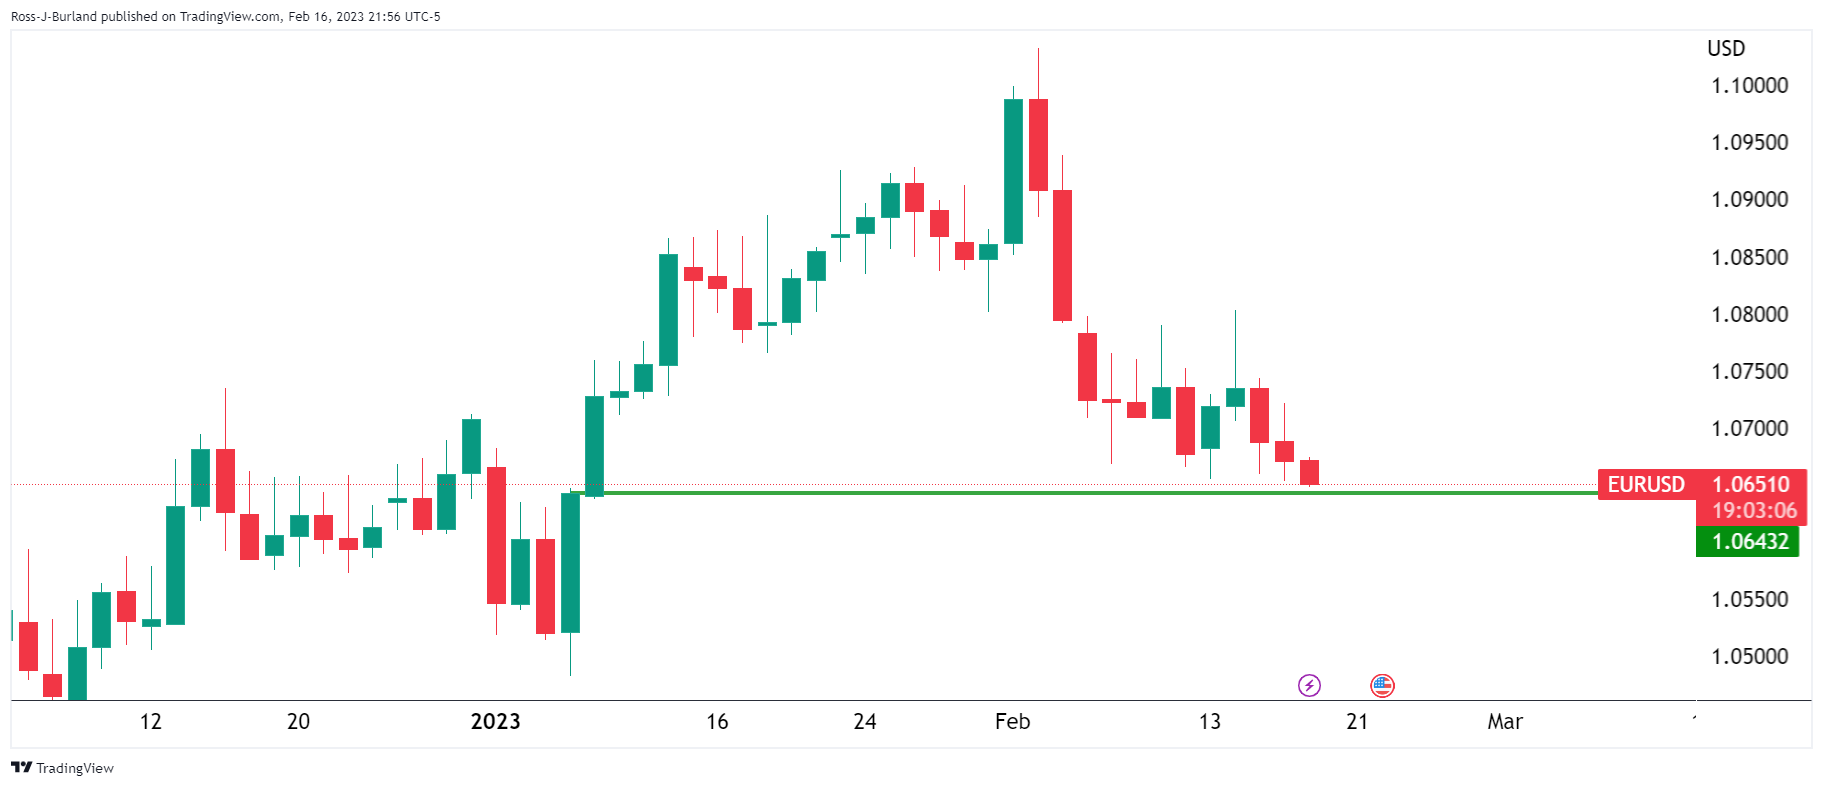
We have a confluence of a closing high here on the daily chart also.
- USD/CHF takes the bids to refresh weekly top during four-day winning streak.
- Hawkish Fed bets, upbeat US data and strong yields underpin US Dollar run-up.
- Risk-off mood adds strength to the upside bias ahead of Swiss Q4 Industrial Production.
USD/CHF pleases bulls around 0.9280-85 as it rises for the fourth consecutive day during early Friday. In doing so, the Swiss Franc (CHF) pair follows the general US Dollar strength amid a light calendar ahead of the fourth quarter (Q4) Industrial Production for Switzerland.
Be it strong US data or the geopolitical risks emanating from China, not to forget hawkish Fed talks and strong US Treasury bond yields, the US Dollar has it all to justify the latest rise. That said, the US Dollar Index (DXY) takes the bids to refresh a six-week high near 104.30 at the latest.
Starting with the US data, Producer Price Index (PPI) for January gained major attention as it jumped the most since June with 0.7% MoM figure. Also positive for the pair was the improvement in the US Initial Jobless Claims for the week ended on February 10, 194K versus 200K expected and 195K prior. On the contrary, a slump in the Housing Starts for January and the Philadelphia Fed Manufacturing Survey for February seemed to have gained a little attention.
The upbeat data allowed the FEDWATCH tool, observed via Reuters, to suggest that the interest rate futures market shows US rates could peak close to 5.25% by July before dropping to 5.0% by the end of the year. The same signals a higher policy pivot than the 5.10% peak conveyed by the Fed in the December meeting, which in turn hints at a few more rate hikes from the US central bank and favors the US Dollar.
Recently, Cleveland Fed President Loretta Mester teased the recession woes while repeating the previous defense of the highest rates. Before that, St. Louis Federal Reserve's James Bullard bolstered the hawkish Fed bias while saying, “Continued policy rate increases can help lock in a disinflationary trend during 2023, even with ongoing growth and strong labor markets, by keeping inflation expectations low.”
On a different page, the fresh US-China tension and Russia’s refrain from stepping back when it comes to attacking Ukraine also weigh on the risk appetite and fuel the USD/CHF pair, due to the US Dollar’s safe-haven demand. That said, US President Joe Biden fired shots at his Chinese counterpart while conveying the expectations for a talk with the Chinese leader, during an interview with NBC News. “I think the last thing that Xi wants is to fundamentally rip the relationship with the United States and with me," said US President Biden per Reuters.
Against this backdrop, S&P 500 Futures dropped 0.30% to 4,086 while poking the weekly low marked the previous day by the press time. In doing so, the US stock futures remain depressed after falling the most in a month on Thursday. Additionally, the US 10-year Treasury bond yields rise to a fresh high since December 30, 2022, up five basis points to 3.896% by the press time. On the same line, two-year US Treasury bond yields print mild gains to end Thursday around 4.64%, the highest levels since November 2022, making rounds 4.679% at the latest.
Moving on, Swiss Q4 Industrial Production, prior 5.2% QoQ, will be important for the USD/CHF pair traders to watch clear directions. However, the bulls are less likely to relinquish control amid the hawkish Fed bias.
Technical analysis
A successful upside break of a three-month-old resistance line, now support around 0.9235, keeps USD/CHF buyers hopeful.
- GBP/USD takes offers to refresh multi-day low, drops for the third consecutive day.
- Clear downside break of six-week-old trend line, bearish MACD signals favor sellers.
- Nearly oversold RSI (14) suggests limited room towards the south.
- 50-SMA holds the key to buyer’s conviction, 1.2000 threshold guards immediate upside.
GBP/USD stands on slippery grounds as it refreshes the 1.5-month low near 1.1950 during early Friday. In doing so, the Cable pair extends the previous day’s downside break of a six-week-old ascending trend line during the three-day losing streak.
Not only the break of a multi-day-old ascending trend line but the bearish MACD signals also favor the GBP/USD sellers.
However, the RSI (14) line is near the oversold territory and suggests consolidation in the Cable price before the next leg towards the south.
As a result, an upward-sloping support line from November 17, 2022, around 1.1920 by the press time, becomes an important support to watch.
Should the GBP/USD pair remains bearish past 1.1920, the odds of witnessing a slump toward the previous monthly low of 1.1841 can’t be ruled out. It’s worth noting that the 1.1900 threshold acts as an extra filter during the anticipated fall.
Alternatively, a convergence of the previous support line from early January and the descending trend line from Tuesday, near the 1.2000 psychological magnet, appears a short-term key hurdle to watch for the GBP/USD pair buyers during a corrective bounce.
Following that the 50-SMA level surrounding 1.2080 should lure the Cable bulls.
On a different page, most of the UK data have been downbeat so far and hence pessimistic expectations from the British Retail Sales for January, up for publishing at 07:00 GMT on Friday, seem to weigh on the quote. Even so, market consensus signals -0.3% MoM figure versus -1.0% previous readings.
GBP/USD: Four-hour chart
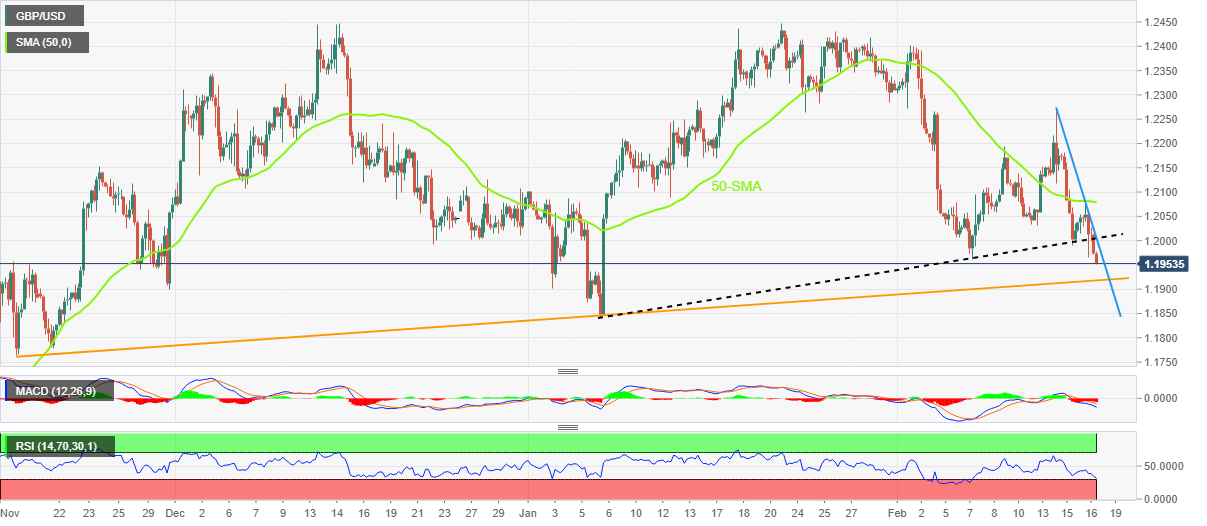
Trend: Limited downside expected
| Raw materials | Closed | Change, % |
|---|---|---|
| Silver | 21.576 | -0.29 |
| Gold | 1836.3 | -0.01 |
| Palladium | 1507.56 | 3.29 |
- Gold price sinks in Asia and the opening range for Friday is wide.
- Bears move in as US Dollar bulls move in to take on key territories.
- US fundamentals are kicking in and finally impacting prices.
The Gold price bears are moving in and are targeting the $1,825 level that has been screaming out since the start of the move in early February. At the time of writing, Gold price is trading at $1,826 as the US dollar surges with pent-up demand.
The US Dollar, as measured against a basket of currencies, has been breaking to the upside and out of a geometrical consolidation's top side resistance albeit on the backside of the prior bullish trends supporting lines. Firmly hawkish Federal Reserve rhetoric and data have seen DXY close firmly above 103.65/80 on Thursday and Friday bulls are moving in for the kill.
The data on Thursday showed that the Producer Price Index (PPI) leapt by 0.7% in January, which was an abrupt reversal of December's 0.2% dip and well above the 0.4% consensus. Year-over-year, the measure fell in at 6%, hotter than the 5.4% projection but a cool-down from the prior (upwardly revised) 6.5% print. The core PPI measure posted a monthly increase of 0.6%, triple the December rate, and an annual increase of 4.5% - a 20 basis point drop from the previous month.
This came on the heels of a blowout January Nonfarm Payrolls report, on Friday and on Thursday, the jobs market data again confirmed that the labour market is still carrying plenty of momentum. The Labor Department reported that jobless claims, for the fifth straight week, came in below the 200,000 level associated with a healthy employment churn.
Retail Sales jumped 3% in January as well, in data showing the prior day, blowing expectations out of the water despite an inflation increase that might have otherwise kept consumers' hands in their pockets, highlighting the strength of the economy.
On Tuesday, the annual Consumer Price Index inflation rate in the US slowed slightly to 6.4% in January from 6.5% in December, the lowest since October 2021 but above market expectations of 6.2%. Last week's Services PMI data for the prior month was impressively high also.
On Thursday, as a consequence, the whole yield curve rose, and markets have started to embrace a higher for longer sentiment as estimates are now rising that the Fed may continue to raise rates into the summer.
Analysts at Societe Generale explained that the current pricing looks for two or three 25bp hikes by September, ''and it may take a bigger inflation scare than we saw in this week's CPI data, or another very strong labour market report at the start of March, to push them higher.''
''Absent that, we will probably get stuck in a range again, before the next move (which we'd guess is more likely to be towards dollar softness as growth resumes elsewhere),'' the analysts said.
Gold & DXY technical analysis
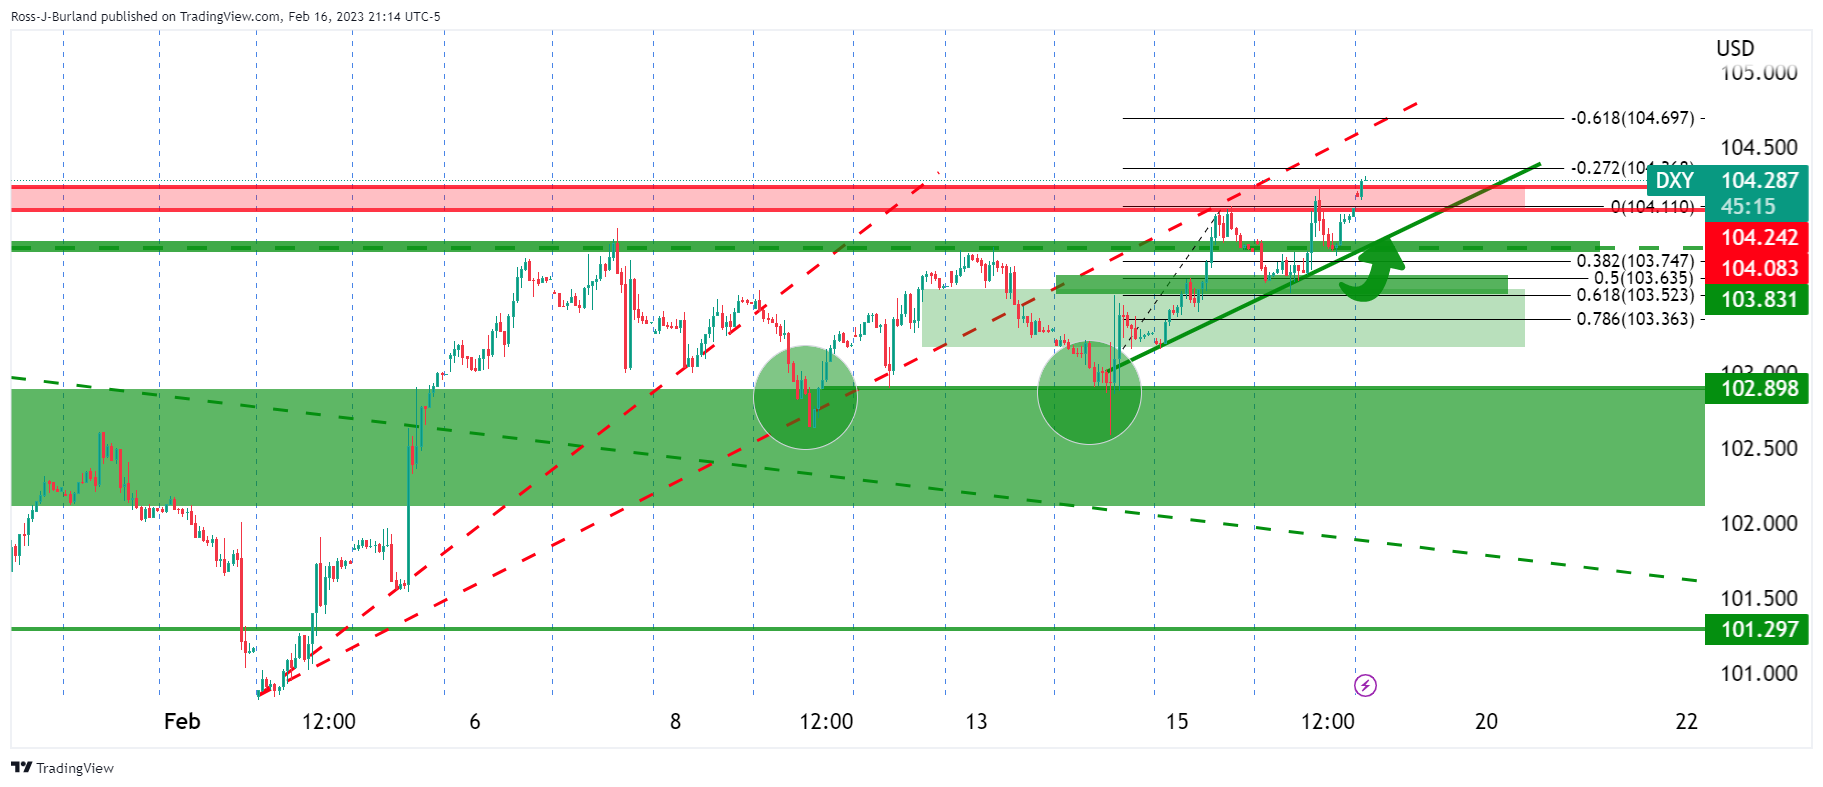
DXY bulls are moving in and breaking new highs which are forcing the offer in Gold price:
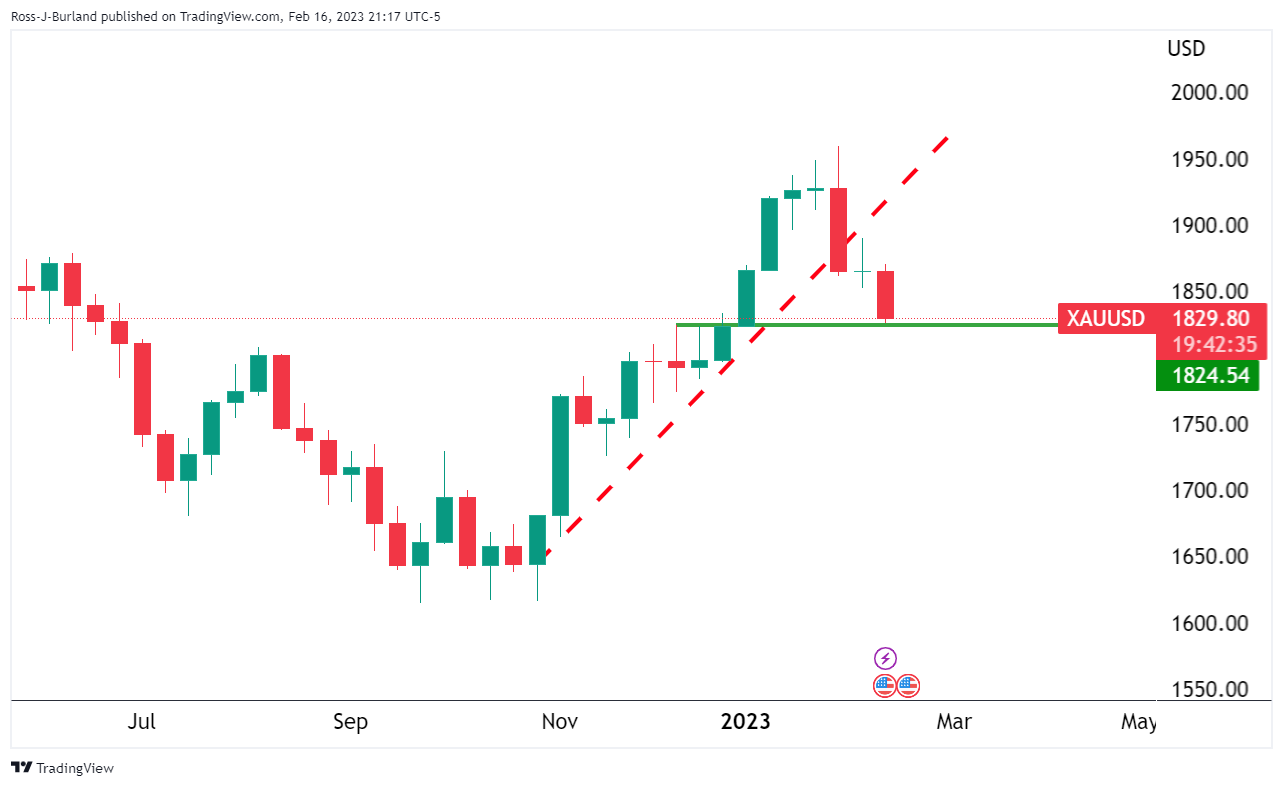
The weekly chart shows the Gold price heading towards the $1,825 target area that has been called out for some weeks in various prior analyses:
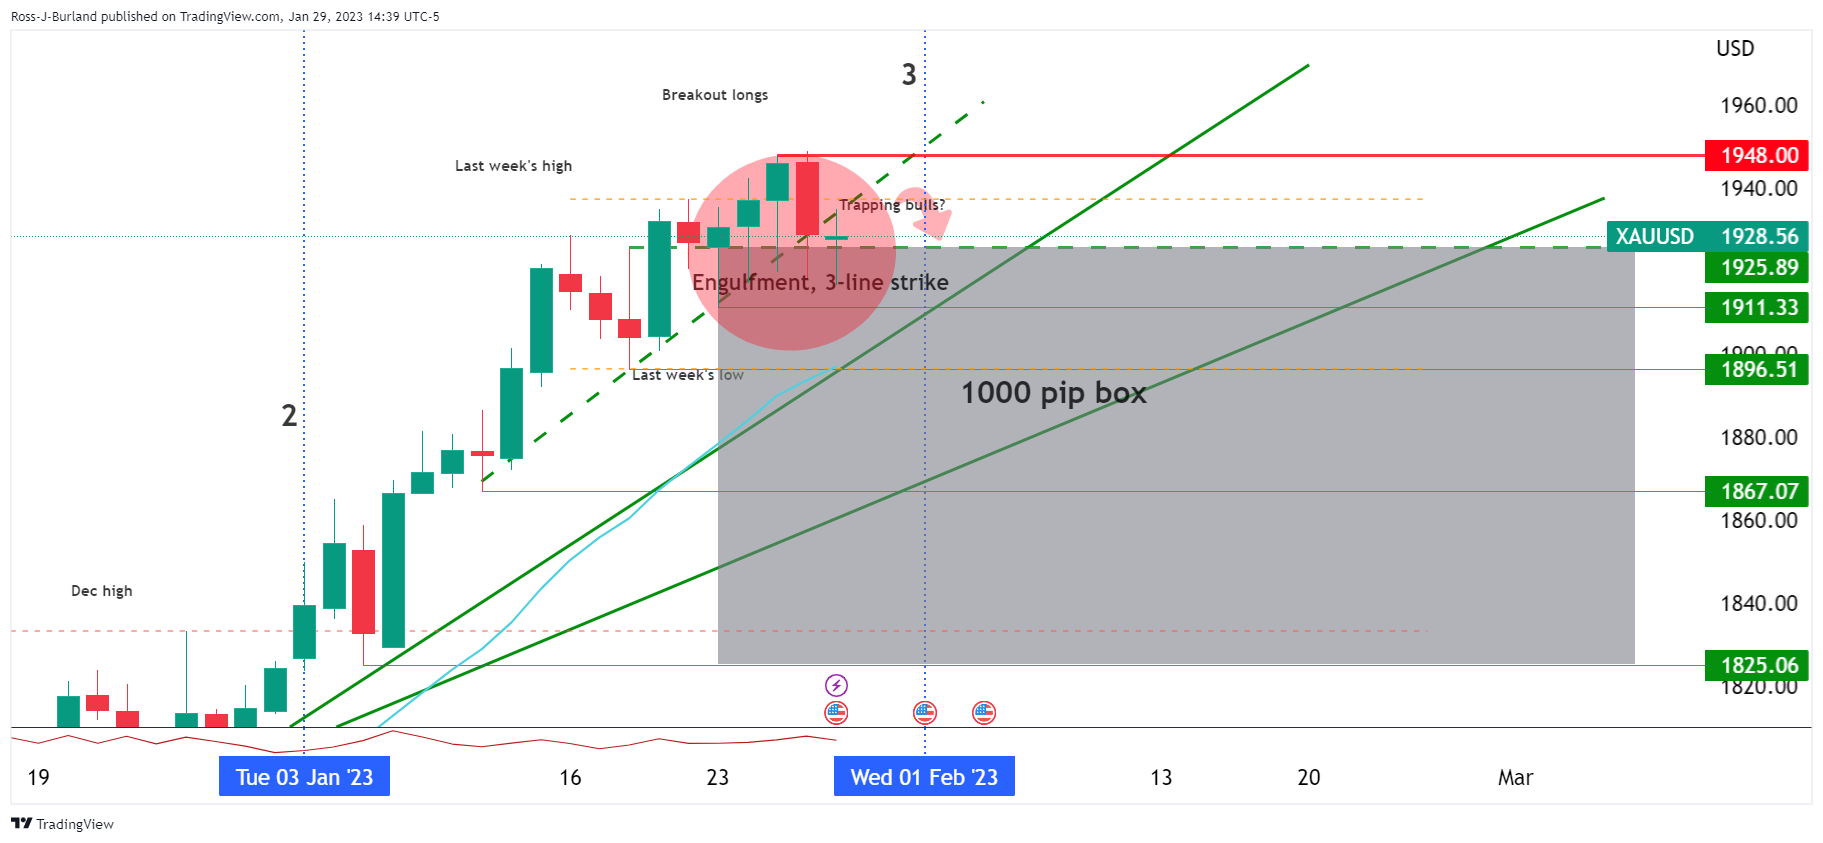
Prior analysis: Gold Price Forecast: XAU/USD bears remain keen on $1,825,
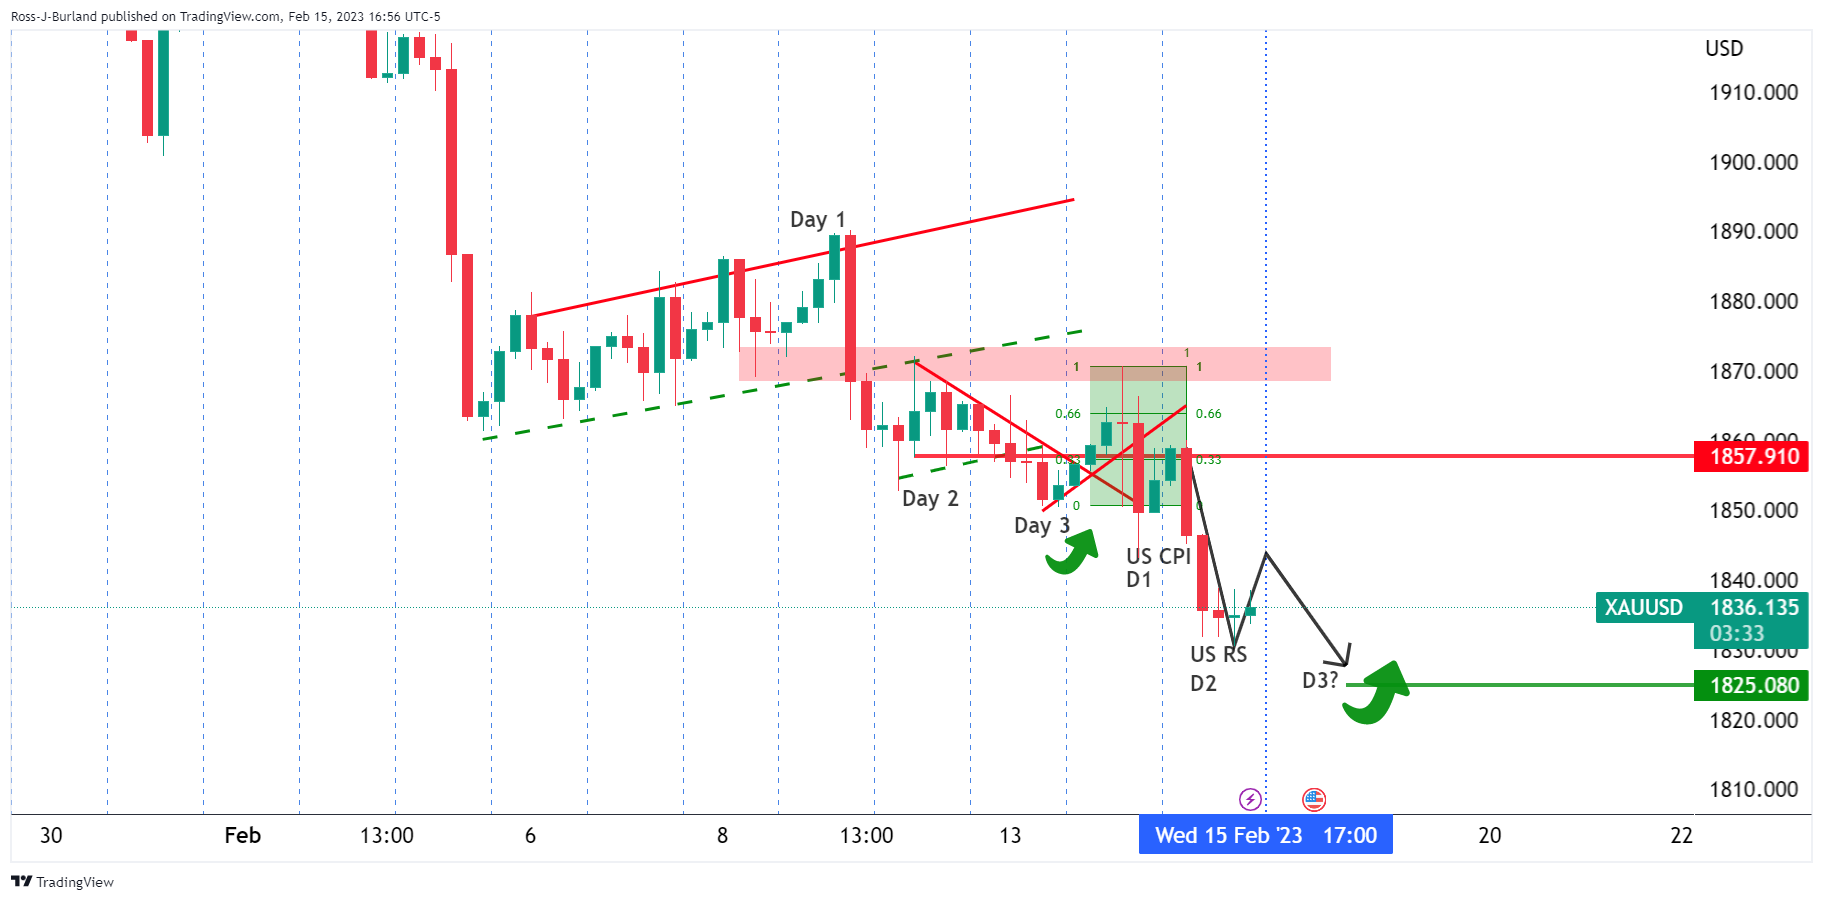
However, Asia could be building the base for a short squeeze to end the week to square the books.
- Market sentiment remains sour as strong US data, Fed talks bolster expectations of higher rates at the US central bank.
- S&P 500 Futures stays pressured near weekly low after falling the most in a month.
- US 10-year Treasury bond yields rally to a fresh high since December 30, 2022.
Risk appetite remains weak during early Friday, extending the previous day’s sour sentiment, as market players anticipate higher Fed rates amid hawkish talks from the US central bank policymakers and upbeat US data.
While portraying the mood, S&P 500 Futures dropped 0.30% to 4,086 while poking the weekly low marked the previous day by the press time. In doing so, the US stock futures remain depressed after falling the most in a month on Thursday.
Additionally, the US 10-year Treasury bond yields rise to a fresh high since December 30, 2022, up five basis points to 3.896% by the press time. On the same line, two-year US Treasury bond yields print mild gains to end Thursday around 4.64%, the highest levels since November 2022, making rounds 4.679% at the latest.
Hawkish comments from the Federal Reserve (Fed) officials and the US-China fears could be considered the latest blow to the risk profile. Recently, Cleveland Fed President Loretta Mester teased the recession woes while repeating the previous defense of the highest rates.
On the other hand, US President Joe Biden fired shots at his Chinese counterpart while conveying the expectations for a talk with the Chinese leader, during an interview with NBC News. “I think the last thing that Xi wants is to fundamentally rip the relationship with the United States and with me," said US President Biden per Reuters.
On the same line could be the headlines suggesting the visit of the Pentagon’s Senior Official to Taiwan.
It should be noted that China’s claims of overcoming Covid woes failed to gain any major attention.
Previously, St. Louis Federal Reserve's James Bullard bolstered the hawkish Fed bias while saying, “Continued policy rate increases can help lock in a disinflationary trend during 2023, even with ongoing growth and strong labor markets, by keeping inflation expectations low.”
US data were also supportive of the expectations suggesting higher Fed rates. That said, US Producer Price Index (PPI) for January gained major attention as it jumped the most since June with 0.7% MoM figure. Also, the US Initial Jobless Claims for the week ended on February 10, 194K versus 200K expected and 195K prior, offered extra blow to the sentiment. Alternatively, a slump in the Housing Starts for January and the Philadelphia Fed Manufacturing Survey for February seemed to have gained a little attention.
While following the data, the latest FEDWATCH read from Reuters signals that the interest rate futures market shows US rates could peak close to 5.25% by July before dropping to 5.0% by the end of the year. The same signals a higher policy pivot than the 5.10% peak conveyed by the Fed in the December meeting, which in turn hints at a few more rate hikes from the US central bank.
To sum up, the geopolitical headlines join the Fed talks to weigh on sentiment amid a light calendar.
- AUD/USD bounces off intraday low to lick its wounds during three-day losing streak.
- Successful break of 50-DMA, two-month-old ascending trend line favor sellers.
- Recovery remains elusive below two-week-old resistance line and weekly top.
AUD/USD picks up bids from the intraday low as it consolidates the weekly low around a multi-day bottom during Friday’s Asian session. Even so, the Aussie pair prints mild losses around 0.6865 by the press time.
The quote’s bearish bias takes clues from the previous day’s clear downside break of the 50-DMA, the first since early November. Also favoring the AUD/USD pair sellers was the quote’s decline below the ascending trend line from December 20, 2022. Furthermore, bearish MACD signals are additional catalysts favoring the Aussie pair’s extra fall.
Amid these plays, the AUD/USD pair is all set to drop further toward the 200-DMA support surrounding 0.6805.
However, the 0.6800 round figure and an upward-sloping support line from mid-October 2022, around 0.6770 by the press time, could challenge the pair bears afterward.
On the flip side, the support-turned-resistance line from December and the 50-DMA restrict immediate AUD/USD rebound near 0.6880-90.
Following that, a downward-sloping resistance line from February 02 and the weekly high, around 0.6980 and 0.7030 in that order, could challenge the AUD/USD pair’s run-up.
In a case where the Aussie pair remains firmer past 0.7030, the odds of witnessing a rally toward the monthly peak of 0.7157 can’t be ruled out.
AUD/USD: Daily chart
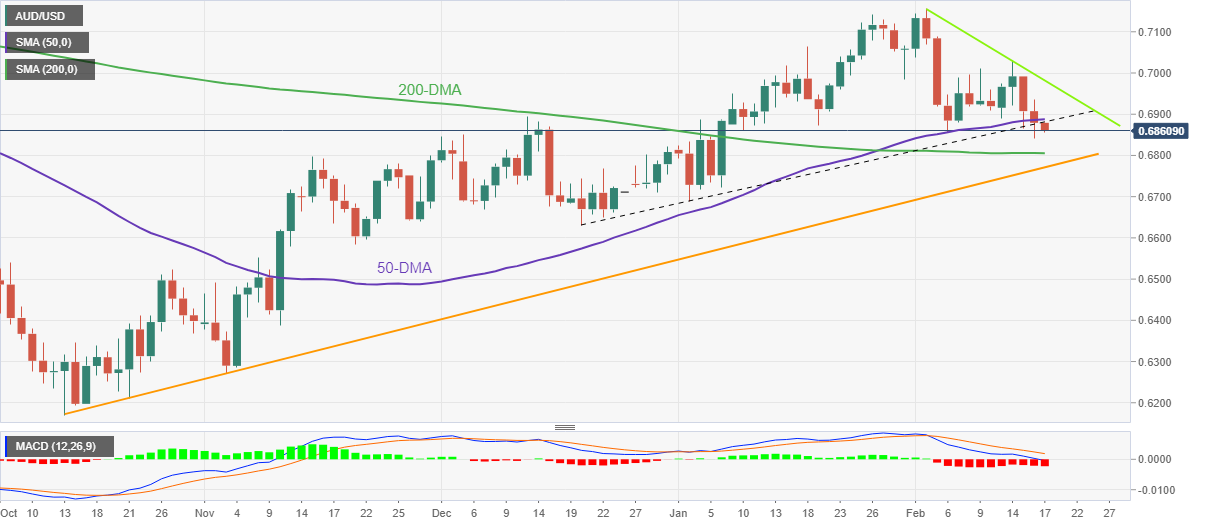
Trend: Further downside expected
In recent trade today, the People’s Bank of China (PBOC) set the yuan at 6.8659 vs. the last close of 6.8550.
About the fix
China maintains strict control of the yuan’s rate on the mainland.
The onshore yuan (CNY) differs from the offshore one (CNH) in trading restrictions, this last one is not as tightly controlled.
Each morning, the People’s Bank of China (PBOC) sets a so-called daily midpoint fix, based on the yuan’s previous day's closing level and quotations taken from the inter-bank dealer.
- USD/CAD remains firmer for the fourth consecutive day, approaches ascending resistance line from January 31.
- Dovish BoC comments versus hawkish Fed talks keeps the buyers hopeful.
- Oil price weakness, upbeat US data add strength to the upside momentum.
USD/CAD grinds higher past 1.3450 as bulls keep the reins during the fourth consecutive day amid the broad US Dollar strength, as well as downbeat prices of WTI crude oil, during early Friday. In doing so, the Loonie pair also justifies dovish commentary from the Bank of Canada (BoC) officials versus the hawkish remarks from the Federal Reserve (Fed) policymakers, not to forget the upbeat US data.
Earlier in Asia, BoC Deputy Governor Paul Beaudry mentioned, “Floating Canadian Dollar gives the bank the flexibility to chart a different path than trading partners and focus on setting interest rates.” The same underpins the dovish bias about the Canadian central bank, as previously confirmed by BoC Governor Tiff Macklem as he said on Thursday, “We’ve seen some evidence that our interest rate increases are starting to slow demand and rebalance our overheated economy."
On the other hand, Cleveland Fed President Loretta Mester teased the recession woes while repeating the previous defense of the highest rates. Previously, St. Louis Federal Reserve's James Bullard said, “Continued policy rate increases can help lock in a disinflationary trend during 2023, even with ongoing growth and strong labor markets, by keeping inflation expectations low.”
Talking about the data, US Producer Price Index (PPI) for January gained major attention from the USD/JPY buyers as it jumped the most since June with 0.7% MoM figure. Also positive for the pair was the improvement in the US Initial Jobless Claims for the week ended on February 10, 194K versus 200K expected and 195K prior. Alternatively, a slump in the Housing Starts for January and the Philadelphia Fed Manufacturing Survey for February seemed to have gained a little attention.
It should be noted that the WTI crude oil prints mild gains while paring the weekly losses around $78.40 by the press time. Given the Canadian economy’s reliance on the WTI exports, the weekly fall in the black gold’s price favors the USD/CAD bulls.
Other than the central bank talks, US data and Oil’s move, the geopolitical catalysts also propel the USD/CAD prices. That said, the fresh US-China tension and Russia’s refrain from stepping back when it comes to attacking Ukraine also weigh on the risk appetite and fuel the Loonie pair, due to the US Dollar’s safe-haven demand. That said, US President Joe Biden fired shots at his Chinese counterpart while conveying the expectations for a talk with the Chinese leader, during an interview with NBC News. “I think the last thing that Xi wants is to fundamentally rip the relationship with the United States and with me," said US President Biden per Reuters.
Amid these plays, the US 10-year Treasury bond yields rises to a fresh high since December 30, 2022, up 3.5 basis points to 3.87% by the press time. On the same line, two-year US Treasury bond yields print mild gains to end Thursday around 4.64%, the highest levels since November 2022, making rounds 4.65% at the latest. Furthermore, Wall Street closed negative and the S&P 500 Futures dropped 0.30% intraday by the press time.
To sum up, the risk-off mood and hawkish Fed talks, versus the dovish BoC can keep the USD/CAD pair firmer even as the Oil price licks its wounds.
Technical analysis
USD/CAD pierces the 50-DMA hurdle surrounding 1.3470 to aim for a two-week-old resistance line near 1.3480.
- NZD/USD holds lower ground near six-week low, prints four-day downtrend.
- Clear break of three-month-old ascending trend line, bearish MACD signals favor sellers.
- Upward-sloping support line from late November holds the key to further downside toward 200-DMA.
- Bulls need validation from fortnight-old descending resistance line.
NZD/USD bears stay in the driver’s seat for the fourth consecutive day, down 0.23% intraday around 0.6240 during early Friday. In doing so, the Kiwi pair remains depressed near the 1.5-month low marked the previous day.
That said, the quote’s sustained downside break of the previous support line from mid-November 2022, now resistance around 0.6300, keeps the pair bears hopeful. Adding strength to the downside bias are the bearish MACD signals and the lower high formation on the daily chart.
As a result, the NZD/USD bears are well-set to battle with a 2.5-month-long support line, currently around 0.6220.
However, the quote’s further downside will need validation from the 0.6200 round figure and the 200-DMA level of 0.6177 to keep the bears in command.
Meanwhile, the previous support line from November, around 0.6300, guards the NZD/USD pair’s recovery moves.
Following that, a two-week-old descending resistance line, close to 0.6340 at the latest, will be crucial for the pair buyers to cross. Even so, the weekly high of 0.6390 and the .06400 round figure could challenge the upside momentum.
In a case where the NZD/USD remains firmer past 0.6400, the odds of witnessing a run-up toward the monthly high near 0.6540 can’t be ruled out.
NZD/USD: Daily chart
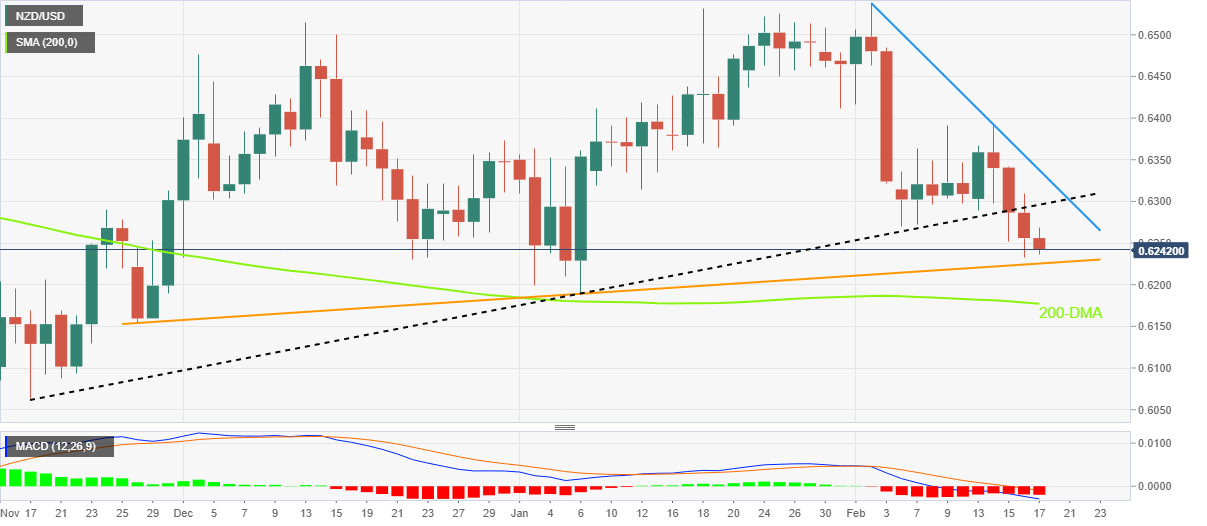
Trend: Further downside expected
- USD/JPY reverses the previous day’s pullback from six-week high.
- Upbeat US data, risk-aversion propels the Yen pair near the multi-day top amid light calendar.
- Fed policymakers appear hawkish but BoJ talks defend current policy.
USD/JPY regains upside momentum near the 1.5-month high, following a retreat from the multi-day top, as the Yen pair renews its intraday high near 134.20 as Tokyo opens for Friday. In doing so, the Yen pair justifies the firmer US Treasury bond yields and the hawkish Fed concerns amid upbeat US data and cautious comments from the Bank of Japan (BoJ) Officials.
That said, the US 10-year Treasury bond yields rises to a fresh high since December 30, 2022, up 3.5 basis points to 3.87% by the press time. On the same line, two-year US Treasury bond yields print mild gains to end Thursday around 4.64%, the highest levels since November 2022, making rounds 4.65% at the latest.
Underlying the strong Treasury bond yields could be the upbeat US data and hawkish Federal Reserve talks.
Recently, Cleveland Fed President Loretta Mester teased the recession woes while repeating the previous defense of the highest rates. Before that, St. Louis Federal Reserve's James Bullard said, “Continued policy rate increases can help lock in a disinflationary trend during 2023, even with ongoing growth and strong labor markets, by keeping inflation expectations low.”
On the other hand, Japan's Finance Minister (FinMin) Shun’ichi Suzuki tried to sell the idea that the latest Bank of Japan (BoJ) nominations are perfect to defend the central bank’s latest role. The same hints at a prolonged easy money policy and weigh on the Japanese Yen (JPY). “Nomination of BoJ nominees as result of consideration towards structural wage hikes and sustainable, stable achievement of the inflation target,” said Japan’s FinMin Suzuki.
It should be noted that the US Producer Price Index (PPI) for January gained major attention from the USD/JPY buyers as it jumped the most since June with 0.7% MoM figure. Also positive for the pair was the improvement in the US Initial Jobless Claims for the week ended on February 10, 194K versus 200K expected and 195K prior. Alternatively, a slump in the Housing Starts for January and the Philadelphia Fed Manufacturing Survey for February seemed to have gained a little attention.
Elsewhere, the fresh US-China tension and Russia’s refrain from stepping back when it comes to attacking Ukraine also weigh on the risk appetite and the EUR/USD prices, due to the US Dollar’s safe-haven demand. That said, US President Joe Biden fired shots at his Chinese counterpart while conveying the expectations for a talk with the Chinese leader, during an interview with NBC News. “I think the last thing that Xi wants is to fundamentally rip the relationship with the United States and with me," said US President Biden per Reuters.
Amid these plays, Wall Street closed negative and the S&P 500 Futures dropped 0.30% intraday by the press time.
Looking forward, USD/JPY buyers are likely to keep the reins and may propel the price towards refreshing the multi-day high above 134.00 amid a lack of major data/events on the calendar, other than what’s already mentioned above.
Technical analysis
A successful daily closing beyond the 200-day Exponential Moving Average (EMA), around 133.80 by the press time, directs USD/JPY toward the 100-day EMA resistance surrounding 134.75-80.
Japan's government picked academic Kazuo Ueda as the new central bank chief on expectations for stably sustaining the inflation target along with structural wage hikes, finance minister Shunichi Suzuki said on Friday.
Suzuki also told reporters after a cabinet meeting Japan is coordinating with other countries on the agenda for when the Group of Seven financial leaders' meeting takes place later this month.
Suzuki explained that the nomination of the Bank of Japan nominees is a result of consideration towards structural wage hikes and sustainable, stable achievement of the inflation target.
''Himino, Uchida presented as nominees for their deep experience of financial, monetary policies,'' he said.
''We are arranging with other countries on agenda for when G7 finmin meeting takes place.''
USD/JPY update
More to come ...
New Zealand Financial Minister Robertson said events will exacerbate a slowdown in the economy and that is evidence that inflation has peaked.
More to come...
| Index | Change, points | Closed | Change, % |
|---|---|---|---|
| NIKKEI 225 | 194.58 | 27696.44 | 0.71 |
| Hang Seng | 175.5 | 20987.67 | 0.84 |
| KOSPI | 47.58 | 2475.48 | 1.96 |
| ASX 200 | 58.1 | 7410.3 | 0.79 |
| FTSE 100 | 14.73 | 8012.53 | 0.18 |
| DAX | 27.3 | 15533.64 | 0.18 |
| CAC 40 | 65.3 | 7366.16 | 0.89 |
| Dow Jones | -431.2 | 33696.85 | -1.26 |
| S&P 500 | -57.19 | 4090.41 | -1.38 |
| NASDAQ Composite | -214.76 | 11855.83 | -1.78 |
- US Dollar Index seesaw near multi-day high amid hawkish Federal Reserve bias.
- Upbeat US data propel Treasury bond yields and Fed bets over higher policy pivot.
- Fed officials reaffirm readiness for further rate hikes.
- US-China story adds to the market’s fears and strengthens US Dollar’s haven demand.
US Dollar Index (DXY) prints mild gains around 104.15 as bulls flirt with the six-week high amid early Friday. That said, the hawkish Federal Reserve (Fed) commentary and upbeat US data, as well as the US-China tension, could be considered to play major roles in portraying the DXY’s three-day uptrend.
On Wednesday, the US Producer Price Index (PPI) for January gained major attention as it jumped the most since June with 0.7% MoM figure. Also positive was the improvement in the US Initial Jobless Claims for the week ended on February 10, 194K versus 200K expected and 195K prior. Alternatively, a slump in the Housing Starts for January and the Philadelphia Fed Manufacturing Survey for February seemed to have gained a little attention.
Following the data, St. Louis Federal Reserve's James Bullard and Cleveland Fed President Loretta Mester conveyed their hawkish bias and bolstered the greenback. Among them, the Fed’s Bullard said, “Continued policy rate increases can help lock in a disinflationary trend during 2023, even with ongoing growth and strong labor markets, by keeping inflation expectations low.” Fed’s Mester, on the same line, stated that the Fed will need to go above 5% and stay there for a while. The policymaker also added that she is not ready to say if the Fed needs a bigger rate increase at the next policy meeting but said that she would not want to surprise the markets.
It should be noted that the latest FEDWATCH read from Reuters signals that the interest rate futures market shows US rates could peak close to 5.25% by July before dropping to 5.0% by the end of the year. The same signals a higher policy pivot than the 5.10% peak conveyed by the Fed in the December meeting, which in turn hints at a few more rate hikes from the Fed and favors the US Dollar bulls.
On a different page, the fresh US-China tension and Russia’s refrain from stepping back when it comes to attacking Ukraine also weigh on the risk appetite and the EUR/USD prices, due to the US Dollar’s safe-haven demand. That said, US President Joe Biden fired shots at his Chinese counterpart while conveying the expectations for a talk with the Chinese leader, during an interview with NBC News. “I think the last thing that Xi wants is to fundamentally rip the relationship with the United States and with me," said US President Biden per Reuters.
Against this backdrop, Wall Street closed negative and the S&P 500 Futures dropped 0.30% intraday by the press time. It should be noted that the US 10-year Treasury bond yields rose to the highest levels in 2023 with the latest print of 3.86% while its two-year counterpart also printed mild gains to end the day around 4.64%, making rounds to the highest levels since November 2022.
Given the fresh fuel to the hawkish Federal Reserve concerns, backed by upbeat US data, a light calendar on Friday can keep the DXY bulls in the driver’s seat ahead of the next week’s Monetary Policy Meeting Minutes for the Federal Open Market Committee’s (FOMC) latest move.
Technical analysis
A successful break of the 50-day Exponential Moving Average (EMA) and the three-month-old descending trend line, respectively near 103.80 and 103.60, keeps US Dollar Index buyers hopeful of challenging January’s high near 105.65.
Reuters reported that Cleveland Fed President Loretta Mester said as the Federal Reserve's higher interest rates slow the economy, a recession may result, though it's not part of her baseline forecast and is not what the central bank wants.
"I don't think it's a positive outcome, but it may happen," Mester said. "We may have a mild recession - I can't rule that out. I haven't penciled that in to my own projection, but when you have growth well below trend, it wouldn't take that much of a negative shock -- but again I don't think that's necessarily a positive thing, that's not what we are engineering to do."
More to come..
| Pare | Closed | Change, % |
|---|---|---|
| AUDUSD | 0.68787 | -0.31 |
| EURJPY | 142.956 | -0.24 |
| EURUSD | 1.06732 | -0.13 |
| GBPJPY | 160.559 | -0.43 |
| GBPUSD | 1.19878 | -0.31 |
| NZDUSD | 0.62566 | -0.36 |
| USDCAD | 1.34568 | 0.53 |
| USDCHF | 0.92574 | 0.32 |
| USDJPY | 133.94 | -0.13 |
© 2000-2026. All rights reserved.
This site is managed by Teletrade D.J. LLC 2351 LLC 2022 (Euro House, Richmond Hill Road, Kingstown, VC0100, St. Vincent and the Grenadines).
The information on this website is for informational purposes only and does not constitute any investment advice.
The company does not serve or provide services to customers who are residents of the US, Canada, Iran, The Democratic People's Republic of Korea, Yemen and FATF blacklisted countries.
Making transactions on financial markets with marginal financial instruments opens up wide possibilities and allows investors who are willing to take risks to earn high profits, carrying a potentially high risk of losses at the same time. Therefore you should responsibly approach the issue of choosing the appropriate investment strategy, taking the available resources into account, before starting trading.
Use of the information: full or partial use of materials from this website must always be referenced to TeleTrade as the source of information. Use of the materials on the Internet must be accompanied by a hyperlink to teletrade.org. Automatic import of materials and information from this website is prohibited.
Please contact our PR department if you have any questions or need assistance at pr@teletrade.global.
