- Analytics
- News and Tools
- Market News
CFD Markets News and Forecasts — 17-02-2021
| Time | Country | Event | Period | Previous value | Forecast |
|---|---|---|---|---|---|
| 00:30 (GMT) | Australia | Unemployment rate | January | 6.6% | 6.5% |
| 00:30 (GMT) | Australia | Changing the number of employed | January | 50 | 20 |
| 07:00 (GMT) | Switzerland | Trade Balance | January | 3.05 | |
| 12:30 (GMT) | Eurozone | ECB Monetary Policy Meeting Accounts | |||
| 13:00 (GMT) | U.S. | FOMC Member Brainard Speaks | |||
| 13:30 (GMT) | U.S. | Continuing Jobless Claims | February | ||
| 13:30 (GMT) | Canada | New Housing Price Index, MoM | January | 0.3% | |
| 13:30 (GMT) | Canada | New Housing Price Index, YoY | January | 4.6% | |
| 13:30 (GMT) | U.S. | Initial Jobless Claims | February | ||
| 13:30 (GMT) | U.S. | Import Price Index | January | 0.9% | |
| 13:30 (GMT) | U.S. | Building Permits | January | 1.704 | |
| 13:30 (GMT) | U.S. | Housing Starts | January | 1.669 | |
| 13:30 (GMT) | U.S. | Philadelphia Fed Manufacturing Survey | February | 26.5 | 22 |
| 15:00 (GMT) | Eurozone | Consumer Confidence | February | -15.5 | |
| 15:00 (GMT) | U.S. | FOMC Member Bostic Speaks | |||
| 16:00 (GMT) | U.S. | Crude Oil Inventories | February | -6.644 | |
| 21:45 (GMT) | New Zealand | PPI Input (QoQ) | Quarter IV | 0.6% | |
| 21:45 (GMT) | New Zealand | PPI Output (QoQ) | Quarter IV | -0.3% | |
| 23:30 (GMT) | Japan | National CPI Ex-Fresh Food, y/y | January | -1% | |
| 23:30 (GMT) | Japan | National Consumer Price Index, y/y | January | -1.2% |
- Labor market still disrupted
- Infections and vaccinations still determining the path of economy
- Payroll creation in January was a pretty weak number
- All major inflation measures are "quite low" right now
- Increase in 10-year Treasury bond yield points to anticipation that economy will do better in second half of the year
- Consumption over the next couple of months will be boosted by fiscal actions already taken and likely to come
- Says he Would be surprised if there a sustained inflation rate that hits Fed's 2% target within next year or two
- If inflation becomes problem "the Fed will take care of it"
The Commerce
Department announced on Wednesday that business inventories rose 0.6 percent
m-o-m in December, following an unrevised 0.5 percent m-o-m advance in November.
That exceeded
economists’ forecast for a 0.5 percent m-o-m increase.
According to
the report, stocks at retailers jumped 1.2 percent m-o-m, while inventories at manufacturers
and wholesalers both rose by 0.3 percent m-o-m.
The National
Association of Homebuilders (NAHB) announced on Wednesday its housing market
index (HMI) rose 1 point to 84 in February from 83 in January.
Economists had
forecast the HMI to stay at 83.
A reading over
50 indicates more builders view conditions as good than poor.
The three HMI
components were mixed this month. The indicator gauging current sales
conditions held steady at 90 in February, while the measure charting sales
expectations dropped 3 points to 80 and the component measuring traffic of
prospective buyers rose 4 points to 72.
NAHB Chairman
Chuck Fowke noted: “Lumber prices have been steadily rising this year and hit a
record high in mid-February, adding thousands of dollars to the cost of a new
home and causing some builders to abruptly halt projects at a time when inventories
are already at all-time lows. Builders remain very focused on regulatory and
other policy issues that could price out households seeking new homes in a
tight market this year.”
Meanwhile, NAHB
Chief Economist Robert Dietz said: “Demand conditions remain solid due to
demographics, low mortgage rates and the suburban shift to lower-cost markets,
but we expect to see some cooling in growth rates for residential construction
in 2021 due to cost factors, supply chain issues and regulatory risks. Some
builders are at capacity and may not be able to expand production due to these
headwinds.”
The Federal
Reserve reported on Wednesday the U.S. industrial production rose 0.9 percent
m-o-m in January 2021, following a revised 1.3 percent m-o-m increase in December
2020 (originally a 1.6 percent m-o-m jump).
Economists had
forecast industrial production would increase 0.5 percent m-o-m in January.
According to
the report, manufacturing output rose 1.0 percent m-o-m in January and mining
production advanced 2.3 percent m-o-m. Meanwhile, the output of utilities decreased
1.2 percent m-o-m.
Capacity
utilization for the industrial sector increased 0.7 percentage points m-o-m to
75.6 percent in January. That was 0.8 percentage point above economists’
forecast but 4.0 percentage points below its long-run (1972-2020) average.
In y-o-y terms,
the industrial output dropped 1.8 percent in January, following a revised 3.2
percent plunge in the prior month (originally a 3.6 percent decline). This was the
smallest decrease since February 2020.
- Says he is optimistic for 2021 but recent fiscal package provides help
- Retail sales bump in January likely aided by stimulus
- Vaccinated populations have a lot of pent up demand starting toward the middle of the year
The Labor
Department reported on Wednesday the U.S. producer-price index (PPI) rose 1.3
percent m-o-m in January 2021, following an unrevised 0.3 percent m-o-m gain in
December 2020. This advance was the largest since the index began in December
2009.
For the 12
months through January, the PPI increased 1.7 percent after an unrevised 0.8
percent advance in the previous month. That was the largest increase since the 12
months ended January 2020.
Economists had
forecast the headline PPI would increase 0.4 percent m-o-m last month and 0.9
percent over the past 12 months.
According to
the report, two-thirds of the January increase in prices for final demand can
be traced to a 1.3-percent m-o-m rise in the index for final demand services. In
addition, prices for final demand goods rose 1.4 percent m-o-m.
Excluding
volatile prices for food and energy, the PPI went up 1.2 percent m-o-m and
jumped 2.0 percent over 12 months. Economists had forecast gains of 0.2 percent
m-o-m and 1.1 percent y-o-y.
U.S. stock-index futures fell on Wednesday, as investors weighed improving economic data and prospects of faster inflation in the U.S.
Global Stocks:
Index/commodity | Last | Today's Change, points | Today's Change, % |
Nikkei | 30,292.19 | -175.56 | -0.58% |
Hang Seng | 31,084.94 | +338.28 | +1.10% |
Shanghai | - | - | - |
S&P/ASX | 6,885.20 | -32.10 | -0.46% |
FTSE | 6,737.43 | -11.43 | -0.17% |
CAC | 5,785.42 | -1.11 | -0.02% |
DAX | 14,000.41 | -64.19 | -0.46% |
Crude oil | $60.79 | +1.23% | |
Gold | $1,775.00 | -1.33% |
(company / ticker / price / change ($/%) / volume)
ALCOA INC. | AA | 22.59 | 0.16(0.71%) | 17645 |
ALTRIA GROUP INC. | MO | 43.39 | -0.02(-0.05%) | 24236 |
Amazon.com Inc., NASDAQ | AMZN | 3,271.00 | 2.05(0.06%) | 22341 |
American Express Co | AXP | 130.08 | -0.60(-0.46%) | 760 |
AMERICAN INTERNATIONAL GROUP | AIG | 42.4 | 0.25(0.59%) | 9094 |
Apple Inc. | AAPL | 131.7 | -1.49(-1.12%) | 1220480 |
AT&T Inc | T | 28.88 | -0.09(-0.31%) | 97364 |
Boeing Co | BA | 215.58 | -1.60(-0.74%) | 36508 |
Caterpillar Inc | CAT | 202.8 | 0.42(0.21%) | 4011 |
Chevron Corp | CVX | 96.3 | 3.17(3.40%) | 176575 |
Cisco Systems Inc | CSCO | 46.36 | -0.15(-0.32%) | 129868 |
Citigroup Inc., NYSE | C | 64.16 | 0.04(0.06%) | 64490 |
E. I. du Pont de Nemours and Co | DD | 71.49 | 0.50(0.70%) | 4540 |
Exxon Mobil Corp | XOM | 52.4 | 0.36(0.69%) | 257773 |
Facebook, Inc. | FB | 272.7 | -1.27(-0.46%) | 59669 |
FedEx Corporation, NYSE | FDX | 262.22 | 0.39(0.15%) | 2929 |
Ford Motor Co. | F | 11.66 | 0.12(1.04%) | 646342 |
Freeport-McMoRan Copper & Gold Inc., NYSE | FCX | 33.13 | 0.23(0.70%) | 123201 |
General Electric Co | GE | 11.89 | -0.08(-0.67%) | 156747 |
General Motors Company, NYSE | GM | 53.37 | -0.09(-0.17%) | 66199 |
Goldman Sachs | GS | 312 | 0.04(0.01%) | 2954 |
Google Inc. | GOOG | 2,119.00 | -2.90(-0.14%) | 3179 |
Hewlett-Packard Co. | HPQ | 27.03 | -0.13(-0.48%) | 1730 |
Home Depot Inc | HD | 275.5 | 0.11(0.04%) | 2656 |
Intel Corp | INTC | 61.8 | -0.67(-1.07%) | 78113 |
International Business Machines Co... | IBM | 119.81 | -0.26(-0.22%) | 6722 |
International Paper Company | IP | 48.36 | -0.32(-0.65%) | 4853 |
Johnson & Johnson | JNJ | 165.3 | 0.23(0.14%) | 13542 |
JPMorgan Chase and Co | JPM | 144.16 | -0.49(-0.34%) | 66604 |
McDonald's Corp | MCD | 214.46 | -0.57(-0.27%) | 1176 |
Merck & Co Inc | MRK | 74.6 | 0.35(0.47%) | 48153 |
Microsoft Corp | MSFT | 242.11 | -1.03(-0.42%) | 79883 |
Nike | NKE | 141.72 | 0.01(0.01%) | 1483 |
Pfizer Inc | PFE | 34.63 | -0.06(-0.17%) | 174230 |
Procter & Gamble Co | PG | 128.11 | 0.19(0.15%) | 3051 |
Starbucks Corporation, NASDAQ | SBUX | 106.06 | 0.36(0.34%) | 6613 |
Tesla Motors, Inc., NASDAQ | TSLA | 784.37 | -11.85(-1.49%) | 464490 |
The Coca-Cola Co | KO | 50.14 | -0.13(-0.26%) | 29563 |
Twitter, Inc., NYSE | TWTR | 73.43 | -0.53(-0.72%) | 73020 |
UnitedHealth Group Inc | UNH | 324.76 | 0.14(0.04%) | 859 |
Verizon Communications Inc | VZ | 56.27 | 2.12(3.92%) | 660247 |
Visa | V | 207.06 | -0.84(-0.40%) | 5994 |
Wal-Mart Stores Inc | WMT | 145.79 | 0.13(0.09%) | 24883 |
Walt Disney Co | DIS | 185.18 | -1.17(-0.63%) | 35417 |
Yandex N.V., NASDAQ | YNDX | 71.13 | -1.64(-2.25%) | 15204 |
The Commerce
Department reported on Wednesday the sales at U.S. retailers surged 5.3 percent
m-o-m in January 2021, following a revised 1.0 percent m-o-m decline in December
2020 (originally a 0.7 percent m-o-m drop). This was the strongest monthly gain
since June 2020.
Economists had
expected total sales would increase1.1 percent m-o-m in January.
According to
the report, the largest advances in retail sales were recorded at electronics
and appliance stores (+14.7 percent m-o-m), furniture and home furnishing
stores (+12.0 percent m-o-m), nonstore retailers (+11.0 percent m-o-m), sporting
goods, hobby, musical instruments (+8 percent m-o-m) and food and drinking
places (+6.9 percent m-o-m).
Excluding auto,
retail sales climbed 5.9 percent m-o-m in January after a revised 1.8 percent
m-o-m drop in the previous month (originally a 1.4 percent m-o-m fall), also being
much better than economists’ forecast of a 1.0 percent m-o-m gain.
Meanwhile,
closely watched core retail sales, which exclude automobiles, gasoline,
building materials and food services, and are used in GDP calculations, jumped 6.0
percent m-o-m in January after a revised 2.4 percent m-o-m decrease in December
(originally a 1.9 percent m-o-m decline). Economists had forecast core retail
sales growing 1.0 percent m-o-m in January.
In y-o-y terms, the U.S. retail sales jumped 7.4
percent in January after a revised 2.5 climb in the previous month (originally
a 2.9 percent surge).
Statistics
Canada reported on Wednesday the country’s consumer price index (CPI) rose 0.6
percent m-o-m in January 2021, following a 0.2 percent m-o-m drop in the
previous month.
On the y-o-y
basis, Canada’s inflation rate increased 1.0 percent last month after advancing
0.7 percent in December 2020.
Economists had
predicted inflation would increase 0.4 percent m-o-m and 0.9 percent y-o-y in January.
According to the report, January’s acceleration in consumer prices was largely due to higher prices for durable goods (+1.7 percent m-o-m) and rising gasoline prices (+6.1 percent m-o-m) compared with December 2020.
Meanwhile, the
closely watched the Bank of Canada's core index rose 1.6 percent y-o-y in January,
following a 1.5 percent y-o-y advance in December. This was the highest rate
since March 2020. Economists had forecast a gain of 1.4 percent y-o-y.
| Time | Country | Event | Period | Previous value | Forecast | Actual |
|---|---|---|---|---|---|---|
| 07:00 | United Kingdom | Retail Price Index, m/m | January | 0.6% | -0.4% | -0.3% |
| 07:00 | United Kingdom | Producer Price Index - Input (MoM) | January | 1.2% | 0.5% | 0.7% |
| 07:00 | United Kingdom | Producer Price Index - Input (YoY) | January | 0.6% | 0.6% | 1.3% |
| 07:00 | United Kingdom | Producer Price Index - Output (YoY) | January | -0.5% | -0.4% | -0.2% |
| 07:00 | United Kingdom | Producer Price Index - Output (MoM) | January | 0.2% | 0.2% | 0.4% |
| 07:00 | United Kingdom | Retail prices, Y/Y | January | 1.2% | 1.3% | 1.4% |
| 07:00 | United Kingdom | HICP ex EFAT, Y/Y | January | 1.4% | 1.4% | |
| 07:00 | United Kingdom | HICP, m/m | January | 0.3% | -0.4% | -0.2% |
| 07:00 | United Kingdom | HICP, Y/Y | January | 0.6% | 0.6% | 0.7% |
| 10:00 | Eurozone | Construction Output, y/y | December | -0.6% | -2.3% |
USD strengthened against most of its major rivals in the European session on Wednesday as the U.S. bond yields and commodity prices jumped on the prospects of further economic recovery and faster inflation.
The U.S. Dollar Index (DXY), measuring the U.S. currency's value relative to a basket of foreign currencies, rose 0.36% to 90.83.
Benchmark 10-year Treasury yields reached 1.31% on Tuesday, their highest levels since February 2020, as investors continued to sell off bonds amid signs of creeping inflation and the Federal Reserve's commitment to keeping short-term rates low for the foreseeable future.
It is expected that the minutes from the U.S Federal Reserve’s January meeting, which are set to be released later today, will confirm that the Fed's officials support accommodative monetary policy stance.
FXStreet reports that Citigroup’s Tobias Levkovich, the U.S. equity strategist, said in his latest client note that the U.S. indices, including the S&P 500, were primed for a 10% correction.
“A 10% pullback in US shares seems very plausible.”
“Our current caution reflects several factors, including ebullient sentiment readings, stretched valuation levels and slipping earnings revision momentum.”
“With limited upside even to others’ bullish targets, a neutral stance is realistic.”
“The S&P 500 seen at 3,800 by the year-end.”
“While they can back off 10%-20%, we do not envision a 50%-plus collapse.”
FXStreet reports that economists at Capital Economics expect relatively poor returns from most commodities over the next three decades. In the cases of both energy commodities and precious metals, returns are expected to be negative.
“The ongoing transition towards clean energy means that growth in oil demand will be weak over the coming decade, and that global consumption will peak in 2030. Accordingly, we think that oil prices will struggle to make meaningful gains in nominal terms over the coming decades and will fall quite sharply in real terms.”
“Over the next decade we anticipate a sharp economic slowdown in China, which accounts for roughly half of global demand for the major base metals. Our view is that it will probably take until at least 2030 for the green revolution to provide enough of a boost to demand for industrial metals to offset the impact of weaker growth in China. And even beyond 2030, we expect the returns from GSCI Industrial Metals Index to be middling, rather than stellar.”
“The outlook for precious metals is quite poor. Their returns tend to be quite closely correlated with those from other safe assets, such as US Treasuries and TIPS. Our forecast that the 10-year TIPS yield will gradually rise to 1.5% by the end of 2050 – from around minus 1% at present – is consistent with a fairly sharp drop in the price of gold. Largely for this reason, we anticipate negative average annual returns from the GSCI Precious Metals Index.”
The Mortgage
Bankers Association (MBA) reported on Wednesday the mortgage application volume
in the U.S. fell 5.1 percent in the week ended February 12, following a 4.1
percent drop in the previous week.
According to
the report, refinance applications declined 4.7 percent, while applications to
purchase a home fell dropped 6.1 percent.
Meanwhile, the
average fixed 30-year mortgage rate rose from 2.96 percent to 2.98 percent, the
highest since the week ended November 13.
“Expectations
of faster economic growth and inflation continue to push Treasury yields and
mortgage rates higher. Since hitting a survey low in December, the 30-year
fixed rate has slowly risen, and last week climbed to its highest level since
November 2020,” noted Joel Kan, MBA’s Associate Vice President of Economic and
Industry Forecasting.
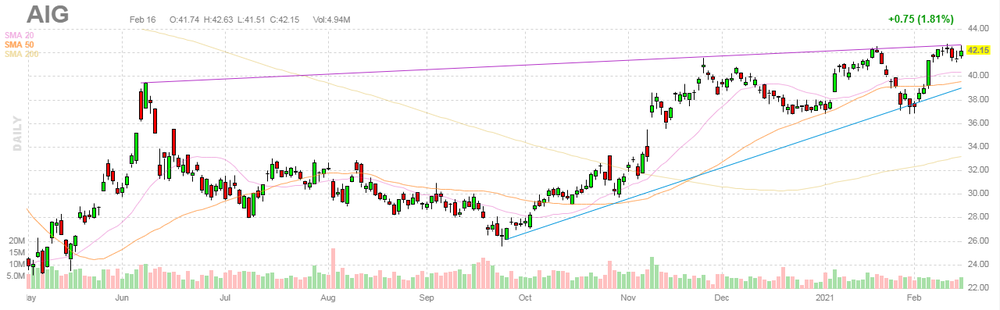
American International Group (AIG) reported Q4 FY 2020 earnings of $0.94 per share (versus $1.03 per share in Q4 FY 2019), beating analysts’ consensus estimate of $0.93 per share.
AIG closed Tuesday's trading session at $42.15 (+1.81%).
FXStreet reports that UOB Group’s FX Strategists suggest that the upside bias in USD/JPY remains well in place and could push the pair to another test of the 106.70 region in the next weeks.
24-hour view: “While we expected USD to ‘advance further’ yesterday, we were of the view ‘the month-to-date high of 105.76 could be just out of reach’. The subsequent strength exceeded our expectation as USD blew past 105.76 and soared to 106.06 (before extending its gains after NY close). The rapid rise appears to be overdone and while further USD strength is not ruled out, a sustained rise beyond 106.35 is unlikely (next resistance is at 106.70). Support is at 105.85 followed by 105.65.”
Next 1-3 weeks: “Upward momentum has improved further and USD could extend its gains to 106.35, possibly as high as 106.70. The current positive outlook for USD is deemed intact as long as it does not move below 105.00 (‘strong support’ level was 104.80 yesterday).”
- Lockdown should be eased in stages
- The unwinding of restrictions will be done in stages
- Speculation on easing of lockdown is understandable but I advise everybody to wait
- Data shows virus variants are spreading quickly in Germany but infection numbers are decreasing
- New UK variant now makes up for more than 20%
- But infections are still decreasing despite higher proportion of new variants
- More deliveries mean that pace of vaccinations can speed up significantly
- Reactions to AstraZeneca vaccine in scope of what had been expected
- Reactions are not bad and it's sign immune system is working
Reuters reports that the Bank of Spain said that Spain's public debt ended 2020 at 117.1% of gross domestic product as the coronavirus pandemic and the measures imposed to curb it lifted borrowing and led to a deep economic contraction.
Debt as a percentage of GDP increased by more than 20 percentage points in 2020 from the 95.5% recorded in December 2019, the Bank of Spain's data showed.
Spain's economy shrank by a record 11% in 2020 from 2019.
FXStreet reports that MUFG Bank discuss AUD/USD prospects.
“So far this year the 10-year US Treasury yield has risen by almost 40 basis points. However, the move higher in the equivalent Australian government bond yield has been even larger as the 10-year yield has risen from a low of 0.97% at the end of last year to a high overnight of 1.40%. As a result, yield spreads have not moved in the US dollar’s favour against the Australian dollar.”
“Downside risks for the Australian dollar would increase if the ongoing rise in US yields was to trigger broader correction lower in risk assets. At the same time, the Australian dollar could prove sensitive to signs of ongoing tensions between the US and China under the Biden administration.”
According to the report from Eurostat, in December 2020 compared with November 2020, seasonally adjusted production in the construction sector decreased by 3.7% in the euro area and by 3.3% in the EU. In November 2020, production in construction increased by 2.3% in the euro area and by 1.8% in the EU.
In December 2020 compared with December 2019, production in construction decreased by 2.3% in the euro area and by 2.1% in the EU.
The annual average production in construction for the year 2020, compared with 2019, fell by 5.7% in the euro area and by 5.0% in the EU.
In the euro area in December 2020, compared with November 2020, building construction decreased by 3.8% and civil engineering by 3.4%. In the EU, building construction decreased by 3.3% and civil engineering by 3.1%.
Among Member States for which data are available, the largest decreases in production in construction were recorded in Slovenia (-13.1%), France (-8.6%) and Germany (-3.2%). Increases were observed in Slovakia (+9.1%), Romania (+2.2%), Poland (+1.9%) and Spain (+1.8%).
eFXdata reports that Barclays Research discusses its expectations for FOMC minutes from the January meeting.
"The Fed made no change to its policy stance or forward guidance at its January meeting, which was widely expected. We expect the main thrust of the minutes to center on two elements. First, that the Fed believes there is a long way to go before the economy can achieve its dual mandate objectives, even if a large fiscal aid package is passed by the end of Q1 as we expect. Hence, any discussion about tapering or exit strategies is premature in the eyes of the committee. Second, with multiple vaccines approved and rollouts begun, the Fed has shifted its risk assessment to view the pandemic as presenting mainly downside risk to the near term as opposed to the medium term." Barclays adds.
FXStreet reports that FX Strategists at UOB Group discuss USD/CNH prospects.
Next 1-3 weeks: “We have expected USD to weaken since early last week. In our latest narrative from yesterday, we highlighted that ‘a break of 6.4000 would shift the focus towards the next support at 6.3800’. USD subsequently dropped to 6.4010 before staging a sudden and sharp rebound. While our ‘strong resistance’ level at 6.4400 is still intact, the rapid loss in momentum suggests that 6.4000 could remain intact for now. The current rebound could extend higher but any advance is likely limited to a test of 6.4500. On the downside, 6.4000 is acting as a very strong support now (minor support is at 6.4080).”
Bloomberg reports that according to Citigroup Inc.’s Tobias Levkovich, a 10% pullback in U.S. shares seems “very plausible” with markets balanced on a risk-reward basis.
“Our current caution reflects several factors, including ebullient sentiment readings, stretched valuation levels and slipping earnings revision momentum,” the bank’s chief U.S. equity strategist wrote. “With limited upside even to others’ bullish targets, a neutral stance is realistic.”
Citigroup has a year-end target of 3,800 for the S&P 500 and the strategy team expects the index to trade in a 3,600 to 4,000 range.
U.S. stocks are not in a bubble and comparisons with the early 2000s don’t stack up as the economy is exiting, not entering, a recession and the Federal Reserve isn’t raising rates, according to Levkovich. That suggests a deep selloff in stocks is unlikely, he said.
FXStreet reports that economists at ANZ Bank discuss NZD/USD prospects.
“A steeper yield curve is generally a good sign, but it was well expected and this looks more like a positioning move/retracement rather than the start of a big USD move. On the COVID-19 front, the market has shown its capacity to look through the move to Levels 2/3 locally; that seems appropriate given how well-resourced the Government is to tackle any outbreaks.”
“Higher milk prices are a reminder of how well commodity prices are holding up.”
Reuters reports that Kimie Harada, a government panel member and an expert on the country's market functions, said that Bank of Japan has room to be more creative in how it buys exchange-traded funds (ETF) to mitigate market distortions caused by the programme.
The BOJ has been buying ETFs for a decade as part of efforts to reflate growth and pull Japan out of deflation. It kept ramping up purchases to prevent a slump in stock prices from hurting household and business confidence, and discourage them from boosting spending.
Harada said that buying tailor-made ETFs instead of standardised ones would allow the BOJ to remove small-cap and low-float stocks from its purchases to prevent its huge presence from distorting price moves.
The BOJ might find idea is worth considering when it conducts a review of its policy tools in March, said Harada, a panel member of Japan's banking regulator and a professor at Chuo University.
"It's been clear for some time that the BOJ's ETF buying is unsustainable," she told. "The BOJ has no awareness it has become a huge investor in Japan's stock market, which is problematic."
| Time | Country | Event | Period | Previous value | Forecast | Actual |
|---|---|---|---|---|---|---|
| 01:00 | Australia | RBA Assist Gov Kent Speaks | ||||
| 07:00 | United Kingdom | Retail Price Index, m/m | January | 0.6% | -0.4% | -0.3% |
| 07:00 | United Kingdom | Producer Price Index - Input (MoM) | January | 1.2% | 0.5% | 0.7% |
| 07:00 | United Kingdom | Producer Price Index - Input (YoY) | January | 0.6% | 0.6% | 1.3% |
| 07:00 | United Kingdom | Producer Price Index - Output (YoY) | January | -0.5% | -0.4% | -0.2% |
| 07:00 | United Kingdom | Producer Price Index - Output (MoM) | January | 0.2% | 0.2% | 0.4% |
| 07:00 | United Kingdom | Retail prices, Y/Y | January | 1.2% | 1.3% | 1.4% |
| 07:00 | United Kingdom | HICP ex EFAT, Y/Y | January | 1.4% | 1.4% | |
| 07:00 | United Kingdom | HICP, m/m | January | 0.3% | -0.4% | -0.2% |
| 07:00 | United Kingdom | HICP, Y/Y | January | 0.6% | 0.6% | 0.7% |
During today's Asian trading, the US dollar rose against most major currencies. The rise in real bond yields increases the attractiveness of the dollar in comparison with other currencies, experts say. However, signs of economic recovery, supported by large-scale economic support measures in the world and gradual vaccination against coronavirus, continue to restrain the strengthening of the dollar.
The ICE Dollar index, which shows the value of the US dollar against six major world currencies, rose by 0.27%.
Meanwhile, data showed that Japan's exports in January increased by 6.4% compared to the same month last year - to 5.78 trillion yen. Experts on average predicted an export growth of 6.6% in January. The volume of Japanese imports in January decreased for the 21st consecutive month. The drop was 9.5%, with an expected decline of 6%.
The euro against the pound is near its lowest level since May 2020. The weakness of the euro against the pound is mainly due to the difference in the rate of vaccination. The first dose of the coronavirus vaccine in the UK has already been received by 15 million people. In this regard, traders expect a faster recovery of the British economy compared to the eurozone.
eFXdata reports that Citi discusses its expectations for FOMC minutes from the January meeting.
"CitiFX Strategy acknowledges that positioning signals seem somewhat mixed, particularly in equities, but not stretched in short rates positions and certainly not in short USD. Citi Economics thinks that Wednesday’s minutes from the January FOMC meeting will reflect Chair Powell’s admonition that it is “premature” to talk about tapering of asset purchases and that he is “not even thinking” about removing accommodation," Citi adds.
According to the report from Office for National Statistics, the Consumer Prices Index (CPI) rose 0.7% in the 12 months to January 2021, up from 0.6% to December 2020. Economists had expected a 0.6% increase. On a monthly basis, CPI fell by 0.2% in January 2021, following a 0.3% rise in December 2020. Economists had expected a 0.4% decrease.
The Consumer Prices Index including owner occupiers’ housing costs (CPIH) rose 0.9% in the 12 months to January 2021, up from 0.8% to December 2020.
The largest contribution to the CPIH 12-month inflation rate came from recreation and culture (0.35 percentage points).
Furniture and household goods, restaurants and hotels, food, and transport had the largest upward contributions to the change in the January 2021 12-month rate, while falling clothing and footwear prices had a downward effect.
On a monthly basis, the CPIH fell by 0.1% in January 2021, following a 0.2% rise in December 2020.
EUR/USD
Resistance levels (open interest**, contracts)
$1.2197 (2447)
$1.2171 (3984)
$1.2153 (1492)
Price at time of writing this review: $1.2080
Support levels (open interest**, contracts):
$1.2051 (2341)
$1.2019 (2148)
$1.1981 (4226)
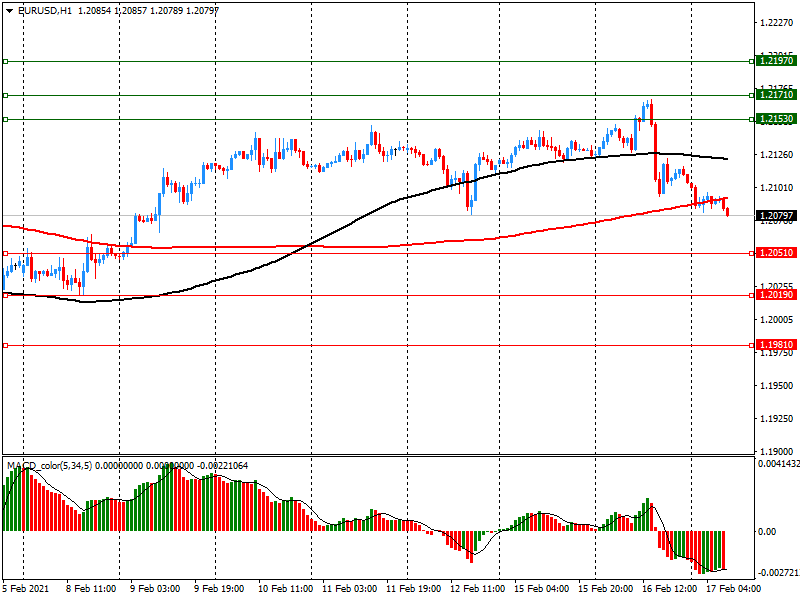
Comments:
- Overall open interest on the CALL options and PUT options with the expiration date March, 5 is 86797 contracts (according to data from February, 16) with the maximum number of contracts with strike price $1,1950 (5358);
GBP/USD
Resistance levels (open interest**, contracts)
$1.3989 (600)
$1.3953 (1843)
$1.3933 (542)
Price at time of writing this review: $1.3882
Support levels (open interest**, contracts):
$1.3794 (214)
$1.3760 (220)
$1.3680 (1127)
Comments:
- Overall open interest on the CALL options with the expiration date March, 5 is 14879 contracts, with the maximum number of contracts with strike price $1,4200 (2830);
- Overall open interest on the PUT options with the expiration date March, 5 is 14082 contracts, with the maximum number of contracts with strike price $1,3100 (1226);
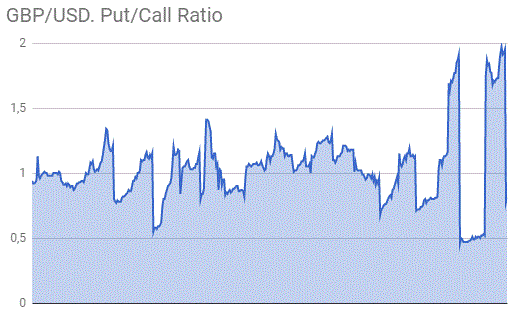
- The ratio of PUT/CALL was 0.95 versus 0.85 from the previous trading day according to data from February, 16
* - The Chicago Mercantile Exchange bulletin (CME) is used for the calculation.
** - Open interest takes into account the total number of option contracts that are open at the moment.
| Raw materials | Closed | Change, % |
|---|---|---|
| Brent | 63.39 | 0.27 |
| Silver | 27.226 | -1.25 |
| Gold | 1794.167 | -1.37 |
| Palladium | 2380.05 | -0.62 |
| Time | Country | Event | Period | Previous value | Forecast |
|---|---|---|---|---|---|
| 01:00 (GMT) | Australia | RBA Assist Gov Kent Speaks | |||
| 07:00 (GMT) | United Kingdom | Retail Price Index, m/m | January | 0.6% | |
| 07:00 (GMT) | United Kingdom | Producer Price Index - Input (MoM) | January | 0.8% | |
| 07:00 (GMT) | United Kingdom | Producer Price Index - Input (YoY) | January | 0.2% | |
| 07:00 (GMT) | United Kingdom | Producer Price Index - Output (YoY) | January | -0.4% | |
| 07:00 (GMT) | United Kingdom | Producer Price Index - Output (MoM) | January | 0.3% | |
| 07:00 (GMT) | United Kingdom | Retail prices, Y/Y | January | 1.2% | |
| 07:00 (GMT) | United Kingdom | HICP ex EFAT, Y/Y | January | 1.4% | |
| 07:00 (GMT) | United Kingdom | HICP, m/m | January | 0.3% | |
| 07:00 (GMT) | United Kingdom | HICP, Y/Y | January | 0.6% | |
| 10:00 (GMT) | Eurozone | Construction Output, y/y | December | -1.3% | |
| 13:30 (GMT) | U.S. | PPI, y/y | January | 0.8% | |
| 13:30 (GMT) | U.S. | PPI, m/m | January | 0.3% | |
| 13:30 (GMT) | U.S. | PPI excluding food and energy, m/m | January | 0.1% | |
| 13:30 (GMT) | U.S. | PPI excluding food and energy, Y/Y | January | 1.2% | |
| 13:30 (GMT) | U.S. | Retail Sales YoY | January | 2.9% | |
| 13:30 (GMT) | U.S. | Retail sales excluding auto | January | -1.4% | 0.8% |
| 13:30 (GMT) | U.S. | Retail sales | January | -0.7% | 0.7% |
| 13:30 (GMT) | Canada | Consumer Price Index m / m | January | -0.2% | |
| 13:30 (GMT) | Canada | Bank of Canada Consumer Price Index Core, y/y | January | 1.5% | |
| 13:30 (GMT) | Canada | Consumer price index, y/y | January | 0.7% | |
| 14:15 (GMT) | U.S. | Capacity Utilization | January | 74.5% | 74.8% |
| 14:15 (GMT) | U.S. | Industrial Production YoY | January | -3.6% | |
| 14:15 (GMT) | U.S. | Industrial Production (MoM) | January | 1.6% | 0.4% |
| 15:00 (GMT) | U.S. | NAHB Housing Market Index | February | 83 | 83 |
| 15:00 (GMT) | U.S. | FOMC Member Rosengren Speaks | |||
| 15:00 (GMT) | U.S. | Business inventories | December | 0.5% | 0.4% |
| 16:00 (GMT) | United Kingdom | MPC Member Ramsden Speaks | |||
| 19:00 (GMT) | U.S. | FOMC meeting minutes | |||
| 23:05 (GMT) | U.S. | FOMC Member Kaplan Speak |
| Pare | Closed | Change, % |
|---|---|---|
| AUDUSD | 0.77554 | -0.3 |
| EURJPY | 128.295 | 0.4 |
| EURUSD | 1.21045 | -0.2 |
| GBPJPY | 147.346 | 0.58 |
| GBPUSD | 1.3902 | -0.02 |
| NZDUSD | 0.72075 | -0.23 |
| USDCAD | 1.269 | 0.47 |
| USDCHF | 0.89244 | 0.31 |
| USDJPY | 105.983 | 0.6 |


© 2000-2026. All rights reserved.
This site is managed by Teletrade D.J. LLC 2351 LLC 2022 (Euro House, Richmond Hill Road, Kingstown, VC0100, St. Vincent and the Grenadines).
The information on this website is for informational purposes only and does not constitute any investment advice.
The company does not serve or provide services to customers who are residents of the US, Canada, Iran, The Democratic People's Republic of Korea, Yemen and FATF blacklisted countries.
Making transactions on financial markets with marginal financial instruments opens up wide possibilities and allows investors who are willing to take risks to earn high profits, carrying a potentially high risk of losses at the same time. Therefore you should responsibly approach the issue of choosing the appropriate investment strategy, taking the available resources into account, before starting trading.
Use of the information: full or partial use of materials from this website must always be referenced to TeleTrade as the source of information. Use of the materials on the Internet must be accompanied by a hyperlink to teletrade.org. Automatic import of materials and information from this website is prohibited.
Please contact our PR department if you have any questions or need assistance at pr@teletrade.global.
transfers