- Analytics
- News and Tools
- Market News
CFD Markets News and Forecasts — 16-09-2024
- EUR/USD climbed back over 1.1100 as rate cut hopes keep markets afloat.
- A thin week on the EU economic calendar leaves Fed rate focus front and center.
- The Fed is expected to begin cutting rates this week and deliver multiple cuts by year-end.
EUR/USD rose on a tide of Greenback shorting pressure on Monday, with bids getting lifted back above the 1.1100 price handle that flummoxed intraday action to cap off last week. Risk-on market sentiment has kicked off the new week firmly in control as investors stare off into the distance at expected rate cuts from the Federal Reserve (Fed).
Little of note exists on the economic calendar on the European side, outside of an appearance from European Central Bank (ECB) President Christine Lagarde. With little of note on the data docket for the EU, Fiber markets will be hinging entirely on this week’s outing from the US central bank.
Forex Today: US data takes centre stage pre-FOMC gathering
US Retail Sales are slated for an update on Tuesday, but the key datapoint that would normally drive some level of volatility is not expected to move the needle this week unless the print comes in wildly out of alignment with forecasts. MoM US Retail Sales growth in August is expected to ease back to 0.2% from July’s 1.0%, while core MoM Retail Sales (excluding automotive purchases) are expected to tick down to 0.3% from 0.4%.
The Fed kicking off a new rate-cutting cycle on Wednesday is all but a given according to investors, and it now comes down to a debate of how much rather than when. According to the CME’s FedWatch Tool, rate traders are pricing in around 60% odds that the Fed’s first rate cut in over four years will be a 50 bps decline in the Fed funds rate, with the remaining 40% expecting a more demure 25 bps. Rate markets are also pricing in a total of 125-150 bps in cuts by the end of the year, with interest rate traders seeing a roughly 80% chance that the Fed funds rate will hit 400-425 total bps by December 18 versus the current interest rate of 525-550.
EUR/USD price forecast
Monday’s one-sided price action has pulled Fiber bids back into the high end above 1.1100, but long-term bulls remain notably skittish on the chart. Price action is still mired in a technical trap after tumbling back from one-year highs in late August, and top side momentum remains tepid despite a bullish bounce from the 1.1000 handle last week.
EUR/USD daily chart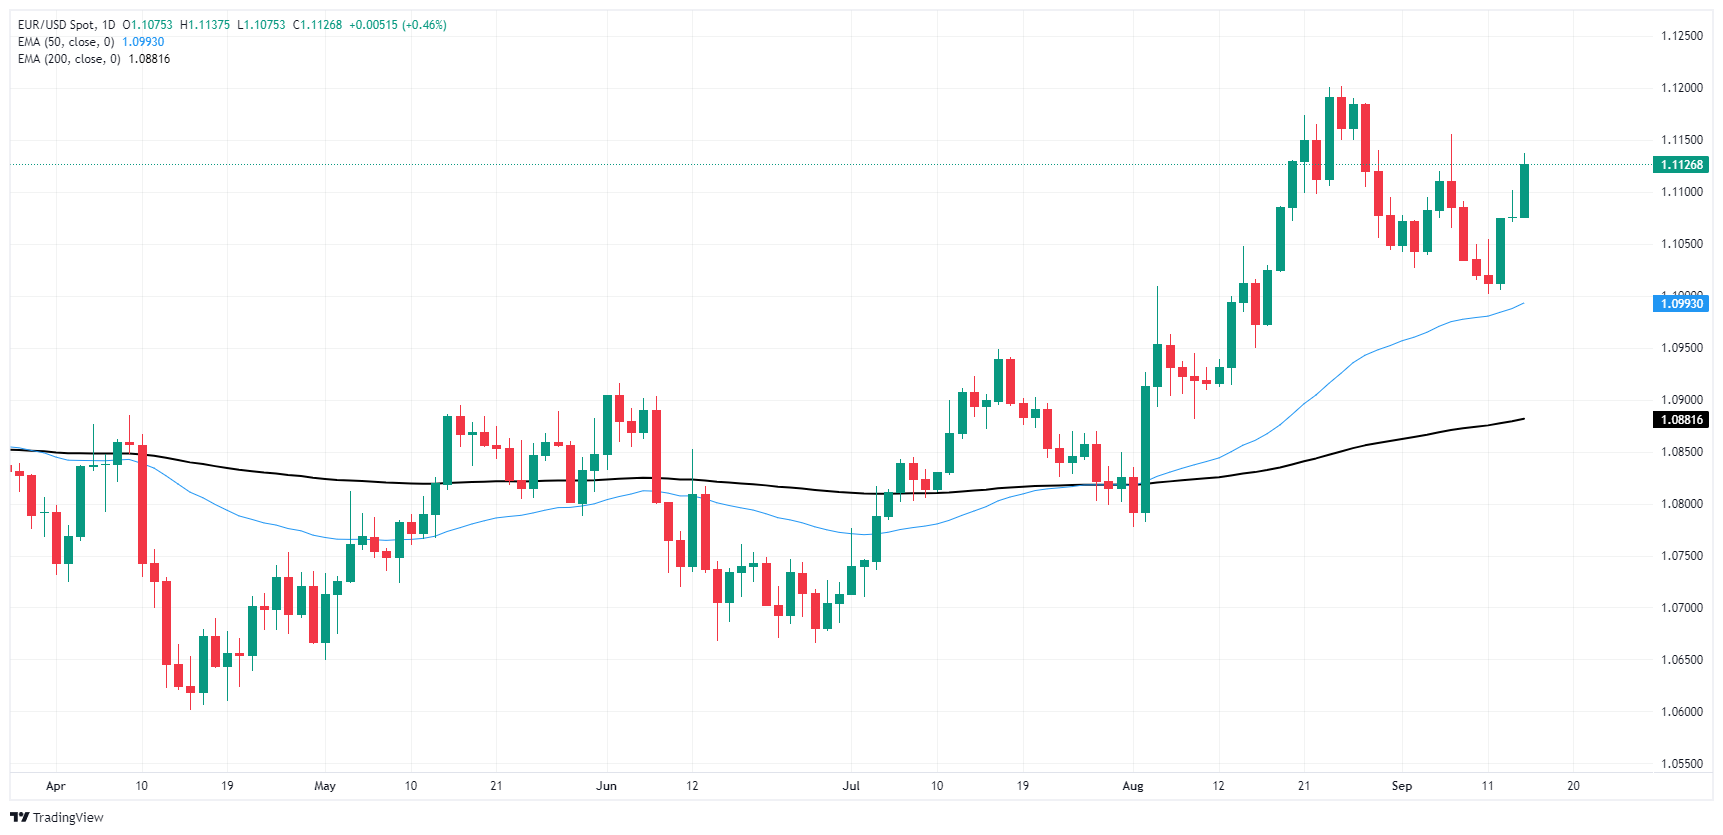
Euro FAQs
The Euro is the currency for the 20 European Union countries that belong to the Eurozone. It is the second most heavily traded currency in the world behind the US Dollar. In 2022, it accounted for 31% of all foreign exchange transactions, with an average daily turnover of over $2.2 trillion a day. EUR/USD is the most heavily traded currency pair in the world, accounting for an estimated 30% off all transactions, followed by EUR/JPY (4%), EUR/GBP (3%) and EUR/AUD (2%).
The European Central Bank (ECB) in Frankfurt, Germany, is the reserve bank for the Eurozone. The ECB sets interest rates and manages monetary policy. The ECB’s primary mandate is to maintain price stability, which means either controlling inflation or stimulating growth. Its primary tool is the raising or lowering of interest rates. Relatively high interest rates – or the expectation of higher rates – will usually benefit the Euro and vice versa. The ECB Governing Council makes monetary policy decisions at meetings held eight times a year. Decisions are made by heads of the Eurozone national banks and six permanent members, including the President of the ECB, Christine Lagarde.
Eurozone inflation data, measured by the Harmonized Index of Consumer Prices (HICP), is an important econometric for the Euro. If inflation rises more than expected, especially if above the ECB’s 2% target, it obliges the ECB to raise interest rates to bring it back under control. Relatively high interest rates compared to its counterparts will usually benefit the Euro, as it makes the region more attractive as a place for global investors to park their money.
Data releases gauge the health of the economy and can impact on the Euro. Indicators such as GDP, Manufacturing and Services PMIs, employment, and consumer sentiment surveys can all influence the direction of the single currency. A strong economy is good for the Euro. Not only does it attract more foreign investment but it may encourage the ECB to put up interest rates, which will directly strengthen the Euro. Otherwise, if economic data is weak, the Euro is likely to fall. Economic data for the four largest economies in the euro area (Germany, France, Italy and Spain) are especially significant, as they account for 75% of the Eurozone’s economy.
Another significant data release for the Euro is the Trade Balance. This indicator measures the difference between what a country earns from its exports and what it spends on imports over a given period. If a country produces highly sought after exports then its currency will gain in value purely from the extra demand created from foreign buyers seeking to purchase these goods. Therefore, a positive net Trade Balance strengthens a currency and vice versa for a negative balance.
- GBP/USD crossed back over 1.3200 on Wednesday amid risk-on sentiment.
- Fed rate call hopes are pinned to the ceiling as market anticipate 50 bps rate trim.
- UK CPI inflation and BoE rate call also on the table this week.
GBP/USD clipped into the high end on a quiet Monday, kicking off the new trading week with a fresh bullish bid back over the 1.3200 handle. Investor sentiment is holding steady on the high side as markets gear up for a hefty central bank showing this week, with a widely anticipated Fed rate cut and another showing from the Bank of England (BoE).
US Retail Sales are slated for an update on Tuesday, but the key datapoint that would normally drive some level of volatility is not expected to move the needle this week unless the print comes in wildly out of alignment with forecasts. MoM US Retail Sales growth in August is expected to ease back to 0.2% from July’s 1.0%, while core MoM Retail Sales (excluding automotive purchases) are expected to tick down to 0.3% from 0.4%.
Forex Today: US data takes centre stage pre-FOMC gathering
On the UK side, Consumer Price Index (CPI) inflation figures are due early Wednesday, with the annualized figure through August expected to hold steady at 2.2% YoY. Like US Retail Sales, the standalone figure isn’t expected to drive much market reaction as long as the print comes in within a reasonable range of median market forecasts.
The Fed kicking off a new rate-cutting cycle on Wednesday is all but a given according to investors, and it now comes down to a debate of how much rather than when. According to the CME’s FedWatch Tool, rate traders are pricing in around 60% odds that the Fed’s first rate cut in over four years will be a 50 bps decline in the Fed funds rate, with the remaining 40% expecting a more demure 25 bps. Rate markets are also pricing in a total of 125-150 bps in cuts by the end of the year, with interest rate traders seeing a roughly 80% chance that the Fed funds rate will hit 400-425 total bps by December 18 versus the current interest rate of 525-550.
The BoE will also be delivering their own rate call on Thursday, but it is expected to be a much less noteworthy outing than the Fed’s rate call. The BoE is expected to hold its main reference rate at 5.0% this week, and the Monetary Policy Committee (MPC) is expected to vote seven-to-two in favor of holding, compared to the five-to-four quarter-point rate cut vote from the BoE’s last outing.
GBP/USD price forecast
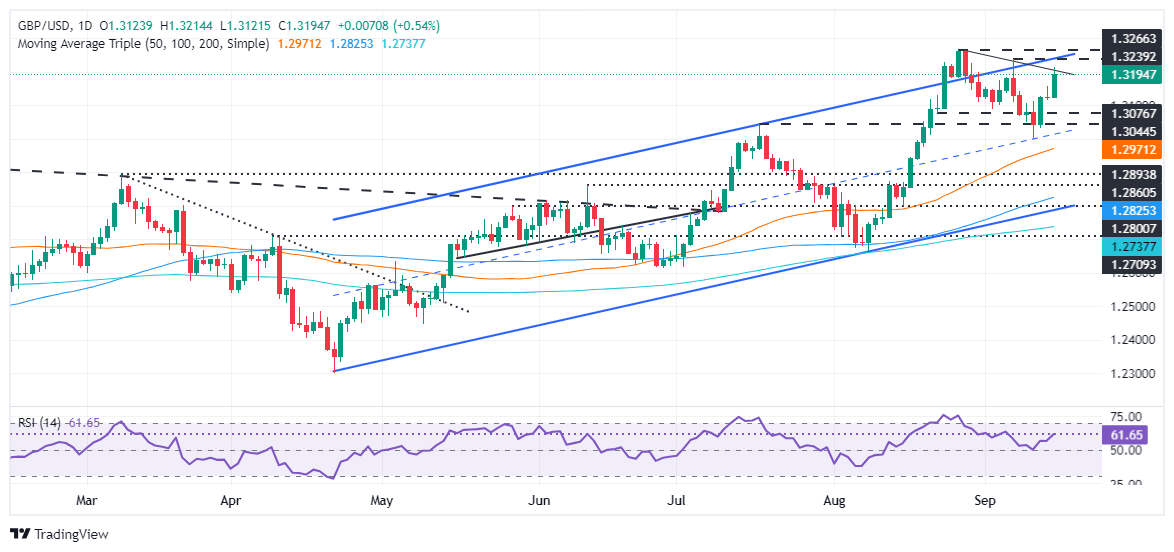
Cable’s 0.6% surge on Monday has dragged the pair back over the 1.3200 handle, with daily candlesticks continuing to grind back into the high side with multi-year highs sitting just north of 1.3250.
Despite an overall bullish tilt, GBP/USD price action is running the risk of getting caught in a bull trap, with the pair having run hot in a 1.66% technical recovery from the last swing low into the 1.3000 handle.
GBP/USD daily chart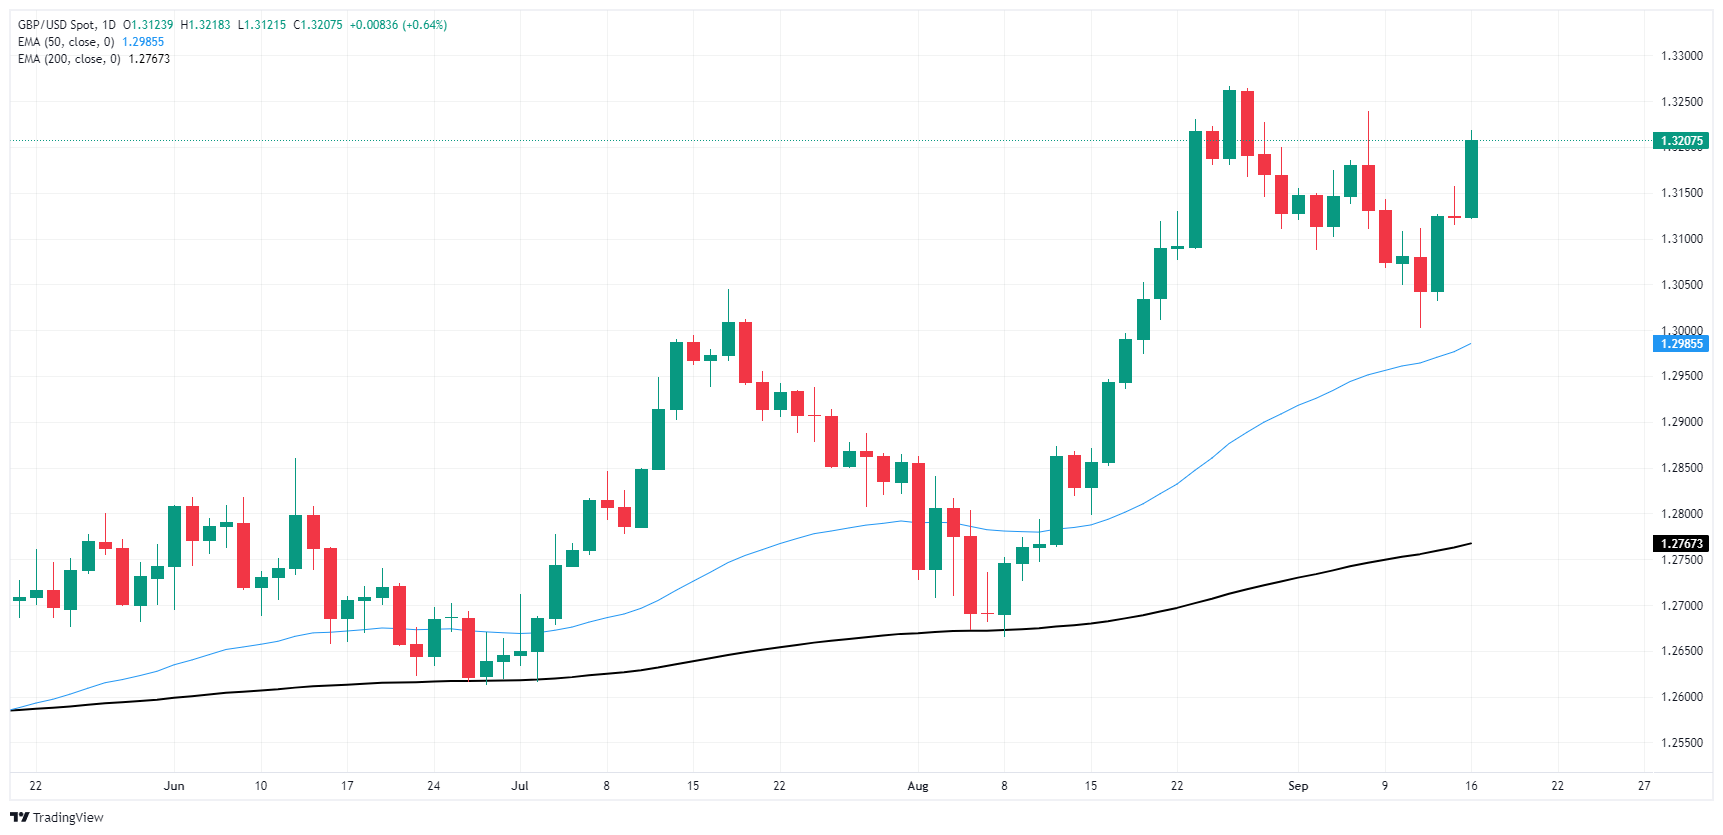
Pound Sterling FAQs
The Pound Sterling (GBP) is the oldest currency in the world (886 AD) and the official currency of the United Kingdom. It is the fourth most traded unit for foreign exchange (FX) in the world, accounting for 12% of all transactions, averaging $630 billion a day, according to 2022 data. Its key trading pairs are GBP/USD, aka ‘Cable’, which accounts for 11% of FX, GBP/JPY, or the ‘Dragon’ as it is known by traders (3%), and EUR/GBP (2%). The Pound Sterling is issued by the Bank of England (BoE).
The single most important factor influencing the value of the Pound Sterling is monetary policy decided by the Bank of England. The BoE bases its decisions on whether it has achieved its primary goal of “price stability” – a steady inflation rate of around 2%. Its primary tool for achieving this is the adjustment of interest rates. When inflation is too high, the BoE will try to rein it in by raising interest rates, making it more expensive for people and businesses to access credit. This is generally positive for GBP, as higher interest rates make the UK a more attractive place for global investors to park their money. When inflation falls too low it is a sign economic growth is slowing. In this scenario, the BoE will consider lowering interest rates to cheapen credit so businesses will borrow more to invest in growth-generating projects.
Data releases gauge the health of the economy and can impact the value of the Pound Sterling. Indicators such as GDP, Manufacturing and Services PMIs, and employment can all influence the direction of the GBP. A strong economy is good for Sterling. Not only does it attract more foreign investment but it may encourage the BoE to put up interest rates, which will directly strengthen GBP. Otherwise, if economic data is weak, the Pound Sterling is likely to fall.
Another significant data release for the Pound Sterling is the Trade Balance. This indicator measures the difference between what a country earns from its exports and what it spends on imports over a given period. If a country produces highly sought-after exports, its currency will benefit purely from the extra demand created from foreign buyers seeking to purchase these goods. Therefore, a positive net Trade Balance strengthens a currency and vice versa for a negative balance.
European Central Bank Governing Council member Martins Kazaks said on Monday that the central bank will ease monetary policy further, though it shouldn’t do so too hastily due to lingering inflation risks, per Bloomberg.
Key quotes
We have at the ECB Governing Council already lowered rates two times this year, and this is not the final destination.
These rates will continue to go down.
If we look at what financial markets expect — and I don’t have any serious reason not to agree with them — then by the middle of next year, rates are expected at 2.5%.
Market reaction
At the time of press, the EUR/USD pair was down 0.07% on the day to trade at 1.1125.
ECB FAQs
The European Central Bank (ECB) in Frankfurt, Germany, is the reserve bank for the Eurozone. The ECB sets interest rates and manages monetary policy for the region. The ECB primary mandate is to maintain price stability, which means keeping inflation at around 2%. Its primary tool for achieving this is by raising or lowering interest rates. Relatively high interest rates will usually result in a stronger Euro and vice versa. The ECB Governing Council makes monetary policy decisions at meetings held eight times a year. Decisions are made by heads of the Eurozone national banks and six permanent members, including the President of the ECB, Christine Lagarde.
In extreme situations, the European Central Bank can enact a policy tool called Quantitative Easing. QE is the process by which the ECB prints Euros and uses them to buy assets – usually government or corporate bonds – from banks and other financial institutions. QE usually results in a weaker Euro. QE is a last resort when simply lowering interest rates is unlikely to achieve the objective of price stability. The ECB used it during the Great Financial Crisis in 2009-11, in 2015 when inflation remained stubbornly low, as well as during the covid pandemic.
Quantitative tightening (QT) is the reverse of QE. It is undertaken after QE when an economic recovery is underway and inflation starts rising. Whilst in QE the European Central Bank (ECB) purchases government and corporate bonds from financial institutions to provide them with liquidity, in QT the ECB stops buying more bonds, and stops reinvesting the principal maturing on the bonds it already holds. It is usually positive (or bullish) for the Euro.
- USD/CAD flat lines around 1.3585 in Monday’s early Asian session.
- The US Fed is widely anticipated to cut interest rates on Wednesday, its first in four years.
- The Canadian CPI inflation report is due later on Tuesday.
The USD/CAD pair trades on a flat note near 1.3585 during the early Asian session on Tuesday. Further decline in the US Dollar (USD) ahead of the key US Federal Reserve (Fed) interest rate decision is likely to cap the upside for the pair. Later on Tuesday, investors will monitor the Canadian Consumer Price Index (CPI) and US Retail Sales for August for fresh impetus.
The Fed will announce its interest rate decision on September 18, and it is widely expected to cut the federal funds rate by either 25 basis points (bps) or 50 bps. According to the CME FedWatch Tool, traders are now pricing in nearly 67% chance of a reduction of 50 bps, up from 50% on Friday. Meanwhile, the odds of a 25 bps rate cut stand at 33%.
After the policy meeting, Fed officials will release new interest rate projections, known as the "dot plot," which might offer some hints about the US interest rate outlook for the remainder of this year and next. The expectation of larger rate cuts might exert some selling pressure on the Greenback in the near term.
Canada's CPI inflation data for August will be released on Tuesday, which is expected to rise 2.2% from a year ago, down from a 2.4% annual gain in July. The forecasters also estimated an inflation increase of 0.1% on a month-over-month basis in August. Any signs of slowing inflation might trigger the Bank of Canada (BoC) to speed up cuts to its key lending rate if circumstances warrant. However, if inflation is stronger than expected, the Canadian central bank could slow the pace of rate cuts.
Canadian Dollar FAQs
The key factors driving the Canadian Dollar (CAD) are the level of interest rates set by the Bank of Canada (BoC), the price of Oil, Canada’s largest export, the health of its economy, inflation and the Trade Balance, which is the difference between the value of Canada’s exports versus its imports. Other factors include market sentiment – whether investors are taking on more risky assets (risk-on) or seeking safe-havens (risk-off) – with risk-on being CAD-positive. As its largest trading partner, the health of the US economy is also a key factor influencing the Canadian Dollar.
The Bank of Canada (BoC) has a significant influence on the Canadian Dollar by setting the level of interest rates that banks can lend to one another. This influences the level of interest rates for everyone. The main goal of the BoC is to maintain inflation at 1-3% by adjusting interest rates up or down. Relatively higher interest rates tend to be positive for the CAD. The Bank of Canada can also use quantitative easing and tightening to influence credit conditions, with the former CAD-negative and the latter CAD-positive.
The price of Oil is a key factor impacting the value of the Canadian Dollar. Petroleum is Canada’s biggest export, so Oil price tends to have an immediate impact on the CAD value. Generally, if Oil price rises CAD also goes up, as aggregate demand for the currency increases. The opposite is the case if the price of Oil falls. Higher Oil prices also tend to result in a greater likelihood of a positive Trade Balance, which is also supportive of the CAD.
While inflation had always traditionally been thought of as a negative factor for a currency since it lowers the value of money, the opposite has actually been the case in modern times with the relaxation of cross-border capital controls. Higher inflation tends to lead central banks to put up interest rates which attracts more capital inflows from global investors seeking a lucrative place to keep their money. This increases demand for the local currency, which in Canada’s case is the Canadian Dollar.
Macroeconomic data releases gauge the health of the economy and can have an impact on the Canadian Dollar. Indicators such as GDP, Manufacturing and Services PMIs, employment, and consumer sentiment surveys can all influence the direction of the CAD. A strong economy is good for the Canadian Dollar. Not only does it attract more foreign investment but it may encourage the Bank of Canada to put up interest rates, leading to a stronger currency. If economic data is weak, however, the CAD is likely to fall.
- NZD/JPY pair has been moving downwards in the last week, but today's price action showed a sharp uptick.
- The RSI is in a negative area, but its value is sharply rising suggesting that buying pressure is recovering.
- The MACD suggests that selling pressure is flattening.
Monday's session saw the NZD/JPY pair rise by 0.60% to 87.20. However, the overall technical outlook for the NZD/JPY remains negative due to the losses seen in the last week as sellers seem to be taking a breather.
The RSI is currently at 36, which is still near the oversold area. However, the slope of the RSI is sharply rising, which suggests that buying pressure is recovering. The MACD is also red and flat, indicating that selling pressure is flat. This suggests that last week’s downward movements became over-extended and the sellers paused to take a breather. This also gives light to the buyers as the cross might continue consolidating upwards.
NZD/JPY daily chart
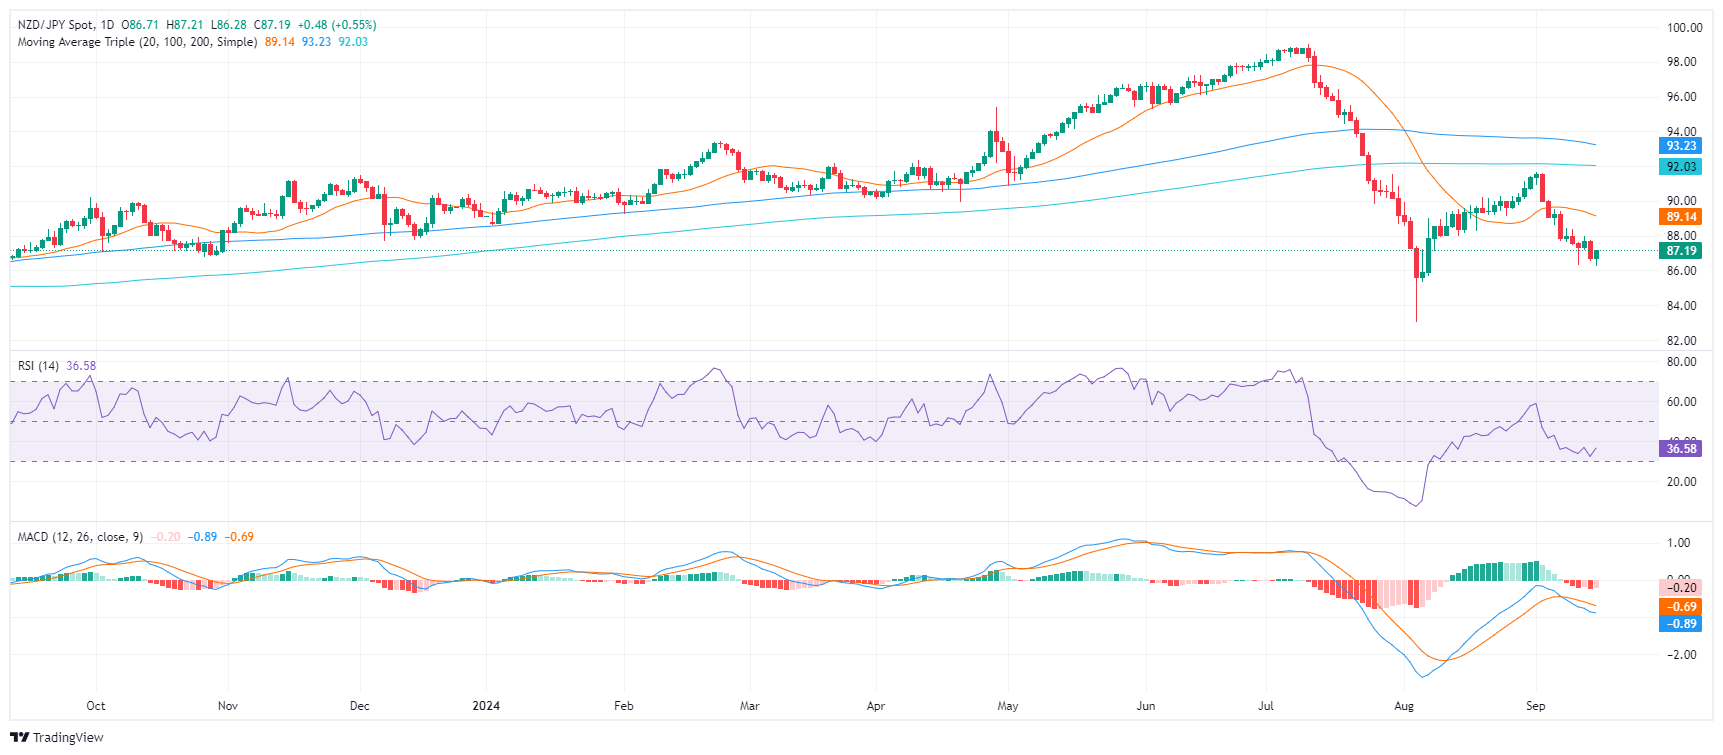
Supports to the downside are located at 86.30, 86.60, and 87.00, while resistances are seen at 87.30, 87.60, and 87.90.
- EUR/JPY remains in a bearish bias despite recent recovery, with momentum flattening and potential consolidation ahead.
- A break above 157.00 could target resistance at 157.46 (Tenkan-Sen) and 158.49 (Senkou Span A).
- For a bearish continuation, EUR/JPY must fall below 155.14, with the YTD low at 154.39 as the next support level.
The EUR/JPY recovered some ground on Monday, registering gains of over 0.40% and climbing past the 156.00 figure. As Tuesday’s Asian session begins, the cross-currency pair exchanges hands at 156.51, virtually unchanged.
Last week, the European Central Bank (ECB) lowered rates by 0.25%, yet signaled that it would most likely pause at the October meeting due to the lack of data policymakers would have at their disposal. This boosted the Euro, though the jump could be short-lived as a Bank of Japan (BoJ) monetary policy decision looms.
EUR/JPY Price Forecast: Technical outlook
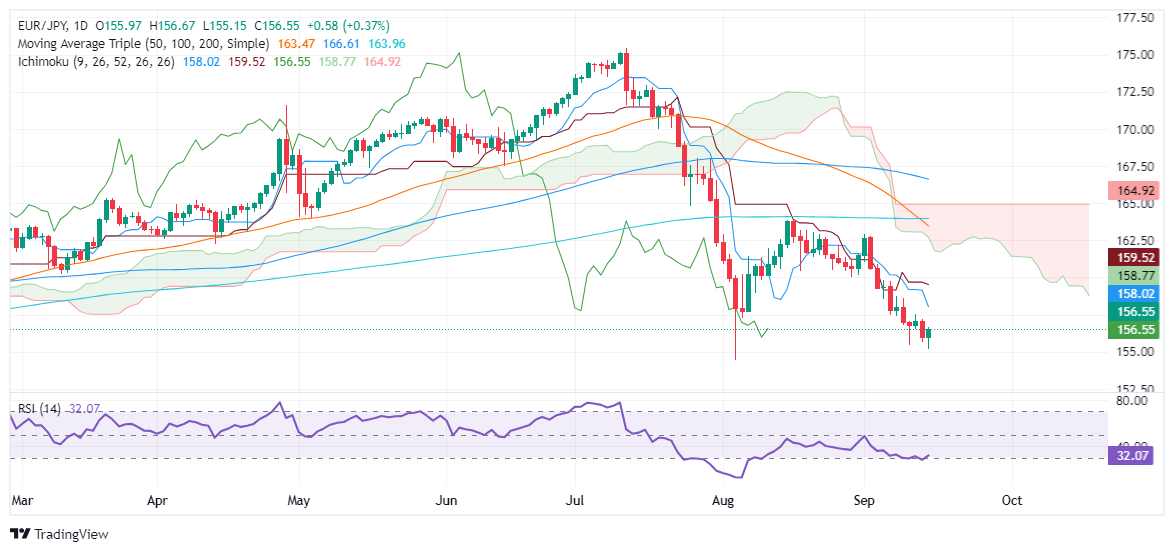
The pair remains downward biased despite recovering from an over 4.70% fall. The momentum is bearish but has flatlined, hinting that consolidation lies ahead. That said, the EUR/JPY could remain range-bound within a 150-pip volatility range.
If EUR/JPY climbs above 157.00, the next resistance will be the Tenkan-Sen at 157.46. A breach of the latter will expose the Senkou Span A at 158.49, followed by the Kijun-Sen at 159.52.
Conversely, for a bearish continuation, EUR/JPY must drop below the September 16 low of 155.14. The next support would be the year-to-date (YTD) low of 154.39.
EUR/JPY Price Action – Daily Chart
Euro PRICE Today
The table below shows the percentage change of Euro (EUR) against listed major currencies today. Euro was the strongest against the Swiss Franc.
| USD | EUR | GBP | JPY | CAD | AUD | NZD | CHF | |
|---|---|---|---|---|---|---|---|---|
| USD | 0.00% | 0.02% | 0.01% | -0.01% | -0.01% | -0.03% | 0.03% | |
| EUR | -0.01% | 0.00% | -0.02% | -0.03% | -0.02% | -0.04% | 0.03% | |
| GBP | -0.02% | -0.01% | 0.00% | -0.02% | -0.02% | -0.04% | -0.01% | |
| JPY | -0.01% | 0.02% | 0.00% | 0.01% | -0.02% | -0.03% | -0.02% | |
| CAD | 0.01% | 0.03% | 0.02% | -0.01% | 0.00% | -0.01% | 0.01% | |
| AUD | 0.00% | 0.02% | 0.02% | 0.02% | -0.00% | -0.01% | -0.02% | |
| NZD | 0.03% | 0.04% | 0.04% | 0.03% | 0.00% | 0.01% | 0.02% | |
| CHF | -0.03% | -0.03% | 0.00% | 0.02% | -0.01% | 0.02% | -0.02% |
The heat map shows percentage changes of major currencies against each other. The base currency is picked from the left column, while the quote currency is picked from the top row. For example, if you pick the Euro from the left column and move along the horizontal line to the US Dollar, the percentage change displayed in the box will represent EUR (base)/USD (quote).
- The NZD/USD pair has been trading choppily within a range between 0.6120 and 0.6200 in the last sessions.
- The RSI is in positive territory with a rising slope, suggesting that buying pressure is increasing.
On Monday, the NZD/USD pair rose by 0.70% to 0.6200, as the bulls took control of the market. The pair has been trading choppily within a range between 0.6120 and 0.6200 in the last trading sessions. That being said, if the bulls gain the 20-day Simple Moving Average (SMA) consolidating above 0.6200, it could be considered a buy signal.
The Relative Strength Index (RSI) is currently at 56, which is in positive territory and has a rising slope, suggesting that the bulls are gaining momentum. However, the Moving Average Convergence Divergence (MACD) printed decreasing red bars, a sign of a potential reversal in the bearish momentum. This is aligned with the recent price action, which shows the bulls are pushing back.
NZD/USD daily chart
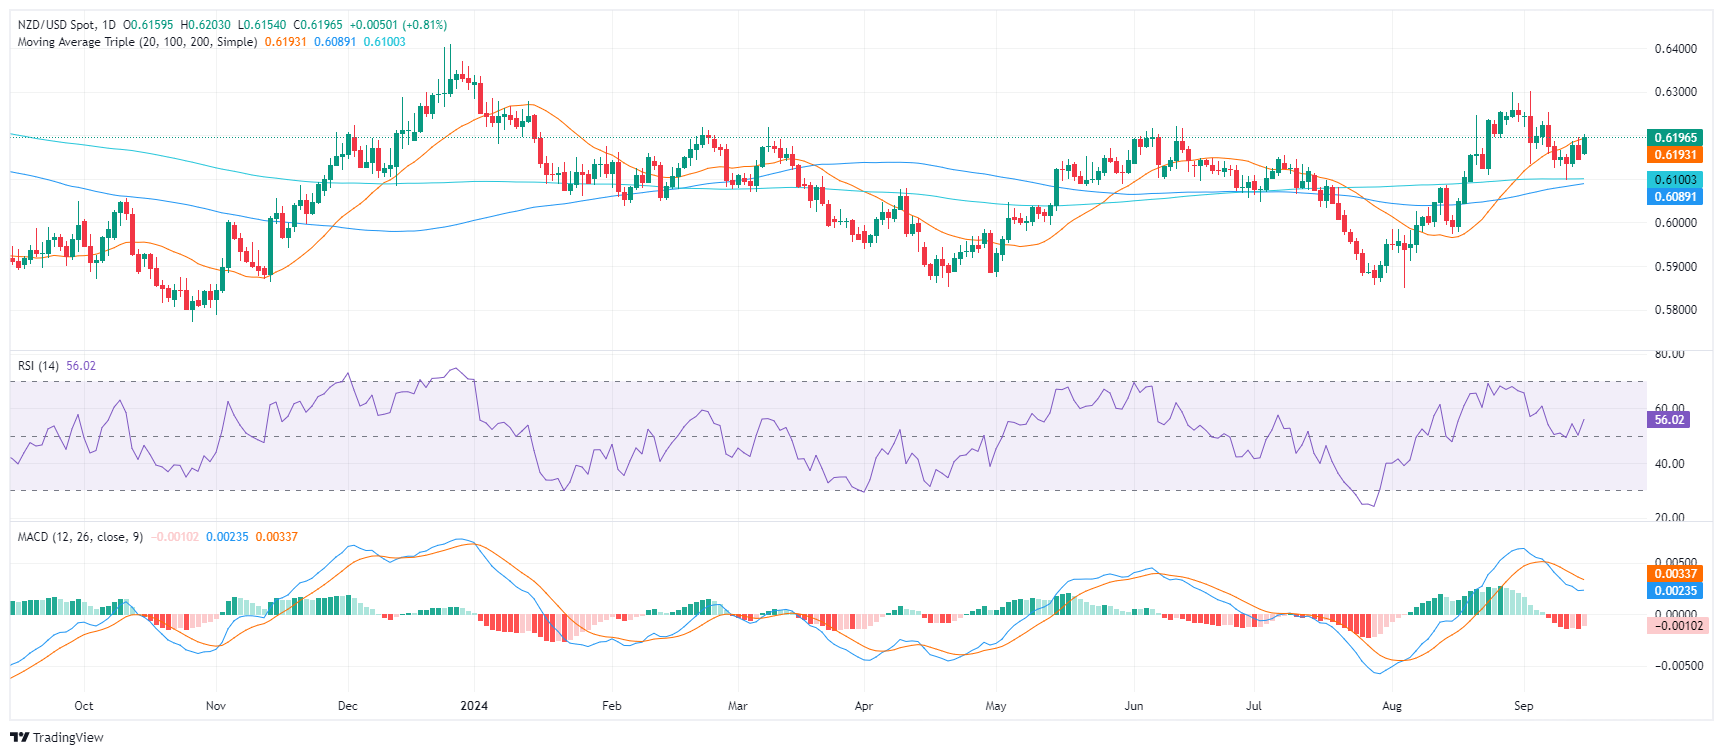
Key support levels to watch are 0.6120, 0.6140, and 0.6160, while resistance levels are 0.6200, 0.6220, and 0.6240. A consolidation above the 0.6200 area would put the pair back above the 20,100 and 200-days SMA which could trigger additional upward movements.
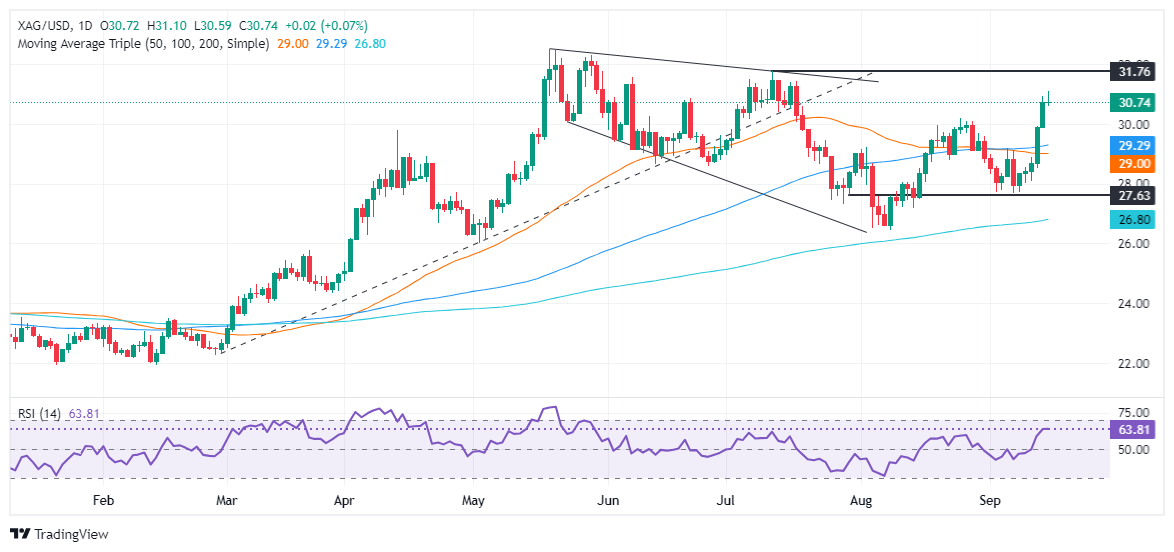
- Silver’s uptrend continues, as solid resistance emerges at $30.70-$30.90.
- A break above $31.00 could lead to further gains, targeting $31.54, $31.75, and the YTD high at $32.51.
- Sellers must push prices below $29.86 for a bearish shift and challenge lower support levels.
Silver prices edged up modestly late on Monday, bolstered by a weaker US Dollar and a drop in US Treasury yields. Speculation that the Federal Reserve would cut rates by 50 basis points (bps) weighed on the buck and yields. The XAG/USD trades at $30.75, extending its winning streak to six days.
XAG/USD Price Forecast: Technical outlook
Silver’s uptrend remains intact after six days of continuing gains, though the grey metal faces strong resistance at a downslope resistance trendline drawn from May-July highs that pass at around $30.70-$30.90.
Momentum favors buyers, as the Relative Strength Index (RSI) shows. However, it has begun to turn flat, hinting that consolidation lies ahead.
XAG/USD must clear the $31.00 figure for a bullish continuation. A decisive break would expose the June 7 high at $31.54, followed by the July 11 peak at $31.75. On additional strength, the next stop would be the $32.00 figure, ahead of the year-to-date (YTD) high at $32.51.
Conversely, sellers must bring prices below the September 13 low of $29.86 to challenge lower prices.
XAG/USD Price Action – Daily Chart
Silver FAQs
Silver is a precious metal highly traded among investors. It has been historically used as a store of value and a medium of exchange. Although less popular than Gold, traders may turn to Silver to diversify their investment portfolio, for its intrinsic value or as a potential hedge during high-inflation periods. Investors can buy physical Silver, in coins or in bars, or trade it through vehicles such as Exchange Traded Funds, which track its price on international markets.
Silver prices can move due to a wide range of factors. Geopolitical instability or fears of a deep recession can make Silver price escalate due to its safe-haven status, although to a lesser extent than Gold's. As a yieldless asset, Silver tends to rise with lower interest rates. Its moves also depend on how the US Dollar (USD) behaves as the asset is priced in dollars (XAG/USD). A strong Dollar tends to keep the price of Silver at bay, whereas a weaker Dollar is likely to propel prices up. Other factors such as investment demand, mining supply – Silver is much more abundant than Gold – and recycling rates can also affect prices.
Silver is widely used in industry, particularly in sectors such as electronics or solar energy, as it has one of the highest electric conductivity of all metals – more than Copper and Gold. A surge in demand can increase prices, while a decline tends to lower them. Dynamics in the US, Chinese and Indian economies can also contribute to price swings: for the US and particularly China, their big industrial sectors use Silver in various processes; in India, consumers’ demand for the precious metal for jewellery also plays a key role in setting prices.
Silver prices tend to follow Gold's moves. When Gold prices rise, Silver typically follows suit, as their status as safe-haven assets is similar. The Gold/Silver ratio, which shows the number of ounces of Silver needed to equal the value of one ounce of Gold, may help to determine the relative valuation between both metals. Some investors may consider a high ratio as an indicator that Silver is undervalued, or Gold is overvalued. On the contrary, a low ratio might suggest that Gold is undervalued relative to Silver.
- AUD/USD soars due to a less hawkish Fed and a more hawkish RBA stance.
- Fed rate cut talks depreciate the US Dollar due to increased odds of 50 bps cut in Wednesday’s meeting.
- Lower US yields also weigh on the US Dollar.
The Australian economy faces a complex outlook amid rising inflation and a cautious central bank. Despite initial expectations of interest rate cuts, the Reserve Bank of Australia's hawkish stance has prompted markets to anticipate only a modest 25 bps reduction in 2024.
Daily digest market movers: Australian Dollar rises sharply on Fed rate cut uncertainty and RBA's hawkish stance
- The Australian Dollar gained on Monday, influenced by the RBA's hawkish stance and uncertainty surrounding the Fed's interest rate decision on Wednesday.
- With inflation remaining elevated, RBA Governor Michele Bullock emphasized the need for caution and indicated that rate cuts remain premature.
- Due to uncertainty over the magnitude of the Fed's rate cut at its Wednesday meeting, US Treasury yields fell, exerting downward pressure on the US Dollar.
- The CME FedWatch Tool indicates a 40% probability of a 25 bps rate cut and a near 60% chance of a 50 bps reduction.
AUD/USD technical outlook: Bulls must take the 20-day SMA to confirm a recovery
The AUD/USD pair has been trading with a mixed outlook in the past sessions. The Relative Strength Index (RSI) is at 55, suggesting that buying pressure is rising. The Moving Average Convergence Divergence (MACD) red bars are decreasing, suggesting that selling pressure is declining but steady. A consolidation above the 20-day Simple Moving Average (SMA) at 0.6735 could be considered a buying signal, which would confirm a bullish outlook for the short-term.
Australian Dollar FAQs
One of the most significant factors for the Australian Dollar (AUD) is the level of interest rates set by the Reserve Bank of Australia (RBA). Because Australia is a resource-rich country another key driver is the price of its biggest export, Iron Ore. The health of the Chinese economy, its largest trading partner, is a factor, as well as inflation in Australia, its growth rate and Trade Balance. Market sentiment – whether investors are taking on more risky assets (risk-on) or seeking safe-havens (risk-off) – is also a factor, with risk-on positive for AUD.
The Reserve Bank of Australia (RBA) influences the Australian Dollar (AUD) by setting the level of interest rates that Australian banks can lend to each other. This influences the level of interest rates in the economy as a whole. The main goal of the RBA is to maintain a stable inflation rate of 2-3% by adjusting interest rates up or down. Relatively high interest rates compared to other major central banks support the AUD, and the opposite for relatively low. The RBA can also use quantitative easing and tightening to influence credit conditions, with the former AUD-negative and the latter AUD-positive.
China is Australia’s largest trading partner so the health of the Chinese economy is a major influence on the value of the Australian Dollar (AUD). When the Chinese economy is doing well it purchases more raw materials, goods and services from Australia, lifting demand for the AUD, and pushing up its value. The opposite is the case when the Chinese economy is not growing as fast as expected. Positive or negative surprises in Chinese growth data, therefore, often have a direct impact on the Australian Dollar and its pairs.
Iron Ore is Australia’s largest export, accounting for $118 billion a year according to data from 2021, with China as its primary destination. The price of Iron Ore, therefore, can be a driver of the Australian Dollar. Generally, if the price of Iron Ore rises, AUD also goes up, as aggregate demand for the currency increases. The opposite is the case if the price of Iron Ore falls. Higher Iron Ore prices also tend to result in a greater likelihood of a positive Trade Balance for Australia, which is also positive of the AUD.
The Trade Balance, which is the difference between what a country earns from its exports versus what it pays for its imports, is another factor that can influence the value of the Australian Dollar. If Australia produces highly sought after exports, then its currency will gain in value purely from the surplus demand created from foreign buyers seeking to purchase its exports versus what it spends to purchase imports. Therefore, a positive net Trade Balance strengthens the AUD, with the opposite effect if the Trade Balance is negative.
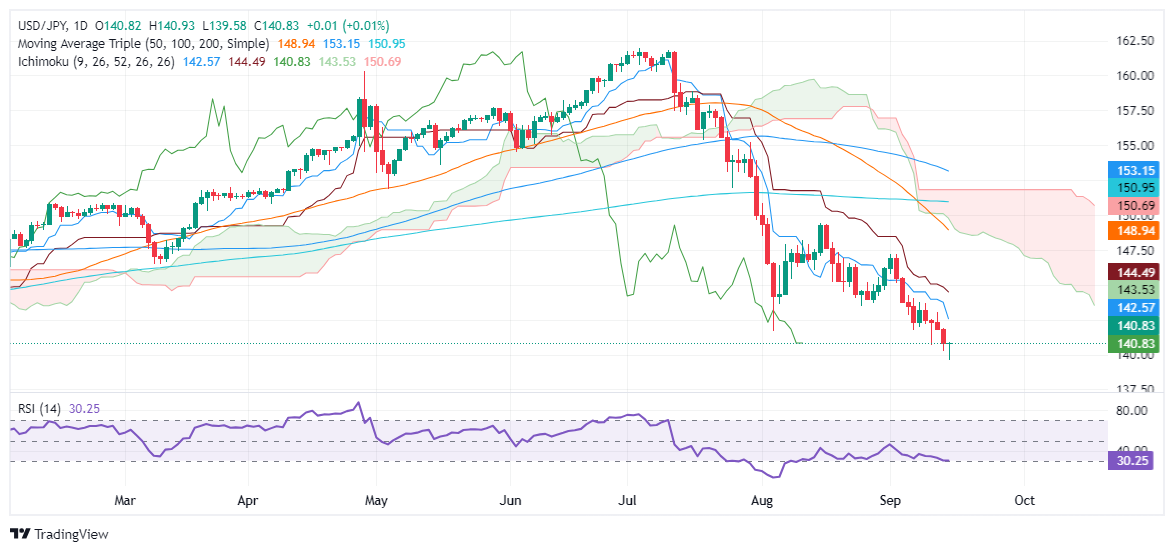
- USD/JPY recovers after diving to a YTD low; a daily close above 140.25 paves the way for further upside.
- Key resistance levels include 142.57 (Tenkan-Sen), 143.52 (Senkou Span A), and 144.48 (Kijun-Sen).
- Momentum remains bearish, but bullish patterns like a ‘dragonfly doji’ or ‘hammer’ could signal a leg higher if confirmed.
The USD/JPY recovers some ground late in the North American session after touching a new year-to-date (YTD) low of 139.58 earlier in the day. At the time of writing, the major pair traded at 140.85 and registered minimal gains of 0.03%.
USD/JPY Price Forecast: Technical outlook
The downtrend would likely continue after clearing December’s 28 low of 140.25, but USD/JPY buyers bought the dip, clearing the latter as the pair aims towards 141.00.
A daily close above 140.25 would open the way to testing key resistance levels amid a busy week of monetary policy decisions from the Federal Reserve and the Bank of Japan.
Momentum hints that sellers remain in control, as shown by the Relative Strength Index (RSI). But if Monday’s price action completes a ‘dragon-fly doji’ or a ‘hammer,’ look for a leg up.
On further strength, USD/JPY's first resistance would be the Tenkan-Sen at 142.57, followed by the Senkou Span A at 143.52. If those levels are cleared, buyers can aim for the Kijun-Sen at 144.48.
Conversely, if sellers drag prices below 140.25, that can pave the way for further downside.
USD/JPY Price Action – Daily Chart
Japanese Yen PRICE Today
The table below shows the percentage change of Japanese Yen (JPY) against listed major currencies today. Japanese Yen was the strongest against the US Dollar.
| USD | EUR | GBP | JPY | CAD | AUD | NZD | CHF | |
|---|---|---|---|---|---|---|---|---|
| USD | -0.44% | -0.65% | 0.06% | -0.05% | -0.64% | -0.49% | -0.25% | |
| EUR | 0.44% | -0.27% | 0.44% | 0.36% | -0.26% | -0.11% | 0.15% | |
| GBP | 0.65% | 0.27% | 0.65% | 0.62% | 0.00% | 0.17% | 0.42% | |
| JPY | -0.06% | -0.44% | -0.65% | -0.10% | -0.63% | -0.51% | -0.36% | |
| CAD | 0.05% | -0.36% | -0.62% | 0.10% | -0.67% | -0.44% | -0.31% | |
| AUD | 0.64% | 0.26% | -0.00% | 0.63% | 0.67% | 0.16% | 0.40% | |
| NZD | 0.49% | 0.11% | -0.17% | 0.51% | 0.44% | -0.16% | 0.25% | |
| CHF | 0.25% | -0.15% | -0.42% | 0.36% | 0.31% | -0.40% | -0.25% |
The heat map shows percentage changes of major currencies against each other. The base currency is picked from the left column, while the quote currency is picked from the top row. For example, if you pick the Japanese Yen from the left column and move along the horizontal line to the US Dollar, the percentage change displayed in the box will represent JPY (base)/USD (quote).
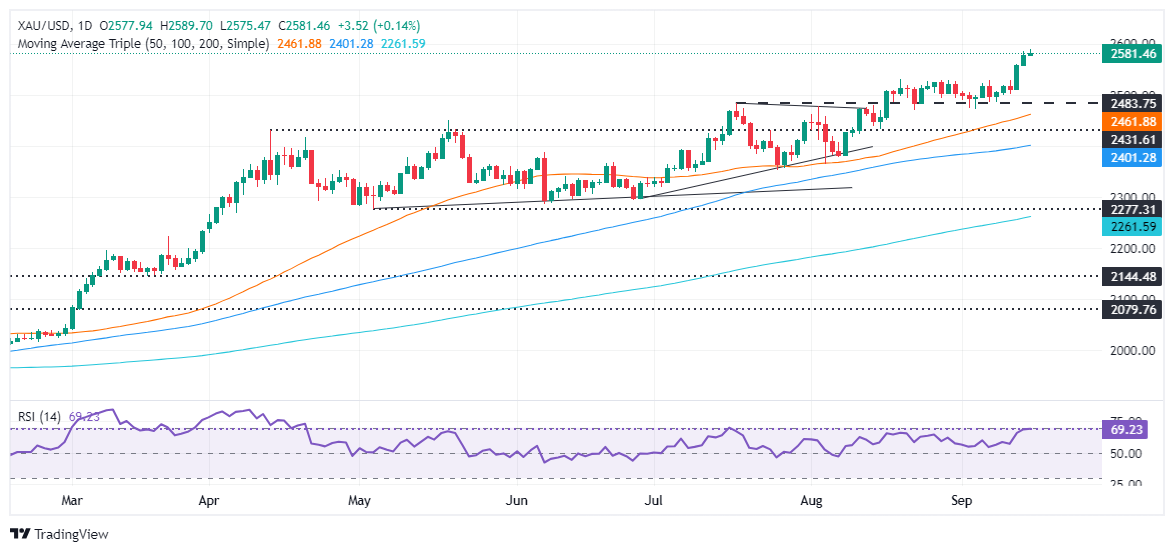
- Gold prices rise as odds for a 50 bps Fed rate cut increase to 59%, supported by falling US Treasury yields.
- US Dollar Index (DXY) drops 0.36% to 100.74, boosting the non-yielding metal.
- Traders await US Retail Sales on Tuesday and housing data ahead of Fed decision and Jerome Powell’s press conference on Wednesday.
Gold price posted gains of over 0.18% during the North American session on Monday, bolstered by a weaker US Dollar as traders eye Wednesday’s US Federal Reserve (Fed) monetary policy decision. Expectations for a larger-than-expected rate cut bolstered the XAU/USD, which trades at $2,582 after bouncing off a daily low of $2,579.
Market sentiment is mixed ahead of the Fed’s decision. Data shows that the chances that Jerome Powell and his colleagues will deliver a 50-basis-point (bps) cut are growing. The CME FedWatch Tool shows that odds for a 50 bps cut rose from 50% to 59%, while for a 25 bps cut they stand at 41%.
The drop in US Treasury yields also supported the golden metal. The US 10-year benchmark T-note is falling two and a half bps to 3.631%, a tailwind for the non-yielding metal.
Consequently, this weighed on the Greenback, which according to the US Dollar Index (DXY) fell 0.36% to 100.74.
In the geopolitical space, risks of an escalation of the Middle East conflict remain while an apparent assassination attempt against former US President Donald Trump weakened the Greenback, according to Bloomberg.
Looking ahead, the US economic schedule will feature August Retail Sales on Tuesday. These are foreseen dropping compared to July’s solid results and are expected to guide the size of the Fed’s cut. Additionally, housing data will be released ahead of the Fed's decision and Chair Jerome Powell's press conference later in the week.
Daily digest market movers: Gold price remains steady above $2,580
- Wall Street economists estimate that US Retail Sales will decline from 1% to 0.2% MoM.
- US Industrial Production is expected to improve from July's -0.6% contraction to 0%.
- Besides the Federal Open Market Committee Decision (FOMC), investors will eye the Summary of Economic Projections (SEP), particularly the Dot Plot for forward guidance on interest rates.
- Data from the Chicago Board of Trade suggests that the Fed is expected to cut at least 112 basis points this year, based on the fed funds rate futures contract for December 2024.
XAU/USD technical outlook: Gold price headed for $2,600
Gold's uptrend remains intact, supported by solid demand and momentum. The Relative Strength Index (RSI) is in bullish territory, staying just below the 80 level, which traders often see as an "extreme" overbought in strong trending conditions.
If XAU/USD clears the all-time high (ATH) of $2,589, the next stop would be $2,600. If surpassed, further upside could be expected with the psychological levels of $2,650 and $2,700 up next.
On the downside, Gold sellers must push prices below $2,550 to regain control. Key support levels after that include the August 20 high at $2,531, followed by the critical $2,500 mark.
Gold FAQs
Gold has played a key role in human’s history as it has been widely used as a store of value and medium of exchange. Currently, apart from its shine and usage for jewelry, the precious metal is widely seen as a safe-haven asset, meaning that it is considered a good investment during turbulent times. Gold is also widely seen as a hedge against inflation and against depreciating currencies as it doesn’t rely on any specific issuer or government.
Central banks are the biggest Gold holders. In their aim to support their currencies in turbulent times, central banks tend to diversify their reserves and buy Gold to improve the perceived strength of the economy and the currency. High Gold reserves can be a source of trust for a country’s solvency. Central banks added 1,136 tonnes of Gold worth around $70 billion to their reserves in 2022, according to data from the World Gold Council. This is the highest yearly purchase since records began. Central banks from emerging economies such as China, India and Turkey are quickly increasing their Gold reserves.
Gold has an inverse correlation with the US Dollar and US Treasuries, which are both major reserve and safe-haven assets. When the Dollar depreciates, Gold tends to rise, enabling investors and central banks to diversify their assets in turbulent times. Gold is also inversely correlated with risk assets. A rally in the stock market tends to weaken Gold price, while sell-offs in riskier markets tend to favor the precious metal.
The price can move due to a wide range of factors. Geopolitical instability or fears of a deep recession can quickly make Gold price escalate due to its safe-haven status. As a yield-less asset, Gold tends to rise with lower interest rates, while higher cost of money usually weighs down on the yellow metal. Still, most moves depend on how the US Dollar (USD) behaves as the asset is priced in dollars (XAU/USD). A strong Dollar tends to keep the price of Gold controlled, whereas a weaker Dollar is likely to push Gold prices up.
- The Canadian Dollar tilted into the red across the board on Monday.
- Canada delivers its latest CPI inflation data this week.
- A speech from BoC’s Macklem and Canadian Retail Sales data due on Friday.
The Canadian Dollar backslid to kick off the trading week, falling into the low end on Monday across the major currency board as CAD traders gear up for a fresh round of Canadian Consumer Price Index (CPI) inflation figures due during the mid-week phase.
Canada releases its latest inflation figures on Tuesday, with the Bank of Canada (BoC) set to deliver their own core CPI basket print at the same time. Later in the week, Canadian Retail Sales figures will be released on Friday, alongside a fresh appearance from BoC head Tiff Macklem. Of course, the key event for global markets this week will be the US Federal Reserve’s (Fed) highly-anticipated rate cut due on Wednesday.
Daily digest market movers
- The Canadian Dollar eased back on quiet Monday flows.
- Canadian MoM CPI inflation due on Tuesday is expected to ease back to 0.1% in August compared to July’s 0.4% print.
- Global markets have pivoted towards the Fed’s upcoming rate call on Wednesday, crimping the likelihood of meaningful chart moves beforehand.
- Market participants are increasingly convinced that the Fed will kick off the next rate cutting cycle with a 50 bps cut on Wednesday with only 40% odds of a 25 bps cut according to the CME’s FedWatch Tool.
- A speech from BoC Governor Macklem and the latest Canadian Retail Sales figures are slated for Friday.
Economic Indicator
BoC Consumer Price Index Core (MoM)
The BoC Consumer Price Index Core, released by the Bank of Canada (BoC) on a monthly basis, represents changes in prices for Canadian consumers by comparing the cost of a fixed basket of goods and services. It is considered a measure of underlying inflation as it excludes eight of the most-volatile components: fruits, vegetables, gasoline, fuel oil, natural gas, mortgage interest, intercity transportation and tobacco products. The MoM figure compares the prices of goods in the reference month to the previous month. Generally, a high reading is seen as bullish for the Canadian Dollar (CAD), while a low reading is seen as bearish.
Read more.Next release: Tue Sep 17, 2024 12:30
Frequency: Monthly
Consensus: -
Previous: 0.3%
Source: Statistics Canada
Canadian Dollar price forecast
The Canadian Dollar (CAD) continues to struggle to come up with reasons to hit the bids, so it simply doesn’t these days. USD/CAD continues to churn away in a technical no-man’s land just below the 200-day Exponential Moving Average (EMA) at 1.3617, and long-term average are grinding steadily toward the 1.36 key technical level as the pair falls into disrepair.
USD/CAD daily chart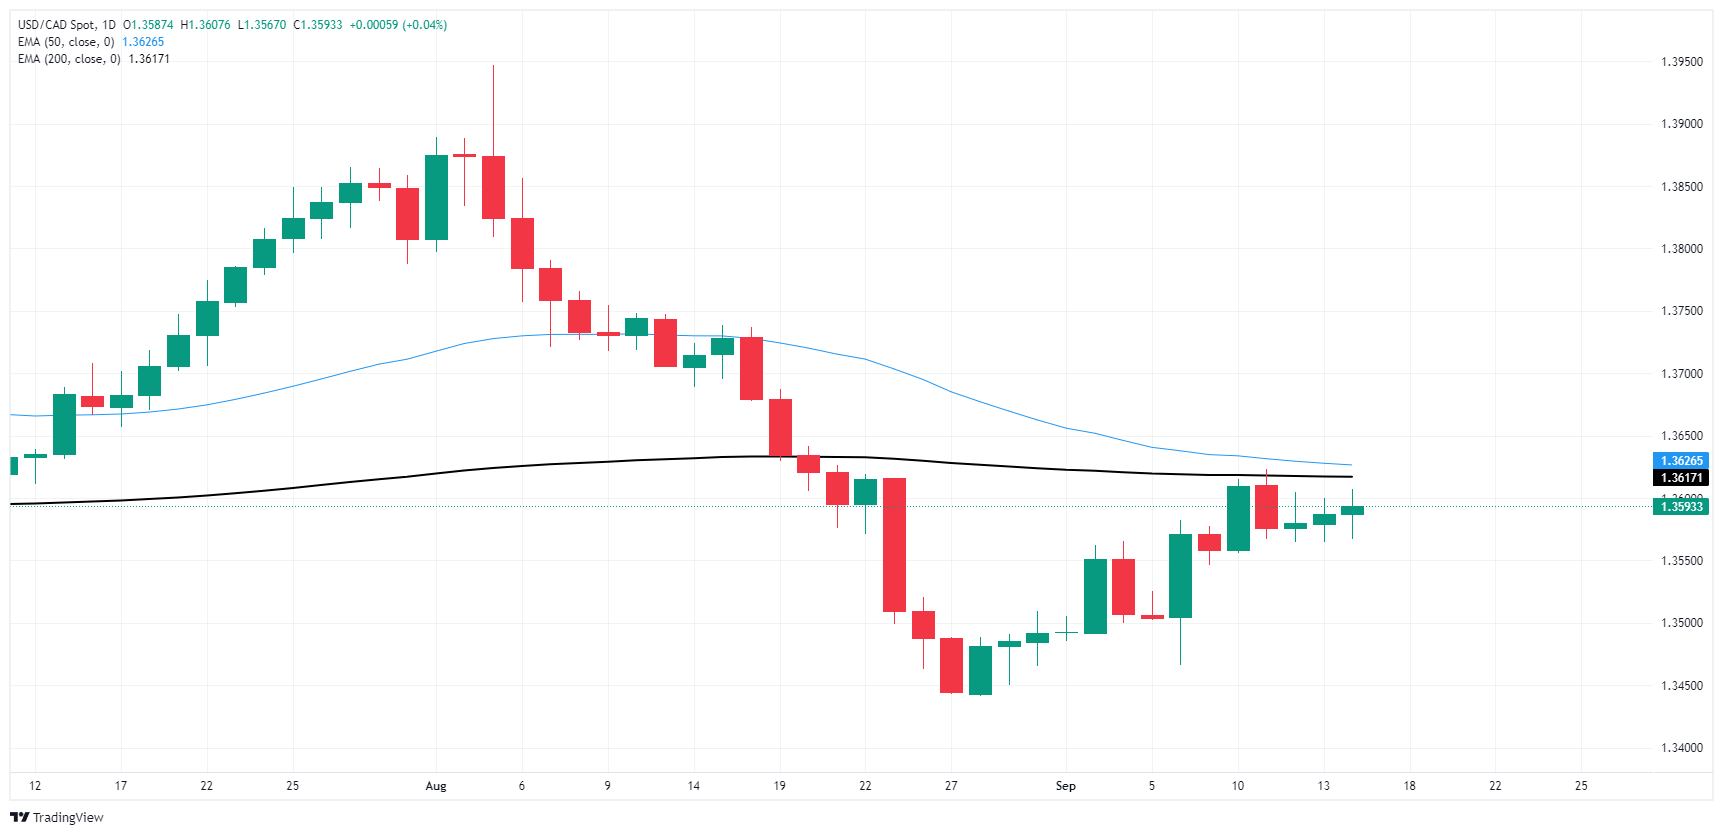
Canadian Dollar FAQs
The key factors driving the Canadian Dollar (CAD) are the level of interest rates set by the Bank of Canada (BoC), the price of Oil, Canada’s largest export, the health of its economy, inflation and the Trade Balance, which is the difference between the value of Canada’s exports versus its imports. Other factors include market sentiment – whether investors are taking on more risky assets (risk-on) or seeking safe-havens (risk-off) – with risk-on being CAD-positive. As its largest trading partner, the health of the US economy is also a key factor influencing the Canadian Dollar.
The Bank of Canada (BoC) has a significant influence on the Canadian Dollar by setting the level of interest rates that banks can lend to one another. This influences the level of interest rates for everyone. The main goal of the BoC is to maintain inflation at 1-3% by adjusting interest rates up or down. Relatively higher interest rates tend to be positive for the CAD. The Bank of Canada can also use quantitative easing and tightening to influence credit conditions, with the former CAD-negative and the latter CAD-positive.
The price of Oil is a key factor impacting the value of the Canadian Dollar. Petroleum is Canada’s biggest export, so Oil price tends to have an immediate impact on the CAD value. Generally, if Oil price rises CAD also goes up, as aggregate demand for the currency increases. The opposite is the case if the price of Oil falls. Higher Oil prices also tend to result in a greater likelihood of a positive Trade Balance, which is also supportive of the CAD.
While inflation had always traditionally been thought of as a negative factor for a currency since it lowers the value of money, the opposite has actually been the case in modern times with the relaxation of cross-border capital controls. Higher inflation tends to lead central banks to put up interest rates which attracts more capital inflows from global investors seeking a lucrative place to keep their money. This increases demand for the local currency, which in Canada’s case is the Canadian Dollar.
Macroeconomic data releases gauge the health of the economy and can have an impact on the Canadian Dollar. Indicators such as GDP, Manufacturing and Services PMIs, employment, and consumer sentiment surveys can all influence the direction of the CAD. A strong economy is good for the Canadian Dollar. Not only does it attract more foreign investment but it may encourage the Bank of Canada to put up interest rates, leading to a stronger currency. If economic data is weak, however, the CAD is likely to fall.
There was no respite for the selling mood hurting the Greenback on Monday, as market participants gave further credit to the likelihood that the Fed might surprise everybody and reduce its rates by a half percentage point on Wednesday.
Here is what you need to know on Tuesday, September 17:
The US Dollar Index (DXY) dropped for the third consecutive session, trading well south of the 101.00 support in combination with lower yields across the board. Retail Sales, Industrial and Manufacturing Production, Business Inventories, the NAHB Housing Market Index and the API’s report on US crude oil inventories are all due on September 17.
Further weakness in the US Dollar propelled EUR/USD well past the 1.1100 barrier to clock new multi-day highs. On September 17 comes the Economic Sentiment gauged by the ZEW institute in Germany and the broader Euroland.
GBP/USD resumed its uptrend and managed to surpass the 1.3200 hurdle, or two-week peaks. The next risk event on the UK docket will be the release of the Inflation Rate on September 18.
USD/JPY dropped and bounced off new lows near 139.60 following the sell-off in the Greenback and declining US yields. The Tertiary Industry Index is expected on September 17.
AUD/USD climbed further north of the 0.6700 yardstick and hit fresh two-week highs. Next on tap Down Under will be the release of the Westpac Leading Index on September 18.
WRTI prices maintained their bullish stance and trespassed the key $70.00 mark per barrel, up for the fourth day in a row.
Prices of Gold hit a record high and gradually approached the key $2,600 mark per barrel amidst the weaker Dollar and speculation of a larger rate cut by the Fed. Silver prices navigated an inconclusive session, hovering just below the $31.00 mark per ounce.
- US Dollar dealt bad hand as market considers higher initial Fed rate cut.
- Market prices in high odds of a 50 bps cut at Wednesday's FOMC meeting.
- Fed Dot Plot unlikely to validate an aggressive rate cut path.
The US Dollar Index (DXY), which measures the value of the USD against a basket of six currencies, is extending a corrective decline amid rising dovish expectations for the Federal Reserve's (Fed) meeting on Wednesday. The DXY is trading lower for the third consecutive day, near 100.70, as the market prices in a decently high probability of a 50-basis-point cut.
With signs of a slowdown in inflation and cooling in the labor market, investors have grown confident in a 50 bps cut and over 100 bps of easing by year-end.
Daily digest market movers: US Dollar declines ahead of FOMC meeting
- Fed easing expectations surge ahead of Wednesday's FOMC decision, buoyed by lukewarm inflation data.
- Analysts widely anticipate a 25 bps rate cut, but some project a bolder 50 bps move, while markets price in a 65% chance of the latter.
- Market expectations of 250 bps of easing over the next year are deemed excessive, with the Fed's Dot Plot unlikely to support such an aggressive path.
- FOMC vote will be closely scrutinized for signs of internal divisions.
Daily digest market movers: DXY shrugs off weak sentiment data on the back of hawkish bets
Technical indicators for the DXY index have resumed their downward trend in negative territory. The index has broken below its 20-day Simple Moving Average (SMA), indicating a loss of buying momentum. The Relative Strength Index (RSI) is below 50, suggesting further declines. The Moving Average Convergence Divergence (MACD) is also trending lower, confirming the bearish outlook.
Support levels to watch are 100.50, 100.30 and 100.00, while resistance levels to consider are 101.00, 101.30 and 101.60.
US Dollar FAQs
The US Dollar (USD) is the official currency of the United States of America, and the ‘de facto’ currency of a significant number of other countries where it is found in circulation alongside local notes. It is the most heavily traded currency in the world, accounting for over 88% of all global foreign exchange turnover, or an average of $6.6 trillion in transactions per day, according to data from 2022. Following the second world war, the USD took over from the British Pound as the world’s reserve currency. For most of its history, the US Dollar was backed by Gold, until the Bretton Woods Agreement in 1971 when the Gold Standard went away.
The most important single factor impacting on the value of the US Dollar is monetary policy, which is shaped by the Federal Reserve (Fed). The Fed has two mandates: to achieve price stability (control inflation) and foster full employment. Its primary tool to achieve these two goals is by adjusting interest rates. When prices are rising too quickly and inflation is above the Fed’s 2% target, the Fed will raise rates, which helps the USD value. When inflation falls below 2% or the Unemployment Rate is too high, the Fed may lower interest rates, which weighs on the Greenback.
In extreme situations, the Federal Reserve can also print more Dollars and enact quantitative easing (QE). QE is the process by which the Fed substantially increases the flow of credit in a stuck financial system. It is a non-standard policy measure used when credit has dried up because banks will not lend to each other (out of the fear of counterparty default). It is a last resort when simply lowering interest rates is unlikely to achieve the necessary result. It was the Fed’s weapon of choice to combat the credit crunch that occurred during the Great Financial Crisis in 2008. It involves the Fed printing more Dollars and using them to buy US government bonds predominantly from financial institutions. QE usually leads to a weaker US Dollar.
Quantitative tightening (QT) is the reverse process whereby the Federal Reserve stops buying bonds from financial institutions and does not reinvest the principal from the bonds it holds maturing in new purchases. It is usually positive for the US Dollar.
- Mexican Peso on the backfoot following last week near 4% appreciation.
- President AMLO signs the judicial reform into law, officially enacted as of Sunday.
- Fed rate cut expectations rise, with a 61% chance of a 50 bps cut on Wednesday, as investors await key US Retail Sales data.
The Mexican Peso retreats moderately against the Greenback during Monday’s session amid thin trading due to Mexico’s closed local markets in observance of Independence Day. At the time of writing, the USD/MXN trades at 19.24, with gains of 0.35%.
The stock market mood is mixed on Wall Street and weighed on the Mexican currency, which appreciated close to 4% last week. A light economic docket in Mexico will feature the release of Aggregate Demand and Private Spending data for the second quarter of 2024 on Wednesday.
In the meantime, President Andres Manuel Lopez Obrador (AMLO) signed into law the Judicial reform, “took effect on Sunday after the text of the constitutional changes was published in the government gazette,” according to Reuters.
Across the north of the border, the US Dollar remains weak as investors brace for the first Federal Reserve (Fed) interest rate cut on Wednesday. Expectations that the Fed would go big with its first rate cut grew during Monday’s session after a news article of Fed whisperer Nick Timiraous hinted at the Fed’s dilemma of starting big or small.
Data from the CME FedWatch Tool shows odds for a 50-basis-point (bps) cut are at 61%, while for a 25 bps, they diminished from 50% last Friday to 39%.
Ahead of the week, the US economic schedule will feature August Retail Sales on Tuesday, which are expected to dip compared to July’s strong figures. This and housing data will be announced before the Fed’s decision and Chair Jerome Powell's press conference.
Daily digest market movers: Mexican Peso weakens on Independence Day
- USD/MXN would continue to be driven by market mood and expectations for a bigger Fed rate cut.
- Mexico’s Inflation dipped below 5% in August, increasing the chances of additional easing by Banxico.
- Bank of Mexico Director of Economic Research, Alejandria Salcedo, said that a robust rule of law environment could generate conditions that encourage investment.
- Wall Street economists estimate that US Retail Sales will dip from 1% to 0.2% MoM.
- US Industrial Production is foreseen improving from July’s -0.6% contraction to 0%.
- Data from the Chicago Board of Trade suggests the Fed will cut at least 112 basis points this year, according to the fed funds rate futures contract for December 2024.
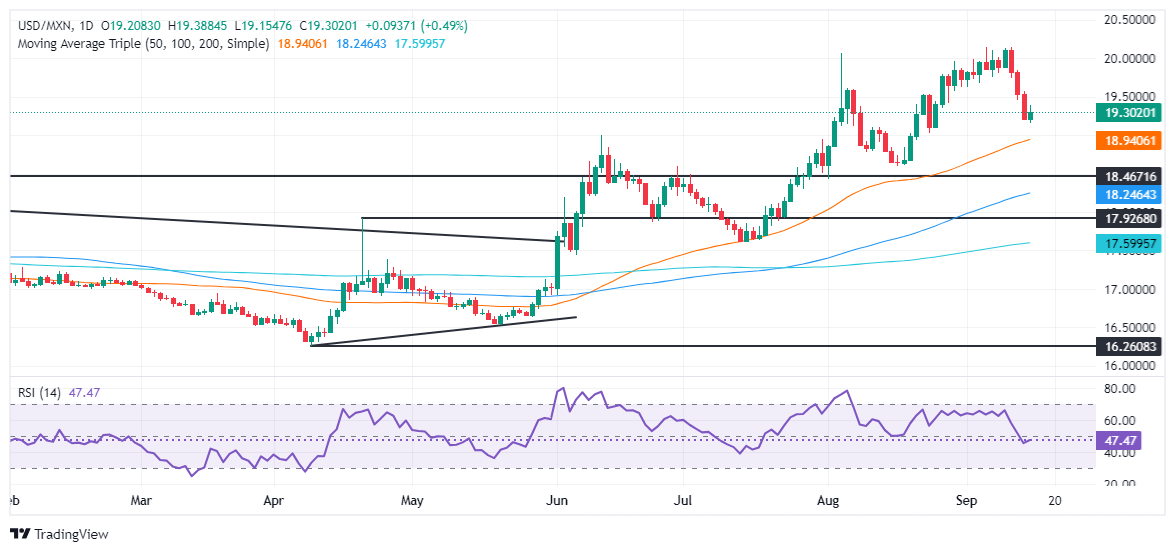
USD/MXN technical outlook: Mexican Peso drops as USD/MXN rises above 19.20
The USD/MXN pullback pushed the pair toward 19.15 before dip buyers emerged and pushed the spot price toward 19.38 before retreating somewhat. Momentum hints that sellers are in charge, but the Relative Strength Index (RSI) about to cross above its neutral line, could pave the way for a leg-up.
In that event, the USD/MXN's next resistance level would be 19.50. On further strength, the next ceiling would be 20.00. Conversely, if USD/MXN extends its losses past 19.15, the 19.02 August 23 low will be within reach. A breach of the latter will expose the 50-day Simple Moving Average (SMA) at 18.99, followed by the August 19 cycle low of 18.59.
Mexican Peso FAQs
The Mexican Peso (MXN) is the most traded currency among its Latin American peers. Its value is broadly determined by the performance of the Mexican economy, the country’s central bank’s policy, the amount of foreign investment in the country and even the levels of remittances sent by Mexicans who live abroad, particularly in the United States. Geopolitical trends can also move MXN: for example, the process of nearshoring – or the decision by some firms to relocate manufacturing capacity and supply chains closer to their home countries – is also seen as a catalyst for the Mexican currency as the country is considered a key manufacturing hub in the American continent. Another catalyst for MXN is Oil prices as Mexico is a key exporter of the commodity.
The main objective of Mexico’s central bank, also known as Banxico, is to maintain inflation at low and stable levels (at or close to its target of 3%, the midpoint in a tolerance band of between 2% and 4%). To this end, the bank sets an appropriate level of interest rates. When inflation is too high, Banxico will attempt to tame it by raising interest rates, making it more expensive for households and businesses to borrow money, thus cooling demand and the overall economy. Higher interest rates are generally positive for the Mexican Peso (MXN) as they lead to higher yields, making the country a more attractive place for investors. On the contrary, lower interest rates tend to weaken MXN.
Macroeconomic data releases are key to assess the state of the economy and can have an impact on the Mexican Peso (MXN) valuation. A strong Mexican economy, based on high economic growth, low unemployment and high confidence is good for MXN. Not only does it attract more foreign investment but it may encourage the Bank of Mexico (Banxico) to increase interest rates, particularly if this strength comes together with elevated inflation. However, if economic data is weak, MXN is likely to depreciate.
As an emerging-market currency, the Mexican Peso (MXN) tends to strive during risk-on periods, or when investors perceive that broader market risks are low and thus are eager to engage with investments that carry a higher risk. Conversely, MXN tends to weaken at times of market turbulence or economic uncertainty as investors tend to sell higher-risk assets and flee to the more-stable safe havens.
- The Dow Jones cracked a fresh all-time high during Monday trading.
- Despite the upside stretch, equities remain tepid overall.
- Investors are buckling down for the wait to Wednesday’s Fed rate call.
The Dow Jones Industrial Average (DJIA) clipped into another record intraday bid to kick off the new trading week. The largest equities on the New York Stock Exchange (NYSE) inched higher on Monday, ahead of Wednesday’s Federal Reserve (Fed) rate call, which is widely expected to be the Fed’s first rate cut since March of 2020.
The Fed kicking off a new rate-cutting cycle on Wednesday is all but a given according to investors, and it now comes down to a debate of how much rather than when. According to the CME’s FedWatch Tool, rate traders are pricing in around 60% odds that the Fed’s first rate cut in over four years will be a 50 bps decline in the Fed funds rate, with the remaining 40% expecting a more demure 25 bps. Rate markets are also pricing in a total of 125-150 bps in cuts by the end of the year, with interest rate traders seeing a roughly 80% chance that the Fed funds rate will hit 400-425 total bps by December 18 versus the current interest rate of 525-550.
US Retail Sales are slated for an update on Tuesday, but the key datapoint that would normally drive some level of volatility is not expected to move the needle this week unless the print comes in wildly out of alignment with forecasts. MoM US Retail Sales growth in August is expected to ease back to 0.2% from July’s 1.0%, while core MoM Retail Sales (excluding automotive purchases) are expected to tick down to 0.3% from 0.4%.
Dow Jones news
Despite an overall tepid tone in US equities on Monday, the Dow Jones has tilted into the bullish side, rising around 130 points and adding 0.3% at the current average near 41,500. The DJIA clipped a new record intraday bid of 41,738 before settling back as investors bide their time.
Intel Corp (INTC) added 2.5%, climbing over $20 per share after it was revealed that the chipmaker was set to receive a $3.5 billion grant from the US government to produce chipsets for the US military and the Pentagon. Despite the Monday pop, INTC is barely off of its decade-plus lows and has yet to recover ground after missing an earnings call in August. A technical recovery has yet to materialize after the silicon giant gleefully announced they would axe over 15,000 employees in a bid to appease shareholders and try to backstop the company’s share value decline of nearly 60% YTD.
On the low end, Apple Inc (AAPL) tumbled -3.3% to $215 per share after reports surfaced that demand for the company’s 16th iteration of its iPhone platform may not be as high as many anticipated. According to analysts, key AI-driven features that Apple was banking on to revive flagging sales figures are still not publicly available, flattening phone sales. At the same time, extended shipping times are further shaking out potential buyers. Sales for the company’s latest annual mobile phone update are down 12% YoY, according to analysis from TF Securities.
Dow Jones price forecast
Despite an overall tepid stance to stock trading on Monday, the Dow Jones is still finding plenty of room on the bidding side, clipping into a fresh all-time high and rounds the corner into a fourth straight trading day of gains. The major equity index has recovered nearly 4.4% bottom-to-top from last week’s swing low below 40,000.
With the DJIA recovering back above the 50-day Exponential Moving Average (EMA) rising through 40,450, action is squarely planted on the bullish side, though long-term bidders will be cautious with price action cycling familiar technical levels. This isn’t the first time the Dow Jones has priced in a topping pattern ahead of major news events, and despite having a short-term memory issue, buyers can still recall July’s bumpy -7.2% decline from previous record highs.
Dow Jones daily chart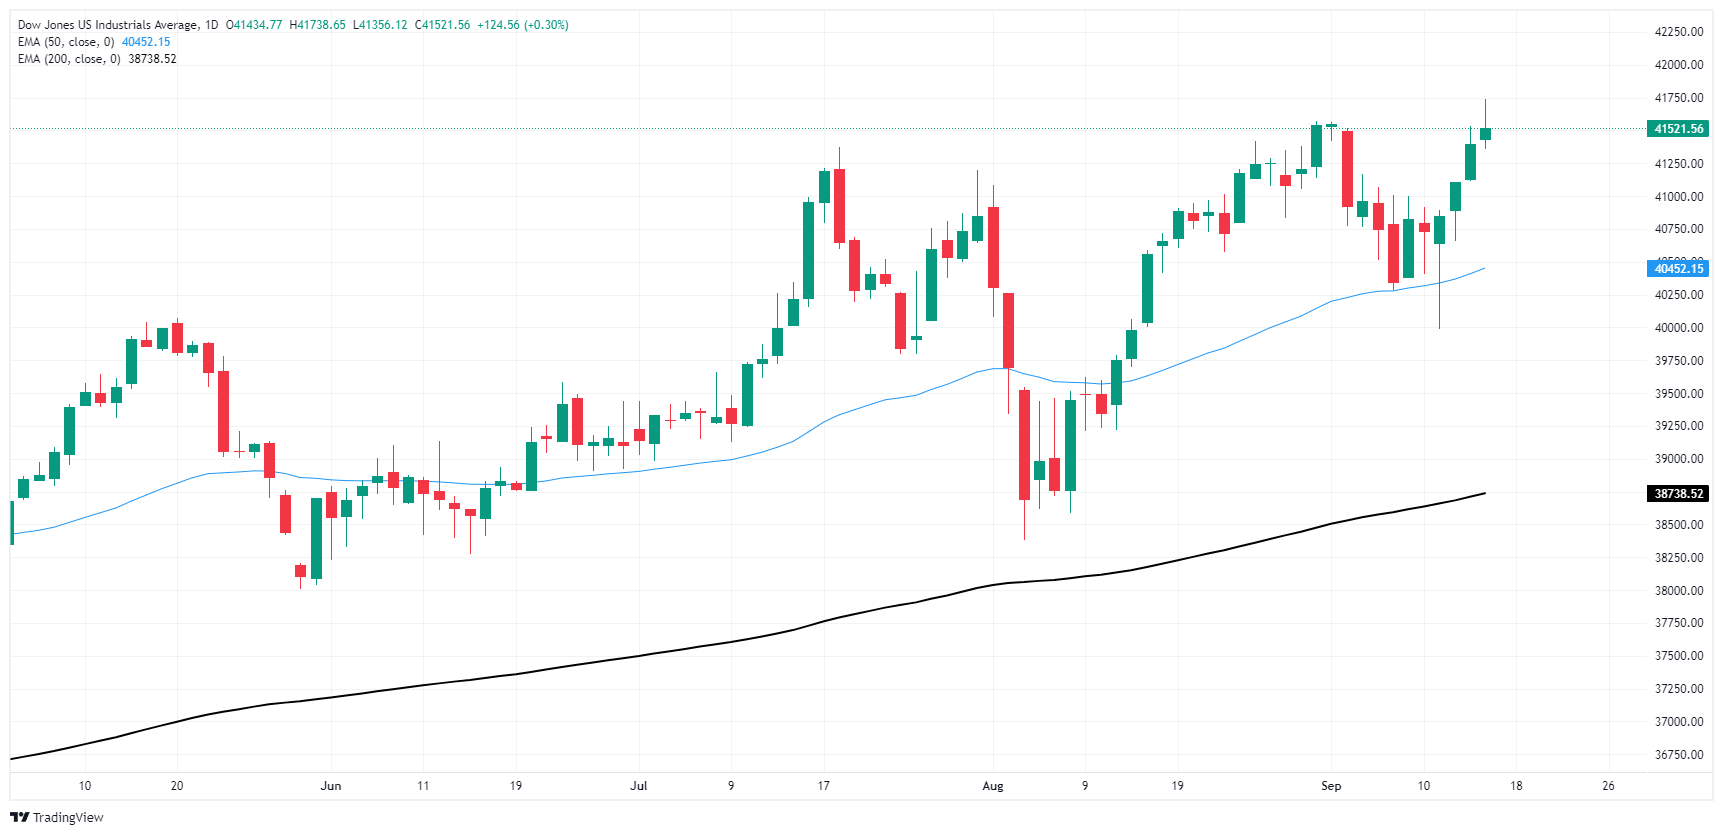
Dow Jones FAQs
The Dow Jones Industrial Average, one of the oldest stock market indices in the world, is compiled of the 30 most traded stocks in the US. The index is price-weighted rather than weighted by capitalization. It is calculated by summing the prices of the constituent stocks and dividing them by a factor, currently 0.152. The index was founded by Charles Dow, who also founded the Wall Street Journal. In later years it has been criticized for not being broadly representative enough because it only tracks 30 conglomerates, unlike broader indices such as the S&P 500.
Many different factors drive the Dow Jones Industrial Average (DJIA). The aggregate performance of the component companies revealed in quarterly company earnings reports is the main one. US and global macroeconomic data also contributes as it impacts on investor sentiment. The level of interest rates, set by the Federal Reserve (Fed), also influences the DJIA as it affects the cost of credit, on which many corporations are heavily reliant. Therefore, inflation can be a major driver as well as other metrics which impact the Fed decisions.
Dow Theory is a method for identifying the primary trend of the stock market developed by Charles Dow. A key step is to compare the direction of the Dow Jones Industrial Average (DJIA) and the Dow Jones Transportation Average (DJTA) and only follow trends where both are moving in the same direction. Volume is a confirmatory criteria. The theory uses elements of peak and trough analysis. Dow’s theory posits three trend phases: accumulation, when smart money starts buying or selling; public participation, when the wider public joins in; and distribution, when the smart money exits.
There are a number of ways to trade the DJIA. One is to use ETFs which allow investors to trade the DJIA as a single security, rather than having to buy shares in all 30 constituent companies. A leading example is the SPDR Dow Jones Industrial Average ETF (DIA). DJIA futures contracts enable traders to speculate on the future value of the index and Options provide the right, but not the obligation, to buy or sell the index at a predetermined price in the future. Mutual funds enable investors to buy a share of a diversified portfolio of DJIA stocks thus providing exposure to the overall index.
- The EUR/GBP pair extended its losses on Monday, declining to 0.8425.
- Technical indicators, including the RSI and MACD, suggest that selling pressure is increasing.
- Bulls failed to conquer the 20-day SMA which paved the way for the downside.
In Monday's session the EUR/GBP and declined by 0.15% to 0.8425. The pair has been trading sideways in a narrow range over the past sessions, with no clear directional bias. However, the latest price action suggests that selling pressure is increasing after the 20-day Simple Moving Average (SMA) rejected the buyers at 0.8445.
The Relative Strength Index (RSI) is currently at 43 and its slope is declining sharply, suggesting that selling pressure is rising. The Moving Average Convergence Divergence (MACD) is flat with a green histogram, indicating that buying pressure is flat. The overall outlook is mixed, with the RSI suggesting that selling pressure is rising and the MACD suggesting that buying pressure is flat leaving the cross exposed to further declines.
EUR/GBP daily chart
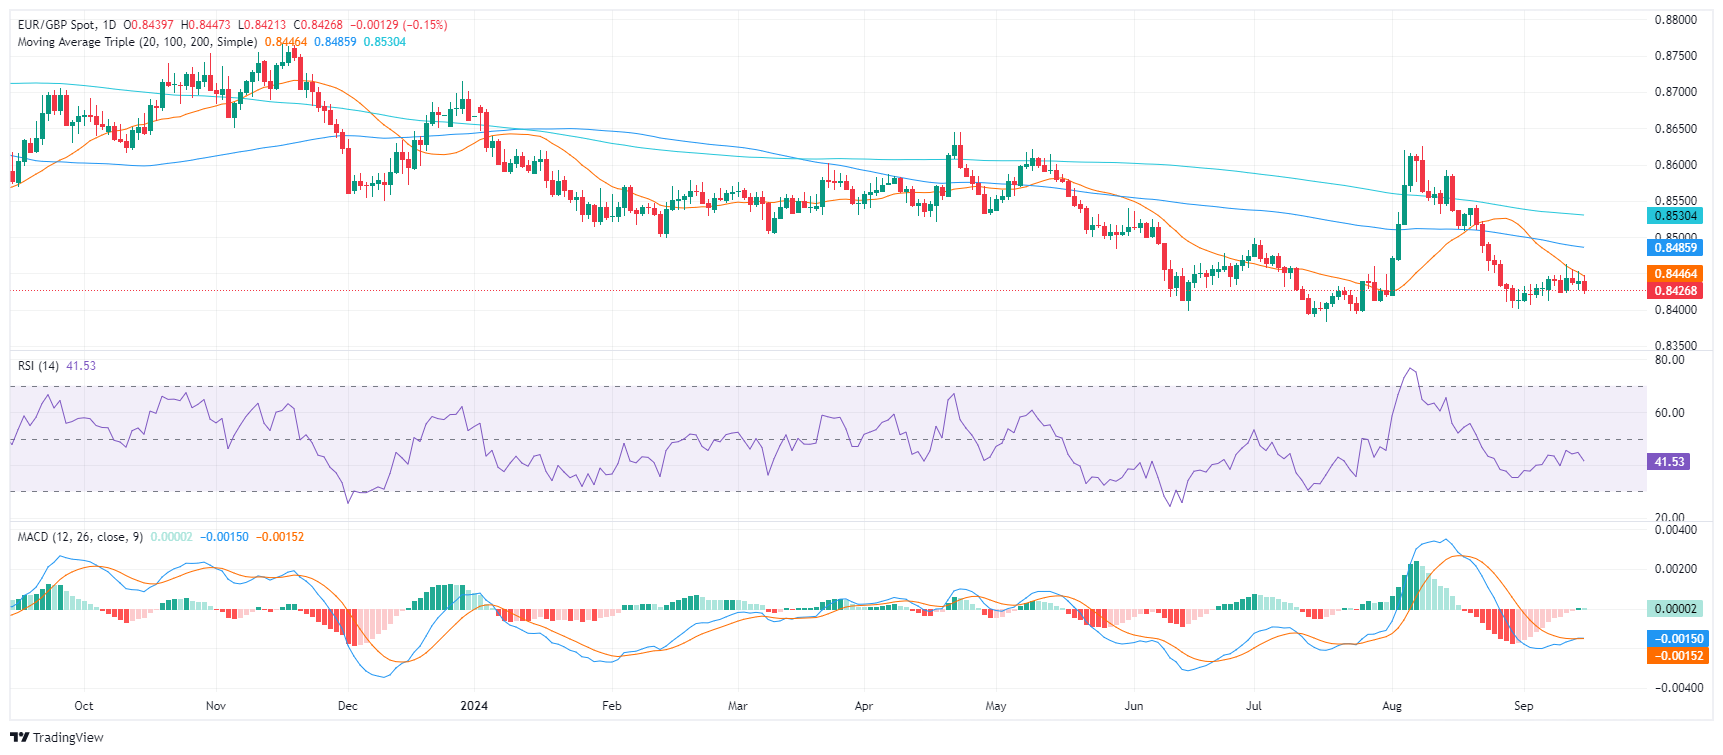
The EUR/GBP pair has been consolidating within a narrow range for the past few trading sessions, fluctuating between 0.8425 and 0.8450. This consolidation is indicative of a lack of clear directional bias in the near term. If the pair manages to break below the immediate support level of 0.8425, it could potentially target 0.8410 and 0.8400. Conversely, a break above 0.8445 (20-day SMA) could open up further upside potential above 0.8470.
The timing of Gold's incursion into new all-time highs struck several market watchers as odd, but the latest CFTC positioning data helps to inform the price action, TDS’ Senior Commodity Strategist Daniel Ghali notes.
Latest leg of the rally might be associated with a short-squeeze
“A few proprietary traders, family offices and macro funds joined the dark side over the prior week, initiating some shorts ahead of the highly anticipated start of the Fed's cutting cycle.”
“Meanwhile, our gauge of macro funds' net positioning nudged lower over the last week, which alongside max'ed out readings for CTA positioning and concurrent liquidations from Shanghai traders, reveals that the latest leg of the rally may well have been associated with a short-squeeze.”
- GBP/USD nears 1.3239, with potential to test the YTD high at 1.3266 and March 2022 peaks.
- Bulls bought the dip at 1.3001, fueling the rally to current levels.
- Failure at 1.3200 could see a pullback towards 1.3150, with further downside risks at 1.3100 and 1.3044.
The Pound Sterling rallied in early trading during the North American session against the Greenback, registering gains of over 0.60% and hitting a five-day peak of 1.3214. At the time of writing, the GBP/USD trades at 1.3199.
GBP/USD Price Forecast: Technical outlook
The GBP/USD has risen sharply, as bullish momentum picked up, as portrayed by the Relative Strength Index (RSI). In addition, bulls buying the dip at 1.3001 lifted spot prices to the current exchange rate.
Still, GBP/USD remains shy of testing the September 6 high of 1.3239. In that outcome, the next resistance level would be the year-to-date (YTD) high at 1.3266. Once surpassed, the daily high on March 23, 2022, would be up for grabs at 1.3298 before the pair hits the March 1, 2022, high at 1.3437.
Conversely, if GBP/USD stands below 1.3200, this could exacerbate a re-test of the 1.3100 figure. But firstly, sellers need to challenge 1.3150. Further losses lie at 1.3044, and the July 17 high turned support.
GBP/USD Price Action – Daily Chart
British Pound PRICE Today
The table below shows the percentage change of British Pound (GBP) against listed major currencies today. British Pound was the strongest against the US Dollar.
| USD | EUR | GBP | JPY | CAD | AUD | NZD | CHF | |
|---|---|---|---|---|---|---|---|---|
| USD | -0.42% | -0.54% | -0.21% | -0.02% | -0.48% | -0.41% | -0.31% | |
| EUR | 0.42% | -0.18% | 0.17% | 0.37% | -0.12% | -0.04% | 0.07% | |
| GBP | 0.54% | 0.18% | 0.28% | 0.54% | 0.06% | 0.15% | 0.26% | |
| JPY | 0.21% | -0.17% | -0.28% | 0.20% | -0.21% | -0.17% | -0.15% | |
| CAD | 0.02% | -0.37% | -0.54% | -0.20% | -0.54% | -0.40% | -0.40% | |
| AUD | 0.48% | 0.12% | -0.06% | 0.21% | 0.54% | 0.08% | 0.17% | |
| NZD | 0.41% | 0.04% | -0.15% | 0.17% | 0.40% | -0.08% | 0.11% | |
| CHF | 0.31% | -0.07% | -0.26% | 0.15% | 0.40% | -0.17% | -0.11% |
The heat map shows percentage changes of major currencies against each other. The base currency is picked from the left column, while the quote currency is picked from the top row. For example, if you pick the British Pound from the left column and move along the horizontal line to the US Dollar, the percentage change displayed in the box will represent GBP (base)/USD (quote).
Real activity appears to have softened in August amid weak domestic demand. We maintain our 2024 growth forecast at 4.8%, but see some downside risks. We expect more RRR and policy rate cuts by year-end, faster fiscal spending under the current budget, Standard Chartered’s economists Hunter Chan and Shuang Ding note.
5% growth target looks increasingly challenging
“Growth momentum remained soft in July-August following a significant q/q slowdown in Q2. August industrial production (IP), retail sales and fixed asset investment (FAI) growth all fell short of expectations on subdued domestic demand and adverse weather. The unemployment rate rose further to 5.3% from 5.2% in July, partly due to college students graduating. Meanwhile, the 3Y CAGR (with 2021 as the base year) for most real activity indicators improved, balancing the generally negative picture.”
“Specifically, IP growth edged down to a five-month low of 4.5% y/y in August from 5.1% in July. Seasonally adjusted retail sales were about flat after a brief rebound in July. Services production index growth fell to a four-month low of 4.6% y/y. Private investment contracted for a second straight month, dragged down by the weak real estate sector. Infrastructure investment growth also slowed further. GDP growth remained below 5% y/y in August, according to our estimate.”
“We maintain our 2024 growth forecast at 4.8%, as we expect more policy support by year-end. We expect the government to focus on accelerating government bond issuance and fiscal spending to fully utilise the fiscal space under the approved budget. We also expect the People’s Bank of China (PBoC) to cut the reserve requirement ratio (RRR) by 25bps this month and lower the policy rate – i.e., the 7D reverse repo rate – by 10bps in Q4.”
The Norges Bank is a relatively recent adopter of inflation targeting. Prior to 2001, it had a very long history of targeting the exchange rate under various systems, the most recent of which was a managed float of the NOK vs its main trading partners., Rabobank’s FX strategist Jane Foley notes.
EUR/NOK pull back to the 11.60 area is possible
“The NOK has remained soft through the summer and the CPI inflation rate remains above target. Ahead of this week’s meeting, the Bloomberg economists’ survey shows a unanimous expectation of steady policy. This would make the Norges Bank one of the most hawkish central banks in the G10.”
“In view of the Norges Bank’s sensitivity to the exchange rate, we assume that Wolden Bache will use guarded language at this week’s policy meeting to avoid triggering another sell off in the exchange rate.”
That said, poor liquidity, Norway’s strong relationship with the oil sector and therefore the complex implications of the energy transition indicate that the outlook for the NOK is far from straight forward. Even so, we expect the NOK to draw some support from the Norges Bank’s relative hawkish position and pull back to the EUR/NOK 11.60 area on a 3-month view.”
- NZD/USD climbs to near 0.6200 with the Fed policy meeting taking center stage.
- Traders raise bets supporting the Fed interest rate cuts by 50 bps to 4.75%-5.00%.
- The RBNZ is expected to cut interest rates in the November and December policy meetings.
The NZD/USD pair refreshes a weekly high of 0.6200 in Monday’s New York session. The Kiwi asset strengthens as the US Dollar (USD) has been hit hard by growing speculation that the Federal Reserve (Fed) would start the policy-easing cycle aggressively in its monetary policy meeting on Wednesday.
The US Dollar Index (DXY), which tracks the Greenback’s value against six major currencies, tumbles below 100.70. According to the CME FedWatch tool, the likelihood of the Fed reducing the key interest rates by 50 basis points (bps) rose to 65% from 30% a week ago.
Market expectations for Fed sizable rate cuts have been prompted by the slower-than-expected United States (US) Producer Price Index (PPI) data for August, published last week. Annual headline producer inflation came in lower at 1.7% than estimates of 1.8% and July’s print of 2.1%.
Before the Fed’s policy announcement, investors will focus on the US Retail Sales data for August, which will be published on Tuesday. The Retail Sales data, a key measure of consumer spending, is estimated to have grown at a slower pace of 0.2% from 1% in July. A sharp slowdown in households’ spending momentum would weigh on the US Dollar.
Meanwhile, the New Zealand (NZD) performs strongly against the US Dollar despite the Reserve Bank of New Zealand (RBNZ) is expected to cut interest rates in all monetary policy meetings remaining this year. Investors expect the RBNZ to maintain a dovish interest rate guidance due to growing economic concerns.
New Zealand Dollar FAQs
The New Zealand Dollar (NZD), also known as the Kiwi, is a well-known traded currency among investors. Its value is broadly determined by the health of the New Zealand economy and the country’s central bank policy. Still, there are some unique particularities that also can make NZD move. The performance of the Chinese economy tends to move the Kiwi because China is New Zealand’s biggest trading partner. Bad news for the Chinese economy likely means less New Zealand exports to the country, hitting the economy and thus its currency. Another factor moving NZD is dairy prices as the dairy industry is New Zealand’s main export. High dairy prices boost export income, contributing positively to the economy and thus to the NZD.
The Reserve Bank of New Zealand (RBNZ) aims to achieve and maintain an inflation rate between 1% and 3% over the medium term, with a focus to keep it near the 2% mid-point. To this end, the bank sets an appropriate level of interest rates. When inflation is too high, the RBNZ will increase interest rates to cool the economy, but the move will also make bond yields higher, increasing investors’ appeal to invest in the country and thus boosting NZD. On the contrary, lower interest rates tend to weaken NZD. The so-called rate differential, or how rates in New Zealand are or are expected to be compared to the ones set by the US Federal Reserve, can also play a key role in moving the NZD/USD pair.
Macroeconomic data releases in New Zealand are key to assess the state of the economy and can impact the New Zealand Dollar’s (NZD) valuation. A strong economy, based on high economic growth, low unemployment and high confidence is good for NZD. High economic growth attracts foreign investment and may encourage the Reserve Bank of New Zealand to increase interest rates, if this economic strength comes together with elevated inflation. Conversely, if economic data is weak, NZD is likely to depreciate.
The New Zealand Dollar (NZD) tends to strengthen during risk-on periods, or when investors perceive that broader market risks are low and are optimistic about growth. This tends to lead to a more favorable outlook for commodities and so-called ‘commodity currencies’ such as the Kiwi. Conversely, NZD tends to weaken at times of market turbulence or economic uncertainty as investors tend to sell higher-risk assets and flee to the more-stable safe havens.
USD net long positions have increased for the third week in a row. EUR net long positions have decreased. GBP net long positions have decreased and JPY net long positions have increased for the fourth consecutive week, Rabobank’s economists Jane Foley and Molly Schwartz note.
JPY net longs are at their highest level since October
“USD net long positions have increased for the third week in a row, driven by a decrease in short positions. Both ADP employment and NFP registered softer than expected at 99k (cons. 145k) and 142k (cons. 165k) respectively, which was compounded by a downward revision to July NFP from 114k to 89k. However, just after US CPI inflation data appear to set the stage for a 25 bp September rate cut from the Fed, at the tail end of last week expectations of a 50 bps move rose again on the back of a WSJ article. Traders are now pricing in a 40% likelihood of a 50bp cut at the September 18th.”
“EUR net long positions have decreased, driven by a fall in long positions. Eurozone final Q2 GDP registered softer than expected at 0.2% q/q (cons. 0.3% q/q). The ECB released its decision to cut the deposit facility rate 25bp from 3.75% to 3.50% last week. This decision was unanimously anticipated by Bloomberg surveyed economists and widely anticipated by traders.”
“GBP net long positions have decreased, driven by a decrease in long positions. GBP is the best performing G10 currency against USD year-to-date, returning 3.67%. The Oct 30 UK budget is coming into view. JPY net long positions have increased for the fourth consecutive week, driven by a decrease in short positions. JPY net long positions are at their highest level since October 2016, and USD/JPY is trading at yearly lows at the time of writing. While there is little to no expectation of a rate hike at the September 20th BoJ meeting, traders will be looking for any indication as to whether October could be a live meeting.”
- EUR/JPY is pulling back within a month-long downtrend.
- Despite some bullish signs the short-term trend remains bearish.
EUR/JPY is pulling back after making a lower low on its persistent journey south.
Since the August 16 high the pair has steadily declined, tracing out a sequence of falling peaks and troughs which indicates EUR/JPY has established a short-term downtrend. According to technical analysis theory this favors more downside because “the trend is your friend”.
EUR/JPY 4-hour Chart
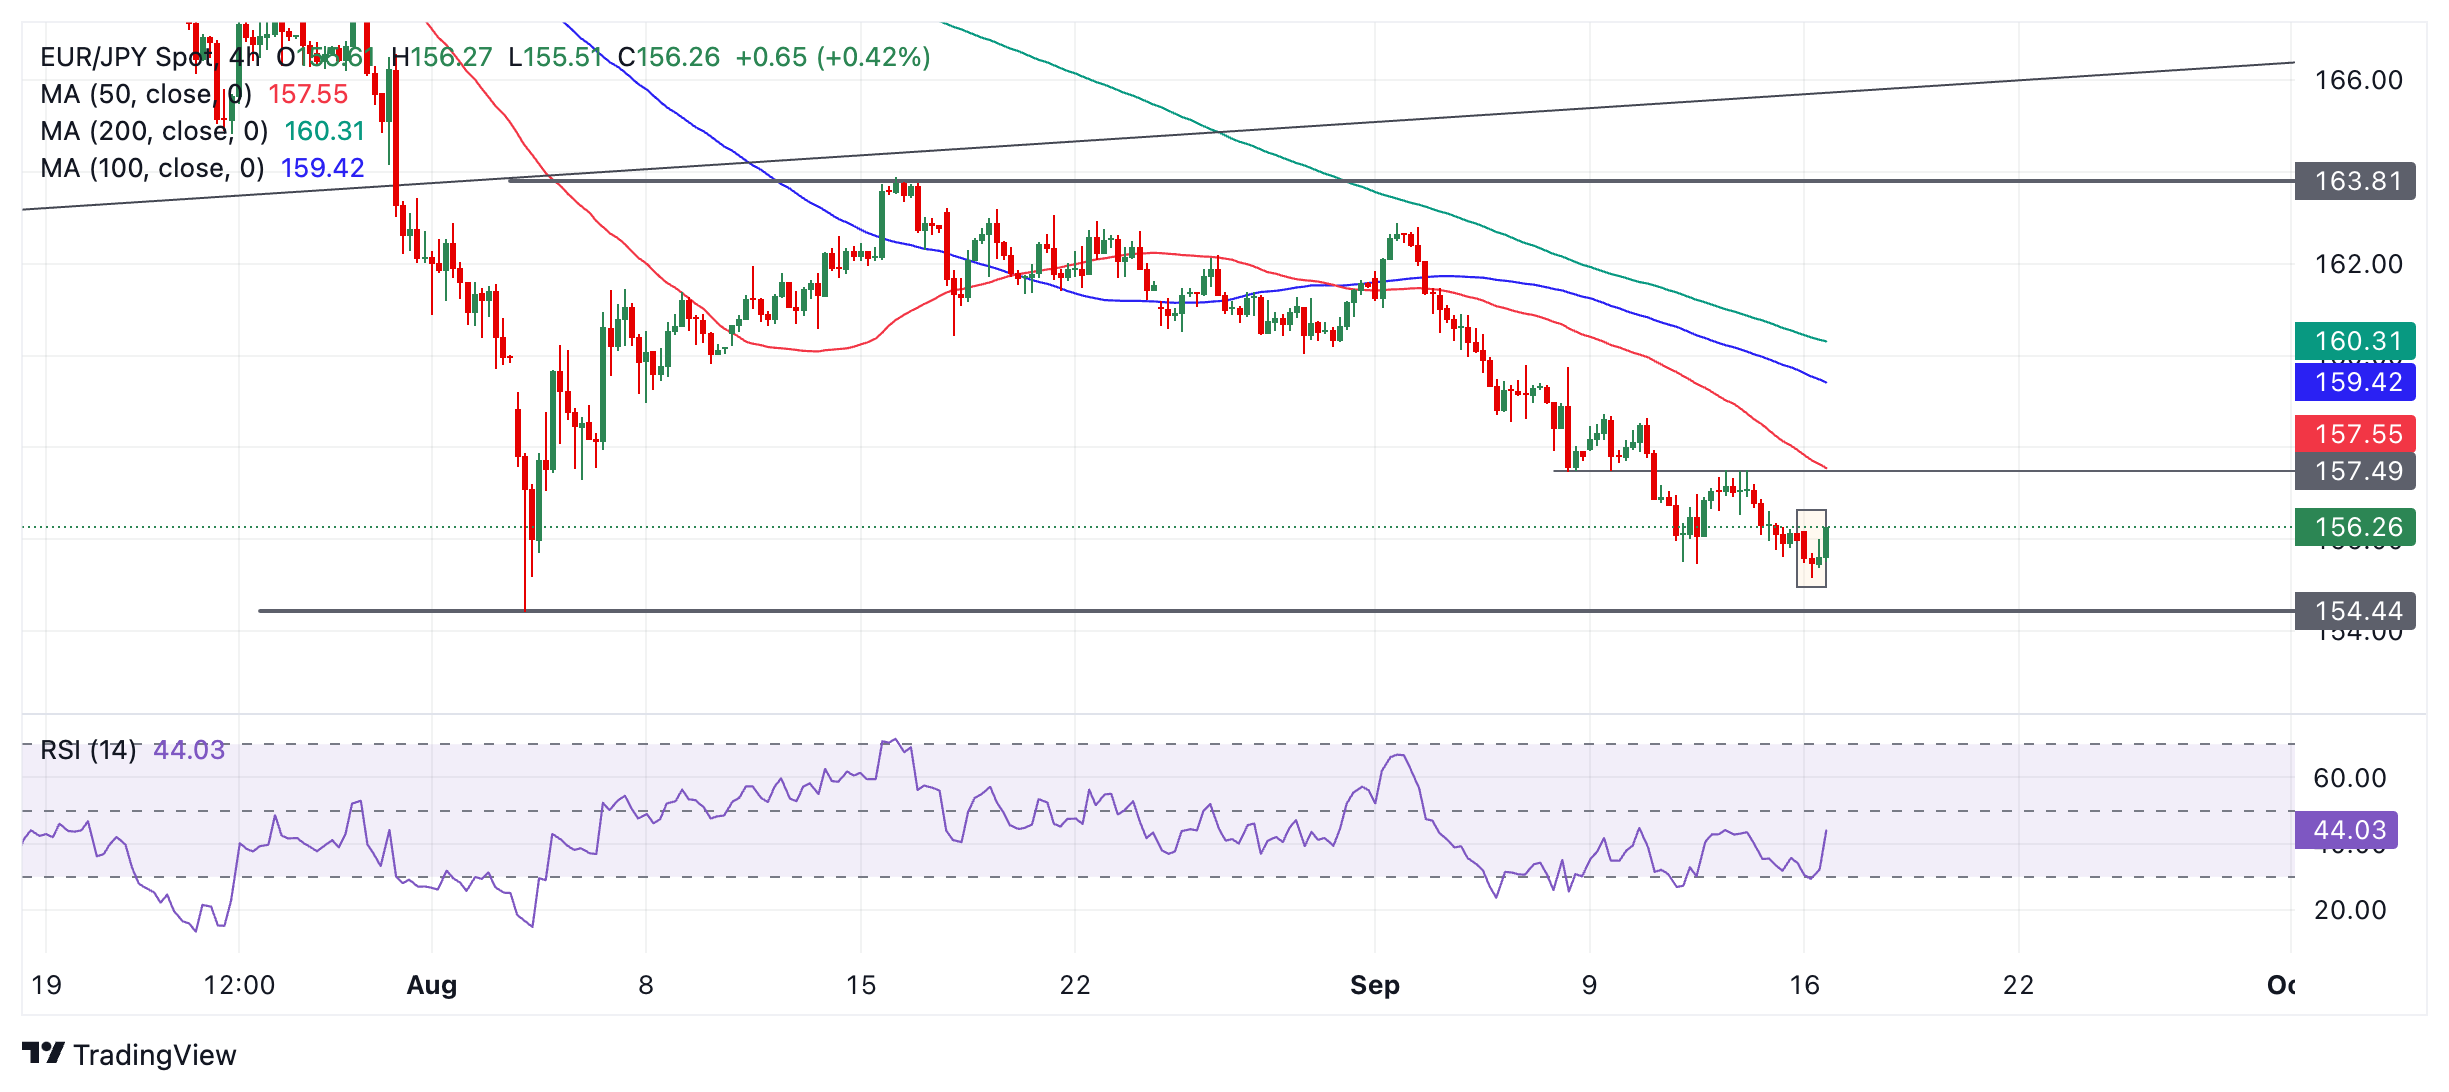
The last few periods, however, have formed a Japanese Hammer candlestick reversal pattern (shaded rectangle on chart). This Hammer was followed by a confirmatory green bullish candlestick. The current period is also strongly bullish – so far although it has not finished.
At the same time the Relative Strength Index (RSI) has moved from oversold back into neutral. This advises traders to close short positions and open long positions.
The correction lacks upside so far, however, which means there is not enough evidence from price action to indicate EUR/JPY has reversed its short-term downtrend.
It is showing bullish warning signs though, and if price can close above 157.49 it will suggest the short-term trend has reversed and the odds favor more upside.
Alternatively the pull back could soon run out of steam, allowing price to resume its downtrending bias. A break below 155.15 (September 16 low) would provide confirmation of a continuation of the bear trend to the next target at 154.44 – the August 5 low.
A break below that would be an even more bearish sign and suggest a probable reversal of the long-term uptrend.
The Pound Sterling (GBP) is a moderate outperformer on the session, helped by the prospect of the BoE taking a pass at this week’s rate decision and holding off on easing rates again until later in the year, Scotiabank’s Chief FX Strategist Shaun Osborne notes.
GBP outperforms
“Swaps reflect a little more than 25% risk of a cut this week. CPI data tomorrow are expected to underscore BoE patience; headline CPI is expected to remain steady at 2.2% Y/Y but core prices and services inflation especially are expected to remain elevated. September’s Rightmove House Price index confirmed recent signs of a strength in the UK housing market, gaining 1.2% in the year.”
“GBP gains on the session are pushing up against consolidation resistance in the low/mid-1.32s. The chart patterns are not as “clean” as the signals on the EUR’s daily chart but a GBPUSD push above 1.3230/40 should signal scope for additional strength.”
“Like the EUR, however, the GBP is getting some solid technical tailwinds from bullishly-aligned trend momentum signals on the intraday, daily and weekly charts once again. This should limit scope for GBP dips (to the mid/upper 1.31s now) and keep the bull trend grinding on. Resistance is 1.3265 and (major) 1.3330.”
- USD/JPY slides sharply to near 139.50 with all eyes on the Fed policy.
- Market expectations for Fed large interest rate cuts have strengthened.
- The BoJ is expected to leave interest rates at 0.25% on Friday.
The USD/JPY pair posts a fresh annual low at 139.50 in Monday’s North American session. The asset weakens ahead of the monetary policy decisions by the Federal Reserve (Fed) and the Bank of Japan (BoJ), which will be announced on Wednesday and Friday, respectively.
The market sentiment remains cheerful as the Fed is almost certain to pivot to policy-normalization from Wednesday. This would be the first interest rate cut decision by the Fed in over four years since it announced the battle against rising inflation due to pandemic-led stimulus.
Meanwhile, the debate over the Fed’s likely interest rate cut size has taken a U-turn. Market expectations for the Fed reducing interest rates by a big margin, which were significantly lower last week before the release of the United States (US) Producer Price Index (PPI), have strengthened. The CME FedWatch tool shows that the probability of the Fed cutting interest rates by 50 basis points (bps) rose to 65% from 30% a week ago.
The US PPI report showed that the annual headline producer inflation decelerated at a faster-than-expected pace to 1.7%, the lowest in six months.
Apart from the interest rate decision, investors will also focus on the Fed’s dot plot, which will indicate interest rate projections for different timeframes by all officials. The CME FedWatch tool also shows that the central bank will cut interest rates atleast by 100 bps this year.
In the Tokyo region, investors see the BoJ keeping interest rates steady but maintaining hawkish guidance on sustaining inflationary pressures and growth prospects. The BoJ has pushed its interest rates to 0.25%. Analysts at Standard Chartered see the BoJ interest rates rising to 0.5% by the year-end. The confidence of market experts has increased due to inflation remaining above 2% for the past 21 months.
Japanese Yen FAQs
The Japanese Yen (JPY) is one of the world’s most traded currencies. Its value is broadly determined by the performance of the Japanese economy, but more specifically by the Bank of Japan’s policy, the differential between Japanese and US bond yields, or risk sentiment among traders, among other factors.
One of the Bank of Japan’s mandates is currency control, so its moves are key for the Yen. The BoJ has directly intervened in currency markets sometimes, generally to lower the value of the Yen, although it refrains from doing it often due to political concerns of its main trading partners. The current BoJ ultra-loose monetary policy, based on massive stimulus to the economy, has caused the Yen to depreciate against its main currency peers. This process has exacerbated more recently due to an increasing policy divergence between the Bank of Japan and other main central banks, which have opted to increase interest rates sharply to fight decades-high levels of inflation.
The BoJ’s stance of sticking to ultra-loose monetary policy has led to a widening policy divergence with other central banks, particularly with the US Federal Reserve. This supports a widening of the differential between the 10-year US and Japanese bonds, which favors the US Dollar against the Japanese Yen.
The Japanese Yen is often seen as a safe-haven investment. This means that in times of market stress, investors are more likely to put their money in the Japanese currency due to its supposed reliability and stability. Turbulent times are likely to strengthen the Yen’s value against other currencies seen as more risky to invest in.
European Central Bank (ECB) Chief Economist Philip Lane said on Monday that the ECB should retain optionality about the speed of policy adjustments, per Reuters.
Key takeaways
"Incoming data on wages and profits have been in line with expectations."
"Negotiated wage growth will remain high and volatile over the remainder of the year."
"We will also look at the possible enhancements of the existing analytical toolkit, including forecasting techniques."
"A gradual approach to dialing back restrictiveness will be appropriate if the incoming data are in line with the baseline projection."
Market reaction
The EUR/USD pair showed no immediate reaction to these comments and was last seen rising 0.45% on the day at 1.1125.
The Canadian Dollar (CAD) is little changed on the session, holding within its recent trading range against the USD without picking up the support that is lifting its G10 (or even commodity) peers, Scotiabank’s Chief FX Strategist Shaun Osborne notes.
CAD trades little changed
“Current spot levels are, however, more or less right on the CAD’s fundamental fair value, according to out model’s output this morning (1.3570). The slight widening in US/Canada short-term yield/swap spreads over the past couple of weeks remain a handbrake on the CAD’s performance. Markets are concerned perhaps that a more aggressive Fed rate cut could open the door for a similar move by the Bank of Canada. July Manufacturing Sales are expected to rise a modest 0.4% after June’s 2.1% decline.”
“A narrowing, upward-sloping range in spot on the daily chart may be an early sign of softening USD momentum and building downside risks (bearish wedge). The USD has also slipped back under the 1.3585 area where the 200-day MA and the mid-year range lows converge. Failure to hold the break above this point last week is a mild USD-negative. Short-term technical resistance is 1.3635 (38.2% retracement of the USD’s August decline) and 1.3695 (50% Fibonacci). Support is 1.3550 (minor, last Monday’s low) and 1.3465.”
- Silver has reached the top of a long-term range.
- It is at risk of pulling back although price action remains quite bullish.
Silver (XAG/USD) has reached the top of a broad range that stretches from the $26s to the $30s.
It has just tested firm resistance from the top of the range and is at risk of pulling back.
Silver 4-hour Chart
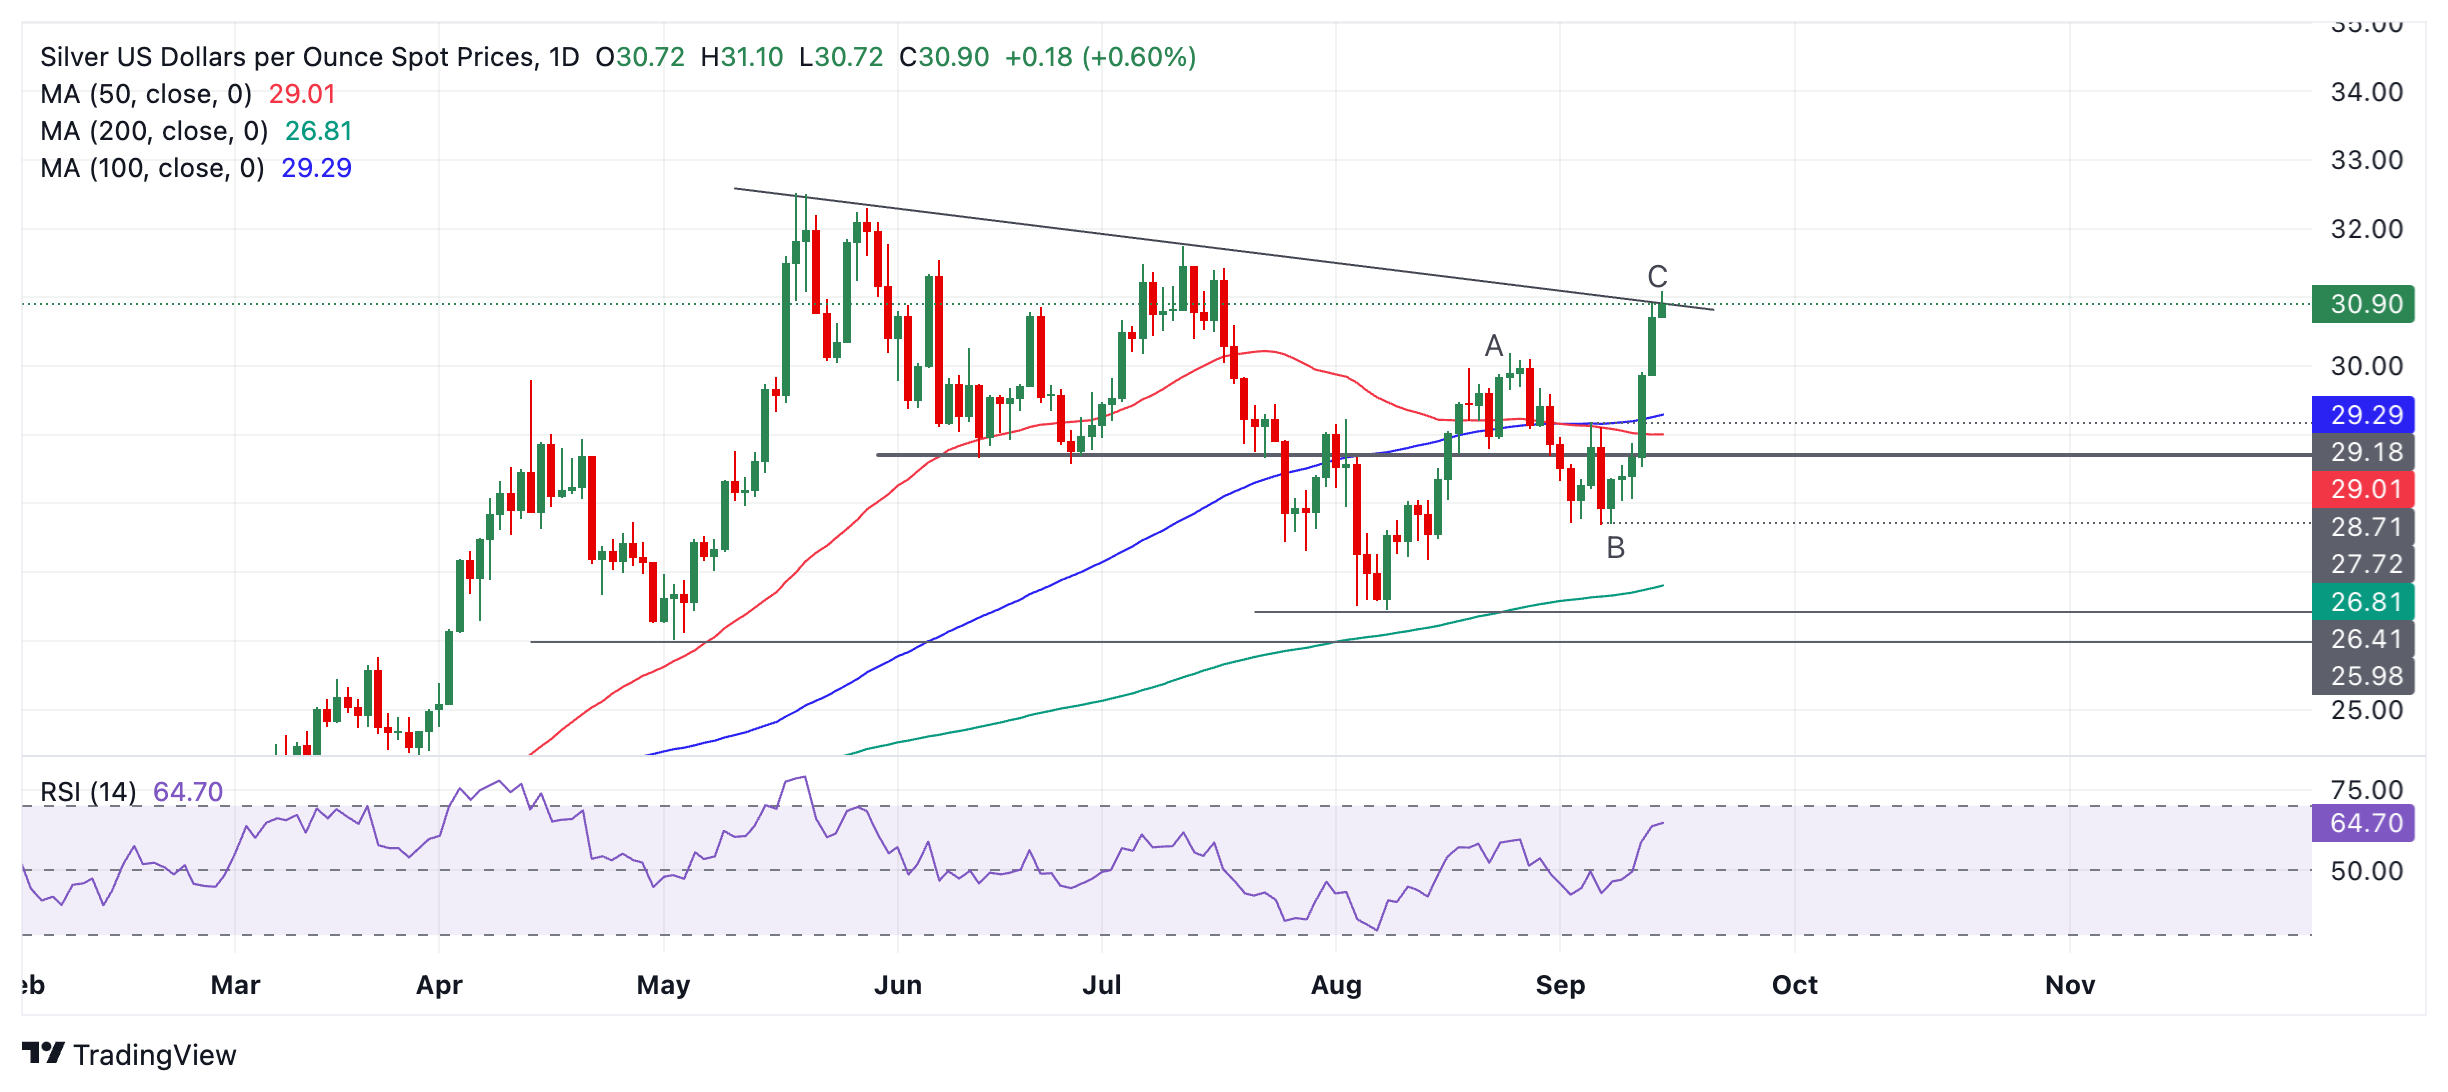
Silver has formed a Measured Move price pattern since the August 8 low. Such patterns consist of three waves in a zig-zag pattern, with waves A and C usually of a similar length. In the case of Silver, A and C are of a similar length, adding credence to the theory price may correct back.
The Relative Strength Index (RSI) momentum indicator is rising in line with price, however, which is mildly supportive of the bullish short-term trend. Given it is a principle of technical analysis that “the trend is your friend” there is a chance Silver could bypass resistance from the top of the range and continue higher. A decisive break above the range ceiling would confirm such a breakout and lead to probable move up to $32.94, the 0.618 Fibonacci ratio of C leg extended higher.
A decisive break would be one accompanied by a long green candlestick that broke clearly above the level and closed near its high, or three candlesticks in a row that broke above the level.
Currently there are no signs from price action that Silver is about to correct back – only the resistance line drawn on the chart. A reversal candlestick pattern, however, such as a Shooting Star or Hanging Man, for example, would substantially increase the odds of a pull back evolving. Such a move would probably find firm support at the $30.00 level, the top of wave A.
After clawing a bit of ground back Friday, the USD is starting a crucial week off back on the defensive, Scotiabank’s Chief FX Strategist Shaun Osborne notes.
USD eases on speculation the Fed could cut aggressively
“G10 FX will likely remain range-bound ahead of Wednesday’s FOMC but the USD is testing the (downside) limits of the past month or so’s range as swaps effectively reflect a 50% chance that the Fed cuts its policy rate 50bps this week. Market bets on a more aggressive move were amped up by press reports in the WSJ and FT last week which suggested policymakers were facing a tough choice over whether to ease by 25 or 50bps.”
“An ease of at least 25bps is all but a done deal; a bolder move would perhaps reflect the feeling among policymakers that they need to catch up with the softening in the labour market since July when the Fed minutes showed that the FOMC was quite close to cutting rates.”
“The DXY is just about holding support at 100.50/60 (recent lows and the low from December). A push under support targets another 1– 1.5% drop in the index at least fairly quickly, I think. Note that our FV estimate for the DXY based on weighted yield spreads suggests the index should already be trading closer to 99.5.”
Fed Chair Powell has given a clear signal for a rate cut in September. However, he has not given any hint about the size of the September cut, or the pace and size of the rate cuts after September, Rabobank’s macro strategists note.
Expect only 25 bps in September
“We expect the labor market to deteriorate further in the remainder of the year, leading to four consecutive rate cuts of 25 bps each in the upcoming four scheduled FOMC meetings: September, November, December and January. There is a substantial risk of a 50 bps cut at one of these meetings, including the September meeting, although it is not our baseline.”
“Given the data so far, we expect only 25 bps in September. However, it is a close call. The lack of guidance from Powell could indicate that the FOMC has not reached a consensus yet. What’s more, Tuesday’s retail sales could still alter the calculus. However, last week’s CPI continues to point at persistence in core inflation.”
“What happens after January will to a large extent depend on the economic policies of the next administration. A Trump victory would likely lead to a universal tariff and a rebound in inflation that should stop the Fed’s cutting cycle in its tracks. A Harris victory would likely be less inflationary and give scope for additional rate cuts in 2025.”
With China celebrating the Mid-Autumn Festival today and tomorrow, the monthly economic data for August was already released on Saturday. And for some, it may have spoiled their appetite for moon cakes. The data disappointed almost across the board and painted a picture of a weak Chinese economy, Commerzbank’s FX strategist Volkmar Baur notes.
CNY is likely to depreciate slightly against the Euro
“On the production side, the industrial index cooled more than expected, rising only 4.5% year-on-year, while the services index rose 4.6%. On the demand side, retail sales disappointed even low expectations, rising only 2.1% yoy. Investment was not much better, rising by only around 2% in August, with the problems in the housing market continuing to weigh on construction investment. The real estate sector remains the biggest headache in China, with housing starts and new home sales down around 20% yoy. There are still no signs of a bottoming out, and home prices show no signs of stabilizing.”
“All of this continues to weigh on China's financial markets, particularly bond yields. As a result, the current interest rate on 10-year Chinese government bonds fell to a new all-time low of just 2.07% at the end of last week. A few weeks ago, the Chinese central bank had mentioned a ‘target’ of 2.25% for 10-year government bonds yields and had intervened in the market. However, despite the recent drop in yields, there was no mention of further action.”
“This limit was more to prevent the interest rate differential with the U.S. from becoming too large in order to support the CNY, which at the time was around 7.27 to the US Dollar. However, this interest rate differential has narrowed significantly as US interest rates have fallen. This, in turn, has taken pressure off the USD/CNY, which has recently been hovering around 7.1. Therefore, falling interest rates are no longer such a big problem for the PBoC. As a result, I expect China's weak economy to continue to weigh on interest rates in the coming months. The upside potential for the CNY against the USD as a result of a weaker US currency should therefore be limited. And hence, the CNY is likely to depreciate slightly against the euro in the coming months.
- USD/CAD is trading mixed on Monday as news weakens both partners in the pair.
- The US Dollar is falling as bets ramp up for a 0.50% cut in interest rates from the Fed.
- The Canadian Dollar weakens as a result of comments from the BoC governor over the weekend.
USD/CAD trades in the 1.3580s, seesawing between tepid gains and losses as both the US Dollar (USD) and the Canadian Dollar (CAD) weaken due to expectations that interest rates will fall more rapidly in both countries compared to their peers.
The expectation of lower interest rates is negative for currencies as it tends to reduce foreign capital inflows. The US Dollar (USD) is down in most of its pairs after market bets surged that the US Federal Reserve (Fed) will cut interest rates by a larger-than-standard 0.50% at its meeting on Wednesday. Such a cut would bring the bank’s key interest rate down to 4.75% - 5.00%.
The Canadian Dollar (CAD), meanwhile, has weakened after commentary from the Governor of the Bank of Canada (BoC) Tiff Macklem over the weekend. The BoC chief said “if growth does not materialize as expected…it could be appropriate to move faster [on] interest rates.” This suggested the BoC could cut interest rates, which are currently at 4.25%, sooner than previously thought.
USD/CAD is edging lower, however, as the US Dollar seems to fractionally weaken the more of the two. The market-based probabilities of the Fed cutting by 0.50% have risen to 69% on Monday, based on the CME FedWatch tool. This is substantially higher than the circa 15% in the middle of last week. The CME tool uses the price of 30-day fed funds futures to calculate its probabilities.
Many strategists still expect a standard 0.25% cut from the Fed. “ We continue to believe the data warrant a 25 bp cut, as does the majority of analysts polled by Bloomberg,” said Dr. Win Thin, Global Head of Markets Strategy at Brown Brother Harriman (BBH). Thus if expectations of a 0.50% cut do not materialize, the USD/CAD could find some support.
The BoC has already cut its prime rate by 0.75% in 2024, most recently in September, with a 0.25% reduction. Macklem’s concerns about growth, therefore, despite the recent reduction, come as a surprise to markets, fueling the sell-off in the CAD.
Tumbling crude Oil prices are another factor weighing on the CAD since Oil is the country’s most important export. WTI crude Oil trades in the $68 per barrel region on Monday after bottoming at $64.75 – but still remains below $70 and suffers from a negative outlook.
The second half of the month is usually quieter in the CEE region. PPI in the Czech Republic and core inflation in Poland for August will be published today. In both cases, markets expect year-on-year numbers unchanged from the previous month. Tomorrow in Romania, industrial production for July will be published. And on Thursday, we will see industrial production and wages in Poland, ING’s FX strategist Frantisek Taborsky notes.
Fed dovish story should be supportive for CEE FX
“On the central bank side, the Central Bank of Turkey is scheduled to meet on Thursday. We expect rates to remain unchanged at 50% and for the main focus to be on the central bank's communication. We think that the recent macroprudential tightening steps by the CBT have underlined hawkish determination. Our economists expect the first rate cut in November, later than markets are currently pricing in.”
“This week, we have scheduled speakers scheduled in the CEE region. The Czech National Bank's blackout period starts on Wednesday, so we can expect a few statements from the Board before then. However, another 25bp rate cut seems a done deal, and what's more important is the outlook for next year. In Hungary, the Minister for Economy will address a conference on Tuesday - the same day as the country's deadline to pay the fine from the EU, which could trigger some headlines. The PM is also scheduled to address the European Parliament on Wednesday.”
“FX in the region this week will be more about a global story and Fed decision. However, a rather dovish story should be supportive for CEE FX. We are bullish on the CZK, which could get a boost this week from a hawkish CNB statement. We are also bullish on the HUF, which is getting stronger after misleading headlines regarding fiscal policy while rates favour stronger FX. We remain neutral on the PLN.”
Spot has nudged a little higher through quiet Asian and European trade, Scotiabank’s Chief FX Strategist Shaun Osborne notes.
ECB stresses slow and measured cuts
“A number of ECB officials have been speaking and messaging is pretty clear— policymakers are in no rush to ease and December is the next likely point at which rates will be cut. The outlook for slow and cautious cuts contrasts with market expectations for bolds, more aggressive easing from the Fed. EZ/US 2Y spreads have narrowed to – 135bps, the narrowest since May last year.”
”EUR/USD is on the cusp of a bullish technical break out. Spot has been consolidating in a downward sloping range since the end of August—a potential bull flag pattern. Gains through the channel ceiling at 1.1125— which is under pressure at writing—should trigger a retest of 1.12 (at least) and should signal scope for a broader move up.”
“Trend momentum is leaning bullish and strengthening again, supporting the outlook for more EUR gains. Major resistance sits at 1.1275. Support is 1.1075.”
USD/SGD fell and closed below 1.30- handle for the first time in nearly 10 years, OCBC’s FX strategists Frances Cheung and Christopher Wong note.
Risks skewed to the downside
“Softer UST yields and USD owing to renewed hopes for larger Fed cut was the main trigger. Bullish momentum on daily chart faded while RSI fell. Risks skewed to the downside. Support at 1.2950 levels (recent low), 1.2910 levels. Resistance at 1.3040 (21 DMA), 1.31 levels.
“S$NEER was last estimated at ~1.87% above our model-implied mid, with model implied spot lower bound at 1.2953. With S$NEER close to its strong end of its band, the room for further downside in USD/SGD will continue to be restrained intra-day unless broader USD takes another leg lower, then the implied lower bound of USDSGD can shift lower.”
“Near term, we expect the pair to take cues from USD. US retail sales (Tue) and FOMC (Thu) may provide the catalyst.”
The Bank of Japan will conclude the central bank week with its meeting on Friday morning, Commerzbank’s FX analyst Volkmar Baur notes.
JPY has a good chance of falling below 140
“Recently, their decisions have been rather erratic. In June, it was expected to be hawkish, but then disappointed. In July, nothing was expected, and they surprised with a rate hike. For Friday, the market and economists agree: no one expects another move from the BoJ, even though various BoJ council members have recently been relentlessly emphasizing that they want to keep raising rates.”
“The market turmoil in early August following the last rate hike is still too fresh in people's minds. Therefore, I expect the BoJ to stay on the sidelines this week, in part because the Fed will be doing most of the work on USD/JPY, and the JPY has a good chance of falling below 140 per USD this week. Even without a rate hike from the BoJ.”
- AUD/USD gains to near 0.6750 as Fed big rate cut bets swell.
- US Jon Faust showed a preference for a 50 bps rate cut on Wednesday if officials plan for the same in the last quarter.
- Investors expect the Australian jobless rate to have remained steady at 4.2%.
The AUD/USD pair rises sharply to near 0.6750 in Monday’s European session. The Aussie asset surges at US Dollar’ expense as the latter faces a sharp selling pressure, with investors focusing on the Federal Reserve’s (Fed) monetary policy meeting, which is scheduled for Wednesday. The US Dollar Index (DXY), which tracks the Greenback’s value against six major currencies, tumbles below 100.70.
The Fed is almost certain to start reducing interest rates but traders remain divided over the likely interest rate cut size. Softer-than-expected United States (US) Producer Price Index (PPI) data for August and persistent concerns over slowing labor market conditions have recently prompted market expectations for the Fed to reduce interest rates by 50 basis points (bps) to 4.75%-5.00%.
According to the CME FedWatch tool, the probability for the Fed reducing interest rates by 50 bps has increased sharply to 57% from 30% a week ago.
Fed jumbo rate cut prospects have also been prompted after the interview of Jon Faust, a recent senior adviser to Fed Chairman Jerome Powell, to Wall Street Journal (WSJ) in which he comments indicated that the central bank should start the policy-easing cycle with 50 bps now rather than in November or December as expected by some officials, with current rates remaining far from their ultimate destination.
In the Aussie region, the Australian Dollar (AUD) will be influenced by the Employment data for August, which will be published on Thursday. The Unemployment Rate is estimated to have remained steady at 4.2%. Fresh payrolls are expected to come in at 25.5K lower than the prior release of 58.2K.
Australian Dollar FAQs
One of the most significant factors for the Australian Dollar (AUD) is the level of interest rates set by the Reserve Bank of Australia (RBA). Because Australia is a resource-rich country another key driver is the price of its biggest export, Iron Ore. The health of the Chinese economy, its largest trading partner, is a factor, as well as inflation in Australia, its growth rate and Trade Balance. Market sentiment – whether investors are taking on more risky assets (risk-on) or seeking safe-havens (risk-off) – is also a factor, with risk-on positive for AUD.
The Reserve Bank of Australia (RBA) influences the Australian Dollar (AUD) by setting the level of interest rates that Australian banks can lend to each other. This influences the level of interest rates in the economy as a whole. The main goal of the RBA is to maintain a stable inflation rate of 2-3% by adjusting interest rates up or down. Relatively high interest rates compared to other major central banks support the AUD, and the opposite for relatively low. The RBA can also use quantitative easing and tightening to influence credit conditions, with the former AUD-negative and the latter AUD-positive.
China is Australia’s largest trading partner so the health of the Chinese economy is a major influence on the value of the Australian Dollar (AUD). When the Chinese economy is doing well it purchases more raw materials, goods and services from Australia, lifting demand for the AUD, and pushing up its value. The opposite is the case when the Chinese economy is not growing as fast as expected. Positive or negative surprises in Chinese growth data, therefore, often have a direct impact on the Australian Dollar and its pairs.
Iron Ore is Australia’s largest export, accounting for $118 billion a year according to data from 2021, with China as its primary destination. The price of Iron Ore, therefore, can be a driver of the Australian Dollar. Generally, if the price of Iron Ore rises, AUD also goes up, as aggregate demand for the currency increases. The opposite is the case if the price of Iron Ore falls. Higher Iron Ore prices also tend to result in a greater likelihood of a positive Trade Balance for Australia, which is also positive of the AUD.
The Trade Balance, which is the difference between what a country earns from its exports versus what it pays for its imports, is another factor that can influence the value of the Australian Dollar. If Australia produces highly sought after exports, then its currency will gain in value purely from the surplus demand created from foreign buyers seeking to purchase its exports versus what it spends to purchase imports. Therefore, a positive net Trade Balance strengthens the AUD, with the opposite effect if the Trade Balance is negative.
- The Greenback sinks to a ten-day low despite a calm Monday start.
- Traders' eyes are on the Fed’s rate decision on Wednesday.
- The US Dollar Index could sink lower as it tests the lower bound of August’s bandwidth.
The US Dollar (USD) trades substantially softer on Monday ahead of the US opening bell. The move comes after traders seem to become increasingly convinced that the US Federal Reserve (Fed) will opt on Wednesday for a big interest-rate cut. This adds even more importance to the Fed meeting, where Fed Chairman Jerome Powell and his colleagues will need to make a decision on which is the right way to start the policy easing process: with a big or small rate cut.
On the economic data front, a slow start for the week in the runup to the Fed meeting on Wednesday. For Tuesday, the US Retail Sales data will be at the forefront in terms of market moving data. For this Monday, the NY Empire State Manufacturing Index for September will be the sole market-moving data point.
Daily digest market movers: Things just got ugly
- There was another possible assassination attempt over the weekend to kill former US President Donald Trump. The Federal Bureau of Investigation (FBI) was quick to foil the attempt and arrest the suspect, CNN reports.
- At 12:30 GMT, the New York Empire State Manufacturing Index for September is to be released. The main index is expected to increase slightly to -3.9 from -4.7 a month earlier.
- The US Treasury will auction a 3-month and a 6-month bill at 15:30 GMT.
- European equities are trading sideways while US futures are trading flat during European trading hours.
- The CME Fedwatch Tool shows a much smaller 41.0% chance of a 25 basis points (bps) interest rate cut by the Fed on Wednesday, further down from the 87% seen last week. Meanwhile, markets have increased the chances of a 50 bps cut to 59.0% on the back of Fed’s Dudley comments and the news articles last week. For the meeting on November 7, another 25 bps cut (if September is a 25 bps cut) is expected by 20.9%, while there is a 50.2% chance that rates will be 75 bps (25 bps + 50 bps) and a 29.0% probability of rates being 100 (25 bps + 75 bps) basis points lower compared to current levels.
- The US 10-year benchmark rate trades at 3.64%, still quite close to the 15-month low of 3.60%.
US Dollar Index Technical Analysis: Will it hold?
Whereas at the start of last week there were chances of the US Dollar Index (DXY) breaking above its upper band at 101.90, this Monday’s technical analysis needs to look at the possibility of the index snapping the lower band at 100.62. The seismic shift that some articles from the press and words from former NY Fed member William Dudley caused is leading to more downside pressure for the US Dollar as markets consider a 50 bps rate cut for both September and even for November. From a catalyst point of view, the current bandwidth should hold until the main event on Wednesday.
The upper level of the bandwidth for this week remains 101.90. Further up, a steep 1.2% uprising would be needed to get the index to 103.18. The next tranche up is a very misty one, with the 55-day Simple Moving Average (SMA) at 103.40, followed by the 200-day SMA at 103.89, just ahead of the big 104.00 round level.
On the downside, 100.62 (the low from December 28) holds strong and has already made the DXY rebound four times in recent weeks. Should it break, the low from July 14, 2023, at 99.58, will be the next level to look out for. If that level gives way, early levels from 2023 are coming in near 97.73.
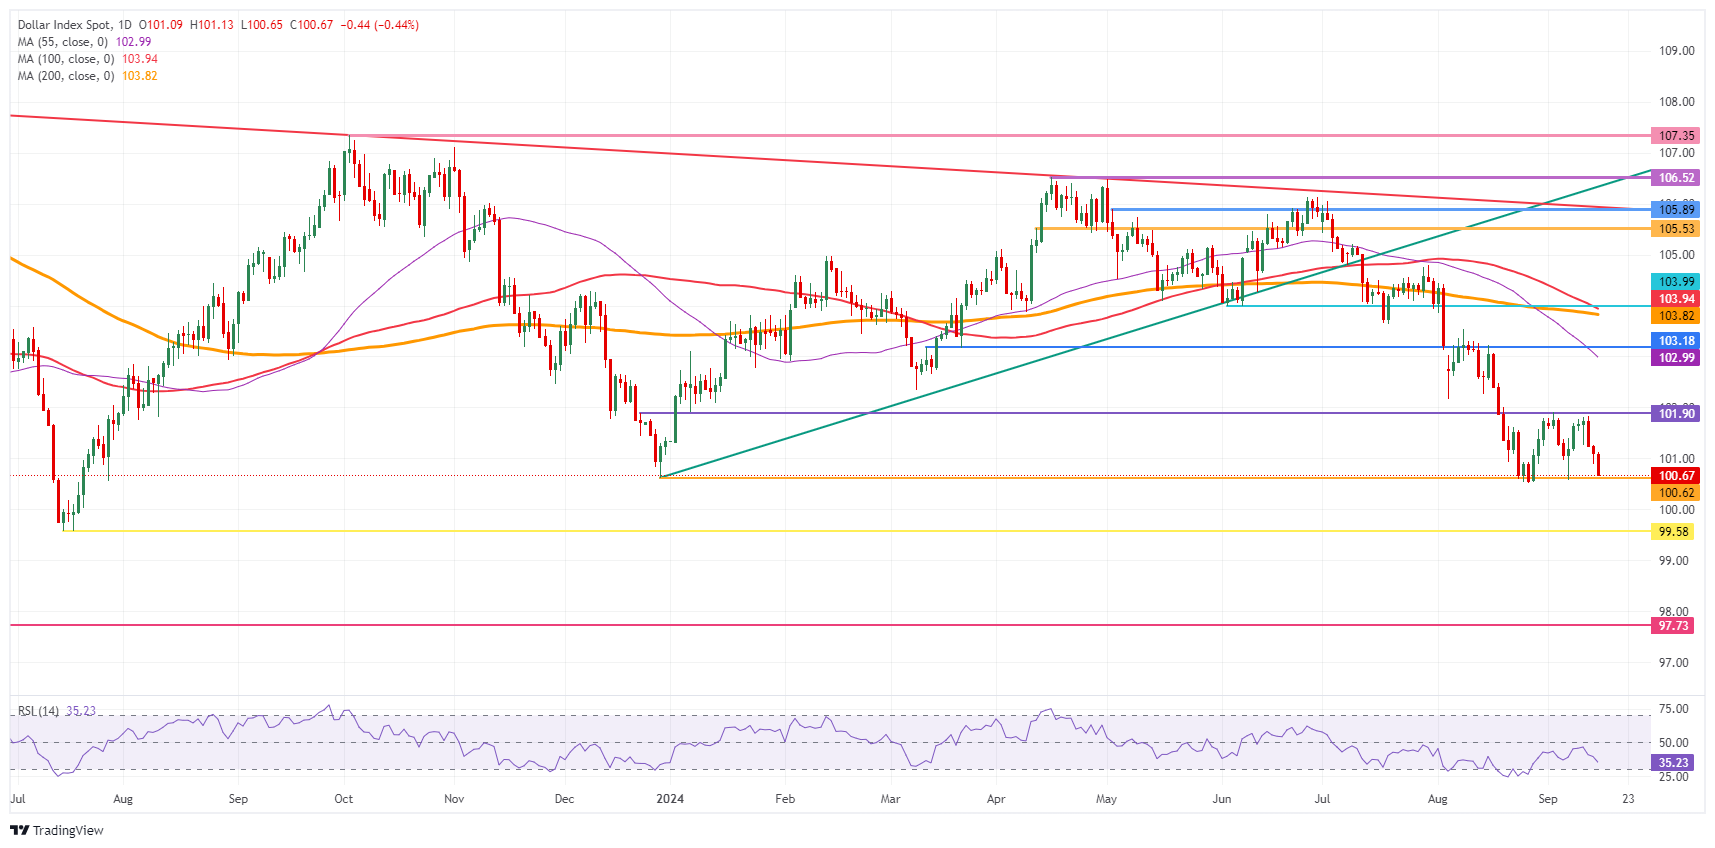
US Dollar Index: Daily Chart
US Dollar FAQs
The US Dollar (USD) is the official currency of the United States of America, and the ‘de facto’ currency of a significant number of other countries where it is found in circulation alongside local notes. It is the most heavily traded currency in the world, accounting for over 88% of all global foreign exchange turnover, or an average of $6.6 trillion in transactions per day, according to data from 2022. Following the second world war, the USD took over from the British Pound as the world’s reserve currency. For most of its history, the US Dollar was backed by Gold, until the Bretton Woods Agreement in 1971 when the Gold Standard went away.
The most important single factor impacting on the value of the US Dollar is monetary policy, which is shaped by the Federal Reserve (Fed). The Fed has two mandates: to achieve price stability (control inflation) and foster full employment. Its primary tool to achieve these two goals is by adjusting interest rates. When prices are rising too quickly and inflation is above the Fed’s 2% target, the Fed will raise rates, which helps the USD value. When inflation falls below 2% or the Unemployment Rate is too high, the Fed may lower interest rates, which weighs on the Greenback.
In extreme situations, the Federal Reserve can also print more Dollars and enact quantitative easing (QE). QE is the process by which the Fed substantially increases the flow of credit in a stuck financial system. It is a non-standard policy measure used when credit has dried up because banks will not lend to each other (out of the fear of counterparty default). It is a last resort when simply lowering interest rates is unlikely to achieve the necessary result. It was the Fed’s weapon of choice to combat the credit crunch that occurred during the Great Financial Crisis in 2008. It involves the Fed printing more Dollars and using them to buy US government bonds predominantly from financial institutions. QE usually leads to a weaker US Dollar.
Quantitative tightening (QT) is the reverse process whereby the Federal Reserve stops buying bonds from financial institutions and does not reinvest the principal from the bonds it holds maturing in new purchases. It is usually positive for the US Dollar.
After the ECB got the ball rolling last week by cutting its deposit rate by 25 basis points, a number of other central banks will announce their policy decisions this week. Some of the decisions could be quite close, but in the end most are likely to leave rates unchanged — except, of course, for the most important one. It would be a big surprise if the Fed did not begin its rate cut cycle on Wednesday. The only question is whether it will start with 25 or 50 basis points, Commerzbank’s FX strategist Volkmar Baur notes.
50% chance of a big first move by the Fed
“At the start of the week, the market is pricing in a little bit more than a 50% chance of a big first move by the Fed. Our economists still expect a move of 25 basis points, and there is a good case to be made for that. But a small first move does not preclude a big one later. That is why the risks are currently tilted towards dollar weakness.”
Norges Bank and the Bank of England will follow on Thursday. In both cases, rates are likely to remain unchanged as inflation risks in both countries remain on the upside. However, while Norges Bank's decision is likely to be fairly clear (the market is not pricing in any change), the situation in the UK is somewhat different.”
“According to Bloomberg, most economists here also do not expect any change. However, the market is pricing in a 25% chance of a cut. The day before, the inflation figures will be released. The expected rise in the core rate is one of the reasons why we do not expect a change in the key rate. However, if this does not happen, the BoE's decision could become more difficult after the recent weaker economic data.”
- EUR/GBP is breaking out below the lower channel of a shallow rising channel.
- If the break holds the pair will probably continue falling.
EUR/GBP pierces below the lower channel line of its rising channel in a breakout attempt lower.
It is possible the bearish bias evident during the steep fall in August is reaserting itself. A close below 0.8423 (September 10 low) would pave the way for further weakness to a downside target at 0.8406, the 0.618 Fib extension lower. Below that lies support at 0.8385.
EUR/GBP 4-hour Chart
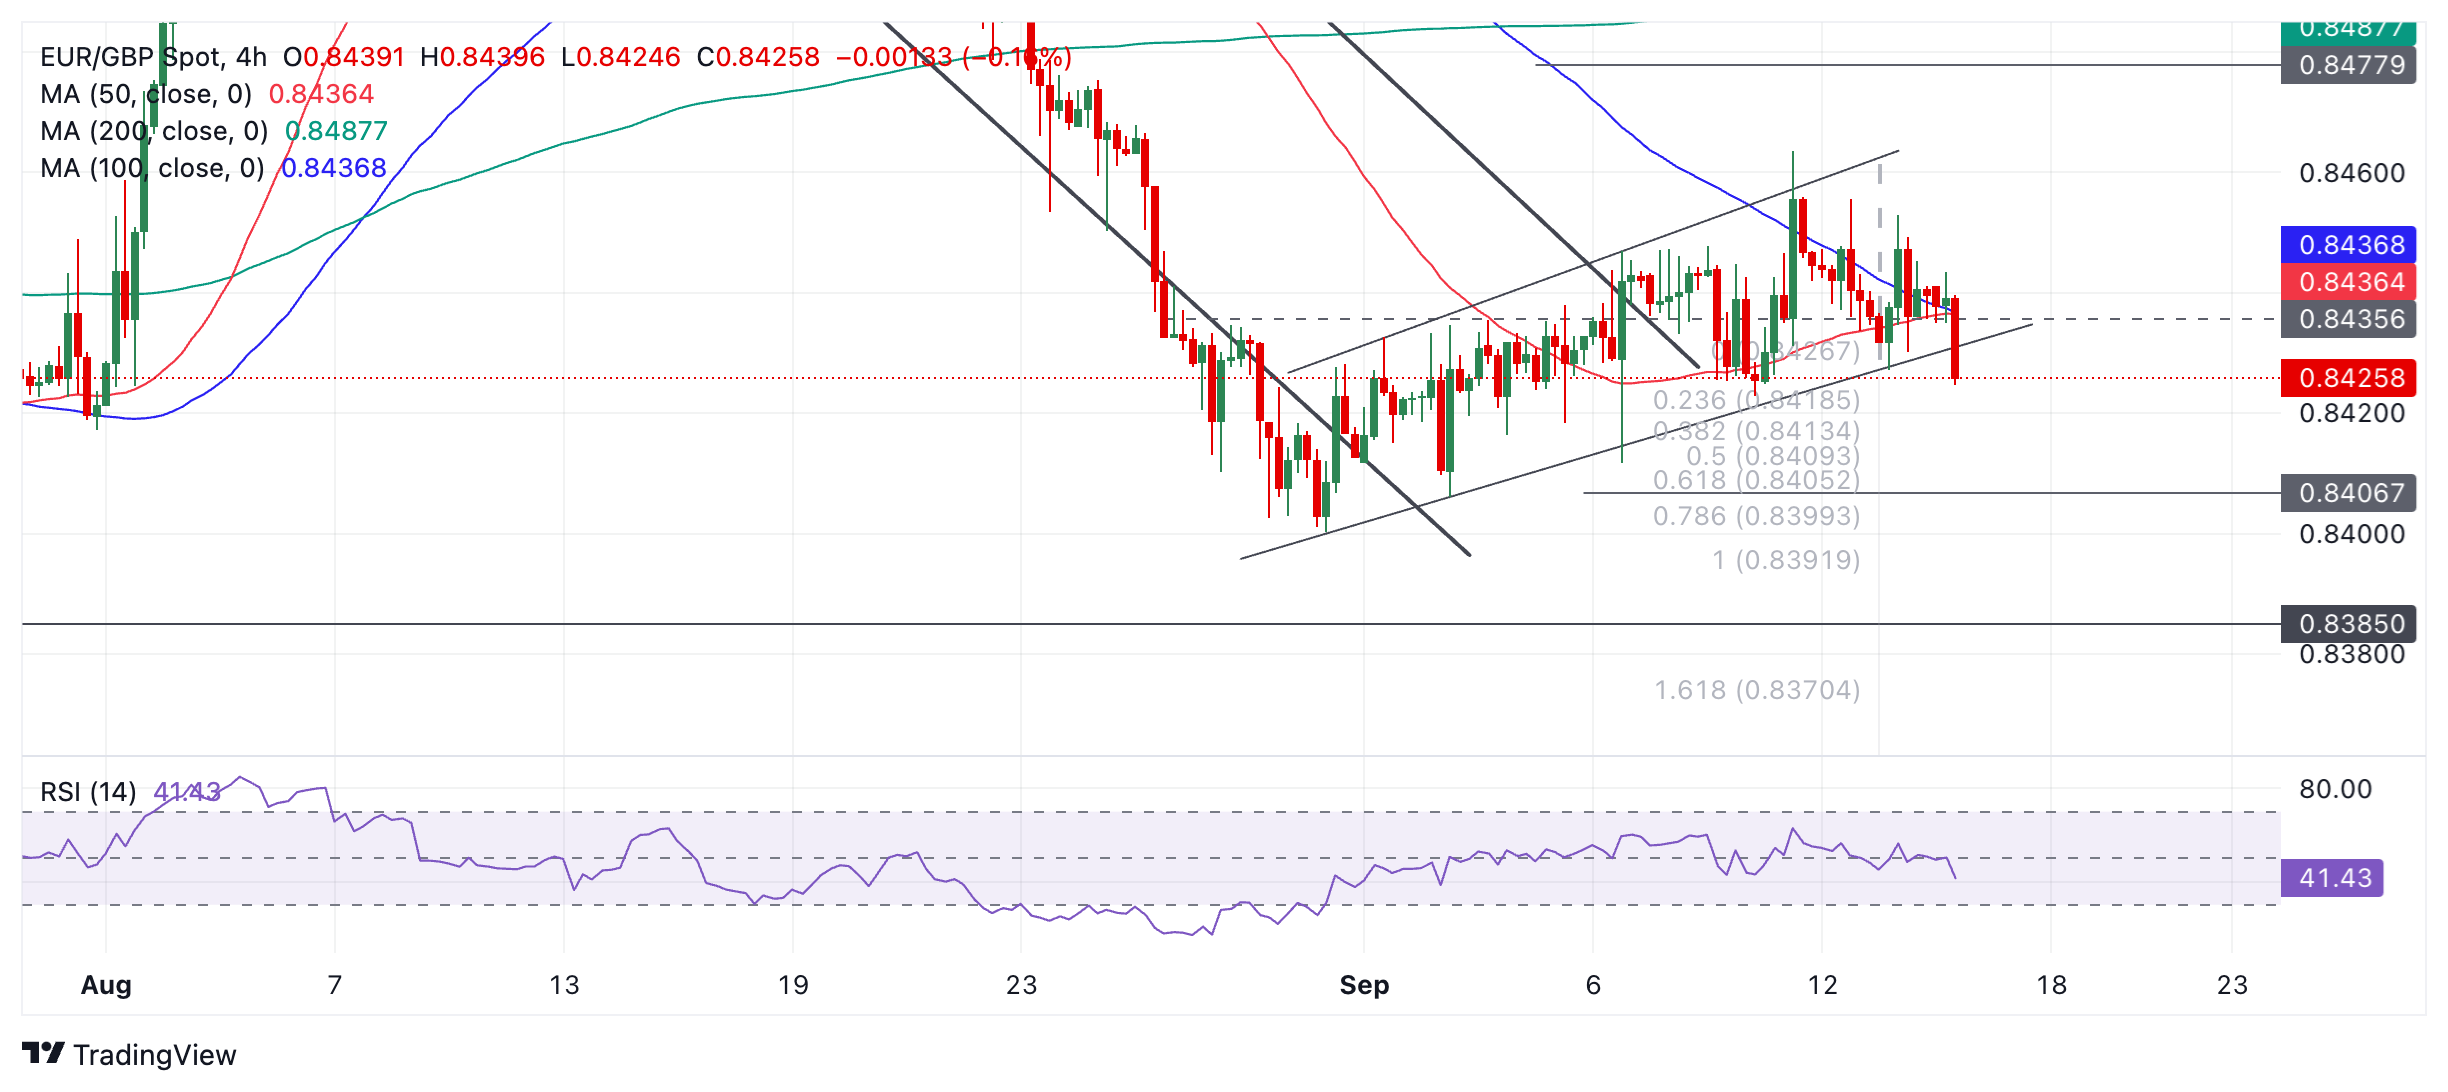
Alternatively, if the break proves false there is a chance the shallow rising channel could extend, with circa 0.8460 as a possible upside target.
A close above the 0.8464 high (September 11 high) would be required to confirm an upside breakout from the channel. Such a move might reach about 0.8477, the 0.618 Fibonacci (Fib) extension if the height of the channel extrapolated higher.
USD/JPY is looking to test 140, DBS FX strategist Philip Wee notes.
BoJ to maintain its commitment to hike rates again
“USD/JPY is looking to test its crucial support level at 140 after ending last week at 140.85, its lowest closing level since July 2023.”
“Barring any hawkish surprises from the Fed, the Bank of Japan will likely maintain its commitment to hike rates again at its meeting on September 20.”
“With US data supporting a soft-landing outlook, a repeat of August’s acute market volatility due to an unwinding of yen carry trades is unlikely.”
The Pound Sterling (GBP) continues to trade on the strong side. Dollar softness is the dominant theme and we have yet to have much bearish sterling news at all, ING’s FX strategist Chris Turner notes.
GBP/USD may head back to the 1.3240/60 area
“Away from the Fed, the biggest event risk for sterling this week is Thursday's Bank of England meeting. So far, the BoE has avoided any forward guidance on the easing cycle. It is unclear whether this will change on Thursday. Instead, a softer BoE profile for rates may have to be driven by the data, rather than being led through central bank communication.”
“Here, Wednesday's release of services inflation data for August may have a greater say in the matter. With greater confidence growing in the dollar's downside, GBP/USD looks like it may want to head back to the 1.3240/60 area short term.”
- Crude Oil falls slightly with all eyes on the Fed meeting on Wednesday.
- More bearish news for Oil emerged over the weekend, with China’s economic data deteriorating even further.
- The US Dollar Index is under pressure, trading at the lower boundary of September’s bandwidth.
Crude Oil edges down slightly on Monday after more weak Chinese economic data released over the weekend weighs on prices. Price action this week will largely depend on the US Federal Reserve (Fed), which is set to cut interest rates with markets deeply divided over whether rates will be lowered by only 25 basis points (bps) or by 50 bps. Traders would stem a bigger rate cut as supportive of growth and demand, supporting Crude Oil prices.
The US Dollar Index (DXY), which tracks the performance of the US Dollar (USD) against a basket of currencies, is facing downward pressure as well. With a bigger-than-expected rate cut on the cards, the Greenback loses its power over other currencies as rate differentials with other central banks would get tighter. All eyes will be of Fed Chairman Jerome Powell on Wednesday.
At the time of writing, Crude Oil (WTI) trades at $68.16 and Brent Crude at $71.57.
Oil news and market movers: Net bearish against Fed rate cuts
- The Commodity Futures Trading Commission (CFTC) has revealed in its weekly report that traders are net bearish Brent futures for the first time since September 2011. Short positions outnumbered long bets by 12,680 lots in the week ended Sept. 10, Bloomberg reports.
- Libya is still in an impasse over who should control its central bank. UN-led talks broke down again with the impasse still in place. This in its turn causes the country’s crude exports to continue to slump, Reuters reports.
- Meanwhile, Houthi rebels claim to have fired hypersonic missiles during their attacks in Israel over the weekend, the New York Times reports. The rare attack is an illustration of how the conflict is picking up in the Middle East.
- A streak of Chinese economic data published on Saturday showed that Industrial Production, Retail Sales and Fixed Asset Investment grew at a slower pace than expected in August. Lower economic activity in China means less demand for Oil.
Oil Technical Analysis: Opposing forces with one question at hand
Crude Oil price is being torn between bears and bulls, although not much evidence is in favor of the bulls. Several elements are factored in at the moment (sluggish global demand, disappointing Chinese data, production normalization from OPEC), but one element is still to come and could snap the rud for Crude Oil: the Fed rate decision. A bigger-than-expected rate cut could see Crude Oil rally in the assumption that demand would pick up and lower rates would unfreeze shelved projects and investments that demand Oil to be developed.
The first level on the upside is $70.00. Once there has been a daily close above the level, $71.46 gets back on the table as the first level to look out for. Ultimately, a return to $75.27 is still possible, but would likely come after a seismic shift in current balances.
Support should be very close by at $68.19, which was the triple bottom back in the summer of 2023. The next level further down the line is $64.38, the low from March and May 2023. Should that level face a second test and snap, $61.65 becomes a target, with of course $60.00 as a psychologically big figure just below it, at least tempting to be tested.
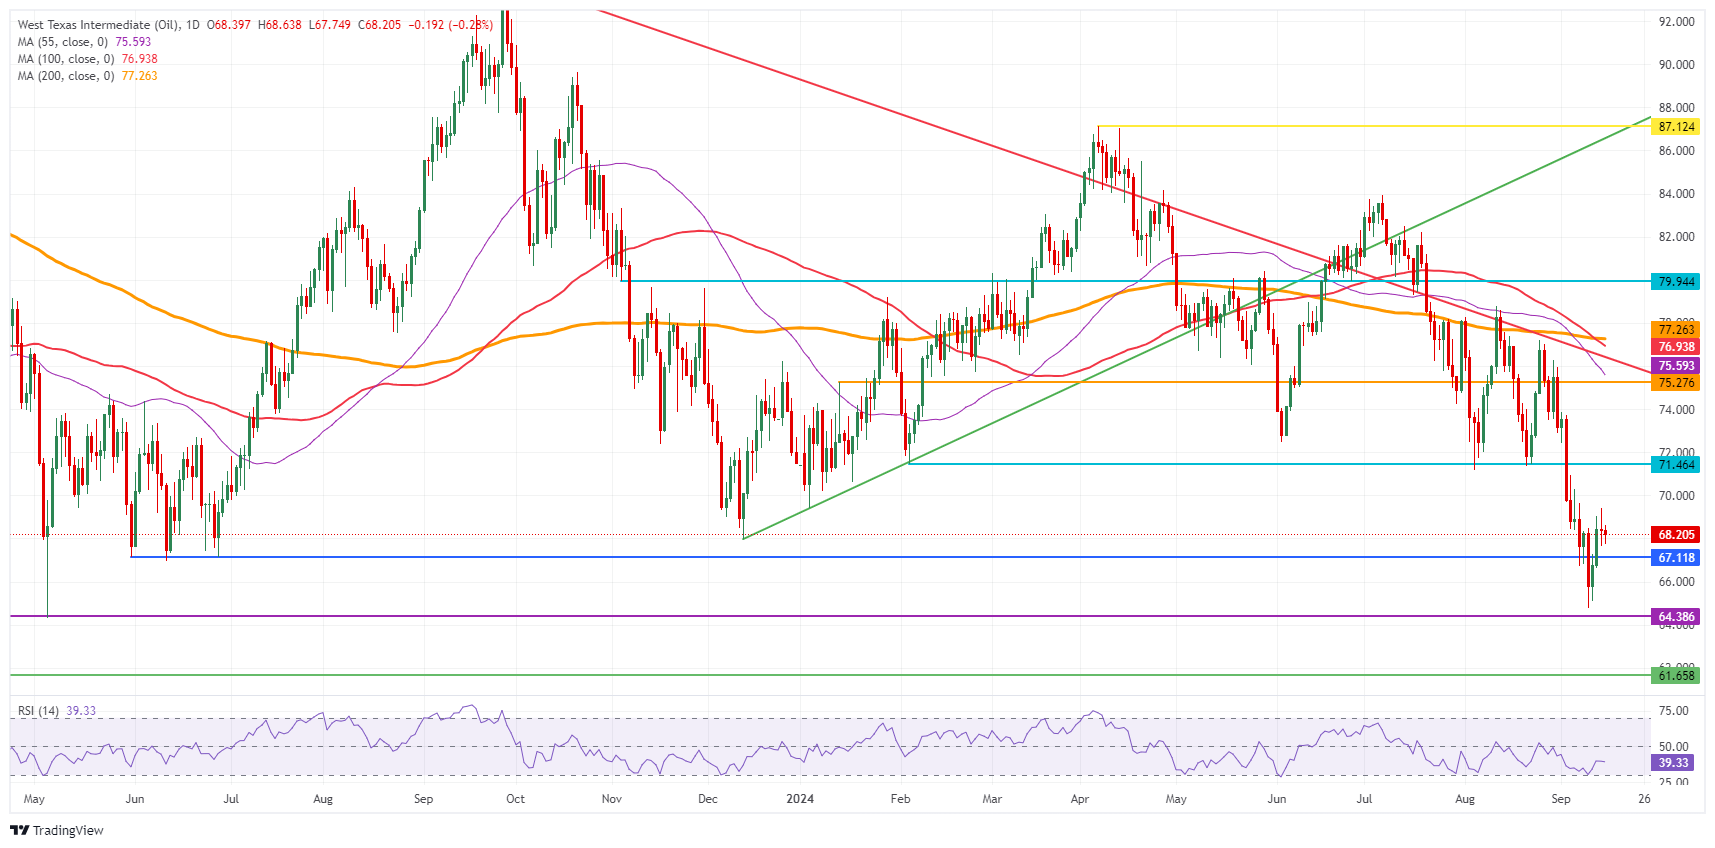
US WTI Crude Oil: Daily Chart
WTI Oil FAQs
WTI Oil is a type of Crude Oil sold on international markets. The WTI stands for West Texas Intermediate, one of three major types including Brent and Dubai Crude. WTI is also referred to as “light” and “sweet” because of its relatively low gravity and sulfur content respectively. It is considered a high quality Oil that is easily refined. It is sourced in the United States and distributed via the Cushing hub, which is considered “The Pipeline Crossroads of the World”. It is a benchmark for the Oil market and WTI price is frequently quoted in the media.
Like all assets, supply and demand are the key drivers of WTI Oil price. As such, global growth can be a driver of increased demand and vice versa for weak global growth. Political instability, wars, and sanctions can disrupt supply and impact prices. The decisions of OPEC, a group of major Oil-producing countries, is another key driver of price. The value of the US Dollar influences the price of WTI Crude Oil, since Oil is predominantly traded in US Dollars, thus a weaker US Dollar can make Oil more affordable and vice versa.
The weekly Oil inventory reports published by the American Petroleum Institute (API) and the Energy Information Agency (EIA) impact the price of WTI Oil. Changes in inventories reflect fluctuating supply and demand. If the data shows a drop in inventories it can indicate increased demand, pushing up Oil price. Higher inventories can reflect increased supply, pushing down prices. API’s report is published every Tuesday and EIA’s the day after. Their results are usually similar, falling within 1% of each other 75% of the time. The EIA data is considered more reliable, since it is a government agency.
OPEC (Organization of the Petroleum Exporting Countries) is a group of 13 Oil-producing nations who collectively decide production quotas for member countries at twice-yearly meetings. Their decisions often impact WTI Oil prices. When OPEC decides to lower quotas, it can tighten supply, pushing up Oil prices. When OPEC increases production, it has the opposite effect. OPEC+ refers to an expanded group that includes ten extra non-OPEC members, the most notable of which is Russia.
USD/JPY continued to trade downwards. Pair was last seen at 140.22, OCBC’s FX strategists Frances Cheung and Christopher Wong note.
Bias to the downside
“USD/JPY continued to trade with a heavy bias driven by decline in the USD leg as expectations for larger Fed cut returned to the table while earlier in the week, hawkish remarks made by BoJ officials lent strength to JPY.”
“Daily momentum is not showing a clear bias for now but RSI fell. Death cross earlier formed is getting more ‘entrenched’. Bias to the downside. Support at 140.30, 138 levels. Resistance at 143.50, 144.40 (21 DMA), 146.40 (23.6% fibo retracement of Jul high to Aug low).”
“BoJ MPC (Fri) – our house view does not expect a move but watch out for potential hawkish remarks from Governor Ueda as that may boost JPY.”
The Euro (EUR) retraced early week’s losses to end the week flat, OCBC’s FX strategists Frances Cheung and Christopher Wong note.
Factors may be supportive of EUR upside
“Lack of ECB dovishness and broad USD weakness were some of the factors underpinning EUR’s late comeback for the week. A day later, she told reporters that ECB is open to considering a rate cut in October if the economy suffers a major setback though the next comprehensive set of information will only be available at the following meeting (which is December). Banque de France’s Villeroy added that the pace has to be highly pragmatic and that policymakers are not pre-committing to any particular rate path, and they keep their full optionality for next meetings.”
“Other ECB officials also chimed in: 1/ Simkus said that policymakers will need strategic patience as they plot the course ahead and services inflation, wage dynamics are the key uncertainties; 2/ Holzmann said there could be room for another 25bp cut in Dec meeting; 3/ Kazaks said that a cut can be considered if economy feels significantly weaker than is currently expected and inflation also significantly declines; 4/ Rehn said that growth remains slow in the euro-area and downside risks to growth have increased over the summer.”
“On net, the focus is on growth. If growth momentum decelerates significantly, then rate cut cycle may pick up pace. But as of now, there is no rush and ECB prefers to maintain full optionality. On this note, ECB’s no rush to ease vs. greater room for Fed to ease may be supportive of EUR upside. Bearish momentum on daily chart shows signs of fading while RSI rose. Risks are slightly skewed to the upside for now. Resistance here at 1.1140 and 1.12 levels. Support at 1.1010, 1.0970 (50-DMA, 38.2% fibo retracement of 2024 low to high).”
Other central banks have taken notice of potential USD weakness stemming from the Fed’s rate cut guidance, DBS FX strategist Philip Wee notes.
Depreciation bias remains below 1.36
“Over the weekend, Bank of Canada Governor Tiff Macklem opened the door to lower rates by 50 bps, citing a weaker labour market and lower oil prices.”
“Despite the recovery in USD/CAD from 1.3440 over the past fortnight, a depreciation bias remains below 1.36.”
- Gold stabilizes at all-time highs after its steep rise at the end of last week.
- The overall trend remains bullish, and much depends on the outcome of the Fed meeting on Wednesday.
- Gold is in the overbought zone, according to the RSI, but in a firm uptrend on all timeframes.
Gold (XAU/USD) is exchanging hands in the $2,580s on Monday, just below the all-time-high (ATH) of $2,589 hit earlier in the day. It has plateaued after rallying strongly on Thursday and Friday but the overall trend remains bullish.
The initial catalyst for the rally to ATHs was a mixed US “factory gate” price inflation data, or Producer Price Index (PPI) data for August, which revealed unexpected softness in the headline figure.
This was followed by two articles in The Wall Street Journal (WSJ) and the Financial Times (FT) that revived the case for the Fed making a relatively large 0.50% cut to its fed funds rate at its meeting on Wednesday.
Gold surges on higher chances of a 0.50% Fed rate cut
Gold rose at the end of last week on increased chances of the Fed making a larger 0.50% cut to its key fed funds rate at its meeting on September 17-18. The expectation of lower interest rates makes the non-interest-paying precious metal more attractive to investors.
As of Monday’s European session, the odds of the Fed cutting rates by 0.50% had risen steeply to 59% (from around 15% in the middle of last week), with a 0.25% cut fully priced in, according to the CME FedWatch tool.
Gold may be impacted by a generally busy schedule for central banks in the week ahead. Not only will the Fed hold its policy meeting but also the Bank of England (BoE), the Bank of Japan (BoJ), and central banks in Brazil, Indonesia, Norway, Turkey and South Africa. If the general consensus is that inflation is falling and central banks are preparing to cut rates at a global level – except the BoJ – this could provide further fuel for the yellow metal’s rally.
Technical Analysis: Gold peaks and plateaus
Gold’s price has peaked and plateaued in the $2,580s. It is overbought according to the Relative Strength Index (RSI), and this indicates that long-holders should not add to their long positions.
If the RSI drops back out of overbought, it would be a sign to liquidate longs and open shorts. Such a move would probably indicate Gold was unfolding a correction.
XAU/USD 4-hour Chart
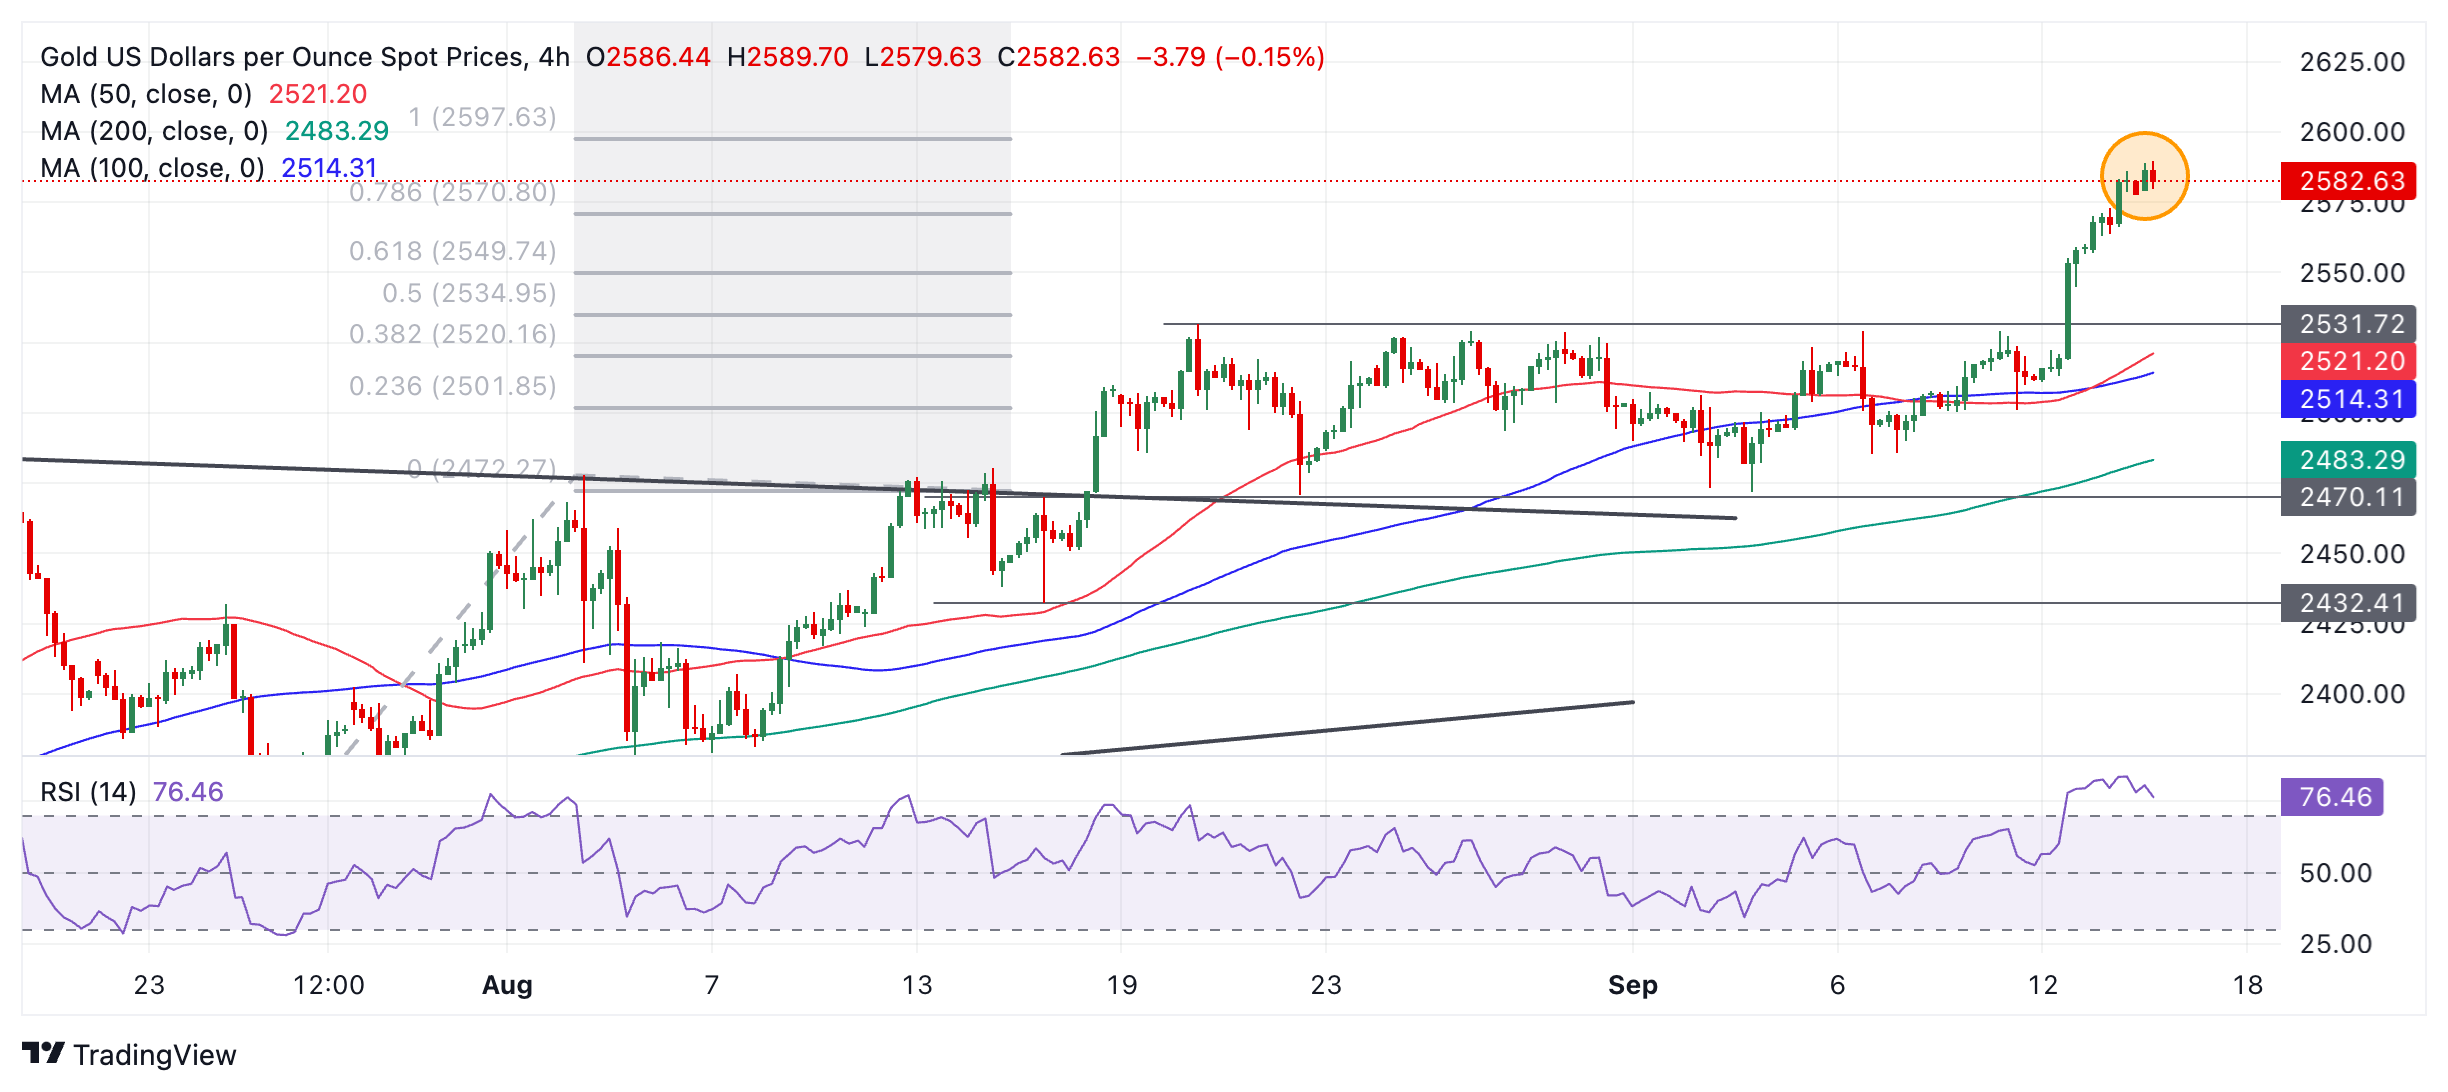
The trend is bullish in the short, medium, and long-term timeframes. Given that it is a principle of technical analysis that “the trend is your friend,” the odds favor more upside. If there is a correction, therefore, it is likely to be short-lived before Gold resumes its broader uptrend.
The precious metal has been posting bearish-looking candles over recent periods (shaded circle). This includes a bearish Doji Star, which didn’t, however, lead to a proper pull-back. Still, the accumulation of bearish candles is a sign that the price could be slowly rolling over and about to correct back.
In the event of a correction, firm support lies at $2,550, $2,544 (0.382 Fibonacci retracement of the September rally), and $2,530 (former range high).
Economic Indicator
Fed Interest Rate Decision
The Federal Reserve (Fed) deliberates on monetary policy and makes a decision on interest rates at eight pre-scheduled meetings per year. It has two mandates: to keep inflation at 2%, and to maintain full employment. Its main tool for achieving this is by setting interest rates – both at which it lends to banks and banks lend to each other. If it decides to hike rates, the US Dollar (USD) tends to strengthen as it attracts more foreign capital inflows. If it cuts rates, it tends to weaken the USD as capital drains out to countries offering higher returns. If rates are left unchanged, attention turns to the tone of the Federal Open Market Committee (FOMC) statement, and whether it is hawkish (expectant of higher future interest rates), or dovish (expectant of lower future rates).
Read more.Next release: Wed Sep 18, 2024 18:00
Frequency: Irregular
Consensus: 5.25%
Previous: 5.5%
Source: Federal Reserve
- USD/CHF witnesses a sharp sell-off near 0.8440 as traders raise bets toward the Fed's sizable rate cuts.
- The US Retail Sales are expected to have risen by 0.2%, slower than 1% in July.
- USD/CHF sees more downside toward 0.8300.
The USD/CHF pair falls sharply to near 0.8440 in Monday’s European session. The Swiss Franc asset tumbles as market speculation for the Federal Reserve (Fed) reducing interest rates by 50 basis points (bps) to 4.75%-5.50% in its monetary policy meeting on Wednesday has strengthened.
The CME FedWatch tool shows that the probability of the Fed reducing interest rates by 50 bps has increased to 59% from 30% a week ago. A swift increase in Fed dovish bets has weighed heavily on the US Dollar (USD). The US Dollar Index (DXY), which tracks the Greenback’s value against six major currencies, slumps to near 100.70.
Before the Fed policy meeting, investors will focus on the United States (US) Retail Sales data for August, which will be published on Tuesday. Economists estimate the Retail Sales data to have grown at a slower pace of 0.2% from July’s print of 1%.
Meanwhile, the Swiss Franc will be influenced by market speculation for the Swiss National Bank (SNB)’s interest rate path. The SNB is expected to cut interest rates again in its late September monetary policy as inflationary pressures continue to decline.
USD/CHF declines toward the horizontal support plotted from 28 December 2023 low of 0.8333 on a daily timeframe. The near-term and broader-term outlooks of the Swiss Franc asset remain bearish as all short-to-long-term Exponential Moving Averages (EMAs) are declining.
The 14-day Relative Strength Index (RSI) oscillates in the bearish range of 20.00-40.00, suggesting that a strong bearish momentum is intact.
More downside would appear if the asset breaks below the round-level support of 0.8400, which would drag the major towards the 28 December 2023 low of 0.8333 and round-level support of 0.8300.
On the flip side, a recovery move above the weekly high near 0.8540 will drive the asset toward the round-level resistance of 0.8600, followed by the August 20 high of 0.8632.
USD/CHF daily chart
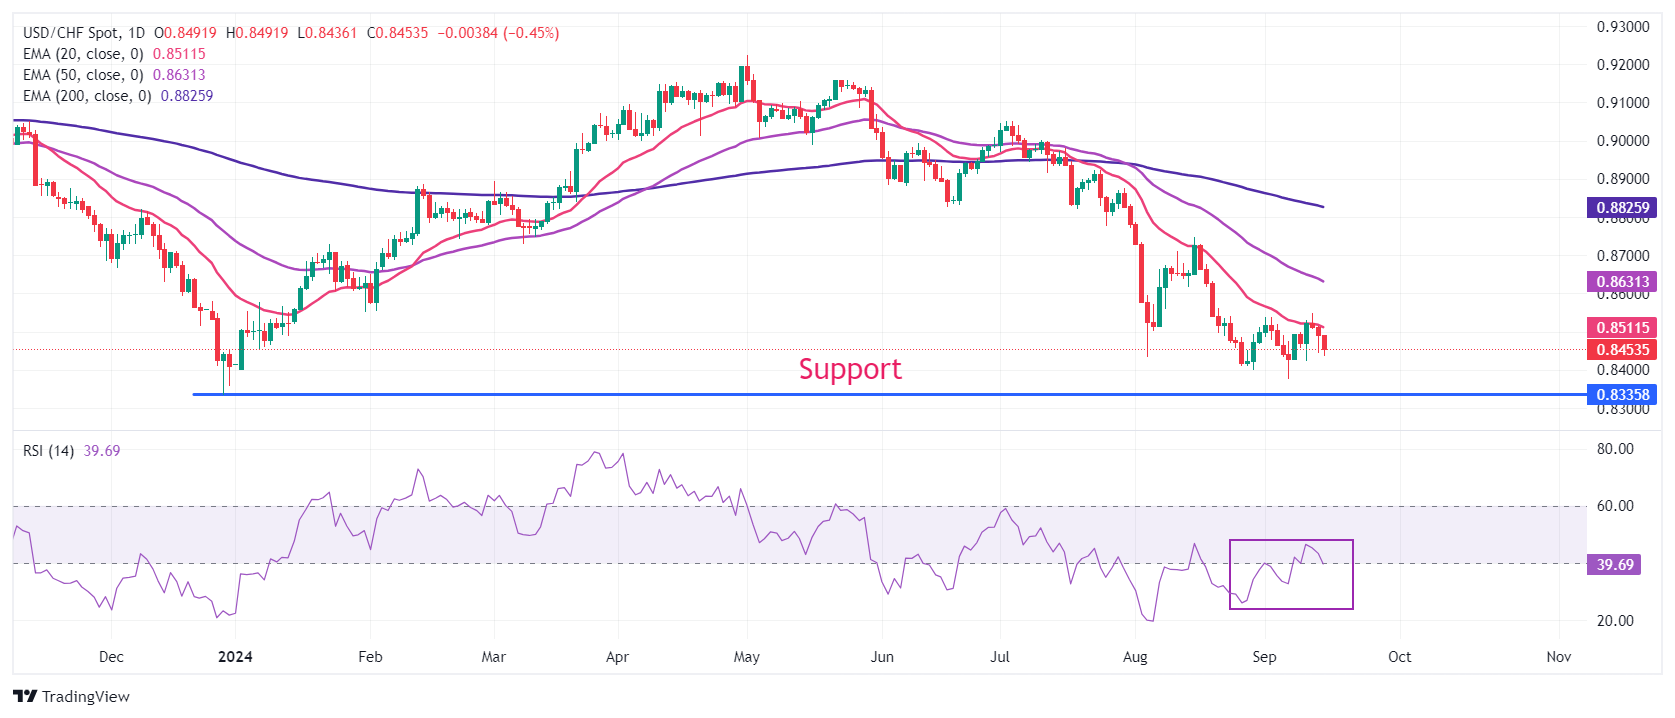
Swiss Franc FAQs
The Swiss Franc (CHF) is Switzerland’s official currency. It is among the top ten most traded currencies globally, reaching volumes that well exceed the size of the Swiss economy. Its value is determined by the broad market sentiment, the country’s economic health or action taken by the Swiss National Bank (SNB), among other factors. Between 2011 and 2015, the Swiss Franc was pegged to the Euro (EUR). The peg was abruptly removed, resulting in a more than 20% increase in the Franc’s value, causing a turmoil in markets. Even though the peg isn’t in force anymore, CHF fortunes tend to be highly correlated with the Euro ones due to the high dependency of the Swiss economy on the neighboring Eurozone.
The Swiss Franc (CHF) is considered a safe-haven asset, or a currency that investors tend to buy in times of market stress. This is due to the perceived status of Switzerland in the world: a stable economy, a strong export sector, big central bank reserves or a longstanding political stance towards neutrality in global conflicts make the country’s currency a good choice for investors fleeing from risks. Turbulent times are likely to strengthen CHF value against other currencies that are seen as more risky to invest in.
The Swiss National Bank (SNB) meets four times a year – once every quarter, less than other major central banks – to decide on monetary policy. The bank aims for an annual inflation rate of less than 2%. When inflation is above target or forecasted to be above target in the foreseeable future, the bank will attempt to tame price growth by raising its policy rate. Higher interest rates are generally positive for the Swiss Franc (CHF) as they lead to higher yields, making the country a more attractive place for investors. On the contrary, lower interest rates tend to weaken CHF.
Macroeconomic data releases in Switzerland are key to assessing the state of the economy and can impact the Swiss Franc’s (CHF) valuation. The Swiss economy is broadly stable, but any sudden change in economic growth, inflation, current account or the central bank’s currency reserves have the potential to trigger moves in CHF. Generally, high economic growth, low unemployment and high confidence are good for CHF. Conversely, if economic data points to weakening momentum, CHF is likely to depreciate.
As a small and open economy, Switzerland is heavily dependent on the health of the neighboring Eurozone economies. The broader European Union is Switzerland’s main economic partner and a key political ally, so macroeconomic and monetary policy stability in the Eurozone is essential for Switzerland and, thus, for the Swiss Franc (CHF). With such dependency, some models suggest that the correlation between the fortunes of the Euro (EUR) and the CHF is more than 90%, or close to perfect.
The US Dollar (USD) continued to trade on a back foot as markets re-price for higher likelihood of 50bps cut at upcoming FOMC, OCBC’s FX strategists Frances Cheung and Christopher Wong note.
Mild bullish momentum on daily chart
“It remains a close call whether Fed cuts 50 or 25bp. While the magnitude of Fed cut may impact USD moves, Fed’s commentary and dot plot guidance should play a slightly more lasting effect than a 25 or 50bp first cut. The dot plot should provide a reality check on market expectations with regards to rate cut trajectory. As of writing, markets are still expecting 120bps cut for 2024 (with 3 more Fed meetings to go).”
“Apart from rate cut trajectory, global growth momentum matters for USD. If Fed cut is non-recessionary driven and that growth outside-US continues to trudge along (not-hot-not cold), then it is more likely that the USD can remain back footed while other FX, sensitive to growth and rates can outperform (i.e. KRW, MYR, THB).”
“DXY gapped lower in the open again. Mild bullish momentum on daily chart intact but RSI fell. 2-way trades likely in the interim. Support at 100.50 levels. Clean break puts 99.60 in focus. Resistance at 101.40 (21 DMA), 102.20 (23.6% fibo retracement of 2023 high to 2024 low), 102.86 (50 DMA). Today is fairly light in terms of data docket, with empire manufacturing on tap.”
European Central Bank (ECB) policymaker and Slovakian central bank Governor Peter Kazimir said on Monday that it would take a significant shift in the outlook for the ECB to lower the policy rate further in October. "The ECB will almost surely have to wait until December for the next rate cut," he added, per Reuters
Kazimir argued that there will be very little new info in the pipeline before the October meeting, saying that it will be safer to wait for the outlook to become clearer.
Market reaction
These comments failed to trigger a noticeable reaction in the Euro. At the time of press, EUR/USD was up 0.43% on the day at 1.1123.
The Dollar Index (DXY) depreciated by 4.5% this quarter, closing last Friday at 101.11, below the 101.33 mark at the end of 2023, DBS FX strategist Philip Wee notes
US GDP growth slowing to 1.7% in 2025
“A knee-jerk rebound is possible if the Fed delivers a 25 bps cut (our call) at the FOMC meeting on September 18 instead of the 50 bps reduction priced in by the futures market. However, looking ahead into late 2024 and 2025, we anticipate a further decline in the DXY, potentially falling below its 101-107 range since December 2022.”
“Unlike the earlier part of 2024, the Fed is not pushing back the market’s aggressive rate cut bets with a ‘higher for longer’ rate stance on sticky US inflation. In the third quarter, the Fed has grown more confident that inflation will continue its downward trend. As a result, the Fed has been paving the ground to start a rate-cutting cycle at this Wednesday’s FOMC meeting to avert a further cooling in the US labour market.”
“Beyond the Fed’s rate outlook, the Greenback also lost momentum with the ‘Trump Trade’. The next presidential term will face two distinct challenges. First, the next term will begin during a Fed rate-cutting cycle, not a hiking cycle. Second, the massive federal debt accumulated during the last two presidential terms will limit the ability to stimulate the US economy. We forecast US GDP growth slowing to 1.7% in 2025 from 2.3% in 2024.”
The continuing drop in short-dated US rates means that at 85bp, the two-year EUR:USD swap differential is at its narrowest level of the year. Assuming equities can hold up, this should be a cautiously positive environment for EUR/USD, ING’s FX strategist Chris Turner notes.
EUR sets a move up to 1.1155
“Additionally, we think some further narrowing of that swap differential can come from the eurozone side. Here, 11bp is still priced for an October European Central Bank cut - something we think is unlikely. On that subject, we hear from three ECB speakers today. Most relevant for markets is probably the 2:00pm CET speech from ECB Chief Economist Philip Lane.”
“Should he pour a little cold water on the chances of an October ECB rate cut, EUR/USD could get a lift. EUR/USD is currently pressing 1.1100 and think momentum and cross-market developments favour a move up to 1.1155.”
- EUR/USD extends last week’s gains near 1.1120 as rising bets for Fed large rate cuts weigh on the US Dollar.
- Soft US PPI and deepening concerns over labor market outlook prompt Fed jumbo rate cut bets.
- The ECB is expected to cut interest rates once again in the last quarter of the year.
EUR/USD extends last week’s gains near 1.1120 in Monday’s European session. The major currency pair rises as growing speculation for the US Federal Reserve (Fed) to begin the policy-easing cycle aggressively on Wednesday has weighed on the US Dollar (USD). The US Dollar Index (DXY), which tracks the Greenback’s value against six major currencies, slides sharply to near 100.70.
According to the CME FedWatch tool, the probability of the Fed reducing interest rates by 50 basis points (bps) to the 4.75%-5.00% range in September has increased sharply to 61% from 30% a week ago.
Market expectations for the Fed reducing interest rates by 50 bps have increased significantly as the United States (US) annual Producer Price Index (PPI) data for August came in sharply lower than expected on Thursday.
The headline producer inflation rose at a slower pace of 1.7% year-over-year (YoY) from the estimates of 1.8% and July’s reading of 2.1%. Generally, a sharp slowdown in producer inflation results from growing worries over the demand outlook, which happens due to the weak purchasing power of households in a high-interest rate environment.
Meanwhile, market experts believe that the Fed will start reducing interest rates in Wednesday’s meeting as officials are worried about deteriorating labor market conditions, with growing confidence that inflationary pressures will sustainably return to the central bank’s target of 2%.
Ahead of the Fed monetary policy decision, investors will focus on the US Retail Sales data for August, which will be published on Tuesday. Retail Sales are estimated to have grown at a slower pace of 0.2% from 1% in July.
Daily digest market movers: EUR/USD moves higher amid weakness in US Dollar
- EUR/USD gains at the US Dollar’s expense. The Euro (EUR) exhibits a mixed performance against its major peers amid uncertainty over the European Central Bank’s (ECB) interest rate cut path. The ECB reduced its Rate on Deposit Facility again by 25 basis points (bps) to 3.50% on Thursday, as expected, but stepped back from providing a pre-defined rate-cut path.
- ECB President Christine Lagarde said at the press conference, "The interest rate decisions will be based on its assessment of inflation outlook in light of incoming economic and financial data, dynamics of underlying inflation and strength of monetary policy transmission."
- After the monetary policy announcement, commentaries from ECB officials have added to confidence that the bank’s battle against Eurozone inflation appears to be in the final leg. ECB Governing Council member and Bundesbank President Joachim Nagel said on Friday, "The inflation picture looks very good." Nagel added, "we are now assuming, and the data has shown, that we will reach our inflation target of 2% by the end of the next year."
- Currently, financial market participants expect that the ECB will cut interest rates one more time in the last quarter of the year due to deepening worries over the German economic outlook. Analysts at Nomura said, “The way we think about Germany is that plentiful structural concerns – ranging from the country's greater exposure to China and the global manufacturing cycle, the energy price ‘sticker shock’ still reverberating through the economy, and poor demographic trends (falling population, a rising dependency ratio) – have lowered the bar for any given cyclical downturn to result in recession.”
Technical Analysis: EUR/USD jumps to near 1.1120
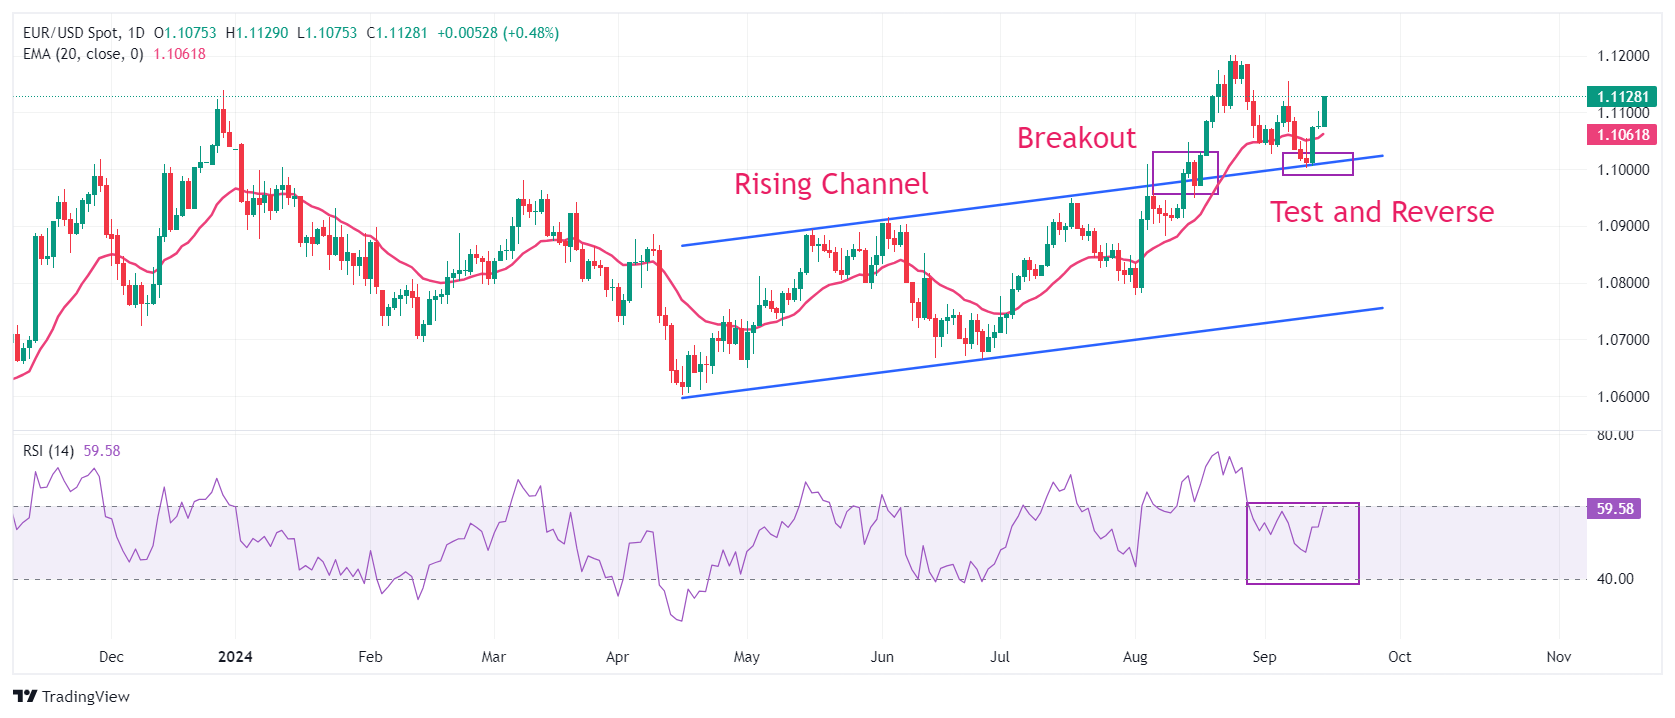
EUR/USD extends its upside to near 1.1120 on Monday. The major currency pair strengthened after retesting the breakout of the Rising Channel chart pattern formed on a daily timeframe near the psychological support of 1.1000. The near-term outlook has strengthened as the pair steadies above the 20-day Exponential Moving Average (EMA), which trades around 1.1060.
The 14-day Relative Strength Index (RSI) moves higher to near 60.00. A bullish momentum would trigger after breaking the above-mentioned level.
Looking up, last week’s high of 1.1155 and the round-level resistance of 1.1200 will act as major barricades for the Euro bulls. On the downside, the psychological level of 1.1000 and the July 17 high near 1.0950 will be major support zones.
Euro FAQs
The Euro is the currency for the 20 European Union countries that belong to the Eurozone. It is the second most heavily traded currency in the world behind the US Dollar. In 2022, it accounted for 31% of all foreign exchange transactions, with an average daily turnover of over $2.2 trillion a day. EUR/USD is the most heavily traded currency pair in the world, accounting for an estimated 30% off all transactions, followed by EUR/JPY (4%), EUR/GBP (3%) and EUR/AUD (2%).
The European Central Bank (ECB) in Frankfurt, Germany, is the reserve bank for the Eurozone. The ECB sets interest rates and manages monetary policy. The ECB’s primary mandate is to maintain price stability, which means either controlling inflation or stimulating growth. Its primary tool is the raising or lowering of interest rates. Relatively high interest rates – or the expectation of higher rates – will usually benefit the Euro and vice versa. The ECB Governing Council makes monetary policy decisions at meetings held eight times a year. Decisions are made by heads of the Eurozone national banks and six permanent members, including the President of the ECB, Christine Lagarde.
Eurozone inflation data, measured by the Harmonized Index of Consumer Prices (HICP), is an important econometric for the Euro. If inflation rises more than expected, especially if above the ECB’s 2% target, it obliges the ECB to raise interest rates to bring it back under control. Relatively high interest rates compared to its counterparts will usually benefit the Euro, as it makes the region more attractive as a place for global investors to park their money.
Data releases gauge the health of the economy and can impact on the Euro. Indicators such as GDP, Manufacturing and Services PMIs, employment, and consumer sentiment surveys can all influence the direction of the single currency. A strong economy is good for the Euro. Not only does it attract more foreign investment but it may encourage the ECB to put up interest rates, which will directly strengthen the Euro. Otherwise, if economic data is weak, the Euro is likely to fall. Economic data for the four largest economies in the euro area (Germany, France, Italy and Spain) are especially significant, as they account for 75% of the Eurozone’s economy.
Another significant data release for the Euro is the Trade Balance. This indicator measures the difference between what a country earns from its exports and what it spends on imports over a given period. If a country produces highly sought after exports then its currency will gain in value purely from the extra demand created from foreign buyers seeking to purchase these goods. Therefore, a positive net Trade Balance strengthens a currency and vice versa for a negative balance.
Silver prices (XAG/USD) rose on Monday, according to FXStreet data. Silver trades at $31.00 per troy ounce, up 0.93% from the $30.72 it cost on Friday.
Silver prices have increased by 30.28% since the beginning of the year.
| Unit measure | Silver Price Today in USD |
|---|---|
| Troy Ounce | 31.00 |
| 1 Gram | 1.00 |
The Gold/Silver ratio, which shows the number of ounces of Silver needed to equal the value of one ounce of Gold, stood at 83.48 on Monday, down from 83.93 on Friday.
Silver FAQs
Silver is a precious metal highly traded among investors. It has been historically used as a store of value and a medium of exchange. Although less popular than Gold, traders may turn to Silver to diversify their investment portfolio, for its intrinsic value or as a potential hedge during high-inflation periods. Investors can buy physical Silver, in coins or in bars, or trade it through vehicles such as Exchange Traded Funds, which track its price on international markets.
Silver prices can move due to a wide range of factors. Geopolitical instability or fears of a deep recession can make Silver price escalate due to its safe-haven status, although to a lesser extent than Gold's. As a yieldless asset, Silver tends to rise with lower interest rates. Its moves also depend on how the US Dollar (USD) behaves as the asset is priced in dollars (XAG/USD). A strong Dollar tends to keep the price of Silver at bay, whereas a weaker Dollar is likely to propel prices up. Other factors such as investment demand, mining supply – Silver is much more abundant than Gold – and recycling rates can also affect prices.
Silver is widely used in industry, particularly in sectors such as electronics or solar energy, as it has one of the highest electric conductivity of all metals – more than Copper and Gold. A surge in demand can increase prices, while a decline tends to lower them. Dynamics in the US, Chinese and Indian economies can also contribute to price swings: for the US and particularly China, their big industrial sectors use Silver in various processes; in India, consumers’ demand for the precious metal for jewellery also plays a key role in setting prices.
Silver prices tend to follow Gold's moves. When Gold prices rise, Silver typically follows suit, as their status as safe-haven assets is similar. The Gold/Silver ratio, which shows the number of ounces of Silver needed to equal the value of one ounce of Gold, may help to determine the relative valuation between both metals. Some investors may consider a high ratio as an indicator that Silver is undervalued, or Gold is overvalued. On the contrary, a low ratio might suggest that Gold is undervalued relative to Silver.
(An automation tool was used in creating this post.)
Despite a mixed batch of US data last week, investors seem to be favouring a 'front-loaded' scenario for the Federal Reserve's easing cycle. This is premised on the view that if the Fed has decided that the time has come for rate cuts, then why not get rates back to some kind of neutral level as quickly as possible without sparking a panic, ING’s FX strategist Chris Turner notes.
DXY drifting down to recent lows in quiet markets
“Currently, the market seems to be pricing a 41bp cut this Wednesday and has also brought forward and lowered the timing of the terminal rate in this easing cycle to something like 2.75% in just one years' time. This is what the OIS forwards market is telling us currently. Our house view remains that Wednesday's decision is an exceptionally close call.”
“With US rates continuing to fall but equity markets largely holding onto gains, the soft landing narrative remains dominant. This should be a bearish environment for the dollar - even though overseas markets do not look particularly attractive. For example, the weekend data dump from China showed another batch of sluggish data that - without more focused stimulus from Chinese authorities - suggests policymakers will again be missing their 5% growth target for this year.”
“Today's data calendar is quite light, but we do not rule out DXY drifting down to recent lows at 100.50/60 in quiet markets.”
- GBP/JPY continues to lose ground despite thin trading amid Japan’s bank holiday.
- The Japanese Yen receives support from the hawkish mood surrounding the Bank of Japan.
- The Bank of England is expected to hold rates steady at Thursday’s policy meeting.
GBP/JPY extends its decline for the second successive day, trading around 184.20 during Monday’s European hours. The Japanese Yen (JPY) finds support despite low trading volumes due to Japan's Respect-for-the-Aged Day Bank Holiday. This downside pressure on GBP/JPY cross is likely driven by the hawkish sentiment surrounding the BoJ.
Traders await interest rate decisions from the Bank of England (BoE) and the Bank of Japan (BoJ) later this week. The BoJ is widely expected to keep rates unchanged while leaving the possibility open for a rate hike as early as October. Similarly, the BoE is also expected to hold rates steady in its upcoming decision.
On Friday, Fitch Ratings' latest report on the Bank of Japan's policy outlook suggests that the BoJ might raise rates to 0.5% by the end of 2024, 0.75% in 2025, and 1.0% by the end of 2026. Additionally, the hawkish BoJ policymaker Naoki Tamura stated on Thursday that the central bank should raise interest rates to at least 1% as early as the second half of the next fiscal year. This comment reinforces the BoJ's commitment to ongoing monetary tightening.
On the United Kingdom (UK) front, the Pound Sterling (GBP) will be guided by the Consumer Price Index (CPI) data for August scheduled for Wednesday. The headline inflation is expected to rise steadily by 2.2% year-on-year in August. Meanwhile, annual Core inflation may grow at a faster pace of 3.5% from 3.3% in July.
Interest rates FAQs
Interest rates are charged by financial institutions on loans to borrowers and are paid as interest to savers and depositors. They are influenced by base lending rates, which are set by central banks in response to changes in the economy. Central banks normally have a mandate to ensure price stability, which in most cases means targeting a core inflation rate of around 2%. If inflation falls below target the central bank may cut base lending rates, with a view to stimulating lending and boosting the economy. If inflation rises substantially above 2% it normally results in the central bank raising base lending rates in an attempt to lower inflation.
Higher interest rates generally help strengthen a country’s currency as they make it a more attractive place for global investors to park their money.
Higher interest rates overall weigh on the price of Gold because they increase the opportunity cost of holding Gold instead of investing in an interest-bearing asset or placing cash in the bank. If interest rates are high that usually pushes up the price of the US Dollar (USD), and since Gold is priced in Dollars, this has the effect of lowering the price of Gold.
The Fed funds rate is the overnight rate at which US banks lend to each other. It is the oft-quoted headline rate set by the Federal Reserve at its FOMC meetings. It is set as a range, for example 4.75%-5.00%, though the upper limit (in that case 5.00%) is the quoted figure. Market expectations for future Fed funds rate are tracked by the CME FedWatch tool, which shapes how many financial markets behave in anticipation of future Federal Reserve monetary policy decisions.
- Silver gains some follow-through traction and climbs to a nearly two-month top on Monday.
- The technical setup suggests that the path of least resistance for the XAG/USD is to the upside.
- Any meaningful corrective slide could be seen as a buying opportunity and remain cushioned.
Silver (XAG/USD) builds on its recent strong upward trajectory witnessed over the past week or so and climbs to a nearly two-month top on Monday. The white metal sticks to its intraday gains through the first half of the European session and currently trades just below the $31.00 mark, up 0.70% for the day.
Looking at the broader picture, Friday's breakout through a short-term descending trend-line was seen as a fresh trigger for bullish traders. The subsequent move up, along with the fact that oscillators on the daily chart have just started gaining positive traction, suggests that the path of least resistance for the XAG/USD is to the upside and supports prospects for additional gains.
Hence, some follow-through strength towards testing the next relevant hurdle, around the $31.45-$31.50 supply zone, looks like a distinct possibility. The momentum could extend further towards reclaiming the $32.00 mark, above which the XAG/USD could climb back towards challenging a one-decade high, around mid-$32.00s touched in May.
On the flip side, the $30.50-$30.45 horizontal zone now seems to protect the immediate downside. Any further decline could be seen as a buying opportunity and remain cushioned near the aforementioned descending trend-line resistance breakpoint, now turned support, currently near the $30.00 psychological mark. The latter could act as a key pivotal point for short-term traders.
A convincing break below might prompt aggressive technical selling and make the XAG/USD vulnerable to accelerate the fall towards the $29.40-$29.35 region en route to the $29.00 round figure. Some follow-through selling might shift the bias in favor of bears and expose the $27.70 area, or the monthly low, with some intermediate support near the $28.20-$28.15 zone.
Silver daily chart
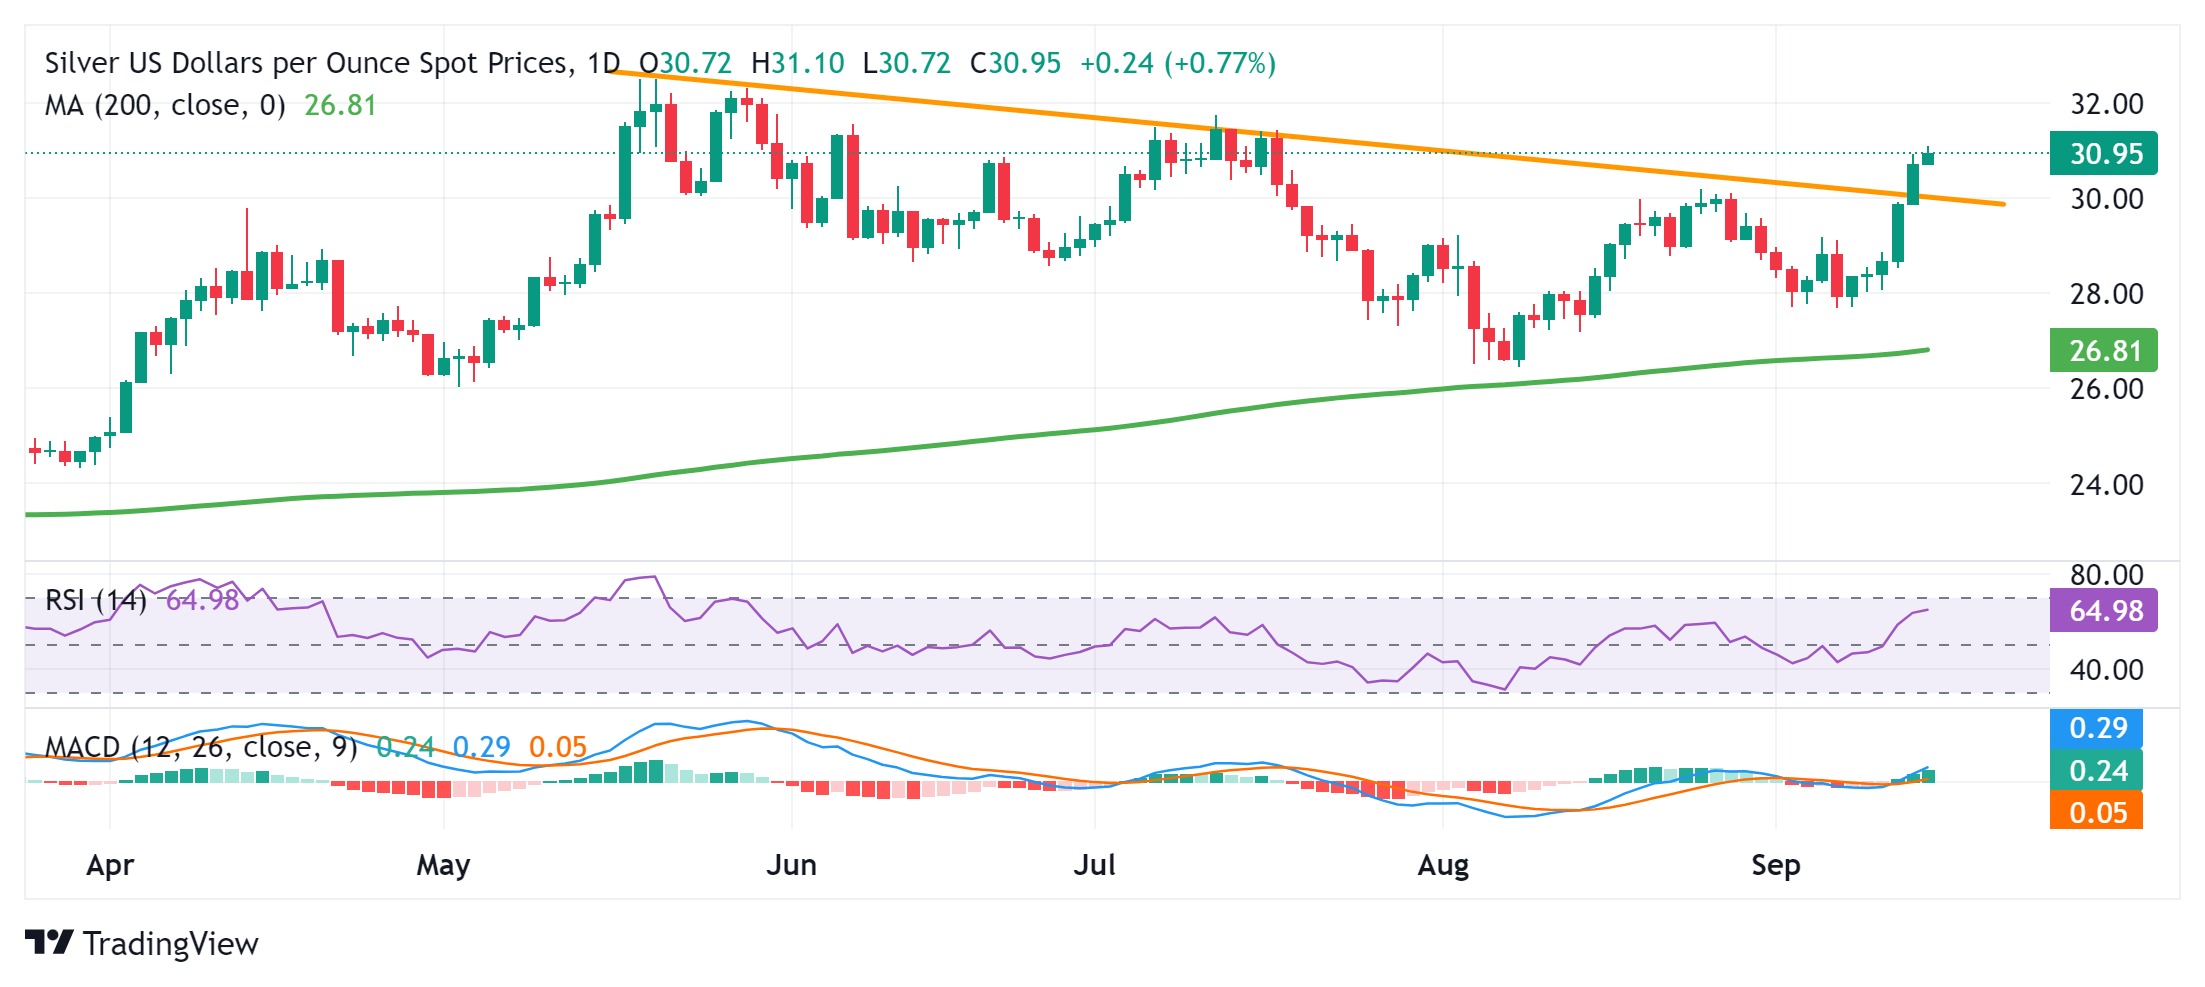
Silver FAQs
Silver is a precious metal highly traded among investors. It has been historically used as a store of value and a medium of exchange. Although less popular than Gold, traders may turn to Silver to diversify their investment portfolio, for its intrinsic value or as a potential hedge during high-inflation periods. Investors can buy physical Silver, in coins or in bars, or trade it through vehicles such as Exchange Traded Funds, which track its price on international markets.
Silver prices can move due to a wide range of factors. Geopolitical instability or fears of a deep recession can make Silver price escalate due to its safe-haven status, although to a lesser extent than Gold's. As a yieldless asset, Silver tends to rise with lower interest rates. Its moves also depend on how the US Dollar (USD) behaves as the asset is priced in dollars (XAG/USD). A strong Dollar tends to keep the price of Silver at bay, whereas a weaker Dollar is likely to propel prices up. Other factors such as investment demand, mining supply – Silver is much more abundant than Gold – and recycling rates can also affect prices.
Silver is widely used in industry, particularly in sectors such as electronics or solar energy, as it has one of the highest electric conductivity of all metals – more than Copper and Gold. A surge in demand can increase prices, while a decline tends to lower them. Dynamics in the US, Chinese and Indian economies can also contribute to price swings: for the US and particularly China, their big industrial sectors use Silver in various processes; in India, consumers’ demand for the precious metal for jewellery also plays a key role in setting prices.
Silver prices tend to follow Gold's moves. When Gold prices rise, Silver typically follows suit, as their status as safe-haven assets is similar. The Gold/Silver ratio, which shows the number of ounces of Silver needed to equal the value of one ounce of Gold, may help to determine the relative valuation between both metals. Some investors may consider a high ratio as an indicator that Silver is undervalued, or Gold is overvalued. On the contrary, a low ratio might suggest that Gold is undervalued relative to Silver.
- The Mexican Peso softens on Monday after three up days in a row.
- Increasing chances of deeper cuts to interest rates and slowing growth prospects had weakened the Peso’s peers.
USD/MXN’s daily chart paints three down days in a row, a pattern called “Three Black Crows”.
The Mexican Peso (MXN) trades moderately against its key pairs in early trade on Monday, after a week in which the Peso rose strongly, gaining about 3.9% on average versus the US Dollar (USD), the Euro (EUR) and the Pound Sterling (GBP).
Much higher probabilities of the US Federal Reserve (Fed) cutting interest rates by a larger-than-standard 0.50% at their meeting on Wednesday drove the appreciation in the Mexican currency against the USD last week.
From probabilities of only around 15% midweek, after the release of the US August Consumer Price Index (CPI), the market-based probabilities of a 0.50% cut by the Fed have now risen to about 59%, according to the CME FedWatch tool.
A larger cut to base interest rates in the US would expand the already wide interest rate differential with Mexico, where interest rates set by the Bank of Mexico (Banxico) are 10.75% versus the Fed’s 5.25%-5.50%. This encourages capital flows into the Mexican Peso because they can earn more interest.
Generally, downbeat expectations regarding the economic outlook for the United Kingdom (UK) and the Eurozone led MXN’s gains against the EUR and the GBP. Weak GDP growth data in the UK and a downward revision to GDP forecasts by the European Central Bank (ECB) acted as catalysts.
Mexican Peso recovers as political risk stabilizes
The Mexican Peso might be gaining a lift from evidence of a less negative assessment of its political outlook.
The currency lost over 10% in June following the general election at which the left-leaning Morena coalition won a supermajority. Investors feared the impact of reforms the party wanted to push through affecting the judicial system and industry regulators, which, they argued, risked reducing foreign investment into the country.
Rating agency Moody’s warned of a potential downgrade resulting from the reforms, and leading investment banks like Morgan Stanley and Bank of America also voiced concerns.
The first tranche of reforms was passed through the Mexican Senate last week and is on its way to becoming a part of the constitution, and although the news caused some volatility for the Peso, markets have since settled down.
Rating agency Fitch has put forward a more neutral, if still slightly negatively biased view, of the country’s creditworthiness in a recent note, reported Christian Borjon Valencia, an Analyst at FXStreet, on Friday.
“The rating outlook is stable, which means that we are seeing a balance between strengths and weaknesses. Before observing a direct downgrade of the sovereign rating, what could be expected from us is a change in the outlook, either from stable to positive or from stable to negative, the latter probably occurring,” said Gerardo Carrillo, Regional Director for LATAM at Fitch Ratings.
Further, Banxico’s Director of Economic Research, Alejandrina Salcedo, “stated that a robust environment in the rule of law can help generate conditions that encourage investment,” and “respecting the rule of law and public safety ‘would provide greater certainty, boost the flow of investment in all regions, and contribute to capitalizing on the opportunities offered by the relocation process,’” writes Borjon Valencia.
At the time of writing, one US Dollar (USD) buys 19.22 Mexican Pesos, EUR/MXN trades at 21.36, and GBP/MXN at 25.29.
Technical Analysis: USD/MXN prints bearish Three Black Crows
USD/MXN has broken out of a rising mini-channel within a wider rising channel and fallen for three days in a row. This has now formed a bearish Three Black Crows Japanese candlestick pattern on the daily chart (shaded rectangle), which indicates the probability that prices will fall even lower in the short term.
USD/MXN Daily Chart
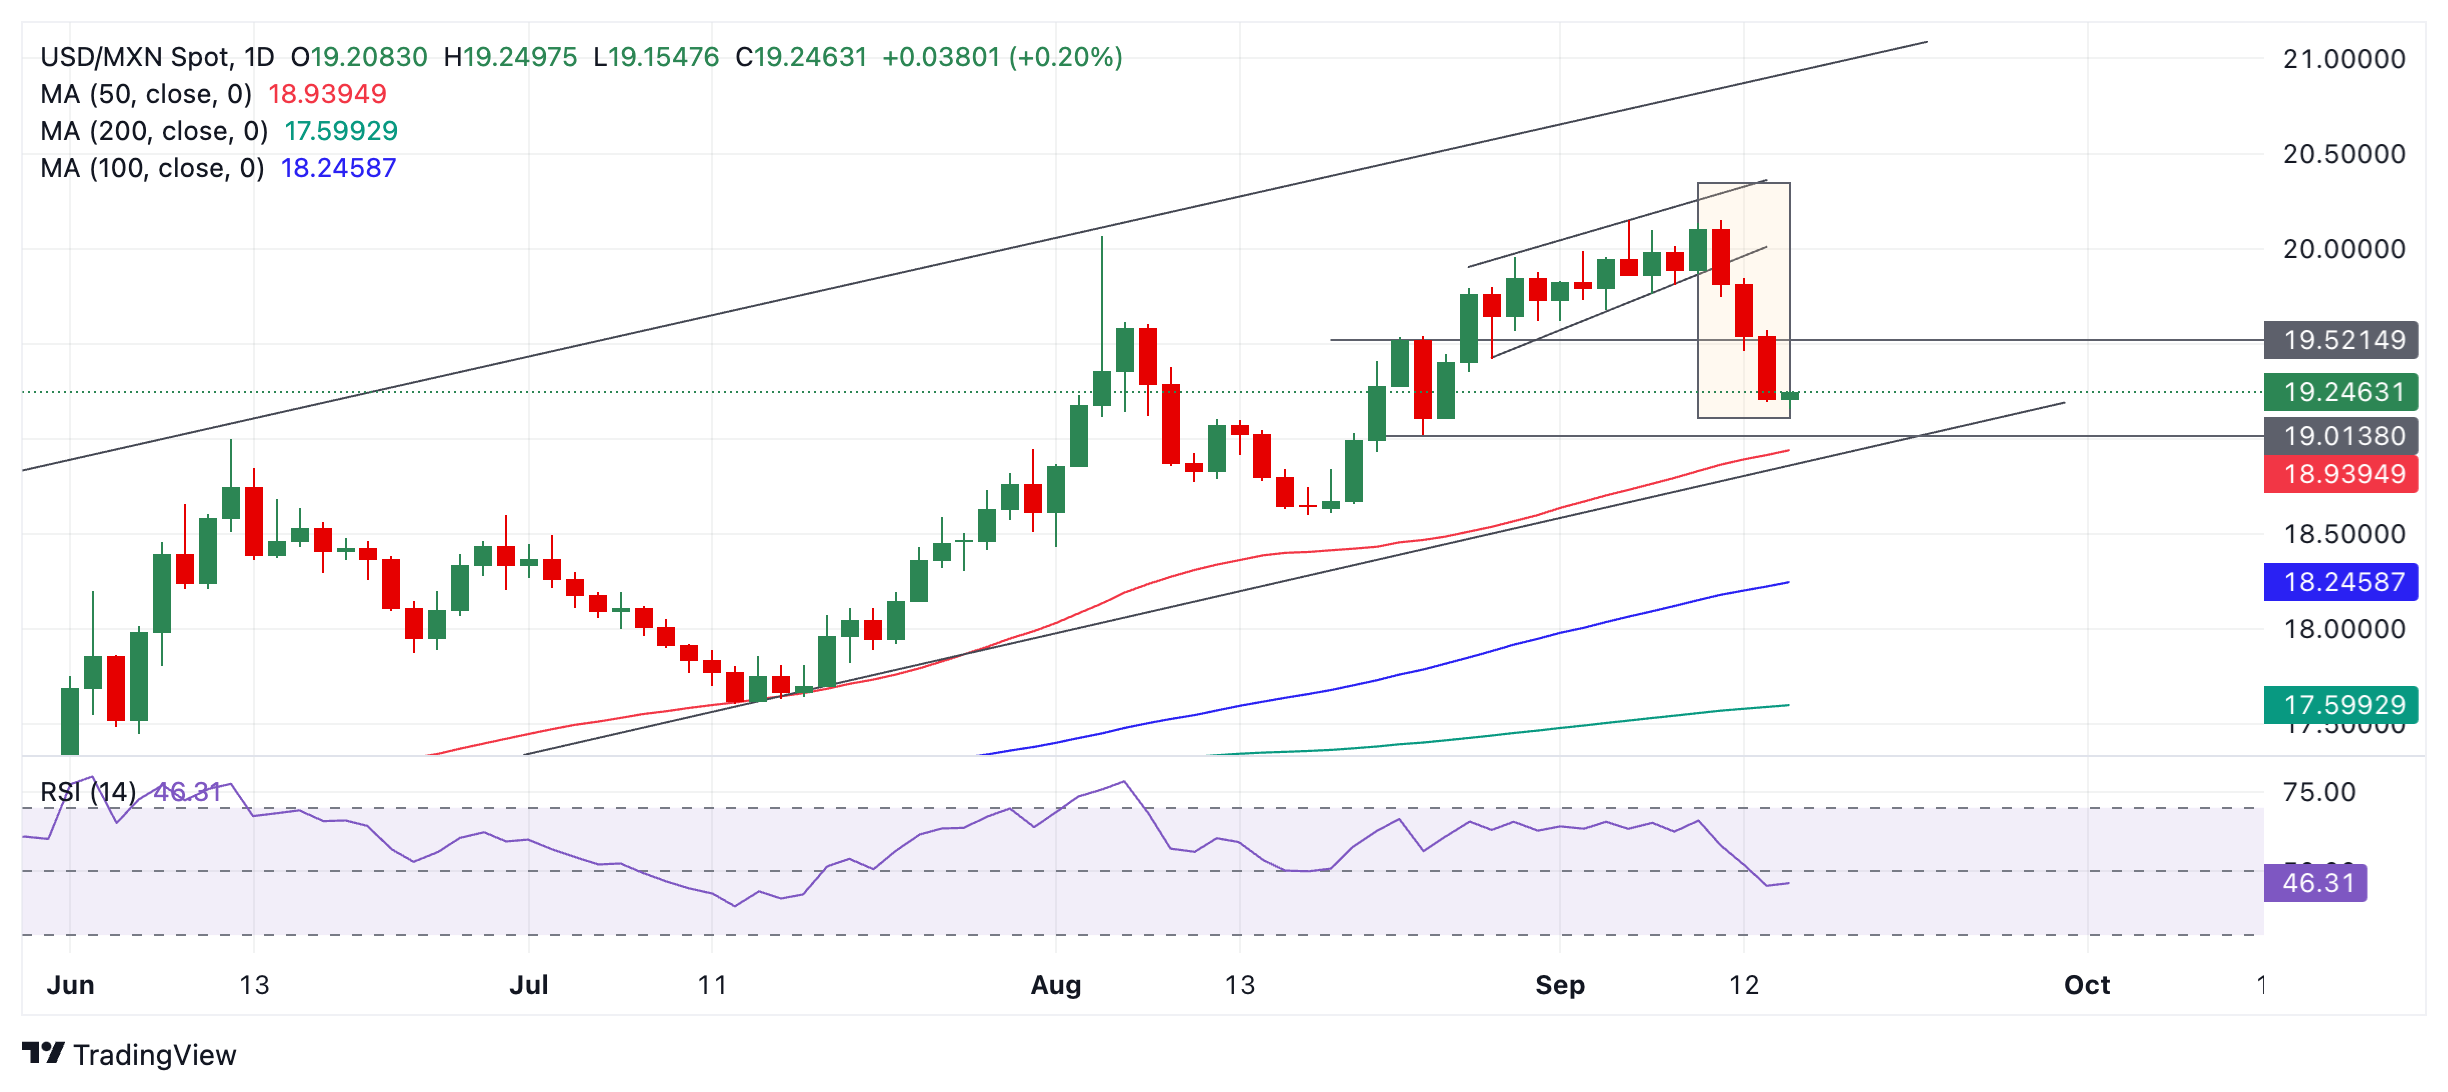
The odds now favor the pair falling to the next downside support level at 19.01 (August 23 low), followed perhaps by further weakness to the 50-day Simple Moving Average (SMA) at 18.94 and the lower trendline of the larger channel a few pips below. At that level, the price will probably find firm support to stabilize and perhaps recover.
Even though the short-term trend is bearish, the medium and long-term trends are still bullish, suggesting the possibility that the pair could recover eventually and continue to trade higher.
Economic Indicator
Fed Interest Rate Decision
The Federal Reserve (Fed) deliberates on monetary policy and makes a decision on interest rates at eight pre-scheduled meetings per year. It has two mandates: to keep inflation at 2%, and to maintain full employment. Its main tool for achieving this is by setting interest rates – both at which it lends to banks and banks lend to each other. If it decides to hike rates, the US Dollar (USD) tends to strengthen as it attracts more foreign capital inflows. If it cuts rates, it tends to weaken the USD as capital drains out to countries offering higher returns. If rates are left unchanged, attention turns to the tone of the Federal Open Market Committee (FOMC) statement, and whether it is hawkish (expectant of higher future interest rates), or dovish (expectant of lower future rates).
Read more.Next release: Wed Sep 18, 2024 18:00
Frequency: Irregular
Consensus: 5.25%
Previous: 5.5%
Source: Federal Reserve
- NZD/USD regains positive traction on Monday amid broad-based USD weakness.
- A sustained move beyond the 0.6200 mark should pave the way for further gains.
- Traders, however, might wait on the sidelines ahead of the Fed on Wednesday.
The NZD/USD pair attracts some dip-buying on the first day of a new week and reverses a major part of Friday's pullback from the 0.6200 neighborhood, or a one-week high renewed US Dollar (USD) selling bias. Spot prices climb to the 0.6180-0.6185 region during the first half of the European session and seem poised to build on last week's bounce from the very important 200-day Simple Moving Average (SMA).
Rising bets for an oversized 50-basis points interest rate cut by the Federal Reserve (Fed) drag the USD Index (DXY) back closer to the YTD low and lend support to the NZD/USD pair. Apart from this, a generally positive tone around the equity markets is seen undermining the safe-haven buck, which helps offset a string of dismal Chinese macro data released over the weekend and benefits the risk-sensitive Kiwi.
From a technical perspective, oscillators on the daily chart – though have been recovering from lower levels – are yet to confirm a positive bias. This makes it prudent to wait for some follow-through buying beyond the 0.6200 mark before placing bullish fresh and ahead of the FOMC decision on Wednesday. The NZD/USD pair might then climb to the 0.6255 area en route to the 0.6300 mark or a multi-month high touched in August.
On the flip side, the 0.6155 region now seems to protect the immediate downside ahead of the Asian session low, around the 0.6135 area. This is followed by the 0.6100 mark, or the 200-day SMA, which if broken decisively will be seen as a fresh trigger for bearish traders. The downward trajectory could then extend towards the 0.6045 intermediate support before the NZD/USD pair eventually drops to the 0.6000 psychological mark.
NZD/USD daily chart
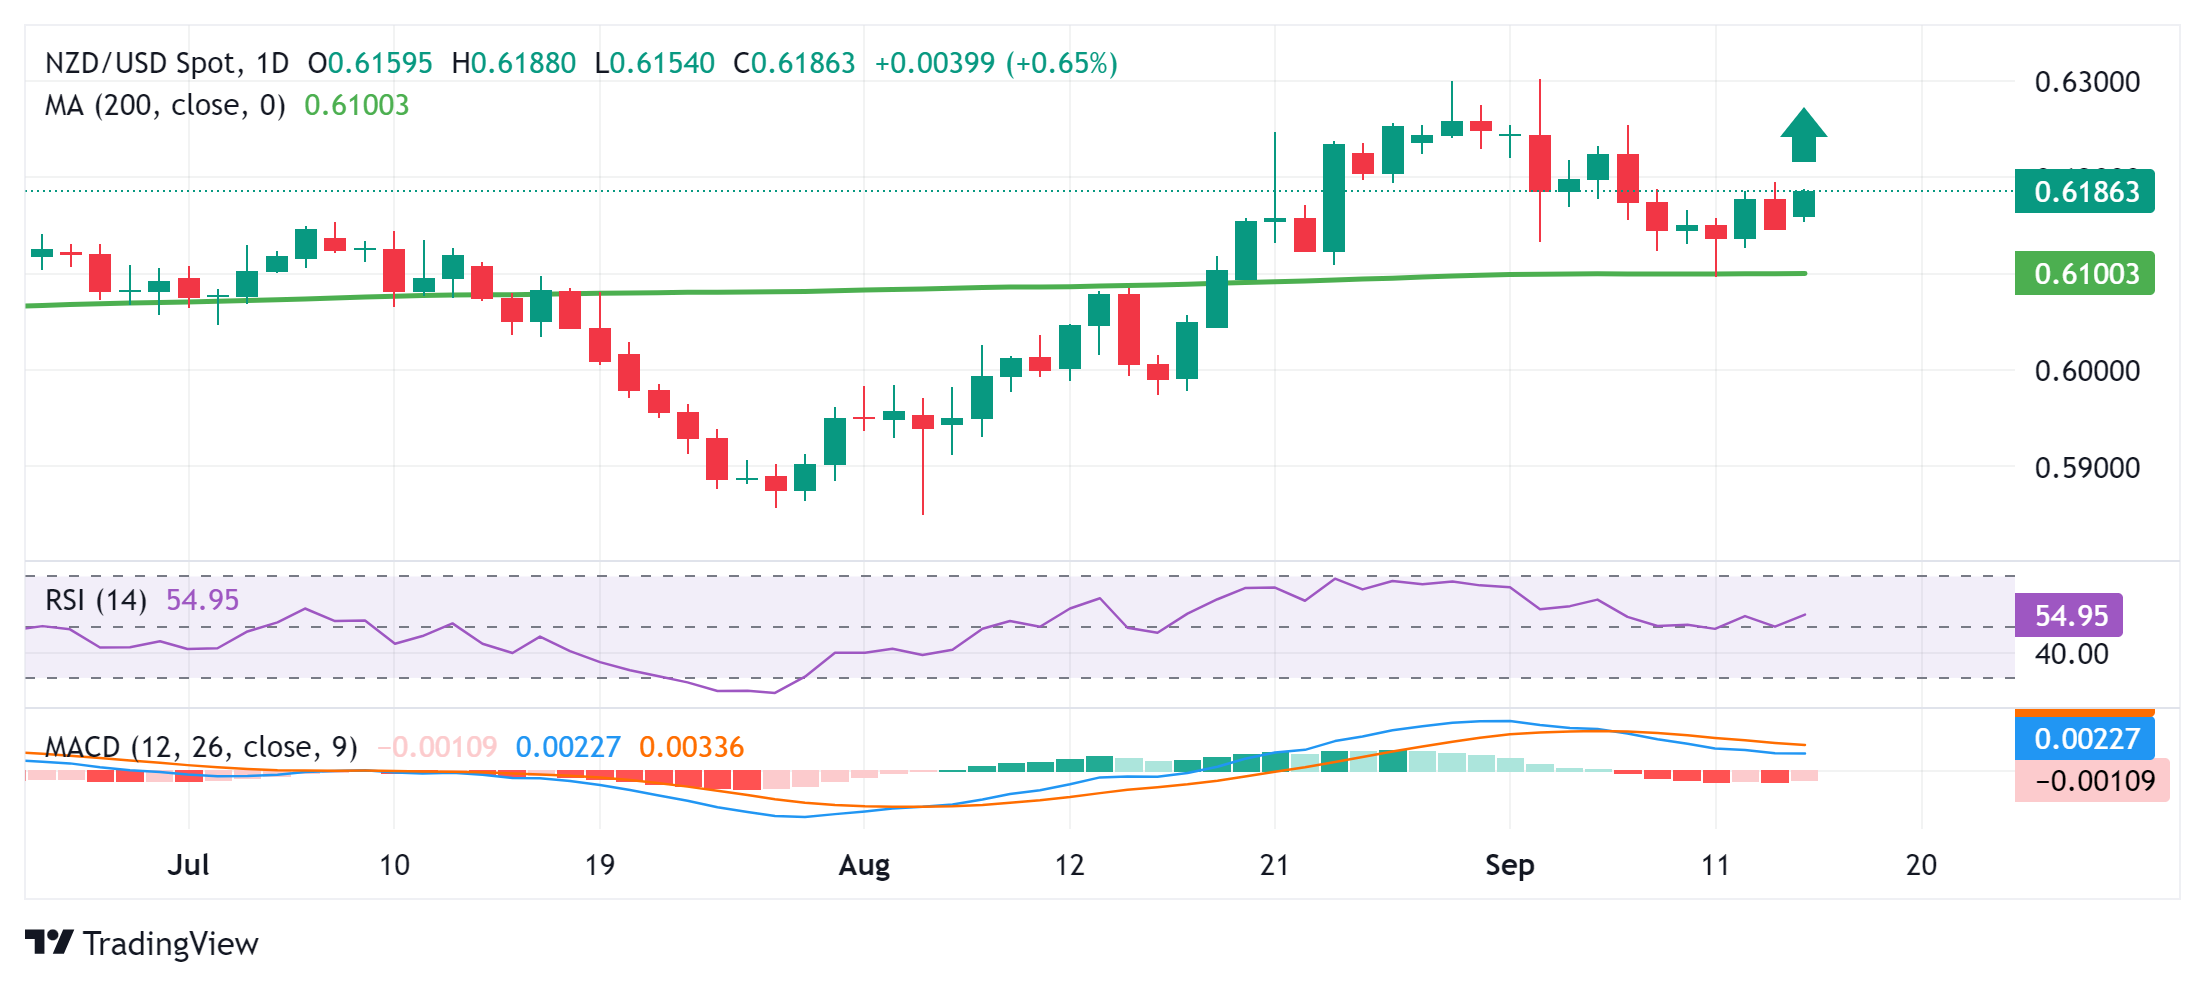
New Zealand Dollar FAQs
The New Zealand Dollar (NZD), also known as the Kiwi, is a well-known traded currency among investors. Its value is broadly determined by the health of the New Zealand economy and the country’s central bank policy. Still, there are some unique particularities that also can make NZD move. The performance of the Chinese economy tends to move the Kiwi because China is New Zealand’s biggest trading partner. Bad news for the Chinese economy likely means less New Zealand exports to the country, hitting the economy and thus its currency. Another factor moving NZD is dairy prices as the dairy industry is New Zealand’s main export. High dairy prices boost export income, contributing positively to the economy and thus to the NZD.
The Reserve Bank of New Zealand (RBNZ) aims to achieve and maintain an inflation rate between 1% and 3% over the medium term, with a focus to keep it near the 2% mid-point. To this end, the bank sets an appropriate level of interest rates. When inflation is too high, the RBNZ will increase interest rates to cool the economy, but the move will also make bond yields higher, increasing investors’ appeal to invest in the country and thus boosting NZD. On the contrary, lower interest rates tend to weaken NZD. The so-called rate differential, or how rates in New Zealand are or are expected to be compared to the ones set by the US Federal Reserve, can also play a key role in moving the NZD/USD pair.
Macroeconomic data releases in New Zealand are key to assess the state of the economy and can impact the New Zealand Dollar’s (NZD) valuation. A strong economy, based on high economic growth, low unemployment and high confidence is good for NZD. High economic growth attracts foreign investment and may encourage the Reserve Bank of New Zealand to increase interest rates, if this economic strength comes together with elevated inflation. Conversely, if economic data is weak, NZD is likely to depreciate.
The New Zealand Dollar (NZD) tends to strengthen during risk-on periods, or when investors perceive that broader market risks are low and are optimistic about growth. This tends to lead to a more favorable outlook for commodities and so-called ‘commodity currencies’ such as the Kiwi. Conversely, NZD tends to weaken at times of market turbulence or economic uncertainty as investors tend to sell higher-risk assets and flee to the more-stable safe havens.
- USD/CAD depreciates due to risk-on mood amid rising odds of a bumper 50 basis points rate cut by the Fed.
- CME FedWatch Tool suggests the likelihood of a 50 basis points Fed rate cut increasing to 59.0%.
- Lower Oil prices might have put downward pressure on the commodity-linked Canadian Dollar.
USD/CAD edges lower to near 1.3580 during the early European hours on Monday as the US Dollar (USD) received downward pressure amid the rising likelihood of the US Federal Reserve opting for an aggressive 50 basis points rate cut at its upcoming monetary policy meeting scheduled for Wednesday.
According to the CME FedWatch Tool, markets anticipate 41.0% odds of a 25 basis point (bps) rate cut by the Fed at its September meeting. The likelihood of a 50 bps rate cut has increased to 59.0%, up from 50.0% a day ago.
Additionally, lower US Treasury yields contribute to the downward pressure for the Greenback. The US Dollar Index (DXY), which measures the value of the US Dollar against its six major peers, trades around 100.70 with 2-year and 10-year yields on US Treasury bonds standing at 3.55% and 3.64%, respectively, at the time of writing.
On the CAD front, lower crude Oil prices might have put downward pressure on the Loonie Dollar and limit the downside of the USD/CAD pair. West Texas Intermediate (WTI) Oil price remains subdued around $68.40 per barrel at the time of writing. Concerns over slowing fuel demand in the world's largest Oil importer resurfaced following a series of disappointing Chinese economic data over the weekend, putting pressure on Oil prices.
Additionally, the Canadian Dollar (CAD) may weaken due to growing expectations of further interest rate cuts by the Bank of Canada (BoC). Traders will likely to monitor Canada's Consumer Price Index (CPI) data for August, scheduled for release on Tuesday. This inflation report could offer fresh insights into the Bank of Canada's outlook ahead of its October policy decision.
Canadian Dollar FAQs
The key factors driving the Canadian Dollar (CAD) are the level of interest rates set by the Bank of Canada (BoC), the price of Oil, Canada’s largest export, the health of its economy, inflation and the Trade Balance, which is the difference between the value of Canada’s exports versus its imports. Other factors include market sentiment – whether investors are taking on more risky assets (risk-on) or seeking safe-havens (risk-off) – with risk-on being CAD-positive. As its largest trading partner, the health of the US economy is also a key factor influencing the Canadian Dollar.
The Bank of Canada (BoC) has a significant influence on the Canadian Dollar by setting the level of interest rates that banks can lend to one another. This influences the level of interest rates for everyone. The main goal of the BoC is to maintain inflation at 1-3% by adjusting interest rates up or down. Relatively higher interest rates tend to be positive for the CAD. The Bank of Canada can also use quantitative easing and tightening to influence credit conditions, with the former CAD-negative and the latter CAD-positive.
The price of Oil is a key factor impacting the value of the Canadian Dollar. Petroleum is Canada’s biggest export, so Oil price tends to have an immediate impact on the CAD value. Generally, if Oil price rises CAD also goes up, as aggregate demand for the currency increases. The opposite is the case if the price of Oil falls. Higher Oil prices also tend to result in a greater likelihood of a positive Trade Balance, which is also supportive of the CAD.
While inflation had always traditionally been thought of as a negative factor for a currency since it lowers the value of money, the opposite has actually been the case in modern times with the relaxation of cross-border capital controls. Higher inflation tends to lead central banks to put up interest rates which attracts more capital inflows from global investors seeking a lucrative place to keep their money. This increases demand for the local currency, which in Canada’s case is the Canadian Dollar.
Macroeconomic data releases gauge the health of the economy and can have an impact on the Canadian Dollar. Indicators such as GDP, Manufacturing and Services PMIs, employment, and consumer sentiment surveys can all influence the direction of the CAD. A strong economy is good for the Canadian Dollar. Not only does it attract more foreign investment but it may encourage the Bank of Canada to put up interest rates, leading to a stronger currency. If economic data is weak, however, the CAD is likely to fall.
- The Pound Sterling surges to near 1.3160 against the US Dollar amid upbeat market sentiment.
- Investors expect the BoE to leave interest rates unchanged at 5% on Thursday.
- Traders remain divided over the size of the Fed’s likely interest-rate cut.
The Pound Sterling (GBP) performs strongly against its major peers at the start of the week, supported by the improved appeal for risk-perceived currencies and a weakening US Dollar, which is pressured by growing prospects that the Federal Reserve (Fed) will opt for a large interest-rate cut on Wednesday.
Firm Fed rate cut prospects have weighed on the US Dollar (USD), with the US Dollar Index (DXY), which tracks the Greenback’s value against six major currencies, posting a fresh weekly low near 100.80.
On the United Kingdom (UK) front, the Pound Sterling will be guided by the Consumer Price Index (CPI) data for August and the Bank of England’s (BoE) monetary policy decision, which are scheduled for Wednesday and Thursday, respectively.
Economists estimate the annual UK core CPI – which excludes volatile components – to have grown at a faster pace of 3.5% from 3.3% in July, with headline inflation rising steadily by 2.2%. Investors will also focus on the UK service inflation data, a closely-watched indicator by BoE officials that has remained high.
The inflation data will significantly influence market speculation for BoE interest rate policy. Currently, financial market participants expect that the BoE will leave interest rates unchanged at 5% and expect it to deliver only one additional interest-rate cut in the remainder of the year.
Daily digest market movers: Pound Sterling outperforms major peers
- The Pound Sterling jumps to near 1.3160 against the US Dollar in Monday’s London session. The GBP/USD pair gains as investors expect that the BoE’s policy-easing cycle will be less aggressive than that from the Fed.
- The Fed is almost certain to begin cutting interest rates on Wednesday. However, traders remain split about whether the rate cut size will be of 25 or 50 basis points (bps). According to the CME FedWatch tool, the probability of the Fed reducing interest rates by 50 bps to 4.75%-5.00% in September has increased sharply to 61% from 30% a week ago.
- Market speculation for the Fed's outsize interest rate cut has been strengthened after the release of the Producer Price Index (PPI) report for August, which showed that the headline producer inflation decelerated at a faster-than-expected pace to 1.7%. Some media reports have also contributed to expectations that the Fed could opt for a large cut.
- Before the Fed policy announcement, investors will focus on the United States (US) Retail Sales data for August, which will be published on Tuesday. Retail Sales data, a key measure of consumer spending, is estimated to have grown by 0.2%, slower than 1.0% increase seen in July.
Technical Analysis: Pound Sterling rises to near 1.3160
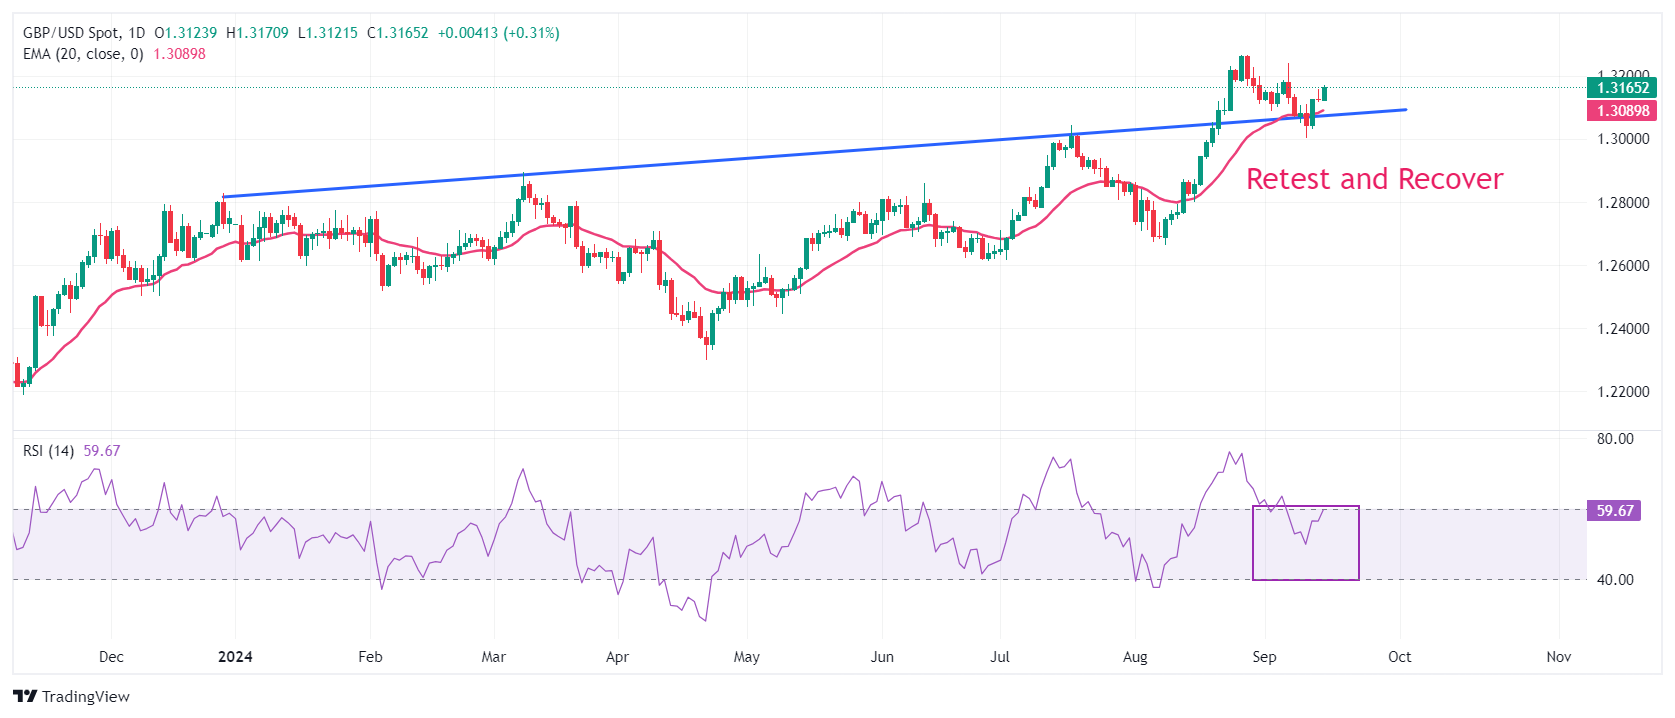
The Pound Sterling gains to near 1.3160 against the US Dollar. The GBP/USD pair extends its recovery after a corrective move to near the trendline plotted from the December 28, 2023, high of 1.2828, from where it delivered a sharp increase after a breakout on August 21. Also, the 20-day Exponential Moving Average (EMA) near 1.3080 has acted as major support for the Pound Sterling.
The 14-day Relative Strength Index (RSI) reaches 60.00. A fresh round of bullish momentum could occur if the oscillator breaks above this level.
Looking up, the Cable will face resistance near the round-level resistance of 1.3200 and the psychological level of 1.3500. On the downside, the psychological level of 1.3000 emerges as crucial support.
Pound Sterling FAQs
The Pound Sterling (GBP) is the oldest currency in the world (886 AD) and the official currency of the United Kingdom. It is the fourth most traded unit for foreign exchange (FX) in the world, accounting for 12% of all transactions, averaging $630 billion a day, according to 2022 data. Its key trading pairs are GBP/USD, aka ‘Cable’, which accounts for 11% of FX, GBP/JPY, or the ‘Dragon’ as it is known by traders (3%), and EUR/GBP (2%). The Pound Sterling is issued by the Bank of England (BoE).
The single most important factor influencing the value of the Pound Sterling is monetary policy decided by the Bank of England. The BoE bases its decisions on whether it has achieved its primary goal of “price stability” – a steady inflation rate of around 2%. Its primary tool for achieving this is the adjustment of interest rates. When inflation is too high, the BoE will try to rein it in by raising interest rates, making it more expensive for people and businesses to access credit. This is generally positive for GBP, as higher interest rates make the UK a more attractive place for global investors to park their money. When inflation falls too low it is a sign economic growth is slowing. In this scenario, the BoE will consider lowering interest rates to cheapen credit so businesses will borrow more to invest in growth-generating projects.
Data releases gauge the health of the economy and can impact the value of the Pound Sterling. Indicators such as GDP, Manufacturing and Services PMIs, and employment can all influence the direction of the GBP. A strong economy is good for Sterling. Not only does it attract more foreign investment but it may encourage the BoE to put up interest rates, which will directly strengthen GBP. Otherwise, if economic data is weak, the Pound Sterling is likely to fall.
Another significant data release for the Pound Sterling is the Trade Balance. This indicator measures the difference between what a country earns from its exports and what it spends on imports over a given period. If a country produces highly sought-after exports, its currency will benefit purely from the extra demand created from foreign buyers seeking to purchase these goods. Therefore, a positive net Trade Balance strengthens a currency and vice versa for a negative balance.
FX option expiries for September 16 NY cut at 10:00 Eastern Time, via DTCC, can be found below.
EUR/USD: EUR amounts
- 1.1000 1.2b
- 1.1005 450m
- 1.1025 1.0b
- 1.1035 756m
- 1.1050 518m
- 1.1080 536m
- 1.1100 440m
- 1.1115 674m
- 1.1125 835m
- 1.1145 2.4b
- 1.1150 1.3b
- 1.1175 546m
USD/JPY: USD amounts
- 140.00 442m
- 141.50 569m
GBP/USD: GBP amounts
- 1.3000 1.6b
- 1.3145 828m
- 1.3175 454m
- 1.3200 1.5b
- 1.3300 974m
USD/CAD: USD amounts
- 1.3650 1.4b
AUD/USD: AUD amounts
- 0.6750 456m
- AUD/JPY extends its downside near 94.25 in Monday’s early European session, down 0.18% on the day.
- Economists expect the BoJ to raise interest rates further by the end of this year.
- The concerns about the Chinese economic slowdown further weigh on the China-proxy AUD.
The AUD/JPY cross extends decline around 94.25 on Monday during the early European session. The stronger Japanese Yen (JPY) and the hawkish vibes ahead of the key Bank of Japan (BoJ) interest rate decision on Friday drag the cross lower.
The BoJ will likely not raise interest rates at its September policy meeting on Friday, but a majority of economists in a Reuters poll still expect a hike by year-end. This, in turn, supports the JPY and weighs on the AUD/JPY cross. Junki Iwahashi, senior economist at Sumitomo Mitsui Trust Bank, noted that the Japanese central bank is anticipated to proceed cautiously with rate hikes at a pace of about once every six months while assessing the impact of monetary tightening on the domestic economy.
On the Aussie front, renewed signs of deflation and a sluggish economy in China continue to undermine the China-proxy Australian Dollar (AUD). It’s worth noting that China is Australia's largest trading partner, and negative developments surrounding the Chinese economy generally weigh on the AUD.
On Thursday, the Australian employment data will be released. The country’s Unemployment Rate is projected to remain steady at 4.2% in August, while Employment Change is estimated to show a 30.8K rise in the same month from 58.2 in July. If the Australian labor market data shows stronger momentum, this could lift the Aussie and cap the cross’s downside.
Australian Dollar FAQs
One of the most significant factors for the Australian Dollar (AUD) is the level of interest rates set by the Reserve Bank of Australia (RBA). Because Australia is a resource-rich country another key driver is the price of its biggest export, Iron Ore. The health of the Chinese economy, its largest trading partner, is a factor, as well as inflation in Australia, its growth rate and Trade Balance. Market sentiment – whether investors are taking on more risky assets (risk-on) or seeking safe-havens (risk-off) – is also a factor, with risk-on positive for AUD.
The Reserve Bank of Australia (RBA) influences the Australian Dollar (AUD) by setting the level of interest rates that Australian banks can lend to each other. This influences the level of interest rates in the economy as a whole. The main goal of the RBA is to maintain a stable inflation rate of 2-3% by adjusting interest rates up or down. Relatively high interest rates compared to other major central banks support the AUD, and the opposite for relatively low. The RBA can also use quantitative easing and tightening to influence credit conditions, with the former AUD-negative and the latter AUD-positive.
China is Australia’s largest trading partner so the health of the Chinese economy is a major influence on the value of the Australian Dollar (AUD). When the Chinese economy is doing well it purchases more raw materials, goods and services from Australia, lifting demand for the AUD, and pushing up its value. The opposite is the case when the Chinese economy is not growing as fast as expected. Positive or negative surprises in Chinese growth data, therefore, often have a direct impact on the Australian Dollar and its pairs.
Iron Ore is Australia’s largest export, accounting for $118 billion a year according to data from 2021, with China as its primary destination. The price of Iron Ore, therefore, can be a driver of the Australian Dollar. Generally, if the price of Iron Ore rises, AUD also goes up, as aggregate demand for the currency increases. The opposite is the case if the price of Iron Ore falls. Higher Iron Ore prices also tend to result in a greater likelihood of a positive Trade Balance for Australia, which is also positive of the AUD.
The Trade Balance, which is the difference between what a country earns from its exports versus what it pays for its imports, is another factor that can influence the value of the Australian Dollar. If Australia produces highly sought after exports, then its currency will gain in value purely from the surplus demand created from foreign buyers seeking to purchase its exports versus what it spends to purchase imports. Therefore, a positive net Trade Balance strengthens the AUD, with the opposite effect if the Trade Balance is negative.
Here is what you need to know on Monday, September 16:
The US Dollar (USD) struggles to stay resilient against its major rivals at the beginning of the week, which will feature monetary policy announcements from major central banks and key macroeconomic data releases. The European Central Bank (ECB) will release a revision to second-quarter Labor Cost data and Eurostat will publish Trade Balance figures for July on Monday. Later in the day, NY Empire State Manufacturing Index data for September will be featured in the US economic docket.
Growing expectations for a large Federal Reserve (Fed) rate cut at this week's policy meeting caused the USD to come under selling pressure in the second half of the previous week. The USD Index stays on the back foot in the European morning and was last seen losing 0.3% on the day below 101.00. In the meantime, US stock index futures trade marginally lower on the day and the benchmark 10-year US Treasury bond yield holds slightly above 3.6%.
US Dollar PRICE Last 7 days
The table below shows the percentage change of US Dollar (USD) against listed major currencies last 7 days. US Dollar was the weakest against the Japanese Yen.
| USD | EUR | GBP | JPY | CAD | AUD | NZD | CHF | |
|---|---|---|---|---|---|---|---|---|
| USD | -0.23% | -0.27% | -1.76% | 0.10% | -0.82% | -0.07% | 0.05% | |
| EUR | 0.23% | -0.09% | -1.48% | 0.38% | -0.64% | 0.18% | 0.26% | |
| GBP | 0.27% | 0.09% | -1.51% | 0.43% | -0.55% | 0.25% | 0.35% | |
| JPY | 1.76% | 1.48% | 1.51% | 1.91% | 0.99% | 1.72% | 2.05% | |
| CAD | -0.10% | -0.38% | -0.43% | -1.91% | -0.88% | -0.19% | 0.11% | |
| AUD | 0.82% | 0.64% | 0.55% | -0.99% | 0.88% | 0.80% | 0.88% | |
| NZD | 0.07% | -0.18% | -0.25% | -1.72% | 0.19% | -0.80% | 0.11% | |
| CHF | -0.05% | -0.26% | -0.35% | -2.05% | -0.11% | -0.88% | -0.11% |
The heat map shows percentage changes of major currencies against each other. The base currency is picked from the left column, while the quote currency is picked from the top row. For example, if you pick the US Dollar from the left column and move along the horizontal line to the Japanese Yen, the percentage change displayed in the box will represent USD (base)/JPY (quote).
EUR/USD closed the previous week virtually unchanged. The pair trades modestly higher on the day, a few pips above 1.1100 in the European morning on Monday.
GBP/USD failed to build on Thursday's gains and ended the last day of the previous week flat. The pair gains traction in the early European session and trades above 1.3150.
Gold continues to stretch higher after registering impressive gains on Thursday and Friday. XAU/USD was last seen trading at a fresh record-high at around $2,590.
USD/JPY stays under bearish pressure to begin the week and trades at its weakest level since July 2023 below 140. The Bank of Japan will announce monetary policy decisions in the Asian session on Friday.
After posting small losses on Friday, AUD/USD benefited from the broad-based selling pressure surrounding the US Dollar and climbed above 0.6700. August employment data from Australia will be published early Thursday.
Central banks FAQs
Central Banks have a key mandate which is making sure that there is price stability in a country or region. Economies are constantly facing inflation or deflation when prices for certain goods and services are fluctuating. Constant rising prices for the same goods means inflation, constant lowered prices for the same goods means deflation. It is the task of the central bank to keep the demand in line by tweaking its policy rate. For the biggest central banks like the US Federal Reserve (Fed), the European Central Bank (ECB) or the Bank of England (BoE), the mandate is to keep inflation close to 2%.
A central bank has one important tool at its disposal to get inflation higher or lower, and that is by tweaking its benchmark policy rate, commonly known as interest rate. On pre-communicated moments, the central bank will issue a statement with its policy rate and provide additional reasoning on why it is either remaining or changing (cutting or hiking) it. Local banks will adjust their savings and lending rates accordingly, which in turn will make it either harder or easier for people to earn on their savings or for companies to take out loans and make investments in their businesses. When the central bank hikes interest rates substantially, this is called monetary tightening. When it is cutting its benchmark rate, it is called monetary easing.
A central bank is often politically independent. Members of the central bank policy board are passing through a series of panels and hearings before being appointed to a policy board seat. Each member in that board often has a certain conviction on how the central bank should control inflation and the subsequent monetary policy. Members that want a very loose monetary policy, with low rates and cheap lending, to boost the economy substantially while being content to see inflation slightly above 2%, are called ‘doves’. Members that rather want to see higher rates to reward savings and want to keep a lit on inflation at all time are called ‘hawks’ and will not rest until inflation is at or just below 2%.
Normally, there is a chairman or president who leads each meeting, needs to create a consensus between the hawks or doves and has his or her final say when it would come down to a vote split to avoid a 50-50 tie on whether the current policy should be adjusted. The chairman will deliver speeches which often can be followed live, where the current monetary stance and outlook is being communicated. A central bank will try to push forward its monetary policy without triggering violent swings in rates, equities, or its currency. All members of the central bank will channel their stance toward the markets in advance of a policy meeting event. A few days before a policy meeting takes place until the new policy has been communicated, members are forbidden to talk publicly. This is called the blackout period.
- EUR/GBP trades softer around 0.8435 in Monday’s early European session.
- ECB cut its rate by 25 bps last week, but the bank offered no indications of what its next move would be.
- The BoE is anticipated to hold the interest rate at 5.0% on Thursday.
The EUR/GBP cross edges lower to near 0.8435 during the early European session on Monday. The upside of the Euro (EUR) might be limited after the European Central Bank’s (ECB) interest rate decision last week. The attention will shift to the UK and Eurozone August inflation data on Wednesday ahead of the Bank of England (BoE) interest rate decision.
The ECB delivered a quarter-point interest rate cut last week, marking its second reduction to the deposit rate this year. Furthermore, the central bank revised its growth forecast for 2024 to 0.8% from an earlier projection of 0.9% due to “weaker contribution from domestic demand over the next few quarters.” The ECB rate cut and lower growth forecasts might undermine the shared currency in the near term.
The ECB Governing Council member Gabriel Makhlouf noted on Friday that the central bank continues to operate in a "highly uncertain environment" and will remain data-dependent when it comes to making future monetary policy decisions.
On the GBP’s front, the BoE rate decision will be the highlight on Thursday, with expectations that it will leave its policy rate unchanged at 5.0% in the September meeting. Ahead of the UK key event, the UK Consumer Price Index (CPI) inflation data will be published, which is expected to show an increase of 2.2% YoY in August. The softer reading could prompt the BoE to consider another cut in November.
ECB FAQs
The European Central Bank (ECB) in Frankfurt, Germany, is the reserve bank for the Eurozone. The ECB sets interest rates and manages monetary policy for the region. The ECB primary mandate is to maintain price stability, which means keeping inflation at around 2%. Its primary tool for achieving this is by raising or lowering interest rates. Relatively high interest rates will usually result in a stronger Euro and vice versa. The ECB Governing Council makes monetary policy decisions at meetings held eight times a year. Decisions are made by heads of the Eurozone national banks and six permanent members, including the President of the ECB, Christine Lagarde.
In extreme situations, the European Central Bank can enact a policy tool called Quantitative Easing. QE is the process by which the ECB prints Euros and uses them to buy assets – usually government or corporate bonds – from banks and other financial institutions. QE usually results in a weaker Euro. QE is a last resort when simply lowering interest rates is unlikely to achieve the objective of price stability. The ECB used it during the Great Financial Crisis in 2009-11, in 2015 when inflation remained stubbornly low, as well as during the covid pandemic.
Quantitative tightening (QT) is the reverse of QE. It is undertaken after QE when an economic recovery is underway and inflation starts rising. Whilst in QE the European Central Bank (ECB) purchases government and corporate bonds from financial institutions to provide them with liquidity, in QT the ECB stops buying more bonds, and stops reinvesting the principal maturing on the bonds it already holds. It is usually positive (or bullish) for the Euro.
- USD/JPY extends its losing streak within a descending channel, suggesting a confirmed bearish bias.
- The momentum indicator 14-day RSI suggests an oversold situation and a potential for an upward correction soon.
- The pair tests the 14-month low at 140.25, followed by the lower boundary of the channel at the 138.50 level.
USD/JPY continues to decline for the fifth consecutive day, trading around 140.30 during the Asian session on Monday. An analysis of the daily chart showed the USD/JPY pair moves downward within a descending channel, indicating a confirmed bearish bias.
Additionally, the nine-day Exponential Moving Average (EMA) is lower than the 21-day EMA, indicating a downward momentum in the asset's price. However, the 14-day Relative Strength Index (RSI), a momentum indicator, is positioned below the 30 level, suggesting an oversold situation for the USD/JPY pair and a potential for an upward correction soon.
In terms of support, the USD/JPY pair is testing 140.25, which is the lowest level since July 2023, followed by the psychological level of 140.00. A successful breach below this level could reinforce the bearish bias and put pressure on the pair to test the lower boundary of the descending channel at the level of 138.50.
On the upside, the USD/JPY pair might first encounter a barrier at the nine-day EMA around 142.19, followed by the 21-day EMA at 144.04 level. A break above these EMAs might weaken the bearish sentiment and push the pair to test the upper boundary of the descending channel at the 145.50 level.
USD/JPY: Daily Chart
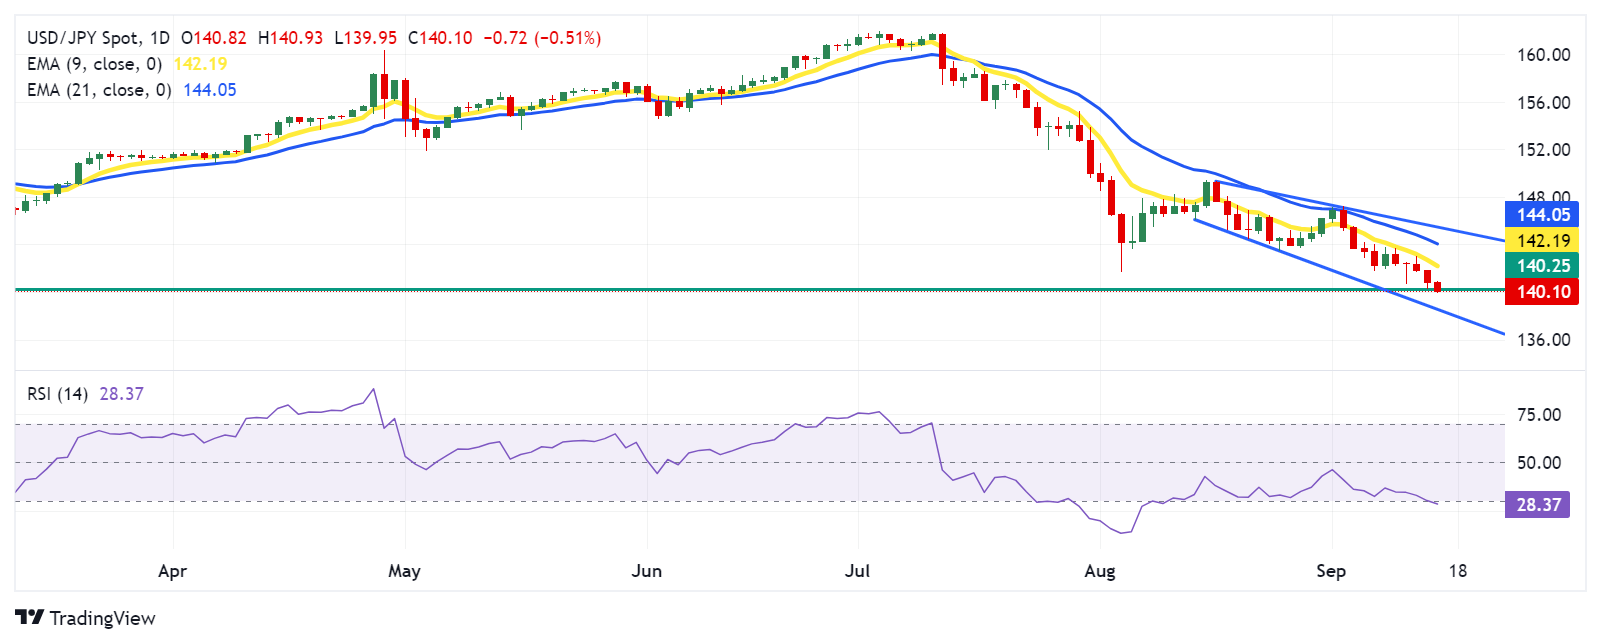
Japanese Yen PRICE Today
The table below shows the percentage change of Japanese Yen (JPY) against listed major currencies today. Japanese Yen was the strongest against the US Dollar.
| USD | EUR | GBP | JPY | CAD | AUD | NZD | CHF | |
|---|---|---|---|---|---|---|---|---|
| USD | -0.21% | -0.25% | -0.41% | -0.16% | -0.33% | -0.22% | -0.19% | |
| EUR | 0.21% | -0.10% | -0.23% | 0.01% | -0.18% | -0.07% | -0.03% | |
| GBP | 0.25% | 0.10% | -0.22% | 0.10% | -0.09% | 0.04% | 0.08% | |
| JPY | 0.41% | 0.23% | 0.22% | 0.25% | 0.13% | 0.20% | 0.15% | |
| CAD | 0.16% | -0.01% | -0.10% | -0.25% | -0.25% | -0.06% | -0.14% | |
| AUD | 0.33% | 0.18% | 0.09% | -0.13% | 0.25% | 0.12% | 0.14% | |
| NZD | 0.22% | 0.07% | -0.04% | -0.20% | 0.06% | -0.12% | 0.04% | |
| CHF | 0.19% | 0.03% | -0.08% | -0.15% | 0.14% | -0.14% | -0.04% |
The heat map shows percentage changes of major currencies against each other. The base currency is picked from the left column, while the quote currency is picked from the top row. For example, if you pick the Japanese Yen from the left column and move along the horizontal line to the US Dollar, the percentage change displayed in the box will represent JPY (base)/USD (quote).
- USD/CHF depreciates due to a rising likelihood of a bumper 50 basis points rate cut by the Fed on Wednesday.
- Lower Treasury yields contribute to downward pressure for the US Dollar.
- The solid Swiss Franc fuels speculation that the SNB could implement a significant rate cut in 2024.
USD/CHF extends its decline for the third successive session, trading around 0.8550 during the Asian hours on Monday. This downside of the USD/CHF pair could be attributed to rising odds of the US Federal Reserve opting for a jumbo 50 basis points rate cut at its upcoming monetary policy meeting scheduled for Wednesday.
The US Dollar (USD) faces challenges as Treasury yields decline. The US Dollar Index (DXY), which measures the value of the US Dollar (USD) against its six major peers, trades around 100.80 with 2-year and 10-year yields on US Treasury bonds standing at 3.58% and 3.65%, respectively, at the time of writing.
On the data front, the University of Michigan’s Consumer Sentiment Index rose to 69.0 in September, exceeding the market expectations of a 68.0 reading and marking a four-month high. This increase reflects a gradual improvement in consumers' outlook on the US economy after months of declining economic expectations, data showed on Friday.
The Swiss Franc (CHF) shows strength, fueling speculation that the Swiss National Bank (SNB) could be the first major central bank to implement a significant rate cut this year. Economists predict the SNB might announce a 25 basis points rate cut at its September meeting.
Additionally, Swiss inflation fell to 1.1% year-on-year in August, heightening speculation about a potential rate cut. Traders are expected to closely monitor this week’s Trade Balance data to assess Swiss economic conditions.
Swiss Franc FAQs
The Swiss Franc (CHF) is Switzerland’s official currency. It is among the top ten most traded currencies globally, reaching volumes that well exceed the size of the Swiss economy. Its value is determined by the broad market sentiment, the country’s economic health or action taken by the Swiss National Bank (SNB), among other factors. Between 2011 and 2015, the Swiss Franc was pegged to the Euro (EUR). The peg was abruptly removed, resulting in a more than 20% increase in the Franc’s value, causing a turmoil in markets. Even though the peg isn’t in force anymore, CHF fortunes tend to be highly correlated with the Euro ones due to the high dependency of the Swiss economy on the neighboring Eurozone.
The Swiss Franc (CHF) is considered a safe-haven asset, or a currency that investors tend to buy in times of market stress. This is due to the perceived status of Switzerland in the world: a stable economy, a strong export sector, big central bank reserves or a longstanding political stance towards neutrality in global conflicts make the country’s currency a good choice for investors fleeing from risks. Turbulent times are likely to strengthen CHF value against other currencies that are seen as more risky to invest in.
The Swiss National Bank (SNB) meets four times a year – once every quarter, less than other major central banks – to decide on monetary policy. The bank aims for an annual inflation rate of less than 2%. When inflation is above target or forecasted to be above target in the foreseeable future, the bank will attempt to tame price growth by raising its policy rate. Higher interest rates are generally positive for the Swiss Franc (CHF) as they lead to higher yields, making the country a more attractive place for investors. On the contrary, lower interest rates tend to weaken CHF.
Macroeconomic data releases in Switzerland are key to assessing the state of the economy and can impact the Swiss Franc’s (CHF) valuation. The Swiss economy is broadly stable, but any sudden change in economic growth, inflation, current account or the central bank’s currency reserves have the potential to trigger moves in CHF. Generally, high economic growth, low unemployment and high confidence are good for CHF. Conversely, if economic data points to weakening momentum, CHF is likely to depreciate.
As a small and open economy, Switzerland is heavily dependent on the health of the neighboring Eurozone economies. The broader European Union is Switzerland’s main economic partner and a key political ally, so macroeconomic and monetary policy stability in the Eurozone is essential for Switzerland and, thus, for the Swiss Franc (CHF). With such dependency, some models suggest that the correlation between the fortunes of the Euro (EUR) and the CHF is more than 90%, or close to perfect.
- EUR/USD trades on a stronger note near 1.1095 in Monday’s Asian session.
- The pair keeps the positive outlook above the 100-period EMA, with the bullish RSI indicator.
- The immediate resistance level emerges at the 1.1100-1.1105 region; the initial support level is located at 1.1072.
The EUR/USD pair gains ground around 1.1095 amid the softer US Dollar (USD) during the Asian trading hours on Monday. Investors will closely monitor the US Federal Reserve (Fed) monetary policy meeting on Wednesday for more cues about how aggressively the Fed will bring down interest rates.
EUR/USD remains capped under the descending trend channel on the four-hour chart. However, the constructive view of the major pair prevails as the price holds above the key 100-period Exponential Moving Averages (EMA). Additionally, the upward momentum is supported by the Relative Strength Index (RSI), which stands above the midline near 63.65, suggesting the path of least resistance is to the upside.
A decisive break above the 1.1100-1.1105 zone, the psychological level and the upper boundary of the trend channel could see a rally to 1.1155, the high of September 6. Further north, the next upside barrier is seen near 1.1200, the high of August 26.
On the other hand, the low of September 14 at 1.1072 acts as an initial support level for the major pair. The next cushion level to watch is 1.1061, the 100-period EMA. A breach of the mentioned level could see a drop to 1.1026, the low of September 3. The additional downside filter emerges at 1.0985, the lower limit of the trend channel.
EUR/USD 4-hour chart
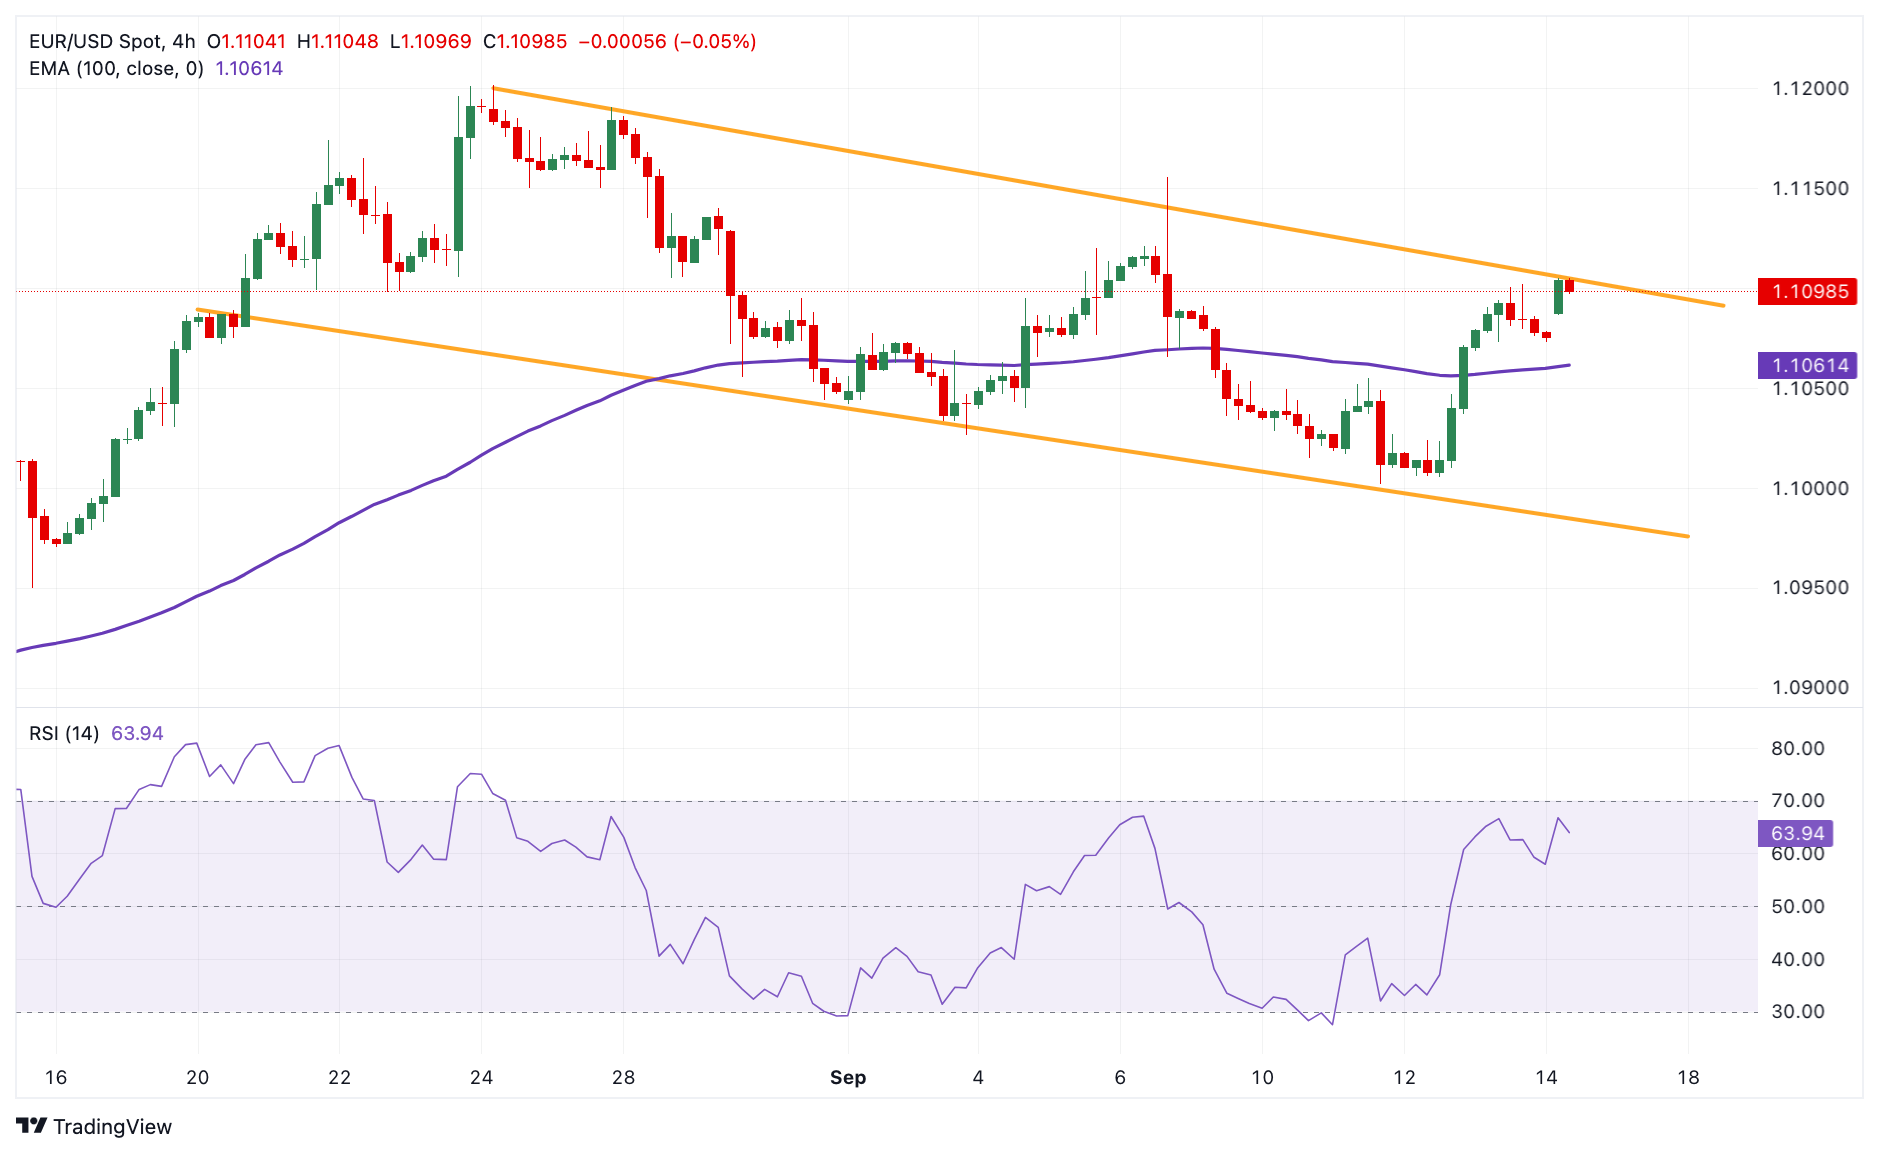
Euro FAQs
The Euro is the currency for the 20 European Union countries that belong to the Eurozone. It is the second most heavily traded currency in the world behind the US Dollar. In 2022, it accounted for 31% of all foreign exchange transactions, with an average daily turnover of over $2.2 trillion a day. EUR/USD is the most heavily traded currency pair in the world, accounting for an estimated 30% off all transactions, followed by EUR/JPY (4%), EUR/GBP (3%) and EUR/AUD (2%).
The European Central Bank (ECB) in Frankfurt, Germany, is the reserve bank for the Eurozone. The ECB sets interest rates and manages monetary policy. The ECB’s primary mandate is to maintain price stability, which means either controlling inflation or stimulating growth. Its primary tool is the raising or lowering of interest rates. Relatively high interest rates – or the expectation of higher rates – will usually benefit the Euro and vice versa. The ECB Governing Council makes monetary policy decisions at meetings held eight times a year. Decisions are made by heads of the Eurozone national banks and six permanent members, including the President of the ECB, Christine Lagarde.
Eurozone inflation data, measured by the Harmonized Index of Consumer Prices (HICP), is an important econometric for the Euro. If inflation rises more than expected, especially if above the ECB’s 2% target, it obliges the ECB to raise interest rates to bring it back under control. Relatively high interest rates compared to its counterparts will usually benefit the Euro, as it makes the region more attractive as a place for global investors to park their money.
Data releases gauge the health of the economy and can impact on the Euro. Indicators such as GDP, Manufacturing and Services PMIs, employment, and consumer sentiment surveys can all influence the direction of the single currency. A strong economy is good for the Euro. Not only does it attract more foreign investment but it may encourage the ECB to put up interest rates, which will directly strengthen the Euro. Otherwise, if economic data is weak, the Euro is likely to fall. Economic data for the four largest economies in the euro area (Germany, France, Italy and Spain) are especially significant, as they account for 75% of the Eurozone’s economy.
Another significant data release for the Euro is the Trade Balance. This indicator measures the difference between what a country earns from its exports and what it spends on imports over a given period. If a country produces highly sought after exports then its currency will gain in value purely from the extra demand created from foreign buyers seeking to purchase these goods. Therefore, a positive net Trade Balance strengthens a currency and vice versa for a negative balance.
- EUR/JPY drifts lower for the second straight day and drops to over a one-month low.
- Hawkish BoJ expectations continue to underpin the JPY and exert downward pressure.
- The Euro draws support from a weaker USD and should limit losses ahead of the BoJ.
The EUR/JPY cross attracts sellers for the second straight day on Monday and drops to its lowest level since early August, below mid-155.00s during the Asian session. The downtick is sponsored by the underlying bullish sentiment surrounding the Japanese Yen (JPY), though lacks follow-through buying ahead of the crucial Bank of Japan (BoJ) policy meeting later this week.
The recent hawkish signals from the Bank of Japan (BoJ) officials suggested that the central bank will raise interest rates further by the end of this year, which, in turn, is seen underpinning the JPY and exerting pressure on the EUR/JPY cross. In fact, BoJ board member Junko Nakagawa said earlier last week that the central bank will raise interest rates further if the economy and inflation move in line with its forecasts. Furthermore, BoJ board member Naoki Tamura said last Thursday that the central bank must push up short-term rates to at least around 1% through fiscal 2026 to stably achieve the 2% inflation target.
This marks a big divergence in comparison to the European Central Bank's (ECB) decision last week to cut interest rates for the second time this cycle and indicates a declining path for borrowing costs in the months ahead. This is seen as another factor behind the shared currency's relative underperformance and contributes to the offered tone surrounding the EUR/JPY cross. That said, reports that the ECB policymakers see an interest rate cut in October as unlikely, barring a major deterioration in the outlook for growth, along with sustained US Dollar (USD), assist the Euro in gaining some positive traction.
Apart from this, a generally positive tone across the global equity markets keeps a lid on any further appreciation for the safe-haven JPY and should cap the upside for the EUR/JPY cross. Traders might also refrain from placing aggressive bearish bets and opt to move to the sidelines ahead of the key central bank event risk – the highly-anticipated BoJ policy decision on Friday. The key focus will be on the BoJ's policy outlook, which will play a key role in influencing the near-term JPY price dynamics and help market participants in determining the next leg of a directional move for the currency.
Economic Indicator
BoJ Interest Rate Decision
The Bank of Japan (BoJ) announces its interest rate decision after each of the Bank’s eight scheduled annual meetings. Generally, if the BoJ is hawkish about the inflationary outlook of the economy and raises interest rates it is bullish for the Japanese Yen (JPY). Likewise, if the BoJ has a dovish view on the Japanese economy and keeps interest rates unchanged, or cuts them, it is usually bearish for JPY.
Read more.Next release: Fri Sep 20, 2024 03:00
Frequency: Irregular
Consensus: -
Previous: 0.15%
Source: Bank of Japan
Gold prices rose in India on Monday, according to data compiled by FXStreet.
The price for Gold stood at 6,974.08 Indian Rupees (INR) per gram, up compared with the INR 6,953.37 it cost on Friday.
The price for Gold increased to INR 81,344.34 per tola from INR 81,102.72 per tola on friday.
| Unit measure | Gold Price in INR |
|---|---|
| 1 Gram | 6,974.08 |
| 10 Grams | 69,740.84 |
| Tola | 81,344.34 |
| Troy Ounce | 216,918.40 |
FXStreet calculates Gold prices in India by adapting international prices (USD/INR) to the local currency and measurement units. Prices are updated daily based on the market rates taken at the time of publication. Prices are just for reference and local rates could diverge slightly.
Gold FAQs
Gold has played a key role in human’s history as it has been widely used as a store of value and medium of exchange. Currently, apart from its shine and usage for jewelry, the precious metal is widely seen as a safe-haven asset, meaning that it is considered a good investment during turbulent times. Gold is also widely seen as a hedge against inflation and against depreciating currencies as it doesn’t rely on any specific issuer or government.
Central banks are the biggest Gold holders. In their aim to support their currencies in turbulent times, central banks tend to diversify their reserves and buy Gold to improve the perceived strength of the economy and the currency. High Gold reserves can be a source of trust for a country’s solvency. Central banks added 1,136 tonnes of Gold worth around $70 billion to their reserves in 2022, according to data from the World Gold Council. This is the highest yearly purchase since records began. Central banks from emerging economies such as China, India and Turkey are quickly increasing their Gold reserves.
Gold has an inverse correlation with the US Dollar and US Treasuries, which are both major reserve and safe-haven assets. When the Dollar depreciates, Gold tends to rise, enabling investors and central banks to diversify their assets in turbulent times. Gold is also inversely correlated with risk assets. A rally in the stock market tends to weaken Gold price, while sell-offs in riskier markets tend to favor the precious metal.
The price can move due to a wide range of factors. Geopolitical instability or fears of a deep recession can quickly make Gold price escalate due to its safe-haven status. As a yield-less asset, Gold tends to rise with lower interest rates, while higher cost of money usually weighs down on the yellow metal. Still, most moves depend on how the US Dollar (USD) behaves as the asset is priced in dollars (XAU/USD). A strong Dollar tends to keep the price of Gold controlled, whereas a weaker Dollar is likely to push Gold prices up.
(An automation tool was used in creating this post.)
- Silver price extends its upside due to rising expectations of an aggressive rate cut by the Fed.
- The demand for dollar-denominated Silver gains attraction as it becomes cheaper for buyers using other currencies.
- Markets assess demand prospects in China, given that Silver is crucial for a range of industrial applications.
Silver price (XAG/USD) continues its winning streak that began on September 9, trading around $31.00 per Troy ounce during Monday’s Asian session. The non-yielding Silver extends its upside due to growing speculation that the US Federal Reserve will opt for a jumbo 50 basis points rate cut at its upcoming monetary policy meeting.
The demand for Silver is gaining traction due to a weaker US Dollar (USD), driven by lower Treasury yields. As Silver is a dollar-denominated commodity, it becomes cheaper for buyers using other currencies, which helps support increased demand for the precious metal.
The US Dollar Index (DXY), which measures the value of the US Dollar (USD) against its six major peers, trades around 100.81 with 2-year and 10-year yields on US Treasury bonds standing at 3.58% and 3.65%, respectively, at the time of writing.
The market is divided over the scale of the rate cut by the Federal Reserve (Fed) on Wednesday. According to the CME FedWatch Tool, markets anticipate 41.0% odds of a 25 basis point (bps) rate cut by the Fed at its September meeting. The likelihood of a 50 bps rate cut has increased to 59.0%, up from 50.0% a day ago.
Additionally, markets are evaluating demand prospects in China after mixed economic indicators. Silver is essential in various industrial applications, such as electronics, solar panels, and automotive components. Given China's status as one of the world's largest manufacturing hubs, the country's industrial demand for Silver is significant.
Silver FAQs
Silver is a precious metal highly traded among investors. It has been historically used as a store of value and a medium of exchange. Although less popular than Gold, traders may turn to Silver to diversify their investment portfolio, for its intrinsic value or as a potential hedge during high-inflation periods. Investors can buy physical Silver, in coins or in bars, or trade it through vehicles such as Exchange Traded Funds, which track its price on international markets.
Silver prices can move due to a wide range of factors. Geopolitical instability or fears of a deep recession can make Silver price escalate due to its safe-haven status, although to a lesser extent than Gold's. As a yieldless asset, Silver tends to rise with lower interest rates. Its moves also depend on how the US Dollar (USD) behaves as the asset is priced in dollars (XAG/USD). A strong Dollar tends to keep the price of Silver at bay, whereas a weaker Dollar is likely to propel prices up. Other factors such as investment demand, mining supply – Silver is much more abundant than Gold – and recycling rates can also affect prices.
Silver is widely used in industry, particularly in sectors such as electronics or solar energy, as it has one of the highest electric conductivity of all metals – more than Copper and Gold. A surge in demand can increase prices, while a decline tends to lower them. Dynamics in the US, Chinese and Indian economies can also contribute to price swings: for the US and particularly China, their big industrial sectors use Silver in various processes; in India, consumers’ demand for the precious metal for jewellery also plays a key role in setting prices.
Silver prices tend to follow Gold's moves. When Gold prices rise, Silver typically follows suit, as their status as safe-haven assets is similar. The Gold/Silver ratio, which shows the number of ounces of Silver needed to equal the value of one ounce of Gold, may help to determine the relative valuation between both metals. Some investors may consider a high ratio as an indicator that Silver is undervalued, or Gold is overvalued. On the contrary, a low ratio might suggest that Gold is undervalued relative to Silver.
- USD/CAD kicks off the new week on a weaker note amid a bearish US Dollar.
- Bets for a 50 bps Fed rate cut and a positive risk tone weighs on the Greenback.
- Sliding Oil prices could undermine the Loonie and help limit any further losses.
The USD/CAD pair struggles to capitalize on its modest gains registered over the past two days and attracts fresh sellers during the Asian session on Monday. Spot prices, however, manage to hold above the 1.3565 support zone, warranting some caution before positioning for any meaningful pullback from a three-week high touched last Wednesday.
The US Dollar (USD) languishes near the YTD low amid rising bets for a more aggressive policy easing by the Federal Reserve (Fed), bolstered by signs of easing inflationary pressures in the US. Apart from this, a generally positive tone around the equity markets is seen denting demand for the safe-haven Greenback and exerting some downward pressure on the USD/CAD pair. The downside, however, seems cushioned in the wake of weaker Crude Oil prices, which tends to undermine the commodity-linked Loonie.
The worse-than-expected Chinese macro data released over the weekend adds to concerns about a slowing fuel demand in the world's second-largest economy and the world's top oil importer. This, in turn, fails to assist Crude Oil prices to capitalize on last week's recovery from the lowest level since May 2023. Furthermore, hopes for additional interest rate cuts by the Bank of Canada (BoC) might keep a lid on any meaningful appreciating move for the Canadian Dollar (CAD) and lend support to the USD/CAD pair.
Traders might also refrain from placing aggressive bets and prefer to move to the sidelines ahead of this week's key central bank event risk – the outcome of the highly-anticipated FOMC meeting on Wednesday. The US central bank is widely anticipated to lower its borrowing costs, though investors remain divided over the size of the rate cut. Hence, the crucial decision, along with the Fed's policy outlook, will play a key role in influencing the USD price dynamics and determining the next leg of a directional move for the USD/CAD pair.
US Dollar PRICE Today
The table below shows the percentage change of US Dollar (USD) against listed major currencies today. US Dollar was the strongest against the Canadian Dollar.
| USD | EUR | GBP | JPY | CAD | AUD | NZD | CHF | |
|---|---|---|---|---|---|---|---|---|
| USD | -0.26% | -0.29% | -0.48% | -0.21% | -0.32% | -0.27% | -0.22% | |
| EUR | 0.26% | -0.09% | -0.26% | 0.00% | -0.12% | -0.08% | -0.00% | |
| GBP | 0.29% | 0.09% | -0.24% | 0.09% | -0.04% | 0.02% | 0.09% | |
| JPY | 0.48% | 0.26% | 0.24% | 0.27% | 0.21% | 0.21% | 0.20% | |
| CAD | 0.21% | -0.01% | -0.09% | -0.27% | -0.19% | -0.07% | -0.12% | |
| AUD | 0.32% | 0.12% | 0.04% | -0.21% | 0.19% | 0.05% | 0.11% | |
| NZD | 0.27% | 0.08% | -0.02% | -0.21% | 0.07% | -0.05% | 0.07% | |
| CHF | 0.22% | 0.00% | -0.09% | -0.20% | 0.12% | -0.11% | -0.07% |
The heat map shows percentage changes of major currencies against each other. The base currency is picked from the left column, while the quote currency is picked from the top row. For example, if you pick the US Dollar from the left column and move along the horizontal line to the Japanese Yen, the percentage change displayed in the box will represent USD (base)/JPY (quote).
- NZD/USD holds ground following the release of an improved Business NZ Performance of Services Index on Monday.
- The Business NZ PSI rose to 45.5 in August from 45.2 in July, reaching its highest level since April.
- The US Dollar receives downward pressure amid uncertainty over the scale of the Fed’s upcoming rate cut.
NZD/USD holds its position following the recent losses from the previous session, trading around 0.6160 during the Asian hours on Monday. Traders are digesting data showing a slight improvement in business activity in New Zealand.
The Business NZ PSI increased to 45.5 in August from 45.2 in July, marking its second consecutive monthly rise and reaching its highest level since April, although it remains in contraction territory.
The New Zealand Dollar (NZD) may struggle due to increasing speculation that the Reserve Bank of New Zealand (RBNZ) will implement aggressive interest rate cuts. After unexpectedly beginning its policy-easing cycle in August, the RBNZ is anticipated to reduce its Official Cash Rate (OCR) at each of its remaining policy meetings for the year.
Traders are expected to await New Zealand’s Gross Domestic Product (GDP) data for the second quarter, scheduled for later in the week, to gain further insights into the Reserve Bank of New Zealand's monetary policy outlook.
Investors are closely watching the upcoming policy decision from the US Federal Reserve (Fed) later this week. The market is divided on whether the Fed will implement a rate cut of 25 basis points (bps) or 50 bps.
According to the CME FedWatch Tool, markets anticipate 48.0% odds of a 25 basis point (bps) rate cut by the Federal Reserve at its September meeting. The likelihood of a 50 bps rate cut has increased to 52.0%, up from 50.0% a day ago.
Traders will closely watch the FOMC Press Conference for insights into the future of US interest rates. If Fed Chair Jerome Powell signals a more aggressive easing approach, it could put downward pressure on the US Dollar, providing a potential boost to the NZD/USD pair.
New Zealand Dollar FAQs
The New Zealand Dollar (NZD), also known as the Kiwi, is a well-known traded currency among investors. Its value is broadly determined by the health of the New Zealand economy and the country’s central bank policy. Still, there are some unique particularities that also can make NZD move. The performance of the Chinese economy tends to move the Kiwi because China is New Zealand’s biggest trading partner. Bad news for the Chinese economy likely means less New Zealand exports to the country, hitting the economy and thus its currency. Another factor moving NZD is dairy prices as the dairy industry is New Zealand’s main export. High dairy prices boost export income, contributing positively to the economy and thus to the NZD.
The Reserve Bank of New Zealand (RBNZ) aims to achieve and maintain an inflation rate between 1% and 3% over the medium term, with a focus to keep it near the 2% mid-point. To this end, the bank sets an appropriate level of interest rates. When inflation is too high, the RBNZ will increase interest rates to cool the economy, but the move will also make bond yields higher, increasing investors’ appeal to invest in the country and thus boosting NZD. On the contrary, lower interest rates tend to weaken NZD. The so-called rate differential, or how rates in New Zealand are or are expected to be compared to the ones set by the US Federal Reserve, can also play a key role in moving the NZD/USD pair.
Macroeconomic data releases in New Zealand are key to assess the state of the economy and can impact the New Zealand Dollar’s (NZD) valuation. A strong economy, based on high economic growth, low unemployment and high confidence is good for NZD. High economic growth attracts foreign investment and may encourage the Reserve Bank of New Zealand to increase interest rates, if this economic strength comes together with elevated inflation. Conversely, if economic data is weak, NZD is likely to depreciate.
The New Zealand Dollar (NZD) tends to strengthen during risk-on periods, or when investors perceive that broader market risks are low and are optimistic about growth. This tends to lead to a more favorable outlook for commodities and so-called ‘commodity currencies’ such as the Kiwi. Conversely, NZD tends to weaken at times of market turbulence or economic uncertainty as investors tend to sell higher-risk assets and flee to the more-stable safe havens.
- WTI kicks off the new week on a weaker note in reaction to the dismal Chinese macro data.
- Dovish Fed-inspired USD selling bias lends support and helps limit losses for the commodity.
- The mixed fundamental backdrop warrants some caution before placing fresh directional bets.
West Texas Intermediate (WTI) US crude Oil prices attract some sellers during the Asian session on Monday and currently trade just below the $68.00 round-figure mark, down over 0.60% for the day.
Concerns about a slowing fuel demand in the world's biggest Oil importer resurfaced after a string of poor Chinese data over the weekend, which, in turn, is seen as a key factor weighing on the black liquid. The National Bureau of Statistics data reported on Saturday that China's Retail Sales rose by 2.1% in August from a year ago, down from the 2.7% increase in the previous month and missing expectations. Adding to this, Industrial Production growth slowed from 5.1% in July to 4.5% during the reported month. Furthermore, Fixed Asset Investment rose by 3.4% for the January to August period, slower than the market forecast, and the jobless rate unexpectedly climbed to a six-month high.
This comes on top of a downward revision of demand growth forecasts by the Organization of Petroleum Exporting Countries (OPEC) and the International Energy Agency (IEA) and prompts fresh selling around Crude Oil prices. That said, the prevalent US Dollar (USD) selling bias, led by expectations for an oversized interest rate cut by the Federal Reserve (Fed), lends support to the commodity and helps limit the downside. Hence, it will be prudent to wait for some follow-through selling before confirming that the recent bounce from the lowest level since May 2023 has run out of steam and positioning for the resumption of the prior downtrend witnessed over the past two months or so.
WTI Oil FAQs
WTI Oil is a type of Crude Oil sold on international markets. The WTI stands for West Texas Intermediate, one of three major types including Brent and Dubai Crude. WTI is also referred to as “light” and “sweet” because of its relatively low gravity and sulfur content respectively. It is considered a high quality Oil that is easily refined. It is sourced in the United States and distributed via the Cushing hub, which is considered “The Pipeline Crossroads of the World”. It is a benchmark for the Oil market and WTI price is frequently quoted in the media.
Like all assets, supply and demand are the key drivers of WTI Oil price. As such, global growth can be a driver of increased demand and vice versa for weak global growth. Political instability, wars, and sanctions can disrupt supply and impact prices. The decisions of OPEC, a group of major Oil-producing countries, is another key driver of price. The value of the US Dollar influences the price of WTI Crude Oil, since Oil is predominantly traded in US Dollars, thus a weaker US Dollar can make Oil more affordable and vice versa.
The weekly Oil inventory reports published by the American Petroleum Institute (API) and the Energy Information Agency (EIA) impact the price of WTI Oil. Changes in inventories reflect fluctuating supply and demand. If the data shows a drop in inventories it can indicate increased demand, pushing up Oil price. Higher inventories can reflect increased supply, pushing down prices. API’s report is published every Tuesday and EIA’s the day after. Their results are usually similar, falling within 1% of each other 75% of the time. The EIA data is considered more reliable, since it is a government agency.
OPEC (Organization of the Petroleum Exporting Countries) is a group of 13 Oil-producing nations who collectively decide production quotas for member countries at twice-yearly meetings. Their decisions often impact WTI Oil prices. When OPEC decides to lower quotas, it can tighten supply, pushing up Oil prices. When OPEC increases production, it has the opposite effect. OPEC+ refers to an expanded group that includes ten extra non-OPEC members, the most notable of which is Russia.
- Gold price trades with a mild positive bias near the all-time peak touched on Friday.
- Rising bets for a 50 bps Fed rate cut later this month continue to act as a tailwind.
- Bulls now await this week’s key central bank event risks before placing fresh bets.
Gold price (XAU/USD) holds steady near the all-time high, around the $2,580 region during the Asian session on Monday amid relatively thin trading volumes on the back of a holiday in China and Japan. Furthermore, traders opt to wait on the sidelines ahead of this week's key central bank event risks, especially the outcome of a two-day Federal Open Market Committee (FOMC) meeting. The Federal Reserve (Fed) is scheduled to announce its decision on Wednesday, which will be followed by the Bank of England (BoE) and the Bank of Japan (BoJ) policy meetings on Thursday and Friday, respectively.
In the meantime, rising bets for a more aggressive policy easing by the Fed, bolstered by signs of easing inflationary pressure in the United States (US), keep the US Treasury bond yields depressed near the 2024 low. This, in turn, continues to weigh on the US Dollar (USD) and acts as a tailwind for the non-yielding Gold price. Apart from this, the US political uncertainty ahead of the November election and persistent geopolitical risks further underpin demand for the safe-haven precious metal. That said, the upbeat market mood holds back bulls from placing fresh bets and should cap the commodity.
Daily Digest Market Movers: Gold price remains supported by dovish Fed-inspired USD selling bias
- Traders lifted bets for an oversized interest rate cut by the Federal Reserve amid signs that inflation in the US is subsiding, which continues to act as a tailwind for the non-yielding yellow metal.
- According to the CME Group's FedWatch Tool, the current market pricing indicates over a 50% chance that the US central bank will lower borrowing costs by 50 basis points later this week.
- The expectations were fueled by the softer US Consumer Price Index (CPI) and the Producer Price Index (PPI) reports last week, which provided further evidence of easing inflationary pressures.
- The yield on the benchmark 10-year US government bond languishes near its lowest level since May 2023, while the US Dollar remains within striking distance of the YTD low touched last month.
- Reports of a second attempted assassination attempt on Republican presidential candidate Donald Trump at his Florida golf club on Sunday further underpin demand for the safe-haven bullion.
- The protracted Russia-Ukraine war, along with rising instability and the risk of a further escalation of tensions in the Middle East, turns out to be another factor lending support to the XAU/USD.
- Bullish traders, however, seem reluctant to place fresh bets and prefer to wait for the outcome of the highly-anticipated FOMC monetary policy meeting on Wednesday before placing fresh bets.
- Investors this week will further take cues from the Bank of England and the Bank of Japan policy meetings, which might infuse volatility in the markets and provide some impetus to the metal.
Technical Outlook: Gold price could pause near upper ascending channel boundary around $2,600
From a technical perspective, the recent move-up along an ascending channel since June points to a well-established uptrend and supports prospects for additional gains. That said, the Relative Strength Index (RSI) on the daily chart is on the verge of breaking in the overbought zone, warranting some caution for bullish traders. Hence, any subsequent move up is more likely to confront stiff resistance and remain capped near the top end of the upward-sloping channel, currently pegged near the $2,600 round figure. The said handle should act as a key pivotal point, which if cleared decisively will mark a fresh breakout and pave the way for a further appreciation.
On the flip side, the $2,565-2,564 area now seems to protect the immediate downside ahead of the $2,532-2,530 strong resistance breakpoint. Any further decline is more likely to attract fresh buyers and remain limited near the $2,500 psychological mark. Some follow-through selling below the $2,485 region, however, could make the Gold price vulnerable to accelerate the slide towards the $2,470 horizontal support en route to the $2,464 confluence. The latter comprises the ascending channel support and the 50-day Simple Moving Average (SMA), which if broken decisively might shift the near-term bias in favor of bearish traders.
Gold FAQs
Gold has played a key role in human’s history as it has been widely used as a store of value and medium of exchange. Currently, apart from its shine and usage for jewelry, the precious metal is widely seen as a safe-haven asset, meaning that it is considered a good investment during turbulent times. Gold is also widely seen as a hedge against inflation and against depreciating currencies as it doesn’t rely on any specific issuer or government.
Central banks are the biggest Gold holders. In their aim to support their currencies in turbulent times, central banks tend to diversify their reserves and buy Gold to improve the perceived strength of the economy and the currency. High Gold reserves can be a source of trust for a country’s solvency. Central banks added 1,136 tonnes of Gold worth around $70 billion to their reserves in 2022, according to data from the World Gold Council. This is the highest yearly purchase since records began. Central banks from emerging economies such as China, India and Turkey are quickly increasing their Gold reserves.
Gold has an inverse correlation with the US Dollar and US Treasuries, which are both major reserve and safe-haven assets. When the Dollar depreciates, Gold tends to rise, enabling investors and central banks to diversify their assets in turbulent times. Gold is also inversely correlated with risk assets. A rally in the stock market tends to weaken Gold price, while sell-offs in riskier markets tend to favor the precious metal.
The price can move due to a wide range of factors. Geopolitical instability or fears of a deep recession can quickly make Gold price escalate due to its safe-haven status. As a yield-less asset, Gold tends to rise with lower interest rates, while higher cost of money usually weighs down on the yellow metal. Still, most moves depend on how the US Dollar (USD) behaves as the asset is priced in dollars (XAU/USD). A strong Dollar tends to keep the price of Gold controlled, whereas a weaker Dollar is likely to push Gold prices up.
- USD/CAD edges lower to 1.3575 in Monday’s Asian session.
- The growing anticipation of larger Fed rate cuts weighs on the US Dollar.
- BoC’s Macklem said he has opened the door to accelerating the pace of interest rate reductions.
The USD/CAD pair loses traction near 1.3575 during the Asian trading hours on Monday, pressured by a softer US Dollar (USD). The Federal Reserve (Fed) interest rate decision will take center stage on Wednesday. Investors will monitor how aggressively the US central bank will bring down interest rates.
Former New York Fed President William Dudley said on Friday that there’s scope for a half-point rate cut at the Fed’s meeting on Wednesday as FOMC members attempt to maneuver a "soft landing" of the economy. The rising anticipation of steeper Fed rate cuts exerts some selling pressure on the Greenback. The CME FedWatch Tool showed the markets have priced in nearly 49% probability of a Fed deeper rate cut, a significant jump from a 28% chance one day prior.
Elsewhere, data released by the University of Michigan on Friday showed that the Consumer Sentiment Index rose to 69.0 in September versus 67.9 prior. This figure came in above the market consensus of 68.0.
On the Loonie front, Bank of Canada (BoC) Governor Tiff Macklem said on Sunday that he has opened the door to accelerating the pace of interest rate reductions. Macklem added that It could be appropriate to move faster interest rates should growth disappoint. This, in turn, might drag the Canadian Dollar (CAD) down against the USD. Meanwhile, lower crude oil prices might cap the downside for the commodity-linked CAD as Canada is the largest oil exporter to the United States (US).
Canadian Dollar FAQs
The key factors driving the Canadian Dollar (CAD) are the level of interest rates set by the Bank of Canada (BoC), the price of Oil, Canada’s largest export, the health of its economy, inflation and the Trade Balance, which is the difference between the value of Canada’s exports versus its imports. Other factors include market sentiment – whether investors are taking on more risky assets (risk-on) or seeking safe-havens (risk-off) – with risk-on being CAD-positive. As its largest trading partner, the health of the US economy is also a key factor influencing the Canadian Dollar.
The Bank of Canada (BoC) has a significant influence on the Canadian Dollar by setting the level of interest rates that banks can lend to one another. This influences the level of interest rates for everyone. The main goal of the BoC is to maintain inflation at 1-3% by adjusting interest rates up or down. Relatively higher interest rates tend to be positive for the CAD. The Bank of Canada can also use quantitative easing and tightening to influence credit conditions, with the former CAD-negative and the latter CAD-positive.
The price of Oil is a key factor impacting the value of the Canadian Dollar. Petroleum is Canada’s biggest export, so Oil price tends to have an immediate impact on the CAD value. Generally, if Oil price rises CAD also goes up, as aggregate demand for the currency increases. The opposite is the case if the price of Oil falls. Higher Oil prices also tend to result in a greater likelihood of a positive Trade Balance, which is also supportive of the CAD.
While inflation had always traditionally been thought of as a negative factor for a currency since it lowers the value of money, the opposite has actually been the case in modern times with the relaxation of cross-border capital controls. Higher inflation tends to lead central banks to put up interest rates which attracts more capital inflows from global investors seeking a lucrative place to keep their money. This increases demand for the local currency, which in Canada’s case is the Canadian Dollar.
Macroeconomic data releases gauge the health of the economy and can have an impact on the Canadian Dollar. Indicators such as GDP, Manufacturing and Services PMIs, employment, and consumer sentiment surveys can all influence the direction of the CAD. A strong economy is good for the Canadian Dollar. Not only does it attract more foreign investment but it may encourage the Bank of Canada to put up interest rates, leading to a stronger currency. If economic data is weak, however, the CAD is likely to fall.
| Raw materials | Closed | Change, % |
|---|---|---|
| Silver | 30.711 | 2.74 |
| Gold | 257.915 | 0.81 |
| Palladium | 1068.51 | 1.93 |
- The Australian Dollar appreciates due to a slight increase in the odds of a 50 basis points Fed rate cut.
- The Aussie Dollar receives support from the RBA’s hawkish stance.
- The US Dollar faces challenges as the Treasury yields decline amid uncertainty over the scale of the Fed rate cut.
The Australian Dollar (AUD) inches higher against the US Dollar (USD) on Monday. The AUD/USD pair may appreciate further due to growing speculation that the US Federal Reserve will opt for a jumbo 50 basis points rate cut at this week’s monetary policy meeting. Traders look forward to a slew of Australian jobs data due later this week to gauge the health of the labor market and the potential implications on domestic monetary policy.
The Reserve Bank of Australia (RBA) has maintained a hawkish stance, with RBA Governor Michele Bullock stating that it is premature to consider rate cuts due to persistently high inflation. RBA Assistant Governor Sarah Hunter also noted that while the labor market remains tight, wage growth appears to have peaked and is expected to slow further.
The US Dollar receives downward pressure as US Treasury yields depreciate amid uncertainty over the scale of the Fed rate cut. According to the CME FedWatch Tool, markets anticipate 48.0% odds of a 25 basis point (bps) rate cut by the Fed at its September meeting. The likelihood of a 50 bps rate cut has increased to 52.0%, up from 50.0% a day ago.
Daily Digest Market Movers: Australian Dollar appreciates amid uncertainty over Fed rate cut
- The University of Michigan’s Consumer Sentiment Index rose to 69.0 in September, exceeding the market expectations of 68.0 reading and marking a four-month high. This increase reflects a gradual improvement in consumers' outlook on the US economy after months of declining economic expectations.
- China's Retail Sales grew by 2.1% year-on-year in August, slowing from 2.7% in the previous month and falling short of the market consensus of 2.5%. Given the close trade relationship between China and Australia, any shifts in China's economic performance could significantly impact the Australian market.
- China's economy weakened in August, with a continued slowdown in industrial activity and declining real estate prices, as Beijing faces growing pressure to increase spending to boost demand. This was reported by the National Bureau of Statistics on Saturday, according to Business Standard.
- The US Producer Price Index (PPI) rose to 0.2% month-on-month in August, exceeding the forecasted 0.1% increase and the previous 0.0%. Meanwhile, core PPI accelerated to 0.3% MoM, against the expected 0.2% rise and July’s 0.2% contraction.
- The former Reserve Bank of Australia (RBA) Governor Bernie Fraser criticized the current RBA Board for being overly focused on inflation at the expense of the job market. Fraser suggested that the Board should lower the cash rate, warning of "recessionary risks" that could have severe consequences for employment.
- Australia’s Consumer Inflation Expectations eased to 4.4% in September, down slightly from August's four-month high of 4.5%. This decline highlights the central bank's efforts to balance bringing inflation down within a reasonable timeframe and maintaining gains in the labor market.
- The US Consumer Price Index dipped to 2.5% year-on-year in August, from the previous reading of 2.9%. The index fell short of the expected 2.6% reading. The headline CPI stood at 0.2% MoM. Meanwhile, Core CPI ex Food & Energy, remained unchanged at 3.2% YoY. On a monthly basis, the index rose to 0.3% from the previous 0.2% reading.
Technical Analysis: Australian Dollar tests the upper boundary of the descending channel around 0.6700
The AUD/USD pair trades near 0.6700 on Monday. Technical analysis of the daily chart indicates that the pair is testing the upper boundary of a descending channel. A successful breach would signal a weakening bearish bias. Additionally, the 14-day Relative Strength Index (RSI) remains above the 50 level, suggesting a shift in momentum from a bearish to a bullish trend.
In terms of upside, a breakout above the upper boundary of the descending channel, near the 0.6700 level, could trigger a bullish bias for the AUD/USD pair. This could potentially push the pair toward its seven-month high of 0.6798 and test the psychological level of 0.6800.
On the downside, the AUD/USD pair could find immediate support around the nine-day Exponential Moving Average (EMA) at the 0.6703 level. A break below this level could reinforce the bearish bias and lead the pair to navigate the region around the lower boundary of the descending channel around the throwback support zone near 0.6575.
AUD/USD: Daily Chart
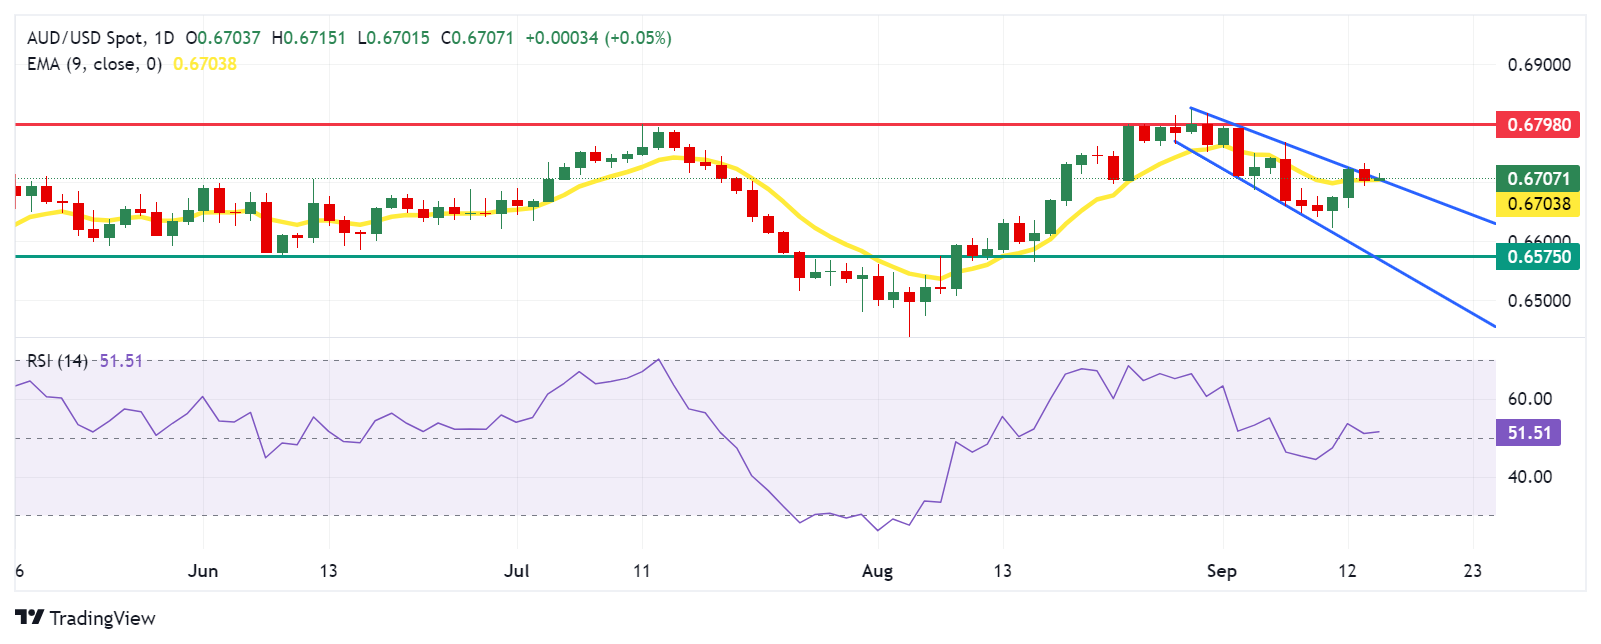
Australian Dollar PRICE Today
The table below shows the percentage change of Australian Dollar (AUD) against listed major currencies today. Australian Dollar was the strongest against the New Zealand Dollar.
| USD | EUR | GBP | JPY | CAD | AUD | NZD | CHF | |
|---|---|---|---|---|---|---|---|---|
| USD | -0.11% | -0.14% | -0.17% | -0.14% | -0.08% | 0.06% | -0.05% | |
| EUR | 0.11% | -0.08% | -0.11% | -0.07% | -0.04% | 0.11% | 0.01% | |
| GBP | 0.14% | 0.08% | -0.11% | 0.01% | 0.05% | 0.20% | 0.10% | |
| JPY | 0.17% | 0.11% | 0.11% | 0.03% | 0.14% | 0.24% | 0.05% | |
| CAD | 0.14% | 0.07% | -0.01% | -0.03% | -0.03% | 0.19% | -0.03% | |
| AUD | 0.08% | 0.04% | -0.05% | -0.14% | 0.03% | 0.15% | 0.03% | |
| NZD | -0.06% | -0.11% | -0.20% | -0.24% | -0.19% | -0.15% | -0.10% | |
| CHF | 0.05% | -0.01% | -0.10% | -0.05% | 0.03% | -0.03% | 0.10% |
The heat map shows percentage changes of major currencies against each other. The base currency is picked from the left column, while the quote currency is picked from the top row. For example, if you pick the Australian Dollar from the left column and move along the horizontal line to the US Dollar, the percentage change displayed in the box will represent AUD (base)/USD (quote).
Australian Dollar FAQs
One of the most significant factors for the Australian Dollar (AUD) is the level of interest rates set by the Reserve Bank of Australia (RBA). Because Australia is a resource-rich country another key driver is the price of its biggest export, Iron Ore. The health of the Chinese economy, its largest trading partner, is a factor, as well as inflation in Australia, its growth rate and Trade Balance. Market sentiment – whether investors are taking on more risky assets (risk-on) or seeking safe-havens (risk-off) – is also a factor, with risk-on positive for AUD.
The Reserve Bank of Australia (RBA) influences the Australian Dollar (AUD) by setting the level of interest rates that Australian banks can lend to each other. This influences the level of interest rates in the economy as a whole. The main goal of the RBA is to maintain a stable inflation rate of 2-3% by adjusting interest rates up or down. Relatively high interest rates compared to other major central banks support the AUD, and the opposite for relatively low. The RBA can also use quantitative easing and tightening to influence credit conditions, with the former AUD-negative and the latter AUD-positive.
China is Australia’s largest trading partner so the health of the Chinese economy is a major influence on the value of the Australian Dollar (AUD). When the Chinese economy is doing well it purchases more raw materials, goods and services from Australia, lifting demand for the AUD, and pushing up its value. The opposite is the case when the Chinese economy is not growing as fast as expected. Positive or negative surprises in Chinese growth data, therefore, often have a direct impact on the Australian Dollar and its pairs.
Iron Ore is Australia’s largest export, accounting for $118 billion a year according to data from 2021, with China as its primary destination. The price of Iron Ore, therefore, can be a driver of the Australian Dollar. Generally, if the price of Iron Ore rises, AUD also goes up, as aggregate demand for the currency increases. The opposite is the case if the price of Iron Ore falls. Higher Iron Ore prices also tend to result in a greater likelihood of a positive Trade Balance for Australia, which is also positive of the AUD.
The Trade Balance, which is the difference between what a country earns from its exports versus what it pays for its imports, is another factor that can influence the value of the Australian Dollar. If Australia produces highly sought after exports, then its currency will gain in value purely from the surplus demand created from foreign buyers seeking to purchase its exports versus what it spends to purchase imports. Therefore, a positive net Trade Balance strengthens the AUD, with the opposite effect if the Trade Balance is negative.
- Indian Rupee trades on a flat note in Monday’s Asian session.
- The combination of lower crude oil prices, strong foreign inflows and firmer Fed rate bets underpin the INR.
- Investors await the Indian Trade Balance and US NY Empire State Manufacturing Index, which are due on Monday.
The Indian Rupee (INR) holds steady on Monday despite a weaker US Dollar (USD). The decline in crude oil prices, strong foreign institutional inflows (FII) into the Indian stock market and the odds of an outsized Federal Reserve (Fed) rate cut at its upcoming monetary policy meeting on Wednesday might support the INR.
However, the consistent USD buying by importers and risk aversion ahead of the key event could boost the Greenback. Looking ahead, the Indian Trade Balance and US NY Empire State Manufacturing Index are due on Monday. The Indian Wholesale Price Index (WPI) Inflation and US Retail Sales for August will be released on Tuesday. The US Federal Reserve (Fed) interest rate decision will be the highlight on Wednesday.
Daily Digest Market Movers: Indian Rupee remains flat despite softer USD, lower crude oil prices
- On Friday, the BSE Sensex closed lower by 72 points, down 0.1%, while the NSE Nifty stood lower by 32 points, down 0.1%. Bajaj Finserv, Axis Bank and Wipro were among the top gainers.
- “The US dollar index has fallen from a level of 106 to around 101 in the past three months. Simultaneously, Asian currencies have appreciated against the greenback. The likely interest rate cuts by the US Fed, a sharp drop in crude oil prices and consistent foreign institutional inflows into Indian stock markets are supportive factors for the rupee. However, the local currency has not appreciated; rather, it remains weak against the US dollar,” said Amit Pabari, MD, CR Forex Advisors.
- The Reserve Bank of India Governor Shaktikanta Das said the country’s expected growth rate over the next few years stood at 7.5%, with upside possibilities.
- University of Michigan Consumer Sentiment Index climbed to 69.0 in September from 67.9 in August, better than the estimation of 68.0.
- The markets are now pricing in a 48% possibility of a 25 basis points (bps ) US rate cut on September 17-18, while the chance of a 50 bps cut stands at 52%, according to the CME FedWatch tool.
Technical Analysis: USD/INR’s constructive outlook remains in place
The Indian Rupee trades flat on the day. The USD/INR pair has broken below an ascending triangle on the daily chart. Nonetheless, in the long term, the pair keeps the bullish vibe as it remains above the key 100-day Exponential Moving Average (EMA). Further consolidation cannot be ruled out as the 14-day Relative Strength Index (RSI) hovers around the midline, indicating the neutral momentum of the pair.
Sustained upside pressure past the 84.00-84.05 region, the confluence of the psychological figure, the upper boundary of the triangle and the high of September 11 could take USD/INR up to the next upside barriers at 84.50.
On the flip side, the initial support level emerges at 83.84, the low of August 30. A break below this level could pave the way to the 100-day EMA at 83.68.
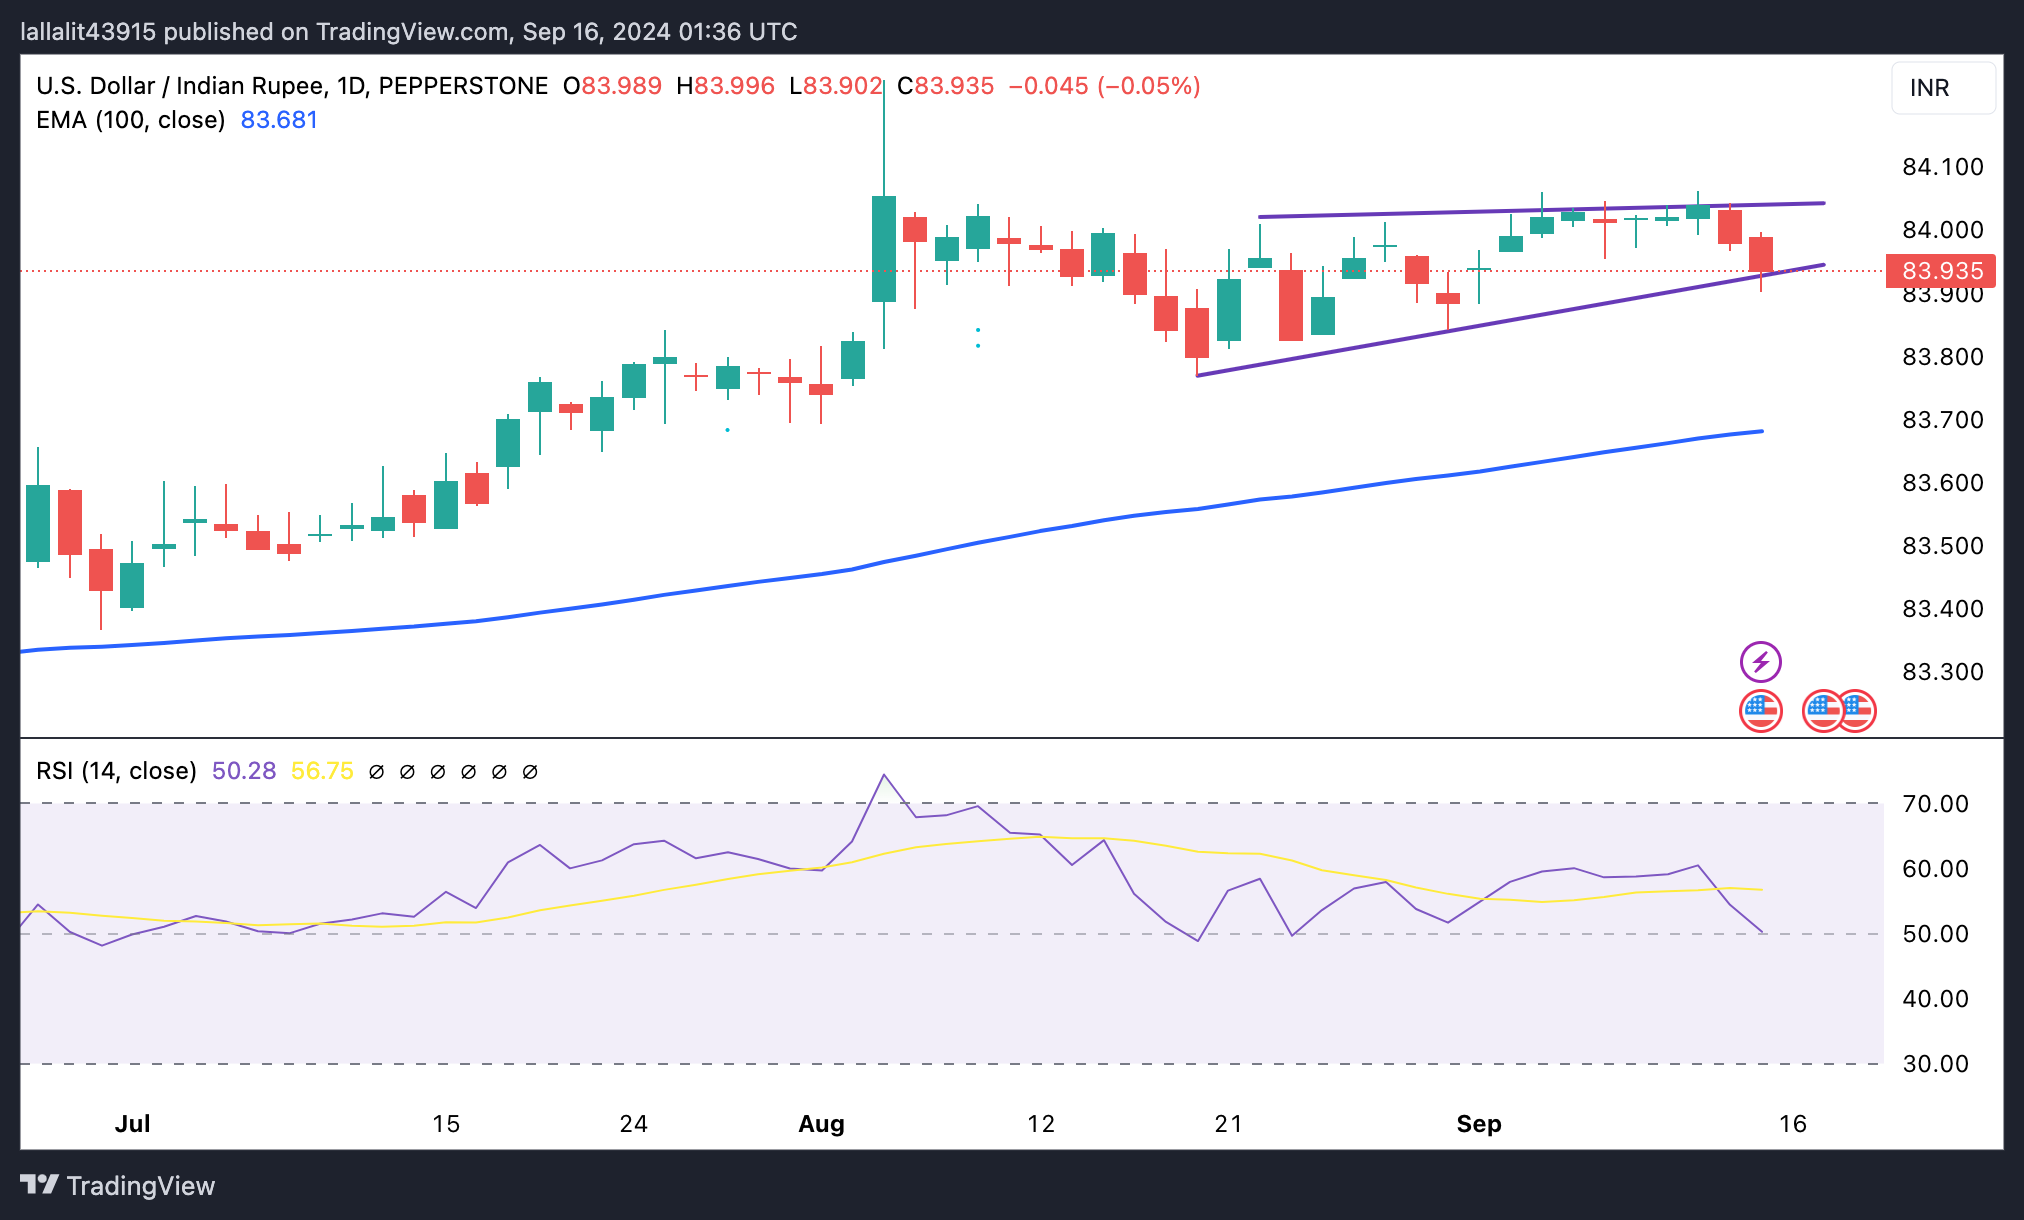
Indian Rupee FAQs
The Indian Rupee (INR) is one of the most sensitive currencies to external factors. The price of Crude Oil (the country is highly dependent on imported Oil), the value of the US Dollar – most trade is conducted in USD – and the level of foreign investment, are all influential. Direct intervention by the Reserve Bank of India (RBI) in FX markets to keep the exchange rate stable, as well as the level of interest rates set by the RBI, are further major influencing factors on the Rupee.
The Reserve Bank of India (RBI) actively intervenes in forex markets to maintain a stable exchange rate, to help facilitate trade. In addition, the RBI tries to maintain the inflation rate at its 4% target by adjusting interest rates. Higher interest rates usually strengthen the Rupee. This is due to the role of the ‘carry trade’ in which investors borrow in countries with lower interest rates so as to place their money in countries’ offering relatively higher interest rates and profit from the difference.
Macroeconomic factors that influence the value of the Rupee include inflation, interest rates, the economic growth rate (GDP), the balance of trade, and inflows from foreign investment. A higher growth rate can lead to more overseas investment, pushing up demand for the Rupee. A less negative balance of trade will eventually lead to a stronger Rupee. Higher interest rates, especially real rates (interest rates less inflation) are also positive for the Rupee. A risk-on environment can lead to greater inflows of Foreign Direct and Indirect Investment (FDI and FII), which also benefit the Rupee.
Higher inflation, particularly, if it is comparatively higher than India’s peers, is generally negative for the currency as it reflects devaluation through oversupply. Inflation also increases the cost of exports, leading to more Rupees being sold to purchase foreign imports, which is Rupee-negative. At the same time, higher inflation usually leads to the Reserve Bank of India (RBI) raising interest rates and this can be positive for the Rupee, due to increased demand from international investors. The opposite effect is true of lower inflation.
- USD/JPY languishes near the YTD low amid the divergent Fed-BoJ policy expectations.
- Bears might refrain from placing fresh bets ahead of this week’s central bank event risks.
- The Fed will announce its decision on Wednesday, followed by the BoJ update on Friday.
The USD/JPY pair remains depressed around mid-140.00s during the Asian session on Monday, amid thin trading volumes on the back of a holiday in Japan and seems vulnerable near the YTD low touched last week. Bearish traders, however, might prefer to wait for this week's key central bank event risks before positioning for any further depreciating move.
The Federal Reserve (Fed) is scheduled to announce its decision at the end of a two-day meeting on Wednesday, which will be followed by the Bank of Japan (BoJ) policy update on Friday. In the meantime, the divergent Fed-BoJ policy expectations led to the recent unwinding of the Japanese Yen (JPY) carry trades and continue to exert some downward pressure on the USD/JPY pair.
The markets started pricing in a greater chance of an oversized, 50 basis points (bps) rate cut by the US central bank after the US CPI and PPI report released last week pointed to signs of easing inflationary pressures. In contrast, the recent hawkish remarks by BoJ officials reaffirmed market bets that the Japanese central bank will announce another interest rate hike by the end of this year.
This, in turn, suggests that the path of least resistance for the USD/JPY pair remains to the downside and supports prospects for an extension of a well-established downtrend witnessed over the past two months or so. That said, a generally positive risk tone could cap any meaningful gains for the safe-haven JPY and hold back bulls from placing fresh bets in the absence of any relevant macro data.
Bank of Japan FAQs
The Bank of Japan (BoJ) is the Japanese central bank, which sets monetary policy in the country. Its mandate is to issue banknotes and carry out currency and monetary control to ensure price stability, which means an inflation target of around 2%.
The Bank of Japan has embarked in an ultra-loose monetary policy since 2013 in order to stimulate the economy and fuel inflation amid a low-inflationary environment. The bank’s policy is based on Quantitative and Qualitative Easing (QQE), or printing notes to buy assets such as government or corporate bonds to provide liquidity. In 2016, the bank doubled down on its strategy and further loosened policy by first introducing negative interest rates and then directly controlling the yield of its 10-year government bonds.
The Bank’s massive stimulus has caused the Yen to depreciate against its main currency peers. This process has exacerbated more recently due to an increasing policy divergence between the Bank of Japan and other main central banks, which have opted to increase interest rates sharply to fight decades-high levels of inflation. The BoJ’s policy of holding down rates has led to a widening differential with other currencies, dragging down the value of the Yen.
A weaker Yen and the spike in global energy prices have led to an increase in Japanese inflation, which has exceeded the BoJ’s 2% target. With wage inflation becoming a cause of concern, the BoJ looks to move away from ultra loose policy, while trying to avoid slowing the activity too much.
- EUR/USD appreciates in the midst of uncertainty over the scale of the Fed’s upcoming rate cut.
- ECB Governing Council member Gabriel Makhlouf said that the central bank is still operating in a "highly uncertain environment".
- Rabobank suggests that unfavorable Eurozone fundamentals will likely limit the upside potential for the EUR/USD pair.
EUR/USD starts the week on a positive note, edging higher to trade around 1.1090 during the Asian session on Monday. Investors are now focused on the highly-anticipated policy decision from the US Federal Reserve (Fed) later this week. Markets remain divided on whether the Fed will cut rates by 25 basis points (bps) or 50 bps.
According to the CME FedWatch Tool, markets anticipate 48.0% odds of a 25 basis point (bps) rate cut by the Federal Reserve at its September meeting. The likelihood of a 50 bps rate cut has increased to 52.0%, up from 50.0% a day ago.
Investors will closely watch the FOMC Press Conference for insights into the future of US interest rates. If Fed Chair Jerome Powell signals a more aggressive easing approach, it could put downward pressure on the US Dollar, providing a potential boost to the EUR/USD pair.
European Central Bank (ECB) Governing Council member and Central Bank of Ireland Governor Gabriel Makhlouf stated on Friday that the central bank is still operating in a "highly uncertain environment" and will rely on data to guide future monetary policy decisions. Makhlouf emphasized that the ECB is not committing to a specific rate path but remains "determined to ensure" that inflation in the Eurozone returns to the 2% target "in a timely manner."
Rabobank's research notes that the ECB announced its second rate cut of the cycle last week, with another cut anticipated before year-end. The latest ECB staff projections also reflect a downward revision in Eurozone growth. While expectations of Fed easing may weaken the USD, Rabobank suggests that unfavorable Eurozone fundamentals are likely to limit the upside potential for the EUR/USD pair in the near future.
Euro FAQs
The Euro is the currency for the 20 European Union countries that belong to the Eurozone. It is the second most heavily traded currency in the world behind the US Dollar. In 2022, it accounted for 31% of all foreign exchange transactions, with an average daily turnover of over $2.2 trillion a day. EUR/USD is the most heavily traded currency pair in the world, accounting for an estimated 30% off all transactions, followed by EUR/JPY (4%), EUR/GBP (3%) and EUR/AUD (2%).
The European Central Bank (ECB) in Frankfurt, Germany, is the reserve bank for the Eurozone. The ECB sets interest rates and manages monetary policy. The ECB’s primary mandate is to maintain price stability, which means either controlling inflation or stimulating growth. Its primary tool is the raising or lowering of interest rates. Relatively high interest rates – or the expectation of higher rates – will usually benefit the Euro and vice versa. The ECB Governing Council makes monetary policy decisions at meetings held eight times a year. Decisions are made by heads of the Eurozone national banks and six permanent members, including the President of the ECB, Christine Lagarde.
Eurozone inflation data, measured by the Harmonized Index of Consumer Prices (HICP), is an important econometric for the Euro. If inflation rises more than expected, especially if above the ECB’s 2% target, it obliges the ECB to raise interest rates to bring it back under control. Relatively high interest rates compared to its counterparts will usually benefit the Euro, as it makes the region more attractive as a place for global investors to park their money.
Data releases gauge the health of the economy and can impact on the Euro. Indicators such as GDP, Manufacturing and Services PMIs, employment, and consumer sentiment surveys can all influence the direction of the single currency. A strong economy is good for the Euro. Not only does it attract more foreign investment but it may encourage the ECB to put up interest rates, which will directly strengthen the Euro. Otherwise, if economic data is weak, the Euro is likely to fall. Economic data for the four largest economies in the euro area (Germany, France, Italy and Spain) are especially significant, as they account for 75% of the Eurozone’s economy.
Another significant data release for the Euro is the Trade Balance. This indicator measures the difference between what a country earns from its exports and what it spends on imports over a given period. If a country produces highly sought after exports then its currency will gain in value purely from the extra demand created from foreign buyers seeking to purchase these goods. Therefore, a positive net Trade Balance strengthens a currency and vice versa for a negative balance.
- GBP/USD kicks off the new week on a positive note amid the prevalent USD selling bias.
- Rising bets for a 50 bps Fed rate cut and the upbeat market mood undermine the buck.
- Bulls might refrain from placing aggressive bets ahead of the key central bank event risks.
The GBP/USD pair attracts some dip-buying on the first day of a new week amid relatively thin trading conditions on the back of a holiday in China and Japan. Spot prices currently trade around the 1.3135-1.3140 region, up just over 0.10% for the day and remain close to a one-week high touched on Friday amid the prevalent US Dollar (USD) selling bias.
The USD Index (DXY), which tracks the Greenback against a basket of six currencies, languishes near the YTD low set in August amid expectations for a more aggressive policy easing by the Federal Reserve (Fed). In fact, traders are pricing in a greater chance that the US central bank will lower borrowing costs by 50 basis points (bps) later this week after data released last week provided further evidence that inflation in the US was subsiding. This keeps the US Treasury bond yields depressed near the 2024 low and the USD bulls on the defensive.
Apart from this, a generally positive risk tone further undermines the Greenback's relative safe-haven status. The British Pound (GBP), on the other hand, benefits from expectations that the Bank of England (BoE) will loosen policy by less than the Fed over the next year. The markets, however, are still betting on more BoE rate cuts, especially after data released last week pointed to a slowdown in the UK wage growth and a flat GDP print for the second straight month in July. This might hold back bulls from placing aggressive bets around the GBP/USD pair.
Investors might also prefer to move to the sidelines ahead of this week's key central bank event risks. The Fed is scheduled to announce its decision at the end of a two-day policy meeting on Wednesday. This will be followed by the BoE meeting on Thursday, which will play a key role in influencing the next leg of a directional move for the GBP/USD pair. Nevertheless, the fundamental backdrop favors the USD bears and supports prospects for an extension of the pair's bounce from the 1.3000 psychological mark, or a multi-week low touched last Wednesday.
Fed FAQs
Monetary policy in the US is shaped by the Federal Reserve (Fed). The Fed has two mandates: to achieve price stability and foster full employment. Its primary tool to achieve these goals is by adjusting interest rates. When prices are rising too quickly and inflation is above the Fed’s 2% target, it raises interest rates, increasing borrowing costs throughout the economy. This results in a stronger US Dollar (USD) as it makes the US a more attractive place for international investors to park their money. When inflation falls below 2% or the Unemployment Rate is too high, the Fed may lower interest rates to encourage borrowing, which weighs on the Greenback.
The Federal Reserve (Fed) holds eight policy meetings a year, where the Federal Open Market Committee (FOMC) assesses economic conditions and makes monetary policy decisions. The FOMC is attended by twelve Fed officials – the seven members of the Board of Governors, the president of the Federal Reserve Bank of New York, and four of the remaining eleven regional Reserve Bank presidents, who serve one-year terms on a rotating basis.
In extreme situations, the Federal Reserve may resort to a policy named Quantitative Easing (QE). QE is the process by which the Fed substantially increases the flow of credit in a stuck financial system. It is a non-standard policy measure used during crises or when inflation is extremely low. It was the Fed’s weapon of choice during the Great Financial Crisis in 2008. It involves the Fed printing more Dollars and using them to buy high grade bonds from financial institutions. QE usually weakens the US Dollar.
Quantitative tightening (QT) is the reverse process of QE, whereby the Federal Reserve stops buying bonds from financial institutions and does not reinvest the principal from the bonds it holds maturing, to purchase new bonds. It is usually positive for the value of the US Dollar.
| Index | Change, points | Closed | Change, % |
|---|---|---|---|
| NIKKEI 225 | -251.51 | 36581.76 | -0.68 |
| Hang Seng | 128.7 | 17369.09 | 0.75 |
| KOSPI | 3.32 | 2575.41 | 0.13 |
| ASX 200 | 24.2 | 8099.9 | 0.3 |
| DAX | 181.01 | 18699.4 | 0.98 |
| CAC 40 | 30.18 | 7465.25 | 0.41 |
| Dow Jones | 297.01 | 41393.78 | 0.72 |
| S&P 500 | 30.26 | 5626.02 | 0.54 |
| NASDAQ Composite | 114.3 | 17683.98 | 0.65 |
Bank of Canada Governor Tiff Macklem said on Sunday that he has opened the door to accelerating the pace of interest rate reductions. Macklem further stated that policymakers could switch to 50 basis point (bps) moves should growth disappoint, per the Financial Times.
Key quotes
As you get closer to the target, your risk management calculus changes.
You become more concerned about the downside risks. And the labour market is pointing to some downside risks.
It could be appropriate to move faster interest rates.
We expect to see rent price inflation come down.
Market reaction
At the time of writing, USD/CAD is trading 0.06% lower on the day to trade at 1.3580.
Canadian Dollar FAQs
The key factors driving the Canadian Dollar (CAD) are the level of interest rates set by the Bank of Canada (BoC), the price of Oil, Canada’s largest export, the health of its economy, inflation and the Trade Balance, which is the difference between the value of Canada’s exports versus its imports. Other factors include market sentiment – whether investors are taking on more risky assets (risk-on) or seeking safe-havens (risk-off) – with risk-on being CAD-positive. As its largest trading partner, the health of the US economy is also a key factor influencing the Canadian Dollar.
The Bank of Canada (BoC) has a significant influence on the Canadian Dollar by setting the level of interest rates that banks can lend to one another. This influences the level of interest rates for everyone. The main goal of the BoC is to maintain inflation at 1-3% by adjusting interest rates up or down. Relatively higher interest rates tend to be positive for the CAD. The Bank of Canada can also use quantitative easing and tightening to influence credit conditions, with the former CAD-negative and the latter CAD-positive.
The price of Oil is a key factor impacting the value of the Canadian Dollar. Petroleum is Canada’s biggest export, so Oil price tends to have an immediate impact on the CAD value. Generally, if Oil price rises CAD also goes up, as aggregate demand for the currency increases. The opposite is the case if the price of Oil falls. Higher Oil prices also tend to result in a greater likelihood of a positive Trade Balance, which is also supportive of the CAD.
While inflation had always traditionally been thought of as a negative factor for a currency since it lowers the value of money, the opposite has actually been the case in modern times with the relaxation of cross-border capital controls. Higher inflation tends to lead central banks to put up interest rates which attracts more capital inflows from global investors seeking a lucrative place to keep their money. This increases demand for the local currency, which in Canada’s case is the Canadian Dollar.
Macroeconomic data releases gauge the health of the economy and can have an impact on the Canadian Dollar. Indicators such as GDP, Manufacturing and Services PMIs, employment, and consumer sentiment surveys can all influence the direction of the CAD. A strong economy is good for the Canadian Dollar. Not only does it attract more foreign investment but it may encourage the Bank of Canada to put up interest rates, leading to a stronger currency. If economic data is weak, however, the CAD is likely to fall.
| Pare | Closed | Change, % |
|---|---|---|
| AUDUSD | 0.67041 | -0.28 |
| EURJPY | 156.026 | -0.59 |
| EURUSD | 1.10741 | 0.01 |
| GBPJPY | 184.881 | -0.63 |
| GBPUSD | 1.3123 | -0.02 |
| NZDUSD | 0.6157 | -0.43 |
| USDCAD | 1.35887 | 0.06 |
| USDCHF | 0.84892 | -0.24 |
| USDJPY | 140.877 | -0.6 |
- Gold price trades in positive territory near $2,580 in Monday’s early Asian session.
- Firmer Fed rate cut expectations and persistent geopolitical risks continue to underpin Gold price.
- Slow momentum in Chinese economic activity might weigh on the precious metal.
Gold price (XAU/USD) gains momentum around $2,580 during the early Asian session on Monday. The precious metal reached a fresh all-time high at $2,586 on Friday amid rising expectations of a significant Federal Reserve (Fed) rate cut. The Federal Open Market Committee (FOMC) meeting on Wednesday will be in the spotlight.
The growing speculation of an interest rate cut by the Fed after US economic data signaled a slowing of the economy has boosted the yellow metal as lower interest rates reduce the opportunity cost of holding non-yielding Gold. Financial markets are now pricing in a 48% chance of a 25 basis points (bps ) US rate cut at its upcoming meeting on September 17-18, while the odds of a 50 bps cut stand at 52%, according to the CME FedWatch tool.
“We are headed towards a lower interest rate environment, so gold is becoming a lot more attractive… I think we could potentially have a lot more frequent cuts as opposed to a bigger magnitude,” said Alex Ebkarian, chief operating officer at Allegiance Gold.
Additionally, the ongoing geopolitical tensions in the Middle East provide further support to the safe-haven Gold price. Israeli Prime Minister Benjamin Netanyahu said on Sunday that Yemen's Houthis will pay a "heavy price" after a missile fired by the group landed in central Israel, per the BBC.
Nonetheless, the sluggish economy and the concerns about the economic slowdown in China might cap the upside for precious metals as China is the world's biggest producer and consumer. The Chinese Retail Sales and Industrial Production were weaker than the expectation in August. Industrial output grew at the slowest pace since March, while Retail Sales had their second-slowest month of the year.
Gold FAQs
Gold has played a key role in human’s history as it has been widely used as a store of value and medium of exchange. Currently, apart from its shine and usage for jewelry, the precious metal is widely seen as a safe-haven asset, meaning that it is considered a good investment during turbulent times. Gold is also widely seen as a hedge against inflation and against depreciating currencies as it doesn’t rely on any specific issuer or government.
Central banks are the biggest Gold holders. In their aim to support their currencies in turbulent times, central banks tend to diversify their reserves and buy Gold to improve the perceived strength of the economy and the currency. High Gold reserves can be a source of trust for a country’s solvency. Central banks added 1,136 tonnes of Gold worth around $70 billion to their reserves in 2022, according to data from the World Gold Council. This is the highest yearly purchase since records began. Central banks from emerging economies such as China, India and Turkey are quickly increasing their Gold reserves.
Gold has an inverse correlation with the US Dollar and US Treasuries, which are both major reserve and safe-haven assets. When the Dollar depreciates, Gold tends to rise, enabling investors and central banks to diversify their assets in turbulent times. Gold is also inversely correlated with risk assets. A rally in the stock market tends to weaken Gold price, while sell-offs in riskier markets tend to favor the precious metal.
The price can move due to a wide range of factors. Geopolitical instability or fears of a deep recession can quickly make Gold price escalate due to its safe-haven status. As a yield-less asset, Gold tends to rise with lower interest rates, while higher cost of money usually weighs down on the yellow metal. Still, most moves depend on how the US Dollar (USD) behaves as the asset is priced in dollars (XAU/USD). A strong Dollar tends to keep the price of Gold controlled, whereas a weaker Dollar is likely to push Gold prices up.


© 2000-2026. All rights reserved.
This site is managed by Teletrade D.J. LLC 2351 LLC 2022 (Euro House, Richmond Hill Road, Kingstown, VC0100, St. Vincent and the Grenadines).
The information on this website is for informational purposes only and does not constitute any investment advice.
The company does not serve or provide services to customers who are residents of the US, Canada, Iran, The Democratic People's Republic of Korea, Yemen and FATF blacklisted countries.
Making transactions on financial markets with marginal financial instruments opens up wide possibilities and allows investors who are willing to take risks to earn high profits, carrying a potentially high risk of losses at the same time. Therefore you should responsibly approach the issue of choosing the appropriate investment strategy, taking the available resources into account, before starting trading.
Use of the information: full or partial use of materials from this website must always be referenced to TeleTrade as the source of information. Use of the materials on the Internet must be accompanied by a hyperlink to teletrade.org. Automatic import of materials and information from this website is prohibited.
Please contact our PR department if you have any questions or need assistance at pr@teletrade.global.
transfers