- Analytics
- News and Tools
- Market News
CFD Markets News and Forecasts — 16-08-2024
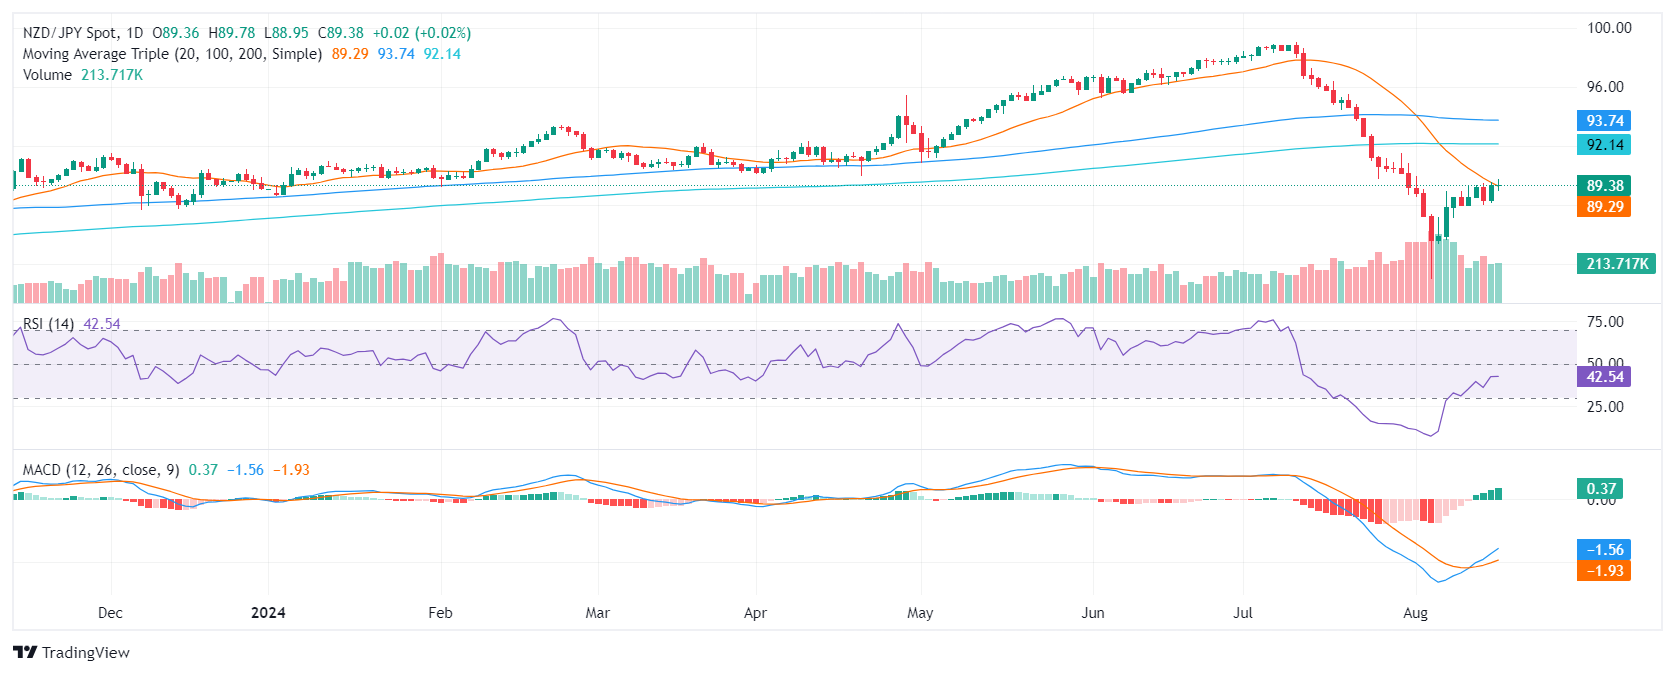
- NZD/JPY mildly rose to 89.30, testing the 20-day SMA.
- The RSI is near 50 while the MACD shows flat green bars, signaling that the momentum is sideways.
- A jump above the 20-day SMA would confirm a bullish outlook.
The NZD/JPY pair gained ground in Friday's session, climbing to 89.30. The uptick follows side-ways movements during the week, but the pair could be ready for a change of trend.
The Relative Strength Index (RSI) is hovering near 50, indicating that the pair is near neutral territory. If the RSI can move above 50, it could signal a potential shift in market sentiment. The Moving Average Convergence Divergence (MACD) shows flat green bars, indicating that the momentum is sideways. The positive divergence between the RSI and MACD shows that the selling pressure is being pressured by the buying force and it is possible that, if this holds, the pair can see upside movements in the next sessions.
The NZD/JPY pair has bounced off the support level of 88.50 and is currently challenging the 20-day SMA. If the pair continues to rise, it could find resistance at 0.8970 and 0.9000. On the downside, support can be found at 0.8900, 0.8880, and 0.8840. A sustained break above 0.8970 could signal a continuation of the uptrend, while a break below 0.8840 could signal a continuation of the downtrend. The volume has been declining during the last few sessions, which is a sign of neutrality.
NZD/JPY daily chart
- The Canadian Dollar was broadly softer, but gained against USD on Friday.
- Canada is due to release its latest CPI inflation update next week.
- US consumer sentiment ticked higher in August, sparking an uptick in risk appetite.
The Canadian Dollar (CAD) was overall softer on Friday, shedding weight across the currency board, but still found gains against the risk-appetite-weakened Greenback to wrap up the trading week. Broad-market risk sentiment improved further on Friday as upbeat US data prints help to temper recent investor fears of a US recession.
Canada will be bringing its latest round of inflation data next Tuesday, and CAD traders will be looking for stable prints in Canadian Consumer Price Index (CPI) figures to keep sentiment on-balance.
Daily digest market movers: CAD soft on Friday, but Greenback softer
- Markets focused squarely on US consumer sentiment figures on Friday, finding one last reason to hit the short button on Greenback flows.
- The University of Michigan’s Consumer Sentiment Index rose to 67.8 in August, up from the previous 66.4.
- Market sentiment lurched higher after the sentiment index handily beat the forecast of 66.9.
- Consumer 5-year Inflation Expectations and held steady at 3.0% in August, unchanged from the previous month.
- The Jackson Hole Symposium begins next Thursday, plenty of central bank policymaker appearances are expected.
Canadian Dollar price forecast: Greenback slide gives CAD fresh leg into near-term highs
The Canadian Dollar (CAD) found room up top thanks to a weakening Greenback on Friday, climbing into a three-week high and sending USD/CAD below the 1.3700 handle.
The pair found a technical rejection from the 50-day Exponential Moving Average (EMA) at 1.3728, with price action hamstrung in the midrange between the 50-day EMA and the 200-day EMA at 1.3634.
USD/CAD daily chart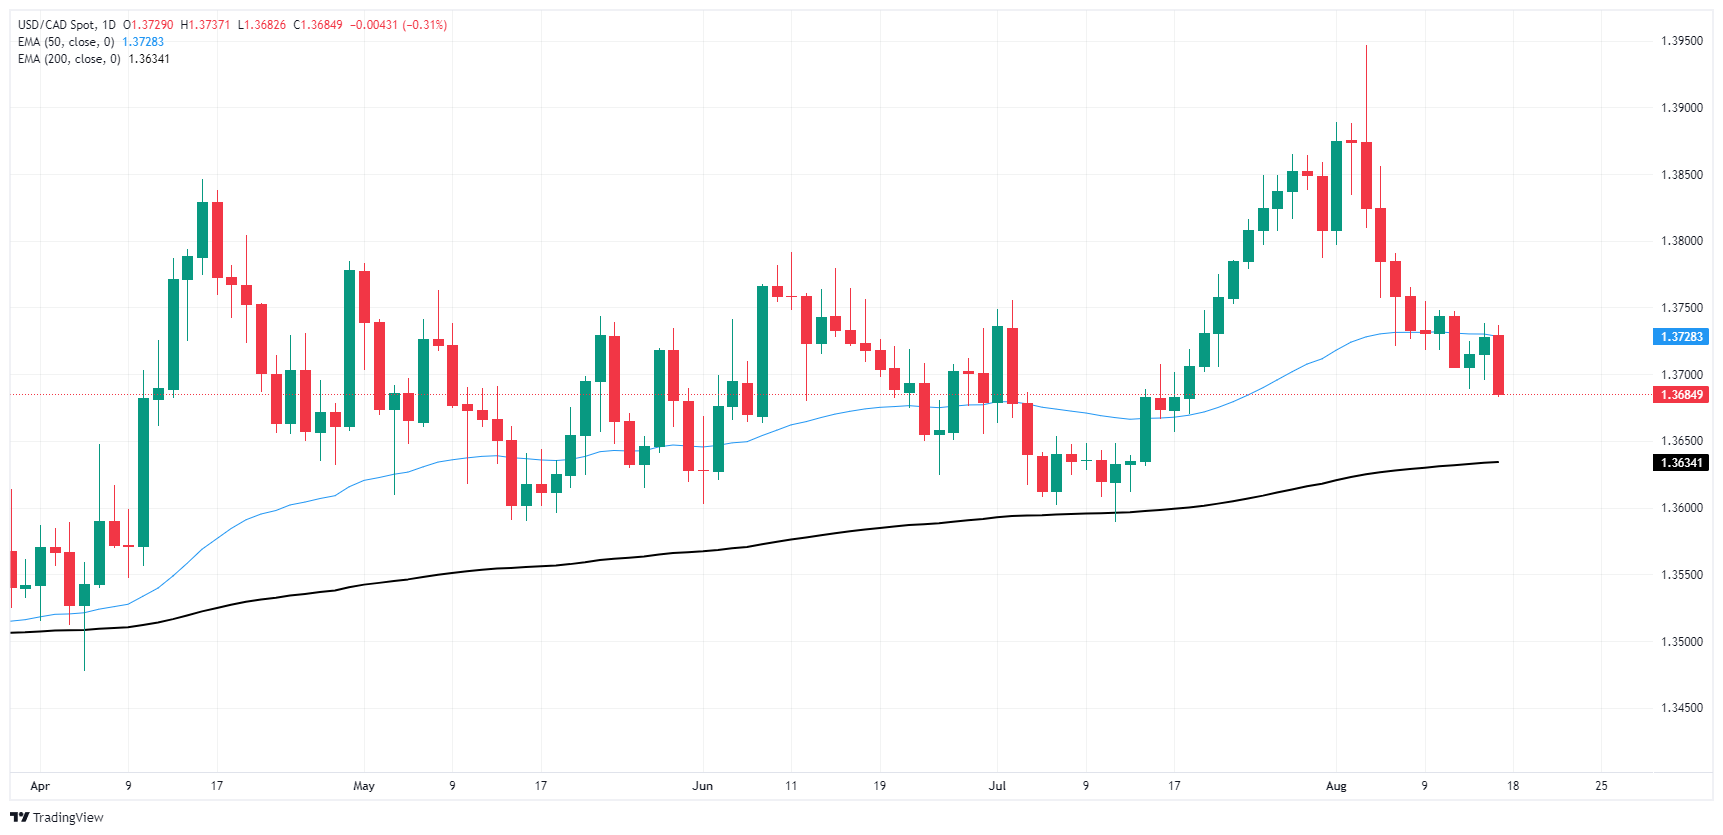
Canadian Dollar FAQs
The key factors driving the Canadian Dollar (CAD) are the level of interest rates set by the Bank of Canada (BoC), the price of Oil, Canada’s largest export, the health of its economy, inflation and the Trade Balance, which is the difference between the value of Canada’s exports versus its imports. Other factors include market sentiment – whether investors are taking on more risky assets (risk-on) or seeking safe-havens (risk-off) – with risk-on being CAD-positive. As its largest trading partner, the health of the US economy is also a key factor influencing the Canadian Dollar.
The Bank of Canada (BoC) has a significant influence on the Canadian Dollar by setting the level of interest rates that banks can lend to one another. This influences the level of interest rates for everyone. The main goal of the BoC is to maintain inflation at 1-3% by adjusting interest rates up or down. Relatively higher interest rates tend to be positive for the CAD. The Bank of Canada can also use quantitative easing and tightening to influence credit conditions, with the former CAD-negative and the latter CAD-positive.
The price of Oil is a key factor impacting the value of the Canadian Dollar. Petroleum is Canada’s biggest export, so Oil price tends to have an immediate impact on the CAD value. Generally, if Oil price rises CAD also goes up, as aggregate demand for the currency increases. The opposite is the case if the price of Oil falls. Higher Oil prices also tend to result in a greater likelihood of a positive Trade Balance, which is also supportive of the CAD.
While inflation had always traditionally been thought of as a negative factor for a currency since it lowers the value of money, the opposite has actually been the case in modern times with the relaxation of cross-border capital controls. Higher inflation tends to lead central banks to put up interest rates which attracts more capital inflows from global investors seeking a lucrative place to keep their money. This increases demand for the local currency, which in Canada’s case is the Canadian Dollar.
Macroeconomic data releases gauge the health of the economy and can have an impact on the Canadian Dollar. Indicators such as GDP, Manufacturing and Services PMIs, employment, and consumer sentiment surveys can all influence the direction of the CAD. A strong economy is good for the Canadian Dollar. Not only does it attract more foreign investment but it may encourage the Bank of Canada to put up interest rates, leading to a stronger currency. If economic data is weak, however, the CAD is likely to fall.
- NZD/USD resumes gains and sees more than 1% gains, rising to 0.6050.
- Rising green bars on the MACD and RSI around 55 indicate increasing bullish momentum.
- Pair trades above immediate support of 0.6030, and faces resistance at 0.6070-0.6100.
In Friday's session, the NZD/USD pair resumed its upward trajectory, extending gains to 1% to reach 0.6050 and managed to clear part of the last two sessions' losses.
On the daily chart, the Relative Strength Index (RSI) is currently around 57, indicating a positive momentum. The Moving Average Convergence Divergence (MACD) is showing rising green bars, further supporting the bullish outlook. These indicators suggest that the buying pressure is increasing and a further rise is possible.
NZD/USD daily chart
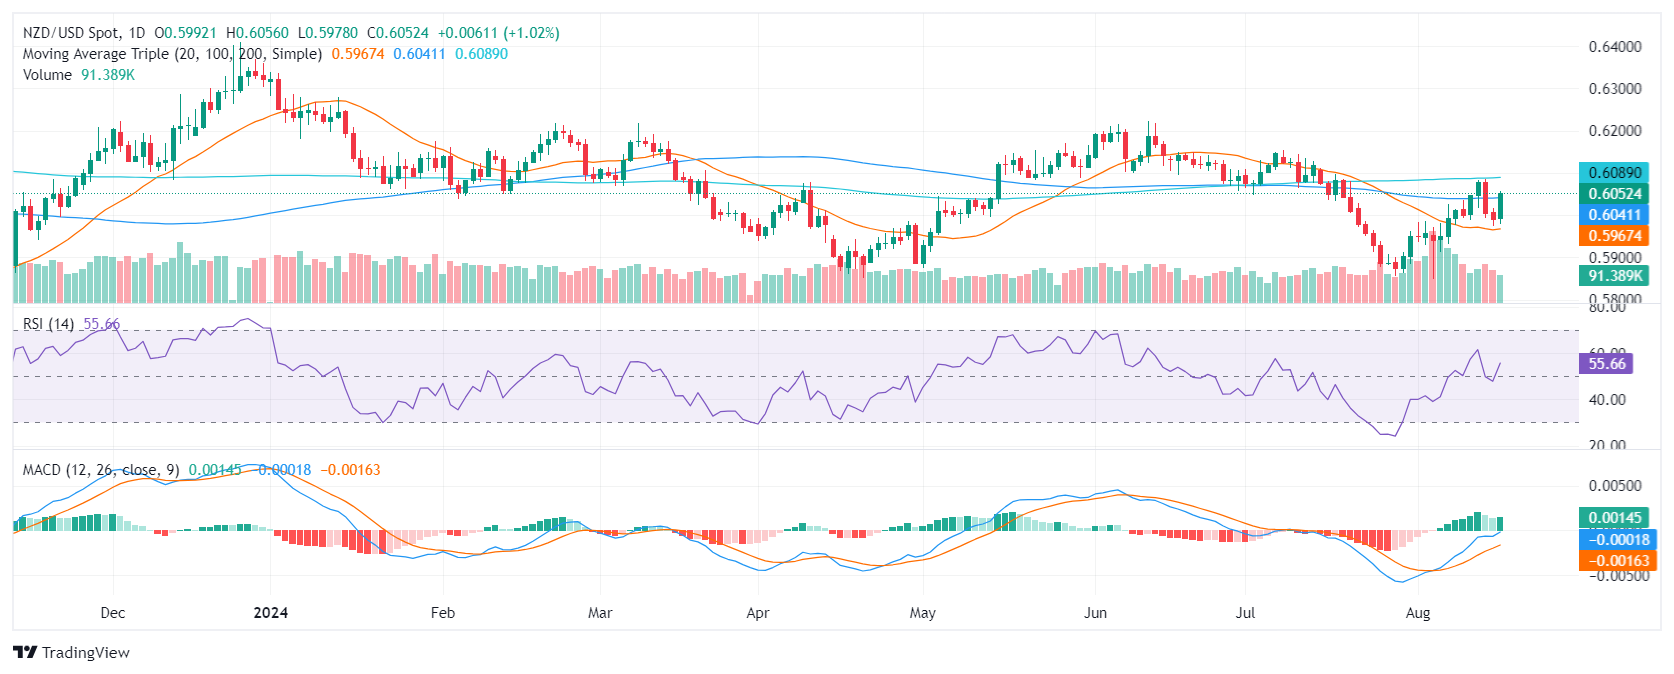
On the daily chart, the NZD/USD pair is facing immediate resistance at 0.6060. A break above this level could open the door for a further rally towards 0.6080 and 0.6100 (200-day SMA). On the downside, immediate support lies at 0.6030. A break below this level could lead to a deeper correction towards 0.5990 (20-day SMA) and 0.5970. Traders should monitor any breaks above or below the mentioned levels as they could trigger sharp movements.
The buyer's task is now to defend the freshly regained 100-day SMA of 0.6040 and build support around it as it has already done with the 20-day SMA.
- AUD/USD shows an increase, climbing to 0.6950.
- RBA’s Bullock was on the wires and maintained its hawkish stance.
- A weaker USD also benefited the Aussie.
The AUD/USD pair experienced an increase of 0.40% during Friday's session, settling near 0.6950. Mixed sentiment data from the United States combined with the words of Reserve Bank of Australia's (RBA) Governor Michele Bullock impacted the Aussie.
The RBA's continued hawkish stance, despite the mixed Australian economic forecast and increasing inflation, has resulted in markets predicting only a 25-basis-point easing for 2024, which seems to be making the Aussie gain interest.
Daily digest market movers: Aussie gains following Gov. Bullock's words
- Friday brought some adjustments in the AUD/USD pair, a reflection of the comments by RBA Governor Bullock.
- She expressed vigilance toward potential inflation risks, deeming it premature to consider any rate cuts.
- Simultaneously, Bullock acknowledged the uncertainty of the outlook, explaining that the bank doesn't foresee being in a position to cut rates in the near term. She noted that, relative to other countries, Australia's policy rate is at its peak of 4.35%.
- A weakened Greenback stems from mixed sentiment figures and weak housing market data from the United States.
- As monetary policies diverge, the pair may see further upside.
AUD/USD technical outlook: AUD/USD buyers remain strong, outlook optimistic
On the technical side, the AUD/USD pair has shown significant volatility, with fluctuations favoring a slight bias toward bullish momentum. The Moving Average Convergence Divergence (MACD) validates this bias, demonstrating rising green bars.
The Relative Strength Index (RSI), an oscillator demonstrating market momentum, has maintained a value around 50 that points northwards and offers a bullish signal. Key support levels are at 0.6600-0.6630, whereas resistance appears near the 0.6650 region. A breakout in either direction could potentially hint at further directional intent.
Australian Dollar FAQs
One of the most significant factors for the Australian Dollar (AUD) is the level of interest rates set by the Reserve Bank of Australia (RBA). Because Australia is a resource-rich country another key driver is the price of its biggest export, Iron Ore. The health of the Chinese economy, its largest trading partner, is a factor, as well as inflation in Australia, its growth rate and Trade Balance. Market sentiment – whether investors are taking on more risky assets (risk-on) or seeking safe-havens (risk-off) – is also a factor, with risk-on positive for AUD.
The Reserve Bank of Australia (RBA) influences the Australian Dollar (AUD) by setting the level of interest rates that Australian banks can lend to each other. This influences the level of interest rates in the economy as a whole. The main goal of the RBA is to maintain a stable inflation rate of 2-3% by adjusting interest rates up or down. Relatively high interest rates compared to other major central banks support the AUD, and the opposite for relatively low. The RBA can also use quantitative easing and tightening to influence credit conditions, with the former AUD-negative and the latter AUD-positive.
China is Australia’s largest trading partner so the health of the Chinese economy is a major influence on the value of the Australian Dollar (AUD). When the Chinese economy is doing well it purchases more raw materials, goods and services from Australia, lifting demand for the AUD, and pushing up its value. The opposite is the case when the Chinese economy is not growing as fast as expected. Positive or negative surprises in Chinese growth data, therefore, often have a direct impact on the Australian Dollar and its pairs.
Iron Ore is Australia’s largest export, accounting for $118 billion a year according to data from 2021, with China as its primary destination. The price of Iron Ore, therefore, can be a driver of the Australian Dollar. Generally, if the price of Iron Ore rises, AUD also goes up, as aggregate demand for the currency increases. The opposite is the case if the price of Iron Ore falls. Higher Iron Ore prices also tend to result in a greater likelihood of a positive Trade Balance for Australia, which is also positive of the AUD.
The Trade Balance, which is the difference between what a country earns from its exports versus what it pays for its imports, is another factor that can influence the value of the Australian Dollar. If Australia produces highly sought after exports, then its currency will gain in value purely from the surplus demand created from foreign buyers seeking to purchase its exports versus what it spends to purchase imports. Therefore, a positive net Trade Balance strengthens the AUD, with the opposite effect if the Trade Balance is negative.
- Dow Jones chalked in further gains on Friday as investors sentiment climbs.
- Equities are on pace for one of their best weeks of the year.
- Consumer sentiment indicators ticked higher on Friday.
The Dow Jones Industrial Average (DJIA) notched in 100 points on the high side on Friday after kicking the day off on the low side. Bids tested low early in the day before recovering the 40,500.00 level and investors are knocking on one of the index’s best single-week performances of the year to-date.
The Dow Jones is up nearly 4% from Monday’s opening prices as investors find the buy button after improving US economic data helped trader slough off broad fears of a US recession. The University of Michigan’s August Consumer Sentiment Index improved to 67.8, well above the previous 66.4 and beat the forecast 66.9.
Improving consumer sentiment indicators helped to bolster investor confidence further, despite UoM 5-year Consumer Inflation Expectations holding firmly at 3.0% MoM in August. Bets of a double cut from the Federal Reserve (Fed) in September have eased to just 25%, down from last week’s peak of 70%, but markets are still fully pricing in some form of rate movement on September 18, with rate markets putting odds of a 25 bps rate cut at 75%.
Dow Jones news
A risk-on Friday means the majority of the Dow Jones index was the green for the day. Less than a third of the DJIA saw red on Friday, with losses being led by Caterpillar Inc. (CAT) and Microsoft, which both fell around six-tenths of one percent. CAT traded near $343.15 per share, while MSFT battled it out near $418.60. Boeing Co. (BA) and Cisco Systems Inc. (CSCO) were neck-and-neck at the top of the boards, each gaining a little less than 2% on the day, with BA testing $180.00 per share and CSCO within reach of $50.00.
Read more: Nike stock gains on continued interest in Ackman stake
Dow Jones price forecast
The Dow Jones is knocking on a 3% single-week gain on Friday, poised to chalk in the index’s single best week-on-week performance in 2024. All-time highs at 41,371.38 set in mid-July have come back into view for bidders as DJIA prices grind their way back into the high side following last week’s brief dip below 38,500.00.
The Dow is testing deep into the green for the fourth straight day, trading within touch range of 40,750.00 after buyers took a thin technical bounce from Monday’s lows at the 39,250.00 level. Price pressures will begin to mount as bids approach 41,000.00, but the DJIA continues to put in a solid run as prices run well north of the 200-day Exponential Moving Average (EMA) at 38,053.00.
Dow Jones daily chart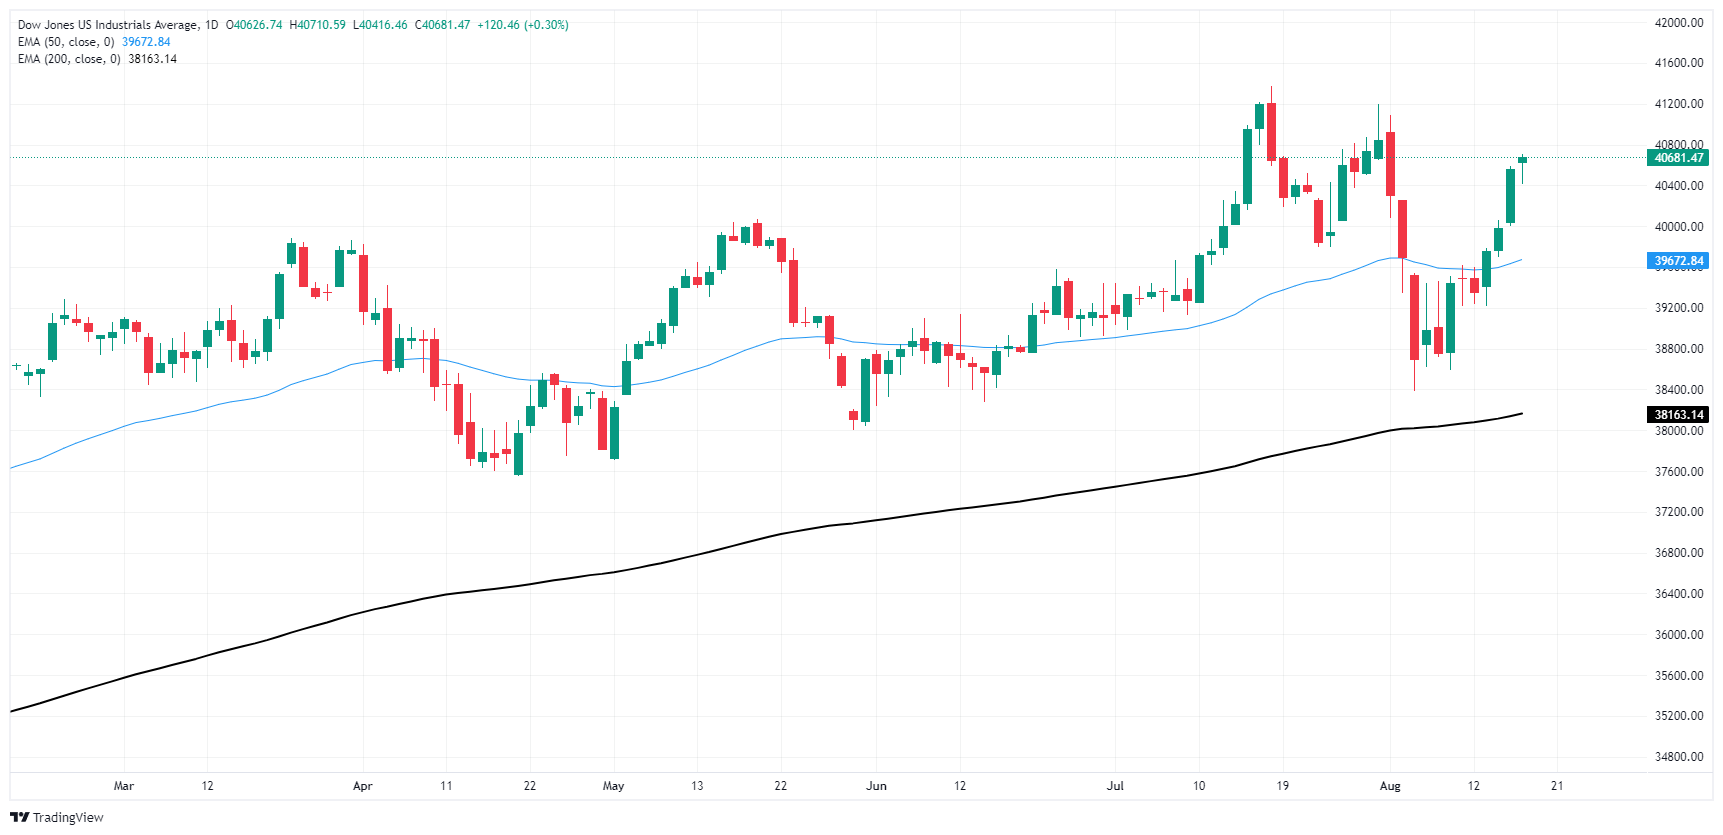
Dow Jones FAQs
The Dow Jones Industrial Average, one of the oldest stock market indices in the world, is compiled of the 30 most traded stocks in the US. The index is price-weighted rather than weighted by capitalization. It is calculated by summing the prices of the constituent stocks and dividing them by a factor, currently 0.152. The index was founded by Charles Dow, who also founded the Wall Street Journal. In later years it has been criticized for not being broadly representative enough because it only tracks 30 conglomerates, unlike broader indices such as the S&P 500.
Many different factors drive the Dow Jones Industrial Average (DJIA). The aggregate performance of the component companies revealed in quarterly company earnings reports is the main one. US and global macroeconomic data also contributes as it impacts on investor sentiment. The level of interest rates, set by the Federal Reserve (Fed), also influences the DJIA as it affects the cost of credit, on which many corporations are heavily reliant. Therefore, inflation can be a major driver as well as other metrics which impact the Fed decisions.
Dow Theory is a method for identifying the primary trend of the stock market developed by Charles Dow. A key step is to compare the direction of the Dow Jones Industrial Average (DJIA) and the Dow Jones Transportation Average (DJTA) and only follow trends where both are moving in the same direction. Volume is a confirmatory criteria. The theory uses elements of peak and trough analysis. Dow’s theory posits three trend phases: accumulation, when smart money starts buying or selling; public participation, when the wider public joins in; and distribution, when the smart money exits.
There are a number of ways to trade the DJIA. One is to use ETFs which allow investors to trade the DJIA as a single security, rather than having to buy shares in all 30 constituent companies. A leading example is the SPDR Dow Jones Industrial Average ETF (DIA). DJIA futures contracts enable traders to speculate on the future value of the index and Options provide the right, but not the obligation, to buy or sell the index at a predetermined price in the future. Mutual funds enable investors to buy a share of a diversified portfolio of DJIA stocks thus providing exposure to the overall index.
Federal Reserve (Fed) Bank of Chicago President Austan Goolsbee noted on Friday that some economic signals are giving policymakers cause for concern, and nodded at a general tightening of credit facilities.
Key highlights
There are some things that are flashing yellow.
Small business defaults are up; now it's getting a little cautionary.
Unemployment is up, and that's a caution sign.
Credit conditions seem tight.
Lately, business contacts say that they can't pass on higher prices to consumers as before.
The impact of past hikes may not be fully realized.
- USD slid following the University of Michigan Sentiment figures and housing market data.
- Markets remain confident about a cut in September.
- Greenback might continue being sensitive on data releases.
On Friday, the US Dollar (USD), as measured by the US Dollar Index (DXY), experienced a decline following the release of the University of Michigan's Consumer Sentiment Index figures and softer-than-expected housing market data.
As per the US economic outlook, careful evaluation of the data suggests that the US economy is maintaining growth above trend. This portrays an overestimation by the market in pricing for aggressive easing as the Federal Reserve (Fed) remains data-dependant.
Daily digest market movers: Dollar down after mixed UoM data and soft housing market figures
- The University of Michigan's Consumer Sentiment Index recorded an improved figure of 67.8 for early August, rising from July's 66.4. It also outperformed the market expectation of 66.9.
- Following a decrease to 60.9 from 62.7, the Current Conditions Index illustrated a decline, while the Consumer Expectations Index registered an increase to 72.1 from 68.8.
- In contrast, Housing Starts in the US recorded a decline of 6.8% in July, down to 1.238 million units, signaling a softened housing market.
- Additionally, Building Permits decreased by 4% after a rise of 3.9% in June.
- Markets remain overconfident that the Fed will rush to cut, but it will all depend on incoming data.
DXY technical outlook: Consolidation trend continues, overall bearish bias remains
Technical analysis indicates a sideways trend in the DXY with indicators showing a deep consolidation in negative terrain. The Relative Strength Index (RSI) is currently around 40 with the Moving Average Convergence Divergence (MACD) indicator’s red bars stabilizing, suggesting subdued price action. Despite gains noted on Thursday, the overall technical picture remains bearish. Buyers are struggling to make a significant move with the DXY index trading in the 102.50-103.30 channel.
Support Levels: 102.40, 102.20, 102.00
Resistance Levels: 103.00, 103.50, 104.00
US Dollar FAQs
The US Dollar (USD) is the official currency of the United States of America, and the ‘de facto’ currency of a significant number of other countries where it is found in circulation alongside local notes. It is the most heavily traded currency in the world, accounting for over 88% of all global foreign exchange turnover, or an average of $6.6 trillion in transactions per day, according to data from 2022. Following the second world war, the USD took over from the British Pound as the world’s reserve currency. For most of its history, the US Dollar was backed by Gold, until the Bretton Woods Agreement in 1971 when the Gold Standard went away.
The most important single factor impacting on the value of the US Dollar is monetary policy, which is shaped by the Federal Reserve (Fed). The Fed has two mandates: to achieve price stability (control inflation) and foster full employment. Its primary tool to achieve these two goals is by adjusting interest rates. When prices are rising too quickly and inflation is above the Fed’s 2% target, the Fed will raise rates, which helps the USD value. When inflation falls below 2% or the Unemployment Rate is too high, the Fed may lower interest rates, which weighs on the Greenback.
In extreme situations, the Federal Reserve can also print more Dollars and enact quantitative easing (QE). QE is the process by which the Fed substantially increases the flow of credit in a stuck financial system. It is a non-standard policy measure used when credit has dried up because banks will not lend to each other (out of the fear of counterparty default). It is a last resort when simply lowering interest rates is unlikely to achieve the necessary result. It was the Fed’s weapon of choice to combat the credit crunch that occurred during the Great Financial Crisis in 2008. It involves the Fed printing more Dollars and using them to buy US government bonds predominantly from financial institutions. QE usually leads to a weaker US Dollar.
Quantitative tightening (QT) is the reverse process whereby the Federal Reserve stops buying bonds from financial institutions and does not reinvest the principal from the bonds it holds maturing in new purchases. It is usually positive for the US Dollar.
- The Mexican Peso is holding on the high side on Friday.
- An uptick in US consumer sentiment has bolstered market risk appetite.
- Hopes for a September Fed rate cut remain high.
The Mexican Peso (MXN) eased slightly higher against the Greenback on Friday, but bullish momentum behind the MXN is draining quickly after putting in three straight days of gains. US consumer sentiment figures from the University of Michigan bolstered risk appetite during the US session, prompting broad weakness in the US Dollar as investors scooped up riskier assets.
Mexico has limited representation on the economic calendar next week, and investors will watch for the kickoff of the Jackson Hole economic symposium later next week.
Daily digest market movers: Mexican Peso looks for gains but momentum remains thin
The University of Michigan’s Consumer Sentiment Index rose to 67.8 in August, up from the previous 66.4.
Market sentiment lurched higher after the sentiment index handily beat the forecast of 66.9.
Consumer 5-year Inflation Expectations and held steady at 3.0% in August, unchanged from the previous month.
The Jackson Hole Symposium kicks on next Thursday, plenty of cent4ral bank policymaker appearances are expected.
Mexican Peso price forecast: Peso bulls at risk of running out of gas
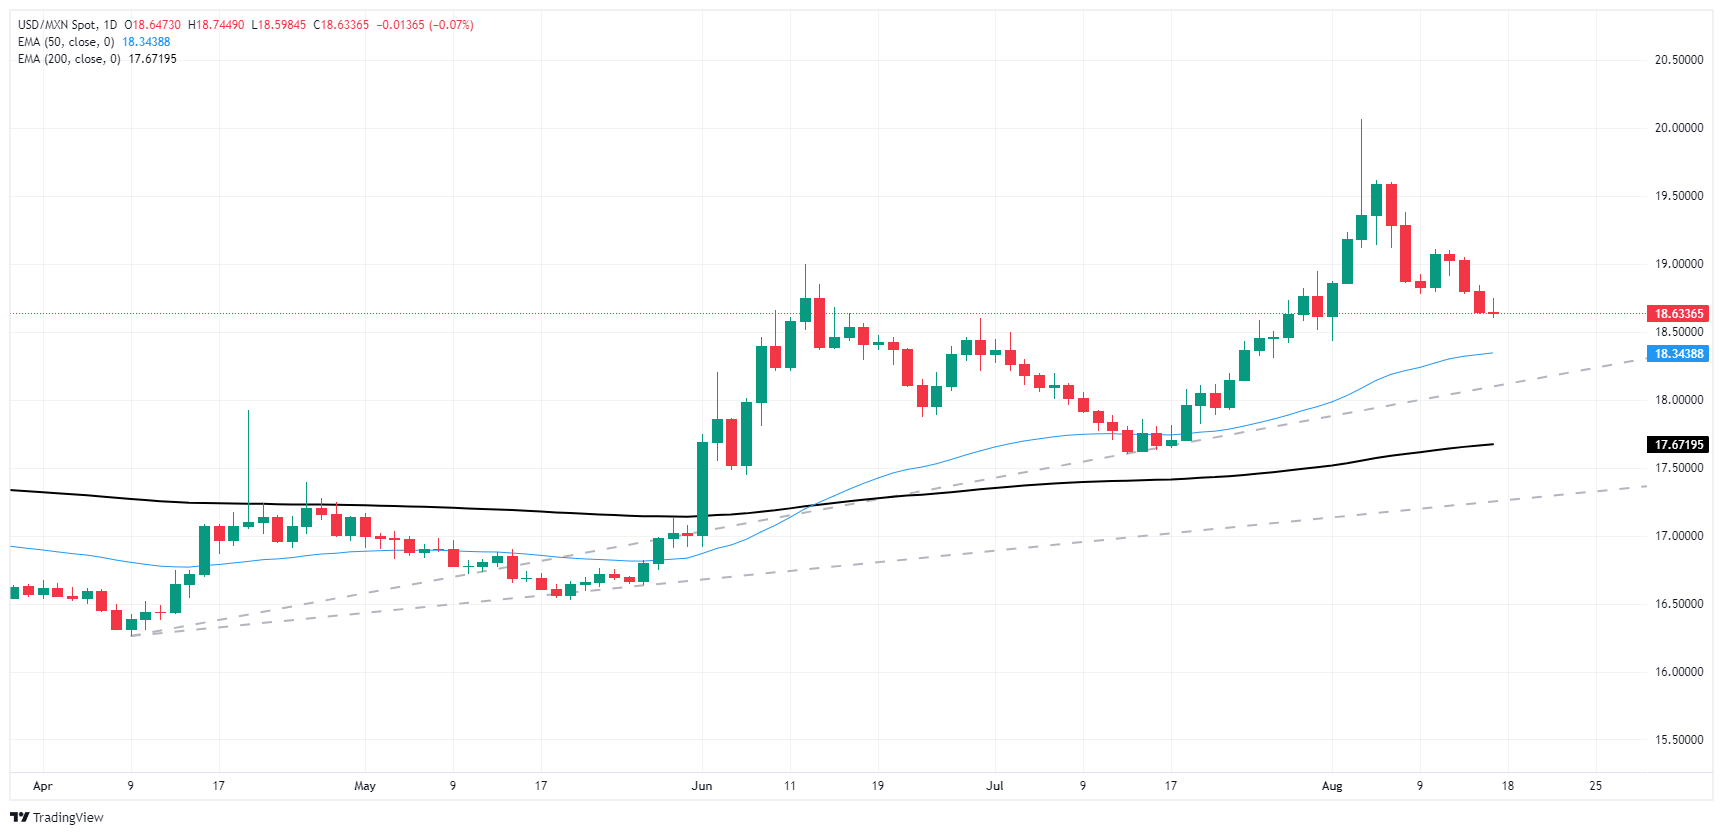
The Mexican Peso (MXN) has recovered significant ground against the US Dollar, climbing over 7.3% peak-to-trough from a nearly two-year low. Still, significant ground still needs to be covered before Peso buyers can consider the MXN on balance, with the Peso still down over 14% from its peak 2024 bids against the Greenback.
USD/MXN has closed in the red for all but one of the last seven consecutive trading days as the Greenback gives back ground to the Peso, but the pair continues to trade north of the 50-day Exponential Moving Average (EMA) at 18.34 and a firm pattern of higher lows is keeping Greenback shorts at bay.
USD/MXN daily chart
Mexican Peso FAQs
The Mexican Peso (MXN) is the most traded currency among its Latin American peers. Its value is broadly determined by the performance of the Mexican economy, the country’s central bank’s policy, the amount of foreign investment in the country and even the levels of remittances sent by Mexicans who live abroad, particularly in the United States. Geopolitical trends can also move MXN: for example, the process of nearshoring – or the decision by some firms to relocate manufacturing capacity and supply chains closer to their home countries – is also seen as a catalyst for the Mexican currency as the country is considered a key manufacturing hub in the American continent. Another catalyst for MXN is Oil prices as Mexico is a key exporter of the commodity.
The main objective of Mexico’s central bank, also known as Banxico, is to maintain inflation at low and stable levels (at or close to its target of 3%, the midpoint in a tolerance band of between 2% and 4%). To this end, the bank sets an appropriate level of interest rates. When inflation is too high, Banxico will attempt to tame it by raising interest rates, making it more expensive for households and businesses to borrow money, thus cooling demand and the overall economy. Higher interest rates are generally positive for the Mexican Peso (MXN) as they lead to higher yields, making the country a more attractive place for investors. On the contrary, lower interest rates tend to weaken MXN.
Macroeconomic data releases are key to assess the state of the economy and can have an impact on the Mexican Peso (MXN) valuation. A strong Mexican economy, based on high economic growth, low unemployment and high confidence is good for MXN. Not only does it attract more foreign investment but it may encourage the Bank of Mexico (Banxico) to increase interest rates, particularly if this strength comes together with elevated inflation. However, if economic data is weak, MXN is likely to depreciate.
As an emerging-market currency, the Mexican Peso (MXN) tends to strive during risk-on periods, or when investors perceive that broader market risks are low and thus are eager to engage with investments that carry a higher risk. Conversely, MXN tends to weaken at times of market turbulence or economic uncertainty as investors tend to sell higher-risk assets and flee to the more-stable safe havens.
- USD/JPY waffled back below 149.00 on Friday as risk appetite recovers balance.
- The US Dollar sees selling pressure across the board to wrap up the trading week.
- Coming up next week: Japanese national inflation data and the start of Jackson Hole.
USD/JPY eased lower on Friday, slipping below 149.00 early in the day and testing near the 148.00 handle. The US Dollar is getting sold off across the board as broad-market sentiment recovers on the back of an upturn in US consumer sentiment figures.
The University of Michigan’s Consumer Sentiment Index showed a firmer-than-expected recovery in surveyed consumers’ outlook in August, rising to 67.8 from the previous 66.4, handily beating the forecast 66.9. Investors grabbed ahold of the headline print and piled back into riskier assets while selling the Greenback, despite the UoM 5-year Consumer Inflation Expectations in August holding steady at 3%, and a slight decay in UoM Consumer Current Conditions outlook, which eased to 60.9 from 62.7, entirely reversing direction on the forecast 63.1.
Next week will open with a quiet tinge to the economic calendar, and the key print for the Yen will be Japanese National Consumer Price Index (CPI) inflation figures, while US traders will be turning to focus on the kickoff of the Jackson Hole economic symposium later in the week.
USD/JPY price forecast
Friday’s decline in USD/JPY bids has dropped the pair back below a rising trendline on daily candlesticks, but price action is still drifting into the high end as buyers take a breather. USD/JPY continues to trade on the south side of the 200-day Exponential Moving Average (EMA) near 151.67, and a poorly-timed break in bullish pressure could see another shortside technical leg begin to form as intraday bids grapple with technical levels below 149.00.
USD/JPY daily chart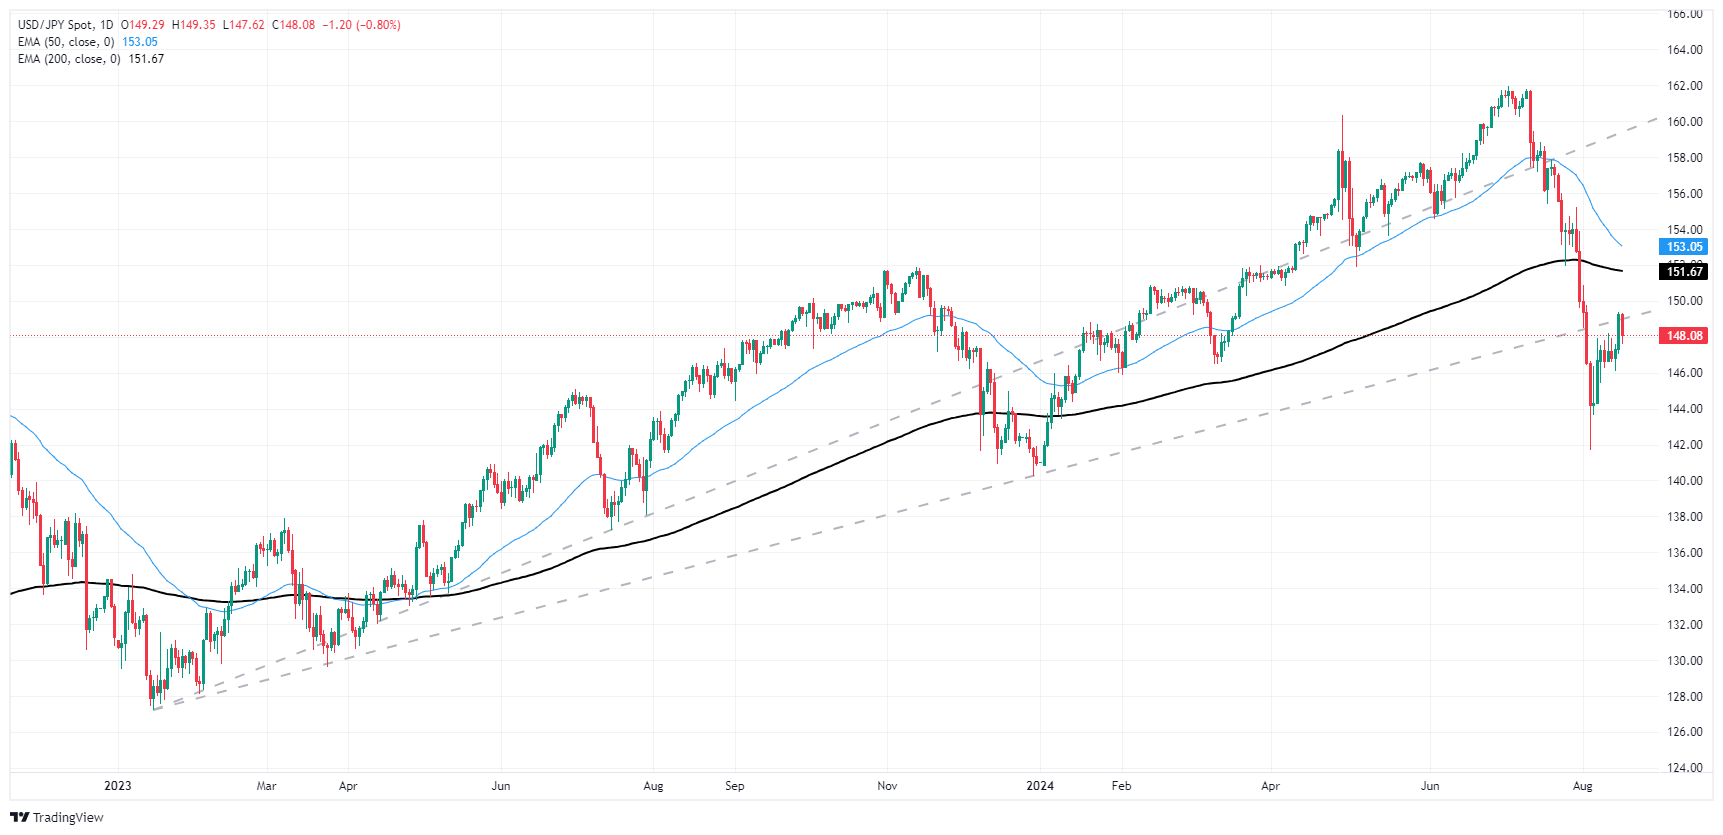
Japanese Yen FAQs
The Japanese Yen (JPY) is one of the world’s most traded currencies. Its value is broadly determined by the performance of the Japanese economy, but more specifically by the Bank of Japan’s policy, the differential between Japanese and US bond yields, or risk sentiment among traders, among other factors.
One of the Bank of Japan’s mandates is currency control, so its moves are key for the Yen. The BoJ has directly intervened in currency markets sometimes, generally to lower the value of the Yen, although it refrains from doing it often due to political concerns of its main trading partners. The current BoJ ultra-loose monetary policy, based on massive stimulus to the economy, has caused the Yen to depreciate against its main currency peers. This process has exacerbated more recently due to an increasing policy divergence between the Bank of Japan and other main central banks, which have opted to increase interest rates sharply to fight decades-high levels of inflation.
The BoJ’s stance of sticking to ultra-loose monetary policy has led to a widening policy divergence with other central banks, particularly with the US Federal Reserve. This supports a widening of the differential between the 10-year US and Japanese bonds, which favors the US Dollar against the Japanese Yen.
The Japanese Yen is often seen as a safe-haven investment. This means that in times of market stress, investors are more likely to put their money in the Japanese currency due to its supposed reliability and stability. Turbulent times are likely to strengthen the Yen’s value against other currencies seen as more risky to invest in.
Large-scale CTA selling activity is hitting the tapes in crude oil markets, TDS Senior Commodity Strategist Daniel Ghali notes.
CTAs to shed their entire position long in Brent crude
“We expect CTAs to shed their entire position long in Brent crude this session and build a net short position, with additional scope to sell WTI crude over the coming week in a downtape scenario for prices.”
“Our statistical analysis of energy supply risks also suggest that supply risk premia is seeping out of energy markets once again, suggesting traders are curiously disregarding the risk of geopolitical aggressions ahead of the weekend.”
- EUR/GBP marginally fell to 0.8530, tallying a two-day losing streak.
- The cross declined despite the release of steady UK retail sales data during the European session.
- The data favors that the BoE will continue cutting rates.
Friday's trading painted a slightly less vibrant picture for the EUR/GBP pair which slid to 0.8530 as investors are digesting mixed Retail Sales figures from the UK.
In July, UK retail sales showed signs of recovery, with total retail sales volume increasing by 0.5% month-on-month, slightly below expectations, but improving from a revised decline of 0.9% in June (previously reported as -1.2%). On a year-on-year basis, retail sales grew by 1.4%, matching expectations and up from a revised -0.3% in June (previously reported as -0.2%).
This increase in sales aligns with the improvement seen in the British Retail Consortium's same-store sales for July, signaling a strong start to the third quarter. Despite robust Q2 GDP figures, the June data indicated a slowdown as the quarter ended. Overall, the economic activity seems to be weak which might prompt the Bank of England to continue cutting.
EUR/GBP technical analysis
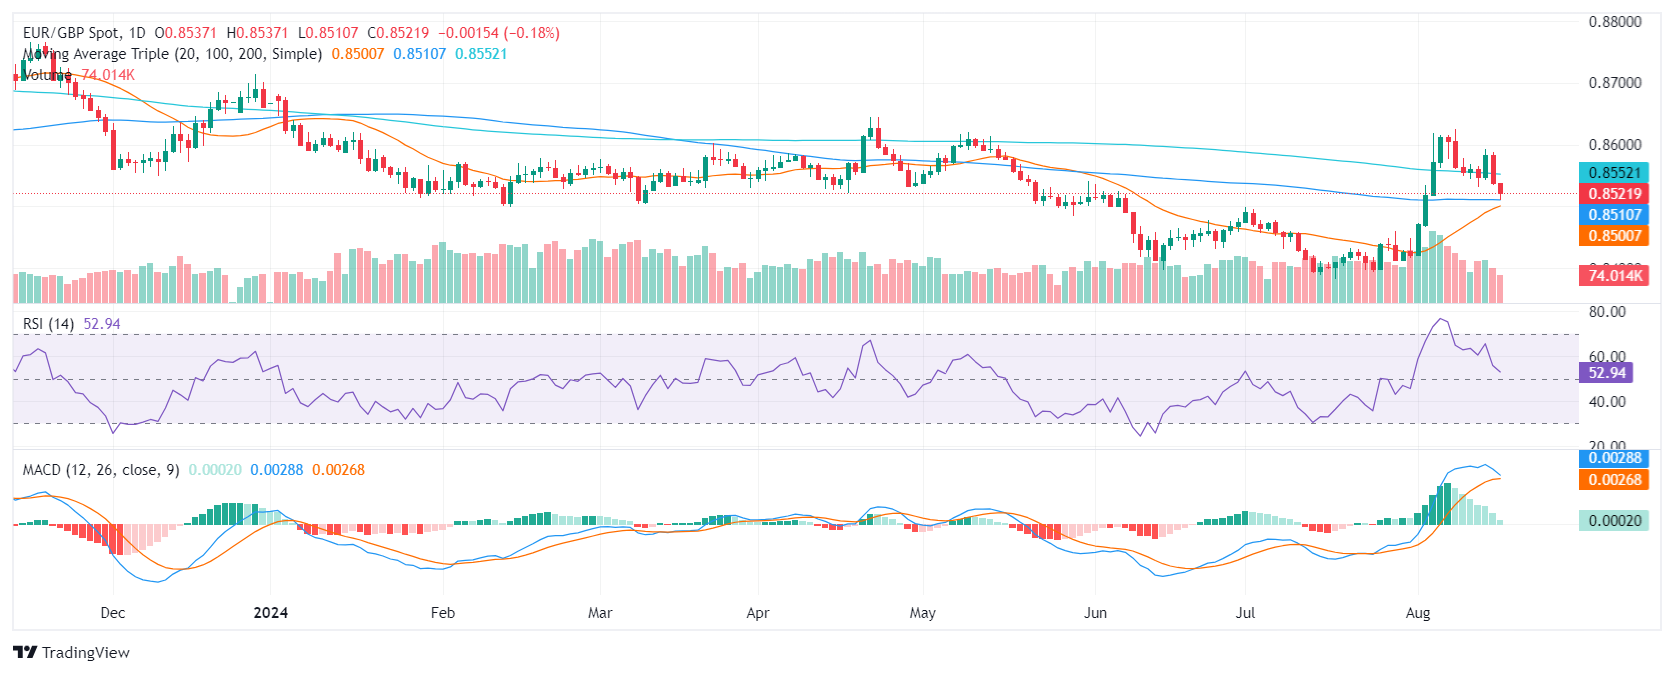
In the span of the last sessions, the EUR/GBP is primarily caught between the 200-day and 100-day Simple Moving Averages (SMAs) at 0.8550 and 0.8510 support and resistance levels respectively, and volume figures signify a gradually diminishing selling pressure. The fact that the bulls gave up the 200-day SMA on Thursday paints the outlook with bearishness.
At a technical level, the Relative Strength Index (RSI) of the pair is lingering around the mid-50s, indicating an equilibrium in market sentiment with neither the bulls nor the bears taking control but with a noticeable falling trend. The Moving Average Convergence Divergence (MACD) indicator is showing decreasing green bars, suggesting a possible downward momentum in future trading sessions.
EUR/GBP daily chart
Large-scale CTA buying activity may have supported Platinum markets last session, but signs of buying exhaustion could now morph into selling activity, TDS Senior Commodity Strategist Daniel Ghali notes.
Palladium may still jump higher
“Prices will now have to rally towards $995/oz to keep CTAs from shedding some of their recently added length, and a big downtape over the coming week could spark massive CTA selling activity totaling up to -40% of the algos' max size.”
“That being said, there are still some scenarios for the coming week that could result in continued buying activity from algorithmic trend followers, but the set-up for flows is already pointing to extreme downside asymmetry.”
“The set-up in Palladium, on the other hand, is nearly symmetric, with a big uptape still likely to catalyze large-scale buying activity from algorithmic trend followers. This is particularly notable given that our gauge of discretionary trader positions suggests that this cohort has now already reestablished its near-record short position.”
- USD/CAD drops as the US Dollar slumps on firm Fed rate-cut prospects.
- Fears of the US entering a recession ebb due to upbeat US Retail Sales data for July.
- Weak Oil prices have weighed on the Canadian Dollar.
The USD/CAD pair falls slightly but holds key support of 1.3700 in Friday’s New York session. The Loonie asset drops as the US Dollar (USD) falls sharply after failing to hold Thursday’s recovery. The US Dollar Index (DXY), which tracks the Greenback’s value against six major currencies, slumps to near 102.70.
The Greenback has come under pressure as the confidence of investors seems to have increased that the Federal Reserve (Fed) will start reducing interest rates from the September meeting. Market expectations for firm Fed rate cuts rose after the United States (US) Consumer Price Index (CPI) report for July indicated that price pressures are on track to return to the desired rate of 2%.
Meanwhile, traders pare bets supporting the Fed reducing interest rates in September with an aggressive approach as risks of potential recession ebbed after upbeat US Retail Sales data for July and lower-than-expected Initial Jobless Claims for the week ending August 9.
The data showed that Retail Sales rose at a robust pace of 1% from the estimates of 0.3% after contracting in June. Upbeat Retail Sales indicated that the overall demand has not collapsed, which investors were anticipating from weak Manufacturing PMI and slower job demand.
Meanwhile, the flash Michigan Consumer Sentiment Index (CSI) for August has improved higher than expected. The sentiment indicator rose to 67.8 from estimates of 66.9 and the prior release of 66.4.
Globally, weak Oil prices have weighed heavily on the Canadian Dollar (CAD). Oil prices have corrected sharply as investors look for fresh developments on Middle East conflicts. Market participants are anxious over Iran’s retaliation to the assassination of the Hamas leader by an Israeli air strike in Tehran.
Canadian Dollar FAQs
The key factors driving the Canadian Dollar (CAD) are the level of interest rates set by the Bank of Canada (BoC), the price of Oil, Canada’s largest export, the health of its economy, inflation and the Trade Balance, which is the difference between the value of Canada’s exports versus its imports. Other factors include market sentiment – whether investors are taking on more risky assets (risk-on) or seeking safe-havens (risk-off) – with risk-on being CAD-positive. As its largest trading partner, the health of the US economy is also a key factor influencing the Canadian Dollar.
The Bank of Canada (BoC) has a significant influence on the Canadian Dollar by setting the level of interest rates that banks can lend to one another. This influences the level of interest rates for everyone. The main goal of the BoC is to maintain inflation at 1-3% by adjusting interest rates up or down. Relatively higher interest rates tend to be positive for the CAD. The Bank of Canada can also use quantitative easing and tightening to influence credit conditions, with the former CAD-negative and the latter CAD-positive.
The price of Oil is a key factor impacting the value of the Canadian Dollar. Petroleum is Canada’s biggest export, so Oil price tends to have an immediate impact on the CAD value. Generally, if Oil price rises CAD also goes up, as aggregate demand for the currency increases. The opposite is the case if the price of Oil falls. Higher Oil prices also tend to result in a greater likelihood of a positive Trade Balance, which is also supportive of the CAD.
While inflation had always traditionally been thought of as a negative factor for a currency since it lowers the value of money, the opposite has actually been the case in modern times with the relaxation of cross-border capital controls. Higher inflation tends to lead central banks to put up interest rates which attracts more capital inflows from global investors seeking a lucrative place to keep their money. This increases demand for the local currency, which in Canada’s case is the Canadian Dollar.
Macroeconomic data releases gauge the health of the economy and can have an impact on the Canadian Dollar. Indicators such as GDP, Manufacturing and Services PMIs, employment, and consumer sentiment surveys can all influence the direction of the CAD. A strong economy is good for the Canadian Dollar. Not only does it attract more foreign investment but it may encourage the Bank of Canada to put up interest rates, leading to a stronger currency. If economic data is weak, however, the CAD is likely to fall.
- Consumer confidence in the US improved slightly in early August.
- UoM survey showed one-year inflation expectation held steady at 2.9%.
Consumer confidence in the US improved slightly in early August, with the University of Michigan's Consumer Sentiment Index edging higher to 67.8 from 66.4 in July. This reading came in above the market expectation of 66.9.
The Current Conditions Index declined to 60.9 from 62.7 and the Consumer Expectations Index rose to 72.1 from 68.8.
The details of the survey revealed that the one-year inflation expectation held steady at 2.9%, while the five-year inflation outlook stood unchanged at 3%.
Market reaction
This report failed to trigger a noticeable reaction in the US Dollar Index, which was last seen losing 0.3% on the day at 102.75.
The International Energy Agency (IEA) has revised its forecast for oil demand slightly downwards this year. This was due to a significant slowdown in demand in the second quarter, particularly in the emerging economies, where the annual increase was the lowest since 2020, which was impacted by the COVID-19 pandemic, Commerzbank’s Commodity Analyst Carsten Fritsch notes.
It less attractive for refineries to process crude oil
“In China, demand was 110 thousand barrels per day lower than in the previous year. The start to the third quarter was also not very promising in China, as shown by the weak crude oil imports and the latest figures from the National Bureau of Statistics on crude oil processing in Chinese refineries. This fell to 13.9 million barrels per day in July, the lowest level since October 2022.”
“In the first seven months of the year, crude oil processing remained 1.2% below the previous year's level. Last time this happened was at the end of 2022, when oil demand in China recorded a hitherto unprecedented annual decline due to the strict COVID-19 policy. The reasons for the weak processing are easy to name. The low processing margins and subdued demand for fuel make it less attractive for refineries to process crude oil.”
“The increasing proportion of electric cars in the vehicle fleet means that the increase in gasoline demand during the summer months, when demand is high, is lower than in the previous year. According to the consultancy Oilchem, the capacity utilization of independent refineries in Shandong province, which is important for refining, was just over 56% in July, 7.3 percentage points lower than in the previous year. The latest downward revision of (Chinese) oil demand by the IEA is therefore unlikely to be the last.”
- GBP/JPY pulls back after touching 200-day SMA despite better-than-expected UK data.
- Analysts still expected the BoE to make rate cuts in 2024.
- The Yen gains strength from positive GDP data and expectations of more rate hikes from BoJ.
GBP/JPY pauses in its recovery rally after touching the 200-day Simple Moving Average (SMA) and pulls back almost half a percent on Friday to trade in the 190.60s, despite the release of broadly positive data out of the UK.
The data failed to impact UK 10-year Gilts, however, which remained at 3.9% and revealed bond traders have not altered their inflation expectations after the releases. This, in turn, suggests they see little change in current expectations for UK monetary policy, a major driver of Pound Sterling.
Data out on Friday showed UK Retail Sales rose by 0.5% in July reversing a 0.9% decline in June. UK GDP was flat in June compared to May, and showed 0.6% growth in Q2 compared Q1, as forecast, when the economy grew 0.7%. Industrial and Manufacturing Production, meanwhile, both easily beat expectations month-over-month in June but continued to show declines on a year-over-year basis. Despite the data being overall positive the Pound weakened versus the Japanese Yen (JPY).
The Japanese Yen (JPY) may be holding up both because of technical selling at the level of the 200-day SMA and because of data on Tuesday which showed Japanese GDP surprising to the upside. The Japanese economy grew by 0.8% in Q2 on a quarter-over-quarter basis – a significant recovery from the 0.6% fall it registered in Q1. It was the strongest quarterly growth since Q1 of 2023, with private consumption, which accounts for more than half of the economy, rising for the first time in five quarters. The result easily beat the consensus estimate of 0.5%. The result was put down to increased spending after the spring wage negotiations that saw an average pay rise 5.17% in the country, the highest in over 30 years, according to Trading Economics.
Central Bank implications
Sterling’s lack of upside following the positive data may be because it does little to alter the outlook for monetary policy and interest rates. Most analysts still expect the Bank of England (BoE) to cut interest rates again in 2024 as inflation eases. This, in turn, is likely to have a broadly negative effect on GBP and GBP/JPY since lower interest rates attract less capital inflows.
“The recovery in (retail) sales marks a good start to Q3. While Q2 GDP data came in firm, the monthly June data reported at the same time suggested a loss of momentum as the quarter closed out. Bottom line: the data suggest the BoE will continue cutting rates,” concludes Dr. Win Thin, Global Head of Markets Strategy, at Brown Brothers Harriman.
Societe Generale’s Kenneth Broux was less unequivocal, saying, “The takeaway for the BoE is not clear cut, but the slowdown in services inflation to 5.2% from 5.7% and average earnings ex-bonuses to 5.4% 3m YoY vindicates the decision to lower bank rate two weeks ago to 5.0%.”
Nor did it alter the view of Capital Economics who are relatively dovish, seeing multiple cuts to UK interest rates in the second half of 2024.
“While expectations for interest rates in the UK have already fallen by 40bp by end-2025 since mid-July, our projections for UK CPI inflation to remain below the 2.0% (BoE) target for much of 2025 and 2026 suggest to us that the Bank of England will ease monetary policy by even more than investors now anticipate,” says Ruben Gargallo Abargues, Assistant Economist at Capital Economics.
Abargues expects 10-year Gilt yields to fall to 3.50% by the end of 2024 and the Pound to weaken from 1.29 now, to 1.25 by year end.
When it comes to Japanese monetary policy the consensus seems to be that the Bank of Japan (BoJ) will probably hike interest rates one more time before the end of 2024. This comes on the back of both the stronger-than-expected GDP data and the quite hawkish comments from the BoJ at the last meeting when they decided to raise interest rates to 0.25% from the 0.0% to 0.10% range it was in before. It is the second time the BoJ has increased rates in 2024.
“We’re still of the view that another hike is on the cards later this year, given the BoJ’s relative hawkishness at last week’s meeting, not to mention the fact that, after today’s move, the yen is now barely any stronger than it was then,” says Thomas Mathews, Head of Markets Asia Pacific for Capital Economics.
Overall the still strong expectation that the BoE will cut interest rates again this year and the BoJ will raise them, suggests a headwind for GBP/JPY as it attempts to recover from the 180.09 August 5 lows.
The Pound Sterling (GBP) is a relatively better performer on the session, posting a 0.4% gain on the USD so far which has lifted Cable back above 1.29, Scotiabank’s Chief FX Strategist Shaun Osborne notes.
Cable may see additional gains towards 1.2950/1.30
“UK Retail Sales data gained 0.5% in the July month, a bit below forecasts, but core sales rose 0.7% in the month, a little better than expected. Very weak June data were revised marginally higher.”
“The recent run of UK data has been mostly positive—jobs, GDP and now Retail—which is curbing market expectations for how much more the BoE can ease this year (swaps imply around 43bps of easing risk).”
“GBP gains have picked up again after spot broke out bullishly from yesterday’s consolidation range in the upper 1.28s. Fresh short-term highs for Cable through 1.29 target additional gains towards 1.2950/1.30.”
Gold (XAU/USD) touched a new all-time high on Friday. Upcoming interest-rate cuts by the Federal Reserve should continue to support prices, Commerzbank's Commodity Analyst Carsten Fritsch notes, raising the forecast for Gold price to $2,500 per troy ounce at year-end from $2,300 previously.
Gold prospects brighten as Fed looks ready to cut rates
“The US inflation rate slipped below the 3% mark in July. However, the core rate excluding energy and food was still slightly higher at 3.2%. Although this is sufficient for the Fed to cut interest rates for the first time in September, it is hardly enough for a rate cut of 50 basis points. The Fed Fund Futures are now pricing in slightly less than 100 basis points of rate cuts by the end of the year, but this is still sizeable. We therefore expect the all-time high to be reached and exceeded in the not-too-distant future.”
“Due to the clear signs of significant interest rate cuts by the Fed, we have raised our forecast for the gold price at the end of the year to $2,500 per troy ounce (previously $2,300). The three interest rate cuts we expect by the end of the year are likely to be followed by three more in the first half of 2025. This is a total of two interest rate cuts more than we had previously expected.”
“Accordingly, we expect the gold price to rise further to $2,600 by the middle of next year. At the end of 2025, the gold price is likely to fall to $2,550 (previously $2,200) in view of the renewed rise in inflation and the associated speculation of interest rate hikes in the following year.”
- EUR/USD rises to near 1.1000 as the US Dollar declines on firm Fed rate-cut prospects.
- The Fed is expected to cut interest rates by 25 bps in September.
- ECB officials refrain from committing a pre-defined rate-cut path.
The EUR/USD pair rebounds to near the psychological resistance of 1.1000 in Friday’s New York session. The major currency pair bounces back as the US Dollar (USD) declines with investors gaining confidence that the Federal Reserve (Fed) will start reducing interest rates from the September meeting.
The US Dollar Index (DXY), which tracks the Greenback’s value against six major currencies, declines to near 102.70. Firm speculation for Fed interest-rate cuts in September has improved appeal for risk-sensitive currencies. 10-year US Treasury yields tumble to near 3.89%.
While market participants remain confident over Fed rate cuts in September, traders pare bets supporting a 50-basis point (bps) interest-rate reduction as fears of the United States (US) entering a recession have waned after robust growth in Retail Sales in July and lower-than-expected Initial Jobless Claims for the week ending August 9.
The next trigger for the US Dollar will be Fed Chair Jerome Powell’s speech at the upcoming Jackson Hole (JH) symposium, which will be held from August 22-24. Jerome Powell is expected to provide cues for interest rate-cut path for the entire year.
Meanwhile, the appeal of the Euro (EUR) remains firm as investors expect that the European Central Bank (ECB) will reduce interest rates gradually. ECB policymakers have been refraining from committing a specific rate-cut path as they worry that price pressures could reaccelerate.
Euro FAQs
The Euro is the currency for the 20 European Union countries that belong to the Eurozone. It is the second most heavily traded currency in the world behind the US Dollar. In 2022, it accounted for 31% of all foreign exchange transactions, with an average daily turnover of over $2.2 trillion a day. EUR/USD is the most heavily traded currency pair in the world, accounting for an estimated 30% off all transactions, followed by EUR/JPY (4%), EUR/GBP (3%) and EUR/AUD (2%).
The European Central Bank (ECB) in Frankfurt, Germany, is the reserve bank for the Eurozone. The ECB sets interest rates and manages monetary policy. The ECB’s primary mandate is to maintain price stability, which means either controlling inflation or stimulating growth. Its primary tool is the raising or lowering of interest rates. Relatively high interest rates – or the expectation of higher rates – will usually benefit the Euro and vice versa. The ECB Governing Council makes monetary policy decisions at meetings held eight times a year. Decisions are made by heads of the Eurozone national banks and six permanent members, including the President of the ECB, Christine Lagarde.
Eurozone inflation data, measured by the Harmonized Index of Consumer Prices (HICP), is an important econometric for the Euro. If inflation rises more than expected, especially if above the ECB’s 2% target, it obliges the ECB to raise interest rates to bring it back under control. Relatively high interest rates compared to its counterparts will usually benefit the Euro, as it makes the region more attractive as a place for global investors to park their money.
Data releases gauge the health of the economy and can impact on the Euro. Indicators such as GDP, Manufacturing and Services PMIs, employment, and consumer sentiment surveys can all influence the direction of the single currency. A strong economy is good for the Euro. Not only does it attract more foreign investment but it may encourage the ECB to put up interest rates, which will directly strengthen the Euro. Otherwise, if economic data is weak, the Euro is likely to fall. Economic data for the four largest economies in the euro area (Germany, France, Italy and Spain) are especially significant, as they account for 75% of the Eurozone’s economy.
Another significant data release for the Euro is the Trade Balance. This indicator measures the difference between what a country earns from its exports and what it spends on imports over a given period. If a country produces highly sought after exports then its currency will gain in value purely from the extra demand created from foreign buyers seeking to purchase these goods. Therefore, a positive net Trade Balance strengthens a currency and vice versa for a negative balance.
We have taken the weak demand data from China into account and lowered our oil price forecast for the end of the year by $5, Commerzbank’s commodity analyst Carsten Fritsch notes.
Expect Brent at $85 and WTI at $80
“We now expect a Brent oil price of $85 and a WTI price of $80 per barrel. This factors in a certain risk premium due to geopolitical tensions in the Middle East. We also assume that the gradual withdrawal of voluntary production cuts by OPEC+ planned from October will be suspended at least until the end of the year. Otherwise, there would be a risk of oversupply and an undesirable fall in prices due to subdued demand in the fourth quarter.”
“However, OPEC+ has already partially ‘brought forward’ the planned increase in production from autumn. According to the IEA, the production volume in July was 920 thousand barrels per day above the agreed level because Iraq, Russia and Kazakhstan produced significantly more than actually agreed.”
“OPEC+ oil production in July was also 250 thousand barrels per day higher than in June. Iraq and Kazakhstan were already producing more in July than would be permitted in September 2025, i.e. at the end of the gradual production increases. Production in Russia is currently at a level that should be reached only in March/April 2025.”
EUR/USD is grinding back against the slide in spot that followed yesterday’s US data round and retains a generally firm undertone, Scotiabank’s Chief FX Strategist Shaun Osborne notes.
Bulls may try to reach 1.1050 near term
“EUR-supportive real and nominal spreads remain a key source of support for the EUR. Swaps also infer the risk of more aggressive rate cuts from the Fed over the balance of the year versus the ECB (swaps are currently implying 65bps or so of additional ECB easing by December).”
“Despite the drop back form the mid-week peak near 1.1050, the overall trend remains EUR-bullish. The intraday chart shows the EUR sustaining a trend rise from the early August low.”
“The daily chart shows the EUR sustaining a steady appreciation trend since June. Short-, medium– and long-term trend oscillators remain EUR bullish. Support is 1.0950/60 intraday. Resistance is 1.1050.”
- Housing Starts and Building Permits in the US declined sharply in July.
- The US Dollar Index stays in negative territory below 103.00.
Housing Starts in the US declined 6.8% in July to 1.238 million units, the monthly data published by the US Census Bureau revealed on Friday. This reading followed the 1.1% increase (revised from 3%) recorded in June.
In the same period, Building Permits decreased 4% after rising 3.9% (revised from 3.4%) in June.
Market reaction
The US Dollar stays on the back foot after these data releases. At the time of press, the USD Index was down 0.3% on the day at 102.73.
The Canadian Dollar (CAD) is barely changed at all on the session, Scotiabank’s chief FX strategist Shaun Osborne notes.
Bulls may try to break above 1.3725/50
“Spot gains edged back above the 1.3725 area briefly—a couple of times—yesterday and remains close to that point this morning but the flat-ish range trade in place over the past week remains more or less intact. The USD is trading above my estimated fair value (1.3668 today) still but factors have turned marginally less CAD-supportive relative to earlier in the week.”
“Weaker crude prices and softer terms of trade may be mild CAD headwinds in the short run. Canada reports Manufacturing Sales, Housing Starts and International Securities Transaction data this morning. Preliminary Manufacturing Sales data for June, released with the May data, indicated a sharp, 2.6% m/m drop in sales in the month.”
“The USD sell-off has stalled but signs of a reversal are—so far—absent. The CAD’s failure to exploit the push under 1.3725 USD support this week might be disappointing from the CAD-bullish perspective but spot may simply be consolidating recent losses and the salient feature of the charts remains the huge, weekly bear signal that developed around last week’s turn lower. The broader outlook remains USD-negative. Support is 1.3675. Resistance remains 1.3725/50.”
Japan’s 2Q24 GDP surprised with the economy expanding more than expected as private consumption and business spending, as well as residential investment and public investments supported growth, offsetting the drags from net exports and net private inventories, UOB Group economist Alvin Liew notes.
Expectations for growth rebound to extend into 3Q
“We expect the latest growth rebound to extend into 3Q supported by an extension of the consumption rebound, aided by influx of tourists and accelerated tech investments. But downside risk factors will continue to loom. While the sequential rebound for 2Q GDP was above expectations, the 1H GDP still contracted by -0.86% y/y. As a result we lower our 2024 GDP growth forecast to 0.2% (2023: 1.9%) before picking up to 1.7% for 2025.”
“We continue to expect the BOJ to stay on the rate tightening trajectory although it may not be a continuous cycle and likely to be a limited normalisation path. We expect BOJ to keep its policy rates unchanged in the next Sep 2024 MPM, and the next hike may come in 4Q 24, via a 25-bps hike to 0.50% which we believe will be the terminal rate.”
The real exchange rate of the Swiss franc (against Switzerland's trading partners, REER) has fluctuated much less strongly in recent years than the nominal exchange rate (NEER). This is exactly what should be expected from economic theory, but unfortunately it is rarely observed, Commerzbank’s Head of FX and commodity research Ulrich Leuchtmann note.
Real exchange rate of CHF fluctuates much less strongly
“The relative stability of the REER shows that exchange rates even out differences in domestic price developments. If a domestic gain or loss in purchasing power leads to proportional gains or losses in the corresponding currency, the NEER will move, but the REER will remain unchanged. This is exactly what has happened to the Swiss franc over the last few years. This effect often gets lost in the general noise.”
“Some observers take this as an opportunity to question the economic concept of (nominal and real) exchange rates as a whole. In such situations, economists are always on the defensive. However, economists cannot conduct experiments with entire economies. Sometimes, however, chance provides us with something that resembles an experiment. The inflation differential between Switzerland and the rest of the world has changed significantly in recent years.”
“This is because Switzerland was almost the only country not affected by the global inflation shock. We can assume with a high degree of certainty that this effect was the dominant factor in the exchange rate development. Everything else was almost ‘constant’ in comparison. Just as the experimental scientist likes it. And because this experiment has impressively confirmed the economic idea, I am happy.”
Silver prices (XAG/USD) fell on Friday, according to FXStreet data. Silver trades at $28.24 per troy ounce, down 0.41% from the $28.36 it cost on Thursday.
Silver prices have increased by 18.70% since the beginning of the year.
| Unit measure | Silver Price Today in USD |
|---|---|
| Troy Ounce | 28.24 |
| 1 Gram | 0.91 |
The Gold/Silver ratio, which shows the number of ounces of Silver needed to equal the value of one ounce of Gold, stood at 87.53 on Friday, up from 86.63 on Thursday.
Silver FAQs
Silver is a precious metal highly traded among investors. It has been historically used as a store of value and a medium of exchange. Although less popular than Gold, traders may turn to Silver to diversify their investment portfolio, for its intrinsic value or as a potential hedge during high-inflation periods. Investors can buy physical Silver, in coins or in bars, or trade it through vehicles such as Exchange Traded Funds, which track its price on international markets.
Silver prices can move due to a wide range of factors. Geopolitical instability or fears of a deep recession can make Silver price escalate due to its safe-haven status, although to a lesser extent than Gold's. As a yieldless asset, Silver tends to rise with lower interest rates. Its moves also depend on how the US Dollar (USD) behaves as the asset is priced in dollars (XAG/USD). A strong Dollar tends to keep the price of Silver at bay, whereas a weaker Dollar is likely to propel prices up. Other factors such as investment demand, mining supply – Silver is much more abundant than Gold – and recycling rates can also affect prices.
Silver is widely used in industry, particularly in sectors such as electronics or solar energy, as it has one of the highest electric conductivity of all metals – more than Copper and Gold. A surge in demand can increase prices, while a decline tends to lower them. Dynamics in the US, Chinese and Indian economies can also contribute to price swings: for the US and particularly China, their big industrial sectors use Silver in various processes; in India, consumers’ demand for the precious metal for jewellery also plays a key role in setting prices.
Silver prices tend to follow Gold's moves. When Gold prices rise, Silver typically follows suit, as their status as safe-haven assets is similar. The Gold/Silver ratio, which shows the number of ounces of Silver needed to equal the value of one ounce of Gold, may help to determine the relative valuation between both metals. Some investors may consider a high ratio as an indicator that Silver is undervalued, or Gold is overvalued. On the contrary, a low ratio might suggest that Gold is undervalued relative to Silver.
(An automation tool was used in creating this post.)
Commerzbank’s economists have revised their Fed forecast downwards very significantly – by more than they are lowering their US inflation forecast. Also, they’re slightly lowering ECB interest rate expectations and significantly lowering their inflation forecast, Commerzbank’s Head of FX and commodity research Ulrich Leuchtmann notes.
USD weakness in the medium term
“We have changed our EUR/USD forecast. As regular readers know, we believe that a good part of the USD strength seen so far was based on the impression of a structural US growth advantage and a particularly active US monetary policy. Since we now have to assume that this impression will be eroded by actual developments in the coming quarters, we now have to assume c.”
“And because at the same time the EUR-negative argument of high eurozone inflation rates and a fairly relaxed ECB monetary policy is at least significantly weakened in view of our more moderate eurozone inflation forecast, some of the EUR-negative arguments also fall away. Both together mean that we now have to assume that EUR/USD will rise significantly. We consider levels around 1.14 to be possible by mid-2025.”
“In the second half of 2025, the picture could change again. If – as we expect – the US economy picks up again, the impression may arise that the Fed at least no longer has any scope for interest rate cuts, and perhaps even fantasies of interest rate hikes will make themselves felt again. And perhaps it will then be time again for the market to take a more skeptical view of the ECB's monetary policy.”
The US Dollar (USD) weakness has stabilised; there is no clear directional bias, and it could trade in a broad range of 146.00/152.00, UOB Group Quek Ser Leang and Lee Sue Ann note.
USD may try to reach 149.50 near term
24-HOUR VIEW: “Our view for USD to trade in a range yesterday was incorrect, as it surged during NY trading, closing sharply higher by 1.33% (149.27). After the sharp and swift rise, conditions are severely overbought. However, barring a breach of 148.20 (minor support is at 148.60), USD could rise above 149.50 before levelling off. The next resistance at 150.00 is unlikely to come under threat.”
1-3 WEEKS VIEW: “Our most recent narrative was from Monday (12 Aug, spot at 146.90), wherein ‘downward momentum is beginning to wane, and a breach of 148.30 would mean that the recent weakness in USD has stabilised.’ After trading sideways for a few days, USD surged yesterday and broke above 148.30. We view the current price movements as part of a range trading phase. In light of the recent high volatility, USD could trade in a broad range of 146.00/152.00, indicating a period of market indecision. In other words, there is no clear directional bias for now.”
The US Dollar (USD) was also weighed down again yesterday by the fact that Fed officials sounded rather dovish.
Dovish Fed talk means USD strength is not justified
“For example, Raphael Bostic, President of the Federal Reserve Bank of Atlanta, is quoted as saying: ‘Now that inflation is coming into range, we have to look at the other side of the mandate, and there, we’ve seen the unemployment rate rise considerably off of its lows’.”
“The unemployment rate was at a low of 3.4% (April 2023), but it is currently at 4.3%. But that is still a very low level. In my opinion, ‘considerably’ is not really the case. The fact that at least some FOMC members are still very openly itching to lower interest rates shows one thing: the Fed is not as fundamentally hawkish as Fed Chair Jay Powell likes to portray it in times of high inflation.”
“At least some of his colleagues are moving away from this as soon as inflation is no longer astronomically high. As I noted at the time, whether a central bank is truly hawkish only becomes apparent when inflation is no longer extremely high. If this dovish Fed talk is more than just an episode, the extreme strength of the USD that we saw in spring is not justified.”
Further advance in US Dollar (USD) seems likely, but it is unlikely to reach 7.2050, not to mention 7.2300, UOB Group Quek Ser Leang and Lee Sue Ann note.
Breaking below 7.1500 is quite possible
24-HOUR VIEW: “After USD fell to 7.1317 two days and rebounded, we indicated yesterday that ‘the decline seems to have stabilised.’ We expected USD to ‘trade in a 7.1350/7.1630 range.’ Instead of trading in a range, USD lifted off in NY trade, soaring to a high of 7.1843. The rapid rise has gathered momentum, and further advance in USD seems likely. However, the resistance at 7.2050 is likely out of reach for now (minor resistance is at 7.1950). To maintain the buildup in momentum, USD must remain above 7.1650 with minor support at 7.1750.”
1-3 WEEKS VIEW: “We have held a negative view in USD since late last month. In our latest narrative from two days ago (14 Aug, spot at 7.1500), we indicated that ‘while downward momentum has been boosted, it is unclear at this time if it is sufficiently enough for USD to break below 7.0635.’ We added, ‘the bias remains on the downside as long as 7.1850 (‘strong resistance’ level) is not breached.’ Yesterday, USD soared, reaching a high of 7.1843. While our ‘strong resistance’ level of 7.1850 has not been clearly breached, downward momentum has faded. Not only has USD weakness stabilised, but upward momentum is also building. From here, we expect USD to edge higher, but given that upward momentum is only beginning to build, any advance is unlikely to reach 7.2300. On the downside, should USD break below 7.1500, it would suggest the momentum buildup has eased.”
The New Zealand Dollar (NZD) strength from early this month has ended; it is likely to trade between 0.5935 and 0.6080 for the time being, UOB Group Quek Ser Leang and Lee Sue Ann note.
NZD may try to breach the 0.6080 resistance
24-HOUR VIEW: “NZD plummeted two days ago. Yesterday, we indicated that ‘while oversold, there is room for NZD to decline to 0.5975 before stabilisation is likely.’ We added, ‘the next support at 0.5935 is not expected to come into view.’ NZD then dropped to 0.5975, closing at 0.5985 (- 0.19%). While the weakness has not quite stabilised, slowing momentum suggests NZD is unlikely to weaken much further. Today, we expect NZD to trade in a range, likely between 0.5975 and 0.6015.”
1-3 WEEKS VIEW: “Our update from yesterday (15 Aug, spot at 0.6000) still stands. As indicated, the NZD strength from early this month has ended. For the time being, NZD is likely to trade in a range, probably between 0.5935 and 0.6080.”
US consumers are proving to be true shopping maniacs, Commerzbank Head of FX and commodity research Ulrich Leuchtmann notes.
Retail sales rise by 1% vs 0.4% expected
“In July, retail sales rose by 1%, as the Census Bureau reported yesterday. Analysts had expected a meager 0.4%. The subcomponents of particular interest were also significantly stronger than analysts had expected. And because it is now a truism that the US consumer is ‘the engine of the US economy’, the retail sales figures at least helped to dispel some of the weakness of the USD in recent days.”
“We do not believe that the US economy is sliding into a recession either. In our view, therefore, the market reaction was not wrong. However, I would like to point out that yesterday's figures were not proof of one or the other view of the US economy. In a hypothetical coming recession, the US labor market would certainly only suffer damage with a time lag. And it is only then that the US consumer typically notices.”
“Do you remember Tom & Jerry? In the cartoon, you often see Tom the cat running over a cliff and continuing to run in the air for a moment before crashing all the harder. If the US economy were to slide into recession in the near future, it seems plausible to me that US retail sales would show a similar behavior. In short, yesterday's strong figure is not a watertight proof of a robust US economy in the near future. But it is a necessary condition for this view.”
- NZD/USD soars to near 0.6030 as market sentiment favors risky assets.
- The RBNZ surprisingly announced an interest rate cut by 25 bps on Wednesday.
- Firm Fed rate-cut prospects keep the US Dollar’s upside limited.
The NZD/USD pair surges to near 0.6030 in Friday’s European session. The Kiwi asset strengthens as appeal for risky assets has improved. Market sentiment improves significantly as fears of the United States (US) entering a recession have ebbed on upbeat Retail Sales for July and lower weekly Jobless Claims in the week ending August 9.
S&P 500 futures have posted decent gains in European trading hours, demonstrating an improvement in investors’ risk-appetite. The US Dollar Index (DXY), which tracks the Greenback’s value against six major currencies, falls to near 102.80.
However, the near-term appeal of the New Zealand Dollar (NZD) remains uncertain as the Reserve Bank of New Zealand (RBNZ) unexpectedly reduced its Official Cash Rate (OCR) by 25 basis points (bps) to 5.25% on Wednesday.
Meanwhile, the next move in the US Dollar will be guided by the market speculation for the Federal Reserve (Fed) interest rate cut path for the entire year. For that, investors await Fed Chair Jerome Powell’s speech at the upcoming Jackson Hole (JH) symposium, which will be held from August 22-24.
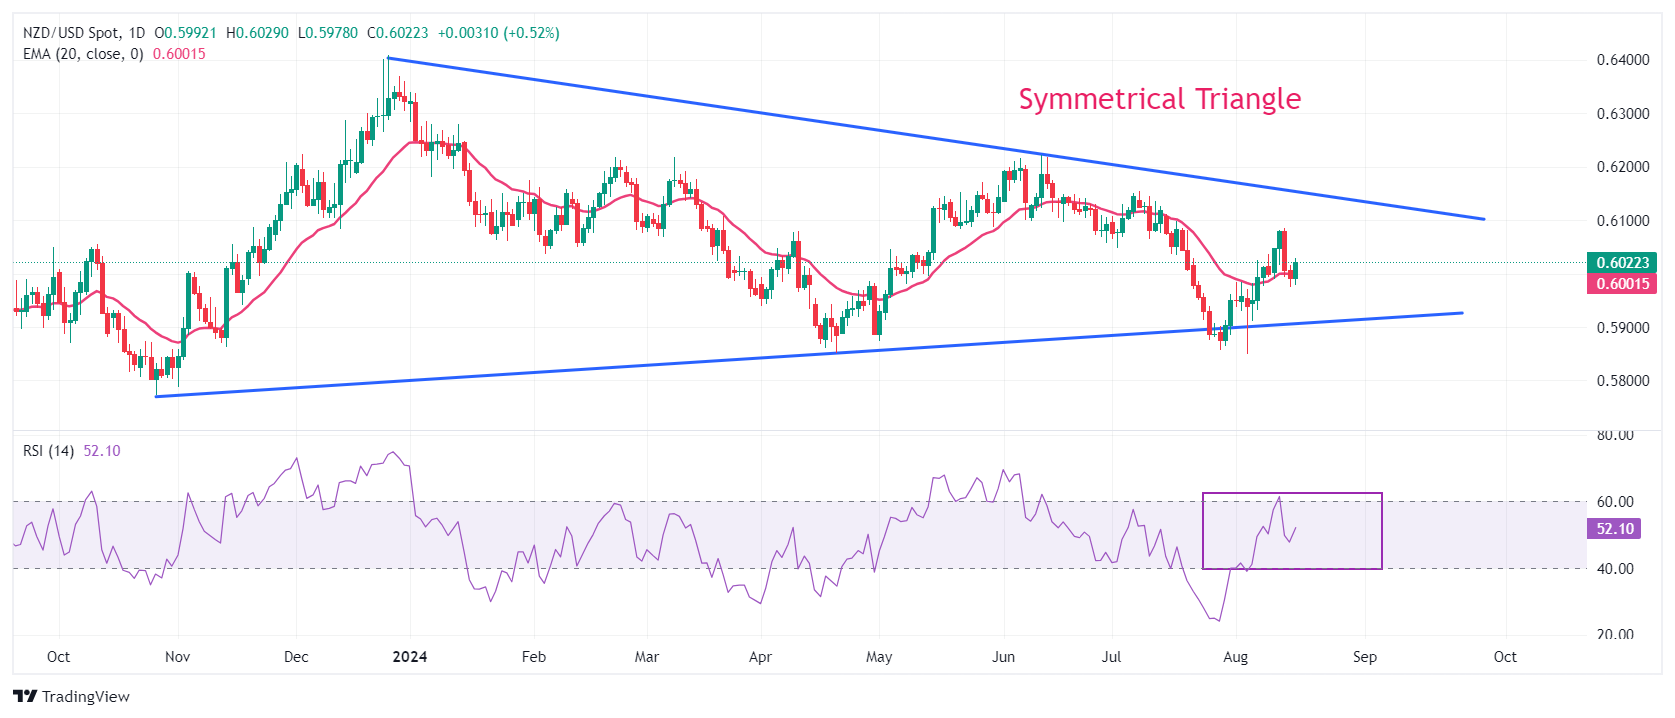
NZD/USD trades in a Symmetrical Triangle chart pattern on a daily timeframe, which exhibits a sharp volatility contraction. The Kiwi asset rises above the 20-day Exponential Moving Average (EMA) near 0.6000, suggesting that the near-term trend is bullish.
The 14-day Relative Strength Index (RSI) oscillates in the 40.00-60.00 range, indicating indecisiveness among market participants.
More upside would appear if the asset decisively breaks May 3 high at 0.6046. This would push the asset higher to July 17 high near 0.6100 and July 12 high of 0.6127.
In an alternate scenario, a downside move below April 19 low around 0.5850 would drag the asset towards the round-level support of 0.5800, followed by 26 October 2023 low at 0.5770.
NZD/USD daily chart
New Zealand Dollar FAQs
The New Zealand Dollar (NZD), also known as the Kiwi, is a well-known traded currency among investors. Its value is broadly determined by the health of the New Zealand economy and the country’s central bank policy. Still, there are some unique particularities that also can make NZD move. The performance of the Chinese economy tends to move the Kiwi because China is New Zealand’s biggest trading partner. Bad news for the Chinese economy likely means less New Zealand exports to the country, hitting the economy and thus its currency. Another factor moving NZD is dairy prices as the dairy industry is New Zealand’s main export. High dairy prices boost export income, contributing positively to the economy and thus to the NZD.
The Reserve Bank of New Zealand (RBNZ) aims to achieve and maintain an inflation rate between 1% and 3% over the medium term, with a focus to keep it near the 2% mid-point. To this end, the bank sets an appropriate level of interest rates. When inflation is too high, the RBNZ will increase interest rates to cool the economy, but the move will also make bond yields higher, increasing investors’ appeal to invest in the country and thus boosting NZD. On the contrary, lower interest rates tend to weaken NZD. The so-called rate differential, or how rates in New Zealand are or are expected to be compared to the ones set by the US Federal Reserve, can also play a key role in moving the NZD/USD pair.
Macroeconomic data releases in New Zealand are key to assess the state of the economy and can impact the New Zealand Dollar’s (NZD) valuation. A strong economy, based on high economic growth, low unemployment and high confidence is good for NZD. High economic growth attracts foreign investment and may encourage the Reserve Bank of New Zealand to increase interest rates, if this economic strength comes together with elevated inflation. Conversely, if economic data is weak, NZD is likely to depreciate.
The New Zealand Dollar (NZD) tends to strengthen during risk-on periods, or when investors perceive that broader market risks are low and are optimistic about growth. This tends to lead to a more favorable outlook for commodities and so-called ‘commodity currencies’ such as the Kiwi. Conversely, NZD tends to weaken at times of market turbulence or economic uncertainty as investors tend to sell higher-risk assets and flee to the more-stable safe havens.
USD/BRL has come off sharply from its early August spike to 5.80. The broad turn lower in the US Dollar (USD) and the global equity market recovery are helping, ING’s FX strategist Chris Turner notes.
USD/BRL set to struggle to break through the 5.40/45 area.
“The commodity story is a worry for the Brazilian real. Brazil's terms of trade have dropped to the lowest levels since January 2023 as weak Chinese demand weighs on both soybeans and iron ore – two of Brazil's key exports. Brazil's terms of trade levels are more consistent with USD/BRL trading at 5.70/5.80.”
“In addition, investors await the Brazilian government's 2025 budget plans – which are announced on 31 August. The market view is split here. If the Lula administration prioritizes social spending, then fiscal targets will be missed and the real will be hit hard.”
“However, some in the market suspect that the government will cut spending to try and keep the bond market on side. Typically, fiscal weakness has always been the Achilles heel of Brazilian asset markets. Given this late August event risk with the budget and the terms of trade drop, we suspect USD/BRL will struggle to break support in the 5.40/45 area.”
The Australian Dollar (AUD) is expected to trade in a range, probably between 0.6580 and 0.6640, or withing a broader range between 0.6545 and 0.6660, UOB Group Quek Ser Leang and Lee Sue Ann note.
Bulls may push towards 0.6660
24-HOUR VIEW: “After AUD pulled back sharply two days ago, we highlighted yesterday that ‘the sharp pullback seems a tad overdone, and AUD is unlikely to weaken much further.’ We expected AUD to ‘trade in a 0.6580/0.6625 range.’ AUD subsequently traded in a wider range of 0.6570/0.6635, closing slightly higher at 0.6610 (+0.20%). The price action did not result in an increase in either downward or upward momentum. Today, we continue to expect AUD to trade in a range, probably between 0.6580 and 0.6640.”
1-3 WEEKS VIEW: “Yesterday (15 Aug, spot at 0.6600), we indicated that ‘if AUD breaks below 0.6580, it would suggest that it is not ready to head higher to 0.6660.’ AUD subsequently dipped to 0.6570 and then rebounded. Momentum indicators are turning neutral, and AUD is likely to trade sideways between 0.6545 and 0.6660 for now.”
- USD/CHF is making higher highs and higher lows as it tracks higher since the August 4 lows.
- The pair is probably in a short-term uptrend which is expected to continue rising.
USD/CHF has established a sequence of rising peaks and troughs on the 4-hour chart (since the pair bottomed on August 4). This suggests the pair is now in a short-term uptrend. Given the old adage that “the trend is your friend” the uptrend is more likely than not to extend higher, at least in the near term.
USD/CHF 4-hour Chart
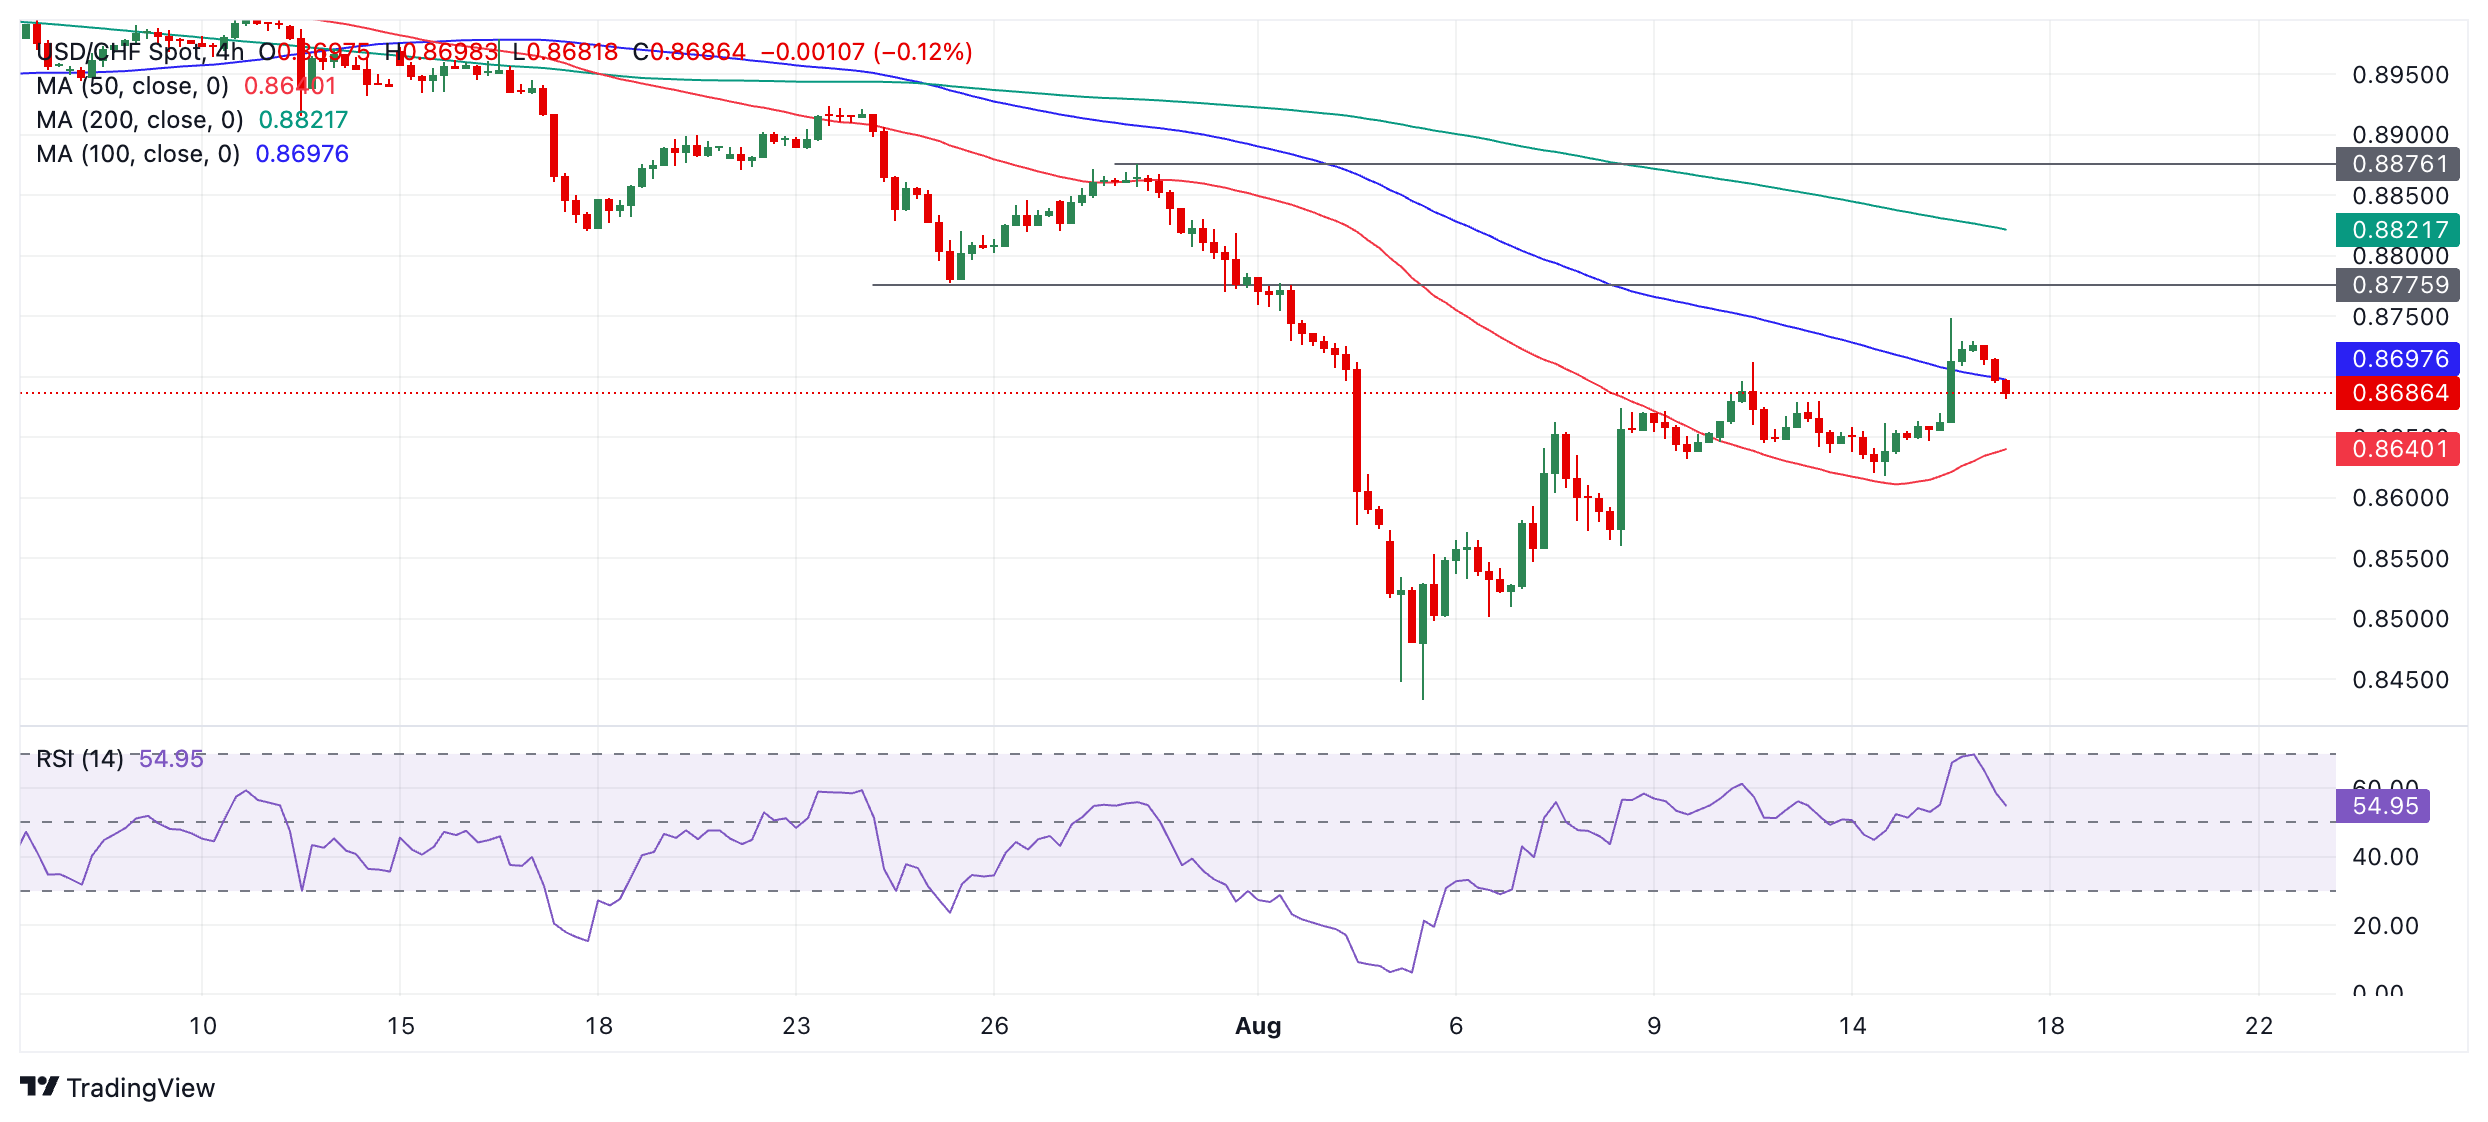
USD/CHF has closed above both the 50 and 100-period Simple Moving Averages (SMA) further reinforcing the view that it is trending higher. The next target to the upside is 0.8776 (July 25 swing low). Above that is the 200-period SMA at 0.8822, which is likely to present a tough barrier of resistance. If USD/CHF can close above that, then the 0.8876 July 30 swing high comes into view.
The Relative Strength Index (RSI) momentum indicator flirted briefly with the overbought zone on Thursday but never quite entered it and at 54.95 still has scope for more upside before it signals an over extension. A move above 70 would increase the risk of a pullback evolving but it would require a break below 0.8560 (August 8 swing low) to indicate a change of trend and the evolution of a more bearish environment.
The Pound Sterling (GBP) could edge higher; there does seem to be enough momentum for it to reach 1.2900. While GBP could rebound, the likelihood of it reaching 1.2950 is not high, UOB Group Quek Ser Leang and Lee Sue Ann note.
To test the 1.2900 level near term
24-HOUR VIEW: “Yesterday, we expected GBP to trade in a sideways range between 1.2780 and 1.2855. However, it traded in a higher range of 1.2798/1.2871, closing modestly higher (1.2854, +0.21%). Upward momentum has increased, albeit just a tad. Today, GBP could edge higher, but there does seem to be enough momentum for GBP to reach 1.2900. Support levels are at 1.2840 and 1.2820.”
1-3 WEEKS VIEW: “We highlighted two days ago (14 Aug, spot at 1.2865) that ‘instead of trading in a range, GBP is likely to rebound further, potentially to 1.2950.’ Since then, GBP has not been able to make much headway on the upside. While we continue to hold the view that GBP could rebound, the likelihood of it reaching 1.2950 is not high. We will hold the same view provided that 1.2780 (no change in ‘strong support’ level) is not breached.”
The US Dollar (USD) received a lift from the better-than-expected retail sales data yesterday, ING’s FX strategist Chris Turner notes.
DXY set to drop to 102.15/25 next week
“The data has prompted investors to shift towards pricing a 25bp Federal Reserve rate cut on 18 September. There will be a myriad of data inputs into the Fed equation and the events calendar picks up next week. For today, however, the focus will be on August University of Michigan consumer confidence data. This survey will have been taken during the stock market rout at the start of August and could see consumer expectations sink further. This could be a little bearish for the dollar.”
“Elsewhere, firmer US rates have allowed USD/JPY to climb back towards 150 and have encouraged flows back into the high yielders like the Mexican peso and the South African rand. We still have our concerns over the peso given potential constitutional reforms next month and doubt investors will chase USD/MXN much under 18.50.”
“DXY is consolidating, but we have a bias for a drop to 102.15/25 next week.”
- USD/JPY has reversed trend and is now rising in the short-term.
- Although it completed an abc correction it failed to decline afterwards, instead breaking higher.
USD/JPY has probably reversed its short-term downtrend and is now trending higher after establishing a new sequence of higher highs and higher lows. Given “the trend is your friend” this suggests a bullish bias exists over the short term.
USD/JPY 4-hour Chart
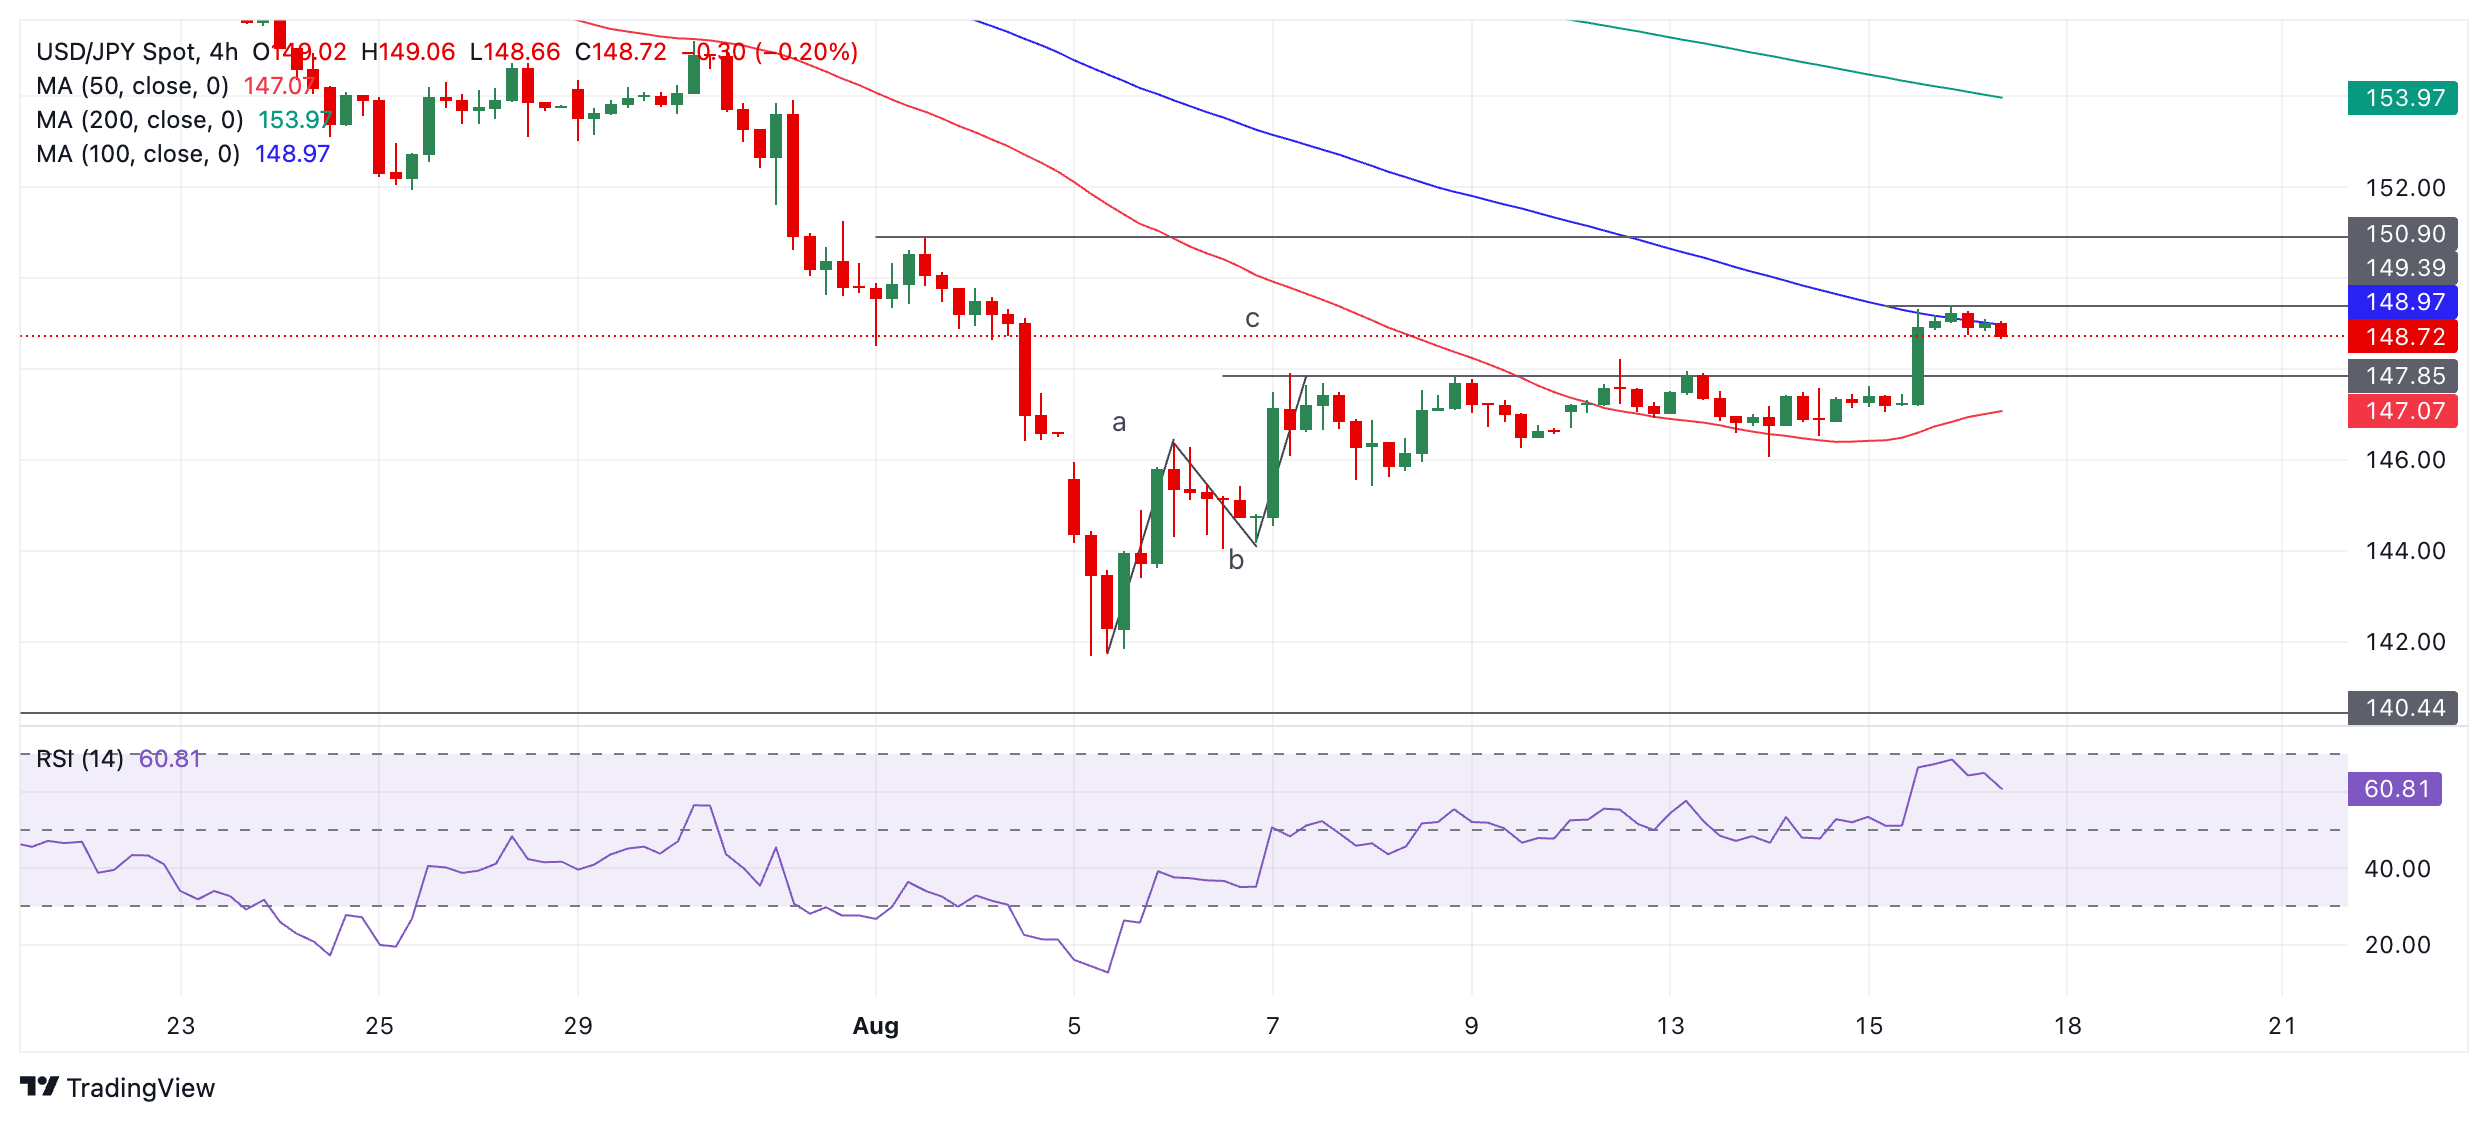
The change in trend comes about after the pair continued rising despite completing an abc correction between August 5-7. Normally the completion of the abc correction would have been a signal the pullback had ended and the dominant downtrend was about to resume. However, in the case of USD/JPY the pair failed to decline and instead traded sideways before breaking decisively higher on August 15.
The break above the top of wave c indicates the short-term trend is now probably bullish and therefore more likely than not to continue rising. The 100-period Simple Moving Average (blue) is currently capping gains but a close above it would probably confirm a continuation higher to a target at 150.90 (August 1 swing high), followed by 151.94 (July 25 swing low) and then perhaps 155.22 (July 30 swing high).
- AUD/USD grips gains near 0.6640 amid sluggish US Dollar.
- The Fed seems prepared to begin reducing interest rates from September.
- Upbeat Aussie Employment adds to evidence that price pressures could remain sticky.
The AUD/USD pair holds onto gains near a three-week high of 0.6640 in Friday’s European session. The Aussie asset exhibits strength as the US Dollar (USD) struggles to hold recovery from a fresh 10-day low on Thursday, which was driven by upbeat United States (US) Retail Sales data for July and lower-than-expected Initial Jobless Claims for the week ending August 9.
The US Dollar Index (DXY), which tracks the Greenback’s value against six major currencies, edges lower to near 102.85.
Data on Thursday showed that US Retail Sales grew at a robust pace of 1% from the estimates of 0.3% after contracting in June. Meanwhile, the number of Americans filing for unemployment benefits for the first time was lower at 227K than estimates of 235K and the prior release of 234K.
The market sentiment remains firm as investors’ confidence in the Federal Reserve (Fed) to begin reducing interest rates from the September meeting remains intact. S&P 500 futures have posted decent gains in the European session, exhibiting a strong risk appetite of investors. 10-year US Treasury yields slump to near 3.91%.
Meanwhile, the Australian Dollar (AUD) performs strongly amid worries that the Reserve Bank of Australia (RBA) could tighten its monetary policy further. Upbeat Aussie Employment data, released on Thursday, added to evidence that price pressures could remain persistent. The data showed that fresh payrolls were higher at 58.2K, compared with estimates of 20K and the prior release of 52.3K.
Australian Dollar FAQs
One of the most significant factors for the Australian Dollar (AUD) is the level of interest rates set by the Reserve Bank of Australia (RBA). Because Australia is a resource-rich country another key driver is the price of its biggest export, Iron Ore. The health of the Chinese economy, its largest trading partner, is a factor, as well as inflation in Australia, its growth rate and Trade Balance. Market sentiment – whether investors are taking on more risky assets (risk-on) or seeking safe-havens (risk-off) – is also a factor, with risk-on positive for AUD.
The Reserve Bank of Australia (RBA) influences the Australian Dollar (AUD) by setting the level of interest rates that Australian banks can lend to each other. This influences the level of interest rates in the economy as a whole. The main goal of the RBA is to maintain a stable inflation rate of 2-3% by adjusting interest rates up or down. Relatively high interest rates compared to other major central banks support the AUD, and the opposite for relatively low. The RBA can also use quantitative easing and tightening to influence credit conditions, with the former AUD-negative and the latter AUD-positive.
China is Australia’s largest trading partner so the health of the Chinese economy is a major influence on the value of the Australian Dollar (AUD). When the Chinese economy is doing well it purchases more raw materials, goods and services from Australia, lifting demand for the AUD, and pushing up its value. The opposite is the case when the Chinese economy is not growing as fast as expected. Positive or negative surprises in Chinese growth data, therefore, often have a direct impact on the Australian Dollar and its pairs.
Iron Ore is Australia’s largest export, accounting for $118 billion a year according to data from 2021, with China as its primary destination. The price of Iron Ore, therefore, can be a driver of the Australian Dollar. Generally, if the price of Iron Ore rises, AUD also goes up, as aggregate demand for the currency increases. The opposite is the case if the price of Iron Ore falls. Higher Iron Ore prices also tend to result in a greater likelihood of a positive Trade Balance for Australia, which is also positive of the AUD.
The Trade Balance, which is the difference between what a country earns from its exports versus what it pays for its imports, is another factor that can influence the value of the Australian Dollar. If Australia produces highly sought after exports, then its currency will gain in value purely from the surplus demand created from foreign buyers seeking to purchase its exports versus what it spends to purchase imports. Therefore, a positive net Trade Balance strengthens the AUD, with the opposite effect if the Trade Balance is negative.
Sharp selloff seems excessive; instead of weakening further, the Euro (EUR) is likely to consolidate in a range of 1.0945/1.1010, or, in the broader range between 1.0910 and 1.1045, UOB Group Quek Ser Leang and Lee Sue Ann note.
Closest resistance is at 1.1010
24-HOUR VIEW: “Two days ago, EUR rose sharply to 1.1047 and then pulled back. Yesterday, we indicated that ‘the pullback in overbought conditions suggests EUR is unlikely to rise further.’ We expected EUR to ‘trade in a sideways range of 1.0985/1.1045.’ EUR traded sideways until NY trading, when it sold off sharply, reaching a low of 1.0948. The selloff seems excessive, and EUR is unlikely to weaken much further. Today, EUR is more likely to consolidate in a range of 1.0945/1.1010.”
1-3 WEEKS VIEW: “Our most recent narrative was from two days ago (14 Aug, spot at 1.0990), wherein EUR ‘is still positive, and the next level to watch is 1.1070.’ We highlighted that ‘only a breach of 1.0955 (‘strong support’) would mean that the EUR strength that started early last week (see annotations in the chart below) has come to an end.’ EUR subsequently rose to 1.1047 and, yesterday, it plummeted and broke below our ‘strong support’ level of 1.0955 (low has been 1.0948). The price action suggests that the EUR strength has ended. EUR has likely entered a consolidation phase. For the time being, it is likely to trade between 1.0910 and 1.1045.”
- The Mexican Peso edges lower as traders opt to cover their longs following the recent rally.
- An easing in market risk has helped the Peso recover, as does stubbornly high inflation expectations in Mexico.
- The Pound Sterling is rising the most against the Peso on Friday after strong UK data.
The Mexican Peso (MXN) is edging lower in its key pairs on Friday as traders take profit from their recent longs. This comes after the Peso gained almost 2.5% in recent days following a turnaround in risk sentiment which has aided emerging market FX.
Lower interest rates are normally negative for a currency as they attract less foreign capital inflows. Although the Banco de Mexico (Banxico) is expected to continue cutting interest rates, the MXN has held its value relatively well due to both the high starting level of its interest rates (over 10%) and the view that stubbornly high inflation could make future cuts more gradual than expected.
At the time of writing, one US Dollar (USD) buys 18.63 Mexican Pesos, EUR/MXN trades at 20.47, and GBP/MXN at 24.02.
Mexican Peso eases after recent rally
The Mexican Peso is edging lower in its most-traded pairs at the end of the trading week.
Better-than-expected US Retail Sales and Initial Jobless Claims data on Thursday helped scotch concerns the US might be on the verge of entering a recession, leading to a general rebound in morale. Although this helped support the US Dollar (USD), it also appreciated the risk-sensitive Mexican Peso.
The VIX volatility index, a common gauge of investor nervousness, has fallen to below the levels it was at prior to the weak July Nonfarm Payrolls triggered the panic sell-off, according to Jim Reid, Research Strategist at Deutsche Bank. This suggests the market has fully recovered from its bruising start to the month – a further plus for emerging market FX.
The Pound Sterling (GBP) is the major currency that is rising most against MXN on Friday. This comes after a slew of data was released out of the UK – including Retail Sales, Industrial Production, Manufacturing Production and GDP – which either beat or came out in line with estimates.
More broadly, a background factor that is supporting the Peso may be the perception that inflation could remain elevated for longer than expected, forcing the Banxico to cut interest rates at a more gradual pace than expected.
Headline inflation in Mexico remains elevated at 5.57% and this could be further supported by stubbornly high dwelling inflation, according to research by Capital Economics. That said, core inflation has fallen for 18 consecutive months to 4.05% and was the prime reason leading Banxico to go for the unexpected 0.25% interest rate cut at its August meeting.
The rate cut brought Banxico’s policy rate down to 10.75%. Relatively speaking, this remains high and continues to attract carry trade flows. The carry trade is an operation by which traders borrow in a currency with low interest rates, like the Japanese Yen (JPY) or the Swiss Franc (CHF), and use the money to buy higher-interest paying assets or currencies such as the Peso.
Technical Analysis: USD/MXN resumes down leg within channel
USD/MXN resumes its down move within a rising channel after the short-lived pullback petered out. This leg lower within the channel is expected to continue, possibly to either the 50-day Simple Moving Average at 18.40 or the lower channel line in the 18.30s.
USD/MXN Daily Chart
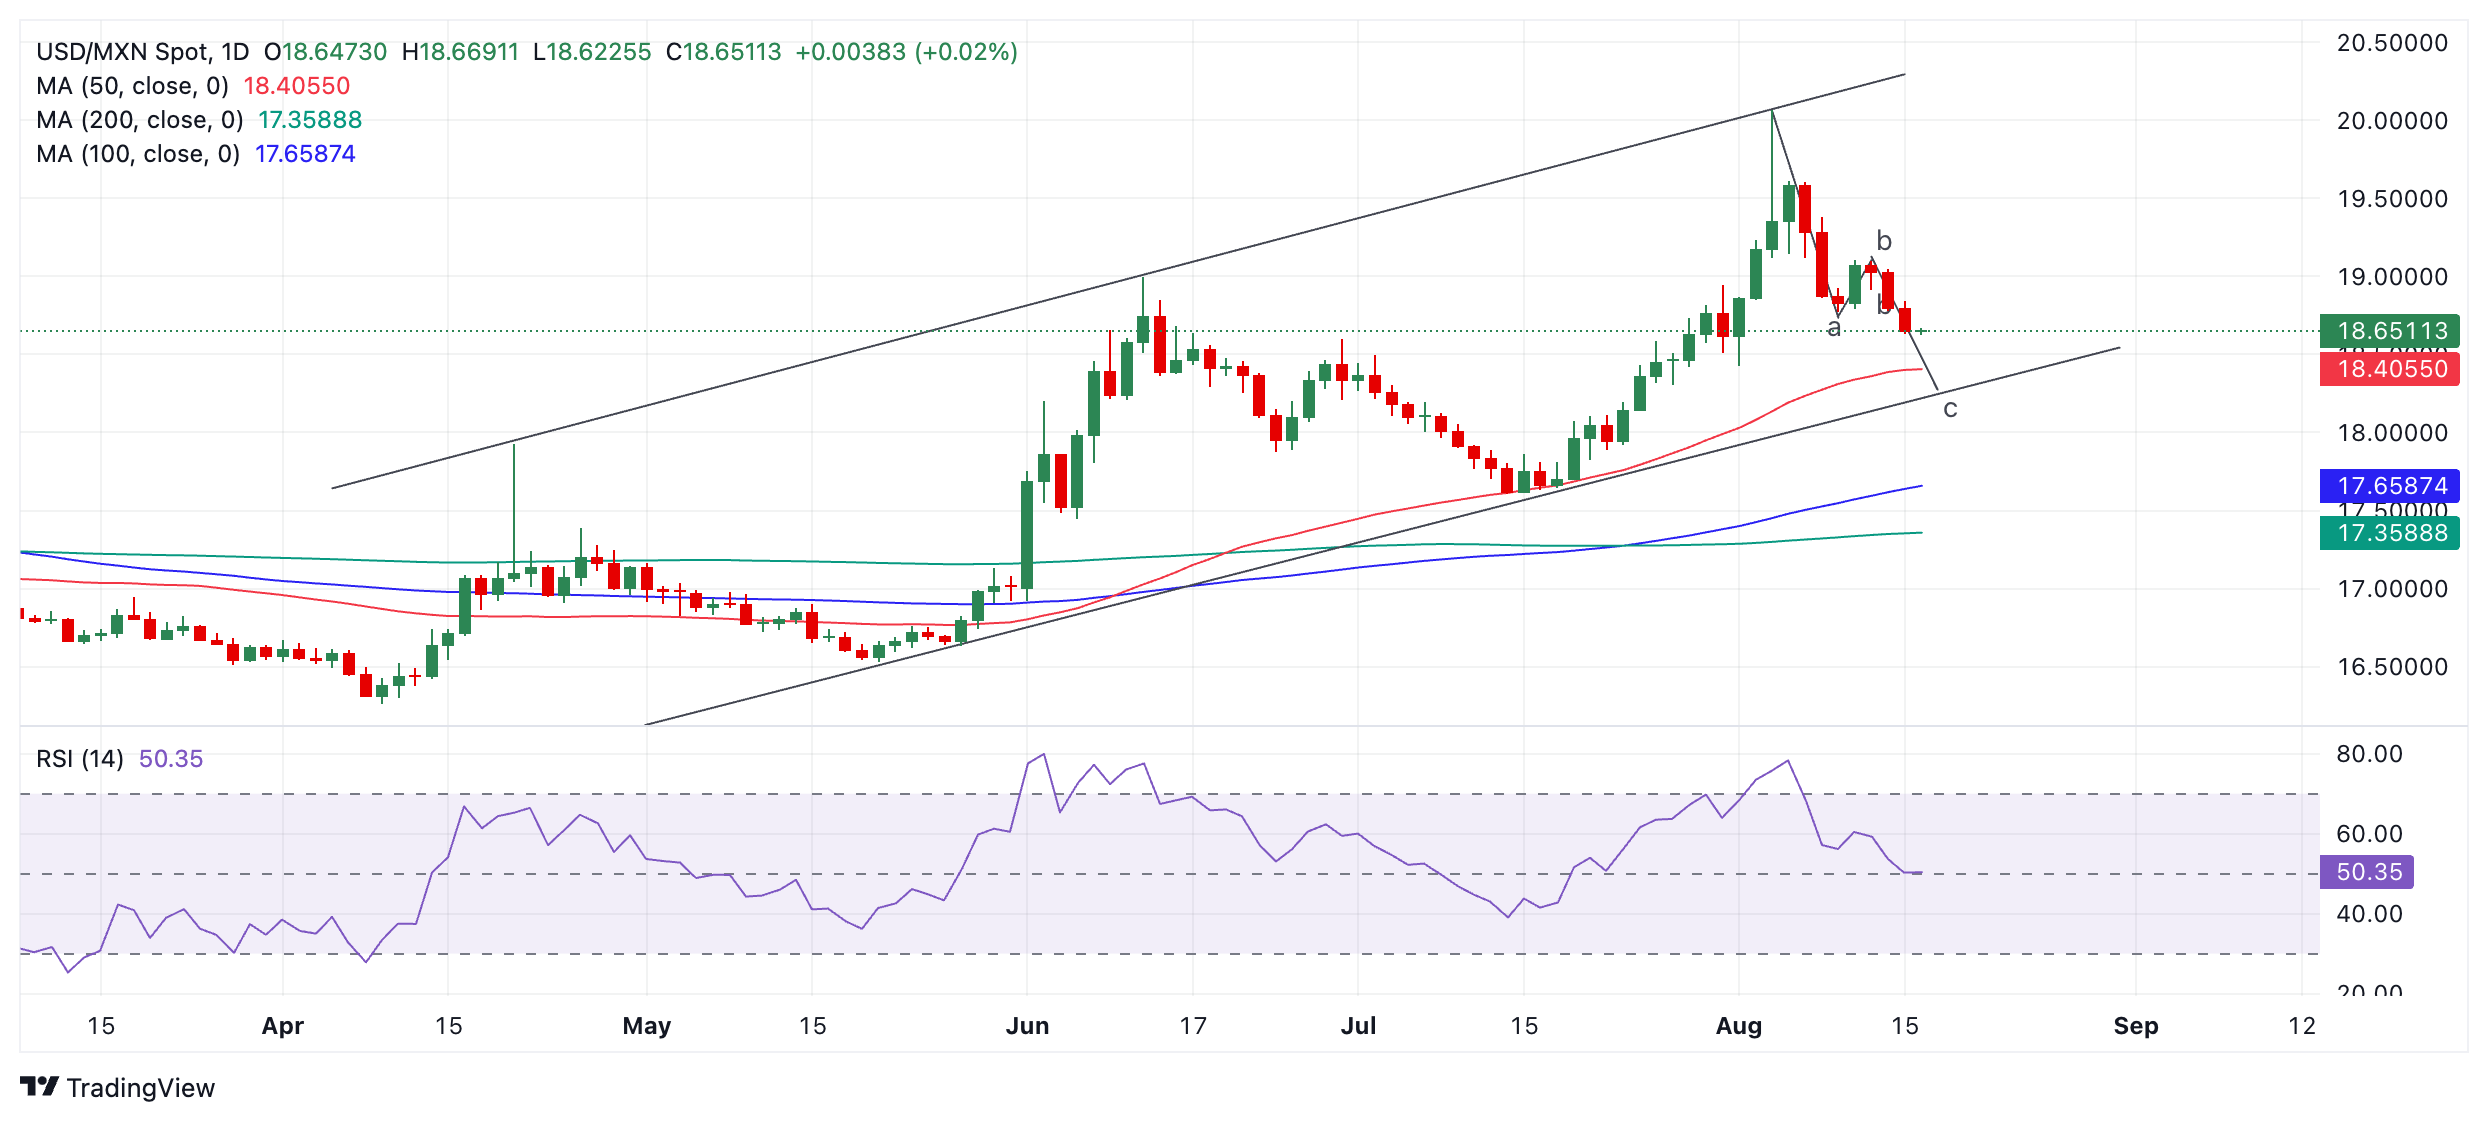
USD/MXN could be unfolding in a bearish abc correction within its rising channel. If so, it looks as if waves “a” and “b” have finished and wave “c” is currently evolving. Usually wave c is a similar length to wave a or a Fibonacci ratio thereof, so the move lower still probably has further to go. It will likely reach the 50-day SMA or even the lower channel line.
Banxico FAQs
The Bank of Mexico, also known as Banxico, is the country’s central bank. Its mission is to preserve the value of Mexico’s currency, the Mexican Peso (MXN), and to set the monetary policy. To this end, its main objective is to maintain low and stable inflation within target levels – at or close to its target of 3%, the midpoint in a tolerance band of between 2% and 4%.
The main tool of the Banxico to guide monetary policy is by setting interest rates. When inflation is above target, the bank will attempt to tame it by raising rates, making it more expensive for households and businesses to borrow money and thus cooling the economy. Higher interest rates are generally positive for the Mexican Peso (MXN) as they lead to higher yields, making the country a more attractive place for investors. On the contrary, lower interest rates tend to weaken MXN. The rate differential with the USD, or how the Banxico is expected to set interest rates compared with the US Federal Reserve (Fed), is a key factor.
Banxico meets eight times a year, and its monetary policy is greatly influenced by decisions of the US Federal Reserve (Fed). Therefore, the central bank’s decision-making committee usually gathers a week after the Fed. In doing so, Banxico reacts and sometimes anticipates monetary policy measures set by the Federal Reserve. For example, after the Covid-19 pandemic, before the Fed raised rates, Banxico did it first in an attempt to diminish the chances of a substantial depreciation of the Mexican Peso (MXN) and to prevent capital outflows that could destabilize the country.
- The US Dollar falls slightly but holds the recent recovery, which was driven by Thursday’s upbeat US data.
- Robust US Retail Sales growth and lower weekly Jobless Claims diminish the risks of a hard landing.
- Traders pare bets favoring a 50 basis point interest-rate cut by the Fed.
The US Dollar (USD) edges lower in Friday’s European session but holds the recovery seen on Thursday as traders’ fears about a recession in the United States (US) ebb. The US Dollar Index (DXY), which tracks the Greenback’s value against six major currencies, hovers near 103.00 after recovering from a 10-day low of 102.27 on Thursday.
The Greenback bounced back strongly after upbeat US economic data also supported bond yields. 10-year US Treasury yields fall to near 3.91% in European trading hours, but are decently up from their weekly low of 3.81%.
The data on Thursday showed that the US Retail Sales grew at a robust pace in July after contracting in June. Retail Sales, a key measure of consumer spending, rose strongly by 1% against expectations of 0.3%, diminishing fears of a hard landing.
Also, fewer-than-expected Americans filing for jobless benefits for the first time for the second consecutive week indicated that labor market conditions are not as bad as they seemed after the release of the Nonfarm Payrolls (NFP) data for July. The US Department of Labor showed that Initial Jobless Claims came in at 227K, lower than estimates of 235K and the prior release of 234K.
Daily digest market movers: US Dollar edges lower as bond yields fall
- The US Dollar holds its recovery move as upbeat US economic data has dashed market expectations that the Fed will begin its policy-easing cycle with an aggressive approach. Market participants started anticipating a 50-basis-point (bps) interest-rate reduction from the Fed in September amid worries that the US could enter a recession.
- According to the CME FedWatch tool, 30-day Federal Finds Futures pricing data shows that the likelihood of a 50-bps interest-rate reduction has diminished to 29.5% from the 51% recorded a week ago. However, the speculation that the Fed will cut rates in September remains intact.
- Meanwhile, Fed policymakers have also admitted that interest rate cuts have become appropriate as risks have now widened to the labor market too. This week, Atlanta Fed Bank President Raphael Bostic said in an interview with the Financial Times (FT) that he is open to rate cuts in September. When asked about the rate cut size, Bostic said that he is comfortable with half a percentage point if the labor market deteriorates further.
- Going forward, investors will focus on Fed Chair Jerome Powell’s speech at the upcoming Jackson Hole (JH) symposium, which will be held from August 22-24. Fed Powell is expected to provide cues about the interest rate cut path as inflation remains on track to return to the desired rate of 2% and the labor market is not overheated anymore.
Technical Forecast: US Dollar remains below 20-day EMA
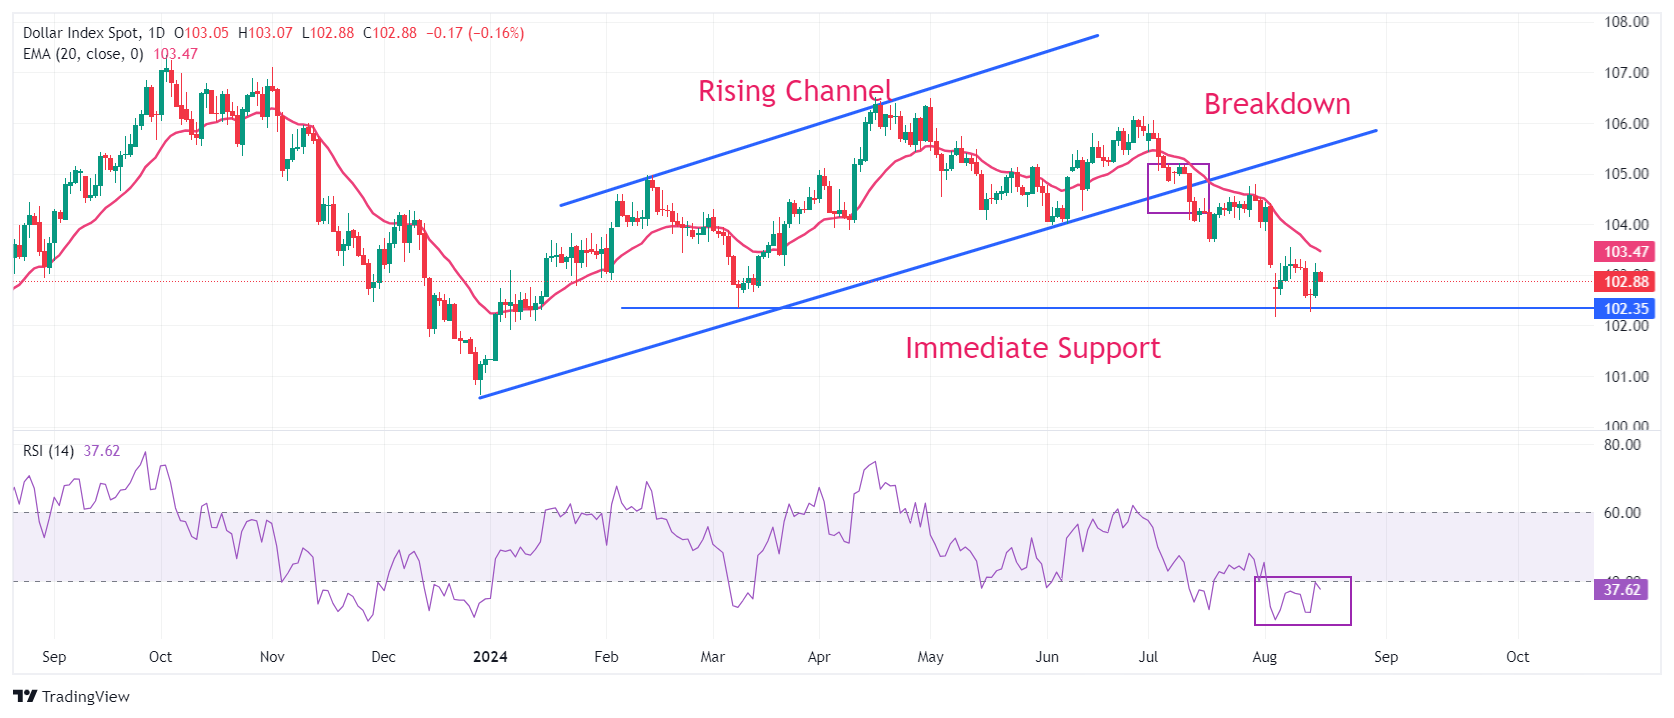
The US Dollar continues to form lower highs and lower lows since the breakdown of the Rising Channel formation on a daily time frame. The declining 20-day Exponential Moving Average (EMA) near 103.50 suggests that the near-term trend is bearish.
The 14-day Relative Strength Index (RSI) oscillates in the 20.00-40.00 range, indicating that the momentum leans strongly to the downside.
Looking down, the March 8 low at 102.35 and the psychological level of 102.00 are immediate support levels for the US Dollar. On the upside, the August 8 high at 103.54 and the June 4 low of 104.00 will act as major resistance for Greenback bulls.
US Dollar FAQs
The US Dollar (USD) is the official currency of the United States of America, and the ‘de facto’ currency of a significant number of other countries where it is found in circulation alongside local notes. It is the most heavily traded currency in the world, accounting for over 88% of all global foreign exchange turnover, or an average of $6.6 trillion in transactions per day, according to data from 2022. Following the second world war, the USD took over from the British Pound as the world’s reserve currency. For most of its history, the US Dollar was backed by Gold, until the Bretton Woods Agreement in 1971 when the Gold Standard went away.
The most important single factor impacting on the value of the US Dollar is monetary policy, which is shaped by the Federal Reserve (Fed). The Fed has two mandates: to achieve price stability (control inflation) and foster full employment. Its primary tool to achieve these two goals is by adjusting interest rates. When prices are rising too quickly and inflation is above the Fed’s 2% target, the Fed will raise rates, which helps the USD value. When inflation falls below 2% or the Unemployment Rate is too high, the Fed may lower interest rates, which weighs on the Greenback.
In extreme situations, the Federal Reserve can also print more Dollars and enact quantitative easing (QE). QE is the process by which the Fed substantially increases the flow of credit in a stuck financial system. It is a non-standard policy measure used when credit has dried up because banks will not lend to each other (out of the fear of counterparty default). It is a last resort when simply lowering interest rates is unlikely to achieve the necessary result. It was the Fed’s weapon of choice to combat the credit crunch that occurred during the Great Financial Crisis in 2008. It involves the Fed printing more Dollars and using them to buy US government bonds predominantly from financial institutions. QE usually leads to a weaker US Dollar.
Quantitative tightening (QT) is the reverse process whereby the Federal Reserve stops buying bonds from financial institutions and does not reinvest the principal from the bonds it holds maturing in new purchases. It is usually positive for the US Dollar.
- WTI fails to build on the overnight recovery and meets with a fresh supply on Friday.
- Bearish traders need to wait for a break below the weekly low, around 75.70-$75.65.
- A sustained move and acceptance above 200-day SMA will negate the negative bias.
West Texas Intermediate (WTI) US crude Oil prices attract fresh sellers on Friday and erode a part of the previous day's modest recovery gains from the vicinity of the weekly low. The commodity remains depressed through the first half of the European session and currently trades below mid-$76.00s, down over 0.70% for the day.
From a technical perspective, Crude Oil prices earlier this week struggled to capitalize on the move beyond the very important 200-day Simple Moving Average (SMA). The subsequent pullback from the monthly peak suggests that the recent recovery from the $71.20-$71.15 region, or the lowest level since January 17 touched last week, has run out of steam. That said, mixed oscillators on the daily chart warrant caution for bearish traders.
It will be prudent to wait for some follow-through selling below the $75.70-$75.65 region, or the weekly low, before positioning for any further depreciating move. Crude Oil prices might then accelerate the downfall towards the $75.00 psychological mark en route to the $74.25 area. The downward trajectory could eventually drag the commodity below the $74.00 mark, towards the next relevant support near the $73.45 region.
On the flip side, immediate resistance is pegged ahead of the $77.00 round figure mark. Any subsequent move up, meanwhile, might still be seen as a selling opportunity near the 200-day SMA, currently near the $77.80 region. This is followed by the $78.00 mark, the $78.20 supply zone and the monthly peak, around the $78.75-$78.80 area. Some follow-through buying will be seen as a fresh trigger for bulls and pave the way for further gains.
WTI daily chart
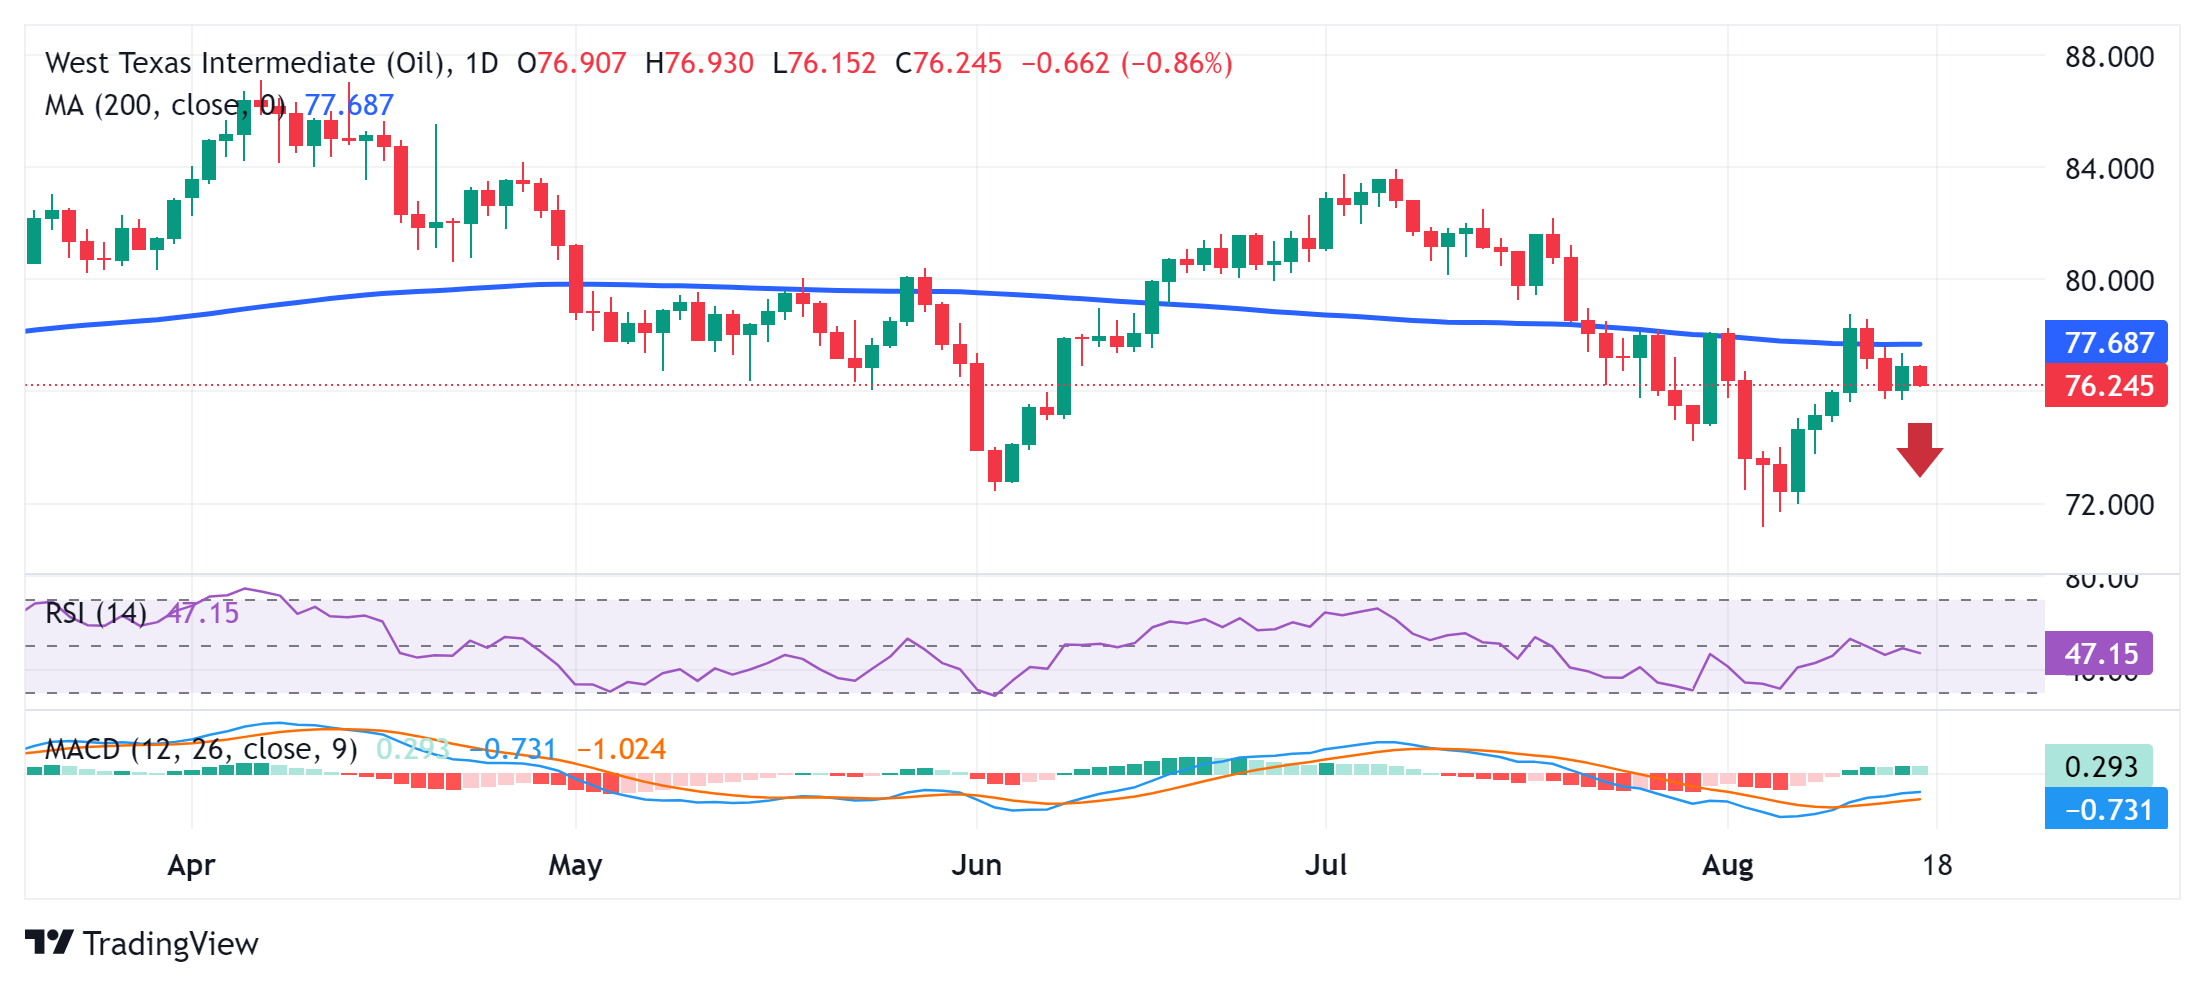
WTI Oil FAQs
WTI Oil is a type of Crude Oil sold on international markets. The WTI stands for West Texas Intermediate, one of three major types including Brent and Dubai Crude. WTI is also referred to as “light” and “sweet” because of its relatively low gravity and sulfur content respectively. It is considered a high quality Oil that is easily refined. It is sourced in the United States and distributed via the Cushing hub, which is considered “The Pipeline Crossroads of the World”. It is a benchmark for the Oil market and WTI price is frequently quoted in the media.
Like all assets, supply and demand are the key drivers of WTI Oil price. As such, global growth can be a driver of increased demand and vice versa for weak global growth. Political instability, wars, and sanctions can disrupt supply and impact prices. The decisions of OPEC, a group of major Oil-producing countries, is another key driver of price. The value of the US Dollar influences the price of WTI Crude Oil, since Oil is predominantly traded in US Dollars, thus a weaker US Dollar can make Oil more affordable and vice versa.
The weekly Oil inventory reports published by the American Petroleum Institute (API) and the Energy Information Agency (EIA) impact the price of WTI Oil. Changes in inventories reflect fluctuating supply and demand. If the data shows a drop in inventories it can indicate increased demand, pushing up Oil price. Higher inventories can reflect increased supply, pushing down prices. API’s report is published every Tuesday and EIA’s the day after. Their results are usually similar, falling within 1% of each other 75% of the time. The EIA data is considered more reliable, since it is a government agency.
OPEC (Organization of the Petroleum Exporting Countries) is a group of 13 Oil-producing nations who collectively decide production quotas for member countries at twice-yearly meetings. Their decisions often impact WTI Oil prices. When OPEC decides to lower quotas, it can tighten supply, pushing up Oil prices. When OPEC increases production, it has the opposite effect. OPEC+ refers to an expanded group that includes ten extra non-OPEC members, the most notable of which is Russia.
- EUR/USD regains positive traction on Friday amid the emergence of some USD selling.
- Fed rate cut bets, along with a positive risk tone, undermine the safe-haven Greenback.
- The technical setup favors bulls and supports prospects for a further appreciating move.
The EUR/USD pair builds on the overnight bounce from the 1.0950 area and gains some follow-through traction on Friday, albeit seems to lack bullish conviction. Spot prices stick to modest intraday gains through the early part of the European session and currently trade around the 1.0985 region, up just over 0.10% for the day.
The US Dollar (USD) struggles to capitalize on Thursday's upbeat US macro data-inspired positive move amid expectations that the Federal Reserve (Fed) will start its rate-cutting cycle in September. Apart from this, a positive tone across the global equity markets undermines the safe-haven Greenback, which, in turn, is seen lending some support to the EUR/USD pair.
From a technical perspective, Thursday's late rebound from the 1.1950 resistance breakpoint, now turned support, favors bullish traders. Moreover, oscillators on the daily chart are holding in positive territory and are still away from being in the overbought zone, suggesting that the path of least resistance for the EUR/USD pair is up and supports prospects for further gains.
Hence, a subsequent strength beyond the 1.1000 psychological mark, towards challenging the YTD peak near the 1.1045-1.1050 region touched on Wednesday, looks like a distinct possibility. Some follow-through buying will be seen as a fresh trigger for bullish traders and pave the way for a move towards reclaiming the 1.1100 mark for the first time since December 2023.
On the flip side, the 1.0950 resistance-turned-support should continue to protect the immediate downside ahead of the 1.0920 horizontal zone and the 1.0900 mark. Some follow-through selling below the 1.0880 mark might expose the 200-day Simple Moving Average (SMA), currently pegged near the 1.0835 region before the EUR/USD pair drops to the 1.0800 mark.
The latter coincides with the 100-day SMA and should act as a key pivotal point. A convincing break below will suggest that spot prices have formed a near-term top and shift the near-term bias in favor of bearish traders.
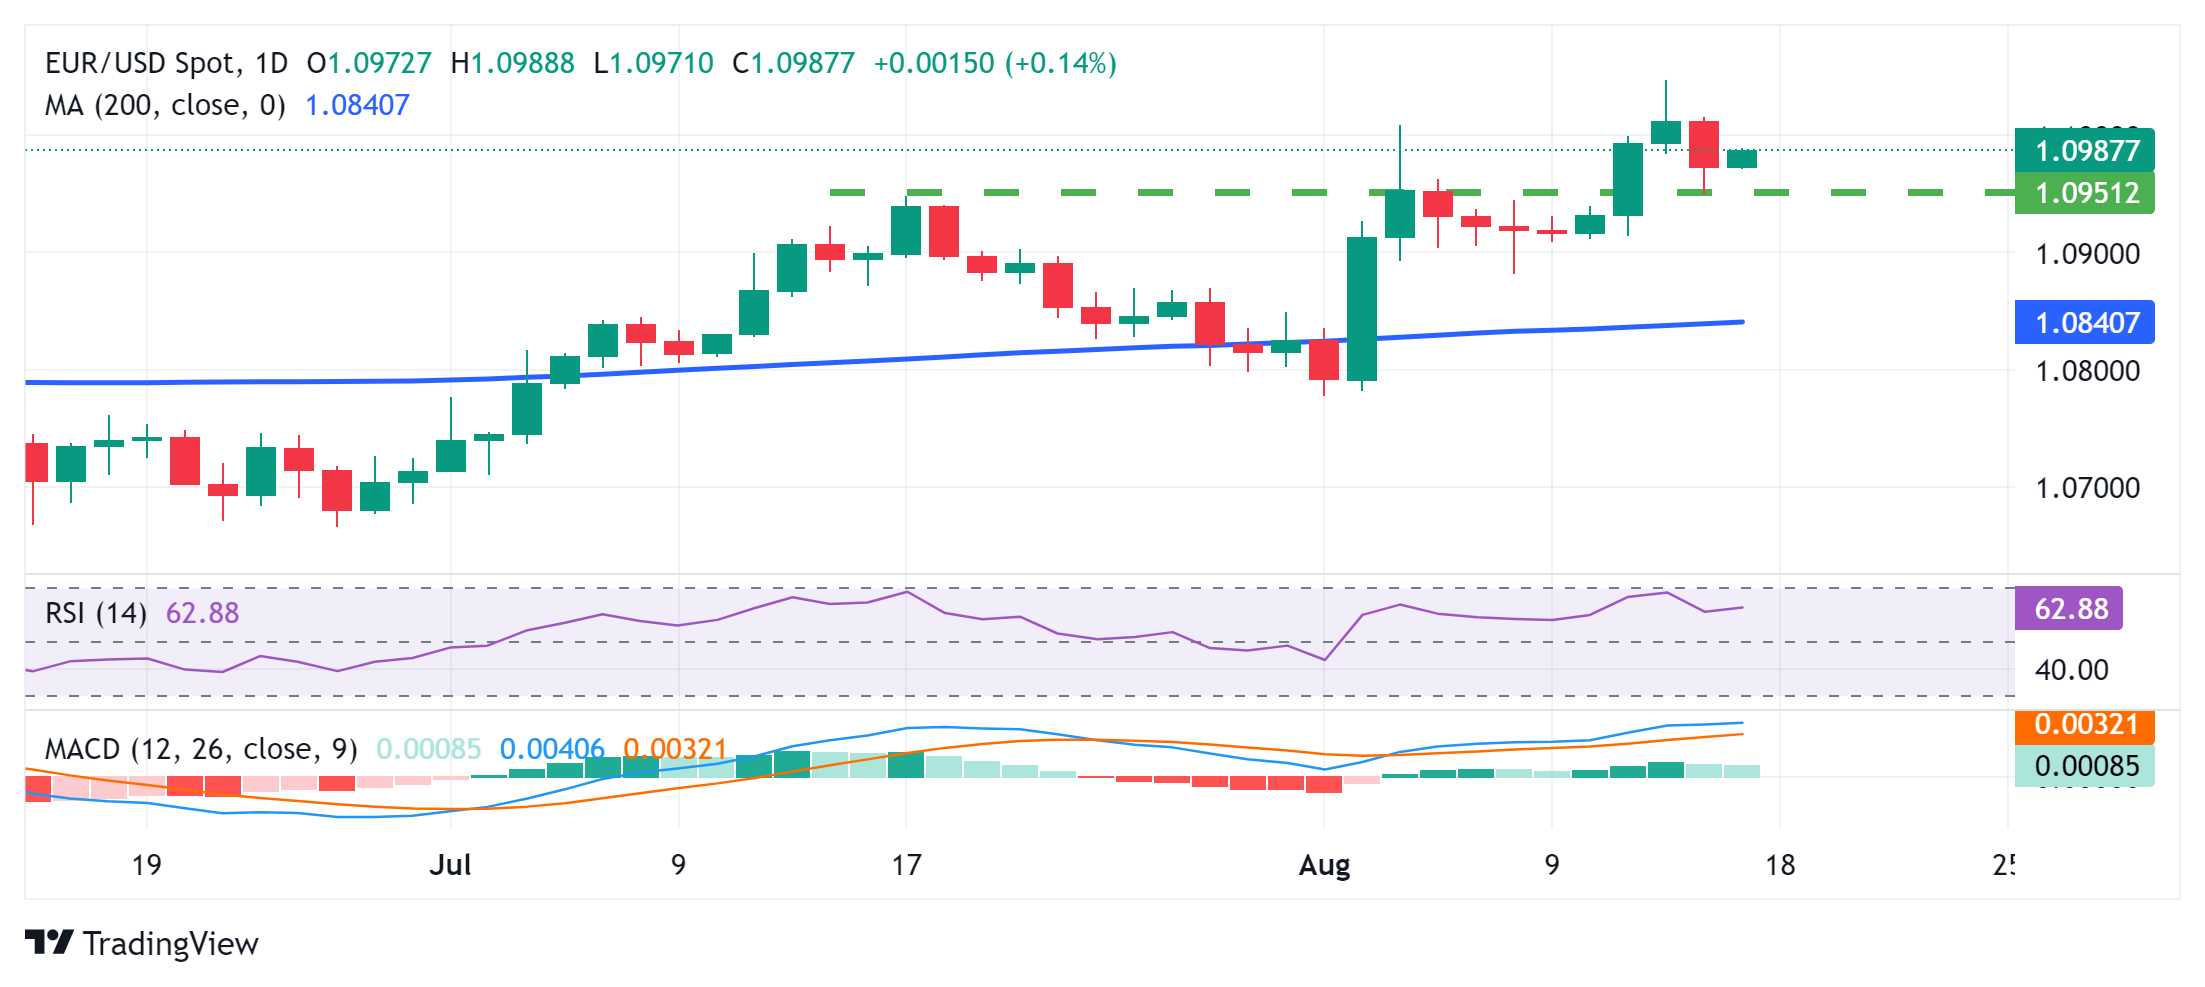
US Dollar PRICE Today
The table below shows the percentage change of US Dollar (USD) against listed major currencies today. US Dollar was the strongest against the Canadian Dollar.
| USD | EUR | GBP | JPY | CAD | AUD | NZD | CHF | |
|---|---|---|---|---|---|---|---|---|
| USD | -0.13% | -0.20% | -0.27% | -0.05% | -0.27% | -0.39% | -0.41% | |
| EUR | 0.13% | -0.07% | -0.15% | 0.08% | -0.18% | -0.38% | -0.25% | |
| GBP | 0.20% | 0.07% | -0.10% | 0.15% | -0.10% | -0.30% | -0.19% | |
| JPY | 0.27% | 0.15% | 0.10% | 0.28% | -0.01% | -0.23% | -0.14% | |
| CAD | 0.05% | -0.08% | -0.15% | -0.28% | -0.25% | -0.48% | -0.36% | |
| AUD | 0.27% | 0.18% | 0.10% | 0.01% | 0.25% | -0.21% | -0.11% | |
| NZD | 0.39% | 0.38% | 0.30% | 0.23% | 0.48% | 0.21% | 0.12% | |
| CHF | 0.41% | 0.25% | 0.19% | 0.14% | 0.36% | 0.11% | -0.12% |
The heat map shows percentage changes of major currencies against each other. The base currency is picked from the left column, while the quote currency is picked from the top row. For example, if you pick the US Dollar from the left column and move along the horizontal line to the Japanese Yen, the percentage change displayed in the box will represent USD (base)/JPY (quote).
- Silver attracts fresh sellers and reverses a part of Thursday’s move up to a nearly two-week top.
- The technical setup favors bearish traders and supports prospects for a further depreciating move.
- A sustained strength beyond the $28.50 hurdle is needed to negate the near-term negative bias.
Silver (XAG/USD) meets with some supply on Friday and erodes a part of the previous day's strong move up to the $28.50 area, or a nearly two-week high. The white metal remains depressed through the early European session and currently trades around the $28.15-$28.10 region, down over 0.70% for the day.
From a technical perspective, the recent recovery from the $26.45 area, or a three-month low touched last week stalls near the 38.2% Fibonacci retracement level of the July-August decline. The said barrier is pegged near mid-$28.00s and should act as a key pivotal point, above which a fresh bout of a short-covering rally should allow the XAG/USD to reclaim the $29.00 mark.
The latter coincides with the 50% Fibo. level, which if cleared decisively should pave the way for additional gains. That said, oscillators on the daily chart – though have recovered from lower levels – are yet to confirm a positive bias and warrant some caution before positioning for any further near-term appreciating move.
On the flip side, a sustained beak and acceptance below the $28.00 mark could drag the XAG/USD back toward the 23.6% Fibo. level, around the $27.75 region en route to the $27.45-$27.40 horizontal support. Some follow-through selling might shift the near-term bias back in favour of bearish traders and pave the way for further near-term losses towards the $27.00 round figure.
The downward trajectory could extend further towards challenging the multi-month low, around the $26.45 area. This is closely followed by the very important 200-day Simple Moving Average (SMA), around the $26.35-$26.30 region, which if broken decisively will make a fresh breakdown. The XAG/USD might then prolong its one-month-old well-established downtrend.
Silver daily chart
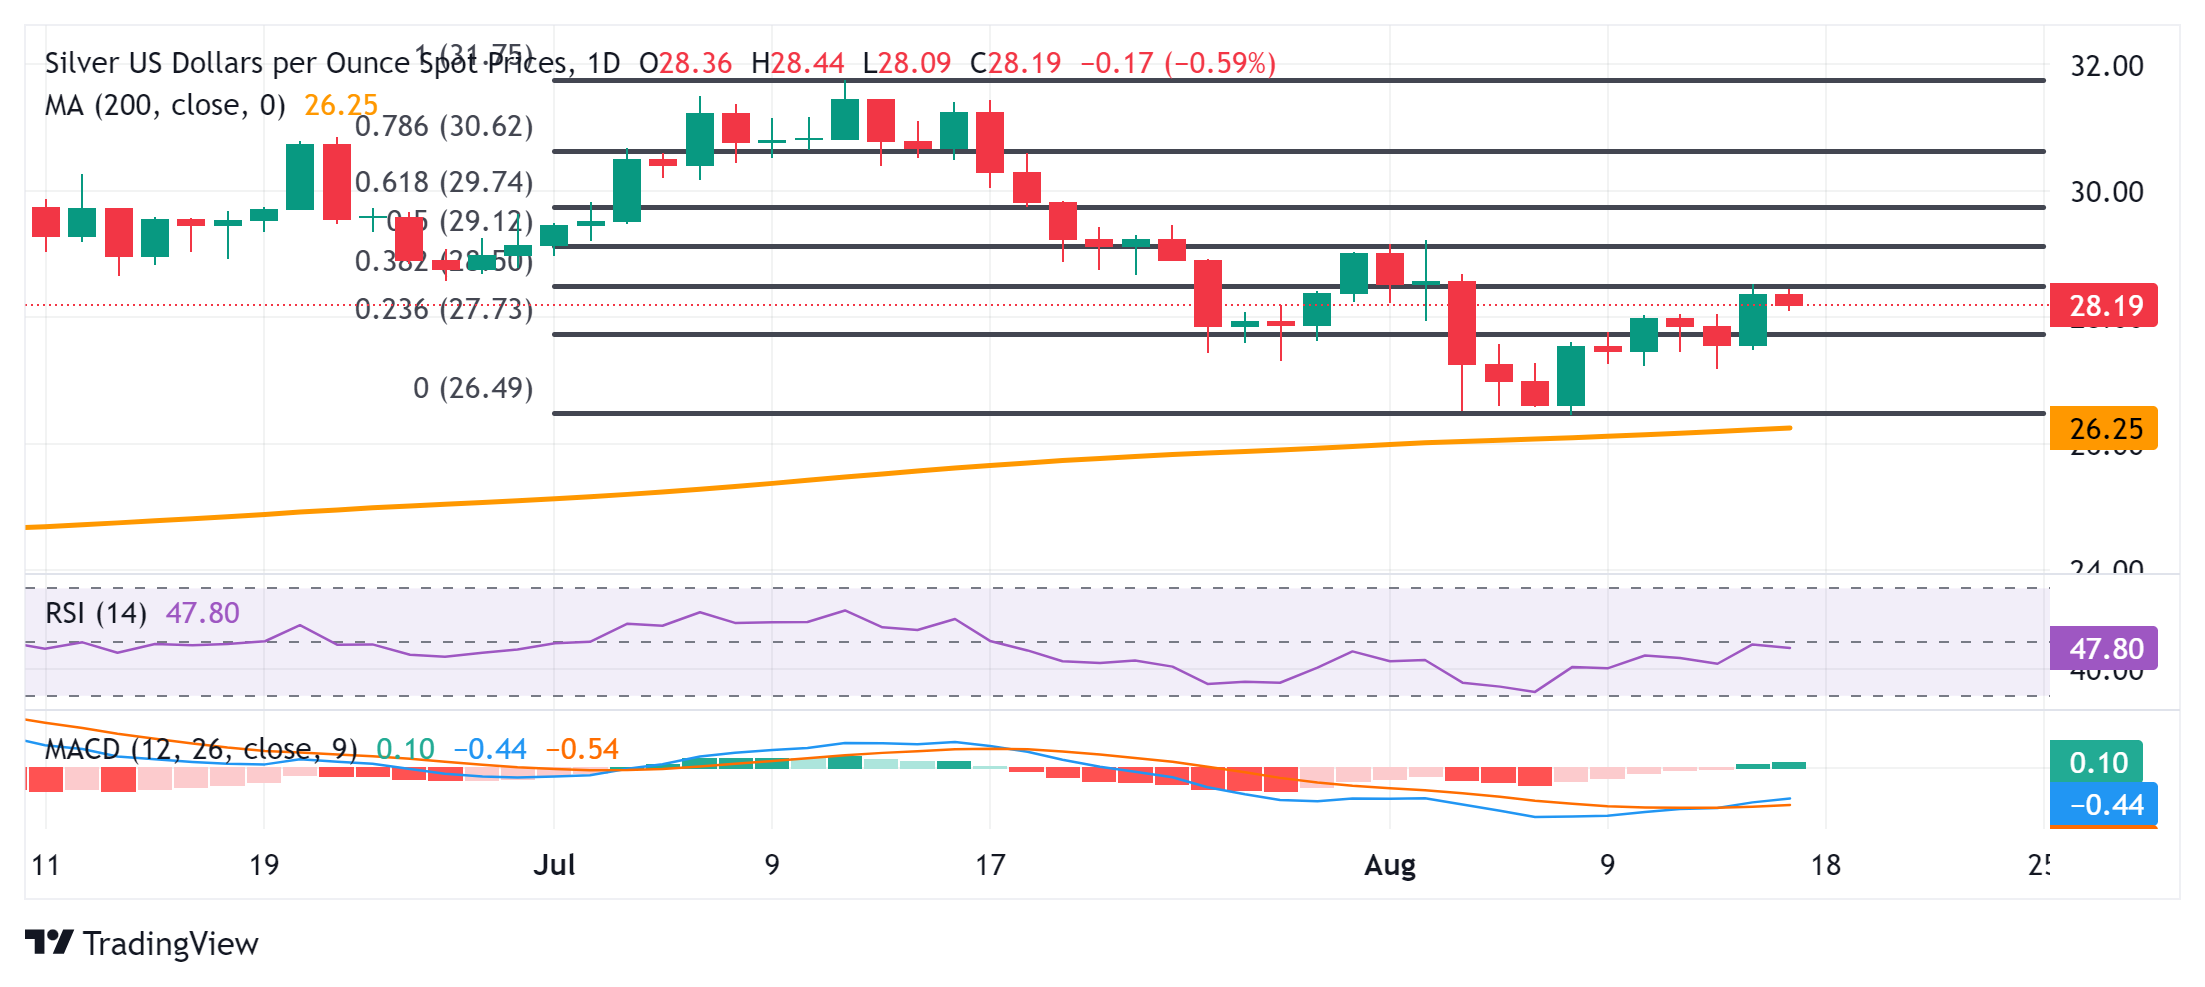
Silver FAQs
Silver is a precious metal highly traded among investors. It has been historically used as a store of value and a medium of exchange. Although less popular than Gold, traders may turn to Silver to diversify their investment portfolio, for its intrinsic value or as a potential hedge during high-inflation periods. Investors can buy physical Silver, in coins or in bars, or trade it through vehicles such as Exchange Traded Funds, which track its price on international markets.
Silver prices can move due to a wide range of factors. Geopolitical instability or fears of a deep recession can make Silver price escalate due to its safe-haven status, although to a lesser extent than Gold's. As a yieldless asset, Silver tends to rise with lower interest rates. Its moves also depend on how the US Dollar (USD) behaves as the asset is priced in dollars (XAG/USD). A strong Dollar tends to keep the price of Silver at bay, whereas a weaker Dollar is likely to propel prices up. Other factors such as investment demand, mining supply – Silver is much more abundant than Gold – and recycling rates can also affect prices.
Silver is widely used in industry, particularly in sectors such as electronics or solar energy, as it has one of the highest electric conductivity of all metals – more than Copper and Gold. A surge in demand can increase prices, while a decline tends to lower them. Dynamics in the US, Chinese and Indian economies can also contribute to price swings: for the US and particularly China, their big industrial sectors use Silver in various processes; in India, consumers’ demand for the precious metal for jewellery also plays a key role in setting prices.
Silver prices tend to follow Gold's moves. When Gold prices rise, Silver typically follows suit, as their status as safe-haven assets is similar. The Gold/Silver ratio, which shows the number of ounces of Silver needed to equal the value of one ounce of Gold, may help to determine the relative valuation between both metals. Some investors may consider a high ratio as an indicator that Silver is undervalued, or Gold is overvalued. On the contrary, a low ratio might suggest that Gold is undervalued relative to Silver.
- AUD/JPY appreciates due to improved risk-on sentiment following reduced fears of a US recession.
- RBA Governor Michele Bullock anticipates no rate cuts in the near term.
- The Japanese Yen may advance further due to the rising odds of a further rate hike by the BoJ.
AUD/JPY advances further for the second consecutive day, trading around 98.90 during the early European session on Friday. The Australian Dollar (AUD) gains ground against the Japanese Yen (JPY) due to improved risk sentiment following the stronger-than-expected recovery in US Retail Sales, which has eased concerns about a potential recession in the United States (US).
Additionally, hawkish comments from Reserve Bank of Australia (RBA) Governor Michele Bullock are boosting the Aussie Dollar and underpinning the AUD/JPY cross. On Friday, Governor Bullock emphasized that the Australian central bank is focused on potential upside risks to inflation and does not foresee any rate cuts in the near future. The board believes it has found the right balance between curbing inflation and maintaining stability in the current economic environment, per ABC News.
Earlier this week data reported in China showed that Retail Sales grew by 2.7% year-on-year in July, exceeding market forecasts of 2.6% and accelerating from June's 17-month low of 2.0%. This might have supported the Aussie Dollar as both countries are close trade partners.
The upside of the AUD/JPY cross could be limited as the Japanese Yen receives support from the recent GDP report indicating growth in Japan’s second quarter. This consistent growth lends support to the possibility of a near-term interest rate hike by the Bank of Japan (BoJ).
In Japan, political uncertainty may contribute to the downside of the JPY. Japanese Prime Minister Fumio Kishida announced at a press conference on Wednesday that he will not seek re-election as the leader of the Liberal Democratic Party (LDP) in September.
Australian Dollar FAQs
One of the most significant factors for the Australian Dollar (AUD) is the level of interest rates set by the Reserve Bank of Australia (RBA). Because Australia is a resource-rich country another key driver is the price of its biggest export, Iron Ore. The health of the Chinese economy, its largest trading partner, is a factor, as well as inflation in Australia, its growth rate and Trade Balance. Market sentiment – whether investors are taking on more risky assets (risk-on) or seeking safe-havens (risk-off) – is also a factor, with risk-on positive for AUD.
The Reserve Bank of Australia (RBA) influences the Australian Dollar (AUD) by setting the level of interest rates that Australian banks can lend to each other. This influences the level of interest rates in the economy as a whole. The main goal of the RBA is to maintain a stable inflation rate of 2-3% by adjusting interest rates up or down. Relatively high interest rates compared to other major central banks support the AUD, and the opposite for relatively low. The RBA can also use quantitative easing and tightening to influence credit conditions, with the former AUD-negative and the latter AUD-positive.
China is Australia’s largest trading partner so the health of the Chinese economy is a major influence on the value of the Australian Dollar (AUD). When the Chinese economy is doing well it purchases more raw materials, goods and services from Australia, lifting demand for the AUD, and pushing up its value. The opposite is the case when the Chinese economy is not growing as fast as expected. Positive or negative surprises in Chinese growth data, therefore, often have a direct impact on the Australian Dollar and its pairs.
Iron Ore is Australia’s largest export, accounting for $118 billion a year according to data from 2021, with China as its primary destination. The price of Iron Ore, therefore, can be a driver of the Australian Dollar. Generally, if the price of Iron Ore rises, AUD also goes up, as aggregate demand for the currency increases. The opposite is the case if the price of Iron Ore falls. Higher Iron Ore prices also tend to result in a greater likelihood of a positive Trade Balance for Australia, which is also positive of the AUD.
The Trade Balance, which is the difference between what a country earns from its exports versus what it pays for its imports, is another factor that can influence the value of the Australian Dollar. If Australia produces highly sought after exports, then its currency will gain in value purely from the surplus demand created from foreign buyers seeking to purchase its exports versus what it spends to purchase imports. Therefore, a positive net Trade Balance strengthens the AUD, with the opposite effect if the Trade Balance is negative.
Here is what you need to know on Friday, August 16:
The US Dollar (USD) outperformed its rivals on Thursday, boosted by the upbeat macroeconomic data releases from the US. After rising 0.5%, the USD Index stays in a consolidation phase below 103.00 as markets await Housing Starts and Building Permits data for July. Additionally, the University of Michigan will release the preliminary Consumer Sentiment Index for August.
US Dollar PRICE This week
The table below shows the percentage change of US Dollar (USD) against listed major currencies this week. US Dollar was the strongest against the Japanese Yen.
| USD | EUR | GBP | JPY | CAD | AUD | NZD | CHF | |
|---|---|---|---|---|---|---|---|---|
| USD | -0.56% | -0.85% | 1.59% | -0.09% | -0.80% | -0.20% | 0.61% | |
| EUR | 0.56% | -0.27% | 2.16% | 0.49% | -0.37% | 0.36% | 1.19% | |
| GBP | 0.85% | 0.27% | 2.68% | 0.74% | -0.13% | 0.62% | 1.46% | |
| JPY | -1.59% | -2.16% | -2.68% | -1.64% | -2.41% | -1.76% | -0.99% | |
| CAD | 0.09% | -0.49% | -0.74% | 1.64% | -0.75% | -0.10% | 0.73% | |
| AUD | 0.80% | 0.37% | 0.13% | 2.41% | 0.75% | 0.72% | 1.55% | |
| NZD | 0.20% | -0.36% | -0.62% | 1.76% | 0.10% | -0.72% | 0.83% | |
| CHF | -0.61% | -1.19% | -1.46% | 0.99% | -0.73% | -1.55% | -0.83% |
The heat map shows percentage changes of major currencies against each other. The base currency is picked from the left column, while the quote currency is picked from the top row. For example, if you pick the US Dollar from the left column and move along the horizontal line to the Japanese Yen, the percentage change displayed in the box will represent USD (base)/JPY (quote).
The USD gathered strength in the early American session on Thursday after the US Department of Labor reported that the weekly Initial Jobless Claims declined to 227,000 in the week ending August 9. Other data from the US showed that Retail Sales rose 1% on a monthly basis in July after declining by 0.2% in June. The benchmark 10-year US Treasury bond yield recovered above 3.9% after this data and gained more than 2% on the day. As Wall Street's main indexes pushed higher after opening in positive territory, the USD's gains remained limited later in the day. Early Friday, US stock index futures trade modestly higher on the day.
The UK's Office for National Statistics reported earlier in the day that Retail Sales increased 0.5% on a monthly basis in July, matching the market expectation. GBP/USD holds its ground in the European morning and was last seen trading at its highest level in nearly three weeks at around 1.2880.
Reserve Bank of New Zealand (RBNZ) Governor Adrian Orr said during the Asian trading hours on Friday that policymakers are very confident that forward indicators show inflation stabilizing within the 1%-3% target range. After closing the previous two trading days in negative territory, NZD/USD stages a rebound on Friday and trades above 0.6000.
AUD/USD gains traction on the last trading day of the week and rises toward 0.6650. Reserve Bank of Australia Governor Michele Bullock said earlier in the day that the central bank remains focused on the potential upside risks to inflation, adding that it does not expect to cut rates in the near term.
EUR/USD snapped a three-day winning streak on Thursday, pressured by the renewed USD strength. The pair hold its ground early Friday but stays below 1.1000.
Gold failed to gather bullish momentum on Thursday and closed the day with small gains. XAU/USD trades in a relatively tight channel slightly above $2,450 early Friday.
USD/JPY broke out of its horizontal trading range and gained more than 1% on Thursday. The pair stays in a consolidation phase near 149.00 in the European morning.
US Dollar FAQs
The US Dollar (USD) is the official currency of the United States of America, and the ‘de facto’ currency of a significant number of other countries where it is found in circulation alongside local notes. It is the most heavily traded currency in the world, accounting for over 88% of all global foreign exchange turnover, or an average of $6.6 trillion in transactions per day, according to data from 2022. Following the second world war, the USD took over from the British Pound as the world’s reserve currency. For most of its history, the US Dollar was backed by Gold, until the Bretton Woods Agreement in 1971 when the Gold Standard went away.
The most important single factor impacting on the value of the US Dollar is monetary policy, which is shaped by the Federal Reserve (Fed). The Fed has two mandates: to achieve price stability (control inflation) and foster full employment. Its primary tool to achieve these two goals is by adjusting interest rates. When prices are rising too quickly and inflation is above the Fed’s 2% target, the Fed will raise rates, which helps the USD value. When inflation falls below 2% or the Unemployment Rate is too high, the Fed may lower interest rates, which weighs on the Greenback.
In extreme situations, the Federal Reserve can also print more Dollars and enact quantitative easing (QE). QE is the process by which the Fed substantially increases the flow of credit in a stuck financial system. It is a non-standard policy measure used when credit has dried up because banks will not lend to each other (out of the fear of counterparty default). It is a last resort when simply lowering interest rates is unlikely to achieve the necessary result. It was the Fed’s weapon of choice to combat the credit crunch that occurred during the Great Financial Crisis in 2008. It involves the Fed printing more Dollars and using them to buy US government bonds predominantly from financial institutions. QE usually leads to a weaker US Dollar.
Quantitative tightening (QT) is the reverse process whereby the Federal Reserve stops buying bonds from financial institutions and does not reinvest the principal from the bonds it holds maturing in new purchases. It is usually positive for the US Dollar.
- Gold has corrected back from chart resistance in the $2,470s after the release of strong US retail sales data.
- Lower US initial jobless claims brought more positive news about the US economy, helping to dispel recession fears.
- The precious metal is probably unfolding a leg down within a sideways trend.
Gold (XAU/USD) swings between mild gains and losses in the $2,450s on Friday. The precious metal is in the midst of a retreat from a key chart resistance line in the $2,470s, which it had been battling with for most of the earlier part of the week.
The pullback was caused by better-than-expected US Retail Sales data released Thursday, which came out at 1.0% month-over-month in July, roundly beat economists estimates of 0.3%, and signaled a turnaround from June’s downwardly-revised 0.2% drop.
The enduring strength of the US consumer eased concerns the US economy might be entering a recession, fears that plagued markets at the start of August. Gold’s safe-haven status means it is actually losing value due to the less pessimistic outlook engendered by the data.
Gold bulls sound the horn after strong US data
Gold has been losing ground after the release of stronger-than-expected US macroeconomic data on Thursday. This not only brought into question the view that the US economy was at risk of entering a recession but also strengthened the US Dollar (USD) which Gold is mainly priced in, and readjusted investor expectations for the future path of interest rates in the US. The stronger data suggests the US Federal Reserve (Fed) may need to keep interest rates higher for longer, a negative scenario for Gold because it is a non-interest paying asset.
Analysts differ as to the overall significance of the strong data. Ulrich Leuchtmann, Head of FX Research at Commerzbank, cautions against reading too much positivity into it because Retail Sales is a lagging economic metric.
“In a hypothetical coming recession, the US labor market would certainly only suffer damage with a time lag. And it is only then that the US consumer typically notices,” says Leuchtmann.
“Do you remember Tom & Jerry? In the cartoon, you often see Tom the cat running over a cliff and continuing to run in the air for a moment before crashing all the harder. If the US economy were to slide into recession in the near future, it seems plausible to me that US retail sales would show a similar behavior,” he adds.
Economists at Capital Economics on the other hand, are more positive, headlining their note “Don’t bet against the US Consumer.”
“There was almost nothing in the July retail sales report for the perma-bears to latch on to,” they said in the report. “That increases the likelihood that the Fed will kick off its loosening cycle with a 25 bp cut in September, rather than a 50 bp move as markets were recently pricing in,” it adds.
US Jobs market also shows signs of resilience
In addition to the strong US Retail sales data, further data out on Thursday also showed US Initial Jobless Claims declining to 227K from an upwardly revised 234K, indicating a rebound in the jobs market – a further positive for the US economy.
Capital economics puts the encouraging jobs data down to the rapid reversal of temporary negative factors – Hurricane Beryl and the temporary shutdown of auto factories in Michigan.
Technical Analysis: Gold steps back from range ceiling
Gold is pulling back from the range ceiling it was pushing up against for most of the earlier part of the week. The short-term trend is probably sideways and, given “the trend is your friend”, is more likely than not to extend in that direction – oscillating within its range.
XAU/USD 4-hour Chart
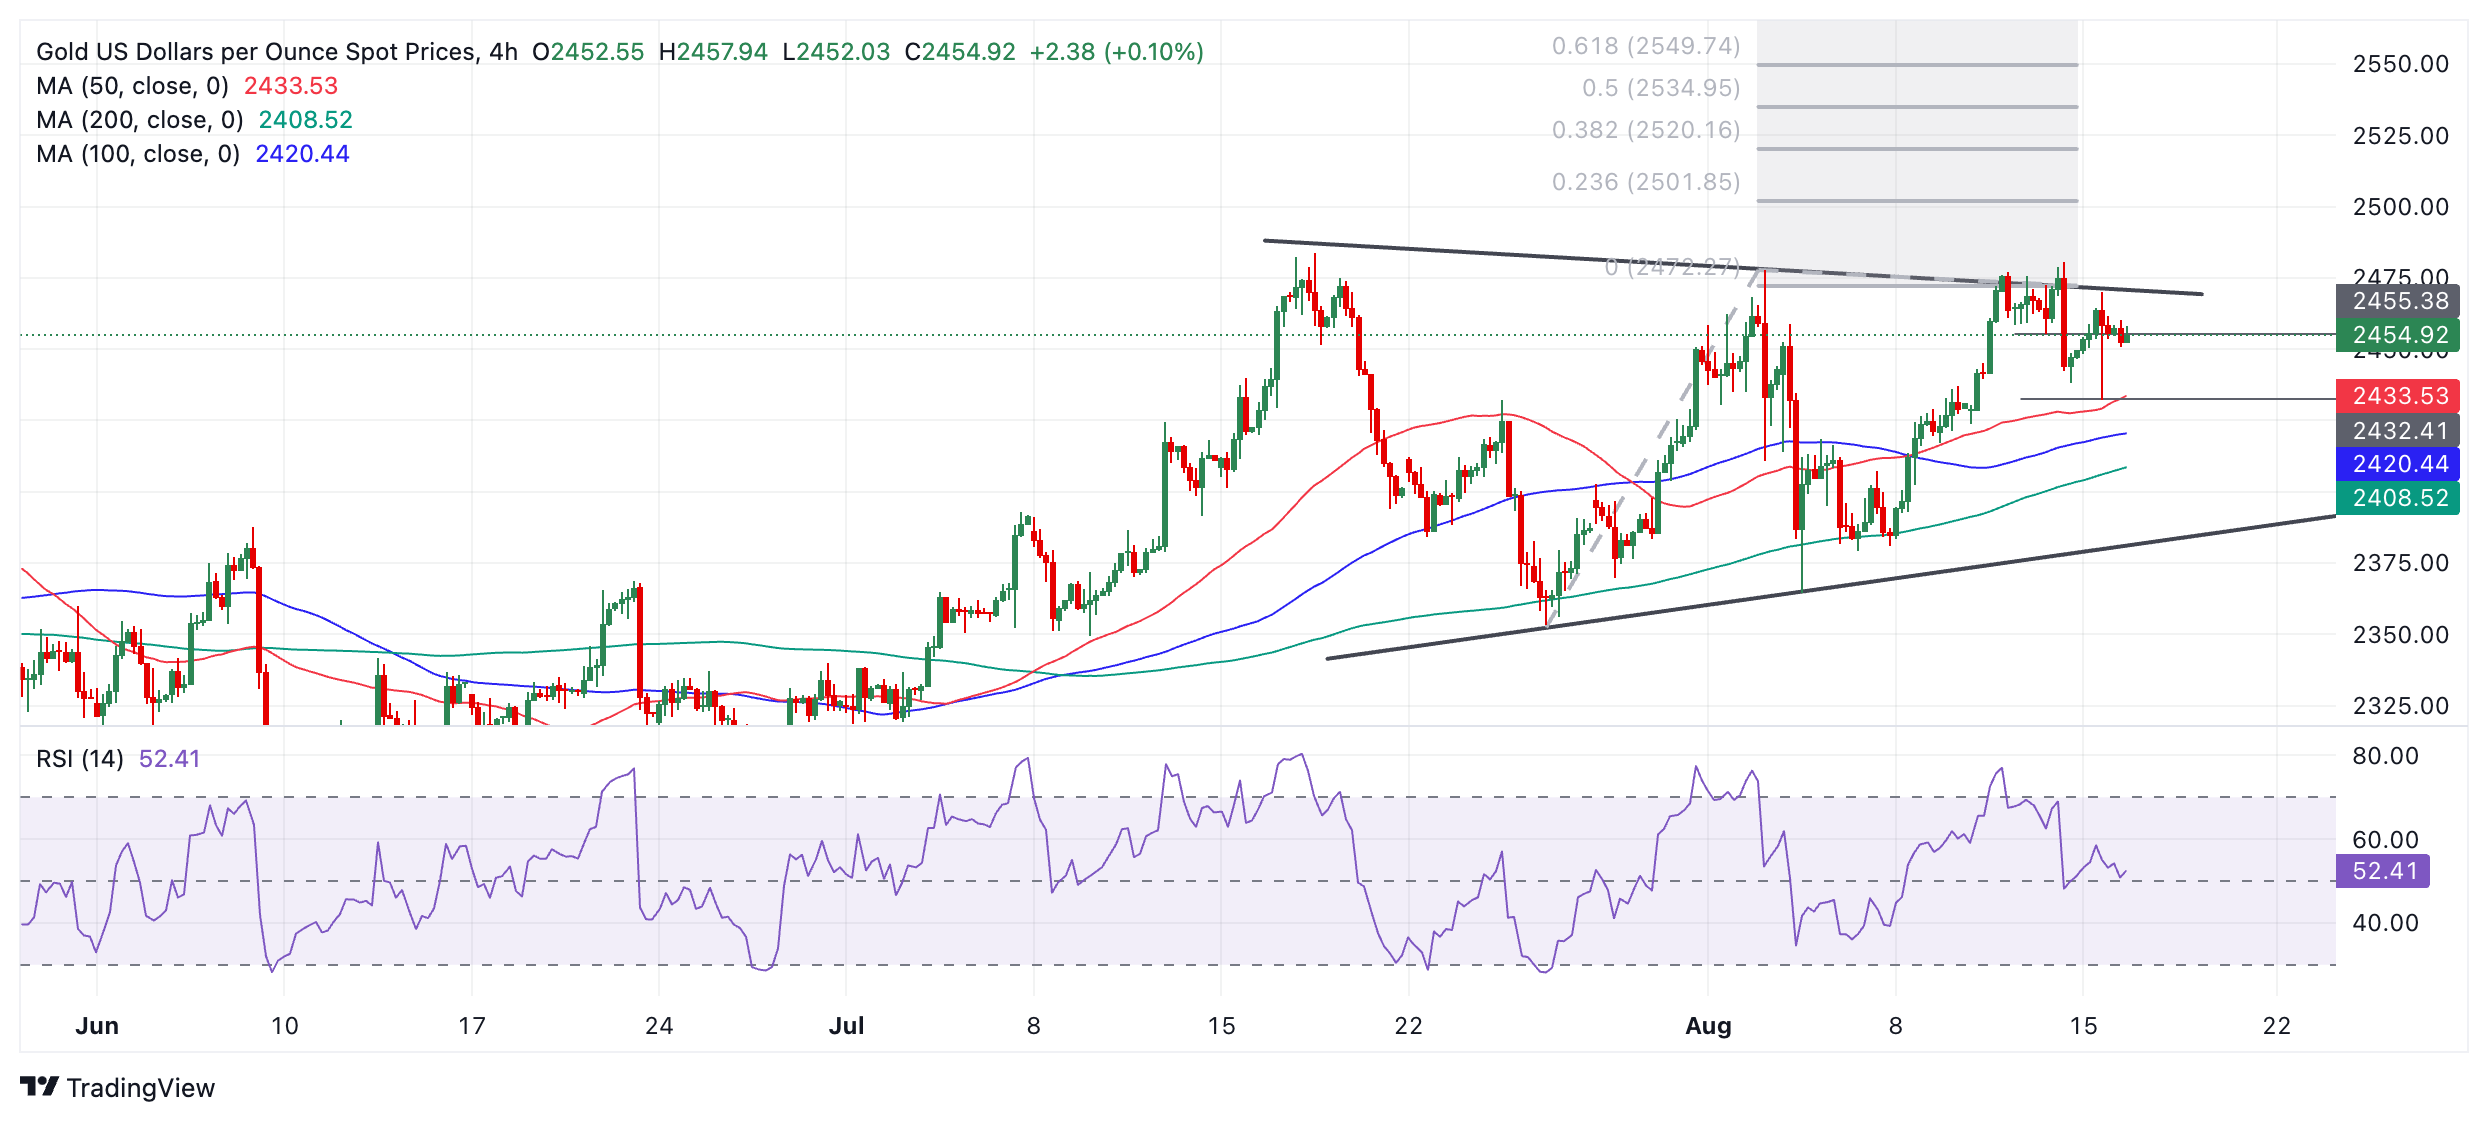
Gold appears to have begun a fresh down leg within the range. It will probably now move down to $2,400, perhaps even reaching the range floor in the $2,390s. Due to the fact the range is tapering slightly, it might also be seen as a triangle pattern in the latter stages of development. A break below $2,432 (August 15 lows) would help provide additional bearish confirmation the down leg was evolving.
It is possible that the pair could breakout higher, continuing the longer-term bullish trend that was in play prior to the formation of the range. A decisive break above the range ceiling would be required, however, to confirm such a development. An upside breakout would then be expected to reach $2,550, a fresh all-time high, calculated by taking the 0.618 Fibonacci ratio of the range’s height and extrapolating it higher.
A decisive break would be one characterized by a long green candle that pierced clearly through the level and closed near its high, or three green candles in a row that breached the level.
Gold FAQs
Gold has played a key role in human’s history as it has been widely used as a store of value and medium of exchange. Currently, apart from its shine and usage for jewelry, the precious metal is widely seen as a safe-haven asset, meaning that it is considered a good investment during turbulent times. Gold is also widely seen as a hedge against inflation and against depreciating currencies as it doesn’t rely on any specific issuer or government.
Central banks are the biggest Gold holders. In their aim to support their currencies in turbulent times, central banks tend to diversify their reserves and buy Gold to improve the perceived strength of the economy and the currency. High Gold reserves can be a source of trust for a country’s solvency. Central banks added 1,136 tonnes of Gold worth around $70 billion to their reserves in 2022, according to data from the World Gold Council. This is the highest yearly purchase since records began. Central banks from emerging economies such as China, India and Turkey are quickly increasing their Gold reserves.
Gold has an inverse correlation with the US Dollar and US Treasuries, which are both major reserve and safe-haven assets. When the Dollar depreciates, Gold tends to rise, enabling investors and central banks to diversify their assets in turbulent times. Gold is also inversely correlated with risk assets. A rally in the stock market tends to weaken Gold price, while sell-offs in riskier markets tend to favor the precious metal.
The price can move due to a wide range of factors. Geopolitical instability or fears of a deep recession can quickly make Gold price escalate due to its safe-haven status. As a yield-less asset, Gold tends to rise with lower interest rates, while higher cost of money usually weighs down on the yellow metal. Still, most moves depend on how the US Dollar (USD) behaves as the asset is priced in dollars (XAU/USD). A strong Dollar tends to keep the price of Gold controlled, whereas a weaker Dollar is likely to push Gold prices up.
- USD/MXN extends the decline around 18.60 in Friday’s early Asian session.
- The expectation of a Fed rate cut in September supports the Mexican Peso.
- The Mexican Peso remains strong despite a surprise rate cut by Banxico last week.
USD/MXN trades in negative territory for the fourth consecutive day around 18.60 during the early European trading hours on Friday. The further downside of the pair is backed by the expectation that the US Federal Reserve (Fed) would cut at least a 25 basis point (bps) in September. Investors will monitor the preliminary US Michigan Consumer Sentiment Index for August, Building Permits, and Housing Starts, which are due later on Friday. Also, the Fed's Austan Goolsbee is set to speak.
The upbeat US economic data on Thursday, including Initial Jobless Claims and Retail Sales, eased fears about a potential recession in the United States. However, traders are still expecting the Fed to cut its interest rate in September, which weighs on the Greenback in the near term. The market is now fully priced for a 25 basis points (bps) Fed rate cut in September and nearly 20% priced for a 50 bps cut, according to the CME FedWatch tool.
The upside of the Mexican Peso occurred despite a surprise rate cut by Mexico’s central bank (Banxico) last week, lowering interest rates by 25 bps from 11% to 10.75%. Mexican economist Alexis Milo, former chief economist at HSBC México, noted, “The markets in the US are having their best day in more than a year, and that is allowing the peso to recover. This effect prevailed over the depreciation that we would have expected with a rate cut. ”
Banxico FAQs
The Bank of Mexico, also known as Banxico, is the country’s central bank. Its mission is to preserve the value of Mexico’s currency, the Mexican Peso (MXN), and to set the monetary policy. To this end, its main objective is to maintain low and stable inflation within target levels – at or close to its target of 3%, the midpoint in a tolerance band of between 2% and 4%.
The main tool of the Banxico to guide monetary policy is by setting interest rates. When inflation is above target, the bank will attempt to tame it by raising rates, making it more expensive for households and businesses to borrow money and thus cooling the economy. Higher interest rates are generally positive for the Mexican Peso (MXN) as they lead to higher yields, making the country a more attractive place for investors. On the contrary, lower interest rates tend to weaken MXN. The rate differential with the USD, or how the Banxico is expected to set interest rates compared with the US Federal Reserve (Fed), is a key factor.
Banxico meets eight times a year, and its monetary policy is greatly influenced by decisions of the US Federal Reserve (Fed). Therefore, the central bank’s decision-making committee usually gathers a week after the Fed. In doing so, Banxico reacts and sometimes anticipates monetary policy measures set by the Federal Reserve. For example, after the Covid-19 pandemic, before the Fed raised rates, Banxico did it first in an attempt to diminish the chances of a substantial depreciation of the Mexican Peso (MXN) and to prevent capital outflows that could destabilize the country.
- The Pound Sterling exhibits sheer strength against the US Dollar on multiple tailwinds.
- Healthy growth in UK Retail Sales could diminish bets of a second straight BoE interest-rate cut.
- The US Dollar struggles to hold onto Thursday's recovery, which was driven by upbeat economic data.
The Pound Sterling (GBP) outperforms its major peers, except Asia-Pacific currencies, in Friday’s London session. The British currency gains significantly as the United Kingdom (UK) Office for National Statistics (ONS) has reported that Retail Sales rebounded in July, as expected, after contracting sharply in June.
The report showed that monthly and annual Retail Sales rose by 0.5% and 1.4%, respectively. As per the report, sales receipts at department stores and sports equipment stores grew strongly, with retailers suggesting that summer discounting and sporting events such as the European Football Championship boosted sales. On the contrary, demand for automotive fuel contracted sharply.
Retail Sales are a key measure of consumer spending. Strong demand from consumers tends to fuel inflationary pressures in the economy, so the data could dampen expectations that the Bank of England (BoE) will opt for another interest-rate cut in September. The BoE started reducing its key borrowing rates in the first week of August, but the rate-cut move was a tough call, with a 5-4 vote split.
BoE’s next monetary policy meeting in September could also be a tough call. Inflation in the UK service sector declined sharply in July due to slowing wage growth momentum. However, the latest labor market data also showed that the Unemployment Rate surprisingly fell, and that the economy is clearly on an expansion path.
Daily digest market movers: Pound Sterling refreshes two-week high against US Dollar
- The Pound Sterling posts a fresh two-week high at 1.2885 against the US Dollar (USD). The GBP/USD pair strengthens as the US Dollar falls slightly in Friday’s European trading hours after a sharp recovery on Thursday. The US Dollar Index (DXY), which tracks the Greenback’s value against six major currencies, hovers near 103.00 after bouncing from a 10-day low of 102.27.
- The recovery move in the US Dollar was prompted by robust growth in United States (US) monthly Retail Sales for July and lower-than-expected weekly Jobless Claims. Upbeat US data diminishes fears of a recession, dashing expectations for an aggressive policy/easing response from the Federal Reserve (Fed) in September.
- According to the CME FedWatch tool, 30-day Federal Finds Futures pricing data shows that the likelihood of 50 basis points (bps) interest-rate reduction has diminished to 29.5% from the 51% recorded a week ago. Even though market speculation for large rate cuts has significantly eased, expectations for a dovish decision in September remain firm.
- A lower number of US individuals claiming jobless benefits for the first time consecutively for two weeks suggests that labor market conditions are not as bad as shown by the Nonfarm Payrolls (NFP) data for July. The official Employment data showed soft labor demand and a significant rise in the Unemployment Rate.
- Meanwhile, Fed policymakers are also signaling they are comfortable with interest-rate cut expectations. On Thursday, St. Louis Federal Reserve President Alberto Musalem said: "The time may be nearing when an adjustment to a moderately restrictive policy may be appropriate." When asked about current labor market conditions, he said that "the labor market is no longer overheated."
Technical Forecast: Pound Sterling approaches 1.2900
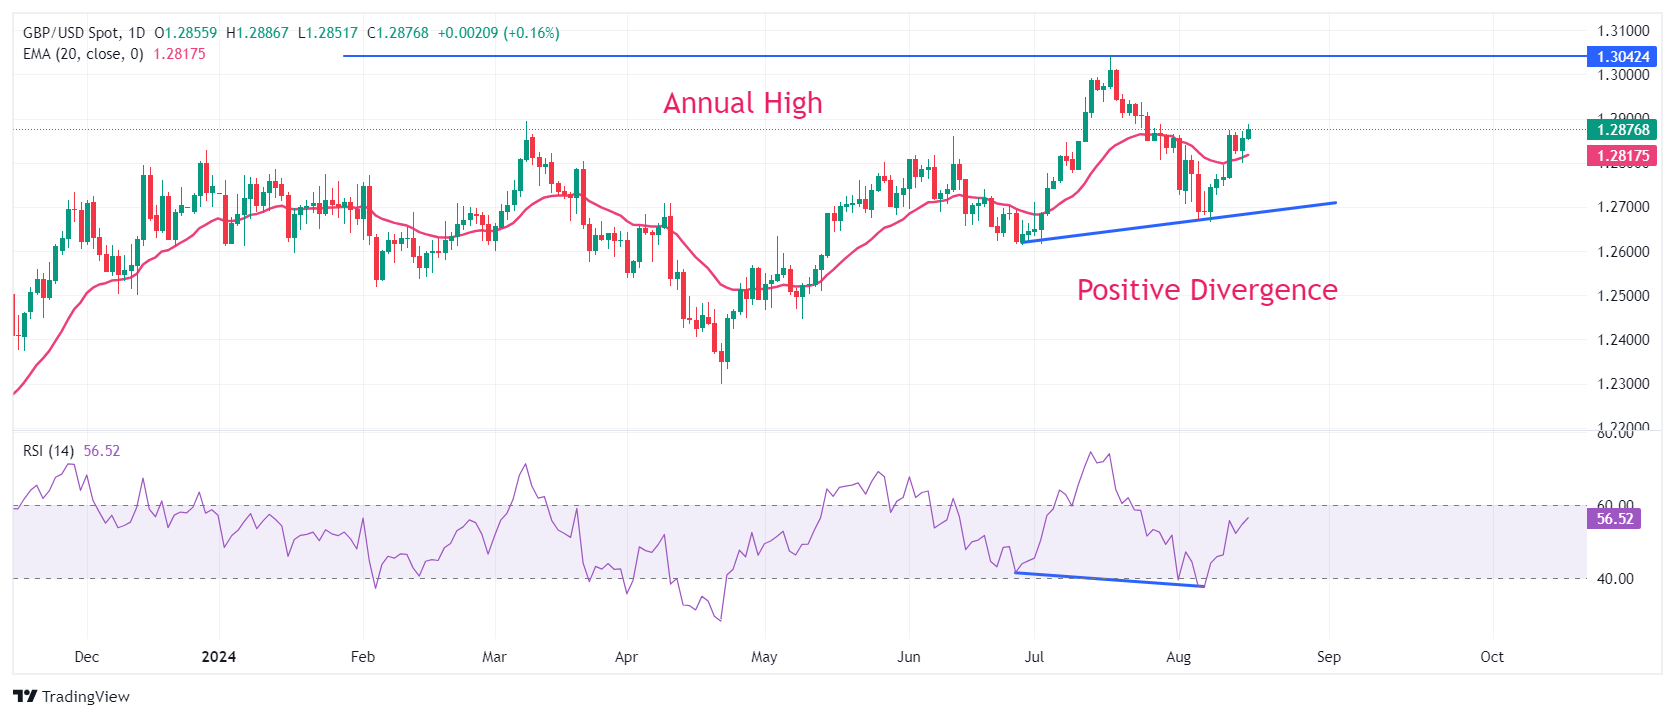
The Pound Sterling jumps to near 1.2885 against the US Dollar. The GBP/USD pair extends an upside trend that started from a six-week low of 1.2665 after a positive divergence formation on a daily time frame, in which the pair continues to build higher lows while the momentum oscillator makes lower lows. This generally results in a resumption of the uptrend, but it should be confirmed with more indicators.
The 14-day Relative Strength Index (RSI) recovers after finding a cushion near 40.00, exhibiting signs of buying interest.
On the upside, the psychological figure of 1.3000 and the annual high at 1.3044 will act as major resistances for the Pound Sterling. Alternatively, the recovery move could falter if the asset breaks below the August 8 low at 1.2665. This would expose the asset to the June 27 low at 1.2613, followed by the April 29 high at 1.2570.
Pound Sterling FAQs
The Pound Sterling (GBP) is the oldest currency in the world (886 AD) and the official currency of the United Kingdom. It is the fourth most traded unit for foreign exchange (FX) in the world, accounting for 12% of all transactions, averaging $630 billion a day, according to 2022 data. Its key trading pairs are GBP/USD, aka ‘Cable’, which accounts for 11% of FX, GBP/JPY, or the ‘Dragon’ as it is known by traders (3%), and EUR/GBP (2%). The Pound Sterling is issued by the Bank of England (BoE).
The single most important factor influencing the value of the Pound Sterling is monetary policy decided by the Bank of England. The BoE bases its decisions on whether it has achieved its primary goal of “price stability” – a steady inflation rate of around 2%. Its primary tool for achieving this is the adjustment of interest rates. When inflation is too high, the BoE will try to rein it in by raising interest rates, making it more expensive for people and businesses to access credit. This is generally positive for GBP, as higher interest rates make the UK a more attractive place for global investors to park their money. When inflation falls too low it is a sign economic growth is slowing. In this scenario, the BoE will consider lowering interest rates to cheapen credit so businesses will borrow more to invest in growth-generating projects.
Data releases gauge the health of the economy and can impact the value of the Pound Sterling. Indicators such as GDP, Manufacturing and Services PMIs, and employment can all influence the direction of the GBP. A strong economy is good for Sterling. Not only does it attract more foreign investment but it may encourage the BoE to put up interest rates, which will directly strengthen GBP. Otherwise, if economic data is weak, the Pound Sterling is likely to fall.
Another significant data release for the Pound Sterling is the Trade Balance. This indicator measures the difference between what a country earns from its exports and what it spends on imports over a given period. If a country produces highly sought-after exports, its currency will benefit purely from the extra demand created from foreign buyers seeking to purchase these goods. Therefore, a positive net Trade Balance strengthens a currency and vice versa for a negative balance.
- USD/CAD edges lower as crude Oil prices are set to end the week higher.
- The US Dollar remains weaker ahead of the Michigan Consumer Sentiment Index release for August.
- Traders fully price in a 25 basis point rate cut at the Fed’s next meeting in September.
USD/CAD halts its two days of gains, trading around 1.3720 during the Asian hours on Friday. The Canadian Dollar (CAD) receives support from the improved risk-on mood following the stronger-than-expected recovery in US Retail Sales, which has eased concerns about a potential recession in the United States (US).
The commodity-linked CAD may continue to advance, as crude Oil prices are poised to end the week higher. This increase comes on the heels of recent US economic data that boosted optimism over demand in the world’s top Oil-consuming nation. Given the fact that Canada is the largest crude exporter to the US. At the time of writing, the price of West Texas Intermediate (WTI) oil is trading near $76.60 per barrel.
In the United States, traders await the preliminary US Michigan Consumer Sentiment Index for August and Building Permits for July to be released later in the North American session on Friday.
The US Dollar (USD) depreciates as traders fully price in a 25 basis point rate reduction by the US Federal Reserve for September. However, a 50 basis point cut remains a possibility, with the CME FedWatch tool indicating a 26% chance of such a move.
However, the Greenback received support following recent better-than-expected US figures released on Thursday. The US Census Bureau reported that US Retail Sales climbed 1.0% month-over-month in July, a sharp turnaround from June's 0.2% decline, surpassing the projected 0.3% increase. Moreover, Initial Jobless Claims for the week ending August 9 reached 227,000, lower than the forecast of 235,000 and down from 234,000 the previous week.
Canadian Dollar FAQs
The key factors driving the Canadian Dollar (CAD) are the level of interest rates set by the Bank of Canada (BoC), the price of Oil, Canada’s largest export, the health of its economy, inflation and the Trade Balance, which is the difference between the value of Canada’s exports versus its imports. Other factors include market sentiment – whether investors are taking on more risky assets (risk-on) or seeking safe-havens (risk-off) – with risk-on being CAD-positive. As its largest trading partner, the health of the US economy is also a key factor influencing the Canadian Dollar.
The Bank of Canada (BoC) has a significant influence on the Canadian Dollar by setting the level of interest rates that banks can lend to one another. This influences the level of interest rates for everyone. The main goal of the BoC is to maintain inflation at 1-3% by adjusting interest rates up or down. Relatively higher interest rates tend to be positive for the CAD. The Bank of Canada can also use quantitative easing and tightening to influence credit conditions, with the former CAD-negative and the latter CAD-positive.
The price of Oil is a key factor impacting the value of the Canadian Dollar. Petroleum is Canada’s biggest export, so Oil price tends to have an immediate impact on the CAD value. Generally, if Oil price rises CAD also goes up, as aggregate demand for the currency increases. The opposite is the case if the price of Oil falls. Higher Oil prices also tend to result in a greater likelihood of a positive Trade Balance, which is also supportive of the CAD.
While inflation had always traditionally been thought of as a negative factor for a currency since it lowers the value of money, the opposite has actually been the case in modern times with the relaxation of cross-border capital controls. Higher inflation tends to lead central banks to put up interest rates which attracts more capital inflows from global investors seeking a lucrative place to keep their money. This increases demand for the local currency, which in Canada’s case is the Canadian Dollar.
Macroeconomic data releases gauge the health of the economy and can have an impact on the Canadian Dollar. Indicators such as GDP, Manufacturing and Services PMIs, employment, and consumer sentiment surveys can all influence the direction of the CAD. A strong economy is good for the Canadian Dollar. Not only does it attract more foreign investment but it may encourage the Bank of Canada to put up interest rates, leading to a stronger currency. If economic data is weak, however, the CAD is likely to fall.
- EUR/JPY trades on a softer note near 163.55 in Friday’s early Asian session.
- The cross resumes its uptrend above the 100-period EMA with a bullish RSI indicator.
- The immediate resistance level emerges at 164.00; the 163.10-163.00 region acts as an initial support level.
The EUR/JPY cross trades weaker around 163.55, snapping the four-day winning streak on Friday during the early European session. The Japanese Yen (JPY) edges higher after recent Japan’s second-quarter Gross Domestic Product (GDP) came in stronger than estimated, growing by 0.8% QoQ in Q2. The encouraging GDP growth numbers lend support to the chance of a near-term interest rate hike by the Bank of Japan (BoJ).
The cross resumes its uptrend on the 4-hour chart, with the price holding above key 100-period Exponential Moving Averages (EMA). The Relative Strength Index (RSI) stands above the midline near 68.50, indicating that bearish vibes are present.
The potential upside barrier for EUR/JPY emerges at the 164.00 psychological mark. A sustained break above this level keeps an eye out for a continuation of the climb back to the 164.89, a low of July 25. Extended gains will see a rally to 166.56, a high of July 31.
On the flip side, the 163.10-163.00 zone acts as an initial support level for the cross. The additional downside filter to watch is 161.95, a low of August 15. The next contention level is seen at 160.59, a low of August 14.
EUR/JPY 4-hour chart
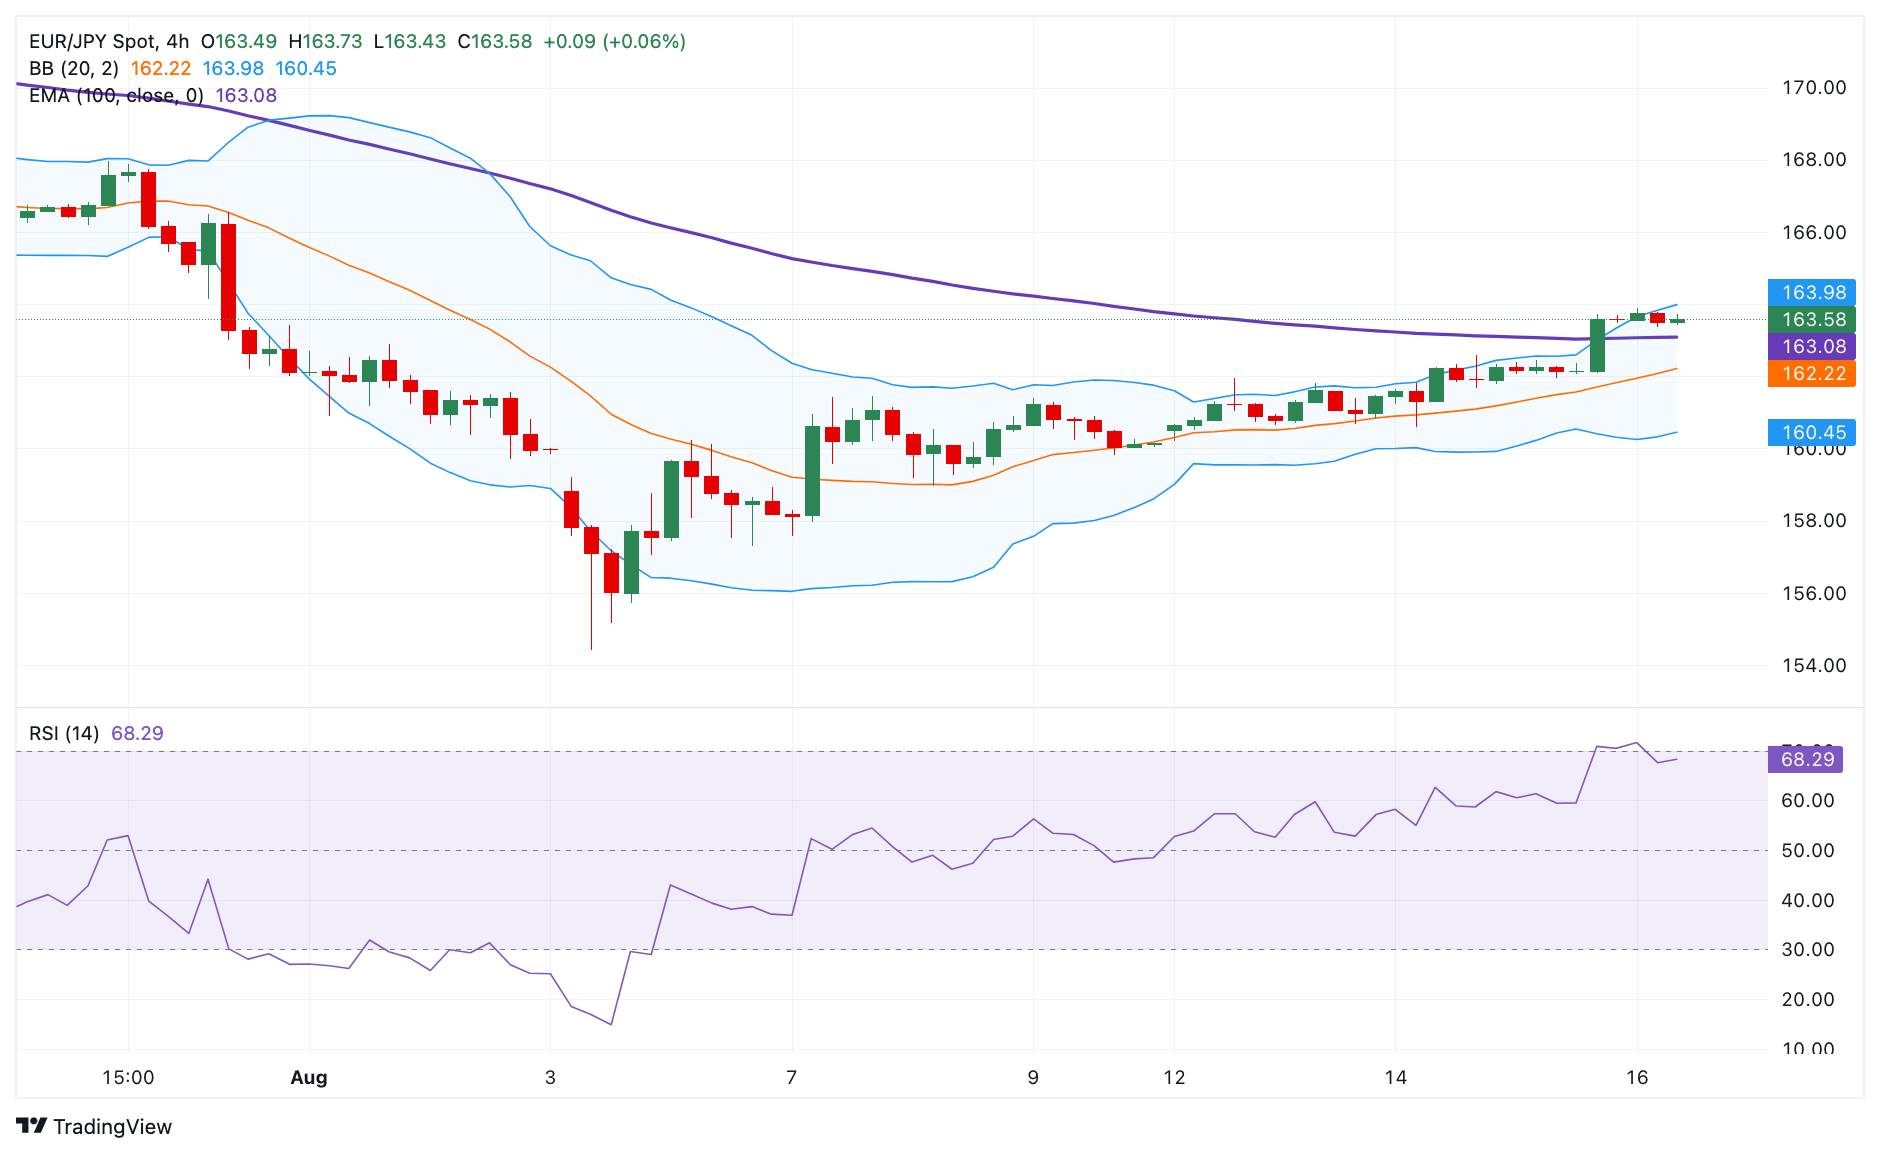
Japanese Yen FAQs
The Japanese Yen (JPY) is one of the world’s most traded currencies. Its value is broadly determined by the performance of the Japanese economy, but more specifically by the Bank of Japan’s policy, the differential between Japanese and US bond yields, or risk sentiment among traders, among other factors.
One of the Bank of Japan’s mandates is currency control, so its moves are key for the Yen. The BoJ has directly intervened in currency markets sometimes, generally to lower the value of the Yen, although it refrains from doing it often due to political concerns of its main trading partners. The current BoJ ultra-loose monetary policy, based on massive stimulus to the economy, has caused the Yen to depreciate against its main currency peers. This process has exacerbated more recently due to an increasing policy divergence between the Bank of Japan and other main central banks, which have opted to increase interest rates sharply to fight decades-high levels of inflation.
The BoJ’s stance of sticking to ultra-loose monetary policy has led to a widening policy divergence with other central banks, particularly with the US Federal Reserve. This supports a widening of the differential between the 10-year US and Japanese bonds, which favors the US Dollar against the Japanese Yen.
The Japanese Yen is often seen as a safe-haven investment. This means that in times of market stress, investors are more likely to put their money in the Japanese currency due to its supposed reliability and stability. Turbulent times are likely to strengthen the Yen’s value against other currencies seen as more risky to invest in.
- EUR/GBP holds losses after the positive UK Retail Sales data release on Friday.
- UK Retail Sales improved by 0.5% and 1.4% for MoM and YoY, respectively, in July.
- Eurozone GDP growth has increased bets for two potential rate cuts by the ECB by October.
EUR/GBP extends its losses for the second consecutive day, trading around 0.8530 during the Asian session on Friday. The EUR/GBP cross maintains its losses following the Retail Sales data from the United Kingdom (UK) released on Friday.
UK Retail Sales saw a 0.5% month-over-month increase in July, as anticipated, recovering from a previous decline of 0.9%. On an annual basis, sales grew by 1.4%, reversing the earlier 0.3% decline and meeting market expectations.
Additionally, UK GDP figures reported on Thursday that the UK economy expanded by 0.6% quarter-on-quarter in the second quarter, in line with expectations. Year-on-year, GDP increased by 0.9% in Q2, matching expectations and up from the 0.3% recorded in Q1.
Finance Minister Rachel Reeves highlighted that the latest data underscores the challenges facing the new government and reiterated her stance that difficult decisions will be necessary to improve economic fundamentals, according to Reuters.
In the Eurozone, on Thursday, recent data indicated a sharp drop in investor confidence and an unexpected decline in industrial activity. Despite this, preliminary Eurozone Gross Domestic Product (GDP) grew by 0.3% quarter-on-quarter in Q2, consistent with the previous period and in line with market expectations. Year-on-year, the economy expanded by 0.6%, as anticipated. This steady growth has increased speculation about two potential rate cuts by the European Central Bank (ECB) by October.
Economic Indicator
Retail Sales (MoM)
The Retail Sales data, released by the Office for National Statistics on a monthly basis, measures the volume of sales of goods by retailers in Great Britain directly to end customers. Changes in Retail Sales are widely followed as an indicator of consumer spending. Percent changes reflect the rate of changes in such sales, with the MoM reading comparing sales volumes in the reference month with the previous month. Generally, a high reading is seen as bullish for the Pound Sterling (GBP), while a low reading is seen as bearish.
Read more.Last release: Fri Aug 16, 2024 06:00
Frequency: Monthly
Actual: 0.5%
Consensus: 0.5%
Previous: -1.2%
Source: Office for National Statistics
FX option expiries for Aug 16 NY cut at 10:00 Eastern Time, via DTCC, can be found below.
EUR/USD: EUR amounts
- 1.0800 683m
- 1.0955 839m
- 1.0960 1b
- 1.1000 2.7b
- 1.1025 1.1b
- 1.1100 635m
GBP/USD: GBP amounts
- 1.2785 454m
- 1.2880 562m
USD/JPY: USD amounts
- 146.85 576m
- 147.00 658m
- 148.00 686m
- 150.00 454m
USD/CHF: USD amounts
- 0.8700 759m
- 0.8720 677m
AUD/USD: AUD amounts
- 0.6520 919m
- 0.6550 721m
- 0.6600 922m
USD/CAD: USD amounts
- 1.3600 897m
- 1.3670 726m
- 1.3700 998m
- 1.3810 710m
EUR/GBP: EUR amounts
- 0.8600 590m
- The UK Retail Sales jumped 0.5% MoM in July, meeting estimates.
- Monthly Core Retail Sales for the UK rebounded 0.7% in July.
- GBP/USD stays unfazed toward 1.2900 after mixed UK data.
The Core Retail Sales, stripping the auto motor fuel sales, jumped 0.7% MoM, against the previous decline of 1.3% and the estimated 0.8% reading.
The annual Retail Sales in the UK climbed by 1.4% in July versus June’s 0.3% fall while the Core Retail Sales increased by 1.4% in the same month versus -0.8% previous. Both figures aligned with the market forecast.
Market reaction to UK Retail Sales report
GBP/USD is unperturbed by the mixed UK data release, 0.26% higher on the day near 1.2885, as of writing.
British Pound PRICE Today
The table below shows the percentage change of British Pound (GBP) against listed major currencies today. British Pound was the strongest against the US Dollar.
| USD | EUR | GBP | JPY | CAD | AUD | NZD | CHF | |
|---|---|---|---|---|---|---|---|---|
| USD | -0.11% | -0.21% | -0.24% | -0.07% | -0.25% | -0.44% | -0.16% | |
| EUR | 0.11% | -0.11% | -0.15% | 0.03% | -0.17% | -0.46% | -0.03% | |
| GBP | 0.21% | 0.11% | -0.06% | 0.14% | -0.06% | -0.34% | 0.06% | |
| JPY | 0.24% | 0.15% | 0.06% | 0.23% | -0.01% | -0.31% | 0.09% | |
| CAD | 0.07% | -0.03% | -0.14% | -0.23% | -0.20% | -0.51% | -0.09% | |
| AUD | 0.25% | 0.17% | 0.06% | 0.01% | 0.20% | -0.29% | 0.11% | |
| NZD | 0.44% | 0.46% | 0.34% | 0.31% | 0.51% | 0.29% | 0.42% | |
| CHF | 0.16% | 0.03% | -0.06% | -0.09% | 0.09% | -0.11% | -0.42% |
The heat map shows percentage changes of major currencies against each other. The base currency is picked from the left column, while the quote currency is picked from the top row. For example, if you pick the British Pound from the left column and move along the horizontal line to the US Dollar, the percentage change displayed in the box will represent GBP (base)/USD (quote).
Gold prices fell in India on Friday, according to data compiled by FXStreet.
The price for Gold stood at 6,624.04 Indian Rupees (INR) per gram, down compared with the INR 6,631.04 it cost on Thursday.
The price for Gold decreased to INR 77,260.81 per tola from INR 77,343.30 per tola a day earlier.
| Unit measure | Gold Price in INR |
|---|---|
| 1 Gram | 6,624.04 |
| 10 Grams | 66,239.81 |
| Tola | 77,260.81 |
| Troy Ounce | 206,028.50 |
FXStreet calculates Gold prices in India by adapting international prices (USD/INR) to the local currency and measurement units. Prices are updated daily based on the market rates taken at the time of publication. Prices are just for reference and local rates could diverge slightly.
Gold FAQs
Gold has played a key role in human’s history as it has been widely used as a store of value and medium of exchange. Currently, apart from its shine and usage for jewelry, the precious metal is widely seen as a safe-haven asset, meaning that it is considered a good investment during turbulent times. Gold is also widely seen as a hedge against inflation and against depreciating currencies as it doesn’t rely on any specific issuer or government.
Central banks are the biggest Gold holders. In their aim to support their currencies in turbulent times, central banks tend to diversify their reserves and buy Gold to improve the perceived strength of the economy and the currency. High Gold reserves can be a source of trust for a country’s solvency. Central banks added 1,136 tonnes of Gold worth around $70 billion to their reserves in 2022, according to data from the World Gold Council. This is the highest yearly purchase since records began. Central banks from emerging economies such as China, India and Turkey are quickly increasing their Gold reserves.
Gold has an inverse correlation with the US Dollar and US Treasuries, which are both major reserve and safe-haven assets. When the Dollar depreciates, Gold tends to rise, enabling investors and central banks to diversify their assets in turbulent times. Gold is also inversely correlated with risk assets. A rally in the stock market tends to weaken Gold price, while sell-offs in riskier markets tend to favor the precious metal.
The price can move due to a wide range of factors. Geopolitical instability or fears of a deep recession can quickly make Gold price escalate due to its safe-haven status. As a yield-less asset, Gold tends to rise with lower interest rates, while higher cost of money usually weighs down on the yellow metal. Still, most moves depend on how the US Dollar (USD) behaves as the asset is priced in dollars (XAU/USD). A strong Dollar tends to keep the price of Gold controlled, whereas a weaker Dollar is likely to push Gold prices up.
(An automation tool was used in creating this post.)
- USD/CHF drifts lower to near 0.8715 in Friday’s early Asian session.
- US July Retail Sales came in better than expected in July, lifting the Greenback.
- The renewed fear of geopolitical tension in the Middle East could support the CHF.
The USD/CHF pair trades on a softer note near 0.8715 during the early European session on Friday. The pair edges lower on the back of the softer US Dollar (USD). Meanwhile, the USD Index (DXY), a measure of the value of the US Dollar relative to a basket of foreign currencies, currently trades around 102.92, losing 0.12% on the day.
The speculation of the US Federal Reserve rate cut in September continues to undermine the Greenback. Nonetheless, traders place lower bets on deeper rate cuts due to the optimistic US Initial Jobless Claims and upbeat Retail Sales data on Thursday. According to the CME FedWatch Tool, financial markets are now pricing in nearly 80%odds of a September rate cut and expect 200 basis points (bps) of reduction in the next 12 months, though that will depend on incoming data.
Switzerland’s Federal Statistical Office (Bundesamt) revealed in its report published on Thursday that the country’s Producer and Import Price Index remained unchanged in July 2024 compared with the previous month. The annual figure declined by 1.7%, compared to the previous reading of a fall of 1.9%, in line with the consensus.
Easing fears about the US economic slowdown boosts investors' sentiment and weighs on the safe-haven currency like the Swiss Franc (CHF). On the other hand, any development surrounding economic uncertainty and geopolitical tension in the Middle East might lift the CHF and create a headwind for USD/CHF.
Swiss Franc FAQs
The Swiss Franc (CHF) is Switzerland’s official currency. It is among the top ten most traded currencies globally, reaching volumes that well exceed the size of the Swiss economy. Its value is determined by the broad market sentiment, the country’s economic health or action taken by the Swiss National Bank (SNB), among other factors. Between 2011 and 2015, the Swiss Franc was pegged to the Euro (EUR). The peg was abruptly removed, resulting in a more than 20% increase in the Franc’s value, causing a turmoil in markets. Even though the peg isn’t in force anymore, CHF fortunes tend to be highly correlated with the Euro ones due to the high dependency of the Swiss economy on the neighboring Eurozone.
The Swiss Franc (CHF) is considered a safe-haven asset, or a currency that investors tend to buy in times of market stress. This is due to the perceived status of Switzerland in the world: a stable economy, a strong export sector, big central bank reserves or a longstanding political stance towards neutrality in global conflicts make the country’s currency a good choice for investors fleeing from risks. Turbulent times are likely to strengthen CHF value against other currencies that are seen as more risky to invest in.
The Swiss National Bank (SNB) meets four times a year – once every quarter, less than other major central banks – to decide on monetary policy. The bank aims for an annual inflation rate of less than 2%. When inflation is above target or forecasted to be above target in the foreseeable future, the bank will attempt to tame price growth by raising its policy rate. Higher interest rates are generally positive for the Swiss Franc (CHF) as they lead to higher yields, making the country a more attractive place for investors. On the contrary, lower interest rates tend to weaken CHF.
Macroeconomic data releases in Switzerland are key to assessing the state of the economy and can impact the Swiss Franc’s (CHF) valuation. The Swiss economy is broadly stable, but any sudden change in economic growth, inflation, current account or the central bank’s currency reserves have the potential to trigger moves in CHF. Generally, high economic growth, low unemployment and high confidence are good for CHF. Conversely, if economic data points to weakening momentum, CHF is likely to depreciate.
As a small and open economy, Switzerland is heavily dependent on the health of the neighboring Eurozone economies. The broader European Union is Switzerland’s main economic partner and a key political ally, so macroeconomic and monetary policy stability in the Eurozone is essential for Switzerland and, thus, for the Swiss Franc (CHF). With such dependency, some models suggest that the correlation between the fortunes of the Euro (EUR) and the CHF is more than 90%, or close to perfect.
- GBP/JPY edges lower as the economic growth in Japan raises bets of a further rate hike by the BoJ.
- The risk-sensitive GBP receives support from the improved risk sentiment following US Retail Sales.
- UK Retail Sales are expected to increase by 0.5% and 1.4% for MoM and YoY for July, respectively.
GBP/JPY breaks its four-day winning streak, trading around 191.60 during Friday’s Asian hours. The decline in the GBP/JPY cross can be attributed to the strengthened Japanese Yen (JPY), which has gained support from recent growth in Japan’s second-quarter GDP, increasing the likelihood of a near-term interest rate hike by the Bank of Japan (BoJ).
However, the JPY could experience volatility due to political uncertainty in Japan. Japanese Prime Minister Fumio Kishida announced at a press conference on Wednesday that he will not seek re-election as the leader of the Liberal Democratic Party (LDP) in September.
However, stronger-than-expected recovery in US Retail Sales has eased concerns about a potential US recession and improved risk-on sentiment. The improved risk-on mood could boost the risk-sensitive Pound Sterling (GBP) and limit the downside of the GBP/JPY cross.
Additionally, the British Pound is supported by positive key economic data from the United Kingdom (UK) released on Thursday, including GDP figures. The UK economy expanded by 0.6% quarter-on-quarter in the second quarter, in line with expectations. Year-on-year, GDP increased by 0.9% in Q2, matching expectations and up from the 0.3% recorded in Q1.
Traders are likely awaiting the release of the UK Retail Sales data scheduled for Friday, with expectations for a month-on-month rebound to a 0.5% increase in July, up from the previous decline of 1.2%. Additionally, annual growth is forecasted to rise by 1.4%, reversing the earlier decline of 0.2%.
Pound Sterling FAQs
The Pound Sterling (GBP) is the oldest currency in the world (886 AD) and the official currency of the United Kingdom. It is the fourth most traded unit for foreign exchange (FX) in the world, accounting for 12% of all transactions, averaging $630 billion a day, according to 2022 data. Its key trading pairs are GBP/USD, aka ‘Cable’, which accounts for 11% of FX, GBP/JPY, or the ‘Dragon’ as it is known by traders (3%), and EUR/GBP (2%). The Pound Sterling is issued by the Bank of England (BoE).
The single most important factor influencing the value of the Pound Sterling is monetary policy decided by the Bank of England. The BoE bases its decisions on whether it has achieved its primary goal of “price stability” – a steady inflation rate of around 2%. Its primary tool for achieving this is the adjustment of interest rates. When inflation is too high, the BoE will try to rein it in by raising interest rates, making it more expensive for people and businesses to access credit. This is generally positive for GBP, as higher interest rates make the UK a more attractive place for global investors to park their money. When inflation falls too low it is a sign economic growth is slowing. In this scenario, the BoE will consider lowering interest rates to cheapen credit so businesses will borrow more to invest in growth-generating projects.
Data releases gauge the health of the economy and can impact the value of the Pound Sterling. Indicators such as GDP, Manufacturing and Services PMIs, and employment can all influence the direction of the GBP. A strong economy is good for Sterling. Not only does it attract more foreign investment but it may encourage the BoE to put up interest rates, which will directly strengthen GBP. Otherwise, if economic data is weak, the Pound Sterling is likely to fall.
Another significant data release for the Pound Sterling is the Trade Balance. This indicator measures the difference between what a country earns from its exports and what it spends on imports over a given period. If a country produces highly sought-after exports, its currency will benefit purely from the extra demand created from foreign buyers seeking to purchase these goods. Therefore, a positive net Trade Balance strengthens a currency and vice versa for a negative balance.
- EUR/USD attracts some buyers on Friday amid a modest US Dollar downdraft.
- Dovish Fed expectations and a positive risk tone weigh on the safe-haven buck.
- Bets for more ECB rate cuts could act as a headwind for the Euro and cap gains.
The EUR/USD pair builds on the previous day's late rebound from the 1.0950 area and gains some positive traction during the Asian session on Friday. Spot prices, however, struggle to capitalize on the uptick and currently trade around the 1.0975-1.0980 region, up just over 0.05% for the day.
A combination of factors prompts fresh selling around the US Dollar (USD), which, in turn, is seen lending some support to the EUR/USD pair. Despite Thursday's upbeat US macro data, investors seem convinced that the Federal Reserve (Fed) will begin its policy-easing cycle in September and have fully priced in a 25 basis rate cut. This, in turn, triggers a modest pullback in the US Treasury bond yields and exerts some downward pressure on the buck.
Apart from this, the prevalent risk-on mood – as depicted by a positive tone across the global equity markets – turns out to be another factor undermining demand for the safe-haven Greenback. That said, the risk of widening conflict in the Middle East could act as a tailwind for the USD. Apart from this, expectations that the European Central Bank (ECB) will cut rates again, amid declining inflation in the Eurozone, seem to cap gains for the EUR/USD pair.
Nevertheless, spot prices remain on track to register modest weekly gains. Moreover, the emergence of some dip-buying near the 1.0950 horizontal resistance-turned-support on Thursday warrants some caution before positioning for deeper losses. Traders now look to the US macro data – Building Starts, Housing Permits and the Preliminary Michigan Consumer Sentiment Index – for short-term opportunities later during the early North American session.
US Dollar PRICE Today
The table below shows the percentage change of US Dollar (USD) against listed major currencies today. US Dollar was the strongest against the Canadian Dollar.
| USD | EUR | GBP | JPY | CAD | AUD | NZD | CHF | |
|---|---|---|---|---|---|---|---|---|
| USD | -0.08% | -0.13% | -0.25% | -0.04% | -0.17% | -0.33% | -0.16% | |
| EUR | 0.08% | -0.06% | -0.18% | 0.02% | -0.13% | -0.38% | -0.06% | |
| GBP | 0.13% | 0.06% | -0.12% | 0.09% | -0.06% | -0.31% | -0.01% | |
| JPY | 0.25% | 0.18% | 0.12% | 0.27% | 0.08% | -0.18% | 0.10% | |
| CAD | 0.04% | -0.02% | -0.09% | -0.27% | -0.16% | -0.43% | -0.12% | |
| AUD | 0.17% | 0.13% | 0.06% | -0.08% | 0.16% | -0.26% | 0.03% | |
| NZD | 0.33% | 0.38% | 0.31% | 0.18% | 0.43% | 0.26% | 0.31% | |
| CHF | 0.16% | 0.06% | 0.01% | -0.10% | 0.12% | -0.03% | -0.31% |
The heat map shows percentage changes of major currencies against each other. The base currency is picked from the left column, while the quote currency is picked from the top row. For example, if you pick the US Dollar from the left column and move along the horizontal line to the Japanese Yen, the percentage change displayed in the box will represent USD (base)/JPY (quote).
- Silver price drifts lower to $28.15 in Friday’s early Asian session, down 0.70% on the day.
- US July Retail Sales came in better than expected, rising 1.0% MoM; Initials Jobless Claims fell to 227K last week.
- Traders will watch the Fed's Goolsbee speech and first reading of US August Michigan Consumer Sentiment Index for fresh impetus.
Silver price (XAG/USD) edges lower to near $28.15 on Friday during the Asian trading hours. The diminishing hope for a deeper interest rate by the US Federal Reserve (Fed) in September after the recent upbeat US data weighs on the white metal.
The encouraging US economic data on Thursday has eased fears about a potential recession in the United States and reduced the speculation of an agressive rate cut by the Fed in September. This, in turn, drags the white metal lower. It’s worth noting that higher interest rates generally decrease the demand for precious metals and price.
The US Census Bureau revealed on Thursday that Retail Sales rose by 1.0% MoM in July versus -0.2% prior, better than the 0.3% increase expected. Additionally, the number of Americans filing new applications for unemployment benefits declined by 7K to 227K for the week ending August 10, lower than the market consensus of 235K and the previous reading of 234K. This is the second consecutive week in which the number of Initial Jobless Claims has been lower than expected, suggesting that labor market conditions are not as weak as the Nonfarm Payrolls (NFP) figures for July showed earlier this month.
On Thursday, St. Louis Fed President Alberto Musalem said that he believes the time is approaching when it will be appropriate for the Fed to cut interest rates as inflation is on a path towards the 2% target. Traders will take more cues from the Fed's Austan Goolsbee speech on Friday for the US interest rate outlook. Any dovish remarks from the Fed official might provide some support to the Silver. Also, the preliminary US Michigan Consumer Sentiment Index for August, Building Permits and Housing Starts will be published later in the day.
Silver FAQs
Silver is a precious metal highly traded among investors. It has been historically used as a store of value and a medium of exchange. Although less popular than Gold, traders may turn to Silver to diversify their investment portfolio, for its intrinsic value or as a potential hedge during high-inflation periods. Investors can buy physical Silver, in coins or in bars, or trade it through vehicles such as Exchange Traded Funds, which track its price on international markets.
Silver prices can move due to a wide range of factors. Geopolitical instability or fears of a deep recession can make Silver price escalate due to its safe-haven status, although to a lesser extent than Gold's. As a yieldless asset, Silver tends to rise with lower interest rates. Its moves also depend on how the US Dollar (USD) behaves as the asset is priced in dollars (XAG/USD). A strong Dollar tends to keep the price of Silver at bay, whereas a weaker Dollar is likely to propel prices up. Other factors such as investment demand, mining supply – Silver is much more abundant than Gold – and recycling rates can also affect prices.
Silver is widely used in industry, particularly in sectors such as electronics or solar energy, as it has one of the highest electric conductivity of all metals – more than Copper and Gold. A surge in demand can increase prices, while a decline tends to lower them. Dynamics in the US, Chinese and Indian economies can also contribute to price swings: for the US and particularly China, their big industrial sectors use Silver in various processes; in India, consumers’ demand for the precious metal for jewellery also plays a key role in setting prices.
Silver prices tend to follow Gold's moves. When Gold prices rise, Silver typically follows suit, as their status as safe-haven assets is similar. The Gold/Silver ratio, which shows the number of ounces of Silver needed to equal the value of one ounce of Gold, may help to determine the relative valuation between both metals. Some investors may consider a high ratio as an indicator that Silver is undervalued, or Gold is overvalued. On the contrary, a low ratio might suggest that Gold is undervalued relative to Silver.
- GBP/USD extends its gains due to improved risk sentiment following improved US Retail Sales.
- The Pound Sterling appreciates as UK Retail Sales data is expected to show growth in July.
- The US Dollar struggles due to fully pricing in of a 25 basis point rate cut by the Fed in September.
GBP/USD continues to strengthen for the second consecutive session, trading around 1.2870 during the Asian hours on Friday. The improved risk sentiment, driven by a stronger-than-expected recovery in US Retail Sales, has eased concerns about a potential US recession and boosted risk-sensitive currencies like the Pound Sterling (GBP).
Additionally, the British Pound gained ground due to positive key economic data released on Friday, including Gross Domestic Product (GDP) data, from the United Kingdom (UK). The UK economy expanded 0.6% quarter-on-quarter in the second quarter, as expected. Meanwhile, the GDP rose 0.9% YoY in Q2 vs. 0.9% expected and 0.3% booked in Q1.
Traders await the UK Retail Sales data scheduled for release on Friday, with expectations of a month-on-month rebound to a 0.5% increase for July, up from the previous decline of 1.2%. Additionally, annual growth is projected to rise by 1.4%, reversing the prior decline of 0.2%.
The US Dollar (USD) depreciates as traders fully price in a 25 basis point rate reduction by the US Federal Reserve for September. However, a 50 basis point cut remains a possibility, with the CME FedWatch tool indicating a 26% chance of such a move.
However, the Greenback received support following recent better-than-expected US figures released on Thursday. The US Census Bureau reported that US Retail Sales climbed 1.0% month-over-month in July, a sharp turnaround from June's 0.2% decline, surpassing the projected 0.3% increase. Moreover, Initial Jobless Claims for the week ending August 9 reached 227,000, lower than the forecast of 235,000 and down from 234,000 the previous week.
Furthermore, the preliminary US Michigan Consumer Sentiment Index for August and Building Permits for July will be eyed later in the North American session.
Pound Sterling FAQs
The Pound Sterling (GBP) is the oldest currency in the world (886 AD) and the official currency of the United Kingdom. It is the fourth most traded unit for foreign exchange (FX) in the world, accounting for 12% of all transactions, averaging $630 billion a day, according to 2022 data. Its key trading pairs are GBP/USD, aka ‘Cable’, which accounts for 11% of FX, GBP/JPY, or the ‘Dragon’ as it is known by traders (3%), and EUR/GBP (2%). The Pound Sterling is issued by the Bank of England (BoE).
The single most important factor influencing the value of the Pound Sterling is monetary policy decided by the Bank of England. The BoE bases its decisions on whether it has achieved its primary goal of “price stability” – a steady inflation rate of around 2%. Its primary tool for achieving this is the adjustment of interest rates. When inflation is too high, the BoE will try to rein it in by raising interest rates, making it more expensive for people and businesses to access credit. This is generally positive for GBP, as higher interest rates make the UK a more attractive place for global investors to park their money. When inflation falls too low it is a sign economic growth is slowing. In this scenario, the BoE will consider lowering interest rates to cheapen credit so businesses will borrow more to invest in growth-generating projects.
Data releases gauge the health of the economy and can impact the value of the Pound Sterling. Indicators such as GDP, Manufacturing and Services PMIs, and employment can all influence the direction of the GBP. A strong economy is good for Sterling. Not only does it attract more foreign investment but it may encourage the BoE to put up interest rates, which will directly strengthen GBP. Otherwise, if economic data is weak, the Pound Sterling is likely to fall.
Another significant data release for the Pound Sterling is the Trade Balance. This indicator measures the difference between what a country earns from its exports and what it spends on imports over a given period. If a country produces highly sought-after exports, its currency will benefit purely from the extra demand created from foreign buyers seeking to purchase these goods. Therefore, a positive net Trade Balance strengthens a currency and vice versa for a negative balance.
- USD/CAD stalls this week’s recovery from the monthly low amid the emergence of some USD selling.
- Dovish Fed expectations, retreating US bond yields and a positive risk tone exert pressure on the USD.
- Softer Crude Oil prices could undermine the Loonie and help limit any further losses for spot prices.
The USD/CAD pair struggles to capitalize on a two-day-old recovery from sub-1.3700 levels, or a nearly one-month low touched earlier this week and attracts fresh sellers during the Asian session on Friday. Spot prices currently hover near the 50-day Simple Moving Average (SMA), around the 1.3725-1.3720 region, and a combination of diverging forces warrants some caution for bearish traders.
The initial market reaction to Thursday's upbeat US macro data turns out to be short-lived amid dovish Federal Reserve (Fed) expectations, which prompts fresh selling around the US Dollar (USD) and the USD/CAD pair. In fact, US Retail Sales rose more than expected in July, which, along with a still resilient labor market, eased concerns about a sharp slowdown in the world's biggest economy. This forced investors to scale back their bets for a more aggressive policy easing by the US central bank.
The markets, however, have fully priced in the prospects for an imminent start of the Fed's rate-cutting cycle in September. This, in turn, triggers a fresh leg down in the US Treasury bond yields, which, along with a generally positive tone around the equity markets, is seen exerting some downward pressure on the safe-haven buck. That said, a modest downtick in Crude Oil prices might undermine demand for the commodity-linked Loonie and help limit any meaningful downfall for the USD/CAD pair.
Hence, it will be prudent to wait for acceptance below the 1.3700 mark before traders start positioning for an extension of the pair's recent sharp pullback from the vicinity of mid-1.3900s, or the highest level since October 2022 touched earlier this month. Traders now look to the second-tier US macro data – Building Starts and Housing Permits, along with the Preliminary Michigan Consumer Sentiment Index – to grab short-term opportunities later during the early North American session.
Canadian Dollar FAQs
The key factors driving the Canadian Dollar (CAD) are the level of interest rates set by the Bank of Canada (BoC), the price of Oil, Canada’s largest export, the health of its economy, inflation and the Trade Balance, which is the difference between the value of Canada’s exports versus its imports. Other factors include market sentiment – whether investors are taking on more risky assets (risk-on) or seeking safe-havens (risk-off) – with risk-on being CAD-positive. As its largest trading partner, the health of the US economy is also a key factor influencing the Canadian Dollar.
The Bank of Canada (BoC) has a significant influence on the Canadian Dollar by setting the level of interest rates that banks can lend to one another. This influences the level of interest rates for everyone. The main goal of the BoC is to maintain inflation at 1-3% by adjusting interest rates up or down. Relatively higher interest rates tend to be positive for the CAD. The Bank of Canada can also use quantitative easing and tightening to influence credit conditions, with the former CAD-negative and the latter CAD-positive.
The price of Oil is a key factor impacting the value of the Canadian Dollar. Petroleum is Canada’s biggest export, so Oil price tends to have an immediate impact on the CAD value. Generally, if Oil price rises CAD also goes up, as aggregate demand for the currency increases. The opposite is the case if the price of Oil falls. Higher Oil prices also tend to result in a greater likelihood of a positive Trade Balance, which is also supportive of the CAD.
While inflation had always traditionally been thought of as a negative factor for a currency since it lowers the value of money, the opposite has actually been the case in modern times with the relaxation of cross-border capital controls. Higher inflation tends to lead central banks to put up interest rates which attracts more capital inflows from global investors seeking a lucrative place to keep their money. This increases demand for the local currency, which in Canada’s case is the Canadian Dollar.
Macroeconomic data releases gauge the health of the economy and can have an impact on the Canadian Dollar. Indicators such as GDP, Manufacturing and Services PMIs, employment, and consumer sentiment surveys can all influence the direction of the CAD. A strong economy is good for the Canadian Dollar. Not only does it attract more foreign investment but it may encourage the Bank of Canada to put up interest rates, leading to a stronger currency. If economic data is weak, however, the CAD is likely to fall.
- The Japanese Yen advances due to rising odds of a further rate hike by the BoJ.
- Due to political uncertainty, the Yen may face challenges; Prime Minister Fumio Kishida will not seek re-election in September.
- The US Dollar faces pressure from declining US Treasury yields and increasing bets on a Fed rate cut.
The Japanese Yen (JPY) bounced back against the US Dollar (USD) on Friday, potentially due to the recent growth in Japan’s second-quarter GDP, which lends support to the possibility of a near-term interest rate hike by the Bank of Japan (BoJ).
However, the JPY might encounter challenges due to political uncertainty in Japan, sparked by reports that Prime Minister Fumio Kishida will not seek re-election as party leader in September, effectively concluding his term as prime minister.
The USD/JPY pair edges lower as the US Dollar loses ground amid lower Treasury yields. Additionally, traders fully price in a 25 basis point rate reduction by the US Federal Reserve for September, according to the CME FedWatch tool.
However, the Greenback received support as recent better-than-expected US economic data eased market concerns about a recession in the United States (US). Furthermore, the preliminary US Michigan Consumer Sentiment Index for August and Building Permits for July will be eyed later in the North American session.
Daily Digest Market Movers: Japanese Yen advances due to a hawkish mood surrounding the BoJ
- On Thursday, the US Census Bureau reported that US Retail Sales climbed 1.0% month-over-month in July, a sharp turnaround from June's 0.2% decline, surpassing the projected 0.3% increase. Moreover, Initial Jobless Claims for the week ending August 9 reached 227,000, lower than the forecast of 235,000 and down from 234,000 the previous week.
- On Thursday, Japanese Economy Minister Yoshitaka Shindo stated that the economy is anticipated to recover gradually as wages and income improve. Shindo also added that the government will collaborate closely with the Bank of Japan to implement flexible macroeconomic policies.
- Japan's Gross Domestic Product (GDP) grew by 0.8% quarter-on-quarter in Q2, surpassing market forecasts of 0.5% and rebounding from a 0.6% decline in Q1. This marked the strongest quarterly growth since Q1 of 2023. Meanwhile, the annualized GDP growth reached 3.1%, exceeding the market consensus of 2.1% and reversing a 2.3% contraction in Q1. This was the strongest yearly expansion since Q2 of 2023.
- Federal Reserve Bank of Chicago President Austan Goolsbee expressed growing concern on Wednesday about the labor market rather than inflation, noting recent improvements in price pressures alongside weak jobs data. Goolsbee added that the extent of rate cuts will be determined by the prevailing economic conditions, per Bloomberg.
- US headline Consumer Price Index (CPI) rose 2.9% year-over-year in July, slightly down from the 3% increase in June and below market expectations. The Core CPI, which excludes food and energy, climbed 3.2% year-over-year, a slight decrease from the 3.3% rise in June but aligned with market forecasts.
- Japanese Prime Minister Fumio Kishida announced at a press conference on Wednesday that he will not seek re-election as the leader of the Liberal Democratic Party (LDP) in September. Kishida emphasized the need to combat Japan's deflation-prone economy by promoting wage and investment growth and achieving the goal of expanding Japan's GDP to ¥600 trillion.
- Rabobank's senior FX strategist, Jane Foley, observes that this week's series of US data releases, along with next week's Jackson Hole event, should provide the market with clearer insights into the potential responses of US policymakers. However, their main expectation is that the Fed will reduce rates by 25 basis points in September and likely cut them again before the end of the year.
Technical Analysis: USD/JPY falls toward 148.50; next support at nine-day EMA
USD/JPY trades around 148.80 on Friday. According to the daily chart analysis, the pair is above the nine-day Exponential Moving Average (EMA), signaling a short-term bullish trend. Still, the 14-day Relative Strength Index (RSI) remains below 50, and an additional rise would confirm the bullish momentum.
In terms of support levels, the USD/JPY pair may encounter immediate support at the nine-day EMA, around 148.09. If the pair falls below this level, it could strengthen the bearish outlook and push the pair toward the seven-month low of 141.69 recorded on August 5. A continued decline could bring the pair closer to the next support level at 140.25.
On the upside, the USD/JPY pair could aim for the 50-day EMA at 153.08, with the possibility of testing the resistance level at 154.50, which has transitioned from previous throwback support to current pullback resistance.
USD/JPY: Daily Chart
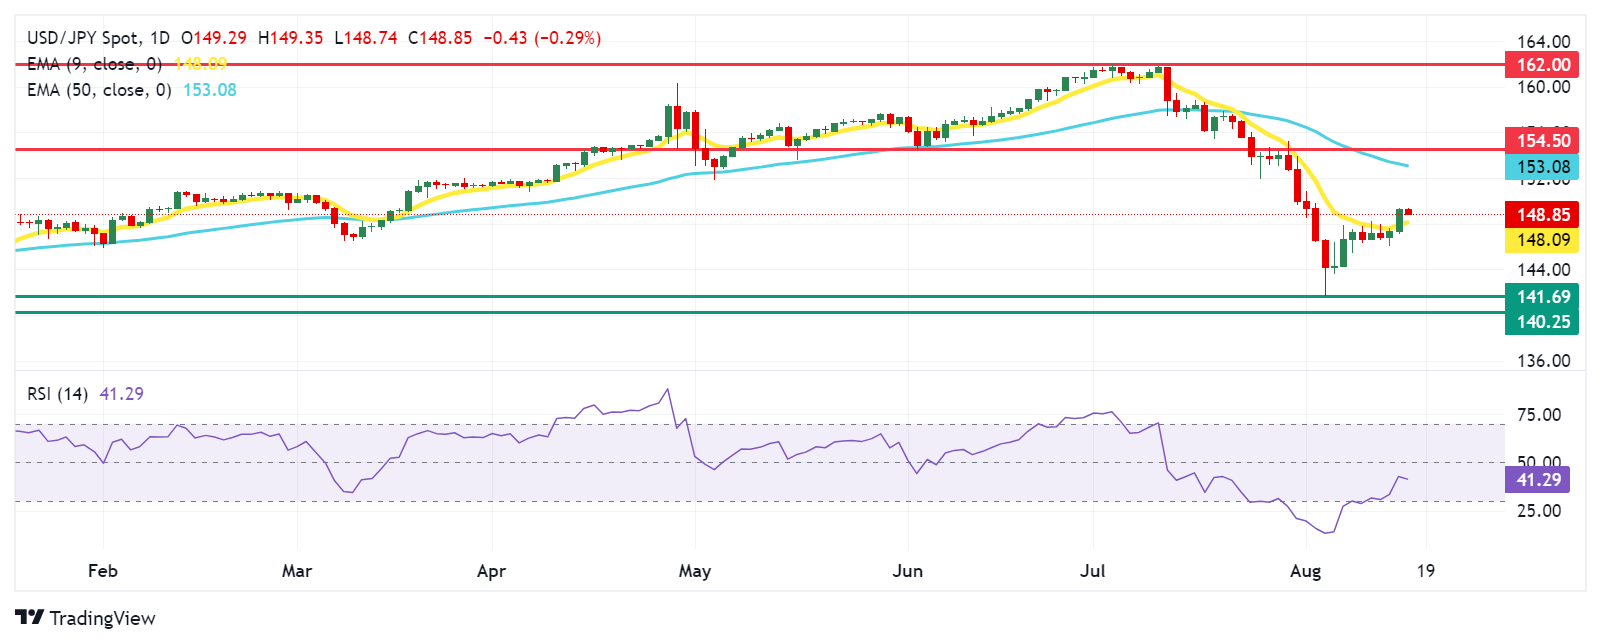
Japanese Yen PRICE Today
The table below shows the percentage change of Japanese Yen (JPY) against listed major currencies today. Japanese Yen was the strongest against the Canadian Dollar.
| USD | EUR | GBP | JPY | CAD | AUD | NZD | CHF | |
|---|---|---|---|---|---|---|---|---|
| USD | -0.07% | -0.14% | -0.30% | -0.05% | -0.17% | -0.21% | -0.17% | |
| EUR | 0.07% | -0.07% | -0.25% | 0.00% | -0.13% | -0.27% | -0.08% | |
| GBP | 0.14% | 0.07% | -0.19% | 0.08% | -0.05% | -0.18% | -0.01% | |
| JPY | 0.30% | 0.25% | 0.19% | 0.32% | 0.14% | -0.01% | 0.14% | |
| CAD | 0.05% | 0.00% | -0.08% | -0.32% | -0.13% | -0.29% | -0.12% | |
| AUD | 0.17% | 0.13% | 0.05% | -0.14% | 0.13% | -0.14% | 0.02% | |
| NZD | 0.21% | 0.27% | 0.18% | 0.00% | 0.29% | 0.14% | 0.18% | |
| CHF | 0.17% | 0.08% | 0.01% | -0.14% | 0.12% | -0.02% | -0.18% |
The heat map shows percentage changes of major currencies against each other. The base currency is picked from the left column, while the quote currency is picked from the top row. For example, if you pick the Japanese Yen from the left column and move along the horizontal line to the US Dollar, the percentage change displayed in the box will represent JPY (base)/USD (quote).
Japanese Yen FAQs
The Japanese Yen (JPY) is one of the world’s most traded currencies. Its value is broadly determined by the performance of the Japanese economy, but more specifically by the Bank of Japan’s policy, the differential between Japanese and US bond yields, or risk sentiment among traders, among other factors.
One of the Bank of Japan’s mandates is currency control, so its moves are key for the Yen. The BoJ has directly intervened in currency markets sometimes, generally to lower the value of the Yen, although it refrains from doing it often due to political concerns of its main trading partners. The current BoJ ultra-loose monetary policy, based on massive stimulus to the economy, has caused the Yen to depreciate against its main currency peers. This process has exacerbated more recently due to an increasing policy divergence between the Bank of Japan and other main central banks, which have opted to increase interest rates sharply to fight decades-high levels of inflation.
The BoJ’s stance of sticking to ultra-loose monetary policy has led to a widening policy divergence with other central banks, particularly with the US Federal Reserve. This supports a widening of the differential between the 10-year US and Japanese bonds, which favors the US Dollar against the Japanese Yen.
The Japanese Yen is often seen as a safe-haven investment. This means that in times of market stress, investors are more likely to put their money in the Japanese currency due to its supposed reliability and stability. Turbulent times are likely to strengthen the Yen’s value against other currencies seen as more risky to invest in.
- WTI edges lower on Friday and erodes a part of the previous day’s positive move.
- China’s economic woes and an unexpected build in US inventories exert pressure.
- Middle East tensions and hopes of improving demand should limit deeper losses.
West Texas Intermediate (WTI) US crude Oil prices struggle to capitalize on the overnight bounce from the vicinity of the weekly low and trade with a mild negative bias during the Asian session on Friday. The commodity currently hovers around the $76.70 area, down 0.25% for the day, though it remains on track to register modest gains for the second straight week.
The risk of supply disruption remains elevated in the wake of escalating tensions in the Middle East. Furthermore, the upbeat US macro data released on Thursday eased fears about a downturn in the world's largest economy. This, along with hopes that rate cuts by the Federal Reserve (Fed) will boost economic activity and push up fuel consumption, might continue to lend some support to Crude Oil prices.
Meanwhile, the US Dollar (USD) struggles to capitalize on the previous day's post-data positive move amid bets that the Fed that the Fed will eventually begin its rate-cutting cycle in September. Furthermore, the prevalent risk-on mood is seen as another factor undermining the safe-haven Greenback, which tends to boost demand for USD-denominated commodities, including Crude Oil prices.
Investors, however, remain worried about an economic slowdown in China – the world's biggest oil importer. Adding to this, the OPEC and the IEA downgraded their forecasts for Oil demand growth in 2024. This, along with an unexpected build in US inventories, suggesting that demand was cooling, acts as a headwind for Crude Oil prices and exerts some downward pressure on the last day of the week.
WTI Oil FAQs
WTI Oil is a type of Crude Oil sold on international markets. The WTI stands for West Texas Intermediate, one of three major types including Brent and Dubai Crude. WTI is also referred to as “light” and “sweet” because of its relatively low gravity and sulfur content respectively. It is considered a high quality Oil that is easily refined. It is sourced in the United States and distributed via the Cushing hub, which is considered “The Pipeline Crossroads of the World”. It is a benchmark for the Oil market and WTI price is frequently quoted in the media.
Like all assets, supply and demand are the key drivers of WTI Oil price. As such, global growth can be a driver of increased demand and vice versa for weak global growth. Political instability, wars, and sanctions can disrupt supply and impact prices. The decisions of OPEC, a group of major Oil-producing countries, is another key driver of price. The value of the US Dollar influences the price of WTI Crude Oil, since Oil is predominantly traded in US Dollars, thus a weaker US Dollar can make Oil more affordable and vice versa.
The weekly Oil inventory reports published by the American Petroleum Institute (API) and the Energy Information Agency (EIA) impact the price of WTI Oil. Changes in inventories reflect fluctuating supply and demand. If the data shows a drop in inventories it can indicate increased demand, pushing up Oil price. Higher inventories can reflect increased supply, pushing down prices. API’s report is published every Tuesday and EIA’s the day after. Their results are usually similar, falling within 1% of each other 75% of the time. The EIA data is considered more reliable, since it is a government agency.
OPEC (Organization of the Petroleum Exporting Countries) is a group of 13 Oil-producing nations who collectively decide production quotas for member countries at twice-yearly meetings. Their decisions often impact WTI Oil prices. When OPEC decides to lower quotas, it can tighten supply, pushing up Oil prices. When OPEC increases production, it has the opposite effect. OPEC+ refers to an expanded group that includes ten extra non-OPEC members, the most notable of which is Russia.
| Raw materials | Closed | Change, % |
|---|---|---|
| Silver | 28.361 | 2.94 |
| Gold | 245.623 | 0.33 |
| Palladium | 938.8 | 0.72 |
- Indian Rupee loses momentum in Friday’s early Asian session.
- The elevated geopolitical risks and weak Indian domestic markets undermine the INR.
- The preliminary US August Michigan Consumer Sentiment Index will be the highlight on Friday.
Indian Rupee (INR) edges lower on Friday due to the modest recovery of the US Dollar (USD). Risk aversion in the global markets amid escalating geopolitical tension in the Middle East dampens the sentiment and undermines the INR. Additionally, the weak domestic markets and India’s foreign outflows are likely to weigh on the local currency in the near term.
On the other hand, the lower crude oil prices could support the INR as India remains one of the top importers of crude oil. The speculation of the US Federal Reserve (Fed) rate cut in September might exert some selling pressure and act as a headwind for the pair. Later on Friday, investors will keep an eye on the preliminary US Michigan Consumer Sentiment Index for August, Building Permits and Housing Starts. Also, the Fed's Austan Goolsbee is scheduled to speak.
Daily Digest Market Movers: Indian Rupee remains sensitive to multiple challenges
- The latest Reserve Bank of India (RBI) surveys indicated an Indian economy that slowed in the second quarter and is expected to continue.
- The US Retail Sales came in better than expected in July, climbing by 1.0% MoM, compared to a decline of 0.2% in June, according to the US Census Bureau reported on Thursday.
- The number of Americans filing new applications for unemployment benefits dropped 7K to 227K for the week ending August 10, better than the 235K estimated and down from 234K in the previous week.
- US Industrial Production came in at -0.6% in July versus 0.3 prior, weaker than the market consensus of 0.3%.
- Federal Reserve Bank of St. Louis President Alberto Musalem said on Friday that he believes the time is approaching when it will be appropriate for the Fed to cut interest rates as inflation is on a path towards the 2% target.
Technical Analysis: USD/INR’s underlying trend remains bullish
Indian Rupee trades in negative territory on the day. The long-term bullish trend of the USD/INR pair is well-established, with the price holding above the key 100-day Exponential Moving Average (EMA) and the 10-week-old uptrend line. The 14-day Relative Strength Index (RSI) stands above the midline near 64.00, supporting the buyers for the time being.
The 84.00 psychological mark appears to be a tough nut to crack for buyers. A decisive above the mentioned level could pave the way to the all-time high of 84.24. Further north, the next upside barrier is seen at 84.50.
On the other hand, a breach of the uptrend line at 83.85 could undergo some downside, possibly dragging USD/INR lower to the 100-day EMA at 83.54. The next contention level to watch is 83.36, the low of June 28.
Indian Rupee FAQs
The Indian Rupee (INR) is one of the most sensitive currencies to external factors. The price of Crude Oil (the country is highly dependent on imported Oil), the value of the US Dollar – most trade is conducted in USD – and the level of foreign investment, are all influential. Direct intervention by the Reserve Bank of India (RBI) in FX markets to keep the exchange rate stable, as well as the level of interest rates set by the RBI, are further major influencing factors on the Rupee.
The Reserve Bank of India (RBI) actively intervenes in forex markets to maintain a stable exchange rate, to help facilitate trade. In addition, the RBI tries to maintain the inflation rate at its 4% target by adjusting interest rates. Higher interest rates usually strengthen the Rupee. This is due to the role of the ‘carry trade’ in which investors borrow in countries with lower interest rates so as to place their money in countries’ offering relatively higher interest rates and profit from the difference.
Macroeconomic factors that influence the value of the Rupee include inflation, interest rates, the economic growth rate (GDP), the balance of trade, and inflows from foreign investment. A higher growth rate can lead to more overseas investment, pushing up demand for the Rupee. A less negative balance of trade will eventually lead to a stronger Rupee. Higher interest rates, especially real rates (interest rates less inflation) are also positive for the Rupee. A risk-on environment can lead to greater inflows of Foreign Direct and Indirect Investment (FDI and FII), which also benefit the Rupee.
Higher inflation, particularly, if it is comparatively higher than India’s peers, is generally negative for the currency as it reflects devaluation through oversupply. Inflation also increases the cost of exports, leading to more Rupees being sold to purchase foreign imports, which is Rupee-negative. At the same time, higher inflation usually leads to the Reserve Bank of India (RBI) raising interest rates and this can be positive for the Rupee, due to increased demand from international investors. The opposite effect is true of lower inflation.
- Gold price failed to build on the overnight positive move in the wake of the upbeat US data.
- Easing US recession fears boost investors’ confidence and contribute to capping the metal.
- Geopolitical risks and bets on an imminent start of the Fed’s rate-cutting cycle lend support.
Gold price (XAU/USD) attracted some dip-buying near the $2,432 area on Thursday and climbed over 1.5% intraday amid the risk of widening conflict in the Middle East. The precious metal, however, stalled the intraday move up near the $2,470 hurdle following the release of the upbeat US macro data, which eased fears of a recession in the world's largest economy and dashed hopes for a more aggressive policy easing by the Federal Reserve (Fed). This, in turn, pushed the US Treasury bond yields and provided a goodish lift to the US Dollar (USD). Apart from this, the risk-on rally in the US equity markets contributed to capping gains for the commodity.
Nevertheless, the Gold price settled with modest intraday gains, snapping a two-day losing streak, and held steady above the $2,450 level during the Asian session on Friday. Investors still seem convinced that the Fed will begin its rate-cutting cycle in September. This keeps a lid on any meaningful upside for the US bond yields and the USD, which, in turn, continues to act as a tailwind for the non-yielding yellow metal. Traders now look to the second-tier US macro data – Building Starts and Housing Permits, along with the Preliminary Michigan Consumer Sentiment Index – for short-term opportunities later during the early North American session.
Daily Digest Market Movers: Gold price struggles to lure buyers amid mixed fundamental backdrop
- Persistent geopolitical tensions stemming from the ongoing conflicts in the Middle East and the protracted Russia-Ukraine war assisted the safe-haven Gold price to regain some positive traction on Thursday.
- As a new round of Gaza ceasefire talks was underway in Doha, investors remained worried about how Iran would respond to the assassination of Hamas leader Ismail Haniyeh in Tehran last month.
- Russia said on Thursday it would beef up border defenses, improve command and control and send in additional forces after Ukraine's biggest attack on its sovereign territory since World War Two.
- The US macro data published on Thursday showed that Retail Sales rose more than expected in July and a still resilient labor market, easing fears of a sharp slowdown in the world's biggest economy.
- The US Census Bureau reported that the total value of sales at the retail level in the US rose 1% in July and sales ex-autos grew 0.4%, beating estimates for an increase of 0.3% and 0.1%, respectively.
- Another report by the US Department of Labor (DOL) revealed that there were 227K initial jobless claims in the week ending August 10, better than the 235K expected and 234K in the previous week.
- The markets were quick to react and are now pricing in a greater chance that the Federal Reserve will lower borrowing costs by just 25 basis points at its upcoming monetary policy meeting in September.
- This, in turn, triggered a fresh leg up in the US Treasury bond yields and assisted the US Dollar in attracting some meaningful buying, which, in turn, capped the upside for the non-yielding yellow metal.
- The XAU/USD remains on track to register modest weekly gains as the focus shifts to the FOMC minutes, due next Tuesday and Fed Chair Jerome Powell's appearance at the Jackson Hole Symposium.
Technical Analysis: Gold price needs to break through the $2,470 barrier for bulls to seize control
From a technical perspective, the overnight failure near the $2,470 resistance makes it prudent to wait for some follow-through buying before positioning for any further gains. Given that oscillators on the daily chart are holding in positive territory, the Gold price might then aim to surpass the all-time peak, around the $2,483-$2,484 area touched in July, and conquer the $2,500 psychological mark. A sustained strength beyond the latter will confirm a breakout through a one-month-old broader trading range and could be seen as a fresh trigger for bullish traders, setting the stage for a further near-term appreciating move.
On the flip side, the $2,447-2,445 horizontal zone now seems to protect the immediate downside ahead of the $2,430-2,429 area and the weekly low, around the $2,424 region. Some follow-through selling could make the Gold price vulnerable to weaken further below the $2,400 mark and test the 50-day Simple Moving Average (SMA) pivotal support, currently pegged near the $2,383 region. A convincing break below the latter might expose the 100-day SMA near the $2,363-2,362 area and the late July swing low, around the $2,353 zone. Failure to defend the said levels should pave the way for deeper losses.
Gold FAQs
Gold has played a key role in human’s history as it has been widely used as a store of value and medium of exchange. Currently, apart from its shine and usage for jewelry, the precious metal is widely seen as a safe-haven asset, meaning that it is considered a good investment during turbulent times. Gold is also widely seen as a hedge against inflation and against depreciating currencies as it doesn’t rely on any specific issuer or government.
Central banks are the biggest Gold holders. In their aim to support their currencies in turbulent times, central banks tend to diversify their reserves and buy Gold to improve the perceived strength of the economy and the currency. High Gold reserves can be a source of trust for a country’s solvency. Central banks added 1,136 tonnes of Gold worth around $70 billion to their reserves in 2022, according to data from the World Gold Council. This is the highest yearly purchase since records began. Central banks from emerging economies such as China, India and Turkey are quickly increasing their Gold reserves.
Gold has an inverse correlation with the US Dollar and US Treasuries, which are both major reserve and safe-haven assets. When the Dollar depreciates, Gold tends to rise, enabling investors and central banks to diversify their assets in turbulent times. Gold is also inversely correlated with risk assets. A rally in the stock market tends to weaken Gold price, while sell-offs in riskier markets tend to favor the precious metal.
The price can move due to a wide range of factors. Geopolitical instability or fears of a deep recession can quickly make Gold price escalate due to its safe-haven status. As a yield-less asset, Gold tends to rise with lower interest rates, while higher cost of money usually weighs down on the yellow metal. Still, most moves depend on how the US Dollar (USD) behaves as the asset is priced in dollars (XAU/USD). A strong Dollar tends to keep the price of Gold controlled, whereas a weaker Dollar is likely to push Gold prices up.
- The Australian Dollar advances further due to hawkish sentiment surrounding the RBA.
- RBA Governor Michele Bullock does not anticipate rate cuts in the near term.
- The US Dollar depreciates as traders fully price in a quarter basis point rate cut by the Fed in September.
The Australian Dollar (AUD) extends its gains for the second consecutive day against the US Dollar (USD) on Friday. The hawkish remarks from the Reserve Bank of Australia (RBA) Governor Michele Bullock fuel the upside of the Aussie Dollar and underpin the AUD/USD pair.
RBA Governor Bullock stated on Friday that the Australian central bank remains focused on the potential upside risks to inflation and does not anticipate rate cuts in the near term. The board believes it has struck the right balance between controlling inflation and maintaining stability in the current economic climate, per ABC News.
Read the full article: RBA's Bullock: Inflation remains too high
The US Dollar edges lower as traders fully price in a 25 basis point rate reduction by the US Federal Reserve for September. However, a 50 basis point cut remains a possibility, with the CME FedWatch tool indicating a 26% chance of such a move. Traders will also be observing the preliminary US Michigan Consumer Sentiment Index for August, which is set to be released on Friday.
Daily Digest Market Movers: Australian Dollar edges higher due to hawkish RBA
- On Friday, US Retail Sales rose by 1.0% month-over-month in July, a significant rebound from June's 0.2% decline, according to the US Census Bureau. This figure exceeded the forecasted increase of 0.3%. Additionally, Initial Jobless Claims for the week ending August 10 came in at 227,000, better than the anticipated 235,000 and a decrease from the previous week's 234,000.
- The People's Bank of China (PBoC) announced on Thursday that it will renew the medium-term lending facility funds maturing on August 15th later this month. The central bank also lent CNY 577.7 billion (USD 80.9 billion) through seven-day reverse bond repurchase agreements at 1.7% in an open market operation, maintaining the previous rate, according to Reuters. Any change in the Chinese economy could impact the Australian market as both countries are close trade partners.
- China's Retail Sales grew by 2.7% year-on-year in July, exceeding market forecasts of 2.6% and accelerating from June's 17-month low of 2.0%. Meanwhile, Industrial Production increased by 5.1% year-on-year, falling short of the 5.2% expected and easing from the 5.3% growth seen in the previous month. This marks the third consecutive month of moderation in industrial output.
- Australian Employment Change is reported at 58.2K for July, surpassing the expected 20.0K and the previous reading of 52.3K. However, the Unemployment Rate increased to 4.2%, exceeding the market expectation of remaining steady at 4.1%. Additionally, Consumer Inflation Expectations for August rose to 4.5%, up from the prior reading of 4.3%.
- Federal Reserve Bank of Chicago President Austan Goolsbee expressed growing concern on Wednesday about the labor market rather than inflation, noting recent improvements in price pressures alongside weak jobs data. Goolsbee added that the extent of rate cuts will be determined by the prevailing economic conditions, per Bloomberg.
- US headline Consumer Price Index (CPI) rose 2.9% year-over-year in July, slightly down from the 3% increase in June and below market expectations. The Core CPI, which excludes food and energy, climbed 3.2% year-over-year, a slight decrease from the 3.3% rise in June but aligned with market forecasts.
- On Tuesday, Atlanta Fed President Raphael Bostic stated that recent economic data has increased his confidence that the Fed can achieve its 2% inflation target. However, Bostic indicated that additional evidence is required before he would support a reduction in interest rates, according to Reuters.
Technical Analysis: Australian Dollar moves above 0.6600
The Australian Dollar trades around 0.6620 on Friday. According to daily chart analysis, the AUD/USD pair is testing the lower boundary of an ascending channel. A break below this level could indicate a weakening of the bullish trend. Additionally, the 14-day Relative Strength Index (RSI) is slightly above the 50 mark, supporting the current bullish momentum.
In terms of support, the lower boundary of the ascending channel, around 0.6610, is the immediate support level for the AUD/USD pair. A break below this could lead the pair to test the nine-day Exponential Moving Average (EMA) at 0.6593, followed by the throwback level at 0.6575. Should the pair fall below this support zone, it could signal a bearish outlook, potentially pushing it toward the throwback level at 0.6470.
On the upside, the AUD/USD pair might target the area near the upper boundary of the ascending channel at the 0.6720 level. A breakout above this could propel the pair toward its six-month high of 0.6798, recorded on July 11.
AUD/USD: Daily Chart
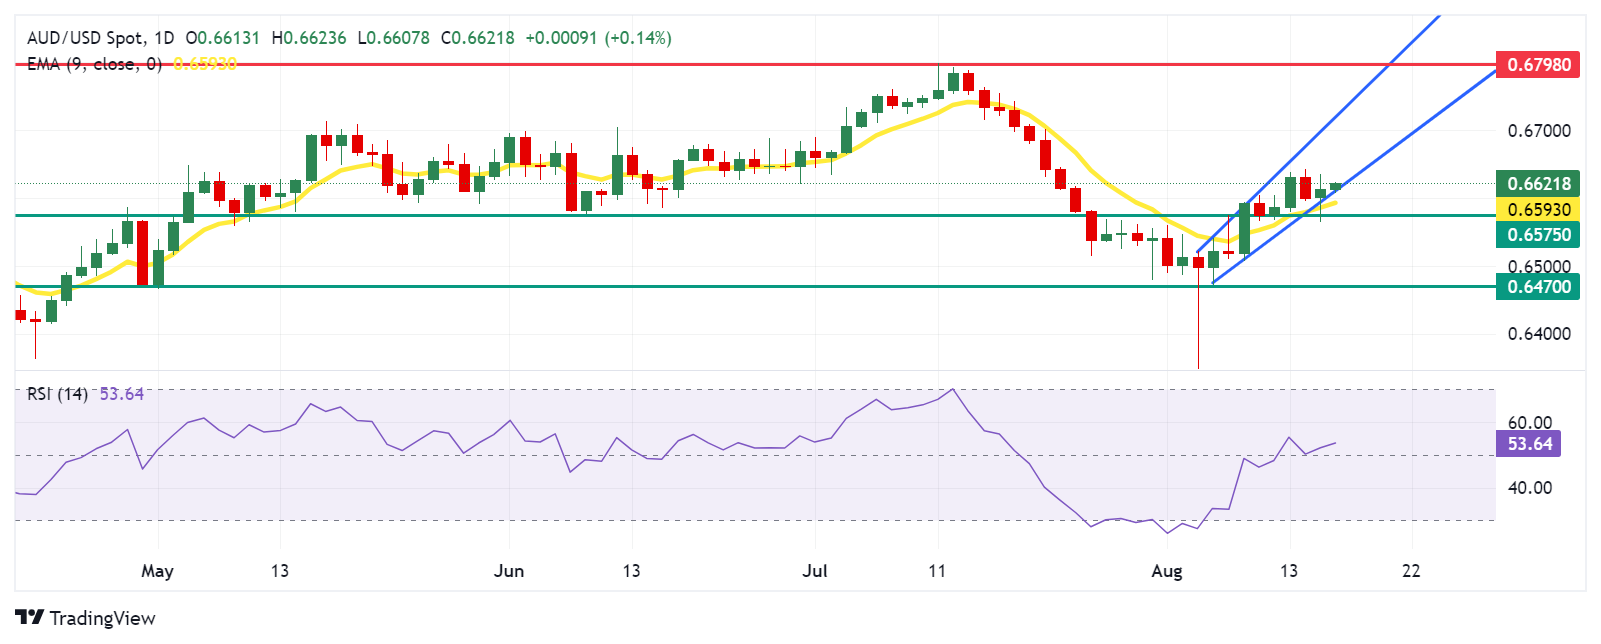
Australian Dollar PRICE Today
The table below shows the percentage change of Australian Dollar (AUD) against listed major currencies today. Australian Dollar was the strongest against the US Dollar.
| USD | EUR | GBP | JPY | CAD | AUD | NZD | CHF | |
|---|---|---|---|---|---|---|---|---|
| USD | -0.06% | -0.12% | -0.22% | -0.04% | -0.17% | -0.08% | -0.15% | |
| EUR | 0.06% | -0.07% | -0.18% | 0.00% | -0.14% | -0.12% | -0.06% | |
| GBP | 0.12% | 0.07% | -0.12% | 0.09% | -0.07% | -0.04% | -0.00% | |
| JPY | 0.22% | 0.18% | 0.12% | 0.26% | 0.07% | 0.08% | 0.10% | |
| CAD | 0.04% | -0.00% | -0.09% | -0.26% | -0.16% | -0.16% | -0.10% | |
| AUD | 0.17% | 0.14% | 0.07% | -0.07% | 0.16% | 0.01% | 0.05% | |
| NZD | 0.08% | 0.12% | 0.04% | -0.08% | 0.16% | -0.01% | 0.06% | |
| CHF | 0.15% | 0.06% | 0.00% | -0.10% | 0.10% | -0.05% | -0.06% |
The heat map shows percentage changes of major currencies against each other. The base currency is picked from the left column, while the quote currency is picked from the top row. For example, if you pick the Australian Dollar from the left column and move along the horizontal line to the US Dollar, the percentage change displayed in the box will represent AUD (base)/USD (quote).
Australian Dollar FAQs
One of the most significant factors for the Australian Dollar (AUD) is the level of interest rates set by the Reserve Bank of Australia (RBA). Because Australia is a resource-rich country another key driver is the price of its biggest export, Iron Ore. The health of the Chinese economy, its largest trading partner, is a factor, as well as inflation in Australia, its growth rate and Trade Balance. Market sentiment – whether investors are taking on more risky assets (risk-on) or seeking safe-havens (risk-off) – is also a factor, with risk-on positive for AUD.
The Reserve Bank of Australia (RBA) influences the Australian Dollar (AUD) by setting the level of interest rates that Australian banks can lend to each other. This influences the level of interest rates in the economy as a whole. The main goal of the RBA is to maintain a stable inflation rate of 2-3% by adjusting interest rates up or down. Relatively high interest rates compared to other major central banks support the AUD, and the opposite for relatively low. The RBA can also use quantitative easing and tightening to influence credit conditions, with the former AUD-negative and the latter AUD-positive.
China is Australia’s largest trading partner so the health of the Chinese economy is a major influence on the value of the Australian Dollar (AUD). When the Chinese economy is doing well it purchases more raw materials, goods and services from Australia, lifting demand for the AUD, and pushing up its value. The opposite is the case when the Chinese economy is not growing as fast as expected. Positive or negative surprises in Chinese growth data, therefore, often have a direct impact on the Australian Dollar and its pairs.
Iron Ore is Australia’s largest export, accounting for $118 billion a year according to data from 2021, with China as its primary destination. The price of Iron Ore, therefore, can be a driver of the Australian Dollar. Generally, if the price of Iron Ore rises, AUD also goes up, as aggregate demand for the currency increases. The opposite is the case if the price of Iron Ore falls. Higher Iron Ore prices also tend to result in a greater likelihood of a positive Trade Balance for Australia, which is also positive of the AUD.
The Trade Balance, which is the difference between what a country earns from its exports versus what it pays for its imports, is another factor that can influence the value of the Australian Dollar. If Australia produces highly sought after exports, then its currency will gain in value purely from the surplus demand created from foreign buyers seeking to purchase its exports versus what it spends to purchase imports. Therefore, a positive net Trade Balance strengthens the AUD, with the opposite effect if the Trade Balance is negative.
Reserve Bank of New Zealand (RBNZ) Governor Adrian Orr commented on the bank’s inflation outlook during his speech on Friday.
Orr said, “Committee has achieved a very strong level of confidence that forward indicators showed low and stable inflation is back within 1% and 3%.”
“I want to see inflation expectations, pricing intentions continue to remain anchored,” the Governor added.
On Friday, the People’s Bank of China (PBOC) set the USD/CNY central rate for the trading session ahead at 7.1464, as against the previous day's fix of 7.1399 and 7.1739 Reuters estimates.
RBNZ Assistant Governor Karen Silk said in an interview on Friday that the New Zealand central bank is taking a measured approach to rate cuts.
Key quotes
Uncertainty remains on how quickly inflation will subside.
Bank is taking a measured approach to rate cuts.
The behavior of price inflation is crucial for the cash rate path ahead.
Market reaction
The NZD/USD pair is trading lower by 0.13% on the day to trade at 0.5983, as of writing.
RBNZ FAQs
The Reserve Bank of New Zealand (RBNZ) is the country’s central bank. Its economic objectives are achieving and maintaining price stability – achieved when inflation, measured by the Consumer Price Index (CPI), falls within the band of between 1% and 3% – and supporting maximum sustainable employment.
The Reserve Bank of New Zealand’s (RBNZ) Monetary Policy Committee (MPC) decides the appropriate level of the Official Cash Rate (OCR) according to its objectives. When inflation is above target, the bank will attempt to tame it by raising its key OCR, making it more expensive for households and businesses to borrow money and thus cooling the economy. Higher interest rates are generally positive for the New Zealand Dollar (NZD) as they lead to higher yields, making the country a more attractive place for investors. On the contrary, lower interest rates tend to weaken NZD.
Employment is important for the Reserve Bank of New Zealand (RBNZ) because a tight labor market can fuel inflation. The RBNZ’s goal of “maximum sustainable employment” is defined as the highest use of labor resources that can be sustained over time without creating an acceleration in inflation. “When employment is at its maximum sustainable level, there will be low and stable inflation. However, if employment is above the maximum sustainable level for too long, it will eventually cause prices to rise more and more quickly, requiring the MPC to raise interest rates to keep inflation under control,” the bank says.
In extreme situations, the Reserve Bank of New Zealand (RBNZ) can enact a monetary policy tool called Quantitative Easing. QE is the process by which the RBNZ prints local currency and uses it to buy assets – usually government or corporate bonds – from banks and other financial institutions with the aim to increase the domestic money supply and spur economic activity. QE usually results in a weaker New Zealand Dollar (NZD). QE is a last resort when simply lowering interest rates is unlikely to achieve the objectives of the central bank. The RBNZ used it during the Covid-19 pandemic.
| Index | Change, points | Closed | Change, % |
|---|---|---|---|
| NIKKEI 225 | 284.21 | 36726.64 | 0.78 |
| Hang Seng | -4.22 | 17109.14 | -0.02 |
| ASX 200 | 14.8 | 7865.5 | 0.19 |
| DAX | 297.64 | 18183.24 | 1.66 |
| CAC 40 | 90.01 | 7423.37 | 1.23 |
| Dow Jones | 554.67 | 40563.06 | 1.39 |
| S&P 500 | 88.01 | 5543.22 | 1.61 |
| NASDAQ Composite | 401.9 | 17594.5 | 2.34 |
Reserve Bank of Australia Governor Michele Bullock said on Friday that the central bank remains focused on the potential upside risks to inflation, adding that it does not expect to cut rates in the near term.
Key quotes
- The board is of the view that it currently has the balance right between reducing inflation in a reasonable timeframe.
- Our full employment goal is not served by letting inflation stay above target indefinitely.
- The board remains focused on the potential upside risks to inflation.
- The board is trying to bring inflation back to target in a reasonable timeframe while preserving as many of the gains in the labour market that we have seen in the past few years.
- There has been further progress on inflation, but it has been very slow.
- The economic outlook remains highly uncertain.
- Underlying inflation remains too high.
- Based on what the board knows at present, it does not expect that it will be in a position to cut rates in the near term.
- The board’s message, though, was that it is premature to be thinking about rate cuts.
- While goods price inflation has declined substantially, it has not been enough to offset continued high service price inflation.
- Geopolitical issues could hinder global efforts against inflation
Market reaction
At the time of writing, AUD/USD is trading 0.02% higher on the day at 0.6615.
RBA FAQs
The Reserve Bank of Australia (RBA) sets interest rates and manages monetary policy for Australia. Decisions are made by a board of governors at 11 meetings a year and ad hoc emergency meetings as required. The RBA’s primary mandate is to maintain price stability, which means an inflation rate of 2-3%, but also “..to contribute to the stability of the currency, full employment, and the economic prosperity and welfare of the Australian people.” Its main tool for achieving this is by raising or lowering interest rates. Relatively high interest rates will strengthen the Australian Dollar (AUD) and vice versa. Other RBA tools include quantitative easing and tightening.
While inflation had always traditionally been thought of as a negative factor for currencies since it lowers the value of money in general, the opposite has actually been the case in modern times with the relaxation of cross-border capital controls. Moderately higher inflation now tends to lead central banks to put up their interest rates, which in turn has the effect of attracting more capital inflows from global investors seeking a lucrative place to keep their money. This increases demand for the local currency, which in the case of Australia is the Aussie Dollar.
Macroeconomic data gauges the health of an economy and can have an impact on the value of its currency. Investors prefer to invest their capital in economies that are safe and growing rather than precarious and shrinking. Greater capital inflows increase the aggregate demand and value of the domestic currency. Classic indicators, such as GDP, Manufacturing and Services PMIs, employment, and consumer sentiment surveys can influence AUD. A strong economy may encourage the Reserve Bank of Australia to put up interest rates, also supporting AUD.
Quantitative Easing (QE) is a tool used in extreme situations when lowering interest rates is not enough to restore the flow of credit in the economy. QE is the process by which the Reserve Bank of Australia (RBA) prints Australian Dollars (AUD) for the purpose of buying assets – usually government or corporate bonds – from financial institutions, thereby providing them with much-needed liquidity. QE usually results in a weaker AUD.
Quantitative tightening (QT) is the reverse of QE. It is undertaken after QE when an economic recovery is underway and inflation starts rising. Whilst in QE the Reserve Bank of Australia (RBA) purchases government and corporate bonds from financial institutions to provide them with liquidity, in QT the RBA stops buying more assets, and stops reinvesting the principal maturing on the bonds it already holds. It would be positive (or bullish) for the Australian Dollar.
- The New Zealand Dollar trades on a weaker note in Friday’s early Asian session.
- RBNZ cut its rate for the first time since March 2020 and flags more cuts ahead, dragging the Kiwi lower.
- Investors await RBNZ Governor Orr's speech ahead of the US economic data on Friday.
The New Zealand Dollar (NZD) loses traction on Friday despite the consolidation of the Greenback. The Kiwi has traded in negative territory for the third consecutive day, pressured by a surprise rate cut by the Reserve Bank of New Zealand (RBNZ) and its dovish stance. Furthermore, the cautious mood amid the elevated geopolitical risks in the Middle East might weigh on riskier assets like the NZD.
On the other hand, the expectation of a Federal Reserve (Fed) interest rate cut in September might undermine the USD and create a tailwind for NZD/USD. The market is now fully priced for a 25 basis points (bps) Fed rate cut in September and nearly 20% priced for a 50 bps cut. Traders will take more cues from the Fed's Austan Goolsbee speech later on Friday. Also, the preliminary US Michigan Consumer Sentiment Index for August, Building Permits and Housing Starts will be released. On the NZD docket, Reserve Bank of New Zealand (RBNZ) Governor Adrian Orr is set to speak.
Daily Digest Market Movers: New Zealand Dollar remains weak on dovish RBNZ
- New Zealand’s Business NZ Performance of Manufacturing Index (PMI) improved to 44.0 in July from the previous reading of 41.1.
- China’s Retail Sales rose by 2.7% YoY in July, compared to 2.0% seen in June, beating market expectations. Industrial Production came in at 5.1% YoY in July versus 5.3% prior, weaker than the estimation of 5.2%.
- The US Retail Sales climbed by 1.0% MoM in July, compared to a decline of 0.2% in June, the US Census Bureau reported on Thursday. This figure surpassed the estimation of a 0.3% increase.
- The Initial Jobless Claims for the week ending August 10 increased by 227K, better than the expectation of 235K and down from the previous week of 234K.
- US Industrial Production came in at -0.6% in July versus 0.3 prior, weaker than the 0.3% expected.
- St. Louis Fed President Alberto Musalem said on Thursday that the time is coming closer for the Fed to consider cutting its interest rate, per Reuters.
Technical Analysis: New Zealand Dollar continues bearish tone
The New Zealand Dollar trades softer on the day. The NZD/USD pair maintains a negative outlook on the daily timeframe as the pair holds below the key 100-day Exponential Moving Average (EMA) and the tested descending trendline. Additionally, the 14-day Relative Strength Index (RSI) points lower below the 50-midline, supporting a continuation of the downtrend.
The significant resistance level to watch is near 0.6050, the key 100-day EMA and the descending trendline. Sustained upside momentum past this level could lift the pair all the way up to 0.6070, the upper boundary of the Bollinger Band. The next hurdle is located at 0.6154, the high of July 8.
On the flip side, the next downside target emerges at 0.5930, the low of August 2. Extended losses could clear the way for a move to 0.5860, the lower limit of the Bollinger Band and the low of July 29.
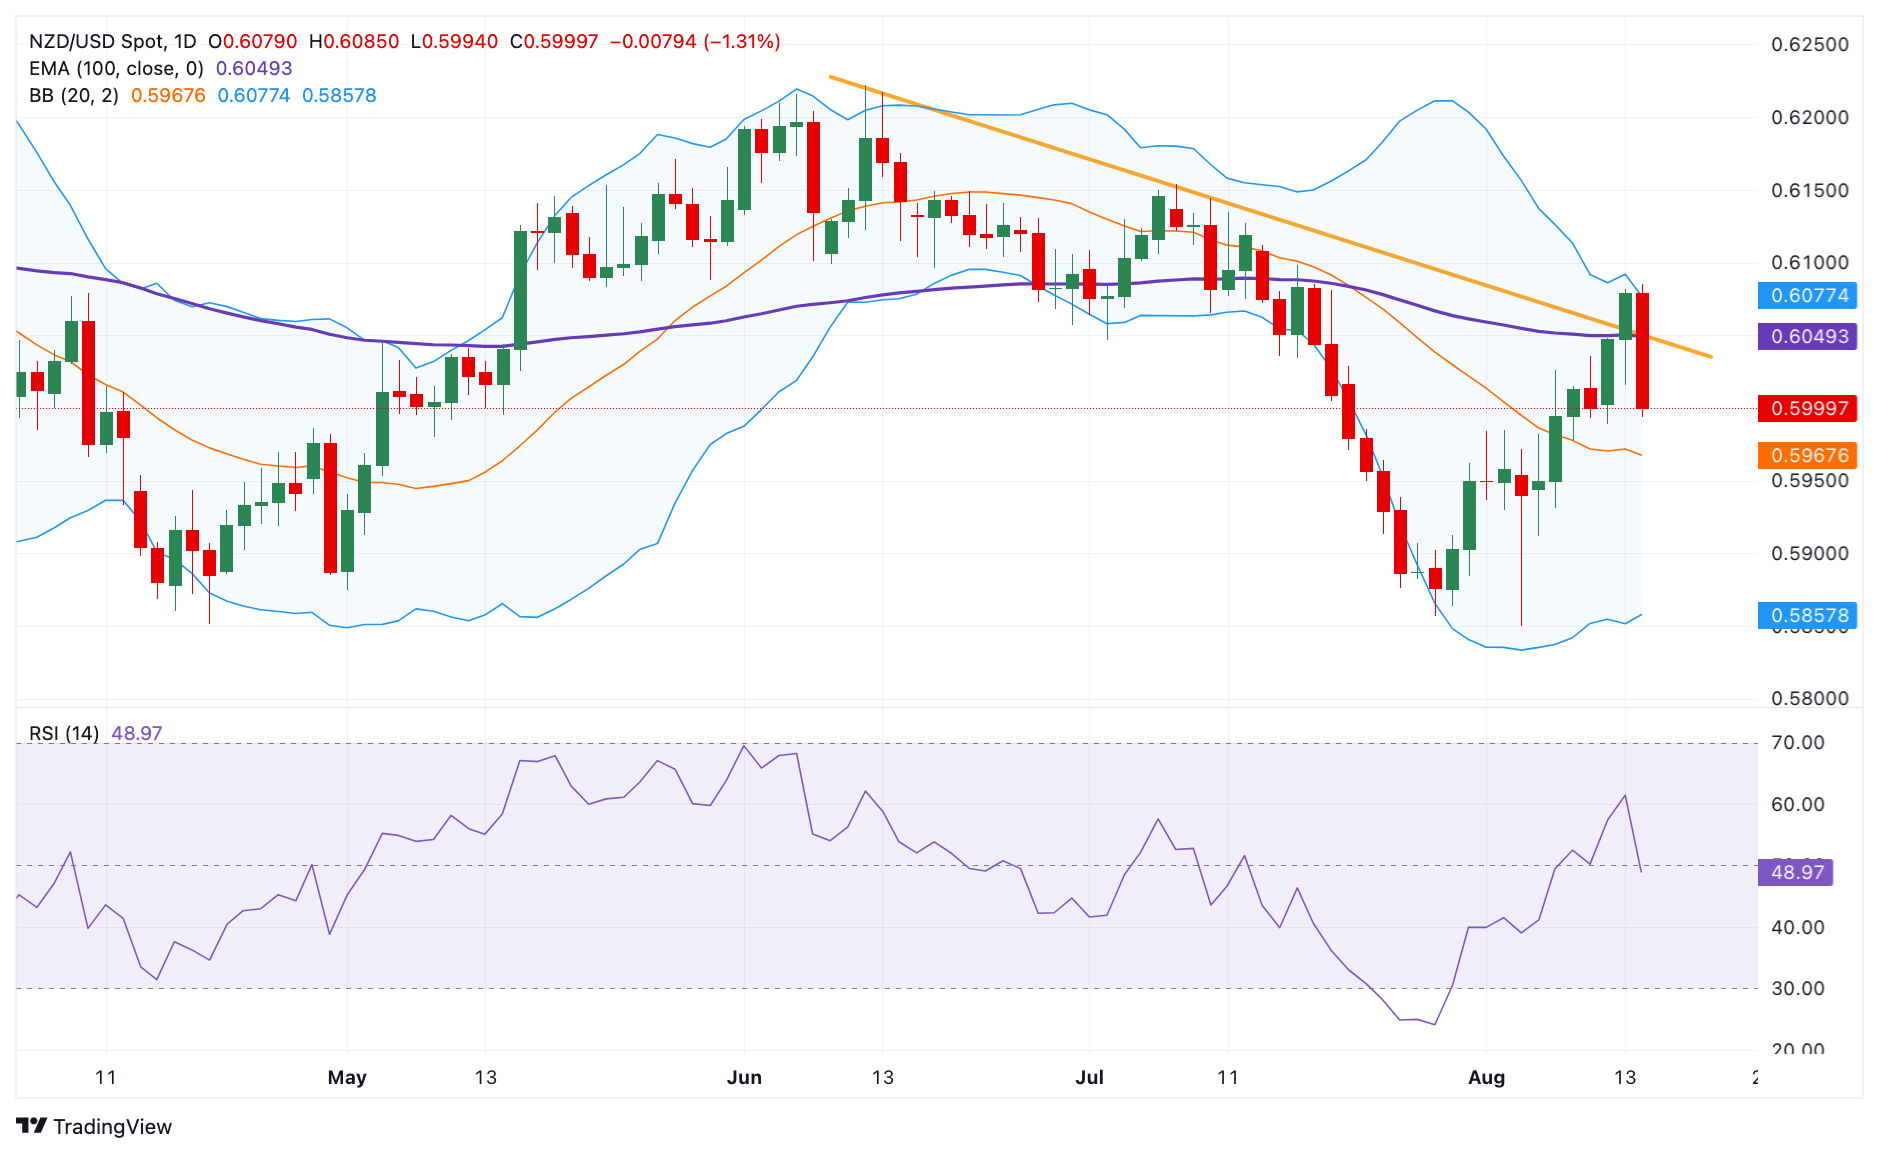
New Zealand Dollar FAQs
The New Zealand Dollar (NZD), also known as the Kiwi, is a well-known traded currency among investors. Its value is broadly determined by the health of the New Zealand economy and the country’s central bank policy. Still, there are some unique particularities that also can make NZD move. The performance of the Chinese economy tends to move the Kiwi because China is New Zealand’s biggest trading partner. Bad news for the Chinese economy likely means less New Zealand exports to the country, hitting the economy and thus its currency. Another factor moving NZD is dairy prices as the dairy industry is New Zealand’s main export. High dairy prices boost export income, contributing positively to the economy and thus to the NZD.
The Reserve Bank of New Zealand (RBNZ) aims to achieve and maintain an inflation rate between 1% and 3% over the medium term, with a focus to keep it near the 2% mid-point. To this end, the bank sets an appropriate level of interest rates. When inflation is too high, the RBNZ will increase interest rates to cool the economy, but the move will also make bond yields higher, increasing investors’ appeal to invest in the country and thus boosting NZD. On the contrary, lower interest rates tend to weaken NZD. The so-called rate differential, or how rates in New Zealand are or are expected to be compared to the ones set by the US Federal Reserve, can also play a key role in moving the NZD/USD pair.
Macroeconomic data releases in New Zealand are key to assess the state of the economy and can impact the New Zealand Dollar’s (NZD) valuation. A strong economy, based on high economic growth, low unemployment and high confidence is good for NZD. High economic growth attracts foreign investment and may encourage the Reserve Bank of New Zealand to increase interest rates, if this economic strength comes together with elevated inflation. Conversely, if economic data is weak, NZD is likely to depreciate.
The New Zealand Dollar (NZD) tends to strengthen during risk-on periods, or when investors perceive that broader market risks are low and are optimistic about growth. This tends to lead to a more favorable outlook for commodities and so-called ‘commodity currencies’ such as the Kiwi. Conversely, NZD tends to weaken at times of market turbulence or economic uncertainty as investors tend to sell higher-risk assets and flee to the more-stable safe havens.
| Pare | Closed | Change, % |
|---|---|---|
| AUDUSD | 0.6611 | 0.2 |
| EURJPY | 163.81 | 1.02 |
| EURUSD | 1.09715 | -0.39 |
| GBPJPY | 191.903 | 1.59 |
| GBPUSD | 1.28515 | 0.16 |
| NZDUSD | 0.59855 | -0.25 |
| USDCAD | 1.37273 | 0.1 |
| USDCHF | 0.87238 | 0.88 |
| USDJPY | 149.297 | 1.42 |


© 2000-2026. All rights reserved.
This site is managed by Teletrade D.J. LLC 2351 LLC 2022 (Euro House, Richmond Hill Road, Kingstown, VC0100, St. Vincent and the Grenadines).
The information on this website is for informational purposes only and does not constitute any investment advice.
The company does not serve or provide services to customers who are residents of the US, Canada, Iran, The Democratic People's Republic of Korea, Yemen and FATF blacklisted countries.
Making transactions on financial markets with marginal financial instruments opens up wide possibilities and allows investors who are willing to take risks to earn high profits, carrying a potentially high risk of losses at the same time. Therefore you should responsibly approach the issue of choosing the appropriate investment strategy, taking the available resources into account, before starting trading.
Use of the information: full or partial use of materials from this website must always be referenced to TeleTrade as the source of information. Use of the materials on the Internet must be accompanied by a hyperlink to teletrade.org. Automatic import of materials and information from this website is prohibited.
Please contact our PR department if you have any questions or need assistance at pr@teletrade.global.
transfers