- Analytics
- News and Tools
- Market News
CFD Markets News and Forecasts — 16-07-2024
- NZD/USD trades on a positive note near 0.6065 in Wednesday’s early Asian session, up 0.23% on the day.
- New Zealand CPI inflation eased more than expected in the second quarter, triggering RBNZ rate cut expectations.
- US Retail Sales unchanged in June.
The NZD/USD pair trades on a stronger note around 0.6065 on the weaker US Dollar (USD) during the early Asian session on Wednesday. The New Zealand Dollar (NZD) edges higher after the release of the New Zealand Consumer Price Index (CPI) reading. Later in the day, the US Building Permits, Housing Starts, Industrial Production and the Fed Beige Book are due. The Federal Reserve’s (Fed) Barkin and Waller are also scheduled to speak.
Data released by Statistics New Zealand on Wednesday showed that the country’s Consumer Price Index (CPI) rose 0.4% QoQ in the second quarter (Q2), compared to 0.6% in the previous quarter. This figure was below analysts' forecasts of 0.6%. The annual rate of CPI inflation fell to its lowest rate in three years, coming in at 3.3% YoY in Q2 from a 4% rise in the 12 months to the March 2024 quarter.
Finance Minister Nicola Willis said that the recent inflation rate showed "we are turning our economy around and winning the fight against rampant inflation.” Westpac analysts noted that more signs of easing inflation could give the RBNZ enough confidence to begin cutting rates as soon as November.
On the USD’s front, the US Retail Sales for June did not change much for the central bank's expectations. Retail Sales in the United States held steady at $704.3 billion in June, after a 0.3% gain (revised from 0.1%) in May and in line with market expectations. Retail sales grew 2.3% year over year in June. Traders are currently betting that the Fed will start cutting the interest rate at the September 17-18 meeting, which might drag the Greenback lower and create a tailwind for NZD/USD.
New Zealand Dollar FAQs
The New Zealand Dollar (NZD), also known as the Kiwi, is a well-known traded currency among investors. Its value is broadly determined by the health of the New Zealand economy and the country’s central bank policy. Still, there are some unique particularities that also can make NZD move. The performance of the Chinese economy tends to move the Kiwi because China is New Zealand’s biggest trading partner. Bad news for the Chinese economy likely means less New Zealand exports to the country, hitting the economy and thus its currency. Another factor moving NZD is dairy prices as the dairy industry is New Zealand’s main export. High dairy prices boost export income, contributing positively to the economy and thus to the NZD.
The Reserve Bank of New Zealand (RBNZ) aims to achieve and maintain an inflation rate between 1% and 3% over the medium term, with a focus to keep it near the 2% mid-point. To this end, the bank sets an appropriate level of interest rates. When inflation is too high, the RBNZ will increase interest rates to cool the economy, but the move will also make bond yields higher, increasing investors’ appeal to invest in the country and thus boosting NZD. On the contrary, lower interest rates tend to weaken NZD. The so-called rate differential, or how rates in New Zealand are or are expected to be compared to the ones set by the US Federal Reserve, can also play a key role in moving the NZD/USD pair.
Macroeconomic data releases in New Zealand are key to assess the state of the economy and can impact the New Zealand Dollar’s (NZD) valuation. A strong economy, based on high economic growth, low unemployment and high confidence is good for NZD. High economic growth attracts foreign investment and may encourage the Reserve Bank of New Zealand to increase interest rates, if this economic strength comes together with elevated inflation. Conversely, if economic data is weak, NZD is likely to depreciate.
The New Zealand Dollar (NZD) tends to strengthen during risk-on periods, or when investors perceive that broader market risks are low and are optimistic about growth. This tends to lead to a more favorable outlook for commodities and so-called ‘commodity currencies’ such as the Kiwi. Conversely, NZD tends to weaken at times of market turbulence or economic uncertainty as investors tend to sell higher-risk assets and flee to the more-stable safe havens.
- USD/CAD trades with mild losses around 1.3670 in Wednesday’s early Asian session.
- US Retail Sales held steady in June, followed a 0.3% increase in May, in line with expectations.
- The cooler-than-expected Canadian CPI triggered expectations of another rate cut by the BoC next week.
The USD/CAD pair trades in a negative territory near 1.3670 during the early Asian session on Wednesday. The rising speculation of a rate cut by the Federal Reserve (Fed) in September continues to undermine the USD Index (DXY). Investors will monitor US Building Permits, Housing Starts, Industrial Production, and the Fed Beige Book. Also, Fed’s Barkin and Waller are set to speak.
US Retail Sales were unchanged in June and did not change expectations that the Fed would start cutting interest rates in September amid the signs of cooling inflation. Retail Sales in the US held steady at $704.3 billion in June, followed the 0.3% increase (revised from 0.1%) in May, and came in line with the market expectations. Retail sales rose 2.3% on a year-on-year basis in June.
Fed Governor Adriana Kugler said on Tuesday that inflation is on course to reach the Fed's 2% target, with goods, services and now housing contributing to easing price pressures. However, the US central bank still needs more evidence of the rate cut puzzle before considering rate cuts. Fed Chair Jerome Powell stated that recent data has boosted confidence that inflation will ease to the 2% target from its current level about half a percentage point above that mark. Financial markets expect a rate cut in September followed by additional cuts in November and December. This, in turn, weighs on the Greenback against the Loonie.
On the other hand, the softer Canadian Consumer Price Index has spurred expectations that the Bank of Canada (BoC) would cut interest rates further next week. "The inflation data for June gave the Bank of Canada what it needed in order to cut interest rates at next week's meeting," said Katherine Judge, senior economist at CIBC Capital Markets. Meanwhile, the decline in crude oil prices might exert some selling pressure on the Canadian Dollar (CAD) and cap the downside of the pair. It’s worth noting that Canada is the biggest Oil exporter to the United States (US).
Canadian Dollar FAQs
The key factors driving the Canadian Dollar (CAD) are the level of interest rates set by the Bank of Canada (BoC), the price of Oil, Canada’s largest export, the health of its economy, inflation and the Trade Balance, which is the difference between the value of Canada’s exports versus its imports. Other factors include market sentiment – whether investors are taking on more risky assets (risk-on) or seeking safe-havens (risk-off) – with risk-on being CAD-positive. As its largest trading partner, the health of the US economy is also a key factor influencing the Canadian Dollar.
The Bank of Canada (BoC) has a significant influence on the Canadian Dollar by setting the level of interest rates that banks can lend to one another. This influences the level of interest rates for everyone. The main goal of the BoC is to maintain inflation at 1-3% by adjusting interest rates up or down. Relatively higher interest rates tend to be positive for the CAD. The Bank of Canada can also use quantitative easing and tightening to influence credit conditions, with the former CAD-negative and the latter CAD-positive.
The price of Oil is a key factor impacting the value of the Canadian Dollar. Petroleum is Canada’s biggest export, so Oil price tends to have an immediate impact on the CAD value. Generally, if Oil price rises CAD also goes up, as aggregate demand for the currency increases. The opposite is the case if the price of Oil falls. Higher Oil prices also tend to result in a greater likelihood of a positive Trade Balance, which is also supportive of the CAD.
While inflation had always traditionally been thought of as a negative factor for a currency since it lowers the value of money, the opposite has actually been the case in modern times with the relaxation of cross-border capital controls. Higher inflation tends to lead central banks to put up interest rates which attracts more capital inflows from global investors seeking a lucrative place to keep their money. This increases demand for the local currency, which in Canada’s case is the Canadian Dollar.
Macroeconomic data releases gauge the health of the economy and can have an impact on the Canadian Dollar. Indicators such as GDP, Manufacturing and Services PMIs, employment, and consumer sentiment surveys can all influence the direction of the CAD. A strong economy is good for the Canadian Dollar. Not only does it attract more foreign investment but it may encourage the Bank of Canada to put up interest rates, leading to a stronger currency. If economic data is weak, however, the CAD is likely to fall.
Inflation in New Zealand, as measured by the change in the Consumer Price Index (CPI), drops to 0.4% QoQ in the second quarter (Q2) of 2024 from 0.6% in the previous reading, Statistics New Zealand reported on Wednesday. The figure was below the market consensus of 0.6%.
Annualized CPI inflation in New Zealand came in at 3.3% YoY compared to the previous period's 4.0%, weaker than the estimation of 3.5%.
Market reaction to New Zealand CPI data
The New Zealand Dollar (NZD) edged higher with the immediate reaction. The NZD/USD pair was last seen rising 0.12% on the day at 0.6058.
New Zealand Dollar FAQs
The New Zealand Dollar (NZD), also known as the Kiwi, is a well-known traded currency among investors. Its value is broadly determined by the health of the New Zealand economy and the country’s central bank policy. Still, there are some unique particularities that also can make NZD move. The performance of the Chinese economy tends to move the Kiwi because China is New Zealand’s biggest trading partner. Bad news for the Chinese economy likely means less New Zealand exports to the country, hitting the economy and thus its currency. Another factor moving NZD is dairy prices as the dairy industry is New Zealand’s main export. High dairy prices boost export income, contributing positively to the economy and thus to the NZD.
The Reserve Bank of New Zealand (RBNZ) aims to achieve and maintain an inflation rate between 1% and 3% over the medium term, with a focus to keep it near the 2% mid-point. To this end, the bank sets an appropriate level of interest rates. When inflation is too high, the RBNZ will increase interest rates to cool the economy, but the move will also make bond yields higher, increasing investors’ appeal to invest in the country and thus boosting NZD. On the contrary, lower interest rates tend to weaken NZD. The so-called rate differential, or how rates in New Zealand are or are expected to be compared to the ones set by the US Federal Reserve, can also play a key role in moving the NZD/USD pair.
Macroeconomic data releases in New Zealand are key to assess the state of the economy and can impact the New Zealand Dollar’s (NZD) valuation. A strong economy, based on high economic growth, low unemployment and high confidence is good for NZD. High economic growth attracts foreign investment and may encourage the Reserve Bank of New Zealand to increase interest rates, if this economic strength comes together with elevated inflation. Conversely, if economic data is weak, NZD is likely to depreciate.
The New Zealand Dollar (NZD) tends to strengthen during risk-on periods, or when investors perceive that broader market risks are low and are optimistic about growth. This tends to lead to a more favorable outlook for commodities and so-called ‘commodity currencies’ such as the Kiwi. Conversely, NZD tends to weaken at times of market turbulence or economic uncertainty as investors tend to sell higher-risk assets and flee to the more-stable safe havens.
- EUR/USD hung up on tense bidding near 1.0900.
- Bullish momentum pulls up short as Fiber fails to crack into new technical highs.
- ECB rate call in the barrel for Thursday after US data sparks renewed rate cut hopes.
EUR/USD rotated around 1.0900 on Tuesday as markets grappled with September rate cut hopes getting pinned even further into the high end after US Retail Sales figures eased in June. Markets have fully priced in the start of a Federal Reserve (Fed) rate-cutting cycle in September, with up to three quarter-point cuts expected for the year. On the European side, the European Central Bank’s (ECB) latest rate call looms ahead on Thursday.
Forex Today: UK, EMU inflation come to the fore along with US data
In June, US Retail Sales remained flat at 0.0%, matching forecasts and dropping from the revised 0.3% in the previous month. This decline in Retail Sales added to the market's expectation of a rate cut at the upcoming Federal Open Market Committee (FOMC) meeting on September 18. The softening of US Retail Sales combined with a recent cooling in Consumer Price Index (CPI) data last week has increased the likelihood of a rate cut in September. According to the CME’s FedWatch Tool, the markets are now anticipating almost a 100% chance of at least a quarter-point rate reduction in September, with the possibility of up to three cuts by 2024.
The ECB is broadly expected to keep rates on hold on Thursday as policymakers wait to see if data will improve following an initial quarter-point cut in June.
Euro PRICE This week
The table below shows the percentage change of Euro (EUR) against listed major currencies this week. Euro was the strongest against the New Zealand Dollar.
| USD | EUR | GBP | JPY | CAD | AUD | NZD | CHF | |
|---|---|---|---|---|---|---|---|---|
| USD | 0.07% | 0.10% | 0.13% | 0.21% | 0.76% | 0.92% | -0.08% | |
| EUR | -0.07% | 0.07% | 0.24% | 0.33% | 0.73% | 1.04% | 0.04% | |
| GBP | -0.10% | -0.07% | 0.27% | 0.26% | 0.66% | 0.92% | -0.03% | |
| JPY | -0.13% | -0.24% | -0.27% | 0.08% | 0.42% | 0.75% | -0.40% | |
| CAD | -0.21% | -0.33% | -0.26% | -0.08% | 0.49% | 0.71% | -0.29% | |
| AUD | -0.76% | -0.73% | -0.66% | -0.42% | -0.49% | 0.31% | -0.69% | |
| NZD | -0.92% | -1.04% | -0.92% | -0.75% | -0.71% | -0.31% | -1.00% | |
| CHF | 0.08% | -0.04% | 0.03% | 0.40% | 0.29% | 0.69% | 1.00% |
The heat map shows percentage changes of major currencies against each other. The base currency is picked from the left column, while the quote currency is picked from the top row. For example, if you pick the Euro from the left column and move along the horizontal line to the US Dollar, the percentage change displayed in the box will represent EUR (base)/USD (quote).
EUR/USD technical outlook
EUR/USD was unable to break decisively through the 1.0900 handle last week, and intraday bidding churns just south of the key technical barrier as markets await a meaningful push in either direction. The Fiber is holding close to a four-month high set at 1.0922 last Friday, and the key for buyers will be to keep EUR/USD buoyed above the 200-day Exponential Moving Average (EMA) at 1.0789.
Fiber trading is hung up on the upper bound of a rough descending channel, and continued weakness could drag bulls back into the low end with the last swing low priced in just north of 1.0650.
EUR/USD hourly chart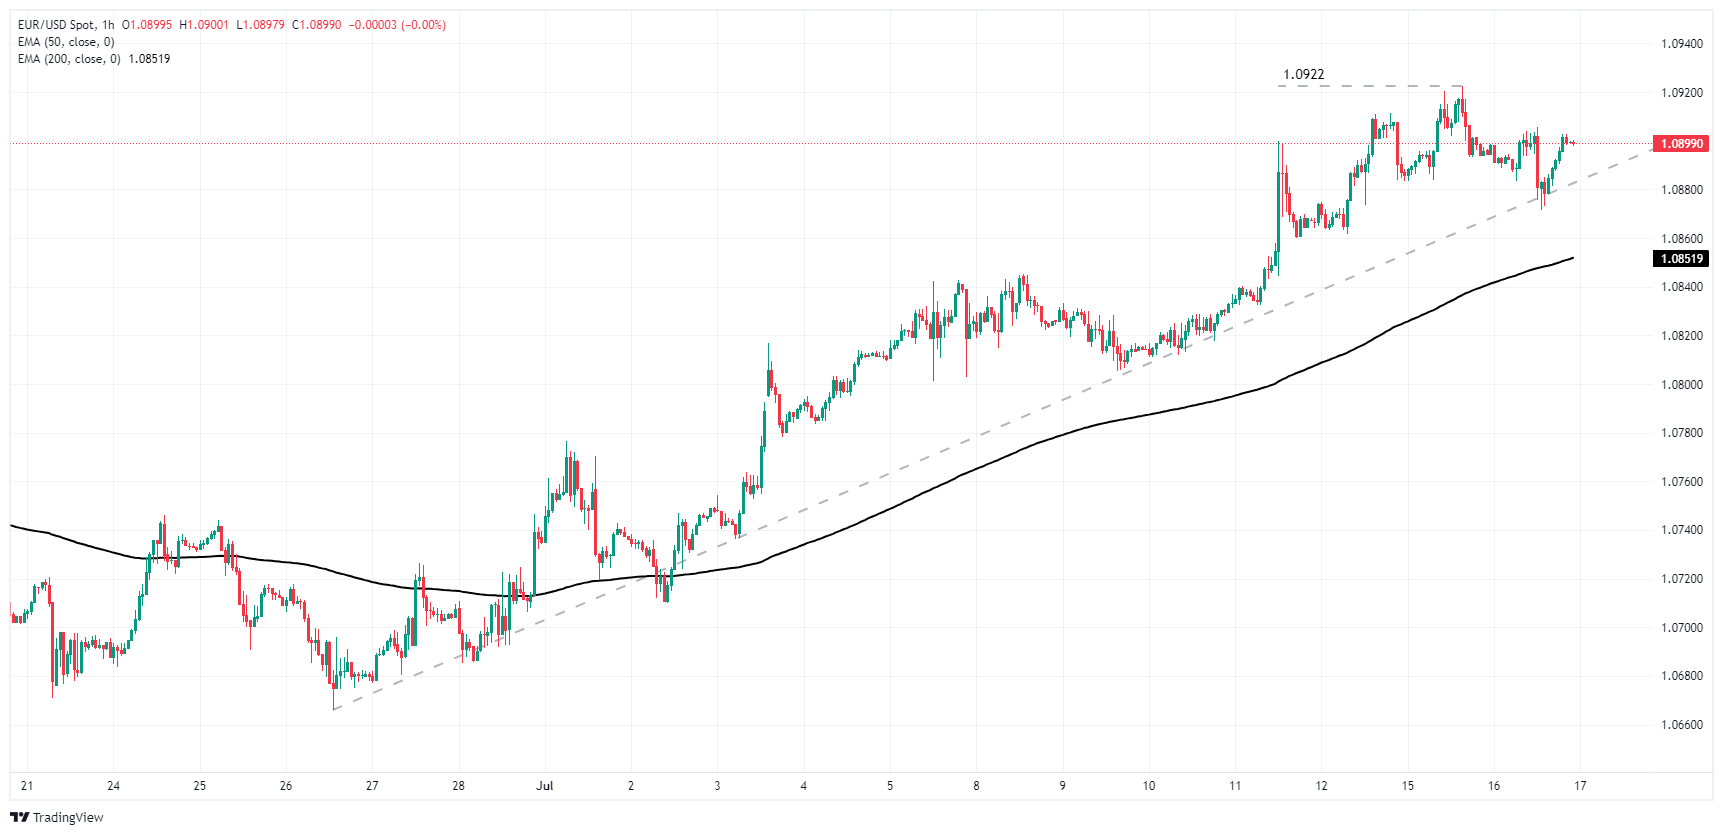
EUR/USD daily chart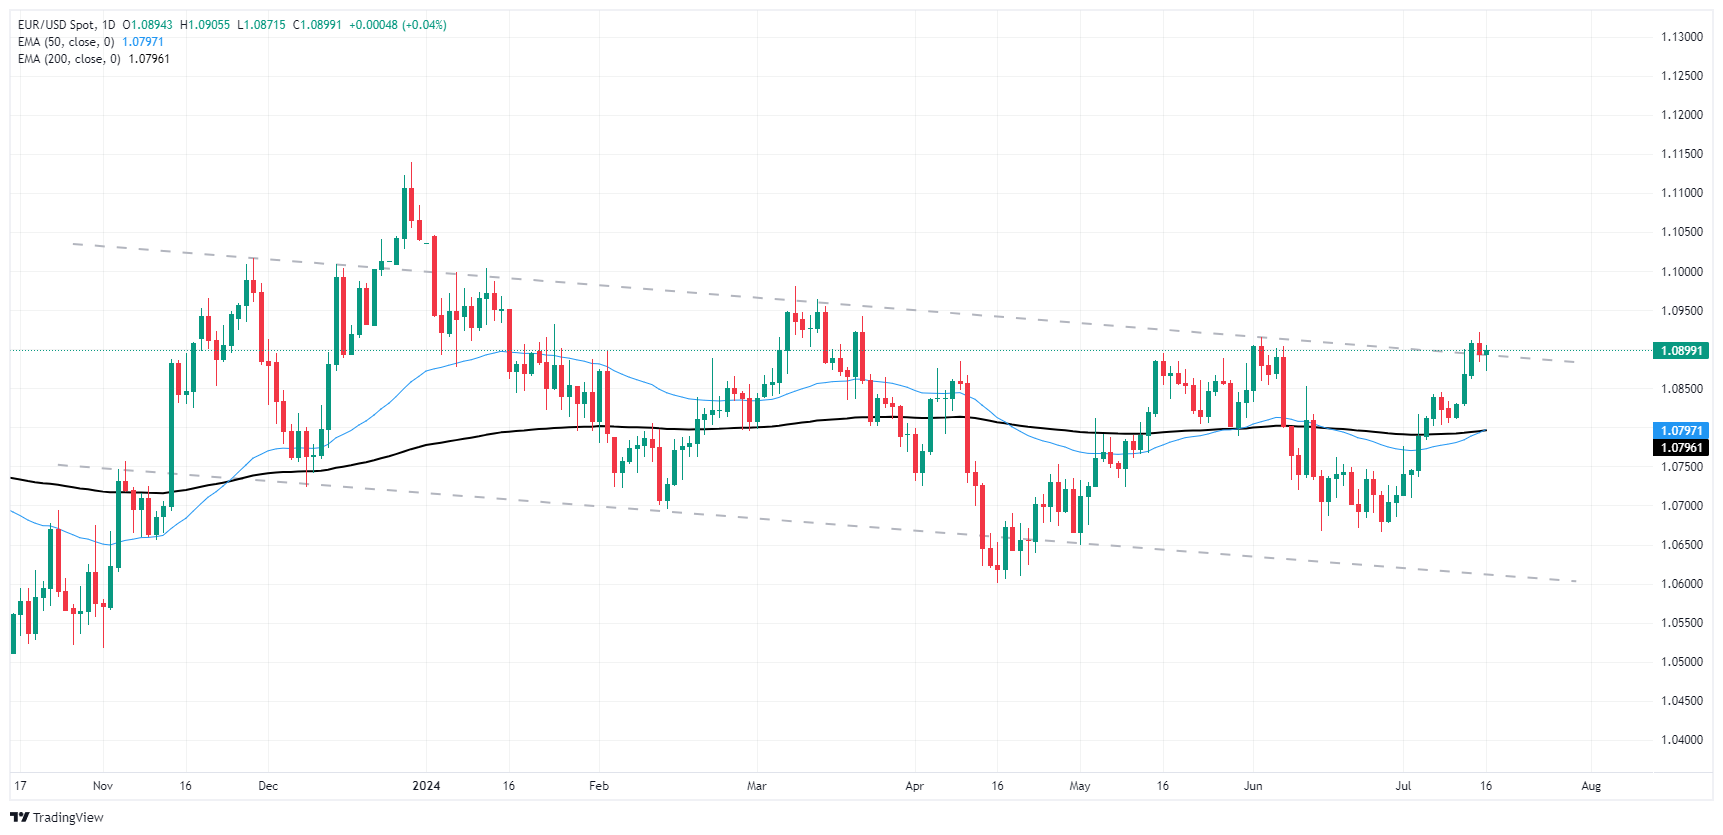
Euro FAQs
The Euro is the currency for the 20 European Union countries that belong to the Eurozone. It is the second most heavily traded currency in the world behind the US Dollar. In 2022, it accounted for 31% of all foreign exchange transactions, with an average daily turnover of over $2.2 trillion a day. EUR/USD is the most heavily traded currency pair in the world, accounting for an estimated 30% off all transactions, followed by EUR/JPY (4%), EUR/GBP (3%) and EUR/AUD (2%).
The European Central Bank (ECB) in Frankfurt, Germany, is the reserve bank for the Eurozone. The ECB sets interest rates and manages monetary policy. The ECB’s primary mandate is to maintain price stability, which means either controlling inflation or stimulating growth. Its primary tool is the raising or lowering of interest rates. Relatively high interest rates – or the expectation of higher rates – will usually benefit the Euro and vice versa. The ECB Governing Council makes monetary policy decisions at meetings held eight times a year. Decisions are made by heads of the Eurozone national banks and six permanent members, including the President of the ECB, Christine Lagarde.
Eurozone inflation data, measured by the Harmonized Index of Consumer Prices (HICP), is an important econometric for the Euro. If inflation rises more than expected, especially if above the ECB’s 2% target, it obliges the ECB to raise interest rates to bring it back under control. Relatively high interest rates compared to its counterparts will usually benefit the Euro, as it makes the region more attractive as a place for global investors to park their money.
Data releases gauge the health of the economy and can impact on the Euro. Indicators such as GDP, Manufacturing and Services PMIs, employment, and consumer sentiment surveys can all influence the direction of the single currency. A strong economy is good for the Euro. Not only does it attract more foreign investment but it may encourage the ECB to put up interest rates, which will directly strengthen the Euro. Otherwise, if economic data is weak, the Euro is likely to fall. Economic data for the four largest economies in the euro area (Germany, France, Italy and Spain) are especially significant, as they account for 75% of the Eurozone’s economy.
Another significant data release for the Euro is the Trade Balance. This indicator measures the difference between what a country earns from its exports and what it spends on imports over a given period. If a country produces highly sought after exports then its currency will gain in value purely from the extra demand created from foreign buyers seeking to purchase these goods. Therefore, a positive net Trade Balance strengthens a currency and vice versa for a negative balance.
- GBP/USD cycled familiar territory on Tuesday as markets weigh rate cuts.
- Sterling traders are buckling down for a key print in UK CPI inflation.
- UK labor figures and Retail Sales promise a hectic back half of the trading week.
GBP/USD churned close to recent highs on Tuesday as markets readjusted odds of a rate cut from the Federal Reserve (Fed). A decline in US Retail Sales capped off a recent batch of US data, implying price pressures have finally eased enough that the Fed may get pushed into a rate-cutting cycle in September.
Forex Today: UK, EMU inflation come to the fore along with US data
US Retail Sales slumped to a flat 0.0% in June, matching forecasts and falling from the previous month’s revised 0.3%. Softening US Retail Sales was the final feather in the cap for rate-cut-hungry markets, which piled into bets of a rate cut when the Federal Open Market Committee (FOMC) gathers for its rate call on September 18.
Slumping Retail Sales growth adds on to a batch of Consumer Price Index (CPI) inflation data last week that reignited broad-market hopes for a September rate cut. According to the CME’s FedWatch Tool, rate markets are now pricing in nearly 100% odds of at least a quarter-point rate trim in September, with up to three rate cuts in total for 2024.
GBP traders are rounding the corner into a series of key data releases on the UK side for the latter half of the trading week. Wednesday kicks things off with a fresh print of UK CPI inflation. Near-term UK CPI inflation is expected to tick down to 0.1% MoM in June from the previous 0.3%, while annualized CPI inflation is expected to hold steady at 2.0% YoY.
Thursday continues the UK data parade with updated labor figures. The UK’s Claiming Count Change in June is expected to fall back to 23.4K from the previous print of 50.4K. Friday will follow up with UK Retail Sales for June, which is forecast to decline -0.4% from the previous print of 2.9%.
British Pound PRICE This week
The table below shows the percentage change of British Pound (GBP) against listed major currencies this week. British Pound was the strongest against the New Zealand Dollar.
| USD | EUR | GBP | JPY | CAD | AUD | NZD | CHF | |
|---|---|---|---|---|---|---|---|---|
| USD | 0.08% | 0.12% | 0.14% | 0.20% | 0.77% | 0.97% | -0.06% | |
| EUR | -0.08% | 0.07% | 0.26% | 0.31% | 0.72% | 1.08% | 0.05% | |
| GBP | -0.12% | -0.07% | 0.29% | 0.24% | 0.65% | 0.96% | -0.02% | |
| JPY | -0.14% | -0.26% | -0.29% | 0.05% | 0.40% | 0.78% | -0.39% | |
| CAD | -0.20% | -0.31% | -0.24% | -0.05% | 0.50% | 0.76% | -0.27% | |
| AUD | -0.77% | -0.72% | -0.65% | -0.40% | -0.50% | 0.35% | -0.67% | |
| NZD | -0.97% | -1.08% | -0.96% | -0.78% | -0.76% | -0.35% | -1.03% | |
| CHF | 0.06% | -0.05% | 0.02% | 0.39% | 0.27% | 0.67% | 1.03% |
The heat map shows percentage changes of major currencies against each other. The base currency is picked from the left column, while the quote currency is picked from the top row. For example, if you pick the British Pound from the left column and move along the horizontal line to the US Dollar, the percentage change displayed in the box will represent GBP (base)/USD (quote).
GBP/USD technical outlook
GBP/USD rallied into a 12-month high last week, coming within reach of the 1.3000 major handle before falling into chart churn just beneath the critical technical level. The Cable put in a stellar two-week run, climbing nearly 3% bottom-to-top before getting stopped just shy of 1.3000.
Bullish momentum has frozen in place, with bidding pressure holding steady and keeping GBP/USD bolstered into the high end well above the 200-day Exponential Moving Average (EMA) at 1.2612.
GBP/USD hourly chart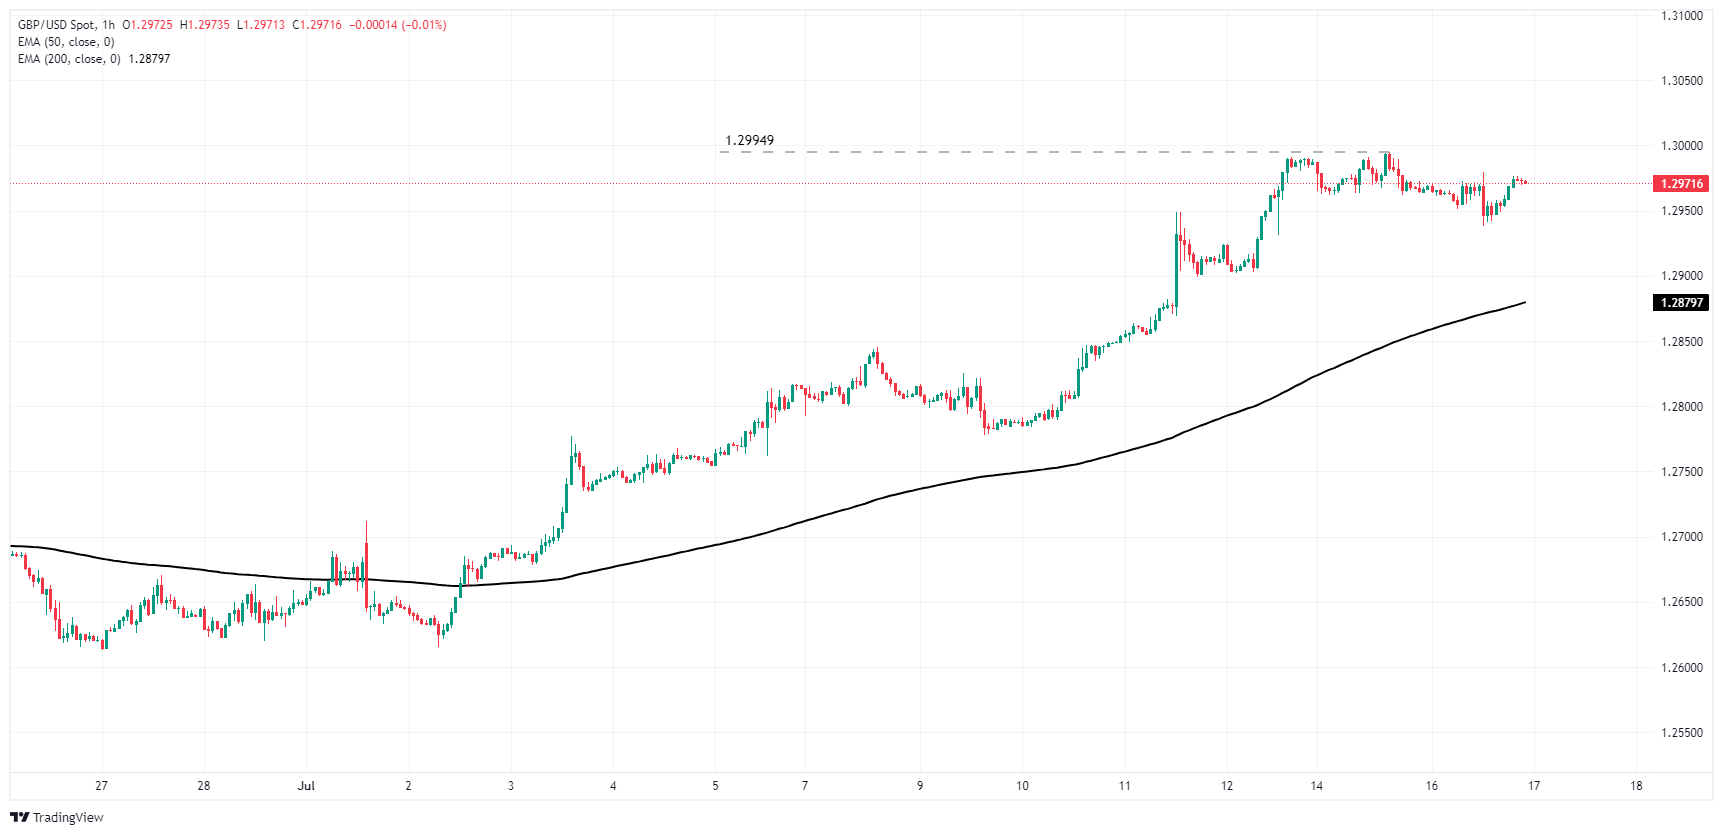
GBP/USD daily chart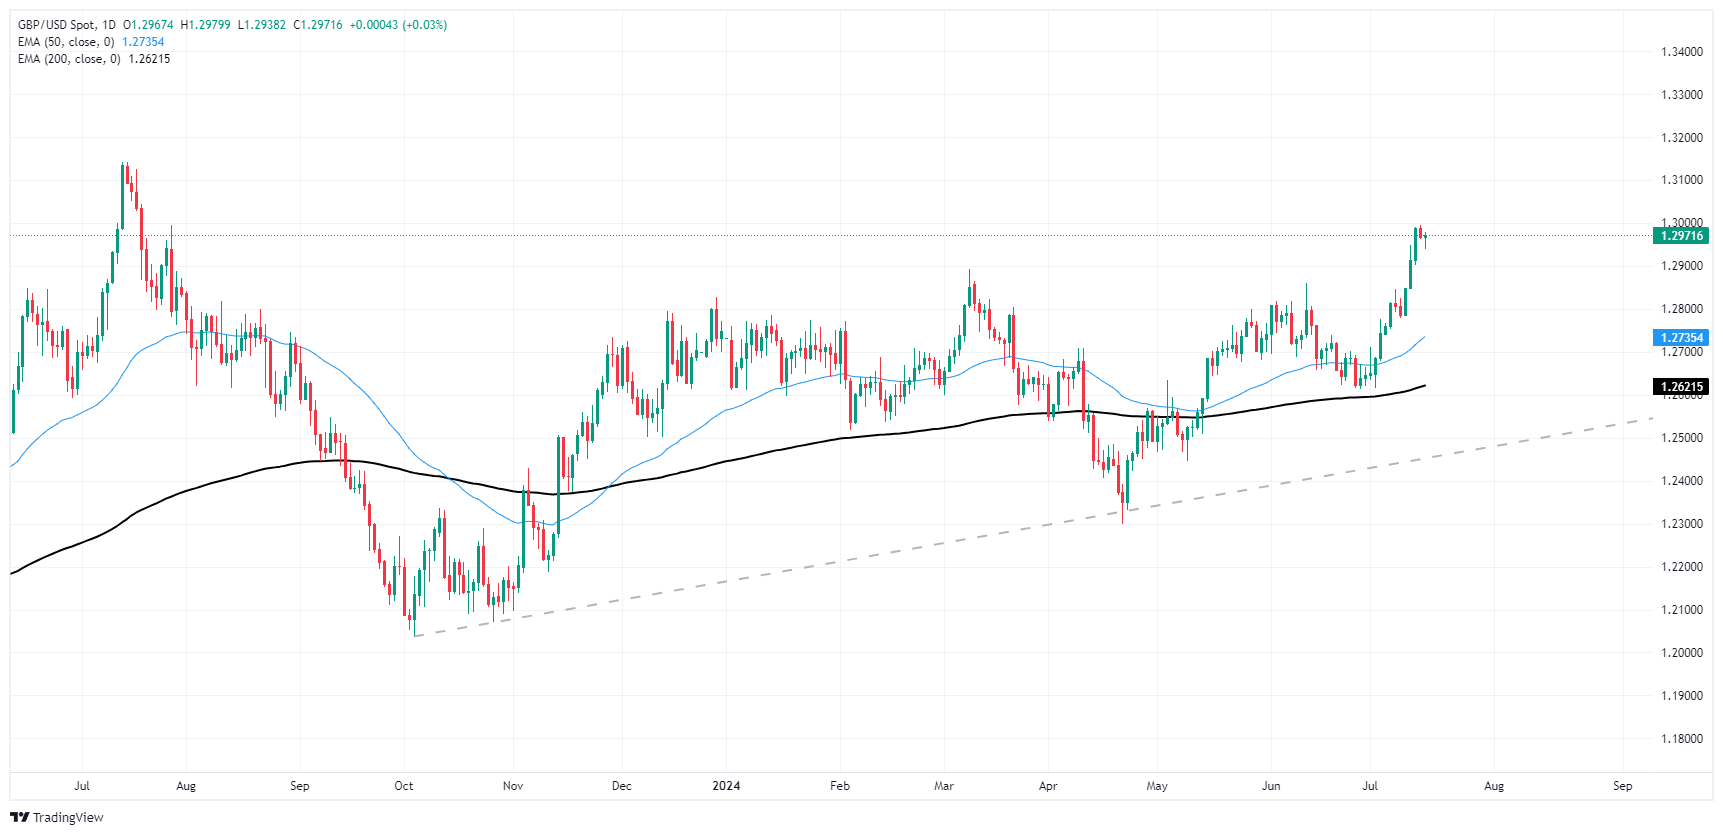
Pound Sterling FAQs
The Pound Sterling (GBP) is the oldest currency in the world (886 AD) and the official currency of the United Kingdom. It is the fourth most traded unit for foreign exchange (FX) in the world, accounting for 12% of all transactions, averaging $630 billion a day, according to 2022 data. Its key trading pairs are GBP/USD, aka ‘Cable’, which accounts for 11% of FX, GBP/JPY, or the ‘Dragon’ as it is known by traders (3%), and EUR/GBP (2%). The Pound Sterling is issued by the Bank of England (BoE).
The single most important factor influencing the value of the Pound Sterling is monetary policy decided by the Bank of England. The BoE bases its decisions on whether it has achieved its primary goal of “price stability” – a steady inflation rate of around 2%. Its primary tool for achieving this is the adjustment of interest rates. When inflation is too high, the BoE will try to rein it in by raising interest rates, making it more expensive for people and businesses to access credit. This is generally positive for GBP, as higher interest rates make the UK a more attractive place for global investors to park their money. When inflation falls too low it is a sign economic growth is slowing. In this scenario, the BoE will consider lowering interest rates to cheapen credit so businesses will borrow more to invest in growth-generating projects.
Data releases gauge the health of the economy and can impact the value of the Pound Sterling. Indicators such as GDP, Manufacturing and Services PMIs, and employment can all influence the direction of the GBP. A strong economy is good for Sterling. Not only does it attract more foreign investment but it may encourage the BoE to put up interest rates, which will directly strengthen GBP. Otherwise, if economic data is weak, the Pound Sterling is likely to fall.
Another significant data release for the Pound Sterling is the Trade Balance. This indicator measures the difference between what a country earns from its exports and what it spends on imports over a given period. If a country produces highly sought-after exports, its currency will benefit purely from the extra demand created from foreign buyers seeking to purchase these goods. Therefore, a positive net Trade Balance strengthens a currency and vice versa for a negative balance.
- USD/JPY edges higher by 0.24%, trading just below 158.50 during North American session.
- Technical signals turn neutral-bearish with price below Tenkan and Kijun-Sen lines.
- Key levels to watch: support at 158.00 and resistance at 158.50, with further gains toward 160.00 possible.
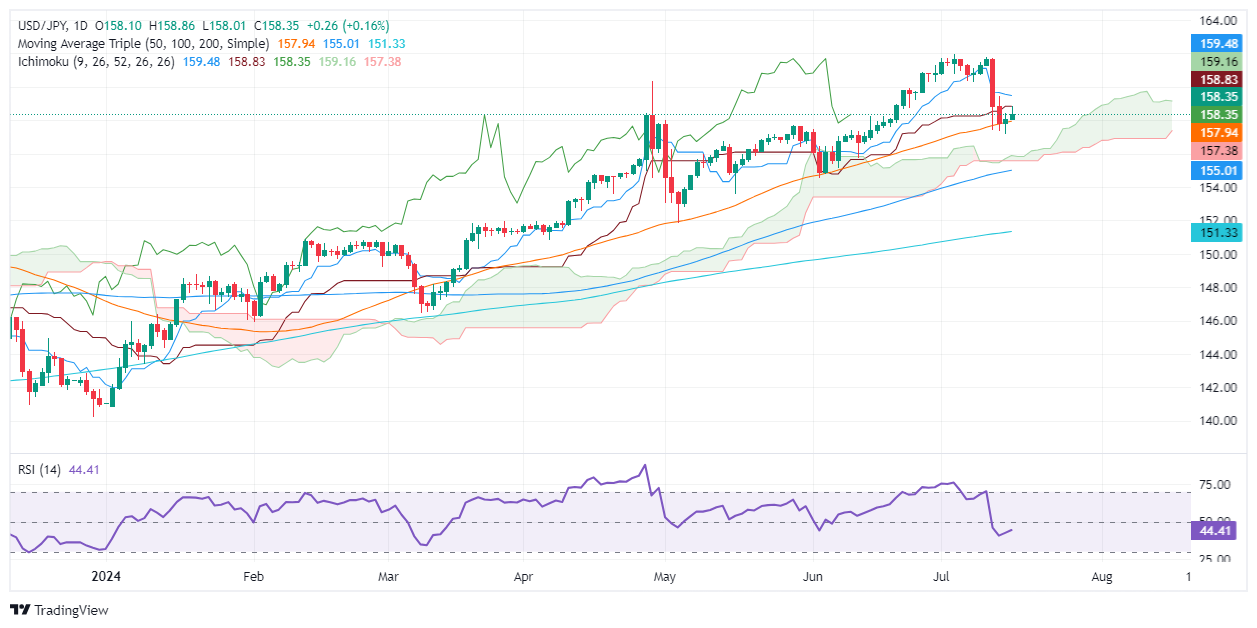
The USD/JPY edged higher during Tuesday’s North American session, registering minuscule gains of 0.24% and trading below the 158.50 figure. As Wednesday’s Asian session begins, the pair trades at 158.34, virtually unchanged.
USD/JPY Price Analysis: Technical outlook
More technical signals suggest the USD/JPY is turning neutral-bearishly biased, with price diving below the Tenkan and Kijun-Sen, showing the lack of buyers in the market. This is confirmed by the Relative Strength Index (RSI) standing bearish but flat, hinting that neither buyers nor sellers are in charge.
If USD/JPY drops below the 158.00 figure, this would pave the way for a test of the July 15 low of 157.14. Once surpassed, the next stop would be the top of the Ichimoku Cloud (Kumo) at 156.30/50.
On the other hand, if buyers lift USD/JPY’s exchange rate past 158.50, this will expose the Kijun-Sen at 158.84, ahead of the 159.00 mark. Additional gains are seen above the Tenkan-Sen lying at 159.47, on buyers’ way towards the 160.00 mark.
USD/JPY Price Action – Daily Chart
Japanese Yen FAQs
The Japanese Yen (JPY) is one of the world’s most traded currencies. Its value is broadly determined by the performance of the Japanese economy, but more specifically by the Bank of Japan’s policy, the differential between Japanese and US bond yields, or risk sentiment among traders, among other factors.
One of the Bank of Japan’s mandates is currency control, so its moves are key for the Yen. The BoJ has directly intervened in currency markets sometimes, generally to lower the value of the Yen, although it refrains from doing it often due to political concerns of its main trading partners. The current BoJ ultra-loose monetary policy, based on massive stimulus to the economy, has caused the Yen to depreciate against its main currency peers. This process has exacerbated more recently due to an increasing policy divergence between the Bank of Japan and other main central banks, which have opted to increase interest rates sharply to fight decades-high levels of inflation.
The BoJ’s stance of sticking to ultra-loose monetary policy has led to a widening policy divergence with other central banks, particularly with the US Federal Reserve. This supports a widening of the differential between the 10-year US and Japanese bonds, which favors the US Dollar against the Japanese Yen.
The Japanese Yen is often seen as a safe-haven investment. This means that in times of market stress, investors are more likely to put their money in the Japanese currency due to its supposed reliability and stability. Turbulent times are likely to strengthen the Yen’s value against other currencies seen as more risky to invest in.
- NZD/USD fails to preserve the 0.6070 level, plunging to lows seen in mid-May.
- Pairs are now trading below the critical 20, 100, and 200-day SMA lines, suggesting a bearish outlook.
- Daily indicators emphasize a mounting selling pressure.
In Tuesday's session, the NZD/USD declined by 0.40% to reach 0.6052 levels. Buyers failed to hold the 0.6070 mark, causing the pair to hit mid-May lows. Notably, the NZD/USD is now below the important Simple Moving Averages (SMA) of 20, 100, and 200 days, indicating a bearish outlook.
Daily technical indicators present a stronger bearish picture. The Relative Strength Index (RSI) stands at 38 after being above 50 last week. Meanwhile, the Moving Average Convergence Divergence (MACD) shows rising red bars, implying an increasing bearish momentum.
NZD/USD daily chart
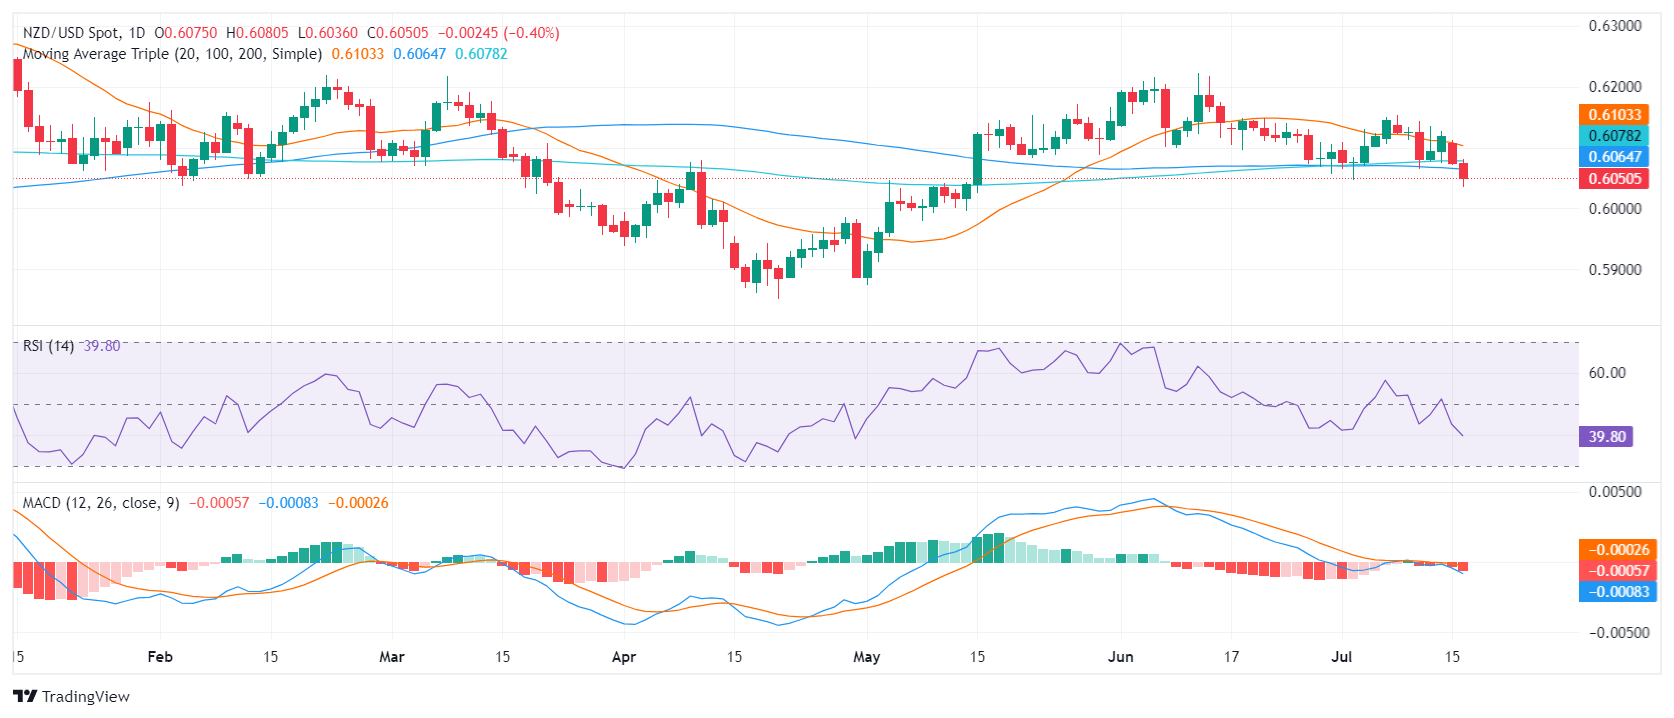
Resistance can now be found at the previous support of 0.6070, followed by the 20-day SMA around 0.6100 and then at 0.6150 and above at 0.6200. Bulls need a decisive close above these levels for a bullish turnaround and to shift the focus upwards.
The downside has a firm support at 0.6050 and then at 0.6030 and adjusting to the bearish shift, a key psychological mark at 0.6000 floats into view. A significant plunge below these levels would confirm the bearish outlook, potentially setting a path for a correction toward lower ranges.
- WTI tumbled below $80.00 per barrel as Crude Oil bids crumble.
- Crude Oil markets are extending a downside slide as Chinese demand slumps.
- WTI bull run sputters, bids within touch range of long-term averages.
West Texas Intermediate (WTI) Crude Oil fell on Tuesday as barrel traders grow fearful at the prospect of a slowdown in Chinese demand for fossil fuels. A decline in American Petroleum Institute (API) week-on-week barrel counts helped to bolster WTI prices into a weak recovery in late Tuesday trading, but an equivalent buildup of distillate products limited bullish potential.
China recently posted a slowdown in growth figures for the second quarter, hobbling broad-market expectations of a surge in Chinese demand for fossil fuels. After spending most of 2024 waiting for an uptick in Chinese Crude Oil demand, barrel traders have flipped to concerns that limited Chinese growth won’t provide enough barrel demand to eat up overhang in global markets.
The API reported yet another contraction in overall Crude Oil supply, showing a -4.44 million barrel contraction in privately counted supplies for the week ended June 12. Despite the extended decline in barrel counts, fully-refined gasoline stocks rose 365K barrels, with an additional buildup of partially-refined distillate inventories of 4.92 million barrels as end-chain refiners struggle to keep up with the availability of Crude Oil products.
WTI technical outlook
Tuesday’s bearish break has dragged WTI further below the 200-hour Exponential Moving Average (EMA) at $81.30 as downside momentum accelerates. WTI has extended a backslide from a recent upswing that fell just short of the $84.00 handle, and US Crude Oil prices have backslid over -5.5% peak-to-trough in July.
After a failed bull run through the top end of a consolidation pattern on daily candlesticks, A low break has dragged WTI bids into touch range of the 200-day EMA at $79.07 after shedding the $80.00 key handle on Tuesday.
WTI hourly chart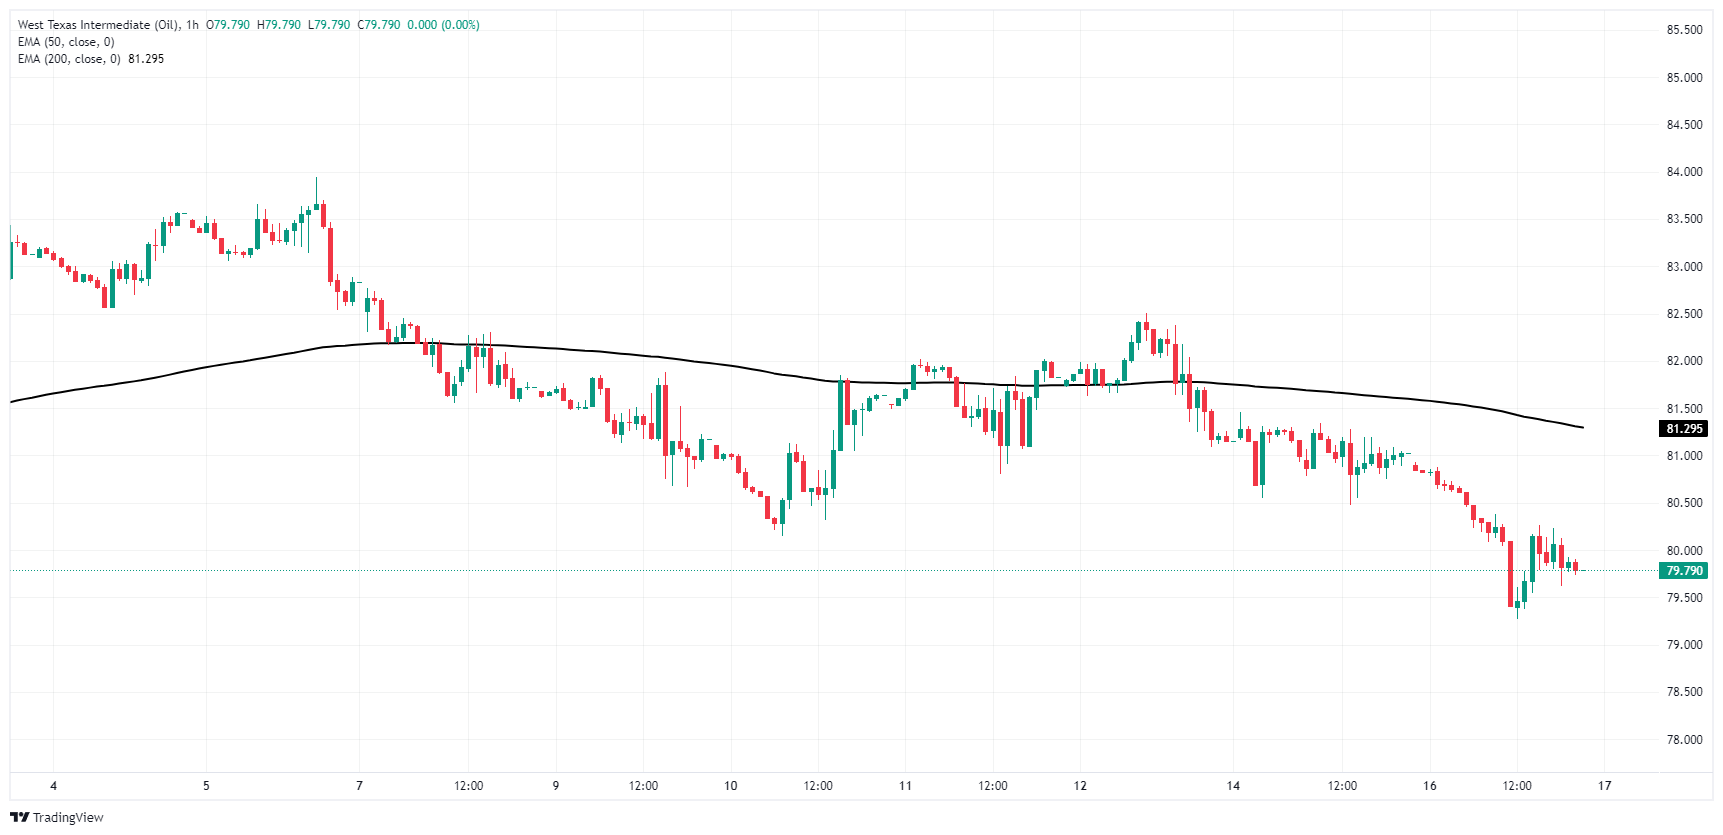
WTI daily chart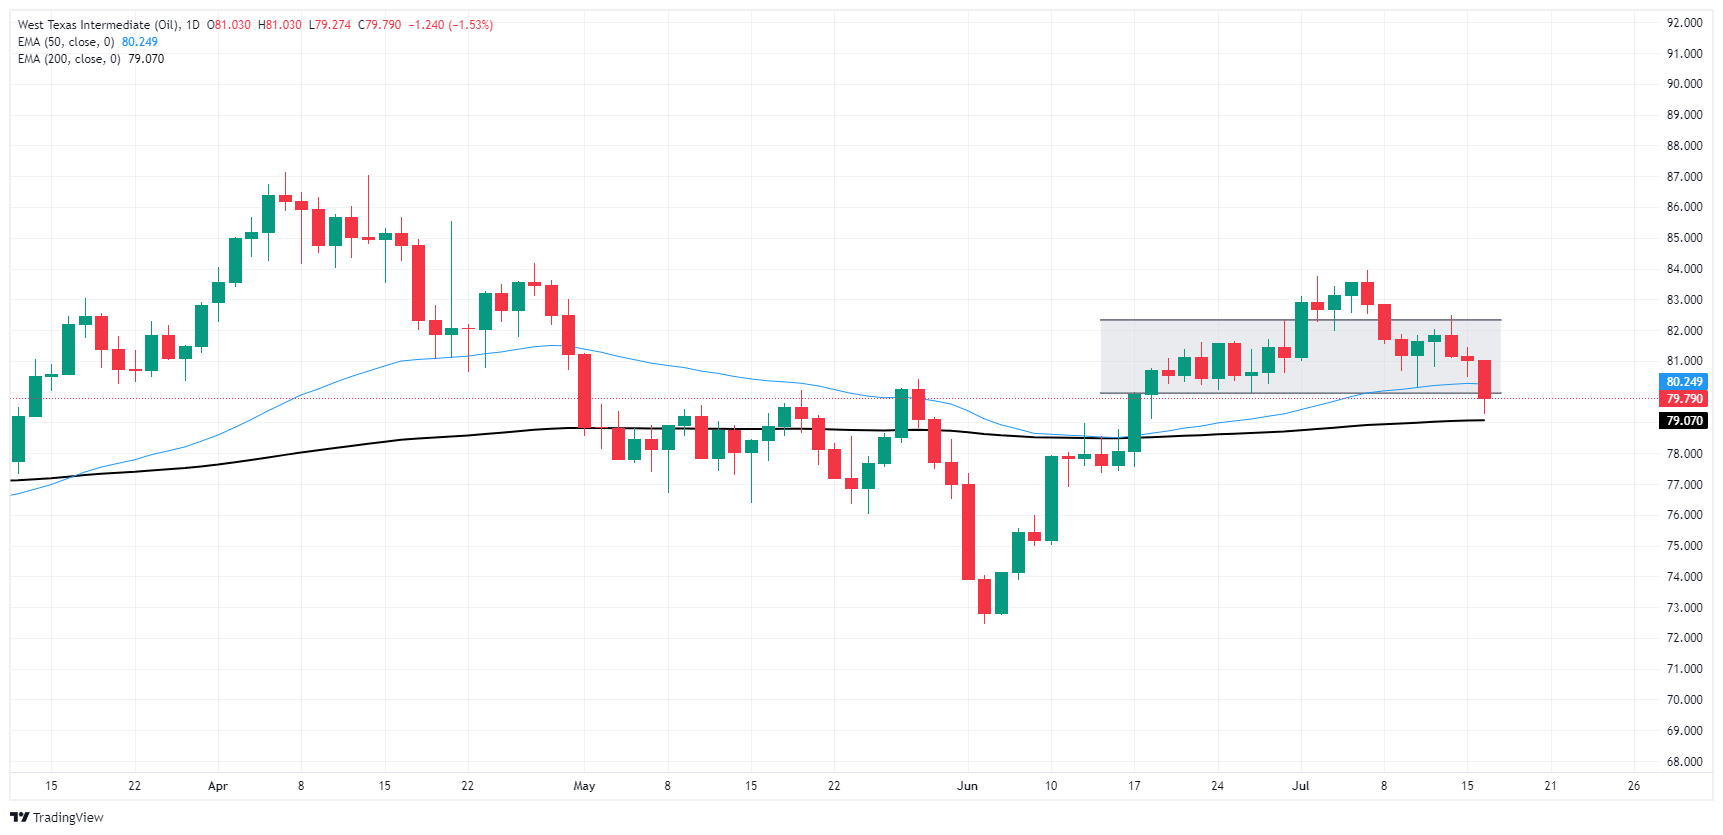
WTI Oil FAQs
WTI Oil is a type of Crude Oil sold on international markets. The WTI stands for West Texas Intermediate, one of three major types including Brent and Dubai Crude. WTI is also referred to as “light” and “sweet” because of its relatively low gravity and sulfur content respectively. It is considered a high quality Oil that is easily refined. It is sourced in the United States and distributed via the Cushing hub, which is considered “The Pipeline Crossroads of the World”. It is a benchmark for the Oil market and WTI price is frequently quoted in the media.
Like all assets, supply and demand are the key drivers of WTI Oil price. As such, global growth can be a driver of increased demand and vice versa for weak global growth. Political instability, wars, and sanctions can disrupt supply and impact prices. The decisions of OPEC, a group of major Oil-producing countries, is another key driver of price. The value of the US Dollar influences the price of WTI Crude Oil, since Oil is predominantly traded in US Dollars, thus a weaker US Dollar can make Oil more affordable and vice versa.
The weekly Oil inventory reports published by the American Petroleum Institute (API) and the Energy Information Agency (EIA) impact the price of WTI Oil. Changes in inventories reflect fluctuating supply and demand. If the data shows a drop in inventories it can indicate increased demand, pushing up Oil price. Higher inventories can reflect increased supply, pushing down prices. API’s report is published every Tuesday and EIA’s the day after. Their results are usually similar, falling within 1% of each other 75% of the time. The EIA data is considered more reliable, since it is a government agency.
OPEC (Organization of the Petroleum Exporting Countries) is a group of 13 Oil-producing nations who collectively decide production quotas for member countries at twice-yearly meetings. Their decisions often impact WTI Oil prices. When OPEC decides to lower quotas, it can tighten supply, pushing up Oil prices. When OPEC increases production, it has the opposite effect. OPEC+ refers to an expanded group that includes ten extra non-OPEC members, the most notable of which is Russia.
- Tuesday's session saw additional losses in the NZD/JPY.
- The cross extended its four-day losing streak to five being 2.50% lower compared to last week.
- The pair might consolidate as indicators approach the oversold terrain.
On Tuesday, the NZD/JPY saw more losses and fell below 96.00. The cross extended its bearish streak to five and is now down by more than 2.50% since last week.
The daily technical indicators still remain under the bear's control. The Relative Strength Index (RSI), currently at 35, marginally moved downwards, keeping the bearish bias intact. In line with this, the Moving Average Convergence Divergence (MACD) continues to print flat red bars that suggest persistent selling activity. However, the RSI near 30, suggests that a correction looms.
NZD/JPY daily chart
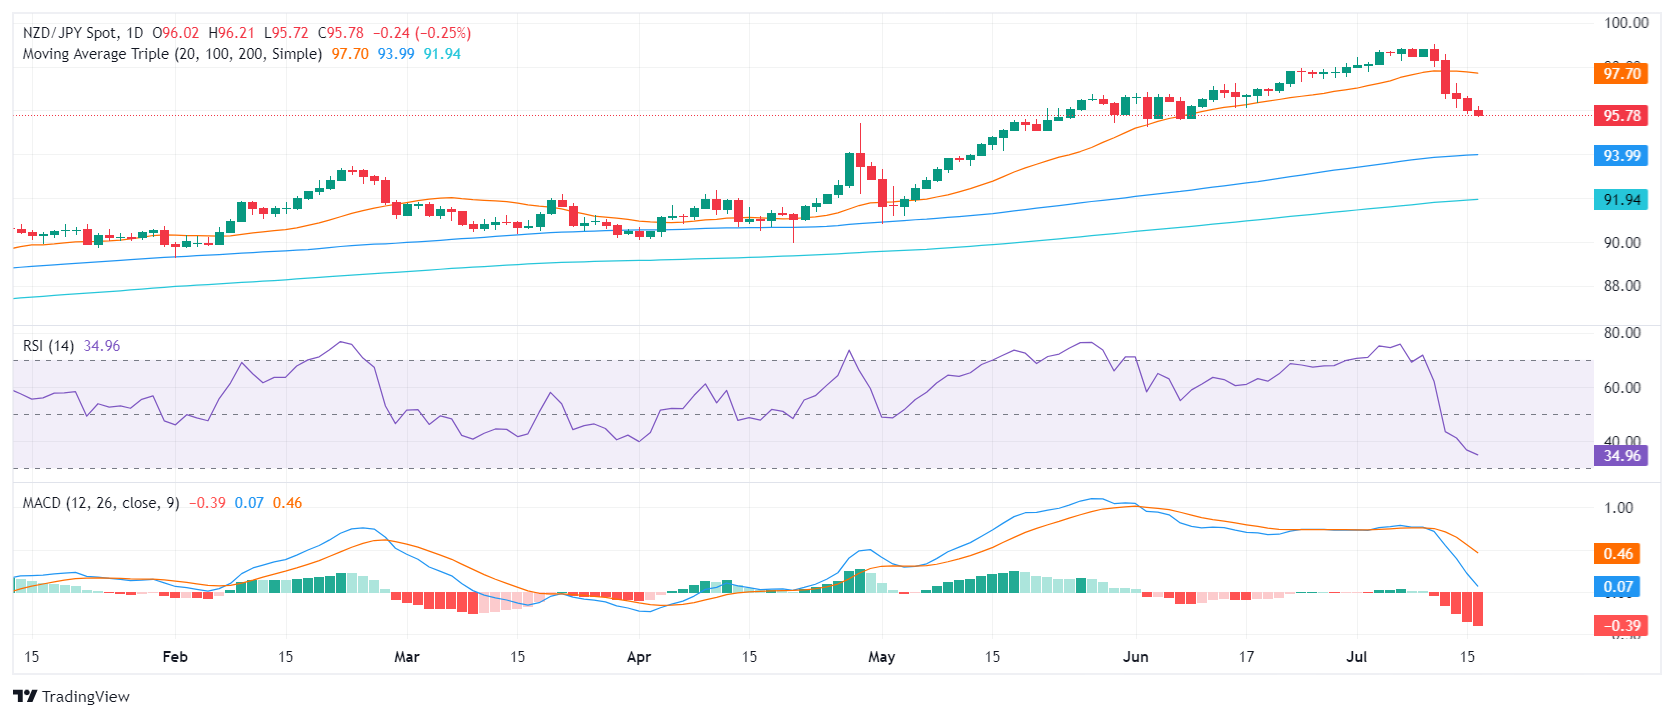
Reflecting the prevailing bearish tone, immediate support levels are identified at 95.50 and the key level at 95.50 and 95.30. A fall below these levels, particularly the strong support at 95.50, could serve as a confirmation of the bear's domination in the short term. On the flip side, the resistance levels can now be spotted at the previous support breakpoints of 97.00, the 20-day Simple Moving Average (SMA) residing at 97.70, and the vital level of 98.00.
- Gold price hits an all-time high of $2,465 on growing expectations of a Fed rate cut in September.
- Trump’s potential election win fuels market volatility, driving investors to non-yielding assets.
- Lower-than-expected inflation data and Powell’s dovish comments underpins Gold.
Gold price skyrockets to a new all-time high of $2,465 on Tuesday amid growing bets that the US Federal Reserve (Fed) will begin its easing cycle in September. This, along with increasing chances that former President Donald Trump would win November’s election, underpinned the yellow metal. The XAU/USD trades at $2465, gains more than 1.70%.
Last week’s lower-than-expected consumer inflation figures pushed non-yielding metal prices higher amid the Fed’s dovish pivot. The CME FedWatch Tool shows that the odds for a 25-basis point rate cut in September are 100%, with a minuscule part of economists foreseeing a 50 bps of easing.
Besides this, over-the-weekend political developments involving former President Trump sponsored a leg-up on the Golden metal. Trump’s Presidency will aim to increase tariffs and cut taxes, which will most likely increase the US budget deficit and generate inflationary pressures.
Meanwhile, Fed Chair Jerome Powell appeared at the Economic Club of Washington, where he commented that the economy performed well and added that the Fed will lower borrowing costs once it is confident that inflation is moving toward the 2% goal.
Data-wise, the US Census Bureau reported that Retail Sales in June were unchanged, as expected. However, excluding autos, sales rose sharply, exceeding forecasts.
Daily digest market movers: Gold climbs as traders ignore mixed US data
- Weaker-than-expected US Consumer Price Index (CPI) data sponsored Gold’s leg-up above $2,400, as the odds for Fed rate cuts increased, as reflected by falling US Treasury bond yields.
- US Retail Sales in June were flat at 0% MoM, as expected. Core sales expanded by 0.4% MoM, above the projected 0.1%.
- June Export and Import Prices both decreased, with Export prices dropping -0.5% MoM, below the forecast of -0.1%. Import prices rose compared to May’s -0.2% decline, coming in at 0%, beneath the estimated 0.2% increase.
- Meanwhile, the US Dollar Index (DXY), which tracks the Greenback against a basket of six currencies, is up by a minimal 0.02% at 104.27.
- December 2024 fed funds rate futures contract implies that the Fed will ease policy by 53 basis points (bps) toward the end of the year, up from 50 last Friday.
- Bullion prices retreated slightly due to the People's Bank of China (PBoC) decision to halt gold purchases in June, as it did in May. By the end of June, China held 72.80 million troy ounces of the precious metal.
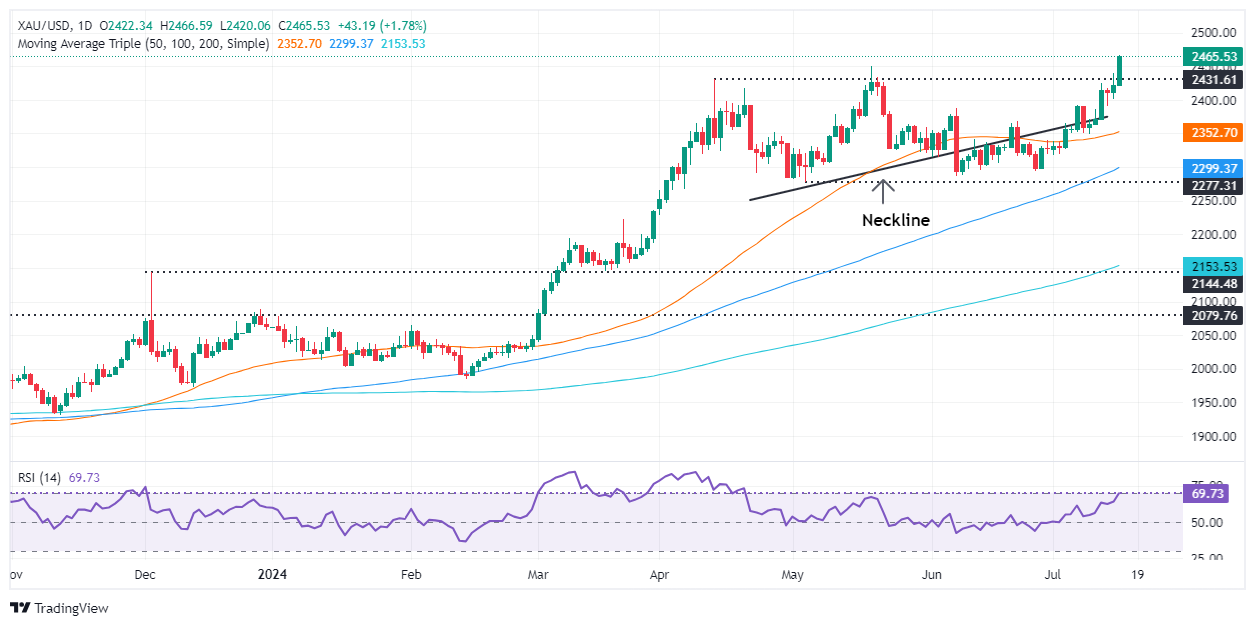
Gold technical analysis: XAU/USD surged and extended rally as traders eye $2,500
Gold prices remain bullish and trading at all-time highs, clearing the May 20 high of $2450, which opened the door for further gains. Momentum is still in the bulls' favor, as depicted by the Relative Strength Index (RSI), which aims higher and is shy of reaching “regular” overbought conditions.
XAU/USD's next resistance would be $2,475, followed by the $2,500 figure. Conversely, if gold prices slide below $2,450, the first resistance would be the $2,400 figure, followed by the July 5 high at $2,392. If cleared, XAU/USD would continue to $2,350.
Gold FAQs
Gold has played a key role in human’s history as it has been widely used as a store of value and medium of exchange. Currently, apart from its shine and usage for jewelry, the precious metal is widely seen as a safe-haven asset, meaning that it is considered a good investment during turbulent times. Gold is also widely seen as a hedge against inflation and against depreciating currencies as it doesn’t rely on any specific issuer or government.
Central banks are the biggest Gold holders. In their aim to support their currencies in turbulent times, central banks tend to diversify their reserves and buy Gold to improve the perceived strength of the economy and the currency. High Gold reserves can be a source of trust for a country’s solvency. Central banks added 1,136 tonnes of Gold worth around $70 billion to their reserves in 2022, according to data from the World Gold Council. This is the highest yearly purchase since records began. Central banks from emerging economies such as China, India and Turkey are quickly increasing their Gold reserves.
Gold has an inverse correlation with the US Dollar and US Treasuries, which are both major reserve and safe-haven assets. When the Dollar depreciates, Gold tends to rise, enabling investors and central banks to diversify their assets in turbulent times. Gold is also inversely correlated with risk assets. A rally in the stock market tends to weaken Gold price, while sell-offs in riskier markets tend to favor the precious metal.
The price can move due to a wide range of factors. Geopolitical instability or fears of a deep recession can quickly make Gold price escalate due to its safe-haven status. As a yield-less asset, Gold tends to rise with lower interest rates, while higher cost of money usually weighs down on the yellow metal. Still, most moves depend on how the US Dollar (USD) behaves as the asset is priced in dollars (XAU/USD). A strong Dollar tends to keep the price of Gold controlled, whereas a weaker Dollar is likely to push Gold prices up.
- AUD/JPY eases to 106.80, still under the 20-day SMA support.
- Downward trajectory continues, yet with a slackening pace as the bearish sentiment seems to be decelerating.
- As bears lose steam the pair might side-ways trade in the next sessions.
In Tuesday's session, the AUD/JPY pair recorded a slight decline to 106.70, following up on the gradual declining trend from last week. However, the bearish momentum seems to be flattening as suggested by the shape of the daily candles, following a four-day losing streak. As such, while the pair is projected to maintain its descent, a slowdown in bearish activity may be approaching.
The daily Relative Strength Index (RSI) for the AUD/JPY pair now stands at 51 while the daily Moving Average Convergence Divergence (MACD) prints flat red bars, implying that the selling activity is easing.
AUD/JPY daily chart
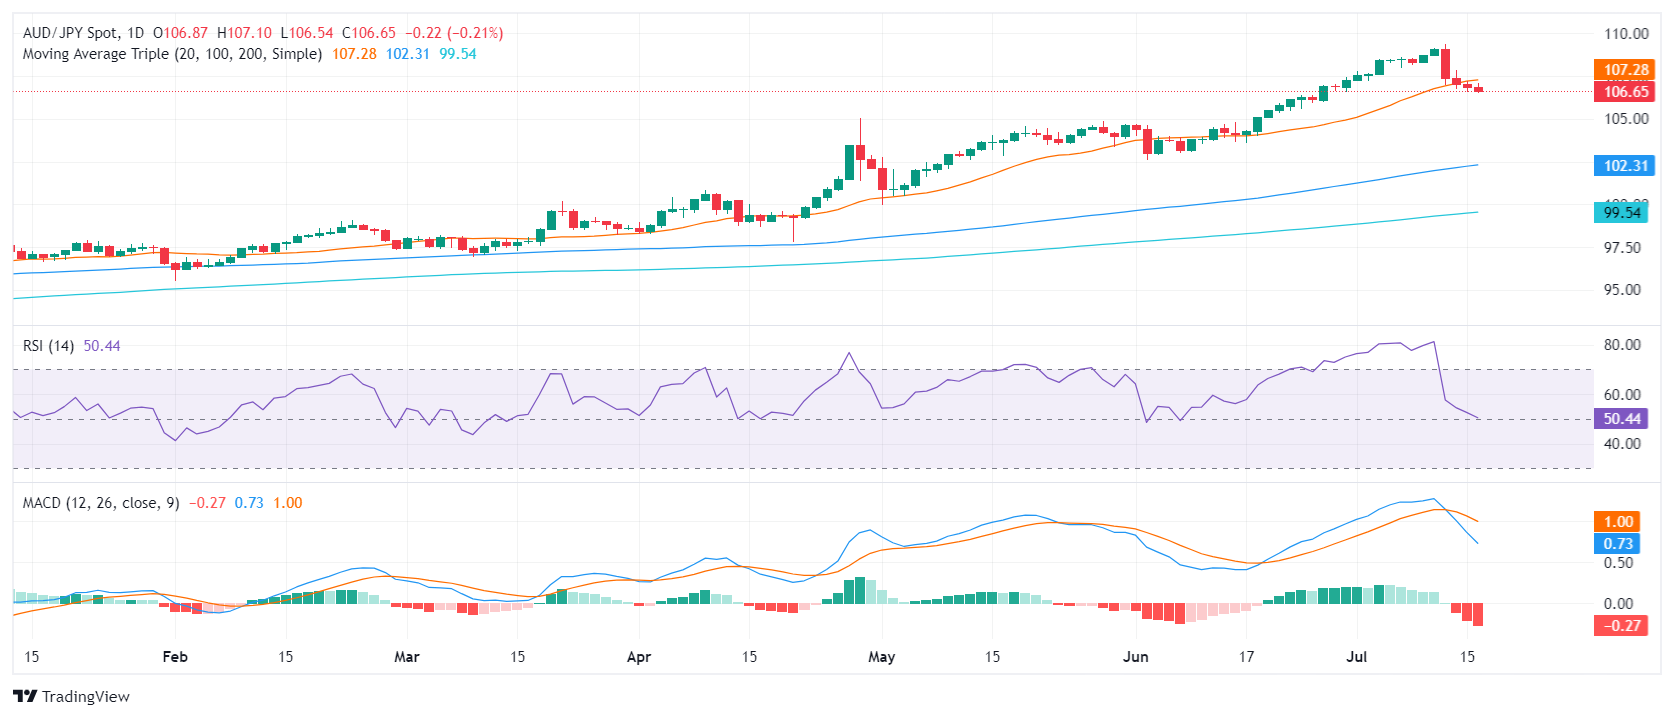
Taking a wider view, the AUD/JPY pair seems to maintain a bearish tendency, further accentuated by its position below the 20-day Simple Moving Average (SMA) support. Should the downward movement proceed, the immediate support levels at 106.50 and 106.00 remain the critical markers to watch. On the flip side, to limit further potential losses, buyers should aim to retrieve the 107.00 level, the 107.30 zone (20-day SMA), and then target the 108.00 barrier as a signal for recovery.
Tuesday’s inconclusive price action in the FX universe came on the back of incessant speculation of a rate cut by the Fed in September, leaving the US Dollar and most of the risk-linked assets almost unchanged from Monday’s closing levels.
Here is what you need to know on Wednesday, July 17:
The USD Index (DXY) hovered around the low-104.00s after the effects from better-than-expected US Retail Sales fizzled out towards the end of Tuesday’s session.The usual weekly Mortgage Applications are due in the first turn on July 17, seconded by Building Permits, Housing Starts, Industrial Production and the Fed Beige Book. In addition, the Fed’s Barkin and Waller are also due to speak.
EUR/USD managed to leave behind the earlier knee-jerk and revisited the 1.0900 zone. On July 17, the final Inflation Rate in the broader Euroland will be the salient event on the old continent.
GBP/USD traded in a vacillating fashion, although it succeeded in keeping business near recent peaks just below 1.3000. The release of UK Inflation Rate takes centre stage on July 17.
USD/JPY added to Monday’s gains on the back of the resumption of the selling pressure around the Japanese currency. The Reuters Tankan Index is expected on July 17.
AUD/USD dropped markedly to multi-day lows near 0.6710, adding to Monday’s pullback amidst lower commodity prices and small gains in the Greenback. The Leading Index tracked by Westpac and the speech by the RBA’s Simon are due in Oz on July 17.
Persistent demand concerns weighed on traders and prompted WTI prices to retreat for the third session in a row and approach the $80.00 mark per barrel.
Prices of Gold advanced to a record high past the $2,460 mark per ounce troy as traders continued to assess rate cuts by the Fed. Its cousin Silver followed suit and rose past the $31.00 mark per ounce after two daily retracements in a row.
Federal Reserve (Fed) Board of Governors member Dr. Adriana Kugler noted on Tuesday that while inflationary pressures have certainly eased, the Fed still needs some pieces to the rate cut puzzle before movement on rates can occur.
Key highlights
If incoming data does not provide confidence that inflation is moving toward the 2% target, it may be appropriate to hold rates steady a little longer.
If the labor market cools too much, it will be appropriate to cut interest rates sooner rather than later.
Upside risks to inflation, downside risks to employment have become more balanced.
It will be appropriate to begin easing monetary policy later this year if economic conditions continue to evolve favorably.
Continued labor market rebalancing suggests inflation will continue to move toward 2% target.
The labor market has seen substantial rebalancing.
Supply and demand are gradually coming into better balance.
Inflation remains above the US central bank's target.
Inflation has continued to trend down, despite a few bumps at start of this year.
- AUD/USD shows a further decrease in Tuesday falling below 0.6730.
- Australian labor data will dictate short-term dynamics which might prompt a more hawkish RBA.
- Strong US data might not be enough to close the divergence between the Fed and RBA policies.
The Australian Dollar (AUD) continued to lose ground against the USD on Tuesday, falling to 0.6730. After an initial decline in Monday's session, the AUD has extended its losses as profit booking by investors heightens. However, the fundamental outlook hints at the AUD's potential resilience against the USD amidst monetary policy divergences between the Federal Reserve and the Reserve Bank of Australia (RBA).
Despite signs of frailty in the Australian economy, stubbornly high inflation has put the brakes on the RBA's intention of lowering interest rates. It is anticipated that the RBA will be one of the last central banks among the G10 countries to begin cutting rates, a factor that might limit the AUD's downside and extend its gains.
Daily digest market movers: AUD may see an upside as the labor market could justify a hike
- Investors are keeping a close eye on the Australian Employment data due for release on Thursday. The report is forecasted to show that in June, 20,000 job-seekers found employment, compared to 39,700 in May.
- If the unemployment rate remains steady at 4.0%, it will signify a robust labor market that may further fuel expectations of the RBA's policy-tightening stance.
- Retail Sales went from 0.1% to 0.0%, with the previous 0.1% revised to 0.3%.
- Retail Sales ex Autos rose by 0.4% after the 0.1% decline in May. That same decline has been revised to 0.1%.
- Market pricing currently indicates nearly a 50% chance of the RBA increasing rates in either September or November. Conversely, the odds of a rate cut by the Federal Reserve in September stand at 90%, subject to incoming data.
Technical Analysis: AUD/USD enters consolidation phase, overall outlook remains positive
Despite the recent losses, the AUD/USD's outlook remains positive, with the pair retaining levels not seen since January. Following a rally of over 1.5% in July, indicators including the Relative Strength Index (RSI) and the Moving Average Convergence Divergence (MACD) approached overbought territory which prompted a slight correction.
The target for the buyers is to sustain between the 0.6700-0.6730 range while additional support lines are marked at 0.6680 and 0.6650.
Australian Dollar FAQs
One of the most significant factors for the Australian Dollar (AUD) is the level of interest rates set by the Reserve Bank of Australia (RBA). Because Australia is a resource-rich country another key driver is the price of its biggest export, Iron Ore. The health of the Chinese economy, its largest trading partner, is a factor, as well as inflation in Australia, its growth rate and Trade Balance. Market sentiment – whether investors are taking on more risky assets (risk-on) or seeking safe-havens (risk-off) – is also a factor, with risk-on positive for AUD.
The Reserve Bank of Australia (RBA) influences the Australian Dollar (AUD) by setting the level of interest rates that Australian banks can lend to each other. This influences the level of interest rates in the economy as a whole. The main goal of the RBA is to maintain a stable inflation rate of 2-3% by adjusting interest rates up or down. Relatively high interest rates compared to other major central banks support the AUD, and the opposite for relatively low. The RBA can also use quantitative easing and tightening to influence credit conditions, with the former AUD-negative and the latter AUD-positive.
China is Australia’s largest trading partner so the health of the Chinese economy is a major influence on the value of the Australian Dollar (AUD). When the Chinese economy is doing well it purchases more raw materials, goods and services from Australia, lifting demand for the AUD, and pushing up its value. The opposite is the case when the Chinese economy is not growing as fast as expected. Positive or negative surprises in Chinese growth data, therefore, often have a direct impact on the Australian Dollar and its pairs.
Iron Ore is Australia’s largest export, accounting for $118 billion a year according to data from 2021, with China as its primary destination. The price of Iron Ore, therefore, can be a driver of the Australian Dollar. Generally, if the price of Iron Ore rises, AUD also goes up, as aggregate demand for the currency increases. The opposite is the case if the price of Iron Ore falls. Higher Iron Ore prices also tend to result in a greater likelihood of a positive Trade Balance for Australia, which is also positive of the AUD.
The Trade Balance, which is the difference between what a country earns from its exports versus what it pays for its imports, is another factor that can influence the value of the Australian Dollar. If Australia produces highly sought after exports, then its currency will gain in value purely from the surplus demand created from foreign buyers seeking to purchase its exports versus what it spends to purchase imports. Therefore, a positive net Trade Balance strengthens the AUD, with the opposite effect if the Trade Balance is negative.
- Dow Jones gains 1.5% in a single day as rate cut hopes surge.
- Easing US Retail Sales data reignited market bets of a September rate cut.
- Dow Jones sets a new record high for a second day in a row.
The Dow Jones Industrial Average (DJIA) surged to a second record-setting day in a row, climbing over 650 points to chalk in a fresh all-time peak above 40,850 as market sentiment buries the needle even further into hopes of a September rate cut from the Federal Reserve (Fed).
US Retail Sales slumped flat in June, printing at 0.0% in-line with forecasts and falling from the previous month’s revised 0.3% uptick, signaling that the US domestic economy is continuing to soften and prompting a broad-market rush into expectations of a September rate cut.
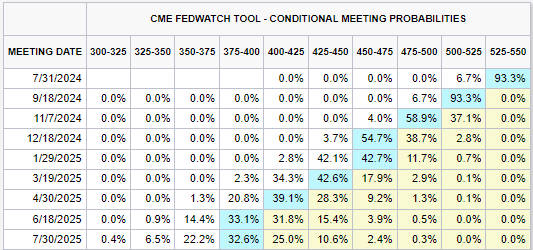
According to the CME’s FedWatch Tool, rate markets have a September rate trim fully priced in, with functionally 100% odds of at least a quarter-point rate cut when the Federal Open Market Committee (FOMC) meets on September. The FOMC’s upcoming rate call on July 31 is still broadly expected to be a hold as policymakers wait for a few more months of data to confirm inflation is easing to targets before pulling the trigger.
Dow Jones news
The Dow Jones soared over 600 points at its highest point on Tuesday as the major equity index makes its way toward 41,000.00 after crossing the 40,000.00 major handle for the first time back in May.
Unitedhealth Group Inc. (UNH) soared 5.55% to $544.16 per share on Tuesday after it reported better-than-expected earnings in Q2, helping to send the Dow Jones further into the stratosphere. Over two-thirds of the Dow Jones in in the green for the day, though tech stocks and AI-adjacents suffered small losses as the market pivots into rate cut exposure.
Merck & Co Inc. (MRK) fell -1.5% to $126.20 per share, followed closely by Microsoft Corp. (MSFT) and Intel Corp. (INTC), falling -1.43% and -1.2%, respectively.
Dow Jones technical outlook
Buyers ran a clinic on short interest on Tuesday, sending the Dow Jones into a record intraday high for the second day in a row. Technical resistance has evaporated on the top end as the major equity index is on pace for one of its best single-day performances of 2024.
The Dow Jones has climbed over 4% and counting over the past five trading days and the index is set to challenge the 41,000.00 technical level sooner rather than later.
Dow Jones five minute chart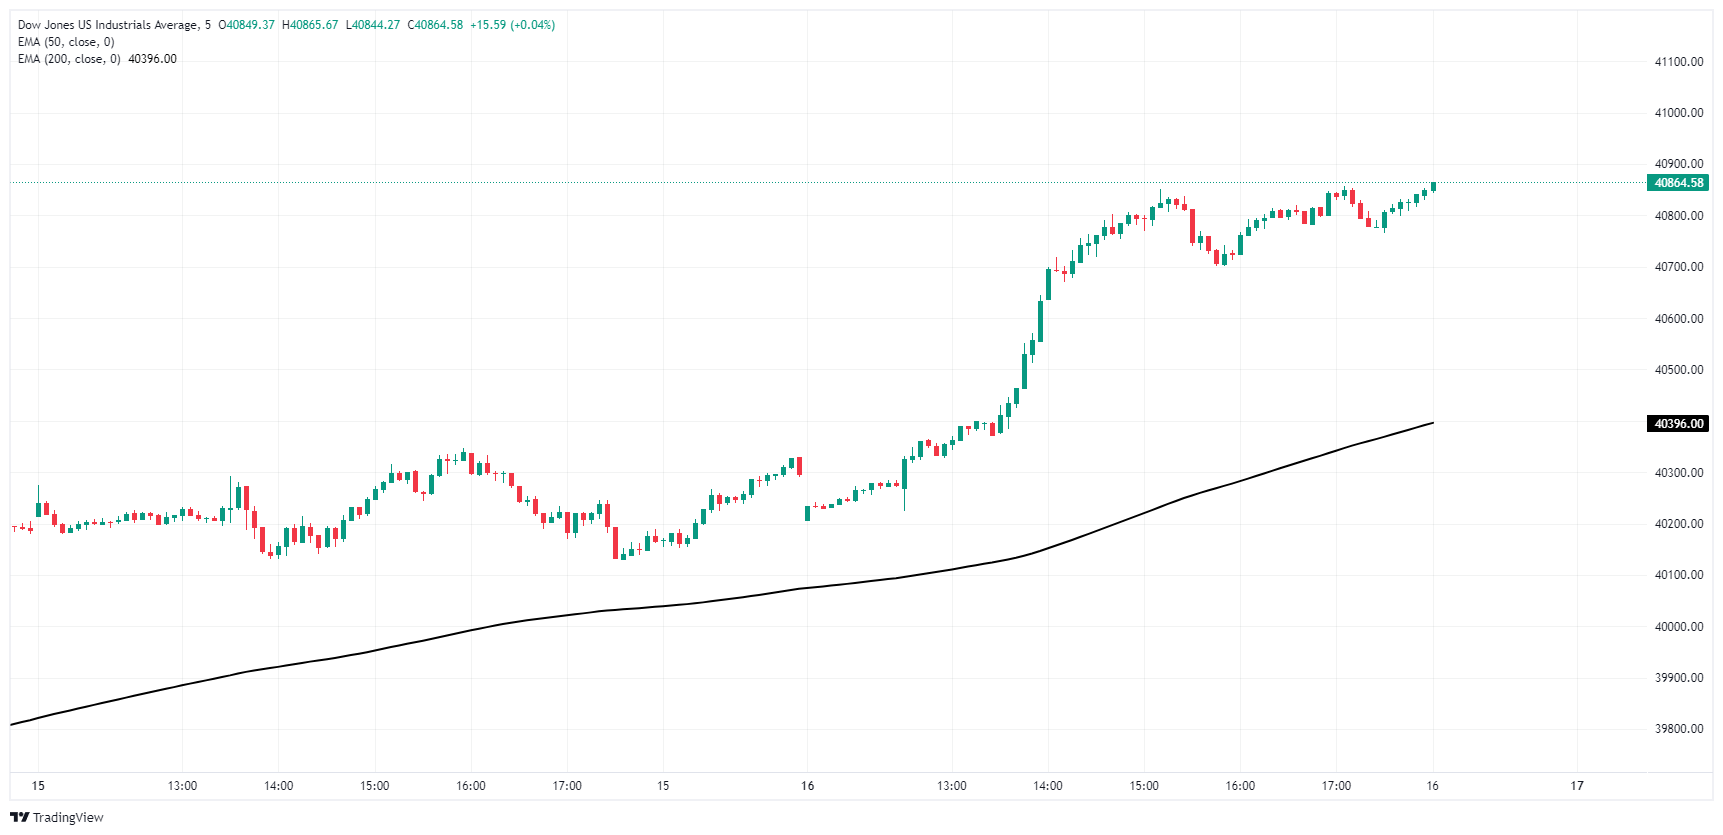
Dow Jones daily chart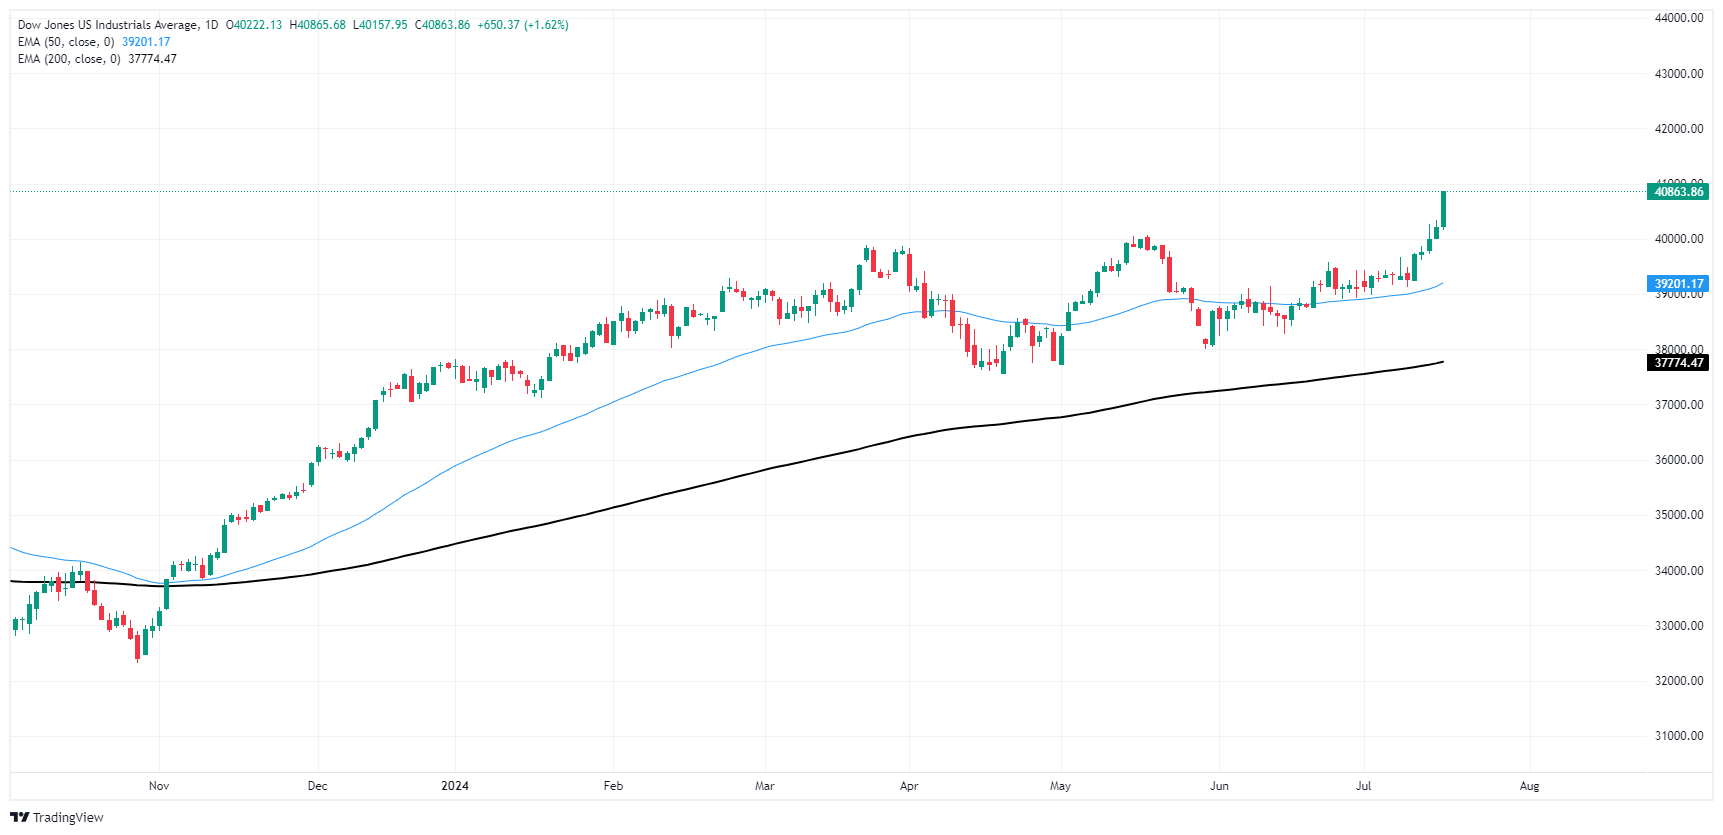
Dow Jones FAQs
The Dow Jones Industrial Average, one of the oldest stock market indices in the world, is compiled of the 30 most traded stocks in the US. The index is price-weighted rather than weighted by capitalization. It is calculated by summing the prices of the constituent stocks and dividing them by a factor, currently 0.152. The index was founded by Charles Dow, who also founded the Wall Street Journal. In later years it has been criticized for not being broadly representative enough because it only tracks 30 conglomerates, unlike broader indices such as the S&P 500.
Many different factors drive the Dow Jones Industrial Average (DJIA). The aggregate performance of the component companies revealed in quarterly company earnings reports is the main one. US and global macroeconomic data also contributes as it impacts on investor sentiment. The level of interest rates, set by the Federal Reserve (Fed), also influences the DJIA as it affects the cost of credit, on which many corporations are heavily reliant. Therefore, inflation can be a major driver as well as other metrics which impact the Fed decisions.
Dow Theory is a method for identifying the primary trend of the stock market developed by Charles Dow. A key step is to compare the direction of the Dow Jones Industrial Average (DJIA) and the Dow Jones Transportation Average (DJTA) and only follow trends where both are moving in the same direction. Volume is a confirmatory criteria. The theory uses elements of peak and trough analysis. Dow’s theory posits three trend phases: accumulation, when smart money starts buying or selling; public participation, when the wider public joins in; and distribution, when the smart money exits.
There are a number of ways to trade the DJIA. One is to use ETFs which allow investors to trade the DJIA as a single security, rather than having to buy shares in all 30 constituent companies. A leading example is the SPDR Dow Jones Industrial Average ETF (DIA). DJIA futures contracts enable traders to speculate on the future value of the index and Options provide the right, but not the obligation, to buy or sell the index at a predetermined price in the future. Mutual funds enable investors to buy a share of a diversified portfolio of DJIA stocks thus providing exposure to the overall index.
- Mexican Peso strengthens by 0.35% as traders fully price in the Fed rate cut for September.
- Banxico’s dovish comments and Fed Chair Powell’s balanced mandate remarks influence market sentiment.
- US Dollar Index (DXY) rises slightly to 104.18; US Retail Sales data meet expectations.
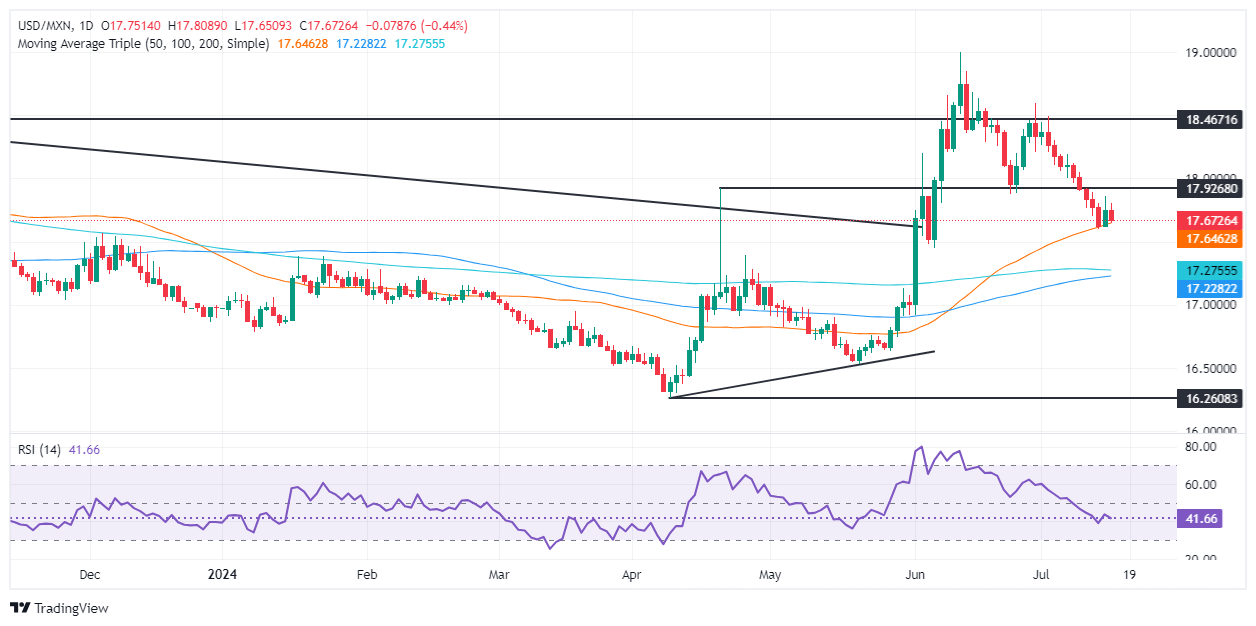
The Mexican Peso recovered and registered gains of more than 0.35% against the US Dollar on Tuesday as traders had fully priced in the Federal Reserve's decision to cut interest rates in September. This will widen the interest rate differential between Mexico and the US, boosting the emerging market currency; hence, the USD/MXN trades at 17.65, down 0.40%.
Mexico’s economic docket remains absent for the current week. Yet, dovish comments by Bank of Mexico’s (Banxico) Deputy Governor Omar Mejia Castelazo spurred a leg-up in the USD/MXN pair.
Across the borders, Federal Reserve Chair Jerome Powell said the US economy fared well in the last couple of years and that they need further confidence in the disinflation process to lower borrowing costs. Powell added that the dual mandate risks had become more balanced and stated, “There is no slack in the labor market…essentially, we’re at equilibrium now.”
Later, San Francisco Fed President Mary Daly said that “confidence is growing that inflation is heading towards the US central bank’s 2% goal.”
In the meantime, the CME FedWatch Tools show the chances for a quarter of a percentage rate cut to the federal funds rate are at 100%, capping the Greenback’s advance. The US Dollar Index (DXY), which tracks the buck's performance against the other six currencies, rose 0.10% to 104.18.
US data-wise, the US Census Bureau revealed that Retail Sales in June were unchanged as expected, excluding autos, which rose sharply, exceeding forecasts.
Daily digest market movers: Mexican Peso appreciates on Fed rate cut bets
- Mexico’s economic docket will be absent during the week, resuming on July 22, when the National Statistics Agency (INEGI) reveals growth figures for the month of May. Nevertheless, Bank of Mexico (Banxico) policymakers and political developments could rock the boat.
- Banxico’s Deputy Governor Omar Mejia Castelazo's recent comments on interest rates have sparked significant interest in the financial markets. Mejia, the sole dissenter in Banxico’s June 27 monetary policy decision, advocated for a quarter of a percentage rate cut, emphasizing the need for any rate adjustments to be gradual and not continuous, adding that further easing would not imply the beginning of a cycle of interest rate cuts.
- Mexico’s June inflation figures were higher than expected due to a rise in food prices when most economists expect Banxico to resume lowering interest rates.
- US Retail Sales in June were flat at 0% MoM, as expected. Core sales expanded by 0.4% MoM, above the 0.1% projected by the consensus.
- Export and Import Prices for the same period decreased, with the former dropping -0.5% MoM, below forecasts of -0.1%. Import prices rose compared to May’s -0.2% plunge and came at 0%, beneath estimates of 0.2% increase.
- June consumer inflation figures were lower than expected in the United States, increasing the chances that the Federal Reserve would lower borrowing costs in 2024 by at least 54 basis points, according to the December 2024 fed funds rate futures contract.
Technical analysis: Mexican Peso climbs as USD/MXN tumbles below 17.70
The USD/MXN is downward biased despite Monday’s upward correction, which breached last Friday’s high of 17.80. Momentum is bearish, as depicted by the Relative Strength Index (RSI), but strong support is found at the 50-day Simple Moving Average (SMA) at 17.63.
In the outcome of a breach under the 50-day SMA, the first support would be the December 5 high at 17.56, followed by the 200-day SMA at 17.27. Further losses would test the 100-day SMA at 17.21.
Conversely, if USD/MXN aims up, the next resistance would be the June 24 low-turned resistance at 17.87, followed by the 18.00 figure. Further upside potential is seen above the July 5 high at 18.19, followed by the June 28 high of 18.59, allowing buyers to aim for the YTD high of 18.99.
Mexican Peso FAQs
The Mexican Peso (MXN) is the most traded currency among its Latin American peers. Its value is broadly determined by the performance of the Mexican economy, the country’s central bank’s policy, the amount of foreign investment in the country and even the levels of remittances sent by Mexicans who live abroad, particularly in the United States. Geopolitical trends can also move MXN: for example, the process of nearshoring – or the decision by some firms to relocate manufacturing capacity and supply chains closer to their home countries – is also seen as a catalyst for the Mexican currency as the country is considered a key manufacturing hub in the American continent. Another catalyst for MXN is Oil prices as Mexico is a key exporter of the commodity.
The main objective of Mexico’s central bank, also known as Banxico, is to maintain inflation at low and stable levels (at or close to its target of 3%, the midpoint in a tolerance band of between 2% and 4%). To this end, the bank sets an appropriate level of interest rates. When inflation is too high, Banxico will attempt to tame it by raising interest rates, making it more expensive for households and businesses to borrow money, thus cooling demand and the overall economy. Higher interest rates are generally positive for the Mexican Peso (MXN) as they lead to higher yields, making the country a more attractive place for investors. On the contrary, lower interest rates tend to weaken MXN.
Macroeconomic data releases are key to assess the state of the economy and can have an impact on the Mexican Peso (MXN) valuation. A strong Mexican economy, based on high economic growth, low unemployment and high confidence is good for MXN. Not only does it attract more foreign investment but it may encourage the Bank of Mexico (Banxico) to increase interest rates, particularly if this strength comes together with elevated inflation. However, if economic data is weak, MXN is likely to depreciate.
As an emerging-market currency, the Mexican Peso (MXN) tends to strive during risk-on periods, or when investors perceive that broader market risks are low and thus are eager to engage with investments that carry a higher risk. Conversely, MXN tends to weaken at times of market turbulence or economic uncertainty as investors tend to sell higher-risk assets and flee to the more-stable safe havens.
- Canadian Dollar went sideways after misfire in Canadian CPI inflation.
- Canada reported a downturn in near-term CPI, but BoC YoY CPI ticked up.
- US Retail Sales print kicks off a fresh round of rate cut hopes.
The Canadian Dollar (CAD) went sideways on Tuesday after CAD traders found little reason to bid too firmly in either direction after a mixed Canadian Consumer Price Index (CPI) inflation print. US data dominated market focus, with a soft print driving broad-market bets of a September rate cut even higher.
With Canadian CPI inflation out of the way, the next data beat worth focusing on for CAD traders will be Friday’s upcoming Canadian Retail Sales. Median market forecasts expect a return to contraction territory in monthly figures after June data recovered from a three-month streak of negative Canadian Retail Sales growth.
Daily digest market movers: Canadian Dollar furrowed by lopsided CPI print, Fed rate cut bets max out
- Headline Canadian CPI inflation in June contracted -0.1% MoM versus the previous 0.6%, missing the forecast slowdown to 0.1%.
- Annualized Canadian CPI eased to 2.7% from the previous 2.9%.
- The Bank of Canada’s (BoC) own CPI inflation gauge likewise fell to -0.1% from 0.6% MoM, while the YoY figure accelerated to 1.9% from the previous 1.8%.
- US Retail Sales fell flat in June, printing at the expected 0.0% MoM compared to the previous month’s 0.3% (revised from 0.1%).
- With a steeper-than-expected decline post-revision, market bets of a Federal Reserve (Fed) rate cut in September have been pinned to the ceiling.
- Rate traders are pricing in 100% odds of at least a quarter-point rate trim in September, according to the CME’s FedWatch Tool.
Canadian Dollar PRICE Today
The table below shows the percentage change of Canadian Dollar (CAD) against listed major currencies today. Canadian Dollar was the strongest against the New Zealand Dollar.
| USD | EUR | GBP | JPY | CAD | AUD | NZD | CHF | |
|---|---|---|---|---|---|---|---|---|
| USD | 0.09% | 0.11% | 0.30% | 0.03% | 0.54% | 0.60% | -0.09% | |
| EUR | -0.09% | 0.01% | 0.22% | -0.04% | 0.43% | 0.50% | -0.19% | |
| GBP | -0.11% | -0.01% | 0.21% | -0.05% | 0.42% | 0.48% | -0.17% | |
| JPY | -0.30% | -0.22% | -0.21% | -0.28% | 0.26% | 0.29% | -0.34% | |
| CAD | -0.03% | 0.04% | 0.05% | 0.28% | 0.51% | 0.56% | -0.09% | |
| AUD | -0.54% | -0.43% | -0.42% | -0.26% | -0.51% | 0.04% | -0.62% | |
| NZD | -0.60% | -0.50% | -0.48% | -0.29% | -0.56% | -0.04% | -0.65% | |
| CHF | 0.09% | 0.19% | 0.17% | 0.34% | 0.09% | 0.62% | 0.65% |
The heat map shows percentage changes of major currencies against each other. The base currency is picked from the left column, while the quote currency is picked from the top row. For example, if you pick the Canadian Dollar from the left column and move along the horizontal line to the US Dollar, the percentage change displayed in the box will represent CAD (base)/USD (quote).
Technical analysis: Canadian Dollar flattens amid a mild uptick in intraday volatility
The Canadian Dollar (CAD) found some chart churn on Tuesday, but struggled to develop any meaningful momentum as CAD traders failed to find a reason to push the needle too far in either direction. The CAD is trading within one-tenth of one percent against its major competitors the US Dollar (USD), Euro (EUR), and Pound Sterling (GBP), while gains of around one-half of one percent against the Australian Dollar (AUD) and the New Zealand Dollar (NZD) were owed to weakness in the Antipodeans.
USD/CAD continued to battle the 1.3700 handle as broad-market bidding bolstered the Greenback. Intraday momentum has evaporated into a choppy standstill just beneath the key handle as bidders struggle to push the pair into further gains after last week’s recovery from a swing low below 1.3600.
USD/CAD hourly chart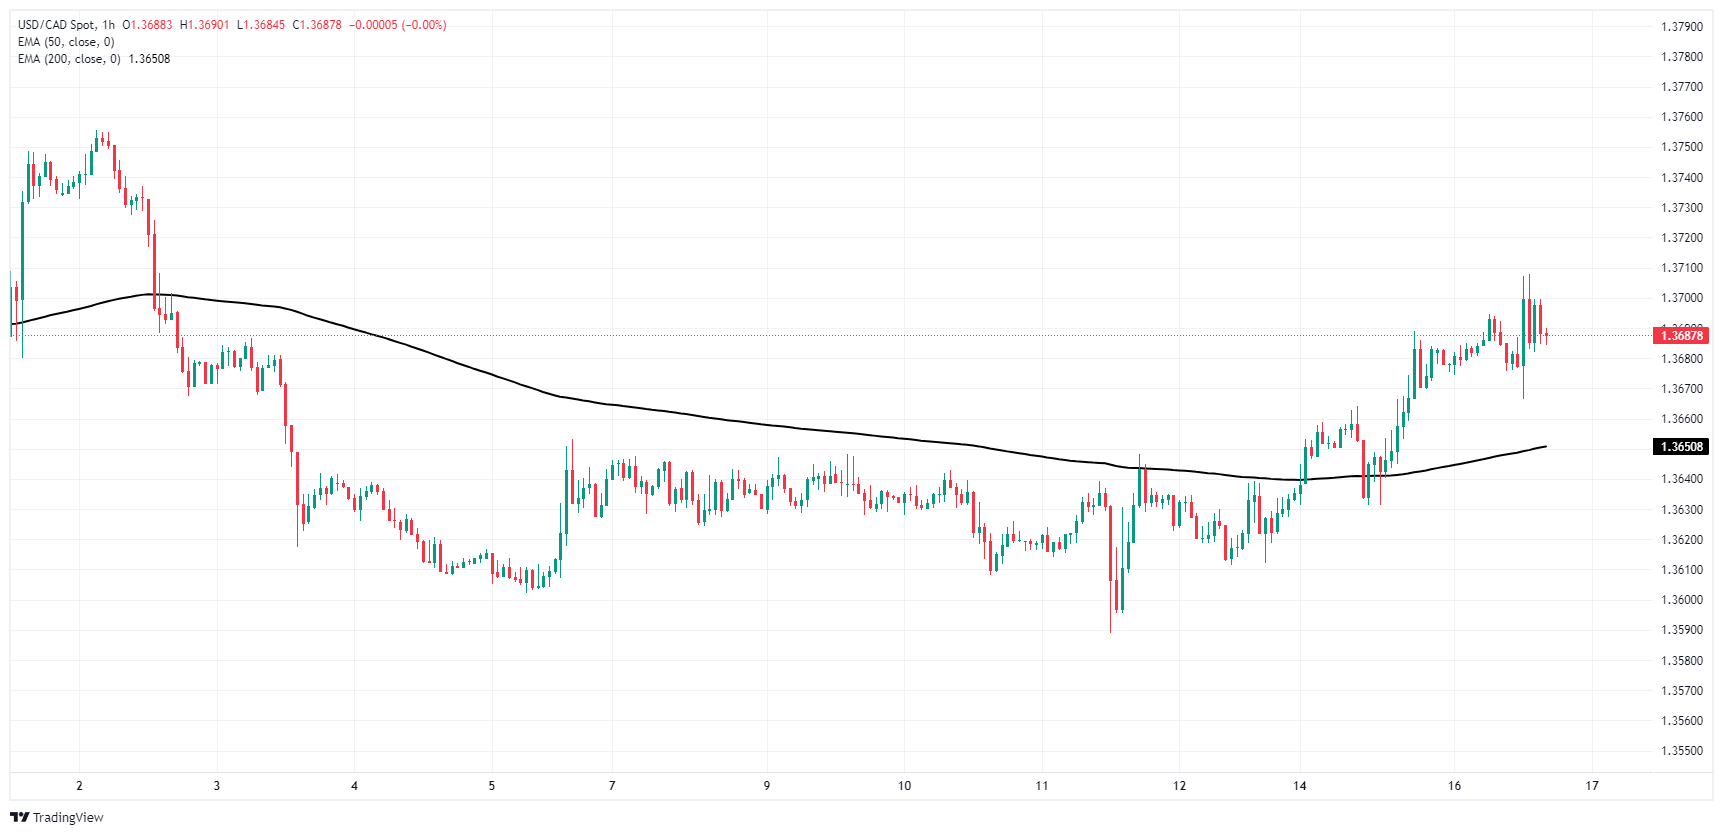
USD/CAD daily chart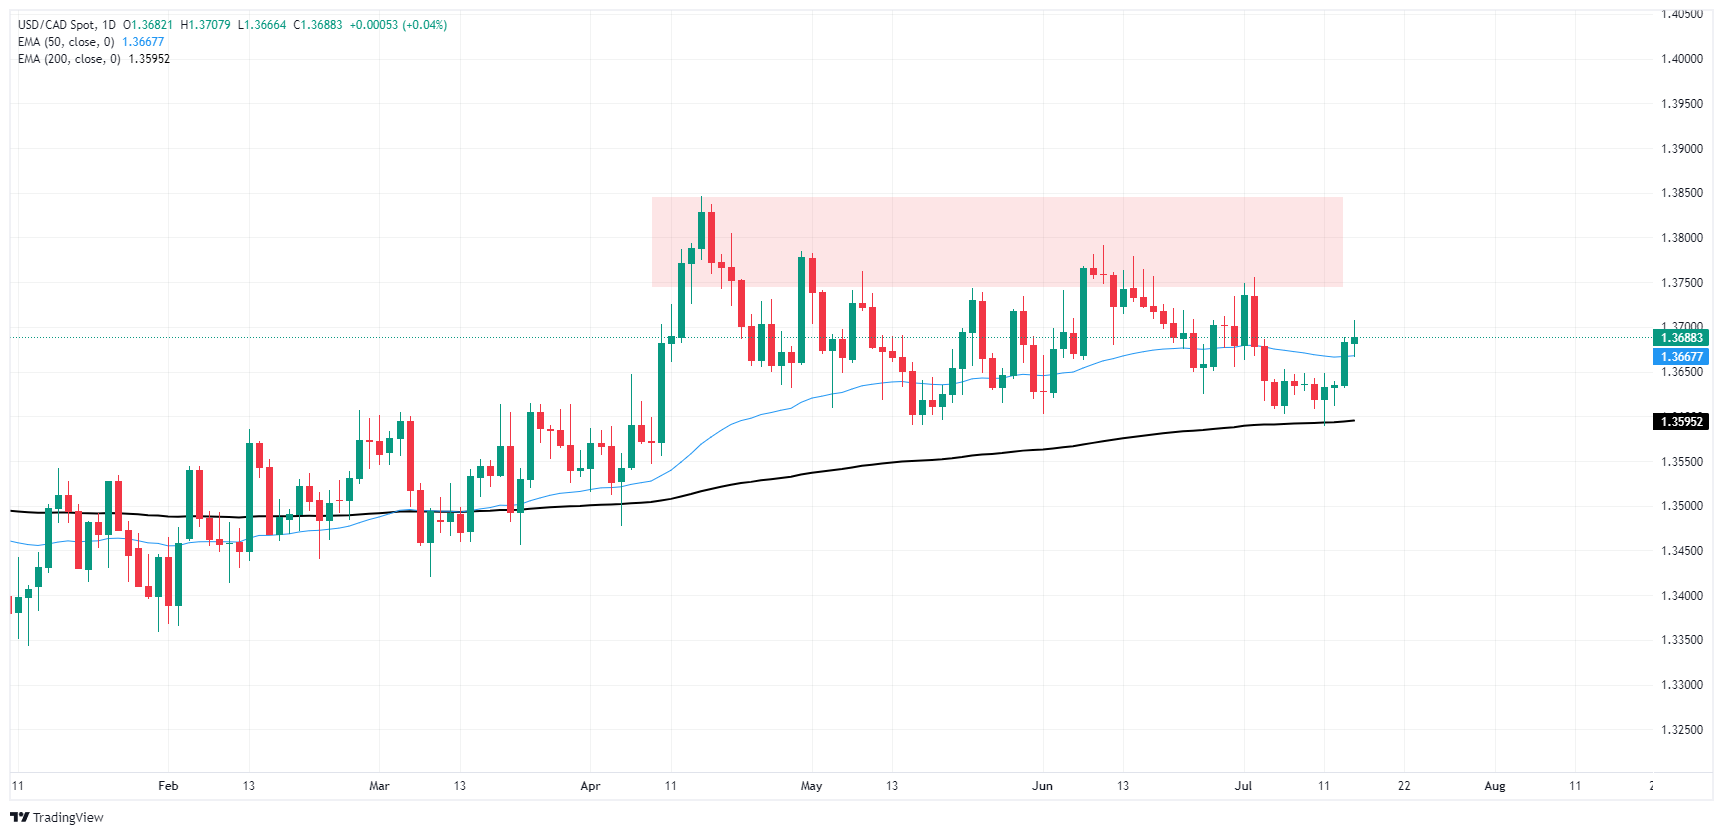
Canadian Dollar FAQs
The key factors driving the Canadian Dollar (CAD) are the level of interest rates set by the Bank of Canada (BoC), the price of Oil, Canada’s largest export, the health of its economy, inflation and the Trade Balance, which is the difference between the value of Canada’s exports versus its imports. Other factors include market sentiment – whether investors are taking on more risky assets (risk-on) or seeking safe-havens (risk-off) – with risk-on being CAD-positive. As its largest trading partner, the health of the US economy is also a key factor influencing the Canadian Dollar.
The Bank of Canada (BoC) has a significant influence on the Canadian Dollar by setting the level of interest rates that banks can lend to one another. This influences the level of interest rates for everyone. The main goal of the BoC is to maintain inflation at 1-3% by adjusting interest rates up or down. Relatively higher interest rates tend to be positive for the CAD. The Bank of Canada can also use quantitative easing and tightening to influence credit conditions, with the former CAD-negative and the latter CAD-positive.
The price of Oil is a key factor impacting the value of the Canadian Dollar. Petroleum is Canada’s biggest export, so Oil price tends to have an immediate impact on the CAD value. Generally, if Oil price rises CAD also goes up, as aggregate demand for the currency increases. The opposite is the case if the price of Oil falls. Higher Oil prices also tend to result in a greater likelihood of a positive Trade Balance, which is also supportive of the CAD.
While inflation had always traditionally been thought of as a negative factor for a currency since it lowers the value of money, the opposite has actually been the case in modern times with the relaxation of cross-border capital controls. Higher inflation tends to lead central banks to put up interest rates which attracts more capital inflows from global investors seeking a lucrative place to keep their money. This increases demand for the local currency, which in Canada’s case is the Canadian Dollar.
Macroeconomic data releases gauge the health of the economy and can have an impact on the Canadian Dollar. Indicators such as GDP, Manufacturing and Services PMIs, employment, and consumer sentiment surveys can all influence the direction of the CAD. A strong economy is good for the Canadian Dollar. Not only does it attract more foreign investment but it may encourage the Bank of Canada to put up interest rates, leading to a stronger currency. If economic data is weak, however, the CAD is likely to fall.
Gold markets lurched into a fresh all-time high on Tuesday as rate markets fully price in a September rate cut from the Federal Reserve (Fed). US Retail Sales slumped flat in June, piling soft data on top of more soft data after last week's US Consumer Price Index (CPI) inflation print cooled more than expected.
With US data softening and growing concerns about an economic downturn weighing on the US domestic economy, rate cut bets have been pinned to the ceiling and investors are piling into Gold, pushing XAU/USD to a record high of $2,465.30 during Tuesday's US market session.
XAU/USD hourly chart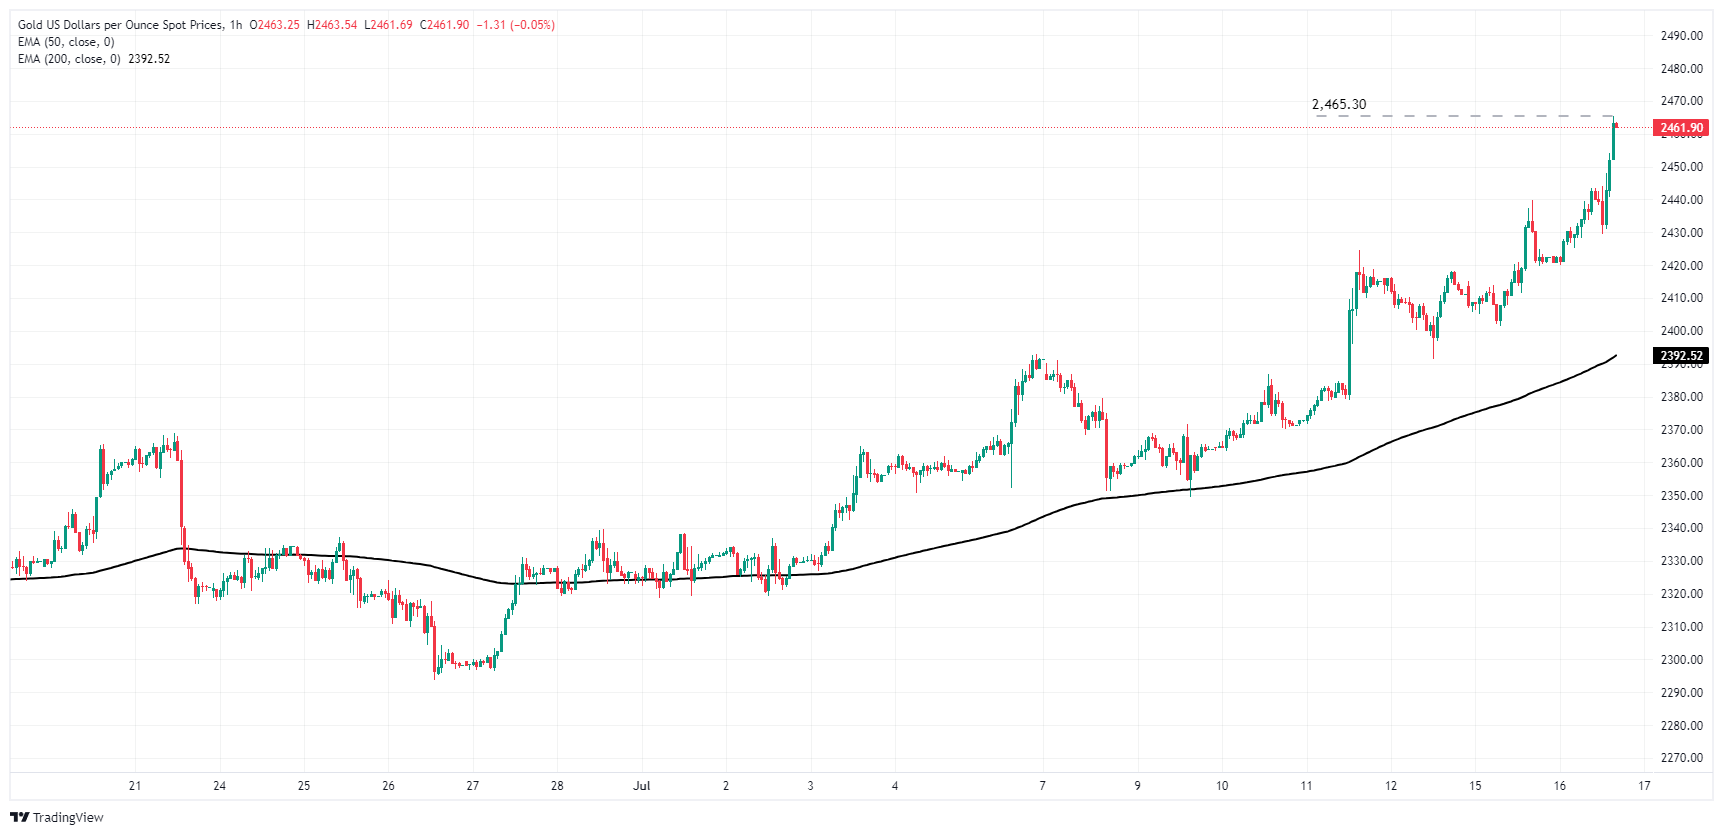
Gold FAQs
Gold has played a key role in human’s history as it has been widely used as a store of value and medium of exchange. Currently, apart from its shine and usage for jewelry, the precious metal is widely seen as a safe-haven asset, meaning that it is considered a good investment during turbulent times. Gold is also widely seen as a hedge against inflation and against depreciating currencies as it doesn’t rely on any specific issuer or government.
Central banks are the biggest Gold holders. In their aim to support their currencies in turbulent times, central banks tend to diversify their reserves and buy Gold to improve the perceived strength of the economy and the currency. High Gold reserves can be a source of trust for a country’s solvency. Central banks added 1,136 tonnes of Gold worth around $70 billion to their reserves in 2022, according to data from the World Gold Council. This is the highest yearly purchase since records began. Central banks from emerging economies such as China, India and Turkey are quickly increasing their Gold reserves.
Gold has an inverse correlation with the US Dollar and US Treasuries, which are both major reserve and safe-haven assets. When the Dollar depreciates, Gold tends to rise, enabling investors and central banks to diversify their assets in turbulent times. Gold is also inversely correlated with risk assets. A rally in the stock market tends to weaken Gold price, while sell-offs in riskier markets tend to favor the precious metal.
The price can move due to a wide range of factors. Geopolitical instability or fears of a deep recession can quickly make Gold price escalate due to its safe-haven status. As a yield-less asset, Gold tends to rise with lower interest rates, while higher cost of money usually weighs down on the yellow metal. Still, most moves depend on how the US Dollar (USD) behaves as the asset is priced in dollars (XAU/USD). A strong Dollar tends to keep the price of Gold controlled, whereas a weaker Dollar is likely to push Gold prices up.
- US Retail Sales saw a slight uptick in June.
- USD's overall outlook still remains skewed to the downside due to dovish bets on the Fed.
- Markets remain confident about a September cut.
On Tuesday, the US Dollar, as measured by the DXY index, saw some gains following promising results in June’s Retail Sales figures reported during the European session.
That being said, the US economic outlook shows indications of disinflation, bolstering the markets' confidence in a rate cut in September. Federal Reserve officials, however, are maintaining a cautious stance, emphasizing their reliance on data before making any significant moves.
Daily digest market movers: DXY sees some light following encouraging Retail Sales, outlook still negative
- As the week began, the USD found itself under pressure due to the effect of the previous week's inflation statistics, which fueled confidence among traders for a likely rate cut in September.
- On the data front, retail sales remained flat at 0.0%, though the previously reported increase of 0.1% was revised upward to 0.3%.
- Retail Sales ex Autos rose by 0.4% after the 0.1% decline in May. That same -0.1% has been revised to 0.1%.
- The CME FedWatch Tool broadly supports the notion of a rate cut in September, with the odds currently standing over 85% for a 25-basis-point cut.
DXY Technical Outlook: Bearish attitude steady while bulls make a stride to recover the 200-day SMA
The outlook for the USD remains bearish despite the DXY index regaining the 200-day Simple Moving Average (SMA). Technical indicators such as the Relative Strength Index (RSI) and Moving Average Convergence Divergence (MACD) are both deep in negative terrain, suggesting it’s the seller's time now.
Despite losing more than 0.80% towards the end of last week, a slight upward correction may occur. Nonetheless, the bullish momentum gained on Tuesday is fragile, making the overall technical outlook decidedly bearish.
US Dollar FAQs
The US Dollar (USD) is the official currency of the United States of America, and the ‘de facto’ currency of a significant number of other countries where it is found in circulation alongside local notes. It is the most heavily traded currency in the world, accounting for over 88% of all global foreign exchange turnover, or an average of $6.6 trillion in transactions per day, according to data from 2022. Following the second world war, the USD took over from the British Pound as the world’s reserve currency. For most of its history, the US Dollar was backed by Gold, until the Bretton Woods Agreement in 1971 when the Gold Standard went away.
The most important single factor impacting on the value of the US Dollar is monetary policy, which is shaped by the Federal Reserve (Fed). The Fed has two mandates: to achieve price stability (control inflation) and foster full employment. Its primary tool to achieve these two goals is by adjusting interest rates. When prices are rising too quickly and inflation is above the Fed’s 2% target, the Fed will raise rates, which helps the USD value. When inflation falls below 2% or the Unemployment Rate is too high, the Fed may lower interest rates, which weighs on the Greenback.
In extreme situations, the Federal Reserve can also print more Dollars and enact quantitative easing (QE). QE is the process by which the Fed substantially increases the flow of credit in a stuck financial system. It is a non-standard policy measure used when credit has dried up because banks will not lend to each other (out of the fear of counterparty default). It is a last resort when simply lowering interest rates is unlikely to achieve the necessary result. It was the Fed’s weapon of choice to combat the credit crunch that occurred during the Great Financial Crisis in 2008. It involves the Fed printing more Dollars and using them to buy US government bonds predominantly from financial institutions. QE usually leads to a weaker US Dollar.
Quantitative tightening (QT) is the reverse process whereby the Federal Reserve stops buying bonds from financial institutions and does not reinvest the principal from the bonds it holds maturing in new purchases. It is usually positive for the US Dollar.
The Dollar Index (DXY) initially rose 0.2% to 104.32 on the “Trump Trade”, but returned to last Friday’s 104.09. DXY needs to break below 104 to move towards 103, DBS Senior FX Strategist Philip Wee notes.
DXY turns up after Powell’s comments
“DXY appreciated slightly by 0.1% to 104.19 amid a 4.7 bps increase in the US Treasury 10Y bond yield to 4.23%. DXY initially rose 0.2% to 104.32 on the “Trump Trade” triggered by the assassination attempt on presidential candidate Donald Trump. However, DXY returned to last Friday’s 104.09 close in anticipation of a dovish interview by Federal Reserve Chair Jerome Powell.”
“Apart from expressing more confidence about US inflation returning to the 2% target, Powell said the Fed could lower rates before inflation hit the target, especially if the labour market weakened unexpectedly. However, DXY started turning up after Powell clearly stated that the Fed was not there yet to provide time-based guidance on rate cuts.”
“DXY needs to break below 104, the support levels in April and June, before it can think about revisiting the year’s low beneath 103. Meanwhile, the DXY’s upside is capped around 104.4-104.8 where its 200- and 100-day moving averages are located.”
Crude oil markets could be about to break down. A downtape could now force trend-followers to liquidate a massive -40% of their max size, TDS senior commodity strategist Daniel Ghali notes.
Trend-followers to liquidate -40% of their max size
“Crude oil markets could be about to break down. The downside in crude markets has remained relatively tame over the last weeks; a downtape could now force trend-followers to liquidate a massive -40% of their max size, suggesting the window for large-scale algorithmic liquidations is now open.”
“With our gauge of global commodity demand trending notably lower, we expect downside pressures to continue to build without an additional boost to supply risk.”
- GBP/USD down 0.14%, after failing to break 1.3000 level.
- Technical outlook shows upward bias, but RSI hints at profit booking.
- Key support at 1.2894, with resistance at 1.2995 and 1.3000, ahead of UK inflation data release.
The Pound Sterling begins the North American session on the backfoot and registers losses of 0.14% after failing to crack the 1.3000 figure. The lack of economic data from the United Kingdom boosted the Greenback, which was battered last week. The GBP/USD trades at 1.2946 after hitting a daily high of 1.2979.
GBP/USD Price Analysis: Technical outlook
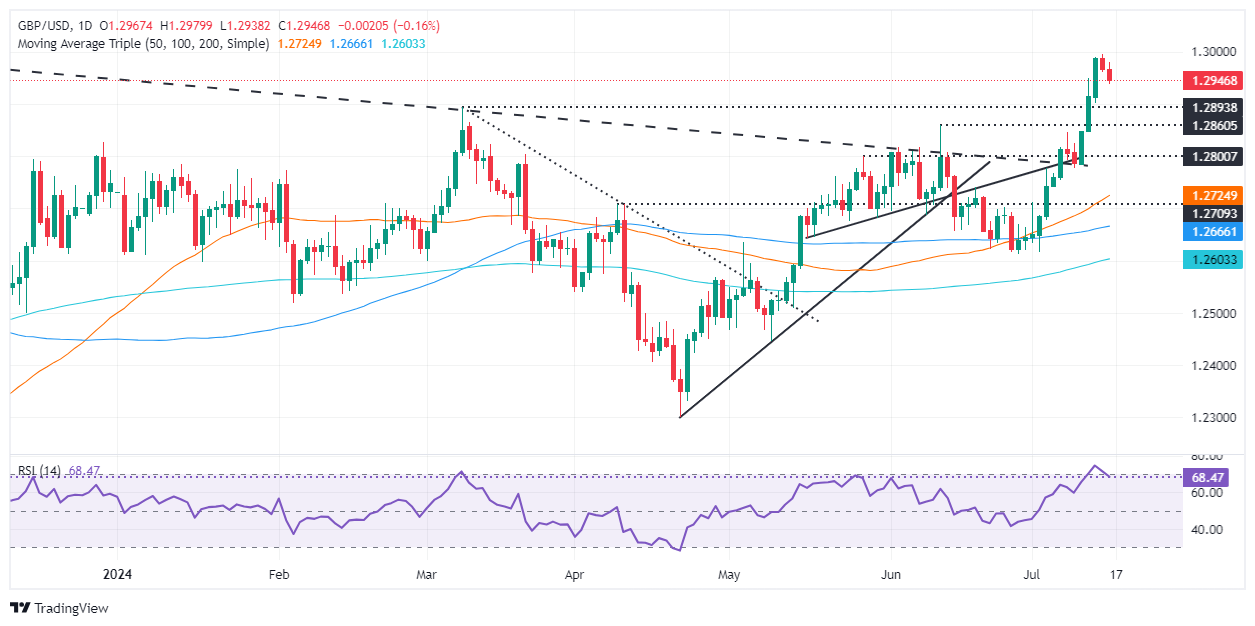
From a daily chart perspective, the GBP/USD remains upward biased as price action has registered successive series of higher highs and higher lows, though the bullish momentum has slightly vanished. The Relative Strength Index (RSI) remains bullish, but exiting from overbought conditions triggered a sell signal, hinting that buyers are booking profits ahead of the release of UK inflation data on Wednesday.
If GBP/USD drops below the March 8 peak turned support at 1.2894, that would sponsor a leg down to challenge the June 12 high at 1.2860. Further losses are seen beneath those two levels, extending toward the 1.2800 figure, ahead of the 50-day moving average (DMA) at 1.2723.
On the other hand, if GBP/USD holds the forth above 1.2900 and climbs past 1.2950, the first resistance would be the July 27, 2023 high at 1.2995 ahead of 1.3000. Further gains lie overhead at 1.3125, July 18, 2023, peak, followed by last year’s top at 1.3142.
GBP/USD Price Action – Daily Chart
Pound Sterling FAQs
The Pound Sterling (GBP) is the oldest currency in the world (886 AD) and the official currency of the United Kingdom. It is the fourth most traded unit for foreign exchange (FX) in the world, accounting for 12% of all transactions, averaging $630 billion a day, according to 2022 data. Its key trading pairs are GBP/USD, aka ‘Cable’, which accounts for 11% of FX, GBP/JPY, or the ‘Dragon’ as it is known by traders (3%), and EUR/GBP (2%). The Pound Sterling is issued by the Bank of England (BoE).
The single most important factor influencing the value of the Pound Sterling is monetary policy decided by the Bank of England. The BoE bases its decisions on whether it has achieved its primary goal of “price stability” – a steady inflation rate of around 2%. Its primary tool for achieving this is the adjustment of interest rates. When inflation is too high, the BoE will try to rein it in by raising interest rates, making it more expensive for people and businesses to access credit. This is generally positive for GBP, as higher interest rates make the UK a more attractive place for global investors to park their money. When inflation falls too low it is a sign economic growth is slowing. In this scenario, the BoE will consider lowering interest rates to cheapen credit so businesses will borrow more to invest in growth-generating projects.
Data releases gauge the health of the economy and can impact the value of the Pound Sterling. Indicators such as GDP, Manufacturing and Services PMIs, and employment can all influence the direction of the GBP. A strong economy is good for Sterling. Not only does it attract more foreign investment but it may encourage the BoE to put up interest rates, which will directly strengthen GBP. Otherwise, if economic data is weak, the Pound Sterling is likely to fall.
Another significant data release for the Pound Sterling is the Trade Balance. This indicator measures the difference between what a country earns from its exports and what it spends on imports over a given period. If a country produces highly sought-after exports, its currency will benefit purely from the extra demand created from foreign buyers seeking to purchase these goods. Therefore, a positive net Trade Balance strengthens a currency and vice versa for a negative balance.
Chinese traders are growing more bearish on Copper, TDS senior commodity strategist Daniel Ghali notes.
Copper shorts grow, Aluminum is on a roll
“Our tracking of positioning for the top traders on Shanghai Futures Exchange (SHFE) Copper highlights a substantial increase in traders' net short positions, with the top ten participants adding more than 10k SHFE lots to their books short over the last week, equivalent to 51.5kt of notional Copper sold short. This fits with reports that China's State Grid may have slowed Copper wire purchases in favor of Aluminum wire.”
“Real-time demand expectations embedded within commodity prices continue to decline at a fast clip, pointing to a hangover from previous stockpiling alongside a deteriorating demand outlook, suggesting downside momentum pressures continue to build in the red metal. CTAs are fighting against this trend, however, and are likely to buy Copper this week in every plausible scenario, even in a big downtape.”
“These flows could create a set-up to engage in downside, with China's Third Plenum unlikely to deliver the large fiscal stimulus that is required to turn the tide, focusing instead on structural reforms. Aluminium remains most vulnerable to downside in the complex, with a large downtape potentially forcing CTAs to completely liquidate their books long.”
The top traders in Shanghai Futures Exchange (SHFE) Gold are piling back into the Yellow Metal, TDS Senior Commodity Strategist Daniel Ghali notes.
Traders pile back Gold longs
“After a month's pause in SHFE traders’ buying activity, positioning for the top traders in SHFE Gold is now rising at a fast clip towards its previous all-time highs set in 2024Q1. This is particularly interesting as it comes at a time when our tracking of Chinese flows also points to divestment from domestic Gold ETFs, suggesting that retail traders are not behind the bid, as was likely the case earlier this year.”
“The top traders on SHFE have now added +10t of Gold to their books over the last five trading sessions, driven almost exclusively by new longs. This also comes as discretionary traders are piling back into Comex Gold, with our analytics suggesting Gold length is potentially benefiting from the Trump trade in addition to expectations for a cutting cycle to commence.”
“Commodity Trading Advisors (CTAs) are also still on the bid, and our simulations of future scenarios suggest that CTAs are likely to buy both Gold and silver in most scenarios this week. Flows continue to be supportive of upside momentum.”
Safe haven demand for the The Swiss Franc (CHF) to pick up if the Eurozone were to run into a rough patch. Risk of jitters around French politics and its budget we see risk of dips in EUR/CHF towards 0.96 on a 1-to-3-month view, Rabobank’s Senior FX Strategist Jane Foley notes.
French political jitters may send EUR/CHF to 0.96
“In view of Switzerland’s history of deflation and disinflation, it can be assumed that the SNB tends not to welcome CHF strength. Despite this year’s modest weakening in the value of the CHF, EUR/CHF has been in a downtrend since 2007. Safe haven demand for the CHF, triggered by the GFC, picked up in 2010 and 2011 in reflection of the Eurozone debt crisis.”
“In September 2011, the SNB set a minimum exchange rate at EUR/CHF1.20, though this was suddenly abandoned in January 2015. After the initial volatility settled down, a period of relative stability followed before EUR/CHF re-embarked on its downtrend in 2018. As a rough rule of thumb, we would expect safe haven demand for the CHF to pick up if the Eurozone were to run into a rough patch.”
“While relief followed France’s news last weekend, it will remain difficult for the country to repair its budget position. Italy’s budget issues may also come into sharper focus this year. In our view this underpins risk of an easier policy bias into 2025. In view of the risk of jitters around French politics and its budget we see risk of dips in EUR/CHF towards 0.96 on a 1-to-3-month view.”
The Pound Sterling (GBP) is little changed just below 1.30. Spot traded just shy of the figure yesterday but option barriers and a little caution ahead of tomorrow’s CPI data for June are keeping gains in check, Scotiabank’s Chief FX Strategist Shaun Osborne notes.
Potential bull flag developes around the recent high
“Note that EURGBP edged under 0.84 for the first time in almost two years yesterday. The Bank of England (BoE) policy debate remains intense among rate setters, reflected in swaps pricing in 12bps of easing risk for the August 1 decision. The Labour government’s desire to reset relations with the EU still constitutes a source of support for the GBP– especially on the cross—I believe.”
“Spot is consolidating below 1.30. Limited GBP losses, solidly bullish trend momentum signals and the pattern of trade developing around the recent high (potential bull flag) suggest pressure for a bullish extension above 1.30 remains intense. Last July’s high sits at 1.3142. Support is 1.2950 and (firmer) 1.2900/10.”
- Silver price sacrifices some of its intraday gains as the US Dollar recovers strongly.
- Better-than-expected US Retail Sales Control Group data has resulted in the US Dollar’s recovery.
- Firm Fed rate-cut prospects keep the Silver price’s outlook strong.
Silver price (XAG/USD) surrenders a majority of the gains and drops to near $30.50 in Tuesday’s American session. The white metal drops as the US Dollar (USD) recovers after the United States (US) Retail Sales report for June exhibited a better performance than market consensus.
Monthly Retail Sales remained flat, as expected, but May’s reading was upwardly revised to 0.3% from 0.1%. Retail Sales Control Group, a key measure to consumer spending component of Gross Domestic Product (GBP) that excludes receipts from auto dealers, building-materials retailers, gas stations, office supply stores, mobile home dealers and tobacco stores, rose at a stronger pace of 0.9% than the former release of 0.4%.
A slightly better Retail Sales report has improved the US Dollar’s appeal. However, the pace at which core Retail Sales have grown is incapable of reversing the disinflation process.
The US Dollar Index (DXY), which tracks the Greenback’s value against six major currencies, jumps to near 104.50. Higher US Dollar makes the Silver an expensive bet for investors.
On a broader note, the Silver price remains firm amid strong speculation that the Federal Reserve (Fed) will start reducing interest rates from the September meeting. Market expectations for Fed rate cuts rose sharply after the Consumer Price Index (CPI) report for June showed that price pressures decelerated at a faster-than-expected pace.
Silver technical analysis
Silver price turns sideways in a range between $30.40-$30.80 for more than one week. The near-term outlook of the Silver price remains firm as the asset holds the breakout of the Falling Channel formation on a four-hour timeframe.
The 50-period Exponential Moving Average (EMA) near $30.70 continues to provide support to the Silver price bulls.
The 14-period Relative Strength Index (RSI) oscillates inside the 40.00-60.00 range, exhibiting indecisiveness among market participants.
Silver four-hour chart
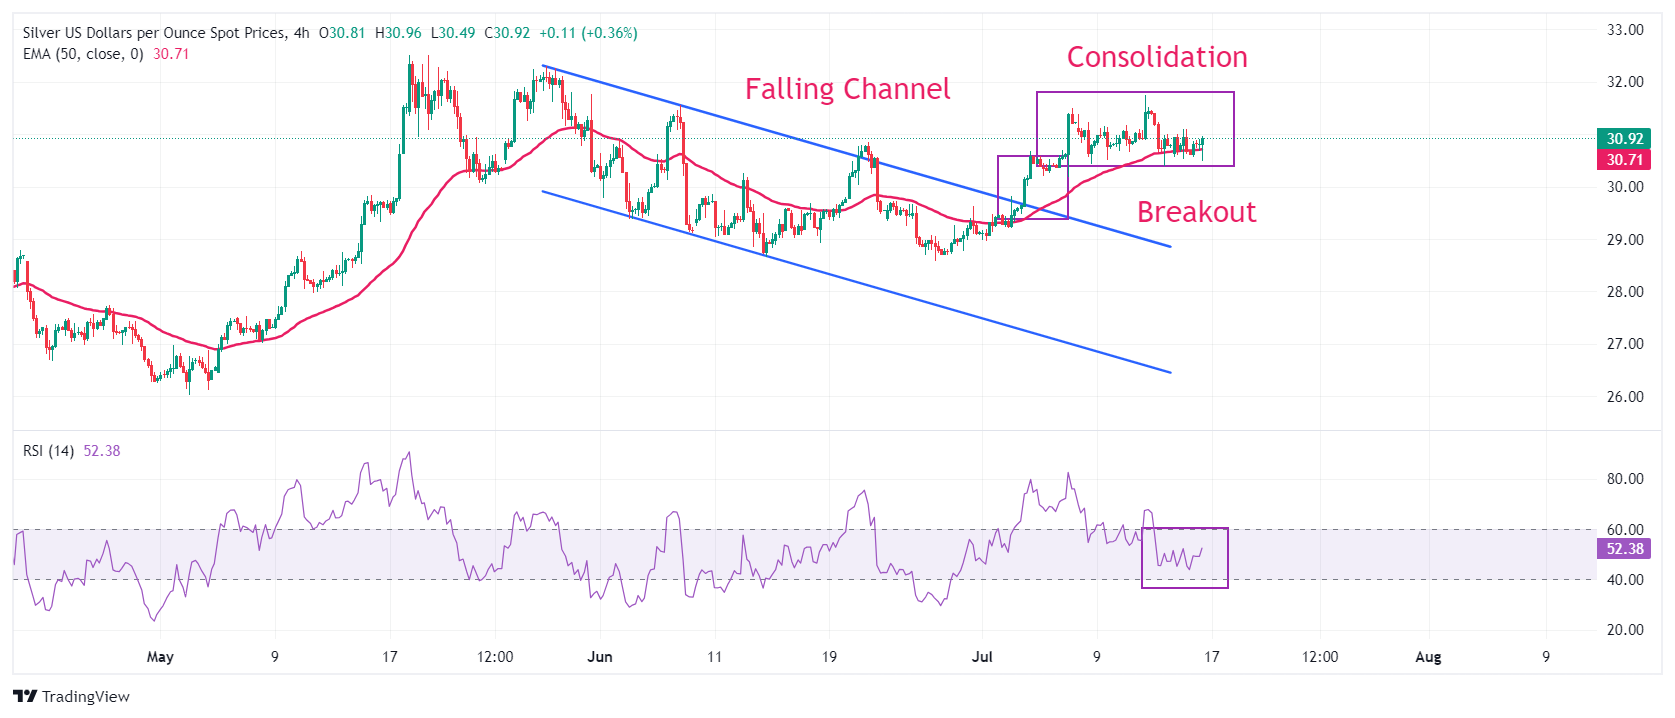
Silver FAQs
Silver is a precious metal highly traded among investors. It has been historically used as a store of value and a medium of exchange. Although less popular than Gold, traders may turn to Silver to diversify their investment portfolio, for its intrinsic value or as a potential hedge during high-inflation periods. Investors can buy physical Silver, in coins or in bars, or trade it through vehicles such as Exchange Traded Funds, which track its price on international markets.
Silver prices can move due to a wide range of factors. Geopolitical instability or fears of a deep recession can make Silver price escalate due to its safe-haven status, although to a lesser extent than Gold's. As a yieldless asset, Silver tends to rise with lower interest rates. Its moves also depend on how the US Dollar (USD) behaves as the asset is priced in dollars (XAG/USD). A strong Dollar tends to keep the price of Silver at bay, whereas a weaker Dollar is likely to propel prices up. Other factors such as investment demand, mining supply – Silver is much more abundant than Gold – and recycling rates can also affect prices.
Silver is widely used in industry, particularly in sectors such as electronics or solar energy, as it has one of the highest electric conductivity of all metals – more than Copper and Gold. A surge in demand can increase prices, while a decline tends to lower them. Dynamics in the US, Chinese and Indian economies can also contribute to price swings: for the US and particularly China, their big industrial sectors use Silver in various processes; in India, consumers’ demand for the precious metal for jewellery also plays a key role in setting prices.
Silver prices tend to follow Gold's moves. When Gold prices rise, Silver typically follows suit, as their status as safe-haven assets is similar. The Gold/Silver ratio, which shows the number of ounces of Silver needed to equal the value of one ounce of Gold, may help to determine the relative valuation between both metals. Some investors may consider a high ratio as an indicator that Silver is undervalued, or Gold is overvalued. On the contrary, a low ratio might suggest that Gold is undervalued relative to Silver.
Germany’s ZEW Survey for July reflected slightly weaker expectations among investors. The Euro (EUR) is trading around the 1.09 area, supported by the recent compression in short-term yield spreads, Scotiabank’s Chief FX Strategist Shaun Osborne notes.
EUR may extend its gains to the mid-1.09s
“Germany’s ZEW Survey for July reflected slightly weaker than expected expectations among investors (41) than markets expected (41.8). The index sat at 47.5 in June. This was the first decline in the index in a year. Investor concerns likely reflect the French election and the outlook for a relatively slow pace of ECB rate cuts moving forward.”
“The Eurozone’s May Trade surplus posted a lower-than-expected surplus of EUR12.3bn in May. The data showed a surplus of EUR14.3bn with the US and a 6.8% rise in exports to the States in the year. These trends may come under more scrutiny in the months ahead. The EUR remains comfortable around the 1.09 area for now, supported by the recent compression in short-term yield spreads.”
“Spot gains stalled above 1.09 yesterday but the EUR’s undertone remains constructive and bullish intraday, daily and weekly momentum readings suggest limited scope for losses for now and may drive gains to extend to the mid-1.09s. Look for spot to remain supported on minor dips through the upper 1.08s.”
- The Canadian Dollar declines after the release of lower-than-forecast inflation in June.
- The data indicates a greater probability the Bank of Canada will lower interest rates again in July.
- The US Dollar strengthens meanwhile, after US Retail Sales data, pushing USD/CAD higher within its range.
USD/CAD is trading higher, and has broken above 1.3700, after the release of Canadian Consumer Price Index (CPI) data for June showed an easing of inflationary conditions in Canada. The data further raises the prospect of the Bank of Canada (BoC) cutting its key interest rate again at its July 24 policy meeting, after already cutting its policy rate by 0.25% to 4.75% in June.
Lower interest rates generally depreciate a currency as they reduce foreign capital inflows. The Canadian Dollar (CAD) is weakening against the US Dollar (USD) after the release – as USD itself pumps higher in most pairs following the release of US Retail Sales data at the same time as Canadian CPI was published.
Canadian Dollar falls after Canadian Inflation cools in June
The Canadian Dollar is weakening after the Canadian Consumer Price Index (CPI) in June showed a decline of 0.1% month-over-month compared to the previous month’s 0.6% gain and missing expectations of 0.1%, data from Statistics Canada shows on Tuesday.
On a yearly basis CPI rose 2.7% in June compared to 2.9% previously.
Core CPI rose by 0.1% compared to 0.3% previously.
The Bank of Canada’s Core CPI rose by 1.9% YoY in June from 1.8% previously, and on a monthly basis fell by 0.1% MoM compared to the 0.6% rise in May.
USD strengthens after US Retail Sales release
The US Dollar strengthens against the Canadian Dollar on Tuesday after Retail Sales data for June comes out – either in line with or – above economists’ expectations. The data suggests the US economy remains resilient which, in turn, supports the Greenback.
US Retail Sales rose by 0.0% in June as expected and below May’s upwardly revised 0.3%, according to data from the US Census Bureau on Tuesday.
The Retail Sales ex Autos rose 0.4% in June when a 0.1% increase had been estimated from a revised-up 0.1% previously.
The Retail Sales Control Group showed an increase of 0.9% from 0.4% in May. The Control Group is adjusted for seasonal variations and trading day differences and is seen as a more accurate measure of sales.
- Retail Sales in the US held steady above $700 billion in June.
- US Dollar Index clings to modest daily gains above 104.00.
Retail Sales in the US remained virtually unchanged at $704.3 billion in June, the US Census Bureau reported on Tuesday. This reading followed the 0.3% increase (revised from 0.1%) recorded in May and came in line with the market expectation. Retail Sales ex Autos grew 0.4% in the same period.
"Total sales for the April 2024 through June 2024 period were up 2.5% from the same period a year ago," the Census Bureau further noted in its press release. "The April 2024 to May 2024 percent change was revised from up 0.1% to up 0.3%."
Market reaction
The US Dollar Index edged slightly higher with the immediate reaction and was last seen rising 0.1% on the day at 104.35.
Focus for the Canadian Dollar (CAD) this morning falls squarely on inflation. Canada reports June CPI at 8.30ET, Scotiabank’s Chief FX Strategist Shaun Osborne.
June CPI is due today
“The street (and Scotia) is looking for a 0.1% rise in headline prices in the month and a 2.8% rise over the year—to reverse a little at least of the uptick to 2.9% seen in the May data.”
“Core measures are expected to moderate a tenth from May. Data in line with expectations will bolster expectations that the Bank will follow up on June’s rate cut with another 25bps reduction next week (19-20bps priced in) and should help underpin USD/CAD’s range base around the 1.36 area, close to where we assess spot fair value sits, for now.”
“The CAD is little changed in overnight trade. A solid rise in the US Dollar off yesterday’s low has not seen any additional follow through demand in overnight trade. Intraday price patterns suggest a minor top/reversal may be developing around 1.3695 (1.3750/55 is major resistance above here) which may see spot drift to test minor support at 1.3645/50. Firm support is at 1.3595/00.”
- USD/CAD starts fresh leg higher within a multi-month range and is poised to continue rising.
- The Canadian Dollar is weakening and USD/CAD has broken above all key Moving Averages.
USD/CAD looks to be starting a leg higher within a range that began unfolding in May.
The pair’s lack of directionality means the short-term trend is sideways and given the “trend is your friend” the odds favor more ups and downs to come.
USD/CAD 4-hour Chart
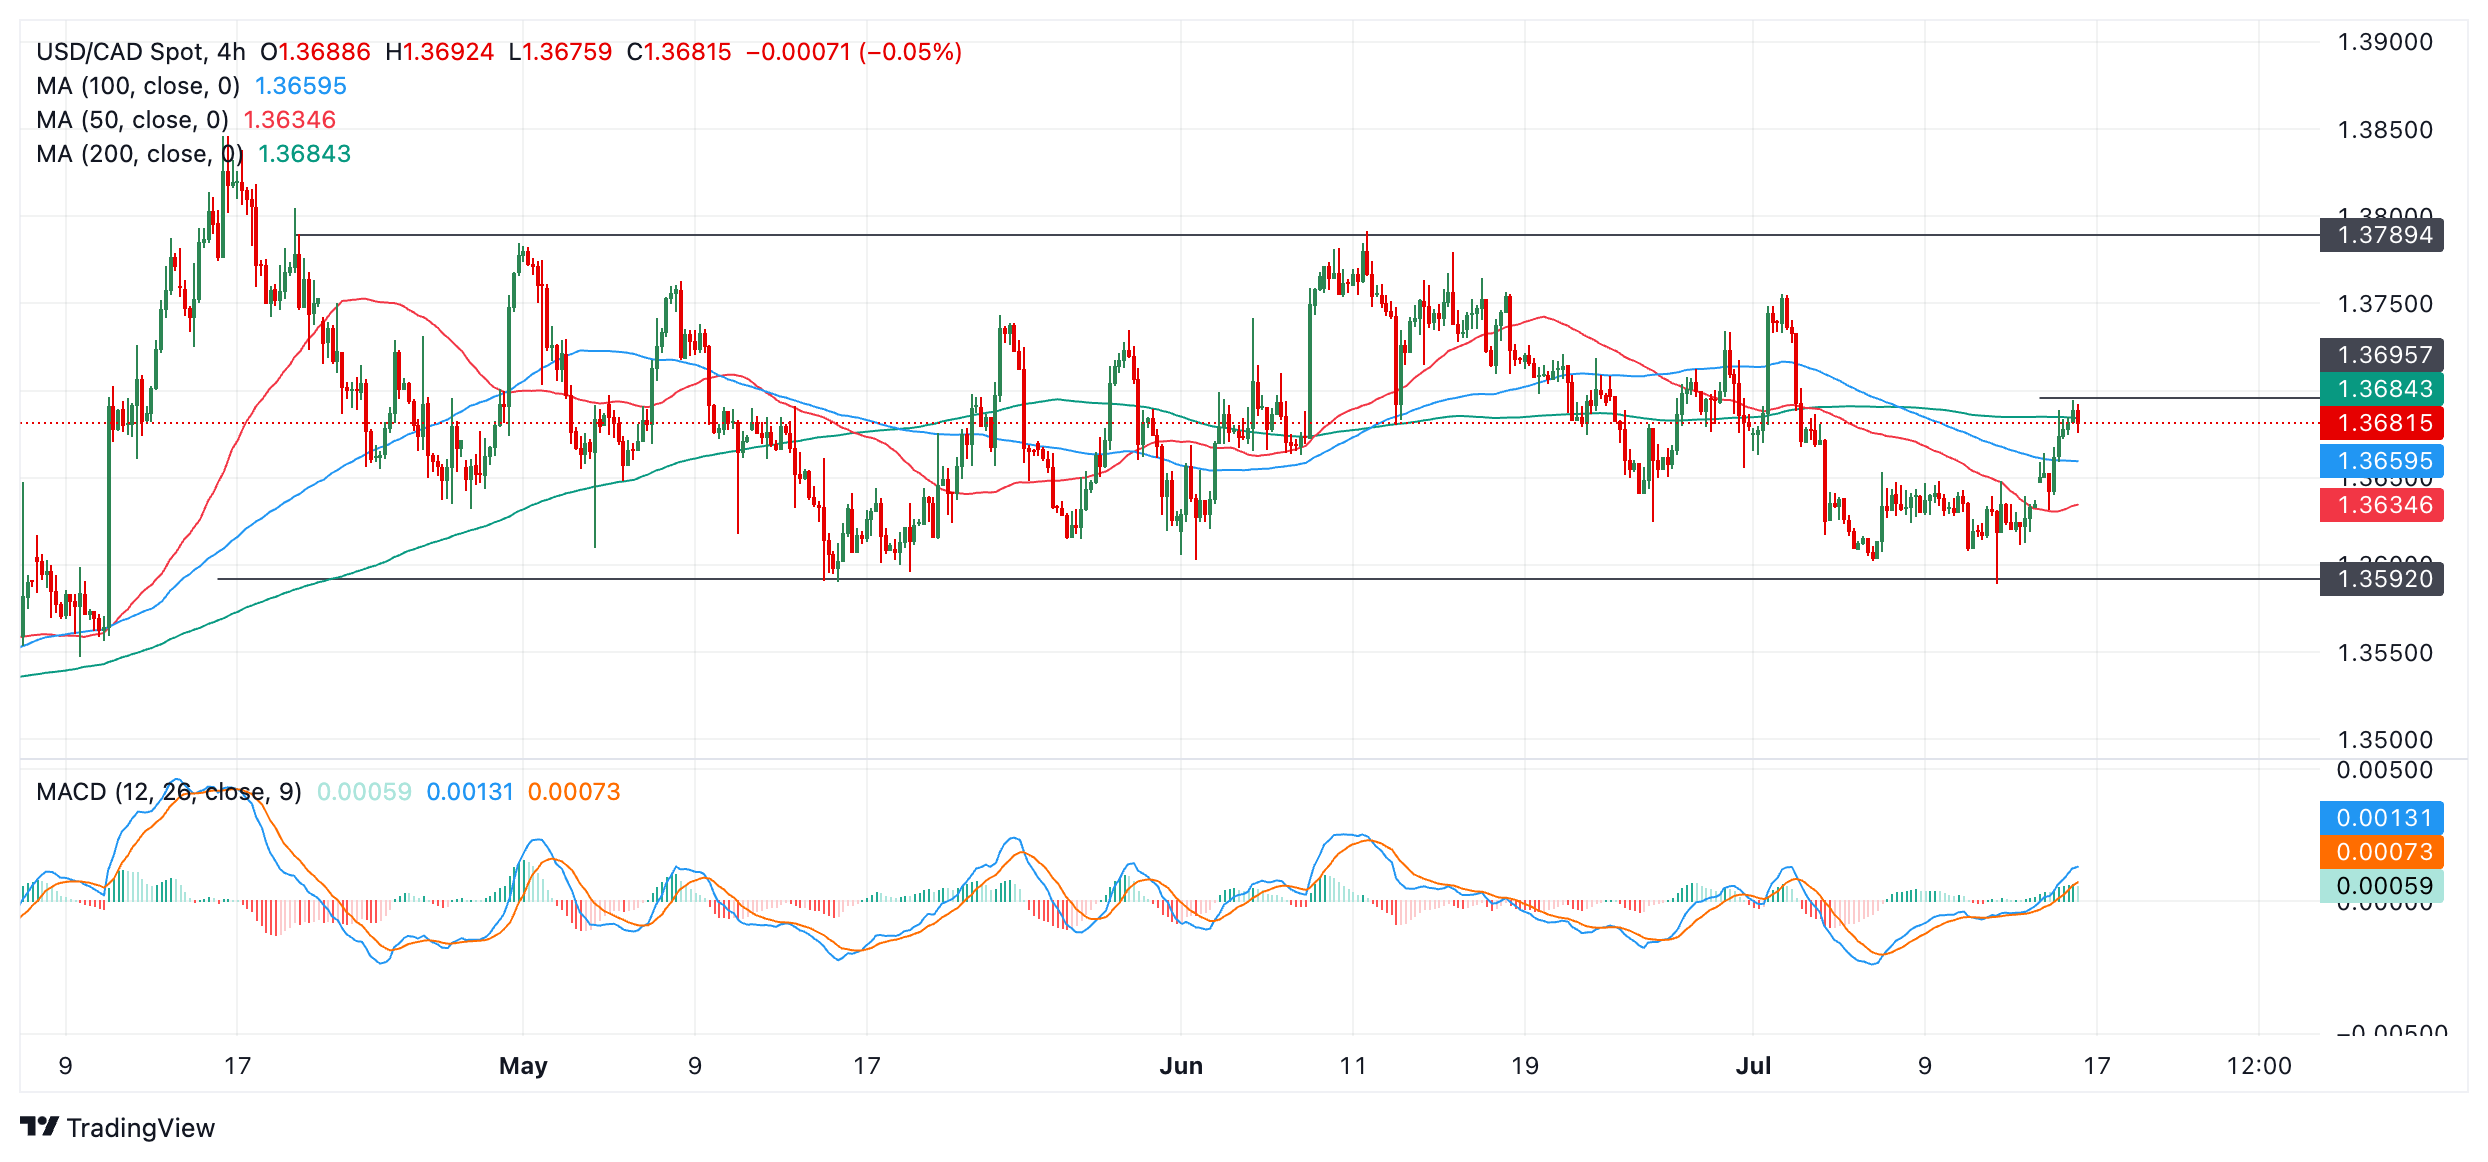
Currently the pair appears to be in the process of rising towards the 1.3788 ceiling as the Canadian Dollar (CAD) undergoes a period of weakening. It has broken above all three major Simple Moving Averages (SMA) – another bullish sign. A break above 1.3695 would confirm further upside.
The Moving Average Convergence Divergence (MACD) indicator crossed above its red signal line on July 5 after the initial bounce and is rising towards the zero line. This corroborates the view that an up leg is evolving. Crosses of the MACD above and below its signal line have coincided with most of the turns within the range so far, suggesting it has been a particularly reliable indicator.
- The US Dollar jumps higher ahead of US Retail Sales data.
- Traders are pricing in a Trump victory with the Fed keeping a lit on projections.
- The US Dollar index moves higher and trades near a pivotal level for more upside.
The US Dollar (USD) edges higher on Tuesday due to several events that took place overnight. First and foremost for financial markets was the interview with US Federal Reserve (Fed) Chairman Jerome Powell, which disappointed traders hoping to hear anything on guidance, but his lips remained sealed. In Milwaukee, former US President Donald Trump took the stage after his shooting over the weekend, announcing that Ohio senator J.D. Vance will be his running mate.
On the economic front, it will all revolve around the consumer, with US Retail Sales and Import/Export Prices for June being published later in the day. A rewind to the previous Retail Sales number revealed that consumers had had enough of the current elevated price levels and were willing to wait for their next purchase until prices would come down. If that is the case again for June numbers, that would mean a substantial decline in Retail Sales, resulting in a weaker US Dollar.
Daily digest market movers: Data to the forefront
- With former US President Trump picking J.D. Vance as running mate, the main theme for Trump’s campaign becomes very clear, as Senator Vance is known for his call for more harsh and severe measures against China. This means a bigger and broader tariff package against China and other countries that import goods to the US.
- At 12:30 GMT, the monthly Retail Sales data for June will be released, together with the Import-Export Price Index:
- Retail Sales are expected to remain unchanged at 0% in the month after growing by 0.1% in May.
- Retail Sales ex Autos are seen growing 0.1% after the -0.1% in May.
- As usual, revisions of the previous numbers will be more important and market-moving than the actual data.
- The monthly Import Price Index is expected to increase by 0.2% in June from -0.4% the previous month.
- The monthly Export Price Index was at -0.6% in May, with no projection forecasted.
- At 14:00 GMT, the Business Inventories data for May will be released, and they are expected to remain stable at 0.3%.
- At the same time, the NAHB Housing Market Index for July will be released by the National Association of Home Builders. Previously, the Index stood at 43, with a small uptick to 44 expected.
- Equity markets are very mixed with no clear pattern, besides that, European equities are on the back foot. US futures are marginally in the green.
- The CME Fedwatch Tool shows an 89.4% chance of a 25 basic points (bps) interest rate cut by the Fed in September and 10.4% for a 50 bps cut. An unchanged scenario with no rate change is off the table.
- The US 10-year benchmark rate trades at 4.20%, flirting with the yearly lows.
US Dollar Index Technical Analysis: Running mate priced in
The US Dollar Index (DXY) is recovering, with traders pricing in some severe trade wars coming up should former President Trump win the elections in November. By picking J.D. Vance as his running mate, Trump has chosen a US Senator who outspokenly disfavors China and wants to limit foreign countries’ influences and imports on the US economy. Trade wars and tariffs are often seen as supportive of the US Dollar, which was the case at the start of 2018 when Trump started by slapping tariffs on Chinese imports and made the DXY rally 16% over two years with the tariffs in place.
On Tuesday, the DXY is still below all three major Simple Moving Averages (SMA) after its meltdown last week. The first barrier to recovery is the 200-day SMA at 104.37. Next, the 100-day SMA resides near 104.81, while the declining 55-day SMA is trading at 105.03.
On the downside, the weak spot has been identified now at 103.99/104.00. Expect to see pressure mounting on that level with each test. Certainly, when the DXY bounces off that level each time, the bounces' highs would become smaller until the support gives way. A technical element to look out for could be that the 55-day SMA starts to break below the 100-day SMA and/or the 200-day SMA, risking a ‘death cross’ in technical terms, which is a catalyst for a substantially longer-term sell-off.
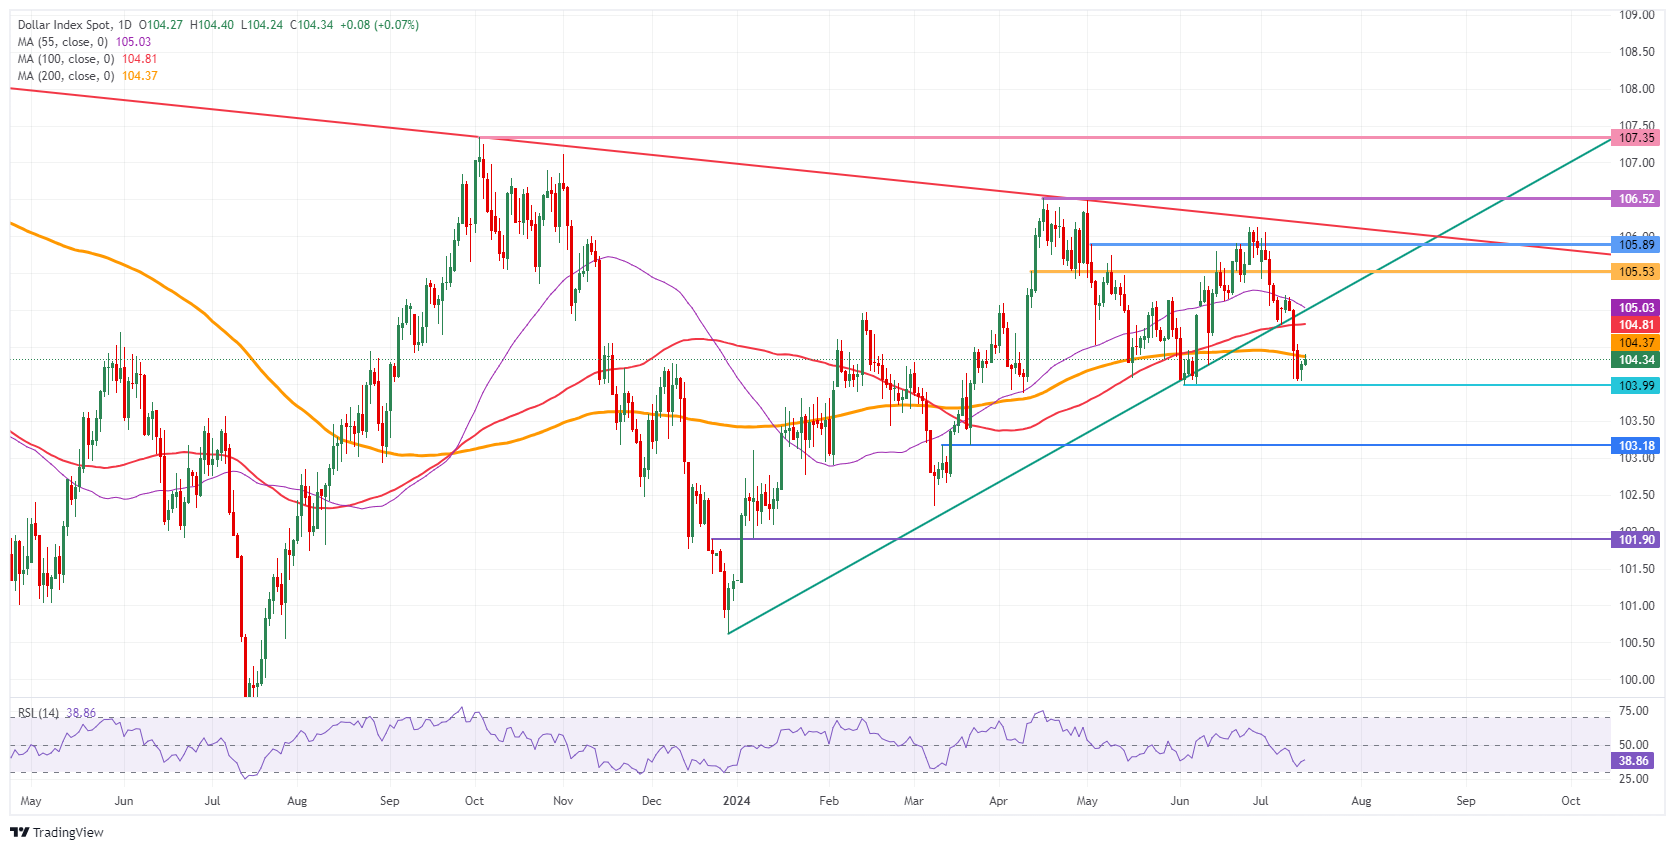
US Dollar Index: Daily Chart
US Dollar FAQs
The US Dollar (USD) is the official currency of the United States of America, and the ‘de facto’ currency of a significant number of other countries where it is found in circulation alongside local notes. It is the most heavily traded currency in the world, accounting for over 88% of all global foreign exchange turnover, or an average of $6.6 trillion in transactions per day, according to data from 2022. Following the second world war, the USD took over from the British Pound as the world’s reserve currency. For most of its history, the US Dollar was backed by Gold, until the Bretton Woods Agreement in 1971 when the Gold Standard went away.
The most important single factor impacting on the value of the US Dollar is monetary policy, which is shaped by the Federal Reserve (Fed). The Fed has two mandates: to achieve price stability (control inflation) and foster full employment. Its primary tool to achieve these two goals is by adjusting interest rates. When prices are rising too quickly and inflation is above the Fed’s 2% target, the Fed will raise rates, which helps the USD value. When inflation falls below 2% or the Unemployment Rate is too high, the Fed may lower interest rates, which weighs on the Greenback.
In extreme situations, the Federal Reserve can also print more Dollars and enact quantitative easing (QE). QE is the process by which the Fed substantially increases the flow of credit in a stuck financial system. It is a non-standard policy measure used when credit has dried up because banks will not lend to each other (out of the fear of counterparty default). It is a last resort when simply lowering interest rates is unlikely to achieve the necessary result. It was the Fed’s weapon of choice to combat the credit crunch that occurred during the Great Financial Crisis in 2008. It involves the Fed printing more Dollars and using them to buy US government bonds predominantly from financial institutions. QE usually leads to a weaker US Dollar.
Quantitative tightening (QT) is the reverse process whereby the Federal Reserve stops buying bonds from financial institutions and does not reinvest the principal from the bonds it holds maturing in new purchases. It is usually positive for the US Dollar.
Not much is expected from the data-dependent ECB at the July meeting. Another rate cut looks very unlikely, and the magnitude of data before the September meeting makes giving firm signals about the September meeting somewhat controversial, Nordea’s Chief Analyst Jan von Gerich notes.
A cut in September is highly likely
“When the ECB cut rates at the June meeting, the signals about future steps were almost totally absent. Only a few members have taken a stronger stance on the schedule of further moves. However, the vast majority of Governing Council members have been vaguer in their comments, in line with the data-dependent and meeting-by-meeting approach.”
“Given the absence of signals that the recent data have been largely in line with expectations and the ECB’s seeming willingness to remove restrictiveness only gradually, another cut at the July meeting would be a major surprise, and it would also be a surprise, if the ECB gave any firmer guidance at the July meeting.”
“Financial markets are currently pricing in around 20bp worth of cuts for the September meeting, pointing to a baseline where the next cut will take place at that meeting. Virtually nothing is being priced in for the July meeting. Our baseline remains a cut in September. While we do not expect any major market moves following the July meeting, dovish comments could push also EUR rate expectations lower.”
Former US President Trump’s selection of Senator Vance as his running mate is not immediately market moving but it is market relevant, UBS macro analyst Paul Donovan notes.
US retail sales set to be lower
“In a television interview, Former US President Trump’s selection of Senator Vance identified China as the US’s greatest threat. Markets have been inclined to think that Trump would not really tax US consumers who buy goods partially made overseas as aggressively as they threaten—but the rhetoric suggests tariff threats may be serious.”
“June US retail sales data are released. Price changes matter, as this is a value measure. Disinflation, deflation, a cyber-attack on auto dealers, strains for lower-income households, and the shift to spending on services suggest a lower number. US consumers’ relentless hedonism suggests something not too low.”
“French President Macron is expected to start proceedings to establish a caretaker government. Meanwhile, the far-left has broken off negotiations with other parties in the Nouveau Front Populaire. This all points to fiscal inertia—no radical fiscal plans, but no attempt to get France onto a sustainable fiscal path.”
- NZD/USD recovers some intraday losses as the US Dollar remains under pressure due to firm Fed rate-cut bets.
- Fed Powell recognized the need for more soft inflation data before pivoting to policy normalization.
- NZ Q2 inflation is estimated to have grown steadily by 0.6%.
The NZD/USD pair rebound strongly after discovering buying support near two-month low around 0.6050 in Tuesday’s European session. The Kiwi asset recovers as the US Dollar (USD) remains on the backfoot due to firm expectations that the Federal Reserve (Fed) will start cutting its key interest rates from the September meeting.
The US Dollar Index (DXY), which tracks the Greenback’s value against six major currencies, struggles to hold its immediate support of 104.00. Meanwhile, investors’ higher risk appetite due to increasing Fed rate-cut prospects has underpinned risk-sensitive assets. S&P 500 futures have posted some losses in European trading hours.
Signs of improving Fed officials’ confidence in the progress in disinflation have boosted expectations for Fed rate cuts in September. Fed Chair Jerome Powell said in his speech at the Economic Club of Washington on Monday, "We've had three better readings, and if you average them, that's a pretty good place," Reuters reported.
Separately, San Francisco Federal Reserve Bank President Mary Daly said, “confidence is growing” that inflation is heading towards 2% target. However, she denied providing a guidance on timeframe for rate cuts.
On the economic front, investors await the United States (US) Retail Sales data for June, which will be published at 12:30 GMT. The report is expected to show that monthly Retail Sales remained stagnant after a meager growth of 0.1% in May.
In the New Zealand region, investors await the Q2 Consumer Price Index (CPI), which will provide cues about when the Reserve Bank of New Zealand (RBNZ) will start reducing interest rates. NZ inflation is estimated to have grown at a steady pace of 0.6%. Annually, price pressures are expected to have decelerated to 3.5% from the former release of 4.0%.
Economic Indicator
Consumer Price Index (QoQ)
The Consumer Price Index (CPI), released by Statistics New Zealand on a quarterly basis, measures changes in the price of goods and services bought by New Zealand households. The CPI is a key indicator to measure inflation and changes in purchasing trends. The QoQ reading compares prices in the reference quarter to the previous quarter. A high reading is seen as bullish for the New Zealand Dollar (NZD), while a low reading is seen as bearish.
Read more.Next release: Tue Jul 16, 2024 22:45
Frequency: Quarterly
Consensus: 0.6%
Previous: 0.6%
Source: Stats NZ
With the Reserve Bank of New Zealand's (RBNZ) inflation target being around the midpoint of 2%, Statistics New Zealand’s quarterly Consumer Price Index (CPI) publication is of high significance. The trend in consumer prices tends to influence RBNZ’s interest rates decision, which in turn, heavily impacts the NZD valuation. Acceleration in inflation could lead to faster tightening of the rates by the RBNZ and vice-versa. Actual figures beating forecasts render NZD bullish.
The USD/CAD pair looks poised to inch higher towards descending trend line drawn since April near 1.3755, Societe Generale FX analysts note.
Inches higher towards 1.3755
“USD/CAD recently defended the trough of May near 1.3580 which is also the 200-DMA. A rebound has materialized after this test; the pair looks poised to inch higher towards descending trend line drawn since April near 1.3755.”
“Graphical levels of 1.3850/1.3900 representing the upper limit of the range since 2022 is an important resistance zone. In case the pair breaks below 1.3580, there would be risk of a deeper pullback.”
- Gold is rallying after the Chairman of the Fed Jerome Powell said good progress was being made on inflation.
- His statements suggest a good chance the Fed will cut interest rates in the short term.
- Market-based probabilities are now showing a 100% chance of the Fed cutting interest rates at the September meeting.
Gold (XAU/USD) is up over half a percent on Tuesday, trading in the $2,440s as it inches up toward the $2,451 all-time high. The rally in the yellow metal is being supported by heightened expectations that the Federal Reserve (Fed) will cut interest rates at their meeting in September as inflation continues to show signs of cooling.
The firmer expectations that interest rates will be lowered contrast with the Fed’s previous non-committal, ambiguous stance. Lower interest rates are positive for Gold because they lower the opportunity cost of holding the non-interest-bearing asset.
Gold rises after Fed Chairman Powell indicates cuts are on their way
Gold is rising after Fed Chairman Jerome Powell commented in a speech on Monday on how inflation was showing promising signs of progress toward the central bank’s target and hinted that cuts to interest rates were on their way. His comments led to a dramatic recalibration of market-based expectations for the trajectory of the Fed Funds rate, the Fed’s key monetary policy rate.
The CME FedWatch tool, which uses the price of 30-day Fed Funds futures to calculate probabilities of future rate changes, is now pricing in a 100% chance of at least a 0.25% cut in the Fed Funds rate to an upper band of 5.25% when the Fed meets in September. Prior to the Chairman’s comments, the probabilities had been hovering just above the 60% mark.
The change in outlook comes after US inflation data in the form of the Consumer Price Index (CPI) undershot expectations in June – falling to 3.0%. Before that,both headline and core Personal Consumption Expenditure (PCE) inflation data – the Fed’s preferred gauge – fell to 2.6% in May, also undershooting expectations.
Technical Analysis: Gold continues rising within a range
Gold is rising within a range, and it is approaching its May 20 all-time high.
The precious metal is probably in a sideways consolidation – a pause within a broader uptrend.
XAU/USD Daily Chart
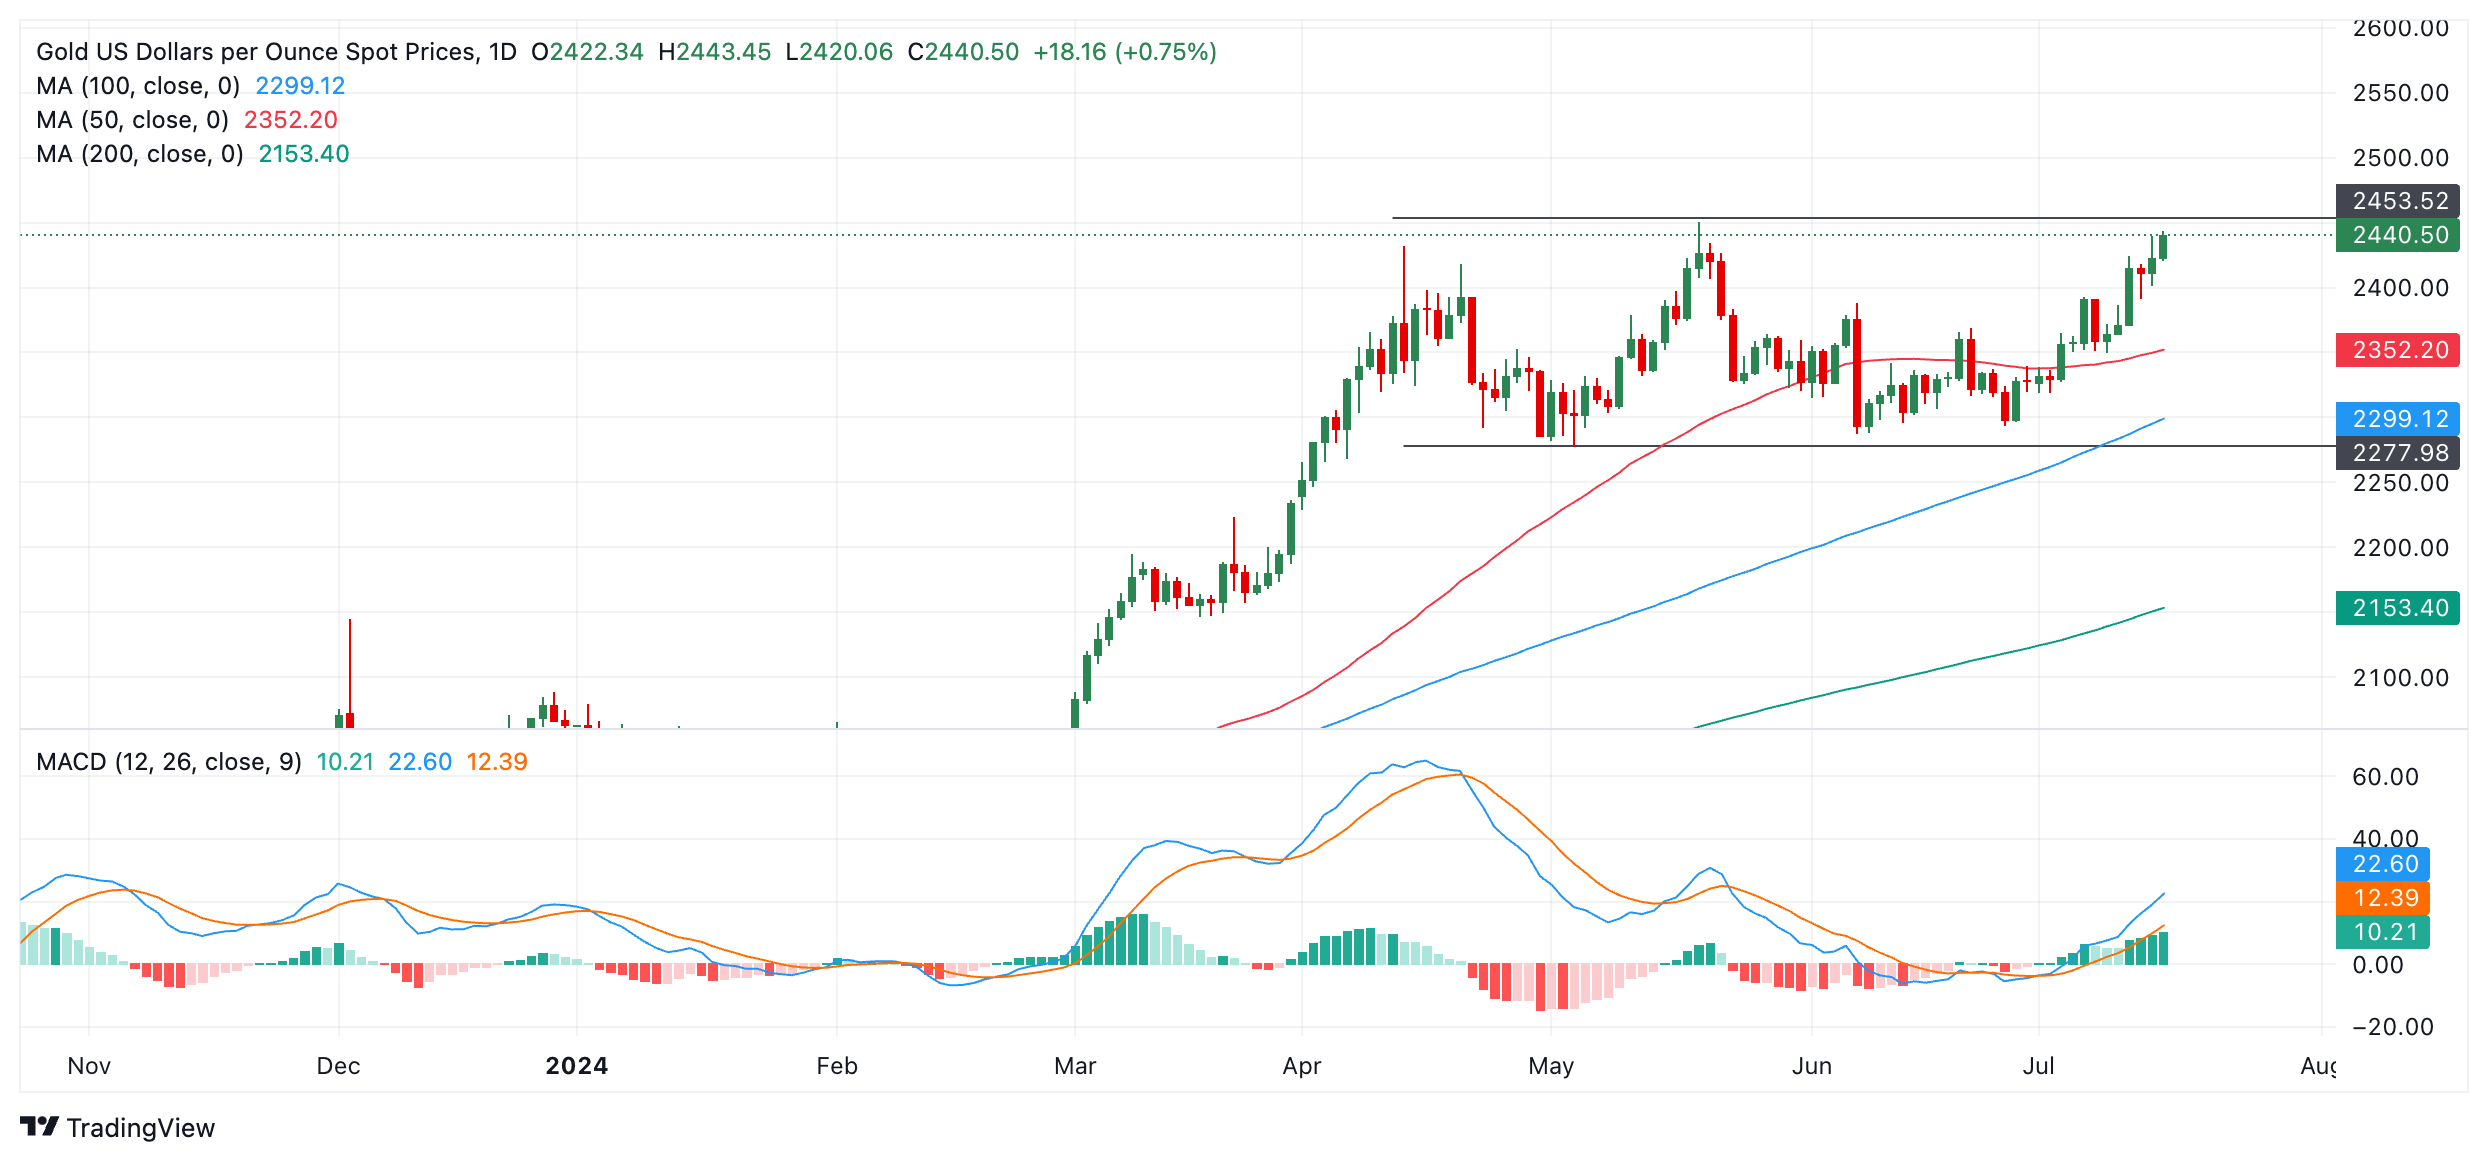
On a short-term basis, Gold could now be in a sideways trend as it extends a leg higher within the range that has unfolded since April. The sideways trend has a floor at roughly $2,280 and a ceiling at $2,451.
Since breaking above the June 7 peak of $2,388, the precious metal has received bullish confirmation, unlocking the next upside target at the $2,451 all-time high.
In the long term, Gold remains in an uptrend, suggesting odds favor an eventual breakout to the upside of the range.
A decisive break above the $2,451 high – which is also the range ceiling – would unlock a target at $2,555, calculated by extrapolating the 0.618 Fibonacci ratio of the height of the range higher.
Economic Indicator
Fed's Chair Powell speech
Jerome H. Powell took office as a member of the Board of Governors of the Federal Reserve System on May 25, 2012, to fill an unexpired term. On November 2, 2017, President Donald Trump nominated Powell to serve as the next Chairman of the Federal Reserve. Powell assumed office as Chair on February 5, 2018.
Read more.Last release: Mon Jul 15, 2024 16:30
Frequency: Irregular
Actual: -
Consensus: -
Previous: -
Source: Federal Reserve
Silver prices (XAG/USD) rose on Tuesday, according to FXStreet data. Silver trades at $30.89 per troy ounce, up 0.69% from the $30.68 it cost on Monday.
Silver prices have increased by 29.82% since the beginning of the year.
| Unit measure | Silver Price Today in USD |
|---|---|
| Troy Ounce | 30.89 |
| 1 Gram | 0.99 |
The Gold/Silver ratio, which shows the number of ounces of Silver needed to equal the value of one ounce of Gold, stood at 79.07 on Tuesday, up from 78.96 on Monday.
Silver FAQs
Silver is a precious metal highly traded among investors. It has been historically used as a store of value and a medium of exchange. Although less popular than Gold, traders may turn to Silver to diversify their investment portfolio, for its intrinsic value or as a potential hedge during high-inflation periods. Investors can buy physical Silver, in coins or in bars, or trade it through vehicles such as Exchange Traded Funds, which track its price on international markets.
Silver prices can move due to a wide range of factors. Geopolitical instability or fears of a deep recession can make Silver price escalate due to its safe-haven status, although to a lesser extent than Gold's. As a yieldless asset, Silver tends to rise with lower interest rates. Its moves also depend on how the US Dollar (USD) behaves as the asset is priced in dollars (XAG/USD). A strong Dollar tends to keep the price of Silver at bay, whereas a weaker Dollar is likely to propel prices up. Other factors such as investment demand, mining supply – Silver is much more abundant than Gold – and recycling rates can also affect prices.
Silver is widely used in industry, particularly in sectors such as electronics or solar energy, as it has one of the highest electric conductivity of all metals – more than Copper and Gold. A surge in demand can increase prices, while a decline tends to lower them. Dynamics in the US, Chinese and Indian economies can also contribute to price swings: for the US and particularly China, their big industrial sectors use Silver in various processes; in India, consumers’ demand for the precious metal for jewellery also plays a key role in setting prices.
Silver prices tend to follow Gold's moves. When Gold prices rise, Silver typically follows suit, as their status as safe-haven assets is similar. The Gold/Silver ratio, which shows the number of ounces of Silver needed to equal the value of one ounce of Gold, may help to determine the relative valuation between both metals. Some investors may consider a high ratio as an indicator that Silver is undervalued, or Gold is overvalued. On the contrary, a low ratio might suggest that Gold is undervalued relative to Silver.
(An automation tool was used in creating this post.)
China’s economy grew at its slowest pace in more than a year. Analysts at UOB Group revise their GDP growth forecast for China to 4.9% for 2024 from 5.1% previously.
China’s economy growth slows down
“China’s economy grew at its slowest pace in more than a year. The 2Q24 GDP growth came in below expectation at 4.7% y/y, 0.7% q/q sa, while 1H24 growth averaged 5.0%.”
“Nominal GDP is estimated to have expanded by 4.0% y/y in 2Q24 compared to 4.2% y/y in 1Q24. Despite coming below the real GDP growth for the fifth consecutive quarter, the gap between the nominal and real growth rate has narrowed. However, weak demand will continue to keep price pressures muted.”
“The moderation in Jun’s activity indicators, particularly the retail sales continue to indicate an uneven recovery. As such, it will be challenging to maintain the growth momentum in the second half of the year. We revise down our GDP growth forecast for China to 4.9% for 2024 from 5.1% previously, with risks that growth could be slightly lower than the official target of ‘around 5%’.”
- AUD/USD slides to near 0.6740 as the US Dollar gains ground after Fed Powell’s speech.
- Fed Powell reiterated the need of more good inflation data for reducing interest rates.
- Investors await the US Retail Sales and the Aussie Employment data.
The AUD/USD pair drops sharply to 0.6740 in Tuesday’s European session. The Aussie asset declines as the US Dollar (USD) manages to get firm-footing as Federal Reserve (Fed) Chair Jerome Powell recognized the need of more soft inflation for policymakers to gain greater confidence before cutting interest rates in his speech at the Economic Club of Washington on Monday.
However, Fed Powell acknowledged that the central bank has made some progress on inflation in the second quarter. Powell said, "We've had three better readings, and if you average them, that's a pretty good place," Reuters reported. His comments on progress in disinflation fuelled confidence that rate cuts are not so far.
Meanwhile, the Fed is widely anticipated to start reducing interest rates from the September meeting. Also, traders bet that there will be two rate cuts instead of one, as signaled by officials in the latest dot plot.
Firm speculation that the Fed will start reducing interest rates from the September meeting has increased risk-appetite of investors. S&P 500 futures have posted nominal gains in European trading hours. The US Dollar Index (DXY), which tracks the Greenback’s value against six major currencies, steadies above 104.00.
Going forward, investors will focus on the United States (US) monthly Sales data for June, which will be published at 12:30 GMT data. The Retail Sales are estimated to have remained unchanged.
In the Asia-Pacific region, investors await the Australian Employment data for June scheduled for Thursday. Economists expect that there were 20K fresh payrolls against 39.7K onboarded in May. The Unemployment Rate is expected to have remained steady at 4.0%. Signs of tight labor market conditions would boost expectations of further policy-tightening by the Reserve Bank of Australia (RBA). Currently, investors expect that the RBA will join the global rate-cut trend next year.
Economic Indicator
Employment Change s.a.
The Employment Change released by the Australian Bureau of Statistics is a measure of the change in the number of employed people in Australia. The statistic is adjusted to remove the influence of seasonal trends. Generally speaking, a rise in Employment Change has positive implications for consumer spending, stimulates economic growth, and is bullish for the Australian Dollar (AUD). A low reading, on the other hand, is seen as bearish.
Read more.Next release: Thu Jul 18, 2024 01:30
Frequency: Monthly
Consensus: 20K
Previous: 39.7K
Source: Australian Bureau of Statistics
- The Japanese Yen trades lower against the Greenback, moving away from support levels.
- Former President Trump revealed its running mate while Fed Chairman Powell said nothing.
- The US Dollar Index holds in the 104.00 area and prints small gains on Tuesday.
The Japanese Yen (JPY) eases for a second day on Tuesday after interventions from the Japanese Ministry of Finance last Thursday pushed the Yen from 162.00 to 157.00 against the US Dollar (USD) in just two days. However, the move is starting to fade and be pared back with the turn of events over the weekend, when former US President Donald Trump got shot during a political rally. The event panned out in favor of the former President, increasing his odds in the race towards the White House. Additionally, by picking Senator J.D. Vance as his running mate, Trump chose a firm believer in trade wars and protective policy to shield the domestic economy with even more tariffs than Trump issued back in 2018.
Meanwhile, the US Dollar Index (DXY) – which gauges the value of the US Dollar against a basket of six foreign currencies – is jumping higher for a second day in a row. Markets were a bit disappointed after Fed Chairman Jerome Powell refrained from commenting on any of the next or upcoming Financial Open Market Committee (FOMC) meetings. Traders would have loved to hear at least some clues about how the Chairman sees inflation pan out in the near future and what it would mean for rate cuts.
Daily digest market movers: Tariffs not just for China?
- Bloomberg reports that several traders attribute the weaker Japanese Yen to market pricing in a potential Donald Trump win for the US presidential election.
- Mitsubishi UFJ Morgan Stanley Securities chief foreign-exchange strategist Daisaku Ueno issued a note that a “Trump trade” means a further strengthening of the US Dollar against the Yen (USD/JPY), with stocks and interest rates in the US set to outpace the Japanese ones.
- Japanese equities managed to eke out small gains on Tuesday and have closed off already with small gains locked in.
- The CME Fedwatch Tool shows an 89.4% chance of a 25 basis points (bps) interest rate cut by the Fed in September and 10.4% for a 50 bps cut. An unchanged scenario with no rate change is off the table.
- The Overnight indexed Swap curve for Japan shows a 43.7% chance of a rate hike on July 31 and a 35.9% chance for a hike on September 20.
- The US 10-year benchmark rate trades at the lower end of this week’s range near 4.17%.
- The benchmark 10-year Japan Treasury Note (JGB) trades around 1.02%, a fresh low for July.
USD/JPY Technical Analysis: Intervention risk might be the new normal
Taking a step back at the recent turn of events since this weekend, it looks like markets have switched views and look to be okay for a Trump win in November. This means rather bad news for the Japanese Yen as pressure will now build towards the US Presidential November elections and will see a stronger US Dollar the more Trump leads in the polls. Seeing the support the Japanese Yen received at 157.60, a return to 160.32 looks to be the next step in the coming weeks.
On the downside, the 55-day Simple Moving Average (SMA) near 157.58is working as support and triggered a bounce on Thursday and Friday last week. On the upside, 160.32 is the first pivotal significant level to look out for, where either a rejection could occur to push the JPY back to 157.58, or might break with another rally taking place towards 162.00.
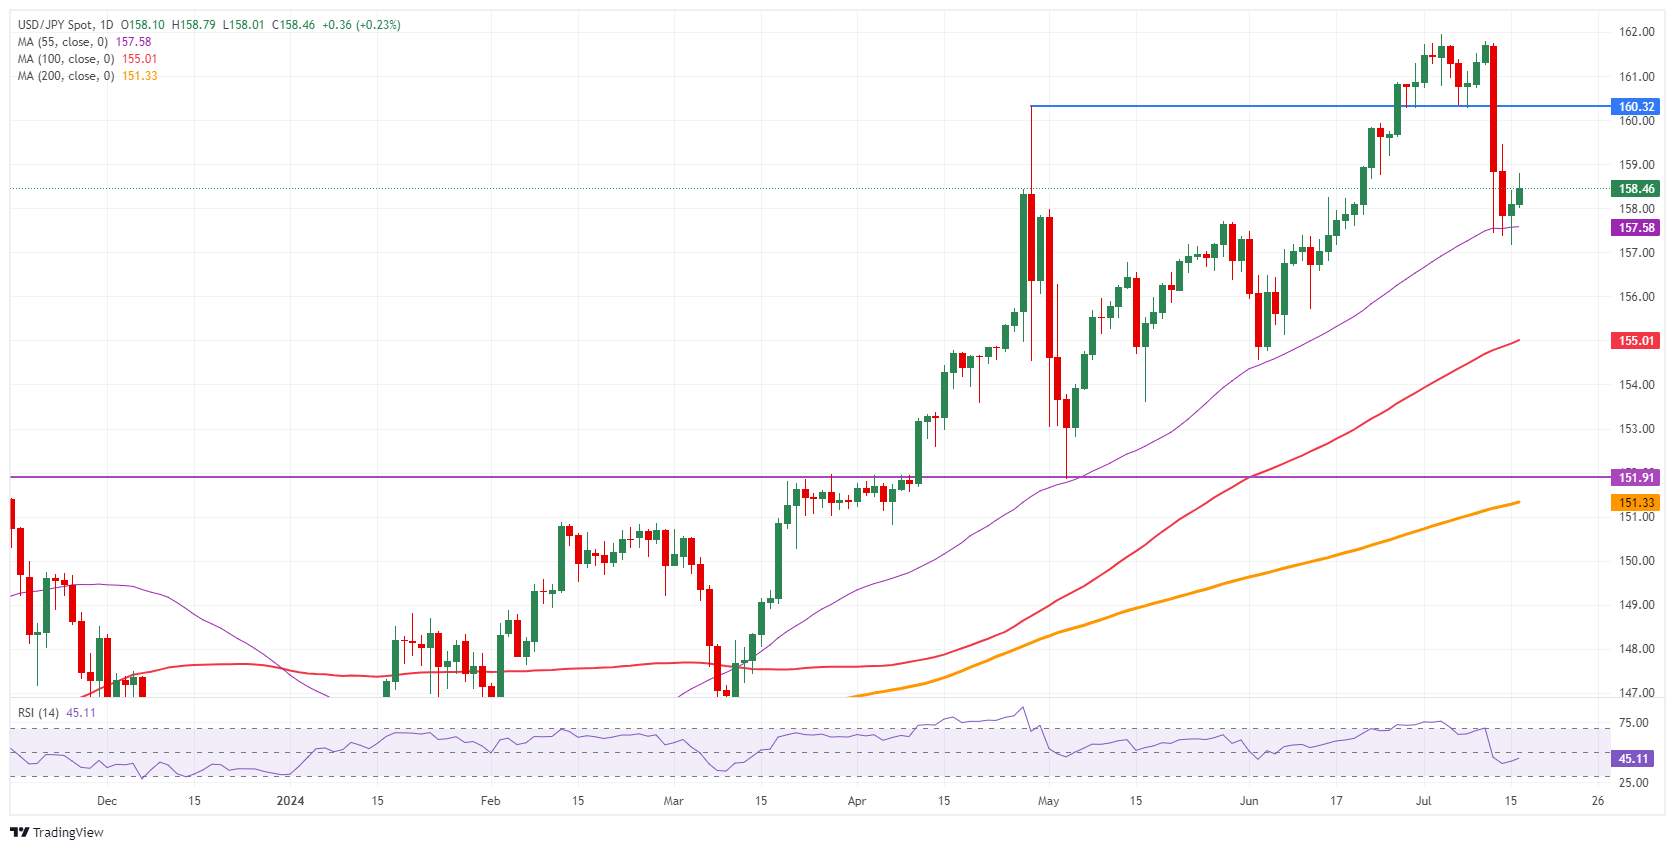
USD/JPY Daily Chart
Japanese Yen FAQs
The Japanese Yen (JPY) is one of the world’s most traded currencies. Its value is broadly determined by the performance of the Japanese economy, but more specifically by the Bank of Japan’s policy, the differential between Japanese and US bond yields, or risk sentiment among traders, among other factors.
One of the Bank of Japan’s mandates is currency control, so its moves are key for the Yen. The BoJ has directly intervened in currency markets sometimes, generally to lower the value of the Yen, although it refrains from doing it often due to political concerns of its main trading partners. The current BoJ ultra-loose monetary policy, based on massive stimulus to the economy, has caused the Yen to depreciate against its main currency peers. This process has exacerbated more recently due to an increasing policy divergence between the Bank of Japan and other main central banks, which have opted to increase interest rates sharply to fight decades-high levels of inflation.
The BoJ’s stance of sticking to ultra-loose monetary policy has led to a widening policy divergence with other central banks, particularly with the US Federal Reserve. This supports a widening of the differential between the 10-year US and Japanese bonds, which favors the US Dollar against the Japanese Yen.
The Japanese Yen is often seen as a safe-haven investment. This means that in times of market stress, investors are more likely to put their money in the Japanese currency due to its supposed reliability and stability. Turbulent times are likely to strengthen the Yen’s value against other currencies seen as more risky to invest in.
The US Dollar (USD) is likely to trade in a sideways range of 7.2650/7.2850 and, ultimately, with a downward bias towards 7.2400, UOB Group FX strategists Quek Ser Leang and Lee Sue Ann note.
USD may test 7.2850 in the short run
24-HOUR VIEW: “We highlighted yesterday that ‘the risk is for USD rising today, but any advance is expected to face strong resistance at 7.2910.’ Our expectations did not quite materialise, as after rising to 7.2862, USD pulled back to close at 7.2740 (+0.04%). The current price movements are likely part of a sideways trading phase. Today, USD is likely to trade in a range of 7.2650/7.2850.”
1-3 WEEKS VIEW: “Last Friday (12 Jul, spot at 7.2685), we indicated that USD ‘is likely to trade with a downward bias towards 7.2400.’ We highlighted that ‘the downward bias is intact as long as USD remains below 7.2910.’ There is no chance in our view.
- EUR/USD consolidates near 1.0900 as investors shift focus to the US monthly Retail Sales and the ECB policy meeting.
- The ECB is expected to leave interest rates unchanged.
- Monthly US Retail Sales are estimated to have remained unchanged in June.
EUR/USD hovers in a tight range near the round-level figure of 1.0900 in Tuesday’s European session as the upside move stalls with a focus on Thursday's European Central Bank (ECB) monetary policy meeting. The major currency pair is broadly firm as investors expect the ECB will not deliver subsequent rate cuts.
The ECB is expected to leave its key rates unchanged as policymakers worry that an aggressive policy-easing approach could uplift price pressures again. In the last monetary policy meeting, the ECB forecasted the price pressures to remain at their current levels for the entire year.
As the ECB is expected to keep interest rates at their current levels, investors will focus on cues about when the central bank will cut interest rates again. Currently, financial markets expect that the ECB will cut interest rates two times more this year. The ECB is expected to deliver rate cuts in the September and December meetings.
On the economic data front, a sharp decline in the German ZEW Survey – Economic Sentiment for July has raised concerns over the economic outlook. The sentiment data, a key measure of the sentiment of institutional investors towards economic growth, falls at a faster pace to 41.8 from the estimates of 42.5 and the former release of 47.5. On the contrary, the other component, known as the Current Situation, surprisingly improves to -68.9. Economists expected the sentiment data to have worsened further to -74.3 and the prior release of -73.8
Daily digest market movers: EUR/USD turns sideways as USD Index steadies around 104.00
- EUR/USD struggles to extend its upside above more than the three-month high of 1.0920. The upside move in the shared currency pair appears to have stalled for the time being as the US Dollar (USD) gains ground after Federal Reserve (Fed) Chair Jerome Powell’s speech at the Economic Club of Washington on Monday. The US Dollar Index (DXY), which tracks the Greenback’s value against six major currencies, manages to protect its immediate support of 104.00.
- In his speech on Monday, Powell acknowledged that the inflation data in the second quarter has added to confidence that inflation will return sustainably to the bank’s target of 2%. However, Powell cited the need of more good data to gain greater confidence before cutting interest rates.
- According to the CME FedWatch tool, 30-day Federal Fund futures pricing data shows that the central bank will cut interest rates twice this year and will start reducing them from the September meeting.
- Recent Consumer Price Index (CPI) data for June showed that headline and core inflation decelerated at a faster pace than expected on a monthly and annual basis. The monthly headline CPI deflated for the first time in more than four years.
- In Tuesday’s session, the major trigger for the US Dollar will be the United States (US) Retail Sales data for June, which will be published at 12:30 GMT. The Retail Sales data, a key measure of consumer spending that drives consumer inflation, is estimated to have remained unchanged month-on-month after barely growing in May.
Technical Analysis: EUR/USD holds symmetrical triangle breakout
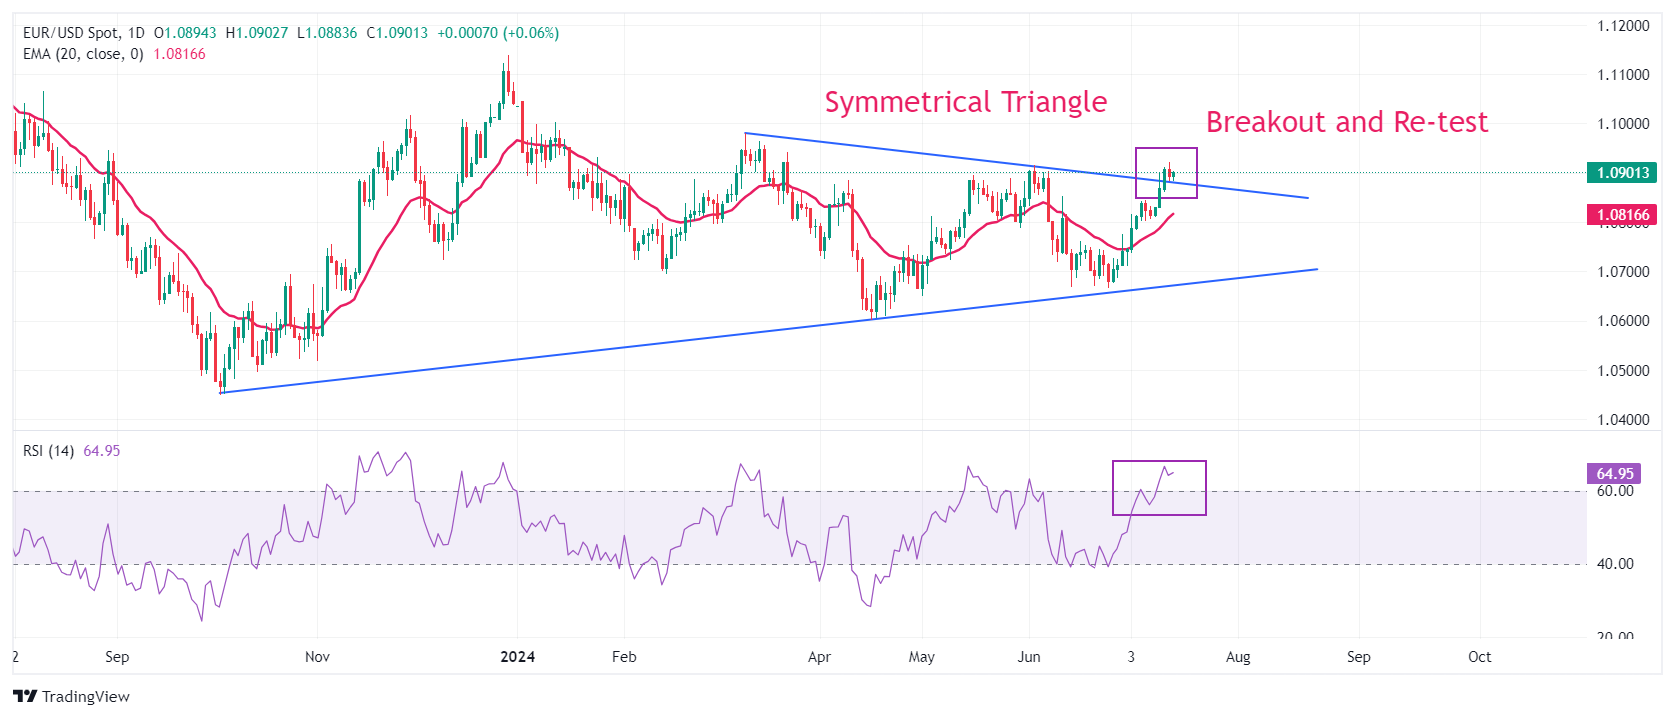
EUR/USD tests the breakout region of the Symmetrical Triangle formation on a daily timeframe near 1.0880. A breakout of the above-mentioned chart pattern results in wider ticks and heavy volume. The near-term outlook of the major currency pair is bullish as the 20-day Exponential Moving Average (EMA) near 1.0816 is sloping higher.
The 14-day Relative Strength Index (RSI) shifts into the bullish range of 60.00-80.00, suggesting a strong upside momentum.
Euro FAQs
The Euro is the currency for the 20 European Union countries that belong to the Eurozone. It is the second most heavily traded currency in the world behind the US Dollar. In 2022, it accounted for 31% of all foreign exchange transactions, with an average daily turnover of over $2.2 trillion a day. EUR/USD is the most heavily traded currency pair in the world, accounting for an estimated 30% off all transactions, followed by EUR/JPY (4%), EUR/GBP (3%) and EUR/AUD (2%).
The European Central Bank (ECB) in Frankfurt, Germany, is the reserve bank for the Eurozone. The ECB sets interest rates and manages monetary policy. The ECB’s primary mandate is to maintain price stability, which means either controlling inflation or stimulating growth. Its primary tool is the raising or lowering of interest rates. Relatively high interest rates – or the expectation of higher rates – will usually benefit the Euro and vice versa. The ECB Governing Council makes monetary policy decisions at meetings held eight times a year. Decisions are made by heads of the Eurozone national banks and six permanent members, including the President of the ECB, Christine Lagarde.
Eurozone inflation data, measured by the Harmonized Index of Consumer Prices (HICP), is an important econometric for the Euro. If inflation rises more than expected, especially if above the ECB’s 2% target, it obliges the ECB to raise interest rates to bring it back under control. Relatively high interest rates compared to its counterparts will usually benefit the Euro, as it makes the region more attractive as a place for global investors to park their money.
Data releases gauge the health of the economy and can impact on the Euro. Indicators such as GDP, Manufacturing and Services PMIs, employment, and consumer sentiment surveys can all influence the direction of the single currency. A strong economy is good for the Euro. Not only does it attract more foreign investment but it may encourage the ECB to put up interest rates, which will directly strengthen the Euro. Otherwise, if economic data is weak, the Euro is likely to fall. Economic data for the four largest economies in the euro area (Germany, France, Italy and Spain) are especially significant, as they account for 75% of the Eurozone’s economy.
Another significant data release for the Euro is the Trade Balance. This indicator measures the difference between what a country earns from its exports and what it spends on imports over a given period. If a country produces highly sought after exports then its currency will gain in value purely from the extra demand created from foreign buyers seeking to purchase these goods. Therefore, a positive net Trade Balance strengthens a currency and vice versa for a negative balance.
The US Dollar (USD) is expected to trade in a 157.50/158.80 range. Scope for USD to continue to weaken; it is too early to determine if the significant support at 155.50 will come into view, UOB Group FX strategists Quek Ser Leang and Lee Sue Ann note.
USD/JPY eyes testing 158.80
24-HOUR VIEW: “Yesterday, we expected USD to trade in a 157.55/159.55 range. However, USD dipped briefly to 157.15 and then rebounded to close largely unchanged (158.01, +0.08%). The brief decline did not result in any clear increase in momentum. Today, we continue to expect USD to trade in a range, probably between 157.50 and 158.80.”
1-3 WEEKS VIEW: “We continue to hold the same view as last Friday (12 Jul, spot at 159.00). As indicated, after the outsized drop last Thursday, there is scope for JPY to continue to weaken. However, it is too early to determine if the significant support level at 155.50 will come into view. All in all, the near-term bias is on the downside, as long as USD remains below 160.00 (‘strong resistance’ was at 160.70 yesterday).”
Underlying tone has softened; NZD is likely to edge lower but is unlikely to break below 0.6045. Current price movements in NZD are likely part of a range trading phase, probably between 0.6045 and 0.6145, UOB Group FX strategists Quek Ser Leang and Lee Sue Ann note.
NZD/USD eyes a test of 0.6045
24-HOUR VIEW: “We highlighted yesterday that ‘further range trading seems likely, but the slightly softened underlying tone suggests a lower range of 0.6070/0.6115.’ Our view was not wrong, as NZD traded between 0.6072 and 0.6112, closing on a soft note at 0.6075. The underlying tone has softened further. Today, NZD is likely to edge lower, but any decline is unlikely to break below 0.6045 (there is another support level at 0.6060). Resistance is at 0.6090; a breach of 0.6105 would mean that the current mild downward pressure has eased.”
1-3 WEEKS VIEW: “Our update from last Friday (12 Jul, spot at 0.6090) still stands. As highlighted, the current price movements are likely part of a range trading phase, probably between 0.6045 and 0.6155.”
- Germany’s ZEW Economic Sentiment Index tumbles to 41.8 in July.
- EUR/USD keeps its range at around 1.0900 after the mixed German and Eurozone ZEW surveys.
The headline German ZEW Economic Sentiment Index dropped sharply from 47.5 in June to 41.8 in July, missing the market expectations of 42.5.
The Current Situation Index, however, improved from -73.8 in June to -68.9 in the same month. The market forecast was for -74.3 in the reported period.
The Eurozone ZEW Economic Sentiment Index came in at 43.7 in July, lower than the June reading of 51.3. The data missed the estimates of 48.1.
Key points
The economic outlook is worsening.
For the first time in a year, economic expectations for Germany are falling.
The fact that German exports decreased more than expected in May, the political uncertainty in France and the lack of clarity regarding the future monetary policy by the ECB have contributed to this development.
Market reaction
The EUR/USD pair is unfazed by the mixed German and Eurozone ZEW surveys. The pair is almost unchanged on the day at around 1.0900, at the press time.
- WTI price depreciates due to the potential for reduced demand in China.
- China's crude Oil imports fell to 46.45 million tons in June.
- Fed Chair Jerome Powell stated that inflation is on track to meet the Fed's target.
West Texas Intermediate (WTI) Oil price extends its losses for the third consecutive session, trading around $80.10 per barrel during the European hours on Tuesday. This decline is attributed to a slowing Chinese economy, which is reducing demand in the world's largest Oil-importing country.
China's Gross Domestic Product (GDP) grew 4.7% year-over-year in the second quarter, compared to a 5.3% expansion in the first quarter and an expected 5.1%. The National Bureau of Statistics (NBS) reported that China's economy operated generally steadily in the first half of the year, with H1 GDP growth at +5.0% year-on-year. Looking ahead, the NBS highlighted increasing external uncertainties and numerous domestic challenges that China's economy faces in the second half of the year.
Crude Oil imports fell both month-over-month and year-over-year to 46.45 million tons in June. This decline aligns with indications that the rapid adoption of electric vehicles in China may mean that demand has already peaked. Year-to-date shipments are 2.3% lower than the same period last year, per Bloomberg.
In the United States, Federal Reserve Chair Jerome Powell mentioned on Monday that this year's three inflation readings "add somewhat to confidence" that inflation is on track to meet the Fed’s target sustainably, suggesting that interest rate cuts may not be far off, per Reuters.
Additionally, Fed Bank of San Francisco President Mary Daly noted that inflation is cooling in a way that increases confidence it’s heading toward the 2% target. However, Daly emphasized the need for more data before making a rate decision. Lower interest rates reduce borrowing costs, potentially boosting economic activity in the United States, the world’s largest economy, which may increase Oil demand.
WTI Oil FAQs
WTI Oil is a type of Crude Oil sold on international markets. The WTI stands for West Texas Intermediate, one of three major types including Brent and Dubai Crude. WTI is also referred to as “light” and “sweet” because of its relatively low gravity and sulfur content respectively. It is considered a high quality Oil that is easily refined. It is sourced in the United States and distributed via the Cushing hub, which is considered “The Pipeline Crossroads of the World”. It is a benchmark for the Oil market and WTI price is frequently quoted in the media.
Like all assets, supply and demand are the key drivers of WTI Oil price. As such, global growth can be a driver of increased demand and vice versa for weak global growth. Political instability, wars, and sanctions can disrupt supply and impact prices. The decisions of OPEC, a group of major Oil-producing countries, is another key driver of price. The value of the US Dollar influences the price of WTI Crude Oil, since Oil is predominantly traded in US Dollars, thus a weaker US Dollar can make Oil more affordable and vice versa.
The weekly Oil inventory reports published by the American Petroleum Institute (API) and the Energy Information Agency (EIA) impact the price of WTI Oil. Changes in inventories reflect fluctuating supply and demand. If the data shows a drop in inventories it can indicate increased demand, pushing up Oil price. Higher inventories can reflect increased supply, pushing down prices. API’s report is published every Tuesday and EIA’s the day after. Their results are usually similar, falling within 1% of each other 75% of the time. The EIA data is considered more reliable, since it is a government agency.
OPEC (Organization of the Petroleum Exporting Countries) is a group of 13 Oil-producing nations who collectively decide production quotas for member countries at twice-yearly meetings. Their decisions often impact WTI Oil prices. When OPEC decides to lower quotas, it can tighten supply, pushing up Oil prices. When OPEC increases production, it has the opposite effect. OPEC+ refers to an expanded group that includes ten extra non-OPEC members, the most notable of which is Russia.
Further range trading seems likely, probably in a range of 0.6740/0.6785. Room for AUD to continue to rise, but it has to surpass 0.6800 before further advance can be expected, UOB Group FX strategists Quek Ser Leang and Lee Sue Ann note.
AUD eyes 0.6735
24-HOUR VIEW: “AUD trade between 0.6753 and 0.6789 yesterday, narrower than our expected range of 0.6745/0.6790. Further range trading seems likely, even though the slight softened underlying tone suggests a lower range of 0.6740/0.6785.”
1-3 WEEKS VIEW: ”We highlighted last Friday (12 Jul, spot at 0.6765) that ‘while there is room for AUD to continue to rise, it has to surpass 0.6800 before further advance can be expected.’ Our view remains unchanged, but given the overbought conditions, it remains to be seen if AUD can break above 0.6800. Overall, only a breach of 0.6735 (no change in ‘strong support’ level) would indicate that the AUD strength from two weeks ago has come to an end.”
The Pound Sterling (GBP) is likely to consolidate in a range of 1.2940/1.2995. GBP must break above 1.3000 before further advance can be expected, UOB Group FX strategists Quek Ser Leang and Lee Sue Ann note.
Rangebound between 1.2940 and 1.2995
24-HOUR VIEW: “We indicated yesterday that GBP ‘could pullback, but any decline is unlikely to threaten the support at 1.2915.’ We noted that ‘resistance levels are at 1.2985 and 1.3000.’ Our view did not materialise as GBP traded between 1.2960 and 1.2995, closing slightly lower at 1.2967 (-0.17%). The current price action is likely part of a consolidation phase. Today, we expect GBP to trade in a 1.2940/1.2995 range.”
1-3 WEEKS VIEW: “In our most recent narrative from last Friday (12 Jul, spot at 1.2925), we indicated that ‘the risk for GBP remains on the upside, but overbought conditions suggest 1.3000 might not come into view so soon.’ Yesterday, GBP edged to a high of 1.2995 and then pulled back. The 1.3000 level is turning out to be a significant resistance, and GBP must break above this level before further advance can be expected. Looking ahead, the next level to watch above 1.3000 is at 1.3045. The risk of GBP breaking clearly above 1.3000 will remain intact as long as 1.2885 (‘strong support’ level was at 1.2870 yesterday) is not breached.”
- The Mexican Peso has lost ground in its major pairs after the assassination attempt on Donald Trump.
- Trump’s poll ratings improved after the incident and if he wins the election he is likely to bring in trade tariffs.
- USD/MXN is showing signs of reversing its recent decline from the June highs.
The Mexican Peso (MXN) dips in its most traded pairs on Tuesday. The Peso’s weakness comes on the back of the news that former US President Donald Trump was wounded in an assassination attempt at a rally in Pennsylvania on Saturday. This has led to sudden rise in US Treasury yields and the US Dollar (USD), but has weakened MXN.
Although the attack harmed Trump physically it improved his poll ratings by several points. This is negative for the Mexican Peso since a Trump presidency would probably lead to increased tariffs on foreign imports including those from Mexico, negatively impacting US-Mexico trade.
At the time of writing, one US Dollar (USD) buys 17.77 Mexican Pesos, EUR/MXN trades at 19.36, and GBP/MXN at 23.03.
Mexican Peso reacts to Banxico dissenter’s comment
The Mexican Peso made back some of its losses on Monday as a result of comments from the Deputy Governor of the Bank of Mexico (Banxico), Omar Mejia which supported the Mexican currency. Mejia was the only person on the Banxico board who voted to cut interest rates at the Banxico’s last June meeting, according to the Minutes which were released last week.
In his comments, Mejia qualified his decision to vote for a 0.25% rate cut by saying that cuts should be implemented gradually, and one interest-rate cut would not imply the beginning of an easing cycle.
The Banxico’s policy interest rate currently stands at 11.00%, one of the highest in a developing country. It is the main reason for the Peso’s show of strength since 2020, when it traded at a low of 25.79 against the US Dollar, only to rise over the following four years to a high of 16.26 in April 2024.
Currencies in countries with high interest rates tend to appreciate because they benefit from greater capital inflows.
Technical Analysis: USD/MXN shows signs of bullish reversal
USD/MXN is showing signs of reversing its recent decline from the June 12 high.
It found support at the 50-day Simple Moving Average (SMA) at 17.65 and formed a green up day on Monday after the long, red down day on Friday (shaded blue rectangle in chart below). This pattern is similar to a two-day reversal pattern and could be a sign the pair is about to start a more bullish phase.
USD/MXN Daily Chart
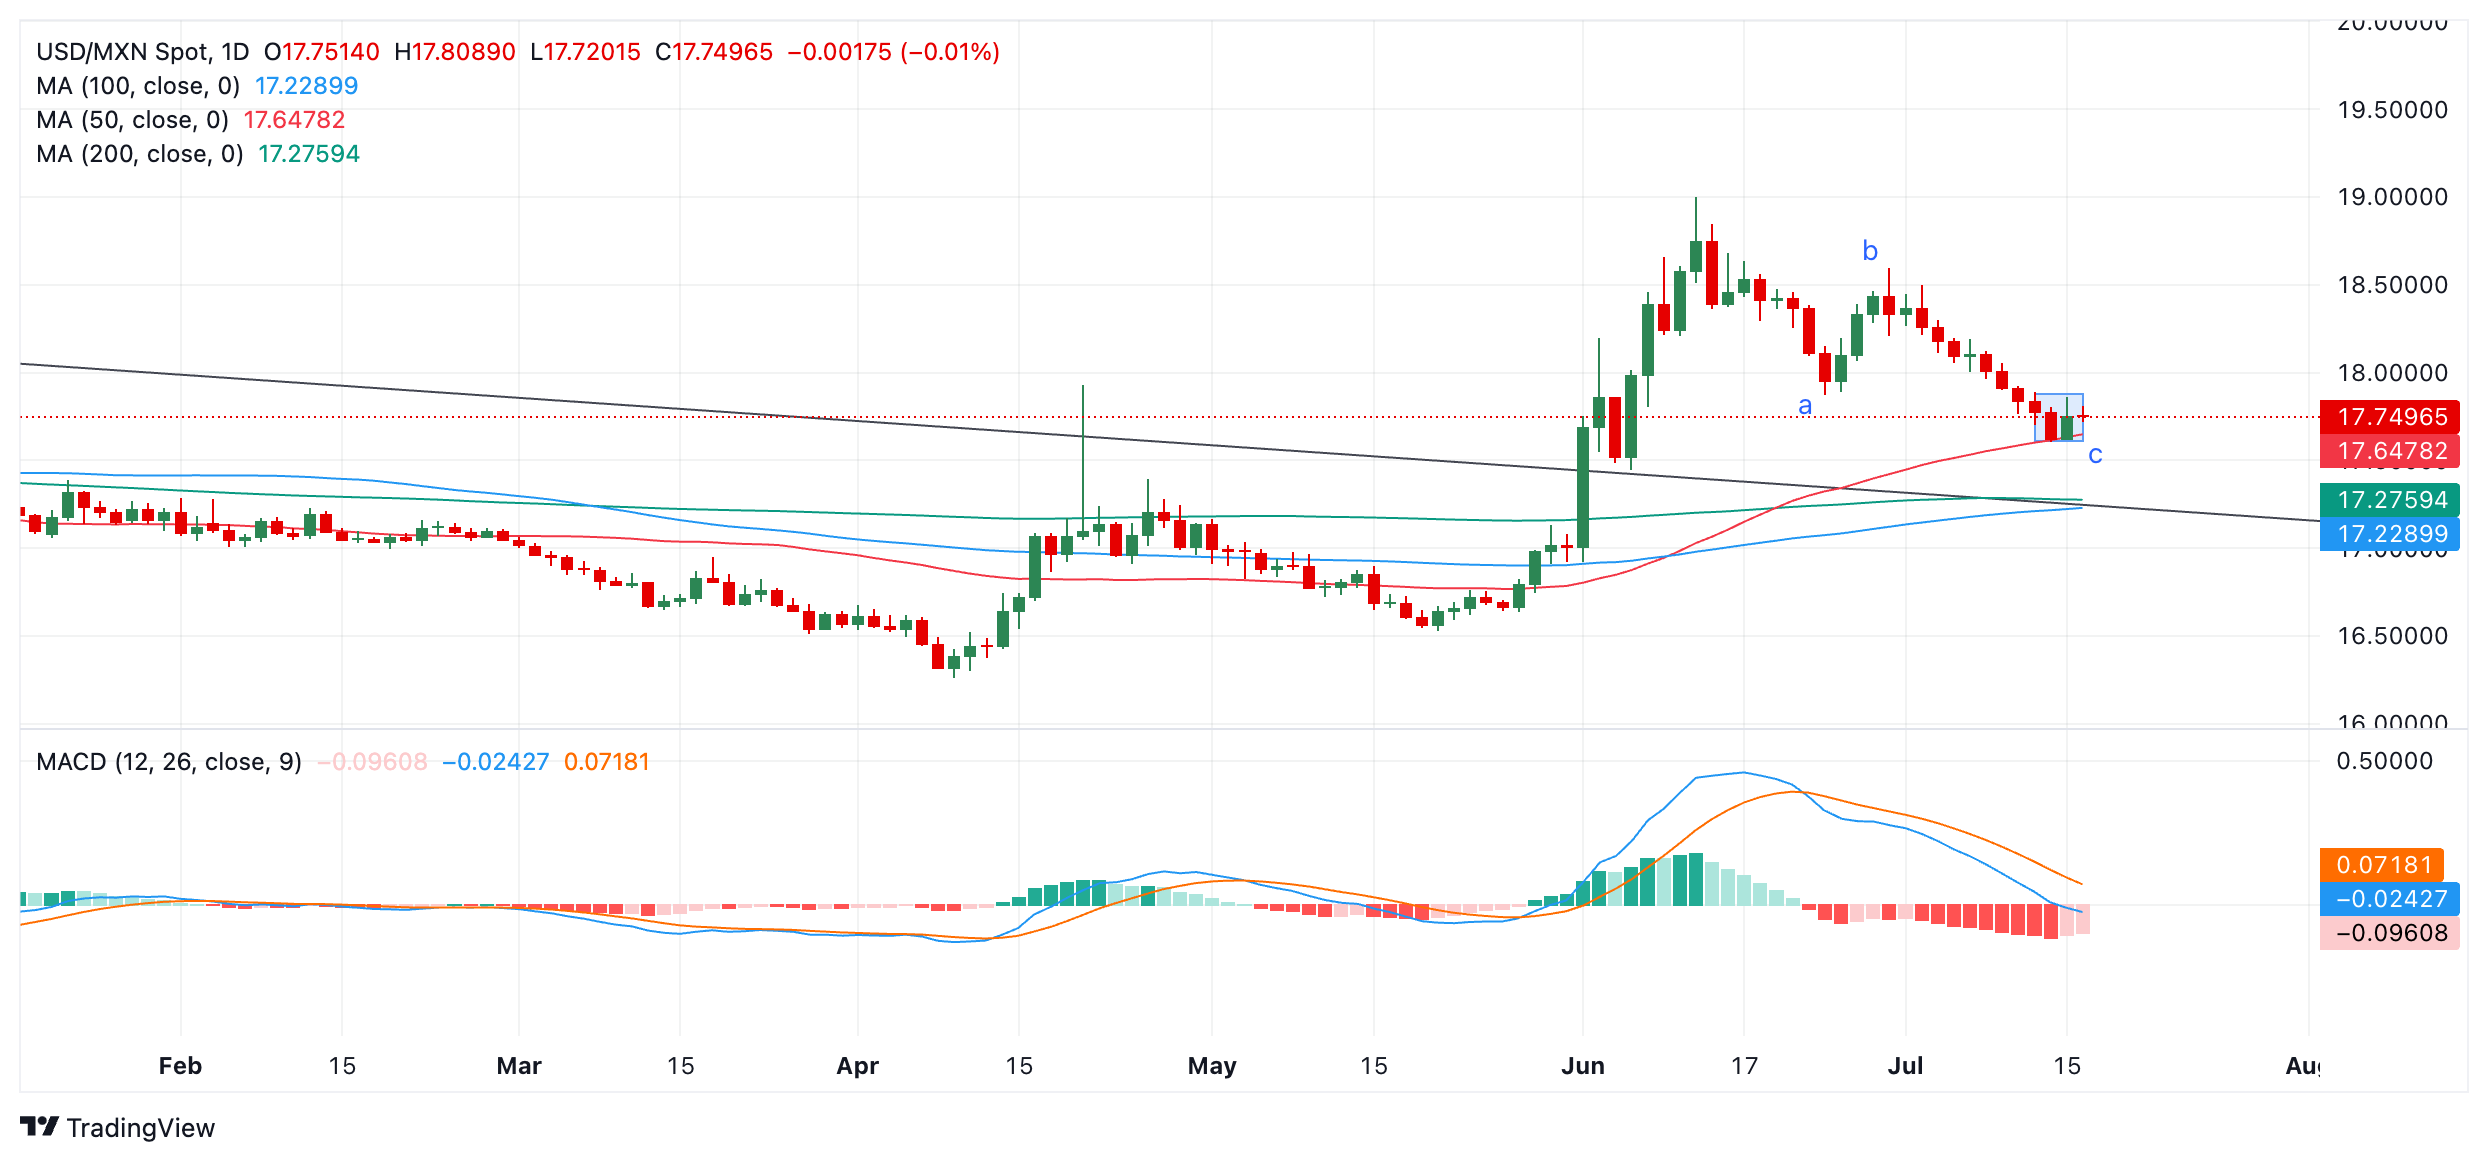
Another bullish sign is that USD/MXN might also have completed a Measured Move (MM) pattern.
MMs are large, three-wave zig-zags, with waves labeled A,B and C. The end of wave C can be estimated using the length of wave A as a guide. C is usually equal to A or, at least, a Fibonacci ratio of A. C is now roughly the same length as A and is more than the Fibonacci 0.618 ratio of A, suggesting the pattern could be complete.
Although it is too early to be sure, the pair could be reversing course and beginning a short-term uptrend.
A break below the 50-day Simple Moving Average (SMA) at 17.60, however, would reconfirm the dominant short-term downtrend and lead to a probable decline to 17.27 at the level of the 200-day SMA and a major multi-month trendline.
Meanwhile, the direction of the medium and long-term trends remain in doubt.
Banxico FAQs
The Bank of Mexico, also known as Banxico, is the country’s central bank. Its mission is to preserve the value of Mexico’s currency, the Mexican Peso (MXN), and to set the monetary policy. To this end, its main objective is to maintain low and stable inflation within target levels – at or close to its target of 3%, the midpoint in a tolerance band of between 2% and 4%.
The main tool of the Banxico to guide monetary policy is by setting interest rates. When inflation is above target, the bank will attempt to tame it by raising rates, making it more expensive for households and businesses to borrow money and thus cooling the economy. Higher interest rates are generally positive for the Mexican Peso (MXN) as they lead to higher yields, making the country a more attractive place for investors. On the contrary, lower interest rates tend to weaken MXN. The rate differential with the USD, or how the Banxico is expected to set interest rates compared with the US Federal Reserve (Fed), is a key factor.
Banxico meets eight times a year, and its monetary policy is greatly influenced by decisions of the US Federal Reserve (Fed). Therefore, the central bank’s decision-making committee usually gathers a week after the Fed. In doing so, Banxico reacts and sometimes anticipates monetary policy measures set by the Federal Reserve. For example, after the Covid-19 pandemic, before the Fed raised rates, Banxico did it first in an attempt to diminish the chances of a substantial depreciation of the Mexican Peso (MXN) and to prevent capital outflows that could destabilize the country.
The Euro (EUR) is expected to trade in a range, likely between 1.0875 and 1.0915. Upward momentum is slowing; it remains to be seen if EUR can rise further to 1.0940, UOB Group FX strategists Quek Ser Leang and Lee Sue Ann note.
Next resistance above 1.0915 is at 1.0940
24-HOUR VIEW: “Yesterday, we expected EUR to trade in a range between 1.0855 and 1.0905. Our expectations were incorrect, as it rose to 1.0922 before pulling back to close at 1.0894 (-0.11%). The advance did not result in any clear increase in momentum. Today, we continue to expect EUR to trade in a range, probably between 1.0875 and 1.0915.”
1-3 WEEKS VIEW: “We highlighted last Friday (12 Jul, spot at 1.0865) that EUR ‘is expected to continue to rise.’ We also highlighted that ‘severely overbought conditions suggest it might take a couple of days before 1.0915 comes into view.’ Yesterday, EUR broke above 1.0915, reaching a high of 1.0922. EUR pulled back from the high, closing at 1.0894 (-0.11%). While there is still scope for EUR to rise further, upward momentum is slowing, and it remains to be seen if any further advance can reach 1.0940. On the downside, a breach of 1.0850 (‘strong support’ level previously at 1.0825) would mean that the EUR strength from early this month has run its course.”
- USD/CAD extends its gains as the commodity-linked CAD struggles due to lower Oil prices.
- WTI price depreciates due to the potential for reduced demand in China, the world's largest Oil-importing country.
- Fed Chair Jerome Powell stated that inflation is on track to meet the Fed's target in a sustainable manner.
USD/CAD continues its winning streak for the fourth successive session, trading around 1.3690 during the European hours on Tuesday. The commodity-linked Canadian Dollar (CAD) faces challenges due to declining Oil prices. Given the fact that Canada is the biggest Oil exporter to the United States (US).
West Texas Intermediate (WTI) Oil price extends its losses for the third consecutive session, trading around $80.30 per barrel at the time of writing. This decline is attributed to a slowing Chinese economy, which is reducing demand in the world's largest oil-importing country.
China's Gross Domestic Product (GDP) grew 4.7% year-over-year in the second quarter, compared to a 5.3% expansion in the first quarter and an expected 5.1%. The National Bureau of Statistics (NBS) reported that China's economy operated generally steadily in the first half of the year, with H1 GDP growth at +5.0% year-on-year. Looking ahead, the NBS highlighted increasing external uncertainties and numerous domestic challenges that China's economy faces in the second half of the year.
Traders are now awaiting the upcoming release of Canada's Consumer Price Index (CPI) inflation data, which could influence the Bank of Canada’s (BoC) decision on potential further rate cuts following a recent quarter-point reduction in June.
On the USD’s front, Fed Chair Jerome Powell mentioned on Monday that the three US inflation readings of this year "add somewhat to confidence" that inflation is on course to meet the Fed’s target sustainably, suggesting that a shift to interest rate cuts may not be far off.
Additionally, Fed Bank of San Francisco President Mary Daly stated that inflation is cooling down in a way that bolsters confidence that it’s on its way to 2%. However, Daly added that more information is needed before making a rate decision.
According to CME Group’s FedWatch Tool, markets now indicate an 85.7% probability of a 25-basis point rate cut at the September Fed meeting, up from 71.0% a week earlier. Investors will likely observe the US Retail Sales data for June, which are set to be released later in the day, for further insights into US economic situation.
Canadian Dollar FAQs
The key factors driving the Canadian Dollar (CAD) are the level of interest rates set by the Bank of Canada (BoC), the price of Oil, Canada’s largest export, the health of its economy, inflation and the Trade Balance, which is the difference between the value of Canada’s exports versus its imports. Other factors include market sentiment – whether investors are taking on more risky assets (risk-on) or seeking safe-havens (risk-off) – with risk-on being CAD-positive. As its largest trading partner, the health of the US economy is also a key factor influencing the Canadian Dollar.
The Bank of Canada (BoC) has a significant influence on the Canadian Dollar by setting the level of interest rates that banks can lend to one another. This influences the level of interest rates for everyone. The main goal of the BoC is to maintain inflation at 1-3% by adjusting interest rates up or down. Relatively higher interest rates tend to be positive for the CAD. The Bank of Canada can also use quantitative easing and tightening to influence credit conditions, with the former CAD-negative and the latter CAD-positive.
The price of Oil is a key factor impacting the value of the Canadian Dollar. Petroleum is Canada’s biggest export, so Oil price tends to have an immediate impact on the CAD value. Generally, if Oil price rises CAD also goes up, as aggregate demand for the currency increases. The opposite is the case if the price of Oil falls. Higher Oil prices also tend to result in a greater likelihood of a positive Trade Balance, which is also supportive of the CAD.
While inflation had always traditionally been thought of as a negative factor for a currency since it lowers the value of money, the opposite has actually been the case in modern times with the relaxation of cross-border capital controls. Higher inflation tends to lead central banks to put up interest rates which attracts more capital inflows from global investors seeking a lucrative place to keep their money. This increases demand for the local currency, which in Canada’s case is the Canadian Dollar.
Macroeconomic data releases gauge the health of the economy and can have an impact on the Canadian Dollar. Indicators such as GDP, Manufacturing and Services PMIs, employment, and consumer sentiment surveys can all influence the direction of the CAD. A strong economy is good for the Canadian Dollar. Not only does it attract more foreign investment but it may encourage the Bank of Canada to put up interest rates, leading to a stronger currency. If economic data is weak, however, the CAD is likely to fall.
- The Pound Sterling ranges near 1.3000 against the US Dollar, focusing on US/UK data.
- Fed’s Powell admitted that recent inflation readings have added some confidence in disinflation towards 2%.
- BoE’s Dhingra supported lowering interest rates sooner.
The Pound Sterling (GBP) turns sideways slightly below the psychological resistance of 1.3000 against the US Dollar (USD) in Tuesday’s London session. The GBP/USD pair struggles to extend its upside as the US Dollar gains ground after Federal Reserve (Fed) Chair Jerome Powell’s speech at the Economic Club of Washington on Monday.
The US Dollar Index (DXY), which tracks the Greenback’s value against six major currencies, manages to hold the key support at around 104.00.
Powell acknowledged that recent inflation data has added confidence that inflation is on course to return to the desired rate of 2%. However, he mentioned that policymakers need to gain more confidence before considering interest rate cuts.
Separately, San Francisco Federal Reserve Bank President Mary Daly said, “confidence is growing” that inflation is heading towards the 2% target. Daly refrained from providing a timeframe for rate cuts. She further said that the central bank should hold rates so that they manage to maintain downside pressure on inflation but not too long that they become a challenge to job growth.
In Tuesday’s session, investors will focus on the US Retail Sales data, which is expected to show that sales at retail stores remained unchanged in June after a meager growth of 0.1% in May.
Daily digest market movers: Pound Sterling remains firm ahead of UK data-packed week
- The Pound Sterling remains broadly bullish against its major peers on Tuesday, with the focus on the United Kingdom (UK) Consumer Price Index (CPI) for June and the employment data for the three months ending May, which will be published on Wednesday and Thursday, respectively.
- Investors will pay close attention to the inflation readings as they will suggest whether the Bank of England (BoE) will start reducing interest rates from the August meeting, as expected by financial markets. Economists expect the annual headline and core CPI, which excludes volatile food and energy prices, to have grown steadily by 2% and 3.5%, respectively. The monthly headline inflation is estimated to have risen at a slower pace of 0.1% from the former reading of 0.3%.
- Apart from the standard inflation components, investors will keenly focus on the status of price pressures in the service sector, a major factor that has been restricting BoE policymakers from advocating early rate cuts.
- On Monday, BoE’s external member of the Monetary Policy Committee Swati Dhingra cited concerns over squeezing consumer spending due to the maintenance of a restrictive interest rate framework. She favored cutting borrowing rates with the belief that inflation is unlikely to rise sharply again.
- Meanwhile, the three-month-ending in May ILO Unemployment Rate is estimated to remain steady at 4.4%. In the same period, other key components on which market participants will keenly focus are Average Earnings, Excluding and Including bonuses, a key measure of wage growth that fuels service inflation. The wage growth measure, Excluding and Including bonuses, is estimated to decelerate to 5.7%.
Technical Analysis: Pound Sterling hovers near 1.3000
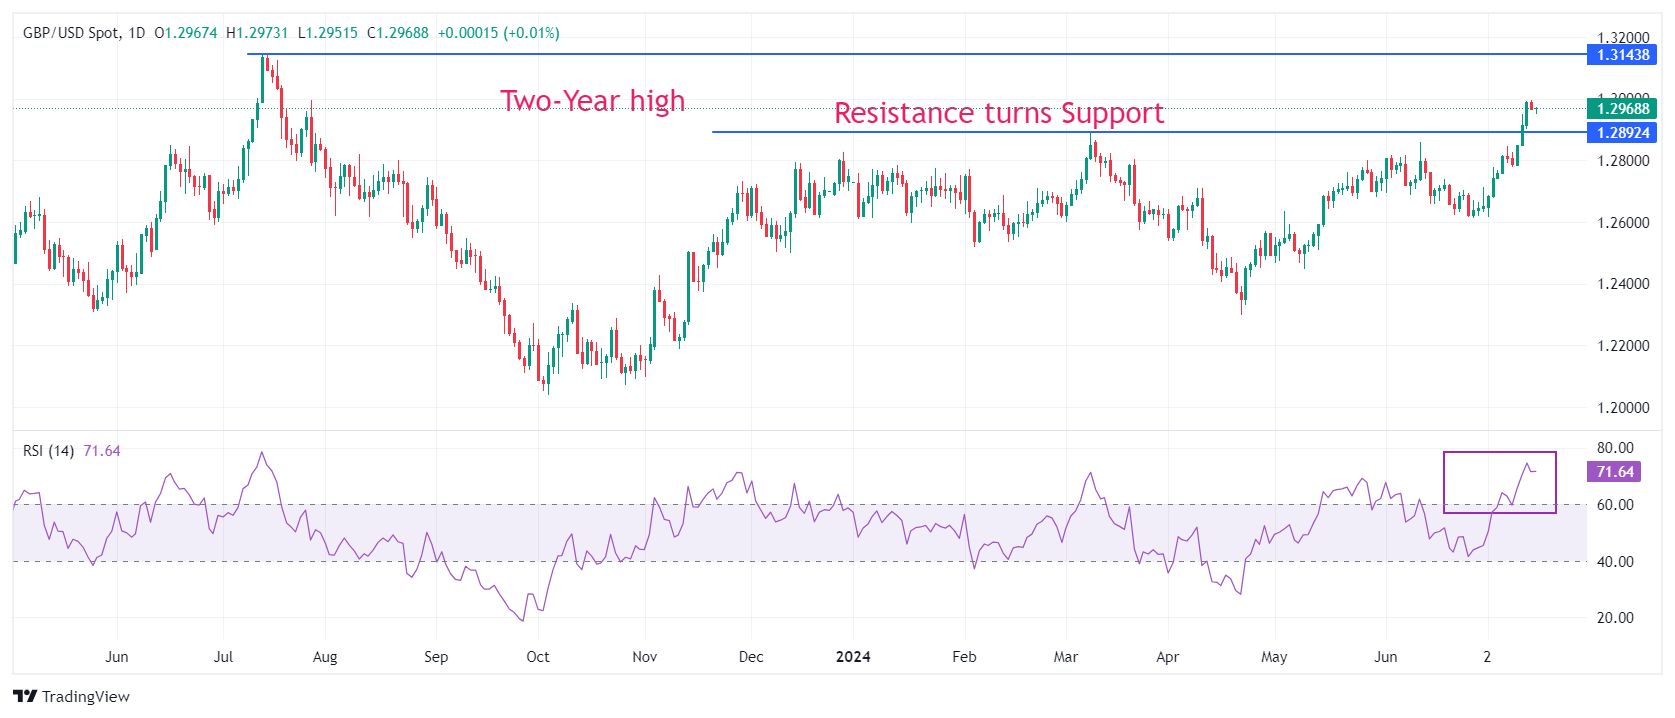
The Pound Sterling trades back and forth after rising to near the psychological figure of 1.3000. The GBP/USD pair clings to gains amid uncertainty over the US Dollar’s outlook. The Cable's near-term appeal has strengthened after a breakout above the March 8 high near 1.2900. The pair is expected to extend its upside towards the two-year high near 1.3140.
All short-to-long-term Exponential Moving Averages (EMAs) are sloping higher, suggesting a strong bullish trend.
The 14-day Relative Strength Index (RSI) jumps to nearly 70.00 for the first time in more than a year, indicating a strong momentum towards the upside.
Pound Sterling FAQs
The Pound Sterling (GBP) is the oldest currency in the world (886 AD) and the official currency of the United Kingdom. It is the fourth most traded unit for foreign exchange (FX) in the world, accounting for 12% of all transactions, averaging $630 billion a day, according to 2022 data. Its key trading pairs are GBP/USD, aka ‘Cable’, which accounts for 11% of FX, GBP/JPY, or the ‘Dragon’ as it is known by traders (3%), and EUR/GBP (2%). The Pound Sterling is issued by the Bank of England (BoE).
The single most important factor influencing the value of the Pound Sterling is monetary policy decided by the Bank of England. The BoE bases its decisions on whether it has achieved its primary goal of “price stability” – a steady inflation rate of around 2%. Its primary tool for achieving this is the adjustment of interest rates. When inflation is too high, the BoE will try to rein it in by raising interest rates, making it more expensive for people and businesses to access credit. This is generally positive for GBP, as higher interest rates make the UK a more attractive place for global investors to park their money. When inflation falls too low it is a sign economic growth is slowing. In this scenario, the BoE will consider lowering interest rates to cheapen credit so businesses will borrow more to invest in growth-generating projects.
Data releases gauge the health of the economy and can impact the value of the Pound Sterling. Indicators such as GDP, Manufacturing and Services PMIs, and employment can all influence the direction of the GBP. A strong economy is good for Sterling. Not only does it attract more foreign investment but it may encourage the BoE to put up interest rates, which will directly strengthen GBP. Otherwise, if economic data is weak, the Pound Sterling is likely to fall.
Another significant data release for the Pound Sterling is the Trade Balance. This indicator measures the difference between what a country earns from its exports and what it spends on imports over a given period. If a country produces highly sought-after exports, its currency will benefit purely from the extra demand created from foreign buyers seeking to purchase these goods. Therefore, a positive net Trade Balance strengthens a currency and vice versa for a negative balance.
- The Canadian Consumer Price Index is expected to lose some traction in June.
- The BoC reiterated that inflation is heading towards the target.
- The Canadian Dollar remains stuck within the 1.3600-1.3800 range vs. the US Dollar.
Canada is set to reveal the latest inflation data on Tuesday, with Statistics Canada publishing the Consumer Price Index (CPI) for June. Forecasts predict disinflationary pressures to resume in both the headline CPI and the Core CPI following May’s hiccup.
In addition to the CPI data, the Bank of Canada (BoC) will release its core Consumer Price Index, which excludes volatile components such as food and energy. As witnessed, the BoC core CPI showed a 0.6% monthly increase and a 1.8% year-on-year rise in May, while the headline print rose by 2.9% over the last twelve months and 0.6% from the previous month.
These figures are closely monitored as they could influence the Canadian Dollar (CAD) in the short term and affect perceptions of the Bank of Canada's monetary policy, particularly after the central bank reduced its policy rate by 25 bps to 4.75% in June.
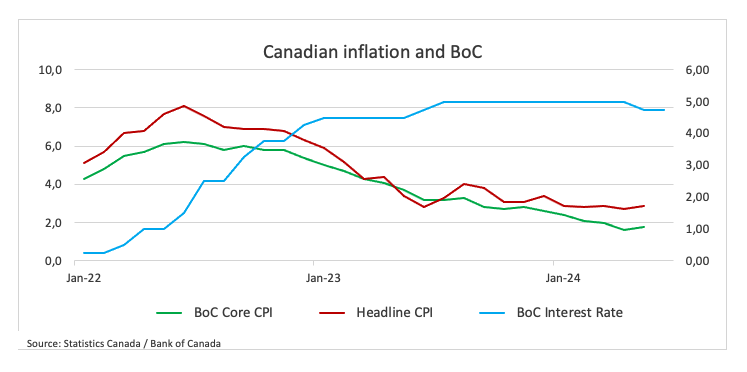
Looking at the FX world, the Canadian Dollar keeps navigating the 1.3600-1.3800 range vs. its American counterpart, while the floor of this range still appears propped up by the key 200-day SMA (1.3596).
What can we expect from Canada’s inflation rate?
Analysts expect that price pressures across Canada will ease marginally in June, albeit still well above the bank’s target. That said, consumer prices should mirror the recent performance seen in the US, where lower-than-estimated CPI data have reignited expectations of a sooner-than-anticipated interest rate cut by the Federal Reserve (Fed).
If the upcoming data aligns with these predictions, investors might consider that the BoC could ease its monetary policy further and go for another quarter-point interest rate cut, taking the policy rate to 4.50% at its July gathering.
According to the Minutes of its June meeting, the BoC has expressed concerns that progress on reducing inflation could stall, adding that officials considered the advantages of delaying interest rate cuts by an additional month before ultimately deciding to ease monetary policy on June 5.
Back to inflation, the BoC’s statement following the interest rate cut in June said, “With continued evidence that underlying inflation is easing, the Governing Council agreed that monetary policy no longer needs to be as restrictive and reduced the policy interest rate by 25 basis points. Recent data has increased our confidence that inflation will continue to move towards the 2% target. Nonetheless, risks to the inflation outlook remain. The Governing Council is closely watching the evolution of core inflation and remains particularly focused on the balance between demand and supply in the economy, inflation expectations, wage growth, and corporate pricing behaviour.”
Analysts at TD Securities argued that: “Markets are 70% priced for a cut, and we look for CPI… to add to the case for easing with headline/core CPI pushing 0.20/0.15pp lower (y/y)...”.
When is the Canada CPI data due, and how could it affect USD/CAD?
On Tuesday at 12:30 GMT, Canada is set to release the Consumer Price Index (CPI) for June. The reaction of the Canadian Dollar will largely depend on shifts in monetary policy expectations from the Bank of Canada (BoC). However, unless there are significant surprises in either direction, the BoC is expected to maintain its current cautious monetary policy stance, similar to the approach of other central banks like the Federal Reserve (Fed).
The USD/CAD has started the new trading year with a strong bullish trend, which eventually morphed into yearly highs north of 1.3800 the figure in April. However, that initial uptrend has gradually run out of steam and motivated spot to embark on a consolidative phase between 1.3600 and 1.3800.
According to Pablo Piovano, Senior Analyst at FXStreet, there is a high probability of USD/CAD maintaining its side-line theme for the time being as market participants remain focused on the Fed-BoC policy divergence as the almost exclusive driver of the price action. “This range-bound pattern appears to be underpinned by the always-relevant 200-day Simple Moving Average (SMA) at 1.3596 so far. On the upside, there is immediate resistance at the June top of 1.3791 (June 11) prior to the 2024 peak of 1.3846 (April 16),” Piovano said. “Conversely, if USD/CAD falls below the 200-day SMA, it could face additional losses, potentially dropping to the January 31 low of 1.3358. Beyond this, notable support levels are scarce until the December 2023 bottom of 1.3177, recorded on December 27.”
Pablo emphasizes that significant increases in CAD volatility would require unexpected inflation figures. A CPI below expectations could strengthen the case for another BoC interest rate cut in the upcoming meeting, thereby boosting USD/CAD. On the flip side, a CPI rebound might offer limited support to the Canadian Dollar. A higher-than-anticipated inflation reading would increase pressure on the Bank of Canada to maintain rates for a longer period, potentially posing prolonged challenges for Canadians dealing with higher interest rates.
Economic Indicator
Consumer Price Index (YoY)
The Consumer Price Index (CPI), released by Statistics Canada on a monthly basis, represents changes in prices for Canadian consumers by comparing the cost of a fixed basket of goods and services. The YoY reading compares prices in the reference month to the same month a year earlier. Generally, a high reading is seen as bullish for the Canadian Dollar (CAD), while a low reading is seen as bearish.
Read more.Last release: Tue Jun 25, 2024 12:30
Frequency: Monthly
Actual: 2.9%
Consensus: 2.6%
Previous: 2.7%
Source: Statistics Canada
- Silver price edges higher due to the dovish sentiment surrounding the Fed regarding its policy stance.
- Fed Chair Jerome Powell mentioned that inflation is on course to meet the Fed’s target in a sustainable manner.
- Silver demand could face challenges as China's economy grew less than expected in Q2.
Silver price (XAG/USD) halts its two-day losing streak, trading around $30.80 per troy ounce during the early European hours on Tuesday. This upward movement is attributed to dovish comments from Federal Reserve Chair Jerome Powell regarding the monetary policy stance, which has increased the appeal of precious metals. Lower borrowing costs make non-yielding assets like Silver more attractive to investors.
Fed Chair Jerome Powell mentioned on Monday that three US inflation readings of this year "add somewhat to confidence" that inflation is on course to meet the Fed’s target sustainably, suggesting that a shift to interest rate cuts may not be far off.
Additionally, Fed Bank of San Francisco President Mary Daly stated that inflation is cooling down in a way that bolsters confidence that it’s on its way to 2%. However, Daly added that more information is needed before making a rate decision.
According to CME Group’s FedWatch Tool, markets now indicate an 85.7% probability of a 25-basis point rate cut at the September Fed meeting, up from 71.0% a week earlier. Investors will likely observe the US Retail Sales data for June, which are set to be released later in the day, for further insights into the US economic situation.
The price of the grey metal may face challenges as economic data on Monday showed that China’s economy grew less than expected in the second quarter and weak domestic demand. Silver is essential in various industrial applications, such as electronics, solar panels, and automotive components. Given China's status as one of the world's largest manufacturing hubs, the country's industrial demand for Silver is significant.
The third plenum of the Chinese Communist Party's 20th National Congress continues today, being held from July 15 to 18. Standard Chartered expects cuts from the People's Bank of China in rates and the reserve requirement ratio (RRR), as GDP growth decelerated in Q2. China’s growth drivers remain uneven, and trade tensions are rising, with the US and EU imposing new tariffs on Chinese electric vehicles (EVs).
Silver FAQs
Silver is a precious metal highly traded among investors. It has been historically used as a store of value and a medium of exchange. Although less popular than Gold, traders may turn to Silver to diversify their investment portfolio, for its intrinsic value or as a potential hedge during high-inflation periods. Investors can buy physical Silver, in coins or in bars, or trade it through vehicles such as Exchange Traded Funds, which track its price on international markets.
Silver prices can move due to a wide range of factors. Geopolitical instability or fears of a deep recession can make Silver price escalate due to its safe-haven status, although to a lesser extent than Gold's. As a yieldless asset, Silver tends to rise with lower interest rates. Its moves also depend on how the US Dollar (USD) behaves as the asset is priced in dollars (XAG/USD). A strong Dollar tends to keep the price of Silver at bay, whereas a weaker Dollar is likely to propel prices up. Other factors such as investment demand, mining supply – Silver is much more abundant than Gold – and recycling rates can also affect prices.
Silver is widely used in industry, particularly in sectors such as electronics or solar energy, as it has one of the highest electric conductivity of all metals – more than Copper and Gold. A surge in demand can increase prices, while a decline tends to lower them. Dynamics in the US, Chinese and Indian economies can also contribute to price swings: for the US and particularly China, their big industrial sectors use Silver in various processes; in India, consumers’ demand for the precious metal for jewellery also plays a key role in setting prices.
Silver prices tend to follow Gold's moves. When Gold prices rise, Silver typically follows suit, as their status as safe-haven assets is similar. The Gold/Silver ratio, which shows the number of ounces of Silver needed to equal the value of one ounce of Gold, may help to determine the relative valuation between both metals. Some investors may consider a high ratio as an indicator that Silver is undervalued, or Gold is overvalued. On the contrary, a low ratio might suggest that Gold is undervalued relative to Silver.
Here is what you need to know on Tuesday, July 16:
Following the previous week's sharp decline, the US Dollar (USD) Index edges higher early Tuesday after posting small gains on Monday. Export Price Index, Import Price Index and Retail Sales data for June will be featured in the US economic docket. Statistics Canada will release June Consumer Price Index (CPI) figures in the early trading hours of the American session.
US Dollar PRICE This week
The table below shows the percentage change of US Dollar (USD) against listed major currencies this week. US Dollar was the strongest against the New Zealand Dollar.
| USD | EUR | GBP | JPY | CAD | AUD | NZD | CHF | |
|---|---|---|---|---|---|---|---|---|
| USD | 0.11% | 0.18% | 0.19% | 0.34% | 0.60% | 0.83% | 0.05% | |
| EUR | -0.11% | 0.11% | 0.28% | 0.42% | 0.53% | 0.91% | 0.13% | |
| GBP | -0.18% | -0.11% | 0.27% | 0.33% | 0.42% | 0.75% | 0.02% | |
| JPY | -0.19% | -0.28% | -0.27% | 0.14% | 0.18% | 0.59% | -0.34% | |
| CAD | -0.34% | -0.42% | -0.33% | -0.14% | 0.19% | 0.48% | -0.30% | |
| AUD | -0.60% | -0.53% | -0.42% | -0.18% | -0.19% | 0.38% | -0.39% | |
| NZD | -0.83% | -0.91% | -0.75% | -0.59% | -0.48% | -0.38% | -0.78% | |
| CHF | -0.05% | -0.13% | -0.02% | 0.34% | 0.30% | 0.39% | 0.78% |
The heat map shows percentage changes of major currencies against each other. The base currency is picked from the left column, while the quote currency is picked from the top row. For example, if you pick the US Dollar from the left column and move along the horizontal line to the Japanese Yen, the percentage change displayed in the box will represent USD (base)/JPY (quote).
The cautious market mood at the start of the week helped the USD stay resilient against its rivals. In the second half of the day, Federal Reserve (Fed) Chairman Jerome Powell refrained from confirming a rate cut in September, further supporting the currency. Powell acknowledged the soft inflation data, saying that the last three readings represent further progress, but reiterated that they will make decisions meeting-by-meeting.
The USD Index edges higher toward 104.50 in the European session and the benchmark 10-year US Treasury bond yield stays near 4.2%. Meanwhile, US stock index futures trade marginally higher after Wall Street's main indexes closed the first trading day of the week in positive territory.
USD/CAD started the week on a bullish note and gained nearly 0.4% on Monday. Investors expect the CPI to rise 0.1% on a monthly basis in June following the surprising 0.6% increase recorded in May. Ahead of the inflation data, USD/CAD inches higher toward 1.3700.
EUR/USD climbed to its highest level since late March above 1.0920 on Monday but failed to preserve its bullish momentum. The pair trades in a tight channel at around 1.0900 in the European morning. ZEW sentiment data for Germany and the Eurozone will be published on Tuesday.
After registering impressive gains for two consecutive weeks, GBP/USD staged a correction as buyers backed away after testing 1.3000. The pair was last seen moving sideways slightly above 1.2950. The UK's Office for National Statistics will publish June inflation data in the early European morning on Wednesday.
Gold regained its traction after testing $2,400 and closed modestly higher on Monday. XAU/USD holds its ground and pushes higher toward $2,440 at the beginning of the European session on Tuesday.
USD/JPY closed the first day of the week virtually unchanged after suffering large losses in the second half of the previous week. The pair gain traction early Tuesday and trades in positive territory near 158.50.
Inflation FAQs
Inflation measures the rise in the price of a representative basket of goods and services. Headline inflation is usually expressed as a percentage change on a month-on-month (MoM) and year-on-year (YoY) basis. Core inflation excludes more volatile elements such as food and fuel which can fluctuate because of geopolitical and seasonal factors. Core inflation is the figure economists focus on and is the level targeted by central banks, which are mandated to keep inflation at a manageable level, usually around 2%.
The Consumer Price Index (CPI) measures the change in prices of a basket of goods and services over a period of time. It is usually expressed as a percentage change on a month-on-month (MoM) and year-on-year (YoY) basis. Core CPI is the figure targeted by central banks as it excludes volatile food and fuel inputs. When Core CPI rises above 2% it usually results in higher interest rates and vice versa when it falls below 2%. Since higher interest rates are positive for a currency, higher inflation usually results in a stronger currency. The opposite is true when inflation falls.
Although it may seem counter-intuitive, high inflation in a country pushes up the value of its currency and vice versa for lower inflation. This is because the central bank will normally raise interest rates to combat the higher inflation, which attract more global capital inflows from investors looking for a lucrative place to park their money.
Formerly, Gold was the asset investors turned to in times of high inflation because it preserved its value, and whilst investors will often still buy Gold for its safe-haven properties in times of extreme market turmoil, this is not the case most of the time. This is because when inflation is high, central banks will put up interest rates to combat it. Higher interest rates are negative for Gold because they increase the opportunity-cost of holding Gold vis-a-vis an interest-bearing asset or placing the money in a cash deposit account. On the flipside, lower inflation tends to be positive for Gold as it brings interest rates down, making the bright metal a more viable investment alternative.
- USD/CHF trades weaker around 0.8945 in Tuesday’s European session.
- The rising bets on Fed rate cuts might cap the pair’s upside.
- The political uncertainty in the US and Europe might underpin the Swiss France for the time being.
The USD/CHF pair trades on a softer note near 0.8945 on Tuesday during the early European session. The pair edges lower despite the modest rebound of Greenback. Later on Tuesday, the release of US Retail Sales will be in the spotlight. Also, the Federal Reserve’s (Fed) Adriana Kugler is scheduled to speak.
The downtick of the pair is supported by the rising expectation, that US Fed would cut the interest rate sooner than earlier this September. This, in turn, exerts some selling pressure on the Greenback. Traders are now pricing in a 100% odds that the Fed funds rate will decline by at least 25 basis points when the Federal Open Market Committee (FOMC) meets in September.
Fed Chair Jerome Powell said on Monday that the recent inflation data had added to confidence that price increases are returning to the target in a sustainable fashion. Powell further stated that the Fed doesn't expect to wait until inflation reaches 2% before acting, suggesting that rate cuts may not be far off.
On the Swiss front, the political uncertainty in the US and the second round of France’s parliamentary elections last weekend provide some support to the safe-haven currency like the CHF. Donald Trump was shot in the ear during his rally in Butler, Pennsylvania in an assassination attempt. One spectator was killed in the attack, two others were critically injured, and Trump was pictured with blood spilling from his ear, per the BBC. Furthermore, the concern about France’s budget remains, which helps to boost the INR.
Swiss economy FAQs
Switzerland is the ninth-largest economy measured by nominal Gross Domestic Product (GDP) in the European continent. Measured by GDP per capita – a broad measure of average living standards –, the country ranks among the highest in the world, meaning that it is one the richest countries globally. Switzerland tends to be in the top spots in global rankings about living standards, development indexes, competitiveness or innovation.
Switzerland is an open, free-market economy mainly based on the services sector. The Swiss economy has a strong export sector, and the neighboring European Union (EU) is its main trading partner. Switzerland is a leading exporter of watches and clocks, and hosts leading firms in the food, chemicals and pharmaceutical industries. The country is considered to be an international tax haven, with significantly low corporate and income tax rates compared with its European neighbors.
As a high-income country, the growth rate of the Swiss economy has diminished over the last decades. Still, its political and economic stability, its high education levels, top-tier firms in several industries and its tax-haven status have made it a preferred destination for foreign investment. This has generally benefited the Swiss Franc (CHF), which has historically kept relatively strong against its main currency peers. Generally, a good performance of the Swiss economy – based on high growth, low unemployment and stable prices – tends to appreciate CHF. Conversely, if economic data points to weakening momentum, CHF is likely to depreciate.
Switzerland isn’t a commodity exporter, so in general commodity prices aren’t a key driver of the Swiss Franc (CHF). However, there is a slight correlation with both Gold and Oil prices. With Gold, CHF’s status as a safe-haven and the fact that the currency used to be backed by the precious metal means that both assets tend to move in the same direction. With Oil, a paper released by the Swiss National Bank (SNB) suggests that the rise in Oil prices could negatively influence CHF valuation, as Switzerland is a net importer of fuel.
- GBP/JPY holds positive ground amid near 205.70 in Tuesday’s European session.
- The cross maintains the bullish contents on the daily chart, above bullish territory.
- The first upside barrier is seen at 206.35; the 100-period EMA at 205.60 acts as an initial support level for the cross.
The GBP/JPY cross recovers some lost ground near 205.70, snapping the three-day losing streak during the early European session on Tuesday. The upside of the cross might be limited as further potential forex (FX) intervention by the Bank of Japan (BoJ) might prevent the JPY from depreciating.
According to the 4-hour chart, the bullish outlook of the cross remains intact as it holds above the key 100-period Exponential Moving Average (EMA). However, further consolidation cannot be ruled out as the Relative Strength Index (RSI) hovers around the 50-midline, indicating the neutral momentum of the cross.
The first upside barrier for GBP/JPY will emerge at 206.35, a high of July 12. Extended gains will see a rally to 206.67, a high of July 8. Any follow-through buying about this level will pave the way to the 207.60–207.70 region, portraying the upper boundary of the Bollinger Band and a high of July 10.
On the downside, the 100-period EMA at 205.60 acts as an initial support level for the cross. A breach of this level will seea drop to 203.50. Further south, the next contention level is seen at the 203.00 psychological level.
GBP/JPY 4-hour chart
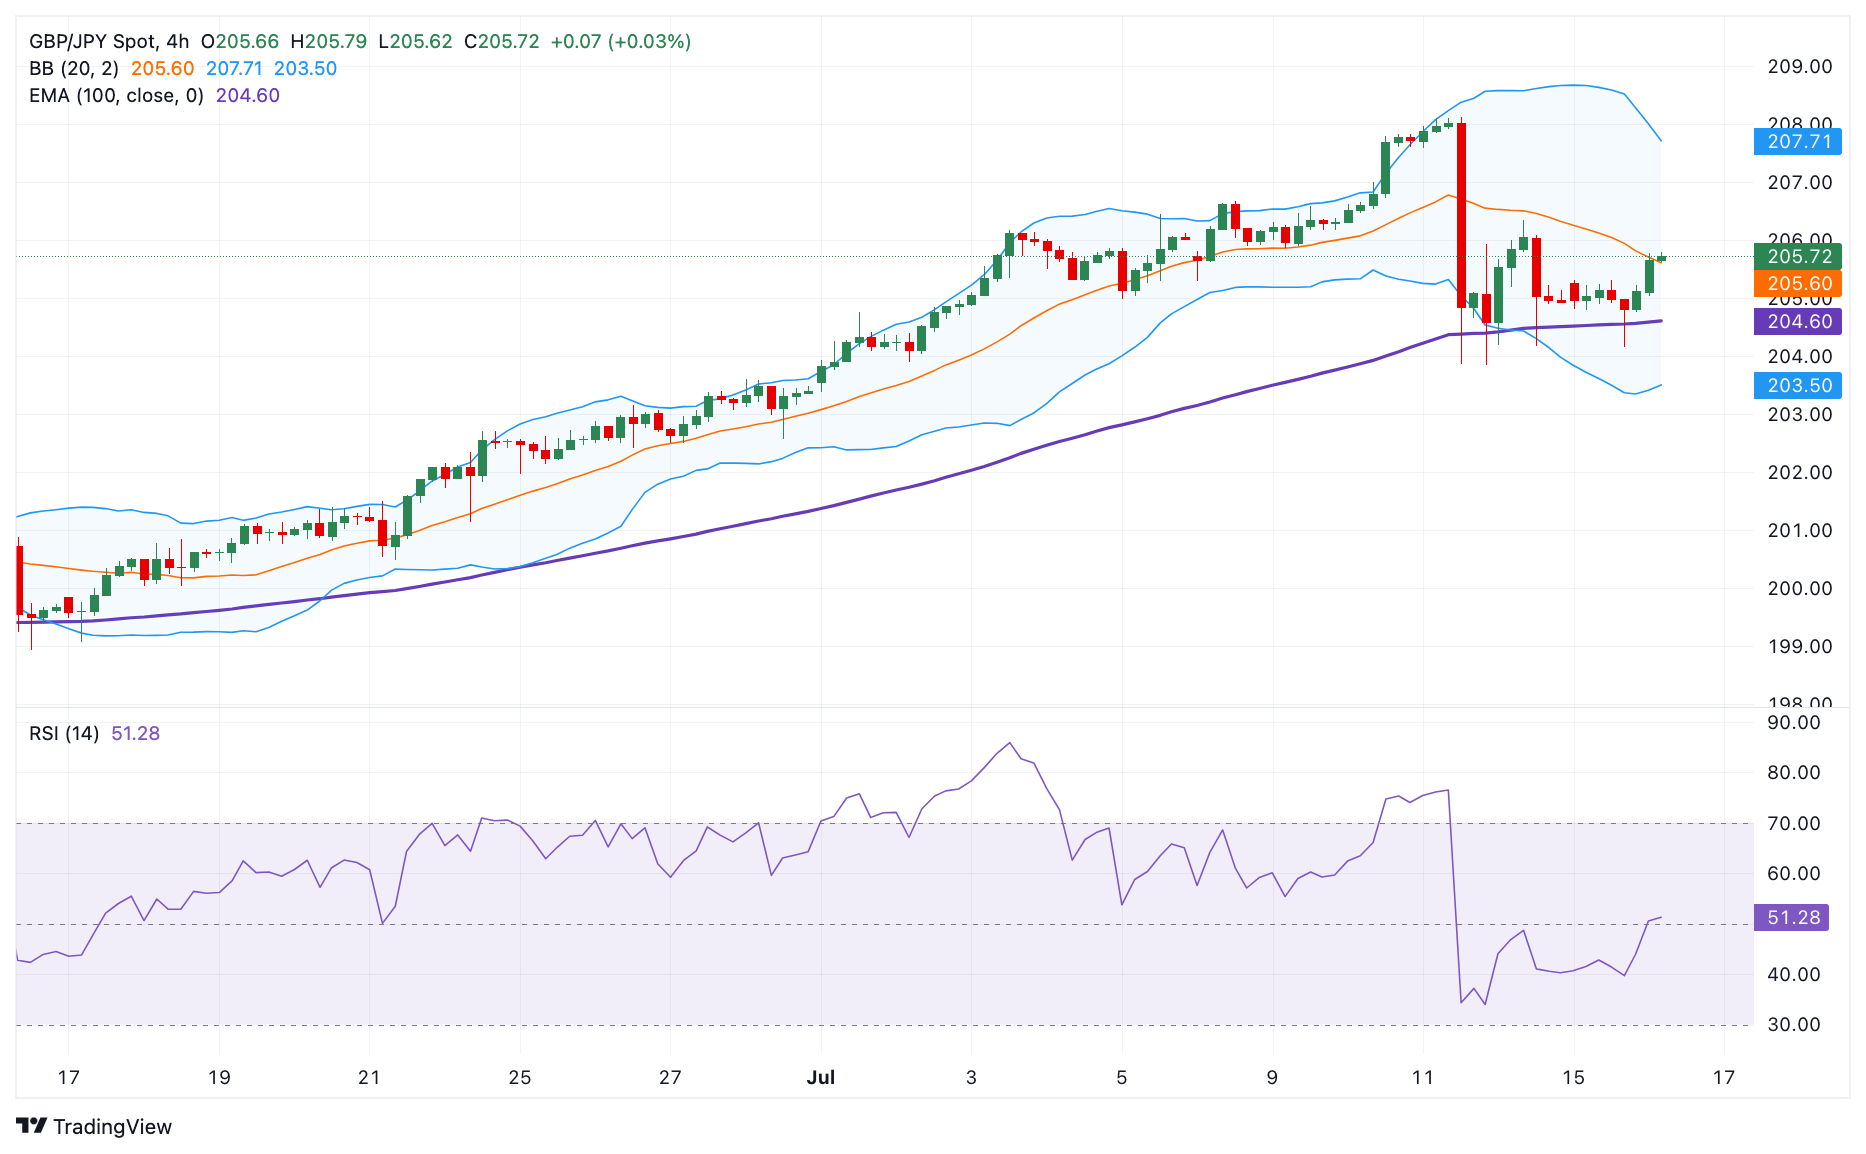
Pound Sterling FAQs
The Pound Sterling (GBP) is the oldest currency in the world (886 AD) and the official currency of the United Kingdom. It is the fourth most traded unit for foreign exchange (FX) in the world, accounting for 12% of all transactions, averaging $630 billion a day, according to 2022 data. Its key trading pairs are GBP/USD, aka ‘Cable’, which accounts for 11% of FX, GBP/JPY, or the ‘Dragon’ as it is known by traders (3%), and EUR/GBP (2%). The Pound Sterling is issued by the Bank of England (BoE).
The single most important factor influencing the value of the Pound Sterling is monetary policy decided by the Bank of England. The BoE bases its decisions on whether it has achieved its primary goal of “price stability” – a steady inflation rate of around 2%. Its primary tool for achieving this is the adjustment of interest rates. When inflation is too high, the BoE will try to rein it in by raising interest rates, making it more expensive for people and businesses to access credit. This is generally positive for GBP, as higher interest rates make the UK a more attractive place for global investors to park their money. When inflation falls too low it is a sign economic growth is slowing. In this scenario, the BoE will consider lowering interest rates to cheapen credit so businesses will borrow more to invest in growth-generating projects.
Data releases gauge the health of the economy and can impact the value of the Pound Sterling. Indicators such as GDP, Manufacturing and Services PMIs, and employment can all influence the direction of the GBP. A strong economy is good for Sterling. Not only does it attract more foreign investment but it may encourage the BoE to put up interest rates, which will directly strengthen GBP. Otherwise, if economic data is weak, the Pound Sterling is likely to fall.
Another significant data release for the Pound Sterling is the Trade Balance. This indicator measures the difference between what a country earns from its exports and what it spends on imports over a given period. If a country produces highly sought-after exports, its currency will benefit purely from the extra demand created from foreign buyers seeking to purchase these goods. Therefore, a positive net Trade Balance strengthens a currency and vice versa for a negative balance.
Gold prices rose in India on Tuesday, according to data compiled by FXStreet.
The price for Gold stood at 6,530.73 Indian Rupees (INR) per gram, up compared with the INR 6,510.33 it cost on Monday.
The price for Gold increased to INR 76,173.20 per tola from INR 75,935.17 per tola a day earlier.
| Unit measure | Gold Price in INR |
|---|---|
| 1 Gram | 6,530.73 |
| 10 Grams | 65,307.34 |
| Tola | 76,173.20 |
| Troy Ounce | 203,134.30 |
FXStreet calculates Gold prices in India by adapting international prices (USD/INR) to the local currency and measurement units. Prices are updated daily based on the market rates taken at the time of publication. Prices are just for reference and local rates could diverge slightly.
Gold FAQs
Gold has played a key role in human’s history as it has been widely used as a store of value and medium of exchange. Currently, apart from its shine and usage for jewelry, the precious metal is widely seen as a safe-haven asset, meaning that it is considered a good investment during turbulent times. Gold is also widely seen as a hedge against inflation and against depreciating currencies as it doesn’t rely on any specific issuer or government.
Central banks are the biggest Gold holders. In their aim to support their currencies in turbulent times, central banks tend to diversify their reserves and buy Gold to improve the perceived strength of the economy and the currency. High Gold reserves can be a source of trust for a country’s solvency. Central banks added 1,136 tonnes of Gold worth around $70 billion to their reserves in 2022, according to data from the World Gold Council. This is the highest yearly purchase since records began. Central banks from emerging economies such as China, India and Turkey are quickly increasing their Gold reserves.
Gold has an inverse correlation with the US Dollar and US Treasuries, which are both major reserve and safe-haven assets. When the Dollar depreciates, Gold tends to rise, enabling investors and central banks to diversify their assets in turbulent times. Gold is also inversely correlated with risk assets. A rally in the stock market tends to weaken Gold price, while sell-offs in riskier markets tend to favor the precious metal.
The price can move due to a wide range of factors. Geopolitical instability or fears of a deep recession can quickly make Gold price escalate due to its safe-haven status. As a yield-less asset, Gold tends to rise with lower interest rates, while higher cost of money usually weighs down on the yellow metal. Still, most moves depend on how the US Dollar (USD) behaves as the asset is priced in dollars (XAU/USD). A strong Dollar tends to keep the price of Gold controlled, whereas a weaker Dollar is likely to push Gold prices up.
(An automation tool was used in creating this post.)
FX option expiries for July 16 NY cut at 10:00 Eastern Time, via DTCC, can be found below.
EUR/USD: EUR amounts
- 1.0790 732m
- 1.0820 645m
- 1.0835 730m
- 1.0875 607m
- 1.0900 2.6b
- 1.0905 598m
- 1.0910 487m
- 1.0925 1.3b
- 1.0975 577m
- 1.1000 935m
USD/JPY: USD amounts
- 156.70 630m
- 158.00 675m
- 158.30 795m
- 159.00 478m
- 159.20 882m
- 159.35 683m
- 160.00 1.3b
USD/CHF: USD amounts
- 0.8915 636m
- 0.9000 554m
- 0.9030 455m
AUD/USD: AUD amounts
- 0.6600 2.1b
- 0.6810 604m
USD/CAD: USD amounts
- 1.3600 1.1b
- 1.3630 560m
- 1.3800 2.2b
- 1.3810 605m
EUR/GBP: EUR amounts
- 0.8400 830m
- 0.8500 1.5b
- EUR/GBP gains ground as the ECB could maintain the main refinancing rate at 4.25% at Thursday’s meeting.
- The Pound Sterling may appreciate further as investors consider UK markets to be a more attractive investment option.
- BoE may initiate reducing interest rates at the August meeting.
EUR/GBP continues to gain ground for the second consecutive session, trading around 0.8400 during the Asian hours on Tuesday. However, the EUR/GBP cross still remains close to 0.8386, the lowest level since August 2022 recorded on Monday.
The Euro finds support from bullish expectations surrounding the European Central Bank (ECB). The ECB is expected to maintain the main refinancing rate at 4.25% during its upcoming July meeting on Thursday. In June, the central bank reduced the interest rate for the first time since 2019, following nine months of unchanged rates. Analysts anticipate two additional rate cuts later this year, likely in September and December.
On the GBP’s side, investors increasingly view the United Kingdom's (UK) financial markets as a preferable investment destination over both European and US markets, which are grappling with political uncertainties. The Labour Party's resounding victory under Keir Starmer has assured stable fiscal policies and streamlined ministerial appointments. This positive sentiment contributes to support for the Pound Sterling (GBP).
Additionally, the GBP's strength has been bolstered by heightened uncertainty surrounding the timing of potential rate cuts by the Bank of England (BoE). Traders anticipate that the BoE will initiate interest rate reductions starting from the August meeting.
Traders assess the upcoming economic data on Wednesday that could impact the Bank of England's monetary policy stance. The Consumer Price Index (YoY) is projected to hold steady at the BoE's 2% target, with core inflation anticipated to dip to 3.4%. Additionally, the Retail Price Index is likely to see a decline, marking the fourth drop in five months.
Interest rates FAQs
Interest rates are charged by financial institutions on loans to borrowers and are paid as interest to savers and depositors. They are influenced by base lending rates, which are set by central banks in response to changes in the economy. Central banks normally have a mandate to ensure price stability, which in most cases means targeting a core inflation rate of around 2%. If inflation falls below target the central bank may cut base lending rates, with a view to stimulating lending and boosting the economy. If inflation rises substantially above 2% it normally results in the central bank raising base lending rates in an attempt to lower inflation.
Higher interest rates generally help strengthen a country’s currency as they make it a more attractive place for global investors to park their money.
Higher interest rates overall weigh on the price of Gold because they increase the opportunity cost of holding Gold instead of investing in an interest-bearing asset or placing cash in the bank. If interest rates are high that usually pushes up the price of the US Dollar (USD), and since Gold is priced in Dollars, this has the effect of lowering the price of Gold.
The Fed funds rate is the overnight rate at which US banks lend to each other. It is the oft-quoted headline rate set by the Federal Reserve at its FOMC meetings. It is set as a range, for example 4.75%-5.00%, though the upper limit (in that case 5.00%) is the quoted figure. Market expectations for future Fed funds rate are tracked by the CME FedWatch tool, which shapes how many financial markets behave in anticipation of future Federal Reserve monetary policy decisions.
- AUD/JPY snaps a three-day losing streak to over a two-week low touched on Monday.
- The risk-on environment undermines the safe-haven JPY and lends support to the cross.
- Intervention fears, along with China’s economic woes, might cap any meaningful gains.
The AUD/JPY cross attracts some buyers during the Asian session on Tuesday and moves away from over a two-week low, around the 106.55 area touched the previous day. Spot prices climb back above the 107.00 mark in the last hour and for now, seem to have snapped a three-day losing streak amid the emergence of fresh selling around the Japanese Yen (JPY).
The prevalent risk-on environment – as depicted by an extension of a runaway rally across the global equity markets – is seen as a key factor undermining the JPY's relative safe-haven status. Apart from this, the JPY depreciating move lacks any obvious catalyst and is likely to remain cushioned in the wake of speculations that Japanese authorities might intervene in the markets to prop up the domestic currency.
In fact, Japanese Chief Cabinet Secretary Yoshimasa Hayashi was out with some verbal intervention earlier this Tuesday and showed readiness to employ all available measures regarding forex. This comes on top of speculations that the Bank of Japan (BoJ) may raise interest rates in response to a weakening domestic currency should act as a tailwind for the JPY, warranting some caution for the AUD/JPY bulls.
Apart from this, concerns about a slowdown Chinese economy – the world's second-largest economy – seem to weigh on the China-proxy Australian Dollar (AUD) and might cap the AUD/JPY cross. The market worries resurfaced after the official data released on Monday showed that China's economy grew by 4.7% over the year during the second quarter of 2024 as compared to the 5.3% rise in the previous quarter.
Hence, it will be prudent to wait for strong follow-through buying before confirming that the recent corrective slide from the highest level since May 1991, around the 109.35 region touched last Thursday, has run its course and positioning for any further appreciating move. Traders now look forward to the release of the monthly Australian employment details for some meaningful impetus on Thursday.
Australian Dollar FAQs
One of the most significant factors for the Australian Dollar (AUD) is the level of interest rates set by the Reserve Bank of Australia (RBA). Because Australia is a resource-rich country another key driver is the price of its biggest export, Iron Ore. The health of the Chinese economy, its largest trading partner, is a factor, as well as inflation in Australia, its growth rate and Trade Balance. Market sentiment – whether investors are taking on more risky assets (risk-on) or seeking safe-havens (risk-off) – is also a factor, with risk-on positive for AUD.
The Reserve Bank of Australia (RBA) influences the Australian Dollar (AUD) by setting the level of interest rates that Australian banks can lend to each other. This influences the level of interest rates in the economy as a whole. The main goal of the RBA is to maintain a stable inflation rate of 2-3% by adjusting interest rates up or down. Relatively high interest rates compared to other major central banks support the AUD, and the opposite for relatively low. The RBA can also use quantitative easing and tightening to influence credit conditions, with the former AUD-negative and the latter AUD-positive.
China is Australia’s largest trading partner so the health of the Chinese economy is a major influence on the value of the Australian Dollar (AUD). When the Chinese economy is doing well it purchases more raw materials, goods and services from Australia, lifting demand for the AUD, and pushing up its value. The opposite is the case when the Chinese economy is not growing as fast as expected. Positive or negative surprises in Chinese growth data, therefore, often have a direct impact on the Australian Dollar and its pairs.
Iron Ore is Australia’s largest export, accounting for $118 billion a year according to data from 2021, with China as its primary destination. The price of Iron Ore, therefore, can be a driver of the Australian Dollar. Generally, if the price of Iron Ore rises, AUD also goes up, as aggregate demand for the currency increases. The opposite is the case if the price of Iron Ore falls. Higher Iron Ore prices also tend to result in a greater likelihood of a positive Trade Balance for Australia, which is also positive of the AUD.
The Trade Balance, which is the difference between what a country earns from its exports versus what it pays for its imports, is another factor that can influence the value of the Australian Dollar. If Australia produces highly sought after exports, then its currency will gain in value purely from the surplus demand created from foreign buyers seeking to purchase its exports versus what it spends to purchase imports. Therefore, a positive net Trade Balance strengthens the AUD, with the opposite effect if the Trade Balance is negative.
- EUR/USD weakens near 1.0890 in Tuesday’s Asian session.
- Fed’s Powell said the central bank will not wait until inflation hits the 2% target to cut interest rates.
- The ECB is expected to hold the key interest rate unchanged at its July meeting on Thursday.
The EUR/USD pair trades on a weaker note around 1.0890 during the early Asian trading hours on Tuesday. The renewed US Dollar (USD) demand weighs on the major pair. Traders will keep an eye on US Retail Sales for June and the speech from the Federal Reserve’s (Fed) Adriana Kugler on Tuesday. On Thursday, the European Central Bank (ECB) interest rate decision will take center stage.
Traders increased their bets that the US Federal Reserve (Fed) would cut the interest rate in September. On Monday, Fed Chair Jerome Powell said that the central bank will not wait until inflation hits the 2% target to cut interest rates. “The implication of that is that if you wait until inflation gets all the way down to 2%, you’ve probably waited too long, because the tightening that you’re doing, or the level of tightness that you have, is still having effects which will probably drive inflation below 2%,” said Powell.
Meanwhile, Fed Bank of San Francisco President Mary Daly stated that inflation is cooling down in a way that bolsters confidence it’s on its way to 2%. However, Daly added that more information is needed before making a rate decision. The Fed rate cut expectation is likely to drag the Greenback lower and create a tailwind for EUR/USD.
On the other hand, the ECB is anticipated to hold the main refinancing rate, the interest rate on the marginal lending facility, and the deposit facility unchanged at 4.25%, 4.50%, and 3.75%, respectively, at its July meeting on Thursday. The ECB decided to cut the interest rate for the first time since 2019 in June after nine months of leaving the rate unchanged. Analysts expect that two more rate cuts are on the table this year, in September and December
Euro FAQs
The Euro is the currency for the 20 European Union countries that belong to the Eurozone. It is the second most heavily traded currency in the world behind the US Dollar. In 2022, it accounted for 31% of all foreign exchange transactions, with an average daily turnover of over $2.2 trillion a day. EUR/USD is the most heavily traded currency pair in the world, accounting for an estimated 30% off all transactions, followed by EUR/JPY (4%), EUR/GBP (3%) and EUR/AUD (2%).
The European Central Bank (ECB) in Frankfurt, Germany, is the reserve bank for the Eurozone. The ECB sets interest rates and manages monetary policy. The ECB’s primary mandate is to maintain price stability, which means either controlling inflation or stimulating growth. Its primary tool is the raising or lowering of interest rates. Relatively high interest rates – or the expectation of higher rates – will usually benefit the Euro and vice versa. The ECB Governing Council makes monetary policy decisions at meetings held eight times a year. Decisions are made by heads of the Eurozone national banks and six permanent members, including the President of the ECB, Christine Lagarde.
Eurozone inflation data, measured by the Harmonized Index of Consumer Prices (HICP), is an important econometric for the Euro. If inflation rises more than expected, especially if above the ECB’s 2% target, it obliges the ECB to raise interest rates to bring it back under control. Relatively high interest rates compared to its counterparts will usually benefit the Euro, as it makes the region more attractive as a place for global investors to park their money.
Data releases gauge the health of the economy and can impact on the Euro. Indicators such as GDP, Manufacturing and Services PMIs, employment, and consumer sentiment surveys can all influence the direction of the single currency. A strong economy is good for the Euro. Not only does it attract more foreign investment but it may encourage the ECB to put up interest rates, which will directly strengthen the Euro. Otherwise, if economic data is weak, the Euro is likely to fall. Economic data for the four largest economies in the euro area (Germany, France, Italy and Spain) are especially significant, as they account for 75% of the Eurozone’s economy.
Another significant data release for the Euro is the Trade Balance. This indicator measures the difference between what a country earns from its exports and what it spends on imports over a given period. If a country produces highly sought after exports then its currency will gain in value purely from the extra demand created from foreign buyers seeking to purchase these goods. Therefore, a positive net Trade Balance strengthens a currency and vice versa for a negative balance.
- GBP/USD receives support as investors consider UK markets a more attractive investment option.
- BoE is expected to start lowering interest rates at the August meeting.
- The US Dollar strengthens due to increased risk aversion triggered by the attack on former US President Donald Trump.
GBP/USD trades around 1.2960 during the Asian session on Tuesday, remaining close 13-month high at 1.2995 recorded in the previous session. The British Pound (GBP) may appreciate further as investors consider UK markets a more attractive investment destination compared to US markets, which face political uncertainties. The decisive victory of Keir Starmer’s Labour Party has assured stable fiscal policies and smooth ministerial appointments.
The increased uncertainty over the timeframe for Bank of England (BoE) rate cuts has been a significant factor in the GBP’s strength. Traders anticipate the BoE to start lowering interest rates at the August meeting.
Traders assess the upcoming economic data on Wednesday that could impact the Bank of England's monetary policy stance. The Consumer Price Index (YoY) is projected to hold steady at the BoE's 2% target, with core inflation anticipated to dip to 3.4%. Additionally, the Retail Price Index is likely to see a decline, marking the fourth drop in five months.
The US Dollar (USD) strengthened amid rising risk aversion triggered by the attempted assassination of former US President Donald Trump on Saturday. However, cooling US inflation strengthened bets for a Federal Reserve rate cut in September, which may limit the upside of the Greenback.
According to CME Group’s FedWatch Tool, markets now indicate an 85.7% probability of a 25-basis point rate cut at the September Fed meeting, up from 71.0% a week earlier.
Pound Sterling FAQs
The Pound Sterling (GBP) is the oldest currency in the world (886 AD) and the official currency of the United Kingdom. It is the fourth most traded unit for foreign exchange (FX) in the world, accounting for 12% of all transactions, averaging $630 billion a day, according to 2022 data. Its key trading pairs are GBP/USD, aka ‘Cable’, which accounts for 11% of FX, GBP/JPY, or the ‘Dragon’ as it is known by traders (3%), and EUR/GBP (2%). The Pound Sterling is issued by the Bank of England (BoE).
The single most important factor influencing the value of the Pound Sterling is monetary policy decided by the Bank of England. The BoE bases its decisions on whether it has achieved its primary goal of “price stability” – a steady inflation rate of around 2%. Its primary tool for achieving this is the adjustment of interest rates. When inflation is too high, the BoE will try to rein it in by raising interest rates, making it more expensive for people and businesses to access credit. This is generally positive for GBP, as higher interest rates make the UK a more attractive place for global investors to park their money. When inflation falls too low it is a sign economic growth is slowing. In this scenario, the BoE will consider lowering interest rates to cheapen credit so businesses will borrow more to invest in growth-generating projects.
Data releases gauge the health of the economy and can impact the value of the Pound Sterling. Indicators such as GDP, Manufacturing and Services PMIs, and employment can all influence the direction of the GBP. A strong economy is good for Sterling. Not only does it attract more foreign investment but it may encourage the BoE to put up interest rates, which will directly strengthen GBP. Otherwise, if economic data is weak, the Pound Sterling is likely to fall.
Another significant data release for the Pound Sterling is the Trade Balance. This indicator measures the difference between what a country earns from its exports and what it spends on imports over a given period. If a country produces highly sought-after exports, its currency will benefit purely from the extra demand created from foreign buyers seeking to purchase these goods. Therefore, a positive net Trade Balance strengthens a currency and vice versa for a negative balance.
WTI drifts lower for the third straight day amid worries about slowing Chinese economy.
A modest US Dollar strength contributes to the driving flows away from the commodity.
Worries about supply disruption from the Middle East might continue to act as a tailwind.
West Texas Intermediate (WTI) US crude Oil prices trade with a negative bias for the third successive day on Tuesday, albeit lack follow-through selling and hold above the overnight swing low. The commodity currently trades around the $80.70 region, down nearly 0.40% for the day and is pressured by a combination of factors.
The official data released on Monday showed that China's economy expanded by 4.7% over the year during the second quarter of 2024, down from the 5.3% rise recorded in the first quarter. This adds to worries about a slowdown in the world's second-largest economy and waning fuel demand in the world's biggest oil importer, which, in turn, is seen as a key factor exerting some downward pressure on Crude Oil prices.
Meanwhile, the US Dollar (USD) gains some positive traction and recovers further from over a three-month trough touched on Monday, which further contributes to driving flow away from the USD-denominated commodity. That said, growing acceptance that the Federal Reserve (Fed) will begin the rate-cutting cycle as soon as September might hold back the USD bulls from placing aggressive bets and positioning for further gains.
Apart from this, concerns about supply disruptions stemming from the ongoing conflicts in the Middle East should act as a tailwind for Crude Oil prices and help limit deeper losses. Hence, it will be prudent to wait for strong follow-through selling before positioning for an extension of the recent pullback from the vicinity of the $84.0 mark, or over the two-month peak touched on July 5. Traders now look to the US Retail Sales for a fresh impetus.
WTI Oil FAQs
WTI Oil is a type of Crude Oil sold on international markets. The WTI stands for West Texas Intermediate, one of three major types including Brent and Dubai Crude. WTI is also referred to as “light” and “sweet” because of its relatively low gravity and sulfur content respectively. It is considered a high quality Oil that is easily refined. It is sourced in the United States and distributed via the Cushing hub, which is considered “The Pipeline Crossroads of the World”. It is a benchmark for the Oil market and WTI price is frequently quoted in the media.
Like all assets, supply and demand are the key drivers of WTI Oil price. As such, global growth can be a driver of increased demand and vice versa for weak global growth. Political instability, wars, and sanctions can disrupt supply and impact prices. The decisions of OPEC, a group of major Oil-producing countries, is another key driver of price. The value of the US Dollar influences the price of WTI Crude Oil, since Oil is predominantly traded in US Dollars, thus a weaker US Dollar can make Oil more affordable and vice versa.
The weekly Oil inventory reports published by the American Petroleum Institute (API) and the Energy Information Agency (EIA) impact the price of WTI Oil. Changes in inventories reflect fluctuating supply and demand. If the data shows a drop in inventories it can indicate increased demand, pushing up Oil price. Higher inventories can reflect increased supply, pushing down prices. API’s report is published every Tuesday and EIA’s the day after. Their results are usually similar, falling within 1% of each other 75% of the time. The EIA data is considered more reliable, since it is a government agency.
OPEC (Organization of the Petroleum Exporting Countries) is a group of 13 Oil-producing nations who collectively decide production quotas for member countries at twice-yearly meetings. Their decisions often impact WTI Oil prices. When OPEC decides to lower quotas, it can tighten supply, pushing up Oil prices. When OPEC increases production, it has the opposite effect. OPEC+ refers to an expanded group that includes ten extra non-OPEC members, the most notable of which is Russia.
- The Japanese Yen could limit its downside as traders remain alert to potential intervention by authorities.
- BoJ data showed that authorities might have spent between ¥3.37 trillion and ¥3.57 trillion on Thursday to support the JPY.
- Fed Chair Jerome Powell mentioned that inflation is on course to meet the Fed’s target sustainably.
The Japanese Yen (JPY) extends its losses on Tuesday with traders remaining on alert after the currency surged about 2% last week on a suspected intervention by Japanese authorities. According to data released by the Bank of Japan (BoJ) on Friday, it's estimated that Japanese authorities may have spent between ¥3.37 trillion to ¥3.57 trillion on Thursday to stem the rapid depreciation of the JPY, as reported by Reuters.
The US Dollar (USD) strengthens amid rising risk aversion triggered by the attempted assassination of former US President Donald Trump on Saturday. However, cooling US inflation strengthened bets for a Federal Reserve rate cut in September, which may limit the upside of the Greenback.
According to CME Group’s FedWatch Tool, markets now indicate an 85.7% probability of a 25-basis point rate cut at the September Fed meeting, up from 71.0% a week earlier.
Daily Digest Market Movers: Japanese Yen declines despite intervention threats
- Fed Chair Jerome Powell mentioned on Monday that the three US inflation readings of this year "add somewhat to confidence" that inflation is on course to meet the Fed’s target sustainably, suggesting that a shift to interest rate cuts may not be far off.
- Fed Bank of San Francisco President Mary Daly stated that inflation is cooling down in a way that bolsters confidence that it’s on its way to 2%. However, Daly added that more information is needed before making a rate decision.
- US President Joe Biden on Monday addressed the nation from the White House, where he condemned all political violence and called for unity, according to CNBC. Biden further stated that “it’s time to cool it down” and noted not just the weekend attack on Trump but also the possibility of election-year violence on multiple fronts.
- ING’s FX analyst Francesco Pesole observes that Japan’s Ministry of Finance has adjusted its FX intervention strategy. Following the soft US CPI print on Friday, the USD/JPY pair declined approximately 2%, a larger drop compared to other USD pairs. The increase in JPY futures volumes appears to align with indications of FX intervention.
- UBS FX strategists observe that speculative investors hold near-record short positions on the Yen. They suggest that if US economic data continues to indicate a soft landing, USD/JPY could experience periods of pullbacks.
- BBH FX strategists highlight that recent softness in US data poses challenges to their perspective that the backdrop of sustained inflation and strong growth in the US largely remains intact. They note increasing concern among Federal Reserve officials regarding weaknesses in the labor market.
- Japanese Chief Cabinet Secretary Yoshimasa Hayashi stated his readiness to employ all available measures regarding forex. Hayashi noted that the Bank of Japan (BoJ) would determine the specifics of monetary policy. He expects the BoJ to implement appropriate measures to sustainably and steadily achieve the 2% price target, reported by Reuters on Friday.
- On Friday, Japanese Finance Minister Shunichi Suzuki emphasized that rapid foreign exchange (FX) movements are undesirable. Suzuki refrained from commenting on FX intervention and declined to address media reports regarding Japan's FX rate checks, as reported by Reuters.
Technical Analysis: USD/JPY breaks above 158.50
USD/JPY trades around 158.70 on Tuesday. The daily chart analysis indicates a reinforcement of the bullish bias as the pair rises toward the lower boundary of an ascending channel pattern. The 14-day Relative Strength Index (RSI) is also slightly below the 50 level. A further increase could strengthen the bullish trend.
The immediate resistance is observed around the nine-day Exponential Moving Average (EMA) at 159.46, followed by the lower boundary of the ascending channel around 160.30. A return to trading within the ascending channel would likely improve sentiment for the USD/JPY pair, with a potential target toward the upper boundary of the ascending channel near 163.70.
On the downside, the USD/JPY pair could find key support around the psychological level of 158.00. A break below this level could exert pressure on the pair to navigate the region around June's low at 154.55.
USD/JPY: Daily Chart
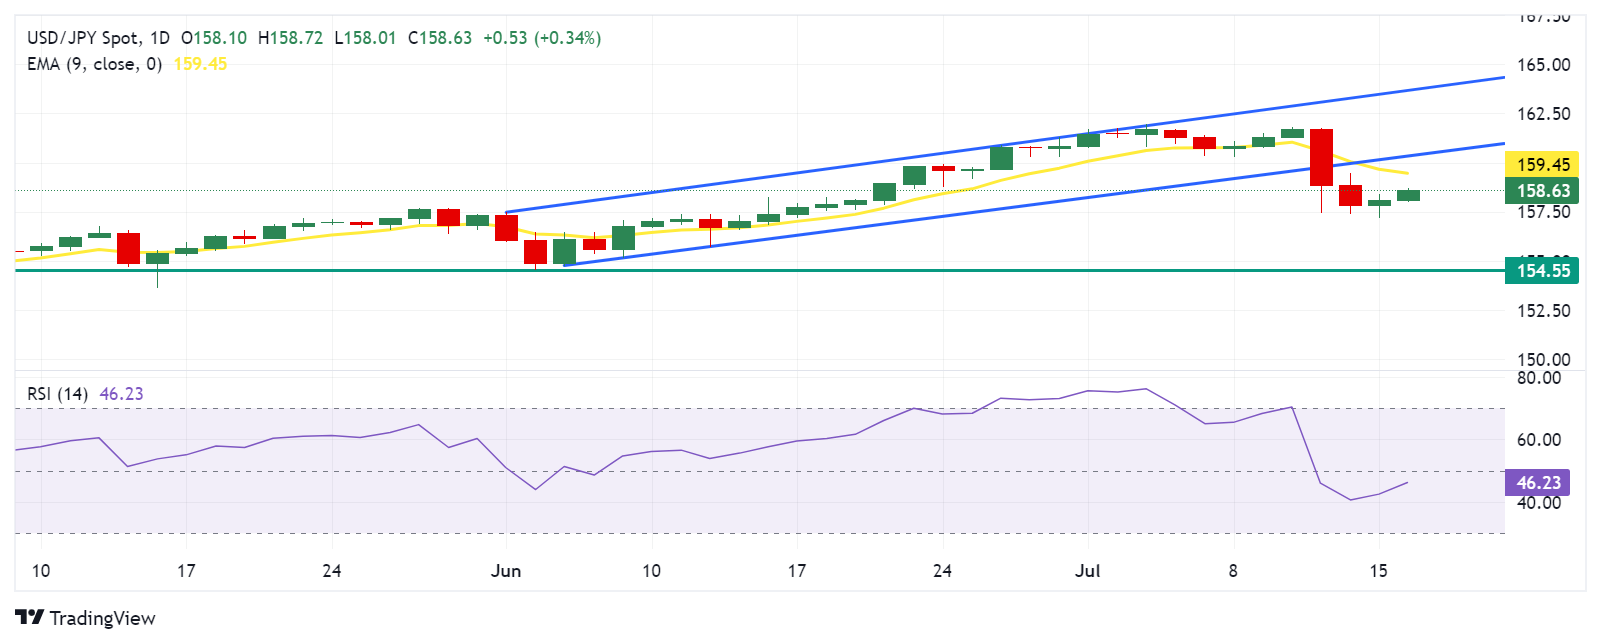
Inflation FAQs
Inflation measures the rise in the price of a representative basket of goods and services. Headline inflation is usually expressed as a percentage change on a month-on-month (MoM) and year-on-year (YoY) basis. Core inflation excludes more volatile elements such as food and fuel which can fluctuate because of geopolitical and seasonal factors. Core inflation is the figure economists focus on and is the level targeted by central banks, which are mandated to keep inflation at a manageable level, usually around 2%.
The Consumer Price Index (CPI) measures the change in prices of a basket of goods and services over a period of time. It is usually expressed as a percentage change on a month-on-month (MoM) and year-on-year (YoY) basis. Core CPI is the figure targeted by central banks as it excludes volatile food and fuel inputs. When Core CPI rises above 2% it usually results in higher interest rates and vice versa when it falls below 2%. Since higher interest rates are positive for a currency, higher inflation usually results in a stronger currency. The opposite is true when inflation falls.
Although it may seem counter-intuitive, high inflation in a country pushes up the value of its currency and vice versa for lower inflation. This is because the central bank will normally raise interest rates to combat the higher inflation, which attract more global capital inflows from investors looking for a lucrative place to park their money.
Formerly, Gold was the asset investors turned to in times of high inflation because it preserved its value, and whilst investors will often still buy Gold for its safe-haven properties in times of extreme market turmoil, this is not the case most of the time. This is because when inflation is high, central banks will put up interest rates to combat it. Higher interest rates are negative for Gold because they increase the opportunity-cost of holding Gold vis-a-vis an interest-bearing asset or placing the money in a cash deposit account. On the flipside, lower inflation tends to be positive for Gold as it brings interest rates down, making the bright metal a more viable investment alternative.
- Silver regains positive traction and stalls a two-day corrective slide from over a one-month top.
- The technical setup warrants some caution before positioning for a further intraday move up.
- A breakout through a short-term trading range is needed to confirm the near-term direction.
Silver (XAG/USD) attracts some buyers during the Asian session on Tuesday, snapping a two-day losing streak and stalling the recent pullback from the $31.75 area or its highest level since May 31 touched last week. The white metal currently trades around the $30.80-$30.85 region, up 0.45% for the day, with bulls now awaiting a sustained move beyond the 200-hour Simple Moving Average (SMA) before positioning for further gains.
Looking at the broader picture, the XAG/USD remains confined in a multi-day-old trading range. Furthermore, neutral technical indicators on the 1-hour chart warrant some caution before positioning for a firm intraday direction. Meanwhile, oscillators on the daily chart are holding in the positive territory and suggest that the path of least resistance for the commodity is to the upside. That said, a convincing break below the short-term trading range support, near the $30.40-$30.35 area, will be seen as a fresh trigger for bearish traders and pave the way for deeper losses.
The XAG/USD might then accelerate the downfall and weaken further below the $30.00 psychological mark, towards testing the next relevant support near the $29.75 horizontal zone. The downward trajectory could extend further towards intermediate support near the $29.40 region en route to the $29.00 round figure and the June monthly swing low, around the $28.55 area.
On the flip side, any further move up is more likely to face some resistance near the $31.00 mark, representing the top end of the trading range. Acceptance above the said handle will suggest that the corrective decline has run its course and pave the way for a move towards the $31.30 hurdle before the XAG/USD eventually climbs to the monthly swing high, around the $31.75 region. The momentum could extend further towards reclaiming the $32.00 mark for the first time since May 30.
Silver 1-hour chart
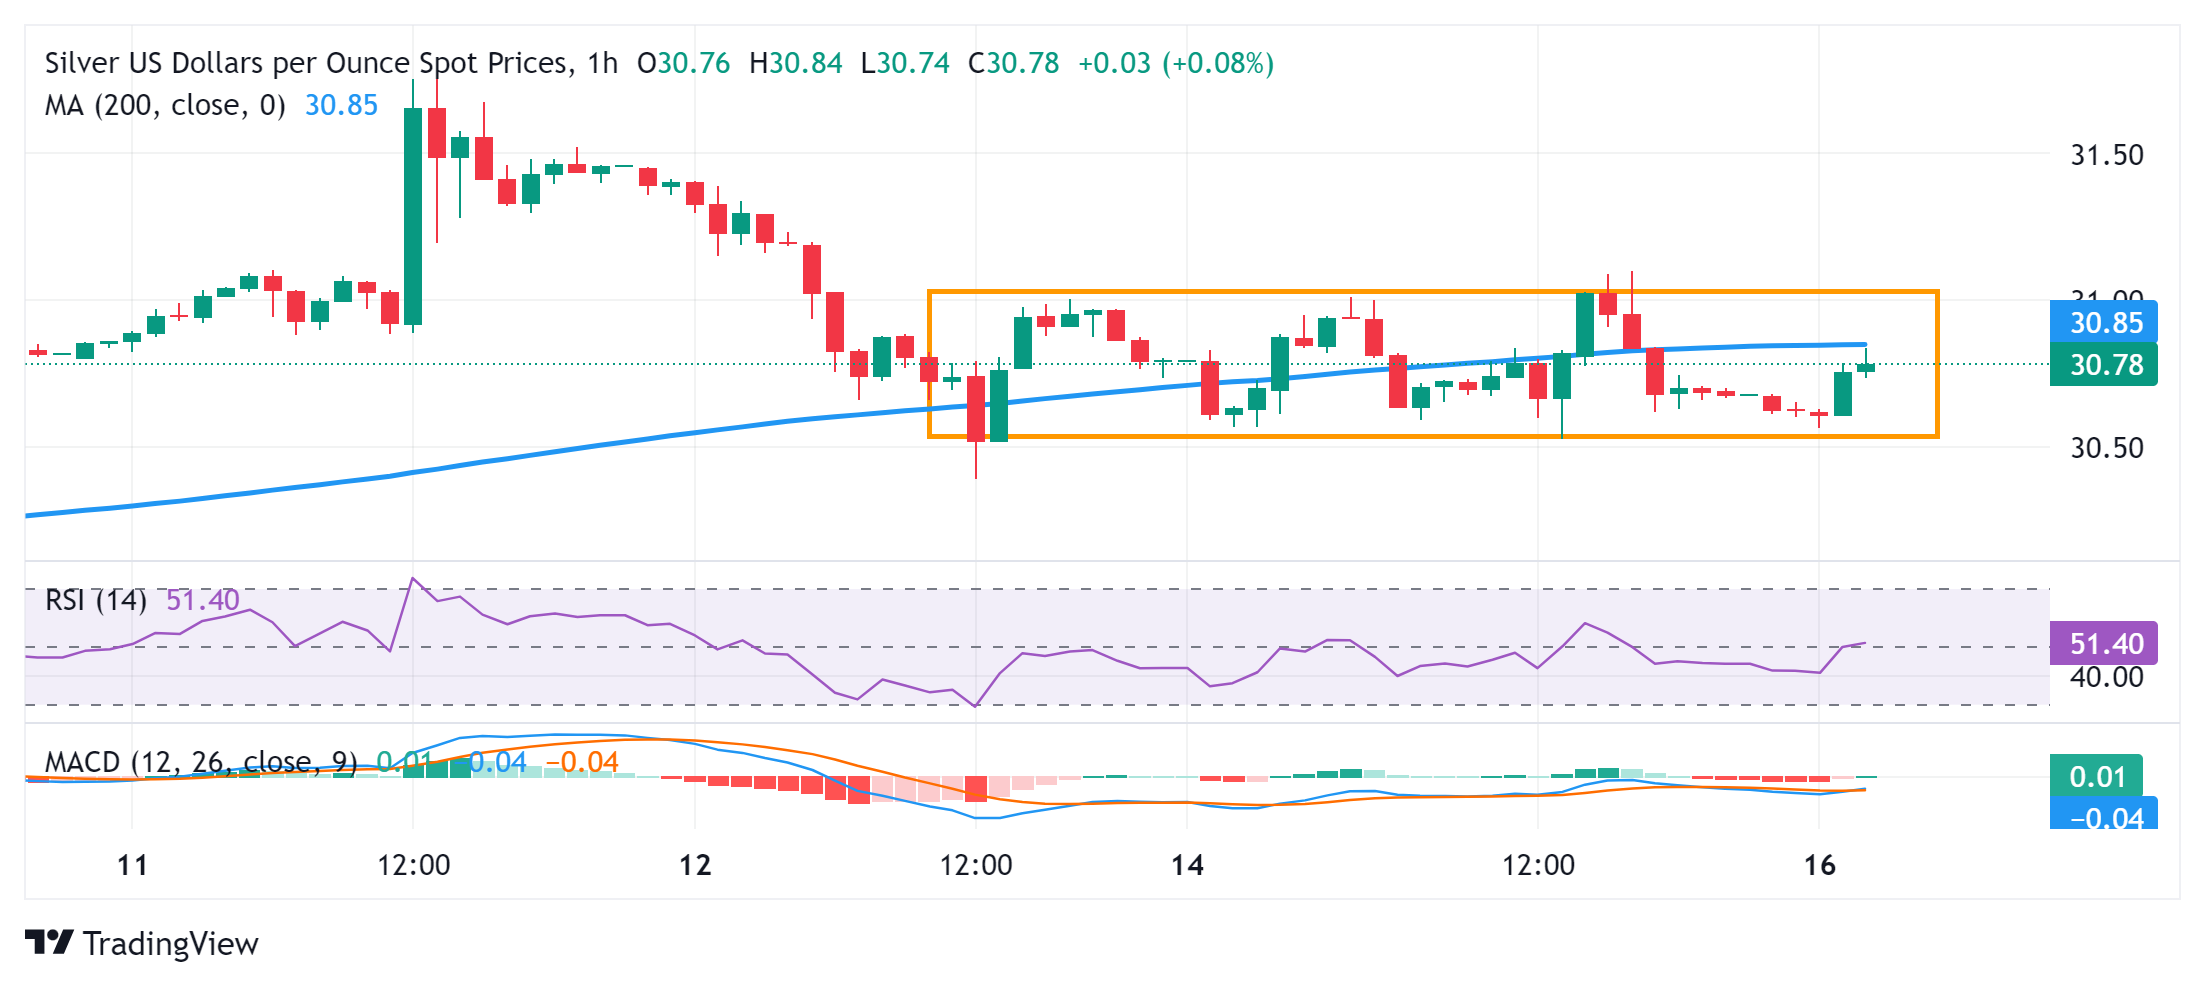
Silver FAQs
Silver is a precious metal highly traded among investors. It has been historically used as a store of value and a medium of exchange. Although less popular than Gold, traders may turn to Silver to diversify their investment portfolio, for its intrinsic value or as a potential hedge during high-inflation periods. Investors can buy physical Silver, in coins or in bars, or trade it through vehicles such as Exchange Traded Funds, which track its price on international markets.
Silver prices can move due to a wide range of factors. Geopolitical instability or fears of a deep recession can make Silver price escalate due to its safe-haven status, although to a lesser extent than Gold's. As a yieldless asset, Silver tends to rise with lower interest rates. Its moves also depend on how the US Dollar (USD) behaves as the asset is priced in dollars (XAG/USD). A strong Dollar tends to keep the price of Silver at bay, whereas a weaker Dollar is likely to propel prices up. Other factors such as investment demand, mining supply – Silver is much more abundant than Gold – and recycling rates can also affect prices.
Silver is widely used in industry, particularly in sectors such as electronics or solar energy, as it has one of the highest electric conductivity of all metals – more than Copper and Gold. A surge in demand can increase prices, while a decline tends to lower them. Dynamics in the US, Chinese and Indian economies can also contribute to price swings: for the US and particularly China, their big industrial sectors use Silver in various processes; in India, consumers’ demand for the precious metal for jewellery also plays a key role in setting prices.
Silver prices tend to follow Gold's moves. When Gold prices rise, Silver typically follows suit, as their status as safe-haven assets is similar. The Gold/Silver ratio, which shows the number of ounces of Silver needed to equal the value of one ounce of Gold, may help to determine the relative valuation between both metals. Some investors may consider a high ratio as an indicator that Silver is undervalued, or Gold is overvalued. On the contrary, a low ratio might suggest that Gold is undervalued relative to Silver.
Japanese Chief Cabinet Secretary Yoshimasa Hayashi is out with some verbal intervention, as the Yen once again sees heavy selling pressure against the US Dollar early Tuesday.e
Key quotes
No comment on forex intervention.
Believe forex should reflect fundamentals.
Market reaction
USD/JPY is holding higher ground near 158.65 on these above comments, adding 0.40% on the day.
| Raw materials | Closed | Change, % |
|---|---|---|
| Silver | 30.665 | -0.41 |
| Gold | 242.18 | 0.41 |
| Palladium | 947.23 | -2.23 |
- The Indian Rupee loses momentum in Tuesday’s Asian session amid a stronger Greenback.
- India’s foreign fund inflows, rising Fed rate cut bets, and lower crude oil prices might cap the INR’s downside.
- Investors await the US June Retail Sales and Fed’s Kugler speech on Tuesday.
The Indian Rupee (INR) extends downside on Tuesday as the US Dollar (USD) strengthened across the board. The weakness in the Chinese Yuan after slower-than-expected economic growth in China for the second quarter might weigh on Asian currencies, including the INR.
Nonetheless, the significant India’s foreign fund inflows and the rising odds of the US Federal Reserve (Fed) rate cuts in September could limit the loss in the local currency. Also, the fall in crude oil prices underpin the INR as India was the third-largest oil consumer after the United States (US) and China. Later on Tuesday, investors will monitor the US Retail Sales for June and the speech from the Federal Reserve’s (Fed) Adriana Kugler.
Daily Digest Market Movers: Indian Rupee remains sensitive to global factors and risk sentiment
- India’s Wholesale Price Index (WPI) Inflation rose to a 16-month high of 3.36% YoY in June from 2.61% in May, according to the latest official data released on Monday. This figure was weaker than the 3.50% expected.
- "Positive rate of inflation in June, 2024 is primarily due to increase in prices of food articles, manufacture of food products, crude petroleum & natural gas, mineral oils, other manufacturing etc," said the official press release.
- Indian WPI Food came in at 10.87% YoY in June, compared to 9.82% in May. Meanwhile, the WPI Fuel arrived at 1.03% versus 1.35% earlier.
- Fed Chair Jerome Powell said on Monday that the US has performed remarkably well in recent years, adding that the central bank won't be waiting until inflation reaches the 2% annual target.
- Federal Reserve Bank of San Francisco President Mary Daly did not provide time-based rate cut guidance but acknowledged significant progress on inflation.
Technical analysis: USD/INR sticks to the consolidation scheme in the short-term
The Indian Rupee weakens on the day. The trend of the USD/INR pair appears to be bullish, with the pair holding above the key 100-day Exponential Moving Average (EMA) on the daily chart. Additionally, the 14-day Relative Strength Index (RSI) points higher above 56.40, indicating that further upside looks favorable.
In the near term, the pair has traded within its month-long trading range since March 21.
A move past the resistance area at the upper boundary of the trading range at 83.65 could clear the way for a move back to the all-time high of 83.75. The next upside barrier will emerge at the 84.00 psychological level.
On the other hand, the initial target could be the support level around the 100-day EMA at 83.37. If bearish momentum continues, look for further downside toward the 83.00 round figure, followed by 82.82, a low of January 12.
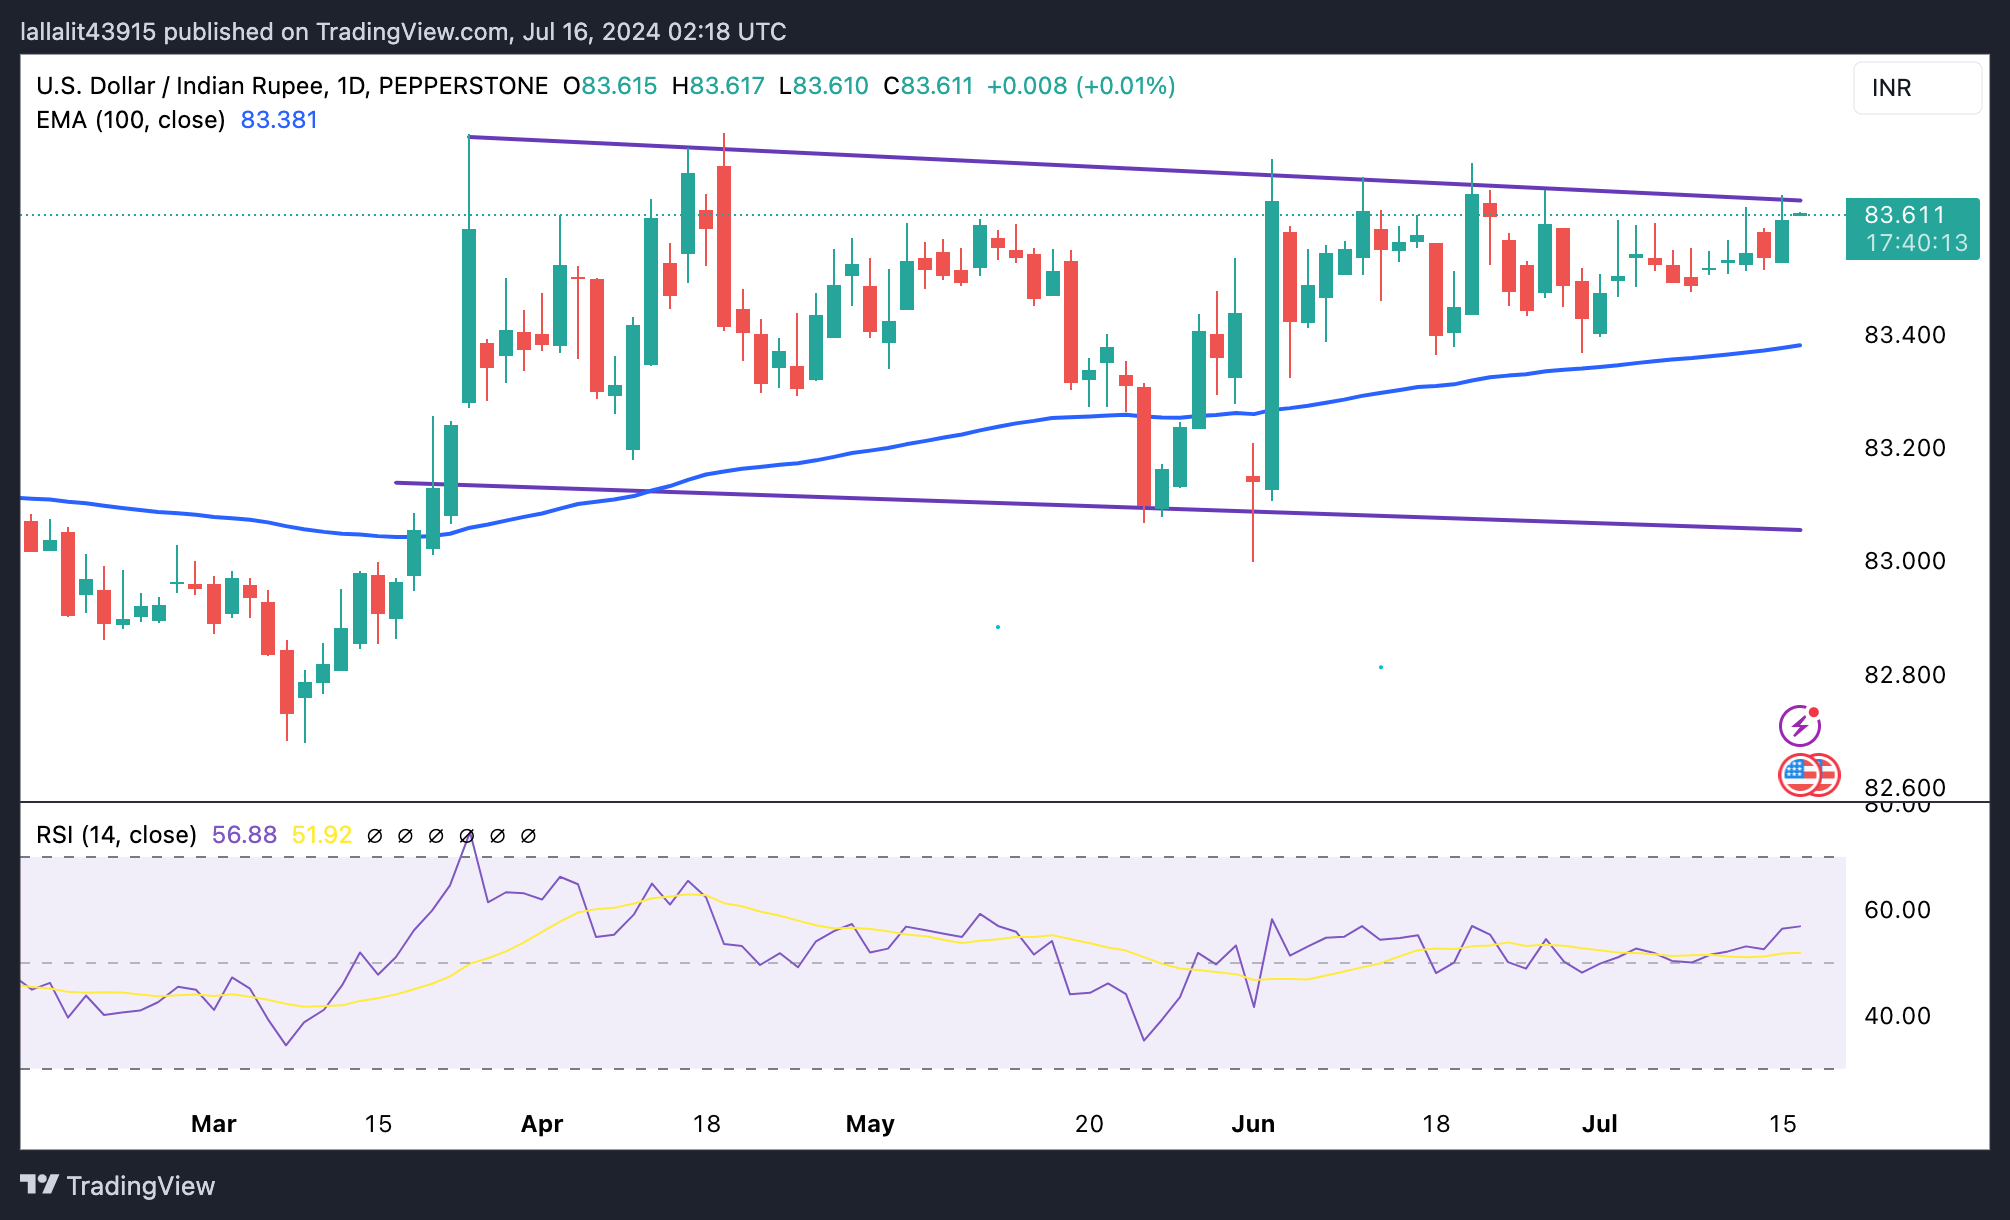
Indian Rupee FAQs
The Indian Rupee (INR) is one of the most sensitive currencies to external factors. The price of Crude Oil (the country is highly dependent on imported Oil), the value of the US Dollar – most trade is conducted in USD – and the level of foreign investment, are all influential. Direct intervention by the Reserve Bank of India (RBI) in FX markets to keep the exchange rate stable, as well as the level of interest rates set by the RBI, are further major influencing factors on the Rupee.
The Reserve Bank of India (RBI) actively intervenes in forex markets to maintain a stable exchange rate, to help facilitate trade. In addition, the RBI tries to maintain the inflation rate at its 4% target by adjusting interest rates. Higher interest rates usually strengthen the Rupee. This is due to the role of the ‘carry trade’ in which investors borrow in countries with lower interest rates so as to place their money in countries’ offering relatively higher interest rates and profit from the difference.
Macroeconomic factors that influence the value of the Rupee include inflation, interest rates, the economic growth rate (GDP), the balance of trade, and inflows from foreign investment. A higher growth rate can lead to more overseas investment, pushing up demand for the Rupee. A less negative balance of trade will eventually lead to a stronger Rupee. Higher interest rates, especially real rates (interest rates less inflation) are also positive for the Rupee. A risk-on environment can lead to greater inflows of Foreign Direct and Indirect Investment (FDI and FII), which also benefit the Rupee.
Higher inflation, particularly, if it is comparatively higher than India’s peers, is generally negative for the currency as it reflects devaluation through oversupply. Inflation also increases the cost of exports, leading to more Rupees being sold to purchase foreign imports, which is Rupee-negative. At the same time, higher inflation usually leads to the Reserve Bank of India (RBI) raising interest rates and this can be positive for the Rupee, due to increased demand from international investors. The opposite effect is true of lower inflation.
- Gold price remains close to a nearly two-month top set on Monday amid rising Fed rate cut bets.
- Investors seem convinced that the Fed will begin its rate-cutting cycle at the September meeting.
- The risk-on mood, along with a modest US Dollar strength, might cap the upside for the XAU/USD.
Gold price (XAU/USD) attracts some dip-buyers during the Asian session on Tuesday and for now, seems to have stalled the previous day's late pullback from the $2,430 area, or its highest level since May 20. The overnight comments from Federal Reserve (Fed) Chair Jerome Powell reaffirmed market expectations that the US central bank will begin cutting interest rates as soon as September. This keeps the US Treasury bond yields depressed and is seen as a key factor acting as a tailwind for the non-yielding yellow metal.
Meanwhile, a failed assassination attempt on leading Republican candidate Donald Trump improved his chances of winning the 2024 presidential election and raised hopes of a looser regulatory environment. This further boosts investors' appetite for riskier assets and might keep a lid on any meaningful appreciating move for the safe-haven Gold price. Moreover, the assumption that Trump policies would add to government debt and inflation benefits the US Dollar (USD), which could also contribute to capping the upside for the XAU/USD.
-
Daily Digest Market Movers: Gold price continues to draw support from dovish Fed expectations
- Federal Reserve Chair Jerome Powell said on Monday that the recent inflation data had added to confidence that price increases are returning to the target in a sustainable fashion.
- The US Labor Department reported last week that the headline CPI dipped in June for the first time in more than four years, and the yearly rate decelerated to 3% from 3.3% in May.
- Powell added that the Fed doesn't expect to wait until inflation reaches 2% before acting, suggesting that rate cuts may not be far off and lending some support to the Gold price.
- The current market pricing indicates a greater chance that the Fed will lower borrowing costs in September and the possibility of another interest rate cut by the end of this year.
- The US Dollar, meanwhile, gains some positive traction and moves away from over a three-month low touched on Monday, which might cap any further gains for the commodity.
- Apart from this, an extension of the risk-on rally across the global equity markets should contribute to keeping a lid on the safe-haven XAU/USD ahead of the US Retail Sales.
- According to the consensus estimates, the headline sales are expected to remain flat in May, while sales excluding automobiles are forecasted to rise by 0.1% during the reported month.
Technical Analysis: Gold price seems poised to retest all-time peak, near $2,450 touched in May
From a technical perspective, last week's breakout through the $2,390-2,388 supply zone and sustained strength above the $2,400 mark favors bullish traders. Furthermore, oscillators on the daily chart hold in positive territory and are still away from being in the overbought zone, suggesting that the path of least resistance for the Gold price is to the upside. Hence, a subsequent strength towards challenging the all-time peak, around the $2,450 area touched in May, looks like a distinct possibility. Some follow-through buying will be seen as a fresh trigger for bullish traders and pave the way for an extension of the recent uptrend witnessed over the past three weeks or so.
On the flip side, dips below the $2,400 round figure could now be seen as a buying opportunity and remain limited near the $2,390-2,388 resistance breakpoint. Some follow-through selling, however, could drag the Gold price to the $2,358 region with some intermediate support near the $2,372-2,371 area. The subsequent fall might expose the 50-day Simple Moving Average (SMA) support, currently pegged near the $2,350 region.
Gold FAQs
Gold has played a key role in human’s history as it has been widely used as a store of value and medium of exchange. Currently, apart from its shine and usage for jewelry, the precious metal is widely seen as a safe-haven asset, meaning that it is considered a good investment during turbulent times. Gold is also widely seen as a hedge against inflation and against depreciating currencies as it doesn’t rely on any specific issuer or government.
Central banks are the biggest Gold holders. In their aim to support their currencies in turbulent times, central banks tend to diversify their reserves and buy Gold to improve the perceived strength of the economy and the currency. High Gold reserves can be a source of trust for a country’s solvency. Central banks added 1,136 tonnes of Gold worth around $70 billion to their reserves in 2022, according to data from the World Gold Council. This is the highest yearly purchase since records began. Central banks from emerging economies such as China, India and Turkey are quickly increasing their Gold reserves.
Gold has an inverse correlation with the US Dollar and US Treasuries, which are both major reserve and safe-haven assets. When the Dollar depreciates, Gold tends to rise, enabling investors and central banks to diversify their assets in turbulent times. Gold is also inversely correlated with risk assets. A rally in the stock market tends to weaken Gold price, while sell-offs in riskier markets tend to favor the precious metal.
The price can move due to a wide range of factors. Geopolitical instability or fears of a deep recession can quickly make Gold price escalate due to its safe-haven status. As a yield-less asset, Gold tends to rise with lower interest rates, while higher cost of money usually weighs down on the yellow metal. Still, most moves depend on how the US Dollar (USD) behaves as the asset is priced in dollars (XAU/USD). A strong Dollar tends to keep the price of Gold controlled, whereas a weaker Dollar is likely to push Gold prices up.
- The Australian Dollar remains weaker due to risk aversion following the attempted assassination of Donald Trump.
- The AUD/USD pair may limit its downside as persistently high inflation prompts the RBA to maintain a hawkish stance.
- CME Group’s FedWatch Tool indicates an 85.7% probability of a 25-basis point cut in September, up from 71.0% a week earlier.
The Australian Dollar (AUD) continues to decline for the second consecutive session on Tuesday. The AUD/USD pair loses ground due to a modest rebound in the US Dollar (USD), which could be attributed to increased risk aversion following the attempted assassination of former US President Donald Trump on Saturday. Investors are also looking ahead to the US June Retail Sales data, which are set to be released later today, for further insights.
The AUD/USD pair remains close to its strongest levels as speculation grows that the Reserve Bank of Australia (RBA) might delay joining the global rate-cutting cycle or even raise interest rates again. Persistently high inflation in Australia prompts the RBA to maintain a hawkish stance. In contrast, cooling US inflation strengthened bets for a Federal Reserve rate cut in September.
The US Dollar (USD) may limit its upside due to increasing speculation that the US Fed will lower borrowing costs. According to CME Group’s FedWatch Tool, markets now indicate an 85.7% probability of a 25-basis point rate cut at the September Fed meeting, up from 71.0% a week earlier.
Daily Digest Market Movers: Australian Dollar declines due to risk-off mood
- Fed Chair Jerome Powell mentioned on Monday that the three US inflation readings of this year "add somewhat to confidence" that inflation is on course to meet the Fed’s target in a sustainable manner, suggesting that a shift to interest rate cuts may not be far off.
- Fed Bank of San Francisco President Mary Daly stated that inflation is cooling down in a way that bolsters confidence that it’s on its way to 2%. However, Daly added that more information is needed before making a rate decision.
- In China, a close trade partner of Australia, Gross Domestic Product (GDP) grew 4.7% year-over-year in the second quarter, compared to a 5.3% expansion in the first quarter and an expected 5.1%.
- The National Bureau of Statistics (NBS) reported that China's economy operated generally steadily in the first half of the year, with H1 GDP growth at +5.0% year-on-year. Looking ahead, the NBS highlighted increasing external uncertainties and numerous domestic challenges that China's economy faces in the second half of the year.
- US President Joe Biden on Monday addressed the nation from the White House, where he condemned all political violence and called for unity, per CNBC. Biden further stated that “it’s time to cool it down” and noted not just the weekend attack on Trump but also the possibility of election-year violence on multiple fronts.
- China's Retail Sales (YoY) increased by 2.0% in June, falling short of the expected 3.3% and below May's 3.7%. Meanwhile, the country's Industrial Production for the same period showed a growth rate of 5.3% year-over-year, surpassing estimates of 5.0%, albeit slightly lower than May's 5.6%.
- On Thursday, the data showed that the US Core Consumer Price Index (CPI), which excludes volatile food and energy prices, rose by 3.3% year-over-year in June, compared to May's increase of 3.4% and the same expectation. Meanwhile, the core CPI increased by 0.1% month-over-month, against the expected and prior reading of 0.2%.
Technical Analysis: Australian Dollar hovers around 0.6750
The Australian Dollar trades around 0.6750 on Tuesday. The analysis of the daily chart shows that the AUD/USD pair consolidates within an ascending channel, indicating a bullish bias. However, the 14-day Relative Strength Index (RSI) declines toward the 50 level, suggesting a correction. A further decline could weaken the bullish trend.
The AUD/USD pair may test the psychological level of 0.6800. A breakthrough above this level could support the pair to approach the upper boundary of the ascending channel near 0.6810.
On the downside, immediate support appears around the nine-day Exponential Moving Average (EMA) at 0.6743. Further support is seen near the lower boundary of the ascending channel at 0.6695. A break below this level could push the AUD/USD pair toward the throwback support at 0.6590.
AUD/USD: Daily Chart
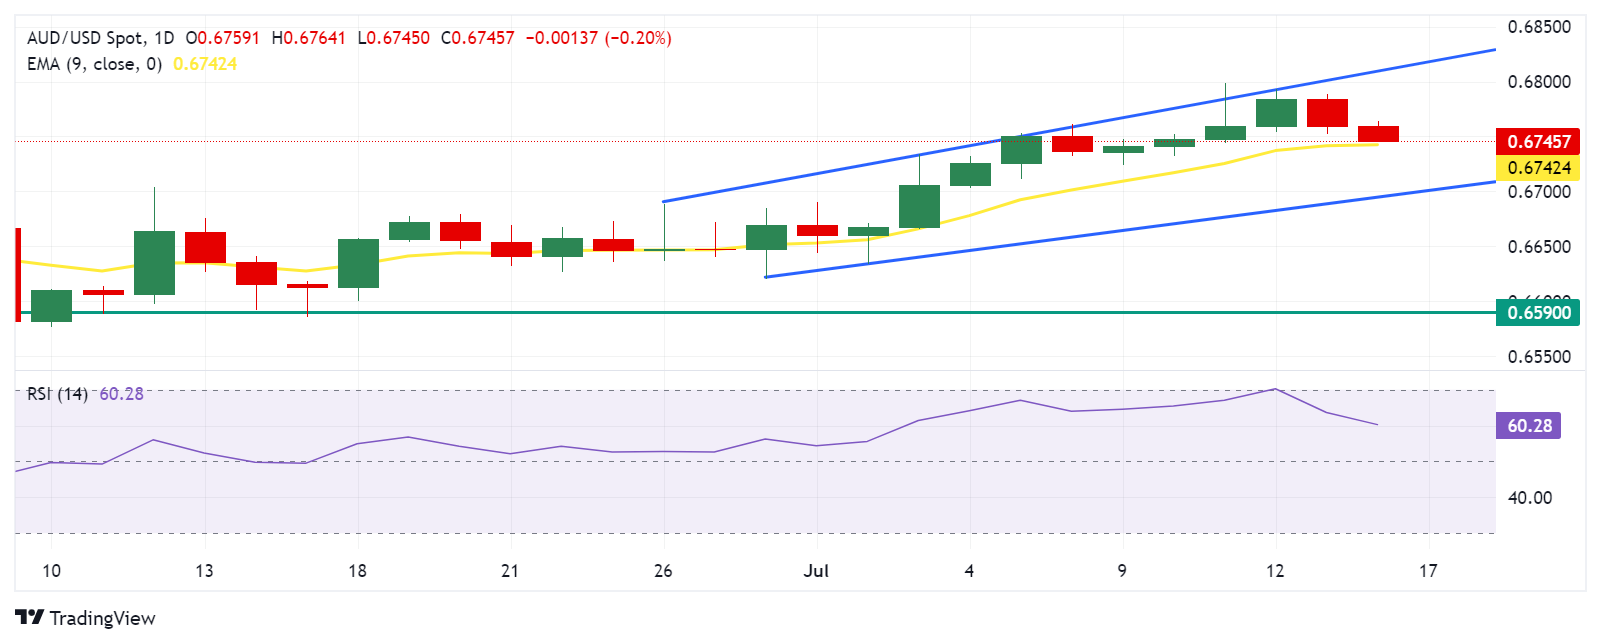
Interest rates FAQs
Interest rates are charged by financial institutions on loans to borrowers and are paid as interest to savers and depositors. They are influenced by base lending rates, which are set by central banks in response to changes in the economy. Central banks normally have a mandate to ensure price stability, which in most cases means targeting a core inflation rate of around 2%. If inflation falls below target the central bank may cut base lending rates, with a view to stimulating lending and boosting the economy. If inflation rises substantially above 2% it normally results in the central bank raising base lending rates in an attempt to lower inflation.
Higher interest rates generally help strengthen a country’s currency as they make it a more attractive place for global investors to park their money.
Higher interest rates overall weigh on the price of Gold because they increase the opportunity cost of holding Gold instead of investing in an interest-bearing asset or placing cash in the bank. If interest rates are high that usually pushes up the price of the US Dollar (USD), and since Gold is priced in Dollars, this has the effect of lowering the price of Gold.
The Fed funds rate is the overnight rate at which US banks lend to each other. It is the oft-quoted headline rate set by the Federal Reserve at its FOMC meetings. It is set as a range, for example 4.75%-5.00%, though the upper limit (in that case 5.00%) is the quoted figure. Market expectations for future Fed funds rate are tracked by the CME FedWatch tool, which shapes how many financial markets behave in anticipation of future Federal Reserve monetary policy decisions.
The People’s Bank of China (PBOC) set the USD/CNY central rate on Tuesday at 7.1328, as against the previous day's fix of 7.1313 and 7.2671 Reuters estimates.
- USD/JPY edges higher to 158.30 in Tuesday’s early Asian session.
- Fed officials acknowledged significant progress on inflation.
- The pair’s upside might be limited amid the fear of FX intervention by Japanese authorities.
The USD/JPY pair trades on a stronger note around 158.30 on Tuesday during the early Asian trading hours. The uptick of the pair is bolstered by the modest rebound in US Dollar (USD). Investors will take more cues from the US June Retail Sales and the speech from the Federal Reserve’s (Fed) Adriana Kugler.
Fed Chair Jerome Powell said on Monday the three US inflation readings of this year "add somewhat to confidence" that the inflation is on course to meet the Fed’s target in a sustainable fashion, suggesting a shift to interest rate cuts may not be far off. Fed Bank of San Francisco President Mary Daly stated that inflation is cooling down in a way that bolsters confidence that it’s on its way to 2%. However, Daly added that more information is needed before making a rate decision.
The growing speculation that the US Fed would lower its borrowing costs might undermine the Greenback in the near term. According to the CME’s FedWatch Tool, the market is now pricing in 100% odds that the Fed funds rate will decline by at least 25 basis points when the Federal Open Market Committee (FOMC) meets in September.
The potential foreign exchange (FX) intervention by Japanese authorities might provide some support to the Japanese Yen (JPY). On Friday, Japanese Finance Minister Shunichi Suzuki highlighted that rapid FX movements are undesirable. Meanwhile, Japanese Chief Cabinet Secretary Yoshimasa Hayashi said that he is “ready to take all possible means on forex.”
Japanese Yen FAQs
The Japanese Yen (JPY) is one of the world’s most traded currencies. Its value is broadly determined by the performance of the Japanese economy, but more specifically by the Bank of Japan’s policy, the differential between Japanese and US bond yields, or risk sentiment among traders, among other factors.
One of the Bank of Japan’s mandates is currency control, so its moves are key for the Yen. The BoJ has directly intervened in currency markets sometimes, generally to lower the value of the Yen, although it refrains from doing it often due to political concerns of its main trading partners. The current BoJ ultra-loose monetary policy, based on massive stimulus to the economy, has caused the Yen to depreciate against its main currency peers. This process has exacerbated more recently due to an increasing policy divergence between the Bank of Japan and other main central banks, which have opted to increase interest rates sharply to fight decades-high levels of inflation.
The BoJ’s stance of sticking to ultra-loose monetary policy has led to a widening policy divergence with other central banks, particularly with the US Federal Reserve. This supports a widening of the differential between the 10-year US and Japanese bonds, which favors the US Dollar against the Japanese Yen.
The Japanese Yen is often seen as a safe-haven investment. This means that in times of market stress, investors are more likely to put their money in the Japanese currency due to its supposed reliability and stability. Turbulent times are likely to strengthen the Yen’s value against other currencies seen as more risky to invest in.
| Index | Change, points | Closed | Change, % |
|---|---|---|---|
| Hang Seng | -277.44 | 18015.94 | -1.52 |
| KOSPI | 3.92 | 2860.92 | 0.14 |
| ASX 200 | 58.3 | 8017.6 | 0.73 |
| DAX | -157.29 | 18590.89 | -0.84 |
| CAC 40 | -91.61 | 7632.71 | -1.19 |
| Dow Jones | 210.82 | 40211.72 | 0.53 |
| S&P 500 | 15.87 | 5631.22 | 0.28 |
| NASDAQ Composite | 74.12 | 18472.57 | 0.4 |
| Pare | Closed | Change, % |
|---|---|---|
| AUDUSD | 0.67599 | -0.11 |
| EURJPY | 172.232 | -0 |
| EURUSD | 1.08936 | 0.05 |
| GBPJPY | 204.988 | -0.08 |
| GBPUSD | 1.2966 | -0.02 |
| NZDUSD | 0.60745 | -0.49 |
| USDCAD | 1.36807 | 0.26 |
| USDCHF | 0.89534 | -0.05 |
| USDJPY | 158.101 | -0.06 |


© 2000-2026. All rights reserved.
This site is managed by Teletrade D.J. LLC 2351 LLC 2022 (Euro House, Richmond Hill Road, Kingstown, VC0100, St. Vincent and the Grenadines).
The information on this website is for informational purposes only and does not constitute any investment advice.
The company does not serve or provide services to customers who are residents of the US, Canada, Iran, The Democratic People's Republic of Korea, Yemen and FATF blacklisted countries.
Making transactions on financial markets with marginal financial instruments opens up wide possibilities and allows investors who are willing to take risks to earn high profits, carrying a potentially high risk of losses at the same time. Therefore you should responsibly approach the issue of choosing the appropriate investment strategy, taking the available resources into account, before starting trading.
Use of the information: full or partial use of materials from this website must always be referenced to TeleTrade as the source of information. Use of the materials on the Internet must be accompanied by a hyperlink to teletrade.org. Automatic import of materials and information from this website is prohibited.
Please contact our PR department if you have any questions or need assistance at pr@teletrade.global.
transfers