- Analytics
- News and Tools
- Market News
CFD Markets News and Forecasts — 16-05-2024
- EUR/USD slumps back from 1.0900 on Thursday’s broad USD recovery.
- Economic data strictly mid-tier on Friday, main focus to be on policymaker appearances.
- Next week brings PMI figures for both the EU and the US.
EUR/USD eased slightly on Thursday, falling back below 1.0880 as the Greenback broadly recovers losses from earlier in the week. The pair remains notably up for the trading week, but a late break for the US Dollar is on the cards as investors second-guess the Fed Reserve’s (Fed) stance on rate cuts and keep one foot in the safe haven USD.
A June rate cut from the European Central Bank (ECB) is getting priced in by traders. ECB policymakers have been prodding markets cautiously in recent appearances, but ECB Governing Council member and Governor of the Latvian central bank Martins Kazaks announced Thursday that a June rate cut is definitely on the table. Markets will be keeping a close eye on next week’s Purchasing Manager’s Index (PMI) figures that are due from both the EU and the US.
Read more: Fed officials stick to cautious tones
Fed officials continue to dominate investor focus, with multiple policymaker from the US central bank giving soundbites on Thursday. Fed officials have broadly struck a notably cautious tone as the Fed tries to keep market hopes for Fed rate cuts to a dull simmer. At current cut, the CME’s FedWatch Tool shows rate markets are pricing in 70% odds of at least a quarter-point cut from the Fed in September, with 90% odds of two total rate cuts by the end of year.
Several central bankers are expected to make appearances on Friday, with a speech from the ECB’s Luis de Guindos, and the Fed’s Neel Kashkari, Christopher Waller, and Mary Daly on the docket to round out the trading week.
EUR/USD technical outlook
EUR/USD trimmed away some gains, briefly falling back below 1.0860 on Thursday, but the pair remains notably bullish in the near-term, trading well above the 200-hour Exponential Moving Average (EMA) at 1.0802. The pair is testing into its highest bids since mid-March, and is on pace to close in the green for a fourth consecutive week.
Bullish momentum has carried EUR/USD back above the 200-day EMA at 1.0799, and the pair is up 2.5% from the last swing low into the 1.0600 handle. A technical ceiling is priced in at the March swing high of 1.0980, and bulls will have their work cut out for them if a push back to the 1.1000 handle is to be achieved.
EUR/USD hourly chart
EUR/USD daily chart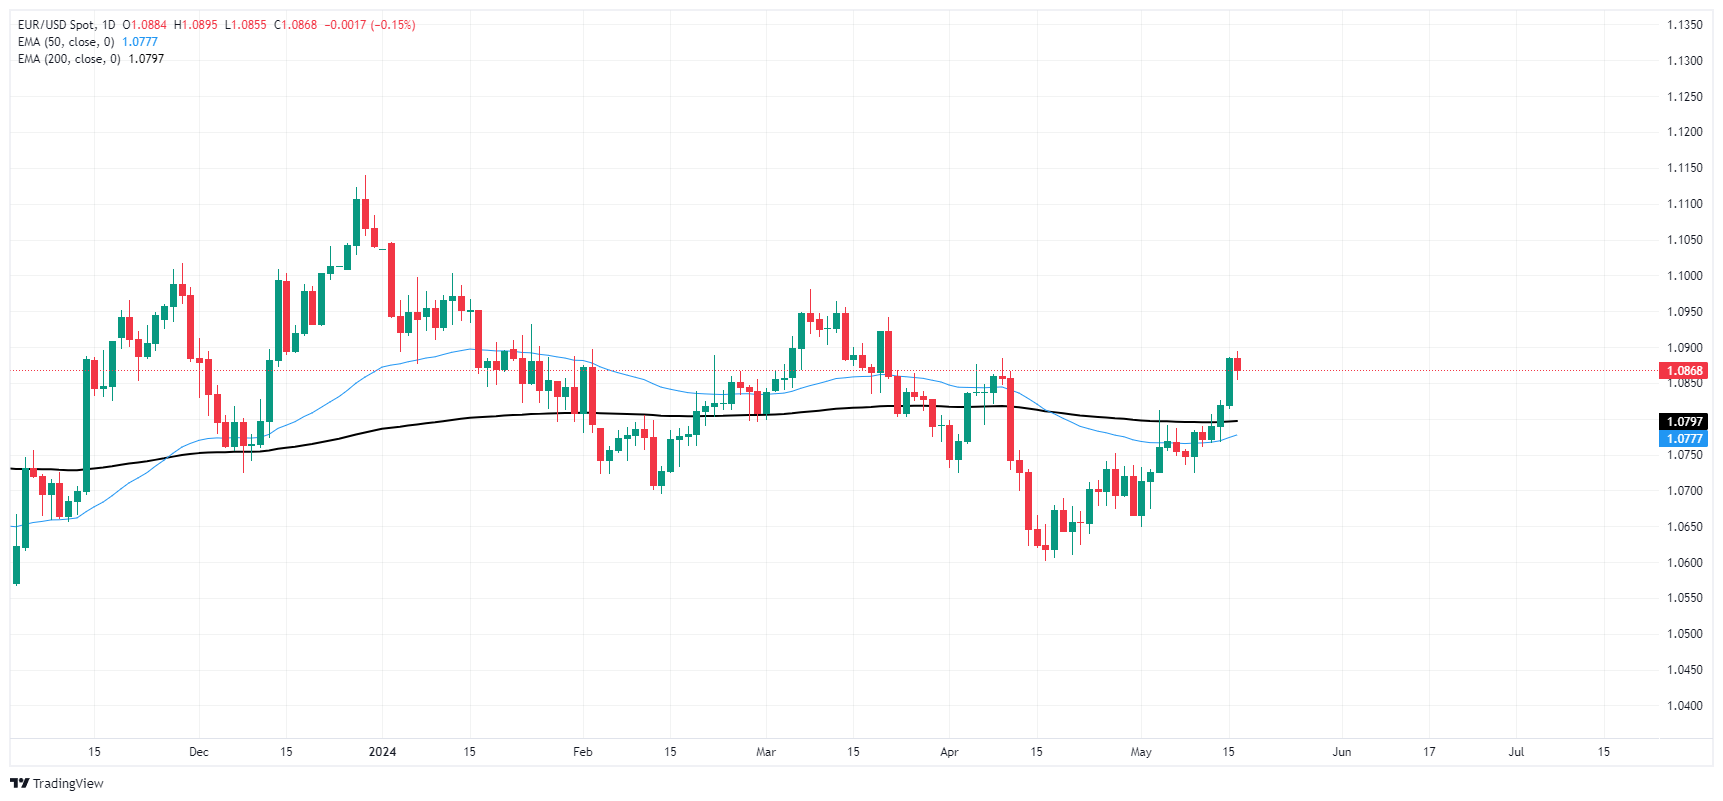
- GBP/USD trades with a mild positive bias around 1.2670 on Friday.
- Fed officials said it might take longer for inflation to reach their target, emphasizing the need to keep rates high for longer.
- BoE’s Greene noted she wants more data on price pressures easing before it starts cutting its rate.
The GBP/USD pair posts modest gains near 1.2670 during the early Asian session on Friday. Meanwhile, the USD Index (DXY) recovers some lost ground after retracing to multi-week lows near 104.00 in the previous session. The Federal Reserve (Fed) sticks to cautious tones regarding inflation and the chance of rate cuts this year. Investors will take more cues from the Fed’s Kashkari, Waller, and Daly speeches later in the day.
Several Fed officials emphasized the need to keep borrowing costs high for longer as they await more evidence that inflation is easing. On Thursday, Fed Bank of Atlanta President Raphael Bostic cautioned about the need for patience with interest rates, saying that there is still a lot of pricing pressure in the US economy. Cleveland Fed President Loretta Mester stated that it might take longer than expected to gain confidence about the path of inflation, adding that the Fed should hold its restrictive stance for longer. The cautious approach from the Fed policymakers has provided some support to the Greenback and weighs on the major pair.
The number of Americans filing new claims for jobless benefits rose by 222K for the week ending May 11, the US Department of Labor (DoL) reported Thursday. The figure came in above the market consensus of 220K and below the previous reading of 232K gains.
On the GBP’s front, the Bank of England (BoE) noted last week that the UK central bank needs to see more evidence that inflation will stay low, but he thought the inflation is moving in the right direction and a June cut cannot be ruled out. The BoE policymaker Megan Greene said the BoE wants more data on price pressures easing before it starts easing policy. The expectation that the UK central bank might cut the interest rate before the US Fed is likely to weigh on the Pound Sterling (GBP) and cap the upside of the GBP/USD pair in the near term.
New Zealand's Producer Price Index (PPI) inputs and outputs rose in the first quarter, with business input prices rising 0.7% (previous 0.9%), and business output prices rising 0.9% (previous 0.7%).
According to Stats NZ, the largest contributor to output prices were electricity and gas, which rose 8.8% QoQ, with energies also making up the largest contributor to input prices, which climbed 11.6%. Insurance costs also contributed heavily to PPI input cost increases, rising 5.0% QoQ.
Market reaction
As markets head into the Pacific Friday market session, NZD/USD is trading on the high side. The pair is testing above 0.6120 after setting a Thursday peak above 0.6145.
About New Zealand's Produce Price Index - Output
The Producer Price Index Out released by the Statistics New Zealand is a measurement of the price changes of goods produced by the producers in New Zealand. Generally speaking, a price hike generates higher retail prices for consumers. Thus, a high reading is seen as positive (or bullish) for the NZD, while a low reading is seen as negative (or bearish).
- Australian Dollar trades at 0.6678, down 0.23%, influenced by higher US yields.
- Jobless claims rise, housing data fluctuates, and industrial production stalls.
- Fed officials suggest higher rates may persist as Australian jobs report shows mixed results with unemployment revised to 4.1%.
The Australian Dollar posted losses of 0.23% against the US Dollar on Thursday amid higher US yields that underpinned the Greenback during the day. Wall Street hit new all-time highs but retreated afterward, ending the session with losses. As Friday’s Asian session begins, the AUD/USD trades at 0.6678, virtually unchanged.
AUD/USD down as US yields rise and traders speculate on potential Federal Reserve policy easing
Traders’ sentiment remains upbeat, as speculations that the Federal Reserve would join the list of central banks that might ease policy grew. The latest US consumer inflation report on Wednesday increased the odds that the Fed might cut at least 41 basis points toward the end of 2024.
On Thursday, Initial Jobless Claims for the last week increased by 222K, above estimates, but trailed the prior week’s 232K. Other data showed that housing data was mixed, with Housing Starts increasing 5.7% YoY, while Building Permits plunged -3%.
Elsewhere, the Fed revealed that Industrial Production stalled in April, coming to 0% MoM, below estimates and the prior month’s 0.1% increase.
Meanwhile, a slew of Fed officials hit the wires on Thursday, saying the central bank should keep rates higher for longer as they wait for more evidence that inflation is slowing. The Fed Regional Bank Presidents Loretta Mester, John Williams, and Thomas Barkin argued that curb inflation to their 2% goal may take longer than expected.
On the Aussies' front, the latest jobs report revealed the economy added 38.5K jobs in April, but the unemployment rate was revised from 3.9% to 4.1%. Most of the jobs added were part-time, with figures rising 44.6K, offsetting the losses of full-time employment of -6.1 K.
ANZ analysts said, “The weakness in hours worked and the moderation in yearly wage growth reported in the Wage Price Index together confirm a picture of a softening labour market. There is no change to our RBA view off the back of these data.”
Ahead of the week, the Australian docket is empty, while the US one will feature further Fed speaking, led by Governor Christopher Waller.
AUD/USD Price Analysis: Technical outlook
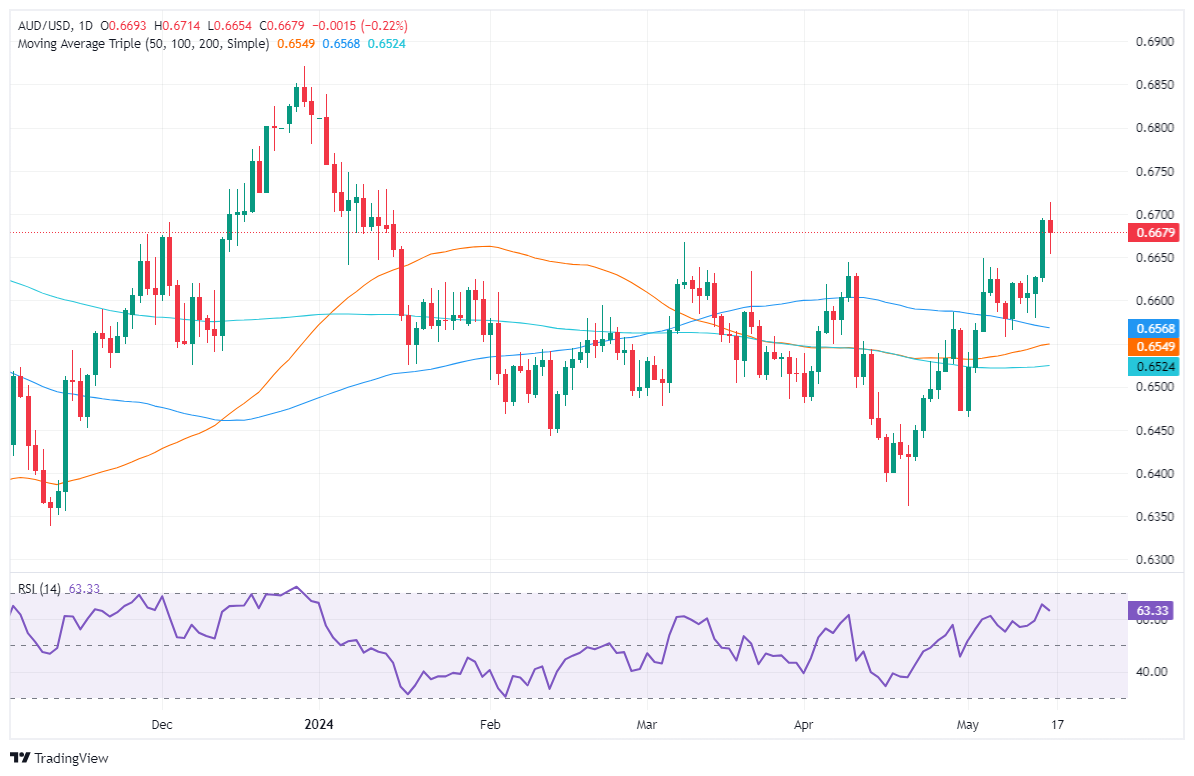
The AUD/USD uptrend remains in place, though it paused after breaching the 0.6700 figure. Although momentum is on the bulls’ side, as depicted by the Relative Strength Index (RSI), a drop below the Thursday low of 0.6654 could exacerbate a drop toward the May 14 low of 0.6579. On the other hand, if buyers regain 0.6700, that could pave the way to test the current week's high of 0.6714, ahead of challenging 0.6750.
Australian Dollar PRICE This week
The table below shows the percentage change of Australian Dollar (AUD) against listed major currencies this week. Australian Dollar was the strongest against the US Dollar.
| USD | EUR | GBP | JPY | CAD | AUD | NZD | CHF | |
|---|---|---|---|---|---|---|---|---|
| USD | -0.87% | -1.14% | -0.22% | -0.39% | -1.13% | -1.58% | -0.04% | |
| EUR | 0.87% | -0.32% | 0.64% | 0.46% | -0.29% | -0.73% | 0.83% | |
| GBP | 1.14% | 0.32% | 0.91% | 0.79% | 0.03% | -0.41% | 1.16% | |
| JPY | 0.22% | -0.64% | -0.91% | -0.20% | -0.89% | -1.43% | 0.23% | |
| CAD | 0.39% | -0.46% | -0.79% | 0.20% | -0.72% | -1.21% | 0.28% | |
| AUD | 1.13% | 0.29% | -0.03% | 0.89% | 0.72% | -0.54% | 1.13% | |
| NZD | 1.58% | 0.73% | 0.41% | 1.43% | 1.21% | 0.54% | 1.57% | |
| CHF | 0.04% | -0.83% | -1.16% | -0.23% | -0.28% | -1.13% | -1.57% |
The heat map shows percentage changes of major currencies against each other. The base currency is picked from the left column, while the quote currency is picked from the top row. For example, if you pick the Australian Dollar from the left column and move along the horizontal line to the US Dollar, the percentage change displayed in the box will represent AUD (base)/USD (quote).
- USD/JPY pares away recent declines but still down from recent peaks.
- Japanese GDP contracts more than expected, battering Yen.
- Fedspeak weighs on risk sentiment, but rate cut hopes remain.
USD/JPY recovered ground on Thursday, climbing back over the 155.00 handle after dipping to 153.60 on Wednesday. Japanese growth figures contracted more than expected, and Federal Reserve (Fed) rate cut hopes are struggling beneath the weight of cautionary talking points from Fed officials.
Japan’s Gross Domestic Product (GDP) contracted more than expected in the first quarter, declining -0.5% QoQ compared to the previous quarter’s flat 0.0% print, revised down slightly from the initial print of 0.1%. Markets were expecting a -0.4% contraction. Annualized Japanese GDP growth also contracted, decline -2.0% for the year ended Q1, worse than the expected -1.5% and down from the previous 0.0% (also revised down from 0.4%).
Read more: Fed officials stick to cautious tones, but outlook beginning to tease rate cuts
Fed officials have begrudgingly begun to hint at the possibility of late-year rate cuts in 2024, but remain overly cautious regarding the US’ inflation outlook and still-tight labor market. Inflationary pressures continue to ease, helping to bolster broad-market hopes for a Fed rate cut, but price growth still remains well above the Fed’s 2% target, and Fed policymakers are leery after disinflation progress slowed in the first quarter.
Despite risk appetite cooling slightly during the Thursday US market session, rate traders still expect the Fed to meet rate cut expectations. According to the CME’s FedWatch Tool, rate markets are pricing in 70% odds of a September rate trim of at least a quarter of a percent.
USD/JPY technical outlook
USD/JPY’s technical recovery on Thursday dragged the pair back over the 155.00 handle, but technical resistance sits nearby at the 200-hour Exponential Moving Average (EMA) at 155.44. The pair remains down from the last swing high above 156.50, but USD/JPY has recovered from the near-term low near 152.00.
USD/JPY is still trading deeply into bull country, bolstered above the 50-day EMA at 153.36 and trading well above the 200-day EMA at 148.48. Despite a suspected “Yentervention” from the Bank of Japan (BoJ) recently, the pair is still up over 10% in 2024.
USD/JPY hourly chart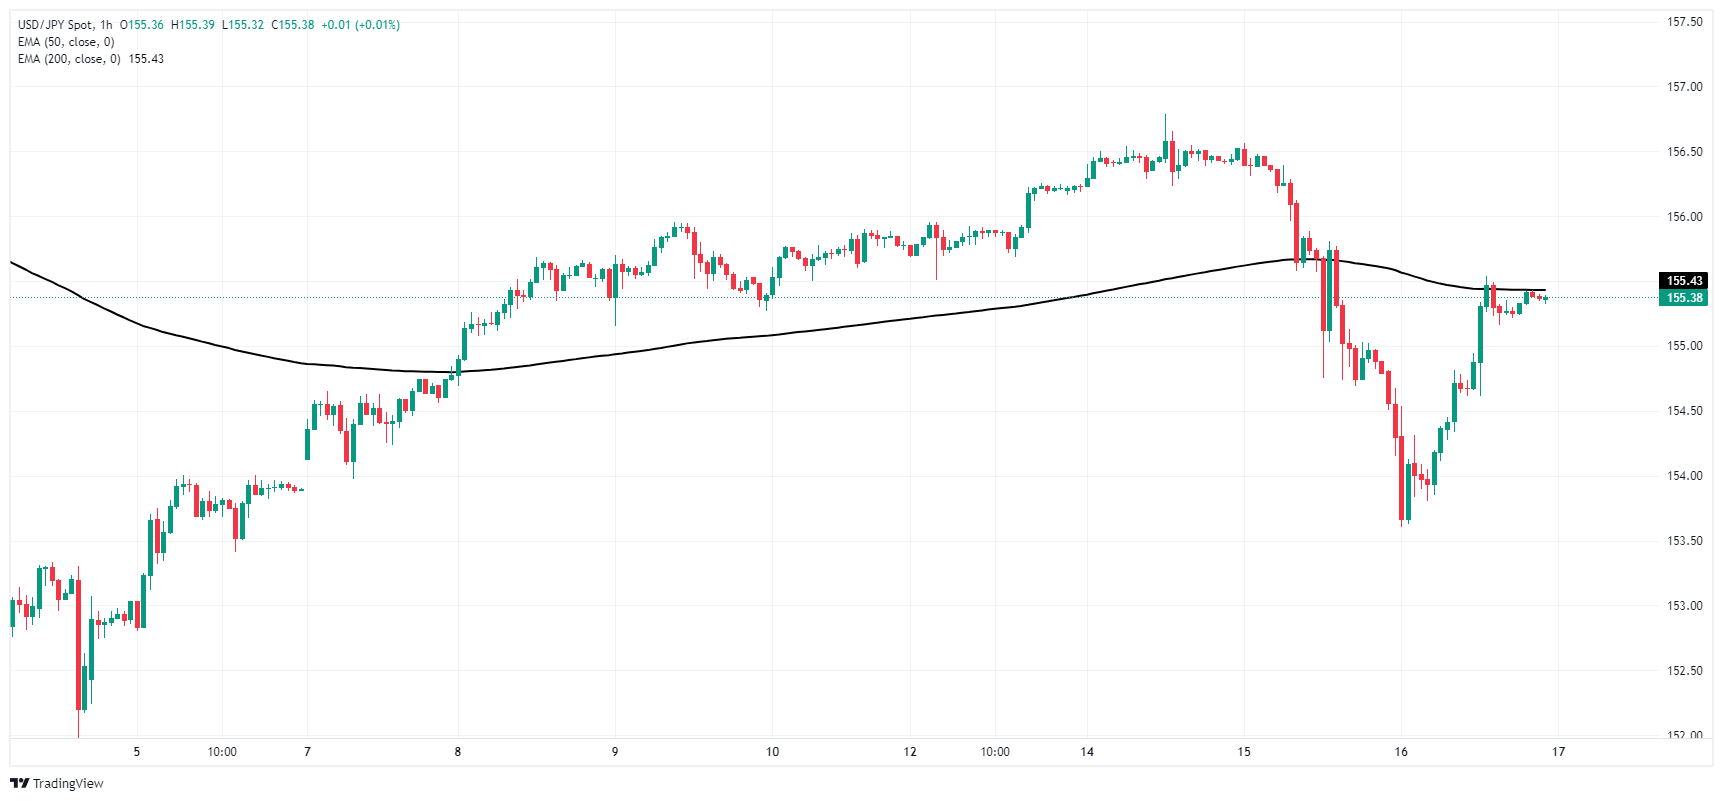
USD/JPY daily chart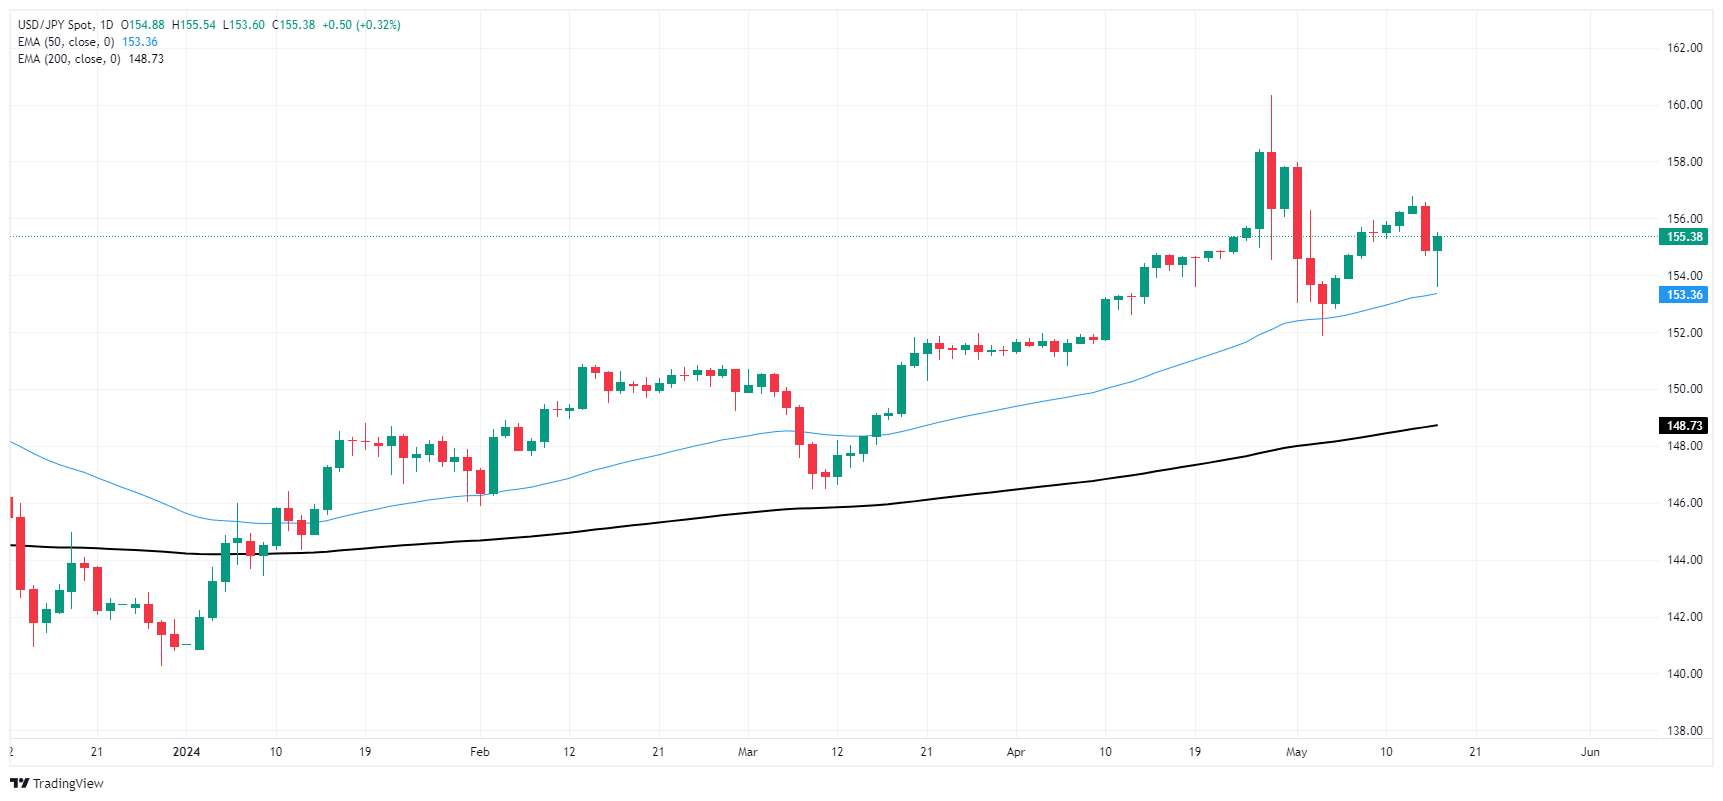
- The daily RSI shows that the pair has strong positive momentum, approaching overbought conditions but turning flat.
- Hourly RSI indicates a slight retreat, hinting at some short-term consolidation.
- The pair remains firm above its main SMAs, signaling a solid bullish sentiment in the near and distant future.
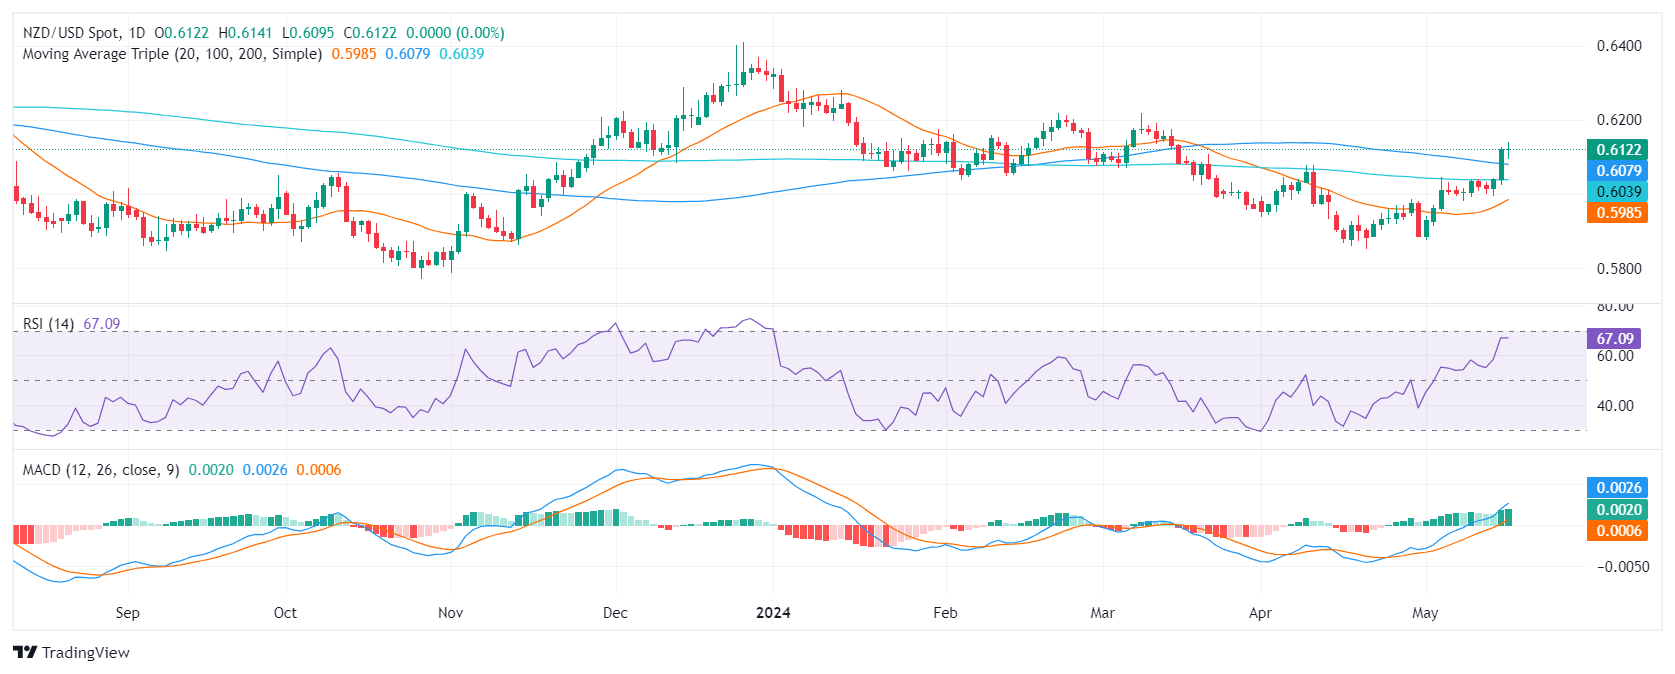
On Thursday's session, the NZD/USD remained flat at around 0.6120, as investors seem to be taking profits. After the Kiwi jumped above its main Simple Moving Averages (SMAs) the outlook turned bullish for the pair, but further consolidation may be in the horizon.
On the daily chart, the Relative Strength Index (RSI) shows positive momentum, fluctuating within positive territory, and nearing overbought status but turned flat on Thursday. The green bars of the Moving Average Convergence Divergence (MACD) reinforce the positive trend but are also flattened.
NZD/USD daily chart
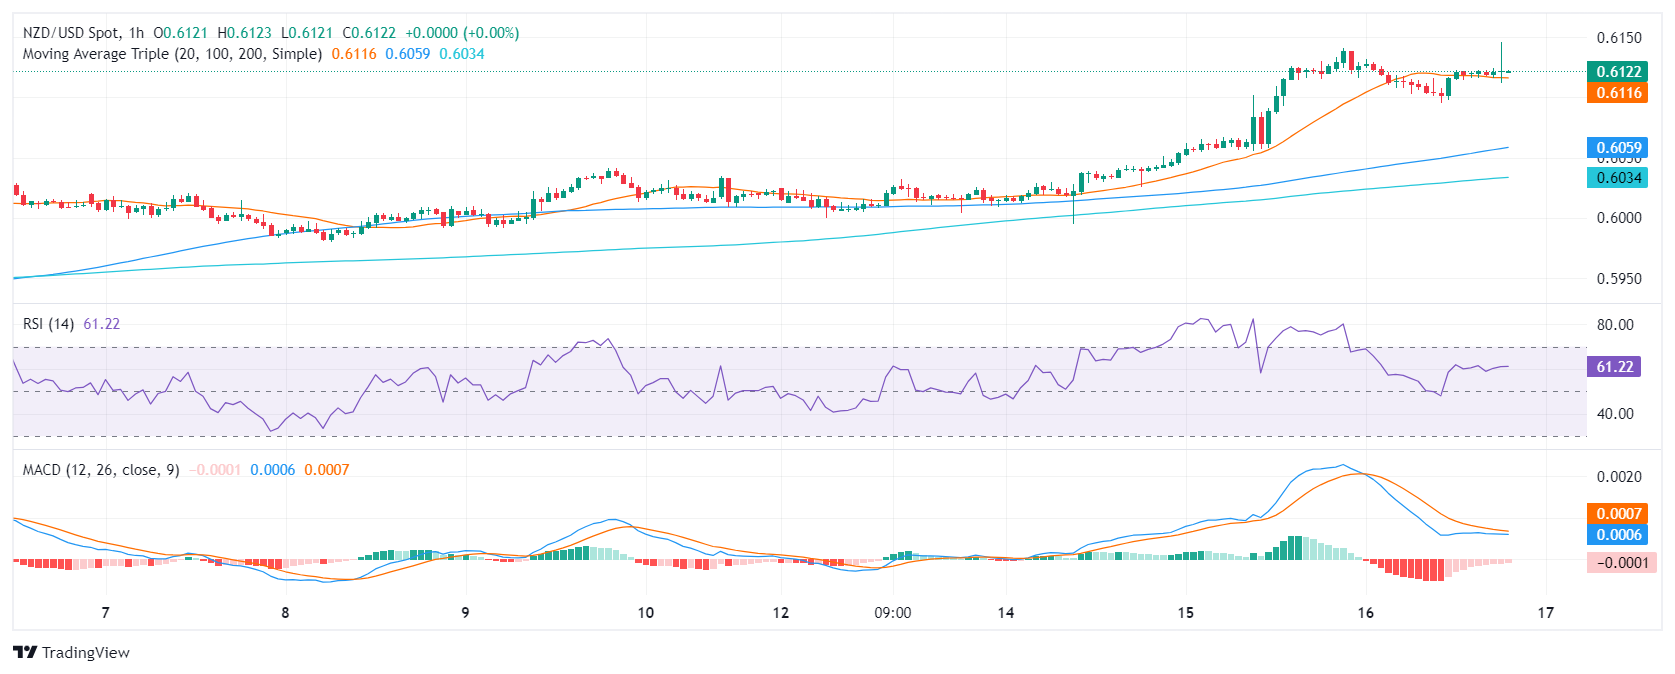
Moving to the hourly chart, mixed signals are visible. The RSI retreated slightly after being deep in overbought terrain, revealing a subtle slowdown in buying enthusiasm in recent hours. The red bars of the MACD suggest that the buying traction was weak in the last hours.
NZD/USD hourly chart
To conclude, bearing in mind the positive RSI indicators and the green MACD histogram, alongside the currency pair being above critical SMAs, the market seems to favor the bulls for the NZD/USD pair in both the short and long term but further consolidation shouldn’t be taken off the table. However, the conquered 100- and 200-day SMA will be a strong support that could limit losses.
- GBP/JPY recovers to familiar highs as JPY recedes.
- Japanese GDP growth contracted faster than expected.
- Sterling traders looking ahead to next week’s UK CPI inflation.
After recovering from a mid-week pullback, GBP/JPY scrambled back towards the 197.00 handle on Thursday. The pair regained ground after Japan’s Gross Domestic Product (GDP) for the first quarter contracted faster than investors expected, further weakening the Japanese Yen (JPY).
Japan reported a -0.5% contraction in Q1 GDP, a deeper growth pullback than median market forecasts of -0.4%. The previous quarter also saw a small downside revision, to 0.0% from the initial print of 0.1%.
Little else of note remains on the economic calendar this week for the Guppy, leaving Sterling traders to focus on next week’s upcoming UK Consumer Price Index (CPI) inflation update. Bank of England (BoE) Governor Andrew Bailey will also be making an appearance, and traders are expected to look for clues about the BoE’s possible path toward rate cuts. BoE Governor Bailey will be speaking at the London School of Economics next Tuesday.
GBP/JPY technical outlook
The Guppy is back into chart paper near the 197.00 handle on Thursday after catching a technical bounce from the 200-hour Exponential Moving Average (EMA) near 195.50. The pair fell in a near-term pullback after intense buying dragged the pair 3% higher from the last swing low into 191.50, but bulls are stepping back in to force the Yen lower against the GBP.
GBP/JPY hourly chart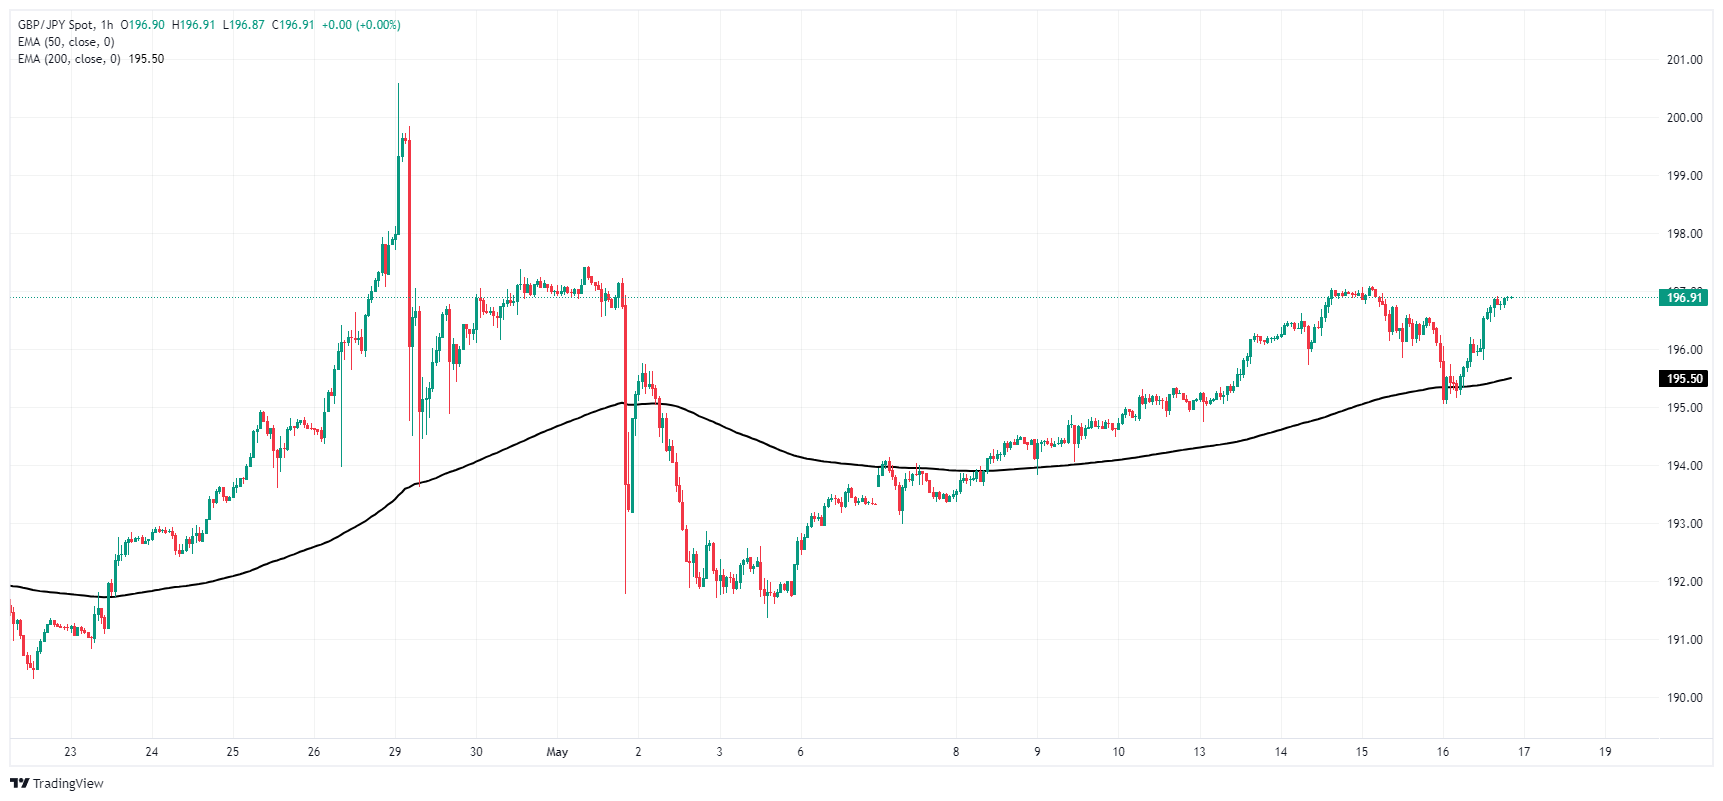
GBP/JPY daily chart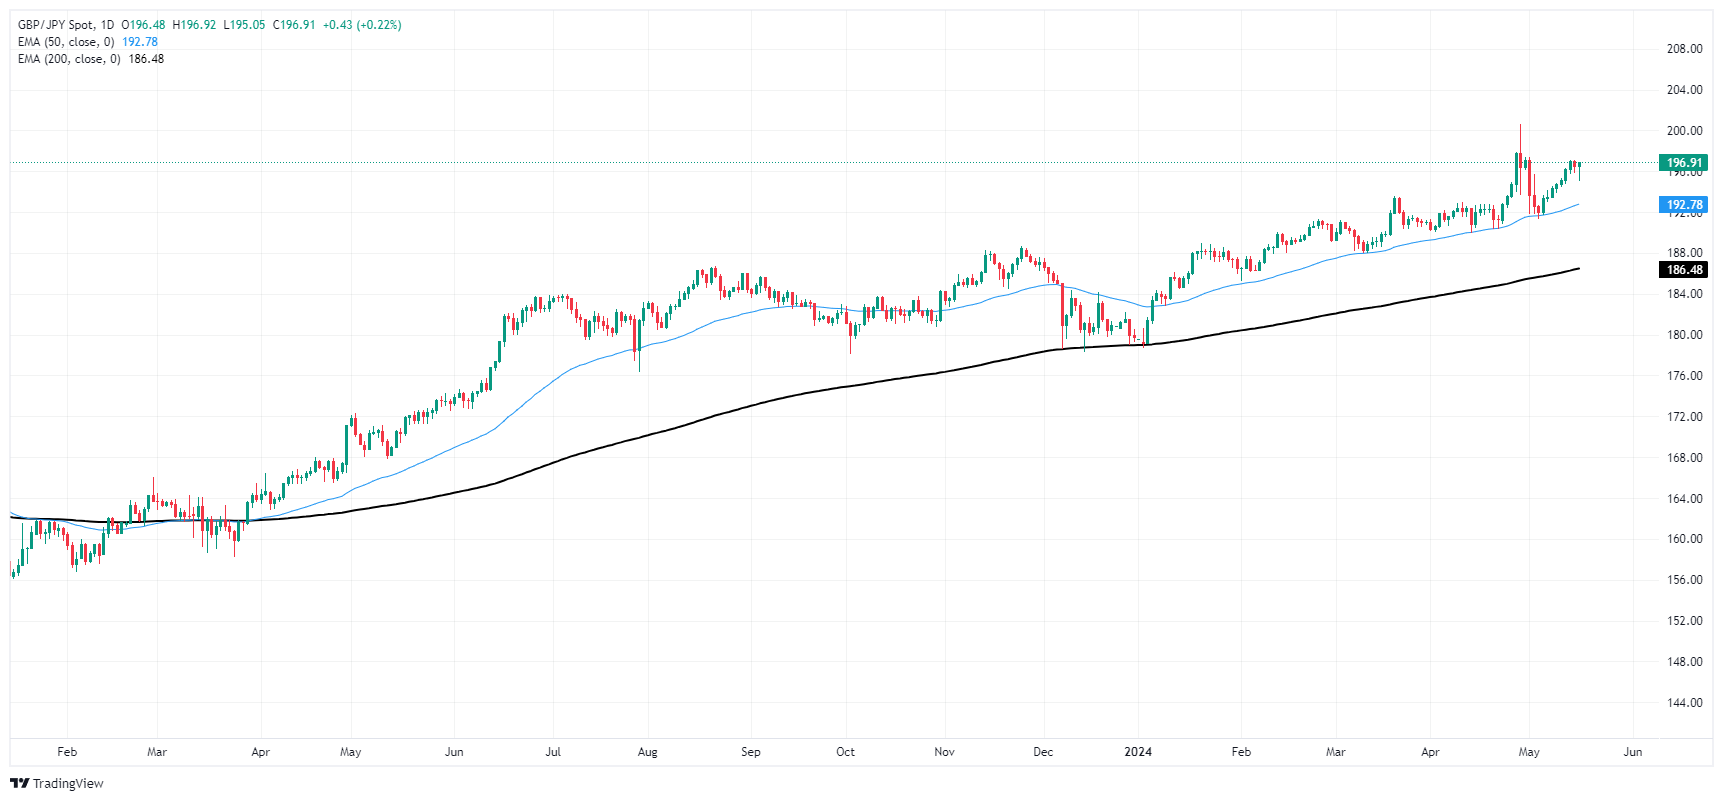
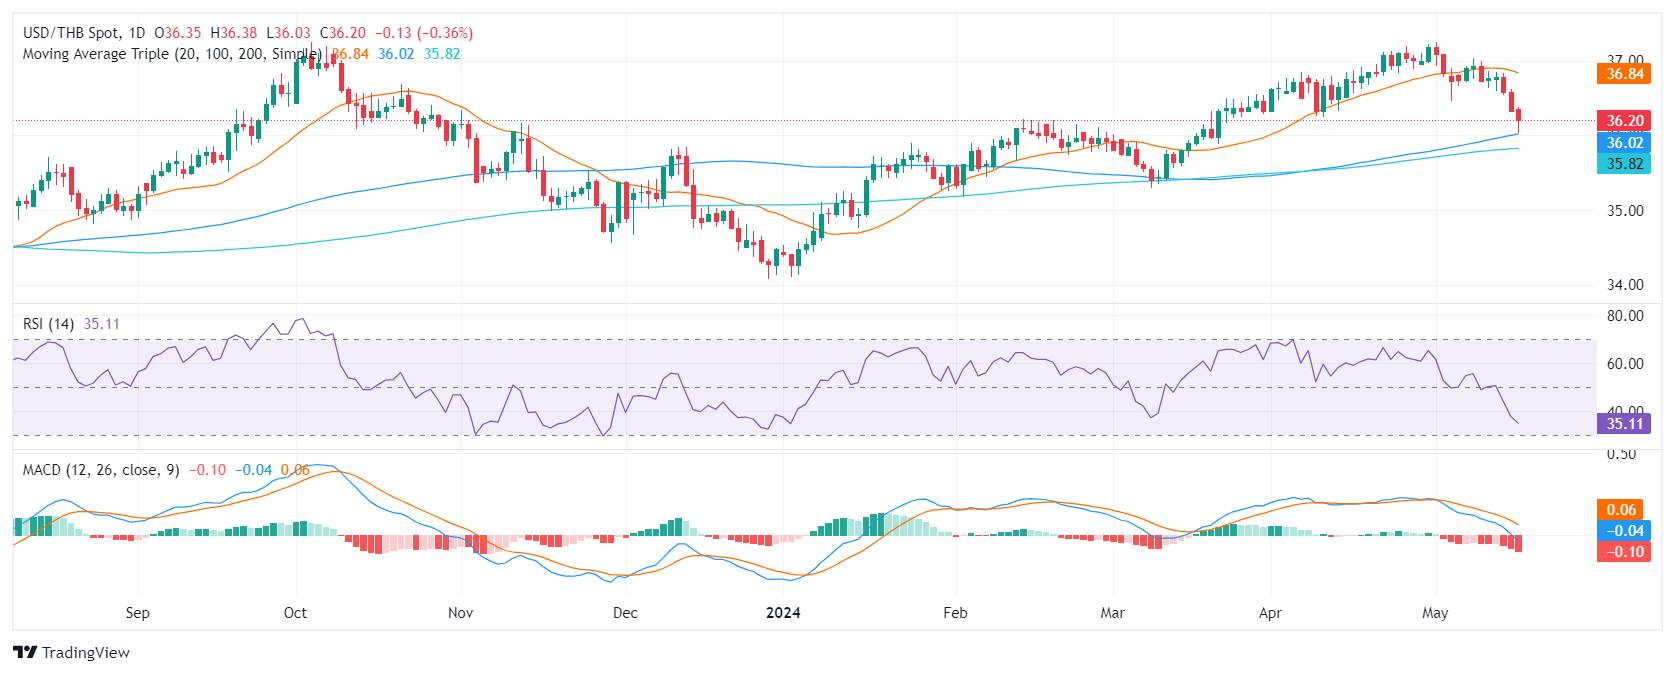
- The USD/THB declined to 36.20 on Thursday with sharp losses seen during the European session.
- Signs of US economic slowdown are unveiled, as Initial Jobless Claims surpassed expectations and the Philadelphia Fed Manufacturing Survey came in soft.
- Given the soft US economic data, the likelihood of the Fed cutting sooner rather than later has increased.
The USD/THB pair is trading weaker on Thursday with 0.35% losses at around 36.20. Soft Initial Jobless Claims and a reduction in the Philadelphia Fed Manufacturing Survey following the lower-than-expected Consumer Price Index (CPI) seem to be driving the USD downwards on rising dovish bets on the Federal Reserve (Fed).
The Initial Jobless Claims for the week ending May 3, touched a high of 222K, outdoing forecasts and marking an upward revision of the previous week's figures which stood at 232K. Continued economic softness may mount pressure on the Federal Reserve (Fed), to cut rates earlier. However, markets continue to see the easing starting in September but if data continues to outperform, the Fed might consider a cut in July.
USD/THB technical analysis
On the daily chart, the Relative Strength Index (RSI) shows a decrease from positive territory to negative in the last session, now nearing oversold conditions. This indicates that sellers currently dominate the market. Concurrently, the Moving Average Convergence Divergence (MACD) histogram details rising red bars, indicative of increasing negative momentum.
The USD/THB pair's position in relation to its Simple Moving Averages (SMAs), shows it positioned below the 20-day but above the 100 and 200-day averages. This suggests that while the short-term outlook is negative, the medium to longer outlook remains positive, as long as buyers defend these levels.
USD/THB daily chart
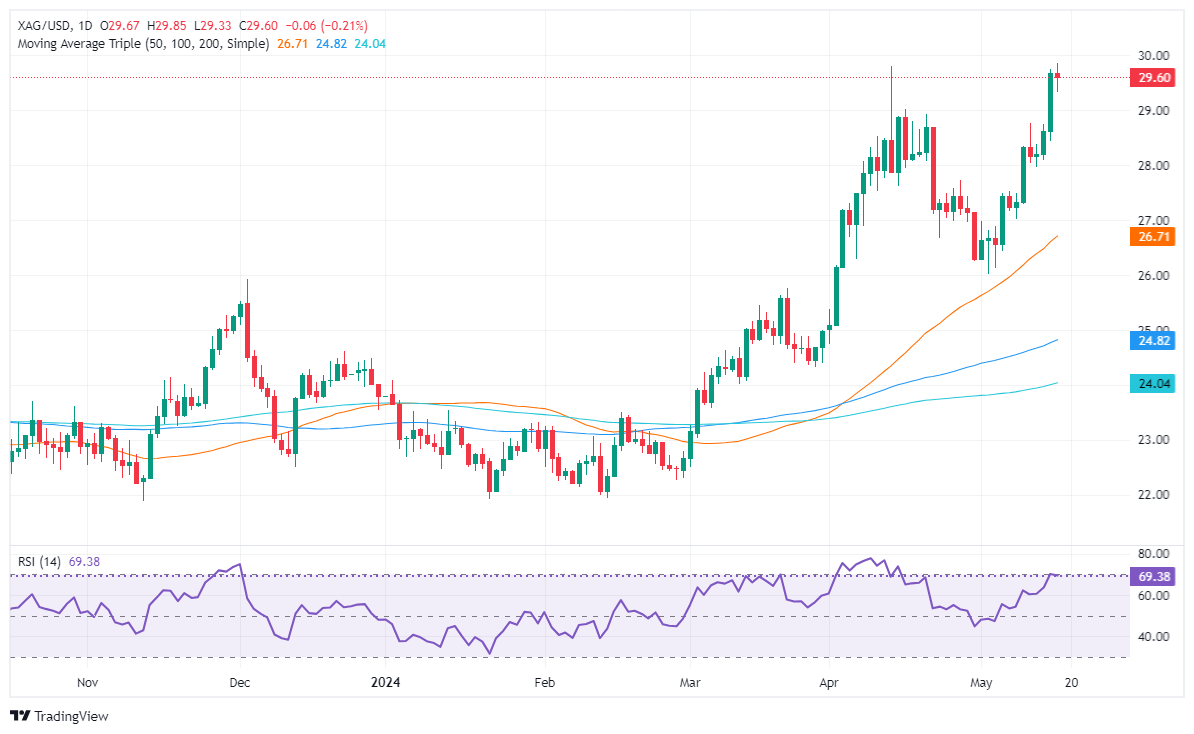
- Silver trades at $29.60, posting slight losses of 0.04% amid mixed US economic data.
- Technical outlook shows a ‘doji’ pattern, signaling indecision among traders.
- Silver must stay above $29.00 to challenge the YTD high of $29.79 and further resistance levels at $32.15 and $35.40.
Silver’s advancement paused on Thursday, as the grey metal posted minuscule losses of 0.04%, exchanging hands virtually unchanged. Jobs data, along with mixed housing data and the lack of strength in the manufacturing and industrial sectors, boosted US yields and the Greenback. Therefore, the grey metal dropped and traded at $29.60 at the time of writing.
XAG/USD Price Analysis: Technical outlook
Silver’s uptrend remains in place, but Thursday’s price action forming a ‘doji’ indicates that neither buyers nor sellers are in the domain of price action. It should be said that a ‘double top’ looms. However, momentum favors the former, as the Relative Strength Index (RSI) continues to aim upward despite approaching overbought conditions.
That said, if XAG/USD stays above $29.00, buyers could remain hopeful of testing the year-to-date (YTD) high of $29.79. A breach of the latter will pave the way to challenge the February 2013 high of $32.15, followed by the October 2012 high of $35.40.
Conversely, sellers must drag Silver’s price below the $29.00 figure. In that outcome, the pullback could reach the May 18, 2021, high turned support at $28.75, followed by the $28.00 mark. Further losses lie below the latter, with key support seen at $27.00.
XAG/USD Price Action – Daily Chart
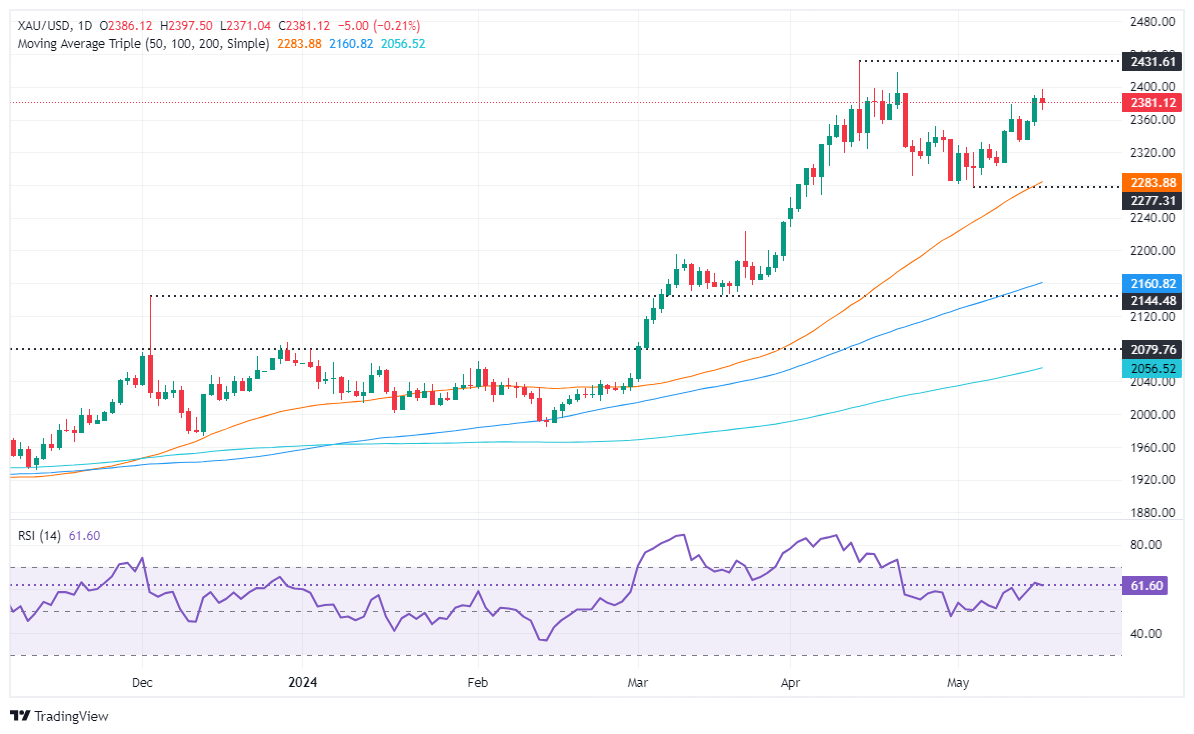
- Gold slips 0.24%, influenced by rising US Treasury yields, firm US Dollar.
- Mixed US economic data includes higher jobless claims and mixed housing data.
- Fed officials highlight ongoing inflation challenges and steady monetary policy stance.
Gold prices fell in the mid-North American session on Thursday, below $2,390, as US Treasury yields recovered and underpinned the Greenback. Wednesday’s inflation report in the United States sponsored the golden metal rally, but Thursday’s data was a mixed bag, which could likely trigger some profit-taking ahead of the weekend.
The XAU/USD trades at $2,381, down by 0.24%. Wall Street continued to trade at or near record highs, denting appetite for safe-haven assets like Gold. US economic data continued to drive Gold prices after the number of Americans filing for unemployment benefits rose above estimates but trailed the previous reading.
Other data showed that construction permits plunged, while Housing Starts increased in April compared to March but missed forecasts.
Recently, the May Philadelphia Fed Manufacturing Index dropped from 15.5 to 4, below forecasts, while Industrial Production in April remained unchanged.
Richmond Fed President Thomas Barkin acknowledged that inflation is decreasing but emphasized that it will "take more time" to reach the Fed’s target. Cleveland Fed President Loretta Mester expressed approval of the latest CPI data, noting that the current monetary policy stance is appropriate as the Fed continues to assess forthcoming economic data.
Daily digest market movers: Gold shines amid dropping US yields as rate cut expectations rise
- Gold prices are undermined by lower US Treasury yields and a battered US Dollar. The US 10-year Treasury note yields 4.373% and is up 3 basis points (bps) from its opening level. DXY climbs 0.19% to 104.47.
- US Bureau of Labor Statistics (BLS) announced that Initial Jobless Claims rose above estimates of 220K and came at 222K for the week ending May 11, but they trailed the prior reading of 232K.
- US Housing Starts rose to 1.36 million in April, marking a 5.7% YoY increase. However, Building Permits, which are an indicator of future construction activity, declined by 3%, falling to a rate of 1.44 million.
- Federal Reserve reveals that April Industrial Production remained unchanged at 0% MoM, below March’s reading and forecasts of 0.1%.
- On Tuesday, Fed Chair Jerome Powell commented that he expects inflation to continue heading lower but wasn’t as confident about the disinflation outlook as he had previously been.
- Wednesday’s inflation and Retail Sales data augmented the odds for rate cut expectations by the Federal Reserve. Data from the Chicago Board of Trade hints that traders expect at least 37 basis points of easing toward December 2024.
Technical analysis: Gold pulls back from weekly highs as buyers take a respite
Gold’s uptrend remains unchanged despite retreating below the $2,380 area, with strong momentum on the side of buyers as depicted by the Relative Strength Index (RSI) indicator. From a market structure standpoint, if XAU/USD drops below the latest higher low seen on May 13 at $2,332, that could open the door for a deeper correction.
In that scenario, the next line of defense for buyers would be the May 8 low of $2,303, followed by the 50-day Simple Moving Average (SMA) at $2,284.
Conversely, if buyers reclaim the $2,400 level, further gains are seen, putting at risk the year-to-date high. A breach of the latter, the immediate supply zone would be the April 19 high at $2,417, followed by the all-time high at $2,431.
Gold FAQs
Gold has played a key role in human’s history as it has been widely used as a store of value and medium of exchange. Currently, apart from its shine and usage for jewelry, the precious metal is widely seen as a safe-haven asset, meaning that it is considered a good investment during turbulent times. Gold is also widely seen as a hedge against inflation and against depreciating currencies as it doesn’t rely on any specific issuer or government.
Central banks are the biggest Gold holders. In their aim to support their currencies in turbulent times, central banks tend to diversify their reserves and buy Gold to improve the perceived strength of the economy and the currency. High Gold reserves can be a source of trust for a country’s solvency. Central banks added 1,136 tonnes of Gold worth around $70 billion to their reserves in 2022, according to data from the World Gold Council. This is the highest yearly purchase since records began. Central banks from emerging economies such as China, India and Turkey are quickly increasing their Gold reserves.
Gold has an inverse correlation with the US Dollar and US Treasuries, which are both major reserve and safe-haven assets. When the Dollar depreciates, Gold tends to rise, enabling investors and central banks to diversify their assets in turbulent times. Gold is also inversely correlated with risk assets. A rally in the stock market tends to weaken Gold price, while sell-offs in riskier markets tend to favor the precious metal.
The price can move due to a wide range of factors. Geopolitical instability or fears of a deep recession can quickly make Gold price escalate due to its safe-haven status. As a yield-less asset, Gold tends to rise with lower interest rates, while higher cost of money usually weighs down on the yellow metal. Still, most moves depend on how the US Dollar (USD) behaves as the asset is priced in dollars (XAU/USD). A strong Dollar tends to keep the price of Gold controlled, whereas a weaker Dollar is likely to push Gold prices up.
The Greenback regained some balance and managed to partially reverse its recent strong sell-off, particularly in the wake of the US CPI. In the meantime, Fed officials sounded cautious regarding inflation and the likelihood of rate cuts later in the year.
Here is what you need to know on Friday, May 17:
The USD Index (DXY) clinched a decent rebound after bottoming out in multi-week lows near 104.00 earlier in the session. On May 17, the CB Leading Index and the speech by FOMC Waller are due.
EUR/USD faced some downside pressure after hitting fresh tops near the 1.0900 region. The final Inflation Rate in the broader Euroland is only due on May 17.
GBP/USD followed its risk-associated peers and returned to the sub-1.2700 region in response to the decent bounce in the US Dollar. On May 17, BoE’s Mann is due to speak.
USD/JPY regained upside traction and recovered part of the ground lost following Wednesday’s sell-off, advancing beyond the 155.00 barrier amidst the Dollar recovery and an uptick in yields.
AUD/USD faded part of the strong weekly advance and came under pressure soon after reaching new peaks north of the 0.6700 hurdle.
WTI prices kept their range bound theme in place for yet another session, always below the $80.00 mark, as traders gauged the recent drop in US inventories and probable interest rate cuts by the Fed.
Prices of Gold corrected lower and receded from the $2,400 region per troy ounce on the back of the mild rebound in the Greenback and higher yields. Silver flirted with yearly highs near the key $30.00 mark per ounce.
- Dow Jones clips into a new record high on Thursday.
- Data calendar remains thin, Fedspeak dominates news cycle.
- Despite record bids, Dow Jones gains remain slim.
The Dow Jones Industrial Average (DJIA) pierced the 40,000 major price level on Thursday as equities float higher amidst a thin data calendar. Stock indexes reached fresh all-time highs following a midweek US inflation print showing price growth continues to cool, sparking fresh hope for Federal Reserve (Fed) rate cuts.
Read more: Fed officials still need further conviction regarding inflation
Despite easing headline inflation figures, Fed officials continue to thread the needle on expectations, highlighting the central bank’s neutral stance until data further confirms that current policies are working to ease inflation. Investors are hesitating as Fedspeak weighs on risk sentiment, however rate markets are still pricing in 70% odds of at least a quarter-point cut from the Fed in September according to the CME’s FedWatch Tool.
Dow Jones news
Nearly a third of the Dow Jones’ constituent securities are in the red on Thursday, crimping overall gains for the major equity index. Caterpillar Inc. (CAT) is down -2.7%, shedding nearly ten points and falling to $350.35 per share. Despite near-term declines, Caterpillar’s stock has been on a tear, doubling in value since the Dow Jones first crossed 30,000 in late 2022.
On the top side, Walmart Inc. (WMT) soared nearly 7% on Thursday, gaining 4.12 points to trade near $64.00 per share. Walmart surged after beating quarterly earnings and revenue forecasts as the commerce giant challenges Amazon as an online retailer after Walmart’s e-commerce sales grew 22% in the US.
Dow Jones technical outlook
The Dow Jones broke north of 40,000.00 on Thursday, reaching a new all-time high of 40,042.54 before investors pulled back midway through the US market session. The DJIA has retreated to the 39,900.00 region, but bidding pressure remains close to the surface.
Despite Thursday’s post-peak hesitation, the DJIA remains firmly bullish, having closed in the green for all but one of the last ten consecutive trading sessions. The Dow Jones is up 6.65% bottom-to-top in 2024, and trading well above the 200-day Exponential Moving Average (EMA) at 37,020.70.
Dow Jones five minute chart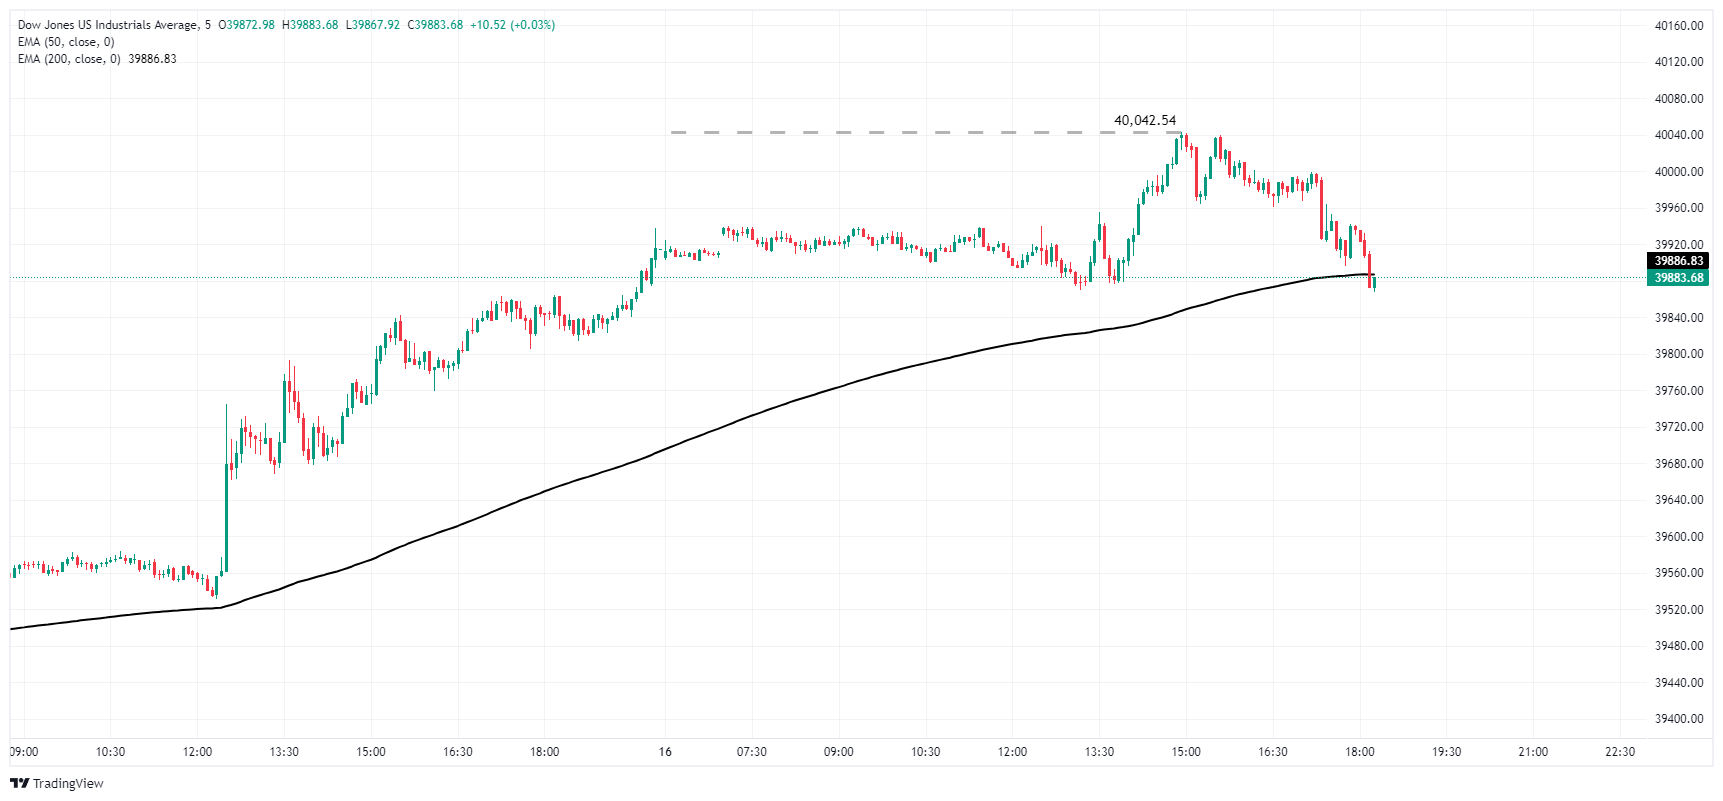
Dow Jones daily chart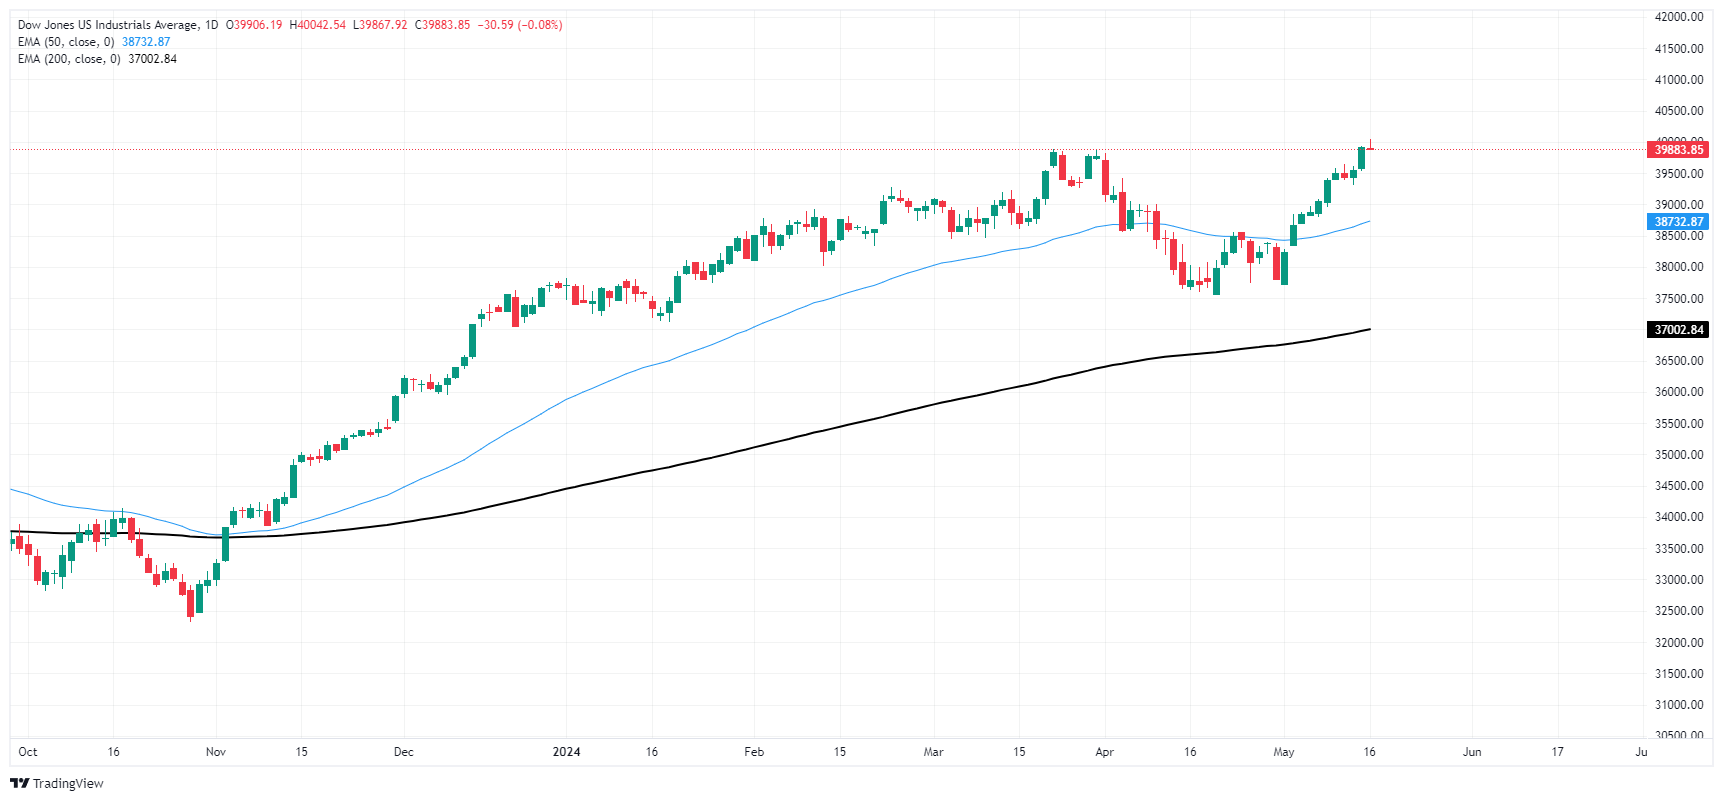
Dow Jones FAQs
The Dow Jones Industrial Average, one of the oldest stock market indices in the world, is compiled of the 30 most traded stocks in the US. The index is price-weighted rather than weighted by capitalization. It is calculated by summing the prices of the constituent stocks and dividing them by a factor, currently 0.152. The index was founded by Charles Dow, who also founded the Wall Street Journal. In later years it has been criticized for not being broadly representative enough because it only tracks 30 conglomerates, unlike broader indices such as the S&P 500.
Many different factors drive the Dow Jones Industrial Average (DJIA). The aggregate performance of the component companies revealed in quarterly company earnings reports is the main one. US and global macroeconomic data also contributes as it impacts on investor sentiment. The level of interest rates, set by the Federal Reserve (Fed), also influences the DJIA as it affects the cost of credit, on which many corporations are heavily reliant. Therefore, inflation can be a major driver as well as other metrics which impact the Fed decisions.
Dow Theory is a method for identifying the primary trend of the stock market developed by Charles Dow. A key step is to compare the direction of the Dow Jones Industrial Average (DJIA) and the Dow Jones Transportation Average (DJTA) and only follow trends where both are moving in the same direction. Volume is a confirmatory criteria. The theory uses elements of peak and trough analysis. Dow’s theory posits three trend phases: accumulation, when smart money starts buying or selling; public participation, when the wider public joins in; and distribution, when the smart money exits.
There are a number of ways to trade the DJIA. One is to use ETFs which allow investors to trade the DJIA as a single security, rather than having to buy shares in all 30 constituent companies. A leading example is the SPDR Dow Jones Industrial Average ETF (DIA). DJIA futures contracts enable traders to speculate on the future value of the index and Options provide the right, but not the obligation, to buy or sell the index at a predetermined price in the future. Mutual funds enable investors to buy a share of a diversified portfolio of DJIA stocks thus providing exposure to the overall index.
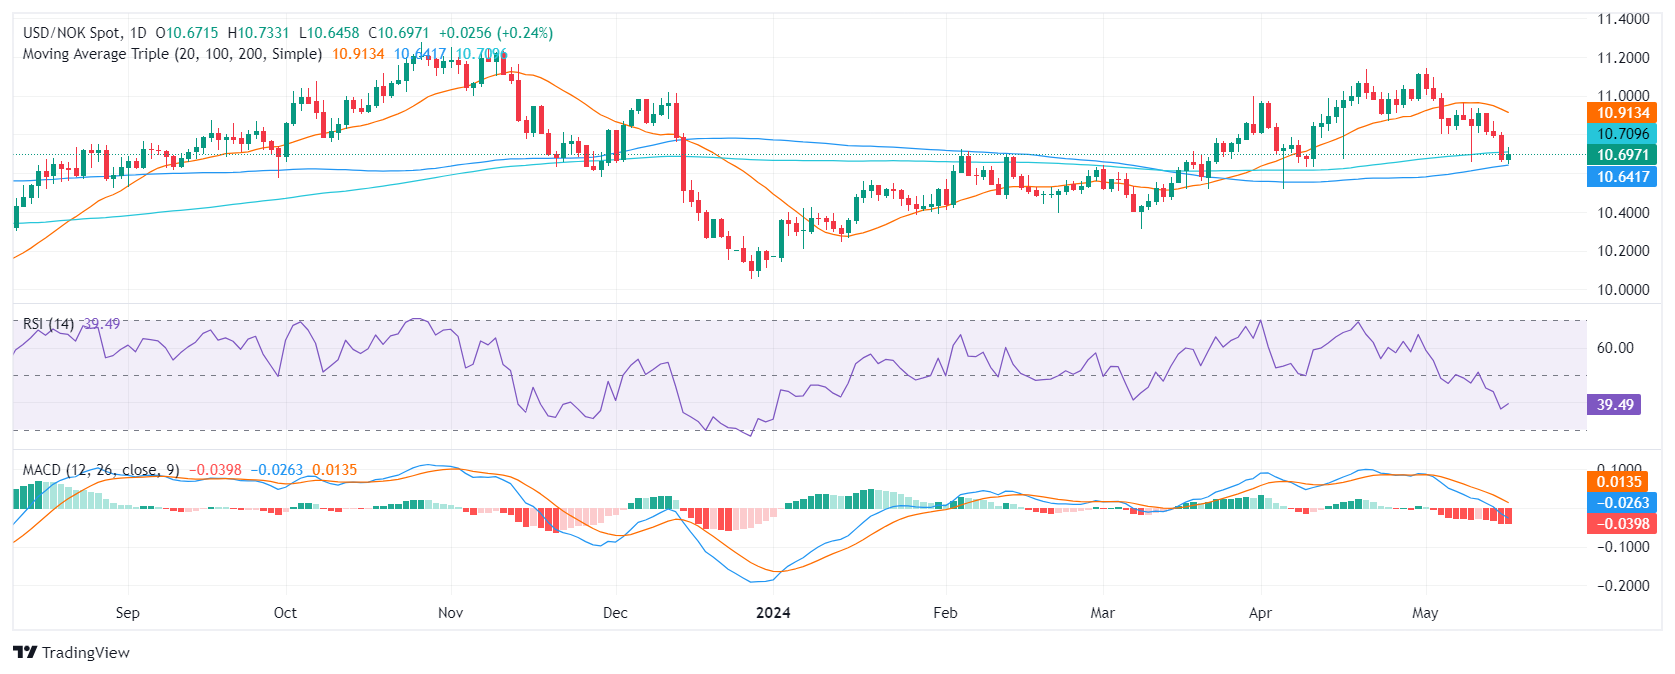
- USD/NOK is trading higher by 0.30%, quoted at 10.69 during Thursday's session.
- A surprise increase in Initial Jobless Claims suggests a slowing down of the US economy, which weighs on the USD.
- Markets are pricing in sooner interest rate cuts by the Fed following the recent soft CPI report.
On Thursday, the USD/NOK traded higher despite the ongoing data including April’s Consumer Price Index (CPI) reported on Wednesday which came in softer than expected. The softer data is making markets think that the Federal Reserve (Fed) might consider sooner rate cuts than anticipated. As for now, the best-case scenario for markets continues to be a first cut in September.
The US economy hints at a potential slowdown as reflected by the unexpected hike in Initial Jobless Claims and the dip in the Philadelphia Fed Manufacturing Survey, shifting markets into believing the Federal Reserve may introduce rate cuts sooner, generating downward pressure on the USD. The weekly Initial Jobless Claims for the week observed a rise to 222K, surpassing predictions, and displaying an upward revision to 232K for the previous week's data. The Philadelphia Fed Manufacturing Survey for May showed a slump to 4.5, failing to meet market expectations.
USD/NOK technical analysis
On the daily chart, the Relative Strength Index (RSI) of USD/NOK suggests negative momentum, signaled by a consistent positioning of the pair below the 50 mark. Despite the negative trend, the RSI value in the most recent session hints at potential easing, edging up to roughly 41 from a near-oversold low of 39.
USD/NOK daily chart
- Mexican Peso dips to 16.69 against US Dollar in early North American session.
- US Initial Jobless Claims rise above forecasts, mixed housing data with Building Permits down and Housing Starts up.
- Fed officials signal patience on inflation target amid potential rate cuts in 2024.
The Mexican Peso registered some losses against the US Dollar in early trading during the North American session on Thursday. The Mexican currency capitalized on a United States (US) inflation report that increased the possibility of rate cuts by the Federal Reserve (Fed) in 2024. At the time of writing, the USD/MXN trades at 16.69, up 0.04%.
The USD/MXN continued to lean on US economic data amid an absent Mexican economic docket. The US Bureau of Labor Statistics (BLS) revealed that the number of Americans filing for unemployment insurance grew above the previous reading and exceeded forecasts.
At the same time, housing data revealed mixed figures. Building Permits missed the mark, while Housing Stars recovered in April after posting disappointing figures in March.
In the meantime, the Philadelphia Fed Manufacturing Index clung to expansionary levels but continued to deteriorate, while Industrial Production remained unchanged.
Recently, Fed officials crossed the wires. Richmond Fed President Thomas Barkin stated that inflation is coming down, but that it will “take more time,” to hit the Fed’s target. Cleveland Fed President Loretta Mester welcomed the latest CPI data, adding that monetary policy is well-positioned as the Fed reviews upcoming data.
Daily digest market movers: Mexican Peso surges on soft US CPI, disappointing Retail Sales
- Mexico’s economic docket will be absent during the current week. The next economic data release is expected to be Retail Sales on May 20, followed by the Gross Domestic Product (GDP), inflation figures and Banxico’s minutes on May 23.
- April's data show that Mexico’s headline inflation is reaccelerating. However, core prices are falling. This spurred Banxico’s revision to its inflation projections, with the bank expected to hit its 3% target toward the last quarter of 2025, later than March’s estimates for Q2 2025. Core inflation is projected to hit 3% in Q2 2025.
- The US Department of Labor revealed the labor market is cooling as Initial Jobless Claims for the latest week came in above forecasts at 222K in the week ending May 11, below the previous reading of 232K but exceeding forecasts of 220K.
- US Housing Starts increased to 1.36 million or 5.7% YoY in April, revealed government data. Building Permits, a proxy for future construction, dropped 3% to a 1.44 million rate.
- Investors have become optimistic that the Fed may cut rates this year after US inflation data showed the downtrend is resuming, while Retail Sales remained unchanged.
- Data from the CME FedWatch Tool shows odds for a 25 bps rate cut at the September meeting remain at 87%, higher than Tuesday's 83%.
Technical analysis: Mexican Peso on the defensive as USD/MXN rises above 16.67
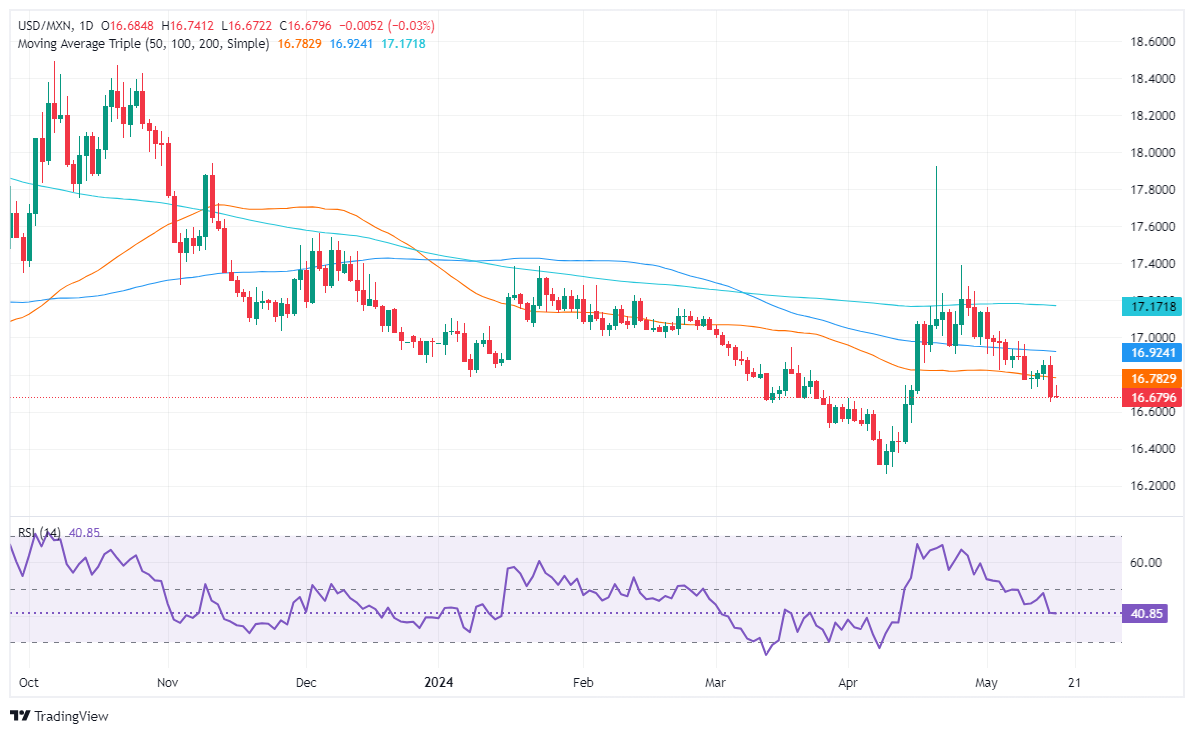
The USD/MXN downtrend continues even though buyers pushed the exchange rate past close to the 50-day Simple Moving Average (SMA) near 16.78. Momentum is on the side of the Mexican Peso as the Relative Strength Index (RSI) remains in bearish territory, aiming toward oversold territory.
If USD/MXN extends its losses beneath last year’s low of 16.62, that could exacerbate a 16.50 test ahead of the current year-to-date low of 16.25.
Conversely, if buyers reclaim the 50-day SMA at 16.78, it could exacerbate a rally toward the 100-day Simple Moving Average (SMA) at 16.92. Once cleared, the next supply zone would be the 17.00 psychological level. In that event, the next stop would be the 200-day SMA at 17.17.
Mexican Peso FAQs
The Mexican Peso (MXN) is the most traded currency among its Latin American peers. Its value is broadly determined by the performance of the Mexican economy, the country’s central bank’s policy, the amount of foreign investment in the country and even the levels of remittances sent by Mexicans who live abroad, particularly in the United States. Geopolitical trends can also move MXN: for example, the process of nearshoring – or the decision by some firms to relocate manufacturing capacity and supply chains closer to their home countries – is also seen as a catalyst for the Mexican currency as the country is considered a key manufacturing hub in the American continent. Another catalyst for MXN is Oil prices as Mexico is a key exporter of the commodity.
The main objective of Mexico’s central bank, also known as Banxico, is to maintain inflation at low and stable levels (at or close to its target of 3%, the midpoint in a tolerance band of between 2% and 4%). To this end, the bank sets an appropriate level of interest rates. When inflation is too high, Banxico will attempt to tame it by raising interest rates, making it more expensive for households and businesses to borrow money, thus cooling demand and the overall economy. Higher interest rates are generally positive for the Mexican Peso (MXN) as they lead to higher yields, making the country a more attractive place for investors. On the contrary, lower interest rates tend to weaken MXN.
Macroeconomic data releases are key to assess the state of the economy and can have an impact on the Mexican Peso (MXN) valuation. A strong Mexican economy, based on high economic growth, low unemployment and high confidence is good for MXN. Not only does it attract more foreign investment but it may encourage the Bank of Mexico (Banxico) to increase interest rates, particularly if this strength comes together with elevated inflation. However, if economic data is weak, MXN is likely to depreciate.
As an emerging-market currency, the Mexican Peso (MXN) tends to strive during risk-on periods, or when investors perceive that broader market risks are low and thus are eager to engage with investments that carry a higher risk. Conversely, MXN tends to weaken at times of market turbulence or economic uncertainty as investors tend to sell higher-risk assets and flee to the more-stable safe havens.
- DXY Index trading exhibits modest gains, rising to 104.45.
- Markets hope Fed announces early rate cut due to lower-than-expected CPI data.
- Weak Initial Job Claims, declining Philadelphia Fed Manufacturing support dovish rhetoric.
The US Dollar Index (DXY) is mildly trading up at 104.45 on Thursday as sellers seem to be consolidating the sharp downward movement from Wednesday's session.
The US economy is hinting toward a slowdown, evidenced by the unexpected Initial Jobless Claims rise and a Philadelphia Fed Manufacturing Survey contraction. Softer-than-expected inflation data reported on Wednesday supports this idea, which makes markets hope that the Federal Reserve (Fed) might consider rate cuts sooner rather than later, a thesis that weakens the USD.
Daily digest market movers: DXY under selling pressure as soft data warns markets
- Wednesday’s softer Consumer Price Index (CPI) indicates potential disinflation, which might speed up Fed's possible interest rate cuts.
- Initial Jobless Claims for the week ending May 3 rose to 222K, surpassing estimates. The figure for the previous week was also revised to a higher 232K.
- Philadelphia Fed Manufacturing Survey (an index assessing the state of manufacturing in Philadelphia) for May depicted a contraction to 4.5, underperforming market predictions.
- CME FedWatch Tool predicts about a 75% chance of reduced fed funds rate post-September meeting, up from pre-CPI expectations of 65%.
DXY technical analysis: DXY finds some light, outlook remains bearish
The Relative Strength Index (RSI) is sitting flat in negative territory on Thursday, indicating the weakening of the buying momentum. This means that, although demand is declining, the selling momentum isn’t getting any stronger. The Moving Average Convergence Divergence (MACD) is exhibiting flat red bars, which suggest a similar situation - neither the bulls nor the bears seem to have a strong grip over the price momentum presently.
Looking at the Simple Moving Averages (SMAs), the DXY is below the 20-day SMA, which spelled a short-term bearish tone. However, the fact that the index remains above the 100-day and 200-day SMAs might be signaling a protective floor ensured by the bulls.
US Dollar FAQs
The US Dollar (USD) is the official currency of the United States of America, and the ‘de facto’ currency of a significant number of other countries where it is found in circulation alongside local notes. It is the most heavily traded currency in the world, accounting for over 88% of all global foreign exchange turnover, or an average of $6.6 trillion in transactions per day, according to data from 2022. Following the second world war, the USD took over from the British Pound as the world’s reserve currency. For most of its history, the US Dollar was backed by Gold, until the Bretton Woods Agreement in 1971 when the Gold Standard went away.
The most important single factor impacting on the value of the US Dollar is monetary policy, which is shaped by the Federal Reserve (Fed). The Fed has two mandates: to achieve price stability (control inflation) and foster full employment. Its primary tool to achieve these two goals is by adjusting interest rates. When prices are rising too quickly and inflation is above the Fed’s 2% target, the Fed will raise rates, which helps the USD value. When inflation falls below 2% or the Unemployment Rate is too high, the Fed may lower interest rates, which weighs on the Greenback.
In extreme situations, the Federal Reserve can also print more Dollars and enact quantitative easing (QE). QE is the process by which the Fed substantially increases the flow of credit in a stuck financial system. It is a non-standard policy measure used when credit has dried up because banks will not lend to each other (out of the fear of counterparty default). It is a last resort when simply lowering interest rates is unlikely to achieve the necessary result. It was the Fed’s weapon of choice to combat the credit crunch that occurred during the Great Financial Crisis in 2008. It involves the Fed printing more Dollars and using them to buy US government bonds predominantly from financial institutions. QE usually leads to a weaker US Dollar.
Quantitative tightening (QT) is the reverse process whereby the Federal Reserve stops buying bonds from financial institutions and does not reinvest the principal from the bonds it holds maturing in new purchases. It is usually positive for the US Dollar.
- GBP/USD pullbacks from weekly highs, down 0.25%, after testing 1.2700.
- Momentum remains bullish, with potential to test 1.2803 and YTD high at 1.2893.
- Further retracement could challenge support at 1.2634/31 and 50-DMA at 1.2594.
The Pound Sterling erased Wednesday’s gains against the US Dollar as investors pushed the major to new weekly highs on the disinflation evolution in the United States (US). Although investors are pricing 38 basis points rate cuts by the Federal Reserve toward the end of the year, the Greenback is staging a comeback. The GBP/USD trades at 1.2654, down 0.25%.
GBP/USD Price Analysis: Technical outlook
The GBP/USD retreated from weekly highs after briefly testing 1.2700 as buyers failed to decisively crack that level, followed by the April 9 high of 1.2709. Despite that, the uptrend remains intact, with buyers taking a respite.
Momentum, as depicted by the Relative Strength Index (RSI), suggests that bulls are in charge, which could lead to further gains.
If buyers manage to reclaim 1.2709, this could potentially open the door for testing 1.2803, the March 21 high, and even the year-to-date (YTD) high of 1.2893.
On the other hand, a continuation of the retracement witnessed on Thursday could set the scenario to challenge the confluence of the May 3 high and the 100-day moving average (DMA) at around 1.2634/31 before diving toward the 50-DMA at 1.2594.
GBP/USD Price Action – Daily Chart

- Initial Jobless Claims rose by 222K vs. the previous week.
- Continuing Jobless Claims rose by nearly 1.8M.
US citizens that applied for unemployment insurance benefits increased by 222K in the week ending May 11, according to the US Department of Labor (DoL) on Thursday. The prints came in a tad above the initial consensus (220K) and below the previous weekly gain of 232K (revised from 231K).
From the press release, the advance seasonally adjusted insured unemployment rate was 1.2% and the 4-week moving average was 217.75K, an increase of 2.5K from the previous week's revised average.
In addition, Continuing Claims increased by 13K to 1.794M in the week ended May 4.
Market reaction
The US Dollar Index (DXY) maintains its daily bounce and flirts with the 104.50 region amidst the mixed performance of US yields across the curve.
- The Japanese Yen weakens after growth contracts by 0.5% in Q1.
- The data reduces further the chances of the BoJ moving to raise relatively low interest rates.
- The data stops the Greenback’s decline against the Yen following cooler-than-expected US inflation data.
The USD/JPY is trading in the 154.70s on Thursday, up a few tenths of a percent on the day after weaker-than-expected Japanese growth data weighed on the Japanese Yen (JPY).
Japanese Gross Domestic Product (GDP) contracted by a deeper-than-forecast 0.5% in Q1 on a quarter-on-quarter basis, when experts had expected a 0.4% fall after a 0.0% change in the previous quarter, according to data from the Japanese Cabinet Office.
The fall in economic growth when taken together with a fall in real wages in March, and cooling inflation in the capital Tokyo, is likely to delay the time when the Bank of Japan (BoJ) decides to raise interest rates. Whilst some commenters expect another rate hike in November others are saying it will now not be until February 2025 that the BoJ raises interest rates again.
A delay in raising interest rates is negative for the JPY (positive for USD/JPY) as it maintains the wide interest rate differential between the US and Japan, which favors the US Dollar (USD) over the Yen.
The Federal Reserve has set its fed funds rate at 5.5% whilst the BoJ has set its equivalent policy rate at 0.1%, indicating a roughly 540 bps wide gap between the two. This disproportionately aids the USD as investors are more likely to park their capital in Dollars where it can earn higher interest.
The recovery in USD/JPY comes after its steep fall on Wednesday following the release of cooler-than-expected Consumer Price Index (CPI) data from the US. This data showed prices only rose 0.3% in April, which was below the 0.4% forecast and 0.4% previous.
In addition, on a yearly basis both headline and core CPI ticked lower. The data revived bets for the Federal Reserve (Fed) cutting interest rates in September, from about 65% prior to the data to 75% after, according to the CME FedWatch tool.
US Retail Sales, out at the same time as the CPI data, further weighed on USD/JPY, after it showed zero growth in sales in April which was well below the 0.4% expected and the 0.6% downward revision in March, according to data from the US Census Bureau.
Bank of England (BoE) Monetary Policy Committee (MPC) member Megan Greene said on Thursday that the inflation persistence has waned since she joined the MPC last July, per Reuters.
Key takeaways
"I think the burden of proof needs to lie in inflation persistence continuing to wane."
"Data released ahead of our next meeting will give a clearer indication of how far along the last mile we have come."
"While I think excess labour hoarding has faded from its peak, it still poses a two-sided risk to our outlook."
Market reaction
These comments failed to trigger a noticeable market reaction. At the time of press, GBP/USD was down 0.22% on the day at 1.2660.
- Natural Gas prices break above $2.60, a four-month high.
- China’s biggest LNG buyers placed orders to further expand its LNG tanker fleet.
- The US Dollar Index sinks after US CPI shows the economy is back on track in its disinflationary path.
Natural Gas price (XNG/USD) is steamrolling on Thursday, reaching the highest level in four months and breaking another important technical level on more headlines that China is cornering the Gas markets. China National Offshore Oil Corporation has placed an order for 12 ships worth 16 billion($2.2 billion) for Liquified Natural Gas (LNG) tankers. This adds to news that several trading hubs such as London have confirmed that more Chinese participants are buying up contracts at local European and US Gas markets.
The US Dollar Index (DXY), which tracks the Greenback’s value against six major currencies, is trading substantially lower after recent Consumer Price Index (CPI) data revealed that the US inflation resumed its decline. Although markets were quick to price in again two rate cuts for 2024, all US Federal Reserve officials and even Fed Chairman Jerome Powell are very vocal in pushing back on those bets by saying that rates might be staying longer at current levels. The trading conditions for the Greenback have changed and could now see further easing (or selling)with every economic data point undershooting market expectations.
Natural Gas is trading at $2.61 per MMBtu at the time of writing.
Natural Gas news and market movers: Divergence between EU-US markets
- While US Gas prices are going through the roof, European Gas markets are rather trading steadily in a tight range with sluggish demand in play with Europe still carrying robust stocks into its refueling season.
- For nearly four months, no LNG carrier has passed through the Red Sea ever since the Houthi rebel attacks started to take place, Bloomberg reports.
- Since the pandemic, China is back on top of the leaderboard in importing LNG, measuring around 71.3 million tons last year.
- Continuing disruptions in the Red Sea are forcing LNG vessels to reroute around Africa to transport fuel between the Atlantic and Pacific ports. As a consequence, Asian buyers only have a limited pool of suppliers available to buy LNG from unless they’re willing to pay for higher shipping costs.
Natural Gas Technical Analysis: Are we really going to $3.00?
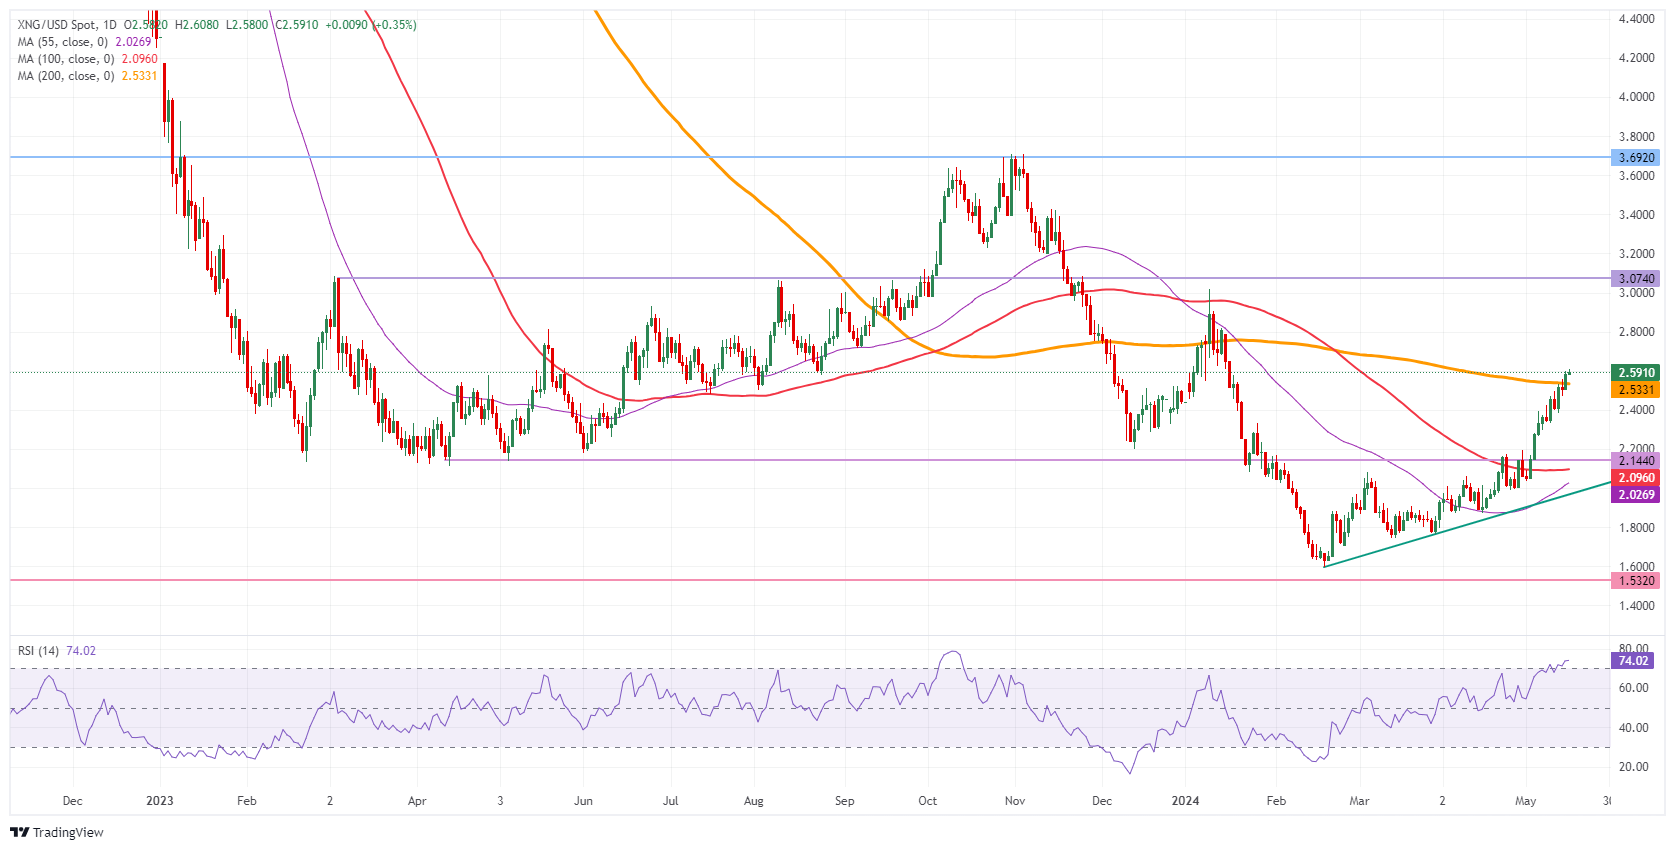
Natural Gas is rising sharply, even taking out the very important 200-day Simple Moving Average (SMA) around $2.53. This brings XNG/USD spot price in a whole other ballpark, where $3.07 looks to be the first upside big profit target at hand. This would mean another 18% gains on the table, should the US Dollar continue to weaken and China keeps propelling demand.
The $3.00 marker as a big figure is the first level to watch on the upside. Once through there, the pivotal level near $3.07 (high of March 6, 2023) will come into play and mark a new high for 2024. Further up, there is room for a quick crossing towards $3.69.
On the downside, ahead of the double belt with the 100-day SMA at $2.09 and the pivotal level at $2.11 (low of April 14, 2023), the 200-day SMA now should act as support near $2.53. Should both support areas fail to hold, then the ascending green trendline near $1.98, together with the 55-day SMA at $2.00, should avoid a further decline.
Natural Gas: Daily Chart
Natural Gas FAQs
Supply and demand dynamics are a key factor influencing Natural Gas prices, and are themselves influenced by global economic growth, industrial activity, population growth, production levels, and inventories. The weather impacts Natural Gas prices because more Gas is used during cold winters and hot summers for heating and cooling. Competition from other energy sources impacts prices as consumers may switch to cheaper sources. Geopolitical events are factors as exemplified by the war in Ukraine. Government policies relating to extraction, transportation, and environmental issues also impact prices.
The main economic release influencing Natural Gas prices is the weekly inventory bulletin from the Energy Information Administration (EIA), a US government agency that produces US gas market data. The EIA Gas bulletin usually comes out on Thursday at 14:30 GMT, a day after the EIA publishes its weekly Oil bulletin. Economic data from large consumers of Natural Gas can impact supply and demand, the largest of which include China, Germany and Japan. Natural Gas is primarily priced and traded in US Dollars, thus economic releases impacting the US Dollar are also factors.
The US Dollar is the world’s reserve currency and most commodities, including Natural Gas are priced and traded on international markets in US Dollars. As such, the value of the US Dollar is a factor in the price of Natural Gas, because if the Dollar strengthens it means less Dollars are required to buy the same volume of Gas (the price falls), and vice versa if USD strengthens.
- USD/JPY bounces back from 153.60 as US Dollar attempts recovery.
- Investors' conviction over Fed to begin reducing interest rates from September has improved.
- The Japanese economy contracted at a faster pace in the first quarter of this year.
The USD/JPY finds buying interest after falling to the day’s low near 153.60 in Thursday’s European session. The asset recovers as the US Dollar stabilizes after a significant fall due to an expected decline in the United States Consumer Price Index (CPI) data for April, which boosted expectations for the Federal Reserve (Fed) to start lowering interest rates from the September meeting.
On Wednesday, the US Bureau of Labor Statistics (BLS) reported that annual figures for headline and the core CPI declined to 3.4% and 3.6%, respectively as expected. This led to a sharp decline in the US Dollar Index (DXY) to monthly low around 104.00. However, the US Dollar seems stabilizing but further is still uncertain.
The CME Fedwatch tool shows that the probability for interest rates coming down from their current levels in September has improved to 73% from 69% recorded a week ago, exhibiting an increase in investors’ confidence in rate cuts. However, Fed policymakers are not expected to start endorsing rate cuts as a one-time decline in price pressures is insufficient to build conviction that inflation will sustainably decline to the 2% target.
Going forward, investors will focus on the US Initial Jobless Claims data for the week ending May 10. The US Department of Labor is expected to show a decline in number of individuals claiming jobless benefits for the first time to 220K from eight-month high of 231K, for the week ending May 3.
On the Japanese Yen front, weaker-than-expected preliminary Q1 Gross Domestic Product (GDP) data has raised concerns over the Bank of Japan’s plans to extend the policy-tightening cycle. The Japanese economy contracted at a faster pace of 0.5% from the consensus of 0.4%. In the last quarter of 2023, the economy remained stagnant.
- The US Dollar faced a hefty correction on Wednesday after the US CPI print.
- Fed’s Kashkari pushed back against market anticipation of rate cuts, repeating that rates need to stay high for longer.
- The US Dollar Index flirts with a 104.00 break to the downside.
The US Dollar (USD) is recovering a touch on Thursday from its depreciation after the latest Consumer Price Index (CPI) showed the disinflationary trend resumed in April. Pieces of the puzzle are starting to fall into place with the recent string of data pointing to some easing on all fronts in the economy, and the softer CPI was the cherry on the cake. Markets responded to evidence of declining inflation popping the champagne bottle, with the S&P 500 reaching new all time highs.
However, Federal Reserve Bank of Chicago President Austan Goolsbee and Federal Reserve Bank of Minneapolis President Neel Kashkari called for keeping rates steady for a while longer, warning that market expectations about interest-rate cuts might swing too far.
On the economic data front, Thursday’s calendar is full of releases, although lighter in terms of importance. The weekly Initial Jobless Claims, the Philadelphia Fed Manufacturing Survey for May and the Industrial Production data will be the most important ones. On the latter, Japan and the Eurozone have recently reported positive industrial output , and a decline in US production might trigger another round of weakness for the Greenback.
Daily digest market movers: More data to confirm
- Kickoff this Thursday at 12:30 GMT with a batch of housing, employment and prices data:
- Building Permits are expected to increase to 1.480 million in April from 1.467 million in March.
- Housing Starts are expected to increase to 1.420 million from 1.321 a month earlier.
- Weekly Jobless Claims could gather more importance than usual after last week’s numbers came well above the consensus:
- Initial Jobless Claims are expected to head to 220,000 from 213,000.
- Continuing Claims expected to remain rather stable,to 1.780 million from 1.785 million.
- The import/export Price Index for April will come in as well.
- The Philadelphia Fed Manufacturing Survey for May is expected to fall to 8 in May from 15.5 in Apri.
- Markets can digest all the above data before a slew of Fed officials are set to take the stage:
- Federal Reserve Vice Chair for Supervision Michael Barr will testify before the US Senate Committee on Banking.
- Federal Reserve Bank of Philadelphia President Patrick Harker will speak on the economic impact of higher education and health care.
- Federal Reserve Bank of Cleveland President Loretta Mester will participate in a luncheon at the Wayne Economic Development Council.
- Federal Reserve Bank of Atlanta President Raphael Bostic participates in a moderated conversation about the US economic outlook at an event organized by the Jacksonville Business Journal.
- All speakers this Thursday are Federal Open Market Committee (FOMC) voters, except for Fed’s Harker.
- The Qatar World Economic Forum started on Tuesday morning. Headlines from world leaders may come out throughout the week.
- Equities outperformed in the US, with the S&P 500 hitting a fresh all-time high which got taken over by Asian equities. European equities look sluggish, undergoing some profit taking, with US futures mildly in the green.
- The CME Fedwatch Tool suggests a 91.6% probability that June will still see no change to the Federal Reserve's fed fund rate. Odds have changed for September with the tool showing a 51.4% chance that rates will be 25 basis points lower than current levels.
- The benchmark 10-year US Treasury Note trades around 4.34%, the lowest level for over a month.
US Dollar Index Technical Analysis: Watch out from here
The US Dollar Index (DXY) has taken out several important support in its downward trajectory on Wednesday. Although some support comes in, several rejection levels now can emerge and trigger another violent sell-off. A crucial level to keep an eye on is 103.83, the 55-week Simple Moving Average (SMA), because if it is broken it would open room for the DXY to sink to 100.00.
On the upside, several levels need to be regained again after Wednesday’s firm correction. The first is the 55-day SMA at 104.68, together with a pivotal level at 104.60. The next step up will be 105.12 and 105.52 in case the DXY has room to recover further.
On the downside, the 100-day SMA around 104.11 is the last man standing to support the decline. Once that snaps, a bit of an air pocket is placed between 104.11 and 103.00. Should US Dollar outflows persist, the low of March at 102.35 and the low from January at 100.61 are levels to keep into consideration.
US Dollar FAQs
The US Dollar (USD) is the official currency of the United States of America, and the ‘de facto’ currency of a significant number of other countries where it is found in circulation alongside local notes. It is the most heavily traded currency in the world, accounting for over 88% of all global foreign exchange turnover, or an average of $6.6 trillion in transactions per day, according to data from 2022. Following the second world war, the USD took over from the British Pound as the world’s reserve currency. For most of its history, the US Dollar was backed by Gold, until the Bretton Woods Agreement in 1971 when the Gold Standard went away.
The most important single factor impacting on the value of the US Dollar is monetary policy, which is shaped by the Federal Reserve (Fed). The Fed has two mandates: to achieve price stability (control inflation) and foster full employment. Its primary tool to achieve these two goals is by adjusting interest rates. When prices are rising too quickly and inflation is above the Fed’s 2% target, the Fed will raise rates, which helps the USD value. When inflation falls below 2% or the Unemployment Rate is too high, the Fed may lower interest rates, which weighs on the Greenback.
In extreme situations, the Federal Reserve can also print more Dollars and enact quantitative easing (QE). QE is the process by which the Fed substantially increases the flow of credit in a stuck financial system. It is a non-standard policy measure used when credit has dried up because banks will not lend to each other (out of the fear of counterparty default). It is a last resort when simply lowering interest rates is unlikely to achieve the necessary result. It was the Fed’s weapon of choice to combat the credit crunch that occurred during the Great Financial Crisis in 2008. It involves the Fed printing more Dollars and using them to buy US government bonds predominantly from financial institutions. QE usually leads to a weaker US Dollar.
Quantitative tightening (QT) is the reverse process whereby the Federal Reserve stops buying bonds from financial institutions and does not reinvest the principal from the bonds it holds maturing in new purchases. It is usually positive for the US Dollar.
- Fed policymakers' comments awaited following the April inflation report.
- Markets see a waning probability of a Fed policy hold in September.
- Fed rate outlook could influence the US Dollar's valuation.
Federal Reserve (Fed) policymakers are scheduled to deliver speeches on Thursday as investors reassess the interest rate outlook following the April Consumer Price Index (CPI) data. According to the CME FedWatch Tool, the probability of a no change in the Fed's policy rate in September declined to nearly 25% from 35% before the inflation report.
Fed Vice Chair for Supervision Michael Barr, Philadelphia Fed President Patrick Harker, Cleveland Fed President Loretta Mester and Atlanta Fed President Raphael Bostic are among the Fed officials that will speak in the American session.
The Fed has adopted a cautious tone regarding the timing of the policy pivot following the stronger-than-expected inflation readings in the first quarter of the year. The US Bureau of Labor Statistics reported on Wednesday that the core Consumer Price Index (CPI) rose 3.6% on a yearly basis in April. This reading followed the 3.8% increase recorded in March and came in line with the market expectation. On a monthly basis, the CPI and the core CPI both rose 0.3% after rising 0.4% in March. The US Dollar (USD) came under bearish pressure as market participants assessed the inflation data and the USD Index fell to its lowest level in over a month, losing 0.7% on the day.
Fed FAQs
Monetary policy in the US is shaped by the Federal Reserve (Fed). The Fed has two mandates: to achieve price stability and foster full employment. Its primary tool to achieve these goals is by adjusting interest rates. When prices are rising too quickly and inflation is above the Fed’s 2% target, it raises interest rates, increasing borrowing costs throughout the economy. This results in a stronger US Dollar (USD) as it makes the US a more attractive place for international investors to park their money. When inflation falls below 2% or the Unemployment Rate is too high, the Fed may lower interest rates to encourage borrowing, which weighs on the Greenback.
The Federal Reserve (Fed) holds eight policy meetings a year, where the Federal Open Market Committee (FOMC) assesses economic conditions and makes monetary policy decisions. The FOMC is attended by twelve Fed officials – the seven members of the Board of Governors, the president of the Federal Reserve Bank of New York, and four of the remaining eleven regional Reserve Bank presidents, who serve one-year terms on a rotating basis.
In extreme situations, the Federal Reserve may resort to a policy named Quantitative Easing (QE). QE is the process by which the Fed substantially increases the flow of credit in a stuck financial system. It is a non-standard policy measure used during crises or when inflation is extremely low. It was the Fed’s weapon of choice during the Great Financial Crisis in 2008. It involves the Fed printing more Dollars and using them to buy high grade bonds from financial institutions. QE usually weakens the US Dollar.
Quantitative tightening (QT) is the reverse process of QE, whereby the Federal Reserve stops buying bonds from financial institutions and does not reinvest the principal from the bonds it holds maturing, to purchase new bonds. It is usually positive for the value of the US Dollar.
- EUR/USD clings to gains near 1.0900 due to strong appeal for risk-sensitive assets.
- Traders expect the ECB reducing interest rates three times this year.
- Investors shift focus to the US weekly jobless claims data.
EUR/USD falls slightly from the crucial resistance of 1.0900 in Thursday’s European session. The major currency pair retraces as the US Dollar (USD) stabilizes after a sharp fall to fresh monthly lows. The US Dollar Index (DXY), which tracks the US Dollar’s value against six major currencies, rebounds to 104.30 after falling to 104.00 earlier on the day. However, the appeal of the US Dollar is downbeat as the Fed is expected to begin lowering interest rates from the September meeting.
The Euro remains firm as traders have priced in three rate cuts by the European Central Bank (ECB) this year. Meanwhile, ECB policymakers are also confident that the central bank will start normalizing the monetary policy from June.
On Wednesday, European Central Bank Governing Council Member and Bank of France Governor François Villeroy de Galhau said: “As we have sufficient confidence, we will very probably begin cutting central-bank rates, doubtless at our meeting at the start of June”, in an interview with RTL radio. Galhau added that lower rates should help the economy to pick up more in 2025.
Daily digest market movers: EUR/USD posts fresh seven-week highs near 1.0900
- EUR/USD refreshes seven-week high near the round-level resistance of 1.0900. The major currency pair strengthens as appeal for risk-sensitive assets improve due to that fact that investors are confident about the Federal Reserve (Fed) returning to policy normalization after maintaining a hawkish interest rate framework for almost two years.
- The confidence of investors for Fed to begin lowering interest rates from the September meeting has increased as United States inflation has declined in April after remaining stubbornly higher in the first quarter of the year. This is expected to provide some relief to Fed policymakers as they were uncertain over the progress in the disinflation process. However, Fed policymakers are expected to continue to emphasize keeping interest rates at their current levels for a longer period as one good inflation reading would be insufficient to improve their conviction about inflation returning sustainably to the 2% target.
- The US Consumer Price Index (CPI) report showed that annual headline and core inflation (which strips off volatile food and energy prices) declined as expected to 3.4% and 3.6%, respectively. The decline in the inflation data came from lower prices of utility gas services and used cars and trucks. Rentals, transportation and medical services price index continue to march higher.
- Meanwhile, the US inflation outlook has also softened as monthly Retail Sales were unchanged in April after expanding 0.6% in March. Economists forecasted them to rise by 0.4%. Weak Retail Sales data suggests that high inflation and interest rates by the Fed have narrowed consumers’ pockets.
- In Thursday’s session, investors will focus on the Initial Jobless Claims data for the week ending May 10. The US Department of Labor is expected to show a decline in number of individuals claiming jobless benefits for the first time to 220K, from eight-month high of 231K registered the week ending May 3.
- Last week, the US Dollar saw a significant fall after the release of the larger-than-expected jobless claims as it raised concerns over the labor market strength.
Technical Analysis: EUR/USD targets 1.1000
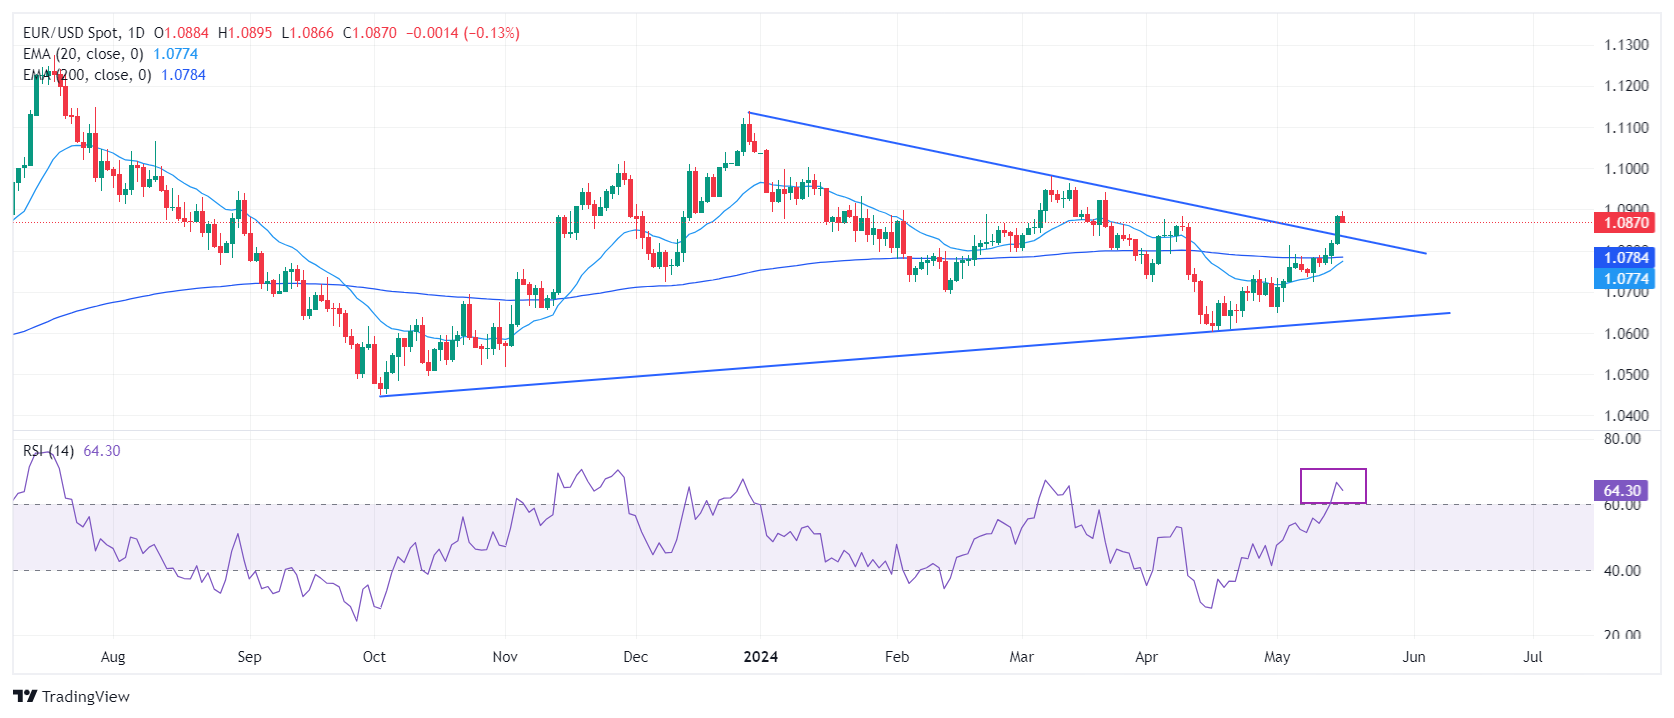
EUR/USD retraces slightly down from 1.0900 in Thursday’s European session but keeps broadly strong after a Symmetrical Triangle breakout on a daily timeframe. A breakout of a volatility contraction pattern results in high buying volume and wider movements.
The appeal of the shared currency pair has strengthened as it seems well-established above all short-to-long-term Exponential Moving Averages (EMAs).
The 14-period Relative Strength Index (RSI) has shifted into the bullish range of 60.00-80.00, suggesting a strong upside move ahead. Going forward, EUR/USD is likely to extend its upside towards the psychological resistance of 1.1000.
Euro FAQs
The Euro is the currency for the 20 European Union countries that belong to the Eurozone. It is the second most heavily traded currency in the world behind the US Dollar. In 2022, it accounted for 31% of all foreign exchange transactions, with an average daily turnover of over $2.2 trillion a day. EUR/USD is the most heavily traded currency pair in the world, accounting for an estimated 30% off all transactions, followed by EUR/JPY (4%), EUR/GBP (3%) and EUR/AUD (2%).
The European Central Bank (ECB) in Frankfurt, Germany, is the reserve bank for the Eurozone. The ECB sets interest rates and manages monetary policy. The ECB’s primary mandate is to maintain price stability, which means either controlling inflation or stimulating growth. Its primary tool is the raising or lowering of interest rates. Relatively high interest rates – or the expectation of higher rates – will usually benefit the Euro and vice versa. The ECB Governing Council makes monetary policy decisions at meetings held eight times a year. Decisions are made by heads of the Eurozone national banks and six permanent members, including the President of the ECB, Christine Lagarde.
Eurozone inflation data, measured by the Harmonized Index of Consumer Prices (HICP), is an important econometric for the Euro. If inflation rises more than expected, especially if above the ECB’s 2% target, it obliges the ECB to raise interest rates to bring it back under control. Relatively high interest rates compared to its counterparts will usually benefit the Euro, as it makes the region more attractive as a place for global investors to park their money.
Data releases gauge the health of the economy and can impact on the Euro. Indicators such as GDP, Manufacturing and Services PMIs, employment, and consumer sentiment surveys can all influence the direction of the single currency. A strong economy is good for the Euro. Not only does it attract more foreign investment but it may encourage the ECB to put up interest rates, which will directly strengthen the Euro. Otherwise, if economic data is weak, the Euro is likely to fall. Economic data for the four largest economies in the euro area (Germany, France, Italy and Spain) are especially significant, as they account for 75% of the Eurozone’s economy.
Another significant data release for the Euro is the Trade Balance. This indicator measures the difference between what a country earns from its exports and what it spends on imports over a given period. If a country produces highly sought after exports then its currency will gain in value purely from the extra demand created from foreign buyers seeking to purchase these goods. Therefore, a positive net Trade Balance strengthens a currency and vice versa for a negative balance.
- EUR/GBP is trading back inside a multi-month range after temporarily breaking out to the upside.
- It could now potentially continue falling to the range lows, with support from 50 and 100 MAs on the way.
- The pair is in a sideways trend that continues extending.
EUR/GBP has fallen back inside its multi-month range after temporarily breaking out to the upside on May 7.
The move back down inside the range continues the pair’s sideways trend. This trend is expected to continue given the old saying that “the trend is your friend”.
EUR/GBP Daily Chart
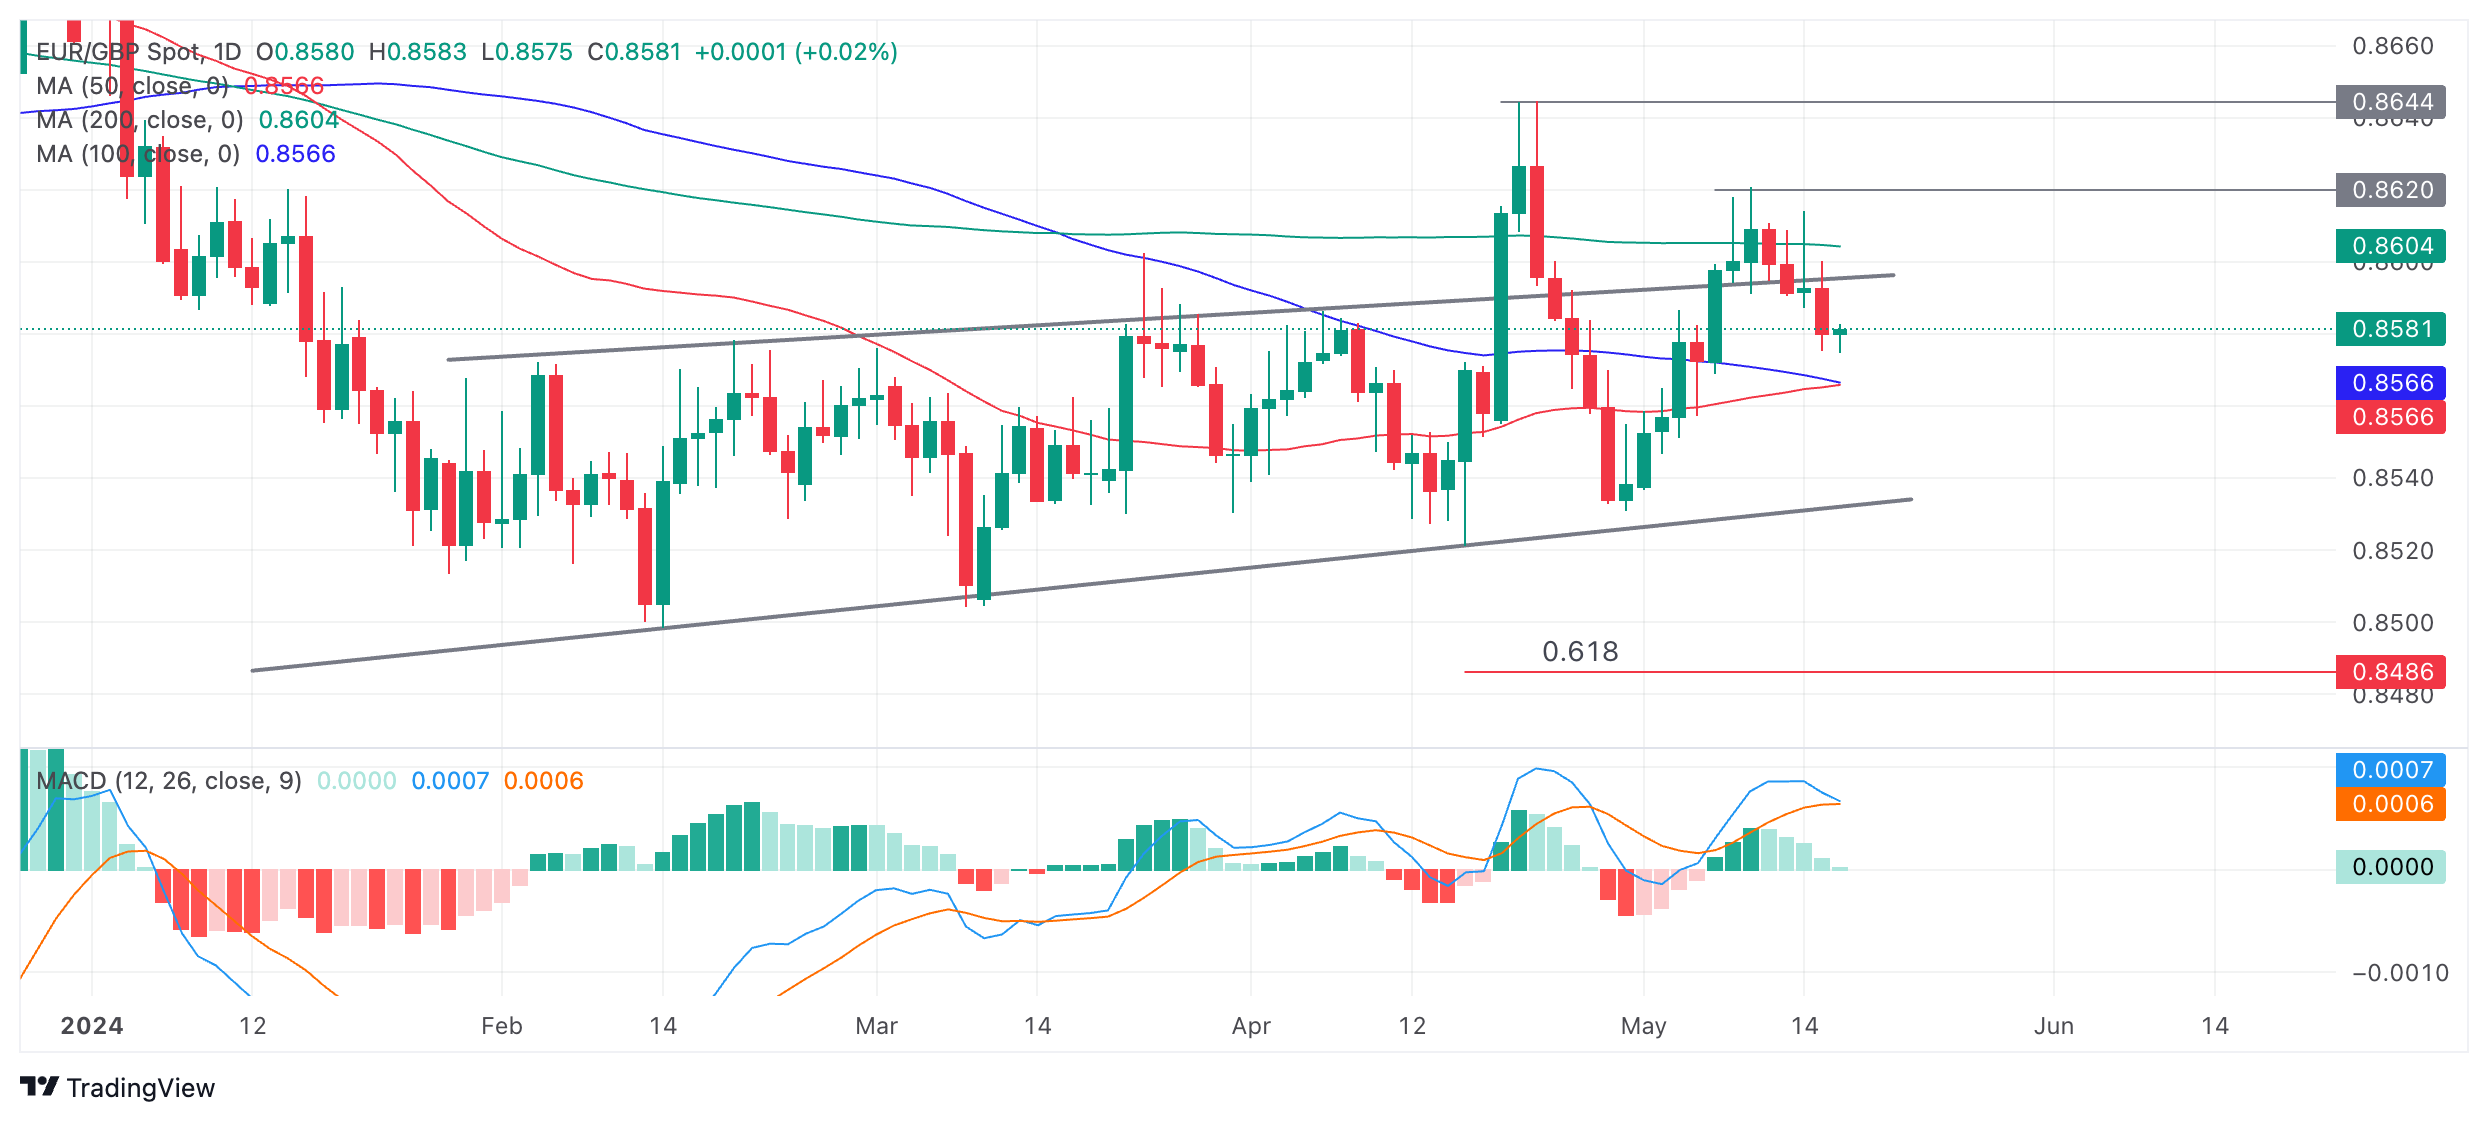
EUR/GBP has decisively broken back inside its medium-term range. There is a chance the pair could now fall back all the way down to support at around 0.8540.
Two major Moving Averages – the 50-day and 100-day Simple Moving Averages (SMA) are converging at 0.8566, however, and these are likely to act as a barrier to further downside. As such, EUR/GBP may pause if it falls to that level.
The Moving Average Convergence Divergence (MACD) indicator is threatening to cross below its red signal line. If such a cross is confirmed (on a daily close basis) it will add further bearish evidence suggesting EUR/GBP will continue descending within the range/channel.
For a change of the sideways trend, EUR/GBP would need to make a decisive break below the range lows or above the April 23 high.
In the case of a break below the range lows the first downside target would be located at 0.8486 – the 0.618 Fibonacci ratio of the height of the range extrapolated lower from the channel’s base. This is the common method used by technical analysts to estimate range breakouts. Further weakness could even see price reach the next target at 0.8460, the full height of the range extrapolated lower.
A decisive break would be one characterized by a long red candlestick that broke completely below the range floor and closed near its low, or three consecutive red candlesticks that broke clearly through the level.
The top of the range has already been breached several times suggesting it has weakened and provides a less reliable resistance level. For confirmation of a new uptrend now, EUR/GBP would need to not only break above the top of the range, but also above the April 23 peak at 0.8644. On the way up, 0.8620 (May 9 high) would supply resistance.
- Gold price steadies after rallying after the release of US data that changed the outlook for interest rates, a key factor for Gold.
- The data revealed cooling inflation and flatlining spending, which suggests interest rates might fall.
- Lower interest rates are positive for Gold price and the pair is in an uptrend on the charts.
Gold price (XAU/USD) trades flat in the $2,380s on Thursday after making significant gains on the previous day. Gold bulls flexed their muscles following the release of US inflation data that led to a recalibration of interest rate expectations, with implications for both the US Dollar (USD) and Gold price.
Gold stabilizes following rally after release of US data
Gold price is stabilizing on Thursday amid profit taking after an over one percent rise on the previous day. The release of cooler US Consumer Price Index (CPI) data and Retail Sales for April led to a change in expectations for the future path of US interest rates, a key factor in Gold valuations.
The lower-than-expected CPI data reflected a disinflationary trend that brought forward the time when the Federal Reserve (Fed) is expected to make its long-awaited cut in interest rates. According to the CME FedWatch Tool, there is around 75% probability that the fed funds rate will be at lower levels after the September meeting. This is much higher than the 65% chance seen before the CPI release, according to FXStreet Editor Lallalit Srijandorn.
The expectation of lower interest rates is positive for Gold as it reduces the opportunity cost of holding the non-yielding asset vis-a-vis cash or bonds. Gold is further lifted by the loss of value of the US Dollar (USD) that attended the data, as like most commodities Gold is chiefly traded in US Dollars.
Still, the outlook for the precious metal remains positive against a backdrop of continued robust demand from central banks – in particular those in emerging markets – high levels of geopolitical risk and concerns regarding a fracturing of world trade along partisan lines.
Indeed, according to data from the World Gold Council (WGC), demand for Gold “rose by 3% to 1,238 tonnes, making it the strongest first quarter since 2016,” writes Srijandorn.
Technical Analysis: Gold price steadies after strong rise
Gold price (XAU/USD) has pushed up to just shy of resistance at $2,400 as it extends its short-term uptrend higher.
XAU/USD 4-hour Chart
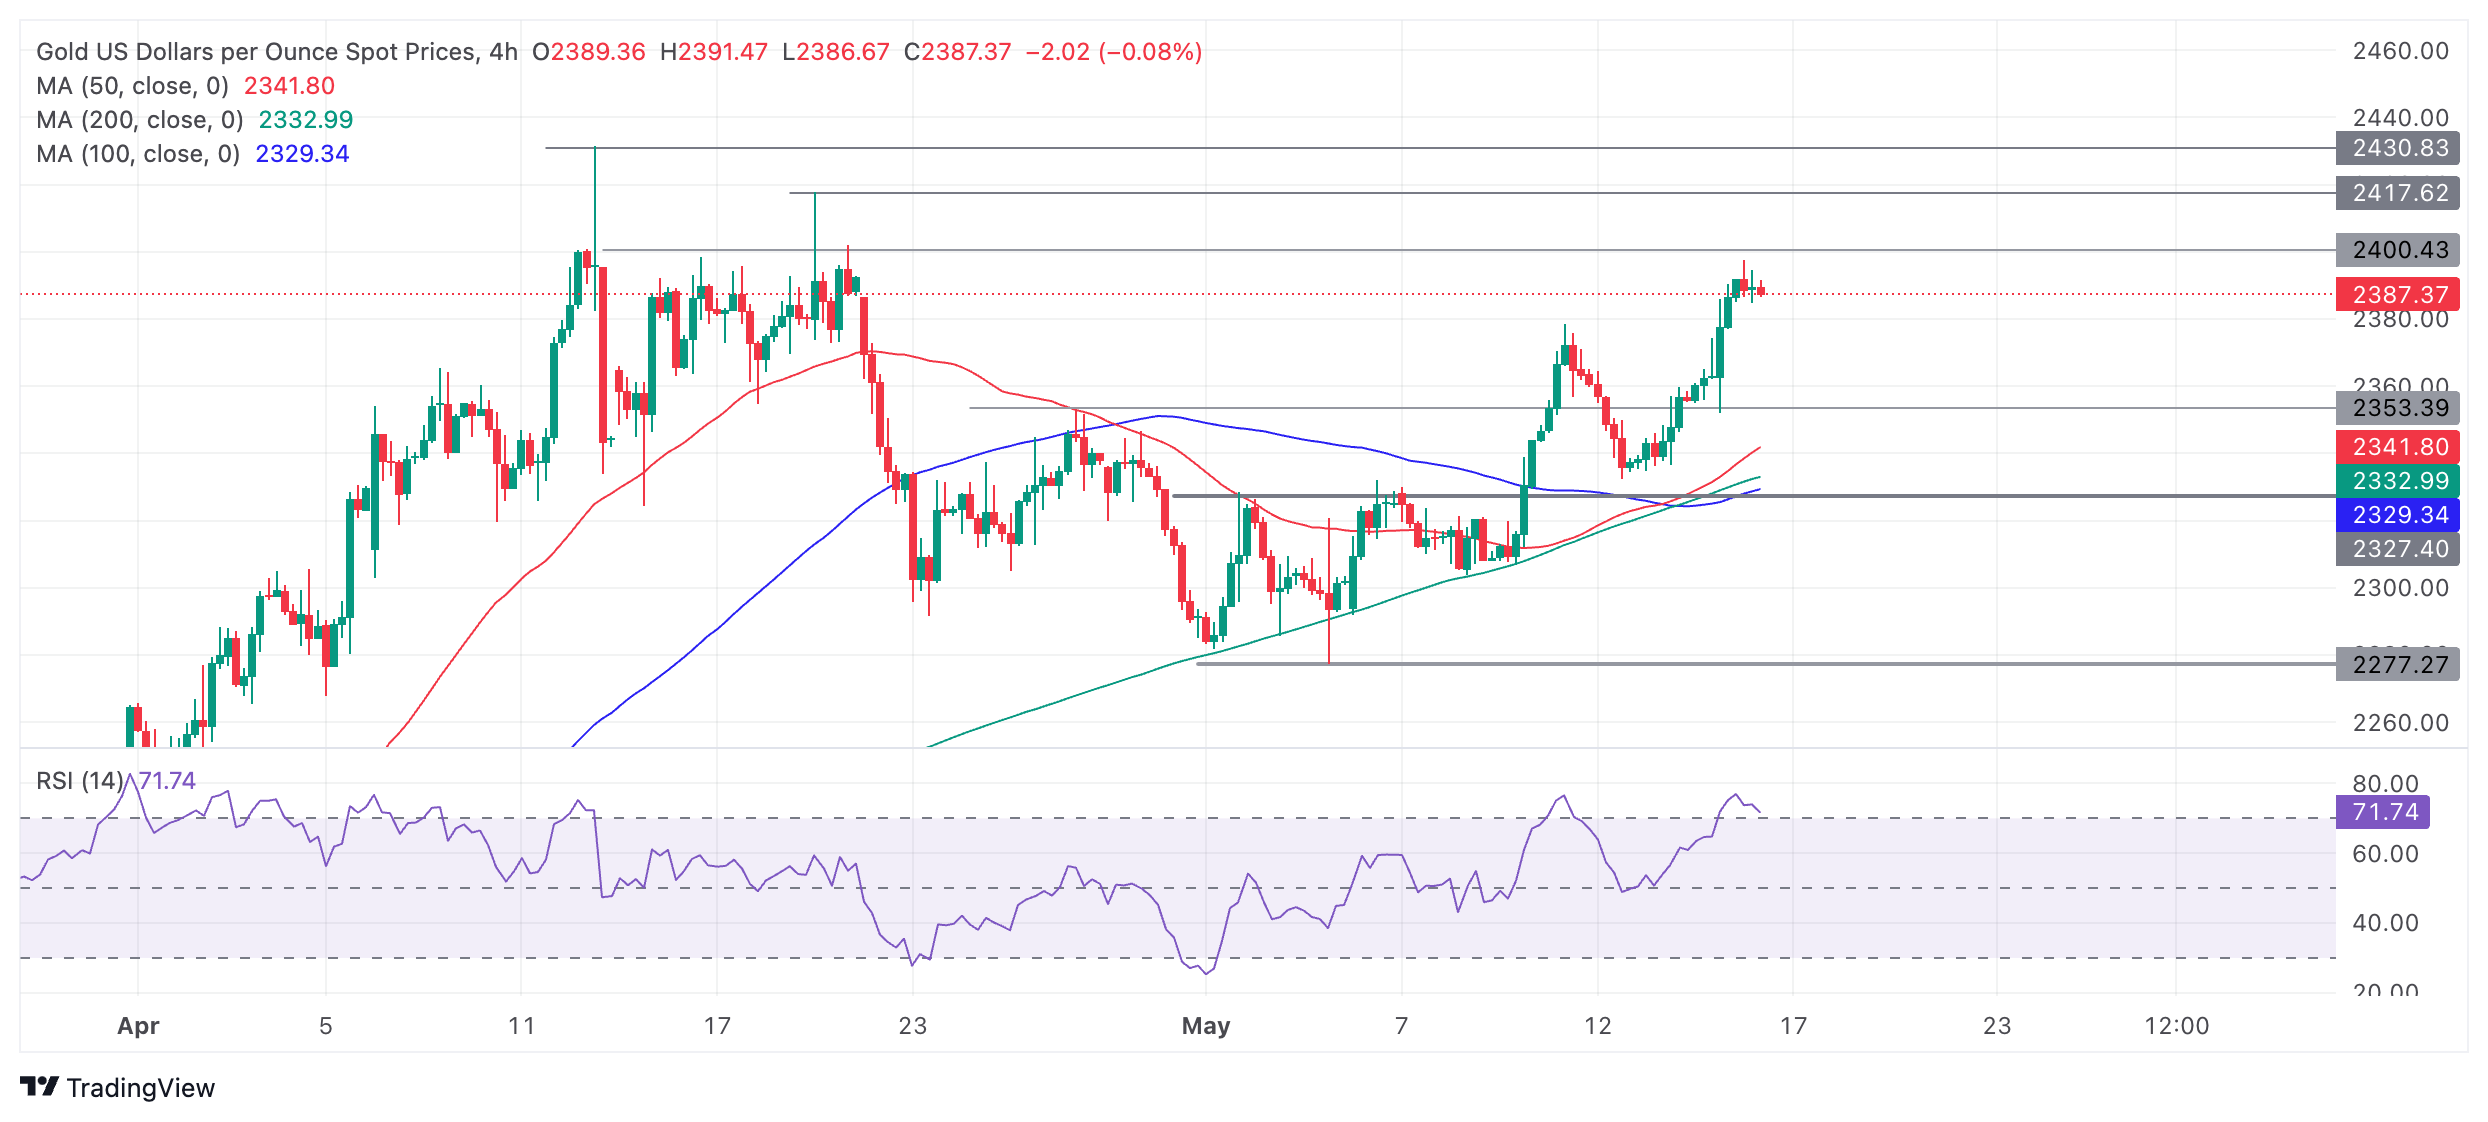
The Relative Strength Index (RSI) is in the overbought zone, cautioning traders not to add to their long positions as there is an increased chance of a pullback. If the RSI exits overbought it will signal a deeper correction is underway.
That said, the precious metal remains in an uptrend and, given the old saying “the trend is your friend,” Gold price is likely to continue trading with a bullish bias. A break above $2,400 would likely see it rally to the next resistance level at $2,417 (the April 19 high), followed by $2,430 – the all-time high.
The medium and long-term charts (daily and weekly) are also bullish, adding a supportive backdrop for Gold.
Economic Indicator
Consumer Price Index (MoM)
Inflationary or deflationary tendencies are measured by periodically summing the prices of a basket of representative goods and services and presenting the data as The Consumer Price Index (CPI). CPI data is compiled on a monthly basis and released by the US Department of Labor Statistics. The MoM figure compares the prices of goods in the reference month to the previous month.The CPI is a key indicator to measure inflation and changes in purchasing trends. Generally, a high reading is seen as bullish for the US Dollar (USD), while a low reading is seen as bearish.
Read more.Last release: Wed May 15, 2024 12:30
Frequency: Monthly
Actual: 0.3%
Consensus: 0.4%
Previous: 0.4%
Source: US Bureau of Labor Statistics
The US Federal Reserve has a dual mandate of maintaining price stability and maximum employment. According to such mandate, inflation should be at around 2% YoY and has become the weakest pillar of the central bank’s directive ever since the world suffered a pandemic, which extends to these days. Price pressures keep rising amid supply-chain issues and bottlenecks, with the Consumer Price Index (CPI) hanging at multi-decade highs. The Fed has already taken measures to tame inflation and is expected to maintain an aggressive stance in the foreseeable future.
- NZD/USD pulls back from a two-month high of 0.6140 marked on Thursday.
- Technical analysis suggests a confirmation of the bullish trend for the pair.
- The pair could find the key resistance at the major level of 0.6150.
NZD/USD retreats from a two-month high of 0.6140, trading around 0.6110 during the European session on Thursday. The pair depreciates due to an upward correction in the US Dollar (USD), which could be attributed to the improved US Treasury yields.
As per the technical analysis, the momentum indicator Moving Average Convergence Divergence (MACD) suggests an upward trend for the NZD/USD pair. This is indicated by the placement of the MACD line above the centerline and shows the divergence above the signal line.
Additionally, the 14-day Relative Strength Index (RSI) remains above the 50 level, indicating a confirmation of the bullish sentiment.
On a daily chart, the key resistance appears at the major level of 0.6150. A break above this level could lead the NZD/USD pair to explore the region around the psychological level of 0.6200, followed by March’s high at 0.6218.
On the downside, the psychological level of 0.6100 could act as the immediate support, followed by the 23.6% Fibonacci retracement level of 0.6081, plotting within coordinates of 0.5886 and 0.6141. A break below the latter could prompt the NZD/USD pair to navigate the region around the 14-day Exponential Moving Average (EMA) at 0.6026.
NZD/USD: Daily Chart

Silver prices (XAG/USD) fell on Thursday, according to FXStreet data. Silver trades at $29.55 per troy ounce, down 0.39% from the $29.67 it cost on Wednesday.
Silver prices have increased by 16.02% since the beginning of the year.
| Unit measure | Today Price |
|---|---|
| Silver price per troy ounce | $29.55 |
| Silver price per gram | $0.95 |
The Gold/Silver ratio, which shows the number of troy ounces of Silver needed to equal the value of one troy ounce of Gold, stood at 80.74 on Thursday, up from 80.43 on Wednesday.
Investors might use this ratio to determine the relative valuation of Gold and Silver. Some may consider a high ratio as an indicator that Silver is undervalued – or Gold is overvalued – and might buy Silver or sell Gold accordingly. Conversely, a low ratio might suggest that Gold is undervalued relative to Silver.
Silver FAQs
Silver is a precious metal highly traded among investors. It has been historically used as a store of value and a medium of exchange. Although less popular than Gold, traders may turn to Silver to diversify their investment portfolio, for its intrinsic value or as a potential hedge during high-inflation periods. Investors can buy physical Silver, in coins or in bars, or trade it through vehicles such as Exchange Traded Funds, which track its price on international markets.
Silver prices can move due to a wide range of factors. Geopolitical instability or fears of a deep recession can make Silver price escalate due to its safe-haven status, although to a lesser extent than Gold's. As a yieldless asset, Silver tends to rise with lower interest rates. Its moves also depend on how the US Dollar (USD) behaves as the asset is priced in dollars (XAG/USD). A strong Dollar tends to keep the price of Silver at bay, whereas a weaker Dollar is likely to propel prices up. Other factors such as investment demand, mining supply – Silver is much more abundant than Gold – and recycling rates can also affect prices.
Silver is widely used in industry, particularly in sectors such as electronics or solar energy, as it has one of the highest electric conductivity of all metals – more than Copper and Gold. A surge in demand can increase prices, while a decline tends to lower them. Dynamics in the US, Chinese and Indian economies can also contribute to price swings: for the US and particularly China, their big industrial sectors use Silver in various processes; in India, consumers’ demand for the precious metal for jewellery also plays a key role in setting prices.
Silver prices tend to follow Gold's moves. When Gold prices rise, Silver typically follows suit, as their status as safe-haven assets is similar. The Gold/Silver ratio, which shows the number of ounces of Silver needed to equal the value of one ounce of Gold, may help to determine the relative valuation between both metals. Some investors may consider a high ratio as an indicator that Silver is undervalued, or Gold is overvalued. On the contrary, a low ratio might suggest that Gold is undervalued relative to Silver.
Gold prices rose in India on Thursday, according to data from India's Multi Commodity Exchange (MCX).
Gold price stood at 73,212 Indian Rupees (INR) per 10 grams, up INR 767 compared with the INR 72,445 it cost on Wednesday.
As for futures contracts, Gold prices increased to INR 73,108 per 10 gms from INR 73,102 per 10 gms.
Prices for Silver futures contracts increased to INR 87,187 per kg from INR 86,865 per kg.
| Major Indian city | Gold Price |
|---|---|
| Ahmedabad | 75,780 |
| Mumbai | 75,530 |
| New Delhi | 75,520 |
| Chennai | 75,730 |
| Kolkata | 75,685 |
Global Market Movers: Comex Gold price edges higher due to cooling US inflation, weaker Retail Sales
- The US Consumer Price Index (CPI) increased by 3.4% YoY in April, compared to a rise of 3.5% in March, which is in line with market expectations. On a monthly basis, the headline CPI inflation dropped to 0.3% MoM in April from 0.4% in March, below the consensus of 0.4%.
- The core CPI inflation, which excludes volatile items like food and energy, rose by 3.6% YoY in April, compared to the previous reading of 3.8%. The monthly core CPI eased to 0.3% MoM in April from 0.4% in March.
- US Retail Sales came in at 0% MoM in April from a 0.6% rise in March, worse than the estimation of 0.4%.
- Fed Bank of Minneapolis President Neel Kashkari said on Wednesday that the central bank needs to watch the economy carefully to see if current policy rates are restrictive enough.
- Financial markets are currently pricing in a nearly 75% chance of a rate cut by the Fed in September 2024, a rise from 65% before the US CPI report, according to the CME's FedWatch Tool.
- According to the World Gold Council's Q1 2024 report, global gold demand climbed by 3% to 1,238 tonnes, marking the strongest first quarter since 2016.
Gold FAQs
Gold has played a key role in human’s history as it has been widely used as a store of value and medium of exchange. Currently, apart from its shine and usage for jewelry, the precious metal is widely seen as a safe-haven asset, meaning that it is considered a good investment during turbulent times. Gold is also widely seen as a hedge against inflation and against depreciating currencies as it doesn’t rely on any specific issuer or government.
Central banks are the biggest Gold holders. In their aim to support their currencies in turbulent times, central banks tend to diversify their reserves and buy Gold to improve the perceived strength of the economy and the currency. High Gold reserves can be a source of trust for a country’s solvency. Central banks added 1,136 tonnes of Gold worth around $70 billion to their reserves in 2022, according to data from the World Gold Council. This is the highest yearly purchase since records began. Central banks from emerging economies such as China, India and Turkey are quickly increasing their Gold reserves.
Gold has an inverse correlation with the US Dollar and US Treasuries, which are both major reserve and safe-haven assets. When the Dollar depreciates, Gold tends to rise, enabling investors and central banks to diversify their assets in turbulent times. Gold is also inversely correlated with risk assets. A rally in the stock market tends to weaken Gold price, while sell-offs in riskier markets tend to favor the precious metal.
The price can move due to a wide range of factors. Geopolitical instability or fears of a deep recession can quickly make Gold price escalate due to its safe-haven status. As a yield-less asset, Gold tends to rise with lower interest rates, while higher cost of money usually weighs down on the yellow metal. Still, most moves depend on how the US Dollar (USD) behaves as the asset is priced in dollars (XAU/USD). A strong Dollar tends to keep the price of Gold controlled, whereas a weaker Dollar is likely to push Gold prices up.
FX option expiries for May 16 NY cut at 10:00 Eastern Time, via DTCC, can be found below
- EUR/USD: EUR amounts
- 1.0640-45 2.7b
- 1.0650 570m
- 1.0655 868m
- 1.0695 824m
- 1.0700 877m
- 1.0735 541m
- 1.0740 1.2b
- 1.0755 832m
- 1.0790 954m
- 1.0795 516m
- 1.0800 531m
- 1.0810 515m
- 1.0820 843m
- 1.0825 907m
- 1.0845-50 2.2b
- 1.0875 1.7b
- 1.0900 1.6b
- 1.0915 1.1b
- 1.0920 848m
- 1.0930 625m
- GBP/USD: GBP amounts
- 1.2600 643m
- USD/CHF: USD amounts
- 0.9025 465m
- 0.9100 702m
- USD/JPY: USD amounts
- 153.00 1.9b
- 153.50 588m
- 153.85 689m
- 154.00 770m
- 154.40 496m
- 155.00 1.2b
- 155.05 560m
- 156.00 587m
- 158.00 561m
- AUD/USD: AUD amounts
- 0.6525 767m
- 0.6550 712m
- 0.6600 1.1b
- 0.6640 741m
- 0.6725 507m
- NZD/USD: NZD amounts
- 0.5885-90 - 1.5b
- 0.6000 749m
- USD/CHF extends losses due to growing expectations of multiple rate cuts by the Fed in 2024.
- Fed’s Neel Kashkari said that the US Fed should maintain policy rates at their current level for longer.
- Traders await Swiss Industrial Production (Q1) due on Friday, seeking fresh impetus on manufacturing conditions in the country.
USD/CHF continues its losing streak, hovering around 0.9000 during the European trading session on Thursday. The pair received pressure as the US Dollar (USD) struggled due to growing expectations of multiple rate cuts by the Federal Reserve (Fed) in 2024.
This dovish sentiment surrounding the Fed was bolstered after the release of the lower-than-expected monthly Consumer Price Index (CPI) and Retail Sales data from the United States (US). US CPI decelerated to 0.3% month-over-month in April and came in at a lower-than-expected 0.4% reading. While Retail Sales flattened, falling short of the expected increase of 0.4%.
However, Minneapolis Federal Reserve Bank President Neel Kashkari remarked on Wednesday that the US Fed should maintain policy rates at their current level "for a while longer until they ascertain the direction of underlying inflation."
On the Swiss front, Producer and Import Prices (YoY) decreased by 1.8% in April, showing a slight improvement from the previous decline of 2.1%. This marked the twelfth consecutive period of decrease, albeit at the slowest rate since December 2023.
Furthermore, traders are anticipated to closely observe Industrial Production (YoY) for the first quarter, set to be released on Friday. This report will offer insights into the volume of production across various sectors, including factories and manufacturing, in Switzerland.
- The Pound Sterling holds gains near 1.2700 amid cheerful market sentiment.
- UK’s steady wage growth keeps BoE rate-cut context uncertain.
- An expected decline in the US CPI strengthens Fed rate-cut bets for September.
The Pound Sterling (GBP) turns sideways after posting a fresh monthly high near 1.2700 against the US Dollar (USD) in Thursday’s London session. The near-term outlook of the GBP/USD pair is upbeat as uncertainty over the Bank of England (BoE) rate-cut timing has deepened due to stubborn United Kingdom (UK) wage growth. This is a favorable scenario for the Pound Sterling.
UK Average Earnings grew steadily in the three months ending March, raising concerns over progress in inflation declining to the desired rate of 2%. High wage growth feeds service inflation, which has remained a major barrier to progress in the disinflation process.
By the weekend, the UK economic calendar has noting much to offer. Therefore, investors will keenly watch the commentary on interest rates from BoE policymakers: Megan Greene and Catherine Mann, who are scheduled to speak on Thursday and Friday, respectively.
Daily digest market movers: Pound Sterling holds on gains amid uncertainty over BoE rate-cuts
- The Pound Sterling trades close to the round-level resistance of 1.2700 against the US Dollar. The GBP/USD pair remains firm as the market sentiment is quite bullish amid strong speculation that the Federal Reserve (Fed) will start lowering interest rates from the September meeting. S&P 500 futures post gains in the European session, exhibiting an improvement in investors’ risk-appetite.
- The CME FedWatch tool shows that the probability of interest rates declining from their current levels in the September meeting has increased to 73% from 69% recorded a week ago. Invertors’ confidence in Fed rate cuts has improved due to soft United States inflation report, easing labor market conditions and stagnant Retail Sales data for April.
- On Wednesday, the US Bureau of Labor Statistics (BLS) reported that annual headline and core Consumer Price Index (CPI) grew at a slower pace of 3.4% and 3.6%, respectively as expected. Fed policymakers mainly focus on the core inflation data for decision-making on interest rates. Though the inflation measure is almost double the required rate of 2%, an expected decline in price pressures has increased investors’ confidence that inflationary pressures will sustainably return to the desired rate of 2%.
- Retail Sales data, a leading indicator of consumer spending that also provides cues about the outlook on inflation, remained unchanged in April but was expected to rise by 0.4%. This has suggested that the inflation outlook has softened.
- Going forward, the next move in the US Dollar will be guided by Fed policymakers’ commentary on the interest rate guidance, with Fed Vice Chair for Supervision Michael Barr, Fed Bank of Philadelphia President Patrick Harker, Fed Bank of Cleveland President Loretta Mester and Fed Bank of Atlanta President Raphael Bostic scheduled to speak on Thursday.
- On the economic data front, investors will focus on the Initial Jobless Claims data for the week ending May 10, which are estimated to have declined to 220K. Last week, individuals claiming jobless benefits were most in eight months at 231K and weighed heavily on the US Dollar.
Technical Analysis: Pound Sterling retraces 61.8% losses to 1.2700
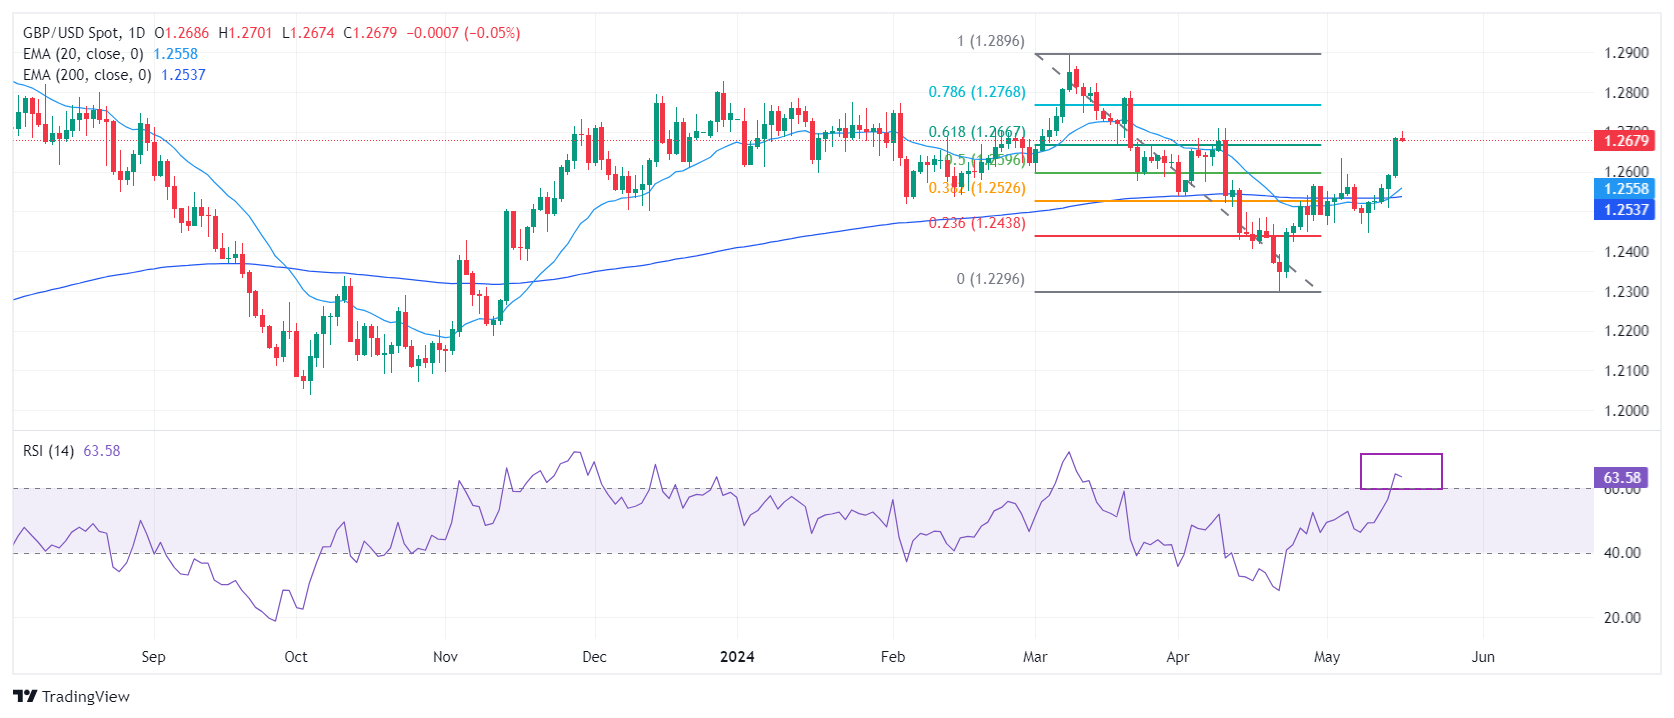
The Pound Sterling retraces 61.8% of its losses recorded from a 10-month high around 1.2900 marked on March 8. Near and long-term outlook of the GBP/USD pair has turned bullish as it climbs above the 20-day and 200-day Exponential Moving Averages (EMAs), which trade around 1.2565 and 1.2536, respectively.
The 14-period Relative Strength Index (RSI) has shifted into the bullish range of 60.00-80.00, suggesting that the momentum has leaned toward the upside.
Pound Sterling FAQs
The Pound Sterling (GBP) is the oldest currency in the world (886 AD) and the official currency of the United Kingdom. It is the fourth most traded unit for foreign exchange (FX) in the world, accounting for 12% of all transactions, averaging $630 billion a day, according to 2022 data. Its key trading pairs are GBP/USD, aka ‘Cable’, which accounts for 11% of FX, GBP/JPY, or the ‘Dragon’ as it is known by traders (3%), and EUR/GBP (2%). The Pound Sterling is issued by the Bank of England (BoE).
The single most important factor influencing the value of the Pound Sterling is monetary policy decided by the Bank of England. The BoE bases its decisions on whether it has achieved its primary goal of “price stability” – a steady inflation rate of around 2%. Its primary tool for achieving this is the adjustment of interest rates. When inflation is too high, the BoE will try to rein it in by raising interest rates, making it more expensive for people and businesses to access credit. This is generally positive for GBP, as higher interest rates make the UK a more attractive place for global investors to park their money. When inflation falls too low it is a sign economic growth is slowing. In this scenario, the BoE will consider lowering interest rates to cheapen credit so businesses will borrow more to invest in growth-generating projects.
Data releases gauge the health of the economy and can impact the value of the Pound Sterling. Indicators such as GDP, Manufacturing and Services PMIs, and employment can all influence the direction of the GBP. A strong economy is good for Sterling. Not only does it attract more foreign investment but it may encourage the BoE to put up interest rates, which will directly strengthen GBP. Otherwise, if economic data is weak, the Pound Sterling is likely to fall.
Another significant data release for the Pound Sterling is the Trade Balance. This indicator measures the difference between what a country earns from its exports and what it spends on imports over a given period. If a country produces highly sought-after exports, its currency will benefit purely from the extra demand created from foreign buyers seeking to purchase these goods. Therefore, a positive net Trade Balance strengthens a currency and vice versa for a negative balance.
- Silver price has rallied up to just shy of $30.00, a key resistance level.
- The $30.00 barrier lies at the top of a four-year consolidation range.
- A breakout above would be a significant technical event for Silver.
Silver (XAG/USD) price is rising up in an ascending channel and on Thursday reached just shy of the $30.00 mark, a significant resistance level.
The precious metal is currently pulling back as traders book profits, however, it remains in a short-term uptrend, which given the old saying that “the trend is your friend” is likely to resume and continue pushing higher.
4-hour Chart
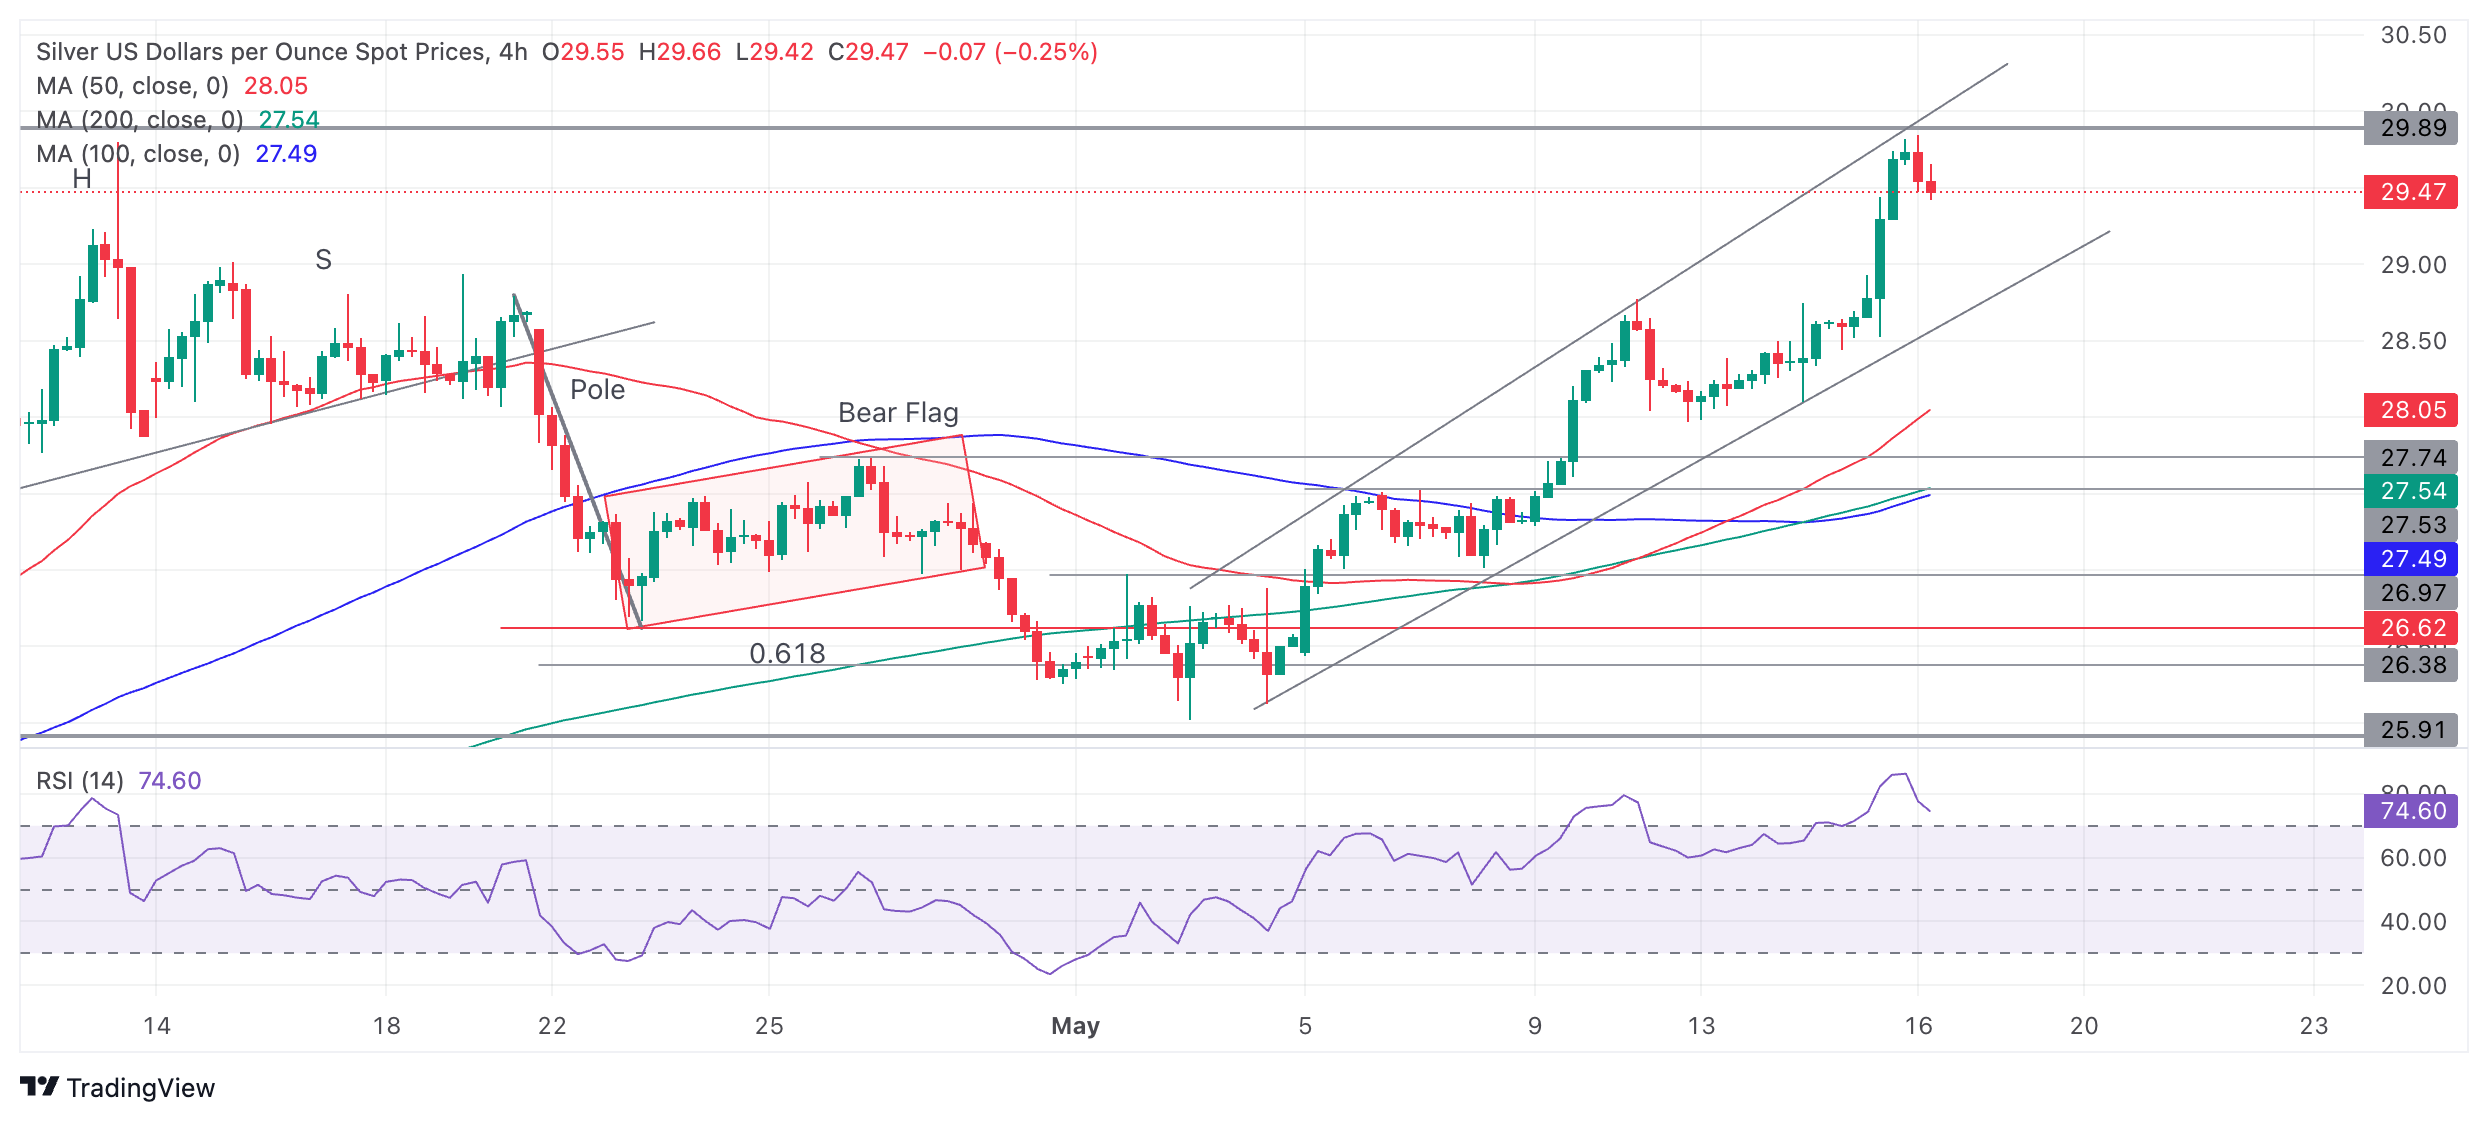
The Relative Strength Index (RSI) is in the overbought zone, suggesting traders should be cautious about adding longs to their bullish positions. If the RSI exits overbought on a closing basis it will signal a deeper correction is taking place.
Eventually the short-term uptrend should reassert itself, however, and Silver price probably rally higher. Key long-term resistance for Silver lies at circa $30.00 which is likely to present a formidable barrier to further upside.
Silver Weekly Chart
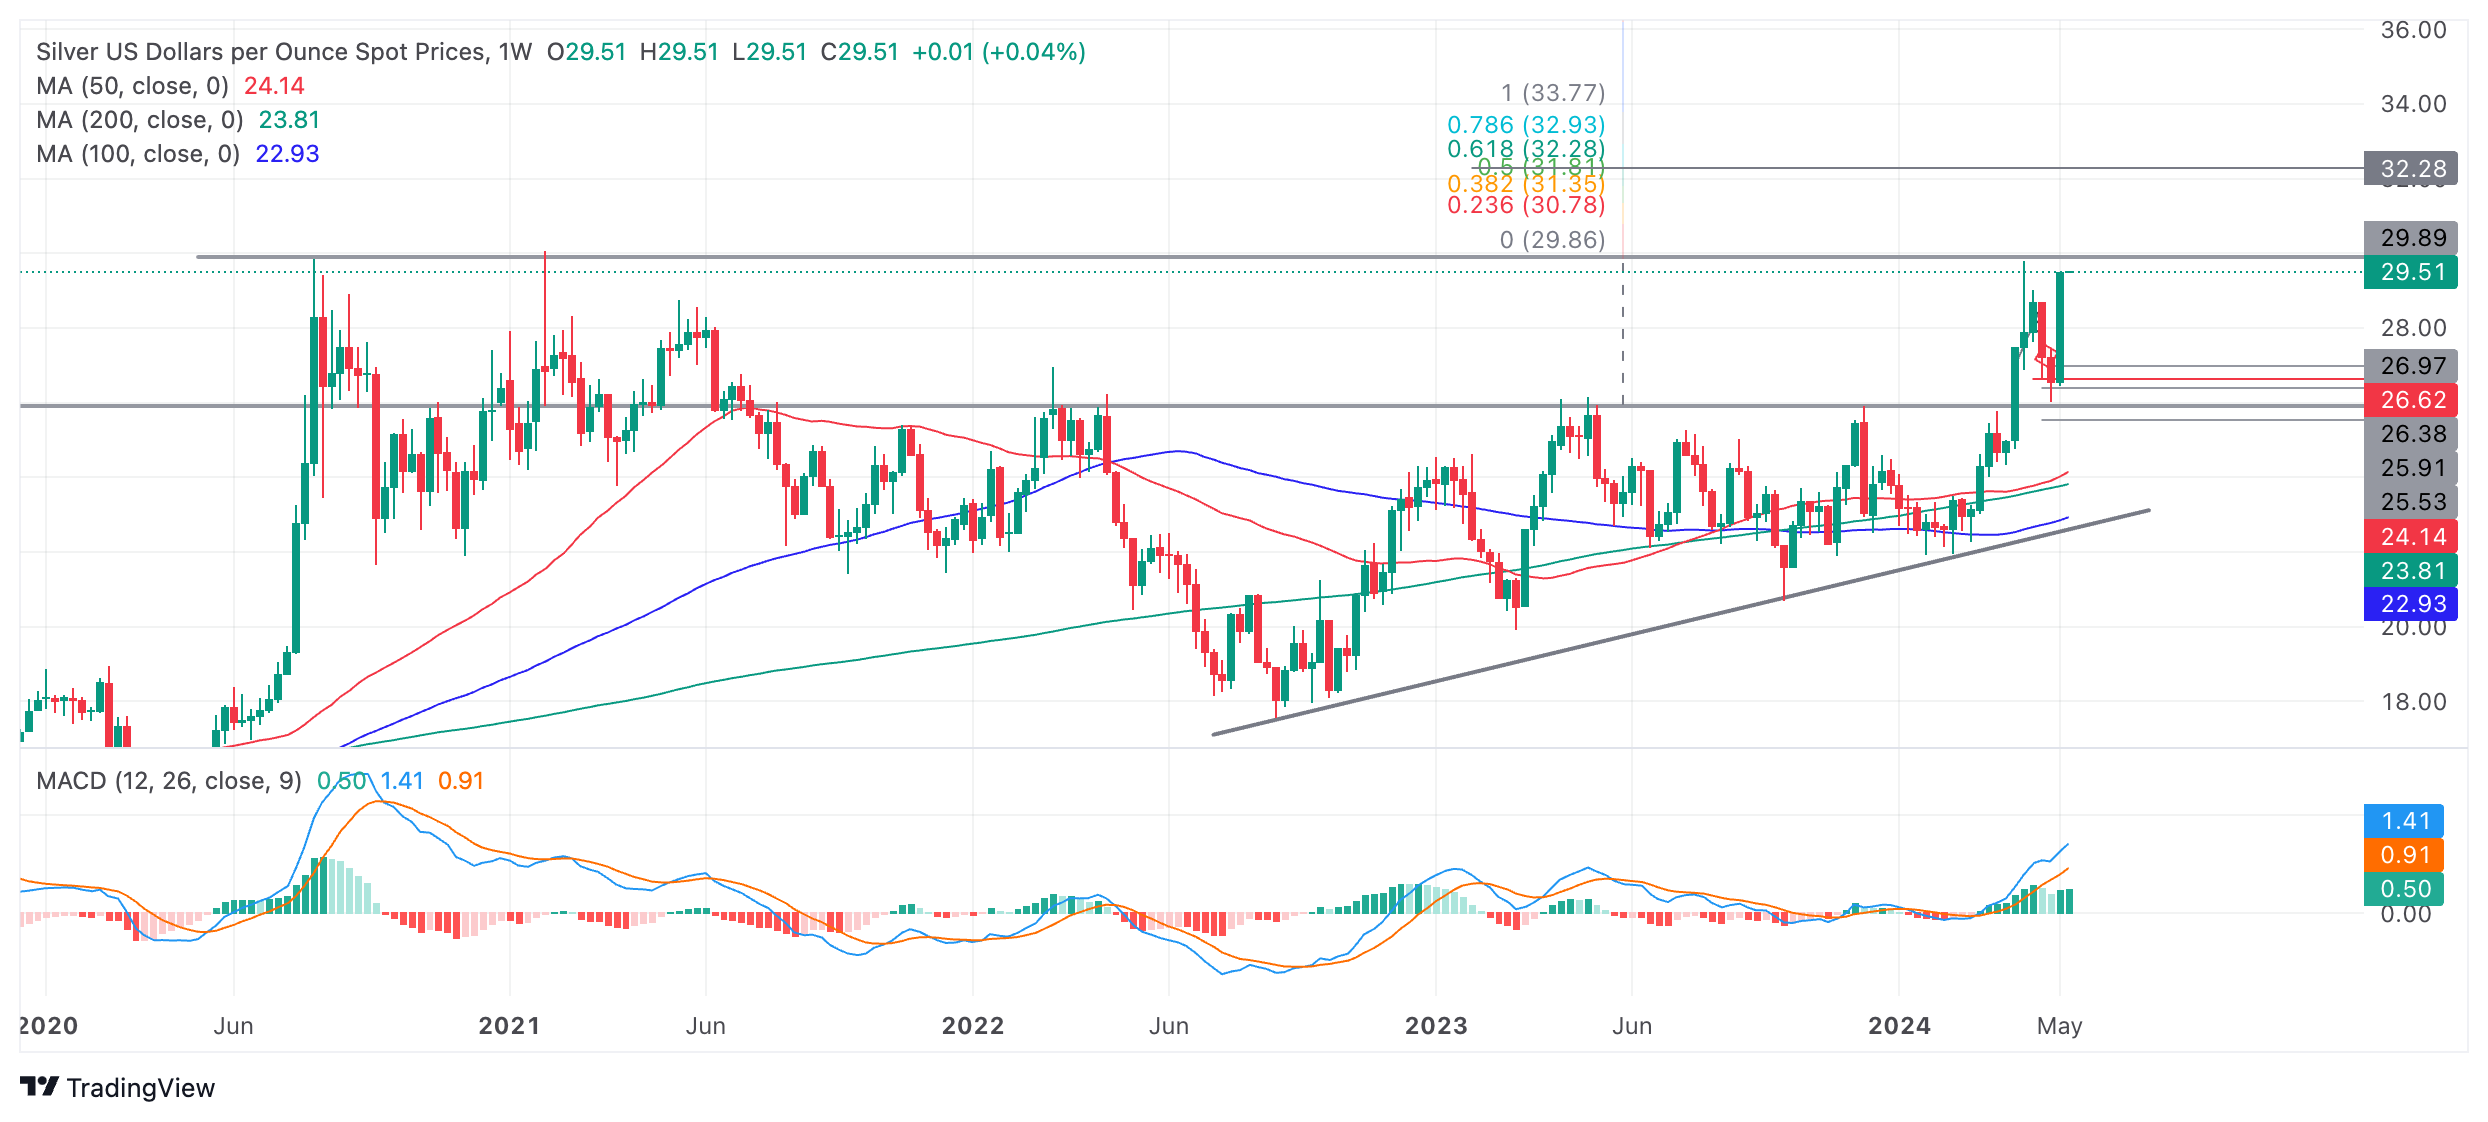
The importance of the $30.00 level can be seen more clearly on the weekly chart above, which shows the level has repeatedly been tested since 2020 when Silver’s long-term sideways consolidation began.
This is the fourth time the level has been tested and it is possible that it will repel price once again, however, a decisive break above the level would probably lead to a volatile move higher. This is so because levels that have been repeatedly touched often generate volatile moves when they are finally penetrated.
A decisive break above $30.00, therefore, would result in an extension of the short-term uptrend and a breakout from a four-year consolidation range. At a minimum such a move ought to reach $32.28, the Fibonacci 0.618 extension of the upper part of the consolidation range higher. This is only an estimate, however, and there is a possibility Silver could go much higher as confidence in the uptrend draws more bulls to the trade. If exuberance is high, $33.83 could be reached, followed even by $36.28, the 1.618 ratio extension of the height of the range.
It would require a decisive break below the rising channel lows at roughly $29.00 to bring the short-term uptrend into doubt and suggest the possibility of a more bearish outlook.
A decisive break would be one accompanied by a long red candlestick that closed near its lows or three red candlesticks in a row.
- USD/INR gains ground as US Treasury yields recover on Thursday.
- The US Dollar may struggle due to the growing expectations of multiple rate cuts by the Fed in 2024.
- India's Trade Deficit increased to $19.1 billion in April due to lower exports and a rise in Gold imports.
The USD/INR pair edges higher to near 83.50 during the early European session on Thursday. The upward correction in the US Dollar (USD) helps the pair to retrace its recent losses registered in the last two days. However, the Greenback depreciated on Wednesday due to growing expectations of multiple rate cuts by the Federal Reserve (Fed) in 2024.
This dovish sentiment surrounding the Fed was bolstered after the release of the lower-than-expected monthly Consumer Price Index (CPI) and Retail Sales data from the United States (US). US CPI decelerated to 0.3% month-over-month in April and came in at a lower-than-expected 0.4% reading. While Retail Sales flattened, falling short of the expected increase of 0.4%.
The US Dollar Index (DXY), which gauges the performance of the US Dollar (USD) against six major currencies, hovers around 104.30. The improved US Treasury yields are providing support for the Greenback. The 2-year and 10-year yields on US Treasury bonds stand at 4.73% and 4.33, respectively, by the press time.
On Wednesday, India's Trade Deficit, released by the Ministry of Commerce and Industry, increased to $19.1 billion in April, from the previous reading of $15.6 billion. This increase could be attributed to lower exports and a surge in Gold imports, according to government data.
Reuters cited a foreign exchange trader at a private bank who suggested that the Indian National Rupee (INR) "should strengthen somewhat, but don't expect the movement to be very significant as the INR would continue to underperform amidst broad USD short positions buildup." Forward premiums on the USD/INR pair saw an uptick, with the one-year implied yield rising by 2 basis points to 1.70%, supported by lower US bond yields.
- The Mexican Peso recovers against the US Dollar and in most key pairs after key US data released on Wednesday.
- US CPI and Retail Sales missed analysts expectations and showed a slow down from previous readings.
- The data puts back on the table the possibility of an early interest rate cut from the Fed, weighing on USD.
The Mexican Peso (MXN) is trading flat in most pairs on Thursday as traders pause after the Peso’s rally on Wednesday. Lower-than-expected Consumer Price Index (CPI) and Retail Sales data for April in the US revealed a cooling down of inflation and economic activity that recalibrated interest-rate expectations.
The data suggests the Federal Reserve (Fed) may be more inclined to lower borrowing costs – a negative for the US Dollar (USD) but overall positive for the Mexican Peso.
At the time of writing USD/MXN is trading at four-week lows of 16.71, EUR/MXN is trading at 18.18 and GBP/MXN at 21.19.
Mexican Peso reverses after US data
The Mexican Peso rebounded against the USD especially – but other major currencies too – after US CPI data undershot expectations, thereby increasing the chances the Fed might lower interest rates sooner than previously expected. Lower interest rates are negative for the USD as they reduce foreign capital inflows.
US headline CPI dropped by 0.3% on a month-on-month (MoM) basis in April, which was below the 0.4% forecast by experts and the 0.4% registered in March, according to data from the US Bureau of Labor Statistics. The year-over-year (YoY) reading came out at 3.4% as estimated, though below the 3.5% of March.
The data for CPI ex Food and Energy, meanwhile, came out in line with expectations of 0.3% MoM, but this too was below the 0.4% of March. YoY, the gauge fell to 3.6% as forecast, from 3.8% previously.
US Retail Sales showed flat consumer spending, with a 0.0% reading in April, which was well below estimates of 0.4% and the downwardly revised 0.6% of the previous month, according to data from the US Census Bureau.
USD/MXN rose almost a percentage point after the news as investors recalibrated their expectations of the future course of US interest rates.
Technical Analysis: USD/MXN resumes downtrend
USD/MXN – the value of one US Dollar in Mexican Pesos – “air-kissed goodbye” the key resistance level at roughly 16.86, which it had returned to after its range breakout, and descended on Wednesday, clocking substantial losses in the progress.
USD/MXN 4-hour Chart
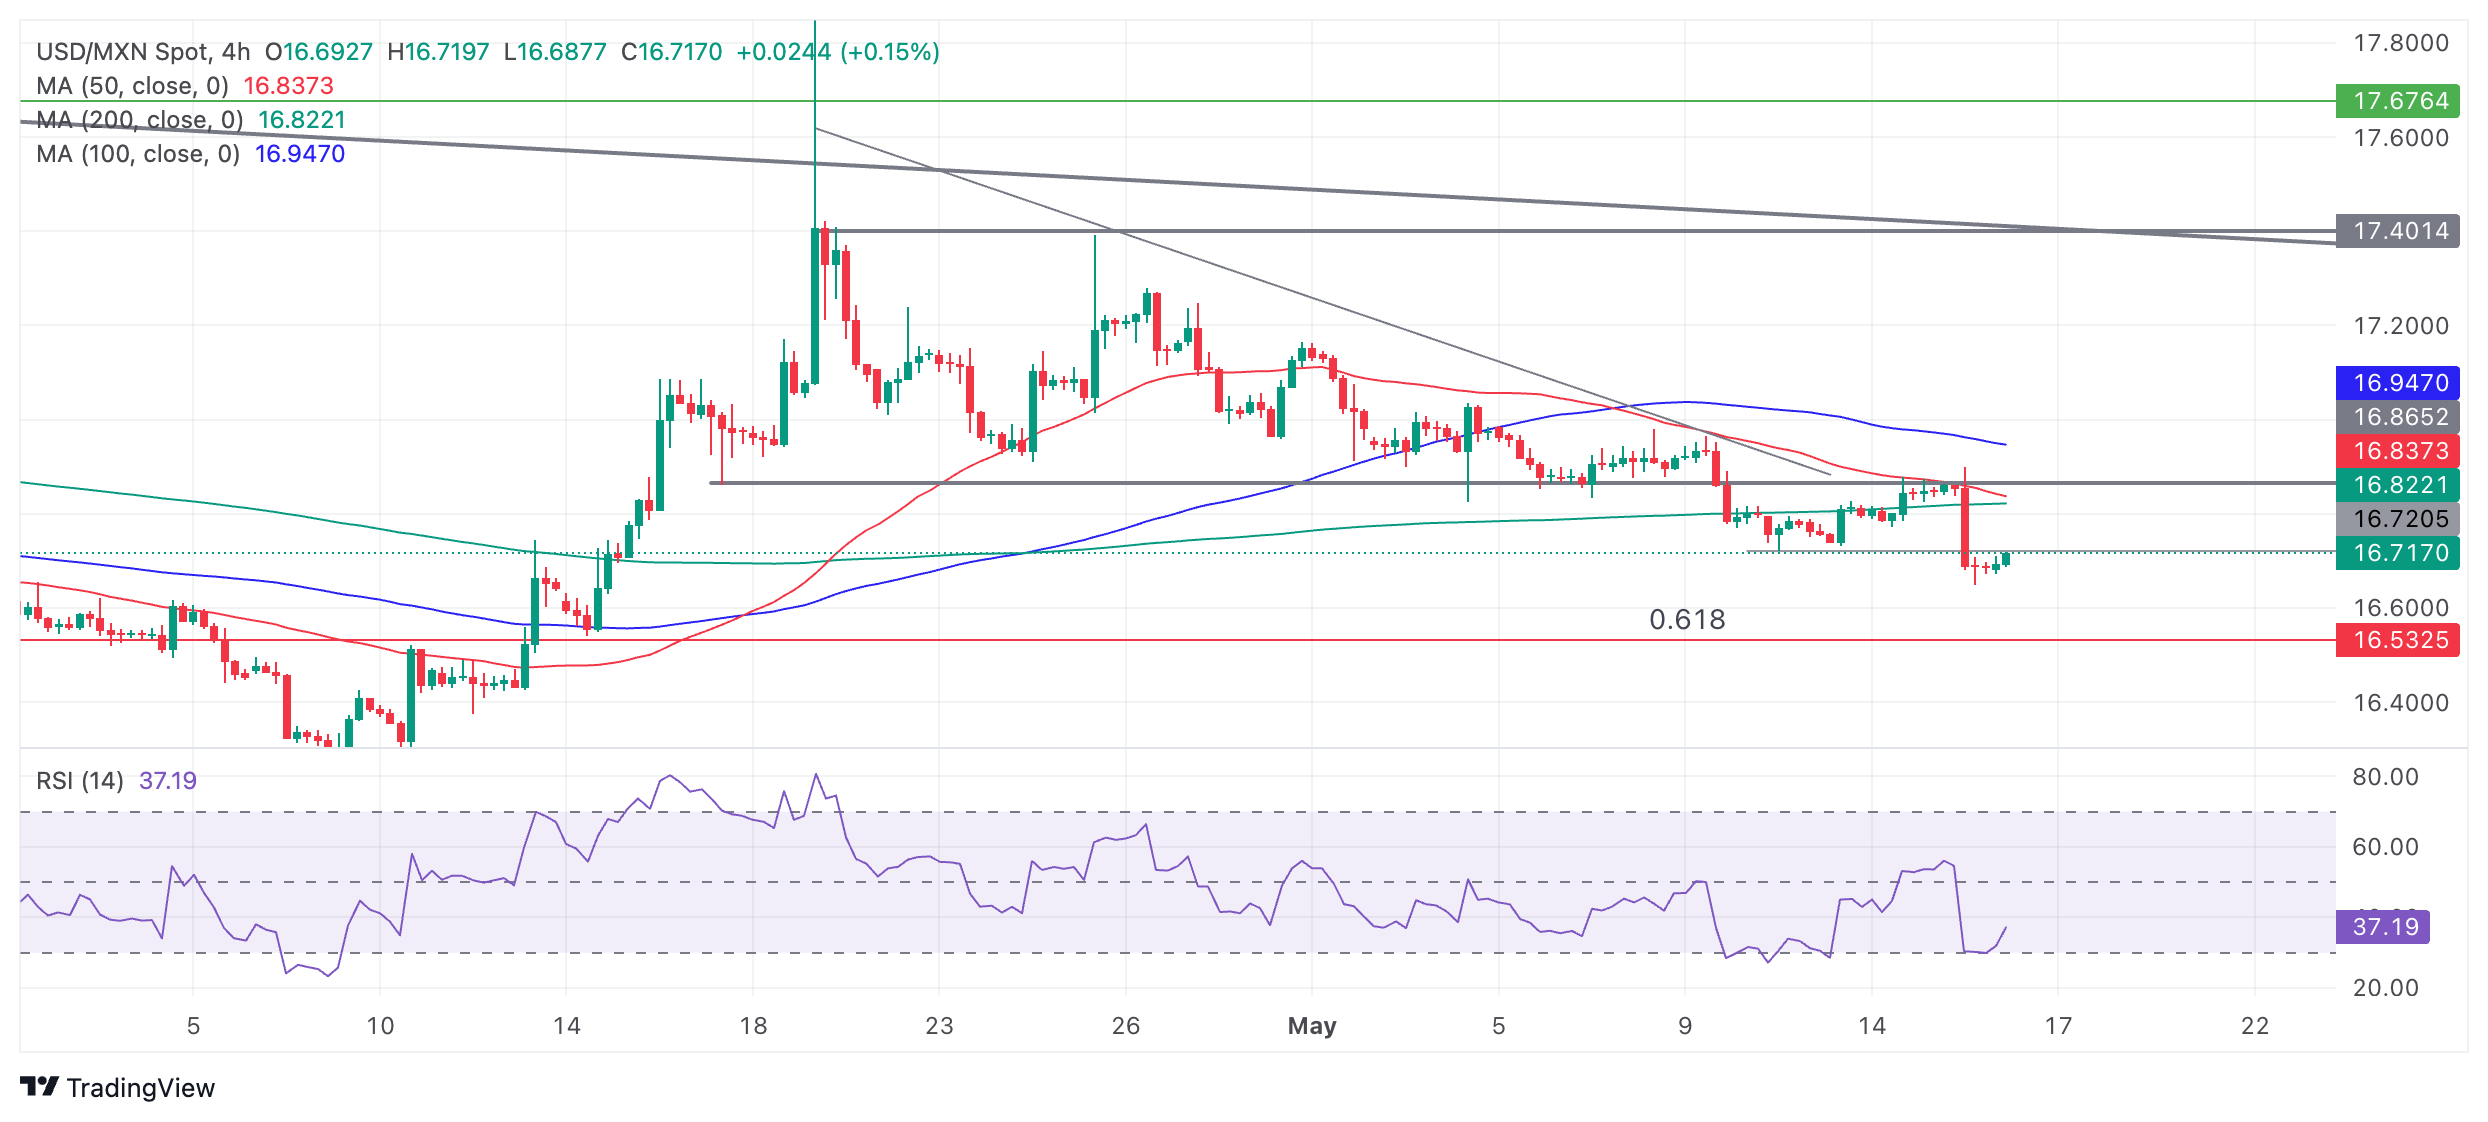
The pair has now resumed its short-term downtrend towards the conservative target for the breakout at 16.54, the 0.681 Fibonacci ratio of the height of the range extrapolated lower. Further bearishness could even reach 16.34, the full height of the range extrapolated lower.
Given the medium and long-term trends are bearish, the odds further favor more downside for the pair in line with those trends.
It would take a recovery and decisive break back inside the range (above 16.86), to reverse the downtrending bias.
A decisive break would be one accompanied by a longer-than-average green candlestick that closed near its high or three green candlesticks in a row.
Economic Indicator
Consumer Price Index (MoM)
Inflationary or deflationary tendencies are measured by periodically summing the prices of a basket of representative goods and services and presenting the data as The Consumer Price Index (CPI). CPI data is compiled on a monthly basis and released by the US Department of Labor Statistics. The MoM figure compares the prices of goods in the reference month to the previous month.The CPI is a key indicator to measure inflation and changes in purchasing trends. Generally, a high reading is seen as bullish for the US Dollar (USD), while a low reading is seen as bearish.
Read more.Last release: Wed May 15, 2024 12:30
Frequency: Monthly
Actual: 0.3%
Consensus: 0.4%
Previous: 0.4%
Source: US Bureau of Labor Statistics
The US Federal Reserve has a dual mandate of maintaining price stability and maximum employment. According to such mandate, inflation should be at around 2% YoY and has become the weakest pillar of the central bank’s directive ever since the world suffered a pandemic, which extends to these days. Price pressures keep rising amid supply-chain issues and bottlenecks, with the Consumer Price Index (CPI) hanging at multi-decade highs. The Fed has already taken measures to tame inflation and is expected to maintain an aggressive stance in the foreseeable future.
- USD/CAD finds support at the 1.3600 psychological level and rebounds to 1.3615 in Thursday’s early European session.
- The recent softer US inflation and weaker Retail Sales have triggered speculation that Fed may cut rates this year.
- Canadian Manufacturing Sales data for March fell 2.1% MoM in March from a 0.9% rise in February, worse than expected.
The USD/CAD pair recovers some lost ground near 1.3615 on Thursday during the early European trading hours. The modest rebound of US Dollar (USD) provides some support for the pair. Later on Thursday, investors will keep an eye on US Building Permits, Housing Starts, the weekly Initial Jobless Claims, the Philly Fed Manufacturing Index, and Industrial Production.
Federal Reserve Bank of Minneapolis President Neel Kashkari said on Wednesday that the central bank needs to monitor the economy closely to see if current policy rates are restrictive enough. Earlier this week, Fed Chair Jerome Powell noted that US inflation might prove to be more persistent than expected, keeping the Fed holding rate higher for longer to achieve the central bank’s 2% target. However, the recent softer US inflation data on Wednesday has triggered speculation that the Fed may cut interest rates this year. This, in turn, boosts the Greenback broadly.
The US Consumer Price Index (CPI) rose by 3.4% YoY in April, compared to an increase of 3.5% in the previous reading. The core CPI inflation, which excludes volatile items like food and energy, climbed by 3.6% YoY in April, compared to the previous reading of 3.8%. Both figures were in line with the consensus. The monthly headline and core CPI inflation eased to 0.3% MoM in April from 0.4% in March. Additionally, US Retail Sales arrived at 0% MoM in April from a 0.6% rise in March, worse than the forecast of 0.4%.
On the CAD’s front, the Canadian Manufacturing Sales data for March came in worse than expected, falling 2.1% MoM from a 0.9% rise in February, Statistics Canada revealed on Wednesday. The downbeat figure exerted some pressure on the Loonie. Nonetheless, the rise in oil prices might cap the downside of the commodity-linked Canadian Dollar (CAD), as Canada is the largest oil exporter to the United States.
Here is what you need to know on Thursday, May 16:
The US Dollar (USD) is struggling to stage a rebound after suffering large losses against its major rivals following the April inflation data from the US on Wednesday. Later in the day, weekly Initial Jobless Claims, April housing, Industrial Production data and Philadelphia Fed Manufacturing Survey will be featured in the US economic docket. Investors will continue to pay close attention to comments from major central banks' policymakers as well.
The US Bureau of Labor Statistics (LBS) reported on Wednesday that the Consumer Price Index (CPI) rose 3.4% on a yearly basis in April. The annual core CPI increased 3.6% in the same period and both of these figures came in line with market expectations. The benchmark 10-year US Treasury bond yield declined more than 2% as the probability of the Federal Reserve (Fed) leaving the policy rate unchanged in September declined toward 25% from 35% before the inflation data release. In turn, the USD Index fell 0.7% and touched its lowest level since April 10. Early Thursday, the USD Index stays flat on the day below 104.50, while the 10-year US yield continues to edge lower toward 4.3%. In the meantime, US stock index futures trade modestly higher after Wall Street's main indexes rose about 1% on Wednesday.
US Dollar PRICE This week
The table below shows the percentage change of US Dollar (USD) against listed major currencies this week. US Dollar was the weakest against the New Zealand Dollar.
| USD | EUR | GBP | JPY | CAD | AUD | NZD | CHF | |
|---|---|---|---|---|---|---|---|---|
| USD | -0.98% | -1.21% | -1.00% | -0.38% | -1.12% | -1.51% | -0.56% | |
| EUR | 0.98% | -0.28% | -0.03% | 0.58% | -0.17% | -0.55% | 0.39% | |
| GBP | 1.21% | 0.28% | 0.18% | 0.86% | 0.11% | -0.27% | 0.67% | |
| JPY | 1.00% | 0.03% | -0.18% | 0.61% | -0.09% | -0.57% | 0.47% | |
| CAD | 0.38% | -0.58% | -0.86% | -0.61% | -0.71% | -1.14% | -0.28% | |
| AUD | 1.12% | 0.17% | -0.11% | 0.09% | 0.71% | -0.49% | 0.55% | |
| NZD | 1.51% | 0.55% | 0.27% | 0.57% | 1.14% | 0.49% | 0.95% | |
| CHF | 0.56% | -0.39% | -0.67% | -0.47% | 0.28% | -0.55% | -0.95% |
The heat map shows percentage changes of major currencies against each other. The base currency is picked from the left column, while the quote currency is picked from the top row. For example, if you pick the US Dollar from the left column and move along the horizontal line to the Japanese Yen, the percentage change displayed in the box will represent USD (base)/JPY (quote).
During the Asian trading hours, the data from Australia showed that the Unemployment Rate rose to 4.1% in April from 3.9% in March. In this period, Full-Time Employment declined 6.1K while Part-Time Employment increased 44.6K. After reaching its highest level since January above 0.6700, AUD/USD turned south and fell toward 0.6670 after the labor market data.
Australia’s Unemployment Rate rises to 4.1% in April vs. 3.9 % expected.
Japan's Gross Domestic Product (GDP) contracted at an annual rate of 2% in the first quarter, Japan’s Cabinet Office's preliminary estimate showed early Thursday. This print came in weaker than the market expectation for a contraction of 1.5%. After falling nearly 1% on Wednesday, USD/JPY ignored the GDP data and extended its slide. At the time of press, the pair was down 0.5% on the day at 154.15.
Japan's Shindo: The economy is expected to continue a moderate recovery.
GBP/USD broke above 1.2600 and gained 0.75% on Wednesday. After testing 1.2700 in the Asian session, the pair staged a correction and was last seen trading flat on the day near 1.2680.
EUR/USD gained 0.6% on Wednesday and closed the third consecutive day in positive territory. Early Thursday, the pair stays in a consolidation phase slightly below 1.0900.
Gold benefited from falling US T-bond yields and advanced to its highest level in three weeks near $2,400 before retreating slightly. In the European morning, XAU/USD holds steady near $2,390.
Gold price gathers strength as US CPI inflation fuels Fed rate cuts.
Inflation FAQs
Inflation measures the rise in the price of a representative basket of goods and services. Headline inflation is usually expressed as a percentage change on a month-on-month (MoM) and year-on-year (YoY) basis. Core inflation excludes more volatile elements such as food and fuel which can fluctuate because of geopolitical and seasonal factors. Core inflation is the figure economists focus on and is the level targeted by central banks, which are mandated to keep inflation at a manageable level, usually around 2%.
The Consumer Price Index (CPI) measures the change in prices of a basket of goods and services over a period of time. It is usually expressed as a percentage change on a month-on-month (MoM) and year-on-year (YoY) basis. Core CPI is the figure targeted by central banks as it excludes volatile food and fuel inputs. When Core CPI rises above 2% it usually results in higher interest rates and vice versa when it falls below 2%. Since higher interest rates are positive for a currency, higher inflation usually results in a stronger currency. The opposite is true when inflation falls.
Although it may seem counter-intuitive, high inflation in a country pushes up the value of its currency and vice versa for lower inflation. This is because the central bank will normally raise interest rates to combat the higher inflation, which attract more global capital inflows from investors looking for a lucrative place to park their money.
Formerly, Gold was the asset investors turned to in times of high inflation because it preserved its value, and whilst investors will often still buy Gold for its safe-haven properties in times of extreme market turmoil, this is not the case most of the time. This is because when inflation is high, central banks will put up interest rates to combat it. Higher interest rates are negative for Gold because they increase the opportunity-cost of holding Gold vis-a-vis an interest-bearing asset or placing the money in a cash deposit account. On the flipside, lower inflation tends to be positive for Gold as it brings interest rates down, making the bright metal a more viable investment alternative.
- EUR/USD received support after the lower CPI and Retail Sales data released on Wednesday.
- US Dollar depreciated due to lower US Treasury yields.
- The Euro appreciates on increasing expectations for a convergence in monetary policy between the Eurozone and the US.
EUR/USD treads water to continue its winning streak for the fourth session, trading around 1.0880 during the Asian hours on Thursday. The US Dollar’s (USD) decline is contributing to pressure on the EUR/USD pair, which could be attributed to the improved risk appetite.
On Wednesday, the lower-than-expected monthly Consumer Price Index (CPI) and Retail Sales data in the United States (US) supported the probability of multiple rate cuts by the Federal Reserve (Fed) in 2024. US CPI decelerated to 0.3% month-over-month in April and came in at a lower-than-expected 0.4% reading. While Retail Sales flattened, falling short of the expected increase of 0.4%.
The US Dollar Index (DXY), which gauges the performance of the US Dollar (USD) against six major currencies, hovers around 104.20. The decline in the US Treasury yields is weakening the Greenback. The 2-year and 10-year yields on US Treasury bonds stand at 4.71% and 4.32, respectively, by the press time.
On the Euro side, on Wednesday, the seasonally adjusted Gross Domestic Product (GDP) for the Eurozone expanded by 0.3% quarter-on-quarter in the first quarter, meeting expectations. This growth signals a recovery from the 0.1% contraction experienced in each of the previous two quarters. Additionally, the annual growth rate matched expectations at 0.4%.
The Euro receives support from increasing expectations for a convergence in monetary policy between the Eurozone and the United States (US). The European Central Bank (ECB) is anticipated to lower rates during its upcoming meeting in June. While, market expectations are rising for the Fed to commence interest rate cuts from September, particularly after core inflation slowed in April for the first time in six months.
- Gold price trades in positive territory due to the weaker USD on Thursday.
- The softer US CPI inflation data prompted the hope that the Fed may cut interest rates, boosting the price of precious metals.
- The Fed’s hawkish remarks might cap gold’s upside; Fed’s Barr, Harker, Mester, and Bostic are set to speak on Thursday.
The gold price (XAU/USD) gains traction amid the weaker US Dollar (USD) on Thursday. The recent Consumer Price Index (CPI) report showed inflation in the US slowed in April, prompting market players to increase their bets on the US Federal Reserve (Fed) rate cuts this year. A lower interest rate might benefit the yellow metal, as it means the borrowing cost of investing in gold decreases.
Gold traders will focus on US Building Permits, Housing Starts, the weekly Initial Jobless Claims, the Philly Fed Manufacturing Index, and Industrial Production on Thursday. Also, the Fed’s Barr, Harker, Mester, and Bostic are scheduled to speak on Thursday. Nonetheless, the hawkish comments from the Fed’s officials might boost the US Dollar (USD) and cap the precious metal’s upside in the near term.
Daily Digest Market Movers: Gold price edges higher due to cooling US inflation, weaker Retail Sales
- The US Consumer Price Index (CPI) increased by 3.4% YoY in April, compared to a rise of 3.5% in March, which is in line with market expectations. On a monthly basis, the headline CPI inflation dropped to 0.3% MoM in April from 0.4% in March, below the consensus of 0.4%.
- The core CPI inflation, which excludes volatile items like food and energy, rose by 3.6% YoY in April, compared to the previous reading of 3.8%. The monthly core CPI eased to 0.3% MoM in April from 0.4% in March.
- US Retail Sales came in at 0% MoM in April from a 0.6% rise in March, worse than the estimation of 0.4%.
- Fed Bank of Minneapolis President Neel Kashkari said on Wednesday that the central bank needs to watch the economy carefully to see if current policy rates are restrictive enough.
- Financial markets are currently pricing in a nearly 75% chance of a rate cut by the Fed in September 2024, a rise from 65% before the US CPI report, according to the CME's FedWatch Tool.
- According to the World Gold Council's Q1 2024 report, global gold demand climbed by 3% to 1,238 tonnes, marking the strongest first quarter since 2016.
Technical Analysis: Gold price’s bullish stance holds strong
The gold price edges higher on the day. Technically, the yellow metal has formed an ascending trend channel since May 2. The yellow metal maintains its positive stance unchanged on the four-hour chart as XAU/USD holds above the 100-period Exponential Moving Averages (EMA). The Relative Strength Index (RSI) stands in bullish territory around 72. The overbought RSI condition indicates that further consolidation cannot be ruled out before positioning for any near-term XAU/USD upside.
The first upside barrier will emerge near the upper boundary of the ascending trend channel and psychological level of $2,400. A bullish breakout above this level will expose $2,432 (all-time high) en route to $2,500 (round figure).
On the downside, a breach of the lower limit of the ascending trend channel of $2,345 will pave the way to $2,334 (100-period EMA), followed by $2,300 (psychological mark).
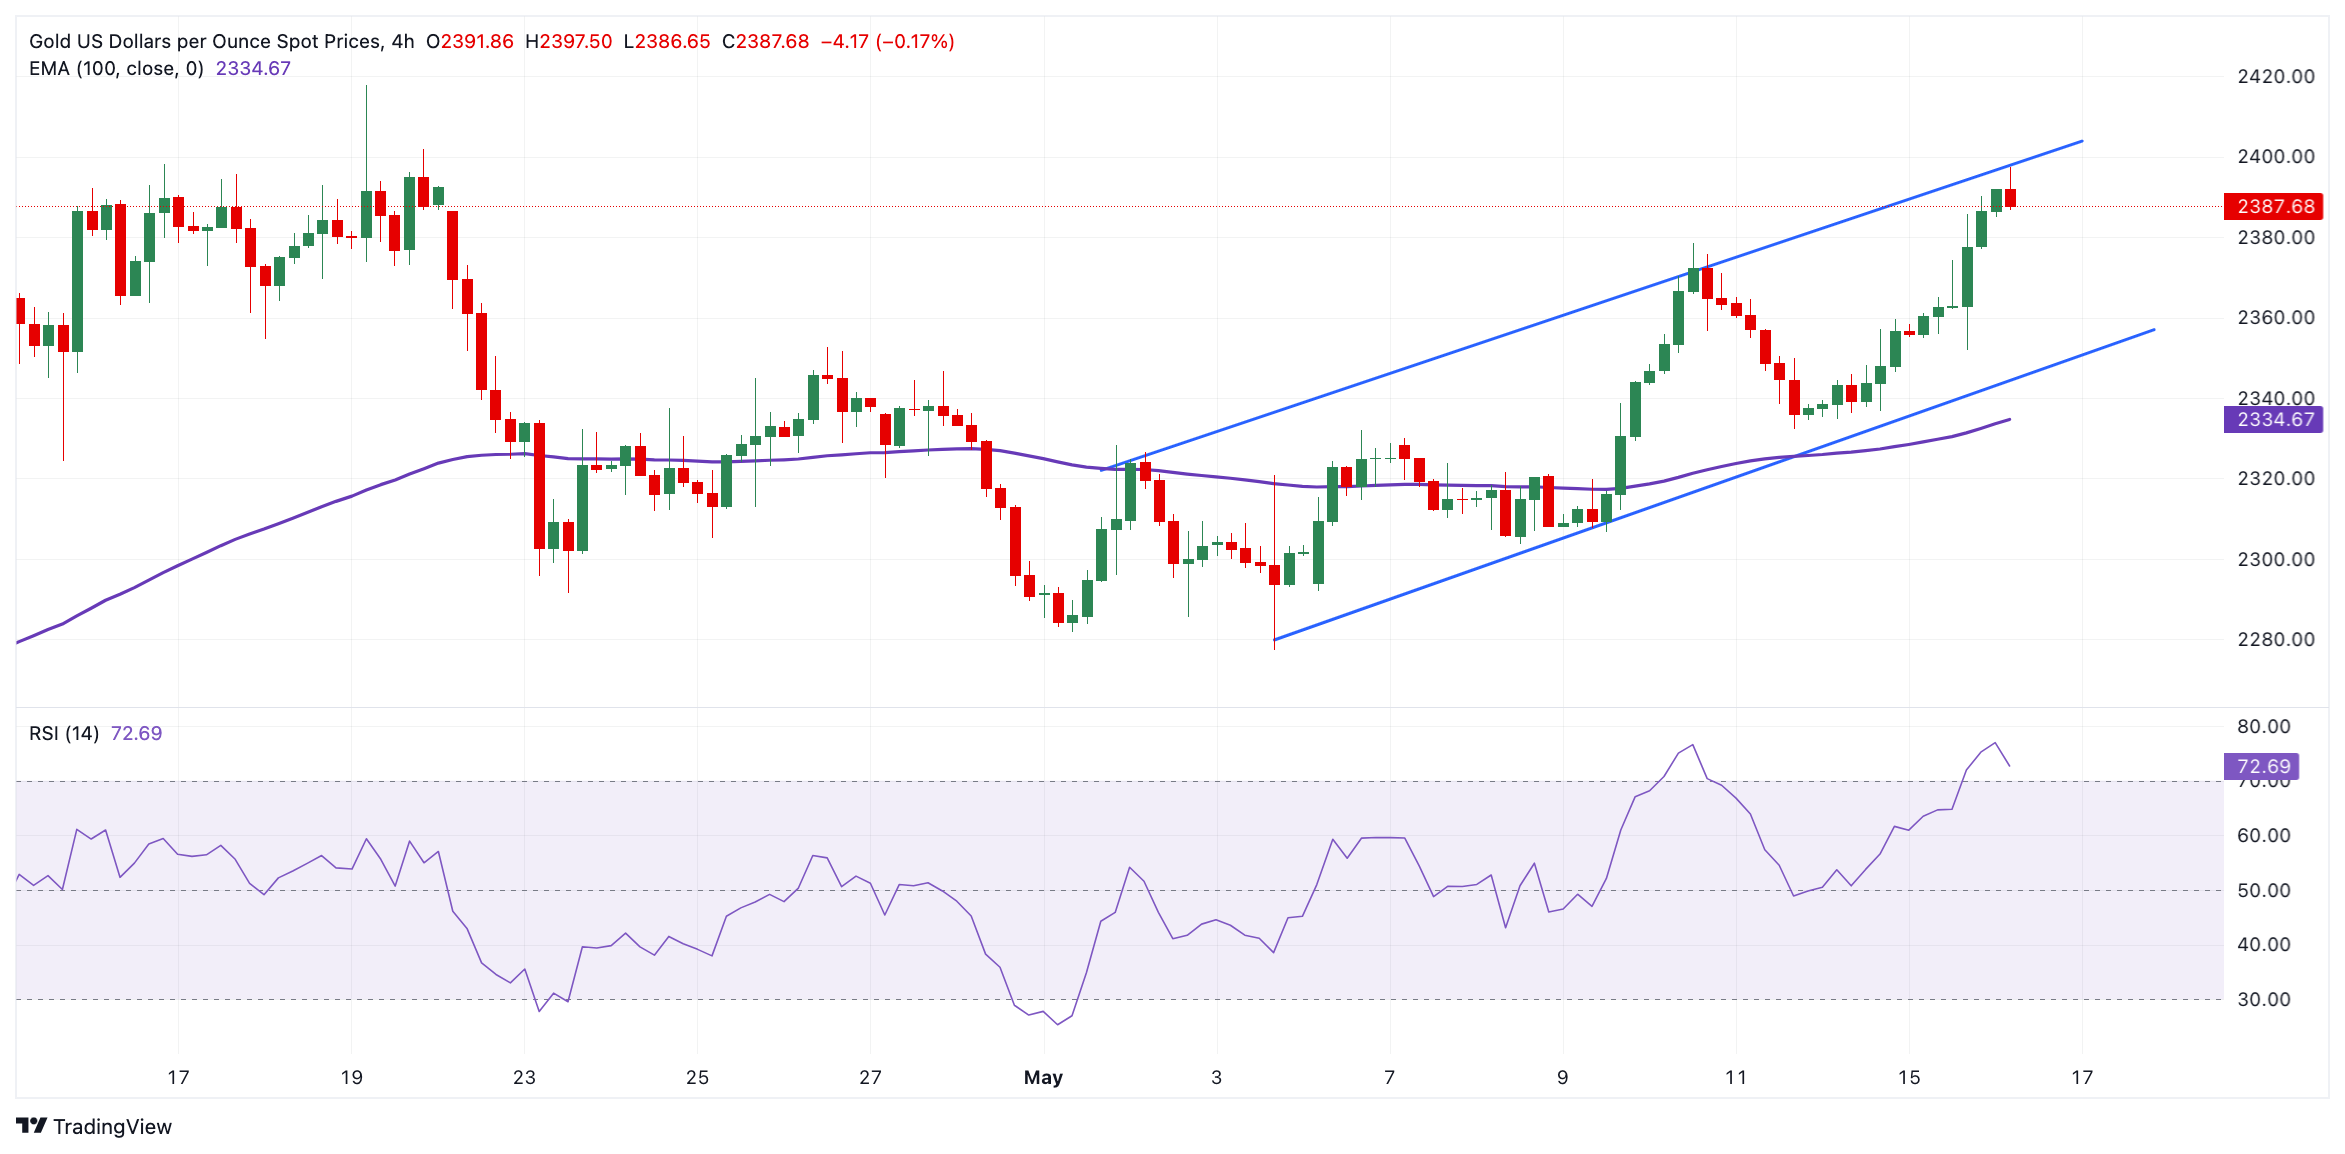
US Dollar price today
The table below shows the percentage change of US Dollar (USD) against listed major currencies today. US Dollar was the weakest against the Japanese Yen.
| USD | EUR | GBP | CAD | AUD | JPY | NZD | CHF | |
| USD | 0.03% | 0.02% | 0.06% | 0.15% | -0.18% | 0.10% | 0.00% | |
| EUR | -0.03% | -0.01% | 0.03% | 0.12% | -0.22% | 0.07% | -0.03% | |
| GBP | -0.02% | 0.00% | 0.04% | 0.14% | -0.20% | 0.07% | -0.03% | |
| CAD | -0.06% | -0.04% | -0.03% | 0.10% | -0.23% | 0.05% | -0.08% | |
| AUD | -0.16% | -0.14% | -0.14% | -0.11% | -0.34% | -0.07% | -0.17% | |
| JPY | 0.20% | 0.22% | 0.22% | 0.24% | 0.36% | 0.27% | 0.16% | |
| NZD | -0.08% | -0.07% | -0.09% | -0.03% | 0.07% | -0.29% | -0.10% | |
| CHF | -0.01% | 0.03% | 0.02% | 0.06% | 0.18% | -0.17% | 0.10% |
The heat map shows percentage changes of major currencies against each other. The base currency is picked from the left column, while the quote currency is picked from the top row. For example, if you pick the Euro from the left column and move along the horizontal line to the Japanese Yen, the percentage change displayed in the box will represent EUR (base)/JPY (quote).
Gold FAQs
Gold has played a key role in human’s history as it has been widely used as a store of value and medium of exchange. Currently, apart from its shine and usage for jewelry, the precious metal is widely seen as a safe-haven asset, meaning that it is considered a good investment during turbulent times. Gold is also widely seen as a hedge against inflation and against depreciating currencies as it doesn’t rely on any specific issuer or government.
Central banks are the biggest Gold holders. In their aim to support their currencies in turbulent times, central banks tend to diversify their reserves and buy Gold to improve the perceived strength of the economy and the currency. High Gold reserves can be a source of trust for a country’s solvency. Central banks added 1,136 tonnes of Gold worth around $70 billion to their reserves in 2022, according to data from the World Gold Council. This is the highest yearly purchase since records began. Central banks from emerging economies such as China, India and Turkey are quickly increasing their Gold reserves.
Gold has an inverse correlation with the US Dollar and US Treasuries, which are both major reserve and safe-haven assets. When the Dollar depreciates, Gold tends to rise, enabling investors and central banks to diversify their assets in turbulent times. Gold is also inversely correlated with risk assets. A rally in the stock market tends to weaken Gold price, while sell-offs in riskier markets tend to favor the precious metal.
The price can move due to a wide range of factors. Geopolitical instability or fears of a deep recession can quickly make Gold price escalate due to its safe-haven status. As a yield-less asset, Gold tends to rise with lower interest rates, while higher cost of money usually weighs down on the yellow metal. Still, most moves depend on how the US Dollar (USD) behaves as the asset is priced in dollars (XAU/USD). A strong Dollar tends to keep the price of Gold controlled, whereas a weaker Dollar is likely to push Gold prices up.
- AUD/JPY loses ground as higher Aussie unemployment data bolsters the dovish sentiment surrounding RBA’s policy stance.
- The Aussie Unemployment Rate rose to 4.1%, marking the highest jobless rate since January.
- The lower Japanese GDP in Q1 has weakened the Japanese Yen (JPY) advance.
AUD/JPY snaps its three-day winning streak, trading around 103.00 during the Asian hours on Thursday. The AUD/JPY cross decline is attributed to the mixed employment data from Australia released on Thursday.
The Australian Bureau of Statistics released the seasonally adjusted Employment Change for April, showing an increase of 38.5K to 14.3 million employed people in Australia. This has surpassed the market expectations of a 23.7K reading, reversing from a small drop in March. While the Unemployment Rate rose to 4.1% from the previous reading of 3.9%. This has marked the highest jobless rate since January with the number of unemployed individuals rising by 30.3K to 604.2K.
Additionally, Australia’s 10-year government bond yield traded lower around 4.2%, after Australia’s Wage Price Index (QoQ) showed a 0.8% increase in the first quarter, although, falling slightly below the expected rise of 0.9%. These figures have supported a dovish sentiment surrounding the Reserve Bank of Australia (RBA) regarding monetary policy.
On the Japanese front, the lower-than-expected Japan’s Gross Domestic Product (GDP) in the first quarter has weakened the advance of the Japanese Yen (JPY) and limited the decline of the AUD/JPY cross.
The preliminary Japanese Gross Domestic Product (GDP) contracted 0.5% QoQ in the first quarter, compared to the previous downwardly revised stagnation. The market expectation was a 0.4% contraction. The Annualized GDP fell by 2.0%, surpassing the forecasted decline of 1.5%. The previous reading was downwardly revised to no growth at 0%.
Japan's Economy Minister, Minister Shindo, has indicated that the economy is anticipated to sustain a moderate recovery. However, Shindo emphasized the necessity to closely monitor risks associated with foreign exchange fluctuations, which could potentially drive up domestic prices.
Japan's Economy Minister Yoshitaka Shindo said on Thursday that Japanese economy is expected to continue moderate recovery. Shindo further stated that he will closely monitor the risks related to foreign exchange fluctuations that would push up domestic prices.
Key quotes
“Economy is expected to continue a moderate recovery.”
“Need to pay close attention to risks related to forex fluctuations that would push up domestic prices.”
“Need to pay close attention to global economic downturn risks such as the outlook on the Chinese economy, crude oil prices due to unstable situations in the Middle East.”
“Government will continue comprehensive efforts to ensure solid wage hikes will spread to mid- and small-sized firms.”
Market reaction
At the time of writing, USD/JPY is trading 0.52% lower on the day at 154.08.
Japanese Yen FAQs
The Japanese Yen (JPY) is one of the world’s most traded currencies. Its value is broadly determined by the performance of the Japanese economy, but more specifically by the Bank of Japan’s policy, the differential between Japanese and US bond yields, or risk sentiment among traders, among other factors.
One of the Bank of Japan’s mandates is currency control, so its moves are key for the Yen. The BoJ has directly intervened in currency markets sometimes, generally to lower the value of the Yen, although it refrains from doing it often due to political concerns of its main trading partners. The current BoJ ultra-loose monetary policy, based on massive stimulus to the economy, has caused the Yen to depreciate against its main currency peers. This process has exacerbated more recently due to an increasing policy divergence between the Bank of Japan and other main central banks, which have opted to increase interest rates sharply to fight decades-high levels of inflation.
The BoJ’s stance of sticking to ultra-loose monetary policy has led to a widening policy divergence with other central banks, particularly with the US Federal Reserve. This supports a widening of the differential between the 10-year US and Japanese bonds, which favors the US Dollar against the Japanese Yen.
The Japanese Yen is often seen as a safe-haven investment. This means that in times of market stress, investors are more likely to put their money in the Japanese currency due to its supposed reliability and stability. Turbulent times are likely to strengthen the Yen’s value against other currencies seen as more risky to invest in.
- The Australian Dollar loses ground due to dovish sentiment surrounding RBA’s policy stance.
- The Australian Unemployment Rate increased to 4.1% in April, from the previous reading of 3.9%.
- The US Dollar lost ground after the release of the lower CPI and Retail Sales data on Wednesday.
The Australian Dollar (AUD) snapped its three-day winning streak after the higher-than-expected Aussie Unemployment Rate on Thursday, which rose to 4.1% in April, from the previous reading of 3.9%. Australia’s 10-year government bond yield traded lower around 4.2% after Australia’s Wage Price Index (QoQ) showed a 0.8% increase in the first quarter, falling slightly below the anticipated rise of 0.9%. These figures have supported a dovish sentiment surrounding the Reserve Bank of Australia (RBA) regarding monetary policy.
The Australian Dollar received support during the early hours on Thursday due to the improved risk appetite following lower-than-expected monthly Consumer Price Index and Retail Sales data in the United States (US) released on Wednesday. This has supported the probability of multiple rate cuts by the Federal Reserve (Fed) in 2024, undermining the US Dollar (USD). The AUD/USD pair has marked a four-month high of 0.6714 on Thursday.
The US Dollar Index (DXY), which gauges the performance of the US Dollar (USD) against six major currencies, extends its losses for the consecutive third session. The decline in the US Treasury yields is weakening the Greenback, which could be attributed to the possibility that the Fed may initiate cutting interest rates from September.
Daily Digest Market Movers: Australian Dollar depreciates due to higher Unemployment data
- US Consumer Price Index (CPI) decelerated to 0.3% month-over-month in April, came in at lower than expected 0.4% reading. While Retail Sales flattened, falling short of the expected increase of 0.4%.
- On Tuesday, the Australian Budget for 2024-25 returned to a deficit after recording a surplus of $9.3 billion in 2023-24. The Australian government aims to tackle headline inflation and alleviate the cost of living pressures by allocating billions to reduce energy bills and rent, alongside initiatives to lower income taxes.
- The US Bureau of Labor Statistics (BLS) reported that the Producer Price Index (PPI) increased by 0.5% month-over-month in April, surpassing the forecast of 0.3% and rebounding from March's contraction of -0.1%. The Core PPI, which excludes volatile food and energy prices, also surged by 0.5% MoM, exceeding projections of 0.2%.
- A Reuters report cited Treasurer of Australia Jim Chalmers, expressing his expectation that the current headline inflation rate of 3.6% will return to the Reserve Bank of Australia’s target range of 2-3% by the end of the year. If this scenario unfolds, the central bank will likely consider cutting interest rates earlier than markets had anticipated.
- As per a Reuters report, China's finance ministry plans to start raising 1 trillion Yuan in issuing 20 to 50 years bonds for larger stimulus measures. China is also contemplating a plan for local governments nationwide to purchase millions of unsold homes. These developments have bolstered the Aussie Dollar, given the close trade ties between Australia and China, where any shifts in the Chinese economy catalyze the Australian market.
- Federal Reserve Chair Jerome Powell has anticipated a continued decline in inflation on Tuesday. Powell expressed less confidence in the disinflation outlook compared to previous assessments. He also highlighted that Gross Domestic Product (GDP) growth is expected to reach 2% or higher, attributing this positive forecast to the strength of the labor market.
Technical Analysis: Australian Dollar moves below 0.6700
The Australian Dollar trades around 0.6680 on Thursday. The AUD/USD pair lies in an ascending triangle on a daily chart. Moreover, the 14-day Relative Strength Index (RSI) indicates a bullish bias, remaining above the 50 level.
The AUD/USD pair may challenge the upper boundary of the ascending triangle around the four-month high of 0.6714. A breakthrough above this level could lead the pair to explore the area around the major level of 0.6750.
On the downside, the key support appears at the nine-day Exponential Moving Average (EMA) at 0.6627, followed by the ascending triangle’s lower boundary around the level of 0.6610. A break below this level could put pressure on the AUD/USD pair to navigate the region around the major support at 0.6558.
AUD/USD: Daily Chart
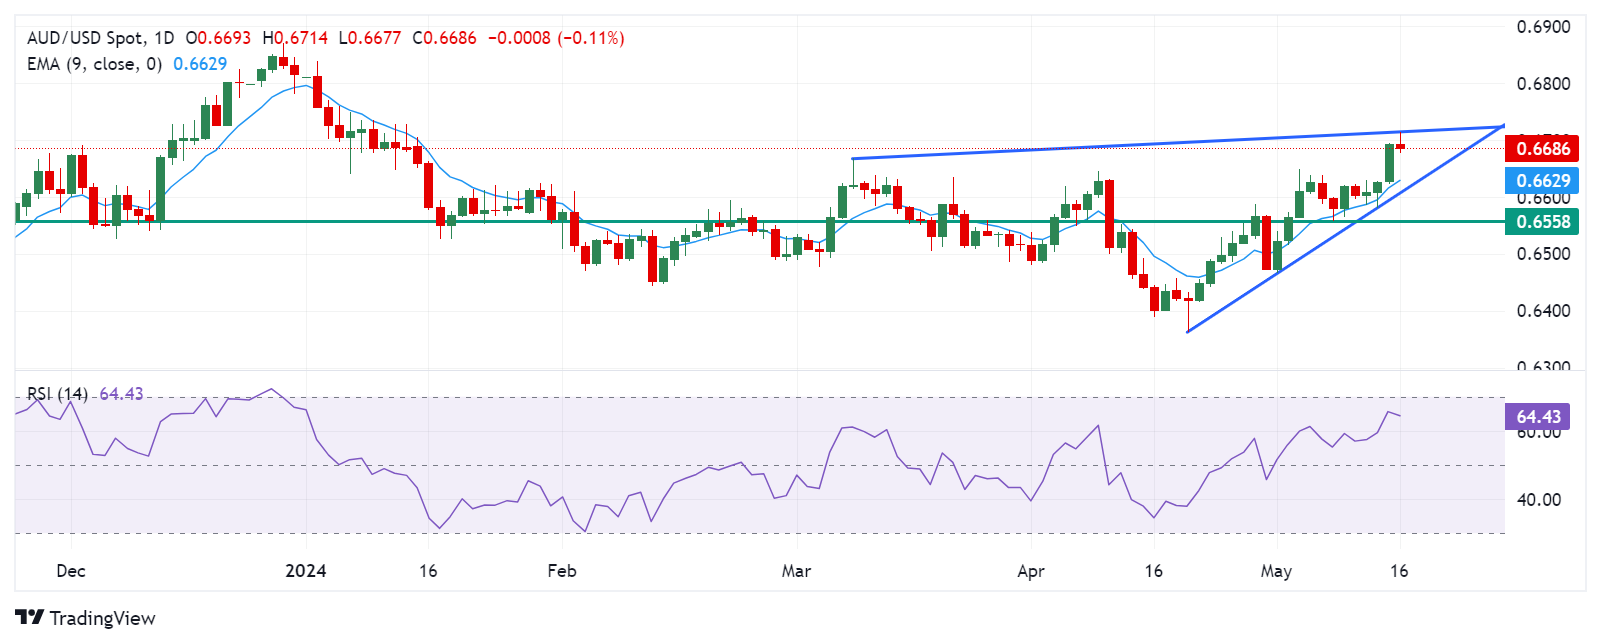
Australian Dollar price today
The table below shows the percentage change of the Australian Dollar (AUD) against listed major currencies today. The Australian Dollar was the weakest against the Japanese Yen.
| USD | EUR | GBP | CAD | AUD | JPY | NZD | CHF | |
| USD | 0.03% | 0.00% | 0.06% | 0.19% | -0.13% | 0.11% | -0.07% | |
| EUR | -0.03% | -0.04% | 0.02% | 0.17% | -0.17% | 0.08% | -0.10% | |
| GBP | 0.01% | 0.02% | 0.05% | 0.20% | -0.15% | 0.10% | -0.08% | |
| CAD | -0.05% | -0.03% | -0.05% | 0.15% | -0.17% | 0.05% | -0.14% | |
| AUD | -0.21% | -0.18% | -0.20% | -0.15% | -0.35% | -0.10% | -0.28% | |
| JPY | 0.14% | 0.18% | 0.18% | 0.20% | 0.35% | 0.25% | 0.07% | |
| NZD | -0.09% | -0.09% | -0.10% | -0.05% | 0.10% | -0.24% | -0.19% | |
| CHF | 0.06% | 0.11% | 0.08% | 0.13% | 0.28% | -0.05% | 0.19% |
The heat map shows percentage changes of major currencies against each other. The base currency is picked from the left column, while the quote currency is picked from the top row. For example, if you pick the Euro from the left column and move along the horizontal line to the Japanese Yen, the percentage change displayed in the box will represent EUR (base)/JPY (quote).
Australian Dollar FAQs
One of the most significant factors for the Australian Dollar (AUD) is the level of interest rates set by the Reserve Bank of Australia (RBA). Because Australia is a resource-rich country another key driver is the price of its biggest export, Iron Ore. The health of the Chinese economy, its largest trading partner, is a factor, as well as inflation in Australia, its growth rate, and Trade Balance. Market sentiment – whether investors are taking on more risky assets (risk-on) or seeking safe havens (risk-off) – is also a factor, with risk-on positive for AUD.
The Reserve Bank of Australia (RBA) influences the Australian Dollar (AUD) by setting the level of interest rates that Australian banks can lend to each other. This influences the level of interest rates in the economy as a whole. The main goal of the RBA is to maintain a stable inflation rate of 2-3% by adjusting interest rates up or down. Relatively high interest rates compared to other major central banks support the AUD, and the opposite for relatively low. The RBA can also use quantitative easing and tightening to influence credit conditions, with the former AUD-negative and the latter AUD-positive.
China is Australia’s largest trading partner so the health of the Chinese economy is a major influence on the value of the Australian Dollar (AUD). When the Chinese economy is doing well it purchases more raw materials, goods and services from Australia, lifting demand for the AUD, and pushing up its value. The opposite is the case when the Chinese economy is not growing as fast as expected. Positive or negative surprises in Chinese growth data, therefore, often have a direct impact on the Australian Dollar and its pairs.
Iron Ore is Australia’s largest export, accounting for $118 billion a year according to data from 2021, with China as its primary destination. The price of Iron Ore, therefore, can be a driver of the Australian Dollar. Generally, if the price of Iron Ore rises, AUD also goes up, as aggregate demand for the currency increases. The opposite is the case if the price of Iron Ore falls. Higher Iron Ore prices also tend to result in a greater likelihood of a positive Trade Balance for Australia, which is also positive of the AUD.
The Trade Balance, which is the difference between what a country earns from its exports versus what it pays for its imports, is another factor that can influence the value of the Australian Dollar. If Australia produces highly sought after exports, then its currency will gain in value purely from the surplus demand created from foreign buyers seeking to purchase its exports versus what it spends to purchase imports. Therefore, a positive net Trade Balance strengthens the AUD, with the opposite effect if the Trade Balance is negative.
| Raw materials | Closed | Change, % |
|---|---|---|
| Silver | 29.668 | 3.76 |
| Gold | 2387.19 | 1.27 |
| Palladium | 1007.15 | 2.88 |
- NZD/USD gains ground near 0.6120 in Thursday’s early Asian session.
- US inflation declined to 3.4% in April, prompting traders to increase their bets on the Fed’s rate cuts this year.
- The RBNZ interest rate decision next week will be in the spotlight, with no change in the OCR rate expected.
The NZD/USD pair gains momentum around 0.6120 during the early trading hours on Thursday. The softer US CPI in April has prompted the prospect of rate cuts from the Federal Reserve (Fed) this year, which exerts some selling pressure on the Greenback. The US housing data, the weekly Initial Jobless Claims, the Philly Fed Manufacturing Index, and Industrial Production will be due later in the day.
Inflation in the United States showed signs of cooling after the US Bureau of Labor Statistics (BLS) reported on Wednesday. The CPI rose by 3.4% YoY, compared to March’s reading of 3.5%, in line with the estimation. The core CPI inflation, which excludes volatile items like food and energy, eased from 3.8% in March to 3.6% in April as expected. Furthermore, US Retail Sales came in at 0% MoM in April, below the market consensus of 0.4%. In response to the softer inflation data and weaker Retail Sales, the US Dollar (USD) loses ground to near five-week lows of 104.20.
Investors anticipate that the Fed will wait for more data to gain confidence that inflation will return to the Fed’s 2% target. The Federal Reserve (Fed) Chairman Jerome Powell said on Tuesday that inflation is falling slower than expected, and the PPI data provided more justification to keep rates higher for longer.
On the Kiwi front, the markets believe that it is unlikely that the RBNZ will cut its interest rate before the Fed, which boosts the New Zealand Dollar (NZD) and create a tailwind for the NZD/USD pair. The Reserve Bank of New Zealand (RBNZ) interest rate decision next week will be closely watched. The RBNZ is anticipated to hold the Official Cash Rate (OCR) unchanged at 5.5% at its May meeting and likely to remain comfortable with the forward outlook communicated in the February meeting, said Westpac analyst.
The People’s Bank of China (PBoC) set the USD/CNY central rate for the trading session ahead on Thursday at 7.1020 as compared to the previous day's fix of 7.1049 and 7.2017 Reuters estimates.
| Index | Change, points | Closed | Change, % |
|---|---|---|---|
| NIKKEI 225 | 29.67 | 38385.73 | 0.08 |
| ASX 200 | 26.9 | 7753.7 | 0.35 |
| DAX | 152.94 | 18869.36 | 0.82 |
| CAC 40 | 14.19 | 8239.99 | 0.17 |
| Dow Jones | 349.89 | 39908 | 0.88 |
| S&P 500 | 61.47 | 5308.15 | 1.17 |
| NASDAQ Composite | 231.21 | 16742.39 | 1.4 |
- USD/JPY trades on a softer note around 154.45 on Thursday.
- Japanese GDP contracted 0.5% QoQ in Q1 vs. 0.1 in Q4 of 2023, weaker than the expectation of a 0.4% contraction.
- The softer US CPI inflation data raised the odds for a Federal Reserve (Fed) rate cut in 2024.
The USD/JPY pair trims losses near 154.45 during the early Asian session on Thursday. The softer US CPI inflation data has exerted some selling pressure on the US Dollar (USD). However, the major pair recovers modestly following the recent weaker-than-expected Japan’s Gross Domestic Product (GDP) in the first quarter of 2024.
Japan’s economy contracted in the first three months of 2024, according to the Cabinet Office showed on Thursday. The preliminary Japanese GDP shrank 0.5% QoQ in Q1 from 0.1 expansion in Q4 of 2023, weaker than the expectation of a 0.4% contraction. The Annualized GDP contracted 2.0% versus the estimation of 1.5% contraction and 0.4% expansion prior. The Japanese Yen (JPY) attracts some sellers following the weaker-than-expected Japan’s GDP growth number.
On Thursday, the US Consumer Price Index (CPI) inflation eased to 3.4% YoY in April from an increase of 3.5% in March, in line with market expectations. The core CPI inflation, which excludes volatile food and energy prices, retreated to 3.6% YoY in April from the previous reading of 3.8%, matching the consensus, the US Bureau of Labor Statistics (BLS) reported on Wednesday. Additionally, US Retail Sales showed no change in April from a 3% increase in March, below the market consensus of 0.4%.
The softer inflation data raised the odds for a Federal Reserve (Fed) rate cut in 2024. Financial markets expect the Fed to wait for more evidence of better inflation data. Fed Chair Jerome Powell said on Tuesday that inflation in the US might prove to be more persistent than expected, keeping the Fed holding rate higher for longer to achieve the central bank’s 2% target. Investors have priced in nearly a 72% chance of a rate cut by the Fed in September 2024, a rise from 65% before the release of US CPI data, according to the CME's FedWatch Tool.
| Pare | Closed | Change, % |
|---|---|---|
| AUDUSD | 0.66905 | 0.99 |
| EURJPY | 168.499 | -0.41 |
| EURUSD | 1.08838 | 0.62 |
| GBPJPY | 196.354 | -0.29 |
| GBPUSD | 1.26828 | 0.74 |
| NZDUSD | 0.61174 | 1.3 |
| USDCAD | 1.36054 | -0.34 |
| USDCHF | 0.90212 | -0.5 |
| USDJPY | 154.813 | -1.03 |


© 2000-2026. All rights reserved.
This site is managed by Teletrade D.J. LLC 2351 LLC 2022 (Euro House, Richmond Hill Road, Kingstown, VC0100, St. Vincent and the Grenadines).
The information on this website is for informational purposes only and does not constitute any investment advice.
The company does not serve or provide services to customers who are residents of the US, Canada, Iran, The Democratic People's Republic of Korea, Yemen and FATF blacklisted countries.
Making transactions on financial markets with marginal financial instruments opens up wide possibilities and allows investors who are willing to take risks to earn high profits, carrying a potentially high risk of losses at the same time. Therefore you should responsibly approach the issue of choosing the appropriate investment strategy, taking the available resources into account, before starting trading.
Use of the information: full or partial use of materials from this website must always be referenced to TeleTrade as the source of information. Use of the materials on the Internet must be accompanied by a hyperlink to teletrade.org. Automatic import of materials and information from this website is prohibited.
Please contact our PR department if you have any questions or need assistance at pr@teletrade.global.
transfers