- Analytics
- News and Tools
- Market News
CFD Markets News and Forecasts — 15-10-2024
Federal Reserve (Fed) Bank of Atlanta President Raphael Bostic hit newswires during the overnight hours of Tuesday's US market session, noting that the US continues to perform well, and doesn't see strong signs of a potential recession looming over the horizon.
Key highlights
Sees robust US economy continuation.
No recession in economic outlook.
Bostic sees overall slower GDP growth in 2024 compared to 2023.
"Fairly confident" inflation is heading back to 2%.
US economy is performing well.
Reserve Bank of New Zealand (RBNZ) Assistant Governor Karen Silk noted early Wednesday that the RBNZ is increasingly confident it will achieve target inflation levels using its current monetary policy strategy, though maybe not as quickly as many would like.
Key highlights
Confident inflation will converge back to 2% target midpoint in medium term.
Assessing and managing inflation amidst economic risks.
Monetary policy supportive of inflation objectives.
RBNZ Committee is gaining confidence in monetary policy effectiveness.
Bank funding spreads have risen year on year.
Reserve Bank of Australia (RBA) Deputy Governor Sarah Hunter noted early Wednesday that while the RBA remains determined to keep inflation under control, and the Australian central bank sees no signs of inflation expectations becoming de-anchored, price growth has remained a sticking point for the RBA.
Key highlights
No immediate concern of expectations becoming de-anchored.
Inflation expectations remain anchored.
RBA constantly alert for signs of emerging risk.
Inflation expectations are only a component of CPI outcome.
Inflation has been more persistent than the RBA expected.
RBA is monitoring data for sticky inflation, and risks on both sides.
RBA is not obligated to conform to other central banks on policies.
Strengths and weaknesses in different sectors of the economy.
Mindful and watchful of overseas developments: Lessons to be learned.
Tax cuts and energy rebates as key risks being examined by RBA.
RBA is still waiting to assess spending response.
RBA focuses on aggregates, takes government spending as given.
- EUR/USD shed another fifth of a percent on Tuesday.
- ECB Bank Survey results trimmed bullish Euro potential.
- ECB broadly expected to deliver another 25 bps rate cut this week.
EUR/USD fell further into the bearish side on Tuesday, declining one-fifth of one percent and slipping below the 200-day Exponential Moving Average (EMA). Price action closed below the 1.0900 handle for the first time since early August. Fiber has now fallen nearly 3% from late September’s peaks just north of the 1.1200 handle.
European banks broadly reported negative repercussions from the European Central Bank’s (ECB) summertime rate cut, with EU-area banks reporting that while credit standards have remain unchanged overall and actually eased for loans to households, consumer credit conditions remain tight. A rebound in housing loan demand is riding exclusively on anticipation of further rate cuts, implying consumers are over-borrowing in the near-term, while EU bank net interest income as a result of ECB policy rate decisions has turned negative for the first time since 2022.
The ECB’s upcoming rate call on Thursday is broadly expected to be a quarter-point rate trim on the main deposit rate with markets widely forecasting a 25 bps rate cut, while the ECB main refi rate is expected to get trimmed by a similar 25 bps to 3.4% from 3.65%.
Elsewhere on the Fiber data docket, US Retail Sales figures for September are slated for Thursday’s US market session. US Retail Sales are expected to rebound for the month of September, forecast to rise to 0.3% MoM from the previous 0.1%.
EUR/USD price forecast
EUR/USD has slid back below the 200-day EMA and lost hold of the 1.0900 handle. The pair has closed in the red for all but three of the last 12 consecutive trading days. Oversold warnings on the Moving Average Convergence-Divergence (MACD) implies that near-term short momentum on Fiber may have run its course, leaving the pair primed for a bullish rebound from the 200-day EMA.
EUR/USD daily chart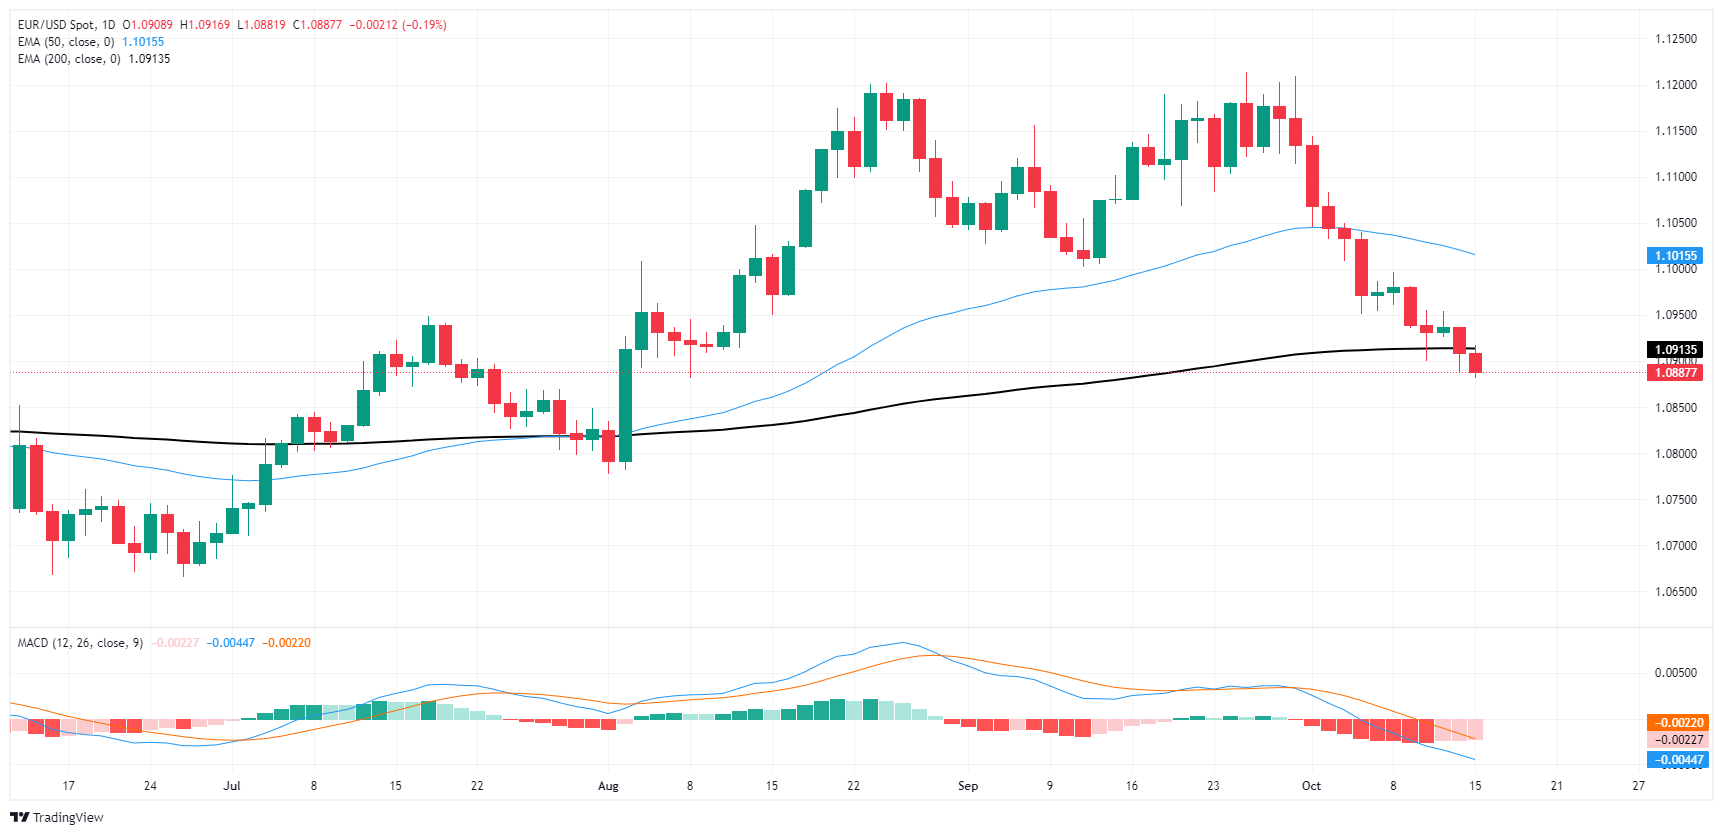
Euro FAQs
The Euro is the currency for the 19 European Union countries that belong to the Eurozone. It is the second most heavily traded currency in the world behind the US Dollar. In 2022, it accounted for 31% of all foreign exchange transactions, with an average daily turnover of over $2.2 trillion a day. EUR/USD is the most heavily traded currency pair in the world, accounting for an estimated 30% off all transactions, followed by EUR/JPY (4%), EUR/GBP (3%) and EUR/AUD (2%).
The European Central Bank (ECB) in Frankfurt, Germany, is the reserve bank for the Eurozone. The ECB sets interest rates and manages monetary policy. The ECB’s primary mandate is to maintain price stability, which means either controlling inflation or stimulating growth. Its primary tool is the raising or lowering of interest rates. Relatively high interest rates – or the expectation of higher rates – will usually benefit the Euro and vice versa. The ECB Governing Council makes monetary policy decisions at meetings held eight times a year. Decisions are made by heads of the Eurozone national banks and six permanent members, including the President of the ECB, Christine Lagarde.
Eurozone inflation data, measured by the Harmonized Index of Consumer Prices (HICP), is an important econometric for the Euro. If inflation rises more than expected, especially if above the ECB’s 2% target, it obliges the ECB to raise interest rates to bring it back under control. Relatively high interest rates compared to its counterparts will usually benefit the Euro, as it makes the region more attractive as a place for global investors to park their money.
Data releases gauge the health of the economy and can impact on the Euro. Indicators such as GDP, Manufacturing and Services PMIs, employment, and consumer sentiment surveys can all influence the direction of the single currency. A strong economy is good for the Euro. Not only does it attract more foreign investment but it may encourage the ECB to put up interest rates, which will directly strengthen the Euro. Otherwise, if economic data is weak, the Euro is likely to fall. Economic data for the four largest economies in the euro area (Germany, France, Italy and Spain) are especially significant, as they account for 75% of the Eurozone’s economy.
Another significant data release for the Euro is the Trade Balance. This indicator measures the difference between what a country earns from its exports and what it spends on imports over a given period. If a country produces highly sought after exports then its currency will gain in value purely from the extra demand created from foreign buyers seeking to purchase these goods. Therefore, a positive net Trade Balance strengthens a currency and vice versa for a negative balance.
- GBP/USD churned just north of 1.3000 for a fourth straight trading day.
- UK labor figures were a non-starter on Tuesday.
- Cable markets are awaiting Wednesday’s upcoming UK CPI inflation update.
GBP/USD churned chart paper in familiar territory for a fourth consecutive trading day on Tuesday. Cable continues to cycle in a dead zone between 1.3100 and 1.3000 as GBP traders await meaningful UK data updates before picking a side to fall on.
UK wages data largely came in as expected on Tuesday, but GBP traders took note of an unexpected uptick in September’s Claimant Count Change, which jumped to 27.9K for the month, compared to the expected 20.2K against August’s 23.7K. On the other side of the same coin, the UK’s ILO Unemployment Rate also ticked down to 4.0% from the expected hold at 4.1%.
Wednesday’s upcoming UK Consumer Price Index (CPI) inflation figures are expected to broadly move lower in September. Headline CPI inflation for the year ended in September is forecast to fall to 1.9% YoY versus the previous period’s 2.2%. Core annualized CPI inflation, meanwhile, is forecast to tick down to 3.4% YoY from the previous 3.6%.
Greenback traders will be looking out for Thursday’s US Retail Sales figures for September, with the UK’s own Retail Sales print slated for Friday. US Retail Sales are expected to bounce to 0.3% MoM in September versus the previous 0.1%, while the UK’s own September Retail Sales figures are forecast to fall into contraction territory, from 0.1% to -0.3%.
GBP/USD price forecast
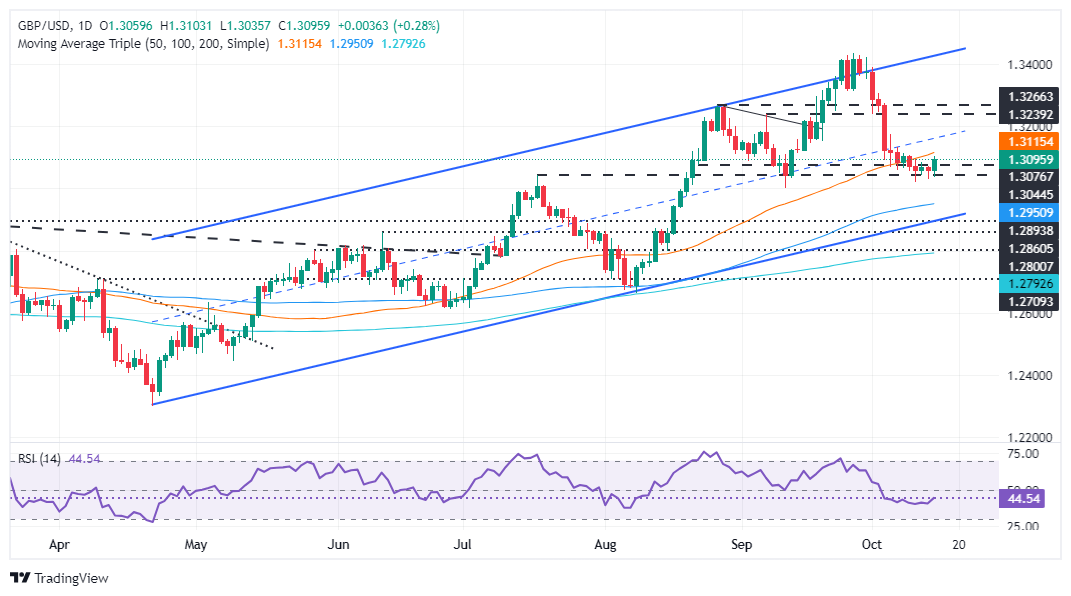
GBP/USD continues to churn in a volatility trap, squeezed between the 1.3000 major price handle and the 50-day Exponential Moving Average (EMA) falling into 1.3100. Technical indicators have become mired in near-term congestion warnings as Cable flounders on the low end of a pullback from late September’s peaks just north of 1.3400.
GBP/USD daily chart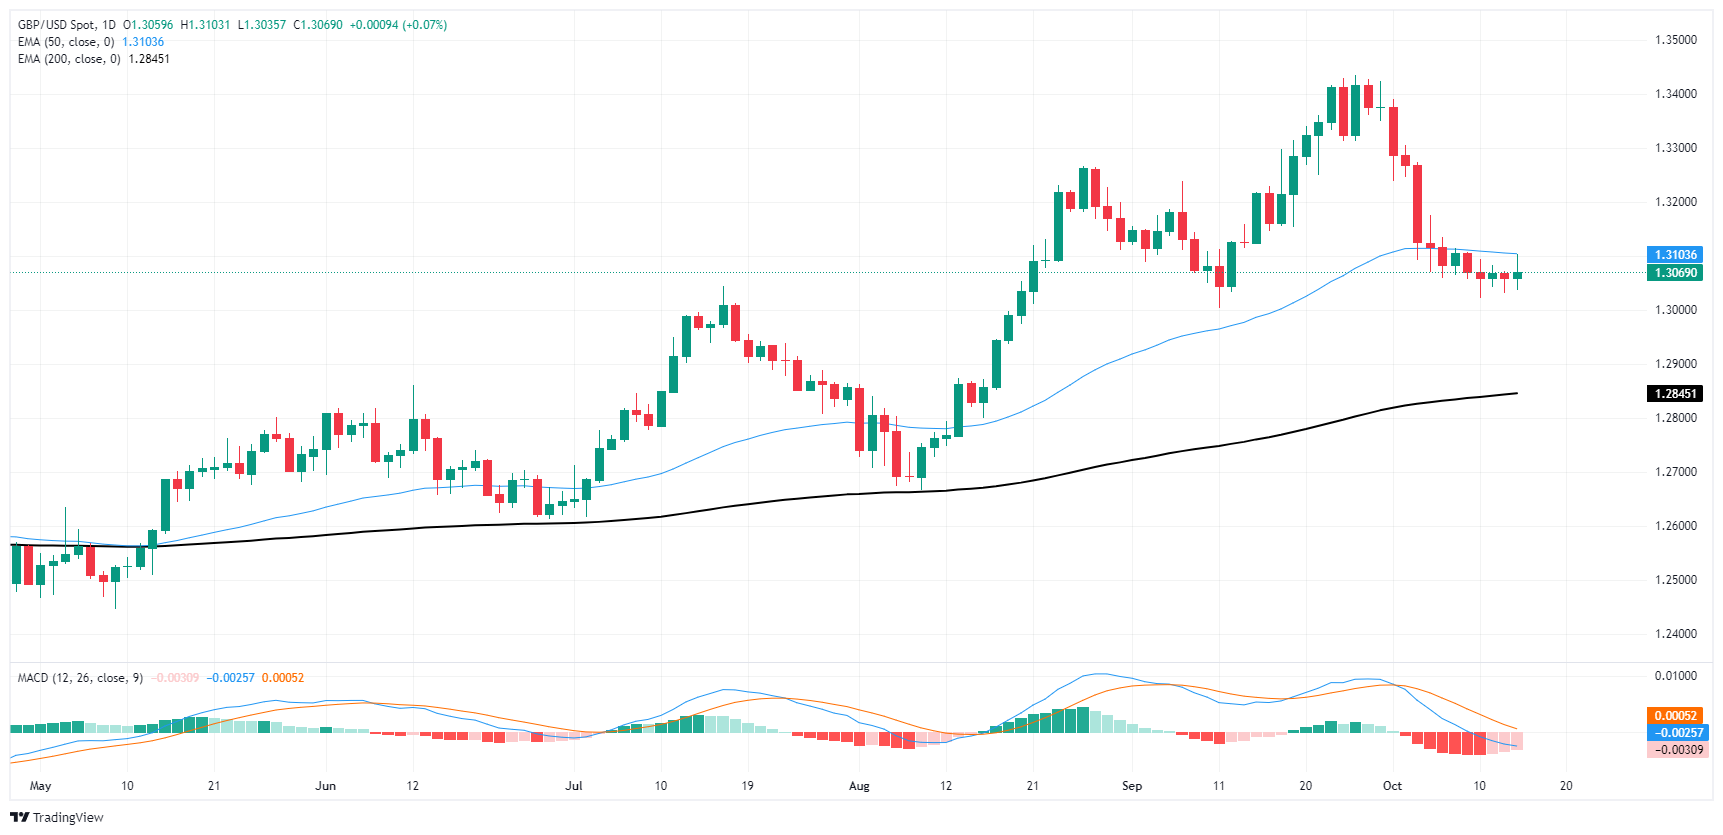
Pound Sterling FAQs
The Pound Sterling (GBP) is the oldest currency in the world (886 AD) and the official currency of the United Kingdom. It is the fourth most traded unit for foreign exchange (FX) in the world, accounting for 12% of all transactions, averaging $630 billion a day, according to 2022 data. Its key trading pairs are GBP/USD, also known as ‘Cable’, which accounts for 11% of FX, GBP/JPY, or the ‘Dragon’ as it is known by traders (3%), and EUR/GBP (2%). The Pound Sterling is issued by the Bank of England (BoE).
The single most important factor influencing the value of the Pound Sterling is monetary policy decided by the Bank of England. The BoE bases its decisions on whether it has achieved its primary goal of “price stability” – a steady inflation rate of around 2%. Its primary tool for achieving this is the adjustment of interest rates. When inflation is too high, the BoE will try to rein it in by raising interest rates, making it more expensive for people and businesses to access credit. This is generally positive for GBP, as higher interest rates make the UK a more attractive place for global investors to park their money. When inflation falls too low it is a sign economic growth is slowing. In this scenario, the BoE will consider lowering interest rates to cheapen credit so businesses will borrow more to invest in growth-generating projects.
Data releases gauge the health of the economy and can impact the value of the Pound Sterling. Indicators such as GDP, Manufacturing and Services PMIs, and employment can all influence the direction of the GBP. A strong economy is good for Sterling. Not only does it attract more foreign investment but it may encourage the BoE to put up interest rates, which will directly strengthen GBP. Otherwise, if economic data is weak, the Pound Sterling is likely to fall.
Another significant data release for the Pound Sterling is the Trade Balance. This indicator measures the difference between what a country earns from its exports and what it spends on imports over a given period. If a country produces highly sought-after exports, its currency will benefit purely from the extra demand created from foreign buyers seeking to purchase these goods. Therefore, a positive net Trade Balance strengthens a currency and vice versa for a negative balance.
- NZD/JPY has been in a sideways movement for the past few sessions, with sharp losses in Tuesday's session.
- RSI is declining sharply, MACD histogram is green and decreasing, suggesting that buying pressure is declining.
- A breakdown below 90.00 could confirm further downside potential.
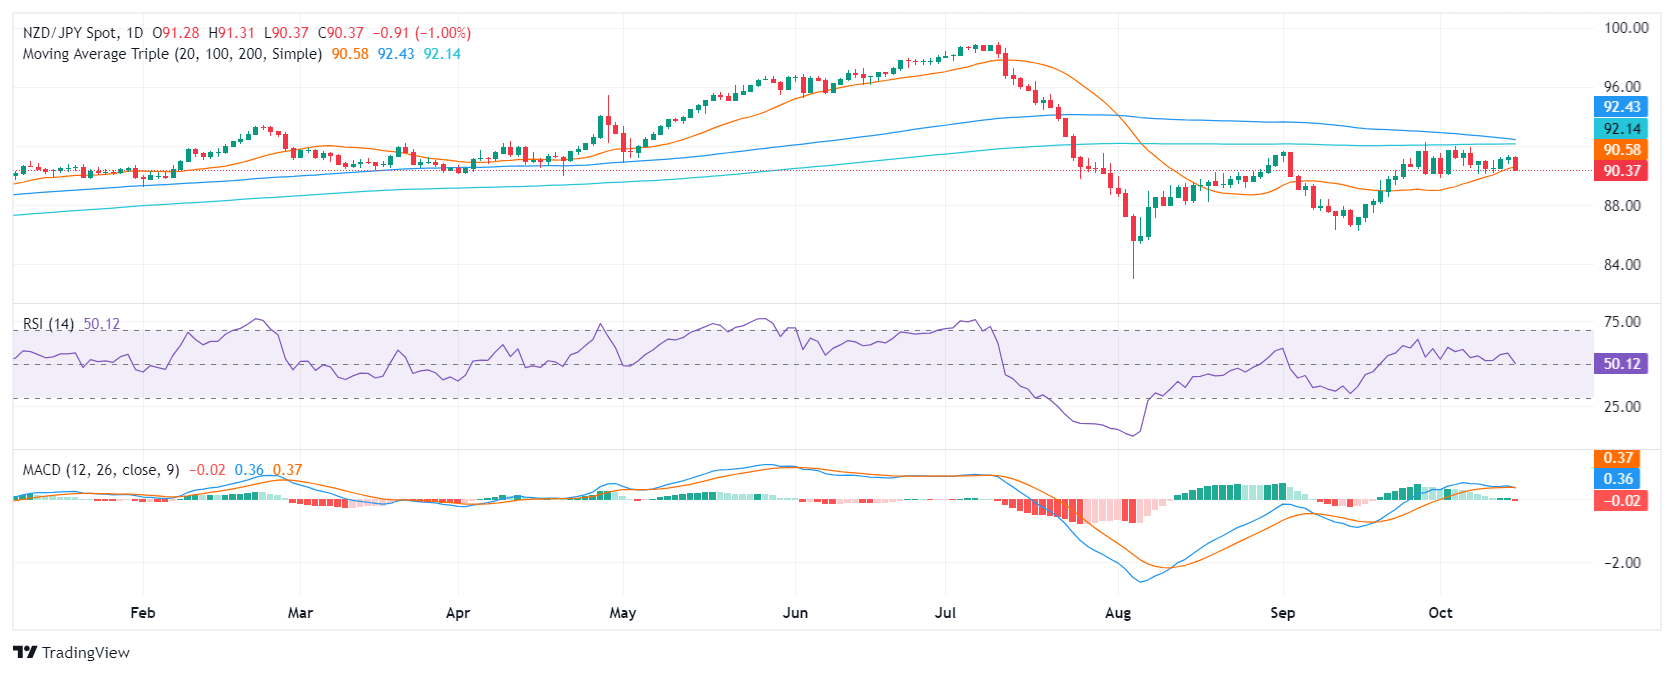
The NZD/JPY pair declined by 0.60% to 90.70 in Tuesday's session and threatens with a reversal in the recent bullish movements.
The daily Relative Strength Index (RSI) is currently at around 52, indicating that the pair is in the positive area. However, the RSI is declining sharply, suggesting that buying pressure is declining. The Moving Average Convergence Divergence (MACD) histogram is green and decreasing, suggesting that buying pressure is declining. The MACD histogram direction is green and decreasing, confirming the bearish momentum.
The 90.00 level is crucial for the pair’s near-term outlook. A breakdown below this support could open the door to additional losses, potentially targeting the next psychological support at 89.50. However, if the pair finds support above this level and buyers step in, a reversal could occur, targeting resistances at 91.00 and potentially 92.00, where the 20, 100, and 200-day simple moving averages converge.
NZD/JPY daily chart
- USD/JPY slips to 149.21 as US 10-year Treasury yield drops over eight basis points.
- Despite recent dip, the pair remains in a neutral to bullish stance, hovering inside the Ichimoku Cloud.
- Key support at 149.00; a break below could trigger further declines towards 147.95 and beyond.
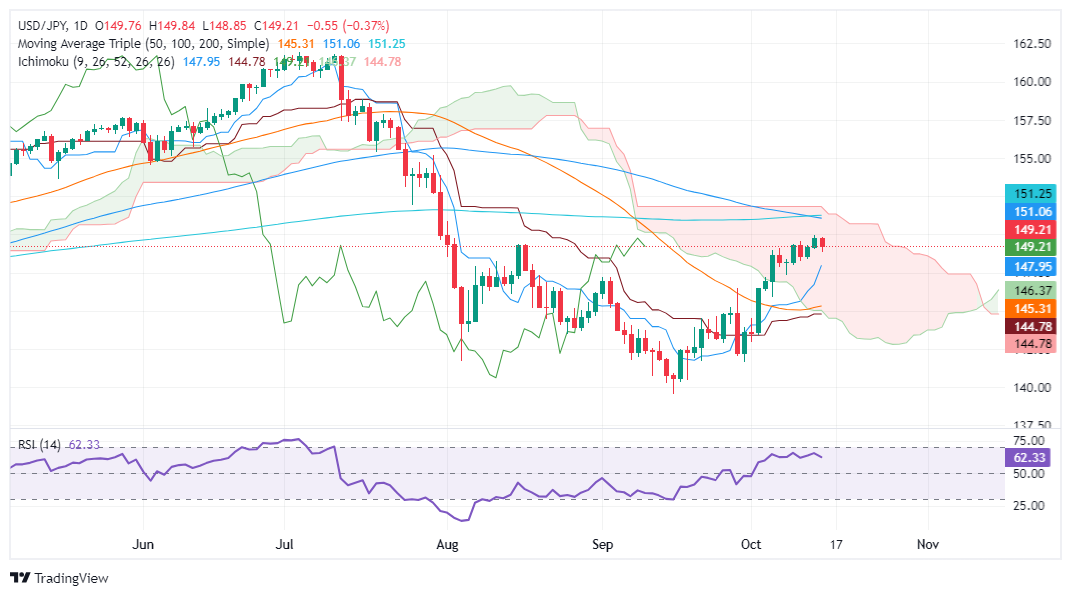
The USD/JPY slipped over 0.30% on Tuesday due to risk aversion and falling US Treasury bond yields. The US 10-year benchmark note rate plummeted over eight basis points (bps) and pushed the exchange rate lower due to its positive correlation with the pair. At the time of writing, the major trades at 149.21, flat as Wednesday’s Asian session begins.
USD/JPY Price Forecast: Technical outlook
The daily chart suggests the USD/JPY is aimed steadily higher, though it is neutral to upward biased.
Although technical signals suggest buyers are in charge, the USD/JPY remains inside the Ichimoku Cloud (Kumo) and caps its advance. Also, despite being bullish, the Relative Strength Index (RSI) has failed to clear the latest three peaks, showing the uptrend could be overextended.
With USD/JPY climbing above 150.00, this clears the path for a move upwards to the 100-day moving average (DMA) at 150.98, ahead of the 200-DMA at 151.27.
If USD/JPY falls below 149.00, the Tenkan-Sen at 147.95 emerges as the first line of defense for bulls. Once surpassed, the Senkou Span A at 146.48, followed by the 50-DMA at 145.36, would be the next key support levels.
USD/JPY Price Action – Daily Chart
Japanese Yen FAQs
The Japanese Yen (JPY) is one of the world’s most traded currencies. Its value is broadly determined by the performance of the Japanese economy, but more specifically by the Bank of Japan’s policy, the differential between Japanese and US bond yields, or risk sentiment among traders, among other factors.
One of the Bank of Japan’s mandates is currency control, so its moves are key for the Yen. The BoJ has directly intervened in currency markets sometimes, generally to lower the value of the Yen, although it refrains from doing it often due to political concerns of its main trading partners. The BoJ ultra-loose monetary policy between 2013 and 2024 caused the Yen to depreciate against its main currency peers due to an increasing policy divergence between the Bank of Japan and other main central banks. More recently, the gradually unwinding of this ultra-loose policy has given some support to the Yen.
Over the last decade, the BoJ’s stance of sticking to ultra-loose monetary policy has led to a widening policy divergence with other central banks, particularly with the US Federal Reserve. This supported a widening of the differential between the 10-year US and Japanese bonds, which favored the US Dollar against the Japanese Yen. The BoJ decision in 2024 to gradually abandon the ultra-loose policy, coupled with interest-rate cuts in other major central banks, is narrowing this differential.
The Japanese Yen is often seen as a safe-haven investment. This means that in times of market stress, investors are more likely to put their money in the Japanese currency due to its supposed reliability and stability. Turbulent times are likely to strengthen the Yen’s value against other currencies seen as more risky to invest in.
- Gold prices rise as US 10-year Treasury yield drops to 4.03%, enhancing the appeal of non-yielding assets.
- The New York Empire State Manufacturing Index shows weakness, but inflation expectations revised upward in September.
- Geopolitical tensions add to Gold’s safe-haven allure as investors brace for key US economic data later this week.
Gold prices advanced Tuesday as US Treasury bond yields retreated, capping US Dollar gains. A light economic docket featured the New York Empire State Manufacturing Index and the release of the NY Fed Consumers Expectations Survey. The XAU/USD trades at $2,664.
The New York Fed revealed the Empire State Manufacturing Index for September, which printed a dismal figure. Meanwhile, inflation expectations were upwardly revised in September, according to the latest NY Fed Consumers Expectations Survey.
The yield of the US 10-year Treasury note dropped eight basis points (bps) down to 4.03%, making the non-yielding metal more appealing while signaling increasing demand for US Treasury bonds.
Bullion prices extended their gains after bouncing off a daily low of $2,638, although the buck remains firm. The US Dollar Index (DXY), which tracks the Greenback’s value against a basket of six currencies, is virtually unchanged at 103.25.
Aside from this, Federal Reserve (Fed) officials continued to grab the headlines. San Francisco Fed President Mary Daly said the Fed’s dual mandate risks are now in balance and that the labor market is not a source of inflation. She added that she’s cautiously optimistic about the economic outlook and foresees one or two rate cuts “if forecasts are met.”
The XAU/USD tends to fare well amidst times of geopolitical risks. Israel revealed that it would target military targets as retaliation against Iran and Hezbollah following the October 1 missile raid.
The Market’s attention turns to upcoming US Retail Sales, Industrial Production data, and Initial Jobless Claims due later this week.
Daily digest market movers: Gold price climbs as investors eye key US data
- The New York Empire State Manufacturing Index for October plummeted sharply to -11.9, missing the consensus of 2.3, well below September’s 11.3.
- The NY Fed Consumer Expectations Survey in September showed that inflation expectations for one year were unchanged at 3%, while for three years they edged up from 2.5% to 2.7%. For five years, inflation is forecasted to rise from the prior 2.8% to 2.9%.
- According to the CME FedWatch tool, traders see a 97.5% chance of a 25-basis-point cut in November.
- Data from the Chicago Board of Trade, based on the December fed funds rate futures contract, indicates that investors are pricing in 50 basis points (bps) of easing by the Fed in the last two months of 2024.
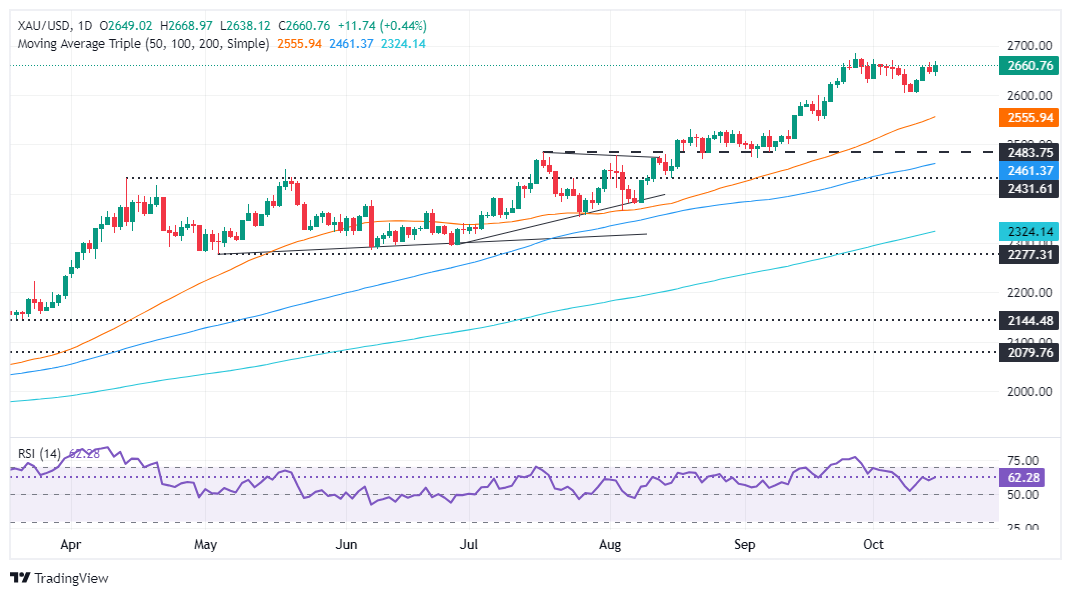
XAU/USD technical outlook: Gold price surges above $2,660, eyes on YTD peak
Gold price uptrend remains intact after climbing above the $2,660 area. Momentum is bullish, as shown by the Relative Strength Index (RSI). With the RSI aiming higher, this indicates that buyers remain in charge.
If XAU/USD clears the October 4 high at $2,670, it would pave the way to challenge the YTD high of $2,685, which is ahead of the $2,700 mark.
On the flip side, once Gold drops below $2,650, it would pave the way for further downside. The next key support level would be $2,600. A breach of the latter would expose the 50-day Simple Moving Average (SMA) at $2,555.
Gold FAQs
Gold has played a key role in human’s history as it has been widely used as a store of value and medium of exchange. Currently, apart from its shine and usage for jewelry, the precious metal is widely seen as a safe-haven asset, meaning that it is considered a good investment during turbulent times. Gold is also widely seen as a hedge against inflation and against depreciating currencies as it doesn’t rely on any specific issuer or government.
Central banks are the biggest Gold holders. In their aim to support their currencies in turbulent times, central banks tend to diversify their reserves and buy Gold to improve the perceived strength of the economy and the currency. High Gold reserves can be a source of trust for a country’s solvency. Central banks added 1,136 tonnes of Gold worth around $70 billion to their reserves in 2022, according to data from the World Gold Council. This is the highest yearly purchase since records began. Central banks from emerging economies such as China, India and Turkey are quickly increasing their Gold reserves.
Gold has an inverse correlation with the US Dollar and US Treasuries, which are both major reserve and safe-haven assets. When the Dollar depreciates, Gold tends to rise, enabling investors and central banks to diversify their assets in turbulent times. Gold is also inversely correlated with risk assets. A rally in the stock market tends to weaken Gold price, while sell-offs in riskier markets tend to favor the precious metal.
The price can move due to a wide range of factors. Geopolitical instability or fears of a deep recession can quickly make Gold price escalate due to its safe-haven status. As a yield-less asset, Gold tends to rise with lower interest rates, while higher cost of money usually weighs down on the yellow metal. Still, most moves depend on how the US Dollar (USD) behaves as the asset is priced in dollars (XAU/USD). A strong Dollar tends to keep the price of Gold controlled, whereas a weaker Dollar is likely to push Gold prices up.
- The Canadian Dollar hit the brakes on a long-run decline.
- Canada saw an acceleration of BoC CPI inflation in September.
- The halt could prove brief as CAD bulls remain elusive.
The Canadian Dollar (CAD) finally found a foothold and halt an ongoing decline against the Greenback that has seen the Loonie shed over 3% in a multi-week bear run that started last month. Despite tapping the breaks, the CAD continues to struggle amid a notable lack of a determined bounce, and USD/CAD has been left dangling in no man’s land near 1.3800.
Canadian Consumer Price Index (CPI) headline inflation figures ticked lower in September, while the Bank of Canada’s (BoC) own CPI measures ticked higher over the same period. Still, markets remain committed to expectations of a 50 bps rate trim from the Bank of Canada (BoC) later this month.
Daily digest market movers
- Headline Canadian CPI inflation eased to just 1.6% YoY in September, down from the previous 2.0% and even lower than the expected 1.8%.
- Despite the decline in headline inflation, the BoC’s own core annualized CPI inflation in September accelerated to 1.6% from the previous 1.5% as inflation pressures in core goods and services remain.
- Despite the uptick in core CPI figures, market analysts are still broadly expecting the BoC to deliver a 50 bps rate trim later this month, limiting the potential for CAD strength.
- Meaningful CAD data remains absent from the economic calendar for the remainder of the trading week.
- Upcoming BoC rate call slated for next Wednesday, October 23.
Canadian Dollar price forecast
The Canadian Dollar finally managed to pump the brakes on a multi-week backslide against the Greenback, keeping USD/CAD pinned on the underside of the 1.3800 handle. Despite the near-term fix, the Loonie is still poised for further weakness against the US Dollar with an impending rate cut and price action on the wrong end of the 200-day Exponential Moving Average (EMA) rising through 1.360.
USD/CAD daily chart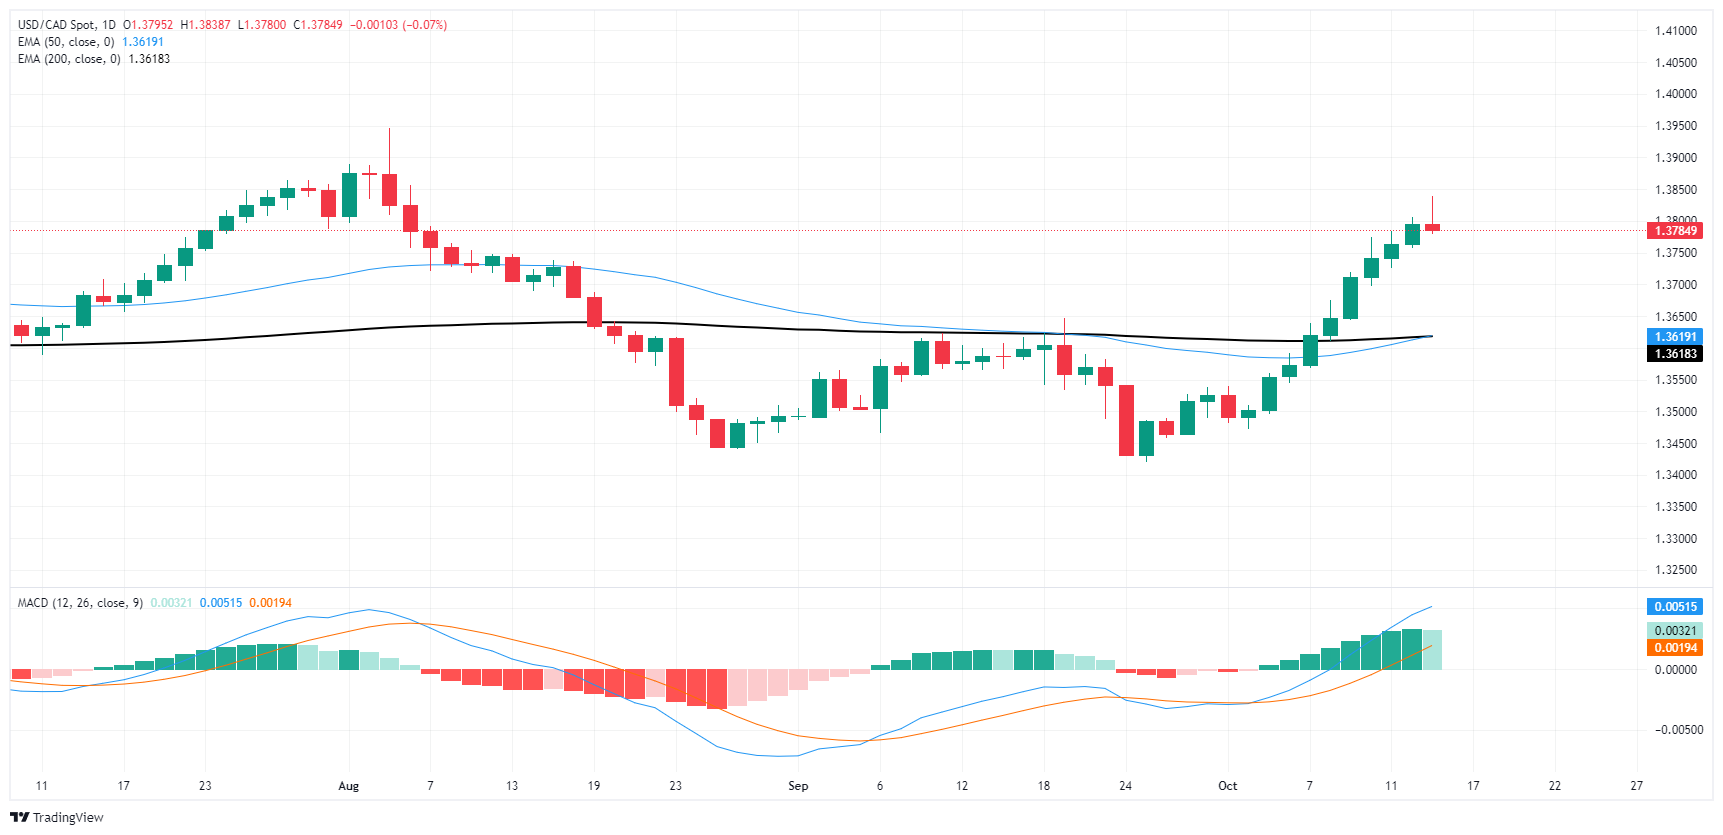
Canadian Dollar FAQs
The key factors driving the Canadian Dollar (CAD) are the level of interest rates set by the Bank of Canada (BoC), the price of Oil, Canada’s largest export, the health of its economy, inflation and the Trade Balance, which is the difference between the value of Canada’s exports versus its imports. Other factors include market sentiment – whether investors are taking on more risky assets (risk-on) or seeking safe-havens (risk-off) – with risk-on being CAD-positive. As its largest trading partner, the health of the US economy is also a key factor influencing the Canadian Dollar.
The Bank of Canada (BoC) has a significant influence on the Canadian Dollar by setting the level of interest rates that banks can lend to one another. This influences the level of interest rates for everyone. The main goal of the BoC is to maintain inflation at 1-3% by adjusting interest rates up or down. Relatively higher interest rates tend to be positive for the CAD. The Bank of Canada can also use quantitative easing and tightening to influence credit conditions, with the former CAD-negative and the latter CAD-positive.
The price of Oil is a key factor impacting the value of the Canadian Dollar. Petroleum is Canada’s biggest export, so Oil price tends to have an immediate impact on the CAD value. Generally, if Oil price rises CAD also goes up, as aggregate demand for the currency increases. The opposite is the case if the price of Oil falls. Higher Oil prices also tend to result in a greater likelihood of a positive Trade Balance, which is also supportive of the CAD.
While inflation had always traditionally been thought of as a negative factor for a currency since it lowers the value of money, the opposite has actually been the case in modern times with the relaxation of cross-border capital controls. Higher inflation tends to lead central banks to put up interest rates which attracts more capital inflows from global investors seeking a lucrative place to keep their money. This increases demand for the local currency, which in Canada’s case is the Canadian Dollar.
Macroeconomic data releases gauge the health of the economy and can have an impact on the Canadian Dollar. Indicators such as GDP, Manufacturing and Services PMIs, employment, and consumer sentiment surveys can all influence the direction of the CAD. A strong economy is good for the Canadian Dollar. Not only does it attract more foreign investment but it may encourage the Bank of Canada to put up interest rates, leading to a stronger currency. If economic data is weak, however, the CAD is likely to fall.
- AUD/USD declines amidst renewed selling pressure, testing 0.6700 support.
- Market sentiment implies a 55% probability of a 25-basis-point rate cut by the RBA this year.
- The fragile economic situation in China also weighs on the Aussie.
The AUD/USD pair declined by 0.40% to 0.6705 in Tuesday's session as the Australian Dollar faced renewed selling pressure. The US Dollar has regained strength, moving toward two-month highs due to increased risk aversion and ongoing concerns about China.
The main mover of the Aussie lately is the economic situation in China, which seems to be unnerving investors and hence pushing them to seek refuge in the US Dollar. In the meantime, markets seem to be confident of the Reserve Bank of Australia (RBA) cutting 25 bps by year’s end.
Daily digest market movers: Australian Dollar sinks on strong USD and Chinese economic woes
- The bearish momentum for the Australian Dollar was caused by an irresolute US Dollar and skepticism about China's stimulus measures.
- A decline in copper prices also contributed to the downward pressure on the Australian Dollar, while iron ore prices remained mostly unchanged.
- Deflationary concerns deepened in China based on September data, raising doubts about the effectiveness of its stimulus efforts.
- Market sentiment reflects a 55% probability of a 25 bps rate cut by the RBA by year-end.
AUD/USD technical outlook: Bearish momentum intensifies, buyers must defend 0.6700
The AUD/USD currency pair has declined in recent sessions with a drop of 0.42% on Tuesday. This decline is in line with several technical indicators. The Relative Strength Index (RSI), which measures the strength of buying and selling pressure, is currently at 36, indicating that the selling pressure is stronger. The RSI is also declining sharply, suggesting that the selling pressure is intensifying.The Moving Average Convergence Divergence (MACD) is another indicator that suggests that bearish pressure is rising. Overall, the technical outlook for the AUD/USD is bearish, suggesting that the pair could continue to fall in the near term. Key support levels to watch include 0.6700, 0.6680 and 0.6650, while resistance levels to watch include 0.6750, 0.6760 and 0.6780.
Australian Dollar FAQs
One of the most significant factors for the Australian Dollar (AUD) is the level of interest rates set by the Reserve Bank of Australia (RBA). Because Australia is a resource-rich country another key driver is the price of its biggest export, Iron Ore. The health of the Chinese economy, its largest trading partner, is a factor, as well as inflation in Australia, its growth rate and Trade Balance. Market sentiment – whether investors are taking on more risky assets (risk-on) or seeking safe-havens (risk-off) – is also a factor, with risk-on positive for AUD.
The Reserve Bank of Australia (RBA) influences the Australian Dollar (AUD) by setting the level of interest rates that Australian banks can lend to each other. This influences the level of interest rates in the economy as a whole. The main goal of the RBA is to maintain a stable inflation rate of 2-3% by adjusting interest rates up or down. Relatively high interest rates compared to other major central banks support the AUD, and the opposite for relatively low. The RBA can also use quantitative easing and tightening to influence credit conditions, with the former AUD-negative and the latter AUD-positive.
China is Australia’s largest trading partner so the health of the Chinese economy is a major influence on the value of the Australian Dollar (AUD). When the Chinese economy is doing well it purchases more raw materials, goods and services from Australia, lifting demand for the AUD, and pushing up its value. The opposite is the case when the Chinese economy is not growing as fast as expected. Positive or negative surprises in Chinese growth data, therefore, often have a direct impact on the Australian Dollar and its pairs.
Iron Ore is Australia’s largest export, accounting for $118 billion a year according to data from 2021, with China as its primary destination. The price of Iron Ore, therefore, can be a driver of the Australian Dollar. Generally, if the price of Iron Ore rises, AUD also goes up, as aggregate demand for the currency increases. The opposite is the case if the price of Iron Ore falls. Higher Iron Ore prices also tend to result in a greater likelihood of a positive Trade Balance for Australia, which is also positive of the AUD.
The Trade Balance, which is the difference between what a country earns from its exports versus what it pays for its imports, is another factor that can influence the value of the Australian Dollar. If Australia produces highly sought after exports, then its currency will gain in value purely from the surplus demand created from foreign buyers seeking to purchase its exports versus what it spends to purchase imports. Therefore, a positive net Trade Balance strengthens the AUD, with the opposite effect if the Trade Balance is negative.
A mildly positive session left the US Dollar trading around recent levels against the backdrop of diminishing yields worldwide, while market participants maintained their attention on messages from Fed’s officials regarding the bank’s likely rate path.
Here is what you need to know on Wednesday, October 16:
The US Dollar Index (DXY) struggled to advance further, maintaining its trade in the upper end of the range in the low 103.00s. The MBA’s Mortgage Applications are due along with Export and Import Prices, all prior to the weekly report on US crude oil inventories by the API.
There was no respite for the downward bias in EUR/USD, which this time receded to new lows near 1.0880. The ECB’s Lagarde is due to speak ahead of the central bank’s interest rate decision on Thursday.
Auspicious data releases on the UK docket helped GBP/USD clinch to daily gains after briefly trespassing the 1.3100 barrier. The UK Inflation Rate takes centre stage.
Fresh appreciation of the Japanese currency prompted USD/JPY to give away part of Monday’s decent advance. Machinery Orders and the speech by the BoJ’s Adachi are next on tap.
AUD/USD added to Monday’s negative price action and revisited the 0.6700 neighbourhood. The Westpac Leading Index and the speech by the RBA’s Hunter are due next.
Demand concerns in combination with alleviating geopolitical concerns weighed heavily on prices of WTI, sending them to the area below the $70.00 mark, or two-week lows.
Prices of Gold resumed their uptrend and surpassed the $2,660 mark per ounce troy following lacklustre gains in the US Dollar and shrinking US yields. Silver prices faded the negative start to the week and rose well past the $31.00 mark per ounce.
- US Dollar weakens following disappointing New York manufacturing data, which contracted unexpectedly in October.
- Fed officials remain cautious with Kashkari favoring modest rate cuts and Waller urging a slower pace.
- Markets are pricing high odds of 25 bps cuts in both November and December.
The US economy is facing mixed signals, with certain sectors indicating a slowdown, while others remain robust. Despite this, the Federal Reserve (Fed) has signaled that its approach to easing monetary policy will be guided by emerging economic indicators.
The US Dollar Index (DXY), which measures the value of the USD against a basket of six currencies, struggles for traction, hovering above 103.00. A disappointing New York manufacturing report, indicating an unexpected contraction in October, has weighed on recent US Dollar momentum.
Daily digest market movers: US Dollar declines amid Fed caution and mixed data
- Fed officials Kashkari and Waller express caution, suggesting a more gradual pace of rate cuts than previously expected.
- Strong jobs and CPI data have tempered expectations of aggressive Fed easing, and 125 bps of total easing over the next 12 months.
- The New York Empire State Manufacturing Index for October was released, showing a significant decline into contraction at -11.9. This contrasts with the previous increase of 11.5 and falls well below expectations, which had anticipated a modest rise to 2.3.
- On Thursday, markets will follow Retail Sales figures, which might shake the USD dynamics and Fed bets.
DXY technical outlook: DXY index shows bullish momentum, nears resistance
Technical analysis for the DXY index suggests a positive outlook, with indicators gaining momentum. The index has crossed above the 100-day SMA and is approaching the 200-day SMA at 103.80, which will be a key resistance level. Still, the Relative Strength Index (RSI) and Moving Average Convergence Divergence (MACD) indicators flash overbought signals, indicating potential profit-taking.
Support lies at 103.00, 102.50 and 102.30. Resistance levels are located at 103.30, 103.50 and 104.00.
US Dollar FAQs
The US Dollar (USD) is the official currency of the United States of America, and the ‘de facto’ currency of a significant number of other countries where it is found in circulation alongside local notes. It is the most heavily traded currency in the world, accounting for over 88% of all global foreign exchange turnover, or an average of $6.6 trillion in transactions per day, according to data from 2022. Following the second world war, the USD took over from the British Pound as the world’s reserve currency. For most of its history, the US Dollar was backed by Gold, until the Bretton Woods Agreement in 1971 when the Gold Standard went away.
The most important single factor impacting on the value of the US Dollar is monetary policy, which is shaped by the Federal Reserve (Fed). The Fed has two mandates: to achieve price stability (control inflation) and foster full employment. Its primary tool to achieve these two goals is by adjusting interest rates. When prices are rising too quickly and inflation is above the Fed’s 2% target, the Fed will raise rates, which helps the USD value. When inflation falls below 2% or the Unemployment Rate is too high, the Fed may lower interest rates, which weighs on the Greenback.
In extreme situations, the Federal Reserve can also print more Dollars and enact quantitative easing (QE). QE is the process by which the Fed substantially increases the flow of credit in a stuck financial system. It is a non-standard policy measure used when credit has dried up because banks will not lend to each other (out of the fear of counterparty default). It is a last resort when simply lowering interest rates is unlikely to achieve the necessary result. It was the Fed’s weapon of choice to combat the credit crunch that occurred during the Great Financial Crisis in 2008. It involves the Fed printing more Dollars and using them to buy US government bonds predominantly from financial institutions. QE usually leads to a weaker US Dollar.
Quantitative tightening (QT) is the reverse process whereby the Federal Reserve stops buying bonds from financial institutions and does not reinvest the principal from the bonds it holds maturing in new purchases. It is usually positive for the US Dollar.
- The Dow Jones slipped back below 43,000 on Tuesday.
- Markets are softer on Tuesday after ripping into new records this week.
- Weak points in tech sector are leading equities lower despite broad earnings beats.
The Dow Jones Industrial Average (DJIA) trimmed lower on Tuesday despite starting the day with a fresh all-time peak bid. The major equity index declined back below the 43,000 major handle through the US market session as chipmakers, health services companies, and the energy sector drag averages lower.
Earnings season is well underway in US equities, with roughly 80% of all reporting companies beating market analyst expectations. However, some dark points are still clouding the skies, with key healthcare and semiconductor producers posting worse-than-expected results in the third quarter.
The economic calendar remains tepid on US data until September’s Retail Sales figures release on Thursday, leaving investors to focus on regular appearances from Federal Reserve (Fed) policymakers that dot the landscape throughout the week. Energy sector stocks broadly eased after the US announced it had secured assurances that Israel won’t be targeting Iranian Crude Oil or nuclear energy facilities as the ongoing Middle East geopolitical conflict roils on.
Dow Jones news
Despite a sharp pullback in key sectors on Tuesday dragging equity indexes lower, most of the Dow Jones listed securities are trading into the green for the day, with losses contained within the bottom third of stocks. Boeing (BA) rebounded 2.3% to trade above $152 per share on Tuesday, recovering from the week’s low below $147.
Unitedhealth Group (UNH) tumbled nearly 7%, backsliding below $565 per share after it revised its full-year earnings outlook lower. Intel (INTC) also swooned on Tuesday, easing over 2% lower and falling below $23 per share in a knock-on bearish slide after Dutch semiconductor producer ASML (ASML) accidentally released its quarterly earnings early. ASML handily beat performance expectations but revealed unexpected weakness in the semiconductor market associated with chipmakers. ASML’s re-tuned forward guidance for 2025 sees a growing soft patch from tech subsectors associated with chipboards and AI tech.
Dow Jones price forecast
Despite a downturn in Tuesday’s overall bids, the Dow Jones continues to grind out fresh highs on the top side. The major equity index hit a new all-time peak bid early Tuesday of 43,175 before bearish sentiment in key equities dragged the DJIA back below the 43,000 handle.
Despite shedding roughly one-third of a percent on Tuesday, the Dow Jones remains firmly buried in bullish territory. The index is up nearly 15% bottom-to-top for the year, with bulls entirely outrunning the 200-day Exponential Moving Average (EMA) since November of 2023, which is struggling to catch up to current price action as the long-run average grinds north of 39,400.
Dow Jones daily chart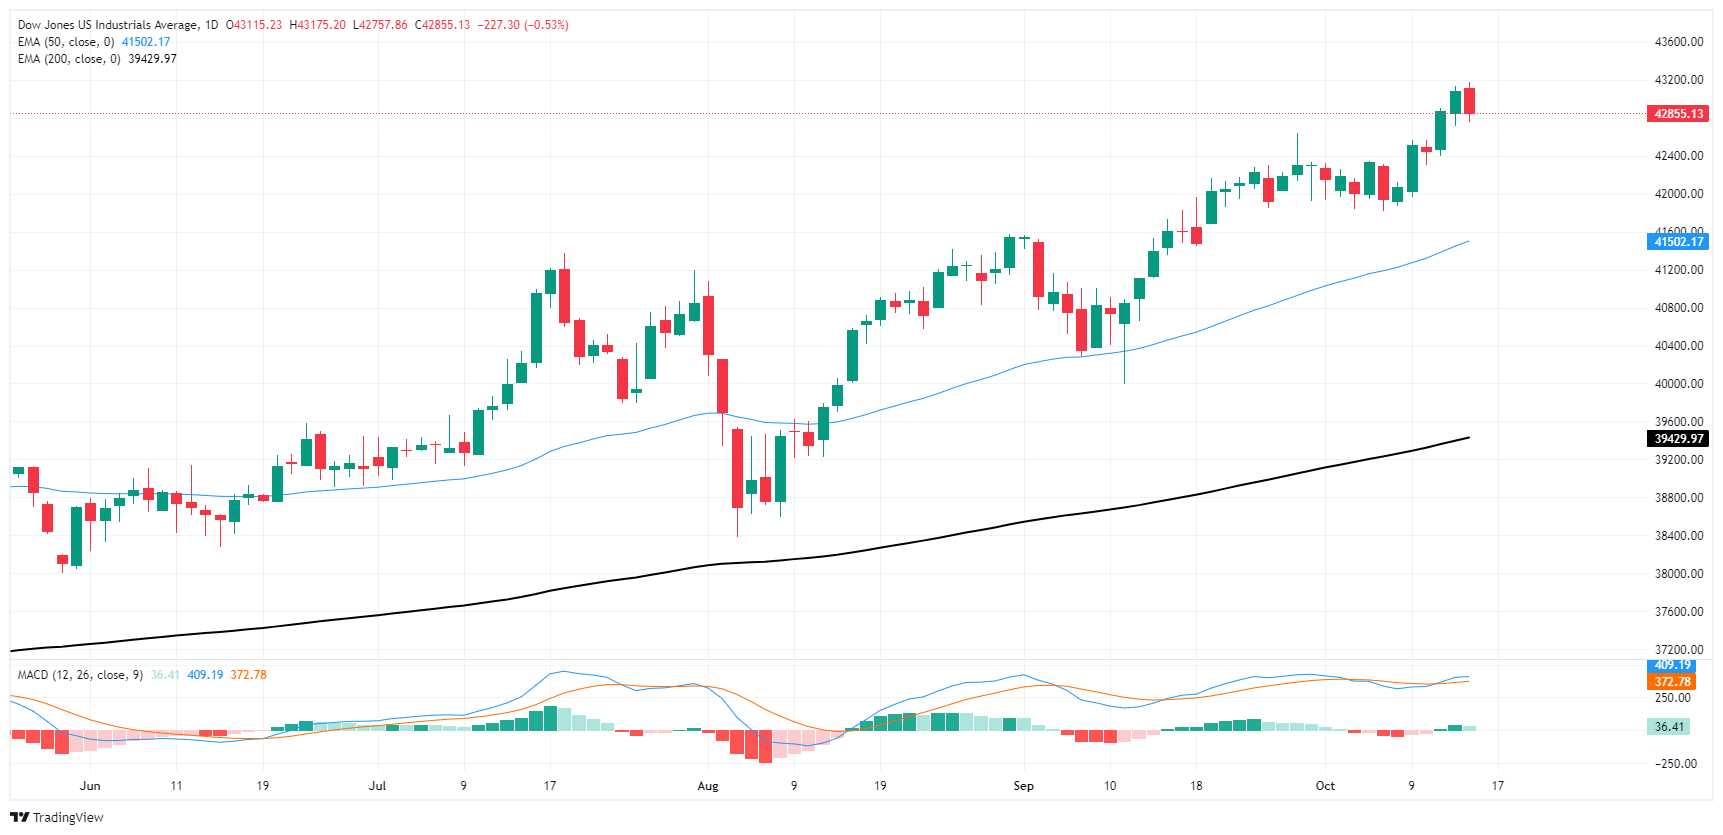
Dow Jones FAQs
The Dow Jones Industrial Average, one of the oldest stock market indices in the world, is compiled of the 30 most traded stocks in the US. The index is price-weighted rather than weighted by capitalization. It is calculated by summing the prices of the constituent stocks and dividing them by a factor, currently 0.152. The index was founded by Charles Dow, who also founded the Wall Street Journal. In later years it has been criticized for not being broadly representative enough because it only tracks 30 conglomerates, unlike broader indices such as the S&P 500.
Many different factors drive the Dow Jones Industrial Average (DJIA). The aggregate performance of the component companies revealed in quarterly company earnings reports is the main one. US and global macroeconomic data also contributes as it impacts on investor sentiment. The level of interest rates, set by the Federal Reserve (Fed), also influences the DJIA as it affects the cost of credit, on which many corporations are heavily reliant. Therefore, inflation can be a major driver as well as other metrics which impact the Fed decisions.
Dow Theory is a method for identifying the primary trend of the stock market developed by Charles Dow. A key step is to compare the direction of the Dow Jones Industrial Average (DJIA) and the Dow Jones Transportation Average (DJTA) and only follow trends where both are moving in the same direction. Volume is a confirmatory criteria. The theory uses elements of peak and trough analysis. Dow’s theory posits three trend phases: accumulation, when smart money starts buying or selling; public participation, when the wider public joins in; and distribution, when the smart money exits.
There are a number of ways to trade the DJIA. One is to use ETFs which allow investors to trade the DJIA as a single security, rather than having to buy shares in all 30 constituent companies. A leading example is the SPDR Dow Jones Industrial Average ETF (DIA). DJIA futures contracts enable traders to speculate on the future value of the index and Options provide the right, but not the obligation, to buy or sell the index at a predetermined price in the future. Mutual funds enable investors to buy a share of a diversified portfolio of DJIA stocks thus providing exposure to the overall index.
- Mexican Peso collapses as USD/MXN climbs past 19.50 after bouncing from daily lows.
- IMF predicts Mexico's economy will grow 1.5% in 2024, further deceleration to 1.3% in 2025.
- San Francisco Fed’s Mary Daly hints at possible rate cuts, boosting USD amid a mixed US economic outlook.
The Mexican Peso lost over 1% against the US Dollar during the North American session as the Greenback strengthened on risk aversion. A scarce economic docket in Mexico left traders leaning on US data, which was mixed as inflation expectations edged higher. The USD/MXN trades at 19.66 after bouncing off daily lows of 19.33.
Market sentiment is downbeat and weighed on risk-sensitive currencies like the Peso. In the meantime, the International Monetary Fund (IMF) revealed that Mexico’s economy is expected to grow by 1.5% in 2024, citing capacity constraints and tight monetary policy.
Next year, the economy is foreseen decelerating further to 1.3%, adding that inflation is expected to get closes to the Bank of Mexico’s (Banxico) 3% goal. The Institute said that “inflation risks remain on the upside” and warned that an economic slowdown in the US, geopolitics, and unforeseen impacts from the judicial reform could impact Mexico’s economy.
Across the border, the New York Empire State Manufacturing Index posted a dismal print, while the latest New York Fed Survey for Inflation Expectations in September remained unchanged at 3%.
The USD/MXN reacted to the upside on remarks by San Francisco Fed President Mary Daly, which sponsored a leg-up toward the current exchange rate. She said the Fed’s dual mandate risks are now in balance and that the labor market is not a source of inflation.
Daly added that she’s cautiously optimistic about the economic outlook and foresees one or two rate cuts “if forecasts are met.”
Ahead in the week, the US economic docket will feature the Balance of Trade on Wednesday. On Thursday, a busy schedule would be led by the release of Retail Sales, Initial Jobless Claims, Industrial Production and further Fed speakers.
Daily digest market movers: Mexican Peso weakens as USD/MXN surges
- Mexico’s deterioration in Consumer Confidence and the IMF forecast weighed on the Mexican Peso, which is falling to two-week lows as USD/MXN rises to 19.67.
- The IMF said that a recent judicial reform creates "important uncertainties about the effectiveness of contract enforcement and the predictability of the rule of law."
- Banxico’s survey revealed that economists estimate the central bank will lower rates by 50 bps for the rest of the year. The USD/MXN exchange rate is projected to end at 19.69, and the economy is expected to grow by 1.45% in 2024.
- The New York Empire State Manufacturing Index for October, which was expected to drop from 11.3 to 2.3, came in at -11.90.
- Data from the Chicago Board of Trade via the December fed funds rate futures contract shows investors estimate 49 bps of Fed easing by the end of the year.
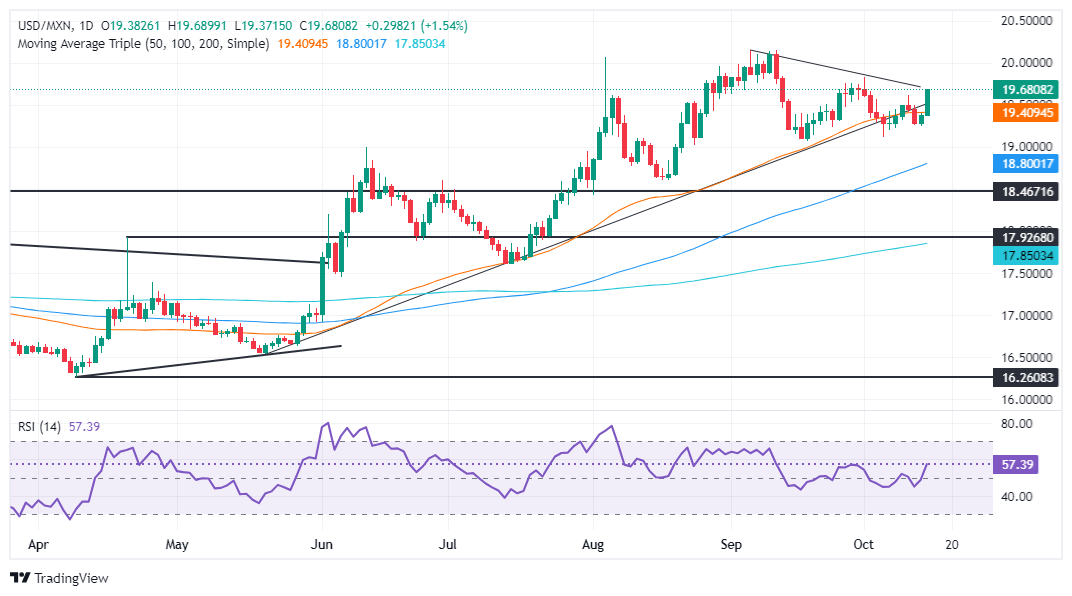
USD/MXN technical outlook: Mexican Peso plummets as USD/MXN eyes 19.70
The USD/MXN uptrend has extended for the second straight day, with buyers eyeing higher prices. Momentum favors buyers, as seen in the Relative Strength Index (RSI).
Given the backdrop, the USD/MXN's next resistance would be the October 1 high at 19.82. Once surpassed, the next stop would be the 20.00 figure, followed by the YTD peak of 20.22.
Conversely, if USD/MXN tumbles below the October 10 daily high of 19.61, up next will be the October 4 swing low of 19.10 before testing 19.00. Once broken, the next support would be the 100-day SMA at 18.78.
Mexican Peso FAQs
The Mexican Peso (MXN) is the most traded currency among its Latin American peers. Its value is broadly determined by the performance of the Mexican economy, the country’s central bank’s policy, the amount of foreign investment in the country and even the levels of remittances sent by Mexicans who live abroad, particularly in the United States. Geopolitical trends can also move MXN: for example, the process of nearshoring – or the decision by some firms to relocate manufacturing capacity and supply chains closer to their home countries – is also seen as a catalyst for the Mexican currency as the country is considered a key manufacturing hub in the American continent. Another catalyst for MXN is Oil prices as Mexico is a key exporter of the commodity.
The main objective of Mexico’s central bank, also known as Banxico, is to maintain inflation at low and stable levels (at or close to its target of 3%, the midpoint in a tolerance band of between 2% and 4%). To this end, the bank sets an appropriate level of interest rates. When inflation is too high, Banxico will attempt to tame it by raising interest rates, making it more expensive for households and businesses to borrow money, thus cooling demand and the overall economy. Higher interest rates are generally positive for the Mexican Peso (MXN) as they lead to higher yields, making the country a more attractive place for investors. On the contrary, lower interest rates tend to weaken MXN.
Macroeconomic data releases are key to assess the state of the economy and can have an impact on the Mexican Peso (MXN) valuation. A strong Mexican economy, based on high economic growth, low unemployment and high confidence is good for MXN. Not only does it attract more foreign investment but it may encourage the Bank of Mexico (Banxico) to increase interest rates, particularly if this strength comes together with elevated inflation. However, if economic data is weak, MXN is likely to depreciate.
As an emerging-market currency, the Mexican Peso (MXN) tends to strive during risk-on periods, or when investors perceive that broader market risks are low and thus are eager to engage with investments that carry a higher risk. Conversely, MXN tends to weaken at times of market turbulence or economic uncertainty as investors tend to sell higher-risk assets and flee to the more-stable safe havens.
Federal Reserve (Fed) Bank of San Francisco President Mary Daly noted on Tuesday that although the Fed has made significant progress on tamping down inflation while also keeping the US labor market within long-run averages, there's still a lot of progress to be done. The Fed policymaker also leaned into the current rate cut spread, noting that it was likely the Fed will only see one or two more rate cuts in 2024.
Key highlights
If forecasts are met, I see one or two more rate cuts this year.
Talk of gradual rate cuts means less than it appears.
I am more comfortable that the Fed can wind down the balance sheet without market trouble.
Inflection points, like now, are likely to generate more dissents.
The lack of Fed dissents doesn't mean that officials fully agree.
See signs the housing market is coming back to life.
I won't be surprised by messy economic data.
3% rate may be around neutral.
The funds rate a long way from where it's likely to settle.
Inflation's retreat has been broad based.
The Fed has been able to get inflation down without major disruption.
I am cautiously optimistic about economic outlook.
A continued expansion remains very possible.
The labor market has cooled, largely normalized from the pandemic.
The economy is clearly in a better place, inflation has eased a lot.
The current unemployment rate is near the long-run level.
The data shows public expects inflation to ease more over time.
Fed monetary policy still restrictive and we are working to lower inflation.
Continued progress on the Fed goals is not assured, the Fed must remain vigilant.
The Fed must deliver 2% inflation while keeping the job market at full employment.
Risks to the Feds job & inflation mandates now more balanced.
- EUR/GBP saw further losses and landed at 0.8330.
- Indicators continue to weaken with the RSI deep in negative terrain.
- As long as the cross holds below the 20-day SMA, the short-term bias will be negative.
The EUR/GBP pair continued its bearish trajectory on Tuesday, extending Monday's decline and falling to 0.8330, down 0.30% for the day. The recent drop reinforces the negative short-term bias, especially as the cross remains below the 20-day Simple Moving Average (SMA), which has turned into a resistance point.
The inability of the bulls to reclaim the 0.8400 resistance level highlights the weakness in buying momentum. This was underscored by a sharp drop in the Relative Strength Index (RSI), which now sits deeper in negative territory, falling below 40. This suggests increased selling pressure as the RSI moves further away from the 50-neutral line.
The Moving Average Convergence Divergence (MACD) continues to emit bearish signals. Although the histogram remains green, it is printing decreasing bars, indicating a fading bullish momentum and further weakening of the pair.
For bears to maintain control, a decisive break below the 0.8300 support level is needed to confirm the downtrend.
Support levels: 0.8320, 0.8300, 0.8280
Resistance levels: 0.8360, 0.8390, 0.8400
EUR/GBP daily chart

China imported 479,000 tons of unwrought Copper and Copper products in September, according to the General Administration of Customs on Monday, Commerzbank’s commodity analyst Carsten Fritsch notes.
Copper imports can be lower in the coming months
“This was a good 15% more than in the previous month. Imports were thus roughly at the previous year's level. The increase in imports is likely to have been in anticipation of stronger demand in the autumn. Whether this occurs or not will depend in part on the success of the monetary policy and fiscal policy stimulus measures that have already been implemented or announced.”
“Year to date, Copper imports are up 2.6% y-o-y. Imports of Copper concentrate in September were 2.44 million tons. This was slightly lower than in the previous month, when the second-highest level since the beginning of the data series was recorded, but almost 9% higher than in the previous year.”
“Imports in the first nine months of the year are 3.7% higher than in the same period of the previous year. The latest data suggest that the supply of Copper ore is improving, which would argue against significant cuts in Copper production in China. This is another reason why Copper imports could be lower in the coming months, which would argue against a rising Copper price.”
- GBP/USD climbs 0.18% after strong UK jobs report shows over 373,000 jobs added, beating forecasts.
- Despite upward momentum, the pair remains within the 1.3000-1.3100 range, testing key resistance levels.
- Break above the 50-day moving average at 1.3112 could open the path to the 1.3174 October high.
The Pound Sterling recovered some ground and rose 0.18% on Tuesday against the US Dollar following a strong UK jobs report that pushed the unemployment rate lower, while the economy added over 373,000 jobs, crushing estimates of 250,000. At the time of writing, the GBP/USD trades at 1.3081 after bouncing off the daily low of 1.3035.
GBP/USD Price Forecast: Technical outlook
The GBP/USD remains consolidated, within the 1.3000-1.3100 range for the sixth consecutive day, even though the pair hit a high of 1.3102.
Momentum remains slightly bearish, as shown by the Relative Strength Index (RSI), but as the RSI edges toward its 50-neutral line, it could pave the way for further upside.
If GBP/USD strengthens further, the next stop would be the 50-day moving average (DMA) at 1.3112. Once surpassed, buyers could target the October 4 daily high at 1.3174, ahead of the 1.3200 figure.
On the other hand, if GBP/USD stays below 1.3100, this could expose the 1.3050 psychological level. The next support would be the October 10 swing low of 1.3010, followed by the September 11 daily low of 1.3001.
GBP/USD Price Action – Daily Chart
British Pound PRICE Today
The table below shows the percentage change of British Pound (GBP) against listed major currencies today. British Pound was the strongest against the Australian Dollar.
| USD | EUR | GBP | JPY | CAD | AUD | NZD | CHF | |
|---|---|---|---|---|---|---|---|---|
| USD | 0.05% | -0.27% | -0.36% | 0.05% | 0.15% | 0.08% | -0.17% | |
| EUR | -0.05% | -0.31% | -0.41% | -0.02% | 0.11% | 0.02% | -0.22% | |
| GBP | 0.27% | 0.31% | -0.06% | 0.31% | 0.42% | 0.34% | 0.16% | |
| JPY | 0.36% | 0.41% | 0.06% | 0.41% | 0.50% | 0.43% | 0.24% | |
| CAD | -0.05% | 0.02% | -0.31% | -0.41% | 0.10% | 0.04% | -0.14% | |
| AUD | -0.15% | -0.11% | -0.42% | -0.50% | -0.10% | -0.07% | -0.25% | |
| NZD | -0.08% | -0.02% | -0.34% | -0.43% | -0.04% | 0.07% | -0.18% | |
| CHF | 0.17% | 0.22% | -0.16% | -0.24% | 0.14% | 0.25% | 0.18% |
The heat map shows percentage changes of major currencies against each other. The base currency is picked from the left column, while the quote currency is picked from the top row. For example, if you pick the British Pound from the left column and move along the horizontal line to the US Dollar, the percentage change displayed in the box will represent GBP (base)/USD (quote).
- USD/CHF is correcting back after peaking as it extends its uptrend.
- The pair will probably resume its bullish bias after the pull back has completed.
USD/CHF is pulling back within its short-term uptrend after peaking at 0.8642 on Monday. The move is only likely to be a temporary correction, however, before the pair resumes its uptrend and extends its sequence of higher highs and higher lows.
USD/CHF 4-hour Chart
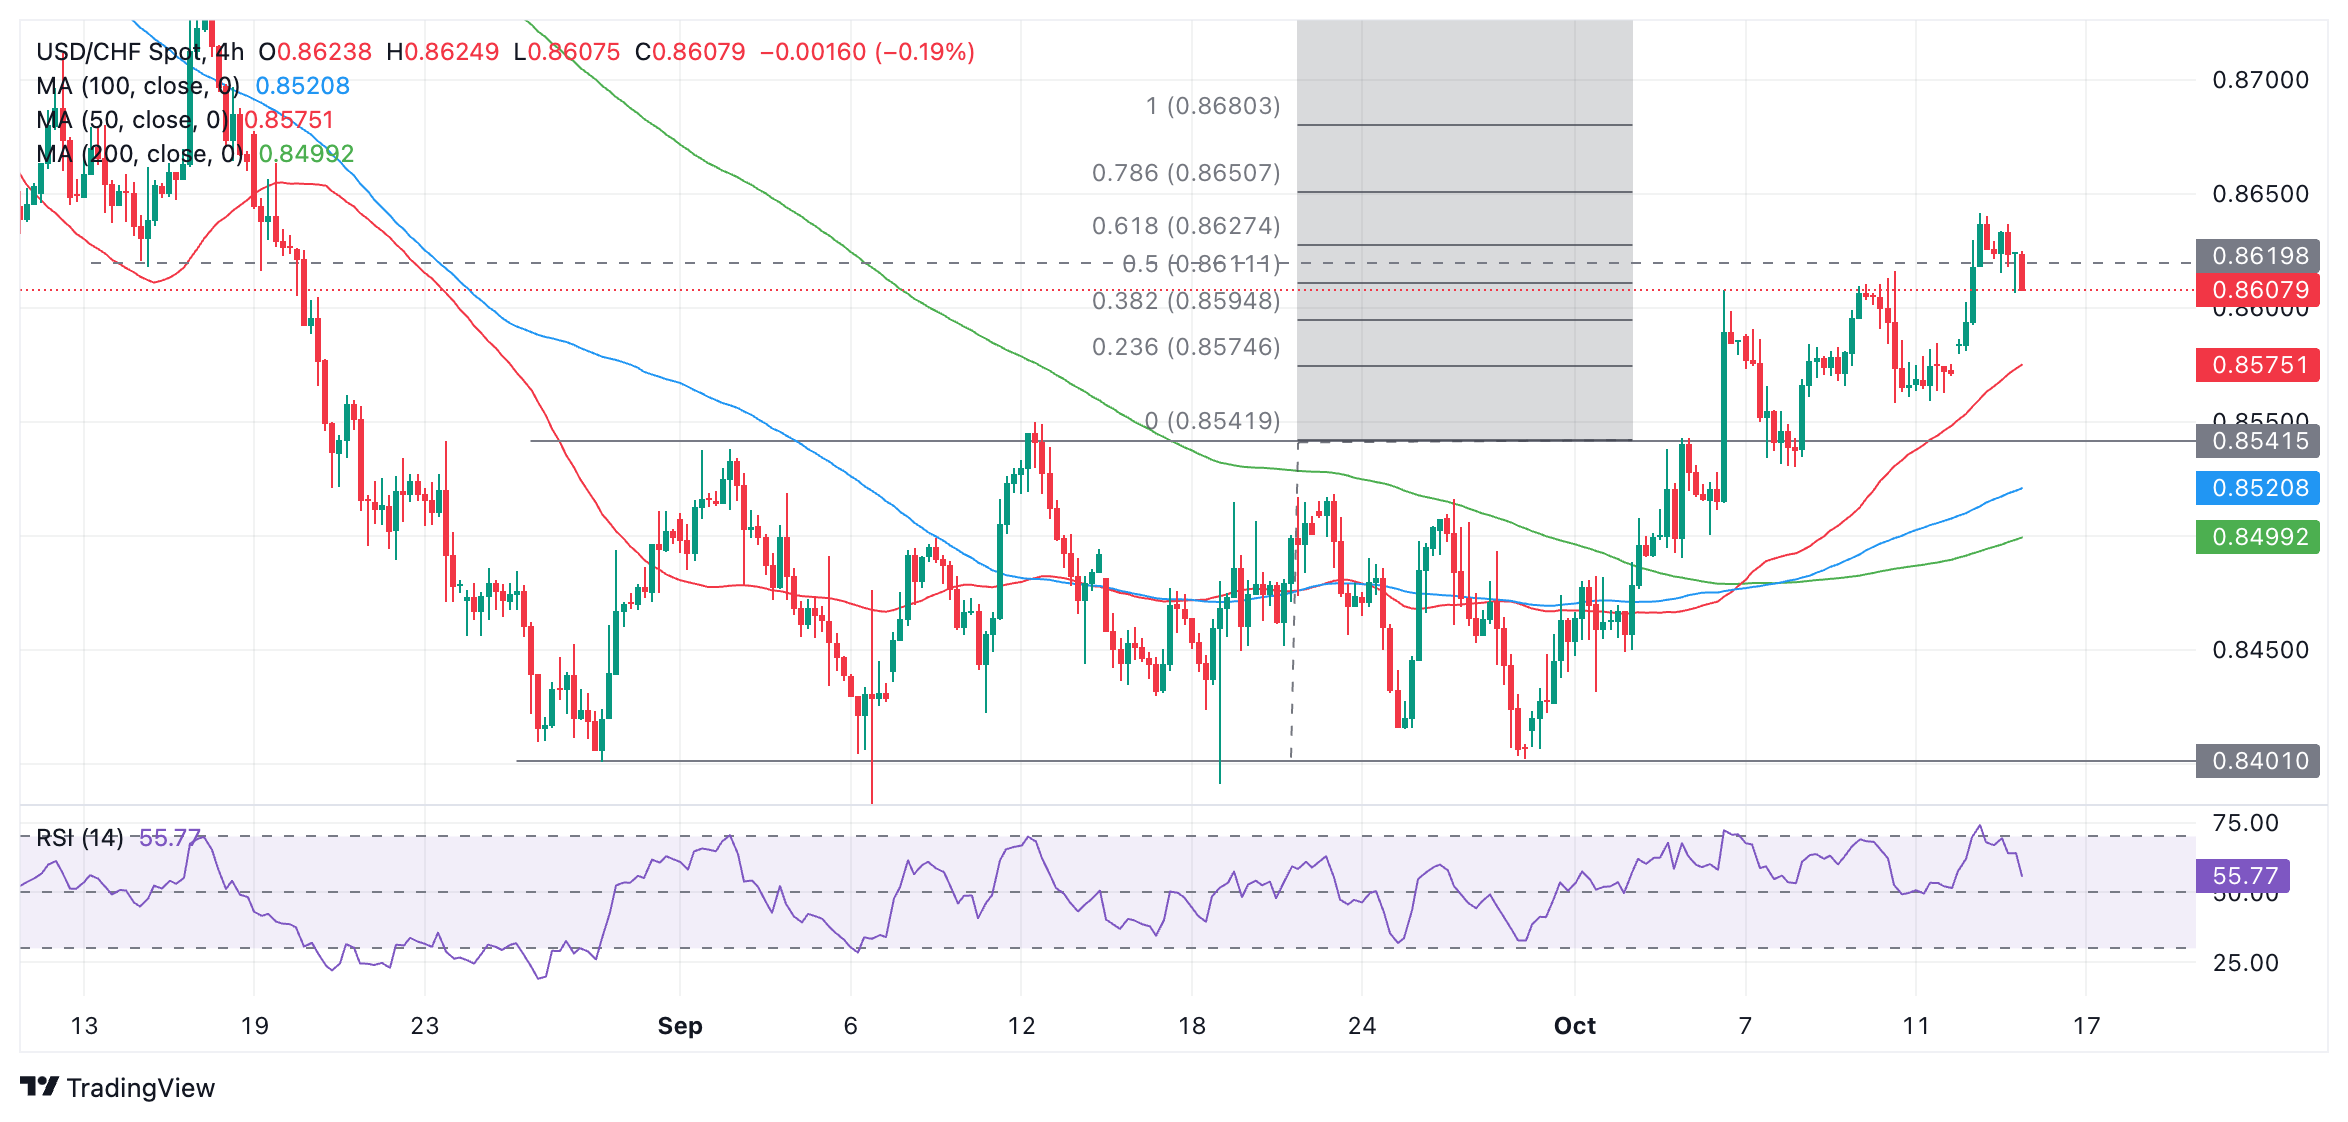
USD/CHF will probably reach the target generated after it broke out of the range, at 0.8680, the 100% Fibonacci (Fib) extrapolation of the height of the range higher. It has already met the conservative target at 0.8627, the 61.8% Fib level.
The Relative Strength Index (RSI) has exited the overbought region giving traders a signal to liquidate their long positions and sell short.
A chart gap opened on Monday morning and there is a risk the market could pull back all the way to fill this gap. If so, it could correct down to 0.8574. It would require a break below the former range highs at 0.8541 to confirm a probable change of trend.
China's crude oil imports fell to 11.1 million barrels per day in September, according to customs data, Commerzbank’s FX analyst Carsten Fritsch notes.
September data for crude oil processing signals subdued China oil demand
“This was the fifth consecutive month that imports were lower than the previous year's level. There was also a decline compared to the previous month, meaning that the monthly increase in August to 11.6 million barrels per day did not mark the beginning of a recovery. In the first nine months of the current year, China's crude oil imports averaged 11 million barrels per day.”
“This is a good 3% lower than in the corresponding period of the previous year. In the remaining three months, there would have to be a significant pick-up in imports to prevent the looming annual decline. To achieve this, imports between October and December would have to exceed 12 million barrels per day, which seems unrealistic.”
“Most recently, Chinese crude oil imports fell in 2021 and 2022 due to the impact of the coronavirus pandemic. This time, weak demand for diesel and gasoline is weighing on crude oil processing at refineries, which are therefore importing less crude oil. Therefore, the data for crude oil processing in September are not expected to be much better on Friday, signaling subdued oil demand in China.”
- USD/CAD peaks after the release of cooler Canadian inflation data.
- Although headline CPI fell to 1.6% in September BoC CPI Core rose.
- The pair has risen for ten days in a row also due to a strong performance by the US Dollar.
USD/CAD extends its stretch of gains to ten days in a row on Tuesday, clocking up over 2.7% over that period as it peaks at 1.3829. The latest gains come thanks to the Canadian Dollar (CAD) temporarily weakening after the release of lower-than-expected Canadian inflation data. This showed the Consumer Price Index (CPI) declining to 1.6% annually in September, from 2.0% in August, and below estimates of 1.8%.
USD/CAD Daily Chart
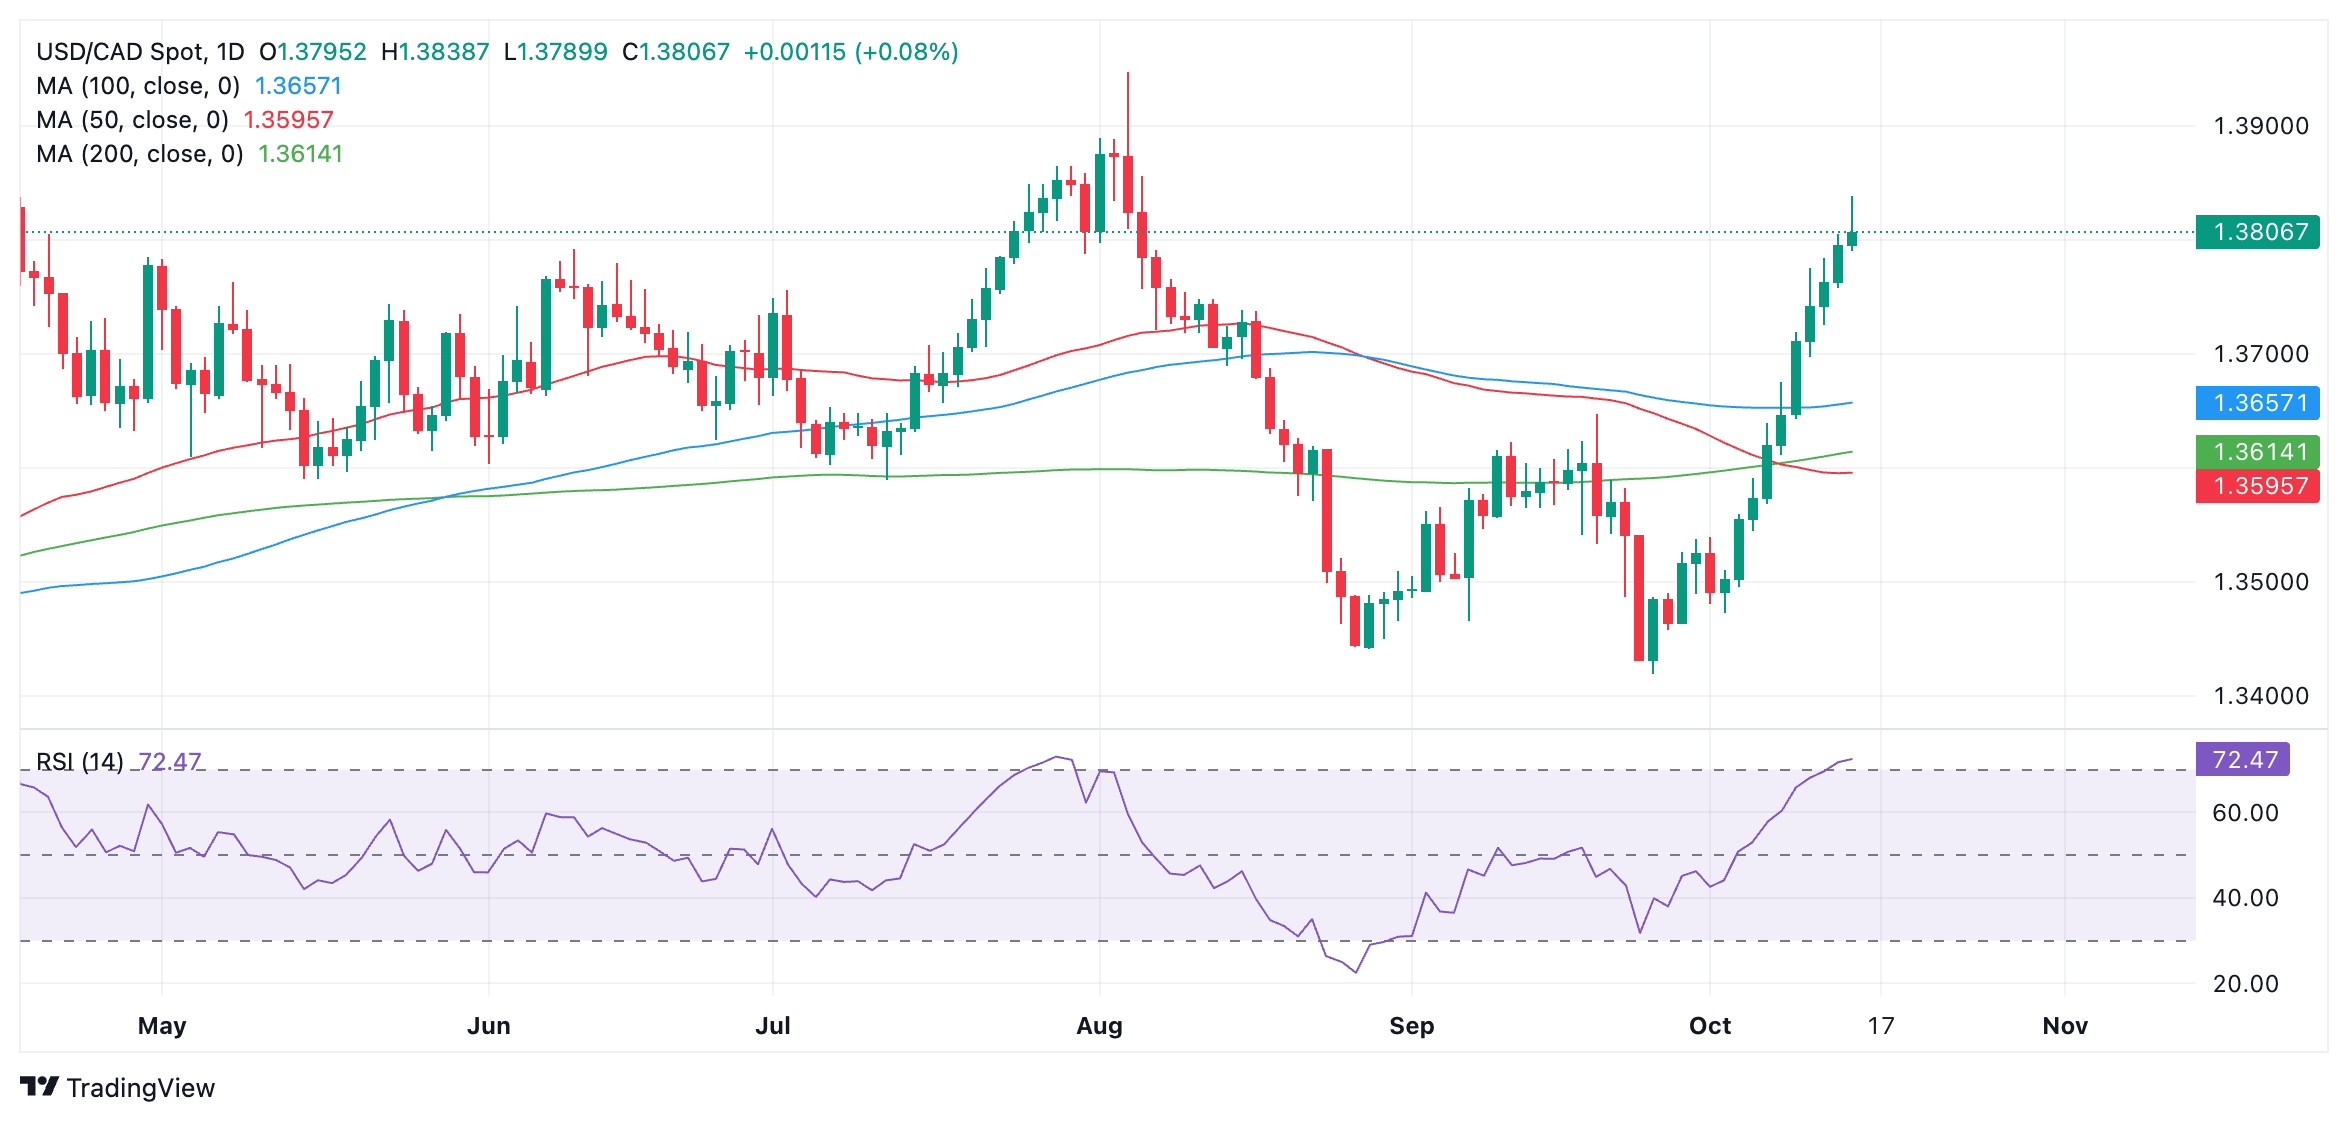
Lower inflation suggests the Bank of Canada (BoC) will have to cut interest rates again after already making three consecutive 0.25% reductions, in order to cut excess supply and underpin the labor market. The expectation of lower interest rates, in turn, reduces foreign capital inflows, which reduces demand for the Canadian Dollar.
The fall in inflation was mainly caused by a 10.7% decline in gasoline prices in September, and also affected related sectors such as transportation (down 1.5%). It marks the second month that headline inflation has fallen below the bank’s 2.0% target. The fall in gasoline prices is due to lower Crude Oil prices which is Canada’s largest export commodity. This, in turn, is a backdraught for the pair as lower Oil prices are bearish for CAD.
Whilst it rallied as an initial reaction to the CPI data, USD/CAD quickly reversed and began falling not long after the release, perhaps due to an uptick in BoC CPI Core, or because the pair might be “overbought” – or entering the realms of overvaluation after its stellar rally in October.
USD/CAD has made further gains due to a strengthening US Dollar (USD) as markets reduce bets the US Federal Reserve (Fed) will go ahead with more aggressive rate cuts at its November meeting after kicking off its easing cycle with a “mega” 50 basis points (bps) (0.50%) cut in September.
From market-based chances of 60% for the Fed to follow up with another 50 bps cut in November a series of better-than-expected data releases, especially labor market data, has reassured markets that the US economy is not teetering on the edge of a precipice and led to a dramatic revision of the probabilities to zero. On Tuesday the probability of the Fed cutting by a lesser 25 bps stood at 90% with a 10% chance the Fed would decide not to cut interest rates at all.
Other data on Tuesday showed the BoC Consumer Price Index Core rose 1.6% YoY in September from 1.5% in August. Core prices rose 0.1% MoM the same as in August, according to data from Statistics Canada.
Headline CPI fell 0.4% MoM compared to the 0.2% decline of the previous month.
Oil prices have fallen sharply since the beginning of the week, Commerzbank’s FX analyst Carsten Fritsch notes.
Price of Brent oil slides below the $75
“The price of Brent oil slid below the $75 per barrel mark in the morning, after trading at just under $79 on Friday. Yesterday, weak data from China initially led to selling pressure. The 4% price drop today is due to reports that Israel could spare Iran's oil and nuclear facilities in the announced retaliation and instead attack military targets.”
“According to the Washington Post, Israeli Prime Minister Netanyahu told this to the US government. This would also significantly reduce the risk of supply disruptions. Some Arab Gulf states had feared that in the event of an Israeli attack on Iranian oil facilities, Iran backed militias could respond by attacking oil facilities in neighboring countries.”
Market pricing of a higher Fed terminal rate seems to reflect more inflation concerns than a growth boost. Inflation-driven Fed tightness is more detrimental for EM economies. Our resilience index shows Mexico, Saudi Arabia and India are comfortably in the safe category. Egypt, Pakistan and Bangladesh are less resilient, Standard Chartered’s economist Madhur Jha notes.
Gauging resilience to elevated Fed rates
“The Fed has started its easing cycle, yet markets are factoring in a higher Fed terminal rate in the medium term. Pricing of a higher Fed terminal rate seems to be largely driven by expectations of higher inflation, but might also be increasingly capturing forecasts of stronger US growth. What is driving the terminal rate higher matters for the rest of the world. Historically, EM countries have fared worse when the Fed tightens policy in response to inflation concerns as there is no offset from stronger US demand.”
“We try to gauge which EM economies are better able to withstand tighter global liquidity conditions medium-term. We focus on indicators that are more macro, such as growth and inflation prospects, but also take into account fiscal space indicators, proxies for policy credibility and external-sector health, which would make an economy particularly vulnerable to less favourable global liquidity conditions.”
“Latam countries, led by Mexico, dominate the list of most resilient economies. Saudi Arabia’s reforms, which are likely to boost growth, and its healthy external debt position place it in a favourable position. And India’s policy credibility, focus on capex and healthy external debt position also place it in the more resilient category. Countries that have IMF programmes like Pakistan and Egypt fall into the most vulnerable category, though many of them are now turning the corner, having been through recent periods of crises.”
The Gold price rose to $2,667 per troy ounce yesterday, coming within less than $20 of its all-time high reached at the end of September, Commerzbank’s FX analyst Carsten Fritsch notes.
Gold price comes close to its all-time high again
“This is all the more remarkable given that expectations of interest rate cuts by the Fed have been scaled back significantly since the beginning of October. At the beginning of the month, 75 basis points of interest rate cuts were still expected by the end of the year, but now the expectation is just under 50 basis points.”
“The fact that the Gold price came under pressure only briefly and has since recovered most of its losses is likely due to the increased geopolitical risks in the Middle East. As a non-interest-bearing investment, Gold benefits not only from expectations of interest rate cuts, but also from its safe-haven status.”
“Should the media reports prove to be true and Israel spare Iran's oil and nuclear facilities in the expected retaliatory strike, geopolitical risks would decrease and support for the Gold price from this side would also fade. We therefore see slight downside risks for the Gold price and expect the Gold price to be $2,600 at the end of the year.”
- EUR/USD continues sliding and making lower lows.
- It has almost reached the first target for the Double Top reversal pattern it completed last month.
EUR/USD bleeds lower after piercing through a long-term trend line. The 50 and 100-day Simple Moving Averages (SMA) also lie broken in its wake. Nothing can stop bears now, or so it seems. The trend is down, and given “the trend is your friend” the odds favor more.
EUR/USD Daily Chart
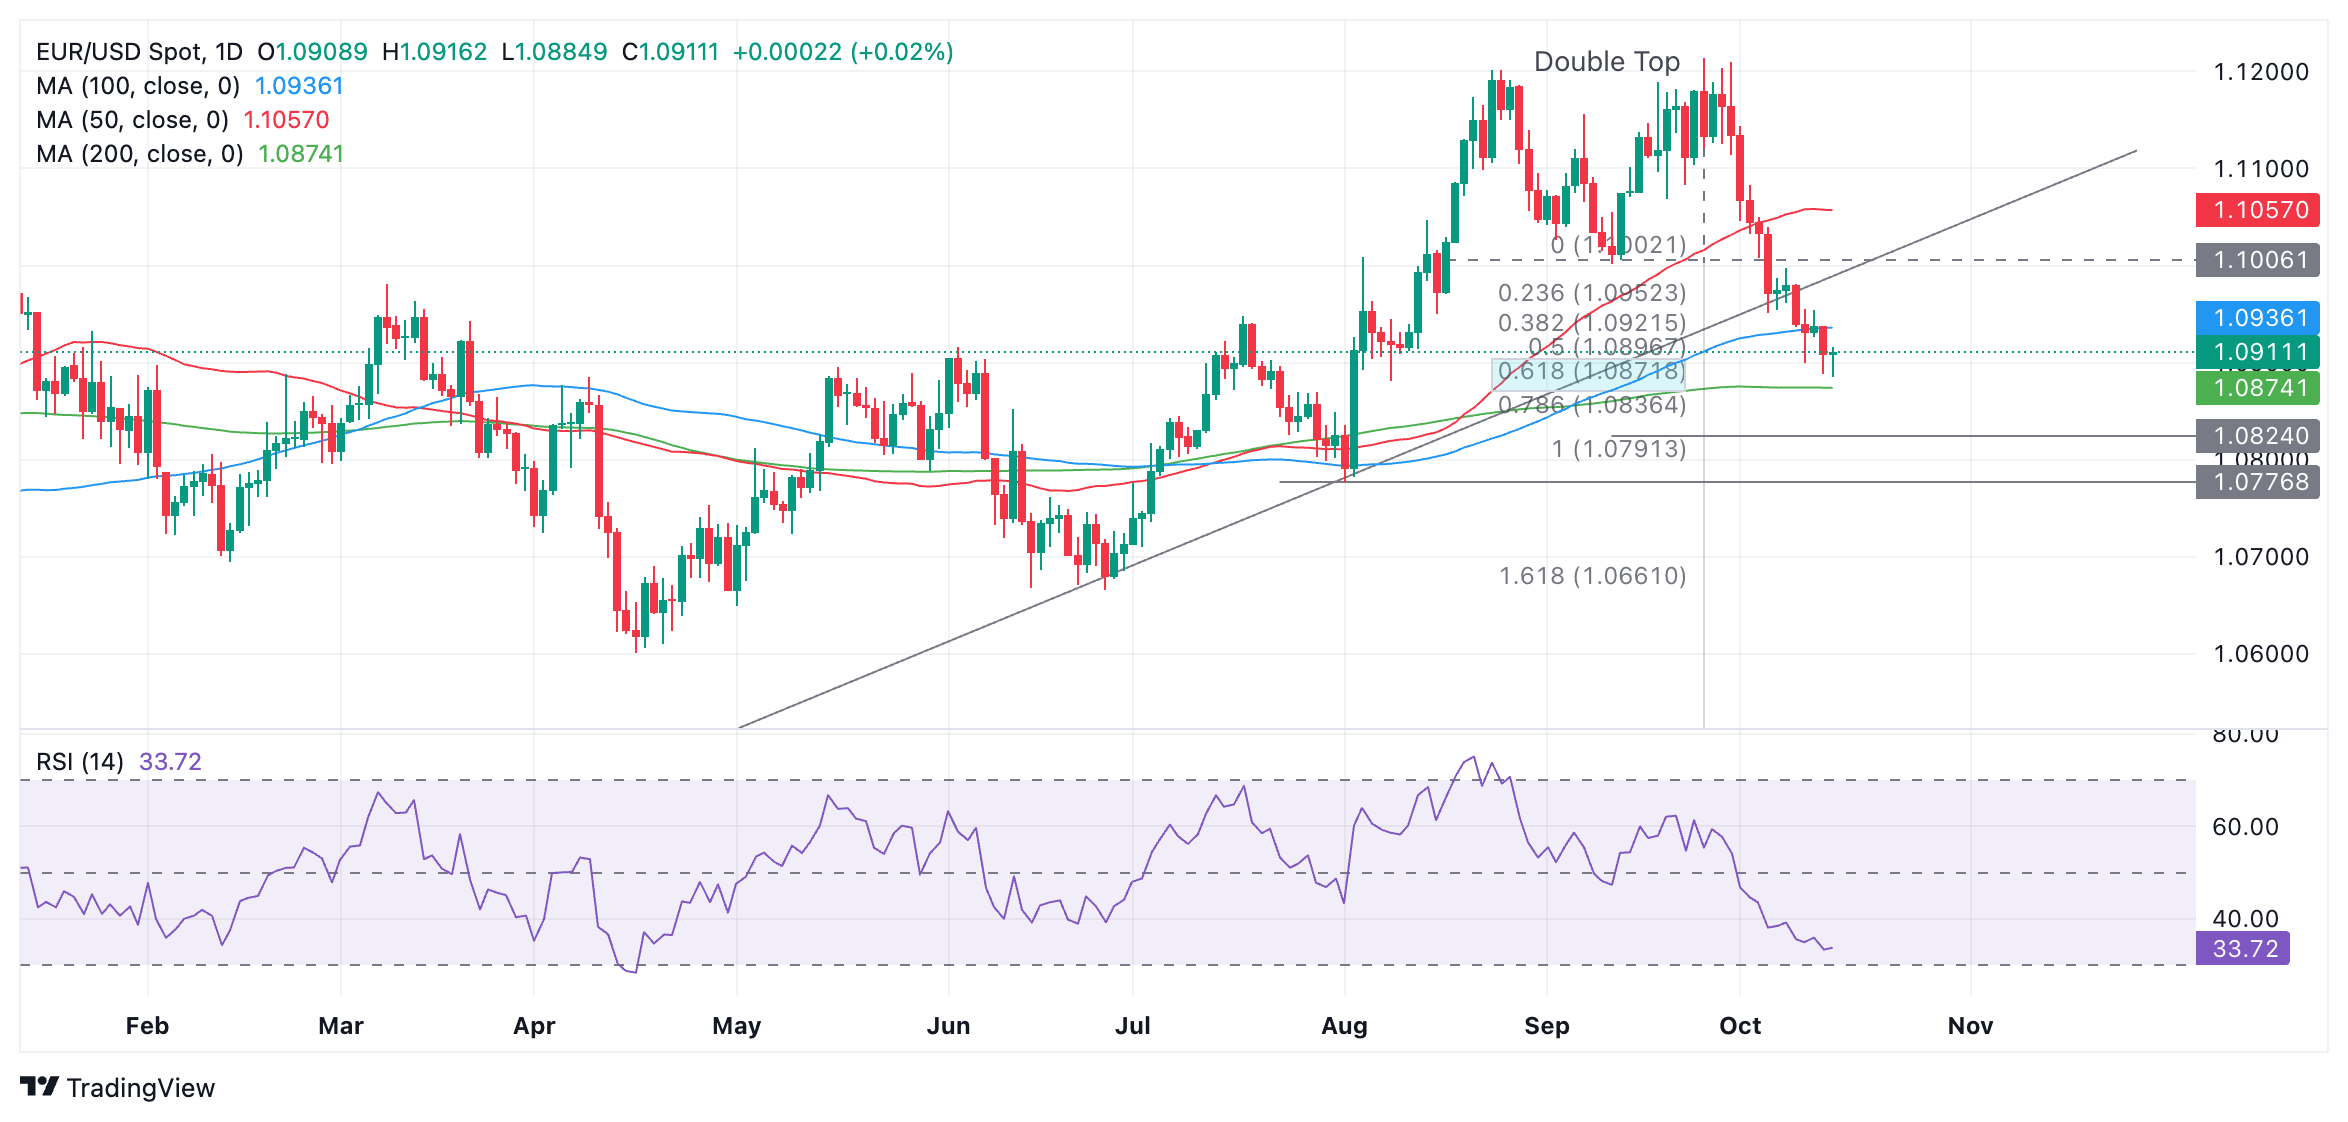
EUR/USD probably formed a Double Top reversal pattern in August and September. The first downside target for the pattern lies at 1.0872 which has almost been met at the low of the day (1.0885). This equates with the 61.8% Fibonacci extension of the height of the Double Top extrapolated lower (blue shaded rectangle on the chart).
A further target lies at 1.0874, at the (green) 200-day SMA. Another more bearish target lies at 1.0824, generated by the trendline break.
The fact the initial target at 1.0872 has almost been met could mean that bearish momentum will ease off. However, momentum is not oversold yet and a break below 1.0860 would probably suggest more downside towards the target at 1.0824.
Momentum, as measured by the Relative Strength Index (RSI), is mirroring price as it tracks lower, which is a mildly bearish sign.
- EUR/JPY continues trying but failing to breakout above the top of a range.
- MACD is diverging bearishly with price and there is a strong possibility of decline unfolding.
EUR/JPY is meeting a brick wall of resistance at the top of its ten-week range and despite repeated attempts has not been able to breakout higher.
EUR/JPY 4-hour Chart
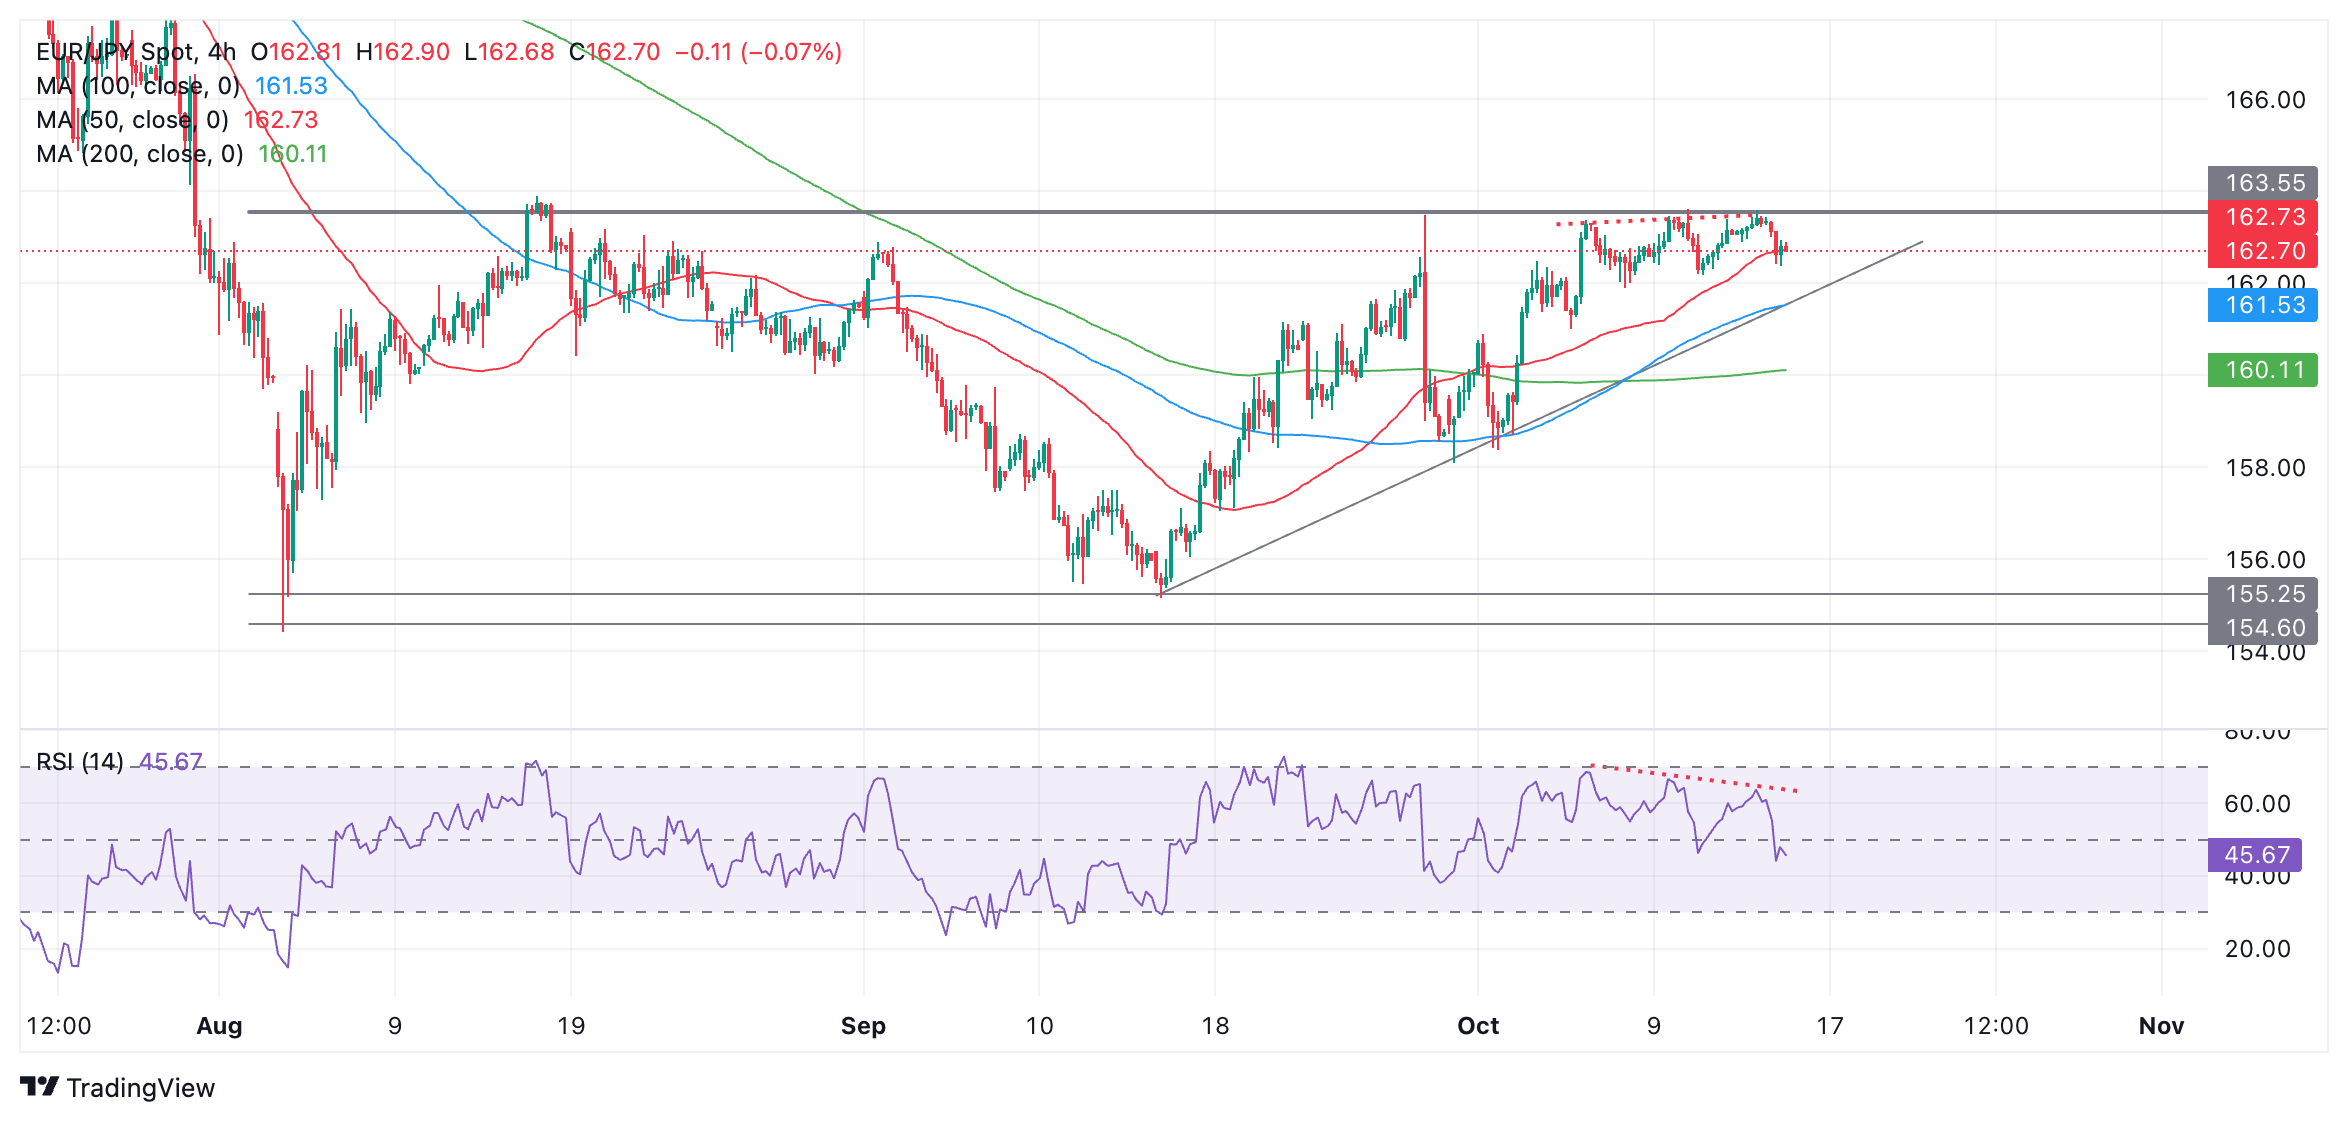
The pair is in an overall range-bound market – its trend is sideways. Since it is a principle of technical analysis that trends tend to extend, the odds favor a continuation of the range.
This suggests that the next move for EUR/JPY will be back down towards the range floor in the 154s.
A move below 161.91 (October 8 low) would help confirm such a move was underway. A break below the trendline for the up leg at around 161.70 (black line on chart) would provide stronger confirmation. The next downside target for EUR/JPY would be at about 158.32 – the October 1 as well as September 30 lows.
The Moving Average Convergence Divergence (MACD) momentum indicator is diverging bearishly with price (red dotted lines on chart). Whilst price has been making slightly higher highs with each breakout attempt, MACD has been declining. This is a further warning sign of losses to come.
Alternatively, it is possible that a decisive break above the range highs would indicate a breakout higher and the evolution of a new short-term uptrend. A decisive move would be one characterized by a longer-than-average green candlestick which cleared the range high and closed near its high, or three green candles in a row breaking above the top of the range.
- Gold is rising as bulls push the price higher again following a temporary consolidation.
- The yellow metal weakened initially on Tuesday after the news that Israel will show restraint when it strikes Iran.
- Gold faces a headwind from a continued reduction in market bets that the Federal Reserve will need to aggressively cut interest rates.
Gold (XAU/USD) recovers into the $2,650s on Tuesday after weakening following an easing of tensions in the Middle East. This came after a The Wall Street Journal (WSJ) exclusive in which Israeli Prime Minister Benjamin Netanyahu reportedly told US President Joe Biden that he would only strike military targets in Iran during the anticipated retaliation.
This, and a continued reduction in market bets that the Federal Reserve (Fed) will slash interest rates, is driving the US Dollar (USD) higher and weighing on Gold price. US survey data is also showing that inflation expectations remain elevated, with the latest Michigan Consumer Sentiment Survey indicating expectations in the long-term (5-10 years) have “skyrocketed” to 7.1% in October, “the highest in 40 years” according to analysts at The Kobeissi Letter.
Concerns regarding China, the world’s largest consumer of Gold, and the slowdown in its economy further weigh, particularly following market disappointment at the lack of clarity provided by Beijing about its much-anticipated fiscal stimulus programme.
Gold to continue to benefit from central bank demand
Gold is finding support, however, from expected continued robust demand from global central banks. The precious metal has enjoyed an increase in demand from this sector over recent years as central banks hoard Gold for its safety, liquidity and as a hedge against currency devaluation. Whilst central bank buying has declined in 2024, it is still expected to remain a major force, according to comments by the heads of three central banks at a recent panel discussion held at the London Bullion Market Association (LBMA).
Representatives of the Central Bank of Mongolia, Czech Republic, and Mexico “all agreed that Gold’s role as a reserve asset in global foreign reserves will continue to grow, even though each central bank views the precious metal differently within its portfolio,” reported Kitco News.
Gold market movers on the calendar
Gold price is more likely to be moved by the verbal rather than data-driven on Tuesday. Speeches from three Fed officials, including San Francisco Fed’s President Mary Daly, Fed Governor Adriana Kugler, and Atlanta Fed’s President Raphael Bostic, could all impact the price of the precious metal if they influence market expectations of the trajectory of interest rates.
On the data side, The NY Empire State Manufacturing Index is the metric of the day for the Greenback, with possible implications for Gold.
Technical Analysis: Gold tests resistance at $2,670
Gold pauses after bouncing following the end of a pullback. The precious metal appears to resume its dominant uptrend after a three-wave (abc) correction concluded at the October 10 lows.
XAU/USD Daily Chart
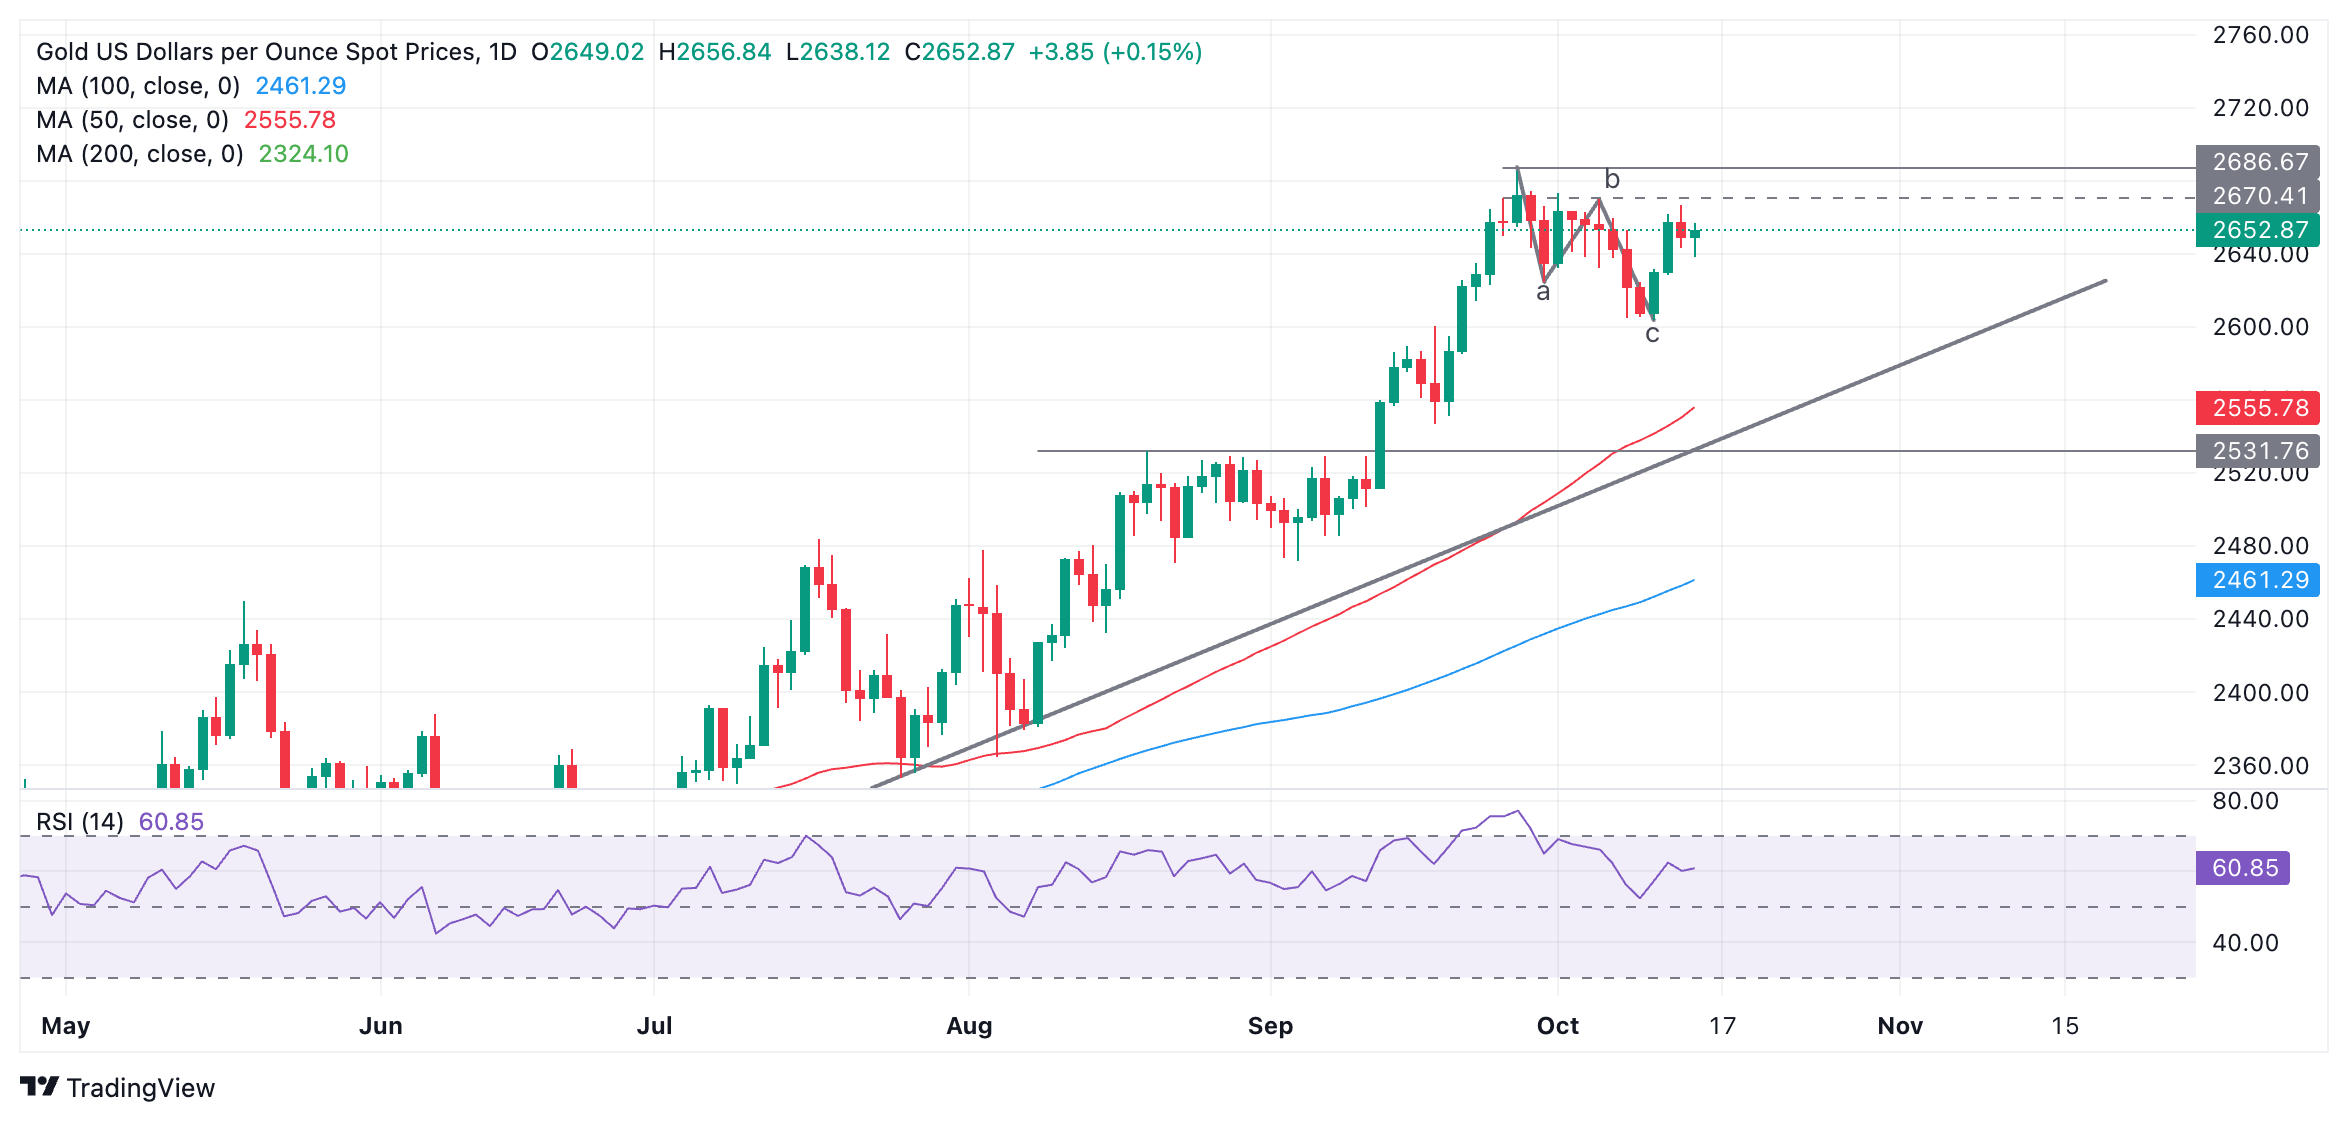
Gold tested a resistance level at around $2,670 on Monday but recoiled. A break of $2,673, however, would bring bullish confirmation and probably lead to a continuation up to the $2,685 all-time high. A break above that would indicate a continuation to the next target at $2,700 – a round number and psychological level.
Gold is in an uptrend on a short, medium, and long-term basis, and given the theory that “the trend is your friend,” the odds continue to favor more upside.
It would require a break below $2,600 (low of wave c on the chart) to flip the uptrend and turn the short and medium-term outlooks bearish.
Gold FAQs
Gold has played a key role in human’s history as it has been widely used as a store of value and medium of exchange. Currently, apart from its shine and usage for jewelry, the precious metal is widely seen as a safe-haven asset, meaning that it is considered a good investment during turbulent times. Gold is also widely seen as a hedge against inflation and against depreciating currencies as it doesn’t rely on any specific issuer or government.
Central banks are the biggest Gold holders. In their aim to support their currencies in turbulent times, central banks tend to diversify their reserves and buy Gold to improve the perceived strength of the economy and the currency. High Gold reserves can be a source of trust for a country’s solvency. Central banks added 1,136 tonnes of Gold worth around $70 billion to their reserves in 2022, according to data from the World Gold Council. This is the highest yearly purchase since records began. Central banks from emerging economies such as China, India and Turkey are quickly increasing their Gold reserves.
Gold has an inverse correlation with the US Dollar and US Treasuries, which are both major reserve and safe-haven assets. When the Dollar depreciates, Gold tends to rise, enabling investors and central banks to diversify their assets in turbulent times. Gold is also inversely correlated with risk assets. A rally in the stock market tends to weaken Gold price, while sell-offs in riskier markets tend to favor the precious metal.
The price can move due to a wide range of factors. Geopolitical instability or fears of a deep recession can quickly make Gold price escalate due to its safe-haven status. As a yield-less asset, Gold tends to rise with lower interest rates, while higher cost of money usually weighs down on the yellow metal. Still, most moves depend on how the US Dollar (USD) behaves as the asset is priced in dollars (XAU/USD). A strong Dollar tends to keep the price of Gold controlled, whereas a weaker Dollar is likely to push Gold prices up.
The Pound Sterling (GBP) continues to draw firm support on softness through the low 1.30s and has rebounded quite firmly from the intraday low again today, Scotiabank’s Chief FX Strategist Shaun Osborne notes.
GBP is trying to bottom out
“UK data showed only moderate progress on elevated wages (Average Weekly Earnings dipped to 3.8% in August from an upwardly revised 4.1%). While jobless claims rose a little more than expected. Swaps pricing continue to suggest a 25bps cut by the BoE in November is all but a done deal though.”
“GBP price action is showing some signs of trying to bottom out, at least in the short run. The intraday chart suggests a “rounded low” base may be developing as bargain-hunters take advantage of GBP dips to the low 1.30s. Solid demand off the European low suggests a firm intraday base at least at 1.3030/35.”
“Resistance is 1.3115 and 1.3130; gains through the latter may add to short-term upward momentum.”
EUR/USD edged below 1.09 briefly overnight behind broader USD strength. EUR short-covering plus a stronger than expected ZEW Expectations reading for October lifted spot slightly, Scotiabank’s Chief FX Strategist Shaun Osborne notes.
EUR recovers from sub-1,09 levels
“The investor sentiment index nudged up to 13.1, form 3.6 in September, above consensus expectations for a rise to 10. The news is only somewhat positive for the EUR as firmer sentiment is being supported by investor hopes for quicker ECB rate cuts.
“The broader bear trend in EUR/USD remains well-entrenched on the short-term chart but intraday price action is reflecting some demand for the EUR on dips below 1.09, with two bull “hammer” signals developing around the lows over the past 24 hours.”
“EUR faces minor resistance at 1.0925 on the hourly chart and will need to push above that point this morning to extend the rebound to the mid/upper-1.09s. Broader technical patterns continue to point to a decline to the 1.08 area, however, so markets will likely took to fade modest EUR gains below 1.10.”
Although the EUR has still managed to outperform most of its other G10 peers in the month to date, the perception that the ECB may have become more concerned about the Eurozone growth backdrop may be punching holes in the single currency’s armour, Rabobank’s FX analyst Jane Foley notes.
EUR/USD to edge lower medium-term
“In the run up to this week’s ECB policy meeting, the spread between 2-year Bund and treasury yields has touched its widest level since last July in a reversal of the trend that has been in place since the spring. This has clearly weighed on EUR/USD.”
“Looking ahead, the guidance offered by ECB President Lagarde on Thursday (if any) will be watched carefully. While there is scope for EUR doves to be disappointed near-term in view of still sticky services sector inflation, we still expect that EUR/USD will edge lower medium-term.”
“The remarkable absence of recognition about the need for budget consolidation by either US Presidential candidate suggests that fiscal policy could be more inflationary in the US. This suggests scope for a stronger for longer USD.”
The Canadian Dollar (CAD) has lost ground against the USD for 10 days on the trot now—Bloomberg reports that this is the worst run for the CAD since 2017. The CAD is oversold and the sustained sell-off is, like the bull run in the USD more broadly, unlikely to extend much further without some sort of pause or minor consolidation in my opinion, Scotiabank’s Chief FX Strategist Shaun Osborne notes.
CAD is getting roughed up
“Today’s CPI is expected to show further progress on headline inflation—down 0.3% in the September month for a 1.8% rise in the year. Core Median and Trim measures are expected to rise 2.3% (the same as August) and 2.5% gains (up from 2.4%) respectively. With the CAD on the ropes and progress on core inflation slow, the data may bring additional reasons for the Bank to avoid an aggressive rate cut at the end of the month.”
“There are no evident signs that the USD is poised to retreat but it’s rally is looking stretched. Some consolidation in the next few days would not surprise but the trend higher remains quite strong and the CAD will need to recover through 1.3600/10 to show any real sign of technical strength. More likely is that minor dips (to the low/mid 1.37 area) will remain well supported.”
|USD/CAD RSI is overbought on the daily study but DMIs are aligning bullishly for the USD across the short- , medium– and long-term oscillators which will keep the USD trend supported on minor dips for now. Resistance is 1.3850 and 1.3950 (recent peaks).”
The Norwegian inflation figures published last week need, in my view, a little more explanation. After all, the figures provided the first indications of a possible interest rate turnaround in the near future – and Norges Bank is one of the few G10 central banks that has not yet started to cut interest rates, and the market is hardly pricing in interest rate cuts, at least so far, Commerzbank’s FX analyst Michael Pfister notes.
The interest rate turnaround to start earlier than expected
“Over the past ten months, the headline rate has actually been slightly lower on average than compatible with the inflation target, with the exception of October and November, when the headline rate was significantly higher than in recent months. The picture is somewhat different for the core rate, but here too we have seen readings over the past four months that are roughly in line with the target.”
“Norway seems to have made significant progress in achieving the target. Of course, it should be noted that it is also quite possible that inflation in Norway will pick up somewhat in the coming months. One factor pointing in this direction is that oil prices have now risen again. Other energy prices are also likely to rise again in view of the colder months ahead. However, it remains to be seen whether this will be the case.”
“On the other hand, this means that the risks that Norges Bank will start the interest rate turnaround earlier than expected have increased considerably over the summer. At present, Norges Bank's interest rate path implies a possible first move in March 2025. But a first hint in November, followed by a first cut at the December meeting or perhaps in January? This seems much more realistic if the latest inflation figures are sustained.”
- Crude Oil corrects sharply lower and is already almost 7% down this week on Tuesday.
- Markets see more moderate comments from Israel’s PM Netanyahu while IEA says oversupply still continues.
- The US Dollar Index orbits around 103.00, though it faces resistance on the upside after two false breaks.
Crude Oil sinks lower for a second day in a row on Tuesday after the release of the monthly report from the International Energy Agency (IEA), and, at the time of writing, it loses almost 7% in the week. Easing tension in the Middle East adds to the downward pressure on Oil prices. A piece from the Washington Post on Monday suggested that Israel would limit its targets to only military positions, refraining from targeting Iranian oil facilities. This adds to more losses after the monthly report from the Organization of the Petroleum Exporting Countries (OPEC) on Monday showed OPEC revising down its demand growth forecast for a third time in a row. With a persistent oversupply and tuned-down geopolitical tensions, a heavy correction is unfolding in Oil’s prices.
The US Dollar Index (DXY), which tracks the performance of the Greenback against six other currencies, orbits around 103.00 and tries to advance. However, red flags have risen, with the DXY unable to move beyond the resistance level at 103.18 for a second day. Another close below that level and easing geopolitical tensions in the Middle East could lead to a sharp correction in the DXY.
At the time of writing, Crude Oil (WTI) trades at $70.12 and Brent Crude at $74.09
Oil news and market movers: Everyone sees oversupply
- It has been a while, but for the first time, the IEA and OPEC are aligned and are seeing an oversupply in markets, Bloomberg reports.
- OPEC’s crude output in September dropped 650k barrels per day (bpd) from a month earlier to 26.72m bpd, reflecting lower volumes from Libya, the IEA said in its monthly market report, Reuters reported.
- Geopolitical risks to oil output in the Middle East and elsewhere are being offset by global oversupplies, the IEA reports. The sizable surplus is expected to remain under these current conditions in the new year if there isn’t any significant disruption, Reuters reports.
- Due to Columbus Day festivity on Monday, the weekly numbers from the American Petroleum Institute (API) are moved to Wednesday.
Oil Technical Analysis: Another big blow
Crude Oil is receiving a second big blow, this time from the IEA. Again, the main takeaway is oversupply, which is still more than enough to fill any gaps that might have occurred in production from, for example, Libya. With the IEA report even pointing to more downsides in demand until the New Year, at the least, more downside moves in Oil’s price could materialize.
There is a challenging path to recovery if Crude Oil wants to get back to $75.00. First, the pivotal level at $71.46, which was strong enough to catch the falling knife on Monday, must be regained again with a daily close above it. Once from there, the hefty technical level at $75.30, with the 100-day Simple Moving Average (SMA) and a few pivotal lines, is possibly the first big hurdle ahead.
On the downside, that previously mentioned $71.46 pivotal level has now turned into resistance and no longer has any value as support. Instead, traders need to look much lower, at $67.11, that supported the price in May-June 2023. In case that level breaks, the year-to-date low will be under pressure near $64.75, followed by $64.38, the low of 2023.
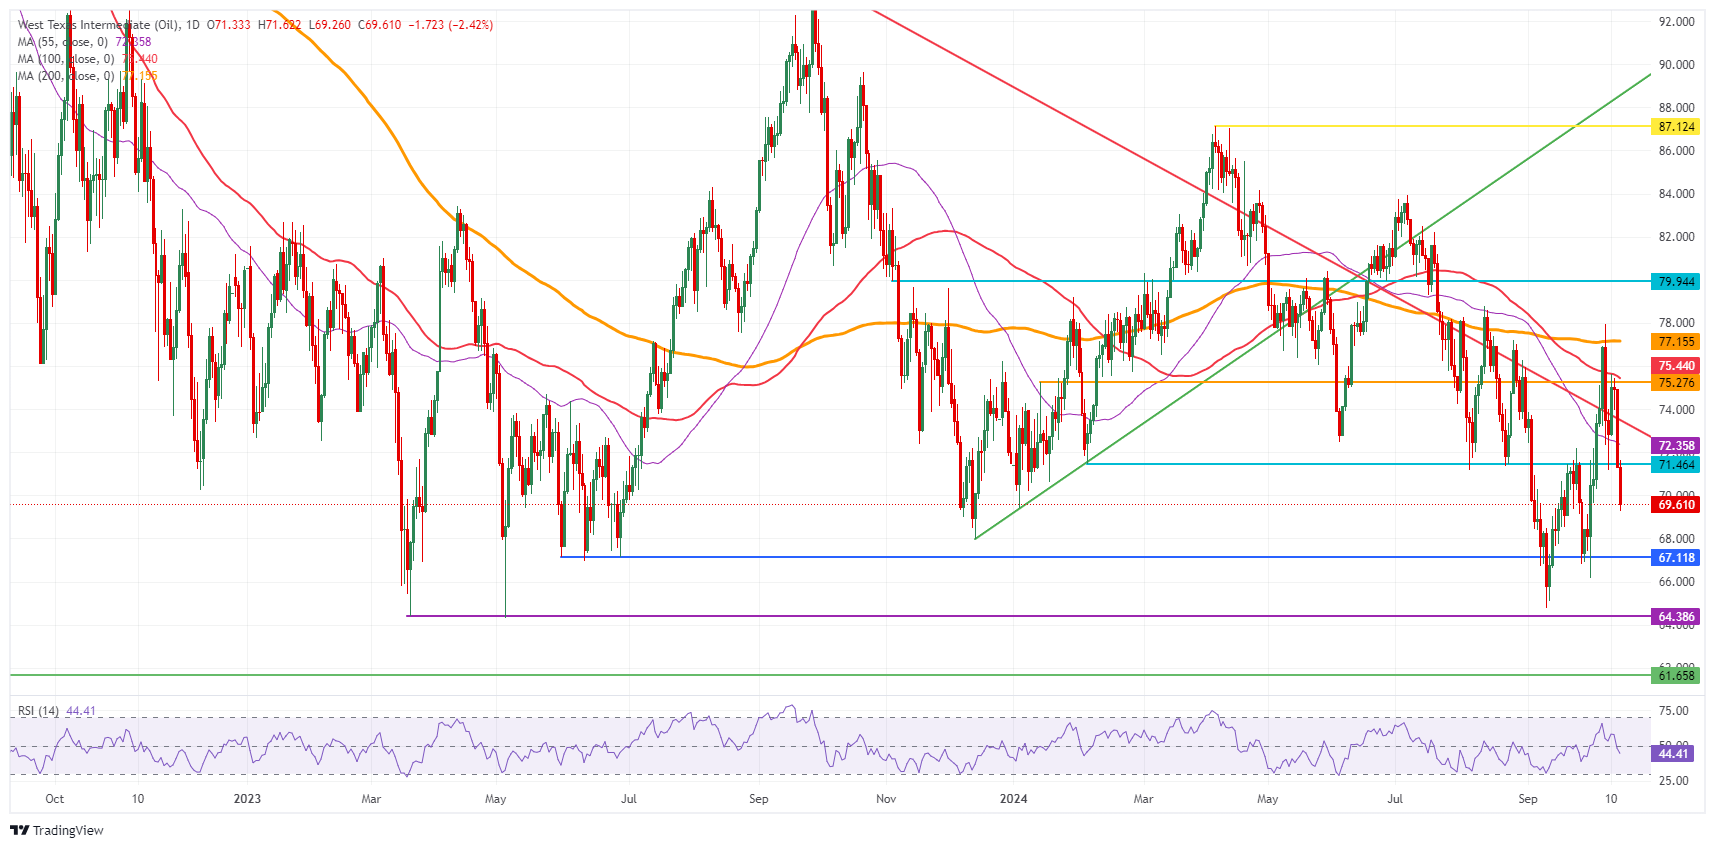
US WTI Crude Oil: Daily Chart
WTI Oil FAQs
WTI Oil is a type of Crude Oil sold on international markets. The WTI stands for West Texas Intermediate, one of three major types including Brent and Dubai Crude. WTI is also referred to as “light” and “sweet” because of its relatively low gravity and sulfur content respectively. It is considered a high quality Oil that is easily refined. It is sourced in the United States and distributed via the Cushing hub, which is considered “The Pipeline Crossroads of the World”. It is a benchmark for the Oil market and WTI price is frequently quoted in the media.
Like all assets, supply and demand are the key drivers of WTI Oil price. As such, global growth can be a driver of increased demand and vice versa for weak global growth. Political instability, wars, and sanctions can disrupt supply and impact prices. The decisions of OPEC, a group of major Oil-producing countries, is another key driver of price. The value of the US Dollar influences the price of WTI Crude Oil, since Oil is predominantly traded in US Dollars, thus a weaker US Dollar can make Oil more affordable and vice versa.
The weekly Oil inventory reports published by the American Petroleum Institute (API) and the Energy Information Agency (EIA) impact the price of WTI Oil. Changes in inventories reflect fluctuating supply and demand. If the data shows a drop in inventories it can indicate increased demand, pushing up Oil price. Higher inventories can reflect increased supply, pushing down prices. API’s report is published every Tuesday and EIA’s the day after. Their results are usually similar, falling within 1% of each other 75% of the time. The EIA data is considered more reliable, since it is a government agency.
OPEC (Organization of the Petroleum Exporting Countries) is a group of 12 Oil-producing nations who collectively decide production quotas for member countries at twice-yearly meetings. Their decisions often impact WTI Oil prices. When OPEC decides to lower quotas, it can tighten supply, pushing up Oil prices. When OPEC increases production, it has the opposite effect. OPEC+ refers to an expanded group that includes ten extra non-OPEC members, the most notable of which is Russia.
The US Dollar (USD) is trading mixed to a little lower overall on the session after a bull run that has stretched for 11 consecutive days through Monday’s trading, Scotiabank’s Chief FX Strategist Shaun Osborne notes.
USD bull run stalls after eleven consecutive daily gains
“Among developed market currencies, these sorts of sustained daily or weekly bull/bear runs rarely extend for deeply into double digits (more than 10 days or weeks in one direction, in other words) without some sort of pause or pull back. The USD is looking generally over extended and prone to a minor correction at least on the charts but that does not necessarily mean a deep or sustained drop.”
“Broader USD gains are supported by the rebound in market-driven US yields amid a resilient economy and the tightening US presidential election race may also have revived pro-dollar ‘Trump trades’ (pro-growth, pro-inflation, tariffs etc.) that were a feature of the markets through mid-year.”
“On the session so far today, somewhat softer US equity futures and a plunge in crude oil (following reports that Israel will not target Iran’s nuclear or oil facilities) are adding to the USD-supportive backdrop.”
Before Thursday's ECB meeting, it is worth taking a brief review of market expectations and EUR/USD. In recent days, interest rate expectations for the Fed and the ECB have partly been revised significantly: By year-end, the market expects the Fed to cut less than 50 basis points in total, while it is much more cautious with regard to the ECB, where it still sees significant cuts at the short end in particular, Commerzbank’s FX analyst Antje Praefcke notes.
USD could struggle to remain below the 1.09
“If ECB President Christine Lagarde expresses concerns about the economic risks in the euro area on Thursday and the data then confirm these concerns, the market could become even more certain about future interest rate cuts and put the euro under pressure. However, our economists think that the market is generally too pessimistic about the development of key rates in the euro area. They expect significantly fewer cuts.”
With regard to our forecast for the Fed funds rate, the market appears to be overly optimistic, as it is pricing in fewer cuts than our forecast. A correction of expectations in the direction of our experts' forecast would suggest losses in the USD. The market would have to correct its expectations for the ECB and Fed and EUR/USD would rise in the foreseeable future.”
“All in all, this means to me that the USD could struggle to remain below the 1.09 mark in EUR/USD on its own, but the ECB and Lagarde could potentially pave the way for this on Thursday on the euro side if the market were to step up its interest rate cut expectations for the ECB again.”
FX markets in the CEE (Central and Eastern Europe) region were muted yesterday due to weaker activity in global markets given the US holidays, ING’s Frantisek Taborsky notes.
CZK seems like the right place to be
“The Czech koruna received a boost after surprisingly strong current account data yesterday. We remain constructive on the slow Polish zloty and CZK gains within the region, although again, a lower EUR/USD does not suggest the possibility of a stronger rally here.”
“On the other hand, local rates remain to be paid across the board, improving the outlook for all CEE FX including Hungary's forint, which is underperforming peers for now. Given the better economic data and surprisingly strong current account, the CZK seems like the right place to be in the region for now.”
“The market was negative on the CZK until recently, which would suggest some short positioning while higher inflation could trigger some hawkish central bank comments ahead of the November CNB meeting. In the medium term, we see EUR/CZK returning to 25.00 and lower later. Short-term global conditions may be a problem for this path, but the rate differential is already pointing to these levels.”
- The US Dollar hits several important levels against most major G10 currencies.
- Markets brace for three Fed speakers lined up to speak.
- The US Dollar Index orbits broke above important upside levels, though struggles to move higher.
The US Dollar (USD) broadly consolidates on Tuesday after reaching a 10-week high on Monday, fuelled by investors’ views that the Federal Reserve won’t cut interest rates as quickly and aggressively as previously expected. Moreover, markets seem to be betting on a possible win for former President Donald Trump in the November 5 presidential election after several betting websites and polls showed the Republican nominee starting to lead.
The US economic calendar is again rather light on Tuesday. Besides the NY Empire State Manufacturing Index for October, there is not much with the potential to thrill markets. Rather look for some moves coming from the three Fed officials that are scheduled to speak.
Daily digest market movers: Fed speakers have their work cut out
- At 12:30 GMT, the NY Empire State Manufacturing Index for October is due. Economists expect it to fall to 2.3 from 11.5 previously.
- At 15:30 GMT, Federal Reserve Bank of San Francisco President Mary Daly delivers keynote remarks and participates in a moderated conversation and an audience Q&A in an event hosted by NYU Stern School of Business.
- Around 17:00 GMT, Federal Reserve Governor Adriana Kugler participates in a webcast about career opportunities and diversity in Economics.
- Federal Reserve Bank of Atlanta President Raphael Bostic will close off this trading day with comments while participating in a moderated conversation at the Gathering Spot on how the economy affects small businesses near 23:00 GMT.
- Equities are all over the place, with Chinese stocks having closed substantially lower, while Japan was up on the day. European equities look sluggish while US futures are rather flat.
- The CME Fed rate expectation for the meeting on November 7 shows an 86.8% probability of a 25 basis point rate cut, while the remaining 13.2% is pricing in no rate cut. Chances for a 50 bps rate cut have been fully priced out.
- The US 10-year benchmark rate is trading at 4.07%, a touch softer than the high from last week at 4.11% on Thursday.
US Dollar Index Technical Analysis: Careful now!
The US Dollar Index (DXY) is facing some resistance with a second false break and rejection at the 100-day Simple Moving Average (SMA) at 103.23. The risk is that, with the second rejection, the DXY sees sellers coming in and defend that 100-day SMA. A broad fade in search of support could play out with a return to 101.90 as first pivotal support level.
The first resistance level at 103.18 is under pressure, with the DXY trading around it for a second day in a row. Once above there, a very choppy area emerges, with the mentioned 100-day Simple Moving Average (SMA) at 103.23, the 200-day SMA at 103.78, and the pivotal 103.99-104.00 levels.
On the downside, the 55-day SMA at 101.90 is the first line of defence, backed by the 102.00 round level to catch any bearish pressure and trigger a bounce. If that level does not work out, 100.62 also acts as support, which was the low of December 28th 2023. Further down, a test of the year-to-date low of 100.16 should take place before more downside. Finally, and that means giving up the big 100.00 level, the July 14, 2023, low at 99.58 comes into play.
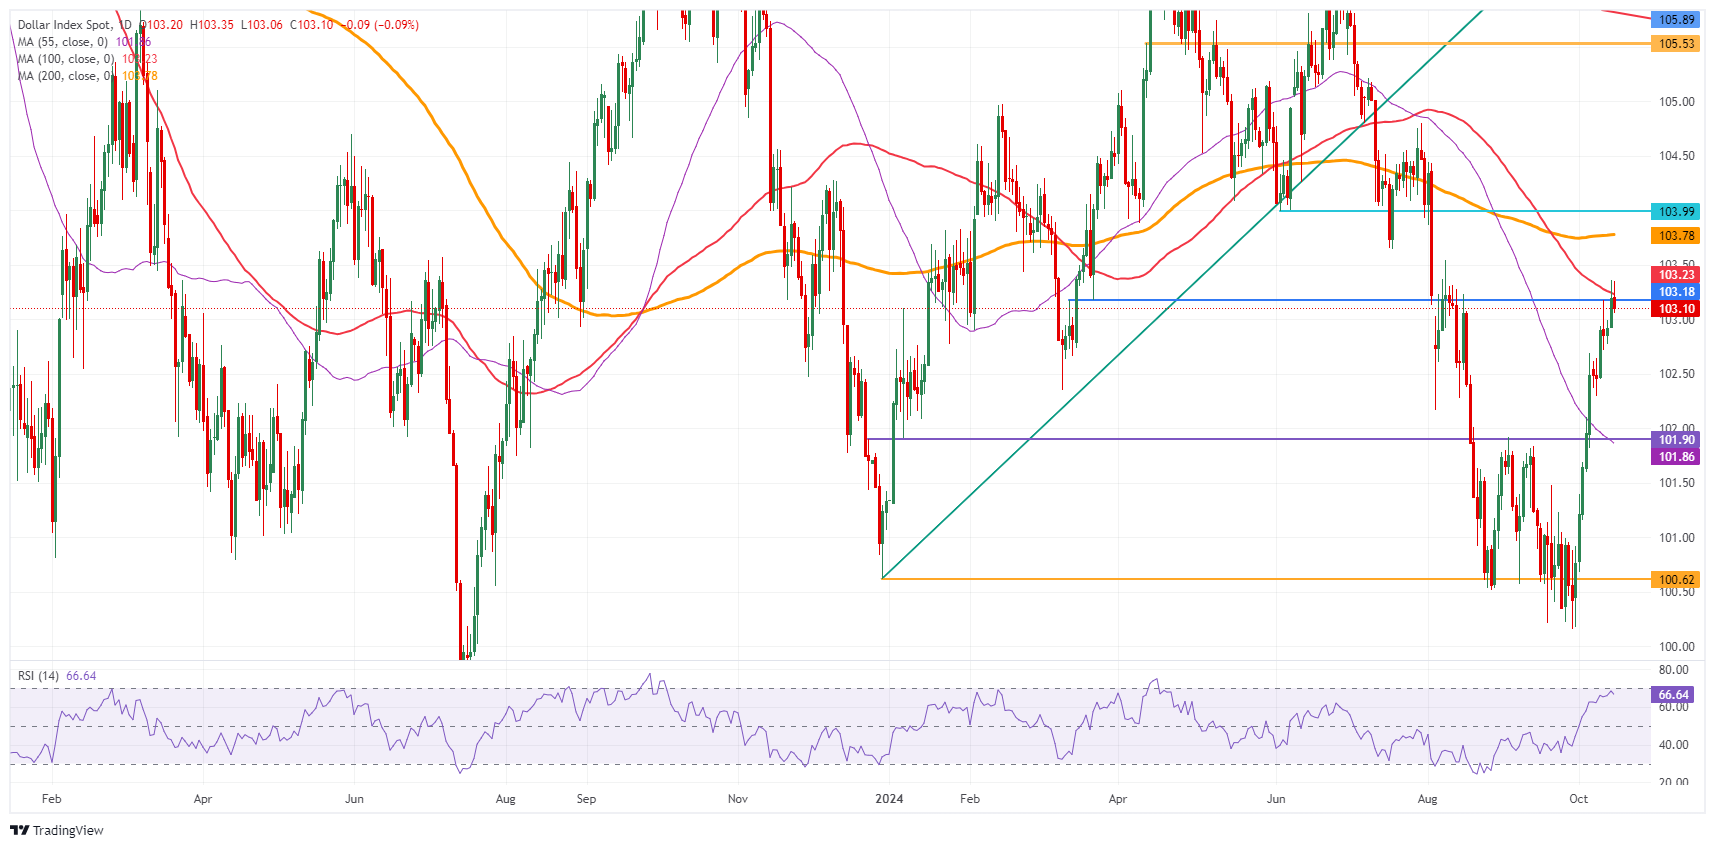
US Dollar Index: Daily Chart
US Dollar FAQs
The US Dollar (USD) is the official currency of the United States of America, and the ‘de facto’ currency of a significant number of other countries where it is found in circulation alongside local notes. It is the most heavily traded currency in the world, accounting for over 88% of all global foreign exchange turnover, or an average of $6.6 trillion in transactions per day, according to data from 2022. Following the second world war, the USD took over from the British Pound as the world’s reserve currency. For most of its history, the US Dollar was backed by Gold, until the Bretton Woods Agreement in 1971 when the Gold Standard went away.
The most important single factor impacting on the value of the US Dollar is monetary policy, which is shaped by the Federal Reserve (Fed). The Fed has two mandates: to achieve price stability (control inflation) and foster full employment. Its primary tool to achieve these two goals is by adjusting interest rates. When prices are rising too quickly and inflation is above the Fed’s 2% target, the Fed will raise rates, which helps the USD value. When inflation falls below 2% or the Unemployment Rate is too high, the Fed may lower interest rates, which weighs on the Greenback.
In extreme situations, the Federal Reserve can also print more Dollars and enact quantitative easing (QE). QE is the process by which the Fed substantially increases the flow of credit in a stuck financial system. It is a non-standard policy measure used when credit has dried up because banks will not lend to each other (out of the fear of counterparty default). It is a last resort when simply lowering interest rates is unlikely to achieve the necessary result. It was the Fed’s weapon of choice to combat the credit crunch that occurred during the Great Financial Crisis in 2008. It involves the Fed printing more Dollars and using them to buy US government bonds predominantly from financial institutions. QE usually leads to a weaker US Dollar.
Quantitative tightening (QT) is the reverse process whereby the Federal Reserve stops buying bonds from financial institutions and does not reinvest the principal from the bonds it holds maturing in new purchases. It is usually positive for the US Dollar.
The US Dollar (USD) is likely to trade in a range, probably between 149.00 and 149.95. In the long run, although momentum has not increased much, further USD strength seems likely. Levels to watch are 150.05 and 151.00, UOB Group’s FX analysts Quek Ser Leang and Lee Sue Ann note.
USD probably to trade between 149.00 and 149.95
24-HOUR VIEW: “We expected USD to edge higher yesterday. However, we pointed out that ‘due to the mild momentum, any advance is likely limited to a test of 149.70, and the major resistance at 150.05 is unlikely to come into view.’ Our view of a higher USD was not wrong, even though it rose more than expected, reaching a high of 149.98. Despite the advance, there has been no significant increase in momentum. Today, instead of continuing to advance, USD is more likely to trade in a range, probably between 149.00 and 149.95.”
1-3 WEEKS VIEW: “We have been expecting a higher USD since early this month. In our most recent narrative from last Thursday (10 Oct, spot at 149.20), we highlighted that ‘although upward momentum has not increased much, further USD strength seems likely, and the levels to watch are at 150.05 and 151.00.’ While USD rose to 149.98 yesterday, upward momentum has not improved much. That said, as long as 148.40 (‘strong support’ level previously at 148.00) is not breached, there is still potential for USD to break above 150.05. At this time, the likelihood of USD rising to 151.00 is not high.”
The New Zealand Dollar (NZD) is likely to consolidate in a range of 0.6070/0.6110. In the longer run, oversold weakness has not stabilised, but NZD must break clearly below 0.6050 before further sustained decline is likely, UOB Group’s FX analysts Quek Ser Leang and Lee Sue Ann note.
NZD to consolidate in a range of 0.6070/0.6110
24-HOUR VIEW: “NZD traded between 0.6071 and 0.6102 yesterday, narrower than our expected consolidation range of 0.6065/0.6115. There has been no increase in either downward or upward momentum, and further consolidation seems likely. Expected range for today: 0.6070/0.6110.”
1-3 WEEKS VIEW: “Our update from last Thursday (10 Oct, spot at 0.6070) is still valid. As highlighted, while the oversold weakness has not stabilised, NZD ‘must break and remain below 0.6050 before further sustained decline is likely.’ The probability of NZD breaking clearly below 0.6050 will remain intact as long as 0.6145 (no change in ‘strong resistance’ level) is not breached. Looking ahead, if NZD were to break 0.6050, the next level to watch is 0.6005.”
Another commodity currency – the Kiwi dollar (NZD) – will face a CPI test today, ING’s FX strategist Francesco Pesole notes.
NZD can find buyers in the 0.6000-0.6050 region
“The Reserve Bank of New Zealand (RBNZ) cut by 50bp this month on the view that inflation has decisively turned lower while growth concerns are building. That is also the basis for markets high conviction call on another half-point reduction in December.”
“While headline CPI should move back close to the 2.0% target range mid-point, we see risks that non-tradeable inflation ends up coming in hotter than the RBNZ hopes. Ultimately, NZD may also get some help from inflation today, as markets may no longer be certain about a 50bp December move.”
“NZD/USD remains vulnerable to some Trump hedges ahead of the election, but an improved rate profile can help the Kiwi dollar find buyers in the 0.6000-0.6050 region.”
Silver prices (XAG/USD) fell on Tuesday, according to FXStreet data. Silver trades at $31.14 per troy ounce, down 0.20% from the $31.20 it cost on Monday.
Silver prices have increased by 30.85% since the beginning of the year.
| Unit measure | Silver Price Today in USD |
|---|---|
| Troy Ounce | 31.14 |
| 1 Gram | 1.00 |
The Gold/Silver ratio, which shows the number of ounces of Silver needed to equal the value of one ounce of Gold, stood at 85.21 on Tuesday, up from 84.91 on Monday.
Silver FAQs
Silver is a precious metal highly traded among investors. It has been historically used as a store of value and a medium of exchange. Although less popular than Gold, traders may turn to Silver to diversify their investment portfolio, for its intrinsic value or as a potential hedge during high-inflation periods. Investors can buy physical Silver, in coins or in bars, or trade it through vehicles such as Exchange Traded Funds, which track its price on international markets.
Silver prices can move due to a wide range of factors. Geopolitical instability or fears of a deep recession can make Silver price escalate due to its safe-haven status, although to a lesser extent than Gold's. As a yieldless asset, Silver tends to rise with lower interest rates. Its moves also depend on how the US Dollar (USD) behaves as the asset is priced in dollars (XAG/USD). A strong Dollar tends to keep the price of Silver at bay, whereas a weaker Dollar is likely to propel prices up. Other factors such as investment demand, mining supply – Silver is much more abundant than Gold – and recycling rates can also affect prices.
Silver is widely used in industry, particularly in sectors such as electronics or solar energy, as it has one of the highest electric conductivity of all metals – more than Copper and Gold. A surge in demand can increase prices, while a decline tends to lower them. Dynamics in the US, Chinese and Indian economies can also contribute to price swings: for the US and particularly China, their big industrial sectors use Silver in various processes; in India, consumers’ demand for the precious metal for jewellery also plays a key role in setting prices.
Silver prices tend to follow Gold's moves. When Gold prices rise, Silver typically follows suit, as their status as safe-haven assets is similar. The Gold/Silver ratio, which shows the number of ounces of Silver needed to equal the value of one ounce of Gold, may help to determine the relative valuation between both metals. Some investors may consider a high ratio as an indicator that Silver is undervalued, or Gold is overvalued. On the contrary, a low ratio might suggest that Gold is undervalued relative to Silver.
(An automation tool was used in creating this post.)
The Australian Dollar (AUD) could retest the 0.6700 level before another rebound is likely. In the long run, bias for AUD remains on the downside; a clear break below 0.6700 would suggest further decline, potentially to 0.6670, UOB Group’s FX analysts Quek Ser Leang and Lee Sue Ann note.
Break below 0.6700 may suggests decline towards 0.6670
24-HOUR VIEW: “Yesterday, we held the view that AUD ‘is likely to trade in a sideways range of 0.6710/0.6760.’ The price action did not turn out as we expected. In NY trade, AUD dropped to 0.6703 before rebounding quickly to close at 0.6726 (-0.36%). While downward momentum only increased slightly, AUD could retest the 0.6700 level before another rebound is likely. A sustained decline below 0.6700 seems unlikely. Resistance levels are at 0.6745 and 0.6760.”
1-3 WEEKS VIEW: “In our most recent narrative from last Thursday (10 Oct, spot at 0.6720), we indicated that ‘while there has been no significant increase in momentum, the bias for AUD remains on the downside.’ Although AUD dropped to 0.6703 yesterday, the decline was brief, and the movement did not result in any further increase in downward momentum. In other words, our view remains unchanged. The downward bias will remain intact provided that 0.6785 (no change in ‘strong resistance’ level) is not breached.”
Last week’s Canadian jobs numbers came in quite strong. Employment rose 47k, almost twice the consensus figure, and unemployment surprisingly dropped back to 6.5%. On the same day, the Bank of Canada released its Business Outlook, which showed a further easing in inflation expectations, but also a rebound in business optimism and expectations for future sales, ING’s FX strategist Francesco Pesole notes.
USD/CAD may struggle to break decisively lower
“The latest data, paired with the hawkish repricing in Fed expectations, should be enough to discourage bets on a 50bp cut by the BoC this year, in our view. However, markets continue to price in 71bp of BoC easing over the next two meetings, with 37bp for next week’s rate announcement.”
“Canadian inflation is released today, but we doubt that will be a game changer for BoC rate expectations. Headline CPI is seen as having dropped below 2.0% in September, but core measures may have stalled. That should continue to point to rate cuts, but the improved jobs picture does not justify 50bp reductions.”
“We expect The Canadian Dollar (CAD) to outperform in the crosses thanks to some BoC hawkish repricing. USD/CAD may struggle to break decisively lower, but a retightening of rate differentials should allow at least a halt in the rally, and perhaps a correction back to 1.37 in the near term.”
- EUR/GBP remains in the negative territory after the release of the economic data from both economies.
- The UK ILO Unemployment Rate (3M) (Aug) eased to 4.0%, down from July’s 4.1% reading.
- The annual inflation in France increased by 1.1%, while in Spain, it was recorded at 1.5% in September.
EUR/GBP continues to lose its ground for the third successive day, trading around 0.8350 during the European session on Tuesday. The EUR/GBP cross remains subdued following the release of mixed employment data from the United Kingdom (UK).
The UK ILO Unemployment Rate fell to 4.0% in the three months leading up to August, down from 4.1% in July and below the market forecast of 4.1%. Employment Change for August saw a notable increase of 373,000, up from 265,000 in July. Meanwhile, Average Earnings excluding Bonuses grew by 4.9% year-on-year for the same period, meeting expectations but slightly below the 5.1% growth registered in July.
Traders will likely focus on a series of key economic data from the United Kingdom, set to be released on Wednesday, including the Consumer Price Index (CPI), the Producer Price Index (PPI) and the Retail Price Index. These data releases could influence the Bank of England's (BoE) policy outlook. However, BoE officials have indicated that they may resume rate cuts at the upcoming meeting in November.
In the Eurozone, France's Consumer Price Index (CPI) fell by 1.2% month-over-month in September, following a 0.5% increase in August. This marks the sharpest monthly decline in prices since the series began in 1990. Year-on-year, inflation rose by 1.1%, down from 1.8% in August, primarily driven by significant drops in energy prices and a slowdown in service costs.
In Spain, annual inflation stood at 1.5% in September, the lowest level since March 2021, down from 2.3% in the previous month. Monthly inflation decreased by 0.6% in September, as expected, while annual core inflation also fell by 2.4%.
According to the October 2024 Bank Lending Survey (BLS), euro area banks noted the first negative impact of the European Central Bank's (ECB) interest rate decisions on their net interest margins since the end of 2022. Meanwhile, the effects on volumes of interest-bearing assets and liabilities continued to be negative.
Inflation FAQs
Inflation measures the rise in the price of a representative basket of goods and services. Headline inflation is usually expressed as a percentage change on a month-on-month (MoM) and year-on-year (YoY) basis. Core inflation excludes more volatile elements such as food and fuel which can fluctuate because of geopolitical and seasonal factors. Core inflation is the figure economists focus on and is the level targeted by central banks, which are mandated to keep inflation at a manageable level, usually around 2%.
The Consumer Price Index (CPI) measures the change in prices of a basket of goods and services over a period of time. It is usually expressed as a percentage change on a month-on-month (MoM) and year-on-year (YoY) basis. Core CPI is the figure targeted by central banks as it excludes volatile food and fuel inputs. When Core CPI rises above 2% it usually results in higher interest rates and vice versa when it falls below 2%. Since higher interest rates are positive for a currency, higher inflation usually results in a stronger currency. The opposite is true when inflation falls.
Although it may seem counter-intuitive, high inflation in a country pushes up the value of its currency and vice versa for lower inflation. This is because the central bank will normally raise interest rates to combat the higher inflation, which attract more global capital inflows from investors looking for a lucrative place to park their money.
Formerly, Gold was the asset investors turned to in times of high inflation because it preserved its value, and whilst investors will often still buy Gold for its safe-haven properties in times of extreme market turmoil, this is not the case most of the time. This is because when inflation is high, central banks will put up interest rates to combat it. Higher interest rates are negative for Gold because they increase the opportunity-cost of holding Gold vis-a-vis an interest-bearing asset or placing the money in a cash deposit account. On the flipside, lower inflation tends to be positive for Gold as it brings interest rates down, making the bright metal a more viable investment alternative.
The Pound Sterling (GBP) is likely to trade sideways, probably in a range of 1.3035/1.3085. In the longer run, there has been no further increase in momentum; a breach of 1.3125 would suggest that 1.3000 is out of reach, UOB Group’s FX analysts Quek Ser Leang and Lee Sue Ann note.
Breach of 1.3125 to suggest that 1.3000 is out of reach
24-HOUR VIEW: “We highlighted yesterday that ‘provided that GBP remain below 1.3090 with minor resistance at 1.3070, it is likely to decline.’ We added, ‘the major support at 1.3000 is probably out of reach (there is another support level at 1.3025).’ GBP subsequently declined to 1.3031 before rebounding to close largely unchanged (1.3061, -0.05%). The price movements did not result in any increase in downward momentum, and GBP is likely to trade sideways today, probably in a range of 1.3035/1.3085.”
1-3 WEEKS VIEW: “We have held a negative GBP view for more than a week (see annotations in the chart below). After GBP fell to 1.3011 and rebounded, we highlighted last Friday (11 Oct, spot at 1.3060) that ‘despite the decline, there has been no further increase in downward momentum’. We added, only a breach of 1.3125 (‘strong resistance’ level) would suggest that 1.3000 is out of reach this time around. We continue to hold the same view.”
In the latest CPI inflation print (released on 10 October), US CPI inflation was coming in a tad hotter than expectations, UOB Group’s economist Alvin Liew notes.
Headline and core CPI above expectations in September
“US CPI inflation was a tad hotter than expectations as headline CPI rose by 0.2% m/m, 2.4% y/y in Sep (August: 0.1% m/m, 2.5% y/y). Despite the miss, it was still the slowest since Feb 2021. But core CPI continued to accelerate as it rose by 0.3% m/m (same pace as August) while compared to 12 months ago, it picked up pace to 3.3% y/y (August: 3.2%). Shelter and food costs were key factors driving headline CPI, offsetting the decline in energy costs, while core services inflation accelerated on a plethora of items, including pricier non-housing services.”
“We still expect US inflation to ease but admittedly near-term challenges are clearly present. We keep our headline CPI forecast to average lower at 2.9% in 2024 (compared to the 4.1% recorded in 2023). While core inflation may also ease, it is now likely to average 3.4% in 2024 (from previous forecast of 3.3%). It is still a significant moderation from the 4.8% average in 2023 but remains well above the Fed’s 2% objective. Our 2025 headline inflation and core forecast are both now at 2.0%.”
“September’s jumbo 50 bps of rate cut increasingly looked to be oneoff and Fed likely to continue to ease but at a gradual pace. The not-so-cool September core CPI certainly dialed back those more aggressive expectations of Fed rate cuts but it probably was not hot enough to grind the Fed to a pause. If anything, it will imply gradualism for the Fed in its pace of easing. We still expect the Fed to continue the rate cut cycle in the remaining meetings this year, with 50-bps cuts for the remainder of 2024 (i.e. two 25-bps cuts, one each in November 24 and December 24 FOMC).”
Eurozone’s industrial sector activity witnessed a turnaround in August, the latest data published by Eurostat showed on Tuesday.
Industrial output in the old continent rose by 1.8% MoM, compared to the expected increase of 1.8% and a -0.5% print in July.
Eurozone Industrial Production increased at an annual rate of 0.1% in August versus July’s -2.1%. The market consensus was for -1.0%.
EUR/USD reaction to the Eurozone Industrial Production data
The Eurozone industrial figures failed to move the needle around the Euro, as EUR/USD continues to hold higher ground above 1.0900. The pair is up 0.04% on the day, at the press time.
Euro PRICE Today
The table below shows the percentage change of Euro (EUR) against listed major currencies today. Euro was the strongest against the Australian Dollar.
| USD | EUR | GBP | JPY | CAD | AUD | NZD | CHF | |
|---|---|---|---|---|---|---|---|---|
| USD | -0.03% | -0.15% | -0.46% | 0.09% | 0.15% | 0.08% | -0.24% | |
| EUR | 0.03% | -0.10% | -0.44% | 0.10% | 0.20% | 0.10% | -0.20% | |
| GBP | 0.15% | 0.10% | -0.27% | 0.22% | 0.31% | 0.21% | -0.03% | |
| JPY | 0.46% | 0.44% | 0.27% | 0.55% | 0.61% | 0.53% | 0.27% | |
| CAD | -0.09% | -0.10% | -0.22% | -0.55% | 0.06% | -0.00% | -0.25% | |
| AUD | -0.15% | -0.20% | -0.31% | -0.61% | -0.06% | -0.08% | -0.34% | |
| NZD | -0.08% | -0.10% | -0.21% | -0.53% | 0.00% | 0.08% | -0.25% | |
| CHF | 0.24% | 0.20% | 0.03% | -0.27% | 0.25% | 0.34% | 0.25% |
The heat map shows percentage changes of major currencies against each other. The base currency is picked from the left column, while the quote currency is picked from the top row. For example, if you pick the Euro from the left column and move along the horizontal line to the US Dollar, the percentage change displayed in the box will represent EUR (base)/USD (quote).
- Germany’s ZEW Economic Sentiment Index improves to 13.1 in October.
- EUR/USD holds above 1.0900 after German and Eurozone ZEW surveys.
The headline German ZEW Economic Sentiment Index improved to 13.1 in October from 3.6 reported in September, beating the market consensus of 10.0.
The Current Situation Index, however, dropped to -86.9 in the tenth month of the year, as against September’s -84.5 readout. Data missed the estimates of -84.5.
The Eurozone ZEW Economic Sentiment Index came in at 20.1 in October versus the September figure of 9.3. The market forecast was 16.9.
Key points
Starting from a very poor assessment of the current situation, the economic sentiment for Germany has risen in the latest survey.
Contributing factors include the expectation of stable inflation rates and the associated prospect of further interest rate cuts by the ECB.
Positive signals are also coming from Germany’s export markets.
Economic expectations for the Eurozone, the USA, and China have also significantly improved.
The increased optimism for China is likely linked to the Chinese government’s economic stimulus measures.
These developments have probably also contributed to the rise in economic expectations for Germany.
Market reaction
The EUR/USD pair holds ground after the mixed German and Eurozone ZEW surveys. The pair is adding 0.03% on the day to trade near 1.0910, at the press time.
The euro is losing some ground ahead of Thursday’s European Central Bank meeting and has now made a decisive break below 1.090. The rewidening in rate differentials with the USD is clearly prompting a shift in strategic EUR/USD positioning, and CFTC data showed net-longs have declined from 13.5% to 5.9% of open interest since early September, ING’s FX strategist Francesco Pesole notes.
EUR/USD may edge back higher
“A more balanced positioning picture means EUR/USD can find some support in the dips. Incidentally, our models return a short-term fair value of around 1.093. USD might reconnect with lower oil and EUR/USD may edge back higher. Moving on, unless the ECB surprises with a hold or out-of-consensus guidance on Thursday, the direction for the pair will be set by US events in the next month or so.”
“In the UK, jobs figures released this morning did not send any unidirectional message to the Bank of England. Unemployment ticked lower, but that is not a highly reliable indicator, while wage growth excluding bonuses slowed as expected. It’s worth noting that the majority of sectors now have vacancy rates below pre-Covid averages when wage growth was around 3.5%, well below the current 5%.”
“Our UK economist believes there is room for a further adjustment lower in wage growth that will ultimately allow the BoE to cut with more confidence. Tomorrow’s UK CPI is the biggest event for sterling markets, and we see risks to the upside for EUR/GBP, which may retest the 0.8400 level.”
Downward momentum has increased slightly; the Euro (EUR) could dip to 1.0885 before the risk of a more sustained rebound is likely. In the longer run, chance of EUR breaking below the major support zone of 1.0860/1.0885; it remains to be seen if it can maintain a foothold below these levels, UOB Group’s FX analysts Quek Ser Leang and Lee Sue Ann note.
EUR can break below 1.0860/1.0885
24-HOUR VIEW: “Yesterday, we indicated that ‘the bias for EUR is tilted to the downside.’ However, we pointed out that ‘given the mild momentum, any decline is unlikely to break clearly below 1.0900, and the next support at 1.0885 is unlikely to come under threat.’ EUR subsequently dropped more than expected to 1.0888, before recovering to close at 1.0909 (-0.26%). Despite the decline, downward momentum only increased slightly. Today, EUR could dip to 1.0885 before a more sustained rebound is likely. The next support at 1.0860 is unlikely to come into view. To maintain the mild momentum, EUR must not break above 1.0935 with minor resistance at 1.0920.”
1-3 WEEKS VIEW: “In our most recent narrative from last Friday (11 Oct, spot at 1.0935), we highlighted that ‘while the outlook for EUR remains negative, downward momentum appears to be slowing, and the probability of EUR breaking the significant support zone between 1.0860 and 1.0885 is not high.’ Yesterday, EUR fell to a low of 1.0888. The slight increase in momentum suggests there is a chance of EUR breaking below the support zone of 1.0860/1.0885, but it remains to be seen if it can maintain a foothold below these levels. Overall, only a breach of 1.0960 (‘strong resistance’ level was 1.0980 yesterday) would mean that the weakness in EUR that started early in this month has stabilised.”
- USD/CHF erodes a part of the overnight strong gains to a nearly two-month top.
- A modest USD pullback turns out to be a key factor exerting downward pressure.
- Smaller Fed rate cut bets should limit the downfall for the USD and the major.
The USD/CHF pair struggles to capitalize on the previous day's strong move up to a nearly two-month high and attracts some intraday sellers during the first half of the European session on Tuesday. The downtick drags spot prices to the 0.8615 region, or a fresh daily low in the last hour and is sponsored by a modest US Dollar (USD) pullback.
The USD Index (DXY), which tracks the Greenback against a basket of currencies, retreats from its highest level since August 8 as bullish traders opt to take some profits off the table following the recent strong rally since the beginning of this month. Any meaningful USD corrective decline, however, seems elusive in the wake of firming expectations for a less aggressive policy easing by the Federal Reserve (Fed).
In fact, the markets have now fully priced out the possibility of another jumbo rate cut and expect the US central bank to lower borrowing costs by 25 basis points (bps) at the November policy meeting. This keeps the yield on the benchmark 10-year US government bond above the 4% threshold, which should continue to act as a tailwind for the Greenback and help limit the depreciating move for the USD/CHF pair.
Apart from this, a generally positive tone across the global equity markets might hold back traders from placing bullish bets around the safe-haven Swiss Franc (CHF) and offer support to the currency pair. Hence, it will be prudent to wait for strong follow-through selling before confirming that the strong move-up witnessed over the past two weeks or so has run out of steam and positioning for further losses.
Next on tap is the release of the Empire State Manufacturing Index from the US, which, along with speeches by influential FOMC members, will drive USD demand later during the North American session. Apart from this, the broader risk sentiment might provide some impetus to the USD/CHF pair and allow traders to grab short-term opportunities.
US Dollar PRICE Today
The table below shows the percentage change of US Dollar (USD) against listed major currencies today. US Dollar was the strongest against the Australian Dollar.
| USD | EUR | GBP | JPY | CAD | AUD | NZD | CHF | |
|---|---|---|---|---|---|---|---|---|
| USD | -0.05% | -0.14% | -0.39% | 0.07% | 0.17% | 0.13% | -0.17% | |
| EUR | 0.05% | -0.09% | -0.34% | 0.10% | 0.23% | 0.16% | -0.12% | |
| GBP | 0.14% | 0.09% | -0.21% | 0.21% | 0.32% | 0.26% | 0.03% | |
| JPY | 0.39% | 0.34% | 0.21% | 0.46% | 0.56% | 0.50% | 0.26% | |
| CAD | -0.07% | -0.10% | -0.21% | -0.46% | 0.10% | 0.06% | -0.18% | |
| AUD | -0.17% | -0.23% | -0.32% | -0.56% | -0.10% | -0.06% | -0.29% | |
| NZD | -0.13% | -0.16% | -0.26% | -0.50% | -0.06% | 0.06% | -0.23% | |
| CHF | 0.17% | 0.12% | -0.03% | -0.26% | 0.18% | 0.29% | 0.23% |
The heat map shows percentage changes of major currencies against each other. The base currency is picked from the left column, while the quote currency is picked from the top row. For example, if you pick the US Dollar from the left column and move along the horizontal line to the Japanese Yen, the percentage change displayed in the box will represent USD (base)/JPY (quote).
The US Dollar (USD) and oil went opposite ways yesterday. The greenback was strong across the board, shrugging off the drop in crude triggered by some media reports that Israel does not plan to hit Iran’s oil and nuclear facilities. That is probably the result of some disappointment among investors about the details of China’s stimulus measures announced on Saturday, ING’s FX strategist Francesco Pesole notes.
USD to reconnect with the softer oil story
“As US markets reopen today after a long weekend, the dollar might reconnect with the softer oil story. Incidentally, the rates picture can hardly turn much more supportive than this for USD given markets are now pricing in only 44bp of Fed easing by year-end, and data has not improved enough to lead markets to push that pricing to just 25bp.”
“Should we see more independent dollar outperformance, we could conclude that is due to some positioning ahead of the US election in three weeks from now. Asset markets seem to be pricing in a win by Kamala Harris, which is seen as the least disruptive outcome, and given how close the candidates are in the swing States polls, some defensive positioning can see dollar inflows into the vote.”
“On the data side, things are quite quiet in the US. The Empire manufacturing index is the only noteworthy release today, and markets will probably be more interested to hear from FOMC member Mary Daly, who is a neutral figure in the committee and may offer a good sense of where the consensus sits after the higher-than-expected jobs and inflation numbers.”
China’s Consumer Price Index (CPI) slowed to 0.4% y/y in September (Bloomberg est: 0.6%; August: 0.6%) and core CPI (excluding food & energy) was near flat at 0.1% y/y, its weakest since March 2021. Both services inflation and consumer goods inflation moderated, to 0.2% y/y (August: 0.5%) and 0.5% y/y (August: 0.7%) respectively in September, UOB Group’s economist Ho Woei Chen notes.
Core inflation near-flat in September
“China’s CPI slowed to 0.4% y/y in September and core CPI (excluding food & energy) was near flat at 0.1% y/y, its weakest since March 2021. PPI deflation continued to deepen in September, falling by a larger than expected -2.8% y/y.”
“We keep our 2024 forecast for the CPI and PPI at 0.5% and -2.0%, respectively, and anticipate some improvements to 1.2% and -0.9% in 2025. Against a backdrop of PBOC’s easing bias, we expect the 1Y and 5Y loan prime rates (LPR) to fall to 3.15% and 3.65% by end-2024 from current 3.35% and 3.85%, respectively.”
“The central bank reduced banks’ reserve requirement ratio (RRR) by 0.5% pt effective from 27 September, its second cut for the year and cited another potential 0.25–0.50% pt reduction later this year. While China’s Finance Ministry pledged stronger support at its briefing on Saturday (12 Oct) and said that there’s still ‘large’ room for the central government to raise debt and for the headline fiscal deficit to increase, there were no details on additional stimulus.”
- The USD/CAD pair may find the barrier around the upper boundary of the ascending channel at the 1.3870 level.
- The 14-day RSI signals an overbought condition, suggesting that a potential downward correction could be on the horizon.
- Potential support appears at the lower boundary of the ascending channel around the 1.3770 level.
USD/CAD continues its upward momentum, extending the rally that began on October 2, trading near 1.3810 during early European hours on Tuesday. The daily chart shows the pair is trending higher within an ascending channel, reinforcing a bullish outlook.
However, the 14-day Relative Strength Index (RSI) is above 70, signaling overbought conditions and suggesting a possible downward correction in the near future.
On the upside, USD/CAD could test the upper boundary of the ascending channel near the 1.3870 level. A break above this point may further boost bullish sentiment, potentially driving the pair toward 1.3946, the highest level since October 2022.
In terms of the downside, USD/CAD may find initial support at the lower boundary of the ascending channel, near the 1.3770 level. A break below this could dampen the bullish sentiment, potentially pushing the pair toward its nine-day Exponential Moving Average (EMA) at 1.3706.
Additional support is seen at the former pullback resistance, now acting as throwback support, around the 1.3620 level, followed by the psychological threshold of 1.3600.
USD/CAD: Daily Chart
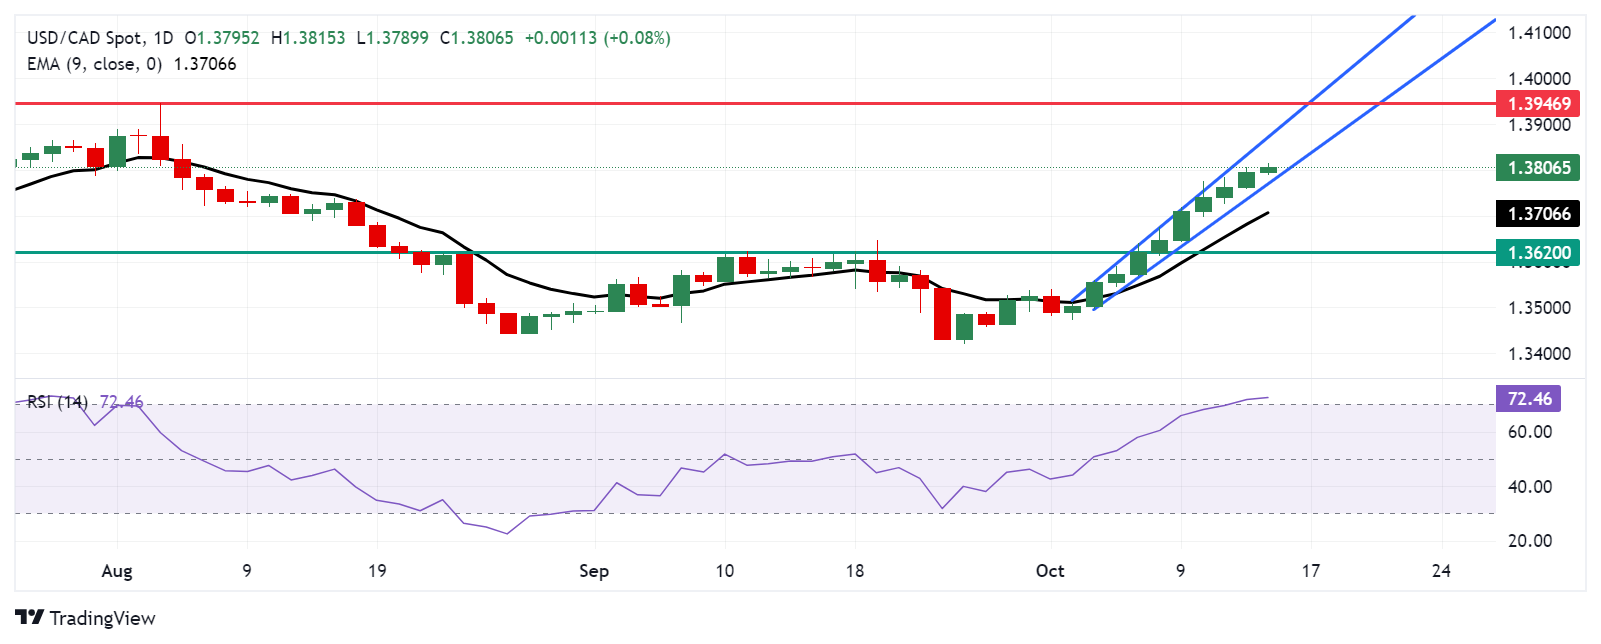
Canadian Dollar PRICE Today
The table below shows the percentage change of Canadian Dollar (CAD) against listed major currencies today. Canadian Dollar was the weakest against the Japanese Yen.
| USD | EUR | GBP | JPY | CAD | AUD | NZD | CHF | |
|---|---|---|---|---|---|---|---|---|
| USD | 0.03% | -0.13% | -0.46% | 0.08% | 0.23% | 0.21% | -0.16% | |
| EUR | -0.03% | -0.15% | -0.50% | 0.04% | 0.22% | 0.17% | -0.18% | |
| GBP | 0.13% | 0.15% | -0.35% | 0.20% | 0.37% | 0.32% | 0.02% | |
| JPY | 0.46% | 0.50% | 0.35% | 0.55% | 0.69% | 0.66% | 0.34% | |
| CAD | -0.08% | -0.04% | -0.20% | -0.55% | 0.14% | 0.13% | -0.19% | |
| AUD | -0.23% | -0.22% | -0.37% | -0.69% | -0.14% | -0.04% | -0.36% | |
| NZD | -0.21% | -0.17% | -0.32% | -0.66% | -0.13% | 0.04% | -0.31% | |
| CHF | 0.16% | 0.18% | -0.02% | -0.34% | 0.19% | 0.36% | 0.31% |
The heat map shows percentage changes of major currencies against each other. The base currency is picked from the left column, while the quote currency is picked from the top row. For example, if you pick the Canadian Dollar from the left column and move along the horizontal line to the US Dollar, the percentage change displayed in the box will represent CAD (base)/USD (quote).
- Silver attracts some dip-buyers near the $30.75 area, albeit it lacks bullish conviction.
- The mixed technical setup warrants caution before placing aggressive directional bets.
- A sustained move and acceptance above $32.00 will be seen as a fresh trigger for bulls.
Silver (XAG/USD) reverses an intraday slide to the $30.75 area and climbs to the top end of its daily range during the early part of the European session on Tuesday. The white metal keeps the red for the second straight day and currently trades just above the $31.00 mark, down 0.40% for the day.
From a technical perspective, the XAG/USD has been showing some resilience below the 100-hour Simple Moving Average (SMA). Moreover, mixed oscillators on the daily chart warrant some caution before positioning for the resumption of the recent retracement slide from the vicinity of the $33.00 mark, or the highest level since December 2012 touched earlier this month.
In the meantime, the daily swing low, around the $30.75 region, now seems to protect the immediate downside ahead of the $30.35-$30.25 area and the $30.00 mark. This is followed by the $29.85-$29.75 confluence, comprising the 100-day and the 50-day SMAs, which if broken decisively will be seen as a fresh trigger for bearish traders and pave the way for deeper losses.
The subsequent downfall could drag the XAG/USD to the $29.45 intermediate support en route to the $29.00 round figure and the $28.80.$28.75 region. The downward trajectory could extend further towards the $28.35-$28.30 area before the white metal eventually drops to the $28.00 mark and aims to test the September monthly swing low, around the $27.70-$27.65 zone.
On the flip side, any subsequent move up is likely to confront stiff resistance near the $31.50 area. Some follow-through buying could allow the XAG/USD to reclaim the $32.00 mark. This is followed by resistance near the 32.25 supply zone, which if cleared could lift the XAG/USD back towards the multi-year peak, just ahead of the $33.00 round figure touched on October 4.
Silver 1-hour chart
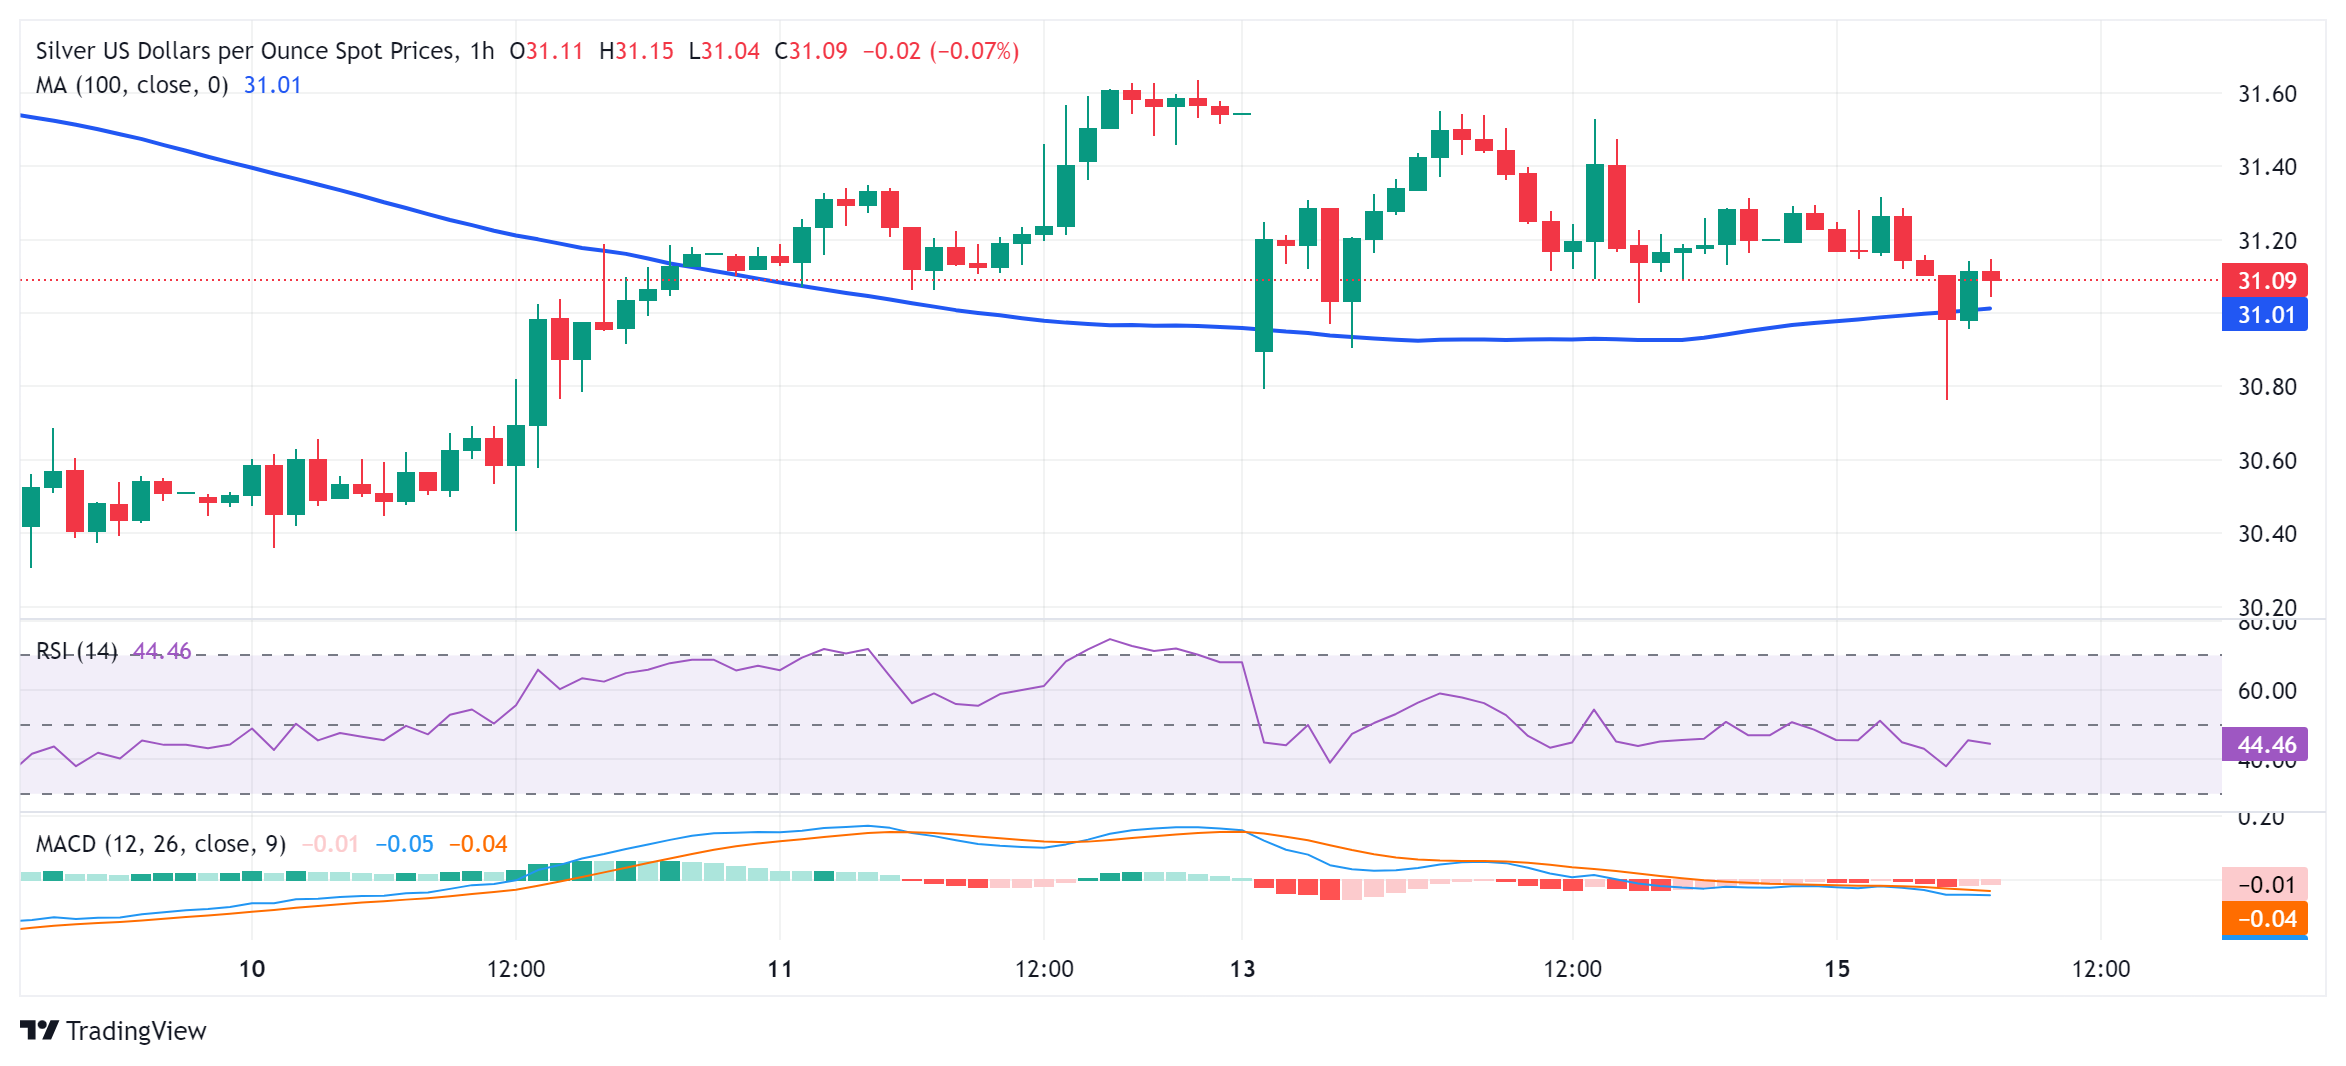
Silver FAQs
Silver is a precious metal highly traded among investors. It has been historically used as a store of value and a medium of exchange. Although less popular than Gold, traders may turn to Silver to diversify their investment portfolio, for its intrinsic value or as a potential hedge during high-inflation periods. Investors can buy physical Silver, in coins or in bars, or trade it through vehicles such as Exchange Traded Funds, which track its price on international markets.
Silver prices can move due to a wide range of factors. Geopolitical instability or fears of a deep recession can make Silver price escalate due to its safe-haven status, although to a lesser extent than Gold's. As a yieldless asset, Silver tends to rise with lower interest rates. Its moves also depend on how the US Dollar (USD) behaves as the asset is priced in dollars (XAG/USD). A strong Dollar tends to keep the price of Silver at bay, whereas a weaker Dollar is likely to propel prices up. Other factors such as investment demand, mining supply – Silver is much more abundant than Gold – and recycling rates can also affect prices.
Silver is widely used in industry, particularly in sectors such as electronics or solar energy, as it has one of the highest electric conductivity of all metals – more than Copper and Gold. A surge in demand can increase prices, while a decline tends to lower them. Dynamics in the US, Chinese and Indian economies can also contribute to price swings: for the US and particularly China, their big industrial sectors use Silver in various processes; in India, consumers’ demand for the precious metal for jewellery also plays a key role in setting prices.
Silver prices tend to follow Gold's moves. When Gold prices rise, Silver typically follows suit, as their status as safe-haven assets is similar. The Gold/Silver ratio, which shows the number of ounces of Silver needed to equal the value of one ounce of Gold, may help to determine the relative valuation between both metals. Some investors may consider a high ratio as an indicator that Silver is undervalued, or Gold is overvalued. On the contrary, a low ratio might suggest that Gold is undervalued relative to Silver.
- The Canadian Consumer Price Index is expected to rise 1.8% YoY in September.
- The Bank of Canada has reduced its policy rate by 75 bps so far this year.
- The Canadian Dollar has been losing considerable ground in October.
Statistics Canada is set to release its latest inflation data tracked by the Consumer Price Index (CPI) for the month of September on Tuesday. Forecasts suggest that the headline CPI could have risen 1.8% year-over-year (YoY) last month.
Alongside the headline data, the Bank of Canada (BoC) will release its core CPI, which excludes more volatile components such as food and energy. In August, the core CPI showed a 0.1% monthly decrease and a 1.5% rise from a year earlier. Meanwhile, the headline CPI climbed by 2.0% over the last twelve months — the lowest level since February 2021 — and dropped by 0.2% compared to the previous month.
These inflation figures are being closely monitored for their potential impact on the Canadian Dollar (CAD), especially in light of the BoC's current easing cycle. It is worth recalling that the BoC has reduced its policy rate by 25 basis points at its June, July, and September meetings so far this year, taking the reference interest rate to 4.25%.
In the FX world, the Canadian Dollar has depreciated in the last nine consecutive days, sending USD/CAD to the 1.3800 zone for the first time since early August.
What can we expect from Canada’s inflation rate?
Analysts appear divided regarding the path of price pressures in Canada in September, though they agree that domestic headline prices will fall below the Bank of Canada's target for the time being. Banning an outsized surprise, the underlying disinflationary trend is likely to prompt the BoC to maintain its course regarding the easing cycle that started in June.
After the BoC's rate cut on September 4, Governor Tiff Macklem stated that a 25 bps reduction was appropriate, although he added that BoC officials discussed different scenarios, including slowing the pace of rate reductions and even a 50 basis point cut.
Regarding inflation, Macklem suggested that further rate cuts are likely, citing the Bank of Canada's progress in reducing inflation towards its 2% target. In an interview in Toronto on September 24, Macklem emphasized the importance of maintaining inflation near the midpoint of the 1%–3% control range, stating, "We need to stick the landing." He also highlighted the need for ongoing moderation in core inflation, which, he noted, remains slightly above 2%.
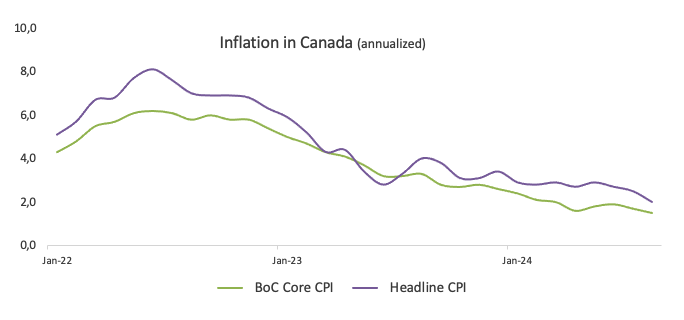
In light of the upcoming release, analysts at TD Securities noted, “We look for CPI to dip to 1.9% on a large drag from gasoline, offset by a stabilization in core goods and strength in travel components. Our forecast would see Q3 CPI undershoot BoC projections from July, but with softer oil prices helping to drive that move and a modest pickup for the BoC's core measures in Sept, we do not believe this would justify a move to 50bp cuts.”
When is the Canada CPI data due, and how could it affect USD/CAD?
Canada will release its September CPI data on Tuesday at 12:30 GMT, and the Canadian Dollar's response will hinge only on any significant surprise in the figures. Absent a major deviation from expectations, the data is unlikely to influence the Bank of Canada's rate outlook.
USD/CAD has kicked off the month with a marked upward bias, reaching two-month highs around 1.3800 on Monday. The monthly advance has so far been on the back of a strong rebound in the US Dollar (USD), which has been keeping the broad risk-linked currencies on the back foot.
Pablo Piovano, Senior Analyst at FXStreet, points out that the continuation of the recovery could well see USD/CAD challenging its 2024 top of 1.3946 (August 5), just ahead of the 1.4000 milestone, an area last visited in May 2020.
“In the opposite direction, there are provisional contention levels at the 100-day and 55-day SMAs of 1.3655 and 1.3618, respectively, prior to the more relevant 200-day SMA at 1.3612. A break below this level could trigger further weakness, potentially targeting the next support at the September bottom of 1.3418 (September 25), ahead of the weekly low of 1.3358 (January 31)”, Pablo adds.
Economic Indicator
BoC Consumer Price Index Core (MoM)
The BoC Consumer Price Index Core, released by the Bank of Canada (BoC) on a monthly basis, represents changes in prices for Canadian consumers by comparing the cost of a fixed basket of goods and services. It is considered a measure of underlying inflation as it excludes eight of the most-volatile components: fruits, vegetables, gasoline, fuel oil, natural gas, mortgage interest, intercity transportation and tobacco products. The MoM figure compares the prices of goods in the reference month to the previous month. Generally, a high reading is seen as bullish for the Canadian Dollar (CAD), while a low reading is seen as bearish.
Read more.Next release: Tue Oct 15, 2024 12:30
Frequency: Monthly
Consensus: -
Previous: -0.1%
Source: Statistics Canada
Bank of Canada FAQs
The Bank of Canada (BoC), based in Ottawa, is the institution that sets interest rates and manages monetary policy for Canada. It does so at eight scheduled meetings a year and ad hoc emergency meetings that are held as required. The BoC primary mandate is to maintain price stability, which means keeping inflation at between 1-3%. Its main tool for achieving this is by raising or lowering interest rates. Relatively high interest rates will usually result in a stronger Canadian Dollar (CAD) and vice versa. Other tools used include quantitative easing and tightening.
In extreme situations, the Bank of Canada can enact a policy tool called Quantitative Easing. QE is the process by which the BoC prints Canadian Dollars for the purpose of buying assets – usually government or corporate bonds – from financial institutions. QE usually results in a weaker CAD. QE is a last resort when simply lowering interest rates is unlikely to achieve the objective of price stability. The Bank of Canada used the measure during the Great Financial Crisis of 2009-11 when credit froze after banks lost faith in each other’s ability to repay debts.
Quantitative tightening (QT) is the reverse of QE. It is undertaken after QE when an economic recovery is underway and inflation starts rising. Whilst in QE the Bank of Canada purchases government and corporate bonds from financial institutions to provide them with liquidity, in QT the BoC stops buying more assets, and stops reinvesting the principal maturing on the bonds it already holds. It is usually positive (or bullish) for the Canadian Dollar.
- GBP/USD edges close to the 1.3000 line in the sand on USD strength.
- The US Dollar strengthens as markets continue dialing back bets of aggressive interest-rate cuts by the Fed.
- The Pound Sterling, however, finds a foothold from strong UK employment data.
GBP/USD edges lower into the 1.3040s on Tuesday as a result of continued US Dollar (USD) strength, which comes from reduced bets the US Federal Reserve (Fed) will need to be as aggressive at slashing interest rates as previously thought.
The US economy is holding up better than expected and from once fearing a hard landing, or recession, passengers on the US enterprise are entertaining the possibility of “no-landing”. This suggests policymakers will not need to reduce interest rates as sharply as anticipated to stimulate the economy. The expectation that interest rates will remain elevated swells foreign capital inflows, which, in turn, increases demand for USD.
GBP/USD fails to rise on positive UK jobs data
GBP/USD is sliding lower despite just-released UK jobs data coming out relatively positive – something which would normally have been expected to strengthen the Pound Sterling (GBP) and elevate the Cable.
The Unemployment Rate fell to 4.0% in the three months to August from 4.1% in the previous three months, and beat expectations of the same (4.1%). The Employment Change showed a 373K rise over the same period from 265K previously, and average earnings rose in line with expectations. The only data point to cause concern was the September Claimant Count, which rose to 27.9K from 23.7K in August, and beat expectations of 20.2K.
Cable movers on the calendar
GBP/USD’s main market-moving events on Tuesday are likely to be verbal rather than data-driven. They consist mainly of speeches from three Fed officials, including San Francisco Fed’s President Mary Daly, Fed Governor Adriana Kugler and Atlanta Fed’s President Raphael Bostic.
On the data side, The NY Empire State Manufacturing Index is the metric-of-the-day, though it is unlikely to move the needle much on the Greenback.
A long list of UK data releases promises to paint Wednesday red, white and blue, with UK broad inflation metric the Consumer Price Index (CPI) and “factory-gate” inflation gauge the Producer Price Index (PPI) both scheduled for release. These may impact the Pound Sterling because they affect the Bank of England’s (BoE) decisions on interest rates.
Inflation data for September will be particularly important because BoE officials have signaled they could resume cutting rates at the next meeting on November 7.
Technical Analysis: GBP/USD reaches the bottom of the slope
GBP/USD reaches the bottom of its slope and pauses for refreshment. The pair has steadily been going downhill since the late September highs when it crested in the 1.3400s. Since then, the Pound has depreciated four cents to find itself back in the 1.3000s.
GBP/USD Daily Chart
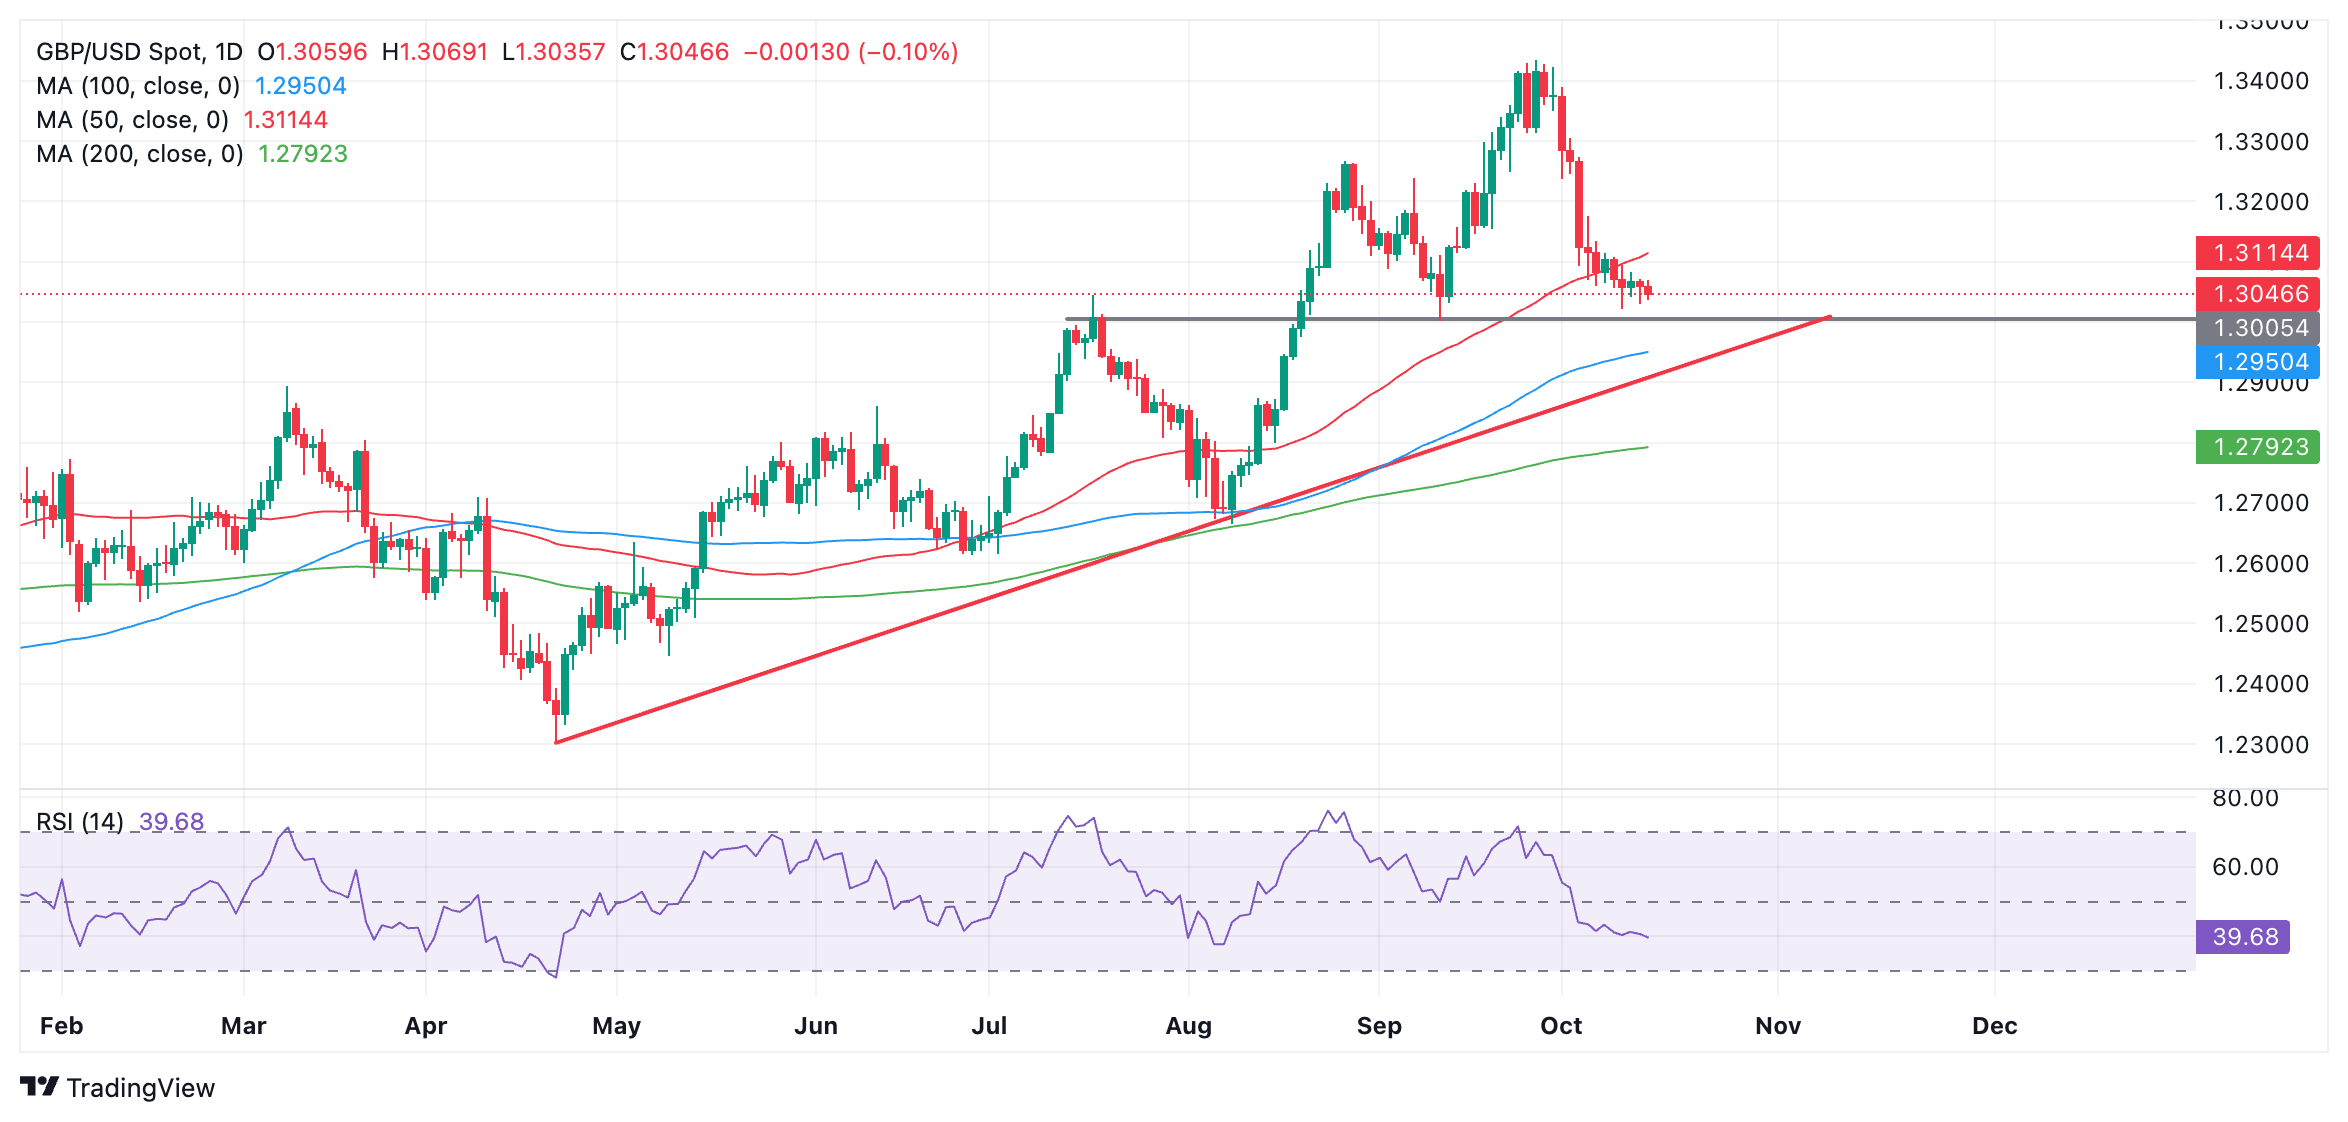
Firm support is close at hand at around the 1.3005 level (thick charcoal line on chart) supplied by former peaks and troughs. The pair could either bounce and recover or break below the ice and sink.
The short-term trend is bearish but the medium and longer-term trends are bullish. A close below 1.3000 would be a necessary prerequisite for expecting the near-term downtrend to extend. Support from a trendline then comes in quite soon after at 1.2950 and could spoil the bear-themed party. A break below that would then be necessary to expect even more weakness.
The Relative Strength Index (RSI) is low but not oversold, so more downside is possible from a momentum perspective.
Price action has not formed any bullish reversal candlestick patterns yet so it’s too soon to call a recovery either. There is a chance one could evolve, however, given the medium and longer-term trends are bullish so broader upcycles could kick in.
Here is what you need to know on Tuesday, October 15:
Following a quiet start to the week, the US Dollar (USD) gathered strength and managed to build on the previous week's gains, with the USD Index reaching its highest level since early August above 103.00 on Monday. The US economic calendar will not offer any high-tier data releases on Tuesday. Eurostat will publish Industrial Production data for August and Germany's ZEW economic research institute will release October sentiment data for the Eurozone and Germany. Finally, Statistics Canada will release September Consumer Price Index figures later in the American session. In the second half of the day, several Federal Reserve (Fed) policymakers are scheduled to deliver speeches.
US Dollar PRICE Last 7 days
The table below shows the percentage change of US Dollar (USD) against listed major currencies last 7 days. US Dollar was the strongest against the Canadian Dollar.
| USD | EUR | GBP | JPY | CAD | AUD | NZD | CHF | |
|---|---|---|---|---|---|---|---|---|
| USD | 0.74% | 0.28% | 0.78% | 1.38% | 0.69% | 0.77% | 0.92% | |
| EUR | -0.74% | -0.46% | 0.03% | 0.64% | -0.05% | 0.00% | 0.17% | |
| GBP | -0.28% | 0.46% | 0.49% | 1.09% | 0.42% | 0.47% | 0.64% | |
| JPY | -0.78% | -0.03% | -0.49% | 0.72% | -0.08% | -0.03% | 0.16% | |
| CAD | -1.38% | -0.64% | -1.09% | -0.72% | -0.68% | -0.60% | -0.45% | |
| AUD | -0.69% | 0.05% | -0.42% | 0.08% | 0.68% | 0.06% | 0.23% | |
| NZD | -0.77% | -0.01% | -0.47% | 0.03% | 0.60% | -0.06% | 0.17% | |
| CHF | -0.92% | -0.17% | -0.64% | -0.16% | 0.45% | -0.23% | -0.17% |
The heat map shows percentage changes of major currencies against each other. The base currency is picked from the left column, while the quote currency is picked from the top row. For example, if you pick the US Dollar from the left column and move along the horizontal line to the Japanese Yen, the percentage change displayed in the box will represent USD (base)/JPY (quote).
The data from Japan showed on Tuesday that Industrial Production contracted by 3.3% on a monthly basis in August, matching the market expectation. Meanwhile, Kyodo News Agency reported that Prime Minister Shigeru Isihiba said that his government aims to compile a supplementary budget for the current fiscal year, projected to exceed last year's 13.1 trillion yen ($87.6 billion). After posting small gains on Monday, USD/JPY edges lower early Tuesday and trades below 149.50.
EUR/USD turned south in the American session on Monday and dropped below 1.0900 for the first time in over two months. The pair struggles to hold its ground in the European morning and stays below this level.
USD/CAD extended its winning streak into a ninth consecutive trading day on Monday. Ahead of the Canadian inflation report, the pair clings to small daily gains slightly above 1.3800 early Tuesday.
The UK's Office for National Statistics announced on Tuesday that the ILO Unemployment Rate eased to 4.0% in the three months to August, following July’s 4.1% reading. Additional details of the report showed the Employment Change data for August arrived at 373K, compared to 265k reported in July. Furthermore, Average Earnings excluding Bonus in the UK rose 4.9% 3M YoY in August versus a 5.1% growth seen in July. GBP/USD showed no immediate reaction to these figures and was last seen moving sideways at around 1.3050.
Gold failed to make a decisive move in either direction on Monday and closed the day virtually unchanged. XAU/USD extends its sideways grind near $2,650 in the European morning.
Inflation FAQs
Inflation measures the rise in the price of a representative basket of goods and services. Headline inflation is usually expressed as a percentage change on a month-on-month (MoM) and year-on-year (YoY) basis. Core inflation excludes more volatile elements such as food and fuel which can fluctuate because of geopolitical and seasonal factors. Core inflation is the figure economists focus on and is the level targeted by central banks, which are mandated to keep inflation at a manageable level, usually around 2%.
The Consumer Price Index (CPI) measures the change in prices of a basket of goods and services over a period of time. It is usually expressed as a percentage change on a month-on-month (MoM) and year-on-year (YoY) basis. Core CPI is the figure targeted by central banks as it excludes volatile food and fuel inputs. When Core CPI rises above 2% it usually results in higher interest rates and vice versa when it falls below 2%. Since higher interest rates are positive for a currency, higher inflation usually results in a stronger currency. The opposite is true when inflation falls.
Although it may seem counter-intuitive, high inflation in a country pushes up the value of its currency and vice versa for lower inflation. This is because the central bank will normally raise interest rates to combat the higher inflation, which attract more global capital inflows from investors looking for a lucrative place to park their money.
Formerly, Gold was the asset investors turned to in times of high inflation because it preserved its value, and whilst investors will often still buy Gold for its safe-haven properties in times of extreme market turmoil, this is not the case most of the time. This is because when inflation is high, central banks will put up interest rates to combat it. Higher interest rates are negative for Gold because they increase the opportunity-cost of holding Gold vis-a-vis an interest-bearing asset or placing the money in a cash deposit account. On the flipside, lower inflation tends to be positive for Gold as it brings interest rates down, making the bright metal a more viable investment alternative.
- GBP/USD remains subdued after the release of the mixed UK employment data on Tuesday.
- The UK ILO Unemployment Rate (3M) (Aug) eased to 4.0%, down from July’s 4.1% reading.
- Fed’s Kashkari reiterated the central bank’s data-dependent approach, highlighting the ongoing easing of inflationary pressures alongside a strong labor market.
GBP/USD edges lower after registering gains in the previous two sessions, trading around 1.3040 during the Asian trading hours on Tuesday. The pair remains subdued following the mixed employment data release from the United Kingdom (UK).
The UK ILO Unemployment Rate eased to 4.0% in the three months leading up to August, down from July’s 4.1% reading and below the market forecast of 4.1%. Employment Change for August showed an increase of 373,000, up from 265,000 in July. Meanwhile, Average Earnings excluding Bonuses rose by 4.9% year-on-year in the three months to August, in line with expectations, though slightly lower than the 5.1% growth recorded in July.
The US Dollar (USD) gains support from increasing expectations that the US Federal Reserve (Fed) will avoid aggressive interest rate cuts, following a strong jobs report and concerns of sticky US inflation. According to the CME FedWatch Tool, markets are currently pricing in an 88.2% probability of a 25-basis-point rate cut in November, with no anticipation of a larger 50-basis-point reduction.
On Monday, Federal Reserve (Fed) Bank of Minneapolis President Neel Kashkari reaffirmed the Fed's data-dependent approach. Kashkari reiterated familiar Fed policymaker views on the strength of the US economy, noting continued easing of inflationary pressures and a robust labor market, despite a recent uptick in the overall unemployment rate, per Reuters.
Economic Indicator
ILO Unemployment Rate (3M)
The ILO Unemployment Rate released by the UK Office for National Statistics is the number of unemployed workers divided by the total civilian labor force. It is a leading indicator for the UK Economy. If the rate goes up, it indicates a lack of expansion within the UK labor market. As a result, a rise leads to a weakening of the UK economy. Generally, a decrease of the figure is seen as bullish for the Pound Sterling (GBP), while an increase is seen as bearish.
Read more.Last release: Tue Oct 15, 2024 06:00
Frequency: Monthly
Actual: 4%
Consensus: 4.1%
Previous: 4.1%
Source: Office for National Statistics
The Unemployment Rate is the broadest indicator of Britain’s labor market. The figure is highlighted by the broad media, beyond the financial sector, giving the publication a more significant impact despite its late publication. It is released around six weeks after the month ends. While the Bank of England is tasked with maintaining price stability, there is a substantial inverse correlation between unemployment and inflation. A higher than expected figure tends to be GBP-bearish.
- The UK Unemployment Rate eases to 4.0% in three months to August.
- The Claimant Count Change for Britain stood at 27.9K in September.
- GBP/USD keeps range around 1.3050 after mixed UK employment data.
The United Kingdom’s (UK) ILO Unemployment Rate eased to 4.0% in the three months to August, following July’s 4.1% reading, the data published by the Office for National Statistics (ONS) showed on Tuesday. The market forecast was 4.1% in the reported period.
Additional details of the report showed that the number of people claiming jobless benefits increased by 27.9K in September, compared with a gain of 23.7K in August, missing the expected 20.2K print.
The Employment Change data for August arrived at 373K, compared to 265k reported in July.
Meanwhile, Average Earnings excluding Bonus in the UK rose 4.9% 3M YoY in August versus a 5.1% growth seen in July. The reading aligned with the expectations of a 4.9% acceleration.
Another measure of wage inflation, Average Earnings including Bonus also increased by 3.8% in the same period after a 4.0% growth seen in the quarter through July. The market expectation was for +3.8%.
GBP/USD reaction to the UK employment report
GBP/USD keeps its range near 1.3050 in reaction to the mixed UK employment data. The pair is trading 0.14% lower on the day at 1.3040, as of writing.
British Pound PRICE Today
The table below shows the percentage change of British Pound (GBP) against listed major currencies today. British Pound was the weakest against the Japanese Yen.
| USD | EUR | GBP | JPY | CAD | AUD | NZD | CHF | |
|---|---|---|---|---|---|---|---|---|
| USD | 0.19% | 0.14% | -0.13% | 0.10% | 0.25% | 0.30% | -0.04% | |
| EUR | -0.19% | -0.05% | -0.34% | -0.11% | 0.07% | 0.10% | -0.23% | |
| GBP | -0.14% | 0.05% | -0.27% | -0.04% | 0.12% | 0.15% | -0.11% | |
| JPY | 0.13% | 0.34% | 0.27% | 0.24% | 0.38% | 0.43% | 0.14% | |
| CAD | -0.10% | 0.11% | 0.04% | -0.24% | 0.14% | 0.21% | -0.07% | |
| AUD | -0.25% | -0.07% | -0.12% | -0.38% | -0.14% | 0.05% | -0.23% | |
| NZD | -0.30% | -0.10% | -0.15% | -0.43% | -0.21% | -0.05% | -0.28% | |
| CHF | 0.04% | 0.23% | 0.11% | -0.14% | 0.07% | 0.23% | 0.28% |
The heat map shows percentage changes of major currencies against each other. The base currency is picked from the left column, while the quote currency is picked from the top row. For example, if you pick the British Pound from the left column and move along the horizontal line to the US Dollar, the percentage change displayed in the box will represent GBP (base)/USD (quote).
FX option expiries for Oct 15 NY cut at 10:00 Eastern Time, via DTCC, can be found below.
EUR/USD: EUR amounts
- 1.0850 825m
- 1.1000 3.3b
- 1.1025 654m
GBP/USD: GBP amounts
- 1.3000 492m
USD/JPY: USD amounts
- 149.00 568m
- 149.90 536m
USD/CHF: USD amounts
- 0.8390 920m
- 0.8650 452m
AUD/USD: AUD amounts
- 0.6675 2.7b
- 0.6730 787m
- 0.6775 2b
- 0.6800 1.9b
USD/CAD: USD amounts
- 1.3610 1.2b
- 1.3705 433m
NZD/USD: NZD amounts
- 0.5920 540m
- 0.6100 722m
EUR/GBP: EUR amounts
- 0.8400 590m
- NZD/USD edges lower as the US Dollar gains support from the fading likelihood of further bumper rate cuts by the Fed.
- Fed’s Kashkari reiterated the central bank’s data-dependent approach, highlighting the ongoing easing of inflationary pressures alongside a strong labor market.
- New Zealand’s Consumer Price Index is anticipated to return to the central bank's 1-3% target range for the September quarter.
NZD/USD halts its three-day winning streak, trading around 0.6080 during the Asian hours on Tuesday. This downside could be attributed to the stronger US Dollar (USD), which gains support from fading expectations that the US Federal Reserve (Fed) will implement aggressive interest rate cuts following a strong jobs report and concerns about sticky US inflation.
The US Dollar Index (DXY), which measures the value of the US Dollar against its six other major peers, extends its winning streak for the sixth consecutive day on Tuesday. The DXY trades around 103.30 with 2-year and 10-year standing at 3.96% and 4.09%, respectively, at the time of writing.
On Monday, Federal Reserve (Fed) Bank of Minneapolis President Neel Kashkari reaffirmed the Fed's data-dependent approach. Kashkari reiterated familiar Fed policymaker views on the strength of the US economy, noting continued easing of inflationary pressures and a robust labor market, despite a recent uptick in the overall unemployment rate, per Reuters.
The New Zealand Dollar (NZD) weakened following Monday’s disappointing trade balance data from China, New Zealand's largest trading partner. Additionally, despite the announcement of China’s fiscal stimulus plan over the weekend, the Kiwi Dollar did not gain traction, as investors remained uncertain about the extent of the package.
China's trade surplus narrowed in September, with the Trade Balance recorded at 81.7 billion, falling short of the 89.8 billion expected and down from the previous 91.02 billion. Exports increased by 2.4% year-over-year, significantly lower than the anticipated 6.0% and down from 8.7% in the prior period. Meanwhile, Imports grew by 0.3%, below the expected 0.9% and the previous increase of 0.5%.
Investors are likely anticipating the release of New Zealand's third-quarter inflation data on Wednesday. The Consumer Price Index (CPI) is expected to fall back within the central bank's 1-3% target range, decreasing to 2.2% year-over-year for the September quarter from the previous 3.3% reading.
The New Zealand Dollar is under downward pressure as markets anticipate an 80% likelihood that the Reserve Bank of New Zealand (RBNZ) will execute another half-point rate cut at its final meeting of the year in November.
New Zealand Dollar FAQs
The New Zealand Dollar (NZD), also known as the Kiwi, is a well-known traded currency among investors. Its value is broadly determined by the health of the New Zealand economy and the country’s central bank policy. Still, there are some unique particularities that also can make NZD move. The performance of the Chinese economy tends to move the Kiwi because China is New Zealand’s biggest trading partner. Bad news for the Chinese economy likely means less New Zealand exports to the country, hitting the economy and thus its currency. Another factor moving NZD is dairy prices as the dairy industry is New Zealand’s main export. High dairy prices boost export income, contributing positively to the economy and thus to the NZD.
The Reserve Bank of New Zealand (RBNZ) aims to achieve and maintain an inflation rate between 1% and 3% over the medium term, with a focus to keep it near the 2% mid-point. To this end, the bank sets an appropriate level of interest rates. When inflation is too high, the RBNZ will increase interest rates to cool the economy, but the move will also make bond yields higher, increasing investors’ appeal to invest in the country and thus boosting NZD. On the contrary, lower interest rates tend to weaken NZD. The so-called rate differential, or how rates in New Zealand are or are expected to be compared to the ones set by the US Federal Reserve, can also play a key role in moving the NZD/USD pair.
Macroeconomic data releases in New Zealand are key to assess the state of the economy and can impact the New Zealand Dollar’s (NZD) valuation. A strong economy, based on high economic growth, low unemployment and high confidence is good for NZD. High economic growth attracts foreign investment and may encourage the Reserve Bank of New Zealand to increase interest rates, if this economic strength comes together with elevated inflation. Conversely, if economic data is weak, NZD is likely to depreciate.
The New Zealand Dollar (NZD) tends to strengthen during risk-on periods, or when investors perceive that broader market risks are low and are optimistic about growth. This tends to lead to a more favorable outlook for commodities and so-called ‘commodity currencies’ such as the Kiwi. Conversely, NZD tends to weaken at times of market turbulence or economic uncertainty as investors tend to sell higher-risk assets and flee to the more-stable safe havens.
- The Indian Rupee declines due to rising risk aversion.
- Lower crude Oil prices may ease downward pressure on the INR.
- The US Dollar gains ground due to the fading likelihood of further bumper rate cuts by the Fed.
The Indian Rupee (INR) edges lower against the US Dollar (USD) on Tuesday. However, the INR may strengthen due to anticipated foreign fund inflows, as the Indian stock market may track the upward trend of its Asian peers, with traders reacting to a record closing on Wall Street.
The USD/INR pair may weaken due to declining Oil prices, as India is the world's third-largest Oil importer, and Oil constitutes a significant portion of the country's import expenditures. Crude Oil prices are experiencing downward pressure following a media report indicating that Israel is inclined to avoid targeting Iranian Oil facilities, which has alleviated concerns about potential supply disruptions.
On Monday, the Indian Rupee received downward pressure as Foreign institutional investors sold a net total of 37.32 billion rupees ($444 million) in stocks, marking their eleventh consecutive session of net selling. In contrast, domestic investors net purchased shares valued at 22.78 billion rupees, per Reuters.
Daily Digest Market Movers: Indian Rupee loses ground due to rising risk aversion
- The USD/INR pair hovers around 84.00, close to its highest level, as the US Dollar continues to appreciate due to the fading likelihood of further aggressive interest rate cuts by the US Federal Reserve (Fed). According to the CME FedWatch Tool, markets are currently pricing in an 83.6% probability of a 25-basis-point rate cut in November, with no anticipation of a larger 50-basis-point reduction.
- The Washington Post reported on Monday that Israeli Prime Minister Benjamin Netanyahu informed the United States (US) that Israel plans to focus on Iranian military targets rather than nuclear or Oil infrastructure.
- Federal Reserve (Fed) Bank of Minneapolis President Neel Kashkari reassured markets late on Monday by reaffirming the Fed's data-dependent approach. Kashkari reiterated familiar Fed policymaker views on the strength of the US economy, noting continued easing of inflationary pressures and a robust labor market, despite a recent uptick in the overall unemployment rate, per Reuters.
- The risk-sensitive INR faces challenges from safe-haven flows amid escalating tensions in the Middle East that have sparked concerns of a broader regional conflict. According to CNN, at least four Israeli soldiers were killed, and over 60 people were injured in a drone attack in north-central Israel on Sunday.
- India’s Consumer Price Index (CPI) increased to 5.49% year-over-year in September, up from 3.65% in the previous month, significantly surpassing market expectations of 5.0%. This marks the highest inflation rate recorded since the beginning of the year, exceeding the Reserve Bank of India's target of 4%, after dipping below this threshold in the first two months of the September quarter.
Technical Analysis: USD/INR remains above 84.00, close to the highest level
The USD/INR pair trades around 84.00 on Tuesday. Analysis of the daily chart shows that the USD/INR pair is positioned within the ascending channel pattern, suggesting a bullish bias. Additionally, the 14-day Relative Strength Index (RSI) remains above the 50 level, confirming the ongoing bullish sentiment for the pair.
In terms of resistance, the USD/INR pair could find a barrier around its all-time high of 84.14, recorded on August 5. A break above this level could support the pair to explore the region around the upper boundary of the ascending channel at 84.30 level.
On the downside, the immediate support appears at the lower boundary of the ascending channel around the psychological level of 84.00 followed by the nine-day Exponential Moving Average (EMA) at 83.97 level.
USD/INR: Daily Chart
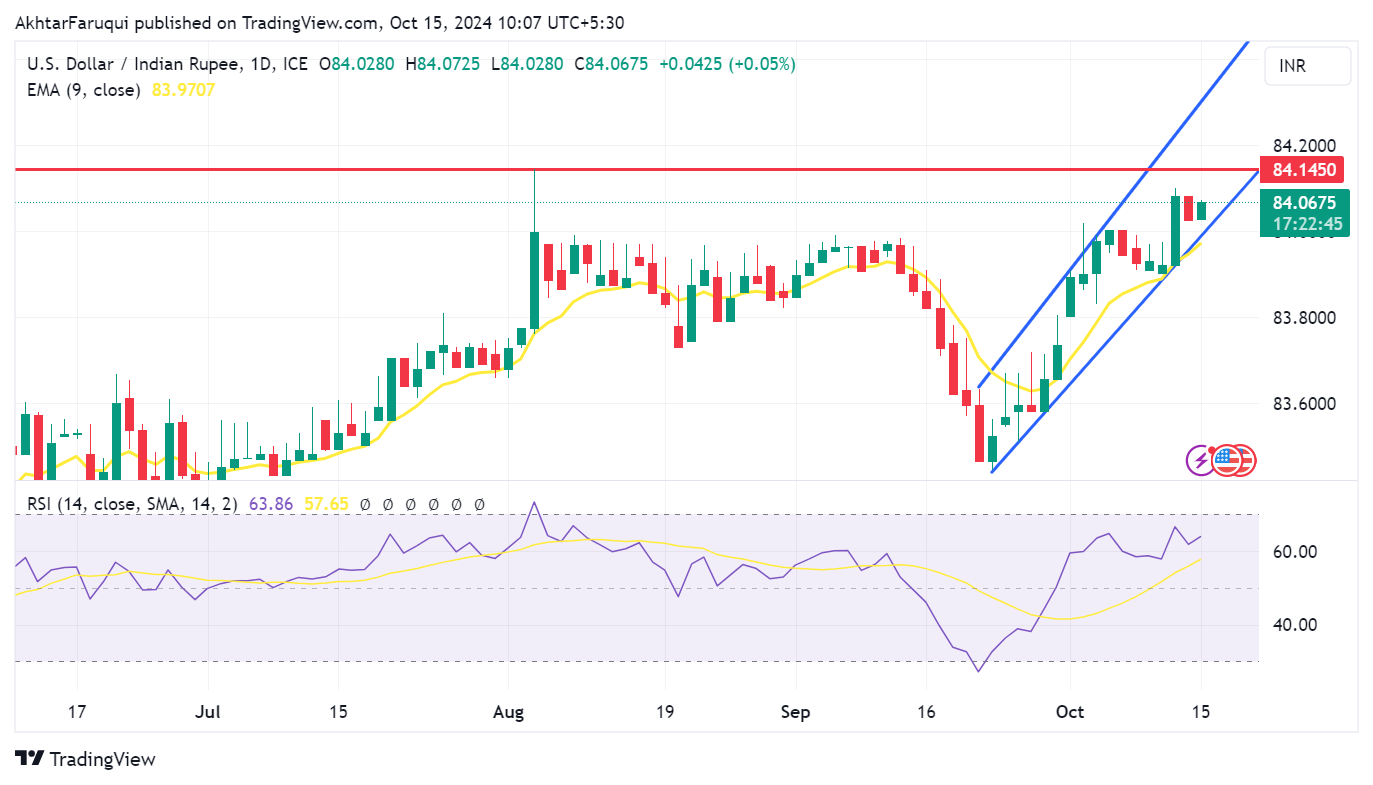
Indian Rupee FAQs
The Indian Rupee (INR) is one of the most sensitive currencies to external factors. The price of Crude Oil (the country is highly dependent on imported Oil), the value of the US Dollar – most trade is conducted in USD – and the level of foreign investment, are all influential. Direct intervention by the Reserve Bank of India (RBI) in FX markets to keep the exchange rate stable, as well as the level of interest rates set by the RBI, are further major influencing factors on the Rupee.
The Reserve Bank of India (RBI) actively intervenes in forex markets to maintain a stable exchange rate, to help facilitate trade. In addition, the RBI tries to maintain the inflation rate at its 4% target by adjusting interest rates. Higher interest rates usually strengthen the Rupee. This is due to the role of the ‘carry trade’ in which investors borrow in countries with lower interest rates so as to place their money in countries’ offering relatively higher interest rates and profit from the difference.
Macroeconomic factors that influence the value of the Rupee include inflation, interest rates, the economic growth rate (GDP), the balance of trade, and inflows from foreign investment. A higher growth rate can lead to more overseas investment, pushing up demand for the Rupee. A less negative balance of trade will eventually lead to a stronger Rupee. Higher interest rates, especially real rates (interest rates less inflation) are also positive for the Rupee. A risk-on environment can lead to greater inflows of Foreign Direct and Indirect Investment (FDI and FII), which also benefit the Rupee.
Higher inflation, particularly, if it is comparatively higher than India’s peers, is generally negative for the currency as it reflects devaluation through oversupply. Inflation also increases the cost of exports, leading to more Rupees being sold to purchase foreign imports, which is Rupee-negative. At the same time, higher inflation usually leads to the Reserve Bank of India (RBI) raising interest rates and this can be positive for the Rupee, due to increased demand from international investors. The opposite effect is true of lower inflation.
- EUR/USD attracts sellers for the second successive day amid a bullish USD.
- Bets for smaller Fed rate cuts and geopolitical risks underpin the Greenback.
- Bears might refrain from placing fresh bets ahead of the ECB on Thursday.
The EUR/USD pair drifts lower for the second straight day on Tuesday and drops to the 1.0890 area in the last hour, back closer to its lowest level since August 8 touched the previous day. Bearish traders, however, need to wait for a break below the 200-day Simple Moving Average (SMA) before placing fresh bets ahead of the key central bank event risk.
The European Central Bank (ECB) is scheduled to announce its policy decision on Thursday and is expected to cut interest rates again for the third time this easing cycle amid mounting concerns over sluggish growth. Furthermore, inflation in the Eurozone fell below the ECB's 2% target for the first time since 2021 and backs the case for further policy easing. This, in turn, undermines the shared currency, which, along with a bullish US Dollar (USD), turns out to be a key factor weighing on the EUR/USD pair.
The USD Index (DXY), which tracks the Greenback against a basket of currencies, stands tall near a two-month top amid firming expectations for a less aggressive policy easing by the Federal Reserve (Fed). In fact, the markets have now fully priced out the possibility of another oversized Fed rate cut in November, which keeps the US Treasury bond yields elevated. Moreover, geopolitical risks benefit the safe-haven buck and support prospects for a further depreciating move for the EUR/USD pair.
Traders now look forward to Tuesday's economic docket – featuring the release of the German ZEW Economic Sentiment Index and Eurozone Industrial Production figures. Later during the North American session, the Empire State Manufacturing Index and speeches by influential FOMC members will drive the USD demand, which, in turn, should provide short-term impetus to the EUR/USD pair.
Economic Indicator
ECB Monetary Policy Statement
At each of the European Central Bank’s (ECB) eight governing council meetings, the ECB releases a short statement explaining its monetary policy decision, in light of its goal of meeting its inflation target. The statement may influence the volatility of the Euro (EUR) and determine a short-term positive or negative trend. A hawkish view is considered bullish for EUR, whereas a dovish view is considered bearish.
Read more.Next release: Thu Oct 17, 2024 12:15
Frequency: Irregular
Consensus: -
Previous: -
Source: European Central Bank
Gold prices fell in India on Tuesday, according to data compiled by FXStreet.
The price for Gold stood at 7,144.44 Indian Rupees (INR) per gram, down compared with the INR 7,159.09 it cost on Monday.
The price for Gold decreased to INR 83,331.34 per tola from INR 83,502.19 per tola a day earlier.
| Unit measure | Gold Price in INR |
|---|---|
| 1 Gram | 7,144.44 |
| 10 Grams | 71,444.39 |
| Tola | 83,331.34 |
| Troy Ounce | 222,217.10 |
FXStreet calculates Gold prices in India by adapting international prices (USD/INR) to the local currency and measurement units. Prices are updated daily based on the market rates taken at the time of publication. Prices are just for reference and local rates could diverge slightly.
Gold FAQs
Gold has played a key role in human’s history as it has been widely used as a store of value and medium of exchange. Currently, apart from its shine and usage for jewelry, the precious metal is widely seen as a safe-haven asset, meaning that it is considered a good investment during turbulent times. Gold is also widely seen as a hedge against inflation and against depreciating currencies as it doesn’t rely on any specific issuer or government.
Central banks are the biggest Gold holders. In their aim to support their currencies in turbulent times, central banks tend to diversify their reserves and buy Gold to improve the perceived strength of the economy and the currency. High Gold reserves can be a source of trust for a country’s solvency. Central banks added 1,136 tonnes of Gold worth around $70 billion to their reserves in 2022, according to data from the World Gold Council. This is the highest yearly purchase since records began. Central banks from emerging economies such as China, India and Turkey are quickly increasing their Gold reserves.
Gold has an inverse correlation with the US Dollar and US Treasuries, which are both major reserve and safe-haven assets. When the Dollar depreciates, Gold tends to rise, enabling investors and central banks to diversify their assets in turbulent times. Gold is also inversely correlated with risk assets. A rally in the stock market tends to weaken Gold price, while sell-offs in riskier markets tend to favor the precious metal.
The price can move due to a wide range of factors. Geopolitical instability or fears of a deep recession can quickly make Gold price escalate due to its safe-haven status. As a yield-less asset, Gold tends to rise with lower interest rates, while higher cost of money usually weighs down on the yellow metal. Still, most moves depend on how the US Dollar (USD) behaves as the asset is priced in dollars (XAU/USD). A strong Dollar tends to keep the price of Gold controlled, whereas a weaker Dollar is likely to push Gold prices up.
(An automation tool was used in creating this post.)
- USD/CAD attracts buyers for the tenth straight day and draws support from a combination of factors.
- Bets for smaller Fed rate cuts assist the USD to preserve its recent strong gains to a two-month high.
- Weaker Oil prices undermine the Loonie and act as a tailwind for the pair ahead of the Canadian CPI.
The USD/CAD pair trades near its highest level since August 6 during the Asian session on Tuesday, with bulls making a fresh attempt to build on the momentum beyond the 1.3800 round-figure mark.
The US Dollar (USD) stands tall near a two-month high amid expectations for a less aggressive policy easing by the Federal Reserve (Fed) and bets for a regular 25 basis points (bps) rate cut in November. This assists the yield on the benchmark 10-year US government bond to hold steady above the 4% mark and continues to offer some support to the buck, which, in turn, is seen as a key factor pushing the USD/CAD pair higher for the tenth straight day.
Meanwhile, a report on Monday suggested that Israel will not attack Iran’s oil and nuclear facilities. Moreover, a fall in China's oil imports for the fifth straight month raised concerns about weak demand in the world's top importer. Adding to this, OPEC lowered its 2024 and 2025 global oil demand forecasts. This leads to a further decline in Crude Oil prices, which undermines the commodity-linked Loonie and lends additional support to the USD/CAD pair.
The aforementioned factors, to a larger extent, overshadow Friday's upbeat Canadian jobs data, which forced investors to pare bets for a larger rate cut by the Bank of Canada (BoC). Traders now look forward to the release of the latest Canadian consumer inflation figures, due later during the North American session. This, along with the Empire State Manufacturing Index and Fedspeak, will influence the USD and provide some impetus to the USD/CAD pair.
Economic Indicator
Consumer Price Index (YoY)
The Consumer Price Index (CPI), released by Statistics Canada on a monthly basis, represents changes in prices for Canadian consumers by comparing the cost of a fixed basket of goods and services. The YoY reading compares prices in the reference month to the same month a year earlier. Generally, a high reading is seen as bullish for the Canadian Dollar (CAD), while a low reading is seen as bearish.
Read more.Next release: Tue Oct 15, 2024 12:30
Frequency: Monthly
Consensus: 1.8%
Previous: 2%
Source: Statistics Canada
Kyodo News Agency carried a report on Tuesday, citing Japan’s Prime Minister (PM) Shigeru Isihiba, as saying that his government aims to compile a supplementary budget for the current fiscal year, projected to exceed last year's 13.1 trillion yen ($87.6 billion).
The extra budget is set to fund an economic package, which could cushion the blow to households from rising living costs, Kyodo reported.
Market reaction
At the time of writing, USD/JPY is losing 0.07% on the day to trade near 149.65, little moved by these headlines.
Japanese Yen FAQs
The Japanese Yen (JPY) is one of the world’s most traded currencies. Its value is broadly determined by the performance of the Japanese economy, but more specifically by the Bank of Japan’s policy, the differential between Japanese and US bond yields, or risk sentiment among traders, among other factors.
One of the Bank of Japan’s mandates is currency control, so its moves are key for the Yen. The BoJ has directly intervened in currency markets sometimes, generally to lower the value of the Yen, although it refrains from doing it often due to political concerns of its main trading partners. The BoJ ultra-loose monetary policy between 2013 and 2024 caused the Yen to depreciate against its main currency peers due to an increasing policy divergence between the Bank of Japan and other main central banks. More recently, the gradually unwinding of this ultra-loose policy has given some support to the Yen.
Over the last decade, the BoJ’s stance of sticking to ultra-loose monetary policy has led to a widening policy divergence with other central banks, particularly with the US Federal Reserve. This supported a widening of the differential between the 10-year US and Japanese bonds, which favored the US Dollar against the Japanese Yen. The BoJ decision in 2024 to gradually abandon the ultra-loose policy, coupled with interest-rate cuts in other major central banks, is narrowing this differential.
The Japanese Yen is often seen as a safe-haven investment. This means that in times of market stress, investors are more likely to put their money in the Japanese currency due to its supposed reliability and stability. Turbulent times are likely to strengthen the Yen’s value against other currencies seen as more risky to invest in.
- Gold price attracts some dip-buyers and stalls its decline from over a one-week top set on Monday.
- Geopolitical risks drive some haven flows, though a bullish USD might cap gains for the commodity.
- Signs of a slowdown in China – the biggest bullion consumer – could further weigh on the XAU/USD.
Gold price (XAU/USD) witnessed an intraday pullback from over a one-week high touched on Monday and finally settled in the red, snapping a two-day winning streak amid broad-based US Dollar (USD) strength. Investors have priced out the possibility of another oversized interest rate cut by the Federal Reserve (Fed) in November. This kept the US Treasury bond yields elevated, which pushed the buck to over a two-month top and drove flows away from the non-yielding yellow metal.
Adding to this, the disappointment over China's fiscal stimulus and weak inflation figures released over the weekend did little to evoke investors' confidence. This turned out to be another factor that undermined the Gold price and contributed to the decline. That said, geopolitical risks stemming from the ongoing conflicts in the Middle East assisted the safe-haven precious metal to stall its intraday slide and hold steady above the $2,640 level during the Asian session on Tuesday.
Daily Digest Market Movers: Gold price draws support from geopolitical risks, smaller Fed rate cut bets to cap gains
- The US Dollar shot to its highest level since August 8 on Monday amid growing acceptance of a less aggressive policy easing by the Federal Reserve and bets for a regular 25 basis points interest rate cut in November.
- Minneapolis Fed President Neel Kashkari said on Monday that the monetary policy is still restrictive and suggested that further modest interest rate cuts could be appropriate as the job market remains strong.
- Fed Governor Christopher Waller noted that the economy is on solid footing, may not be slowing as much as desired, and that the central bank should proceed with more caution on rate cuts than at the September meeting.
- The lack of numerical details for China's fiscal stimulus, along with signs of economic softness in the biggest bullion consumer, prompted some intraday selling around the Gold price on the first day of a new week.
- Israel vowed a forceful response to Hezbollah’s drone attack on its army base on Sunday, which killed four soldiers and severely wounded seven others, raising the risk of a further escalation of geopolitical tensions.
- This comes amid growing concern that Israel may mount an offensive against Iranian assets and a broader regional conflict in the Middle East, which offers some support to the safe-haven precious metal.
- Traders now look to the release of the Empire State Manufacturing Index, which, along with Fedspeak, should produce short-term trading opportunities around the XAU/USD later during the North American session.
Technical Outlook: Gold price could aim to surpass the all-time peak touched in September and conquer the $2,700 mark
From a technical perspective, the overnight swing high, around the $2,666-2,667 region, now seems to act as an immediate hurdle. A sustained strength beyond has the potential to lift the Gold price back towards the all-time peak, around the $2,685-2,686 region touched in September. This is closely followed by the $2,700 round-figure mark, which if cleared decisively will set the stage for an extension of a well-established multi-month-old uptrend.
On the flip side, weakness below the $2,632-2,630 immediate support is likely to attract some buyers and remain limited near the $2,600 round-figure mark. Failure to defend the said handle will be seen as a fresh trigger for bearish traders and make the Gold price vulnerable to accelerate the fall towards the next relevant support near the $2,560 zone. The corrective slide could extend further towards the $2,535-2,530 region en route to the $2,500 psychological mark.
Gold FAQs
Gold has played a key role in human’s history as it has been widely used as a store of value and medium of exchange. Currently, apart from its shine and usage for jewelry, the precious metal is widely seen as a safe-haven asset, meaning that it is considered a good investment during turbulent times. Gold is also widely seen as a hedge against inflation and against depreciating currencies as it doesn’t rely on any specific issuer or government.
Central banks are the biggest Gold holders. In their aim to support their currencies in turbulent times, central banks tend to diversify their reserves and buy Gold to improve the perceived strength of the economy and the currency. High Gold reserves can be a source of trust for a country’s solvency. Central banks added 1,136 tonnes of Gold worth around $70 billion to their reserves in 2022, according to data from the World Gold Council. This is the highest yearly purchase since records began. Central banks from emerging economies such as China, India and Turkey are quickly increasing their Gold reserves.
Gold has an inverse correlation with the US Dollar and US Treasuries, which are both major reserve and safe-haven assets. When the Dollar depreciates, Gold tends to rise, enabling investors and central banks to diversify their assets in turbulent times. Gold is also inversely correlated with risk assets. A rally in the stock market tends to weaken Gold price, while sell-offs in riskier markets tend to favor the precious metal.
The price can move due to a wide range of factors. Geopolitical instability or fears of a deep recession can quickly make Gold price escalate due to its safe-haven status. As a yield-less asset, Gold tends to rise with lower interest rates, while higher cost of money usually weighs down on the yellow metal. Still, most moves depend on how the US Dollar (USD) behaves as the asset is priced in dollars (XAU/USD). A strong Dollar tends to keep the price of Gold controlled, whereas a weaker Dollar is likely to push Gold prices up.
- WTI depreciates as Israel is willing to refrain from targeting Iranian oil facilities.
- Israeli Prime Minister Benjamin Netanyahu informed the US that Israel plans to attack Iranian military targets rather than nuclear or Oil infrastructure.
- OPEC Monthly Market Report revised down its global Oil demand growth outlook for 2024 and 2025.
West Texas Intermediate (WTI) Oil price continues its decline for the third successive session, trading around $71.10 per barrel during Tuesday’s Asian hours. Crude Oil prices are facing downward pressure following a media report suggesting that Israel is willing to refrain from targeting Iranian oil facilities, easing concerns about potential supply disruptions.
The Washington Post reported on Monday that Israeli Prime Minister Benjamin Netanyahu informed the United States (US) that Israel plans to focus on Iranian military targets rather than nuclear or Oil infrastructure. Last week, Oil prices had gained support as investors feared supply risks after Israel indicated plans to retaliate against a missile attack from Iran.
On Monday, Crude Oil prices dropped nearly 5% following the release of the OPEC Monthly Market Report, which revised its global Oil demand growth outlook for 2024 and 2025. OPEC also cut its forecast for China's crude oil demand growth for the third consecutive month in October, citing the growing adoption of electric vehicles and sluggish economic growth as key factors.
The Monthly Oil Market Report (MOMR) by the Organization of the Petroleum Exporting Countries (OPEC) suggests China's crude Oil demand will expand by 580,000 barrels per day (bpd) in 2024. This estimate is down from the 650,000 bpd gain forecast in September and is also 180,000 bpd below the rise of 760,000 bpd OPEC was predicting in July for the world's biggest oil importer.
Oil market sentiment has turned pessimistic due to China's increasing deflationary pressures, which have raised concerns about slowing economic growth. Despite recent stimulus plans, uncertainty surrounding the size of the package has failed to alleviate fears of downside risks to China's economic outlook, further dampening traders' confidence.
Saudi Arabia could ramp up production amid declining cohesion among OPEC+ members. Despite voluntary production cuts, OPEC+ producers have been overproducing by as much as 800,000 barrels per day. The Saudi oil minister cautioned that prices could fall to $50 per barrel if member countries do not adhere to the agreed-upon cuts.
WTI Oil FAQs
WTI Oil is a type of Crude Oil sold on international markets. The WTI stands for West Texas Intermediate, one of three major types including Brent and Dubai Crude. WTI is also referred to as “light” and “sweet” because of its relatively low gravity and sulfur content respectively. It is considered a high quality Oil that is easily refined. It is sourced in the United States and distributed via the Cushing hub, which is considered “The Pipeline Crossroads of the World”. It is a benchmark for the Oil market and WTI price is frequently quoted in the media.
Like all assets, supply and demand are the key drivers of WTI Oil price. As such, global growth can be a driver of increased demand and vice versa for weak global growth. Political instability, wars, and sanctions can disrupt supply and impact prices. The decisions of OPEC, a group of major Oil-producing countries, is another key driver of price. The value of the US Dollar influences the price of WTI Crude Oil, since Oil is predominantly traded in US Dollars, thus a weaker US Dollar can make Oil more affordable and vice versa.
The weekly Oil inventory reports published by the American Petroleum Institute (API) and the Energy Information Agency (EIA) impact the price of WTI Oil. Changes in inventories reflect fluctuating supply and demand. If the data shows a drop in inventories it can indicate increased demand, pushing up Oil price. Higher inventories can reflect increased supply, pushing down prices. API’s report is published every Tuesday and EIA’s the day after. Their results are usually similar, falling within 1% of each other 75% of the time. The EIA data is considered more reliable, since it is a government agency.
OPEC (Organization of the Petroleum Exporting Countries) is a group of 12 Oil-producing nations who collectively decide production quotas for member countries at twice-yearly meetings. Their decisions often impact WTI Oil prices. When OPEC decides to lower quotas, it can tighten supply, pushing up Oil prices. When OPEC increases production, it has the opposite effect. OPEC+ refers to an expanded group that includes ten extra non-OPEC members, the most notable of which is Russia.
| Raw materials | Closed | Change, % |
|---|---|---|
| Silver | 31.163 | 0.36 |
| Gold | 264.777 | -0.08 |
| Palladium | 1029.01 | -1.72 |
- The Australian Dollar depreciated as China's fiscal stimulus plan failed to boost the market sentiment.
- The ANZ-Roy Morgan Consumer Confidence index remained steady at 83.4 this week.
- The US Dollar receives support from the fading likelihood of further bumper rate cuts by the Fed.
The Australian Dollar (AUD) remains subdued against the US Dollar (USD) on Tuesday, weighed down by weak trade balance data from China, Australia's largest trading partner, released on Monday. Furthermore, China's fiscal stimulus plan, announced over the weekend, failed to boost the Aussie Dollar, as investors were left uncertain about the scale of the package.
The Australian weekly survey of Consumer Confidence showed little movement, with the ANZ-Roy Morgan Consumer Confidence index remaining steady at 83.4 this week. Despite the unchanged figure, the longer-term trend shows that Consumer Confidence has been below the 85.0 mark for a record 89 consecutive weeks. The current reading is 1.3 points higher than the 2024 weekly average of 82.1.
The US Dollar (USD) gains support from increasing expectations that the US Federal Reserve (Fed) will avoid aggressive interest rate cuts. According to the CME FedWatch Tool, markets are currently pricing in an 83.6% probability of a 25-basis-point rate cut in November, with no anticipation of a larger 50-basis-point reduction.
Daily Digest Market Movers: Australian Dollar remains subdued over economic woes in China
- Federal Reserve (Fed) Bank of Minneapolis President Neel Kashkari reassured markets late on Monday by reaffirming the Fed's data-dependent approach. Kashkari reiterated familiar Fed policymaker views on the strength of the US economy, noting continued easing of inflationary pressures and a robust labor market, despite a recent uptick in the overall unemployment rate, per Reuters.
- The AUD might have received downward pressure from a detailed note from the Commonwealth Bank of Australia indicating expectations that the Reserve Bank of Australia (RBA) will implement a 25 basis point rate cut by the end of 2024. The report suggested that a stronger disinflationary trend than the RBA anticipates is essential for the Board to consider easing policy within this calendar year.
- The risk-sensitive AUD/USD pair might have received downward pressure due to escalating tensions in the Middle East that have sparked concerns of a broader regional conflict. According to CNN, at least four Israeli soldiers were killed, and over 60 people were injured in a drone attack in north-central Israel on Sunday.
- China's military initiated drills in the Taiwan Strait and around Taiwan on Monday. A spokesperson for the US Department of State expressed serious concern regarding the People's Liberation Army's (PLA) military actions. In response, Taiwan's Defense Ministry stated, “We will not escalate conflict in our response.”
- The National Bureau of Statistics of China reported that the country's monthly Consumer Price Index (CPI) remained unchanged at 0% in September, down from August's 0.4% increase. The annual inflation rate rose by 0.4%, falling short of the anticipated 0.6%. Additionally, the Producer Price Index (PPI) decreased by 2.8% year-on-year, a larger drop than the previous decline of 1.8% and exceeding expectations of a 2.5% decrease.
- On Saturday, the National People’s Congress expressed an optimistic outlook following a briefing from China’s Ministry of Finance (MoF). The MoF emphasized key priorities focused on stabilizing the property market and tackling local government debt issues. The ministry indicated that special bonds would be issued to support both bank recapitalization and efforts to stabilize the real estate sector.
- Chicago Fed President Austan Goolsbee spoke to Bloomberg, commending the progress on inflation and the labor market. Goolsbee noted that despite the positive jobs report for September, there are no indications of overheating in the economy.
- Last week, the Reserve Bank of Australia released the Minutes from its September monetary policy meeting, suggesting that board members examined potential scenarios for both lowering and raising interest rates in the future. The discussion indicated that future financial conditions may need to be either tighter or looser than current levels to meet the Board's objectives.
Technical Analysis: Australian Dollar remains below 0.6750 within the descending channel
The AUD/USD pair hovers around 0.6730 on Tuesday. Technical analysis of the daily chart shows the pair testing the upper boundary of a descending channel pattern. A successful breakout above this level could signal a shift in momentum from bearish to bullish. However, the 14-day Relative Strength Index (RSI) remains below the 50 mark, indicating that bearish momentum remains.
Suppose the AUD/USD pair breaks above the descending channel. In that case, it may encounter initial resistance at the nine-day Exponential Moving Average (EMA) around the 0.6758 level, followed by the key psychological resistance at 0.6800.
On the downside, the AUD/USD pair may target the lower boundary of the descending channel near the 0.6630 level, with further support at its eight-week low of 0.6622, last recorded on September 11.
AUD/USD: Daily Chart
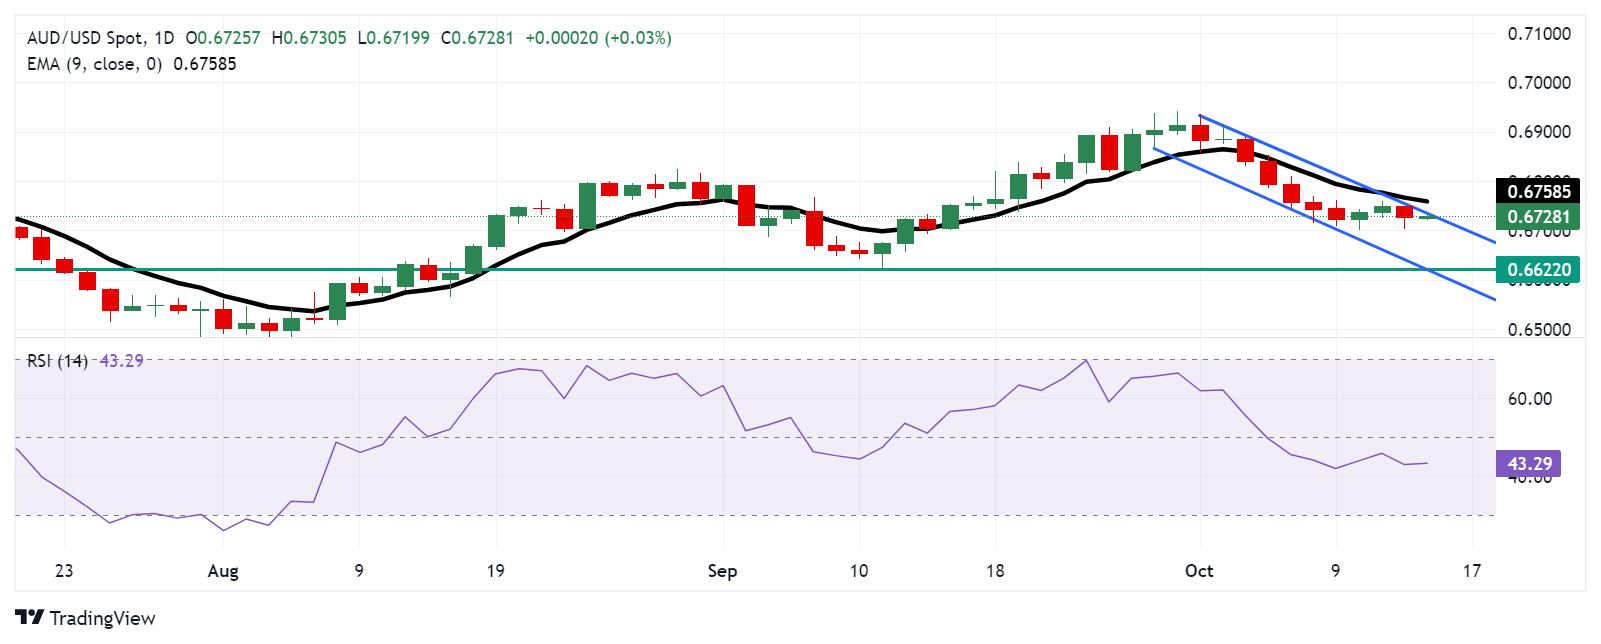
Australian Dollar PRICE Today
The table below shows the percentage change of Australian Dollar (AUD) against listed major currencies today. Australian Dollar was the weakest against the Japanese Yen.
| USD | EUR | GBP | JPY | CAD | AUD | NZD | CHF | |
|---|---|---|---|---|---|---|---|---|
| USD | 0.00% | -0.05% | -0.21% | 0.01% | -0.05% | 0.12% | -0.17% | |
| EUR | -0.01% | -0.06% | -0.23% | -0.02% | -0.05% | 0.10% | -0.18% | |
| GBP | 0.05% | 0.06% | -0.16% | 0.05% | 0.00% | 0.16% | -0.06% | |
| JPY | 0.21% | 0.23% | 0.16% | 0.21% | 0.15% | 0.31% | 0.07% | |
| CAD | -0.01% | 0.02% | -0.05% | -0.21% | -0.06% | 0.11% | -0.12% | |
| AUD | 0.05% | 0.05% | -0.01% | -0.15% | 0.06% | 0.16% | -0.07% | |
| NZD | -0.12% | -0.10% | -0.16% | -0.31% | -0.11% | -0.16% | -0.23% | |
| CHF | 0.17% | 0.18% | 0.06% | -0.07% | 0.12% | 0.07% | 0.23% |
The heat map shows percentage changes of major currencies against each other. The base currency is picked from the left column, while the quote currency is picked from the top row. For example, if you pick the Australian Dollar from the left column and move along the horizontal line to the US Dollar, the percentage change displayed in the box will represent AUD (base)/USD (quote).
Australian Dollar FAQs
One of the most significant factors for the Australian Dollar (AUD) is the level of interest rates set by the Reserve Bank of Australia (RBA). Because Australia is a resource-rich country another key driver is the price of its biggest export, Iron Ore. The health of the Chinese economy, its largest trading partner, is a factor, as well as inflation in Australia, its growth rate and Trade Balance. Market sentiment – whether investors are taking on more risky assets (risk-on) or seeking safe-havens (risk-off) – is also a factor, with risk-on positive for AUD.
The Reserve Bank of Australia (RBA) influences the Australian Dollar (AUD) by setting the level of interest rates that Australian banks can lend to each other. This influences the level of interest rates in the economy as a whole. The main goal of the RBA is to maintain a stable inflation rate of 2-3% by adjusting interest rates up or down. Relatively high interest rates compared to other major central banks support the AUD, and the opposite for relatively low. The RBA can also use quantitative easing and tightening to influence credit conditions, with the former AUD-negative and the latter AUD-positive.
China is Australia’s largest trading partner so the health of the Chinese economy is a major influence on the value of the Australian Dollar (AUD). When the Chinese economy is doing well it purchases more raw materials, goods and services from Australia, lifting demand for the AUD, and pushing up its value. The opposite is the case when the Chinese economy is not growing as fast as expected. Positive or negative surprises in Chinese growth data, therefore, often have a direct impact on the Australian Dollar and its pairs.
Iron Ore is Australia’s largest export, accounting for $118 billion a year according to data from 2021, with China as its primary destination. The price of Iron Ore, therefore, can be a driver of the Australian Dollar. Generally, if the price of Iron Ore rises, AUD also goes up, as aggregate demand for the currency increases. The opposite is the case if the price of Iron Ore falls. Higher Iron Ore prices also tend to result in a greater likelihood of a positive Trade Balance for Australia, which is also positive of the AUD.
The Trade Balance, which is the difference between what a country earns from its exports versus what it pays for its imports, is another factor that can influence the value of the Australian Dollar. If Australia produces highly sought after exports, then its currency will gain in value purely from the surplus demand created from foreign buyers seeking to purchase its exports versus what it spends to purchase imports. Therefore, a positive net Trade Balance strengthens the AUD, with the opposite effect if the Trade Balance is negative.
- The Japanese Yen recovers a bit against the USD, from over a two-month low set on Monday.
- The BoJ rate-hike uncertainty and the upbeat market mood to cap gains for the safe-haven JPY.
- Bets for smaller interest rate cuts by the Fed underpin the USD and favor the USD/JPY bulls.
The Japanese Yen (JPY) edges higher against its American counterpart during the Asian session on Tuesday and reverses a part of the previous day's losses to the 150.00 psychological mark, or the lowest level since early August. Any meaningful upside for the JPY, however, still seems elusive in the wake of the uncertainty over the Bank of Japan's (BoJ) rate-hike plans. Apart from this, the prevalent risk-on environment might contribute to capping the safe-haven JPY.
Meanwhile, traders no longer expect another outsized interest rate cut by the Federal Reserve (Fed) in November, which had been a key factor behind the recent upswing in the US Treasury bond yields. This, in turn, keeps the US Dollar (USD) well supported near a two-month peak and could further undermine the low-yielding JPY. Hence, any subsequent slide in the USD/JPY pair might be seen as a buying opportunity and is more likely to remain limited.
Daily Digest Market Movers: Japanese Yen seems vulnerable amid diminishing odds for more BoJ rate hikes in 2024
- Japanese Prime Minister Shigeru Ishiba's recent comments successfully pushed back market expectations for any further interest rate increases by the Bank of Japan (BoJ) in the near term.
- US equity indices carried forward the upward momentum on Monday, with the S&P 500 and the Dow Jones Industrial Average hitting new record highs amid hopes for solid earnings.
- The US Dollar built on its recent gains registered over the past two weeks or so and shot to its highest level since August 8 amid bets for smaller interest rate cuts by the Federal Reserve.
- Minneapolis Fed President Neel Kashkari said on Monday that the recent jobs data shows labor market isn't weakening and the path of policy to be driven by data, the economy's performance.
- Separately, Fed Governor Christopher Waller noted the US central bank should proceed with more caution on interest rate cuts than was needed at the September policy meeting.
- According to the CME Group's FedWatch Tool, traders are pricing in a greater chance of a regular 25 basis points rate reduction in November and over a 15% probability of a no-cut.
- A quick increase in 10-year US government bond yields over the last few weeks to levels beyond the 4% threshold favors the USD bulls and should cap the low-yielding Japanese Yen.
- Traders now look to the release of the Empire State Manufacturing Index for some impetus later during the North American session ahead of speeches by influential FOMC members.
Technical Outlook: USD/JPY bulls retain control near two-month top; move beyond 150.00 psychological mark awaited
From a technical perspective, any further slide is more likely to attract dip-buying near the 149.00 mark. This might help limit the downside for the USD/JPY pair near the 148.55-148.50 region. The latter is likely to act as a key pivotal point, which if broken might prompt aggressive selling and drag spot prices below the 148.00 round figure, towards last week's swing low, around the 147.35-147.30 area.
On the flip side, sustained strength and acceptance above the 150.00 psychological mark will be seen as a fresh trigger for bullish traders. Given that oscillators on the daily chart are holding in positive territory and are still away from being in the overbought zone, the USD/JPY pair might then aim to challenge the August monthly swing high, around the 150.85-150.90 region. Some follow-through buying beyond the 151.00 round figure will suggest that spot prices have bottomed out and pave the way for a further near-term appreciating move.
Japanese Yen FAQs
The Japanese Yen (JPY) is one of the world’s most traded currencies. Its value is broadly determined by the performance of the Japanese economy, but more specifically by the Bank of Japan’s policy, the differential between Japanese and US bond yields, or risk sentiment among traders, among other factors.
One of the Bank of Japan’s mandates is currency control, so its moves are key for the Yen. The BoJ has directly intervened in currency markets sometimes, generally to lower the value of the Yen, although it refrains from doing it often due to political concerns of its main trading partners. The BoJ ultra-loose monetary policy between 2013 and 2024 caused the Yen to depreciate against its main currency peers due to an increasing policy divergence between the Bank of Japan and other main central banks. More recently, the gradually unwinding of this ultra-loose policy has given some support to the Yen.
Over the last decade, the BoJ’s stance of sticking to ultra-loose monetary policy has led to a widening policy divergence with other central banks, particularly with the US Federal Reserve. This supported a widening of the differential between the 10-year US and Japanese bonds, which favored the US Dollar against the Japanese Yen. The BoJ decision in 2024 to gradually abandon the ultra-loose policy, coupled with interest-rate cuts in other major central banks, is narrowing this differential.
The Japanese Yen is often seen as a safe-haven investment. This means that in times of market stress, investors are more likely to put their money in the Japanese currency due to its supposed reliability and stability. Turbulent times are likely to strengthen the Yen’s value against other currencies seen as more risky to invest in.
The People’s Bank of China (PBoC) set the USD/CNY central rate for the trading session ahead on Tuesday at 7.0830, as compared to the previous day's fix of 7.0723 and 7.0840 Reuters estimates.
| Index | Change, points | Closed | Change, % |
|---|---|---|---|
| Hang Seng | -159.11 | 21092.87 | -0.75 |
| KOSPI | 26.38 | 2623.29 | 1.02 |
| ASX 200 | 38.3 | 8252.8 | 0.47 |
| DAX | 134.46 | 19508.29 | 0.69 |
| CAC 40 | 24.17 | 7602.06 | 0.32 |
| Dow Jones | 201.36 | 43065.22 | 0.47 |
| S&P 500 | 44.82 | 5859.85 | 0.77 |
| NASDAQ Composite | 159.75 | 18502.69 | 0.87 |
| Pare | Closed | Change, % |
|---|---|---|
| AUDUSD | 0.67249 | -0.14 |
| EURJPY | 163.351 | 0.16 |
| EURUSD | 1.09063 | -0.24 |
| GBPJPY | 195.551 | 0.37 |
| GBPUSD | 1.30578 | -0.01 |
| NZDUSD | 0.60946 | 0.03 |
| USDCAD | 1.37939 | 0.17 |
| USDCHF | 0.86246 | 0.57 |
| USDJPY | 149.763 | 0.39 |


© 2000-2026. All rights reserved.
This site is managed by Teletrade D.J. LLC 2351 LLC 2022 (Euro House, Richmond Hill Road, Kingstown, VC0100, St. Vincent and the Grenadines).
The information on this website is for informational purposes only and does not constitute any investment advice.
The company does not serve or provide services to customers who are residents of the US, Canada, Iran, The Democratic People's Republic of Korea, Yemen and FATF blacklisted countries.
Making transactions on financial markets with marginal financial instruments opens up wide possibilities and allows investors who are willing to take risks to earn high profits, carrying a potentially high risk of losses at the same time. Therefore you should responsibly approach the issue of choosing the appropriate investment strategy, taking the available resources into account, before starting trading.
Use of the information: full or partial use of materials from this website must always be referenced to TeleTrade as the source of information. Use of the materials on the Internet must be accompanied by a hyperlink to teletrade.org. Automatic import of materials and information from this website is prohibited.
Please contact our PR department if you have any questions or need assistance at pr@teletrade.global.
transfers