- Analytics
- News and Tools
- Market News
CFD Markets News and Forecasts — 15-08-2014
Stock indices closed lower as the Ukrainian government said its troops attacked a military convoy that entered the country from Russia. In the earlier trading session, stocks traded higher on speculation that the ECB will add new stimulus measures to support the economy.
The UK gross domestic product grew at annual rate of 3.2% in the second quarter, exceeding expectations for a 3.1% gain, after a 3.1% rise in the first quarter. That was the fastest pace since the end of 2007.
On a monthly basis, the UK GDP increased 0.8% in the second quarter, in line with expectations, after a 0.8% rise in the first quarter.
Indexes on the close:
Name Price Change Change %
FTSE 100 6,689.08 +3.82 +0.06%
DAX 9,092.6 -132.50 -1.44%
CAC 40 4,174.36 -31.07 -0.74%
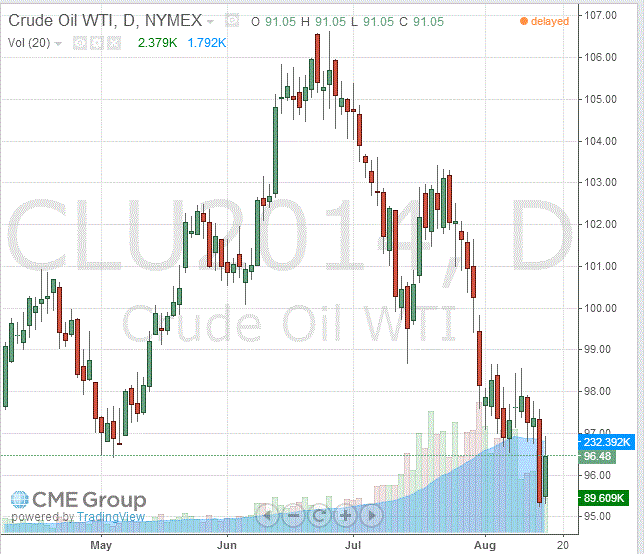
The price of oil rose today, while rising above $ 103 per barrel (Brent), but still remained near 13-month low due to the weakening of the threat reduction of supplies from Iraq. Traders note that oil is going up against the fact that investors have found a dip in the last few days excessive.
"The market is oversold, so expect crude oil purchases. Unresolved issue before the weekend remains a factor of tension between Russia and Ukraine ", - said the head of Mizuho Securities USA Inc. Bob Yoger. Recall, according to the Ministry of Energy of the United States, released on Thursday, the oil production in the country increased in July to 8.5 million barrels per day, with a peak in April 1987. Meanwhile, the US crude stocks rose last week by 1.4 million barrels to 367 million barrels.
Market participants also drew attention to today's reports. The Federal Reserve said that in July, the volume of industrial production in the United States increased by 0.4% compared with June. Economists had expected the index by 0.3%. The June rise in industrial production was revised down from 0.2% to 0.4%. The main factor of growth in July was the jump in car production by 10.1% - the highest since July 2009. Production in the manufacturing industry increased last month by 1% after rising a revised 0.3% in June. The growth rate in July was the best in five months and significantly exceeded the forecast (0.4%). Excluding autos and auto components, industrial production rose by 0.4%.
Investors are also watching the geopolitical situation. As it became known, Ukrainian troops attacked and destroyed "part" of the column of military equipment, which came into the country through the border post Izvarino controlled by pro-Russian rebels. The representative of the Russian Defense Ministry refused to comment on the phone operational.
The cost of the September futures for the American light crude oil WTI (Light Sweet Crude Oil) rose to $ 96.48 per barrel and then declined to $ 97.25 per barrel on the New York Mercantile Exchange (NYMEX).
September futures price for North Sea Brent crude oil mixture rose $ 1.07 to $ 103.07 a barrel on the London exchange ICE Futures Europe.
The U.S. dollar traded mixed against the most major currencies after mixed economic data from the U.S. The U.S. producer price index rose 0.1% in July, in line with expectations, after a 0.4% gain in June.
On a yearly basis, the U.S. producer price index increased 1.7% in July, missing expectations for a 1.8% gain, after a 0.4% rise in June.
The U.S. producer price inflation, excluding food and energy, climbed 0.2% in July, in line with expectations, after a 0.2% rise the previous month.
On a yearly basis, the U.S. producer price index, excluding food and energy, gained 1.6% in July, in line with expectations, after a 1.8% increase in June.
The Reuters/Michigan consumer sentiment index declined to 79.2 in August from 81.8 in June. Analysts had expected the index to increase to 82.7.
The NY Fed Empire State manufacturing index decreased to 14.7 in August from 25.6 in July, missing expectations for a fall to 20.3.
The euro traded higher against the U.S. dollar in the absence of any major economic reports in the Eurozone.
The U.S. industrial production rose 0.4% in July, exceeding expectations for a 0.3% rise, after a 0.4% gain in June. June's figure was revised up from a 0.2% increase.
The British pound traded mixed against the U.S. dollar after the better-than-expected UK GDP. The UK gross domestic product grew at annual rate of 3.2% in the second quarter, exceeding expectations for a 3.1% gain, after a 3.1% rise in the first quarter. That was the fastest pace since the end of 2007.
On a monthly basis, the UK GDP increased 0.8% in the second quarter, in line with expectations, after a 0.8% rise in the first quarter.
The Canadian dollar traded mixed against the U.S. dollar after the better-than-expected Canadian manufacturing shipments. The Canadian manufacturing shipments climbed 0.6% in June, beating expectations for a 0.5% rise, after a 1.7% gain in May. May's figure was revised up from a 1.6% increase.
The New Zealand dollar traded mixed against the U.S dollar in the absence of any major economic reports in New Zealand.
The Australian dollar traded lower against the U.S. dollar. No major economic reports were released in Australia.
The Japanese yen increased against the U.S. dollar in absence of any major economic reports in Japan.
Gold prices fell sharply today, but in the last few hours were able to restore most of the lost ground amid reports of infiltration of the Russian armed forces in Ukraine. Recall, economic and geopolitical events around the world remains a source of instability and uncertainty.
On the dynamics of trade continue to affect yesterday's data from the World Gold Council, which showed that global demand for gold in the second quarter of 2014 decreased compared to the same period of 2013 by 16% to 963.8 Tonny (30.98 million ounces) in mainly due to the reduction in demand from the jewelry industry in the third. In value terms, demand for gold in the second quarter totaled $ 39.922 billion, a decline of 24% or $ 12.31 billion compared with the same period a year earlier. Demand for gold in China in the second quarter of 2014 fell by half to 208 tons for a total of $ 8.6 billion. In India, demand has also decreased by 39% to 204 tons for a total of $ 8.45 billion. Total supply of gold in the second quarter increased by 10% to 1,078 thousand. tons, including world production - by 13% to 815.3 tons. The World Gold Council expects that the supply of gold will reach its peak in 2014 and is held at this level for the next 4-6 quarters.
Little influenced by today's reports on the United States, which has shown that price indicator in the United States rose slightly in July - it's a sign that inflationary pressures remain modest in the USA economy. Producer price index for final demand, which measures changes in the prices that companies get when they sell goods and services, increased a seasonally adjusted 0.1% last month from June, the Labor Department reported Friday. Excluding volatile categories of food and energy, producer prices rose 0.2%. The result coincided with economists' expectations. Producer prices rose 1.7% in July compared with a year earlier, down from an annual rate of growth of 1.9% in June, 2% in May and 2.1% in April.
Meanwhile, it was reported that hedge fund manager John Paulson, the billionaire has retained its stake in the largest exchange-traded products backed by gold, as the metal prices rose. During the three months ended June 30, Paulson & Co., the biggest investor in the SPDR Gold Trust (GLD), upheld its share of $ 10.23 million. Shares, the government reported yesterday. Rate has not changed the fourth consecutive quarter.
This year, the assets of SPDR Gold Trust fell 0.3 percent to 795.6 metric tons, after falling 41 percent in 2013.
The cost of the September futures contract for gold on COMEX today dropped to $ 1305.90 per ounce.
EUR/USD $1.3365(E200mn), $1.3400(E545mn), $1.3425(E519mn)
USD/JPY Y101.80-85($200mn), Y102.00($100mn), Y102.25($100mn), Y102.50($150mn), Y103.00($220mn), Y103.50($455mn)
GBP/USD $1.6740(stg263mn)
EUR/GBP stg0.7940(E250mn), stg0.8000(E160mn), stg0.8100(E200mn)
AUD/USD $0.9275(A$132mn), $0.9315-25(A$450mn), $0.9375(A$100mn)
NZD/USD $0.8450(NZ$100mn)
USD/CAD C$1.0815($200mn), C$1.0850($481mn), C$1.0875($490mn), C$1.0915-25($450mn), C$1.0950($327mn)
The U.S. Labor Department released the producer price data today. The U.S. producer price index rose 0.1% in July, in line with expectations, after a 0.4% gain in June.
On a yearly basis, the U.S. producer price index increased 1.7% in July, missing expectations for a 1.8% gain, after a 0.4% rise in June.
Gasoline prices declined 2.1in July, while food prices rose 0.4% last month.
Prices for services increased 0.1% in July.
The U.S. producer price inflation, excluding food and energy, climbed 0.2% in July, in line with expectations, after a 0.2% rise the previous month.
On a yearly basis, the U.S. producer price index, excluding food and energy, gained 1.6% in July, in line with expectations, after a 1.8% increase in June.
U.S. stock-index futures advanced as investors weighed developments in Ukraine and data showing wholesale prices grew at a slower pace last month.
Global markets:
Nikkei 15,314.57 +100.94 +0.66%
Hang Seng 24,801.36 -88.98 -0.36%
Shanghai Composite 2,206.47 -16.41 -0.74%
FTSE 6,680.79 +24.11 +0.36%
CAC 4,198.36 +3.57 +0.09%
DAX 9,209.91 +11.03 +0.12%
Crude oil $95.78 (+0.21%)
Gold $1304.20 (-0.87%)
(company / ticker / price / change, % / volume)
| Johnson & Johnson | JNJ | 102.04 | +0.02% | 0.6K |
| Wal-Mart Stores Inc | WMT | 74.50 | +0.15% | 0.9K |
| Verizon Communications Inc | VZ | 49.08 | +0.16% | 23.6K |
| Home Depot Inc | HD | 84.00 | +0.17% | 3.5K |
| Intel Corp | INTC | 34.00 | +0.18% | 15.2K |
| Exxon Mobil Corp | XOM | 99.28 | +0.19% | 0.9K |
| Walt Disney Co | DIS | 88.80 | +0.21% | 5.7K |
| Cisco Systems Inc | CSCO | 24.60 | +0.24% | 32.1K |
| General Electric Co | GE | 25.95 | +0.27% | 15.4K |
| Microsoft Corp | MSFT | 44.40 | +0.29% | 6.8K |
| American Express Co | AXP | 87.53 | +0.30% | 0.1K |
| JPMorgan Chase and Co | JPM | 57.15 | +0.30% | 0.1K |
| Visa | V | 213.17 | +0.31% | 1.1K |
| AT&T Inc | T | 35.03 | +0.34% | 3.0K |
| Pfizer Inc | PFE | 28.85 | +0.42% | 1.5K |
| Caterpillar Inc | CAT | 106.12 | +0.44% | 0.1K |
| E. I. du Pont de Nemours and Co | DD | 65.50 | +0.46% | 0.1K |
| Boeing Co | BA | 124.75 | +0.52% | 1.2K |
| The Coca-Cola Co | KO | 40.92 | +1.84% | 0.1K |
| McDonald's Corp | MCD | 93.66 | 0.00% | 11.6K |
| Chevron Corp | CVX | 126.36 | -0.47% | 0.5K |
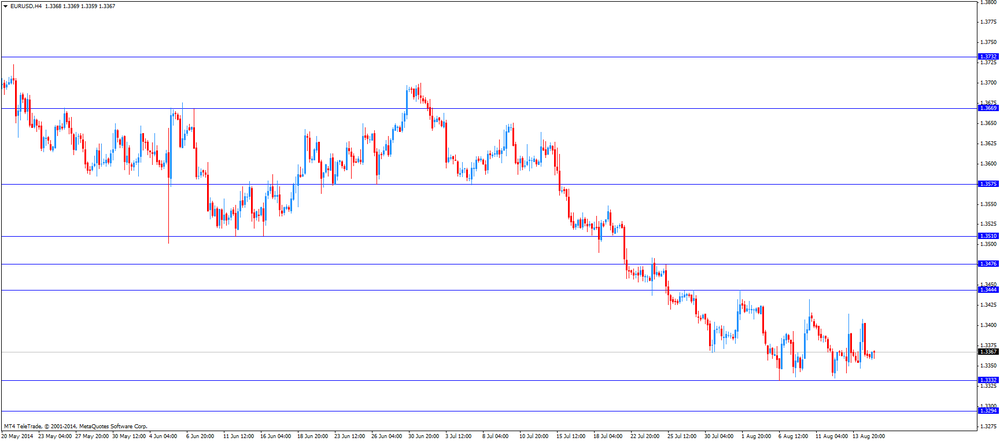
EUR/USD
Offers $1.3445-50
Bids $1.3335-30
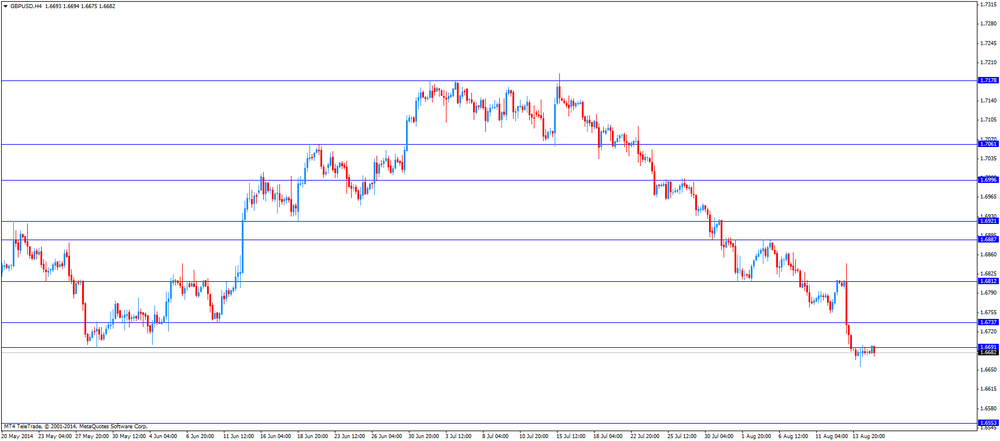
GBP/USD
Offers $1.6800/10, $1.6725-30, $1.6700-05
Bids $1.6650, $1.6620
AUD/USD
Offers $0.9400, $0.9380, $0.9350
Bids $0.9300, $0.9285/80, $0.9240, $0.9220/00
EUR/JPY
Offers Y138.20, Y138.00, Y137.50
Bids Y137.00, Y136.80, Y136.50, Y136.25/20
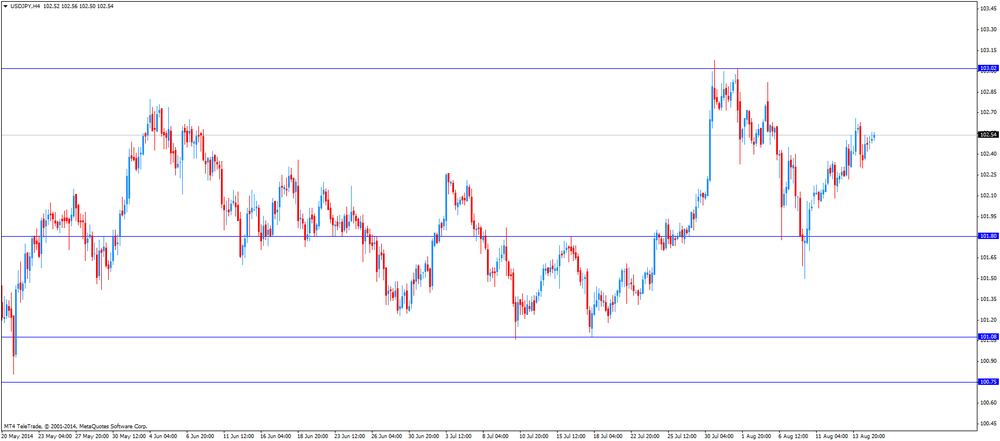
USD/JPY
Offers Y103.50, Y103.00, Y102.80/85, Y102.65/70
Bids Y102.25/20, Y102.00, Y101.80, Y101.50
EUR/GBP
Offers stg0.8100
Bids stg0.8000, stg0.7990
Economic calendar (GMT0):
(Time/ Region/ Event/ Period/ Previous/ Forecast/ Actual)
06:00 France Bank holiday
08:30 United Kingdom GDP, q/q (Revised) Quarter II +0.8% +0.8% +0.8%
08:30 United Kingdom GDP, y/y (Revised) Quarter II +3.1% +3.1% +3.2%
The U.S. dollar traded mixed to lower against the most major currencies ahead of the economic data from the U.S. Yesterday's disappointing the number of initial jobless claims in the U.S. weighed on the greenback. The number of initial jobless claims in the week ending August 9 rose by 21,000 to 311,000 from 290,000 in the previous week.
The euro traded higher against the U.S. dollar in the absence of any major economic reports in the Eurozone.
The British pound traded mixed against the U.S. dollar after the better-than-expected UK GDP. The UK gross domestic product grew at annual rate of 3.2% in the second quarter, exceeding expectations for a 3.1% gain, after a 3.1% rise in the first quarter. That was the fastest pace since the end of 2007.
On a monthly basis, the UK GDP increased 0.8% in the second quarter, in line with expectations, after a 0.8% rise in the first quarter.
The Canadian dollar traded mixed against the U.S. dollar ahead of the Canadian manufacturing shipments. The Canadian manufacturing shipments are expected to climb 0.5% in June, after a 1.6% gain in May.
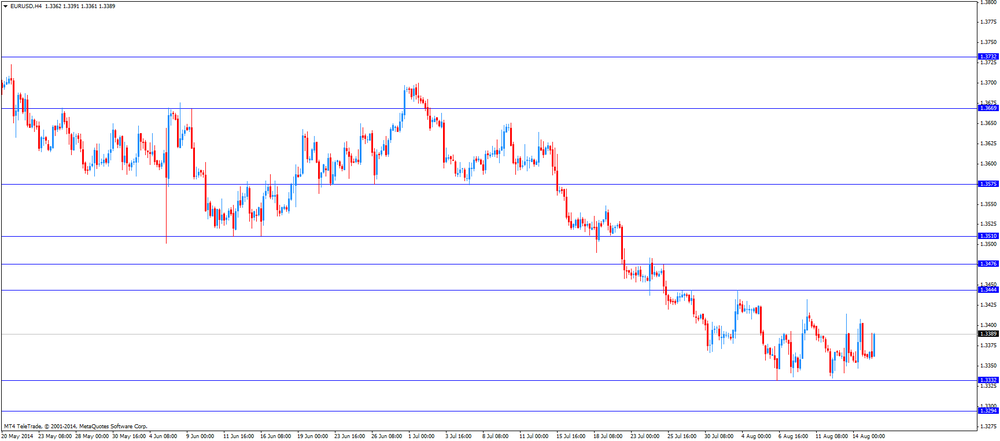
EUR/USD: the currency pair rose to $1.3391
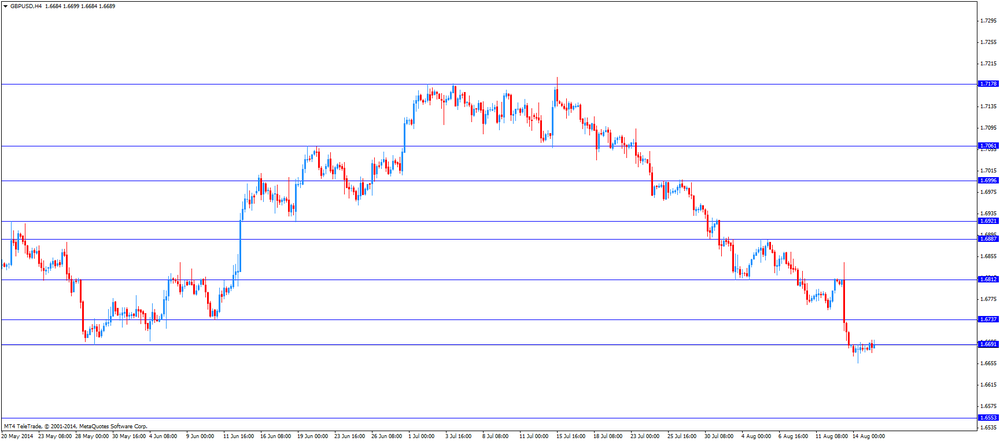
GBP/USD: the currency pair traded mixed
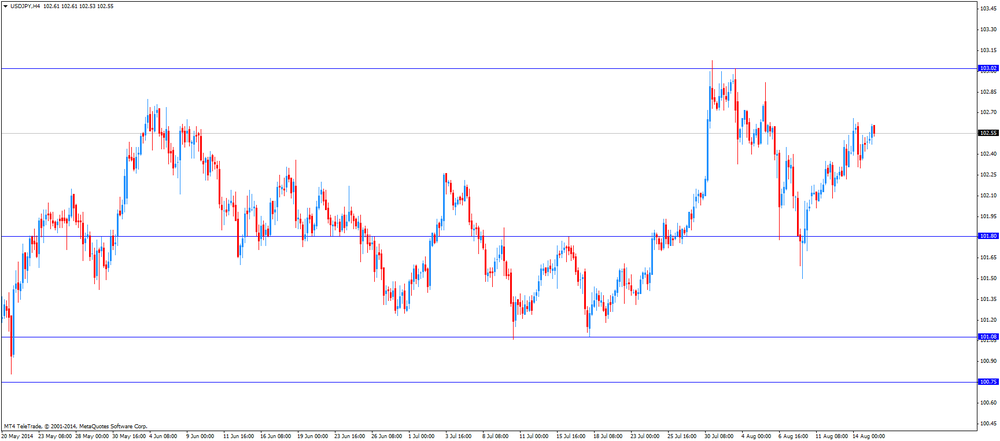
USD/JPY: the currency pair increased to Y102.62
The most important news that are expected (GMT0):
12:30 Canada Manufacturing Shipments (MoM) June +1.6% +0.5%
12:30 U.S. PPI, m/m July +0.4% +0.1%
12:30 U.S. PPI, y/y July +1.9% +1.8%
12:30 U.S. PPI excluding food and energy, m/m July +0.2% +0.2%
12:30 U.S. PPI excluding food and energy, Y/Y July +1.8% +1.6%
12:30 U.S. NY Fed Empire State manufacturing index August 25.6 20.3
13:00 U.S. Total Net TIC Flows June 19.4 27.3
13:00 U.S. Net Long-term TIC Flows June 35.5
13:15 U.S. Industrial Production (MoM) July +0.2% +0.3%
13:15 U.S. Capacity Utilization July 79.1% 79.2%
13:55 U.S. Reuters/Michigan Consumer Sentiment Index (Preliminary) August 81.3 82.7
Stock indices advanced on speculation that the ECB will add new stimulus measures to support the economy.
The UK gross domestic product grew at annual rate of 3.2% in the second quarter, exceeding expectations for a 3.1% gain, after a 3.1% rise in the first quarter. That was the fastest pace since the end of 2007.
On a monthly basis, the UK GDP increased 0.8% in the second quarter, in line with expectations, after a 0.8% rise in the first quarter.
Current figures:
Name Price Change Change %
FTSE 100 6,728.04 +42.78 +0.64%
DAX 9,319.45 +94.35 +1.02%
CAC 40 4,244.24 +38.81 +0.92%
The Office for National Statistics (ONS) released revised gross domestic product estimate. The UK gross domestic product grew at annual rate of 3.2% in the second quarter, exceeding expectations for a 3.1% gain, after a 3.1% rise in the first quarter. That was the fastest pace since the end of 2007.
On a monthly basis, the UK GDP increased 0.8% in the second quarter, in line with expectations, after a 0.8% rise in the first quarter.
The construction sector has showed a stronger performance than previously calculated.
The service sector expanded by 1%.
Asian stock indices closed higher in the subdued trade. Investors were focused on corporate earnings, and also weighed geopolitical tensions.
Chinese stocks traded higher due to speculation that the government in China will add stimulus measures to support the economy.
Trading on markets in Japan was subdued because of the Obon holidays.
BHP Billiton Ltd. shares rose 2.3% after reporting that the company may announce a spinoff of assets next week.
China Mobile Ltd. jumped 5.8% after Credit Suisse Group AG and Barclays Plc upgraded the company's stock.
Indexes on the close:
Nikkei 225 15,318.34 +3.77 +0.02%
Hang Seng 24,954.94 +153.58 +0.62%
Shanghai Composite 2,226.73 +20.27 +0.92%
EUR/USD $1.3365(E200mn), $1.3400(E545mn), $1.3425(E519mn)
USD/JPY Y101.80-85($200mn), Y102.00($100mn), Y102.25($100mn), Y102.50($150mn), Y103.00($220mn), Y103.50($455mn)
GBP/USD $1.6740(stg263mn)
EUR/GBP stg0.7940(E250mn), stg0.8000(E160mn), stg0.8100(E200mn)
AUD/USD $0.9275(A$132mn), $0.9315-25(A$450mn), $0.9375(A$100mn)
NZD/USD $0.8450(NZ$100mn)
USD/CAD C$1.0815($200mn), C$1.0850($481mn), C$1.0875($490mn), C$1.0915-25($450mn), C$1.0950($327mn)
Economic calendar (GMT0):
(Time/ Region/ Event/ Period/ Previous/ Forecast/ Actual)
06:00 France Bank holiday
08:30 United Kingdom GDP, q/q (Revised) Quarter II +0.8% +0.8% +0.8%
08:30 United Kingdom GDP, y/y (Revised) Quarter II +3.1% +3.1% +3.2%
The U.S. dollar traded mixed to lower against the most major currencies. Yesterday's disappointing the number of initial jobless claims in the U.S. weighed on the U.S. currency. The number of initial jobless claims in the week ending August 9 rose by 21,000 to 311,000 from 290,000 in the previous week.
The New Zealand dollar traded mixed against the U.S dollar in the absence of any major economic reports in New Zealand.
The Australian dollar rose against the U.S. dollar due to yesterday's weaker-than-expected number of initial jobless claims in the U.S. No major economic reports were released in Australia.
The Japanese yen traded mixed against the U.S. dollar in absence of any major economic reports in Japan.
EUR/USD: the currency pair traded mixed
GBP/USD: the currency pair traded mixed
USD/JPY: the currency pair traded mixed
The most important news that are expected (GMT0):
12:30 Canada Manufacturing Shipments (MoM) June +1.6% +0.5%
12:30 U.S. PPI, m/m July +0.4% +0.1%
12:30 U.S. PPI, y/y July +1.9% +1.8%
12:30 U.S. PPI excluding food and energy, m/m July +0.2% +0.2%
12:30 U.S. PPI excluding food and energy, Y/Y July +1.8% +1.6%
12:30 U.S. NY Fed Empire State manufacturing index August 25.6 20.3
13:00 U.S. Total Net TIC Flows June 19.4 27.3
13:00 U.S. Net Long-term TIC Flows June 35.5
13:15 U.S. Industrial Production (MoM) July +0.2% +0.3%
13:15 U.S. Capacity Utilization July 79.1% 79.2%
13:55 U.S. Reuters/Michigan Consumer Sentiment Index (Preliminary) August 81.3 82.7
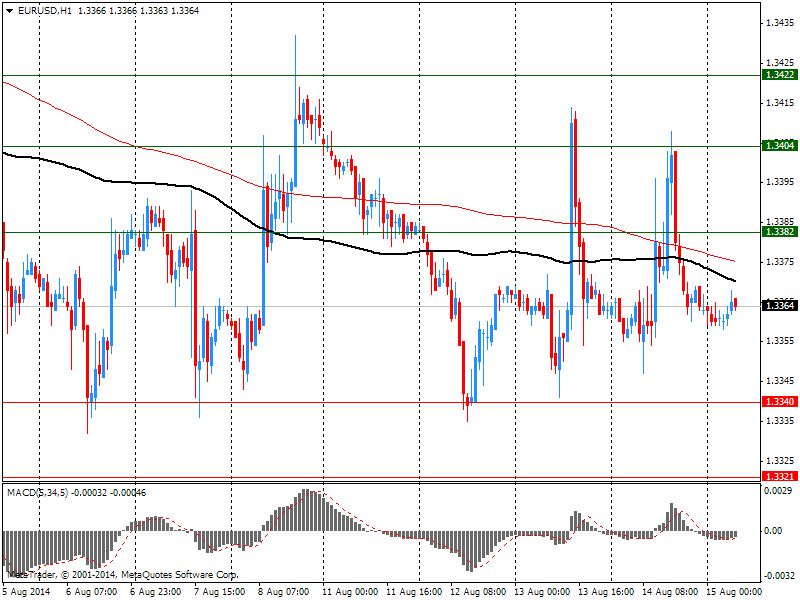
EUR / USD
Resistance levels (open interest**, contracts)
$1.3422 (1303)
$1.3404 (682)
$1.3382 (39)
Price at time of writing this review: $ 1.3364
Support levels (open interest**, contracts):
$1.3340 (1790)
$1.3321 (4601)
$1.3296 (4371)
Comments:
- Overall open interest on the CALL options with the expiration date September, 5 is 54227 contracts, with the maximum number of contracts with strike price $1,3400 (5731);
- Overall open interest on the PUT options with the expiration date September, 5 is 56824 contracts, with the maximum number of contracts with strike price $1,3100 (6055);
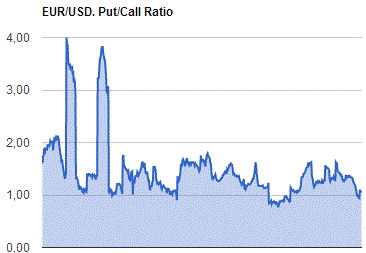
- The ratio of PUT/CALL was 1.05 versus 1.06 from the previous trading day according to data from August, 14
GBP/USD
Resistance levels (open interest**, contracts)
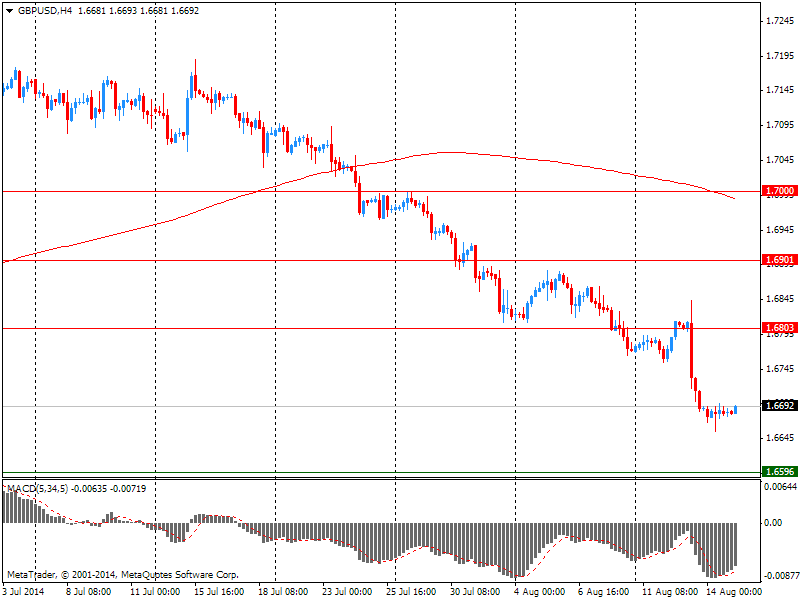
$1.7000 (3314)
$1.6901 (2208)
$1.6803 (1525)
Price at time of writing this review: $1.6692
Support levels (open interest**, contracts):
$1.6596 (1894)
$1.6498 (1920)
$1.6399 (752)
Comments:
- Overall open interest on the CALL options with the expiration date September, 5 is 27465 contracts, with the maximum number of contracts with strike price $1,7000 (3314);
- Overall open interest on the PUT options with the expiration date September, 5 is 29260 contracts, with the maximum number of contracts with strike price $1,6800 (4007);
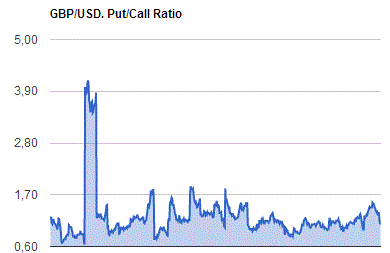
- The ratio of PUT/CALL was 1.07 versus 1.09 from the previous trading day according to data from August, 14
* - The Chicago Mercantile Exchange bulletin (CME) is used for the calculation.
** - Open interest takes into account the total number of option contracts that are open at the moment.
© 2000-2026. All rights reserved.
This site is managed by Teletrade D.J. LLC 2351 LLC 2022 (Euro House, Richmond Hill Road, Kingstown, VC0100, St. Vincent and the Grenadines).
The information on this website is for informational purposes only and does not constitute any investment advice.
The company does not serve or provide services to customers who are residents of the US, Canada, Iran, The Democratic People's Republic of Korea, Yemen and FATF blacklisted countries.
Making transactions on financial markets with marginal financial instruments opens up wide possibilities and allows investors who are willing to take risks to earn high profits, carrying a potentially high risk of losses at the same time. Therefore you should responsibly approach the issue of choosing the appropriate investment strategy, taking the available resources into account, before starting trading.
Use of the information: full or partial use of materials from this website must always be referenced to TeleTrade as the source of information. Use of the materials on the Internet must be accompanied by a hyperlink to teletrade.org. Automatic import of materials and information from this website is prohibited.
Please contact our PR department if you have any questions or need assistance at pr@teletrade.global.
