- Analytics
- News and Tools
- Market News
CFD Markets News and Forecasts — 15-05-2024
Japanese Gross Domestic Product (GDP) for the first quarter (Q1) came in at -0.5% QoQ versus -0.4% expected and 0.1% prior, the Cabinet Office showed on Thursday.
Furthermore, the Annualized GDP contracted 2.0% versus the expectation of 1.5% contraction and 0.4% expansion prior.
Market reaction
Following the Japanese growth numbers, the USD/JPY pair is down 0.40% on the day to trade at 154.27.
Japanese Yen FAQs
The Japanese Yen (JPY) is one of the world’s most traded currencies. Its value is broadly determined by the performance of the Japanese economy, but more specifically by the Bank of Japan’s policy, the differential between Japanese and US bond yields, or risk sentiment among traders, among other factors.
One of the Bank of Japan’s mandates is currency control, so its moves are key for the Yen. The BoJ has directly intervened in currency markets sometimes, generally to lower the value of the Yen, although it refrains from doing it often due to political concerns of its main trading partners. The current BoJ ultra-loose monetary policy, based on massive stimulus to the economy, has caused the Yen to depreciate against its main currency peers. This process has exacerbated more recently due to an increasing policy divergence between the Bank of Japan and other main central banks, which have opted to increase interest rates sharply to fight decades-high levels of inflation.
The BoJ’s stance of sticking to ultra-loose monetary policy has led to a widening policy divergence with other central banks, particularly with the US Federal Reserve. This supports a widening of the differential between the 10-year US and Japanese bonds, which favors the US Dollar against the Japanese Yen.
The Japanese Yen is often seen as a safe-haven investment. This means that in times of market stress, investors are more likely to put their money in the Japanese currency due to its supposed reliability and stability. Turbulent times are likely to strengthen the Yen’s value against other currencies seen as more risky to invest in.
- GBP/USD gains momentum around 1.2688 amid the weaker USD on Thursday.
- The US CPI inflation eased to 3.4% YoY in April from 3.5% in March, as estimated.
- Steady UK wage growth raised fears of persistent inflationary pressures.
The GBP/USD pair extends its upside near 1.2688 on Thursday during the early Asian session. The uptick of the major pair is supported by the weaker Greenback after the release of softer US CPI inflation data. Later in the day, the US Building Permits, Housing Starts, the weekly Initial Jobless Claims, the Philly Fed Manufacturing Index, and Industrial Production will be released. Also, the Federal Reserve’s (Fed) Barr, Harker, Mester, and Bostic are set to speak on Thursday.
Inflation in the United States eased slightly in April. The Consumer Price Index (CPI) rose 3.4% on a yearly basis in April, compared to an increase of 3.5% in March, according to the US Bureau of Labor Statistics (BLS) on Wednesday. The annual core CPI inflation eased to 3.6% YoY in April from 3.8% in the previous reading. Both figures came in line with the estimation. On a monthly basis, the CPI and the core CPI both rose 0.3% MoM in April. The softer inflation data raised the odds for a Federal Reserve (Fed) rate cut in 2024, which drag the US Dollar (USD) lower and create a tailwind for the GBP/USD pair.
Furthermore, the final reading of Retail Sales showed no change in April from the previous reading of a 3% increase, worse than the market expectation of 0.4%.
On the GBP’s front, the UK employment data showed job market conditions deteriorated for the third consecutive month as the Unemployment Rate rose. Nonetheless, the Bank of England (BoE) policymakers remain concerned over high service inflation as it could stall progress in the disinflation process. This prompted uncertainty over the BoE interest rate cuts.
- Australian Dollar gained over 1% against the US Dollar, on Wednesday.
- US April CPI rose by 0.3% MoM, core CPI dipped as expected.
- Australian wages grew less than estimated, hinting at easing inflationary pressures.
The Australian Dollar surged more than 1% against the US Dollar on Wednesday after data showed that consumer inflation moderated in April, with the underlying Consumer Price Index (CPI) edging lower for the first time in six months. As Thursday’s Asian session begins, the AUD/USD trades at 0.6695, virtually unchanged.
AUD/USD climbs as inflation moderates in both Australia and the US
Inflation in the US began to show signs of cooling after posting consecutive readings of stalling, which sparked a change of tone amongst Federal Reserve officials.
The US Department of Labor revealed that April’s CPI rose by 0.3% MoM, down from March’s 0.4% and estimates. The so-called core CPI, which excludes volatile items like food and energy, dipped from 0.4% to 0.3% as expected.
At the same time, Retail Sales were unchanged in April, at 0% MoM, missing projections of a 0.6% increase as higher borrowing costs and mounting debt, weighed on American consumers.
Minneapolis Fed President Neel Kashkari stated that, given the higher government debt, achieving the 2% inflation target might necessitate higher borrowing costs in the near term. He expressed surprise at the resilience of consumer spending and highlighted the critical question of "how restrictive monetary policy is.”
On the Aussie’s front, wages increased less than estimated in Q1 2024, hinting that inflationary pressures could be easing. The Wage Price Index (WPI) came at 0.8% QoQ, down from 1% in Q4 2023, and missed estimates of 0.9%.
Ahead in the economic docket is Australia’s Employment report. Estimates suggest the economy added 23.7K employees to the workforce after laying off 6.6K in March. The unemployment rate is forecast to increase to 3.9% after ticking higher to 3.8% previously.
AUD/USD Price Analysis: Technical outlook
The daily chart suggests that the AUD/USD uptrend will continue, but buyers must decisively surpass the 0.6700 figure. Momentum is on their side, as the Relative Strength Index (RSI) aims up, shy of turning overbought.
That said, once 0.6700 is cleared, the next stop would be the psychological 0.6750 figure, followed by the 0.6800 mark. Conversely, if AUD/USD stays below 0.6700, look for a pullback to the May 3 high at 0.6647, ahead of diving to 0.6600.

Australian Dollar FAQs
One of the most significant factors for the Australian Dollar (AUD) is the level of interest rates set by the Reserve Bank of Australia (RBA). Because Australia is a resource-rich country another key driver is the price of its biggest export, Iron Ore. The health of the Chinese economy, its largest trading partner, is a factor, as well as inflation in Australia, its growth rate and Trade Balance. Market sentiment – whether investors are taking on more risky assets (risk-on) or seeking safe-havens (risk-off) – is also a factor, with risk-on positive for AUD.
The Reserve Bank of Australia (RBA) influences the Australian Dollar (AUD) by setting the level of interest rates that Australian banks can lend to each other. This influences the level of interest rates in the economy as a whole. The main goal of the RBA is to maintain a stable inflation rate of 2-3% by adjusting interest rates up or down. Relatively high interest rates compared to other major central banks support the AUD, and the opposite for relatively low. The RBA can also use quantitative easing and tightening to influence credit conditions, with the former AUD-negative and the latter AUD-positive.
China is Australia’s largest trading partner so the health of the Chinese economy is a major influence on the value of the Australian Dollar (AUD). When the Chinese economy is doing well it purchases more raw materials, goods and services from Australia, lifting demand for the AUD, and pushing up its value. The opposite is the case when the Chinese economy is not growing as fast as expected. Positive or negative surprises in Chinese growth data, therefore, often have a direct impact on the Australian Dollar and its pairs.
Iron Ore is Australia’s largest export, accounting for $118 billion a year according to data from 2021, with China as its primary destination. The price of Iron Ore, therefore, can be a driver of the Australian Dollar. Generally, if the price of Iron Ore rises, AUD also goes up, as aggregate demand for the currency increases. The opposite is the case if the price of Iron Ore falls. Higher Iron Ore prices also tend to result in a greater likelihood of a positive Trade Balance for Australia, which is also positive of the AUD.
The Trade Balance, which is the difference between what a country earns from its exports versus what it pays for its imports, is another factor that can influence the value of the Australian Dollar. If Australia produces highly sought after exports, then its currency will gain in value purely from the surplus demand created from foreign buyers seeking to purchase its exports versus what it spends to purchase imports. Therefore, a positive net Trade Balance strengthens the AUD, with the opposite effect if the Trade Balance is negative.
- EUR/USD climbs on broad-market Greenback selloff.
- US CPI inflation eases further, sparking Fed rate cut hopes.
- Bets for September rate cut firm up.
EUR/USD climbed on Wednesday in one of the pair’s single-best days of 2024, climbing towards 1.0900 and on pace to etch in a fourth consecutive gain week. Broad-market selling pressure deflated the US Dollar (USD) after risk appetite roared to the forefront after US Consumer Price Index (CPI) inflation eased more than investors expected.
US CPI inflation eased to 0.3% MoM, below median market forecasts of a steady 0.4% print and triggering a broad-market risk rally as sentiment pinned further into hope for an approaching rate cut from the Federal Reserve (Fed) in September. According to the CME’s FedWatch Tool, rate markets are pricing in over 70% odds of at least a quarter-point rate trim when the Fed meets in September.
European final Gross Domestic Product (GDP) figures broadly came in as expected for the first quarter, with Q1 GDP printing at 0.3% QoQ, which is in line with forecasts and the previous quarter’s growth. The rest of the week is strictly mid-tier data releases on both sides of the Atlantic, leaving markets to wistfully look ahead to whether or not the Fed will cut interest rates late in the third quarter.
EUR/USD technical outlook
EUR/USD is taking a bullish run at the 1.0900 handle as the pair extends a bullish bounce from the 200-hour Exponential Moving Average (EMA) from 1.0730. The 200-hour EMA is rising above 1.0780, but intraday bidding has dragged EUR/USD well above technical indicators, and the pair is up over 2.7% from April’s swing low near 1.0600.
Daily candles pierced the 200-day EMA at 1.0798 on Wednesday, but a descending pattern of lower highs threatens a clean extension with a near-term technical ceiling priced in from 1.0950.
EUR/USD hourly chart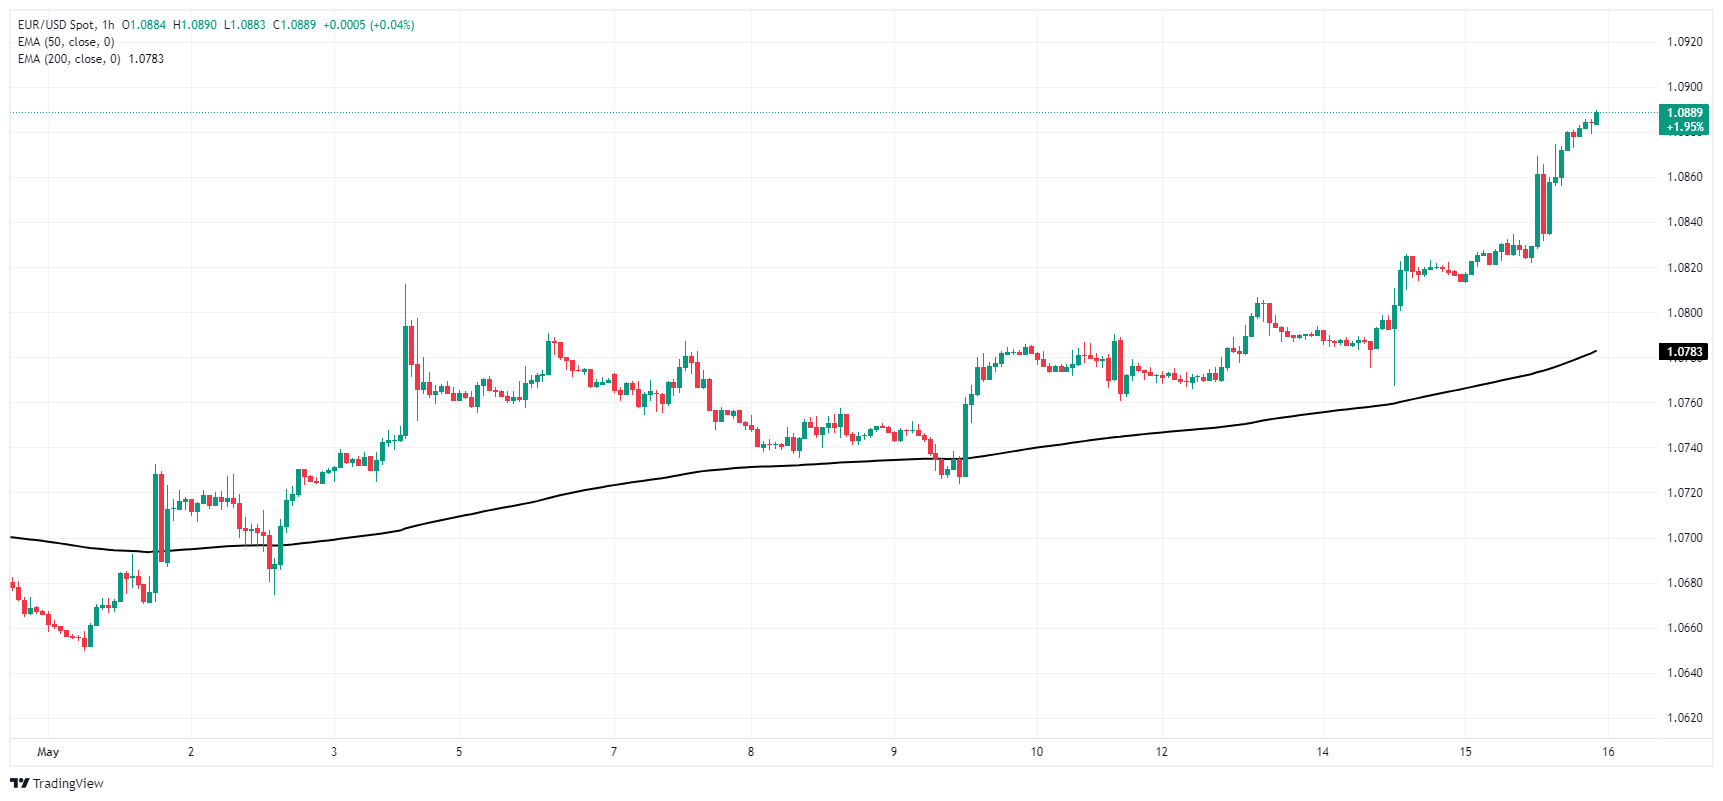
EUR/USD daily chart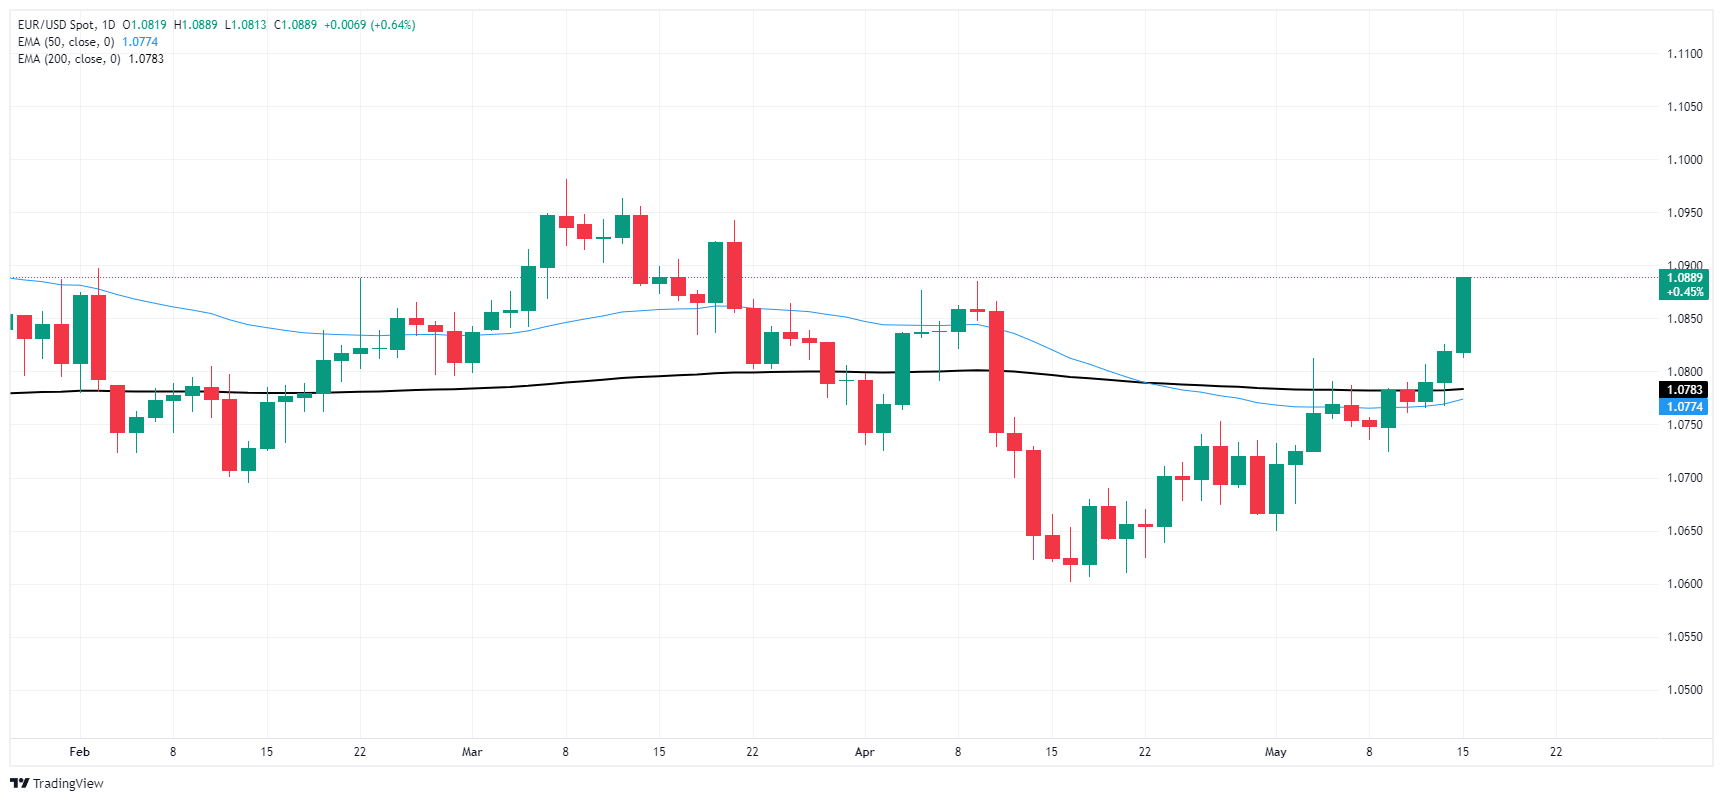
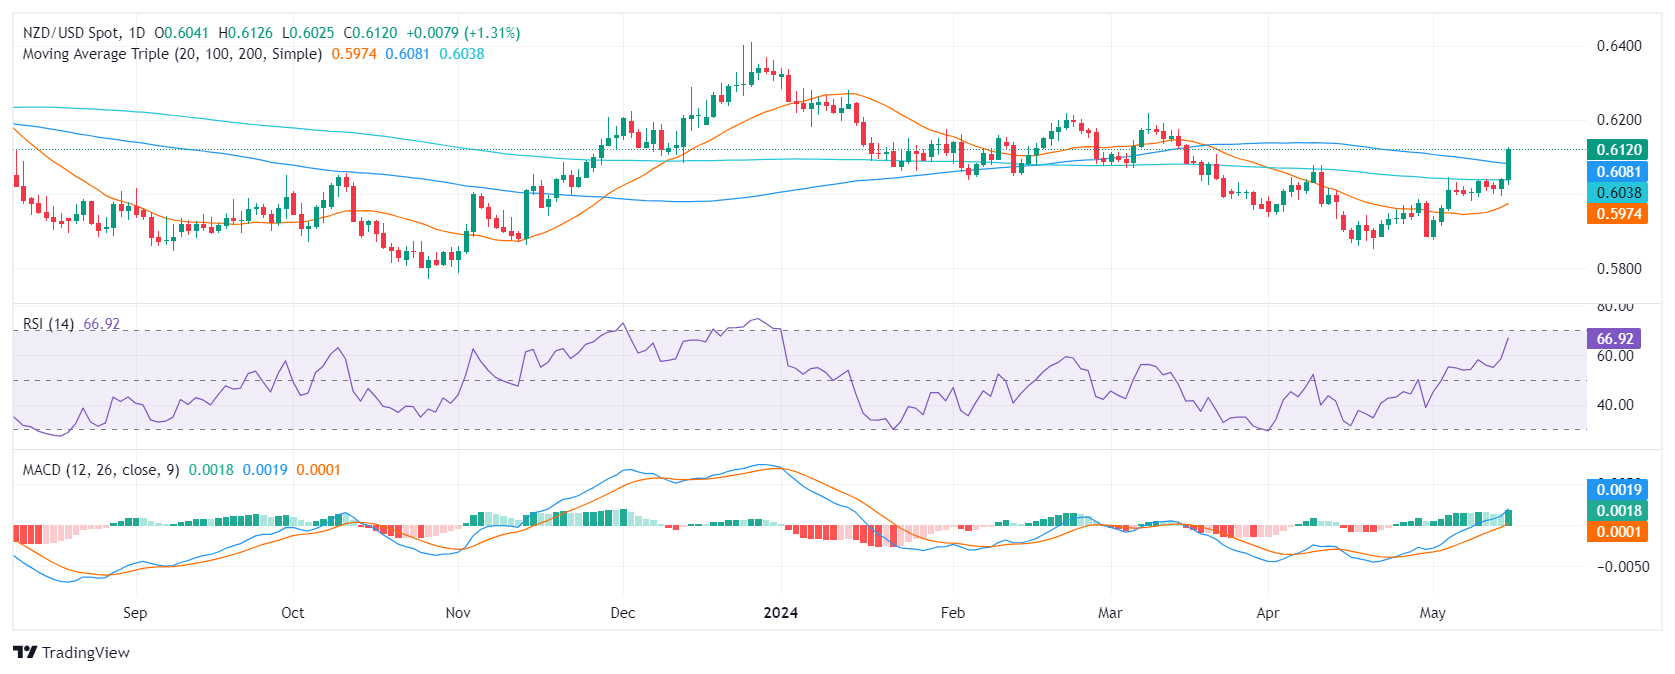
- The daily RSI of the NZD/USD signals it is approaching overbought, which often indicates future consolidation or potential reversal.
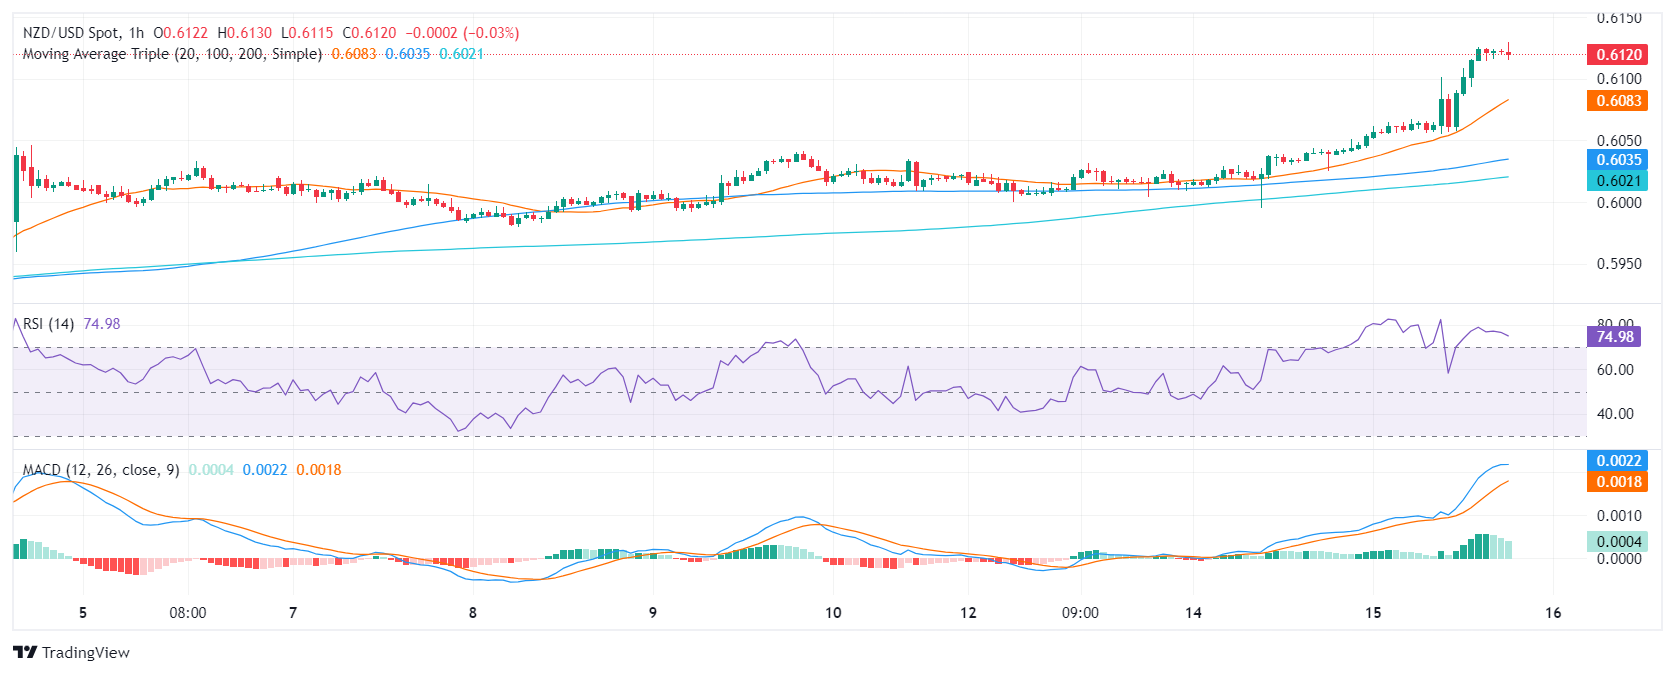
- The same indicators in the hourly chart further strengthen this view, specifically, with the RSI crossing the 70 mark.
- Buyers regained the 100 and 200-day SMAs, and this points to a bullish outlook.
In the Wednesday session, the NZD/USD pair rides a strong bullish wave, with a recent increase of 1.28%. The uptick made the pair jump above its 100 and 200-day Simple Moving Averages (SMAs), indicating that the outlook turned positive for the pair. However, as indicators approach overbought conditions, a consolidation may be incoming.
On the daily chart, the Relative Strength Index (RSI) indicates that NZD/USD is approaching overbought territory. The positive trend evident over the past few days, along with the recent surge, reveals that the strength is currently with buyers. However, this upward pressure may soon decrease, as the RSI nearing overbought conditions often signals future consolidation or potential reversal.
NZD/USD daily chart
The hourly chart shows that RSI readings exceeded 70, reinforcing indications of overbought conditions. The recent Moving Average Convergence Divergence (MACD) showing flat green bars indicates sustained but flat positive momentum.
NZD/USD hourly chart
In conclusion, the technical indicators for NZD/USD suggest strong buyer momentum. However, the RSI's proximity to overbought conditions hints at a potential easing of this upward pressure. This, coupled with the strong bullish trend indicated by the jumping above longer-term SMAs, presents a positive outlook but demands careful observation for potential corrections.
- The Australian Unemployment Rate is expected to continue rising in April.
- Employment Change could post a modest improvement after March’s slump.
- AUD/USD could run past 0.6700 on an upbeat employment report.
Australia will publish the April employment report on Thursday at 1:30 GMT. The Australian Bureau of Statistics (ABS) is expected to announce the country added 23.7K new job positions in the month, after losing 6.6K in March. The Unemployment Rate is foreseen to increase to 3.9% after ticking higher to 3.8% previously.
It is worth remembering that Australia reports the monthly Employment Change split into full-time and part-time positions. Generally speaking, full-time jobs imply working 38 hours per week or more and usually include additional benefits, but they mostly represent consistent income. On the other hand, part-time employment generally means higher hourly rates but lacks consistency and benefits. That’s why the economy prefers full-time jobs.
In March, the economy added 27.9K full-time jobs and lost 34.5 part-time ones, for a net loss of 6.6K employees. At the same time, the Unemployment Rate rose from 3.7% in February to 3.8%, while the Participation Rate declined 0.1 percentage points to 66.6%. The discouraging report was widely anticipated following an outstanding February report, and the Australian Dollar (AUD) actually appreciated against the US Dollar (USD) right after the release.
Australian unemployment rate expected to keep rising in April
Market analysts anticipate the Australian Unemployment Rate increased to 3.9% in April after rising to 3.8% in March. As previously noted, the country is expected to have created roughly 24K new job positions.
Tight labor market conditions have been an issue for central banks around the world for most of 2023, as it poses an upward risk to inflation. The problem has extended throughout the first quarter of 2024, with some tepid signs of loosening conditions falling short of being enough to spook concerns.
Australia is no exception to this, as the sector has remained relatively strong. The Reserve Bank of Australia (RBA) met in early May, and as widely anticipated, policymakers kept the Official Cash Rate (OCR) unchanged at 4.35%. Governor Michele Bullock delivered a speech following the decision and noted that policymakers “must” be vigilant on inflation risks and said they would adjust policy as needed. However, Bullock added she does not think they will necessarily have to tighten again, but refused to commit to rate cuts.
The tepid March employment report followed a strong one in February, keeping the labor market off the RBA’s radar. On the contrary, inflation remains the main concern. The Australian Bureau of Statistics (ABS) publishes the Consumer Price Index (CPI) quarterly. According to the latest release, the CPI rose 1.0% in the first quarter of the year, higher than the previous 0.6%. On a positive note, the report showed that over the twelve months to the March quarter, the CPI rose 3.6%, easing from the 4.1% posted in the twelve months to December.
At this point, market participants anticipate the first interest-rate reduction could happen in March 2025.
When will the Australian employment report be released, and how could it affect AUD/USD?
The ABS will publish the April employment report early on Thursday. As previously stated, Australia is expected to have created 23.7K new jobs in the month, while the Unemployment Rate is foreseen at 3.9%. The Participation Rate was reported at 66.6% previously.
With that in mind, a solid employment report will likely cool further hopes for a soon-to-come rate cut and provide near-term support to the AUD. An extremely poor outcome could spell trouble for the Aussie, although the broad US Dollar’s weakness will likely prevail after the dust settles. Furthermore, it would take more than one dismal report to consider the labor market is loosening, which means it would hardly impact RBA’s future monetary policy decisions.
From a technical perspective, Valeria Bednarik, Chief Analyst at FXStreet, notes: “The AUD/USD pair surged to fresh four-month highs following the release of the United States (US) Consumer Price Index (CPI) and trades in the 0.6660 region ahead of the event. The pair struggles to extend its upward momentum as selling interest has rejected advances around the current price zone since early March. Persistent buying interest could push AUD/USD towards 0.6700, while beyond the latter, resistance could be found at 0.6730 and 0.6770. A dismal report, on the contrary, may temporarily weigh on the Aussie. Near-term support comes at 0.6600, followed by the 0.6550-0.6560 price zone. Bear in mind, bulls will likely take their chances on intraday slides.”
Bednarik adds: “AUD/USD gains are directly linked to persistent US Dollar’s weakness, amid diminished hopes the Federal Reserve (Fed) will trim interest rates in the upcoming months. With that in mind, the pair is set to resume its pre-release trend once speculative interest digests the employment figures.”
Employment FAQs
Labor market conditions are a key element to assess the health of an economy and thus a key driver for currency valuation. High employment, or low unemployment, has positive implications for consumer spending and thus economic growth, boosting the value of the local currency. Moreover, a very tight labor market – a situation in which there is a shortage of workers to fill open positions – can also have implications on inflation levels and thus monetary policy as low labor supply and high demand leads to higher wages.
The pace at which salaries are growing in an economy is key for policymakers. High wage growth means that households have more money to spend, usually leading to price increases in consumer goods. In contrast to more volatile sources of inflation such as energy prices, wage growth is seen as a key component of underlying and persisting inflation as salary increases are unlikely to be undone. Central banks around the world pay close attention to wage growth data when deciding on monetary policy.
The weight that each central bank assigns to labor market conditions depends on its objectives. Some central banks explicitly have mandates related to the labor market beyond controlling inflation levels. The US Federal Reserve (Fed), for example, has the dual mandate of promoting maximum employment and stable prices. Meanwhile, the European Central Bank’s (ECB) sole mandate is to keep inflation under control. Still, and despite whatever mandates they have, labor market conditions are an important factor for policymakers given its significance as a gauge of the health of the economy and their direct relationship to inflation.
Economic Indicator
Employment Change s.a.
The Employment Change released by the Australian Bureau of Statistics is a measure of the change in the number of employed people in Australia. The statistic is adjusted to remove the influence of seasonal trends. Generally speaking, a rise in Employment Change has positive implications for consumer spending, stimulates economic growth, and is bullish for the Australian Dollar (AUD). A low reading, on the other hand, is seen as bearish.
Read more.Next release: Thu May 16, 2024 01:30
Frequency: Monthly
Consensus: 23.7K
Previous: -6.6K
Source: Australian Bureau of Statistics
- WTI hits two-month low before recovering into familiar territory.
- US CPI inflation eased further, bolstering rate cut hopes.
- EIA barrel counts posted a steeper contraction than expected.
West Texas Intermediate (WTI) US Crude Oil sank to an eight-week low on Wednesday, tumbling below $76.40 before recovering into $78.40. Broad-market risk appetite surged during the US market session after falling US Consumer Price Index (CPI) inflation sparked further market hopes for Federal Reserve (Fed) rate cuts.
US CPI inflation eased in April, falling to 0.3% MoM compared to the forecast hold at 0.4%, and market bets on Fed rate cuts sparked a broad recovery in risk appetite, sending Crude Oil higher. Easing inflation helped bolster rate cut speculation, and the CME’s FedWatch Tool shows that rate markets are pricing in over 70% odds of a September rate trim from the Fed.
According to the Energy Information Administration (EIA), week-on-week Crude Oil Stocks Change fell faster than expected. EIA barrel counts decreased by -2.508 million barrels in the week ended May 10, below the forecast -1.35 million and slipping further back from the previous week’s -1.362 million barrel decline. With US Crude Oil reserves falling on a weekly basis, Crude Oil barrel bids found even further support as energy markets look for signs that US Crude Oil production will fail to meet or beat market demand.
WTI technical outlook
US Crude Oil dipped to a two-month low near $76.40 on Wednesday, tumbling through a near-term demand zone before quickly recovering back above the $78.00 handle. WTI remains on the bearish side, trading on the south side of the 200-hour Exponential Moving Average (EMA) at $78.70.
Daily candles show WTI stuck in recent consolidation, just below the 200-day EMA at $79.28 as energy markets struggle to develop bullish momentum. WTI is down around ten percent from April’s peaks near $87.00.
WTI hourly chart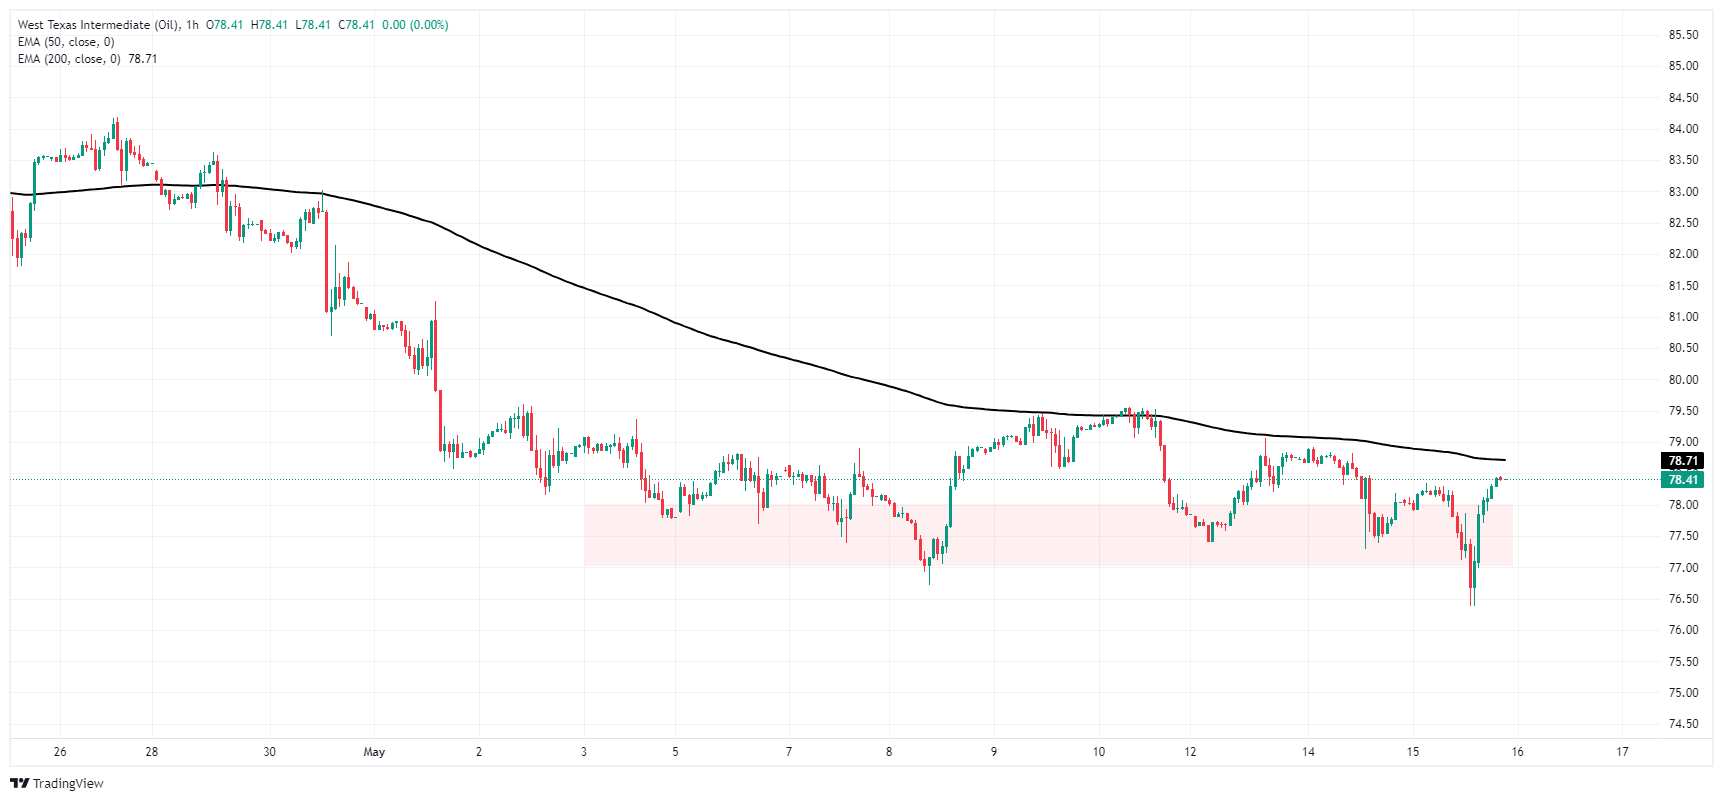
WTI daily chart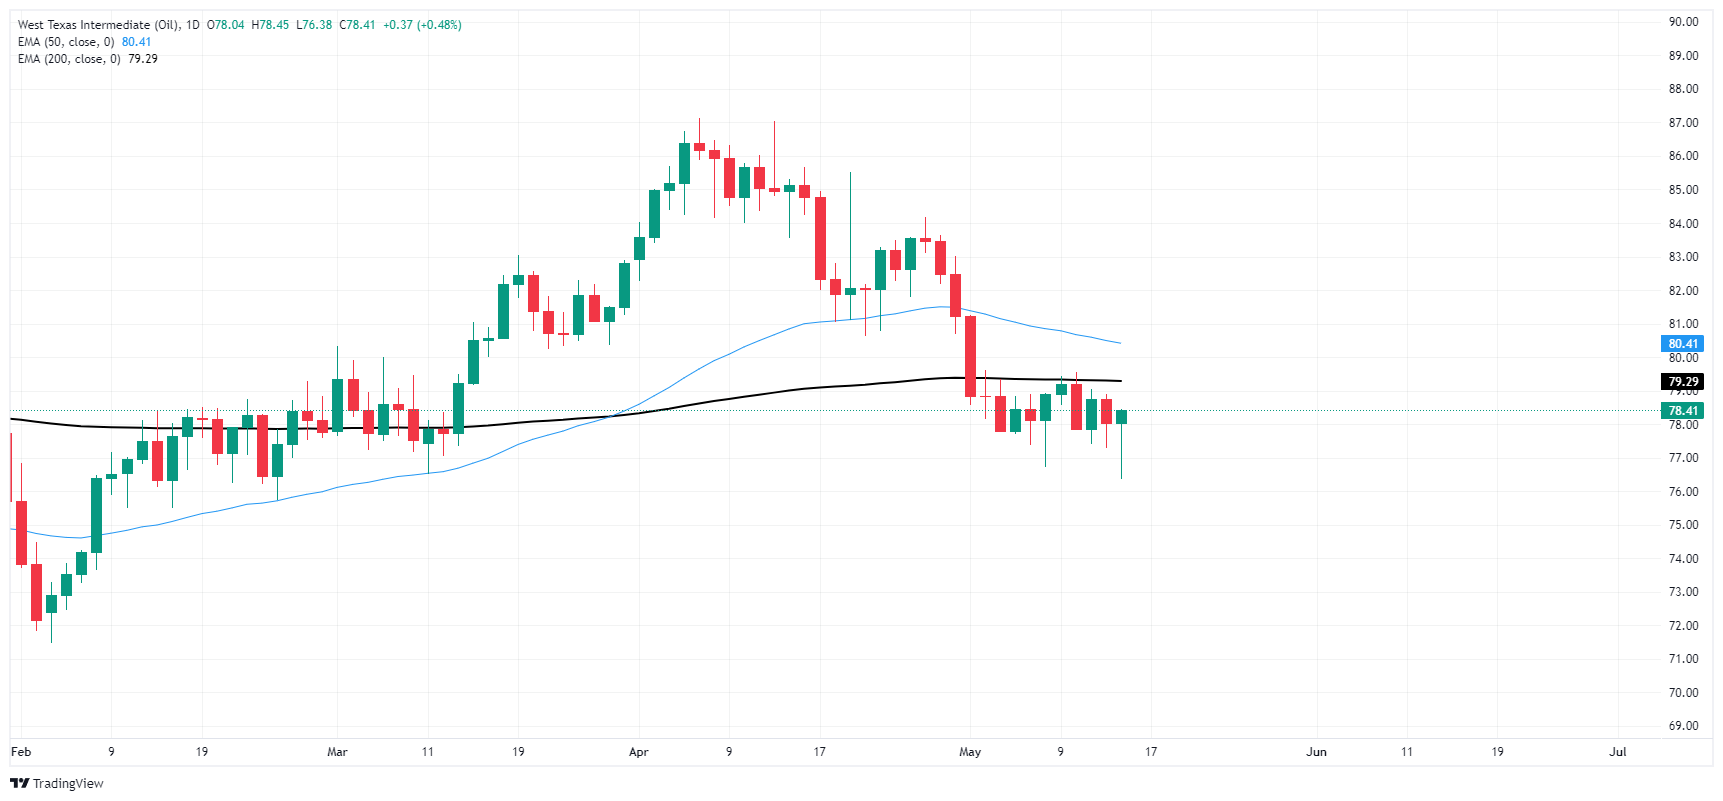
- Silver trades at $29.73, up over 3.80% after softer US CPI report.
- XAG/USD must surpass $29.79 and $30.00 for bullish momentum to continue.
- Key supports at $28.75 and $28.00 if prices fall below $29.00.
Silver’s rally continued Wednesday after a softer-than-expected Consumer Price Index (CPI) report in the United States (US) sent US yields tumbling, a tailwind for the precious metal. The XAG/USD trades at $29.73, up by more than 3.80% on the day.
XAG/USD Price Analysis: Technical outlook
Silver’s price surpassed the $29.00 and $29.50 psychological levels yet remains shy of cracking the year-to-date (YTD) high of $29.79. That left a double top looming, but momentum favors the buyers, as depicted by the Relative Strength Index (RSI).
The XAG/USD must clear the YTD high and the $30.00 psychological level for a bullish continuation. A breach of those levels will expose the February 2013 high at $32.15, followed by the October 2012 high at $35.40.
On the other hand, sellers need to drag Silver’s price below the $29.00 figure. In that outcome, the pull back could get to the May 18, 2021, high turned support at $28.75, followed by the $28.00 mark. Further losses lie below the latter, with key support seen at $27.00.
XAG/USD Price Action – Daily Chart

- The daily RSI shows strong buying momentum, deep in positive territory.
- Hourly chart displays a contrast, as RSI dips into the negative zone and MACD shows flat red bars, indicating short-term selling traction.
- As the pair approached cycle highs, a pause in the momentum seemed probable before a retest.
In Wednesday's session, the EUR/JPY pair maintains robust bullish momentum, despite encountering selling pressure and declining to 168.63. Despite brushing against highs around the 170.00 mark, investors temporarily halt, potentially indicating short-term consolidation and this pause could pave the way for further upward movements.
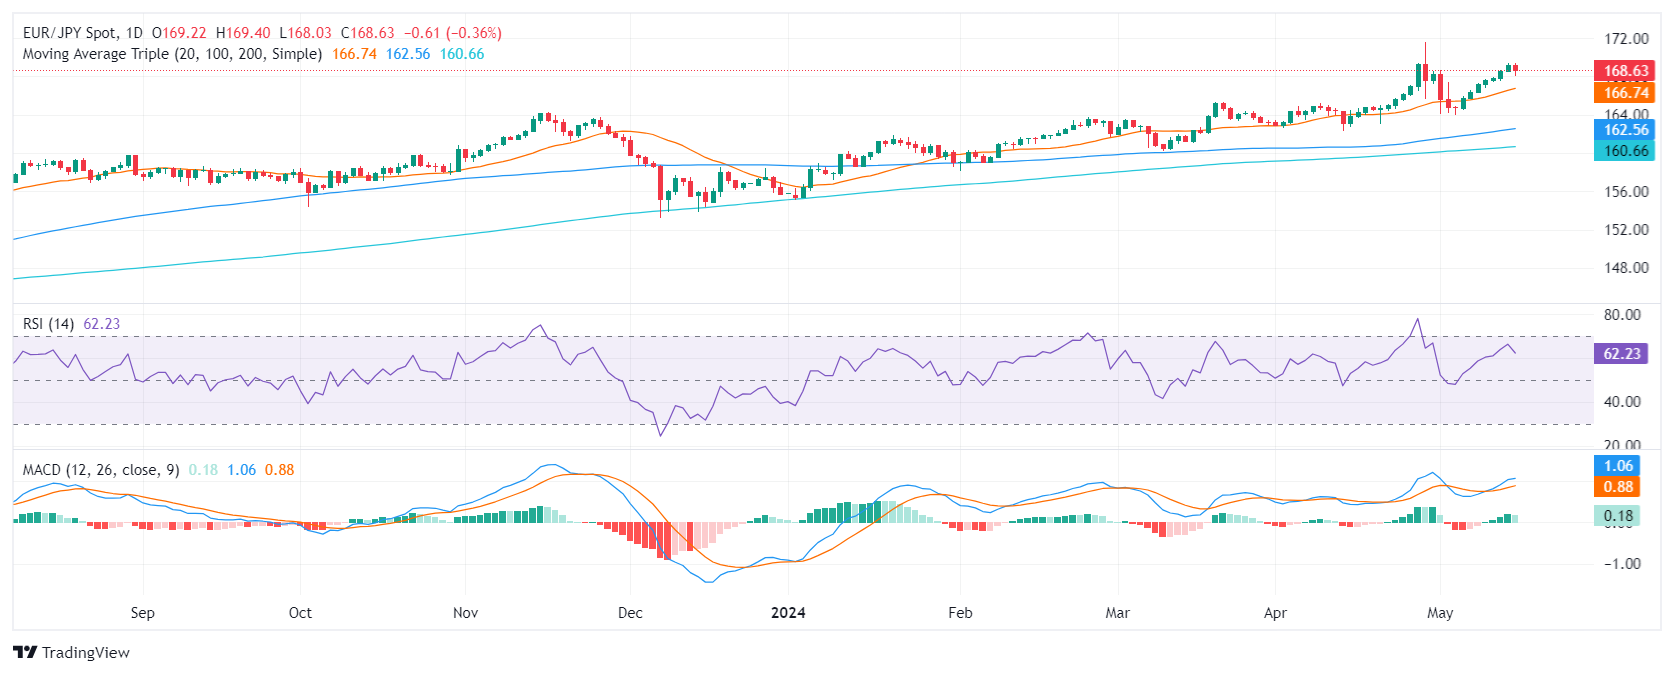
On the daily chart, the Relative Strength Index (RSI) stands in the positive territory, reflecting an upward momentum from bulls but points down indicating the mentioned halt in the bullish traction.
EUR/JPY daily chart
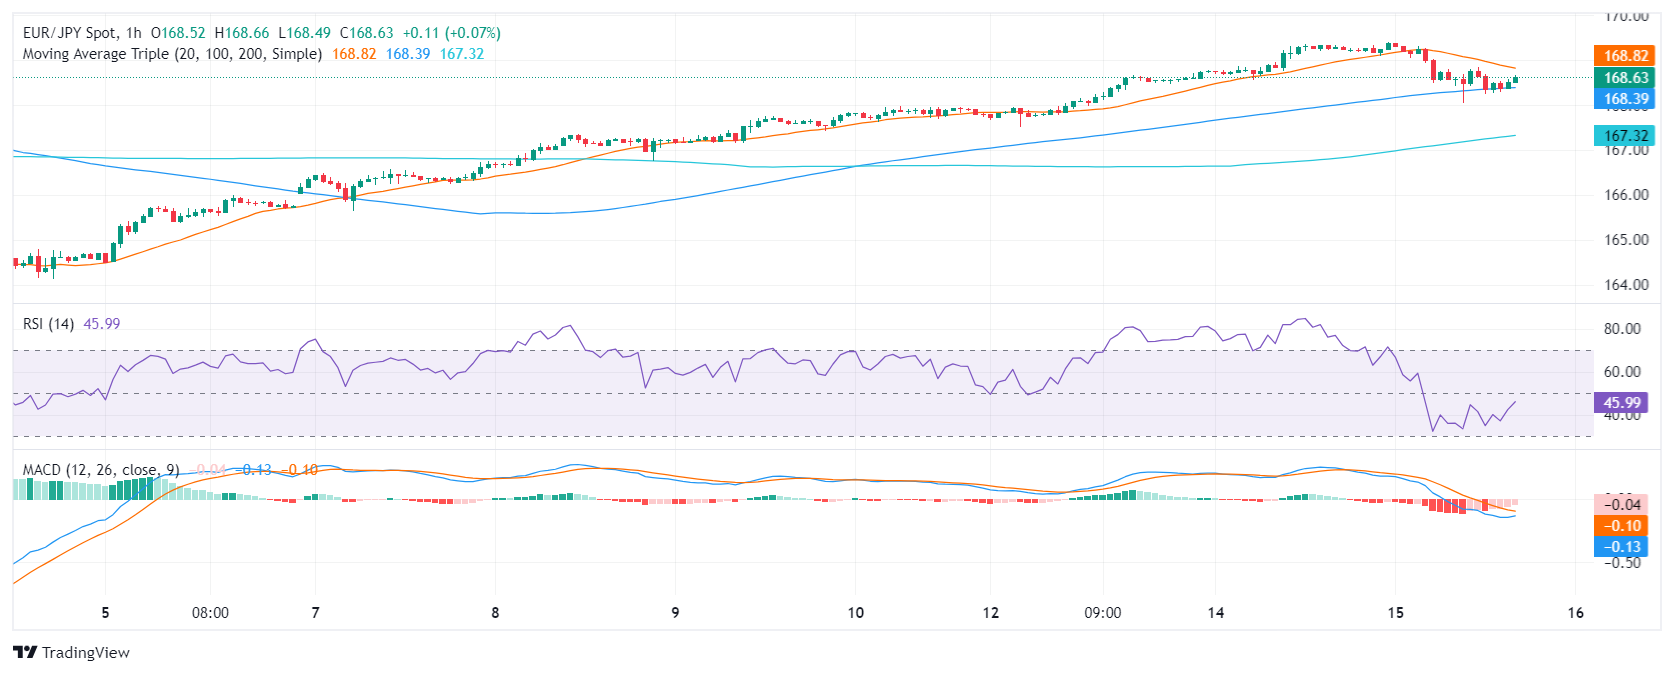
The hourly chart, in contrast, presents a weaker picture. The RSI dipped into the negative territory with the latest reading at 45. The Moving Average Convergence Divergence (MACD) remains bearish, printing flat red bars, suggesting short-term selling pressure. However, indicators seem to recover in this frame ahead of the Asian session.
EUR/JPY hourly chart
Reflecting on EUR/JPY's broader picture, it's in a bullish short- and long-term position as it stays above the 20, 100, and 200-day SMAs. This posture suggests a strong upward momentum for the pair, poised for continued bullishness.
In conclusion, while the overall technical outlook for EUR/JPY remains bullish based on the SMA analysis and daily chart, traders need to monitor the extent of the correction. Still, any movement that keeps the pair above its main SMAs wouldn’t threaten the positive outlook.
- Gold price hits $2,390, its highest level in three weeks, gaining over 1%.
- US Treasury bond yields plunge, US Dollar Index drops to five-week low.
- April Retail Sales stagnate, while Fed officials express concerns about restrictive monetary policy.
Gold price extended its uptrend for the second straight day on Wednesday and hit a three-week high of $2,390 after data revealed by the US Bureau of Labor Statistics (BLS) showed inflation is ebbing, increasing the odds for a Federal Reserve (Fed) rate cut in 2024. Hence, US Treasury bond yields are plunging, while the Greenback tumbles to a five-week low as depicted by the US Dollar Index (DXY).
The XAU/USD trades at $2,384 and gains more than 1%. Despite standing above 3% on an annual basis, consumer inflation slowed in monthly figures, easing pressure on the Fed. US Treasury yields along the short and long ends of the curve are diving between 8 and 10 basis points.
Other data announced by the US BLS witnessed a deterioration in consumer spending, as Retail Sales in April remained unchanged at 0% MoM, below estimates of a 0.4% increase.
Elsewhere, Fed officials continued to make headlines. Minneapolis Fed President Neel Kashkari said that with higher government debt, it might take higher borrowing costs in the near term to achieve 2% inflation. He said he’s surprised by consumers' spending and added that the big question is “how restrictive monetary policy is.”
Daily digest market movers: Gold shines amid dropping US yields as rate cut expectations rise
- Gold prices are underpinned by lower US Treasury yields and a battered US Dollar. The US 10-year Treasury note yields 4.352% and is down 9 basis points (bps) from its opening level. DXY falls 0.66% to 104.33.
- On Tuesday, Fed Chair Jerome Powell commented that he expects inflation to continue heading lower but wasn’t as confident about the disinflation outlook as he had previously been.
- BLS reveals that April’s Consumer Price Index rose by 0.3% MoM, below estimates and March’s 0.4%. Core CPI rose by 0.3% MoM as expected but beneath the prior reading of 0.4%.
- Other data showed that Retail Sales missed estimates of 0.4% and came at 0% MoM, below March’s 0.6%. In the twelve months to April, Retail Sales grew by 3%, below the 3.8% increase of the previous reading.
- Further data will be featured during the week, led by Initial Jobless Claims and Industrial Production on May 16.
- The New York Federal Reserve released its monthly Survey of Consumer Expectations on Monday, showing that the year's inflation expectations increased to 3.3% vs. 3% in March. The data came after the University of Michigan Consumer Sentiment poll showed that inflation expectations for a one-year outlook rose from 3.2% to 3.5%.
- Interest rate cut expectations toward the end of the year edged up from 35 basis points on Tuesday to 42 bps, according to data provided by the Chicago Board of Trade.
Technical analysis: Gold price clears May 10 high, on its way towards $2,400
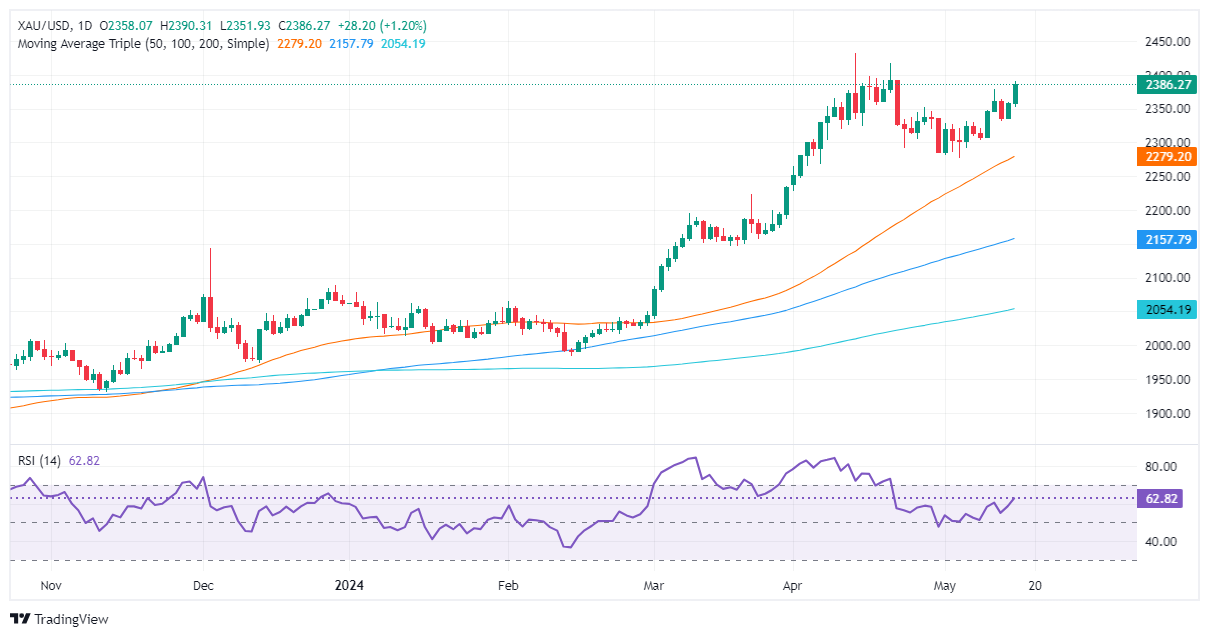
Gold price’s rally was prolonged for the second straight day, yet it was shy of challenging the $2,400 figure. Once buyers surpassed $2,378, the May 10 high paved the way for a new trading range within the $2,380 to $2,400 range.
Momentum favors buyers as the Relative Strength Index (RSI) remains bullish with readings above 60. Therefore, the path of least resistance is upward.
That said, the XAU/USD first resistance would be $2,400. Once surpassed, the immediate supply zone would be the April 19 high at $2,417, followed by the all-time high at $2,431.
Conversely, if sellers moved in and pushed prices below $2,359, that could sponsor a leg down toward the May 9 low of $2,306, followed by the $2,300 figure. Once surpassed, the next stop would be the 50-day Simple Moving Average (SMA) at $2,249.
Gold FAQs
Gold has played a key role in human’s history as it has been widely used as a store of value and medium of exchange. Currently, apart from its shine and usage for jewelry, the precious metal is widely seen as a safe-haven asset, meaning that it is considered a good investment during turbulent times. Gold is also widely seen as a hedge against inflation and against depreciating currencies as it doesn’t rely on any specific issuer or government.
Central banks are the biggest Gold holders. In their aim to support their currencies in turbulent times, central banks tend to diversify their reserves and buy Gold to improve the perceived strength of the economy and the currency. High Gold reserves can be a source of trust for a country’s solvency. Central banks added 1,136 tonnes of Gold worth around $70 billion to their reserves in 2022, according to data from the World Gold Council. This is the highest yearly purchase since records began. Central banks from emerging economies such as China, India and Turkey are quickly increasing their Gold reserves.
Gold has an inverse correlation with the US Dollar and US Treasuries, which are both major reserve and safe-haven assets. When the Dollar depreciates, Gold tends to rise, enabling investors and central banks to diversify their assets in turbulent times. Gold is also inversely correlated with risk assets. A rally in the stock market tends to weaken Gold price, while sell-offs in riskier markets tend to favor the precious metal.
The price can move due to a wide range of factors. Geopolitical instability or fears of a deep recession can quickly make Gold price escalate due to its safe-haven status. As a yield-less asset, Gold tends to rise with lower interest rates, while higher cost of money usually weighs down on the yellow metal. Still, most moves depend on how the US Dollar (USD) behaves as the asset is priced in dollars (XAU/USD). A strong Dollar tends to keep the price of Gold controlled, whereas a weaker Dollar is likely to push Gold prices up.
- USD/JPY easing back, US Dollar sees broad-market selling pressure.
- US CPI inflation ticked lower, sparking rate cut hopes.
- Japanese GDP in the barrel for early Thursday.
USD/JPY eased on Wednesday, backsliding into the 155.00 handle after the US Dollar (USD) eased across the board, shedding weight against all of its major currency peers. The Japanese Yen (JPY) is also finding a reprieve from broad-market selling pressure, recovering ground as the Greenback recedes.
US Consumer Price Index (CPI) inflation ticked lower on Wednesday, with headline CPI inflation in April ticking down to 0.3% compared to the market’s forecast of a hold at 0.4%. Easing inflation pressures are sparking a rise in rate cut hopes as investors clamor for a rate trim from the Federal Reserve (Fed).
Up next is Japan’s Gross Domestic Product (GDP) growth, slated for during Thursday’s early Pacific market session. Japan’s growth is forecast to contract in the first quarter, expected to print at -0.4% compared to the previous quarter’s 0.1%.
USD/JPY technical outlook
USD/JPY knocked sharply lower on Wednesday, tumbling from the week’s highs near 156.80 to trade at the 155.00 handle. Despite the near-term decline sparked by a relief rally in the Yen, USD/JPY is still trading on the high side of a recent swing low into 152.00 after the pair fell from multi-decade highs above 160.00.
USD/JPY is still trading firmly in bull country, holding chart paper north of the 200-day Exponential Moving Average (EMA) at 148.44. The nearest technical support sits at the 50-day EMA at 153.28.
USD/JPY hourly chart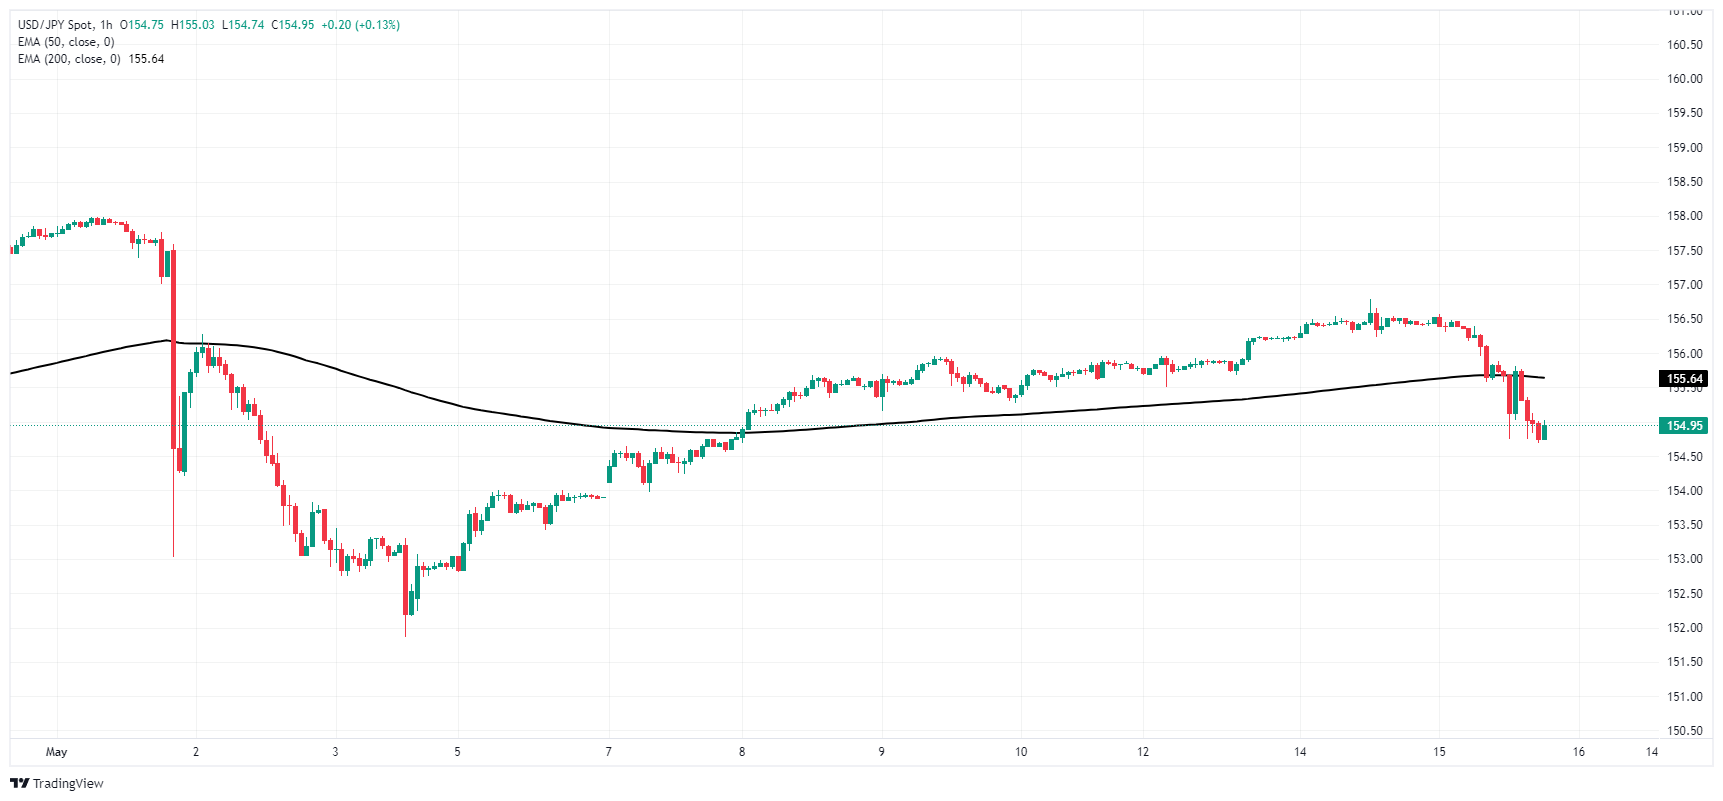
USD/JPY daily chart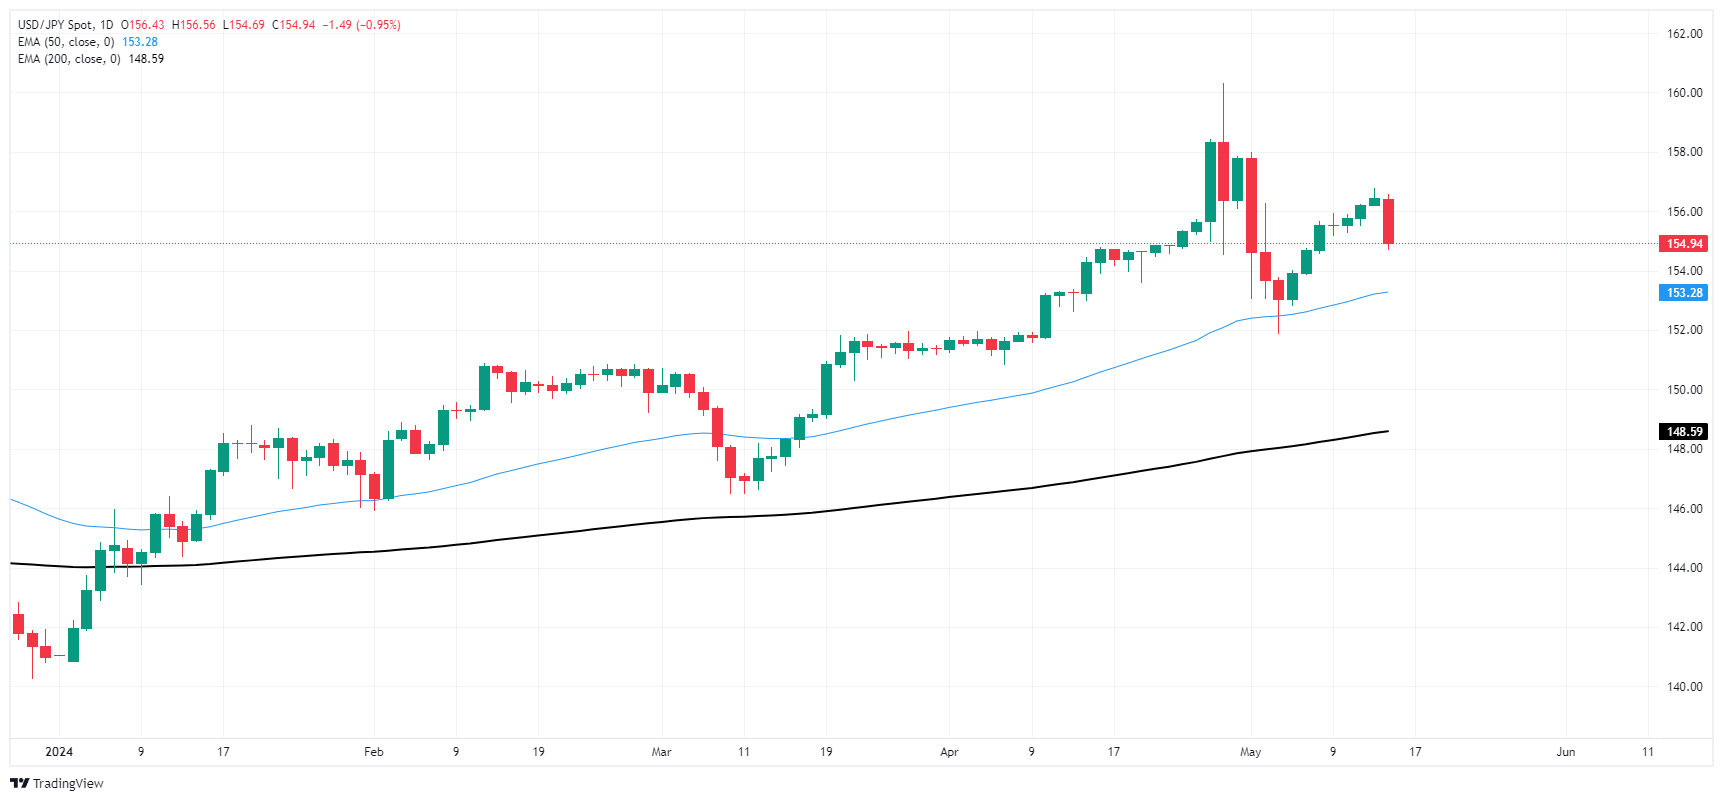
The risk complex regained strong upside traction on the back of the generalized offered stance in the US Dollar in the wake of the release of US inflation data measured by the CPI in April.
Here is what you need to know on Thursday, May 16:
A dreadful session for the Greenback saw the USD Index (DXY) retreat further and revisit the area of the key 200-day SMA near 104.30 on Wednesday. On May 16, the US housing sector takes centre stage with the releases of monthly Building Permits and Housing Starts seconded by the usual Initial Jobless Claims, the Philly Fed Manufacturing Index and Industrial Production. In addition, Fed’s Barr, Harker, Mester and Bostic are all due to speak.
EUR/USD rose for the third session in a row and approached the 1.0900 hurdle always on the back of further USD-selling.The ECB’s Financial Stability Review will be the sole release on the domestic docket on May 16.
GBP/USD extended further its march north and traded at shouting distance from the 1.2700 hurdle. The BoE’s Financial Stability Report will be out on May 16.
USD/JPY interrupted its multi-day uptrend and receded to multi-session lows in the sub-155.00 zone following increasing weakness in the Dollar and declining yields. The advanced Q1 GDP Growth Rate, final Industrial Production prints and weekly Foreign Bond Investment are expected on May 16.
A robust session in the risk-linked assets propelled AUD/USD to levels just shy of the 0.6700 hurdle ahead of key data in Australia. The release of the labour market report and the speech by RBA’s Hunter are all due on May 16 in Oz.
A larger-than-expected drop in US crude oil supplies and the sharp pullback in the Greenback sustained the decent uptick in WTI prices despite the discouraging IEA report.
Gold prices surged to the proximity of the $2,400 zone per troy ounce on the back of rising expectations of Fed interest rate cuts, the weaker Dollar, and lower US yields. Silver followed suit and approached the key $30.00 mark per ounce, or five-week highs.
- US CPI and Retail Sales came in lower than expected.
- The odds of a cut from the Fed in July slightly increase, and September continues being the best-case scenario.
- Fed officials might change their tone as economic figures showed softness.
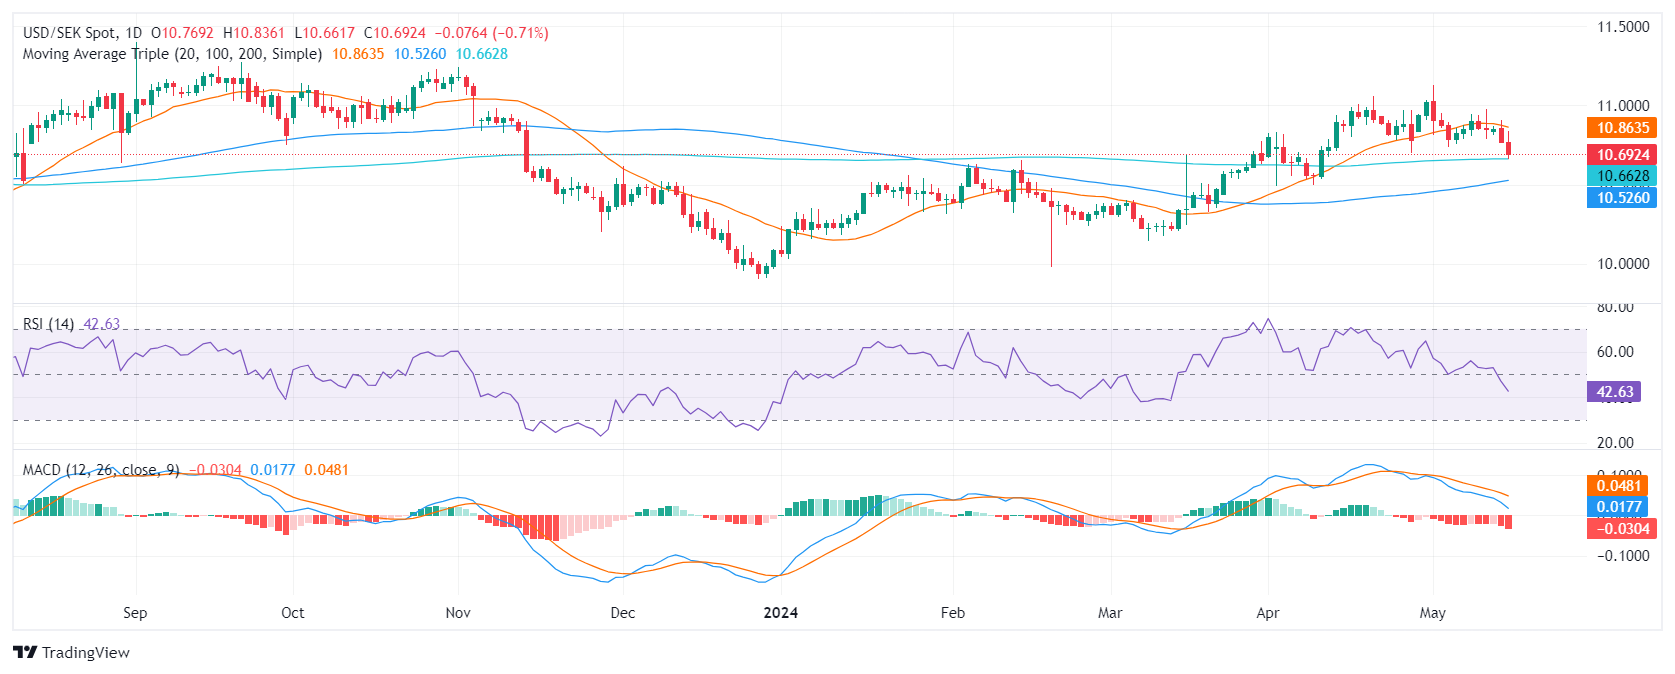
On Wednesday, the USD/SEK saw sharp losses as the potential for sooner interest rate cuts by the Fed, in light of the recent Consumer Price Index (CPI) disinflation and lackluster Retail Sales, may exert weight on the USD.
On the data front, the US Bureau of Labor Statistics reported that the US witnessed a marginal decrease in inflation, with the headline CPI moving down from 3.5% in March to 3.4% in April. Core CPI also observed a fall, retreating from 3.8% to 3.6%, aligning with market expectations. In addition, U.S. Retail sales in April remained stagnant, a dip from the anticipated 0.4% growth.
The cooling economic indicators imply that the Federal Reserve might contemplate a sooner start of the easing cycle which would invariably exert pressure on the USD. The CME FedWatch Tool highlights that investors have already priced in that there will be no changes in interest rates in June, but continue seeing with good eyes a cut in September. Those odds slightly increase for the July meeting but remain low.
USD/SEK technical analysis
On the daily chart, the Relative Strength Index (RSI) for the USD/SEK pair resides in negative territory. The latest reading, marking a downward trend, suggests that sellers are dominating. Moreover, the Moving Average Convergence Divergence (MACD) is producing rising red bars, thus demonstrating negative momentum.
That being said, strong support was noted at the 200-day Simple Moving Average (SMA) with buyers defending the level at 10.66. This defense acts as a crucial bulwark against any potential downward trend reversals.
- Dow Jones continues march to fresh all-time highs, approaching 40,000.00.
- US CPI inflation ticked lower in April, sparking fresh Fed rate cut hopes.
- US Retail Sales eased, further bolstering hopes that downturn will push Fed to cut.
The Dow Jones Industrial Average (DJIA) clipped higher on Wednesday, gaining three-quarters of a percent during the US market session after US Consumer Price Index (CPI) inflation slipped further back. Broad-market hopes for Federal Reserve (Fed) rate cuts in the third quarter of 2024 reignited as inflation continues to cool and economic activity recedes.
US CPI inflation in April eased to 0.3% MoM compared to the forecast hold at 0.4%. Core US CPI also ticked lower, meeting forecasts of 3.6% YoY versus the previous period’s 3.8%. Inflation is still running much higher than the Fed’s 2% annual target, but steady progress is pushing up market bets that the Fed will make a first quarter-point cut in September.
US Retail Sales in April also receded faster than expected, printing flat at 0.0% for the month. Median market estimates expected US Retail Sales to tick down to 0.4% from the previous 0.6%, revised from 0.7%.
With inflation grinding slowly towards targets and wobbly domestic economic activity flashing warning signs of weakness, investors are scrambling for Fed rate cut bets. According to the CME’s FedWatch Tool, rate traders are now pricing in 71% odds of a first 25-basis-point rate cut in September.
Dow Jones news
The Dow Jones equity index is broadly higher on Wednesday, though gains are on the slim side compared to the other major US indexes. About two-thirds of the securities that comprise the DJIA are in the green as the rising tide of risk appetite lifts most boats.
Walt Disney Co. (DIS) is still down around -2.5% on Wednesday, falling to $102.74 per share after the company revealed softer-than-expected Q2 earnings reporting. On the high side, Salesforce Inc. (CRM) soared 3.35% to $286.06 per share as analysts expect the stock to outperform its already-lofty performance expectations of 12% YoY growth.
Dow Jones technical outlook
The Dow Jones is climbing on Wednesday, inching towards record highs and the 40,000.00 handle. The DJIA is pushing further into a bull run that kicked off after a mild pullback near 37,500.00. The Dow Jones is poised to close another day in the green, and has seen upside momentum in all but one of the last ten consecutive trading days.
Bulls are firmly in control with the Dow Jones trading well above the 200-day Exponential Moving Average (EMA) at 36,993.87. The DJIA is up nearly 6% for 2024, and 18% since crossing above the 200-day EMA back in November.
Dow Jones five minute chart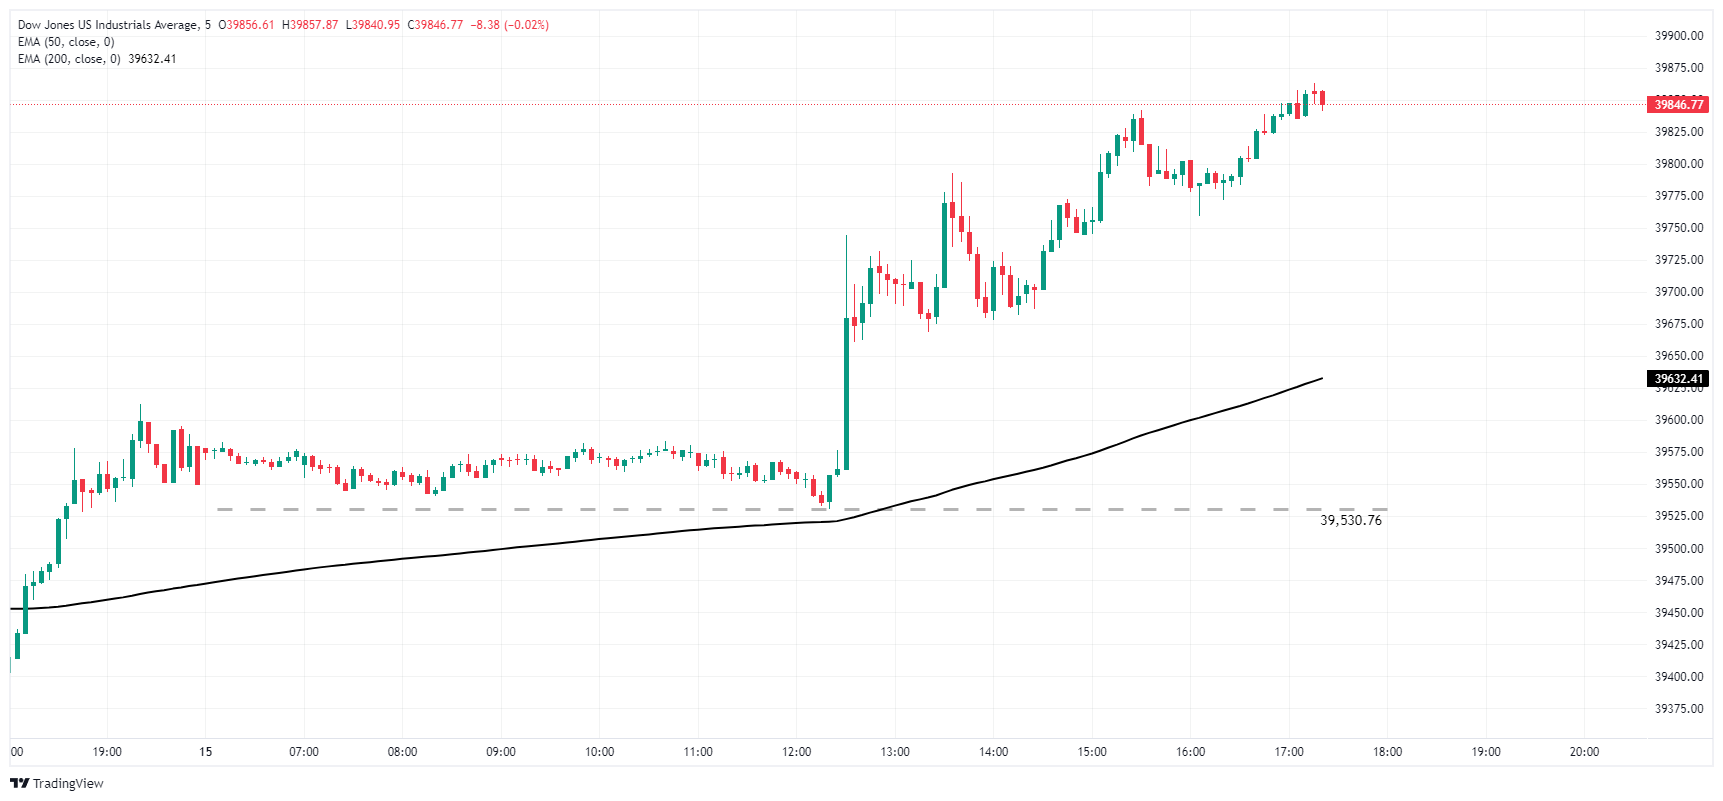
Dow Jones daily chart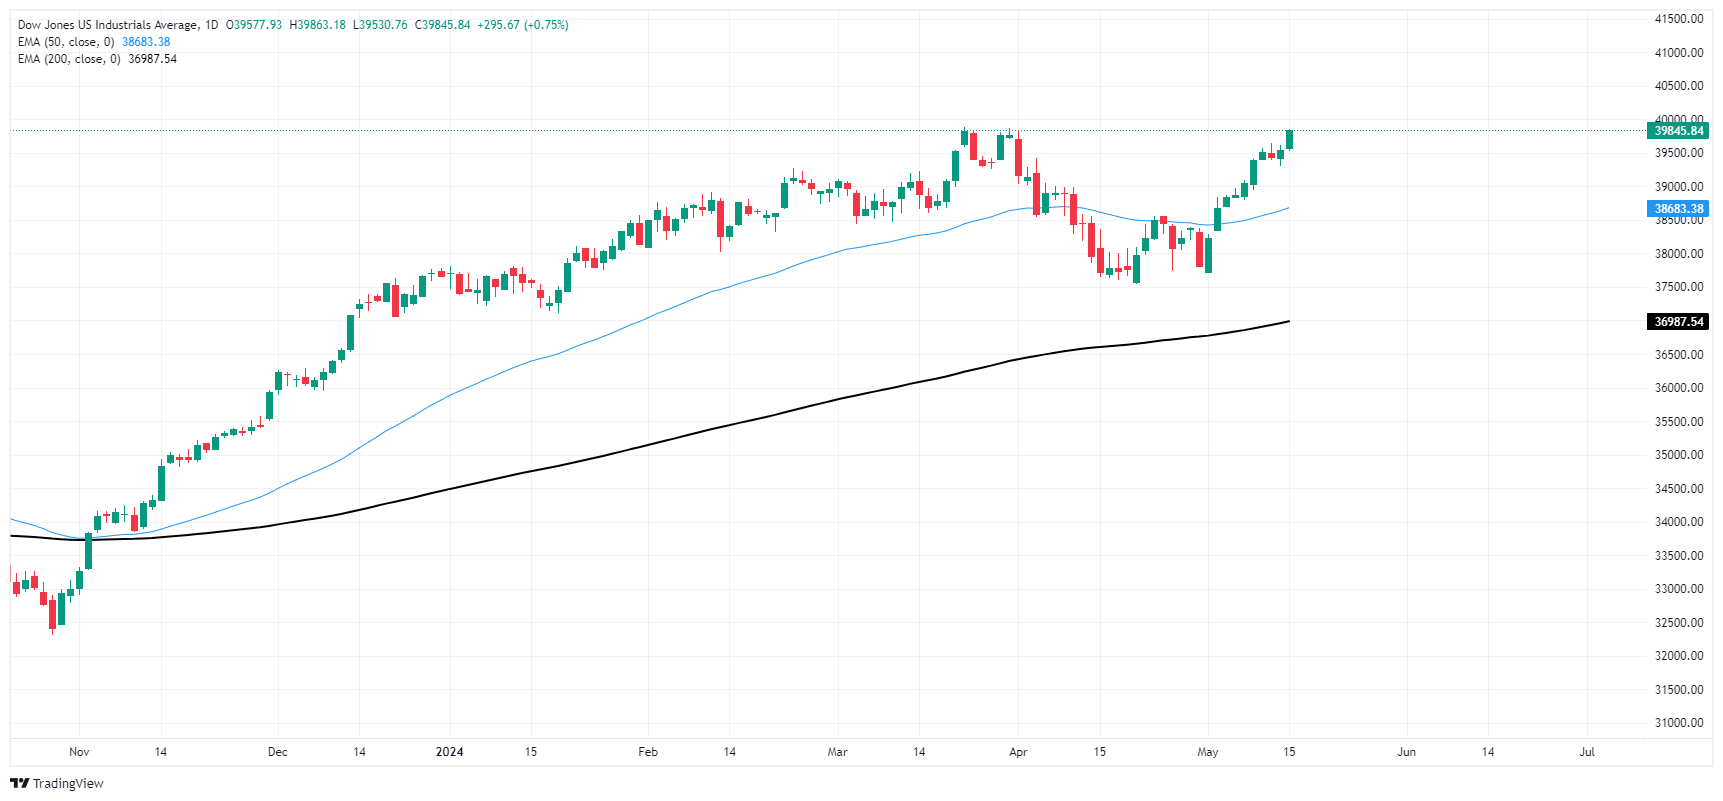
Dow Jones FAQs
The Dow Jones Industrial Average, one of the oldest stock market indices in the world, is compiled of the 30 most traded stocks in the US. The index is price-weighted rather than weighted by capitalization. It is calculated by summing the prices of the constituent stocks and dividing them by a factor, currently 0.152. The index was founded by Charles Dow, who also founded the Wall Street Journal. In later years it has been criticized for not being broadly representative enough because it only tracks 30 conglomerates, unlike broader indices such as the S&P 500.
Many different factors drive the Dow Jones Industrial Average (DJIA). The aggregate performance of the component companies revealed in quarterly company earnings reports is the main one. US and global macroeconomic data also contributes as it impacts on investor sentiment. The level of interest rates, set by the Federal Reserve (Fed), also influences the DJIA as it affects the cost of credit, on which many corporations are heavily reliant. Therefore, inflation can be a major driver as well as other metrics which impact the Fed decisions.
Dow Theory is a method for identifying the primary trend of the stock market developed by Charles Dow. A key step is to compare the direction of the Dow Jones Industrial Average (DJIA) and the Dow Jones Transportation Average (DJTA) and only follow trends where both are moving in the same direction. Volume is a confirmatory criteria. The theory uses elements of peak and trough analysis. Dow’s theory posits three trend phases: accumulation, when smart money starts buying or selling; public participation, when the wider public joins in; and distribution, when the smart money exits.
There are a number of ways to trade the DJIA. One is to use ETFs which allow investors to trade the DJIA as a single security, rather than having to buy shares in all 30 constituent companies. A leading example is the SPDR Dow Jones Industrial Average ETF (DIA). DJIA futures contracts enable traders to speculate on the future value of the index and Options provide the right, but not the obligation, to buy or sell the index at a predetermined price in the future. Mutual funds enable investors to buy a share of a diversified portfolio of DJIA stocks thus providing exposure to the overall index.
- Mexican Peso recovers after two-day decline, buoyed by weaker-than-expected US CPI report.
- US CPI miss leads to cooling inflation, boosting prospects for Fed rate cuts.
- US Treasury yields drop, DXY falls 0.60% to 104.39, weakening Greenback.
- Minneapolis Fed's Kashkari questions monetary policy restrictiveness amid unexpected consumer spending levels.
The Mexican Peso erased two days of losses and rallies against the US Dollar on Wednesday after the latter continued to weaken due to a softer-than-expected US inflation report.
Consequently, expectations for a Federal Reserve (Fed) rate cut increased, exerting pressure on the American currency. At the time of writing, the USD/MXN trades at 16.65, dropping to four-week lows.
Mexico’s economic docket remains absent and will not resume until next week. Across the border, the US Bureau of Labor Statistics (BLS) revealed that the Consumer Price Index (CPI) was below estimates and the prior month’s data. Underlying inflation showed signs of cooling, which means that easing policy in the United States is back on the table.
US Treasury bond yields are plunging across the short and long end of the curve, a headwind for the Greenback. The US Dollar Index (DXY) fell 0.60% to 104.39.
In the meantime, Minneapolis Fed President Neel Kashkari hit the wires. He said that Americans have been spending “more than I would have expected,” adding that the big question is “how restrictive policy currently is”.
On Tuesday, Fed Chair Jerome Powell revealed that inflation is moving lower, though he added that he’s not as confident as he was before about inflation’s path to 2%. Powell noted that restrictive monetary policy could take longer than expected to do its work and bring inflation to the Fed’s goal.
Daily digest market movers: Mexican Peso surges on soft US CPI, disappointing Retail Sales
- On Monday, Bank of Mexico (Banxico) Governor Victoria Rodriguez Ceja made some dovish comments. She said the central bank could evaluate lowering rates as soon as the next meeting on June 27. She added that depending on the evolution of the inflationary outlook, the bank could slash the main reference rate that stands at 11.00%.
- Mexico’s economic docket will be absent during the current week. The next economic data release is expected to be Retail Sales on May 20, followed by the Gross Domestic Product (GDP), inflation figures and Banxico’s minutes on May 23.
- April's data show that Mexico’s headline inflation is reaccelerating. However, core prices are falling. This spurred Banxico’s revision to its inflation projections, with the bank expected to hit its 3% target toward the last quarter of 2025, later than March’s estimates for Q2 2025. Core inflation is projected to hit 3% in Q2 2025.
- The US Department of Labor showed that the CPI rose by 0.3% MoM in April, below estimates and March’s 0.4%. Core CPI rose by 0.3% MoM as expected but beneath the prior reading of 0.4%.
- Other data showed that Retail Sales missed estimates of 0.4% and came at 0% MoM, below March’s 0.6%. In the twelve months to April, Retail Sales grew by 3%, below the 3.8% increase of the previous reading.
- After the report, investors trimmed bets that the Fed may cut rates faster than expected, though the odds for a September cut have lately adjusted to 97%, higher than Tuesday’s 83%.
- The deterioration in consumer sentiment, alongside a cooling labor market, has opened the door for investors to price in rate cuts by the Fed. This is because US central bank policymakers acknowledged that risks to achieving its dual mandate on employment and inflation “moved toward better balance over the past year.”
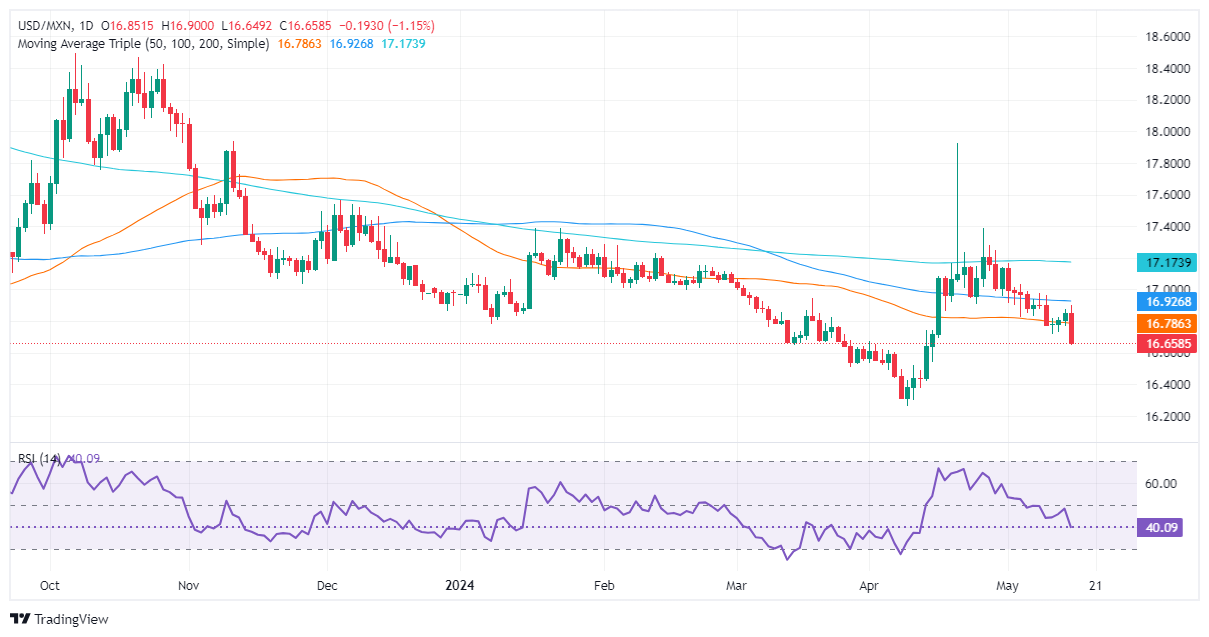
Technical analysis: Mexican Peso counterattacks as USD/MXN plummets below 16.70
Following worse-than-expected US data, the USD/MXN extended its losses past the 16.70 figure. Momentum is on the side of the Mexican currency as the exotic pair has dropped to new four-week lows, poised to test the next support level seen at the 2023 low of 16.62, followed by the current year-to-date low of 16.25.
On the flip side, buyers must reclaim the 50-day SMA at 16.78, which could exacerbate a rally toward the 100-day Simple Moving Average (SMA) at 16.92. Once cleared, the next supply zone would be the 17.00 psychological level. In that event, the next stop would be the 200-day SMA at 17.17.
Mexican Peso FAQs
The Mexican Peso (MXN) is the most traded currency among its Latin American peers. Its value is broadly determined by the performance of the Mexican economy, the country’s central bank’s policy, the amount of foreign investment in the country and even the levels of remittances sent by Mexicans who live abroad, particularly in the United States. Geopolitical trends can also move MXN: for example, the process of nearshoring – or the decision by some firms to relocate manufacturing capacity and supply chains closer to their home countries – is also seen as a catalyst for the Mexican currency as the country is considered a key manufacturing hub in the American continent. Another catalyst for MXN is Oil prices as Mexico is a key exporter of the commodity.
The main objective of Mexico’s central bank, also known as Banxico, is to maintain inflation at low and stable levels (at or close to its target of 3%, the midpoint in a tolerance band of between 2% and 4%). To this end, the bank sets an appropriate level of interest rates. When inflation is too high, Banxico will attempt to tame it by raising interest rates, making it more expensive for households and businesses to borrow money, thus cooling demand and the overall economy. Higher interest rates are generally positive for the Mexican Peso (MXN) as they lead to higher yields, making the country a more attractive place for investors. On the contrary, lower interest rates tend to weaken MXN.
Macroeconomic data releases are key to assess the state of the economy and can have an impact on the Mexican Peso (MXN) valuation. A strong Mexican economy, based on high economic growth, low unemployment and high confidence is good for MXN. Not only does it attract more foreign investment but it may encourage the Bank of Mexico (Banxico) to increase interest rates, particularly if this strength comes together with elevated inflation. However, if economic data is weak, MXN is likely to depreciate.
As an emerging-market currency, the Mexican Peso (MXN) tends to strive during risk-on periods, or when investors perceive that broader market risks are low and thus are eager to engage with investments that carry a higher risk. Conversely, MXN tends to weaken at times of market turbulence or economic uncertainty as investors tend to sell higher-risk assets and flee to the more-stable safe havens.
- The DXY fell to its lowest level since mid-April on Wednesday.
- Weak US inflation data and unimpressive Retail Sales increase odds of a Fed interest rate cut in the near term.
- Markets are still discounting higher odds of the first cut being in September.
The US Dollar Index (DXY) is trading near 104.4 on Wednesday, showing sharp losses triggered by the softer-than-expected Consumer Price Index (CPI) and flat Retail Sales figures from April.
The US economy is showing signs of pressure as inflation in April seems to have decelerated. Federal Reserve (Fed) Chair Jerome Powell's cautious stance, coupled with mixed Producer Price Index (PPI) readings, are highlighting concerns over future inflation dynamics, which seem to be weighing on the Greenback.
Daily digest market movers: DXY dives on soft CPI figures
- US Bureau of Labor Statistics reported a decrease in the inflation rate to 3.4% YoY, down from 3.5% in the previous month and in line with market expectations.
- Annual core CPI fell to 3.6% in April, coming down from 3.8% YoY in March and matching forecasts.
- Both CPI and core CPI reported 0.3% increase MoM in this time frame.
- Retail Sales in the US showed no growth in April, underperforming the 0.4% expected MoM rise and indicating a decline from the 0.6% MoM reported a month earlier.
- Downturn in Retail Sales may signify potential trouble for US economy, possibly sending Fed to consider sooner rate cuts.
- As per CME FedWatch tool, a hold in June is near to being priced in as odds of July cut slightly increase. The meeting with the highest odds of a cut is September’s FOMC.
DXY technical analysis: DXY shows negative bias, yet bullish signs remain
The indicators on the daily chart reflect a mixed technical picture for DXY but are largely tilted to the downside. The Relative Strength Index (RSI) displays a negative slope and is in negative territory, indicating strong selling momentum. This suggests that bears are gaining control in the immediate term. In addition, the Moving Average Convergence Divergence (MACD) shows rising red bars, signaling that bearish momentum is strengthening.
The asset's position relative to its Simple Moving Averages (SMAs) paints some optimism for the Greenback. Despite being below the 20-day SMA and thus facing short-term selling pressure, DXY remains above both its 100-day and 200-day SMAs. This means that, despite the recent bearish push, the medium-term to long-term trend still favors the bulls. However, the bears are approaching the 200-day SMA at 104.10, which in case of breaching it would paint the technical outlook with red.
US Dollar FAQs
The US Dollar (USD) is the official currency of the United States of America, and the ‘de facto’ currency of a significant number of other countries where it is found in circulation alongside local notes. It is the most heavily traded currency in the world, accounting for over 88% of all global foreign exchange turnover, or an average of $6.6 trillion in transactions per day, according to data from 2022. Following the second world war, the USD took over from the British Pound as the world’s reserve currency. For most of its history, the US Dollar was backed by Gold, until the Bretton Woods Agreement in 1971 when the Gold Standard went away.
The most important single factor impacting on the value of the US Dollar is monetary policy, which is shaped by the Federal Reserve (Fed). The Fed has two mandates: to achieve price stability (control inflation) and foster full employment. Its primary tool to achieve these two goals is by adjusting interest rates. When prices are rising too quickly and inflation is above the Fed’s 2% target, the Fed will raise rates, which helps the USD value. When inflation falls below 2% or the Unemployment Rate is too high, the Fed may lower interest rates, which weighs on the Greenback.
In extreme situations, the Federal Reserve can also print more Dollars and enact quantitative easing (QE). QE is the process by which the Fed substantially increases the flow of credit in a stuck financial system. It is a non-standard policy measure used when credit has dried up because banks will not lend to each other (out of the fear of counterparty default). It is a last resort when simply lowering interest rates is unlikely to achieve the necessary result. It was the Fed’s weapon of choice to combat the credit crunch that occurred during the Great Financial Crisis in 2008. It involves the Fed printing more Dollars and using them to buy US government bonds predominantly from financial institutions. QE usually leads to a weaker US Dollar.
Quantitative tightening (QT) is the reverse process whereby the Federal Reserve stops buying bonds from financial institutions and does not reinvest the principal from the bonds it holds maturing in new purchases. It is usually positive for the US Dollar.
- Canadian Dollar weaker on Wednesday but climbs over retreating USD.
- Canada housing and manufacturing figures mixed with little impact.
- Easing US inflation renews September rate cut hopes.
The Canadian Dollar (CAD) is broadly softer on Wednesday as one of the day’s weakest performers, but the CAD will have to settle for second-worst as the US Dollar (USD) broadly retreats following a cooler-than-expected print of US Consumer Price Index (CPI) inflation. Easing inflation pressure is reigniting broad-market hopes for rate cuts from the Federal Reserve (Fed) in September.
Canada saw a slight decrease in the number of Housing Starts for the year through April, though the figure came in higher than expected. Canadian Manufacturing Sales also contracted more than expected in March. Despite misfires, Canadian economic data is strictly low-tier on Wednesday with markets squarely focused on US CPI inflation.
Daily digest market movers: CAD softens on Wednesday, but USD softer
- MoM US CPI inflation in April cooled to 0.3% from the expected hold at 0.4%, reigniting risk appetite and sending Greenback to floorboards.
- Core US CPI inflation for year through April also cooled, printing at the average forecast of 3.6% compared to previous period’s 3.8%.
- Easing inflation pressures are stoking investor hopes for a Fed rate cut in September; according to the CME’s FedWatch Tool, rate markets are pricing in 71% odds of at least a 25-basis-point rate trim.
- US Retail Sales in April also printed below expectations at a flat 0.0%, worse than the forecasted tick down to 0.4% from the previous 0.6% (revised from 0.7%).
- Easing Retail Sales figures add to market hopes for rate cuts as the US economy cools off.
- Canadian Housing Starts for the year ended April by easing to 240.2K, above the forecast for 238K but still back slightly from the previous figure of 242.3K.
- Canadian Manufacturing Sales for March declined -2.1%, worse than expected -1.4%. The previous month’s physical inventory sales were revised slightly higher to 0.9% from 0.7%.
Canadian Dollar PRICE Today
The table below shows the percentage change of Canadian Dollar (CAD) against listed major currencies today. Canadian Dollar was the strongest against the US Dollar.
| USD | EUR | GBP | JPY | CAD | AUD | NZD | CHF | |
|---|---|---|---|---|---|---|---|---|
| USD | -0.46% | -0.62% | -1.01% | -0.31% | -0.81% | -1.10% | -0.37% | |
| EUR | 0.46% | -0.16% | -0.56% | 0.12% | -0.39% | -0.63% | 0.08% | |
| GBP | 0.62% | 0.16% | -0.41% | 0.29% | -0.22% | -0.48% | 0.26% | |
| JPY | 1.01% | 0.56% | 0.41% | 0.69% | 0.20% | -0.10% | 0.66% | |
| CAD | 0.31% | -0.12% | -0.29% | -0.69% | -0.51% | -0.77% | -0.04% | |
| AUD | 0.81% | 0.39% | 0.22% | -0.20% | 0.51% | -0.28% | 0.47% | |
| NZD | 1.10% | 0.63% | 0.48% | 0.10% | 0.77% | 0.28% | 0.74% | |
| CHF | 0.37% | -0.08% | -0.26% | -0.66% | 0.04% | -0.47% | -0.74% |
The heat map shows percentage changes of major currencies against each other. The base currency is picked from the left column, while the quote currency is picked from the top row. For example, if you pick the Canadian Dollar from the left column and move along the horizontal line to the US Dollar, the percentage change displayed in the box will represent CAD (base)/USD (quote).
Technical analysis: Canadian Dollar finds technical barriers limiting gains against Greenback
The Canadian Dollar (CAD) is broadly weaker on Wednesday, shedding weight against all of its major currency peers except for the even weaker US Dollar. The CAD is down nearly seven-tenths of one percent against the Japanese Yen (JPY) but up over a quarter of one percent against the Greenback.
USD/CAD tumbled into the low side of a near-term demand zone, testing the 1.3600 handle but unable to develop further bearish legs. Accelerating declines have the pair pinned below the 200-hour Exponential Moving Average (EMA) at 1.3678, and a further move lower could be on the cards if bidders remain uninterested in defending 1.3600 to 1.3620.
Recent losses are beginning to pile up with USD/CAD on pace to close in the red for a sixth consecutive trading day. The pair has broken into the bearish side of the 50-day EMA at 1.3638, and the immediate price floor underneath daily candlesticks sits at the 200-day EMA at 1.3546.
USD/CAD hourly chart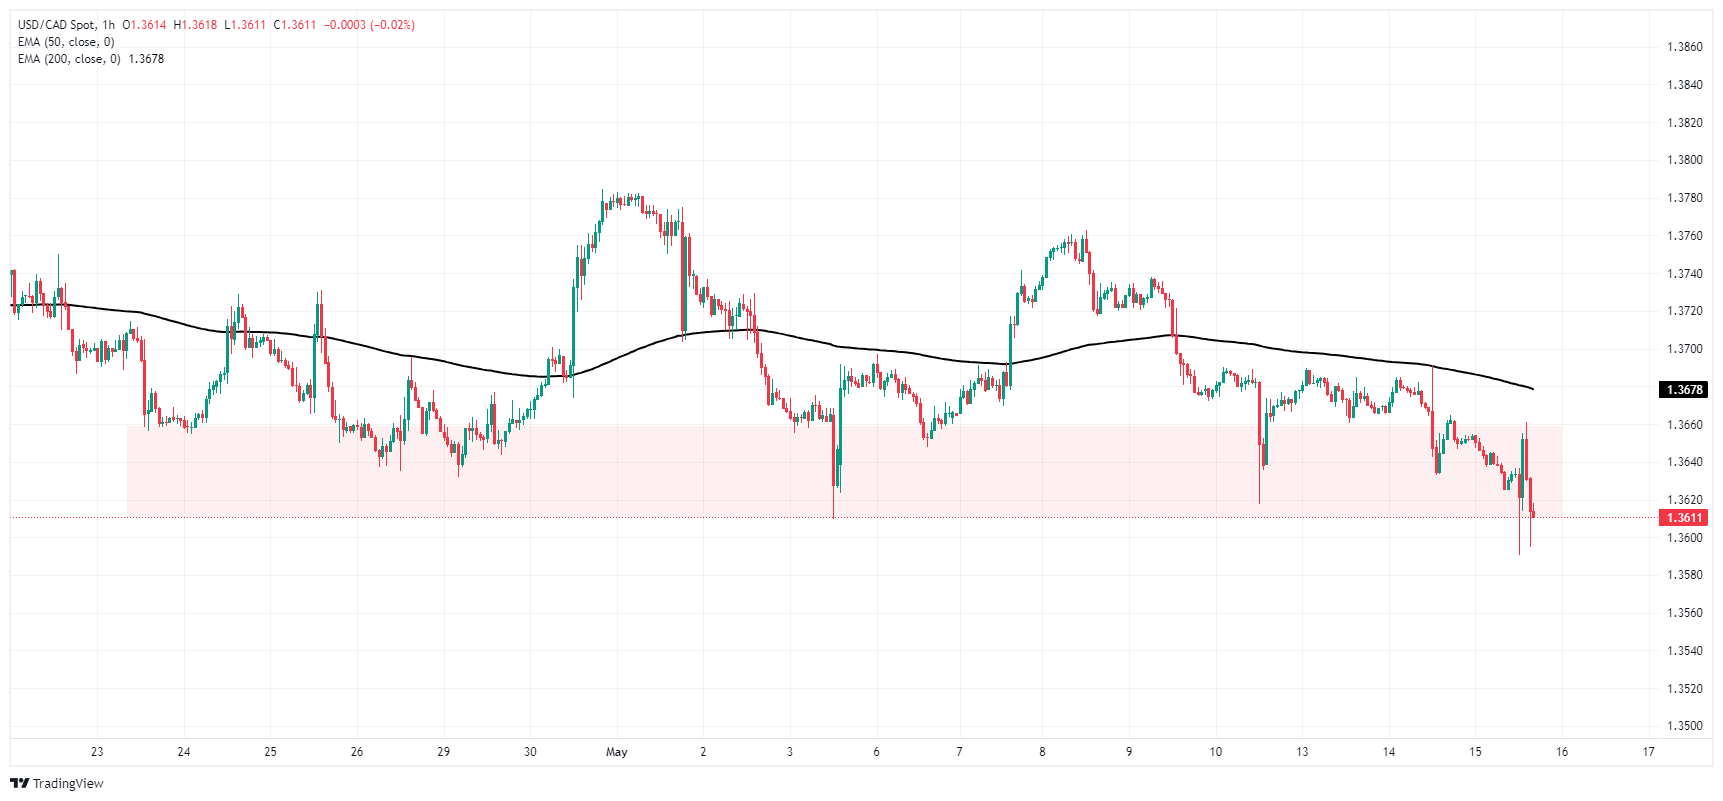
USD/CAD daily chart
Canadian Dollar FAQs
The key factors driving the Canadian Dollar (CAD) are the level of interest rates set by the Bank of Canada (BoC), the price of Oil, Canada’s largest export, the health of its economy, inflation and the Trade Balance, which is the difference between the value of Canada’s exports versus its imports. Other factors include market sentiment – whether investors are taking on more risky assets (risk-on) or seeking safe-havens (risk-off) – with risk-on being CAD-positive. As its largest trading partner, the health of the US economy is also a key factor influencing the Canadian Dollar.
The Bank of Canada (BoC) has a significant influence on the Canadian Dollar by setting the level of interest rates that banks can lend to one another. This influences the level of interest rates for everyone. The main goal of the BoC is to maintain inflation at 1-3% by adjusting interest rates up or down. Relatively higher interest rates tend to be positive for the CAD. The Bank of Canada can also use quantitative easing and tightening to influence credit conditions, with the former CAD-negative and the latter CAD-positive.
The price of Oil is a key factor impacting the value of the Canadian Dollar. Petroleum is Canada’s biggest export, so Oil price tends to have an immediate impact on the CAD value. Generally, if Oil price rises CAD also goes up, as aggregate demand for the currency increases. The opposite is the case if the price of Oil falls. Higher Oil prices also tend to result in a greater likelihood of a positive Trade Balance, which is also supportive of the CAD.
While inflation had always traditionally been thought of as a negative factor for a currency since it lowers the value of money, the opposite has actually been the case in modern times with the relaxation of cross-border capital controls. Higher inflation tends to lead central banks to put up interest rates which attracts more capital inflows from global investors seeking a lucrative place to keep their money. This increases demand for the local currency, which in Canada’s case is the Canadian Dollar.
Macroeconomic data releases gauge the health of the economy and can have an impact on the Canadian Dollar. Indicators such as GDP, Manufacturing and Services PMIs, employment, and consumer sentiment surveys can all influence the direction of the CAD. A strong economy is good for the Canadian Dollar. Not only does it attract more foreign investment but it may encourage the Bank of Canada to put up interest rates, leading to a stronger currency. If economic data is weak, however, the CAD is likely to fall.
Federal Reserve (Fed) Bank of Minneapolis President Neel Kashkari highlighted the Fed's need to watch the economy carefully to see if current policy rates are restrictive enough. Minneapolis Fed President Kashkari was participating at a fireside chat at the Williston Basin Petroleum Conference.
Key highlights
The Fed is focused on underlying demand in the economy to get inflation down.
Americans have been spending more than I would have expected.
The housing market has been more resilient than I expected, it's an area I'm very focused on.
The big questions mark now is, how restrictive is policy right now?
We probably need to sit here for a while longer to figure out where inflation is headed.
- GBP/USD climbs past 100-DMA, with buyers gaining traction.
- Buying interest remains strong, as RSI points upwards, yet to become overbought.
- Key resistance lies at 1.2670, which would exacerbate followed by 1.2700.
- Sellers target a close below the 100-DMA to challenge 1.2600.
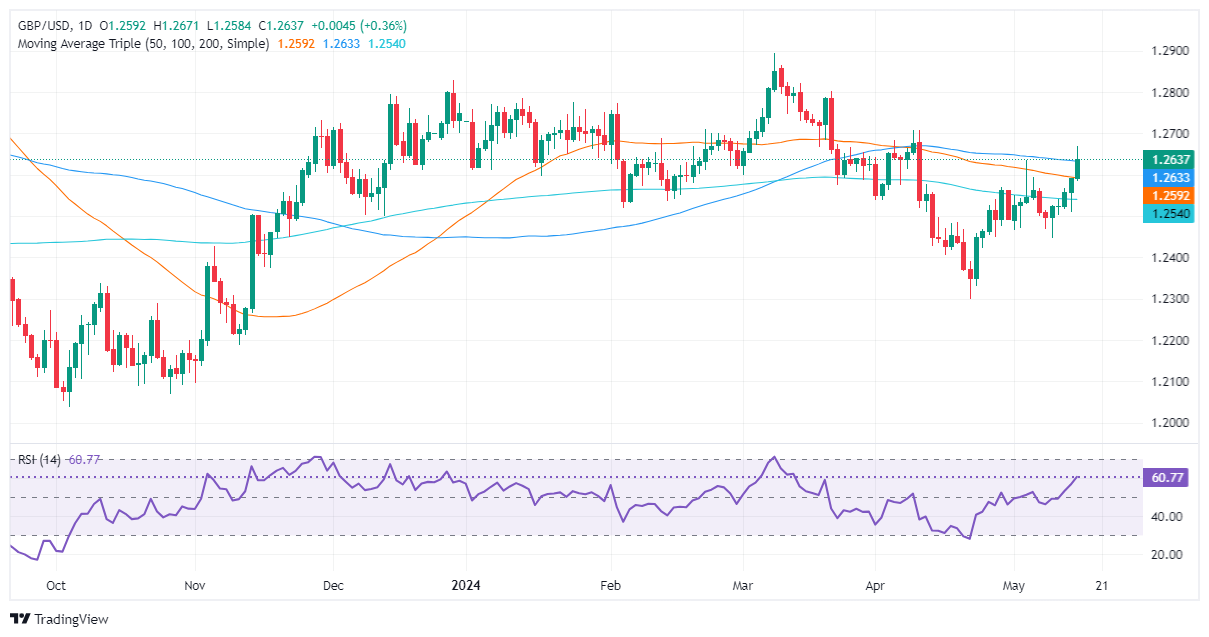
The Pound Sterling advanced some 0.30% and hit a five-week high of 1.2670 following the release of the US Consumer Price Index (CPI). The data was mostly aligned with estimates, showing a continuation of the disinflation process, which weighed on the Greenback. The GBP/USD trades at 1.2641 at the time of writing.
GBP/USD Price Analysis: Technical outlook
The GBP/USD remains neutral to upward bias and hit a weekly high at 1.2670 following a soft US inflation report. However, the pair has retreated toward the 100-day moving average (DMA) at 1.2632, seen as the next key technical level that, once surpassed, could pave the way for further gains.
The Relative Strength Index (RSI) shows that momentum favors buyers. The RSI aims upward with enough room before portraying overbought conditions.
If buyers reclaim the 100-DMA, the next resistance would be today’s high at 1.2670. A breach of the latter will expose the April 9 high at 1.2709, ahead of rallying to the next supply zone at 1.2803, the March 21 high. Once surpassed, the next stop would be the year-to-date (YTD) high at 1.2894.
Conversely, sellers remain hopeful that the GBP/USD exchange rate could tumble below the 100-DMA and achieve a daily close below that level, to challenge 1.2600. Once cleared, the next stop would be the 50-DMa at 1.2591, followed by the 200-DMA at 1.2539.
GBP/USD Price Action – Daily Chart
- Silver price has risen to a new high for May following the release of US data.
- Silver has become overbought on the 4-hour chart and is in the process of pulling back.
- It could correct lower but the overall uptrend suggests it will recover and continue pushing higher.
Silver (XAG/USD) price has risen up to a new high for May at $29.20 after the release of market-moving data from the US.
Silver is in a short-term uptrend but it has become overbought according to the Relative Strength Index (RSI) momentum indicator. The RSI is also diverging bearishly with price.
4-hour Chart

A bearish divergence occurs when price rallies to a new high but RSI does not follow suit as happened between May 10 and May 15. It is a bearish sign.
Price is pulling back on the current bar and looks like it might be forming a bearish Shooting Star Japanese candlestick pattern. If such a pattern is confirmed on close and it is followed by another bearish bar the Shooting Star will gain relevance and denote a short-term reversal lower.
When taken together with the indications from the RSI, it could be indicating Silver is about to undergo a correction – much depends on how the current and next bars develop.
Eventually the short-term uptrend should reassert itself, however, and Silver price rally higher. A break above the day’s high at $29.20 could give added confirmation of more upside to the next resistance level at circa $30.00.
A decisive break below $27.97 would bring the short-term uptrend into question.
A decisive break would be one accompanied by a long red candlestick that closed near its lows or three red candlesticks in a row.
- USD/CAD bounces back from 1.3600 on weak Canadian Manufacturing Sales data.
- The US Dollar faces a sell-off due to an expected decline in the US inflation data.
- Weak US Retail Sales also weighed on the US Dollar.
The USD/CAD pair rebounds sharply after falling to near the round-level support of 1.3600 in Wednesday’s New York session. The Loonie asset recovers as poor Canadian Manufacturing Sales data weakens the Canadian Dollar.
Earlier, the major faced selling pressure as the US Dollar tumbled after the United States (US) Bureau of Labor Statistics (BLS) has reported that the Consumer Price Index (CPI) data for April declines in consistent with estimates. However, the US Dollar has rebounded but is expected to remain on the edge.
The expected decline in the US inflation data has boosted expectations about the Federal Reserve (Fed) to begin reducing interest rates from the September meeting. This has also improved investors risk-appetite. The S&P 500 has posted significant gains at open. 10-year US Treasury yields have plummeted to 4.38%. The US Dollar Index (DXY) reverses to 104.80 after printing a fresh monthly low near 104.50 but is still down.
The US agency reported that annual headline, and core CPI (which strips off volatile food and energy prices) grew in line with estimates of 3.4% and 3.6% respectively. The decline in the inflation data came from lower prices of utility gas services and used cars and trucks. Rentals, transportation and medical services price index continue to gain higher.
Apart from soft US inflation figures, weak monthly Retail Sales data also built pressure on the US Dollar. Monthly Retail Sales were unchanged while investors anticipated an increase by 0.4%.
On the Loonie front, weak monthly Manufacturing Sales data for March has also built pressure on the Canadian Dollar. Statistics Canada reported that Manufacturing Sales contracted at a faster pace of 2.1% while investors forecasted a decline by 1.4%. In February, the economic data rose by 0.9%, upwardly revised from 0.7%.
- Retail Sales in the US were virtually unchanged in April.
- US Dollar Index stays deep in negative territory below 105.00.
The US Census Bureau reported on Wednesday that Retail Sales in the US were virtually unchanged on a monthly basis at $705.2 billion in April. This reading followed the 0.6% increase recorded in March and came in below the market expectation of 0.4%.
"Total sales for the February 2024 through April 2024 period were up 3.0% from the same period a year ago," the press release read. "Retail trade sales were virtually unchanged from March 2024, but up 2.7% above last year. Nonstore retailers were up 7.5% from last year, while food services and drinking places were up 5.5% from April 2023."
Market reaction
The US Dollar stays under bearish pressure following the disappointing Retail Sales data. At the time of press, the US Dollar Index was down 0.37% on the day at 104.65.
- AUD/USD has rallied up to tough resistance and stalled.
- It must break decisively above this barrier to continue to short-term uptrend higher.
- A successful break might lead to a move all the way up to the end of wave C of a Measured Move price pattern.
AUD/USD has reached key long-term resistance at around 0.6650 and has stalled.
AUD/USD 4-hour Chart
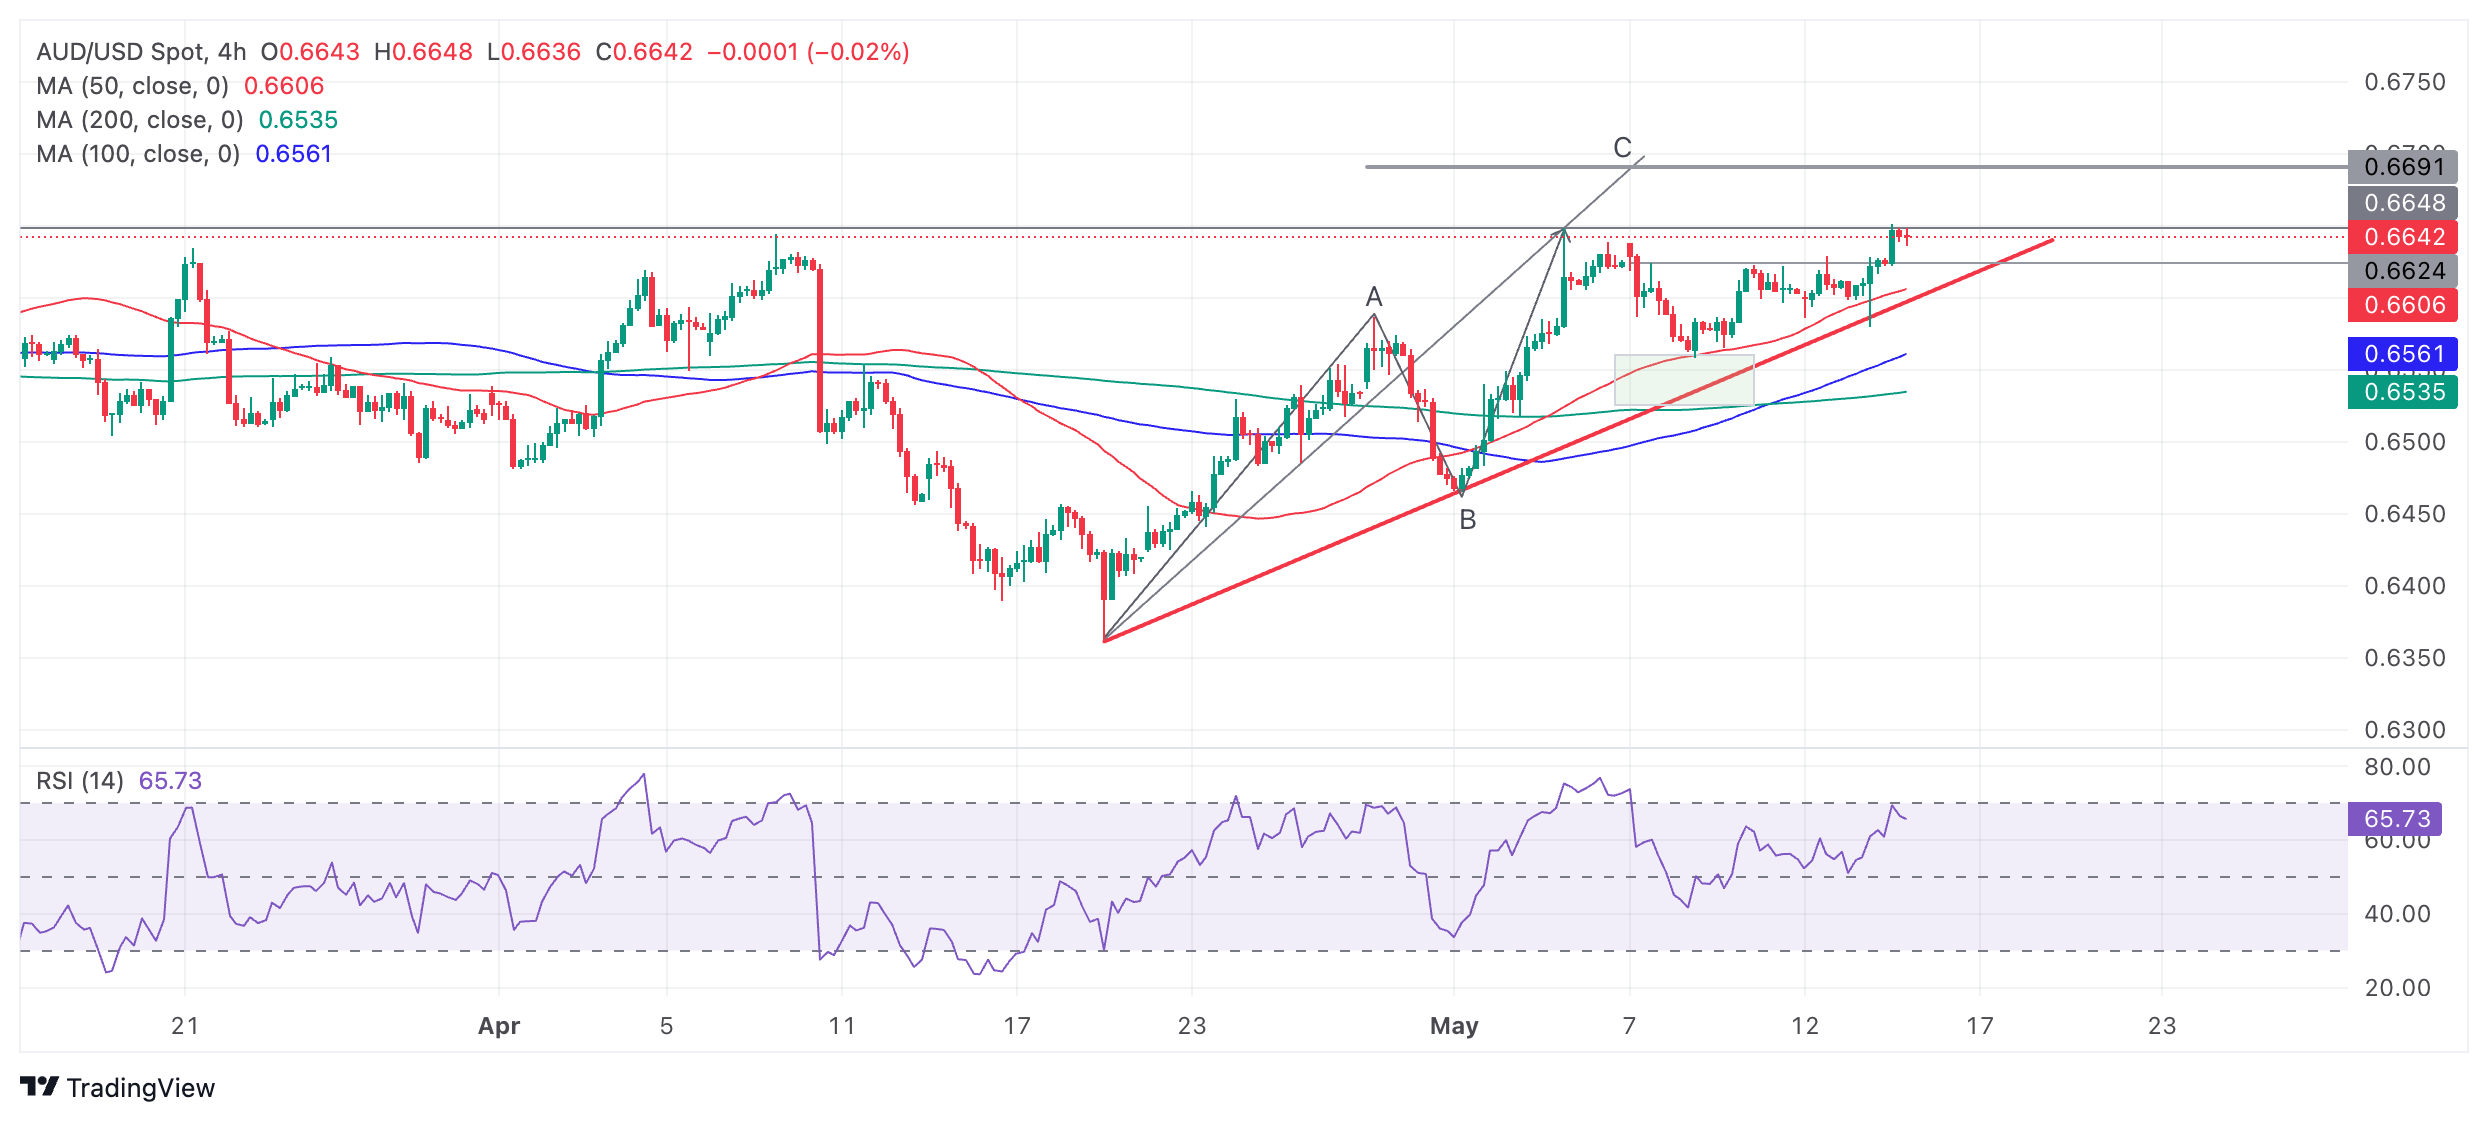
The pair is probably in a short-term uptrend, however, evidenced by the rising sequence of peaks and troughs since the April 19 bottom. Given the old saying that “the trend is your friend”, this means the odds overall favor AUD/USD going higher.
However, AUD/USD needs to break decisively above the resistance at 0.6650 to continue trending higher.
A decisive break is one which is accompanied by a long green candlestick that breaks and closes near its high or three green candlesticks in a row that break above the level.
If AUD/USD can successfully break above the resistance level it will probably move up to the level of the May 8 high at 0.6667. A break above that would be highly bullish and lead to a move up to a target at around 0.6690. The latter target is generated by a possible Measured Move pattern that AUD/USD has formed since the April 19 lows.
Measured Moves are large zig-zag like patterns composed of three waves, usually labeled A, B and C. The general expectation is that wave C will be either the same length as A or a Fibonacci 0.681 ratio of A.
Wave C has already reached the Fibonacci 0.681 ratio target when it rallied up to the May 3 highs, however, it could also achieve the target where C=A at 0.6690.
On the other hand, a decisive break below the red trendline would be a bearish sign and could denote a change of the short-term trend.
- Oil hangs around $78.00 after both OPEC and IEA released their monthly reports.
- While OPEC stuck to previous expectations, sluggish demand is forecasted in the IEA release.
- The US Dollar Index eases ahead of the US CPI print.
Oil prices remain steady near $78 on Wednesday, but faces increasing downward pressure when factoring in all elements that are on the table at the moment. Besides the fragile equilibrium in the Middle East and the Red Sea, the recent OPEC and International Energy Administration (IEA) reports aren’t portraying a clear picture either, with the IEA slashing its forecast for Oil demand and OPEC sticking to its previous expectations. As if the outlook picture is not blurred enough, the steady-for-longer stance from the US Federal Reserve (Fed) is postponing that initial rate cut, which would mean a surge in demand.
Meanwhile, the US Dollar Index (DXY) is retreating below 105.00 ahead of the US Consumer Price Index (CPI) print. Markets seem to be convinced the number will be lower than previously anticipated after the Producer Price Index (PPI) release on Tuesday saw downward revision across the board in both core and headline PPI. With traders looking for a weaker print, a surprise jump in inflation would mean mayhem in the markets and a prevailing Greenback at the end of the day.
At the time of writing, Crude Oil (WTI) trades at $78.18 and Brent Crude at $82.51.
Oil news and market movers: Does OPEC even know?
- Ahead of the next OPEC meeting, the group has ordered an outside, external review to know how much capacity each member has, Bloomberg reports.
- Mexico has lowered its pricing for Maya Oil for Gulf Coast refiners, Reuters reports.
- The IEA reports that World consumption will increase by 1.1 million barrels per day this year, which is 140k barrels less than expected a month ago.
Oil Technical Analysis: Demand not to pick up in the US
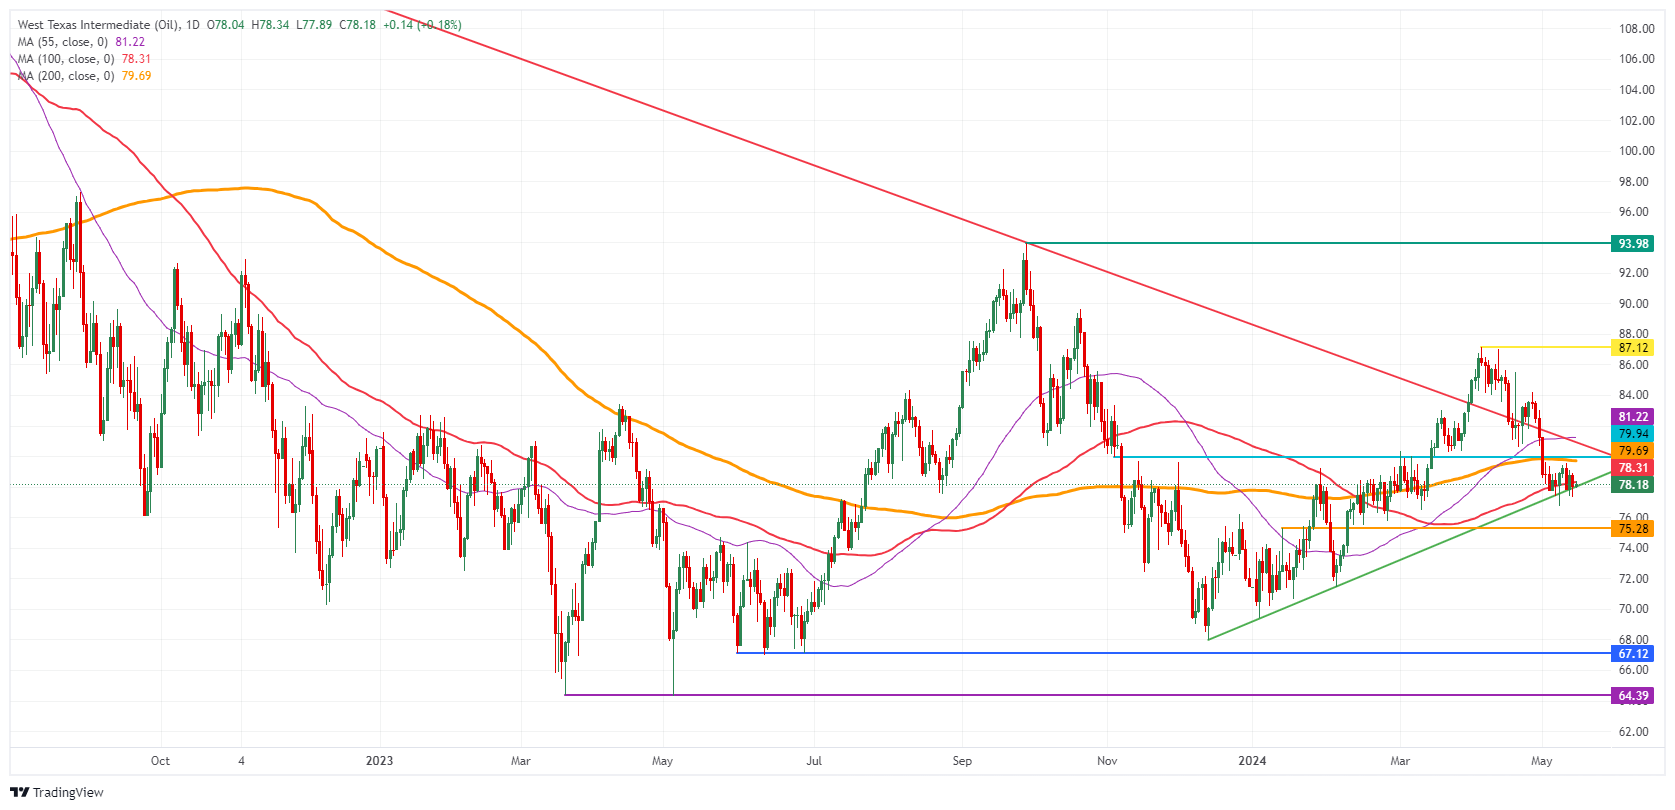
Oil prices are set to crack under pressure with the steady-for-longer rate stance of the Federal Reserve. Fed Chairman Jerome Powell confirmed this stance again on Tuesday during a speech in Amsterdam. This means that the surge in demand from the US will not take place until after the summer at earliest, so Crude isn’t likely to break above substantial pivotal levels as long as demand is not outpacing supply.
On the upside, the line in the sand remains at $79.73 with the 200-day Simple Moving Average (SMA). Once above that level, a double layer comes up with the 100-day SMA at $78.23. In case of an upward extension above that zone, the road is open for $87.12 again.
On the downside, the pivotal level at $75.28 is the last solid line in the sand that could end this decline. If this level is unable to hold, investors could expect an accelerated sell-off towards $72.00 and $70.00. That would erase all gains for 2024 and then Oil price could test $68, the December 13 low.
US WTI Crude Oil: Daily Chart
WTI Oil FAQs
WTI Oil is a type of Crude Oil sold on international markets. The WTI stands for West Texas Intermediate, one of three major types including Brent and Dubai Crude. WTI is also referred to as “light” and “sweet” because of its relatively low gravity and sulfur content respectively. It is considered a high quality Oil that is easily refined. It is sourced in the United States and distributed via the Cushing hub, which is considered “The Pipeline Crossroads of the World”. It is a benchmark for the Oil market and WTI price is frequently quoted in the media.
Like all assets, supply and demand are the key drivers of WTI Oil price. As such, global growth can be a driver of increased demand and vice versa for weak global growth. Political instability, wars, and sanctions can disrupt supply and impact prices. The decisions of OPEC, a group of major Oil-producing countries, is another key driver of price. The value of the US Dollar influences the price of WTI Crude Oil, since Oil is predominantly traded in US Dollars, thus a weaker US Dollar can make Oil more affordable and vice versa.
The weekly Oil inventory reports published by the American Petroleum Institute (API) and the Energy Information Agency (EIA) impact the price of WTI Oil. Changes in inventories reflect fluctuating supply and demand. If the data shows a drop in inventories it can indicate increased demand, pushing up Oil price. Higher inventories can reflect increased supply, pushing down prices. API’s report is published every Tuesday and EIA’s the day after. Their results are usually similar, falling within 1% of each other 75% of the time. The EIA data is considered more reliable, since it is a government agency.
OPEC (Organization of the Petroleum Exporting Countries) is a group of 13 Oil-producing nations who collectively decide production quotas for member countries at twice-yearly meetings. Their decisions often impact WTI Oil prices. When OPEC decides to lower quotas, it can tighten supply, pushing up Oil prices. When OPEC increases production, it has the opposite effect. OPEC+ refers to an expanded group that includes ten extra non-OPEC members, the most notable of which is Russia.
- EUR/GBP is breaking back inside a medium-term range after briefly breaching to the upside.
- The pair is extending its sideways trend and could fall all the way back down to the range lows.
- The MACD has crossed below its signal line giving a bearish signal.
EUR/GBP is falling back inside its multi-month range after temporarily breaking out to the upside on May 7.
The move back down inside the range continues the pair’s sideways trend. This trend is tipped to continue given the old market saying that “the trend is your friend”.
EUR/GBP 4-hour Chart
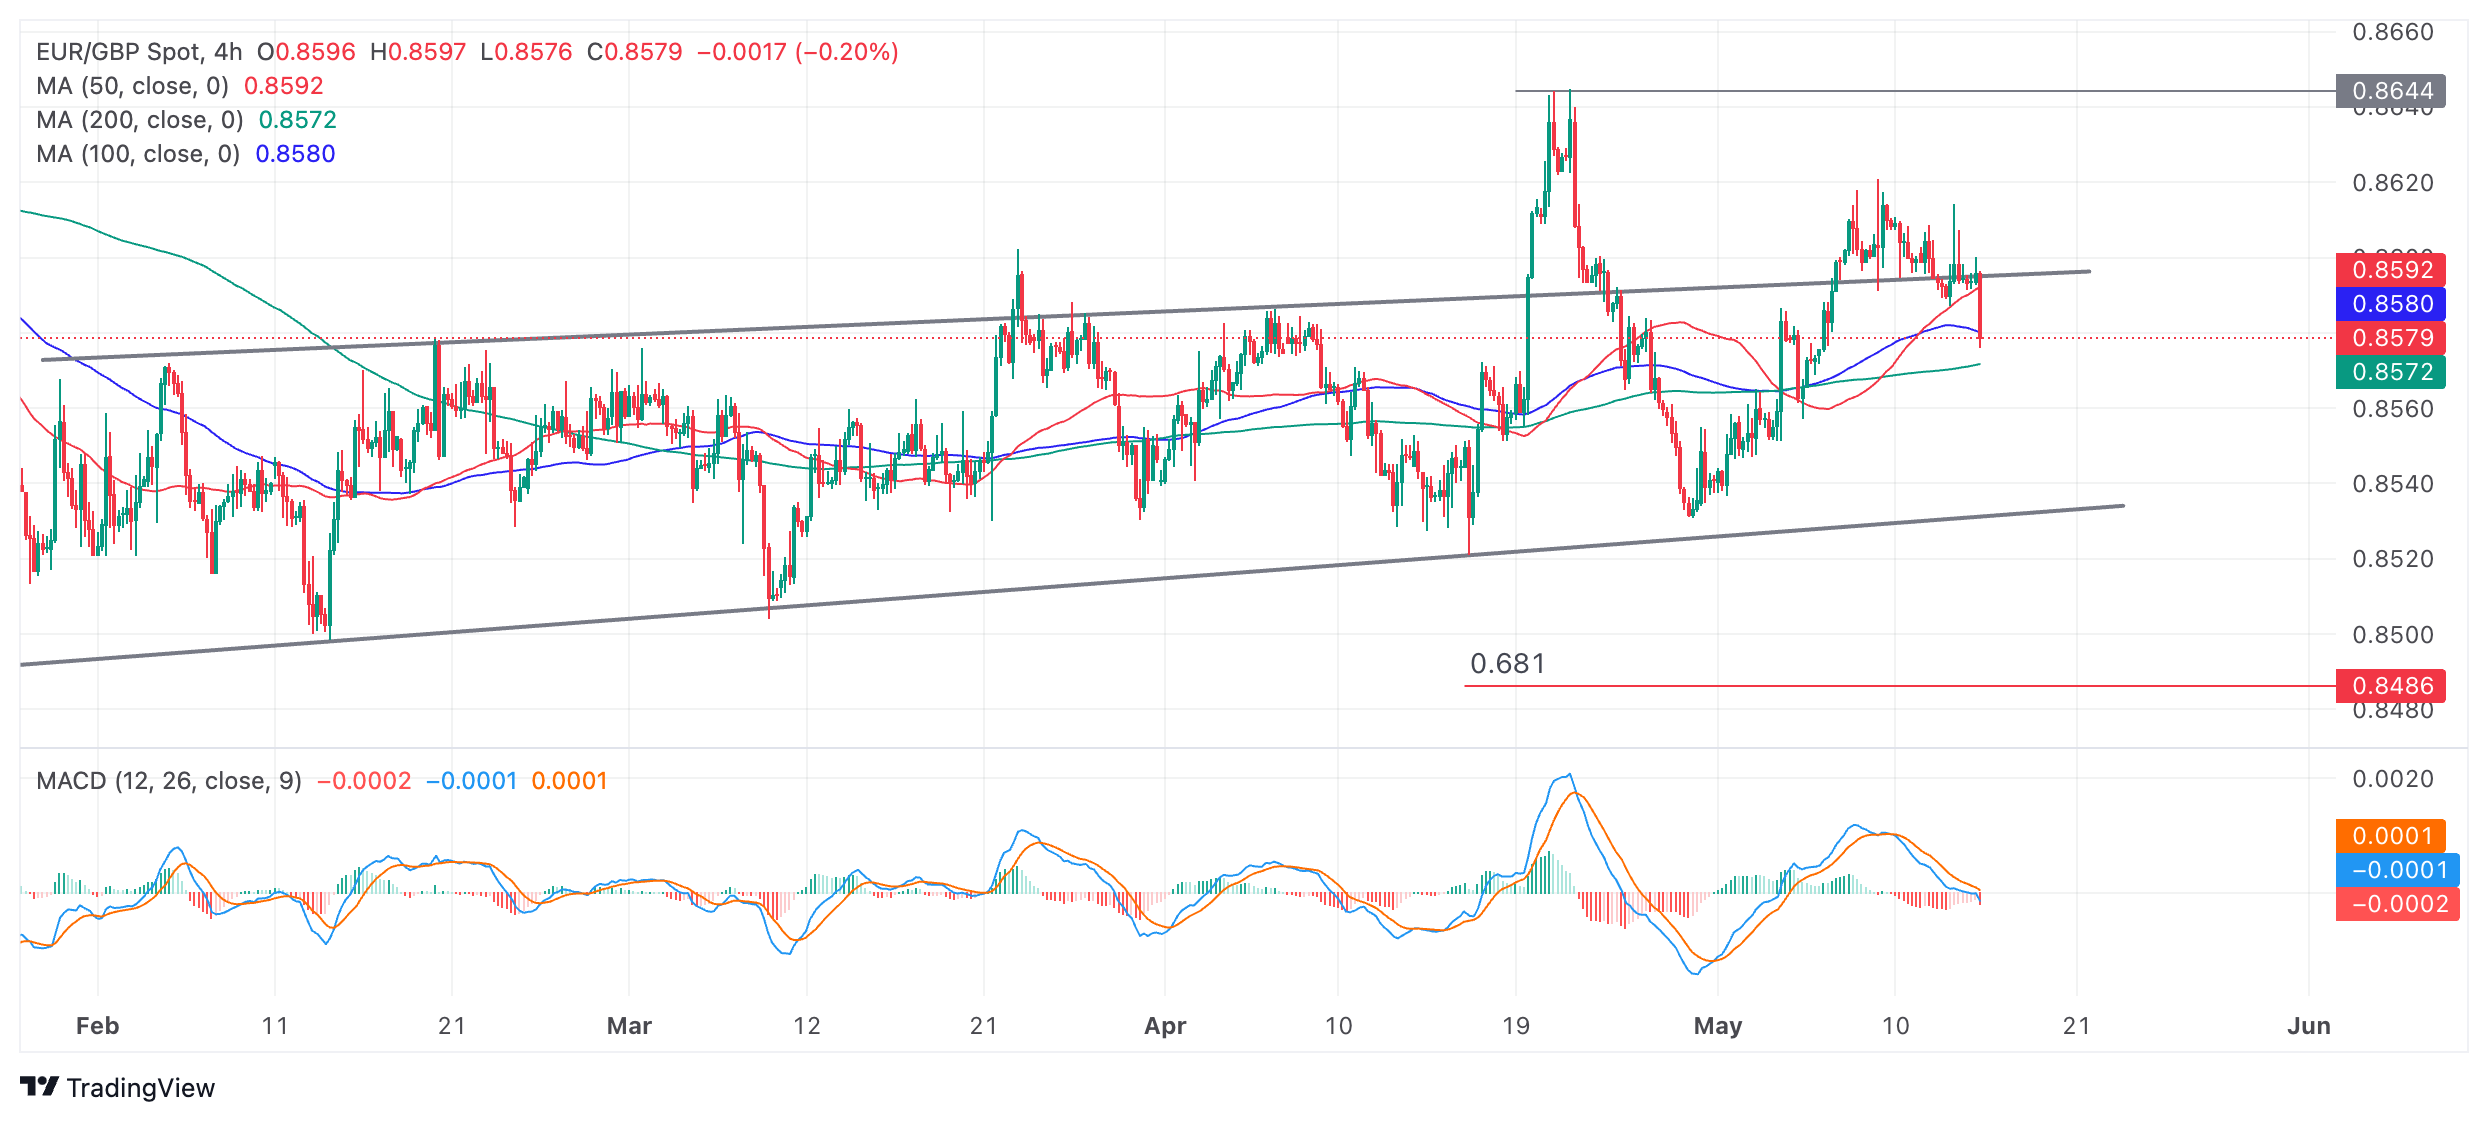
After breaking out above the top of the range on May 7, EUR/GBP formed a multiple topping pattern. It has now broken down through the neckline of the topping pattern and begun a steep descent back inside the middle of the range. There is a chance the pair could now fall back all the way down to support at around 0.8540.
The Moving Average Convergence Divergence (MACD) indicator crossed below its red signal line on May 10, giving a sell signal. This led to more downside for EUR/GBP and an eventual break lower.
For a change of the sideways trend to be confirmed, EUR/GBP would need to make a decisive break below the range lows or above the April 23 high.
In the case of a break below the range floor such a move would open the way to a downside target at 0.8486 – the 0.681 Fibonacci ratio of the height of the range extrapolated lower from the channel’s base. This is the method used by technical analysts to estimate range breakouts. Further weakness could even see price reach the next target at 0.8460, the full height of the range extrapolated lower (1.000).
A decisive break would be one characterized by a long red candlestick that broke completely below the range floor and closed near its low, or three consecutive red candlesticks that broke clearly through the level.
The top of the range has already been breached several times suggesting it has weakened and provides a less reliable support or resistance level. For confirmation of a new uptrend now, it would not be enough for EUR/GBP to simply break above the top of the range, rather it would have to make a higher high above the April 23 peak at 0.8645.
- EUR/USD rises to 1.0830 as the US Dollar remains on the back foot ahead of US Inflation and Retail Sales data.
- The US inflation data is expected to decline after remaining stubbornly higher in the first quarter of the year.
- ECB’s Wunsch expects that the likelihood of two rate cuts is very high.
EUR/USD refreshes monthly high near 1.0830 in Wednesday’s European session. The major currency pair exhibits a firm footing ahead of the release of the United States Consumer Price Index
(CPI) and the monthly Retail Sales data for April, which will be published at 12:30 GMT.
The US Dollar (USD) slumps to more than a week low even though the US Producer Price Index (PPI) report for April remained stubbornly high. The annual headline and core PPI, which excludes volatile food and energy prices, grew as expected, while monthly figures were stronger than the consensus. The US Dollar Index (DXY), which tracks the Greenback’s value against six major currencies, dips below the crucial support of 105.00.
It seems that firm speculation about the Federal Reserve (Fed) returning to policy normalization from the September meeting is keeping the downside pressure on the US Dollar. 10-year US Treasury yields have also dropped to 4.42%. Market expectations for the Fed to start lowering interest rates in September remained firm as Fed Chair Jerome Powell ruled out the likelihood of more rate hikes. Powell emphasized maintaining a restrictive policy framework for a longer period to bring inflation down in his speech at the annual general meeting of the Foreign Bankers' Association in Amsterdam on Tuesday.
Daily digest market movers: EUR/USD rises as US Dollar slumps
- EUR/USD advances to 1.0830 as the market sentiment remains bullish on firm Fed rate-cut prospects for September. S&P 500 futures remain flat in the European session but hold gains near all-time highs. However, the sentiment could be volatile ahead after the release of the US consumer inflation data.
- Annual headline CPI is forecasted to have softened to 3.4% from 3.5% in March. In the same period, the core inflation, which strips off volatile food and energy prices, is anticipated to decelerate to 3.6% from the prior reading of 3.8%. Economists expect that monthly headline CPI to grow at a steady pace of 0.4% while core CPI has grown at a slower pace of 0.3% from the prior reading of 0.4%.
- The US inflation reports for the last three months have remained hotter than expected. Due to this, investors postponed expectations for the Fed to begin reducing rates in September from March, which was anticipated at the beginning of the year. The Fed could not start lowering interest rates until it gets confidence that inflation will sustainably return to the 2%.
- To get confidence that inflation is on track to return to 2%, price pressures must decline consistently for at least three months. Inflationary pressures remaining stubborn would force traders to pare rate-cut bets for September, while a soft inflation report will do the contrary.
- Meanwhile, the Euro remains upbeat as investors hope that higher interest rates for longer by the Fed will slow down the pace at which the European Central Bank (ECB) was anticipated to return to policy normalization.
- On Tuesday, ECB policymaker and Banque Nationale de Belgique Governor Pierre Wunsch commented that the first two 25 basis points (bps) reductions in key ECB rates are close to a "no-brainer" but added that high rates for longer by the US Federal Reserve could lead to a slower pace of rate cuts.
- Historically, investors underpin the US Dollar against the Euro if the policy divergence between the Fed and the ECB widens. A weak Euro brings significant business to Eurozone merchants from overseas markets. This could strengthen the economic outlook and result in higher employment and wage growth, which eventually will flare up price pressures again.
- On the economic data front, Eurostat has released a second estimate of preliminary Q1 Gross Domestic Product (GDP) data. The GDP report indicated that quarterly and annualized GDP growth were in line with the consensus and the preliminary reading at 0.3% and 0.4%, respectively. While EUR/USD didn't react to the second estimate as investors' focus remains on the US CPI data.
Technical Analysis: EUR/USD is at make or a break above 1.0800
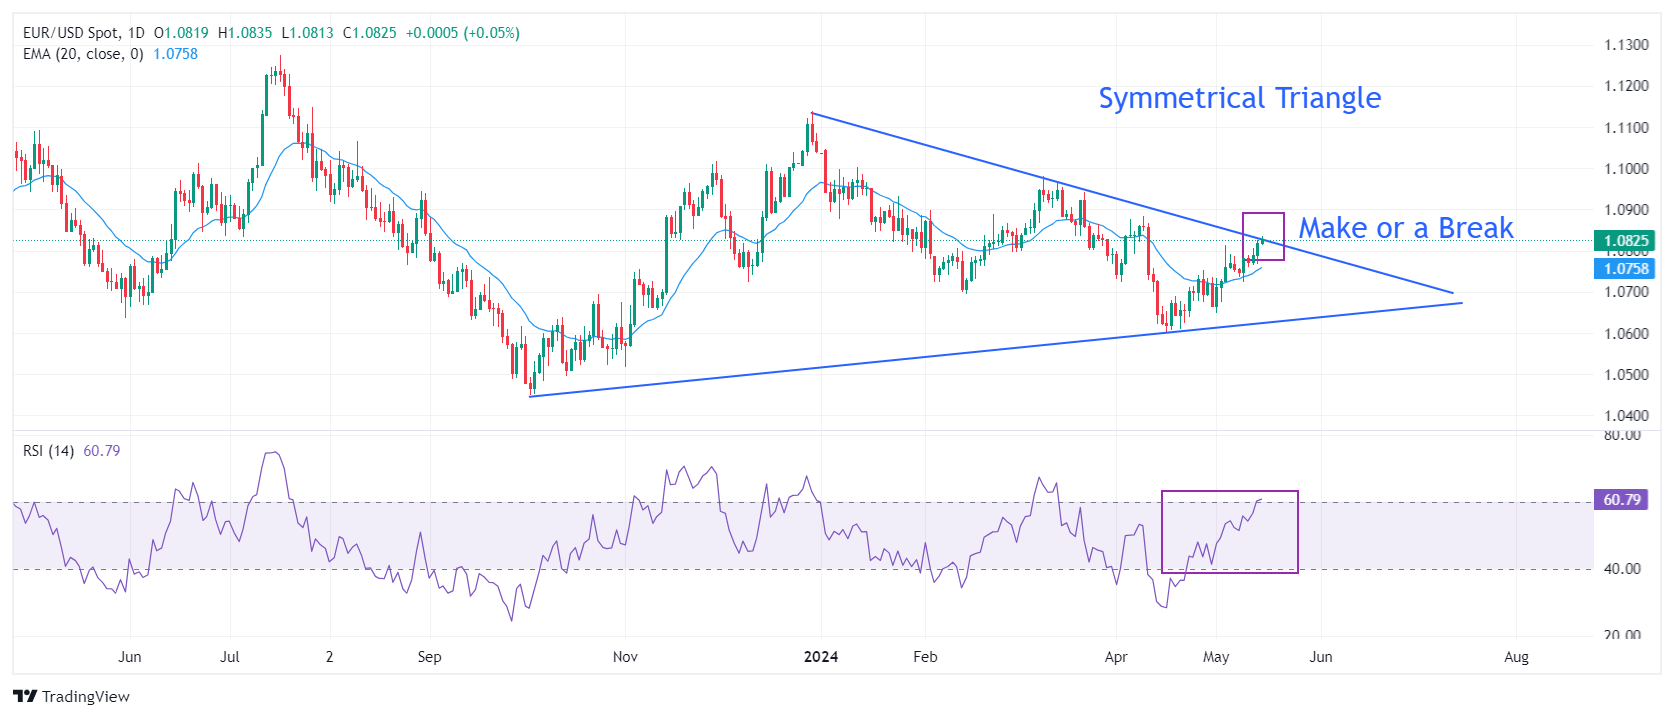
EUR/USD rises above the round-level resistance of 1.0800. The asset has advanced to the downward-sloping border of the Symmetrical Triangle pattern formed on a daily timeframe, which is plotted from December 28 high around 1.1140. The upward-sloping border of the triangle pattern is marked from October 3 low at 1.0448. The Symmetrical Triangle formation exhibits a sharp volatility contraction.
The major currency pair is at a make-or-break near 1.0830. A breakout of the Symmetrical Triangle formation could put the Euro bulls in the driving seat for a longer period. On the contrary, sharp selling pressure could drag them toward the upward-sloping border.
The 14-period Relative Strength Index (RSI) rises to 60.00. A bullish momentum would trigger if the RSI sustains above these levels.
Euro FAQs
The Euro is the currency for the 20 European Union countries that belong to the Eurozone. It is the second most heavily traded currency in the world behind the US Dollar. In 2022, it accounted for 31% of all foreign exchange transactions, with an average daily turnover of over $2.2 trillion a day. EUR/USD is the most heavily traded currency pair in the world, accounting for an estimated 30% off all transactions, followed by EUR/JPY (4%), EUR/GBP (3%) and EUR/AUD (2%).
The European Central Bank (ECB) in Frankfurt, Germany, is the reserve bank for the Eurozone. The ECB sets interest rates and manages monetary policy. The ECB’s primary mandate is to maintain price stability, which means either controlling inflation or stimulating growth. Its primary tool is the raising or lowering of interest rates. Relatively high interest rates – or the expectation of higher rates – will usually benefit the Euro and vice versa. The ECB Governing Council makes monetary policy decisions at meetings held eight times a year. Decisions are made by heads of the Eurozone national banks and six permanent members, including the President of the ECB, Christine Lagarde.
Eurozone inflation data, measured by the Harmonized Index of Consumer Prices (HICP), is an important econometric for the Euro. If inflation rises more than expected, especially if above the ECB’s 2% target, it obliges the ECB to raise interest rates to bring it back under control. Relatively high interest rates compared to its counterparts will usually benefit the Euro, as it makes the region more attractive as a place for global investors to park their money.
Data releases gauge the health of the economy and can impact on the Euro. Indicators such as GDP, Manufacturing and Services PMIs, employment, and consumer sentiment surveys can all influence the direction of the single currency. A strong economy is good for the Euro. Not only does it attract more foreign investment but it may encourage the ECB to put up interest rates, which will directly strengthen the Euro. Otherwise, if economic data is weak, the Euro is likely to fall. Economic data for the four largest economies in the euro area (Germany, France, Italy and Spain) are especially significant, as they account for 75% of the Eurozone’s economy.
Another significant data release for the Euro is the Trade Balance. This indicator measures the difference between what a country earns from its exports and what it spends on imports over a given period. If a country produces highly sought after exports then its currency will gain in value purely from the extra demand created from foreign buyers seeking to purchase these goods. Therefore, a positive net Trade Balance strengthens a currency and vice versa for a negative balance.
- USD/JPY falls sharply to 155.50 amid soft US Dollar.
- Firm speculation for Fed rate cuts in September keeps the US Dollar on the backfoot.
- The Japanese economy is estimated to have contracted by 0.4% in the first quarter of this year.
The USD/JPY pair drops sharply to 155.50 in Wednesday’s European session. The asset falls sharply as the US Dollar extends its losing spell for the third trading session. The US Dollar Index (DXY) has dropped below 105.00 as investors remain confident that the Federal Reserve (Fed) will start reducing interest rates from September.
Speculation for the Fed to begin lowering borrowing rate from September remains firm despite the United States (US) Producer Price Index (PPI) growing faster than the consensus in April. Investors remain confident over rate cuts as Fed Chair Jerome Powell ruled out expectations of further policy-tightening. However, Powell emphasized keeping interest rates at their current levels for a longer period.
Meanwhile, investors await the US Consumer Price Index (CPI) data for April, which will be published at 12:30. The consumer inflation data will provide a clear picture over the interest rate outlook. Annual headline CPI is forecasted to have softened to 3.4% from 3.5% in March. In the same period, the core inflation that strips off volatile food and energy prices is anticipated to decelerate to 3.6% from the prior reading of 3.8%. Economists expect that monthly headline and core CPI have grown at a slower pace of 0.3% from the prior reading of 0.4%.
The US consumer inflation has remained higher-than-projected in all three months of the first quarter of this year. A continuation of the same could force traders to shift rate cut bets towards the end of the year or to the start of 2025.
On the Tokyo front, investors await Japan’s Q1 Gross Domestic Product (GDP) data, which will be published on Thursday.
Economists expect that the Japanese economy contracted by 0.4% after expanding by 0.1% in the last quarter of 2023. On an annualized basis, the Japanese economy is estimated to have contracted significantly by 1.5%. Weak GDP growth will raise concerns over BoJ’s plan to continue the policy-tightening cycle.
- The US Dollar retreats further on Wednesday ahead of US CPI release.
- Downward US PPI revisions for March and speculation over China supporting its property sector trigger a wave of Dollar weakness.
- The US Dollar Index drops below 105.00 and sets sail to mid-104.00 range.
The US Dollar (USD) eases on Wednesday and falls below 105.00 ahead of the highly anticipated US Consumer Price Index (CPI) release for April. Overnight, US Federal Reserve (Fed) Chairman Jerome Powell delivered a speech which seemed to prepare markets for the chance that the initial interest rate cut would only come after the summer or even later.
Markets ignored these comments and likely focused solely on the revisions in the Producer Price Index (PPI) numbers, which were all to the downside. Additionally, news that the Chinese government is forming a rescue package to bail out its plagued real estate sector made headlines on Wednesday, seems to put much more pressure on the US Dollar Index (DXY).
On the economic front, the CPI release will take up most of the attention, though Retail Sales data for April are to be released at the same time. So traders can expect volatility to pick up, and should both numbers be mixed or oppose one another, choppy price action is to be expected. Traders can afterwards hear from Federal Reserve Bank of Minneapolis President Neel Kashkari and Federal Reserve Governor Michelle Bowman for any guidance on how to read the inflation release.
Daily digest market movers: Mayhem expected at 12:30 GMT
- At 11:00 GMT, the Mortgage Bankers Association will release its Mortgage Applications index for the week ending May 10. The index increased by 2.6% the previous week.
- At 12:30 GMT, the US economic calendar will include the US CPI and the Retail Sales data for April:
- April CPI numbers:
- Monthly Headline CPI is expected to increase at the same pace as the March reading of 0.4%.
- Yearly Headline CPI is expected to rise 3.4% from 3.5% in March.
- Monthly core CPI is expected to rise by 0.3% in April from 0.4% the previous month.
- Yearly core CPI is expected to rise 3.6% from 3.8% in March.
- April Retail Sales:
- Monthly Retail Sales are expected to rise 0.4% in April from 0.7% in March.
- Retail Sales, excluding cars and transportation, are expected to increase by 0.2% from 1.1% the previous month.
- Note that the revisions could be more market-movers than the actual numbers.
- April CPI numbers:
- At 14:00 GMT, the National Association of Home Builders Housing Market Index for May will be released, and is expected to remain stable at 51.
- Business Inventories for March are also to be released at 14:00 GMT and are expected to head to -0.1% from 0.4%.
- Federal Reserve Bank of Minneapolis President Neel Kashkari will speak at 16:00 GMT. He is a non-voter for this year.
- Federal Reserve Governor Michelle Bowman will take the stage around 19:20 GMT.
- The Qatar World Economic Forum started on Tuesday morning. Headlines from world leaders may come out throughout the week.
- Equities in the US outperformed on Tuesday night at the closing bell, though are trading flat ahead of the start of the US session. European equities are mildly in the green.
- The CME Fedwatch Tool suggests a 91.3% probability that June will still see no change to the Federal Reserve's fed fund rate. Odds of a rate cut in July are also out of the cards, while for September the tool shows a 49.7% chance that rates will be 25 basis points lower than current levels.
- The benchmark 10-year US Treasury Note trades around 4.42%, the lowest level for this week.
US Dollar Index Technical Analysis: CPI again market moving?
The US Dollar Index (DXY) eases and retraces below the important 105.00 level on Wednesday. All eyes are on the US CPI data, as most market participants now expect this print to confirm that disinflation is still on track. The risk is that any beat on estimates could trigger another shock move in markets with the DXY as biggest winner as expectations show a slowdown in inflation pressures.
On the upside, 105.52 (a pivotal level since April 11) must be recovered, ideally through a daily close above this level, before targeting the April 16 high at 106.52. Further up and above the 107.00 round level, the DXY index could meet resistance at 107.35, the October 3 high.
On the downside, the 55-day and the 200-day Simple Moving Averages (SMAs), currently at 104.69 and 104.34 respectively, have already provided ample support recently. If those levels are unable to hold, the 100-day SMA near 104.09 is the next best candidate.
US Dollar FAQs
The US Dollar (USD) is the official currency of the United States of America, and the ‘de facto’ currency of a significant number of other countries where it is found in circulation alongside local notes. It is the most heavily traded currency in the world, accounting for over 88% of all global foreign exchange turnover, or an average of $6.6 trillion in transactions per day, according to data from 2022. Following the second world war, the USD took over from the British Pound as the world’s reserve currency. For most of its history, the US Dollar was backed by Gold, until the Bretton Woods Agreement in 1971 when the Gold Standard went away.
The most important single factor impacting on the value of the US Dollar is monetary policy, which is shaped by the Federal Reserve (Fed). The Fed has two mandates: to achieve price stability (control inflation) and foster full employment. Its primary tool to achieve these two goals is by adjusting interest rates. When prices are rising too quickly and inflation is above the Fed’s 2% target, the Fed will raise rates, which helps the USD value. When inflation falls below 2% or the Unemployment Rate is too high, the Fed may lower interest rates, which weighs on the Greenback.
In extreme situations, the Federal Reserve can also print more Dollars and enact quantitative easing (QE). QE is the process by which the Fed substantially increases the flow of credit in a stuck financial system. It is a non-standard policy measure used when credit has dried up because banks will not lend to each other (out of the fear of counterparty default). It is a last resort when simply lowering interest rates is unlikely to achieve the necessary result. It was the Fed’s weapon of choice to combat the credit crunch that occurred during the Great Financial Crisis in 2008. It involves the Fed printing more Dollars and using them to buy US government bonds predominantly from financial institutions. QE usually leads to a weaker US Dollar.
Quantitative tightening (QT) is the reverse process whereby the Federal Reserve stops buying bonds from financial institutions and does not reinvest the principal from the bonds it holds maturing in new purchases. It is usually positive for the US Dollar.
- Gold returns to close to the May highs as buyers continued to pile in amid underlying geopolitical tensions.
- Robust central-bank demand is a key factor in keeping the precious metal bid.
- After a deep correction, XAU/USD resumes its uptrending bias and pushes higher.
Gold price (XAU/USD) trades higher on Wednesday, up by over half a percent in the $2,370s, as continued hoarding by central banks on the back of simmering geopolitical tensions drives demand.
The upside could be capped, however, by comments by the Federal Reserve (Fed) Chairman Jerome Powell, who suggested higher interest rates are here to stay, keeping the opportunity cost of holding the non-yielding precious metal unattractively high.
Gold price creeps higher on the back of sustained demand
Gold price creeps higher on Wednesday as the demand outlook for the precious metal remains buoyant amid continued geopolitical and global trade tensions.
In a speech at Stanford last week, Gita Gopinath, the First Deputy Managing Director of the International Monetary Fund (IMF), said that central banks, particularly in emerging markets, have been hoarding Gold in recent years as a hedge against the risk of, among other things, sanctions imposed by the West.
“Gold purchases by some central banks may have been driven by concerns about sanctions risk. This is consistent with a recent IMF study confirming that FX reserve managers tend to increase Gold holdings to hedge against economic uncertainty and geopolitical including sanctions risk,” said Gopinath.
The view is also backed up by data from the World Gold Council (WGC) showing strong demand in 2024 from central banks.
Given the heightened tensions in the Middle East, Ukraine and the increasingly polarized stand-off between the BRICS nations and US-led allies, the trend is expected to sustain, keeping Gold prices supported.
US inflation data on tap
Gold price are likely to be impacted by US Consumer Price Index (CPI) data out on Wednesday, due to its influence on US interest rates. If the CPI data reflects a rise in inflation, it will force the Fed to keep interest rates at their current level or higher for longer. This in turn is likely to negatively impact the price of non-yielding Gold.
In a speech on Tuesday, the Chairman of the Federal Reserve Jerome Powell suggested interest rates would remain high for a protracted period.
"Inflation in Q1 was notable for the lack of further progress,” said Powell, adding, "We did not expect a smooth road on inflation, we have to be patient and let policy do its work."
Although the Fed had anticipated making several rate cuts in 2024, comments from many Fed officials including Powell have reflected a change in stance. Now, officials are saying the Fed needs to maintain interest rates at their current level to bring inflation down in a sustainable manner. This is likely to provide a headwind for Gold as it moves higher.
Technical Analysis: Gold price recovers after backslide
Gold price (XAU/USD) has recovered back up to almost the level of the May highs at $2,379, after finding support and resuming its short-term uptrend.
XAU/USD 4-hour Chart
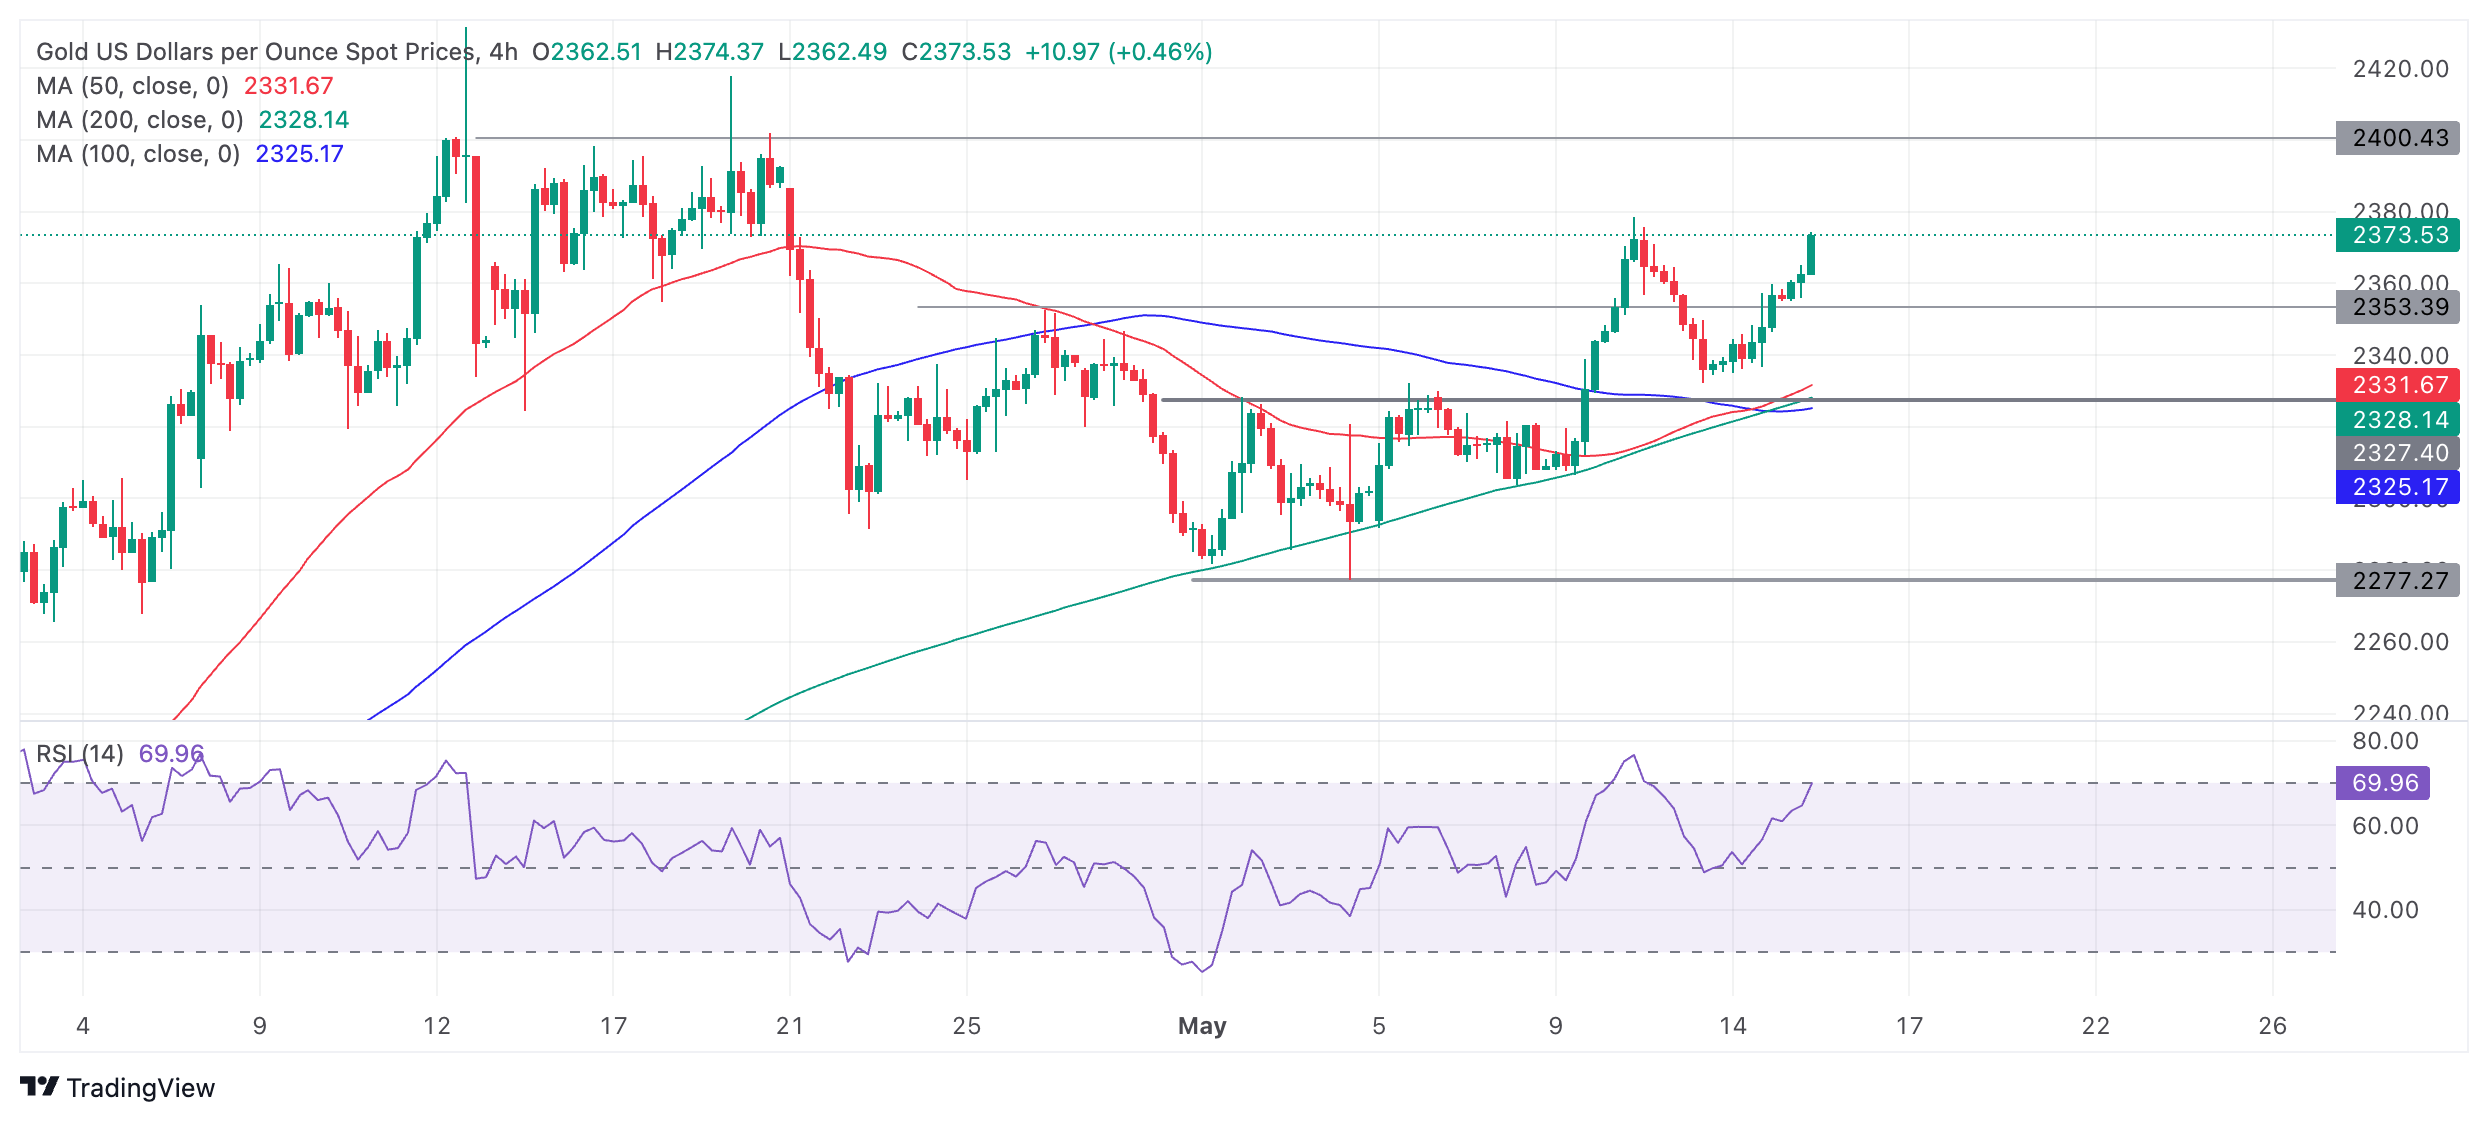
Given the old saying “the trend is your friend”, Gold is likely to continue pushing higher, with the next target at around $2,400, roughly at the April highs. A break back above the $2,378 May 10 high would provide extra confirmation.
The medium and long-term charts (daily and weekly) are also bullish, adding a supportive backdrop for Gold.
Economic Indicator
Consumer Price Index (MoM)
Inflationary or deflationary tendencies are measured by periodically summing the prices of a basket of representative goods and services and presenting the data as The Consumer Price Index (CPI). CPI data is compiled on a monthly basis and released by the US Department of Labor Statistics. The MoM figure compares the prices of goods in the reference month to the previous month.The CPI is a key indicator to measure inflation and changes in purchasing trends. Generally, a high reading is seen as bullish for the US Dollar (USD), while a low reading is seen as bearish.
Read more.Next release: Wed May 15, 2024 12:30
Frequency: Monthly
Consensus: 0.4%
Previous: 0.4%
Source: US Bureau of Labor Statistics
The US Federal Reserve has a dual mandate of maintaining price stability and maximum employment. According to such mandate, inflation should be at around 2% YoY and has become the weakest pillar of the central bank’s directive ever since the world suffered a pandemic, which extends to these days. Price pressures keep rising amid supply-chain issues and bottlenecks, with the Consumer Price Index (CPI) hanging at multi-decade highs. The Fed has already taken measures to tame inflation and is expected to maintain an aggressive stance in the foreseeable future.
Silver prices (XAG/USD) rose on Wednesday, according to FXStreet data. Silver trades at $28.77 per troy ounce, up 0.54% from the $28.62 it cost on Tuesday.
Silver prices have increased by 12.96% since the beginning of the year.
| Unit measure | Today Price |
|---|---|
| Silver price per troy ounce | $28.77 |
| Silver price per gram | $0.92 |
The Gold/Silver ratio, which shows the number of troy ounces of Silver needed to equal the value of one troy ounce of Gold, stood at 82.36 on Wednesday, down from 82.41 on Tuesday.
Investors might use this ratio to determine the relative valuation of Gold and Silver. Some may consider a high ratio as an indicator that Silver is undervalued – or Gold is overvalued – and might buy Silver or sell Gold accordingly. Conversely, a low ratio might suggest that Gold is undervalued relative to Silver.
Silver FAQs
Silver is a precious metal highly traded among investors. It has been historically used as a store of value and a medium of exchange. Although less popular than Gold, traders may turn to Silver to diversify their investment portfolio, for its intrinsic value or as a potential hedge during high-inflation periods. Investors can buy physical Silver, in coins or in bars, or trade it through vehicles such as Exchange Traded Funds, which track its price on international markets.
Silver prices can move due to a wide range of factors. Geopolitical instability or fears of a deep recession can make Silver price escalate due to its safe-haven status, although to a lesser extent than Gold's. As a yieldless asset, Silver tends to rise with lower interest rates. Its moves also depend on how the US Dollar (USD) behaves as the asset is priced in dollars (XAG/USD). A strong Dollar tends to keep the price of Silver at bay, whereas a weaker Dollar is likely to propel prices up. Other factors such as investment demand, mining supply – Silver is much more abundant than Gold – and recycling rates can also affect prices.
Silver is widely used in industry, particularly in sectors such as electronics or solar energy, as it has one of the highest electric conductivity of all metals – more than Copper and Gold. A surge in demand can increase prices, while a decline tends to lower them. Dynamics in the US, Chinese and Indian economies can also contribute to price swings: for the US and particularly China, their big industrial sectors use Silver in various processes; in India, consumers’ demand for the precious metal for jewellery also plays a key role in setting prices.
Silver prices tend to follow Gold's moves. When Gold prices rise, Silver typically follows suit, as their status as safe-haven assets is similar. The Gold/Silver ratio, which shows the number of ounces of Silver needed to equal the value of one ounce of Gold, may help to determine the relative valuation between both metals. Some investors may consider a high ratio as an indicator that Silver is undervalued, or Gold is overvalued. On the contrary, a low ratio might suggest that Gold is undervalued relative to Silver.
- Silver price exhibits strength amid soft US Dollar ahead of US CPI data.
- US consumer inflation remained stubbornly higher in the first three months of this year.
- US bond yields drop amid firm speculation that the Fed will pivot to policy normalization from September.
Silver price (XAG/USD) trades in a confined range around $28.60 in Wednesday’s European session. The white metal clings to gains inspired by the soft US Dollar, which fell sharply despite the release of the hot United States Producer Price Index (PPI) inflation report for April.
Annual PPI figures grew expectedly while monthly figures beat expectations. The US Dollar Index (DXY) dips sightly below 105.00. The appeal for dollar-denominated Silver improves due to soft Greenback. After the release of the PPI report, Federal Reserve (Fed) Jerome Powell commented that the overall data was mixed.
When asked about the inflation outlook, Powell ruled out the likelihood of more rate hikes but emphasized keeping the monetary policy restrictive for a longer period to bring inflation down. 10-year US Treasury yields drop further to 4.43% as traders remain confident that the Fed will start lowering interest rates from the September meeting. Generally, falling yields on interest-bearing assets reduce the opportunity cost of holding an investment in non-yielding assets, such as Silver.
Meanwhile, investors await the US Consumer Price Index (CPI) and monthly Retail Sales data for April, which will be published at 12:30 GMT. The economic indicators will significantly influence speculation for Fed rate cuts.
US consumer inflation has remained stubbornly higher in the first quarter of the year. A higher-than-projected US inflation report will deepen fears that the last mile to the 2% inflation road is significantly more persistent than what was previously anticipated.
Silver technical analysis
Silver price recovers sharply after discovering buying interest near the horizontal support plotted from 14 April 2023 high around $26.09 on a daily timeframe. The above-mentioned support was earlier a major resistance for the Silver price bulls. The white metal is approaching the multi-year high at $29.80.
The near-term outlook of Silver has improved as it returns above the 20-period Exponential Moving Average (EMA), which trades around $27.30.
The 14-period Relative Strength Index (RSI) shifts into the bullish range of 60.00-80.00, suggesting that a bullish momentum has been triggered.
Silver daily chart
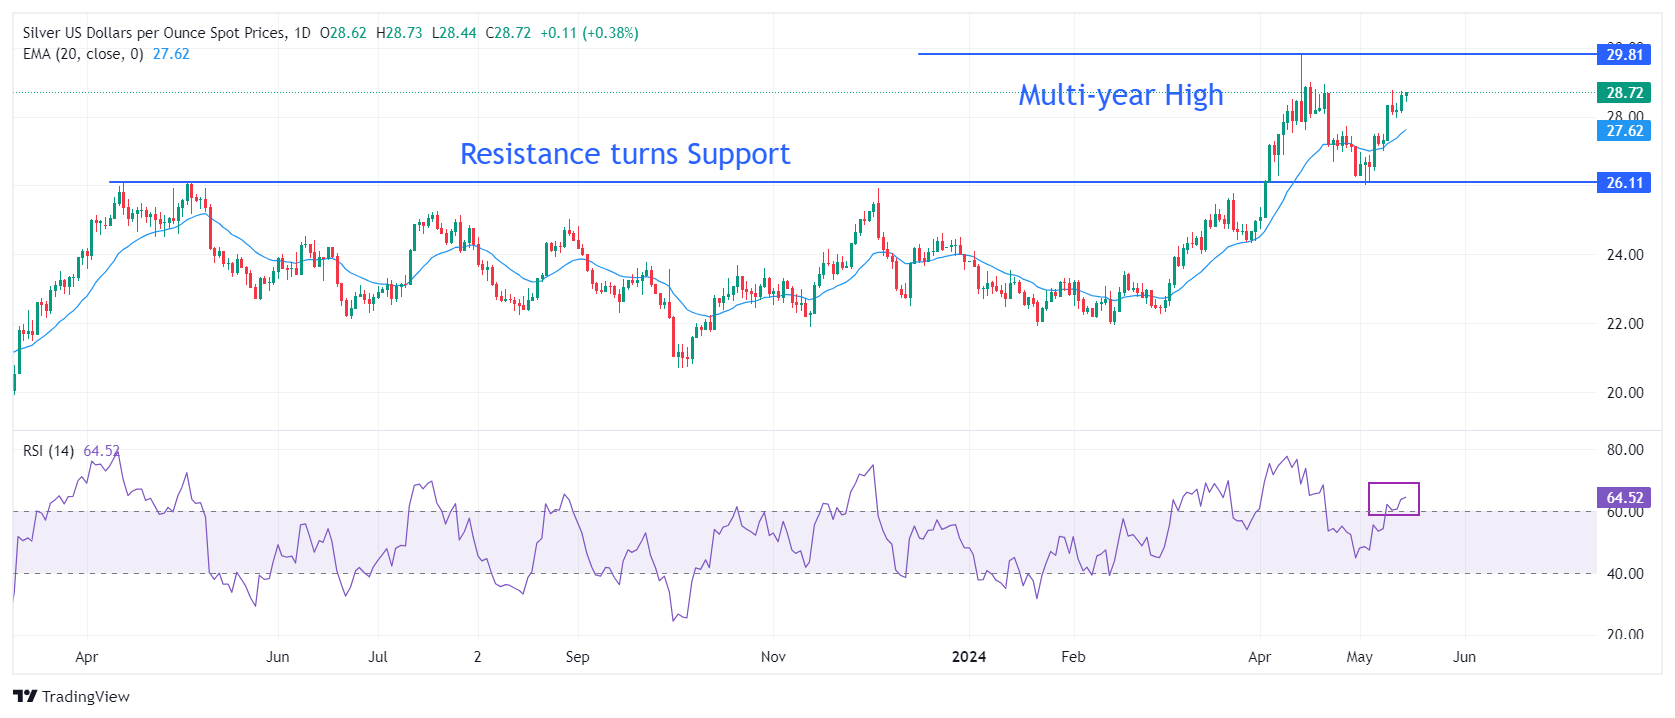
Economic Indicator
Consumer Price Index ex Food & Energy (YoY)
Inflationary or deflationary tendencies are measured by periodically summing the prices of a basket of representative goods and services and presenting the data as the Consumer Price Index (CPI). CPI data is compiled on a monthly basis and released by the US Department of Labor Statistics. The YoY reading compares the prices of goods in the reference month to the same month a year earlier. The CPI Ex Food & Energy excludes the so-called more volatile food and energy components to give a more accurate measurement of price pressures. Generally speaking, a high reading is bullish for the US Dollar (USD), while a low reading is seen as bearish.
Read more.Next release: Wed May 15, 2024 12:30
Frequency: Monthly
Consensus: 3.6%
Previous: 3.8%
Source: US Bureau of Labor Statistics
The US Federal Reserve has a dual mandate of maintaining price stability and maximum employment. According to such mandate, inflation should be at around 2% YoY and has become the weakest pillar of the central bank’s directive ever since the world suffered a pandemic, which extends to these days. Price pressures keep rising amid supply-chain issues and bottlenecks, with the Consumer Price Index (CPI) hanging at multi-decade highs. The Fed has already taken measures to tame inflation and is expected to maintain an aggressive stance in the foreseeable future.
Gold prices rose in India on Wednesday, according to data from India's Multi Commodity Exchange (MCX).
Gold price stood at 72,445 Indian Rupees (INR) per 10 grams, up INR 523 compared with the INR 71,922 it cost on Tuesday.
As for futures contracts, Gold prices increased to INR 72,540 per 10 gms from INR 72,297 per 10 gms.
Prices for Silver futures contracts increased to INR 85,525 per kg from INR 85,417 per kg.
| Major Indian city | Gold Price |
|---|---|
| Ahmedabad | 74,950 |
| Mumbai | 74,735 |
| New Delhi | 74,735 |
| Chennai | 74,930 |
| Kolkata | 74,870 |
Global Market Movers: Comex Gold price gains momentum amid investment demand
- The US Producer Price Index (PPI) rose 2.2% YoY in April, compared to the 1.8% increase in March and matching expectations. The Core PPI jumped 2.4% YoY in the same period, compared to an increase of 2.1% in March. On a monthly basis, the PPI and the core PPI both rose 0.5% MoM in April.
- Fed Chair Jerome Powell said that inflation is falling slower than expected, and the PPI data provided more justification to keep rates higher for longer. Powell added that more rate hikes likely won't be needed.
- Kansas City Fed President Jeffrey Schmid noted that inflation remains too high, and the US central bank has more work to do.
- The annual headline Consumer Price Index (CPI) inflation is expected to ease to 3.4% in April from 3.5% in the first estimates. The Core CPI inflation is estimated to drop to 3.6% in April from 3.8% prior.
- The US Retail Sales is projected to decline to 0.4% MoM in April from 0.7% in the preliminary reading.
- Financial markets are currently pricing in nearly 65% odds of a rate cut by the Fed in September 2024, according to the CME's FedWatch Tool.
- Global gold demand rose by 3% to 1,238 tonnes, making it the strongest first quarter since 2016, according to the World Gold Council's Q1 2024 report.
(An automation tool was used in creating this post.)
Gold FAQs
Gold has played a key role in human’s history as it has been widely used as a store of value and medium of exchange. Currently, apart from its shine and usage for jewelry, the precious metal is widely seen as a safe-haven asset, meaning that it is considered a good investment during turbulent times. Gold is also widely seen as a hedge against inflation and against depreciating currencies as it doesn’t rely on any specific issuer or government.
Central banks are the biggest Gold holders. In their aim to support their currencies in turbulent times, central banks tend to diversify their reserves and buy Gold to improve the perceived strength of the economy and the currency. High Gold reserves can be a source of trust for a country’s solvency. Central banks added 1,136 tonnes of Gold worth around $70 billion to their reserves in 2022, according to data from the World Gold Council. This is the highest yearly purchase since records began. Central banks from emerging economies such as China, India and Turkey are quickly increasing their Gold reserves.
Gold has an inverse correlation with the US Dollar and US Treasuries, which are both major reserve and safe-haven assets. When the Dollar depreciates, Gold tends to rise, enabling investors and central banks to diversify their assets in turbulent times. Gold is also inversely correlated with risk assets. A rally in the stock market tends to weaken Gold price, while sell-offs in riskier markets tend to favor the precious metal.
The price can move due to a wide range of factors. Geopolitical instability or fears of a deep recession can quickly make Gold price escalate due to its safe-haven status. As a yield-less asset, Gold tends to rise with lower interest rates, while higher cost of money usually weighs down on the yellow metal. Still, most moves depend on how the US Dollar (USD) behaves as the asset is priced in dollars (XAU/USD). A strong Dollar tends to keep the price of Gold controlled, whereas a weaker Dollar is likely to push Gold prices up.
FX option expiries for May 15 NY cut at 10:00 Eastern Time, via DTCC, can be found below
- EUR/USD: EUR amounts
- 1.0650 874m
- 1.0665 1.2b
- 1.0670 435m
- 1.0750 999m
- 1.0775 455m
- 1.0790 488m
- 1.0795 498m
- 1.0800 794m
- 1.0825 1.3b
- 1.0850 724m
- 1.0900 875m
- GBP/USD: GBP amounts
- 1.2455 487m
- USD/CAD: USD amounts
- 1.3940 1.2b
- USD/JPY: USD amounts
- 155.50 566m
- 156.00 1.3b
- AUD/USD: AUD amounts
- 0.6580 639m
- 0.6600 1.6b
- NZD/USD: NZD amounts
- 0.5915 731m
- 0.5945 439m
- AUD/JPY extends its gains due to improved risk appetite on Wednesday.
- The Australian government aims to address headline inflation and alleviate cost-of-living pressures by allocating billions in funding.
- Japan’s Finance Minister Shunichi Suzuki will coordinate with the BoJ regarding the FX market to take possible measures if necessary.
AUD/JPY continues its winning streak, hovering around 103.70 during the European session on Wednesday due to the improved risk appetite. The Australian Budget for 2024-25 has returned to a deficit after recording a surplus of $9.3 billion in 2023-24. The Australian government aims to tackle headline inflation and alleviate the cost of living pressures by allocating billions to reduce energy bills and rent, alongside initiatives to lower income taxes.
On Wednesday, the Australian Bureau of Statistics released the Wage Price Index (Q1), an indicator of labor cost inflation. The index showed a 0.8% increase in the first quarter, falling slightly below the anticipated rise of 0.9%. On a year-over-year basis, it saw a 4.1% increase, also slightly lower than the expected 4.2% rise.
On the JPY front, Japan’s Finance Minister Shunichi Suzuki stated on Tuesday that the government is collaborating with the Bank of Japan to ensure alignment in policy objectives regarding foreign exchange. He further noted that they are implementing all feasible measures to closely monitor movements in the Japanese Yen.
Japan's 10-year government bond yield remains steady at around 0.95%, marking its highest level in over six months. This comes as the Bank of Japan (BoJ) reduced the amount of Japanese government bonds it would purchase this week, marking the first such move since lifting its negative interest rate policy in March.
The interest rate differential between Japan and other major economies has encouraged investors to borrow the Japanese Yen (JPY) and invest in higher-yielding currencies, leading to a depreciation of the JPY.
- The Mexican Peso trades steady after weakening for two days in a row.
- Commentary from the Governor of the Banxico and robust economic data for its key peers weigh on the Peso.
- Traders now await US CPI data as USD/MXN reaches a key technical resistance level.
The Mexican Peso (MXN) trades little changed during the European session on Wednesday as markets brace for the release of US Consumer Price Index (CPI) data for April, the main economic highlight of the day, and market sentiment stabilizes.
The Peso has weakened for two days running in most of its pairs, on the back of comments from the Governor of the Bank of Mexico (Banxico), Victoria Rodríguez Ceja, and strong economic data from rivals.
At the time of writing USD/MXN is meeting significant technical resistance at 16.85, EUR/MXN is trading at 18.27 and GBP/MXN at 21.24.
Mexican Peso treads water ahead of US CPI data
The Mexican Peso snakes along on Wednesday ahead of US Consumer Price index data with its potential to shift the outlook for US interest rates and the US Dollar (USD).
Analysts expect the headline CPI to show a 0.4% monthly increase in April and for core to rise 0.3%. This would translate into 3.4% and 3.6% rises respectively year-over-year, decelerating from the previous month’s readings.
A higher-than-expected result might further delay the Federal Reserve’s (Fed) plans to cut interest rates, lending a backwind to the US Dollar (USD) and lifting USD/MXN. The opposite would be the case for a lower-than-expected result.
In Europe, meanwhile, the preliminary Gross Domestic Product (GDP) data for the first quarter is about to be released and could impact EUR/MXN if it deviates substantially from economists’ expectations, which are for 0.3% GDP growth in Q1 on a quarterly basis, and 0.4% YoY.
Mexican Peso weakens for two days in a row
The Mexican Peso finished Tuesday in the red, dropping for the second day in a row in its most heavily traded pairs.
The decline was partially due to commentary from the Governor of the Bank of Mexico Victoria Rodríguez Ceja on Monday, who hinted Banxico might consider cutting interest rates in June. The expectation of lower interest rates is negative for a currency as it reduces foreign capital inflows.
Ceja commented, “We could evaluate downward adjustments” to the main reference rate at the Banxico June 27 policy meeting. She went on to note that while headline inflation had continued to rise, underlying prices had not, but much depended on the evolution of the inflationary outlook, reported Christian Borjan Valencia, Editor at FXstreet.
Banxico cut its policy rate from 11.25% to 11.00% at the March meeting, the first rate cut since 2021. However, it chose to keep the policy rate unchanged at the May meeting due to persistent inflationary forces.
Technical Analysis: USD/MXN pull back hits key resistance level
USD/MXN – the value of one US Dollar in Mexican Pesos – has risen to a key resistance level at roughly 16.86, which corresponds with the base of the range it traded in during the second half of April and the first half of May.
USD/MXN had previously broken out of the range and declined sharply to a low of 16.72 on Friday May 10, however, it stalled and reversed course. Since then, it has been making a steady recovery.
USD/MXN 4-hour Chart

The recovery move has now met resistance from the previous range floor. The move could be what technical analysts call a “throwback” – a temporary rebound that happens after breakouts whereby the price returns to the original breakout level to “air kiss” it goodbye one final time before continuing lower.
If this is the case, the pair will probably soon resume its downtrend and eventually surpass the May 10 lows before reaching the conservative target for the breakout, the 0.681 Fibonacci ratio of the height of the range extrapolated lower, at 16.54. Further bearishness could even reach 16.34, the full height of the range extrapolated lower.
A break below the May 10 lows at 16.72 would provide extra confirmation of a continuation south.
Given the medium and long-term trends are bearish, the odds further favor more downside for the pair in line with those trends.
A decisive break back inside the range, however, would reverse the downtrending bias in the short-term and suggest the pair is moving higher. It would also negate the price targets for the breakout.
A decisive break would be one accompanied by a longer-than-average green candlestick that closed near its high or three green candlesticks in a row.
Economic Indicator
Consumer Price Index (MoM)
Inflationary or deflationary tendencies are measured by periodically summing the prices of a basket of representative goods and services and presenting the data as The Consumer Price Index (CPI). CPI data is compiled on a monthly basis and released by the US Department of Labor Statistics. The MoM figure compares the prices of goods in the reference month to the previous month.The CPI is a key indicator to measure inflation and changes in purchasing trends. Generally, a high reading is seen as bullish for the US Dollar (USD), while a low reading is seen as bearish.
Read more.Next release: Wed May 15, 2024 12:30
Frequency: Monthly
Consensus: 0.4%
Previous: 0.4%
Source: US Bureau of Labor Statistics
The US Federal Reserve has a dual mandate of maintaining price stability and maximum employment. According to such mandate, inflation should be at around 2% YoY and has become the weakest pillar of the central bank’s directive ever since the world suffered a pandemic, which extends to these days. Price pressures keep rising amid supply-chain issues and bottlenecks, with the Consumer Price Index (CPI) hanging at multi-decade highs. The Fed has already taken measures to tame inflation and is expected to maintain an aggressive stance in the foreseeable future.
- The Pound Sterling jumps to 1.2600 amid uncertainty over BoE rate cuts and a soft US Dollar.
- Steady UK wage growth deepens fears of persistent inflationary pressures.
- The US Dollar is on the back foot ahead of crucial US inflation data for April.
The Pound Sterling (GBP) posts a fresh weekly high at the round-level resistance of 1.2600 against the US Dollar (USD) in Wednesday’s London session. The GBP/USD pair holds strength as the US Dollar is on the back foot ahead of the United States Consumer Price Index (CPI) data for April, which will be published at 12:30 GMT. The US Dollar Index (DXY), which tracks the Greenback’s value against six major currencies, dips below the crucial support of 105.00.
Economists expect that monthly headline inflation grew at a steady 0.4%. The core CPI, which strips off volatile food and energy prices, is expected to have risen at a slower pace of 0.3% in April, from March’s reading of 0.4%. Annual headline CPI is forecasted to have softened to 3.4% from 3.5% in March. In the same period, core inflation is anticipated to have decelerated to 3.6% from the prior reading of 3.8%.
The inflation data will significantly influence speculation for the Federal Reserve (Fed) interest-rate cuts. Currently, financial markets expect that the Fed will choose the September meeting as the point to start lowering interest rates. Along with the inflation reading, investors will also focus on the monthly Retail Sales for April, an indicator of household spending which can also give clues about the inflation outlook. The Retail Sales data is estimated to have grown at a slower rate of 0.4% from a 0.7% increase in March.
Daily digest market movers: Pound Sterling strengthens on multiple tailwinds
- The Pound Sterling extends its winning spell for the third trading session on Wednesday. The Cable capitalizes on the soft US Dollar and uncertainty over when the Bank of England (BoE) will opt for interest-rate cuts. Currently, investors anticipate that the central bank will start to do so from the June meeting.
- The United Kingdom Employment report for the three months ending March, which was released on Tuesday, indicated that job market conditions deteriorated for the third time in a row. Due to rising joblessness, the Unemployment Rate rose to 4.3% as expected. Historically, easing labor market conditions boost expectations for the central bank to adopt a dovish stance on interest rates. However, the impact of this loosened labor market was offset by steady wage growth.
- BoE policymakers remain concerned over high service inflation as it could stall progress in the disinflation process. Services inflation is majorly driven by wage growth, which appears to be significantly stronger than what is required for inflation to return to the desired rate of 2%.
- After the labor market data, BoE Chief Economist Huw Pill commented: "Rates of pay growth remain quite well above what would be consistent for meeting the 2% inflation target sustainably." Pill emphasized the need to maintain a restrictive stance on monetary policy that continues to build downside pressure on domestic inflation. About rate cuts, Pill said that it is reasonable to believe that over the summer, “we will see enough confidence to consider lowering interest rates.”
Technical Analysis: Pound Sterling tests 1.2600

The Pound Sterling extends its upside to the crucial resistance of 1.2600. The GBP/USD pair climbs above the major resistance plotted from December 8 low of 1.2500. The near-term outlook of the Cable has improved as it seems well-established above the 20-day Exponential Moving Average (EMA), which trades around 1.2540. The asset has retraced 50% losses recorded from a 10-month high at around 1.2900.
The 14-period Relative Strength Index (RSI) gradually approaches the 60.00 barrier. A decisive break above this level will trigger bullish momentum.
Pound Sterling FAQs
The Pound Sterling (GBP) is the oldest currency in the world (886 AD) and the official currency of the United Kingdom. It is the fourth most traded unit for foreign exchange (FX) in the world, accounting for 12% of all transactions, averaging $630 billion a day, according to 2022 data. Its key trading pairs are GBP/USD, aka ‘Cable’, which accounts for 11% of FX, GBP/JPY, or the ‘Dragon’ as it is known by traders (3%), and EUR/GBP (2%). The Pound Sterling is issued by the Bank of England (BoE).
The single most important factor influencing the value of the Pound Sterling is monetary policy decided by the Bank of England. The BoE bases its decisions on whether it has achieved its primary goal of “price stability” – a steady inflation rate of around 2%. Its primary tool for achieving this is the adjustment of interest rates. When inflation is too high, the BoE will try to rein it in by raising interest rates, making it more expensive for people and businesses to access credit. This is generally positive for GBP, as higher interest rates make the UK a more attractive place for global investors to park their money. When inflation falls too low it is a sign economic growth is slowing. In this scenario, the BoE will consider lowering interest rates to cheapen credit so businesses will borrow more to invest in growth-generating projects.
Data releases gauge the health of the economy and can impact the value of the Pound Sterling. Indicators such as GDP, Manufacturing and Services PMIs, and employment can all influence the direction of the GBP. A strong economy is good for Sterling. Not only does it attract more foreign investment but it may encourage the BoE to put up interest rates, which will directly strengthen GBP. Otherwise, if economic data is weak, the Pound Sterling is likely to fall.
Another significant data release for the Pound Sterling is the Trade Balance. This indicator measures the difference between what a country earns from its exports and what it spends on imports over a given period. If a country produces highly sought-after exports, its currency will benefit purely from the extra demand created from foreign buyers seeking to purchase these goods. Therefore, a positive net Trade Balance strengthens a currency and vice versa for a negative balance.
- EUR/USD attracts some buyers to 1.0825 amid weaker USD on Wednesday.
- The pair resumes its upside as it holds above the key EMA; RSI indicator stands in bullish territory.
- The next upside barrier is seen at 1.0885; the first downside target is located at 1.0795.
The EUR/USD pair extends the rally near 1.0825 on Wednesday during the early European trading hours. The uptick of the major pair is bolstered by the upbeat ZEW Economic Sentiment Survey and the softer US Dollar (USD). Investors will closely monitor the Eurozone GDP growth number, which is forecast to grow by 0.3% QoQ in the first quarter of 2024.
According to the daily chart, EUR/USD has remained confined in a descending trend channel since mid-December 2023. The bullish outlook of the major pair resumes as it crosses above the key 100-day Exponential Moving Average (EMA). Additionally, the upward momentum is bolstered by the 14-day Relative Strength Index (RSI) stands in bullish territory around 60.80, indicating that further upside looks favorable.
The major pair breaks above the upper boundary of the descending trend channel and the psychological level of 1.0800. The next resistance level is seen at a high of April 9 at 1.0885. The additional upside filter to watch is a high of March 21 at 1.0943, en route to a high of March 8 at 1.0981, and finally the 1.1000 psychological level.
On the other hand, the first downside target for EUR/USD will emerge near the 100-day EMA at 1.0795. Any follow-through selling below this level will see a drop to a low of May 9 at 1.0724. Further south, the next contention level is located around a low of May 2 at 1.0650, followed by a low of April 16 at 1.0600.
EUR/USD daily chart
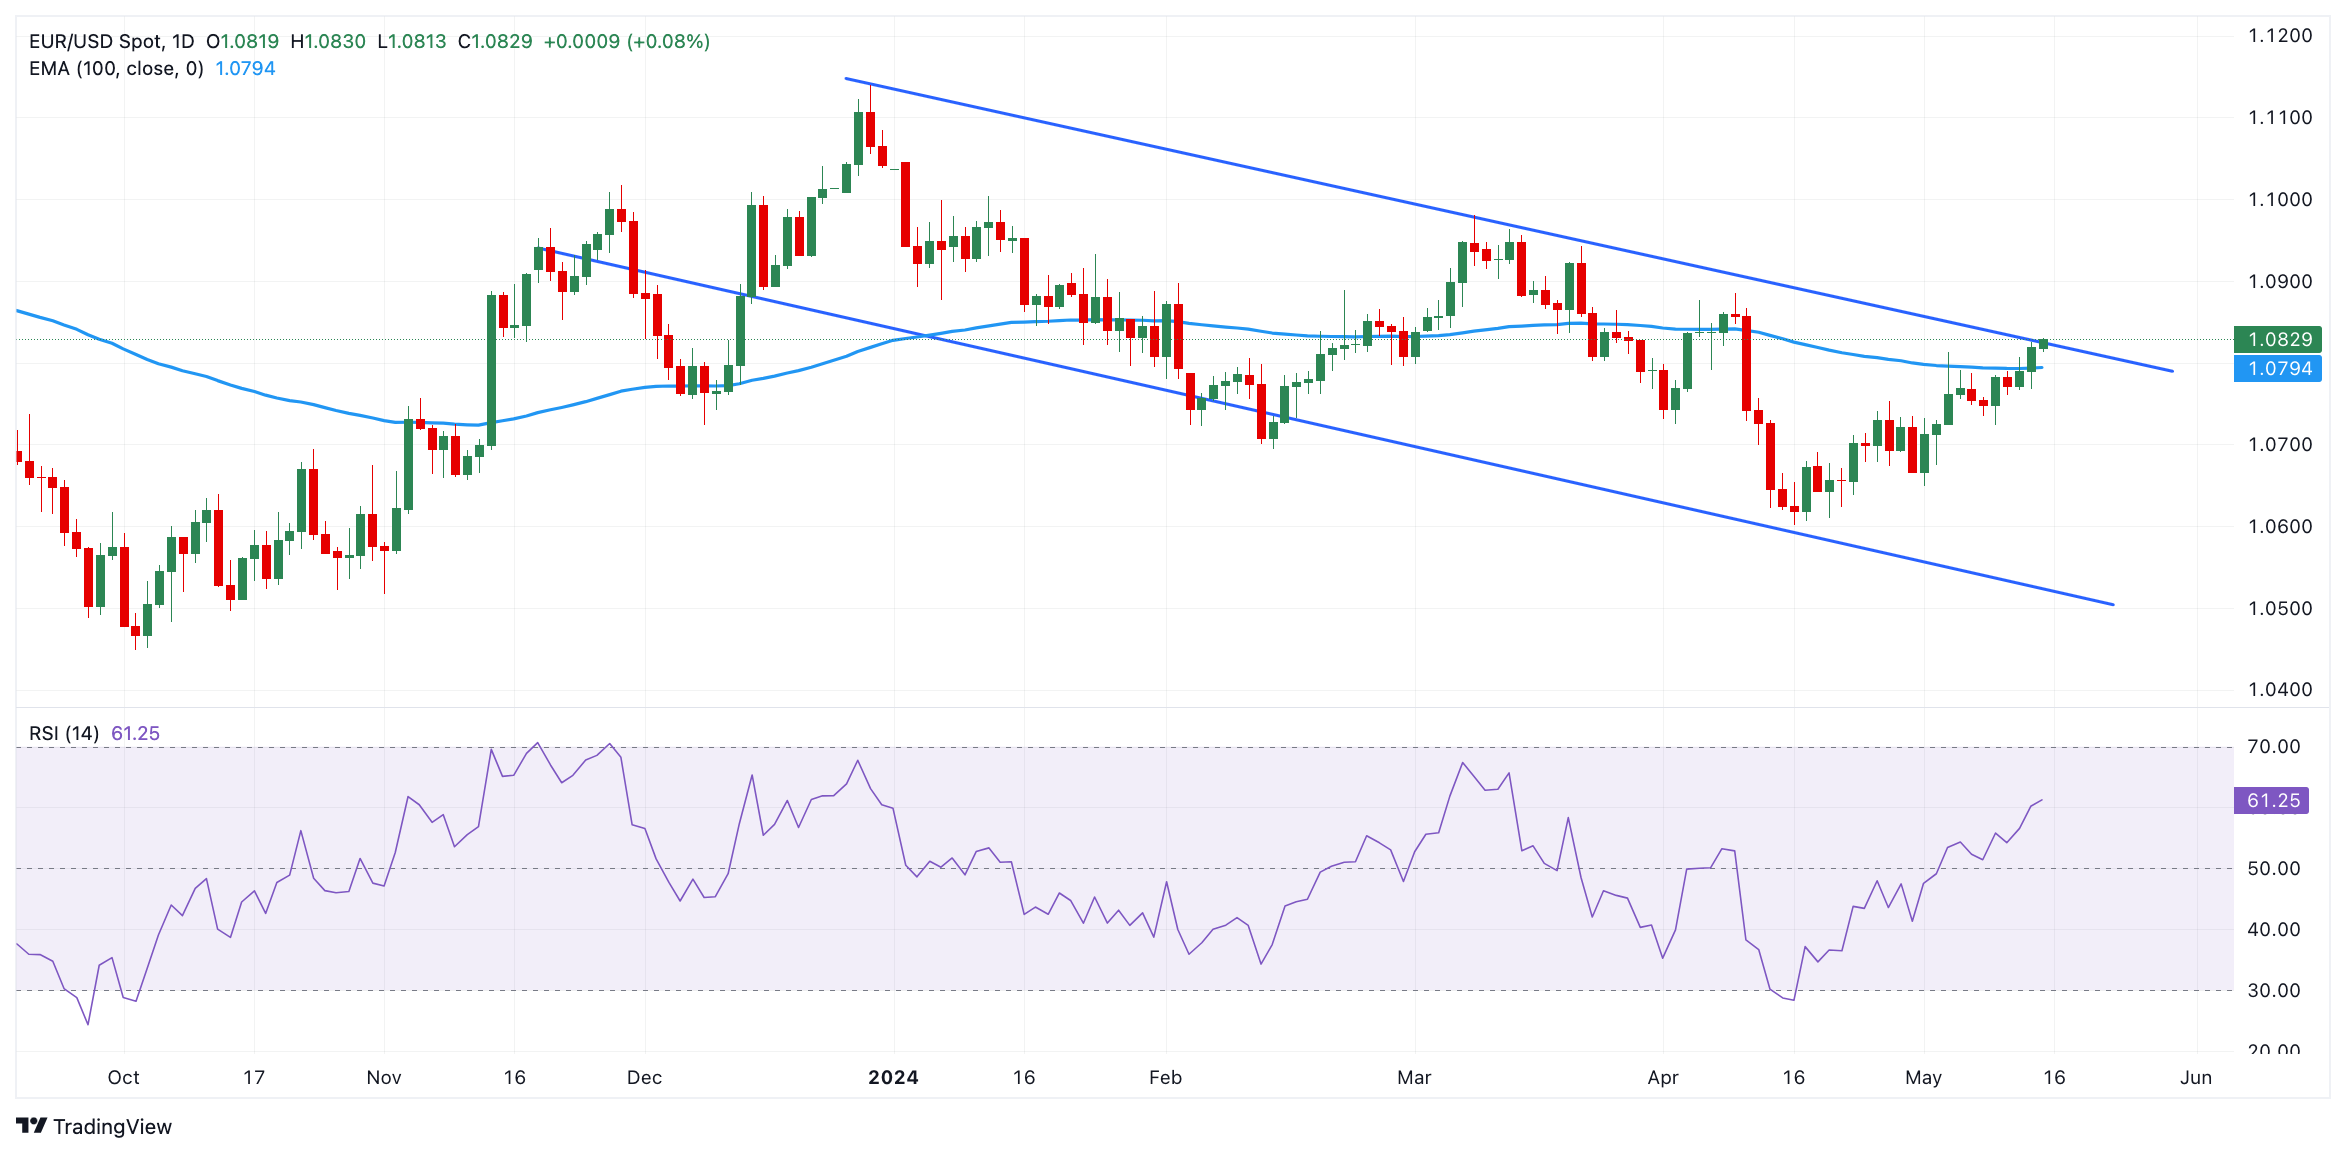
Here is what you need to know on Wednesday, May 15:
The US Dollar (USD) is finding it difficult to stay resilient against its major rivals in the European morning on Wednesday. Eurostat will publish the preliminary Gross Domestic Product (GDP) data for the first quarter. Later in the day, the Consumer Price Index and Retail Sales data for April will be featured in the US economic docket alongside the NY Empire State Manufacturing Index.
US CPI set to grow at slower pace in April amid mounting concerns about inflation pickup.
The US Bureau of Labor Statistics reported on Tuesday that the Producer Price Index (PPI) rose 2.2% on a yearly basis in April. This reading followed the 1.8% increase recorded in March and came in above the market expectation of 1.8%. Although the initial market reaction helped the USD gather strength, the improving risk mood caused the currency to lost its traction later in the American session. The USD Index closed the second consecutive day in negative territory on Tuesday and was last seen fluctuating below 105.00. Meanwhile, US stock index futures trade mixed early Wednesday after Wall Street's main indexes gained between 0.3% and 0.7% on Tuesday. Finally, the benchmark 10-year US Treasury bond yield edges lower toward 4.4%.
US Dollar PRICE This week
The table below shows the percentage change of US Dollar (USD) against listed major currencies this week. US Dollar was the weakest against the Australian Dollar.
| USD | EUR | GBP | JPY | CAD | AUD | NZD | CHF | |
|---|---|---|---|---|---|---|---|---|
| USD | -0.50% | -0.51% | 0.39% | -0.21% | -0.58% | -0.57% | -0.04% | |
| EUR | 0.50% | -0.06% | 0.90% | 0.29% | -0.13% | -0.09% | 0.43% | |
| GBP | 0.51% | 0.06% | 0.89% | 0.33% | -0.05% | -0.03% | 0.49% | |
| JPY | -0.39% | -0.90% | -0.89% | -0.64% | -0.94% | -1.02% | -0.42% | |
| CAD | 0.21% | -0.29% | -0.33% | 0.64% | -0.34% | -0.37% | 0.08% | |
| AUD | 0.58% | 0.13% | 0.05% | 0.94% | 0.34% | -0.08% | 0.54% | |
| NZD | 0.57% | 0.09% | 0.03% | 1.02% | 0.37% | 0.08% | 0.52% | |
| CHF | 0.04% | -0.43% | -0.49% | 0.42% | -0.08% | -0.54% | -0.52% |
The heat map shows percentage changes of major currencies against each other. The base currency is picked from the left column, while the quote currency is picked from the top row. For example, if you pick the US Dollar from the left column and move along the horizontal line to the Japanese Yen, the percentage change displayed in the box will represent USD (base)/JPY (quote).
EUR/USD benefited from the selling pressure surrounding the USD and gained 0.3% on Tuesday. The pair continues to stretch higher early Wednesday and was last seen trading at its highest level since early April above 1.0820.
After falling toward 1.2500 in the early American session on Tuesday, GBP/USD reversed its direction and advanced toward 1.2600 later in the day. The pair holds steady slightly below this level in the European morning.
The data from Australia showed in the Asian session that the Wage Price Index rose 0.8% on a quarterly basis in the first quarter. Although this print came in slightly below the market expectation of 0.9%, it failed to trigger a noticeable in AUD/USD. At the time of press, the pair was up 0.2% on the day at 0.6640. Early Thursday, the Australian Bureau of Statistics will release labor market data for April.
Australian Dollar gains ground ahead of US CPI.
USD/JPY continued to edge higher but erased a portion of its daily gains in the second half of the day on Tuesday. Early Wednesday, the pair holds steady slightly below 156.50.
Gold took advantage from the pullback seen in the US T-bond yields on Tuesday and retraced Monday's decline. XAU/USD stays in a consolidation phase above $2,350 early Wednesday.
Gold price trades with modest gains, investors await US CPI and Retail Sales data.
Economic Indicator
Consumer Price Index (YoY)
Inflationary or deflationary tendencies are measured by periodically summing the prices of a basket of representative goods and services and presenting the data as The Consumer Price Index (CPI). CPI data is compiled on a monthly basis and released by the US Department of Labor Statistics. The YoY reading compares the prices of goods in the reference month to the same month a year earlier.The CPI is a key indicator to measure inflation and changes in purchasing trends. Generally speaking, a high reading is seen as bullish for the US Dollar (USD), while a low reading is seen as bearish.
Read more.Next release: Wed May 15, 2024 12:30
Frequency: Monthly
Consensus: 3.4%
Previous: 3.5%
Source: US Bureau of Labor Statistics
The US Federal Reserve has a dual mandate of maintaining price stability and maximum employment. According to such mandate, inflation should be at around 2% YoY and has become the weakest pillar of the central bank’s directive ever since the world suffered a pandemic, which extends to these days. Price pressures keep rising amid supply-chain issues and bottlenecks, with the Consumer Price Index (CPI) hanging at multi-decade highs. The Fed has already taken measures to tame inflation and is expected to maintain an aggressive stance in the foreseeable future.
- USD/CHF edges lower due to a decline in the US Dollar and lower US yields.
- Fed Chair Jerome Powell has anticipated a sustained decrease in inflation, indicating diminished confidence in the disinflation outlook.
- Swiss Producer and Import Prices dropped 1.8% in April, marking the twelfth consecutive period of decrease.
USD/CHF edges lower for the second successive session, trading around 0.9060 during the Asian hours on Wednesday. The decline of the USD/CHF pair could be attributed to the weaker US Dollar (USD) as investors shrugged off the higher-than-expected US Producer Price Index data for April. Investors will likely await the Consumer Price Index report scheduled for Wednesday.
The US Bureau of Labor Statistics (BLS) reported that the Producer Price Index (PPI) rose 0.5% MoM in April, surpassing the market expectations of a 0.3% increase. The producer prices have rebounded from March's contraction of 0.1%. Additionally, the Core PPI, which excludes volatile food and energy prices, also surged 0.5% month-over-month, exceeding projections of 0.2%.
Federal Reserve Chair Jerome Powell shared his views after the release of US PPI. According to a Reuters report, Powell has anticipated a continued decline in inflation and expressed less confidence in the disinflation outlook compared to previous assessments. He also highlighted that Gross Domestic Product (GDP) growth is expected to reach 2% or higher, attributing this positive forecast to the strength of the labor market.
In Switzerland, Producer and Import Prices (YoY) dropped 1.8% in April, marking a slight improvement from the preceding decline of 2.1%. This marks the twelfth consecutive period of decrease, albeit at the slowest rate since December 2023. On a monthly basis, the measure of consumer price inflation increased by 0.6%, following a 0.1% rise in the previous month.
Furthermore, traders are expected to closely monitor Industrial Production (YoY) for the first quarter, scheduled for release on Friday. This report will provide insights into the volume of production across industries such as factories and manufacturing in Switzerland.
- NZD/USD holds positive ground around 0.6055, adding 0.32% in Wednesday’s early European session.
- Fed’s Powell said inflation might prove to be more persistent than expected, keeping the Fed to hold rate higher for longer.
- Westpac analysts anticipate the RBNZ will leave the OCR at 5.5% at its May meeting next week.
The NZD/USD pair gains traction near 0.6055 on Wednesday during the early European trading hours. The pair edges higher for the second consecutive day and holds above the key 100-day Exponential Moving Average (EMA), supported by the softer USD Index (DXY) below the 105.00 level. The final reading of the US Consumer Price Index (CPI) and Retail Sales for April will be in the spotlight later on Wednesday.
The Federal Reserve (Fed) Chairman Jerome Powell said on Tuesday that inflation in the US might prove to be more persistent than expected, keeping the Fed holding rate higher for longer to achieve the central bank’s 2% target. Powell added that it is unlikely to hike rates more, even if the chances for rate cuts have become less. Investors have priced in nearly a 65% chance of a rate cut by the Fed in September 2024, according to the CME's FedWatch Tool.
The US Producer Price Index (PPI), wholesale inflation, hit its highest rate in a year, according to the Bureau of Labor Statistics on Tuesday. The annual PPI rose 2.2% YoY in April, compared to the 1.8% increase in March (revised from 2.1%), in line with the estimate. The Core PPI jumped 2.4% YoY in April, compared to an increase of 2.1% in the previous reading. The April CPI data might offer some hints about future monetary policy by the Fed. The hotter inflation outcome could delay the rate cut timeline for this year and lift the Greenback against its rivals.
On the Kiwi front, the Reserve Bank of New Zealand (RBNZ) will hold its meeting next week. Westpac analysts expect the RBNZ will leave the Official Cash Rate (OCR) unchanged at 5.5% at its May meeting. The New Zealand central bank is likely to remain comfortable with the forward outlook communicated in the February meeting. The markets believe that it is unlikely that the RBNZ will ease its policy before the Fed. This, in turn, might provide some support to the Kiwi and act as a tailwind for NZD/USD for the time being.
- USD/CAD edges lower due to a weaker US Dollar amid improved risk appetite.
- Fed Chair Jerome Powell has anticipated for a sustained decrease in inflation, indicating less confidence in the disinflation outlook.
- The higher WTI price contributes support for the Canadian Dollar.
USD/CAD has extended losses for the second successive session, trading around 1.3640 during the Asian hours on Wednesday. The decline of the pair could be attributed to the weaker US Dollar (USD) as investors digested higher-than-expected US Producer Price Index data for April while awaiting the Consumer Price Index report scheduled for Wednesday.
The US Bureau of Labor Statistics (BLS) reported that the Producer Price Index (PPI) rose 0.5% MoM in April, surpassing the market expectations of a 0.3% increase. The producer prices have rebounded from March's contraction of 0.1%. Additionally, the Core PPI, which excludes volatile food and energy prices, also surged 0.5% month-over-month, exceeding projections of 0.2%.
Federal Reserve Chair Jerome Powell shared his views after the release of US PPI. According to a Reuters report, Powell has anticipated a continued decline in inflation and expressed less confidence in the disinflation outlook compared to previous assessments. He also highlighted that Gross Domestic Product (GDP) growth is expected to reach 2% or higher, attributing this positive forecast to the strength of the labor market.
In Canada, the Royal Bank of Canada has revised its forecast for the USD/CAD pair to 1.3700 by the end of June 2024. This adjustment is attributed to the contrasting trajectories of interest rates between Canada and the United States (US). The Bank of Canada (BoC) is anticipated to implement four consecutive rate cuts in 2024, with an additional reduction of 100 basis points (bps) in 2025. While hawkish remarks from the Fed officials suggest maintaining the higher rates for longer.
Regarding commodities, the rise in crude Oil prices could bolster the Canadian Dollar (CAD), undermining the USD/CAD pair. Canada's status as the largest oil exporter to the United States, and the largest oil consumer, contributes to this dynamic.
West Texas Intermediate (WTI) crude Oil price retraces its recent losses, trading around $78.30 per barrel during Wednesday's Asian session. The advance of the crude Oil prices could be attributed to the latest crude Oil supply update from the American Petroleum Institute (API) released on Tuesday. Additionally, concerns have arisen due to wildfires nearing Fort McMurray, which serves as the central hub for Canada's Oil sands industry, contributing approximately 3.3 million barrels per day, equivalent to two-thirds of the nation's total output.
- WTI price appreciates due to the potential for supply disruptions amid Canadian wildfires.
- The API Weekly Crude Oil Stock dropped 3.104 million barrels, below the forecasted decline of 1.35 million barrels.
- OPEC maintained its forecast of an increase of 2.25 million barrels per day in 2024.
West Texas Intermediate (WTI) crude Oil price retraces its recent losses, trading around $78.30 per barrel during Wednesday's Asian session. The advance of the crude Oil prices could be attributed to the latest crude Oil supply update from the American Petroleum Institute (API) released on Tuesday.
API's Weekly Statistical Bulletin (WSB) provides comprehensive data on refinery operations and the production of major petroleum products in the United States (US) and its regions. For the week ending May 10, the API Weekly Crude Oil Stock dropped 3.104 million barrels, significantly exceeding the forecasted 1.35 million-barrel decline. This sharp decrease completely offset the previous week's gain of 0.509 million barrels.
In Canada, concerns have arisen due to wildfires in remote western regions. Of particular worry is a large wildfire nearing Fort McMurray, which serves as the central hub for Canada's Oil sands industry, contributing approximately 3.3 million barrels per day, equivalent to two-thirds of the nation's total output.
However, crude Oil prices lost ground due to higher-than-anticipated US producer prices in April, sparking concerns about the Federal Reserve (Fed) potentially maintaining elevated interest rates for an extended period. These higher interest rates can dampen economic activities in the United States, the world's largest oil consumer, affecting Oil demand.
The US Bureau of Labor Statistics (BLS) reported that the Producer Price Index (PPI) increased by 0.5% month-over-month in April, surpassing the forecast of 0.3% and rebounding from March's contraction of -0.1%. While the Core PPI, which excludes volatile food and energy prices, also surged by 0.5% MoM, exceeding projections of 0.2%.
Additionally, the recent report of OPEC+ (the Organization of the Petroleum Exporting Countries and its allies, led by Russia) showed that member nations surpassed their agreed-upon limit by producing an extra 568,000 barrels per day (bpd) last month. Nevertheless, OPEC maintained an optimistic outlook on global Oil demand, forecasting an increase of 2.25 million barrels per day in 2024 and 1.85 million barrels per day in 2025.
- Gold price edges higher on Wednesday amid the softer USD.
- The growth in gold demand and geopolitical tensions lift the price of precious metals.
- The US CPI and PPI data on Wednesday could offer some hints about the Fed’s monetary policy path.
The gold price (XAU/USD) posts modest gains on the weaker US Dollar (USD) on Wednesday. The rising gold demand from robust over-the-counter (OTC) market investments, consistent central bank purchases, and safe-haven flows amid Middle East geopolitical risk act as a tailwind for XAU/USD. Nonetheless, the Federal Reserve (Fed) officials' hawkish remarks, including Chairman Jerome Powell's suggestion to keep interest rates higher for longer, might drag the yellow metal lower in the near term.
Later on Wednesday, the US Consumer Price Index (CPI) for April will be released, and it could offer insights into the timing of the Fed's initial rate adjustment. Also, the Retail Sales for April will be published, and insight into consumer spending trends will be provided. The hotter-than-estimated inflation data could lead the Fed to a more aggressive stance, which boosts the Greenback and exerts some selling pressure on USD-denominated gold.
Daily Digest Market Movers: Gold price gains momentum amid gold investment demand
- The US Producer Price Index (PPI) rose 2.2% YoY in April, compared to the 1.8% increase in March and matching expectations. The Core PPI jumped 2.4% YoY in the same period, compared to an increase of 2.1% in March. On a monthly basis, the PPI and the core PPI both rose 0.5% MoM in April.
- Fed Chair Jerome Powell said that inflation is falling slower than expected, and the PPI data provided more justification to keep rates higher for longer. Powell added that more rate hikes likely won't be needed.
- Kansas City Fed President Jeffrey Schmid noted that inflation remains too high, and the US central bank has more work to do.
- The annual headline Consumer Price Index (CPI) inflation is expected to ease to 3.4% in April from 3.5% in the first estimates. The Core CPI inflation is estimated to drop to 3.6% in April from 3.8% prior.
- The US Retail Sales is projected to decline to 0.4% MoM in April from 0.7% in the preliminary reading.
- Financial markets are currently pricing in nearly 65% odds of a rate cut by the Fed in September 2024, according to the CME's FedWatch Tool.
- Global gold demand rose by 3% to 1,238 tonnes, making it the strongest first quarter since 2016, according to the World Gold Council's Q1 2024 report.
Technical Analysis: Gold price holds a constructive picture
The gold price trades on a positive note on the day. According to the four-hour chart, the yellow metal maintains its positive stance unchanged as XAU/USD holds above the key 100-period Exponential Moving Average (EMA). The 14-day Relative Strength Index (RSI) stands in the bullish zone at 60.70, suggesting that the path of least resistance is to the upside.
Any follow-through buying above a high of May 10 at $2,378 could clear the path for a rally to the next major resistance near the $2,400 psychological barrier. A decisive upside break above the mentioned level will expose an all-time high near $2,432 en route to the $2,500 round figure.
On the flip side, the key support level for gold will emerge at the $2,325–$2,330 region, representing the confluence of the lower limit of the descending trend channel, the 100-period EMA, and a low of May 13. The breach of this level will see a drop to the $2,300 round figure, followed by a low of May 2 at $2,281.
US Dollar price today
The table below shows the percentage change of US Dollar (USD) against listed major currencies today. US Dollar was the weakest against the Australian Dollar.
| USD | EUR | GBP | CAD | AUD | JPY | NZD | CHF | |
| USD | -0.11% | -0.10% | -0.09% | -0.30% | -0.06% | -0.24% | -0.10% | |
| EUR | 0.11% | 0.01% | 0.02% | -0.19% | 0.05% | -0.13% | 0.02% | |
| GBP | 0.09% | -0.01% | 0.01% | -0.20% | 0.03% | -0.14% | 0.01% | |
| CAD | 0.09% | -0.02% | 0.00% | -0.19% | 0.03% | -0.16% | -0.01% | |
| AUD | 0.29% | 0.19% | 0.20% | 0.22% | 0.23% | 0.07% | 0.21% | |
| JPY | 0.07% | -0.04% | -0.04% | -0.02% | -0.24% | -0.18% | -0.04% | |
| NZD | 0.23% | 0.13% | 0.15% | 0.14% | -0.05% | 0.18% | 0.15% | |
| CHF | 0.09% | -0.02% | 0.00% | 0.01% | -0.20% | 0.03% | -0.15% |
The heat map shows percentage changes of major currencies against each other. The base currency is picked from the left column, while the quote currency is picked from the top row. For example, if you pick the Euro from the left column and move along the horizontal line to the Japanese Yen, the percentage change displayed in the box will represent EUR (base)/JPY (quote).
Gold FAQs
Gold has played a key role in human’s history as it has been widely used as a store of value and medium of exchange. Currently, apart from its shine and usage for jewelry, the precious metal is widely seen as a safe-haven asset, meaning that it is considered a good investment during turbulent times. Gold is also widely seen as a hedge against inflation and against depreciating currencies as it doesn’t rely on any specific issuer or government.
Central banks are the biggest Gold holders. In their aim to support their currencies in turbulent times, central banks tend to diversify their reserves and buy Gold to improve the perceived strength of the economy and the currency. High Gold reserves can be a source of trust for a country’s solvency. Central banks added 1,136 tonnes of Gold worth around $70 billion to their reserves in 2022, according to data from the World Gold Council. This is the highest yearly purchase since records began. Central banks from emerging economies such as China, India and Turkey are quickly increasing their Gold reserves.
Gold has an inverse correlation with the US Dollar and US Treasuries, which are both major reserve and safe-haven assets. When the Dollar depreciates, Gold tends to rise, enabling investors and central banks to diversify their assets in turbulent times. Gold is also inversely correlated with risk assets. A rally in the stock market tends to weaken Gold price, while sell-offs in riskier markets tend to favor the precious metal.
The price can move due to a wide range of factors. Geopolitical instability or fears of a deep recession can quickly make Gold price escalate due to its safe-haven status. As a yield-less asset, Gold tends to rise with lower interest rates, while higher cost of money usually weighs down on the yellow metal. Still, most moves depend on how the US Dollar (USD) behaves as the asset is priced in dollars (XAU/USD). A strong Dollar tends to keep the price of Gold controlled, whereas a weaker Dollar is likely to push Gold prices up.
- The US Consumer Price Index is set to rise 3.4% YoY in April, following the 3.5% increase in March.
- Annual core CPI inflation is expected to edge lower to 3.6% in April.
- The inflation report could influence the timing of the Fed’s policy pivot.
The high-impact US Consumer Price Index (CPI) inflation data for April will be published by the Bureau of Labor Statistics (BLS) on Wednesday at 12:30 GMT. Inflation data could alter the market’s pricing about the timing of the Federal Reserve (Fed) policy pivot, while uncertainty regarding the rate outlook grows amid policymakers’ hawkish tone and disappointing macroeconomic data releases. Hence, a surprise in CPI data could ramp up the US Dollar’s (USD) volatility.
What to expect in the next CPI report?
Inflation in the United States (US) is forecast to rise at an annual pace of 3.4% in April, at a slightly softer pace than the 3.5% increase recorded in March. The core CPI inflation rate, which excludes volatile food and energy prices, is forecast to edge lower to 3.6% from 3.8% in the same period.
The monthly CPI and the core CPI are seen increasing 0.4% and 0.3%, respectively, in April.
Several Fed policymakers have recently voiced their concerns over the inflation outlook. Richmond Fed President Thomas Barkin argued that a patient approach to policy would eventually reduce inflation toward the 2% target, while Minneapolis Fed President Neel Kashkari noted that the lack of progress in inflation was raising questions about how restrictive the policy is. Moreover, Fed Board of Governors member Michelle Bowman said that she doesn’t rate cuts as warranted this year, adding that she would like to see a number of better inflation data.
Previewing the April inflation report, “we expect next week's CPI report to show that core inflation slowed to a "soft" 0.3% m/m pace after posting a third consecutive strong gain at 0.4% in March,” said TD Securities analysts. “The headline likely rose by a softer 0.3% m/m despite another notable gain in energy prices. Note that our unrounded core CPI forecast at 0.27% m/m suggests larger risks for a dovish surprise to a rounded 0.2% increase.”
How could the US Consumer Price Index report affect EUR/USD?
Following the 0.3% increase recorded in January, the CPI and the core CPI rose 0.4% both in February and March, reviving concerns over a slowdown in the disinflationary progress and causing market participants to refrain from forecasting a rate cut until September.
Meanwhile, the BLS reported an increase of 175,000 in Nonfarm Payrolls in April. This marked the smallest growth in payrolls since October and pointed to loosening conditions in the labor market. Other data from the US showed that the business activity in the manufacturing and service sectors contracted in April, with the ISM Manufacturing and Services Purchasing Managers Index (PMI) both coming in below 50. Additionally, the US Department of Labor announced that there were 231,000 first-time applications for unemployment benefits in the week ending May 4, the highest print since early November.
Despite the strong inflation figures seen in the last couple of months, disappointing data releases keep the optimism about a policy pivot in September alive. According to the CME FedWatch Tool, investors are currently pricing in a 35% probability of a no change in the Fed interest rate in September. Hence, the market positioning suggests that the US Dollar faces a two-way risk heading into the inflation data release.
In case the monthly core CPI rises 0.4% or more, it could revive expectations for a policy hold in September. In this scenario, US Treasury bond yields are likely to gain traction and allow the USD to gather strength against its major rivals. On the other hand, a reading of 0.2% or lower could have the opposite impact on the currency’s valuation.
Eren Sengezer, European Session Lead Analyst at FXStreet, offers a brief technical outlook for EUR/USD and explains: “The Relative Strength Index (RSI) indicator on the daily chart stays above 50 but EUR/USD needs to flip 1.0800-1.0820 area, where the 200-day and the 100-day Simple Moving Averages (SMA) are located, into support to extend its uptrend. Above this area, 1.0900 (static level) could be seen as interim resistance before 1.0980 (March 8 high).”
“If EUR/USD fails to clear 1.0800-1.0820 area, buyers could get discouraged. In this case, supports could be seen at 1.0720 (20-day SMA) and 1.0600 (April 16 low, static level).”
Economic Indicator
Consumer Price Index (YoY)
Inflationary or deflationary tendencies are measured by periodically summing the prices of a basket of representative goods and services and presenting the data as The Consumer Price Index (CPI). CPI data is compiled on a monthly basis and released by the US Department of Labor Statistics. The YoY reading compares the prices of goods in the reference month to the same month a year earlier.The CPI is a key indicator to measure inflation and changes in purchasing trends. Generally speaking, a high reading is seen as bullish for the US Dollar (USD), while a low reading is seen as bearish.
Read more.Next release: Wed May 15, 2024 12:30
Frequency: Monthly
Consensus: 3.4%
Previous: 3.5%
Source: US Bureau of Labor Statistics
The US Federal Reserve has a dual mandate of maintaining price stability and maximum employment. According to such mandate, inflation should be at around 2% YoY and has become the weakest pillar of the central bank’s directive ever since the world suffered a pandemic, which extends to these days. Price pressures keep rising amid supply-chain issues and bottlenecks, with the Consumer Price Index (CPI) hanging at multi-decade highs. The Fed has already taken measures to tame inflation and is expected to maintain an aggressive stance in the foreseeable future.
US Dollar FAQs
The US Dollar (USD) is the official currency of the United States of America, and the ‘de facto’ currency of a significant number of other countries where it is found in circulation alongside local notes. It is the most heavily traded currency in the world, accounting for over 88% of all global foreign exchange turnover, or an average of $6.6 trillion in transactions per day, according to data from 2022. Following the second world war, the USD took over from the British Pound as the world’s reserve currency. For most of its history, the US Dollar was backed by Gold, until the Bretton Woods Agreement in 1971 when the Gold Standard went away.
The most important single factor impacting on the value of the US Dollar is monetary policy, which is shaped by the Federal Reserve (Fed). The Fed has two mandates: to achieve price stability (control inflation) and foster full employment. Its primary tool to achieve these two goals is by adjusting interest rates. When prices are rising too quickly and inflation is above the Fed’s 2% target, the Fed will raise rates, which helps the USD value. When inflation falls below 2% or the Unemployment Rate is too high, the Fed may lower interest rates, which weighs on the Greenback.
In extreme situations, the Federal Reserve can also print more Dollars and enact quantitative easing (QE). QE is the process by which the Fed substantially increases the flow of credit in a stuck financial system. It is a non-standard policy measure used when credit has dried up because banks will not lend to each other (out of the fear of counterparty default). It is a last resort when simply lowering interest rates is unlikely to achieve the necessary result. It was the Fed’s weapon of choice to combat the credit crunch that occurred during the Great Financial Crisis in 2008. It involves the Fed printing more Dollars and using them to buy US government bonds predominantly from financial institutions. QE usually leads to a weaker US Dollar.
Quantitative tightening (QT) is the reverse process whereby the Federal Reserve stops buying bonds from financial institutions and does not reinvest the principal from the bonds it holds maturing in new purchases. It is usually positive for the US Dollar.
| Raw materials | Closed | Change, % |
|---|---|---|
| Silver | 28.608 | 1.41 |
| Gold | 2357.83 | 0.88 |
| Palladium | 979.74 | 1.78 |
- The Australian Dollar appreciates due to the improved risk sentiment on Wednesday.
- The Australian government is targeting headline inflation and seeking to ease cost-of-living pressures by earmarking billions.
- The US Dollar lost ground as investors digested higher-than-expected US PPI data.
The Australian Dollar (AUD) remains steady with a positive sentiment despite the lower-than-expected Wage Price Index (Q1) released on Wednesday by the Australian Bureau of Statistics. This index serves as an indicator of labor cost inflation. The appreciation of the Aussie Dollar could be attributed to the improved risk appetite.
The Australian Budget for 2024-25 has returned to a deficit after recording a surplus of $9.3 billion in 2023-24. The Australian government aims to tackle headline inflation and alleviate the cost of living pressures by allocating billions to reduce energy bills and rent, alongside initiatives to lower income taxes.
The US Dollar Index (DXY), which gauges the performance of the US Dollar (USD) against six major currencies, is experiencing continued losses for the second session. Investors have digested higher-than-expected US Producer Price Index data for April while awaiting the Consumer Price Index report scheduled for Wednesday.
Federal Reserve Chair Jerome Powell has anticipated a continued decline in inflation. Powell expressed less confidence in the disinflation outlook compared to previous assessments. He also highlighted that Gross Domestic Product (GDP) growth is expected to reach 2% or higher, attributing this positive forecast to the strength of the labor market.
Daily Digest Market Movers: Australian Dollar appreciates due to improved risk appetite
- Australia’s Wage Price Index (QoQ) showed a 0.8% increase in the first quarter, falling slightly below the anticipated rise of 0.9%. On a year-over-year basis, it saw a 4.1% increase, also slightly lower than the expected 4.2% rise.
- The US Bureau of Labor Statistics (BLS) reported that the Producer Price Index (PPI) increased by 0.5% month-over-month in April, surpassing the forecast of 0.3% and rebounding from March's contraction of -0.1%. Additionally, the Core PPI, which excludes volatile food and energy prices, also surged by 0.5% MoM, exceeding projections of 0.2%.
- A Reuters report cited Treasurer of Australia Jim Chalmers, expressing his expectation that the current headline inflation rate of 3.6% will return to the Reserve Bank of Australia’s target range of 2-3% by the end of the year. In the event that this scenario unfolds, it is likely that the central bank will consider cutting interest rates earlier than markets had anticipated.
- Australia's Treasury announced on Sunday that they forecasted that inflation could re-enter the Reserve Bank of Australia's (RBA) target range by the end of 2024. In their December outlook, officials predicted that CPI inflation would decrease to 3.75% by mid-2024 and 2.75% by mid-2025, aligning it with the RBA's target range.
- Federal Reserve Bank of New York conducted a consumer sentiment survey, indicating that US consumers anticipate a broad acceleration in inflation over the next year, with expectations reaching 3.3%. This marks an increase from the 3.0% figure reported in March for consumer one-year inflation expectations.
- According to Reuters, Fed Vice Chair Philip Jefferson advocated for the retention of current interest rates until signs of inflation easing become more apparent.
Technical Analysis: Australian Dollar maintains its position above 0.6600
The Australian Dollar trades around 0.6630 on Wednesday. The AUD/USD pair is consolidating within a symmetrical triangle pattern. Moreover, the 14-day Relative Strength Index (RSI) indicates a bullish bias, remaining above the 50 level.
The AUD/USD pair may challenge the upper boundary near the swing area at 0.6650. A breakthrough above this level could lead the pair to revisit March's high at 0.6667, with further upward momentum possibly targeting the psychological level of 0.6700.
On the downside, the psychological level of 0.6600 appears as the immediate support, followed by the 14-day Exponential Moving Average (EMA) at 0.6585. If the pair breaks below this EMA, it might face additional selling pressure, potentially moving toward the region around the lower boundary of the symmetrical triangle around the support level of 0.6465.
AUD/USD: Daily Chart

Australian Dollar price today
The table below shows the percentage change of the Australian Dollar (AUD) against listed major currencies today. The Australian Dollar was the strongest against the US Dollar.
| USD | EUR | GBP | CAD | AUD | JPY | NZD | CHF | |
| USD | -0.06% | -0.05% | -0.04% | -0.12% | -0.04% | -0.05% | -0.05% | |
| EUR | 0.05% | 0.01% | 0.01% | -0.08% | 0.01% | 0.01% | 0.02% | |
| GBP | 0.05% | -0.02% | 0.00% | -0.09% | 0.00% | 0.01% | 0.02% | |
| CAD | 0.02% | -0.03% | -0.02% | 0.05% | -0.04% | 0.05% | -0.04% | |
| AUD | 0.11% | 0.08% | 0.09% | 0.09% | 0.09% | 0.08% | 0.09% | |
| JPY | 0.04% | 0.00% | 0.00% | -0.01% | -0.08% | -0.01% | -0.01% | |
| NZD | 0.04% | 0.00% | 0.00% | 0.00% | -0.07% | 0.00% | 0.02% | |
| CHF | 0.04% | -0.02% | 0.00% | 0.00% | -0.07% | 0.00% | -0.01% |
The heat map shows percentage changes of major currencies against each other. The base currency is picked from the left column, while the quote currency is picked from the top row. For example, if you pick the Euro from the left column and move along the horizontal line to the Japanese Yen, the percentage change displayed in the box will represent EUR (base)/JPY (quote).
Australian Dollar FAQs
One of the most significant factors for the Australian Dollar (AUD) is the level of interest rates set by the Reserve Bank of Australia (RBA). Because Australia is a resource-rich country another key driver is the price of its biggest export, Iron Ore. The health of the Chinese economy, its largest trading partner, is a factor, as well as inflation in Australia, its growth rate and Trade Balance. Market sentiment – whether investors are taking on more risky assets (risk-on) or seeking safe-havens (risk-off) – is also a factor, with risk-on positive for AUD.
The Reserve Bank of Australia (RBA) influences the Australian Dollar (AUD) by setting the level of interest rates that Australian banks can lend to each other. This influences the level of interest rates in the economy as a whole. The main goal of the RBA is to maintain a stable inflation rate of 2-3% by adjusting interest rates up or down. Relatively high interest rates compared to other major central banks support the AUD, and the opposite for relatively low. The RBA can also use quantitative easing and tightening to influence credit conditions, with the former AUD-negative and the latter AUD-positive.
China is Australia’s largest trading partner so the health of the Chinese economy is a major influence on the value of the Australian Dollar (AUD). When the Chinese economy is doing well it purchases more raw materials, goods and services from Australia, lifting demand for the AUD, and pushing up its value. The opposite is the case when the Chinese economy is not growing as fast as expected. Positive or negative surprises in Chinese growth data, therefore, often have a direct impact on the Australian Dollar and its pairs.
Iron Ore is Australia’s largest export, accounting for $118 billion a year according to data from 2021, with China as its primary destination. The price of Iron Ore, therefore, can be a driver of the Australian Dollar. Generally, if the price of Iron Ore rises, AUD also goes up, as aggregate demand for the currency increases. The opposite is the case if the price of Iron Ore falls. Higher Iron Ore prices also tend to result in a greater likelihood of a positive Trade Balance for Australia, which is also positive of the AUD.
The Trade Balance, which is the difference between what a country earns from its exports versus what it pays for its imports, is another factor that can influence the value of the Australian Dollar. If Australia produces highly sought after exports, then its currency will gain in value purely from the surplus demand created from foreign buyers seeking to purchase its exports versus what it spends to purchase imports. Therefore, a positive net Trade Balance strengthens the AUD, with the opposite effect if the Trade Balance is negative.
The People’s Bank of China (PBOC), China's central bank kept the one-year Medium-term Lending Facility (MLF) rate steady at 2.50% on Wednesday. The PBoC also kept the five-year LPRs unchanged.
The one-year MLF was last cut in August 2023, from 2.65%.
The People’s Bank of China (PBoC) set the USD/CNY central rate for the trading session ahead on Wednesday at 7.1049 as compared to the previous day's fix of 7.1053 and 7.2279 Reuters estimates.
- EUR/USD gains momentum 1.0815 on Wednesday.
- Fed’s Schmid said inflation remains too high and the US central bank has more work to do.
- The Eurozone ZEW Economic Sentiment Survey came in better than expected, improving to 47.0 in May, compared to 43.9 prior.
The EUR/USD pair trades with a bullish bias around 1.0815 during the early Asian trading hours on Wednesday. Markets might turn to a cautious mood later in the day ahead of key economic data from the Eurozone and the US. The first reading of the Eurozone Gross Domestic Product (GDP) for the first quarter and the US April Consumer Price Index (CPI) will be the highlights on Wednesday.
On Tuesday, Federal Reserve (Fed) Chairman Jerome Powell said that inflation is falling slower than expected, and the PPI data provided more justification to keep rates higher for longer. Powell added that it’s unlikely in his view that the central bank would have to raise further interest rates, even if the chances for rate cuts have become less. Additionally, Kansas City Fed President Jeffrey Schmid noted that inflation remains too high and the US central bank has more work to do. These hawkish comments might lift the US Dollar (USD) and weigh on the major pair in the near term.
However, the US CPI data is due later in the day, and it might influence the Fed interest rate decision in the next meeting. The annual headline CPI inflation is expected to ease to 3.4% in April from 3.5% in the previous reading. The Core CPI inflation is projected to drop to 3.6% in April from 3.8% prior. If the forthcoming CPI data meets expectations, it could trigger the prospect of rate cuts. This, in turn, might drag the Greenback lower and act as a tailwind for EUR/USD.
Across the pond, the upbeat ZEW Economic Sentiment Survey has provided some support to the major pair for the time being. The Eurozone ZEW Economic Sentiment Survey improved to 47.0 in May from 43.9 in the previous month, above the estimation of 46.1. The attention will shift to the European GDP growth numbers, which are estimated to grow by 0.3% QoQ in Q1, while the Annualized GDP growth is forecast to hold steady at 0.4% YoY.
Kansas City Federal Reserve Bank President Jeffrey Schmid spoke at the regional bank's agricultural summit on Tuesday. Schmid said that inflation remains too high and the US central bank has more work to do.
Key quotes
“Policy is in the correct place.”
“Continued vigilance, flexibility are necessary.”
“Prepared to be patient as inflation eases back toward 2%.”
“Inflation expectations remain relatively low and anchored.”
“Inflation is still too high, Fed has more work to do.”
“Interest rates could remain high for some time.”
“Labor market has come off a historic boil by many measures.”
“There are signs that imbalances driving inflation are easing.”
“Fed must preempt inflation from becoming ingrained.”
“Fed's job on inflation is made easier by supply increases.”
“My preference is to shrink Fed's balance sheet as much as possible, consistent with the operating framework.”
"I don't think we should have slowed the balance sheet runoff."
"Whatever we don't run off on the balance sheet we should reinvest in short-term treasury debt."
"We need room on the Fed's balance sheet, which is a monetary tool."
"Productivity growth can moderate inflation, in the long run can help get to 2% inflation."
Market reaction
The US Dollar Index (DXY) is trading 0.04% higher on the day at 105.04, as of writing.
Fed FAQs
Monetary policy in the US is shaped by the Federal Reserve (Fed). The Fed has two mandates: to achieve price stability and foster full employment. Its primary tool to achieve these goals is by adjusting interest rates. When prices are rising too quickly and inflation is above the Fed’s 2% target, it raises interest rates, increasing borrowing costs throughout the economy. This results in a stronger US Dollar (USD) as it makes the US a more attractive place for international investors to park their money. When inflation falls below 2% or the Unemployment Rate is too high, the Fed may lower interest rates to encourage borrowing, which weighs on the Greenback.
The Federal Reserve (Fed) holds eight policy meetings a year, where the Federal Open Market Committee (FOMC) assesses economic conditions and makes monetary policy decisions. The FOMC is attended by twelve Fed officials – the seven members of the Board of Governors, the president of the Federal Reserve Bank of New York, and four of the remaining eleven regional Reserve Bank presidents, who serve one-year terms on a rotating basis.
In extreme situations, the Federal Reserve may resort to a policy named Quantitative Easing (QE). QE is the process by which the Fed substantially increases the flow of credit in a stuck financial system. It is a non-standard policy measure used during crises or when inflation is extremely low. It was the Fed’s weapon of choice during the Great Financial Crisis in 2008. It involves the Fed printing more Dollars and using them to buy high grade bonds from financial institutions. QE usually weakens the US Dollar.
Quantitative tightening (QT) is the reverse process of QE, whereby the Federal Reserve stops buying bonds from financial institutions and does not reinvest the principal from the bonds it holds maturing, to purchase new bonds. It is usually positive for the value of the US Dollar.
| Index | Change, points | Closed | Change, % |
|---|---|---|---|
| NIKKEI 225 | 176.6 | 38356.06 | 0.46 |
| Hang Seng | -41.35 | 19073.71 | -0.22 |
| KOSPI | 3.13 | 2730.34 | 0.11 |
| ASX 200 | -23.2 | 7726.8 | -0.3 |
| DAX | -25.8 | 18716.42 | -0.14 |
| CAC 40 | 16.52 | 8225.8 | 0.2 |
| Dow Jones | 126.6 | 39558.11 | 0.32 |
| S&P 500 | 25.26 | 5246.68 | 0.48 |
| NASDAQ Composite | 122.94 | 16511.18 | 0.75 |
| Pare | Closed | Change, % |
|---|---|---|
| AUDUSD | 0.66248 | 0.26 |
| EURJPY | 169.194 | 0.38 |
| EURUSD | 1.0817 | 0.25 |
| GBPJPY | 196.913 | 0.36 |
| GBPUSD | 1.25895 | 0.23 |
| NZDUSD | 0.60392 | 0.37 |
| USDCAD | 1.36507 | -0.12 |
| USDCHF | 0.90643 | -0.2 |
| USDJPY | 156.408 | 0.13 |
- USD/JPY extends the rally around 156.55 in Wednesday’s early Asian session.
- Fed’s Powell said central bank will keep rates on hold for an extended period as inflation eases slower than expected.
- Japanese government will closely work with the BoJ on FX market and will take all possible measures if necessary.
The USD/JPY pair trades in positive territory for the fourth consecutive day near 156.55 on Wednesday during the early Asian session. The uptick of the pair is bolstered by the speculation that the Federal Reserve (Fed) might maintain rates higher for longer amid the elevated inflation. However, the fear that Japanese authorities could intervene in the foreign exchange markets might cap the upside of USD/JPY.
The Fed Chair Jerome Powell reiterated Tuesday that inflation is easing slower than expected, and the April PPI figure provided more justification to keep rates higher for longer. Nonetheless, Powell further stated that he does not expect the Fed to raise rates. The hawkish remarks from Fed officials might boost the US Dollar (USD) and create a tailwind for USD/JPY.
On Tuesday, the Bureau of Labor Statistics revealed that the US Producer Price Index (PPI) rose 2.2% YoY in April, compared to the 1.8% increase in March (revised from 2.1%) and matching the expectation. Meanwhile, the Core PPI, excluding volatile food and energy costs, jumped 2.4% YoY in the same period, compared to an increase of 2.1% in March. On a monthly basis, the PPI and the core PPI both rose 0.5% MoM in April.
Looking ahead, investors will focus on the US Consumer Price Index (CPI) and Retail Sales reports for April. These reports could offer insights into the timing of the Fed's initial rate adjustment.
On the JPY’s front, Finance Minister Shunichi Suzuki said on Tuesday that the Japanese government will closely work with the Bank of Japan (BoJ) on the foreign exchange (FX) market and will take all possible measures if necessary. The fear of further FX intervention from Japanese authorities might provide some support to the Japanese Yen (JPY) and cap the pair’s upside.


© 2000-2026. All rights reserved.
This site is managed by Teletrade D.J. LLC 2351 LLC 2022 (Euro House, Richmond Hill Road, Kingstown, VC0100, St. Vincent and the Grenadines).
The information on this website is for informational purposes only and does not constitute any investment advice.
The company does not serve or provide services to customers who are residents of the US, Canada, Iran, The Democratic People's Republic of Korea, Yemen and FATF blacklisted countries.
Making transactions on financial markets with marginal financial instruments opens up wide possibilities and allows investors who are willing to take risks to earn high profits, carrying a potentially high risk of losses at the same time. Therefore you should responsibly approach the issue of choosing the appropriate investment strategy, taking the available resources into account, before starting trading.
Use of the information: full or partial use of materials from this website must always be referenced to TeleTrade as the source of information. Use of the materials on the Internet must be accompanied by a hyperlink to teletrade.org. Automatic import of materials and information from this website is prohibited.
Please contact our PR department if you have any questions or need assistance at pr@teletrade.global.
transfers