- Analytics
- News and Tools
- Market News
CFD Markets News and Forecasts — 15-03-2022
US inflation expectations, as per the 10-year breakeven inflation rate per the St. Louis Federal Reserve (FRED) data, remain on the back foot for the second consecutive day by the end of Tuesday’s North American trading session.
In doing so, the inflation gauge dropped to 2.84% after refreshing the all-time high with a 2.94% figure on Friday.
Despite the latest pullback, the inflation expectations do suggest an upside risk and can push the US Federal Reserve (Fed) to rethink over 0.50% rate hike in today’s Federal Open Market Committee (FOMC).
Read: Fed Interest Rate Decision Preview: Is history a guide?
In addition to the Fed’s verdict, the peace talks between Russia and Ukraine in Turkey and China’s covid woes are also the key risk catalysts to watch for today.
- AUD/USD bears are lurking below the counter trendline.
- The M-formation on the daily chart is compelling as the price stalls around 0.7200.
AUD/USD is stalling with a bullish closing candle on Tuesday that could mark a meanwhile pause to the bearish breakout below the trendline support.
AUD/USD daily chart
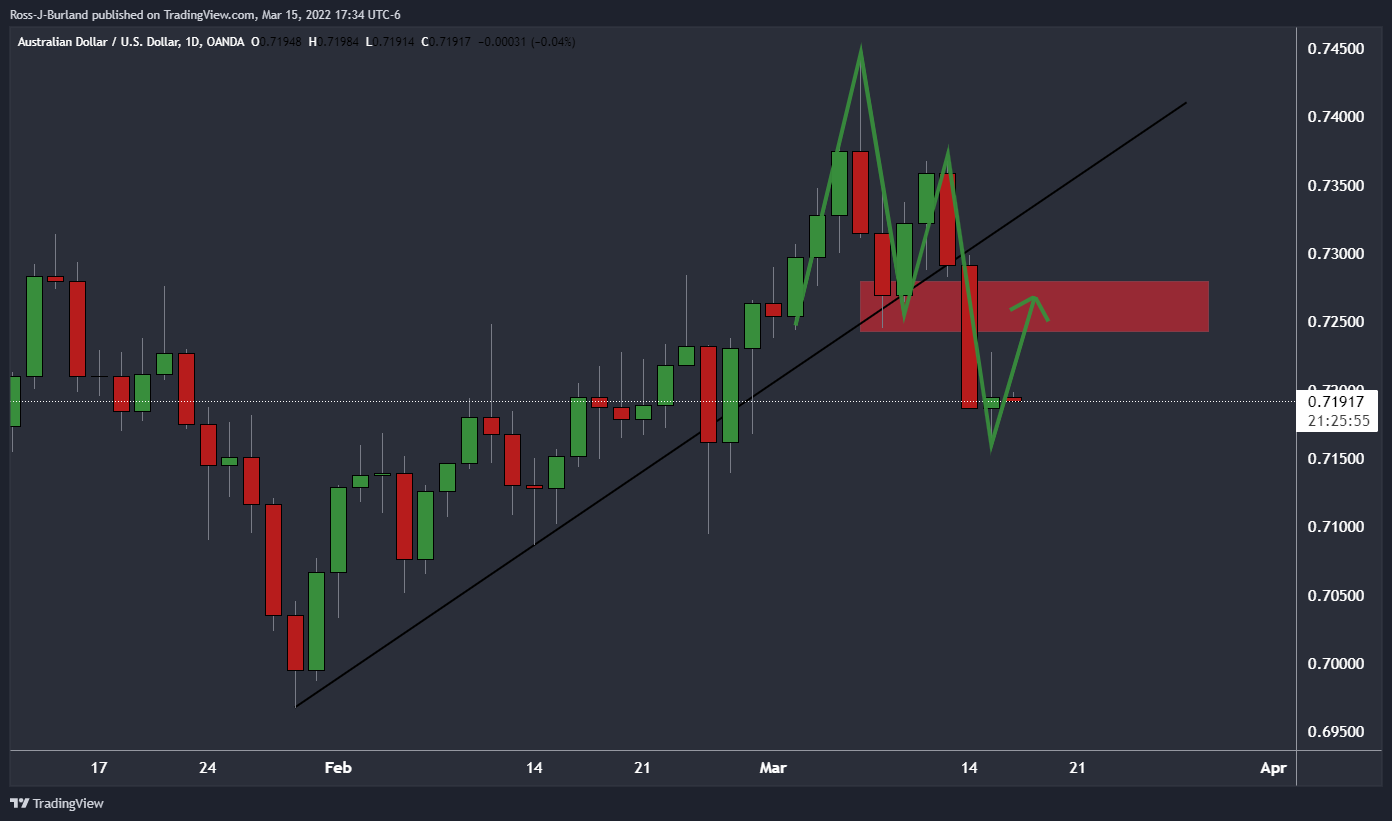
The M-formation is a reversion pattern and the price would be expected to revert back to the neckline near 0.7250. If this level were to hold as resistance, then a downside continuation could come as a result:
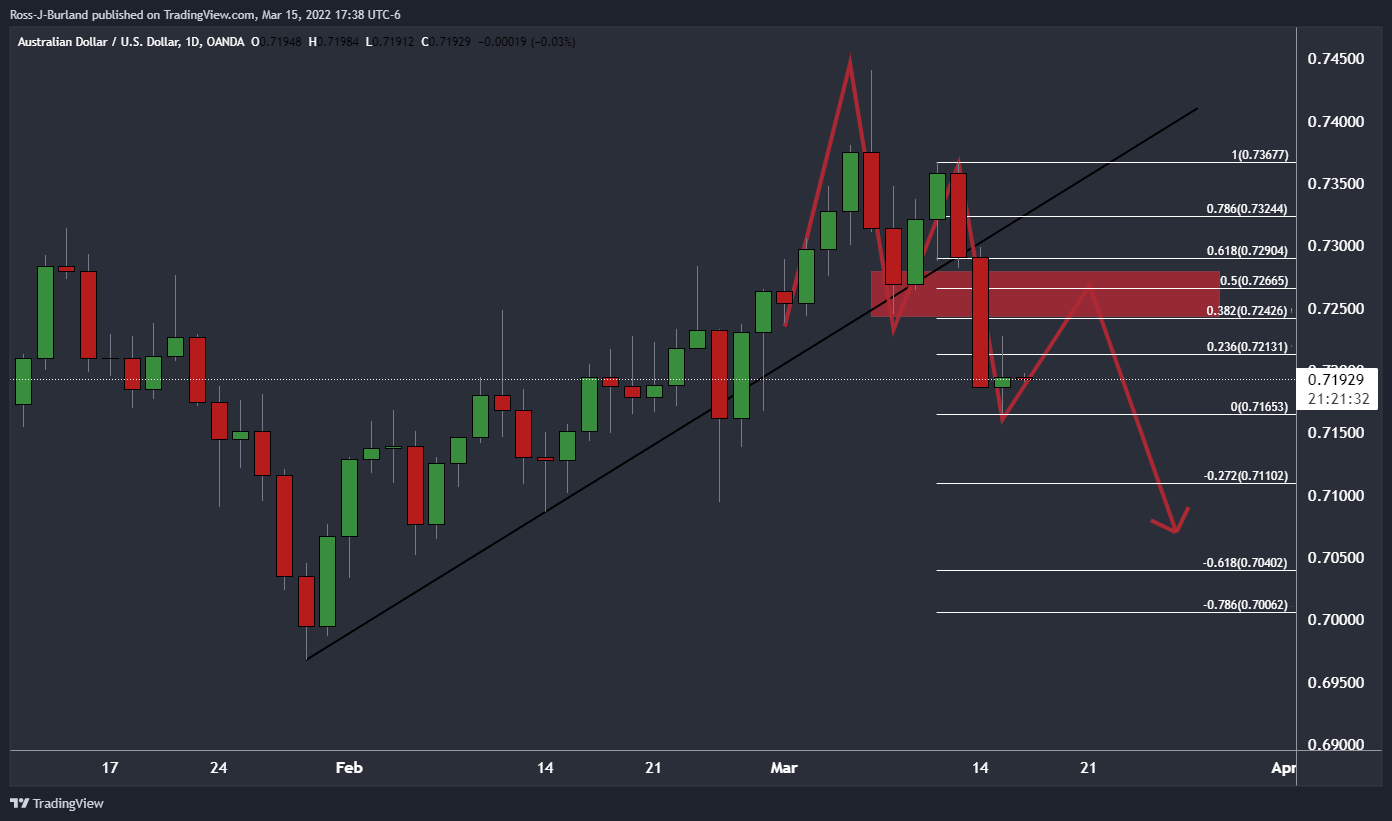
As illustrated, the neckline area has a confluence with the 38.2% Fibonacci and 50% ratio that adds additional resistance.
- Gold remains on the back foot around fortnight low, after three-day downtrend.
- Market sentiment dwindles amid pre-Fed anxiety, mixed clues over Ukraine-Russia and coronavirus resurgence in China.
- Treasury yields seesaw around mid-2019 peak, S&P 500 Futures differs from upbeat Wall Street close during sluggish Asian session.
- Fed March Preview: Gold needs a dovish Fed to regain traction
Gold (XAU/USD) portrays the fourth consecutive daily loss near $1,917 while poking the monthly low, despite being inactive during Wednesday’s Asian session. The yellow metal’s losses could be linked to the firmer US Treasury yields and the market’s anxiety ahead of the top-tier events.
That said, the US 10-year Treasury yields ended Tuesday unchanged despite rising to mid-2019 levels during the initial day, down one basis point (bp) to 2.149% at the latest. On the same line, the five-year bond coupon also eases from the highest levels since May 2019 marked the previous day. Further, S&P 500 Futures print mild losses despite the positive performance of Wall Street.
Talking about the key catalysts, Russia-Ukraine tussles continue but a halt in further deterioration seems to cut the fears of late. global markets initially cheered hopes of the Ukraine-Russia peace, as signaled by Ukraine President Volodymyr Zelenskyy’s adviser, before Russian President Vladimir Putin said Kyiv is not serious about finding a mutually acceptable solution. Following that, Mykhailo Podoliyak, one of the representatives of Ukraine at Russian-Ukrainian negotiations cites room for compromise. It’s worth noting that the UK added more sanctions on Russia whereas Japan is up for removing Moscow from favored trade status. In return, Moscow banned Canadian PM from entering their country and levied sanctions on US President Joe Biden.
Further, China turned out as a fresh risk for the markets with a surge in the local covid numbers and lockdowns in multiple cities, the latest one being near to the capital Beijing.
It’s worth noting that the US Producer Price Index (PPI) matched YoY expectations of 10% growth whereas NY Empire State Manufacturing Index printed the biggest downside since May 2020, adding to the market’s pre-Fed anxiety. Also testing Fed hawks is the recently easing US inflation expectations from the record top, as signaled by the 10-year breakeven inflation rate per the St. Louis Federal Reserve (FRED) data.
Moving on, gold traders will pay close attention to how the Fed battles inflation fears, which in turn will pave way for the short-term trend. Also important will be China’s covid headlines and Russia-Ukraine news as the risk-off mood may cushion the metal against the hard-hitting if the Fed manages to praise the USD bulls.
Technical analysis
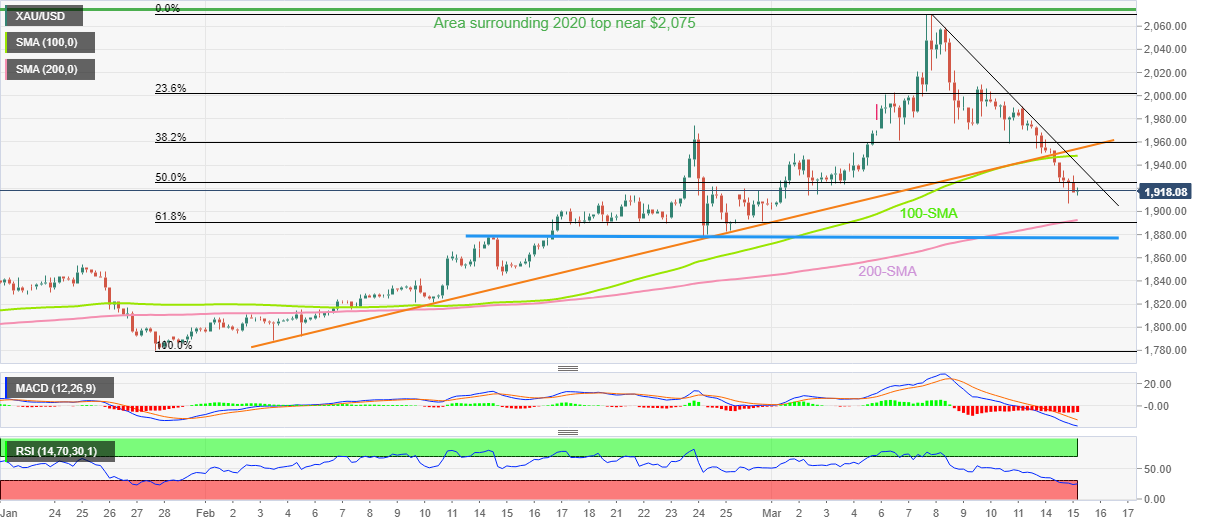
Gold justifies a clear downside break of a six-week-old rising trend line and the 100-SMA, amid bearish MACD signals, around a two-week low.
Although oversold RSI conditions on the four-hour chart test the gold bears, 50% Fibonacci retracement (Fibo.) of January-March upside and the weekly resistance line challenge any corrective pullback around $1,925 and $1,942 respectively.
Even if the quote manages to rise past-1,942, the 100-SMA and the previous support line, close to $1,948 and $1,954 in that order, will act as additional upside filters before giving control to gold bulls targeting the $2,000 threshold.
Meanwhile, a convergence of the 200-SMA and 61.8% Fibo. near $1,890 is on the XAU/USD seller’s radar ahead of the monthly horizontal support near $1,877.
Gold: Four-hour chart
Trend: Bearish
It’s worth noting that the daily chart also highlights $1,877 as the key support, comprising tops marked during November 2021.
Gold: Daily chart
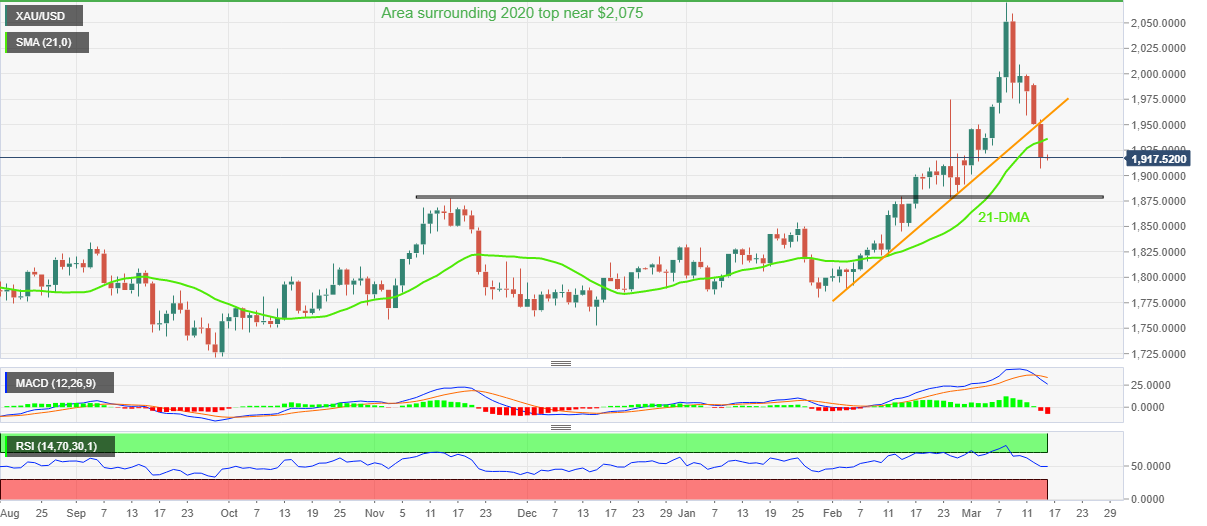
Trend: Further weakness expected
- USD/CHF is oscillating around 0.9400 ahead of the Fed’s policy meet.
- Investors are more focused on the extent of the interest rate hike by the Fed.
- The DXY is steady around 99.00 but may grind higher towards 100.00 amid a broader risk-aversion theme.
The USD/CHF pair is grinding higher amid a broader risk-aversion in the market. The major has witnessed a four-day winning streak and may continue the momentum if it manages to surpass Tuesday’s high at 0.9432.
The rising uncertainty over the interest rate decision from the Federal Reserve (Fed) is strengthening the greenback against the Swiss franc. The odds of a rate hike are at skyscrapers; however, investors are more focusing on the extent of the rate hike. Investors are in a dilemma whether the Fed will choose a 25 basis point (bps) and a ‘wait and watch approach for the monetary policies later this year or a 50 bps rate hike to tame the soaring inflation now.
If we consider the recent cues from Fed Chair Jerome Powell, a 25 bps rate hike is more likely as per his recent testimony. While recent print of the US Consumer Price Index (CPI) at 7.9% is dictating an aggressive hawkish story.
Meanwhile, the US dollar index (DXY) is gearing up for a fresh impulsive wave towards the psychological figure of 100.00 amid improving appeal for the safe-haven assets. The 10-year US Treasury yields have reclaimed 2.15% ahead of a likely tightening monetary policy on Wednesday.
Apart from the Fed Operation Market Committee (FOMC) meet, investors will also look for US Retail Sales, which are due on Wednesday. A preliminary estimate for the US Retail Sales is 0.4%, significantly lower than the prior print of 3.8%.
- The NZD/JPY would remain subject to market sentiment until Friday when the Bank of Japan would unveil its monetary policy,
- The cross-currency would trade in a narrow range ahead of the US Federal Reserve.
- NZD/JPY Price Forecast: Still upward biased but facing solid resistance around the 80.00 mark.
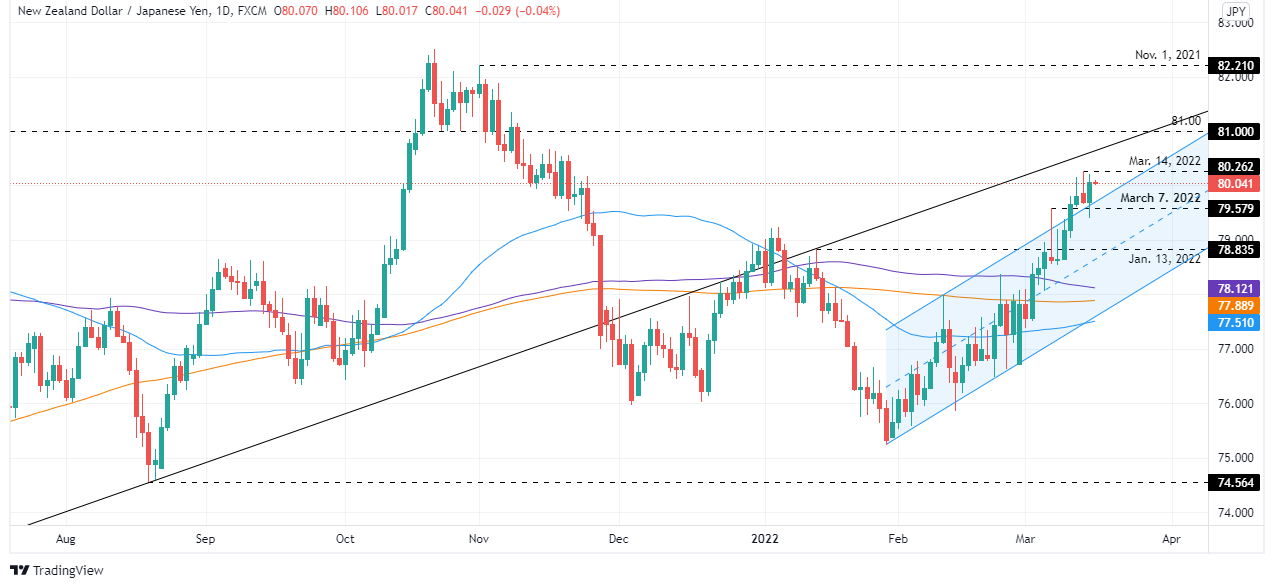
On Tuesday, the NZD/JPY finished the day with gains of 0.46% but fell short of reaching a new YTD high, retreating from 80.21 to 80.07, on a sudden shift in market sentiment. At the time of writing, the NZD/JPY is trading at 80.04.
NZD/JPY Price Forecast: Technical outlook
The NZD/JPY entered a consolidation phase, around the 79.50-80.00 area, ahead of the US Federal Reserve monetary policy meeting, as market players get ready. Most G8 currencies would remain in tight ranges unless a geopolitical event ignites violent shifts ahead of one of the most critical events in the calendar.
Noteworthy, the slope of the daily moving averages (DMAs), almost horizontal but below the spot price, suggesting the cross-currency pair might print another leg-up. However, the 200-DMA at 77.88 is trapped between the 100-DMA at 78.12 and the 50-DMA at 77.51.
If the NZD/JPY aims to go higher, the first resistance would be March 14, 80.26 high. Breach of the latter would expose the 81.00 mark, followed by a challenge of November 1, 2021, daily high at 82.21.
On the flip side, the NZD/JPY first support would be 79.57, March 7 daily high previous resistance-turned-support. Once cleared, the next support would be the 79.00 mark, followed by 78.83, January 13 resistance/support.
Early Wednesday morning in Asia, Reuters Tankan poll showed that Japanese manufacturers' business confidence improved for the first time in three months in March, to +8 versus +6 in February, as automakers became less pessimistic, though firms feared a fresh surge in energy prices due to the Ukraine crisis.
“The service-sector index extended a decline for the second month to a five-month low of minus 1, compared with the previous month's 3,” adds Reuters.
Additional details
Service-sector sentiment turned negative for the first time since October due to COVID-19 curbs and as global inflation squeezed corporate profits, according to the poll, which tracks the Bank of Japan's (BOJ) closely watched "Tankan" quarterly survey.
While the mood among manufacturers remained positive for the 14th straight month, managers voiced concerns about a wide array of downside risks that cloud the outlook for the world's third-largest economy, days before the BOJ's next policy meeting.
Elsewhere, Yomiuri came out with the news that Japan’s Prime Minister (PM) Fumio Kishida is expected to order the compilation of additional stimulus.
On a different page, “The most-favored nation designation of Russia will be revoked by Japan,” said NHK.
USD/JPY remains sidelined at five-year high
Given the pre-Fed anxiety and mixed concerns over Ukraine-Russia, USD/JPY stays mostly steady around the five-year high of 118.44.
Read: USD/JPY Price Analysis: Bears looking for a long squeeze to test 118.00/10 area
- The antipodean is underpinned against the Japanese yen after a pullback near 84.80.
- AUD/JPY has surpassed the 50-period EMA at 85.10, which adds to the upside filters.
- For more validation, the RSI (14) needs to violate 60.00 on the upside.
The AUD/JPY pair has witnessed some significant bids near 85.00 amid an expansion in the risk appetite of investors. The risk barometer ended Tuesday’s session on a positive note and is carry-forwarding Tuesday’s optimism on Wednesday.
On an hourly scale, AUD/JPY is trading in a rising channel in which every pullback towards the lower end is considered as a buying opportunity by the market participants. The upper end of the rising channel is placed from February 23 high at 83.84, while the lower end is marked from February 24 low at 82.01. The cross has found a pullback after a confluence of 200-period Exponential Moving Average (EMA) and lower end of the rising channel near 84.80.
The cross has breached a minor trendline placed from March 13 high at 85.82. The pair has also breached the 50-period EMA at 85.10 on the upside, which adds to the upside filters.
The Relative Strength Index (RSI) (14) is oscillating in a range of 40.00-60.00, which indicates a consolidation phase. For a bullish setup, the RSI (14) needs to violate 60.00. Should this occur, Aussie bulls will get validation from the RSI (14).
For more upside, the risk barometer needs to surpass Tuesday’s high at 85.37. The violation of Tuesday’s high will drive the cross towards March 11 high at 85.89, which will be followed by 21 October 2021 high at 86.25.
On the flip side, bears can dictate levels if the pair slip below Tuesday’s average traded price at 84.92 decisively, which will send the cross to March 15 low at 84.60. Breach of the latter will drag the cross towards March 9 low at 84.16.
AUD/JPY hourly chart
-637829819123137479.png)
- USD/CAD holds lower ground after reversing from three-week-old horizontal resistance.
- Downbeat MACD signals, RSI conditions also favor sellers.
- 200-SMA, fortnight-old ascending trend line restricts short-term declines.
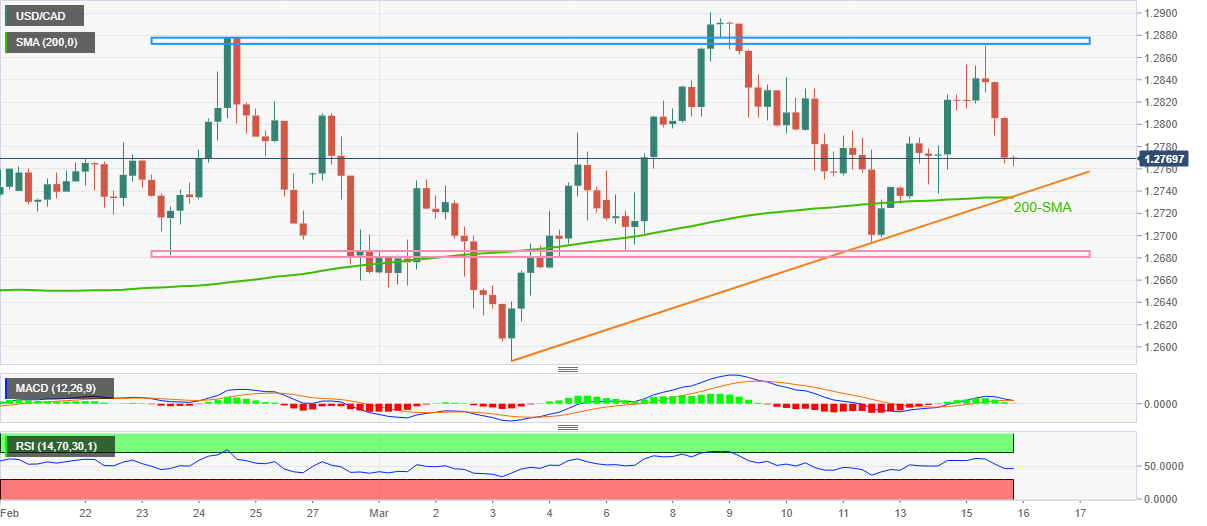
USD/CAD licks its wounds around 1.2770 during early Wednesday’s Asian session, following the heaviest daily fall in a week.
The Loonie pair rose to the highest levels since the last Wednesday before reversing from a fortnight-long horizontal hurdle.
The pullback also gains support from descending RSI line, not oversold, as well as an impending bear cross, of the MACD line over the signal line.
With this, USD/CAD bears are on the way to testing the 1.2730 support confluence, including the 200-SMA and an ascending trend line from March 03.
However, any further downside will be challenged by a horizontal area comprising multiple levels marked since February 23, between 1.2680 and 1.2685.
Alternatively, recovery moves not only need to cross the aforementioned resistance-zone surrounding 1.2872-77 but also need to refresh the monthly low, currently around 1.2900, to convince USD/CAD bulls.
Following that, the year 2021 top near 1.2965 and the 1.3000 threshold will be in focus.
USD/CAD: Four-hour chart
Trend: Further weakness expected
“President Biden is expected to announce more than $1 billion in new military assistance to the Ukraine government as early as Wednesday, according to US officials,” said the Wall Street Journal (WSJ) early Wednesday morning in Asia.
The news sites, “Ukrainian President Volodymyr Zelensky is expected to make a plea to Congress for more aid to defend his country,” as a reason.
Key quotes
The money would come from the roughly $13.6 billion allotted for Ukraine in the omnibus budget bill Mr. Biden signed Tuesday.
While the White House is considering sending more troops to Europe to add to the roughly 15,000 deployed there since the Russia-Ukraine crisis began, Mr. Biden isn’t expected to deploy more troops now, U.S. officials said.
FX implications
The news adds to the already strained relations between the US and Russia and weighs on the market sentiment, which in turn pushes S&P 500 Futures to print mild losses despite Wall Street’s upbeat closing. That said, the US stock futures drop 0.15% intraday at the latest.
Read: Forex Today: Dollar up ahead of Fed and as fear rules
- The common currency gained 0.14% on Tuesday as the Asian session began.
- A mixed market mood increased the appetite for the safe-haven US dollar.
- EUR/USD Price Forecast: Failure to reclaim 1.1000 left the euro vulnerable to further losses.
The shared currency extended its weekly advance for two consecutive days but retraced from around 1.1000 as the Federal Reserve is set to embark on the beginning of its hiking cycle for the first time since 2018. The EUR/USD is trading at 1.0961 at the time of writing.
The EUR significantly influenced by Russia-Ukraine tussles
On Tuesday, the common currency began around the day’s lows at 1.0930, jumped near the 1.1020 area but broke downwards under the 1.1000 mark on a market sentiment shift. Elsewhere, Russia-Ukraine discussions, which had been reported as “positive” in the last couple of days, were downtoned by Russian President Vladimir Putin, saying that Kyiv is not serious about finding a mutually acceptable solution. The headline spurred a risk-off gust of wind, with the EUR/USD moving from 1.0976 to 1.0925.
Data-wise, on Tuesday, the Eurozone docket reported the German ZEW economic sentiment, which plunged from 54.3 to -39.3, showing that financial analysts expect Germany to hit a recession. The Eurozone ZEW Economic Sentiment also tumbled, falling from 48.6 to -38.7.
On the US front, prices paid to US producers (PPI) increased 10% y/y in February, adding to heightened inflationary pressures on the US economy, last seen in the 1980s. Along with the US consumer inflation expanding at an annual rate of 7.9% in February, that data makes a case for the Fed’s first rate hike to the Federal Funds Rate (FFR) in three years.
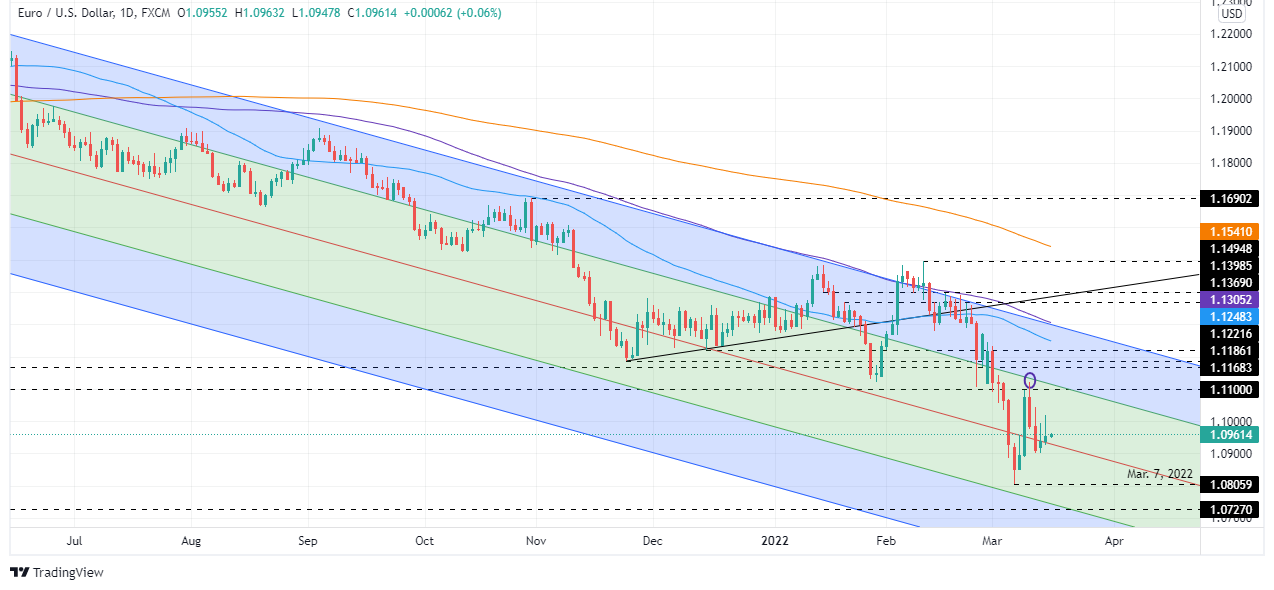
EUR/USD Price Forecast: Technical outlook
EUR/USD tested in the last two days, the 1.1000 mark, failing to record a daily close above it, exposing the shared currency to further losses beyond the YTD low at 1.0806. That said, the EUR/USD first support would be the 1.0900 mark. Once cleared, the next support would be the March 7 daily low at 1.0806, followed by 1.0727 April 2020 lows.
- NZD/USD fails to extend the first daily gain in three on mixed concerns, downbeat data at home.
- Equities improved as yields retreat from multi-day high, commodities remained pressured as well.
- Russian President Vladimir Putin dashes hopes of any solution from talks, Ukraine hints at compromise.
- China covid updates, Kyiv-Moscow news and US Retail Sales eyed ahead of Fed’s verdict for clear direction.
NZD/USD steps back to 0.6770 during early Wednesday morning in Asia, following a failed attempt to cross the 0.6800 during the previous day’s rebound.
The kiwi pair’s recovery on Tuesday could be linked to the cautious optimism over Ukraine-Russia talks, as well as strong data from China. However, pre-Fed anxiety joins recently mixed concerns over peace in Kyiv, not to forget downbeat New Zealand data to weigh on the NZD/USD prices of late.
That said, New Zealand’s Current Account for Q4 dropped to $-7.26B versus $6.213B expected and $-8.3B prior. Further, the Current Account – GDP Ratio for the stated period worsened to -5.8% compared to -5.6% market forecast and -4.6% previous readouts. On Tuesday, Business NZ PSI improved to 48.6 from 45.9 for February, preceding the upbeat prints of China Retail Sales and Industrial Production for the said month.
Elsewhere, global markets initially cheered hopes of the Ukraine-Russia peace, as signaled by Ukraine President Volodymyr Zelenskyy’s adviser, before Russian President Vladimir Putin said Kyiv is not serious about finding a mutually acceptable solution. Following that, Mykhailo Podoliyak, one of the representatives of Ukraine at Russian-Ukrainian negotiations cites room for compromise. It’s worth noting that the UK added more sanctions on Russia whereas Japan is up for removing Moscow from favored trade status. In return, Moscow banned Canadian PM from entering their country and levied sanctions on US President Joe Biden. Hence, the conditions relating to the Ukraine-Russia war aren’t clear but a halt in further deterioration seems to recede the fears of late.
It’s worth noting that China’s record covid numbers and lockdowns in multiple cities renew early pandemic woes and weigh on the NZD/USD prices.
Talking about the US data, the US Producer Price Index (PPI) matched YoY expectations of 10% growth whereas NY Empire State Manufacturing Index printed the biggest downside since May 2020.
Amid these plays, Wall Street benchmarks closed in the positive territory while the US Treasury yields ended Tuesday unchanged despite rising to mid-2019 levels during the initial day.
Looking forward, covid updates from China precede US Retail Sales for February, expected 0.4% from 3.8% prior, to entertain NZD/USD traders before directing them towards the Federal Open Market Committee (FOMC). Additionally, chatters surrounding Ukraine-Russia woes are also important for fresh clues.
Technical analysis
NZD/USD fades bounce off 50-DMA level of 0.6727 amid bearish MACD signals, suggesting another attempt to meet an upward sloping support line from late January, near 0.6720 by the press time. Meanwhile, 100-DMA around 0.6815 guards immediate upside.
- A positive open-test drive session on Tuesday indicates a temporary bullish reversal.
- The confluence of an oversold oscillator and the lower end of a falling channel may produce a pullback.
- The 20- and 50-period EMAs are trending lower, which adds to the downside filters.
The GBP/USD pair has witnessed a base formation around 1.3000 after a significant plunge from February 23 high at 1.3620. The cable has witnessed a positive open-test drive session on Tuesday as the pair opened 1.3003, slipped near round 1.3000, and found some significant bids that drove the major higher.
On the daily scale, GBP/USD is auctioning in a falling channel formation whose upper end is placed from 6 January 2021 high at 1.4249 and the lower end is marked from 24 January 2021 low at 1.3670. A tap near the lower end of the falling channel is considered a pullback by the market participants. It is more likely that the cable will find a pullback around 1.2965.
The 20-period and 50-period Exponential Moving Averages (EMAs) at 1.3243 and 1.3370 respectively, are trending lower, which indicates significant weakness ahead.
Meanwhile, the Relative Strength Index (RSI) (14) is oscillating in a range of 20.00-40.00, which indicates a bearish setup. However, a confluence of an oversold situation with the lower end of a falling channel may result in a potential pullback.
The cable may likely find significant bids near 1.2965, which will push the pair on the upside towards March 8 low at 1.3082 and 8 December 2021 low at 1.3160.
While bears can continue holding grip if the major slips below 2 November 2020 low at 1.2854. This will send the cable lower towards 30 September 2020 low at 1.2805 and 23 September 2020 low at 1.2675.
GBP/USD daily chart
-637829795254912516.png)
- AUD/USD holds steady as traders await the Fed.
- Markets were jittery on Tuesday but the Aussie holds near 0.7200.
AUD/USD is trading around flat on the day in early Asia after a quiet afternoon trade in North American markets with the price sticking to a narrow 10 pip range between 0.7188 and 0.7201. The Aussie is now caught between falling commodity prices and rising stocks as traders will turn to the labour market data later in the week and the FOMC meeting on Wednesday
On Tuesday, oil prices continued to fall, triggering a lift in US equities. However, as analysts at ANZ Bank explained, there has been ''little progress has been achieved in the talks between Ukraine and Russia with Putin accusing Ukraine of not being serious about finding a mutually acceptable solution.'
''But,'' the analysts said, ''there are hopes a nuclear deal with Iran may soon be concluded, which may bring some stability to the Middle East and shore up oil supplies. New sanctions on Russia were added by the UK, including banning luxury goods exports.''
Meanwhile, fears that coronavirus disruptions in China could hurt demand for commodities, just as Beijing is seeking to expand production at home, is a factor trader will be weighing up. Commodity prices were hit at the start of this week when Beijing locked down the city of Shenzen and imposed a movement ban on the province of Jilin. The daily number of coronavirus cases jumped sharply on Tuesday, raising the risk of more restrictions.
Reuters states that mainland China reported 3,602 new confirmed coronavirus cases on March 14, the national health authority said on Tuesday, compared with 1,437 a day earlier. This was a huge spike. ''Of the new cases, 3,507 were locally transmitted, the National Health Commission said, compared with 1,337 a day earlier. The number of new asymptomatic cases, which China does not classify as confirmed cases, stood at 1,768 compared with 906 a day earlier. There were no new deaths, leaving the death toll unchanged at 4,636.As of March 14, mainland China had confirmed 120,504 cases.''
Meanwhile, China’s government has ordered a province of 24 million people into lockdown as it tries to contain the new outbreak that has spread to multiple locations. The risk to markets is that the lockdowns could trigger shock waves across global supply chains.
A slowdown in China due to the virus would be an added complication for the Reserve Bank of Australia (RBA) as it wrestles with when to start raising interest rates. Minutes of its March meeting showed that the central bank was still prepared to be patient on policy. The RBA also noted the conflict in Ukraine and the resulting spike in some resource prices was a shock to the global economy that would lift inflation and drag on growth.
''Markets are wagering the inflationary impulse will be the stronger and force the RBA to hike the 0.1% cash rates as soon as June. Investors have also shifted to price in almost six rate rises this year, with December futures implying 1.39%,'' Reuters reported.
- The H1 W-formation is compelling as the price tires on the bid.
- USD/JPY is on the verge of a run towards 118 the figure.
The price of USD/JPY is slowing down as it reached the mid-point of the 118 area on Tuesday. From a lower time frame perspective, an intraday trade opportunity for the Asian session could come into play on the break of 118.25 as illustrated in the following analysis.
USD/JPY H1 chart
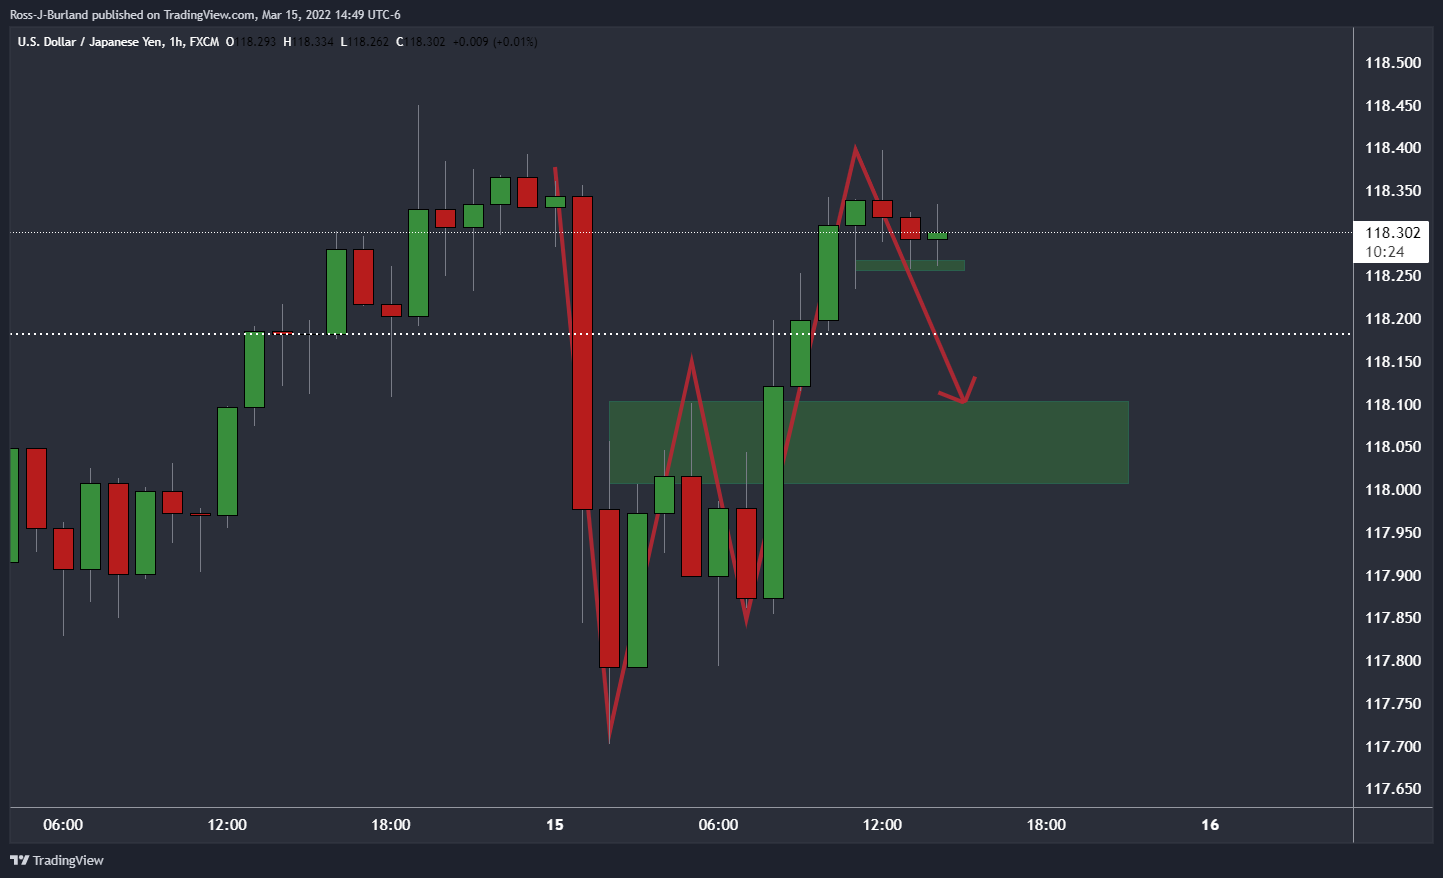
The W-formation is a reversion pattern whereby price would be expected to retrace back to test the neckline of the W. For catching an optimal entry, traders can move down the smaller time frames to monitor for bearish structure, as follows:
USD/JPY M5 chart
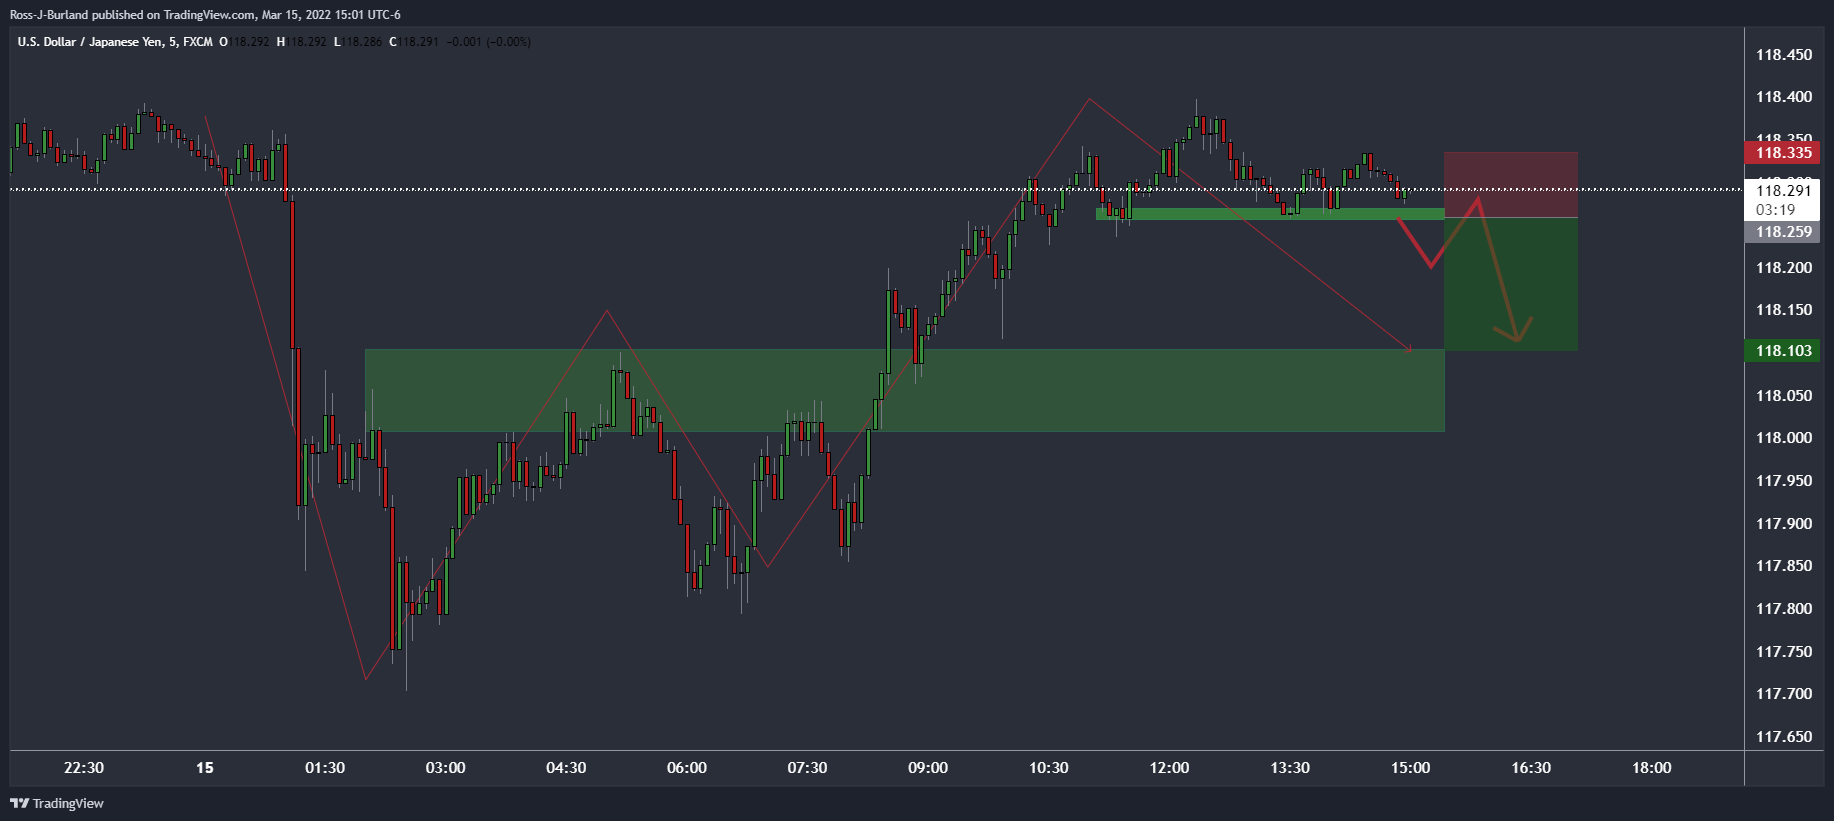
As illustrated, the price is bobbing along a short term support structure. However, a break of there, 118.25, the price would be expected to move lower to the neckline of the W-formation.
In doing so, there would be a high probability that before it reaches the 118.10/00 target area, the 118.25 level will be retested as resistance from where traders can enter short.
| Time | Country | Event | Period | Previous value | Forecast |
|---|---|---|---|---|---|
| 04:30 (GMT) | Japan | Industrial Production (MoM) | January | -1% | -1.3% |
| 04:30 (GMT) | Japan | Industrial Production (YoY) | January | 2.7% | |
| 09:00 (GMT) | France | IEA Oil Market Report | |||
| 12:30 (GMT) | Canada | Wholesale Sales, m/m | January | 0.6% | 3.9% |
| 12:30 (GMT) | U.S. | Retail sales | February | 3.8% | 0.4% |
| 12:30 (GMT) | U.S. | Retail Sales YoY | February | 13% | |
| 12:30 (GMT) | U.S. | Retail sales excluding auto | February | 3.3% | 0.9% |
| 12:30 (GMT) | U.S. | Import Price Index | February | 2% | 1.5% |
| 12:30 (GMT) | Canada | Consumer Price Index m / m | February | 0.9% | 0.9% |
| 12:30 (GMT) | Canada | Bank of Canada Consumer Price Index Core, y/y | February | 4.3% | 4.5% |
| 12:30 (GMT) | Canada | Consumer price index, y/y | February | 5.1% | 5.5% |
| 13:30 (GMT) | Canada | Wholesale Sales, m/m | January | 0.6% | |
| 14:00 (GMT) | U.S. | NAHB Housing Market Index | March | 82 | 81 |
| 14:00 (GMT) | U.S. | Business inventories | January | 2.1% | 1.1% |
| 14:30 (GMT) | U.S. | Crude Oil Inventories | March | -1.863 | -0.967 |
| 18:00 (GMT) | U.S. | FOMC Economic Projections | |||
| 18:00 (GMT) | U.S. | Fed Interest Rate Decision | 0.25% | 0.5% | |
| 18:30 (GMT) | U.S. | Federal Reserve Press Conference | |||
| 21:45 (GMT) | New Zealand | GDP y/y | Quarter IV | -0.3% | 3.3% |
| 21:45 (GMT) | New Zealand | GDP q/q | Quarter IV | -3.7% | |
| 23:50 (GMT) | Japan | Core Machinery Orders, y/y | January | 5.1% | 8.1% |
| 23:50 (GMT) | Japan | Core Machinery Orders | January | 3.6% | -2.2% |
- Silver slides as the North American session winds down.
- The Russia-Ukraine conflict and Federal Reserve monetary policy decision boosts US Treasury yields, weighs on silver.
- XAG/USD Price Forecast: Upward biased but price action on Wednesday is set to be tight, ahead of the FOMC.
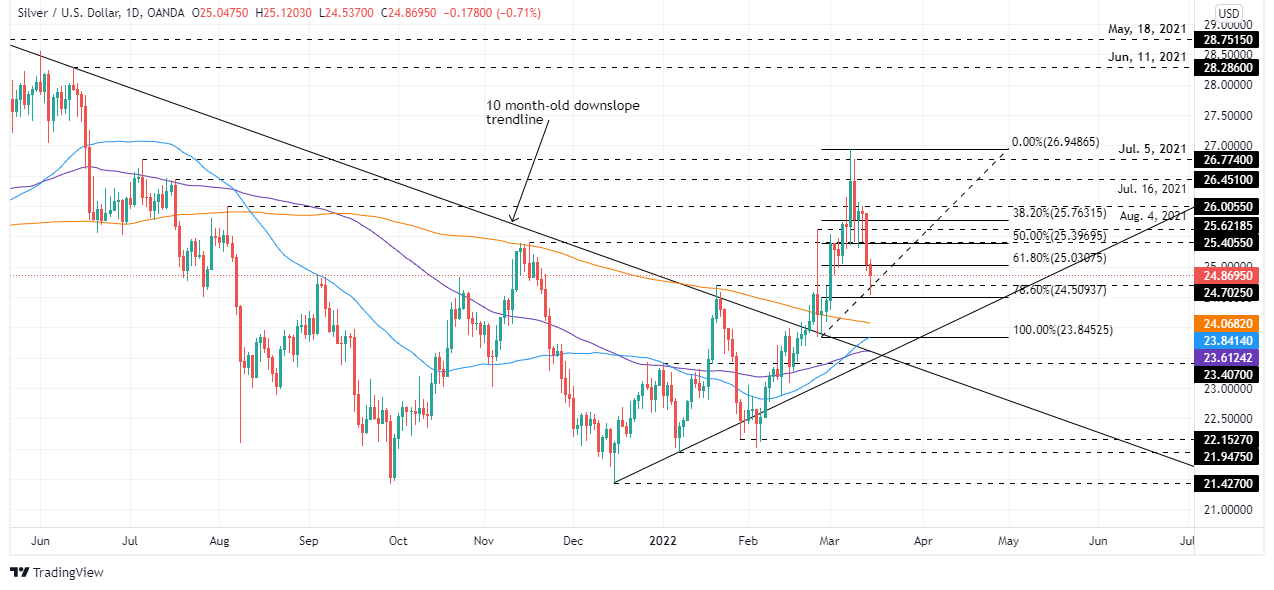
Silver (XAG/USD), even though it remains trading with losses, bounced off the 78.6% Fibonacci retracement, a solid buying zone, and pushed XAG/USD shy of the $25.00 area, which also confluences with the 61.8% golden ratio. At the time of writing, XAG/USD is trading at $24.87, down some 0.67%.
Geopolitical jitters and FOMC monetary policy meeting boost the greenback
Following XAG/USD’s last week rally, which witnessed a jump from $25.00 to YTD highs around $26.94, it was expected that silver would register a mean reversion move that could push the white metal towards a renewed re-test of 2022 highs. Meanwhile, Russia-Ukraine talks, although had been reported as “positive” in the last couple of days, were downtoned by Russian President Vladimir Putin, saying that Kyiv is not serious about finding a mutually acceptable solution.
XAG/USD’s jumped on the headline, from $24.70 towards daily highs around $25.05, but stabilized around the $24.80-90 area, as the Federal Reserve monetary policy looms.
The US Federal Reserve to hike 25 bps on Wednesday
US Treasury yields pared earlier losses and finished in the green, with the 10-year T-note yield at 2.149%, barely flat, but reflecting Fed’s first rate hike.
On Wednesday, the US central bank is widely expected to hike rates for the first time in three years, which would leave the Federal Funds Rate at 0.25%. It would be followed by Fed’s Chair Jerome Powell’s press conference, in which he would be questioned about the Russia-Ukraine impact on the US economy.
Worth noting that the Fed would reveal the Summary of Economic Projections (SEP) and the update of the so-called dot-plot, which reflects the monetary policy projections of the board.
XAG/USD Price Forecast: Technical outlook
On Tuesday, silver visited the 78.6% Fibonacci retracement, a solid demand level for the white metal, just short of intersecting with the January 20 high previous resistance/support around $24.70. Noteworthy that XAG/USD spot price is above the daily moving averages (DMAs), and while the 50-DMA sits between the 200 (top) and the 100-DMAs (bottom), it is accelerating towards crossing above the 200-DMA, which could cause a golden-cross.
That said, XAG/USD bias is upwards, and its first resistance level would be $25.00. A decisive break would expose the confluence of the 50% Fibonacci level and November 25, 2021 high at $25.39, followed by the $26.00 mark.
Mykhailo Podoliyak, one of the representatives of Ukraine at Russian-Ukrainian negotiations, has said, ''we'll continue tomorrow. A very difficult and vicious negotiation process. There are fundamental contradictions. But there is certainly room for compromise. During the break, work in subgroups will be continued...''
Meanwhile, the Wall Street Journal reported that ''Russia lobbed more missiles into Kyiv, amid heightened fighting in the city’s outskirts as a delegation of European leaders headed to the embattled Ukrainian capital to meet with President Volodymyr Zelensky.
''One missile destroyed a building associated with an arms maker in central Kyiv in a predawn strike, blowing the windows out of buildings in a one-block radius. In a second strike, two rockets hit apartment buildings, setting fire to one of them.''
''Two residents died in the apartment complex and dozens were taken to a nearby hospital to be treated for smoke inhalation. There were no fatalities in the other strike, officials said.''
''Fox News cameraman Pierre Zakrzewski was killed on assignment covering the war in Ukraine.''
What you need to take care of on Wednesday, March 16:
The dollar started the day on the back foot but managed to recover the ground lost during US trading hours. The EUR/USD pair is trading at around 1.0940, while GBP/USD changes hands at 1.3035.
President Vladimir Putin said Kyiv is not serious about finding a mutually acceptable solution. The news cooled hopes for a diplomatic agreement. Earlier in the day, Ukraine President Volodymyr Zelenskyy’s adviser said they were confident they could reach a diplomatic solution in the next few weeks.
Beyond sanctions, Russia submitted a request to leave the Council of Europe after being suspended on February 25. Additionally, Moscow announced a series of sanctions on US authorities, including President Joe Biden and banned Canadian Prime Minister Justin Trudeau from entering the country.
European Central Bank President Christine Lagarde spoke at the WELT Economic Summit and noted that the uncertainty surrounding the economic outlook had increased dramatically, as the war would reduce growth and create inflation due to increasing energy and commodities costs. She also said that inflation is still forecast to decline gradually and settle near the central bank’s 2% target by 2024.
China announced record coronavirus contagions and put over 17 million people into strict lockdown, dampening economic growth expectations. Stocks and commodities were on the back foot amid concerns related to decreased demand throughout the first half of the day.
Gold bottomed at $1,907.04 a troy ounce, bouncing modestly ahead of the close to settle around $1,920 a troy ounce. Crude oil prices extended their latest decline, and WTI ended the day at $96.50 a barrel.
The AUD/USD pair spent the day inside a tight range, ending the day little changed sub-0.7200. The Canadian dollar benefited from falling oil prices and soaring commodities, resulting in USD/CAD falling to 1.2766.
Wall Street posted substantial gains despite mounting concerns related to the Russia-Ukraine crisis. US government bond yields were up, with the yield on the 10-year Treasury note reaching a multi-week high of 2.169%, finishing the day nearby.
The market’s focus shifts now to the US Federal Reserve, as the US central bank will announce its monetary policy decision on Wednesday and is expected to trigger a rate hike of at least 25 bps.
Top 3 Price Prediction Bitcoin, Ethereum, XRP: Crypto bulls continue to hold, but for how long?
Like this article? Help us with some feedback by answering this survey:
- Gold is on the backfoot and trading in the bear's lair.
- The Fed is expected to come with a hawkish tone and the US dollar could be supported.
- Little progress has been achieved in the talks between Ukraine and Russia.
- Gold to extend downward correction on hawkish Fed
The gold price is down 1.5% at the time of writing after falling from a high of $1,954.72 to a low of $1,907.08, slipping below a critical level on the daily chart with the downside now fully exposed. The price of oil has been falling and markets are volatile ahead of tomorrow’s US Federal Reserve decision.
This offers something for both the bulls and bears in the gold market, but little progress has been achieved in the talks between Ukraine and Russia with Putin accusing Ukraine of not being serious about finding a mutually acceptable solution. This can lend support to the price of gold. However, the hopes of a nuclear deal with Iran can keep the optimism alive and weigh on the yellow metal, for oil has been a major contributor to the risk-off sentiment of late that had been supporting price higher.
For that matter, US stocks rose midday Tuesday while the slump in crude oil deepened. S&P 500 had lifted 1.8% by 19.00GMT. European equity markets were weaker, however, with the Euro Stoxx 50 down 0.1% while the FTSE 100 fell 0.2%. The US yield on the US 10-year note lifted just 1.6bps to 2.149% while the German bond yield fell 4bps.
US Producer Price inflation eased more than forecast on the eve of a likely rate increase by the Federal Reserve where it is expected to him interest rates. Last week, the Fed's Chairman, Jerome Powell gave a green light for a 25bp liftoff in March during his testimony before Congress.
The central bank would be now expected to convey the message that despite the ongoing conflict between Russia and Ukraine, the Fed is ready to continue with its process of monetary policy normalization during the rest of the year. That would be expected to support the greenback
As for the trajectory of the gold price, it has already shown its cards in the recent break of $1,914, the March 2 low. While this area is acting as support with the price back to $1,920, the bearish commitments could see a strong daily close below there in the coming days that could catalyze a substantial selling program.
''If the market has started to discount a future in which the growth shock could fade at a faster pace than the inflation shock, as we exected, then gold prices could be especially vulnerable to a more hawkish Fed profile, opening the door to a deeper consolidation,'' analysts at TD Securities explained.
Gold technical analysis
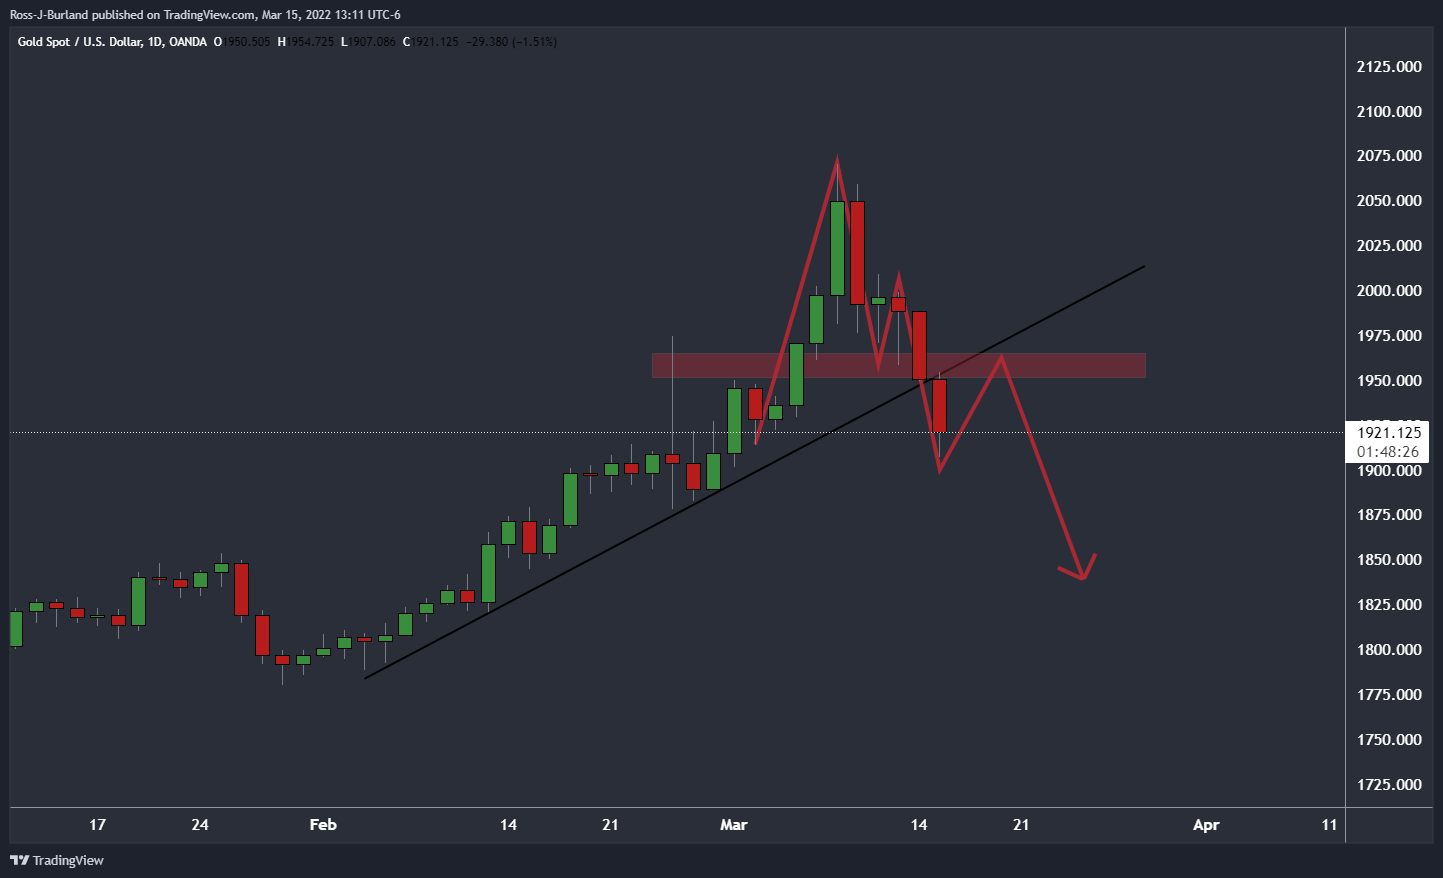
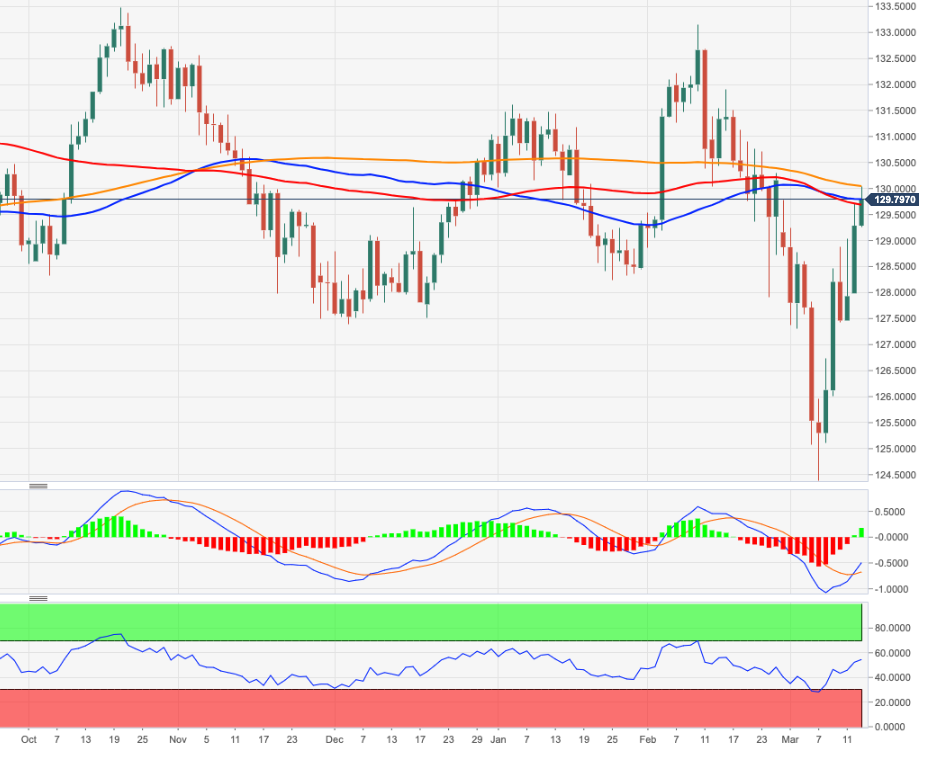
The price is breaking the trendline and has printed an M-formation on the daily chart. A reversion to test the counter trendline and neckline of the pattern could be in order prior to the next leg lower.
- The British pound rally continues vs. the Japanese yen.
- Positive UK labor data and GDP further cement a BoE’s rate hike.
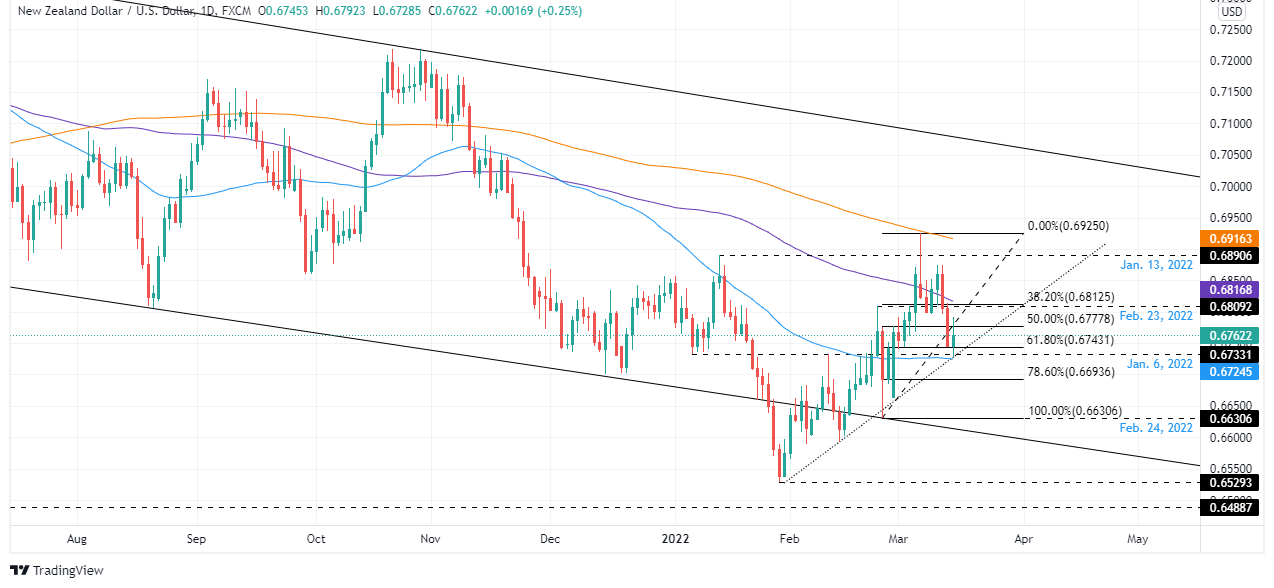
- GBP/JPY Price Forecast: Neutral-upward biased, but downside risks remain due to solid resistance around the 154.60-155.00.
GBP/JPY extends its rally to three straight days, thus negating the double-top chart pattern, as the cross-currency pair turns bullish on a positive UK employment report amid a mixed market mood. At the time of writing, the GBP/JPY is trading at 154.21.
Late in the New York session, the market mood is “somewhat” positive, as portrayed by US equities trading with gains. In the FX space, safe-haven peers trade softer as the trading day progresses.
Goodish UK data and a “hawkish” BoE to lift the pound
Data-wise, the UK reported employment figures, which beat expectations, thus raising the prospects of the GBP. Along with last Friday’s solid GDP data, those figures and the Bank of England (BoE) third rate hike on Thursday would keep the GBP buoyant against the JPY.
Overnight, the GBP/JPY climbed near the 154.50 area but plunged 100-pips, though recovered on risk-appetite near the 154.50 area, which is a strong resistance level, difficult to break for GBP/JPY bulls.
GBP/JPY Price Forecast: Technical outlook
The GBP/JPY is neutral-upward biased. The longer time-frame daily moving averages (DMAs) like the 100 and the 200-DMAs reside below the spot price, a sign of bullishness in the pair. Contrarily the 50-DMA is at 155.11, above the spot price, and due to the last couple of candles, the 154.60-155.00 area would be a solid resistance area to overcome.
Upwards, the GBP/JPY first resistance would be March 15 high at 154.68. Breach of the latter would expose the 155.00 mark but beware of a possible consolidation in the 154.60-155.00 range. Nevertheless, a decisive break of the former would expose 156.00.
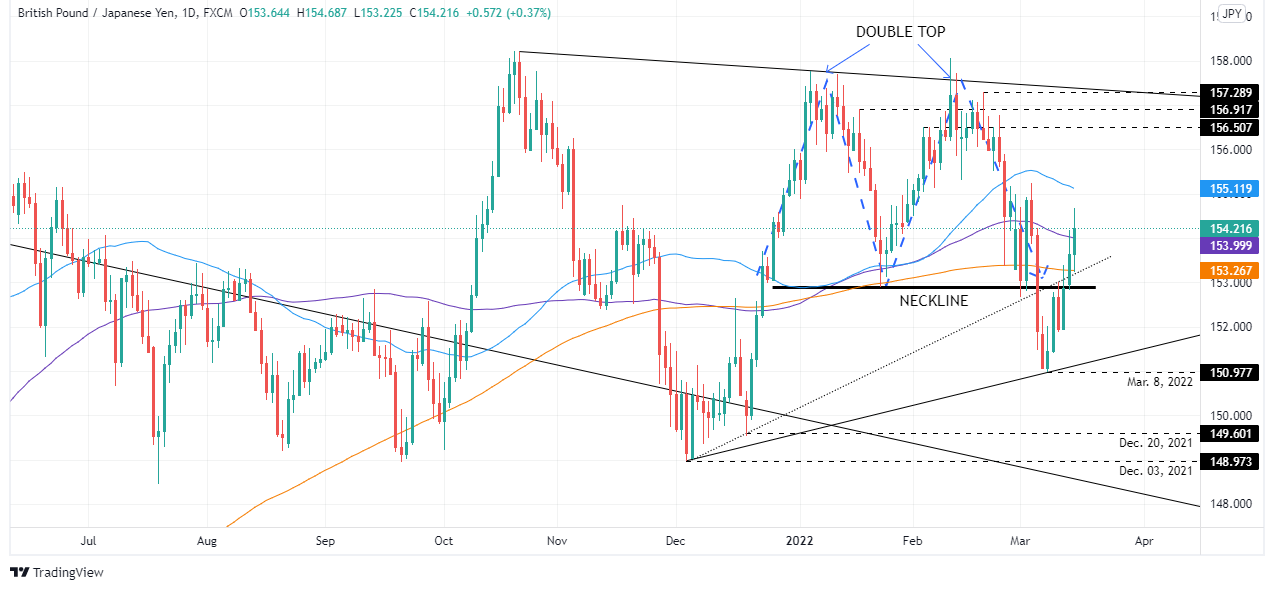
- US dollar pulls back to 1.2780 from 1.2870 highs.
- The Canadian dollar appreciated favored by a brighter market mood.
- USD/CAD is now testing trendline support at 1.2780.
The US dollar’s recovery from last Friday’s lows sub-1.2700 has found resistance at 1.2870 highs earlier today. The pair has dropped about 0.7% over the European and US sessions, to hit intra-day highs at 1.2780 so far.
The loses ground as risk sentiment improves
The USD has lost ground on Tuesday, with the lonie favored by the moderate market sentiment improvement. Investors’ hopes of seeing some progress in the peace talks between Russia and Ukraine have lifted the market mood, buoying the Canadian dollar in spite of the sharp decline in oil prices.
Marker sentiment, however, has been shattered during the US session after Russia’s President, Putin, affirmed that the Ukrainians are not being serious to find a mutually acceptable solution. These comments supported the US dollar, which seems to have firmed up to tick up to levels near 1.2800.
USD/CAD: testing support trendline at 1.2780
The hourly chart shows the pair attempting to bounce at short-term trendline support, from March 11 lows at 1.2695.
A confirmed breach of that level would increase bearish pressure on the US dollar, pushing the pair towards 1.2730 intra-day level before testing the support area at 1.2680/95 (March 4, 7, and 11 lows).
On the upside above 1.2800, the pair might find resistance at 1.2840 (March 10 high) and intra-day high at 1.2870.
USD/CAD hourly chart
Technical levels to watch
- Australian dollar's recovery halts at 0.7225, the pair returns below 0.7200.
- The Aussie loses steam as market sentiment worsens.
- Back below 0.7200, the AUD/USD maintains its near-term bearish bias intact.
The aussie has erased previous gains during Tuesday’s US trading session, pulling back below 0.7200 after hitting intra-day highs at 0.7225. The pair remains flat on the daily chart, tr4ading at 0.7185 at the time of writing.
USD regains lost ground as market sentiment sours
The risk-sensitive Australian dollar has lost ground as hopes of progress about the Russia – Ukraine peace talks faded for the second consecutive day. The fragile market optimism has been shattered after Russia’s President Vladimir Putin’s accused Ukrainian representatives of not being serious to find a mutually acceptable solution.
The market has been rattled by these comments. US stock markets have pulled back from session highs and the US dollar bounced up on safe-haven demand. Beyond that, the Federal Reserve is widely expected to hike rates for the first time in the last three years on Wednesday which is contributing to keeping US dollar weakness in check.
Earlier today, the AUDUSD has attempted to pare losses, after the last two days’ sell-off. The positive Chinese data, with industrial production and retail sales beating expectations in February, and a somewhat softer greenback had been buoying aussie’s demand.
AUD/USD capped below 0.7225 resistance
From a technical point of view, the pair maintains its near-term bearish bias intact as the upside correction has been limited at the 0.7225 area, where previous intra-day support meets the 100-day SMA.
On the downside, below 0.7200 the pair eyes the aforementioned two-week low at 0.7165 before the February 28 low at 0.7140.
On the contrary, another bullish reaction should breach 0.7225, before aiming towards 0.7245 (March 8 low) and the 200-day SMA, at 0.7310 before aiming towards the March 10, 11 highs at 0.7365.
Technical levels to watch
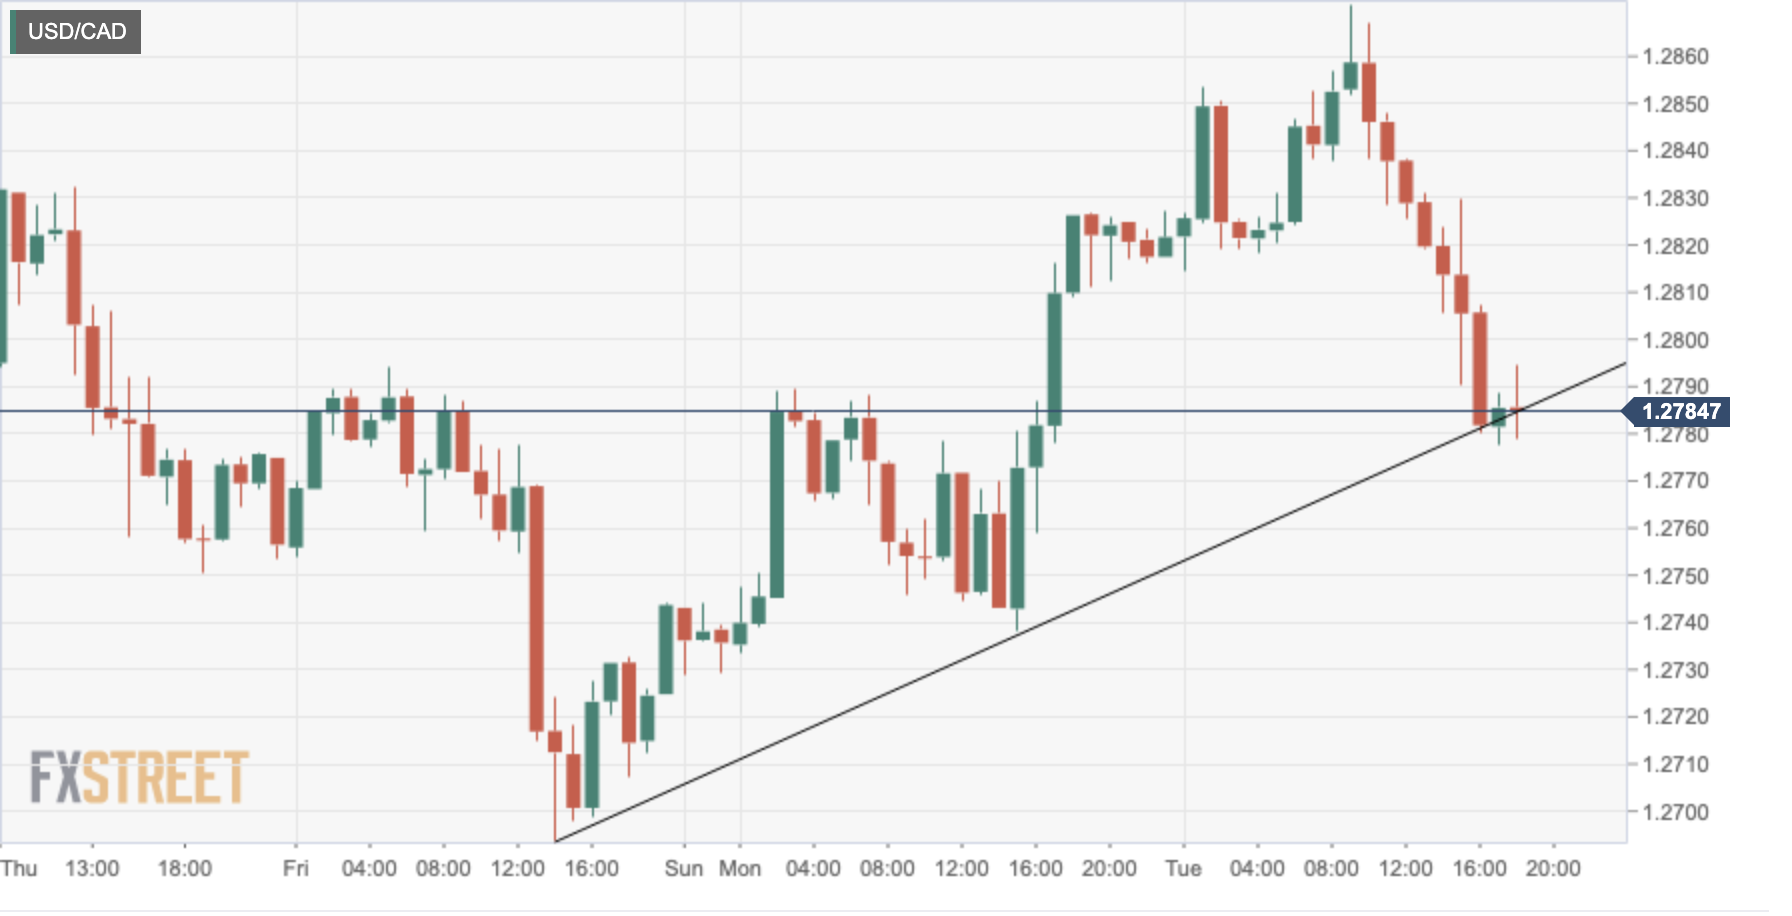
- GBP/USD holds in a key area of support on the weekly chart.
- The Fed and BoE are both meeting this week, expected to raise interest rates.
GBP/USD is attempting to stabilise in Tuesday's US session following a weak start in the morning as the US dollar took off. The moves in the greenback are aligning with a rally in US yields, with the 10-year yield moving in again on the recent highs, up 0.5% at the time of writing.
Nevertheless, the pound has had some good news of late. A strong jobs report supported the prospect of a Bank of England rate hike for this month's meeting. The UK's Unemployment Rate fell more than expected to 3.9% in the three months to January, official figures showed, while vacancies hit a record high in the three months to February. meanwhile, money markets continue to fully price in a 25 basis points BoE interest rate hike on Thursday.
However, both the Federal Reserve and the BoE are expected to raise rates by 25 bps this week. What could weigh on the pound is the divergence in rhetoric between the two central banks. ''The MPC is likely to do so with far less enthusiasm,'' analysts at Rabobank said. ''A hike this week for the BoE would mark the third consecutive move and the voting pattern of MPC members is likely to illustrate far less conviction than in the February and December policy meetings.''
Meanwhile, there is a focus on Ukriane crisis for which cable has declined sharply since the start of the conflict. ''We expect the pound to remain on the back foot going forward,'' analysts at Rabobank said.
''Among the weekend news was the rallying headlines from both Ukrainian and Russian officials that progress in diplomatic talks between the two sides could be established in the coming days. This has led to a modest reduction in demand for safe-haven assets and allowed cable to pull away from its earlier lows.''
''That said, significant headwinds are facing the UK economy in the form of higher energy and tax bills and the Bank may already be running out of room to hike rates.,'' the analysts added further. ''Consequently, it is likely that relative to the Fed, the BoE will sound a more cautious note at this week’s policy meeting and this could weigh on cable. In our view, cable could remain mostly within a GBP/USD 1.30 to 1.33 range in the coming months.''
GBP/USD technical analysis
In the start of the week's analysis, it was stated that ''the M-formation is mature and bulls will be in anticipation of a correction starting from within the demand area, as illustrated don the weekly chart above. A weekly bullish close is required to signal the prospects of the leg higher. ''
- The New Zealand dollar snaps two days of consecutive losses, gaining 0.26%.
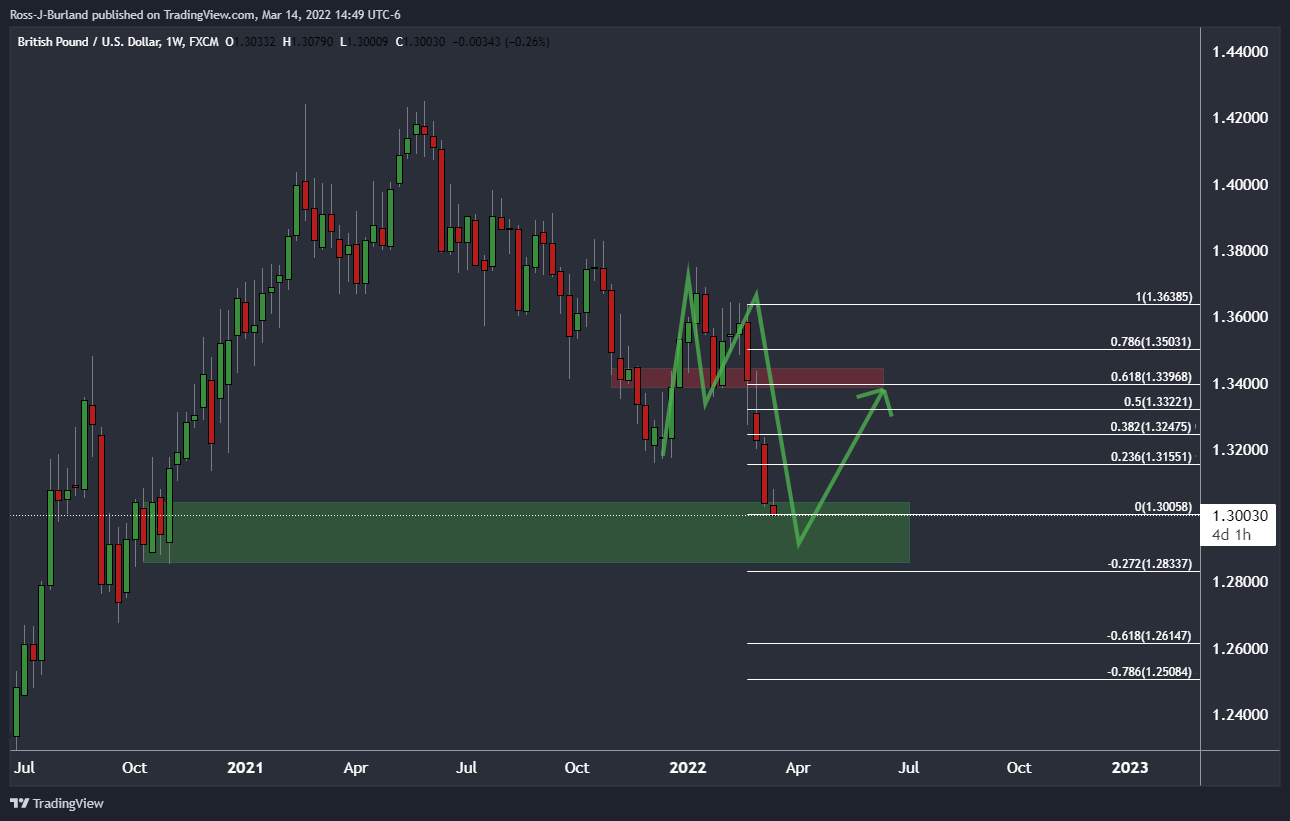
- The NZD/USD sits between the 50% and the 61.8% Fibonacci levels ahead of the FOMC.
- NZD/USD Price Forecast: Neutral-downward biased, though it appears to consolidate pre-Federal Reserve monetary policy announcement.
The NZD/USD trims some of Monday’s losses, bouncing off daily lows near the 50-day moving average (DMA), grinding higher during the North American session. At 0.6762, the NZD/USD does not reflect the market sentiment, which turned mixed on headlines out from Eastern Europe, as portrayed by European equities finishing with losses, while US bourses rise.
Russia-Ukraine tensions increase as Putin contradicting earlier news
Developments in Eastern Europe appointed to continuing talks between Russia and Ukraine, but the fighting remained. Elsewhere, the Ukrainian air force claimed that a Russian drone crossed into Poland before returning to Ukraine, it was shot down by air defenses, while Russia’n Minister of Defense reported that they had taken control of Kherson Ukraine, according to Sputnik.
However, in the last couple of hours, Russian President Vladimir Putin said that Kyiv is not serious about finding a mutually acceptable solution, contradicting with news in the couple of days, which appointed to progress in discussions between Russia and Ukraine.
In the Asian session, the New Zealand economic docket featured the Business NZ Performance of Services Index, which rose to 48.6 in February of 2022 from an upwardly revised 46 in the prior month, marking the seventh straight contraction for the Kiwi services sector and well below the long-term average of 53.6.
Across the pond, the US docket revealed the Producer Price Index (PPI) for February, which rose by 10%, matching market expectations and staying at levels not seen since 1981. The rise in US Consumer and Producer Price indexes would further cement the Federal Reserve case to increase rates on Wednesday, as money market futures have priced in at least a 25 basis points hike.
NZD/USD Price Forecast: Technical outlook
Overnight, the NZD/USD traded in the 0.6720-50 area, though late in the European session, witnessed a jump towards daily highs at 0.6792, short of the 0.6800 mark, as FOMC Wednesday’s meeting looms. Despite that, the New Zealand dollar showed some strength, in line with the US equity markets behavior, the pair is neutral downwards, with the 200 and the 100-day moving averages (DMAs) residing above the exchange rate.
That said, the NZD/USD first support would be the 61.8% Fibonacci retracement at 0.6743. Breach of the latter would expose the 50-DMA at 0.6724, followed by the 78.6 Fibonacci at 0.6693.
- WTI futures pick up to $98.00 from three-week lows at $93.40
- Oil prices plunge on easing supply concerns and COVID-19 cases in China.
- From a wider perspective, US oil futures remain biased lower.
The US benchmark crude oil futures are attempting a mild correction on Tuesday’s US trading session. Front-month West Texas Intermediate contracts have appreciated about $4 over the last two hours, returning to levels past $98.00 after hitting three-week lows at 93.45 earlier today
Oil prices dive on easing concerns about supply
Oil prices have plunged nearly 30% from early-March highs above $129.00. Market concerns about a global supply shortage on the back of sanctions on Russian oil seem to have eased on hopes that Saudi Arabia and the United Arab Emirates are ready to increase production.
Furthermore, the exponential increment of coronavirus infections in China, which has already imposed lockdowns in some cities, has triggered concerns about a decline in demand from the Asian giant which is contributing to cool prices.
WTI Oil is trading within a sharp downward trend
A look at the 4-hour chart shows oil futures trapped within a clear negative trend from early March highs. WTI futures are testing support right above the 50-day SMA, around $92.00, with the next potential targets on the downside, at $89.80 (February 25 low) and $86.40 (Jan. 28 and 31 lows)
On the upside, the pair is struggling to extend past $98.20. Above here, the next targets might be at $99.30 (intra-day high) and the $100.00 level.
Technical levels to watch
- The euro fails to break above 1.1000 for the second consecutive day.
- The US dollar is trimming daily losses with the focus shifting to the Fed's meeting.
- EUR/USD might decline towards 1.05 over the coming months – BofA.
The euro is losing ground on Tuesday’s US trading session after failing to extend beyond the 1.1000 level for the second day in a row. The pair is giving away earlier gains and remains barely changed on the daily chart, trading right above 1.0950.
The euro loses steam with all eyes on the Federal Reserve
The common currency is losing momentum with the greenback picking up as the market braces for Wednesday’s Federal Reserve’s monetary policy decision. With consumer inflation at levels not seen in decades, The Fed is poised to hike rates for the first time in three years, which is providing some support to the USD.
Earlier today, the euro has seen some positive price action, favored by the sustained reversal on oil prices and the moderate optimism regarding the Russia – Ukraine peace talks. The pair, however, has been capped right above 1.1000 before returning to the mid-range of 1.0900.
EUR/USD could extend its decline towards 1.05 – BofA
In the longer-term, the Bank of America Global Research sees the euro extending its downtrend over the coming months: “Initiation of Fed hiking cycles has typically not boded well for USD prospects, but a hawkish Fed tone amid high inflation risks could end up supporting the dollar for a while longer if terminal rate expectations continue to rise against the backdrop of persistent risk aversion and high commodity prices related to the war in Ukraine (…) We recently downwardly-revised our EUR/USD forecast to 1.05 and continue to see downside potential over a short to medium-term horizon.”
Technical levels to watch
- The shared currency retraces from weekly highs as tensions between Russia-Ukraine increase, to the detriment of the EUR.
- Market sentiment alongside the BoE hiking rates for the third consecutive meeting favors the GBP vs. the EUR.
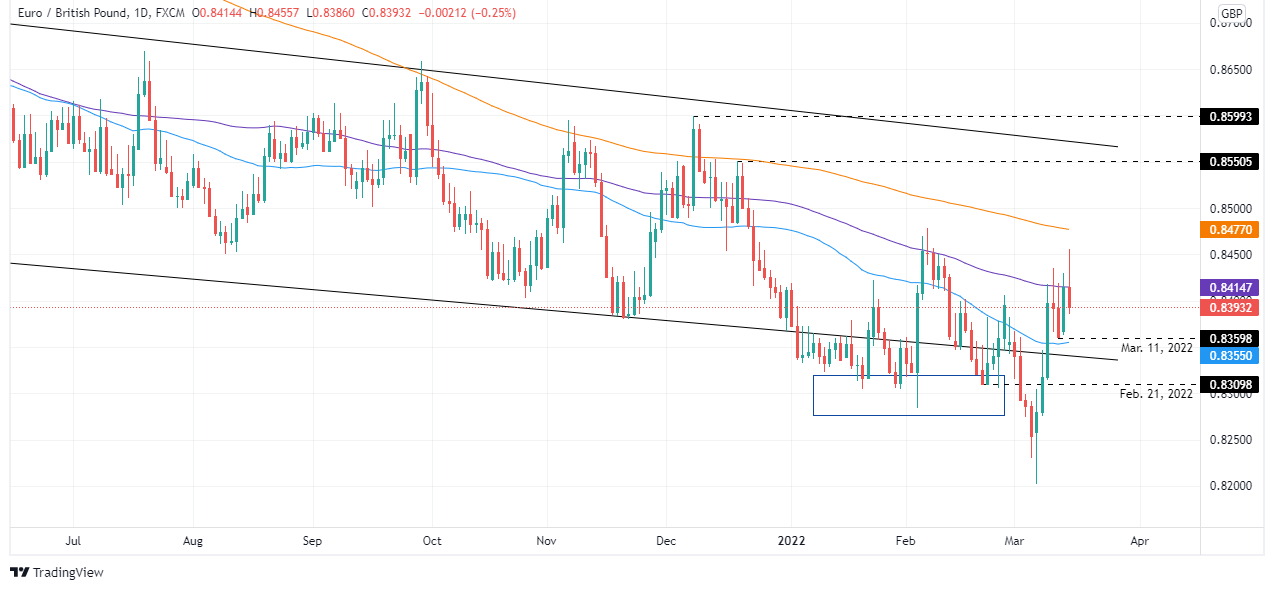
- EUR/GBP Price Forecast: Neutral-downward biased, as long as the pair trades above 0.8359.
On Tuesday, the EUR/GBP retreats from weekly highs near the 0.8450 mark and breaks below the 0.8400 mark amidst a mixed market mood, spurred by geopolitical woes. At press time, the EUR/GBP is trading at 0.8396.
Russia-Ukraine tensions increase
The market sentiment is mixed, though it would likely shift towards a risk-off on Russian President Vladimir Putin’s saying that Kyiv is not serious to find a mutually acceptable solution, contradicting with news in the couple of days, which appointed to progress in discussions between Kyiv and Moscow.
Overnight, the EUR/GBP climbed towards 0.8400 from the 0.8400 figure. However, the Russia/Ukraine conflict and its influence on Europe increased demand for the British pound. Since the mid-European session, it has been appreciating vs. the shared currency, causing a move under the 0.8400 mark.
Therefore, EUR/GBP traders would need to be aware of central bank policy divergence, with the Bank of England (BoE) set to raise rates to 0.75% by Thursday, while the ECB could probably begin by the end of the year. That alongside market sentiment would be the main drivers for the pair, though, during the week, GBP strength could override some market mood vs. the EUR.
EUR/GBP Price Forecast: Technical outlook
The EUR/GBP depicts a neutral-downward bias, confirmed by the location of the daily moving averages (DMAs) above the spot price, except for the 50-DMA. Furthermore, Tuesday’s daily high, around 0.8455, failed to break above the last cycle high at 0.8478, extending the downtrend, which has been following the 100-DMA s direction since May of 2021.
That said, the EUR/GBP’s first support would be the confluence of the 50-DMA and the March 11 low around the 0.8355-0.8359. Breach of the latter would expose the bottom-trendline of a descending channel around 0.8340, followed by the February 21 daily low at 0.8309, short of the 0.8300 mark.
- The US dollar extends its rally to 11-month highs at 0.9425.
- A moderate risk appetite and Fed's tightening expectations are underpinning the USD.
- Above 0.9375 the pair aims to 0.9473 – Credit Suisse.
The US dollar found support at 0.9370 earlier today to resume its seven-day rally and break above 0.9400 for the first time since April 2021.
The US dollar picks up with the Fed on focus
The greenback is picking up during the US trading hours, following a weak performance on previous sessions. The positive Wall street opening seems to have spurred some dollar bids with the market awaiting the outcome of the Federal Reserve’s monetary policy meeting, due on Wednesday.
The Fed is widely expected to hike interest rates for the first time in three years, in order to tame soaring inflation levels. These hopes have pushed US treasury bonds to multi-year highs, fuelling demand for the greenback.
Furthermore, a moderate optimism about the possibility of some progress on the Russia – Ukraine peace talks seems to have triggered a cautious optimism. Comments hinting at the possibility of an agreement in the coming weeks have cheered investors, offering support to the USD/CHF.
USD/CHF above 0.9375, next target is 0.9473 – Credit Suisse
The FX Analysis Team at Credit Suisse, confirmation above 0.9375 would increase bulls’ confidence and clear the path towards 0.9473: “Only a sustained break above 0.9367/75 would confirm the recent strength and raise a prospect of a fresh medium-term uptrend emerging clearing the way for strength back to the 0.9473 high of last year and likely higher we think in due course.”
- The Mexican peso holds steady versus the US dollar despite volatility.
- USD/MXN with a bearish bias, still holding above 20.852.
The USD/MXN holds a negative bias in the short-term but it needs to break the key short-term support at 20.85. A daily close below should open the doors to more losses, targeting 20.70 initially. An extension below could target the 20.50 zone.
So far, the Mexican peso has been unable to break firmly 20.85. It bottomed on Tuesday at 20.82, the lowest level since March 4 but quickly bounced to the upside amid a deterioration in market sentiment.
The first resistance is seen at 20.90, a downtrend line. Above, a test of 21.00 is expected. A break and a consolidation above 21.05 would add support to the dollar for an extension. The next strong barrier that should limit the upside is 21.30.
The main trend remains bullish but a daily close below 20.65 should turn the bias to neutral. Ahead of the FOMC meeting, with the war in Ukraine and global uncertainty, volatility is set to remain elevated.
USD/MXN daily chart
-637829568809906223.png)
Russia's President Vladimir V. Putin has said that Kyiv is not serious about finding a mutually acceptable solution, according to Bloomberg.
Markets have reacted negatively to the news, with stocks retreating from the highs and the safe-haven dollar and gold rising.
--more to come
- US dollar posts mixed results as the FOMC meeting begins.
- Loonie turns positive versus US dollar, holds in negative against AUD and NZD.
- USD/CAD: Bullish bias but limited by 1.2900.
The USD/CAD pulled back more than 50 pips from the daily highs and turned negative. The pair hit earlier on Wednesday a five-day high at 1.2871, and as of writing, it trades at 1.2799, the fresh daily low.
The retreat occurred amid an improvement in market sentiment and even as crude oil prices extended losses. The WTI barrel is falling almost 9%.
Economic data from the US showed an increase in the Producer Price Index to 10% (annual), the highest level in decades and a sharp decline in the Empire Manufacturing Index for February. The numbers had little impact on the greenback as market participants focused on the two-day meeting of the Federal Reserve and the war in Ukraine.
The FOMC is expected to raise the key interest rate for the first time since 2018, in a complex environment with high inflation, supply disruptions, a war in Ukraine and soaring crude oil prices. The tone of the statement and Chairman Powell's words will likely trigger volatility across the financial markets. Also, on Wednesday, inflation data from Canada is due.
The 1.2900 area still holds the key
A weekly close above 1.2900 should trigger more gains over the medium term, favoring a rally above 1.3000. The same chart shows a relevant support around 1.2700, the 20-week Simple Moving average, a consolidation below should weaken the dollar, exposing the next supports at 1.2580 and 1.2445.
Technical levels
-637829559779185731.png)
- US Stock markets open with gains as the oil reversal gathers pace.
- Easing concerns about supply shortages and COVID-19 in China are weighing energy markets.
- All eyes are on the outcome of the Federal Reserve's meeting.
US stock markets have opened in a moderately positive tone on Tuesday, with oil prices pulling back for the second consecutive day and all eyes on the US Federal Reserve’s monetary policy meeting.
The S&P 500 Index advances 1.25%, while the Nasdaq Technological Index and the Dow Jones Industrial Index are 1.93% and 0.99% up respectively at the time of writing.
Oil prices dive from highs on easing supply concerns
Concerns about an oil supply shortage on the back of sanctions to Russia seem to be fading on hopes that Saudi Arabia and the United Arab Emirates would be ready to increase production.
Beyond that, the fast-spreading COVID-19 outbreak in China, which has already forced to impose lockdowns in some cities, is contributing to pulling oil prices lower. The benchmark US West Texas Intermediate has dropped nearly 30% from last week’s highs at $126 per barrel to levels below $93 so far.
On the other hand, investors are awaiting the conclusion of the two-day monetary policy meeting, starting today. The Fed is widely expected to be hiking interest rates for the first time in three years aiming to bring inflation under control.
Down to sectors, Consumer Discretionary stocks, 2.7% higher and Technology, 1,96% up are leading gains with only Energy and Materials in the red with 4.62% and 0.08% respective declines.
Technical levels to watch
- The USD/JPY retraces from 118.45 YTD highs but clings to the 118.00 ahead of the FOMC.
- A mixed market sentiment keeps bourses seesawing while the US Treasury yields fall.
- USD/JPY Price Forecast: Tuesday’s price action is forming a doji, meaning indecision of bulls and bears.
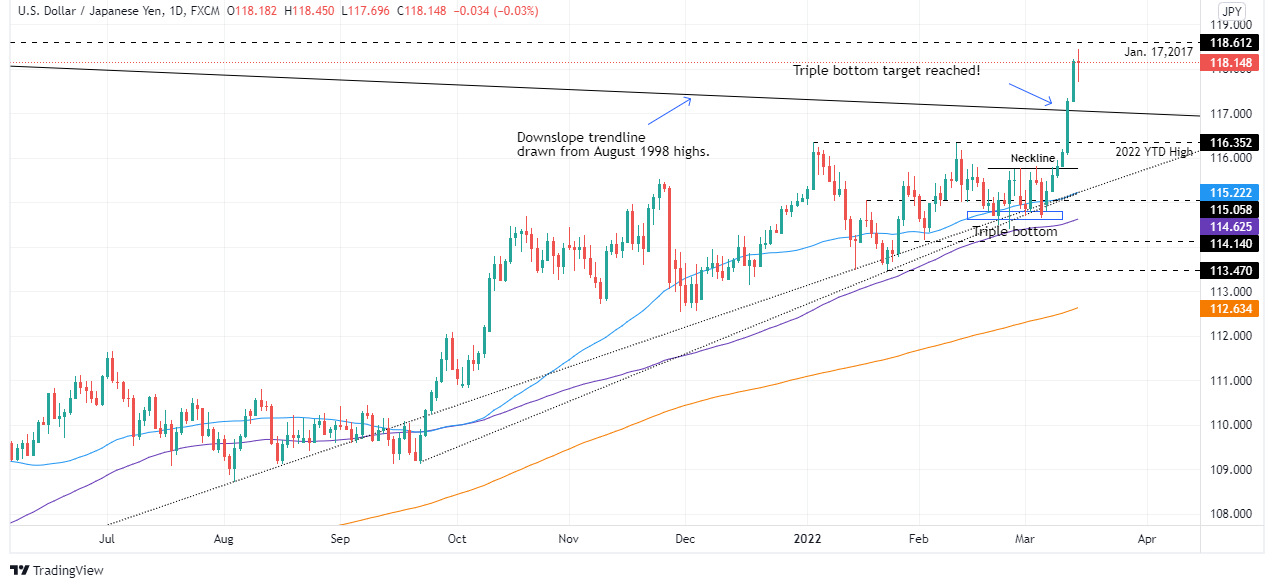
The USD/JPY slides for the first time in seven days amid a mixed market mood as illustrated by global equities fluctuating between gainers and losers, courtesy of geopolitical jitters. In the FX space, the Japanese yen recovers some ground vs. most G8 currencies, except the risk-barometer AUD. At the time of writing, the USD/JPY is trading at 118.14.
Russia-Ukraine conflict persists, talks to continue
Latest developments in Eastern Europe appoint to continuing talks between Russia and Ukraine, though hostilities remain. Meanwhile, the Ukrainian air force claimed that a Russian drone crossed into Poland before returning to Ukraine, it was shot down by air defenses, while Russia’n Minister of Defense reported that they had taken control of Kherson Ukraine, according to Sputnik.
Yields of US Treasuries retrace and demand for the greenback diminishes
In the meantime, the USD/JPY is trading mostly flat in the day, underpinned by falling US Treasury yields, led by the 10-year T-note down three basis points, sitting at 2.110%. The greenback trades with losses, with the US Dollar Index under the 99 mark, at 98.79, down 0.21%.
An absent Japanese economic docket leaves USD/JPY traders leaning on US economic data. On the US front, the Producer Price Index (PPI) for February rose by 10%, matching market expectations and staying at levels not seen since 1981. The data further cemented the need for higher rates, as the Federal Reserve would unveil its monetary policy statement on Wednesday at 18:00 GMT, followed by Fed’s Chief Powell presser.
USD/JPY Price Forecast: Technical outlook
The USD/JPY depicts an upward bias, though Tuesday’s price action is forming a doji near the YTD highs, meaning that USD bulls fail to commit to higher prices as the US central bank’s first rate hike looms.
If the USD/JPY aims to move lower, the first support would be 118.00. Breach of the latter would expose the 24-year-old downslope trendline, around 117.00., which once clear would leave the January 4 high resistance/support at 116.35 as the next demand zone.
Upwards, the USD/JPY first resistance would be 118.45. A decisive break would push the pair towards 119.00, followed by the 120.00 mark.
- USD/TRY regains downside traction and revisits 14.50.
- The selling bias in the dollar helps the EM FX space.
- The CBRT is expected to hold rates later this week.
The Turkish lira appreciates further and drags USD/TRY to new 4-day lows in the 14.50 region on turnaround Tuesday.
USD/TRY looks to risk trends, geopolitics
USD/TRY retreats for the third consecutive session so far on Tuesday against the backdrop of the renewed and persistent offered stance in the US dollar, while the risk complex looks bolstered by hopes of a diplomatic solution to the war in Ukraine.
In addition, another strong decline in crude oil prices means to bring extra respite to the economic outlook for Turkey along with somewhat diminishing geopolitical concerns.
Moving forward, consensus around the next meeting by the Turkish central bank (CBRT) leans towards a steady hand, with no changes to the One-Week Repo Rate, currently at 14.00%.
On the docket, Turkey’s Budget surplus more than doubled in February to TL69.74B (from TL30.00B).
What to look for around TRY
The lira regained some poise in past sessions, leaving the area of YTD lows vs. the US dollar around the 15.00 zone (March 11). In the very near term, price action in the Turkish currency is expected to gyrate around the performance of crude oil, the broad risk appetite trends, the FOMC event and the progress of the peace talks in the Russia-Ukraine front. Extra risks facing TRY also come from the domestic backyard, as inflation gives no signs of easing, real interest rates remain negative and the political pressure to keep the CBRT biased towards low interest rates remain omnipresent.
Key events in Turkey this week: Budget Balance (Tuesday) – CBRT Meeting (Thursday).
Eminent issues on the back boiler: Progress (or lack of it) of the government’s new scheme oriented to support the lira via protected time deposits. Constant government pressure on the CBRT vs. bank’s credibility/independence. Bouts of geopolitical concerns. Structural reforms. Earlier Presidential/Parliamentary elections?
USD/TRY key levels
So far, the pair is retreating 0.76% at 14.6529 and a drop below 13.7143 (low Feb.25) would expose 13.5091 (low Feb.18) and finally 12.4317 (low Feb.11). On the other hand, the next up barrier lines up at 14.9889 (2022 high Mar.11) seconded by 18.2582 (all-time high Dec.20) and then 19.00 (round level).
Citing Russia's foreign ministry, Reuters reported on Tuesday that Russia has decided to impose sanctions on US President Joe Biden and Secretary of State Anthony Blinken.
"Russian sanctions also apply to US Defense Minister, National Security Adviser, Chief of CIA and others," Reuters further added.
Market reaction
This development doesn't seem to be having a significant impact on risk sentiment. As of writing, the S&P 500 Index was up 1.3% and the Dow Jones Industrial Average was gaining 1%.
Meanwhile, the US Dollar Index stays in negative territory near 98.80.
- Australian dollar's recovery from 0.7160 lows extends beyond 0.7200.
- Upbeat Chinese data and a softer UD dollar are underpinning aussie's rebound.
- Above 0.7225, The AUD/USD might extend to 0.7245 and 0.7310.
The Australian dollar has been building up momentum on Tuesday’s European session. The pair’s recovery from a two-week low of 0.7170 has reached intra-day highs at 0.7225 so far.
Chinese data and a weaker US dollar have buoyed the AUD
The AUD/USD has managed to pick up about 0.7% on the day so far to regain lost ground after dropping about 2.5% over the previous two days. A set of upbeat Chinese macroeconomic figures and the US dollar’s downside correction are supporting Aussie’s rebound.
Earlier today, Chinese data has beaten expectations with industrial production growing at a 7.5% pace year-on-year and retail consumption expanding at a 6.7% yearly pace in February.
Beyond that, the moderate reversal posted by the US dollar, with the Dollar Index about 0.5% down on the day on the back of retreating US Bond yields has contributed to the Australian dollar’s recovery.
AUD/USD testing resistance at 0.7225
From a technical point of view, the pair seems to be struggling to breach 0.7225area, where previous intra-day support meets the 100-day SMA.
Above here, the next potential targets might be 0.7245 (March 8 low) and the 200-day SMA, at 0.7310 before aiming towards March 10, 11 highs at 0.7365.
On the downside, a bearish reversal past 0.7200 would expose the mentioned two-week low at 0.7165 before eyeing Feb. 28 low at 0.7140 and Feb. 15, 24 lows at 0.7090/95.
Technical levels to watch
The US dollar is set to become potentially stronger for a bit longer, according to economists at Bank of America Global Research, who maintains a bullish bias on the USD over the coming weeks.
Hawkish Fed tone amid high inflation risks to supporting USD for a while longer
“Initiation of Fed hiking cycles has typically not boded well for USD prospects, but a hawkish Fed tone amid high inflation risks could end up supporting the dollar for a while longer if terminal rate expectations continue to rise against backdrop of persistent risk aversion and high commodity prices related to the war in Ukraine.”
"We recently downwardly-revised our EUR/USD forecast to 1.05 and continue to see downside potential over a short to medium-term horizon. However, downside risks should be contained absent a severe energy-shock-related recession in the euro-area preventing ECB normalization; or, alternatively, upside risks to the already-severe US inflation problem.”
Gold bugs could find themselves offloading length in a vaccuum. A break under the $1,914 mark would leave XAU/USD vulnerable to further downfalls, strategists at TD Securities report.
Massive impulse in gold demand could be coming to an end
“The massive impulse in gold demand from ETF and comex flows could be coming to an end, in line with historical analogs as safe-haven flows tend to be short-lived. However, the bar is also razor thin for substantial trend follower liquidations in gold, while consumer demand is now showing signs of weakness following the surge in prices.
“While a coordinated buying impulse from a broad group of gold traders had helped gold prices rise dramatically in past weeks, we could now see a coordinated reversal in flows. To start, a break below $1914/oz would catalyze a substantial selling program.”
“If the market has started to discount a future in which the growth shock could fade at a faster pace than the inflation shock, as we expected, then gold prices could be especially vulnerable to a more hawkish Fed profile, opening the door to a deeper consolidation.”
- EUR/USD gathers extra pace and surpasses the 1.1000 hurdle.
- Immediately to the upside aligns the weekly high at 1.1121.
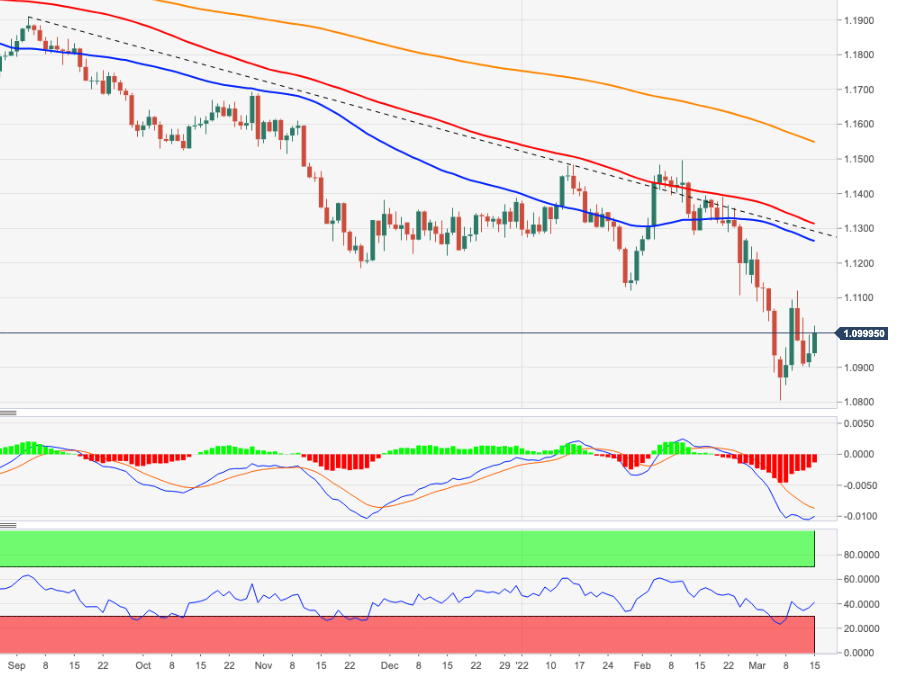
EUR/USD adds to Monday’s advance and retakes the psychological barrier at 1.1000 the figure.
In case bulls remain in control, then EUR/USD could extend the rebound to the weekly top at 1.1121 (March 10) ahead of the temporary hurdle at the 20-day SMA at 1.1127. The selling pressure is seen alleviated once the pair clears the 6-month resistance line, today just below 1.1300.
The negative outlook for EUR/USD is expected to remain unchanged while below the key 200-day SMA, today at 1.1547.
EUR/USD daily chart
The Japanese yen has fallen 2.5% against the US dollar so far this year, with the bulk of the decline coming in the wake of Russia’s invasion of Ukraine. Beyond the clear USD advantage from nominal yield spreads, JPY faces other challenges. Subsequently, economists at Scotiabank expect the US/JPY to edge higher towards 120 in 2023.
JPY remains prone to weakness
“Rising US yields will likely draw more flows to US Treasury product from Japanese investors and support USD gains versus the JPY.”
“Aside from the direct implications of the war in Ukraine, we think that the risk of tenser China/Taiwan relations represents another potential headwind for the JPY in the future.”
“We are forecasting USD/JPY ending this year at 118 and at 120 in 2023 (compared with Bloomberg consensus estimates of 116 and 115 respectively). The risk to our forecast is clearly to the upside in the near to medium-term”
“The USD is looking overbought in the short run but we expect solid support on minor USD/JPY dips to the mid-116s and unless there is a clear reversal in the recent USD gains shortly, we think USD gains mean the technical path for the USD to push on towards 125 is becoming clearer.”
- GBP/USD staged modest recovery from the 1.3000 mark, or a fresh low since November 2020.
- Upbeat UK jobs report reaffirmed BoE rate hike bets and extended support to the British pound.
- Hopes for diplomacy in Ukraine, retreating US bond yields undermined the safe-haven greenback.
The GBP/USD pair added to its intraday recovery gains and climbed to a fresh daily high, around the 1.3075-1.3080 region during the early North American session.
A combination of factors assisted the GBP/USD pair to attract some buying near the 1.3000 psychological mark on Tuesday and stage a goodish rebound from the lowest level since November 2020. The British pound drew support from upbeat UK employment details, which cemented expectations that the Bank of England will hike interest rates at its meeting on Thursday. Apart from this, modest US dollar weakness provided an additional lift to the GBP/USD pair and contributed to the intraday positive move.
Despite the fact that the Russian bombardment of Ukrainian cities has intensified, the optimism over a diplomatic solution to end the war underpinned the global risk sentiment. This was evident from a generally positive tone around the equity markets, which, along with retreating US Treasury bond yields, weighed on the safe-haven greenback. That said, expectations for an imminent start of the policy tightening by the Fed should act as a tailwind for the buck and cap the GBP/USD pair.
The market seems convinced that the recent geopolitical developments might do little to hold back the US central bank from hiking its target funds rate to rein in inflationary expectations. This was seen as a key factor behind the recent sell-off in the US money markets, which pushed the yield on the benchmark 10-year government bond to its highest level since June 2019 on Monday. The fundamental backdrop favours the USD bulls and warrants caution before placing bullish bets around the GBP/USD pair.
On the economic data front, the US Bureau of Labor Statistics reported that the Producer Price Index (PPI) for final demand rose to 10% on a yearly basis in February from the 9.7% previous. Meanwhile, the annual Core PPI, which excludes food and energy prices, edged higher to 8.4% from 8.3% as against 8.7% estimated. Separately, the Empire State Manufacturing Index declined to -11.8 in March from 3.1 in February and missed the 7.25 expected by a big margin. The data failed to provide any meaningful impetus to the USD or the GBP/USD pair as the focus remains on fresh geopolitical developments.
Investors also seemed reluctant and might prefer to wait on the sidelines ahead of the key central bank event risks. The Fed is scheduled to announce the outcome of a two-day policy meeting during the US session on Wednesday. This will be followed by the BoE policy meeting on Thursday, which will play a key role in determining the next leg of a directional move for the GBP/USD pair. This further makes it prudent to wait for some follow-through buying before confirming that a near-term bottom.
Technical levels to watch
Downside pressure for the S&P 500 continues to increase. The index is expected to see a move below 4158 for a retest of the 4115 current cycle low, analysts at Credit Suisse report.
Initial resistance is seen at 4204
“We stay directly negative for a break of the 4158 recent low to clear the way for a retest of the late February low at 4115. Below here in due course can see support at the 38.2% retracement of the entire 2020/2021 bull trend at 3855/15.”
“Resistance is seen at 4204 initially, then 4248, with tougher resistance seen starting at the aforementioned 13-day moving average at 4274 and stretching up to the 4291/99 recent highs, which we look to continue to cap on a closing basis.”
EUR/USD is struggling to make much room through 1.10, stopping at 1.1020 to move back under the figure. Economists at Scotiabank note that the pair remains under pressure while below the 1.1050 area.
Support is seen at the 1.0930 daily low
“Since its test of 1.08, the EUR has been on an ascending trajectory, but the broader trend in the EUR remains negative and it may take a move past the mid-1.10s and more firmly a test of 1.11 to suggest a firmer reversal is in the cards.”
“The daily low of 1.0930 is support followed by a firmer floor at the figure.”
Analysts at Natixis seek to determine in what cases (for what origins of inflation) the central bank is justified in fighting inflation. They then seek to identify what this means for current monetary policy in the United States and the eurozone, especially after the sharp rise in commodity prices caused by the war in Ukraine.
What type of inflation should monetary policy respond to?
“Inflation is caused by: In the US, the decline in labour supply; insufficient production capacity for oil, metals, transport and semiconductors; rising profit margins; In the eurozone, only insufficient production capacity for commodities, transport and semiconductors; In both countries/regions, currently the war in Ukraine, ultimately the energy transition.”
“We see that the only valid reason for switching to a more restrictive monetary policy is the rise in profit margins in the US.”
- Silver continued losing ground on Tuesday and dropped to a two-week low, around mid-$24.00s.
- The technical set-up favours bearish traders and supports prospects for a further depreciating move.
- Any meaningful recovery back above the $25.00 mark could now be seen as a selling opportunity.
Silver added to the previous day's heavy losses and witnessed some follow-through selling for the third successive day on Tuesday. This also marked the third day of a negative move in the previous four and dragged spot prices to a fresh two-week low, around mid-$24.00s during the mid-European session.
The XAG/USD has now found acceptance below the key $25.00 psychological mark and seems vulnerable to extending its recent decline from the vicinity of the $27.00 mark or the highest level since June 2021. The outlook is reinforced by the fact that oscillators on the daily chart have been losing traction.
Some follow-through selling below the daily low, which coincides with the 50% Fibonacci retracement level of the $22.00-$26.95 strong move up, will reaffirm the bearish bias. The XAG/USD would then turn vulnerable to accelerate the downfall towards testing sub-$24.00 levels, or the 61.8% Fibo. level.
On the flip side, the 38.2% Fibo. level, around the $25.00 mark, now seems to act as immediate strong resistance. Any subsequent move up could be seen as an opportunity for bearish traders and runs the risk of fizzling out quickly near the $25.75-$25.80 region, or the 23.6% Fibo. level.
This is closely followed by the $26.00 round-figure mark, which if cleared decisively would shift the bias back in favour of bullish traders. The next relevant hurdle is pegged near the $26.40 region, above which the XAG/USD is more likely to make a fresh attempt to conquer the $27.00 mark.
Silver daily chart
-637829460115708560.png)
Levels to watch
- Russian invasion of Ukraine overshadows coronavirus-related jitters, which return to the table.
- US government bond yields on the rise fuel demand for the US dollar.
- Gold Price is technically poised to extend its decline in the upcoming sessions.
Gold Price has extended its slide to an almost two-week low of $1,920.51 a troy ounce, as hopes for an end to the Russia-Ukraine crisis weighed on commodity prices. At the same time, the US dollar is finding demand – helping the retracement on XAUUSD – on the back of soaring government bond yields ahead of the US Federal Reserve monetary policy decision on Wednesday. In turn, soaring yields undermine demand for high-yielding stocks.
Ukrainian President Volodymyr Zelenskyy’s adviser said that they are expecting to reach a peace agreement with Russia in the next couple of weeks, in May at the latest.
The sour tone of equities could also be explained by the latest coronavirus outbreak in China, which led to a massive lockdown in the country. Speculative interest is now expecting slower economic progress and a decreased demand for commodities coming from the Chinese government. It is worth noting that some European countries are also experiencing a COVID-19 outbreak, overshadowed in the headlines by Moscow’s attack on Kyiv.
Also read: Gold is trending lower – A break below 1910 is a sell signal [Video]
XAUUSD technical outlook
XAUUSD is currently trading at around the 50% retracement of the January/March rally at $1,2925.20. Gold Price is down for a third consecutive day and biased lower according to technical readings in the daily chart, which shows that technical indicators are heading south almost vertically.
The 61.8% retracement of the mentioned advance comes at $1,890.64, providing static support. A break below the latter should send the bright metal into a selling spiral that could extend toward the 1,800 figure in the upcoming days.
There are no technical signs of bearish exhaustion, which suggests that intraday recoveries should continue to attract sellers. A near-term resistance level is located at $1,935.50, while a more relevant one is the $1,960 price zone, where the metal has the 38.2% retracement of the aforementioned rally.
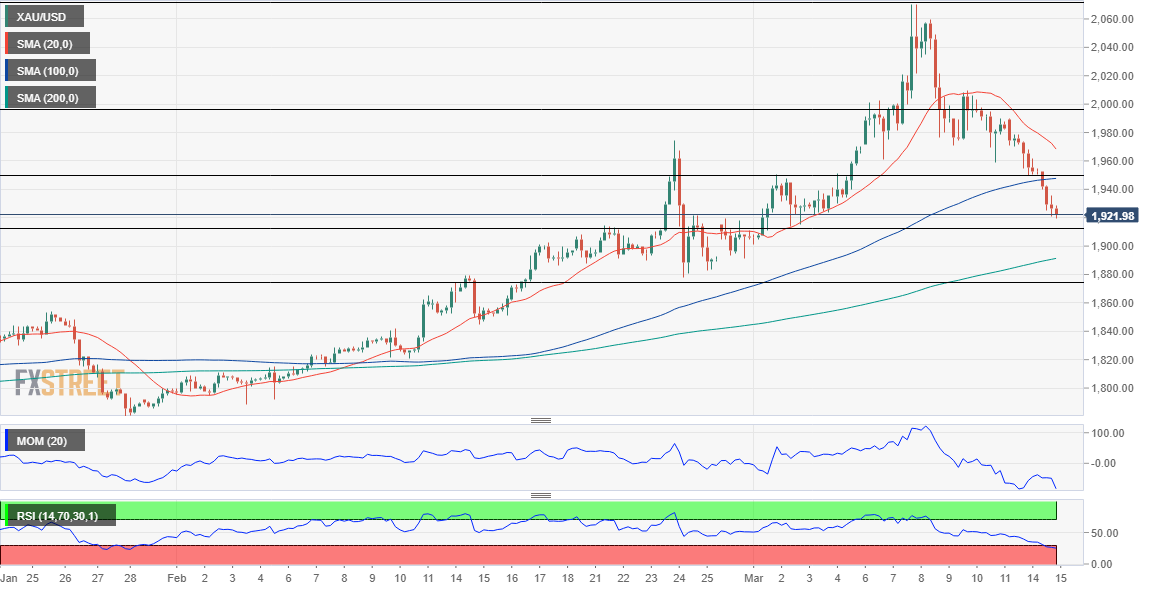
- NY Fed's Empire State Manufacturing Index fell sharply in March.
- The dollar continues to weaken against its rivals in the early American session.
The data published by the Federal Reserve Bank of New York revealed on Tuesday that the Empire State Manufacturing Index declined to -11.8 in March from 3.1 in February. This print missed the market expectation of 7.25 by a wide margin.
"Business activity declined in New York State for the first time since early in the pandemic, according to firms responding to the March 2022 Empire State Manufacturing Survey," the publication read. "The prices paid index remained very elevated, and the prices received index reached yet another record high."
Market reaction
The greenback stays under pressure after this report and the US Dollar Index was last seen losing 0.4% on the day at 98.70.
- Annual PPI in US jumped to 10% in February as expected.
- US Dollar Index stays deep in negative territory below 99.00.
The Producer Price Index (PPI) for final demand rose to 10% on a yearly basis in February from 9.7% in January, the data published by the US Bureau of Labor Statistics announced on Tuesday. This reading matched the market expectation.
Annual Core PPI, which excludes food and energy prices, edged higher to 8.4% from 8.3% but this print came in lower than analysts' estimate of 8.7%.
Market reaction
This report doesn't seem to be having a significant impact on the dollar's performance against its rivals. As of writing, the US Dollar Index was down 0.35% on a daily basis at 98.75.
- USD/CAD struggled to preserve its modest gains to a multi-day high amid weaker USD.
- Softer US bond yields, hopes for diplomacy in Ukraine weighed on the safe-haven buck.
- A slump in oil prices undermined the loonie and helped limit the downside for the major.
The USD/CAD pair surrendered a major part of its intraday gains to a multi-day peak and was last seen trading just a few pips above the daily low, around the 1.2830-1.2825 region.
The pair gained some positive traction during the first half of the trading on Tuesday, though the intraday uptick ran out of steam near the 1.2870 region amid modest US dollar weakness. Hopes of progress in peace talks between Ukraine and Russia, along with softer US Treasury bond yields, prompted some USD profit-taking and capped the early uptick for the USD/CAD pair.
The pair retreated around 40 pips from the daily swing high, though the downside seems cushioned amid a slump in crude oil prices, which tend to undermine the commodity-linked loonie. The latest optimism over the possibility of a diplomatic solution to end the war in Ukraine helped ease fears of supply disruption and dragged the black liquid to its lowest in almost three weeks.
Adding to this, expectations that the Fed would announce an imminent start of policy tightening cycle on Wednesday acted as a tailwind for the US bond yields and the greenback. The markets seem convinced that the recent geopolitical developments might do little to hold back the US central bank from hiking its target funds rate to rein in inflationary expectations.
The fundamental backdrop favours bullish traders and supports prospects for a further near-term appreciating move for the USD/CAD pair. That said, traders might refrain from placing aggressive bets and prefer to wait for the outcome of a two-day FOMC policy meeting on Wednesday. In the meantime, geopolitical developments will be looked upon for some impetus.
Next on tap is the US economic docket, featuring the release of the Producer Price Index and Empire State Manufacturing Index. Traders will further take cues from the US bond yields and the broader market risk sentiment, which will influence the USD. Apart from this, oil price dynamics should allow traders to grab short-term opportunities around the USD/CAD pair.
Technical levels to watch
- DXY adds to Monday’s decline below the 99.00 level.
- Further downside exposes a retest of the 97.70 region.
DXY accelerates the recent breakdown of the 99.00 area and drops to 2-day lows near 98.60 on Tuesday.
The ongoing corrective downside carries the potential to extend further in the very near term, therefore exposing a probable decline to the weekly low at 97.71 (March 10) ahead of the temporary support at the 20-day SMA at 97.46.
The current bullish stance in the index remains supported by the 6-month line, today near 95.80, while the longer-term outlook for the dollar is seen constructive while above the 200-day SMA at 94.39.
DXY daily chart
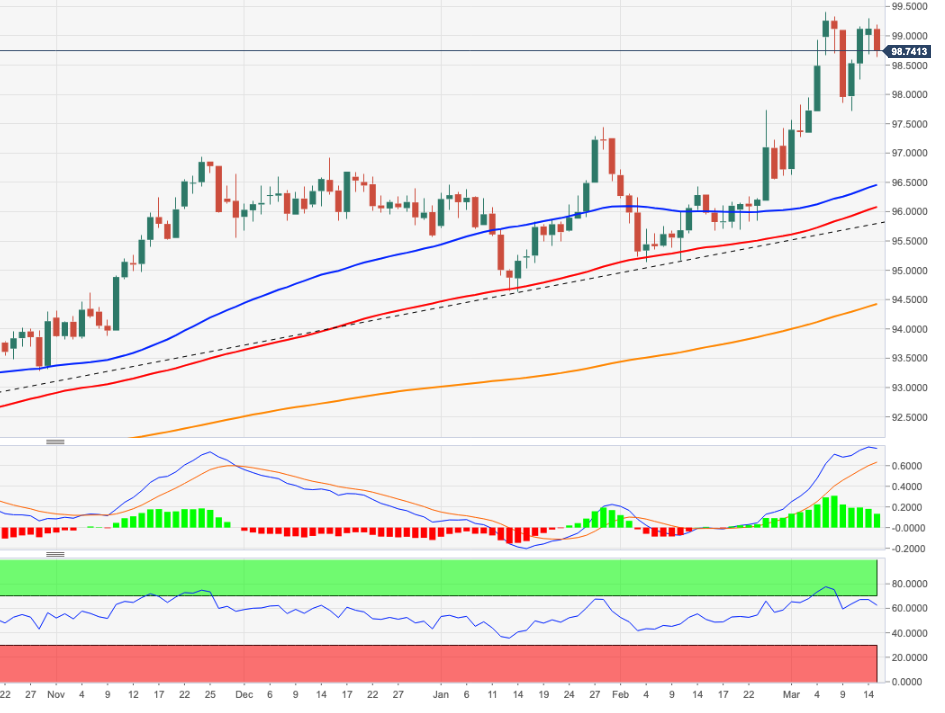
- GBP/JPY attracted dip-buying near 200-DMA on Tuesday and turned positive for the third straight day.
- Upbeat UK jobs report benefitted the British pound and extended support amid BoE rate hike bets.
- Hope for diplomacy in Ukraine undermined the safe-haven JPY and remained supportive of the move.
The GBP/JPY cross recovered nearly 90 pips from the daily swing low and climbed back above the 154.00 mark during the mid-European session.
Following an intraday pullback from the vicinity of mid-154.00s, the GBP/JPY cross attracted some dip-buying near the 200-day SMA on Tuesday and turned positive for the fourth successive day. This also marked the fifth day of an uptick in the previous six and might have set the stage for an extension of the recent goodish rebound from sub-151.00 levels, or the YTD low touched last week.
The British pound drew support from upbeat UK employment details, which reaffirmed expectations that the Bank of England will hike interest rates at its policy meeting on Thursday. In fact, the UK Office for National Statistics (ONS) reported that the jobless rate fell to 3.9% in January. Adding to this, the number of people claiming unemployment-related benefits fell by 48.1K in February.
On the other hand, hopes for a diplomatic solution to end the war in Ukraine weighed on traditional safe-haven assets and capped the intraday gains for the Japanese yen. Apart from this, expectations that the Bank of Japan (BoJ) will maintain the current accommodative policy stance at its meeting on Friday undermined the JPY. This further acted as a tailwind for the GBP/JPY cross.
Given the overnight move back above a technically significant 200-DMA, the emergence of fresh buying on Tuesday supports prospects for a further near-term appreciating move. Some follow-through buying beyond the daily peak, around mid-154.00s, will add credence and validate the near-term constructive outlook. This would allow the GBP/JPY cross to aim to reclaim the key 155.00 psychological mark.
That said, traders might refrain from placing aggressive bets and prefer to wait on the sidelines ahead of the key central bank event risk. Both the BoE and the BoJ are scheduled to announce their policy decision on Thursday and Friday, respectively. This, along with fresh developments surrounding the Russia-Ukraine saga, should provide a fresh directional impetus to the GBP/JPY cross.
Technical levels to watch
- EUR/JPY extends the upside momentum to 130.00.
- Next on the upside now comes the 131.90 level.
EUR/JPY rises for the third consecutive session and reclaims the 130.00 zone for the first time since late February.
Considering the ongoing price action, extra advance in EUR/JPY appears most likely, particularly if the cross surpasses the key 200-day SMA at 130.00 on a sustainable fashion. Against that, a visit to the weekly high at 131.90 (February 16) could start shaping up in the short-term horizon.
In the meantime, if the cross advances above the 200-day SMA, the outlook for the cross is expected to shift to constructive.
EUR/JPY daily chart
The yellow metal is under pressure. XAU/USD has dropped to $1,925 – its lowest level since early March. The hopes of a ceasefire and an end in the near future to the war in Ukraine are causing precious metals prices to fall sharply, economists at Commerzbank report.
End to the war would substantially reduce the risk of Palladium supply outages
“The hopes of an end to hostilities are also increasing the risk appetite of market participants. This can be seen clearly from the steep rise in bond yields. This raises the opportunity costs of holding gold, which does not yield any interest. In real terms, however, that is to say after deducting inflation expectations, interest rates are still significantly negative, which should preclude any more pronounced price slide.”
“Russia is the world’s second-largest palladium producer after South Africa and accounts for just shy of 40% of the mining supply. An end to the war would thus substantially reduce the risk of supply outages. Furthermore, according to its biggest shareholder, Russia’s largest palladium producer has apparently found new transport routes for its palladium shipments following the closure of air space.”
As recently as in January, the Czech koruna surprised markets by inexplicable strength. Then it swung in the opposite direction with force after the Russia-Ukraine conflict. Looking ahead, economists at Commerzbank expect the EUR/CZK pair to move sideways around the 25 level.
CZK to stay volatile this year
“Although things may appear to calm down, we remain cautious about volatility in CEE currencies in the months ahead, not only because of geopolitical risks but also because the Fed and ECB will progressively tighten their stance.”
“We see EUR/CZK sideways at around the 25.00 mark over the coming year.”
Following the economic sentiment data, Germany’s ZEW expresses its take on the economy, in light of the Russia-Ukraine war.
Key takeaways
A recession is becoming more and more likely.
The war in Ukraine and the sanctions against Russia are significantly dampening the economic outlook for Germany.
Collapsing economic expectations are accompanied by an extreme rise in inflation expectations.
Experts, therefore, expect stagflation in the coming months.
Worsened outlook affects practically all sectors of the German economy, but especially the energy-intensive sectors and the financial sector.
-
EUR/USD has the 1.1040 mark in its crosshairs
- German ZEW Economic Sentiment arrived at -39.3 in March, down from 54.3 previous.
- The ZEW Current Situation for Germany came in at -21.4 in March vs. February’s -8.1.
- EUR/USD keeps its range around 1.1000 on mixed German and Eurozone data.
The German ZEW headline numbers for March showed that the Economic Sentiment Index deteriorated sharply amid the Russia-Ukraine war, coming in at -39.3 from 54.3 previous while missing estimates of 10.0 by a wide margin.
Meanwhile, the Current Conditions sub-index slumped to -21.4 in March as against -8.1 recorded in the previous month and -22.5 expectations.
The Eurozone ZEW Economic Sentiment Index tumbled to -38.7 the current month as compared to the 48.6 previous reading.
Separately, Industrial Production in the bloc arrived at 0% MoM in the first month of 2022 vs. a 0.1% increase expected and 1.3% last.
On an annualized basis, the industrial output fell by 1.3% in January versus a 0.5% decrease expected and December’s 2.0%.
FX market reaction
The euro remains unfazed by the mixed ZEW Surveys and Eurozone data. EUR/USD was last seen trading at 1.1000, up 0.56% on the day.
GBP/USD has struggled to extend rebound beyond 1.3050. As FXstreet’s Eren Sengezer notes, technicals reveal a lack of recovery momentum.
Buyers are yet to control cable's action
“The Relative Strength Index (RSI) indicator on the four-hour chart stays near 40 and GBP/USD continues to trade below the 20-period SMA, suggesting that buyers are yet to control the pair's action.”
“1.3000 (psychological level, static level) aligns as significant support and additional losses toward 1.2920 (static level) could be witnessed in case this level turns into resistance.”
“Resistances are located at 1.3050 (static level, 20-period SMA), 1.3100 (psychological level, static level) and 1.3150 (static level, 50-period SMA).”
- USD/CHF witnessed an intraday turnaround from the fresh YTD peak touched earlier this Tuesday.
- The risk-off impulse in the markets benefitted the safe-haven CHF and prompted some profit-taking.
- Retreating US bond yields undermined the USD profit-taking and contributed to the intraday decline.
The USD/CHF pair recovered a few pips from the daily low touched during the early European session and was last seen trading in the neutral territory, around the 0.9385 region.
The pair prolonged its recent strong bullish trajectory and gained some positive traction during the first half of the trading on Tuesday. The momentum pushed the USD/CHF pair to the highest level since April 2021, though bulls struggled to capitalize on the move or find acceptance above the 0.9400 round-figure mark.
The market sentiment remains fragile in the wake of the risk of a further escalation in the Russia-Ukraine conflict. Apart from this, the latest COVID-19 outbreak in China took its toll on the risk sentiment. This was evident from a fresh leg down in the equity markets, which drove haven flows towards the Swiss franc.
The flight to safety triggered a corrective slide in the US Treasury bond yields and exerted some downward pressure on the US dollar. This was seen as another factor behind the USD/CHF pair's pullback of around 40 pips. That said, hawkish Fed expectations helped limit losses for the buck and extended support to the pair.
The markets seem convinced that the recent geopolitical developments might do little to hold back the Fed from announcing an imminent start of the policy tightening cycle. Apart from this, hopes for a diplomatic solution to end the war in Ukraine supports prospects for the emergence of some dip-buying around the USD/CHF pair.
Hence, the focus will remain on the outcome of a two-day FOMC monetary policy meeting, scheduled to be announced during the US session on Wednesday. Apart from this, investors will take cues from fresh developments surrounding the Russia-Ukraine saga. The combination of factors should help determine the near-term trajectory for the USD/CHF pair.
Technical levels to watch
The Kremlin said, “work continues between the delegations of Russia and Ukraine” when asked about a peace deal with Ukraine.
“We don't want to rush out predictions about talks with Ukraine but it is positive that the talks are continuing,” The Kremlin added in its statement.
Market reaction
Markets are reacting positively to the above statements from the Kremlin, as the S&P 500 futures is seeing a minor bounce, although still down 0.46% on the day. EUR/USD has recaptured 1.1000 while the AUD/USD pair struggles below 0.7200.
As a result of significant population ageing, strategist at Natixis believe that China’s economy will be completely transformed to become similar to the Japanese economy due to five developments.
Sluggish domestic demand and growth being dependent on exports
“Domestic demand is expected to grow little in China as is already the case in Japan because households are building up large precautionary savings in anticipation of a deterioration in pension systems. As a result of sluggish domestic demand, growth depends mainly on exports, which makes the economy dependent on the rest of the world, and this was not the strategy of the authorities in China or Japan.”
Low potential growth
“The decline in the working-age population, due to very low immigration, in China as in Japan, leads to low potential growth. Given productivity gains and demographics, potential growth will not exceed 2-2.5% in China and will be barely positive in Japan.”
Private sector deleveraging
“The rise in the proportion of elderly people relative to young people in the population is likely to lead to private sector deleveraging (pensioners deleverage, young people get into debt), which has actually been seen in Japan and is starting to be seen in China, and which reinforces the weakness of domestic demand.”
Sharp increase in public debt
“Fiscal policy must become expansionary in China, as has been the case in Japan, in order to: Stimulate domestic demand, which has been weakened; Substitute public debt for private debt, which is declining.”
A highly expansionary monetary policy
“The increase in public debt will lead, in China as in Japan, to a highly expansionary monetary policy, which is necessary to ensure public debt sustainability.”
The Turkish lira (-2.4%) has been the worst-performing EM currency over the past week. Economists at MUFG Bank expect the TRY to suffer further losses as energy prices remain high.
Oil price shock to weigh heavily on TRY
“We still favour further downside for the TRY in the near-term given Turkey’s vulnerability to the negative shock from higher price of oil.”
“We do not expect the CBRT to raise rates in the week ahead in response to building upside risks to already elevated inflation leaving the real policy rate even deeper in negative territory.”
Economist at UOB Group Enrico Tanuwidjaja reviews the prospects for inflation and GDP in Indonesia for the current year.
Key Takeaways
“Higher energy and basic raw food prices resulting from the Russia-Ukraine ongoing tensions will result into higher inflation in Indonesia.”
“Higher inflation, in turn, will be growth-negative and hence affecting our 2022 forecast.”
“We revised our 2022 inflation forecast to 3.3% from 2.4% previously, and our growth estimate range is now revised lower to 4.6-5.0% (mid-point of 4.8%) from 4.7-5.3% (mid-point of 5%) before.”
EUR/USD is trading near 1.10 and it looks to extend its rebound in case risk flows continue to dominate the financial markets. The next bullish target for the pair is located at 1.1040 ahead of 1.1080, FXStreet’s Eren Sengezer reports.
Euro could lose interest if it fails to hold above 1.10
“In case investors continue to price in a possible peace agreement between Russia and Ukraine, EUR/USD should preserve its recovery momentum. On the other hand, the pair could find it difficult to keep its footing if geopolitical tensions re-escalate.”
“In case the pair manages to hold above 1.1000 (psychological level, Fibonacci 38.2% retracement of the latest downtrend), it could target 1.1040 (Fibonacci 50% retracement) and 1.1080 (100-period SMA, Fibonacci 61.8% retracement).”
“On the downside, 1.0960 (50-period SMA) aligns as interim support ahead of 1.0930 (Fibonacci 23.6% retracement) and 1.0900 (psychological level, static level).”
- EUR/USD adds to Monday’s gains around 1.1000.
- Hopes of an end to the military conflict prop up spot.
- Germany/EMU ZEW Survey comes next in the calendar.
The single currency extends the upbeat tone and encourages EUR/USD to surpass once again the key barrier at 1.1000 on Tuesday.
EUR/USD supported by risk appetite
EUR/USD advances for the second session in a row and manages to put further distance from recent lows in the 1.0900 neighbourhood against the backdrop of the relentless improvement in the risk-associated galaxy, which remain in turn underpinned by cautious optimism surrounding the Russia-Ukraine peace talks.
Higher German 10y Bund yields have been also lending legs to the recovery in the pair despite the ongoing knee-jerk on the back of some recovery in the global money markets. It is worth mentioning that the 10y German benchmark yields climbed to levels last seen in December 2018 around 0.38% on Monday.
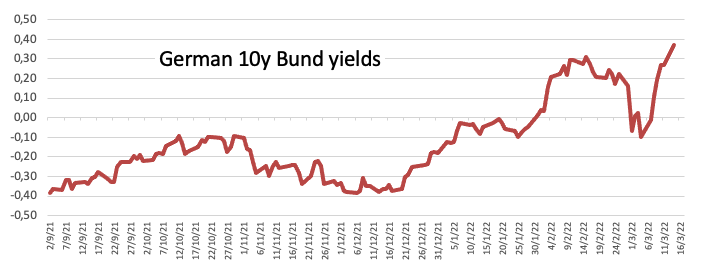
In the meantime, investors are expected to closely follow further diplomatic negotiations aimed at ending the military dispute as soon as possible, while extra attention should shift to the imminent FOMC gathering on Wednesday.
Data wise in Euroland, the ZEW survey is due and will show the performance of the Economic Sentiment in both Germany and the broader euro area in March. Across the pond, Producer Prices will be in the limelight seconded by TIC Flows.
What to look for around EUR
The European currency manages to reclaim some ground lost and flirt with the 1.1000 zone once again, always on the back of the renewed bid bias in the risk-linked universe. Pockets of strength in the euro should appear propped up by the speculation of the start of the hiking cycle by the ECB at some point by year end, while higher German yields, elevated inflation, the decent pace of the economic recovery and auspicious results from key fundamentals in the region are also supportive of a firmer currency for the time being.
Key events in the euro area this week: EcoFin Meeting, Germany/EMU ZEW Survey (Tuesday) – ECB Lagarde, EMU Final CPI (Thursday) – EMU Balance of Trade (Friday).
Eminent issues on the back boiler: Asymmetric economic recovery post-pandemic in the euro area. Speculation of ECB tightening/tapering later in the year. Presidential elections in France in April. Impact of the geopolitical conflict in Ukraine.
EUR/USD levels to watch
So far, spot is gaining 0.50% at 1.0994 and faces the next up barrier at 1.1121 (weekly high Mar.10) followed by 1.1127 (20-day SMA) and finally 1.1262 (55-day SMA). On the other hand, a drop below 1.0900 (weekly low Mar.14) would target 1.0805 (2022 low Mar.7) en route to 1.0766 (monthly low May 7 2020).
- The pullback in US Treasury yields seems to offer a brief reprieve to gold bulls.
- The US dollar drops with yields but the Ukraine uncertainty to keep downside limited.
- Gold Price eyes monthly lows near $1,900, as focus shifts to Fed.
Gold price remains vulnerable despite a brief pause in its three-day downtrend amid a sharp pullback in the US Treasury yields, which has dragged the dollar lower alongside. The price action in the dollar and yields is a pre-Fed repositioning by the market participants, as they brace for the critical interest rate decision due to be announced on Wednesday. On the geopolitical front, hopes for diplomacy between Russia and Ukraine are also adding to the greenback’s bearish reversal while sending commodities, including gold and oil prices, into a tailspin.
Read: Russia-Ukraine: Five scenarios for the war and implications for stocks, the dollar, gold and oil
Gold Price: Key levels to watch
The Technical Confluences Detector shows that gold price is trimming losses, at the moment, which could turn out to be a good selling opportunity for traders who felt left out earlier this week.
The immediate support is envisioned at the Fibonacci 23.6% one-month at $1,930, below which the $1,942 area could be probed.
That demand zone is the confluence of the previous low four-hour and the pivot point one-day S2.
A sustained move below the latter will trigger a fresh downswing towards the March lows of $1,902.
On the other side, the recovery could find an initial upside hurdle around $1,936, which is the convergence of the pivot point one-week S1, pivot point one-day S1 and the Bollinger Band one-day Middle.
Acceptance above the latter is needed to retest the previous high four-hour at $1,942. Fresh buying opportunities could be created above the latter, opening doors towards the $1,955 – the intraday highs.
The next critical resistance level is seen at around $1,960, where the previous year’s high, the previous week’s low and the Fibonacci 23.6% one-day coincide.
Here is how it looks on the tool
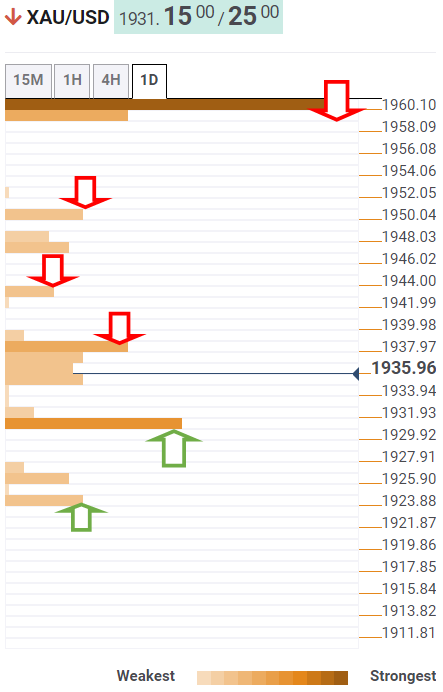
About Technical Confluences Detector
The TCD (Technical Confluences Detector) is a tool to locate and point out those price levels where there is a congestion of indicators, moving averages, Fibonacci levels, Pivot Points, etc. If you are a short-term trader, you will find entry points for counter-trend strategies and hunt a few points at a time. If you are a medium-to-long-term trader, this tool will allow you to know in advance the price levels where a medium-to-long-term trend may stop and rest, where to unwind positions, or where to increase your position size.
EUR/NOK could fall towards 9.50 by the summer if energy prices remain high and risk sentiment improves. However, economists at Nordea believe the window for a stronger krone will tighten by the summer because Norges Bank will have to sell NOK by June.
Risk for oil prices remains to the upside, implying more downside in EUR/NOK
“Energy prices remain higher than before the war in Ukraine while risk sentiment is slowly improving. If this holds, EUR/NOK could fall towards 9.50 by the summer. However, Norges Bank will start to sell NOK by June at the latest. We, therefore, see EUR/NOK trading around 10.00 in the longer run.”
“The Fed will raise the key rate on Wednesday and signal even faster rate hikes ahead. Compared the Fed, the ECB will need more time to normalise monetary policy. This argues for a lower EUR/USD; USD/NOK will likely continue to trade around 9.00 ahead.”
- USD/JPY witnessed some profit-taking from the multi-year high touched earlier this Tuesday.
- Retreating US bond yields weighed on the USD and prompted aggressive long-unwinding trade.
- The risk-off impulse benefitted the safe-haven JPY and further contributed to the selling bias.
The USD/JPY pair witnessed an intraday turnaround from the multi-year high and dropped to the 117.70 area during the early part of the European session.
A combination of factors prompted bulls to take some profit-taking off the table and led to the USD/JPY pair's corrective pullback from the 118.45 area, or the highest level since January 2017. A fresh wave of the global risk-aversion trade extended some support to the safe-haven Japanese yen. Apart from this, retreating US Treasury bond yields turned out to be another factor that inspired bearish traders and contributed to the intraday decline.
The market sentiment remains fragile in the wake of the risk of a further escalation in the Russia-Ukraine conflict and the latest COVID-19 outbreak in China. This, to a larger extent, overshadowed the latest optimism over a possible diplomatic resolution to end the war in Ukraine and triggered a slide in the equity markets. The anti-risk flow dragged the US bond yields lower, which undermined the US dollar and further weighed on the USD/JPY pair.
The downside, however, remains cushioned amid expectations for an imminent start of the policy tightening cycle by the Fed. The markets seem convinced that the recent geopolitical developments might do little to hold back the US central bank from hiking its target funds rate to rein in inflationary expectations. This should act as a tailwind for the US bond yields and supports prospects for the emergence of some USD dip-buying.
Conversely, the Bank of Japan (BoJ) is widely expected to maintain the current accommodative policy stance at its meeting on Friday. The divergence in the BoJ-Fed policy outlooks might continue to weigh on the JPY and lend support to the USD/JPY pair. Investors might also be reluctant to place aggressive bets heading into the key central bank event risks - the outcome of a two-day FOMC meeting and the BoJ policy decision on Friday.
Technical levels to watch
UOB Group’s FX Strategists believe USD/CNH could extend further the upside momentum and test 6.4100 ahead of 6.4300 in the next weeks.
Key Quotes
24-hour view: “While our view for a stronger USD was correct, we did not anticipate the strong rally that sent it rocketing to a high of 6.3973 before extending its advance during Asian hours. In view of the impulsive momentum, USD could strengthen further to 6.4050, as high as 6.4100. Support is at 6.3880 followed by 6.3800.”
Next 1-3 weeks: “Yesterday, we highlighted that upward momentum received a strong boost and USD could extend its advance to 6.3800. However, the boost sent USD rocketing to 6.3973. The rally appears to have ample fuel and USD could continue to rally to 6.4100, as high as 6.4300 On the downside, the ‘strong support’ level has moved sharply higher to 6.3600 from 6.3400 yesterday.”
- DXY remains on the defensive below the 99.00 mark.
- The risk-on sentiment mood continues to hurt the dollar.
- Producer Prices, TIC Flows next on tap in the US docket.
The greenback, in terms of the US Dollar Index (DXY), extends the pessimism in the first half of the week and revisits the 98.60 region, or 2-day lows, on turnaround Tuesday.
US Dollar Index looks to Ukraine, Fed
The index is down for the second session in a row and fades further Monday’s bullish attempt to the 99.30 zone, always against the backdrop of persistent appetite for the risk complex and hopes of a diplomatic solution to the Russia-Ukraine conflict.
The daily pullback in the greenback also comes pari passu with the so far corrective move in US yields across the curve, as the recent selloff in cash markets around the world seems to be taking a breather on Tuesday.

While the geopolitical landscape remains almost unchanged, all the attention is expected to remain on another round of peace talks between officials of both countries later in the day.
In addition, cautiousness among investors is seen on the rise, as the Federal Reserve’s 2-day meeting kicks in later on Tuesday.
In the US data space, February’s Producer Prices are due seconded by TIC Flows for the month of January.
What to look for around USD
The index sees some correction from recent peaks in response to the mild optimism surrounding the Russia-Ukraine peace dialogue along with the moderate persistence of the sentiment towards the risk-associated space. However, the leg lower in the buck is deemed as temporary amidst the current uncertain context around the war in Ukraine, while bouts of risk aversion should prop up inflows into the safe havens and lent legs to the dollar at the same time. Also supportive of the stronger buck appears the current elevated inflation narrative, the start of the Fed’s normalization of its monetary conditions later this week and the solid performance of the US economy.
Key events in the US this week: Producer Prices, TIC Flows (Tuesday) – Retail Sales, Business Inventories, NAHB Index, FOMC Meeting, Powell press conference (Wednesday) – Building Permits, Housing Starts, Philly Fed Index, Initial Claims, Industrial Production (Thursday) – CB Leading Index, Existing Home Sales (Friday).
Eminent issues on the back boiler: Escalating geopolitical effervescence vs. Russia and China. Fed’s rate path this year. US-China trade conflict. Futures of Biden’s Build Back Better plan.
US Dollar Index relevant levels
Now, the index is losing 0.32% at 98.77 and a break above 99.29 (high Mar.14) would open the door to 99.41 (2022 high Mar.7) and finally 99.97 (high May 25 2020). On the flip side, the next down barrier emerges at 97.71 (weekly low Mar.10) followed by 97.44 (monthly high Jan.28) and then 96.45 (55-day SMA).
- USD/CAD benefits from sliding oil prices despite risk-aversion, USD sell-off.
- USD/CAD bulls gain strength to test the critical daily resistance line at 1.2920.
- Daily RSI remains firmer above 50.00 while 21-DMA acts as strong support.
USD/CAD is extending its recovery into the second straight day this Tuesday, reversing the previous week’s sluggish performance.
The renewed strength in the major can be associated with the continued sell-off in oil prices, as markets remain hopeful for a truce in the Russia-Ukraine war.
Officials from both sides have been trying hard to achieve progress on their peace talks, although the ground realities appear different amid the ongoing missiles attacks on Kyiv.
Meanwhile, markets look to reposition ahead of the critical two-day Fed meeting, which begins later on Tuesday. A profit-taking slide is seen in the US dollar alongside the Treasury yields but the slump in oil prices is helping overcome the bearish pressures on the USD/CAD pair.
Technically, USD/CAD looks to extend its rebound from the bullish 21-Daily Moving Average (DMA) support, now at 1.2753.
In doing so, bulls target the two-month-old rising trendline resistance at 1.2920 on a clear break of the 1.2900 round level.
The 14-day Relative Strength Index (RSI) is pointing higher above the midline, underpinning the bullish potential.
USD/CAD: Daily chart
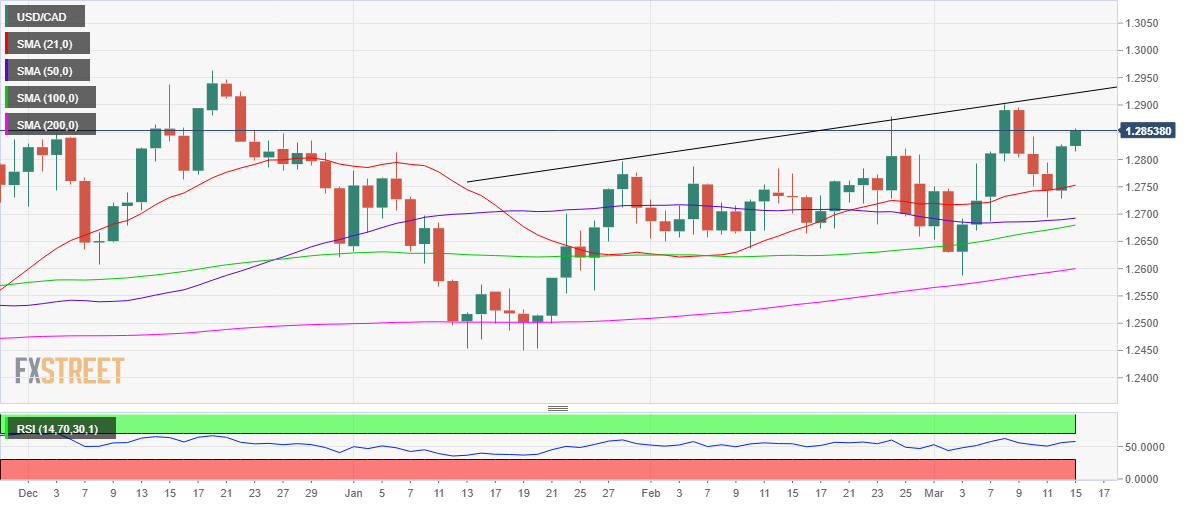
On the flip side, any retracement will test the daily lows of 1.2814, below which a sharp decline towards the 21-DMA will be in the offing.
A sustained break below the latter will bring strong support at 1.2692 in play. That is the ascending 50-DMA.
USD/CAD: Additional levels to consider
USD/JPY could attempt a visit to the 119.10 level once 118.65 is cleared, commented FX Strategists at UOB Group.
Key Quotes
24-hour view: “While we expected USD to ‘advance further’ yesterday, we were of the view that ‘overbought conditions suggest that 118.00 is likely out of reach for now’. We underestimated the upward momentum as USD soared to 118.21 before extending its advance after NY close. Conditions remain deeply overbought and while further USD strength is not ruled out, the chance for a break of the major resistance at 118.65 is not high for today. On the downside, a breach of 117.75 would indicate that the strong rally is ready to take a breather.”
Next 1-3 weeks: “We have expected a higher USD since late last week. In our latest narrative from yesterday (14 Mar, spot at 117.50), we highlighted that impulsive momentum suggests further USD strength. We added, “the next resistance level of note is at 118.00 followed by 2017 high near 118.65”. Our view was not wrong as USD surged to 118.21 during NY session before extending its gain. Overall, the current USD strength could continue for a while more and only a break of 117.30 (‘strong support’ level was at 116.40 yesterday) would indicate that the current strong upward pressure has eased. Looking ahead, a clear break of 118.65 would shift the focus to 119.10.”
“Russian forces are not currently trying to take Kyiv,” an adviser to the Ukrainian President Volodymyr Zelenskyy said on Tuesday.
“We are at a crossroads: either there will be agreement at talks or Russia will go on the offensive,” he said.
Separately, the European Commission releases a statement, citing that the European Union (EU) bans the rating of Russia and Russian companies by the EU credit rating agencies.
Market reaction
The encouraging headlines seem to have failed to lift the market mood, as investors turn their attention towards the Fed decision.
The S&P 500 futures lose 0.61% on a daily basis while AUD/USD is retreating below 0.7200.
- AUD/USD attracted some buying on Tuesday and reversed an early dip to over a two-week low.
- Retreating US bond yields prompted some USD profit-taking and extended support to the pair.
- The Russia-Ukraine crisis, Fed rate hike expectations should keep a lid on any meaningful gains.
The AUD/USD pair seesawed between tepid gains/minor losses through the early European session and was last seen trading with modest intraday gains, around the 0.7200 mark.
The pair attracted some buying near the 0.7165 region on Tuesday and for now, seems to have defended support marked by an upward sloping trend-line extending from the YTD low touched in January. China reported better-than-expected growth in retail sales, fixed-asset investment and industrial production data on Tuesday. This, along with the emergence of some US dollar selling, assisted the AUD/USD pair to stall its recent pullback from the vicinity of mid-0.74000s, or a near five-month high touched last week.
The USD downtick could be attributed to some profit-taking amid retreating US Treasury bond yields, though a combination of factors should help limit the downside. The market sentiment remains fragile in the wake of the risk of a further escalation in the Russia-Ukraine conflict and the latest COVID-19 outbreak in China. Apart from this, expectations for an imminent start of the policy tightening cycle by the Fed should act as a tailwind for the greenback and keep a lid on any meaningful recovery for the AUD/USD pair.
The markets seem convinced that the recent geopolitical developments might do little to hold back the US central bank from hiking its target funds rate to rein in inflationary expectations. This, in turn, was seen as a key factor that pushed the yield on the benchmark 10-year US government bond to its highest level since June 2019 on Monday and favours the USD bulls. Hence, the focus will remain glued to the outcome of a two-day FOMC policy meeting, scheduled to be announced during the US session on Wednesday.
In the meantime, traders might take cues from the US economic docket, featuring the release of the Producer Price Index and the Empire State Manufacturing Index later during the early North American session. The data, however, might do little to provide any meaningful impetus to the AUD/USD pair as investors will keep a close eye on the incoming headlines surrounding the Russia-Ukraine saga.
Technical levels to watch
Gold has given up gains off its recent march higher, to fetch a $2,070 high. Correction is the fancied assumption, according to Benjamin Wong, Strategists at DBS Bank, who maintains a bullish outlook while XAU/USD trades above the $1,850/16 area.
Gold fancies a decline towards a near-term head-and-shoulders bearish top’s target at $1,906
“On its weekly chart, gold’s inherent bull trait remains intact given the moving average convergence divergence (MACD) signal remains hoisted higher. However, there remains a watching vigil. The $2,075/70 peaks can turn out to be a double top should the price corrosion not be contained.”
“For now, at least from a weekly price perspective, gold remains bullish if it holds the $1,850/16 price zone. The former marks the drop from $1,992 at $1,850; trappings of a former neckline break and the latter hosts $1,816, a pivotal moving average level.”
“The move lower from $2,070 now takes the mould of a potential near head-and-shoulders top. This provides the backdrop for the corrective move to either motion towards the 61.8% retracement of the recent $2,070-$1,780 range grip measured at $1,891, or the head-and-shoulders pattern target calibrating $1,906.”
Hope that the talks between the Russian and Ukrainian negotiators might lead to an imminent and peaceful solution after all are supporting the euro. However, the shared currency is expected to remain under pressure as whereas the reversal in interest rates in the US is relatively certain this is still uncertain in the eurozone, economists at Commerzbank report.
The Fed is prepared to fight inflation now whereas the ECB is still hesitating
“No doubt a solution of the conflict and an end of the war would be positive for EUR. However, doubts as to how much EUR would be able to appreciate in the end are justified.”
“This week the US central bank is likely to fire the starting shot for its rate hike cycle, thus making it clear once again that a pretty large difference remains between the Fed’s and the ECB’s monetary policy. The US central bank is prepared to fight inflation now whereas the ECB is still hesitating. And that does not exactly point towards EUR appreciating against USD at present.”
European Central Bank (ECB) Governing Council member and Spanish central bank chief Pablo Hernandez de Cos said Tuesday, “Russian's invasion of Ukraine will have adverse consequences on economic activity and increase inflationary pressures.”
He added, “Russia’s invasion of Ukraine has increased uncertainty for the economic outlook in Europe and Spain” and that the “scenario will depend on length and severity of the conflict.”
Market reaction
EUR/USD is flirting with 1.1000, having hit daily highs at 1.1020 in the last hour. The spot is adding 0.56% on the day.
SEK, a key benchmark for Ukraine-related sentiment, has rebounded strongly on the back of peace-talks optimism. Still, more positive news on this front are needed to see the EUR/SEk pair trading below the 10.50 mark, economists at ING report.
Above expectation inflation read in Sweden
“The krona’s good momentum is linked to a hawkish re-pricing of Riksbank’s rate expectations, which were fuelled first by the ECB meeting last week and by yet another above-consensus CPI read in Sweden yesterday. With core CPIF inflation running at 3.4%, a hike by the Riksbank already in 2022 no longer appears as a remote possibility.”
“Still, 100bp of tightening is already in the price for the next 12 months, which means that more optimism on the Ukraine war will be needed for EUR/SEK to consistently trade below 10.50.”
See – EUR/SEK: Only in the course of 2023 will the krona make any further gains – Commerzbank
EUR/USD is back to being fully driven by sentiment around the Russia-Ukraine conflict. The pair has climbed back to 1.10 and should stabilize above here, shrugging off weak ZEW Survey from Germany, economists at ING report.
Grim ZEW should have little impact
“Markets appear to be taking a relatively sanguine approach when it comes to ongoing peace talks despite no signs of de-escalation, and have continued to gradually price some geopolitical risk out of commodities and European currencies.”
“Today, some focus will also be on data in the eurozone, with the German ZEW set to show a very significant contraction given the impact of the war and high energy prices. Still, this should not itself prevent a move back above 1.10 in EUR/USD today, given the ECB’s rhetoric that fighting inflation now matters more than growth considerations.”
The Bank of England (BoE) monetary policy decision is unlikely to lift the pound. Economists at OCBC Bank note that the GBP/USD is set to suffer substantial losses to 1.2850/00 on a break under 1.30.
BoE to exert limited positivity for the cable
“The BoE decision (Thu) should exert limited positivity for the pair.”
“With the pair flexing against the 1.30 support, do not rule out an eventual breach and a further extension towards the 1.2800/50 range.”
EUR/USD was last seen testing 1.10. The pair may gyrate within a wide 1.08 to 1.11 range pending the geopolitical headlines, economists at OCBC Bank report.
Potential for consolidation within the 1.08 to 1.11 range
“Geopolitics should still be the main driver for the EUR/USD. The outright negativity seems to have paused, with the focus shifting towards talks.”
“A near-term base at 1.08 could well be in place.”
“Potential for consolidation within the 1.08 to 1.11 range.”
GBP/USD trades in positive territory near 1.3050. The pair has shrugged off the upbeat UK employment data as remains at the mercy of the Ukraine crisis. Positive updates on this front could avoid a break under 1.30, economists at ING report.
Jobs data endorse BoE hike
“This morning’s UK jobs report for the month of February continued to signal tightness in the labour market and accelerating wage-growth dynamics, which support the prospect of another hike by the BoE on Thursday. A 25bp hike was already fully priced in by the market, so the jobs data had no positive impact on GBP this morning.”
“The pound is set to remain entirely driven by sentiment on the Russia-Ukraine war, where the recent optimism can help GBP/USD avert a break below the key 1.30 support but will likely continue to put upward pressure on EUR/GBP, given the euro’s higher beta to the conflict.”
The US Dollar Index (DXY) is down 0.3% below 99.00 as takes a breather ahead of the 100 level. Nonetheless, DXY is unlikely to extend its losses below the 97.50 mark, economists at Westpac report.
DXY weakness unlikely to extend beyond the mid-97s
“Looks like it wants to pause for breath just in front of 100, but the ongoing Russia-Ukraine war, renewed questions about China recovery momentum amid fresh lockdowns and a hawkish Fed should keep DXY bid this week.”
“The Fed will stay the course despite Ukraine uncertainty, with a +25bp hike (and couple hawkish dissenters), a revised dot plot showing 5-6 hikes this year and hawkish messaging.”
“DXY weakness likely does not extend beyond the mid-97s, 100+ looks more likely than not in coming weeks.”
The war in Ukraine will have significant indirect effects on Asian economies via a sharp rise in commodity prices. The region is bracing for higher energy prices, which will hurt from a number of angles, with the Indian rupee and Thai bath looking the most vulnerable currencies, in the view of economists at TD Securities.
Asia bracing for the fallout
“The surge in oil prices will likely result in worsening current accounts, higher inflation, and fiscal pressures. We expect this to negatively impact INR and THB in particular. PHP and IDR will also be vulnerable to a lesser extent. CNY, SGD, KRW and MYR look to be in better shape.”
“Singapore's hit to its current account from higher energy prices can easily be absorbed while India, Thailand and Philippines would be more at risk.”
“Most of EM-Asia is likely to see a hit to GDP growth from higher oil prices, with Thailand and India more vulnerable. Inflation could also rise acutely in Indonesia, China and Thailand.”
- GBP/USD staged modest recovery from the 1.3000 mark, or the lowest level since November 2020.
- The emergence of some USD selling, upbeat UK jobs data remained supportive of the positive move.
- The Ukraine crisis held back bulls from placing aggressive bets ahead of the FOMC/BoE meetings.
The GBP/USD pair held on to its modest intraday gains through the early European session and was last seen trading near the daily high, just below mid-1.3000s.
The pair continued showing some resilience and attracted some buying near the 1.3000 mark on Tuesday, snapping three successive days of the losing streak to the lowest level since November 2020. The uptick was sponsored by the emergence of some US dollar selling and was further supported by better-than-expected UK monthly employment details.
In fact, the UK Office for National Statistics (ONS) reported that the jobless rate fell to 3.9% in January as against a dip to 4.0% anticipated from the 4.1% in the previous month. Adding to this, the number of people claiming unemployment-related benefits fell by 48.1K in February when compared to -31.9K booked previously.
The data reaffirmed market expectations that the Bank of England will hike interest rates at its upcoming meeting on Thursday and underpinned the British pound. The GBP/USD pair, however, lacked bullish conviction as the market sentiment remains fragile amid the risk of a further escalation in the Russia-Ukraine conflict.
Apart from the geopolitical risks, growing acceptance about an imminent start of the policy tightening cycle by the Fed and the recent surge in the US Treasury bond yields should benefit the buck. This, in turn, warrants some caution for aggressive bullish traders and before positioning for any further appreciating move for the GBP/USD pair.
Investors might also prefer to wait on the sidelines heading into the key central bank event risks. The Fed is scheduled to announce the outcome of a two-day policy meeting on Wednesday, which will be followed by the BoE decision on Thursday. This will play a key role in determining the next leg of a directional move for the GBP/USD pair.
Technical levels to watch
Here is what you need to know on Tuesday, March 15:
The dollar is struggling to find demand early Tuesday as markets assess the latest Russia-Ukraine headlines and the implications of surging coronavirus cases in Asia. Later in the day, January Industrial Production data from the euro area, ZEW Survey from Germany and the February Producer Price Index (PPI) from the US will be watched closely by investors.
Despite the upbeat Retail Sales and Industrial Production data from China, the Shanghai Composite Index lost nearly 5% on Tuesday as the entire Jilin province and the technology centre Shenzen went into lockdowns due to a record number of coronavirus cases.
On a positive note, Ukrainian President Volodymyr Zelenskyy's adviser said that they were expecting to reach a peace agreement with Russia within a couple of weeks at the earliest or in May at the latest. Nevertheless, US stock index futures are down nearly 0.5% in the early European session and the 10-year US Treasury bond yield is falling 1.5% at 2.1%. Although these market developments point to a risk-averse environment, the US Dollar Index is down 0.3% below 99.00 and the barrel of West Texas Intermediate (WTI) is losing more than 4% at $98.00.
EUR/USD closed the first day of the week little changed near 1.0900 and gained traction early Tuesday. The pair was last seen testing 1.1000.
GBP/USD trades in positive territory near 1.3050. The data published by the UK's Office for National Statistics revealed that the ILO Unemployment Rate declined to 3.9% in three months to January from 4.1%.
Gold registered large losses on Monday and stays under heavy bearish pressure on Tuesday. XAU/USD was last seen losing nearly 1% on a daily basis at $1,935.
Despite the broad-based dollar weakness, USD/CAD is clinging to modest daily gains near 1.2850 as falling crude oil prices make it difficult for the commodity-sensitive loonie to find demand.
USD/JPY reached its highest level since January 2017 at 108.44 during the Asian trading hours on Tuesday but reversed its direction. Pressured by retreating US T-bond yields, the pair trades below 118.00 in the early European session.
Bitcoin rose nearly 5% on Monday but turned south on Tuesday after failing to reclaim $40,000. Ethereum staged a rebound on Monday but failed to hold above $2,600. ETH/USD was last seen falling toward $2,500, losing more than 2% on the day.
CNY fixing has been set sharply weaker over recent days, suggesting that the People’s Bank of China (PBoC) is increasingly concerned about CNY strength. Prospects for more aggressive steps to weaken the currency are growing and the near-term outlook for CNY/CNH is worsening, economists at TD Securities.
PBoC increasingly concerned about CNY strength amid weaker growth momentum
“We continue to expect cuts in the Loan Prime Rate (LPR) and Reserve Requirement Ratio (RRR) in the weeks ahead as growth loses momentum.”
“We note that the CNY fixing has been set sharply weaker over recent days, suggesting that the PBoC is increasingly concerned about CNY strength at a time of weaker growth momentum.”
“The prospects for more aggressive steps to weaken the currency are growing and the near-term outlook for CNY/CNH is worsening.”
The kiwi remains on the skids; it is feeling the pinch of softer commodities, weaker Asian equities and higher US yields. Failure to hold the 0.6775 opens the door to further weakness, according to economists at ANZ Bank.
Markets remain very skittish and more volatility seems likely
“The drivers appear to be softer commodity prices, late weakness in US equities, and Chinese economic growth concerns, all of which has knocked the AUD too. So, the week hasn’t gotten off to a good start for the kiwi, and although there is some domestic data coming up this week (which should be pretty good and which we think might be more influential) global events continue to dominate sentiment.”
“Technically, the break of 0.6775 doesn’t bode well, and the sharp rise in US bond yields might keep the USD bid.”
“Markets remain very skittish and more volatility seems likely.”
“Support 0.6540/0.6715 Resistance 0.6875/0.6995/0.7105”
In recent weeks, the Swedish krona has suffered strongly from the increased risk aversion in the wake of the Ukraine conflict. Once the war events subside, the SEK should be able to correct the losses. However, as long as the Riksbank maintains its ultra-expansionary stance, the krona will not be able to make any additional gains until 2023, economists at Commerzbank report.
Bringing up the rear thanks to risk aversion and Riksbank
“If the Ukraine conflict subsides, the krona could at least recover the losses associated with risk aversion. But it is likely to have a hard time against the euro this year, as the ECB is expected to raise the key interest rate in the fall.”
“The krona could appreciate again only well into next year when the Riksbank is likely to slowly make its monetary policy somewhat less expansionary.”
- Gold lost ground for the third straight day and dropped to over a one-week low on Tuesday.
- Hopes for diplomacy in Ukraine undermined the safe-haven metal amid surging US bond yields.
- Expectations for the start of the policy tightening by the Fed should now act as a headwind.
Gold extended its recent sharp pullback from the vicinity of the all-time high, around the $2,070 area touched last week and witnessed heavy selling for the third successive day on Tuesday. This also marked the fourth day of a negative move in the previous five and dragged spot prices to a one-and-half-week low, around the $1,925 region in the last hour. Hopes for progress in the Russia-Ukraine ceasefire talks and a diplomatic solution to end the war dampened the precious metal's safe-haven appeal. In fact, Russian and Ukrainian delegations held the fourth round of negotiations on Monday and the discussions are due to resume on Tuesday.
Adding to this, the recent strong rally in the US Treasury bond yields was seen as another factor driving flows away from the non-yielding XAU/USD. The markets seem convinced that the Fed will confirm an imminent start of the policy tightening cycle and hike its target funds rate to combat stubbornly high inflation. This, in turn, pushed the yield on the benchmark 10-year US government bond to its highest level since June 2019. Hence, the market focus will remain on the outcome of a two-day FOMC monetary policy meeting, scheduled to be announced on Wednesday. This will influence the USD in the near term and provide a fresh impetus to the dollar-denominated gold.
In the meantime, traders will take cues from the incoming geopolitical headlines amid the risk of a further escalation in the Russia-Ukraine conflict. In fact, Russia attacked a large Ukrainian base near the border with NATO member Poland on Sunday. Adding to this, a Kremlin spokesperson said on Monday that all the plans of Russia in Ukraine will be fulfilled in full and in the time frames outlined. The data, however, might do little to provide any meaningful impetus as investors are likely to keep a close eye on fresh developments surrounding the Russia-Ukraine saga.
Technical outlook
From a technical perspective, the XAU/USD has now dropped to the 50% Fibonacci retracement level of the $1,780-$2,070 strong move up to the multi-year high. Some follow-through selling will suggest that the markets have already started looking past the initial shock at Russia’s invasion of Ukraine and set the stage for further losses. Gold could then accelerate the decline towards testing sub-$1,900 levels - support marked by the 61.8% Fibo. level. This is followed by support near the $1,875 region, which if broken decisively will shift the near-term bias in favour of bearish traders.
On the flip side, the $1,948-$1,950 region now seems to act as an immediate resistance ahead of the 38.2% Fibo. level, around the $1,960 area. Sustained strength beyond has the potential to push gold back towards the key $2,000 psychological mark. The latter coincides with the 23.6% Fibo. level, above which the metal seems all set to resume its upward trajectory and jump towards the next relevant hurdle near the $2,048-$2,050 region.
Gold daily chart
-637829257308208337.png)
Key levels to watch
Open interest in natural gas futures markets rose for the third straight session on Monday, now by around 1.5K contracts according to advanced prints from CME Group. Volume, instead, shrank for the fourth consecutive day, this time by around 48.2K contracts.
Natural Gas remains supported by $4.40
Monday’s pullback in prices of natural gas was in tandem with rising open interest, indicative that further decline could be in the pipeline in the very near term. However, the moderate drop in volume could slow the pace of the downtrend. That said, natural gas prices still remain well contained by the 200-day SMA near the $4.40 region per MMBtu.
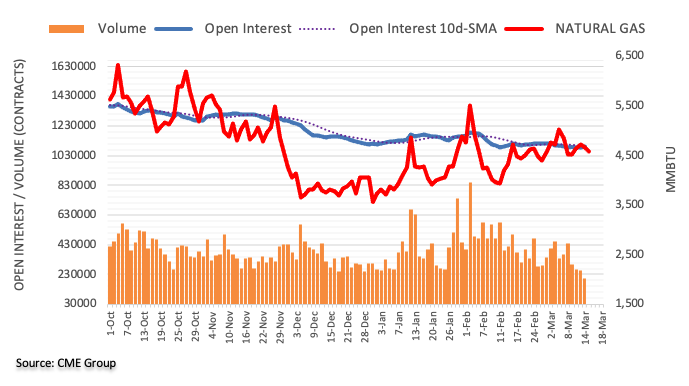
- The Unemployment Rate in the UK dropped to 3.9% in January.
- UK Claimant Count Change arrived at -48.1K in February.
- The UK wages excluding bonuses rose to 3.8% YoY in January vs. 3.7% expected.
The Office for National Statistics (ONS) showed on Tuesday, the UK’s official jobless rate arrived at 3.9% in January vs. the previous 4.1% and 4.0% expected while the claimant count change showed a bigger than previous drop last month.
The number of people claiming jobless benefits fell by 48.1K in February when compared to -31.9K booked previously. The claimant count rate came in at 4.4% last month vs. 4.6% prior.
The UK’s average weekly earnings, excluding bonuses, arrived at 3.8% 3Mo/YoY in January versus +3.7% last and +3.7% expected while the gauge including bonuses came in at 4.8% 3Mo/YoY in January versus +4.3% previous and +4.6% expected.
Key points (via ONS)
There were 275,000 more people in payrolled employment in February 2022 when compared with January 2022.
The UK vacancies hit record high of 1.318 mln in three months to Feb, underscoring the labor shortage facing many employers.
GBP/USD reaction
GBP/USD is fading its rebound despite the upbeat UK employment data.
The spot was last seen trading at 1.3035, up 0.27% on the day.
About UK jobs
The UK Average Earnings released by the Office for National Statistics (ONS) is a key short-term indicator of how levels of pay are changing within the UK economy. Generally speaking, the positive earnings growth anticipates positive (or bullish) for the GBP, whereas a low reading is seen as negative (or bearish).
Gold price is heavy so far this Tuesday’s trading, meandering near weekly lows below $1,940 amid a mixed market mood. Focus is on Tuesday’s close as the yellow metal breaches critical daily support levels, eyeing monthly lows near $1,900, FXStreet’s Dhwani Mehta reports.
Ukraine crisis, hawkish Fed expectations to underpin the DXY, down gold price
“The ongoing uptrend in the US Treasury yields keeps the bearish pressures intact on the non-interest-bearing gold. Hawkish Fed’s expectations underpin the global borrowing costs while lending support to the US dollar.”
“The Russia-Ukraine war is likely to come to end by early May, according to the Ukrainian Presidential adviser Oleksiy Arestovich. The uncertainty amid prolonged diplomatic talks will leave investors scurrying for safety in the greenback while exerting downward pressure on gold.”
“A daily closing below the $1,955 critical daily trendline support will open doors for a drop towards the March lows of $1,902 should the 21-DMA at $1,934 give way on a sustained basis.”
“Recapturing the trendline support now resistance at $1,955 is critical to initiating a meaningful recovery towards the $2,000 mark. The next relevant stop for bulls is seen at the March 10 highs of $2,009. Further up, a fresh upswing towards the psychological level of $1,950 cannot be ruled out.”
See – Gold Price Forecast: XAU/USD vulnerable to a more hawkish Fed – TDS
- Platinum prices remain on the back foot around one-month low, marked earlier in Asia.
- Clear break of a three-month-old ascending trend line keep sellers hopeful.
- 61.8% Fibonacci retracement adds to the downside filters.
Platinum (XPT/USD) bounces off the monthly bottom while picking up bids near $1,030 heading into Tuesday’s European session.
Even so, the precious metal holds onto the previous day’s downside break of an ascending trend line from December 2021, around $1,058 at the latest.
Adding strength to the downside bias are the bearish MACD signals and a clear U-turn from the 21-DMA.
That said, the latest XPT/USD downside eyes the 200-DMA level of $1,010. However, the 61.8% Fibonacci retracement (Fibo.) of December 2021 to March 2022 upside, near $1,006 and the $1,000 threshold will challenge the bullion bears afterward.
Meanwhile, corrective pullback need not only cross the support-turned-resistance line around $1,058 but also the 21-DMA level of $1,080 to recall the platinum bulls.
Following that, the $1,100 round figure and February’s high near $1,130 may offer intermediate halts during the run-up to the monthly peak of $1,182.
Platinum: Daily chart
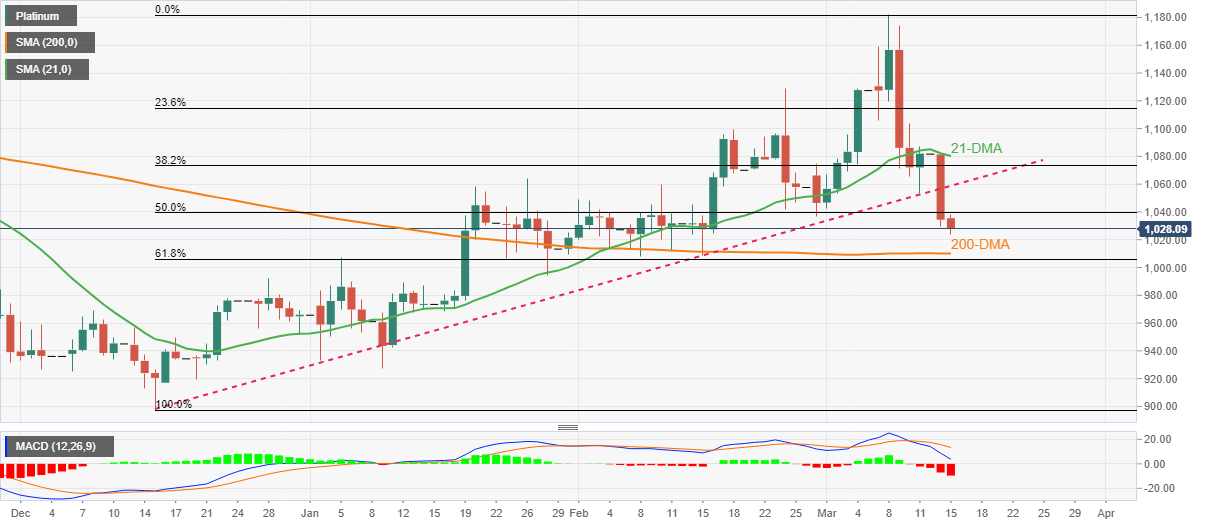
Trend: Further weakness expected
FX option expiries for March 15 NY cut at 10:00 Eastern Time, via DTCC, can be found below.
- EUR/USD: EUR amounts
- 1.0880-85 521m
- 1.0900 437m
- 1.0935-45 1.6b
- 1.0965 408m
- 1.1100 1.3b
- GBP/USD: GBP amounts
- 1.3050 498m
- USD/JPY: USD amounts
- 115.60 412m
- 116.00 1.6b
- 117.25 545m
- USD/CHF: USD amounts
- 0.9355 500m
- AUD/USD: AUD amounts
- 0.7050 1.2b
- USD/CAD: USD amounts
- 1.2730 360m
- 1.2860-65 750m
NZD/USD risks a potential drop to the 0.6700 level in the next weeks, suggested FX Strategists at UOB Group.
Key Quotes
24-hour view: “Yesterday, we highlighted that NZD ‘could dip below 0.6770 but is unlikely to threaten the major support at 0.6740’. Our view turned out to be correct as NZD dropped to a low of 0.6745 during late NY hours. While downward momentum has not improved by much, NZD could weaken further. That said, the major support at 0.6700 is unlikely to come into the picture (minor support is at 0.6725). Resistance is at 0.6770 followed by 0.6795.”
Next 1-3 weeks: “We have expected NZD to consolidate and trade between 0.6740 and 0.6900 since last Wednesday (09 Mar, spot at 0.6815). After trading sideways for a few days, NZD dropped to a low of 0.6745 yesterday. Shorter-term downward momentum is beginning to improve and NZD is likely to trade with a downward bias towards 0.6700. A break of 0.6700 would shift the focus to 0.6660. The downward bias is intact as long as NZD does not move above 0.6810 (‘strong resistance’ level).”
- USD/CHF grinds higher to renew multi-day top amid sluggish markets.
- Fears over Ukraine-Russia war eases amid signs of peace ahead of May.
- China’s covid woes, hopes of faster monetary policy tightening test risk-on mood.
- Second-tier Swiss data, US PPI may entertain traders but risk catalysts are important for fresh impulse.
USD/CHF extends a four-day uptrend towards poking April 2021 peak ahead of Tuesday’s European session. In doing so, the quote rises to the 0.9400 mark, up 0.13% intraday by the press time.
The risk barometer pair initially cheered hints from Ukraine that the Moscow-Kyiv tussles will be over by May. The cautious optimism gained support from the restart of the peace talks, after Monday’s abrupt halt, as well as comments from US Senator Marco Rubio who said, “Russia does not have the morale, manpower to take Kyiv at present,” suggesting a sooner end to the geopolitical crisis.
Furthermore, the European Union (EU) regulators’ rejection to ban bank payouts over Ukraine also underpins the market’s mildly positive sentiment, which in turn propels USD/CHF prices.
It’s worth noting that the multi-month high US Treasury yields are an extra factor in favor of the USD/CHF bulls.
However, worsening virus conditions in China and Russia’s readiness to achieve their goals in Ukraine in full suggests darker days are ahead.
Amid these plays, the US 10-year Treasury yields rose to the fresh high since June 2019 before the latest retreat to 2.14% whereas the 5-year coupon, on the other hand, refreshed 34-month high ahead of stepping back to 2.098% at the latest. It’s worth noting that the stock futures in the US and Europe also print mild gains at the latest.
Looking forward, Swiss Producer and Import Prices for February, expected to ease to 5.1% from 5.4% prior, will precede the US Producer Price Index (PPI) for the said month, expected to refresh multi-day high with 10.0% YoY figures, versus 9.7% prior, to give immediate directions. Though, headlines concerning Russia, China and the US Federal Reserve (Fed) will be more important for fresh impetus.
Technical analysis
A clear upside break of the 0.9370-75 key hurdle, comprising highs marked during early March 2021 and November the last year, keeps USD/CHF buyers directed towards the 2021 peak of 0.9472.
CME Group’s preliminary readings for crude oil futures markets noted traders scaled back their open interest positions by around 14.7K contracts at the beginning of the week. Volume followed suit and went down for the third session in a row, this time by around 39.2K contracts.
WTI: Door open to a test of $90.00
Prices of the WTI resumed the downside on Monday. The downtick was accompanied by diminishing open interest and volume, hinting at the idea that the continuation of the leg lower could lose some traction in the very near term. That said, the next support of note emerges at the $90.00 neighbourhood per barrel, levels prevailing before the start of the Russian invasion of Ukraine.
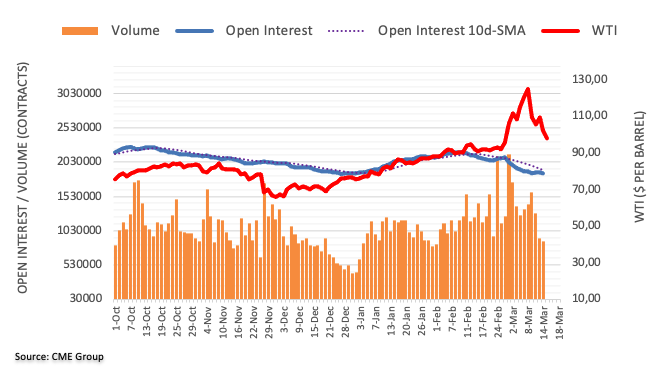
EUR/USD is exposed to downside risks, which could push it lower, analysts at Nomura said in their latest client note.
Key quotes
Three "types of exposure that risk pushing EUR lower: higher energy prices in a very Russian gas and oil-dependent Europe higher food prices the cost of sanctions for European banks.”
“Given these risks, we revise down the profile of our EUR/USD forecast to 1.08 in Q2 but with a stronger recovery likely from Q3 to 1.10, 1.14 by year-end 2022 and 1.20 by end-2023.”
“EUR support ahead would likely emerge from an easing of the Russia-Ukraine conflict, a possible Iran nuclear deal or OPEC output surprise that helps to stabilize energy prices, a shift towards more positivity on the euro area growth outlook and increased expectations of ECB monetary policy normalization (a hike in December goes ahead).”
“The negative risks for EUR include an extended geopolitical crisis that intensifies further into Q3, which could lead EUR/USD even closer towards parity of around 1.02-1.03 if we see fresh extremes in energy prices lead to factory closures.”
FX Strategists at UOB Group suggested a deeper retracement is on the cards in case GBP/USD breaks below the 1.3000 support in the next weeks.
Key Quotes
24-hour view: “Yesterday, we were of the view that ‘further GBP weakness would not be surprising and a break of 1.3000 seems likely’. However, the anticipated weakness did not break 1.3000 as GBP dropped to 1.3001 during late NY hours. While GBP could still edge below 1.3000, waning downward momentum coupled with oversold conditions suggests that a sustained decline is unlikely. The next support at 1.2950 is unlikely to come under threat. Resistance is at 1.3040 followed by 1.3075.”
Next 1-3 weeks: “There is not much to add to our update from yesterday (14 Mar, spot at 1.3045). As highlighted, GBP could breach 1.3000 and if it can close below this support, it is likely to trigger further weakness to 1.2900. Overall, the weak phase in GBP that started more than 2 weeks ago is intact as long as it does not move above 1.3140 (‘strong resistance’ level was at 1.3170 yesterday).”
Considering flash data from CME Group for gold futures markets, open interest shrank by around 8.3K contracts on Monday, partially reversing the previous day’s build. In the same line, volume dropped for yet another session, this time by around 170.6K contracts.
Gold: Further downside could retest $1900
Gold prices extended the downtrend at the beginning of the week amidst shrinking open interest and volume. Against that, a deeper pullback remains out of favour, while decent contention is seen around the monthly low at $1900 per ounce troy (March 1).
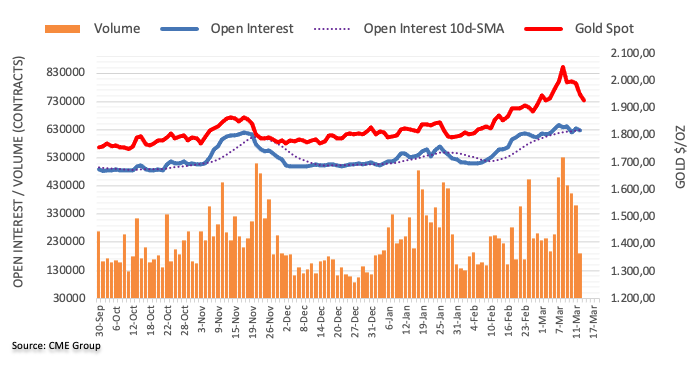
- USD/CAD is oscillating around 1.2830 but is likely to rebound amid falling oil prices.
- The DXY is drifted near 98.87 on rising uncertainty over the interest rate decision by the Fed.
- Apart from the Fed’s monetary policy, Canada's CPI numbers are also due on Wednesday.
The USD/CAD is oscillating in a narrow range of 1.2818-1.2827 on Tuesday but is likely to witness a fresh impulsive wave amid falling oil prices. The oil prices have plunged below the $100.00 mark, trading around $96.72, at the press time.
West Texas Intermediate (WTI) prices have witnessed an intensified selling from March 8 high at $126.51 after the OPEC cartel promised to be determined towards fixing the gap in the demand-supply mechanism. The OPEC promised to pump more oil into the total global supply after the US imposed sanctions on Russia post its invasion of Ukraine and other Western leaders decided to lower their dependency on Russian oil imports gradually. Apart from that, the Iran nuclear deal is likely to be released from sanctions as the think tank is looking for Russian oil substitutes aggressively.
Meanwhile, the US dollar index (DXY) has drifted below 99.00 ahead of the interest rate decision by the Federal Reserve. Investors are eyeing the extent of a rate hike by the Fed’s Chair Jerome Powell and stance over the monetary policies later this year. Fewer headlines from the Russia-Ukraine war have also brought some offers in the DXY and it slipped near 98.87, at the time of writing.
Although the headlines from the Russia-Ukraine war and the monetary policy dictation from the Fed will remain the major driver for the asset, investors will also focus on Canada’s Consumer Price Index (CPI) data, which is due on Wednesday. A preliminary estimate of Canada CPI numbers is 4.8%, higher than the prior figure of 4.3%.
- USD/JPY remains sidelined after rising to the fresh high since January 2017.
- Overbought RSI multiple hurdles to the north hints at a pullback.
- Previous resistance from early 2021, 78.6% FE restricts immediate downside.
USD/JPY seesaws around 118.30-35 heading into Tuesday’s European session, following the run-up to refresh the five-year high in early Asia.
The yen pair buyers seem to take a breather amid overbought RSI. However, the sellers aren’t likely to take the risk until the quote drops below a convergence of the resistance-turned-support from March 2021 and 78.6% Fibonacci Expansion (FE) of September-November 2021 moves, around 117.65-60.
Even so, the 61.8% FE and January 2022 tops, respectively near 116.50 and 116.35, will challenge the USD/JPY bears before highlighting the 100-DMA level of 114.65, also known as the last defense for the pair buyers.
Meanwhile, tops marked during 2017 guard the quote’s immediate upside around 118.65-70 ahead of the 100% FE level near 119.00.
In a case where the USD/JPY prices rally beyond 119.00, the odds of witnessing the 120.00 threshold on the chart can’t be ruled out.
USD/JPY: Daily chart
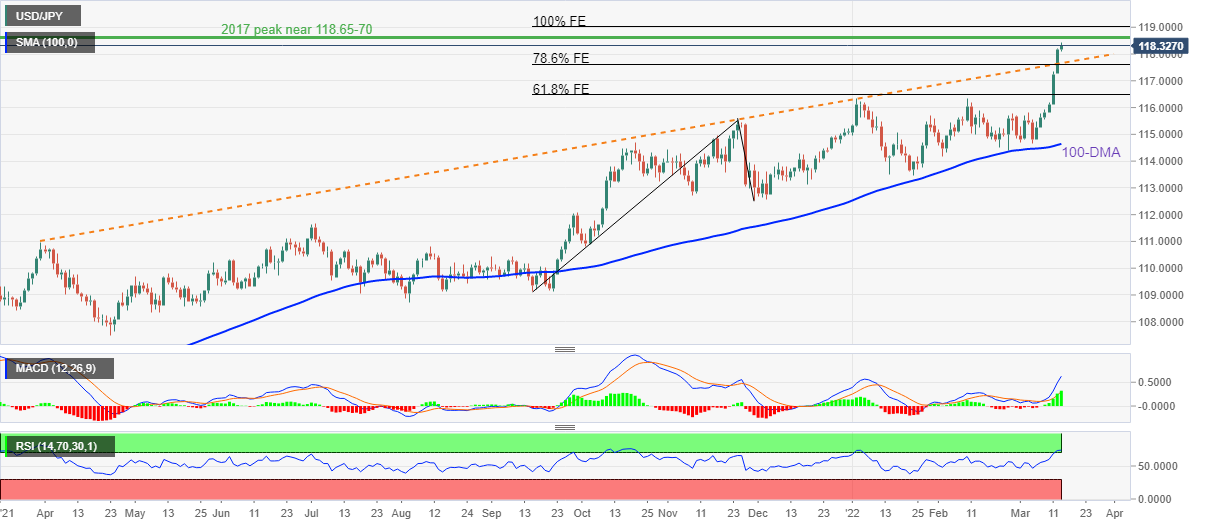
Trend: Bullish
In opinion of FX Strategists at UOB Group, EUR/USD is still seen within the 1.0870-1.1080 range.
Key Quotes
24-hour view: “We highlighted yesterday that ‘while downward momentum has not improved by much, there is scope for EUR to test the major support at 1.0870 before a recovery is likely’. However, EUR only dipped to 1.0899 before rebounding. Downward pressure has eased and the current movement is viewed as part of a consolidation. In other words, EUR is likely to trade sideways for today, expected to be within a range of 1.0900/1.1000.”
Next 1-3 weeks: “There is not much to add to our update from yesterday (14 Mar, spot at 1.0930). As highlighted, EUR is likely to trade sideways within a range of 1.0870/1.1080. Looking ahead, if EUR closes below 1.0870, it would likely revisit the major support at 1.0805.”
Andrea Enria, Chair of the European Central Bank’s (ECB) supervisory board, remains calm even though the European Union (EU) regulators have ruled out a blanket ban on bank dividends and share buybacks in response to the escalating Ukraine crisis, per the Financial Times (FT) on Tuesday.
Key takeaways
“Eurozone lenders, including some with sizeable Russian operations, are planning to pay tens of billions of euros to shareholders this year.”
“I’m not concerned by the overall ballpark of dividends and buybacks.”
“An increase in the percentage of earnings being paid out by the 115 banks the ECB supervises — to 50 percent now from around 45 percent before the Covid-19 crisis — included a “slight catch up” after missed payments during the pandemic.”
“As supervisors we look at individual banks’ capital trajectories.”
“Some banks may need to review their plans if those trajectories are affected by the Ukraine fallout.”
Related reads
- EUR/USD eyes to regain 1.1000 as Ukraine fears ebb ahead of ECB’s Lagarde
- Ukraine’s Presidential Adviser: War with Russia could be over by May
- GBP/JPY picks up bids to poke monthly high, up for the third consecutive day.
- Receding fears of Russia-Ukraine war joins firmer US Treasury yields to favor bulls.
- Hopes of firmer UK data, BOE’s rate-hike keep buyers hopeful ahead of February jobs report.
GBP/JPY rises to the highest levels since March 03, up 0.50% intraday around 154.40 heading into Tuesday’s London open. In doing so, the yen cross prints a three-day uptrend amid firmer US Treasury yields and cautious optimism in the market ahead of the UK’s monthly employment data.
US 10-year Treasury yields rose to the fresh high since June 2019 before the latest retreat to 2.14%. The 5-year coupon, on the other hand, refreshed 34-month high ahead of stepping back to 2.098% at the latest.
While the US T-bond yields portray the market’s firm belief that the Fed will rush for faster monetary policy tightening, stock futures in the US and Europe also printed mild gains amid expectations that Ukraine will have peace with Russia by May. Also adding to the market’s cautious optimism is the restart of the diplomatic negotiations that were halted abruptly the previous day.
On the contrary, escalating covid woes in China and Russia’s readiness to achieve all goals in full test the GBP/JPY buyers.
It’s worth noting that the traders’ view of a 0.25% rate hike by the Bank of England (BOE) also underpins the pair’s run-up. As per the latest reading of the CME’s BOEWatch Tool, 100% probability is favoring such a move.
For immediate directions, UK Claimant Count Change for February and ILO Unemployment Rate for three months to January will be crucial. However, risk catalysts gain major attention when it comes to yen pairs.
Read: When are the UK jobs and how could they affect GBP/USD?
Technical analysis
A clear upside break of a five-week-old trend, around 153.70 by the press time, directs GBP/JPY buyers towards the 50-DMA level surrounding 155.20.
- USD/TRY pair is oscillating in a narrow range of 14.78-14.84 after two indecisive candlesticks formation.
- The greenback bulls have pushed the asset above 50% Fibo retracement at 14.34.
- The RSI (14) is oscillating in a range of 60.00-80.00, which indicates an ongoing bullish trend.
The USD/TRY pair is oscillating in a narrow range of 14.78-14.84 on Tuesday after two consecutive indecisive candlestick formations.
On the daily scale, USD/TRY is trading in a neutral channel whose upper end is placed from January 3 high at 13.94 and the lower end is marked from January 31 low at 13.27. Recently, the major has extended its gains after overstepping the 50% Fibonacci retracement (placed from 20 December 2021 high at 18.37 to 23 December low at 10.25) at 14.34.
The pair is holding above the 30-period Exponential Moving Average (EMA) at 14.09, which adds to the upside filters.
The Relative Strength Index (RSI) (14) is oscillating in a range of 60.00-80.00, which indicates an ongoing bullish move in the asset.
For more upside, bulls need to violate Friday’s high at 15.07, which will drift the greenback bulls towards 16 December 2021 high at 15.75 and 20 December 2021 opening price at 16.60.
On the contrary, the Turkish lira bulls can drag the asset lower if the major slip below Monday’s low at 14.52. This will send the pair towards the 30-period EMA at 14.09 and further to 38.2% Fibo retracement at 13.38.
USD/TRY Daily chart
-637829194332672275.png)
- WTI sellers attack three-month-old support line while renewing fortnight low.
- MACD flashes the heaviest bearish signal since early December 2021, downside break of 21-DMA also favors sellers.
- Two-week-old horizontal area adds to the upside filters, 50-DMA lures bears.
WTI crude oil prices remain pressured around a two-week low near $96.70, down 3.8% intraday, heading into Tuesday’s European session.
In doing so, the black gold justifies the previous day’s downside break of the 21-DMA, as well as the MACD’s biggest bearish signal since December 03, 2021.
However, an upward sloping trend line from December 20, 2021, around $95.20, challenges the energy bears.
Following that, the 50-DMA and 61.8% Fibonacci retracement (Fibo.) of December 2021 to March 2022 upside, respectively near $91.60 and $86.70, will lure the WTI bears.
On the contrary, the recovery moves need to cross the 21-DMA level of $100.20 before attacking a short-term horizontal hurdle near $106.90.
In a case where WTI bulls cross $106.90, the $115.00 and $122.00 may test the upside momentum ahead of the latest peak surrounding $126.50.
Overall, WTI crude oil prices are near decisive support while suggesting further downside.
WTI: Daily chart
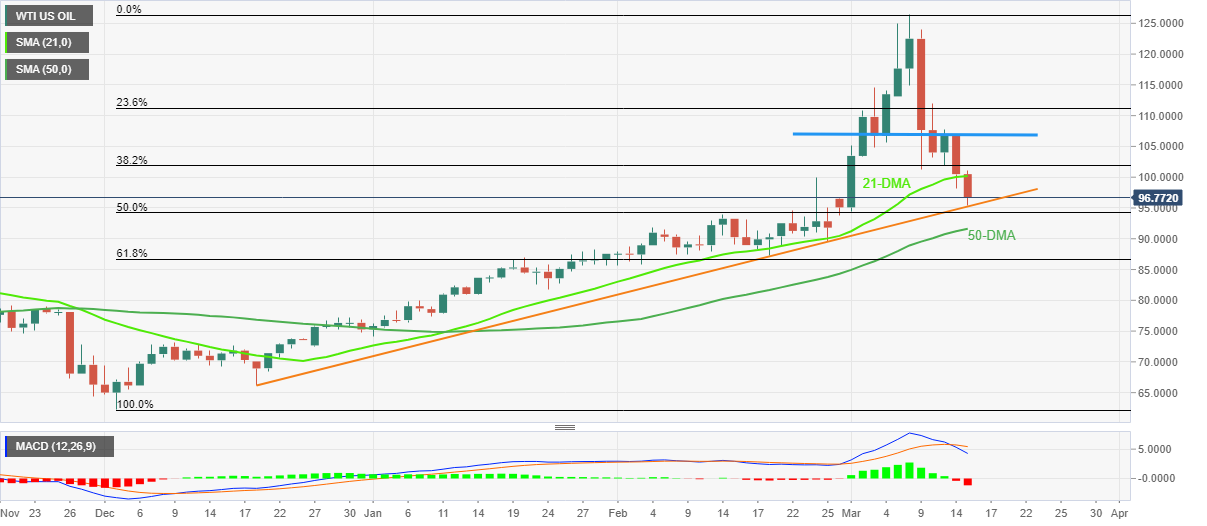
Trend: Further weakness expected
- Chinese equities plunge heavily on soaring Covid-19 cases in China.
- Japan’s Nikkie225 is positive around 0.4% amid a minute expansion in risk appetite.
- Gold prices, DXY, and US Treasury yields have tumbled ahead of the Fed’s interest rate decision.
Markets in the Asian domain are trading weak on Tuesday after soaring Covid-19 cases in China. The Chinese authority was required to resort to lockdown in Shenzhen city to contain the galloping cases of the Omicron variant.
Chinese equities have witnessed a carry-forward selling despite upbeat Retail Sales and Industrial Production numbers. China’s Retail Sales printed at 6.7% outperformed the preliminary estimates of 3% and prior print of 1.7%. While, the Industrial Production landed at 7.5%, improved significantly than the market consensus and previous print of 3.9% and 4.3% respectively. China A50 has plunged around 2.25%, at the press time.
Adding to that, the Peoples Bank of China has left its one-year Medium-term lending facility (MLF) rate unchanged against the expectation of a rate cut by 5 to 10 basis points (bps), which has also weighed on Chinese equities.
Meanwhile, Japan’s Nikkie225 is trading positive on a minute improvement in the risk appetite of investors. The US dollar index (DXY) is slipped below 99.00 while the Gold prices have tumbled near $1,940.
Going forward, markets are likely to remain subdued ahead of the monetary policy from the Federal Reserve (Fed), which is due on Wednesday. The street is expecting a rate hike by 25 basis points (bps) and an aggressive hawkish stance for the later monetary policies. The 10-year US Treasury yields retreat from 2.15% amid uncertainty over the monetary policy action from the Fed.
UK Jobs report overview
Early Tuesday, the UK’s Office for National Statistics (ONS) will release the February month Claimant Count figures together with the Unemployment Rate in the three months to January at 07:00 AM GMT.
Given the expectations of another rate hike by the Bank of England (BOE), coupled with the upbeat economic growth and inflation fears, today’s jobs report becomes crucial to recall the GBP/USD pair buyers. Also highlighting today’s employment numbers is the cable’s recent corrective pullback from a 16-month low.
The UK labor market report is expected to show that the average weekly earnings, including bonuses, in the three months to January, rise to 4.6% from the previous figures of 4.3%, while ex-bonuses, the wages are seen remaining intact around 3.7% during the stated period.
Further, the ILO Unemployment Rate is likely to ease to 4.0% from 4.1% for the three months ending in January. It’s worth noting that the Claimant Count Change figures may have to cross the -31.9K previous readings to keep buyers hopeful.
Deviation impact on GBP/USD
Readers can find FXStreet's proprietary deviation impact map of the event below. As observed the reaction is likely to remain confined around 20-pips in deviations up to + or -2, although in some cases, if notable enough, a deviation can fuel movements over 60-70 pips.
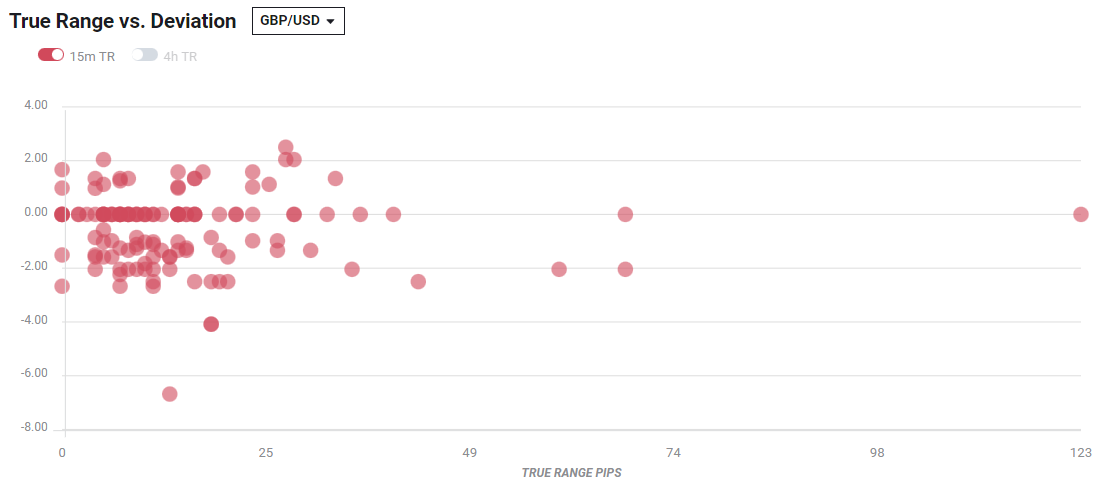
How could they affect GBP/USD?
GBP/USD cheers softer USD, as well as cautious optimism in the market, to portray a rebound from the lowest levels since November 2020 heading into Tuesday’s London open.
While the recent improvement in British economic growth and firmer inflation data keeps pushing the BOE towards more rate-hikes, today’s employment data need to stay in line to keep the GBP/USD buyers hopeful.
As a result, Westpac says, “The UK’s recovery should continue to edge the ILO unemployment rate lower in January (market forecast: 4.0%).
Even so, major attention is given to the Fed’s rate-hike and hence any disappointment from the UK’s jobs report will be enough to recall the GBP/USD bears.
Technically, the 1.3000 psychological magnet challenges short-term GBP/USD declines ahead of a downward sloping trend line from April 2020, around 1.2950 by the press time. However, recovery remains elusive until crossing 2021 bottom of 1.3160.
Key notes
GBP/USD eyes below 1.3000 on Russia-Ukraine war escalation amid China’s aid to Moscow
GBP/USD Price Analysis: Bulls on the sidelines, watching how the week plays out
About UK jobs
The UK Average Earnings released by the Office for National Statistics (ONS) is a key short-term indicator of how levels of pay are changing within the UK economy. Generally speaking, the positive earnings growth anticipates positive (or bullish) for the GBP, whereas a low reading is seen as negative (or bearish).
- USD/IDR remains on the back foot around intraday low.
- Indonesia Exports grew below expectations in February but Trade Balance came in upbeat.
- Cautious optimism in the market, USD pullback also weighs on the prices.
- Risk catalysts are more important for fresh impulse.
USD/IDR stays pressured around $14,310, after refreshing the daily low to $14,293, on better-than-previous Indonesia trade numbers during early Tuesday morning in Europe. Also supporting the pair sellers is the risk-on mood and the US dollar pullback amid a sluggish Asian session.
Indonesia Exports grew 34.14% versus 327.32% expected and 25.31% prior reading in February. However, the Imports eased below 40.04% market consensus and 36.77% previous readings to 25.43% during the stated month. Above all, Trade Balance rose to $3.82B from $1.66B expected and $0.93B prior.
It’s worth noting that the latest coal ban in Indonesia may have played a role to improve the latest trade numbers.
The IDR run-up could also be linked to the comments from Indonesian Finance Minister Sri Mulyani Indrawati, crossed wires during late Friday. “Indonesia is expecting an arduous economic recovery process along with a challenging transition from the Covid-19 pandemic to an endemic,” said the diplomat per Reuters’ news quoting the Tempo. co portal.
Additionally, the US dollar’s failure to extend the three-day uptrend and hopes of overcoming the Russia-Ukraine crisis by May also underpin the IDR strength.
However, covid woes from China and firmer US Treasury yields do challenge the USD/IDR sellers.
Moving on, USD/IDR traders should pay attention to the geopolitical and covid updates for fresh impulse ahead of the US Producer Price Index (PPI) for February, expected 10.0% YoY figures, versus 9.7% prior.
Technical analysis
A convergence of the 21-DMA and 50-DMA, around $14,350, restricts short-term upside moves of the USD/IDR prices.
- EUR/USD picks up bids to extend previous day’s rebound amid cautious optimism in the market.
- Yields renews multi-day top but fail to lift DXY amid market’s cautious optimism.
- EU Commission announced ore sanctions on Russia, Moscow showed readiness to pay Eurobond coupon.
- China’s covid updates, Ukraine-Russia peace talks and US PPI are extra catalysts to watch for fresh impulse.
EUR/USD holds onto the week-start rebound to renew daily high around 1.0980, up 0.33% intraday during very early Tuesday morning in Europe.
The pair’s latest run-up could be linked to the US dollar’s pullback amid hopes of overcoming the Ukraine-Russia crisis by May. In doing so, the major currency pair ignores firmer US Treasury yields, as worsening covid woes in China.
Early Asian session comments from an Adviser to Ukraine President Volodymyr Zelenskyy’s office, Oleksiy Arestovych, suggesting an end of a war with Russia latest by May triggered initial risk-on mood on Tuesday. The moves also gained support from US Senator Marco Rubio who said, “Russia does not have the morale, manpower to take Kyiv at present,” suggesting a sooner end to the geopolitical crisis. However, chatters surrounding cruise missile strikes in Kyiv seem to challenge the market sentiment, as well as the EUR/USD buyers.
Also on the risk-negative side is the latest jump in China’s covid counts that caused fresh lockdowns in multiple cities, recently near the capital Beijing. “Mainland China reported 3,602 new confirmed coronavirus cases on March 14, the national health authority said on Tuesday, compared with 1,437 a day earlier,” said Reuters.
It’s worth noting that the European Commission increased sanctions on Russia the previous day even as Moscow showed readiness to pay Eurobond coupon, although in either Russian ruble or Chinese yuan. On the other hand, the US warned that China is offering military help to Moscow.
Against this backdrop, the market remains cautiously optimistic as the stock futures from the US and Europe print mild gains whereas the US Treasury yields renew the highest level since 2019. However, the US Dollar Index (DXY) fails to cheer the firmer yields and keep EUR/USD sellers hopeful ahead of today’s key events.
Among them, the Ukraine-Russia peace talks will gain major attention as the same was halted without any information the previous day. Following that, the US Producer Price Index (PPI) for February and a speech from the European Central Bank (ECB) President Christine Lagarde will be important to watch for fresh impulse. The US PPI is expected to refresh multi-day high with 10.0% YoY figures, versus 9.7% prior, which in turn could test EUR/USD bulls by supporting faster rate-hikes by the Fed. On the other hand, ECB’s Lagarde may reiterate her cautious optimism and defend the latest policy moves of the Quantitative Tightening (QT).
Technical analysis
EUR/USD buyers need a clear upside break of the 200-HMA, surrounding 1.0975 at the latest, to regain the 1.1000 threshold. However, 61.8% Fibonacci retracement (Fibo.) of February 25 to March 07 downside, at 1.1095, will challenge the pair buyers afterward.
In order to cushion the economic blow from the Ukraine crisis, the Japanese government must compile a fresh stimulus package, Tatsuo Fukuda, an executive of Japan’s ruling Liberal Democratic Party (LDP), said at a news conference on Tuesday.
Key quotes
“Must take into account risk Japan’s economy may stagnate, slow due to rising inflation, shortage of labor, goods and supply.”
“There is chance Japan may suffer stagflation given rising inflation.”
“US, European central banks are embarking on rate hikes but BOJ cannot do so, which could affect forex moves.”
Market reaction
USD/JPY was last seen trading at 118.33, adding 0.14% on the day.
- USD/INR remains on the back foot for the second consecutive day.
- Hidden bearish divergence on RSI keeps pair sellers hopeful.
- Bulls need to overcome weekly horizontal region to retake control.
USD/INR sellers jostle with a short-term key support line around 76.45 during Tuesday’s Asian session.
In doing so, the Indian rupee (INR) pair justifies multiple failures to cross 76.75-80 horizontal area to print the second consecutive daily loss by the press time.
Other than the pullbacks from weekly resistance, hidden bearish RSI divergence also favor USD/INR sellers. The stated bearish RSI divergence occurs when prices make higher lows but the RSI fails to track the run-up, which in turn hints at traders’ disinterest in long positions.
That said, an upward sloping support line from late February limits the immediate downside of USD/INR around 76.43.
In a case where the quote remains bearish past 76.43, the 100-SMA and 200-SMA, respectively near 75.85 and 75.40, will be in focus.
Alternatively, an upside clearance of the aforementioned horizontal resistance area near 76.75-80 will trigger fresh advances targeting the 77.00 threshold.
It’s worth noting that the USD/INR run-up beyond 77.00 won’t hesitate to refresh the record high, currently around 77.17.
USD/INR: Four-hour chart
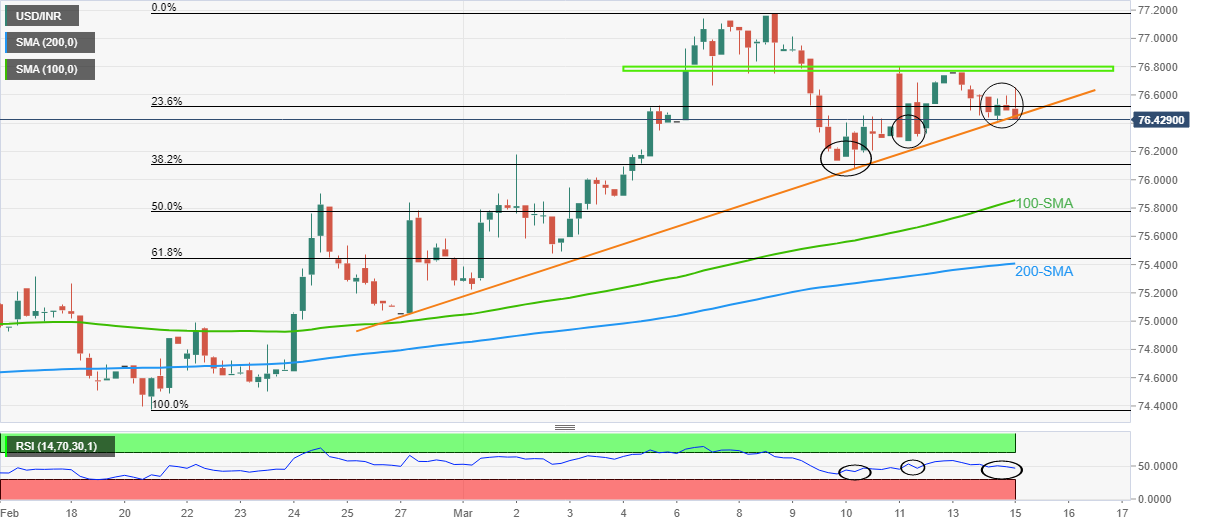
Trend: Further weakness expected
- USD/RUB steadies near 120.00 amid a minor plunge in the DXY.
- Ukraine officials are expecting a ceasefire in May after Russia will out of its resources.
- Unsold oil in Russia due to sanctions by the West is getting toxic for their economy.
The USD/RUB pair is oscillating around 120.00 after a minute sell-off in the US dollar index (DXY). The major has been volatile since the headline of Russia’s invasion of Ukraine and is continuously delivering wide ticks and volumes amid carnage in the Russian economy. The visibility of death and destruction in Ukraine President Volodymyr Zelenskyy’s area displays the crisis in Ukraine but one thing is for sure the stockpiles of oil in Russia is being toxic for the Russian economy.
Adding to that, the interest rates are at the rooftop in Moscow after the collapse of the SWIFT international payment system and galloping credit risk in their economy. Therefore, Russia is also facing a crisis, which may leave some serious dents on the financial condition of their economy for decades post the ceasefire.
Meanwhile, Oleksiy Arestovich, an adviser to the Ukrainian President's Chief of Staff said late Monday, the Russia-Ukraine war is expected to end by early May, per Reuters. Ukraine's authority believes that a war with Moscow will be over when the latter will be out of resources.
Earlier, the US claimed on request of military assistance to China by the Russian rebels and China’s willingness to bail out Russia against tough sanctions from the West. In response to that, ''The Chinese embassy in the US on Sunday said it had no knowledge of any Russian request or positive Chinese response to Moscow.
On the dollar front, the DXY has plunged below 99.00 amid a rebound in the risk-on market impulse. Risk-perceived assets are finding bids after a steady weakness while the appeal for safe-haven assets is modestly eased.
“Japan’s economy is still halfway in recovering from pandemic's impact,” a senior Bank of Japan (BOJ) official said in his speech on Tuesday.
Additional quotes
The expected rise in Japan’s inflation driven largely by energy costs, won't lead to a sustainable, steady rise toward BOJ’s 2% target.
BOJ will maintain powerful monetary easing as Japan’s wage, prices likely to remain subdued.
BOJ will scrutinize market impact of its policy.
Market reaction
The Japanese yen is recovering ground despite these dovish comments from the BOJ official, as the risk sentiment remains tepid amid surging covid cases in China and looming Ukraine risks.
USD/JPY is off the 118.44 highs, now trading at 118.31, adding 0.12% on the day.
- NZD/USD has rebounded from 0.6730 on the outperformance of Chinese macros.
- The DXY has tumbled below 99.00 amid a minute expansion in the risk appetite of investors.
- The market participants are waiting for the interest rate decision from the Fed to initiate fresh positions.
The NZD/USD pair has rebounded from 0.6730 as Chinese authorities post robust yearly Retail Sales growth for February. China’s Retail Sales print at 6.7% much higher than the market estimates of 3% and prior figure of 1.7%.
It seems that the antipodean has neglected the effect of sell-off in the Chinese equities, which has been witnessed this week amid rising Covid-19 cases in China. Moreover, galloping cases of the Omicron variant have forced the Chinese administration to lockdown Shenzhen city. Earlier, in response to the rising cases of Covid-19, Toyota announced a halt on manufacturing activities in China’s Changchun city, considering the COVID-19 shutdown measures while Foxconn suspended production at its iPhone site in Shenzhen city.
Apart from China’s Retail Sales data, Industrial Production numbers have also outperformed the prior figures. The yearly Industrial Production has landed at 7.5%, higher than the preliminary estimate and previous print of 3.9% and 4.3% respectively.
Meanwhile, the US dollar index (DXY) is slipped marginally below 99.00 after trading lackluster for the past few ticks. The DXY has attracted some offers amid a minute expansion in the risk appetite of investors. Global equities have rebounded sharply, which is clearly visible from a sharp reversal in the Chinese equities.
Well, a slippage in the DXY may be a temporary one as investors are waiting for the mega event of the Federal Reserve (Fed)’s monetary policy, which is due on Wednesday.
| Raw materials | Closed | Change, % |
|---|---|---|
| Brent | 105.95 | -3.52 |
| Silver | 25.04 | -2.86 |
| Gold | 1951.41 | -1.43 |
| Palladium | 2369.08 | -13.82 |
Ukraine’s Presidential Adviser: War with Russia could be over by May
more to come ....
- AUD/USD bears took a breather around two-week low on upbeat China data.
- China’s Retail Sales, Industrial Production favored NBS to praise economic growth for the first two months of 2022.
- Market sentiment dwindles amid covid woes from Beijing, indecision over Russia-Ukraine crisis.
- Yields stay firmer around multi-day top, equities dwindle but commodities, DXY remains on the back foot.
AUD/USD consolidates intraday losses while taking a U-turn from the lowest levels in two weeks, marked before a few minutes. That said, the Aussie pair picks up bids to 0.7185 at the latest on upbeat data from the largest customer China during Tuesday’s Asian session.
China’s Retail Sales rallied 6.7% YoY in February, crossing 3.0% market forecasts and 1.7% prior. Further, the Industrial Production (IP) also rose past 3.9% expected and 4.3% previous readouts with 7.5% YoY readings. Following the release, China’s National Bureau of Statistics (NBS) said, “National economy recovered better than expectation in the first two months of 2022.”
Read: China’s Feb Retail Sales jump 6.7%, Industrial Output leaps 7.5% – big beat
Earlier in the day, the People’s Bank of China (PBOC) surprised marked by keeping the monetary policy unchanged.
Read: PBOC leaves its MLF rate unchanged, Chinese stocks selling off to lowest levels since 2016
However, escalating covid woes in China and indecision over the Moscow-Kyiv peace talks seem to challenge the AUD/USD buyers, due to its risk-barometer status.
With over 5,000 covid cases, China extends virus-led lockdowns in major cities. The latest one is near to the capital Beijing and hence raises market fears.
On the other hand, headlines from Ukraine have been promising as President Volodymyr Zelenskyy announced the restart of peace talks and his Adviser Oleksiy Arestovych hints at a peace agreement with Moscow by the latest May.
Elsewhere, hopes of the Fed’s 0.50% rate-hike during this week’s Federal Open Market Committee (FOMC) challenge AUD/USD buyers.
Against this backdrop, the S&P 500 Futures print mild gains while the US 10-year Treasury yields seesaw near the highest levels since July 2019, around 2.16% by the press time.
Moving on, risk catalyst will be important to watch for fresh impulse, with eyes on China and Russia-Ukraine crisis.
Technical analysis
A clear downside break of an upward sloping trend line from late January, around 0.7180 at the latest, joins bearish MACD signals to direct AUD/USD sellers towards the early January’s low near 0.7130 and the 0.7100 threshold.
Following the release of the January-February activity numbers, China’s National Bureau of Statistics (NBS) released a statement, via Reuters, expressing their take on the economy.
Key headlines
China's economy faces many risks and challenges, external environment complex and severe.
National economy recovered better than expectation in the first two months of 2022.
Momentum of China’s economic recovery sound in Jan-Feb.
Sees increasing positive changes in economic performance.
Foundation for economic recovery not solid yet.
Need to watch COVID-19’s impact on China’s economy.
Market reaction
AUD/USD is erased most losses to now trade flat at 0.7183 on the upbeat Chinese data and NBS comments.
China’s February Retail Sales YoY, arrived at 6.7% vs. 3.0% expected and 1.7% previous while Industrial Output YoY came in at 7.5% and 3.9% exp and 4.3% prior.
Meanwhile, the Fixed Asset Investment YoY leaps to 12.2% vs 5.0% expected and 4.9% last.
Additional details
China's economy created 1.63 mln new urban jobs in Jan-Feb.
China daily crude oil throughput in Jan-Feb hit lowest level since dec 2020.
China Jan-Feb private sector fixed-asset investment +11.4% YoY.
Market reaction
The Australian dollar cheers the big beat on the Chinese data, with the AUD/USD pair rebounding towards 0.7200. At the time of writing, the spot is trading at 0.7180, still down 0.10% on the day.
- USD/CNH refreshes five-month high during three-day uptrend on PBOC’s status-quo.
- PBOC refrains from rate-cut, renews medium-term loans during the latest policy meeting.
- Descending trend line from April 2021, 200-DMA challenge bulls amid overbought RSI.
- Previous resistance line, 100-DMA restricts short-term downside.
USD/CNH rises to the highest levels since late October following the People’s Bank of China’s (PBOC) status-quo during Tuesday’s Asian session. That said, the offshore Chinese yuan (CNH) currency pair rises 0.20% intraday around 6.4060 by the press time.
The PBOC surprised markets with no change in the benchmark rates but didn’t refrain from injecting liquidity.
Read: PBOC leaves its MLF rate unchanged, Chinese stocks selling off to lowest levels since 2016
With this, the USD/CNH prices stretched the previous day’s upside break of the 100-DMA and a descending trend line from July 2021 towards poking an 11-month-long resistance line around 6.4100.
Even so, the overbought RSI conditions challenge the pair buyers, as well as the 200-DMA level near 6.4115.
In a case where the USD/CNH prices rally beyond 6.4115, a rally towards the late 2021 peak of 6.4880 can’t be ruled out.
Meanwhile, pullback moves remain elusive until decline below the 6.3670-60 area comprising the previous resistance line and the 100-DMA.
Following that, the year 2021 low near 6.3300 may offer an intermediate halt during the south-run targeting February’s bottom of 6.3060 and the 6.3000 round figure.
USD/CNH: Daily chart
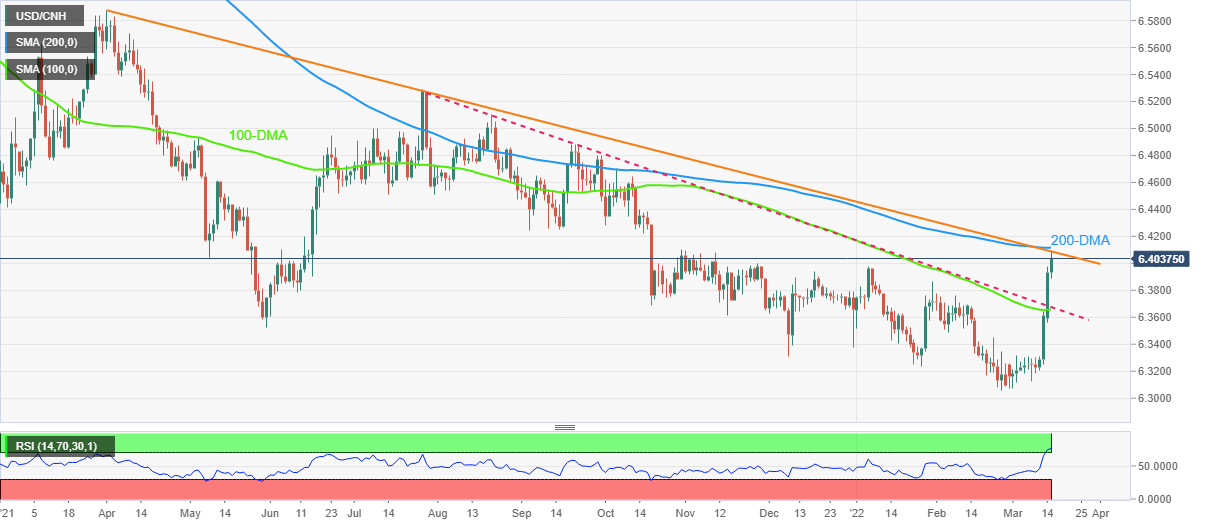
Trend: Pullback expected
The Peoples Bank of China has left its MLF rate unchanged which has weighed on Chinese stocks in the open as a 5 to 10 basis point cut was priced in.
China's central bank was expected to roll over maturing medium-term policy loans and cut borrowing costs for the second time this year, a Reuters poll showed on Monday, as the a fresh wave of coronavirus infections weighs on the broader economy.
Reuters reported that twenty-nine out of the 49 traders and analysts, or 59% of all participants, predicted a reduction to the interest rate on one-year medium-term lending facility (MLF) when the central bank is set to renew 100 billion yuan ($15.75 billion) worth of such loans on Tuesday.
Meanwhile, China’s government has ordered a province of 24 million people into lockdown as it tries to contain the new outbreak that has spread to multiple locations. The risk to markets is that the lockdowns could trigger shock waves across global supply chains.
At the time of writing, the Hang Seng Index is down 3.82%, marking the lest levels since 2016:
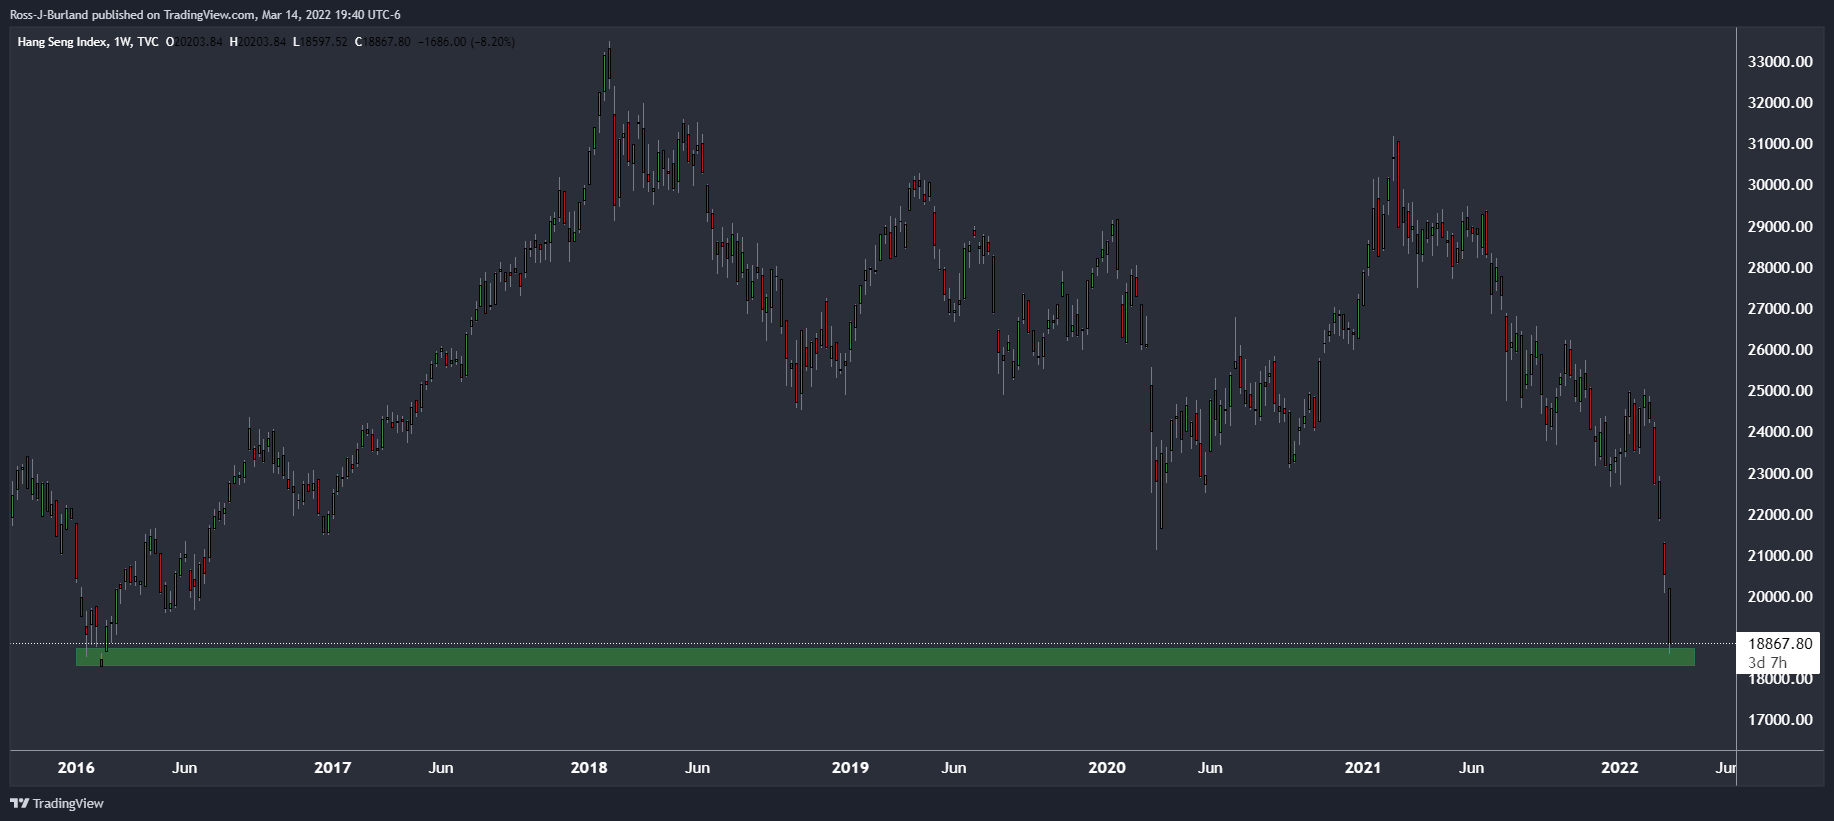
According to a majority of the economists polled by Reuters, the Bank of England (BOE) is expected to raise the bank rate by 25 basis points this Thursday.
Key takeaways
“The Monetary Policy Committee will add another 25 basis points to Bank Rate this week, taking it to 0.75% - its pre-pandemic level.”
“The Bank is expected to follow up this week's increase with another 25 basis point rise next quarter and a matching increase in Q3.”
“It will then raise Bank Rate to 1.50% early next year, the median showed, although that rate was picked by 15 of 44 economists while 21 saw it lower and eight higher. In February it wasn't expected to reach there until 2024.”
“Inflation was expected to peak at 7.7% next quarter, almost four times the Bank's 2% goal and a sharp upgrade from the 6.6% median given last month. It was expected to slow in following quarters but won't reach target until late 2023.”
“And 15 of 18 economists said it was likely or very likely they upgraded their medium-term inflation forecasts in the coming months. Only three said it was unlikely.”
“Following January's buoyant expansion this quarter's outlook was changed to 0.7% from 0.4% but the following quarters were all downgraded to 0.4% from last month's 0.9%, 0.6% and 0.6%.”
“Annual rates were also lowered with growth now pegged at 3.9% this year and 1.7% next, down from 4.3% and 2.1%.”
- Gold prices remain pressured around one-week low, prints three-day downtrend.
- Market struggle for clear direction in Asia as yields stabilize around multi-month high, Ukraine flashes signals on peace with Russia.
- Coronavirus conditions worsen in China, Langfang city near Beijing is locked down.
- Gold and other havens retreat amid Russia and Ukraine negotiations
Gold (XAU/USD) renews intraday low around $1,942, down 0.45% on a day, as COVID-19 fears of China add to the yellow metal’s latest weakness during Tuesday’s Asian session. Also favoring the bears are the mixed concerns over the Russia-Ukraine crisis as well as firmer US Treasury yields amid hopes of faster monetary policy tightening by the Federal Reserve (Fed).
That said, the yellow metal began the trading week on a negative side amid firmer US dollar and indecision over the Ukraine-Russia stand-off.
Having marked the biggest daily jump in covid infections, the latest virus numbers from China didn’t provide any relief. “Mainland China reported 3,602 new confirmed coronavirus cases on March 14, the national health authority said on Tuesday, compared with 1,437 a day earlier,” said Reuters. The dragon nation also announced a virus-led lockdown in Langfang city which is near to Beijing.
Elsewhere, Sputnik quoted an Adviser to Ukraine President Volodymyr Zelenskyy’s office, Oleksiy Arestovych, to raise expectations of a Moscow-Kyiv peace as early as two weeks or before late May. On the same line were the latest comments from Ukraine President Zelenskyy who said that the peace talks with Russia will continue on Tuesday, following an abrupt pause on Monday. However, reports of a Russian drone over Poland and sanctions on Moscow, as well as Russia-Belarus rejection to pay energy supplies in the USD, challenge the mood and weigh on the gold prices.
Amid these plays, the S&P 500 Futures pare early Asian session gain while the US 10-year Treasury yields seesaw near the highest levels since July 2019, around 2.14% by the press time.
Moving on, geopolitical and covid updates may entertain gold traders with immediate attention on China’s Retail Sales and Industrial Production for February, expected 3.0% and 3.9% YoY versus 1.7% and 4.3% respectively. Following that, US PPI and ECB President Lagarde’s speech will be important to watch for fresh intraday clues.
Technical analysis
Gold extends the previous day’s downside break of an ascending support line from early February towards a convergence of the 21-DMA and 38.2% Fibonacci retracement of September 2021 to March 2022 upside, around $1,935.
The bearish bias also gains support from the most downbeat MACD signals since the initial days of the last month, as well as the downward-sloping RSI line.
It’s worth noting, however, that a clear downside break of $1,935 will quickly direct XAU/USD bears towards the $1,900 threshold. Though, tops marked during November 2021, around $1,877, could challenge the metal sellers afterward.
On the contrary, recovery moves need to rise beyond the previous support line, around $1,952 by the press time.
Even so, the $2,000 threshold and $2,050 may challenge the gold buyers before directing them to the $2,070-75 area, comprising highs marked during late 2020 and this month.
Gold: Daily chart
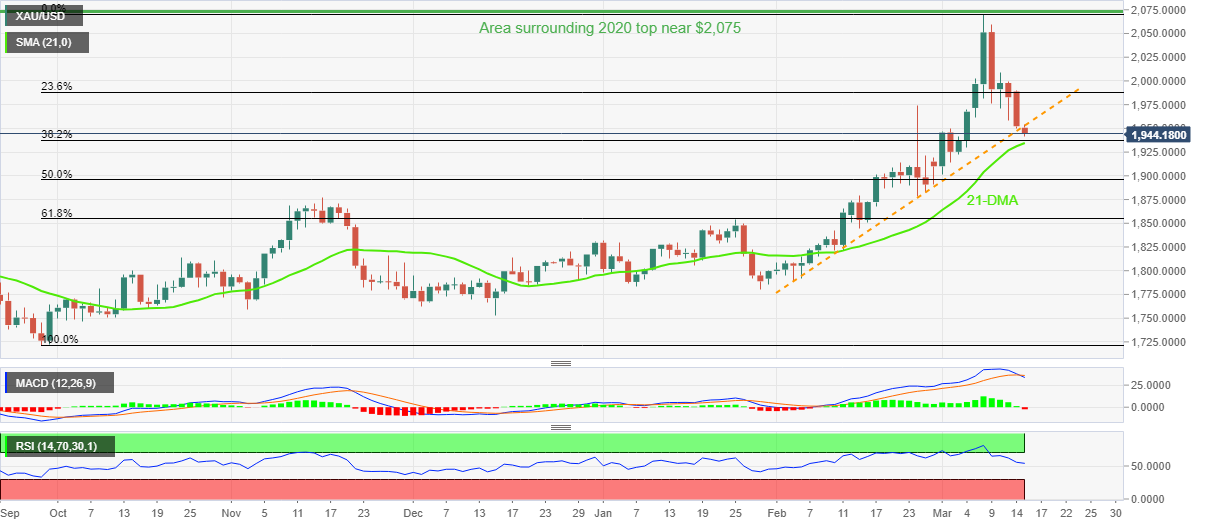
Trend: Further weakness expected
| Time | Country | Event | Period | Previous value | Forecast |
|---|---|---|---|---|---|
| 00:30 (GMT) | Australia | House Price Index (QoQ) | Quarter IV | 5% | 3.9% |
| 00:30 (GMT) | Australia | RBA Meeting's Minutes | |||
| 02:00 (GMT) | China | Retail Sales y/y | 1.7% | 3% | |
| 02:00 (GMT) | China | Industrial Production y/y | 4.3% | 3.9% | |
| 02:00 (GMT) | China | Fixed Asset Investment | 4.9% | 5% | |
| 07:00 (GMT) | United Kingdom | Average earnings ex bonuses, 3 m/y | January | 3.7% | 3.7% |
| 07:00 (GMT) | United Kingdom | Average Earnings, 3m/y | January | 4.3% | 4.6% |
| 07:00 (GMT) | United Kingdom | ILO Unemployment Rate | January | 4.1% | 4% |
| 07:00 (GMT) | United Kingdom | Claimant count | February | -31.9 | |
| 07:30 (GMT) | Switzerland | Producer & Import Prices, y/y | February | 5.4% | |
| 07:45 (GMT) | France | CPI, m/m | February | 0.3% | 0.7% |
| 07:45 (GMT) | France | CPI, y/y | February | 2.9% | 3.6% |
| 10:00 (GMT) | Eurozone | ZEW Economic Sentiment | March | 48.6 | |
| 10:00 (GMT) | Eurozone | Industrial production, (MoM) | January | 1.2% | 0.1% |
| 10:00 (GMT) | Eurozone | Industrial Production (YoY) | January | 1.6% | -0.5% |
| 10:00 (GMT) | Germany | ZEW Survey - Economic Sentiment | March | 54.3 | 10 |
| 12:15 (GMT) | Canada | Housing Starts | February | 230.8 | 238 |
| 12:30 (GMT) | Canada | Manufacturing Shipments (MoM) | January | 0.7% | 1.3% |
| 12:30 (GMT) | U.S. | NY Fed Empire State manufacturing index | March | 3.1 | 7 |
| 12:30 (GMT) | U.S. | PPI, y/y | February | 9.7% | 10% |
| 12:30 (GMT) | U.S. | PPI, m/m | February | 1% | 0.9% |
| 12:30 (GMT) | U.S. | PPI excluding food and energy, Y/Y | February | 8.3% | 8.7% |
| 12:30 (GMT) | U.S. | PPI excluding food and energy, m/m | February | 0.8% | 0.6% |
| 20:00 (GMT) | U.S. | Total Net TIC Flows | January | -52.4 | |
| 20:00 (GMT) | U.S. | Net Long-term TIC Flows | January | 114.5 | |
| 21:45 (GMT) | New Zealand | Current Account | Quarter IV | -8.3 | -6.213 |
| 23:30 (GMT) | Australia | Leading Index | February | 0.1% | |
| 23:50 (GMT) | Japan | Trade Balance Total, bln | February | -2191.1 | -112.6 |
A Senior Bank of Japan official's comments are crossing the wires:
''Once Japan sustainably achieves 2% target, BoJ no longer needs to maintain massive stimulus so long-term rates will come under upward pressure.''
'Will sustain massive monetary stimulus as it will likely take time to achieve its price target.''
There has been no reaction to these comments although USD/JPY continues to move higher, now printing 118.39, the highest levels since January 2017.
The US dollar is strong at the start of the week in risk-off conditions.
Weekend headlines included an FT report claiming that US officials believe Russia asked China to supply military equipment. The Chinese embassy in Washington, DC, said it had not heard of this.
In recent trade today, the People’s Bank of China (PBOC) set the yuan (CNY) at 6.3760 vs the estimated 6.3649 and the previous 6.3506.
About the fix
China maintains strict control of the yuan’s rate on the mainland.
The onshore yuan (CNY) differs from the offshore one (CNH) in trading restrictions, this last one is not as tightly controlled.
Each morning, the People’s Bank of China (PBOC) sets a so-called daily midpoint fix, based on the yuan’s previous day closing level and quotations taken from the inter-bank dealer.
Reuters states that mainland China reported 3,602 new confirmed coronavirus cases on March 14, the national health authority said on Tuesday, compared with 1,437 a day earlier.
''Of the new cases, 3,507 were locally transmitted, the National Health Commission said, compared with 1,337 a day earlier.The number of new asymptomatic cases, which China does not classify as confirmed cases, stood at 1,768 compared with 906 a day earlier. There were no new deaths, leaving the death toll unchanged at 4,636.As of March 14, mainland China had confirmed 120,504 cases.''
Meanwhile, China’s government has ordered a province of 24 million people into lockdown as it tries to contain the new outbreak that has spread to multiple locations. The risk to markets is that the lockdowns could trigger shock waves across global supply chains.
''Another major port lockdown in China could have a ‘phenomenal’ impact on global supply chains still recovering from two years of pandemic-related setbacks. Strict virus-containment efforts by local governments will weigh on cargo movement inside and out of China while raising shipping prices, logistics experts say,'' the South China Morning Post wrote.
- The greenback bulls are firmer amid a bullish pennant formation.
- The RSI (14) has shifted its range from 40.00-60.00 to 60.00-80.00, which signals for a fresh rally going forward.
- The 50- and 200-period EMAs are scaling higher, which adds to the upside filters.
The USD/CAD pair is juggling in a range of 1.2810-1.2826 on Tuesday after a strong upside move from Monday’s low at 1.2740.
On an hourly scale, the major is forming a bullish pennant pattern which signals a directionless move after a strong run towards the north and leads to a further upside if consolidation breaks out decisively.
Generally, a consolidation phase denotes the placement of longs by the market participants who didn’t capitalize upon the initial rally or those investors place bids, which prefer to enter in an auction after a bullish bias sets in.
Earlier, the greenback bulls found significant bids near 61.8% Fibo retracement (placed from March 3 low at 1.2587 to March 8 high at 1.2900) at 1.2708.
The asset is comfortably holding above the 50-period and 200-period Exponential Moving Averages (EMA) at 1.2781 and 1.2772 respectively, which add to the upside filters.
The Relative Strength Index (RSI) (14) has shifted its range from 40.00-60.00 to 60.00-80.00, which signals for a fresh rally going forward.
For more upside, bulls need to surpass Monday’s high at 1.2827 decisively, which will send the greenback bulls towards March 8 high at 1.2900 and 20 December 2021 high at 1.2964.
On the flip side, loonie bulls can dictate levels if the major slips below Friday’s high at 1.2794. This will drag the pair to 50% and 61.8% Fibo retracements at 1.2745 and 1.2708 respectively.
USD/CAD hourly chart
-637829032796313675.png)
- Silver seesaws around short-term key SMA, keeps Monday’s support break.
- Bearish MACD adds to the downside bias targeting 200-SMA.
- Weekly resistance line adds to the upside filters.
Silver (XAG/USD) licks its wounds around $25.00 following the biggest daily fall in six weeks. In doing so, the bright metal takes rounds to the 100-SMA during Tuesday’s Asian session.
However, a clear downside break of the support-turned-resistance from late January joins bearish MACD signals to keep XAG/USD sellers hopeful.
That said, the 50% Fibonacci retracement (Fibo.) of January-March upside, near $24.45, will offer an intermediate halt during the quote’s downside towards the 200-SMA, close to $24.10 at the latest.
It’s worth noting that the $24.00 threshold and 61.8% Fibo. near $23.90 will challenge the XAG/USD bears afterward.
Meanwhile, recovery moves need to cross the previous support line, around $25.25 at the latest.
Even so, a one-week-old downward sloping resistance line, around $25.65, followed by the $26.00 round figure, will test the silver buyers.
Silver: Four-hour chart
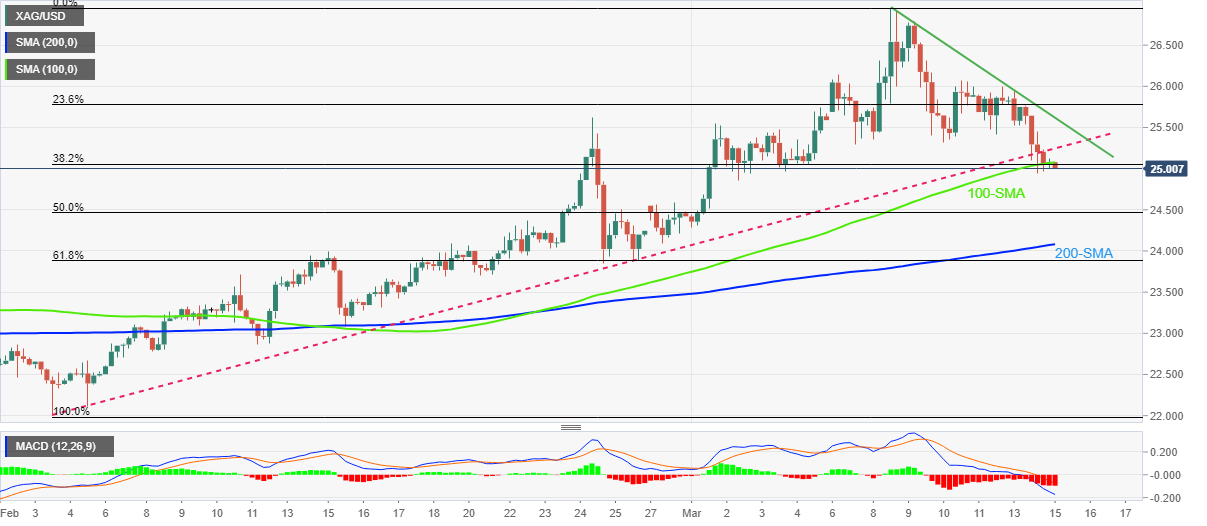
Trend: Further weakness expected
Japan's finance minister Shun'ichi Suzuki's recent comments are crossing the wires:
- FX stability is very important.
- Closely watching market moves.
- Did not comment when asked whether weak yen is negative.
There has been no reaction to these comments. USD/JPY is moving in on the higher levels since January 2017 and trades near 118.30. The US dollar is strong at the start of the week in risk-off conditions. Weekend headlines included an FT report claiming that US officials believe Russia asked China to supply military equipment. The Chinese embassy in Washington, DC, said it had not heard of this.
“Morgan Stanley cut its economic growth forecast for China to zero for the current quarter, and predicts Beijing will miss its annual target this year thanks to restrictive policies to bar the spread of Covid,” said Bloomberg during Tuesday’s Asian session.
Key quotes
The Wall Street bank lowered its 2022 forecast to a 5.1% gain for Gross Domestic Product -- down from 5.3% previously and below the Chinese leadership’s target of about 5.5%.
It previously saw GDP rising 0.6% this quarter compared with the previous three months.
Morgan Stanley made the changes after China placed the city of Shenzhen into lockdown for at least a week and forbade people from leaving Jilin -- the first time the government sealed off an entire province since early 2020.
Higher infrastructure spending and an easing of housing policies can be expected, but the larger issue remains finding a Covid exit strategy.
Also read: AUD/USD flirts with 0.7200 on RBA Minutes, China data, Ukraine eyed
- AUD/USD pokes intraday high, snaps two-day downtrend while bouncing off a fortnight low.
- RBA Minutes reiterate rejection for rate-hike, cites Ukraine war as a major uncertainty but suggests economic pick-up.
- Market sentiment improves despite China’s covid announcements as Ukraine hints at sooner peace agreement with Russia.
- China Retail Sales, Industrial Production for February will offer immediate direction, risk catalysts are the key.
AUD/USD holds onto the mild gains printed during the early Asian session while making rounds to 0.7200 after the RBA Minutes on Tuesday. That said, The Aussie pair prints 0.7205 as a quote to rise 0.21% on a day by the press time.
As per the latest Reserve Bank of Australia (RBA) Monetary Policy Meeting Minutes, the “Board will not increase the cash rate until actual inflation is sustainably within the 2 to 3 percent target band.” The minutes statement also highlighted Ukraine war as a major uncertainty despite expecting pick-up in economic activities.
Read: RBA Minutes: Will not riase cash rate until price is sustainably in the 2-3% target band
Although the RBA Minutes weren’t so exciting, Australia Housing Price Index for Q4 and mild risk-on mood favor the AUD/USD buyers of late.
Australia’s House Price Index rose past 3.9% expected to 4.7% QoQ, as well as crossing 21.7% prior to 23.7% YoY.
Market sentiment improved as Sputnik quotes an Adviser to Ukraine President Volodymyr Zelenskyy’s office, Oleksiy Arestovych, to raise expectations of a Moscow-Kyiv peace as early as two weeks or before late May. On the same line were the latest comments from Ukraine President Zelenskyy who said that the peace talks with Russia will continue on Tuesday, following an abrupt pause on Monday.
On the contrary, reports of a Russian drone over Poland and sanctions on Moscow, as well as Russia-Belarus rejection to pay energy supplies in the USD, challenge the mood. Also weighing on the risk appetite is the news that China announced activity restrictions in Langfang city near Beijing, due to the covid outbreak. The dragon nation witnesses heavy daily infection numbers and raise fears of another COVID-19 wave as the latest figures were the highest since May 2020.
It should be noted that market sentiment soured on Monday, after an initially positive mood, as optimism surrounding the Ukraine-Russia peace ebbed, also joined by the news of coronavirus resurgence in China. Also challenging the AUD/USD prices were firmer yields on hopes of a faster rate-hike trajectory by the US Federal Reserve (Fed).
Against this backdrop, the S&P 500 Futures rise 0.22% to snap a three-day downtrend while the US 10-year Treasury yields seesaw near the highest levels since July 2019, around 2.14% by the press time.
Moving on, AUD/USD traders will keep their eyes on the Ukraine-Russia headlines for fresh impulse while China’s Retail Sales and Industrial Production for February, expected 3.0% and 3.9% YoY versus 1.7% and 4.3% respectively, could direct immediate moves.
Technical analysis
Despite the latest rebound, AUD/USD prints the first daily closing below the 100-DMA in over two weeks and the most bearish MACD signals since early February, which in turn keeps sellers hopeful.
That said, an upward sloping support line from late January, around 0.7180 at the latest, will challenge short-term sellers. Meanwhile, recovery moves remain elusive until providing a daily close beyond the 100-DMA, at 0.7222 by the press time.
- West Texas Intermediate (WTI) is on the backfoot.
- Bears are moving in on new supply hopes.
US oil is meeting resistance on the hourly time frame and trades some 01.6% lower at $100.66 at the time of writing. Oil prices are falling as investors weigh positive comments from ceasefire talks between Russia and Ukraine.
Russian and Ukrainian officials gave their most upbeat assessments on Sunday of progress in their talks to end the conflict, with some delegates saying draft agreements could be reached within days. The news has sent oil prices to their lowest levels in two weeks on the prospects of supply.
Meanwhile, analysts at TD Securities said that the hostilities in the Middle East are further raising concerns as a geopolitical hotspot that could potentially see the conflict expand beyond Ukraine's borders.
''For the time being, the set-up in crude oil was ripe for a consolidation, but energy traders have also focused on signs from the UAE suggesting the Gulf could be willing to increase output, despite the nation's energy minister quickly tempering the message.''
''Nonetheless,''the analysts said, ''this has raised the prospect of a backroom deal between the Gulf nations and the West, opening the door to substantial relief from the shock in Ukraine. While this, an increase in US shale production, alongside an Iran nuclear deal and the potential easing of sanctions on Venezuela could help ease the burden over a 12-month time horizon, it would still rid the world of most of its remaining spare capacity. In this sense, elevated geopolitical risks in the Middle East would create acute vulnerabilities for the energy complex, suggesting the right tail remains fat.''
The Reserve Bank of Australia stated in the minutes that the war in Ukraine was a major new source of uncertainty.
Key minutes
The board will not increase the cash rate until actual inflation is sustainably within the 2 to 3 percent target band.
While inflation had picked up, members agreed it was too early to conclude that it was sustainably within the target band.
Australian economy remained resilient and spending was expected to pick up further after the omicron outbreak.
The board is prepared to be patient as it monitors how the various factors affecting inflation in Australia evolve.
War in Ukraine and the associated increase in energy prices had created additional uncertainty about the inflation outlook.
There were uncertainties about how persistent pick-up in inflation would be given recent developments in global energy markets and ongoing supply-side problems.
Meanwhile, AUD/USD flirts with 0.7200 on RBA Minutes, China data, Ukraine eyed.
About the RBA minutes
The Reserve Bank of Australia (RBA) publishes the minutes of its monetary policy meeting two weeks after the interest rate decision is announced. It provides a detailed record of the discussions held between the RBA’s board members on monetary policy and economic conditions that influenced their decision on adjusting interest rates and/or bond buys, significantly impacting the AUD. The minutes also reveal considerations on international economic developments and the exchange rate value.
- S&P 500 Futures differs from Wall Street’s losses, snaps three-day downtrend.
- US 10-year Treasury yields ease from 32-month high, 5-year coupons drop from May 2019 levels.
- An adviser to Ukraine’s President Zelenskyy hints at peace agreement with Russia at the latest in May.
- China locks down Langfang city near Beijing due to covid outbreak.
It’s déjà vu feeling for global traders as market sentiment improves during the early Asian session on Tuesday, as the previous day, even as key challenges to risk appetite remain unsolved.
While portraying the mood, S&P 500 Futures rise 0.22% to snap a three-day downtrend while the US 10-year Treasury yields step back from the highest levels since July 2019, down 1.1 basis points (bps) to 2.129% by the press time.
It’s worth noting that the 10-year Treasury yields rose 13 basis points (bps) to refresh 32-month high the previous day while the 5-year coupon rallied to the highest since May 2019 level, currently down four bps near 2.088%.
Helping the market sentiment are the latest headlines from Ukraine as Sputnik quotes an Adviser to Ukraine President Volodymyr Zelenskyy’s office, Oleksiy Arestovych, to raise expectations of a Moscow-Kyiv peace in as early as two weeks or before late May. On the same line were the latest comments from Ukraine President Zelenskyy who said that the peace talks with Russia will continue on Tuesday, following an abrupt pause on Monday.
However, reports of a Russian drone over Poland and sanctions on Moscow, as well as Russia-Belarus rejection to pay energy supplies in the USD, challenge the market’s mood. Additionally, weighing the risk appetite is the news that China announced activity restrictions in Langfang city near Beijing, due to the covid outbreak. The dragon nation witnesses heavy daily infection numbers and raise fears of another COVID-19 wave. The latest figures from China were the highest since May 2020.
On Monday, market sentiment soured after an initially positive mood as optimism surrounding the Ukraine-Russia peace ebbed, also joined by the news of coronavirus resurgence in China.
Looking forward, market players will keep their eyes on the Ukraine-Russia headlines for fresh impulse while China’s Retail Sales and Industrial Production for February, expected 3.0% and 3.9% YoY versus 1.7% and 4.3% respectively, will decorate the calendar in Asia.
Read: Forex Today: Dollar on the rise amid mounting tensions with Russia
| Pare | Closed | Change, % |
|---|---|---|
| AUDUSD | 0.71906 | -1.35 |
| EURJPY | 129.333 | 0.99 |
| EURUSD | 1.09424 | 0.25 |
| GBPJPY | 153.663 | 0.49 |
| GBPUSD | 1.30014 | -0.23 |
| NZDUSD | 0.6747 | -0.79 |
| USDCAD | 1.28177 | 0.66 |
| USDCHF | 0.93797 | 0.48 |
| USDJPY | 118.183 | 0.73 |
- USD/JPY looks to reclaim a 5-year high at 118.66 on weakening yen amid soaring commodity prices.
- The expectation of China’s military assistance to Russia is underpinning the safe-haven appeal.
- Interest rate decisions from the Fed and BOJ will be the key events to watch out for this week.
The USD/JPY is rallying sharply as investors are underpinning the greenback against the Japanese yen on a likely interest rate hike from the Federal Reserve (Fed) in its Wednesday’s monetary policy meeting. The major is continued with its six-day winning streak and is aiming to reclaim a 5-year high at 118.66.
The US dollar index (DXY) is trading subdued around 99.00 as investors are waiting for the announcement of the monetary policy by the Fed before initiating fresh positions. An interest rate hike is much likely on the cards but the catalyst, which carries significant importance, is the extent of the interest rate hike by the Fed. Moreover, investors demand more clarity over the recent development of the Russia-Ukraine war. The US has claimed that China is willing to provide military assistance to Russia after Moscow requested Sino for military support in the invasion of Ukraine. In response to that, China has denied any kind of request.
The interest rate decision from the Bank of Japan (BOJ) is also due later this week. The BOJ has kept its interest rates to the ground and is looking to maintain the status-quo on rising odds of stagflation in Japan. Rising prices of various commodities post-attack on Ukraine have dampened the financial flows of leading importers. Japan, being a major importer of oil and base metals is facing serious outflows, which is hurting its fiscal mathematics.
- Bears are looking to 152.80 as bulls take them on at critical hourly resistance.
- GBP/JPY has completed a weekly 38.2% Fib retracement.
GBP/JPY is starting to look rich according to the following analysis that illustrates the market's structure on the weekly, daily and hourly charts.
GBP/JPY weekly chart
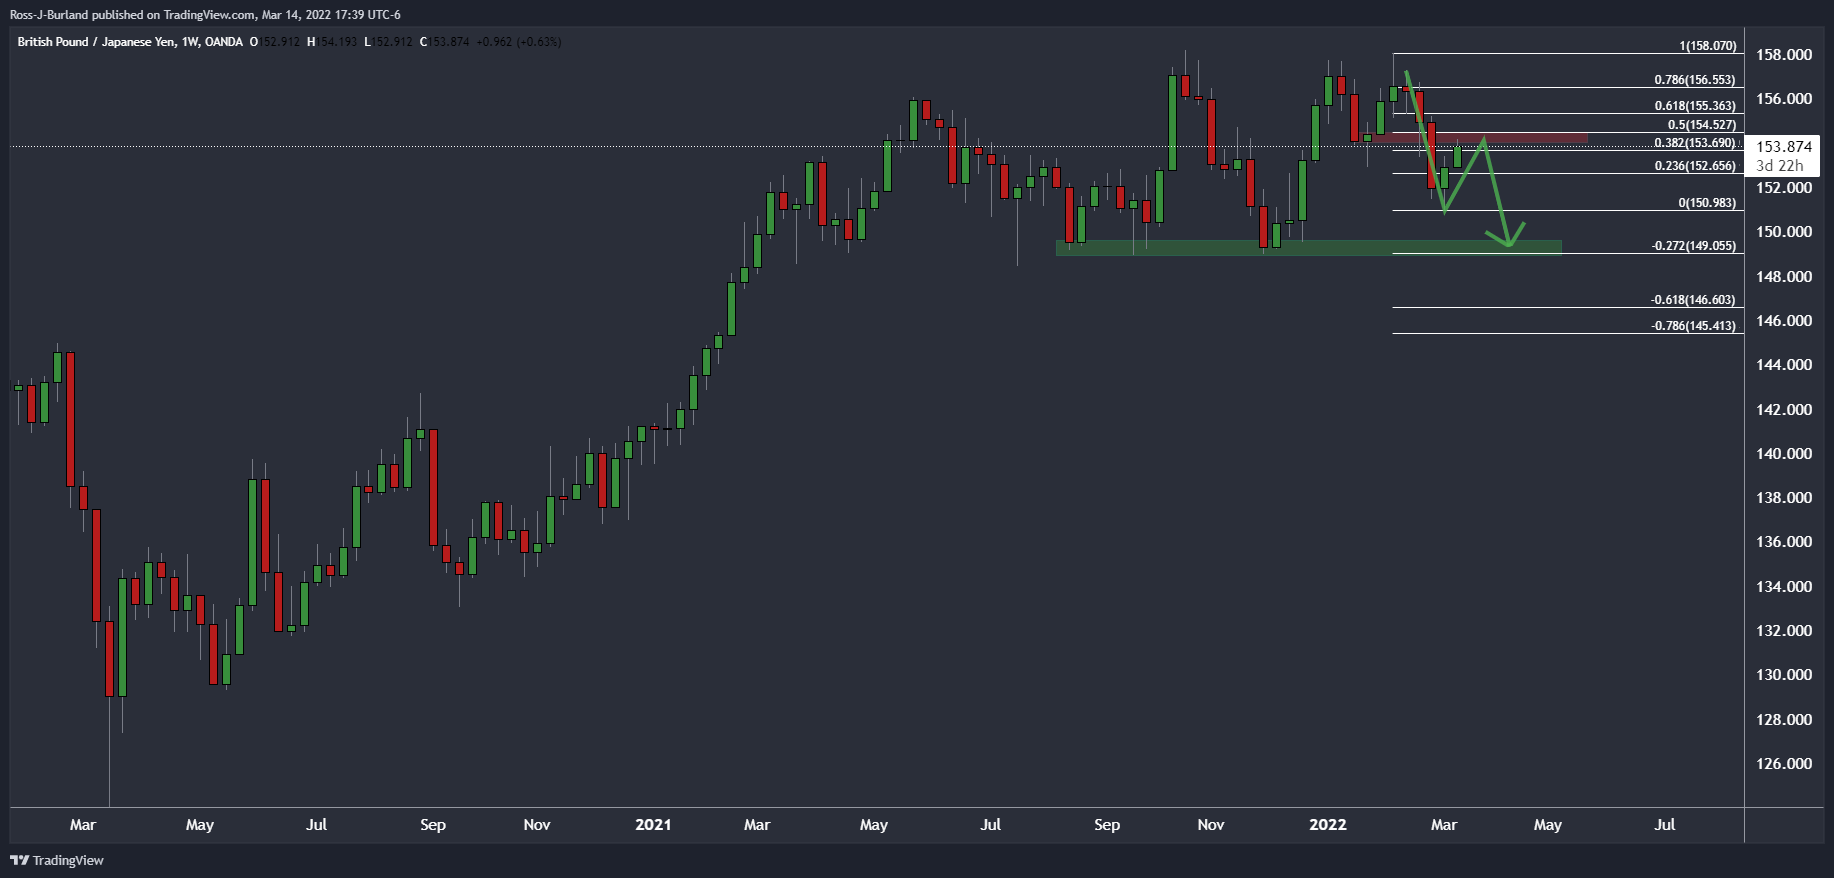
The cross has formed an M-formation on the weekly chart and the peace has reached the neckline of the reversion pattern. This also correlates with a 38.2% Fibonacci retracement level in the highs which could reinforce the area as resistance, potentially leading to a sell-off in the coming days.
GBP/JPY daily chart
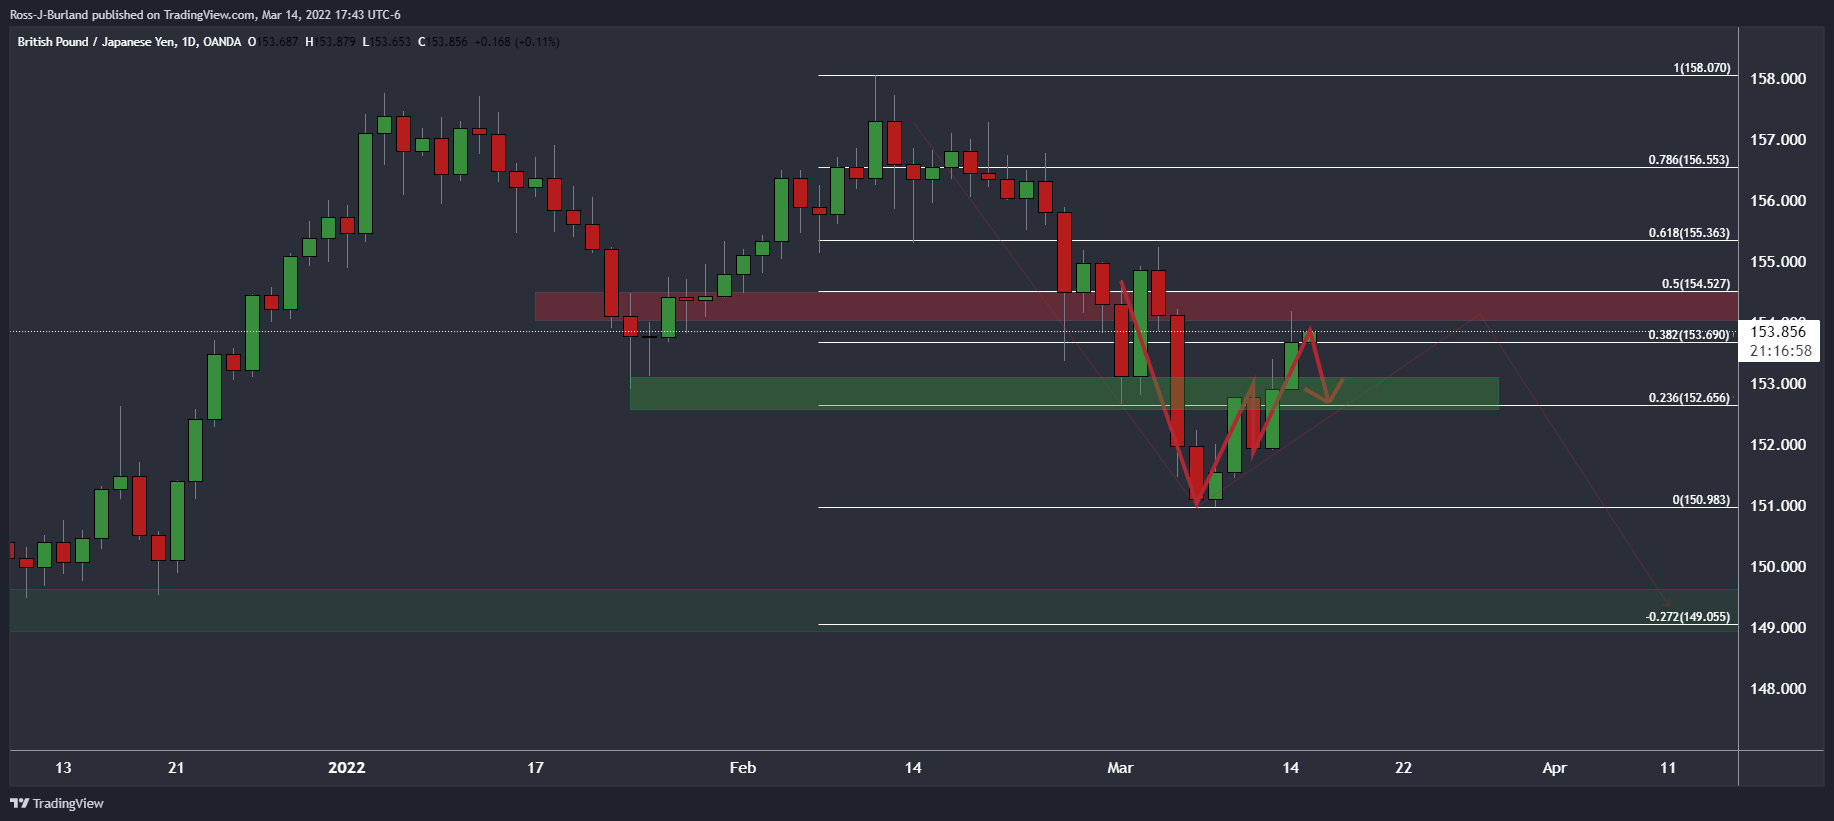
The daily W-formation is compelling in this regard as the price moves in on resistance near 154 the figure. The neckline of the formation around some 100 pips lower guards a continuation to the downside.
GBP/JPY H1 chart
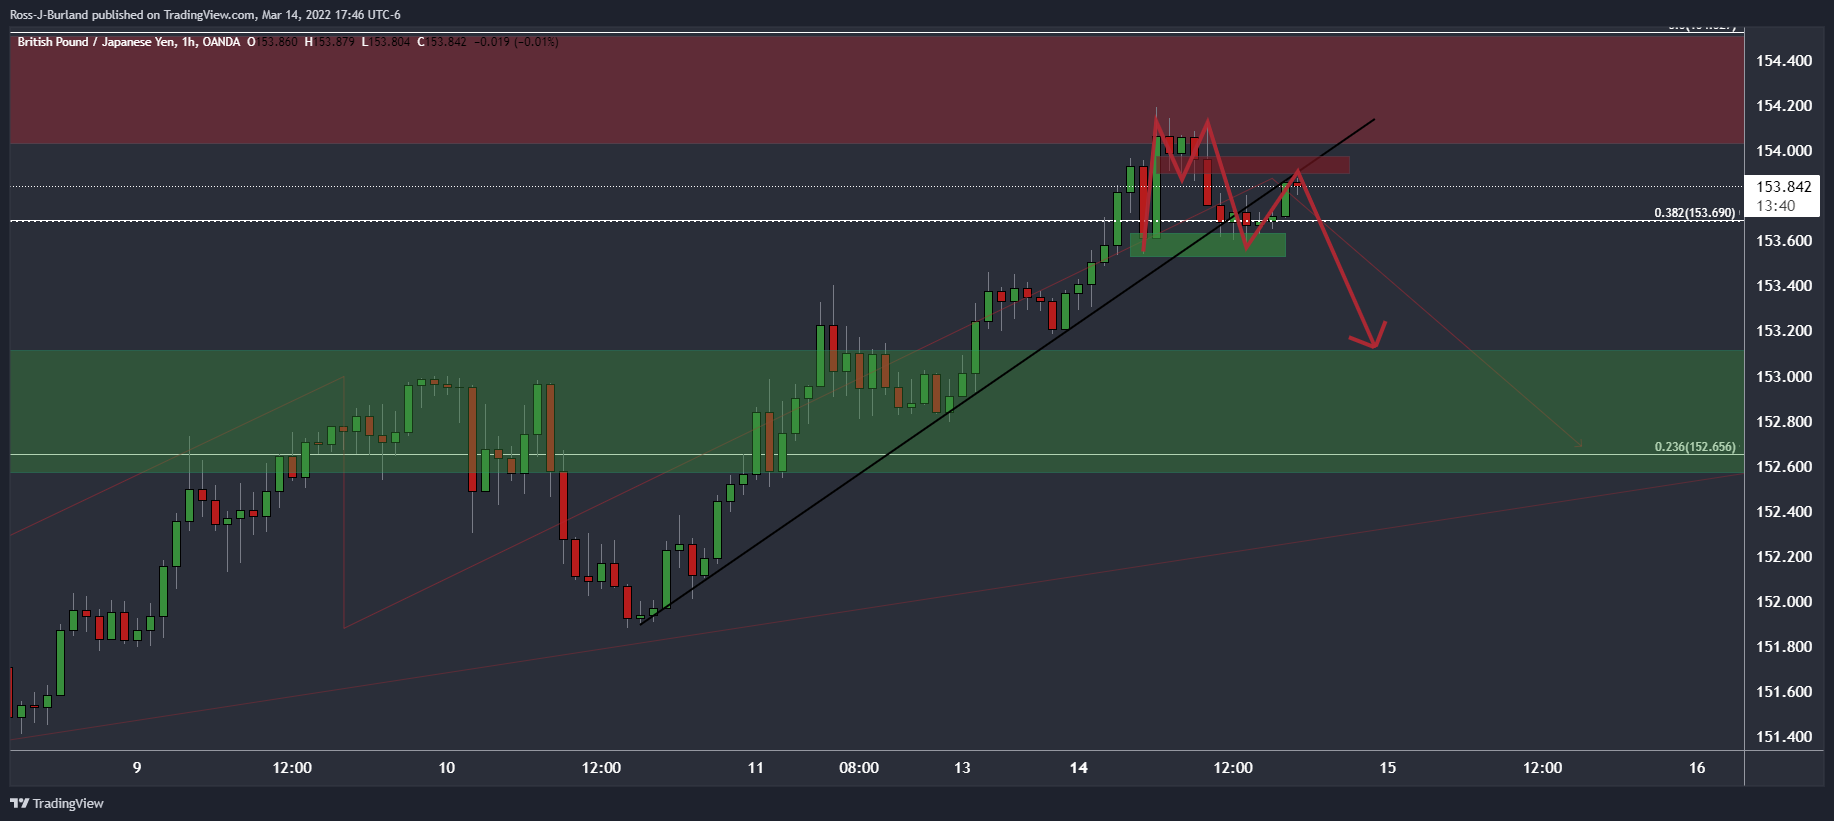
From an hourly perspective, the M-formation's neckline has a confluence with the counter-trendline for which the price is retesting. If the bears move in at this juncture, then 152.80 will be eyed.
© 2000-2026. All rights reserved.
This site is managed by Teletrade D.J. LLC 2351 LLC 2022 (Euro House, Richmond Hill Road, Kingstown, VC0100, St. Vincent and the Grenadines).
The information on this website is for informational purposes only and does not constitute any investment advice.
The company does not serve or provide services to customers who are residents of the US, Canada, Iran, The Democratic People's Republic of Korea, Yemen and FATF blacklisted countries.
Making transactions on financial markets with marginal financial instruments opens up wide possibilities and allows investors who are willing to take risks to earn high profits, carrying a potentially high risk of losses at the same time. Therefore you should responsibly approach the issue of choosing the appropriate investment strategy, taking the available resources into account, before starting trading.
Use of the information: full or partial use of materials from this website must always be referenced to TeleTrade as the source of information. Use of the materials on the Internet must be accompanied by a hyperlink to teletrade.org. Automatic import of materials and information from this website is prohibited.
Please contact our PR department if you have any questions or need assistance at pr@teletrade.global.
