- Analytics
- News and Tools
- Market News
CFD Markets News and Forecasts — 15-02-2023
January month employment statistics from the Australian Bureau of Statistics, up for publishing at 00:30 GMT on Thursday, will be the immediate catalyst for the AUD/USD pair traders.
Market consensus suggests that the headline Unemployment Rate may remain unchanged at 3.5% on a seasonally adjusted basis whereas Employment Change could rise by 20.0K versus the previous contraction of 14.6K. Further, the Participation Rate is expected to remain unchanged at 66.6% prior level.
It should be noted that Australia Consumer Inflation Expectations for February, expected to remain unchanged at 5.6%, could also entertain AUD/USD traders around 00:00 GMT on Thursday.
Considering the Reserve Bank of Australia (RBA) policymakers’ struggle to defend the hawkish bias, as well as the fears of higher inflation, today’s Aussie jobs report become crucial for the AUD/USD pair traders.
Ahead of the event, analysts at Westpac said,
Illness-related absences and a ‘catch-up’ in abnormally low summer leave should see employment growth print slightly below trend in January (Westpac forecast 15K, market 20K, rebounding from December’s -15K). With participation holding flat, Westpac expects the unemployment rate to hold at 3.5%, in line with consensus.
On the same, FXStreet’s Valeria Bednarik mentioned,
Indeed, sharp deviations one way or the other could trigger near-term volatile moves in AUD/USD. But after the dust settles, the pair will likely return to sentiment-related trading, with the focus on the US Dollar and whatever speculative interest believes about the United States Federal Reserve.
How could the data affect AUD/USD?
AUD/USD remains sidelined near 0.6900 while licking its wounds near the weekly low, following the biggest daily slump in a fortnight, as the Aussie pair traders await crucial jobs report amid sluggish market hours.
Although the pre-data anxiety probes AUD/USD bears amid hopes of upbeat Aussie data, the risk barometer pair is likely to remain depressed, after showing an initial reaction to the actual outcome, unless witnessing too optimistic Aussie employment numbers. The reason could be linked to comparatively more hawkish Federal Reserve (Fed) bets, backed by stronger US data.
Technically, a U-turn from the 3.5-month-old previous support line keeps AUD/USD bears hopeful but the 50-DMA and the 200-DMA challenge the Aussie pair’s further downside around 0.6885 and 0.6800 respectively.
Key Notes
Australian Employment Preview: Better figures in the docket, doubtful impact on RBA
AUD/USD licks its wounds near 0.6900 ahead of Aussie employment data
About the Employment Change
The Employment Change released by the Australian Bureau of Statistics is a measure of the change in the number of employed people in Australia. Generally speaking, a rise in this indicator has positive implications for consumer spending which stimulates economic growth. Therefore, a high reading is seen as positive (or bullish) for the AUD, while a low reading is seen as negative (or bearish).
About the Unemployment Rate
The Unemployment Rate released by the Australian Bureau of Statistics is the number of unemployed workers divided by the total civilian labor force. If the rate hikes, indicates a lack of expansion within the Australian labor market. As a result, a rise leads to weaken the Australian economy. A decrease of the figure is seen as positive (or bullish) for the AUD, while an increase is seen as negative (or bearish).
- EUR/USD seeks clear direction after falling the most in a week.
- US data renew hawkish Fed concerns and propel Treasury bond yields, US Dollar.
- ECB’s Lagarde reiterates the call for 50 bps rate hike in March.
- Second-tier data/events eyed for fresh impulse, risk catalysts are the key.
EUR/USD makes rounds to 1.0690 while struggling to extend the late Wednesday’s corrective bounce during early Thursday. That said, the major currency pair dropped the most in a week after the US data propelled the Fed bets and allowed the US Treasury bond yields, as well as the US Dollar, to refresh multi-day high. However, the recently hawkish comments from European Central Bank (ECB) President Christine Lagarde seemed to have put a floor under the prices.
That said, the US 10-year Treasury bond yields rose to a fresh six-week high and the US Dollar Index (DXY) also jumped to a 1.5-month top after the key US data hints at a further increase in the Federal Reserve’s (Fed) interest rates.
On Wednesday, US Retail Sales growth jumped to 3.0% YoY in January versus 1.8% expected and -1.1% prior. Further, The Retail Sales ex-Autos grew by 2.3% in the same period, compared to analysts' estimate of +0.8%. On the same line, the NY Empire State Manufacturing Index for February improved to a three-month high of -5.8 versus -18.0 expected and -32.9 market forecasts. Alternatively, the US Industrial Production marked 0.0% MoM figures for January, compared to analysts’ estimate of 0.5% and -0.7% previous readings, but failed to push back the hawkish bias surrounding the Federal Reserve’s (Fed) next move.
Following the data, the market’s bets on the Fed’s next moves, as per the FEDWATCH tool of Reuters, suggest that the US central bank rates are to peak in July around 5.25% versus the December Federal Reserve prediction of 5.10% top rate.
On the other hand, ECB’s Lagarde stated that even though most measures of longer-term inflation expectations currently stand at around 2%, these measures warrant continued monitoring. The policymaker mentioned, “Price pressures remain strong and underlying inflation is still high,” while showing her intention to lift rates by 50 basis points at the March meeting.
Amid these plays, Wall Street benchmarks closed with mild gains, following the day-end recovery, but S&P 500 Futures hesitate in following suit.
Looking forward, the ECB’s monthly bulletin and multiple ECB speakers can offer an entertaining day together with the second-tier US data concerning the housing market, industrial activity and producer prices.
Technical analysis
EUR/USD seesaws between the 21-day Exponential Moving Average (EMA) and the 50-day EMA, respectively near 1.0760 and 1.0680 as bears keep the reins.
“US Treasuries held by foreigners increased for a second consecutive month in December as yields started to decline from their peaks, becoming more attractive to offshore investors,” per the latest report from the US Treasury Department published on Wednesday reported Reuters.
Key quotes
Foreign holdings rose $7.314 trillion in December, up from $7.268 trillion in the previous month.
Treasury holdings in December, however, were 5.5% lower from the December 2021 level of $7.740 trillion.
Still, buying in both December and November paled in comparison to selling in October and September.
Japan remained the largest non-U.S. holder of Treasuries, with $1.076 trillion in December, down slightly from $1.082 trillion in the prior month.
Data also showed holdings of China, the second biggest non-U.S. holder of Treasuries, fell to $867.1 billion in December, from $870.2 billion in November.
China's holdings were the lowest since May 2010 when it had $843.7 billion.
Data also showed foreign inflows of $54.98 billion in US stocks in November, the largest since December 2020.
Market implications
The news backs the recent run-up in the US Treasury bond yields. That said, the US 10-year Treasury bond yields stay firmer around the six-week high, which in turn favors the US Dollar and weighs on the market sentiment.
Also read: Forex Today: US Dollar strength continues amid resilient American economy
- GBP/JPY bulls failed to conquer the 200-day EMA at 161.81 and erased their earlier gains.
- GBP/JPY Price Analysis: A bearish flag emerged at the 1-hour chart, which paved the way for further downside.
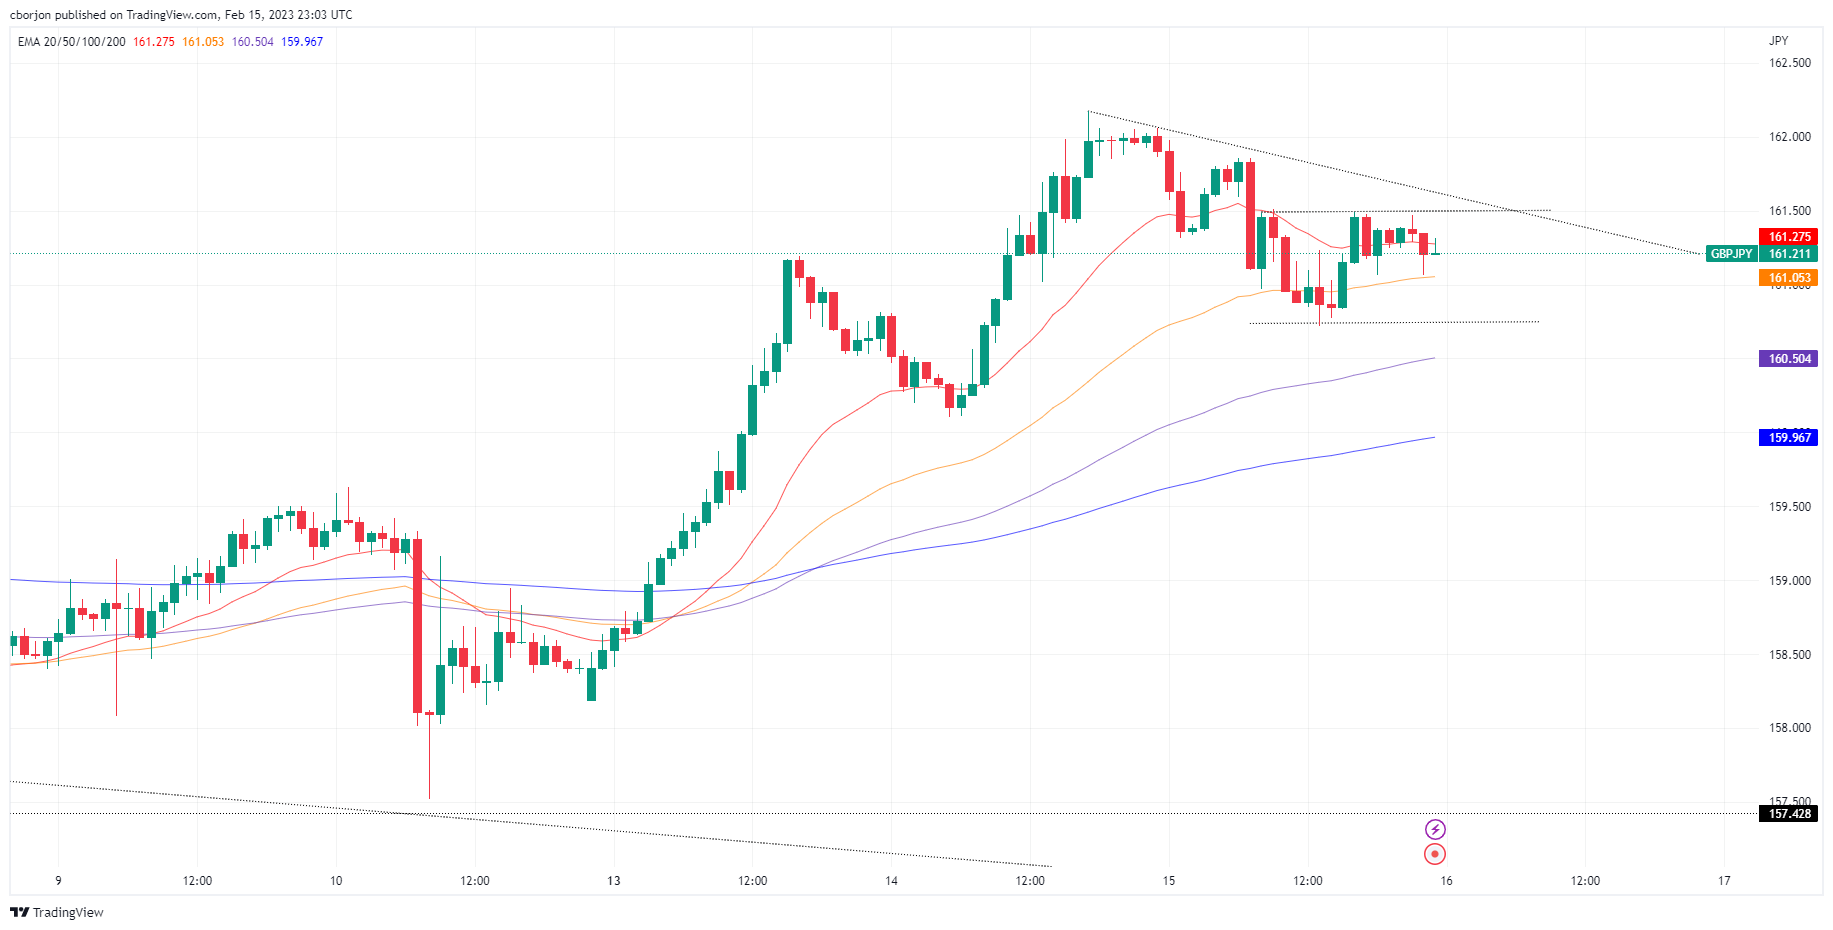
The GBP/JPY retreats after reaching weekly highs at 161.46 and drops beneath 161.30 as Thursday’s Asian Pacific session begins. Even though the GBP/JPY remains upward biased unless it breaks crucial support levels. At the time of writing, the GBP/JPY exchanges hands at 161.27, below its opening price by a minuscule 0.05%.
From a daily chart perspective, the GBP/JPY is neutral biased, though an uptick toward 161.81, which would put into play the 200-day Exponential Moving Average (EMA). A break of resistance and the 100-day EMA at 161.98 would be next, ahead of 162.00. Once all those supply areas are hurdled, the GBP/JPY would rally towards 163.00, ahead of the December 20 daily high at 167.02.
In the meantime, the GBP/JPY 1-hour chart suggests the pair as neutral biased, though slightly tilted downwards, as a bearish flag emerged. In addition, the Relative Strength Index (RSI) turned bearish, while the Rate of Change (RoC) depicted that buying pressure waned.
Hence, the GBP/JPY Is poised downwards. The first demand zone to be tested would be the 50-EMA at 161.04. A breach of the latter and the GBP/JPY pair would fall to the bottom of the bearish flag at 160.72. Once cleared, GBP/JPY prices would be driven toward the 100-EMA at 161.49, ahead of the 200-EMA At 159.95.
GBP/JPY 1-Hour chart
GBP/JPY Key technical levels
“US Treasury Department will exhaust its ability to pay all its bills sometime between July and September unless the current $31.4 trillion cap on borrowing is raised or suspended,” warned the US Congressional Budget Office (CBO) on Wednesday per Reuters.
The CBO released its annual budget outlook together with a report suggesting that a historic federal debt default could occur before July if revenue flowing into the Treasury in April - when most Americans typically submit annual income tax filings - lags expectations, reported Reuters.
“Over the long term, our projections suggest that changes in fiscal policy must be made to address the rising costs of interest and mitigate other adverse consequences of high and rising debt,” said CBO Director Phillip Swagel.
Key quotes
If the debt limit is not raised or suspended before the extraordinary measures are exhausted, the government would be unable to pay its obligations fully.
As a result, the government would have to delay making payments for some activities, default on its debt obligations, or both.
Annual US budget deficits will average $2 trillion between 2024 and 2033, approaching pandemic-era records by the end of the decade - a forecast likely to stoke Republican demands for spending cuts.
CBO estimated an unemployment rate of 4.7% this year, far above the current 3.4%.
Market implications
The news could be considered a catalyst for late Wednesday’s corrective bounce in the market sentiment. However, strong US data and hawkish Fed bets keep the risk barometer AUD/USD pair depressed.
Also read: AUD/USD licks its wounds near 0.6900 ahead of Aussie employment data
- GBP/USD consolidates the biggest daily loss in a fortnight around weekly low.
- Ascending trend lines from January and last November precede 200-DMA to challenge bears.
- U-turn from 50-DMA, bearish MACD signals favor sellers.
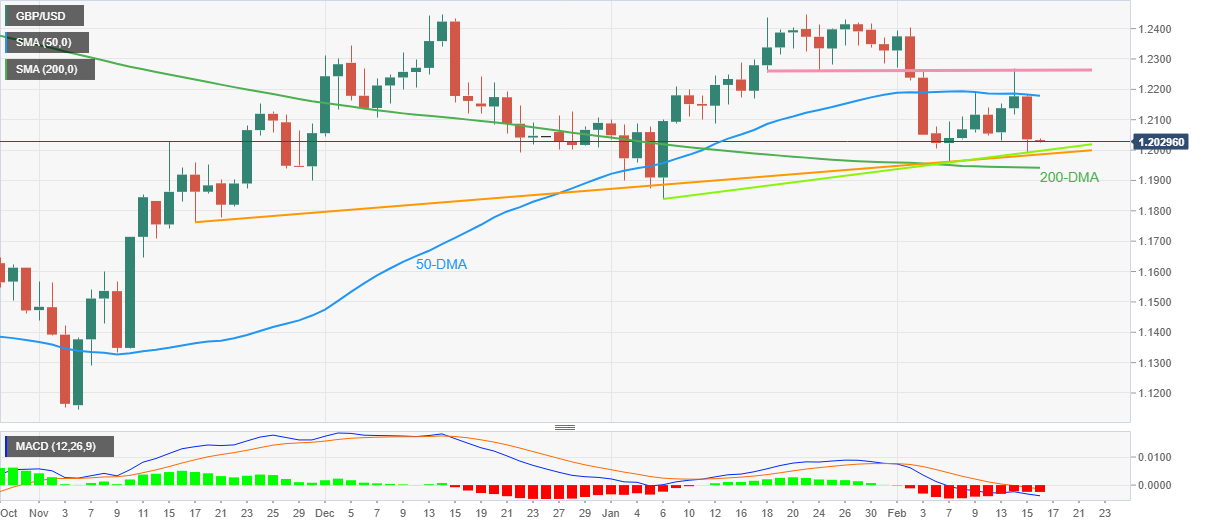
GBP/USD stays defensive around 1.2030, bouncing off the weekly low, as it licks the previous day’s wounds during early Thursday.
In doing so, the Cable pair rebounds from a six-week-old support line after falling the most in a fortnight. The recovery moves, however, remain elusive considering the quote’s sustained U-turn from the 50-DMA and the bearish MACD signals.
It’s worth noting, though, that the ascending support lines from early January and mid-November 2022, respectively around 1.2000 and 1.1985 in that order, restrict the short-term downside of the GBP/USD pair.
Following that, the 200-DMA level of 1.1940 gains the major attention of the bears targeting the mid-November 2022 bottom around 1.1760. However, the previous monthly low surrounding 1.1840 could offer an intermediate halt during the fall.
Meanwhile, GBP/USD rebound recovery remains elusive unless crossing the 50-DMA hurdle of near 1.2180.
In a case where the GBP/USD price remains firmer past 50-DMA, a one-month-old horizontal resistance near 1.2260 will be in focus as it holds the key for the Cable pair’s run-up toward the multiple tops marked since late 2022 around 1.2450.
Overall, GBP/USD is likely to remain depressed but the downside room appears limited.
GBP/USD: Daily chart
Trend: Limited downside expected
- AUD/USD consolidates the biggest daily loss in a fortnight at weekly low.
- Strong US data saw Treasury bond yields, US Dollar run-up.
- RBA’s Lowe fails to impress hawks despite signaling inflation fears.
- Australia employment data for January appears the key for immediate directions.
AUD/USD seesaws around 0.6900 as it struggles to defend late Wednesday’s corrective bounce off the weekly low ahead of the key Aussie jobs report. That said, the Aussie pair dropped the most in two weeks the previous day amid broad US Dollar strength, backed by upbeat data, as well as the Reserve Bank of Australia (RBA) Governor Philip Lowe’s failure to convince the policy hawks.
That said, US Retail Sales growth jumped to 3.0% YoY in January versus 1.8% expected and -1.1% prior. Further, The Retail Sales ex-Autos grew by 2.3% in the same period, compared to analysts' estimate of +0.8%. On the same line, the NY Empire State Manufacturing Index for February improved to a three-month high of -5.8 versus -18.0 expected and -32.9 market forecasts. Alternatively, the US Industrial Production marked 0.0% MoM figures for January, compared to analysts’ estimate of 0.5% and -0.7% previous readings, but failed to push back the hawkish bias surrounding the Federal Reserve’s (Fed) next move.
At home, RBA’s Lowe Lowe said inflation is way too high and that it needs to come down. The policymaker also stated, “We're still unsure how far rates can go,” and added, “Rates have not yet reached their peak.”
It should be noted that the latest round of the US data, especially in the last two weeks, have been upbeat enough to renew the calls for a higher Fed rate, which in turn propel the US Treasury bond yields and the US Dollar. The same, however, exert downside pressure on the market’s sentiment and the riskier assets like the Australia Dollar and equities.
Amid these plays, Wall Street closed mild gains after the day-end recovery whereas the US 10-year Treasury bond yields stay firmer around the six-week high, which in turn portrays the risk-off mood and weighs on the AUD/USD price.
Given the US data backing the hawkish concerns surrounding the Federal Reserve (Fed) and the RBA’s inability to convince the policy hawks, AUD/USD traders will pay attention to January’s employment numbers for fresh impulse. That said, the headline Employment Change is likely to reverse the previous contraction of 14.06K with an addition of 20.0K while the Unemployment Rate is expected to remain unchanged at 3.5%. As a result, the Aussie pair may extend the latest corrective bounce in case the scheduled jobs report match or surpass the anticipated positive figures.
Technical analysis
Although a U-turn from the 3.5-month-old previous support line keeps AUD/USD bears hopeful, the 50-DMA and the 200-DMA challenge the Aussie pair’s further downside around 0.6885 and 0.6800 respectively.
- USD/CHF faced solid resistance at around 0.9260s, the top of a trading range.
- The USD/CHF pair is neutral-downward biased from a daily chart perspective.
- In the short term, the USD/CHF might fall to the bottom of the range, below 0.9200.
The US Dollar (USD) continued to strengthen vs. the Swiss Franc (CHF) on Wednesday, bolstered by US economic data that supported speculations for further aggression by the Federal Reserve (Fed). Also, Fed officials' hawkish commentary increased the likelihood of rates being hiked above the 5% threshold. Hence, the USD/CHF is trading at 0.9239 after hitting a daily low of 0.9209.
The USD/CHF pair daily chart portrays the major as neutral to downward biased, though it appears to have bottomed at around the YTD low at 0.9059, and since that day, the pair edged towards 0.9290. The USD/CHF traded sideways within the 0.9130-0.9260 range, unable to conquer the 0.9300 figure, which, once cleared, could open the door to test the long-term daily Exponential Moving Averages (EMAs) at around 0.9397, 0.9460.
In the short term, as shown by the 4-hour chart, the USD/CHF is range-bound, seesawing around the top of the range at 0.9260, with sellers leaning into that area. If the USD/CHF tumbles below the confluence of the 20/50-Exponential Moving Averages (EMAs) at 0.9214/21, that would send the USD/CHF pair sliding toward the 0.9200 figure before reaching the lows of February 14 at 0.9135. A decisive breach and the 0.9100 figure would be put into play.
USD/CHF 4-Hour chart
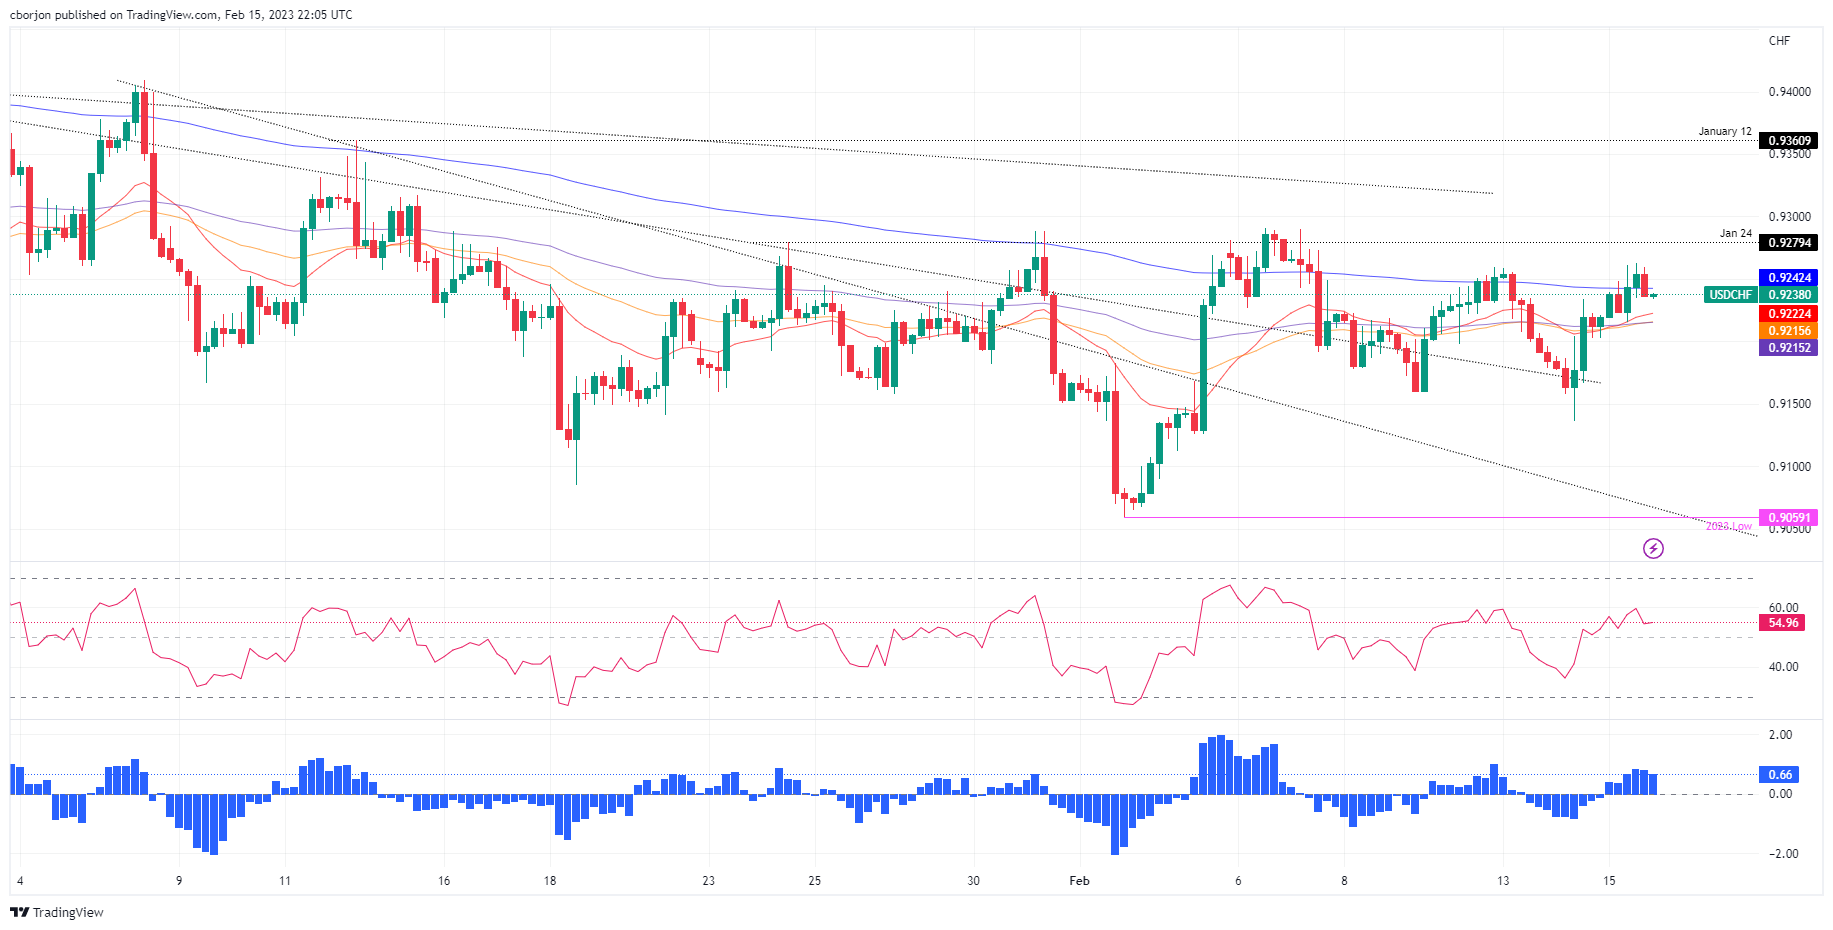
USD/CHF Key technical levels
- Gold price sinks to fresh bear cycle lows and there could be more to come from the Gold price bears.
- US Dollar is on the bid following United States of America data that is firming.
- US Retail Sales, services and Consumer Price Index all came in hot in a series of releases of late, flipping the script on the Federal Reserve pivot narrative.
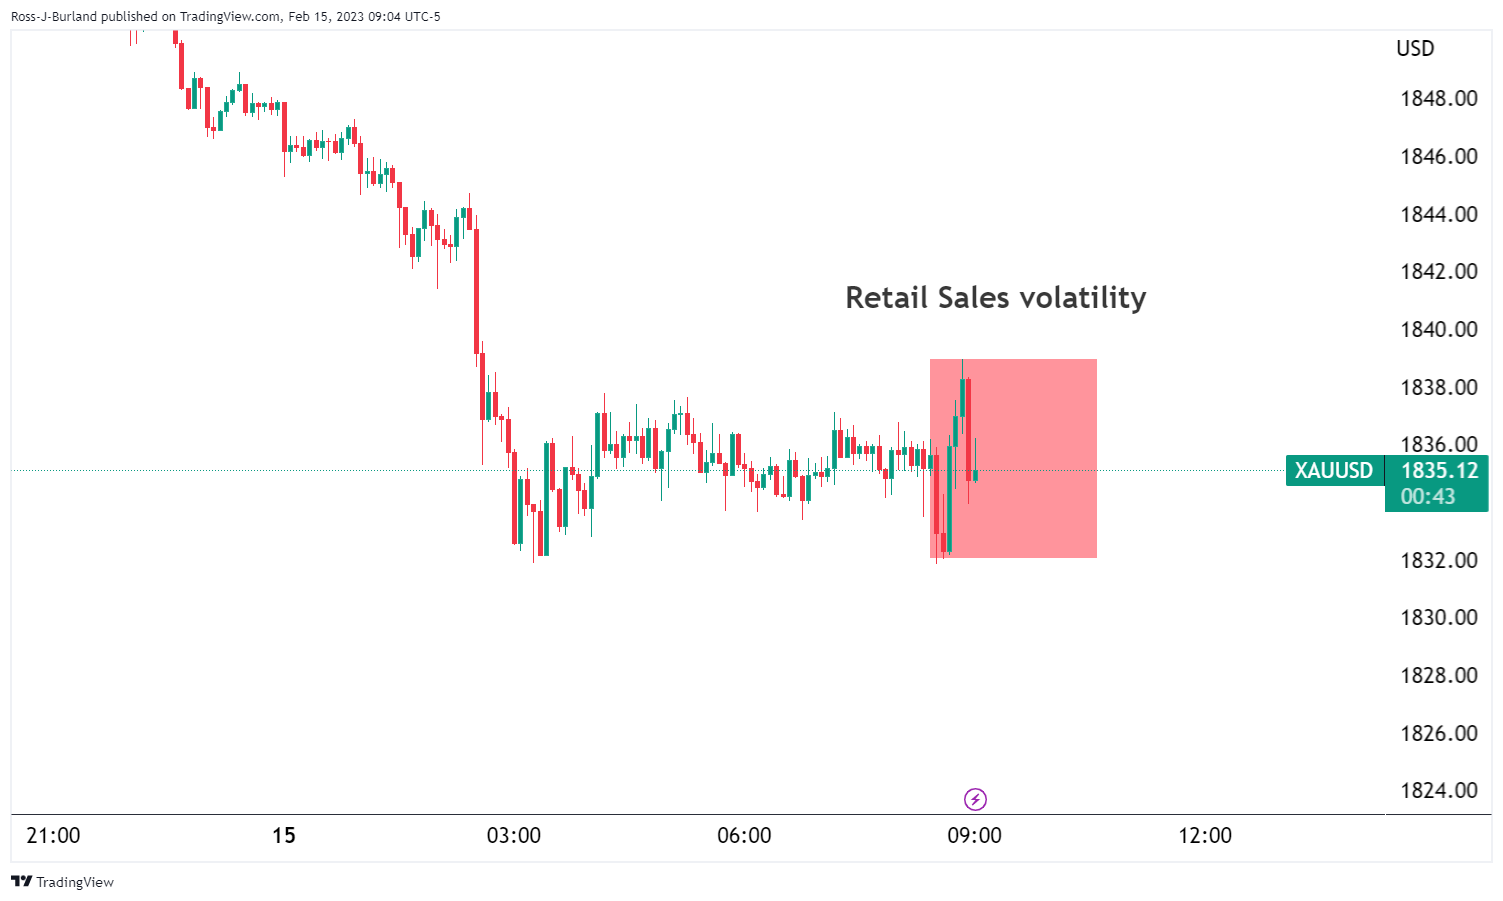
Gold price was pressured on a firmer US Dollar on Wednesday. The United States Retail sales jump 3% in January, smashing expectations despite an inflation increase that might have otherwise kept consumers' hands in their pockets. Gold price dropped, popped, dropped again and is now slowly correcting from the day's lows and has so far held in familiar post-data ranges around $1,835.
United States Retail Sales data
With the latest data showing that retail sales rebounded more than expected in January, and rose the most since March 2021, highlighting the strength of the economy, the US Dollar has still not been able to take off which is giving the Gold bulls a lifeline currently:
The data arrived as follows:
- US Retail Sales Advance (MoM) Jan: 3.0% (est 2.0%; prev -1.1%).
- US Retail Sales Ex Auto (MoM) Jan: 2.3% (est 0.9%; prev -1.1%).
- US Retail Sales Ex Auto And Gas Jan: 2.6% (est 0.9%; prev -0.7%).
- US Retail Sales Control Group Jan: 1.7% (est 1.0%; prev -0.7%).
The Retail Sales data suggest a healthy rise in Personal Consumption for the month, which is likely to be reflected in a more optimistic round of economists’ estimates for the United States of America's first quarter Gross Domestic Product. Manufacturing production also lifted 1.0% MoM in January, and the Empire Manufacturing index rose to -5.8 (-18.0 previously).
''It was not all good news today insofar as the US industrial production data for January recorded a worse than expected flat m/m, with a drop in utilities dragging down was otherwise a better picture for manufacturing,'' analysts at ANZ Bank said.
'' Even so,'' the analysts added, ''the disappointment of the production data has not been enough to put much more than a small dent in the strength exhibited in January US labour and the retail sales data, particularly given the robustness demonstrated in this week’s US January Consumer Price Index inflation report.''
Federal Reserve outlook
On Tuesday, the annual Consumer Price Index inflation rate in the US slowed slightly to 6.4% in January from 6.5% in December, the lowest since October 2021 but above market expectations of 6.2%. The latest Federal Reserve commentary also underpinned that Federal Reserve policymakers largely backed more rate increases, fueling a bid in the greenback after what was an indecisive show from markets around the inflation data initially. The markets are starting to have second thoughts as to whether there will be cuts in 2023.
Federal Reserve rates currently stand at 4.5% to 4.75% but Fed board members' median projection foresaw interest rates peaking at 5.1% this year. However, interest rate futures markets have still priced a peak above 5.2%, based on late Tuesday's prices.
Federal Reserve officials have been mostly consistent in their warnings that rates are set to be higher for longer. ''On the back of the inflation report yesterday, Fed futures have already adjusted higher to reflect the risk of more Fed rate hikes this cycle,'' analysts at Rabobank explained.
''It is our view that the top of the target band for Fed funds will be 5.5%. Given that the market had cut it long USD positions at the end of last year and into January, the risk of a higher peak for Fed funds is suggestive of the potential for further USD gains into the middle of the year,'' the analysts added.
Gold price technical analysis
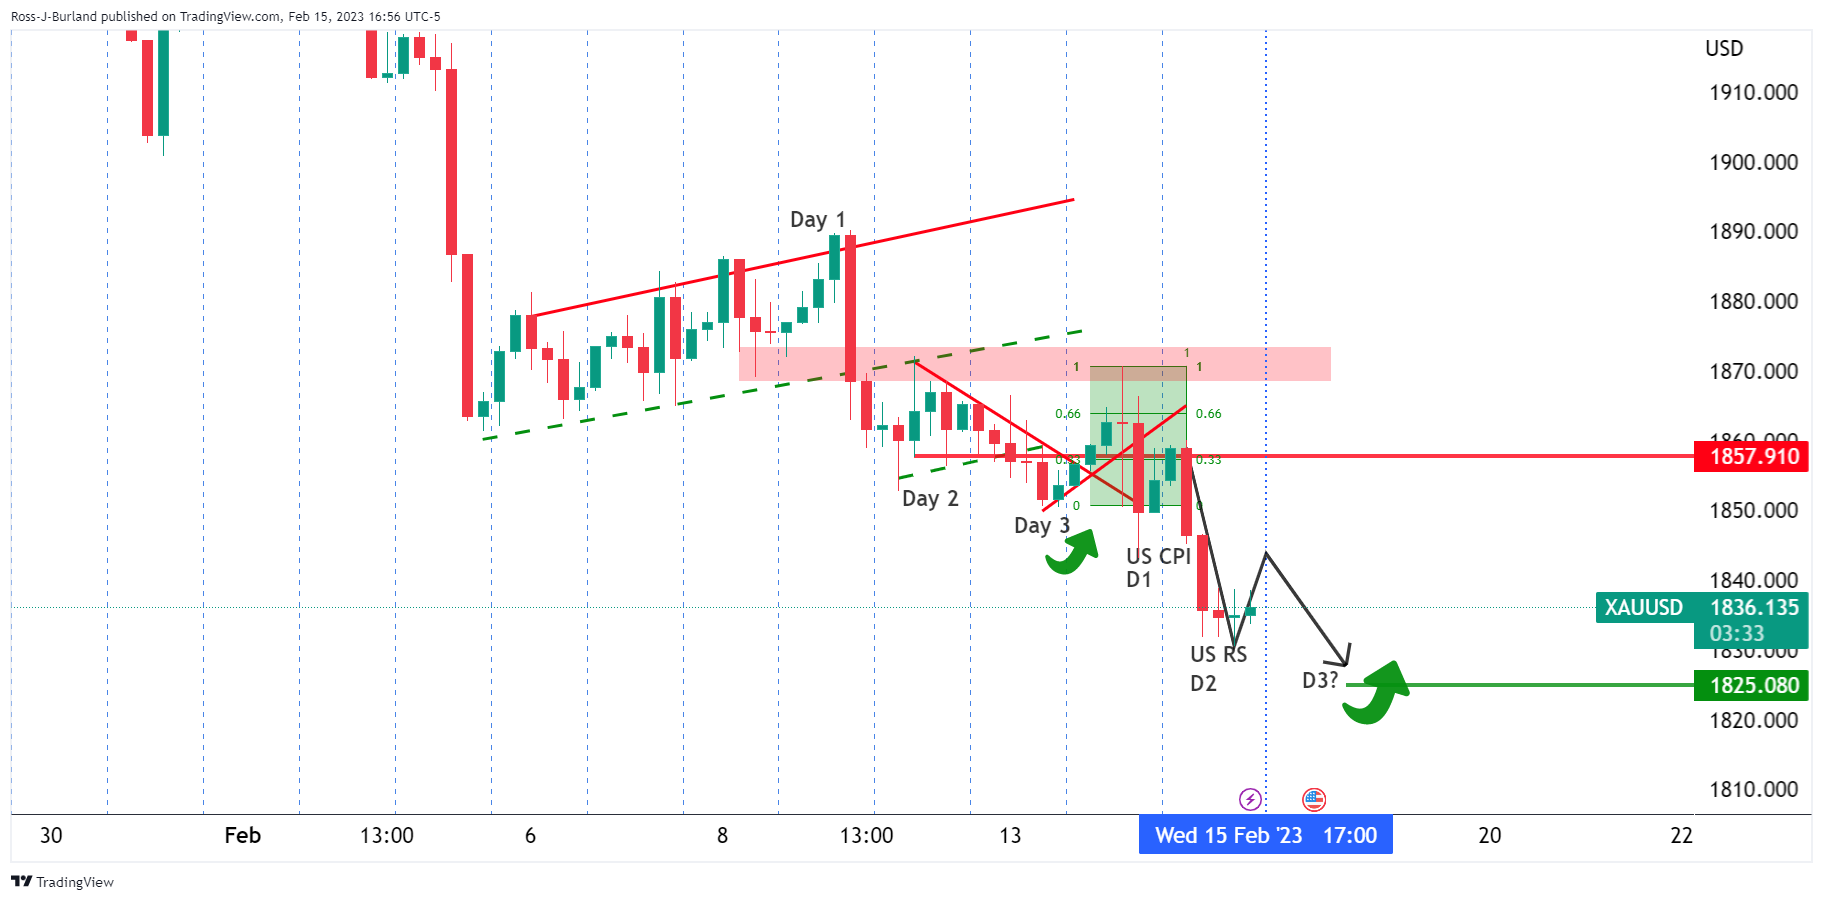
There is scope for a move in Gold price to the 1000 box destination this week as prior analysis has been targeting:
in prior Gold price analysis, it was stated that we were in the upper third of the 2023 range and on the backside of the first trendline that is broken and acting as a counter-trendline. A break of Gold price $1,925 was expected to open the risk of a move to test $1,896 and then $1,867 as the top of the lower third of the range that guarded a 1000 pip Gold price box low of $1,825:
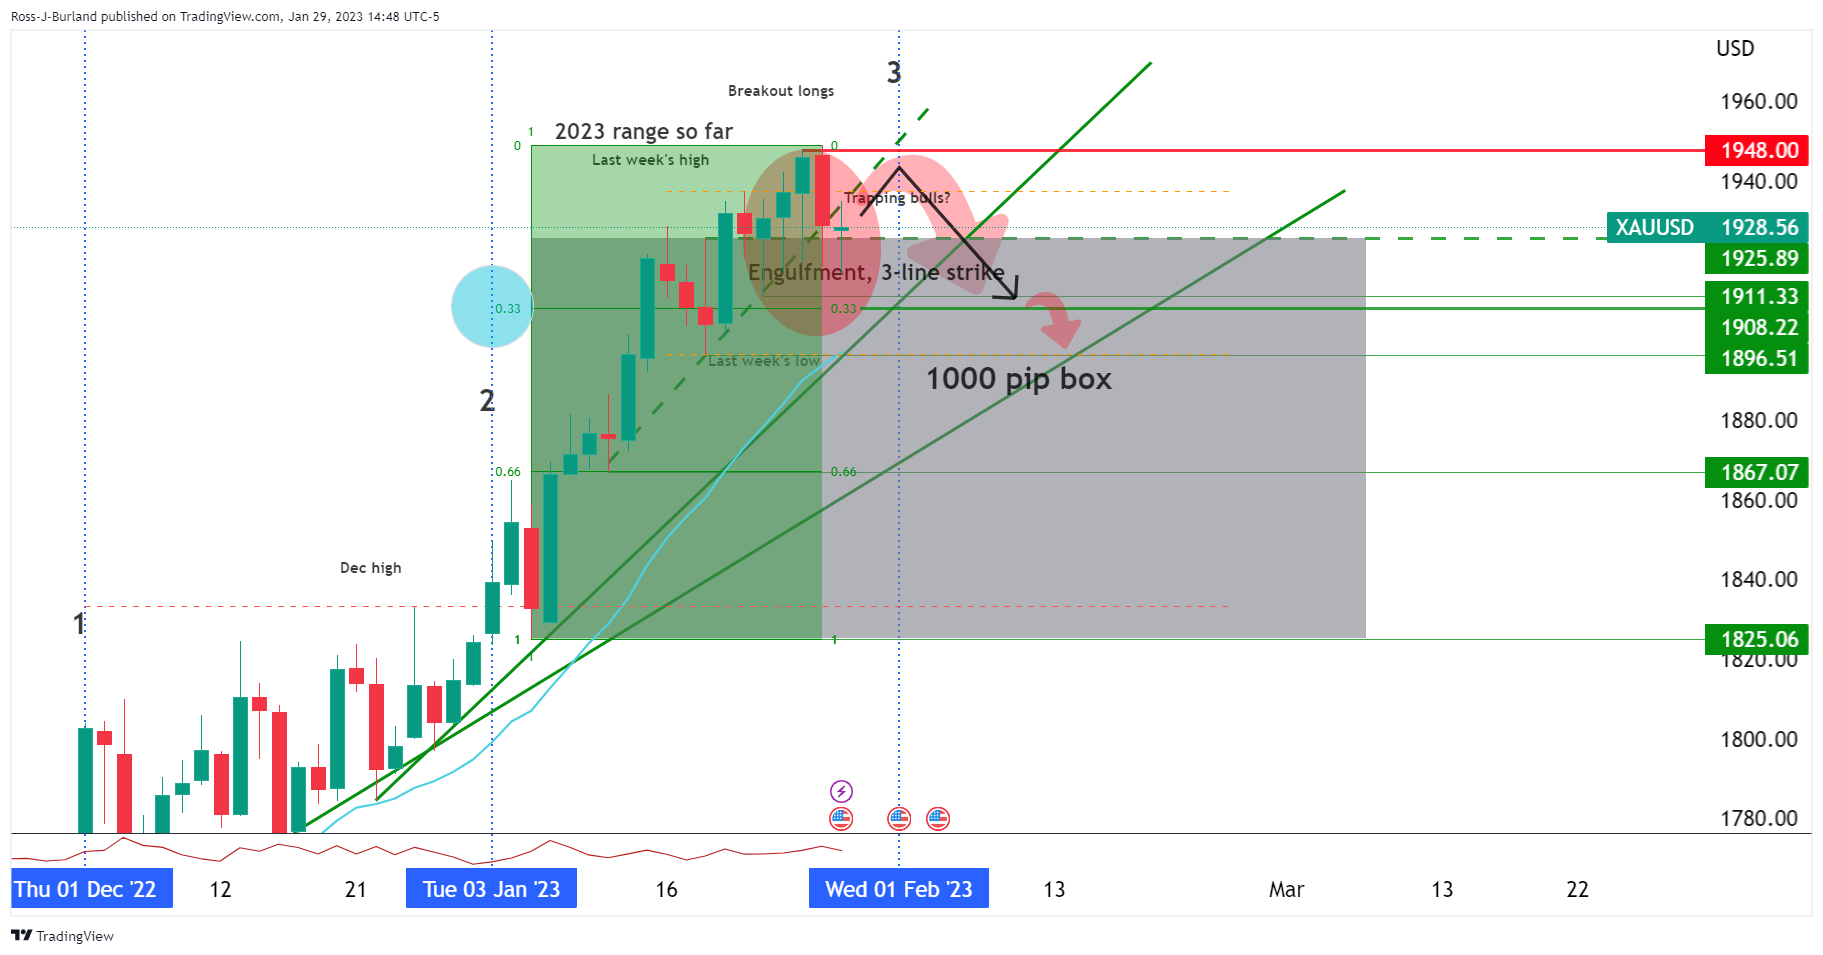
The above chart was analysis drawn at the end of January and below is where we are up to date ahead of the week commencing 12 February open:
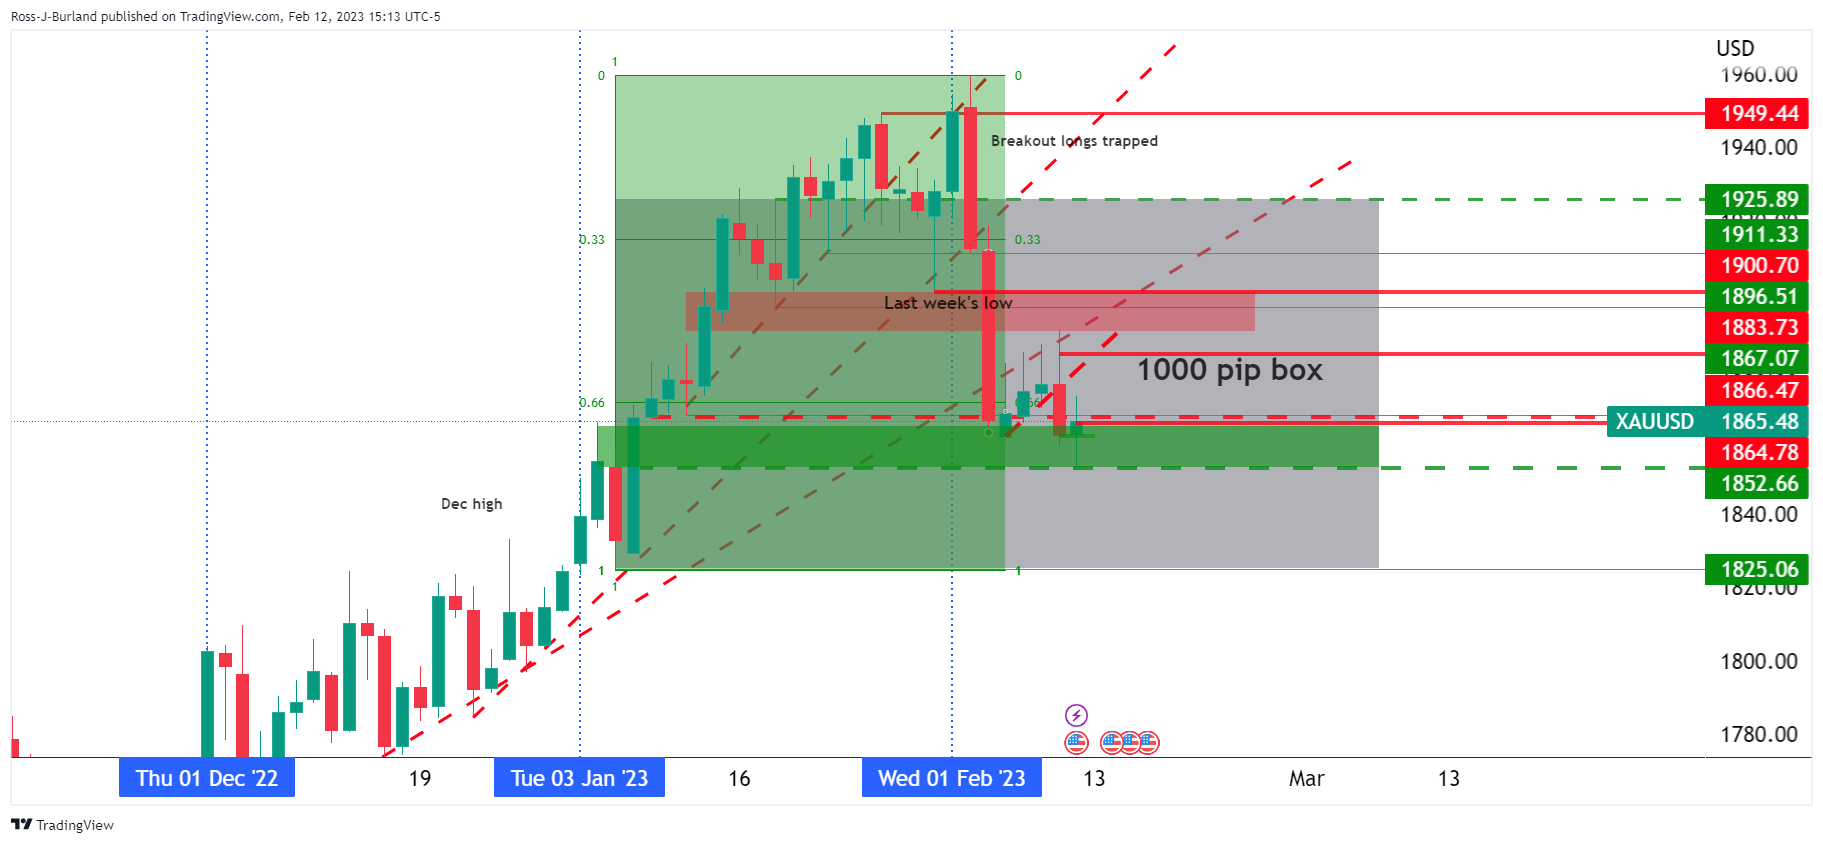
- NZD/USD bears target the low 0.62s following the break of structure.
- A bullish correction is in process currently, but if bears commit below 0.6300, then this correlates with near a 61.8% ratio.
NZD/USD is down on the day as we enter the end of the North American session as the markets tussle with the prospects of higher for longer inflation in the United States and watch the Fed pivot disappear over the horizon.
At the time of writing, NZD/USD is trading at 0.6280 and is down some 0.8% on the day after falling from a high of 0.6337 to a low of 0.6252. The US Dollar, as measured in the DXY index, broke to the topside in the wake of strong US Retail Sales on the back of the prior day's Consumer Price index. Both reports saw bond yields there ratchet up another notch which has played into the hands of risk-off assets and the greenback.
Analysts at ANZ Bank said, ''regular readers will be aware that we have for some time been worried that the USD might re-firm if interest rate expectations there started rising and expectations for late-2023 rate cuts were to fade, and that’s what seem to be playing out.''
''But at the same time, unlike last year’s USD surge, this time we don’t have other central banks going slow – with the European Central Bank and Reserve Bank of New Zealand both on track to hike by 50bp at their next meetings,'' the analyst explained further. ''That, and valuations, may cap (but perhaps not stop) USD upside, but counting on that could be risky.''
NZD/USD technical analysis
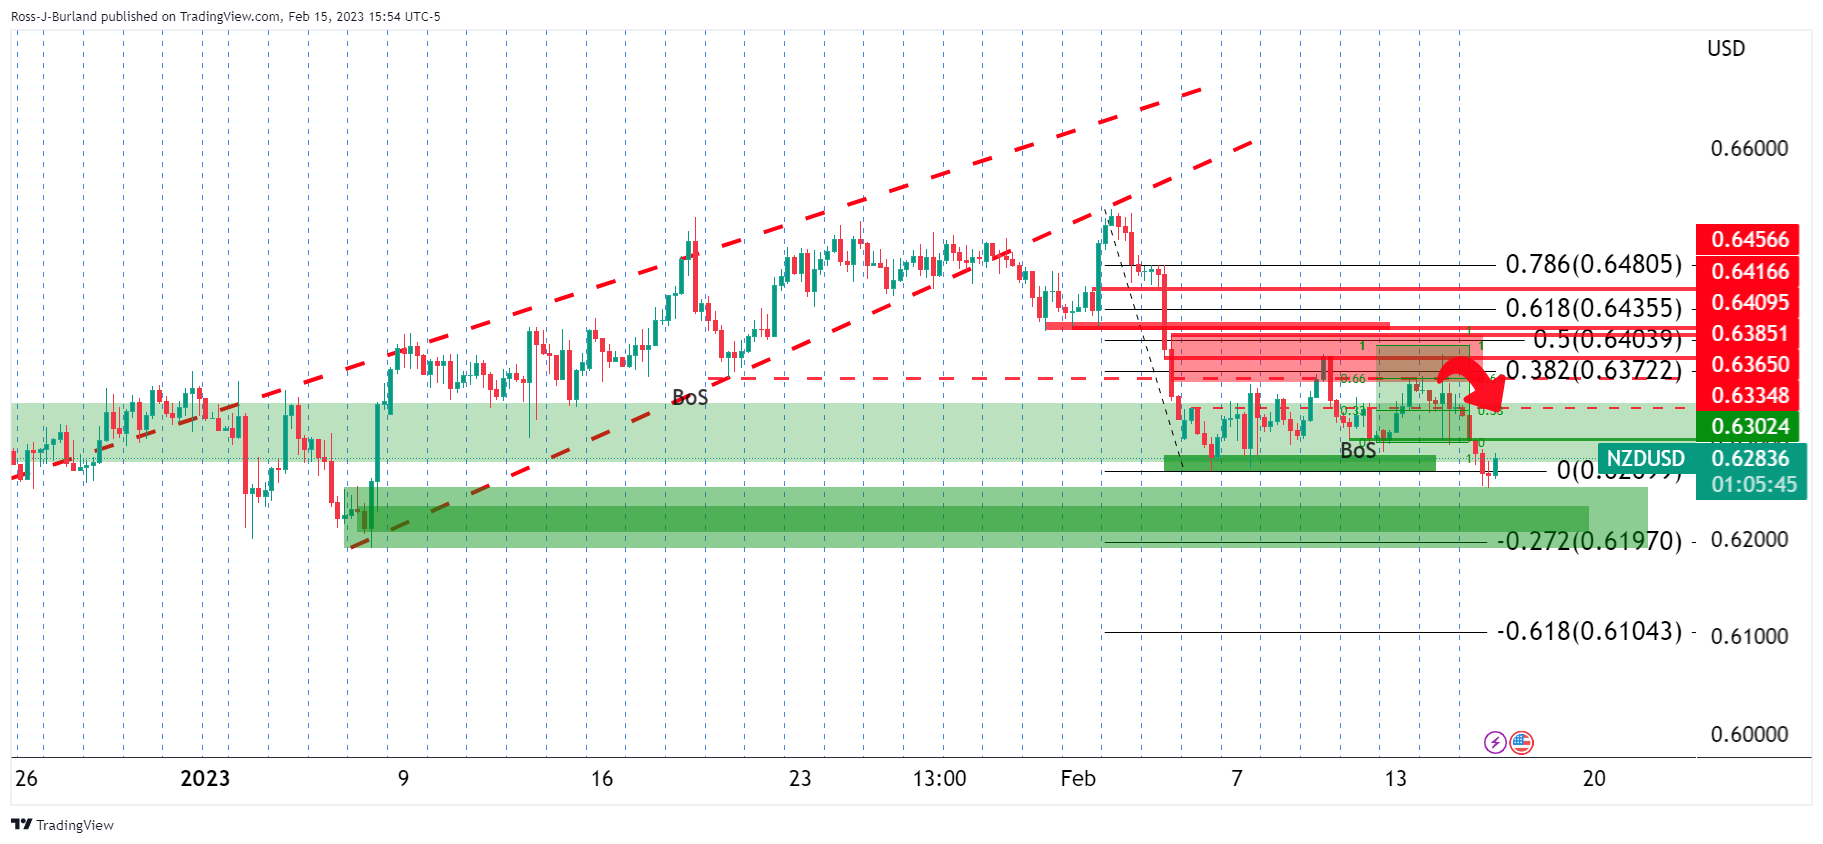
Meanwhile, there are seeing prospects of a move lower.
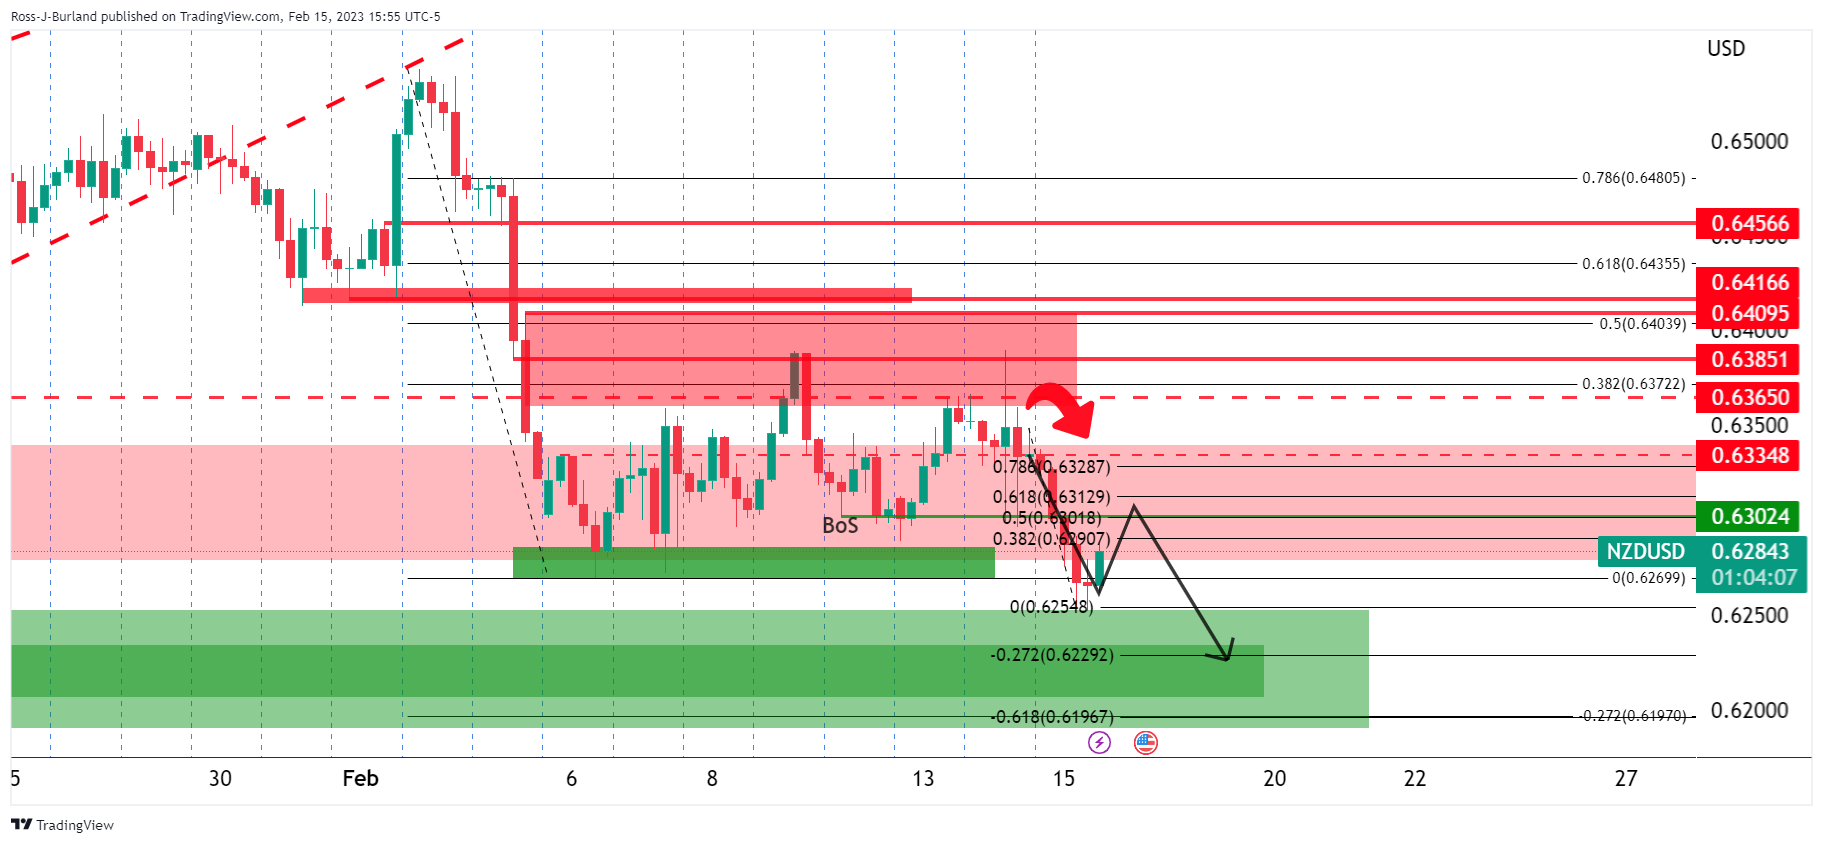
While below resistance, the odds are for a move into the low 0.62s following the break of structure. a correction is in process currently, but if bears commit, say below 0.6300, then a sell-off from the region of a 50%, 61.8% ratio could be on the cards for the day ahead.
- EUR/USD bulls are in play as they correct the recent slide.
- The dominant trend remains bearish while on the backside of the daily bullish cycle's support trend.
EUR/USD bears have been in play following a series of negative data for the pair on the US side. The pair fell this week in what has been a continuation trade for the shorts that broke the prior long-term trendline support:
EUR/USD daily chart
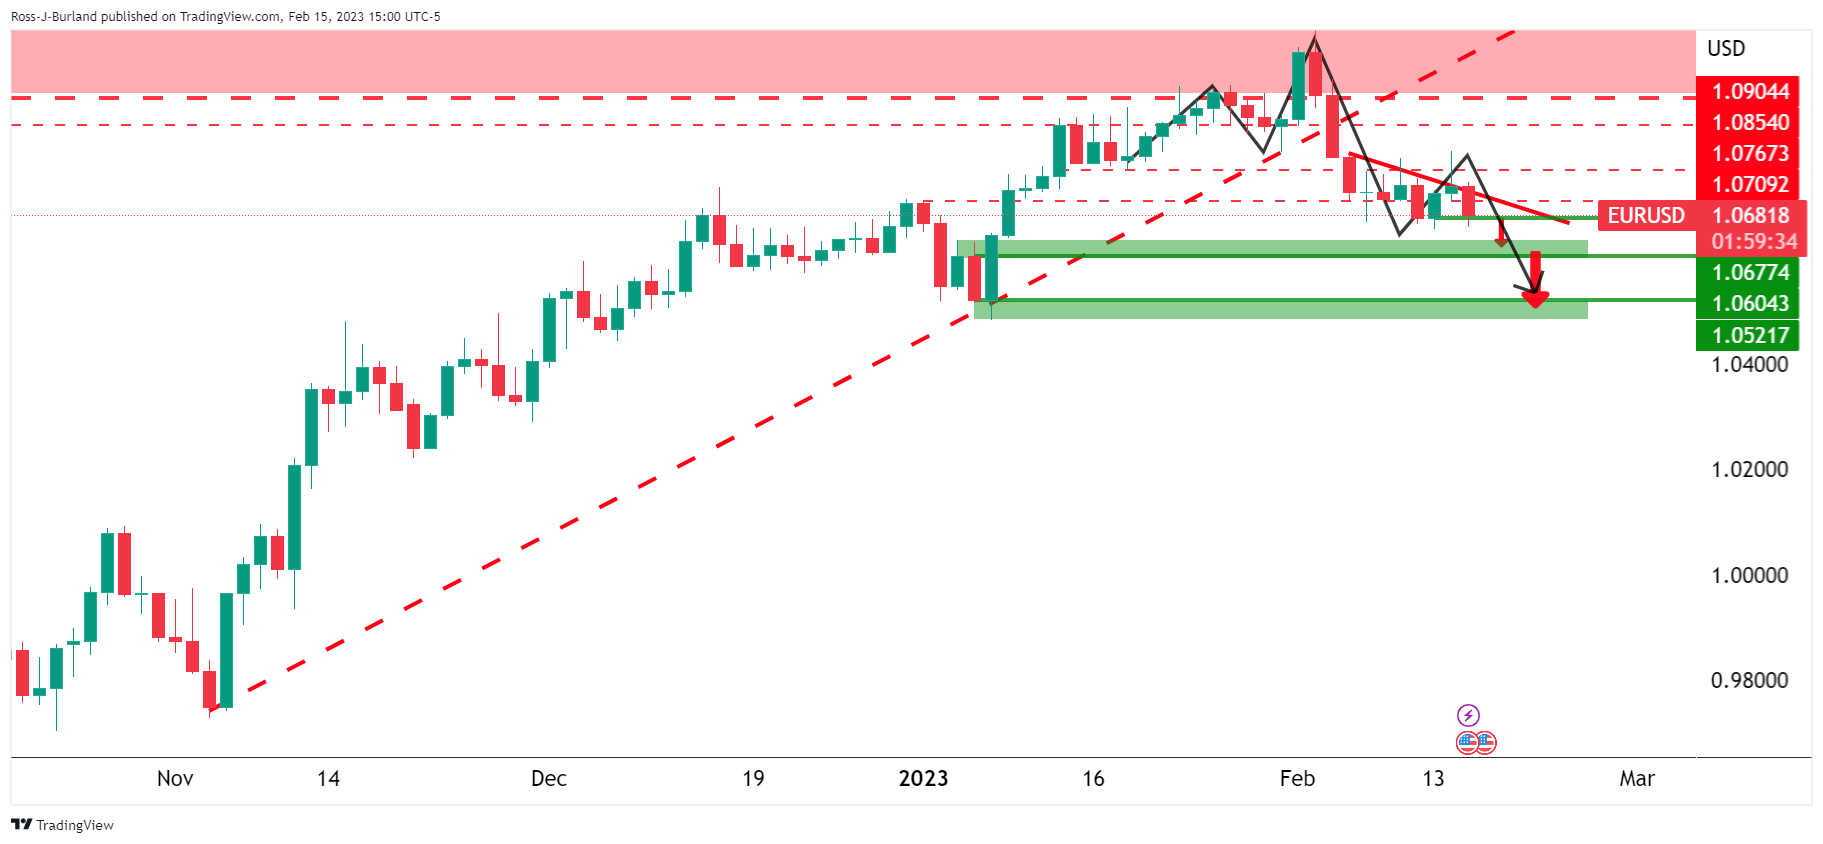
With the price now on the backside of the trendline, a bearish thesis is in play. The next target for the bears is in the 1.0670s with the 1.0520s eyed thereafter.
EUR/USD is building a case for such a move but a correction cannot be ruled out at this point:
EUR/USD H4 chart
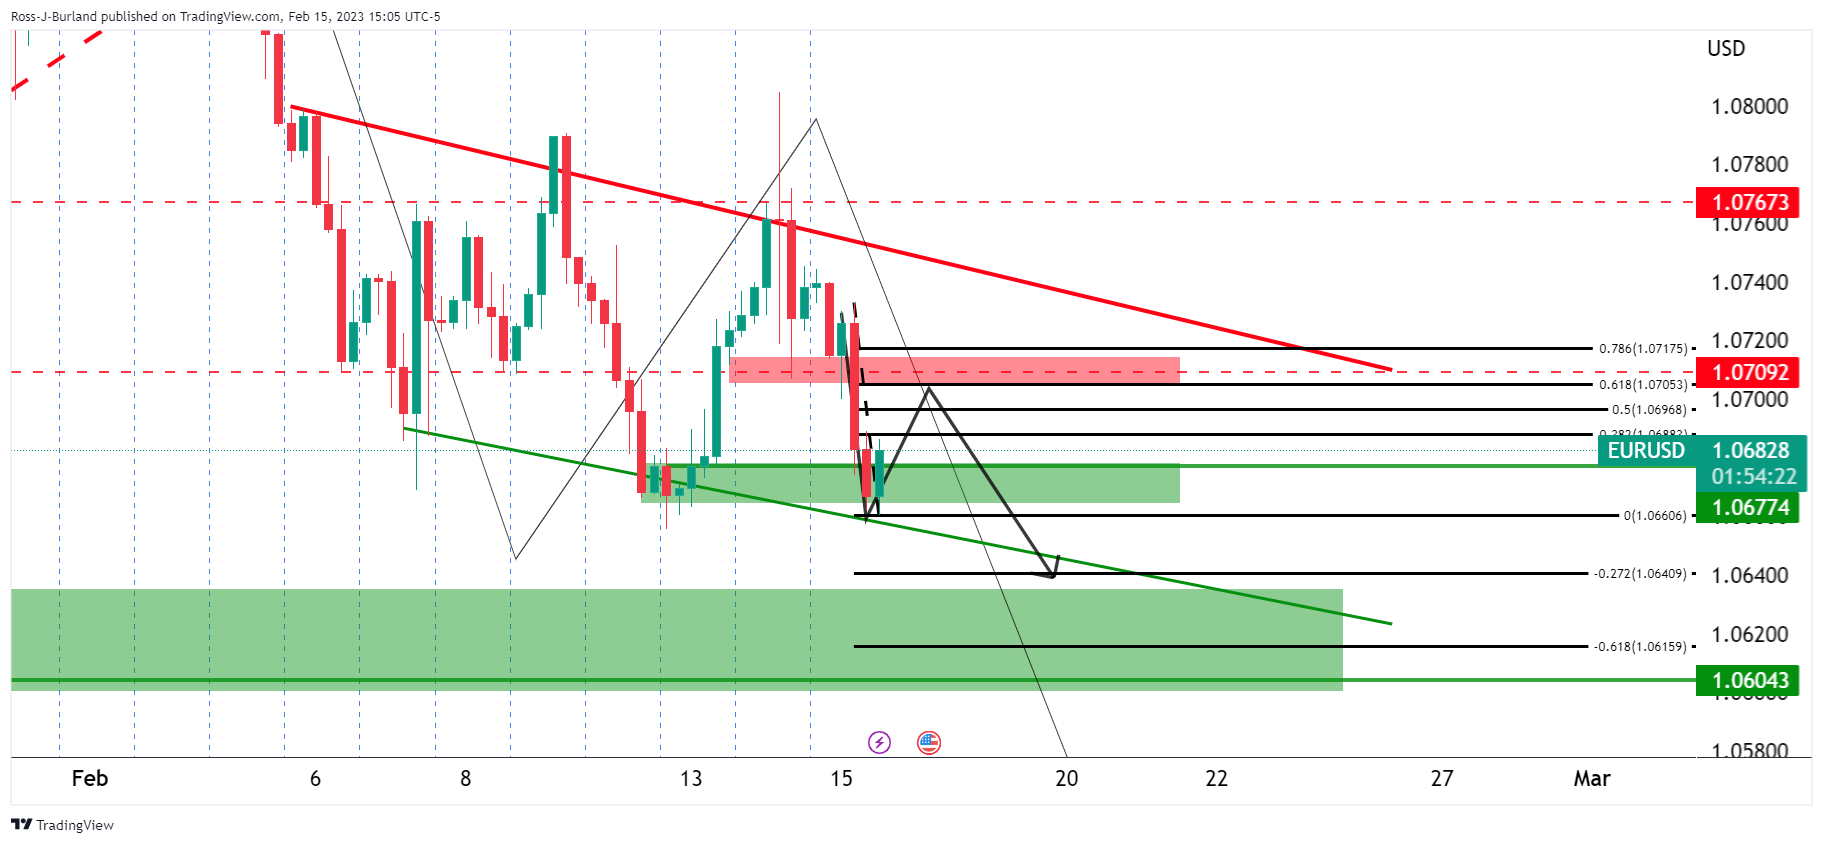
On the four-hour chart, the price is correcting the recent slide and has come up to test the bear's commitments towards a 38.2% Fibonacci correction of the bearish impulse. The candle is strong and would be expected to be followed but a further higher low and closing high for the end of the day.
What you need to take care of on Thursday, February 16:
The US Dollar remained strong on Wednesday, with demand for the Greenback easing ahead of Wall Street's close as stocks bounced from their intraday lows.
The Greenback benefited from renewed concerns about the continued US Federal Reserve's monetary tightening spurring risk aversion. As American inflation eased just modestly in January, hopes for a Fed's pivot faded. The United States published Retail Sales on Wednesday, which surged by 3% MoM in January, much better than anticipated. The figure provided fresh impetus to the USD and kept stock markets on the back foot.
Earlier in the day, the UK reported that the annual CPI rose by 10.1% in January, easing from 10.5% in December, while core CPI was up 5.8% on a yearly basis from 6.3% previously. Easing inflation supports the case of an easIER path of tightening in the kingdom. GBP/USD is down to 1.2020.
European data missed expectations adding pressure on the Euro. Industrial Production contracted 1.7% YoY in December, while the Trade Balance in the same month posted a deficit of €18.1 billion. EUR/USD bottomed at 1.0660, now trading in the 1.0680 region
The AUD/USD pair fell to 0.6864 but recovered the 0.6900 threshold ahead of the close amid the stocks' bounce. Australian employment figures and inflation expectations coming up early Thursday.
USD/CAD trades at 1.3390, with the Canadian dollar benefiting from a crude oil prices comeback. WTI trades at $78.60 a barrel after falling to $77.25. The EIA reported a large build in US stocks, up to 16.283 million barrels in the week ended February 10.
USD/JPY trades at 134.15, sharply up in the day. Higher US government bond yields provided support alongside comments from Japan's Prime Minister Kishida earlier in the day. Kishida said that he expects the new Bank of Japan (BoJ) governor to keep the appropriate monetary policy, taking into account of economy, inflation and market situations.
Gold extended its February slide to $1,830.53 a troy ounce, now hovering around $1,836.
FTX bankruptcy judge rejects independent examiner appointment motion fearing $100 million loss
Like this article? Help us with some feedback by answering this survey:
- WTI extended its losses to three consecutive days beneath $80.00 a barrel.
- US EIA reported that stockpiles had risen the most since June 2021.
- WTI Price Analysis: Subdued but it remains slightly tilted to the downside.
Western Texas Intermediate (WTI), the US crude oil benchmark, is extending its fall to three straight days of consecutive losses, weighed by crude oil inventories in the United States (US) jumping more than estimates. Speculations of further interest rate hikes by the US Federal Reserve (Fed) bolstered the greenback, a headwind for oil prices. At the time of writing, WTI is trading at $78.40.
WTI is climbing above the 50-day Exponential Moving Average (EMA) even though US crude oil inventories have risen the most since June 2021. The US Energy Information Administration (EIA) agency revealed that crude stockpiles increased by 16.3 million barrels, in the week of February 10, to 471.4 million barrels.
Crude inventories in Cushing, Oklahoma, a delivery hub for futures, jumped by 659K last week, while refinery crude fell by 383K barrels per day. Gasoline inventories advanced by 2.3 million barrels to 241.9 million, exceeding analysts’ estimates of a 1.5 million barrels rise. Distillate inventories which account for diesel and heating oil, dropped by 1.3 million to 119.2 million, vs. expectations for a 400K barrel increase.
Aside from this, US Retail Sales for January smashed expectations and exceeded estimates. Therefore, recent Fed hawkish commentary, following Tuesday’s CPI print and today’s data, sparked speculation that the Federal Reserve would continue to tighten conditions, a tailwind for the greenback.
WTI Technical analysis
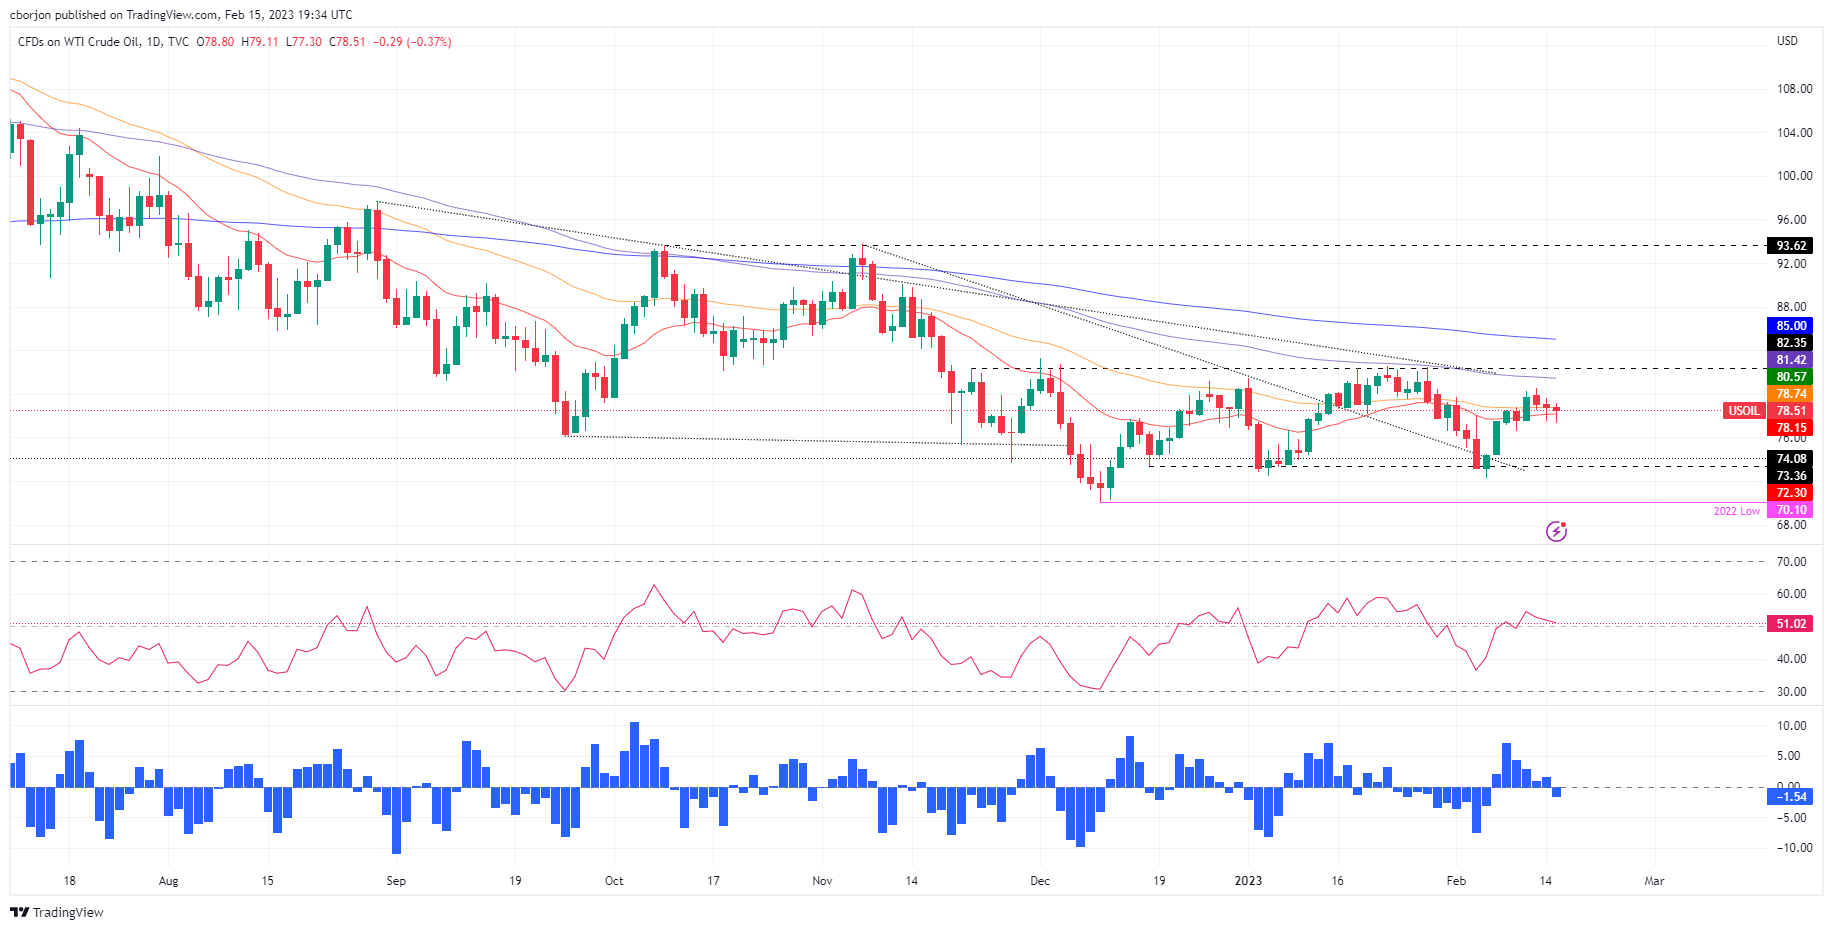
Albeit WTI remains neutral to downward biased, it remains consolidated in the $77.30-$80.50 range. The Relative Strength Index (RSI) in the bullish territory is almost flat, portraying oil as rangebound. In contrast, the Rate of Change (RoC) portrays sellers gaining momentum. Therefore, mixed signals suggest caution is warranted.
For WTI to resume its uptrend, it will need to conquer $80.50, which would open the door to test the 100 and 200-day EMAs, each at $81.43 and $85.00. As an alternate scenario, oil prices would resume their downtrend, with a decisive break below $77.00, dragging prices towards the YTD Low at $72.30.
- AUD/USD bears are seeking a significant run to 0.6720 while the bulls need to get above 0.6920 and then 0.7000.
- 0.6870 is seen as a critical structure guarding the downside.
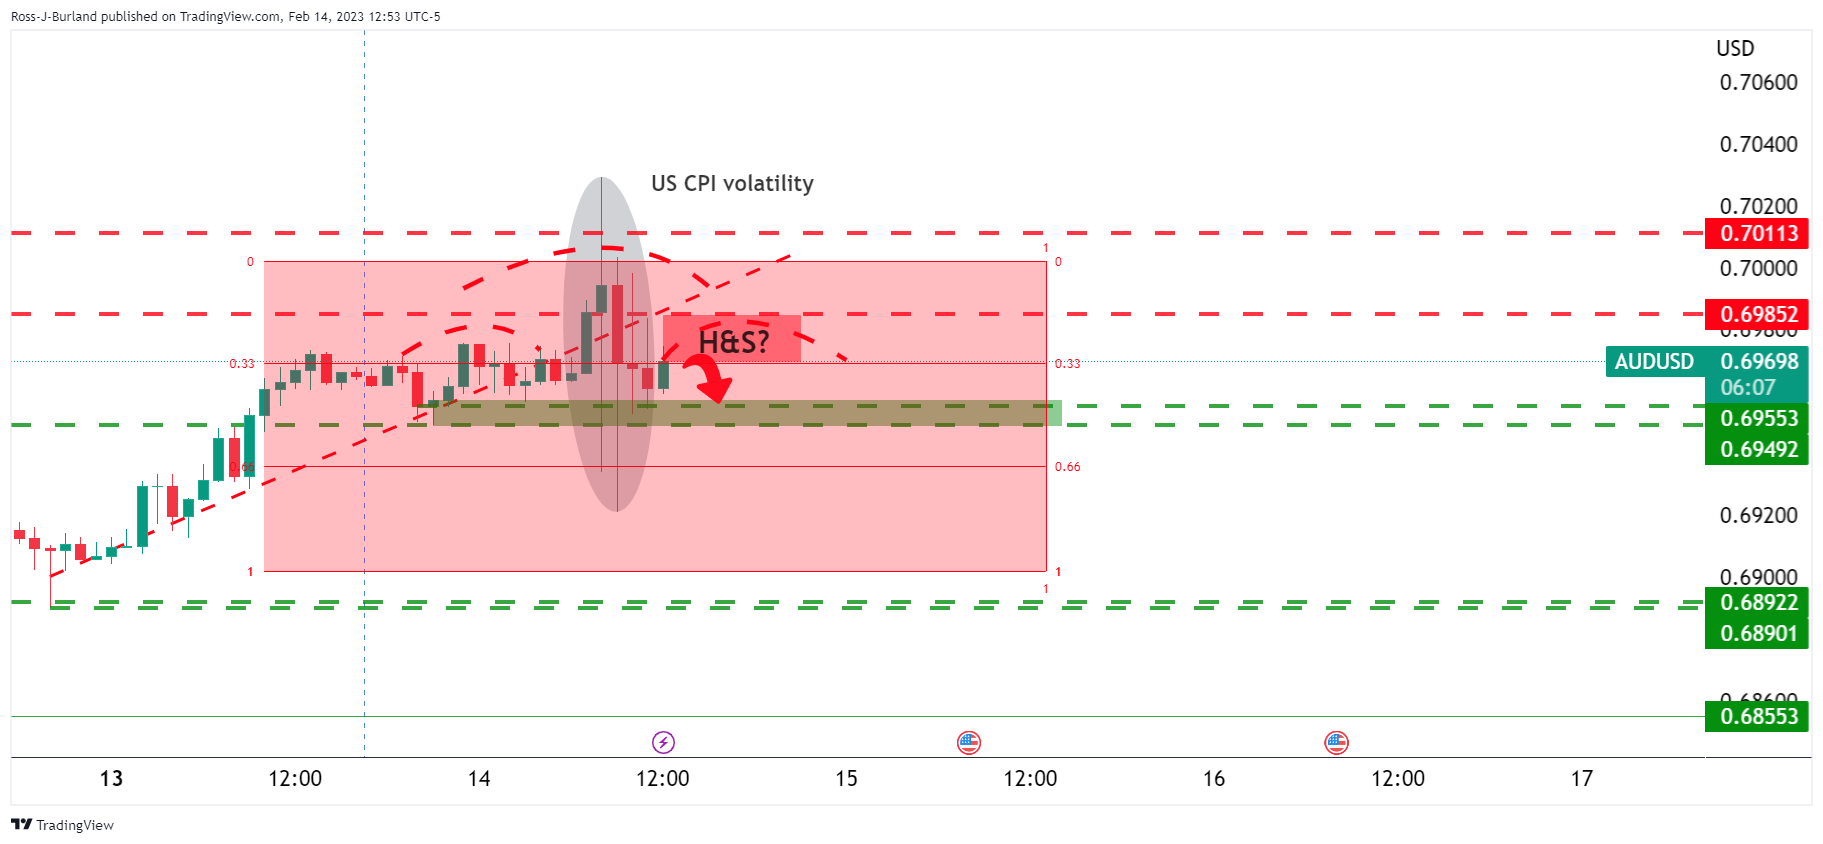
As per the prior analysis, AUD/USD Price Analysis: Bears are dominating the bias with eyes on break of 0.6900, the price is under water following the breakout below the hand and shoulder pattern that was identified on Tuesday on the hourly chart:
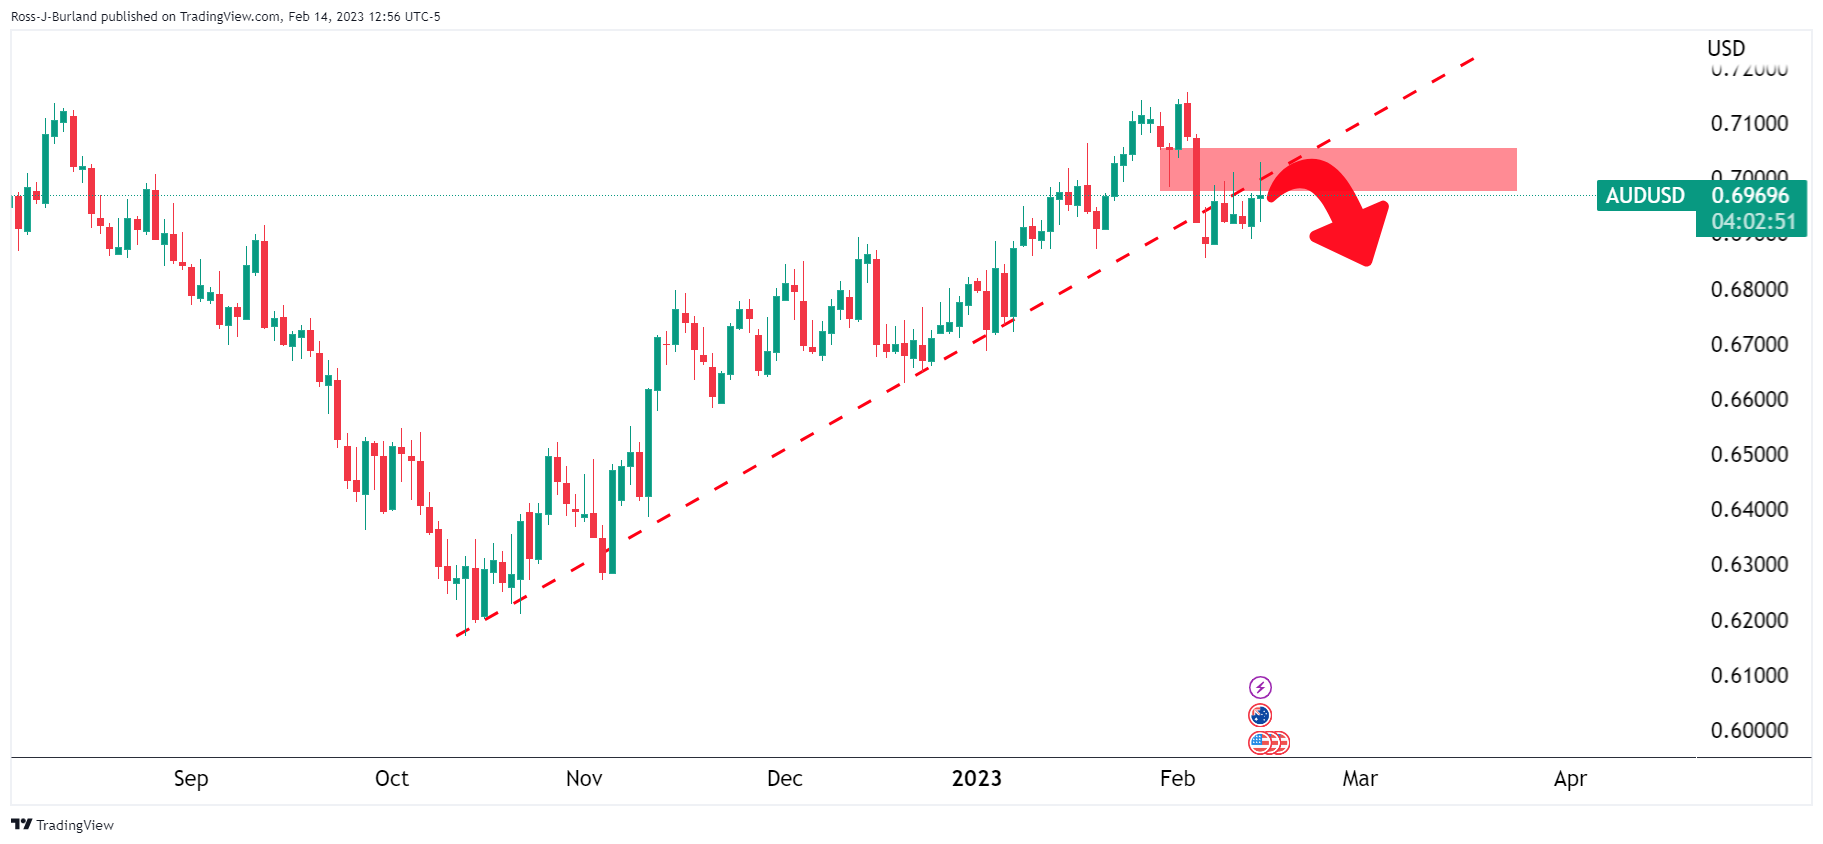
It was stated that a break below 0.6950 opened the risk of a test of 0.6900 again and from a daily perspective, this could have been the most probable outcome for the days ahead:
AUD/USD update
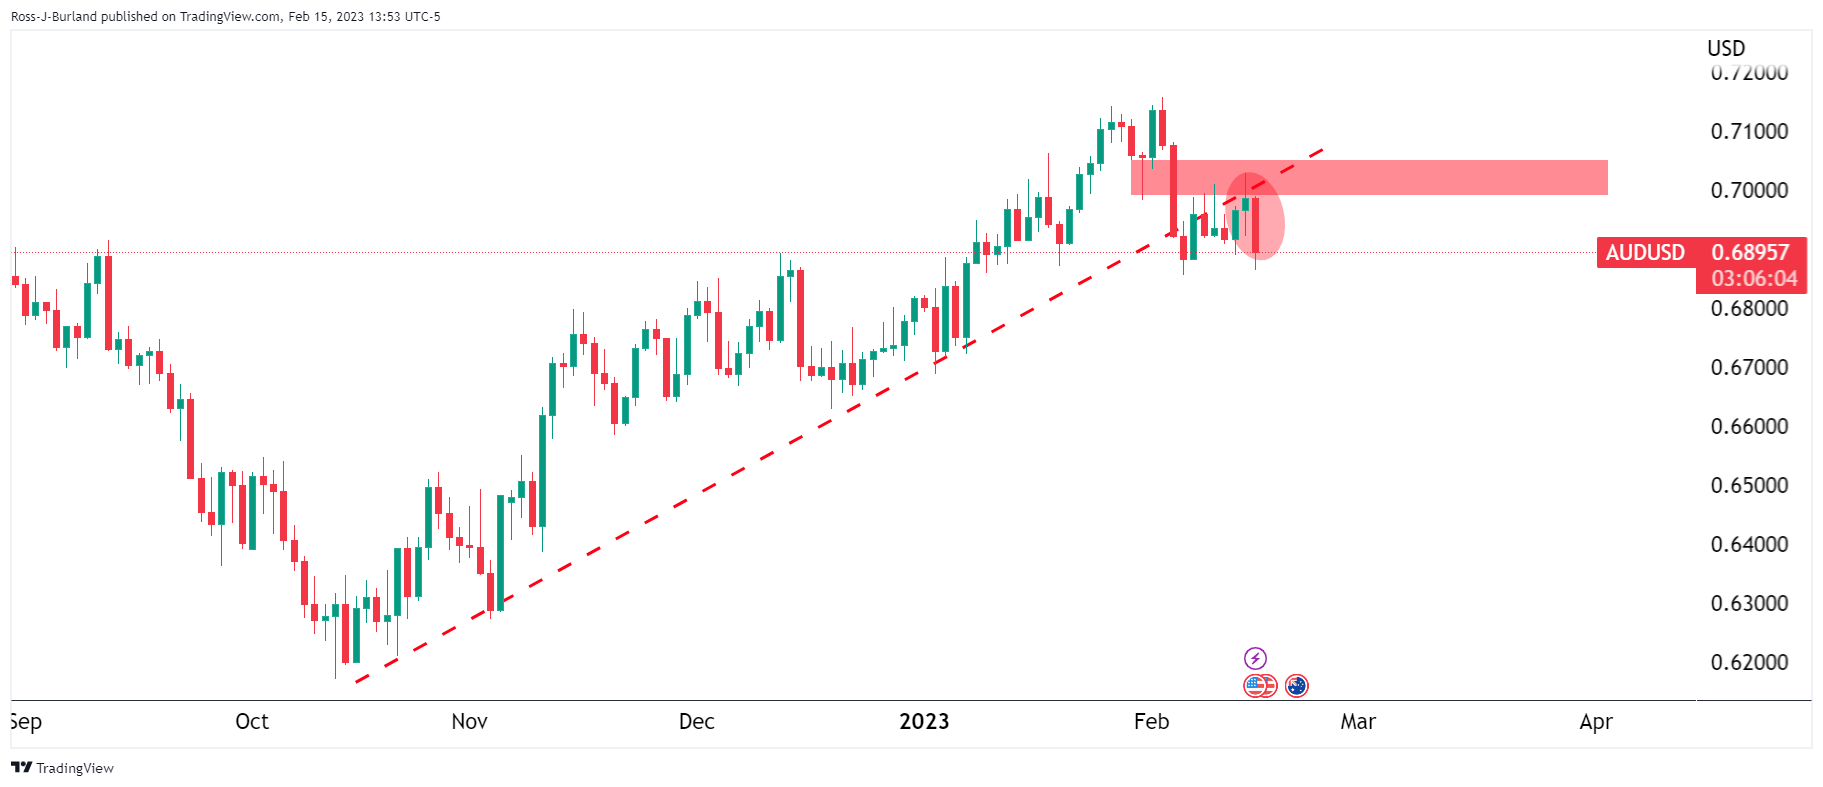
Zoomed in ...
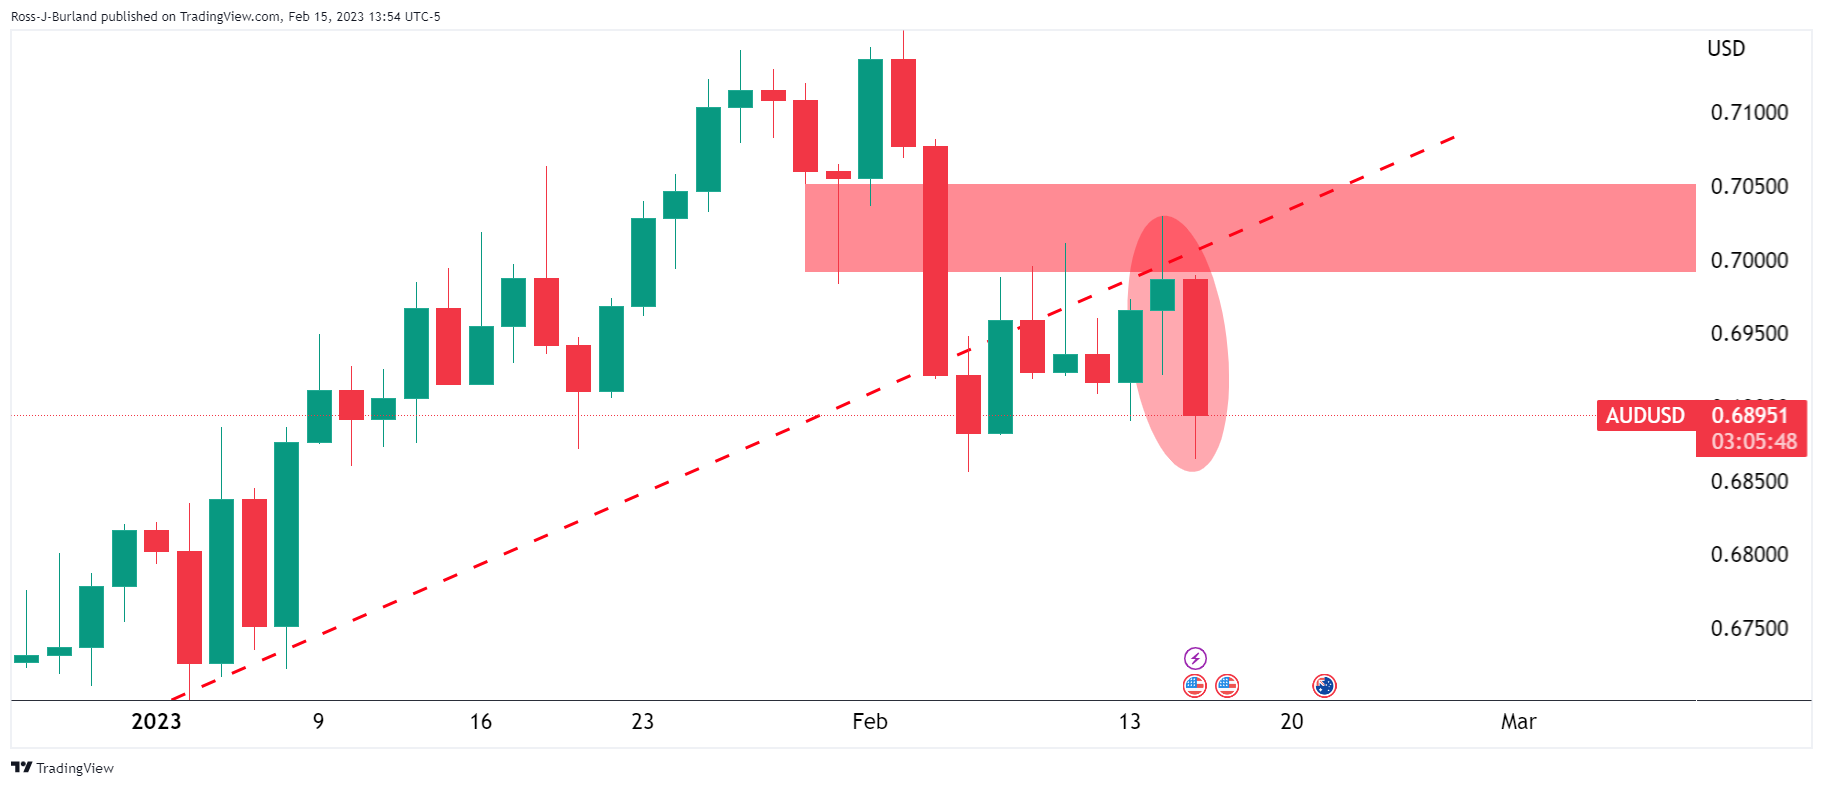
AUD/USD H1 chart
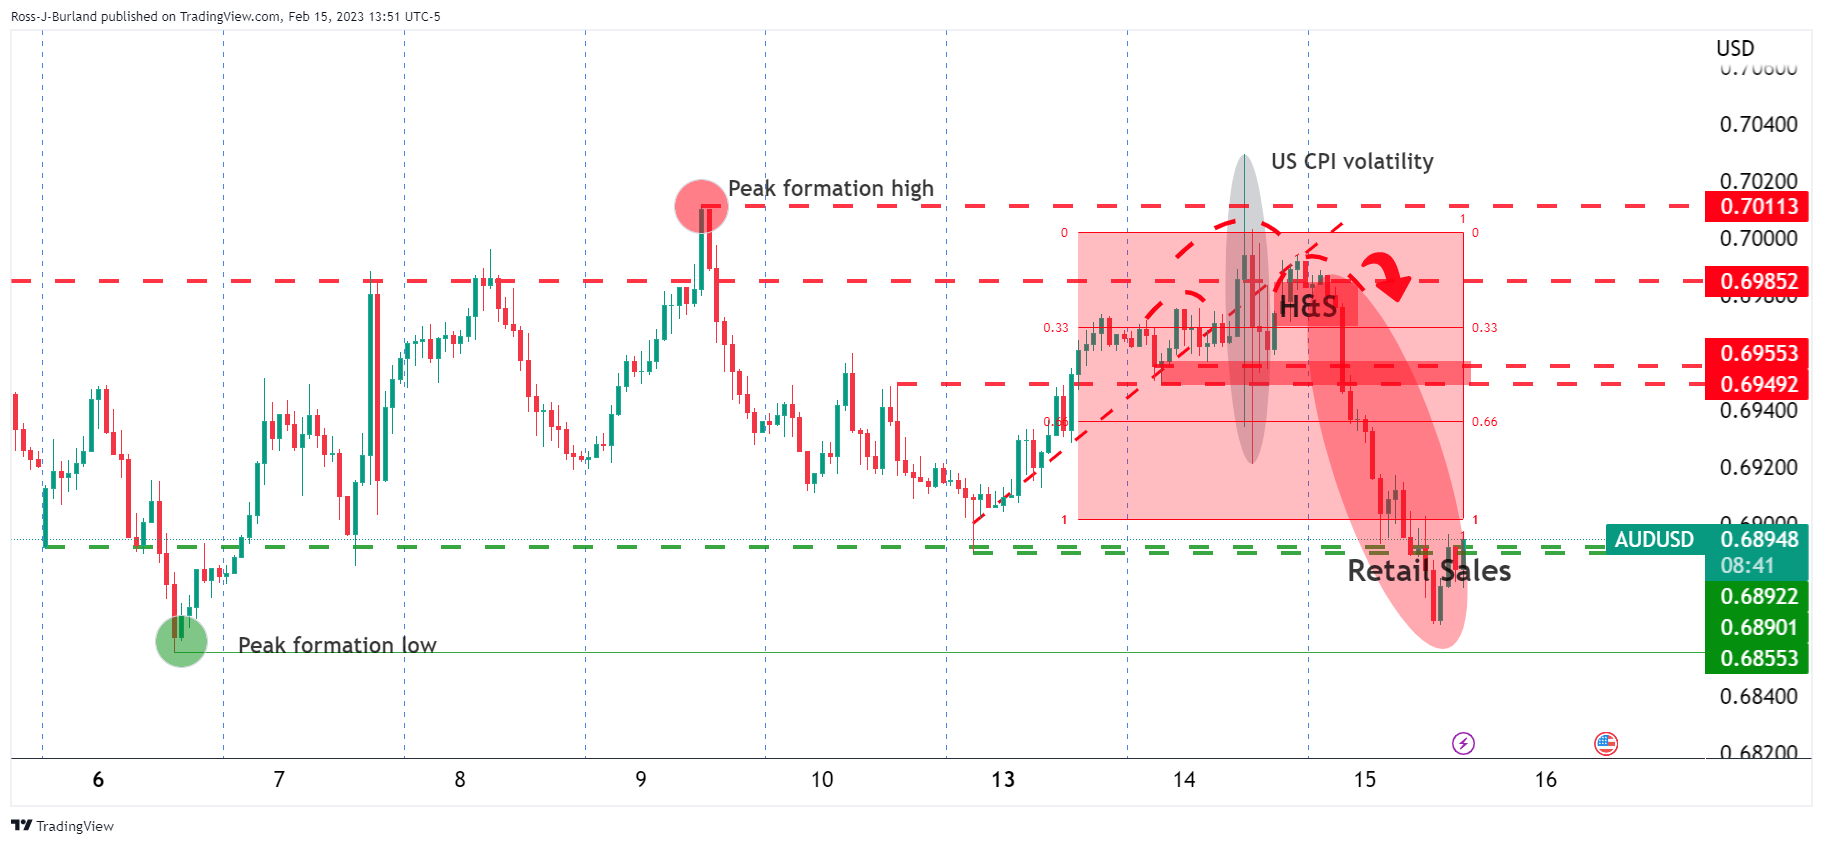
As illustrated, the price fell and reached towards the prior peak formation near 0.6850
The price is now stalling despite a strong retail Sales number with 90% of the leg work already done in the Asian and European markets.
The risks are now tilted towards a period of consolidation above last week's lows near 0.6850 but a break of resistance and 0.6920 could start to form a bullish consensus on the charts for the days ahead:
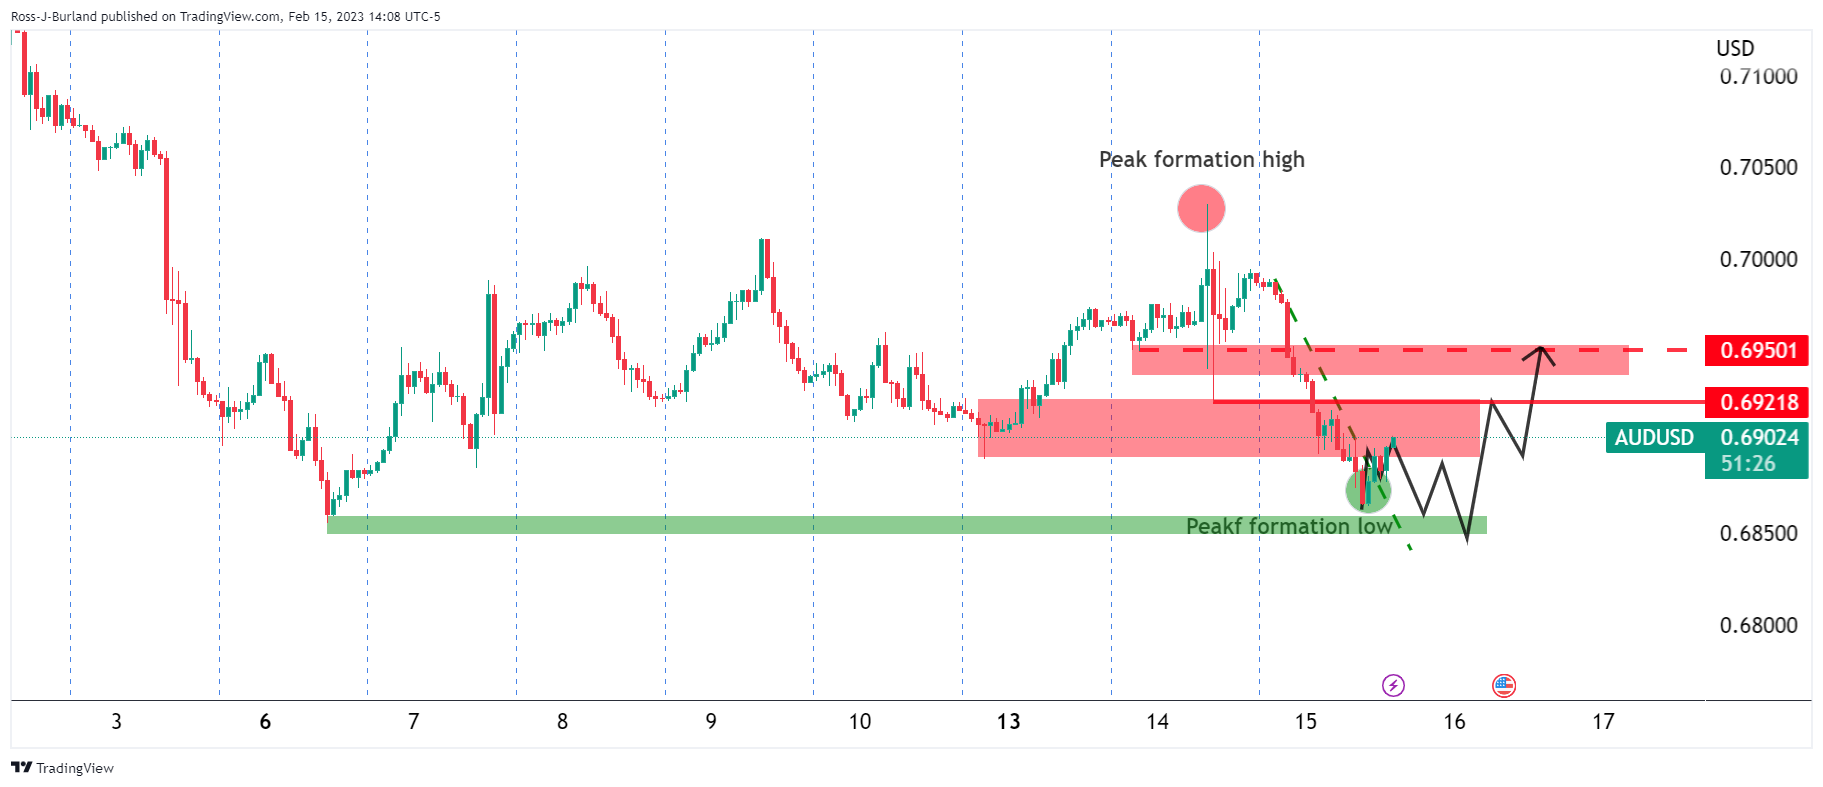
With the price now being on the backside of the trend, the bulls could start to accumulate positions here and a move into the shorts could be on the cards.
However, should the bears commit below 0.6920:
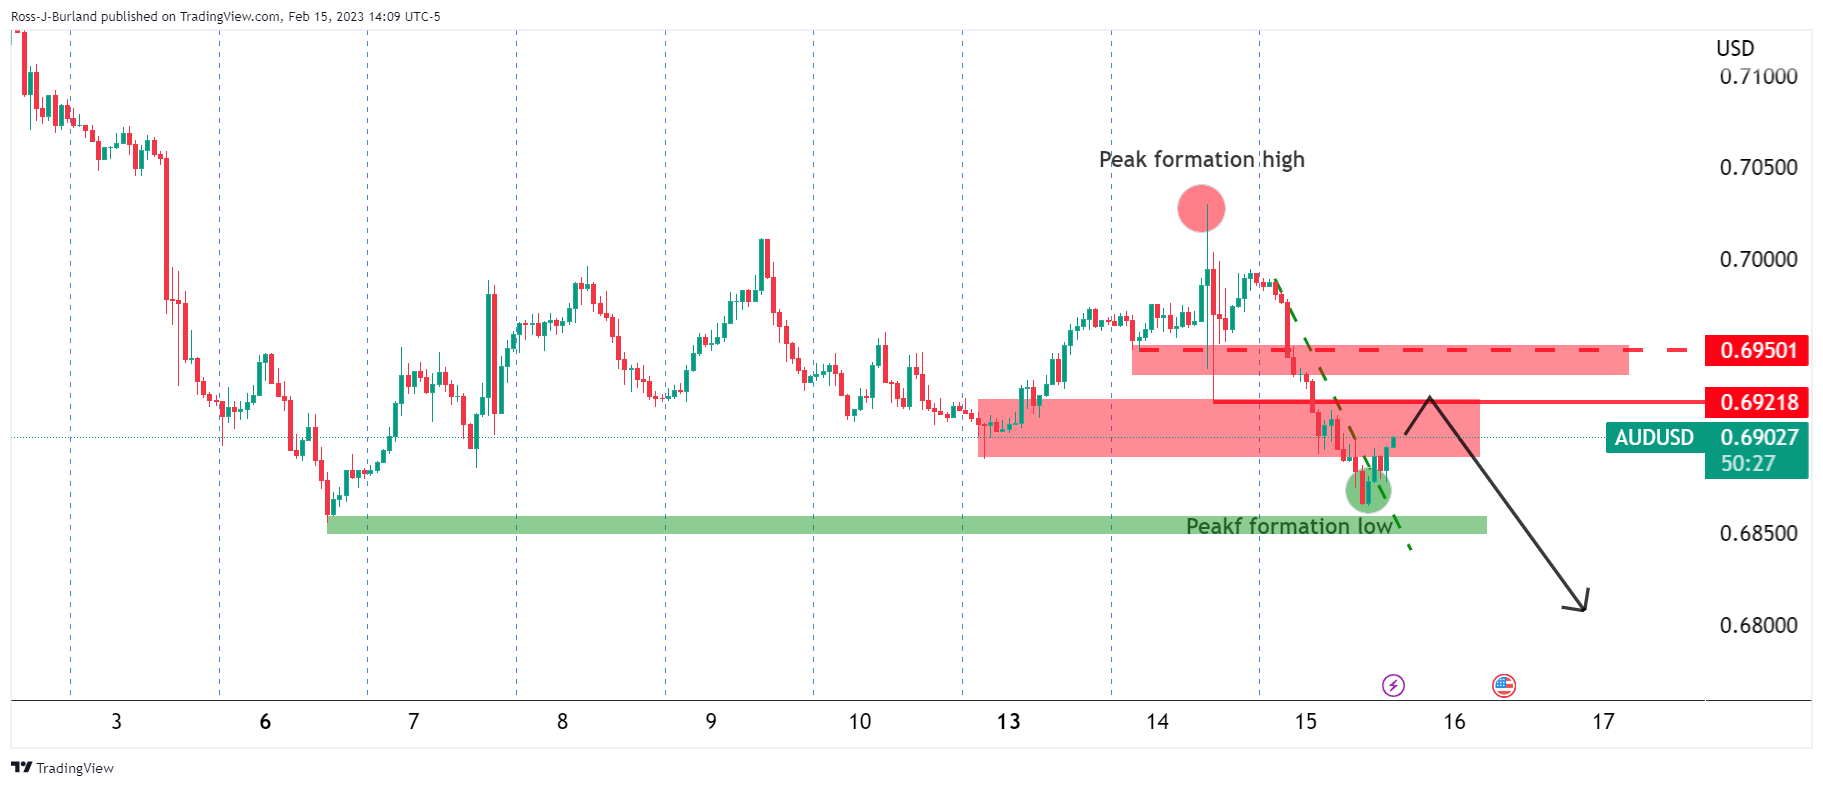
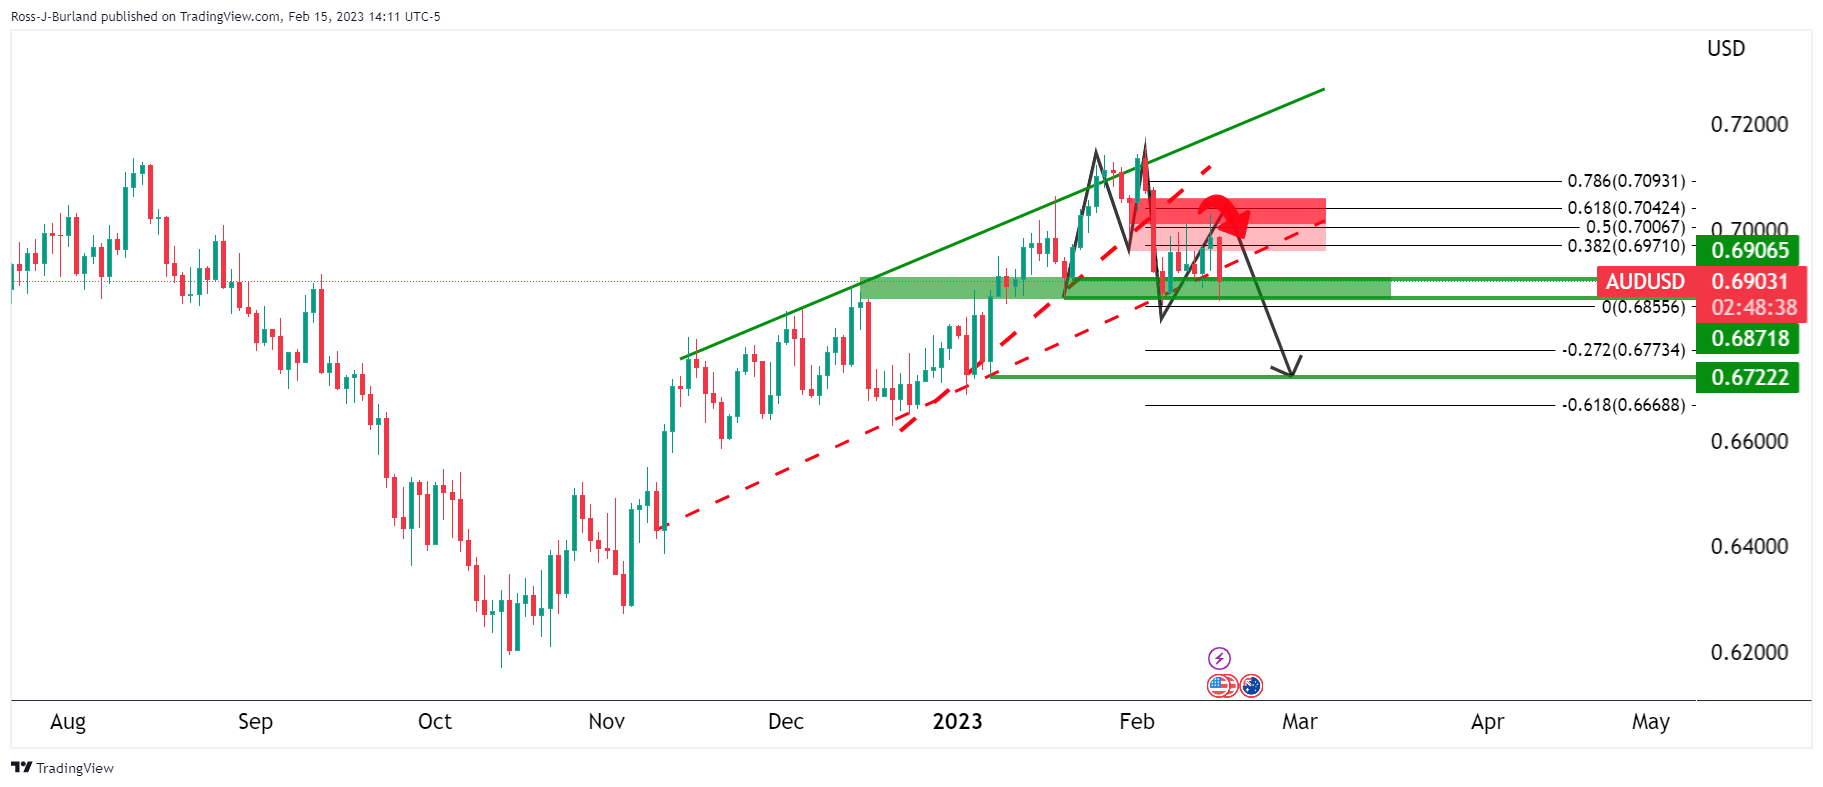
There will be probabilities of a much deeper breakout with 0.6720 eyed at the extreme as per the daily chart.
- GBP/USD bears are moving in near the lows of the day.
- The British Pound is under pressure due to a series of bearish data for the currency.
GBP/USD is back under pressure in midday US trade after a series of data has kept a lid on attempts to correct the major sell-off that ensued following a round of negative data for cable. At the time of writing, GBP/USD is trading at 1.2005 and down 1.35%, pressured within the day's range of between 1.1989 and 1.2181, retreating from near two-week lows and on course for its sharpest one-day decline this month.
The pair has moved lower to break a seven-day rally against the euro, after a bigger-than-expected drop in UK inflation in January has led investors to believe that the Bank of England might curtail its interest rate hiking cycle. Inflation decelerated to an annual rate of 10.1% in January from 10.5% in December, compared to expectations of 10.3% in a Wall Street Journal survey of analysts.
Then to rub salt in the bull's wounds, the US Dollar climbed to a six-week high against a currency basket on Wednesday after hotter-than-expected US Retail Sales data last month that followed high Consumer Price Index data the prior day. Year-on-year, Retail Sales prices rose 6.4%. That was down from 6.5% in December but above economists' expectations of 6.2%Retail Sales rose 3% in January, easily topping the 1.8% estimate, the Commerce Department reported Wednesday.
''Today’s US Retail Sales data release support risks that the Federal Reserve will have to work harder to curtail demand and bring inflation under control,'' analysts at Rabobank said.
Investors are starting to have second thoughts as to whether there will be cuts in 2023. Rates currently stand at 4.5% to 4.75% but Fed board members' median projection foresaw interest rates peaking at 5.1% this year. However, interest rate futures markets have still priced a peak above 5.2%, based on late Tuesday's prices.
- USD/CAD rallied above 1.3400 after solid US economic data, putting pressure on the Federal Reserve.
- January’s Retail Sales in the United States smashed estimates, backing up Fed officials’ hawkish comments.
- Money market futures are pricing in two 25 bps rate hikes by the US Federal Reserve.
USD/CAD is still upward biased after hitting a daily high of 1.3440, though it retreated some of its gains but remains above its opening price. Data from the United States (US) sparked speculation that the Federal Reserve (Fed) would continue to tighten policy, with forecasts eyeing the Fed Funds Rate (FFR) at around 5.10%. At the time of writing, the USD/CAD exchange hand sat 1.3422 after hitting a low of 1.3331.
A positive Retail Sales report from the United States (US) bolstered the US Dollar (USD) on speculations that the Fed is ways to go to tame elevated inflation. The US Commerce Department revealed that Retail Sales in January increased significantly by 3.0% compared to the previous month, which exceeded the 1.8% growth predicted by analysts. This surge in sales followed two consecutive months of decline. The primary factor contributing to the increase in sales is the tight labor market, which has led to substantial wage growth. Additionally, higher gasoline prices might have tilted sales up.
After the data release, US Treasury bond yields, namely the US 2-year note rate, the most sensitive to changes in interest rates, peaked around 4.703%, reflecting that traders expect at least two additional rate hikes, as shown by futures data. Money market futures estimate that the FFR would hit the 5.0%-5.25% range, meaning 25 bps in March and May meetings are foreseeable.
Hence, the USD/CAD edged toward its daily high at 1.3428 before reversing course below 1.3400. However, the London Fix gave USD/CAD bulls a fresh impulse, with them eyeing a break above the 50-day Exponential Moving Average (EMA) at 1.3429.
On the Canadian side, Housing Starts fell by 13% in January “from the previous month 215,365 dwellings, well below the 240,000 units that economists had expected,” according to Reuters. Even though Canadian bond yields increased, falling oil prices weighed on the Loonie (CAD).
Of late, Industrial Production (IP) in the US remained unchanged, as reported by the US Federal Reserve (Fed), while output was weaker than foreseen, spurred by higher borrowing costs in the manufacturing sector.
USD/CAD Key technical levels
Europen Central Bank governor, Christine Lagarde has said that even though most measures of longer-term inflation expectations currently stand at around 2%, these measures warrant continued monitoring.
She says price pressures remain strong and underlying inflation is still high. She intends to lift rates by 50 basis points at the March meeting.
Lagarde says while confidence is rising and energy prices have fallen, we expect activity to remain weak in the near term.
EUR/USD update
Lagarde's comments are supporting EUR/USd at the time of writing. The Euro meanwhile, fell against the US Dollar on Wednesday after hotter-than-expected US Retail Sales data last month, coming a day after a report showing stubbornly high US consumer prices. EUR/USD is currently trading down some 0.6% after falling from a high of 1.0744 to a low of 1.0661 in the day's range so far.
- USD/JPY rallies above 134.00 after breaking above the 200-day EMA.
- USD/JPY Price Analysis: Upward biased, though a daily close above the 200-DMA could cement the uptrend.
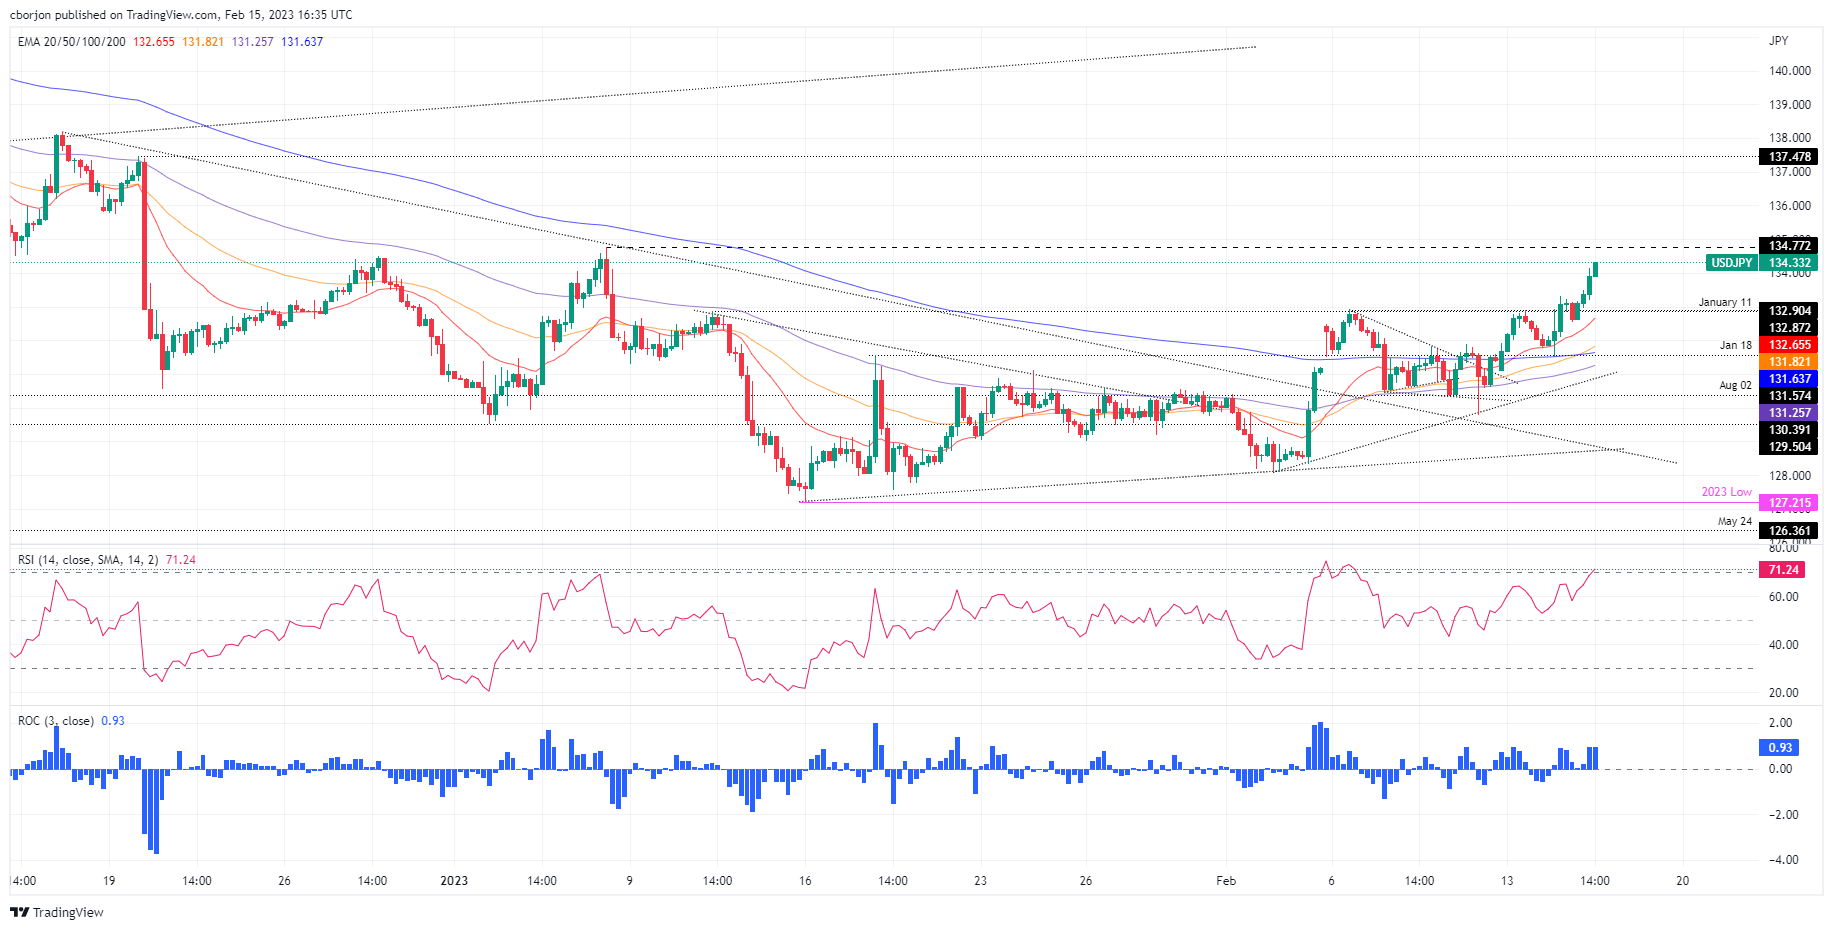
The USD/JPY rallies more than 100 pips and clears the 134.00 mark, breaking north of the 200-day Exponential Moving Average (EMA) at 133.77, a bullish/bearish bias measure for an asset. Hence, the USD/JPY shifted bullish during the session, though a daily close above the 200-day EMA would keep bulls hopeful for further upside. At the time of writing, the USD/JPY exchanges hand at 134.28 after hitting a low of 132.54.
From a daily chart perspective, the USD/JPY shifted upward biased after dropping from last year’s high of 151.94 towards the YTD low of 127.21 on January 16. Nevertheless, the USD/JPY needs to clear the confluence of the 100-day EMA and the YTD high at 134.77 to cement the uptrend.
The Relative Strength Index (RSI) and the Rate of Change (RoC) show that buyers are gathering momentum. Hence, the USD/JPY might test the 135.00 psychological level in the near term.
The USD/JPY 4-hour chart depicts the pair as bullish biased after breaking from the 131.70-133.00 consolidation range, eyeing to test the YTD high at 134.77. Even though the RSI shifted overbought, as long as it stays below 80, it portrays the USD/JPY in a strong uptrend. The RoC shows buyers are in control and might continue to ride the trend.
Therefore, the USD/JPY first resistance would be the YTD high at 134.77. A breach of the latter and the pair might get to 135.00, followed by 136.00, and then the December 19 daily high of 137.47.
USD/JPY 4-Hour chart
USD/JPY Key technical levels
The labour market report, due for publication on Thursday at 00:30 GMT, is important for the Australian Dollar. Economists at Commerzbank discuss how employment figures could impact the Aussie.
AUD to come under pressure on signs of rising unemployment
“In December employment fell, but the unemployment rate remained at 3.5%. If it were to emerge that unemployment is beginning to rise the market might adjust its expectations for the key rate, which it currently expects to peak in the area of 3.75-4%, to the downside which would put pressure on AUD.”
“If, on the other hand, the labour market does not display any signs of easing, the market is more likely to feel confirmed in its view that the RBA will have to do more, which should principally support AUD.”
See – Australian Employment Preview: Forecasts from six major banks, a January rebound
Economists at Danske Bank forecast the USD/CAD pair at 1.35 in three-months and at 1.37 in six-months.
Energy prices to remain elevated, but broad USD effect is set to dominate
“Bank of Canada has clearly expressed that they now believe to have reached the peak in policy rates amid signs of a slowing labour market and concerns as to the level of private debt in the economy. Our call is in line with these signals, which in turn means that relative rates look set to be a positive for the cross in the months ahead.”
“We still have a higher USD/CAD as our base case and although we expect energy prices to remain elevated we believe the broad USD effect is set to dominate – especially on a 3-6M horizon.”
“Forecast: 1.34 (1M), 1.35 (3M), 1.37 (6M), 1.38 (12M).”
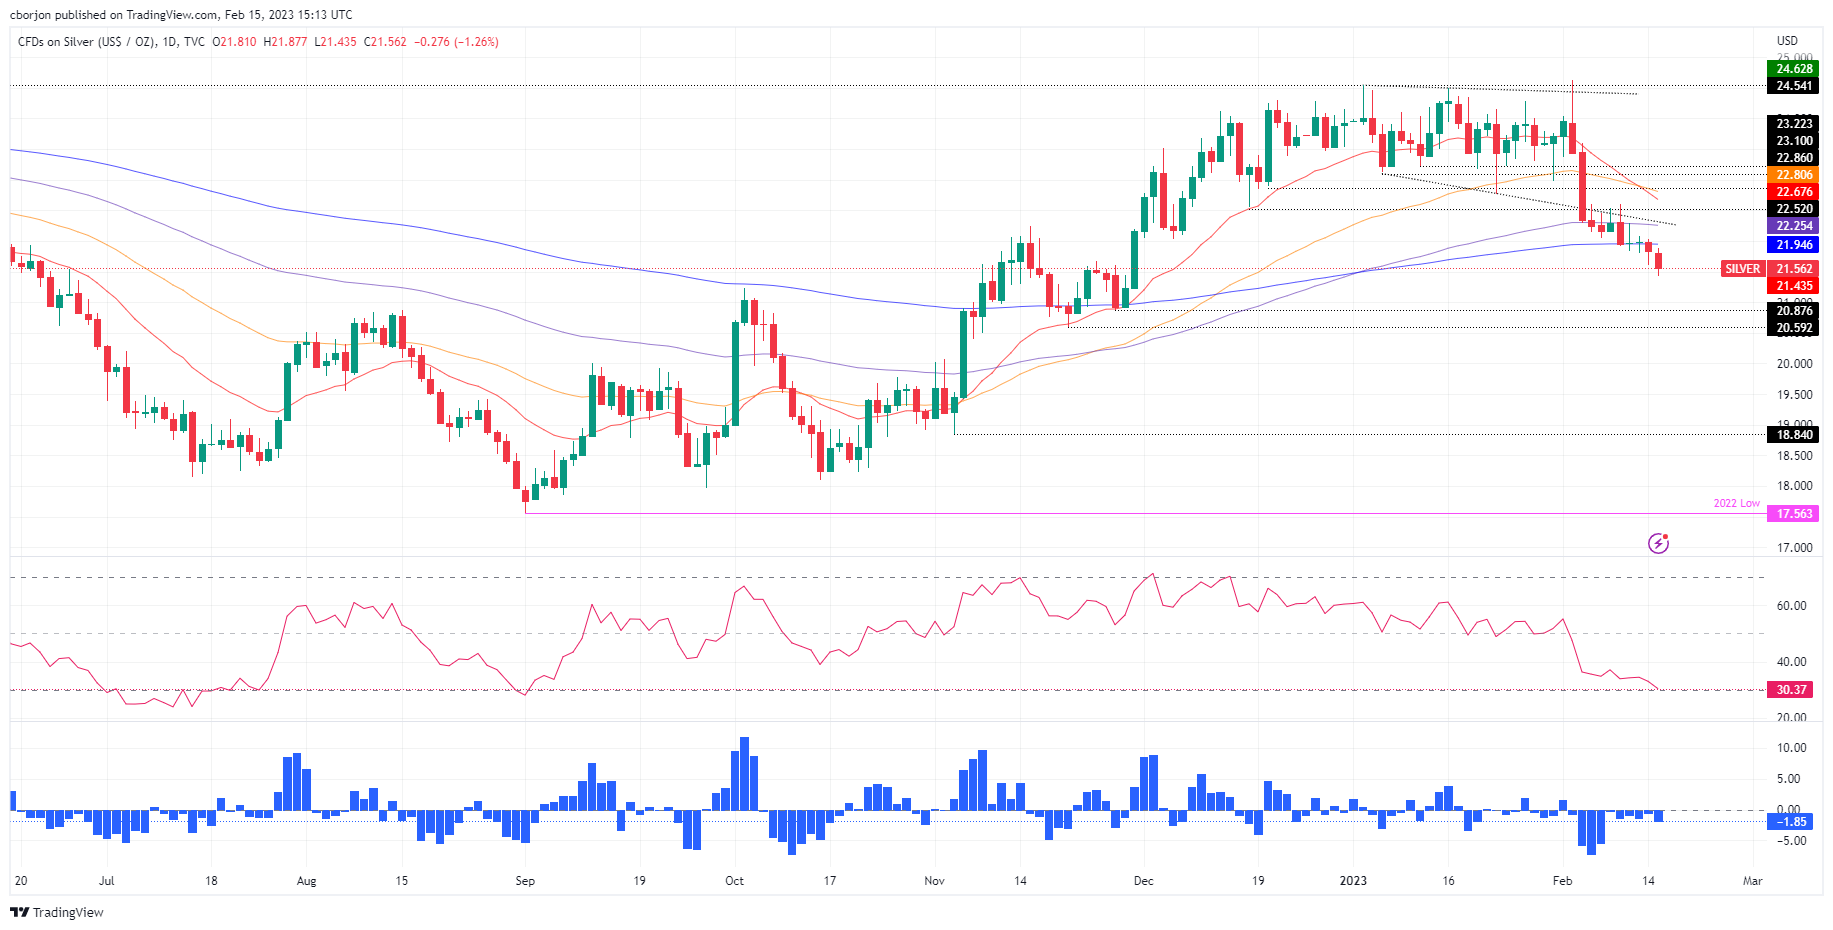
- Silver drops below the 200-day EMA, extending its losses to two straight days.
- Stronger-than-estimated Retail Sales augmented appetite for the US Dollar.
- XAG/USD Price Analysis: Turned bearish once it distanced from the 200-day EMA, eyeing the $21.00 mark.
Silver price extended its losses for the second consecutive day and distanced from the 200-day Exponential Moving Average (EMA) resting at $21.50, as US economic data from the Commerce Department revealed that Retail Sales improved. Therefore, the US Dollar (USD) it’s making its case for a comeback. At the time of writing, the XAG/USD exchanges hands at $21.50 after hitting a high of $21.87.
US economic data warrants further tightening by the Federal Reserve
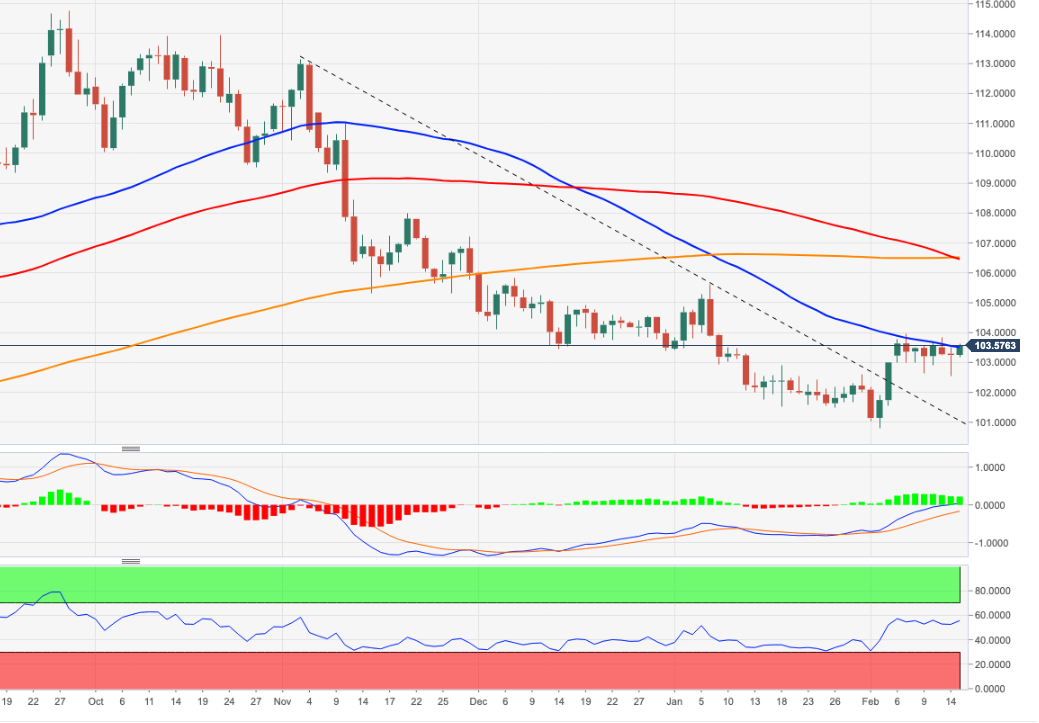
The XAG/USD continues to dive, weighed by the strength of the greenback, which, underpinned by rising US Treasury bond yields, advances 0.64%, at 103.93, per the US Dollar Index. The 10-year US Treasury bond yield is up three and a half bps, up at 3.772%, a headwind for the non-yielding metal.
US Retails Sales for January jumped by an astonishing 3.0% MoM vs. estimates of 1.8% by analysts after two consecutive months of shrinkage. The increase in sales it’s mainly attributed to a tight labor market, which continues to generate strong wage growth, while higher gasoline prices might have inflated receipts at service stations.
Of late, Industrial Production (IP) in the US remained unchanged, as reported by the US Federal Reserve (Fed), while output was weaker than foreseen, spurred by higher borrowing costs in the manufacturing sector.
Given the backdrop, the US Federal Reserve might continue to tighten monetary conditions, with markets estimating two additional rate hikes of 25 bps, which would drag the Federal Funds Rate (FFR) to the 5.0%-5.25% range. On Tuesday, a slew of Fed policymakers commented that the Fed is not done hiking rates and emphasized what Fed Chair Powell said, that interest rates would remain “higher for longer.”
Hence, Silver prices would remain pressured, as a strong greenback would continue to hurt the white metal prospects. With the Federal Reserve set to cut rates until 2024, the white metal could see a bounce once the Fed pauses its tightening cycle. Nevertheless, a hawkish Fed would bolster the US Dollar prospects in the short term.
XAG/USD Technical analysis
After dropping beneath the 200-day EMA, XAG/USD might extend its fall toward the November 28 swing low at $20.87, followed by November 21 at $20.59. A breach of those demand areas, and Silver, might head to the $20.00 psychological barrier, followed by the November monthly low of $19.42. Backing the previously mentioned are oscillators, with the Relative Strength Index (RSI) remaining at bearish territory, while the Rate of Change (RoC) suggests that sellers are gathering momentum.
Senior Economist Julia Goh and Economist Loke Siew Ting at UOB Group assess the latest performance of FX reserves and foreign portfolio in Malaysia.
Key Takeaways
“Foreigners bought more MYR denominated debt securities in the first month of the year (Jan 2023: +MYR0.5bn, Dec 2022: -MYR0.9bn) mainly concentrated in government bonds. However, foreigners remained net sellers of equities for the 5th straight month albeit by a smaller quantum (Jan 2023: -MYR0.3bn, Dec 2022: -MYR1.4bn). Taken together, foreigners turned net buyers of Malaysian portfolio instruments by a marginal MYR0.2bn in Jan 2023 (Dec 2022: MYR2.2bn).”
“Foreign holdings of government bonds rose by MYR2.7bn to MYR228.9bn (or 22.1% of total outstanding). This was due to higher net buying of Malaysian Government Securities (MGS, +MYR1.3bn) and Government Investment Issues (GII, +MYR1.4bn). Foreigners sold more Malaysian Treasury bills, including Islamic T-bills (-MYR1.7bn) and conventional T-bills (-MYR0.5bn).”
“Bank Negara Malaysia (BNM)’s foreign reserves rose by USD0.5bn in Jan 2023 to USD115.2bn. This marks the highest FX reserves level since Mar 2022. It is sufficient to finance 5.3 months of imports of goods and services and is 1.0 time of the total short-term external debt. BNM’s net short position in FX swaps widened by USD0.4bn to USD26.4bn (or 23.0% of FX reserves) as at end-Dec 2022, its highest level on record.”
January saw a partial reversal of DXY’s decline, although it remains 9% off its peak. While inflation risks are likely to persist to mid-year, thereafter the US Dollar down-trend will gather momentum and sustain through to end-2024, according to economists at Westpac.
Euro to lead the way
“We remain of the view that the US Dollar will move materially lower than its current level, although likely not for some months. The reason for this is that inflation risks linger in the US and other developed markets; and there remains a view amongst market participants that the country most able to navigate this period is the US, thanks to the strength of their labour market and the FOMC’s willingness to do ‘what it takes’.”
“By the middle of 2023, not only will US disinflation broaden to services, but job creation will throttle back while wage growth continues to slow. The market’s focus from that point on will be growth differentials, with the Euro Area and Canada to outperform the US, and the UK to outperform current expectations of market participants.”
- EUR/USD drops to 2-day lows near 1.0660 on Wednesday.
- ECB C.Lagarde is due to speak later in the day.
- US Retail Sales surprised to the upside in January.
The now strong rebound in the greenback puts the risk universe under further pressure and forces EUR/USD to trade at shouting distance from the monthly lows on Wednesday.
EUR/USD: Selling pressure picks up pace on US data
EUR/USD saw its daily knee-jerk pick up pace after the greenback’s rebound gathered further steam on Wednesday.
Indeed, the selling pressure keeps the pair’s price action depressed and near the February low around 1.0650, particularly following solid prints from US Retail Sales for the month of January, while further upside in US yields across the curve also prop up the dollar.
Additional releases in the US calendar saw the NY Empire State Manufacturing Index improve to -5.8 for the month of February, while Industrial Production expanded 0.8% in the year to January and came in flat vs. the previous month.
Next on tap will be the NAHB index as well as Business Inventories.
What to look for around EUR
Despite the recent rebound to the 1.0800 region, EUR/USD remains within the multi-day consolidative phase and decently supported near 1.0650 for the time being.
In the meantime, price action around the European currency should continue to closely follow dollar dynamics, as well as the potential next moves from the ECB after the bank has already anticipated another 50 bps rate raise at the March event.
Back to the euro area, recession concerns now appear to have dwindled, which at the same time remain an important driver sustaining the ongoing recovery in the single currency as well as the hawkish narrative from the ECB.
Key events in the euro area this week: EMU Balance of Trade, Industrial Production, ECB Lagarde (Wednesday).
Eminent issues on the back boiler: Continuation of the ECB hiking cycle amidst dwindling bets for a recession in the region and still elevated inflation. Impact of the Russia-Ukraine war on the growth prospects and inflation outlook in the region. Risks of inflation becoming entrenched.
EUR/USD levels to watch
So far, the pair is retreating 0.57% at 1.0680 and a drop below 1.0655 (weekly low February 13) would target 1.0481 (2023 low January 6) en route to 1.0324 (200-day SMA). On the flip side, the next up barrier aligns at 1.0804 (weekly high February 14) seconded by 1.1032 (2023 high February 2) and finally 1.1100 (round level).
UOB Group’s Senior Economist Julia Goh and Economist Loke Siew Ting comment on the publication of the GDP results in Malaysia.
Key Takeaways
“Malaysia’s real GDP growth moderated to 7.0% y/y in 4Q22 (3Q22: 14.2%) as low base effects wane. However, growth surpassed ours (6.3%) and Bloomberg consensus (6.7%), as well as the long-term average (5.1%). On a seasonally adjusted basis, real GDP contracted 2.6% q/q (3Q22: +1.9% q/q) which marks the first decline in five quarters as support from stimulus effects wane. Full-year GDP growth came in at 8.7% for 2022 (vs 3.1% in 2021) which was higher than our estimate of 8.6% and the official forecast (6.5%-7.0%).”
“Growth uplift in 4Q22 was mainly attributed to robust private consumption and steady rise in investments. All sectors expanded with strong support from services, mining and construction. Domestic demand was the key driver of growth while net exports provided further support because of slower imports relative to exports. This helped to widen the current account surplus to MYR25.7bn (or 5.5% of GDP) in 4Q22, marking the highest quarterly surplus since 3Q20.”
“BNM reiterated they do not expect a recession this year. We concur and remain cautiously optimistic and maintain our 2023 GDP growth forecast of 4.0% (official est: 4.0%-5.0%). More restrictive global monetary policy settings, potential escalation of geopolitical tensions, weaker-than-expected global demand, ongoing global tech down cycle, and domestic policy changes are key downside risks to the country’s economic outlook ahead, while being weighed down by high year-ago base effects.”
- Industrial Production in the US remained unchanged on a monthly basis in January.
- US Dollar Index clings to strong daily gains at around 104.00.
Industrial Production in the US unchanged in January following December's 1% contraction, the US Federal Reserve reported on Wednesday. This reading came in weaker than the market expectation for an increase of 0.5%.
"In January, manufacturing output moved up 1.0% and mining output rose 2.0% following two months with substantial decreases for each sector," the Fed further noted in its publication. "Capacity utilization declined 0.1 percentage point in January to 78.3%, a rate that is 1.3 percentage points below its long-run (1972–2022) average."
Market reaction
The US Dollar preserves its strength after this report and the US Dollar Index was last seen rising 0.65% on the day at 103.95.
- Gold price was initially reluctant to move lower on big surprise in US retail Sales.
- Gold price bears are slowly emerging again as the dust settles.
The United States Retail sales jump 3% in January, smashing expectations despite an inflation increase that might have otherwise kept consumers' hands in their pockets. Gold price has so far held in familiar pre-data ranges around $1,835.
The data arrived as follows:
- US Retail Sales Advance (MoM) Jan: 3.0% (est 2.0%; prev -1.1%).
- US Retail Sales Ex Auto (MoM) Jan: 2.3% (est 0.9%; prev -1.1%).
- US Retail Sales Ex Auto And Gas Jan: 2.6% (est 0.9%; prev -0.7%).
- US Retail Sales Control Group Jan: 1.7% (est 1.0%; prev -0.7%).
The US Dollar index strengthened to almost 104 on Wednesday, the highest in nearly five weeks after a stronger-than-expected US CPI report bolstered expectations the Federal Reserve will need to keep pushing interest rates higher to bring down inflation. It moved to below 104 into the New York session as traders got set for the Retail Sales data which kept Gold bulls in the game ahead of the data.
On Tuesday, the annual inflation rate in the US slowed slightly to 6.4% in January from 6.5% in December, the lowest since October 2021 but above market expectations of 6.2%. The latest Fed commentary also showed that policymakers largely backed more rate increases, fueling a bid in the greenback after what was an indecisive show from markets around the inflation data initially.
With the latest data showing that retail sales rebounded more than expected in January, and rose the most since March 2021, highlighting the strength of the economy, the US Dollar has still not been able to take off which is giving the Gold bulls a lifeline currently:
Gold technical analysis
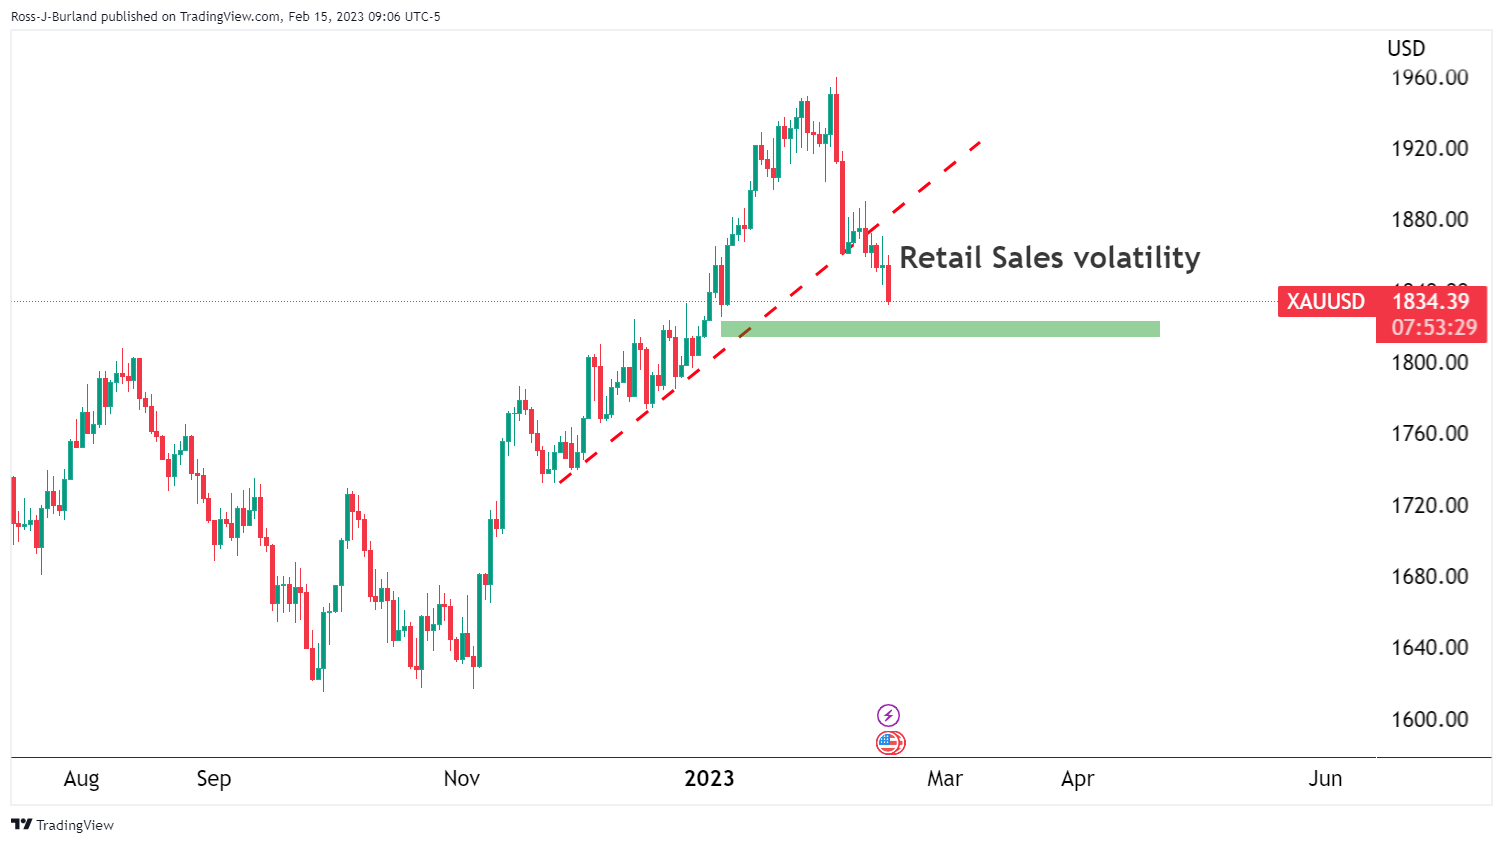
From a daily perspective, the price would be expected to fulfil a 1000 pip move to $1,825 whereby traders were trapped long at the start of the month. In prior analysis, it was stated that we were in the upper third of the 2023 range and on the backside of the first trendline that is broken and acting as a counter-trendline. A break of $ $1,925 was expected to open the risk of a move to test $1,896 and then $1,867 as the top of the lower third of the range that guarded a 1000 pip box low of $1,825:

The above chart was analysis drawn at the end of January and below is where we are up to date ahead of the week commencing 12 February open:

Australia is set to report its January employment figures on Thursday, February 16 at 00:30 GMT and as we get closer to the release time, here are forecasts from economists and researchers at six major banks regarding the upcoming employment data.
Australia is expected to have added 20K jobs vs. -14.6K in December, while the unemployment rate is expected to remain steady at 3.5%.
ING
“After last month’s decline in part-time work, we will probably see that part of the survey moderate, combined with perhaps a smaller increase in full-time jobs of about 10K to deliver a total employment change of 15-20,000. If that is broadly right, we may see the unemployment rate edge up to 3.6% – still very low by historical standards.”
ANZ
“We will be watching the labour market results closely next week to confirm that the 15,000 drop in employment in December was a one-off. Our labour market outlook is still very strong through 2023 given elevated job vacancies and ongoing difficulty to find labour, though a turn in business conditions and very low business confidence may be an early sign the tide is turning here. We expect the unemployment rate to be steady at 3.5%.”
Westpac
“Our forecast 15K gain in employment is enough to hold the unemployment rate at 3.5%.”
SocGen
“We expect January labour-market data to show a slight rebound in employment (15K) from the dip observed in December, which would mean that the underlying employment recovery momentum has continued despite the contraction seen at the end of last year. This likely gain should almost recoup the loss in December. We forecast unemployment and participation rates matching those in December, showing that labour-market conditions remain tight. The number of hours worked is also likely to have increased after contracting in November and December. In conclusion, labour-market data should confirm the growth in economic activity and inflation pressures from the labour market, which will support the RBA’s tightening campaign.”
Citibank
“Citi unemployment rate forecast; 3.5%, Previous; 3.5%; Citi employment change forecast; 5K, Previous; -14.6K; Citi participation rate forecast; 66.5%, Previous; 66.6%. Overall, risks to the labor force report are likely skewed to the downside. However, given the survey sample period and a larger than usual number of people on holidays, there’s a risk that the January LFS could be noisy.”
Wells Fargo
“Given the reopening of China's economy, we believe Australia's economy will avoid recession this year. And while the January labor market report won't be definitive, a solid report would nonetheless provide some reassurance that the soft patch seen late in 2022 is likely to be temporary. The consensus forecast is consistent with a solid labor market outcome for January, with employment expected to rebound by 20K and the unemployment rate forecast to remain steady at 3.5%. Such an outcome would, we believe, keep the RBA moving along its monetary tightening path in the immediate months ahead.”
- AUD/USD drops back closer to the monthly low amid strong follow-through USD buying.
- The upbeat US macro data reaffirms hawkish Fed expectations and boost the Greenback.
- The prevalent risk-off mood also benefits the buck and weighs on the risk-sensitive Aussie.
The AUD/USD pair maintains its heavily offered tone through the early North American session and drops back closer to the monthly low in reaction to the upbeat US macro data. The pair is currently trading around the 0.6885-0.6880 area, with bears now awaiting a sustained break below the 50-day SMA before placing fresh bets.
The US Census Bureau reported that monthly Retail Sales grew by 3% in January, beating estimates for a 1.8% by a big margin. Furthermore, core retail sales, excluding autos, jumped 2.3% during the reported month, up sharply from the 0.9% decline (revised higher) recorded in December. Separately, the New York Fed's Empire State Manufacturing Index also surpassed expectations and improved to -5.8 in February from -32.9 previous.
The data cemented bets for further policy tightening by the Fed and provides a fresh lift to the US Dollar, which, in turn, exerts downward pressure on the AUD/USD pair. Meanwhile, worries about economic headwinds stemming from rapidly rising borrowing costs take its toll on the global risk sentiment. This is evident from a sea of red across the equity markets and is seen as another factor weighing on the risk-sensitive Aussie.
From a technical perspective, the AUD/USD pair now seems to have confirmed a bearish breakdown through an upward-sloping trend-line extending from October 2022 swing low. Some follow-through selling below the 50-day SMA will reaffirm the negative bias. This should pave the way for an extension of the recent pullback from the highest level since June 2022, around the 0.7155-0.7160 area touched earlier this month.
Technical levels to watch
- NY Fed Empire State Manufacturing Index rose in February but stayed in negative territory.
- US Dollar Index clings to strong daily gains slightly below 104.00.
The headline General Business Conditions Index of the Federal Reserve Bank of New York's Empire State Manufacturing survey recovered to -5.8 in February from -32.9 in January. This reading came in better than the market expectation of -18.
"Delivery times shortened, and inventories edged higher," the NY Fed noted in its publication. "Employment levels declined for the first time since early in the pandemic, and the average workweek shortened for a third consecutive month"
Regarding inflation-related developments, "both input and selling price increases picked up. Looking ahead, firms expect business conditions to improve somewhat over the next six months," the NY Fed said.
Market reaction
The US Dollar Index preserves its bullish momentum after this data and was last seen rising 0.6% on the day at 103.85.
- Retail Sales in the US at a stronger pace than expected in January.
- US Dollar Index continues to push higher toward 104.00 after the upbeat data.
Retail Sales in the United States rose by 3% to $697 billion in January, the US Census Bureau reported on Wednesday. This reading followed December's decrease of 1.1% and came in better than the market expectation for an increase of 1.8%.
Retail Sales ex-Autos expanded by 2.3% in the same period, compared to analysts' estimate of +0.8%.
"Total sales for the November 2022 through January 2023 period were up 6.1% from the same period a year ago," the publication further read. "Retail trade sales were up 2.3% from December 2022, and up 3.9% above last year."
Market reaction
The US Dollar gathered strength with the initial reaction and the US Dollar Index was last seen rising 0.65% on the day at 103.93.
EUR/USD slips after failing to extend through 1.08. Economists at Scotiabank expect the pair to test the Monday low near 1.0660.
ECB comments ahead
“ECB officials continue to manage rate expectations astutely, with rhetoric supporting the outlook for more tightening. ECB President Lagarde speaks today. Comments are likely to reaffirm the outlook for another 50 bps hike in Mar and more data dependent hikes (i.e., a likely downshift to 25 bps hikes) thereafter.”
“The EUR’s failure and rejection (via a bearish outside range signal on the 6-hour chart) against noted resistance around 1.08 yesterday seals the near-term technical outlook for the single currency and targets a retest of the Monday low near 1.0660. A break below here targets a drop to 1.05.”
- GBP/USD dives back closer to the weekly low and is pressured by a combination of factors.
- The softer-than-expected UK CPI print weighs on the pair amid broad-based USD strength.
- Bearish traders now look forward to the US economic data for some meaningful impetus.
The GBP/USD pair comes under intense selling pressure on Wednesday and extends the previous day's late pullback from over a one-week high. The downfall remains uninterrupted through the mid-European session and drags spot prices back closer to the weekly low, around the 1.2035 region in the last hour.
The British Pound weakens across the board in reaction to softer-than-expected UK consumer inflation figures. This comes on the back of a dovish assessment of the Bank of England's policy decision and suggests that the current rate-hiking cycle might be nearing the end. Apart from this, a strong follow-through buying around the US Dollar contributes to the GBP/USD pair's steep intraday decline of nearly 150 pips.
In fact, the USD Index, which tracks the Greenback against a basket of currencies, stands tall near a multi-week high amid expectations for further policy tightening by the Fed. The bets were lifted by the US CPI report and hawkish comments by several FOMC members on Tuesday. Adding to this, the prevalent risk-off mood - as depicted by a generally weaker tone around the equity markets - further underpins the safe-haven buck.
With the latest leg down, the GBP/USD pair reverses its weekly gains and seems poised to depreciate further. Some follow-through selling below the weekly low, around the 1.2030 area, will reaffirm the negative bias. This, in turn, should pave the way for a slide further below the 1.2000 psychological mark, towards challenging a technically significant 200-day SMA support, which is currently pegged near the 1.1935 region.
Next on tap is the US economic docket, highlighting the release of Retail Sales figures and the Empire State Manufacturing Index. Traders will further take cues from the broader risk sentiment, which will influence the USD price dynamics and provide a fresh impetus to the GBP/USD pair. Nevertheless, the aforementioned fundamental backdrop favours bearish trades and suggests that the path of least resistance for spot prices is to the downside.
Technical levels to watch
The CAD is down nearly half a percent on the day against the generally firm USD. USD/CAD may retest mid/upper-1.34s, according to economists at Scotiabank.
USD/CAD holds range
“Weak risk sentiment and generally softer commodities are headwinds for the CAD but spot remains within recent trading ranges and we expect scope for losses remains relatively limited for the moment at least.”
Canada releases Jan Housing Starts, Dec Manufacturing Sales (expected down 1.5%) and Jan Existing Home Sales. Soft data may add to pressure on the CAD in the short run, pushing spot towards the mid/upper-1.34s where the USD peaked last week.”
The US Dollar is trading firmer following yesterday’s US CPI. Economists at Scotiabank expect the greenback to remain resilient amid positive US data.
USD gains supported by rising yields
“Higher terminal rate pricing – the implied peak in the Fed cycle vias swaps has extended to a little above 5.25% – is reason to think the USD can remain firm in the short run at least.”
“Retail Sales are expected to rise a solid 2.0% (ax-autos +0.9%). The Feb Empire survey’s Jan weakness is expected to moderate somewhat. Jan IP is forecast to post a 0.5% m/m rise. Business Inventories are called 0.3% higher MoM while the Feb NAHB housing market index is expected to improve modestly from Jan’s 35 reading. Firm US data prints should add to USD underpinning in the near term.”
See – US Retail Sales Preview: Forecasts from seven major banks, noticeable increase
US Monthly Retail Sales Overview
Wednesday's US economic docket highlights the release of monthly Retail Sales figures for January, due later during the early North American session at 13:30 GMT. The headline sales are expected to rebound sharply after declining by 1.1% in December and post strong growth of 1.8% during the reported month. Excluding autos, core retail sales probably climbed by 0.8% in January, up from the 1.1% fall recorded the previous month.
According to analysts at NBF: “Car dealers likely contributed positively to the headline number, as auto sales surged during the month. Gasoline station receipts could have increased as well judging from a rise in pump prices. All told, headline sales could have jumped 2.1% in the month. Spending on items other than vehicles may have expanded a bit less, advancing 1.0%.”
How Could it Affect EUR/USD?
Ahead of the key release, the US Dollar stands tall near a multi-week high amid expectations that the Fed will stick to its hawkish stance for longer in the wake of stubbornly high inflation. A stronger-than-expected US macro data will reaffirm hawkish Fed expectations and provide a fresh lift to the Greenback. Conversely, any disappointment from the US Retail Sales figures is more likely to be offset by bets that interest rates are going to remain higher for longer. This, in turn, suggests that the path of least resistance for the EUR/USD pair is to the downside and any attempted recovery could be seen as a selling opportunity.
Meanwhile, Eren Sengezer, Editor at FXStreet, offers a brief technical outlook and writes: “EUR/USD failed to hold above the 50-period Simple Moving Average (SMA) on the four-hour chart despite having tested this level several times on Tuesday. Additionally, the Relative Strength Index (RSI) indicator on the same chart retreated below 50, suggesting that buyers remain on the sidelines.”
Eren also outlines important technical levels to trade the EUR/USD pair: “On the downside, 1.0700 (psychological level, Fibonacci 61.8% retracement of the latest uptrend) aligns as key support. A four-hour close below that level could trigger another leg lower toward 1.0645/50 (static level) and 1.0600 (psychological level).”
“Interim resistance for the pair is located at 1.0730 (50-period SMA) ahead of 1.0760 (Fibonacci 50% retracement). In case the pair rises above the latter resistance, it is likely to face another strong hurdle at 1.0775, where the 200-period SMA is located,” Eren adds further.
Key Notes
• US Retail Sales Preview: Forecasts from seven major banks, noticeable increase
• EUR/USD Forecast: Euro closes in on key support
• EUR/USD: Buying dips below 1.06 targeting 1.0950 – Credit Suisse
About US Retail Sales
The Retail Sales released by the US Census Bureau measures the total receipts of retail stores. Monthly per cent changes reflect the rate of changes in such sales. Changes in Retail Sales are widely followed as an indicator of consumer spending. Generally speaking, a high reading is seen as positive (or bullish) for the USD, while a low reading is seen as negative (or bearish).
- EUR/USD gives away part of the recent 2-session gains on Wednesday.
- Further downside lies ahead once the monthly low is breached.
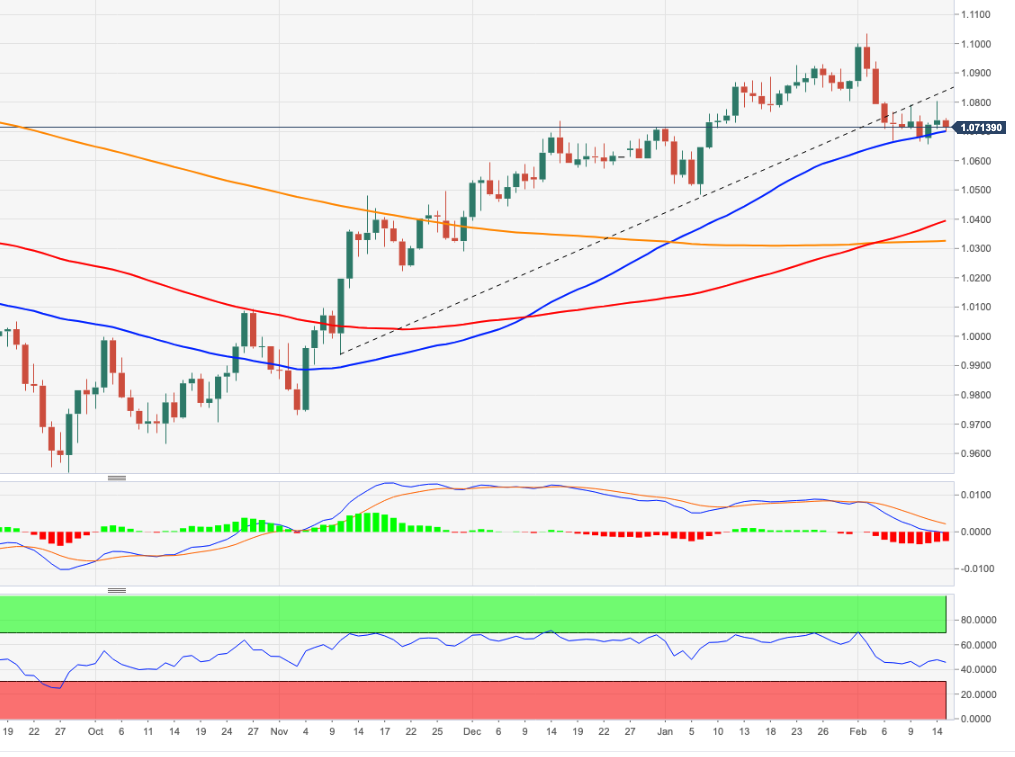
EUR/USD could not sustain Tuesday’s bull run to levels just beyond the 1.0800 barrier, sparking a corrective decline soon afterwards.
If the selling pressure gathers extra impulse, the pair could dispute the February low at 1.0655 (February 13) in the near term. Against that, the breach of this level could expose further weakness to the next support of note at the YTD low at 1.0481 (January 6).
In the longer run, the constructive view remains unchanged while above the 200-day SMA, today at 1.0324.
EUR/USD daily chart
Sterling got a lift last week from some relative optimism about growth. However, economists at Société Générale expect the EUR/GBP pair to advance nicely on forecasts of extended economic stagnation.
It is all about growth (and stagnation)
“The release of softer-than-feared inflation data in the UK has turned the currency around today, but the growth story will be more important in the end.”
“Unfortunately, replacing the fears of the gloomiest UK forecasts with expectations of lengthy stagnation is about as much as can be hoped for. The slow climb in EUR/GBP is set to last all year.”
In the view of UOB Group’s Economist Lee Sue Ann, the Bank Indonesia (BI) could raise its key rates by 25 bps at the upcoming gathering on Thursday.
Key Takeaways
“The end of the current hiking cycle is imminent as we have alluded to before.”
“We keep our BI rate forecast for a terminal rate of 6.00% that is likely to occur this month, though there is an increasing risk that Jan’s rate hike might be the last one for the current hiking cycle.”
- The index maintains the erratic activity around 103.00 so far.
- The monthly high near 104.00 continues to cap the upside.
DXY reverses the recent 2-day retracement and regains the 103.60 region on Wednesday.
The ongoing price action leaves the door open to the continuation of the consolidative note for the time being. Occasional bouts of strength, however, are expected to remain limited by the proximity of the 104.00 zone, or February highs (February 7).
In the longer run, while below the 200-day SMA at 106.45, the outlook for the index remains negative.
DXY daily chart
Gold price is trading at its lowest level since early January below $1,850. Recent repricing of market expectations around the Fed tightening could create a short-term headwind for the yellow metal, strategists at ANZ Bank report.
Central banks purchases to remain resilient this year
“We expect Gold to experience short-term volatility as the market’s rates expectations diverge from the Fed’s outlook. Unemployment is historically low, and inflation is persisting above the Fed’s target range. This could keep the Fed hawkish.”
“The market for physical Gold is softening as demand in India and China remains lacklustre. Central bank buying should remain strong
but could retreat from record-high levels. Therefore, investment demand needs to be strong to clear the market this year.”
“We are not changing our 12-month price target of $1,900.”
Lee Sue Ann, Economist at UOB Group, sees the BSP raising its policy rate by 25 bps at its meeting on February 16.
Key Takeaways
“We think that the slower-than-expected headline inflation outturn in Dec is less likely to throw BSP off its rate-hike path. But, the softer inflation reading coupled with gloomier global growth prospects will allow BSP to continuously embark on a slower rate hike path in the coming months.”
“We are thus sticking to our BSP call for two more 25bps hikes in 1Q23 before taking a pause at 6.00% thereafter.”
- EUR/JPY advances to new 2023 high past 143.00 on Wednesday.
- Extra strength could revisit the December 2022 high near 146.70.
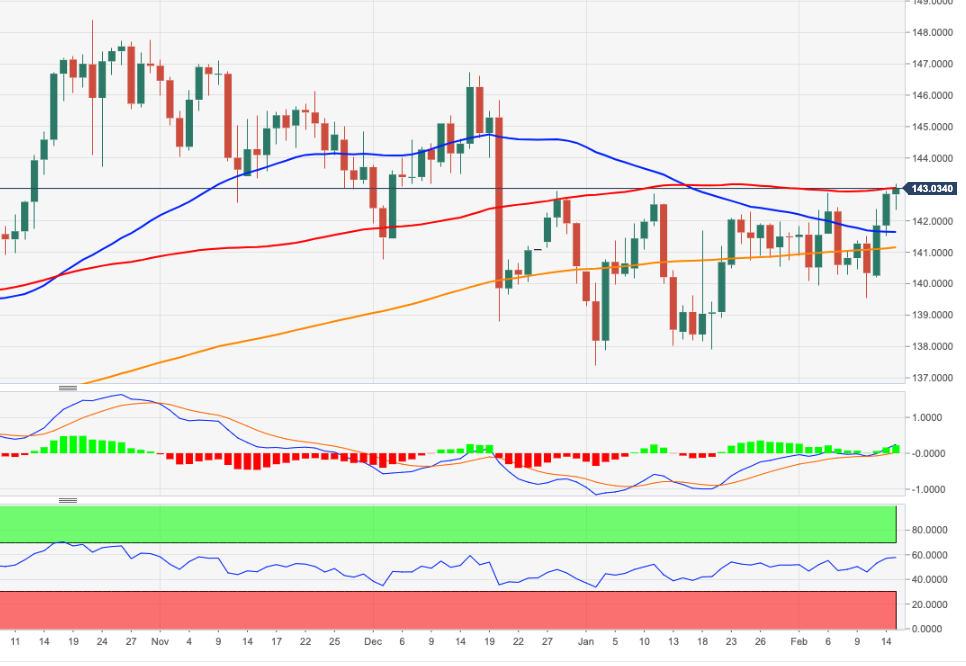
EUR/JPY adds to the weekly recovery and surpasses the 143.00 hurdle to clinch new YTD peaks on Wednesday.
While the cross looks broadly side-lined for the time being, a convincing break above the 143.00 region could trigger a move higher to, initially, the December 2022 top at 146.72 (December 15).
In the meantime, while above the 200-day SMA, today at 141.11, the outlook for the cross is expected to remain positive.
EUR/JPY daily chart
Economist at UOB Group Ho Woei Chen reviews the latest release of inflation figures in the Chinese economy.
Key Takeaways
“Headline inflation was in line with consensus forecast at 2.1% y/y in Jan, led by a jump in food prices while non-food inflation remained modest. China’s Producer Price Index (PPI) remained in deflation in Jan for the fourth consecutive month at -0.8% y/y.”
“Despite the modest gains in non-food inflation, there are some segments that experienced larger price pressures. As a result of the easing of China’s COVID19 measures, demand for travel and entertainment consumption increased sharply in Jan.”
“We maintain our forecast for headline inflation at 2.8% this year (2022: 2.0%) with stronger pick-up in inflation to slightly above 3% in 2H23. Meanwhile, the deflation trend for PPI is likely to continue through 1H23 as a result of a high base of comparison and weaker global demand. For the full year in 2023, PPI could be slightly negative at -1.0% after rising 4.1% in 2022 and 8.1% in 2021.”
Economists at HSBC anticipate two phases to the USD’s decline this year. The USD is going through the “chop” phase now. The second phase is categorised as the “flop” when the broader USD resumes weakening.
Choppiness, followed by broader weakness
“The USD is going through the ‘chop’ phase now, as the market reassesses its view on the Federal Reserve (Fed) and other risks that can temper the recent optimism in markets. Compared to the end of January.”
“Once the Fed actually stops hiking, alongside China’s recovery gaining ground, and perhaps the global economy shows signs of bottoming out, then the next phase to the USD decline should occur – the ‘flop’, which we expect to start in late 1Q/2Q23 and persist into 2024. In the ‘flop’ phase, we also think the behaviour of exchange rates could change and become less USD-centric.”
- USD/CAD gains strong positive traction on Wednesday and climbs to a fresh weekly high.
- Sliding crude oil prices undermine the Loonie and lend support amid sustained USD buying.
- A break through the trend-channel hurdle is needed to support prospects for additional gains.
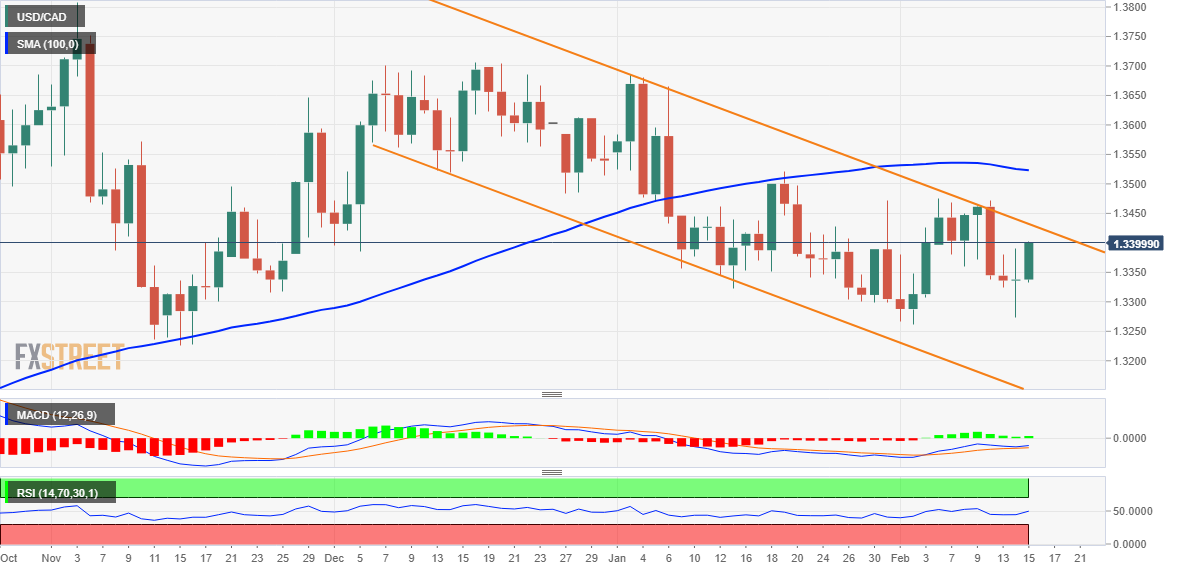
The USD/CAD pair builds on the overnight late recovery from the 1.3275 area, or a one-and-half-week low and gains strong follow-through traction on Wednesday. Spot prices climb to a fresh weekly high during the first half of the European session, with bulls now looking to extend the momentum beyond the 1.3400 round-figure mark.
Crude oil prices prolong this week's rejection slide from the 100-day SMA and remain depressed for the third successive day. This, in turn, undermines the commodity-linked Loonie. Apart from this, broad-based US Dollar strength, bolstered by expectations for additional rate hikes by the Fed and the risk-off mood, acts as a tailwind for the USD/CAD pair.
From a technical perspective, some follow-through buying above the 1.3430 area, or a resistance marked by the top end of over a two-month-old descending trend channel, will set the stage for further gains. The USD/CAD pair might then accelerate the momentum towards testing the 1.3470-1.3475 supply zone, which if cleared will mark a fresh bullish breakout.
The subsequent move-up should allow the USD/CAD pair to surpass the 1.3500 psychological mark and test the 100-day SMA, currently around the 1.3520 region. A sustained move beyond the latter could allow the bulls to reclaim the 1.3600 mark. The momentum could get extended to the 1.3645-1.3650 hurdle en route to the December swing high, around the 1.3700 round figure.
On the flip side, any meaningful pullback might now attract fresh buyers near the 1.3330 area. This is followed by the 1.3300 mark and the overnight swing low, around the 1.3275 region. Failure to defend the said support levels will make the USD/CAD pair vulnerable to weaken further towards the November 2022 swing low, around the 1.3230-1.3225 region.
Spot prices could eventually drop to the 1.3200 round figure and continue the downward trajectory towards challenging the descending channel support, currently near the 1.3125 zone.
USD/CAD daily chart
Key levels to watch
Economists at Westpac expect the USD/JPY to move gradually lower and fall to 124 by the end of 2024.
USD/JPY is only forecast to ease to 129 by end-2023
“It seems most appropriate to expect the Yen to, more or less, follow the US Dollar trend over the forecast period given the turn in sentiment against the USD; Japan’s robust growth prospects; and its exposure to the Asian region, where momentum and opportunity are clearly building.”
“USD/JPY is only forecast to ease to 129 by end-2023. However, as rate cuts are delivered in the US and the rate differential narrows, the down-trend is expected to accelerate, with 124 the target for end-2024.”
According to UOB Group’s Economist Lee Sue Ann and Markets Strategist Quek Ser Leang, chances for USD/CNH to break above the 6.8500 level have been on the rise as of late.
Key Quotes
24-hour view: “We expected USD to trade within a range of 6.8050/6.8350 yesterday. USD swung between 6.8062 and 6.8400 in NY trade before settling at 6.8369 (+0.20%). Despite the volatile price actions, the underlying tone has firmed somewhat and USD is likely to edger higher. That said, a break of the major resistance at 6.8500 is unlikely today. Support is at 6.8260, followed by 6.8130.”
Next 1-3 weeks: “There is not much to add to our update from Monday (13 Feb, spot at 6.8275). As highlighted, upward momentum is beginning to build and the likelihood of USD breaking above 6.8500 has increased. The next resistance level above 6.8500 remains at 6.8800. Overall, only a break of 6.7800 (no change in ‘strong resistance’ level) would indicate that 6.8500 is not coming into view.”
US January Consumer Price Index (CPI) data released yesterday were the week’s highlight. Economists at Credit Suisse continue along the path they have been on this year following the inflation figures.
USD/JPY to move only slowly towards 125 rather than collapsing
“USD strength isn’t especially impressive. The constructive risk environment, muted interest rate differentials and unhelpful terms of trade shifts are likely factors behind the lackluster upward USD momentum.”
“This leads us to continue along the path we’ve been on this year, which in effect is range trading EUR/USD, aiming to buy dips below 1.0600 targeting 1.0950, looking for USD/JPY to move only slowly towards 125 rather than collapsing through that level quickly, selecting specific currencies like AUD that have some grounds for outperformance while also sticking to long-held carry plays like MXN.”
The upside bias in USD/JPY looks firm for the time being, comment UOB Group’s Economist Lee Sue Ann and Markets Strategist Quek Ser Leang.
Key Quotes
24-hour view: “We expected USD to trade sideways between 131.50 and 133.00 yesterday. However, USD chopped between 131.50 and 133.31 before closing at 133.11 (+0.54%). Upward momentum has firmed slightly but while USD is likely to edge higher, the major resistance at 134.00 is unlikely to come into view today (there is another resistance level at 133.50). Support is at 132.40, followed by 132.00.”
Next 1-3 weeks: “Two days ago (13 Feb, spot at 131.50), we highlighted the outlook for USD is mixed and we expected it to trade in a broad range of 130.00 and 133.00. Yesterday, USD rose to a high of 133.31 before closing at 133.11 (+0.54%). Upward momentum appears to be building and there is room for USD to edge higher. That said, the major resistance at 134.00 might not come into view so soon. On the downside, a break of 131.40 would indicate that the build-up in momentum has fizzled out.”
- USD/JPY scales higher for the third straight day and climbs to a fresh multi-week high.
- Expectations for additional rate hikes by the Fed underpin the USD and lend support.
- A combination of factors benefits the JPY and caps any meaningful upside for the pair.
The USD/JPY pair attracts some dip-buying near the mid-132.00s and turns positive for the third successive day on Wednesday. The pair sticks to its mildly positive tone through the first half of the European session and is currently placed just below the 133.50 level, or the highest level since January 6 touched in the last hour.
The US Dollar stands tall near a multi-week high and remains well supported by expectations for further policy tightening by the Fed, which, in turn, is seen acting as a tailwind for the USD/JPY pair. The markets now seem convinced that interest rates are going to remain higher for longer in the wake of stubbornly high inflation. The bets were lifted by the US CPI report released on Tuesday and hawkish comments by several FOMC members.
That said, a combination of factors seems to underpin the Japanese Yen (JPY) and caps any meaningful upside for the USD/JPY pair, at least for now. The market sentiment remains fragile amid concerns about economic headwinds stemming from rapidly rising borrowing costs. Moreover, the recent yield curve inversion adds to worries about an impending recession and takes its toll on the risk sentiment, which, in turn, benefits the safe-haven JPY.
Apart from this, the appointment of Kazuo Ueda to be the new Governor of the Bank of Japan (BoJ) fuels speculations about an eventual policy tightening sooner rather than later. In fact, Japan's former Finance Minister Eisuke Sakakibara said that Ueda is likely to initially keep monetary policy steady and might raise rates in the fourth quarter. This is seen as another factor lending support to the JPY and keeping a lid on the USD/JPY pair.
Market participants now look forward to the US economic docket, featuring monthly Retail Sales and the Empire State Manufacturing Index later during the early North American session. The data might influence the USD price dynamics, which, along with the broader risk sentiment, should allow traders to grab short-term opportunities around the USD/JPY pair.
Technical levels to watch
Open interest in natural gas futures markets reversed the previous daily build and shrank by around 1.3K contracts on Tuesday according to preliminary readings from CME Group. In the same line, volume dropped markedly by around 127.7K contracts after three daily builds in a row.
Natural Gas: Further consolidation likely ahead of extra losses
Tuesday’s uptick in prices of the natural gas was amidst shrinking open interest and volume, hinting at the likelihood that further recovery appears not favoured in the very near term. The continuation of the current range bound theme seems on the cards in the near term ahead of a potential drop to the $2.00 zone per MMBtu.
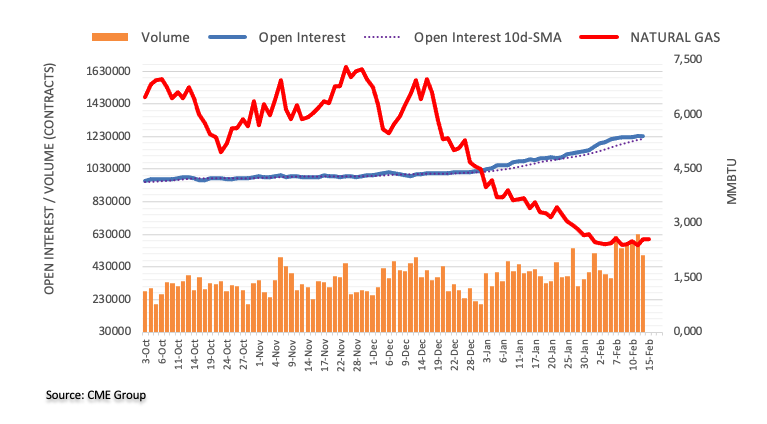
US Dollar keeps its footing ahead of mid-tier data releases. Economists at ING believe that we could still see at least some support coming the greenback’s way as US data for January should prove strong.
Still eyes on data
“We think data will remain the key driver for the Dollar and the global risk environment, as the depth of the US economic slowdown is still a key driver of rate expectations, especially when it comes to the timing, size and pace of Fed easing in the medium term.”
“We think that January’s US data may come in rather strong throughout on the back of weather-related factors and this may keep short-term US rates and the Dollar supported in the near term.”
“Today, we’ll keep a close eye on retail sales data, industrial production and empire manufacturing, which should all improve.”
See – US Retail Sales Preview: Forecasts from seven major banks, noticeable increase
- NZD/USD remains under heavy selling pressure for the second successive day on Wednesday.
- Spot prices drop closer to the monthly low amid strong follow-through buying around the USD.
- Expectations for additional rate hikes by the Fed and the risk-off mood benefit the greenback.
The NZD/USD pair extends the overnight late pullback from the vicinity of the 0.6400 mark, or a nearly two-week high and remains under heavy selling pressure for the second straight day on Wednesday. The pair drops closer to the monthly low, around the 0.6275 region, during the first half of the European session and is weighed down by strong follow-through buying around the US Dollar.
In fact, the USD Index, which tracks the Greenback against a basket of currencies, stands tall near a multi-week top amid the prospects for further policy tightening by the Federal Reserve. Investors seem convinced that the US central bank will stick to its hawkish stance for longer and The bets were lifted by a stronger US CPI report on Tuesday. Adding to this, several FOMC members stressed the need to keep raising rates gradually to fully gain control of inflation.
The markets were quick to start pricing in at least by 25 bps lift-off at each of the next two FOMC policy meetings in March and in May. Apart from this, the prevalent risk-off environment - as depicted by a generally weaker tone around the equity markets - further benefits the safe-haven buck and exerts additional pressure on the risk-sensitive Kiwi. Investors remain concerned about economic headwinds stemming from the continuous rise in borrowing costs.
Furthermore, the recent yield curve inversion adds to worries about an impending recession and takes its toll on the global risk sentiment. This, in turn, suggests that the path of least resistance for the NZD/USD pair is to the downside and any attempted recovery is more likely to attract fresh sellers at higher levels. Traders now look to the US economic docket, featuring monthly Retail Sales and the Empire State Manufacturing Index, for a fresh impetus.
Technical levels to watch
In its latest oil market report published on Wednesday, the International Energy Agency (IEA) said that China reopening will drive oil demand in 2023 but still deficit could loom.
Additional takeaways
Russian oil exports to the EU declined 450,000 bpd in Jan.
Russian crude exports increased in Jan by nearly 300,000 MoM.
Russian oil output in jan was down only 160,000 bpd from pre-war levels.
Global oil output set to rise 1.2 mln bpd in 2023, driven by non-OPEC+ producers.
Uptick in air traffic emphasises central role of jet fuel in 2023 demand growth.
Supply-demand balance could quickly shift to deficit as demand recovers, some Russian output shut in.
World oil supply looks set to exceed demand through the first half of 2023.
China set to account for 900,000 bpd of 2023 oil demand growth after COVID-19 reopening.
Global oil demand is set to rise by 2 mln bpd in 2023, to 101.9 mln bpd.
Market reaction
WTI is cutting losses from near daily lows of $77.84 to regain the $78 mark, in the wake of the upbeat IEA’s outlook on global oil demand. The US oil is still down 1.65% on the day.
- EUR/USD gives away part of the weekly advance on Wednesday.
- Chairwoman C.Lagarde is due to speak later in the session.
- Markets’ attention is expected to be on the US Retail Sales.
Sellers seem to have regained the upper hand around the European currency and now put EUR/USD under some pressure near the 1.0700 neighbourhood on Wednesday.
EUR/USD appears supported near 1.0700, looks at Lagarde
After two consecutive daily advances – including a brief test of the area beyond 1.0800 the figure on Tuesday - EUR/USD now faces some loss of momentum and recedes to the 1.0700 zone, where decent contention seems to have turned up.
In the meantime, the dollar regains some composure following the heightened volatility in the wake of the publication of the US inflation figures on Tuesday.
Furthermore, the pair keeps the multi-session consolidative theme in the lower end of the recent range unchanged so far, as investors continue to closely monitor message from both the ECB and the Fed policymakers.
In the domestic calendar, EMU Balance of Trade figures are due seconded by Industrial Production and the speech by Chairwoman C.Lagarde at the European Parliament. Busy day across the pond, as Retail Sales, MBA Mortgage Applications, Industrial Production, the NAHB Index, Business Inventories, the NY Empire State Index and TIC Flows are all scheduled for later in the NA session.
What to look for around EUR
Despite the recent rebound to the 1.0800 region, EUR/USD remains within the multi-day consolidative phase and decently supported near 1.0650 for the time being.
In the meantime, price action around the European currency should continue to closely follow dollar dynamics, as well as the potential next moves from the ECB after the bank has already anticipated another 50 bps rate raise at the March event.
Back to the euro area, recession concerns now appear to have dwindled, which at the same time remain an important driver sustaining the ongoing recovery in the single currency as well as the hawkish narrative from the ECB.
Key events in the euro area this week: EMU Balance of Trade, Industrial Production, ECB Lagarde (Wednesday).
Eminent issues on the back boiler: Continuation of the ECB hiking cycle amidst dwindling bets for a recession in the region and still elevated inflation. Impact of the Russia-Ukraine war on the growth prospects and inflation outlook in the region. Risks of inflation becoming entrenched.
EUR/USD levels to watch
So far, the pair is retreating 0.09% at 1.0727 and a drop below 1.0655 (weekly low February 13) would target 1.0481 (2023 low January 6) en route to 1.0324 (200-day SMA). On the flip side, the next up barrier aligns at 1.0804 (weekly high February 14) seconded by 1.1032 (2023 high February 2) and finally 1.1100 (round level).
GBP/USD trades deep in negative territory below 1.2100. Sterling could suffer more losses if BoE members deliver dovish comments.
BoE should reach the end of the rate hike cycle in March
“We principally see the risk of the market being disappointed in its rate hike expectations.”
“Our economists assume that the BoE should reach the end of the rate hike cycle in March.”
“If there is an increase in dovish comments from members of the monetary policy committee over the coming weeks Sterling is likely to get under depreciation pressure.”
FX option expiries for Feb 15 NY cut at 10:00 Eastern Time, via DTCC, can be found below.
- EUR/USD: EUR amounts
- 1.0800 397m
UOB Group’s Economist Lee Sue Ann and Markets Strategist Quek Ser Leang note price action in AUD/USD is now seen within the 0.6865-0.7055 range in the next few weeks.
Key Quotes
24-hour view: “We highlighted yesterday that AUD could rise to 0.7000 first before the risk of a pullback increases. We added, ‘The major resistance at 0.7055 is not expected to come under threat’. AUD soared briefly to 0.7030, dropped to 0.6922 before ending the day at 0.6985 (+0.27%). We view the price actions as part of a broad consolidation range and expect AUD to trade between 0.6930 and 0.7015 today.”
Next 1-3 weeks: “Our view from one week ago (08 Feb, spot at 0.6960) is still valid. As highlighted, AUD is in a consolidation phase and it is likely to trade between 0.6865 and 0.7055 for now.”
Considering advanced prints from CME Group for crude oil futures markets, open interest went up for the third session in a row on Tuesday, now by around 5.5K contracts. Volume followed suit and rose by nearly 26K contracts, partially reversing the previous daily drop.
WTI: Minor support comes near $76.60
Prices of the WTI prolonged the weekly leg lower on Tuesday. The daily decline was on the back of increasing open interest and volume and it is indicative that further losses lie ahead for the commodity. That said, the loss of the minor support at $76.58 (February 9) could pave the way for a drop to the 2023 low at $72.30 (February 6).
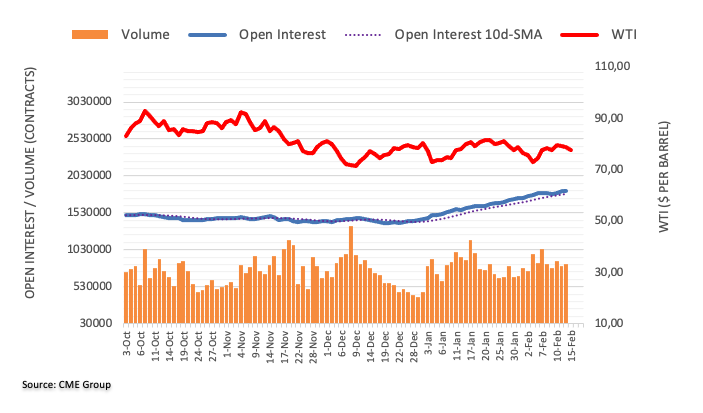
EUR/USD remains primarily a Dollar story. Economists at ING believe that the pair could slide to the 1.0650/1.0700 area later this week.
Lagarde’s speech may be a non-event
“Despite having survived the US CPI risk event, we continue to see some downside risks in the near term on the back of raising bets on Fed tightening and a lack of drivers from the Euro side.”
“We don’t think that today’s speech by European Central Bank President Christine Lagarde will drive major market moves.”
“We see room for EUR/USD to slip back to 1.0650/1.0700 by the end of this week on the back of a strengthening Dollar.”
- EUR/GBP gains strong positive traction and snaps a seven-day losing streak to a two-week low.
- The softer UK CPI print weighs on the Sterling and prompts an aggressive short-covering move.
- Bets for additional jumbo interest rate hikes by the ECB underpin the Euro and remain supportive.
The EUR/GBP cross catches aggressive bids on Wednesday and snaps a seven-day losing streak to a two-week low, around the 0.8800 mark touched the previous day. The cross sticks to its strong gains through the early part of the European session and is currently placed near the 0.8865-0.8870 region, or the top end of the weekly range.
The British Pound weakens across the board in reaction to softer-than-expected UK consumer inflation figures and triggers an intraday short-covering move around the EUR/GBP cross. In fact, the UK Office for National Statistics reported that the headline CPI declined by 0.6% in January, more than the 0.4% fall anticipated. Adding to this, the yearly rate decelerated from 10.5% in December to 10.1% during the reported month, again missing estimates for a reading of 10.3%.
More importantly, Core CPI, which excludes seasonally volatile products such as food and energy, came in at 5.8% YoY as compared to the 6.3% previous and 6.2% expected. The data could ease pressure on the Bank of England to deliver aggressive rate hikes, especially after the strong UK wage growth figures on Tuesday. Apart from this, bets for additional jumbo rate hikes by the European Central Bank (ECB) underpin the Euro and provide an additional lift to the EUR/GBP cross.
The aforementioned fundamental backdrop supports prospects for a further near-term appreciating move. That said, the lack of follow-through buying warrants some caution for bullish traders. Hence, it will be prudent to wait for a sustained strength back above the 0.8900 mark before confirming that the EUR/GBP pair's recent pullback from the highest level since September 2022 has run its course.
Technical levels to watch
European Central Bank’s (ECB) policymaker Pablo Hernandez de Cos said on Wednesday, “withdrawal of fiscal support measures could make inflation more persistent.”
Additional quotes
‘Lower gas prices will eventually trigger reverse transmission on inflation.”
“The upward effects of energy and food commodity prices could still be significant in 2023.”
“Data, gas price developments point to inflation falling more strongly in the coming months than envisaged in December.”
“Recent data on euro area inflation and some of its key determinants are somewhat encouraging.”
Market reaction
At the time of writing, EUR/USD is trading 0.22% lower at 1.0709, undermined by a broad-based US Dollar strength.
The US Dollar (USD) preserves its strength against its major rivals. Nonetheless, a strong Dollar rally beyond one or two cents is unlikely, in the view of economists at Commerzbank.
The development of inflation is difficult to predict and to evaluate
“In case of a small fall in prices and continued decent economic data (we will see a bunch of releases for the rest of this week) the US Dollar might be able to appreciate a little until then as the market might adjust its expectations again.”
“Even the Fed is just driving at sight and is waiting for more data as the development of inflation is difficult to predict and to evaluate.”
“A strong Dollar rally beyond one or two cents is unlikely though, as the market will at some point look ahead beyond the peak of the rate cycle. After all, what goes up quickly might easily fall just as quickly afterward.”
- AUD/USD meets with heavy supply on Wednesday and dives back closer to the weekly low.
- Rising bets for additional rate hikes by the Fed push the USD back closer to a multi-week top.
- The risk-off mood also benefits the safe-haven buck and weighs on the risk-sensitive Aussie.
The AUD/USD pair comes under intense selling pressure on Wednesday and retreats further from over a one-week high, around the 0.7025-0.7030 region touched the previous day. The pair maintains its heavily offered tone through the early European session and is currently placed near the weekly low, around the 0.6900 round-figure mark.
The US Dollar stands tall near a multi-week high amid expectations for further policy tightening by the Federal Reserve and is seen as a key factor dragging the AUD/USD pair lower. Investors seem convinced that the US central bank will stick to its hawkish stance for longer in the wake of stubbornly high inflation. The bets were reaffirmed by the crucial US CPI report and comments by several FOMC members on Tuesday.
Apart from this, the prevalent risk-off mood - as depicted by a generally weaker tone around the equity markets - further benefits the safe-haven Greenback. The recent yield curve inversion adds to worries about an impending recession and takes its toll on the global risk sentiment. This is seen as another factor weighing on the risk-sensitive Aussie and contributing to the offered tone surrounding the AUD/USD pair.
With the latest leg down, spot prices have moved back closer to the 50-day SMA support. A convincing break below will be seen as a fresh trigger for bearish traders and set the stage for an extension of the AUD/USD pair's recent retracement slide from the highest level since June 2022. Traders now look to the US economic docket, featuring monthly Retail Sales and the Empire State Manufacturing Index for a fresh impetus.
Technical levels to watch
Economists at ING expect EUR/GBP to rebound towards 0.90 over the course of the year. However, they note that the pair could fall below 0.88 in the near term.
UK annualized inflation softens
“This morning's UK inflation data missed estimates (5.8% vs est. 6.2% year-on-year). Looking at the details, this is also true of 'core services', the index we know the Bank of England is paying closest attention to.”
“We would still expect a 25 bps hike in March, but if this trend continues then it would heavily lean towards a pause in May.”
“The EUR/GBP fall could extend and force a break below 0.8800, but we think the bearish story may soon run out of steam and we favour a rebound to 0.9000 over the course of 2023.”
Bank Indonesia (BI) will hold its monthly governor board meeting on Thursday, February 16. Here you can find the expectations as forecast by the economists and researchers of five major banks regarding the upcoming central bank's rate decision.
BI is expected to keep rates steady at 5.75%. At the last policy meeting on January 19, the central bank hiked rates by 25 basis points (bps) to 5.75%.
SocGen
“We believe that BI will opt for a pause in February and keep its policy (7-day Reverse Repo) rate unchanged at 5.75%. We would like to believe that it has reached the end of its rate-hike cycle and could choose to take a long pause before probably opting for a rate cut by end-2023.”
Standard Chartered
“We expect BI to keep the 7-day reverse repo rate unchanged at 5.75% to maintain an attractive interest rate spread against US rates, which should support IDR stability. We expect BI to stay cautious on global uncertainty, including US interest rate hikes and global financial market stability; it may continue to signal that policy will be data-dependent. We maintain our call for BI to keep the policy rate unchanged this year, with rate cuts starting only next year.”
ING
“BI could still opt to hike by 25 bps given renewed hawkish signals from the Fed while also ensuring core inflation heads much lower before pausing.”
ANZ
“We expect BI to keep the policy rate on hold at 5.75%. Although the IDR, likeother regional currencies, has come under some downward pressure after a strong US jobs report, it is still stronger than it was at the start of 2023. Unless there are clear signs that suggest the US Fed’s terminal policy rate is likely to surpass BI’s expectation of 5.25%, we maintain that the latter’s rate-hike cycle has ended.”
TDS
“BI is increasingly comfortable with the inflation trajectory and likely feels less compelled to raise rates further. BI is also likely comfortable with IDR levels.”
GBP/USD is now seen navigating within the 1.2040-1.2260 range in the short-term horizon, suggest UOB Group’s Economist Lee Sue Ann and Markets Strategist Quek Ser Leang.
Key Quotes
24-hour view: “While we expected GBP to strengthen yesterday, we were of the view that ‘a sustained rise above the major resistance at 1.2200 is unlikely’. In NY trade, GBP popped to a high of 1.2269, dropped quickly from the high and traded choppily before ending the day at 1.2176 (+0.29%). The price actions are likely part of a broad consolidation range and we expect GBP to trade between 1.2110 and 1.2220 today.”
Next 1-3 weeks: “Yesterday (14 Feb, spot at 1.2140), we highlighted that instead of heading lower, GBP is more likely to consolidate and trade between 1.2040 and 1.2260. GBP popped briefly to 1.2269 in NY trade before closing at 1.2176 (+0.29%). There is no change in our view and we continue to expect GBP to trade between 1.2040 and 1.2260.”
- GBP/JPY meets with a fresh supply on Wednesday and erodes a part of the overnight gains.
- The softer UK CPI print eases pressure on the BoE to tighten further and weighs on the GBP.
- The risk-off mood underpins the safe-haven JPY and also contributes to the intraday decline.
The GBP/JPY cross comes under some selling pressure on Wednesday and snaps a two-day winning streak to a fresh YTD peak, around the 162.15-162.20 region touched the previous day. The cross remains depressed through the early European session and hits a fresh daily low, around the 161.15 area, following the release of the UK consumer inflation figures.
In fact, the UK Office for National Statistics reported that the headline CPI declined by 0.6% in January, more than the 0.4% fall anticipated. Adding to this, the yearly rate decelerated from 10.5% in December to 10.1% during the reported month, again missing estimates for a reading of 10.3%. Moreover, Core CPI, which excludes seasonally volatile products such as food and energy, came in at 5.8% YoY as compared to the 6.3% previous and 6.2% expected.
The data points to signs of easing inflationary pressure and could allow the Bank of England to slow the pace of its policy-tightening, which, in turn, weighs on the British Pound. The Japanese Yen (JPY), on the other hand, is underpinned by speculations that Kazuo Ueda, the Bank of Japan (BoJ) governor candidate, will dismantle the yield curve control. This, along with the risk-off mood, benefits the safe-haven JPY and exerts pressure on the GBP/JPY cross.
The aforementioned fundamental backdrop favours bearish traders and suggests that the recent move-up witnessed over the past two weeks or so has run out of steam. That said, it will still be prudent to wait for some follow-through selling below the 161.00 mark before confirming the negative outlook and positioning for any further intraday depreciating move.
Technical levels to watch
Here is what you need to know on Wednesday, February 15:
Following Tuesday's volatile action, markets remain risk-averse early Wednesday and the US Dollar (USD) preserves its strength against its major rivals. January Retail Sales and Industrial Production data will be featured in the US economic docket alongside the NY Fed's Empire State Manufacturing Survey and December Business Inventories. European Central Bank President Christine Lagarde will be speaking later in the day.
The data published by the US Bureau of Labor Statistics revealed on Tuesday that the Consumer Price Index (CPI) rose 0.5% on a monthly basis in January, marking its biggest one-month increase since June. The Core CPI, which excludes volatile food and energy prices, increased 0.4% in the same period. Although the initial market reaction to the data was mixed in the early American session, the benchmark 10-year US Treasury bond yield climbed above 3.7% and helped the USD regain its traction. Following the inflation figures, the CME Group FedWatch Tool shows markets are pricing in a more than 80% probability that the Fed will opt for one more rate hike of at least 25 basis points in May.
Reflecting the souring market mood, US stock index futures were down between 0.4% and 0.7% in the early European morning on Wednesday.
The UK's Office for National Statistics announced on Wednesday that the annual CPI declined to 10.1% in January from 10.5% in December, compared to the market expectation of 10.3%. Similarly, the Core CPI fell to 5.8% on a yearly basis from 6.3% in December. Pressured by the soft inflation, GBP/USD trades deep in negative territory near 1.2100 in the early European session.
During the Asian trading hours, Reserve Bank of Australia (RBA) Governor Philip Lowe said that inflation was still too high and added that there is a risk that the RBA hasn't done enough with rates. Despite these hawkish comments, AUD/USD stayed under heavy bearish pressure and was last seen losing nearly 1% on a daily basis slightly above 0.6900.
Boosted by rising US Treasury bond yields, USD/JPY climbed to its highest level in nearly five weeks and was last seen trading modestly higher on the day above 133.00. Japan's Prime Minister Kishida said earlier in the day that he expects the new Bank of Japan (BoJ) governor to keep appropriate monetary policy, taking into account of economy, inflation and market situations.
After having climbed above 1.0800 in the early American session on Tuesday, EUR/USD erased its gains to end the day flat below 1.0750. The pair stays on the back foot early Wednesday and retreats toward 1.0700.
Gold price extended its slide with the 10-year US T-bond yield holding comfortably above 3.7% during the Asian trading hours on Wednesday. XAU/USD was last seen trading at its lowest level since early January below $1,850.
Bitcoin gained nearly 2% on Tuesday and seems to have gone into a consolidation phase slightly above $22,000 on Wednesday. Ethereum rose more than 3% on Tuesday and reclaimed $1,500 after having declined in the previous two days. Early Wednesday, ETH/USD is moving sideways in a narrow range at around $1,550.
- GBP/USD extends the previous day’s pullback from fortnight high to snap two-day uptrend.
- UK CPI slides to 10.1% YoY in January versus 10.3% expected and 10.5% prior.
- Upbeat Treasury bond yields, hawkish Fed speak underpin US Dollar rebound.
- Hopes of overcoming UK’s labor crisis, BoE’s cautious optimism probe Cable buyers.
GBP/USD takes offers to refresh the intraday low near 1.2100, adding strength to the first daily loss in three during early Wednesday, as the UK inflation data disappoints.
That said, UK Consumer Price Index dropped to 10.1% YoY in January versus 10.3% market forecasts and 10.5% previous readings. With this, the headline inflation marks the third monthly decline after rising to the 41-year high in October. More importantly, the Core CPI, which excludes volatile food and energy items, slide to 5.8% on yearly basis compared to the 6.2% expected and 6.3% in previous readings.
Also read: Breaking: UK annualized CPI inflation softens to 10.1% in January vs.10.3% expected
Given the mostly downbeat UK inflation numbers, backed by the previous day’s mixed jobs report, the GBP/USD could witness further downside as the Bank of England (BoE) Officials have recently highlighted the data dependency for further rate hikes
Further, a separate survey of economists from Reuters signaled no more than one rate lift of 25 basis points (bps), in March, before the BoE initiates the policy pivot calls. The same could exert additional downside pressure on the GBP/USD prices, because the Fed policymakers are comparatively more hawkish despite the latest soft US inflation.
Alternatively, the Financial Times (FT) quoted officials familiar with the matter to mention that UK Prime Minister Rishi Sunak and Finance Minister Jeremy Hunt are up for a deal with workers including a lump sum payment by backdating next year's pay award. The same joins the previous attempts of the UK firms to increase the labor pay to underpin the inflation woes and put a floor under the GBP/USD price.
However, hawkish Federal Reserve (Fed) comments and a recovery in the US Treasury bond yields, despite unimpressive US Consumer Price Index (CPI), seem to exert downside pressure on the Cable pair.
Against this backdrop, US 10-year Treasury bond yields remain intact at around 3.75%, after rising three basis points (bps) to refresh a six-week high the previous day whereas the two-year counterpart copies the moves near the highest level since early November 2022 by poking 4.62%, near 4.61% at the latest. That said, the S&P 500 Futures dropped half a percent while tracing Wall Street’s losses and favor the US Dollar’s haven demand, which in turn allowed the US Dollar Index (DXY) to print the first daily gains in three, up 0.27% intraday near 103.55 by the press time.
Having witnessed the initial market reaction to the key UK data, GBP/USD traders should wait for the US Retail Sales and Industrial Production details for January, as well as NY Empire State Manufacturing Index for February, for clear directions. That said, a few central bankers from the Fed and the BoE are also lined up for speeches and may entertain the Cable traders ahead of Friday’s UK Retail Sales.
Technical analysis
GBP/USD pair’s U-turn from the 50-DMA, around 1.2185 by the press time, joins bearish MACD signals and the RSI retreat, to direct sellers towards the weekly support line surrounding 1.2060.
- UK CPI eases to 10.1% YoY in January vs. 10.3% expected.
- Monthly UK CPI arrives at -0.6% in January vs. -0.4% expected.
- GBP/USD extends losses toward 1.2100 on disappointing UK CPIs.
The UK annualized Consumer Prices Index (CPI) came in at 10.1% in January against the 10.5% increase recorded in December while missing estimates of a 10.3% print, the UK Office for National Statistics (ONS) reported on Wednesday. The index keeps moving away from its highest level since January 1981, reached at 11.1% last year.
Meanwhile, the Core CPI gauge (excluding volatile food and energy items) eased to 5.8% YoY last month versus 6.3% seen in December. The market consensus was for a 6.2% print.
The monthly figures showed that the UK consumer prices declined by 0.6% in January vs. -0.4% expectations and 0.4% prior.
The UK Retail Price Index for January stood at 0% MoM and 13.4% YoY, beating expectations across the time horizon.
Additional takeaways (via ONS)
“The largest downward contribution to the change in both the CPIH and CPI annual inflation rates between December 2022 and January 2023 came from transport (particularly passenger transport and motor fuels), and restaurants and hotels, with rising prices in alcoholic beverages and tobacco making the largest partially offsetting upward contribution to the change.”
“Core CPIH (excluding energy, food, alcohol and tobacco) fell to 5.3% in the 12 months to January 2023 from 5.8% in December 2022, the annual CPIH goods index eased slightly from 13.4% to 13.3% over the same period, while the annual CPIH services index fell from 5.8% to 5.2%.”
FX implications
In an initial reaction to the UK CPI numbers, the GBP/USD pair extended losses to test 1.2100, down 0.49% on the day.
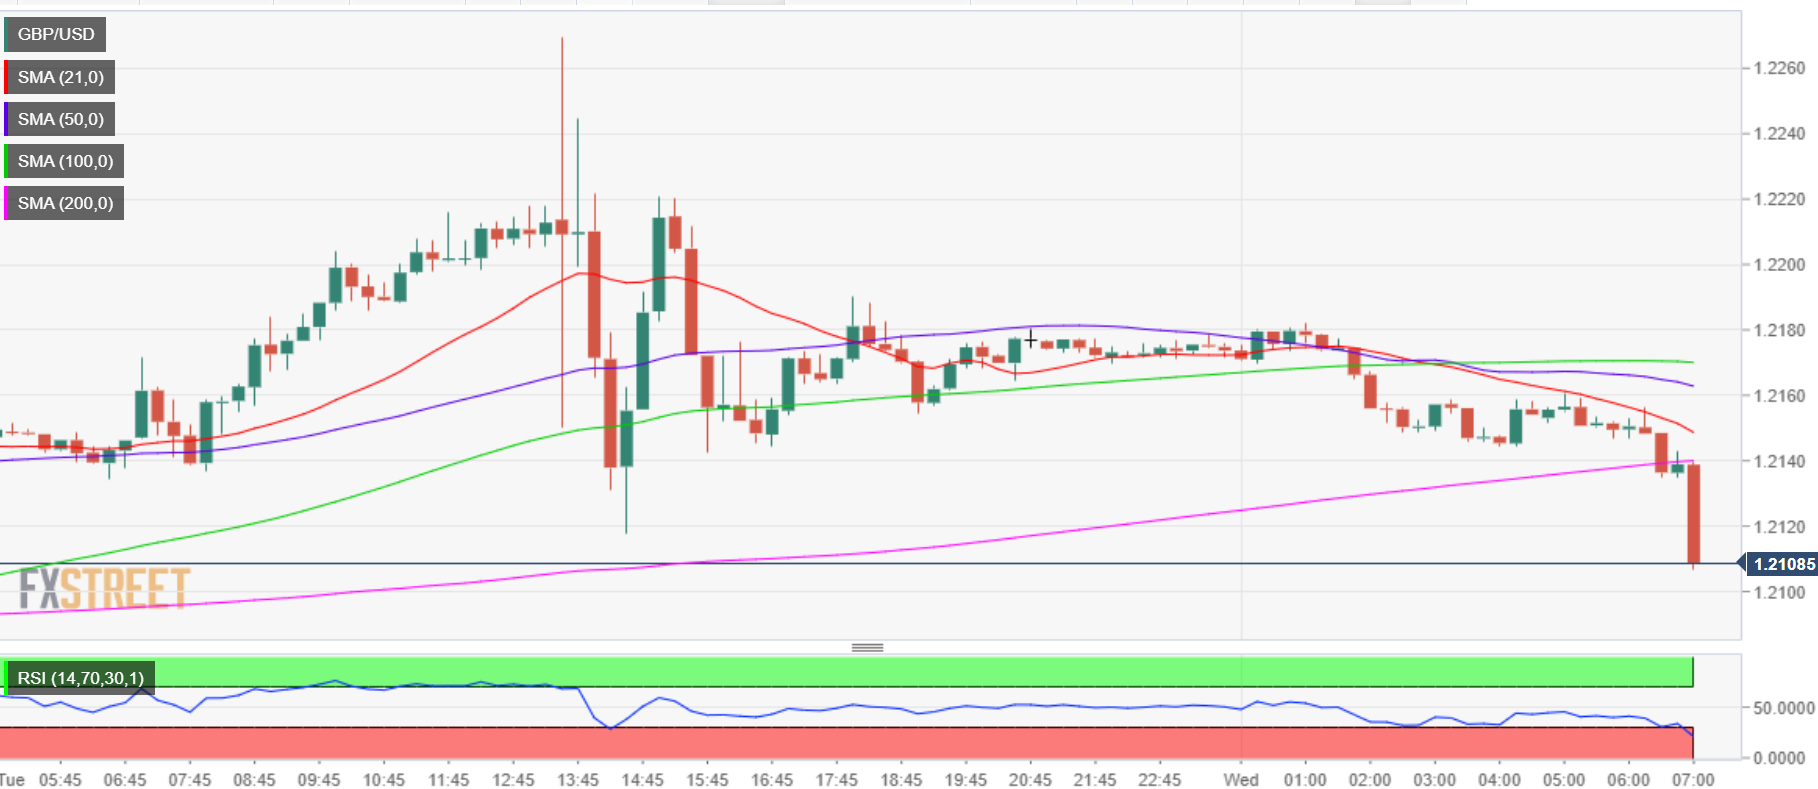
GBP/USD: 15-minutes chart
Why does UK inflation matter to traders?
The Bank of England (BOE) is tasked with keeping inflation, as measured by the headline Consumer Price Index (CPI) at around 2%, giving the monthly release its importance. An increase in inflation implies a quicker and sooner increase in interest rates or the reduction of bond-buying by the BOE, which means squeezing the supply of pounds. Conversely, a drop in the pace of price rises indicates looser monetary policy. A higher-than-expected result tends to be GBP bullish.
Gold price is resuming its downtrend below $1,850 in Wednesday’s trading so far. $1,825 remains in sight for XAU/USD bears, as FXStreet’s Dhwani Mehta notes.
Gold remains vulnerable whilst below the 50DMA barrier
“The next downside target is the falling trendline support at $1,838 should the previous day’s low give way. Further declines could challenge bullish commitments at the horizontal trendline support from the January 5 low at $1,825.”
“Recapturing the 50-Daily Moving Average resistance at $1,860 is critical for Gold bulls to initiate any meaningful recovery toward the $1,870 supply zone.”
- The index flirts with 103.50 amidst the broader consolidative theme.
- Investors keep favouring a 25 bps rate hike by the Fed in March.
- Retail Sales, Industrial Production take centre stage in the NA session.
The greenback, in terms of the USD Index (DXY), sets aside two daily drops in a row and trades with decent gains ahead of the opening bell in the old continent on Wednesday.
USD Index focuses on data
The index manages to regain some balance and leaves behind two consecutive daily drops, although it remains largely within the multi-session consolidative phase so far on Wednesday.
Indeed, following the post-CPI volatile session on Tuesday, the dollar now appears stabilized above the 103.00 mark ahead of upcoming key data in the US calendar.
In fact, despite US inflation was higher than expected, it kept the downtrend well in place in January after rising at an annualized 6.4% and 5.6% when it comes to the Core CPI. However, consumer prices are still elevated and support the Fed’s plan to keep hiking rates for the time being. On this, and according to CME Group’s FedWatch Tool, the probability of a 25 bps rate hike in March is now nearly 90%.
In the NA calendar, the focus of attention will be on the Retail Sales, seconded by MBA Mortgage Applications, Industrial Production, the NAHB Index, Business Inventories, the NY Empire State Index and TIC Flows.
What to look for around USD
The dollar remains within a consolidative phase above the 103.00 level against the backdrop of the persistent range bound mood and ahead of key results in the US calendar.
The probable pivot/impasse in the Fed’s normalization process narrative is expected to remain in the centre of the debate along with the hawkish message from Fed speakers, all after US inflation figures for the month of January showed consumer prices are still elevated.
The loss of traction in wage inflation – as per the latest US jobs report - however, seems to lend some support to the view that the Fed’s tightening cycle have started to impact on the still robust US labour markets somewhat.
Key events in the US this week: MBA Mortgage Applications, Retail Sales, Industrial Production, Business Inventories, NAHB Index, TIC Flows (Wednesday) – Building Permits, Housing Starts, Initial Jobless Claims, Philly Fed Index (Thursday) – CB Leading Index (Friday).
Eminent issues on the back boiler: Rising conviction of a soft landing of the US economy. Slower pace of interest rate hikes by the Federal Reserve vs. shrinking odds for a recession in the next months. Fed’s pivot. Geopolitical effervescence vs. Russia and China. US-China trade conflict.
USD Index relevant levels
Now, the index is advancing 0.25% at 103.53 and faces the next up barrier at 103.96 (monthly high February 7) seconded by 105.63 (2023 high January 6) and then 106.45 (200-day SMA). On the other hand, the breach of 100.82 (2023 low February 2) would open the door to 100.00 (psychological level) and finally 99.81 (weekly low April 21 2022).
- Gold price languishes near its lowest level since January amid sustained US Dollar buying.
- Tuesday’s US CPI reaffirms Federal Reserve’s hawkish outlook and underpins the greenback.
- Recession fears weigh on investors’ sentiment and could lend some support to Gold price.
Gold price comes under some renewed selling pressure on Wednesday and remains on the defensive heading into the European session. The XAU/USD is currently placed just below the $1,845 level, flirting with its lowest level since January 6 touched in the last hour, and seems vulnerable to decline further.
Stronger US Dollar drive flows away from Gold price
The US Dollar (USD) stands tall near a multi-week high amid expectations that the Federal Reserve (Fed) will stick to its hawkish stance in the wake of stubbornly high inflation. This, in turn, is seen as a key factor driving flows away from the US Dollar-denominated Gold price. The market bets that interest rates are going to remain higher for longer were lifted by data, showing that the headline Consumer Price Index (CPI) in the United States (US) rose in line with expectations, by 0.5% in January. On an annualized basis, US CPI eased from 6.5% to 6.4% during the reported month, though remained above consensus estimates for a reading of 6.2%. More importantly, Core CPI which excludes food and energy prices, also came in higher-than-anticipated, at a 5.6% YoY rate.
Hawkish Federal Reserve officials further weigh on Gold price
Adding to this, FOMC members stressed the need to keep raising rates gradually to beat inflation. In fact, Richmond Fed President Thomas Barkin told Bloomberg TV that inflation is normalizing but it’s coming down slowly. If it persists at levels well above the target, the Fed will have to raise rates to a higher level than previously anticipated, Barkin added. Separately, Dallas Fed President Lorie Logan said, “we must remain prepared to continue rate increases for a longer period than anticipated." Adding to this, New York Fed President John Williams flagged a prolonged battle against inflation over the coming months. The markets were quick to price in at least 25 bps lift-off at each of the next two Federal Open Market Committee (FOMC) meetings in March and in May.
Recession fears could lend support to safe-haven XAU/USD
This, in turn, pushes the US Treasury bond yields higher, which is seen as another factor benefitting the Greenback and exerting downward pressure on the non-yielding Gold price. That said, the recent yield curve inversion adds to worries about an impending recession and takes its toll on the global risk sentiment. The risk-off mood is evident from a generally weaker tone around the equity markets and could lend some support to the safe-haven precious metal, at least for now. Nevertheless, the fundamental backdrop seems tilted in favour of bearish traders and suggests that the path of least resistance for the XAU/USD is to the downside. Traders now look to the US economic docket, featuring monthly Retail Sales and the Empire State Manufacturing Index for a fresh impetus.
Gold price technical outlook
From a technical perspective, acceptance below the 50-day Simple Moving Average (SMA) adds credence to the negative outlook and supports prospects for deeper losses. Furthermore, oscillators on the daily chart are holding deep in the bearish territory and are still far from being in the oversold zone. Hence, a subsequent slide towards the $1,830 intermediate support, en route to the $1,818-$1,817 zone and the $1,800 round figure, looks like a distinct possibility.
On the flip side, the 50-day SMA, currently around the $1,858-$1,859 region, now seems to act as an immediate hurdle ahead of the overnight swing high, around the $1,870-$1,871 zone. Any further recovery might still be seen as a selling opportunity and runs the risk of fizzling out rather quickly near the $1,890 barrier. That said, some follow-through buying beyond the $1,900 mark could prompt some short-covering move and lift the Gold price to the next relevant resistance near the $1,925-$1,930 congestion zone.
Key levels to watch
- USD/JPY retreats from intraday high, indecisive after two-day winning streak.
- Sustained break of 50-DMA, upbeat oscillators favor bulls within bearish chart pattern.
- A clear downside break of 130.60 confirms rising wedge and can recall sellers.
USD/JPY bulls take a breather during early Wednesday morning in Europe, after a two-day uptrend, as it eases to 133.00 by the press time. Even so, the Yen pair remains around a six-week high, marked the previous day.
USD/JPY buyers cheered the upside break of the 50-DMA, as well as bullish MACD signals and firmer RSI (14), to refresh the monthly high on Tuesday. However, the market’s lack of acceptance of the recent bullish bias seemed to have probed the quote’s further upside.
That said, the USD/JPY remains inside a one-month-old rising wedge bearish chart formation.
Hence, the DMA breakout joins upbeat oscillators to support the bulls but the upside room appears limited to the stated wedge’s top line, close to 133.60.
Even if the quote rises past 133.60, a two-month-old horizontal resistance region near 134.50-70, will precede the 200-DMA level surrounding 136.90 to challenge the USD/JPY bulls.
Meanwhile, pullback moves remain elusive unless staying beyond the 50-DMA level of 132.00.
Following that, a convergence of the 21-DMA and the aforementioned wedge’s lower line, close to 130.60, appears a tough nut to crack for the USD/JPY bears.
It should be noted that the 130.00 round figure will act as an extra filter towards the south of 130.60 before directing the USD/JPY sellers towards the theoretical target of the stated wedge, namely 125.50.
USD/JPY: Daily chart
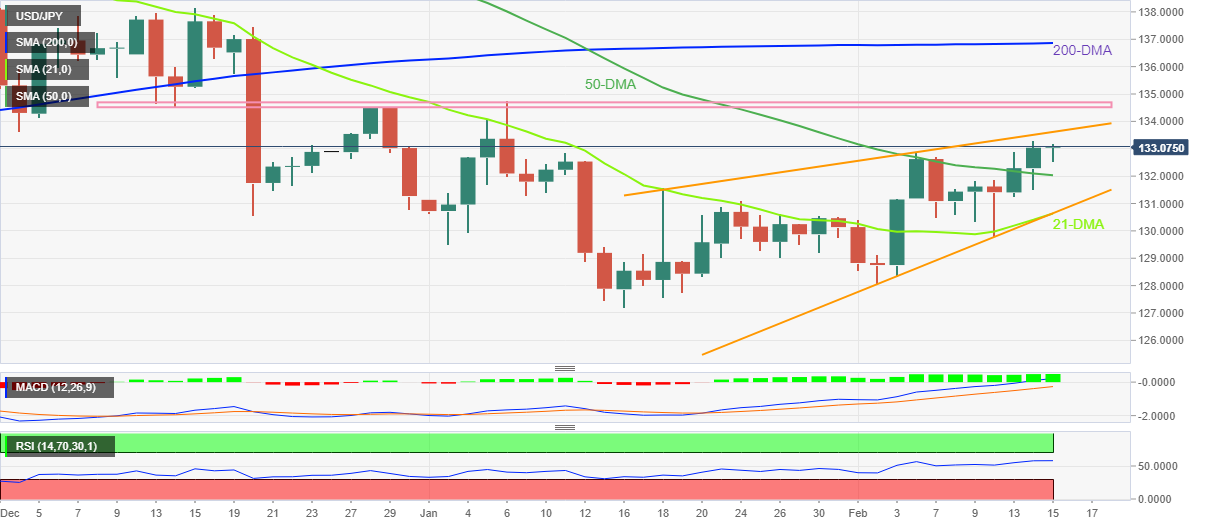
Trend: Limited upside expected
CME Group’s flash data for gold futures markets noted traders extended the downtrend for yet another session on Tuesday, this time by just 121 contracts. Volume, instead, reversed two daily pullbacks in a row and increased by around 83.6K contracts.
Gold: A drop to $1800 starts shaping up
Price action around gold was inconclusive and advanced marginally on Tuesday. This move was against the backdrop of shrinking open interest and leaves the door open to the continuation of the decline with the immediate target at the key $1800 region per ounce troy.
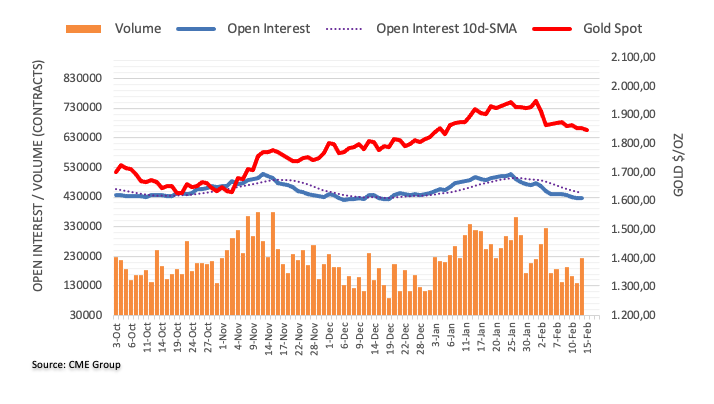
- WTI crude oil drops for the third consecutive day as risk-aversion joins fears of more supplies.
- US SPR release, UAE Energy Minister’s comments join surprise inventory build to underpin higher supply hopes.
- Expectations of more energy demand, Russia-linked output cut challenge bears.
- US Dollar’s run-up amid hawkish Fed concerns exerts additional downside pressure on Oil price.
WTI crude oil holds onto the week-start bearish bias as it renews its intraday low near $78.40 during early Wednesday morning in Europe. In doing so, the black gold bears the burden of the broad US Dollar recovery and downbeat sentiment amid expectations of more Oil supplies.
That said, UAE Energy Minister Suhail Mohamed Al Mazrouei mentioned on Tuesday that UAE is committed to the OPEC deal lasting until the end of 2023. The diplomat, however, stated that he is more worried about supply than demand for next year. While saying the same, UAE Energy Minister said, “The US Strategic Petroleum Reserve (SPR) release won't shock the market.”
Although comments from the Arab official should have ideally put a floor under the prices, hawkish statements from the Federal Reserve (Fed) policymakers, despite unimpressive US inflation, joined a surprise build in US Oil inventories to weigh on prices.
On Tuesday, US Consumer Price Index (CPI) rose past market expectations to 6.4% YoY but posted the slowest increase since 2021 while easing below 6.5% prior. More importantly, CPI ex Food & Energy, better known as the Core CPI, grew 5.6% YoY compared to 5.5% market forecasts and the 5.7% previous readings. Following the data, Dallas Fed President Lorie Logan stated that they must remain prepared to continue rate increases for a longer period than previously anticipated. On the same line was New York Fed President John Williams who noted that the work to control too high inflation is not yet done. Additionally, Philadelphia Fed President Patrick Harker signaled that they are not done (with lifting rates), but they are likely close.
Elsewhere, the American Petroleum Institute (API) released its Weekly Crude Oil Stock until February 10 while noting an increase of 10.507 million barrels versus the previous draw of 2.184 million barrels.
It should be noted that the fears surrounding the global economic slowdown and the US readiness to keep using the SPR balance to battle the Russia-linked Oil shortage seem to have favored the black gold sellers. Alternatively, geopolitical fears and the OPEC+ output cut puts a floor under the energy benchmark’s price.
While portraying the mood, US 10-year Treasury bond yields retreat to around 3.74%, after rising three basis points (bps) to refresh a six-week high the previous day whereas the two-year counterpart jumped to the highest level since early November 2022 by poking 4.62%, near 4.61% at the latest. Further, S&P 500 Futures trace Wall Street’s downbeat closing to highlight the mildly offbeat mood and help the US Dollar Index (DXY) to extend the post-US CPI run-up to 103.45 by the press time.
Technical analysis
Although failure to cross the 100-DMA recalled the WTI bears on Monday, the quote’s further downside appears elusive as it approaches the 50-DMA support, close to $77.70 by the press time.
Analysts at Scotiabank offer a sneak peek at what they expect from Wednesday’s United States Retail Sales data.
Key quotes
“Looking for a headline +2.2%.”
“The US consumer’s fundamentals remain sound.”
“Job markets are very tight, wage gains are decent, the debt-to-income ratio is at a twenty-two year low, debt payments as a share of incomes are toward record lows, cash balances are very high after socking away pandemic stimulus and Americans have a one-way option to refi in a falling rate environment that locked in pandemic lows for 30-year mortgages.”
In the opinion of UOB Group’s Economist Lee Sue Ann and Markets Strategist Quek Ser Leang, EUR/USD is now expected to trade between 1.0655 and 1.0815 in the next few weeks.
Key Quotes
24-hour view: “In NY trade yesterday, EUR popped to a high of 1.0705, dropped sharply and swiftly to 1.0705 before trading choppily for the rest of the session. EUR could continue to trade in a choppy manner, likely within a range of 1.0695/1.0775.”
Next 1-3 weeks: “Yesterday, EUR popped briefly above our ‘strong resistance’ level of 1.0800 (high of 1.0804). The breach of the ‘strong resistance’ level indicates that the EUR weakness from early last week has come to an end. The current price movements are likely the early stages of a consolidation phase and EUR is expected to trade between 1.0655 and 1.0815.”
- USD/CAD regains positive traction on Wednesday and is supported by a combination of factors.
- Sliding crude oil prices undermines the Loonie and acts as a tailwind amid sustained USD buying.
- The prospects for more rate hikes by the Fed and the risk-off mood benefit the safe-haven buck.
The USD/CAD pair catches fresh bids on Wednesday following the previous day's post-US CPI volatility and sticks to its intraday gains heading into the European session. The pair trades around the 1.3365 region, up nearly 0.25% for the day, and is supported by a combination of factors.
Weaker crude oil prices undermine the commodity-linked Loonie, which, along with broad-based US Dollar strength, acts as a tailwind for the USD/CAD pair. Investors now seem worried that economic headwinds stemming from rising borrowing costs will dent fuel demand. Apart from this, signs of another massive build in US crude inventories weigh on the black liquid. In fact, the American Petroleum Institute (API) report showed on Tuesday that US crude stockpiles grew over 10 million barrels in the week to February 10.
The USD, on the other hand, stands tall near a multi-week high amid firming expectations for further policy tightening by the Federal Reserve. In fact, the markets seen convinced that the US central bank will stick to its hawkish stance for longer in the wake of stubbornly high inflation. The bets were reaffirmed by the latest US CPI report released and hawkish commentary by several FOMC officials on Tuesday. This, along with the prevalent risk-off mood, benefits the safe-haven buck and lends support to the USD/CAD pair.
The aforementioned fundamental backdrop favours bullish traders and suggests that the path of least resistance for the USD/CAD pair is to the upside. Hence, some follow-through positive move, back towards reclaiming the 1.3400 round-figure mark, looks like a distinct possibility. The focus now shifts to the US economic docket, featuring the release of monthly Retail Sales and the Empire State Manufacturing Index. Traders will further take cues from oil price dynamics to grab short-term opportunities around the pair.
Technical levels to watch
- Silver prints three-day losing streak as sellers flirt with 2.5-month low.
- Clear downside break of 100-DMA, bearish MACD signals favor sellers.
- 50% Fibonacci retracement, 200-DMA challenge further downside.
- Recovery remains elusive unless crossing $23.15, ascending trend line from early September 2022 adds to the downside filters.
Silver price (XAG/USD) remains on the bear’s radar as the bright metal renews intraday low near $21.70 during early Wednesday in Europe. In doing so, the bullion stays pressured around the lowest levels since November 30 amid a three-day downtrend.
The quote’s weakness could be linked to the daily closing below the 100-DMA, as well as sustained trading below the previous support line from early December 2022, respectively near $21.95 and $23.15.
As a result, the XAG/USD bears have a free hand while expecting further downside of the metal.
However, the 50% Fibonacci retracement of September 2022 to February 2023 upside, near $21.10, precedes the 200-DMA level of $21.00 to offer a strong challenge to the Silver sellers.
Following that, the 61.8% Fibonacci retracement surrounding $20.30, also known as the golden Fibonacci ratio, as well as a 5.5-month-old ascending support line, close to $20.00 round figure, will become the key for the XAG/USD sellers to watch.
Alternatively, recovery moves need to stay beyond the 100-DMA hurdle of $21.95, as well as the $22.00 round figure to convince intraday buyers of the Silver.
Even so, the previous weekly high near $22.60 and the support-turned-resistance line from December 06, 2022, close to $23.15, could challenge the XAG/USD bulls before giving them control.
Silver price: Daily chart
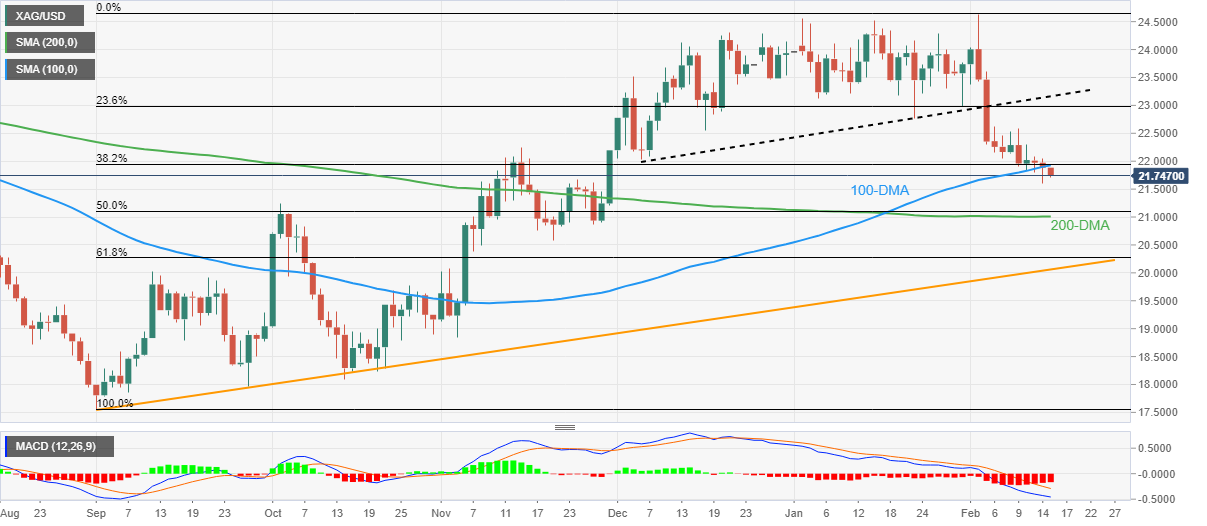
Trend: Further downside expected
The UK CPIs Overview
The cost of living in the UK as represented by the Consumer Price Index (CPI) for January month is due early on Wednesday at 07:00 GMT.
Given the recently released mixed employment data, coupled with the firmer economic activity numbers and the doubts over the Bank of England’s (BOE) next moves, today’s British inflation data will be watched closely by the GBP/USD traders.
That said, the headline CPI inflation is expected to decline further from the 41-year high marked in October while easing to 10.3% YoY in January, versus 10.5% prior. Further, the Core CPI, which excludes volatile food and energy items, is likely to decline to a 6.2% yearly figure versus 6.3% previous readings. Talking about the monthly figures, the CPI could slump to -0.4% versus 0.4% prior.
Also important to watch is the Retail Price Index (RPI) figures for January, expected to ease to -0.2% MoM and 13.2% YoY versus 0.6% and 13.4% in that order.
In this regard, FXStreet’s Dhwani Mehta said,
A softer-than-expected headline print could prompt the Bank of England to weigh a pause in its rate hike trajectory, sending GBP/USD sharply lower.
Deviation impact on GBP/USD
Readers can find FXStreet's proprietary deviation impact map of the event below. As observed, the reaction is likely to remain confined around 20-pips in deviations up to + or -3, although in some cases, if notable enough, a deviation can fuel movements over 50-60 pips.
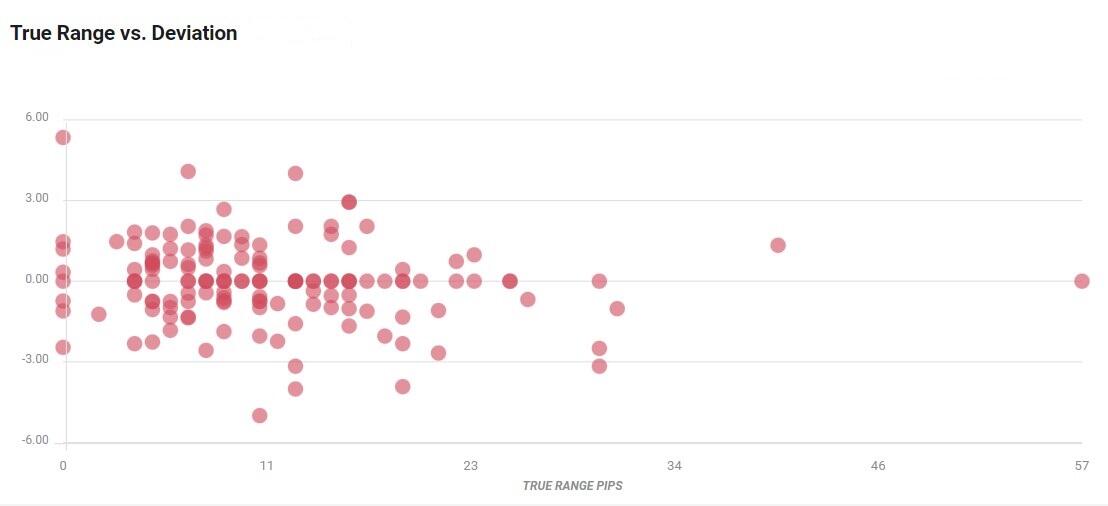
How could it affect GBP/USD?
GBP/USD holds lower grounds near 1.2150 heading into Wednesday’s London open. The Cable pair’s latest weakness could be linked to the broad US Dollar rebound amid hawkish Federal Reserve (Fed) talks despite the unimpressive increase in the US inflation data.
In doing so, the Cable pair snaps a two-day winning streak while easing from a one-week high. It should, however, be noted that the hopes of overcoming the UK’s labor crisis and the recent hawkish comments from the Bank of England (BoE) Officials seem to put a floor under the GBP/USD prices.
Given the recent improvement in the British data and expectations of overcoming the labor problems, softer UK inflation data may help the GBP/USD bears to tighten their grips.
Technically, a successful break of the 50-DMA, around 1.2190 by the press time, becomes necessary for the GBP/USD buyers to keep the reins. Until then, the Cable pair remains vulnerable to declining towards the one-week-old ascending support line, near 1.2070 at the latest.
Key notes
UK Inflation Preview: Will softer CPI raise odds of a BoE pause?
GBP/USD grinds toward 1.2200 ahead of UK inflation, US Retail Sales
About the UK CPIs
The Consumer Price Index released by the Office for National Statistics is a measure of price movements by the comparison between the retail prices of a representative shopping basket of goods and services. The purchasing power of the GBP is dragged down by inflation. The CPI is a key indicator to measure inflation and changes in purchasing trends. Generally, a high reading is seen as positive (or bullish) for the GBP, while a low reading is seen as negative (or Bearish).
- EUR/USD prints the first daily loss in three, holds lower ground of late.
- Fed Officials ignore sticky inflation to defend rate hike bias, underpin yields and US Dollar rebound.
- ECB talks appear less lucrative and so do the Eurozone statistics.
- Dovish bias of ECB’s Lagarde, upbeat US Retail Sales, Industrial Production needed to extend latest weakness.
EUR/USD slips to 1.0715 as it prints the first daily loss in three during early Wednesday morning in Europe. The Euro pair’s latest losses could be linked to the US Dollar’s broad gains, backed by the risk-off mood and the firmer Treasury bond yields, ahead of the key catalysts scheduled to release from the Eurozone and the US.
It should be noted that the market’s sour sentiment seems taking clues from the hopes of aggressive monetary policies at the key central banks, including the Federal Reserve (Fed), Bank of England (BoE) and the European Central Bank (ECB). Adding strength to the mildly offbeat sentiment are the jitters surrounding the US-China ties amid alleged spying via balloons. While portraying the mood, S&P 500 Futures trace Wall Street’s downbeat closing to highlight the mildly offbeat mood.
Elsewhere, US 10-year Treasury bond yields retreat to around 3.74%, after rising three basis points (bps) to refresh a six-week high the previous day whereas the two-year counterpart jumped to the highest level since early November 2022 by poking 4.62%, near 4.61% at the latest.
The return of the US Treasury bond sellers appears linked to the hawkish Fed talks, as well as the better-than-forecast US Consumer Price Index (CPI) for January, which in turn joined downbeat sentiment to favor the US Dollar Index (DXY).
On the other hand, unimpressive prints of the Eurozone growth numbers joined mixed statements from ECB Officials to weigh on the Euro amid a sluggish trading session ahead of the key data.
Looking ahead, Industrial Production details for the Eurozone and the US will join the US Retail Sales, as well as NY Empire State Manufacturing Index, to decorate the calendar and offer additional clues to the EUR/USD pair traders. However, major attention will be given to ECB President Christine Lagarde’s speech as major of the latest policymakers, including Governing Council members Gabriel Makhlouf and Mario Centeno, appeared hawkish but couldn’t ignore economic fears and remained unimpressive to the Euro bulls.
Technical analysis
EUR/USD remains inside a one-week-long megaphone chart formation, a trend-widening pattern between 1.0810 and 1.0655.
- NZD/USD marks the second defeat from 50-DMA, renews intraday low.
- Three-month-old rising wedge restricts downside ahead of 200-DMA.
- Bearish MACD signals, downbeat RSI and failure to cross 50-DMA favor sellers.
NZD/USD takes offers to refresh the intraday low near 0.6300 as it extends the previous day’s pullback from the 50-DMA hurdle during early Wednesday.
In doing so, the Kiwi pair marks the second such failure to cross the key Daily Moving Average (DMA) while staying inside a three-month-old rising wedge bearish chart formation.
Other than the failure to cross the 50-DMA, bearish MACD signals join the downbeat RSI (14), not oversold, to keep the bears hopeful.
However, a clear downside break of the three-month-old ascending support line, forming part of the stated rising wedge bearish chart formation, near 0.6290, becomes necessary.
Following that, the 200-DMA support surrounding 0.6180 and the mid-November 2022 swing low around 0.6065, could act as the last defense before directing the Kiwi pair toward the theoretical target of 0.5810. During the fall, the 0.6000 round figure may act as an extra filter towards the north.
Alternatively, a daily closing beyond the 50-DMA hurdle surrounding 0.6375 could aim for the 0.6400 threshold and the stated wedge’s top line near 0.6540. Though, any further upside appears less lucrative unless crossing the June 2022 high of near 0.6575.
NZD/USD: Daily chart
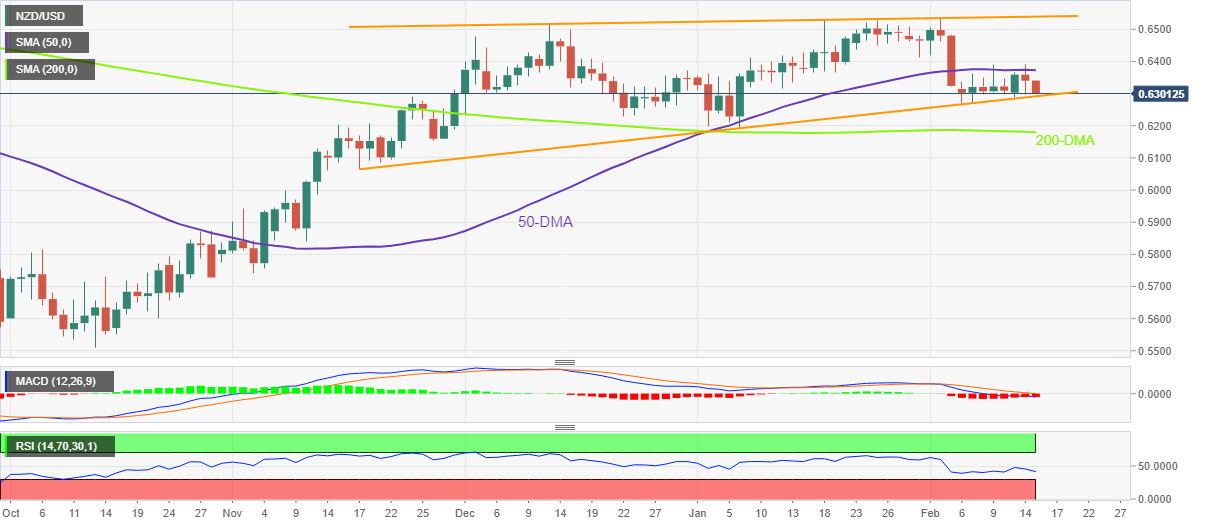
Trend: Further downside expected
- USD/INR seesaws around multi-day high as firmer US Dollar jostles with sluggish markets, downbeat Oil price.
- Fed Officials ignore sticky inflation to defend hawkish bias and propel US Treasury bond yields, USD.
- Upbeat WPI inflation favor RBI rate hike expectations and put a floor under Indian Rupee.
- US data, risk catalysts eyed for fresh impulse.
USD/INR bulls take a breather around the 1.5-month high, flirting with the multi-day-old resistance line near 83.00 by the press time, as markets await more clues to extend the previous day’s run-up.
It’s worth noting that the Indian Rupee (INR) dropped to the lowest levels since early January the previous day after the Federal Reserve (Fed) policymakers ignored unimpressive US inflation numbers to defend their hawkish bias and propel the US Dollar. However, upbeat inflation numbers at home seemed to have probed the USD/INR bulls afterward.
That said, US Consumer Price Index (CPI) rose past market expectations to 6.4% YoY but posted the slowest increase since 2021 while easing below 6.5% prior. More importantly, CPI ex Food & Energy, better known as the Core CPI, grew 5.6% YoY compared to 5.5% market forecasts and the 5.7% previous readings.
On the other hand, India's WPI Inflation grew more than expected 4.54% to 4.73%, versus 4.95% prior, during January, which in turn justifies the Reserve Bank of India’s (RBI) inflation woes and readiness for further rate increases.
Other than India’s WPI inflation, downbeat Oil prices also weigh on the USD/INR pair, mainly due to the Asian nation’s reliance on energy imports and the record-high deficit. That said, WTI crude oil drops 0.80% intraday to $78.70 while printing a three-day downtrend by the press time.
Talking about the Fed commentary, Dallas Fed President Lorie Logan stated that they must remain prepared to continue rate increases for a longer period than previously anticipated. On the same line was New York Fed President John Williams who noted that the work to control too high inflation is not yet done. Additionally, Philadelphia Fed President Patrick Harker signaled that they are not done (with lifting rates), but they are likely close.
Amid these plays, US 10-year Treasury bond yields retreat to around 3.74%, after rising three basis points (bps) to refresh a six-week high the previous day whereas the two-year counterpart jumped to the highest level since early November 2022 by poking 4.62%, near 4.61% at the latest. Further, S&P 500 Futures trace Wall Street’s downbeat closing to highlight the mildly offbeat mood and help the US Dollar Index (DXY) to extend the post-US CPI run-up.
Moving on, US Retail Sales and Industrial Production details for January, as well as NY Empire State Manufacturing Index for February, should be watched closely to confirm the Fed’s hawkish bias ahead of the next week’s Federal Open Market Committee (FOMC) Minutes.
Technical analysis
A daily closing beyond the four-month-old descending resistance line, around 83.00 by the press time, becomes necessary for the USD/INR bulls to keep the reins.
- USD/JPY is in the red for the first time this week, back below the 133.00 level.
- US Dollar benefits from risk aversion but US Treasury yields remain a drag.
- Bearish 50DMA support is in sight amid the pullback from multi-week highs.
USD/JPY is on a corrective downside journey so far this Wednesday, witnessing losses for the first time this week. The pair is retreating from fresh six-week highs of 133.31 reached a day before, trading under 133.00 amid broad risk aversion.
Hotter-than-expected US Consumer Price Index (CPI) data combined with hawkish commentary from US Federal Reserve (Fed) officials have spooked investors, negatively impacting global stocks. The rush to safety in the US bond market is sending the US Treasury bond yields lower, in turn, weighing down on the USD/JPY pair.
Further, expectations that the new Bank of Japan (BoJ) Governor Kazuo Ueda could likely abandon the central bank’s yield curve policy are lending support to the Japanese Yen.
However, the renewed demand for the US Dollar, amid dominating risk-off flows, is fuelling the latest uptick in the spot. All eyes now turn toward the US Retail Sales data due later in the NA session for fresh trading impetus.
From a short-term technical perspective, USD/JPY is reattempting the 133.00 level, having found support near the 132.50 psychological level.
The 14-day Relative Strength Index (RSI) is edging higher above the midline, suggesting that the recovery momentum remains well in place.
Buyers need to take out the six-week high at 133.31 to extend the recent uptrend toward the static resistance at 133.50.
On the flip side, a sustained move below the 132.50 demand area will put the 50-Daily Moving Average (DMA) support at 132.03 under threat.
USD/JPY: Daily chart
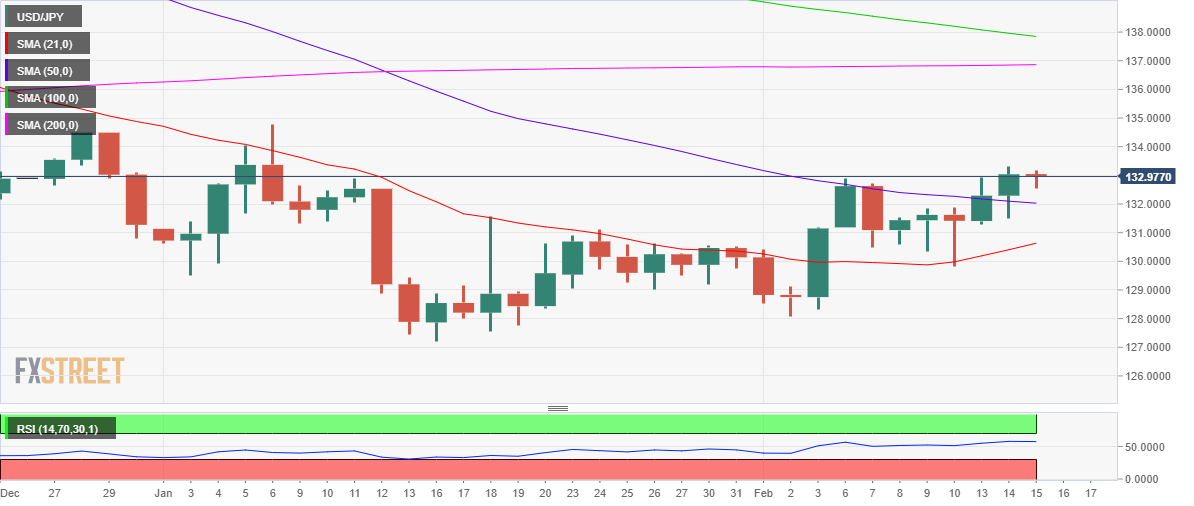
USD/JPY: Additional technical levels
- AUD/USD takes offers to refresh intraday low, prints the first daily loss in three.
- RBA’s Lowe fails to impress hawks despite citing inflation woes.
- Failures to cross immediate hurdles, bearish MACD signals favor sellers.
- Two-month-old ascending support line, 50-DMA challenge further downside.
AUD/USD recalls bears, after a two-day absence, as it renews its intraday low near the mid-0.6900s as the Reserve Bank of Australia (RBA) Governor failed to impress policy hawks in his testimony early Wednesday.
Also read: RBA Lowe: Inflation is way too high, needs to come down
In doing so, AUD/USD takes offers to print the first daily loss in three while reversing from the 21-DMA hurdle. The downside move also gains support from the bearish MACD signals and downbeat RSI (14), not oversold.
It should be noted, however, that an upward-sloping support line from December 20, 2022, close to 0.6930 by the press time, restricts immediate declines of the AUD/USD pair.
Following that, the 50-DMA support of 0.6885 will precede the monthly low of 0.6855 to act as final defenses for the Aussie pair buyers before giving control to the AUD/USD bears.
In that case, the previous monthly low near 0.6730 could gain major attention.
Alternatively, a daily closing beyond the 21-DMA, around the 0.7000 round figure, can propel the AUD/USD prices towards the late January swing high near 0.7065 before highlighting the 0.7100 threshold as the key resistance.
During the quote’s run-up beyond 0.7100, the monthly high of 0.7157 will be crucial to watch as it holds the key to a rally targeting the June 2022 peak surrounding 0.7285.
AUD/USD: Daily chart
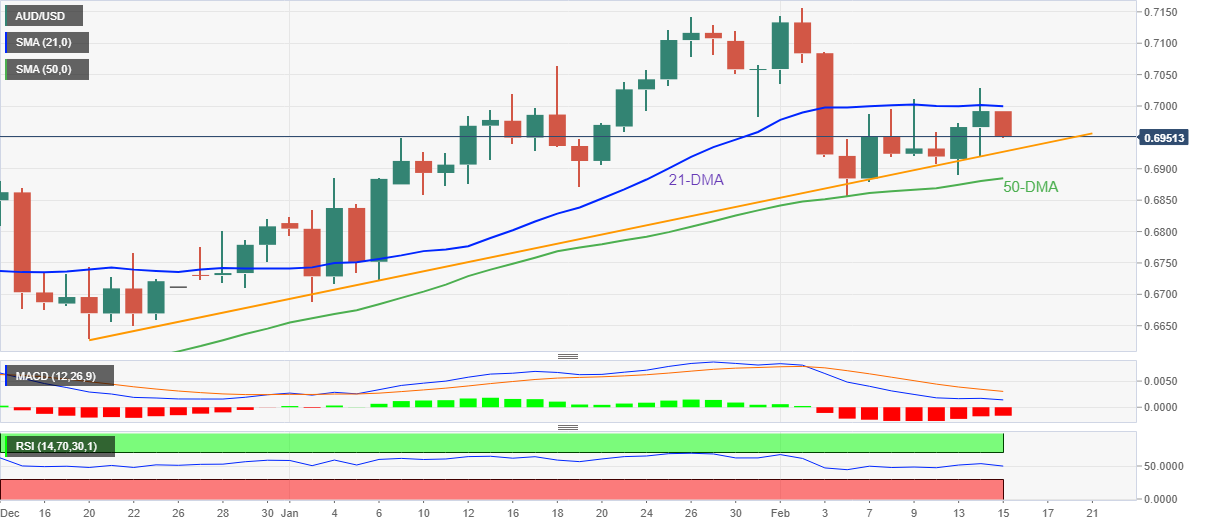
Trend: Limited downside expected
- USD/CHF picks up bids to refresh intraday high, extend the previous day’s bounce off one-week low.
- Upbeat MACD signals, sustained trading beyond 200-HMA favor buyers inside bullish chart formation.
- Sellers need to conquer the golden Fibonacci ratio to retake control.
USD/CHF stands on a firmer footing near 0.9225 while refreshing intraday high during early Wednesday. In doing so, the Swiss Franc (CHF) pair stretches the previous day’s rebound from the lowest level in a week with a one-week-old bullish triangle formation.
Adding strength to the upside bias is the quote’s latest bounce off the 200-Hour Moving Average (HMA), around 0.9215 by the press time, as well as the bullish MACD signals.
That said, the USD/CHF pair’s current advances aim for the top line of the stated triangle, close to 0.9250 at the latest.
Should the bulls manage to cross the key upside hurdle, the odds of witnessing further run-up towards the monthly high of 0.9291 and then to the 0.9300 threshold can’t be ruled out.
It’s worth observing that the USD/CHF rise beyond 0.9300 won’t hesitate to challenge January’s peak of 0.9409.
On the contrary, a clear break of the 200-HMA level surrounding 0.9215 isn’t an open invitation to the bears as the 0.9200 round figure could probe the downside move.
Even so, the 50% Fibonacci retracement level of the USD/CHF pair’s February 02-06 upside and the aforementioned triangle’s bottom line, close to 0.9175 and 0.9160 in that order, could probe the bears.
In a case where the USD/CHF sellers keep the reins past 0.9160, the 61.8% Fibonacci retracement level of .9147, also known as the golden Fibonacci ratio, can be considered the last defense of the pair buyers.
USD/CHF: Hourly chart
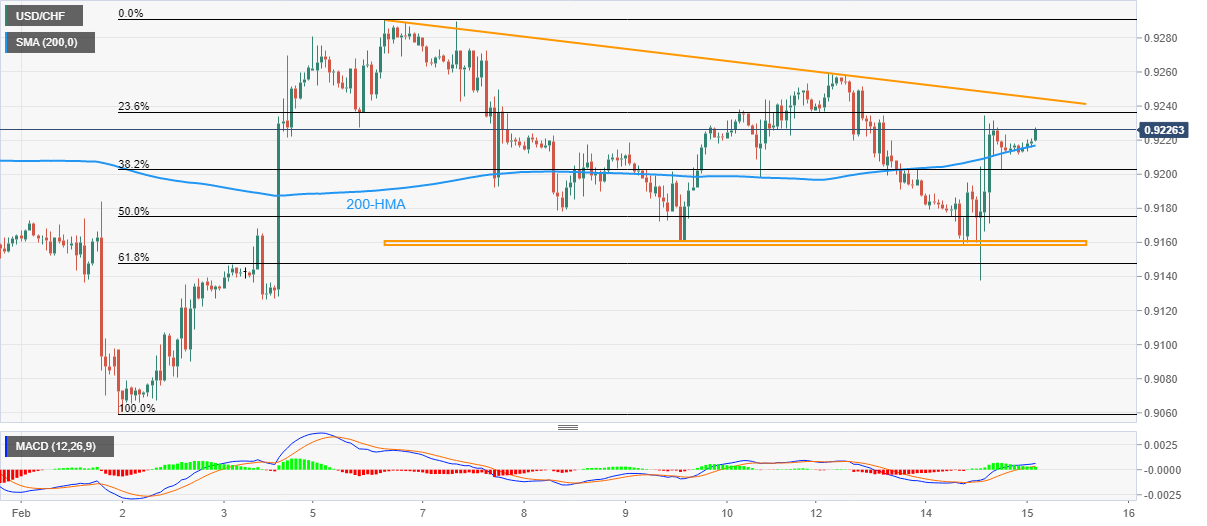
Trend: Further upside expected
| Raw materials | Closed | Change, % |
|---|---|---|
| Silver | 21.854 | -0.66 |
| Gold | 1854.35 | 0.04 |
| Palladium | 1497.55 | -4.31 |
- Gold price picks up bids to extend the bounce off six-week low.
- XAU/USD grinds higher as hawkish Fed bets fail to gain acceptance amid softer US inflation.
- Multiple hurdles stand tall to challenge XAU/USD run-up, bears need validation from $1,850.
- Second-tier US data, central bank comments eyed for more directions.
Gold price (XAU/USD) renews its intraday high near $1,860, following a bounce off a 1.5-month low, as market players react to the softer US inflation data during early Wednesday. That said, the yellow metal witnessed a volatile Tuesday but ended up with 0.04% intraday gains as the Federal Reserve (Fed) officials reiterated their hawkish bias despite the lowest US Consumer Price Index (CPI) increase since 2021. Also likely to have probed the Gold buyers previously were the upbeat US Treasury bond yields and the rebound in the US Dollar.
However, a retreat in the benchmark US bond coupons from the monthly highs joins fresh doubts on the hawkish Fed bets to underpin the latest Gold price recovery. Moving on, US Retail Sales and Industrial Production details for January, as well as NY Empire State Manufacturing Index for February and Fed talks, should be watched closely for clear directions.
Also read: Gold Price Forecast: XAU/USD eyes further downside on hawkish Federal Reserve talks
Gold Price: Key levels to watch
The Technical Confluence Detector shows that the Gold price appears stuck inside a jungle of technical levels on both sides, despite the latest recovery moves from the immediate key support surrounding $1,851, which includes Pivot Point one month S1, previously weekly low and four-hour bottom.
That said, Fibonacci 23.6% on one-week joins the 5-DMA to guard the XAU/USD’s immediate upside near $1,863.
Following that, Fibonacci 61.8% on one month joins Pivot Point one-day R1 and 50-Hour Moving Average (HMA) to highlight $1,872 as the key upside hurdle.
It’s worth observing that the Fibonacci 61.8% on weekly, close to $1,877, acts as the last defense of the Gold bears.
On the flip side, a break below the $1,851 support will need validation from the $1,848 mark comprising the Pivot Point one-week S1 to validate the Gold price south-run.
Here is how it looks on the tool
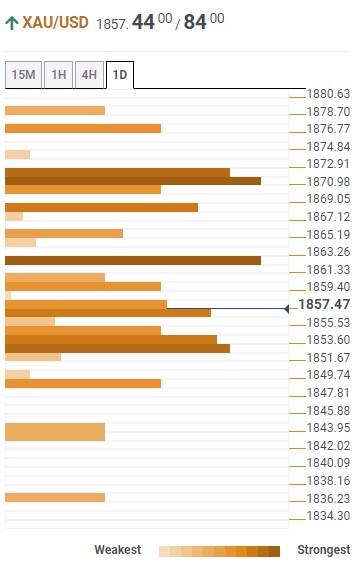
About Technical Confluences Detector
The TCD (Technical Confluences Detector) is a tool to locate and point out those price levels where there is a congestion of indicators, moving averages, Fibonacci levels, Pivot Points, etc. If you are a short-term trader, you will find entry points for counter-trend strategies and hunt a few points at a time. If you are a medium-to-long-term trader, this tool will allow you to know in advance the price levels where a medium-to-long-term trend may stop and rest, where to unwind positions, or where to increase your position size.
- AUD/JPY bears moving into the length built up from 90.00.
- The daily W-formation is in play and bears eye a break of trendline support for the day ahead.
AUD/JPY has rallied in the week but is now coming under pressure with longs being out under heat and the weak hands moving out. We have three days of build-up since Friday's failed break of below 90.00 which leaves the scope for a meaningful correction for the day (s) ahead.
AUD/JPY daily chart
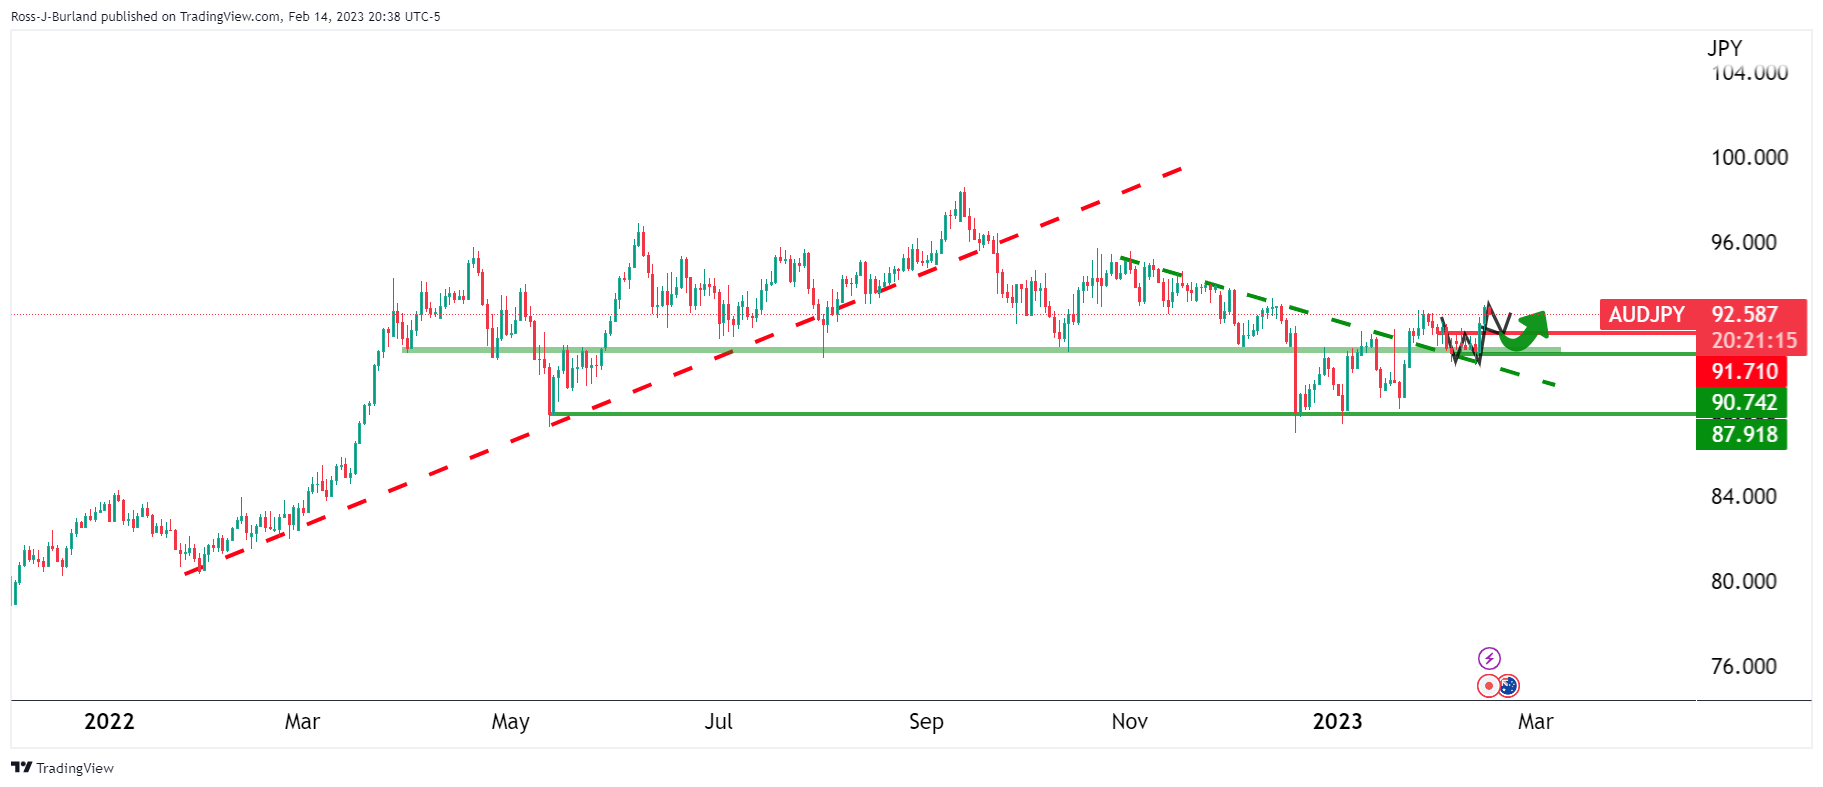
The daily chart is showing signs of exhaustion on the bid and the W-formation is a firm reversion pattern that could well see the price move in for the retest of the neckline near 91.70:
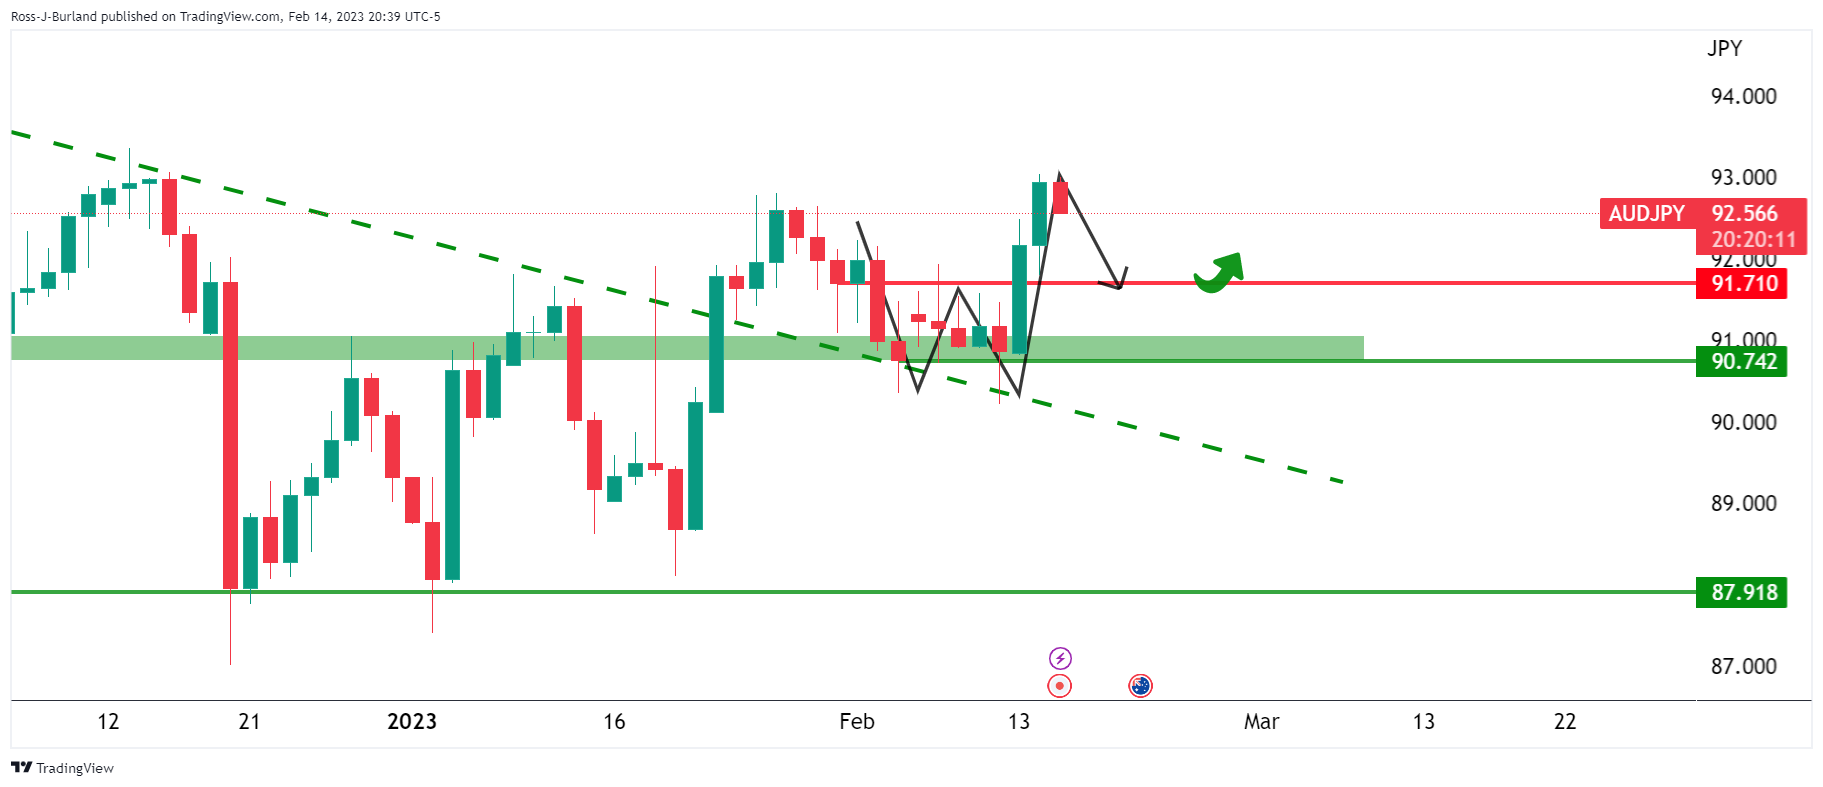
The price is indeed resting above the trendline support, however, so the overall outlook remains bullish so long as the bulls commit to the neckline of the W-formation and build their foundations for the next move higher from there. A break of this area, however, will put the bulls in jeopardy of a major sell-off:
AUD/JPY H1 chart

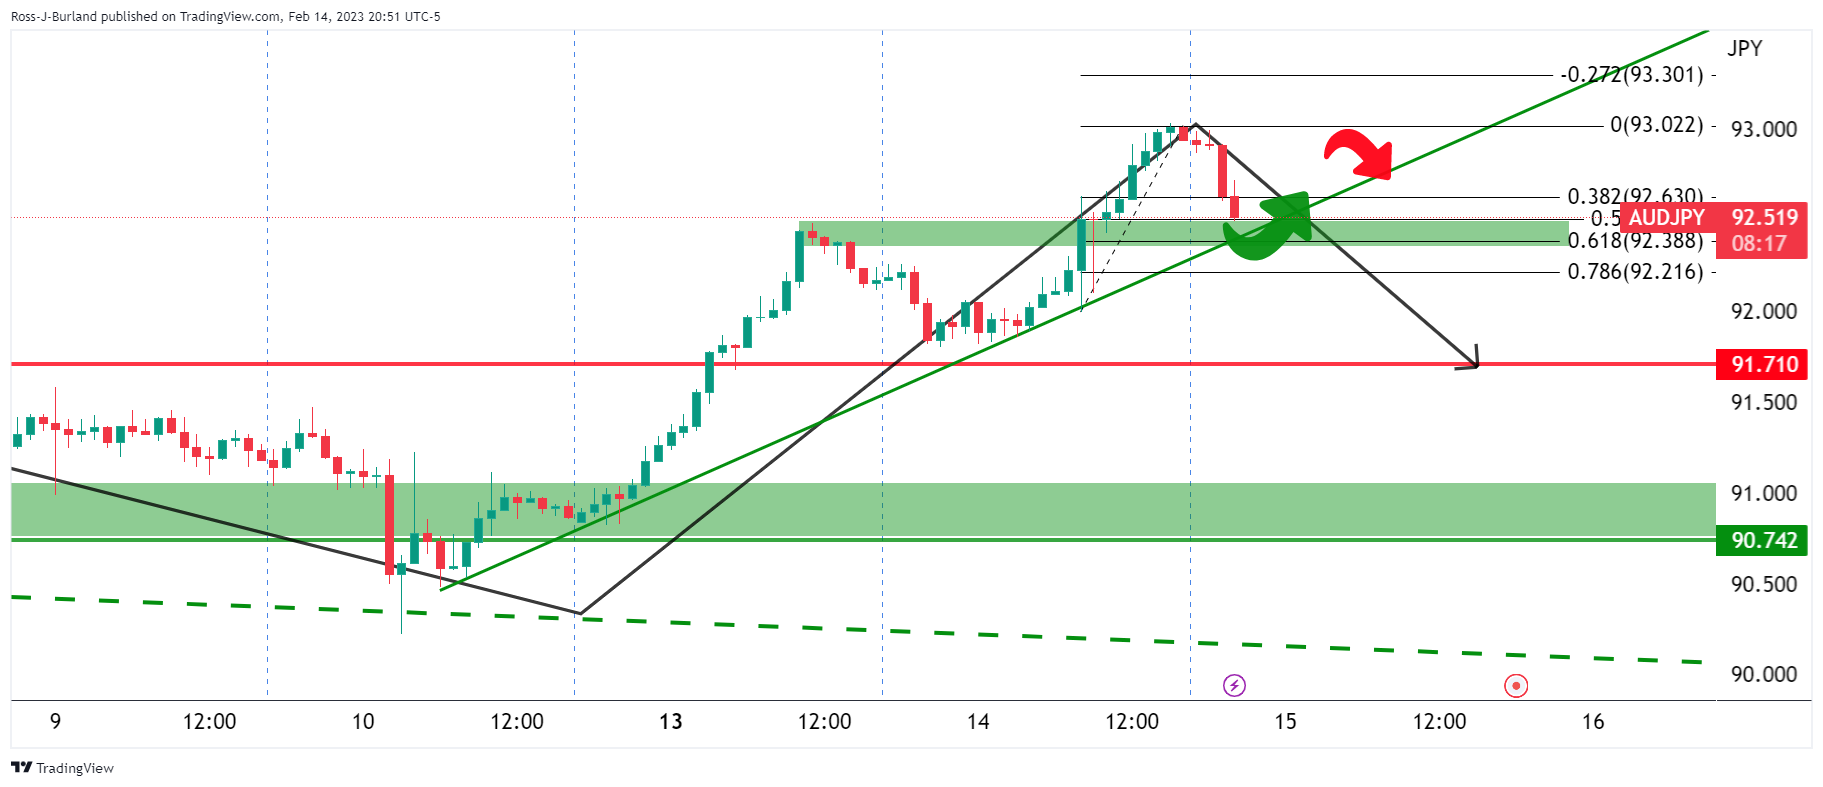
The support is still intact, however, and we could see a move up into retrying the high prior to resistance kicking in which leaves the London and US sessions open in this regard.
- GBP/USD remains sidelined after a volatile day, grinds higher of late.
- Mostly upbeat UK jobs report, hopes of British government-labor deal underpin bullish bias for the Cable.
- Unimpressive US inflation, retreat in Treasury bond yields add to the upside expectations.
- UK CPI for February eyed for intraday directions, US data appears important too.
GBP/USD portrays the pre-data anxiety by treading water around 1.2180 during early Wednesday.
The Cable pair rose to the two-week high the previous day before reversing from 1.2270 as the US inflation propelled market moves. Even so, upbeat UK employment data joined hopes of overcoming the British workers’ strikes seemed to have put a floor under the GBP/USD prices.
Late Tuesday, the Financial Times (FT) quoted officials familiar with the matter to mention that UK Prime Minister Rishi Sunak and Finance Minister Jeremy Hunt are mulling giving NHS staff and other key workers a lump sum payment by backdating next year's pay award, which takes effect from April, likely to the start of January 2023.
Before that, the UK Office for National Statistics (ONS) released mixed employment numbers with an unchanged ILO Unemployment Rate of 3.7% for three months to December contrasting with a decline in the Claimant Count Change, to -12.9K versus -3.2K prior. The details suggested an increase in Average Earnings Excluding Bonuses and a number of payrolled employees versus a fall in the UK vacancies. The mixed data, however, managed to help the British Pound (GBP) on release.
On the other hand, the US US Consumer Price Index (CPI) rose past market expectations to 6.4% YoY but posted the slowest increase since 2021 while easing below 6.5% prior. Following the data, Dallas Fed President Lorie Logan stated that they must remain prepared to continue rate increases for a longer period than previously anticipated. On the same line was New York Fed President John Williams who noted that the work to control too high inflation is not yet done. Additionally, Philadelphia Fed President Patrick Harker signaled that they are not done (with lifting rates), but they are likely close.
Against this backdrop, US 10-year Treasury bond yields seesaw around 3.75%, after rising three basis points (bps) to refresh a six-week high whereas the two-year counterpart jumped to the highest level since early November 2022 by poking 4.62%, around 4.61% at the latest. Further, S&P 500 Futures trace Wall Street’s downbeat closing to highlight the mildly offbeat mood.
Looking forward, the UK CPI for January, expected to ease to 10.3% YoY versus 10.5% prior, becomes crucial for the GBP/USD traders amid hopes that the Bank of England (BoE) has limited scope for further rate hikes. Following that, US Retail Sales and Industrial Production details for January, as well as NY Empire State Manufacturing Index for February, should be watched closely for clear directions.
Also read: UK Inflation Preview: Will softer CPI raise odds of a BoE pause?
Technical analysis
A successful break of the 50-DMA, around 1.2190 by the press time, becomes necessary for the GBP/USD buyers to keep the reins.
The People's Bank of China keeps 1-year MLF interest rate unchanged at 2.75% and the 1-year medium-term lending facility volume Feb 15: 499.0bb (est 500.0b; prev 779.0b).
There has been no reaction in USD/CNY. In recent trade today, the People’s Bank of China (PBOC) set the yuan at 6.8183 vs. the estimate of 6.8196 and the last close of 6.8309.
In recent trade today, the People’s Bank of China (PBOC) set the yuan at 6.8183 vs. the estimate of 6.8196 and the last close of 6.8309.
About the fix
China maintains strict control of the yuan’s rate on the mainland.
The onshore yuan (CNY) differs from the offshore one (CNH) in trading restrictions, this last one is not as tightly controlled.
Each morning, the People’s Bank of China (PBOC) sets a so-called daily midpoint fix, based on the yuan’s previous day's closing level and quotations taken from the inter-bank dealer.
- EUR/USD treads water after probing two-day uptrend, sidelined of late.
- Megaphone chart formation, steady RSI (14) favors continuation of sideways performance.
- 200-SMA adds to the upside filters within one-week-old megaphone trend-widening pattern.
EUR/USD remains mostly steady around 1.0740 as traders await more clues to defend late Tuesday’s bearish bias amid Wednesday’s sluggish hours.
The major currency pair bounced off 1.0706 the previous day before reversing from the weekly high surrounding 1.0800. In doing so, the quote remained inside a one-week-long megaphone chart formation, a trend-widening pattern.
In addition to the megaphone chart formation, the steady line of the RSI (14) and bullish MACD signals also favor the odds of the EUR/USD pair’s further sideways grind, with an expanding range.
That said, the 50% Fibonacci retracement level of the pair’s January-February moves and the 200-Simple Moving Average (SMA), respectively near 1.0760 and 1.0780, restrict the short-term upside of the EUR/USD pair.
Following that, the stated megaphone’s top line, close to 1.0810 by the press time, will be crucial to watch for the pair buyers.
On the contrary, a downside break of the 61.8% Fibonacci retracement, also known as the golden ratio, near 1.0690, becomes necessary for the EUR/USD bear’s conviction. Even so, the lower line of the aforementioned trend-widening pattern, close to 1.0655, could challenge the quote’s downside.
In a case where EUR/USD remains bearish past 1.0655, the odds of witnessing a gradual south toward the previous monthly low near 1.0480 can’t be ruled out.
EUR/USD: Four-hour chart
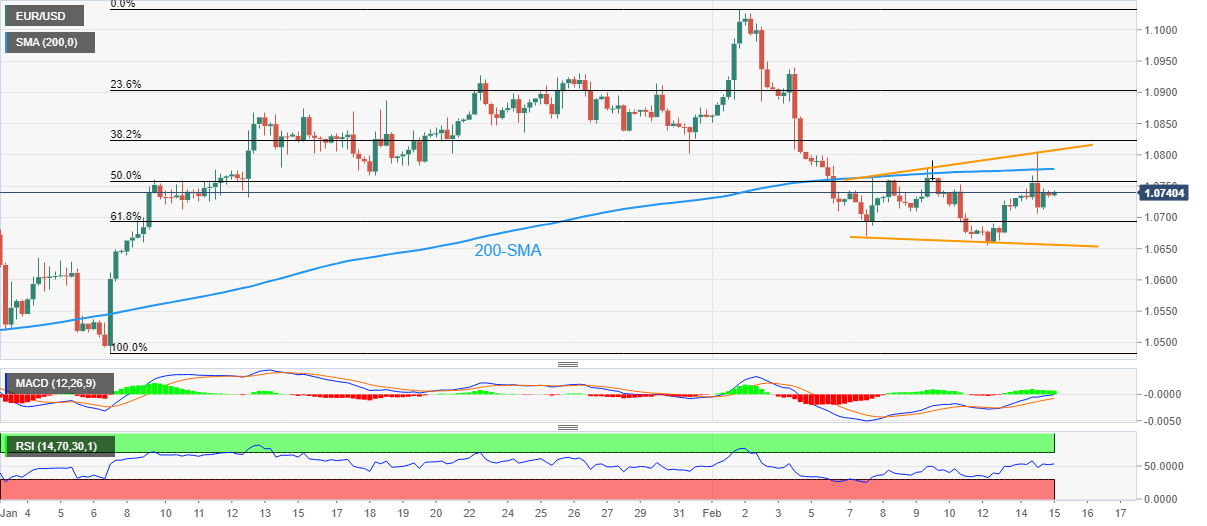
Trend: Limited recovery expected
Japan's Prime Minister Kishida is crossing the wires and has said that the appointment of Ueda as the new Bank of Japan governor was made after considering the market impact.
Key comments
He expects the new governor to keep appropriate monetary policy taking into account of economy, inflation and market situations.
Ueda is the greatest person to lead boJ because he is a well-known economist around the world.
USD/JPY update
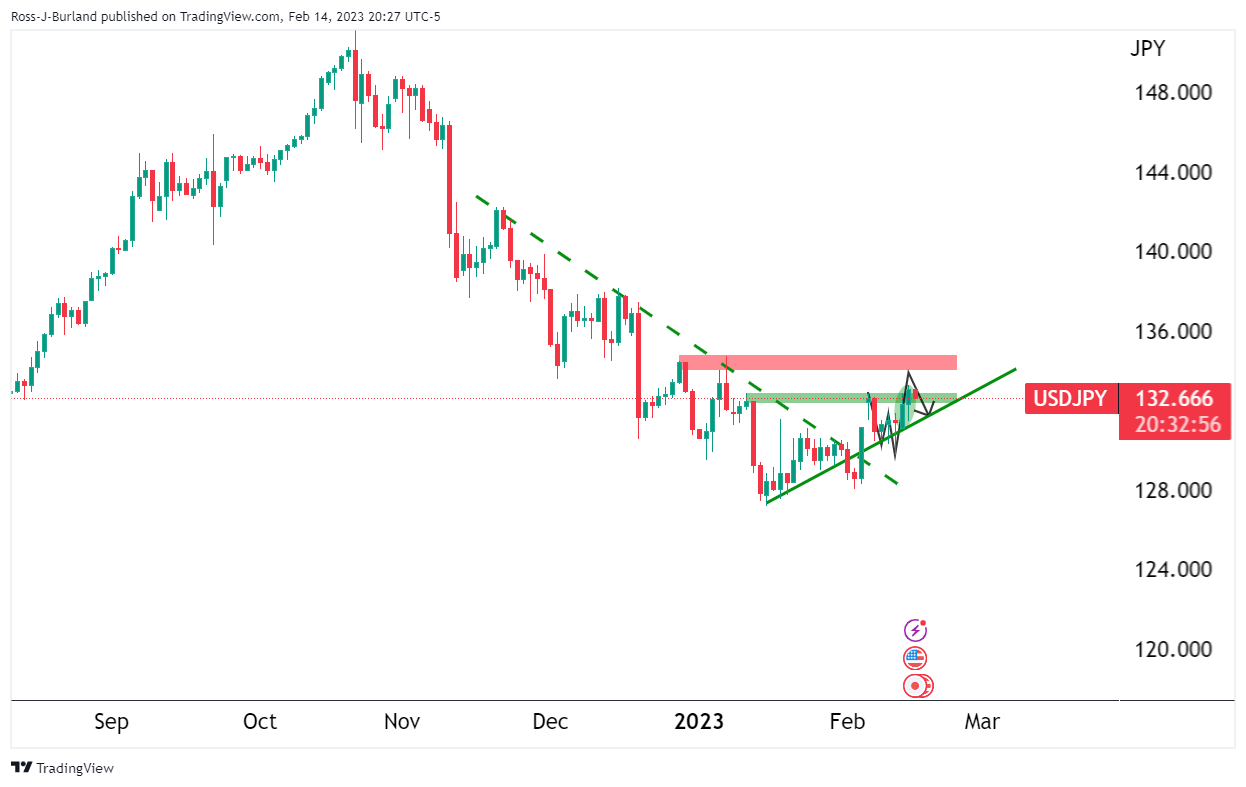
The daily chart sees the price correcting towards the W-formaiton's neckline while it rides trendline support with eyes back there for a restest as the price fails to convince above 132.50 support, so far. A break of 132.50 opens the risk of a move to 100 pips lower to the neckline.
- USD/JPY takes offers to refresh intraday low, prints the first daily loss in three.
- US Treasury bond yields grind near monthly high after Fed policymakers defend rate hikes.
- BoJ governing board nominations appear hawkish enough to favor JPY bulls.
- Unimpressive US inflation highlights Retail Sales, NY Empire State Manufacturing for clear directions.
USD/JPY returns to the bear’s radar on early Wednesday, following a two-day winning streak, as market players reassess the hawkish Fed verdict vis-à-vis expectations of the Bank of Japan’s (BoJ) next move. That said, the Yen pair renews its intraday low near 132.70 while printing the first daily loss in three, down 0.20% on a day by the press time.
The Japanese government’s selection of a hawkish leader for the Bank of Japan (BoJ) board seemed to have challenged USD/JPY bears of late, despite the run-up in the US Treasury bond yields and the US Dollar’s rebound following the US inflation data.
On Tuesday, the Japanese government officially nominated Kazuo Ueda as the BoJ Governor. It should be noted that Bloomberg ran out a story suggesting challenges to the BoJ’s easy money policy due to Ueda’s hawkish bias.
Elsewhere, most of the Federal Reserve (Fed) policymakers were in favor of further rate hikes even as the United States inflation failed to match “positive surprise” hopes. The same propelled the US Treasury bond yields and US Dollar.
US Consumer Price Index (CPI) rose past market expectations to 6.4% YoY but posted the slowest increase since 2021 while easing below 6.5% prior. More importantly, CPI ex Food & Energy, better known as the Core CPI, grew 5.6% YoY compared to 5.5% market forecasts and the 5.7% previous readings.
Following the data, Dallas Fed President Lorie Logan stated that they must remain prepared to continue rate increases for a longer period than previously anticipated. On the same line was New York Fed President John Williams who noted that the work to control too high inflation is not yet done. Additionally, Philadelphia Fed President Patrick Harker signaled that they are not done (with lifting rates), but they are likely close.
Amid these plays, US 10-year Treasury bond yields seesaw around 3.75%, after rising three basis points (bps) to refresh a six-week high whereas the two-year counterpart jumped to the highest level since early November 2022 by poking 4.62%, around 4.61% at the latest.
That said, S&P 500 Futures trace Wall Street’s downbeat closing to highlight the mildly offbeat mood and weigh on the USD/JPY prices, mainly due to the Japanese Yen’s (JPY) traditional risk-safety allure.
Moving on, a lack of major data/events from Japan puts the USD/JPY pair at the mercy of the US catalysts for clear directions. Among them, Retail Sales and Industrial Production details for January, as well as NY Empire State Manufacturing Index for February, should be watched closely for clear directions.
Technical analysis
Unless providing a daily close beyond the 200-day Exponential Moving Average (EMA), the USD/JPY pair remains on the bear’s radar.
- AUD/USD remains depressed at intraday low, snaps two-day winning streak.
- RBA Governor Lowe’s Testimony before Senate Economics Legislation Committee appears less hawkish.
- Fed policymakers defend rate hike bias despite unimpressive US inflation.
- US data, risk catalysts eyed for intermediate directions ahead of Thursday’s Aussie jobs report.
AUD/USD holds lower ground near 0.6980 after Reserve Bank of Australia (RBA) Governor Philip Lowe’s Testimony during the mid-Asian session on Wednesday. In doing so, the Aussie pair appears to give more weight to the hawkish Fed signals and the market’s offbeat mood ahead of the key data/events from the US and Australia.
In his testimony before the Senate Economics Legislation Committee, RBA Governor Lowe said, “Inflation is way too high,” and that it needs to come down. The policymaker, however, also stated that the government fiscal policy is broadly neutral, which in turn suggests the need for other efforts to tame inflation than the rate hikes. The same seemed to have favored the Aussie bears in keeping the reins around the daily low.
Also read: RBA Lowe: Inflation is way too high, needs to come down
It should be noted that Lowe’s comments weren’t as impressive as the Federal Reserve (Fed) officials’ defense to the higher rates, despite the softer US Consumer Price Index (CPI). As a result, the AUD/USD pair returns to the bear’s radar after a two-day absence.
That said, most of the Federal Reserve (Fed) policymakers were in favor of further rate hikes even as the United States inflation failed to match “positive surprise” hopes. The same propelled the US Treasury bond yields and US Dollar.
US 10-year Treasury bond yields seesaw around 3.75%, up three basis points (bps) after refreshing a six-week high whereas the two-year counterpart jumped to the highest level since early November 2022 by poking 4.62%. The same joined day-end losses of Wall Street, as well as mildly offered S&P 500 Futures, to underpin the US Dollar Index (DXY) rebound.
Given the risk-off mood and the firmer US Treasury bond yields, as well as the hawkish Fed bets, the AUD/USD bears are likely to remain in the driver’s seat. However, today’s US Retail Sales and Industrial Production details for January, as well as NY Empire State Manufacturing Index for February, should be watched for intraday clues. Above all, Thursday’s Aussie employment data eyed for clear directions.
Technical analysis
A clear downside break of the 50-DMA support, around 0.6885 at the latest, becomes necessary for the AUD/USD bears to keep the reins.
| Index | Change, points | Closed | Change, % |
|---|---|---|---|
| NIKKEI 225 | 175.45 | 27602.77 | 0.64 |
| Hang Seng | -50.66 | 21113.76 | -0.24 |
| KOSPI | 12.94 | 2465.64 | 0.53 |
| ASX 200 | 13.1 | 7430.9 | 0.18 |
| FTSE 100 | 6.25 | 7953.85 | 0.08 |
| DAX | -16.78 | 15380.56 | -0.11 |
| CAC 40 | 5.22 | 7213.81 | 0.07 |
| Dow Jones | -156.66 | 34089.27 | -0.46 |
| S&P 500 | -1.16 | 4136.13 | -0.03 |
| NASDAQ Composite | 68.36 | 11960.15 | 0.57 |
The Reserve Bank of Australia's governor Philip Lowe said inflation is way too high and that it needs to come down.
Key comments
Current monetary policy stance is restrictive.
Government fiscal policy is broadly neutral.
More to come..
- WTI bulls staying in the game, but at risk of a push below support.
- Bears eye a break to $77.00 while bulls need to get over dynamic resistance.
West Texas Intermediate crude oil was down following the US CPI but the bulls burst back to life taking out the shorts back to the start again. WTI fell initial;y to a support area that guards a move towards $77.00bbls:
WTI H1 chart
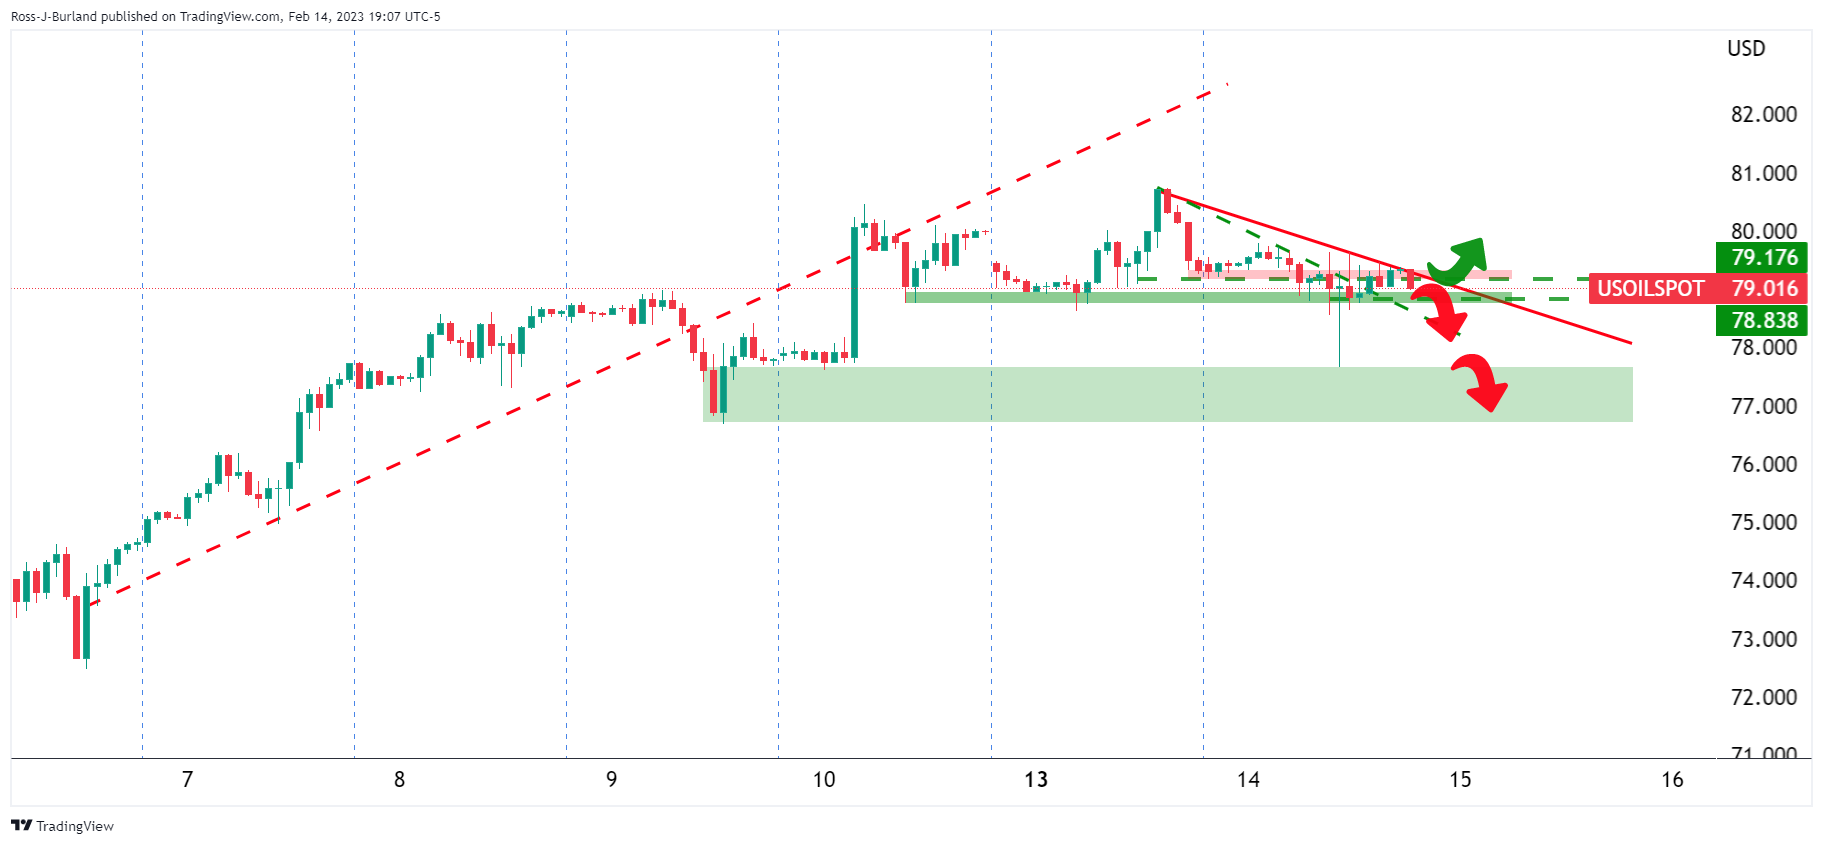
The hourly chart shows that the price is caught up high with longs form last week still in the trend. This leaves scope for a move lower while on the front side of overhead dynamic support and on the backside of the prior bullish trendline.
A break of the support opens the risk of a move to the $77.00 area again and guards a move towards $76.00 for the days ahead. On a break of resistance, however, the bulls will be back in the game as per the daily chart:
WTI daily chart
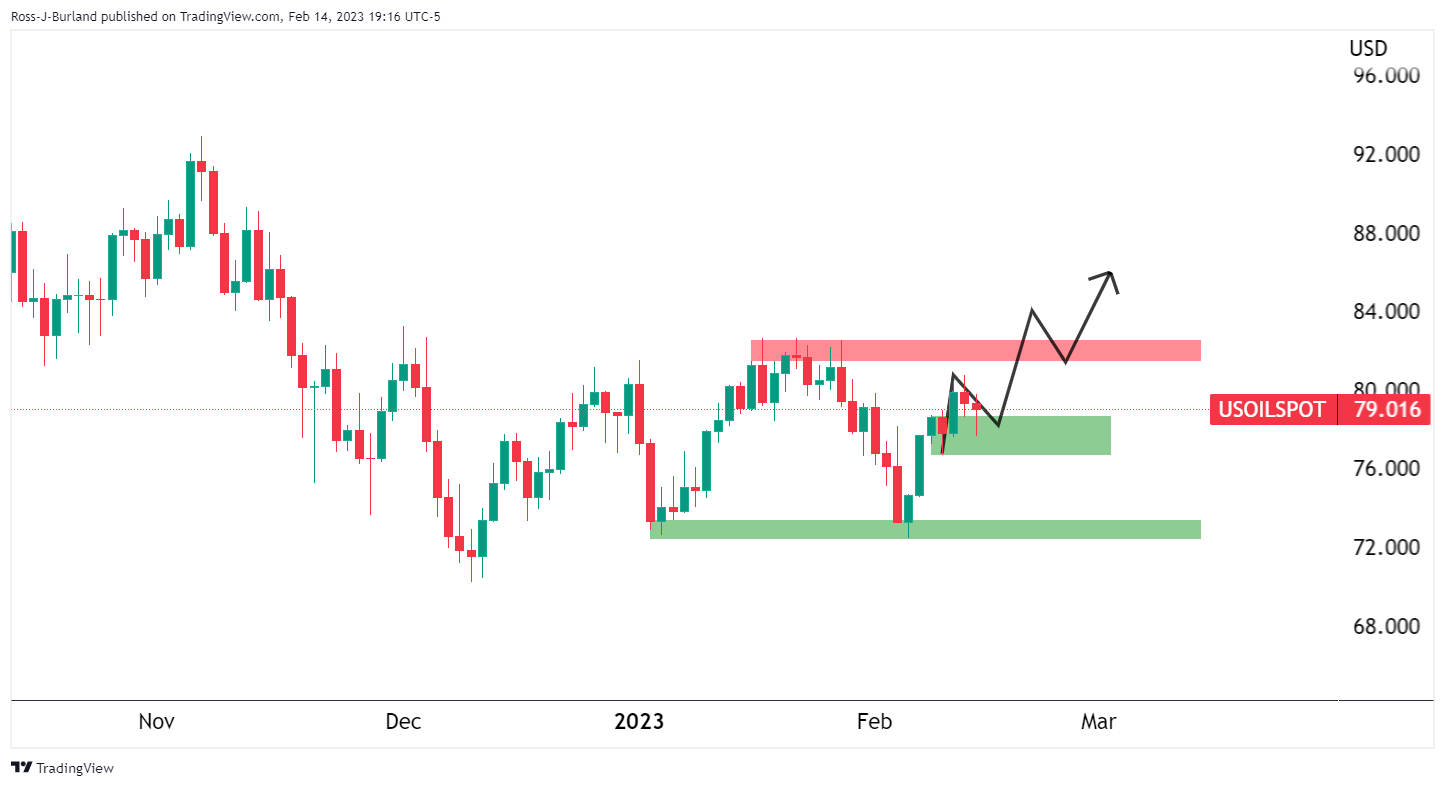
| Pare | Closed | Change, % |
|---|---|---|
| AUDUSD | 0.69874 | 0.32 |
| EURJPY | 142.883 | 0.64 |
| EURUSD | 1.07362 | 0.16 |
| GBPJPY | 162.049 | 0.92 |
| GBPUSD | 1.21767 | 0.39 |
| NZDUSD | 0.63388 | -0.27 |
| USDCAD | 1.3337 | 0.04 |
| USDCHF | 0.92163 | 0.28 |
| USDJPY | 133.084 | 0.54 |
- US Dollar Index probes two-day downtrend near the weekly bottom.
- Fed talks defend rate hike bias despite softer US inflation.
- Treasury yields renew multi-day high following the US CPI on upbeat Fed talks and propel DXY’s rebound.
- US Retail Sales, second-tier data eyed for fresh impulse.
US Dollar Index (DXY) stays defensive around 103.30, following the bounce off a one-week low, as the greenback bulls await more clues to snap a two-day downtrend during early Wednesday.
The greenback’s gauge versus six major currencies dropped to the lowest level in a week the previous day as the US inflation data initially failed to impress US Dollar bulls. However, the hawkish Federal Reserve (Fed) comments propelled the US Treasury bond yield and the DXY afterward.
US Consumer Price Index (CPI) rose past market expectations to 6.4% YoY but posted the slowest increase since 2021 while easing below 6.5% prior. More importantly, CPI ex Food & Energy, better known as the Core CPI, grew 5.6% YoY compared to 5.5% market forecasts and the 5.7% previous readings.
Following the data, most of the Federal Reserve (Fed) policymakers were in favor of further rate hikes even as the United States inflation failed to match “positive surprise” hopes. The same propelled the US Treasury bond yields and US Dollar. That said, Dallas Fed President Lorie Logan stated that they must remain prepared to continue rate increases for a longer period than previously anticipated. On the same line was New York Fed President John Williams who noted that the work to control too high inflation is not yet done. Additionally, Philadelphia Fed President Patrick Harker signaled that they are not done (with lifting rates), but they are likely close.
As a result, US 10-year Treasury bond yields seesaw around 3.75%, up three basis points (bps) after refreshing a six-week high whereas the two-year counterpart jumped to the highest level since early November 2022 by poking 4.62%. The same joined day-end losses of Wall Street to underpin the DXY rebound.
However, the US Dollar Index traders should pay attention to Wednesday’s US Retail Sales and Industrial Production details for January, as well as NY Empire State Manufacturing Index for February, to confirm the hawkish Fed bias and keep the recovery moves intact.
Technical analysis
Unless providing a successful daily close beyond the 50-DMA, around 103.40 by the press time, the US Dollar Index remains on the bear’s radar and can keep poking the 21-DMA support, close to 102.50 at the latest.
- NZD/USD is flat in the Tokyuo open as the dust settles over US CPI.
- Eyes now turn to the RBNZ for direction in the Kiwi.
NZD/USD is flat into the Tokyo open after an up-and-down day surrounding the US consumer Price index. The Kiwi is trading at 0.6330 and has stuck to a 10-pip range so far following Tuesday's 0.6389 and 0.6296.
The annual inflation rate in the US, as measured by the Consumer Price Index, cooled only a touch to 6.4% in January from 6.5% in December, less than market forecasts of 6.2%, suggesting that getting inflation under control will take more time than expected. The US Dollar index traded around 103.00 on Tuesday but posied higher due to the hotter-than-expected US inflation dashing hopes that the Federal Reserve will soon end its tightening campaign.
RBNZ outlook
''The lack of a NZD drift likely reflects the idea the factors holding up US inflation may also impact here, even if inflation expectations data yesterday “pleased” local bond market,'' analysts at ANZ Bank said.
''Now that local markets have swung back more towards expecting a 50bp hike next week, rather than 75bp, the focus turns wholeheartedly towards next week’s RBNZ MPS.''
''We expect the RBNZ will raise the Official Cash Rate (OCR) 50bp to 4.75% at its Monetary Policy Statement (MPS) next Wednesday. In terms of alternatives, a 75bp hike is more likely than +25bp, in our view,'' the analysts argued.
''A hawkish tone is likely, along with only a marginally lower OCR track, if it’s lowered at all. And it’s no small beer for the RBNZ to deliver a double hike when they’ve already raised 400bp, house prices are down 15% and still falling, and business and consumer confidence are on the floor,'' the analysts added.
© 2000-2026. All rights reserved.
This site is managed by Teletrade D.J. LLC 2351 LLC 2022 (Euro House, Richmond Hill Road, Kingstown, VC0100, St. Vincent and the Grenadines).
The information on this website is for informational purposes only and does not constitute any investment advice.
The company does not serve or provide services to customers who are residents of the US, Canada, Iran, The Democratic People's Republic of Korea, Yemen and FATF blacklisted countries.
Making transactions on financial markets with marginal financial instruments opens up wide possibilities and allows investors who are willing to take risks to earn high profits, carrying a potentially high risk of losses at the same time. Therefore you should responsibly approach the issue of choosing the appropriate investment strategy, taking the available resources into account, before starting trading.
Use of the information: full or partial use of materials from this website must always be referenced to TeleTrade as the source of information. Use of the materials on the Internet must be accompanied by a hyperlink to teletrade.org. Automatic import of materials and information from this website is prohibited.
Please contact our PR department if you have any questions or need assistance at pr@teletrade.global.
