- Analytics
- News and Tools
- Market News
CFD Markets News and Forecasts — 15-02-2022
- Gold prices remain sidelined after reversing from fresh high in eight months.
- Receding pessimism over Russia’s invasion of Ukraine triggered the metal’s pullback, despite mixed updates.
- US Retail Sales for January, Fed Minutes will be watched for fresh impulse, in addition to qualitative catalysts.
- Gold Price Forecast: Corrective decline may continue once below 1,841.40
Gold (XAU/USD) seeks fresh clues while taking rounds to $1,850 during Wednesday’s initial Asian session, following a notable pullback from an eight-month high.
The yellow metal marked an uptick to refresh the multi-day high before posting the biggest daily loss in three weeks by the end of Tuesday’s North American session. In doing so, the bullion traders respected the change in market sentiment, mainly due to headlines concerning the Russia-Ukraine war.
Headlines suggesting the retreat of some Russian troops from borders could be cited as the key catalyst for the market’s latest shift in mood, from a negative tone that previously underpinned the gold buying. Though comments from Russian President Vladimir Putin and his US counterpart Joe Biden keep the geopolitical risk on the table and challenge gold sellers, despite getting lesser attention. That said, Russia’s Putin conveyed dissatisfaction with how negations are going over Ukraine’s NATO membership while US President Biden said, “Russian attack on Ukraine still very much a possibility.”
It’s worth noting that a jump in the US Treasury yields also weighed on the gold prices as the benchmark 10-year T-bond coupons rose 4.7 basis points (bps) to 2.043%. It’s worth noting that the Wall Street benchmarks closed positive the previous day.
Escalating odds of Fed’s 0.50% rate hike in March, as well as firmer US inflation expectations portrayed by the 10-year breakeven inflation rate per the St. Louis Federal Reserve (FRED) data, also weighed on the gold prices.
Talking about the US data, the US Producer Price Index (PPI) data showed a hot factory-gate inflation figure supporting the Fed’s rate-hike concerns. That said, the PPI rose past 9.1% YoY expectations to 9.7%, versus upwardly revised 9.8% prior, in January whereas the Producer Price Index ex Food & Energy, also known as Core PPI, rallied to 8.3% versus 7.9% market consensus. Additionally, NY Empire State Manufacturing Index eased below 12.15 forecasts to 3.1, compared to -0.7 previous readouts.
Looking forward, China’s headline inflation data for January, namely Consumer Price Index (CPI) and Producer Price Index (PPI), should be watched for immediate direction. Forecasts suggest the CPI will ease to 1.0% YoY from 1.5% whereas the PPI may drop to 9.5% versus 10.3% previous reading. Should the data matches downbeat expectations, AUD/USD may have a reason to consolidate recent gains. However, major attention will be given to January Retail Sales from the US and Federal Open Market Committee (FOMC) Minutes amid chatters of a 0.50% rate lift in March.
Read: FOMC Minutes Preview: Dollar selling opportunity? Doves set for a comeback after hawkish meeting
Technical analysis
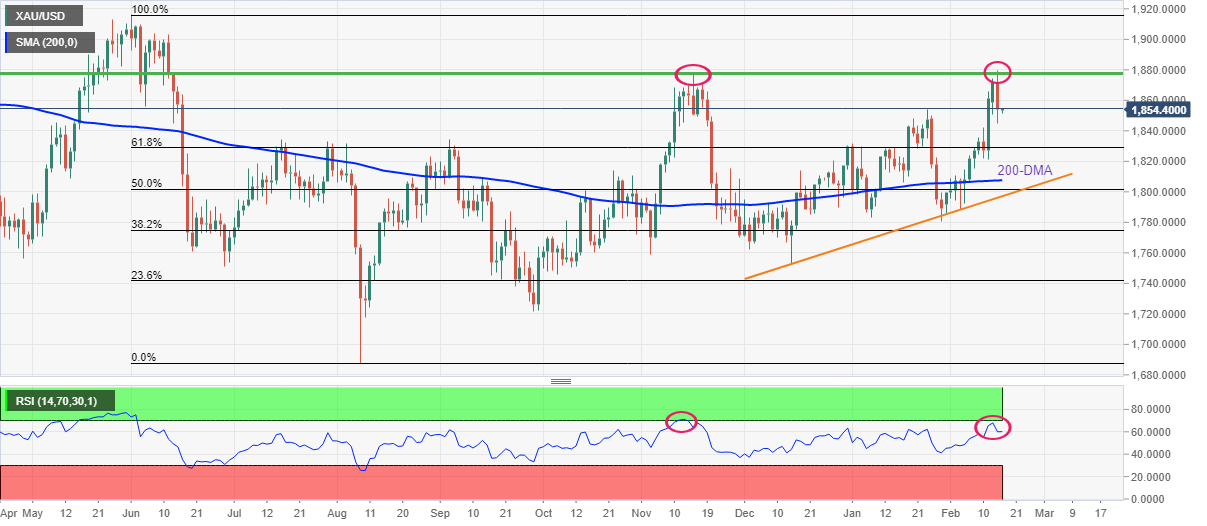
Gold’s U-turn from the highest levels last seen during June 2021 portrays a double-top bearish formation on the daily chart. The hopes of further downside also gain support from the RSI divergence as the higher high in prices mismatches the oscillator’s performance.
However, a clear downside break of the previous month’s peak near $1,853, also the $1,850 round figure becomes necessary for the gold seller’s conviction.
Following that, the 61.8% Fibonacci retracement (Fibo.) of June-August 2021 downside, around $1,828, holds the key to the bullion’s further weakness towards the 200-DMA and a two-month-old support line, respectively around $1,807 and $1,796.
Alternatively, the corrective pullback may initially be challenged by the $1,870 level ahead of highlighting the double tops around $1,878-80.
Should gold buyers manage to keep reins past $1,880, the $1,900 threshold and mid-January 2021 high around $1,917 will be in focus.
Gold: Daily chart
Trend: Further weakness expected
As per the latest Reuters Tankan poll, published early Wednesday morning in Asia, “Japanese manufacturers' business confidence fell to an 11-month low in February as measures to contain the pandemic and high raw material costs hurt sentiment.”
Manufacturers were less optimistic about the three months ahead than they were in January, while service-sector firms' outlook held up, according to the poll that tracks the Bank of Japan's (BOJ) closely watched "tankan" quarterly survey, per Reuters.
Key quotes
The Reuters Tankan sentiment index for manufacturers fell to 6 in February from 17 in January, hitting its lowest since last March.
The service-sector index slipped for the first time in five months, to 3 from the prior month's 8.
The poll also showed companies continued to confront surging commodity costs, which have started to hurt firms at the lower end of the supply chain such as consumer staples makers and service providers.
Market implications
USD/JPY remains sidelined around 115.60, after mildly positive performances in the last two days.
Read: USD/JPY Price Analysis: Extends Monday’s bounce as buyers eye 116.00
- USD/CAD remains pressured on breaking weekly support line after two-day downtrend.
- Steady RSI, failures to cross six-week-old resistance line keep bears hopeful.
- 200-SMA becomes the key support, 61.8% Fibonacci retracement adds to upside filters.
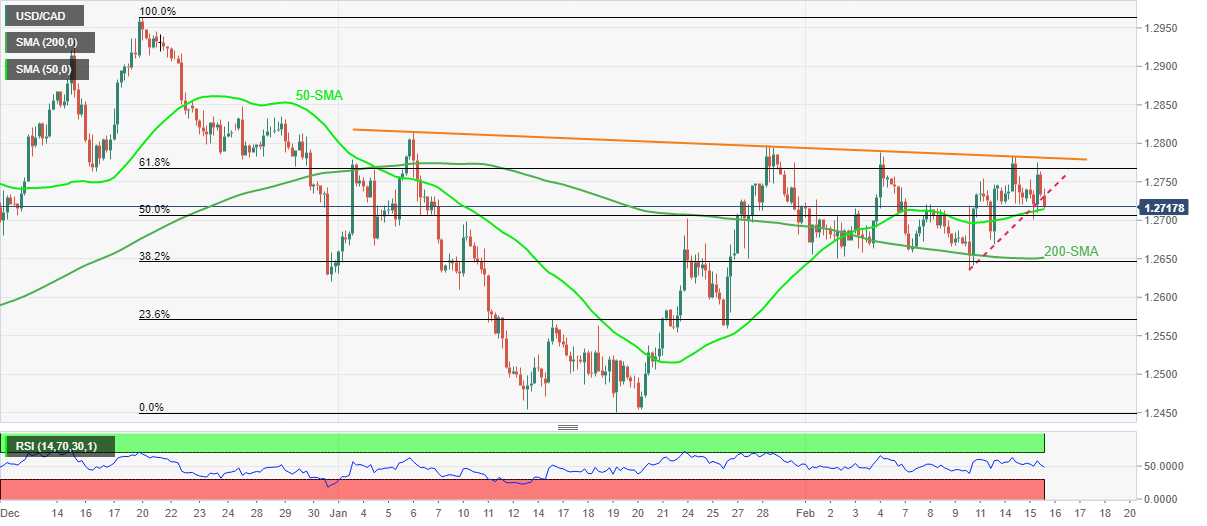
USD/CAD remains on the back foot around 1.2720 during Wednesday’s initial Asian session, keeping the previously downbeat tone with reservations.
After multiple failures to cross a downward sloping trend line from January 06, the Loonie pair broke a one-week-old rising support line the previous day. The bearish bias also gains support from the RSI line.
However, a clear downside break of the 50-SMA level, around 0.7115 by the press time, becomes necessary for the USD/CAD sellers.
Also acting as a downside filter is the 50% Fibonacci retracement (Fibo.) of December 2021 to January 2022 downside, around 1.2705, as well as the 1.2700 threshold.
Should the pair bears dominate past 1.2700, the 200-SMA level around 1.2650 will regain the market’s attention.
Alternatively, the corrective pullback may initially battle the support-turned-resistance line around 1.2730 ahead of challenging the 61.8% Fibo. level close to 1.2770.
Though, USD/CAD bulls remain unconvinced before witnessing a clear upside break of the aforementioned six-week-old resistance line, close to 1.2785.
USD/CAD: Four-hour chart
Trend: Further weakness expected
- The GBP/USD in the week is almost flat, down 0.07%.
- Easing tensions in Eastern Europe improved the financial market mood.
- GBP/USD Technical Outlook: Neutral-upward biased, but caution is warranted as the 200-DMA lies on top of the exchange rate.
As the North American sesión ends, the British pound advances in the day amid an improved market mood, inferred by easing tensions in the Russia/Ukraine conflict in Eastern Europe. At the time of writing, the GBP/USD is trading at 1.3540.
Tuesday’s session witnessed a GBP/USD pair fluctuating in the tops/bottoms of the daily range. Late in the Asian session, the GBP/USD reached a daily high at 1.3566, followed by a drop in the early North American session, from 1.3547 towards 1.3488 on the back of a news headline of a Guardian Journalist that cited “Western officials” saying that there was no de-escalation and that “we see the opposite.”
Coinciding with the headline, the GBP/USD was meandering around the 100 and the 200-hour simple moving averages (SMAs), which were located above the spot price, as resistance levels. The GBP bull’s failure to overcome the latter sparked the downward move.
GBP/USD Price Forecast: Technical outlook
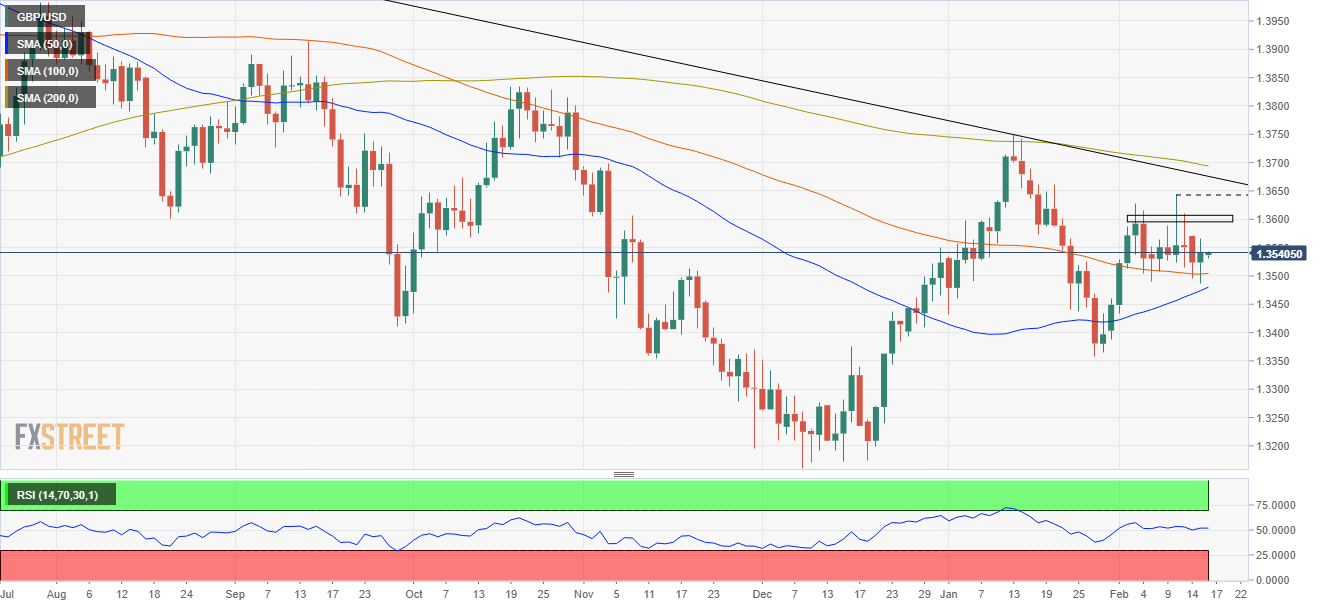
With that scenario in play, the GBP/USD is neutral-upward biased. The short time-frame daily moving averages (DMAs) reside below the spot price, while the 200-DMA lies near the 1.3700 figure.
The GBP/USD first resistance would be the 1.3600 figure. Breach of the latter would expose February 10 1.3643 daily high, followed by a ten-month-old fall slope trendline around 1.3655-70 area and then the 200-DMA at 1.3690.
- AUD/USD grinds higher after snapping three-day downtrend, bouncing off one-week low.
- Market sentiment improved on easing fears of Russian invasion.
- RBA Minutes conveyed policymakers’ caution while Aussie Treasury Secretary signaled tapering of fiscal support, US data came in mixed.
- China CPI, US Retail Sales and FOMC Minutes are the key data/events, risk catalysts are also important for clear direction.
AUD/USD treads water around mid-0.7100s during the early hours of Wednesday morning in Asia, after staging a notable rebound from a one-week low.
Having extended the risk-off during early Tuesday, amid escalating fears of a Russian invasion of Ukraine, the Aussie pair portrayed the recovery in market sentiment the previous day. The reason could be linked to headlines suggesting the retreat of some Russian troops from borders.
However, comments from Russian President Vladimir Putin and his US counterpart Joe Biden keep the geopolitical risk on the table and challenge the market’s optimism, despite getting lesser attention. That said, Russia’s Putin conveyed dissatisfaction with how negations are going over Ukraine’s NATO membership while US President Biden said, “Russian attack on Ukraine still very much a possibility.”
Elsewhere, RBA Minutes showed the policymakers’ hesitance in respecting the rate-hike concerns by citing the hopes of delay in economic recovery due to the covid. It should be noted that Australian Treasury Secretary Kennedy testified before the Australian parliament's Senate estimates committee and signaled tapering of fiscal support out of covid while saying, “Fiscal policy support has to be cut back, which will allow monetary policy to get back to more normal.” However, the diplomat also mentioned, “Premature tightening could prevent hitting full employment.”
On the other hand, the US Producer Price Index (PPI) data showed a hot factory-gate inflation figure supporting the Fed’s rate-hike concerns. That said, the PPI rose past 9.1% YoY expectations to 9.7%, versus upwardly revised 9.8% prior, in January whereas the Producer Price Index ex Food & Energy, also known as Core PPI, rallied to 8.3% versus 7.9% market consensus. Additionally, NY Empire State Manufacturing Index eased below 12.15 forecasts to 3.1, compared to -0.7 previous readouts.
Against this backdrop, the US 10-year Treasury yields rose 4.7 basis points (bps) to 2.043% whereas the Wall Street benchmarks also closed positive by the end of Tuesday’s North American session.
Moving on, AUD/USD traders will pay close attention to China’s headline inflation data for January, namely Consumer Price Index (CPI) and Producer Price Index (PPI), for immediate direction. Forecasts suggest the CPI will ease to 1.0% YoY from 1.5% whereas the PPI may drop to 9.5% versus 10.3% previous reading. Should the data matches downbeat expectations, AUD/USD may have a reason to consolidate recent gains. Though, major attention will be given to January Retail Sales from the US and Federal Open Market Committee (FOMC) Minutes amid chatters of a 0.50% rate lift in March.
Read: FOMC Minutes Preview: Dollar selling opportunity? Doves set for a comeback after hawkish meeting
Technical analysis
AUD/USD poses a recovery from the 38.2% Fibonacci retracement (Fibo.) of January 13-28 downturn, around 0.7100, with firmer MACD signals and steady RSI line signaling further advances.
However, the Aussie pair remains below the previous support line from January 28, suggesting the need for a 0.7185 break for the buyer’s conviction. Also acting as an immediate upside hurdle is the convergence of the 50-DMA and a descending trend line from January 20, close to 0.7170.
- EUR/USD bulls stay in control and target a deeper correction for the day ahead.
- The 61.8% ratio is within reach, but Russia remains a threat and the bulls are not out of the woods yet.
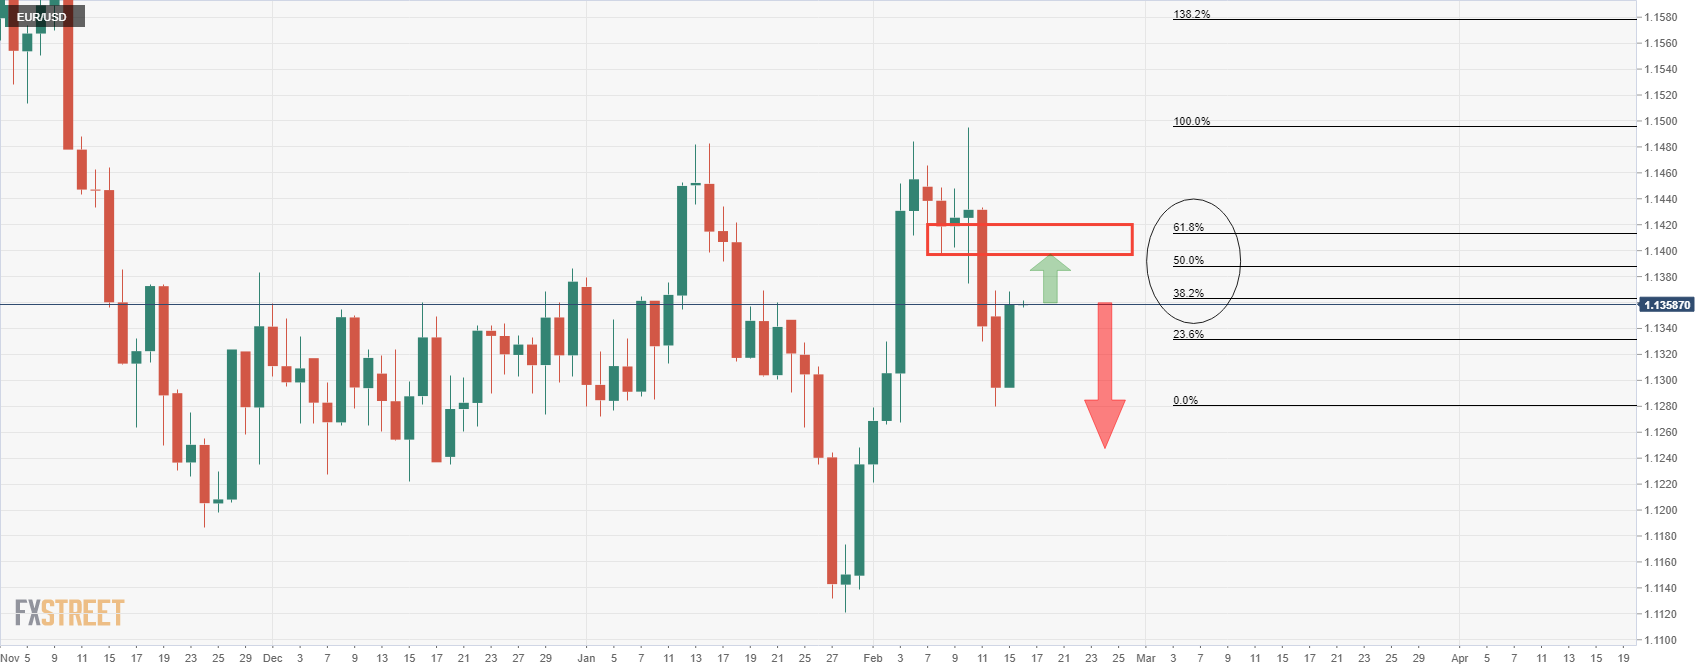
As per the prior day's pre-Europen analysis, EUR/USD bulls tread around with caution in a field of land mines and disruptive Russian headlines, whereby the euro was on a firmer footing and expected to continue higher, the price has moved in on the 38.2% ratio as follows:
EUR/USD prior analysis
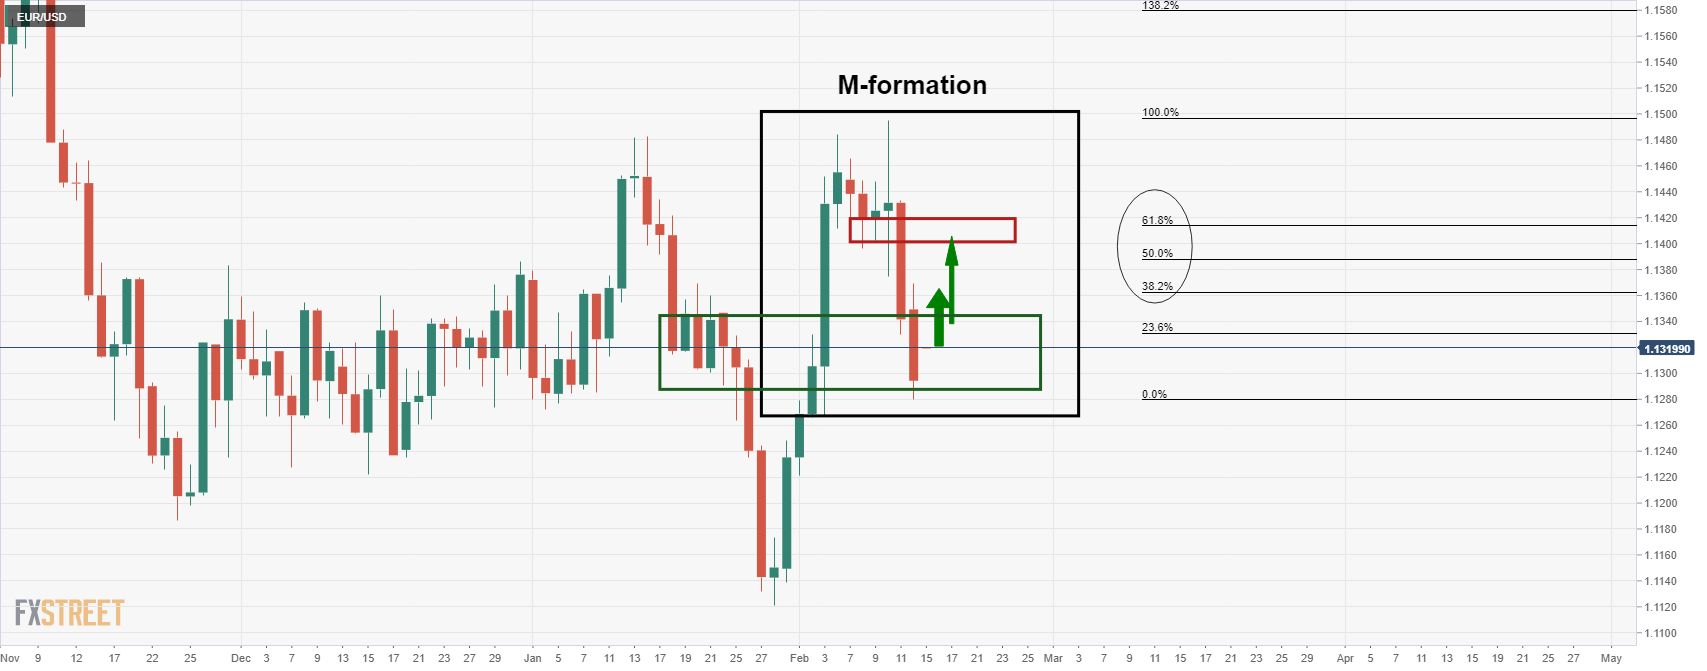
It was stated prior to Tuesday's trading in Europe that ''with the price stabilising in a familiar support area, the M-formation is compelling especially as the neckline has a confluence with the 50% and 61.8% ratios.''
Given the de-escalation type of rhetoric from the Russian president, Vladimir Putin, on Tuesday, the price has continued its approach towards the aforementioned confluence area as follows:
EUR/USD daily chart
Russian President Vladimir Putin on Tuesday said he was “ready” to work with the West on de-escalating tensions, the latest signal that the prospect of war with Ukraine could be receding. "We are ready to work further together. We are ready to go down the negotiations track," Putin said following talks with German Chancellor Olaf Scholz in Moscow.
However, the bulls are not out of the woods yet and the situation is on a knife's edge still. US President Joe Biden said "we have not yet verified the Russian military units are returning to their home bases. Indeed, our analysts indicate that they remain very much in a threatening position." The President also underscored that "Russia has more than 150,000 troops circling Ukraine and Belarus and along Ukraine's border, and invasion remains distinctly possible."
Markets can turn on a dime at the drop of a disruptive Russian headline, and the 1.11 area is by no means a distant possibility.
- GBP/JPY snaps two days of losses as buyers eye a second test of the YTD highs above 157.00.
- GBP/JPY Technical Outlook: The cross-currency pair is upward biased, as indicated by three technical signals.
The British pound recovers from two straight days of losses amid an improved market sentiment as the North American session winds down. At the time of writing, the GBP/JPY is trading at 156.52.
GBP/JPY Price Forecast: Technical outlook
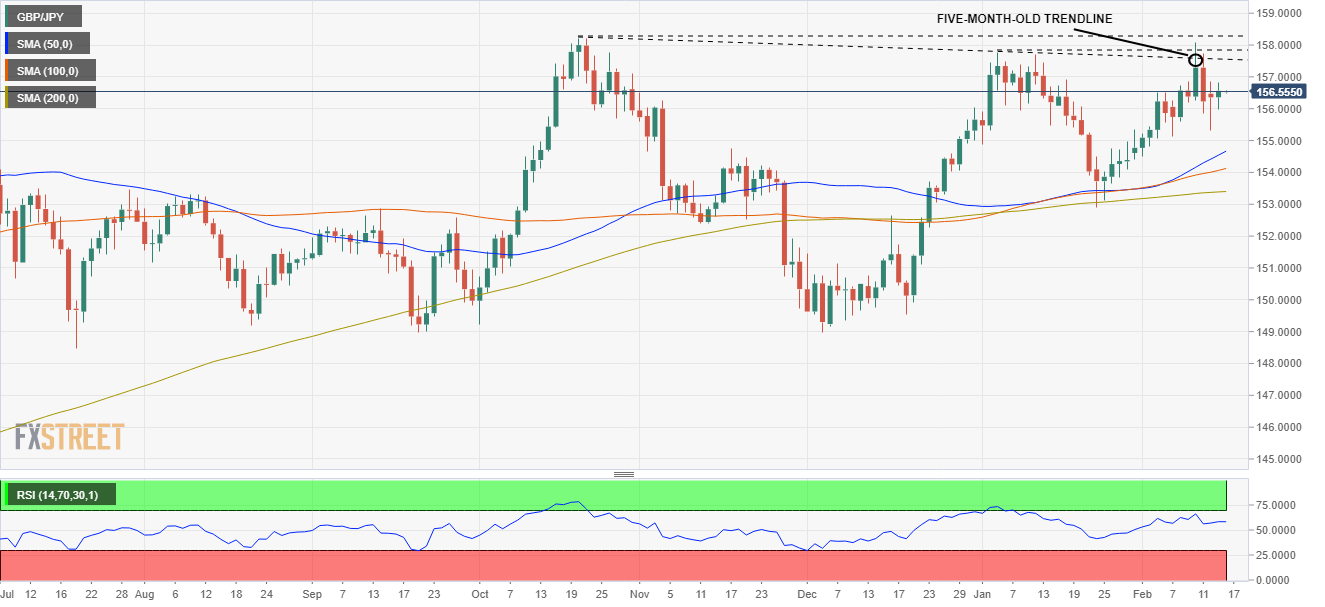
The GBP/JPY upward move on February 10 fell short of breaking above the January 5 157.76 daily high, retreating under a five-month-old downslope trendline that passes around the 157.20-40 area. At the end, that left a candlestick with a larger wick on the top, indicating that selling pressure kept the GBP/KPY of printing a higher daily close which could have exacerbated a move to the upside.
Nevertheless, the daily moving averages (DMAs) are located below the exchange rate, indicating a bullish bias in the pair. That factor, alongside a Relative Strenght Index (RSI) at 58, aiming higher and a forming “bullish harami” candle pattern, could catalyst a move to the upside.
With that scenario in play, the GBP/JPY first resistance would be 157.00. Breach of the latter would expose January 5 157.78 daily high, followed by the psychological 158.00 level and finally the October 20 158.22 daily high.
- NZD/USD bulls let off as risk sentiment improves on the Russian pivot.
- The imbalance left between 0.6690's and the 0.6650's for the days ahead in focus.
NZD/USD is trading 0.37% higher on the day as markets suspect that an imminent Russian invasion has been averted which has enabled a recovery in risk appetite on Tuesday. Russia said it had withdrawn some of its troops from the Ukraine border. However, the announcement, the United States and NATO said they had yet to see evidence of a drawdown.
Nevertheless, the Kiwi is higher again, averting a sell-off from 4-hour resistance. However, there are still plenty of uncertainties within a very fluid situation surrounding Russia and Ukraine. Not least, the Federal Reserve could be a ticking time bomb for the forex space with regards to its next move at the March meeting.
''Volatility remains the order of the day,'' analysts at ANZ bank argued. ''Higher US yields are battling things like higher commodity prices for attention; while rates have had less of an influence on FX of late, the knee-jerk reaction to higher US bond yields tends to be NZD-negative.''
US yields started the week off depressed from safe-haven flows but Federal Reserve's James Bullard’s continued hawkishness on Monday led to a complete turnaround. Bullard advocates for 100 bps of tightening by July. Bullard says that he is worried that the Fed is not moving fast enough as inflation is much higher than expected. On Wednesday, Bullards concerns were met by the US Producer Price Index data that arrived much hotter than anticipated for January at 9.7% YoY. Core PPI is now at 8.3% YoY indicating that inflation is running at a rampant pace.
Fed tightening expectations
Meanwhile, Fed tightening expectations remain elevated and the following is noted by Brown Brothers Harriman:
WIRP suggests nearly 70% odds of a 50 bp move next month, up from 60% at the start of this week. Two 25 bp hikes May 4 and June 15 are still fully priced in that would take the rate up 100 bp by mid-year. Another 50 bp of tightening in H2 is fully priced in, with 60% odds of another 25 bp hike by year-end vs. over 40% odds at the start of the week. Looking further out, swaps market now sees a terminal Fed Funds rate around 2.25% and that should eventually move closer to 2.5% or even higher once this risk off episode ends.
NZD/USD technical analysis
As per the prior analysis, NZD/USD Price Analysis: Trapped and consolidation is in play below bearish structure, it was noted that the price was respecting the prior 4-hour lows as resistance, but the daily support structure was menacing for the bears.
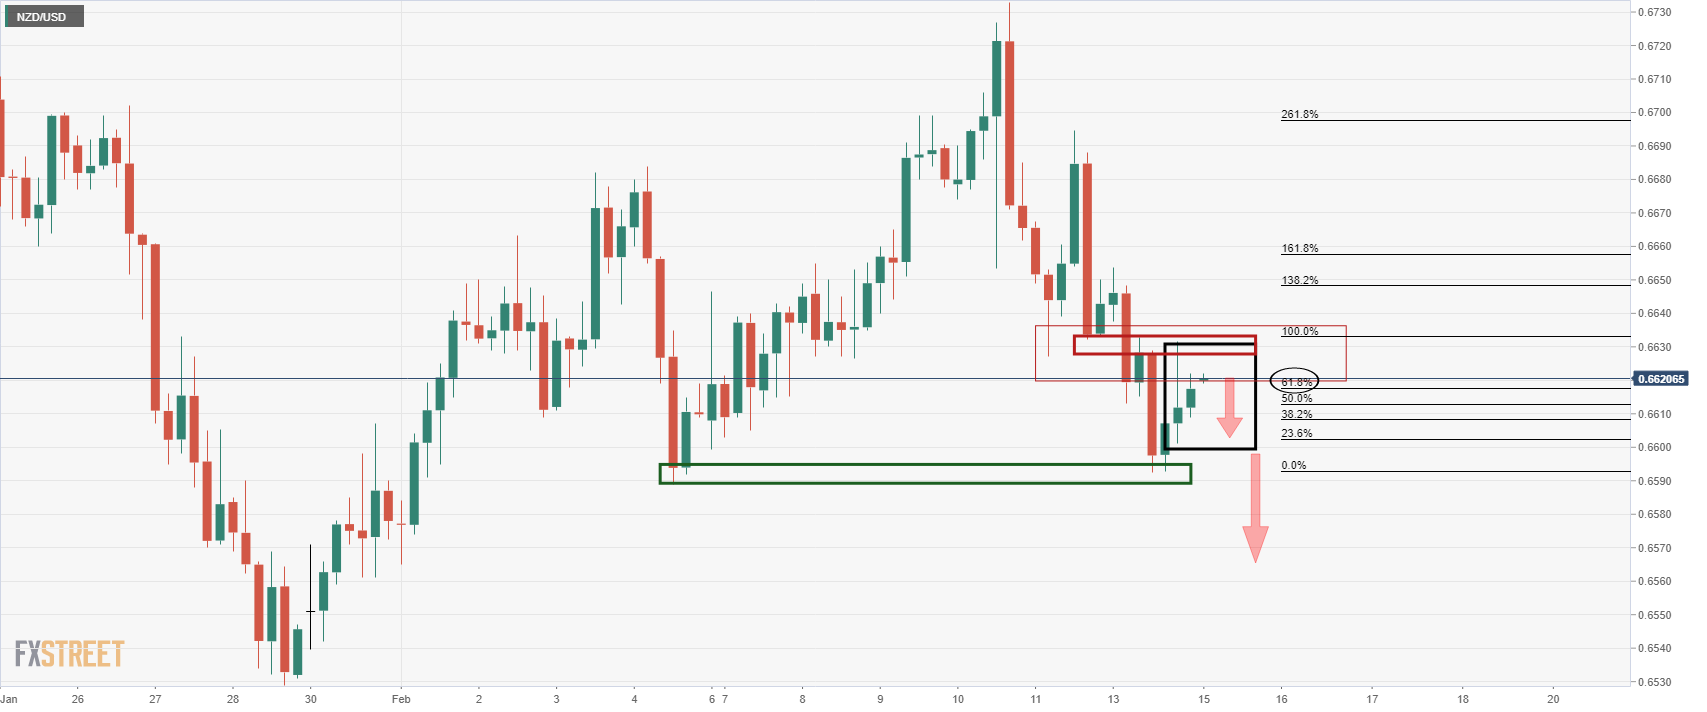
The price had been creeping in on the old support turned to resistance but the prospects of a downside continuation were thwarted in New York's trade when the price broke to fresh corrective highs:
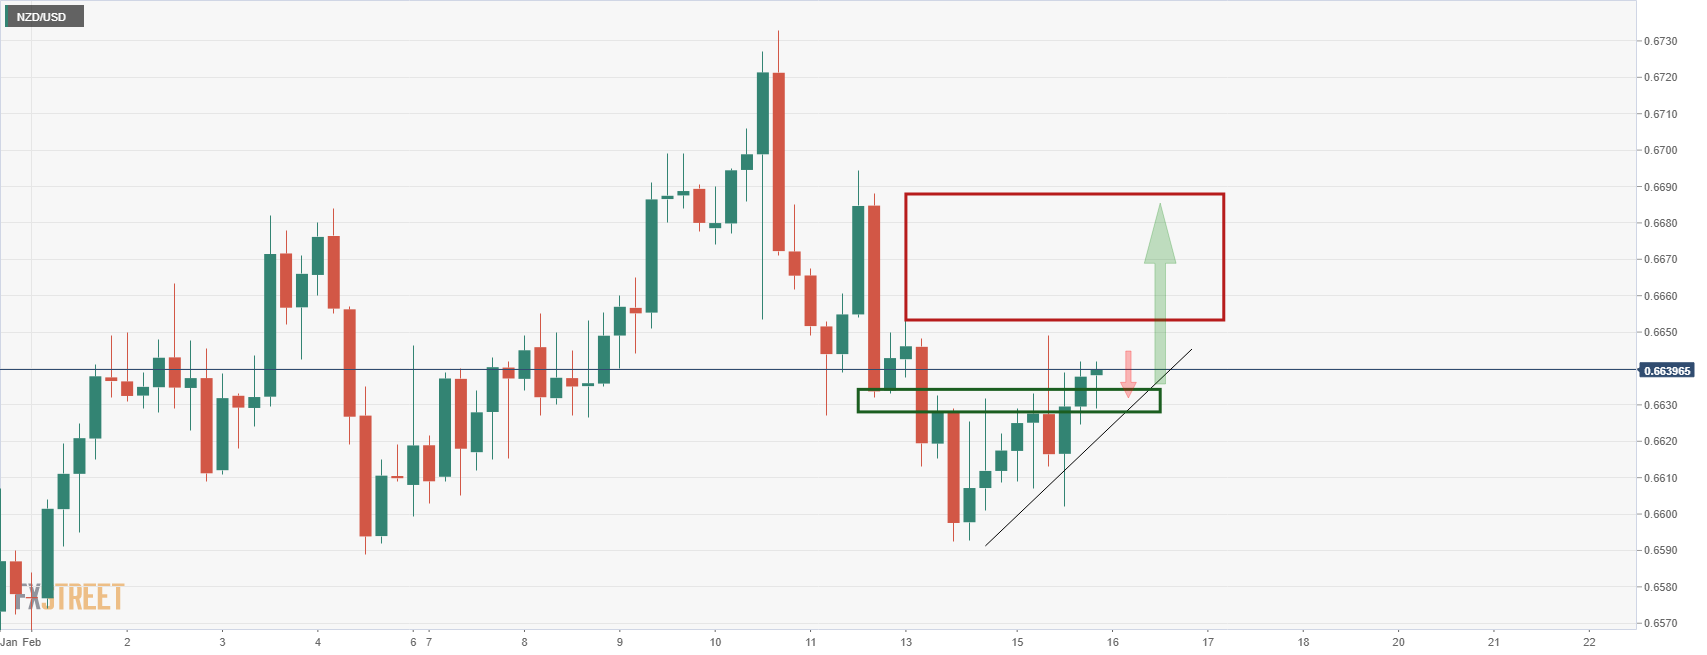
This leaves the bulls in play and there are prospects of a surge into the imbalance left between 0.6690's and the 0.6650's for the days ahead.
European Central Bank executive board member Isabel Schnabel said on Tuesday, in an interview with the FT, that the bank must consider the "unprecedented" rise in house prices when it comes to assessing inflation and deciding on how fast monetary policy settings should be tightened. The FT framed her comments as the most hawkish yet by an ECB executive board member in the run-up to next month's meeting.
“If this [rise in house prices] were included, it would have a substantial effect on measured inflation, in particular on core inflation, where the weight of owner-occupied housing is larger" Schnabel told the UK paper. “It has to be part of our general considerations" she added.
Elsewhere, Schnabel warned that with Consumer Price Inflation having risen to a new Eurozone record high of 5.1% in January and with the unemployment rate having dropped to a Eurozone record low of 7.0% in December, “the risk of acting too late has increased." "Therefore," she continued, "we need a careful reassessment of the inflation outlook”. Schnabel warned that given the recent shift in the inflation outlook, the benefits of further QE purchases may not justify the additional costs and there is a growing argument for ending purchases altogether.
Market Reaction
FX markets haven't reacted to Schnabel's latest remarks, but as volumes pick up during Asia Pacific trade and then into Wednesday's European session they might well lend the euro some support as traders price in a faster pace of QE taper.
US President Joe Biden said on Tuesday in an address to the nation that a Russian attack on Ukraine still very much remained a possibility, cautioning that the US hasn't yet verified Russian units returning home and an invasion remains possible. However, Biden continued, diplomacy should have every chance to succeed and there are real ways to address Russian security concerns.
The US is proposing new arms control and other measures to Russia, Biden said, adding that the US and NATO do not have plans to put missiles in Ukraine. The US and NATO are not a threat to Russia, Biden emphasised, saying directly to Russian citizens that "we are not your enemy". The US is not targeting Russian people or stability, Biden added.
If Russia attacks Ukraine, it would be without cause or reason and the human cost would be immense, Biden said. The US and its allies are ready to impose powerful sanctions and export controls on Russia if it invades, he continued, saying that the Nord Stream 2 pipeline would not go ahead. Biden reiterated that the US will defend every inch of NATO territory with the full force of American power, and the US will soon conduct military exercises with allies and partners.
A Russian invasion would have consequences for US citizens at home, Biden warned, saying there could be an impact on energy prices. If Russia attacks through cyber or other asymmetrical means, the US and its allies will respond, he noted. Biden closed his remarks by saying that if the US does not stand for freedom where it is at risk, we will pay the price tomorrow.
Market Reaction
FX markets did not react to Biden's latest comments, which served more as a reiteration of what US and NATO officials have been repeatedly saying in recent days.
- EUR/JPY saw a decent rebound on Tuesday as the geopolitical risk premia eased, propelling the pair into the mid-131.00s.
- In the scenario of continued de-escalation, a move back above 132.00 towards last week’s highs is on the cards.
EUR/JPY saw a decent rebound on Tuesday as the geopolitical risk premia that has weighed on the euro in recent days eased somewhat. The pair rallied back into the mid-131.00s and, at current levels in the 131.30s, is more than 1.0% above Monday’s near-130.00 lows with about 0.6% of that rally coming on Tuesday. Russia said it would partially withdraw troops from near the Ukraine border, as the nation continued to label Western warnings about potential military action against Ukraine as hysteria. Financial market participants read the move as de-escalating tensions somewhat, hence the more upbeat macro mood on Tuesday.
The general market theme was that stocks and risk-sensitive currencies rallied while safe-haven bonds and currencies underperformed, though the euro was a standout G10 performer on the day as traders assessed risks to the Russian gas import-dependent Eurozone as having lessened. That helped the euro shrug off weaker than expected German ZEW February survey results released in the European morning, while the second estimate of Eurozone Q4 GDP growth was unchanged from the first at 4.6% YoY and 0.3% QoQ.
Looking ahead, amid a lack of notable economic events on the Eurozone and Japanese economic calendars for the rest of the week, the main driver of EUR/JPY will remain geopolitics. If Friday arrives with no Russian military action having yet happened against Ukraine, EUR/JPY will have likely have continued to pare the losses it incurred last Friday on US warnings that war could break out as soon as this week. In the optimistic case where war does not happen and looks increasingly unlikely, EUR/JPY could likely rebounds back to the north of the 132.00 level and retest last week’s highs near 133.00.
- NZD/USD rebounded from the 0.6600 level to move higher on Tuesday, as the kiwi benefitted from strong risk appetite.
- Russia confirming intentions to withdraw some troops from the Ukraine border helped boost sentiment, aiding the kiwi.
- Geopolitics remains in focus, but attention also turns to a barrage of important upcoming US and NZ economic events.
NZD/USD found decent support at the 0.6600 level on Tuesday, rebounding from a dip towards the big figure shortly after the US cash open to current levels in the 0.6630s, where the pair trades about 0.3% higher on the day. That makes it one of the better performing G10 currencies alongside its Aussie counterpart, with the antipodean currencies boosted by a broad improvement in macro risk appetite on an apparent easing of immediate geopolitical risks in Eastern Europe.
Russia said it was partially withdrawing some of its troops from the border with Ukraine, easing fears about an imminent military incursion into the country. However, NATO officials cautioned that it was too soon to say that Russia has decided against invasions and some geopolitical strategists still view the possibility of a flare-up of tensions in the Eastern Ukraine Donbas region as highly likely.
The improvement in market mood was enough to see NZD/USD shrug off a much hotter than expected US Producer Price Inflation report that economists said strengthens the hand of hawkish Fed policymakers arguing for a faster pace of policy tightening. NZD/USD traders will now look ahead to US Retail Sales data and the release of the Fed minutes of the January policy meeting on Wednesday, followed by a barrage of Fed speak on Thursday and Friday. New Zealand Producer Price Inflation data for Q4 will also be in focus during Friday’s Asia Pacific session and will be viewed in the context of how it influences the chances of a 50bps rate hike at the RBNZ’s next meeting.
That might suggest some upside risk for the pair going forward, only that US data and Fed speak will be viewed the same way. Indeed, US money markets on Tuesday were pricing about a 60% likelihood of a 50bps rate hike from the Fed in March. Commentary from the likes of influential Fed policymakers Christopher Waller, John Williams and Lael Brainard on Friday could swing things either way, making for choppy NZD/USD price action.
What you need to know on Wednesday, February 16:
The market mood improved on Tuesday as market players rushed to price in a de-escalation of the Russia-Ukraine tensions after the Russian Minister of Defense announced that some of the troops at the border would return to their bases.
Nevertheless, comments from Russian President Vladimir Putin released during the American afternoon were not that encouraging. Putin said that he is not satisfied with assurances that Ukraine will not become a NATO member in the near future and wants the issue to be settled right now or soon through a negotiating process.
Also, German Chancellor Olaf Scholz is in Moscow undergoing diplomatic talks. A key gas line from Russia to Germany may come out of order in the event of a war. Finally, UK PM Boris Johnson noted Russia is giving mixed signals and continues preparation to respond to a Russian invasion.
Financial markets maintained the upbeat tone through the European and American sessions, and indexes in both continents posted substantial gains. Wall Street, however, retreated from intraday highs ahead of the close.
Demand for the dollar receded, but its decline was partially offset by renewed strength in government bond yields. The US 10-year Treasury note yielded as much as 2.05% on Tuesday.
The EUR/USD pair settled in the 1.1350 region, while the GBP/USD hovers around 1.3540. The AUD/USD pair recovered to 0.7150, while USD/CAD trades in the 1.2730 price zone.
Commodities gave up, with gold plummeting to the current $1,850 area. Crude oil prices shed a good bunch of their recent gains, with WTI currently trading at around $91.60 a barrel.
The focus now shifts to US Retail Sales and FOMC Meeting Minutes.
Top 3 Price Prediction Bitcoin, Ethereum, Ripple: Crypto forms higher lows, begin new bull market
Like this article? Help us with some feedback by answering this survey:
- The USD/CHF advances some 0.15% during the North American session.
- The USD/CHF is range-bound at the 0.9220-60 regions.
- USD/CHF Technical Outlook: Consolidated amid the lack of a catalyst to break the range.
On Tuesday, the USD/CHF pares two days of losses courtesy of geopolitical jitters, which spurred a flight towards the safe-haven status of the Swiss franc to the detriment of the greenback. At the time of writing, the USD/CHF is trading at 0.9256.
USD/CHF Price Forecast: Technical outlook
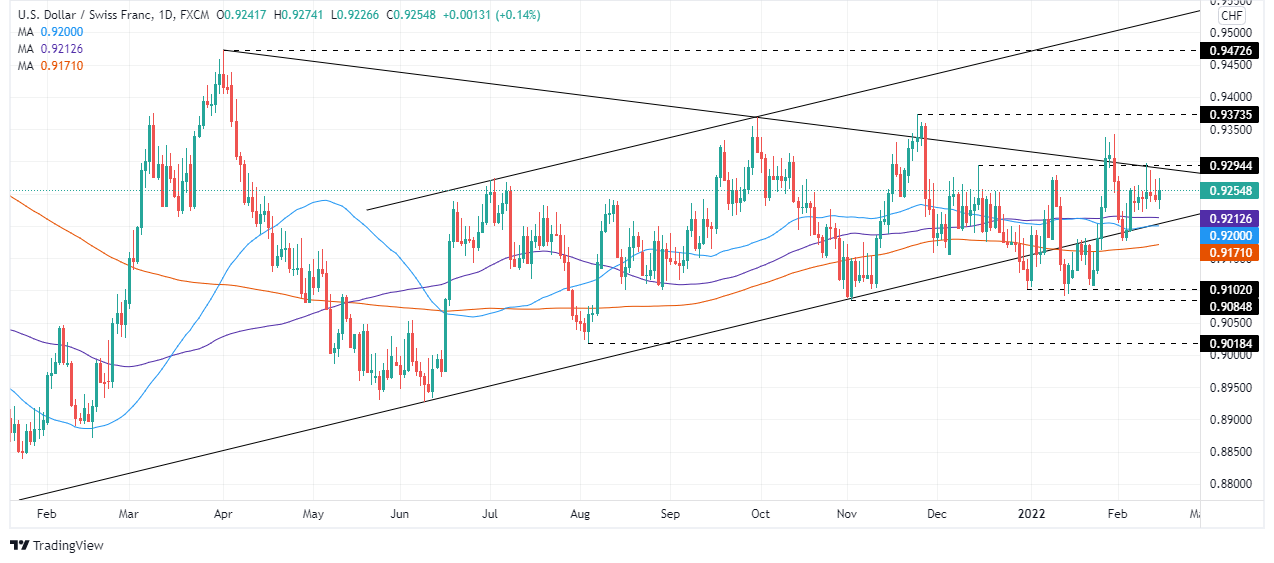
The USD/CHF price action in the last week and a half witnessed that USD bulls have been unable to “decisively” break resistance above the 0.9260-80 area, with only one attempt on February 10, when the USD/CHF pierced 0.9296, followed by a close at 0.9254, a 40-pip drop by the end of the trading session.
That said, the USD/CHF is range-bound, in the 0.9220-60 area; although some “spikes” lie above the top of it, the large wicks left by the candlesticks show that intense selling pressure lies above that level.
Upwards, the USD/CHF first resistance level would be the 0.9260 area. A daily close above that level would expose the February 10 high at 0.9296, followed by November 24, 2021, a daily high at 0.9373.
On the flip side, the USD/CHF first support would be the 100-day moving average (DMA) at 0.9220. Breach of the latter confirmed by a daily close would expose the confluence of the 50-DMA and the psychological 0.9200 figure. Once that level is cleared, the next support would be 200-DMA at 0.9170.
- AUD/USD bulls are on the move with eyes on 0.7180.
- The 0.7300 target will be next in range as bulls take control.
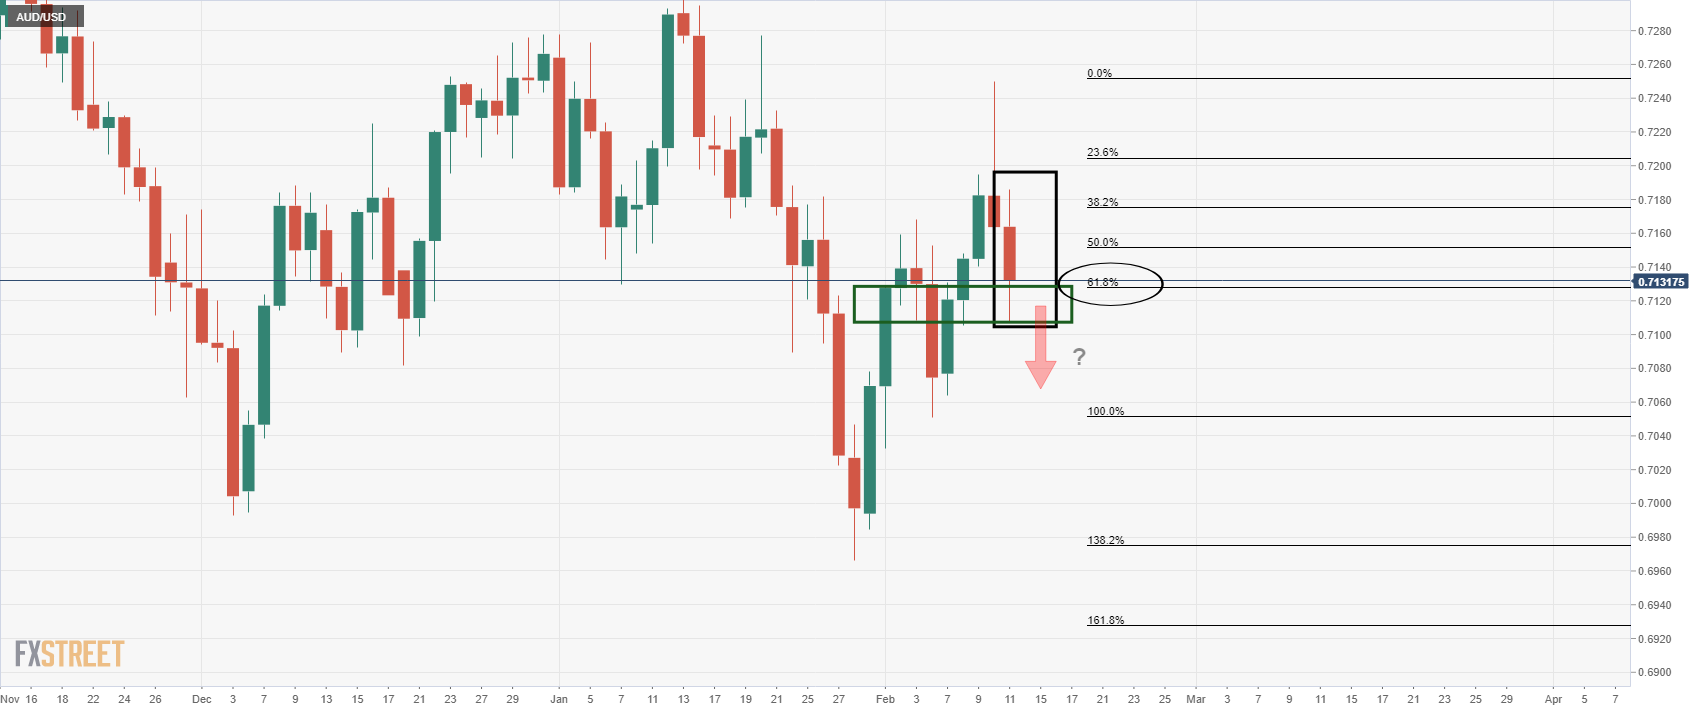
As per the prior analysis at the start of the week, AUD/USD Price Analysis: Bears testing bullish commitments at critical support, AUD/USD bears indeed took on the bulls, but only momentarily.
The following illustrates a bullish perspective as the fundamentals tides turn in favour of the upside, at least from a meanwhile risk-on perspective.
AUD/USD prior analysis
AUD/USD live market, daily chart

As illustrated, the bears did move in but the price is back to stabilising around the 61.8% ratio on Tuesday. This leaves prospects of a bullish continuation on the cards for the rest of the week and the foreseeable future.
AUD/USD H4 chart
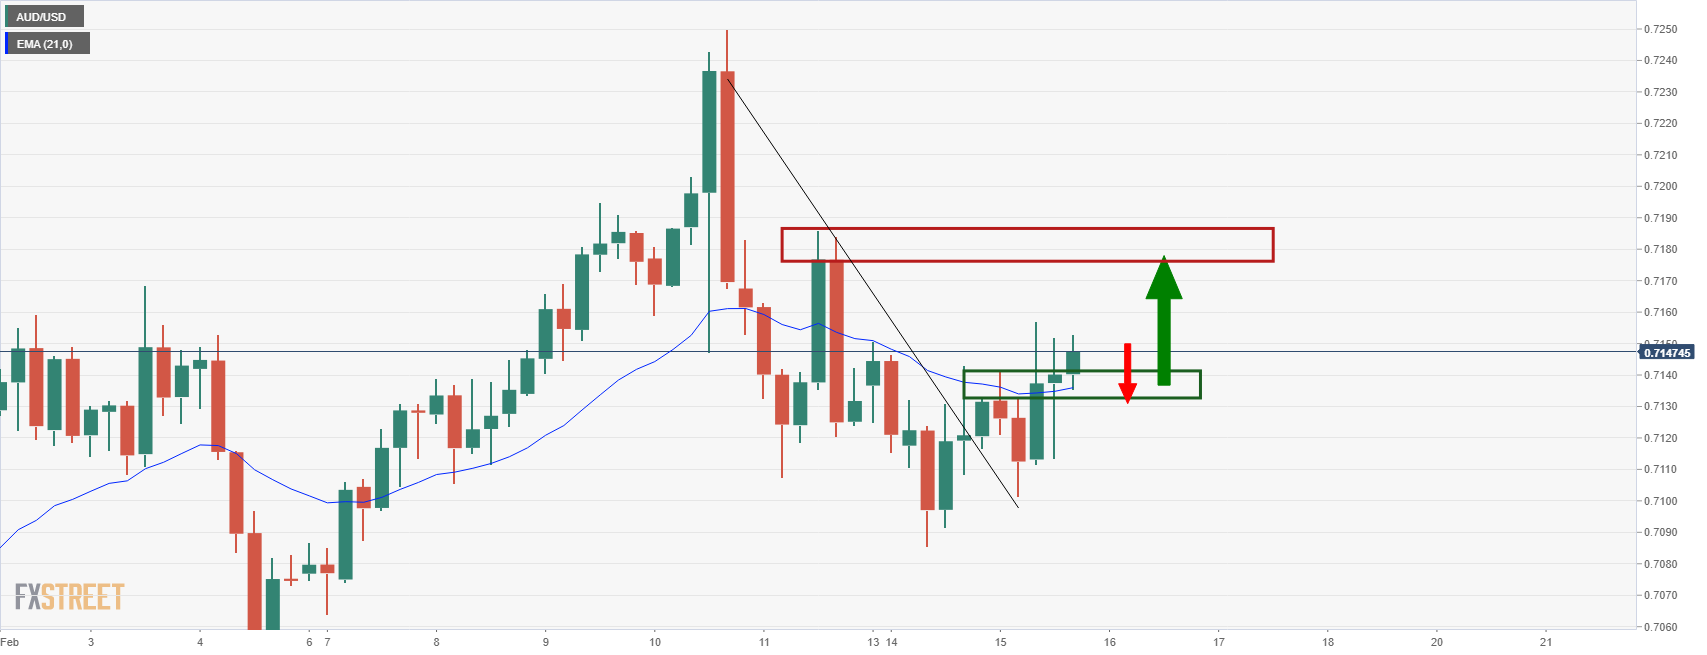
AUD/USD is breaking to the upside with the price now above H4 21-EMA which is an encouraging development for the bulls. Eyes will be on 0.7180s and then 0.73 the figure as a critical milestone in the pursuit of a higher daily high.
- The white metal drops sharply 2% on increasing market mood sentiment.
- Eastern Europe tensions diminished as Russia withdrew “some” troops as negotiations continued.
- XAG/USD Technical Outlook: Neutral biased, but the path of least resistance is downwards.
Silver (XAG/USD) follows gold’s footsteps during the North American session, plunging from a ten-month-old downslope resistance trendline towards the 100-day moving average (DMA), which lies at $23.20. At the time of writing, XAG/USD is trading at $23.38.
Geopolitical tensions abate between Russia, Ukraine, and NATO
On Tuesday, tensions between Russia/Ukraine appeared to abate after German chancellor Olaf Scholz met with Russian President Vladimir Putin. Putin told reporters that talks with Scholz were businesslike.
The meeting happened after last Friday’s announcement by the US press that according to US officials, Russias invasion of Ukraine was “imminent.” At the same time, the Kremlin denied those accusations. In fact, earlier news crossing the wires said that “some” Russian troops were returning home.
European and US equities took that as a positive development in the region, as all of the indices trade in the green. In the meantime, the US 10-year T-note yield rises four basis points sit at 2.035%., weighing on Silver’s non-yielding status.
Putting geopolitical matters aside, factors like the Federal Reserve tightening keep the non-yielding metal under selling pressure. On Monday, St. Louis President James Bullard reiterated his view that the US central bank would need to hike 100 bps by the July meeting. Also, he emphasized that the balance sheet reduction could begin in Q2 and wants discussions to get underway.
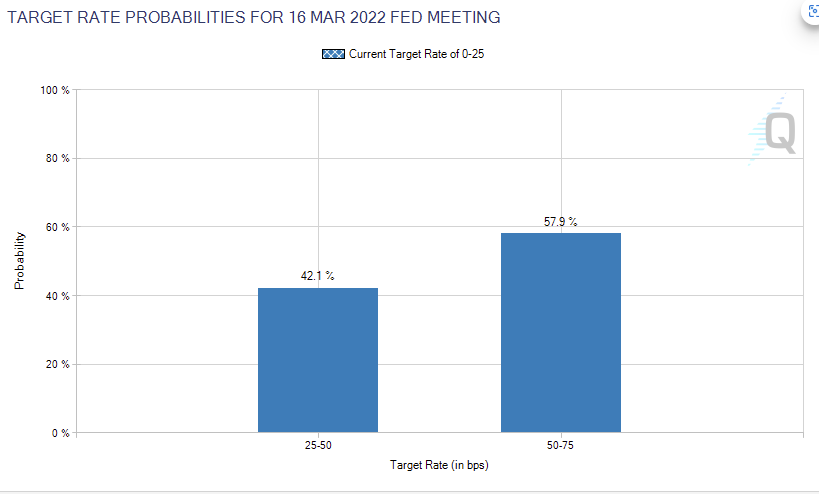
As of Tuesday, the FEDWATCh Tool has a 100% chance of a 25 bps rate hike, while a 57.9% chance of a 50 bps. The next Federal Reserve meeting would be in March but following the release of the US Consumer Price Index (CPI) of February, which could give clues regarding the possible outcome of the reunion.
Prices paid by producers in the US are 0.6% y/y higher than estimated
Meanwhile, the Department of Labor reported the Producer Price Index (PPI) for January, which came unchanged in line with the previous month, increasing by 9.7% y/y, higher than the 9,1% estimated. The so-called Core PPI rose to 8.3% y/y, two tenths lower than December’s but higher than 7.9% foreseen.
XAG/USD Price Forecast: Technical outlook
XAG/USD dropped $1.00 during the overnight session, on fundamental news, but also a ten-month-old downslope trendline around $23.65-70 area exacerbated the downward move that stalled near the $23.00 figure.
That said, XAG/USD is neutral biased. However, the path of least resistance is downwards, and its first support would be the 100-DMA at $23.24. Breach of the latter would expose the confluence of the figure and the 50-DMA at $23.00. Once that area gives way for USD buyers, the next challenge would be the February 3 daily low at $22.00.
- USD/CAD bulls are making progress on a daily time frame for a test of 1.2800.
- Oil markets are vulnerable to the Russian premium dissolving.
- All eyes will turn to Canadian inflation with hawkish sentiment at BoC brewing.
USD/CAD has been trading between 1.27 the figure and 1.2774 on Tuesday, thrown around within the range on headlines related to the risk of a Russian invasion of Ukraine. initially, CAD rose against the greenback as fears eased that Russia would invade Ukraine. However, as noted in an article in Asia, USD/CAD traders turn to oil prices for direction, energy markets are in the driving seat.
A pullback in oil prices has dented the performance of the CAD after prices fell off seven-year highs early on Tuesday. In a signal that Russia may be open to a diplomatic solution in order to avert heavy economic sanctions it would otherwise suffer if it were to invade its neighbour, markets are relieved and the premium in oil is bleeding out.
West Texas Intermediate crude for March delivery was last seen down US$2.51 to US$92.95 per barrel, while April Brent crude, the global benchmark, was down US$2.28 to US$94.20.
Reuters reported, in relation to news in the Guardian, that ''after meetings in Moscow Monday between Russian President Vladimir Putin and German Chancellor Olaf Scholz, Russia said it is returning some troops station on the Ukrainian border to base. However, NATO Secretary-general Jens Stoltenberg told reporters on Tuesday that the alliance has yet to see any significant de-escalation from Moscow.''
As for the impact in the oil markets, nearly 5-million barrels per day of Russian oil exports are at stake. Russia could also weaponize its energy exports to prevent severe sanctions. This has led to a colossal bid in oil of late, sending prices to their highest since the autumn of 2014. However, as analysts at TD Securities argue, In turn, energy prices still appear tactically vulnerable to de-escalation in Russian-Ukrainian tensions.''
As for domestic data, Canadian Housing Starts fell 3% in January compared with the previous month. This was a weight for the currency ahead of Canada's inflation report for January, due on Wednesday. This is expected to
give more clues on the outlook for Bank of Canada interest rate hikes. The CAD has been befitting from prospects a rate hike next month, a move that will break the status quo that has been in place at the BoC since October 2018. Subsequently, in the anticipation of a more hawkish outlook at the central bank, Canadian government bond yields remain higher across the curve, tracking the move in US Treasuries. The 10-year was up 3.1 basis points at 1.937%, after touching on Friday its highest level in nearly three years at 1.961%.
USD/CAD technical analysis
The outlook is bullish from an hourly perspective as follows:
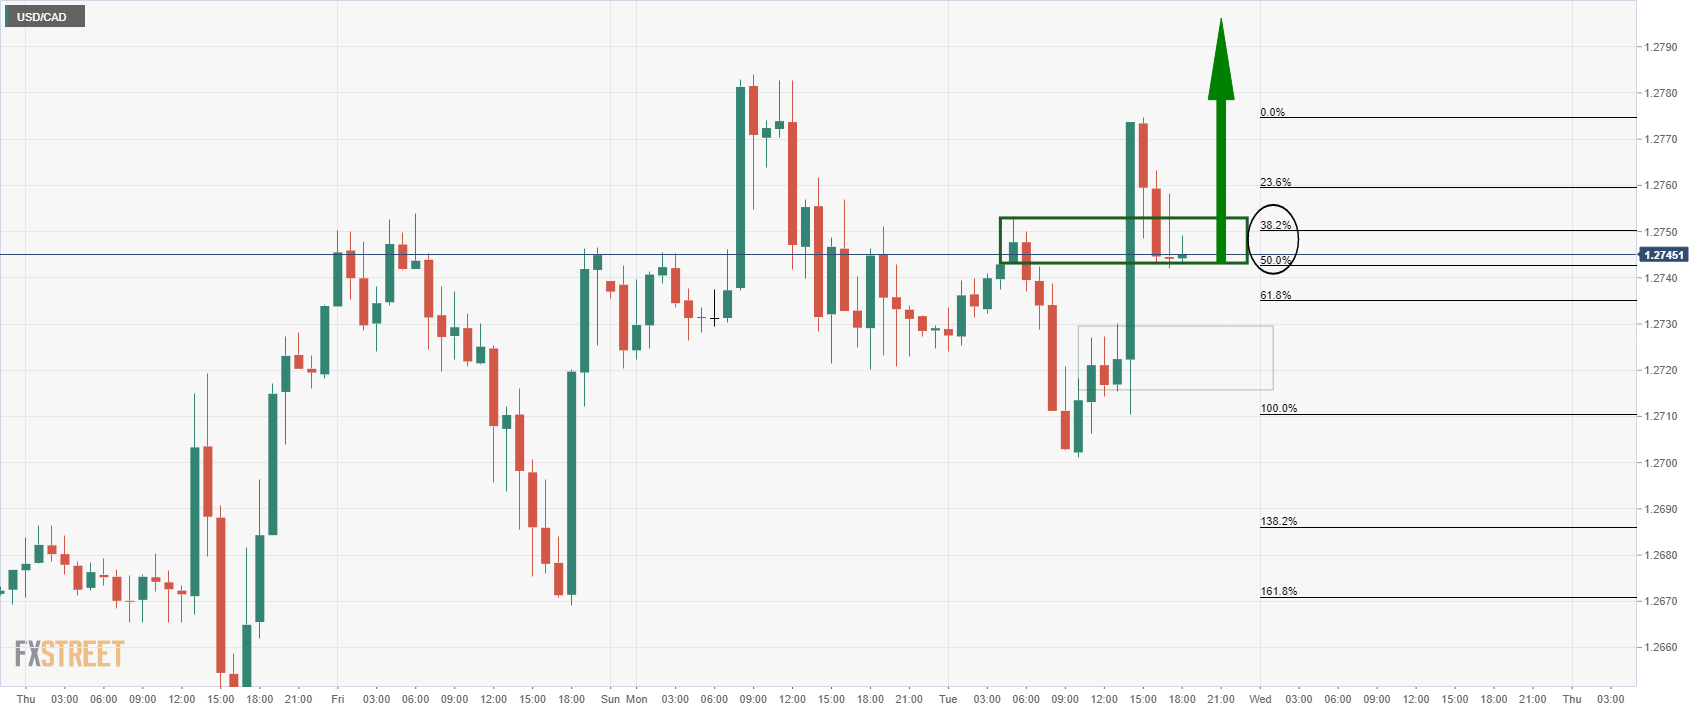
The price has met a 50% mean reversion and is being held up at old resistance. This would be expected to lead to a fresh wave of demand to take the pair to fresh hourly highs.
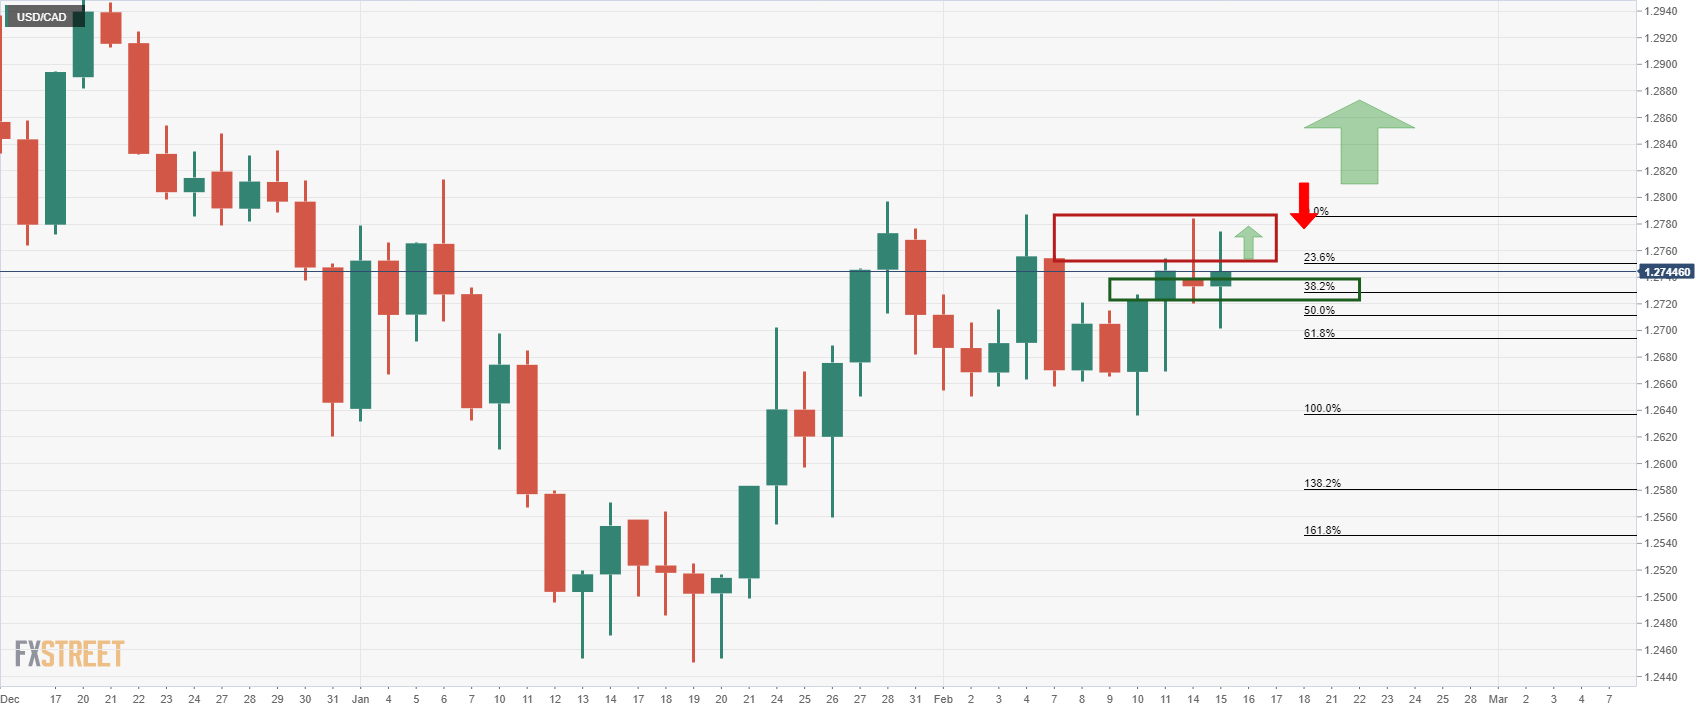
From a more boarder perspective, as illustrated in the prior analysis as follows, the bulls still need to get over the line at 1.28 the figure:
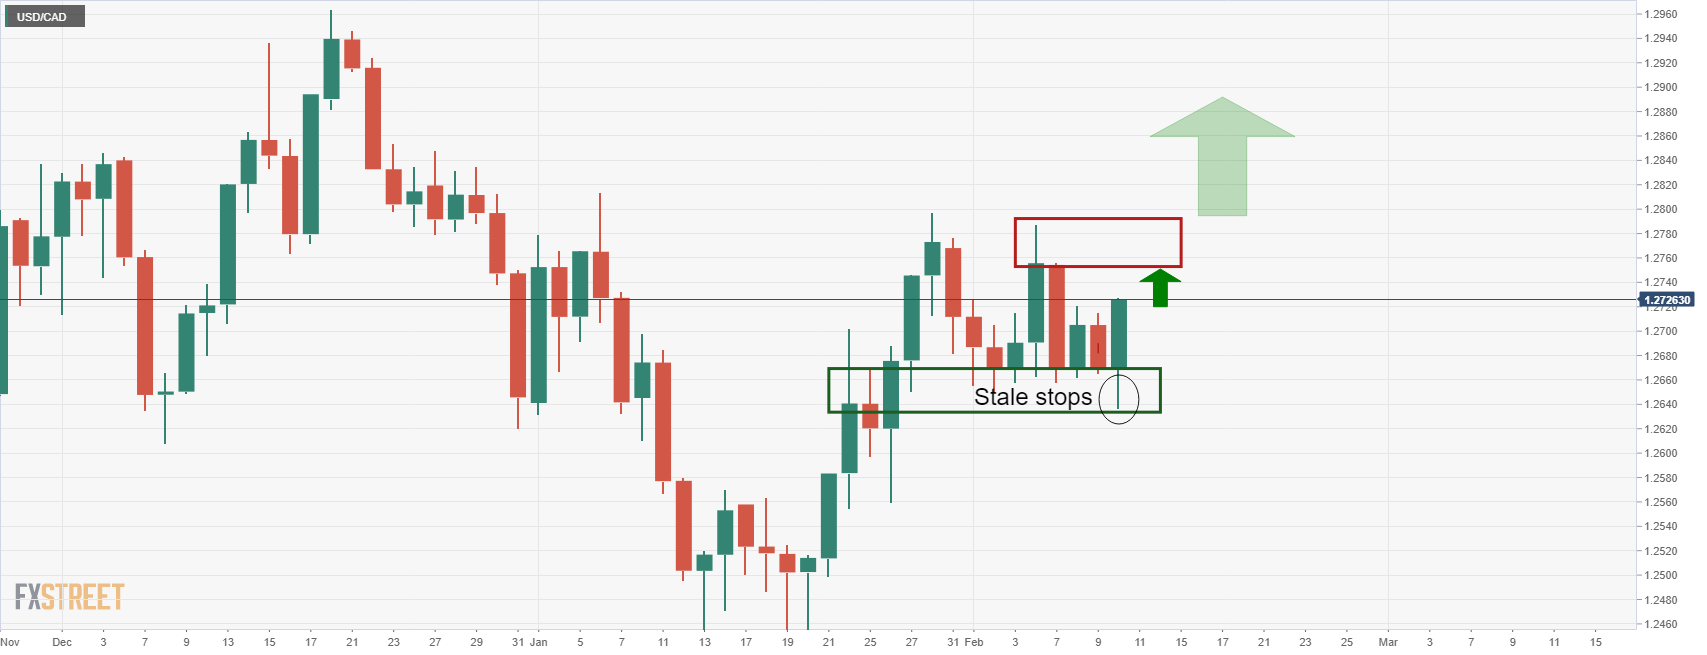
USD/CAD bulls making progress
- GBP/USD has been choppy on Tuesday, swinging around the lower 1.3500s, with GBP subdued despite better risk appetite.
- Cable looks to have formed a descending triangle in recent weeks, implying a potential downside breakout towards recent sub-1.3400 lows.
GBP/USD has seen choppy, two-way trading conditions on Tuesday, swinging between session highs in the 1.3560s and sub-1.3500 session lows as the pair, for the most part, stuck to recent intra-day ranges. Despite a decent rebound in global equity markets on signs of easing Russia/Ukraine tensions and despite hotter than expected December UK wage growth figures which economists said bolsters the case for BoE tightening, GBP has been lackluster. At current levels near 1.3525, GBP/USD trades flat on the day.
Cable looks to have formed a descending triangle in recent weeks and the pair seemingly did not have enough conviction to mount a meaningful bullish breakout. Bearish technicians thus pay hope that GBP/USD breaks below support in the 1.3500 area and press lower towards last month’s sub-1.3400 lows. While easing geopolitical tensions may have knocked the US dollar in the short-term amid a weakened safe-haven bid, Producer Price Inflation figures on Tuesday came in hotter than expected, strengthening the argument of hawkish Fed policymakers like James Bullard.
Bullard has called for 100bps of tightening by July 1, meaning he likely supports a 50bps move in March. Other Fed policymakers have pushed back against this idea and said they would prefer a more measured policy shift. But markets seem to think the hawks will win this debate, with CME’s Fed Watch tool suggesting a roughly 60% chance of a 50bps hike in March versus just 25% one week ago (prior to the hot January Consumer Price Inflation report).
Looking ahead to the rest of the week, geopolitics will of course remain key to watch, but there is also plenty of US/UK data for GBP/USD traders to sink their teeth into. UK January CPI and US January Retail Sales figures and the Fed minutes of the last meeting are out on Wednesday. Thursday and Friday are then packed with Fed speak, while UK January Retail Sales figures are out on Friday.
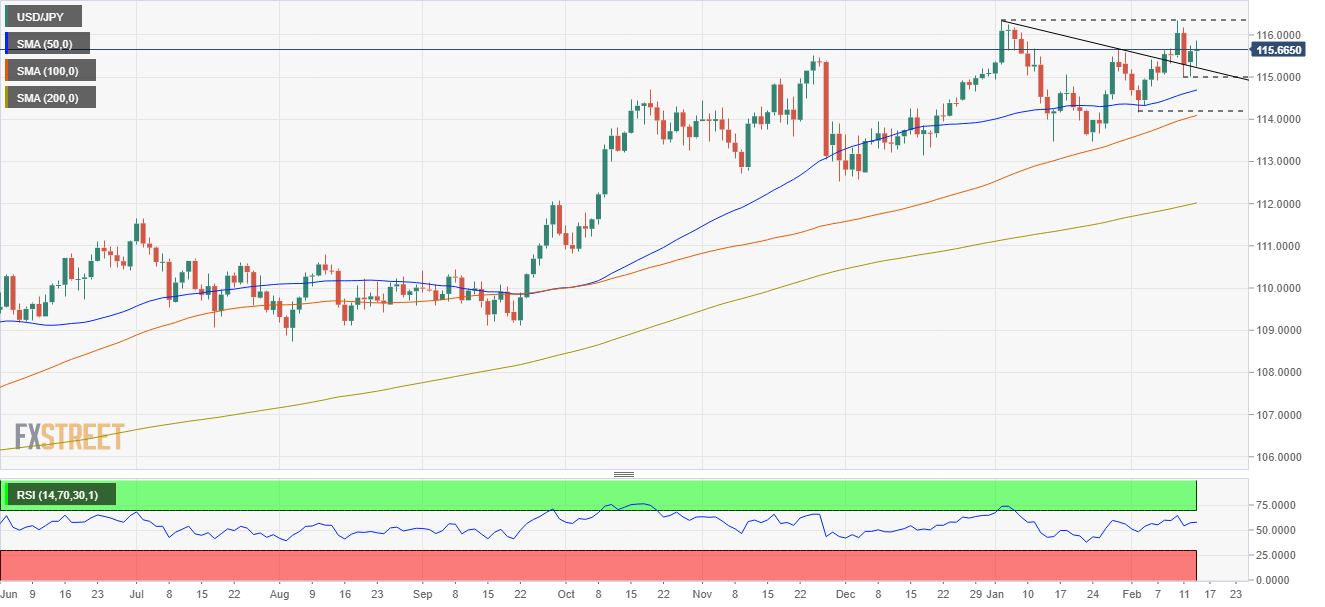
- The USD/JPY buyers need a daily close above 115.60 to cement an attack towards the YTD high at 116.35.
- USD/JPY Technical Outlook: It is upward biased, confirmed by DMAs and RSI in bullish territory.
On Tuesday, the USD/JPY bounces off a two-month-old downslope trendline, the previous resistance-turned-support around the 115.00-15 area, at the same time reclaim above November 24, 2021, high at 115.51, a prior supply zone. At the time of writing, the USD/JPY is trading at 115.64.
USD/JPY Price Forecast: Technical outlook
The USD/JPY is upward biased, as depicted by the daily moving averages (DMAs) located well below the spot price. Additionally, a daily close above the January 28 daily high at 115.68 would further cement the upward bias, as USD/JPY buyers attempt to challenge the 116.35 daily low for the second time in the year. Further confirmation by the Relative Strength Index (RSI) at 59 aiming up has enough room before reaching overbought conditions.
That said, the USD/JPY first resistance would be 116.00. Breach of the latter would expose the YTD high at 116.35, followed by a challenge of a 24-month-old downslope trendline around 117.00. A clear break of that ceiling level would pave the way towards January 2017 swing high at 118.61.
On the flip side, the USD/JPY first support would be February 14 daily low at 115.00. A sustained break would expose the 50-DMA at 114.67, followed by the February 2 low at 114.14 and then the 100-DMA at 114.07.
Russian President Vladimir Putin said on Tuesday that he is not satisfied with assurances that Ukraine will not become a NATO member in the near future, wants the issue to be settled right now or soon through a negotiating process, reported the Washington Post.
Market Reaction
Markets have not reacted to the latest Putin comments, though the macro mood remains positive with Russian troops expected to be withdrawn from the Ukraine border and Putin instead expected to pursue the path of diplomacy, at least in the coming days.
The bias for the EUR/USD is neutral, according to analysts at MUFG Bank. They see the pair in the 1.1050-1.1650 range over the next weeks. They warn the euro could weaken sharply if the Federal Reserve raises interest rates in larger increments than currently expected.
Key Quotes:
“Higher yields in Europe should help provide more support for the EUR and could prove to be an important game changer for future performance. Short EUR positions in recent years have been built up on the anticipation that ECB policy will remain loose which will be more seriously challenged going forward. Low yields in Europe prompted record portfolio outflows into foreign debt by European investors over the past year. A reversal of those flows could help to lift the EUR more than expected.”
“The Fed is expected to raise rates by over 150bps by the end of this year with a larger 0.50 point hike now seen as the most likely outcome from the upcoming FOMC meeting on 16th March. Without the ECB’s hawkish policy pivot, EUR/USD would likely be trading closer to the 1.1000-level.”
“Risks for the EUR are more balanced now. The EUR could weaken more sharply than expected if the Fed raises rates in larger increments and starts shrinking their balance sheet sooner and faster than expected to bring policy back to neutral sooner. The EUR could come under more selling pressure initially as well if Russia launches a full on invasion the Ukraine with the aim to take control of the whole country and restricts energy supply to Europe in retaliation for sanctions. On the other hand, the EUR could strengthen more than expected if the ECB outlines plans in March to end QE sooner than Q3 and talks up the possibility of multiple rates hikes which would bring an end to negative rates in Europe.”
Republican Senator Pat Toomey said on Tuesday that the Senate Banking Committee should not proceed with a vote on Fed nominee Sarah Bloom Raskin unless she answers questions on her role as a director of Reserve Trust. Reserve Trust is a fintech company that obtained a Fed master account while Raskin was serving as a board member. "We've asked basic questions and she's refused to provide answers" he said. Toomey will instruct Republican voters to sit out a vote on Tuesday, denying the Democrats of the quorum needed to move forward with a vote on Raskin's nomination. Toomey added that if Senate Banking Committee Chair Sherrod Brown proceeds on a vote on the other Fed nominees without Raskin, the Republicans will attend and vote.
Market Reaction
FX markets did not react to the latest developments.
- Gold’s $20+ fall, courtesy of an improved market mood, stalled at November 2021 daily high.
- Russia/Ukraine conflict tensions appear to abate, weighing on Gold’s safe-haven status.
- XAU/USD Technical Outlook: Upward biased but faces strong resistance around $1,855-60.
Gold (XAU/USD) plunges $20 during the North American session as Russia/Ukraine conflict tensions ease a tone as investors move from the non-yielding metals towards riskier assets. At the time of writing, XAU/USD is trading at $1849.25.
Eastern Europe geopolitical tensions subside
As portrayed by European and US equities rise, the market sentiment remains positive, as easter Europe tension abate some after German chancellor Olaf Scholz met with Russian President Vladimir Putin. Putin told reporters that talks with Scholz were businesslike.
The reunion happened after the US warned of a possible Russian attack on Ukraine, as the US press said an invasion was “imminent.” Meanwhile, officials in Moscow repeatedly denied the aforementioned. Moreover, updates crossing the wires that some Russian troops are returning to the base weighed on the safe-haven status of Gold.
Putting geopolitical matters aside, factors like the Federal Reserve tightening keep the non-yielding metal under selling pressure. On Monday, St. Louis President James Bullard reiterated his view that the US central bank would need to hike 100 bps by the July meeting. Also, he emphasized that the balance sheet reduction could begin in Q2 and wants discussions to get underway.
US hot fees paid per producer increases the odds of a bigger rate hike
On Tuesday, the Department of Labor reported that prices paid by producers for January were unchanged in line with the previous month, increasing by 9.7% y/y, higher than the 9,1%, though unchanged vs. the December number. The so-called Core PPI rose to 8.3% y/y, two tenths lower than December’s but higher than 7.9% foreseen.
In the meantime, the US 10-year Treasury yield advances five basis points sits at 2.04%, weighs on the non-yielding metal, which fell from daily tops around $1,877 down to $1,849 a $24 in a matter of hours. Worth noting that the 10-year TIPS, a proxy for real yields, sits at -0.45%, one basis point down.
XAU/USD Price Forecast: Technical outlook
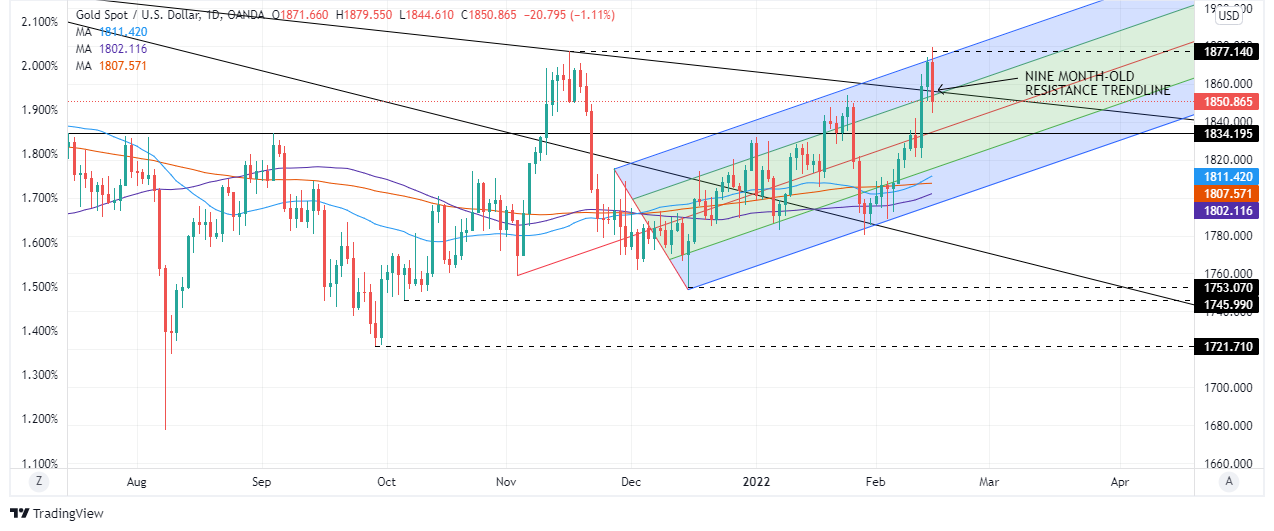
On Tuesday, the XAU/USD free-fall helped USD bulls to reclaim under a nine-month-old trendline, broken two days ago and pushed under the mid-line between the top-central Pitchfork’s uptrend channel. That said, the confluence of both trendlines around the $1,855-60 range would be resistance, that in the event of being broken, could exacerbate a move towards $1,900. A break of the former would expose November 16, 2021, a daily high at $1,877.14, followed by the latter $1,900.
However, despite that XAU/USD is upward biased, the $20 drop appears to be a profit-taking move unless USD bulls push for a daily close under the January 25 $1,853.88 daily high. In that event, the first support would be July 15, 2021, high at $1,834, followed by the mid-line between the bottom-central Pitchfork’s channel at $1,815-20 area.
- AUD/USD has recovered some ground on Tuesday and is now probing the 0.7150 level.
- The pair is getting a boost as risk appetite improves on easing geopolitical tensions, having shrugged off dovish RBA minutes.
The dovish tone to Tuesday’s RBA minutes release, which confirmed the view espoused at the last policy meeting that the central bank is in no rush to start tightening monetary policy settings, has failed to hobble the Aussie. Indeed, AUD/USD has been trading with a positive bias on Tuesday having found good buying interest upon dips towards the 0.7100 level, though for now, the pair remains capped by resistance in the 0.7150 area. At current levels in the 0.7140s, AUD/USD is about 0.25% stronger on the day, making the Aussie the second-best performing G10 currency on the day after the euro.
Risk appetite has improved on Tuesday with Russian government officials, including President Vladimir Putin, confirming that troops will be partially withdrawn from the Ukrainian border. Geopolitical tensions remain elevated and the risk of a new Russia/Ukraine conflict high, but generally speaking, risk-sensitive assets have been doing well, which partially explains AUD strength. The latest much hotter than expected US Producer Price Inflation figures, though strengthening the argument of more hawkish Fed members calling for a 50bps hike in March, did not impact FX markets much.
Looking ahead, AUD/USD will continue to focus on geopolitical developments amid as risks of an escalation of tensions between Russia and Ukraine over the latter’s breakaway Eastern provinces rise. Otherwise, there will also be plenty of US/Aussie data releases for traders to sink their teeth into. US Retail Sales and Fed minutes are due on Wednesday, Australian employment data, US weekly jobless claims and Philly Fed survey data plus Fed speak are due on Thursday and a further barrage of Fed speak is due Friday.
Analysts at MUFG Bank have a positive outlook for the USD/JPY pair. They forecast it will trade in the range 113.00-118.00 over the next weeks. They see the pair is in the final period of the move higher.
Key Quotes:
“With the USD/JPY spot rate close to realising new closing highs the risks are certainly more skewed to the upside. Yen selling could be further reinforced on a break of 117.00 which we believe is an important long-term resistance point technically. As stated here before, yield spreads cannot be relied upon over the timeframe of the impending Fed tightening cycle – that correlation eventually breaks down. But there appears scope for that influence to play a role, perhaps into the first rate increase by the Fed on 16th March.”
“We are in the final period of the move higher in USD/JPY. Yield spreads will lose their influence given how much is now priced into the US curve while the overall withdrawal of monetary accommodation will result in more challenging financial market conditions that will likely benefit the yen. Our PPP estimates point to USD/JPY overvaluation approaching 20%.”
“The more elevated risks associated to possible conflict between Russia and Ukraine is the primary risk to USD/JPY advancing further higher from here. The newsflow is fluid and changes rapidly but at the time of writing the pullback of Russian troops from Ukrainian border areas is a positive development. Higher yields more generally globally that cause asset price corrections is the second primary risk to USD/JPY but this risk feels further away than the imminent threat related to Russia.”
- EUR/USD bottoms at 1.1319 and redounds back to the 1.1355 area.
- US dollar mixed across the board, on risk aversion and higher yields.
- Wall Street extends gains, S&P 500 up by 1.50%.
The EUR/USD recovered quickly from a drop to 1.1320 and rose back to the 1.1350 area. It holds a bullish tone and is trading at daily highs at 1.1361.
EUR/USD gains on stronger euro, mixed dollar
Stocks prices are up across the globe. In Europe, main indices finished up by 1.25% on average. On Wall Street, the Dow Jones gains 1.31% and the Nasdaq 1.90%. The rally was triggered by easing tensions on Ukraine’s borders.
The improvement in risk sentiment pushed bond prices to the downside. Eurozone and Treasury yields rose significantly boosting the euro particularly. EUR/GBP is up by more than 40 pips, trading near 0.8400, while EUR/JPY rose toward 131.50.
The US dollar is falling modestly across the board, although it is up versus the yen supported by higher yields. The US 10-year yield rose from 1.97% to 2.05%. It peaked after the release of US data that showed an increase of the Producer Price Index in January above expectations. On Wednesday, the retail sales report is due.
Short-term outlook
If the EUR/USD extends the rally, the next resistance might be seen at the 1.1375 zone, followed by 1.1400 and 1.1425. The positive tone will likely remain while the pair holds above 1.1330 (20-hour moving average); a break lower should weaken the euro, exposing the 1.1320 support.
Technical levels
- US equities are up sharply on Tuesday as investors breathe a sigh of relief amid apparently easing geopolitical tensions.
- News of Russian troop withdrawals from Ukraine’s border helped distract equities from ugly PPI and NY Fed survey data.
- The S&P 500 was up about 1.5%, the Nasdaq 100 up nearly 2.0% and the Dow about 1.3%.
The S&P 500 opened Tuesday trade sharply higher and currently trades to the north of the 4450 level, up about 1.5% on the day. Russia has confirmed it is moving troops away from the Ukrainian border, easing concerns about imminent military action, hence the rebound in not just US but global equities. But as NATO and Western leaders caution that Russia remains in a position where it could swiftly take military action against Ukraine and as Russia looks on the verge of recognising the independence of breakaway regions in Eastern Ukraine, tensions remain high.
Recognition of the independence of these regions, coupled with Russia’s talking up of how Ukraine is committing a “genocide” against Russian speakers in its East could form the pretext for a reignition of open hostilities, investors continue to fear. While there remains a huge amount of uncertainty as to how the geopolitical situation in Eastern Europe will unfold, one thing is for sure; for the time being, headlines pertaining to Russia/Ukraine will remain a key driver of equity market sentiment.
The seeming de-escalation of imminent war risk amid Russian troop withdrawal helped distract/shield US equities from some pretty ugly US economic data out prior to Tuesday’s open. The latest Producer Price Inflation report came in significantly hotter than expected, with both the MoM and YoY metrics coming in well above expectations for both the headline and core. With the Fed split over whether to go big with a 50bps rate hike in March, such data will strengthen the argument of the hawkish camp. NY Fed Manufacturing survey data for February also didn’t make for pretty reading, coming in significantly weaker than expected.
The data, despite putting upwards pressure on US bond yields, was not enough to dampen appetite for growth and big tech stocks, gains in which have helped propel the Nasdaq 100 index to a near 2.0% on-the-day gain. The tech-heavy index now trades back to the north of the 14.5K level, while the Dow has been able to recover back to 35K, up about 1.3% on the day. The CBOE S&P 500 Volatility Index, often referred to as the VIX, was down about 2.5 points to back below 26.00, a now more than 6.0 point drop from Monday’s highs above 32.0.
- The NZD/USD eyes to break below 0.6600 amid tensions on the Russian/Ukraine conflict.
- The market mood is upbeat, as portrayed by risk-sensitive currencies.
- NZD/USD is downward biased, but it could shift to neutral if NZD buyers achieve a daily close above 0.6650.
The NZD/USD extends to four days of losses in the North American session, courtesy of the financial markets’ risk-off environment since Friday. At the time of writing is trading at 0.6605.
Risk appetite is back so far. Updates crossing the wires that some Russian troops are returning to the base provided a lift up on US equity futures, while European bourses are in the green. The Russia/Ukraine narrative shift towards a diplomatic exit boosted risk-sensitive currencies to the detriment of safe-haven peers, namely the USD and the JPY.
In the meantime, around 14:23 GMT, it crossed the wires that Russian President Vladimir Putin does not want war in Europe but reiterated that his proposals had not been answered and the decision about a partial withdrawal of troops has been taken.
US Producer Prices approach the 10% barrier
Before the Wall Street Open, the US Bureau of Labor reported that the Producer Price Index (PPI) for January rose by 9.7% y/y, unchanged per the December reading but higher than the 9.1% estimated by analysts. On Core PPI metrics, they came at 8.3% y/y, lower than the 8.5% from December but larger than the 7.9% foreseen.
In the Asian Pacific session, New Zealand and China modernized their 2008 free-trade agreement (FTA). The NZ Minister of Trade and Export Growth Damien O’Connor said that “our primary industry exports forecast to hit a record $50 billion this year alone.”
Meanwhile, the NZ economic docket featured Tourist Arrivals for December increased to 4.4%, from 3.8%, in the November reading.
NZD/USD Price Forecast: Technical outlook
The NZD/USD is downward biased, as depicted by recent price action in the daily chart. The location of the daily moving averages (DMAs) above the spot price confirms the aforementioned. Failure to reclaim the 50-DMA at 0.6742 on February 10 exerted downward pressure on the pair, retreating towards the 0.6500 area before reclaiming the 0.6600 figure, on improved risk market mood.
However, to shift the NZD/USD outlook to a neutral bias, NZD bulls would need to place a daily close above February 14 0.6650 daily high. In that event, the NZD/USD could probe the 0.6700 figure alongside the 50-DMA at 0.6734. Otherwise, the NZD/USD first support would be February 4 daily low at 0.6589, followed by January 28 daily low at 0.6529.
- WTI has pulled back sharply on Tuesday from Monday’s multi-year highs near $96.00 and is back in the $91.00s.
- Fears of an imminent Russian invasion into Ukraine have eased as Russia withdraws some troops, weighing on oil prices.
Oil prices have pulled back sharply from Monday’s multi-year highs, with front-month WTI futures now trading back to the south of the $92.00 level, down about $3.0 per day and more than $4.0 below Monday’s multi-year highs near $96.00. Press reports about a withdrawal of troops on the Ukrainian border to their bases has spurred a rebound in risk appetite and reduction in demand for safe havens on Tuesday.
Such flows could have further legs in wake of remarks from Russian President Vladimir Putin who just said that a decision on partial troop withdrawal had been taken. For oil, tentative signs of de-escalation have triggered profit-taking as geopolitical risk premia is reduced somewhat, though Western nations and NATO remain highly concerned that Russia maintains the option for a near-term attack.
One theme to watch is that Russian President Vladimir Putin might imminently recognise the independence of the Luhansk and Donetsk People’s Republics (LPR and DPR), both breakaway regions of Ukraine located in the East. Western officials have criticised Russia’s State Duma for voting in favour of the recognition, which would break the Minsk Agreement designed to implement a ceasefire in the Ukraine civil war.
Geopolitical strategists fear that Russia might create a false pretext for military action against Ukraine by rekindling violence in the East, with a recognition of LPR and DPR independence a potential step in this direction. For now, WTI traders will remain on tenterhooks and trading conditions will remain choppy/headline-driven.
Near-term WTI bears will likely eye an imminent test of an uptrend that has been supporting the price action for the whole of 2022 thus far in the $90.00s. A break below this could see oil prices swiftly move back under $90.00 and hit support in the form of last week’s lows in the mid-$88.00s. Aside from Eastern European geopolitics, oil traders will also be keeping an eye on upcoming private weekly US oil inventory data at 2130GMT, as well as indirect US/Iran nuclear negotiations, which continue to rumble on in the background.
Price action in the GBP/USD pair looks contained to a 1.35-1.36 range for the most part. While a move above 1.36 is not ruled out in the short-term, economists at Scotiabank expect cable to resume the downtrend towards the 1.34 level.
Intraday support aligns at 1.3525/30 followed by 1.3500/90
“The GBP’s range-trade of 1.35-1.36 is now going on two weeks, and while shorter-term price action suggests the next move will be a break above 1.36 and 1.3650, the GBP remains in a half-year downtrend that points to an eventual test of 1.34.”
“Intraday support is 1.3525/30 followed by 1.3500/90 and the mid 1.34s area.”
- USD/TRY adds to Monday’s gains and approaches 13.70.
- Turkey’s Budget Balance showed a TL30.0B surplus.
- Markets’ attention remains on the CBRT meeting on Thursday.
The Turkish currency extends the pessimism seen at the beginning of the week and is now pushing USD/TRY to new monthly peaks near 13.70 on Tuesday.
USD/TRY in multi-day highs
USD/TRY rises to levels last seen back in mid-January around the 13.70 zone in the first half of the week despite the greenback trading on the defensive vs. the majority of its currency peers in response to the better mood in the risk complex.
Indeed, positive news citing some de-escalation of the Russia-Ukraine effervescence puts the buck under pressure and allows some breathing room for risk-associated assets on Tuesday.
In the domestic calendar, the Turkish Treasury reported a TL30.0B surplus in the Budget Balance in the first month of the year, reversing the acute TL145.74B deficit recorded in December.
What to look for around TRY
The pair keeps its multi-week consolidative theme well in place, always within the 13.00-14.00 range. While skepticism keeps running high over the effectiveness of the ongoing scheme to promote the de-dollarization of the economy – thus supporting the inflows into the lira - the reluctance of the CBRT to change the (collision?) course and the omnipresent political pressure to favour lower interest rates in the current context of rampant inflation and (very) negative real interest rates are a sure recipe to keep the domestic currency under pressure for the time being.
Key events in Turkey this week: Budget Balance (Tuesday) – CBRT interest rate decision (Thursday) – Consumer Confidence (Friday).
Eminent issues on the back boiler: Progress (or lack of it) of the government’s new scheme oriented to support the lira via protected time deposits. Constant government pressure on the CBRT vs. bank’s credibility/independence. Bouts of geopolitical concerns. Much-needed structural reforms. Growth outlook vs. progress of the coronavirus pandemic. Earlier Presidential/Parliamentary elections?
USD/TRY key levels
So far, the pair is advancing 0.42% at 13.6449 and a drop below 13.4317 (weekly low Feb.11) would expose 13.2327 (monthly low Feb.1) and finally 12.7523 (2022 low Jan.3). On the other hand, the next up barrier lines up at 13.6746 (weekly high Feb.14) seconded by 13.9319 (2022 high Jan.10) and then 18.2582 (all-time high Dec.20).
Russian President Vladimir Putin said on Monday that Russia does not want war in Europe, which is why the country has set forth security proposals. A decision on a partial withdrawal of troops has been taken, he added, though he did criticise the Western response to security proposals as not constructive. However, Putin claimed that there is a "genocide" taking place in Eastern Ukraine's Donbass region and that the majority of Russians support the rebel-held regions of the country. We have to try and solve the problems of the Donbass, he continued, saying the solution should be based on the Minsk peace process.
Market Reaction
There hasn't been a notable reaction to Putin's latest remarks, as markets attempt to process the seemingly declining risk of a all-out invasion of Ukraine, but potentially rising risk of a rekindling of the conflict in Eastern Ukraine.
In the year to date, the Swedish krona is the second-worst performing G10 currency after the New Zealand dollar. However, economists at Rabobank expect the EUR/SEk to turn back lower towards 10.20 as the Riksbank ditches dovish stance.
ECB officials has capped upside potential for EUR/SEK
“The failure of the Riksbank to follow the ECB’s hawkish pivot this month boosted the upside trend in EUR/SEK. That said, ECB officials have subsequently been attempting to pare back market expectations about any forthcoming policy moves from the Governing Council. This has capped upside potential for EUR/SEK.”
“Assuming there is no escalation in Russian military operations, we see scope for EUR/SEK to turn lower on a three-month view on the assumption that the Riksbank will announce its own hawkish pivot in the coming months.”
“Our three-month EUR/SEK forecast stands at 10.20.”
See – EUR/SEK: Bearish krona trend to remain in place until bigger shift in Riksbank policy – MUFG
The USD/CAD is marginally lower on the session. According to economists at Scotiabank, a push under 1.2720 targets mid-1.26s.
Short-term price action is turning a little more CAD-positive
“The USD closed well off the intraday peak yesterday and the low close plus spot’s move under 1.2720 support has triggered a minor Head & Shoulders top on the intraday chart which points to USD losses extending to 1.2650/60 in the next 1-2 days.”
“We look for resistance intraday at 1.2720/30.”
EUR/USD technical picture is looking a touch more positive with today’s recovery from the 1.13 but it is still too early to call a clear change in direction while below the 1.1370/75 zone, in the opinion of economists at Scotiabank.
EUR/USD may resettle into the 1.12-1.14 range
“The EUR will have to move above the mid-figure zone followed by 1.1370/75 to suggest a clearer rejection of downward pressure – and possibly move back above 1.14.”
“Support after 1.13 is yesterday’s low of 1.1280 followed by the mid-1.12s.”
“EUR/USD may resettle into the 1.12-1.14 range where it traded through December and the first half of January.”
- Silver witnessed a dramatic turnaround from over a three-week high touched earlier this Tuesday.
- Slightly oversold RSI on the 1-hour chart might hold back bearish traders from placing fresh bets.
- Sustained strength back above the $23.55 region is needed for the resumption of the bullish trend.
Silver extended its sharp intraday pullback from the $24.00 mark, or over a three-week high touched earlier this Tuesday and continued losing ground through the early North American session. The white metal has now reversed its gains recorded over the past two trading sessions and was last seen trading just above the $23.00 round figure.
The aforementioned handle coincides with the 200-hour SMA, which is closely followed by the 50% Fibonacci retracement level of the $22.00-$23.99 strong move up. Technical indicators on the 4-hour chart have just started drifting into the negative territory and also retreated sharply on the daily chart, favouring bearish traders.
That said, RSI (14) on the 1-hour chart is already flashing slightly oversold conditions and warrants some caution before placing aggressive bearish bets. Hence, it will be prudent to wait for some intraday consolidation or a convincing break below the $23.00 mark before positioning for an extension of the intraday depreciating move.
The next relevant support is pegged near the $22.75 region, which coincides with the 61.8% Fibo. level. Some follow-through selling will be seen as a fresh trigger for bearish traders and pave the way for a slide towards the mid-$22.00 mark. The XAG/USD could eventually drop to challenge the double-bottom support, around the $21.40 region.
On the flip side, any meaningful move back above the 38.2% Fibo. level, around the $23.25 region, might now be seen as a selling opportunity and cap the XAG/USD near the $23.55 hurdle. The latter marks the 23.6% Fibo. level, which if cleared decisively will suggest that the corrective slide has run its course and set the stage for a fresh leg up.
Silver 1-hour chart
-637805301410728575.png)
Key levels to watch
- The headline NY Fed Index rose less than expected to 3.1 in February versus forecasts for a rise to 12.15.
- The dollar has been weakening in response to the data, perhaps more due to easing Core PPI price pressures (YoY).
The New York Fed's Empire State Current Business Conditions Index rose to 3.1 in February from -0.7 in January, well below the expected rebound to 12.15. The New Orders Index rose to 1.4 from -5.0 in January, the Prices Paid Index fell slightly to 76.6 from 76.7, the Employment Index rose to 23.1 from 16.1 and the Six-month Business Conditions Index rose to 28.2 from 35.1.
Market Reaction
The dollar has been weakening in recent trade, with the DXY recently dipping to session lows under 96.00, with weaker than forecast headline NY Fed data not helping, but likely mostly due to a drop in the YoY rate of Core Producer Price Inflation.
- Headline PPI rose at 9.7% YoY in January, unchanged from December and significantly above expected.
- Core PPI metrics were also hotter than expected, though the YoY rate fell versus December, prompting some modest USD weakness.
The headline US Producer Price Index (PPI) rose at an annual pace of 9.7% in January, according to the latest report from the US Bureau of Labor Statistics on Tuesday. That was well above the median economist forecast for 9.1% and was unchanged versus December's 9.7% reading. MoM, PPI came in at 1.0% in January, well above expectations for a 0.5% MoM gain. Core PPI metrics were also significantly hotter than expected, with the YoY rate falling less than expected to 8.3% in January from 8.5% the month prior against forecasts for a decline to 7.9% and the MoM rate rising to 0.8% from 0.6% in December, well above the expected 0.5% gain.
Market Reaction
Despite the much hotter than expected PPI metrics, the fact that the YoY rate of core PPI fell versus January levels seems to be weighing a tad on the US dollar. The DXY recently dipped to fresh session lows under 96.00.
- A combination of diverging forces failed to provide any meaningful impetus to USD/CAD.
- The technical setup seems tilted in favour of bulls and supports prospects for some upside.
- Bulls might still wait for a break through the 1.2785 barrier before placing aggressive bets.
The USD/CAD pair seesawed between tepid gains/minor losses through the early North American session and was influenced by a combination of diverging forces. A positive turnaround in the risk sentiment weighed on the safe-haven US dollar and acted as a headwind for the major.
That said, a sharp pullback in crude oil prices undermined the commodity-linked loonie and assisted the USD/CAD pair to attract some dip-buying near the 1.2700 mark. The pair, for now, seems to have stalled the overnight retracement slide from the 1.2780-1.2785 strong hurdle.
The latter marks the top boundary of a near three-week-old trading range and should act as a key pivotal point for short-term traders. Given that technical indicators on the daily chart are holding in the positive territory, the bias seems tilted in favour of bullish traders.
Hence, any subsequent slide below the 1.2700 mark could be seen as a buying opportunity. This, in turn, should help limit the downside near the 1.2660 horizontal support. This is followed by the monthly low, around the 1.2635 area, which if broken will negate the bullish bias.
The USD/CAD pair could then break below the 1.2600 mark and slide to the 1.2570-1.2560 support. Some follow-through selling would expose the very important 200-day SMA, around the 1.2520-1.2515 area, and the 1.2500 psychological mark before bears aim to challenge YTD low, around mid-1.2400s.
On the flip side, immediate resistance is pegged near the 1.2765 region ahead of the 1.2780-1.2785 strong barrier. A convincing breakthrough, leading to a subsequent move beyond the 1.2800 mark will reaffirm the bullish bias and lift the USD/CAD pair to the 1.2835 zone.
The momentum could further get extended towards reclaiming the 1.2900 round-figure mark, with some intermediate hurdle near the 1.2870-75 area.
USD/CAD daily chart
-637805285052062152.png)
Key levels to watch
- EUR/GBP rebounded from support in the 0.8350 area and is trading around 0.8375 amid euro outperformance as geopolitical tensions ease.
- EUR has underperformed recently on fears that a Russia/Ukraine war and associated sanctions might hurt the Russian gas import-dependent Eurozone.
- Strong UK wage growth is helping to keep the gains capped under 0.8400, with analysts also eyeing Wednesday UK CPI.
EUR/GBP has rebounded from support at the 0.8350 area to trade closer to 0.8375, up around 0.3% on the day, amid broad euro outperformance as Russia/Ukraine tensions seemingly ease. Reports suggested on Tuesday that Russian troops have been returning to their bases from attack positions, a move which financial market participants have interpreted as a de-escalation of the risk of imminent war. That has subsequently eased concerns about the Eurozone’s economic vulnerability to a Ukraine/Russia conflict and associated sanctions on the former given the bloc’s reliance upon Russian gas imports.
The pair continues to trade substantially below last Friday’s pre-geopolitical tension-related euro underperformance levels above 0.8400 and will likely struggle to rally to the north of the big figure in the absence of further signs of de-escalation. Another factor contributing to the likelihood that EUR/GBP’s gains will, for now, remain capped, was UK labour market data on Tuesday, which economists said strengthens the case for further tightening from the BoE in the coming months. The UK unemployment rate was 4.1% as expected in December, unchanged from November’s levels, though wage growth metrics came in substantially hotter than forecast.
“December's pick-up in wage growth will maintain the pressure on the MPC to hike the Bank Rate again at next month's meeting” said analysts at Pantheon Macroeconomics. With the latest remarks from ECB officials, including President Christine Lagarde on Monday, seeking to push back against expectations for excessively hasty policy tightening from the ECB, BoE/ECB divergence could weigh on EUR/GBP this week. Analysts flagged Wednesday’s release of UK January Consumer Price Inflation data as another risk event to keep an eye on that could further add to this narrative.
The S&P 500 is expected to continue to hold the 61.8% retracement of the January/February rally at 4365 for now. However, analysts at Credit Suisse maintain their broader negative bias for a clear break in due course and a retest of the 4223/4199 key support cluster.
Above 4451/53 to see a deeper rebound to 4484/86
“We look for some fresh consolidation above the 61.8% retracement of the January/February rally at 4365 for now but we maintain our broader negative view following the prior rejection from our recovery target and key resistance at 4491/95.”
“Post a pause, we look for a retest and then break below 4365 with support then seen next at 4292 and eventually the major support cluster at 4223/4199. Failure to hold here would mark a major top.”
“Resistance is seen at 4426 initially, then 4451/53, which we look to try and cap. Above can see a deeper rebound to the 13-day exponential average at 4484/86, but with this expected to now prove a tougher barrier.”
See: S&P 500 Index needs to recapture 4600 to extend up-move – SocGen
Financial crises occur following a period during which three types of imbalances combine. Macroeconomic imbalances, regulatory imbalances and behavioural imbalances. The three imbalances needed for the next financial crisis to take place are present today, according to analysts at Natixis.
Cause for concern
“There are again signs today of confluent macroeconomic, regulatory and behavioural imbalances. This is cause for concern, as the simultaneous presence of these three forms of imbalance has led to financial crises in the past.”
“Central banks are increasingly being caught in the same trap: in the wake of a crisis, they do not want to use policies to prevent the occurrence of a financial crisis and prefer to wait for the crisis to break out before responding. This explains the macroeconomic imbalance and some of the regulatory imbalance, as investors rotate into risky assets and risk premia are squeezed.”
- GBP/USD gained some positive traction on Tuesday, though the uptick lacked bullish conviction.
- The technical set-up seems tilted in favour of bulls and supports prospects for additional gains.
- A convincing break below the 1.3500-1.3490 area is needed to negate the near-term positive bias.
The GBP/USD pair retreated a few pips from the daily high and was last seen trading with modest intraday gains, just below mid-1.3600s heading into the North American session.
The British pound drew some support from mostly in-line UK monthly employment report released earlier this Tuesday. On the other hand, a positive turnaround in the global risk sentiment undermined the safe-haven US dollar and extended some support to the GBP/USD pair.
That said, expectations for a faster policy tightening by the Fed and rallying US Treasury bond yields helped limit any deeper USD losses. Apart from this, tensions over the Northern Ireland Protocol of the Brexit agreement capped any further gains for the GBP/USD pair.
Looking at the broader picture, the pair has been oscillating in a familiar trading range over the past two weeks or so. This points to indecision among traders over the near-term trajectory for the GBP/USD pair and warrants some caution before placing directional bets.
Technical indicators, however, are holding with a mild positive bias. Moreover, the GBP/USD pair has repeatedly shown some resilience below the key 1.3500 psychological mark. The set-up seems tilted in favour of bullish traders and supports prospects for additional gains.
Any subsequent move beyond the 1.3600 mark, however, could confront stiff resistance near a downward sloping trend-line extending from July 2021. The said hurdle, currently around the 1.3625 region, coincides with last week's swing high and should act as a pivotal point.
On the flip side, acceptance below the 1.3500-1.3490 area will be seen as a fresh trigger for bearish traders and make the GBP/USD pair vulnerable. The downward momentum could then drag spot prices towards the next relevant support near the 1.3435 region en-route the 1.3400 mark.
GBP/USD daily chart
-637805264022606334.png)
Key technical levels
- Gold has pulled back under $1850 after hitting fresh eight-month highs earlier in the session near-$1880.
- Signs of geopolitical de-escalation have eased nerves about an imminent Ukraine/Russia war, weighing on safe-haven assets like gold.
Amid hopes of geopolitical de-escalation at the Ukraine/Russia border as reports suggest some Russian troops are returning to their bases following the completion of military drills, risk assets have been rallying on Tuesday whilst safe-havens, including gold, have been falling. Spot gold (XAU/USD) prices recently dipped back below the $1850 mark as the heightened geopolitical risk premia embedded in prices since last Friday is unwound. That marks a more than 1.3% drop on the day and pullback of over 1.5% from eight-month highs hit earlier in the session near $1880.
Geopolitical developments remain in the spotlight ahead of talks between German Chancellor Olaf Scholz and Russian President Vladimir Putin on Tuesday and as the head of NATO warned that everything was still in place for a Russian attack on Ukraine. That suggests XAU/USD, as other asset classes, is set to remain choppy and headline driven. Gold traders will also need to keep an eye on upcoming US data releases, including the January Producer Price Inflation report and February NY Fed Manufacturing survey, both out at 1330GMT.
Another key theme driving precious metals and macro risk appetite at the moment is expectations regarding Fed tightening, with upcoming US data releases to be viewed in this context. For now, the technical picture continues to look promising for the bulls, after XAU/USD broke to the north of a long-term pennant structure and has since retraced to retest the pennant. Some technicians may view this retracement as an opportunity to reload on longer-term long positions. But for gold to mount a more meaningful break above November’s highs in the $1875 region, geopolitical tensions will likely need to remain elevated.
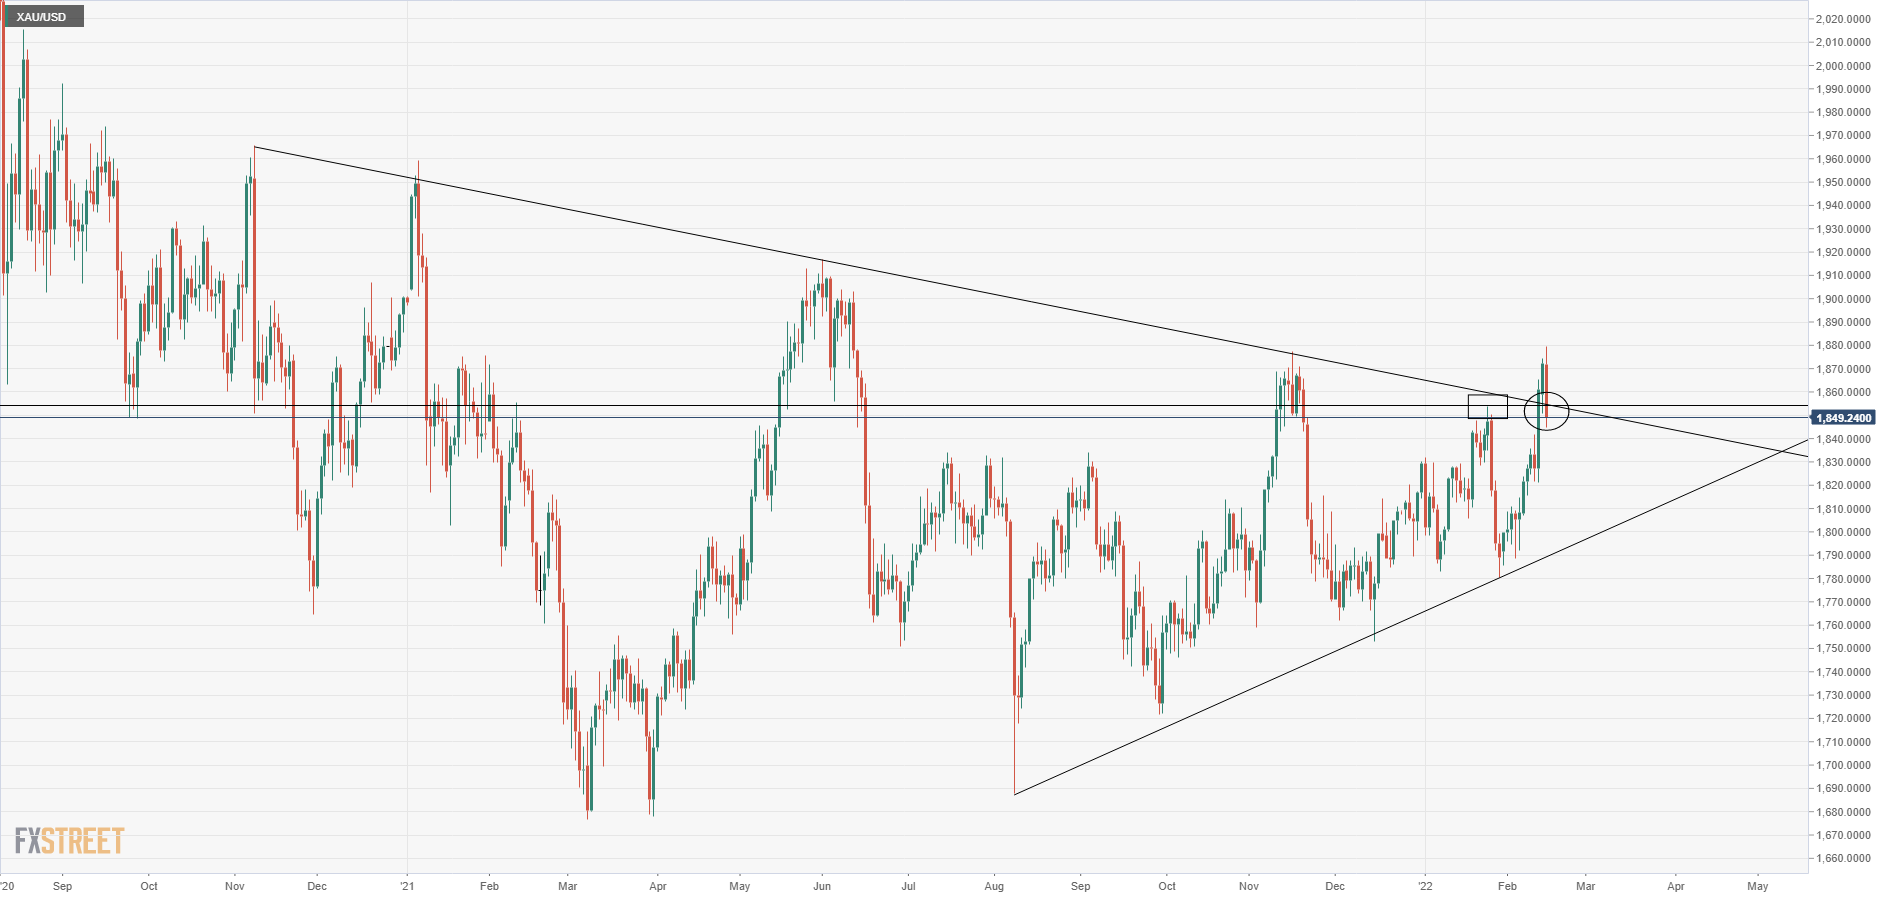
- EUR/USD manages to bounce off recent lows near 1.1280.
- Immediate target comes at the 1.1390 area.
EUR/USD stages a moderate rebound following the pullback to the 1.1280 at the beginning of the week.
Further upside in the pair is expected to revisit the 5-month line in the 1.1390 area. The surpass of this level should alleviate downside pressure and refocus instead on the upside. In such scenario, the next magnet for bulls emerges at the 2022 peak at 1.1494 (February 10).
In the longer run, EUR/USD is expected to keep the negative outlook as long as it trades below the key 200-day SMA, today at 1.1652.
EUR/USD daily chart
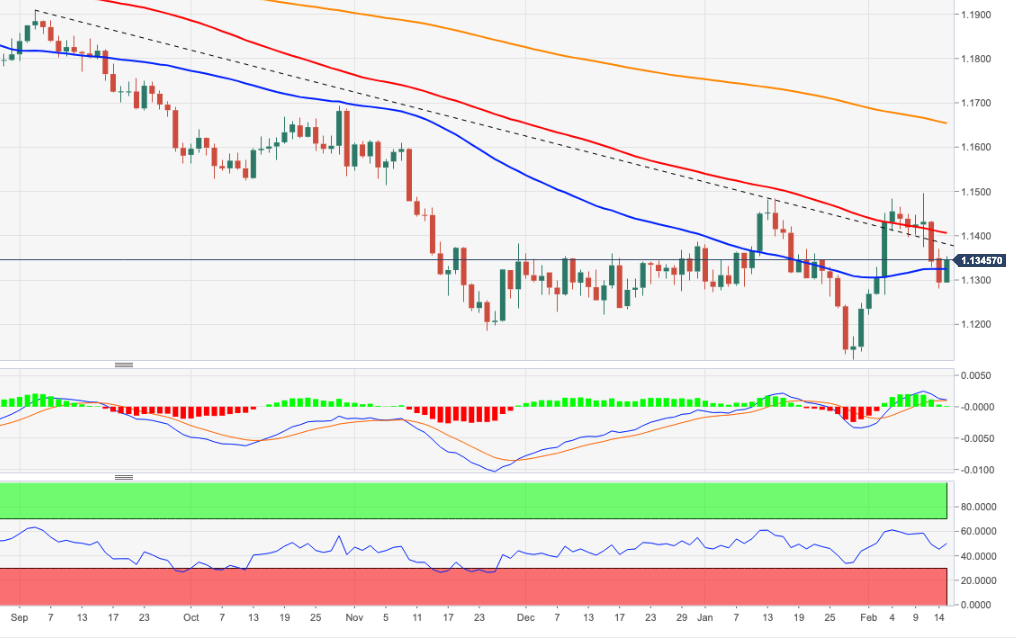
- DXY comes under pressure following recent peaks near 96.50.
- The immediate outlook remains positive above the 5-month line.
DXY gives away part of the recent advance after three daily gains in a row on Tuesday.
If the recovery gains serious traction, then the index is expected to revisit the 96.90 region in the not-so-distant future, an area where the November and December 2021 highs coincide.
In the meantime, the constructive stance should remain well in place as long as the 5-month line near 95.25 holds the downside. In the longer run, the outlook for the dollar is seen as positive above the 200-day SMA at 93.65.
DXY daily chart
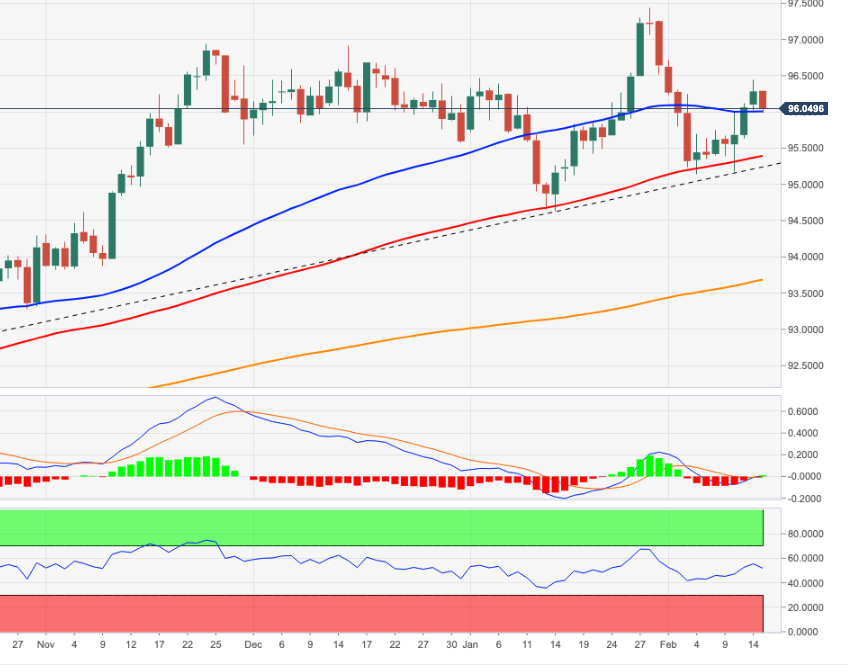
- USD/CHF lacked any firm directional bias and extended its sideways price moves on Tuesday.
- A turnaround in the risk sentiment undermined the safe-haven CHF and extended some support.
- The upside remains capped amid modest USD weakness, though the fundamental favour bulls.
The USD/CHF pair seesawed between tepid gains/minor losses through the mid-European session and was last seen trading in the neutral territory, just below mid-0.9200s.
The pair continued with its struggle to gain any meaningful traction and remained confined in a familiar trading range held over the past one week or so. The USD/CHF pair did get a minor lift during the second half of the trading on Tuesday, though the uptick lacked follow-through buying and ran out of steam near the 0.9270 region.
Fears about a full-blown conflict between Russia and the West over Ukraine receded after the former reportedly said that they are pulling back military troops as some drills have been completed. The headlines led to a dramatic turnaround in the global risk sentiment and undermined traditional safe-haven currencies, including the Swiss franc.
Bulls, however, failed to capitalize on the uptick amid modest US dollar weakness. That said, bets for a faster policy tightening by the Fed, along with the risk-on impulse triggered a fresh leg up in the US Treasury bond yields. In fact, the yield on the benchmark 10-year US government bond shot above the 2% mark and should limit the USD losses.
The fundamental backdrop supports prospects for the emergence of some buying around the USD/CHF pair, though the price action warrants some caution for aggressive bullish traders. Hence, it will be prudent to wait for sustained strength beyond the 0.9270 region before traders start positioning for any meaningful appreciating move.
Next on tap will be the release of the US Producer Price Index (PPI) for January, due later during the early North American session. This, along with the US bond yields, should influence the USD price dynamics. Apart from this, the broader market risk sentiment could produce some short-term trading opportunities around the USD/CHF pair.
Technical levels to watch
- EUR/JPY regains traction and advances above the 200-day SMA.
- Next on the upside comes the YTD high past the 133.00 barrier.
EUR/JPY regains upside traction after two straight sessions closing in the negative territory on Tuesday.
The near-term price action in the cross looks inconclusive for the time being. That said, the upside remains capped by the recent 2022 highs in the 133.10/15 band (February 10), while occasional bearish moves are expected to meet initial contention at the 200-day SMA at 130.45 ahead of the weekly low at 130.04 (February 14).
While above the 2-month support line, today around 128.60, further upside should remain on the table.
EUR/JPY daily chart
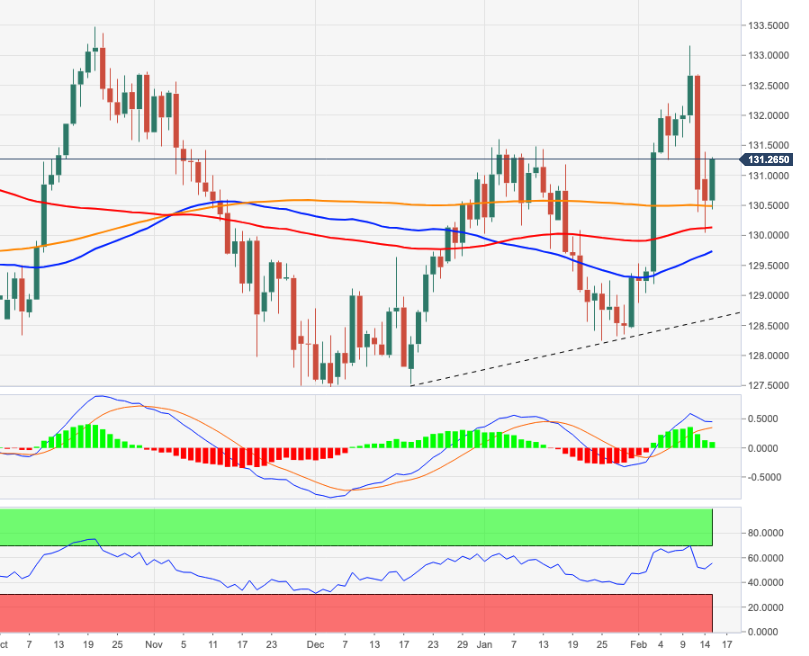
According to Quek Ser Leang at UOB Group’s Global Economics & Markets Research, AUD/USD still risks a potential decline within the next two months.
Key Quotes
“In Dec last year, AUD/USD tried twice but both times failed to break the Nov 2020 low of 0.6990. In Jan this year, AUD/USD dipped below 0.6690 but rebounded sharply from 0.6968. Weekly MACD is ‘vacillating’ and there is no clear AUD/USD direction for now. That said, there are several strong resistance levels on the upside. The levels between 0.7310 and 0.7330 is a solid resistance zone (55-week exponential moving average and declining trend-line). Higher up, the top of the Ichimoku cloud is at 0.7500. The top of the Ichimoku cloud is followed closely by the Oct 2021 high of 0.7556. In other words, while AUD/USD could strengthen from here, the resistance levels mentioned are likely to impede any advance.”
“Conversely, on the downside, if AUD/USD closes below 0.6990 on a weekly basis, it could potentially trigger a swift decline as the next support level is near 0.6760, the 50% retracement of the rally from Mar 2020 low of 0.5510 to Feb 2021 high of 0.8807. Overall, while there is no clear direction at this stage, the risk within these couple of months appears to be greater on the downside.”
According to the Interfax news agency, Russia's military has increased inspections of its units in the rebel-held parts of Ukraine, as reported by Reuters.
Earlier in the session, Russian Foreign Minister Sergei Lavrov said that they will continue the dialogue with the west and added that a result was achievable.
Market reaction
The market mood remains upbeat following these headlines. As of writing, Germany's DAX 30 Index was rising 1.4% on a daily basis, US stock futures were up between 1% and 1.9%.
- A combination of supporting factors assisted USD/JPY to attract some dip-buying on Tuesday.
- A turnaround in the risk sentiment undermined the safe-haven JPY and acted as a tailwind.
- Rallying US bond yields, hawkish Fed expectations support prospects for additional gains.
The USD/JPY pair held on to its modest intraday gains through the first half of the European session and was last seen trading near the daily high, around the 115.60 region.
The pair attracted some dip-buying near the 115.25 area on Tuesday and turned positive for the second successive day, with bulls looking to build on the overnight bounce from the 115.00 mark. The intraday uptick was sponsored by a positive turnaround in the global risk sentiment, which tends to undermine the safe-haven Japanese yen.
The Russian-Ukraine tensions eases after the former said that several military drills have finished and troops near the border have started returning to bases. This helped ease worries about an imminent Russian invasion of Ukraine and triggered a sharp recovery in the equity markets, which, in turn, weighed on safe-haven assets.
Bullish traders further took cues from a fresh leg up in the US Treasury bond yields, though modest US dollar weakness kept a lid on any further gains for the USD/JPY pair. The risk-on flow, along with the prospects for a faster policy tightening by the Fed pushed the yield on the benchmark 10-year US government bond back above the 2.0% threshold.
The markets seem convinced that the US central bank would adopt a more aggressive policy stance to combat stubbornly high inflation and have been pricing in a 50 bps rate hike in March. This, in turn, supports prospects for the emergence of some USD buying at lower levels and a further near-term appreciating move for the USD/JPY pair.
Market participants now look forward to the release of the US Producer Price Index, due later during the early North American session. This, along with the US bond yields, will influence the USD price dynamics. Traders will further take cues from the broader market risk sentiment to grab some short-term opportunities around the USD/JPY pair.
Technical levels to watch
- AUD/USD attracted some dip-buying on Tuesday and was supported by a combination of factors.
- A turnaround in the risk sentiment undermined the safe-haven USD and provided a goodish lift.
- Rising US bond yields, hawkish Fed expectations helped limit the USD losses and capped the pair.
The AUD/USD pair retreated a few pips from the daily high touched in the last hour and was last seen trading just below mid-0.7100s, up over 0.25% for the day.
The pair attracted fresh buying near the 0.7100 mark on Tuesday and rallied to a two-day high during the first half of the European session. A positive turnaround in the global risk sentiment undermined the safe-haven US dollar and turned out to be a key factor that benefitted the perceived riskier aussie.
In the latest geopolitical development, Russia said that several military drills have finished and some troops near the Ukraine border have started returning to bases. The headlines helped ease worries about an imminent Russian invasion of Ukraine, which was evident from a solid rebound in the equity markets.
The risk-on impulse, along with the growing acceptance that the Fed will adopt a more aggressive policy response to combat stubbornly high inflation triggered a fresh leg up in the US Treasury bond yields. In fact, the yield on the benchmark 10-year US government bond jumped back above the 2.0% threshold in the last hour.
This, along with rising bets for a 50 bps Fed rate hike move in March, acted as a tailwind for the greenback and kept a lid on any meaningful upside for the AUD/USD pair, at least for now. This warrants some caution for bullish traders and before positioning for a further intraday appreciating move for the pair.
Market participants now await the release of the US Producer Price Index (PPI) for January, due later during the early North American session. This, along with the US bond yields, should influence the USD demand. Apart from this, the broader market risk sentiment could produce some trading opportunities around the AUD/USD pair.
Technical levels to watch
GBP/USD has reversed its direction after falling all the way down to 1.3500 and recovered above 1.3550. Resolution of the Russia-Ukraine conflict could open the door to 1.3600, FXStreet’s Eren Sengezer reports.
1.3520 seen as the first support
“Market participants will keep a close eye on geopolitics and GBP/USD could face renewed bearish pressure if safe-haven flows start to flood the markets.”
“GBP/USD needs to clear 1.3550/1.3560 resistance (200-period SMA, Fibonacci 23.6% retracement) to extend its recovery. Above that level, 1.3600 (psychological level, static level) aligns as the next bullish target ahead of 1.3620 (static level).”
“On the downside, 1.3520 (Fibonacci 38.2% retracement) could be seen as the first support before 1.3500 (psychological level, Fibonacci 50% retracement) and 1.3470 (Fibonacci 61.8% retracement).”
See: GBP/USD to slide below 1.34 towards 1.32 on a Russian invasion of Ukraine – Scotiabank
- German ZEW Economic Sentiment arrived at 54.3 in February, up from 51.7 previous.
- The ZEW Current Situation for Germany came in at -8.1 in February vs -10.2 in January.
- EUR/USD holds higher ground near 1.1350 on mixed German and Eurozone data.
The German ZEW headline numbers for February showed that the Economic Sentiment Index jumped again, registering 54.3 from 51.7 previous while missing estimates of 55.0.
Meanwhile, the Current Conditions sub-index slowed its pace of decline to -8.1 in February as against -10.2 recorded in the previous month and -6.0 expectations.
The Eurozone ZEW Economic Sentiment rose to 48.6 for the current month as compared to the 49.4 previous reading.
Separately, the second estimate of the bloc’s Q4 Gross Domestic Product (GDP) came in at 0.3% QoQ vs. 0.3% expected and 0.3% previous.
The Eurozone Employment Change for Q4 arrived at 0.5% QoQ vs. 0.4% expected and 0.9% prior.
FX market reaction
The euro remains unfazed by the mixed ZEW Surveys and Eurozone data. EUR/USD was last seen trading at 1.1350, up 0.42% on the day.
- USD/CAD witnessed some selling on Tuesday amid modest USD weakness.
- Retreating oil prices could undermine the loonie and extend some support.
- Rallying US bond yields should act as a tailwind for the USD and the major.
The USD witnessed some selling during the first half of the European session and dragged the USD/CAD pair to a fresh daily low, around the 1.2710 region in the last hour.
Following an early uptick to the 1.2750 area, the USD/CAD pair met with a fresh supply on Tuesday and moved further away from over one-week high touched the previous day. A positive turnaround in the global risk sentiment weighed on the safe-haven US dollar, which, in turn, was seen as a key factor exerting pressure on the USD/CAD pair.
In the latest geopolitical developments, Russia said that several military drills have finished and some troops have started returning to bases. The headlines helped ease worries about a significant military action/confrontation and triggered a solid rebound in the equity markets, forcing investors to dump traditional safe-haven assets.
The risk-on impulse, along with the prospects for a faster policy tightening by the Fed pushed the yield on the benchmark 10-year US government bond back above the 2.0% mark. This should help limit the USD losses. Apart from this, a sharp pullback in oil prices could undermine the commodity-linked loonie and lend support to the USD/CAD pair.
The fundamental backdrop suggests that the path of least resistance for the pair is to the upside and warrants some caution for aggressive bearish traders. Hence, any subsequent slide might still be seen as an opportunity to initiate bullish positions around the USD/CAD pair and remain cushioned, at least for the time being.
Market participants now await the release of the US Producer Price Index (PPI) for January, due later during the early North American session. This, along with the US bond yields, should influence the USD demand. Apart from this, traders will take cues from oil price dynamics to grab some short-term opportunities around the USD/CAD pair.
Technical levels to watch
In an Economic Bulletin article published on Tuesday, the European Central Bank (ECB) warned against the negative impact of any gas supply disruption on the Eurozone’s economic growth.
Key takeaways
“Expect high energy prices would reduce eurozone economic output by around 0.2% this year, compared with baseline levels of GDP, with the biggest impact in the first quarter.”
“Negative economic impacts would be aggravated if the bloc loses some of its gas supply.”
“The direct and indirect impact of a hypothetical 10% gas rationing shock on the corporate sector is estimated to reduce euro area gross value added by about 0.7%,”
“Austria and Slovakia would take the biggest hit.”
developing story ....
EUR/USD has regained its traction after dropping below 1.1300 on Monday. But as FXStreet’s Eren Sengezer notes, the pair needs to clear 1.1350 to extend recovery.
1.1320 aligns as the first support level
“In case EUR/USD the 1.1350 resistance, where the Fibonacci 38.2% retracement of the latest uptrend and the 200-period SMA on the four-hour chart meet rises above that level and starts using it as support, it could target 1.1400 (psychological level, Fibonacci 23.6% retracement).”
“On the downside, 1.1320 (100-period SMA) aligns as the first support level before 1.1300 (psychological level, Fibonacci 50% retracement) and 1.1260 (Fibonacci 61.8% retracement).”
See – EUR/USD: Constructive outlook while above January lows of 1.1121 – DBS Bank
UOB Group’s Senior Economist Julia Goh and Economist Loke Siew Ting reviews the latest GDP figures in the Malaysian economy.
Key Takeaways
“Real GDP rebounded by +3.6% y/y in 4Q21 (3Q21: -4.5%). This came in lower than our estimate (4.3%) but higher than Bloomberg consensus (3.3%). On a seasonally adjusted quarterly basis, real GDP rose by 6.6% q/q (3Q21: -3.6%). This brings full-year GDP growth to 3.1% in 2021 (2020: -5.6%), below our projection (3.3%) and Bloomberg consensus (3.4%).”
“4Q21’s GDP was lifted by improvements in the manufacturing (+9.1%), services (+3.2%), and agriculture (+2.8%) sectors. Meanwhile, construction (-12.2%) and mining (-0.9%) declined further. Higher private consumption (+3.7%) provided a fillip as the economy reopened across almost all states of Malaysia last quarter amid higher vaccination rates. Interstate travelling resumed in Dec 21 which helped revive domestic tourism. Investments contracted further while net trade grew.”
“We continue to expect a pick-up in growth to 5.5% in 2022 albeit the path will not be smooth as pandemic risks linger. External challenges also arise with heightened market volatility as global central banks embark on monetary policy normalisation. Our 2022 growth outlook is in line with official forecasts of 5.5%-6.5%, but lower than market consensus of 6.1% (based on Feb estimates).”
- EUR/USD picks up pace on alleviated geopolitical jitters.
- The dollar loses some shine on Russia-Ukraine headlines.
- EMU Flash Q4 GDP, ZEW Economic Sentiment next on tap.
Fresh headlines citing Russian troops are now expected to return to their base lend much-needed oxygen to EUR/USD and lifts it to fresh tops in the mid-1.1300s on Tuesday.
EUR/USD up on risk-on mood
EUR/USD reverses the recent weakness and manages to regain upside traction and reclaim the area beyond the 1.1300 barrier on Tuesday.
The current uptick in spot comes on the back of mitigating concerns around the Russia-Ukraine conflict, which at the same time have removed tailwinds from the greenback and the rest of the safe haven universe.
The recovery in the pair is also accompanied by another uptick in yields of the German 10y Bund, this time retaking the 0.30% region and approaching the recent area of more than 3-year highs recorded on February 10. In the US money markets, the appetite for riskier assets also lifts US yields to the area of recent peaks across the curve.
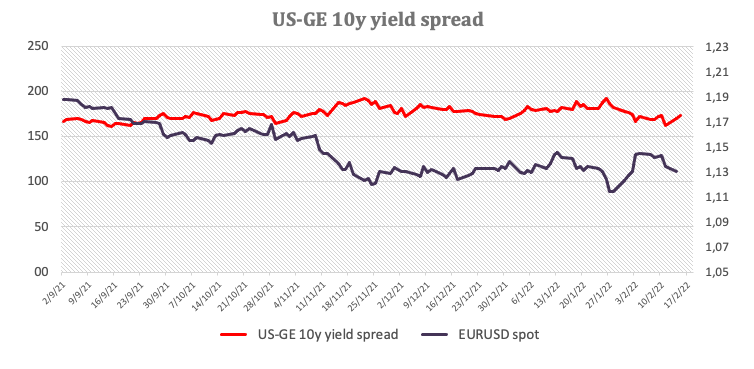
It will be an interesting day data wise in Euroland, where the ZEW survey is due in Germany and the bloc seconded by another revision of the Q4 GDP in the euro area. Across the Atlantic, Producer Prices, the NY Empire State Index and TIC Flows are all due later in the NA session.
What to look for around EUR
EUR/USD could not sustain the post-US CPI raise to the vicinity of the 1.1500 barrier, sparking a corrective move to the sub-1.1300 area on the back of the renewed and quite strong bias towards the US dollar. Despite the ongoing knee-jerk, the improvement in the pair’s outlook appears underpinned by fresh speculation of a potential interest rate hike by the ECB at some point by year end, higher German yields, persevering elevated inflation and a decent pace of the economic activity and other key fundamentals in the region
Key events in the euro area this week: Advanced EMU Q4 GDP, EMU/Germany ZEW Economic Sentiment (Tuesday) – EMU Industrial Production (Wednesday) – Flash EMU Consumer Confidence (Friday).
Eminent issues on the back boiler: Asymmetric economic recovery post-pandemic in the euro area. Speculation of ECB tightening/tapering later in the year. Presidential elections in France in April. Geopolitical concerns from the Russia-Ukraine conflict.
EUR/USD levels to watch
So far, spot is advancing 0.34% at 1.1344 and faces the next up barrier at 1.1388 (10-day SMA) followed by 1.1491 (200-week SMA) and finally 1.1494 (2022 high Feb.10). On the other hand, a drop below 1.1279 (weekly low Feb.14) would target 1.1186 (monthly low Nov.24 2021) en route to 1.1121 (2022 low Jan.28).
EUR/PLN has suffered a sharp fall in February. Economists at Danske Bank lower their forecasts for the pair though they still expect EUR/PLN to move higher over the coming months.
Zloty to enjoy support from NBP tightening in the near-term
“We think that the PLN will continue to enjoy support from NBP tightening at least in next 3M and forecast unchanged or slight lower EUR/PLN. However, beyond that, we think global risk environment will be hit by more aggressive tightening by Fed and weakening inflation-fighting commitment of NBP as economic prospect of the Polish economy weakens, which will lead to rising EUR/PLN.”
“Or new path for EUR/PLN is 4.52 (from 4.56) in 1M, 4.54 in 3M (from 4.58), 4.58 in 6M (from 4.64) and 4.62 in 12M (from 4.64).”
S&P 500 has staged the expected pullback from the interim hurdle of 4600, the lower limit of previous channel. The index needs to recover this level to see additional gains, economists at Société Générale report.
Critical support aligns at 4300/4280
“S&P 500 is now testing support of 4360, the 61.8% retracement of the rebound. An initial bounce is not ruled out towards 4505 with next resistance at 4600. The index has to establish itself above this to affirm an extended up-move.”
“Last October lows of 4300/4280 will be a crucial support near-term.”
Economists at Danske Bank still see EUR/USD at 1.08 in a 12-month view as policymakers seem increasingly committed to curtail global inflation by tightening financial conditions.
Dollar still has the upper hand
“We keep our current forecast on EUR/USD unchanged at 1.08 in 12M as we see policy makers as having become increasingly committed to curtail global inflation by tightening financial conditions; and further, the economic cycle is slowing. Thus, we see the surprise potential for the European economy as small.”
“The key risk to see EUR/USD towards 1.20 is seeing global inflation pressures fade and industrial production increase.”
“The risk to take EUR/USD below 1.08 is a scenario where central banks tightens further amid a cyclical slowdown, akin a scenario like seen in early 80’s.”
USD/INR has rebounded strongly from 73.80. Economists at Société Générale expect the pair to target 75.95 and the December peak of 76.40.
Holding 75.00 is crucial to see further gains
“USD/INR has overcome the daily Ichimoku cloud (now at 75.00). Next potential hurdles are at projections of 75.95 and December peak of 76.40.”
“Defending 75.00 is essential for further up move.”
Economists at UBS recommend considering geopolitical hedges, including commodities. They expect the USD/RUB to enjoy considerable gains in case of further escalations in the Russia-Ukraine conflict.
Oil prices to rise further this year
“Energy prices would likely rise in the event of a supply disruption, and regardless of the situation in Ukraine we expect oil prices to rise further this year thanks to rising demand and somewhat constrained supply.”
“Alternative ‘geopolitical hedges’ include investments in cybersecurity, given that cyber warfare between state actors could play a role in any conflict, or establishing short positions in the Russian ruble.”
“We would expect USD/RUB to reach 80-90 in the event of an escalation, but we note the risk premium incorporated in the ruble has risen to a significant extent already so such a hedge could come at a high cost if tensions ease.”
“Any further aggression in Europe could also favor a traditional safe haven like the Japanese yen over the euro.”
USD/CNH is still seen navigating within the 6.3520-6.3670 range in the next weeks, noted FX Strategists at UOB Group.
Key Quotes
24-hour view: “USD traded between 6.3555 and 6.3675 yesterday, narrower than our sideway-trading range of 6.3550/6.3730. Further sideway-trading appears likely, expected to be within a range of 6.3520/6.3670.”
Next 1-3 weeks: “There is no change in our view from last Monday (07 Feb, spot at 6.3600). We continue to view the current movement as part of a consolidation phase and expect USD to trade between 6.3400 and 6.3805 for now.”
EUR/USD failed to reclaim the peak of January near 1.1485 after which a pullback is underway. The pair is approaching towards 1.1260, the 61.8% retracement of the bounce. A break below here would open up losses to the recent low of 1.1120, economists at Société Générale report.
Immediate hurdles are at 1.1365 and 1.1415
“Daily MACD has been posting positive divergence denoting receding downward momentum.”
“Short-term, failure to hold 1.1260 could result in further pullback towards 1.1210 and recent low of 1.1120.”
“Immediate hurdles are at 1.1365 and 1.1415.”
- GBP/JPY gained traction on Tuesday and built on the overnight recovery from a one-week low.
- A turnaround in the risk sentiment undermined the safe-haven JPY and provided a goodish lift.
- The UK-EU impasse over the NI Protocol warrants some caution for aggressive bullish traders.
The GBP/JPY cross rallied over 70 pips from the early European session low and shot back closer to the overnight swing high, around the 156.70 region in the last hour.
Following an early dip to sub-156.00 levels, the GBP/JPY cross attracted fresh buying on Tuesday and is now looking to build on the overnight goodish rebound from the 155.30 area, or a one-week low. The latest leg of a sudden spike over the past hour or so could be attributed to a turnaround in the risk sentiment, which tends to undermine the safe-haven Japanese yen.
In the latest developments, Russia said that several military drills have finished and some troops near Ukraine have started returning to bases. This helped ease worries about an imminent Russian invasion of Ukraine and triggered a solid rebound in the equity markets, which, in turn, drove flows away from traditional safe-haven currencies, including the JPY.
On the other hand, the British pound was supported by a more hawkish Bank of England and mostly in-line UK jobs data released earlier this Tuesday. The UK Office for National Statistics reported that the number of people claiming unemployment-related benefits fell 31.9K in January and the Unemployment Rate held steady at 4.1% during the three months ending December.
That said, tensions over the Northern Ireland protocol of the Brexit agreement might hold back traders from placing aggressive bullish bets and cap gains for the GBP/JPY cross. Hence, it will be prudent to wait for strong follow-through buying before confirming that the recent corrective pullback from a multi-month high, around the 158.00 mark has run its course.
Technical levels to watch
Geopolitics has been a headwind for the Russian rouble – especially over the last month. Economists at Danske Bank expect the USD/RUB to surge above the 85.00 level in a full war scenario in Ukraine.
Mild escalation to take USD/RUB to the 77-80 area
“On net, the tail risks for RUB weakening (war in Ukraine) are substantial but have not been realized. In a worst-case full war scenario, we see USD/RUB moving above 85.00 whereas a mild escalation would take spot to 77-80-area.”
“Expect spot to remain volatile and gab risk is present.”
“We keep our RUB-positive forecast, which is also supported by our continued expectation to politicians finding a compromise vis-à-vis Ukraine.”
“An abrupt repricing of the risk premium in RUB on the back of a deterioration in the geopolitical situation, and/or a substantial global dollar strength are likely risks – and these should not be neglected.”
“A number of drills have finished, troops are expected to return to bases,” Interfax reports, citing Russia’s military.
Additional headlines
“It continues set of drills involving almost all districts and navies.”
“Some units of western and southern military districts have started returning to bases.”
Market reaction
The risk sentiment got a much-needed boost from these headlines, as S&P 500 futures jumped to daily highs of 4,432, up 0.70% on the day.
AUD/USD is rebounding to test 0.7150, gaining 0.30% so far.
With a hawkish shift in the European Central Bank (ECB) rhetoric and inflation outlook, economists at HSBC expect a faster QE taper and rate “lift-off” in October. Yet, it is not a “shock and awe” moment for the euro, which remains a low yielder. While for the USD to turn sustainably lower, we would need to see an acceleration in global growth alongside pared back Fed expectations, in their view.
ECB to announce a faster QE taper in March, paving the way for a rate hike in October
“With the inflation outlook and change in ECB tone, we now expect a faster ECB QE taper to be announced in March, with net asset purchases ending completely in Q4, shortly before a rate rise of 25bp in October.”
“Inflation is high in the Eurozone and elsewhere but the former’s growth has struggled to rise above pre-pandemic levels. This should emphasise how the stagflation challenge is more obvious in the Eurozone than in the US, and the ECB hiking rates would do little to change this for the better. This also means the EUR’s yield support would still be low, compared to many other currencies.”
“Taking into account the latest economic data and the Fed's rhetoric, our economists now expect 150bp in Fed hikes in 2022, starting with 50bp in March.”
“We believe as the level of short-term yields rise, the currency should be supported over time. Unless global growth starts accelerating and the Fed pares back tightening expectations, the USD should remain resilient.”
USD/JPY continues to fluctuate between 115.00 and 115.50. Looking ahead, economists at Danske Bank expect the pair to move downward and fall to the 110 level.
Lower on declining commodities and flatter yield curves
“We expect tailwinds for JPY going forward as commodities start to slide and we see further curve flattening ahead.”
“We forecast the cross at 115 in 1M, 113.5 in 3M, 112 in 6M and 110 in 12M.”
EUR/USD has moved to a 1.1495 high from a 1.1123 low. Although the pair remains restrained by 200-week moving average of 1.1493, it is building a constructive falling wedge pattern, as Benjamin Wong, Strategists at DBS Bank, notes.
Range dips to be supported
“Remember that 1.1493 houses a robust 200-week moving average marker. A breakthrough is thus needed to get a nudge past this; the next key resistance is at 1.1560, enroute to 200-day moving average (DMA) of 1.1658.”
“A neckline break has approximated its target landing when EUR/USD traded down to the January lows of 1.1121. On its standard deviation measure, EUR is also displaying a bullish divergence. The pair is as well shielded by the 76.4% Fibonacci retracement support of the 1.0636-1.2349 range grip at 1.1042. This explains why EUR is finding range dip support.”
“EUR’s decline from 1.2266 takes the mould of a falling wedge, which is deemed a bullish reversal but ultimately requires a dose of momentum and acceleration. Given the inability to surmount 1.1495, there is a minor double top to factor in. That should contour a dip into its 61.8% Fibonacci retracement of 1.1495-1.1121 at 1.1264 to get long.”
EUR/GBP has continued to move higher since the beginning of the month. GBP strength has likely come to an end and analysts at Danske Bank see a flat forecast profile at 0.84 in the coming 12 months as well as look for new trends for the cross.
Looking for new trends in EUR/GBP
“Looking forward, on one hand, the positive USD environment is usually benefitting GBP relative to EUR. On the other hand, relative rates now seem supportive for EUR relative to GBP.”
“Overall, we keep our 12M target unchanged at 0.84, while we are looking for new trends in EUR/GBP.”
Here is what you need to know on Tuesday, February 15:
Markets remain relatively quiet early Tuesday following Monday's flight-to-safety as investors remain focused on geopolitics. The greenback is struggling to preserve its strength against its major rivals and US stocks futures trade flat in the European morning. Eurostat will release the euro area GDP growth and Employment Change data for the fourth quarter and the ZEW Survey from Germany will be looked upon for fresh impetus as well. Later in the day, January Producer Price Index (PPI) will be featured in the US economic docket.
Russia's Foreign Minister Sergey Lavrov told President Vladimir Putin in a televised meeting on Monday that it was still possible to find a diplomatic solution. Although these comments helped the market mood improve in the second half of the day, reports showing that Russia has sent thousands more troops to the Ukraine border force investors to stay cautious.
The US Dollar Index, which touched its highest level in nearly two weeks at 96.43 on Monday, is posting small daily losses at 96.20. The benchmark 10-year US Treasury bond yield is virtually unchanged on the day slightly below 2%. St Louis Fed President James Bullard reiterated on Monday that he saw the need for the Fed to hike the policy rate by 100 basis points by July. Meanwhile, Kansas City Fed President Esther George argued that the Fed should weigh asset sales to curb inflation.
EUR/USD fell to a 12-day low of 1.1280 but ended up closing the day a few pips above 1.1300 on Monday. The pair is clinging to modest recovery gains ahead of mid-tier data releases.
GBP/USD closed in the negative territory on Monday but seems to have found support around 1.3500. The data from the UK showed earlier in the day that the ILO Unemployment Rate remained unchanged at 4.1% in three months to December as expected. The Average Earnings Including Bonus edged higher to 4.3% from 4.2% in the same period.
USD/JPY continues to fluctuate between 115.00 and 115.50. Japan's Ministry of Economy, Trade and Industry announced on Tuesday that Industrial Production expanded by 2.7% on a yearly basis in December, matching analysts' forecast.
Gold extended its rally and touched its highest level since June at $1,879. XAU/USD is consolidating its gains above $1,870 heading into the European session.
Bitcoin snapped a four-day losing streak on Monday and extended its rebound toward $44,000. Ethereum added 2% on Monday and was last seen rising more than 4% on the day at $3,050.
Asset prices have moved to price in some degree of military intervention in Ukraine, but are far from embedding a full-fledged Russian invasion. Let's see whether today's Scholz-Putin meeting paves the way for a diplomatic solution – this could hold the dollar back and help pro-cyclicals recover, in the view of analysts at ING.
Scholz-Putin meeting holds key to today's market mood
“Markets will follow very closely today’s meeting between German Chancellor Scholz and Russian President Putin, largely seen as one last chance for the West to mediate a diplomatic solution. Meanwhile, the US has pledged to provide substantial financial help to Ukraine in case of invasion.”
“There is a considerable amount of downside risk for high-beta currencies, and in particular, the European ones, should tensions escalate further. Oil’s rally can offer some shield to Canada's dollar and Norway's krone.”
“While indications that the Ukrainian situation may be heading to a diplomatic solution could help pro-cyclical currencies recover and lift some support from safe-havens (including the dollar), we expect the narrative around frontloading of tightening by the Federal Reserve to put a floor under the dollar in the near term even if the geopolitical risk is priced out.”
- NZD/USD caught fresh bids on Tuesday and snapped three successive days of the losing streak.
- Modest USD weakness extended some support to the major, though the upside seems limited.
- Hawkish Fed expectations, geopolitical tensions to act as a tailwind for the buck and cap gains.
The NZD/USD pair maintained its bid tone through the early European session and was last seen trading near the daily high, around the 0.6625-0.6630 area.
The pair gained some positive traction on Tuesday and recovered a part of the previous day's slide to sub-0.6600 levels, or over a one-week low. The uptick assisted the NZD/USD pair to snap three consecutive days of the losing streak and was sponsored by modest US dollar weakness. That said, any meaningful upside still seems elusive amid the prospects for a faster policy tightening by the Fed and geopolitical tensions.
The markets seem convinced that the Fed would adopt a more aggressive policy response to combat high inflation and have been pricing in a 50 bps rate hike in March. The bets were reinforced by the red-hot US CPI released last week and comments from St. Louis Fed President James Bullard, who reiterated calls for a faster pace of interest rate hikes. This, along with a softer risk tone, should act as a tailwind for the greenback.
The mobilising of Russian troops to forward locations on the Ukraine border fueled worries about a significant military action/confrontation. This, in turn, continued weighing on investors' sentiment, which was evident from the cautious mood around the equity markets. Hence, it will be prudent to wait for strong follow-through buying before confirming that NZD/USD pair's recent pullback from the monthly high has run its course.
Market participants now look forward to the release of the US Producer Price Index (PPI) for January, due later during the North American session. Apart from this, the market focus will be on fresh geopolitical developments, which will play a key role in influencing the broader market risk sentiment. This would drive the USD demand and produce some meaningful trading opportunities around the NZD/USD pair.
Technical levels to watch
EUR/NOK has overall traded quite volatile the past month and is currently trading below the 10.10 level. Analysts at Danske Bank continue to expect the pair to move higher going into 2022 on the back of a shift in the global investment environment, tighter global liquidity conditions, less fiscal NOK buying and shakier risk appetite leaving NOK vulnerable to negative news.
Topside favoured given the external environment
“We still think the balance of risk favours the topside in EUR/NOK. We face a record tightening of global liquidity and monetary conditions in order to fight inflation at a time where the global economy was already slowing. In such an environment, NOK rarely does well and short-term this is only worsened by geopolitical risks. Also, NB is likely to turn a considerable net krone seller of NOK500-800M later in the year.”
“We forecast EUR/NOK at 10.20 in 1M (from 9.90), 10.30 in 3M (from 10.20), 10.40 in 6M (unchanged) and 10.40 in 12M (unchanged).”
The Australian dollar has been the worst-performing G10 currency in today’s Asian session as iron ore prices dropped by more than 10%. Economists at ING expect the AUD to stay under pressure as iron ore prices are set to move downward.
China's stance against iron ore speculation clouds the outlook
“Today’s signal from Chinese authorities is clear: a recovery in activity will not be accompanied by another big rally in commodity prices. This limits the upside potential from iron ore despite an expected rise in steel production, with direct and indirect intervention against price speculation from Beijing likely to be the new normal.”
“Our commodities team continues to favour a gradual contraction in iron ore prices and warns of the material possibility of seeing sub-100$/t levels by year-end. This should limit any sustained rally in the aussie dollar for most of 2022.”
“For today, AUD/USD may hold above 0.7100 unless the Ukrainian situation deteriorates.”
EUR/SEK has continued its move higher on rebalancing flows and monetary policy divergence. With a dovish repricing of the Riksbank and outlook of global growth decelerating, economists at Danske Bank remain bearish on the krona in the medium-term and target EUR/SEK at 10.60 in 12 months.
Relaxed Riksbank
“In coming months, we expect core inflation in Sweden to rise above the Riksbank’s new forecast. If we are right, markets will probably continue pushing for hikes and that the Riksbank will eventually yield. This, alongside stabilizing risk sentiment, have the potential to push EUR/SEK slightly lower in 1-3M.”
“With a longer horizon, we expect inflation to fall back below target and from that perspective markets’ expectations are still too aggressive – a headwind for the krona.”
“On balance, we still see a slightly stronger SEK short-term, targeting 10.30 in 3M. Medium-term, dovish repricing of the Riksbank and global growth deceleration eventually takes the cross towards 10.60 by year-end.”
- GBP/USD regained positive traction on Tuesday and reversed a major part of the overnight losses.
- The uptick lacked bullish conviction and seemed rather unaffected by mostly in-line UK jobs data.
- Hawkish Fed expectations, geopolitical tensions underpinned the safe-haven USD and capped gains.
The GBP/USD pair held on to its modest intraday gains around the 1.3535 region and had a rather muted reaction to the UK employment details.
Having shown some resilience below the key 1.3500 psychological mark, the GBP/USD pair attracted some buying on Tuesday and reversed a major part of the overnight losses to a one-week low. The uptick, however, lacked bullish conviction and also seemed rather unaffected by mixed UK jobs report.
According to the data released by the UK Office for National Statistics this Tuesday, the number of people claiming unemployment-related benefits fell by 31.9K in January as against 43.3K previous. Adding to this, the ILO Unemployment rate held steady at 4.1% during the three months ending December.
Additional details revealed that Average Earnings decelerated further in December, though were slightly better than market expectations. This, however, did little to provide any meaningful impetus to the British pound or assist the GBP/USD pair to capitalize on its modest intraday uptick.
Worries over an imminent Russian invasion of Ukraine continued weighing on investors' sentiment. This, along with the prospects for a faster policy tightening by the Fed, acted as a tailwind for the safe-haven US dollar and kept a lid on any further gains for the GBP/USD pair, at least for now.
Market participants now look forward to the release of the US Producer Price Index (PPI) for January, due later during the North American session. Apart from this, the focus will be on geopolitical developments, which might influence the USD and produce trading opportunities around the GBP/USD pair.
Technical levels to watch
- Asia-Pacific shares trade mixed as China, India entertain bulls amid broad risk-off mood.
- CNY injects CNY 300 billion via one-year MLF, India cancels weekly debt auction for the second consecutive time.
- Japan’s Q4 2021 GDP eased below forecasts, RBA Minutes repeated policymakers’ concerns to remain patient.
- US, EU stock futures print mild losses, Treasury yields are down too.
Markets in Asia-Pacific region portray sour sentiment, except for China and India, amid escalating concerns of Russia’s imminent invasion of Ukraine. Also challenging the risk appetite are the headlines suggesting faster Fed rate-hike and US-China trade tussles.
Amid these plays, the MSCI’s index of Asia-Pacific shares ex-Japan drops 0.40% whereas Japan’s Nikkei 225 prints 0.80% intraday losses while heading into Tuesday’s European session.
Headlines conveying satellite images of multiple pre-war measures near the Russia-Ukraine border seem to have recently spoiled the market’s mood. It’s worth noting that the chatters over February 16 being the D-day for the Russian invasion of Ukraine have previously weighed on the risk appetite. However, no official communication relating to the same has been found, which in turn keeps markets hopeful of overcoming the recent fears.
Japan’s Preliminary Gross Domestic Product (GDP) for Q4 rose 1.3% QoQ versus 1.4% expected and -0.9% prior. Further, GDP Annualized also reversed the previous readouts of -3.6% with +5.4% figures but stayed below 5.8% market consensus. Further, the preliminary readings of GDP Deflator dropped to -1.3% YoY, below -1.2% expected and prior.
Also decorating the calendar were RBA Minutes and Indonesia trade numbers. The latest Minutes of the Reserve Bank of Australia (RBA) monetary policy meeting stated, “Members observed that the achievement of the goals was within sight for the first time in several years.” However, the comments line, “Board is prepared to be patient as it monitors how the various factors affecting inflation in Australia evolve,” favored ASX 200 to trim losses, down 0.50% intraday at the latest.
On the other hand, Indonesia’s Exports dropped below 33.86% expected and 35.3% prior to 25.31% whereas the Imports declined to 36.77% versus 51.38% market consensus and 47.93% previous readouts. However, Trade Balance improved to $0.93B compared to the $0.19B forecasts, versus $1.02B prior. This seems to help IDX Composite, coupled with gains in China, to rise 0.75% on a day.
Moving on, the People’s Bank of China (PBOC) injected CNY300 billion via one-year medium-term lending (MLF) facility. In doing so, the Chinese central bank kept the rate for one-year MLF operation rate unchanged at 2.85% after cutting it from 2.95% last month. The same favored stocks in China and Hong Kong.
It should be noted that the Indian government’s cancellation of the weekly debt auction also renewed optimism in the local markets and favored BSE Sensex to rise 1.40% by the press time.
On a broader front, risk-off mood the US Treasury yields pare intraday losses around 1.98%, down 1.5 basis points (bps), whereas the S&P 500 Futures remain indecisive at the latest. On Monday, the bond coupons regained upside momentum after stepping back from a 2.5-year high on Friday whereas the Wall Street benchmark closed in the red, despite mildly positive week-start performance.
Read: US T-bond yields fade week-start rebound, S&P 500 Futures remain indecisive
- The unemployment rate in the UK remained unchanged at 4.1% in December.
- UK claimant count change arrived at -31.9K in January.
- The UK wages excluding bonuses fell to 3.7% YoY 3.6% expected.
The Office for National Statistics (ONS) showed on Tuesday, the UK’s official jobless rate arrived at 4.1% in December vs. the previous 4.1% and 4.1% expected while the claimant count change showed a smaller than previous drop last month.
The number of people claiming jobless benefits fell to -31.9K in January when compared to -51.6K booked previously. The claimant count rate came in at 4.6% vs. 4.6% last.
The UK’s average weekly earnings, excluding bonuses, arrived at 3.7% 3Mo/YoY in December versus +3.8% last and +3.6% expected while the gauge including bonuses came in at 4.3% 3Mo/YoY in December versus +4.2% previous and +3.9% expected.
Key points (via ONS)
“In quarter four (Oct to Dec) 2021, output per hour worked was 2.3% above levels recorded prior to the coronavirus.”
“Output per worker was above the 2019 average level for the first time since the coronavirus pandemic began, growing 0.8% on 2019 and 1.1% quarter-on-quarter.“
“The UK output per hour worked +0.5% QoQ, +1.0% YoY in Q4 2021.”
GBP/USD reaction
GBP/USD keeps its range intact at around 1.3530 on the upbeat UK jobs report.
The spot was last seen trading at 1.3537, up 0.09% on the day.
About UK jobs
The UK Average Earnings released by the Office for National Statistics (ONS) is a key short-term indicator of how levels of pay are changing within the UK economy. Generally speaking, the positive earnings growth anticipates positive (or bullish) for the GBP, whereas a low reading is seen as negative (or bearish).
XAU/USD approaches $1,900. Gold buyers are likely to keep reins, however, RSI conditions may test the bulls, FXStreet’s Haresh Menghani reports.
XAU/USD bulls could target $1,900 amid Russia-Ukraine tensions
“Market participants will further take cues from geopolitical developments, which will continue to play a key role in driving the broader market risk sentiment and demand for the safe-haven XAU/USD.”
“Some follow-through strength towards an intermediate resistance near the $1,888 area, en-route the $1,900 mark, remains a distinct possibility. That said, RSI on the daily chart has moved on the verge of breaking into the overbought territory and warrants some caution for aggressive bullish traders.”
“The $1,868-$1,867 region now seems to protect the immediate downside ahead of the $1,858 area. Any further decline would now be seen as a buying opportunity and is more likely to remain limited near the $1,850-$1,848 zone. A convincing break below the latter might trigger a corrective pullback towards the next relevant support near the $1,832-$1,830 region.”
See – Gold Price Forecast: XAU/USD to climb as high as $1,923/1,930 – SocGen
- DXY gives away some gains near 96.20 on Tuesday.
- The Russia-Ukraine standoff remains in the centre of the debate.
- Producer Prices, NY Empire State Index, TIC Flows next on tap.
The US Dollar Index (DXY), which gauges the greenback vs. a bundle of its main competitors, seems to be taking a breather around the 96.20 area on turnaround Tuesday.
US Dollar Index looks to geopolitics
The index eases some ground and fades Monday’s uptick to multi-day highs in the 96.40/45 band. Indeed, rising geopolitical tensions stemming from the Russia-Ukraine conflict coupled with supportive Fedspeak lent extra legs to the dollar’s rebound at the beginning of the week.
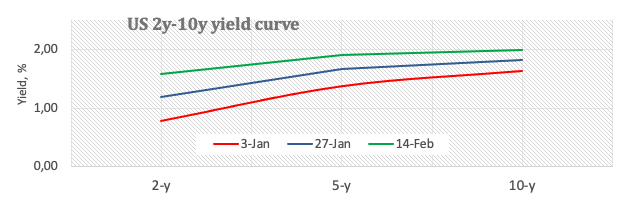
Higher yields, in the meantime, also followed another bout of hawkish rhetoric from St. Louis Fed J.Bullard, who reiterated his preference for a full percentage point of interest rate hikes already by July. On this, and according to MCE Group’s FedWatch Tool, the probability of a 50 bps rate hike at the March 16 meeting is close to 60%, up from nearly 30% just a week ago.
In the US data space, January Producer Prices will take centre stage later in the NA session seconded by the NY Empire State Index and TIC Flows for the month of December.
What to look for around USD
The upside momentum in the greenback remains sustained by geopolitics, higher yields and prospects of Fed tightening as soon as in March. However, the extent and duration of this improvement in the dollar remains to be seen, as much of the current elevated inflation narrative was already priced in by market participants as well as the probability (bigger now) of a 50 bps rate hike by the Fed (instead of the more conventional 25 bps move). Looking at the longer run, and while the constructive outlook for the greenback appears well in place for the time being, recent hawkish messages from the BoE and the ECB carry the potential to undermine the expected move higher in the dollar in the next months.
Key events in the US this week: Producer Prices (Tuesday) – MBA Mortgage Applications, Retail Sales, Industrial Production, NAHB Index, FOMC Minutes (Wednesday) – Building Permits, Housing Starts, Initial Claims, Philly Fed Manufacturing Index (Thursday) – CB Leading Index, Existing Home Sales (Friday).
Eminent issues on the back boiler: Escalating geopolitical effervescence vs. Russia and China. Fed’s rate path this year. US-China trade conflict under the Biden administration. Debt ceiling issue.
US Dollar Index relevant levels
Now, the index is losing 0.07% at 96.22 and a break above 96.43 (weekly high Feb.14) would open the door to 97.44 (2022 high Jan.28) and finally 97.80 (high Jun.30 2020). On the flip side, the next down barrier emerges at 95.17 (weekly low Feb.10) followed by 95.13 (weekly low Feb.4) and then 94.62 (2022 low Jan.14).
- USD/CAD seesaws near intraday high as traders struggle amid sour sentiment.
- WTI crude oil consolidates recent gains around the key resistance line.
- Russia-Ukraine headlines, Canadian politics will be important for near-term directions, Fedspeak, US data should be eyed too.
USD/CAD retreats from intraday surrounding 1.2750 ahead of Tuesday’s European session, printing mild gains after reversing from a one-week top the previous day.
A pullback in the prices of Canada’s key export item, WTI crude oil, seems to underpin the Loonie pair’s latest run-up. That said, WTI prints 0.35% intraday losses around $92.90 by the press time, portraying a pullback from a seven-month-old resistance line amid overbought RSI conditions.
Also favoring the quote could be the gradual recovery from intraday low by the US Dollar Index (DXY), mainly due to the Russia-linked risk-off mood. Headlines conveying satellite images of multiple pre-war measures near the Russia-Ukraine border seem to have recently weighed on the market sentiment, which in turn could have favored the DXY amid faster rate hike expectations from the Fed.
However, hopes of overcoming the truckers’ protests that paralyzed North America’s biggest trade route challenge USD/CAD bears. “Canadian Prime Minister Justin Trudeau on Monday activated rarely used emergency powers in an effort to end protests that have shut some U.S. border crossings and paralyzed parts of the capital,” said Reuters.
Amid these plays, the US Treasury yields are intraday losses around 1.98%, down 1.5 basis points (bps), whereas the S&P 500 Futures remain indecisive at the latest. On Monday, the bond coupons regained upside momentum after stepping back from a 2.5-year high on Friday whereas the Wall Street benchmark closed in the red, despite mildly positive week-start performance.
Looking forward, the US Producer Price Index (PPI) for January, expected 9.1% YoY versus 9.7% prior, as well as the Empire State Manufacturing Index for February, bearing the market consensus of 12 versus -0.7% previous readouts, will direct intraday moves of the USD/CAD pair. However, major attention will be given to Russia-Ukraine headlines and Fedspeak, not to forget weekly oil inventory details and Canadian political news.
Technical analysis
USD/CAD remains sidelined between a six-week-old descending resistance line and the 100-DMA, respectively around 1.2785 and 1.2625. However, bullish MACD signals and recently firmer RSI keep buyers hopeful.
- EUR/USD looks vulnerable while below the 21 and 50-DMAs confluence.
- The Ukraine tensions spook markets, yields drag the USD lower.
- Bearish RSI keeps sellers hopeful, focus shifts to German ZEW Survey.
EUR/USD is losing conviction on its road to recovery above 1.1300, as sellers continue to lurk at higher levels.
The major attempts a rebound, snapping a two-day downtrend, as the US Treasury yields tumble amid a flight to safety into the bonds. This, in turn, is weighing negatively on the US dollar across its main rivals.
The tensions surrounding the Ukrainian crisis intensified, with war drums continue beating, in light of the latest tweets that reported a fresh arrival of war troops, machines near the Ukraine-Russia border.
Markets will continue to watch over the Russia-Ukraine crisis ahead of the German ZEW Survey and Eurozone GDP revision.
From a short-term technical perspective, the path of least resistance for EUR/USD appears down, as the bears are likely to remain in control so long as the 1.1325 upside barrier holds.
That level is the confluence of the 21 and 50-Daily Moving Averages (DMAs).
Acceptance above the latter will open doors towards the 1.1350 psychological level. The next relevant resistance is seen at 1.1405, the mildly bearish 100-DMA.
EUR/USD: Daily chart

The 14-day Relative Strength Index (RSI), however, remains bearish below the midline, suggesting that sellers will likely maintain control in the near term.
Therefore, a break below Monday’s low of 1.1280, will reopen the downside towards the February 3 low of 1.1267 and the 1.1250 round figure.
EUR/USD: Additional levels to consider
According to FX Strategists at UOB Group, further advance in USD/JPY seems unlikely and the pair could now move into a 114.75-116.05 range.
Key Quotes
24-hour view: “We highlighted yesterday that USD “could retest 115.00 but a sustained decline below this level is unlikely”. Our view was not wrong as USD dropped to 114.99 before rebounding. Downward pressure has eased and USD is likely to consolidate and trade sideways for today, expected to be between 115.10 and 115.80.”
Next 1-3 weeks: “There is not much to add to our update from yesterday (14 Feb, spot at 115.40). As highlighted, the current movement is viewed as part of a consolidation and USD is likely to trade between 114.75 and 116.05 for now. Looking ahead, a break of 114.75 could potentially trigger a deep decline in USD.”
Open interest in natural gas futures markets rose by around 4.3K contracts on Monday, reversing at the same time five consecutive daily pullbacks according to advanced prints from CME Group. On the other hand, volume extended the erratic performance and went down by nearly 190K contracts.
Natural Gas regains the 200-day SMA
Prices of natural gas started the week on a positive footing and regained the $4.00 mark per MMBtu amidst rising open interest. That said, further gains remain in the pipeline in the very near term at least. A sustainable break above the 200-day SMA at $4.22 should underpin that scenario.
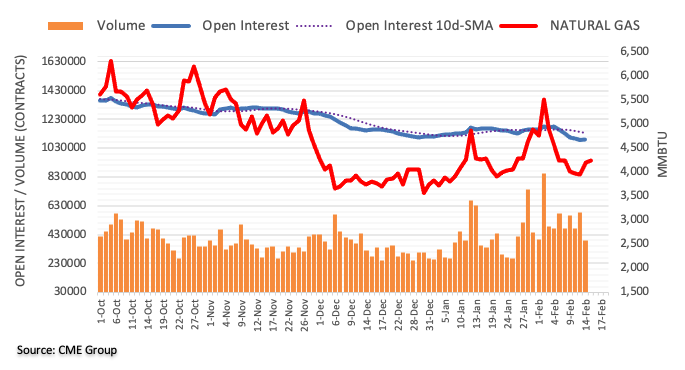
- USD/JPY remains on the back foot around intraday low, fades the previous day’s bounce off triangle’s support.
- Receding bullish bias of MACD, bearish chart pattern keeps sellers hopeful.
- 50-DMA adds to the downside filters, double tops around 116.35 become the key resistance.
USD/JPY portrays the market’s risk-off mood while staying pressured around intraday low, close to 115.30 ahead of Tuesday’s European session.
In doing so, the risk barometer pair attacks a 100-DMA level of 115.30 inside an ascending triangle bearish chart formation established since January 04.
Also keeping the pair bears hopeful are the recently retreating MACD line and the pair’s failures to keep the previous day’s bounce off the stated triangle’s support.
That said, the pair sellers currently eyes the triangle’s support line of 115.10, a break of which will confirm the bearish chart pattern and direct USD/JPY sellers towards the late January’s swing low of 113.46. However, the 115.00 threshold may act as a validation point.
It’s worth noting that the pair’s declines past 113.45 will make it vulnerable to aim for June 2021 peak surrounding 111.65.
Meanwhile, recovery moves may initially target the 116.00 round figure but remain elusive until crossing the latest double tops near 116.35.
Following that, a run-up towards the 120.00 psychological magnet becomes expected. During the rise, the December 2016 peak of 118.66 may act as an intermediate halt.
USD/JPY: Daily chart
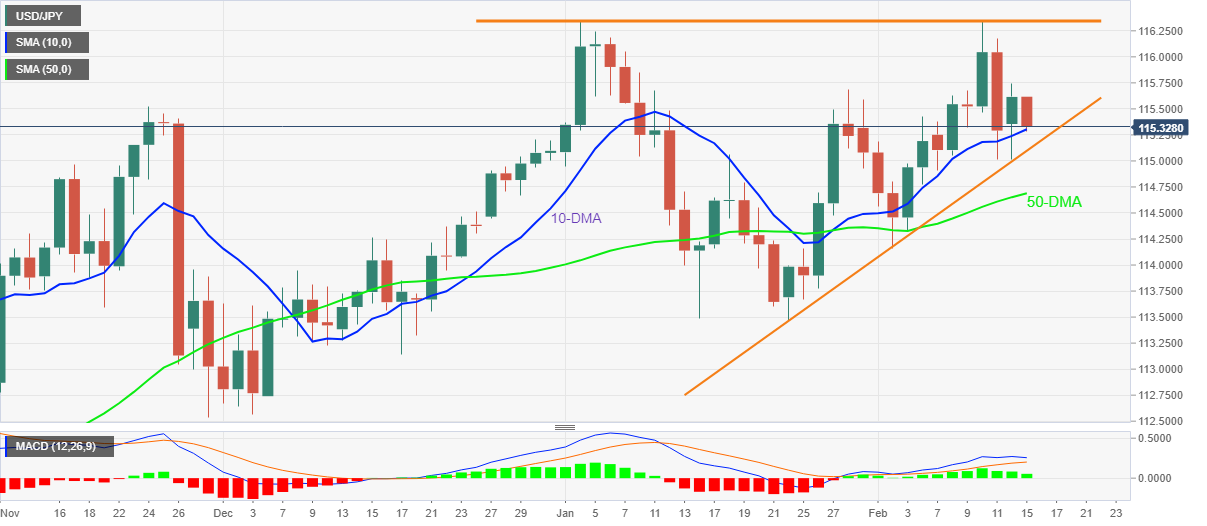
Trend: Further weakness expected
The breakdown of 0.6580 could motivate NZD/USD to slip back to the 0.6550 level in the next weeks, commented FX Strategists at UOB Group.
Key Quotes
24-hour view: “We highlighted yesterday that NZD ‘could dip below 0.6620’. We added, ‘the major support at 0.6580 is not expected to come under threat’. Our view was not wrong as NZD dropped to 0.6593 during early London hours before trading mostly sideways. Downward pressure has waned and NZD is unlikely to weaken much further. For today, NZD is likely to trade sideways, expected to be between 0.6590 and 0.6650.”
Next 1-3 weeks: “Our latest narrative was from last Friday (11 Feb, spot at 0.6655) where we expect NZD to trade between 0.6580 and 0.6720. NZD dropped to a low of 0.6593 yesterday (14 Feb) and the underlying tone has softened somewhat. From here, a break of 0.6580 could trigger a decline to 0.6550. At this stage, the chance for a break of 0.6580 are not high but it would remain intact as long as NZD does not move above 0.6690 (‘strong resistance’ level) within these few days.”
Considering preliminary readings from CME Group for crude oil futures markets, open interest dropped for the second session in a row, this time by around 18.8K contracts on Monday. In the same line, volume went down by around 397.7K contracts after three consecutive daily builds.
WTI: All eyes point to $100.00/bbl
The rally in crude oil prices remains everything but abated. Monday’s uptick, however, was on the back of shrinking open interest and volume, indicative that the continuation of the uptrend could take a breather in the very near term. The current overbought condition of the commodity also underpins that view. In the meantime, it seems that a test of the key $100.00 mark per barrel is a question of when rather and if.
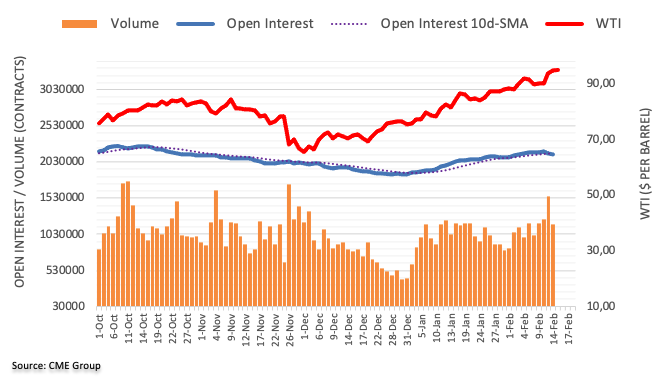
GBP/USD is expected to keep trading between 1.3450 and 1.3645 in the next weeks, suggested FX Strategists at UOB Group.
Key Quotes
24-hour view: “Our expectations for GBP to ‘trade sideways between 1.3530 and 1.3610’ yesterday were incorrect as it dropped to 1.3495 before rebounding to close at 1.3532 (-0.21%). Despite the decline, downward momentum has barely improved and GBP is unlikely to weaken much further. For today, GBP is more likely to trade between 1.3490 and 1.3570.”
Next 1-3 weeks: “Our view from last Friday (11 Feb, spot at 1.3550) still stands. As highlighted, GBP is likely trade between 1.3450 and 1.3645 for now.”
CME Group’s flash data for gold futures markets noted investors added around 14.6K contracts to their open interest positions on Monday, reaching the sixth consecutive daily build. Volume, instead, reversed two daily builds in a row and shrank by around 12.3K contracts.
Gold: On its way to $1,900
Gold clinched new 2022 highs past the $1,870 mark at the beginning of the week. The leg higher was amidst rising open interest, which remains supportive of potential further upside in the very near term. Against that, the immediate hurdle emerges at the $1,900 mark per ounce troy.
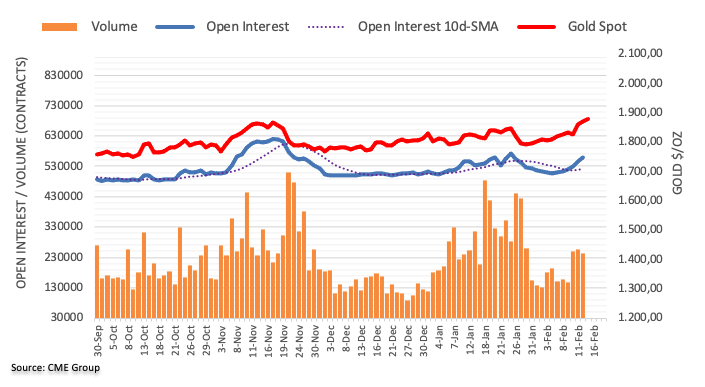
- Gold renews eight-month high on the way to $1,900, prints three-day uptrend.
- Chatters that Russian invasion of Ukraine becomes imminent joins softer yields to keep buyers hopeful.
- Hawkish Fedspeak challenges upside momentum, a daily closing beyond $1,878 become necessary for the bulls.
- Gold Price Forecast: Gold recovers its shine as geopolitical tensions escalate
Gold (XAU/USD) cheers the market’s rush for risk-safety while ticking up to refresh multi-day peak around $1,880 ahead of Tuesday’s European session, near $1,878 by the press time.
Fears of the imminent Russian invasion of Ukraine join chatters surrounding faster rate hikes by the Fed to direct traders towards gold. Also favoring gold buyers is the softer US Dollar Index (DXY), backed by downbeat Treasury yields.
Read: US Dollar Index retreat from fortnight high towards 96.00 as yields ease
The recent push to gold prices towards the north was from the headlines conveying satellite images of multiple pre-war measures near the Russia-Ukraine border.
Further, comments from St. Louis Fed President James Bullard also weigh on the risk appetite. Fed’s Bullard repeated his call for 100 basis points (bps) in interest rate hikes by July 1 by citing the last four inflation reports which show broadening inflationary pressures.
That said, the US Treasury yields consolidate the previous day’s recovery moves with the fresh drop to 1.979%, down 1.7 basis points (bps), whereas the S&P 500 Futures print mild gains by the press time. On Monday, the bond coupons regained upside momentum after stepping back from a 2.5-year high on Friday whereas the Wall Street benchmark closed in the red, despite mildly positive week-start performance.
Moving on, the US Producer Price Index (PPI) for January, expected 9.1% YoY versus 9.7% prior, as well as the Empire State Manufacturing Index for February, bearing the market consensus of 12 versus -0.7% previous readouts, will direct intraday moves of gold. However, major attention will be given to Russia-Ukraine headlines and Fedspeak.
Technical analysis
Gold pokes November 2021 high amid nearly overbought RSI conditions and bullish MACD signals during early Tuesday morning in Europe.
Given the metal’s sustained break of a descending trend line from June 2021 and clearance of the resistance line of an 11-week-old upward sloping channel, gold buyers are likely to keep reins.
However, RSI conditions may test the bulls, which in turn signal a short-term pullback before the buyers recall the $1,900 threshold on the chart.
During the quote’s rise past $1,900, tops marked during June and January 2021, respectively near $1,917 and $1,960 will be in focus.
Meanwhile, pullback moves may initially aim for the stated channel’s upper line, around $1,868, ahead of resting on the resistance-turned-support line from June, close to $1,850 by the press time.
Even if the gold prices drop below $1,850, 61.8% Fibonacci retracement (Fibo.) of June-August downside, near $1,828, will precede the 200-DMA level of $1,807 to act as the last defense for the bulls.
Gold: Daily chart

Trend: Further upside expected
FX Strategists at UOB Group noted EUR/USD faces a potential drop to the 1.1240 region in the next weeks.
Key Quotes
24-hour view: “We expected EUR to weaken yesterday but we were of the view that ‘the major support at 1.1300 is unlikely to come into the picture’. The anticipated weakness exceeded our expectations as EUR dropped to 1.1278 during late NY session. From here, EUR is likely to weaken further but oversold conditions suggest any decline could be limited to 1.1270. The next major support at 1.1240 is unlikely to come under threat. On the upside, a breach of 1.1350 (minor resistance is at 1.1330) would indicate that the current downward pressure has eased.”
Next 1-3 weeks: “Yesterday (14 Feb, spot at 1.1365), we highlighted downward pressure has increased slightly and we expected EUR to ‘edge lower and test 1.1300’. We did not anticipate the rapid manner by which EUR dropped below 1.1300 (low of 1.1278). Downward momentum has improved and EUR is likely to weaken further. The next level to watch is at 1.1240. Overall, the downward pressure in EUR is intact as long as EUR does not move above 1.1400 (‘strong resistance’ level was at 1.1440 yesterday).”
Early Tuesday morning in Europe, chatters over a satellite image conveying fresh arrival of troops and attack helicopters, ground-attack aircraft and fighter-bomber jets to forward locations on the Russia-Ukraine border gained momentum.
The news from local media also includes, “Ground units also appear to be in attack formations.”
It’s worth noting that an ambiguous date of February 16 is seen as the D-Day for the Russian invasion of Ukraine despite no official confirmation.
Elsewhere, Russian Foreign Minister Sergey Lavrov told President Putin that the US had put forward concrete proposals on reducing military risks and that he could see a way to move forward with talks. However, Russia’s Lavrov also mentioned that EU and NATO responses have not been satisfactory, which in turn highlights risk-off mood despite easing fears.
FX implications
Given the recent market attention on the Russian headlines, such news weigh on the market sentiment and favors risk-safe assets, like gold and the US dollar. Also, oil prices get additional support, other than from softer USD, as supply fears will rise should Russia invade Ukraine.
Read: US T-bond yields fade week-start rebound, S&P 500 Futures remain indecisive
UK Jobs report overview
Early Tuesday, the UK’s Office for National Statistics (ONS) will release the January month Claimant Count figures together with the Unemployment Rate in the three months to December at 07:00 AM GMT.
Given the expectations of another rate hike by the Bank of England, coupled with the upbeat economic growth and inflation fears, today’s jobs report becomes crucial for the GBP/USD pair traders. Also highlighting today’s employment numbers is the cable’s recently sidelined performance above the 100-DMA.
The UK labor market report is expected to show that the average weekly earnings, including bonuses, in the three months to December, ease to 3.9% from the previous figures of 4.2%, while ex-bonuses, the wages are seen declining to 3.6% from 3.8% during the stated period.
Further, the ILO Unemployment Rate is likely to remain unchanged at 4.1% for the three months ending in December. It’s worth noting that the Claimant Count Change figures are likely to improve to -28.0K versus -43.3K prior in January.
Deviation impact on GBP/USD
Readers can find FXStreet's proprietary deviation impact map of the event below. As observed the reaction is likely to remain confined around 20-pips in deviations up to + or -2, although in some cases, if notable enough, a deviation can fuel movements over 60-70 pips.
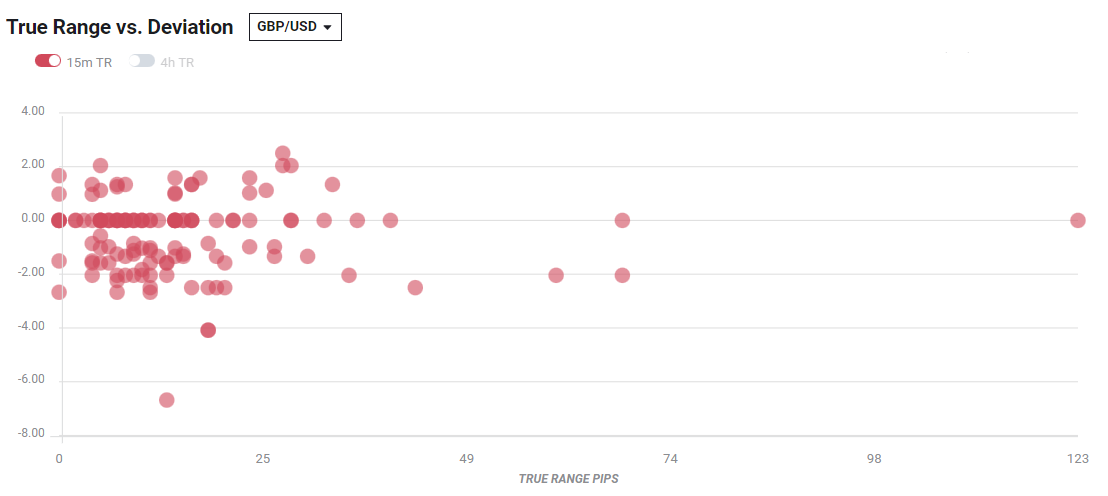
How could they affect GBP/USD?
GBP/USD struggles to justify hawkish BOE concerns amid risk-off mood and Brexit woes of late, which in turn keeps the quote inside a 100-pip trading range between the 100-DMA and 1.3600. That said, the quote recently cheers pullback in the US dollar, due to easy Treasury yields, while printing mild gains around 1.3540 during early Tuesday morning in Europe.
That said, the UK employment data may offer intermediate direction to the GBP/USD prices but may witness a milder response as global markets remain most interested in the Russian updates and Fedspeak in recent times. Even so, firmer data can keep the pair buyers hopeful.
“UK’s recovery should continue to edge the ILO unemployment rate lower in December (market f/c: 4.1%),” said analysts at Westpac.
Technically, the recent rebound in the Momentum indicator enables the pair buyers to flex muscles ahead of the key data/events. However, 1.3600 and the 200-DMA level of 1.3700 will restrict the short-term upside of the cable pair. On the contrary, the 100-DMA level near 1.3500 challenges the GBP/USD pair sellers.
Key notes
GBP/USD Forecast: Pound tests key 1.3500 support, pressured by risk aversion
GBP/USD seesaws past-1.3500 on Brexit, Russia news, UK Unemployment Rate eyed
About UK jobs
The UK Average Earnings released by the Office for National Statistics (ONS) is a key short-term indicator of how levels of pay are changing within the UK economy. Generally speaking, the positive earnings growth anticipates positive (or bullish) for the GBP, whereas a low reading is seen as negative (or bearish).
- USD/IDR prints three-day downtrend despite recently sidelined performance.
- Indonesia Exports, Imports eased in January, Trade Balance improved.
- USD tracked pullback in yields even as market sentiment remains sour.
- US PPI, Empire State Manufacturing Index will join risk catalysts to direct short-term moves.
USD/IDR stays on the back foot for the third consecutive day, despite the recent bounce off the intraday low. That said, the Indonesia rupiah (IDR) pair remains sidelined around $14,290 by the press time of early Tuesday morning in Europe.
In doing so, the USD/IDR pair cheers a pullback in the US dollar while paying a little heed to the mixed Indonesia trade numbers for January.
Indonesia’s Exports dropped below 33.86% expected and 35.3% prior to 25.31% whereas the Imports declined to 36.77% versus 51.38% market consensus and 47.93% previous readouts. However, Trade Balance improved to $0.93B compared to the $0.19B forecasts, versus $1.02B prior.
Elsewhere, headlines concerning Russia-Ukraine tussles and signals for the Fed’s March rate-hike keep challenging the market sentiment. However, the US Treasury yields couldn’t cheer the risk-off mood, which in turn weighs on the US Dollar Index (DXY) by the press time.
Read: US Dollar Index retreat from fortnight high towards 96.00 as yields ease
It’s worth noting, however, that the mixed performance of US stock futures and Asia-Pacific equities also challenge the USD/IDR moves but the USD pullback keeps the pair sellers hopeful.
That said, today’s US Producer Price Index (PPI) for January, expected 9.1% YoY versus 9.7% prior, whereas the Empire State Manufacturing Index for February, having the market consensus of 12 versus -0.7% previous readouts, will offer immediate direction to the pair.
Technical analysis
Unless crossing the $14,450 level on a daily closing basis, USD/IDR stays vulnerable to test December 2021 bottom surrounding $14,140.
- USD/INR keeps pullback from two-month high, bounces from intraday low of late.
- India’s retail inflation jumped to seven-month high at the latest but RBI tried to placate bears before the release.
- Major analysts, banks expect RBI to start normalizing monetary policy.
- Risk-off mood, upbeat Fedspeak keep buyers hopeful, second-tier US data to decorate calendar.
Although USD/INR takes a U-turn from the intraday bottom, the quote remains down on a daily basis around 75.60 during the initial hour of the Indian trading session on Tuesday.
The quote refreshed a two-month high the previous day but ended up printing a bearish candlestick formation below an upward sloping trend line from early January. The reason could be linked to the broad risk-off mood, as well as mixed concerns over the Reserve Bank of India’s (RBI) next step.
India’s retail inflation jumped to a seven-month high of 6.01% YoY in January versus 5.66% prior. However, comments from RBI Governor Das raised concerns over the Indian central bank's credibility amid the need for tighter monetary policy.
“Warning the markets before the data release, Shaktikanta Das, RBI governor, said the uptick in annual inflation should not create any panic and the central bank remained committed to its inflation mandate,” Reuters said. The news also mentioned, “Forced to choose between soothing bond markets grappling with runaway yields fuelled by the government's expansionary budget or fighting inflation, the central bank has opted for the former, as it continues to prioritize growth.”
It’s worth noting that multiple analysts from Nomura, Bank of American, Barclays, as well as Morgan Stanley, keep expecting the sooner beginning of the RBI’s policy normalization measures.
On the other hand, the market’s anxiety over the Russian invasion of Ukraine and the Fed’s rate hike challenge the USD/INR bears.
That said, the US Producer Price Index (PPI) for January, expected 9.1% YoY versus 9.7% prior, as well as the Empire State Manufacturing Index for February, will direct intraday USD/INR moves. However, major attention will be given to geopolitical headlines and Fedspeak.
Technical analysis
Monday’s pin bar candlestick below an ascending resistance line from January 04, near 75.80 by the press time, keeps USD/INR sellers hopeful.
- EUR/USD stabilising despite Russian invasion angst and weakness in Asian equities.
- Daily M-formation neckline has a confluence with the 50% and 61.8% ratios.
- Bears in anticipation of a disruptive Russian headline to put 1.11's in focus.
EUR/USD is trading higher by some 0.12% in Asia with the euro catching a bid as it attempts to correct vs the greenback in what appears to be 'wait and see' market conditions unfolding. The bulls moved on the lows of Monday's trade and stay in control through Asia, despite Russian invasion jitters and a wobble in Asian equities.
Asian share benchmarks have fallen on Tuesday as investors contemplated the implications of a potential imminent Russian invasion of Ukraine. There were plenty of headlines swirling over financial markets at the start of the week that caused a tense atmosphere in both European and US sessions.
Asia is feeling some of that today. The MSCI's broadest index of Asia-Pacific shares outside Japan was down 0.4% in early regional trade, tracking lost ground on Monday in the West. Overnight, the Dow Jones Industrial Average lost 0.49%, the S&P 500 (SPX) fell 0.38%. Japan's Nikkei was down 0.5% at the time of writing and while in Australia, the S&P/ASX200 was off 0.14%. Hong Kong's Hang Seng Index (HSI) slid 0.67% early in the session, although China's CSI300 Index (399300) bucked the trend and was up 0.41%.
The ebbs and flows of Russian tensions in markets
Washington had said Russia could invade Ukraine "any day now," and British Prime Minister Boris Johnson on Monday called the situation "very, very dangerous." The US Secretary of State Antony Blinken said the US embassy would be relocated from Kyiv to Lviv, citing the "dramatic acceleration of the buildup of Russian forces," and this was accompanied by what was perceived as a confirmation from the Ukraine president that there would be an invasion on the 16th Feb.
Ukraine President Volodymyr Zelenskiy urged Ukrainians to fly the country's flags from buildings and sing the national anthem in unison on Feb. 16, a date some Western media have cited as the possible start of a Russian invasion. However, a Ukrainian official said that Zelenskiy was not predicting an attack on that date, but instead responding with scepticism to foreign media reports.
This caused some two-way knee-jerk reaction in markets overnight but the dust settled as the more dominant theme is one of diplomacy considering Russia's president, Vladimir Putin, had signalled that there would be continued efforts to find a diplomatic solution to the standoff. Additionally, in a 40-minute call, Joe Biden and Boris Johnson agreed a deal was still possible despite a chorus of warnings of imminent Russian military action.
Trapped between a rock, (war) and a hard place, (inflation)
Meanwhile, besides the threat of world war 3, one eye is still being pointed at central bank divergences and the futures markets are portraying the likelihood of the Federal Reserve raising interest rates at its March meeting. St. Louis Federal Reserve President James Bullard was calling, again, for faster US Federal Reserve interest rate hikes.
Fed fund futures sold off again and continued to price in a high risk of a 50bp move in March. ''Meanwhile,'' analysts at ANZ bank said, ''the European Central Bank faces a challenging communication hurdle having recently pivoted in its assessment of inflation.''
The analysts warn that id If sanctions were to be imposed on Russia, ''that would hurt European exports as Russia is the EU’s fifth-largest trading partner. Any exacerbation of energy supply tightness would also hurt EU growth while raising inflationary pressures in the short run.''
In response to the threat of rising inflation in the eurozone as a consequence, the ECB President, Christine Lagarde, has reiterated that the central bank will act when appropriate and with due regard to the volatility in prices. She also stressed the ECB’s gradual approach.
Meanwhile, for the calendar, there will be a slew of important data and we will have another look at the ZEW survey of expectations that has recently rebounded firmly above average. Analysts at Westpac say that this is ''indicating that omicron disruptions are expected to only temporarily slow growth prospects.''
The other key release will come in the form of the second estimate for Q4 Gross Domestic Product that the analysts at Westpac say ''will confirm the slowing of year-end activity for the region (market f/c: 0.3%).''
EUR/USD technical analysis
As for the daily chart, the euro has room to correct, so long as the media keeps a lid on the Russian invasion angst and does not misinterpret statements from global officials such as what happened in New York's trade on Monday.
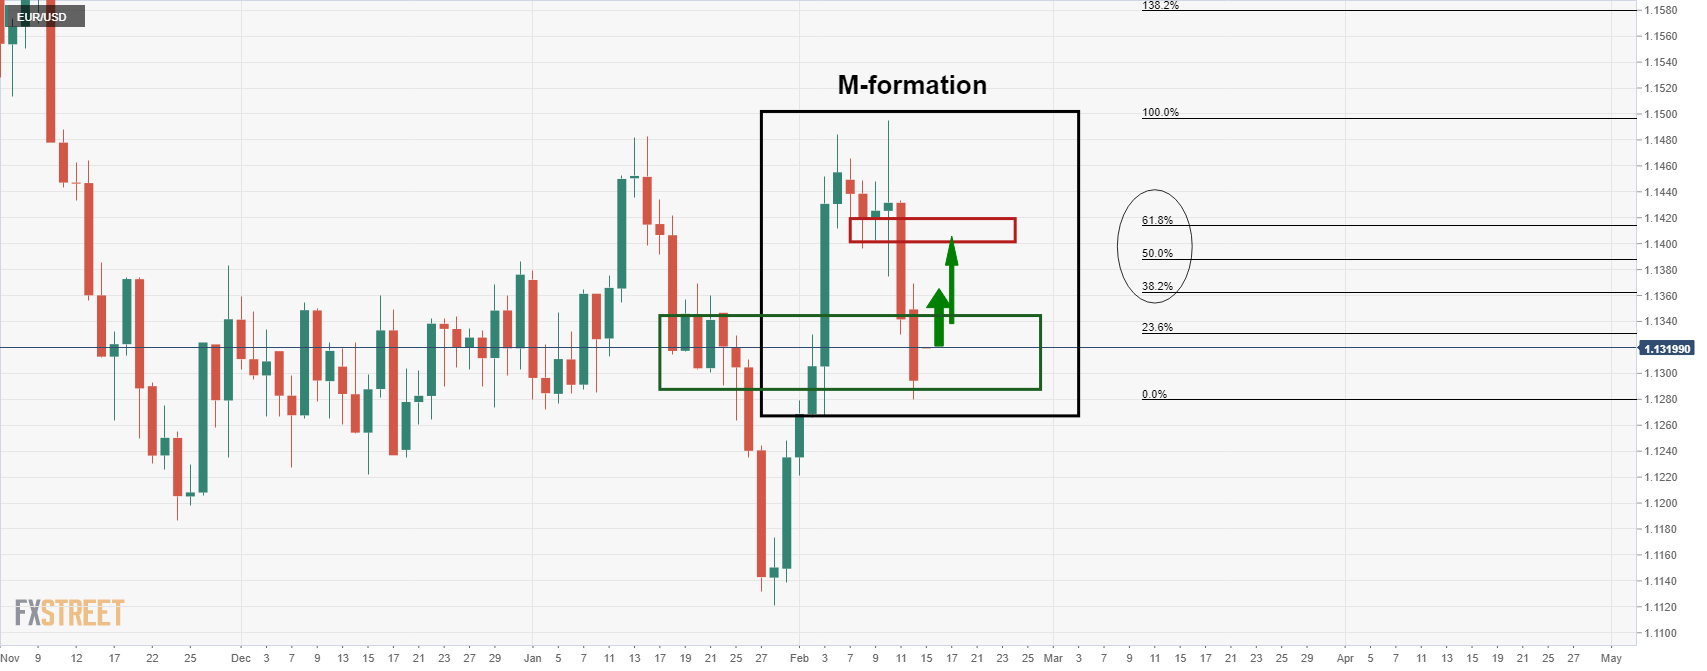
With price stabilising in a familiar support area, the M-formation is compelling especially as the neckline has a confluence with the 50% and 61.8% ratios. With that being said, markets can turn on a dime at the drop of a disruptive Russian headline, and the 1.11 area is by no means a distant possibility.
- AUD/USD retreats from intraday high, pares the first daily gains in four.
- Sustained break of previous support line, upbeat Momentum on the selling side favor bears.
AUD/USD struggles to keep daily gains, the first in four days, around 0.7130 during Tuesday’s Asian session.
In doing so, the Aussie pair retreats from 50% Fibonacci retracement (Fibo.) of January moves, as well as the 21-DMA.
Given the gradual advance in the Momentum line during the pair’s latest declines, coupled with the sustained downside break of previous support from January 28, AUD/USD bears are likely to keep reins.
That said, a three-week-old horizontal surrounding 0.7090-80 restricts immediate downside ahead of the 23.6% Fibo. near 0.7050.
It’s worth noting, however, that a downside break of 0.7050, may take a rest near the 0.7000 threshold before directing sellers towards the recent multi-month low around 0.6965.
Alternatively, 21-DMA and the stated support-turned-resistance, respectively around 0.7130 and 0.7165 in that order, restrict immediate upside moves of the AUD/USD pair.
Following that, 61.8% Fibonacci retracement level and the monthly high, near 0.7180 and 0.7250 in that order, will challenge the recovery ahead of calling back the bulls.
AUD/USD: Daily chart
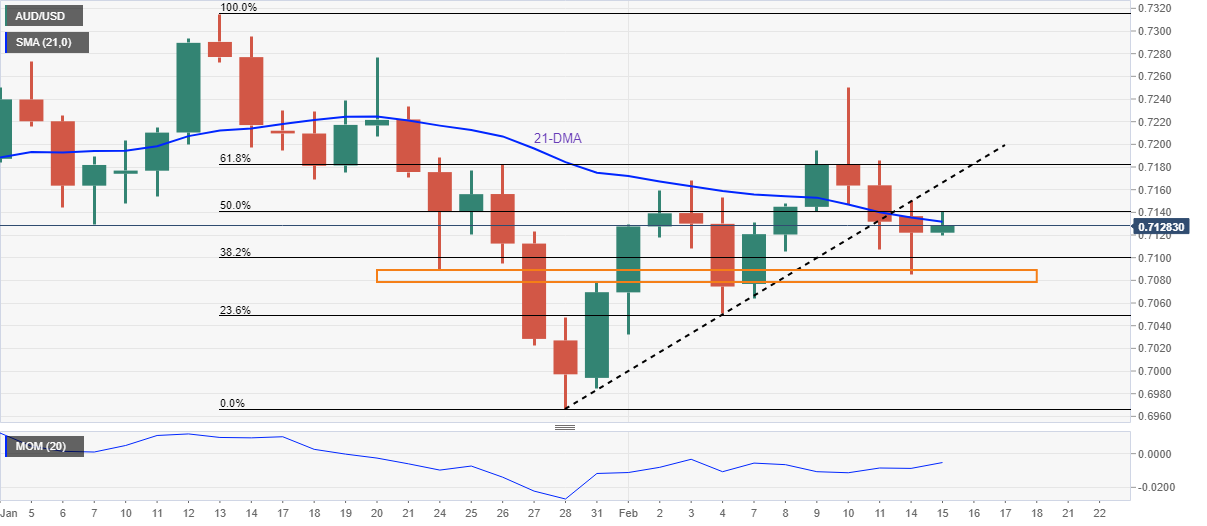
Trend: Further weakness expected
US Secretary of State Antony Blinken is out with the statement on Tuesday, as he offers a sovereign loan guarantee to Ukraine of up to USD1 billion.
No further details are provided on the same.
The Russia-Ukraine tensions are still keeping oil markets on edge, despite the stand-off and a potential de-escalation, with the Western world urging calming of the situation around the Ukrainian border.
Market reaction
The risk sentiment remains jittery, with the Asian stocks a mixed bag while the S&P 500 futures adding 0.22% on the day.
| Raw materials | Closed | Change, % |
|---|---|---|
| Brent | 95.91 | -0.06 |
| Silver | 23.859 | 1.45 |
| Gold | 1871.69 | 0.87 |
| Palladium | 2362 | 2.45 |
- NZD/USD bears are holding off the bulls and the daily support structure could come under pressure.
- The weekly chart is weighed with a bearish bias.
As per the prior day's analysis, NZD/USD Price Analysis: Bears could move in for the kill at any moment according to H4 structure, the price is respecting the prior 4-hour lows as resistance but the daily support structure is menacing.
NZD/USD H4 chart, prior analysis
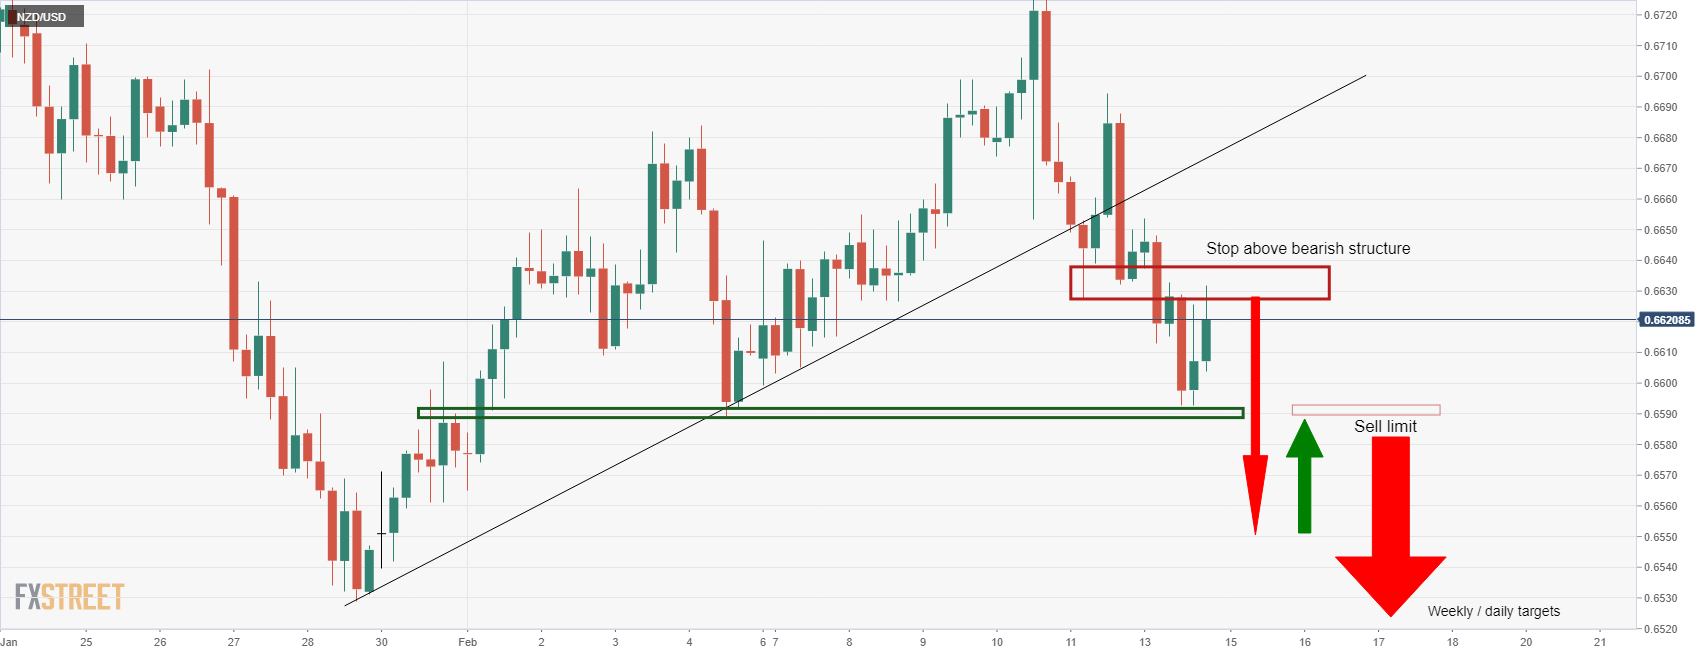
It was stated in the New York session that the ''bears will be encouraged by a break of daily support at 0.6589 and might engage fully from there on the restest of the structure.'' The chart above illustrates that ''this would be expected to act as a firm resistance and ultimately lead to a downside continuation of the weekly chart's bear trend,'' as follows:
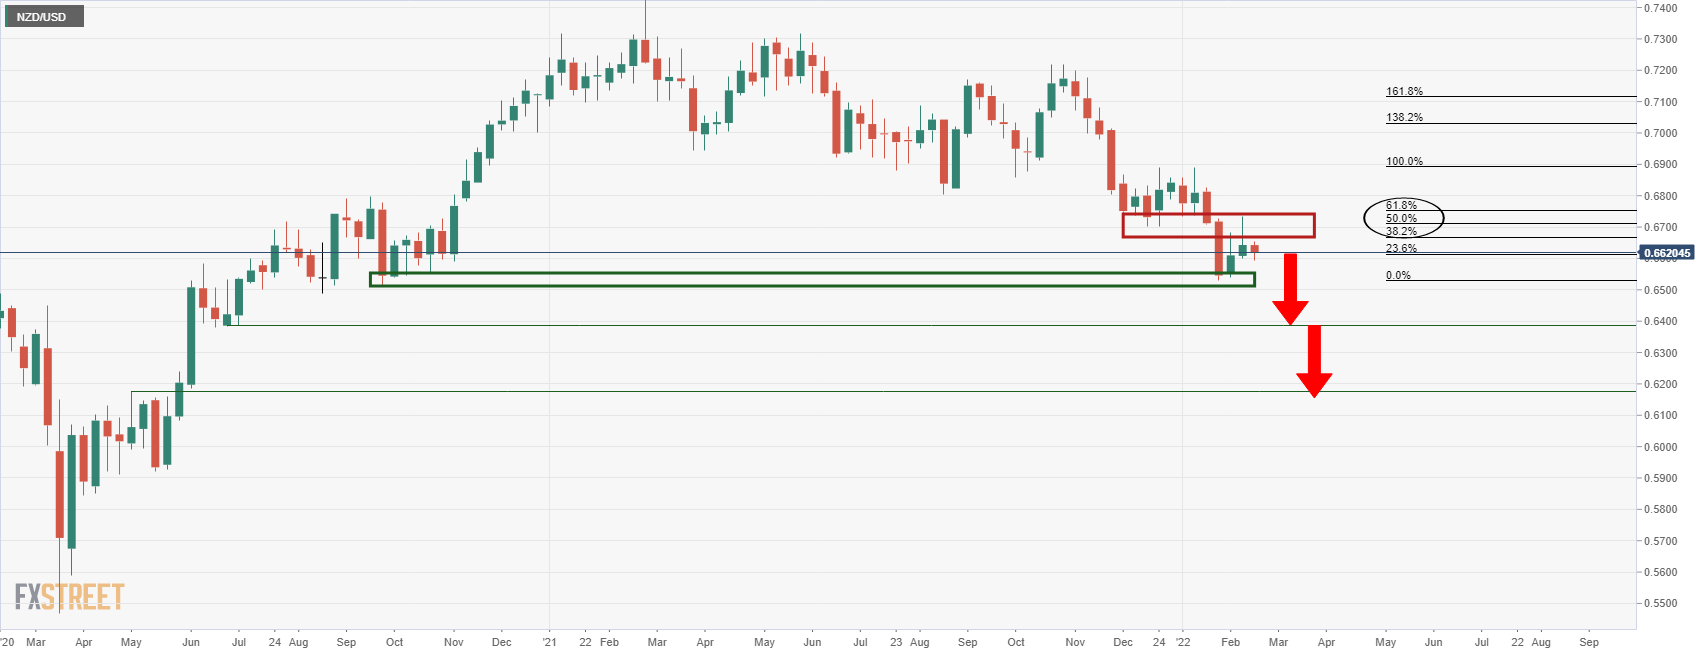
NZD/USD live market
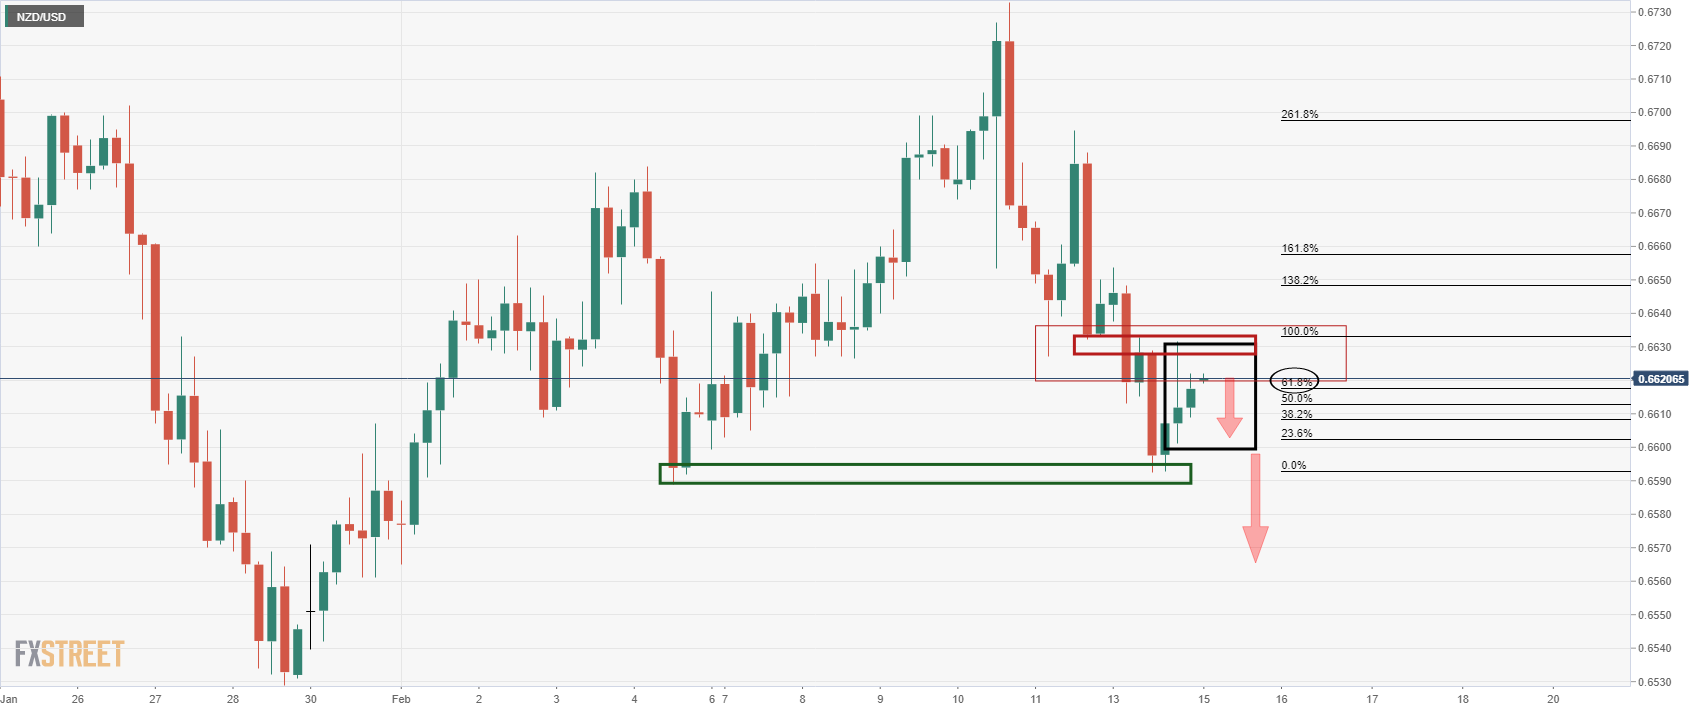
The price has been creeping in on the old support turned to resistance and the 61.8% golden ratio appears to be doing a good job of containing the price, so far. Should the bears commit at this juncture, the daily support structure near 0.6590 will come under pressure, again, and could give way on the third attempt for a breakout.
- Market sentiment remains sour amid geopolitical, Fed-linked fears.
- US 10-year Treasury yields refresh intraday low, stay around 2.5 year high.
- S&P 500 Futures struggle for clear direction but part ways from Wall Street’s losses.
- US data, Russia-Ukraine headlines and Fedspeak are the key for near-term market direction.
Risk appetite stays weak during Tuesday’s Asian session as traders juggle with headlines concerning Russia-Ukraine tussles and hawkish Fedspeak. Also challenging the market sentiment is the latest news showing fresh Sino-American tensions.
While portraying the mood, the US Treasury yields consolidate the previous day’s recovery moves with the fresh drop to 1.979%, down 1.7 basis points (bps), whereas the S&P 500 Futures print mild gains by the press time. On Monday, the bond coupons regained upside momentum after stepping back from a 2.5-year high on Friday whereas the Wall Street benchmark closed in the red, despite mildly positive week-start performance.
The Western leaders initially highlighted fears of Russia’s attack on Ukraine during this week before market chatters of February 16 to be the D-day. On the positive side were headlines covering Russian Foreign Minister Sergey Lavrov who told President Putin that the US had put forward concrete proposals on reducing military risks and that he could see a way to move forward with talks. Russia’s Lavrov also mentioned that EU and NATO responses have not been satisfactory, which in turn highlights risk-off mood despite easing fears.
On the other hand, comments from St. Louis Fed President James Bullard also weigh on the risk appetite. Fed’s Bullard repeated his call for 100 basis points (bps) in interest rate hikes by July 1 by citing the last four inflation reports which show broadening inflationary pressures.
It should be noted that five-week high US inflation expectations, as measured by the 10-year breakeven inflation rate per the St. Louis Federal Reserve (FRED) data, join firmer probabilities of 0.50% rate hike by the Fed in March to also weigh on the market sentiment.
Elsewhere, Bloomberg came out with the news suggesting an end to the US-China trade negotiations due to Beijing’s failures to meet the pledges. “The US is continuing conversations with China despite Beijing’s failures to abide by a trade agreement reached during the Trump administration, but that process could soon come to an end, according to people familiar with the matter,” said Bloomberg.
The risk-off mood fails to help DXY but gold and oil prices remain firmer. That said, second-tier from the US will also direct intraday market moves, other than the risk catalysts mentioned above. The US Producer Price Index (PPI) for January, expected 9.1% YoY versus 9.7% prior, whereas the Empire State Manufacturing Index for February, having the market consensus of 12 versus -0.7% previous readouts.
Read: Can we expect inflation to have peaked this week?
Japanese Chief Cabinet Secretary Hirokazu Matsuno is making some comments on the Ukraine crisis and the economic outlook, in an appearance on Tuesday.
Additional quotes
“The government is strongly urging diplomatic negotiations to resolve Ukraine crisis.”
“Growth in GDP attributed to lifting covid state of emergency, improvement in supply chain constraint from southeast Asia.”
“While the economic outlook continues to be upward, we need to be mindful of downside risk such as omicron variant, rise in raw material costs.”
This comes after Japan's GDP preliminary for Q4 2021 arrived at +1.3% QoQ vs. expected 1.4% and -0.9% booked in the previous quarter.
Market reaction
At the time of writing, USD/JPY is under pressure near 115.40, down 0.09% on the day.
- USD/CHF takes offers to refresh intraday low after breaking an ascending trend line from January 24.
- Steady RSI keeps bearish bias intact, key DMAs to offer a bumpy road to the south.
- An 11-day-old resistance line adds to the upside filters.
USD/CHF refreshes intraday low around 0.9235, down 0.25% on a day after breaking a short-term crucial support line during Tuesday’s Asian session.
Given the absence of oversold RSI conditions and the pair’s sustained trading below a two-week-old resistance line, USD/CHF prices are likely to decline further.
As a result, the 100-DMA and the monthly low, respectively around 0.9215 and 0.9180, pop up on the bear’s radars.
However, the 200-DMA level of 0.9175 and multiple lows marked since late 2021 around 0.9090 will challenge the USD/CHF pair’s further downside.
On the flip side, recovery moves beyond the previous support line, around 0.9245 at the latest, isn’t an open invitation to the USD/CHF buyers as a short-term resistance line at 0.9280 will test the pair’s additional upside.
In a case where USD/CHF bulls keep reins past 0.9280, the 0.9300 threshold and the latest peak surrounding 0.9345, marked in January, will be crucial to watch.
USD/CHF: Daily chart
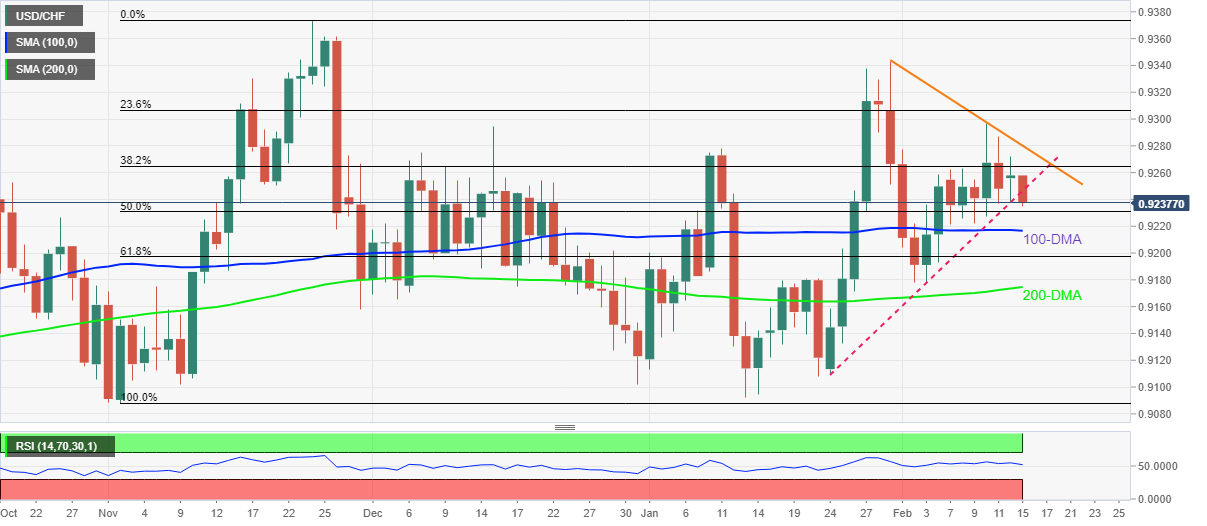
Trend: Further weakness expected
- The USD/CAD bears are banking on higher oil prices.
- Russia invasion risks underpin the US dollar while traders anticipate imminent Fed hike.
USD/CAD is steady in Asia as traders sit on their hands in anticipation of the possibility of heightened tensions surrounding prospects of a Russian invasion of Ukraine. The price of oil, for which CAD trades as a proxy has surged in line with Russia risk premium. Consequently, the loonie has been a difficult opponent for the US dollar bulls with USD/CAD rallies faded below prior daily highs.
All eyes on Russia's next move
At the time of writing, USD/CAD is trading at 1.2734 in a 10 pip range while geopolitical tensions, which could still drive oil prices into triple digits, are being monitored very closely. There was a close call of confirmation that Russia intended to invade Ukraine but only by misinterpretation of Ukraine's president's Facebook message to his country by various media sources.
Ukraine President Volodymyr Zelenskiy urged Ukrainians to fly the country's flags from buildings and sing the national anthem in unison on Feb. 16, a date some Western media have cited as the possible start of a Russian invasion. However, the comments were interpreted as if the president of Ukraine had been officially informed that Wednesday would be the day of the attack.
Markets reacted in kind and sold-off, but not as they should if an actual invasion was really going to take place, There was an air of doubt in the market's air and the moves were contained to what looked like more of a false start. Shortly after the initial knee-jerk moves, a Ukrainian official said Zelenskiy was not predicting an attack on the 16th but instead was responding with scepticism to foreign media reports.
Nonetheless, it was enough of a scare for energy markets that sent the price of oil to the highest levels yet in the current bull cycle with WTI printing $95.79bbls. USD/CAD subsequently took a trip to print a session low of 1.2719.
However, the US dollar is a double-edged sword and benefits from both risk-off and the prospects of a faster pace of Federal Reserve tightening. The US dollar index reached a two-week high on Monday on not only escalations of the prospects of war, but also due to comments from St. Louis Federal Reserve President James Bullard who reiterated calls for faster Fed interest rate hikes. The dollar index (DXY) reached 96.435, its highest since Feb. 1.
- DXY snaps three-day uptrend to step back from two-week top.
- US 10-year Treasury yields resume downtrend after positive week-start.
- Market sentiment sours amid fears of imminent Russian invasion of Ukraine, February 16 is the widely talked date.
- US PPI, NY Manufacturing survey data will decorate the calendar but risk catalysts, Fedspeak are the key.
US Dollar Index (DXY) begins Tuesday on a back foot while retreating from a fortnight top 96.20 during the Asian session. In doing so, the greenback gauge drops 0.07% intraday to print the first daily loss in four, tracking the downbeat US Treasury yields.
Downbeat signals over the Russia-Ukraine story joined increasing odds of the 0.50% rate hike in March to keep the DXY bulls in comments during the last few days. However, the market’s indecision and a light calendar seem to trigger the latest pullback of the US Dollar Index.
On the other hand, headlines covering Russian Foreign Minister Sergey Lavrov initially helped the markets to stay optimistic over no imminent fears of the Russia-Ukraine war, as he showed likes for the US proposals. However, comments like, “EU and NATO responses have not been satisfactory,” kept the risk-off mood high.
Also challenging the market sentiment were comments from St. Louis Fed President James Bullard who repeated his call for 100 basis points (bps) in interest rate hikes by July 1 by citing the last four inflation reports which show broadening inflationary pressures.
Further, the CME FedWatch Toll suggesting around 61% probabilities for 50-75 basis points (bps) of a rate hike during the March meeting also weigh on the sentiment.
While portraying the mood, the US Treasury yields consolidate the previous day’s recovery moves with the fresh drop to 1.972%, down 2.4 basis points (bps), whereas the S&P 500 Futures print mild losses at the latest. On Monday, the bond coupons regained upside momentum after stepping back from a 2.5-year high on Friday whereas the Wall Street benchmark closed in the red, despite mildly positive week-start performance.
That said, the DXY pullback seems to have a limited life as geopolitical fears join hawkish Fed concerns.
In addition to the risk catalysts, the US Producer Price Index (PPI) for January, expected 9.1% YoY versus 9.7% prior, as well as the Empire State Manufacturing Index for February, bearing the market consensus of 12 versus -0.7% previous readouts, will also direct DXY move.
Technical analysis
A convergence of the 21-DMA and 50-DMA restricts the immediate downside of the US Dollar Index around the 96.00 round figure. Until then, buyers keep their eyes on November 2021 peak surrounding the 97.00 round figure.
The People’s Bank of China (PBOC) injected CNY300 billion via one-year medium-term lending (MLF) facility on Tuesday.
The Chinese central bank kept the rate for one-year MLF operation rate unchanged at 2.85% after cutting it from 2.95% last month.
The PBOC’s decision on the monthly Loan Prime Rate (LPR) is due to be announced on the 20th.
| Time | Country | Event | Period | Previous value | Forecast |
|---|---|---|---|---|---|
| 00:30 (GMT) | Australia | RBA Meeting's Minutes | |||
| 04:30 (GMT) | Japan | Industrial Production (MoM) | December | 7% | -1% |
| 04:30 (GMT) | Japan | Industrial Production (YoY) | December | 5.1% | |
| 07:00 (GMT) | United Kingdom | Average earnings ex bonuses, 3 m/y | December | 3.8% | 3.6% |
| 07:00 (GMT) | United Kingdom | Average Earnings, 3m/y | December | 4.2% | 3.8% |
| 07:00 (GMT) | United Kingdom | ILO Unemployment Rate | December | 4.1% | 4.1% |
| 07:00 (GMT) | United Kingdom | Claimant count | January | -43.3 | -28 |
| 10:00 (GMT) | Eurozone | Employment Change | Quarter IV | 0.9% | |
| 10:00 (GMT) | Eurozone | Trade balance unadjusted | December | -1.5 | |
| 10:00 (GMT) | Eurozone | ZEW Economic Sentiment | February | 49.4 | |
| 10:00 (GMT) | Germany | ZEW Survey - Economic Sentiment | February | 51.7 | 55 |
| 10:00 (GMT) | Eurozone | GDP (QoQ) | Quarter IV | 2.2% | 0.3% |
| 10:00 (GMT) | Eurozone | GDP (YoY) | Quarter IV | 3.9% | 4.6% |
| 13:15 (GMT) | Canada | Housing Starts | January | 236.1 | 245 |
| 13:30 (GMT) | U.S. | NY Fed Empire State manufacturing index | February | -0.7 | 12.15 |
| 13:30 (GMT) | U.S. | PPI, y/y | January | 9.7% | 9.1% |
| 13:30 (GMT) | U.S. | PPI, m/m | January | 0.3% | 0.5% |
| 13:30 (GMT) | U.S. | PPI excluding food and energy, m/m | January | 0.5% | 0.5% |
| 13:30 (GMT) | U.S. | PPI excluding food and energy, Y/Y | January | 8.3% | 7.9% |
| 21:00 (GMT) | U.S. | Total Net TIC Flows | December | 223.9 | |
| 21:00 (GMT) | U.S. | Net Long-term TIC Flows | December | 137.4 | |
| 23:30 (GMT) | Australia | Leading Index | January | -0.03% |
In recent trade today, the People’s Bank of China (PBOC) set the yuan (CNY) at 6.3605 vs the last close of 6.3575 and vs. the estimate at 6.3595.
About the fix
China maintains strict control of the yuan’s rate on the mainland.
The onshore yuan (CNY) differs from the offshore one (CNH) in trading restrictions, this last one is not as tightly controlled.
Each morning, the People’s Bank of China (PBOC) sets a so-called daily midpoint fix, based on the yuan’s previous day closing level and quotations taken from the inter-bank dealer.
- AUD/JPY refreshes intraday bottom while consolidating the previous day bounce off one-week low.
- Preliminary Japan Q4 GDP missed upbeat forecasts but stayed positive, RBA Minutes repeated readiness to be patient on policy moves.
- 200-DMA acts as immediate hurdle ahead of previous support line from late January.
- 50-DMA, 50% Fibonacci retracement restrict nearby downside amid bullish MACD signals.
AUD/JPY seesaws between the 200-DMA and 50-DMA, taking offers to refresh intraday low around 82.20 as markets witness the duet of Japan Q4 GDP and RBA Minutes during Tuesday’s Asian session.
That said, Japan’s Preliminary Gross Domestic Product (GDP) for Q4 rose 1.3% QoQ versus 1.4% expected and -0.9% prior. Further, GDP Annualized also reversed the previous readouts of -3.6% with +5.4% figures but stayed below 5.8% market consensus. Further, the preliminary readings of GDP Deflator dropped to -1.3% YoY, below -1.2% expected and prior.
Read: USD/JPY hovers around mid-115.00s amid sluggish yields, mixed Japan Q4 GDP
On the other hand, the latest Minutes of the Reserve Bank of Australia (RBA) monetary policy meeting stated, “Members observed that the achievement of the goals was within sight for the first time in several years.” However, the comments line, “Board is prepared to be patient as it monitors how the various factors affecting inflation in Australia evolve,” challenged AUD/USD buyers.
Read: RBA minutes: Members observed that inflation had picked up more quickly than the bank had expected
Technically, the AUD/JPY pair keeps the last week’s downside break of an upward sloping trend line from January 28, which in turn favors sellers. However, the 50-DMA level of 82.20 restricts the quote’s immediate decline.
Also challenging AUD/JPY sellers is the 50% Fibonacci retracement (Fibo.) of December-January upside, near 81.50.
Should the quote drop below 81.50, the 61.8% Fibo. near 80.90 may test the bears before directing them to January’s low near 80.35 and the 80.00 threshold.
Meanwhile, the 200-DMA level of 82.40 guards recovery moves of the pair ahead of the support-turned-resistance near 82.65.
AUD/JPY: Daily chart
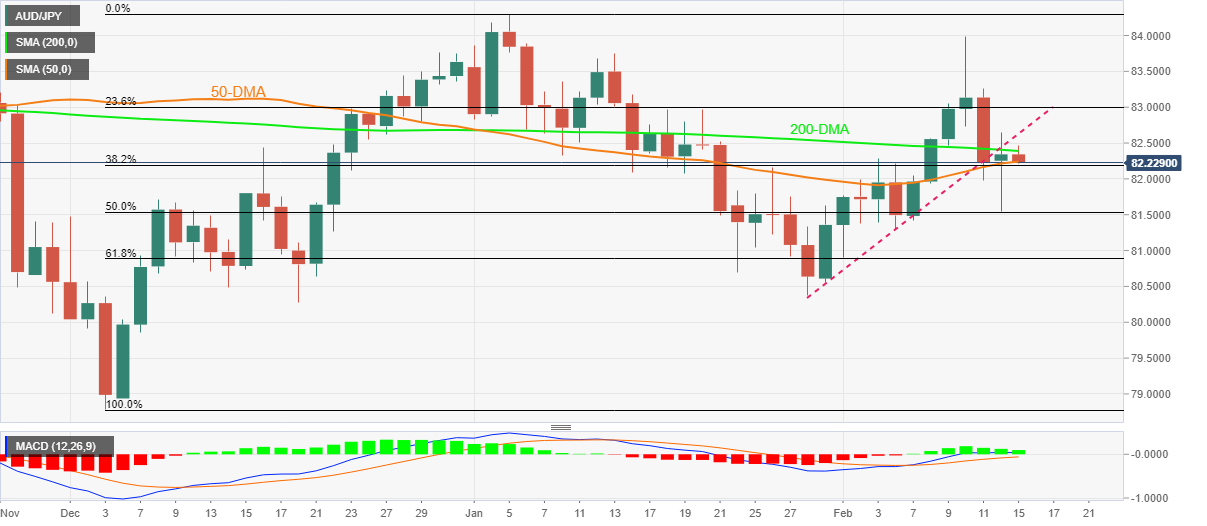
Trend: Sideways
- AUD/USD retreats from daily top as bulls struggle to keep the bounce off one-week low.
- RBA Minutes reiterated readiness to be patient, cited achievement of goals within sight for the first time in several years.
- Market sentiment sours amid Ukraine-Russia chatters, hawkish Fedspeak.
- US data, Fedspeak will add burden to the watchers’ list, risk catalysts are the key.
AUD/USD steps back from intraday high to 0.7130 as RBA Minutes fail to support the pair’s early Asian session corrective pullback during Tuesday. Also challenging the Aussie pair buyers is the weaker risk appetite amid Russia-linked headlines and Fedspeak, due to the quote’s risk barometer status.
That said, the latest Minutes of the Reserve Bank of Australia (RBA) monetary policy meeting stated, “Members observed that the achievement of the goals was within sight for the first time in several years.” However, the comments line, “Board is prepared to be patient as it monitors how the various factors affecting inflation in Australia evolve,” challenged AUD/USD buyers.
Read: RBA minutes: Members observed that inflation had picked up more quickly than the bank had expected
On the other hand, headlines covering Russian Foreign Minister Sergey Lavrov initially helped the markets to stay optimistic over no imminent fears of the Russia-Ukraine war, as he showed likes for the US proposals. However, comments like, “EU and NATO responses have not been satisfactory,” kept the risk-off mood high.
Also challenging the market sentiment were comments from St. Louis Fed President James Bullard who repeated his call for 100 basis points (bps) in interest rate hikes by July 1 by citing the last four inflation reports which show broadening inflationary pressures.
Amid these plays, the US Treasury yields consolidate the previous day’s recovery moves with the fresh drop to 1.979%, down 1.7 basis points (bps) whereas S&P 500 Future print mild losses at the latest. On Monday, the bond coupons regained upside momentum after stepping back from a 2.5-year high on Friday whereas the Wall Street benchmark closed in the red, despite mildly positive week-start performance.
Having witnessed the initial market reaction to the RBA Minutes, AUD/USD pair traders will keep their eyes on the risk catalysts. Also important will be, the US Producer Price Index (PPI) for January, expected 9.1% YoY versus 9.7% prior, as well as the Empire State Manufacturing Index for February, bearing the market consensus of 12 versus -0.7% previous readouts.
Technical analysis
The 21-DMA and previous support line from January 28, respectively around 0.7135 and 0.7160, restrict the short-term upside of the AUD/USD prices ahead of the key 100-DMA resistance surrounding 0.7245.
Meanwhile, 0.7080 and the 0.7000 threshold may entertain short-term sellers.
The Reserve Bank of Australia (RBA) has published minutes of the last meeting and has stated that they will not raise interest rates until the target is met. The RBA is prepared to be patient but notes that inflation picked up more quickly than expected.
''Australia's central bank is closer to meeting its economic goals than it has been for years, but is prepared to be patient on policy as wage growth continues to lag even as inflation picks up,'' Reuters reported.
''Minutes of the Reserve Bank of Australia's (RBA) February meeting released on Tuesday showed its Board was yet to be convinced that the acceleration in inflation would be sustained and wanted to see wages respond before moving on interest rates.''
"The Board is prepared to be patient as it monitors how the various factors affecting inflation in Australia evolve," the minutes showed.
AUD/USD is a touch weaker on the minutes, 5 pips lower.
Key notes
Board is prepared to be patient as it monitors how the various factors affecting inflation in Australia evolve.
Economic outlook was being supported by household and business balance sheets.
While inflation had picked up, members agreed it was too early to conclude that it was sustainably within the target band.
Members observed that inflation had picked up more quickly than the bank had expected.
Members noted that some moderation in inflation was expected as supply problems were resolved.
Members observed that the achievement of the goals was within sight for the first time in several years.
Why it matters to traders?
The Reserve Bank of Australia (RBA) publishes the minutes of its monetary policy meeting two weeks after the interest rate decision is announced. It provides a detailed record of the discussions held between the RBA’s board members on monetary policy and economic conditions that influenced their decision on adjusting interest rates and/or bond buys, significantly impacting the AUD. The minutes also reveal considerations on international economic developments and the exchange rate value.
- WTI crude oil retreats from the highest levels last seen during September 2014.
- Overbought RSI conditions, failure to cross key resistance hint at further pullback.
- 10-DMA, yearly support line restrict further downside, late 2014 peaks can challenge bulls on the way to $100.00 threshold.
WTI eases to $92.80, down 0.45% intraday during Tuesday’s Asian session. In doing so, the black gold portrays a pullback from an ascending resistance line from July 2021 amid overbought RSI conditions.
That said, the energy benchmark refreshed a multi-day high while poking $94.00 level, the highest since September 2014, the previous day.
Given the RSI conditions and the failure to cross the key hurdle, WTI may witness further profit-booking around multi-day tops.
However, the bears may remain cautious until witnessing a clear downside break of the October 2021 peak surrounding $85.00.
Before that, 10-DMA and an upward sloping support line from January, respectively around $90.30 and $89.70, may challenge sellers. Also acting as a downside filter is the 21-DMA level of $87.88.
Alternatively, a clear upside break of the stated resistance line, around $93.80, needs validation from the recent high close to $94.00 to convince buyers.
Even so, multiple highs marked during late 2014 around $94.00 and $95.00 will offer a bumpy road to the oil bulls.
WTI: Daily chart
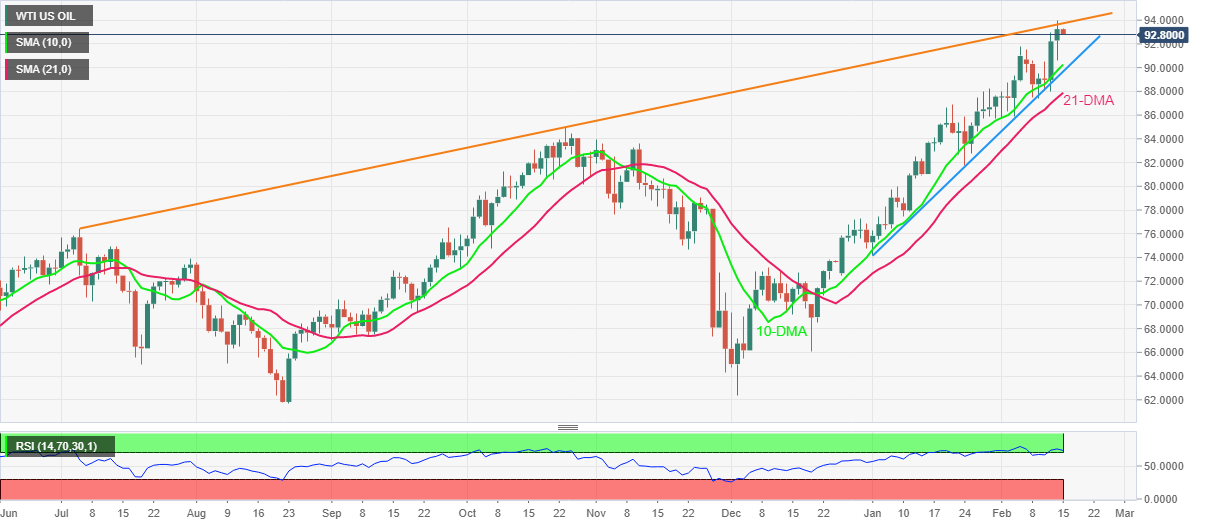
Trend: Pullback expected
reuters reported that the Bank of Japan Governor Haruhiko Kuroda said on Tuesday the central bank's offer to buy an unlimited amount of government bonds reflected its view the recent rise in the country's long-term interest rates was driven by factors unrelated to its economy.
"We don't expect to conduct such operation frequently. We'll do this as needed," Kuroda told parliament, referring to the BOJ's market operation on Monday aimed at capping the 10-year Japanese government bond (JGB) yield at its implicit 0.25% ceiling.
Kuroda said that Japan's economy, price condition warrants keeping monetary policy loose.
Key comments
Will explain to G20 counterparts japan's economic situation, seek understanding over japan's monetary policy management.
BoJ's market operation yesterday has had intended effect, pushed down 10-year JGB yield to 0.22% from near 0.25%.
Global economy at critical stage with grave situation in Ukraine leading to rise in oil prices.
BoJ's offer to buy unlimited amount of JGBs to defend its rate target is 'poweful' means, not something taken by other central banks.
BoJ's market operation yesterday reflected its view recent rise in JGB yields were driven by factors unrelated to japan's economy, such as rising overseas interest rates.
We don't intended to conduct unlimited bond buy offers too frequently, will do this as needed.
Our current monetary framework seeks to balance need to support economy while mitigating negative impact on banks, JGB market functions.
Forex moves reflect various factors, not driven just by interest rate differentials between each country.
Our baseline forecast is for Japan's economy, prices to gradually pick up as rising real household income underpin consumption,
One notable source of concern is escalating tension regarding Ukraine which could hurt global, Japanese economies if it drives up oil, commodity costs,
BoJ must debate exit strategy when inflation approaches 2%, doing so before that would risk mislead markets.
What fed is doing now would offer clues for when BoJ debates specifics of exit strategy.
USD/JPY traders await Russia headlines
There have been no impact other yen this far that is otherwise being driven y offshore influences in geopolitics. The probabilities of an imminent attack on Ukraine by Russia were perceived higher on Monday after President Volodymyr Zelenskiy urged Ukrainians to fly the country's flags from buildings and sing the national anthem in unison on Feb. 16, a date some Western media have cited as the possible start of a Russian invasion. The yen picked up a bid on the sentiment. USD/JPY is holding below 115.50.
Japans Gross Domestic Product preliminary for the fourth quarter arrived 2021 +1.3% QoQ vs. expected 1.4%.
The markets are instead fixated on geopolitics so the data had no effect on the price of the yen. The probabilities of an imminent attack on Ukraine were higher on Monday after President Volodymyr Zelenskiy urged Ukrainians to fly the country's flags from buildings and sing the national anthem in unison on Feb. 16, a date some Western media have cited as the possible start of a Russian invasion. The yen picked up a bid on the sentiment.
-
USD/JPY is thrown around on interpretations of Ukraine's Feb 16 Russian invasion
About Japan GDP
The Gross Domestic Product released by the Cabinet Office shows the monetary value of all the goods, services and structures produced in Japan within a given period of time. GDP is a gross measure of market activity because it indicates the pace at which the Japanese economy is growing or decreasing. A high reading or a better than expected number is seen as positive for the JPY, while a low reading is negative.
- USD/JPY struggles to defend Monday’s corrective pullback, tight-lipped of late.
- Japan’s preliminary readings of Q4 GDP fell below upbeat forecast but reversed previous negative figures.
- US Treasury yields remain sidelined after recovering the previous day, stock futures print mild gains.
- Russia-Ukraine story, US PPI will entertain traders, bond yields are in focus.
USD/JPY renews intraday low to 115.50, paring the previous day’s gains as Tokyo opens for Tuesday. In doing so, the yen pair justifies a pullback in the US Treasury yields and market’s indecision, as well as mixed GDP data from home.
Japan’s Preliminary Gross Domestic Product (GDP) for Q4 rose 1.3% QoQ versus 1.4% expected and -0.9% prior. Further, GDP Annualized also reversed the previous readouts of -3.6% with +5.4% figures but stayed below 5.8% market consensus. Further, the preliminary readings of GDP Deflator dropped to -1.3% YoY, below -1.2% expected and prior.
That said, the US Treasury yields consolidate the previous day’s recovery moves with the fresh drop to 1.979%, down 1.7 basis points (bps). On Monday, the bond coupons regained upside momentum after stepping back from a 2.5-year high on Friday whereas the Wall Street benchmark closed in the red, despite mildly positive week-start performance.
The recovery in US Treasury bond coupons, as well as in the USD/JPY prices, could be linked to the market’s fears of an immediate Russian invasion of Ukraine. Also weighing on the sentiment was hawkish Fedspeak.
The Western leaders initially highlighted fears of Russia’s attack on Ukraine during this week before market chatters of February 16 to be the D-day. On the positive side were headlines covering Russian Foreign Minister Sergey Lavrov who told President Putin that the US had put forward concrete proposals on reducing military risks and that he could see a way to move forward with talks. Russia’s Lavrov also mentioned that EU and NATO responses have not been satisfactory, which in turn highlights risk-off mood despite easing fears.
On the other hand, St. Louis Fed President James Bullard reiterated his call for 100 basis points (bps) in interest rate hikes by July 1 by citing the last four inflation reports which show broadening inflationary pressures.
Against this backdrop, S&P 500 Futures print mild gains but Japan’s Nikkei 225 begins the day on a negative side.
Looking forward, major attention will be given to the Fedspeak and risk catalysts. However, US Producer Price Index (PPI) for January, expected 9.1% YoY versus 9.7% prior, will join Empire State Manufacturing Index for February, market consensus 12 versus -0.7% previous readouts, to decorate the daily calendar and direct short-term USD/JPY moves.
Technical analysis
USD/JPY remains sidelined between a three-week-old support line near 115.00 and double-top around 116.35-40.
| Pare | Closed | Change, % |
|---|---|---|
| AUDUSD | 0.71277 | 0.01 |
| EURJPY | 130.634 | -0.15 |
| EURUSD | 1.13071 | -0.29 |
| GBPJPY | 156.352 | -0.01 |
| GBPUSD | 1.3533 | -0.14 |
| NZDUSD | 0.66162 | -0.29 |
| USDCAD | 1.27243 | -0.08 |
| USDCHF | 0.92446 | -0.05 |
| USDJPY | 115.537 | 0.15 |
© 2000-2026. All rights reserved.
This site is managed by Teletrade D.J. LLC 2351 LLC 2022 (Euro House, Richmond Hill Road, Kingstown, VC0100, St. Vincent and the Grenadines).
The information on this website is for informational purposes only and does not constitute any investment advice.
The company does not serve or provide services to customers who are residents of the US, Canada, Iran, The Democratic People's Republic of Korea, Yemen and FATF blacklisted countries.
Making transactions on financial markets with marginal financial instruments opens up wide possibilities and allows investors who are willing to take risks to earn high profits, carrying a potentially high risk of losses at the same time. Therefore you should responsibly approach the issue of choosing the appropriate investment strategy, taking the available resources into account, before starting trading.
Use of the information: full or partial use of materials from this website must always be referenced to TeleTrade as the source of information. Use of the materials on the Internet must be accompanied by a hyperlink to teletrade.org. Automatic import of materials and information from this website is prohibited.
Please contact our PR department if you have any questions or need assistance at pr@teletrade.global.


