- Analytics
- News and Tools
- Market News
CFD Markets News and Forecasts — 15-01-2025
The Federal Reserve (Fed) commented in its latest Beige Book survey released on Wednesday that economic activity increased “slightly to moderately” across the US in late November and December, supported by strong holiday sales.
Key quotes
Economic activity increased slightly to moderately across the twelve Federal Reserve Districts in late November and December.
Consumer spending moved up moderately, with strong holiday sales exceeding expectations.
Manufacturing decreased slightly on the net; some manufacturers stockpiled inventories in anticipation of higher tariffs.
Commercial real estate sales edged up.
More optimism about the 2025 outlook, though concerns remain about immigration and tariff policy affecting the economy.
Employment ticked up slightly, with six Districts reporting increases and six reporting no change.
Wage growth picked up at a moderate pace, but there were reports of easing wage pressures.
Prices increased modestly overall, with growth ranging from flat to moderate.
Market reaction
The US Dollar Index (DXY) is trading 0.04% lower on the day at 109.06, as of writing.
Fed FAQs
Monetary policy in the US is shaped by the Federal Reserve (Fed). The Fed has two mandates: to achieve price stability and foster full employment. Its primary tool to achieve these goals is by adjusting interest rates. When prices are rising too quickly and inflation is above the Fed’s 2% target, it raises interest rates, increasing borrowing costs throughout the economy. This results in a stronger US Dollar (USD) as it makes the US a more attractive place for international investors to park their money. When inflation falls below 2% or the Unemployment Rate is too high, the Fed may lower interest rates to encourage borrowing, which weighs on the Greenback.
The Federal Reserve (Fed) holds eight policy meetings a year, where the Federal Open Market Committee (FOMC) assesses economic conditions and makes monetary policy decisions. The FOMC is attended by twelve Fed officials – the seven members of the Board of Governors, the president of the Federal Reserve Bank of New York, and four of the remaining eleven regional Reserve Bank presidents, who serve one-year terms on a rotating basis.
In extreme situations, the Federal Reserve may resort to a policy named Quantitative Easing (QE). QE is the process by which the Fed substantially increases the flow of credit in a stuck financial system. It is a non-standard policy measure used during crises or when inflation is extremely low. It was the Fed’s weapon of choice during the Great Financial Crisis in 2008. It involves the Fed printing more Dollars and using them to buy high grade bonds from financial institutions. QE usually weakens the US Dollar.
Quantitative tightening (QT) is the reverse process of QE, whereby the Federal Reserve stops buying bonds from financial institutions and does not reinvest the principal from the bonds it holds maturing, to purchase new bonds. It is usually positive for the value of the US Dollar.
Canadian Prime Minister Justin Trudeau said on Wednesday that Canada will consider every kind of countermeasure if US President-elect Donald Trump goes ahead with a threat to impose a 25% tariff on Canadian imports, per Reuters.
Key quotes
"Nothing can be off the table if the U.S. continues to choose to move forward with these punishing tariffs," Trudeau said after meeting the premiers of the 10 provinces to discuss potential responses.”
"I support the principle of a proportional dollar for dollar response.”
Market reaction
The USD/CAD pair is trading 0.05% higher on the day at 1.4335, as of writing.
Canadian Dollar FAQs
The key factors driving the Canadian Dollar (CAD) are the level of interest rates set by the Bank of Canada (BoC), the price of Oil, Canada’s largest export, the health of its economy, inflation and the Trade Balance, which is the difference between the value of Canada’s exports versus its imports. Other factors include market sentiment – whether investors are taking on more risky assets (risk-on) or seeking safe-havens (risk-off) – with risk-on being CAD-positive. As its largest trading partner, the health of the US economy is also a key factor influencing the Canadian Dollar.
The Bank of Canada (BoC) has a significant influence on the Canadian Dollar by setting the level of interest rates that banks can lend to one another. This influences the level of interest rates for everyone. The main goal of the BoC is to maintain inflation at 1-3% by adjusting interest rates up or down. Relatively higher interest rates tend to be positive for the CAD. The Bank of Canada can also use quantitative easing and tightening to influence credit conditions, with the former CAD-negative and the latter CAD-positive.
The price of Oil is a key factor impacting the value of the Canadian Dollar. Petroleum is Canada’s biggest export, so Oil price tends to have an immediate impact on the CAD value. Generally, if Oil price rises CAD also goes up, as aggregate demand for the currency increases. The opposite is the case if the price of Oil falls. Higher Oil prices also tend to result in a greater likelihood of a positive Trade Balance, which is also supportive of the CAD.
While inflation had always traditionally been thought of as a negative factor for a currency since it lowers the value of money, the opposite has actually been the case in modern times with the relaxation of cross-border capital controls. Higher inflation tends to lead central banks to put up interest rates which attracts more capital inflows from global investors seeking a lucrative place to keep their money. This increases demand for the local currency, which in Canada’s case is the Canadian Dollar.
Macroeconomic data releases gauge the health of the economy and can have an impact on the Canadian Dollar. Indicators such as GDP, Manufacturing and Services PMIs, employment, and consumer sentiment surveys can all influence the direction of the CAD. A strong economy is good for the Canadian Dollar. Not only does it attract more foreign investment but it may encourage the Bank of Canada to put up interest rates, leading to a stronger currency. If economic data is weak, however, the CAD is likely to fall.
The Bank of England (BoE) policymaker Alan Taylor said on Wednesday that the BoE should move quickly to cut interest rates “pre-emptively” as the UK is “in the last half mile on inflation.”
Key quotes
"Right now, I think it makes sense to cut rates pre-emptively to take out a little insurance against this change in the balance of risks, given that our policy rate is still far above neutral and would still remain very restrictive.”
"We are in the last half mile on inflation, but with the economy weakening, it’s time to get interest rates back toward normal to sustain a soft landing.”
"It is this logic that convinced me to vote for an interest rate cut in December.”
“On multiple fronts, UK businesses and households could face a near-term cashflow squeeze, and we need to keep a careful eye on this important potential downside trigger.”
“I fully appreciate these challenges for businesses and households and the headwinds they pose for the UK economic outlook, together with all the other emerging downside economic risks in the UK and around the world.”
Market reaction
The GBP/USD pair is trading 0.03% lower on the day at 1.2239, as of writing.
BoE FAQs
The Bank of England (BoE) decides monetary policy for the United Kingdom. Its primary goal is to achieve ‘price stability’, or a steady inflation rate of 2%. Its tool for achieving this is via the adjustment of base lending rates. The BoE sets the rate at which it lends to commercial banks and banks lend to each other, determining the level of interest rates in the economy overall. This also impacts the value of the Pound Sterling (GBP).
When inflation is above the Bank of England’s target it responds by raising interest rates, making it more expensive for people and businesses to access credit. This is positive for the Pound Sterling because higher interest rates make the UK a more attractive place for global investors to park their money. When inflation falls below target, it is a sign economic growth is slowing, and the BoE will consider lowering interest rates to cheapen credit in the hope businesses will borrow to invest in growth-generating projects – a negative for the Pound Sterling.
In extreme situations, the Bank of England can enact a policy called Quantitative Easing (QE). QE is the process by which the BoE substantially increases the flow of credit in a stuck financial system. QE is a last resort policy when lowering interest rates will not achieve the necessary result. The process of QE involves the BoE printing money to buy assets – usually government or AAA-rated corporate bonds – from banks and other financial institutions. QE usually results in a weaker Pound Sterling.
Quantitative tightening (QT) is the reverse of QE, enacted when the economy is strengthening and inflation starts rising. Whilst in QE the Bank of England (BoE) purchases government and corporate bonds from financial institutions to encourage them to lend; in QT, the BoE stops buying more bonds, and stops reinvesting the principal maturing on the bonds it already holds. It is usually positive for the Pound Sterling.
The Trade Balance, which is the difference between what a country earns from its exports versus what it pays for its imports, is another factor that can influence the value of the Australi
- USD/CAD softens to around 1.4335 in Thursday’s early Asian session.
- The cooler-than-expected US core CPI revives bets on Fed rate cuts this year.
- Crude oil prices rise on US crude draw and Russia sanctions, supporting the commodity-linked Loonie.
The USD/CAD pair extends the decline to near 1.4335 during the early Asian session on Thursday. The US Dollar (USD) weakens after the cooler-than-expected inflation data triggered the expectation that the US Federal Reserve (Fed) could cut interest rates twice this year.
Data released by the Bureau of Labor Statistics on Thursday showed that the US Consumer Price Index (CPI) climbed 2.9% on a yearly basis in December, compared to 2.7% in November. This reading came in line with market expectations. The core CPI, which excludes volatile food and energy prices, rose 3.2% on a yearly basis in December, below the previous reading and the market consensus of 3.3%.
The softer inflation data revives the bets on Fed rate cuts this year, weighing on the Greenback. "The cooler inflation print was a sign for traders to cut some long positions in the dollar, said Joseph Trevisani, senior analyst at FX Street in New York.
On the Loonie front, a rise in crude oil prices amid a large draw in U.S. crude stockpiles and potential supply disruptions caused by new United States (US) sanctions on Russia boosts the commodity-linked Canadian Dollar (CAD). Canada is the largest oil exporter to the US, and higher crude oil prices tend to have a positive impact on the CAD value.
Canadian Dollar FAQs
The key factors driving the Canadian Dollar (CAD) are the level of interest rates set by the Bank of Canada (BoC), the price of Oil, Canada’s largest export, the health of its economy, inflation and the Trade Balance, which is the difference between the value of Canada’s exports versus its imports. Other factors include market sentiment – whether investors are taking on more risky assets (risk-on) or seeking safe-havens (risk-off) – with risk-on being CAD-positive. As its largest trading partner, the health of the US economy is also a key factor influencing the Canadian Dollar.
The Bank of Canada (BoC) has a significant influence on the Canadian Dollar by setting the level of interest rates that banks can lend to one another. This influences the level of interest rates for everyone. The main goal of the BoC is to maintain inflation at 1-3% by adjusting interest rates up or down. Relatively higher interest rates tend to be positive for the CAD. The Bank of Canada can also use quantitative easing and tightening to influence credit conditions, with the former CAD-negative and the latter CAD-positive.
The price of Oil is a key factor impacting the value of the Canadian Dollar. Petroleum is Canada’s biggest export, so Oil price tends to have an immediate impact on the CAD value. Generally, if Oil price rises CAD also goes up, as aggregate demand for the currency increases. The opposite is the case if the price of Oil falls. Higher Oil prices also tend to result in a greater likelihood of a positive Trade Balance, which is also supportive of the CAD.
While inflation had always traditionally been thought of as a negative factor for a currency since it lowers the value of money, the opposite has actually been the case in modern times with the relaxation of cross-border capital controls. Higher inflation tends to lead central banks to put up interest rates which attracts more capital inflows from global investors seeking a lucrative place to keep their money. This increases demand for the local currency, which in Canada’s case is the Canadian Dollar.
Macroeconomic data releases gauge the health of the economy and can have an impact on the Canadian Dollar. Indicators such as GDP, Manufacturing and Services PMIs, employment, and consumer sentiment surveys can all influence the direction of the CAD. A strong economy is good for the Canadian Dollar. Not only does it attract more foreign investment but it may encourage the Bank of Canada to put up interest rates, leading to a stronger currency. If economic data is weak, however, the CAD is likely to fall.
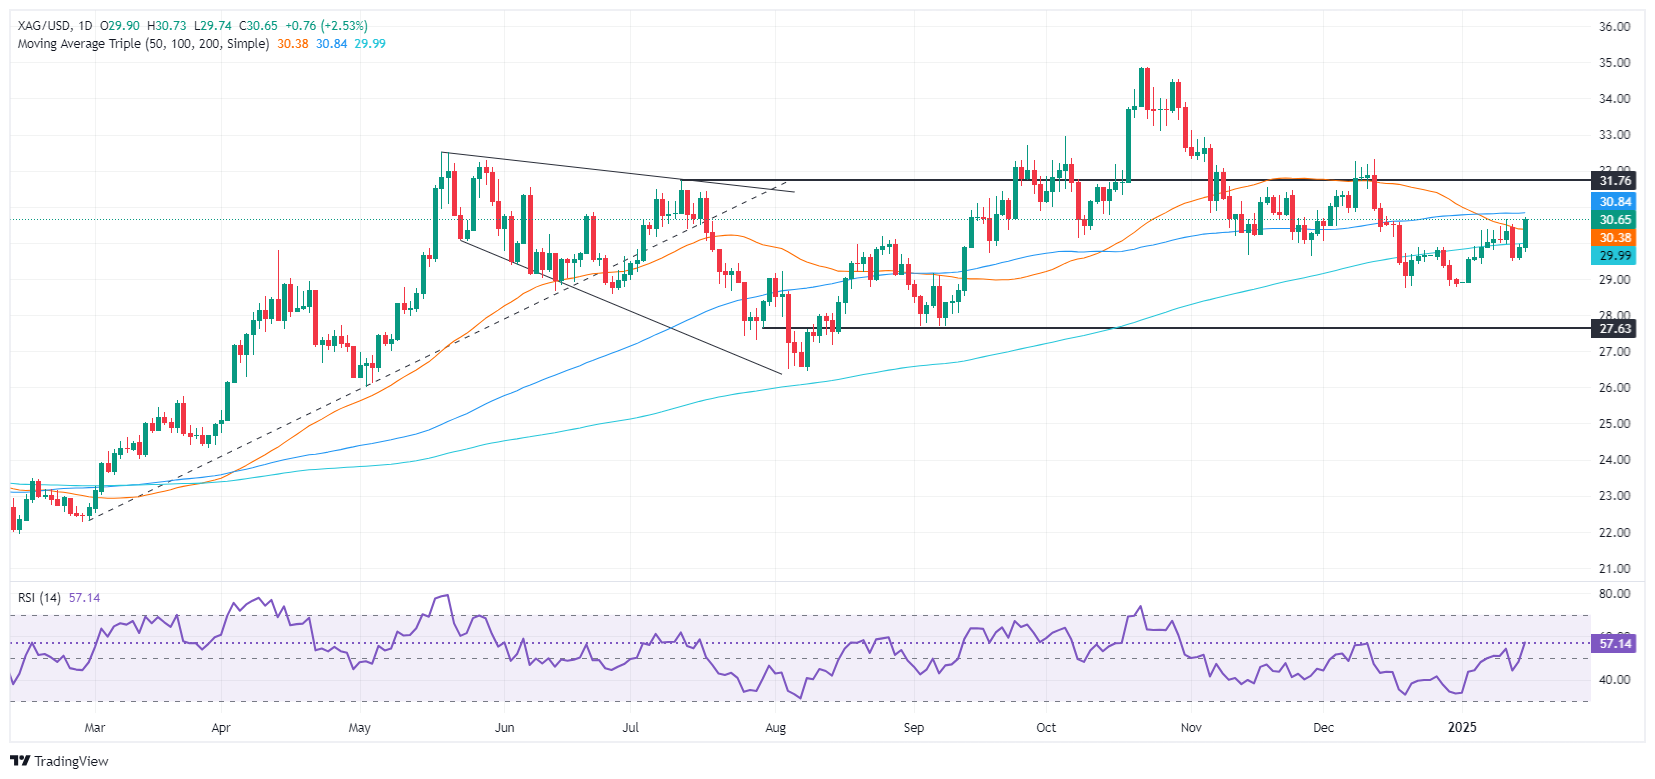
- Silver climbs, breaching 200-day SMA at $29.98, enhancing buying momentum.
- Major resistance at $31.00; break could aim for December 12 high of $32.32.
- Pullback below 50-day SMA might prompt retest of 200-day SMA, down to $28.74.
Silver's price stages a comeback, rising above the 50-day Simple Moving Average (SMA) at $30.32 and eyeing a break of the 100-day SMA. At the time of writing, the XAG/USD trades at $30.64, having gained over 2.64% on Wednesday.
XAG/USD Price Forecast: Technical outlook
On its way toward its current price, XAG/USD cleared the 200-day SMA at $29.98, which exacerbated the upward move. Yet buyers need to clear the 100-day SMA at $30.82 so Silver can extend its gains.
Momentum favors further upside, yet consolidation lies ahead as the Relative Strength Index (RSI) is flat, but above the latest peak.
If buyers clear the 100-day SMA, $31.00 emerges as the next key resistance level. A break above this level opens the door to testing the latest cycle high at $32.32, the December 12 daily high.
On the other hand, if sellers step in and push XAG/USD below the 50-day SMA, it could pave the way towards $29.98, the 200-day SMA. On further weakness, the next stop would be December’s 19 swing low of $28.74.
XAG/USD Price Chart - Daily
Silver FAQs
Silver is a precious metal highly traded among investors. It has been historically used as a store of value and a medium of exchange. Although less popular than Gold, traders may turn to Silver to diversify their investment portfolio, for its intrinsic value or as a potential hedge during high-inflation periods. Investors can buy physical Silver, in coins or in bars, or trade it through vehicles such as Exchange Traded Funds, which track its price on international markets.
Silver prices can move due to a wide range of factors. Geopolitical instability or fears of a deep recession can make Silver price escalate due to its safe-haven status, although to a lesser extent than Gold's. As a yieldless asset, Silver tends to rise with lower interest rates. Its moves also depend on how the US Dollar (USD) behaves as the asset is priced in dollars (XAG/USD). A strong Dollar tends to keep the price of Silver at bay, whereas a weaker Dollar is likely to propel prices up. Other factors such as investment demand, mining supply – Silver is much more abundant than Gold – and recycling rates can also affect prices.
Silver is widely used in industry, particularly in sectors such as electronics or solar energy, as it has one of the highest electric conductivity of all metals – more than Copper and Gold. A surge in demand can increase prices, while a decline tends to lower them. Dynamics in the US, Chinese and Indian economies can also contribute to price swings: for the US and particularly China, their big industrial sectors use Silver in various processes; in India, consumers’ demand for the precious metal for jewellery also plays a key role in setting prices.
Silver prices tend to follow Gold's moves. When Gold prices rise, Silver typically follows suit, as their status as safe-haven assets is similar. The Gold/Silver ratio, which shows the number of ounces of Silver needed to equal the value of one ounce of Gold, may help to determine the relative valuation between both metals. Some investors may consider a high ratio as an indicator that Silver is undervalued, or Gold is overvalued. On the contrary, a low ratio might suggest that Gold is undervalued relative to Silver.
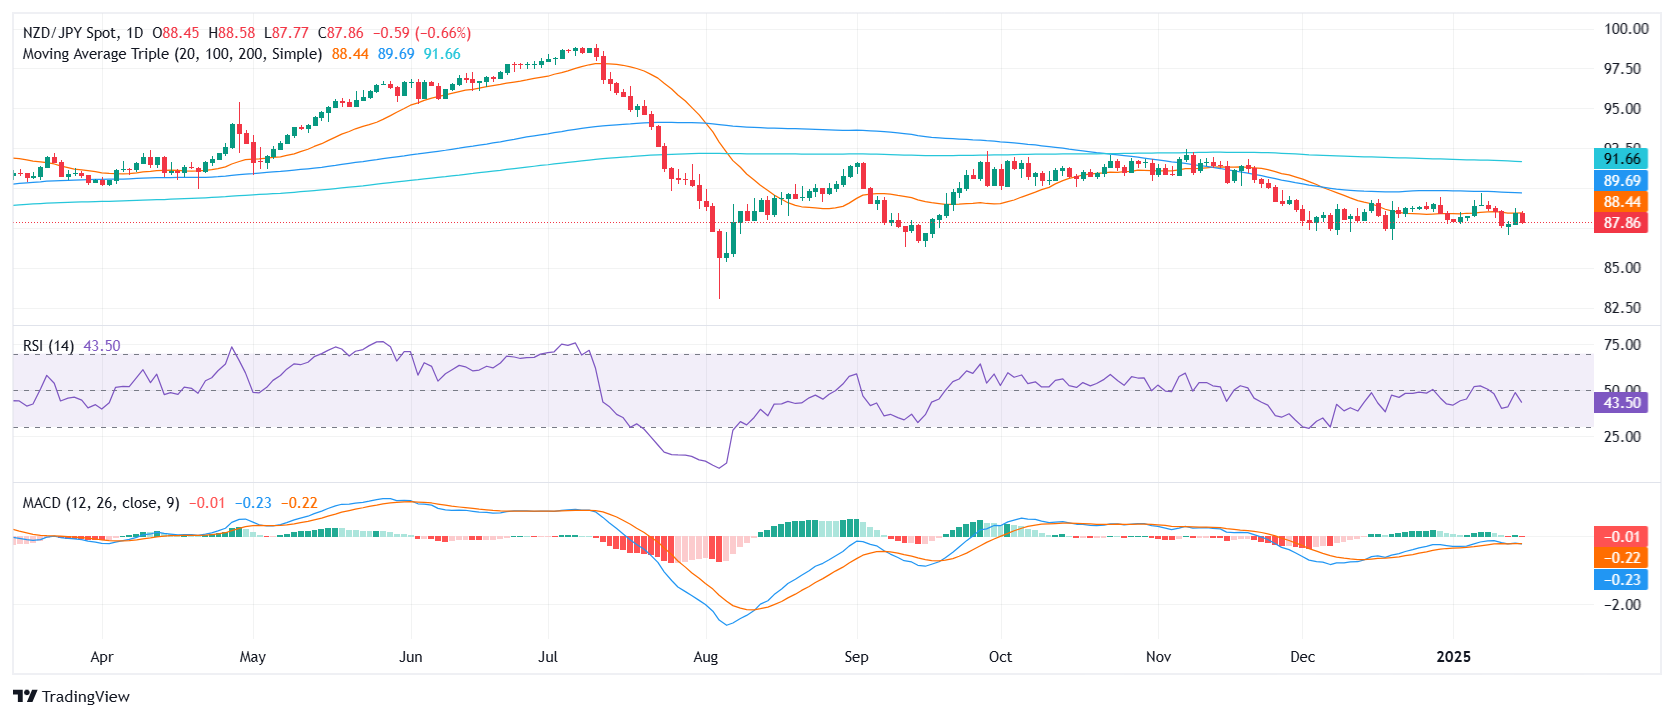
- NZD/JPY landed near 87.80 after the latest rejection at 89.00.
- RSI slides to 44 in negative territory, hinting that selling forces may be gaining ground.
- MACD histogram prints flat red bars, underscoring the pair’s fragile recovery attempts.
The NZD/JPY cross entered deeper negative territory on Wednesday, giving back 0.77% as it settled around 87.80. Sellers took charge following yet another failed effort to conquer the 20-day Simple Moving Average (SMA) near the 89.00 mark. Although the pair had initially shown signs of stabilization within the broader 89.00–87.00 channel, persistent selling pressure has kept it from mounting a convincing rebound.
On the technical front, the Relative Strength Index (RSI) has weakened to 44, reflecting a loss of buying momentum. Similarly, the Moving Average Convergence Divergence (MACD) histogram remains flat and in the red, indicating that the pair’s attempts at recovery lack robust follow-through. This combination of weakening indicators and repeated rejections at 89.00 casts doubt on any near-term upside potential.
As for immediate levels to watch, a drop under 87.50 would place the 87.00 floor under scrutiny, potentially dragging NZD/JPY into deeper territory if selling picks up. In contrast, a clean break above 89.00 remains critical to shifting the short-term bias back toward bullish territory, though buyers seem reluctant to push the market decisively higher at this juncture.
NZD/JPY daily chart
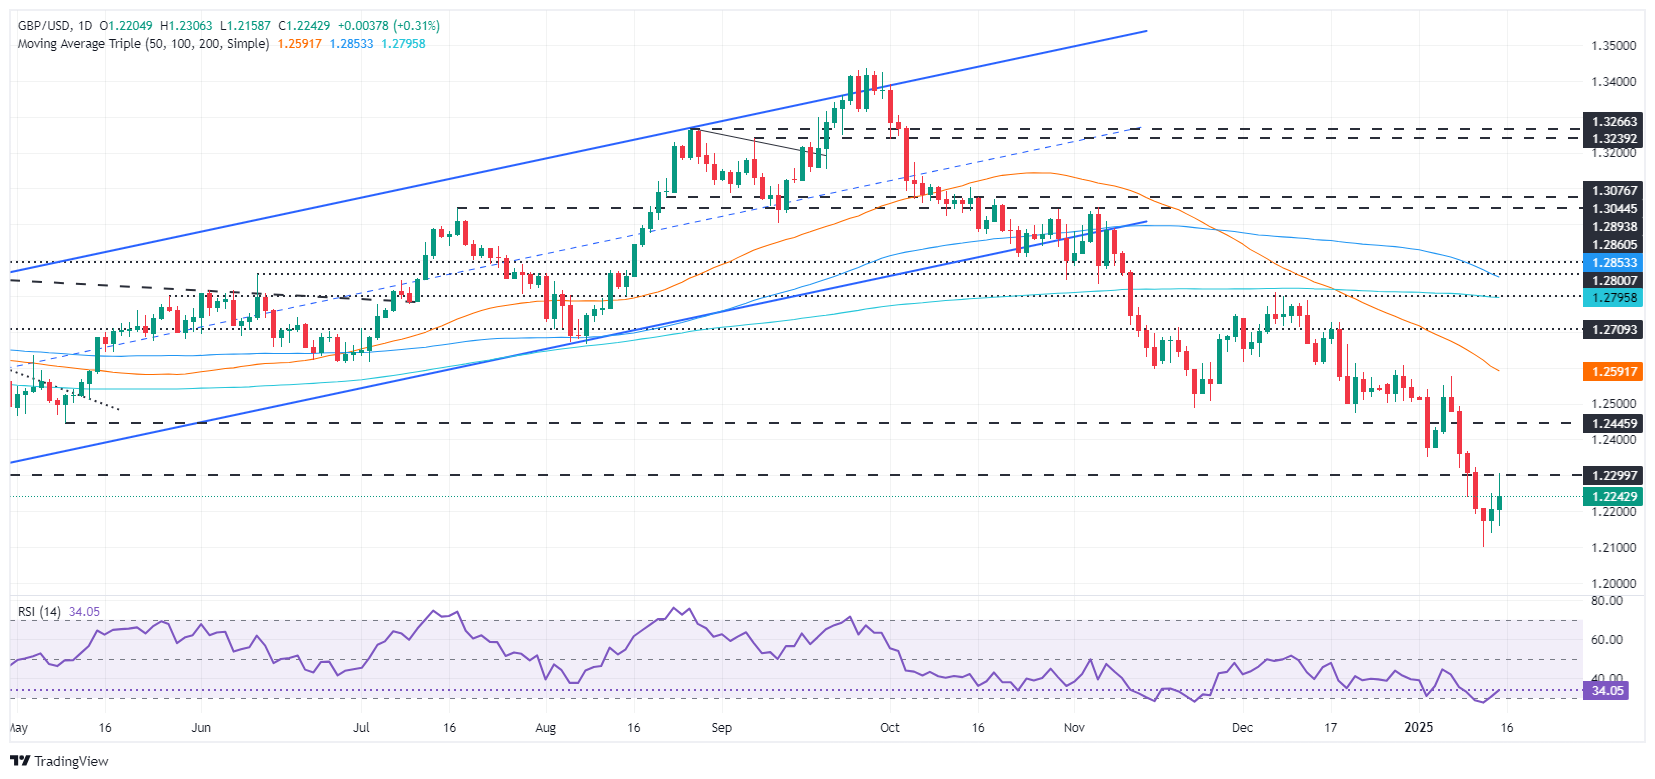
- Pound closes slightly below Tuesday's high, consolidating between 1.2210 and 1.2240.
- Resistance at 1.2299; above 1.2250 could extend gains to 1.2351.
- Break below 1.2200 may renew selling, targeting supports at 1.2136 and 1.2099.
The Pound Sterling posted modest gains on Wednesday after hit seesawing in a wide range of 1.2154 - 1.2306 during the day, yet stabilized at current exchange rates. At the time of writing, the GBP/USD trades at 1.2241, set to close below Tuesday’s high of 1.2249.
GBP/USD Price Forecast: Technical outlook
The GBP/USD downtrend remains in place, although it consolidated at around 1.2210 - 1.2240. During the session, buyers tested strong resistance at the April 22 low of 1.2299 before retreating beneath 1.2250. Should they hold to gains above the latter, they could challenge 1.2299 before targeting 1.2351, the January 2 swing low that turned resistance. Further upside is at 1.2400.
The downtrend could resume once sellers clear 1.2200. Once cleared, the next support would be the January 14 low of 1.2136, followed by the January 13 bottom of 1.2099.
GBP/USD Price Chart - Daily
British Pound PRICE Today
The table below shows the percentage change of British Pound (GBP) against listed major currencies today. British Pound was the strongest against the Japanese Yen.
| USD | EUR | GBP | JPY | CAD | AUD | NZD | CHF | |
|---|---|---|---|---|---|---|---|---|
| USD | -0.00% | -0.00% | 0.00% | -0.00% | -0.00% | -0.01% | 0.01% | |
| EUR | 0.00% | -0.01% | 0.02% | 0.00% | -0.01% | 0.00% | 0.01% | |
| GBP | 0.00% | 0.00% | 0.04% | 0.00% | 0.00% | -0.01% | 0.00% | |
| JPY | 0.00% | -0.02% | -0.04% | -0.01% | -0.02% | -0.02% | -0.02% | |
| CAD | 0.00% | 0.00% | -0.00% | 0.00% | -0.00% | -0.01% | 0.00% | |
| AUD | 0.00% | 0.00% | -0.00% | 0.02% | 0.00% | 0.00% | 0.00% | |
| NZD | 0.00% | 0.00% | 0.00% | 0.02% | 0.00% | -0.00% | 0.00% | |
| CHF | -0.01% | -0.01% | -0.01% | 0.02% | -0.00% | -0.00% | -0.01% |
The heat map shows percentage changes of major currencies against each other. The base currency is picked from the left column, while the quote currency is picked from the top row. For example, if you pick the British Pound from the left column and move along the horizontal line to the US Dollar, the percentage change displayed in the box will represent GBP (base)/USD (quote).
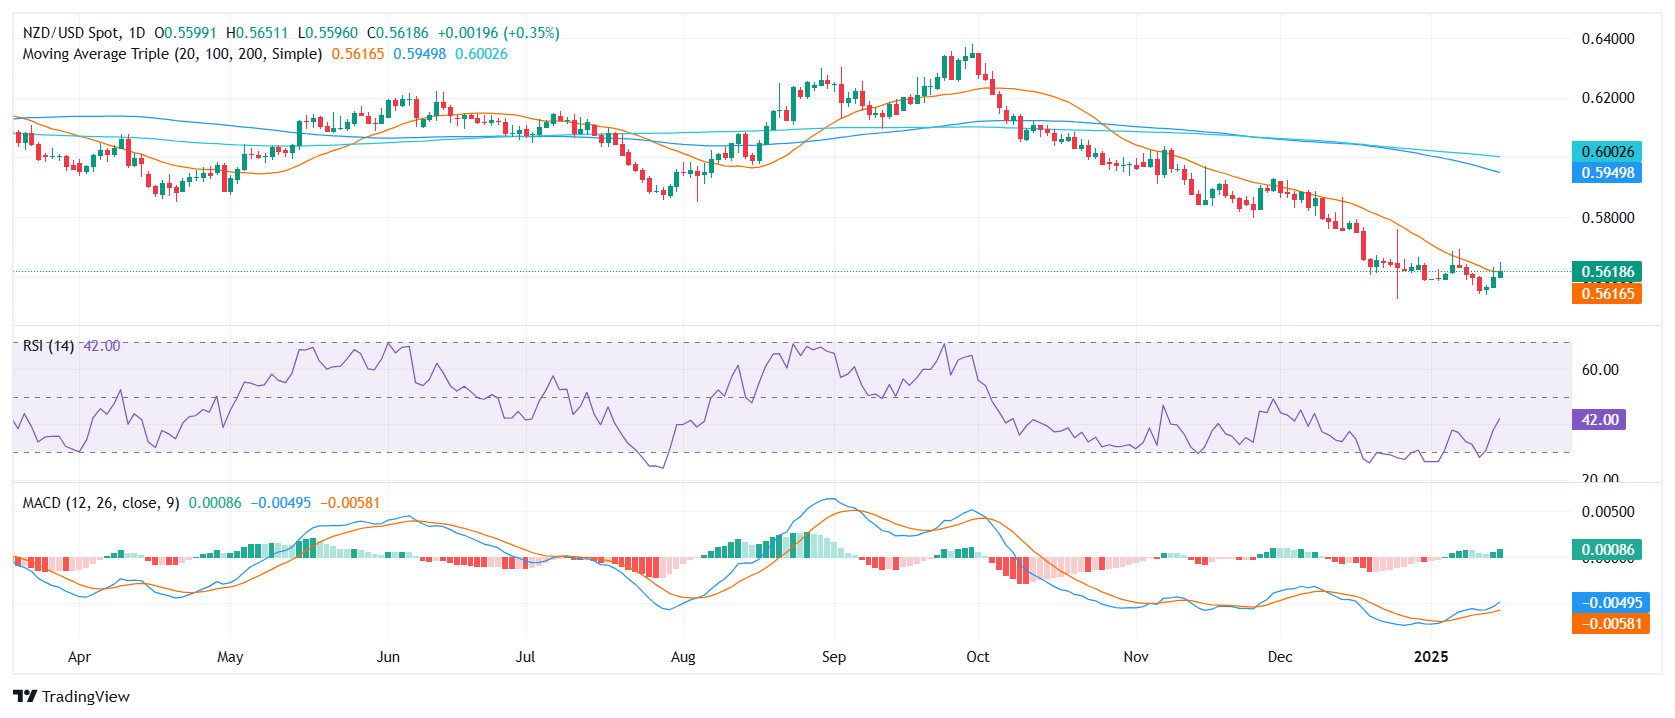
- NZD/USD rises settling near 0.5615 as it flirts with the 20-day SMA.
- RSI jumps to 42, moving sharply upward yet still anchored in negative territory.
- MACD histogram prints decreasing green bars, highlighting a tempered recovery outlook.
The NZD/USD pair added a modest 0.30% on Wednesday, edging up to 0.5615 after extending gains beyond its 20-day Simple Moving Average (SMA). This marginal push above the moving average could be the catalyst bulls have been waiting for, provided it holds steady in the coming sessions. Sentiment has shown signs of improving from oversold levels, although the market tone remains cautious overall.
Technical readings suggest that momentum is beginning to shift. While the Relative Strength Index (RSI) has climbed to 42, indicating a hopeful uptick, it remains positioned in negative territory. Meanwhile, the Moving Average Convergence Divergence (MACD) histogram is producing fewer green bars, signaling that, although buyers are gradually stepping in, the pair’s rebound remains fragile.
If NZD/USD can solidify its stance above the 20-day SMA near 0.5600, traders may eye further upside toward the 0.5650 resistance zone, with a move beyond this level potentially opening the door to 0.5700. Conversely, a drop back under 0.5580 would undermine the recent bounce and leave the pair vulnerable to retesting the 0.5550 handle or lower.
NZD/USD daily chart
- The Australian Unemployment Rate is foreseen at 4% in December.
- Employment Change is expected to include a large increase in full-time jobs.
- AUD/USD corrected from multi-year lows, sellers retain control.
The Australian Bureau of Statistics (ABS) will release the December monthly employment report at 00:30 GMT on Thursday. The country is expected to have added 15K new job positions, while the Unemployment Rate is expected to tick higher from the 3.9% posted in November to 4.0%. The Australian Dollar (AUD) is at around 0.6200 against the US Dollar (USD), not far from a fresh multi-year low of 0.6130 posted in early January.
The ABS Employment Change report separates full-time from part-time jobs. According to its definition, full-time jobs imply working 38 or more hours per week and usually include additional benefits, but they mostly represent consistent income. On the other hand, part-time employment generally offers higher hourly rates but lacks consistency and benefits. This is why full-time jobs are given more weight than part-time ones when setting the directional path for the AUD.
In November, Australia created 35.6K new job positions, adding 52.6K new full-time positions and losing 17k part-time ones.
Australian Unemployment Rate seen up in December
The Australian Unemployment Rate stood between 4% and 4.2% between April and September 2024, and the decline to 3.9% in November was a positive surprise. The anticipated 4% in December, despite being higher than the previous, is not a level that could trigger any concerns.
Meanwhile, the Reserve Bank of Australia (RBA) has decided to leave the cash rate target unchanged at 4.35%. On the one hand, the Board welcomed that inflation “has fallen substantially since the peak in 2022,” with headline inflation at 2.8% over the year to the September quarter. However, underlying inflation stood at 3.5% in the same period, “still some way from the 2.5% midpoint of the inflation target.” The RBA maintained its inflation forecast, indicating that price pressures won’t fall significantly within the target band until 2026.
Regarding employment, policymakers noted that a range of indicators suggest that labour market conditions remain tight. “The unemployment rate was 4.1% in September, up from the trough of 3.5% in late 2022. But the participation rate remains at record highs, vacancies are still elevated and average hours worked have stabilised. At the same time, some cyclical measures of the labour market including youth unemployment and underemployment have recently declined,” the monetary policy meeting statement reads.
The monthly report does not include wage growth. Such figures are released on a quarterly basis and the latest one showed the annualised Wage Price Index at 3.5%, also above the desired 2.5% midpoint.
Finally, it is worth remembering that financial markets are looking elsewhere: United States (US) President-elect Donald Trump will take office next Monday and pledged to impose massive tariffs. Risk aversion dominates financial boards amid fears his policies will push inflationary pressures up. As a result, the USD reached fresh multi-month highs against most major rivals this week and market players suspect the USD rally is far from over.
When will the Australian employment report be released and how could it affect AUD/USD?
The ABS will publish the December employment report early on Thursday. As previously stated, Australia is expected to have added 15K new job positions in the month, while the Unemployment Rate is foreseen at 4.0%. Finally, the Participation Rate is expected to hold at 67%.
Generally speaking, a better-than-anticipated employment report will boost the AUD, even if the more significant increase comes from part-time jobs. However, the advance could be more sustainable if the increase comes from full-time positions. The opposite scenario is also valid, with soft figures weighing on the Australian currency. At this point, the report has no chance of impacting the upcoming RBA decision.
As mentioned, the AUD/USD pair trades around the 0.6200 mark, not far from an almost four-year low of 0.6130. According to Valeria Bednarik, Chief Analyst at FXStreet, “the current AUD/USD advance seems corrective, given the USD extreme overbought conditions. Caution ahead of Trump’s government favors demand for safe-haven assets.”
Bednarik adds: “From a technical point of view, AUD/USD could soon resume its decline. The daily chart shows that it is up for a third consecutive day, yet still below all its moving averages. A firmly bearish 20 Simple Moving Average (SMA) provides near-term dynamic resistance at around 0.6220. At the same time, the 100 SMA is crossing below the 200 SMA, although both of them develop over 300 pips above the current level, in line with the dominant bearish trend. Finally, technical indicators corrected extreme oversold conditions, but remain within negative levels.”
“A critical resistance comes at 0.6301, January 1st top. Sellers will likely reappear around it, should strong employment figures push it higher. The immediate support, on the other hand, is the January 14 low at 0.6160, followed by the mentioned 0.6130 low. A break below the latter exposes the psychological 0.6000 mark.”
Employment FAQs
Labor market conditions are a key element to assess the health of an economy and thus a key driver for currency valuation. High employment, or low unemployment, has positive implications for consumer spending and thus economic growth, boosting the value of the local currency. Moreover, a very tight labor market – a situation in which there is a shortage of workers to fill open positions – can also have implications on inflation levels and thus monetary policy as low labor supply and high demand leads to higher wages.
The pace at which salaries are growing in an economy is key for policymakers. High wage growth means that households have more money to spend, usually leading to price increases in consumer goods. In contrast to more volatile sources of inflation such as energy prices, wage growth is seen as a key component of underlying and persisting inflation as salary increases are unlikely to be undone. Central banks around the world pay close attention to wage growth data when deciding on monetary policy.
The weight that each central bank assigns to labor market conditions depends on its objectives. Some central banks explicitly have mandates related to the labor market beyond controlling inflation levels. The US Federal Reserve (Fed), for example, has the dual mandate of promoting maximum employment and stable prices. Meanwhile, the European Central Bank’s (ECB) sole mandate is to keep inflation under control. Still, and despite whatever mandates they have, labor market conditions are an important factor for policymakers given its significance as a gauge of the health of the economy and their direct relationship to inflation.
RBA FAQs
The Reserve Bank of Australia (RBA) sets interest rates and manages monetary policy for Australia. Decisions are made by a board of governors at 11 meetings a year and ad hoc emergency meetings as required. The RBA’s primary mandate is to maintain price stability, which means an inflation rate of 2-3%, but also “..to contribute to the stability of the currency, full employment, and the economic prosperity and welfare of the Australian people.” Its main tool for achieving this is by raising or lowering interest rates. Relatively high interest rates will strengthen the Australian Dollar (AUD) and vice versa. Other RBA tools include quantitative easing and tightening.
While inflation had always traditionally been thought of as a negative factor for currencies since it lowers the value of money in general, the opposite has actually been the case in modern times with the relaxation of cross-border capital controls. Moderately higher inflation now tends to lead central banks to put up their interest rates, which in turn has the effect of attracting more capital inflows from global investors seeking a lucrative place to keep their money. This increases demand for the local currency, which in the case of Australia is the Aussie Dollar.
Macroeconomic data gauges the health of an economy and can have an impact on the value of its currency. Investors prefer to invest their capital in economies that are safe and growing rather than precarious and shrinking. Greater capital inflows increase the aggregate demand and value of the domestic currency. Classic indicators, such as GDP, Manufacturing and Services PMIs, employment, and consumer sentiment surveys can influence AUD. A strong economy may encourage the Reserve Bank of Australia to put up interest rates, also supporting AUD.
Quantitative Easing (QE) is a tool used in extreme situations when lowering interest rates is not enough to restore the flow of credit in the economy. QE is the process by which the Reserve Bank of Australia (RBA) prints Australian Dollars (AUD) for the purpose of buying assets – usually government or corporate bonds – from financial institutions, thereby providing them with much-needed liquidity. QE usually results in a weaker AUD.
Quantitative tightening (QT) is the reverse of QE. It is undertaken after QE when an economic recovery is underway and inflation starts rising. Whilst in QE the Reserve Bank of Australia (RBA) purchases government and corporate bonds from financial institutions to provide them with liquidity, in QT the RBA stops buying more assets, and stops reinvesting the principal maturing on the bonds it already holds. It would be positive (or bullish) for the Australian Dollar.
- Aussie climbs 0.42% against the USD to 0.6225 on Wednesday.
- China trade data, Yuan stabilization bolster risk appetite.
- US Dollar slips after softer inflation signals lead investors to dump the Greenback.
The Australian Dollar receives support from improved market sentiment and strong commodity prices. The AUD gained ground on robust trade data from China and Beijing’s moves to stabilize the Yuan. Meanwhile, the US Dollar depreciated in the wake of underwhelming Consumer Price Index (CPI) inflation figures reported on Wednesday.
Daily digest market movers: Aussie continues weak run after stellar US jobs report
- The US Dollar Index oscillated between gains and losses on Wednesday, dipping below 109.00 after the CPI release, then bouncing to 109.30 near the session’s end.
- The Australian Dollar extended its rebound above 0.6200, eyeing a possible test of the 0.6300 region in the short term.
- The annual CPI came in at 2.9%, up from 2.7%, while core inflation rose 0.2% MoM and 3.2% YoY, slightly below expectations.
- US Treasury yields sank post-CPI, with the 10-year benchmark dropping to 4.65% after hitting a 14-month high of 4.80%.
- On the negative side for the Aussie, the Reserve Bank of Australia considers a potential rate cut in February, citing tepid domestic growth and subdued inflation risks.
AUD/USD technical outlook: Bulls reclaim 20-day SMA as momentum improves
The AUD/USD rose to 0.6225 on Wednesday, extending its recovery from multi-year lows. The Relative Strength Index (RSI) stands at 49, climbing sharply from negative territory, while the Moving Average Convergence Divergence (MACD) histogram prints flat red bars, hinting that bearish pressure is waning.
Notably, the pair managed to jump above its 20-day Simple Moving Average (SMA), a development that could encourage additional upside if follow-through buying emerges. Nonetheless, the Aussie remains vulnerable to lingering RBA dovishness and a still-resilient US Dollar underpinned by robust economic data.
Australian Dollar FAQs
One of the most significant factors for the Australian Dollar (AUD) is the level of interest rates set by the Reserve Bank of Australia (RBA). Because Australia is a resource-rich country another key driver is the price of its biggest export, Iron Ore. The health of the Chinese economy, its largest trading partner, is a factor, as well as inflation in Australia, its growth rate and Trade Balance. Market sentiment – whether investors are taking on more risky assets (risk-on) or seeking safe-havens (risk-off) – is also a factor, with risk-on positive for AUD.
The Reserve Bank of Australia (RBA) influences the Australian Dollar (AUD) by setting the level of interest rates that Australian banks can lend to each other. This influences the level of interest rates in the economy as a whole. The main goal of the RBA is to maintain a stable inflation rate of 2-3% by adjusting interest rates up or down. Relatively high interest rates compared to other major central banks support the AUD, and the opposite for relatively low. The RBA can also use quantitative easing and tightening to influence credit conditions, with the former AUD-negative and the latter AUD-positive.
China is Australia’s largest trading partner so the health of the Chinese economy is a major influence on the value of the Australian Dollar (AUD). When the Chinese economy is doing well it purchases more raw materials, goods and services from Australia, lifting demand for the AUD, and pushing up its value. The opposite is the case when the Chinese economy is not growing as fast as expected. Positive or negative surprises in Chinese growth data, therefore, often have a direct impact on the Australian Dollar and its pairs.
Iron Ore is Australia’s largest export, accounting for $118 billion a year according to data from 2021, with China as its primary destination. The price of Iron Ore, therefore, can be a driver of the Australian Dollar. Generally, if the price of Iron Ore rises, AUD also goes up, as aggregate demand for the currency increases. The opposite is the case if the price of Iron Ore falls. Higher Iron Ore prices also tend to result in a greater likelihood of a positive Trade Balance for Australia, which is also positive of the AUD.
The Trade Balance, which is the difference between what a country earns from its exports versus what it pays for its imports, is another factor that can influence the value of the Australian Dollar. If Australia produces highly sought after exports, then its currency will gain in value purely from the surplus demand created from foreign buyers seeking to purchase its exports versus what it spends to purchase imports. Therefore, a positive net Trade Balance strengthens the AUD, with the opposite effect if the Trade Balance is negative.
- The Mexican Peso maintains its upward trajectory against the Dollar, buoyed by improved Gross Fixed Investment in October.
- Mixed US inflation data, with core figures below expectations, bolsters the market view of possible continued Fed easing.
- Divergent monetary policies between Banxico and the Fed could limit the Peso’s advance, with key economic data due next week.
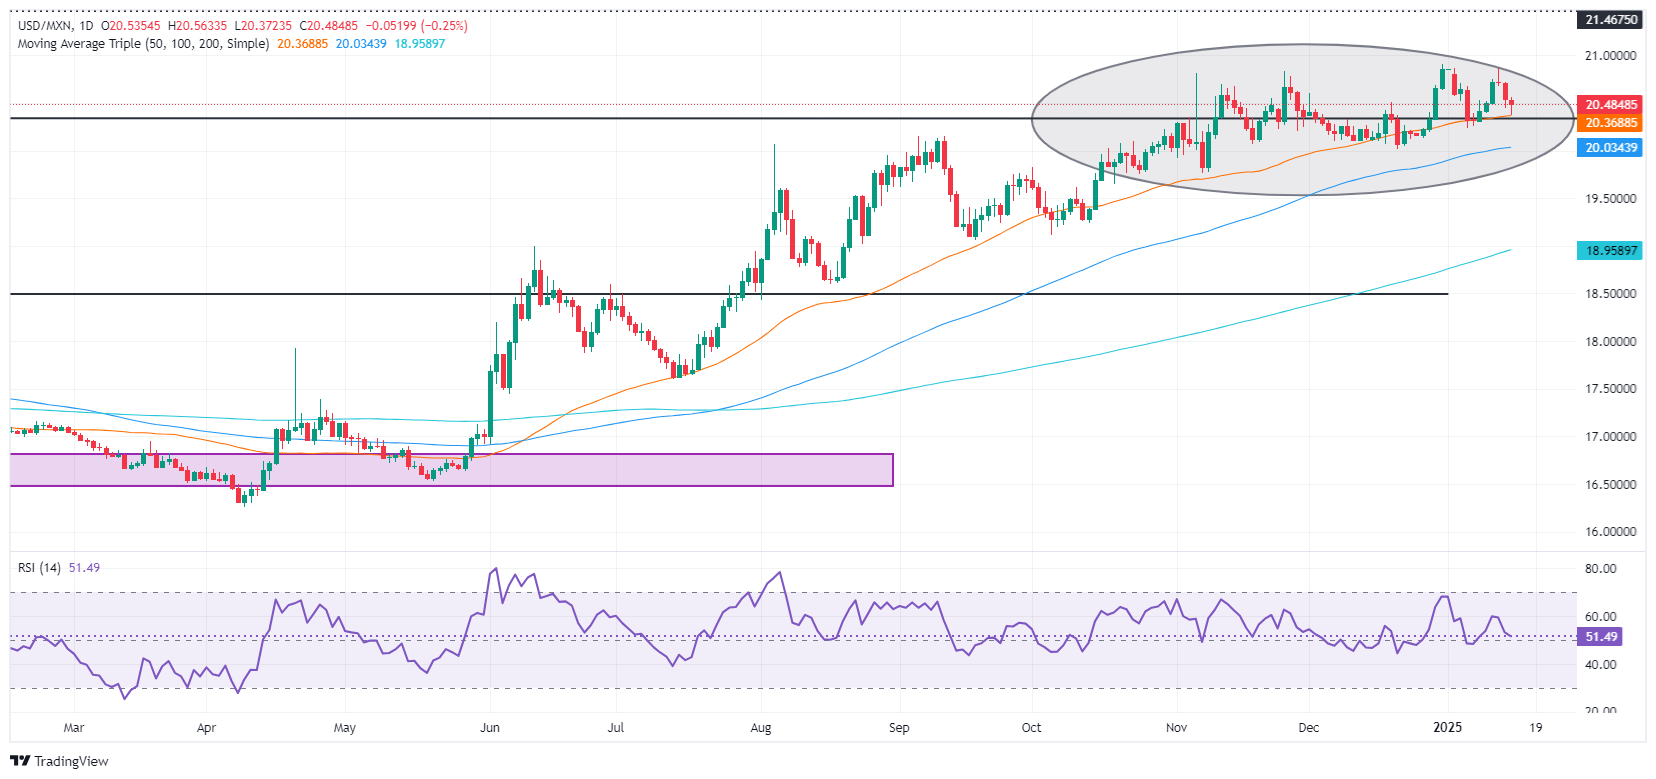
The Mexican Peso clings to earlier gains against the Greenback on Wednesday following the release of mixed United States (US) inflation data. Though headline inflation increased, core figures dipped compared to estimates and previous data. Therefore, the USD/MXN dropped 0.09%, trading at 20.48 at the time of writing.
The market mood remains upbeat following the release of US inflation data. Mixed figures revealed by the US Bureau of Labor Statistics (BLS) weighed in the US Dollar as traders grew confident that the Federal Reserve (Fed) might continue to ease monetary policy. Recently, Fed policymakers acknowledged they were less worried about the labor market yet showed concerns about “stickier” prices.
In Mexico, Gross Fixed Investment improved in October, according to monthly figures. However, on an annual basis, investment shrank for the second straight month.
After the data, USD/MXN continued its downtrend for the third day. However, charts suggest that the pair may face strong support before testing the crucial $20.00 figure.
In addition, the Central Bank divergence between the Bank of Mexico (Banxico) and the Federal Reserve could cap Peso’s gains. Banxico hinted it’s ready to increase the rhythm of monetary policy easing, while the Fed has opted for a gradual approach.
Mexico’s economic docket is absent this week, but next week’s inflation figures for the first fifteen days of January could set Banxico’s tone for the first meeting of the year. Investors will also eye the release of Economic Activity figures, a proxy for the Gross Domestic Product (GDP)
The US schedule will feature Retail Sales and Initial Jobless Claims data on Thursday.
Daily digest market movers: Mexican Peso benefits from weak US Dollar
- Overall, the US Dollar weakness keeps USD/MXN pressured. The US Dollar Index (DXY), which tracks the performance of the Greenback versus six other currencies, falls 0.05% to 109.12.
- The December US Consumer Price Index (CPI) increased by 2.9% YoY, in line with expectations and higher than November’s 2.7%. Core CPI rose by 3.2% YoY, slightly below the 3.3% recorded in the previous month.
- Mexico’s Gross Fixed Investment expanded by 0.1% in October from the previous month, revealed the Instituto Nacional de Estadistica Geografia e Informatica (INEGI). For the same period a year earlier, machinery, equipment and construction spending plunged 2.6%, up from a 2.9% contraction.
- Upcoming US data includes Retail Sales, which are projected to grow by 0.6% Month over Month in December, down from November’s 0.7%. Initial Jobless Claims for the week ending January 11 are expected to rise to 210K, up from 201 K.
- New York Fed President John Williams noted that the neutral interest rate is elevated due to the country’s high debt levels. While inflation has eased, Williams emphasized the Fed is monitoring potential fiscal policy changes by elected officials.
- Chicago’s Fed Austan Goolsbee was dovish. He said he still sees continued progress on inflation and added that for the last six months, PCE inflation has run close to the 2% goal. Earlier, Richmond Fed Thomas Barkin commented that inflation is approaching the 2% target and added that the labor market has stabilized.
- Minneapolis Fed President Neel Kashkari said that tariffs do not cause inflation. But tit-for-tat retaliation is more complicated.
USD/MXN technical outlook: Mexican Peso recovers as USD/MXN falls below 20.50
The USD/MXN pair is upward biased despite retreating toward the 50-day Simple Moving Average (SMA) of 20.32. Although the exotic pair is trending lower during the current week, the Relative Strength Index (RSI) suggests that buyers remain in charge.
If USD/MXN clears the 50-day SMA, this will expose the 100-day SMA at 19.99. A breach of the latter will send the pair towards the October 18 swing low of 19.64, ahead of the 19.50 figure.
Conversely, if USD/MXN rises past 20.50, the first resistance will be the year-to-date (YTD) peak of 20.90. If surpassed, the next stop would be March 8, 2022, which is a high of 21.46, ahead of 21.50, and at the 22.00 psychological level.
Mexican Peso FAQs
The Mexican Peso (MXN) is the most traded currency among its Latin American peers. Its value is broadly determined by the performance of the Mexican economy, the country’s central bank’s policy, the amount of foreign investment in the country and even the levels of remittances sent by Mexicans who live abroad, particularly in the United States. Geopolitical trends can also move MXN: for example, the process of nearshoring – or the decision by some firms to relocate manufacturing capacity and supply chains closer to their home countries – is also seen as a catalyst for the Mexican currency as the country is considered a key manufacturing hub in the American continent. Another catalyst for MXN is Oil prices as Mexico is a key exporter of the commodity.
The main objective of Mexico’s central bank, also known as Banxico, is to maintain inflation at low and stable levels (at or close to its target of 3%, the midpoint in a tolerance band of between 2% and 4%). To this end, the bank sets an appropriate level of interest rates. When inflation is too high, Banxico will attempt to tame it by raising interest rates, making it more expensive for households and businesses to borrow money, thus cooling demand and the overall economy. Higher interest rates are generally positive for the Mexican Peso (MXN) as they lead to higher yields, making the country a more attractive place for investors. On the contrary, lower interest rates tend to weaken MXN.
Macroeconomic data releases are key to assess the state of the economy and can have an impact on the Mexican Peso (MXN) valuation. A strong Mexican economy, based on high economic growth, low unemployment and high confidence is good for MXN. Not only does it attract more foreign investment but it may encourage the Bank of Mexico (Banxico) to increase interest rates, particularly if this strength comes together with elevated inflation. However, if economic data is weak, MXN is likely to depreciate.
As an emerging-market currency, the Mexican Peso (MXN) tends to strive during risk-on periods, or when investors perceive that broader market risks are low and thus are eager to engage with investments that carry a higher risk. Conversely, MXN tends to weaken at times of market turbulence or economic uncertainty as investors tend to sell higher-risk assets and flee to the more-stable safe havens.
- The Canadian Dollar found a scant 0.2% gain against the Greenback.
- Data from Canada remains limited on the docket throughout this week.
- Cooling core CPI inflation figures from the US are pushing down USD flows.
The Canadian Dollar (CAD) caught another thin bid on Wednesday, gaining a thin one-fifth of one percent against the Greenback as investor sentiment broadly picks up. The CAD is now on a three-day winning streak against the safe haven US Dollar, but the Loonie is still sticking close to multi-year lows as confidence remains tepid.
Canadian Manufacturing and Wholesale Sales figures from November came in on Wednesday, but overall, markets were focused squarely on key US Consumer Price Index (CPI) inflation metrics that were released side-by-side with the long-dated Canadian data.
Daily digest market movers: Canadian Dollar catches a break from Greenback bidding
- The Canadian Dollar rose 0.2% against the US Dollar, dragging USD/CAD down to 1.4330.
- Canadian Manufacturing Sales rose 0.8% MoM in November, beating the forecast 0.5% but still falling from the previous 2.1%.
- Canadian Wholesale Sales contracted 0.2% over the same period, beating the expected -0.7% but still down from the revised 1.3%.
- US headline CPI inflation accelerated in December, but core CPI ticked down slightly, prompting further market hopes of easing inflation pressures that could, ostensibly, lead to further Federal Reserve (Fed) rate cuts in the future.
- The Fed is currently expected to stand pat on interest rates until sometime in the second half of 2025.
Canadian Dollar price forecast
The Canadian Dollar’s near-term rebound is helping to ease pressure in the USD/CAD chart, but bullish momentum behind the Loonie remains tepid, if not downright half-hearted. The pair is still trading well within a consolidation pattern hardening on the daily candles, and the 1.4300 handle is looking like more of a barrier than a target for CAD bidders.
USD/CAD daily chart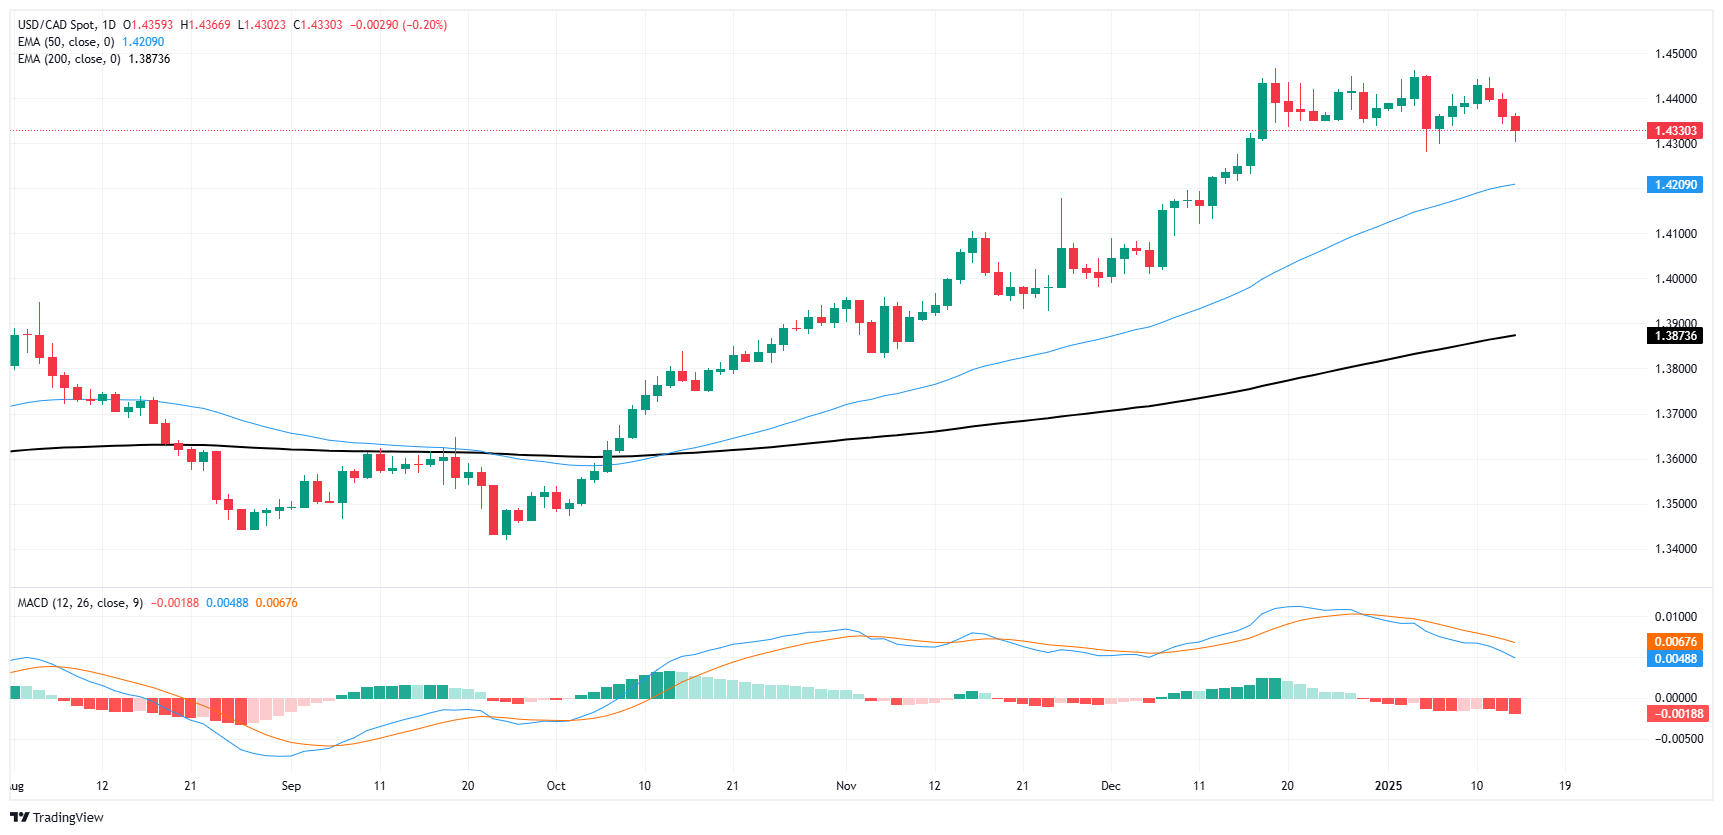
Canadian Dollar FAQs
The key factors driving the Canadian Dollar (CAD) are the level of interest rates set by the Bank of Canada (BoC), the price of Oil, Canada’s largest export, the health of its economy, inflation and the Trade Balance, which is the difference between the value of Canada’s exports versus its imports. Other factors include market sentiment – whether investors are taking on more risky assets (risk-on) or seeking safe-havens (risk-off) – with risk-on being CAD-positive. As its largest trading partner, the health of the US economy is also a key factor influencing the Canadian Dollar.
The Bank of Canada (BoC) has a significant influence on the Canadian Dollar by setting the level of interest rates that banks can lend to one another. This influences the level of interest rates for everyone. The main goal of the BoC is to maintain inflation at 1-3% by adjusting interest rates up or down. Relatively higher interest rates tend to be positive for the CAD. The Bank of Canada can also use quantitative easing and tightening to influence credit conditions, with the former CAD-negative and the latter CAD-positive.
The price of Oil is a key factor impacting the value of the Canadian Dollar. Petroleum is Canada’s biggest export, so Oil price tends to have an immediate impact on the CAD value. Generally, if Oil price rises CAD also goes up, as aggregate demand for the currency increases. The opposite is the case if the price of Oil falls. Higher Oil prices also tend to result in a greater likelihood of a positive Trade Balance, which is also supportive of the CAD.
While inflation had always traditionally been thought of as a negative factor for a currency since it lowers the value of money, the opposite has actually been the case in modern times with the relaxation of cross-border capital controls. Higher inflation tends to lead central banks to put up interest rates which attracts more capital inflows from global investors seeking a lucrative place to keep their money. This increases demand for the local currency, which in Canada’s case is the Canadian Dollar.
Macroeconomic data releases gauge the health of the economy and can have an impact on the Canadian Dollar. Indicators such as GDP, Manufacturing and Services PMIs, employment, and consumer sentiment surveys can all influence the direction of the CAD. A strong economy is good for the Canadian Dollar. Not only does it attract more foreign investment but it may encourage the Bank of Canada to put up interest rates, leading to a stronger currency. If economic data is weak, however, the CAD is likely to fall.
The selling pressure remained well in place around the Greenback, which saw its weekly corrective decline gather extra pace after US inflation tracked by the CPI matched market consensus in December. The door for a rate cut in January appears still open.
Here is what you need to know on Thursday, January 16:
The US Dollar Index (DXY) dropped to new five-day lows after breaking below the 109.00 support, as investors seem to have placed some hopes on a Fed rate cut later in the month. Retail Sales and weekly Initial Jobless Claims take centre stage, seconded by Import/Export Prices, the Philly Fed Manufacturing Index, Business Inventories, and the NAHB Housing Market index.
EUR/USD broke above the 1.0300 hurdle with certain conviction in response to initial USD-selling, although this move lost traction afterwards, leaving the pair with modest losses for the day. The final Inflation Rate in Germany is due along with EMU’s Balance of Trade results and the ECB Accounts.
GBP/USD advanced for the third consecutive day on Wednesday, managing to briefly trespass 1.2300 the figure following another negative day in the Greenback. An interesting UK docket on Thursday will include GDP figures, Industrial and Manufacturing Production, Construction Output, and Balance of Trade.
USD/JPY retreated heavily to four-week lows in the sub-156.00 region following the marked pullback in the Dollar and diminishing US yields across the curve. Japan’s Producer Prices will be at the centre of the debate.
Another positive day for the risk complex saw AUD/USD advance to six-day highs near 0.6250. The main focus in Oz will be on the release of the Australian labour market report.
Prices of WTI resumed their uptrend and traded at shouting distance from recent peaks just above the $79.00 mark per barrel.
Prices of Gold traded in a constructive fashion following the Dollar’s pullback and the marked retracement in US yields across different time frames, with the ounce troy hovering around the $2,700 mark on Wednesday. Silver prices added to Tuesday’s gains and climbed beyond the key $30.00 mark per ounce.
- Lingering economic uncertainties drive traders to revisit growth forecasts, spurring cautious positioning across major currency pairs.
- Softer-than-forecast inflation prints spark questions over the Federal Reserve’s next move, compelling markets to reassess rate expectations.
- Benchmark Treasury yields tumble from recent peaks, highlighting market jitters following the latest inflation figures.
The US Dollar (DXY) turns this week into a firm loss, eking out more weakness on Wednesday. The US December CPI release arrived a bit softer than predicted, fueling speculation about the Fed’s path ahead. The US Dollar Index, which measures the value of the USD against a basket of currencies, snaps below 109.00 and could accelerate its downside from here.
Daily digest market movers: US Dollar remains soft after CPI data
- Headline CPI for December climbed by 2.9% YoY, undershooting some market whispers of a stronger result.
- Core CPI rose by 3.2% over the same period, stepping down from November’s pace as monthly core inflation printed at 0.2%.
- The CME FedWatch Tool implies that investors have priced in a hold this month, consistent with a data-dependent stance.
- Yields crumble: The 10-year note slips to around 4.65% from Monday’s 14-month high, reflecting diminished inflation expectations and lighter risk premium.
- Regional surveys point to mixed economic activity with some districts reporting subdued expansion while others see a mild pullback.
- Tariff talk remains a wildcard as some districts worry new policy changes might introduce an upside inflation risk, complicating the Fed’s job.
DXY technical outlook: Mild setback near multi-year highs
The US Dollar Index slid below the 109.00 threshold as traders locked in gains following softer inflation readings. Despite the pullback, the broader uptrend remains intact near multi-year peaks with the 20-day Simple Moving Average repelling sellers.
US Dollar FAQs
The US Dollar (USD) is the official currency of the United States of America, and the ‘de facto’ currency of a significant number of other countries where it is found in circulation alongside local notes. It is the most heavily traded currency in the world, accounting for over 88% of all global foreign exchange turnover, or an average of $6.6 trillion in transactions per day, according to data from 2022. Following the second world war, the USD took over from the British Pound as the world’s reserve currency. For most of its history, the US Dollar was backed by Gold, until the Bretton Woods Agreement in 1971 when the Gold Standard went away.
The most important single factor impacting on the value of the US Dollar is monetary policy, which is shaped by the Federal Reserve (Fed). The Fed has two mandates: to achieve price stability (control inflation) and foster full employment. Its primary tool to achieve these two goals is by adjusting interest rates. When prices are rising too quickly and inflation is above the Fed’s 2% target, the Fed will raise rates, which helps the USD value. When inflation falls below 2% or the Unemployment Rate is too high, the Fed may lower interest rates, which weighs on the Greenback.
In extreme situations, the Federal Reserve can also print more Dollars and enact quantitative easing (QE). QE is the process by which the Fed substantially increases the flow of credit in a stuck financial system. It is a non-standard policy measure used when credit has dried up because banks will not lend to each other (out of the fear of counterparty default). It is a last resort when simply lowering interest rates is unlikely to achieve the necessary result. It was the Fed’s weapon of choice to combat the credit crunch that occurred during the Great Financial Crisis in 2008. It involves the Fed printing more Dollars and using them to buy US government bonds predominantly from financial institutions. QE usually leads to a weaker US Dollar.
Quantitative tightening (QT) is the reverse process whereby the Federal Reserve stops buying bonds from financial institutions and does not reinvest the principal from the bonds it holds maturing in new purchases. It is usually positive for the US Dollar.
- The Dow Jones lurched over 750 points higher on Wednesday.
- Equities are broadly pivoting into a risk-on sentiment stance.
- Investors brush off rising headline CPI as core CPI measures tick down.
The Dow Jones Industrial Average (DJIA) climbed around 750 points at its peak on Wednesday, pushing into the bullish side to pass back through the 43,000 handle before getting hung up on the 50-day Exponential Moving Average (EMA). Equity markets are tilting firmly into the bullish camp after a key core inflation gauge ticked slightly lower.
According to the Consumer Price Index (CPI), headline inflation rose in December from a year before, with prices climbing 2.9% YoY compared to 2.7% previously. The acceleration in headline inflation was anticipated by market analysts, though December’s standalone figure still surprised to the upside, coming in at 0.4% MoM compared to the expected flat hold at 0.3%.
The real magic for equity markets came in the core CPI print, which excludes volatile items liike food and energy prices. Annualized core inflation ticked down to 3.2% YoY, beating the expected hold at the previous period’s 3.3%. Choosing to ignore rising food and energy prices doesn’t mean consumers won’t magically have to stop paying for them, and investors are running the risk of getting lost in the details and focusing on the wrong thing: odds of a Federal Reserve (Fed) rate cut on January 29 moved from 2.0% to 2.7% after the CPI print, according to the CME’s FedWatch Tool.
Dow Jones news
Wednesday is turning out to be a firmly bullish day for the Dow Jones, with all but five of the average’s listed securities trading above the day’s opening bids. Honeywell International (HON) pulled back around 0.6% to $217 as investors took profits on a recent bullish upswing for the company. Goldman Sachs (GS) rose to the top of the DJIA during the midweek market session, climbing 6.5% and pushing into $604 per share after the major investment bank’s profits surged to a three-year high.
Dow Jones price forecast
The Dow Jones’ latest bearish weak point could be over as price action pushes back north of the 50-day EMA and reclaims the 43,000 handle. The major equity index pulled back into alarm bell territory just above the 200-day EMA near 41,200, but things may be back to their bullish ways now that the Dow has climbed 3.7% in just three days.
42,000 has proven to be the technical floor holding up bids, at least for the time being. Selling pressure has remained unable to push prices meaningfully back below the key figure, and bidders are coming out of the woodwork to try and push the Dow Jones back into record highs set above 45,000.
Dow Jones daily chart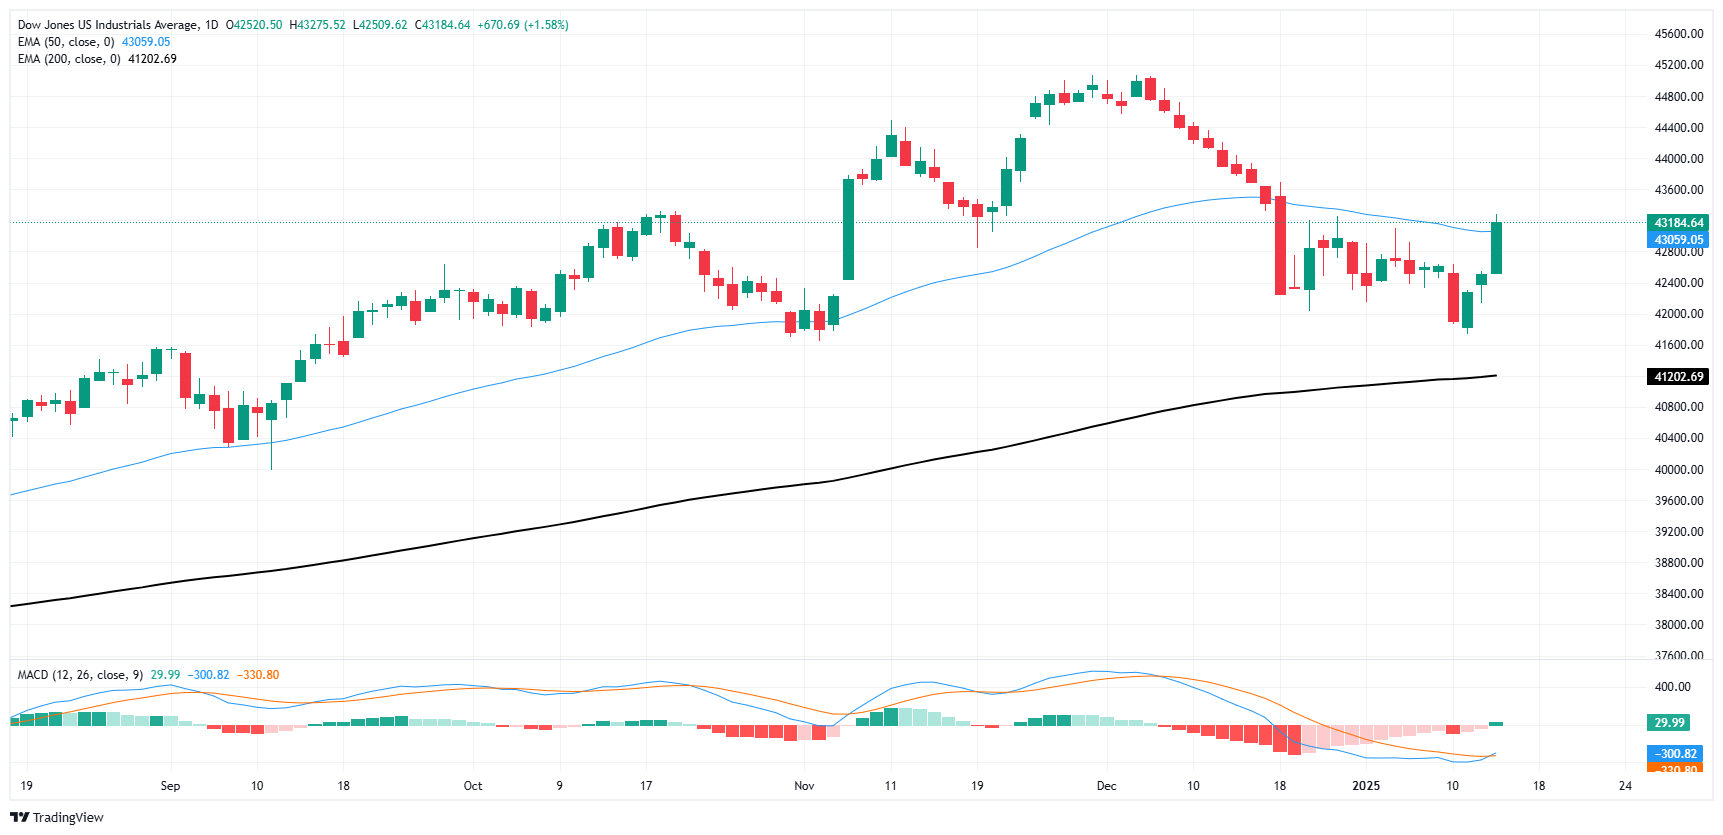
Dow Jones FAQs
The Dow Jones Industrial Average, one of the oldest stock market indices in the world, is compiled of the 30 most traded stocks in the US. The index is price-weighted rather than weighted by capitalization. It is calculated by summing the prices of the constituent stocks and dividing them by a factor, currently 0.152. The index was founded by Charles Dow, who also founded the Wall Street Journal. In later years it has been criticized for not being broadly representative enough because it only tracks 30 conglomerates, unlike broader indices such as the S&P 500.
Many different factors drive the Dow Jones Industrial Average (DJIA). The aggregate performance of the component companies revealed in quarterly company earnings reports is the main one. US and global macroeconomic data also contributes as it impacts on investor sentiment. The level of interest rates, set by the Federal Reserve (Fed), also influences the DJIA as it affects the cost of credit, on which many corporations are heavily reliant. Therefore, inflation can be a major driver as well as other metrics which impact the Fed decisions.
Dow Theory is a method for identifying the primary trend of the stock market developed by Charles Dow. A key step is to compare the direction of the Dow Jones Industrial Average (DJIA) and the Dow Jones Transportation Average (DJTA) and only follow trends where both are moving in the same direction. Volume is a confirmatory criteria. The theory uses elements of peak and trough analysis. Dow’s theory posits three trend phases: accumulation, when smart money starts buying or selling; public participation, when the wider public joins in; and distribution, when the smart money exits.
There are a number of ways to trade the DJIA. One is to use ETFs which allow investors to trade the DJIA as a single security, rather than having to buy shares in all 30 constituent companies. A leading example is the SPDR Dow Jones Industrial Average ETF (DIA). DJIA futures contracts enable traders to speculate on the future value of the index and Options provide the right, but not the obligation, to buy or sell the index at a predetermined price in the future. Mutual funds enable investors to buy a share of a diversified portfolio of DJIA stocks thus providing exposure to the overall index.
- Gold extends gains as US core inflation was better than expected, sparking a drop in Treasury yields.
- Traders now anticipate the Fed might cut rates by 40 basis points by the end of 2025, adjusting market expectations.
- Potential tariffs by the upcoming Trump administration could counter disinflationary trends, impacting gold's trajectory.
Gold climbed for the second straight day due to a plunge in United States (US) yields following data that hinted at fading core inflation. This suggests that the Federal Reserve (Fed) could ease policy due to the disinflation trend. The XAU/USD trades at $2,690.
The golden metal resumed its uptrend after the US Bureau of Labor Statistics (BLS) revealed that underlying consumer inflation dipped compared to estimates and the previous month’s reading. The data sent US yields tumbling, as there is an increasing chance that the Fed will not exclude interest rate cuts following the December meeting.
After the data, traders estimate the US central bank to deliver 40 basis points (bps) of easing towards the end of 2025.
However, Gold is not out of the woods yet, as the upcoming Donald Trump administration has on its agenda applying tariffs, which could stoke inflation and prevent the Fed from lowering borrowing costs.
If the upcoming administration does indeed proceed with tariffs, this could boost the US Dollar (USD) to the detriment of the non-yielding metal.
Meanwhile, financial markets focus on US Retail Sales, unemployment claims and Fed speaking.
Daily digest market movers: Gold’s jump sponsored by plummeting US real yields
- Gold extended its gains as real yields dropped. Measured by the 10-year Treasury Inflation-Protected Securities (TIPS) yield, tumbled nine and a half basis points (bps) from 2.33% to 2.234%.
- The US Dollar Index (DXY), which tracks the dollar's performance against six currencies, rose 0.09% to 109.29, recovering from a daily low of 108.62.
- In December, the Consumer Price Index (CPI) rose by 2.9% YoY as expected, above the previous month’s 2.7%. Core CPI for the same period expanded by 3.2% YoY, less than the 3.3% registered in November,
- Ahead in the calendar, Retail Sales are expected at 0.6% MoM, down from 0.7% in November. Initial Jobless Claims for the week ending January 11 are projected to jump from 201K to 210K.
- New York Fed President John Williams said the neutral rate is much higher due to the country’s high debt levels. He added that inflation has retreated, yet the Fed is awaiting what elected officials might do on fiscal policy.
- The CME FedWatch Tool shows investors are eyeing the first rate cut for the June 18 meeting.
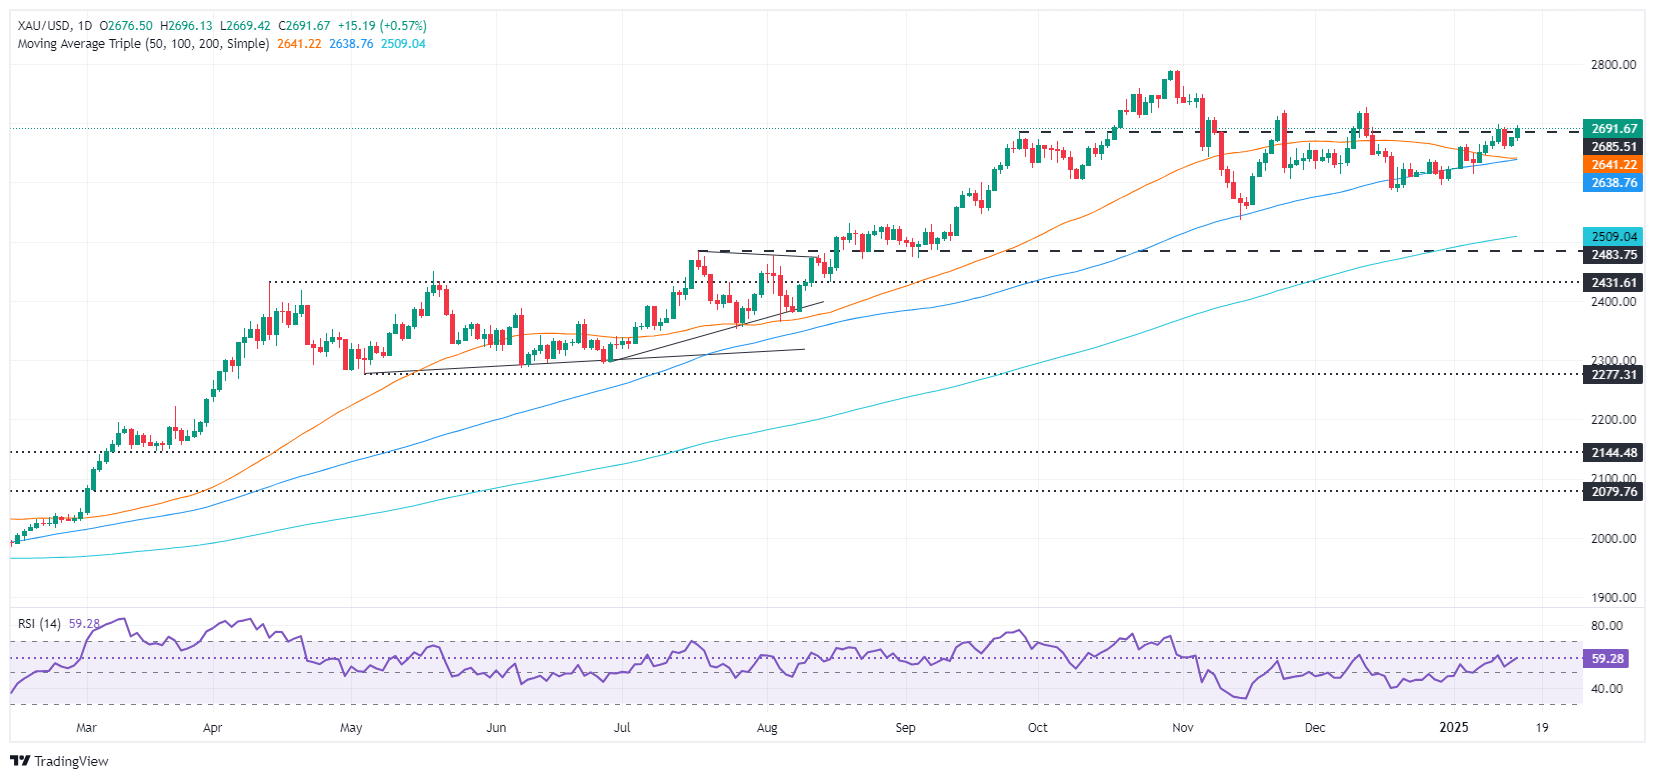
XAU/USD technical outlook: Gold price surges towards $2,700 as US yields drop
Gold’s uptrend remains intact, with buyers eyeing a clear break of $2,700. Bulls are gathering steam, as depicted by the Relative Strength Index (RSI) and aiming up indicates that momentum favors higher prices. Once XAU/USD clears $2,700, the next resistance would be the December 12 peak of $2,726, followed by the record high at $2,790.
Conversely, if XAU/USD drops below $2,650, the next support would be the 50-day Simple Moving Average (SMA) at $2,643, followed by the 100-day SMA at $2,633.
Gold FAQs
Gold has played a key role in human’s history as it has been widely used as a store of value and medium of exchange. Currently, apart from its shine and usage for jewelry, the precious metal is widely seen as a safe-haven asset, meaning that it is considered a good investment during turbulent times. Gold is also widely seen as a hedge against inflation and against depreciating currencies as it doesn’t rely on any specific issuer or government.
Central banks are the biggest Gold holders. In their aim to support their currencies in turbulent times, central banks tend to diversify their reserves and buy Gold to improve the perceived strength of the economy and the currency. High Gold reserves can be a source of trust for a country’s solvency. Central banks added 1,136 tonnes of Gold worth around $70 billion to their reserves in 2022, according to data from the World Gold Council. This is the highest yearly purchase since records began. Central banks from emerging economies such as China, India and Turkey are quickly increasing their Gold reserves.
Gold has an inverse correlation with the US Dollar and US Treasuries, which are both major reserve and safe-haven assets. When the Dollar depreciates, Gold tends to rise, enabling investors and central banks to diversify their assets in turbulent times. Gold is also inversely correlated with risk assets. A rally in the stock market tends to weaken Gold price, while sell-offs in riskier markets tend to favor the precious metal.
The price can move due to a wide range of factors. Geopolitical instability or fears of a deep recession can quickly make Gold price escalate due to its safe-haven status. As a yield-less asset, Gold tends to rise with lower interest rates, while higher cost of money usually weighs down on the yellow metal. Still, most moves depend on how the US Dollar (USD) behaves as the asset is priced in dollars (XAU/USD). A strong Dollar tends to keep the price of Gold controlled, whereas a weaker Dollar is likely to push Gold prices up.
Federal Reserve (Fed) Bank of Chicago President Austan Goolsbee hit newswires on Wednesday shortly after a fresh update to US inflation figures.
Key highlights
I still see continued progress on inflation.
I am optimistic for 2025 on a soft landing.
For the last 6 months, PCE inflation has run close to the 2% target.
There's been an uptick in business confidence and uncertainty since the election.
The CPI report is somewhat encouraging, and somewhat discouraging, in equal measure.
I am wary of the seasonal pattern of inflation.
If Congress and the President begin drafting policies that will raise prices, the Fed has to think about that. What matters is the impact of policies as a whole.
Federal Reserve Bank of New York President John Williams noted on Wednesday that the Fed's future monetary policy decisions will depend heavily on economic data. He highlighted the significant uncertainty facing the Fed, much of which stems from potential changes in government policy.
Key Quotes
Monetary policy data-dependent in highly uncertain environment.
Government policy outlook main source of uncertainty.
Monetary policy ‘well positioned’ for economic outlook.
Disinflation process to continue, could be choppy.
Improvement in supply/demand balance allowed rate cuts.
Balance sheet drawdown proceeding smoothly.
Expects growth to moderate to 2% this year.
Expects unemployment rate to hold between 4%-4.25%.
Sees move to 2% inflation over coming years.
Housing related inflation pressures are easing.
Economy has returned to balance.
Inflation expectations are anchored.
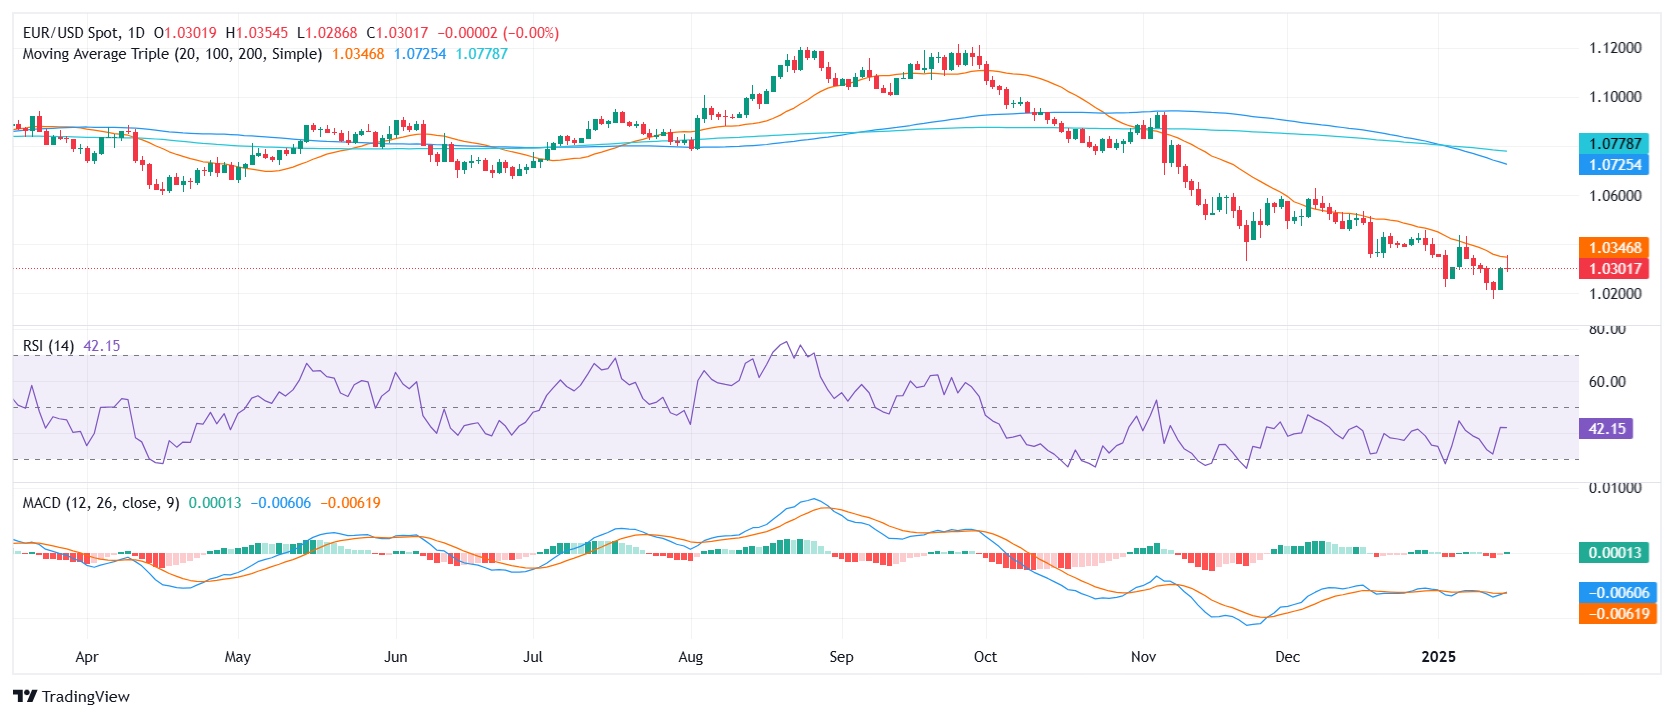
- EUR/USD edges higher on Wednesday, reaching 1.0335 as buyers attempt a comeback.
- RSI climbs to 47, signaling a sharp pickup in momentum yet still residing in negative territory.
- MACD histogram shows flat red bars, hinting that bullish traction remains tentative.
EUR/USD managed a modest rise to around 1.0335 on Wednesday, extending a cautious bid despite struggling to firmly overtake the 20-day Simple Moving Average (SMA). While the pair has garnered some support following recent declines, the rejection at this technical barrier underscores lingering doubts over the sustainability of the recovery.
From a momentum standpoint, the Relative Strength Index (RSI) has improved to 47, an indication of reviving sentiment, yet it maintains a foothold in negative territory, suggesting that buyers still face headwinds. Meanwhile, the Moving Average Convergence Divergence (MACD) histogram prints flat red bars, reinforcing the notion that bullish forces remain far from dominant.
For now, immediate resistance aligns with the 20-day SMA near 1.0350, where a decisive break could brighten the short-term outlook and open the door toward 1.0400. On the downside, failure to defend the 1.0300 mark may see sellers resurface, potentially dragging the pair toward 1.0270 or below.
EUR/USD daily chart
Richmond Federal Reserve President Thomas Barkin remarked on Wednesday that December’s US inflation data suggests price pressures are continuing to ease. His comments came after a government report revealed that a key underlying measure of price increases had slowed during the month.
Key Quotes
Inflation is coming down towards 2% target
Says he can see paths where inflation is sticky or continues to progress towards target
Says he was encouraged by the unemployment rate in December
Seems the job market has stabilized
Not much to support arguments that the economy is growing weaker
Says he is not concerned about overheating economy right now; demand is solid but not booming
Long rates right now are consistent with early 2000s, which was not a restrictive time for business
Says he has not seen anything in long rates that would influence Fed policy at this point
Regarding incoming Trump administration's policies, the direction of travel may be clear on things like tariffs but the details are not
Businesses generally saying that price-setting behavior is moving to pre-pandemic patterns
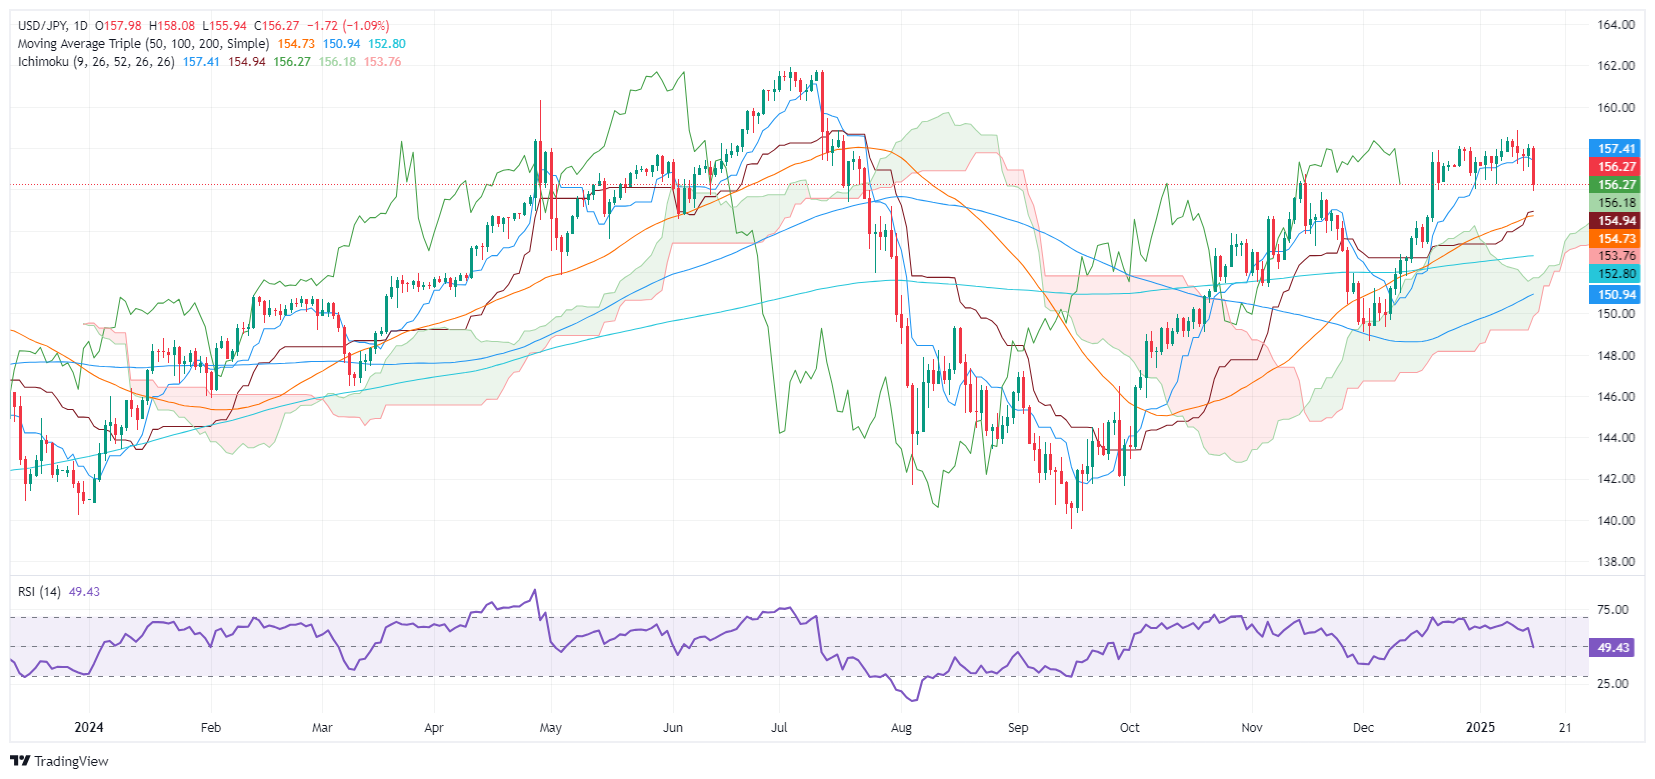
- USD/JPY falls sharply as U.S. consumer inflation data shows slowing core inflation.
- Bank of Japan Governor's hawkish comments lift Yen; U.S. 10-year yields drop 12bps.
- Upcoming Fed speeches and U.S. economic data key for further market direction.
The USD/JPY dropped over 1% in early trading during the North American session as inflation data in the United States (US) resumed its downward trajectory in core figures. The pair trades at 156.33 at the time of writing.
US Dollar falls to 156.33 against Yen following US inflation data that showed a slowdown in core price
The US Bureau of Labor Statistics (BLS) revealed that consumer inflation rose by 0.4% Month over Month, exceeding estimates of 0.3% for an unchanged number compared to November’s reading. Annualized, the Consumer Price Index (CPI) rose 2.9% as expected, up two ticks from the previous reading of 2.7%.
Excluding volatile items, the so-called core inflation expanded by 0.2% MoM, as expected. At the same time, in the twelve months to date, it is up 3.2%, lower than the 3.3% printed in November and projected by economists.
The Yen extended its gains as the USD/JPY slipped from around 157.00 to current spot prices. Following suit, the US 10-year Treasury note yield plunged over twelve basis points (bps) to 4.661%.
Earlier during the Asian session, Bank of Japan (BoJ) Governor Kazuo Ueda was hawkish. He stated that they will hike rates and adjust the degree of monetary support if the economy improves and price conditions continue. He emphasized that Spring wage talks are crucial and noted that BoJ’s branch managers’ meeting showed an encouraging view on pay.
Later in the day, Fed speakers Thomas Barkin, Neel Kashkari, and John Williams will cross the newswires ahead of Thursday's Retail Sales and jobless claims data. The Japanese economic docket is empty for the remainder of the week.
USD/JPY Price Analysis: Technical outlook
The uptrend remains intact, yet the USD/JPY might retreat in the short term. Once sellers pushed prices below the Tenkan-sen of 157.41, that opened the door for further losses. The next key support would be the 156.00 figure, followed by the Kijun-sen at 154.94. The next support would be the 50-day Simple Moving Average (SMA) at 154.74 if cleared.
Japanese Yen PRICE Today
The table below shows the percentage change of Japanese Yen (JPY) against listed major currencies today. Japanese Yen was the strongest against the US Dollar.
| USD | EUR | GBP | JPY | CAD | AUD | NZD | CHF | |
|---|---|---|---|---|---|---|---|---|
| USD | -0.22% | -0.49% | -1.03% | -0.20% | -0.72% | -0.64% | -0.19% | |
| EUR | 0.22% | -0.27% | -0.82% | 0.00% | -0.50% | -0.42% | 0.03% | |
| GBP | 0.49% | 0.27% | -0.58% | 0.29% | -0.23% | -0.15% | 0.32% | |
| JPY | 1.03% | 0.82% | 0.58% | 0.84% | 0.32% | 0.40% | 0.87% | |
| CAD | 0.20% | -0.00% | -0.29% | -0.84% | -0.52% | -0.43% | 0.02% | |
| AUD | 0.72% | 0.50% | 0.23% | -0.32% | 0.52% | 0.09% | 0.54% | |
| NZD | 0.64% | 0.42% | 0.15% | -0.40% | 0.43% | -0.09% | 0.46% | |
| CHF | 0.19% | -0.03% | -0.32% | -0.87% | -0.02% | -0.54% | -0.46% |
The heat map shows percentage changes of major currencies against each other. The base currency is picked from the left column, while the quote currency is picked from the top row. For example, if you pick the Japanese Yen from the left column and move along the horizontal line to the US Dollar, the percentage change displayed in the box will represent JPY (base)/USD (quote).
Conversely, if USD/JPY climbs past 157.00, it clears the path to challenge the Tenkan-sen at 157.41. On further strength, the next resistance will be the 158.00 mark.
The Euro’s (EUR) grind higher has extended above 1.03, barely, in quiet trade, Scotiabank's Chief FX Strategist Shaun Osborne notes.
EUR grinds higher
"Caution on the ECB policy outlook has helped narrow EZ/US short-term spreads—the 2Y bond spread has compressed more than 25bps over the past month or so. But ECB policy doves continue to press their views that rates are poised to fall relatively quickly (Villeroy said earlier that it made sense to cut rates to 2% by mid-year). That prospect may limit the EUR’s ability to recover in the near-term."
"Yesterday’s rise in the EUR followed a bullish “hammer” signal Monday and the combination of price action over the past three trading sessions has developed a compelling “morning star” reversal pattern on the daily candle chart."
"There is a fair amount of congestion on the charts in the low/mid 1.03 zone, however, so progress may be slow. EUR gains should pick up a little more above 1.0365. Support is 1.0250/60."
- EUR/GBP edges lower as UK gilt yields cool down after soft inflation data for December.
- Traders have raised BoE dovish bets on the back of soft inflation data.
- The ECB is expected to cut interest rates atleast three times this year.
The EUR/GBP pair edges lower to near 0.8440 in Wednesday’s North American session. Five-day rally in the cross that was built on surging yields on United Kingdom (UK) gilts appears to be losing fuel. 30-year UK gilt yields tumble from their more-than-26-year high of 5.47% to 5.38% after the release of the soft UK Consumer Price Index (CPI) report for December, which led to a recovery move in the Pound Sterling (GBP).
The UK CPI report showed that the core inflation – which excludes volatile items, such as food, energy, oil, and tobacco – grew by 3.2%, slower than estimates of 3.4% and the former reading of 3.5%. Annual headline inflation surprisingly decelerated to 2.5% from 2.6% in November. Economists expected the underlying inflation data to have accelerated to 2.7%.
Signs of cooling price pressures have prompted expectations for the Bank of England (BoE) to cut interest rates in February’s policy meeting. Markets currently see an 84% chance of the BoE cutting rates by 25 basis points (bps) on February 6, compared to a 62% chance at Tuesday's close.
Technically, cooling inflationary pressures weigh on the currency. However, the Pound Sterling rebounded as it was declining sharply for a week due to surging gilt yields. Investors were dumping government bonds as they lacked confidence in the UK economic outlook due to stubborn price pressures and a likely trade war with the United States (US), given that President-elect Donald Trump will raise import tariffs sharply. This scenario would heavily weigh on the UK’s exports.
Investors expected a sharp rise in the UK government’s borrowing costs would force the administration to cut spending heavily.
Meanwhile, the Euro (EUR) broadly underperforms on Wednesday as European Central Bank (ECB) officials are comfortable with market expectations for the central bank to deliver atleast three interest rate cuts this year. Trades have priced in a significant number of ECB interest rate cuts as the Eurozone inflation has broadly remained under control.
Euro PRICE Today
The table below shows the percentage change of Euro (EUR) against listed major currencies today. Euro was the strongest against the US Dollar.
| USD | EUR | GBP | JPY | CAD | AUD | NZD | CHF | |
|---|---|---|---|---|---|---|---|---|
| USD | 0.00% | -0.17% | -0.61% | -0.03% | -0.14% | -0.11% | -0.08% | |
| EUR | -0.01% | -0.18% | -0.63% | -0.06% | -0.15% | -0.12% | -0.09% | |
| GBP | 0.17% | 0.18% | -0.48% | 0.14% | 0.03% | 0.05% | 0.10% | |
| JPY | 0.61% | 0.63% | 0.48% | 0.59% | 0.48% | 0.51% | 0.56% | |
| CAD | 0.03% | 0.06% | -0.14% | -0.59% | -0.11% | -0.07% | -0.03% | |
| AUD | 0.14% | 0.15% | -0.03% | -0.48% | 0.11% | 0.04% | 0.08% | |
| NZD | 0.11% | 0.12% | -0.05% | -0.51% | 0.07% | -0.04% | 0.04% | |
| CHF | 0.08% | 0.09% | -0.10% | -0.56% | 0.03% | -0.08% | -0.04% |
The heat map shows percentage changes of major currencies against each other. The base currency is picked from the left column, while the quote currency is picked from the top row. For example, if you pick the Euro from the left column and move along the horizontal line to the US Dollar, the percentage change displayed in the box will represent EUR (base)/USD (quote).
ECB policymaker and Governor of the Bank of France François Villeroy de Galhau said in Wednesday’s European session, "It makes sense for interest rates to reach 2% by the summer" as we have practically won the "battle against inflation".
UK markets breathed a sigh of relief after this morning’s UK inflation data, Scotiabank's Chief FX Strategist Shaun Osborne notes.
GBP is trading steady on the day
"December CPI rose 0.3% in the month and 2.5% over the year, a little below forecasts. Core and Services price measures slowed more significantly, boosting expectations that the BoE will proceed with rate cuts."
"The data brings some relief to the Gilts market after the recent turmoil. 10Y yields have eased 8bps on the day. Swaps reflect 22bps of easing priced in for the February MPC versus 16bps late yesterday. The data is a double-edged sword for the pound which has been choppy but is trading little changed on the day."
"The Pound Sterling (GBP) is not making a lot of progress but the heavy losses seen in the market last week have been halted. Monday and Tuesday’s sessions suggested firm demand on dips below 1.22 and a similar pattern is evident so far today. This may set the pound up for a minor squeeze higher. Resistance is 1.2255. Support is 1.2175."
The Canadian Dollar (CAD) is lagging its commodity peers and trading little changed on the session. Tariff risks remain a constraint on the CAD’s performance, Scotiabank's Chief FX Strategist Shaun Osborne notes.
CAD little changed
"This morning’s Manufacturing and Wholesale Sales data are unlikely to move the CAD significantly. Markets are anticipating a 0.7% drop in November Wholesale Sales, in line with the estimate Statcan provided with the October report."
"The Liberal Party leadership battle appears to be whittling down to a handful of candidates—former Finance Minister Freeland and former BoC Governor Carney, who may announce his run for leader this week. The CAD’s fair value estimate has improved to 1.4254 today."
"Firstly, solid resistance in the mid1.44 zone over the past month has blunted the USD’s bull run and trimmed bull trend momentum. Secondly, a bearish outside range session developed Monday, with losses yesterday “confirming” the signal. Thirdly, spot losses are pressuring trend support off the September low. A clear push under 1.4340 may see USD losses pick up to test key shortterm support at 1.4280."
The Japanese Yen (JPY) is leading gains amongst the majors, Scotiabank's Chief FX Strategist Shaun Osborne notes.
JPY outperforms following BoJ Governor Ueda comments
"The JPY is leading gains amongst the majors following comments from BoJ Governor Ueda who remarked that he had heard encouraging reports on wages at events over the new year period."
"Swaps reflect strengthening expectations that the BoJ will lift its policy rate at next week’s decision, with 18bps of tightening risk priced in, up from 10bps last week."
"Firm risk appetite is lifting EM/high beta FX, with the core majors outside the JPY lagging and posting only moderate gains on the session."
The US Dollar (USD) is modestly lower for a second day. US PPI came in below consensus expectations yesterday, Scotiabank's Chief FX Strategist Shaun Osborne notes.
USD edges lower as US yields dip
"This morning’s CPI data is expected to come in at up 0.4% in the December month, with core forecast to rise 0.3%. Those sorts of results would give a 2.9% increase in headline prices over the year, up for m 2.7% in November, with core prices steady at 3.3% in the year."
"While PPI was a bit softer than expected some components (domestic airfares) relevant as inputs for PCE were somewhat elevated. The devil will be in the details for the CPI report as well. US yields remain elevated but have edged back from recent peaks. Markets are also reflecting some caution about what sort of tariff regime will follow next week’s inauguration, weighing on the USD."
"Extended USD positioning and somewhat frothy USD sentiment continue to suggest—to me, at least— that the USD is prone to consolidation or a correction."
- The US Dollar extends correction from earlier elevated levels.
- All eyes are on the US CPI release while President-elect Donald Trump remains silent on the tariff schemes.
- The US Dollar Index (DXY) dips below 110.00 and might even break below 109.00 on a disinflationary CPI release.
The US Dollar Index (DXY), which tracks the Greenback’s value against six major currencies, extends its correction from a two-year high above 110.00 reached on Monday and trades near 109.10 at the time of writing on Wednesday. It will be a very data-dependent day as all eyes are on the upcoming United States (US) Consumer Price Index (CPI) data for December on Wednesday after markets were caught by a surprise softer-than-expected Producer Price Index (PPI) the previous day. Because of that, expectations have swung now to the assumption the upcoming CPI numbers will be disinflationary and might see a revision of the timing when the Federal Reserve (Fed) will continue its rate cut cycle in 2025.
Thus, the US economic calendar will orbit around one thing: the US CPI for December. A look under the hood reveals estimates for the monthly headline reading ranging from 0.2% to 0.5% compared to the previous 0.3%. The monthly core reading has very tight estimates ranging between 0.2% and 0.3% compared to the 0.3% seen in November.
Given the tight expectation range for the core CPI reading, a number outside the range could be the most market-moving element. Any print below 0.2% will trigger substantial weakness in the US Dollar (USD), whereas a print above 0.3% will strengthen the USD.
Daily digest market movers: CPI on high importance
- At 13:30 GMT, the US Consumer Price Index data for December will be released.
- The monthly core CPI measure is expected to rise 0.2% compared to 0.3% the previous month. The monthly headline CPI reading is expected to increase steadily by 0.3%.
- The yearly core CPI reading should rise steadily by 3.3%, while the headline reading is expected to tick up 2.9% compared to 2.7% in November.
- At 14:00 GMT, Federal Reserve Bank of Chicago President Austan Goolsbee will discuss the economy at the Wisconsin Bankers Association 2025 Midwest Economic Forecast Forum.
- At 15:00 GMT, Minneapolis Fed President Neel Kashkari will give welcoming remarks and participate in a fireside chat with Jay Debertin, President and CEO of CHS, Inc., as part of the Minneapolis Fed’s 2025 Regional Economic Conditions Conference.
- At 16:00 GMT, Federal Reserve Bank of New York President John Williams delivers keynote remarks at the "CBIA Economic Summit and Outlook 2025" event organized by the Connecticut Business and Industry Association (CBIA) in Connecticut.
- Equities are marginally in the green on Wednesday, with traders awaiting the US CPI release.
- The CME FedWatch Tool projects a 97.3% chance that interest rates will be kept unchanged at current levels in the January meeting. Expectations are for the Federal Reserve (Fed) to remain data-dependent with uncertainties that could influence the inflation path once President-elect Donald Trump takes office on January 20.
- US yields are softening substantially. The 10-year benchmark trades around 4.774% at the time of writing on Wednesday, fading from its fresh 14-month high of 4.802% seen on Monday.
US Dollar Index Technical Analysis: Data-dependent as the Fed wants it
The US Dollar Index (DXY) has become volatile, and it has the Federal Reserve to thank. With little to no real guidance from Fed officials, markets need to treat each data point as an assessment of where they think the Fed will initiate its policy rate move this year. Jumping from one data point to the next, it is quite normal for the DXY to also jump around the chart and see a volatility peak.
On the upside, the 110.00 psychological level remains the key resistance to beat. Further up, the next big upside level to hit before advancing any further remains at 110.79. Once beyond there, it is quite a stretch to 113.91, the double top from October 2022.
On the downside, the DXY is testing the ascending trend line from December 2023, which currently comes in around 108.95 as nearby support. In case of more downside, the next support is 107.35. Further down, the next level that might halt any selling pressure is 106.52, with interim support at the 55-day Simple Moving Average (SMA) at 107.01.

US Dollar Index: Daily Chart
US Dollar FAQs
The US Dollar (USD) is the official currency of the United States of America, and the ‘de facto’ currency of a significant number of other countries where it is found in circulation alongside local notes. It is the most heavily traded currency in the world, accounting for over 88% of all global foreign exchange turnover, or an average of $6.6 trillion in transactions per day, according to data from 2022. Following the second world war, the USD took over from the British Pound as the world’s reserve currency. For most of its history, the US Dollar was backed by Gold, until the Bretton Woods Agreement in 1971 when the Gold Standard went away.
The most important single factor impacting on the value of the US Dollar is monetary policy, which is shaped by the Federal Reserve (Fed). The Fed has two mandates: to achieve price stability (control inflation) and foster full employment. Its primary tool to achieve these two goals is by adjusting interest rates. When prices are rising too quickly and inflation is above the Fed’s 2% target, the Fed will raise rates, which helps the USD value. When inflation falls below 2% or the Unemployment Rate is too high, the Fed may lower interest rates, which weighs on the Greenback.
In extreme situations, the Federal Reserve can also print more Dollars and enact quantitative easing (QE). QE is the process by which the Fed substantially increases the flow of credit in a stuck financial system. It is a non-standard policy measure used when credit has dried up because banks will not lend to each other (out of the fear of counterparty default). It is a last resort when simply lowering interest rates is unlikely to achieve the necessary result. It was the Fed’s weapon of choice to combat the credit crunch that occurred during the Great Financial Crisis in 2008. It involves the Fed printing more Dollars and using them to buy US government bonds predominantly from financial institutions. QE usually leads to a weaker US Dollar.
Quantitative tightening (QT) is the reverse process whereby the Federal Reserve stops buying bonds from financial institutions and does not reinvest the principal from the bonds it holds maturing in new purchases. It is usually positive for the US Dollar.
Momentum indicators are turning flat, suggesting further range trading, probably in a range of 7.3380/7.3580. Upward momentum is beginning to fade; a breach of 7.3250 would suggest that 7.3700 is not coming into view, UOB Group's FX analysts Quek Ser Leang and Peter Chia note.
Momentum indicators are turning flat
24-HOUR VIEW: "We highlighted yesterday that 'while downward momentum has not increased much, there is room for USD to test the 7.3320 level.' USD did not quite test 7.3320 and it traded in a 7.3350/7.3520 range. It closed largely unchanged at 7.3455 (-0.02%). Momentum indicators are turning flat, suggesting further range trading today, probably in a range of 7.3380/7.3580."
1-3 WEEKS VIEW: "We have held the view that 'there is room for USD to retest the 7.3700' since early last week. Yesterday (14 Jan, spot at 7.3410), we noted that 'upward momentum is beginning to fade, and a breach of 7.3250 (‘strong support’ level) would suggest that 7.3700 is not coming into view.' We continue to hold the same view."
Further range trading seems likely, probably between 157.30 and 158.30. In the longer run, current price movements are likely part of a consolidation phase, expected to be between 156.50 and 158.50, UOB Group's FX analysts Quek Ser Leang and Peter Chia note.
USD/JPY range trading seems likely
24-HOUR VIEW: "After USD traded in a range on Monday, we pointed out yesterday that 'the price action did not result in an increase in either downward or upward momentum.' We expected USD to 'continue to trade in a range, most likely between 157.00 and 158.00.' USD subsequently traded between 157.10 and 158.20, closing at 157.96 (+0.31%). The price action provides no fresh clues, and further range trading seems likely, probably between 157.30 and 158.30."
1-3 WEEKS VIEW: "Not much has changed since our update yesterday (14 Jan, spot at 157.50). As mentioned, the current price movements are likely part of a consolidation phase, expected to be between 156.50 and 158.50."
- Gold price edges higher for a second day in a row on Wednesday.
- Gradual US tariff schemes and tuned-down inflation expectations create tailwinds for Gold.
- Gold breaks out of the pennant chart formation again and could set sail to $2,700.
Gold’s price (XAU/USD) recovers initial weekly losses and edges higher for the second day in a row, trading in the $2,680s on Wednesday, after a softer-than-expected United States (US) Producer Price Index (PPI) release the previous day triggered substantial easing in US yields. Market expectations are now higher for a softer US Consumer Price Index (CPI) release this Wednesday as well. A softer reading would be beneficial for Gold to head higher.
On the economic data front, the US CPI release for December will draw all attention on Wednesday. After the surprise softer PPI print on Tuesday, market expectations are that both the monthly headline and core CPI gauges would soften from their previous readings. Later in the day, be on the lookout for comments from three Federal Reserve officials.
Daily digest market movers: Silence is golden
- President-elect Donald Trump did not comment or push back on the rumors that his administration would likely implement its tariff schemes in a very steady and gradual approach.
- The US 10-year benchmark rate falls to 4.77% at the time of writing on Wednesday, fading from its fresh 14-month high of 4.802% seen on Monday.
- The CME (Chicago Mercantile Exchange) Fedwatch tool currently shows that the Federal Reserve will keep rate expectations steady until its meeting on June 18, when odds of keeping rates unchanged at current levels stand at 43.6%, compared to 56.4% for lower rates.
- At 13:30 GMT, the US Consumer Price Index data for December will be released. The monthly core CPI measure is expected to rise 0.2% compared to 0.3% in the previous month. The monthly headline CPI reading is expected to increase steadily by 0.3%.
- At 14:00 GMT, Federal Reserve Bank of Chicago President Austan Goolsbee will discuss the economy at the Wisconsin Bankers Association 2025 Midwest Economic Forecast Forum.
- At 15:00 GMT, Minneapolis Fed President Neel Kashkari will give welcoming remarks and participate in a fireside chat with Jay Debertin, President and CEO of CHS, Inc., as part of the Minneapolis Fed’s 2025 Regional Economic Conditions Conference.
- At 16:00 GMT, Federal Reserve Bank of New York President John Williams delivers keynote remarks at the "CBIA Economic Summit and Outlook 2025" event organized by the Connecticut Business and Industry Association (CBIA) in Connecticut.
Technical Analysis: Going with a bang
Gold bulls have avoided re-entering the pennant chart formation and sent prices back above the descending trend line. From here on out, Bullion should be able to spring away now. This Wednesday’s CPI release would be ideal for pouring oil on the fire.
On the downside, the 55-day Simple Moving Average (SMA) at $2,648 is the first support. Further down, the 100-day SMA at $2,638 is the next in line. Ultimately, the ascending trend line at the lower boundary of the pennant should contain the price action from falling, standing at $2,618 for now.
On the upside, the October 23 low at $2,708 is the next pivotal level to watch. Once that level is cleared, though still quite far off, the all-time high of $2,790 is the key upside level.
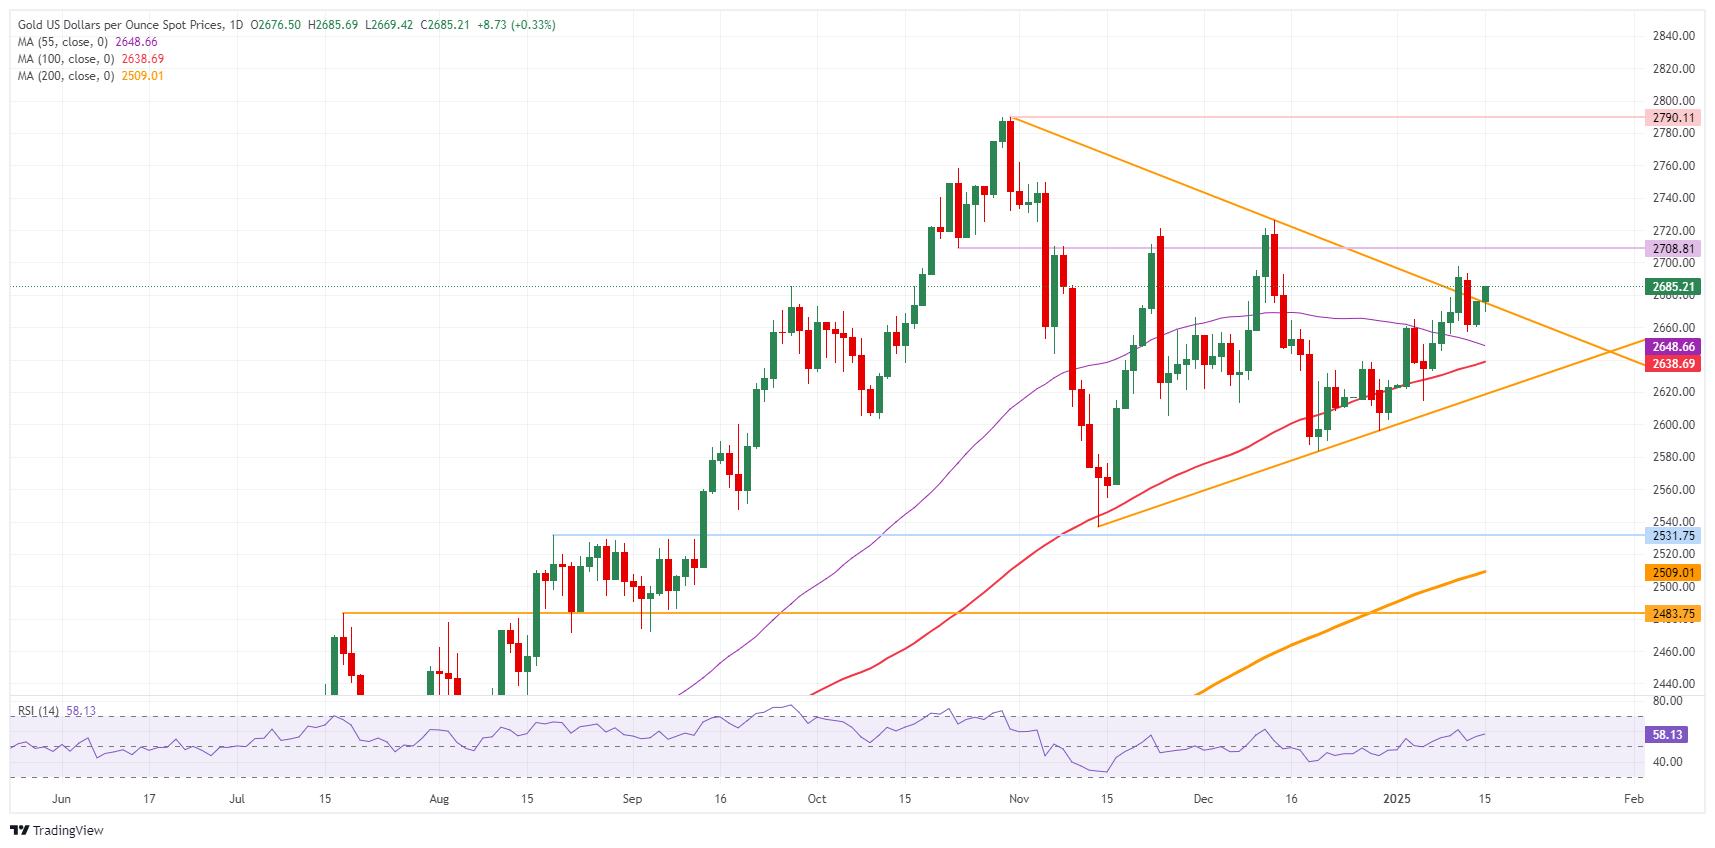
XAU/USD: Daily Chart
Gold FAQs
Gold has played a key role in human’s history as it has been widely used as a store of value and medium of exchange. Currently, apart from its shine and usage for jewelry, the precious metal is widely seen as a safe-haven asset, meaning that it is considered a good investment during turbulent times. Gold is also widely seen as a hedge against inflation and against depreciating currencies as it doesn’t rely on any specific issuer or government.
Central banks are the biggest Gold holders. In their aim to support their currencies in turbulent times, central banks tend to diversify their reserves and buy Gold to improve the perceived strength of the economy and the currency. High Gold reserves can be a source of trust for a country’s solvency. Central banks added 1,136 tonnes of Gold worth around $70 billion to their reserves in 2022, according to data from the World Gold Council. This is the highest yearly purchase since records began. Central banks from emerging economies such as China, India and Turkey are quickly increasing their Gold reserves.
Gold has an inverse correlation with the US Dollar and US Treasuries, which are both major reserve and safe-haven assets. When the Dollar depreciates, Gold tends to rise, enabling investors and central banks to diversify their assets in turbulent times. Gold is also inversely correlated with risk assets. A rally in the stock market tends to weaken Gold price, while sell-offs in riskier markets tend to favor the precious metal.
The price can move due to a wide range of factors. Geopolitical instability or fears of a deep recession can quickly make Gold price escalate due to its safe-haven status. As a yield-less asset, Gold tends to rise with lower interest rates, while higher cost of money usually weighs down on the yellow metal. Still, most moves depend on how the US Dollar (USD) behaves as the asset is priced in dollars (XAU/USD). A strong Dollar tends to keep the price of Gold controlled, whereas a weaker Dollar is likely to push Gold prices up.
- USD/CHF appears to be cautious around 0.9100 with investors focusing on the US inflation data for December.
- The Fed is expected to cut interest rates only once this year.
- Investors expect further policy-easing by the SNB due to growing risks of inflation remaining lower.
The USD/CHF pair trades with caution slightly above the key support of 0.9100 in Wednesday’s European session. The Swiss Franc pair ticks lower as the US Dollar (USD) falls slightly ahead of the United States (US) Consumer Price Index (CPI) data for December, which will be published at 13:30 GMT.
The US Dollar Index (DXY), which gauges the Greenback’s value against six major currencies, drops to near the key support of 109.00.
Investors will pay close attention to the US inflation data, which will indicate how long the Federal Reserve (Fed) will keep interest rates at their current levels this year. According to the CME FedWatch tool, the Fed is expected to cut interest rates only once this year, and that will not happen before June’s policy meeting.
Economists expect the annual headline inflation to have accelerated to 2.9% from 2.7% in November, with the core reading growing steadily by 3.3%.
Meanwhile, the Swiss Franc (CHF) remains under pressure as investors expect the Swiss National Bank (SNB) to continue reducing interest rates to avoid risks of inflation undershooting their 0-2% range.
USD/CHF is on track to revisit its 15-month high, around 0.9200. The outlook of the Swiss Franc pair remains firm as the 20-week Exponential Moving Average (EMA) near 0.8879 is sloping higher.
The 14-week Relative Strength Index (RSI) oscillates in the bullish range of 60.00-80.00, suggesting a strong upside momentum.
For a fresh upside toward the round-level resistance of 0.9300 and the 16 March 2023 high of 0.9342, the asset needs to break decisively above the October 2023 high of 0.9244.
On the flip side, a downside move below the psychological support of 0.9000 would drag the asset towards the November 22 high of 0.8958, followed by the December 16 low of 0.8900.
USD/CHF weekly chart
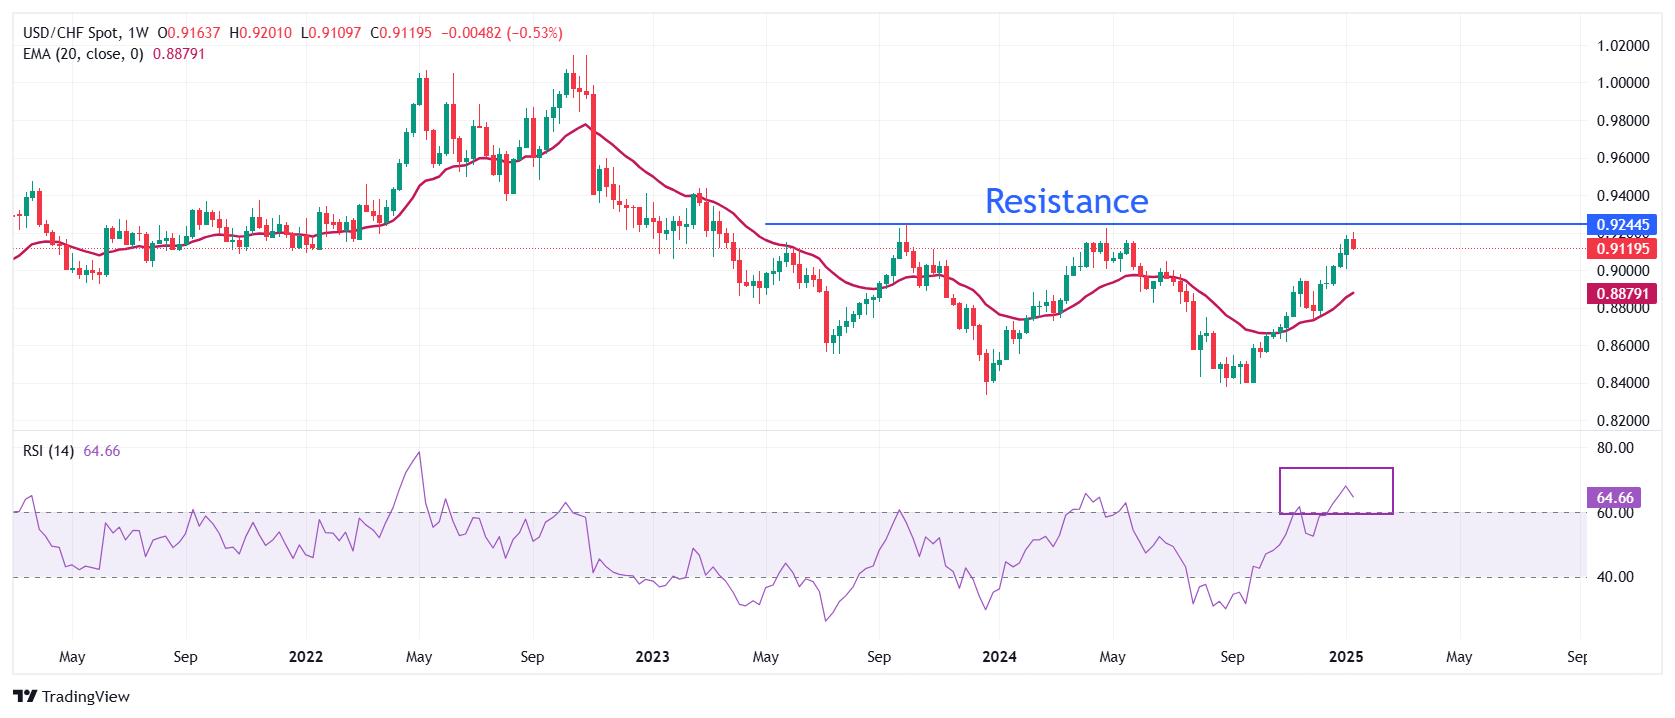
US Dollar FAQs
The US Dollar (USD) is the official currency of the United States of America, and the ‘de facto’ currency of a significant number of other countries where it is found in circulation alongside local notes. It is the most heavily traded currency in the world, accounting for over 88% of all global foreign exchange turnover, or an average of $6.6 trillion in transactions per day, according to data from 2022. Following the second world war, the USD took over from the British Pound as the world’s reserve currency. For most of its history, the US Dollar was backed by Gold, until the Bretton Woods Agreement in 1971 when the Gold Standard went away.
The most important single factor impacting on the value of the US Dollar is monetary policy, which is shaped by the Federal Reserve (Fed). The Fed has two mandates: to achieve price stability (control inflation) and foster full employment. Its primary tool to achieve these two goals is by adjusting interest rates. When prices are rising too quickly and inflation is above the Fed’s 2% target, the Fed will raise rates, which helps the USD value. When inflation falls below 2% or the Unemployment Rate is too high, the Fed may lower interest rates, which weighs on the Greenback.
In extreme situations, the Federal Reserve can also print more Dollars and enact quantitative easing (QE). QE is the process by which the Fed substantially increases the flow of credit in a stuck financial system. It is a non-standard policy measure used when credit has dried up because banks will not lend to each other (out of the fear of counterparty default). It is a last resort when simply lowering interest rates is unlikely to achieve the necessary result. It was the Fed’s weapon of choice to combat the credit crunch that occurred during the Great Financial Crisis in 2008. It involves the Fed printing more Dollars and using them to buy US government bonds predominantly from financial institutions. QE usually leads to a weaker US Dollar.
Quantitative tightening (QT) is the reverse process whereby the Federal Reserve stops buying bonds from financial institutions and does not reinvest the principal from the bonds it holds maturing in new purchases. It is usually positive for the US Dollar.
- The US Consumer Price Index is set to rise 2.9% YoY in December.
- The core CPI inflation is seen steady at 3.3% last month.
- The Fed is widely anticipated to keep interest rates unchanged in January.
The US Consumer Price Index (CPI) report for December, a critical gauge of inflation, is set to be released on Wednesday at 13:30 GMT, courtesy of the Bureau of Labor Statistics (BLS).
The release of the CPI figures could boost the US Dollar's (USD) upward momentum, though it’s unlikely to prompt any immediate changes in the Federal Reserve’s (Fed) monetary policy plans, at least in the very near term.
What to expect in the next CPI data report?
Inflation in the US, as measured by the Consumer Price Index (CPI), is expected to rise by 2.9% annually in November, up slightly from 2.7% in November. Core CPI inflation, which strips out the more volatile food and energy categories, is projected to hold steady at 3.3% from a year earlier.
On a monthly basis, forecasts suggest a 0.3% increase for the headline CPI and a 0.2% rise for core CPI.
Previewing the report, analysts at TD Securities noted: “We look for core inflation to step down a touch after four reports where it printed firmer 0.3% m/m expansions. We expect goods deflation to act as a key drag, helping to offset a likely rebound in housing inflation. On a y/y basis, headline CPI inflation is expected to inch higher to 2.9% while core inflation likely closed the year unchanged at 3.3% y/y.”
According to the release of the FOMC Minutes of the December 17-18 meeting, Fed officials voiced worries about growing risks of inflation trending higher and highlighted how potential shifts in trade and immigration policies could complicate efforts to bring it under control. The Minutes made several references to the potential economic and inflationary impact of these policy changes, underscoring their importance in shaping the US economic outlook.
How could the US Consumer Price Index report affect EUR/USD?
The incoming Trump administration is expected to take a stricter stance on immigration, adopt a more relaxed fiscal policy, and reintroduce tariffs on imports from China and Europe. These factors, combined with a resilient labour market, are likely to put upward pressure on inflation and have already started to reshape investor expectations. Markets now anticipate that the Federal Reserve will cut interest rates by just 25 basis points this year, keeping the outlook for the US Dollar stable for now.
However, with the US labour market cooling at a slow pace and inflation remaining stubbornly high, the December inflation report is unlikely to prompt any major shifts in the Fed’s monetary policy. Currently, CME Group’s FedWatch Tool indicates a 97% probability that the Fed will leave rates unchanged at its January 29 meeting.
Turning to the EUR/USD, Pablo Piovano, Senior Analyst at FXStreet, shares his technical outlook. He identifies the 2025 low of 1.0176 (January 13) as the first key support level, followed by the psychological parity mark of 1.0000. If parity breaks, the pair could test the November 2022 low of 0.9730 (November 3).
On the upside, resistance lies at the 2025 high of 1.0436 (January 6), seconded by the provisional 55-day Simple Moving Average (SMA) at 1.0516, and the December peak of 1.0629 (December 6). Pablo also notes that the daily Relative Strength Index (RSI) has bounced off the oversold territory. However, he cautions that any recovery is likely to be modest and short-lived.
Economic Indicator
Consumer Price Index (MoM)
Inflationary or deflationary tendencies are measured by periodically summing the prices of a basket of representative goods and services and presenting the data as The Consumer Price Index (CPI). CPI data is compiled on a monthly basis and released by the US Department of Labor Statistics. The MoM figure compares the prices of goods in the reference month to the previous month.The CPI is a key indicator to measure inflation and changes in purchasing trends. Generally, a high reading is seen as bullish for the US Dollar (USD), while a low reading is seen as bearish.
Read more.Next release: Wed Jan 15, 2025 13:30
Frequency: Monthly
Consensus: 0.3%
Previous: 0.3%
Source: US Bureau of Labor Statistics
The US Federal Reserve has a dual mandate of maintaining price stability and maximum employment. According to such mandate, inflation should be at around 2% YoY and has become the weakest pillar of the central bank’s directive ever since the world suffered a pandemic, which extends to these days. Price pressures keep rising amid supply-chain issues and bottlenecks, with the Consumer Price Index (CPI) hanging at multi-decade highs. The Fed has already taken measures to tame inflation and is expected to maintain an aggressive stance in the foreseeable future.
Inflation FAQs
Inflation measures the rise in the price of a representative basket of goods and services. Headline inflation is usually expressed as a percentage change on a month-on-month (MoM) and year-on-year (YoY) basis. Core inflation excludes more volatile elements such as food and fuel which can fluctuate because of geopolitical and seasonal factors. Core inflation is the figure economists focus on and is the level targeted by central banks, which are mandated to keep inflation at a manageable level, usually around 2%.
The Consumer Price Index (CPI) measures the change in prices of a basket of goods and services over a period of time. It is usually expressed as a percentage change on a month-on-month (MoM) and year-on-year (YoY) basis. Core CPI is the figure targeted by central banks as it excludes volatile food and fuel inputs. When Core CPI rises above 2% it usually results in higher interest rates and vice versa when it falls below 2%. Since higher interest rates are positive for a currency, higher inflation usually results in a stronger currency. The opposite is true when inflation falls.
Although it may seem counter-intuitive, high inflation in a country pushes up the value of its currency and vice versa for lower inflation. This is because the central bank will normally raise interest rates to combat the higher inflation, which attract more global capital inflows from investors looking for a lucrative place to park their money.
Formerly, Gold was the asset investors turned to in times of high inflation because it preserved its value, and whilst investors will often still buy Gold for its safe-haven properties in times of extreme market turmoil, this is not the case most of the time. This is because when inflation is high, central banks will put up interest rates to combat it. Higher interest rates are negative for Gold because they increase the opportunity-cost of holding Gold vis-a-vis an interest-bearing asset or placing the money in a cash deposit account. On the flipside, lower inflation tends to be positive for Gold as it brings interest rates down, making the bright metal a more viable investment alternative.
New Zealand Dollar (NZD) is expected to trade in a range, most likely between 0.5570 and 0.5835. Whippy price action has resulted in a mixed outlook; for the time being, NZD could trade in a sideways range of 0.5540/0.5650, UOB Group's FX analysts Quek Ser Leang and Peter Chia note.
NZD can trade in a sideways range of 0.5540/0.5650
24-HOUR VIEW: "We expected NZD to 'trade in a 0.5560/0.5620 range.' However, NZD traded in a higher range of 0.5580/0.5631, closing at 0.5604 (+0.38%). There has been no significant increase in upward momentum, and we continue to expect NZD to trade in a range, most likely between 0.5570 and 0.5635."
1-3 WEEKS VIEW: "There is not much to add to our update from yesterday (14 Jan, spot at 0.5590). As highlighted, the recent whippy price action 'has resulted in a mixed outlook.' For the time being, NZD could trade in a sideways range of 0.5540/0.5650."
Slight increase in upward momentum is likely to lead to a higher trading range of 0.6170/0.6215. Australian Dollar (AUD) is expected to trade in a range, probably between 0.6130 and 0.6240, UOB Group's FX analysts Quek Ser Leang and Peter Chia note.
Slight increase in upward momentum
24-HOUR VIEW: "Yesterday, we noted that the outlook for AUD 'is mixed.' We were of the view that it 'may trade in a range, probably between 0.6140 and 0.6205.' AUD traded in a narrower range than expected (0.6167/0.6207), closing higher by 0.31% at 0.6195. There has been a slight increase in upward momentum. However, this will likely lead to a higher trading range of 0.6170/0.6215 instead of a sustained advance."
1-3 WEEKS VIEW: "We highlighted yesterday (14 Jan, spot at 0.6180) that 'the buildup in downward momentum is fading quickly, and if AUD were to break above 0.6205 (‘strong resistance’ level), it would mean it is likely to trade in a range instead of declining to 0.6100.' Our ‘strong resistance’ level was slightly breached as AUD rose to a high of 0.6207. From here, we expect AUD to trade in a range, probably between 0.6140 and 0.6240."
Finally, some good news for the gilt market. December’s UK inflation – released this morning – slowed more than expected. Services CPI, which is what the Bank of England is mostly focused on, came in at 4.4% versus the consensus of 4.8%. Core CPI slowed from 3.5% to 3.2% and headline from 2.6% to 2.5%, ING's FX analyst Francesco Pesole notes.
This CPI print points to BoE cuts
"We expect gilts to show some signs of relief once they open today. We have been calling for the BoE to cut rates by 25bp in February and that reinforces our view. Before the release, markets were pricing in 17bp for February, so we could see a dovish shift in the Sonia curve this morning."
"The Pound Sterling (GBP) would have normally tanked on the back of a soft inflation print but is instead flat. That is another testament to it currently acting like an emerging market currency, being more sensitive to long-term borrowing costs than the short-term central bank outlook."
"EUR/GBP had a good run yesterday, but largely on the back of strong euro performance. It is too early to turn optimistic on a sterling rebound, but some recovery in the UK bond market is a necessary condition for preventing new major FX sell-offs. Still, looking a few months ahead, this CPI print points to BoE cuts that should allow sustained GBP depreciation."
Eurozone’s industrial sector activity showed steady performance in November, the latest data published by Eurostat showed on Wednesday.
Industrial output in the old continent came in 0.2% MoM in November, compared to the estimated increase of 0.3% and 0.2% recorded in October.
Eurozone Industrial Production dropped at an annual rate of 1.9% in November versus October’s -1.1%. Data aligned with the market expectations.
EUR/USD reaction to the Eurozone Industrial Production data
Eurozone industrial figures fail to move the needle around the Euro, as EUR/USD holds the bounce above 1.0300. The pair is flat on the day, at the press time.
Copper moved higher yesterday following a report the incoming Trump administration will slowly increase trade tariffs rather than impose sizable duties in one go, which weighed on the dollar. According to the report, the plan would boost import duties 2-5% a month on trade partners, ING's commodity analysts Warren Patterson and Ewa Manthey note.
Copper is up more than 4% so far this year
"During his presidential campaign, Trump threatened to impose minimum tariffs of 10% to 20% on all imported goods, and 60% or higher on shipments from China. The proposed approach is reportedly aimed at boosting negotiating leverage and helping to avoid a spike in inflation, however, it is still in its early stages and hasn’t been presented to Trump yet."
"We believe the timing as well as the scope of the US tariffs will be key for demand for Copper and other industrial metals this year. A continued trade war remains the key downside risk to our industrial metals outlook. However, the prospect of a prolonged trade war has raised expectations for Beijing to unveil more aggressive stimulus measures. We believe Trump’s tariffs could trigger bigger stimulus from China, limiting the downside to Copper prices. Copper is up more than 4% so far this year."
"The latest LME COTR report shows that speculators increased their net long position in Copper by 4,203 lots for a second consecutive week to 62,767 lots for the week ending 10 January, the highest since the week ending on 29 November. Similarly, net bullish bets for Aluminum rose by 1,294 lots to 105,528 lots at the end of last week. In contrast, money managers decreased net bullish bets for zinc by 1,835 lots for a fourth consecutive week to 27,095 lots as of last Friday."
- USD/JPY slumps to near 157.00 as BoJ Ueda’s hawkish remarks improve the appeal of the Japanese Yen.
- BoJ Ueda keeps the offer of raising interest rates in the policy meeting on January 23-24 on the table.
- The next move in the USD will be influenced by the US inflation data for December.
The USD/JPY pair falls sharply to near 157.00 in Wednesday’s European session. The asset dives vertically as the Japanese Yen (JPY) strengthens after hawkish remarks from Bank of Japan (BoJ) Governor Kazuo Ueda on Wednesday.
Japanese Yen PRICE Today
The table below shows the percentage change of Japanese Yen (JPY) against listed major currencies today. Japanese Yen was the strongest against the US Dollar.
| USD | EUR | GBP | JPY | CAD | AUD | NZD | CHF | |
|---|---|---|---|---|---|---|---|---|
| USD | -0.07% | -0.12% | -0.75% | -0.09% | -0.26% | -0.33% | -0.12% | |
| EUR | 0.07% | -0.05% | -0.68% | -0.03% | -0.19% | -0.26% | -0.01% | |
| GBP | 0.12% | 0.05% | -0.65% | 0.04% | -0.13% | -0.21% | 0.02% | |
| JPY | 0.75% | 0.68% | 0.65% | 0.67% | 0.49% | 0.41% | 0.65% | |
| CAD | 0.09% | 0.03% | -0.04% | -0.67% | -0.18% | -0.24% | -0.02% | |
| AUD | 0.26% | 0.19% | 0.13% | -0.49% | 0.18% | -0.07% | 0.15% | |
| NZD | 0.33% | 0.26% | 0.21% | -0.41% | 0.24% | 0.07% | 0.22% | |
| CHF | 0.12% | 0.01% | -0.02% | -0.65% | 0.02% | -0.15% | -0.22% |
The heat map shows percentage changes of major currencies against each other. The base currency is picked from the left column, while the quote currency is picked from the top row. For example, if you pick the Japanese Yen from the left column and move along the horizontal line to the US Dollar, the percentage change displayed in the box will represent JPY (base)/USD (quote).
Kazuo Ueda kept the possibility of an interest rate hike in the policy meeting on January 23-24 on the table. Ueda said that the central bank is currently “analysing data thoroughly” and will compile the findings in the quarterly outlook report, and on based on that the bank will discuss whether to “raise interest rates at next week's policy meeting”.
On the wage growth outlook, Ueda said that there was a lot of “positive talk on the wage outlook" when he met BoJ's regional branch managers last week.
Meanwhile, a sharp sell-off in the asset is also driven by a slight decline in the US Dollar (USD) ahead of the US Consumer Price Index (CPI) data for December, which will be published at 13:30 GMT. The US Dollar Index (DXY), which tracks the Greenback’s value against six major currencies, drops to near 109.00.
Investors will keep a close eye on the US inflation data as it will influence market expectations for the Federal Reserve’s (Fed) monetary policy outlook. Year-on-year headline inflation is expected to have accelerated to 2.9% from 2.7% in November, with core reading – which excludes volatile food and energy prices – growing steadily by 3.3%. According to the CME FedWatch tool, traders expect the Fed to cut interest rates only once this year.
Japanese Yen FAQs
The Japanese Yen (JPY) is one of the world’s most traded currencies. Its value is broadly determined by the performance of the Japanese economy, but more specifically by the Bank of Japan’s policy, the differential between Japanese and US bond yields, or risk sentiment among traders, among other factors.
One of the Bank of Japan’s mandates is currency control, so its moves are key for the Yen. The BoJ has directly intervened in currency markets sometimes, generally to lower the value of the Yen, although it refrains from doing it often due to political concerns of its main trading partners. The BoJ ultra-loose monetary policy between 2013 and 2024 caused the Yen to depreciate against its main currency peers due to an increasing policy divergence between the Bank of Japan and other main central banks. More recently, the gradually unwinding of this ultra-loose policy has given some support to the Yen.
Over the last decade, the BoJ’s stance of sticking to ultra-loose monetary policy has led to a widening policy divergence with other central banks, particularly with the US Federal Reserve. This supported a widening of the differential between the 10-year US and Japanese bonds, which favored the US Dollar against the Japanese Yen. The BoJ decision in 2024 to gradually abandon the ultra-loose policy, coupled with interest-rate cuts in other major central banks, is narrowing this differential.
The Japanese Yen is often seen as a safe-haven investment. This means that in times of market stress, investors are more likely to put their money in the Japanese currency due to its supposed reliability and stability. Turbulent times are likely to strengthen the Yen’s value against other currencies seen as more risky to invest in.
The USD-negative events yesterday have prompted a return to 1.030 in EUR/USD, but US CPI is expected to resume pressure on the pair. The eurozone data calendar does not include market-moving releases, although we will hear from ECB members, ING's FX analyst Francesco Pesole notes.
Technical aspect for EUR/USD is relatively supportive
"Our short-term fair value model returns a risk premium of around 2.5% on the pair. That is intuitively linked to expectations of US protectionism, and we doubt there is that much room for this valuation gap to be closed despite the latest reports on gradual tariffs."
"Still, we cannot ignore this relatively supportive technical aspect for EUR/USD, and probably another material leg lower in the pair does require some rewidening in the short-term rate differential. A 0.3% MoM US core CPI read could not be enough to take EUR/USD sustainably above 1.020 for now."
- EUR/USD locks in key resistance of 1.0300 after recovering from over a two-year low of 1.0175, with the US CPI data for December in focus.
- The US Dollar faces pressures after softer-than-expected US PPI data for December.
- ECB’s Holzmann expects the path towards the neutral rate won’t be straightforward.
EUR/USD clings to gains near 1.0300 in Wednesday’s European session after a strong recovery on Tuesday. The major currency pair consolidates as investors await the United States (US) Consumer Price Index (CPI) data for December, which will be published at 13:30 GMT. Investors will pay close attention to US inflation as it will influence market speculation for the Federal Reserve’s (Fed) monetary policy outlook.
Month-on-month headline inflation is estimated to have grown steadily by 0.3%. In the same period, the core CPI – which excludes volatile food and energy items – is expected to have risen by 0.2%, slower than the former release of 0.3%. Economists expect the annual headline CPI to have accelerated to 2.9% from 2.7% in November, with core reading rising steadily by 3.3%.
Signs of stubborn price pressures could accelerate expectations that the Fed will avoid cutting interest rates this year. While some slowdown in inflationary pressures is unlikely to boost Fed dovish bets as investors expect incoming policies under Trump’s administration, such as immigration controls, tax cuts, and tariff hikes, would fuel growth rate.
Ahead of the US inflation data, the US Dollar Index (DXY), which tracks the Greenback’s value against six major currencies, slips to near 109.00. The US Dollar (USD) corrected sharply on Tuesday after the release of the US Producer Price Index (PPI) data for December, which showed that producer inflation grew at a slower-than-expected pace.
According to the CME FedWatch tool, traders expect the Fed to cut interest rates just once this year, compared to two rate cuts projected by Fed officials in December’s Summary of Economic Projections (SEP). Traders pare dovish bets after the release of the surprisingly upbeat US Nonfarm Payrolls (NFP) data for December on Friday.
Daily digest market movers: EUR/USD gains ground as US Dollar corrects
- EUR/USD holds onto gains near 1.0300 at the expense of the US Dollar. The Euro (EUR) performs weakly against its major peers on Wednesday as investors are cautious ahead of President-elect Donald Trump's return to the White House. Higher import tariffs from Trump’s administration are expected to falter the Eurozone’s exports, making them costlier for US importers.
- Rising concerns over Eurozone economic growth and price pressures remaining broadly under control have boosted expectations of more interest rate cuts from the European Central Bank (ECB) this year. The ECB cut its Deposit Facility rate by 100 basis points (bps) in 2024 and is expected to cut a full percentage point again by mid-summer to reach 2%.
- ECB Chief Economist Philip Lane commented at a Goldman Sachs event on Tuesday that he is confident that inflation in the services sector will come down “quite a bit” in the coming months. This could lead to a sustainable return of price pressures towards the ECB’s target of 2%.
- While a lot of ECB policymakers are comfortable with market expectations for the ECB to reduce interest rates by 25 bps at each of the next four policy meetings, ECB policymaker and Austrian Central Bank Governor Robert Holzmann expects the path to lower rates is not as “straightforward as it seems”. Holzmann added that the core inflation is currently “closer to 3% than to 2%” and highlighted some energy-related challenges that could impact the ECB’s decisions.
Technical Analysis: EUR/USD climbs to near 1.0300
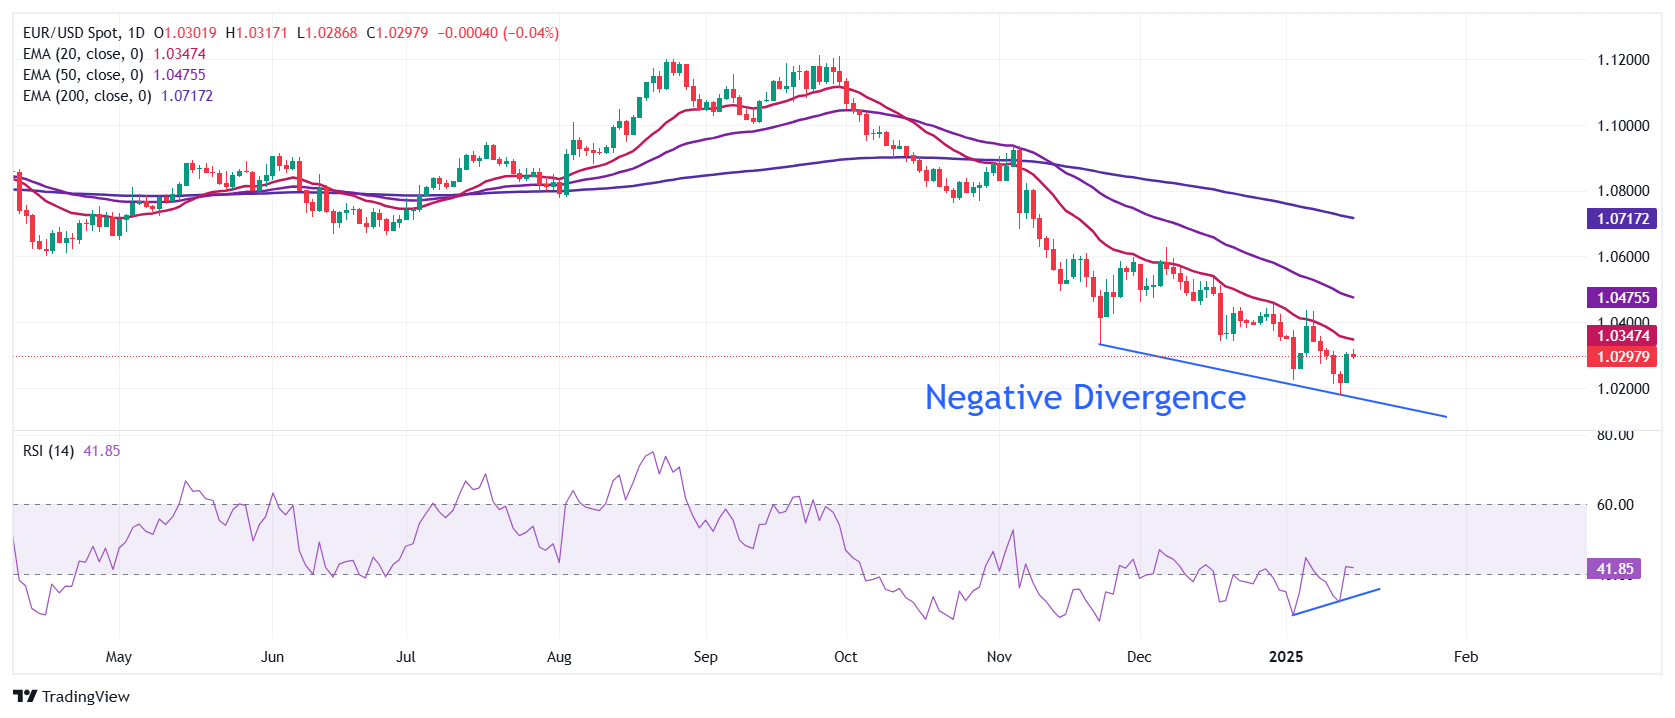
EUR/USD rebounds to near 1.0300 after gaining ground from the over-two-year low of 1.0175 reached on Monday. The major currency pair bounces back on divergence in momentum and price action. The 14-day Relative Strength Index (RSI) formed a higher low near 35.00, while the pair made lower lows.
However, the outlook of the shared currency pair is still bearish as all short-to-long-term Exponential Moving Averages (EMAs) are sloping downwards.
Looking down, Monday’s low of 1.0175 will be the key support zone for the pair. Conversely, the January 6 high of 1.0437 will be the key barrier for the Euro bulls.
Euro FAQs
The Euro is the currency for the 19 European Union countries that belong to the Eurozone. It is the second most heavily traded currency in the world behind the US Dollar. In 2022, it accounted for 31% of all foreign exchange transactions, with an average daily turnover of over $2.2 trillion a day. EUR/USD is the most heavily traded currency pair in the world, accounting for an estimated 30% off all transactions, followed by EUR/JPY (4%), EUR/GBP (3%) and EUR/AUD (2%).
The European Central Bank (ECB) in Frankfurt, Germany, is the reserve bank for the Eurozone. The ECB sets interest rates and manages monetary policy. The ECB’s primary mandate is to maintain price stability, which means either controlling inflation or stimulating growth. Its primary tool is the raising or lowering of interest rates. Relatively high interest rates – or the expectation of higher rates – will usually benefit the Euro and vice versa. The ECB Governing Council makes monetary policy decisions at meetings held eight times a year. Decisions are made by heads of the Eurozone national banks and six permanent members, including the President of the ECB, Christine Lagarde.
Eurozone inflation data, measured by the Harmonized Index of Consumer Prices (HICP), is an important econometric for the Euro. If inflation rises more than expected, especially if above the ECB’s 2% target, it obliges the ECB to raise interest rates to bring it back under control. Relatively high interest rates compared to its counterparts will usually benefit the Euro, as it makes the region more attractive as a place for global investors to park their money.
Data releases gauge the health of the economy and can impact on the Euro. Indicators such as GDP, Manufacturing and Services PMIs, employment, and consumer sentiment surveys can all influence the direction of the single currency. A strong economy is good for the Euro. Not only does it attract more foreign investment but it may encourage the ECB to put up interest rates, which will directly strengthen the Euro. Otherwise, if economic data is weak, the Euro is likely to fall. Economic data for the four largest economies in the euro area (Germany, France, Italy and Spain) are especially significant, as they account for 75% of the Eurozone’s economy.
Another significant data release for the Euro is the Trade Balance. This indicator measures the difference between what a country earns from its exports and what it spends on imports over a given period. If a country produces highly sought after exports then its currency will gain in value purely from the extra demand created from foreign buyers seeking to purchase these goods. Therefore, a positive net Trade Balance strengthens a currency and vice versa for a negative balance.
A surprisingly mild US PPI inflation print yesterday caused some dollar softness. The 0.0% MoM core PPI directly impacts the December core PCE, which is the Fed’s preferred inflation measure, but it does not automatically mean today’s core CPI will be as benign, ING's FX analyst Francesco Pesole notes.
Markets are pricing in US protectionism
"Our US economist notes that two PPI components – airline fares and car rental prices – rose substantially, and are expected to be major contributors to another hot core CPI print. Consensus is split between 0.2% and 0.3% MoM, with the average forecast at 0.25% (rounding up to 0.3%). That means 0.3% – which is our call – should be interpreted as a hawkish signal for the Fed and favour dollar appreciation."
"Also weighing on the dollar yesterday was the report that Trump’s economic advisers are drafting a plan to raise tariffs only gradually (by 2-5% a month). This approach is aimed at giving Trump negotiating leverage while having greater control over the inflationary effects compared to large one-off tariffs. This is the second major report suggesting the new administration will not take an aggressive, carpet approach to protectionism. That is also consistent with indications that Congress will focus on delivering a three-in-one (migration, energy, tax cuts) bill by April, a signal that the very initial focus could be on domestic policies."
"We doubt that warrants any substantial unwinding of dollar longs though. Markets are pricing in US protectionism, but probably not a big universal tariff delivered in one go. Even if tariffs are hiked gradually, markets may not be as optimistic as Trump’s team that inflation can be controlled. A hot CPI today could easily get investors jittery on the inflation topic before tariffs are even considered."
Silver prices (XAG/USD) rose on Wednesday, according to FXStreet data. Silver trades at $30.09 per troy ounce, up 0.64% from the $29.90 it cost on Tuesday.
Silver prices have increased by 4.13% since the beginning of the year.
| Unit measure | Silver Price Today in USD |
|---|---|
| Troy Ounce | 30.09 |
| 1 Gram | 0.97 |
The Gold/Silver ratio, which shows the number of ounces of Silver needed to equal the value of one ounce of Gold, stood at 89.28 on Wednesday, down from 89.53 on Tuesday.
Silver FAQs
Silver is a precious metal highly traded among investors. It has been historically used as a store of value and a medium of exchange. Although less popular than Gold, traders may turn to Silver to diversify their investment portfolio, for its intrinsic value or as a potential hedge during high-inflation periods. Investors can buy physical Silver, in coins or in bars, or trade it through vehicles such as Exchange Traded Funds, which track its price on international markets.
Silver prices can move due to a wide range of factors. Geopolitical instability or fears of a deep recession can make Silver price escalate due to its safe-haven status, although to a lesser extent than Gold's. As a yieldless asset, Silver tends to rise with lower interest rates. Its moves also depend on how the US Dollar (USD) behaves as the asset is priced in dollars (XAG/USD). A strong Dollar tends to keep the price of Silver at bay, whereas a weaker Dollar is likely to propel prices up. Other factors such as investment demand, mining supply – Silver is much more abundant than Gold – and recycling rates can also affect prices.
Silver is widely used in industry, particularly in sectors such as electronics or solar energy, as it has one of the highest electric conductivity of all metals – more than Copper and Gold. A surge in demand can increase prices, while a decline tends to lower them. Dynamics in the US, Chinese and Indian economies can also contribute to price swings: for the US and particularly China, their big industrial sectors use Silver in various processes; in India, consumers’ demand for the precious metal for jewellery also plays a key role in setting prices.
Silver prices tend to follow Gold's moves. When Gold prices rise, Silver typically follows suit, as their status as safe-haven assets is similar. The Gold/Silver ratio, which shows the number of ounces of Silver needed to equal the value of one ounce of Gold, may help to determine the relative valuation between both metals. Some investors may consider a high ratio as an indicator that Silver is undervalued, or Gold is overvalued. On the contrary, a low ratio might suggest that Gold is undervalued relative to Silver.
(An automation tool was used in creating this post.)
Australian Dollar’s (AUD) decline slowed this week as USD bulls took a breather, while on tariff aspect, there was report that the Trump team is considering more gradual pace of increases. AUD was last at 0.6190 levels, OCBC's FX analyst Christopher Wong notes.
Rebound risks not ruled out
"Rebound in Chinese equities did provide some relief for risk assets. This week’s focus on data – employment report (Thu) before next week’s much anticipated US presidential inauguration. A hotter print may lend strength to AUD momentum."
"Elsewhere, markets are keen to find out how soon and what magnitude and scope are for tariffs. Worries of tariffs may keep sentiment pressured and AUD trading soggy. But at the same time, a less drastic approach or any delay to tariff implementation could see risk proxies take an extended breather."
"Daily momentum is mild bullish while RSI rose. Rebound risks not ruled out but may require the blessing of a robust AU labour market report and for China to hold up. Resistance at 0.6210 (21 DMA), 0.6320 (23.6% fibo retracement of 2024 high to 2025 low) and 0.6360 (50 DMA). Support at 0.6130 (recent low), 0.60 psychological level."
The Pound Sterling (GBP) is likely to trade in a 1.2150/1.2275 range. In the longer run, deeply oversold conditions signal GBP could trade in a range for a couple of days; any decline is expected to face significant support at 1.2100, UOB Group's FX analysts Quek Ser Leang and Peter Chia note.
GBP can trade in a range for a couple of days
24-HOUR VIEW: "GBP dropped to a low of 1.2100 on Monday and then rebounded sharply. Yesterday (Tuesday), when GBP was at 1.2230, we pointed out that 'the rebound in deeply oversold conditions indicates that GBP is unlikely to weaken today' We expected it to 'trade in a 1.2160/1.2270 range.' Our view of range trading was not wrong, even though GBP traded in a lower range of 1.2140/1.2251, closing modestly higher at 1.2217 (+0.11%). There has been no increase in either downward or upward momentum, and we continue to expect range trading today, most likely in a range of 1.2150/1.2275."
1-3 WEEKS VIEW: "We continue to hold the same view as yesterday (14 Jan, spot at 1.2230). As highlighted, deeply oversold conditions signal GBP could trade in a range for a couple of days. However, a breach of 1.2300 (no change in ‘strong resistance’ level from yesterday) would mean that the weakness in GBP that started late last week (as annotated in the chart below) has stabilised. Looking ahead, any further decline is expected to face significant support at the low of 1.2100."
- WTI price depreciates despite growing concerns over potential supply disruptions triggered by new US sanctions targeting Russian Oil.
- API Weekly Crude Oil Stock declined by 2.6 million barrels in the previous week, below the expected 3.5 million barrel reduction.
- US EIA suggested that Oil prices are expected to face downward pressure over the next two years.
West Texas Intermediate (WTI) Oil price remains in the negative territory for the second successive day, trading around $76.60 per barrel during the European session on Wednesday. However, crude Oil prices could recover as tighter supply concerns and declining US stockpiles.
Oil prices may continue to rise amid heightened concerns over potential supply disruptions driven by new US sanctions on Russian Oil revenue. On Friday, the US Treasury imposed broader sanctions targeting Russian Oil producers Gazprom Neft and Surgutneftegas, along with 183 vessels involved in transporting Russian Oil.
Additionally, American Petroleum Institute (API) data reported a 2.6 million barrel drop in US crude inventories for the week ending January 10, below the anticipated 3.5 million barrel reduction. This follows a previous decline of 4.022 million barrels. The EIA Crude Oil Stocks Change report, scheduled for release later in the North American session, is also expected to show a 3.5 million barrel decline for the prior week.
US Energy Information Administration (EIA) suggested in its Short-Term Energy Outlook report released on Tuesday that Oil prices are expected to face downward pressure over the next two years as global production growth surpasses demand. Many analysts anticipate an oversupplied Oil market in 2025, following a sharp slowdown in demand growth in 2024, particularly in the largest energy-consuming nations, the US and China, per Reuters.
The EIA now projects global Oil and liquid fuel production to average 104.4 million barrels per day (bpd) in 2025, up from its previous forecast of 104.2 million bpd. In contrast, global Oil demand is expected to average 104.1 million bpd, down from the earlier estimate of 104.3 million bpd and still below pre-pandemic trends, the EIA noted.
WTI Oil FAQs
WTI Oil is a type of Crude Oil sold on international markets. The WTI stands for West Texas Intermediate, one of three major types including Brent and Dubai Crude. WTI is also referred to as “light” and “sweet” because of its relatively low gravity and sulfur content respectively. It is considered a high quality Oil that is easily refined. It is sourced in the United States and distributed via the Cushing hub, which is considered “The Pipeline Crossroads of the World”. It is a benchmark for the Oil market and WTI price is frequently quoted in the media.
Like all assets, supply and demand are the key drivers of WTI Oil price. As such, global growth can be a driver of increased demand and vice versa for weak global growth. Political instability, wars, and sanctions can disrupt supply and impact prices. The decisions of OPEC, a group of major Oil-producing countries, is another key driver of price. The value of the US Dollar influences the price of WTI Crude Oil, since Oil is predominantly traded in US Dollars, thus a weaker US Dollar can make Oil more affordable and vice versa.
The weekly Oil inventory reports published by the American Petroleum Institute (API) and the Energy Information Agency (EIA) impact the price of WTI Oil. Changes in inventories reflect fluctuating supply and demand. If the data shows a drop in inventories it can indicate increased demand, pushing up Oil price. Higher inventories can reflect increased supply, pushing down prices. API’s report is published every Tuesday and EIA’s the day after. Their results are usually similar, falling within 1% of each other 75% of the time. The EIA data is considered more reliable, since it is a government agency.
OPEC (Organization of the Petroleum Exporting Countries) is a group of 12 Oil-producing nations who collectively decide production quotas for member countries at twice-yearly meetings. Their decisions often impact WTI Oil prices. When OPEC decides to lower quotas, it can tighten supply, pushing up Oil prices. When OPEC increases production, it has the opposite effect. OPEC+ refers to an expanded group that includes ten extra non-OPEC members, the most notable of which is Russia.
Speaking in a scheduled appearance on Wednesday, European Central Bank (ECB) policymaker Francois Villeroy de Galhau noted: “It makes sense for interest rates to reach 2% by the summer.”
Additional comments
We have practically won the battle against inflation.
It makes sense for interest rates to reach 2% by the summer.
Risks to French growth forecast (0.9% for 2025) are to the downside.
But we do not see a recession happening.
- Silver gains positive traction for the second straight day, though the upside seems limited.
- The recent decline along a descending channel points to a well-established downtrend.
- Neutral oscillators on the daily chart further warrant some caution for bullish traders.
Silver (XAG/USD) attracts some buyers for the second straight day and climbs back above the $30.00 psychological mark during the first half of the European session on Wednesday. The technical setup, however, warrants some caution for bullish traders and before positioning for any further appreciating move.
The recent pullback from the vicinity of the $35.00 mark, or a multi-year peak touched in October, has been along a descending channel, which points to a well-established downtrend. Moreover, oscillators on the daily chart – though have recovered from bearish territory – are yet to gain positive traction. Hence, any subsequent move up might continue to confront some hurdle near the top boundary of the said channel, around the $30.45 region.
This is followed by the 100-day Simple Moving Average (SMA), currently pegged ahead of the $31.00 round figure. A sustained strength beyond the latter will suggest that a nearly three-month-old corrective decline has run its course and pave the way for further gains. The XAG/USD might then accelerate the positive move towards the $31.70 intermediate hurdle en route to the $32.00 mark and the December swing high, around the $32.30-$32.35 region.
On the flip side, the weekly trough, around mid-$29.00s touched on Monday, could offer immediate support. A convincing break below will reaffirm the negative setup and make the XAG/USD vulnerable to weaken further below the $29.00 mark, towards retesting the $28.75-$28.70 support, or a multi-month low touched in December. Some follow-through selling will be seen as a fresh trigger for bearish traders and pave the way for a further depreciating move.
Silver daily chart
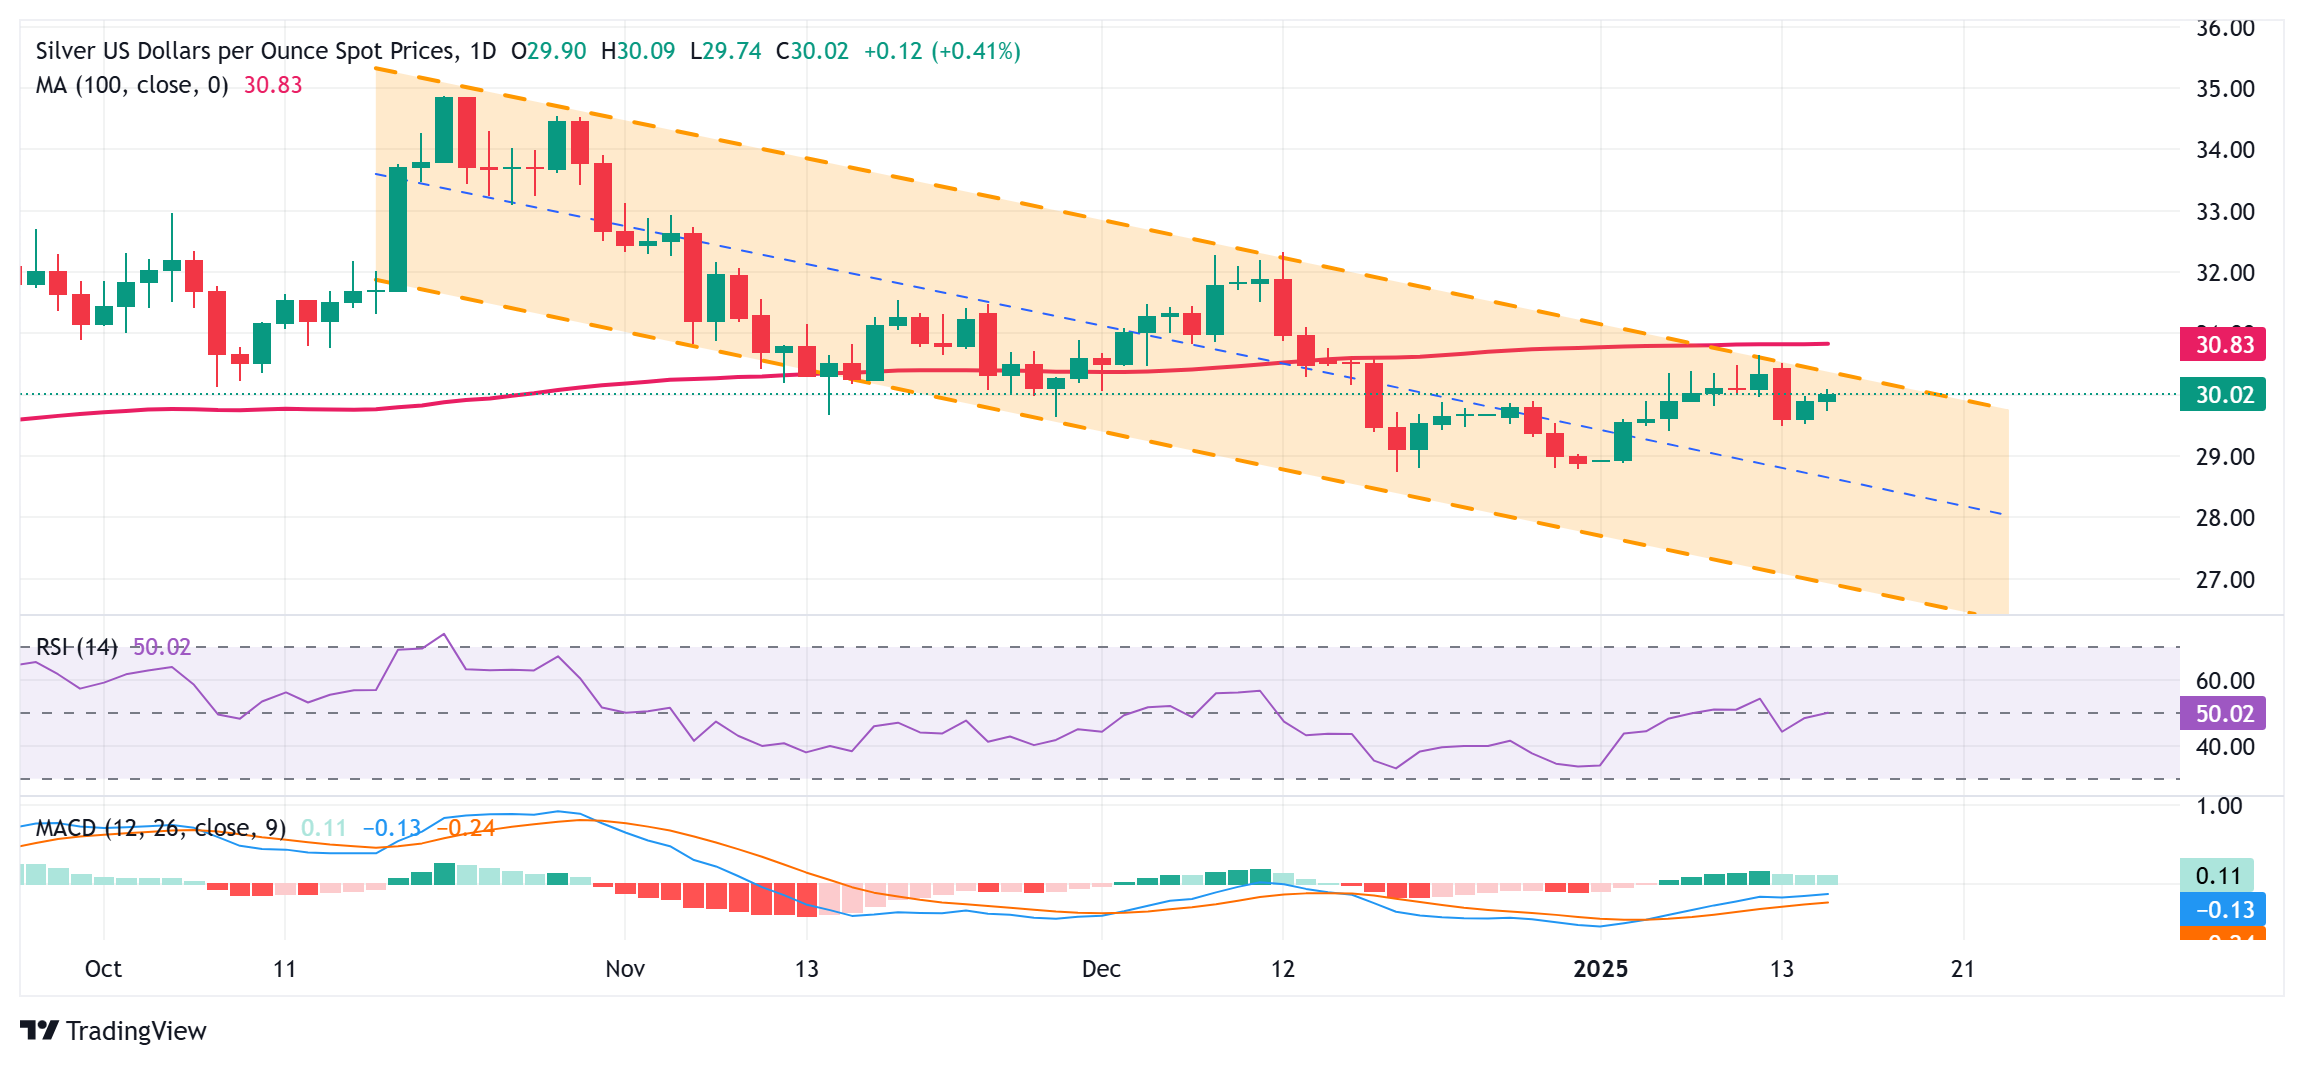
Silver FAQs
Silver is a precious metal highly traded among investors. It has been historically used as a store of value and a medium of exchange. Although less popular than Gold, traders may turn to Silver to diversify their investment portfolio, for its intrinsic value or as a potential hedge during high-inflation periods. Investors can buy physical Silver, in coins or in bars, or trade it through vehicles such as Exchange Traded Funds, which track its price on international markets.
Silver prices can move due to a wide range of factors. Geopolitical instability or fears of a deep recession can make Silver price escalate due to its safe-haven status, although to a lesser extent than Gold's. As a yieldless asset, Silver tends to rise with lower interest rates. Its moves also depend on how the US Dollar (USD) behaves as the asset is priced in dollars (XAG/USD). A strong Dollar tends to keep the price of Silver at bay, whereas a weaker Dollar is likely to propel prices up. Other factors such as investment demand, mining supply – Silver is much more abundant than Gold – and recycling rates can also affect prices.
Silver is widely used in industry, particularly in sectors such as electronics or solar energy, as it has one of the highest electric conductivity of all metals – more than Copper and Gold. A surge in demand can increase prices, while a decline tends to lower them. Dynamics in the US, Chinese and Indian economies can also contribute to price swings: for the US and particularly China, their big industrial sectors use Silver in various processes; in India, consumers’ demand for the precious metal for jewellery also plays a key role in setting prices.
Silver prices tend to follow Gold's moves. When Gold prices rise, Silver typically follows suit, as their status as safe-haven assets is similar. The Gold/Silver ratio, which shows the number of ounces of Silver needed to equal the value of one ounce of Gold, may help to determine the relative valuation between both metals. Some investors may consider a high ratio as an indicator that Silver is undervalued, or Gold is overvalued. On the contrary, a low ratio might suggest that Gold is undervalued relative to Silver.
Euro (EUR) held on to small gains overnight amid USD’s pullback. EUR/USD was last seen at 1.03 levels.
Mild rebound not ruled out in the near term
"On ECB-speaks, Holzmann said it is unclear whether ECB will lower rates again at its upcoming MPC on 30 Jan, as he pointed to “hiccups” in euro area inflation. He highlighted that core inflation is still closer to 3% than to 2% and policymakers have a lot of challenges with regard to energy."
"Daily momentum turned flat while RSI rose from near oversold conditions. Mild rebound not ruled out in the near term. Resistance at 1.0350 (21 DMA), 1.0405 (50% fibo). Support at 1.01, 0.9950 levels (76.4% fibo retracement of 2022 low to 2023 high)."
Oil prices fell yesterday with ICE Brent down 1.35% and settling below US$80/bbl. Reports of a potential ceasefire between Israel and Hamas would have supported this move. This is the first daily decline since the US announced stricter sanctions against the Russian energy sector. It is still unclear what the impact of these sanctions will be on Oil flows, ING's commodity analysts Warren Patterson and Ewa Manthey note.
Oil prices fall to settle below US$80/bbl
"However, buyers of Russian oil have been looking at alternatives, in case these sanctions turn out to be disruptive. Any significant impact, however, is likely to be short-lived with Russia eventually finding ways to circumvent these latest sanctions. The uncertainty over the impact means that oil prices will likely be better supported than initially expected through the first quarter of the year."
"Oil prices are trading firmer in early morning trading in Asia today after API numbers showed that US crude oil inventories fell more than expected over the last week. US crude oil inventories fell by 2.6m barrels. However, this is where the support ended in the release. Cushing crude oil stocks increased by 600k barrels, although inventories are still historically low."
"The EIA yesterday released its latest Short-Term Energy Outlook, where it marginally increased its US crude oil production estimate for 2025 from 13.52m b/d to 13.55m b/d, growing by around 340k b/d year-on-year. The EIA also released its first production estimates for 2026 and expects US crude output to grow by just 70k b/d YoY to 13.62m b/d."
It’s a fairly busy day for energy markets. IEA and OPEC will release their monthly oil market reports
with outlooks for the oil market, ING's commodity analysts Warren Patterson and Ewa Manthey note.
IEA and OPEC to release monthly oil market reports
"Both the IEA and OPEC will release their monthly oil market reports, where they will share their outlook for the oil market."
"In addition, the EIA will also release its weekly US oil inventory report. And outside of energy markets, we will get US CPI data, which may alter expectations on what the Fed may do concerning monetary policy in the months ahead."
US Dollar (USD) slipped overnight after PPI missed estimates (+0.2% m/m vs. 0.4% expected), OCBC's FX analyst Christopher Wong notes.
Bearish divergence appears on RSI
"Earlier report on Trump team considering a schedule of gradual tariffs increasing by about 2% to 5% a month also helped to support sentiments. Most non-USD FX rebounded while Dollar Index (DXY) eased but it remains to be seen if the recent move has legs. Admittedly, the idea of gradual tariff increase remains in the early stages for now. DXY was last seen trading at 109.25."
"Mild bullish momentum on daily chart intact but RSI eased. Broader bias remains skewed to the upside, but we do not rule out retracement play in the short term. Bearish divergence observed on RSI – we continue to monitor price action for confirmation. Support at 108.50 (21 DMA), 107.15 (50DMA). Resistance at 110.10, 110.90 levels."
"Focus today on CPI. We would need a much softer print to help to apply brakes on dollar. Failing which, another hot print should fuel USD higher."
European Central Bank (ECB) Vice President Luis de Guindos said on Wednesday that “if incoming data confirms our baseline, we can expect further rate cuts.”
Further comments
Risks to economic growth remain tilted to the downside.
The disinflation process is well on track.
We are not pre-committing to a particular rate path.
If incoming data confirms our baseline, we can expect further rate cuts.
But high level of uncertainty calls for prudence in terms of rate-setting.
The balance of risks has shifted from concerns about high inflation to concerns about low growth.
Severe global trade frictions could increase fragmentation of the world economy.
Renewed geopolitical tensions could also affect energy prices.
Market reaction
EUR/USD keeps its range near 1.0300 following these comments, down 0.07% on the day.
ECB FAQs
The European Central Bank (ECB) in Frankfurt, Germany, is the reserve bank for the Eurozone. The ECB sets interest rates and manages monetary policy for the region. The ECB primary mandate is to maintain price stability, which means keeping inflation at around 2%. Its primary tool for achieving this is by raising or lowering interest rates. Relatively high interest rates will usually result in a stronger Euro and vice versa. The ECB Governing Council makes monetary policy decisions at meetings held eight times a year. Decisions are made by heads of the Eurozone national banks and six permanent members, including the President of the ECB, Christine Lagarde.
In extreme situations, the European Central Bank can enact a policy tool called Quantitative Easing. QE is the process by which the ECB prints Euros and uses them to buy assets – usually government or corporate bonds – from banks and other financial institutions. QE usually results in a weaker Euro. QE is a last resort when simply lowering interest rates is unlikely to achieve the objective of price stability. The ECB used it during the Great Financial Crisis in 2009-11, in 2015 when inflation remained stubbornly low, as well as during the covid pandemic.
Quantitative tightening (QT) is the reverse of QE. It is undertaken after QE when an economic recovery is underway and inflation starts rising. Whilst in QE the European Central Bank (ECB) purchases government and corporate bonds from financial institutions to provide them with liquidity, in QT the ECB stops buying more bonds, and stops reinvesting the principal maturing on the bonds it already holds. It is usually positive (or bullish) for the Euro.
- NZD/USD appreciates amid risk-on mood following reports of the incoming Trump administration considering gradual hikes in import tariffs.
- The US Dollar depreciated following the disappointing US December Producer Price Index data.
- The New Zealand Dollar receives support from robust trade data from China and Beijing's stimulus measures.
The NZD/USD cross extends its gains for the third consecutive day, trading near 0.5620 during European trading hours on Wednesday. The risk-sensitive New Zealand Dollar (NZD) benefits from improved market sentiment after reports, via Bloomberg, suggested that US President-elect Donald Trump's economic team is considering a gradual approach to increasing import tariffs, bolstering investor confidence.
Additionally, the upside of the NZD/USD pair could be attributed to the subdued US Dollar (USD) following the disappointing US December Producer Price Index (PPI) data. Market participants will keep an eye on the US Consumer Price Index (CPI) inflation data, which is due later on Wednesday.
US Producer Price Index for final demand rose 0.2% month-over-month in December after a 0.4% advance in November, softer than the 0.3% expected. The PPI climbed 3.3% YoY in December, the most since February 2023, after increasing 3.0% in November. This reading came in below the consensus of 3.4%.
The US Dollar may regain strength as hawkish sentiment builds around the Federal Reserve’s (Fed) policy outlook for January. According to the CME FedWatch tool, 30-day Fed Funds futures indicate a higher likelihood of just one interest rate cut from the Fed this year, contrasting with the two cuts projected in the Fed's latest dot plot from the Summary of Economic Projections (SEP).
The New Zealand Dollar gained support from robust trade data from China and Beijing's efforts to stabilize the Yuan. However, its upside remains limited as markets anticipate the Reserve Bank of New Zealand (RBNZ) will reduce its 4.25% cash rate by 50 basis points in February due to the country's weak economic conditions.
New Zealand Dollar FAQs
The New Zealand Dollar (NZD), also known as the Kiwi, is a well-known traded currency among investors. Its value is broadly determined by the health of the New Zealand economy and the country’s central bank policy. Still, there are some unique particularities that also can make NZD move. The performance of the Chinese economy tends to move the Kiwi because China is New Zealand’s biggest trading partner. Bad news for the Chinese economy likely means less New Zealand exports to the country, hitting the economy and thus its currency. Another factor moving NZD is dairy prices as the dairy industry is New Zealand’s main export. High dairy prices boost export income, contributing positively to the economy and thus to the NZD.
The Reserve Bank of New Zealand (RBNZ) aims to achieve and maintain an inflation rate between 1% and 3% over the medium term, with a focus to keep it near the 2% mid-point. To this end, the bank sets an appropriate level of interest rates. When inflation is too high, the RBNZ will increase interest rates to cool the economy, but the move will also make bond yields higher, increasing investors’ appeal to invest in the country and thus boosting NZD. On the contrary, lower interest rates tend to weaken NZD. The so-called rate differential, or how rates in New Zealand are or are expected to be compared to the ones set by the US Federal Reserve, can also play a key role in moving the NZD/USD pair.
Macroeconomic data releases in New Zealand are key to assess the state of the economy and can impact the New Zealand Dollar’s (NZD) valuation. A strong economy, based on high economic growth, low unemployment and high confidence is good for NZD. High economic growth attracts foreign investment and may encourage the Reserve Bank of New Zealand to increase interest rates, if this economic strength comes together with elevated inflation. Conversely, if economic data is weak, NZD is likely to depreciate.
The New Zealand Dollar (NZD) tends to strengthen during risk-on periods, or when investors perceive that broader market risks are low and are optimistic about growth. This tends to lead to a more favorable outlook for commodities and so-called ‘commodity currencies’ such as the Kiwi. Conversely, NZD tends to weaken at times of market turbulence or economic uncertainty as investors tend to sell higher-risk assets and flee to the more-stable safe havens.
There has been a tentative buildup in momentum; Euro (EUR) could rise to 1.0325, potentially reaching 1.0350. In the longer run, EUR has entered a range trading phase; it is likely to trade between 1.0220 and 1.0400 for the time being, UOB Group's FX analysts Quek Ser Leang and Peter Chia note.
EUR/USD likely to trade between 1.0220 and 1.0400
24-HOUR VIEW: "Following EUR sharp rebound from 1.0176 on Monday, we indicated yesterday, when EUR was at 1.0265, that 'there is potential for EUR to rise further.' We also indicated that 'any advance is unlikely to break the strong resistance at 1.0310.' We pointed out that 'support levels are at 1.0235 and 1.0205.' The subsequent price movements were in line with our expectations, as EUR dipped to 1.0237 before rising to a high of 1.0308 in the late NY session. Upward momentum is beginning to build, albeit tentatively. Today, EUR could rise to 1.0325, potentially reaching 1.0350. Support levels are at 1.0275 and 1.0245."
1-3 WEEKS VIEW: "We revised our EUR view on Monday (13 Jan, spot at 1.0245), indicating that 'the risk for EUR has shifted to the downside, and the level to monitor is 1.0190.' After EUR dropped to 1.0176 and rebounded sharply, we indicated yesterday (14 Jan, spot at 1.0265) that 'downward momentum has slowed somewhat, but only a breach of 1.0310 (‘strong resistance’ level) would mean that the downside risk has subsided.' EUR rose to a high of 1.0308 during NY trade. While our ‘strong resistance’ level of 1.0310 has not been clearly breached yet, downward momentum has largely subsided. EUR has likely entered a range trading phase. For the time being, we expect it to trade between 1.0220 and 1.0400."
- The Pound Sterling bounces back after a softer-than-expected UK CPI report for December.
- Soft UK inflation data would prompt traders to price in a higher number of BoE interest rate cuts for the year.
- The US Dollar corrects after slower-than-expected US PPI data, awaiting the US CPI report for December.
The Pound Sterling (GBP) bounces back in Wednesday’s London session after reacting wildly after the release of the United Kingdom (UK) Consumer Price Index (CPI) report for December, which revealed that inflationary pressures grew moderately. The CPI report showed that annual headline inflation surprisingly rose at a slower pace of 2.5% compared to 2.6% in November. Economists expected the inflation data to have accelerated to 2.7%.
On a monthly basis, headline inflation rose by 0.3%, faster than the 0.1% growth in November but slower than estimates of 0.4%.
The core CPI – which excludes volatile items such as food, energy, oil, and tobacco – grew by 3.2% year-over-year, slower than estimates of 3.4% and the former reading of 3.5%.
Services inflation, a closely watched indicator by Bank of England (BoE) officials, decelerated to 4.4% from 5% in November. This sharp slowdown suggests that the BoE would cut interest rates faster this year than in 2024. This scenario would be unfavorable for the near-term outlook of the Pound Sterling.
Earlier, the British currency was underperforming as rising yields on UK gilts have jeopardized Chancellor of the Exchequer Rachel Reeves’ decision not to fund day-to-day spending through foreign borrowings. 30-year UK gilt yields have risen to near 5.47%, the highest level over 26 years. UK yields surged as market participants turned cautious over the UK economic outlook on the back of a likely trade war with the United States (US). President-elect Donald Trump is expected to raise import tariffs heavily, a scenario that will falter the UK’s export sector, being one of the leading trading partners of the US.
A moderate UK inflation growth is expected to force investors to slow down the pace of selling government debts. Slowing price pressures would pave way for the BoE to cut interest rates in the policy meeting in February, a scenario that will improve UK economic outlook.
Daily digest market movers: Pound Sterling moves higher against US Dollar ahead of US inflation data
- The Pound Sterling slightly recovers against the US Dollar (USD) to near 1.2240 in Wednesday’s European session after the release of the UK inflation data. The GBP/USD pair gains as softer-than-expected UK CPI data boosted the Pound Sterling's appeal. Also, the US Dollar Index (DXY), which gauges the Greenback’s value against six major currencies, also trades cautiously near the five-day low of 109.05. The Greenback corrected sharply on Tuesday after the US Producer Price Index (PPI) data for December showed a slower-than-expected growth in producer inflation.
- A moderate increase in the US PPI data eased fears that price pressures would remain stubborn, but market expectations that the Federal Reserve (Fed) would cut interest rates more than once this year didn’t accelerate. Market participants expect that the inflation outlook will remain stubborn, as policies such as immigration controls, higher tariffs, and lower taxes under Trump’s administration will boost the economic outlook by fuelling demand for domestically produced goods and services.
- For more cues about the current status of inflation, investors will pay close attention to the US CPI data for December, which will be published at 13:30 GMT. The CPI report is expected to show that month-on-month core inflation rose at a slower pace of 0.2% from November’s reading of 0.3%, with the headline reading rising steadily by 0.3%. On a yearly basis, the core CPI is expected to rise steadily by 3.3%, while the headline figure is expected to accelerate to 2.9% from the former reading of 2.7%.
Technical Analysis: Pound Sterling rebounds above 1.2200
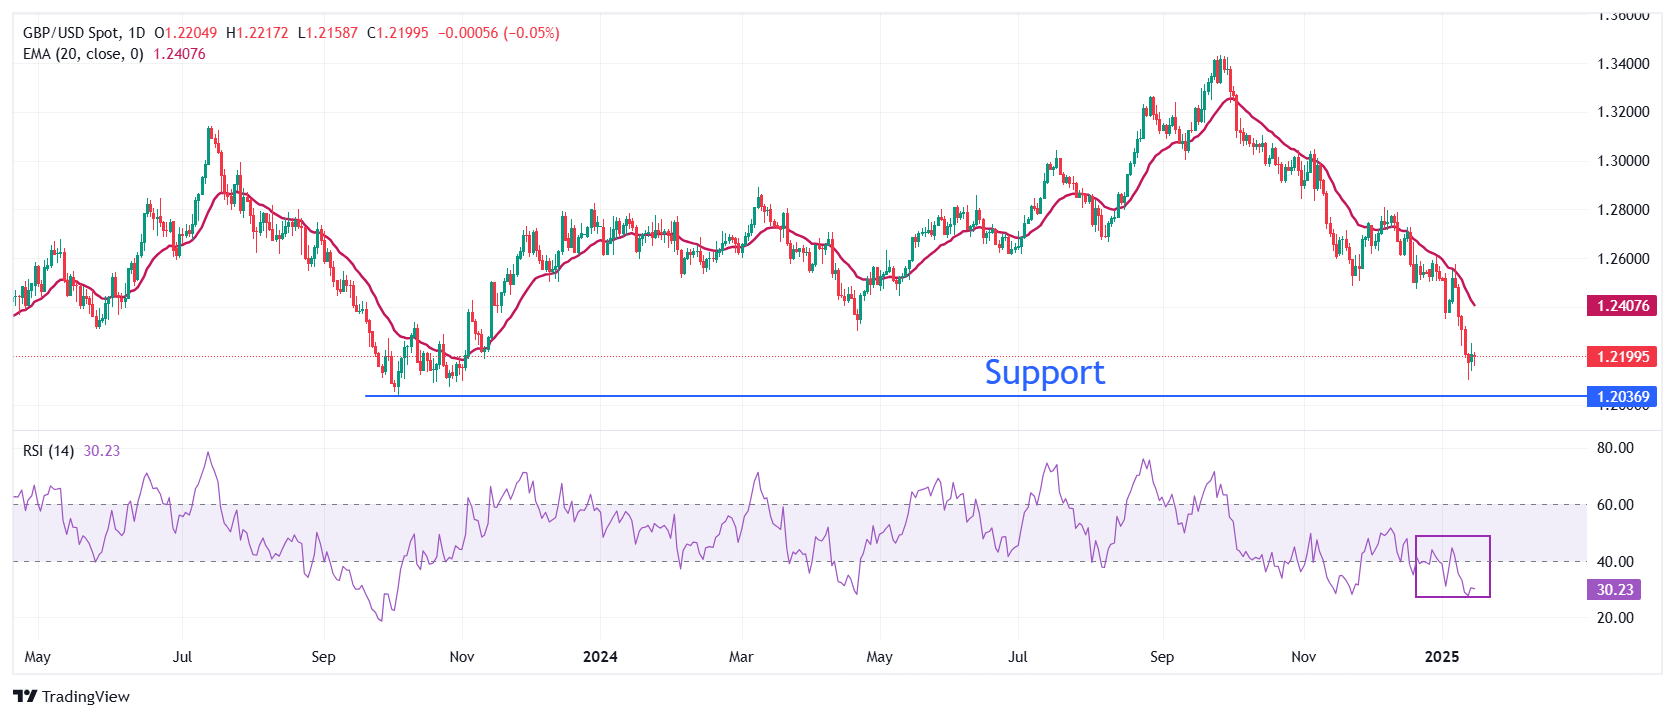
The Pound Sterling trades around the key level of 1.2200 against the US Dollar on Wednesday. The outlook for the Cable remains weak as the vertically declining 20-day Exponential Moving Average (EMA) near 1.2405 suggests that the near-term trend is extremely bearish.
The 14-day Relative Strength Index (RSI) rebounds slightly after diving below 30.00 as the momentum oscillator turned oversold. However, the broader scenario remains bearish until it recovers inside the 20.00-40.00 range.
Looking down, the pair is expected to find support near the October 2023 low near 1.2050. On the upside, the 20-day EMA will act as key resistance.
Pound Sterling FAQs
The Pound Sterling (GBP) is the oldest currency in the world (886 AD) and the official currency of the United Kingdom. It is the fourth most traded unit for foreign exchange (FX) in the world, accounting for 12% of all transactions, averaging $630 billion a day, according to 2022 data. Its key trading pairs are GBP/USD, also known as ‘Cable’, which accounts for 11% of FX, GBP/JPY, or the ‘Dragon’ as it is known by traders (3%), and EUR/GBP (2%). The Pound Sterling is issued by the Bank of England (BoE).
The single most important factor influencing the value of the Pound Sterling is monetary policy decided by the Bank of England. The BoE bases its decisions on whether it has achieved its primary goal of “price stability” – a steady inflation rate of around 2%. Its primary tool for achieving this is the adjustment of interest rates. When inflation is too high, the BoE will try to rein it in by raising interest rates, making it more expensive for people and businesses to access credit. This is generally positive for GBP, as higher interest rates make the UK a more attractive place for global investors to park their money. When inflation falls too low it is a sign economic growth is slowing. In this scenario, the BoE will consider lowering interest rates to cheapen credit so businesses will borrow more to invest in growth-generating projects.
Data releases gauge the health of the economy and can impact the value of the Pound Sterling. Indicators such as GDP, Manufacturing and Services PMIs, and employment can all influence the direction of the GBP. A strong economy is good for Sterling. Not only does it attract more foreign investment but it may encourage the BoE to put up interest rates, which will directly strengthen GBP. Otherwise, if economic data is weak, the Pound Sterling is likely to fall.
Another significant data release for the Pound Sterling is the Trade Balance. This indicator measures the difference between what a country earns from its exports and what it spends on imports over a given period. If a country produces highly sought-after exports, its currency will benefit purely from the extra demand created from foreign buyers seeking to purchase these goods. Therefore, a positive net Trade Balance strengthens a currency and vice versa for a negative balance.
- GBP/JPY loses ground as the Pound Sterling loses ground after the weaker UK inflation data released on Wednesday.
- The UK Consumer Price Index increased by 2.5% YoY in December, staying above the BoE’s 2% target.
- The Japanese Yen rises due to hawkish remarks from BoJ Governor Kazuo Ueda.
GBP/JPY has surrendered its recent gains from the previous session, trading around 192.00 during early European hours on Wednesday. The GBP/JPY cross depreciates as the Pound Sterling (GBP) weakens following weaker-than-expected inflation data from the United Kingdom (UK).
The UK Consumer Price Index (CPI) increased by 2.5% year-over-year in December, down from 2.6% in November and below the market forecast of 2.7%. Despite the slowdown, the figure remained above the Bank of England’s (BoE) 2% target. On a monthly basis, the UK CPI rose to 0.3% in December, up from 0.1% in November but falling short of the expected 0.4%.
The annual core CPI, which excludes volatile food and energy items, grew by 3.2% in December, compared to a 3.5% increase in November, missing market expectations of 3.4%. Additionally, services inflation declined sharply to 4.4% year-over-year in December, down from 5% in November.
Moreover, the Japanese Yen (JPY) strengthened following hawkish remarks from Bank of Japan (BoJ) Governor Kazuo Ueda. Speaking at the BoJ branch managers' meeting on Wednesday, Ueda stated that the central bank "will raise rates and adjust the degree of monetary support if improvements in economic and price conditions continue." He also noted that a decision would be made next week while closely monitoring developments in the US economy.
Additionally, comments from Japan’s Finance Minister Katsunobu Kato heightened concerns about potential government intervention, further supporting the JPY. Kato expressed concern over "one-sided, rapid moves" in the currency market, emphasizing the importance of stable exchange rates that reflect economic fundamentals. He also noted alarm over foreign exchange movements, particularly those driven by speculative activity.
Economic Indicator
Consumer Price Index (YoY)
The United Kingdom (UK) Consumer Price Index (CPI), released by the Office for National Statistics on a monthly basis, is a measure of consumer price inflation – the rate at which the prices of goods and services bought by households rise or fall – produced to international standards. It is the inflation measure used in the government’s target. The YoY reading compares prices in the reference month to a year earlier. Generally, a high reading is seen as bullish for the Pound Sterling (GBP), while a low reading is seen as bearish.
Read more.Last release: Wed Jan 15, 2025 07:00
Frequency: Monthly
Actual: 2.5%
Consensus: 2.7%
Previous: 2.6%
Source: Office for National Statistics
The Bank of England is tasked with keeping inflation, as measured by the headline Consumer Price Index (CPI) at around 2%, giving the monthly release its importance. An increase in inflation implies a quicker and sooner increase of interest rates or the reduction of bond-buying by the BOE, which means squeezing the supply of pounds. Conversely, a drop in the pace of price rises indicates looser monetary policy. A higher-than-expected result tends to be GBP bullish.
Here is what you need to know on Wednesday, January 15:
Markets are witnessing a typical cautious environment before the release of the all-important US Consumer Price Index (CPI) data for December, which will provide fresh insights on the US Federal Reserve’s (Fed) interest rates trajectory.
The US Dollar (USD) remains consolidated following the recent correction from over two-year highs against its major currency rivals. The US benchmark 10-year US Treasury bond yields also lick wounds, with traders digesting a softer US Producer Price Index (PPI) report.
US Dollar PRICE Today
The table below shows the percentage change of US Dollar (USD) against listed major currencies today. US Dollar was the strongest against the Euro.
| USD | EUR | GBP | JPY | CAD | AUD | NZD | CHF | |
|---|---|---|---|---|---|---|---|---|
| USD | 0.08% | 0.05% | -0.50% | -0.03% | -0.10% | -0.11% | -0.09% | |
| EUR | -0.08% | -0.03% | -0.57% | -0.13% | -0.18% | -0.19% | -0.17% | |
| GBP | -0.05% | 0.03% | -0.56% | -0.08% | -0.15% | -0.17% | -0.12% | |
| JPY | 0.50% | 0.57% | 0.56% | 0.47% | 0.40% | 0.38% | 0.44% | |
| CAD | 0.03% | 0.13% | 0.08% | -0.47% | -0.07% | -0.08% | -0.04% | |
| AUD | 0.10% | 0.18% | 0.15% | -0.40% | 0.07% | -0.01% | 0.03% | |
| NZD | 0.11% | 0.19% | 0.17% | -0.38% | 0.08% | 0.01% | 0.04% | |
| CHF | 0.09% | 0.17% | 0.12% | -0.44% | 0.04% | -0.03% | -0.04% |
The heat map shows percentage changes of major currencies against each other. The base currency is picked from the left column, while the quote currency is picked from the top row. For example, if you pick the US Dollar from the left column and move along the horizontal line to the Japanese Yen, the percentage change displayed in the box will represent USD (base)/JPY (quote).
Data published on Tuesday showed that the US annual PPI rose 3.3% in December, missing the expected 3.4% growth, while the core PPI inflation rose to 3.5% in the same period, compared to the estimates of 3.8%. Monthly figures also disappointed. Despite the softer data, markets have fully priced in a rate cut pause at the Fed's policy meeting later this month.
Traders continue to remain wary of the lingering Chinese economic concerns, US President-elect Donald Trump’s policies and the prospects of fewer Fed rate cuts this year, leaving forex majors on the defensive.
Across the FX board, USD/JPY sidelined near 158.00 almost throughout the Asian session before Bank of Japan (BoJ) Governor Kazuo Ueda came in and propped up the Japanese Yen. The pair remains under heavy selling pressure in the early European session, trading below 157.50. Ueda said the central bank “will raise interest rates and adjust the degree of monetary support if improvements in the economy and price conditions continue.” His comments ramped up bets of a BoJ rate hike next week.
AUD/USD extends its sluggish momentum below 0.6200 amid a cautious risk tone, notwithstanding ongoing efforts by China to support the local currency and the economy. Looming US-Sino trade war fears and dovish Reserve Bank of Australia (RBA) policy expectations keep the underlying bearish sentiment intact around the Aussie.
The Pound Sterling meets fresh supply, dragging GBP/USD back below 1.2200 following an unexpected UK CPI inflation cooldown. The UK annual CPI rose 2.5% in the year to December, down from 2.6% the month before, the Office for National Statistics (ONS) said, missing the estimated 2.7% growth. Services inflation declined sharply to 4.4% YoY in December from November’s 5%. Soft data will likely fan expectations of further easing by the Bank of England (BoE).
EUR/USD turns to the backseat below 1.0300 in early Europe as traders weigh the latest comments from European Central Bank (ECB) Chief Economist Phillip Lane. Lane said:“It takes time for monetary easing to impact and take effect.” Euro buyers refrain from placing fresh bets on the major heading into the high-impact US data.
USD/CAD moves back and forth in a narrow range at around 1.4350 amid a pause in the Oil price rally and a steady US Dollar. WTI oil price is modestly flat on the day, trading just below $77 as of writing.
Gold price finds fresh demand in the European session, reversing Asian losses to advance toward the $2,700 barrier.
- EUR/GBP gains momentum to near 0.8445 in Wednesday’s early European session.
- UK CPI inflation eases to 2.5% YoY in December vs. 2.7% expected.
- ECB’s Rehn said it makes sense to continue rate cuts.
The EUR/GBP cross extends the rally to around 0.8445 during the early European trading hours on Wednesday. The Pound Sterling (GBP) weakens against the shared currency after the cooler-than-expected UK Consumer Price Index (CPI) inflation data for December. Later on Wednesday, the Eurozone Industrial Production will be released. Also, the European Central Bank (ECB) Vice President Luis de Guindos will deliver a speech on the same day.
Data released by the United Kingdom’s Office for National Statistics on Wednesday showed that the country’s headline CPI rose 2.5% YoY in December, compared to 2.6% in November. This reading came in softer than the 2.7% expected. The Core CPI, which excludes the volatile prices of food and energy, climbed 3.2% YoY in December versus 3.5% prior, below the market consensus of 3.4%. Meanwhile, the monthly UK CPI inflation increased to 0.3% in December from 0.1% in November. Markets expected a 0.4% print.
The Pound Sterling attracts some sellers in an immediate reaction to the downbeat UK CPI inflation data. Additionally, the concerns about the UK's fiscal sustainability and rising bond yields might continue to undermine the GBP. Analysts expect higher borrowing costs may force the government to rein in spending or raise taxes to meet its fiscal rules, potentially weighing on the UK's future growth.
On the Euro front, the ECB delivered rate cuts four times last year, and traders expect three or four moves in 2025 due to the Eurozone's weak economic outlook. This, in turn, could exert some downward pressure on the Euro against the GBP. The ECB Governing Council member Olli Rehn on Monday said, “Against the backdrop of disinflation being on track and the growth outlook having weakened it makes sense to continue rate cuts.”
Pound Sterling FAQs
The Pound Sterling (GBP) is the oldest currency in the world (886 AD) and the official currency of the United Kingdom. It is the fourth most traded unit for foreign exchange (FX) in the world, accounting for 12% of all transactions, averaging $630 billion a day, according to 2022 data. Its key trading pairs are GBP/USD, also known as ‘Cable’, which accounts for 11% of FX, GBP/JPY, or the ‘Dragon’ as it is known by traders (3%), and EUR/GBP (2%). The Pound Sterling is issued by the Bank of England (BoE).
The single most important factor influencing the value of the Pound Sterling is monetary policy decided by the Bank of England. The BoE bases its decisions on whether it has achieved its primary goal of “price stability” – a steady inflation rate of around 2%. Its primary tool for achieving this is the adjustment of interest rates. When inflation is too high, the BoE will try to rein it in by raising interest rates, making it more expensive for people and businesses to access credit. This is generally positive for GBP, as higher interest rates make the UK a more attractive place for global investors to park their money. When inflation falls too low it is a sign economic growth is slowing. In this scenario, the BoE will consider lowering interest rates to cheapen credit so businesses will borrow more to invest in growth-generating projects.
Data releases gauge the health of the economy and can impact the value of the Pound Sterling. Indicators such as GDP, Manufacturing and Services PMIs, and employment can all influence the direction of the GBP. A strong economy is good for Sterling. Not only does it attract more foreign investment but it may encourage the BoE to put up interest rates, which will directly strengthen GBP. Otherwise, if economic data is weak, the Pound Sterling is likely to fall.
Another significant data release for the Pound Sterling is the Trade Balance. This indicator measures the difference between what a country earns from its exports and what it spends on imports over a given period. If a country produces highly sought-after exports, its currency will benefit purely from the extra demand created from foreign buyers seeking to purchase these goods. Therefore, a positive net Trade Balance strengthens a currency and vice versa for a negative balance.
FX option expiries for Jan 15 NY cut at 10:00 Eastern Time via DTCC can be found below.
EUR/USD: EUR amounts
- 1.0200 2.6b
- 1.0250 2.2b
- 1.0300 2.9b
- 1.0330 834m
- 1.0400 1.2b
GBP/USD: GBP amounts
- 1.2275 703m
USD/JPY: USD amounts
- 156.25 637m
- 157.00 515m
- 160.00 1.2m
AUD/USD: AUD amounts
- 0.6175 421m
- 0.6370 1.2b
NZD/USD: NZD amounts
- 0.5875 606m
EUR/GBP: EUR amounts
- 0.8370 979m
Japan’s Finance Minister Katsunobu Kato said on Wednesday that he “will closely monitor discussions at the Bank of Japan (BoJ) policy meeting next week.”
Additional quotes
Expect the BoJ to conduct monetary policy appropriately.
Believe the BoJ is playing its role based on its accord with government.
Up to the BoJ to decide on monetary policy.
Market reaction
USD/JPY is losing 0.40% on the day to trade near 157.30 following these above comments.
- USD/CAD depreciated following reports of the incoming Trump administration considering gradual tariff hikes.
- Canada’s employment figures have lowered expectations for near-term interest rate cuts by the Bank of Canada.
- The US Dollar depreciated following the disappointing US December PPI data; CPI inflation data will be eyed on Wednesday.
USD/CAD stays silent after two days of losses, trading around 1.4360 during the Asian hours on Wednesday. The downside in the USD/CAD pair can be attributed to an improved outlook for foreign currency inflows, reduced US trade concerns, and hawkish expectations for the Bank of Canada (BoC).
Stronger-than-expected Canadian labor market data for December has diminished expectations for near-term interest rate cuts by the BoC. Employment in Canada surged by 91,000 in December, marking the largest gain since January 2023. Additionally, the unemployment rate dropped to 6.7%, down from 6.8% the previous month.
Furthermore, reports indicating the gradual implementation of proposed import tariffs by the incoming Trump administration have eased concerns for Canadian exporters, boosting demand for the Canadian Dollar (CAD).
The US Dollar Index (DXY), which measures the US Dollar’s performance against six major currencies, trades near 109.20. The Greenback faced challenges following the disappointing US December Producer Price Index (PPI) data. Market participants will keep an eye on the US Consumer Price Index (CPI) inflation data, which is due later on Wednesday.
US Producer Price Index for final demand rose 0.2% month-over-month in December after an 0.4% advance in November, softer than the 0.3% expected. The PPI climbed 3.3% YoY in December, the most since February 2023, after increasing 3.0% in November. This reading came in below the consensus of 3.4%.
Canadian Dollar PRICE Today
The table below shows the percentage change of Canadian Dollar (CAD) against listed major currencies today. Canadian Dollar was the strongest against the Euro.
| USD | EUR | GBP | JPY | CAD | AUD | NZD | CHF | |
|---|---|---|---|---|---|---|---|---|
| USD | 0.01% | 0.00% | -0.42% | 0.00% | -0.01% | -0.03% | -0.05% | |
| EUR | -0.01% | -0.01% | -0.44% | -0.03% | -0.03% | -0.05% | -0.07% | |
| GBP | -0.00% | 0.01% | -0.44% | 0.00% | -0.02% | -0.05% | -0.04% | |
| JPY | 0.42% | 0.44% | 0.44% | 0.45% | 0.42% | 0.39% | 0.39% | |
| CAD | -0.00% | 0.03% | 0.00% | -0.45% | -0.01% | -0.03% | -0.04% | |
| AUD | 0.01% | 0.03% | 0.02% | -0.42% | 0.01% | -0.02% | -0.03% | |
| NZD | 0.03% | 0.05% | 0.05% | -0.39% | 0.03% | 0.02% | -0.01% | |
| CHF | 0.05% | 0.07% | 0.04% | -0.39% | 0.04% | 0.03% | 0.00% |
The heat map shows percentage changes of major currencies against each other. The base currency is picked from the left column, while the quote currency is picked from the top row. For example, if you pick the Canadian Dollar from the left column and move along the horizontal line to the US Dollar, the percentage change displayed in the box will represent CAD (base)/USD (quote).
- USD/CHF edges lower to near 0.9120 in Wednesday’s early European session.
- Traders will keep an eye on the US December CPI and the threat of potential tariff policies by Trump.
- Geopolitical risks could boost the CHF and act as a headwind for the pair.
The USD/CHF pair trades with a mild negative bias around 0.9120 during the early European session on Wednesday. The markets might turn cautious ahead of the US Consumer Price Index (CPI) inflation data for December on Wednesday.
The softer-than-expected US PPI report on Tuesday weighs on the Greenback against the Swiss Franc (CHF). The attention will shift to the US December CPI inflation data, which is due later on Wednesday. Analysts said the impact on the USD from the inflation report is likely to be short-lived as traders will closely monitor the threat of potential tariffs on imported goods by President-elect Donald Trump's incoming administration.
"Markets are still looking ahead to the incoming administration's policies and the impact on prices," said Carol Kong, a currency strategist at Commonwealth Bank of Australia.
On the Swiss front, Palestinians and Israelis have expressed cautious optimism that a deal on a ceasefire in the Gaza Strip and the release of hostages held there is close after 15 months of devastating war. The escalating geopolitical tensions in the Middle East and the ongoing Russia-Ukraine conflict could boost the safe-haven flows, benefitting the Swiss Franc.
Swiss Franc FAQs
The Swiss Franc (CHF) is Switzerland’s official currency. It is among the top ten most traded currencies globally, reaching volumes that well exceed the size of the Swiss economy. Its value is determined by the broad market sentiment, the country’s economic health or action taken by the Swiss National Bank (SNB), among other factors. Between 2011 and 2015, the Swiss Franc was pegged to the Euro (EUR). The peg was abruptly removed, resulting in a more than 20% increase in the Franc’s value, causing a turmoil in markets. Even though the peg isn’t in force anymore, CHF fortunes tend to be highly correlated with the Euro ones due to the high dependency of the Swiss economy on the neighboring Eurozone.
The Swiss Franc (CHF) is considered a safe-haven asset, or a currency that investors tend to buy in times of market stress. This is due to the perceived status of Switzerland in the world: a stable economy, a strong export sector, big central bank reserves or a longstanding political stance towards neutrality in global conflicts make the country’s currency a good choice for investors fleeing from risks. Turbulent times are likely to strengthen CHF value against other currencies that are seen as more risky to invest in.
The Swiss National Bank (SNB) meets four times a year – once every quarter, less than other major central banks – to decide on monetary policy. The bank aims for an annual inflation rate of less than 2%. When inflation is above target or forecasted to be above target in the foreseeable future, the bank will attempt to tame price growth by raising its policy rate. Higher interest rates are generally positive for the Swiss Franc (CHF) as they lead to higher yields, making the country a more attractive place for investors. On the contrary, lower interest rates tend to weaken CHF.
Macroeconomic data releases in Switzerland are key to assessing the state of the economy and can impact the Swiss Franc’s (CHF) valuation. The Swiss economy is broadly stable, but any sudden change in economic growth, inflation, current account or the central bank’s currency reserves have the potential to trigger moves in CHF. Generally, high economic growth, low unemployment and high confidence are good for CHF. Conversely, if economic data points to weakening momentum, CHF is likely to depreciate.
As a small and open economy, Switzerland is heavily dependent on the health of the neighboring Eurozone economies. The broader European Union is Switzerland’s main economic partner and a key political ally, so macroeconomic and monetary policy stability in the Eurozone is essential for Switzerland and, thus, for the Swiss Franc (CHF). With such dependency, some models suggest that the correlation between the fortunes of the Euro (EUR) and the CHF is more than 90%, or close to perfect.
- EUR/USD maintains its position following reports of the incoming Trump administration considering gradual tariff hikes.
- The US Dollar depreciated following the disappointing US December PPI data; CPI inflation data is due later on Wednesday.
- ECB officials continue to strengthen expectations of additional policy easing, fueled by the ongoing weak economic outlook in the Eurozone.
EUR/USD remains steady following recent gains registered in the previous session, trading around 1.0300 during the Asian hours on Wednesday. The pair received support as the market sentiment is improved due to recent reports about US President-elect Donald Trump's economic team considering a gradual increase in import tariffs boosted investor confidence, per Bloomberg.
The US Dollar Index (DXY), which measures the US Dollar’s performance against six major currencies, trades near 109.20. The Greenback faced challenges following the disappointing US December Producer Price Index (PPI) data. Market participants will keep an eye on the US Consumer Price Index (CPI) inflation data, which is due later on Wednesday.
US Producer Price Index for final demand rose 0.2% month-over-month in December after a 0.4% advance in November, softer than the 0.3% expected. The PPI climbed 3.3% YoY in December, the most since February 2023, after increasing 3.0% in November. This reading came in below the consensus of 3.4%.
The US Dollar may regain strength as hawkish sentiment builds around the Federal Reserve’s (Fed) policy outlook for January. According to the CME FedWatch tool, 30-day Fed Funds futures indicate a higher likelihood of just one interest rate cut from the Fed this year, contrasting with the two cuts projected in the Fed's latest dot plot from the Summary of Economic Projections (SEP).
The EUR/USD pair may face additional downward pressure as European Central Bank (ECB) officials continue to reinforce market expectations of further policy easing, driven by the Eurozone's weak economic outlook.
At a conference on Monday, ECB policymaker and Bank of Finland Governor Olli Rehn stated that he anticipates monetary policy will exit restrictive territory within the coming months, likely by “midsummer.”
Euro PRICE Today
The table below shows the percentage change of Euro (EUR) against listed major currencies today. Euro was the strongest against the British Pound.
| USD | EUR | GBP | JPY | CAD | AUD | NZD | CHF | |
|---|---|---|---|---|---|---|---|---|
| USD | 0.02% | 0.03% | -0.28% | -0.03% | -0.05% | -0.10% | -0.04% | |
| EUR | -0.02% | 0.01% | -0.29% | -0.06% | -0.07% | -0.12% | -0.06% | |
| GBP | -0.03% | -0.01% | -0.33% | -0.06% | -0.08% | -0.14% | -0.06% | |
| JPY | 0.28% | 0.29% | 0.33% | 0.26% | 0.23% | 0.17% | 0.25% | |
| CAD | 0.03% | 0.06% | 0.06% | -0.26% | -0.03% | -0.07% | -0.01% | |
| AUD | 0.05% | 0.07% | 0.08% | -0.23% | 0.03% | -0.05% | 0.02% | |
| NZD | 0.10% | 0.12% | 0.14% | -0.17% | 0.07% | 0.05% | 0.07% | |
| CHF | 0.04% | 0.06% | 0.06% | -0.25% | 0.00% | -0.02% | -0.07% |
The heat map shows percentage changes of major currencies against each other. The base currency is picked from the left column, while the quote currency is picked from the top row. For example, if you pick the Euro from the left column and move along the horizontal line to the US Dollar, the percentage change displayed in the box will represent EUR (base)/USD (quote).
Speaking at the Bank of Japan (BoJ) branch manager meeting on Wednesday, Governor Kazuo Ueda said on that they “will raise rates and adjust degree of monetary support if improvement in economy and price conditions continues.”
Additional quotes
Will make a decision next week.
Watching developments in the US economy.
Momentum heading into spring wage negotiations is crucial.
There was a lot of positive talk about wage hikes at the meeting.
Timing of adjusting monetary policy is up to future economic, price, and financial conditions.
Market reaction
The Japanese Yen has picked up fresh bids on these comments, dragging USD/JPY 0.25% lower on the day to near 157.50.
Japanese Yen PRICE Today
The table below shows the percentage change of Japanese Yen (JPY) against listed major currencies today. Japanese Yen was the strongest against the British Pound.
| USD | EUR | GBP | JPY | CAD | AUD | NZD | CHF | |
|---|---|---|---|---|---|---|---|---|
| USD | 0.03% | 0.03% | -0.27% | -0.03% | -0.06% | -0.11% | -0.04% | |
| EUR | -0.03% | 0.02% | -0.29% | -0.07% | -0.08% | -0.12% | -0.07% | |
| GBP | -0.03% | -0.02% | -0.33% | -0.06% | -0.09% | -0.13% | -0.06% | |
| JPY | 0.27% | 0.29% | 0.33% | 0.26% | 0.22% | 0.18% | 0.25% | |
| CAD | 0.03% | 0.07% | 0.06% | -0.26% | -0.04% | -0.07% | -0.00% | |
| AUD | 0.06% | 0.08% | 0.09% | -0.22% | 0.04% | -0.03% | 0.04% | |
| NZD | 0.11% | 0.12% | 0.13% | -0.18% | 0.07% | 0.03% | 0.07% | |
| CHF | 0.04% | 0.07% | 0.06% | -0.25% | 0.00% | -0.04% | -0.07% |
The heat map shows percentage changes of major currencies against each other. The base currency is picked from the left column, while the quote currency is picked from the top row. For example, if you pick the Japanese Yen from the left column and move along the horizontal line to the US Dollar, the percentage change displayed in the box will represent JPY (base)/USD (quote).
- GBP/USD struggles to capitalize on this week’s modest bounce from a multi-year low.
- Stagflation fears and UK fiscal concerns undermine the GBP and weigh on the major.
- Subdued USD demand acts as a tailwind for the pair ahead of the UK/US CPI prints.
The GBP/USD pair attracts some sellers during the Asian session on Wednesday, albeit it lacks follow-through and remains well within the previous day's broader trading range. Spot prices currently trade around the 1.2200 mark, down 0.20% for the day, as investors now look forward to the release of the high-impact Consumer Price Index (CPI) data from the UK and the US before positioning for the next leg of a directional move.
The crucial CPI report would influence the Bank of England’s (BoE) and the Federal Reserve's (Fed) interest rates outlook, which, in turn, will play a key role in determining the next leg of a directional move for the GBP/USD pair. Heading into the key data risk, the risk of stagflation – a combination of high inflation and weak economic growth – and concerns over the UK’s fiscal situation undermine the British Pound (GBP).
Furthermore, the recent surge in UK borrowing costs contributes to denting sentiment surrounding the GBP and turns out to be a key factor weighing on the GBP/USD pair. The US Dollar (USD), on the other hand, languishes near the weekly low touched in reaction to the release of softer US producer prices on Tuesday and helps limit the downside for spot prices. That said, the Fed's hawkish shift acts as a tailwind for the Greenback.
In fact, market participants now seem convinced that the US central bank would pause its rate-cutting cycle later this month and the expectations were reaffirmed by the upbeat US Nonfarm Payrolls (NFP) report on Friday. This remains supportive of elevated US Treasury bond yields and favors the USD bulls, suggesting that any attempted recovery in the GBP/USD pair might be seen as a selling opportunity and remain capped.
Economic Indicator
Consumer Price Index (YoY)
The United Kingdom (UK) Consumer Price Index (CPI), released by the Office for National Statistics on a monthly basis, is a measure of consumer price inflation – the rate at which the prices of goods and services bought by households rise or fall – produced to international standards. It is the inflation measure used in the government’s target. The YoY reading compares prices in the reference month to a year earlier. Generally, a high reading is seen as bullish for the Pound Sterling (GBP), while a low reading is seen as bearish.
Read more.Next release: Wed Jan 15, 2025 07:00
Frequency: Monthly
Consensus: 2.7%
Previous: 2.6%
Source: Office for National Statistics
The Bank of England is tasked with keeping inflation, as measured by the headline Consumer Price Index (CPI) at around 2%, giving the monthly release its importance. An increase in inflation implies a quicker and sooner increase of interest rates or the reduction of bond-buying by the BOE, which means squeezing the supply of pounds. Conversely, a drop in the pace of price rises indicates looser monetary policy. A higher-than-expected result tends to be GBP bullish.
Gold prices remained broadly unchanged in India on Wednesday, according to data compiled by FXStreet.
The price for Gold stood at 7,442.63 Indian Rupees (INR) per gram, broadly stable compared with the INR 7,444.55 it cost on Tuesday.
The price for Gold was broadly steady at INR 86,809.41 per tola from INR 86,831.80 per tola a day earlier.
| Unit measure | Gold Price in INR |
|---|---|
| 1 Gram | 7,442.63 |
| 10 Grams | 74,426.34 |
| Tola | 86,809.41 |
| Troy Ounce | 231,492.00 |
FXStreet calculates Gold prices in India by adapting international prices (USD/INR) to the local currency and measurement units. Prices are updated daily based on the market rates taken at the time of publication. Prices are just for reference and local rates could diverge slightly.
Gold FAQs
Gold has played a key role in human’s history as it has been widely used as a store of value and medium of exchange. Currently, apart from its shine and usage for jewelry, the precious metal is widely seen as a safe-haven asset, meaning that it is considered a good investment during turbulent times. Gold is also widely seen as a hedge against inflation and against depreciating currencies as it doesn’t rely on any specific issuer or government.
Central banks are the biggest Gold holders. In their aim to support their currencies in turbulent times, central banks tend to diversify their reserves and buy Gold to improve the perceived strength of the economy and the currency. High Gold reserves can be a source of trust for a country’s solvency. Central banks added 1,136 tonnes of Gold worth around $70 billion to their reserves in 2022, according to data from the World Gold Council. This is the highest yearly purchase since records began. Central banks from emerging economies such as China, India and Turkey are quickly increasing their Gold reserves.
Gold has an inverse correlation with the US Dollar and US Treasuries, which are both major reserve and safe-haven assets. When the Dollar depreciates, Gold tends to rise, enabling investors and central banks to diversify their assets in turbulent times. Gold is also inversely correlated with risk assets. A rally in the stock market tends to weaken Gold price, while sell-offs in riskier markets tend to favor the precious metal.
The price can move due to a wide range of factors. Geopolitical instability or fears of a deep recession can quickly make Gold price escalate due to its safe-haven status. As a yield-less asset, Gold tends to rise with lower interest rates, while higher cost of money usually weighs down on the yellow metal. Still, most moves depend on how the US Dollar (USD) behaves as the asset is priced in dollars (XAU/USD). A strong Dollar tends to keep the price of Gold controlled, whereas a weaker Dollar is likely to push Gold prices up.
(An automation tool was used in creating this post.)
- Gold price attracts some sellers as the risk-on mood undermines demand for safe-haven assets.
- The prospects for a slower Fed rate cut contribute to driving flows away from the XAU/USD pair.
- A softer USD and geopolitical risks could support the precious metal ahead of the US CPI report.
Gold price (XAU/USD) struggles to capitalize on the previous day's bounce from a one-week low and meets fresh supply during the Asian session on Wednesday. The global risk sentiment remains supported by easing fears about US President-elect Donald Trump's disruptive trade tariffs and gets an additional boost from Tuesday's softer-than-expected inflation data from the US. This, in turn, is seen as a key factor undermining demand for the safe-haven precious metal.
Furthermore, the upbeat US monthly jobs report released on Friday reaffirmed the Federal Reserve's (Fed) hawkish outlook and keeps the US Treasury bond yields elevated, which contributes to driving flows away from the non-yielding Gold price. The US Dollar (USD), meanwhile, struggles to attract buyers and languishes near the weekly low touched on Tuesday. This, along with geopolitical risks, should support the XAU/USD ahead of the US consumer inflation figures.
Gold price is pressured by a positive risk tone but downside remains cushioned
- A Bloomberg report, citing people familiar with the matter, said on Monday that US President-elect Donald Trump's economic advisers are considering a program to gradually increase tariffs month by month.
- Moreover, softer-than-expected inflation data from the US helped pause the recent surge in the US Treasury bond yields and boosted investors' appetite for riskier assets, undermining the safe-haven Gold price.
- The US Bureau of Labor Statistics reported on Tuesday that the Producer Price Index, which measures wholesale inflation, rose 0.2% in December and the core gauge remained flat during the reported month.
- This comes on the back of the upbeat US monthly jobs report on Friday and makes it difficult for investors to project the Federal Reserve's next moves on interest rates, which keeps the US Dollar bulls on the defensive.
- Ukraine launched its largest air attacks on Russia since the start of the war nearly three years ago. The Russian military said that the attacks would not go unanswered and launched more projectiles towards Ukraine.
- Israel launched fierce strikes on Gaza and intensified bombing on Tuesday, killing at least 13 people. Meanwhile, negotiators are nearing a breakthrough on the Gaza ceasefire after intense discussions in Qatar.
- Traders now look forward to the US Consumer Price Index (CPI) report for more insight into the Fed’s policy outlook, which will drive the USD demand and provide some meaningful impetus to the XAU/USD.
Gold price bulls have the upper hand while above $2,615-2,614 confluence support
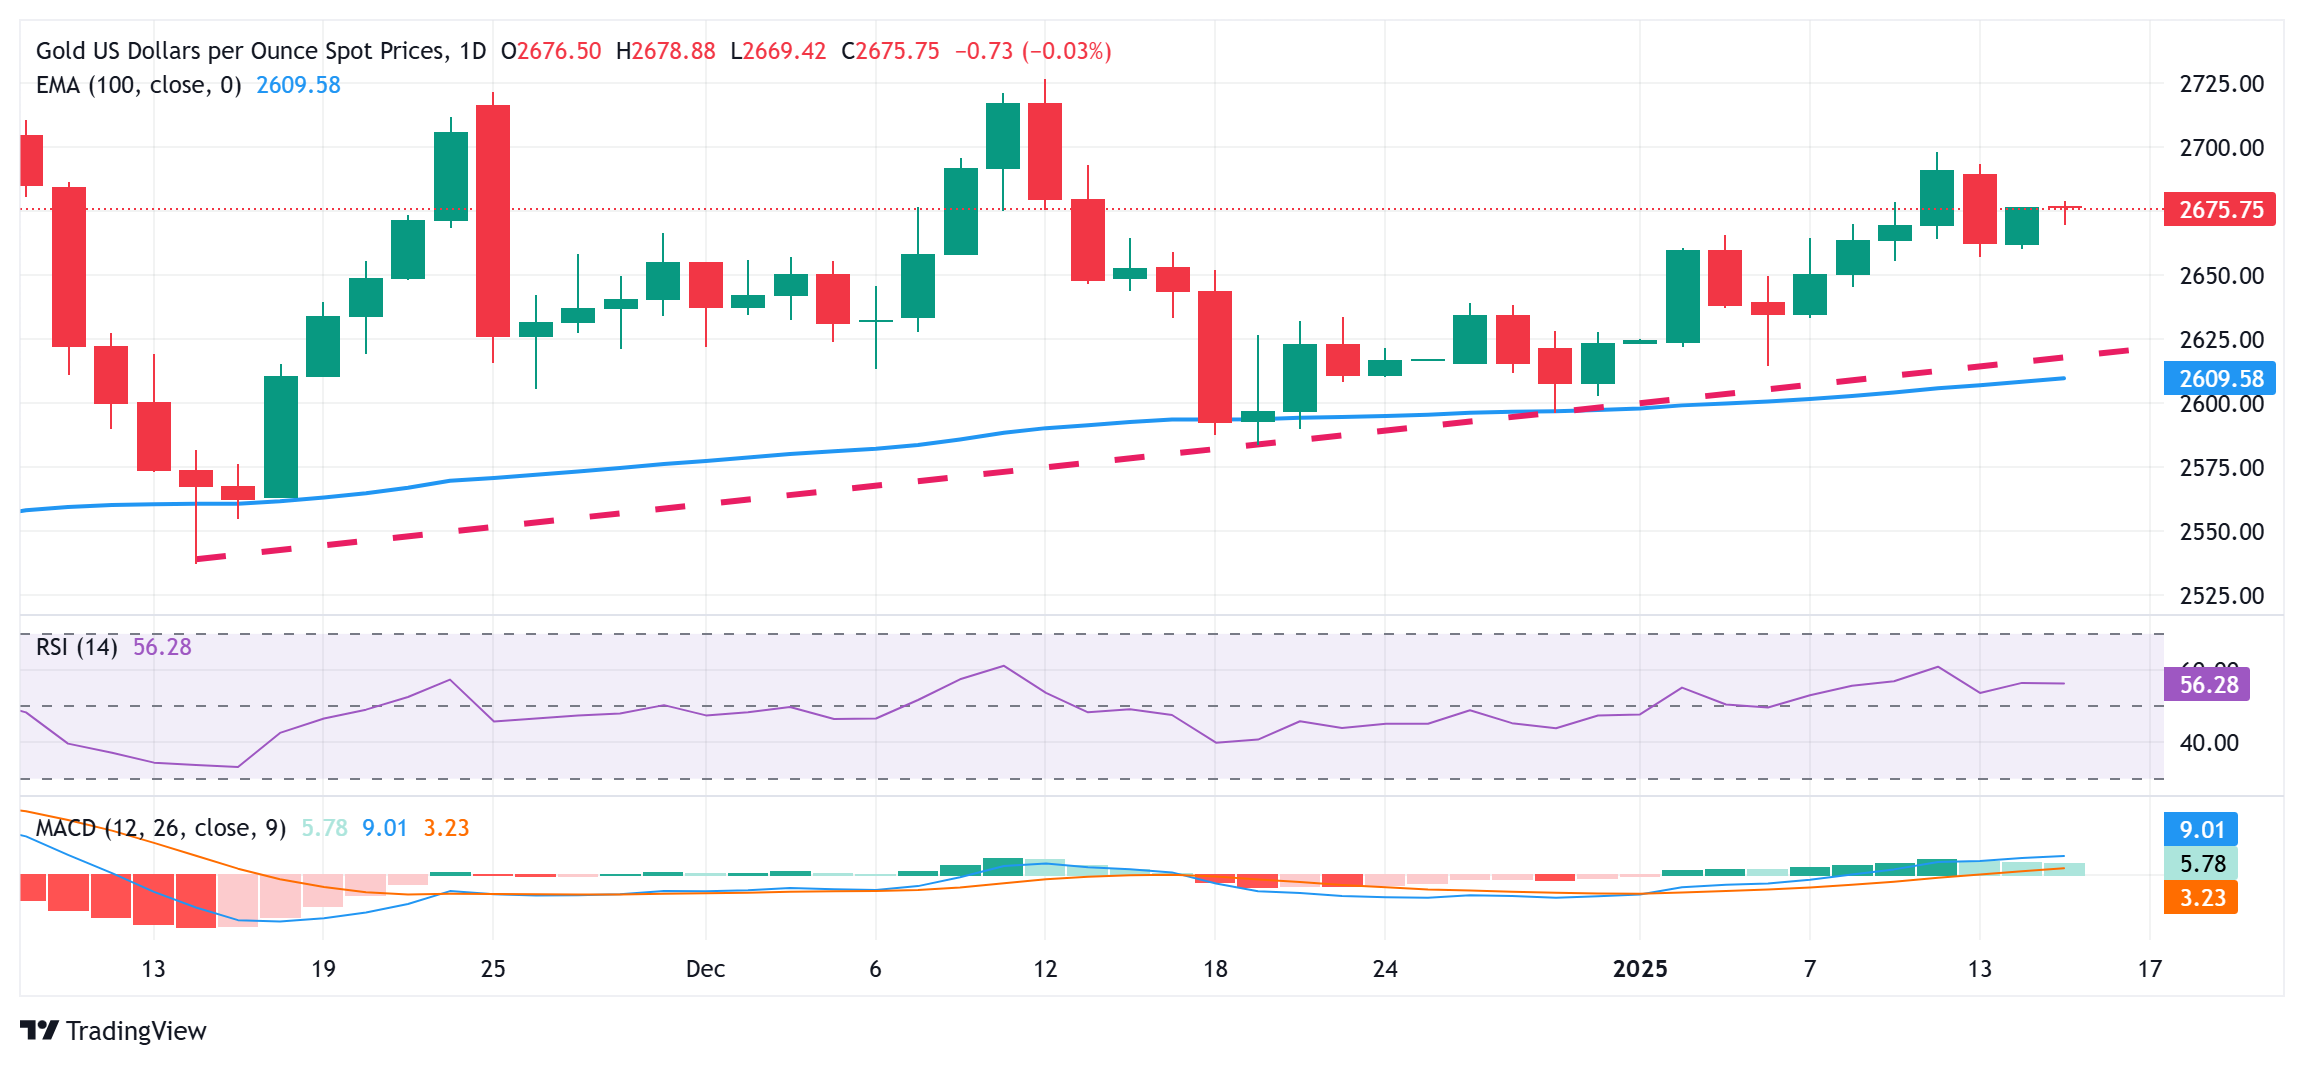
Technical indicators on the daily chart have been gaining positive traction and support prospects for the emergence of some dip-buyers near the $2,663-2,662 area. Some follow-through selling, however, could drag the Gold price to the next relevant support near the $2,336-$2,635 region. The downward trajectory could extend further towards the $2,615-2,614 confluence, comprising the 100-day Exponential Moving Average (SMA) and a multi-week-old ascending trend line. A convincing break below the latter would shift the near-term bias in favor of bearish traders and pave the way for deeper losses.
On the flip side, the $2,690 zone is likely to act as an immediate hurdle ahead of the $2,700 mark. Some follow-through buying will set the stage for an extension of over a three-week-old up-trend and lift the Gold price to the $2,716-2,717 hurdle en route to the December monthly swing high, around the $2,726 region.
Gold FAQs
Gold has played a key role in human’s history as it has been widely used as a store of value and medium of exchange. Currently, apart from its shine and usage for jewelry, the precious metal is widely seen as a safe-haven asset, meaning that it is considered a good investment during turbulent times. Gold is also widely seen as a hedge against inflation and against depreciating currencies as it doesn’t rely on any specific issuer or government.
Central banks are the biggest Gold holders. In their aim to support their currencies in turbulent times, central banks tend to diversify their reserves and buy Gold to improve the perceived strength of the economy and the currency. High Gold reserves can be a source of trust for a country’s solvency. Central banks added 1,136 tonnes of Gold worth around $70 billion to their reserves in 2022, according to data from the World Gold Council. This is the highest yearly purchase since records began. Central banks from emerging economies such as China, India and Turkey are quickly increasing their Gold reserves.
Gold has an inverse correlation with the US Dollar and US Treasuries, which are both major reserve and safe-haven assets. When the Dollar depreciates, Gold tends to rise, enabling investors and central banks to diversify their assets in turbulent times. Gold is also inversely correlated with risk assets. A rally in the stock market tends to weaken Gold price, while sell-offs in riskier markets tend to favor the precious metal.
The price can move due to a wide range of factors. Geopolitical instability or fears of a deep recession can quickly make Gold price escalate due to its safe-haven status. As a yield-less asset, Gold tends to rise with lower interest rates, while higher cost of money usually weighs down on the yellow metal. Still, most moves depend on how the US Dollar (USD) behaves as the asset is priced in dollars (XAU/USD). A strong Dollar tends to keep the price of Gold controlled, whereas a weaker Dollar is likely to push Gold prices up.
- The EUR/JPY cross may regain its ground the daily chart analysis suggests a prevailing bullish bias.
- The bullish bias strengthens as the 14-day RSI remains slightly above the 50 mark.
- The primary support appears at the 14-day EMA at 162.53, followed by the psychological level at 162.50.
EUR/JPY trades slightly lower, hovering around 162.60 during Wednesday’s Asian trading session, following a 1% gain in the previous session. Technical analysis of the daily chart indicates that the currency cross remains within an ascending channel pattern, reflecting a continued bullish trend.
The 14-day Relative Strength Index (RSI) sits just above the 50 mark, reinforcing the bullish outlook for the EUR/JPY cross. Moreover, the currency cross's position above the nine- and 14-day Exponential Moving Averages (EMAs) highlights improved short-term price momentum and supports the potential for further gains.
On the upside, the EUR/JPY cross may find its primary resistance around its two-month low at the 164.90 level. A break above this level could improve the bullish bias and support the currency cross to approach the upper boundary of the ascending channel at the psychological level of 166.50, followed by a six-month high of 166.69, a level last seen in October 2024.
In terms of support, the EUR/JPY cross may find primary support at the 14-day EMA at 162.53, aligned with the nine-day EMA at 162.51 and psychological level of 162.50. A break below this crucial support zone would weaken the short-term price momentum and put pressure on the currency cross to navigate the region around the ascending channel’s lower boundary around the psychological level of 160.50, followed by a four-month low of 156.18, recorded on December 3.
EUR/JPY: Daily Chart
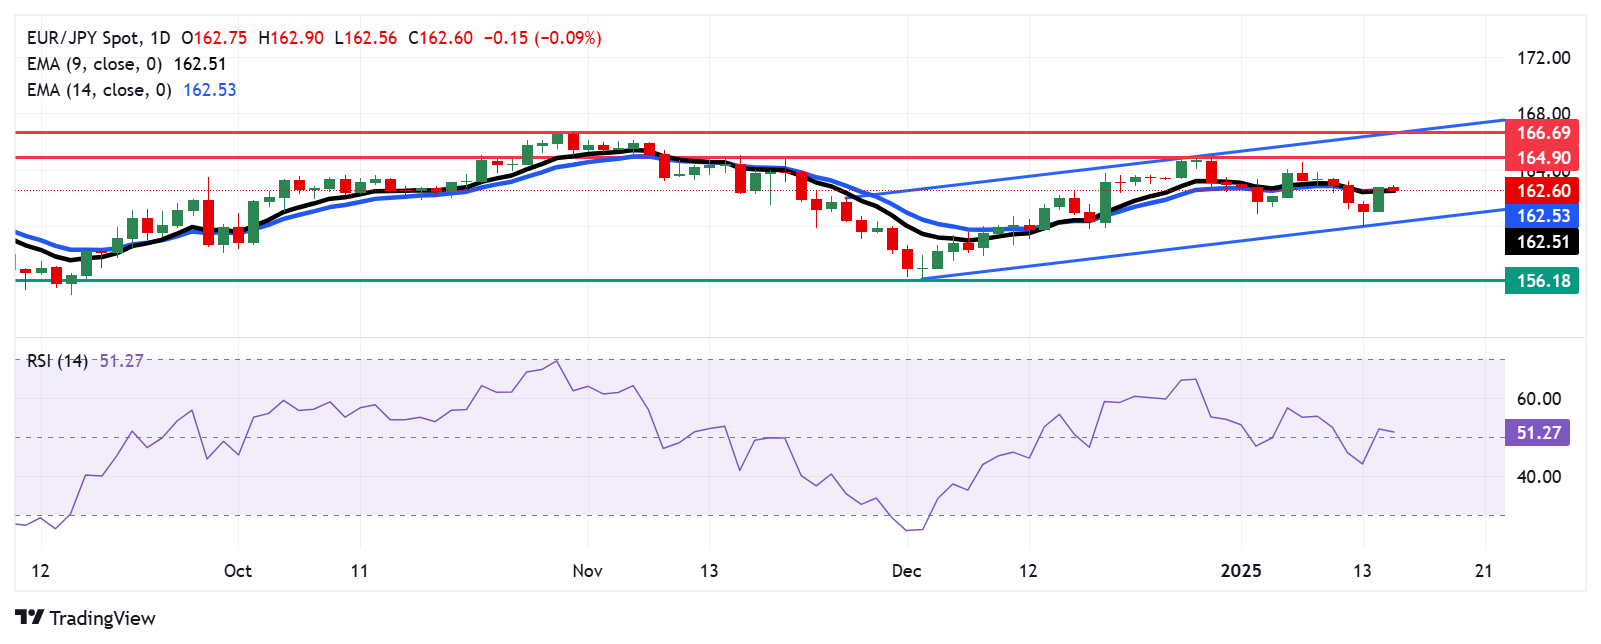
Euro PRICE Today
The table below shows the percentage change of Euro (EUR) against listed major currencies today. Euro was the weakest against the New Zealand Dollar.
| USD | EUR | GBP | JPY | CAD | AUD | NZD | CHF | |
|---|---|---|---|---|---|---|---|---|
| USD | 0.04% | 0.04% | -0.03% | -0.04% | -0.05% | -0.12% | -0.03% | |
| EUR | -0.04% | 0.00% | -0.08% | -0.09% | -0.10% | -0.16% | -0.07% | |
| GBP | -0.04% | -0.00% | -0.10% | -0.08% | -0.10% | -0.17% | -0.05% | |
| JPY | 0.03% | 0.08% | 0.10% | -0.01% | -0.02% | -0.09% | 0.02% | |
| CAD | 0.04% | 0.09% | 0.08% | 0.00% | -0.02% | -0.09% | 0.03% | |
| AUD | 0.05% | 0.10% | 0.10% | 0.02% | 0.02% | -0.06% | 0.05% | |
| NZD | 0.12% | 0.16% | 0.17% | 0.09% | 0.09% | 0.06% | 0.10% | |
| CHF | 0.03% | 0.07% | 0.05% | -0.02% | -0.03% | -0.05% | -0.10% |
The heat map shows percentage changes of major currencies against each other. The base currency is picked from the left column, while the quote currency is picked from the top row. For example, if you pick the Euro from the left column and move along the horizontal line to the US Dollar, the percentage change displayed in the box will represent EUR (base)/USD (quote).
European Central Bank (ECB) Chief Economist Phillip Lane is speaking at Goldman Sachs' Global Macro conference in Hong Kong on Wednesday.
Key quotes
Economy is still recovering.
Expect investment to pick up this year.
Eurozone economic growth 1.1% in 2024, expects a firmer economic recovery in 2025.
It takes time for monetary easing to impact and take effect.
Savings rate will come down in euro zone though not massively.
Expect strong employment and wage growth - will support consumption.
Market reaction
EUR/USD battles 1.0300 on these above comments, down 0.07% on the day.
ECB FAQs
The European Central Bank (ECB) in Frankfurt, Germany, is the reserve bank for the Eurozone. The ECB sets interest rates and manages monetary policy for the region. The ECB primary mandate is to maintain price stability, which means keeping inflation at around 2%. Its primary tool for achieving this is by raising or lowering interest rates. Relatively high interest rates will usually result in a stronger Euro and vice versa. The ECB Governing Council makes monetary policy decisions at meetings held eight times a year. Decisions are made by heads of the Eurozone national banks and six permanent members, including the President of the ECB, Christine Lagarde.
In extreme situations, the European Central Bank can enact a policy tool called Quantitative Easing. QE is the process by which the ECB prints Euros and uses them to buy assets – usually government or corporate bonds – from banks and other financial institutions. QE usually results in a weaker Euro. QE is a last resort when simply lowering interest rates is unlikely to achieve the objective of price stability. The ECB used it during the Great Financial Crisis in 2009-11, in 2015 when inflation remained stubbornly low, as well as during the covid pandemic.
Quantitative tightening (QT) is the reverse of QE. It is undertaken after QE when an economic recovery is underway and inflation starts rising. Whilst in QE the European Central Bank (ECB) purchases government and corporate bonds from financial institutions to provide them with liquidity, in QT the ECB stops buying more bonds, and stops reinvesting the principal maturing on the bonds it already holds. It is usually positive (or bullish) for the Euro.
- United Kingdom’s Office for National Statistics will release the December CPI data on Wednesday.
- The annual UK headline CPI inflation is set to rise in December, with the core figure cooling slightly.
- The UK CPI report will likely rock the Pound Sterling amid the BoE’s cautious policy approach.
The United Kingdom’s (UK) Office for National Statistics (ONS) will release the high-impact Consumer Price Index (CPI) data for December on Wednesday at 07:00 GMT.
The UK CPI inflation report could significantly impact the direction of the Bank of England’s (BoE) interest rates and the Pound Sterling (GBP) amid the persistent turmoil in the global bond market.
What to expect from the next UK inflation report?
The UK Consumer Price Index is expected to increase 2.7% year-over-year (YoY) in December, following a 2.6% growth in November, moving further away from the BoE’s 2.0% target.
Core CPI inflation, which excludes energy, food, alcohol and tobacco, will likely edge a tad lower to 3.4% YoY in December, compared to the 3.5% print reported in November.
According to a Bloomberg survey of economists, official data is expected to show that service inflation fell to 4.8% in December after remaining at 5% in the prior month.
The BoE forecast the annual headline CPI to be 2.5% and the services CPI to be 4.7% for December.
Meanwhile, the British monthly CPI is seen rising 0.4% in the same period, as against the previous growth of 0.1%.
Previewing the UK inflation data, TD Securities analysts noted: “We look for the headline of 2.7% but the more important core and services are likely to see decelerations, especially services, which we expect to fall from 5.0% YoY in November. That said, there remains big uncertainty about airfares, which were likely very weak in the month on account of the survey data.”
How will the UK Consumer Price Index report affect GBP/USD?
The BoE policymakers wrapped up 2024 with a decision to leave the benchmark policy rate unchanged at 4.75% in its December meeting after UK inflation climbed to an eight-month high.
In a dovish tilt, the voting composition was more divided than expected. Three members of the Monetary Policy Committee (MPC) voted to reduce rates, while six favoured a hold. Amidst weak economic prospects, BoE Governor Andrew Bailey said: “We think a gradual approach to future interest-rate cuts remains right. But with heightened uncertainty in the economy, we can’t commit to when or by how much we will cut rates in the coming year.”
The ongoing rout in the UK bond market indicates the bleak economic outlook and increased inflationary concerns in the United States (US) President-elect Donald Trump 2.0 era.
In light of these factors, the stakes are high heading into the December UK CPI data release, as it could alter the market’s pricing of the BoE’s path forward on interest rates.
The hotter-than-expected headline and core inflation data will likely reaffirm the BoE’s gradual easing stance, providing the much-needed respite to the Pound Sterling. In this case, GBP/USD could see a decent recovery from over a year’s low. Conversely, softer-than-expected inflation readings could call for aggressive BoE rate cuts amid a fragile economic situation, smashing the GBP/USD toward sub-1.2000 levels.
Dhwani Mehta, Asian Session Lead Analyst at FXStreet, offers a brief technical outlook for the major and explains: “GBP/USD is heavily oversold on the daily time frame ahead of the UK CPI data release, with the 14-day Relative Strength Index (RSI) holding below 30. Therefore, the pair appears primed for a brief recovery in the near term.”
Dhwani adds: “The pair could initiate a meaningful recovery on acceptance above the 1.2300 round level, above which the January 9 high of 1.2367 will be tested. The next upside target is seen at the 21-day Simple Moving Average (SMA) at 1.2462. On the flip side, the immediate support is seen at the 14-month low of 1.2100, below which the 1.2050 psychological barrier will come into play.”
Economic Indicator
Consumer Price Index (YoY)
The United Kingdom (UK) Consumer Price Index (CPI), released by the Office for National Statistics on a monthly basis, is a measure of consumer price inflation – the rate at which the prices of goods and services bought by households rise or fall – produced to international standards. It is the inflation measure used in the government’s target. The YoY reading compares prices in the reference month to a year earlier. Generally, a high reading is seen as bullish for the Pound Sterling (GBP), while a low reading is seen as bearish.
Read more.Next release: Wed Jan 15, 2025 07:00
Frequency: Monthly
Consensus: 2.7%
Previous: 2.6%
Source: Office for National Statistics
The Bank of England is tasked with keeping inflation, as measured by the headline Consumer Price Index (CPI) at around 2%, giving the monthly release its importance. An increase in inflation implies a quicker and sooner increase of interest rates or the reduction of bond-buying by the BOE, which means squeezing the supply of pounds. Conversely, a drop in the pace of price rises indicates looser monetary policy. A higher-than-expected result tends to be GBP bullish.
Inflation FAQs
Inflation measures the rise in the price of a representative basket of goods and services. Headline inflation is usually expressed as a percentage change on a month-on-month (MoM) and year-on-year (YoY) basis. Core inflation excludes more volatile elements such as food and fuel which can fluctuate because of geopolitical and seasonal factors. Core inflation is the figure economists focus on and is the level targeted by central banks, which are mandated to keep inflation at a manageable level, usually around 2%.
The Consumer Price Index (CPI) measures the change in prices of a basket of goods and services over a period of time. It is usually expressed as a percentage change on a month-on-month (MoM) and year-on-year (YoY) basis. Core CPI is the figure targeted by central banks as it excludes volatile food and fuel inputs. When Core CPI rises above 2% it usually results in higher interest rates and vice versa when it falls below 2%. Since higher interest rates are positive for a currency, higher inflation usually results in a stronger currency. The opposite is true when inflation falls.
Although it may seem counter-intuitive, high inflation in a country pushes up the value of its currency and vice versa for lower inflation. This is because the central bank will normally raise interest rates to combat the higher inflation, which attract more global capital inflows from investors looking for a lucrative place to park their money.
Formerly, Gold was the asset investors turned to in times of high inflation because it preserved its value, and whilst investors will often still buy Gold for its safe-haven properties in times of extreme market turmoil, this is not the case most of the time. This is because when inflation is high, central banks will put up interest rates to combat it. Higher interest rates are negative for Gold because they increase the opportunity-cost of holding Gold vis-a-vis an interest-bearing asset or placing the money in a cash deposit account. On the flipside, lower inflation tends to be positive for Gold as it brings interest rates down, making the bright metal a more viable investment alternative.
- The Indian Rupee softens in Wednesday’s Asian session.
- The strong USD, higher crude oil prices, and equity market capital outflows exert selling pressure on the INR.
- Investors brace for the US December CPI inflation data, which is due later on Wednesday.
The Indian Rupee (INR) weakens on Wednesday, pressured by intense demand for the US Dollar (USD). Furthermore, a rise in crude oil prices and continued outflows from foreign investors contribute to the INR’s downside.
Any significant depreciation of the INR might be limited, even though the Reserve Bank of India (RBI) adopts a flexible approach to the INR and does not intend to target specific levels for the local currency. Investors will closely monitor the US December Consumer Price Index (CPI) inflation data, which is due later on Wednesday. Also, the Federal Reserve’s (Fed) Thomas Barkin, Neel Kashkari, John Williams, and Austan Goolsbee are scheduled to speak later in the day.
Indian Rupee remains fragile due to global economic factors
- The "Trump Tantrum," referring to the impact of Donald Trump's presidency on the Indian Rupee, is likely to be a short-term phenomenon, noted the State Bank of India (SBI).
- RBI Governor Sanjay Malhotra has shown a willingness to allow the INR to move more freely in tandem with peers in the region while still intervening in the foreign exchange market to curb excessive moves, per Bloomberg.
- India’s Wholesale Price Index (WPI) inflation rose to 2.37% in December from 1.89% in November, according to the Ministry of Commerce and Industry on Tuesday. This figure came in hotter than the expectation of 2.30%.
- India’s Consumer Price Index (CPI) rose 5.22% YoY in December, compared to 5.48% in the previous reading, softer than the expectation of 5.3%.
- The US PPI rose by 3.3% YoY in December, compared to 3.0% in November, the US Bureau of Labor Statistics reported on Tuesday. This reading came in softer than the market expectation of 3.4%.
- The core PPI, excluding the volatile prices of food and energy, climbed 3.5% YoY in December versus 3.4% prior, below the market consensus of 3.8%.
USD/INR’s bullish tone remains in play, overbought RSI warrants caution for bulls
The Indian Rupee trades softer on the day. The strong uptrend of the USD/INR pair remains in place, with the pair forming higher highs and higher lows while holding above the key 100-day Exponential Moving Average (EMA) on the daily chart. However, the 14-day Relative Strength Index (RSI) moves beyond the 70.00 mark, indicating overbought conditions and warranting some caution. This suggests that further consolidation is on the cards.
The immediate resistance level for USD/INR emerges at an all-time high of 86.69. If buyers hold the line and trading stays above this level, the pair could gear up for another run at the 87.00 psychological level.
On the bearish move, the initial support level for the pair is located at 85.85, the low of January 10. Sustained trading below the mentioned level could drag the pair toward 85.65, the low of January 7, followed by 85.00, a round figure.
Indian Rupee FAQs
The Indian Rupee (INR) is one of the most sensitive currencies to external factors. The price of Crude Oil (the country is highly dependent on imported Oil), the value of the US Dollar – most trade is conducted in USD – and the level of foreign investment, are all influential. Direct intervention by the Reserve Bank of India (RBI) in FX markets to keep the exchange rate stable, as well as the level of interest rates set by the RBI, are further major influencing factors on the Rupee.
The Reserve Bank of India (RBI) actively intervenes in forex markets to maintain a stable exchange rate, to help facilitate trade. In addition, the RBI tries to maintain the inflation rate at its 4% target by adjusting interest rates. Higher interest rates usually strengthen the Rupee. This is due to the role of the ‘carry trade’ in which investors borrow in countries with lower interest rates so as to place their money in countries’ offering relatively higher interest rates and profit from the difference.
Macroeconomic factors that influence the value of the Rupee include inflation, interest rates, the economic growth rate (GDP), the balance of trade, and inflows from foreign investment. A higher growth rate can lead to more overseas investment, pushing up demand for the Rupee. A less negative balance of trade will eventually lead to a stronger Rupee. Higher interest rates, especially real rates (interest rates less inflation) are also positive for the Rupee. A risk-on environment can lead to greater inflows of Foreign Direct and Indirect Investment (FDI and FII), which also benefit the Rupee.
Higher inflation, particularly, if it is comparatively higher than India’s peers, is generally negative for the currency as it reflects devaluation through oversupply. Inflation also increases the cost of exports, leading to more Rupees being sold to purchase foreign imports, which is Rupee-negative. At the same time, higher inflation usually leads to the Reserve Bank of India (RBI) raising interest rates and this can be positive for the Rupee, due to increased demand from international investors. The opposite effect is true of lower inflation.
- Silver prices edged lower amid a risk-on market sentiment, driven by optimism as Trump's incoming team considered gradual tariff hikes.
- The non-yielding Silver depreciates as the recent US labor market data reinforced the Fed’s hawkish policy stance in January.
- The industrial demand for Silver could increase following China's recent stimulus measures.
Silver price (XAG/USD) retraces its recent gains from the previous session, trading around $29.80 per barrel during the Asian hours on Wednesday. The price of the safe-haven Silver faces challenges due to risk-on market sentiment following reports about US President-elect Donald Trump's economic team considering a gradual increase in import tariffs boosted investor confidence.
Bloomberg reported on Monday that Trump's incoming administration is evaluating a phased approach to implementing tariffs, aiming to prevent a sharp rise in inflation while managing trade policy adjustments.
The non-yielding Silver faces challenges as the recent US labor market figures for December, which is expected to support the US Federal Reserve’s (Fed) decision to maintain interest rates at current levels in January.
Moreover, reinforced hawkish sentiment surrounding the Fed has sparked a rise in US Treasury yields. Rising yields boosted the US Dollar to recent highs, making Silver more expensive for buyers using foreign currencies and dampening Silver demand.
However, the Greenback corrects downwards following the disappointing US December Producer Price Index (PPI) data. Market participants will keep an eye on the US Consumer Price Index (CPI) inflation data, which is due later on Wednesday.
The demand for Silver could increase following China's recent stimulus measures. As the world's largest consumer of metals, any improvement in China's economic conditions could significantly boost the industrial use of Silver.
People's Bank of China (PBOC) Governor Pan Gongsheng stated on Monday that "interest rate and reserve requirement ratio (RRR) tools will be utilized to maintain ample liquidity." Gongsheng reaffirmed China's plans to increase the fiscal deficit and emphasized that China will continue to be a driving force for the global economy.
Silver FAQs
Silver is a precious metal highly traded among investors. It has been historically used as a store of value and a medium of exchange. Although less popular than Gold, traders may turn to Silver to diversify their investment portfolio, for its intrinsic value or as a potential hedge during high-inflation periods. Investors can buy physical Silver, in coins or in bars, or trade it through vehicles such as Exchange Traded Funds, which track its price on international markets.
Silver prices can move due to a wide range of factors. Geopolitical instability or fears of a deep recession can make Silver price escalate due to its safe-haven status, although to a lesser extent than Gold's. As a yieldless asset, Silver tends to rise with lower interest rates. Its moves also depend on how the US Dollar (USD) behaves as the asset is priced in dollars (XAG/USD). A strong Dollar tends to keep the price of Silver at bay, whereas a weaker Dollar is likely to propel prices up. Other factors such as investment demand, mining supply – Silver is much more abundant than Gold – and recycling rates can also affect prices.
Silver is widely used in industry, particularly in sectors such as electronics or solar energy, as it has one of the highest electric conductivity of all metals – more than Copper and Gold. A surge in demand can increase prices, while a decline tends to lower them. Dynamics in the US, Chinese and Indian economies can also contribute to price swings: for the US and particularly China, their big industrial sectors use Silver in various processes; in India, consumers’ demand for the precious metal for jewellery also plays a key role in setting prices.
Silver prices tend to follow Gold's moves. When Gold prices rise, Silver typically follows suit, as their status as safe-haven assets is similar. The Gold/Silver ratio, which shows the number of ounces of Silver needed to equal the value of one ounce of Gold, may help to determine the relative valuation between both metals. Some investors may consider a high ratio as an indicator that Silver is undervalued, or Gold is overvalued. On the contrary, a low ratio might suggest that Gold is undervalued relative to Silver.
- The Japanese Yen struggles to lure buyers amid wavering BoJ rate hike expectations.
- The risk-on mood and the wider US-Japan yield differential also undermine the JPY.
- Subdued USD demand acts as a headwind for USD/JPY ahead of the US CPI report.
The Japanese Yen (JPY) struggles to gain any meaningful traction and languishes near a multi-month low against its American counterpart amid doubts over the Bank of Japan's (BoJ) rate hike plans. Signs of broadening inflationary pressures in Japan keep the door open for a BoJ rate hike in January or March. Adding to this, BoJ Deputy Governor, Ryozo Himino, signaled on Tuesday that a rate hike remains a tangible possibility at the upcoming meeting. Himino's comments, however, lacked direct clues on the possibility of a January rate hike. Moreover, some investors are betting that the BoJ may wait until the spring negotiations before pulling the trigger.
Meanwhile, the Federal Reserve's (Fed) hawkish shift in December has been a key factor behind the recent surge in the US Treasury bond yields. This resulted in the widening of the US-Japan yield differential, which, in turn, is seen as another factor undermining the lower-yielding JPY. Apart from this, the risk-on mood is holding back traders from placing bullish bets around the safe-haven JPY. That said, subdued US Dollar (USD) price action acts as a headwind for the USD/JPY pair ahead of the release of the latest US consumer inflation figures. The crucial US Consumer Price Index (CPI) report might influence the Fed's policy path and drive the USD demand.
Japanese Yen bulls remain on the sidelines amid BoJ rate hike uncertainty
- A fall in Japan's household spending and real wages for the fourth successive month in November amid higher prices, keeping the door open for a rate hike by the Bank of Japan in January or March.
- BoJ Deputy Governor Ryozo Himino said on Tuesday that the central bank will discuss potentially raising the policy rate at the January meeting, though he did not strongly signal a hike next week.
- Some economists think that the BoJ will assess US President-elect Donald Trump's economic policies and wait until the results of Japan's annual spring wage negotiations become available in March.
- The Reuters Tankan poll showed that Japanese manufacturers' sentiment recovered in January after a dip last month, but their outlook remains flat due to uncertainty over proposed Trump policies.
- The yield on the benchmark 10-year US government bond remains close to a 14-month high in the wake of growing acceptance that the Federal Reserve will pause its rate-cutting cycle later this month.
- Against the backdrop of the upbeat US Nonfarm Payrolls report released on Friday, a moderate rise in the US producer prices makes it difficult for investors to project the Fed's next moves on interest rates.
- The Bureau of Labor Statistics (BLS) reported that the Producer Price Index rose 3.3% in December from a year earlier, marking a notable uptick from 3.0% previous, though it fell short of the 3.4% expected.
- The US Dollar extended Monday's retracement slide from over a two-year peak and acts as a headwind for the USD/JPY pair as traders now look to the US Consumer Price Index for a fresh impetus.
- The headline US CPI is expected to rise 0.3% in December and the yearly rate to 2.9% from 2.7% in November. The core CPI, meanwhile, is anticipated to hold steady and come in at a 3.3% YoY rate.
USD/JPY technical setup favors bulls, sustained strength above 158.00 awaited
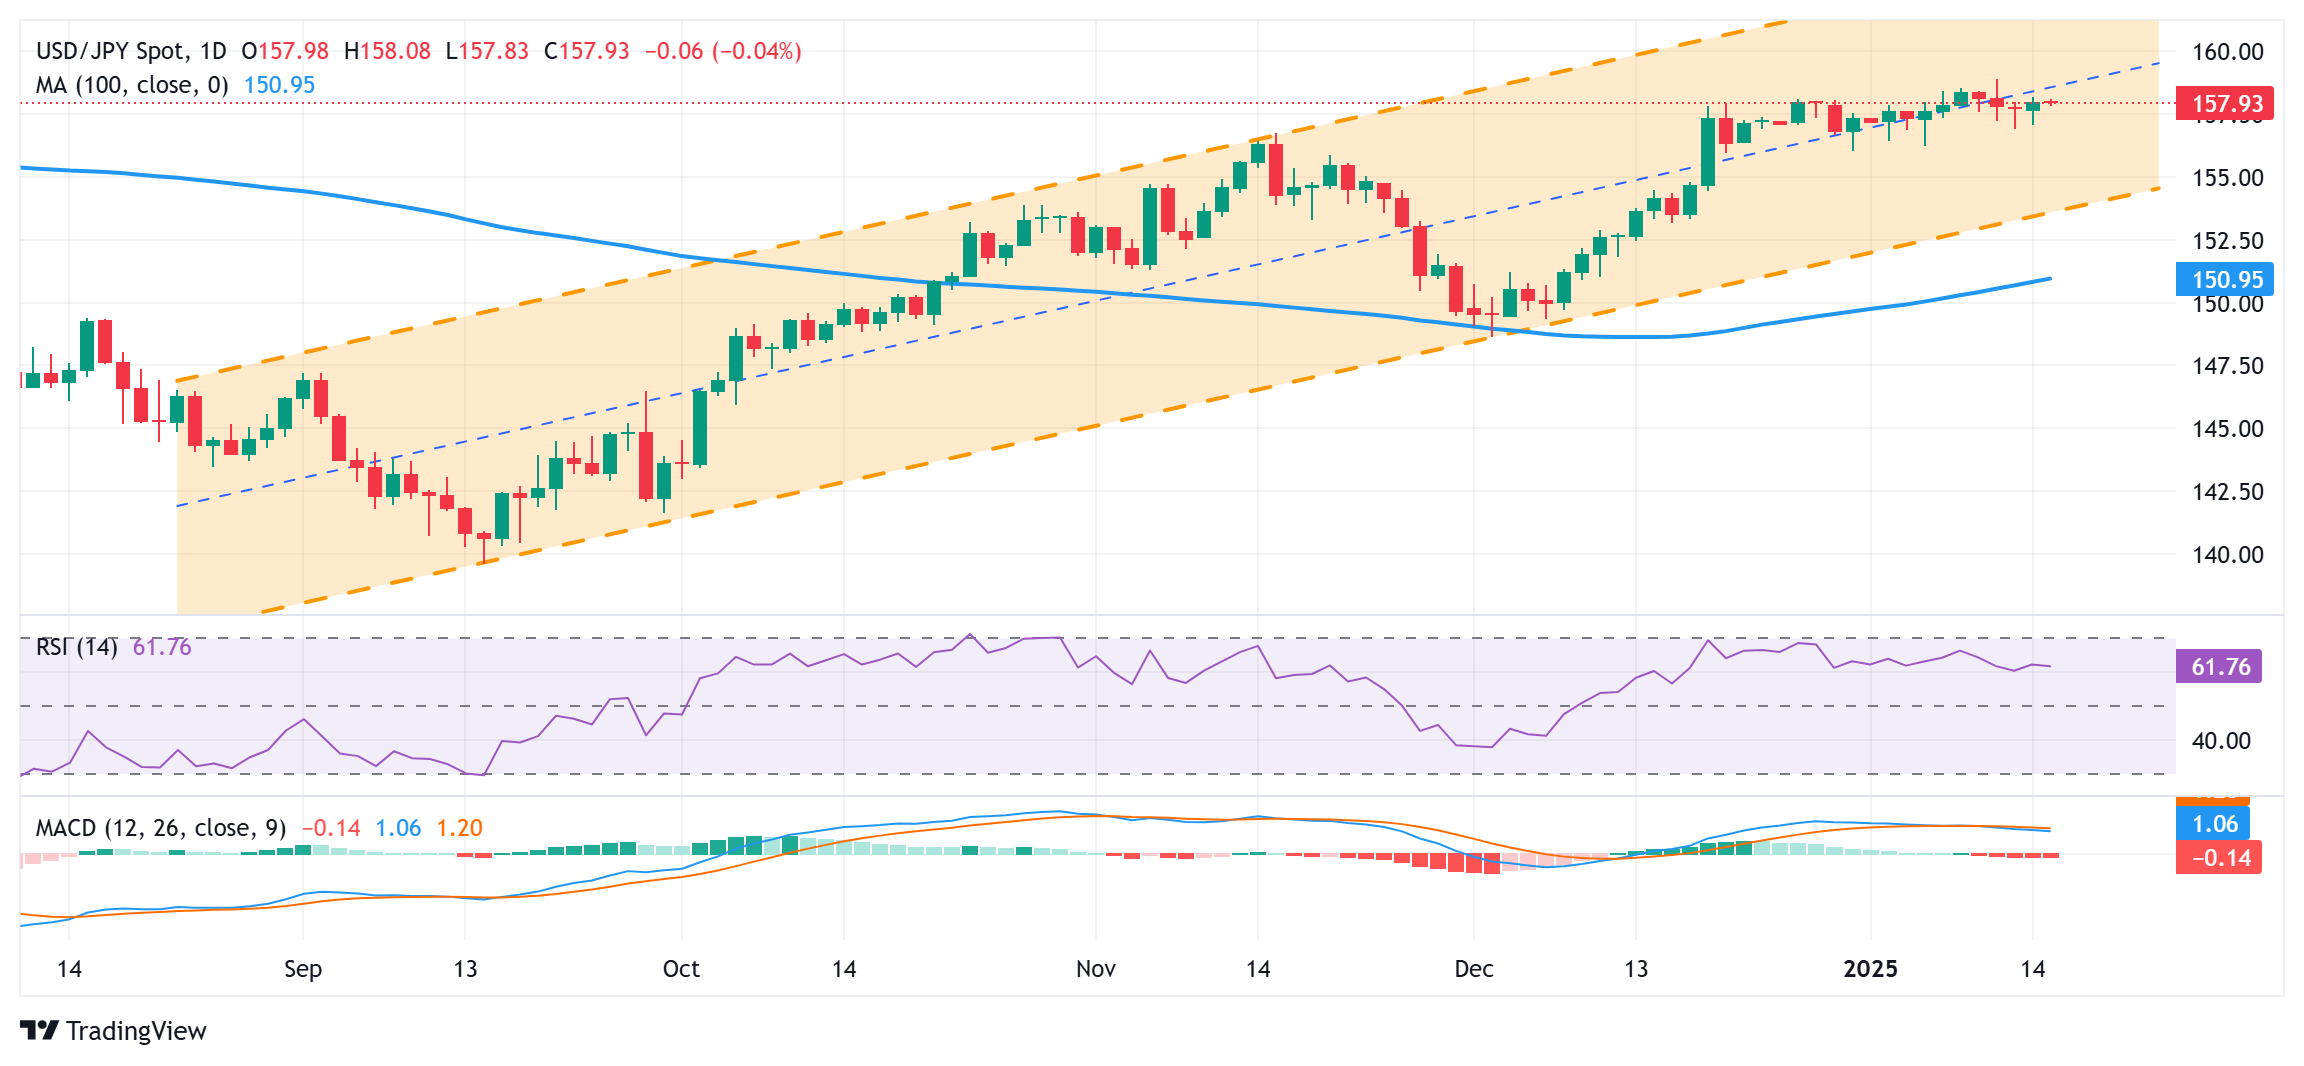
From a technical perspective, bulls are likely to wait for sustained strength and acceptance above the 158.00 mark before placing fresh bets. Given that oscillators on the daily chart are holding in positive territory and are still a distance away from being in the overbought zone, the USD/JPY pair might then aim to retest the multi-month top, around the 158.85-158.90 zone. Some follow-through buying above the 159.00 mark will set the stage for further gains towards the next relevant hurdle near the mid-159.00s before spot prices aim to reclaim the 160.00 psychological mark.
On the flip side, the 157.45 area now seems to protect the immediate downside ahead of the 157.00 mark. Any further slide could be seen as a buying opportunity around the 156.25-156.20 area, or last week's swing low. This should help limit the downside for the USD/JPY pair near the 156.00 mark, which if broken decisively might shift the near-term bias in favor of bearish traders and pave the way for some meaningful corrective decline.
Japanese Yen FAQs
The Japanese Yen (JPY) is one of the world’s most traded currencies. Its value is broadly determined by the performance of the Japanese economy, but more specifically by the Bank of Japan’s policy, the differential between Japanese and US bond yields, or risk sentiment among traders, among other factors.
One of the Bank of Japan’s mandates is currency control, so its moves are key for the Yen. The BoJ has directly intervened in currency markets sometimes, generally to lower the value of the Yen, although it refrains from doing it often due to political concerns of its main trading partners. The BoJ ultra-loose monetary policy between 2013 and 2024 caused the Yen to depreciate against its main currency peers due to an increasing policy divergence between the Bank of Japan and other main central banks. More recently, the gradually unwinding of this ultra-loose policy has given some support to the Yen.
Over the last decade, the BoJ’s stance of sticking to ultra-loose monetary policy has led to a widening policy divergence with other central banks, particularly with the US Federal Reserve. This supported a widening of the differential between the 10-year US and Japanese bonds, which favored the US Dollar against the Japanese Yen. The BoJ decision in 2024 to gradually abandon the ultra-loose policy, coupled with interest-rate cuts in other major central banks, is narrowing this differential.
The Japanese Yen is often seen as a safe-haven investment. This means that in times of market stress, investors are more likely to put their money in the Japanese currency due to its supposed reliability and stability. Turbulent times are likely to strengthen the Yen’s value against other currencies seen as more risky to invest in.
| Raw materials | Closed | Change, % |
|---|---|---|
| Silver | 29.892 | 0.91 |
| Gold | 2677.69 | 0.5 |
| Palladium | 939.34 | -0.46 |
- The Australian Dollar receives support from improved market sentiment and strong commodity prices.
- The AUD gained ground from robust trade data from China and Beijing's initiatives to stabilize the Yuan.
- The US Dollar depreciated following the disappointing December US Producer Price Index data.
The Australian Dollar (AUD) holds steady on Wednesday after two consecutive days of gains against the US Dollar (USD). The AUD/USD pair benefited from risk-on market sentiment, supported by strong trade data from China, Beijing’s efforts to stabilize the Yuan, and rising commodity prices. Traders are awaiting Australian employment data, scheduled for release later this week, for further insights into the Reserve Bank of Australia's (RBA) policy direction.
Investor confidence grew as US President-elect Donald Trump's economic team considered a gradual increase in import tariffs. This optimism bolstered risk-sensitive currencies like the AUD and contributed to the appreciation of the AUD/JPY pair.
Traders assessed data revealing a second consecutive monthly decline in consumer confidence, likely driven by the Australian Dollar's depreciation against the US Dollar. In January 2025, Australia’s Westpac Consumer Confidence Index dropped by 0.7% to 92.1 points, reflecting ongoing consumer pessimism.
The decline in consumer confidence sparked concerns about the outlook for interest rates and Australia’s broader economic health. Markets are now pricing in a 67% likelihood that the Reserve Bank of Australia will lower its 4.35% cash rate by 25 basis points in February, with a full rate cut expected by April.
Australian Dollar gains ground as US Dollar depreciates following PPI data
- The US Dollar Index (DXY), which measures the US Dollar’s performance against six major currencies, trades near 109.20. The Greenback faced challenges following the disappointing US December Producer Price Index (PPI) data. Market participants will keep an eye on the US Consumer Price Index (CPI) inflation data, which is due later on Wednesday.
- US Producer Price Index for final demand rose 0.2% MoM in December after an unrevised 0.4% advance in November, softer than the 0.3% expected. The PPI climbed 3.3% YoY in December, the most since February 2023, after increasing 3.0% in November. This reading came in below the consensus of 3.4%.
- US Nonfarm Payrolls (NFP) increased by 256K in December, significantly exceeding market expectations of 160K and surpassing the revised November figure of 212K (previously reported as 227K).
- Federal Reserve Board of Governors member Michelle Bowman added her voice to a chorus of Fed speakers last week as policymakers work double-duty to try and smooth over market reactions to a much tighter pace of rate cuts in 2025 than many market participants had previously anticipated.
- Kansas Fed President Jeffrey Schmid made headlines on Thursday, stating that most of the Federal Reserve's mandated targets have recently been achieved. Schmid emphasized the need to reduce the Fed's balance sheet, suggesting that interest rate policy is approaching its long-term equilibrium. He noted that any future rate cuts should be gradual and guided by economic data.
- On Monday, the China Foreign Exchange Committee (CFXC) pledged to support the Chinese Yuan during a meeting in Beijing on Monday, held under the guidance of the People’s Bank of China (PBOC). Separately, the PBOC and the State Administration of Foreign Exchange (SAFE), China’s FX regulator, announced an increase in the macro-prudential adjustment parameter for cross-border financing from 1.5 to 1.75, effective January 13, 2025.
- People's Bank of China (PBOC) Governor Pan Gongsheng stated on Monday that "interest rate and reserve requirement ratio (RRR) tools will be utilized to maintain ample liquidity." Gongsheng reaffirmed China's plans to increase the fiscal deficit and emphasized that China will continue to be a driving force for the global economy.
Australian Dollar remains below 0.6200, descending channel’s upper boundary
The AUD/USD pair trades around 0.6190 on Wednesday, maintaining its bearish outlook as it remains within a descending channel on the daily chart. The 14-day Relative Strength Index (RSI) remains above the 30 level, indicating a recovery from oversold conditions.
The AUD/USD pair faces immediate resistance at the nine-day Exponential Moving Average (EMA) at 0.6193, followed by the 14-day EMA at 0.6207. A more significant resistance level lies near the upper boundary of the descending channel, around 0.6220.
Regarding its support, the AUD/USD pair may test the lower boundary of the descending channel, close to the 0.5940 level.
AUD/USD: Daily Chart

Australian Dollar PRICE Today
The table below shows the percentage change of Australian Dollar (AUD) against listed major currencies today. Australian Dollar was the strongest against the British Pound.
| USD | EUR | GBP | JPY | CAD | AUD | NZD | CHF | |
|---|---|---|---|---|---|---|---|---|
| USD | 0.02% | 0.07% | -0.05% | -0.02% | 0.06% | -0.04% | -0.03% | |
| EUR | -0.02% | 0.05% | -0.07% | -0.05% | 0.04% | -0.06% | -0.05% | |
| GBP | -0.07% | -0.05% | -0.13% | -0.08% | -0.00% | -0.12% | -0.08% | |
| JPY | 0.05% | 0.07% | 0.13% | 0.03% | 0.11% | -0.01% | 0.03% | |
| CAD | 0.02% | 0.05% | 0.08% | -0.03% | 0.08% | -0.02% | 0.00% | |
| AUD | -0.06% | -0.04% | 0.00% | -0.11% | -0.08% | -0.10% | -0.08% | |
| NZD | 0.04% | 0.06% | 0.12% | 0.00% | 0.02% | 0.10% | 0.02% | |
| CHF | 0.03% | 0.05% | 0.08% | -0.03% | -0.00% | 0.08% | -0.02% |
The heat map shows percentage changes of major currencies against each other. The base currency is picked from the left column, while the quote currency is picked from the top row. For example, if you pick the Australian Dollar from the left column and move along the horizontal line to the US Dollar, the percentage change displayed in the box will represent AUD (base)/USD (quote).
Australian Dollar FAQs
One of the most significant factors for the Australian Dollar (AUD) is the level of interest rates set by the Reserve Bank of Australia (RBA). Because Australia is a resource-rich country another key driver is the price of its biggest export, Iron Ore. The health of the Chinese economy, its largest trading partner, is a factor, as well as inflation in Australia, its growth rate and Trade Balance. Market sentiment – whether investors are taking on more risky assets (risk-on) or seeking safe-havens (risk-off) – is also a factor, with risk-on positive for AUD.
The Reserve Bank of Australia (RBA) influences the Australian Dollar (AUD) by setting the level of interest rates that Australian banks can lend to each other. This influences the level of interest rates in the economy as a whole. The main goal of the RBA is to maintain a stable inflation rate of 2-3% by adjusting interest rates up or down. Relatively high interest rates compared to other major central banks support the AUD, and the opposite for relatively low. The RBA can also use quantitative easing and tightening to influence credit conditions, with the former AUD-negative and the latter AUD-positive.
China is Australia’s largest trading partner so the health of the Chinese economy is a major influence on the value of the Australian Dollar (AUD). When the Chinese economy is doing well it purchases more raw materials, goods and services from Australia, lifting demand for the AUD, and pushing up its value. The opposite is the case when the Chinese economy is not growing as fast as expected. Positive or negative surprises in Chinese growth data, therefore, often have a direct impact on the Australian Dollar and its pairs.
Iron Ore is Australia’s largest export, accounting for $118 billion a year according to data from 2021, with China as its primary destination. The price of Iron Ore, therefore, can be a driver of the Australian Dollar. Generally, if the price of Iron Ore rises, AUD also goes up, as aggregate demand for the currency increases. The opposite is the case if the price of Iron Ore falls. Higher Iron Ore prices also tend to result in a greater likelihood of a positive Trade Balance for Australia, which is also positive of the AUD.
The Trade Balance, which is the difference between what a country earns from its exports versus what it pays for its imports, is another factor that can influence the value of the Australian Dollar. If Australia produces highly sought after exports, then its currency will gain in value purely from the surplus demand created from foreign buyers seeking to purchase its exports versus what it spends to purchase imports. Therefore, a positive net Trade Balance strengthens the AUD, with the opposite effect if the Trade Balance is negative.
- NZD/USD trades with mild gains around 0.5600 in Wednesday’s Asian session.
- US PPI came in softer than expected last month.
- Expectations that Trump will impose graduated tariffs increasing by about 2% to 5% a month might help limit the pair’s losses.
The NZD/USD pair posts modest gains to near 0.5600 on Wednesday during the Asian trading hours. The cooler-than-expected US December Producer Price Index (PPI) inflation data drags the US Dollar (USD) lower and creates a tailwind for the pair.
The US Dollar Index (DXY), which measures the value of the USD against a basket of currencies, weakens to around 109.20 after the PPI report. Data released by the US Bureau of Labor Statistics on Tuesday showed that the PPI rose by 3.3% YoY in December, compared to 3.0% in November. This reading came in softer than the market expectation of 3.4%. Meanwhile, the core PPI, excluding the volatile prices of food and energy, climbed 3.5% in December versus 3.4% prior, below the market consensus of 3.8%.
Traders will shift their attention to the US December Consumer Price Index (CPI) inflation report, which is due later on Wednesday. A surprise upside in inflation could trigger the US Federal Reserve's (Fed) hawkish bets, supporting the Greenback and US Treasury yields. The potential US tariffs by Donald Trump and the new administration remained in the spotlight.
On the Kiwi front, reports published by Bloomberg suggested Trump might take a more strategic approach to imposing trade tariffs, which might bring some relief to the New Zealand Dollar (NZD). "Currency markets are breathing a sigh of relief after a report suggested that the incoming Trump administration could follow a 'gradual' trajectory in ratcheting tariffs higher," said Karl Schamotta, a foreign exchange analyst at Corpay.
New Zealand Dollar FAQs
The New Zealand Dollar (NZD), also known as the Kiwi, is a well-known traded currency among investors. Its value is broadly determined by the health of the New Zealand economy and the country’s central bank policy. Still, there are some unique particularities that also can make NZD move. The performance of the Chinese economy tends to move the Kiwi because China is New Zealand’s biggest trading partner. Bad news for the Chinese economy likely means less New Zealand exports to the country, hitting the economy and thus its currency. Another factor moving NZD is dairy prices as the dairy industry is New Zealand’s main export. High dairy prices boost export income, contributing positively to the economy and thus to the NZD.
The Reserve Bank of New Zealand (RBNZ) aims to achieve and maintain an inflation rate between 1% and 3% over the medium term, with a focus to keep it near the 2% mid-point. To this end, the bank sets an appropriate level of interest rates. When inflation is too high, the RBNZ will increase interest rates to cool the economy, but the move will also make bond yields higher, increasing investors’ appeal to invest in the country and thus boosting NZD. On the contrary, lower interest rates tend to weaken NZD. The so-called rate differential, or how rates in New Zealand are or are expected to be compared to the ones set by the US Federal Reserve, can also play a key role in moving the NZD/USD pair.
Macroeconomic data releases in New Zealand are key to assess the state of the economy and can impact the New Zealand Dollar’s (NZD) valuation. A strong economy, based on high economic growth, low unemployment and high confidence is good for NZD. High economic growth attracts foreign investment and may encourage the Reserve Bank of New Zealand to increase interest rates, if this economic strength comes together with elevated inflation. Conversely, if economic data is weak, NZD is likely to depreciate.
The New Zealand Dollar (NZD) tends to strengthen during risk-on periods, or when investors perceive that broader market risks are low and are optimistic about growth. This tends to lead to a more favorable outlook for commodities and so-called ‘commodity currencies’ such as the Kiwi. Conversely, NZD tends to weaken at times of market turbulence or economic uncertainty as investors tend to sell higher-risk assets and flee to the more-stable safe havens.
On Wednesday, the People’s Bank of China (PBoC) set the USD/CNY central rate for the trading session ahead at 7.1883 as compared to the previous day's fix of 7.1878 and 7.3240 Reuters estimates.
- WTI price posts modest gains near $76.75 in Wednesday’s early Asian session.
- US EIA expected oil demand to steady in 2025 and 2026.
- US crude oil inventories dropped by 2.6 million barrels last week, according to the API.
West Texas Intermediate (WTI), the US crude oil benchmark, is trading around $76.75 on Wednesday. The WTI price edges higher as new US sanctions on Russian oil exports threaten to tighten global supplies. The upside for black gold might be limited after a US government agency forecast steady US oil demand in 2025.
The Biden administration announced new sanctions on Russia's oil sector last week, blacklisting almost 200 vessels from its so-called shadow fleet and targeting the Russian oil producers Gazprom Neft and Surgutneftegas. The mounting concerns over supply disruptions could support the WTI in the near term.
On the other hand, WTI price could face some selling pressure due to global oil production outpacing demand, according to the US Energy Information Administration (EIA) report on Tuesday. The EIA noted that the US's oil demand would remain steady at 20.5 million barrels per day (bpd) in 2025 and 2026, with domestic oil output rising to 13.55 million bpd, an increase from the agency's previous forecast of 13.52 million bpd for this year.
The US crude inventories fell less than expected last week, signalling a weaker demand for WTI price. The API weekly report showed crude oil stockpiles in the United States for the week ending January 10 decreased by 2.6 million barrels, compared to a fall of 4.022 million barrels in the previous week. The market consensus estimated that stocks would decline by 3.5 million barrels.
Later on Wednesday, Oil traders will monitor the US Consumer Price Index (CPI) inflation data for December for fresh impetus. In case of a softer-than-expected outcome, this could drag the Greenback lower and lift the USD-denominated commodity price.
WTI Oil FAQs
WTI Oil is a type of Crude Oil sold on international markets. The WTI stands for West Texas Intermediate, one of three major types including Brent and Dubai Crude. WTI is also referred to as “light” and “sweet” because of its relatively low gravity and sulfur content respectively. It is considered a high quality Oil that is easily refined. It is sourced in the United States and distributed via the Cushing hub, which is considered “The Pipeline Crossroads of the World”. It is a benchmark for the Oil market and WTI price is frequently quoted in the media.
Like all assets, supply and demand are the key drivers of WTI Oil price. As such, global growth can be a driver of increased demand and vice versa for weak global growth. Political instability, wars, and sanctions can disrupt supply and impact prices. The decisions of OPEC, a group of major Oil-producing countries, is another key driver of price. The value of the US Dollar influences the price of WTI Crude Oil, since Oil is predominantly traded in US Dollars, thus a weaker US Dollar can make Oil more affordable and vice versa.
The weekly Oil inventory reports published by the American Petroleum Institute (API) and the Energy Information Agency (EIA) impact the price of WTI Oil. Changes in inventories reflect fluctuating supply and demand. If the data shows a drop in inventories it can indicate increased demand, pushing up Oil price. Higher inventories can reflect increased supply, pushing down prices. API’s report is published every Tuesday and EIA’s the day after. Their results are usually similar, falling within 1% of each other 75% of the time. The EIA data is considered more reliable, since it is a government agency.
OPEC (Organization of the Petroleum Exporting Countries) is a group of 12 Oil-producing nations who collectively decide production quotas for member countries at twice-yearly meetings. Their decisions often impact WTI Oil prices. When OPEC decides to lower quotas, it can tighten supply, pushing up Oil prices. When OPEC increases production, it has the opposite effect. OPEC+ refers to an expanded group that includes ten extra non-OPEC members, the most notable of which is Russia.
| Index | Change, points | Closed | Change, % |
|---|---|---|---|
| NIKKEI 225 | -716.1 | 38474.3 | -1.83 |
| Hang Seng | 345.64 | 19219.78 | 1.83 |
| KOSPI | 7.84 | 2497.4 | 0.31 |
| ASX 200 | 39.1 | 8231 | 0.48 |
| DAX | 138.48 | 20271.33 | 0.69 |
| CAC 40 | 15.03 | 7423.67 | 0.2 |
| Dow Jones | 0 | 42297.12 | 0 |
| S&P 500 | 6.69 | 5842.91 | 0.11 |
| NASDAQ Composite | -43.71 | 19044.39 | -0.23 |
| Pare | Closed | Change, % |
|---|---|---|
| AUDUSD | 0.61937 | 0.29 |
| EURJPY | 162.818 | 0.94 |
| EURUSD | 1.03069 | 0.6 |
| GBPJPY | 192.94 | 0.47 |
| GBPUSD | 1.22141 | 0.14 |
| NZDUSD | 0.56035 | 0.46 |
| USDCAD | 1.43481 | -0.17 |
| USDCHF | 0.91241 | -0.4 |
| USDJPY | 157.963 | 0.33 |


© 2000-2026. All rights reserved.
This site is managed by Teletrade D.J. LLC 2351 LLC 2022 (Euro House, Richmond Hill Road, Kingstown, VC0100, St. Vincent and the Grenadines).
The information on this website is for informational purposes only and does not constitute any investment advice.
The company does not serve or provide services to customers who are residents of the US, Canada, Iran, The Democratic People's Republic of Korea, Yemen and FATF blacklisted countries.
Making transactions on financial markets with marginal financial instruments opens up wide possibilities and allows investors who are willing to take risks to earn high profits, carrying a potentially high risk of losses at the same time. Therefore you should responsibly approach the issue of choosing the appropriate investment strategy, taking the available resources into account, before starting trading.
Use of the information: full or partial use of materials from this website must always be referenced to TeleTrade as the source of information. Use of the materials on the Internet must be accompanied by a hyperlink to teletrade.org. Automatic import of materials and information from this website is prohibited.
Please contact our PR department if you have any questions or need assistance at pr@teletrade.global.
transfers