- Analytics
- News and Tools
- Market News
CFD Markets News and Forecasts — 14-09-2021
| Time | Country | Event | Period | Previous value | Forecast |
|---|---|---|---|---|---|
| 00:30 (GMT) | Australia | Westpac Consumer Confidence | September | 104.1 | |
| 02:00 (GMT) | China | Retail Sales y/y | August | 8.5% | 7% |
| 02:00 (GMT) | China | Industrial Production y/y | August | 6.4% | 5.8% |
| 02:00 (GMT) | China | Fixed Asset Investment | August | 10.3% | 9% |
| 04:30 (GMT) | Japan | Tertiary Industry Index | July | 2.3% | |
| 06:00 (GMT) | United Kingdom | Retail Price Index, m/m | August | 0.5% | 0.5% |
| 06:00 (GMT) | United Kingdom | Producer Price Index - Input (YoY) | August | 9.9% | 10.3% |
| 06:00 (GMT) | United Kingdom | Producer Price Index - Input (MoM) | August | 0.8% | 0.2% |
| 06:00 (GMT) | United Kingdom | Producer Price Index - Output (YoY) | August | 4.9% | 5.4% |
| 06:00 (GMT) | United Kingdom | Producer Price Index - Output (MoM) | August | 0.6% | 0.4% |
| 06:00 (GMT) | United Kingdom | Retail prices, Y/Y | August | 3.8% | 4.7% |
| 06:00 (GMT) | United Kingdom | HICP ex EFAT, Y/Y | August | 1.8% | |
| 06:00 (GMT) | United Kingdom | HICP, m/m | August | 0.0% | 0.5% |
| 06:00 (GMT) | United Kingdom | HICP, Y/Y | August | 2% | 2.9% |
| 06:45 (GMT) | France | CPI, y/y | August | 1.2% | 1.9% |
| 06:45 (GMT) | France | CPI, m/m | August | 0.1% | 0.6% |
| 09:00 (GMT) | Eurozone | Industrial Production (YoY) | July | 9.7% | 6.3% |
| 09:00 (GMT) | Eurozone | Industrial production, (MoM) | July | -1% | 0.6% |
| 12:30 (GMT) | U.S. | NY Fed Empire State manufacturing index | September | 18.3 | 18 |
| 12:30 (GMT) | U.S. | Import Price Index | August | 0.3% | 0.3% |
| 12:30 (GMT) | Canada | Consumer Price Index m / m | August | 0.6% | 0.1% |
| 12:30 (GMT) | Canada | Bank of Canada Consumer Price Index Core, y/y | August | 3.3% | |
| 12:30 (GMT) | Canada | Consumer price index, y/y | August | 3.7% | 3.9% |
| 13:15 (GMT) | U.S. | Capacity Utilization | August | 76.1% | 76.4% |
| 13:15 (GMT) | U.S. | Industrial Production (MoM) | August | 0.9% | 0.4% |
| 13:15 (GMT) | U.S. | Industrial Production YoY | August | 6.6% | |
| 14:30 (GMT) | U.S. | Crude Oil Inventories | September | -1.529 | -3.903 |
| 22:45 (GMT) | New Zealand | GDP q/q | Quarter II | 1.6% | 1.3% |
| 22:45 (GMT) | New Zealand | GDP y/y | Quarter II | 2.4% | 16.3% |
| 23:50 (GMT) | Japan | Trade Balance Total, bln | August | 441 | -47.7 |
FXStreet reports that Jane Foley, Senior FX Strategist at Rabobank, thinks that the AUD/USD pair has room to fall below the 0.72 level in the next weeks.
“A dovish central bank, a Treasurer who is mindful of the need of Australian companies to diversify from trade with China, the fall in iron ore prices on the back of Chinese steel production curbs and heavy COVID-19 related restrictions should keep investors wary.”
“In our view, AUD/USD is at risk of another dip lower below 0.72 in the coming weeks. This assumes the USD can stay on the front foot.”
eFXdata reports that analysts at CIBC Research discuss their reaction to today's U.S. CPI report for August.
"Monthly price increases may be cooling, but the annual rate of inflation remains red hot for now. Headline CPI rose by a seasonally adjusted 0.3% in August, a tick below the consensus forecast for a 0.4% gain. However, the annual rate eased only one tick to a still very lofty 5.3%. The slightly softer than anticipated headline reading was the result of an only modest 0.1% monthly gain in prices excluding food and energy (consensus +0.3%)."
"This supports our forecast that there will be a temporary lull in inflation this fall/winter, before a recovery in demand and some continued supply disruptions see monthly price increases accelerate again in early/mid 2022."
FXStreet notes that the U.S. headline inflation rose 0.3% month-on-month, a touch below the 0.4% consensus, while core rose a very modest 0.1% (consensus 0.3%). A softer inflation print helped drive modest USD weakness. Economists at TD Securities think this has limitations, however, as the Fed's meeting next week will likely keep established ranges intact.
“The total CPI was +0.3% MoM in August, a little below the 0.4% consensus. The core index was +0.1% MoM, well below the 0.3% consensus and down from +0.3% in July, +0.9% in June, +0.7% in May and +0.9% in April. The 12-month change in the overall CPI fell to a still-high 5.3% from 5.4%; the 12-month change in core fell to 4.0% from 4.3%.”
“The reaction following the CPI print was playbook, with a softer core measure contributing to a knee-jerk reaction lower in the USD. But, in gauging the capacity for further retrenchment, we think the dip will be fairly shallow for the USD as the Fed's shadow lingers. For EUR/USD, that should mean fairly rangebound behavior until then, with the 1.1909 level key resistance and 1.1750 pivotal support.”
Statistics
Canada released its Monthly Survey of Manufacturing, which showed that the
Canadian manufacturing sales declined 1.5 percent m-o-m in July to CAD59.55 billion,
following a revised 3.6 percent m-o-m jump in June (originally a 2.1 percent
m-o-m increase).
Economists
had anticipated a fall of 1.2 percent m-o-m for July.
According
to the survey, sales dropped in 12 of 21 industries, led by the wood product
(-21.8 percent m-o-m), aerospace product and parts (-19.0 percent m-o-m),
miscellaneous (-12.1 percent m-o-m) and petroleum and coal product (-2.3 percent
m-o-m) industries. The declines, however, were partially offset by higher sales
in the motor vehicles (+13.5 percent m-o-m), primary metal (+3.9 percent m-o-m)
and motor vehicle parts (+7.6 percent m-o-m) industries.
Overall,
sales of durable goods plunged 2.7 percent m-o-m in July, while sales of
non-durable goods went down 0.3 percent m-o-m.
In
y-o-y terms, manufacturing sales climbed 12.2 percent in July.
U.S. stock-index futures advanced on Tuesday after the key U.S. inflation report showed that surge in consumer prices slowed in August.
Global Stocks:
Index/commodity | Last | Today's change, points | Today's change, % |
Nikkei | 30,670.10 | +222.73 | +0.73% |
Hang Seng | 25,502.23 | -311.58 | -1.21% |
Shanghai | 3,662.60 | -52.77 | -1.42% |
S&P/ASX | 7,437.30 | +12.10 | +0.16% |
FTSE | 7,065.56 | -2.87 | -0.04% |
CAC | 6,671.05 | -5.88 | -0.09% |
DAX | 15,752.01 | +50.59 | +0.32% |
Crude oil | $70.96 | +0.72% | |
Gold | $1,790.80 | -0.20% |
FXStreet reports that EUR/CHF surged back higher again on Monday and analysts at Credit Suisse believe that a break above 1.0898/0918 would open up significantly higher levels.
“With daily MACD still firmly in bullish territory and the market maintaining a large base, we stay biased higher, with the market now testing the 200-day average and medium-term downtrend at 1.0898/1.0918, above which would confirm the medium-term downtrend is indeed over.”
“A break above 1.0898/1.0918 would open up the next important resistance at 1.0976/89 and likely beyond.”
“First support is seen at the exponential moving average at 1.0851, then 1.0782, which now needs to hold to maintain the base.”
(company / ticker / price / change ($/%) / volume)
3M Co | MMM | 186 | 0.77(0.42%) | 2889 |
ALCOA INC. | AA | 48.92 | -0.30(-0.61%) | 32447 |
ALTRIA GROUP INC. | MO | 49.3 | -0.78(-1.56%) | 39762 |
Amazon.com Inc., NASDAQ | AMZN | 3,473.98 | 16.81(0.49%) | 20245 |
American Express Co | AXP | 162.53 | 1.08(0.67%) | 2346 |
AMERICAN INTERNATIONAL GROUP | AIG | 55.5 | 0.38(0.69%) | 292 |
Apple Inc. | AAPL | 150.26 | 0.71(0.47%) | 1144012 |
AT&T Inc | T | 27.55 | 0.03(0.11%) | 30803 |
Boeing Co | BA | 215.7 | 1.22(0.57%) | 151769 |
Caterpillar Inc | CAT | 207 | 0.80(0.39%) | 5211 |
Chevron Corp | CVX | 98.46 | 0.49(0.50%) | 230095 |
Cisco Systems Inc | CSCO | 58.29 | 0.19(0.33%) | 591039 |
Citigroup Inc., NYSE | C | 70.8 | 0.28(0.40%) | 48815 |
Deere & Company, NYSE | DE | 362.01 | 0.49(0.14%) | 796 |
E. I. du Pont de Nemours and Co | DD | 70.75 | 0.08(0.11%) | 201 |
Exxon Mobil Corp | XOM | 55.85 | 0.48(0.87%) | 265563 |
Facebook, Inc. | FB | 376.78 | 0.27(0.07%) | 86532 |
FedEx Corporation, NYSE | FDX | 262 | 0.14(0.05%) | 4120 |
Ford Motor Co. | F | 13.01 | 0.02(0.15%) | 424238 |
Freeport-McMoRan Copper & Gold Inc., NYSE | FCX | 35.13 | -0.16(-0.45%) | 71870 |
General Electric Co | GE | 104.12 | -0.34(-0.33%) | 3594 |
General Motors Company, NYSE | GM | 51.27 | 0.45(0.89%) | 62946 |
Goldman Sachs | GS | 410.5 | 1.24(0.30%) | 2262 |
Google Inc. | GOOG | 2,860.01 | -9.29(-0.32%) | 2255 |
Hewlett-Packard Co. | HPQ | 28.43 | 0.05(0.18%) | 2493 |
Home Depot Inc | HD | 336 | 0.55(0.16%) | 1994 |
Intel Corp | INTC | 55.28 | 0.29(0.53%) | 79277 |
International Business Machines Co... | IBM | 138.4 | 0.25(0.18%) | 786 |
International Paper Company | IP | 59.83 | 1.23(2.09%) | 645 |
Johnson & Johnson | JNJ | 166.38 | 0.58(0.35%) | 4412 |
JPMorgan Chase and Co | JPM | 160.37 | 0.51(0.32%) | 10639 |
Merck & Co Inc | MRK | 72.94 | -0.24(-0.33%) | 34146 |
Microsoft Corp | MSFT | 298.75 | 1.76(0.59%) | 84338 |
Nike | NKE | 159.69 | 0.17(0.11%) | 12010 |
Pfizer Inc | PFE | 44.65 | 0.07(0.16%) | 87432 |
Procter & Gamble Co | PG | 146.1 | 0.42(0.29%) | 1834 |
Starbucks Corporation, NASDAQ | SBUX | 119.35 | 0.17(0.14%) | 7232 |
Tesla Motors, Inc., NASDAQ | TSLA | 743.15 | 0.15(0.02%) | 154520 |
The Coca-Cola Co | KO | 55.74 | -0.33(-0.59%) | 18226 |
Twitter, Inc., NYSE | TWTR | 59.92 | 0.26(0.44%) | 20043 |
UnitedHealth Group Inc | UNH | 415.24 | 0.72(0.17%) | 608 |
Verizon Communications Inc | VZ | 54.69 | 0.07(0.13%) | 6214 |
Visa | V | 224.99 | 0.36(0.16%) | 6574 |
Wal-Mart Stores Inc | WMT | 145.45 | 0.39(0.27%) | 12732 |
Walt Disney Co | DIS | 185.2 | 0.22(0.12%) | 8989 |
Yandex N.V., NASDAQ | YNDX | 81.2 | -0.53(-0.65%) | 7497 |
Dow (DOW) initiated with an Overweight at Piper Sandler; target $78
The
Labor Department announced on Tuesday the U.S. consumer price index (CPI) rose
0.3 percent m-o-m in August, following an unrevised 0.5 percent m-o-m gain in the
previous month.
This was the smallest one-month increase in headline CPI since January.
Over
the last 12 months, the CPI climbed 5.3 percent y-o-y, decelerating from +5.4 percent
y-o-y reported for the period ending in July. This represented the lowest
reading in the last three months.
Economists
had forecast the CPI to increase 0.4 percent m-o-m and 5.3 percent y-o-y in the
12-month period.
According
to the report, the indexes for gasoline (+2.8 percent m-o-m), household
furnishings and operations (+1.3 percent m-o-m), food (+0.4 percent m-o-m), and
shelter (+0.2 percent m-o-m) all rose in August and contributed to the monthly
all items seasonally adjusted gain.
Meanwhile,
the core CPI excluding volatile food and fuel costs edged up 0.1 percent m-o-m
in August after an unrevised 0.3 percent m-o-m advance
in the previous month.
In
the 12 months through August, the core CPI rose 4.0 percent compared to an unrevised 4.3
percent climb for the 12 months ending July. This was the smallest 12-month
increase since May.
Economists
had forecast the core CPI to increase 0.3 percent m-o-m and 4.2 percent y-o-y
last month.
FXStreet reports that aluminium (LME) shot up to a thirteen-year high at 3000 before giving back some of its recent gains. Axel Rudolph, Senior FICC Technical Analyst at Commerzbank, believes that short-term consolidation back towards the 2803.00 2011 high is on the cards.
“Last week, Aluminium overshot the 2011 peak at 2803 and rallied all the way to psychological resistance at 3000 this week before consolidating below this level. Further short-term consolidation back towards the 2803 2011 high is on the cards.
“Only a slip and daily chart close below the two-month uptrend line at 2779.50 could potentially lead to the May and July highs at 2642.00/2603.00 being revisited.”
“A rise and daily chart close above the 3000.00 mark would engage the March 2008 high at 3255.00 and also the May 2006 peak at 3310.00. Further up sits the July 2008 high at 3380.10."
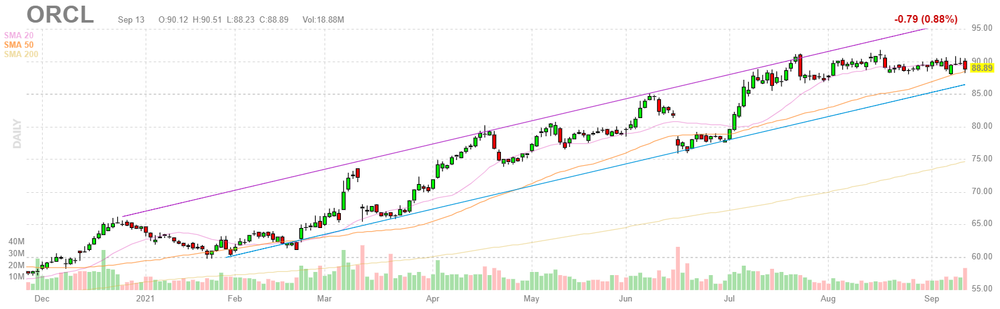
Oracle (ORCL) reported Q1 FY 2022 earnings of $1.03 per share (versus $0.93 per share in Q1 FY 2021), beating analysts’ consensus estimate of $0.97 per share.
The company’s quarterly revenues amounted to $9.728 bln (+3.8% y/y), roughly in line with analysts’ consensus estimate of $9.774 bln.
ORCL fell to $86.80 (-2.35%) in pre-market trading.
FXStreet reports that the Credit Suisse analyst team notes that EUR/JPY is holding its key 200-day moving average (DMA) now at 129.56 and suggests that the pair is set to look for an important floor here and a move back to retest key resistance at 130.75/131.10.
“Our bias remains to look for an important floor at the key 129.56 200-DMA and for a fresh move higher again to emerge. Immediate resistance is seen at 130.28, above which is needed to add weight to our view to clear the way for a move back to retest key resistance from the 50% retracement of the June/August fall, early September high and mid-July high and downtrend from early June at 130.75/131.10.”
“Above 130.75/131.10 would now see a ‘head and shoulders’ base established to mark a more important turn higher.”
“Support moves to 129.84/80 initially.”
| Time | Country | Event | Period | Previous value | Forecast | Actual |
|---|---|---|---|---|---|---|
| 06:00 | United Kingdom | Average earnings ex bonuses, 3 m/y | July | 7.3% | 6.8% | 6.8% |
| 06:00 | United Kingdom | Average Earnings, 3m/y | July | 8.8% | 8.2% | 8.3% |
| 06:00 | United Kingdom | ILO Unemployment Rate | July | 4.7% | 4.6% | 4.6% |
| 06:00 | United Kingdom | Claimant count | August | -7.8 | -58.6 | |
| 06:30 | Switzerland | Producer & Import Prices, y/y | August | 3.3% | 4.4% | |
| 08:00 | France | IEA Oil Market Report |
USD traded mixed against other major currencies in the European session on Tuesday as investors awaited the release of the U.S. inflation data for August (due at 12:30 GMT), hoping to get clues on the timing of stimulus withdrawal by the U.S. Federal Reserve.
The U.S. currency rose against AUD and NZD, declined against GBP, and changed little against JPY, EUR and CAD.
The U.S. Dollar Index (DXY), measuring the U.S. currency's value relative to a basket of foreign currencies, edged down 0.05% to 92.63.
Economists forecast that consumer prices in August rose 0.4% m/m and 5.4% y/y. These readings come after the report on producer prices for August, which showed a 0.7% m/m gain and an 8.3% y/y jump, the largest annual advance since the 12-month data were first calculated in November 2010.
It is believed that hotter-than-expected August inflation data could compel the Fed’s officials to announce the tapering of the bond purchases, when they gather for a two-day policy meeting on September 21. At the same time, the data showing a cooling of inflation pressure would give the U.S. central bankers another month of breathing space to watch the incoming data and the development of the coronavirus situation in the U.S.
Earlier this month, several Fed policymakers stated that the U.S. central bank should start reducing bond purchases by the end of the year, despite a steep slowdown in the U.S. jobs growth in August.
FXStreet reports that Karen Jones, Team Head FICC Technical Analysis Research at Commerzbank, expects cable to challenge the 1.3984/1.4018 medium-term pivot.
“GBP/USD is holding near-term below one-month highs at 1.3893.”
“Short-term, the pair is underpinned by 1.3734/26, and we would allow for recovery and a further upside attempt to the more important 1.3984/1.4018 medium term pivot, where we suspect that the market will fail.”
- People aged 50 and older should be given a booster shot
- Third dose should not be given until 6 months after second shot
FXStreet reports that FX Strategists at UOB Group note that the outlook for USD/CNH remains mixed for the time being.
24-hour view: “USD traded between 6.4424 and 6.4539 yesterday, much narrower than our expected range of 6.4330/6.4600. The quiet price actions offer no fresh clues and USD could trade sideways for today, likely between 6.4350 and 6.4550.”
Next 1-3 weeks: "As highlighted, the outlook for USD remains mixed and it could trade within a 6.4240/6.4800 range for now.”
FXStreet reports that economists at Société Générale suggest that while above the 1.1750 support, EUR/USD can see gains, which will be extended on a break of the aforementioned 1.1910 resistance.
“It will be interesting to see if the pair can carve out a higher trough as compared to the one in August at 1.1660.”
“Immediate support is located at 1.1750/1.1730, the 61.8% retracement of the bounce. Holding above this, it could attempt a move towards 1.1855 and 1.1910.”
“Overcoming 1.1910 can result in a larger up move.”
eFXdata reports that Danske Research discusses EUR/USD outlook.
"With Fed in its silent period (ahead of the FOMC meeting) and ECB done, we are likely to continue to see a very high correlation between spot EUR/USD and equity sentiment. This week, focus will turn to the release of US CPI, retail sales and US regional surveys, with the latter being leading indicators of ISM manufacturing. In our view, it will be the correlation between these data releases and global equities which is likely to set the mood in EUR/USD over the week," Danske adds.
FXStreet reports that strategists at DBS Bank are not convinced that real rates should be this low.
“Inflation has been more persistent and higher than expected over the past few months. The Fed has generally stuck to its transitory inflation view but we think that risks may be tilted to the upside. In any case, excessively loose monetary policy may not increase output or employment but may worsen price pressures and distort market signals further.”
“We think that growth risks may be overpriced in US Treasuries. Real yields should rise as market participants recognize that we may be past peak Delta fears and a period of recovery could lie ahead. Moreover, we are not convinced that the Fed would want real yields to stay this low when they shift focus towards inflation and normalization. Assuming long-term US inflation of 2% and neutral real yields of between -0.5 to zero percent, nominal 10Y yields can comfortably hover in the 1.5-2.0% range (similar to levels seen pre-pandemic).”
Reuters reports that Bank of America's September survey showed that barely a tenth of respondents in a monthly fund manager survey expect a stronger global economy in the coming months, marking the lowest proportion since last April's initial COVID-19 panic.
Economic growth expectations are now at a net 13%, the lowest since April 2020 and markedly down from a 91% peak in March this year.
Despite the growing caution on the macroeconomic outlook, positioning in asset markets remains overwhelmingly bullish.
Equity market protection designed to shield portfolios against a sharp drop in asset values was at the lowest levels since January 2008.
Nearly half of BofA's clients, with $840 billion in assets under management, said they have removed protection against a sharp fall in equity prices over the next three months, the lowest figure since January 2018.
Moreover, broader equity market positioning remains firmly bullish with net global equity allocations at 50%, far above a 20-year average of 29%, the survey said.
CNBC reports that U.S. Treasury yields rose, ahead of the release of inflation data later in the morning.
The yield on the benchmark 10-year Treasury note climbed nearly 2 basis points to 1.341%. The yield on the 30-year Treasury bond added 1 basis point at 1.915%.
August’s consumer price index is due to be released at 12:30 GMT. The CPI is forecast to have risen 0.4% in August month on month and 5.4% year on year.
Inflation data is being closely watched by the Federal Reserve, as it considers when to start tightening monetary policy. The Fed is due to kick off its latest two-day policy meeting next Tuesday.
Steven Bell, chief economist at BMO GAM, said on Tuesday that he expected the Fed to confirm plans to start tapering bond purchases at the end of the year.
Bloomberg reports that the International Energy Agency said that the world will have to wait until October for additional oil supplies as output losses from Hurricane Ida wipe out increases from OPEC+.
According to the IEA monthly report, consumers should have been enjoying “solid gains” in production as the Organization of Petroleum Exporting Countries and its allies continued their revival of idle capacity. Instead, global supply fell by 540,000 barrels a day in August due to unexpected disruptions and will be flat this month.
Global oil demand has been falling since July as rising Covid-19 cases prompt mobility restrictions in Asia, the IEA said.
World fuel consumption will contract by 310,000 barrels a day on average each month from July to September, the IEA said. Yet there are signs that the coronavirus resurgence is abating and the agency expects a sharp rebound in demand of 1.6 million barrels a day next month, with continued growth to the end of the year.
The matching shifts in supply and demand meant this year’s prevailing oil-market trend -- shrinking inventories -- continued unabated. Fuel stockpiles in developed economies fell by 30 million barrels last month, putting them 186 million barrels below the five-year average, according to preliminary IEA estimates. There should be “hefty draws” again this month, the agency said.
FXStreet reports that economists at HSBC expect the USD to strengthen gradually, due to the slowdown in global growth and the Fed’s path towards normalisation.
“COVID-19 in the US has been challenging lately, and that has been cited as a near-term downside risk by the Fed. Indeed, the US economy is losing some speed. All this fuels the idea that the Fed may delay tapering. A potential delay in the slowing of the Fed’s balance sheet would test the USD, although we believe it would be temporary.”
“We still believe the USD is gradually transitioning to a stronger path for two key reasons. First, global growth may be losing speed but is not seen as decelerating quickly. Second, the Fed is edging closer towards eventual rate hikes, which should support the USD”.
Reuters reports that Bundesbank President Jens Weidmann said that a digital euro, currently under design by the ECB, should have a limited role initially as it could disrupt the bank sector and overly extend the role of central banking.
"A gradual approach might make sense given the risks involved - that means a digital euro with a specific set of features and the option to add further functionalities later," Weidmann said.
The ECB gave the digital euro a green light earlier this summer but the actual launch of the currency could still be around five years away.
Reuters reports that travel industry body ABTA said that Britain's travel sector is bracing for a new wave of job cuts.
Airlines and travel companies have slammed Britain's travel rules as overly expensive and complicated, and blame them for a second lost summer of holiday trade in 2021.
ABTA said that new bookings were 83% lower in summer 2021 compared to their pre-pandemic levels, and as a result most of its members were planning more job cuts at the end of this month when a furlough scheme ends.
Estimated new redundancies will bring the total number of jobs lost during COVID-19 to nearly 100,000 in the outbound travel sector, said ABTA, a figure which rises to 226,000 once the impact on the supply chain is included.
ABTA echoed calls from airlines and airports for the government to scrap the requirement for fully vaccinated travellers returning to the UK to take expensive PCR tests.
| Time | Country | Event | Period | Previous value | Forecast | Actual |
|---|---|---|---|---|---|---|
| 01:30 | Australia | National Australia Bank's Business Confidence | August | -7 | -5 | |
| 01:30 | Australia | House Price Index (QoQ) | Quarter II | 5.4% | 6% | 6.7% |
| 04:30 | Japan | Industrial Production (YoY) | July | 23.0% | 11.6% | |
| 04:30 | Japan | Industrial Production (MoM) | July | 6.5% | -1.5% | -1.5% |
| 06:00 | United Kingdom | Average earnings ex bonuses, 3 m/y | July | 7.3% | 6.8% | 6.8% |
| 06:00 | United Kingdom | Average Earnings, 3m/y | July | 8.8% | 8.2% | 8.3% |
| 06:00 | United Kingdom | ILO Unemployment Rate | July | 4.7% | 4.6% | 4.6% |
| 06:00 | United Kingdom | Claimant count | August | -7.8 | -58.6 | |
| 06:30 | Switzerland | Producer & Import Prices, y/y | August | 3.3% | 4.4% |
During today's Asian trading, the US dollar fell slightly against the major currencies. The focus of the market today is the August data on consumer prices in the United States. Inflation is expected to slow slightly - to 5.3% compared to 5.4% in July.
Traders are closely monitoring the inflation indicators, as they directly affect the plans of the Federal Reserve System (Fed) regarding the curtailment of anti-crisis measures to support the economy. Recent comments by Fed representatives suggest that the Fed intends to start reducing the volume of bond repurchases by the end of this year.
The Australian dollar fell 0.3% against the US dollar. The head of the Reserve Bank of Australia (RBA), Philip Lowe, said on Tuesday that a new outbreak of COVID-19 in the country and the quarantine measures introduced in this regard are likely to lead to a sharp reduction in the country's GDP in the 3rd quarter. The decline in Australian GDP in the current quarter will be at least 2%, and possibly even significantly more, Lowe said.
The ICE index, which tracks the dynamics of the dollar against six currencies (euro, swiss franc, yen, canadian dollar, pound sterling and swedish krona), fell by 0.09%.
FXStreet reports that analysts at MUFG Bank said that diverging paths for policy normalization are set to drag the AUD/NZD pair down.
“RBA Governor Lowe pushed back against market pricing for early rate increases. The RBA is still not planning to begin raising rates until at least 2024 at the earliest.”
“Governor Lowe explained that the delayed recovery in Australia in response to the current lockdowns made it appropriate to delay until February the next decision to taper QE further.”
“The latest developments continue to support our short AUD/NZD trade recommendation which is moving closer to our target of 1.0250. The trade idea was recommended to take advantage of the widening policy divergence between the RBA and RBNZ as the RBNZ moves closer to raising rates while the RBA stands pat.”
According to the report from the Federal Statistical Office, the Producer and Import Price Index rose in August 2021 by 0.7% compared with the previous month, reaching 103.9 points (December 2020 = 100). Economists had expected a 0.2% increase. Chemical products and pharmaceutical products in particular saw higher prices. Compared with August 2020, the price level of the whole range of domestic and imported products rose by 4.4%.
In particular, higher prices for pharmaceutical products and for chemical products were responsible for the increase in the producer price index compared with the previous month. Basic metals and semi-finished metal products, products of sawmilling and planing, rubber and plastic products as well as fresh vegetables also became more expensive. In contrast, falling prices were seen for scrap and pork.
The import price index registered higher prices compared with July 2021, particularly for organic products of the chemical industry, plastics in primary forms, petroleum and natural gas, basic metals and semi-finished metal products, timber products as well as for rubber and plastic products. The same applied to other chemical products, paper, paper products and green coffee. Pharmaceutical preparations and petroleum products on the other hand, became cheaper.
EUR/USD
Resistance levels (open interest**, contracts)
$1.1933 (2088)
$1.1901 (1726)
$1.1876 (802)
Price at time of writing this review: $1.1808
Support levels (open interest**, contracts):
$1.1773 (1242)
$1.1748 (3365)
$1.1717 (2477)
Comments:
- Overall open interest on the CALL options and PUT options with the expiration date October, 8 is 64443 contracts (according to data from September, 13) with the maximum number of contracts with strike price $1,2200 (8173);
GBP/USD
$1.3958 (1058)
$1.3929 (319)
$1.3886 (155)
Price at time of writing this review: $1.3837
Support levels (open interest**, contracts):
$1.3776 (1301)
$1.3729 (1769)
$1.3663 (1010)
Comments:
- Overall open interest on the CALL options with the expiration date October, 8 is 11607 contracts, with the maximum number of contracts with strike price $1,4150 (2167);
- Overall open interest on the PUT options with the expiration date October, 8 is 13456 contracts, with the maximum number of contracts with strike price $1,3800 (1769);
- The ratio of PUT/CALL was 1.16 versus 1.15 from the previous trading day according to data from September, 13
* - The Chicago Mercantile Exchange bulletin (CME) is used for the calculation.
** - Open interest takes into account the total number of option contracts that are open at the moment.
According to the report from the Office for National Statistics, the most recent data show the labour market continuing to recover.
The number of payroll employees showed another monthly increase, up 241,000 to 29.1 million in August 2021, returning to pre-coronavirus (COVID-19) pandemic (February 2020) levels.
Following a period of employment growth and low unemployment, since the start of the pandemic the employment rate has generally decreased, and the unemployment rate has increased. However, since the end of 2020, both have shown signs of recovery. In the latest period (May to July 2021), there was a quarterly increase in the employment rate of 0.5 percentage points, to 75.2%, and a decrease in the unemployment rate of 0.3 percentage points, to 4.6%. The economic inactivity rate is down 0.3 percentage points on the previous quarter, to 21.1%.
The number of job vacancies in June to August 2021 was 1,034,000, which is the first time vacancies have risen over 1 million since records began, and is now 249,000 above its pre-pandemic January to March 2020 level. Vacancies grew on the quarter in June to August 2021 by 269,300 (35.2%), with all industry sectors increasing their number of vacancies and the majority reaching record levels; the largest increase was seen in accommodation and food service activities, which rose by 57,600 (75.4%).
Growth in average total pay (including bonuses) was 8.3% and regular pay (excluding bonuses) was 6.8% among employees for the three months May to July 2021. However, annual growth in average employee pay is being affected by temporary factors that have inflated the increase in the headline growth rate: base effects where the latest months are now compared with low base periods when earnings were first affected by the coronavirus pandemic, and compositional effects where there has been a fall in the number and proportion of lower-paid employee jobs, therefore increasing average earnings.
| Raw materials | Closed | Change, % |
|---|---|---|
| Brent | 73.74 | 0.33 |
| Silver | 23.72 | -0.16 |
| Gold | 1793.218 | 0.33 |
| Palladium | 2081.56 | -0.91 |
| Time | Country | Event | Period | Previous value | Forecast |
|---|---|---|---|---|---|
| 01:30 (GMT) | Australia | National Australia Bank's Business Confidence | August | -8 | |
| 01:30 (GMT) | Australia | House Price Index (QoQ) | Quarter II | 5.4% | 6.1% |
| 04:30 (GMT) | Japan | Industrial Production (YoY) | July | 23.0% | |
| 04:30 (GMT) | Japan | Industrial Production (MoM) | July | 6.5% | -1.5% |
| 06:00 (GMT) | United Kingdom | Average earnings ex bonuses, 3 m/y | July | 7.4% | 6.8% |
| 06:00 (GMT) | United Kingdom | Average Earnings, 3m/y | July | 8.8% | 8.2% |
| 06:00 (GMT) | United Kingdom | ILO Unemployment Rate | July | 4.7% | 4.6% |
| 06:00 (GMT) | United Kingdom | Claimant count | August | -7.8 | |
| 06:30 (GMT) | Switzerland | Producer & Import Prices, y/y | August | 3.3% | |
| 08:00 (GMT) | France | IEA Oil Market Report | |||
| 12:30 (GMT) | Canada | Manufacturing Shipments (MoM) | July | 2.1% | -1% |
| 12:30 (GMT) | U.S. | CPI excluding food and energy, m/m | August | 0.3% | 0.3% |
| 12:30 (GMT) | U.S. | CPI, m/m | August | 0.5% | 0.4% |
| 12:30 (GMT) | U.S. | CPI, Y/Y | August | 5.4% | 5.3% |
| 12:30 (GMT) | U.S. | CPI excluding food and energy, Y/Y | August | 4.3% | 4.2% |
| 22:45 (GMT) | New Zealand | Current Account | Quarter II | -2.895 | |
| 23:50 (GMT) | Japan | Core Machinery Orders, y/y | July | 18.6% | 15.7% |
| 23:50 (GMT) | Japan | Core Machinery Orders | July | -1.5% | 3.1% |
| Pare | Closed | Change, % |
|---|---|---|
| AUDUSD | 0.73674 | 0.2 |
| EURJPY | 129.921 | 0.17 |
| EURUSD | 1.18082 | -0.02 |
| GBPJPY | 152.179 | 0.18 |
| GBPUSD | 1.38361 | 0.03 |
| NZDUSD | 0.71168 | 0.05 |
| USDCAD | 1.26439 | -0.29 |
| USDCHF | 0.92165 | 0.42 |
| USDJPY | 109.994 | 0.17 |


© 2000-2026. All rights reserved.
This site is managed by Teletrade D.J. LLC 2351 LLC 2022 (Euro House, Richmond Hill Road, Kingstown, VC0100, St. Vincent and the Grenadines).
The information on this website is for informational purposes only and does not constitute any investment advice.
The company does not serve or provide services to customers who are residents of the US, Canada, Iran, The Democratic People's Republic of Korea, Yemen and FATF blacklisted countries.
Making transactions on financial markets with marginal financial instruments opens up wide possibilities and allows investors who are willing to take risks to earn high profits, carrying a potentially high risk of losses at the same time. Therefore you should responsibly approach the issue of choosing the appropriate investment strategy, taking the available resources into account, before starting trading.
Use of the information: full or partial use of materials from this website must always be referenced to TeleTrade as the source of information. Use of the materials on the Internet must be accompanied by a hyperlink to teletrade.org. Automatic import of materials and information from this website is prohibited.
Please contact our PR department if you have any questions or need assistance at pr@teletrade.global.
transfers