- Analytics
- News and Tools
- Market News
CFD Markets News and Forecasts — 14-05-2024
- GBP/USD takes a breather near 1.2590 in Wednesday’s early Asian session.
- The US PPI came in line with expectations, rising by 2.2% YoY in April, compared to the 1.8% increase in March.
- The UK Unemployment Rate rose to 4.3%, and private-sector wage growth slowed.
The GBP/USD pair consolidates its gains around 1.2590 during the early Asian session on Wednesday. The major pair holds above the key 100-day Exponential Moving Average (EMA) but remains capped under the 1.2600 hurdle. The US Consumer Price Index and Retail Sales report for April will be in the spotlight. Also, the Fed’s Kashkari and Bowman are due to speak.
Wholesale inflation, as measured by the Producer Price Index (PPI), hit its highest rate in a year, the Bureau of Labor Statistics showed Tuesday. The US PPI figure rose 2.2% on a yearly basis in April, compared to the 1.8% increase recorded in March (revised from 2.1%), and came in line with the estimation. The Core PPI, which excludes food and energy costs, climbed 2.4% YoY in the same period, compared to an increase of 2.1% in the previous reading and matching the expectation. On a monthly basis, the PPI and the core PPI both rose 0.5% MoM in April.
The US Federal Reserve (Fed) said on Tuesday that the April PPI provides more justification to keep rates higher for longer, but it does not necessarily mean the Fed will need to hike again. Meanwhile, Cleveland Fed President Loretta Mester stated that she would still like the central bank to start tapering asset purchases this year, adding that the Fed is in a "really good place" to study the economy before charting the rate path.
Investors await the US CPI inflation data on Wednesday for fresh impetus. The hotter-than-expected inflation reading could dampen hope for a Fed rate cut this year and boost the Greenback against the Pound Sterling (GBP).
On the other hand, the UK employment reports showed signs of cooling, which prompted the expectation that the Bank of England (BoE) might cut interest rates in the coming months. The ILO Unemployment Rate rose to 4.3% in three months to March from 4.2% in the previous reading, the highest since last summer. While overall wage growth excluding bonuses, remained unchanged at 6.0% in the same reporting period,. The UK Employment Change arrived at -177K in the three months to March, versus a -156K decrease in the previous reading, the UK Office for National Statistics reported on Tuesday.
The financial markets expect the BoE to cut rates before the Fed as early as June or August. This, in turn, might weigh on the Cable and cap the upside of the GBP/USD pair in the near term.
- AUD/USD holds at 0.6624, resisting pressure from Powell's hawkish stance after US PPI rises 0.5% MoM.
- Higher April PPI fuels concerns over extended inflation; Powell's confidence in disinflation wanes, foresees 2% GDP growth.
- Australia's 2024-25 budget returns to deficit; ANZ cites fiscal easing of 0.25-0.5% GDP.
- Key Australian data ahead: Wage Price Index expected stable at 0.9% QoQ, 4.2% YoY.
The Australian Dollar registered gains against the US Dollar on Tuesday, even though inflation in the United States (US) edged, spurring hawkish remarks by Fed Chair Jerome Powell. The AUD/USD trades at 0.6624, virtually unchanged as Wednesday’s Asian session commences.
AUD/USD holds above 0.6600 as markets await Australia's Wage Price Index
Federal Reserve Chair Jerome Powell hit the wires after releasing the Producer Price Index (PPI). He said that, although he anticipates inflation to continue declining, he is less confident about the disinflation outlook than he was previously. Powell also noted that the Gross Domestic Product (GDP) is expected to grow by 2% or more, attributing this positive forecast to the strength of the labor market.
Meanwhile, the US Bureau of Labor Statistics (BLS) revealed the Producer Price Index (PPI) rose by 0.5% MoM in April, above the 0.3% consensus and March’s -0.1% contraction. Core PPI also jumped by 0.5% MoM, above projections of 0.2%.
On Australia’s front, the budget for 2024-25 returns to a deficit after printing a surplus of $9.3 billion in 2023-24. ANZ analysts commented, "The amount of net new spending in 2024-25 ($9.5bn) is consistent with our previously expressed view that the Budget would contain a discretionary fiscal easing equivalent to around ¼ to ½% of GDP in that year.”
In the meantime, the Aussie’s economic docket will feature the release of the latest Wage Price Index (WPI), which is expected to remain steady at 0.9% QoQ and 4.2% YoY.
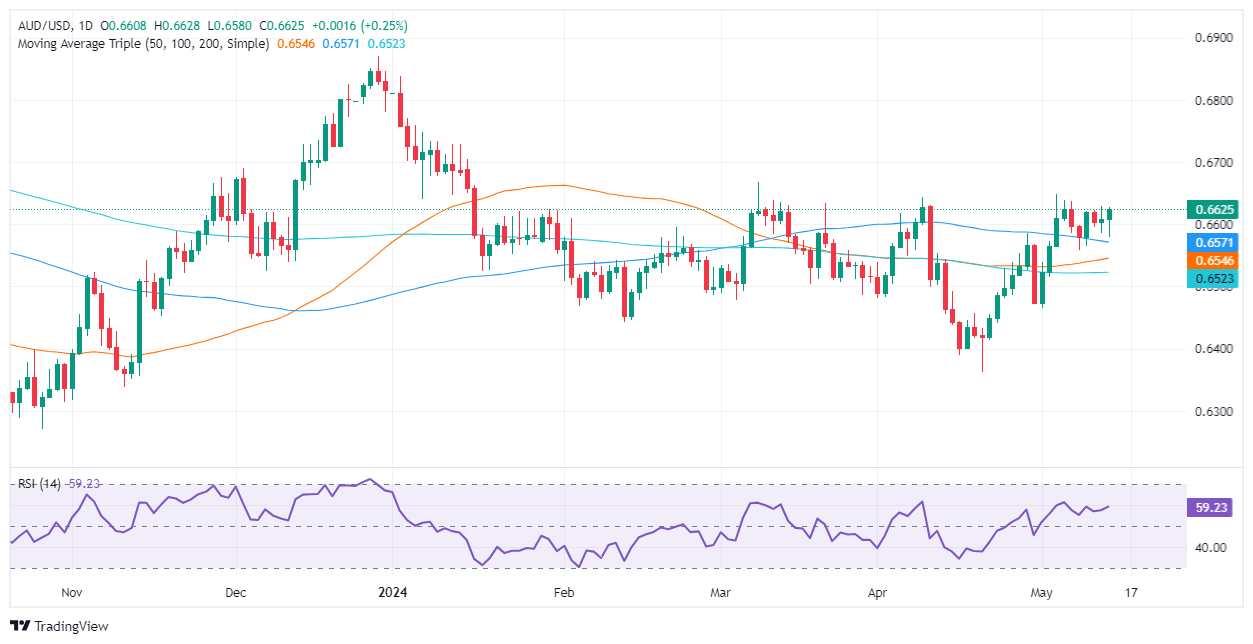
AUD/USD Price Analysis: Technical outlook
In the short term, the pair is neutral to upward biased, trading near this week’s high. Bulls are eyeing a break of the May 3 daily high of 0.6648, which could pave the way for further gains.
In that outcome, the next key resistance level would be 0.6700, followed by the year-to-date (YTD) high of 0.6728. Once surpassed, up next would be the December 28 high of 0.6871
Conversely, if sellers drag the AUD/USD exchange rate below 0.6600, look for a pullback beneath the 100-day moving average (DMA) at 0.6569, followed by the 50-DMA at 0.6546. Once cleared, the next stop would be the 200-DMA at 0.6521.
- The daily RSI and MACD of the NZD/USD highlight a growing buying momentum.
- The hourly RSI and MACD show a gradual reduction in the bullish momentum as indicators neared overbought conditions.
- For further upwards movements, the buyers will need to reclaim the main 200-day SMAs.
On Tuesday, the NZD/USD saw gains but the pair maintains and overall bearish outlook. Despite a marginal recovery challenge to the 200-day Simple Moving Averages (SMA), momentum stays subdued. Should the pair fail to breach the 200-day SMA in the near term, further downward movement might be impending.
The daily Relative Strength Index (RSI) for the NZD/USD pair on the daily chart reflects a positive trend. With the latest reading positioned above the 50 level, the pair is leaning towards positive territory. The Moving Average Convergence Divergence (MACD) exhibits flat green bars which alludes to a continuation of positive momentum, albeit at a stagnant pace.
NZD/USD daily chart

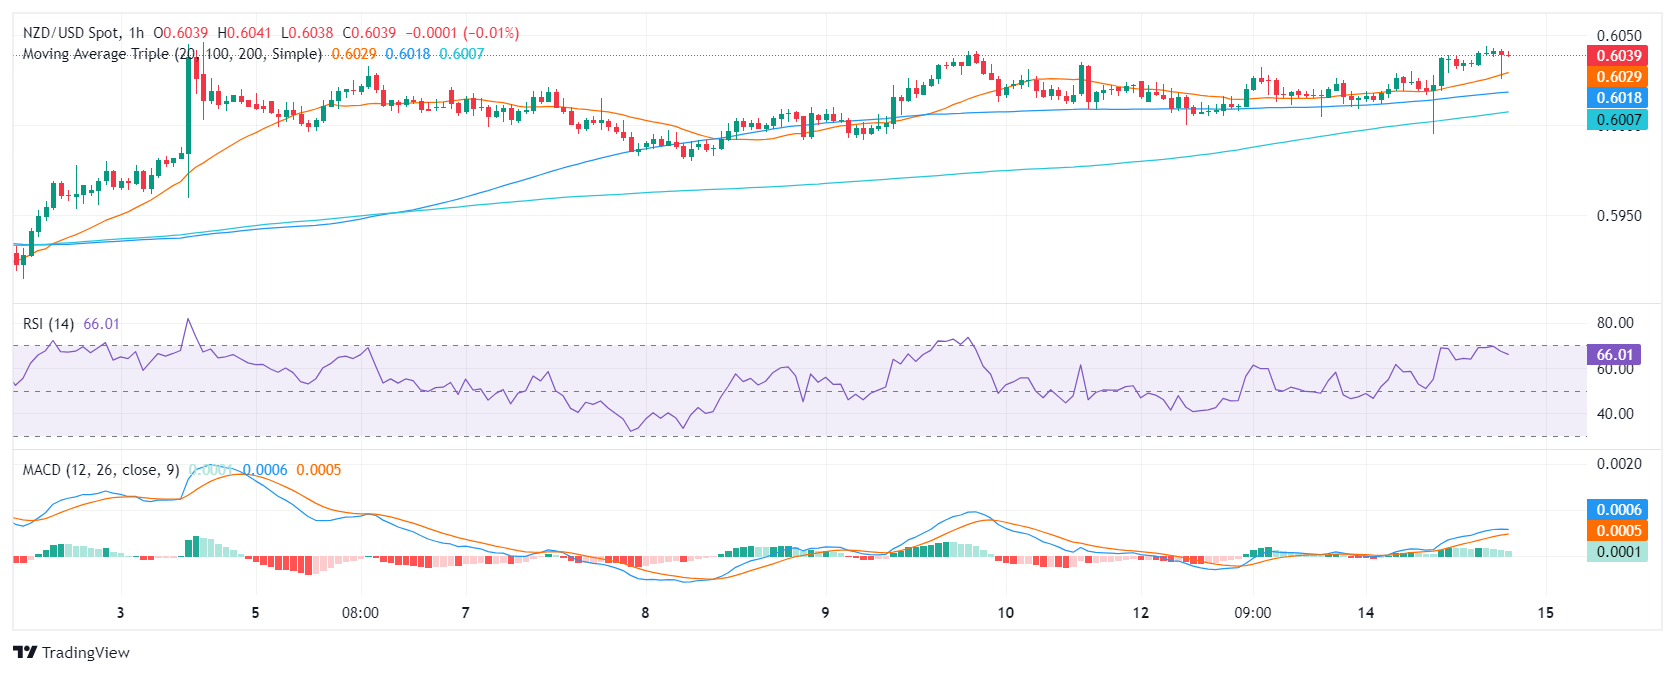
Comparatively, the hourly RSI has shown fluctuations in positive territory on Tuesday, reaching into the overbought region earlier in the session. The hourly MACD presents decreasing green bars, indicating a slow gradual reduction in the positive momentum as investors may be taking profits ahead of the Asian session.
NZD/USD hourly chart
With that said, the overall picture shows a downward inclination for the NZD/USD. Given its status relative to the key SMAs of 100 and 200-day SMAs, market participants shouldn’t consider the latest movements as a buying signal, unless the buyers manage to conquer the 200-day SMA, which would brighten the outlook for the pair.
- WTI fell back into familiar lows on Tuesday before a late-day jump.
- API barrel counts fell back further than expected.
- Broad-market sentiment is struggling under the weight of higher-for-longer Fed rates.
West Texas Intermediate (WTI) US Crude Oil fell to $77.30 on Tuesday as market sentiment regarding Federal Reserve (Fed) interest rate cut expectations begins to crumble, but a late-day Crude Oil supply update from the American Petroleum Institute (API) helped to bolster barrel bids.
According to barrel counts from the API, Weekly Crude Oil Stocks for the week ended May 10 fell much more than expected. US Crude Oil Stocks tracked by the API recorded a -3.104 million barrel drawdown, well below the forecast -1.35 million barrel decline and entirely eating away the previous week’s 509K barrel gain.
Crude Oil prices have been in a slump recently as it looks increasingly likely the ongoing Israel-Palestinian Hamas conflict is not going to spill over to neighboring countries and pose a threat to global Crude Oil production and supply. Further weighing on Crude Oil bids is US inflation, which continues to print higher than expected and keeping the Fed’s hands tied when it comes to interest rate cuts, hobbling broad-market risk appetite as investors look for signs the Fed could cut rates sooner rather than later.
US Consumer Price Index (CPI) inflation figures are due on Wednesday and threaten to destabilize intraday market volatility if inflation continues to run hotter than market forecasts can adapt to.
WTI technical outlook
US Crude Oil trades within a near-term demand zone between $78.00 and $77.00. A bullish extension to the topside will need to overcome the last major swing high near $79.60, while a bearish pierce of technical prices near $77.00 will threaten an extended run into prices set in March.
WTI hourly chart
WTI daily chart
As reported by the Wall Street Journal, Federal Reserve (Fed) Bank of Cleveland President Loretta Mester noted in an interview on Tuesday that she believes the Fed is in a "really good place" regarding rates.
Key highlights
I am not eager to consider interest rate hikes.
Fed is in a "really good place" to study the economy before charting rate path.
It's too early to really conclude that we stalled out or that inflation is going to reverse.
There are definite signs that the real side of thee economy is moderating, and that is helping to bring balance back to the economy.
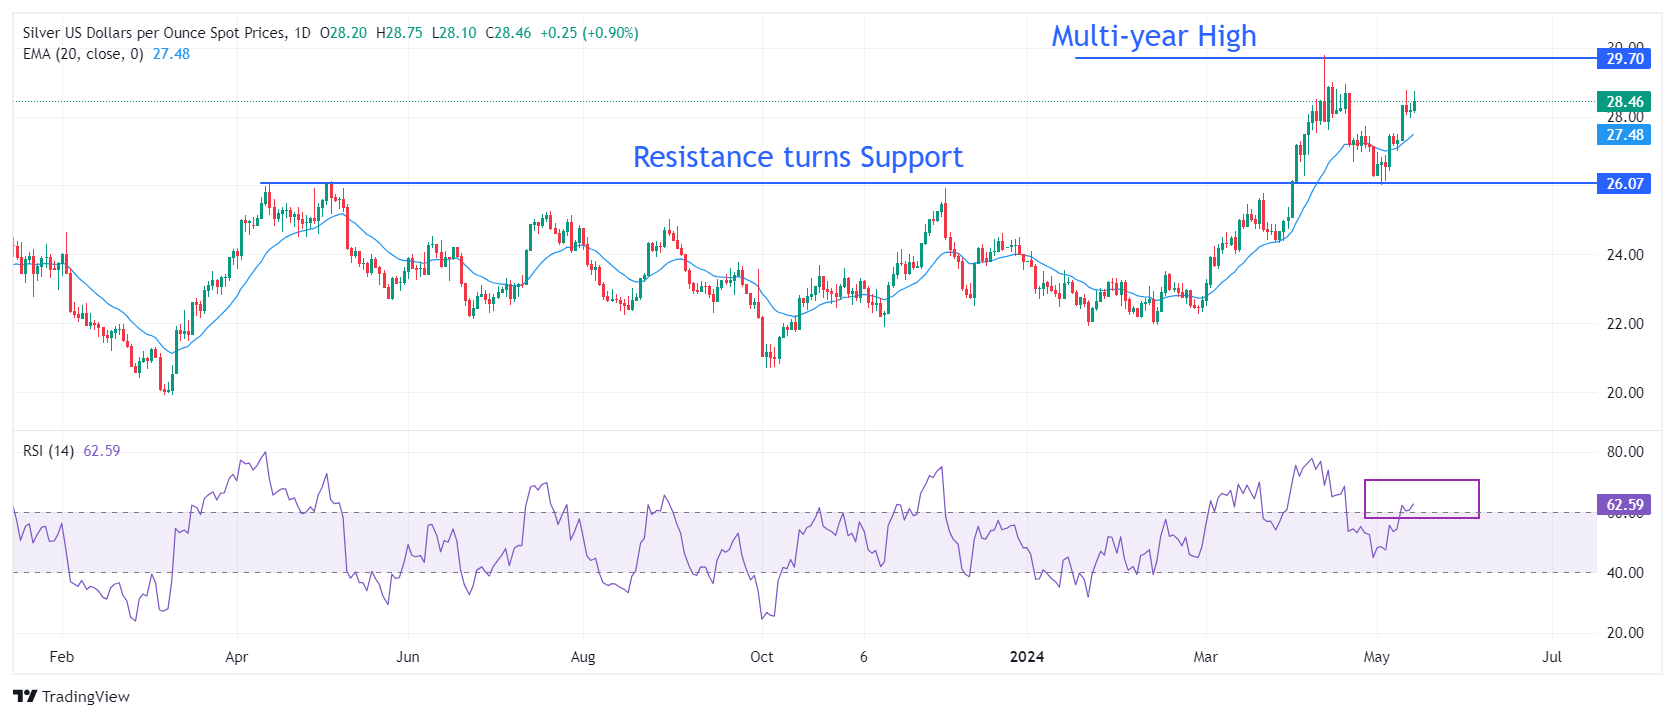
- Silver rises 1.32% to $28.57, buoyed by lower US Treasury yields and a weakening dollar.
- XAG/USD shows strong upward trend within $28.00-$28.80 range, up from early May low of $26.02.
- To maintain momentum, silver aims to breach $29.00, targeting YTD high of $29.79 and $30.00.
- Support at $28.00; further supports at 38.2% Fib retracement ($27.70) and 50% Fib ($27.06).
Silver's price moved higher late in the North American session due to lower US Treasury yields and a softer US Dollar. Although the latest inflation figures in the US were higher than expected, the non-yielding metal climbed. The XAG/USD trades at $28.57, gains 1.32%.
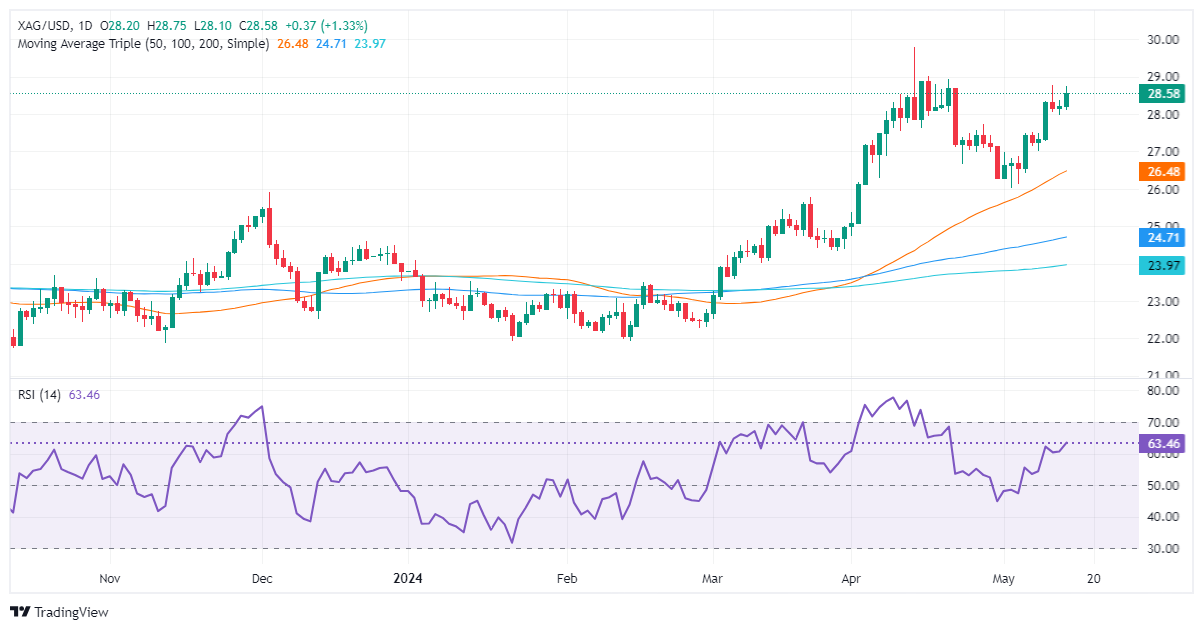
XAG/USD Price Analysis: Technical outlook
During the last three days, Silver has been seesawing within the $28.00-$28.80 range after registering exponential gains since May 2, which brought the grey metal’s price from around $26.02 to current spot prices.
XAG/USD is upward biased, though is at the brisk of forming a ‘double top.’ Momentum favors buyers, with the Relative Strength Index (RSI) standing at bullish territory.
For a bullish continuation, buyers need to reclaim the $29.00 psychological figure. Once cleared, the next stop would be the year-to-date (YTD) high at $29.79, followed by the $30.00 mark.
Conversely, if sellers stepped in and pushed prices below $28.00, look for further losses. The first demand zone would be the 38.2% Fib retracement at $27.70. A breach of the latter will expose the 50% Fib retracement at $27.06.
XAG/USD Price Action – Daily Chart
- Recent US PPI data for April from the US met expectations.
- Jerome Powell's cautionary comments on inflation and stringent policy measures instill a sense of uncertainty surrounding the USD.
- All eyes are on Wednesday’s CPI figures from the US.
The USD/THB saw sharp losses on Tuesday, facing mixed influences from a robust US economy and cautious posture from the Federal Reserve (Fed). The US Producer Price Index (PPI) didn’t show surprises as markets gear up for Wednesday’s Consumer Price Index (CPI) report from the US.
On the US data front, the US PPI figures for April reinforced the US economic resilience showing a 2.2% year-on-year increase, in sync with market projections. Despite these robust indicators, cautiousness prevails with the Fed Chairman, Jerome Powell, maintaining a vigilant watch on inflation trends and emphasizing the need for pledging that rates may need to be kept higher for longer. Markets are betting, that the bank will start cutting in September and that a November cut is already priced in. However, the outcome of the CPI report might change those odds.
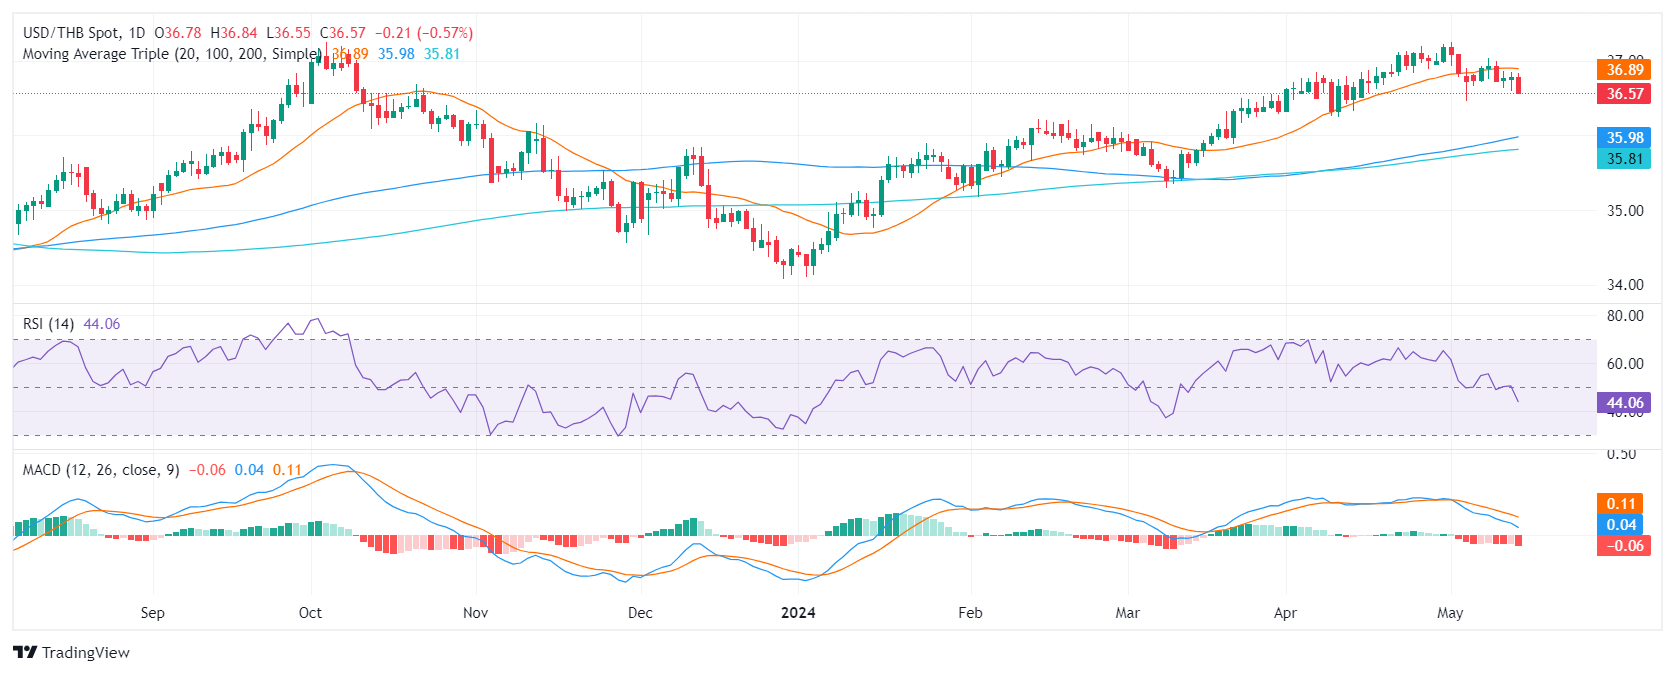
USD/THB technical analysis
The daily Relative Strength Index (RSI) of the USD/THB pair most recently recorded a level of 45. This RSI reading falls into negative territory, suggesting an elevation of selling momentum. The Moving Average Convergence Divergence (MACD) histogram prints red bars, indicating an increase in negative momentum for the USD/THB pair. The amalgamation of the negative RSI and negatively trending MACD implies a dominance of sellers in the market.
- Gold jumps 0.97% after US producer price data shows higher-than-expected inflation.
- Despite a spike, Treasury yields reversed to 4.445%, weakening Greenback and boosting Gold.
- Powell's waning confidence in disinflation and optimistic GDP outlook of 2% or more fuel Gold's rise.
Gold prices climbed past the $2,359 figure on Tuesday after data released by the US Department of Labor revealed that factory gate inflation rose above estimates, signaling that prices remained elevated. Despite that, US Treasury yields are sliding, a headwind for the Greenback.
Federal Reserve (Fed) Chair Jerome Powell made headlines after the release of the Producer Price Index (PPI). He commented that he expects inflation to continue heading lower but wasn’t as confident about the disinflation outlook as he had previously been. He added that the Gross Domestic Product (GDP) is expected to grow by 2% or better due to the labor market's strength.
The XAU/USD trades at $2,359, up 0.97%. The US Bureau of Labor Statistics (BLS) revealed that prices paid by producers increased above estimates, with just one reading aligning with economists’ consensus. US Treasury yields jumped sharply toward a daily high of 4.534%, before reversing later.
Daily digest market movers: Gold bright amid falling US yields, soft US Dollar
- Gold prices fell amid lower US Treasury yields and a strong US Dollar. The US 10-year Treasury note yields 4.451% and is down nearly 4 basis points (bps) from its opening level. The US Dollar Index (DXY), which tracks the Greenback's performance against six other currencies, falls 0.20% to 105.00.
- The US Bureau of Labor Statistics (BLS) reported that the Producer Price Index (PPI) increased by 0.5% MoM, surpassing the forecasted 0.3% rise. Similarly, the core PPI, which excludes food and energy prices, also rose by 0.5%, beating the expected 0.2% increase. Both figures were significantly higher than March's decline of 0.1% in both general and underlying inflation, indicating a jump in producer prices.
- April’s Consumer Price Index (CPI) is projected to remain unchanged compared to March’s reading at 0.4% MoM. The core CPI is expected to resume its lower trend from 0.4% in March to 0.3% MoM.
- Further data will be featured during the week, led by Retail Sales on May 15, Initial Jobless Claims, and Industrial Production on May 16.
- The New York Federal Reserve released its monthly Survey of Consumer Expectations on Monday, showing that the year's inflation expectations increased to 3.3% vs. 3% in March. The data came after the University of Michigan Consumer Sentiment poll showed that inflation expectations for a one-year outlook rose from 3.2% to 3.5%.
- Interest rate cut expectations toward the end of the year remain at 35 basis points (bps), according to data provided by the Chicago Board of Trade (CBOT).
Technical analysis: Gold price surge above $2,350 with bulls eyeing $2,400
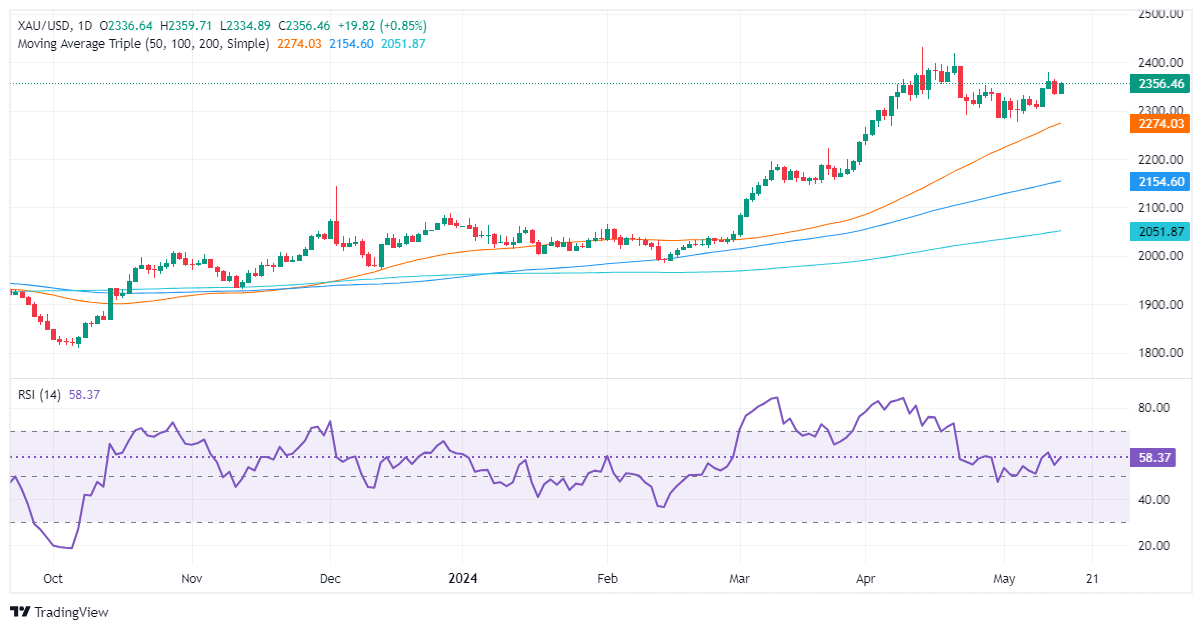
Gold’s uptrend extended after posting losses on Monday, yet it remains below the latest cycle high of $2,378, seen on May 10. This could keep the XAU/USD range bound. According to readings of the Relative Strength Index (RSI), momentum is in favor of the bulls.
Therefore, the XAU/USD first resistance would be the May 10 high at $2,378. If broken, the next technical hurdle would be the psychological $2,400 mark, immediately followed by the April 19 high at $2,417, and the all-time high at $2,431.
Conversely, if sellers moved in and pushed prices below $2,359, that could sponsor a leg down toward the May 9 low of $2,306, followed by the $2,300 figure. Once surpassed, the next stop would be the 50-day Simple Moving Average (SMA) at $2,249.
Gold FAQs
Gold has played a key role in human’s history as it has been widely used as a store of value and medium of exchange. Currently, apart from its shine and usage for jewelry, the precious metal is widely seen as a safe-haven asset, meaning that it is considered a good investment during turbulent times. Gold is also widely seen as a hedge against inflation and against depreciating currencies as it doesn’t rely on any specific issuer or government.
Central banks are the biggest Gold holders. In their aim to support their currencies in turbulent times, central banks tend to diversify their reserves and buy Gold to improve the perceived strength of the economy and the currency. High Gold reserves can be a source of trust for a country’s solvency. Central banks added 1,136 tonnes of Gold worth around $70 billion to their reserves in 2022, according to data from the World Gold Council. This is the highest yearly purchase since records began. Central banks from emerging economies such as China, India and Turkey are quickly increasing their Gold reserves.
Gold has an inverse correlation with the US Dollar and US Treasuries, which are both major reserve and safe-haven assets. When the Dollar depreciates, Gold tends to rise, enabling investors and central banks to diversify their assets in turbulent times. Gold is also inversely correlated with risk assets. A rally in the stock market tends to weaken Gold price, while sell-offs in riskier markets tend to favor the precious metal.
The price can move due to a wide range of factors. Geopolitical instability or fears of a deep recession can quickly make Gold price escalate due to its safe-haven status. As a yield-less asset, Gold tends to rise with lower interest rates, while higher cost of money usually weighs down on the yellow metal. Still, most moves depend on how the US Dollar (USD) behaves as the asset is priced in dollars (XAU/USD). A strong Dollar tends to keep the price of Gold controlled, whereas a weaker Dollar is likely to push Gold prices up.
- EUR/USD recovered ground after hesitating early Tuesday.
- US PPI inflation ticked higher in the near-term, but rate cut bets hold steady.
- EU GDP growth, US CPI inflation prints due Wednesday.
EUR/USD recovered ground on Tuesday, vaulting back over the 1.0800 handle and settling near 1.0820 at the tail end of the American market session. The pair is heading into a densely-packed economic data docket on Wednesday, with European Gross Domestic Product (GDO) and US Consumer Price Index (CPI) inflation figures due throughout the day.
US Producer Price Index (PPI) figures came in mostly as-expected on Tuesday, with annualized Core PPI printing at the forecast 2.4% YoY, but this figure showed a near-term uptick in prices after the previous period’s figure was revised down to 2.1% from the initial print of 2.4%.
Read more: US annual PPI inflation rises to 2.2% in April as expected
May’s pan-European ZEW Economic Sentiment Survey results helped to bolster the Euro after a cautious step forward in consumer sentiment. The ZEW Economic Sentiment Survey improved to 47.0, above the forecast 46.1 and rising from the previous month’s 43.9. The survey printed at its highest figure since February of 2022.
Coming up on Wednesday, European GDP growth is expected to come in at 0.3% in the first quarter. Annualized GDP growth is likewise forecast to hold steady at 0.4% QoY.
US CPI inflation on Wednesday is expected to hold steady at 0.4% MoM, with YoY CPI in April forecast to tick down to 3.4% from the previous 3.5%. Core CPI inflation will draw investor eyes, and is forecast to tick down to 3.6% YoY versus the previous 3.8%. US Retail Sales are also expected to cool off slightly, with April’s MoM Retail Sales expected to grow 0.4% compared to the previous 0.7%.
EUR/USD technical outlook
EUR/USD’s Tuesday jump dragged the pair further into near-term bullish territory, recovering above 1.0800 and clipping into the pair’s highest bids since early April. The pair has been on a wobbly recovery from the last major swing low into the 1.0600 handle, rising over 2% since mid-April.
Tuesday’s bullish bid has pushed the pair back over the 200-day Exponential Moving Average (EMA) at 1.0797, but a firm pattern of lower highs is weighing on the EUR/USD with the last swing high failing to capture the 1.0900 level.
EUR/USD hourly chart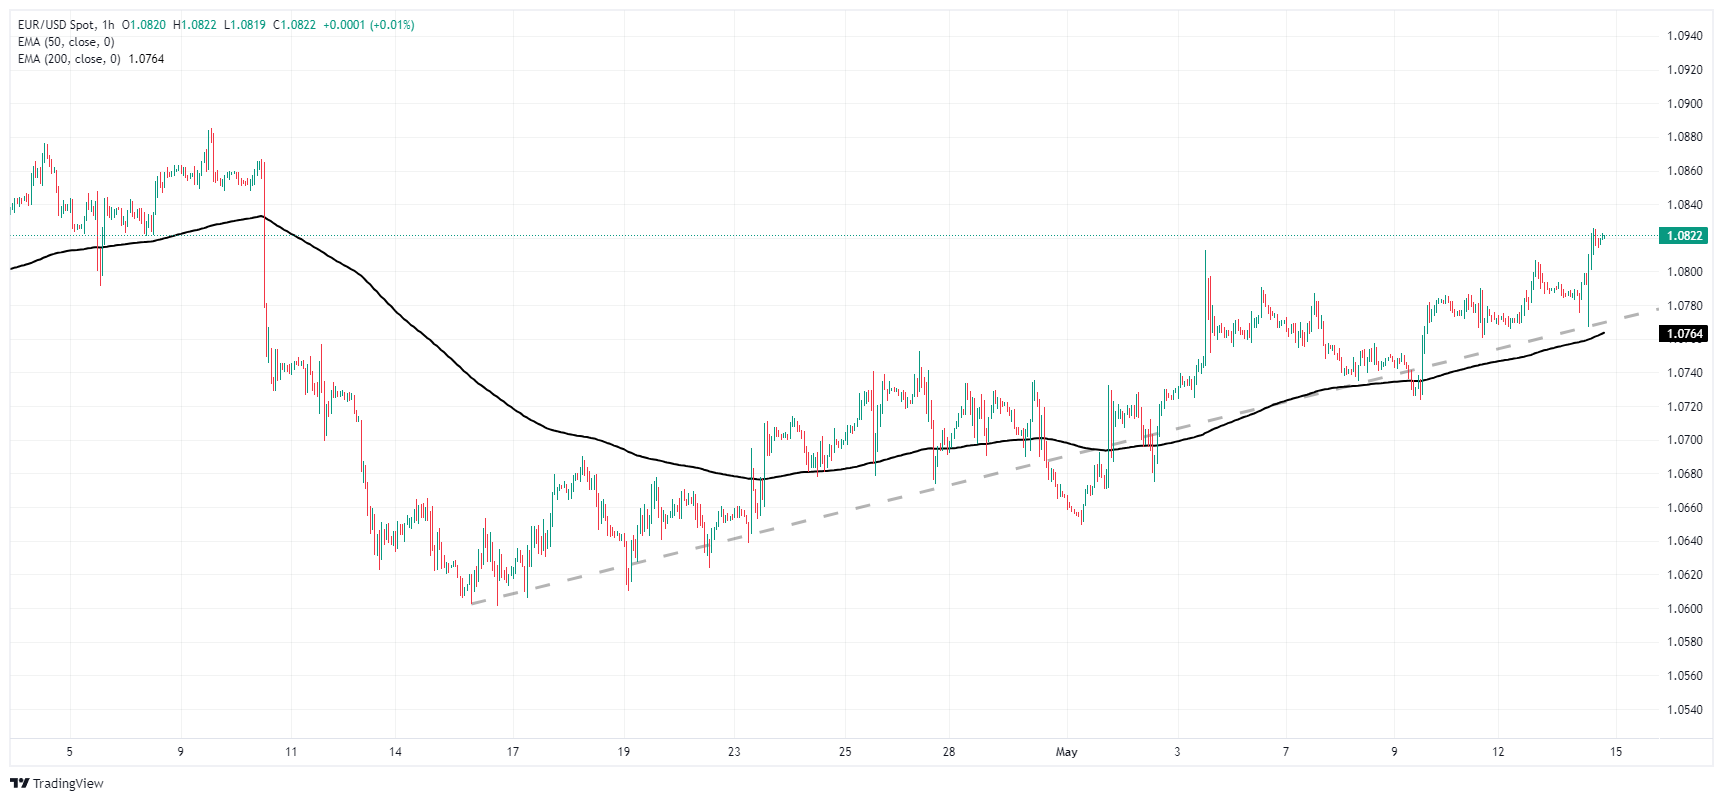
EUR/USD daily chart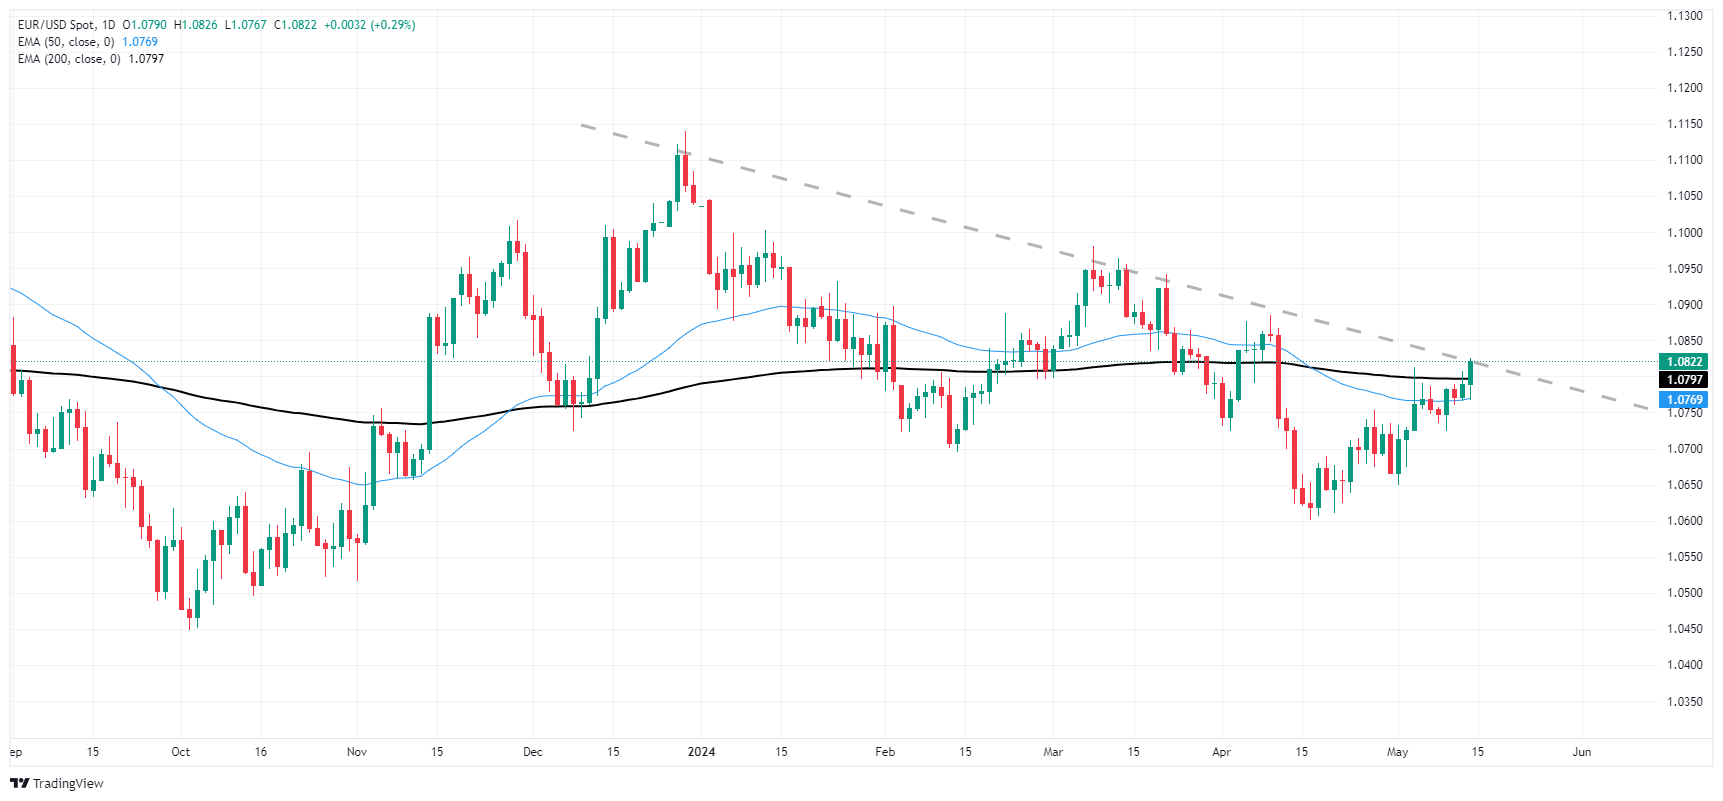
- GBP/JPY marches higher as markets eat away at “Yentervention” territory.
- UK labor figures worsened, but not as badly as expected.
- Japanese GDP growth due on Thursday.
GBP/JPY rose further on Tuesday, clipping into the 197.00 handle as the broader FX market continues to sell the Japanese Yen (JPY) across the board. UK labor figures wobbled on Tuesday, but investors skirted the worst of it after unemployment benefits claims rose less than expected and wages grew at a healthy pace.
The Bank of Japan (BoJ) is broadly believed to have stepped into global markets on two separate occasions in recent weeks after the Japanese central bank’s activities reports revealed the BoJ overspent on miscellaneous financial operations by around nine billion Yen. However, the Yen’s aggressive recovery is proving to be short-lived. The GBP/JPY ground its way back to the 197.00 handle, recovering from the recent low near 191.50.
The UK’s ILO Unemployment Rate ticked higher to 4.3% over the three months ended March, matching market forecasts and rising from the previous period’s 4.2%. Average UK Earnings Including Bonuses rose 5.7% for the three-month period ending in March compared to the same time last year. Net employment change in the UK for the quarter ended in March fell, shedding -177K jobs compared to the previous period’s -157K, knocking the GBP briefly back.
Markets have broadly recovered on Tuesday, and Yen pairs will be looking ahead to early Thursday’s Japanese Gross Domestic Product (GDP) growth for the first quarter. Japanese Q1 GDP is expected to contract -0.4% versus the previous quarter’s slim growth of 0.1%.
GBP/JPY technical outlook
The Guppy continues to trade north of the 200-hour Exponential Moving Average (EMA) at 194.95 as the Sterling accelerates gains against the Yen. The pair recovered back into the 1.97.00 handle for the first time since the start of the month, but the pair remains down 1.8% from the multi-decade peak reached at 200.60 in late April.
GBP/JPY hourly chart
GBP/JPY daily chart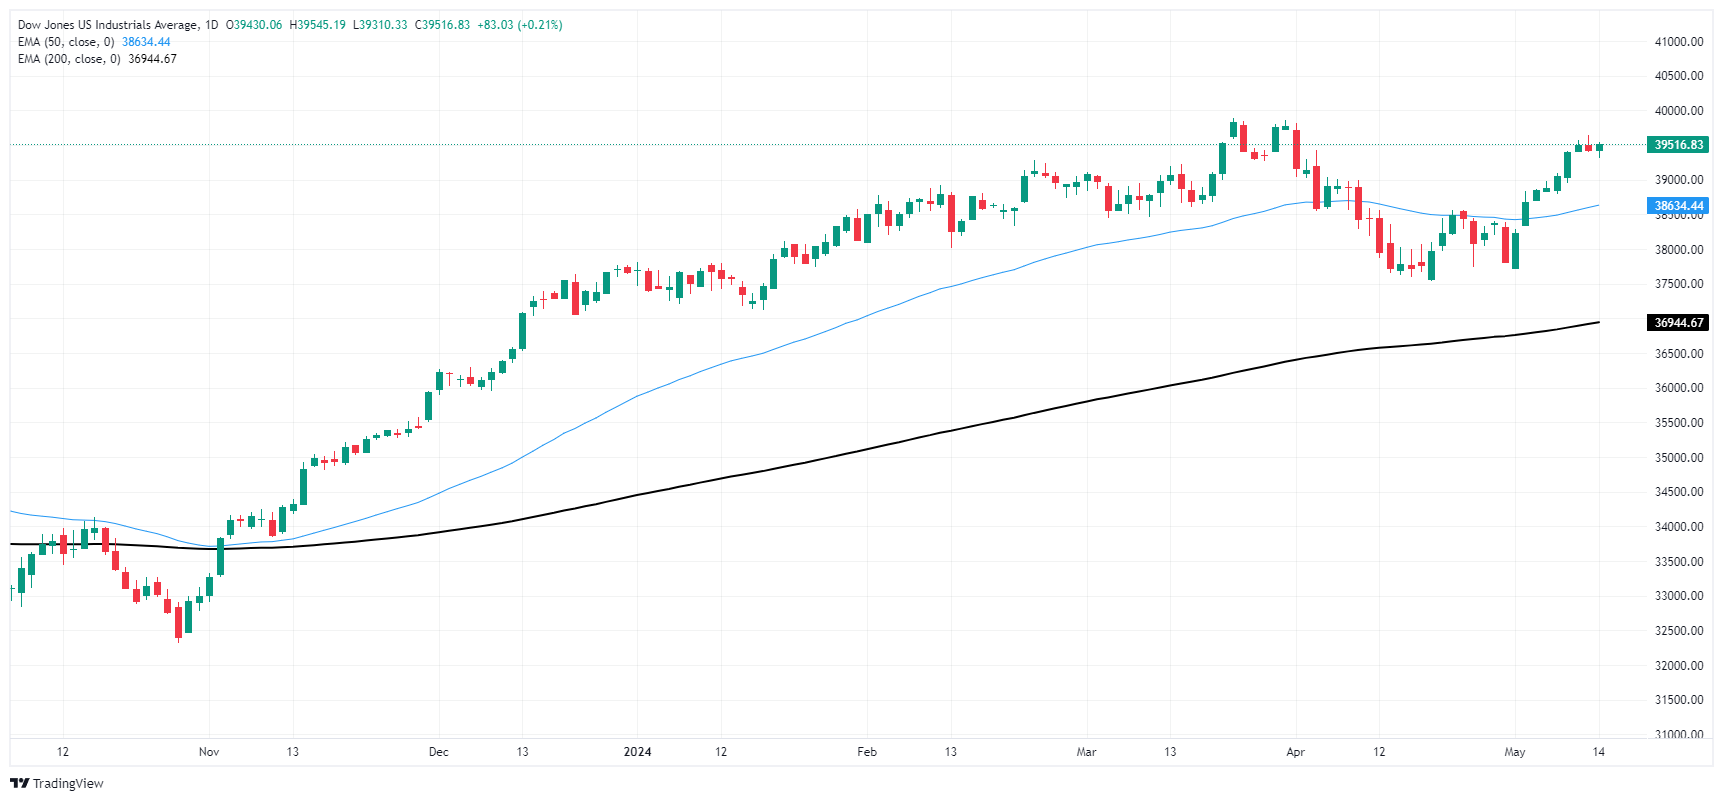
- EUR/JPY edges up 0.44%, extending its winning streak to seven days amid positive market sentiment.
- Technical outlook remains bullish; RSI nears overbought territory, indicating strong upward momentum.
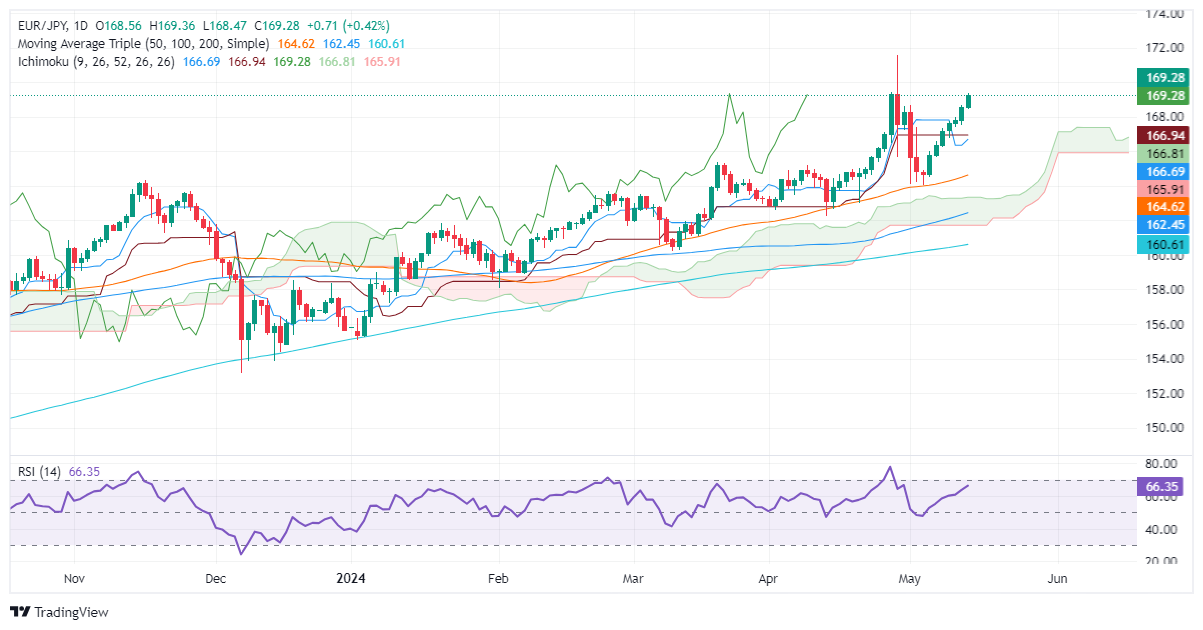
- Watch resistance at April’s 26 high of 169.39, 170.00, and YTD high at 171.58.
- Key support levels at 169.00, 166.93/81, and 165.90.
During the North American session, the Euro prolonged its gains versus the Japanese Yen in late trading. Market sentiment remains upbeat; hence, the EUR/JPY trades with gains of 0.44%, at 169.27 at the time of writing.
EUR/JPY Price Analysis: Technical outlook
From a technical perspective, the EUR/JPY remains upward biased, extending its gains for seven straight days, whereas fears that Japanese authorities could intervene in the Forex markets can limit the upside.
Momentum remains favoring the uptrend, as the Relative Strength Index is in bullish territory and about to become overbought. However, due to the strength of the uptrend, the most extreme level wouldn’t be 70, as most traders would use 80.
With that said, the first key resistance level would be the April 26 high at 169.39. Once surpassed, sellers' next line of defense would be the 170.00 figure, followed by the year-to-date (YTD) high at 171.58.
Conversely, if EUR/JPY retreats and dives below 169.00, that could exert downward pressure on the cross. The first support level would be the confluence of the Kijun-Sen and the Senkou Span A at around 166.93/81, followed by the Tenkan-Sen at 166.68. A breach of the latter will expose the Senkou Span B at 165.90.
EUR/JPY Price Action – Daily Chart
- Jerome Powell stated on Tuesday that his confidence in inflation coming down is lower.
- The US reported that April’s PPI aligned with expectations.
- April’s CPI and Retail Sales will define the outlook of the USD.
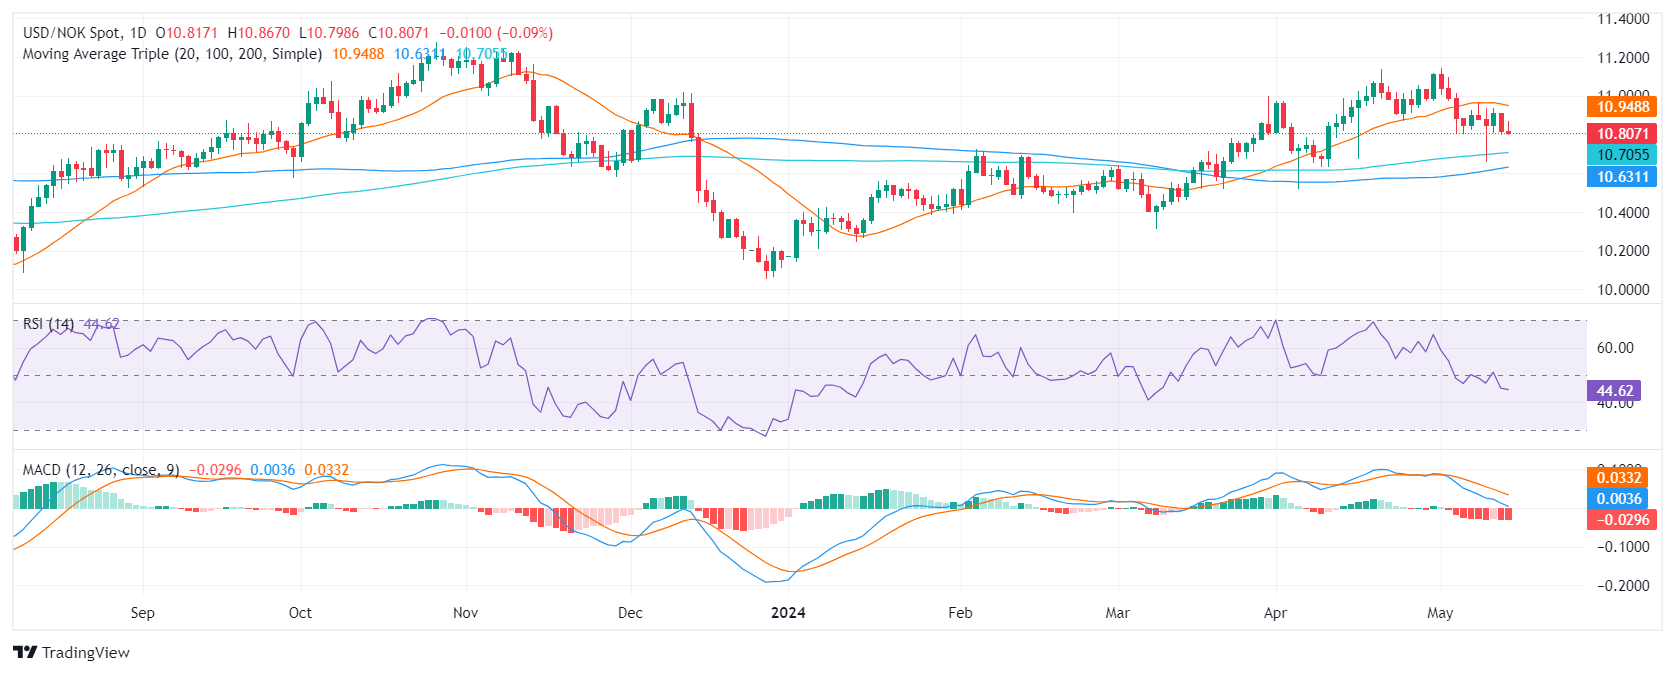
The USD/NOK pair is trading lower on Tuesday. Overall, the USD strength persists despite a mild bearish pressure and Jerome Powell confirmed its wait-and-watch approach by the bank.
The US economy continues to showcase considerable strength, with persistent indications of a resilient labor market and sustained consumer spending, as noted by Federal Reserve Chairman Jerome Powell on Tuesday. His sentiment, however, carried a note of caution regarding the dilemma of inflation and the subsequent need for consistency in implementing restrictive policies.
On the data front, the US Producer Price Index (PPI) figures resonated with these insights, reporting a year-on-year increase of 2.2% in April, in conformity with market forecasts. On Wednesday, the US will report April's Consumer Price Index (CPI) which is expected to have shown a deceleration and will shape the expectations for the next Fed decision. As for now, the kick-off of the easing is seen starting in September.
USD/NOK technical analysis
On the daily chart, the Relative Strength Index (RSI) is oscillating within negative territory, signaling that sellers may continue to control the market. Despite a brief shift in momentum on Monday, with the RSI hitting 50.99, the most recent session sees the RSI at 46.20, suggesting a continuation of the bearish sentiment. The Moving Average Convergence Divergence (MACD) histogram further bolsters this sentiment, with its red bars increasing, indicative of a growing bearish momentum.
The Greenback extended the discouraging start to the week and retreated to multi-day lows as market participants digested sticky US producer prices and the neutral message from Chair Powell ahead of the release of US CPI on Wednesday.
Here is what you need to know on Wednesday, May 15:
The USD Index (DXY) added to Monday’s decline and broke below the 105.00 level against the backdrop of further weakness in US yields. On May 15, the US Inflation Rate takes centre stage seconded by Retail Sales, Business Inventories, the NAHB Housing Market Index, weekly Mortgage Applications by MBA and TIC Flows. In addition, Fed’s Kashkari and Bowman are due to speak.
EUR/USD maintained its bullish bias and advanced to five-week highs past the 1.0800 barrier. Another estimate of the EMU Q1 GDP Growth Rate is expected on May 15 along Industrial Production in the broader euro area.
GBP/USD rose further north of the key 200-day SMA, approaching at the same time the 1.2600 hurdle. The next release of note in the UK calendar will be the BoE’s Financial Stability Report on May 16.
USD/JPY printed its sixth day of gains out of the last seven, this time surpassing the 156.00 barrier to clinch new two-week peaks. Next on tap on the Japanese docket will be the preliminary Q1 GDP Growth Rate, final Industrial Production readings and Foreign Bond Investment on May 16.
AUD/USD kept its consolidative mood in place in the upper end of the range, always below the May peak around 0.6650. In Australia, the Wage Price Index is due on May 15.
Prices of WTI faded Monday’s advance and refocused on the downside on the back of the unchanged OPEC monthly report and the upside surprise in US producer prices.
Prices of Gold resumed their upward bias and flirted with the $2,360 zone per troy ounce in response to the weaker dollar and lower US yields. It cousin Silver added to Monday’s uptick and flirted with monthly highs around $28.75 per ounce.
- Mexican Peso drops down for second day, losing 0.24%.
- Powell's cautious inflation remarks and potential for ongoing tight policy boost USD, aided by high April PPI.
- Contrasting Powell, Banxico's Ceja hints at possible rate cuts, contributing to Peso's decline ahead of June 27 meeting.
The Mexican Peso extended its losses against the US Dollar for the second straight day, following hawkish remarks by Federal Reserve (Fed) Chair Jerome Powell and dovish remarks by Bank of Mexico Governor Victoria Rodriguez Ceja. The Mexican currency is down 0.56% in the week. The USD/MXN trades at 16.84 and records gains of 0.24%.
Fed Chair Jerome Powell said he’s not expecting a “smooth road on inflation,” adding that it is moving lower and that “my confidence on that is not as high as it was before.” He expects the Gross Domestic Product (GDP) to grow by 2% or better with a strong labor market.
Powell noted that restrictive monetary policy “may” take longer than expected to do its work and bring inflation to the Fed’s 2% goal.
Earlier, the US Department of Labor revealed that the Producer Price Index (PPI) for April was higher than expected, in some measures, prompting investors to buy the Greenback. US Treasury yields edged up, while US equities trended lower before recovering at the time of writing.
On Monday, Bank of Mexico (Banxico) Governor Victoria Rodriguez Ceja said, “We could evaluate downward adjustments” to the main reference rate. She added that while general inflation has continued to rise, underlying prices have not. Therefore, depending on the evolution of the inflationary outlook, Banxico could evaluate continuing its easing cycle as soon as the next meeting on June 27. These comments came after the Mexican central bank kept the main reference rate unchanged at 11% last Thursday.
Daily digest market movers: Mexican Peso drops on Powell’s remarks
- Mexico’s economic docket will be absent during the current week. The next economic data released would be Retail Sales expected on May 20, followed by the Gross Domestic Product (GDP), inflation figures and the release of Banxico’s minutes on May 23.
- April's data show that Mexico’s headline inflation is reaccelerating. However, core prices are falling. This spurred Banxico’s revision to its inflation projections, with the bank expected to hit its 3% target toward the last quarter of 2025, later than March’s estimates for Q2 2025. Core inflation is projected to hit 3% in Q2 2025.
- The US Bureau of Labor Statistics (BLS) revealed that the PPI rose 0.5% MoM, exceeding forecasts of a dip to 0.3%, with core PPI also expanding at the same pace as headline data, above estimates of 0.2%. Both readings were above March’s -0.1% drop in general and underlying inflation.
- After the report, investors trimmed bets that the Fed may cut rates faster than expected, though the odds for a September cut have lately adjusted to 83.6%, higher than Monday’s 79%.
- The deterioration in consumer sentiment, alongside a cooling labor market, has opened the door for investors to price in rate cuts by the Fed. This is because US central bank policymakers acknowledged that risks to achieving its dual mandate on employment and inflation “moved toward better balance over the past year.”
Technical analysis: Mexican Peso falls as USD/MXN rises above 16.80
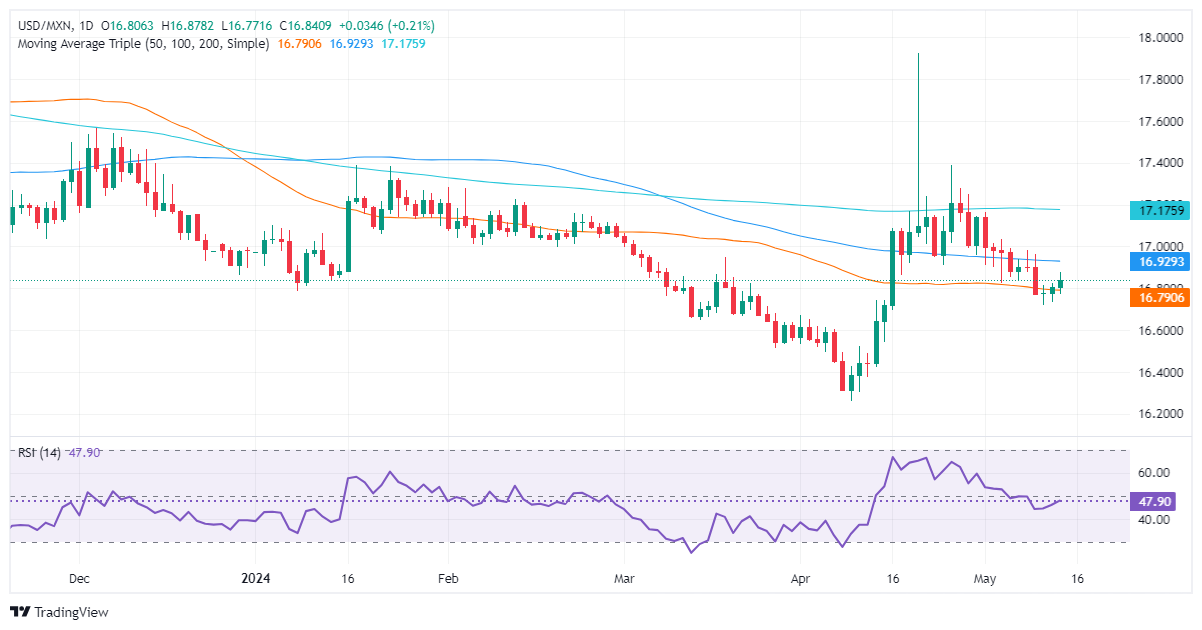
The USD/MXN downtrend remains in play, even though buyers lifted the pair above Friday’s close, which could pave the way for a leg up. In the near term, momentum remains bearish, but the Relative Strength Index (RSI) aiming upward suggests that buyers are in charge.
At the time of writing, the USD/MXN is shy of conquering the 100-day Simple Moving Average (SMA) at 16.92. Once cleared, the next supply zone would be the 17.00 psychological level. A breach of the latter would expose the 200-day SMA at 17.17, followed by the January 23 swing high of 17.38 and the year-to-date high of 17.92.
On the other hand, a bearish continuation could resume if the USD/MXN tumbles below the 50-day SMA at 16.78, opening the door to test the 2023 low of 16.62, followed by the current year-to-date low of 16.25.
Mexican Peso FAQs
The Mexican Peso (MXN) is the most traded currency among its Latin American peers. Its value is broadly determined by the performance of the Mexican economy, the country’s central bank’s policy, the amount of foreign investment in the country and even the levels of remittances sent by Mexicans who live abroad, particularly in the United States. Geopolitical trends can also move MXN: for example, the process of nearshoring – or the decision by some firms to relocate manufacturing capacity and supply chains closer to their home countries – is also seen as a catalyst for the Mexican currency as the country is considered a key manufacturing hub in the American continent. Another catalyst for MXN is Oil prices as Mexico is a key exporter of the commodity.
The main objective of Mexico’s central bank, also known as Banxico, is to maintain inflation at low and stable levels (at or close to its target of 3%, the midpoint in a tolerance band of between 2% and 4%). To this end, the bank sets an appropriate level of interest rates. When inflation is too high, Banxico will attempt to tame it by raising interest rates, making it more expensive for households and businesses to borrow money, thus cooling demand and the overall economy. Higher interest rates are generally positive for the Mexican Peso (MXN) as they lead to higher yields, making the country a more attractive place for investors. On the contrary, lower interest rates tend to weaken MXN.
Macroeconomic data releases are key to assess the state of the economy and can have an impact on the Mexican Peso (MXN) valuation. A strong Mexican economy, based on high economic growth, low unemployment and high confidence is good for MXN. Not only does it attract more foreign investment but it may encourage the Bank of Mexico (Banxico) to increase interest rates, particularly if this strength comes together with elevated inflation. However, if economic data is weak, MXN is likely to depreciate.
As an emerging-market currency, the Mexican Peso (MXN) tends to strive during risk-on periods, or when investors perceive that broader market risks are low and thus are eager to engage with investments that carry a higher risk. Conversely, MXN tends to weaken at times of market turbulence or economic uncertainty as investors tend to sell higher-risk assets and flee to the more-stable safe havens.
- April’s US Producer Price Index prints higher monthly reading than expected.
- Fed Chair Jerome Powell signals strong US economic outlook, which may delay interest rate cuts.
- Markets await CPI data on Wednesday to continue placing their bets on the easing cycle of the Fed.
The US Dollar Index (DXY) is currently trading at around 105.35, displaying minimal losses. The US Producer Price Index (PPI) showed no surprise on the annual print, but monthly prices rose more than expected. Jerome Powell attached to the script given in the last Federal Reserve (Fed) decision that interest rates might have to be kept higher for longer but that cuts will eventually come and inflation will get back to target.
The US economy is displaying robust growth and persistent inflation, which is making the Fed remain cautious about cutting rates. On Wednesday, April’s Consumer Price Index (CPI) data will likely impact the expectations on the easing cycle, which is seen starting in September.
Daily digest market movers: DXY is mildly down as markets digest PPI data ahead of CPI
- US Bureau of Labor Statistics revealed that the Producer Price Index (PPI) increased by 2.2% on a yearly basis in April. Annual core PPI and monthly core PPI both posted a rise of 2.4% and 0.5%, respectively, in line with March figures.
- Both PPI and core PPI reported a 0.5% rise in April MoM.
- The odds of a cut in June and July remain low as the best-case scenario for the markets at the moment is that the Fed will start cutting in September. A cut in November is fully priced in.
DXY technical analysis: DXY posts correctives but maintains bullish bias
On the daily chart, the Relative Strength Index (RSI) traces a negative slope in negative territory, which indicates that selling momentum is still present. In addition, the Moving Average Convergence Divergence (MACD) shows rising red bars, which demonstrates increasing bearish momentum in the short-term outlook.
That being said, the DXY’s position relative to its Simple Moving Averages (SMAs) paints a different picture. Currently, the index is below the 20-day SMA, showcasing the recent bearish control, but the fact that it is above the 100 and 200-day SMAs points out that the underpinning support from the bulls is not all lost.
US Dollar FAQs
The US Dollar (USD) is the official currency of the United States of America, and the ‘de facto’ currency of a significant number of other countries where it is found in circulation alongside local notes. It is the most heavily traded currency in the world, accounting for over 88% of all global foreign exchange turnover, or an average of $6.6 trillion in transactions per day, according to data from 2022. Following the second world war, the USD took over from the British Pound as the world’s reserve currency. For most of its history, the US Dollar was backed by Gold, until the Bretton Woods Agreement in 1971 when the Gold Standard went away.
The most important single factor impacting on the value of the US Dollar is monetary policy, which is shaped by the Federal Reserve (Fed). The Fed has two mandates: to achieve price stability (control inflation) and foster full employment. Its primary tool to achieve these two goals is by adjusting interest rates. When prices are rising too quickly and inflation is above the Fed’s 2% target, the Fed will raise rates, which helps the USD value. When inflation falls below 2% or the Unemployment Rate is too high, the Fed may lower interest rates, which weighs on the Greenback.
In extreme situations, the Federal Reserve can also print more Dollars and enact quantitative easing (QE). QE is the process by which the Fed substantially increases the flow of credit in a stuck financial system. It is a non-standard policy measure used when credit has dried up because banks will not lend to each other (out of the fear of counterparty default). It is a last resort when simply lowering interest rates is unlikely to achieve the necessary result. It was the Fed’s weapon of choice to combat the credit crunch that occurred during the Great Financial Crisis in 2008. It involves the Fed printing more Dollars and using them to buy US government bonds predominantly from financial institutions. QE usually leads to a weaker US Dollar.
Quantitative tightening (QT) is the reverse process whereby the Federal Reserve stops buying bonds from financial institutions and does not reinvest the principal from the bonds it holds maturing in new purchases. It is usually positive for the US Dollar.
- Dow Jones shied away from gains after PPI printed higher than expected.
- Fed Chair Powell made an appearance to soothe investor nerves after inflation print.
- US CPI inflation and Retail Sales in the barrel for Wednesday.
The Dow Jones Industrial Average (DJIA) stumbled on Tuesday, slipping back to 39,320.00 after US Producer Price Index (PPI) inflation came in higher than expected. Market sentiment recovered and dragged the DJIA back to even. However, a double-header of US Consumer Price Index (CPI) inflation and Retail Sales are still loaded in the barrel for Wednesday.
US PPI inflation rose to 0.5% MoM in April, over and above the forecast 0.3% and rebounding from the previous month’s -0.1% decline (revised down from 0.2%). Core annualized PPI came in at the expected 2.4% YoY, rising from the previous period’s 2.1% which was revised down from 2.4%.
Next up will be the US’ data headliner for the week with Wednesday’s Consumer Price Index (CPI) inflation print. US CPI inflation is expected to hold steady in April at 0.4% MoM, while YoY headline CPI inflation is expected to drop slightly to 3.4% from 3.5%.
US Retail Sales are also due on Wednesday, and investors are forecasting that MoM Retail Sales growth in April will ease to 0.4% from the previous month’s 0.7%.
Dow Jones news
About half of the securities that make up the Dow Jones Industrial Average are in the red on Tuesday. Visa Inc. (V) fell -1.5%, shedding -4.2 points and trading below $276.00 per share, closely followed by Walmart Inc. (WMT) which shed -1.25% and fell below $60.00 per share.
On the high side, Goldman Sachs Group Inc. (GS) gained around 1.6%, climbing seven points to trade above $460.00 per share. Boeing Co. (BA) and Intel Corp. (INTC) are battling for second place, up around 1.3% apiece on Tuesday and trading near $181.00 and $31.00 per share, respectively.
Dow Jones technical outlook
The Dow Jones Industrial Average (DJIA) is mired in intraday technical congestion near 39,400.00 on Tuesday as the major equity index grapples with twisting investor sentiment. The index dumped below 39,320.00 on reaction to inflation data, but the Dow Jones recovered back above the day’s opening bids before treading water.
Downside potential is weighing on the Dow Jones after snapping a winning streak that saw the index gain nearly 5% over seven consecutive trading days. The last bull run on daily candlesticks fell short of crossing all-time highs as the equity index nears the 40,000.00 major handle.
Dow Jones five minute chart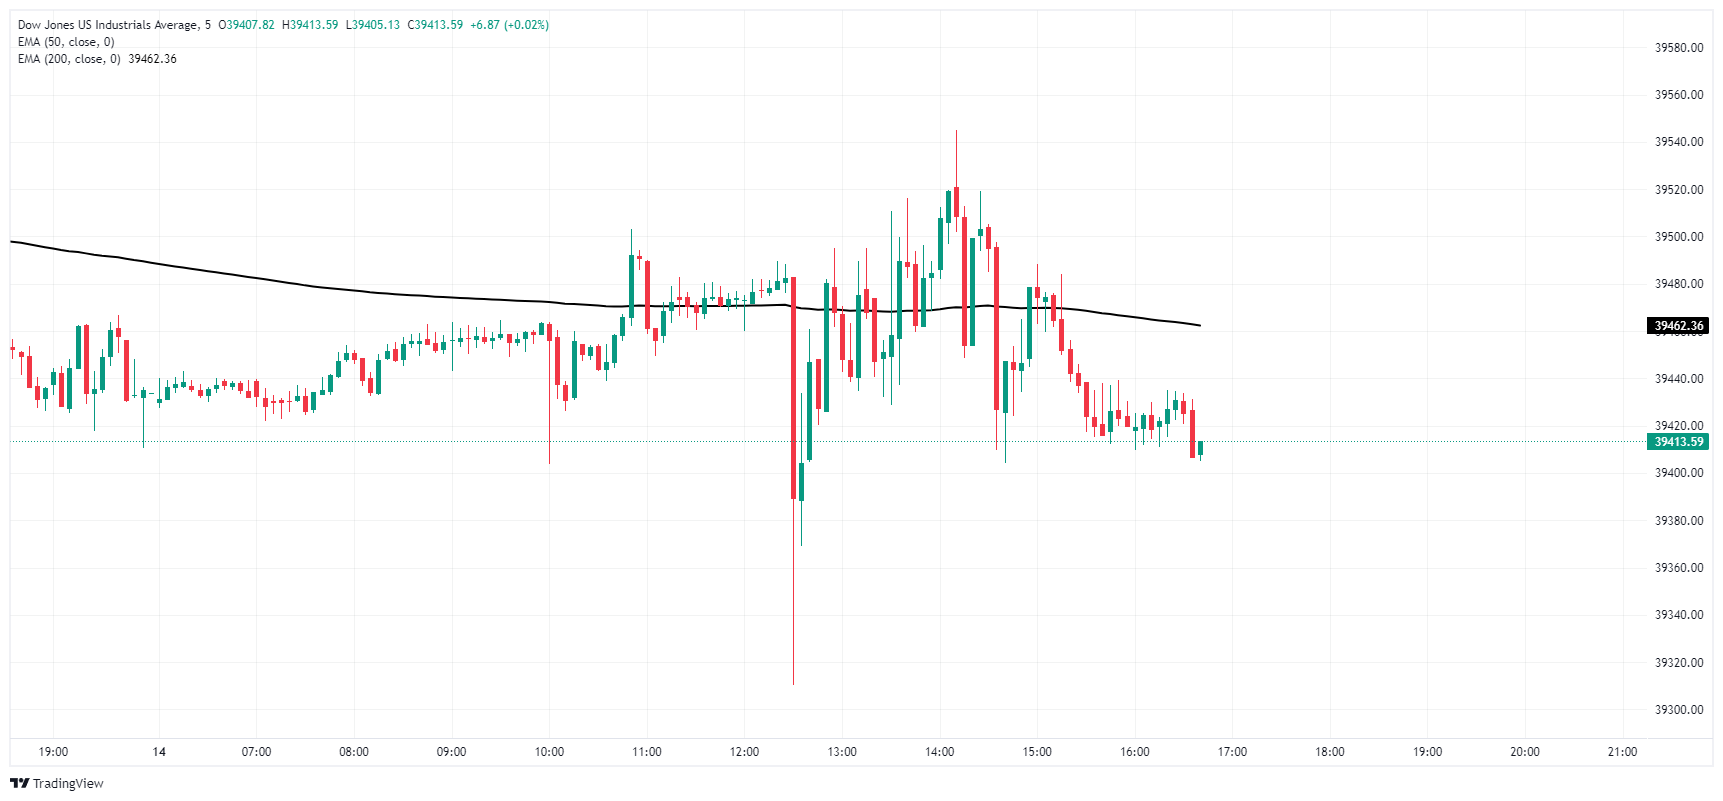
Dow Jones daily chart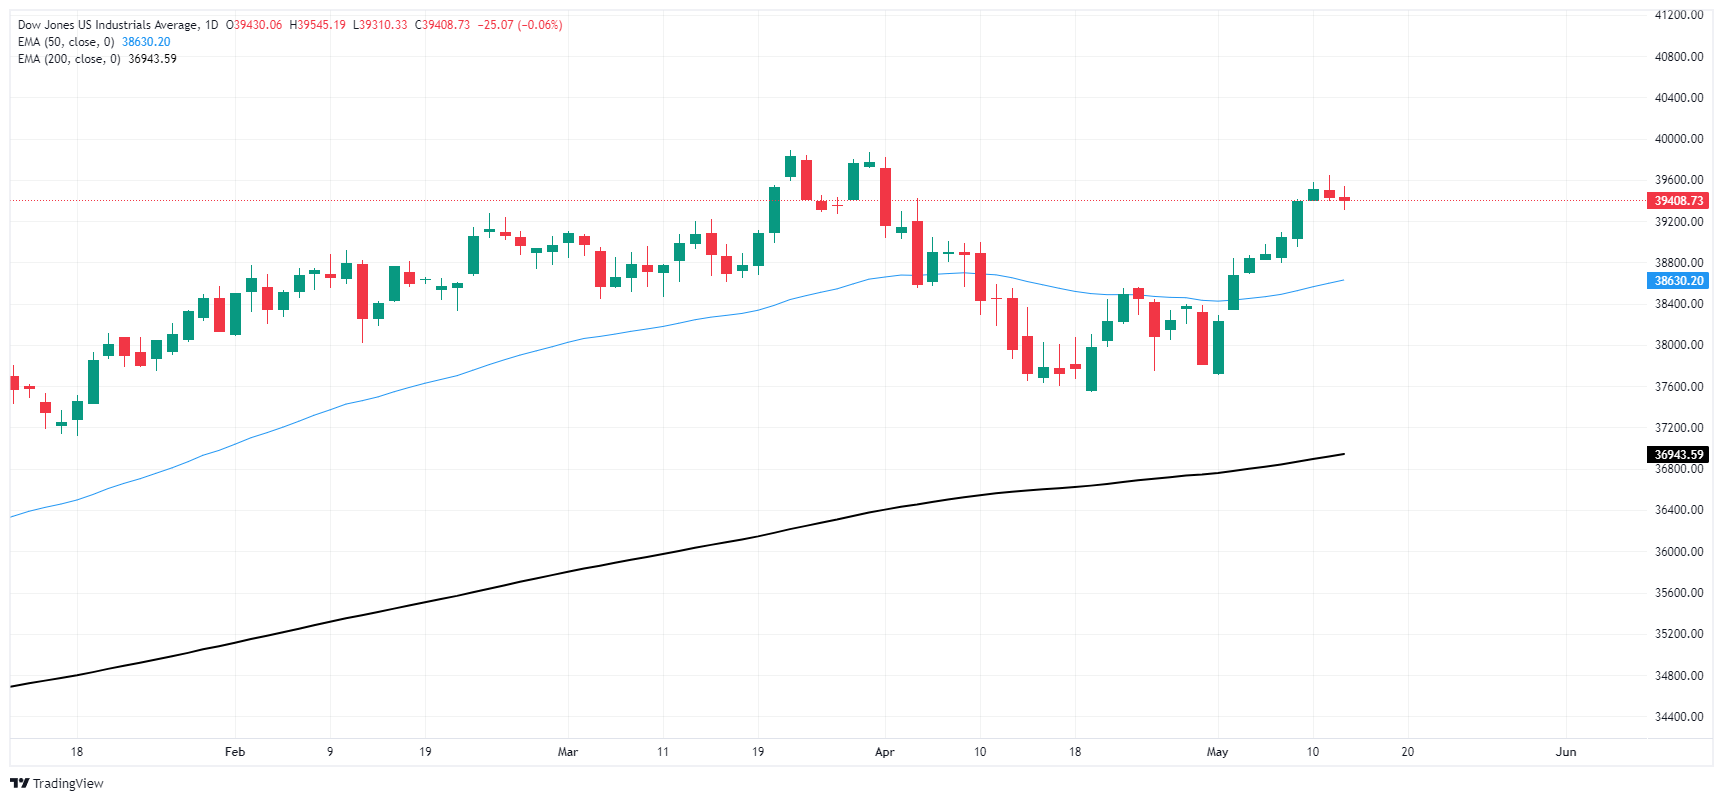
Dow Jones FAQs
The Dow Jones Industrial Average, one of the oldest stock market indices in the world, is compiled of the 30 most traded stocks in the US. The index is price-weighted rather than weighted by capitalization. It is calculated by summing the prices of the constituent stocks and dividing them by a factor, currently 0.152. The index was founded by Charles Dow, who also founded the Wall Street Journal. In later years it has been criticized for not being broadly representative enough because it only tracks 30 conglomerates, unlike broader indices such as the S&P 500.
Many different factors drive the Dow Jones Industrial Average (DJIA). The aggregate performance of the component companies revealed in quarterly company earnings reports is the main one. US and global macroeconomic data also contributes as it impacts on investor sentiment. The level of interest rates, set by the Federal Reserve (Fed), also influences the DJIA as it affects the cost of credit, on which many corporations are heavily reliant. Therefore, inflation can be a major driver as well as other metrics which impact the Fed decisions.
Dow Theory is a method for identifying the primary trend of the stock market developed by Charles Dow. A key step is to compare the direction of the Dow Jones Industrial Average (DJIA) and the Dow Jones Transportation Average (DJTA) and only follow trends where both are moving in the same direction. Volume is a confirmatory criteria. The theory uses elements of peak and trough analysis. Dow’s theory posits three trend phases: accumulation, when smart money starts buying or selling; public participation, when the wider public joins in; and distribution, when the smart money exits.
There are a number of ways to trade the DJIA. One is to use ETFs which allow investors to trade the DJIA as a single security, rather than having to buy shares in all 30 constituent companies. A leading example is the SPDR Dow Jones Industrial Average ETF (DIA). DJIA futures contracts enable traders to speculate on the future value of the index and Options provide the right, but not the obligation, to buy or sell the index at a predetermined price in the future. Mutual funds enable investors to buy a share of a diversified portfolio of DJIA stocks thus providing exposure to the overall index.
- Canadian Dollar holds onto slim gains against softer USD.
- Canada remains data-light this week, US inflation data takes center stage.
- US PPI inflation rises on Tuesday, US CPI inflation due Wednesday.
The Canadian Dollar (CAD) is mixed on Tuesday after broader markets focused on the latest round of inflation figures from the US as investors continue to look for signs of rate cuts from the Federal Reserve (Fed). The CAD held onto recent gains against the Greenback but remains mired in technical consolidation.
Canada saw a slightly better-than-expected decline in MoM Wholesale Sales in March, but strictly low-tier data from Canada this week leaves investors overwhelmingly focused on US inflation data. US Producer Price Index (PPI) inflation for April came in higher than expected MoM. Annualized producer-level inflation arrived as expected but was still higher than before as price growth continues to grip the US economy.
Daily digest market movers: Canadian Dollar holds onto the midrange as inflation dominates
- Canadian Wholesales Sales in March fell -1.1%, less than the expected -1.3% decline but still down from the previous month’s 0.2% (revised from 0.0%). Market impact was muted on the low-tier data release.
- US PPI inflation rose again in April, with MoM PPI growing 0.5% compared to the 0.3% forecast and rebounding from the previous month’s -0.1% decline.
- Core PPI for the year ended in April came in as expected at 2.4%, but still rose from the previous period’s 2.1% (revised from 2.4%).
- US Consumer Price Index (CPI) inflation figures are due on Wednesday, and markets are hoping for an easing in consumer-level inflation. YoY CPI is forecast to tick down to 0.3% from 0.4%, and Core CPI is expected to ease slightly to 3.6% from 3.8%.
- Fed Chair Jerome Powell noted in an appearance on Tuesday that “inflation in Q1 was notable for the lack of further progress.”
- Fed Chair Jerome Powell: Producer Price Index reading was quite mixed
Canadian Dollar PRICE Today
The table below shows the percentage change of Canadian Dollar (CAD) against listed major currencies today. Canadian Dollar was the strongest against the Japanese Yen.
| USD | EUR | GBP | JPY | CAD | AUD | NZD | CHF | |
|---|---|---|---|---|---|---|---|---|
| USD | -0.26% | -0.22% | 0.17% | -0.08% | -0.20% | -0.28% | -0.17% | |
| EUR | 0.26% | 0.02% | 0.44% | 0.19% | 0.07% | -0.02% | 0.08% | |
| GBP | 0.22% | -0.02% | 0.39% | 0.12% | 0.02% | -0.05% | 0.05% | |
| JPY | -0.17% | -0.44% | -0.39% | -0.24% | -0.38% | -0.46% | -0.33% | |
| CAD | 0.08% | -0.19% | -0.12% | 0.24% | -0.14% | -0.19% | -0.10% | |
| AUD | 0.20% | -0.07% | -0.02% | 0.38% | 0.14% | -0.08% | 0.03% | |
| NZD | 0.28% | 0.02% | 0.05% | 0.46% | 0.19% | 0.08% | 0.11% | |
| CHF | 0.17% | -0.08% | -0.05% | 0.33% | 0.10% | -0.03% | -0.11% |
The heat map shows percentage changes of major currencies against each other. The base currency is picked from the left column, while the quote currency is picked from the top row. For example, if you pick the Canadian Dollar from the left column and move along the horizontal line to the US Dollar, the percentage change displayed in the box will represent CAD (base)/USD (quote).
Technical analysis: Canadian Dollar grips near-term gains, but bullish stance weakens
The Canadian Dollar (CAD) is broadly mixed on Tuesday, gaining further ground against the Japanese Yen (JPY) and holding steady against the US Dollar (USD). However, the CAD shed thin weight against the Euro (EUR) and Pound Sterling (GBP).
USD/CAD slid back into a familiar demand zone below 1.3660, but the pair is treading water in the near term. Bids continue to cycle near the 200-hour Exponential Moving Average (EMA) at 1.3691.
Technical support is baked into daily candles at the 50-day EMA near 1.3640, and USD/CAD is still trading north of the 200-day EMA at 1.3546 despite trading on the low side of the last swing high near 1.3850. The pair is up over 3% for 2024.
USD/CAD hourly chart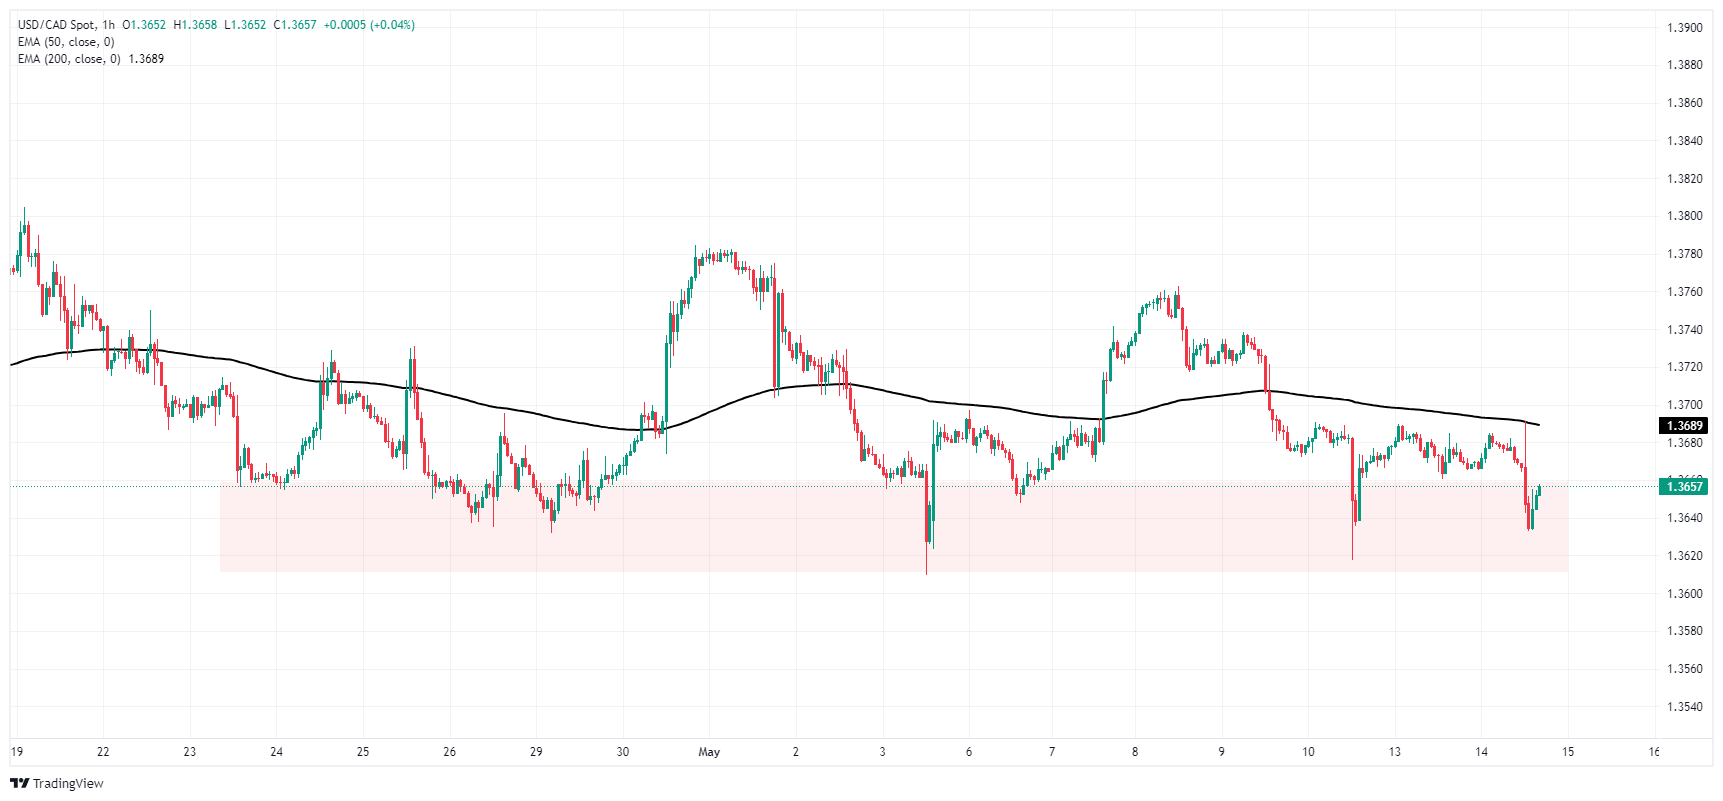
USD/CAD daily chart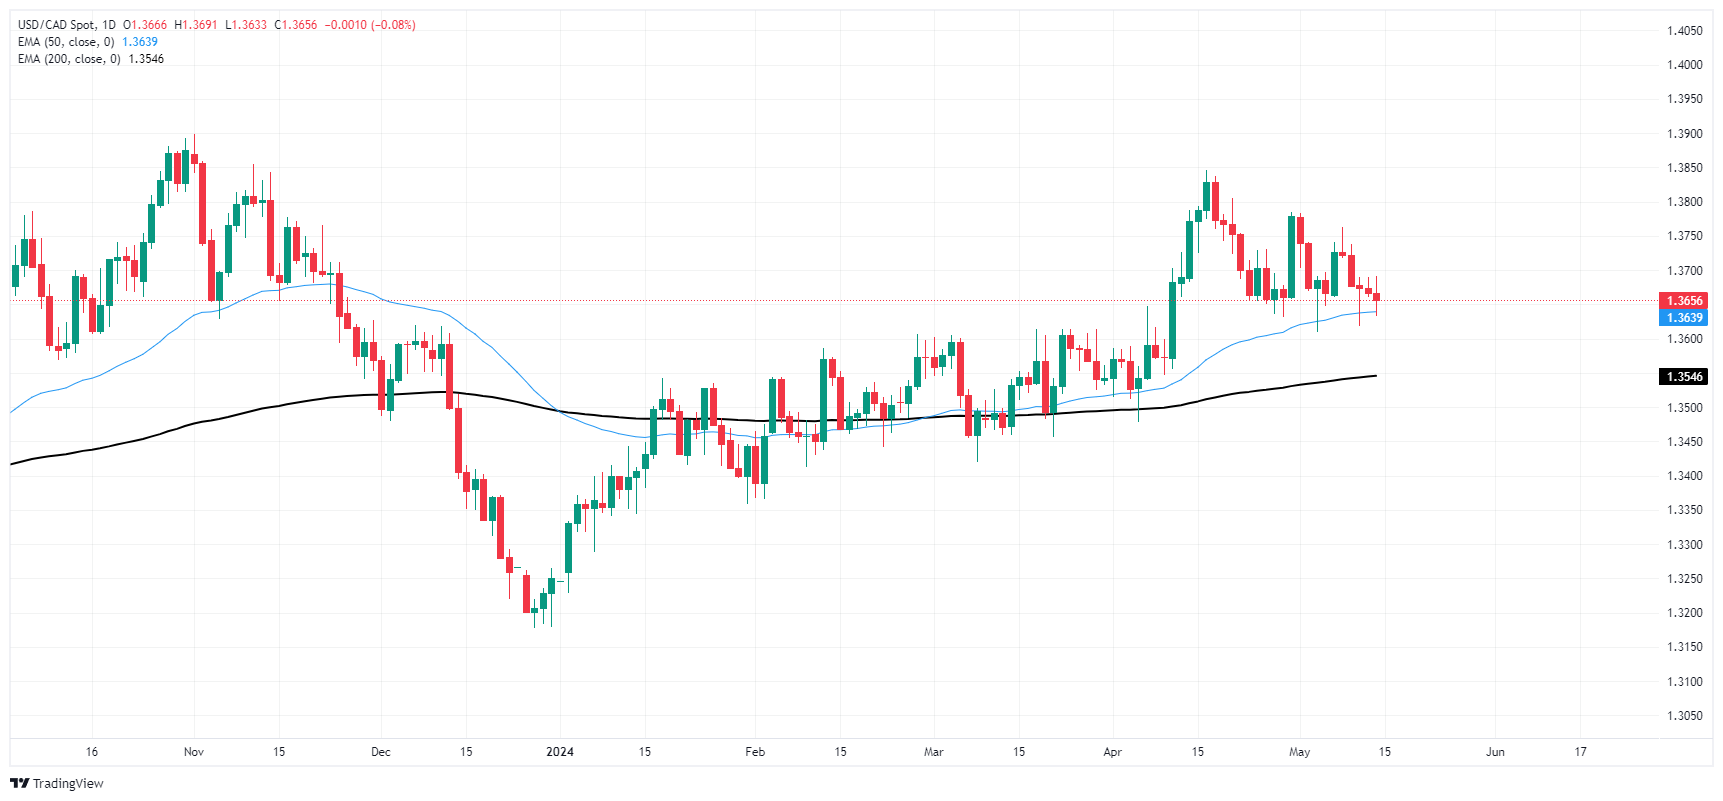
Canadian Dollar FAQs
The key factors driving the Canadian Dollar (CAD) are the level of interest rates set by the Bank of Canada (BoC), the price of Oil, Canada’s largest export, the health of its economy, inflation and the Trade Balance, which is the difference between the value of Canada’s exports versus its imports. Other factors include market sentiment – whether investors are taking on more risky assets (risk-on) or seeking safe-havens (risk-off) – with risk-on being CAD-positive. As its largest trading partner, the health of the US economy is also a key factor influencing the Canadian Dollar.
The Bank of Canada (BoC) has a significant influence on the Canadian Dollar by setting the level of interest rates that banks can lend to one another. This influences the level of interest rates for everyone. The main goal of the BoC is to maintain inflation at 1-3% by adjusting interest rates up or down. Relatively higher interest rates tend to be positive for the CAD. The Bank of Canada can also use quantitative easing and tightening to influence credit conditions, with the former CAD-negative and the latter CAD-positive.
The price of Oil is a key factor impacting the value of the Canadian Dollar. Petroleum is Canada’s biggest export, so Oil price tends to have an immediate impact on the CAD value. Generally, if Oil price rises CAD also goes up, as aggregate demand for the currency increases. The opposite is the case if the price of Oil falls. Higher Oil prices also tend to result in a greater likelihood of a positive Trade Balance, which is also supportive of the CAD.
While inflation had always traditionally been thought of as a negative factor for a currency since it lowers the value of money, the opposite has actually been the case in modern times with the relaxation of cross-border capital controls. Higher inflation tends to lead central banks to put up interest rates which attracts more capital inflows from global investors seeking a lucrative place to keep their money. This increases demand for the local currency, which in Canada’s case is the Canadian Dollar.
Macroeconomic data releases gauge the health of the economy and can have an impact on the Canadian Dollar. Indicators such as GDP, Manufacturing and Services PMIs, employment, and consumer sentiment surveys can all influence the direction of the CAD. A strong economy is good for the Canadian Dollar. Not only does it attract more foreign investment but it may encourage the Bank of Canada to put up interest rates, leading to a stronger currency. If economic data is weak, however, the CAD is likely to fall.
- USD/JPY up 0.17% driven by US producer price data suggesting potential for sustained high Fed rates.
- Technicals: Six days of gains, with strong upward momentum above the Ichimoku Cloud.
- Resistance at 157.00, then May 1 high of 157.98 and April 26 high of 158.44.
- Support at 156.00, 155.90 (Kijun-Sen), and 155.10 (Senkou Span A).
The USD/JPY climbed during the North American session after inflation data in the United States (US) showed that prices on the producer side edged higher than expected. This suggests the Fed might maintain rates higher for longer amid fears that consumer inflation could reaccelerate. The pair trades at 156.48, up by 0.17%.
USD/JPY Price Analysis: Technical outlook
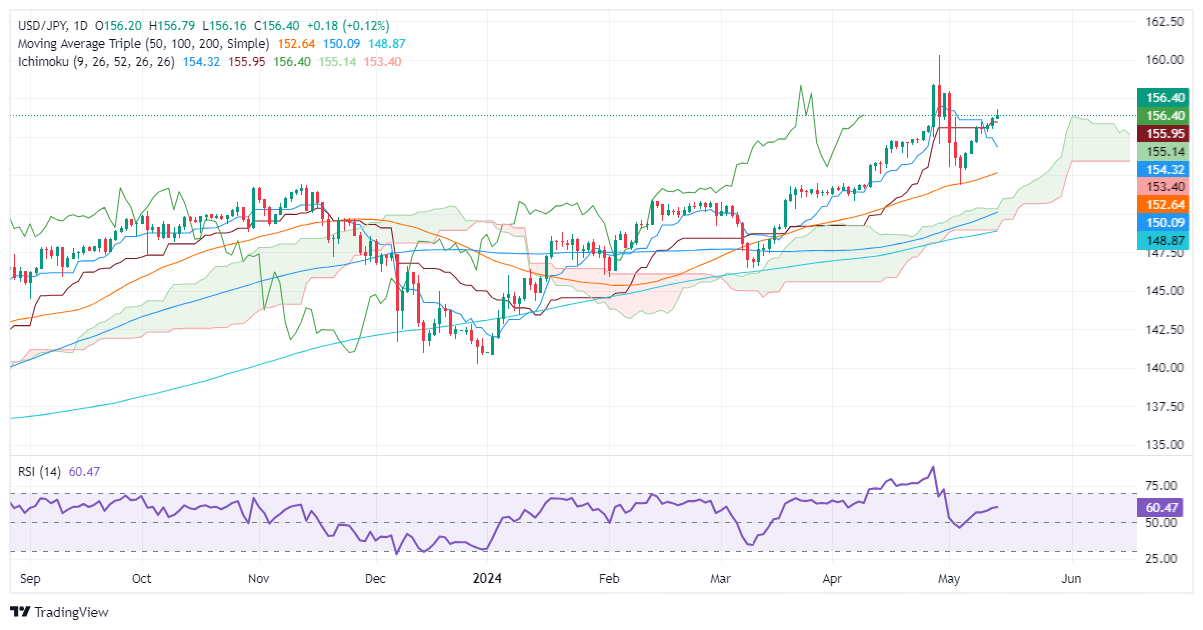
The USD/JPY extended its gains for the sixth consecutive trading day, reigniting fears that Japanese authorities could intervene in the Forex markets. Momentum remains tilted to the upside, as price action remains above the Ichimoku Cloud (Kumo). At the same time, the Relative Strength Index (RSI) trends are higher in bullish territory, which could open the door to re-test yearly highs.
If buyers reclaim the 157.00 figure, that could open the door to challenging the May 1 high at 157.98. Once surpassed, key resistance levels emerge, like Apri’s26 high at 158.44, followed by the April 29 high of 160.22.
On the other hand, if sellers drag prices below 156.00, further losses lie below. The next support would be the Kijun-Sen at 155.90. Should the pair extend its downtrend, the next demand area emerges at the Senkou Span A at 155.10 before sellers challenge the Tenkan-Sen at 154.31.
USD/JPY Price Action – Daily Chart
- Silver price rises toward two-week high of $28.80 as US Dollar edges down.
- The US Dollar drops even though US PPI grew at a faster rate in April.
- The Fed could delay rate cuts beyond September.
Silver price (XAG/USD) jumps higher to $28.60 in Tuesday’s New York session. The white metal strengthens as the US Dollar drops despite the United States Bureau of Labor Statistics (BLS) has published a stubborn Producer Price Index (PPI) report.
Monthly headline PPI grew at a faster rate of 0.5% from the estimates of 0.3%, suggesting price pressures remained persistent at the start of the second quarter. The Core PPI that excludes volatile food and energy prices also rose by 0.5%. Annual headline and the core PPI data grew in line with estimates of 2.2% and 2.4%.
This has deepened fears about the Federal Reserve (Fed) delaying rate cuts beyond September or keeping interest rates in their current range of 5.25%-5.50% for the entire year. The US Dollar Index (DXY), which tracks the US Dollar’s value against six major currencies, falls to 105.00. The appeal for dollar-denominated Silver improves when the Greenback edges down.
10-year US Treasury yields fall further to 4.46%. Generally, deepening risks of persistent inflation boost yields on interest-bearish assets. However, in this case, bond yields have fallen. This has diminished the opportunity cost of holding an investment in non-yielding assets, such as Silver.
This week, the US Consumer Price Index (CPI) data for April will be the major economic indication that will help investors to project the next move in the Silver price, US Dollar and the bond yields, which will be published on Wednesday. Investors will also focus on the monthly Retail Sales, which will be published along with the consumer inflation data.
Silver technical analysis
Silver price recovers sharply after discovering buying interest near the horizontal support plotted from 14 April 2023 high around $26.09 on a daily timeframe. The above-mentioned support was earlier a major resistance for the Silver price bulls. The white metal is approaching the multi-year high at $29.80.
The near-term outlook of Silver has improved as it returns above the 20-period Exponential Moving Average (EMA), which trades around $27.30.
The 14-period Relative Strength Index (RSI) shifts into the bullish range of 60.00-80.00, suggesting that a bullish momentum has been triggered.
Silver daily chart
Federal Reserve Chairman Jerome Powell speaks at a moderated discussion with De Nederlandsche Bank (DNB) President Klaas Knot at the Foreign Bankers' Association's Annual General Meeting in Amsterdam.
Key takeaways
"US economy has been performing very well."
"US economy has a very strong labor market."
"Households are in good shape financially."
"Consumer spending, business investment remain strong."
"Still there are labor shortages in many industries."
"Overall, it's a good picture looking at the US economic data so far."
"Labor market is coming back into better balance."
"Labor market is now about as tight as it was before the pandemic."
"Signs of gradual cooling in the labor market with supply and demand getting into better balance."
"Inflation in Q1 was notable for the lack of further progress."
"We did not expect a smooth road on inflation, we have to be patient and let policy do its work."
"We expect continued GDP growth of 2% or better."
"We expect the labor market to continue to rebalance but remain strong."
"We expect inflation to move down back to levels more like last year."
"Confidence in inflation moving back down is lower than it was. My confidence on that is not as high as it was before."
"Producer Price Index reading was quite mixed."
"Firms are still report labor shortages."
"Restrictive policy may take longer than expected to bring inflation down but we will get inflation back to 2%."
"It's a question of keeping policy at the current rate for longer."
"Don't think it's likely that the next move would be a rate hike, more likely that we would hold policy rate where it is."
"Housing inflation has been a bit of a puzzle."
"Current rent increases have been low for some time, not showing up in rollover leases."
"Lags between decline in market rates and it showing up are longer than we thought."
Market reaction
The US Dollar stays under modest bearish pressure following these comments. At the time of press, the US Dollar Index was down 0.2% on the day at 105.00.
Fed FAQs
Monetary policy in the US is shaped by the Federal Reserve (Fed). The Fed has two mandates: to achieve price stability and foster full employment. Its primary tool to achieve these goals is by adjusting interest rates. When prices are rising too quickly and inflation is above the Fed’s 2% target, it raises interest rates, increasing borrowing costs throughout the economy. This results in a stronger US Dollar (USD) as it makes the US a more attractive place for international investors to park their money. When inflation falls below 2% or the Unemployment Rate is too high, the Fed may lower interest rates to encourage borrowing, which weighs on the Greenback.
The Federal Reserve (Fed) holds eight policy meetings a year, where the Federal Open Market Committee (FOMC) assesses economic conditions and makes monetary policy decisions. The FOMC is attended by twelve Fed officials – the seven members of the Board of Governors, the president of the Federal Reserve Bank of New York, and four of the remaining eleven regional Reserve Bank presidents, who serve one-year terms on a rotating basis.
In extreme situations, the Federal Reserve may resort to a policy named Quantitative Easing (QE). QE is the process by which the Fed substantially increases the flow of credit in a stuck financial system. It is a non-standard policy measure used during crises or when inflation is extremely low. It was the Fed’s weapon of choice during the Great Financial Crisis in 2008. It involves the Fed printing more Dollars and using them to buy high grade bonds from financial institutions. QE usually weakens the US Dollar.
Quantitative tightening (QT) is the reverse process of QE, whereby the Federal Reserve stops buying bonds from financial institutions and does not reinvest the principal from the bonds it holds maturing, to purchase new bonds. It is usually positive for the value of the US Dollar.
- AUD/USD moves higher to 0.6620 amid cheerful market mood and a decline in the US Dollar.
- Stubborn US PPI data fails to boost the US Dollar’s appeal.
- Economists expect that Australia’s Wage Price Index grew steadily in Q1 of this year.
The AUD/USD pair rises further to 0.6620 in Tuesday’s New York session. The Aussie asset strengthens as the US Dollar comes under pressure even though the United States Producer Price Index (PPI) report for April has turned out slightly hot. The US Dollar Index (DXY), which tracks the Greenback’s value against six major currencies, falls to near the crucial support of 105.00.
Annual headline, and the core PPI data that strips off volatile food and energy prices grew in line with estimates of 2.2% and 2.4%. Monthly headline and core PPI rose strongly by 0.5%, beat the consensus and prior readings. Higher prices by business owners are majorly the outcome of rising input prices or robust household spending or a mix of both.
A large uptick in the producer inflation exhibits signs of persistent price pressures, which could negatively influence speculation for rate cuts by the Federal Reserve (Fed), for which financial markets expect that the September meeting will be the earliest point.
Meanwhile, the market sentiment is positive as investors shrugged off uncertainty of the US Consumer Price Index (CPI) data for April, releasing on Wednesday. The S&P 500 opens on a slightly bullish note. The US inflation data has remained hotter-than-expected in the first quarter of this year. A similar set of numbers would dent Fed rate-cut prospects for the entire year.
On the Australian Dollar front, investors await the Q1 Wage Price Index data, which will be published on Wednesday. Quarterly and annual wage inflation data is forecasted to have grown steadily by 0.9% and 4.2%, respectively. Persistent wage growth data would flare up upside risks to inflation, which would force the Reserve Bank of Australia (RBA) to maintain a restrictive interest rate framework for a longer period.
European Central Bank (ECB) policymaker Pierre Wunsch told German newspaper Handelsblatt the first two 25 basis points reductions in key ECB rates were close to a "no-brainer" but added that high rates for longer by the US Federal Reserve could lead to a slower pace of rate cuts.
"Nevertheless, we should proceed gradually and not too quickly. We should refrain from committing to a second rate cut already in July," Wunsch added.
Market reaction
EUR/USD edged slightly higher following these comments and was last seen rising 0.24% on the day at 1.0815.
- Producer inflation in the US climbed to 2.2% on a yearly basis in April.
- US Dollar Index stays in positive territory above 105.00 after PPI data.
The Producer Price Index (PPI) for final demand in the US rose 2.2% on a yearly basis in April, the data published by the US Bureau of Labor Statistics showed on Tuesday. This reading followed the 1.8% increase recorded in March (revised from 2.1%) and came in line with the market expectation.
The annual core PPI rose 2.4% in the same period, matching March's increase and analysts' estimate. On a monthly basis, the PPI and the core PPI both rose 0.5% in April.
Market reaction
The US Dollar (USD) gathered strength against its rivals with the immediate reaction. After spiking to a daily high near 105.50, however, the USD Index retreated and was last seen gaining 0.1% on the day at 105.32.
- The US Dollar consolidates in a very narrow range.
- The economic calendar picks up with US PPI and Fed speakers ahead.
- The US Dollar Index hovers around 105.25, above 105.00.
The US Dollar (USD) is not making any big waves on Tuesday after a rather dull Monday. The only main takeaway were comments from Federal Reserve (Fed) Vice Chair Philip Jefferson, who said that rates need to stay higher for longer. All eyes will be on Fed Chairman Jerome Powell to hear if he supports that view and pushes back against any early initial rate cut forecasts.
On the economic front, a lot of data to dive into with the Producer Price Index (PPI) measures as the biggest element on the table. The monthly movements in the headline and the core will be the most market-moving elements as an increase in both indices would ripple through into a higher Consumer Price Index (CPI) in the coming months. Higher costs for producers often mean higher prices for the end-consumer.
Daily digest market movers: PPI ahead of CPI
- The Qatar World Economic Forum started on Tuesday morning. Headlines from world leaders may come out throughout the week.
- The US Small-Business Optimism Index for April from the National Federation of Independent Business came in at 89.7 from 88.5 in March.
- At 12:30 GMT, the final reading for the Producer Price Index for April will be released:
- Monthly headline PPI is expected to head to 0.3% from 0.2%.
- Yearly headline PPI expected to accelerate to 2.2% from 2.1%.
- Monthly core PPI should remain stable at 0.2%.
- Yearly core PPI should remain stable as well at 2.4%.
- The US Redbook for the week ending May 10 should be released around 12:55 GMT. The previous number was at 6%.
- Two Fed speakers on the docket this Tuesday:
- Voting Federal Reserve Governor Lisa Cook wil speak about economic growth around 13:10 GMT.
- Federal Reserve Chairman Jerome Powell participates in a moderated discussion with the Dutch central bank Governor Klaas Knot in Amsterdam around 14:00 GMT.
- European equities have taken over the negative tone at the US closing bell from Monday and are trading in the red. US equity futures are trading flat.
- The CME Fedwatch Tool suggests a 91.1% probability that June will still see no change to the Federal Reserve's fed fund rate. Odds of a rate cut in July are also out of the cards, while for September the tool shows a 49% chance that rates will be 25 basis points lower than current levels.
- The benchmark 10-year US Treasury Note trades around 4.47%, around the lower range for this week after hitting 4.94% earlier.
US Dollar Index Technical Analysis: PPI not to move the needle
The US Dollar Index (DXY) trades quite stable above 105.00, though it is a bit afloat. Traders are clearly looking for direction or confirmation on what to do next for the Greenback. Rather Fed Chairman Jerome Powell or the Consumer Price Index print on Wednesday will be better moments to see where the DXY will be heading.
On the upside, 105.52 (a pivotal level since April 11) needs to be recovered, ideally through a daily close above this level, before targeting the April 16 high at 106.52 for a third time. Further up and above the 107.00 round level, the DXY index could meet resistance at 107.35, the October 3 high.
On the downside, the 55-day and the 200-day Simple Moving Averages (SMAs) at 104.54 and 104.25, respectively, have already provided ample support. If those levels are unable to hold, the 100-day SMA near 103.89 is the next best candidate.
US Dollar FAQs
The US Dollar (USD) is the official currency of the United States of America, and the ‘de facto’ currency of a significant number of other countries where it is found in circulation alongside local notes. It is the most heavily traded currency in the world, accounting for over 88% of all global foreign exchange turnover, or an average of $6.6 trillion in transactions per day, according to data from 2022. Following the second world war, the USD took over from the British Pound as the world’s reserve currency. For most of its history, the US Dollar was backed by Gold, until the Bretton Woods Agreement in 1971 when the Gold Standard went away.
The most important single factor impacting on the value of the US Dollar is monetary policy, which is shaped by the Federal Reserve (Fed). The Fed has two mandates: to achieve price stability (control inflation) and foster full employment. Its primary tool to achieve these two goals is by adjusting interest rates. When prices are rising too quickly and inflation is above the Fed’s 2% target, the Fed will raise rates, which helps the USD value. When inflation falls below 2% or the Unemployment Rate is too high, the Fed may lower interest rates, which weighs on the Greenback.
In extreme situations, the Federal Reserve can also print more Dollars and enact quantitative easing (QE). QE is the process by which the Fed substantially increases the flow of credit in a stuck financial system. It is a non-standard policy measure used when credit has dried up because banks will not lend to each other (out of the fear of counterparty default). It is a last resort when simply lowering interest rates is unlikely to achieve the necessary result. It was the Fed’s weapon of choice to combat the credit crunch that occurred during the Great Financial Crisis in 2008. It involves the Fed printing more Dollars and using them to buy US government bonds predominantly from financial institutions. QE usually leads to a weaker US Dollar.
Quantitative tightening (QT) is the reverse process whereby the Federal Reserve stops buying bonds from financial institutions and does not reinvest the principal from the bonds it holds maturing in new purchases. It is usually positive for the US Dollar.
- USD/JPY rises to 156.50 with eyes on crucial US inflation readings.
- Investors expect that the fed will start lowering interest rates from September.
- Japan’s Q1 GDP will indicate the economic strength.
The USD/JPY pair extends its upside to 156.50 in Tuesday’s European session. The asset strengthens as investors turn cautious ahead of the release of the United States Consumer Price Index (CPI) data for April and the Japan’s preliminary Q1 Gross Domestic Product (GDP) data.
The US inflation data will force traders to reassess market expectations for Federal Reserve’s (Fed) rate cuts, which financial markets anticipate that the central bank will start from the September meeting.
Annual headline CPI is forecasted to have softened to 3.4% from 3.5% in March. In the same period, the core inflation that strips off volatile food and energy prices is anticipated to decelerate to 3.6% from the prior reading of 3.8%. Economists expect that monthly headline and core CPI have grown at a slower pace of 0.3% from the prior reading of 0.4%.
Before the release of the consumer inflation data, investors will focus on the US Producer Price Index (PPI) data for April that will be published at 12:30 GMT. The producer inflation will indicate the chance in prices of goods and services at their premises.
Meanwhile, the Japanese Yen remains on the backfoot as investors worry about the Bank of Japan’s (BoJ) policy-tightening scope in the upcoming meetings. Going forward, investors will focus on the Q1 GDP data, which will be published on Thursday.
Economists expect that the Japanese economy contracted by 0.4% after expanding by 0.1% in the last quarter of 2023. On an annualized basis, the Japanese economy is estimated to have contracted significantly by 1.5%. Weak GDP growth will raise concerns over BoJ’s plan to continue the policy-tightening cycle.
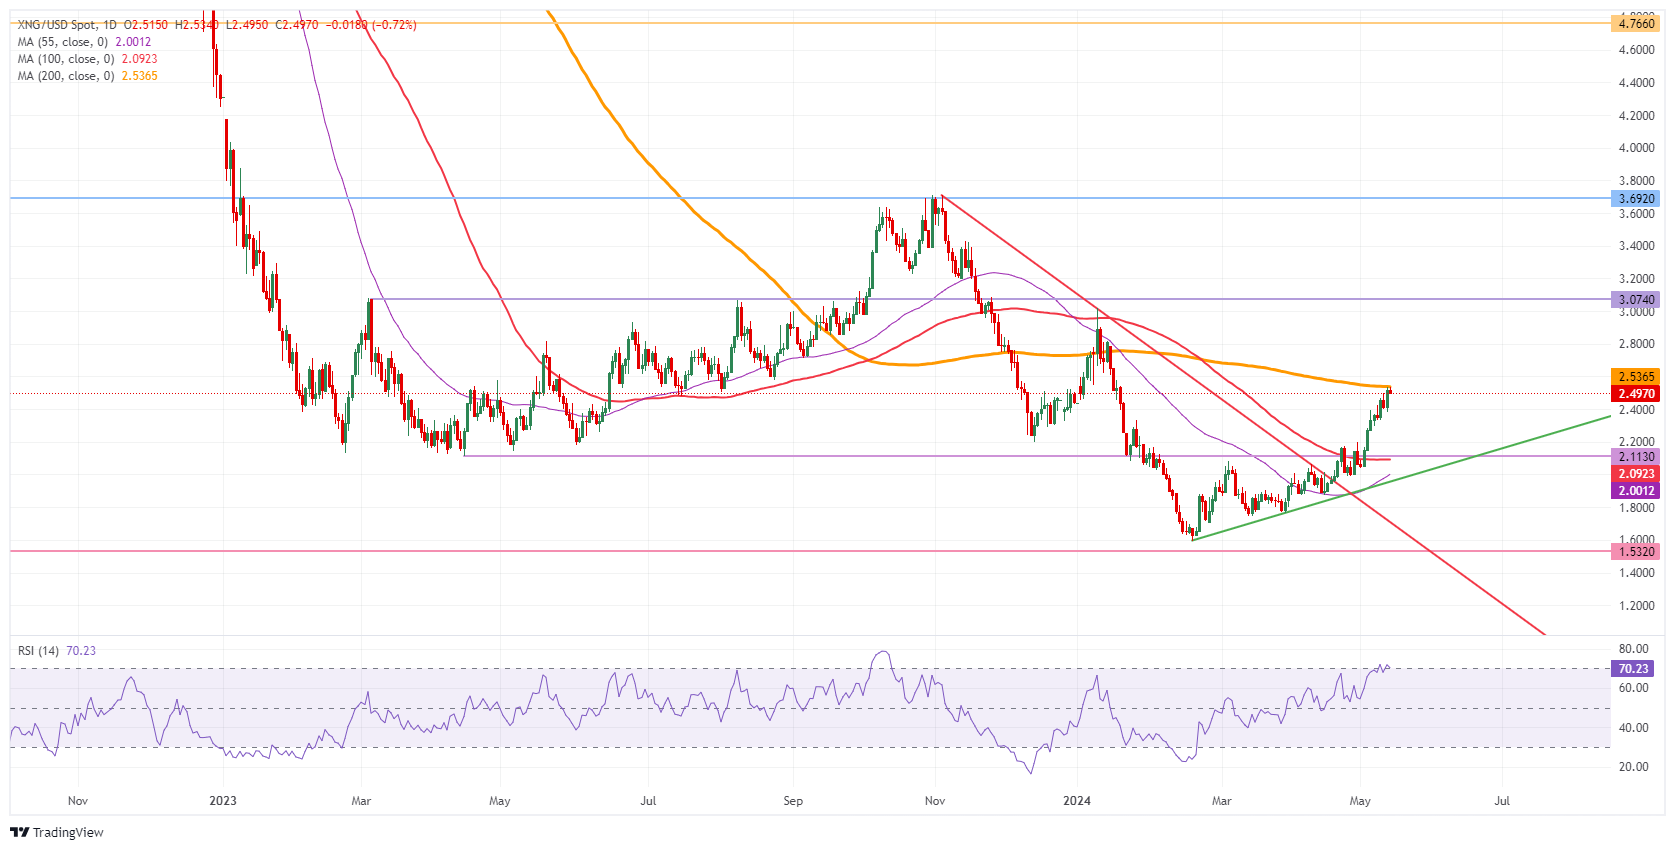
- Natural Gas prices are facing a substantial cap at $2.53.
- Geopolitical risks ease a bit while the Qatar Economic Forum gets underway.
- The US Dollar Index holds and consolidates above 105.00.
Natural Gas price (XNG/USD) has given traders a nice run, rallying 40% since the end of March. This movement partially came on the back of Israel and its continuing attacks on Gaza. With pressure building from world leaders, calling out Israel to at least have a ceasefire, tensions are likely to ease from here. Meanwhile, Europe has secured enough Gas supply before the next heating season and ahead of the substantial longer-term measures that will kick in as of 2025 in 2028, making the bloc independent from Russian Gas.
The US Dollar Index (DXY), which tracks the Greenback’s value against six major currencies, trades steadily above the crucial support of 105.00 on Tuesday ahead of the speech from the US Federal Reserve (Fed) Chairman Jerome Powell. Markets are already bracing for the Consumer Price Index (CPI) for April, which is set to be released on Wednesday, so any words from Fed Chairman Powell on possibly keeping rates higher for longer might influence the initial Fed rate cut prospects to later 2024 or even earlier 2025. The outcome of that scenario would be a stronger US Dollar across the board, weighing on Gas prices denominated in USD.
Natural Gas is trading at $2.50 per MMBtu at the time of writing.
Natural Gas news and market movers: Headline risk this week
- The Qatar World Economic Forum started on Tuesday morning. Headlines from world leaders may come out throughout the week. Prime Minister of Qatar, Mohammed bin Abdulrahman Al Thani, already kept an opening statement, condemning Israel’s approach towards Gaza and calling for peace and a ceasefire to work out a deal that works for all parties, Bloomberg Television broadcasted.
- The OPEC Monthly Market Report will be released on Tuesday. Although it deals with Oil, the energy complex as a whole might face some head or tailwinds from any outlook or firm changes in its policy.
- Germany will need to diversify its energy capacity by building new gas-fired plants as Bloomberg calculated that 25% of the current coal plants are set to close by the end of the year.
- The Freeport LNG plant is producing Liquified Natural Gas at the highest level in six months after a prolonged period of unforeseen outages and maintenance. Currently, the three production trains are jointly producing 2.09 billion cubic feet of Gas per day, Reuters reports.
Natural Gas Technical Analysis: End of the line
Natural Gas rally trade since the end of April is running out of steam. The rally has reached the end of the line and faces a firm rejection against the 200-day Simple Moving Average (SMA) at $2.53 on Tuesday. A big catalyst or driver will be needed to push through that cap on the topside.
If Gas price breaks above the 200-day SMA, the $3.00 marker is the first level to watch. Once through there, the pivotal level near $3.07 (high of March 6, 2023) will come into play and mark a new high for 2024. Further up, there is room for a quick crossing towards $3.69.
On the downside, a double belt is awaiting to provide support with the 100-day SMA at $2.09 and the pivotal level at $2.11 (low of April 14, 2023). Should this support area fail to hold, then the ascending green trendline near $1.98, together with the 55-day SMA at $2.00, should avoid a further decline.
Natural Gas: Daily Chart
Natural Gas FAQs
Supply and demand dynamics are a key factor influencing Natural Gas prices, and are themselves influenced by global economic growth, industrial activity, population growth, production levels, and inventories. The weather impacts Natural Gas prices because more Gas is used during cold winters and hot summers for heating and cooling. Competition from other energy sources impacts prices as consumers may switch to cheaper sources. Geopolitical events are factors as exemplified by the war in Ukraine. Government policies relating to extraction, transportation, and environmental issues also impact prices.
The main economic release influencing Natural Gas prices is the weekly inventory bulletin from the Energy Information Administration (EIA), a US government agency that produces US gas market data. The EIA Gas bulletin usually comes out on Thursday at 14:30 GMT, a day after the EIA publishes its weekly Oil bulletin. Economic data from large consumers of Natural Gas can impact supply and demand, the largest of which include China, Germany and Japan. Natural Gas is primarily priced and traded in US Dollars, thus economic releases impacting the US Dollar are also factors.
The US Dollar is the world’s reserve currency and most commodities, including Natural Gas are priced and traded on international markets in US Dollars. As such, the value of the US Dollar is a factor in the price of Natural Gas, because if the Dollar strengthens it means less Dollars are required to buy the same volume of Gas (the price falls), and vice versa if USD strengthens.
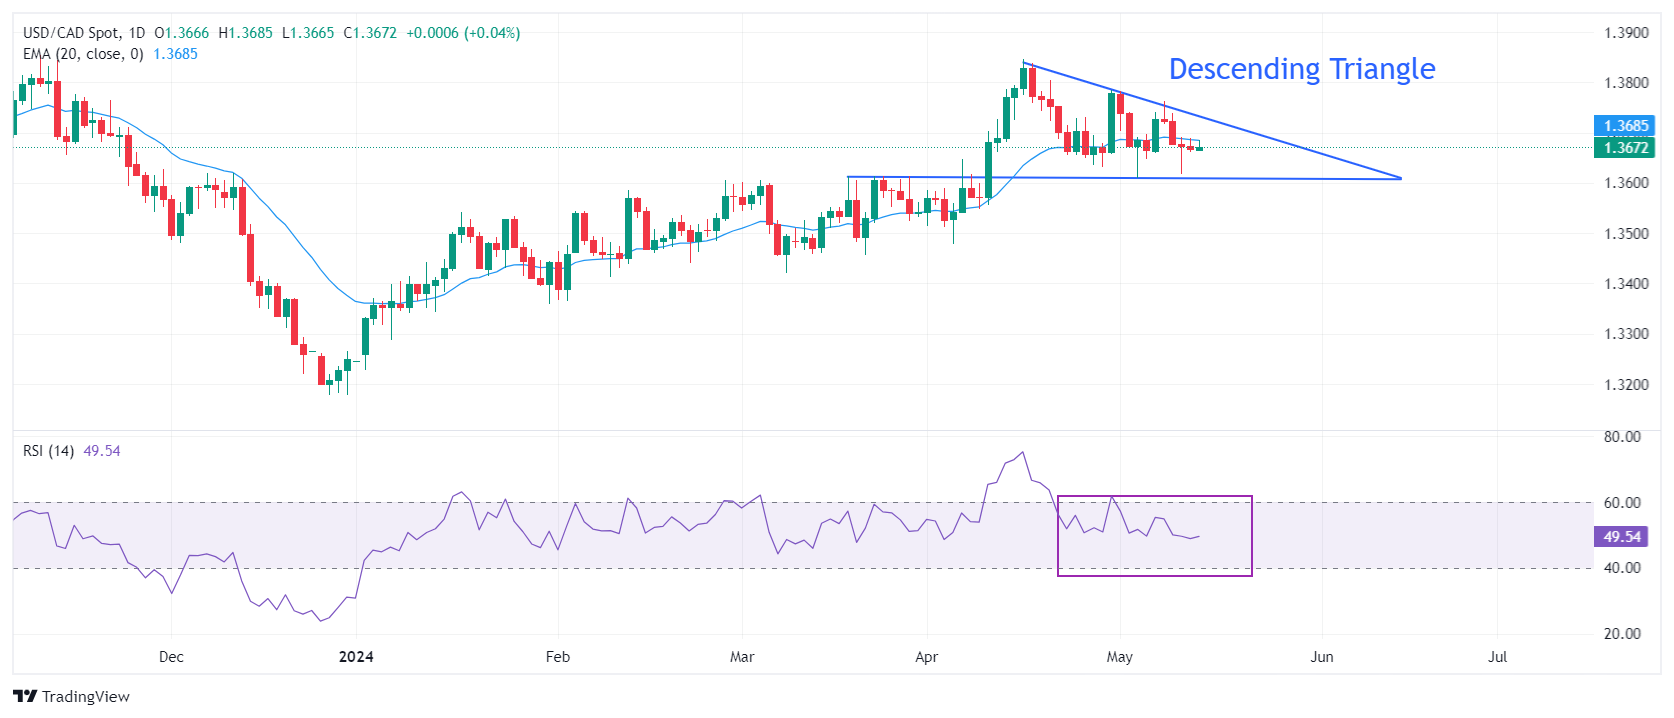
- USD/CAD oscillates in a tight range below 1.3700 ahead of crucial US economic data.
- The US inflation data will impact Fed rate-cut prospects for September.
- USD/CAD trades in a Descending Triangle pattern, suggesting indecisiveness among investors.
The USD/CAD pair stays on sidelines below the round-level resistance of 1.3700 in Tuesday’s European session. The Loonie asset consolidates as investors await the release of the United States Producer Price Index (PPI) and the Consumer Price Index (CPI) data for April, which will be published at 12:30 GMT and on Wednesday, respectively.
US producer and consumer inflation readings will provide fresh cues about the Federal Reserve’s (Fed) inflation outlook. The CME FedWatch tool indicates that the September meeting will be the earliest point from when the central bank will start reducing interest rates.
Meanwhile, the market sentiment is cautious ahead of US inflation data. S&P 500 futures remain flat in the European session. The US Dollar Index (DXY) rebounds from the crucial support of 105.00.
The Canadian Dollar attains a firm footing as strong Canadian job data for April has shaken investors’ confidence about the Bank of Canada (BoC) to begin reducing interest rates from the June meeting. Statistics Canada reported that Canadian employers hired 90.4K job-seekers in April, significantly higher than the consensus of 18K. In March, the job market recorded a lay-off of 2.2K employees. The Unemployment Rate remains steady at 6.1% while investors estimated the joblessness to rise to 6.2%.
USD/CAD oscillates in a Descending Triangle chart formation on a daily timeframe. The downward-sloping border of the above-mentioned chart pattern is plotted from April 16 high at 1.3846, while the horizontal support is placed from March 19 high at 1.3614. The 20-day Exponential Moving Average (EMA) at 1.3684 continues to act as a major barricade for the US Dollar bulls.
The 14-period Relative Strength Index (RSI) remains inside the 40.00-60.00 range, suggesting a sharp volatility contraction.
Fresh buying opportunity would emerge if the asset breaks above April 30 high at 1.3785. This would drive the asset towards April 17 high at 1.3838, followed by the round-level resistance of 1.3900.
In an alternate scenario, a breakdown below May 3 low around 1.3600 will expose the asset to the April 9 low around 1.3547 and the psychological support of 1.3500.
USD/CAD daily chart
Dr. Marco Wagner, Senior Economist at Commerzbank, notes that there is virtually no doubt that the European Central Bank (ECB) will lower key interest rates in June but argues that the ECB will hardly be able to lower the deposit rate below 3%.
ECB's room for maneuver for further interest rate cuts will be limited
"In the short term, the ECB's picture is likely to be quite accurate, namely that inflation should continue to fall over the remainder of 2024, albeit with fluctuations. However, there is a huge underlying structural inflationary pressure that will drive inflation in the coming years."
"The central bankers will therefore only have a window of opportunity for interest rate cuts in the coming months, which we believe will close in the spring of next year. The ECB's room for maneuver for further interest rate cuts will be limited as high inflationary pressure then becomes increasingly visible."
Analysts at TD Securities preview the upcoming Consumer Price Index (CPI) and Retail Sales data from the US.
Retail sales to rise for a third consecutive month in April
"We expect next week's CPI report to show that core inflation slowed to a "soft" 0.3% m/m pace after posting a third consecutive strong gain at 0.4% in March. The headline likely rose by a softer 0.3% m/m despite another notable gain in energy prices. Note that our unrounded core CPI forecast at 0.27% m/m suggests larger risks for a dovish surprise to a rounded 0.2% increase."
"We look for retail sales to rise for a third consecutive month in April, opening the second quarter on a firm footing. Volatile auto and gasoline stations sales will likely provide a big boost to growth, with the control group also helping to juice the headline—though down vs March. We also project sales in bars/restaurants—the report's only services component—to remain firm."
- EUR/USD drops from 1.0800 as investors turn cautious ahead of key US inflation readings and Eurozone Q1 GDP data.
- Eurozone price index is on track to return to 2% as service inflation eases to 3.7%.
- The US inflation data will influence Fed rate-cut prospects for September.
EUR/USD falls slightly below the round-level resistance of 1.0800 in Tuesday’s European session. The major currency pair drops as investors await the release of the United States Consumer Price Index (CPI) for April and the Eurozone’s preliminary Q1 Gross Domestic Product (GDP) data, which will be published on Wednesday.
US consumer inflation data will significantly influence speculation for the Federal Reserve (Fed) rate cuts, which it is expected to begin from the September meeting. US CPI remained hotter than expected in the first quarter of the year due to tight labor market conditions and robust household spending. Therefore, investors will keenly focus on it as the continuation of the release of hot readings will force traders to pare bets for Fed rate cuts in September. Hot inflation reading will also offset the Fed rate-cut optimism built on easing labor market conditions.
Daily digest market movers: EUR/USD drops slightly ahead of key data
- EUR/USD is down slightly below the crucial resistance of 1.0800. The major currency pair moves inside Monday’s trading range as the US Dollar remains steady ahead of the release of producer and consumer inflation readings for April. The US Dollar Index (DXY), which tracks the Greenback’s value against six major currencies, trades steadily above the crucial support of 105.00.
- The US consumer inflation data will be the major event of the week, which is expected to soften. But before that, investors will focus on the Producer Price Index (PPI) data, which will be published at 12:30 GMT on Tuesday. Investors expect that the producer inflation will remain stubborn. Annual headline PPI is estimated to accelerate by 2.2% from the prior reading of 2.1%, with core readings growing steadily by 2.4%.
- On the other side of the Atlantic, investors await the preliminary Eurozone Q1 GDP, which is expected to have expanded at a steady rate. Quarterly and annualized GDP are projected to have grown stably by 0.3% and 0.4%, respectively. Upbeat GDP growth would provide relief to European Central Bank (ECB) policymakers, which are planning to start lowering borrowing rates from the June meeting.
- Price pressures in the Eurozone economy are on course to return to the desired rate of 2% as the service inflation, which remained consistent at 4% in the November-March period, declined sharply to 3.7% in April. Financial markets have anticipated that the ECB will reduce interest rates by 70 basis points (bps) this year.
Technical Analysis: EUR/USD faces pressure near 1.0800
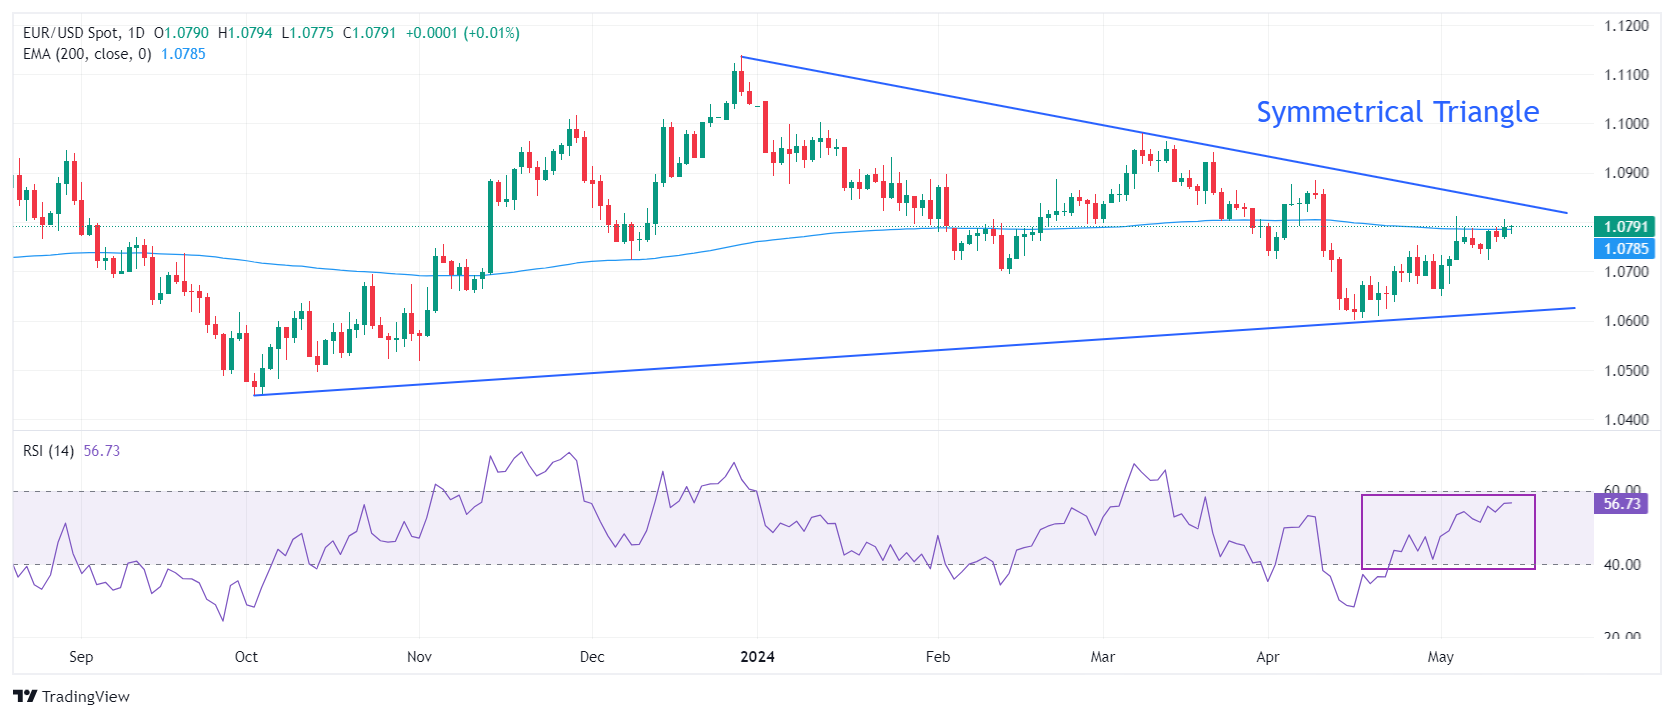
EUR/USD faces selling pressure near the round-level resistance of 1.0800. The 200-day Exponential Moving Average (EMA) near 1.0800 is acting as a strong barrier for Euro bulls.
Even though, the major currency pair is on course towards the downward-sloping border of the Symmetrical Triangle pattern formed on a daily timeframe, which is plotted from the December 28 high around 1.1140. The upward-sloping border of the triangle pattern is marked from the October 3 low at 1.0448. The Symmetrical Triangle formation exhibits a sharp volatility contraction.
The 14-period Relative Strength Index (RSI) oscillates inside the 40.00-60.00 range, suggesting indecisiveness among market participants.
Euro FAQs
The Euro is the currency for the 20 European Union countries that belong to the Eurozone. It is the second most heavily traded currency in the world behind the US Dollar. In 2022, it accounted for 31% of all foreign exchange transactions, with an average daily turnover of over $2.2 trillion a day. EUR/USD is the most heavily traded currency pair in the world, accounting for an estimated 30% off all transactions, followed by EUR/JPY (4%), EUR/GBP (3%) and EUR/AUD (2%).
The European Central Bank (ECB) in Frankfurt, Germany, is the reserve bank for the Eurozone. The ECB sets interest rates and manages monetary policy. The ECB’s primary mandate is to maintain price stability, which means either controlling inflation or stimulating growth. Its primary tool is the raising or lowering of interest rates. Relatively high interest rates – or the expectation of higher rates – will usually benefit the Euro and vice versa. The ECB Governing Council makes monetary policy decisions at meetings held eight times a year. Decisions are made by heads of the Eurozone national banks and six permanent members, including the President of the ECB, Christine Lagarde.
Eurozone inflation data, measured by the Harmonized Index of Consumer Prices (HICP), is an important econometric for the Euro. If inflation rises more than expected, especially if above the ECB’s 2% target, it obliges the ECB to raise interest rates to bring it back under control. Relatively high interest rates compared to its counterparts will usually benefit the Euro, as it makes the region more attractive as a place for global investors to park their money.
Data releases gauge the health of the economy and can impact on the Euro. Indicators such as GDP, Manufacturing and Services PMIs, employment, and consumer sentiment surveys can all influence the direction of the single currency. A strong economy is good for the Euro. Not only does it attract more foreign investment but it may encourage the ECB to put up interest rates, which will directly strengthen the Euro. Otherwise, if economic data is weak, the Euro is likely to fall. Economic data for the four largest economies in the euro area (Germany, France, Italy and Spain) are especially significant, as they account for 75% of the Eurozone’s economy.
Another significant data release for the Euro is the Trade Balance. This indicator measures the difference between what a country earns from its exports and what it spends on imports over a given period. If a country produces highly sought after exports then its currency will gain in value purely from the extra demand created from foreign buyers seeking to purchase these goods. Therefore, a positive net Trade Balance strengthens a currency and vice versa for a negative balance.
United States Trade Representative Katherine Tai announced on Tuesday that she will be proposing modifications to China tariffs and will continue to work with partners to continue to expand opportunities for US workers and manufacturers, per Reuters.
Key takeaways
"Further action required beyond tariff changes to address China's unfair policies."
"Will recommend establishing exclusion process for machinery used in domestic manufacturing, including 19 exclusions for solar manufacturing equipment."
"Will recommend additional funding for US customs and border protection to increase enforcement of Sect. 301 tariffs."
"Will recommend greater collaborations between private companies and government to combat state-sponsored technology theft."
"China has not eliminated many of its technology transfer-related acts, policies, and practices."
"China has in some cases become aggressive, including through cyber intrusions and cybertheft in attempts to acquire foreign tech."
"Research shows tariffs have minimal impacts on economy-wide prices and employment."
"Research shows prior Section 301 tariffs have contributed to reducing US imports of Chinese goods and increasing imports from US allies and partners."
Market reaction
These remarks don't seem to be having an immediate impact on risk mood. At the time of press, US stock index futures were trading modestly higher on the day.
- Germany’s ZEW Economic Sentiment Index advanced to 47.1 in May.
- EUR/USD continues to fluctuate below 1.0800 after the sentiment data.
The headline German ZEW Economic Sentiment Index improved to 47.1 in May from 42.9 in April. This reading came in above the market expectation of 46.3.
Similarly, the Current Situation Index rose to -72.3 from -79.2, surpassing analysts' estimate of -75.
The Eurozone ZEW Economic Sentiment Index arrived at 47 in May, compared to 43.9 in April and the market expectation of 46.1.
"Signs of an economic recovery are growing, bolstered by better assessments of the overall Eurozone and of China as a key export market," the ZEW Institue said in its press release. "The increased optimism is reflected in particular in the sharp rise in expectations for domestic consumption, followed by the construction and machinery sectors."
Market reaction
EUR/USD showed no immediate reaction to these data and was last seen trading little changed on the day at 1.0785.
- Gold finds its feet amid continued geopolitical risk aversion.
- Demand from investors including central banks due to Gold’s safe-haven qualities remains high.
- XAU/USD finds support and remains in a short-term uptrend, indicating it could recover.
Gold price (XAU/USD) stabilizes in the $2,330s on Tuesday as geopolitical risks continue to stoke demand for the safe-haven asset.
Gains may be capped, however, after data out of the US indicated interest rates will probably remain elevated for some time yet, reducing the attractiveness of the non-yielding precious metal.
Gold price finds a floor on geopolitical risks
Gold price finds a floor on Tuesday as rising geopolitical risks prime demand for the safe-haven asset.
Increasing protests against Israel’s occupation of Gaza, Russia’s opening up of a new front in Ukraine, as well as fears of a fragmentation in global trade have lifted the “threat-level” of geopolitical risk up a notch.
IMF warns that global trade is at risk
In a speech to the Stanford Institute for Economic Policy Research on Monday, Gita Gopinath, the First Deputy Managing Director of the IMF warned: “Countries are reevaluating their trading partners based on economic and national security concerns,” adding that if the trend continued, “we could see a broad retreat from global rules of engagement and, with it, a significant reversal of the gains from economic integration.”
Western and US sanctions against Russia, Iran and other emerging market nations are a factor in the “fragmentation” of trade alliances along geopolitical lines. The response by investors and central banks is to horde Gold.
Golden alternative to the US Dollar
The move by BRICs nations away from the use of the US Dollar as the medium of international trade has increased demand for Gold as a possible replacement.
This has been the main reason for the surge in non-Western central bank demand for Gold and a corresponding reduction in US Dollar reserves.
Gold is seen as a possible replacement for the US Dollar as a safe store of value in international trade deals between nations with volatile domestic currencies, according to Carnegie Endowment for International Peace, an advisory service based in Washington.
Gold capped by US data
Gold price upside may be capped, however, following survey data from the Reserve Bank of New York which showed US consumers still expect shop prices to rise over the next year. The data indicates the Federal Reserve (Fed) might have to keep interest rates elevated for longer to wrestle inflation down.
NY Consumer Sentiment in April, released on Monday, showed one-year-ahead inflation expectations rose to 3.3%, from 3.0% in March, the level it had been at since November 2023. The reading is well above the 2.0% target of the Federal Reserve and makes it likely the Fed will keep interest rates higher for longer.
Since Gold is a non-interest-bearing asset it’s a less attractive option when real interest rates are high.
Real interest rates – or interest investors can get minus inflation – remain relatively high according to data from the Federal Reserve Bank of Cleveland, increasing the opportunity-cost of holding non-yielding assets such as Gold.
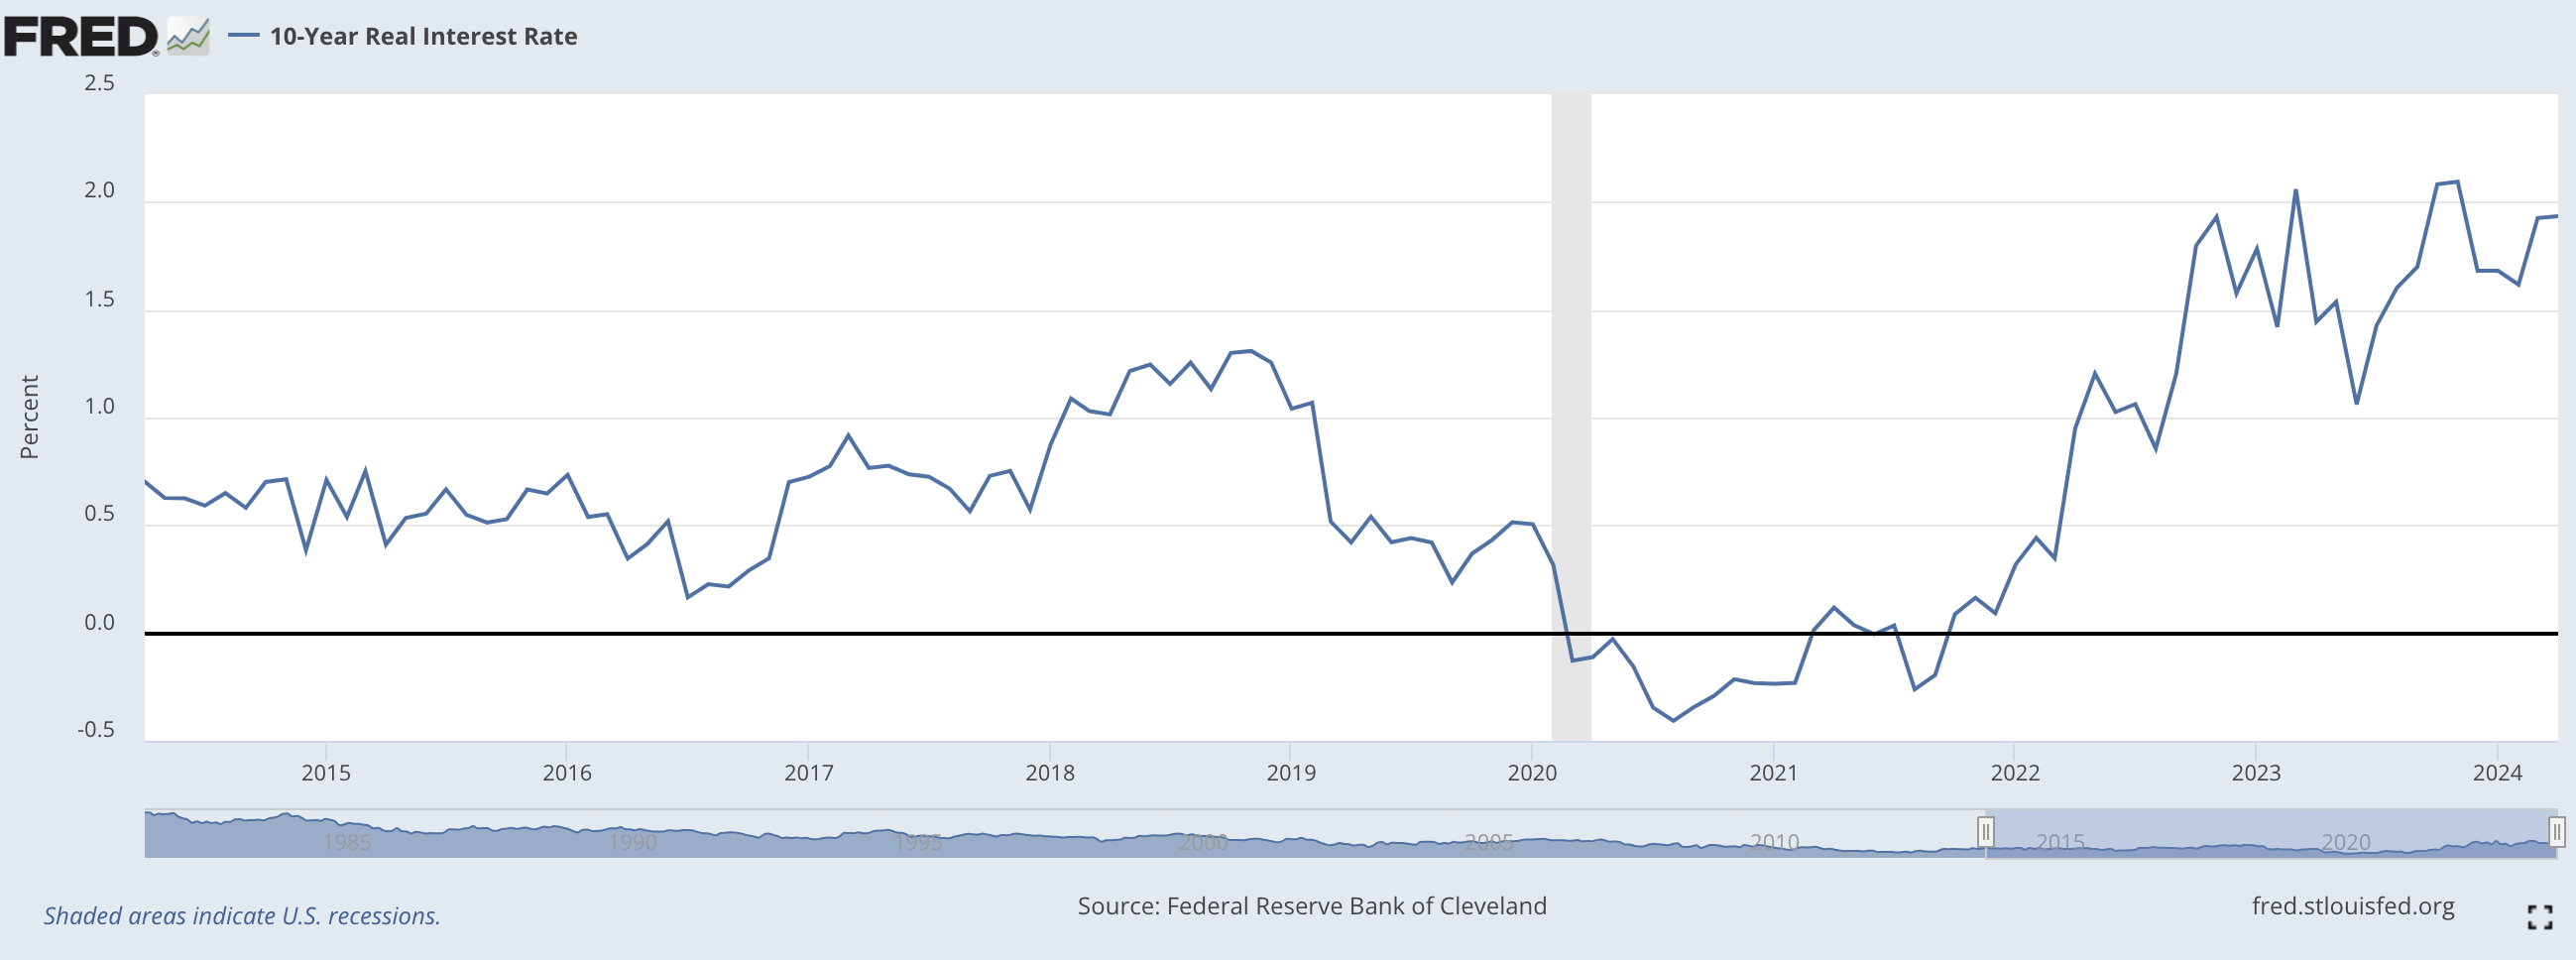
10-Year Real Interest Rate. Source: Federal Reserva Bank of Cleveland
Technical Analysis: Gold price finds support after backslide
Gold price (XAU/USD) has found a floor after backsliding over recent sessions.
Gold broke below major support from previous highs at around $2,350 but has since found support just above another set of highs at around $2,330.
XAU/USD 4-hour Chart
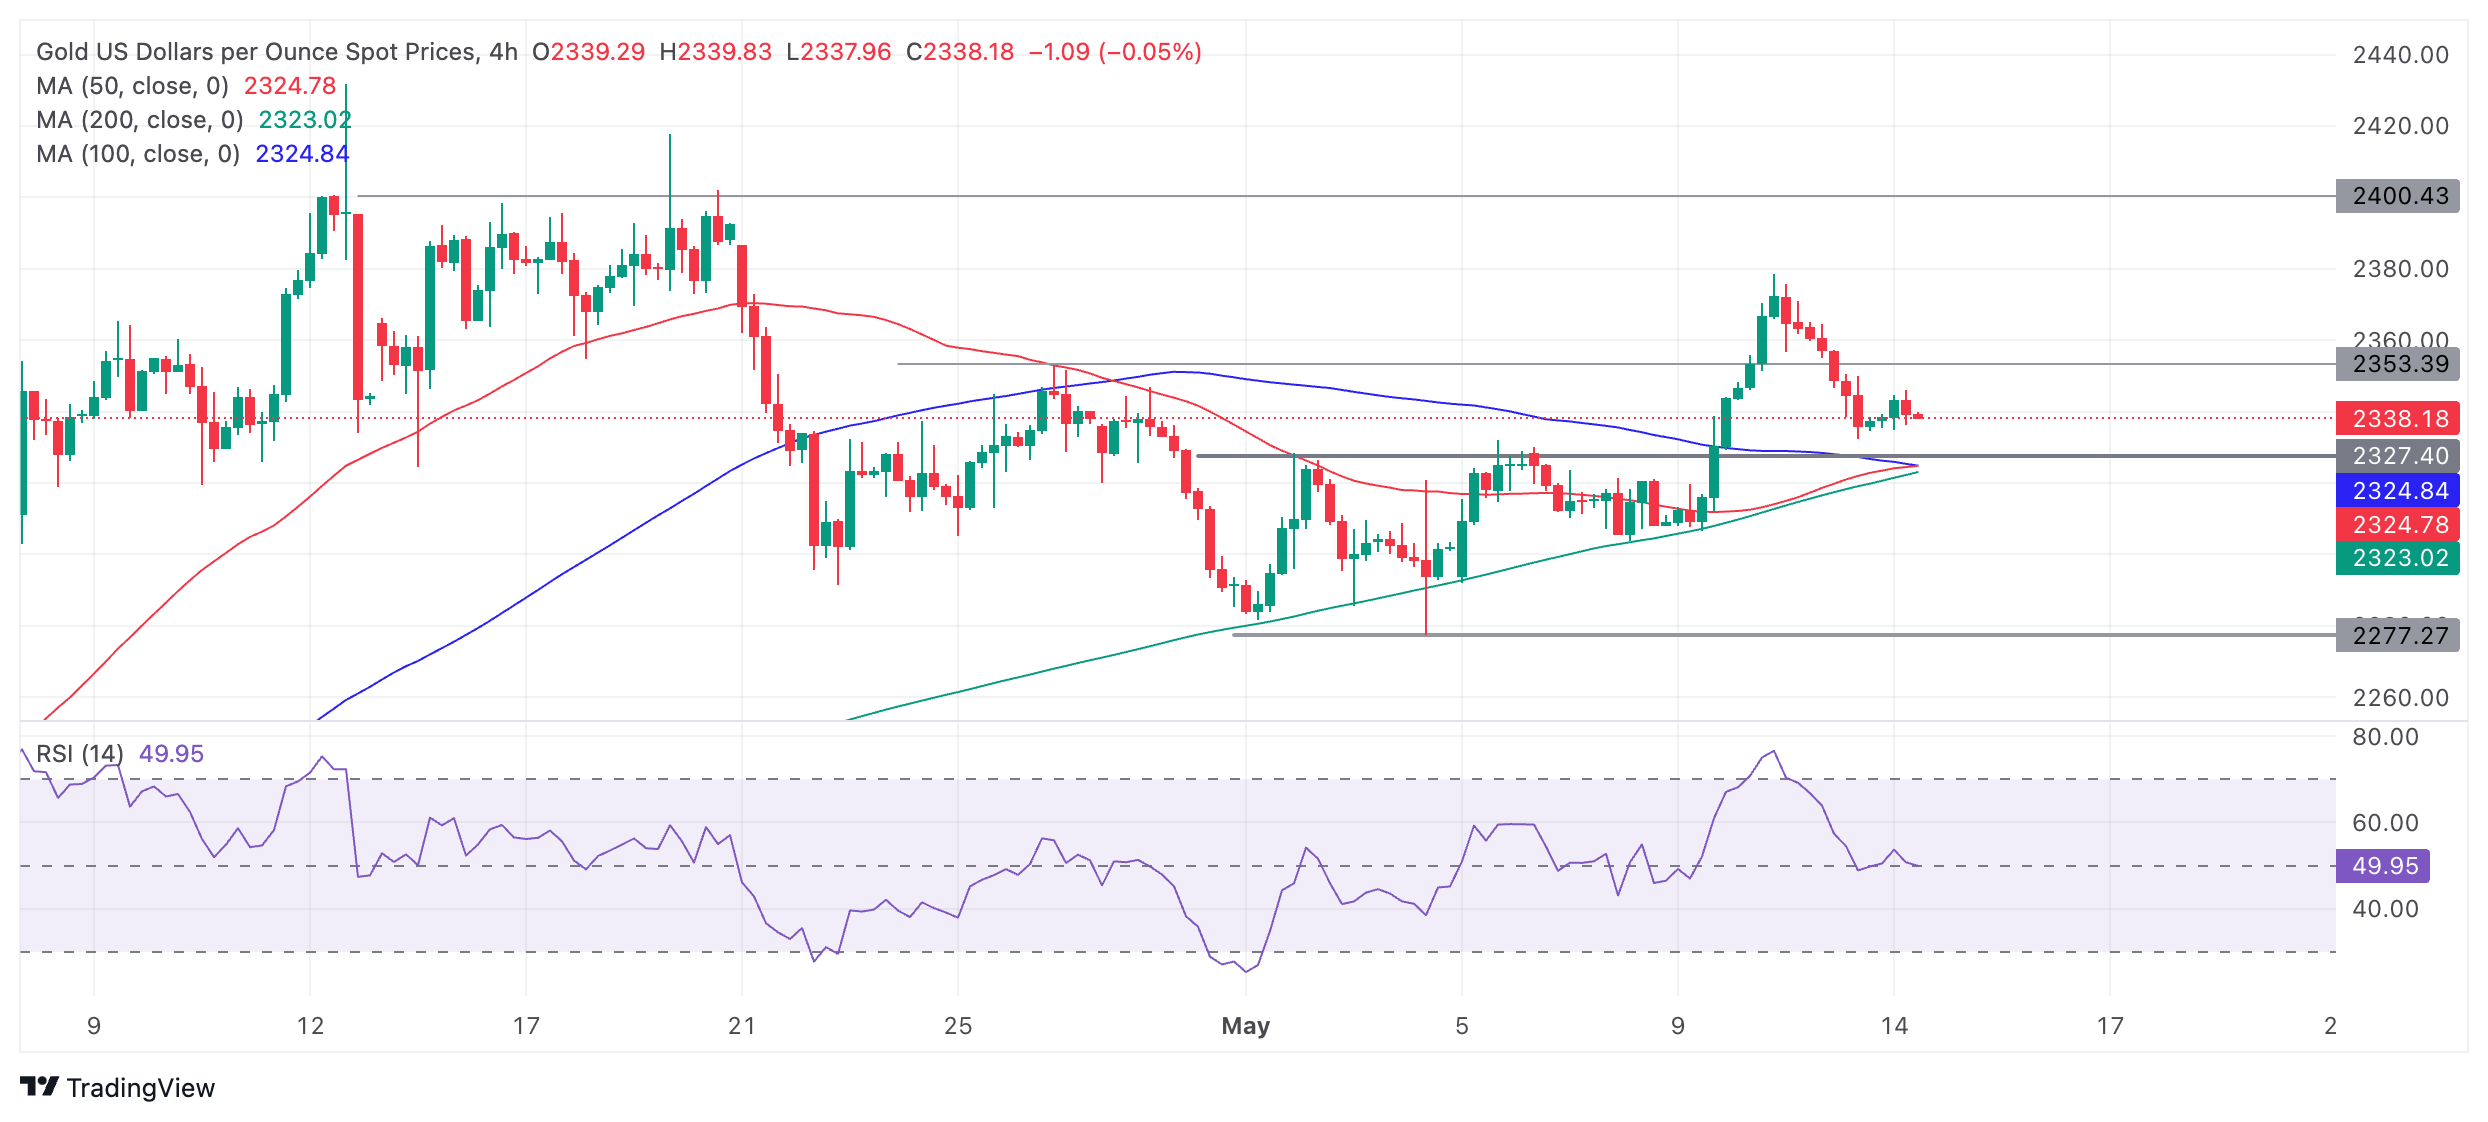
Despite the steep correction, the precious metal remains in a bullish short-term trend, which given the old saying “the trend is your friend”, is likely to resume and push prices higher again. There are no signs yet the uptrend is resuming, although bearish momentum on the pullback has petered out for now.
Assuming the uptrend does resume, the next target for Gold would be at around $2,400, roughly at the April highs. A breakback above the $2,378 May 10 high would provide confirmation.
The medium and long-term charts (daily and weekly) are also bullish, adding a supportive backdrop for Gold.
Gold FAQs
Gold has played a key role in human’s history as it has been widely used as a store of value and medium of exchange. Currently, apart from its shine and usage for jewelry, the precious metal is widely seen as a safe-haven asset, meaning that it is considered a good investment during turbulent times. Gold is also widely seen as a hedge against inflation and against depreciating currencies as it doesn’t rely on any specific issuer or government.
Central banks are the biggest Gold holders. In their aim to support their currencies in turbulent times, central banks tend to diversify their reserves and buy Gold to improve the perceived strength of the economy and the currency. High Gold reserves can be a source of trust for a country’s solvency. Central banks added 1,136 tonnes of Gold worth around $70 billion to their reserves in 2022, according to data from the World Gold Council. This is the highest yearly purchase since records began. Central banks from emerging economies such as China, India and Turkey are quickly increasing their Gold reserves.
Gold has an inverse correlation with the US Dollar and US Treasuries, which are both major reserve and safe-haven assets. When the Dollar depreciates, Gold tends to rise, enabling investors and central banks to diversify their assets in turbulent times. Gold is also inversely correlated with risk assets. A rally in the stock market tends to weaken Gold price, while sell-offs in riskier markets tend to favor the precious metal.
The price can move due to a wide range of factors. Geopolitical instability or fears of a deep recession can quickly make Gold price escalate due to its safe-haven status. As a yield-less asset, Gold tends to rise with lower interest rates, while higher cost of money usually weighs down on the yellow metal. Still, most moves depend on how the US Dollar (USD) behaves as the asset is priced in dollars (XAU/USD). A strong Dollar tends to keep the price of Gold controlled, whereas a weaker Dollar is likely to push Gold prices up.
- GBP/JPY depreciates after the mixed UK employment data released on Tuesday.
- The ILO Unemployment Rate (3M) rose to 4.3% in March and remained above levels from a year ago.
- Former BoJ executive Kazuo Momma has suggested that the central bank is likely to postpone its next rate hike until September.
GBP/JPY snaps its six-day winning streak, trading around 195.90 during the European session on Tuesday. The Pound Sterling (GBP) is encountering challenges following the release of mixed UK employment data, which is undermining the GBP/JPY cross.
The ILO Unemployment Rate (3M) rose to 4.3% in March from 4.2% in the previous reading, aligning with the market consensus of 4.3%. The number of unemployed individuals rose by 46,000 to a total of 1.49 million, which remained above levels from a year ago.
Additionally, the number of people claiming jobless benefits increased by 8.9K in April from a decline of 2.4K in March. The UK Employment Change came in at -177K in the three months to March, compared to a previous reading of -156K.
Huw Pill, Chief Economist at the Bank of England (BoE), commented, "We can cut interest rates while maintaining a restrictive policy stance. It's not unreasonable to believe that over the summer, we will have enough confidence to consider rate cuts," as reported by forexlive.com.
On the JPY front, former Bank of Japan’s (BoJ) executive Kazuo Momma suggested that the central bank is expected to delay its next rate hike until September. Momma indicates that policymakers are likely to prefer waiting until at least September to gather more information from the government's monthly wage data for July and August.
Japan’s Finance Minister Shunichi Suzuki has stated that the government is collaborating with the Bank of Japan to ensure alignment in policy objectives regarding foreign exchange. He further noted that they are implementing all feasible measures to closely monitor movements in the Japanese Yen.
Silver prices (XAG/USD) rose on Tuesday, according to FXStreet data. Silver trades at $28.36 per troy ounce, up 0.56% from the $28.20 it cost on Monday.
Silver prices have increased by 11.35% since the beginning of the year.
| Unit measure | Today Price |
|---|---|
| Silver price per troy ounce | $28.36 |
| Silver price per gram | $0.91 |
The Gold/Silver ratio, which shows the number of troy ounces of Silver needed to equal the value of one troy ounce of Gold, stood at 82.51 on Tuesday, down from 82.85 on Monday.
Investors might use this ratio to determine the relative valuation of Gold and Silver. Some may consider a high ratio as an indicator that Silver is undervalued – or Gold is overvalued – and might buy Silver or sell Gold accordingly. Conversely, a low ratio might suggest that Gold is undervalued relative to Silver.
Silver FAQs
Silver is a precious metal highly traded among investors. It has been historically used as a store of value and a medium of exchange. Although less popular than Gold, traders may turn to Silver to diversify their investment portfolio, for its intrinsic value or as a potential hedge during high-inflation periods. Investors can buy physical Silver, in coins or in bars, or trade it through vehicles such as Exchange Traded Funds, which track its price on international markets.
Silver prices can move due to a wide range of factors. Geopolitical instability or fears of a deep recession can make Silver price escalate due to its safe-haven status, although to a lesser extent than Gold's. As a yieldless asset, Silver tends to rise with lower interest rates. Its moves also depend on how the US Dollar (USD) behaves as the asset is priced in dollars (XAG/USD). A strong Dollar tends to keep the price of Silver at bay, whereas a weaker Dollar is likely to propel prices up. Other factors such as investment demand, mining supply – Silver is much more abundant than Gold – and recycling rates can also affect prices.
Silver is widely used in industry, particularly in sectors such as electronics or solar energy, as it has one of the highest electric conductivity of all metals – more than Copper and Gold. A surge in demand can increase prices, while a decline tends to lower them. Dynamics in the US, Chinese and Indian economies can also contribute to price swings: for the US and particularly China, their big industrial sectors use Silver in various processes; in India, consumers’ demand for the precious metal for jewellery also plays a key role in setting prices.
Silver prices tend to follow Gold's moves. When Gold prices rise, Silver typically follows suit, as their status as safe-haven assets is similar. The Gold/Silver ratio, which shows the number of ounces of Silver needed to equal the value of one ounce of Gold, may help to determine the relative valuation between both metals. Some investors may consider a high ratio as an indicator that Silver is undervalued, or Gold is overvalued. On the contrary, a low ratio might suggest that Gold is undervalued relative to Silver.
Gold prices fell in India on Tuesday, according to data from India's Multi Commodity Exchange (MCX).
Gold price stood at 71,922 Indian Rupees (INR) per 10 grams, down INR 287 compared with the INR 72,209 it cost on Monday.
As for futures contracts, Gold prices increased to INR 71,887 per 10 gms from INR 71,855 per 10 gms.
Prices for Silver futures contracts increased to INR 85,180 per kg from INR 84,886 per kg.
| Major Indian city | Gold Price |
|---|---|
| Ahmedabad | 74,520 |
| Mumbai | 74,230 |
| New Delhi | 74,250 |
| Chennai | 74,510 |
| Kolkata | 74,390 |
Global Market Movers: Comex Gold price holds positive ground, all eyes are on the crucial US inflation data
- Fed vice chair Philip Jefferson called for holding interest rates at current levels until inflation shows more signs of easing, adding that he will continue to look for additional evidence that inflation is going to return to the 2% target.
- The Fed is likely to cut the Fed funds rate by 25 basis points (bps) in September, said 70 of 108 economists, while cutting rates by 50 bps in 2024, said 65 of 108 economists, according to the Reuters poll.
- On Monday, Israeli soldiers moved deep into the ruins of Gaza's northern frontier to retake an area from Hamas rebels, while tanks and troops pushed a highway into Rafah, forcing Palestinian residents to flee, per Reuters.
- The US Producer Price Index (PPI) for April is expected to show an increase of 2.2% YoY, while the Core PPI figure is estimated to show an increase of 2.4% YoY in the same period.
- The US Consumer Price Index (CPI) inflation is forecast to ease to 3.4% YoY in April from 3.5% prior. Core CPI inflation is projected to drop to 3.6% YoY in April from 3.8% in March.
Gold FAQs
Gold has played a key role in human’s history as it has been widely used as a store of value and medium of exchange. Currently, apart from its shine and usage for jewelry, the precious metal is widely seen as a safe-haven asset, meaning that it is considered a good investment during turbulent times. Gold is also widely seen as a hedge against inflation and against depreciating currencies as it doesn’t rely on any specific issuer or government.
Central banks are the biggest Gold holders. In their aim to support their currencies in turbulent times, central banks tend to diversify their reserves and buy Gold to improve the perceived strength of the economy and the currency. High Gold reserves can be a source of trust for a country’s solvency. Central banks added 1,136 tonnes of Gold worth around $70 billion to their reserves in 2022, according to data from the World Gold Council. This is the highest yearly purchase since records began. Central banks from emerging economies such as China, India and Turkey are quickly increasing their Gold reserves.
Gold has an inverse correlation with the US Dollar and US Treasuries, which are both major reserve and safe-haven assets. When the Dollar depreciates, Gold tends to rise, enabling investors and central banks to diversify their assets in turbulent times. Gold is also inversely correlated with risk assets. A rally in the stock market tends to weaken Gold price, while sell-offs in riskier markets tend to favor the precious metal.
The price can move due to a wide range of factors. Geopolitical instability or fears of a deep recession can quickly make Gold price escalate due to its safe-haven status. As a yield-less asset, Gold tends to rise with lower interest rates, while higher cost of money usually weighs down on the yellow metal. Still, most moves depend on how the US Dollar (USD) behaves as the asset is priced in dollars (XAU/USD). A strong Dollar tends to keep the price of Gold controlled, whereas a weaker Dollar is likely to push Gold prices up.
Bank of England (BoE) Chief Economist Huw Pill said on Tuesday that they still have some work to do on inflation persistence, as reported by Reuters.
Key takeaways
"UK labour market remains pretty tight by historical standards."
"Pay growth data is consistent with small decline in Q1."
"Rates of pay growth remain quite well above what would be consistent for meeting 2% inflation target sustainably."
"We need to keep a restrictive stance on monetary policy that continues to bear down on domestic inflation persistence."
"Not unreasonable to believe that over summer we will see enough confidence to consider rate cuts."
Market reaction
GBP/USD stays under modest bearish pressure following these comments and was last seen losing 0.22% on the day at 1.2530.
FX option expiries for May 14 NY cut at 10:00 Eastern Time, via DTCC, can be found below
- EUR/USD: EUR amounts
- 1.0650 1.9b
- 1.0665 563m
- 1.0675 704m
- 1.0690 810m
- 1.0695 416m
- 1.0750 1.5b
- 1.0760 409m
- 1.0800 1.5b
- 1.0850 1.2b
- GBP/USD: GBP amounts
- 1.2495 919m
- 1.2500 1.1b
- 1.2525 680m
- 1.2650 726m
- 1.2655 1.1b
- USD/CHF: USD amounts
- 0.9000 521m
- 0.9100 1.9b
- USD/JPY: USD amounts
- 155.15 602m
- AUD/USD: AUD amounts
- 0.6515 1.8b
- 0.6590 2.2b
- 0.6600 577m
- 0.6700 648m
- USD/CAD: USD amounts
- 1.3700 735m
- 1.3755 579m
- Silver price appreciates due to escalated tensions in the Middle East on Tuesday.
- Israeli troops have advanced into the northern region of Gaza in an attempt to retake territory from Hamas militants.
- Fed officials indicated maintaining higher rates for longer, which may undermine the non-yielding assets like Silver.
Silver price extends its gains for the second consecutive session, trading around $28.30 per troy ounce during the early European session on Tuesday. The increase in the value of the safe-haven Silver can be attributed to the escalating geopolitical tensions in the Middle East. According to Reuters, Israeli forces have advanced significantly into the northern part of Gaza in an effort to reclaim territory from Hamas fighters.
The Silver price was bolstered after the weekly US Initial Jobless Claims released on Thursday, which surged to a near eight-month high at 231,000. This signaled a weakening labor market and potentially provided the Federal Reserve (Fed) with room to commence its easing cycle sooner rather than later.
However, Fed officials emphasized the importance of maintaining higher rates for longer given the elevated inflation. Fed Vice Chair Philip Jefferson reiterated this stance on Monday, advocating for keeping current interest rates until signs of inflation easing emerge. Higher interest rates typically dampen the attractiveness of non-yielding assets such as Silver.
Later in the day, traders will likely monitor the US Producer Price Index (PPI), a crucial economic indicator. The PPI report could have a significant impact on the US market. Traders might utilize the PPI data to gauge the potential outcome of the Consumer Price Index (CPI). If the PPI data surpasses expectations, it could reinforce the hawkish sentiment surrounding the Fed's commitment to maintaining higher rates for an extended period. This could potentially exert pressure on Silver prices.
- The Mexican Peso pulls back after its recent run of gains on the back of fears of global trade becoming fragmented.
- US Dollar recovers against the Peso after data shows the Fed is likely to kick the can of lowering interest rates further down the road.
- USD/MXN stalls in its short-term downtrend, but more downside is still foreseen.
The Mexican Peso (MXN) meets resistance in its upwards climb on Tuesday – and pulls back – possibly due to growing concerns about the fragmentation of international trade that could especially hit export-based emerging-market economies like Mexico.
Against the US Dollar (USD) more specifically, MXN weakens after US data showed heightened US inflation expectations, which are likely to keep interest rates in the US elevated for some time, increasing capital inflows to the Dollar.
USD/MXN is exchanging hands at 16.80, EUR/MXN at 18.12 and GBP/MXN at 21.10, at the time of publication.
Mexican Peso loses upside momentum on geopolitical concerns
The Mexican Peso lost ground on Monday after the International Monetary Fund (IMF) warned global economic growth might lose momentum due to a fragmentation of international trade along geopolitical lines.
In a speech at Stanford Institute for Economic Policy Research, IMF First Deputy Managing Director Gita Gopinath, said: “Countries are reevaluating their trading partners based on economic and national security concerns,” adding that if the trend continued, “we could see a broad retreat from global rules of engagement and, with it, a significant reversal of the gains from economic integration.”
The news comes after the US plans to impose further protectionist policies by quadrupling tariffs on Chinese electric vehicles and BRICS countries continued to erode the hegemony of the US Dollar.
At the start of May, India and Nigeria, for example, agreed to settle all their trade using their domestic currencies rather than the US Dollar. This follows similar agreements between other nations, especially China, Russia and Iran, designed to circumvent Western sanctions.
USD/MXN recovers on elevated US inflation expectations
The US Dollar gained in most pairs, including versus the Mexican Peso, after data from the Reserve Bank of New York showed a rise in inflation expectations which reinforced the inflationary outlook presented in Friday’s Michigan sentiment survey.
The NY Survey of Consumer Expectations showed consumer inflation expectations for one year ahead increased to 3.3% in April, from 3.0% in March – and the three previous months. It was the highest level since November and stands well above the Federal Reserve’s 2.0% target.
The data further reduces the chance of the Fed moving to cut interest rates in the near future, which is positive for the USD since an expectation of higher interest rates increases foreign capital inflows.
Technical Analysis: USD/MXN pulls back in a downtrend
USD/MXN – the value of one US Dollar in Mexican Pesos – has pulled back after decisively breaking below the bottom of a short-term range last week.
The breakout of the range was a decisive technical development that suggests a protracted move lower. However, after falling to a new low of 16.72 on Friday, USD/MXN reversed and started recovering.
USD/MXN 4-hour Chart
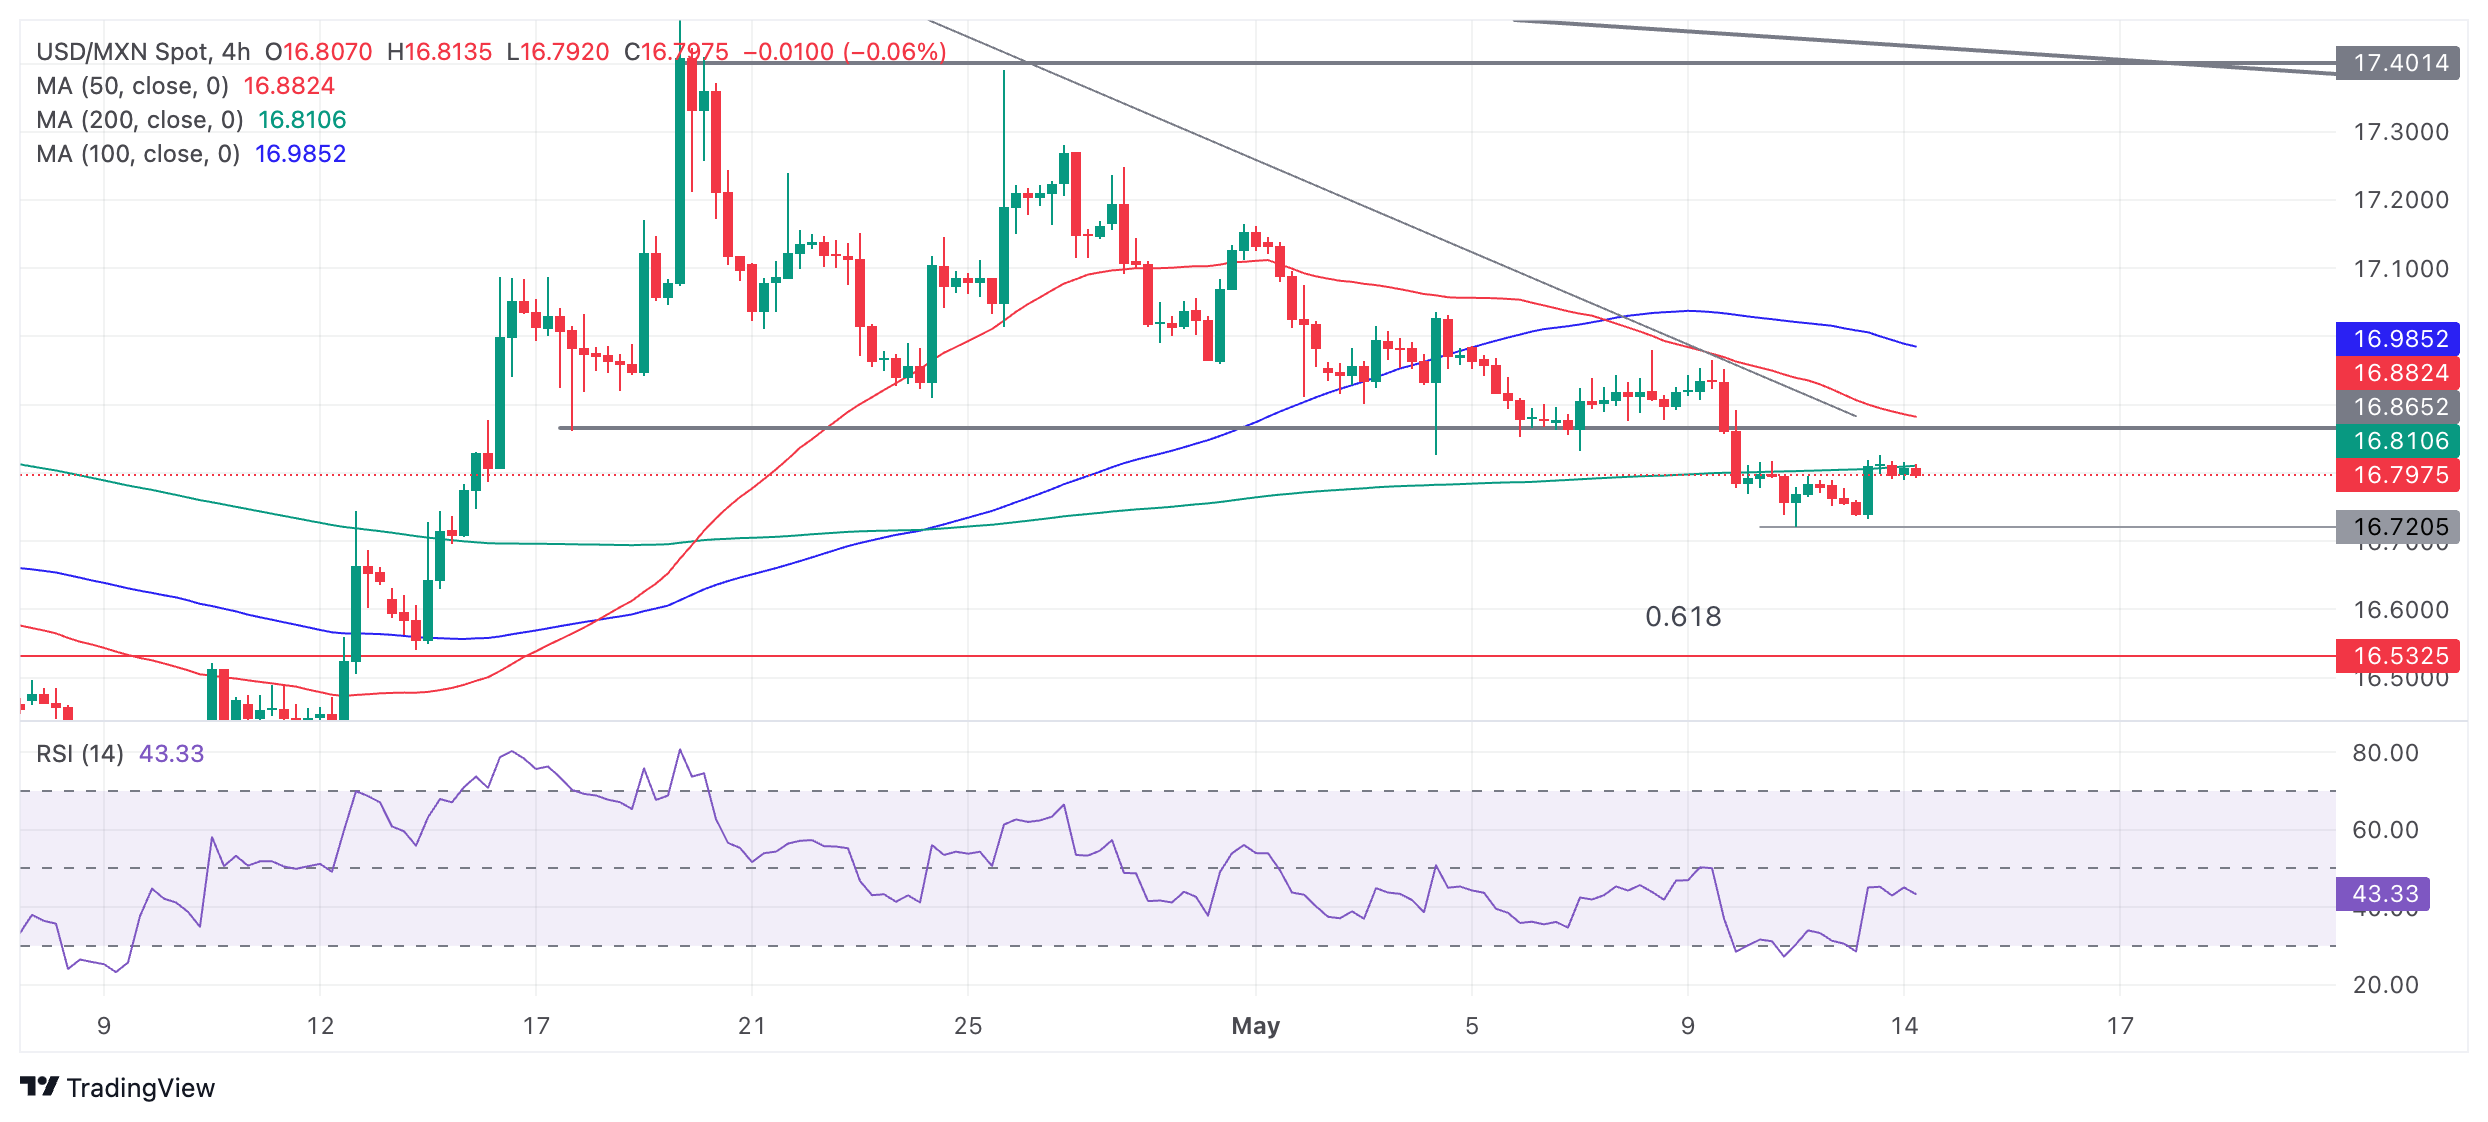
The recovery is not yet strong enough to negate the bearish implications of the breakdown from the range. The short-term trend is still probably bearish, which, given the old adage that the “trend is your friend”, suggests the odds continue favoring more downside.
The pair is still probably likely to resume its downtrend and hit the conservative target for the breakout at 16.54. This is the 0.681 Fibonacci ratio of the height of the range extrapolated lower. Further bearishness after that could reach 16.34, the full height of the range extrapolated lower.
A break below 16.72 would confirm a continuation south.
Given the medium and long-term trends are bearish, the odds further favor more downside for the pair in line with those trends.
Risk sentiment FAQs
In the world of financial jargon the two widely used terms “risk-on” and “risk off'' refer to the level of risk that investors are willing to stomach during the period referenced. In a “risk-on” market, investors are optimistic about the future and more willing to buy risky assets. In a “risk-off” market investors start to ‘play it safe’ because they are worried about the future, and therefore buy less risky assets that are more certain of bringing a return, even if it is relatively modest.
Typically, during periods of “risk-on”, stock markets will rise, most commodities – except Gold – will also gain in value, since they benefit from a positive growth outlook. The currencies of nations that are heavy commodity exporters strengthen because of increased demand, and Cryptocurrencies rise. In a “risk-off” market, Bonds go up – especially major government Bonds – Gold shines, and safe-haven currencies such as the Japanese Yen, Swiss Franc and US Dollar all benefit.
The Australian Dollar (AUD), the Canadian Dollar (CAD), the New Zealand Dollar (NZD) and minor FX like the Ruble (RUB) and the South African Rand (ZAR), all tend to rise in markets that are “risk-on”. This is because the economies of these currencies are heavily reliant on commodity exports for growth, and commodities tend to rise in price during risk-on periods. This is because investors foresee greater demand for raw materials in the future due to heightened economic activity.
The major currencies that tend to rise during periods of “risk-off” are the US Dollar (USD), the Japanese Yen (JPY) and the Swiss Franc (CHF). The US Dollar, because it is the world’s reserve currency, and because in times of crisis investors buy US government debt, which is seen as safe because the largest economy in the world is unlikely to default. The Yen, from increased demand for Japanese government bonds, because a high proportion are held by domestic investors who are unlikely to dump them – even in a crisis. The Swiss Franc, because strict Swiss banking laws offer investors enhanced capital protection.
- The Pound Sterling remains on the sidelines around 1.2560 after weak UK Employment data.
- UK employers laid off workers for the third time in a row but wage growth remains steady.
- The US Dollar consolidates ahead of US inflation, Retail Sales data for April.
The Pound Sterling (GBP) remains in a confined range of around 1.2560 in Tuesday’s London session as investors take time to analyse the United Kingdom Employment data for three months ending in March. The United Kingdom (UK) Office for National Statistics (ONS) has reported that labor market has witnessed a drawdown for the third time in a row while wage growth momentum remains steady at relatively high levels.
UK employers laid off 177K workers, which was higher than the firing of 156K employees in the December-February period. The ILO Unemployment Rate rises to 4.3% as expected from the former reading of 4.2%. The labor market data clearly indicates that the economy is struggling to bear the consequences of higher interest rates by the Bank of England (BoE).
In the current scenario, the situation seems favorable for the BoE to begin reducing interest rates, as price pressures are also consistently softening. However, strong wage growth that is feeding service inflation will continue to remain a major concern for BoE policymakers.
Annual Average Earnings (both excluding and including bonuses) grew steadily by 6.0% and 5.7%, respectively, for the three months to March period. Investors anticipated Average Earnings, including bonuses, to decelerate to 5.3%.
Daily digest market movers: Pound Sterling consolidates as traders reassess BoE rate-cut hopes after UK Employment report
- The Pound Sterling ranges around 1.2560 against the US Dollar. The US Dollar Index (DXY), which tracks the US Dollar’s value against six major currencies, rebounded after discovering buying interest near the weekly low at around 105.00. However, it has turned sideways, around 105.20, as investors await the United States Producer Price Index (PPI) data for April, which will be published at 12:30 GMT.
- Annual headline PPI is forecasted to have grown by 2.2% from 2.1% in March. In the same period, the core PPI, which strips off volatile food and energy prices, is estimated to have grown by 2.4%, at the same pace as the previous month. Economists anticipate that monthly headline PPI rose at a higher pace of 0.3% from the prior reading of 0.2% with core reading growing steadily by 0.2%.
- This week, the US economic calendar is filled with top-tier data. The next move in the US Dollar will be majorly driven by the Consumer Price Index (CPI) and Retail Sales data for April, which will be published on Wednesday. The consumer inflation data will influence speculation about the Federal Reserve (Fed) returning to policy normalisation from the September meeting.
Technical Analysis: Pound Sterling remains well-supported above 20-day EMA
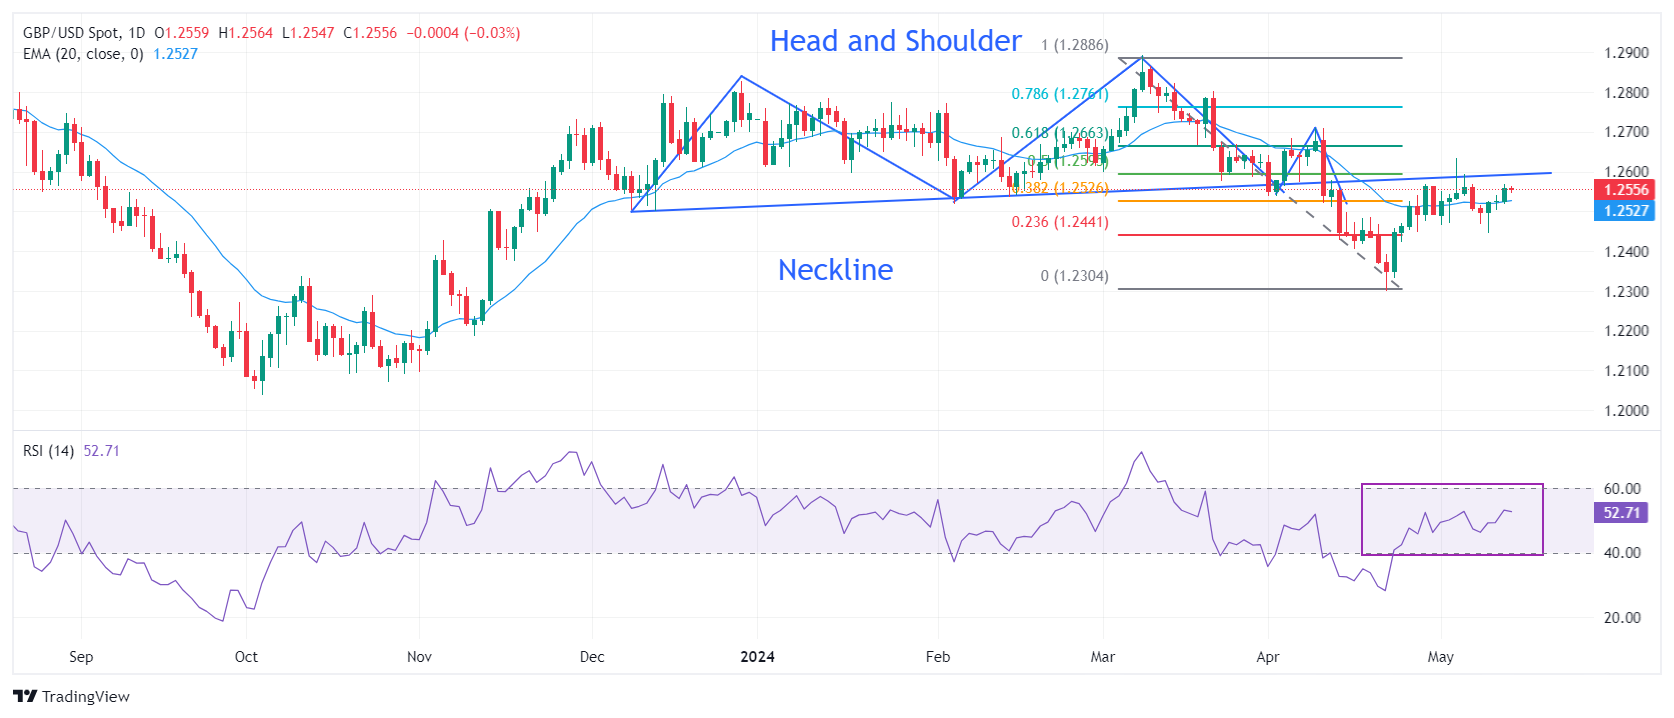
The Pound Sterling exhibits strength near 1.2560 due to a strong near-term outlook. The GBP/USD pair remains comfortably established above the 20-day Exponential Moving Average (EMA), which trades around 1.2530. The pair has retraced 38.2% losses recorded from a 10-month high around 1.2900.
The Cable continues to face pressure near the neckline of the Head and Shoulder (H&S) chart pattern formed on a daily timeframe. On April 12, the pair fell sharply after breaking below the neckline of the H&S pattern plotted from December 8 low around 1.2500.
The 14-period Relative Strength Index (RSI) oscillates in the 40.00-60.00 range, suggesting indecisiveness among market participants.
Pound Sterling FAQs
The Pound Sterling (GBP) is the oldest currency in the world (886 AD) and the official currency of the United Kingdom. It is the fourth most traded unit for foreign exchange (FX) in the world, accounting for 12% of all transactions, averaging $630 billion a day, according to 2022 data. Its key trading pairs are GBP/USD, aka ‘Cable’, which accounts for 11% of FX, GBP/JPY, or the ‘Dragon’ as it is known by traders (3%), and EUR/GBP (2%). The Pound Sterling is issued by the Bank of England (BoE).
The single most important factor influencing the value of the Pound Sterling is monetary policy decided by the Bank of England. The BoE bases its decisions on whether it has achieved its primary goal of “price stability” – a steady inflation rate of around 2%. Its primary tool for achieving this is the adjustment of interest rates. When inflation is too high, the BoE will try to rein it in by raising interest rates, making it more expensive for people and businesses to access credit. This is generally positive for GBP, as higher interest rates make the UK a more attractive place for global investors to park their money. When inflation falls too low it is a sign economic growth is slowing. In this scenario, the BoE will consider lowering interest rates to cheapen credit so businesses will borrow more to invest in growth-generating projects.
Data releases gauge the health of the economy and can impact the value of the Pound Sterling. Indicators such as GDP, Manufacturing and Services PMIs, and employment can all influence the direction of the GBP. A strong economy is good for Sterling. Not only does it attract more foreign investment but it may encourage the BoE to put up interest rates, which will directly strengthen GBP. Otherwise, if economic data is weak, the Pound Sterling is likely to fall.
Another significant data release for the Pound Sterling is the Trade Balance. This indicator measures the difference between what a country earns from its exports and what it spends on imports over a given period. If a country produces highly sought-after exports, its currency will benefit purely from the extra demand created from foreign buyers seeking to purchase these goods. Therefore, a positive net Trade Balance strengthens a currency and vice versa for a negative balance.
- EUR/GBP weakens to 0.8590 following the UK employment data on Tuesday.
- The UK Unemployment Rate climbed to 4.3% in the three months to March from 4.2%, as expected.
- The markets are largely pricing in the ECB rate cut as early as next month, with two possible further cuts this year.
The EUR/GBP cross trades on a softer note near 0.8590 during the early European trading hours on Tuesday. The cross faces rejection after retracing from its nearly 0.8600 psychological level due to mixed UK employment data. The attention will shift to the ZEW Survey from the Eurozone and Germany, along with the ECB's Schnabel speech later in the day.
The latest data from the UK Office for National Statistics on Tuesday showed that the ILO Unemployment Rate rose to 4.3% in the three months to March from 4.2% in the previous reading, in line with the market consensus of 4.3%. Meanwhile, the number of people claiming jobless benefits rose by 8.9K in April from a decline of 2.4K in March. The UK Employment Change came in at -177K in the three months to March, versus a -156K decrease in the previous reading. However, these reports had little to no market reaction to the Pound Sterling (GBP).
On the Euro front, the European Central Bank (ECB) kept rates on hold at a record high at its meeting last month, as widely expected. The ECB policymakers hinted that a June rate cut was much in consideration as inflation measures continued to decline and wage growth eased. Investors will take more cues from the advanced Eurozone Gross Domestic Product (GDP) for Q1, due on Wednesday about the economic outlook. In case of a weaker-than-expected outcome, this might weigh on the Euro (EUR) and drag the EUR/GBP cross lower.
Here is what you need to know on Tuesday, May 14:
The action in foreign exchange markets remain quiet following Monday's subdued trading. The US Dollar (USD) Index continues to fluctuate in a tight channel above as investors await producer inflation data for April and Federal Reserve Chairman Jerome Powell's speech. Earlier in the day, the European economic docket will feature ZEW Survey results for Germany and the Euro area.
The benchmark 10-year US Treasury bond yield ended the first trading day of the week flat and main equity indexes closed little changed. The Producer Price Index (PPI) is forecast to rise 0.3% on a monthly basis in April following the 0.2% increase recorded in March. In the early American session, Chairman Powell will appear at a moderated discussion with De Nederlandsche Bank (DNB) President Klaas Knot at the Foreign Bankers' Association's Annual General Meeting in Amsterdam.
US Dollar PRICE This week
The table below shows the percentage change of US Dollar (USD) against listed major currencies this week. US Dollar was the strongest against the British Pound.
| USD | EUR | GBP | JPY | CAD | AUD | NZD | CHF | |
|---|---|---|---|---|---|---|---|---|
| USD | 0.13% | 0.23% | -0.44% | -0.07% | -0.05% | -0.15% | -0.24% | |
| EUR | -0.13% | 0.15% | -0.56% | -0.17% | -0.15% | -0.26% | -0.36% | |
| GBP | -0.23% | -0.15% | -0.63% | -0.33% | -0.30% | -0.41% | -0.51% | |
| JPY | 0.44% | 0.56% | 0.63% | 0.39% | 0.35% | 0.34% | 0.16% | |
| CAD | 0.07% | 0.17% | 0.33% | -0.39% | -0.01% | -0.07% | -0.10% | |
| AUD | 0.05% | 0.15% | 0.30% | -0.35% | 0.00% | -0.01% | -0.21% | |
| NZD | 0.15% | 0.26% | 0.41% | -0.34% | 0.07% | 0.00% | -0.10% | |
| CHF | 0.24% | 0.36% | 0.51% | -0.16% | 0.10% | 0.21% | 0.10% |
The heat map shows percentage changes of major currencies against each other. The base currency is picked from the left column, while the quote currency is picked from the top row. For example, if you pick the US Dollar from the left column and move along the horizontal line to the Japanese Yen, the percentage change displayed in the box will represent USD (base)/JPY (quote).
EUR/USD climbed above 1.0800 on Monday but erased a small portion of its daily gains in the American session to close below this level. Early Tuesday, the pair fluctuates in a narrow channel at around 1.0780.
USD/JPY rose 0.3% on Monday and continued to push higher toward 156.50 early Tuesday. Japanese Finance Minister Shunichi Suzuki repeated on Tuesday that it is important for currencies to move in a stable manner, reflecting fundamentals. He added that they will closely monitor the foreign exchange moves. Earlier in the day, the data from Japan showed that the PPI rose 0.9% on a yearly basis in April, matching the market expectation and March's increase.
Meanwhile, the International Monetary Fund (IMF) said that Japan's commitment to allowing the Japanese Yen (JPY) to move flexibly would let the Bank of Japan (BoJ) focus on achieving price stability and warned against the call by certain experts to use monetary policy to limit the currency's depreciation, as reported by Reuters.
The UK's Office for National Statistics reported on Tuesday that the ILO Unemployment Rate edged higher to 4.3% in the three months to March from 4.2% as expected. The Claimant Count Change rose 8.9K, while the Employment Change was down 177K in April. Additionally, Average Earnings Excluding Bonus rose 6% (YoY) in the three months to March, while Average Earnings Including Bonus were up 5.7% (YoY) in the same period. GBP/USD showed no immediate reaction to these data and was last seen moving up and down in a narrow band at around 1.2550.
Gold staged a downward correction and lost about 1% on Monday. XAU/USD edged higher early Tuesday but remains below $2,350.
Economic Indicator
Fed's Chair Powell speech
Jerome H. Powell took office as a member of the Board of Governors of the Federal Reserve System on May 25, 2012, to fill an unexpired term. On November 2, 2017, President Donald Trump nominated Powell to serve as the next Chairman of the Federal Reserve. Powell assumed office as Chair on February 5, 2018.
Read more.Next release: Tue May 14, 2024 14:00
Frequency: Irregular
Consensus: -
Previous: -
Source: Federal Reserve
- The Unemployment Rate in the UK edged higher to 4.3%.
- GBP/USD continues to trade in a tight range at around 1.2550.
The UK's Office for National Statistics reported on Tuesday that the ILO Unemployment Rate edged higher to 4.3% in the three months to March from 4.2%. This reading matched the market expectation.
Other details of the job report showed that the Claimant Count Change rose 8.9K, while the Employment Change was down 177K in April. Additionally, Average Earnings Excluding Bonus rose 6% (YoY) in the three months to March while Average Earnings Including Bonus were up 5.7% (YoY) in the same period.
Market reaction
These figures failed to trigger a noticeable reaction in GBP/USD and the pair was last seen trading virtually unchanged on the day slightly above 1.2550.
- USD/CHF appreciates as the Fed is expected to maintain higher interest rates for longer.
- Fed Vice Chair Philip Jefferson has advocated for keeping rates higher until signs of inflation easing become clear.
- The Swiss Franc may encounter selling pressure as the SNB intensifies its focus on combating inflation.
USD/CHF continues to gain ground for the third successive session, trading around 0.9090 during the Asian hours on Tuesday. The US Dollar edges higher against the Swiss Franc (CHF) due to cautious statements from Federal Reserve (Fed) officials, emphasizing the importance of maintaining higher rates for longer given the elevated inflation. Fed Vice Chair Philip Jefferson reiterated this stance on Monday, advocating for keeping current interest rates until signs of inflation easing emerge.
On Tuesday, traders will likely watch the US Producer Price Index (PPI), a pivotal economic indicator. The PPI report could significantly impact the US market. Traders may use the PPI data to assess the potential outcome of the Consumer Price Index (CPI). If the PPI data exceeds expectations, it could further strengthen the US Dollar.
On the Swiss front, SECO Consumer Climate (YoY) experienced a slight decline in April, with a reading of -38.1. However, it still significantly trailed the long-term average. On Tuesday, Producer and Import Prices data for April is due, an indicator of consumer price inflation provided by the Federal Statistical Office of Switzerland.
The Swiss Franc may struggle as the Swiss National Bank (SNB) has redirected its attention from deliberately strengthening the Swiss Franc (CHF), as the central bank intensifies its focus on combating inflation. Last week, the SNB saw its foreign exchange reserves climb to CHF 720 billion in April, marking the fifth consecutive increase.
- NZD/USD attracts some sellers around 0.6015 in Tuesday’s early European session.
- The Fed's Jefferson was the latest policymaker to call for holding rates at current levels until inflation shows more signs of easing.
- New Zealand’s two-year inflation expectations dropped from 2.50% in Q1 to 2.33% in Q2 of 2024.
The NZD/USD pair extends its downside near 0.6015 during the early European session on Tuesday. The downtick of the pair is backed by the stronger US Dollar (USD) broadly. Traders turn to a cautious mood ahead of the US Producer Price Index (PPI) for April and Federal Reserve (Fed) Chair Jerome Powell's speech later in the day.
Fed policymakers emphasized the need to hold the rate for longer amid stubborn inflation in the US. On Monday, Fed Vice Chair Philip Jefferson called for holding rates at current levels until inflation shows more signs of easing, and he will monitor more evidence to make sure that inflation is going to return to the 2% target.
Meanwhile, San Francisco Fed President Mary Daly highlighted the need for prolonged restrictive policy to achieve the Fed's inflation targets. Minneapolis Fed Neel Kashkari noted that he is in “wait and see mode” about future monetary policy. These hawkish remarks have boosted the Greenback broadly and created a headwind for the NZD/USD pair.
On the Kiwi front, the Reserve Bank of New Zealand (RBNZ) showed on Monday that New Zealand’s two-year inflation expectations dropped from 2.50% in Q1 2024 to 2.33% in Q2 of this year, while the average one-year inflation expectations eased to 2.73% in Q2 vs. 3.22% seen in the first quarter of 2024. The falling inflation expectations exert some selling pressure on the New Zealand Dollar (NZD).
- GBP/USD holds its position around the major level of 1.2550 due to improved risk sentiment.
- Unemployment Rate (3M) is expected to show an increase in unemployed workers.
- Fed Vice Chair Philip Jefferson has advocated for maintaining current interest rates until signs of inflation easing become apparent.
GBP/USD hovers around 1.2560 during the Asian session on Tuesday following the improved risk appetite. The Pound Sterling (GBP) received support from higher-than-anticipated UK Gross Domestic Product (GDP) figures released on Friday. The UK economy expanded by 0.6% in Q1, surpassing expectations and signaling the end of the country's brief recession. This robust economic rebound represents the strongest growth seen in over two years.
Market participants are now turning their attention to employment data expected later in the day. There are anticipations of an increase in the number of individuals claiming jobless benefits in April, as indicated by the UK Claimant Count Change. Additionally, the ILO Unemployment Rate (3M) is expected to show a rise in the number of unemployed workers in the UK.
The US Dollar Index (DXY), which measures the US Dollar (USD) against six major currencies, advances due to cautious statements from Federal Reserve (Fed) officials. They emphasize the importance of maintaining higher rates for an extended period given the elevated inflation. Fed Vice Chair Philip Jefferson reiterated this stance on Monday, advocating for keeping current interest rates until signs of inflation easing emerge.
The Federal Reserve Bank of New York conducted a consumer sentiment survey, suggesting that US consumers foresee a widespread acceleration in inflation over the next year. Expectations have risen to 3.3%, up from the 3.0% figure reported in March for consumer one-year inflation expectations.
Investors are closely watching the Producer Price Index (PPI) on Tuesday, a pivotal economic indicator. The PPI report could significantly impact the market, serving as a catalyst. Traders may use the PPI data to assess the potential outcome of the Consumer Price Index (CPI). If the PPI data exceeds expectations, it could further strengthen the US Dollar.
- WTI Oil price remains firmer due to uncertainties surrounding Oil supply amid wildfires in Canada.
- The WTI price may face challenges as Fed officials have suggested that interest rates may stay higher for longer.
- The Oil supply could be affected as Iraq has committed to the voluntary production cuts agreed upon by OPEC.
West Texas Intermediate (WTI) crude Oil price trades around $79.50 per barrel during Tuesday's Asian session. These gains in Oil prices could be attributed to uncertainties surrounding crude Oil supply amid wildfires in remote western Canada. Concerns arose regarding the country's production capacity of 3.3 million barrels per day (bpd). Firefighters on Monday were in a race against time to contain blazes in British Columbia and Alberta, which are situated close to the heart of the country's Oil sands industry.
The Oil supply could also be affected as Hayan Abdul Ghani, Deputy Prime Minister for Energy Affairs and Minister of Oil of Iraq, reiterated Iraq's dedication to the voluntary Oil production cuts agreed upon by the Organization of the Petroleum Exporting Countries (OPEC), Reuters cited Iraqi state news agency.
In the United States (US), Federal Reserve (Fed) officials have suggested that interest rates may stay elevated for a prolonged duration, a move that could potentially impact economic growth and diminish Oil demand in the United States (US), the world's largest Oil consumer. Fed Vice Chair Philip Jefferson echoed this sentiment on Monday, advocating for the retention of current interest rates until signs of inflation easing become more apparent.
On Tuesday, investors are anticipating the release of the OPEC Monthly Market Report (MOMR), which delves into significant factors influencing the global Oil market and offers insights into crude Oil market trends for the upcoming year. Additionally, attention will be on the API Weekly Crude Oil Stock report, which will provide comprehensive data on total US and regional refinery operations and the production of major petroleum products.
- Gold price trades on a stronger note on Tuesday.
- Any signs of sticky inflation might further diminish expectations of US interest rate cuts this year, pressuring yellow metal.
- The US PPI report for April and Fed Chair Jerome Powell's speech will be in the spotlight on Tuesday.
The gold price (XAU/USD) rebounds despite the consolidation of the US Dollar (USD) on Tuesday. The upside of yellow metal might be limited as traders might wait on the sidelines ahead of key US inflation data this week. The higher-for-longer US rate mantra has exerted some selling pressure on the XAU/USD in recent sessions. However, the safe-haven flows due to escalating Middle East tensions might boost the gold price for the time being.
Investors will closely watch the key US economic data this week. The US Producer Price Index (PPI) for April is due on Tuesday, along with Fed Chair Jerome Powell's speech. The attention will shift to the US Consumer Price Index (CPI), due on Wednesday. These reports could offer insights into the timing of the Fed's initial rate adjustment. The hotter-than-expected inflation figures might dampen the prospect of a Fed rate cut, weighing on the precious metal. Higher interest rates may reduce overall investment demand for gold as they increase the opportunity cost associated with holding gold.
Daily Digest Market Movers: Gold price holds positive ground, all eyes are on the crucial US key inflation data
- Fed vice chair Philip Jefferson called for holding interest rates at current levels until inflation shows more signs of easing, adding that he will continue to look for additional evidence that inflation is going to return to the 2% target.
- The Fed is likely to cut the Fed funds rate by 25 basis points (bps) in September, said 70 of 108 economists, while cutting rates by 50 bps in 2024, said 65 of 108 economists, according to the Reuters poll.
- On Monday, Israeli soldiers moved deep into the ruins of Gaza's northern frontier to retake an area from Hamas rebels, while tanks and troops pushed a highway into Rafah, forcing Palestinian residents to flee, per Reuters.
- The US Producer Price Index (PPI) for April is expected to show an increase of 2.2% YoY, while the Core PPI figure is estimated to show an increase of 2.4% YoY in the same period.
- The US Consumer Price Index (CPI) inflation is forecast to ease to 3.4% YoY in April from 3.5% prior. Core CPI inflation is projected to drop to 3.6% YoY in April from 3.8% in March.
Technical Analysis: Gold price maintains a positive outlook
The gold price edges higher on the day. The yellow metal keeps the bullish vibe unchanged as XAU/USD remains above the key 100-day Exponential Moving Average (EMA) on the four-hour chart. The upward momentum is reinforced by the 14-day Relative Strength Index (RSI), which is in the bullish zone at 52.70, indicating the support level is likely to hold rather than break.
A high of May 10 at $2,378 acts as an immediate resistance level for the precious metal. Extended gains will pave the way to the $2,400 psychological level. A break above this level will see a rally to an all-time high near $2,432, en route to the $2,500 round figure.
On the other hand, the crucial support level will emerge around the $2,325–$2,340 zone, portraying the confluence of the resistance-turned-support level and the 100-period EMA. The breach of this level will expose a low of May 2 at $2,281.
US Dollar price today
The table below shows the percentage change of US Dollar (USD) against listed major currencies today. US Dollar was the weakest against the Pound Sterling.
| USD | EUR | GBP | CAD | AUD | JPY | NZD | CHF | |
| USD | 0.06% | 0.05% | 0.12% | 0.14% | 0.13% | 0.15% | 0.06% | |
| EUR | -0.07% | 0.00% | 0.05% | 0.06% | 0.08% | 0.09% | 0.01% | |
| GBP | -0.05% | 0.02% | 0.08% | 0.09% | 0.10% | 0.11% | 0.02% | |
| CAD | -0.12% | -0.05% | -0.08% | 0.02% | 0.02% | 0.03% | -0.05% | |
| AUD | -0.15% | -0.06% | -0.09% | 0.00% | 0.01% | 0.00% | -0.05% | |
| JPY | -0.13% | -0.07% | -0.10% | -0.02% | 0.00% | -0.01% | -0.07% | |
| NZD | -0.13% | -0.03% | -0.07% | -0.03% | 0.00% | 0.02% | -0.05% | |
| CHF | -0.09% | -0.01% | -0.03% | 0.05% | 0.06% | 0.07% | 0.08% |
The heat map shows percentage changes of major currencies against each other. The base currency is picked from the left column, while the quote currency is picked from the top row. For example, if you pick the Euro from the left column and move along the horizontal line to the Japanese Yen, the percentage change displayed in the box will represent EUR (base)/JPY (quote).
Gold FAQs
Gold has played a key role in human’s history as it has been widely used as a store of value and medium of exchange. Currently, apart from its shine and usage for jewelry, the precious metal is widely seen as a safe-haven asset, meaning that it is considered a good investment during turbulent times. Gold is also widely seen as a hedge against inflation and against depreciating currencies as it doesn’t rely on any specific issuer or government.
Central banks are the biggest Gold holders. In their aim to support their currencies in turbulent times, central banks tend to diversify their reserves and buy Gold to improve the perceived strength of the economy and the currency. High Gold reserves can be a source of trust for a country’s solvency. Central banks added 1,136 tonnes of Gold worth around $70 billion to their reserves in 2022, according to data from the World Gold Council. This is the highest yearly purchase since records began. Central banks from emerging economies such as China, India and Turkey are quickly increasing their Gold reserves.
Gold has an inverse correlation with the US Dollar and US Treasuries, which are both major reserve and safe-haven assets. When the Dollar depreciates, Gold tends to rise, enabling investors and central banks to diversify their assets in turbulent times. Gold is also inversely correlated with risk assets. A rally in the stock market tends to weaken Gold price, while sell-offs in riskier markets tend to favor the precious metal.
The price can move due to a wide range of factors. Geopolitical instability or fears of a deep recession can quickly make Gold price escalate due to its safe-haven status. As a yield-less asset, Gold tends to rise with lower interest rates, while higher cost of money usually weighs down on the yellow metal. Still, most moves depend on how the US Dollar (USD) behaves as the asset is priced in dollars (XAU/USD). A strong Dollar tends to keep the price of Gold controlled, whereas a weaker Dollar is likely to push Gold prices up.
- EUR/USD could test the upper boundary of the symmetrical triangle.
- Breaking above the upper boundary could potentially shift momentum toward a bullish trend.
- A breach below the 14-day EMA at 1.0752 could prompt the pair to test the psychological threshold of 1.0700.
EUR/USD has recovered its recent gains registered in the previous session, trading around 1.0780 during the Asian session on Tuesday. From a technical perspective, analysis indicates a sideways trend for the pair as it continues to lie within the symmetrical triangle. A surpassing of the upper boundary could shift the momentum toward a bullish trend.
However, the momentum indicator Moving Average Convergence Divergence (MACD) indicates an upward momentum for the EUR/USD pair. While it is positioned above the centerline, there is a divergence observed above the signal line. If the signal line crosses over the centerline, it would reinforce the bullish sentiment.
The EUR/USD pair faces an immediate barrier at the upper boundary of the symmetrical triangle aligned with the psychological level of 1.0800. A break above this level could support the pair to test April’s high of 1.0885.
On the downside, key support for the EUR/USD pair is anticipated around the 14-day Exponential Moving Average (EMA) at 1.0752. A break below the latter could lead the pair to navigate the region around the psychological threshold of 1.0700, coinciding with the lower boundary of the symmetrical triangle around the level of 1.0690. Further support levels may emerge around April’s low at 1.0601.
EUR/USD: Daily Chart
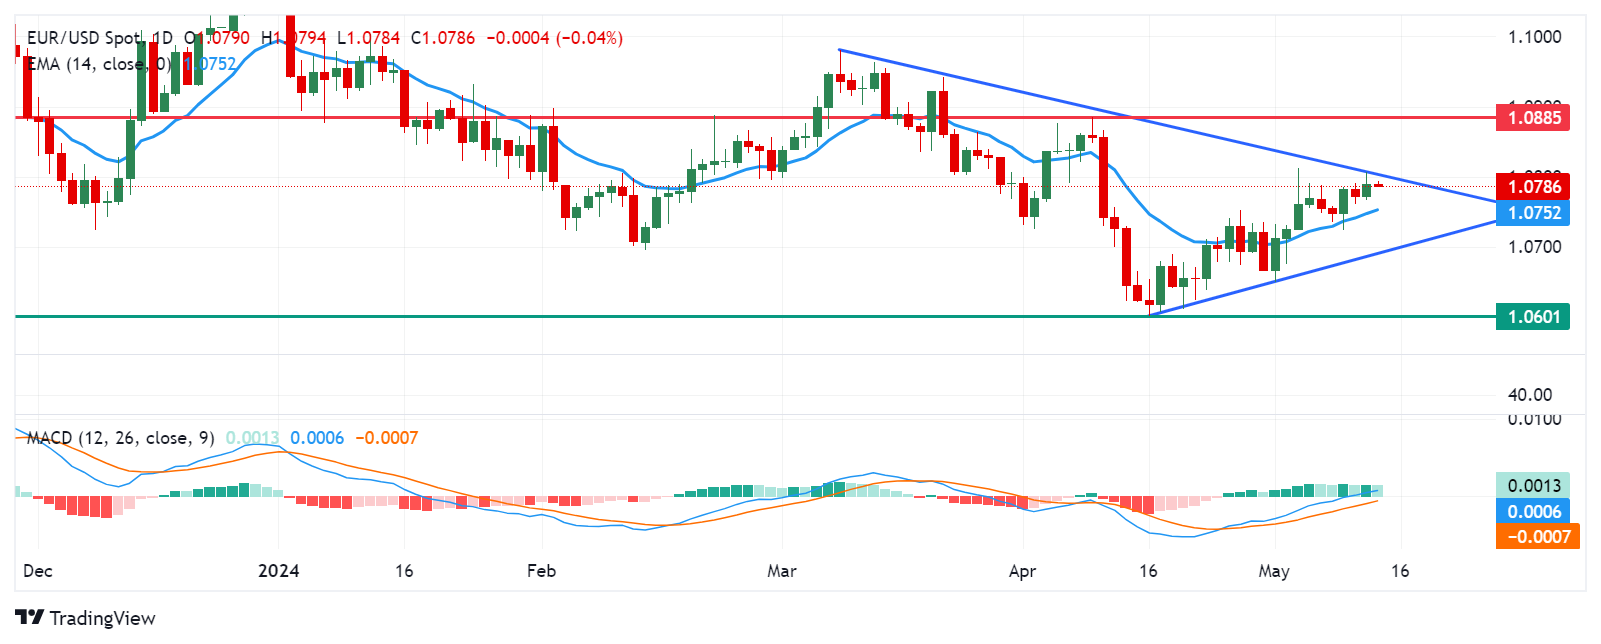
| Raw materials | Closed | Change, % |
|---|---|---|
| Silver | 28.205 | 0.13 |
| Gold | 2336.63 | -1.05 |
| Palladium | 964.15 | -1.56 |
- The Australian Dollar received pressure due to the dovish RBA.
- Australia's Treasury predicted that CPI inflation would decrease to 3.75% by mid-2024.
- The US Dollar remains firmer as Fed officials indicated to maintain higher rates for longer.
The Australian Dollar (AUD) retraces its recent gains on Tuesday ahead of the Yearly Budget Release by the Australian Government due to be published later in the day. Treasurer Jim Chalmers hinted at positive developments during Sunday morning television interviews, suggesting that the upcoming budget could show a faster decline in inflation than the Reserve Bank of Australia (RBA) had predicted, as reported by The Guardian.
The Australian Dollar received pressure following the RBA's less hawkish stance after opting to maintain its interest rate at 4.35% last week. Speculation had been rife in the markets that the central bank might lean toward a more hawkish position, spurred by recent inflation data surpassing expectations.
The US Dollar Index (DXY), which gauges the performance of the US Dollar (USD) against six major currencies, gains ground due to cautious remarks from Federal Reserve (Fed) officials, highlighting the necessity of maintaining higher rates for an extended period as inflation remains elevated. Fed Vice Chair Philip Jefferson echoed this sentiment on Monday, advocating for the retention of current interest rates until signs of inflation easing become more apparent.
On Tuesday, investors are expected to closely monitor the crucial economic indicator, the Producer Price Index (PPI), which could serve as a significant market catalyst. Traders may utilize the PPI report to gauge the potential outcome of the Consumer Price Index (CPI), and if the data turns out to be higher than expected, it could further bolster the US Dollar.
Daily Digest Market Movers: Australian Dollar edges lower due to a dovish RBA
- National Australia Bank's Business Conditions fell to 7 in April, from the previous reading of 9. Meanwhile, National Australia Bank's Business Confidence stood at the reading of 1.
- Australia's Treasury announced on Sunday that they forecasted that inflation could re-enter the Reserve Bank of Australia's (RBA) target range by the end of 2024. In their December outlook, officials predicted that CPI inflation would decrease to 3.75% by mid-2024 and 2.75% by mid-2025, aligning it with the RBA's target range.
- Federal Reserve Bank of New York conducted a consumer sentiment survey, indicating that US consumers anticipate a broad acceleration in inflation over the next year, with expectations reaching 3.3%. This marks an increase from the 3.0% figure reported in March for consumer one-year inflation expectations.
- According to Reuters, Neel Kashkari, President of the Minneapolis Federal Reserve (Fed), expressed caution regarding the level of restrictiveness in monetary policy. On Friday, Kashkari stated in an interview with CNBC that while the threshold for another rate hike is high, it cannot be entirely ruled out. Additionally, San Francisco Fed President Mary Daly emphasized the necessity of maintaining a prolonged restrictive policy to attain the Federal Reserve's inflation objectives.
- On Friday, the University of Michigan Consumer Sentiment Index, dropped to 67.4 in May from April's 77.2, marking a six-month low and falling short of market expectations of 76 reading. Meanwhile, the UoM 5-year Consumer Inflation Expectation rose to 3.1%, a six-month high, up from 3.0% prior.
- The Commonwealth Bank of Australia (CBA) has revised down its forecasts for the Australian Dollar at the end of 2024 is 0.69, down from 0.71 previously. CBA cites factors such as the interest rate gap and elevated US Treasury bond yields, which are bolstering the US Dollar. The Federal Reserve's cautious stance on high inflation and its reluctance to implement rate cuts further support the US Dollar, as reported on forexlive.com.
Technical Analysis: Australian Dollar maintains its position near the major level of 0.6600
The Australian Dollar trades around 0.6600 on Monday. The AUD/USD pair consolidates within a symmetrical triangle pattern. Additionally, the 14-day Relative Strength Index (RSI) suggests a bullish inclination as it remains above the 50 level.
Potential movements indicate that the AUD/USD pair may challenge the upper boundary near the swing area at 0.6650. A breakthrough above this level could lead to a retest of March's high at 0.6667, with further upward momentum possibly targeting the psychological threshold of 0.6700.
Conversely, immediate support is foreseen around the 14-day Exponential Moving Average (EMA) at 0.6569. If the pair breaches below this EMA, it might face additional selling pressure, potentially descending towards the region around the lower boundary of the symmetrical triangle, approximately at 0.6465.
AUD/USD: Daily Chart
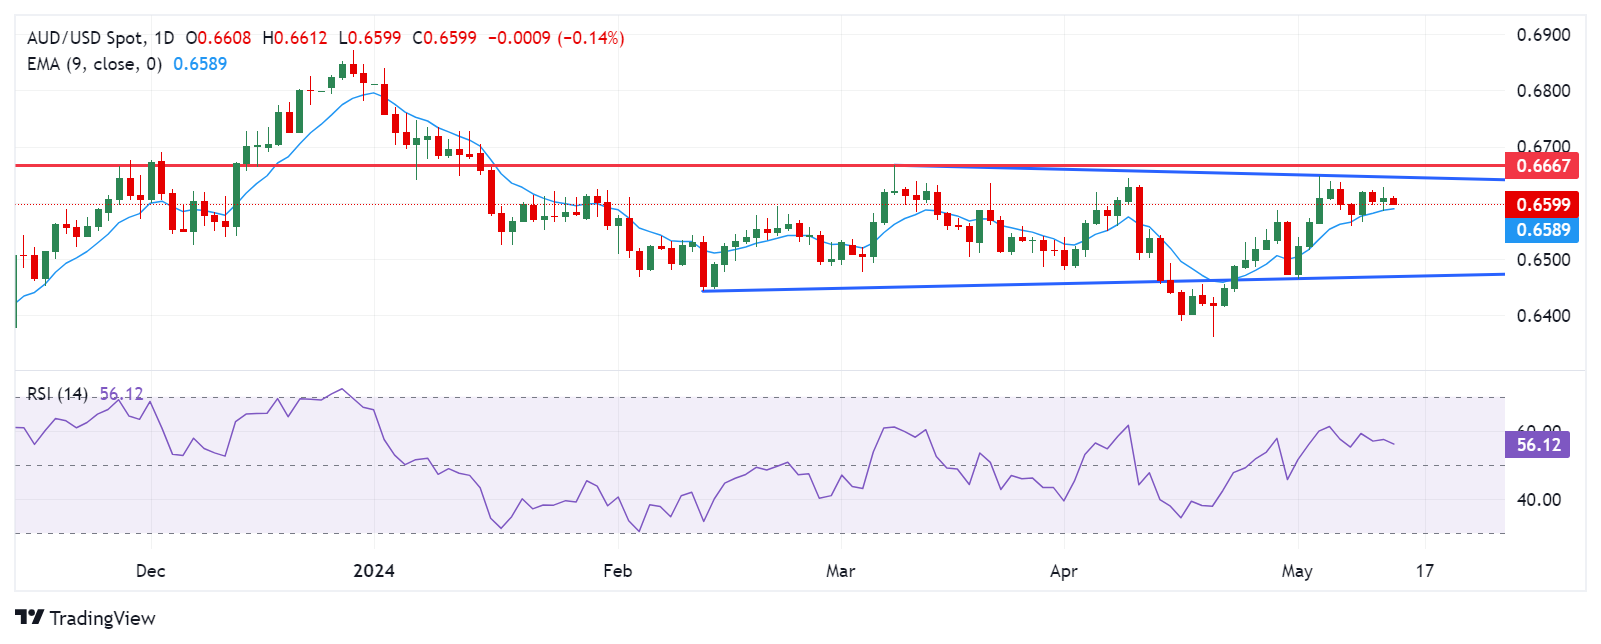
Australian Dollar price today
The table below shows the percentage change of the Australian Dollar (AUD) against listed major currencies today. The Australian Dollar was the weakest against the US Dollar.
| USD | EUR | GBP | CAD | AUD | JPY | NZD | CHF | |
| USD | 0.05% | 0.03% | 0.07% | 0.09% | 0.10% | 0.13% | 0.02% | |
| EUR | -0.06% | -0.02% | 0.02% | 0.04% | 0.07% | 0.09% | -0.01% | |
| GBP | -0.03% | 0.02% | 0.04% | 0.09% | 0.08% | 0.11% | 0.01% | |
| CAD | -0.07% | -0.03% | -0.06% | 0.04% | 0.04% | 0.06% | -0.03% | |
| AUD | -0.13% | -0.07% | -0.08% | -0.04% | 0.00% | 0.02% | -0.08% | |
| JPY | -0.10% | -0.05% | -0.08% | -0.04% | -0.01% | 0.02% | -0.07% | |
| NZD | -0.13% | -0.06% | -0.08% | -0.06% | -0.02% | -0.01% | -0.09% | |
| CHF | -0.05% | 0.00% | -0.01% | 0.03% | 0.07% | 0.07% | 0.09% |
The heat map shows percentage changes of major currencies against each other. The base currency is picked from the left column, while the quote currency is picked from the top row. For example, if you pick the Euro from the left column and move along the horizontal line to the Japanese Yen, the percentage change displayed in the box will represent EUR (base)/JPY (quote).
Australian Dollar FAQs
One of the most significant factors for the Australian Dollar (AUD) is the level of interest rates set by the Reserve Bank of Australia (RBA). Because Australia is a resource-rich country another key driver is the price of its biggest export, Iron Ore. The health of the Chinese economy, its largest trading partner, is a factor, as well as inflation in Australia, its growth rate, and Trade Balance. Market sentiment – whether investors are taking on more risky assets (risk-on) or seeking safe havens (risk-off) – is also a factor, with risk-on positive for AUD.
The Reserve Bank of Australia (RBA) influences the Australian Dollar (AUD) by setting the level of interest rates that Australian banks can lend to each other. This influences the level of interest rates in the economy as a whole. The main goal of the RBA is to maintain a stable inflation rate of 2-3% by adjusting interest rates up or down. Relatively high interest rates compared to other major central banks support the AUD, and the opposite for relatively low. The RBA can also use quantitative easing and tightening to influence credit conditions, with the former AUD-negative and the latter AUD-positive.
China is Australia’s largest trading partner so the health of the Chinese economy is a major influence on the value of the Australian Dollar (AUD). When the Chinese economy is doing well it purchases more raw materials, goods and services from Australia, lifting demand for the AUD, and pushing up its value. The opposite is the case when the Chinese economy is not growing as fast as expected. Positive or negative surprises in Chinese growth data, therefore, often have a direct impact on the Australian Dollar and its pairs.
Iron Ore is Australia’s largest export, accounting for $118 billion a year according to data from 2021, with China as its primary destination. The price of Iron Ore, therefore, can be a driver of the Australian Dollar. Generally, if the price of Iron Ore rises, AUD also goes up, as aggregate demand for the currency increases. The opposite is the case if the price of Iron Ore falls. Higher Iron Ore prices also tend to result in a greater likelihood of a positive Trade Balance for Australia, which is also positive of the AUD.
The Trade Balance, which is the difference between what a country earns from its exports versus what it pays for its imports, is another factor that can influence the value of the Australian Dollar. If Australia produces highly sought after exports, then its currency will gain in value purely from the surplus demand created from foreign buyers seeking to purchase its exports versus what it spends to purchase imports. Therefore, a positive net Trade Balance strengthens the AUD, with the opposite effect if the Trade Balance is negative.
- USD/CAD holds positive ground near 1.3675 on Tuesday.
- Fed officials said in recent comments that the high-for-longer interest rate narrative is needed to bring down inflation.
- The lower crude oil price weighs on the commodity-linked Canadian Dollar (CAD).
The USD/CAD pair trades on a stronger note around 1.3675 during the Asian session on Tuesday. Amid the light week in terms of Canadian economic data, investors will keep an eye on the US Producer Price Index (PPI) on Tuesday and, the Consumer Price Index (CPI) on Wednesday.
Several Federal Reserve (Fed) officials stated in recent weeks that the current level of interest rate should be held higher for longer to bring down inflation. During the press conference, Fed Chair Jerome Powell said that an interest rate hike was “unlikely,” but he did not fully rule it out. Powell emphasized the need to take more time to gain “greater confidence” that inflation is moving towards the Fed’s 2% target.
Dallas Fed President Lorie Logan said that there are upside risks to inflation, adding that it is too soon to cut interest rates. The high-for-longer US rate narrative is likely to underpin the Greenback and create a tailwind for USD/CAD for the time being.
On the other hand, the decline in crude oil price continues to drag the commodity-linked Canadian Dollar (CAD) lower, as Canada is the leading exporter of oil to the United States. Nonetheless, the upbeat Canadian employment market data for April might convince the Bank of Canada (BoC) to wait longer t to ensure that inflation will be sustained. This, in turn, might cap the downside of the CAD.
The People’s Bank of China (PBoC) set the USD/CNY central rate for the trading session ahead on Tuesday at 7.1053 as compared to the previous day's fix of 7.1030 and 7.2307 Reuters estimates.
Japanese Finance Minister Shunichi Suzuki said on Tuesday that it is important for currencies to move in stable manner, reflecting fundamentals. Suzuki further stated that he will closely monitor the foreign exchange (FX) moves.
Key quotes
“Important for currencies to move in stable manner, reflecting fundamentals.”
“Important for government, BoJ to coordinate policy.”
“Will take thorough response for forex.”
“Closely watching FX moves.”
Market reaction
These comments have little to no market reaction to the Japanese Yen (JPY). At the time of writing, USD/JPY is trading 0.06% higher on the day to trade at 156.31.
Japanese Yen FAQs
The Japanese Yen (JPY) is one of the world’s most traded currencies. Its value is broadly determined by the performance of the Japanese economy, but more specifically by the Bank of Japan’s policy, the differential between Japanese and US bond yields, or risk sentiment among traders, among other factors.
One of the Bank of Japan’s mandates is currency control, so its moves are key for the Yen. The BoJ has directly intervened in currency markets sometimes, generally to lower the value of the Yen, although it refrains from doing it often due to political concerns of its main trading partners. The current BoJ ultra-loose monetary policy, based on massive stimulus to the economy, has caused the Yen to depreciate against its main currency peers. This process has exacerbated more recently due to an increasing policy divergence between the Bank of Japan and other main central banks, which have opted to increase interest rates sharply to fight decades-high levels of inflation.
The BoJ’s stance of sticking to ultra-loose monetary policy has led to a widening policy divergence with other central banks, particularly with the US Federal Reserve. This supports a widening of the differential between the 10-year US and Japanese bonds, which favors the US Dollar against the Japanese Yen.
The Japanese Yen is often seen as a safe-haven investment. This means that in times of market stress, investors are more likely to put their money in the Japanese currency due to its supposed reliability and stability. Turbulent times are likely to strengthen the Yen’s value against other currencies seen as more risky to invest in.
The International Monetary Fund (IMF) said on Tuesday that Japan's commitment to allowing the Japanese Yen (JPY) to move flexibly would let the Bank of Japan (BoJ) focus on achieving price stability while warning against the call by certain experts to use monetary policy to limit the currency's depreciation, per Reuters.
Key quotes
“Further hikes in Japan's short-term policy rate should proceed at a gradual pace and be data-dependent.”
"underscored that Japan's longstanding commitment to a flexible exchange rate regime will help absorb shocks and support monetary policy's focus on price stability.”
“BOJ's state-contingent purchases of JGBs will help mitigate excessive shifts in yields that could undermine financial stability during policy transition.”
“Clear, effective communication strategy by BOJ that continues to underscore factors behind the pace of rate hike will be a key.”
Market reaction
At the time of writing, USD/JPY is trading 0.08% higher on the day to trade at 156.32.
Bank of Japan FAQs
The Bank of Japan (BoJ) is the Japanese central bank, which sets monetary policy in the country. Its mandate is to issue banknotes and carry out currency and monetary control to ensure price stability, which means an inflation target of around 2%.
The Bank of Japan has embarked in an ultra-loose monetary policy since 2013 in order to stimulate the economy and fuel inflation amid a low-inflationary environment. The bank’s policy is based on Quantitative and Qualitative Easing (QQE), or printing notes to buy assets such as government or corporate bonds to provide liquidity. In 2016, the bank doubled down on its strategy and further loosened policy by first introducing negative interest rates and then directly controlling the yield of its 10-year government bonds.
The Bank’s massive stimulus has caused the Yen to depreciate against its main currency peers. This process has exacerbated more recently due to an increasing policy divergence between the Bank of Japan and other main central banks, which have opted to increase interest rates sharply to fight decades-high levels of inflation. The BoJ’s policy of holding down rates has led to a widening differential with other currencies, dragging down the value of the Yen.
A weaker Yen and the spike in global energy prices have led to an increase in Japanese inflation, which has exceeded the BoJ’s 2% target. Still, the Bank judges that the sustainable and stable achievement of the 2% target has not yet come in sight, so any sudden change in the current policy looks unlikely.
| Index | Change, points | Closed | Change, % |
|---|---|---|---|
| NIKKEI 225 | -49.65 | 38179.46 | -0.13 |
| Hang Seng | 151.38 | 19115.06 | 0.8 |
| KOSPI | -0.42 | 2727.21 | -0.02 |
| ASX 200 | 1 | 7750 | 0.01 |
| DAX | -30.63 | 18742.22 | -0.16 |
| CAC 40 | -9.86 | 8209.28 | -0.12 |
| Dow Jones | -81.33 | 39431.51 | -0.21 |
| S&P 500 | -1.26 | 5221.42 | -0.02 |
| NASDAQ Composite | 47.37 | 16388.24 | 0.29 |
- USD/JPY extends its upside near 156.20 in Tuesday’s early Asian session.
- Investors will monitor the US PPI figure on Tuesday, which is estimated to rise 2.2% YoY in April.
- The BoJ cut the amount of Japanese government bonds it offered to buy in a regular purchase operation.
The USD/JPY pair extends the rally around 156.20 during the early Asian trading hours on Tuesday. The Japanese Yen loses ground against the US Dollar (USD) despite the hawkish signal from the Bank of Japan (BoJ) to cut purchases of Japanese government bonds on Monday and the downbeat Nonfarm Payrolls (NFP) for April last week.
Investors will take more cues from the key US economic data this week, including the Producer Price Index (PPI), Consumer Price Index (CPI), and Retail Sales. These reports will offer some hints as to whether inflation remains stubborn, is receding somewhat, or is even perhaps increasing. The PPI figure, a measure of inflation at the wholesale level, is due on Tuesday and is expected to rise 2.2% YoY in April. The core PPI, excluding energy and food costs, is projected to increase by 2.4% YoY in the same report period. Traders might use the PPI report to gauge the potential CPI outcome, and the hotter-than-expected data might continue to boost the US Dollar (USD) against the Japanese Yen (JPY).
On the JPY’s front, the Bank of Japan (BoJ) sent a hawkish signal on Monday by reducing the amount of Japanese government bonds (JGBs) it offered to buy in a regular purchase operation. This move is expected to put upward pressure on Japanese bond yields and possibly narrow the gap between Japan and the United States, which has weakened the JPY. However, the recent move was muted and had little effect on the Yen. On the Japanese docket, the nation’s GDP growth number for Q1 2024 will be released on Thursday. The stronger reading might lift the JPY and cap the upside of the USD/JPY pair in the near term.
| Pare | Closed | Change, % |
|---|---|---|
| AUDUSD | 0.66068 | 0.06 |
| EURJPY | 168.544 | 0.48 |
| EURUSD | 1.07898 | 0.17 |
| GBPJPY | 196.143 | 0.57 |
| GBPUSD | 1.25571 | 0.26 |
| NZDUSD | 0.60163 | 0.02 |
| USDCAD | 1.36675 | -0.05 |
| USDCHF | 0.90802 | 0.23 |
| USDJPY | 156.199 | 0.31 |


© 2000-2026. All rights reserved.
This site is managed by Teletrade D.J. LLC 2351 LLC 2022 (Euro House, Richmond Hill Road, Kingstown, VC0100, St. Vincent and the Grenadines).
The information on this website is for informational purposes only and does not constitute any investment advice.
The company does not serve or provide services to customers who are residents of the US, Canada, Iran, The Democratic People's Republic of Korea, Yemen and FATF blacklisted countries.
Making transactions on financial markets with marginal financial instruments opens up wide possibilities and allows investors who are willing to take risks to earn high profits, carrying a potentially high risk of losses at the same time. Therefore you should responsibly approach the issue of choosing the appropriate investment strategy, taking the available resources into account, before starting trading.
Use of the information: full or partial use of materials from this website must always be referenced to TeleTrade as the source of information. Use of the materials on the Internet must be accompanied by a hyperlink to teletrade.org. Automatic import of materials and information from this website is prohibited.
Please contact our PR department if you have any questions or need assistance at pr@teletrade.global.
transfers