- Analytics
- News and Tools
- Market News
CFD Markets News and Forecasts — 14-02-2023
- USD/CAD remains sidelined after reversing from two-week low.
- Bullish candlestick formation, clear bounce off 1.3270 support confluence lure buyers.
- November 2022 low adds to the downside filters.
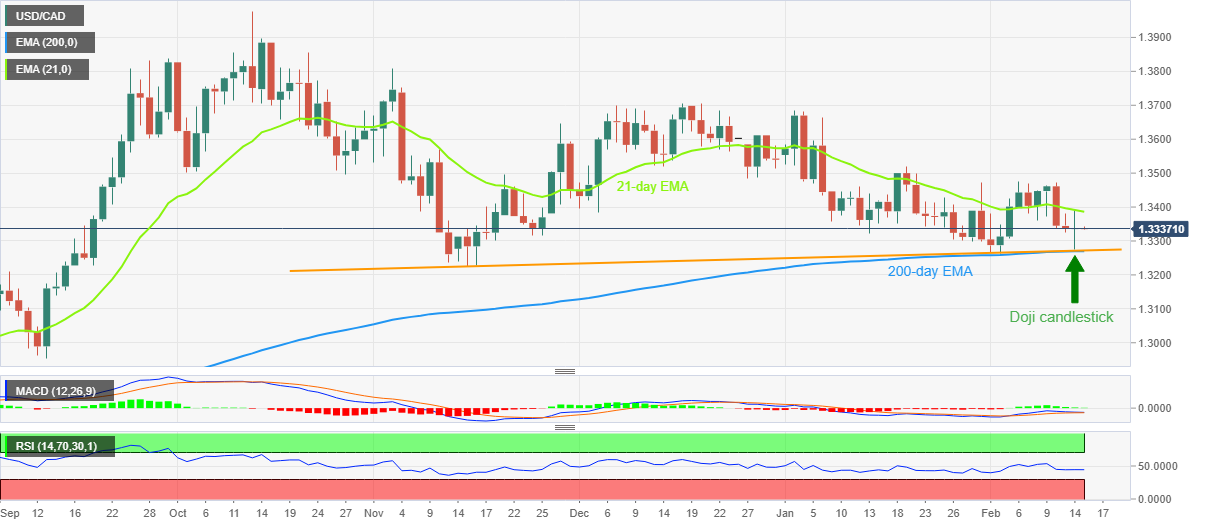
USD/CAD treads water around 1.3330 during early Wednesday, following a volatile day that initially refreshed two-week bottom before bouncing off the 1.3270 support confluence to end the day near 1.3337. In doing so, the Loonie pair portrayed a bullish Doji candlestick on Tuesday.
Not only the candlestick and the recovery from the convergence of the 200-day Exponential Moving Average (EMA) and a three-month-old ascending trend line but steady RSI (14) and a lack of bearish MACD signals also underpin the bullish bias for the USD/CAD pair.
That said, the 21-day EMA level surrounding 1.3385 guards immediate USD/CAD rebound ahead of the 1.3400 round figure and the monthly peak of near 1.3475.
Following that, a run-up towards the January 19 swing high of 1.3520 and then to the previous monthly high near 1.3685 can’t be ruled out.
On the flip side, the aforementioned support confluence challenges the USD/CAD bears around 1.3270, a break of which will need validation from the lows marked in February 2023 and November 2022, respectively near 1.3260 and 1.3225, to convince Loonie pair bears.
Even so, the 1.3200 threshold could act as the last defense of the pair buyers.
Overall, USD/CAD is up for a short-term rebound but the buyers seek validation from the 21-day EMA.
USD/CAD: Daily chart
Trend: Recovery expected
- Gold price remains depressed around six-week low after a volatile day.
- Federal Reserve officials remained hawkish on interest rates despite softer United States inflation.
- Fed talks weighed on XAU/USD via upbeat US Treasury bond yields, US Dollar.
- Risk catalyst, US Retail Sales eyed for fresh impulse.
Gold price (XAU/USD) prints mild losses around the mid-$1,800s, fading the bounce off a 1.5-month low, as traders await more clues to extend the United States inflation-inflicted downside during early Wednesday. Even so, the hawkish Federal Reserve comments and technical breakdown keep the XAU/USD bears hopeful of keeping the reins ahead of the US Retail Sales.
United States Inflation eased
The United States Consumer Price Index (CPI) rose past market expectations to 6.4% YoY but posted the slowest increase since 2021 while easing below 6.5% prior. More importantly, CPI ex Food & Energy, better known as the Core CPI, grew 5.6% YoY compared to 5.5% market forecasts and the 5.7% previous readings. Following the data, the US Dollar renewed its intraday low before the Federal Reserve (Fed) talks propelled the US Treasury bond yields and the US Dollar, which in turn weighed on the Gold price.
Federal Reserve hawks remain in the driver’s seat
Most of the Federal Reserve (Fed) policymakers were in favor of further rate hikes even as the United States inflation failed to match “positive surprise” hopes. The same propelled the US Treasury bond yields and US Dollar. That said, Dallas Fed President Lorie Logan stated that they must remain prepared to continue rate increases for a longer period than previously anticipated. On the same line was New York Fed President John Williams who noted that the work to control too high inflation is not yet done. Additionally, Philadelphia Fed President Patrick Harker signaled that they are not done (with lifting rates), but they are likely close.
Recovery in US Treasury bond yields weighs on Gold price
Given the Federal Reserve (Fed) officials’ hawkish comments, despite unimpressive United States inflation, the US Treasury bond yields refreshed their monthly high and allowed the US Dollar buyers to return following an initial dip to refresh the weekly low. T
US 10-year Treasury bond yields seesaw around 3.75%, up three basis points (bps) after refreshing a six-week high whereas the two-year counterpart jumped to the highest level since early November 2022 by poking 4.62%. That said, the US Dollar Index (DXY) bounced off one week low to end the day on the positive side near 103.25. Further, Wall Street closed mixed even after the mostly upbeat performance of the Asian and European markets.
XAU/USD bears need validation from US data
Although the Fed hawks joined the technical breakdown to tease the Gold bears, the metal’s further downside hinges on how well the scheduled United States data can entertain the XAU/USD sellers. Among them, US Retail Sales for January, expected 1.8% versus -1.1% prior, will be closely watched for clear directions. Should the data manage to reverse the previous monthly contraction, the odds of witnessing further XAU/USD downside can’t be ruled out.
Other than the data, fears surrounding the US-China geopolitical ties and the Federal Reserve (Fed) talks will also be important for Gold traders to watch for clear directions.
Gold price technical analysis
Gold price portrays the first daily closing below the 50-DMA since early November 2022 and joins the bearish signals from the Moving Average Convergence and Divergence (MACD) to keep the sellers hopeful. Also favoring the downside bias is the Relative Strength Index (RSI) line, placed at 14, as well as a sustained break of the previous support line stretched from late November.
That said, the XAU/USD appears vulnerable to testing the 38.2% Fibonacci retracement level of the Gold price upside from September 2022 to February 2023, near $1,827. However, a six-month-old horizontal support region, around $1,805, could challenge the metal sellers afterward.
On the contrary, the 50-DMA and the multi-day-old previous support line, respectively near $1,860 and $1,878, can cap short-term XAU/USD rebound before highlighting the previous weekly top surrounding $1,890 as the hurdle for the Gold buyers.
It’s worth noting that the Gold price upside remains elusive unless the quote remains successfully above the $1,900 threshold.
Gold price: Daily chart

Trend: Further downside expected
- USD/JPY bulls are in the market and pushing the price into the 133 area.
- US CPI supported the US Dollar while the new BoJ head stays the course with YCC.
USDJPY is flat in early Asia, consolidating the overnight volatility that occurred in a relatively standard range as the market continues to try to second-guess the Federal Reserve's next move based on the latest data. The pair rallied to a high of 133.31 from a low of 131.498.
First of all, the Yen was initially bid on the back of the surprise choice in the new Bank of Japan's governor Academic Kazuo Ueda who faces a rocky time. ''He is respected but as an outsider lacks factional support within the financial bureaucracy and faces an unpopular prime minister pushing an expensive agenda,'' reporters at Reuters wrote.
It was anticipated that Ueda would have to modify or abandon YCC given how much damage it is doing to the bond market and the BOJ’s balance sheet. But he is unlikely to start normalising rates straight away and he announced that the central bank will need to stick with the YCC. Speaking on Japanese TV, earlier in the week, Ueda remarked that it is important for the BoJ to keep easing for now. As a consequence, JPY gave back many of its initial gains ahead of the US Consumer Price Index on Tuesday.
''Assuming some relaxation in YCC, we see scope for a move to USD/JPY128 on a 3 month view. However, a hawkish Fed is likely to limit the scope for JPY appreciation,'' analysts at Rabobank said.
The annual inflation rate in the US, as measured by the Consumer Price Index, slowed only slightly to 6.4% in January from 6.5% in December, less than market forecasts of 6.2%, suggesting that getting inflation under control will take more time than expected.
The US Dollar index traded around 103.00 on Tuesday but posied higher due to the hotter-than-expected US inflation dashing hopes that the Federal Reserve will soon end its tightening campaign.
- EUR/JPY printed a fresh YTD high and approached the 143.00 mark.
- EUR/JPY Price Analysis: Turned bullish bias after cracking the February 13 daily high of 142.38.
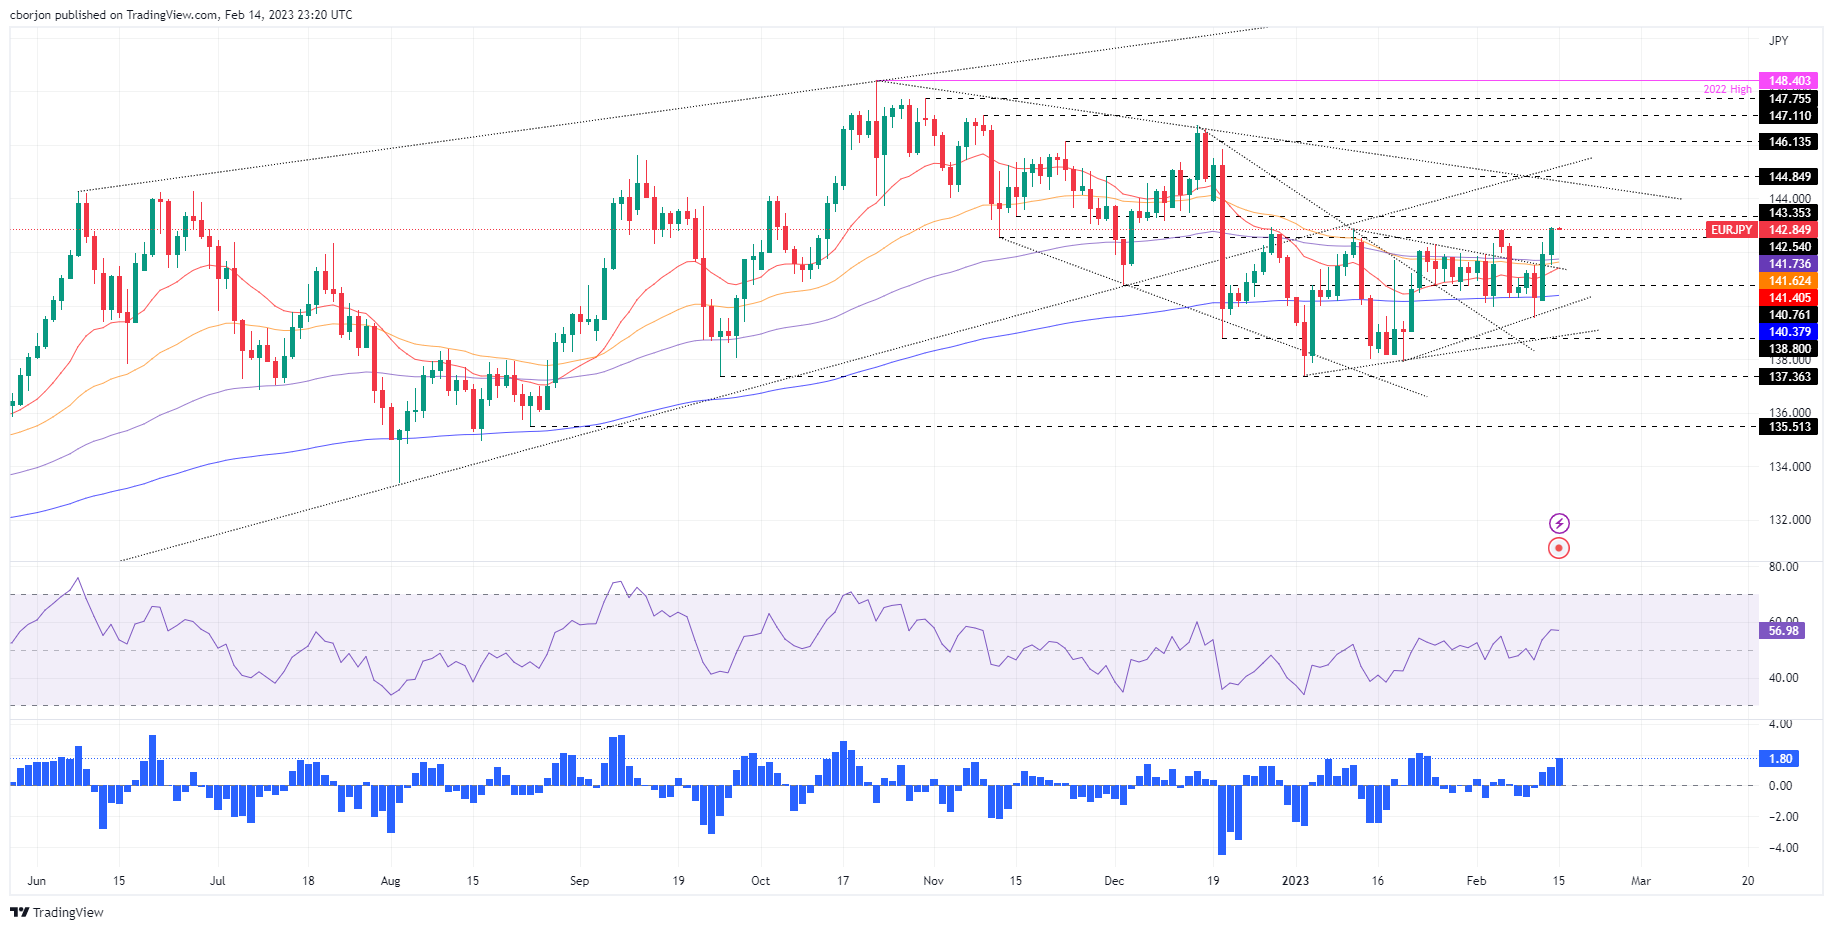
The EUR/JPY extends its weekly gains to two straight days and hit a fresh YTD high at 142.94 before trimming some of Tuesday’s gains. As Wednesday’s Asian session begins, the EUR/JPY exchanges hands at 142.85, below its opening price by a minuscule 0.03%.
After the EUR/JPY failed to crack below the YTD low of 137.38, the EUR/JPY enjoyed a bounce, which lifted the pair towards its YTD high of 142.94. Even though it took almost one and a half months, the EUR/JPY pair shifted to a neutral-bullish biased, meaning that further upside is expected.
If the EUR/JPY clears 143.00, the next resistance would be the psychological 144.00 figure, ahead of the December 20 swing high at 145.83. As an alternate scenario, the EUR/JPY first support would be the February 13 daily high of 142.38, ahead of the 142.00 price level. A decisive break and the pair might fall towards a busy confluence area of the 100/50/20-day Exponential Moving Averages (EMAs), each at 141.73, 141.62, and 141.40, respectively, ahead of the 200-day EMA at 140.38.
Oscillators like the Relative Strength Index (RSI) aim higher, while the Rate of Change (RoC) indicates that buyers are gathering momentum. Therefore, the first above-mentioned scenario it’s most likely to pan out.
EUR/JPY Daily chart
EUR/JPY Key technical levels
- AUD/USD fades upside momentum after refreshing one-week high, probes two-day winning streak.
- US Dollar traces yields to rebound despite softer US inflation data, hawkish Fed talks are the key.
- RBA’s Lowe should be observed amid hawkish rate hike and mixed monetary policy statement, as well as upbeat data.
- Strong US numbers could justify hawkish Fed and keep the Aussie bears hopeful.
AUD/USD prints mild losses around 0.6980, the first in three days, as market players await the next round of catalysts during early Wednesday after the US inflation data offered a volatile Tuesday. Other than the cautious mood ahead of the data/events, recently hawkish Federal Reserve (Fed) comments also weigh on the risk-barometer Aussie pair.
Most of the Fed policymakers were in favor of further rate hikes even as the US inflation failed to match “positive surprise” hopes. The same propelled the US Treasury bond yields and US Dollar. At home, upbeat Aussie data and cautious optimism allowed the quote to remain firmer before the US data.
That said, Australia’s NAB Business Confidence rose to 6.0 in January, from -1.0 prior and 1.0 expected while the NAB Business Conditions rallied to 18.0 compared to 8.0 expected and 12.0 prior. It’s worth noting that Australia’s Westpac Consumer Confidence, flashed earlier on Tuesday, dropped to -6.9% for February versus 5.0% prior.
On the other hand, US Consumer Price Index (CPI) rose past market expectations to 6.4% YoY but posted the slowest increase since 2021 while easing below 6.5% prior. More importantly, CPI ex Food & Energy, better known as the Core CPI, grew 5.6% YoY compared to 5.5% market forecasts and the 5.7% previous readings. Following the data, the US Dollar renewed its intraday low before the Federal Reserve (Fed) talks propelled the US Treasury bond yields and the US Dollar.
Despite the unimpressive increase in inflation, Dallas Federal Reserve President Lorie Logan stated that they must remain prepared to continue rate increases for a longer period than previously anticipated. On the same line was New York Fed President John Williams who noted that the work to control too high inflation is not yet done. Additionally, Philadelphia Fed President Patrick Harker signaled that they are not done (with lifting rates), but they are likely close.
Against this backdrop, US 10-year Treasury bond yields seesaw around 3.75%, up three basis points (bps) after refreshing a six-week high, which in turn allowed the US Dollar to bounce off one week to end the day on a positive side. Further, Wall Street closed mixed even after the mostly upbeat performance of the Asian and European markets.
Looking ahead, Reserve Bank of Australia (RBA) Governor Philip Lowe is up for a testimony before the Senate Economics Legislation Committee and will need to justify the latest hawkish monetary policy actions to push back the AUD/USD bears. Following that, US Retail Sales for January, expected 1.8% versus -1.1% prior, will be closely watched for clear directions.
Technical analysis
Although the 21-DMA hurdle surrounding 0.7010 restricts the AUD/USD pair’s immediate upside, recently improving RSI (14) and sustained trading beyond the 50-DMA, around 0.6885 at the latest, seem to keep the Aussie pair buyers hopeful.
The Hong Kong Monetary Authority has intervened in the market and this has sent the Hong Kong Dollar higher within its permitted trading range as follows:
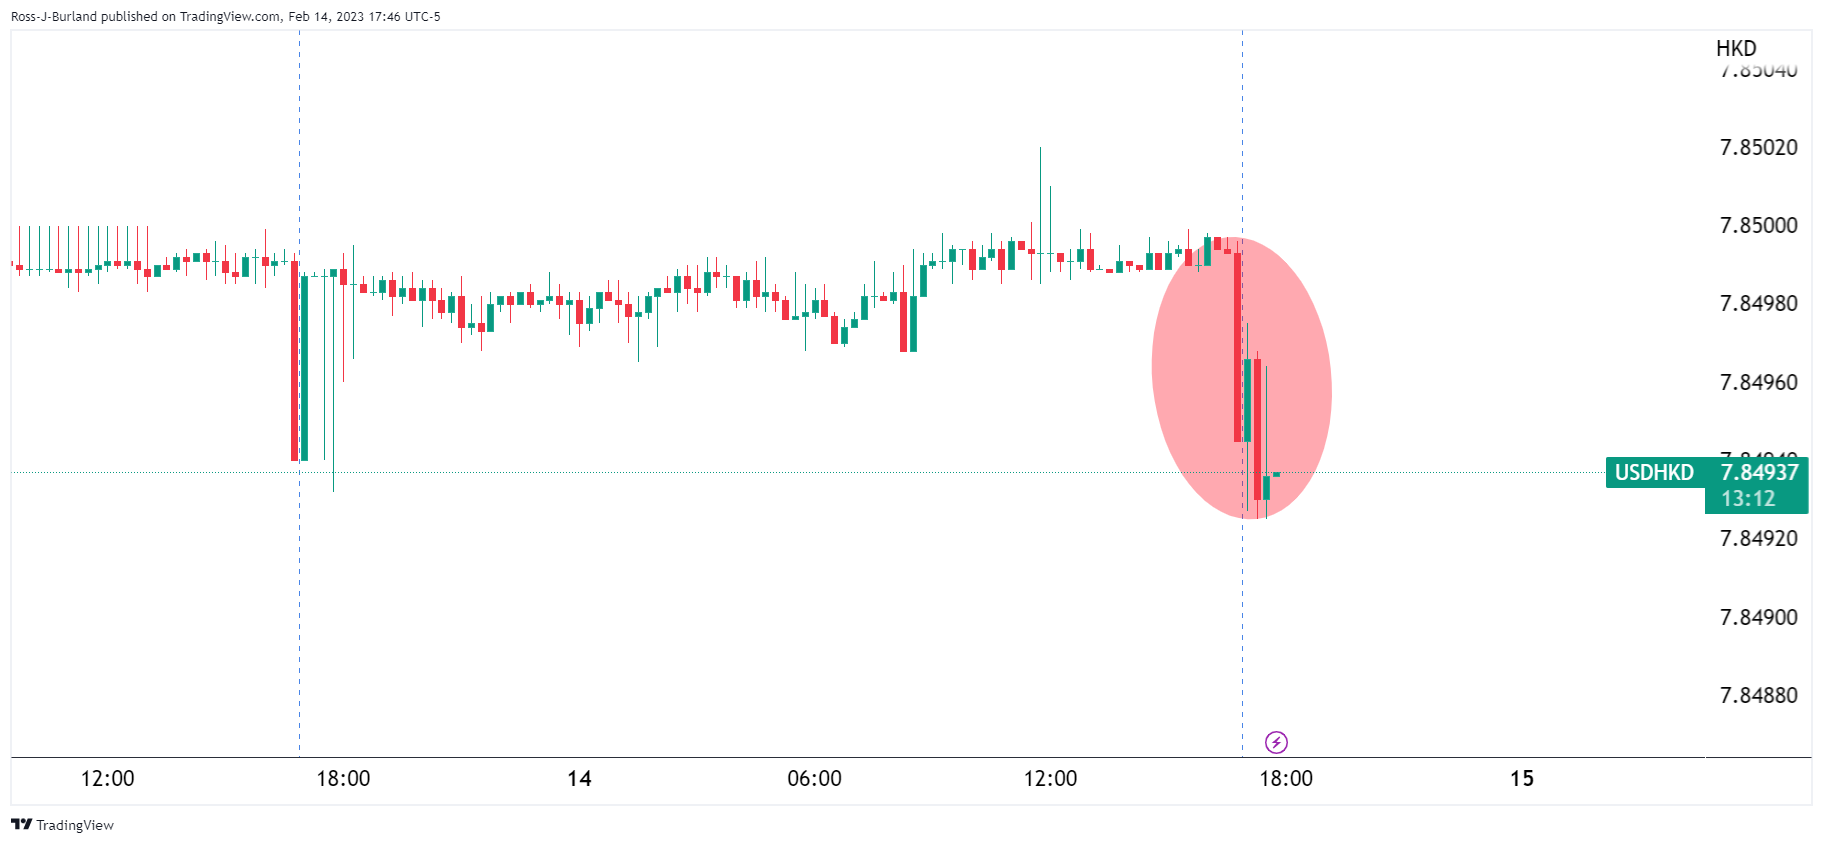
Hong Kong uses a linked exchange rate system, trading since May 2005 in the range US$1:HK$7.75–7.85
British Prime Minister Rishi Sunak and finance minister Jeremy Hunt are considering a deal to end a wave of strikes among Britain's public sector workers that would backdate next year's pay rise, the Financial Times (FT) reported on Tuesday per Reuters.
Developing story
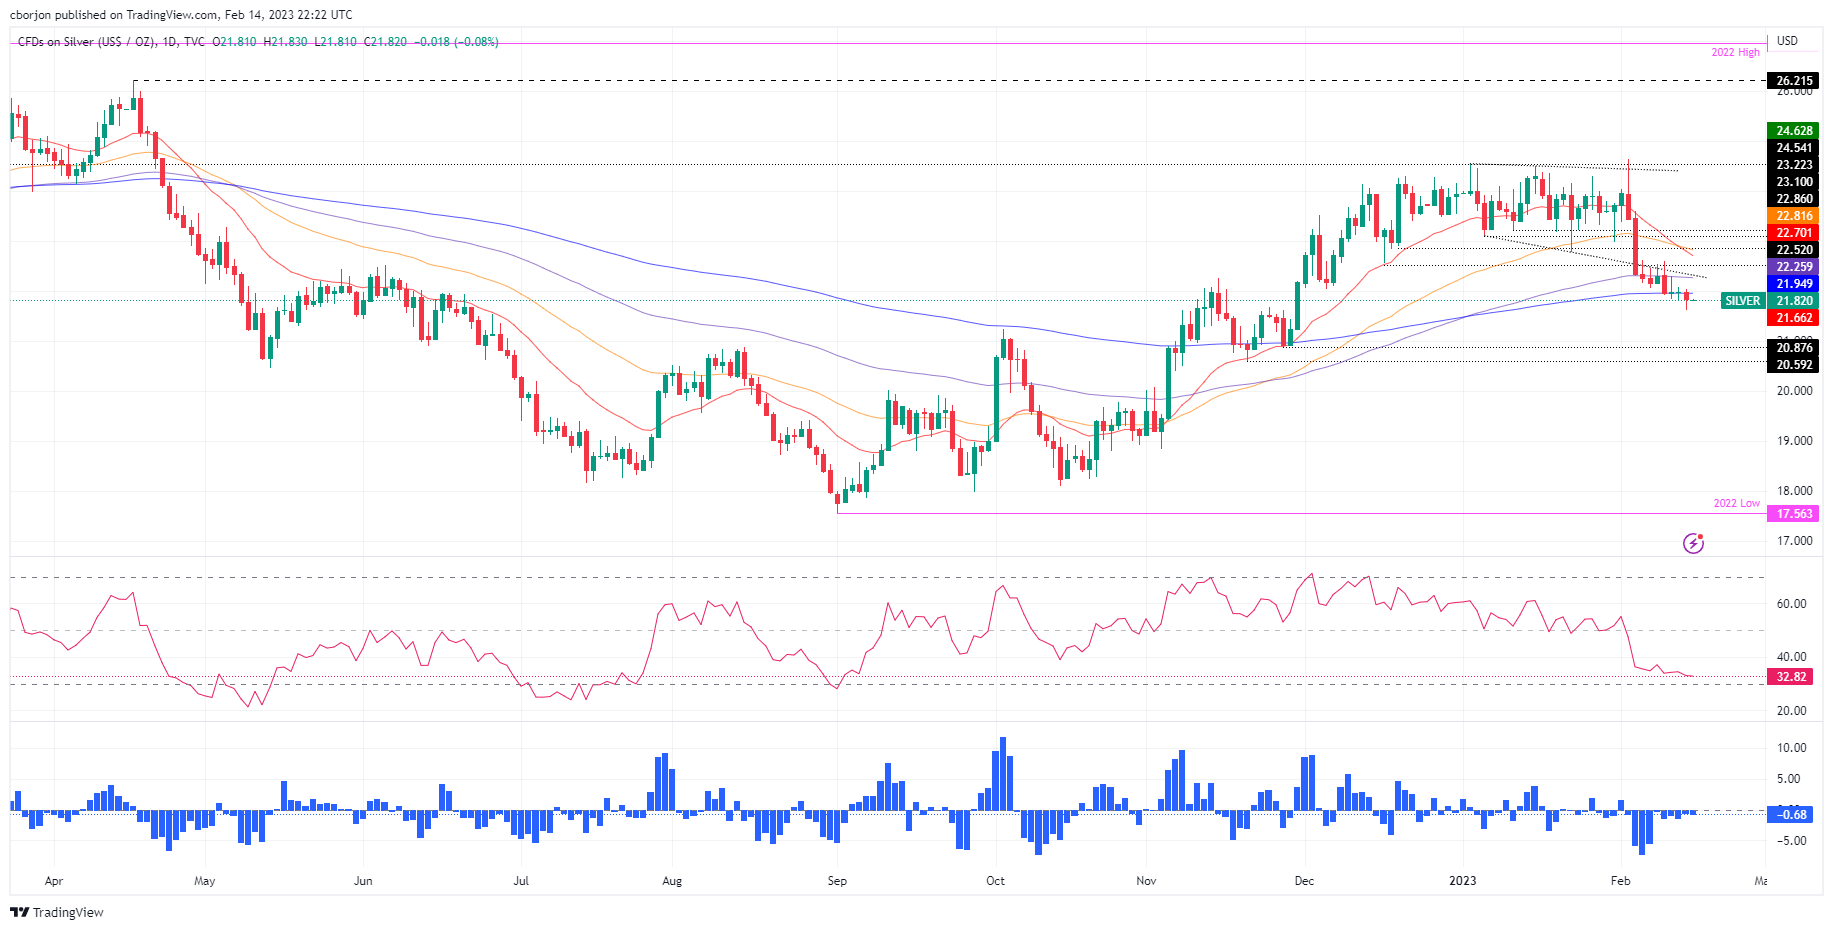
- Silver price stumbles below the 200-day EMA at $21.95, shifting its bias to neutral-downwards.
- XAG/USD Price Analysis: Shifted neutral-to-downwards, though two more closes below the 200-DMA would cement its downward bias.
Silver price continues to trade beneath the bottom-trendline of a megaphone formation and below the 200-day Exponential Moving Average (EMA) at 21.95, a bearish signal for the white metal. It should be said that a daily close below the latter would pave the way for further downside. At the time of writing, XAG/USD exchanges hands at $21.84 a troy ounce after hitting a daily high of $22.03.
After dropping below the bottom-trendline of a megaphone formation, the XAG/USD has failed to regain the $22.50 mark and exposed the 200-day EMA. A daily close is needed to further cement a change on the neutral bias to neutral-downwards, and it will expose untested support areas since December of 2022.
If that scenario plays out, the XAG/USD first support would be the November 28 daily low of $20.87, followed by the November 21 swing low of $20.59. Once cleared, the psychological level of $20.00 would be up for grabs.
In an alternate scenario, the XAG/USD first resistance would be the 200-day EMA at $21.94, ahead of the $22.00 figure. Once broken, Silver could aim inside the megaphone formation, but firstly it needs to crack the bottom trendline at $22.20.
It should be said that oscillators like the Relative Strength Index (RSI) suggest a bearish continuation, but the Rate of Change (RoC), confirms that sellers are losing momentum. Hence, the XAG/USD might consolidate around the $21.60-$22.00 area, awaiting a fresh catalyst before determining its direction.
XAG/USD Daily chart
XAG/USD Key technical levels
- EUR/USD remains steady after a volatile day, positive on the week so far.
- US inflation data came in better than forecast but came in below previous readings in January.
- Hawkish Fed talks propelled US Treasury bond yield and US Dollar.
- An absence of hawkish tone in Lagarde’s speech, upbeat US data needed for further downside.
EUR/USD seesaws around 1.0730 after a volatile Wednesday that initially refreshed the weekly top before posting a 100-pip fall and then bouncing off 1.0706. In doing so, the major currency pair struggles for clear directions but defends the policymakers’ hawkish bias for the Federal Reserve (Fed) rates, despite unimpressive US and European data, mainly the US inflation.
That said, the US Consumer Price Index (CPI) rose past market expectations to 6.4% YoY but posted the slowest increase since 2021 while easing below 6.5% prior. More importantly, CPI ex Food & Energy, better known as the Core CPI, grew 5.6% YoY compared to 5.5% market forecasts and the 5.7% previous readings. Following the data, the US Dollar renewed its intraday low before the Federal Reserve (Fed) talks propelled the US Treasury bond yields and the US Dollar.
While considering the data, Dallas Federal Reserve President Lorie Logan stated that they must remain prepared to continue rate increases for a longer period than previously anticipated. On the same line was New York Fed President John Williams who noted that the work to control too high inflation is not yet done. Additionally, Philadelphia Fed President Patrick Harker signaled that they are not done (with lifting rates), but they are likely close.
On the other hand, the preliminary readings of the Eurozone fourth quarter (Q4) Gross Domestic Product (GDP) matched 0.1% QoQ and 1.9% YoY forecasts while reprinting the previous figures.
Following the data, European Central Bank (ECB) Governing Council member Gabriel Makhlouf said, “ECB could raise rates above 3.5% and hold them there for the remainder of the year,” per the Wall Street Journal (WSJ). Earlier on Tuesday, ECB policymaker Mario Centeno said that the full impact of rate hikes may not reach the European economy.
Amid these plays, US 10-year Treasury bond yields seesaw around 3.75%, up three basis points (bps) after refreshing a six-week high, which in turn allowed the US Dollar to bounce off one-week to end the day on a positive side. Further, Wall Street closed mixed even after the mostly upbeat performance of the Asian and European markets.
Moving on, ECB President Christine Lagarde’s speech and monthly prints of the US Retail Sales for January, expected 1.8% versus -1.1% prior, will be closely watched for clear directions. Given the recent risk-off mood and firmer yields, the EUR/USD sellers are likely to return to the table in case the scheduled data/events allow.
Technical analysis
Although failure to provide a daily close beyond the 21-day Exponential Moving Average (EMA), around 1.0770, appears elusive for EUR/USD bears unless the quote breaks the 50-day EMA support, near 1.0680 by the press time.
- GBP/USD bulls stay the course and eye a higher high for Wednesday.
- US Retail Sales are the next major news on the calendar.
GBP/USD rallied early on Tuesday after data showed British wages rose faster than expected in the last three months of 2022. The data raised the prospects of a more hawkish Bank of England as the inflation battle consumes sentiment in markets. In that regard, the US Consumer Price Index was the next key event for the pair with the data underpinning the outlook for further rate hikes from the Federal Reserve.
At the time of writing, GBP/USD is trading near 1.2170 and between the day's range of 1.2116 and 1.2269, a high reached as investors read that there are signs that price and wage rises are becoming entrenched, something that would typically boost the pound.
''Pay growth over recent months has still been strong enough, in our view, to justify another 25bp hike by the Bank of England at its March meeting, though of course, we’ll have had another labour market report by then (and two CPI prints,'' analysts at Nomura explained. Meanwhile, a Reuters poll of analysts that the Bank of England will hike by another 25 basis points on March 23, taking the main rate to 4.25%, and then pause.
As for the New York session, US inflation data hit the screens and caused two-way price action with the US dollar whipsawed around the numbers as investors tried to digest and draw conclusions from a mixed report. the data ultimately will help the Federal Reserve to decide on its interest rate plans for the coming months, and subsequently would be expected to drive markets globally for the coming days.
The annual inflation rate in the US, as measured by the Consumer Price Index, slowed only slightly to 6.4% in January from 6.5% in December, less than market forecasts of 6.2%, suggesting that getting inflation under control will take more time than expected. As a consequence, the US Dollar index traded in a volatile fashion around 103.00 but was posied higher due to the hotter-than-expected data that was regarded to be dashing hopes that the Federal Reserve will soon end its tightening campaign.
For Wednesday's key data in the US, analysts look for a strong rebound in retail sales following December's sharp contraction, with a surge in auto sales playing a significant role after consecutive declines in Nov-Dec. ''Importantly, control group sales likely also jumped owing to a strong showing in online spending. We also look for sales in bars/restaurants to have advanced (firmly) for the first time in three months.''
GBP/USD technical analysis
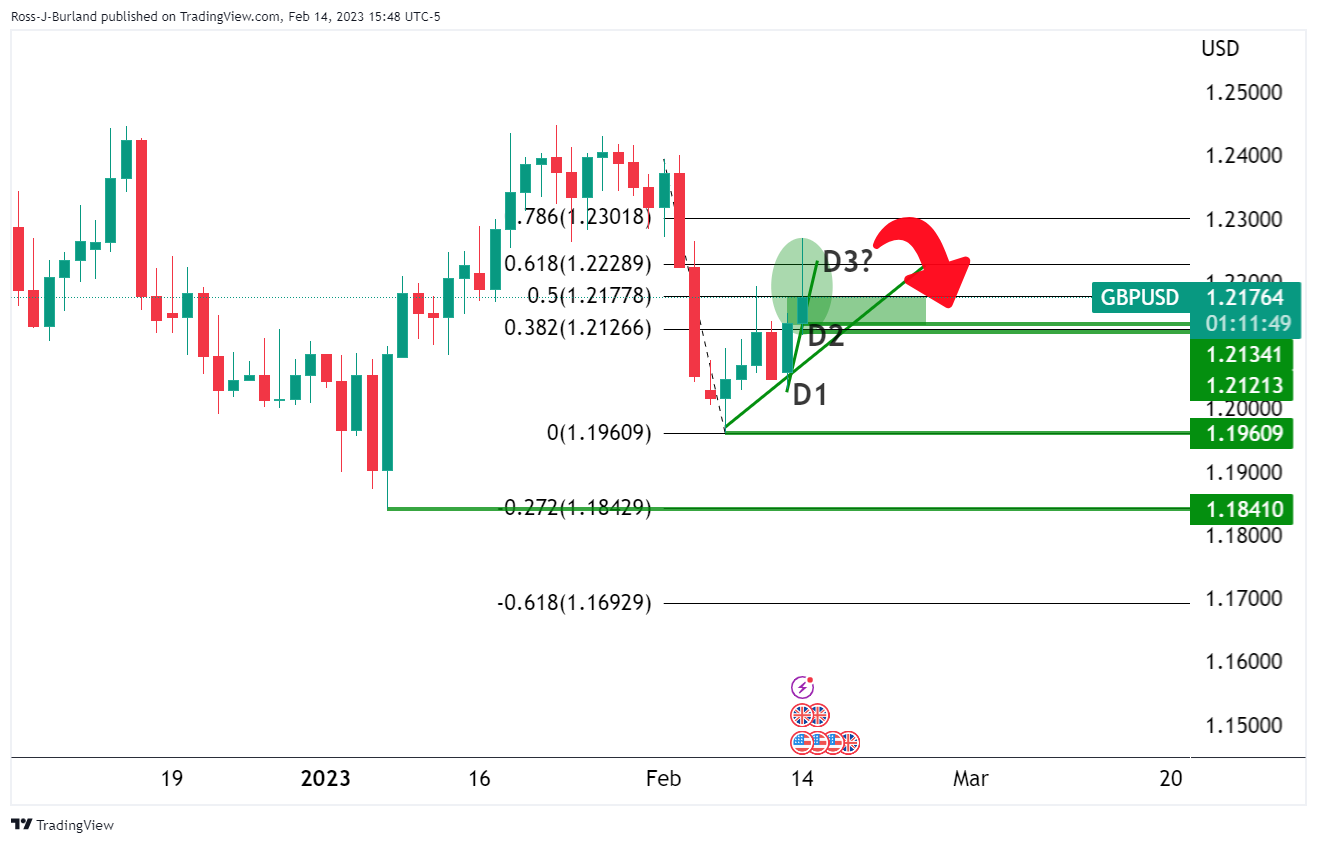
The price has picked up two days of longs in the market and tomorrow could be pulling in additional bullish bets as the bulls hunt down the 1.22 area. This could be offering the bears an opportunity on Wednesday:
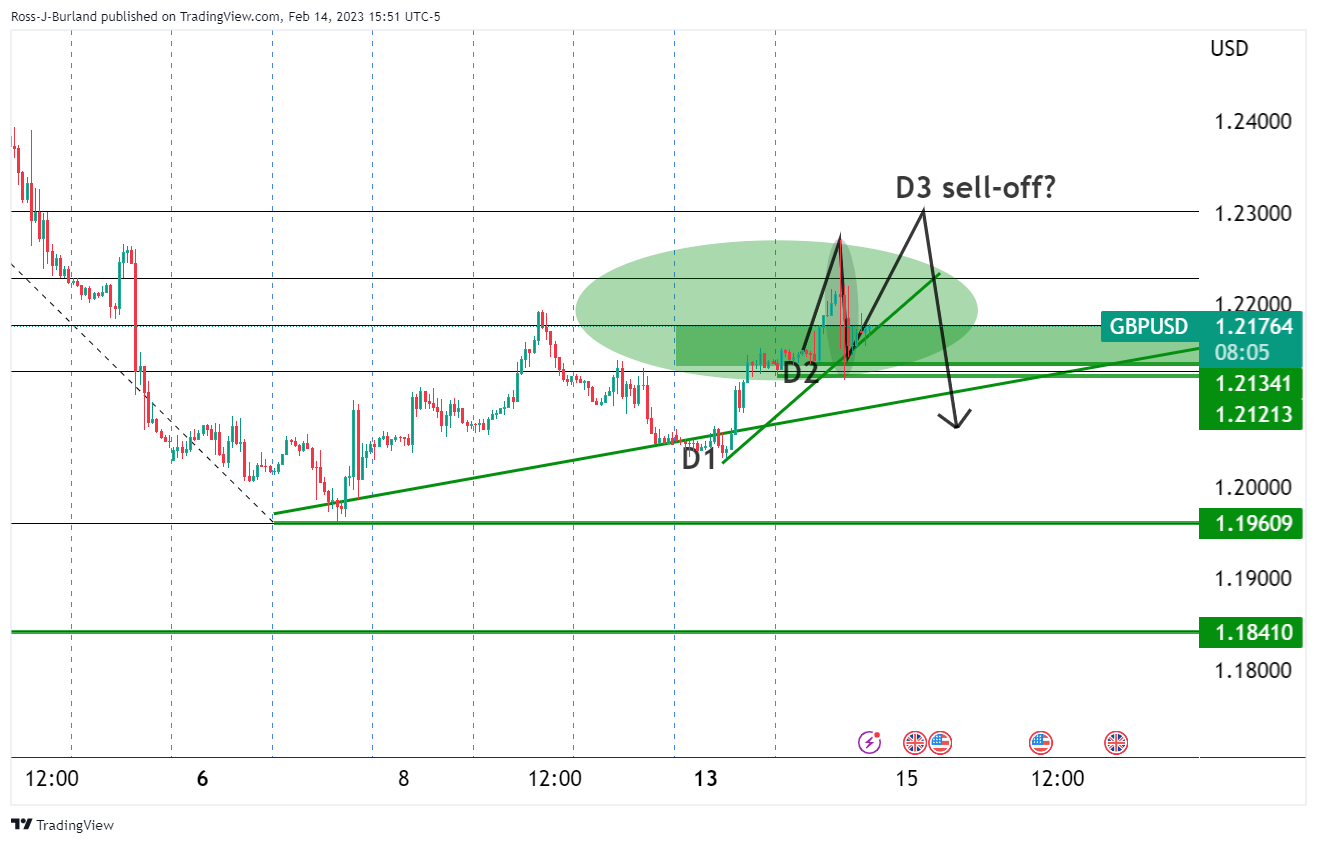
- GBP/JPY is a complicate mix between USD/JPY and GBP/USD.
- There are prospects of a move higher rin GBP/JPY as per the bull flag, but bears are lurking.
As per the prior analysis on the Yen, USD/JPY Price Analysis: Bullish fundamentals meet a technically bullish chart bias, the Japanese currency has indeed weakened and that is playing out through the crosses such as GBP/JPY.
USD/JPY daily charts, before & after
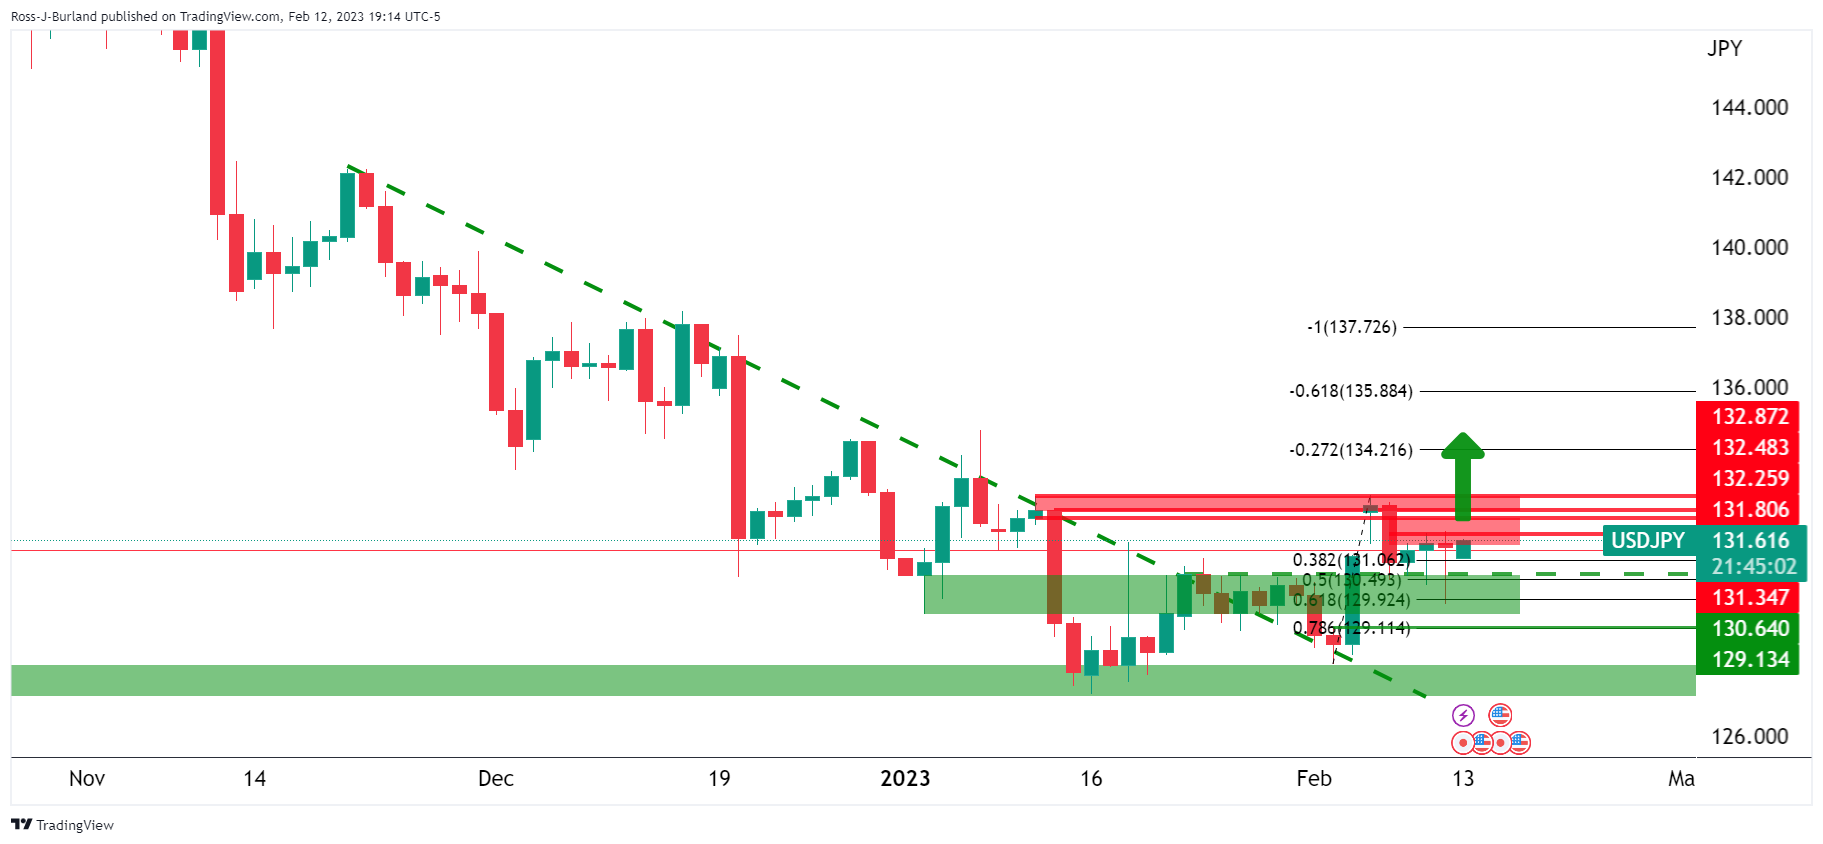
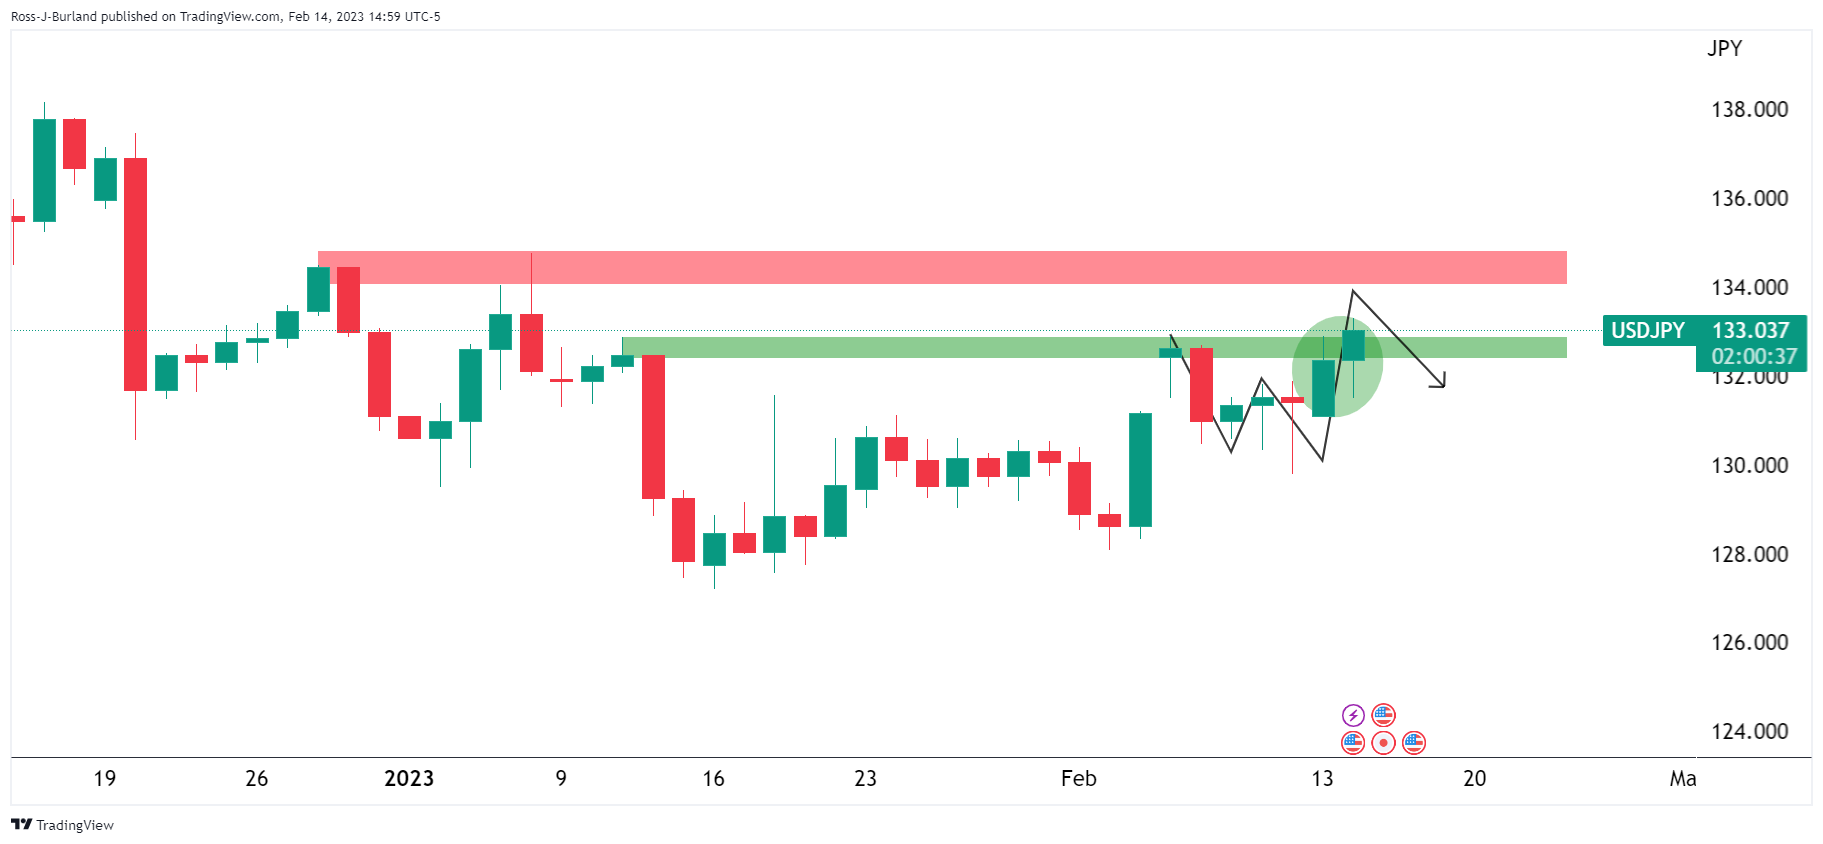
As seen, the Yen fell and USD/JPY is now above an old resistance. However, the W-formation is a reversion pattern sp this could keep the pair hamstrung, stalling the advance. Also, there has been as surprise pick in Kazuo Ueda who was nominated as the Bank of Japan's next governor and market chatter suggests he’s a pragmatist rather than a hawk or a dove.
Meanwhile, the following illustrates the bias at this point for a move lower given how far the Pound has rallied and Yen has fallen.
GBP/JPY H1 chart
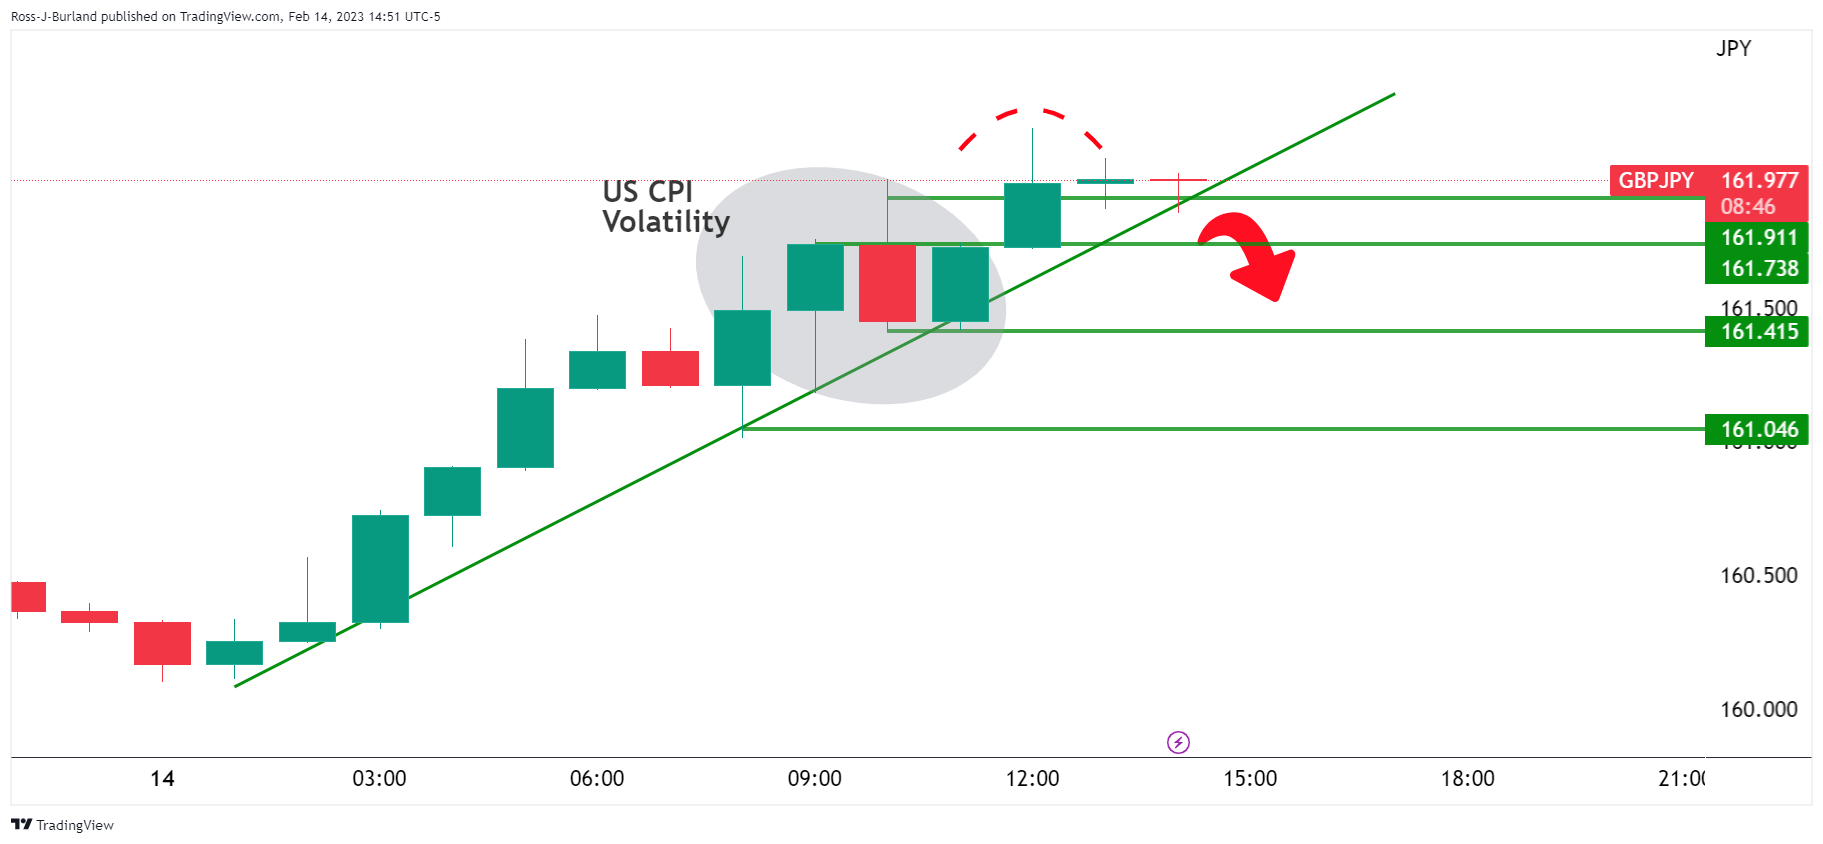
a break of the trendline support opens risks of a move lower below 162.00.
GBP/JPY M15 chart
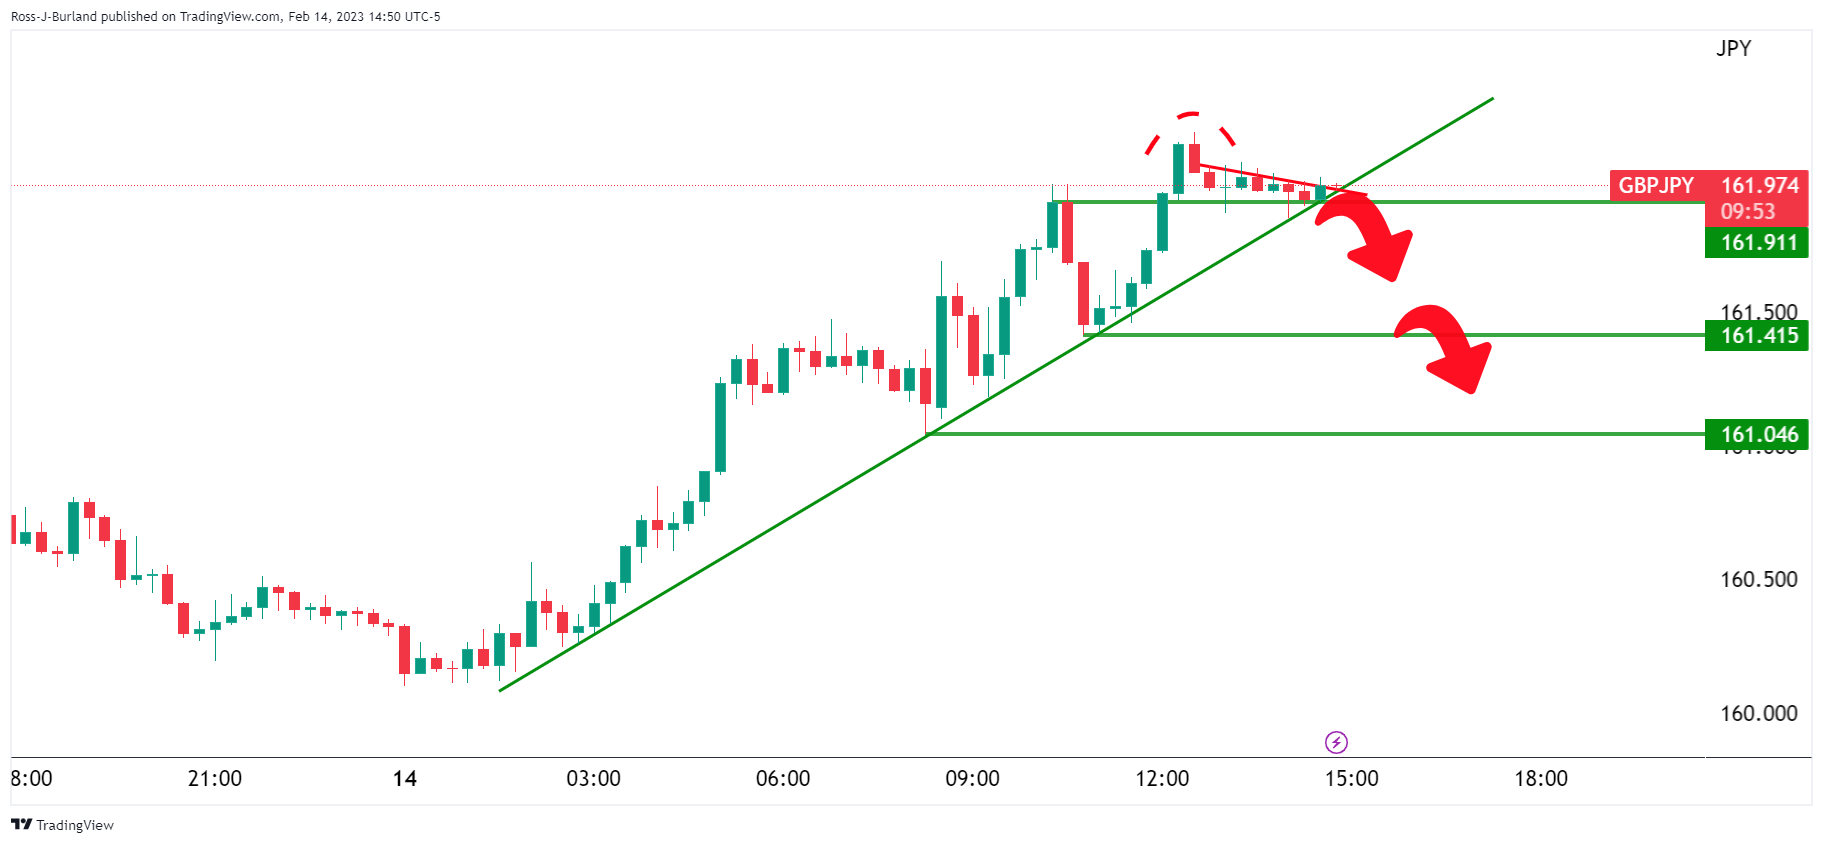
We have a potential topping pattern but the price needs to close sharply lower or it may otherwise be regarded as a bullish flag:

The 78.6% Fibonacci near 161.50 could be the trap door that the bears will want to break through to invalidate the bull flag thesis.
GBP/USD Price Analysis
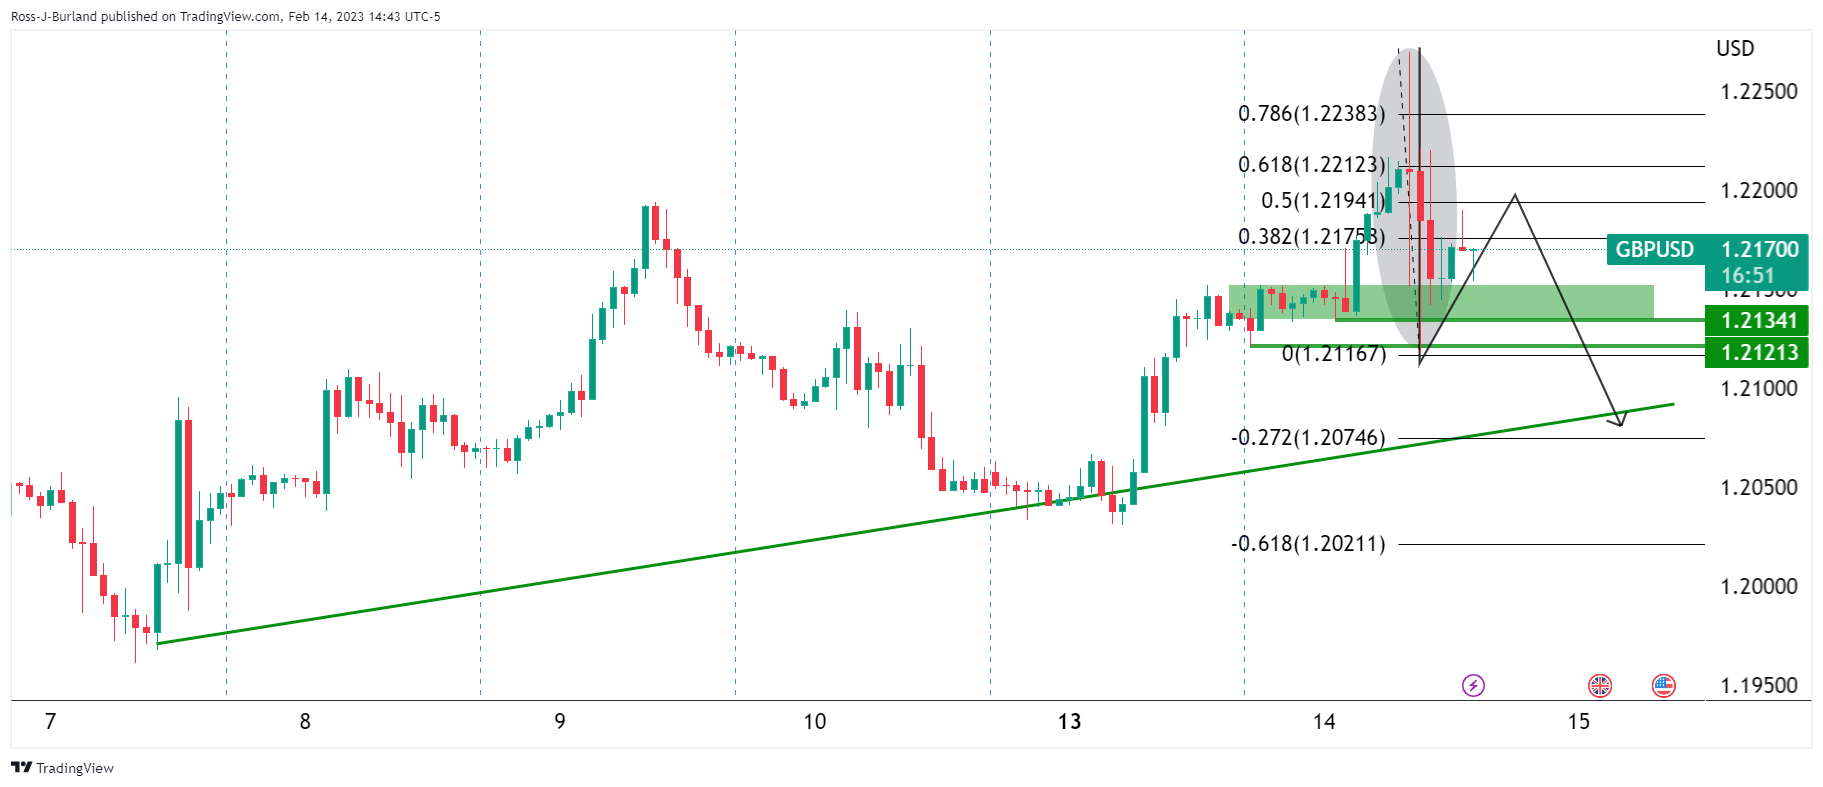
Looking to GBP/USD, if the bears commit, then we could see a move below support and that could trigger a deep correction in GBP/JPY.
What you need to take care of on Wednesday, February 15:
Financial markets traded with an optimistic yet cautious tone throughout the first half of the day, as investors awaited the release of US inflation figures. The United States Consumer Price Index rose at an annualized pace of 6.4% in January, better than the previous 6.5% but missing the 6.2% expected.
Financial markets struggled with the figures, as inflation eased, but at a slower-than-anticipated pace. That means the US Federal Reserve could keep tightening the monetary policy until achieving its 2% target. Markets moved away from high-yielding assets, with Wall Street edging sharply lower and the US Dollar surging.
Comments from Dallas Federal Reserve President Lorie Logan added pressure on stocks, as she noted that “we must remain prepared to continue rate increases for a longer period than previously anticipated. Also, Federal Reserve Bank of New York President John Williams hit the wires and noted that the work to control too high inflation is not yet done. Finally, Philadelphia Fed President Patrick Harker reinforced the idea by saying they are not done, but they are likely close.
Across the pond, European Central Bank (ECB) Governing Council member Gabriel Makhlouf said on Tuesday that the ECB could raise rates above 3.5% and hold them there for the remainder of the year.
EUR/USD traded between 1.0700 and 1.0800 to finally settle at around 1.0730. GBP/USD peaked at 1.2268 but ended the day around 1.2160. The USD/JPY pair surged to end the day above 133.00.
AUD/USD hovers around 0.6980 as market players await Reserve Bank of Australia Governor Philip Lowe’s testimony before the Senate. USD/CAD trimmed early losses and stands in the 1.3340 region.
Spot gold dipped to 1,843.22 but ended the day above $1,850 a troy ounce. Crude oil prices are little changed on a daily basis, with WTI changing hands at $79 a barrel.
Like this article? Help us with some feedback by answering this survey:
- USD/CAD snapped two days of losses and rose towards 1.3350s on US inflation data.
- The US Consumer Price Index for January was mixed, with MoM aligned with estimates, while YoY figures were above forecasts.
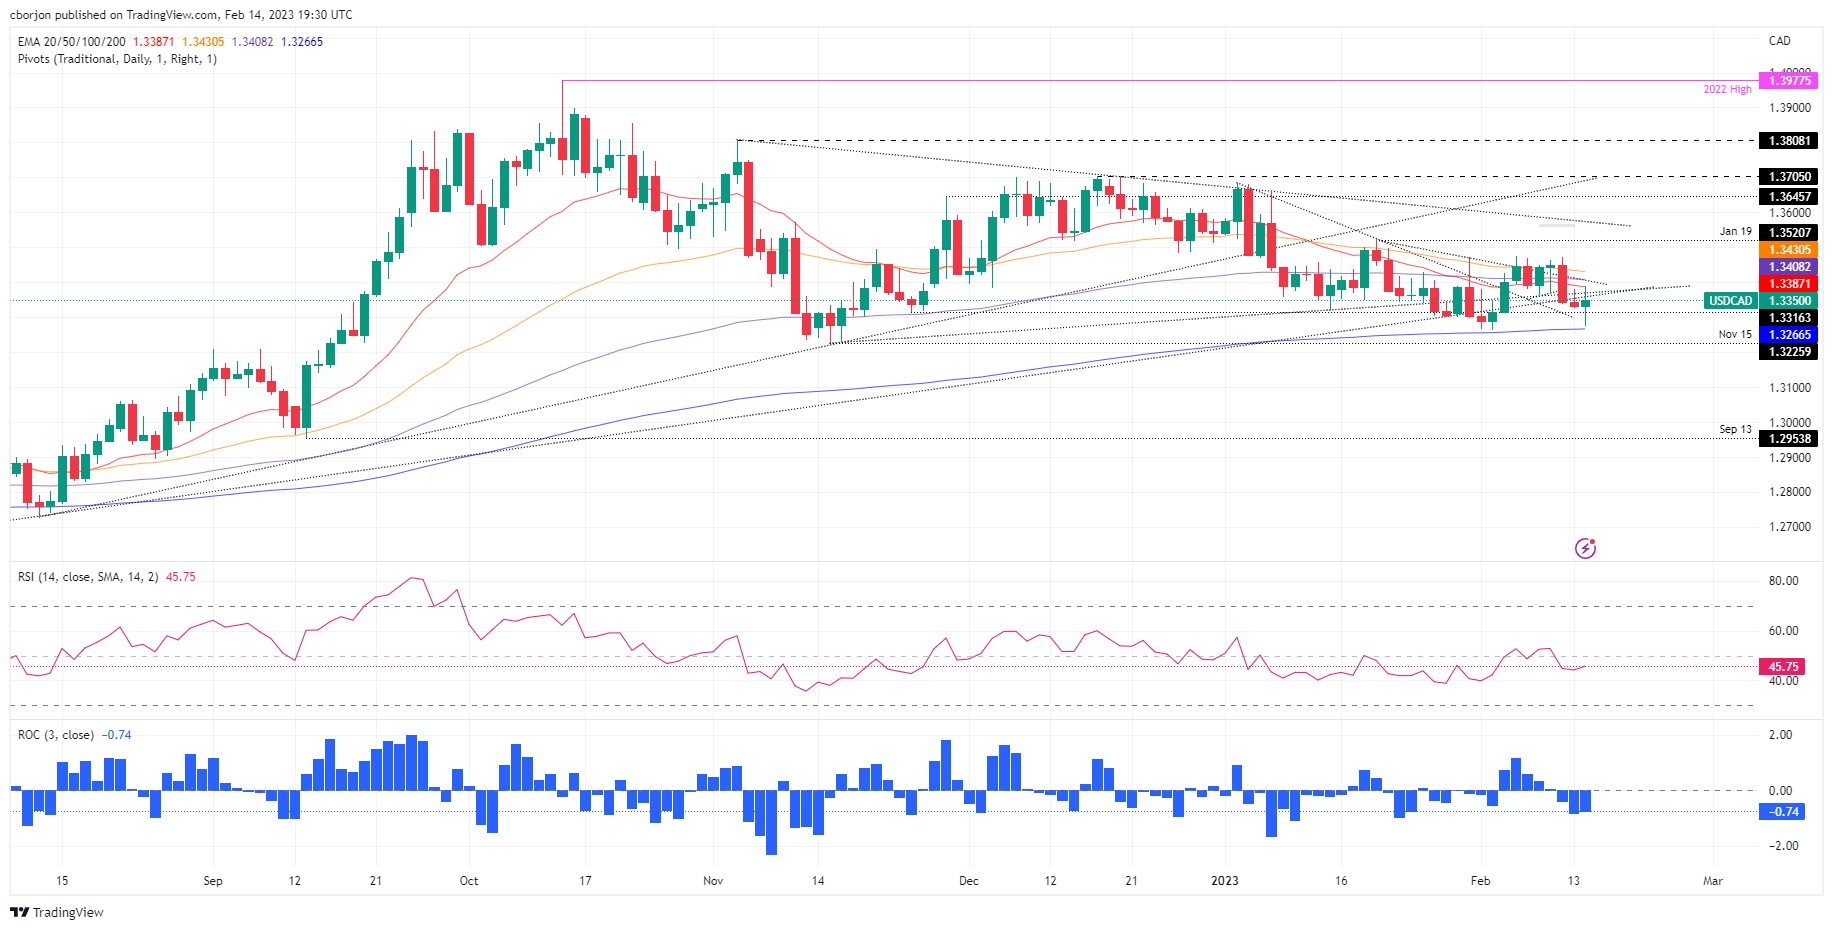
- USD/CAD Price Analysis: Set for higher prices as a bullish engulfing pattern forms.
The USD/CAD braces to its early gains in the day, though it retreated after hitting a daily high of 1.3390 on news that inflation edged down, though it was above expectations. That increased demand for the greenback, which has remained bid, during the New York session. Hence, the USD/CAD is trading at 1.3352 after hitting a low of 1.3273
The US Bureau of Labor Statistics (BLS) reported that the Consumer Price Index (CPI) for January increased by 6.4% compared to the same period last year, which was higher than the predicted rate of 6.2%. Similarly, the core CPI rose by 5.6% year-on-year, above the estimated figure of 5.5%. Month-over-month data readings were consistent with the predicted values.
Following the release of the US inflation report, a slew of Federal Reserve (Fed) policymakers had crossed newswires. Officials expressed that the US central bank is not done hiking rates while emphasizing that inflation is high and that further tightening is needed. They stressed that higher-for-longer is their playbook and are not expecting to cut rates in 2023.
Given the backdrop, the USD/CAD remained on the front foot and was bolstered by falling US crude oil prices, with WTI dropping 1.53%. Money market futures estimate the Federal Reserve will hike above the 5% threshold, expecting the first rate cut by December 2023.
Aside from this, even though the Bank of Canada (BoC) is foreseen to raise rates further, the interest rate differential between both countries would benefit the US Dollar (USD). Therefore, further upside is expected on the USD/CAD pair.
What to watch?
The Canadian docket will feature housing and manufacturing data. The US economic calendar will unveil Retail Sales, the NY Fed Manufacturing Index, and Industrial Production.
USD/CAD Technical analysis
The USD/CAD daily chart suggests an upward reversion is forming, as Tuesday’s price action is engulfing the previous day. Therefore, a bullish engulfing candle pattern might open the door for further upside though solid resistance remains. The 20-day Exponential Moving Average (EMA), at around 1.3386, would be the bears’ first line of defense. A breach of the latter and 1.3400 is up for grabs, closely followed by the 100 and 50-day EMAs, each at 1.3408 and 1.3430.
Federal Reserve Bank of New York President John Williams has crossed the wires with a hawkish tone. He said on Tuesday that inflation remains too high and central bank action aimed at cooling price pressures will exact some unavoidable pain on the economy.
Reuters reported as follows:
Over the last year the Fed “has taken strong actions to bring inflation down,” Williams said in a speech prepared for delivery before a bankers’ group in New York. But, “although we have seen some moderation in recent months, the inflation rate remains far too high at 5%," and underlying rates of inflation are also too high, he said.
“We must restore balance to the economy and bring inflation down to 2% on a sustained basis,” Williams said, "Our work is not yet done," he said, adding "we will we stay the course until our job is done."
''Williams did not offer any firm guidance about the rate actions ahead of the Fed but he said the path the central bank must pursue “will likely entail a period of subdued growth and some softening of labor market conditions.”
''Williams said in his remarks that he believes core price pressures as measured by the core personal consumption expenditures price index could fall to 3% this year and to 2% over the next few years. ''
''Williams also said in his remarks that growth will likely come in at a tepid 1% this year. What is currently a 3.4% jobless rate will likely rise to between 4% and 4.5%, he said. He added the job market is currently “extremely tight” and wage gains are elevated.''
US Dollar update
The US Dollar index traded around 103.00 on Tuesday but posied higher due to the hotter-than-expected US inflation dashing hopes that the Federal Reserve will soon end its tightening campaign.
The annual inflation rate in the US, as measured by the Consumer Price Index, slowed only slightly to 6.4% in January from 6.5% in December, less than market forecasts of 6.2%, suggesting that getting inflation under control will take more time than expected.
The US labour demand will weaken on rising interest rates, south-dominated jobs recovery, Fitch Ratings has reported:
Fitch Ratings expects the US labor market to weaken as aggregate demand stagnates over the course of the year in response to the lagged effects of higher interest rates, according to a new Fitch report.
"The 517K payroll growth number for January 2023 was an upside surprise that is likely not going to be sustained." said Olu Sonola, Head of U.S. Regional Economics. "Job growth has decelerated in five of the last six months. U.S. labor market conditions are still very strong, but they look set to continue the cooling trend in 2023."
''Employment recovery in 2022 was dominated by the South, particularly in high wage industries, such as information, and professional and business services. Four states in the South (Texas, Florida, North Carolina and Georgia) accounted for approximately 50% of job growth in the information, and professional and business services sectors, relative to pre-pandemic levels. Weakness in these sectors in 2023 will likely be a drag on job growth in these four states.''
The note follows today's annual inflation rate in the US, as measured by the Consumer Price Index, slowing only slightly to 6.4% in January from 6.5% in December, less than market forecasts of 6.2%, suggesting that getting inflation under control will take more time than expected.
- AUD/USD bears are gathering with volume up high within the recent range.
- A breakout could be imminent and 0.6950/00 is the key.
In the opening article for the week on AUD/USD, AUD/USD Price Analysis: Key support in play with eyes on 0.6900/50 for the opening range, it was stated that on the hourly chart, ''we have 0.6950 to clear before a bullish thesis can be solidified, so it is a case of seeing how the opening range on Monday develops.''

However, while holding above the trendline and said support, there were prospects of a short squeeze to test 0.6950 for Monday and p[prospects of a move into low-hanging fruit below 0.6900 and into the 0.6880s beforehand:
AUD/USD updates

The target areas were done as illustrated above ahead of US CPI volatility on Tuesday:
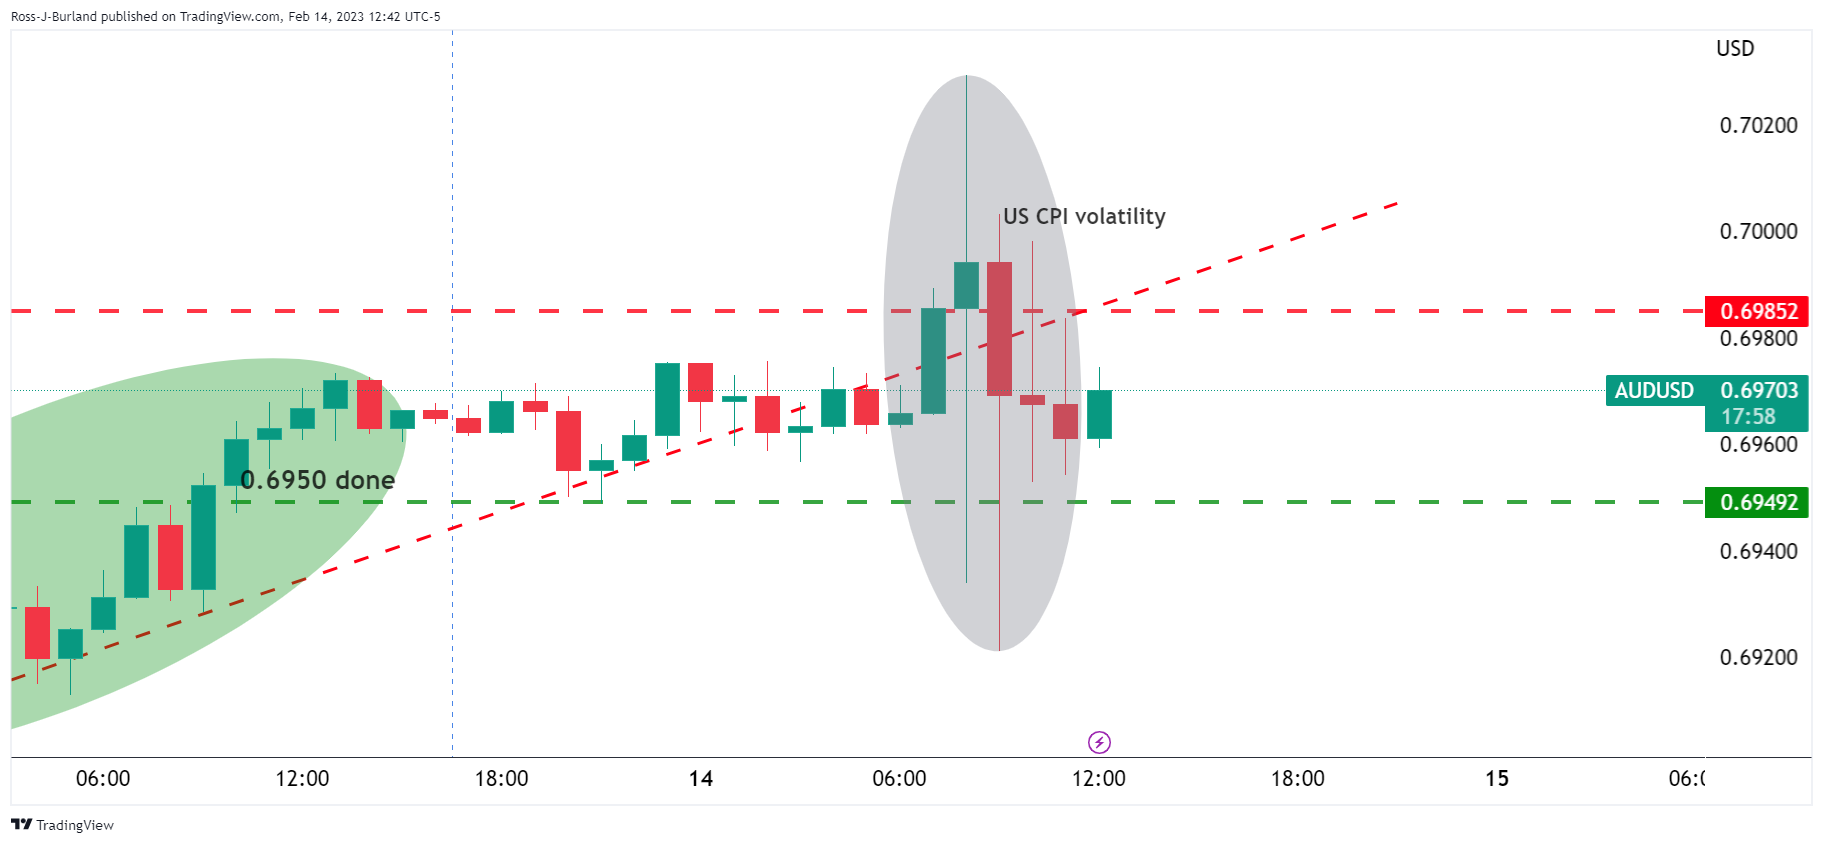
The market was essentially stuck in a range into the data so picking which side to bias one way or the other was a task of improbable outcomes unless hedging your bets. However, with the dust settling, the price is up high in the consolidative range and there could be a bearish thesis drawn as follows:
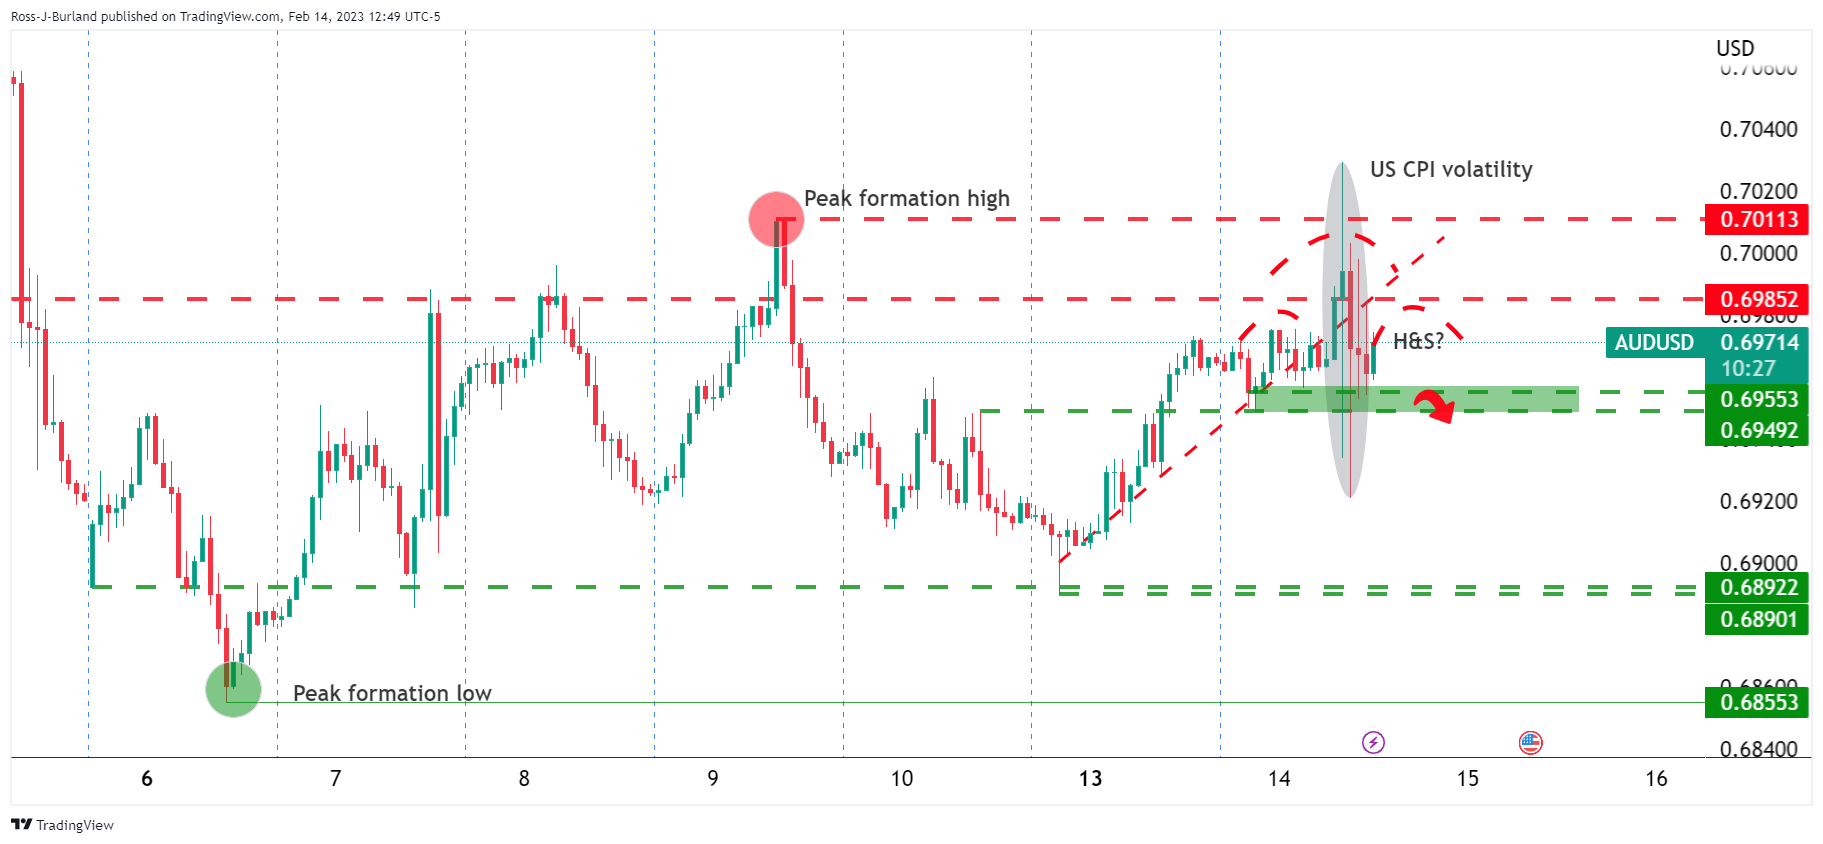
We have a possible bearish head and shoulders up high within the range:
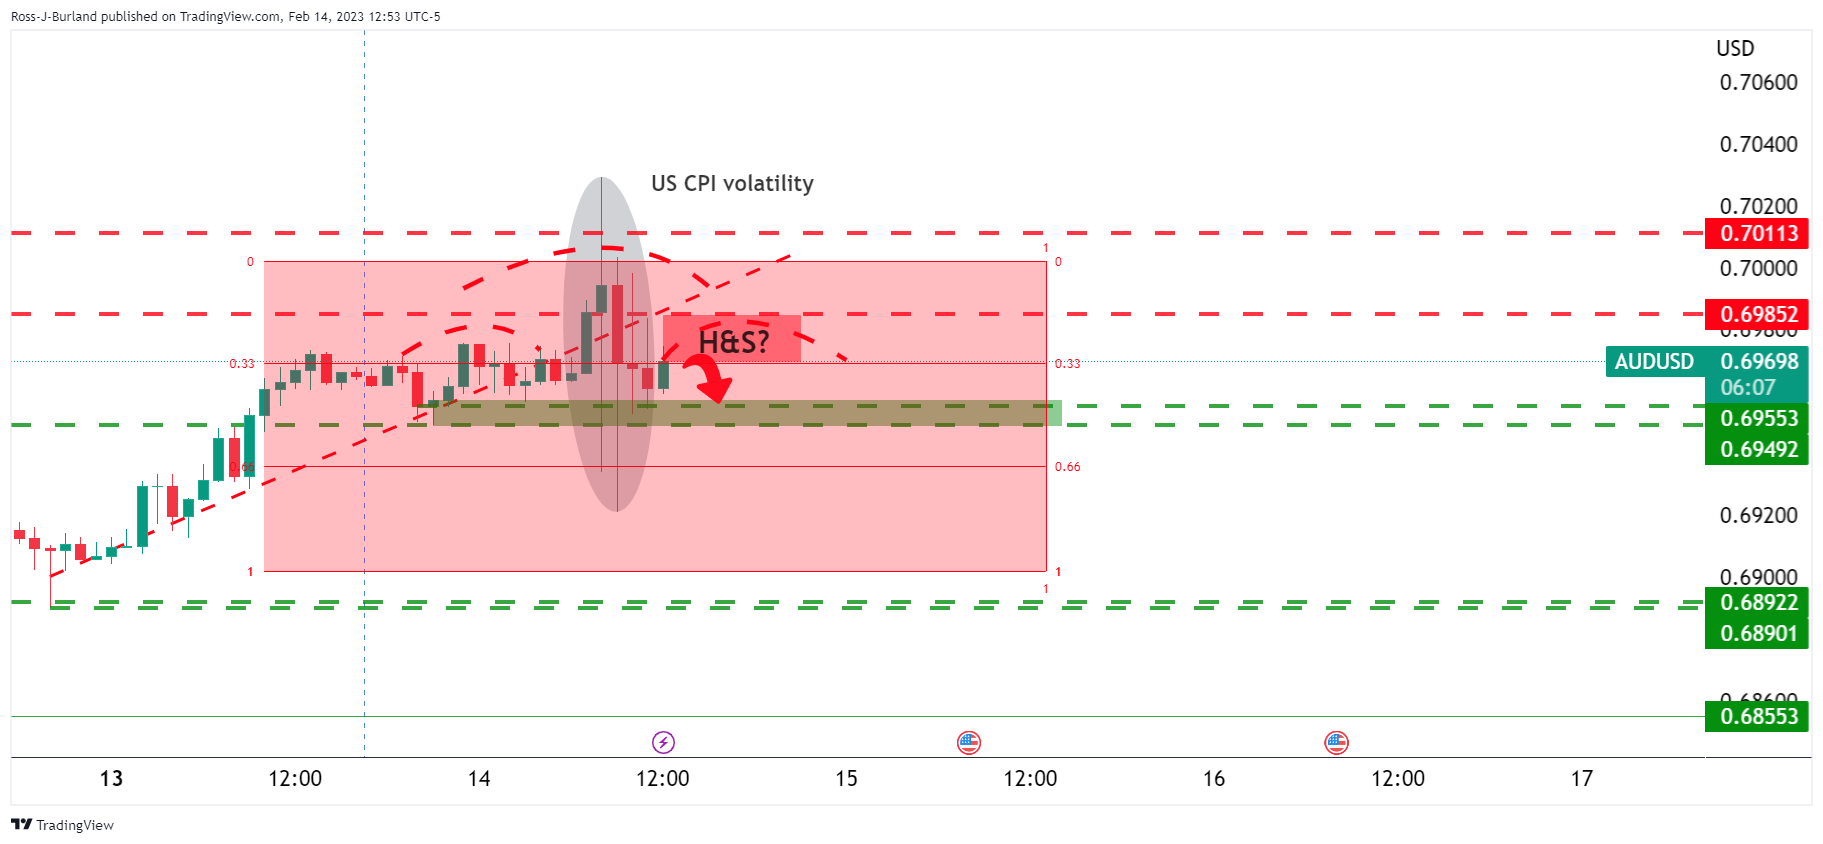
A break below 0.6950 opens risk of a test of 0.6900 again and from a daily perspective, this could be the most probable outcome for the days head:
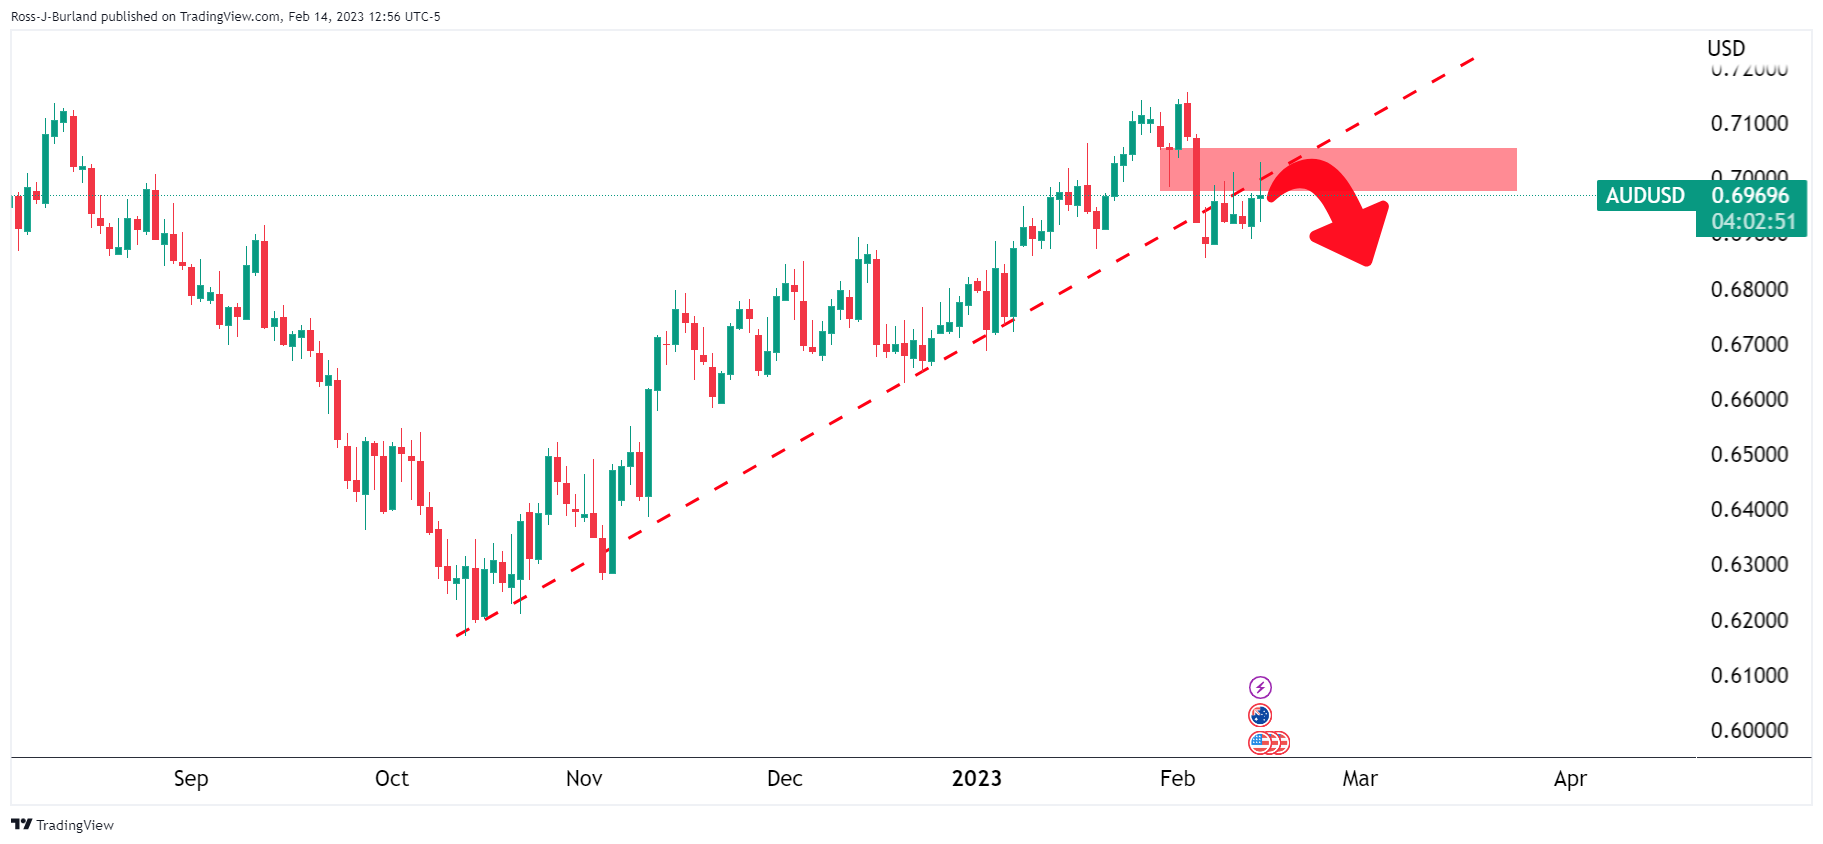
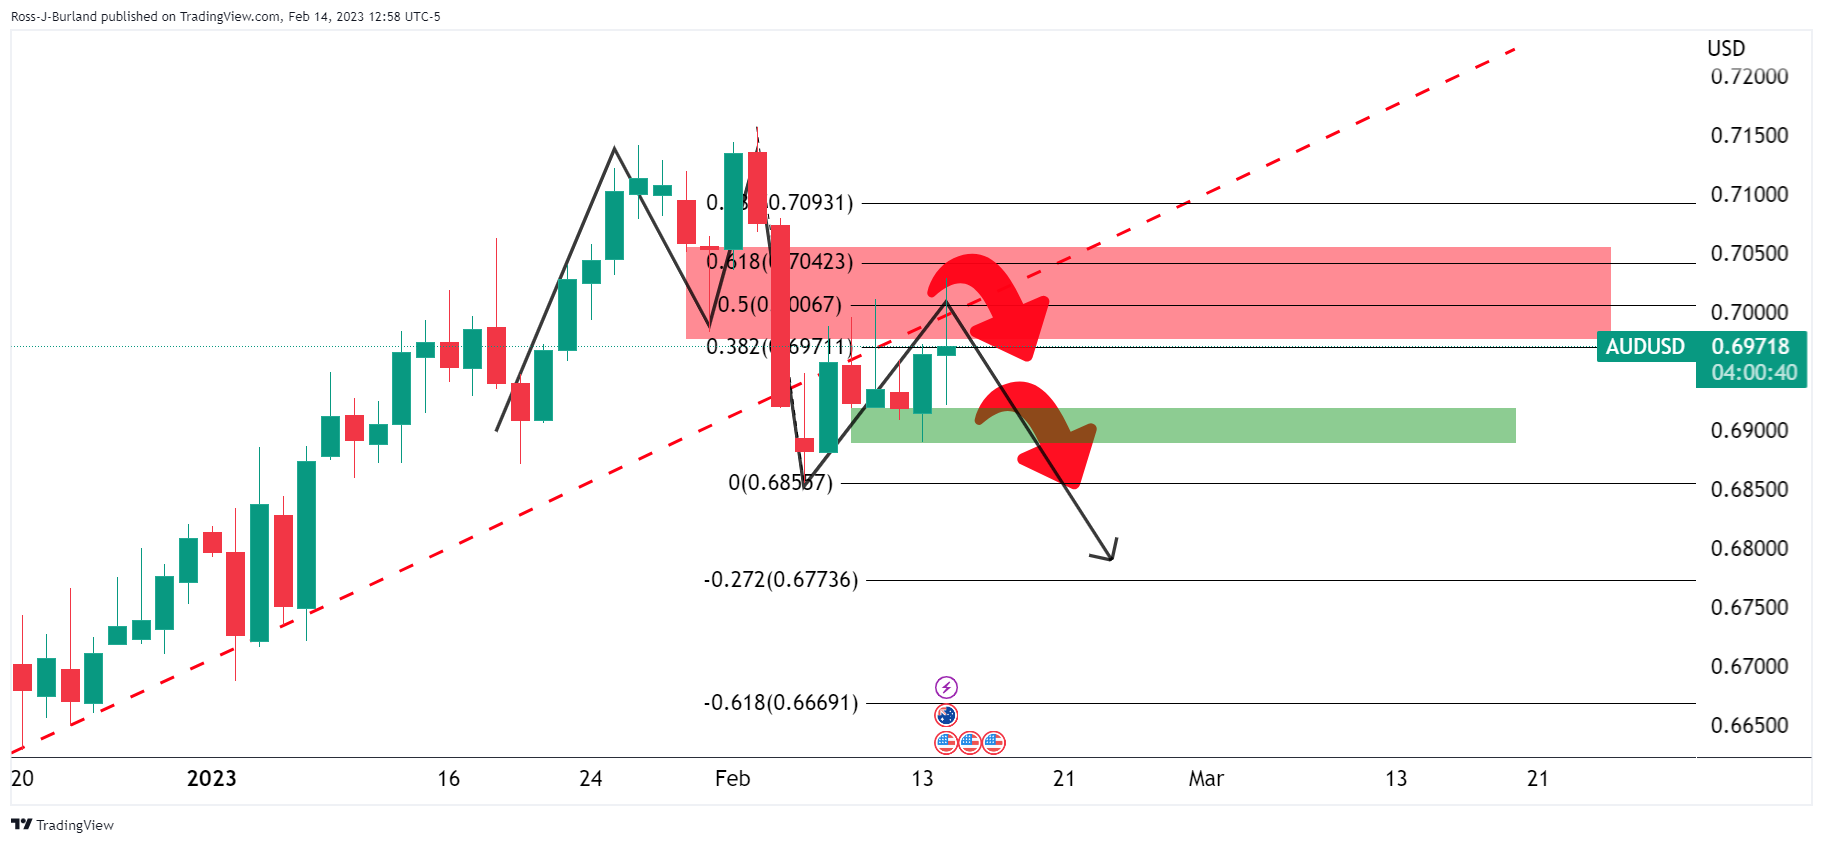
There has already been a move to test the neckline of the M-formation neckline and a test of the 61.8% Fibonacci retracement level. We also have a W-formation which is also a bearish feature as follows:

- USD/MXN dropped to a new YTD low at 18.4975 during the session.
- The US Dollar is extending its losses after a mixed US inflation report.
- USD/MXN Price Analysis: To resume its downward bias if it achieves a daily close below $18.50.
The Mexican Peso (MXN) extended its gains against the US Dollar (USD) on Tuesday following the release of US inflation data, which showed that prices in the United States are slowing down. Therefore, speculators pricing in a less hawkish Fed sold the greenback vs. the peso. At the time of writing, the USD/MXN exchanges hand at 18.5115, below its opening price by 0.27%.
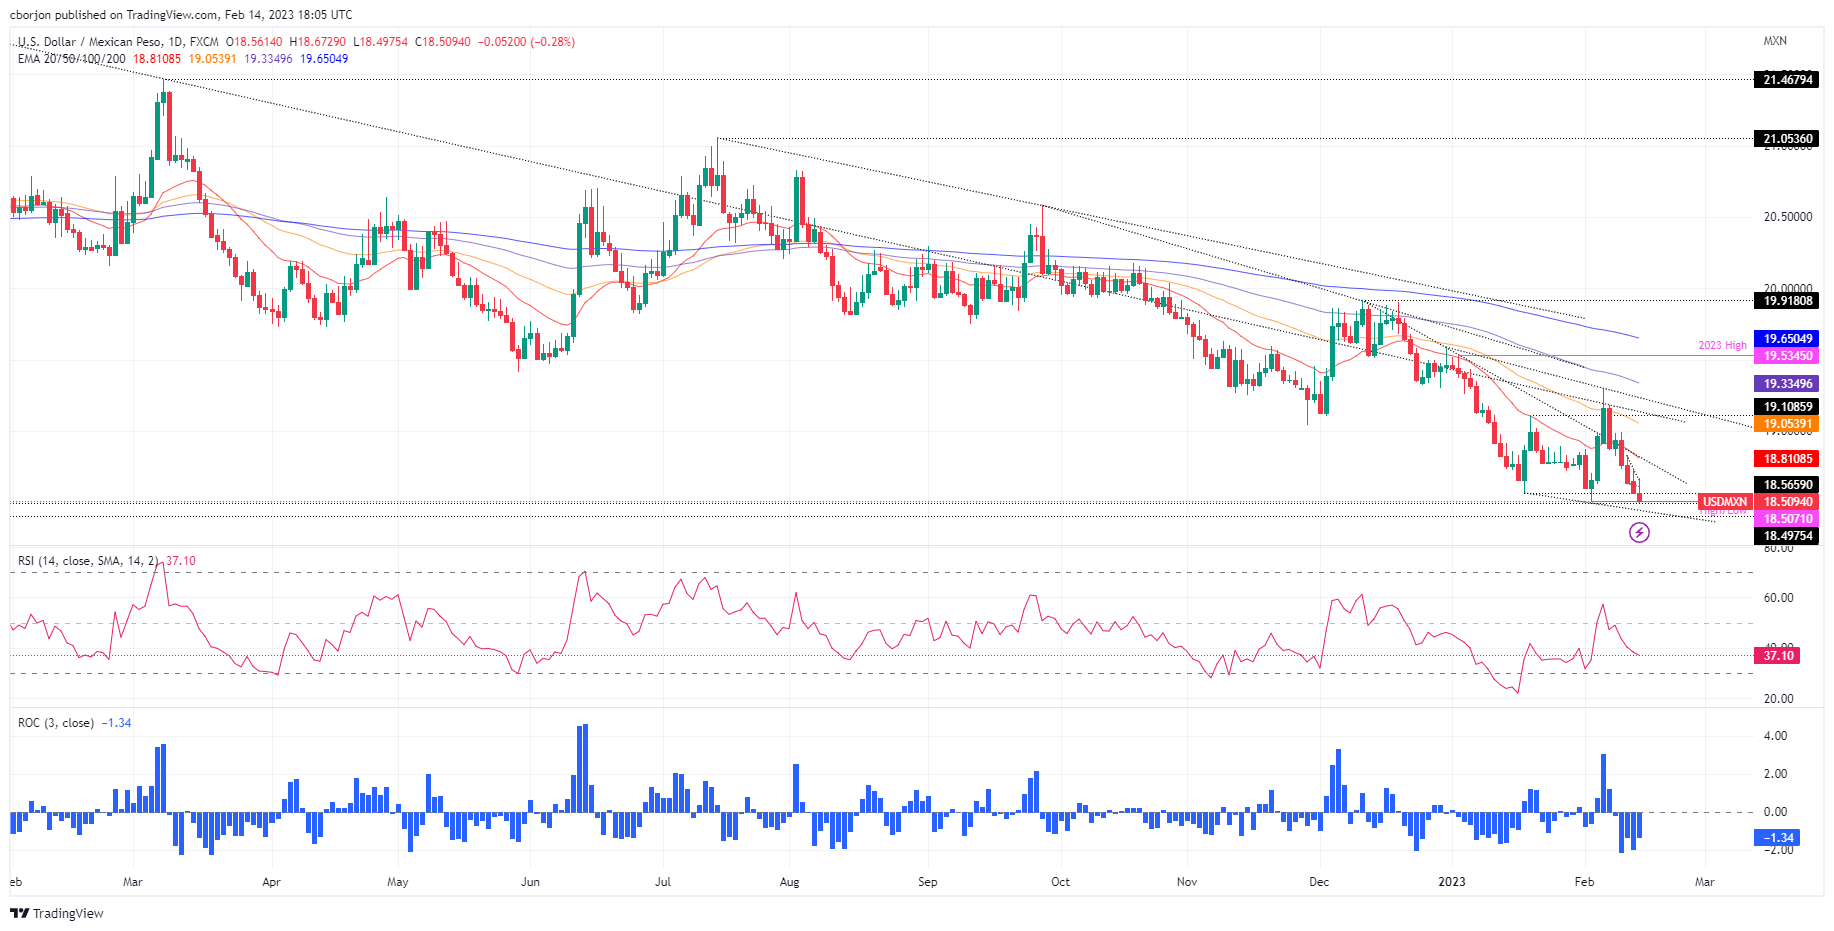
Technically speaking, the USD/MXN would continue to aim lower, as portrayed by the daily chart. After spiking to its daily high of 18.6729, the USD/MXN resumed its downtrend, which witnessed the pair dropping to fresh four and a half year low at 18.4975, a level last seen in August 2019. However, a bounce in that area trimmed some of the pair’s losses, sitting at around 18.50.
If the USD/MXN achieves a daily close below 18.50, that will exacerbate a fall towards August 7, 2018, at 18.4047, followed by a test of the $18.00 figure. In an alternate scenario, the USD/MXN’s first resistance would be the February 13 daily high of 18.7284. Break above would expose the 20-day Exponential Moving Average (EMA) at 18.8133, followed by the psychological barrier at 19.0000.
Oscillators, like the Relative Strength Index (RSI), suggest a bearish continuation, though a positive divergence is in the making, indicating that a reversal could be around the corner. The Rate of Change (RoC) portrays that although sellers are in control, momentum is fading.
USD/MXN Daily chart
USD/MXN Key technical levels
Philadelphia Fed President Patrick Harker said on Tuesday that in his view,'' we are not done yet … but we are likely close," Harker said in prepared remarks at an event in Philadelphia.
"At some point this year, I expect that the policy rate will be restrictive enough that we will hold rates in place and let monetary policy do its work."
"I do think we will see a very slight uptick in unemployment, probably topping out modestly above 4 percent this year. It's an underrated advantage that the Federal Reserve is taking on inflation from a position of such labor market strength," Harker said.
US Dollar update
The US Dollar index traded around 103.00 on Tuesday but posied higher due to the hotter-than-expected US inflation dashing hopes that the Federal Reserve will soon end its tightening campaign.
The annual inflation rate in the US, as measured by the Consumer Price Index, slowed only slightly to 6.4% in January from 6.5% in December, less than market forecasts of 6.2%, suggesting that getting inflation under control will take more time than expected.
- USD/JPY registers gains of 0.50%, above the 133.00 mark.
- US inflation data, albeit mixed, spurred a jump in US Treasury bond yields, a tailwind for the USD/JPY.
- USD/JPY Price Analysis: Daily close above 133.00 would pave the way for further gains.
The USD/JPY reached a new YTD high of 133.13, though it failed to cling to those gains, retracing beneath last week’s high of 132.90 after the release of US economic data, spurring a retracement. Therefore, the USD/JPY consolidates within the 132.70-133.00 area. At the time of writing, exchanges hands at 133.06.
Fundamentally speaking, the Department of Labor (DoL) revealed that inflation in the United States (US) cooled down annually but came slightly above estimates. The Consumer Price Index (CPI) for January rose by 6.4% YoY, above forecasts of 6.2%, while core CPI jumped to 5.6% YoY, against data estimated at 5.5%. Monthly basis readings were in line with estimates.
On the Japanese front, the confirmation of the Bank of Japan’s (BoJ) new Governor, Kazuo Ueda, sparked speculations that the BoJ would abandon the Yield Curve Control (YCC) imposed under Governor Haruhiko Kuroda’s term. Thar should be considered bullish for the Japanese Yen (JPY), which has extended its losses in the North American session so far.
Elsewhere, Federal Reserve (Fed) officials continued to express the need to hike rates for longer than expected, according to Dallas Fed President Lorie Logan. She echoed some earlier comments of Richmond’s Fed President Thomas Barkin, who said that inflation risks still outweigh others.
USD/JPY Technical analysis
After hitting a daily low of 131.49, the USD/JPY encountered some buyers around the latter, rallying sharply towards 133.00, underpinned by the US 10-year Treasury bond yield. To further extend its gains, the USD/JPY needs to clear the 200-day Exponential Moving Average (EMA) at 133.76, which would pave the way to 134.00. In an alternate scenario, the USD/JPY struggling to hold above 133.00 would open the door toward the 50-day EMA At 132.67, ahead of the 132.00 figure.
"We must remain prepared to continue rate increases for a longer period than previously anticipated, if such a path is necessary to respond to changes in the economic outlook or to offset any undesired easing in conditions," Dallas Federal Reserve President Lorie Logan said on Tuesday, as reported by Reuters.
Additional takeaways
"Even after pausing rate hikes, need to stay flexible, tighten further if conditions call for it."
"Need continued gradual rate hikes until see convincing evidence inflation falling to 2% in sustainable, timely way."
"Tightening policy too little is top risk."
"Tightening too much or too fast risks weakening labor market more than necessary."
"Should not lock in a peak Fed policy rate or precise rate path."
"Has been some progress on inflation, will need to see slower inflation in services."
"Little sign of improvement in core services ex housing inflation; symptomatic of tight labor market."
"Need better balance in labor market to bring inflation sustainably back to 2%."
"US job market is incredibly strong; likely to need substantially slower wage growth to reduce inflation."
Market reaction
The US Dollar Index showed no immediate reaction to these comments and was last seen trading flat on the day at around 103.30.
The US Census Bureau will release the January Retail Sales report on Wednesday, February 15 at 13:30 GMT and as we get closer to the release time, here are the forecasts of economists and researchers of seven major banks regarding the upcoming data.
Retail Sales in the US are expected to rise by 1.9% vs. -1.1% in December. Meanwhile, while sales ex-autos are expected at 0.8% vs. -1.1% in December. The so-called control group used for GDP calculations is expected at 0.8% MoM vs. -0.7% in December.
Commerzbank
“After the weak figures for November and December, there are signs of a countermovement. According to industry data, car sales have increased considerably. In addition, the renewed rise in gasoline prices is inflating nominal sales at service stations. Overall, we expect sales to increase by 1.3%.”
RBC Economics
“January US Retail Sales likely rose 1.9% from a 1.2% decline in December, thanks to an 18% surge in unit vehicle sales.”
NBF
“Car dealers likely contributed positively to the headline number, as auto sales surged during the month. Gasoline station receipts could have increased as well judging from a rise in pump prices. All told, headline sales could have jumped 2.1% in the month. Spending on items other than vehicles may have expanded a bit less, advancing 1.0%.”
CIBC
“Retail sales likely bounced back in January, as gas prices climbed and unit auto sales surged, which likely added to an increase in restaurant spending as the weather improved in many areas. Total retail sales likely rose by a robust 1.6%. Sales could have looked less impressive but still healthy elsewhere, with the control group (ex. gasoline, autos, restaurants, and building materials) likely posting a 0.5% increase. That would represent only a partial rebound from December’s decline, as spending on discretionary goods could have been squeezed by higher gasoline prices and spending on services.”
Citibank
“US January Retail Sales – Citi: 2.4%, prior: -1.1%; Retail Sales ex Auto – Citi: 1.4%, prior: -1.1%; Retail Sales ex Auto, Gas – Citi: 1.2%, prior: -0.7%; Retail Sales Control Group – Citi: 1.0%, prior: -0.7%. We expect total retail sales to rebound strongly by 2.4% MoM in January and expect a 1% MoM increase in control group sales with broad-based strength.”
TDS
“Retail Sales are expected to have rebounded significantly in January at 2% MoM after December's sharp contraction, with a surge in auto sales playing a significant role after consecutive declines in the final two months of 2022. Control group sales likely also jumped owing to a strong showing in online spending.”
Wells Fargo
“We expect to see glimmers of positive activity in the retail sales report for January. More muted inflation helps pump up real spending via higher real income growth. Real disposable personal income has risen for six consecutive months through December and is providing some support to consumers' purchasing power. This appears to have somewhat manifested itself in a rebound in durables purchases. Separately released data showed January vehicle sales were at their highest monthly level since May 2021. That should considerably flatter the headline growth rate, and we forecast overall retail sales rose 1.7%. Base effects of two disappointing months in a row prior may also help boost other retail categories. Excluding autos, we expect sales rose 0.5%.”
- The GBP/USD holds to its early gains in a volatile trading session.
- US inflation rose above estimates but cooled compared to December’s data.
- GBP/USD Price Analysis: It could resume its uptrend if it conquers 1.2200.
The GBP/USD dropped sharply in the North American session following the release of inflation data in the United States, which, although increased, initially sent the GBP/USD spiking towards its daily high at 1.2269 before reversing its course to the 1.2130 area. However, a late bounce sparked a recovery in the GBP/USD, trading at 1.2166, above its opening price.
US CPI cooled on an annual basis but was higher than forecasts
US inflation reported by the Department of Labor (DoL) showed that the Consumer Price Index (CPI) for January rose by 6.4% YoY, above estimates of 6.2%, while core CPI jumped to 5.6% YoY, against data estimated at 5.5%. Monthly basis readings were in line with estimates.
After the data release, US Treasury bond yields advanced, with the US 2-year Treasury bond yield edging towards 4.622%, as an initial reaction to the data, which warrants further tightening by the US Federal Reserve (Fed). Consequently, the greenback advanced, with the US Dollar Index (DXY) peaking at around 103.83 before reversing its course, toward the 103.09 area.
In the meantime, the swaps markets estimate the Fed would hike rates until the 5%-5.25% range, and then some cuts are expected by the end of the year.
Across the pond, data from the United Kingdom (UK), capped the Pound Sterling (GBP) fall vs. the US Dollar (USD). According to Reuters, wages in Britain grew quickly in the last quarter of 2022, keeping the Bank of England (BoE), pressured. Investors increased “slightly” their bets that the BoE would raise rates by 25 bps at their March meeting.
Elsewhere, Fed officials led by Thomas Barkin from the Richmond Fed are crossing the wires. Commented that the inflation report was “about as expected,” adding that inflation, although normalizing, it’s doing it slowly. Therefore, Barkin said there’s a good cause for leaving rates higher for a longer period.
GBP/USD Technical analysis
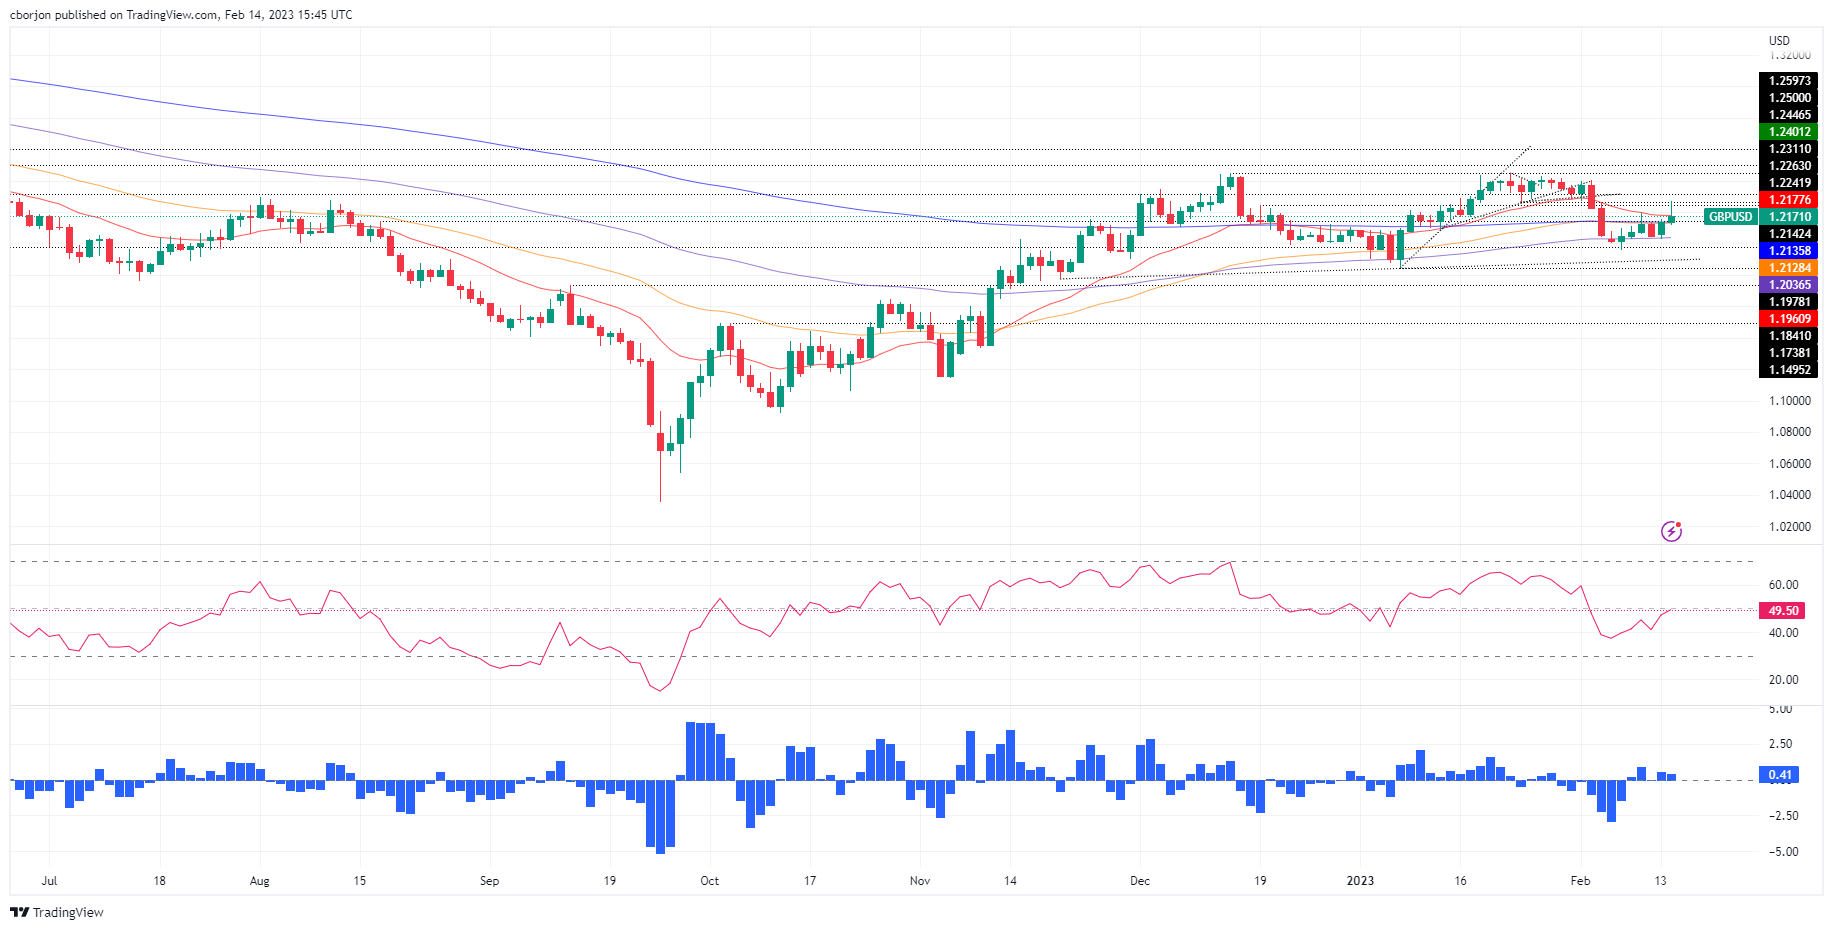
From a technical perspective, the GBP/USD daily chart suggests the pair is neutral to upward biased. Upward continuation will resume if the GBP/USD clears the 1.2200 figure, which could lift the major towards the February high of 1.2401. Firstly, it needs to hurdle the psychological 1.2300 barrier. On the flip side, a GBP/USD fall underneath the 20-day EMA at 1.2179 would expose the confluence of the 200/50-day EMA at 1.2136/1.2128, respectively, ahead of falling to 1.21000.
Brent Crude is trading at a similar level to the start of the year, around $85. But economists at UBS believe that the tightening of the oil market this year will eventually put prices on an upward trajectory.
Oil price recovery to gain traction as Russia cuts output
“We expect Russian crude production to fall below 9 million barrels per day in 2023 from levels above 10 mbpd at the start of 2022 and 9.77 mbpd in December.”
“We believe two-thirds of growth in oil demand this year will come from emerging Asia, led by China’s reopening – which we think will lift global oil demand to above 103 mbpd in the second half of the year.”
“We expect non-OPEC+ nations to provide only modest supply growth this year, adding 1.3 mbpd primarily from US oil production, but trailing oil demand growth of 1.6 mbpd this year.”
“We maintain our positive outlook on oil as we continue to expect Brent to rise to $110 and WTI to $107 this year.”
Economists at the Bank of America Global Research see scope for a mild recession this year in the United States and hold a bearish USD view.
Fed cuts to begin only in March 2024
“We expect a mild recession starting mid-2023 and Fed cuts to begin only in March 2024. For 2023, the market expects a much milder recession, with the Fed still hiking rate 1-2 more times before slightly cutting rates in second half of the year.”
“For now, we still hold a bearish USD view for the medium term; 2023 playing out in line with leading indicator historical precedents would increase the upside risk to our bearish USD outlook.”
- The index dropped to multi-session lows post-CPI.
- US inflation rose more than expected during January.
- FOMC’s Logan, Harker and Williams come next in the docket.
The USD Index (DXY), which gauges the greenback vs. a basket of its main competitors, manages to regain some composure and leaves behind earlier lows in the sub-103.00 region on turnaround Tuesday.
USD Index meets support near 102.60
After bottoming out in multi-day lows near 102.60, the index seems to have met some dip buyers and quickly regained the 103.00 barrier and beyond.
The dollar, in the meantime, now alternates gains with losses after US inflation figures tracked by the CPI rose more than initially estimated during January. On this, consumer prices rose 6.4% over the last twelve months and 5.6% when excluding food and energy costs.
Earlier in the session, the NFIB Business Optimism Index edged higher to 90.3 in January. Later in the session, Dallas Fed L.Logan (voter, centrist), Philly Fed P.Harker (voter, hawk) and NY Fed J.Williams (permanent voter, centrist) are all due to speak.
What to look for around USD
The dollar remains within a consolidative phase in the lower end of the recent range just above the 103.00 level against the backdrop of flat risk appetite trends.
The probable pivot/impasse in the Fed’s normalization process narrative is expected to remain in the centre of the debate along with the hawkish message from Fed speakers, all after US inflation figures for the month of January showed consumer prices are still elevated.
The loss of traction in wage inflation – as per the latest US jobs report - however, seems to lend some support to the view that the Fed’s tightening cycle have started to impact on the still robust US labour markets somewhat.
Key events in the US this week: Inflation Rate (Tuesday) – MBA Mortgage Applications, Retail Sales, Industrial Production, Business Inventories, NAHB Index, TIV Flows (Wednesday) – Building Permits, Housing Starts, Initial Jobless Claims, Philly Fed Index (Thursday) – CB Leading Index (Friday).
Eminent issues on the back boiler: Rising conviction of a soft landing of the US economy. Slower pace of interest rate hikes by the Federal Reserve vs. shrinking odds for a recession in the next months. Fed’s pivot. Geopolitical effervescence vs. Russia and China. US-China trade conflict.
USD Index relevant levels
Now, the index is retreating 0.11% at 103.18 and the breach of 100.82 (2023 low February 2) would open the door to 100.00 (psychological level) and finally 99.81 (weekly low April 21 2022). On the other hand, the next resistance level emerges at 103.96 (monthly high February 7) seconded by 105.63 (2023 high January 6) and then 106.45 (200-day SMA).
Economists at Deutsche Bank expect the S&P 500 Index to fall towards 3250 in the third quarter. However, the index is expected to move back higher to end the year at 4500.
Current bear market rally to continue through Q1 into Q2
“In the short term, we see the current bear market rally continuing through Q1 into Q2.”
“After a flat performance in Q2 as recession concerns build, equities will then fall significantly in Q3 as the recession begins, with the S&P 500 falling to 3250.”
“We expect the S&P to bottom half-way through the recession and recover the decline during Q4, reaching 4500 by 2023 year-end.”
- WTI is falling into the abyss and eyes below $77.50 lows.
- US CPI sees the US Dollar catch a late bid.
US crude prices are adding to earlier declines, falling after the US Consumer Price index data and during the Wall Street cash open. West Texas Intermediate crude oil was down 1.4% on the day at the time of writing, slightly up from the lows of around $77.69 a barrel but well below the highs of USD79.80bbls.
The US inflation report came in a bit hotter than expected, raising some concerns about future oil and fuel demand in the world's top oil-consuming nation. However, overall, Fed swaps indicate that 2023's anticipated funds rates won't change much as a result and that had seen some softness in the US Dollar initially.
Ahead of the data, markets expected the Fed's target rate to peak at 5.188% in July, from a current range of 4.5% to 4.75%. Fed funds futures are now pricing in top-fed funds fund rate of 5.%-5.25% by July, vs earlier near-even odds seen of a higher fed funds rate. However, the US Dollar turned higher as markets started to digest the data which has also weighed don the oil price.
US Consumer Price Index has come out in line with expectations for the month-over-month data 0.4% vs 0.4% expected. Meanwhile, US January CPI for the year came in at +6.4% vs +6.2% expected.
It is also worth noting that analysts at TD Securities explained that ''CTA trend followers are marginally adding back their shorts in Brent crude after reports of congressionally mandated SPR sales soured sentiment in the energy complex.''
''RBOB gasoline is taking the brunt of the hit from CTAs, with current prices pointing to a substantial selling program equivalent to -9% of the cohort's maximum historical position size. Still, the trend in time spreads points to a tighter physical market on the horizon, as evidence of a demand boom from China's reopening is apparent in travel.''
WTI technical analysis
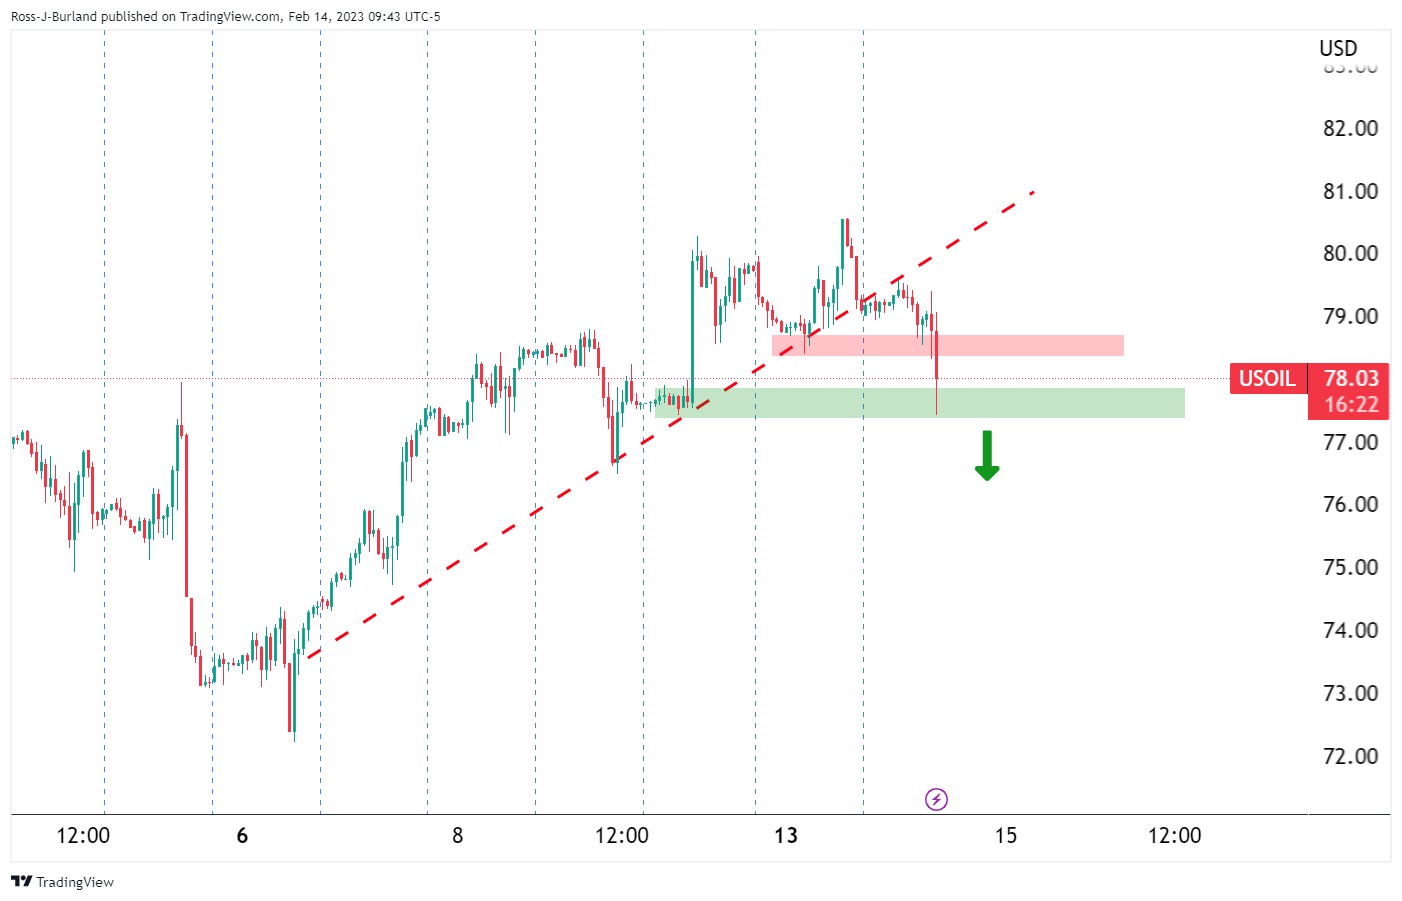
The price is falling to key support area that guards a move towards $77.00bbls. The ATR is $2.50 which gives room for some more to go to the downside.
US annual CPI data declined to 6.4% in January vs. 6.2% expected. Thus, economists at Commerzbank expect further rate hikes.
Fed will raise key rates by a total of 50 bps
“Inflation in the US is easing, but only slowly. This was confirmed by the January figures, with a slight drop from 6.5% to 6.4%. The Federal Reserve can therefore not yet be satisfied.”
“We continue to forecast that the Fed will raise key rates by a total of 50 bps, the upper bound of the target corridor would then be 5.25%.”
- Gold price has rallied on the back of US CPI.
- Federal Reserve expectations are little changed, fuelling the bid in the Gold price.
The Gold price is choppy as the markets digest the comprehensive inflation data that has been released from the United States of America. US Consumer Price Index has come out in line with expectations for the month-over-month data 0.4% vs 0.4% expected. Meanwhile, US January CPI for the year came in at +6.4% vs +6.2% expected.
Fed swaps indicate that 2023's anticipated funds rates won't change much as a result and that has seen some softness in the US Dollar which is helping to lift the Gold price. At the time of writing, Gold price is trading in the middle of the day's range at $1,860.
Fed expectations little changed
The market is likely to scale back its interest rate expectations, on this data which is allowing the gold price to rise as although bullion is considered an inflation hedge, it is highly sensitive to rising US interest rates, as they increase the opportunity cost of holding the zero-yield asset.
Ahead of the data, markets expected the Fed's target rate to peak at 5.188% in July, from a current range of 4.5% to 4.75%. Fed funds futures are now pricing in top-fed funds fund rate of 5.%-5.25% by July, vs earlier near-even odds seen of a higher fed funds rate.
Gold technical analysis
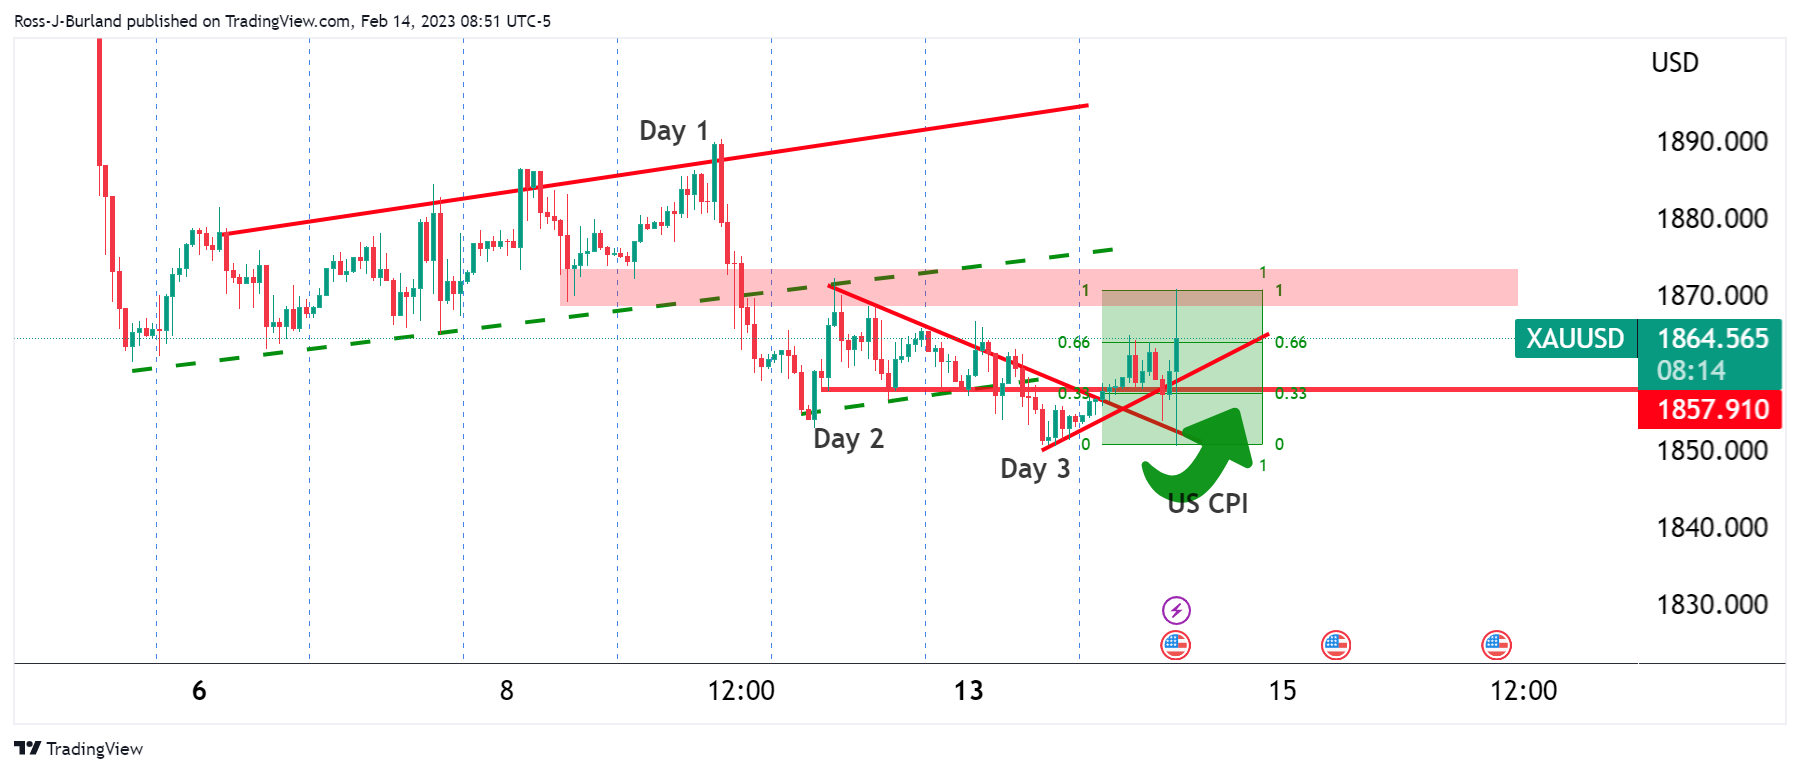
The Gold price has rallied and is moving towards a stronger test of resistance after a series of days of shorts in the market with eyes back on a move into the rising channel near $1,880.
- AUD/USD reverses swiftly from the daily low and rallies to over a one-week high in the last hour.
- The USD weakens despite a slightly higher-than-expected US CPI print and lends support to the pair.
- A softer risk tone helps turns out to be a key factor capping the upside for the risk-sensitive Aussie.
The AUD/USD pair rallies nearly 100 pips from the daily low touched in the last hour and spikes to over a one-week high following the release of the US consumer inflation figures. The pair is currently placed just above the 0.7000 psychological mark, though lacks any follow-through buying.
The US Dollar witnessed a typical "buy the rumour, sell the news" kind of trade after the US Bureau of Labor Statistics reported that the headline CPI rose by 0.5% in January. The reading was in line with market expectations and was accompanied by a higher-than-expected yearly rate, which ticked down to 6.4% from the 6.5% previous. More importantly, Core CPI, which excludes food and energy prices, came in at 0.4% MoM and 5.6% YoY.
Given that a stronger print was already priced in the markets, the USD weakens across the board in the absence of any major surprise to the upside from the US CPI. This, in turn, is seen as a key factor pushing the AUD/USD pair higher. That said, a generally softer tone around the equity markets seems to benefit the Greenback's relative safe-haven status and keeps a lid on any further gains for the risk-sensitive Aussie, at least for the time being.
From a technical perspective, repeated failures to find acceptance above the 0.7000 mark suggest that the AUD/USD pair's recent pullback from its highest level since June 2020 is still far from being over. Hence, it will be prudent to wait for a strong follow-through buying before positioning for any further appreciating move.
Technical levels to watch
- EUR/USD advances further north of the 1.0800 mark.
- Flash EMU Q4 GDP came in at 1.9% YoY, 0.1% QoQ.
- US inflation figures surprised to the upside in January.
EUR/USD picks up extra pace and trespasses the key barrier at 1.0800 the figure on Tuesday, or multi-session highs.
EUR/USD firmer post-US data
EUR/USD extends the uptick just beyond the 1.0800 mark in the wake of the release of US inflation figures for the month of January.
Indeed, the pair saw its ongoing weekly rebound gather extra impulse after US headline CPI rose at an annualized 6.4% in January and 5.6% when it comes to the Core CPI. The prints, albeit higher than previously estimated, keep showing a loss of momentum in consumer prices.
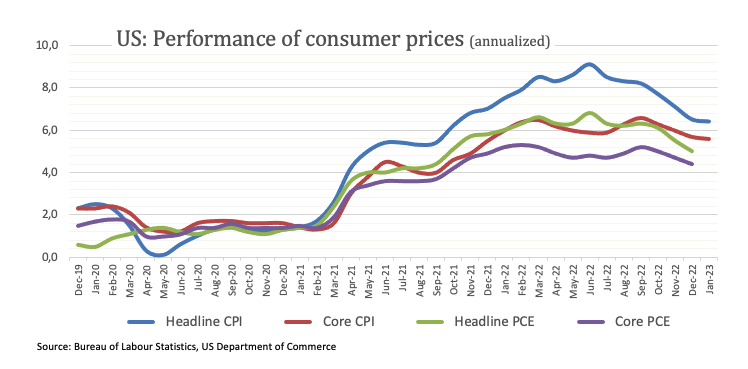
Earlier on Tuesday, flash EMU Q4 GDP saw the economy still expected to expand 1.9% YoY in the October-December period and 0.1% inter-quarter.
What to look for around EUR
EUR/USD seems to have embarked in a decent bounce following Monday’s drop to the 1.0650 region, although the resistance line above 1.0800 continues to cap occasional bullish attempts for the time being.
In the meantime, price action around the European currency should continue to closely follow dollar dynamics, as well as the potential next moves from the ECB after the central bank delivered a 50 bps at its meeting last week.
Back to the euro area, recession concerns now appear to have dwindled, which at the same time remain an important driver sustaining the ongoing recovery in the single currency as well as the hawkish narrative from the ECB.
Key events in the euro area this week: ECOFIN Meeting, EMU Flash Q4 GDP (Tuesday) – EMU Balance of Trade, Industrial Production, ECB Lagarde (Wednesday).
Eminent issues on the back boiler: Continuation of the ECB hiking cycle amidst dwindling bets for a recession in the region and still elevated inflation. Impact of the Russia-Ukraine war on the growth prospects and inflation outlook in the region. Risks of inflation becoming entrenched.
EUR/USD levels to watch
So far, the pair is gaining 0.46% at 1.0767 and is expected to meet the next up barrier at 1.0804 (weekly high February 14) seconded by 1.1032 (2023 high February 2) and finally 1.1100 (round level). On the flip side, a drop below 1.0655 (weekly low February 13) would target 1.0481 (2023 low January 6) en route to 1.0323 (200-day SMA).
EUR/USD seems to have anchored itself in a 1.05-1.10 trading range. Economists at TD Securities see see much more upside than downside in the quarters ahead.
EUR/USD Q2 forecast at 1.15
“EUR/USD seems to have anchored itself in a 1.05-1.10 trading range. At current levels, we’re around the mid-point of that range, leaving us waiting for better levels to engage.”
“We see much more upside than downside in the quarters ahead, reflecting our Q2 forecast of 1.15. Still, we prefer to exercise patience, aiming to buy towards the lower end of the new range.”
Strong economic momentum points to a higher terminal rate in the United States. Economists at ANZ Bank have revised up their Fed Funds Rate forecast by 50 bps to 5.50%.
Cyclical components of inflation may stay high
“We have revised up our FFR forecast range by 50 bps to 5.25-5.50%. We now expect the FOMC will extend tightening through Q2 and anticipate 25 bps rate increases at the May and June FOMC meetings, in addition to the March hike that we already expected.”
“Economic momentum at the end of last year and in early 2023 has been stronger than anticipated. We have revised up our Q1 GDP forecast to 0.5% QoQ vs 0.3% QoQ, inferring resilient growth. Based on available and expected data, we have downgraded our near-term view of recession risks.”
“Whilst the increase in January Nonfarm Payrolls (517K) was way above “normal” and may not be repeated in coming months, there is no denying labour market strength. This implies cyclical components of inflation may stay high.”
“We think the FOMC will have to upgrade its GDP forecasts and reduce its unemployment forecasts when it publishes its Summary of Economic Projections in March. The risks to the median dot plot lie to the topside.”
- USD/CAD drifts into negative territory for the third successive day amid sustained USD selling.
- Sliding Crude Oil prices could undermine the Loonie and help limit the downside for the major.
- Traders might also refrain from placing aggressive bearish bets ahead of the key US CPI report.
The USD/CAD pair meets with a fresh supply following an early uptick to the 1.3355 region and turns lower for the third successive day on Tuesday. The pair drops to a one-and-half-week low, around the 1.3320 region heading into the North American session and is pressured by strong follow-through selling around the US Dollar.
In fact, the USD Index, which tracks the Greenback against a basket of currencies, extends the previous day's retracement slide from a multi-week high amid a further decline in the US Treasury bond yields. Apart from this, a mildly positive tone around the equity markets is seen as another factor weighing on the safe-haven buck. That said, weaker Crude Oil prices could undermine the commodity-linked Loonie and help limit the downside for the major, at least for the time being.
Traders might also refrain from placing aggressive bets and prefer to wait on the sidelines ahead of the release of the US consumer inflation figures. The US Labor Department's annual revisions of CPI data last Friday, which showed that monthly consumer prices rose in December instead of falling as previously estimated, raises the risk of a stronger US CPI print. This, in turn, supports prospects for further policy tightening by the Fed and favours the USD bulls.
Heading into the key US data risk, the aforementioned fundamental backdrop warrants some caution for bearish traders and before positioning for any further depreciating move for the USD/CAD pair. Hence, any subsequent slide is more likely to find decent support and remain limited near the 1.3300 mark. The said handle should act as a pivotal point for intraday traders, which if broken should pave the way for deeper losses and expose the monthly low, around the 1.3260 region.
Technical levels to watch
EUR’s rebound extends through low-1.07s. However, economists at Scotiabank do not expect the EUR/USD pair to extend its race higher.
Resistance should be firm at 1.0790/00
“We are not fully convinced the EUR rebound has staying power. Risk reversal pricing suggests markets bets are tilting towards renewed weakness in the near term, with 1m EUR risk reversal pricing slipping to -0.89%, reflecting relative higher demand for EUR puts over calls.”
“Trend signals are not aligned in a way that gives me confidence that the rally can extend much more at the moment and spot may simply be consolidating ahead of another push lower; resistance should be firm at 1.0790/00.”
“Intraday losses below 1.0730 will likely see renewed softness towards or below the figure.”
European Central Bank (ECB) Governing Council member Gabriel Makhlouf said on Tuesday that the ECB could raise rates above 3.5% and hold them there for the remainder of the year, the Wall Street Journal reported.
Earlier in the day, ECB policymaker Mario Centeno said that the full impact of rate hikes may not reach the European economy.
Market reaction
EUR/USD edged slightly higher with the initial reaction to Makhlouf's comments. As of writing, the pair was trading at 1.0760, where it was up 0.37% on a daily basis.
- NZD/USD meets with a fresh supply on Tuesday, though the downside remains cushioned.
- The ongoing USD retracement slide from multi-week high acts as a tailwind for the major.
- Traders also seem reluctant to place aggressive bets and keenly await the key US CPI data.
The NZD/USD pair attracts some sellers following an early uptick to the 0.6365 area and reverses a part of the previous day's positive move. The pair remains depressed heading into the North American session and is currently placed near the lower end of its daily range, just below mid-0.6300s.
The downside for the NZD/USD pair, meanwhile, remains limited amid strong follow-through selling around the US Dollar, which is seen extending the overnight pullback from a multi-week high. A further decline in the US Treasury bond yields, along with signs of stability in the financial markets, turn out to be a key factor weighing on the safe-haven Greenback. Traders, however, seem reluctant to place aggressive bets and keenly await the release of the latest US consumer inflation figures.
The crucial US CPI report will play a key role in influencing the Fed's rate-hike path, which, in turn, should drive the USD demand and help determine the near-term trajectory for the NZD/USD pair. In the meantime, the risk of stronger US inflation data should help limit the USD losses. The expectations were fueled by the US Labor Department's annual revisions of CPI data last Friday, which showed that monthly consumer prices rose in December instead of falling as previously estimated.
Moreover, several Federal Open Market Committee (FOMC) policymakers, including Fed Chair Jerome Powell, recently stressed the need for additional interest rate hikes to fully gain control of inflation. Hence, any positive surprise from the US CPI print should allow the US central bank to stick to its hawkish stance for longer. This could trigger a fresh leg up for the USD and set the stage for an extension of the NZD/USD pair's recent pullback from its highest level since June 2022.
Technical levels to watch
- EUR/USD extends the weekly rebound well past the 1.0700 mark.
- The next hurdle of note aligns at the 3-month line near 108.30.
The upside bias in EUR/USD manages to gather extra impulse following the breakout of the key barrier at 1.0700 on Tuesday.
Further upside is initially focused on 1.0790 (daily high February 9), while the surpass of this level should motivate the pair to confront the 3-month resistance line in the 108.30 region. Beyond the latter, there are no hurdles of note until the 2023 peak at 1.1032 (February 2).
In the longer run, the constructive view remains unchanged while above the 200-day SMA, today at 1.0323.
EUR/USD daily chart
- The index remains on the defensive in the first half of the week.
- Next on the downside emerges the 102.60 zone.
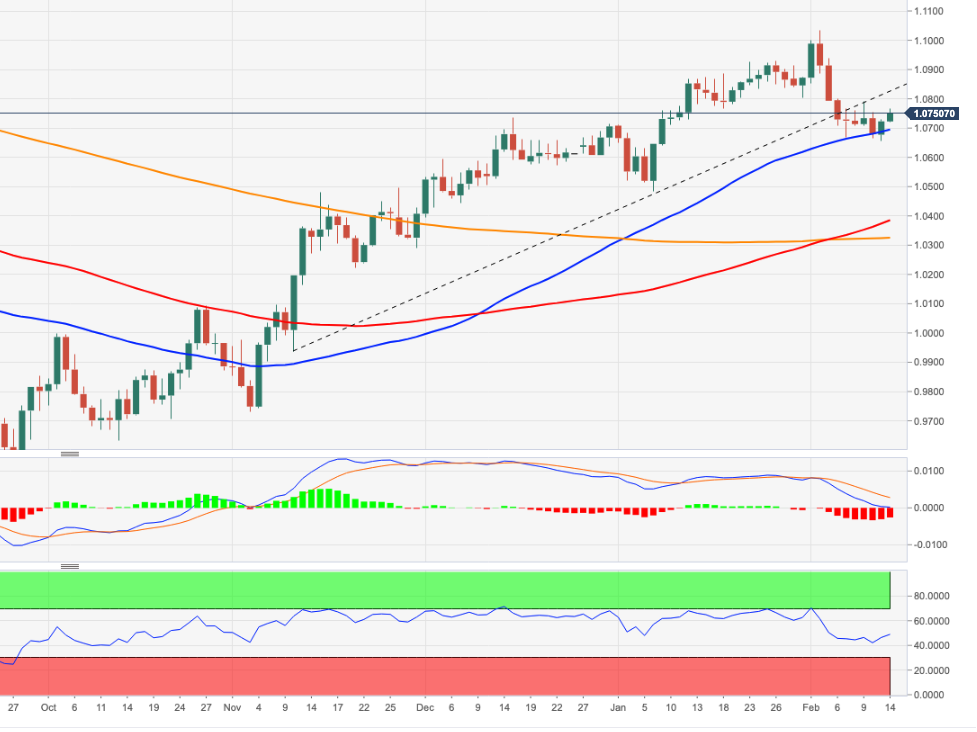
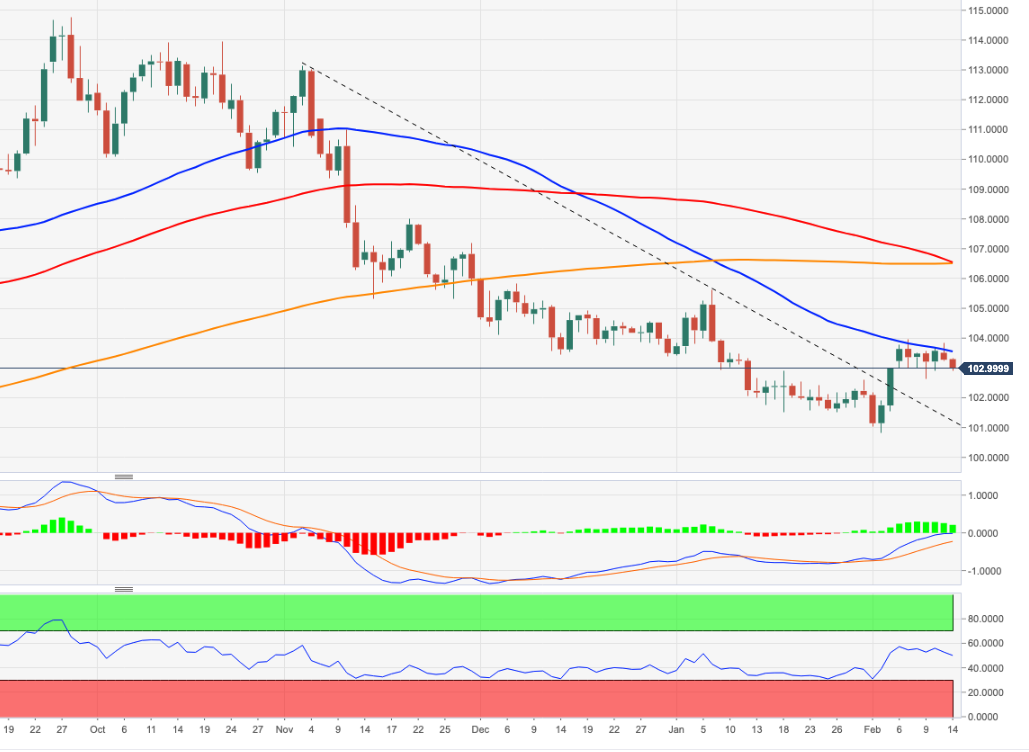
DXY adds to the bearish note recorded on Monday and puts the 103.00 support level to the test on Tuesday.
The recent price action leaves the door open to the continuation of the consolidative phase for the time being. However, a drop below last week’s low at 102.64 (February 9) should open the door to a deeper pullback in the short term to, initially, the 3-month support line, today near 102.35.
In the longer run, while below the 200-day SMA at 106.45, the outlook for the index remains negative.
DXY daily chart
According to Markets Strategist Quek Ser Leang at UOB Group, USD/IDR could extend the upside bias further in the short-term horizon.
Key Quotes
“We highlighted last Monday (07 Feb, spot at 15,125) that ‘There is room for USD/IDR to rise to 15,190’. We added, ‘In view of the overbought short-term conditions, a sustained rise above this level is unlikely this week’. USD/IDR subsequently rose to 15,146, closed at 15,130 before surging above 15,190 in Asian trade today.”
“The price actions suggest USD/IDR is likely to advance further this week. Resistance levels are at 15,270, followed by a major level at 15,350. On the downside, support is at 15,130, a break of 15,050 would indicate that USD/IDR is not advancing further.”
The rebound for the Dollar has been relatively muted still. But economists at MUFG Bank expect a strong US Consumer Price Index (CPI) report to trigger a Dollar rally.
How the US equity market reacts to inflation data will be key for the Dollar
“The DXY is very close to the closing level from 3rd February and has barely advanced at all since. The lack of follow-through for the USD in part reflects the resilience of US equity markets and the reaction of the S&P 500 to today’s inflation print will be important as well. We would assume a stronger than expected CPI data today would prompt that resilience to give way more clearly as the rates market moves to price an additional 25 bps rate hike beyond May.”
“We certainly see a stronger CPI print as more disruptive for risk and that could be the catalyst for a more pronounced rally back for the Dollar than what we have seen since the initial reaction on 3rd February.”
- GBP/USD gains strong traction for the second straight day and rallies to over a one-week high.
- The upbeat UK jobs report lifts bets for another BoE rate hike and underpin the British Pound.
- The offered tone surrounding the USD provides an additional boost ahead of the US CPI report.
The GBP/USD pair builds on the overnight solid rebound from the 1.2030 area up and gains strong follow-through traction for the second successive day on Tuesday. Spot prices climb above the 1.2200 mark, hitting a one-and-half-week high during the mid-European session, with bulls looking to extend the momentum beyond the 50-day SMA.
The British Pound gets a boost in reaction to the upbeat UK labor market data, which, along with the prevalent US Dollar selling bias, act as a tailwind for the GBP/USD pair. The UK Office for National Statistics Office for National Statistics reported that the number of people claiming unemployment-related benefits unexpectedly fell by 12.9K in January. Furthermore, Average Earnings excluding bonuses were up 6.7% during the three months to December. This marks the fastest rise since records began in 2001, excluding the pandemic period, and could add pressure on the Bank of England (BoE) to deliver another interest rate hike next month.
The USD, on the other hand, extends the previous day's retracement slide from a multi-week high and is pressured by a further decline in the US Treasury bond yields. Apart from this, a generally positive tone around the equity markets further undermines the safe-haven Greenback and provides an additional lift to the GBP/USD pair. Any further move up, however, seems limited as traders keenly await the release of the latest US consumer inflation figures. The crucial US CPI report will play a key role in influencing the Fed's rate-hike path, which, in turn, will drive the USD demand and help determine the next leg of a directional move for the pair.
Nevertheless, a sustained strength beyond last week's swing high, which coincided with the 50-day SMA hurdle, and the 1.2200 mark might have already set the stage for additional gains. Hence, some follow-through strength, back towards reclaiming the 1.2300 round figure, looks like a distinct possibility. Traders, however, might refrain from placing aggressive bets and prefer to wait on the sidelines ahead of the US inflation data risk.
Technical levels to watch
- EUR/JPY adds to Monday’s uptick above the 142.00 barrier.
- Extra gains now target the resistance area around 143.00.
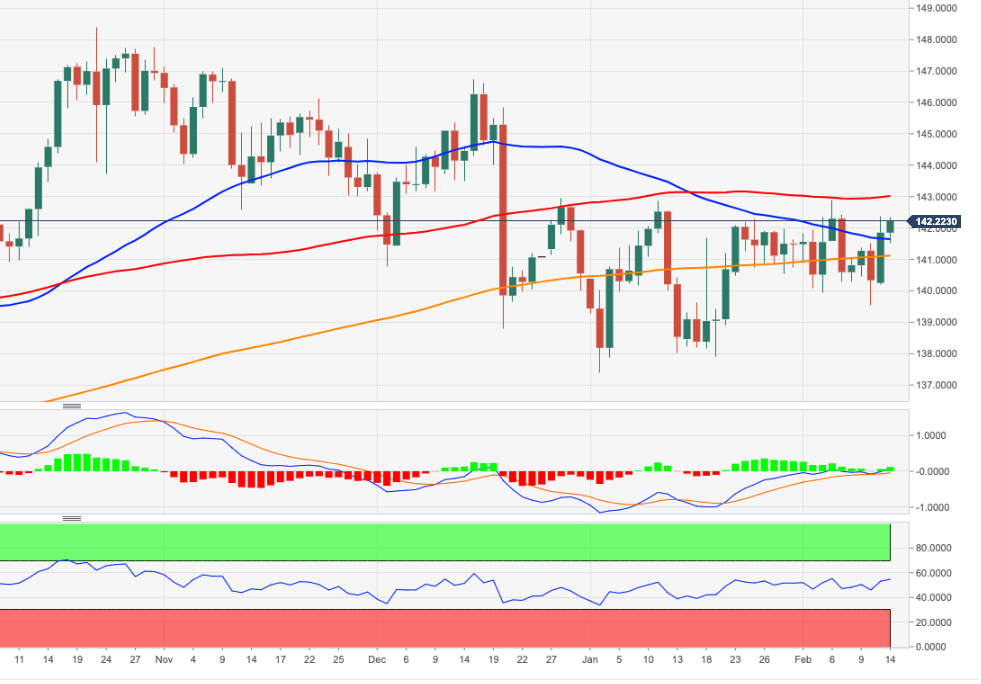
EUR/JPY pushes higher and surpasses the key barrier at 142.00 the figure on Tuesday.
While the cross looks broadly side-lined for the time being, further gains could prompt a test of the key 143.00 hurdle to re-emerge on the horizon ahead of the December 2022 high near 146.70.
A convincing breakout of the 200-day SMA, today at 141.08, should shift the outlook to a more constructive one.
EUR/JPY daily chart
If US data today and tomorrow exceeds expectations, GBP/USD could slump below the 1.20 level, analysts at Société Générale report.
An imminent return to early 2023 highs of around 1.2450 is implausible
“GBP/USD recovered from a decline below 1.20 for the first time in a month but a return below te psychological level cannot be ruled out this week if US CPI and/or retail sales surprise to the upside.”
“With the BoE nearer to pausing the tightening cycle than the Fed, an imminent return of GBP/USD to early 2023 highs of around 1.2450 is implausible.”
“The 200-DMA remains first support below 1.20 at 1.1944.”
Extra gains could encourage USD/MYR to challenge the key barrier at 4.4000 in the short term, suggests Markets Strategist Quek Ser Leang at UOB Group.
Key Quotes
“We highlighted last Monday (07 Feb, spot at 4.3000) that ‘the rapid increase in momentum is likely to lead to further USD/MYR strength towards 4.3250’. We added, ‘the next resistance at 4.3480 is likely out of reach this week’. Our view was not wrong as USD/MYR soared to 4.3300, closed at 4.3290 before rising above 4.3480 in early Asian trade. Not surprisingly, upward momentum has improved further and the risk for USD/MYR this week is still on the upside.”
“There is a strong resistance level at 4.3660, a break of this level could potentially trigger a rapid rise to 4.4000. In order to keep the momentum going, USD/MYR should not breach the strong support at 4.2950 (minor support is at 4.3290).”
Gold price dropped yesterday to $1,850, its lowest level since early January. Soft United States Consumer Price Index could scale back hawkish Federal Reserve bets, allowing the yellow metal to rise, strategists at Commerzbank report.
All eyes on the United States Consumer Price Index
“The US inflation figures that are due to be published today could result in some price movement.”
“Like our economists, the market expects the inflation rate in January to have fallen to 6.2%. If so, this would constitute the lowest increase in the CPI since October 2021. If the inflation rate turns out to be even lower, the market is likely to scale back its interest rate expectations again somewhat, allowing Gold to rise.”
The Japanese government named Kazuo Ueda to become the next governor of the Bank of Japan (BoJ). Economists at ING expect JPY volatility to remain elevated.
No indications that Uead will favour an abrupt end to BoJ’s ultra-dovish policy stance
“The Yen continues to see elevated volatility as markets struggle to assess the implications of the Bank of Japan appointing – now officially – Kazuo Ueda as next governor.”
“We expect JPY volatility to stay high as Ueda may refrain from offering clear direction on any policy shift before taking the role in April.”
“For now, there are no indications he will favour an abrupt end to the BoJ’s ultra-dovish policy stance.”
- USD/JPY edges lower on Tuesday, though the downside lacks strong follow-through.
- Speculations for a hawkish shift by the BoJ benefit the JPY amid sustained USD selling.
- The downside remains cushioned as traders seem reluctant ahead of the US CPI report.
The USD/JPY pair comes under some selling pressure on Tuesday and erodes a part of the previous day's strong gains to the 133.00 neighbourhood or a fresh monthly top. The pair, however, manages to recover a few pips during the first half of the European session and is now trading around the 132.15-132.20 region, down less than 0.20% for the day.
The US Dollar extends the overnight retracement slide from a multi-week high amid a further decline in the US Treasury bond yields. Furthermore, speculations that the new Bank of Japan (BoJ) governor candidate Kazuo Ueda will dismantle the yield curve control sooner rather than later underpins the Japanese Yen (JPY). This turns out to be a key factor exerting some downward pressure on the USD/JPY pair.
The downside, however, remains cushioned, at least for the time being, as traders seem reluctant to place aggressive bets ahead of the US consumer inflation figures. The crucial US CPI report is due for release later during the early North American session and will play a key role in influencing the Fed's rate-hike path. This, in turn, will drive the USD demand and provide a fresh directional impetus to the USD/JPY pair.
In the meantime, the risk of a stronger US CPI print should help limit the USD losses and continue to lend some support to the USD/JPY pair. The expectations were fueled by the US Labor Department's annual revisions of CPI data released last Friday, which showed that monthly consumer prices rose in December instead of falling as previously estimated. This, in turn, warrants some caution before positioning for further losses.
Technical levels to watch
US Consumer Price Index (CPI) report will be followed by Retail Sales tomorrow. Economists at Société Générale analyze how the upcoming data could impact the US Dollar.
Test of corrective February bond/FX trend
“We forecast a gain in headline of 0.4% MoM, the largest since October. A hot number that lends credibility to the repricing of the Fed outlook could mean more trouble for risk assets and high beta FX, accelerate the unwinding of bullish January trends which have characterised the first two weeks of February.”
“Underwhelming data will trigger short covering in bonds (lower yields, steeper curve) and could place the dollar back on a weakening trend.”
“Dollar bulls will be inclined to raise targets to 105 area for the DXY (+1.9%) if data today and tomorrow exceeds expectations. This would correspond to 1.05 in EUR/USD and 1.19 in GBP/USD.”
Markets Strategist Quek Ser Leang at UOB Group notes USD/THB faces a solid barrier at the 34.20 level.
Key Quotes
“Last Monday (07 Feb, spot at 33.62), we highlighted that ‘deeply overbought conditions suggest USD/THB could consolidate for a couple of days first before heading higher’. While USD/THB subsequently consolidated, it did not make any headway on the upside. That said, short-term upward momentum is beginning to build and the bias for USD/THB this week is tilted to the upside.”
“Overall, barring a breach of 33.35 (minor support is at 33.55), the chance of USD/THB breaking 34.00 is increasing. Looking ahead, the next resistance above 34.00 is at 34.20.”
Today's market highlight will be the US Consumer Price Index (CPI) print for January. Economists at ING suspect that a consensus 0.4% month-on-month read in core inflation may be enough to weigh on risk assets and support the Dollar.
A consensus reading may be enough to support the Dollar
“The market's reaction will likely be driven once again by the MoM figure, which we expect to match consensus expectations at 0.5% for the headline rate and 0.4% for core inflation. This should translate into YoY reads of around 6.2% and 5.5%, respectively.
Such a consensus read may be enough to weigh on risk assets and support the USD, as it should allow markets to fully price in 50 bps of additional tightening by the Fed and offer the chance to scale back rate cut expectations (around 50 bps priced in for 2H23).”
“Given that core inflation in December came in at 0.3%, a 0.2% print (or below) today should be enough to trigger a Dollar correction, and a 0.5% (or above) could trigger a Dollar rally.”
- Gold price regains positive traction on Tuesday amid the ongoing US Dollar retracement slide.
- Recession fears also benefit the safe-haven XAU/USD, though the uptick lacks follow-through.
- Investors keenly await the release of the crucial consumer inflation data from the United States.
Gold price attracts some buying on Tuesday and recovers a major part of the previous day's slide to the $1,850 level, or its lowest level since January 6. The XAU/USD sticks to modest intraday gains through the first half of the European session and is currently trading just above the $1,860 level, up nearly 0.50% for the day.
Weaker US Dollar, recession fears benefit Gold price
The US Dollar (USD) extends the overnight pullback from a multi-week top amid a further decline in the US Treasury bond yields. This, in turn, is seen as a key factor benefitting the US Dollar-denominated Gold price. Adding to this, the cautious market mood - amid looming recession risks - offers additional support to the safe-haven precious metal, though the uptick lacks bullish conviction.
Focus remains on consumer inflation figures from United States
Traders now seem reluctant to place aggressive bets and prefer to wait on the sidelines ahead of the latest Consumer Price Index (CPI) data from the United States (US). The crucial US CPI report will play a key role in influencing the Federal Reserve’s (Fed) next policy moves. This, in turn, will drive the USD demand and provide a fresh directional impetus to the non-yielding Gold price.
Federal Reserve’s hawkish outlook should cap Gold price
The Labor Department's annual revisions of CPI data showed last Friday that monthly consumer prices in the US rose in December instead of falling as previously estimated. This raises the risk of a stronger US CPI print, which could allow the US central bank to stick to its hawkish stance for longer. The prospects for further tightening by the Fed could boost the Greenback and undermine the Gold price.
Several Federal Open Market Committee (FOMC) policymakers, including Fed Chair Jerome Powell, recently stressed the need for additional interest rate hikes to fully gain control of inflation. Hence, the immediate market reaction to a softer-than-expected US CPI print is more likely to remain limited. This, in turn, suggests that the path of least resistance for Gold price is to the downside.
Gold price technical outlook
From a technical perspective, the overnight break below the 50-day Simple Moving Average (SMA) could be seen as a fresh trigger for bearish traders. Hence, any subsequent recovery might still be seen as a selling opportunity and runs the risk of fizzling out rather quickly near the $1,872-$1,875 region. This is closely followed by the $1,890 hurdle, above which Gold price could surpass the $1,900 mark and test the next relevant resistance near the $1,925-$1,930 congestion zone.
On the flip side, the $1,850 level now seems to protect the immediate downside. Some follow-through selling could drag Gold price further towards the $1,830 intermediate support en route to the $1,818-$1,817 zone and the $1,800 round figure.
Key levels to watch
Considering advanced prints from CME Group for natural gas futures markets, open interest resumed the uptrend and increased by around 13.6K contracts on Monday. Volume followed suit and rose by around 35.4K contracts, up for the third straight session.
Natural Gas: The $2.50 region holds the downside so far
Monday’s retracement in prices of the natural gas came in tandem with rising open interest and volume, hinting at the likelihood of extra weakness in the very near term. So far, the $2.50 region per MMBtu seems to have emerged as a tough contention area for the commodity.
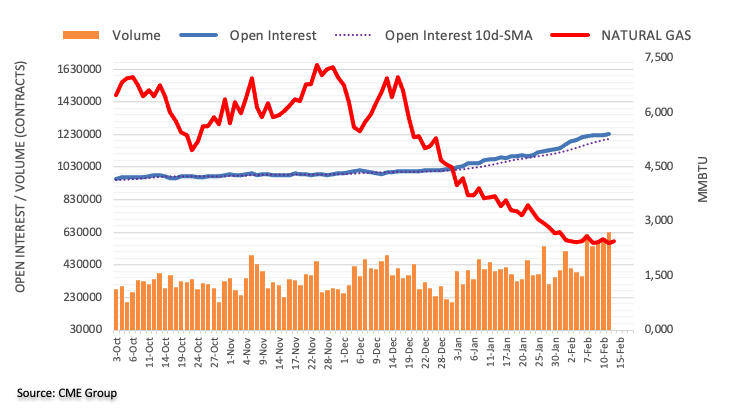
Further upside could now prompt USD/CNH to challenge the 6.8500 region in the short-term horizon, comment Lee Sue Ann and Markets Strategist Quek Ser Leang at UOB Group.
Key Quotes
24-hour view: “We highlighted yesterday that ‘the increase is upward momentum is likely to lead to further USD strength but 6.8500 could be out of reach today’. Our view was not wrong as USD rose to 6.8444 before pulling back. The pullback amid overbought conditions suggests USD is unlikely to advance further. Today, we expect USD to trade sideways, expected to be within a range of 6.8050/6.8350.”
Next 1-3 weeks: “There is not much to add to our update from yesterday (13 Feb, spot at 6.8275). As highlighted, upward momentum is beginning to build and the likelihood of USD breaking above 6.8500 has increased. The next resistance level above 6.8500 remains at 6.8800. Overall, only a break of 6.7800 (no change in ‘strong resistance’ level) would indicate that 6.8500 is not coming into view.”
The Japanese government nominated Kazuo Uedo to become the next governor of the Bank of Japan (BoJ). The Yen reacted in a relaxed manner. Economists at Commerzbank believe that the case for a substantial JPY appreciation has diminished.
Ueda’s nomination as BoJ governor confirmed
“Interestingly enough USD/JPY is trading more or less exactly at the same levels as seen on Friday before Ueda’s potential nomination was leaked. That is probably justified as Ueda is likely to be exactly the candidate who will maintain the uncertainty about the BoJ's future course.”
“The risk of significant JPY appreciation this year has fallen with Ueda’s nomination. But for now, there is stil residual hope that in the future Japanese monetary policy will be less expansionary while neither inflation nor Ueda send out clear signals. Correspondingly, JPY still trades approx. 3.5% stronger against USD than it did prior to the December decision.”
CME Group’s flash data for crude oil futures markets noted traders added around 23.4K contracts to their open interest positions on Monday, reaching the second consecutive daily build. On the other hand, volume remained erratic and went down by nearly 66K contracts.
WTI: Gains look limited above $80.00
Prices of the WTI started the week on the back foot amidst increasing open interest, which is indicative that further decline appears favoured in the very near term. There is an interim support at the 55-day SMA at $77.51, while the upside remains limited by the area above the $80.00 mark per barrel.
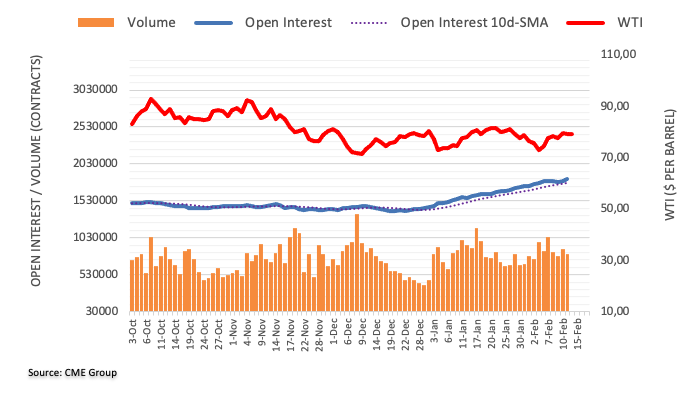
UAE Energy Minister Suhail Mohamed Al Mazrouei said on Tuesday, “UAE are committed to the OPEC deal lasting until the end of 2023.”
Additional quotes
“More worried about supply than demand for next year.”
“The US SPR release won't shock the market.”
Market reaction
WTI is paying little heed to the latest comments by the UAE Energy Minister. The US oil is keeping its range trade intact around the $79.50 level, consolidating the previous decline from two-week highs of $80.75.
FX option expiries for Feb 14 NY cut at 10:00 Eastern Time, via DTCC, can be found below.
- EUR/USD: EUR amounts
- 1.0700 531m
- AUD/USD: AUD amounts
- 0.6900 371m
- GBP/JPY reverses an intraday dip to the 160.00 neighbourhood, though lacks follow-through.
- The monthly upbeat UK jobs data underpins the Sterling and acts as a tailwind for the cross.
- Recession fears, expectations for a hawkish shift by the BoJ benefit the JPY and caps gains.
The GBP/JPY cross attracts some dip-buying in the vicinity of the 160.00 psychological mark and turns neutral during the first half of the European session on Tuesday. The cross is currently placed just above the mid-160.00s and remains well within the striking distance of a two-week high touched on Monday.
A combination of factors provides a modest lift to the British Pound, which, in turn, is seen acting as a tailwind for the GBP/JPY cross. The US Dollar extends the overnight pullback from a multi-week top, which, along with the upbeat UK jobs data, underpins the Sterling. In fact, the UK Office for National Statistics reported that the number of people claiming unemployment-related benefits fell by 12.9K in January. Moreover, the previous month's reading was also revised down sharply to -3.2K from the 19.7k rise estimated originally.
Additional details of the report revealed that Average Earnings excluding bonuses were up 6.7% during the three months to December. Excluding the pandemic period, this is the fastest rise since records began in 2001 and adds pressure on the Bank of England (BoE) to deliver another interest-rate increase next month. This, along with the overnight breakout through the 159.40-159.50 horizontal resistance, supports prospects for a further near-term appreciating move for the GBP/JPY cross. That said, the emergence of some buying around the Japanese Yen (JPY) caps the upside.
The markets now seem to speculate that the possible Bank of Japan (BoJ) governor candidate Kazuo Ueda will dismantle the yield curve control sooner rather than later. Apart from this, looming recession risks continue to weigh on investors' sentiment and drive some haven flows towards the JPY. This, to a larger extent, helps offset the data, which showed that the Japanese economy grew less than expected in the fourth quarter. Hence, it will be prudent to wait for a strong follow-through buying around the GBP/JPY cross before positioning for any further appreciating move.
Technical levels to watch
Wage data in the UK came in higher than expected, lifting the Pound. But GBP/USD could drop back below 1.21 following the US Consumer Price Index (CPI) report, economists at ING report.
Sticky wages cement BoE March hike expectations
“The Bank of England’s preferred measure of wage growth, the 3-month/3-month annualised change has now been consistently above 7% for a few months, and there is very little evidence of that wage slowdown suggested by some surveys.”
“Tomorrow’s CPI release will be another key event for the pound, but we think that given the increased focus of the Bank of England on wage dynamics, today’s data strongly endorses a March 25 bps rate hike (which is our base case).”
“EUR/GBP may well break below 0.8800 this week, while GBP/USD could fall back below 1.2100 after the US CPI print.”
See – US CPI Forecast: Preview from 12 major banks, inflation continues to decelerate
According to Lee Sue Ann and Markets Strategist Quek Ser Leang at UOB Group, USD/JPY is expected to keep trading within 130.00 and 133.00for the time being.
Key Quotes
24-hour view: “While we expected USD to strengthen yesterday, we were of the view that ‘a sustained rise above 132.20 is unlikely’. The anticipated USD strength exceeded our expectations as USD soared to a high of 132.91 before pulling back to end the day at 132.40 (+0.75%). The pullback amid overbought conditions suggests USD is unlikely to advance much further. Today, USD is more likely to trade sideways, expected to be between 131.40 and 133.00.”
Next 1-3 weeks: “Our update from yesterday (13 Feb, spot at 131.50) is still valid. As highlighted, after the recent choppy price actions, the outlook for USD is mixed and it is likely to trade in a broad range of 130.00 and 133.00 for now. Looking ahead, if USD were to break and stay above 133.00, it could lead to an advance towards 134.00.”
- EUR/USD climbs to 2-day highs near 1.0750.
- Flash EMU Q4 GDP due later in the domestic docket.
- US inflation figures take centre stage later in the NA session.
The European currency extends the auspicious start of the week and pushes EUR/USD to the area of 2-day peaks near 1.0750 on Tuesday.
EUR/USD looks firm ahead of data
EUR/USD so far advances for the second session in a row and manages to extend further Monday’s rebound past the 1.0700 mark.
The daily uptick in the pair comes in tandem with the continuation of the selling pressure in the dollar amidst steady cautiousness prior to the release of US inflation figures due later across the pond.
Declining US yields across the curve, in the meantime, accompany the daily retracement in spot along with further range bound in the German 10-year Bund yields.
Later in the euro area, another revision of the Q4 GDP will be the sole release in the region on Tuesday.
What to look for around EUR
EUR/USD seems to have embarked in a decent bounce following Monday’s drop to the 1.0650 region, although the resistance line around 1.0800 continues to cap occasional bullish attempts for the time being.
In the meantime, price action around the European currency should continue to closely follow dollar dynamics, as well as the potential next moves from the ECB after the central bank delivered a 50 bps at its meeting last week.
Back to the euro area, recession concerns now appear to have dwindled, which at the same time remain an important driver sustaining the ongoing recovery in the single currency as well as the hawkish narrative from the ECB.
Key events in the euro area this week: ECOFIN Meeting, EMU Flash Q4 GDP (Tuesday) – EMU Balance of Trade, Industrial Production, ECB Lagarde (Wednesday).
Eminent issues on the back boiler: Continuation of the ECB hiking cycle amidst dwindling bets for a recession in the region and still elevated inflation. Impact of the Russia-Ukraine war on the growth prospects and inflation outlook in the region. Risks of inflation becoming entrenched.
EUR/USD levels to watch
So far, the pair is gaining 0.12% at 1.0731 and is expected to meet the next up barrier at 1.0790 (high February 9) seconded by 1.1032 (2023 high February 2) and finally 1.1100 (round level). On the flip side, a drop below 1.0655 (weekly low February 13) would target 1.0481 (2023 low January 6) en route to 1.0323 (200-day SMA).
NZD/USD is now seen navigating a consolidative range between 0.6270 and 0.6450 in the next few weeks, suggest Lee Sue Ann and Markets Strategist Quek Ser Leang at UOB Group.
Key Quotes
24-hour view: “Yesterday, we held the view that NZD ‘is under mild downward pressure and could edge lower but the odds of a break of the major support at 0.6270 are not high’. NZD dipped briefly to 0.6291 before rebounding strongly to a high of 0.6365 in NY trade. While there is room for NZD to advance today, it is unlikely to break 0.6400. Support is at 0.6340, a breach of 0.6320 would indicate that NZD is not advancing further.”
Next 1-3 weeks: “Our latest narrative was from last Friday (10 Feb, spot at 0.6330) where ‘unless NZD breaks below 0.6270 in the next 1-2 days, the chances of it declining further are slim’. In NY trade yesterday, NZD rebounded strongly to a high of 0.6365. While our ‘strong resistance’ at 0.6380 is not breached, downward momentum has more or less faded. In other words, NZD is unlikely to decline further. From here, NZD is more likely to consolidate and trade between 0.6270 and 0.6450.”
The FX market is quite nervy about today’s January inflation data. Economists at Commerzbank expect the US Dollar to remain on a solid foot for the time being.
There is very little reason for the Fed to become less restrictive
“For now, the risk tilted towards a stronger Dollar is likely to dominate at present.”
“As long as the labour market remains strong, with inflation remaining well above the target, there is very little reason for the Fed to become less restrictive. This is unlikely to be changed by today’s inflation data.”
“Only once there is a clear indication that the monetary tightening is having a significant cooling effect on the US economy, the framework conditions have been created for a fall in inflation, followed by rate cuts. The Dollar is only likely to tend weaker at that state.”
See – US CPI Forecast: Preview from 12 major banks, inflation continues to decelerate
- USD/CAD gains some positive traction on Tuesday, though lacks bullish conviction.
- Subdued crude oil prices undermine the Loonie and act as a tailwind for the pair.
- The ongoing USD retracement slide from a multi-month top caps any further gains.
- Traders also seem reluctant and prefer to wait for the release of the US CPI report.
The USD/CAD pair attracts some buyers near the 1.3330 area on Tuesday and sticks to its modest intraday gains through the early part of the European session. The pair is currently placed near the daily top, around mid-1.3300s and for now, seems to have snapped a two-day losing streak to over a one-week low touched on Monday.
Subdued action around crude oil prices undermines the commodity-linked Loonie, which, in turn, is seen acting as a tailwind for the USD/CAD pair. The Biden Administration announced on Monday that it will sell 26 million barrels of crude from the Strategic Petroleum Reserve as part of a release mandated by Congress. This comes in the wake of worries about weakening demand, amid pressure on economic activity from higher interest rates and inflation, and weighs on the black liquid.
The upside for the USD/CAD pair, however, remains capped amid the ongoing US Dollar retracement slide from a multi-week high touched the previous day. A further decline in the US Treasury bond yields seems to be the only factor exerting downward pressure on the Greenback. That said, expectations that the Fed will stick to its hawkish stance for longer should limit the downside for the US bond yields. Adding to this, recession fears should limit losses for the safe-haven buck.
Traders might also refrain from placing aggressive USD bearish bets amid the risk of a stronger US CPI print for January. The speculations were reaffirmed by the Labor Department's annual revisions of CPI data released on Friday, which showed that monthly consumer prices rose in December instead of falling as previously estimated. Moreover, the University of Michigan survey's one-year inflation expectations climbed to 4.2% for the current month from 3.9% in January.
Hence, the market focus will remain glued to the latest US consumer inflation figures, due for release later during the early North American session. The crucial US CPI report will play a key role in influencing the Fed's rate-hike path, which, in turn, should drive the USD demand. This, along with oil price dynamics, should provide some impetus to the USD/CAD pair and allow traders to grab short-term opportunities.
Technical levels to watch
EUR/USD should be moved almost solely by the US inflation report today. The pair could drop back to the 1.0650/1.0700 area should US Core inflation come in at 0.4% or 0.5% mont-on-month, economists at ING report.
Euro lacks any solid domestic support
“EUR/USD may slip back to 1.0650/1.0700 should core inflation come in at 0.4% or 0.5% MoM. Anything above that would likely trigger a larger contraction and 1.0600 should be tested.”
“We continue to see downside risks for EUR/USD in the very near term as US data may endorse further Fed hikes and the Euro lacks any solid domestic support.”
See – US CPI Forecast: Preview from 12 major banks, inflation continues to decelerate
Swiss inflation surprises on the upside – Franc benefits. Economists at Commerzbank note that for the EUR/CHF pair, the lower end remains attractive for the time being.
SNB tolerance for CHF weakness will become increasingly smaller the higher inflation rises
“The Franc is currently benefitting from the fact that the Swiss National Bank (SNB) is assumed to retain considerable firepower at this stage. Rate expectations have risen over the past few days and the CHF has been able to benefit from the development.”
“The risk of possible SNB interventions to strengthen the Franc also plays an important part. The SNB communicated that it would continue to sell foreign currency in the future if this was necessary from a monetary policy point of view, i.e. if a weak CHF is putting upside pressure on inflation. Today’s producer and import prices are likely to illustrate that this is not currently the case.”
“Any FX trader is nonetheless likely to be aware that SNB tolerance for CHF weakness will become increasingly smaller the higher inflation rises. For EUR/CHF that means that for now, the lower end remains attractive.”
- AUD/USD lacks any firm intraday direction and oscillates in a narrow range on Tuesday.
- Recession fears seem to cap the risk-sensitive Aussie, though a weaker USD lends support.
- Traders keenly await the US consumer inflation data for January before placing fresh bets.
The AUD/USD pair struggles to capitalize on the previous day's goodish rebound from sub-0.6900 levels and oscillates in a narrow band through the early European session on Tuesday. Spot prices remain below the 0.7000 psychological mark, though the downside remains cushioned amid some follow-through US Dollar selling.
In fact, the USD Index, which tracks the Greenback against a basket of currencies, moves further away from a multi-week high touched on Monday amid the ongoing decline in the US Treasury bond yields. That said, looming recession risks hold back traders from placing aggressive bets around the risk-sensitive Aussie and keep a lid on any meaningful upside for the AUD/USD pair, at least for the time being.
Traders also seem reluctant amid expectations that the Federal Reserve will stick to its hawkish stance for longer. The bets were reaffirmed by data released on Friday, which showed that consumer prices rose in December instead of falling as estimated previously. Adding to this, the University of Michigan survey's one-year inflation expectations jumped to 4.2% this month from 3.9% in January.
Hence, the market focus will remain glued to the latest US consumer inflation figures, due for release later during the early North American session. The crucial US CPI report will play a key role in influencing the Fed's rate-hike path, which, in turn, should drive the USD demand in the near term. This, along with broader risk sentiment, should provide some meaningful impetus to the AUD/USD pair.
Heading into the key US data risk, a more hawkish outlook by the Reserve Bank of Australia (RBA) might continue to act as a tailwind for the AUD/USD pair. In fact, the minutes of the RBA monetary policy meeting held in February signalled that further rate increases will be needed to ensure that inflation returns to target. This could lead to an extension of subdued range-bound price action.
Technical levels to watch
Japan’s Chief Cabinet Secretary Hirokazu Matsuno said on Tuesday, “monetary policy is up to the Bank of Japan (BoJ) to decide.”
Additional comments
“Hope for appropriate policy management.”
“Ueda is an internationally prominent economist, well-versed in financial policy.”
Market reaction
USD/JPY is extending its range play near 132.00, awaiting the US CPI data for a fresh trading direction. The spot is down 0.29% on the day.
Crude had its best week since October. Brent Oil rose $1.89 to $86.39. Strategists at Deutsche Bank expect the black gold to end the year around the $80 level.
Signs of excess supply for H1 before demand recovers in H2 2023
“We see Brent at $75/bbl for H1 before balances improve in H2 to $80/bbl.”
“We see recession slowing demand growth, but as China’s exit from zero-Covid occurred earlier than expected, there is less scope for ‘slingshot’ rebound in Q2. By H2, global demand should rise to 1 mmb/d above H2-2019 level.”
“We see excess supply sustaining downside pressure for H1, creating tension with OPEC’s policy bias, before demand recovers in H2 2023.”
Open interest in gold futures markets rose by just 375 contracts for the first time since February 2 on Monday, according to preliminary readings from CME Group. Volume, instead, shrank for the second consecutive session, this time by nearly 25K contracts.
Gold could slip back to the $1800 region
Gold prices started the week on the defensive. Despite the small uptick in open interest, there is room for further weakness in the very near term and with the next target of note at the key $1800 region per ounce troy.
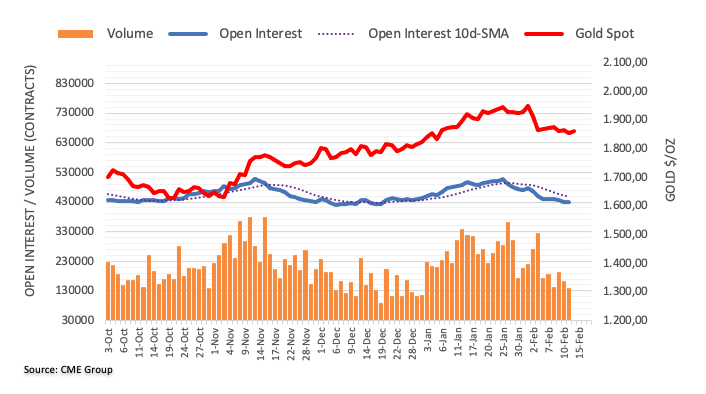
- GBP/USD scales higher for the second straight day and is supported by a combination of factors.
- The better-than-expected UK jobs data benefits the British Pound amid sustained USD selling.
- The upside potential, however, seems limited ahead of the crucial US consumer inflation data.
The GBP/USD pair builds on the overnight strong intraday rally of over 100 pips from the 1.2030 region and gains traction for the second successive day on Tuesday. The pair gets an additional lift following the release of the upbeat UK jobs data and climbs to a three-day high, around the 1.2170 region during the early European session.
The UK Office for National Statistics Office for National Statistics reported that the number of people claiming unemployment-related benefits fell by 12.9K in January. Moreover, the previous month's reading was also revised down sharply to -3.2K as compared to the 19.7 rise estimated originally. This, to a larger extent, helps offset the mixed UK wage growth data and continues to underpin the British Pound.
The US Dollar, on the other hand, is seen extending the previous day's retracement slide from a multi-week high, which, in turn, is seen as another factor pushing the GBP/USD pair higher. That said, any subsequent move-up is more likely to remain capped. Traders might refrain from placing aggressive bets ahead of the crucial US consumer inflation figures, due for release later during the early North North American session.
The US CPI report will play a key role in influencing the Fed's rate-hike path, which, in turn, should drive the USD demand and provide a fresh directional impetus to the GBP/USD pair. In the meantime, expectations that the Bank of England (BoE) is nearing the end of its current policy-tightening cycle could hold back bulls from placing fresh bets around the Sterling. This might further contribute to capping gains for the major.
Nevertheless, the latest leg up pushes the GBP/USD pair back closer to the 50-day SMA resistance, which should continue to act as a strong barrier. That said, a convincing breakthrough might prompt some technical buying and pave the way for some meaningful appreciating move heading into the key US data risk.
Technical levels to watch
Here is what you need to know on Tuesday, February 14:
Markets remain quiet early Tuesday as investors move to the sidelines while preparing for key macroeconomic data releases that will ramp up the volatility. The European economic docket will feature the Employment Change and Gross Domestic Product data for the fourth quarter. In the early American session, the US Bureau of Labor Statistics will release the all-important Consumer Price Index (CPI) inflation data for January.
US Consumer Price Index Preview: US Dollar vulnerable to violent crash, every 0.1% in Core CPI matters.
Following a cautious start to the week, markets turned risk-positive in the second half of the day with Wall Street's main indexes posting gains of more than 1% on the day. In turn, the US Dollar struggled to preserve its strength and the US Dollar Index (DXY) closed in negative territory. Early Tuesday, US stock index futures trade flat and DXY holds steady slightly above 103.00 while the benchmark 10-year US Treasury bond yield moves sideways within a touching distance of 3.7%.
During the Asian trading hours, the data from Australia showed that National Australia Bank's Business Confidence Index improved to 6 in January from -1 in December. On a negative note, Westpac Consumer Confidence Index dropped to -6.9% in February from 5% in January. AUD/USD failed to build on Monday's gains following the mixed data and was last seen trading flat on the day above 0.6950.
The Reserve Bank of New Zealand reported that the Inflation Expectations for the first quarter dropped to 3.3% from 3.62%. NZD/USD lost its traction after this data and turned negative on the day below 0.6350.
As expected, the Japanese government nominated Kazuo Uedo to become the next governor of Bank of Japan (BoJ) on Tuesday. Former Financial Services Agency (FSA) chief Ryozo Himino and career central banker and BoJ executive Shinichi Uchida are also nominated as the two deputy governors. USD/JPY showed no immediate reaction to this development and was last seen moving sideways at around 132.00.
EUR/USD took advantage of the weaker US Dollar in the second half of the day on Monday and closed in positive territory above 1.0700. The pair edges higher toward 1.0750 in the early European morning on Tuesday.
GBP/USD gathered bullish momentum on Monday and erased all the losses it suffered on Friday. The UK's Office for National Statistics reported on Tuesday that the ILO Unemployment Rate unchanged at 3.7% in three months to December as expected with the Claimant Count Change arriving at -12.9K. The wage inflation, as measured by the Average Earnings Excluding Bonus, climbed to 6.7% on a yearly basis in the same period from 6.5%. With the initial reaction to these figures, the pair extended its recovery beyond 1.2150 on Tuesday.
Gold price failed to stage a rebound on Monday and registered its lowest daily close in a month slightly above $1,850 as the 10-year US T-bond yield held steady at around 3.7%. Early Tuesday, XAU/USD stages a technical correction and stays in positive territory above $1,860.
Bitcoin dropped to its lowest level in nearly three weeks below $21,400 on Monday but erased its losses to close the day flat. Early Tuesday, BTC/USD trades flat slightly below $21,800. Ethereum registered small losses on Monday and trades within a touching distance of $1,500 on Tuesday.
- EUR/GBP reverses bounce off key support confluence on strong UK employment data.
- UK Unemployment Rate stays unchanged but Claimant Count Change drops.
- Divergence between ECB and BoE policymakers may recall pair buyers if EU Q4 GDP improves.
EUR/GBP reverses from intraday high while declining nearly 20 pips to 0.8830 on the upbeat UK jobs report during early Tuesday. In doing so, the cross-currency pair reversed the early-day run-up from the key 0.8830 support confluence.
UK’s Unemployment Rate matches market forecasts and reprints the 3.7% figure for three months to December. However, a slump in January’s Claimant Count Change to -12.9K versus -3.2K prior, as well as strong prints of the Average Earnings Excluding Bonus for the said month seemed to have favored EUR/GBP bears of late.
In contrast to the upbeat UK data, a comparatively more hawkish bias at the European Central Bank (ECB) versus the Bank of England (BoE) joins the upbeat European Commission (EC) economics forecasts to underpin the regional currency’s bullish bias.
On Monday, the European Commission (EC) released its quarterly economic projections for the Eurozone wherein it revised up the economic growth forecast to 0.9% for 2023 from 0.3% previously expected, projecting 2024 growth unchanged at 1.5%. The EC, however, lowered the Eurozone inflation forecast for 2023 to 5.6% YoY from 6.1% earlier expected. Further, the EC also cut 2024 inflation predictions to 2.5% for 2024, versus 2.6% previously anticipated.
That said, European Central Bank (ECB) Vice-President Luis de Guindos said on Monday, “Rate increases beyond March are to depend on data.” On the same line, ECB policymaker Mario Centeno said, “Inflation is going down faster than we expected,” while adding that smaller hikes would need mid-term inflation nearing 2%.
On the other hand, Bank of England’s (BoE) policymaker Jonathan Haskel cited a rise in inactivity in the UK labor market and challenged the British Pound (GBP) buyers previously. BoE’s Haskel also mentioned, “I would prefer to make policy with much more attention on the data flow over the next few months.”
On a broader front, the cautious mood ahead of the top-tier data/events joins softer US Treasury bond yields to favor the mild optimism in the market, which in turn seems to favor the Euro (EUR).
Having witnessed the initial reaction to the British data and EU fundamentals, EUR/GBP pair traders should wait for the preliminary readings of the fourth quarter (Q4) Gross Domestic Product (GDP) data for the Eurozone for clear directions. Given the recently upbeat economic projections from the European Commission and the ECB’s hawkish bias, the EUR/GBP pair is likely to remain firmer unless the EU GDP disappoints.
Technical analysis
Unless breaking 0.8830 support confluence comprising the 21-DMA and a one-month-old ascending trend line, the EUR/GBP remains on the buyer’s radar.
- The Unemployment Rate in the UK stood unchanged at 3.7% in December.
- UK Claimant Count Change came in at -12.9K in January.
- The UK wages excluding bonuses jumped by 6.7% YoY in December vs. 6.5% expected.
According to the latest data released by the Office for National Statistics (ONS) on Tuesday, the UK’s ILO Unemployment Rate remained unchanged at 3.7% in December vs. the 3.7% expected while the claimant count change showed a decline in the reported month.
The number of people claiming jobless benefits fell by 12.9K in January when compared to -3.2K booked previously.
The UK’s average weekly earnings, excluding bonuses, arrived at 6.7% 3Mo/YoY in December versus 6.5% last and 6.5% expected while the gauge including bonuses came in at 5.9% 3Mo/YoY in December versus 6.5% previous and 6.2% expected.
Key points (via ONS)
The number of payrolled employees in the UK continues to rise, this time by 0.3% or a rise of 102,000 persons compared to December last year.
UK vacancies fell by 76,000 on the quarter to 1,134,000 in three months to Jan.
UK LFS unemployment +45K 3m/3m in 3 months to Dec.
GBP/USD reaction
GBP/USD catches a fresh bid on the mixed UK employment data, rising back above 1.2150, as of writing.
About UK jobs
The UK Average Earnings released by the Office for National Statistics (ONS) is a key short-term indicator of how levels of pay are changing within the UK economy. Generally speaking, positive earnings growth anticipates positive (or bullish) for the GBP, whereas a low reading is seen as negative (or bearish).
Gold price rebounds from week lows at $1,850. But XAU/USD could resume drop toward $1,825 on hot US Consumer Price Index, FXStreet’s Dhwani Mehta reports.
Bulls will get a fresh life should US CPI revive dovish Fed outlook
“A hot US Consumer Price Index print could fuel a fresh downswing in the bright metal, breaking below the $1,850 support. Gold bears will target the January 5 low of $1,825 on sustained selling.”
“Should the US inflation data revive the dovish Federal Reserve outlook, Gold bulls will get a fresh life, motivating them to embark on a recovery toward the $1,870 supply zone. The next upside target is envisioned at the February 9 high at $1,890.”
See – US CPI Preview: Forecasts from 12 major banks, inflation continues to decelerate
- Consumer Price Index in the US is expected to increase to 0.5% MoM in January.
- Monthly Core CPI is forecast to remain at 0.4%.
- US Dollar will need a hot US CPI print to kickstart another rally.
United States Consumer Price Index (CPI) data release for January, published by the US Bureau of Labor Statistics (BLS), will be out on Tuesday, February 14. The US Dollar (USD) is struggling to extend the recovery against its rivals since the last Federal Reserve (Fed) meeting.
The United States (US) inflation report will be published after the February Federal Reserve policy decision and could significantly impact the USD valuation.
What to expect in the next CPI data report?
On a yearly basis, the CPI data is forecast to decline to 6.2% in January from December’s 6.5%. The Core CPI, which excludes volatile food and energy prices, is expected to edge lower to 5.5% from 5.7%. On a monthly basis, the CPI is seen rising to 0.5% versus 0.1% previous. Meanwhile, the Core CPI is likely to remain at 0.4%, the same number it posted for December after a late revision of the data.
Investors will closely scrutinize the US CPI report, as it is the most influential macroeconomic indicator to measure consumer inflation, providing significant insights into the Federal Reserve’s monetary policy outlook.
Yohay Elam, Senior Analyst at FXStreet, signals that high expectations for the US CPI data don’t leave much room for a US Dollar rally:
“The mere talk of stronger inflation has already been pushing the US Dollar higher and stocks lower. It also means that without a positive surprise, recent moves may come undone. I expect the Greenback to fall on an increase of 0.4% in CPI. It may also suffer an adverse ‘buy the rumor, sell the fact’ response in response to a 0.5% read. It would take an unequivocally strong 0.6% figure to send the US Dollar up. A downbeat 0.3% figure or below would send it .”
When will be the Consumer Price Index report and how could it affect EUR/USD?
The Consumer Price Index data report is scheduled for release at 13:30 GMT, on February 14. The monthly CPI data will draw more attention, as it is likely to rebound and emerge as a cause for concern for the Federal Reserve. Additionally, the declining trend in the annualized inflation is not seen as a surprise after peaking out at 9.1% in June last year.
A softer-than-expected reading would reinforce market expectations that the Fed could bring a pause to its policy tightening after the first quarter, prompting fresh selling around the US Dollar.
This, in turn, should allow the EUR/USD pair to initiate a meaningful recovery through the 1.0800 mark. In contrast, a surprisingly hot US CPI print could strengthen expectations of more rate increases from the Fed and add legs to the ongoing recovery in the US Dollar.
The US CPI data is likely to set the tone for markets in the coming weeks, in the lead-up to the February employment data and another CPI release before the March Fed policy meeting.
Nevertheless, any meaningful divergence from the expected readings should infuse some volatility in the markets and allow traders to grab short-term opportunities around the EUR/USD pair.
Dhwani Mehta offers a brief technical outlook for the major and explains: “EUR/USD has managed to recover ground above the 50-Daily Moving Average (DMA) on the daily chart in the run-up to the US CPI showdown. The 14-day Relative Strength Index (RSI), however, continues to hold below the midline, warranting caution for the Euro bulls.”
Dhwani also outlines important technical levels to trade the EUR/USD pair: “Buyers need to find acceptance above the 1.0750 psychological barrier to build on the recovery from five-week lows of 1.0655. Further up, the static resistance at 1.0800 will be the level to beat for bulls. On the flip side, if the 50DMA caves in again, then the multi-week low of 1.0655 will be retested. A sustained break below the latter will open floors for a test of the 1.0600 round figure.”
CPI data related content
- EUR/USD Analysis: Bulls at the mercy of USD price dynamics ahead of Eurozone GDP, US CPI
- Gold Price Forecast: XAU/USD could resume drop toward $1,825 on hot US Consumer Price Index
- US Consumer Price Index Preview: US Dollar vulnerable to violent crash, every 0.1% in Core CPI matters
About the Consumer Price Index
The Consumer Price Index released by the US Bureau of Labor Statistics is a measure of price movements by the comparison between the retail prices of a representative shopping basket of goods and services. The purchase power of USD is dragged down by inflation. The CPI is a key indicator to measure inflation and changes in purchasing trends. Generally speaking, a high reading is seen as positive (or bullish) for the USD, while a low reading is seen as negative (or Bearish).
- Silver extends its sideways consolidative price move around the $22.00 mark on Tuesday.
- The technical setup favours bearish traders and supports prospects for additional losses.
- A sustained break below the 100-day SMA support is needed to confirm the negative bias.
Silver continues with its struggle to gain any meaningful traction on Tuesday and remains confined in a narrow range through the early European session. The white metal is currently placed around the $22.00 mark and seems vulnerable to prolonging its recent pullback from the $24.65 area, or the highest level since April 2022 touched earlier this month.
Last week's sustained break and acceptance below the 38.2% Fibonacci retracement level of the recent rally from October 2022 adds credence to the negative outlook. Furthermore, technical indicators on the daily chart are holding deep in the negative territory and are still far from being in the oversold zone. This, in turn, supports prospects for a further near-term depreciating move.
That said, bearish traders might wait for some follow-through selling below the 100-day SMA, currently around the $21.75 region, before placing fresh bets. The XAG/USD would then turn vulnerable to testing the 50% Fibo. level, around the $21.35 area. The downward trajectory could get extended further towards the $21.00 level en route to the 61.8% Fibo. level, around the $20.60-$20.55 zone.
On the flip side, a recovery above 38.2% Fibo. level, around the $22.15 area, is more likely to attract fresh sellers near the $22.60-$22.70 supply zone. This should cap the XAG/USD near the $23.00 mark, representing the 23.6% Fibo. That said, a convincing breakthrough the latter could offset the negative outlook and shift the near-term bias in favour of bullish traders.
The subsequent move up has the potential to lift the XAG/USD further towards reclaiming the $24.00 round-figure mark. Bulls might then aim back to challenge the $24.50 supply zone, which if cleared decisively should pave the way for a fresh leg up.
Silver daily chart
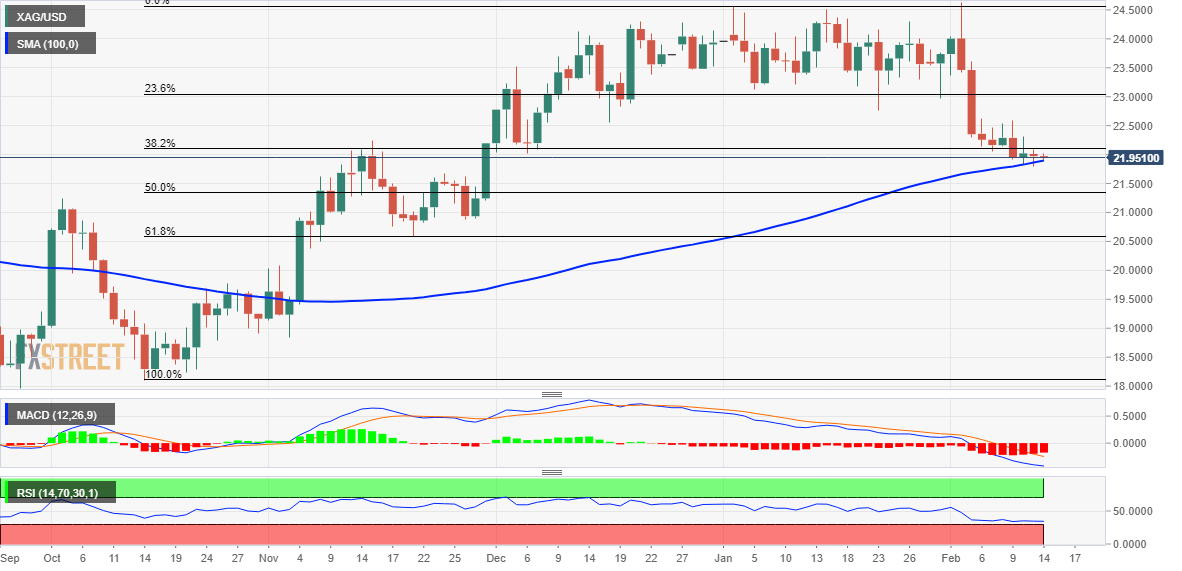
Key levels to watch
In the opinion of Economist Lee Sue Ann and Markets Strategist Quek Ser Leang at UOB Group, GBP/USD is now seen within the 1.2040-1.2260 range in the next few weeks.
Key Quotes
24-hour view: “Our expectations for GBP to dip below 1.2015 yesterday were incorrect as it rebounded strongly to 1.2151 before closing on a firm note at 1.2141 (+0.68%). The rebound is likely to extend but a sustained rise above the major resistance at 1.2200 is unlikely. Support is at 1.2120, a breach of 1.2090 would indicate that GBP is not rebounding further.”
Next 1-3 weeks: “We highlighted yesterday (13 Feb, spot at 1.2050) that while downward momentum appears to be building, GBP has to break below the major support at 1.1960 before a sustained decline is likely. We added, ‘The chance of GBP breaking 1.1960 is low for the time being but it would increase as long as GBP does not rise above 1.2140 in the next few days’. GBP rose sharply to a high of 1.2151 in NY trade. The breach of our ‘strong resistance’ at 1.2140 indicates that GBP is not ready to head lower. Instead, GBP is likely to consolidate for now, expected to be between 1.2040 and 1.2260.”
- The index remains side-lined around the 103.00 region.
- Bullish attempts appear capped by the 104.00 area so far.
- All the attention will be on the release of US CPI later in the session.
The greenback, in terms of the USD Index (DXY), struggles to find footing near the 103.00 zone on turnaround Tuesday.
USD Index looks at US CPI
The index extends the pessimism seen at the beginning of the week and trades at shouting distance from the key 103.00 support on Tuesday.
In the meantime, the dollar keeps the range bound theme well in place amidst persistent investors’ prudence ahead of the release of key US inflation figures for the month of January due later in the NA session.
Other than the CPI, the docket will show the result of the NFIB Business Optimism Index in January and speeches by Dallas Fed L.Logan (voter, centrist), Philly Fed P.Harker (voter, hawk) and NY Fed J.Williams (permanent voter, centrist).
What to look for around USD
The dollar remains within a consolidative phase in the lower end of the recent range just above the 103.00 level against the backdrop of flat risk appetite trends.
The probable pivot/impasse in the Fed’s normalization process narrative will be put to the test later in the session with the publication of US inflation figures for the month of January, all amidst a so far favoured 25 bps rate hike at the March meeting.
The loss of traction in wage inflation – as per the latest US jobs report - however, seems to lend some support to the view that the Fed’s tightening cycle have started to impact on the still robust US labour markets somewhat.
Key events in the US this week: Inflation Rate (Tuesday) – MBA Mortgage Applications, Retail Sales, Industrial Production, Business Inventories, NAHB Index, TIV Flows (Wednesday) – Building Permits, Housing Starts, Initial Jobless Claims, Philly Fed Index (Thursday) – CB Leading Index (Friday).
Eminent issues on the back boiler: Rising conviction of a soft landing of the US economy. Slower pace of interest rate hikes by the Federal Reserve vs. shrinking odds for a recession in the next months. Fed’s pivot. Geopolitical effervescence vs. Russia and China. US-China trade conflict.
USD Index relevant levels
Now, the index is retreating 0.15% at 103.13 and the breach of 100.82 (2023 low February 2) would open the door to 100.00 (psychological level) and finally 99.81 (weekly low April 21 2022). On the other hand, the next resistance level emerges at 103.96 (monthly high February 7) seconded by 105.63 (2023 high January 6) and then 106.45 (200-day SMA).
- USD/JPY prints mild losses while reversing from monthly high.
- Treasury bond yields remain pressured amid market’s indecision ahead of the key US CPI.
- Mixed Japan GDP gained little attention as Ueda’s nomination as BoJ leader appears hawkish.
USD/JPY bounces off intraday low but remains stuck with mild losses near 132.00 amid early Tuesday morning in Europe.
The Yen pair initially cheered the pullback in the Treasury bond yields before the Japanese government’s announcements of Bank of Japan (BoJ) officials triggered hawkish concerns and weighed on the prices. Also favoring the USD/JPY bears is the broad US Dollar pullback as traders brace for a positive surprise from the US Consumer Price Index (CPI) for January.
Earlier in the day, Japan’s preliminary readings of the fourth quarter (Q4) Gross Domestic Product (GDP) data printed mixed readings. Following that, the official nomination of Kazuo Ueda as the BoJ leader weighed on the USD/JPY prices. That said, Bloomberg came out with an analysis suggesting further challenges to the Bank of Japan’s (BoJ) easy money policy during the incoming Kazuo Ueda’s reign. It’s worth noting that Ueda previously defended the current monetary policy in his latest public speech.
On other hand, the US Federal Reserve (Fed) hawks kept defending the rate hike concerns but the market’s pricing of slower rate lifts and a nearer peak seemed to have weighed on the US Treasury bond yields. As a result, the US 10-year Treasury bond yields drop nearly two basis points to 3.69% at the latest, after reversing from a one-month high the previous day.
Elsewhere, fresh fears of the US-China tension over the balloon shooting also challenge the sentiment and put a floor under the USD/JPY price. US Congress will take a bipartisan look at unidentified aerial objects that have made their way into U.S. and Canadian airspace, and why they were not found sooner,” said US Senate Majority Leader Chuck Schumer. It’s worth noting that a US Military General previously ruled out odds favoring the likely hand of China in the “unidentified objects” which were shot down during the weekend.
Against this backdrop, S&P 500 Futures print mild losses whereas Japan’s Nikkei 225 rises 0.65% intraday to near 27,600 by the press time.
Moving on, the market consensus anticipates 6.2% YoY print of the US CPI for January but the odds of the positive surprise during the year-start are high, which in turn keeps USD/JPY bears on the dicey floor.
Technical analysis
USD/JPY extends the early-day pullback from the previous weekly top surrounding 132.90 and forms “Double tops”, a bearish chart pattern. Also justifying the Yen pair’s latest weakness is the RSI (14) line that took a U-turn from the overbought conditions, not to forget the bearish MACD signals.
- NZD/USD is looking to stretch its recovery move above 0.6350 amid the risk-on mood.
- Federal Reserve might remain favored for policy tightening continuation despite inflation softening ahead.
- Reserve Bank of New Zealand inflation expectations has dropped to 3.30% from the prior release of 3.62% for two years from now.
- NZD/USD is oscillating in an Inverted Flag that favors the downside on a broader basis.
NZD/USD has rebounded firmly after a corrective move to near 0.6330 in the Asian session. The Kiwi asset is looking to stretch its recovery move above the immediate resistance of 0.6350 as the US Dollar Index (DXY) has extended its downside to near 102.77. Considering the downside pressure in the USD Index ahead of the release of the January inflation report, it is likely that investors are highly confident that the annual Consumer Price Index (CPI) will continue its declining trend consecutively for the seventh time.
S&P500 futures are demonstrating a subdued performance, portraying a minor caution for fresh buying. However, the upside strength shown by the 500-US stocks basket on Monday indicates that the risk appetite theme is extremely solid. The demand for US government bonds is escalating vigorously, which has trimmed the return generated on the 10-year US Treasury yields to 3.70%.
Annual US Inflation looks to trim consecutively for the seventh time
From the whooping figure of 9.1%, the headline inflation in the United States has already come down to 6.5% in January and investors are expecting further decline as higher interest rates have forced the firms to scale down their production activities.
Analysts at RBC Economics expect CPI growth to edge down to 6.2% in January from 6.5% in December (YoY). Food price growth likely also continued to slow, albeit from very high levels. By contrast, we expect energy price growth to tick up for the first time in 7 months – though to an 8% rate that is still well below a June peak of 42%. We look for core inflation to slow further in January, coming in at 5.4% YoY, down from 5.7% in December. All told, recent inflation reports have pointed to a relatively broadly-based easing in price pressures.”
Another school of thought believes that the Consumer Price Index (CPI) could deliver a surprise move as the labor market has remained upbeat in January month. Higher demand for labor is contained by offering them higher wages, which carries the potential of propelling the overall consumer spending as households will be equipped with more funds for disposal.
Meanwhile, the Federal Reserve Bank of New York's monthly Survey of Consumer Expectations showed on Monday that the US consumers' one-year inflation expectation stayed unchanged at 5% in January.
Federal Reserve to continue sound hawkish despite softer CPI release
The street is laser-focused on the release of the price index data as it will provide meaningful cues for further monetary policy action by the Federal Reserve. Fed chair Jerome Powell has already cleared that inflation is stubborn in nature and a premature consideration of pausing rates or cutting them could paddle up the inflationary pressures again. No doubt, December’s economic indicators were in favor of a policy tightening pause, however, the stronger-than-anticipated US Nonfarm Payrolls (NFP) stole the spotlight.
For interest-rate guidance, Fed Governor Michelle Bowman said on Monday the Fed will continue to raise interest rates, pointing out there will be a lot of data releases between now and the next policy meeting.
RBNZ to consider mega rate hike despite slowing inflation projections
The Reserve Bank of New Zealand (RBNZ) has been hiking its Official Cash Rate (OCR) significantly to decelerate the pace of price pressures. After recording a multi-decade high of 7.3%, New Zealand’s inflation dropped marginally to 7.2% in the fourth quarter of CY2022. Led by higher interest rates from Reserve Bank of New Zealand Governor Adrian Orr, employment opportunities have slowed down and the Unemployment Rate has increased to 3.4%. Also, inflation expectations reported by the Reserve Bank of New Zealand have dropped to 3.3% on a quarterly basis from the former release of 3.62% for two years from now.
In spite of the indicators favoring further exhaustion in the inflationary pressures, the Reserve Bank of New Zealand might continue to hike interest rates with a big number. The inflation rate is extremely skewed upside from the desired rate of 2%. Therefore, a decision of bumper interest rate hike cannot be ruled out.
NZD/USD technical outlook
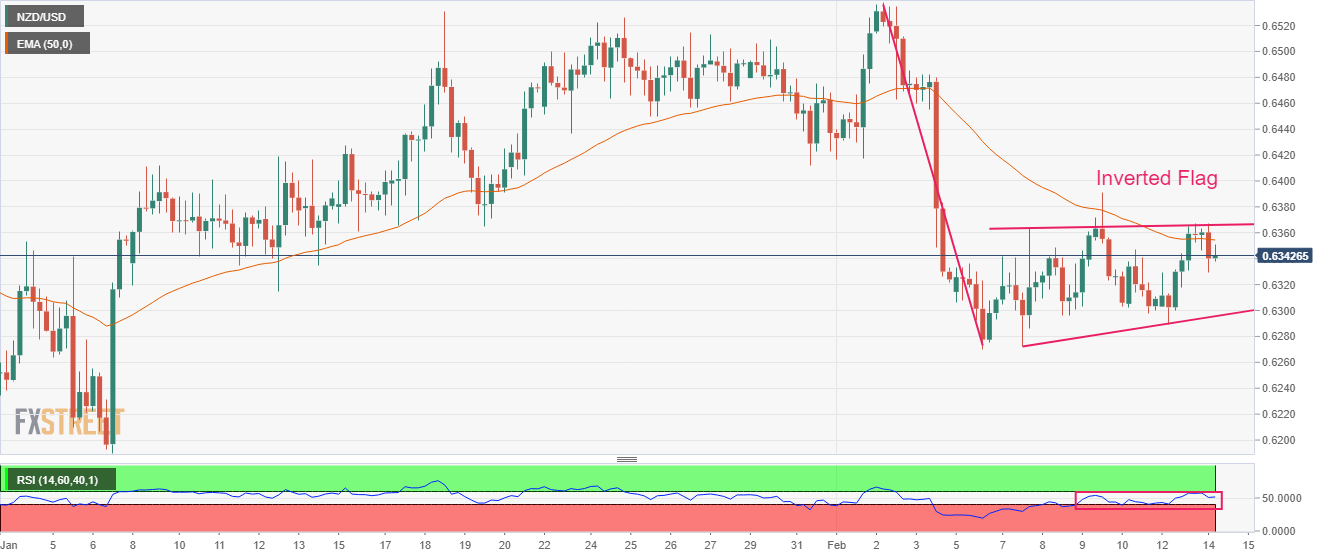
NZD/USD is oscillating in an Inverted Flag chart pattern on a four-hourly scale. The chart pattern indicates a sheer consolidation that is followed by a breakdown. Usually, the consolidation phase of the chart pattern serves as an inventory adjustment in which those participants initiate shorts, which prefer to enter an auction after the establishment of a bearish bias.
The New Zealand Dollar is continuously facing pressure from the 50-period Exponential Moving Average (EMA) at 0.6355, which indicates more weakness ahead.
Meanwhile, the Relative Strength Index (RSI) (14) is oscillating in the 40.00-60.00, which indicates that investors await a potential trigger for a decisive move.
- EUR/USD picks up bids to refresh intraday high, prints two-day uptrend inside weekly bearish channel.
- Clear upside break of one-week-old descending trend line, bullish MACD signals favor buyers.
- Downside remains elusive unless breaking 1.0660 support line.
EUR/USD bulls keep the reins as markets brace for the preliminary readings of the fourth quarter (Q4) Eurozone Gross Domestic Product (GDP) and the US Consumer Price Index (CPI) for January during early Tuesday. That said, the major currency pair renews its intraday high near 1.0740 by the press time.
Also read: EUR/USD advances towards 1.0770 as USD Index struggles to find cushion ahead of US CPI
The quote’s latest advances could be linked to the successful break of the descending resistance line from February 03, now support around 1.0700. Also favoring the EUR/USD buyers are the bullish MACD signals.
It’s worth noting, however, that a convergence of the 200-Hour Moving Average (HMA) joins the top line of a one-week-old descending trend channel to offer a tough nut to crack for the EUR/USD bulls around 1.0780.
Following that, the 1.0800 round figure may act as an extra filter towards the north before directing the pair towards the monthly peak of around 1.1035.
On the flip side, a clear break of the resistance-turned-support line, close to 1.0700 at the latest, isn’t an open welcome to the EUR/USD bears as the aforementioned channel’s lower line acts as the last defense of the Euro pair buyers around 1.0655.
Should the EUR/USD pair remains bearish past 1.0655, the odds of witnessing a slump toward January’s low near 1.0485 can’t be ruled out.
EUR/USD: Hourly chart
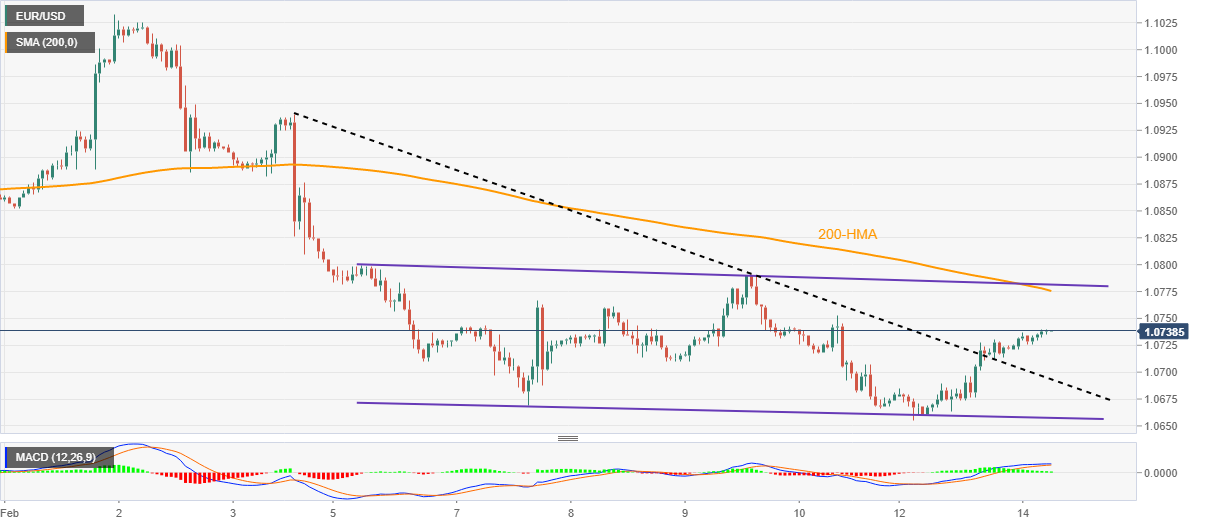
Trend: Further upside expected
Economist Lee Sue Ann and Markets Strategist Quek Ser Leang at UOB Group note there is still scope for EUR/USD to revisit 1.0615 in the near term.
Key Quotes
24-hour view: “We expected EUR to weaken yesterday but we were of the view that the major support at 1.0615 is unlikely to come under threat. Our view was not wrong as EUR dropped to 1.0654 but we did not quite expect the sharp bounce from the low (high has been 1.0729). Downward pressure has eased and EUR is likely to consolidate today, possibly within a range of 1.0670/1.0750.”
Next 1-3 weeks: “We highlighted yesterday (13 Feb, spot at 1.0675) that the downward trajectory in EUR has resumed. We added, ‘the next level to focus on remains at 1.0615’. EUR subsequently dropped to 1.0654 before rebounding strongly to end the day at 1.0720 (+0.42%). While there is no change in our view, a break of 1.0750 (no change in ‘strong resistance’ level) would indicate that the EUR weakness that started early last week has come to an end.”
- Shares in the Asia-Pacific region grind higher amid cautious mood.
- Japan GDP, hawkish hopes from BoJ appointments probe sentiment.
- Fears of fresh US-China tension, hawkish Fed talks also challenge risk profile.
- Market’s positioning for upbeat US CPI allows bulls to keep the reins.
Risk appetite remains mildly positive in the Asia-Pacific zone as traders brace for the key US inflation data during early Tuesday. That said, softer US Treasury yields and the upbeat performance of Wall Street put a floor under the equities but hawkish concerns surrounding the Bank of Japan (BoJ) join mixed Aussie data and fears emanating from China to weigh on sentiment.
While portraying the mood, MSCI’s index of Asia-Pacific shares outside Japan rises 0.33% intraday whereas Japan’s Nikkei 225 adds 0.65% to 27,600 heading into the European session.
It’s worth noting that Japan’s preliminary readings of the fourth quarter (Q4) Gross Domestic Product (GDP) data came in mixed and favored the equity trader in Tokyo. As per the readings, the Q4 GDP reversed the previous 0.2% contraction with the same quarterly growth figures. However, the GDP Deflator rose to 1.1% versus -0.3% expected and prior during the stated period. On the contrary was the official nomination of Kazuo Ueda as the BoJ leader. Earlier in the day, Bloomberg came out with an analysis suggesting further challenges to the Bank of Japan’s (BoJ) easy money policy during the incoming Kazuo Ueda’s reign. It’s worth noting that Ueda previously defended the current monetary policy in his latest public speech.
Elsewhere, Australia’s NAB Business Confidence rose to 6.0 in January, from -1.0 prior and 1.0 expected while the NAB Business Conditions rallied to 18.0 compared to 8.0 expected and 12.0 prior. It’s worth noting that Australia’s Westpac Consumer Confidence, flashed earlier in Asia, dropped to -6.9% for February versus 5.0% prior. On the same line, the Reserve Bank of New Zealand’s (RBNZ) Inflation Expectations for the first quarter (Q1) of 2023 pushed back the policy hawks by showing 3.3% figures versus 3.62% prior.
On the other hand, fresh fears of the US-China tension over the balloon shooting also challenge the sentiment and probe the GBP/USD buyers. US Congress will take a bipartisan look at unidentified aerial objects that have made their way into U.S. and Canadian airspace, and why they were not found sooner,” said US Senate Majority Leader Chuck Schumer. It’s worth noting that a US Military General previously ruled out odds favoring the likely hand of China in the “unidentified objects” which were shot down during the weekend.
Amid these plays, stocks in Australia and New Zealand print mild gains but those from China remain depressed even as the People’s Bank of China (PBOC) is up for increasing the quota of its Medium-term Lending Facility (MLF) in February, per China Securities News.
On a broader front, hawkish Fed talks join a retreat in the US inflation expectations to confuse market players ahead of the key US data. However, softer US Treasury bond yields allow traders to remain optimistic. It should be observed that the S&P 500 Futures remain indecisive following the biggest daily jump of the month while the US 10-year Treasury bond yields drop nearly two basis points to 3.69% at the latest, after reversing from a one-month high the previous day. Further, the US Dollar Index (DXY) remains pressured while equities in the Asia-Pacific region trade mixed at the latest.
Also read: S&P 500 Futures, US Treasury bond yields remain dicey as traders await US inflation
- USD/CHF takes offers to renew intraday low, stretching pullback from weekly top.
- Clear downside break of short-term key trend line, SMA joins downbeat oscillators to favor bearish bias.
- Recovery remains elusive unless crossing five-week-old resistance line.
USD/CHF prints mild losses around 0.9180 heading into Tuesday’s European session, stretching the previous day’s downside break of the key support ahead of the all-important US inflation data.
Not only the downside break of the 100-SMA and a two-week-old ascending trend line but bearish MACD signals and downbeat RSI (14), not oversold, also favor the USD/CHF bears.
That said, a horizontal area comprising multiple levels marked since January 09, close to 0.9165-60, appears imminent support for the Swiss currency pair to test.
Following that, the 0.9100 round figure and the previous monthly low near 0.9085 could act as intermediate halts before directing the USD/CHF bears toward the monthly bottom surrounding 0.9060.
Meanwhile, recovery moves appear elusive unless crossing the convergence of the 100-SMA and the aforementioned support line, close to 0.9210.
Even if the USD/CHF manages to stay firmer past 0.9210, a downward-sloping resistance line from January 06, near 0.9260, could act as the last defense of the pair bears.
Overall, USD/CHF remains bearish as traders brace for the key US inflation data. However, the downside room appears limited.
USD/CHF: Four-hour chart
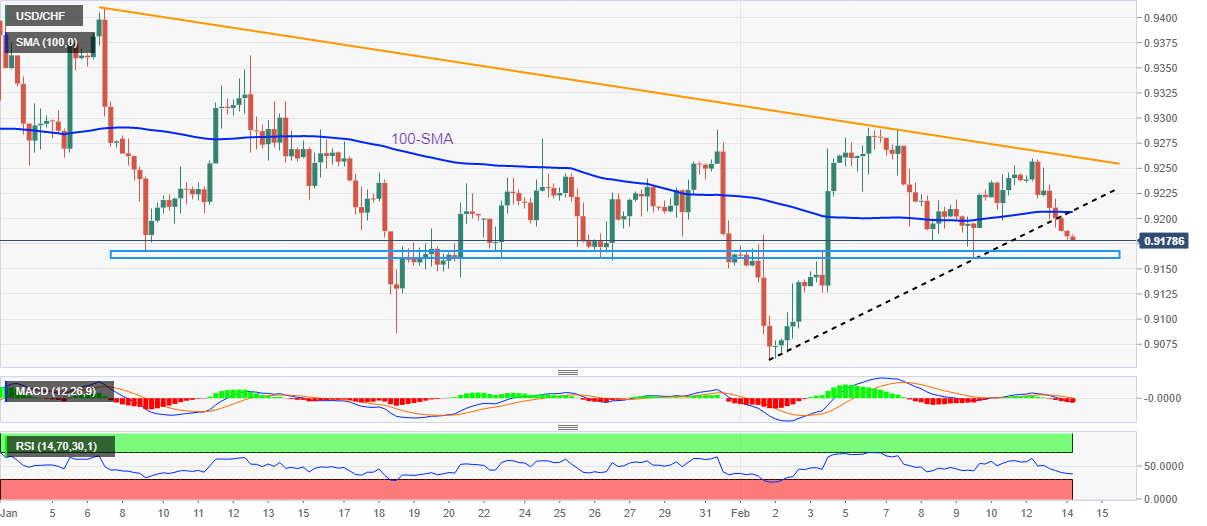
Trend: Further downside expected
- Gold price is looking to stretch its recovery move to near $1,860.00 amid a decline in safe-haven’s appeal.
- Rising expectations for a surprise rise in US inflation are not providing any cushion to yields.
- Fed Bowman sees a continuation of rate hikes, pointing out there will be a lot of data releases between now and the next policy meeting.
Gold price (XAU/USD) is marginally far from reclaiming the critical resistance of $1,860.00 in the Tokyo session. The precious metal recovered firmly after sensing buying interest around $1,850.00 as the US Dollar Index (DXY) surrendered the immediate support of 102.80. The further downside in the USD Index looks favored as the risk appetite of the market participants is extremely solid.
S&P500 futures are effectively recovering their minor losses, witnessed in the Asian session. Rising expectations for a surprise rise in the United States inflation is not providing any cushion to the US Treasury yields. The alpha delivered on 10-year US Treasury bonds has dropped below 3.70%.
Analysts at NBF expect “The energy component likely rebounded in the month, helping the headline index to advance 0.5%. If we’re right, the YoY rate should come down from 6.5% to 6.2%. The core index, meanwhile, may have continued to be supported by rising rent prices and advanced 0.3% on a monthly basis. This would translate into a three-tick decline of the 12-month rate to 5.4%.”
Despite a decline in the US Consumer Price Index (CPI), the Federal Reserve (Fed) won’t tone down its hawkish stance as the stubbornness in the inflationary pressures will take time in easing.
Fed Governor Michelle Bowman said on Monday the Fed will continue to raise interest rates, pointing out there will be a lot of data releases between now and the next policy meeting.
Gold technical analysis
Gold price has attempted a recovery move after sensing a loss in the downside momentum near $1,850.00. The momentum oscillator, Relative Strength Index (RSI) (14), has shown that the Gold price was making Lower Highs while the oscillators delivered Higher Lows. This indicates an absence of strength in the downside momentum.
Meanwhile, the Gold price is looking to shift its business above the 20-period Exponential Moving Average (EMA) at around $1,860.00. An occurrence of the same will strengthen the Gold bulls.
Gold two-hour chart

- WTI remains sidelined after reversing from 12-day top.
- US SPR announces another tranche of Oil release to battle Russia-induced output crunch.
- OPEC’s Al Ghais expects a rebound in energy demand to pre-pandemic levels.
- Oil inventories, US inflation eyed for fresh impulse.
WTI crude oil remains indecisive around $79.50 during early Tuesday, after reversing from a two-week high the previous day. In doing so, the black gold portrays the market’s cautious mood ahead of the key US inflation data for January.
Also read: US Consumer Price Index Preview: US Dollar vulnerable to violent crash, every 0.1% in Core CPI matters
Adding to the commodity’s trading barriers are the mixed headlines surrounding the Oil demand and supply flows. That said, the latest blow to Oil prices could be from the news that US President Joe Biden’s team is ready for releasing another 26 million barrels of crude oil from the Strategic Petroleum Reserve (SPR).
Previously, Russia’s threat of cutting production and the hopes of more energy demand in 2023, as conveyed by Organization of the Petroleum Exporting Countries (OPEC) Secretary-General Haitham Al Ghais, seemed to have pleased the Oil buyers.
Elsewhere, fresh fears of the US-China tension over the balloon shooting also challenge the sentiment and WTI crude oil traders. US Congress will take a bipartisan look at unidentified aerial objects that have made their way into U.S. and Canadian airspace, and why they were not found sooner,” said US Senate Majority Leader Chuck Schumer. It’s worth noting that a US Military General previously ruled out odds favoring the likely hand of China in the “unidentified objects” which were shot down during the weekend.
While portraying the mood, the S&P 500 Futures remain indecisive following the biggest daily jump of the month while the US 10-year Treasury bond yields drop nearly two basis points to 3.69% at the latest, after reversing from a one-month high the previous day. Further, the US Dollar Index (DXY) remains pressured while equities in the Asia-Pacific region trade mixed at the latest.
Looking ahead, the US Consumer Price Index (CPI) for January becomes the key for markets and also for the WTI traders to watch as firmer inflation data means higher Fed rates, which in turn can weigh on the Oil price. Additionally important will be the weekly inventories from the American Petroleum Institute (API) and the US Energy Information Administration (EIA).
Technical analysis
Failure to cross the descending resistance line from early November 2022, around $80.50, as well as the 100-DMA level of near $80.90, challenge the WTI crude oil buyers but recently firmer MACD signals tease the commodity buyers.
- USD/CAD holds lower ground at weekly bottom, pressured after two-day downtrend.
- Clear downside break of key EMA, Fibonacci retracement join looming bear cross on MACD to lure bears.
- Monthly resistance line, descending trend line from October challenge pair buyers.
USD/CAD remains depressed around 1.3330 even as bulls and bears jostle during early Tuesday, due to the market’s inaction ahead of the key US inflation data. In doing so, the Loonie pair probes the two-day losing streak at the lowest levels in more than a week.
It’s worth noting that the quote’s sustained downside break of the 100-day Exponential Moving Average (EMA) and the 61.8% Fibonacci retracement level of the September-October upside joins a looming bear cross on the MACD to keep USD/CAD sellers hopeful.
As a result, a convergence of the ascending trend line from mid-November and the 200-day EMA, around 1.3270 by the press time, gains major attention.
Should the pair offers a clear downside break of the 1.3270 key level, the last November’s low near 1.3225 may act as a validation point for the south-run targeting the September 2022 bottom surrounding 1.2955. It should be observed that the 1.3100 and the 1.3000 round figures may act as intermediate halts during the anticipated fall.
Meanwhile, the stated key Fibonacci retracement level, also known as the golden ratio, guards immediate USD/CAD rebound near 1.3345, a break of which highlights the 100-day EMA level of 1.3410.
Following that, a descending resistance line from January 19 and a four-month-old downward-sloping trend line, respectively around 1.3455 and 1.3530, could challenge the USD/CAD bulls.
USD/CAD: Daily chart
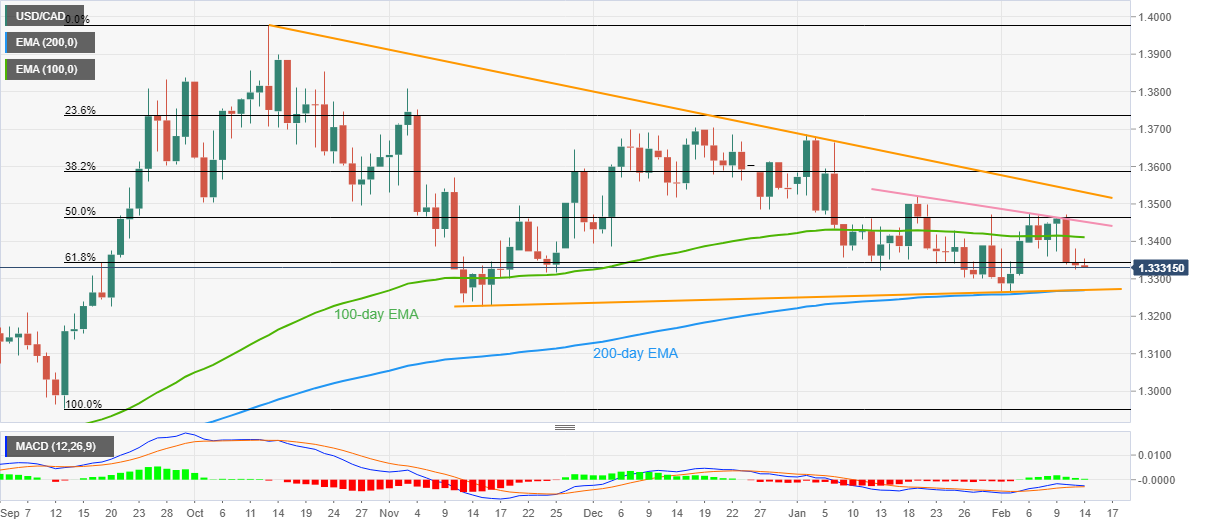
Trend: Further downside expected
- USD/INR is aiming to deliver a break above 82.60 as the USD Index is eyeing more weakness.
- The market mood is upbeat as investors have digested the consequences associated if US inflation delivers a surprise jump.
- To tame core inflation, the RBI might hike its repo rate further by 25bps.
The USD/INR pair is struggling to extend above the immediate resistance of 82.60 in the Asian session. The upside move in the asset looks favored as the US Dollar Index (DXY) has recorded a fresh day’s low at 102.81. The USD Index is looking for more downside as the overall market sentiment is extremely positive.
Investors have digested the consequences associated if United States inflation delivering a surprise jump after declining meaningfully for the past six months consecutively. Therefore, the demand for risk-perceived assets has improved dramatically. S&P500 futures have recovered some of their losses, portraying a recovery in the risk appetite theme. The demand for US government bonds is escalating vigorously, which has trimmed the return generated on the 10-year US Treasury yields to 3.70%.
On an overall note, the street is worried that a surprise rise in the core Consumer Price Index (CPI) could force the Federal Reserve (Fed) to maintain higher interest rates for a longer period.
Ace editor of the Wall Street Journal (WSJ) Nick Timiraos cited the Federal Reserve’s (Fed) research paper titled, “Residual Seasonality in Core Consumer Price Inflation: An Update,” to justify his expectations stating, “Core inflation has generally come in higher in the first of the year than the second half of the year.”
Meanwhile, the Indian Rupee bulls are likely to remain solid as the Reserve Bank of India (RBI) might look for tightening the policy further to impact the core inflation. Economists at Commerzbank see at least another 25 bps hike in the first half this year and possibly even 50 bps particularly if domestic demand remains firm and core inflation fails to cool. This should provide some support for INR.
Meanwhile, the oil price has turned sideways above $79.00 ahead of the release of the US inflation data. It is worth noting that India is one of the leading importers of oil in the world and volatility in oil prices impacts the Indian Rupee critically.
- GBP/USD struggles to extend the previous day’s gains amid sluggish markets.
- Hopes of overcoming labor crisis, US Dollar pullback underpin bullish bias.
- Expectations favoring positive surprise from US inflation, dovish concerns over BoE probe Cable buyers.
- Upbeat UK jobs report may offer intermediate strength to GBP/USD but major attention should be given to US CPI.
GBP/USD bulls take a breather around mid-1.2100s heading into Tuesday’s London open, after posting the biggest daily jump in a month. In doing so, the Cable pair fails to cheer the US Dollar's weakness as traders seem cautious ahead of the UK jobs report.
The cause for the GBP/USD traders’ anxiety ahead of the monthly employment report could be linked to the headlines suggesting an end to the UK bus drivers’ strikes and an extended version of the medical staff’s agitation. Also, workers’ associations at major retailers also plan to stage an agitation in the UK and highlight the grim conditions amid rallying inflation, mainly due to a downbeat jump in the payout.
It should be noted that the cautious optimism surrounding the Bank of England’s (BoE) next move also caps the GBP/USD price. That said, the latest Reuters poll said that the Bank of England to lift the bank rate 25 basis points to 4.25% in March and then pause. On the same line, BoE policymaker Jonathan Haskel cited a rise in inactivity in the UK labor market. BoE’s Haskel also mentioned, “I would prefer to make policy with much more attention on the data flow over the next few months.”
On the other hand, downbeat prints of the US inflation expectations contrast with the hawkish Fed speak to challenge the market moves. Further weighing on the sentiment and putting a floor on the GBP/USD price are the hopes of positive surprise from the US inflation and fresh US-China jitters add strength to the mild pessimism.
That said, the US inflation expectations, as per the 10-year and 5-year breakeven inflation rates from the St. Louis Federal Reserve (FRED) eased from monthly highs to 2.31% and 2.44% at the latest. Even so, Fed Governor Michelle Bowman said on Monday that the Federal Reserve will need to continue to raise interest rates in order to get them to a level high enough to bring inflation back down to the central bank's target rate, per Reuters.
Elsewhere, fresh fears of the US-China tension over the balloon shooting also challenge the sentiment and probe the GBP/USD buyers. US Congress will take a bipartisan look at unidentified aerial objects that have made their way into U.S. and Canadian airspace, and why they were not found sooner,” said US Senate Majority Leader Chuck Schumer. It’s worth noting that a US Military General previously ruled out odds favoring the likely hand of China in the “unidentified objects” which were shot down during the weekend.
Against this backdrop, the S&P 500 Futures remain indecisive following the biggest daily jump of the month while the US 10-year Treasury bond yields drop nearly two basis points to 3.69% at the latest, after reversing from a one-month high the previous day. Further, the US Dollar Index (DXY) remains pressured while equities in the Asia-Pacific region trade mixed at the latest.
Looking forward, a likely improvement in the UK’s Average Earnings Excluding Bonus could join the no change in Unemployment Rate to offer intermediate pleasure to the GBP/USD buyers. However, the Cable pair’s further upside hinges on how well the US Consumer Price Index (CPI) data for January crosses the market forecast of 6.2% YoY versus 6.5% prior.
Technical analysis
GBP/USD pair’s successful trading above the 100-day Exponential Moving Average (EMA), around 1.2040 by the press time, keeps buyers hopeful of overcoming the 200-day EMA resistance of around 1.2140.
- AUD/USD has corrected marginally to near 0.6950, however, the upside looks favored.
- The upward-sloping trendline placed from 0.6629 is providing a cushion to the Australian Dollar.
- A 40.00-60.00 range oscillation by the RSI (14) indicates an absence of a potential trigger.
The AUD/USD pair is looking for demand after a minor correction to near 0.6950 in the Tokyo session. The Aussie asset is expected to display a sideways auction as investors are awaiting the release of the US Inflation for fresh impetus. The US Dollar Index (DXY) is not demonstrating any action as the inflation data might surprise investors.
A mix of indicators in their December report called for further inflation softening, however, January’s upbeat Nonfarm Payrolls (NFP) data has dampened the expectations of further deceleration in the living cost index. S&P500 futures have recovered some losses reported in the Asian session, indicating that the risk appetite is recovering again.
The Australian Dollar will display action after the speech from Reserve Bank of Australia (RBA) Governor Philip Lowe, which is scheduled for Wednesday.
AUD/USD has rebounded after sensing firmer buying interest around the upward-sloping trendline placed from December 20 low at 0.6629 on a four-hour scale. The movement in the Aussie asset has bounded in the 0.6886-0.6992 range, portraying a sheer contraction in volatility.
The 50-period Exponential Moving Average (EMA) at around 0.6960 is acting as a major barricade for the Australian Dollar.
Meanwhile, the Relative Strength Index (RSI) (14) is oscillating in the 40.00-60.00, which indicates that investors await a potential trigger for a decisive move.
A breakdown below January 10 low at 0.6860 will drag the asset toward December 28 high around 0.6800. A slippage below the latter will further drag the asset toward December 22 high at 0.6767.
In an alternate scenario, a decisive break above the psychological resistance of 0.7000 will drive the asset towards January 18 high at 0.7064 followed by January 26 high at 0.7143.
AUD/USD four-hour chart
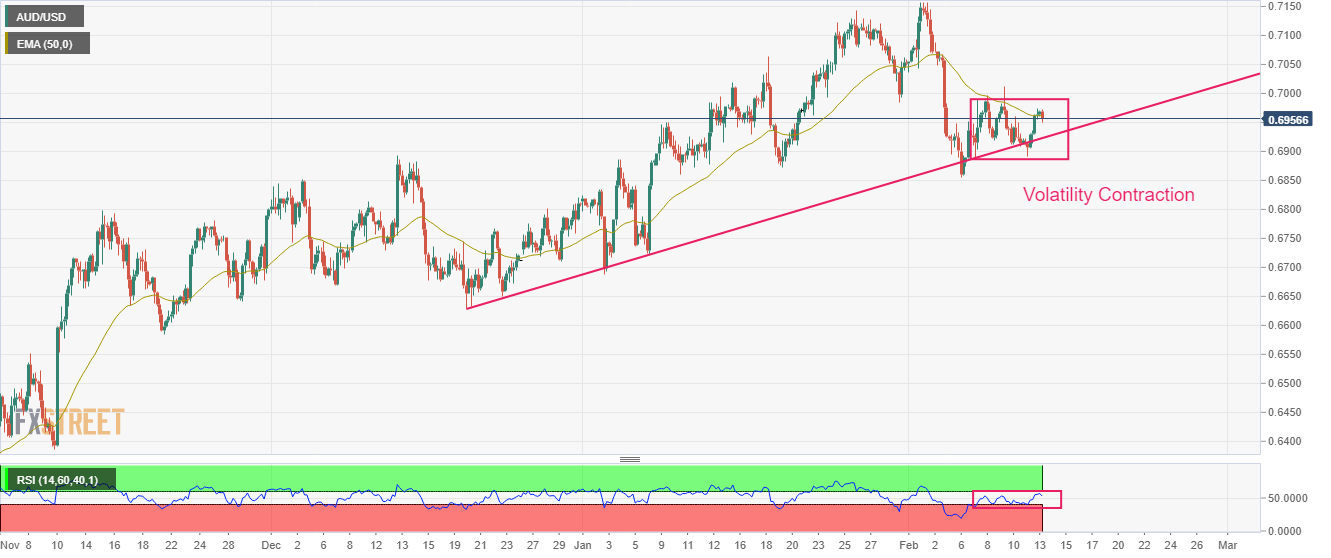
- EUR/USD is marching towards 1.0770 as USD Index is showing signs of more weakness ahead.
- S&P500 futures have witnessed a minor correction, portraying caution in fresh buying in an overall upbeat market mood.
- Eurozone GDP looks set to dodge recession amid an absence of contraction in activities.
The EUR/USD pair refreshed its day’s high around 1.0730 and is hovering around it continuously in the Tokyo session. The major currency pair is expected to continue its upside momentum as the US Dollar Index (DXY) is struggling to place feet ahead of the United States Consumer Price Index (CPI) data. The USD Index (DXY) has shifted its business below 103.00 and is expected to continue its downside journey as investors have ignored inflation’s upside risks.
S&P500 futures have witnessed a minor correction in the Asian session, portraying a caution for fresh buying while the broader market mood is extremely solid. Fears associated with airborne threats-headlines to the United States have eased, which has trimmed the appeal for safe-haven assets. A decline in investors’ anxiety about US inflation has improved demand for US government bonds. This has led to a decline in the 10-year US Treasury yields to 3.70%.
The movement for the US Dollar highly banks upon January’s inflation report as higher-than-anticipated inflation could fade the downside risks. Goldman Sachs, on inflation expectations, mentioned that their economists have argued that inflation readings might be stronger at the start of the year because a disproportionate number of prices are reset at the start of the year, and firms might set contract rates higher than usual in the current environment.
The investment banking firm further added “If the January inflation data fail to "rise to the occasion," then the macro backdrop could continue to push towards Dollar depreciation.”
On the Eurozone front, investors are awaiting the release of the preliminary Gross Domestic Product (GDP) (Q4). Considering the consensus, the economy has managed to deliver constant growth akin to the prior figures.
Meanwhile, the quarterly European Commission (EC) report, depicts a decline in the inflation projections and higher anticipation for economic growth, citing labor market and consumer spending as resilient.
- USD/MXN picks up bids to snap three-day downtrend around the lowest levels in eight days.
- Hawkish Fed speak, hopes of positive surprise from US CPI weigh on market sentiment and test US Dollar bears.
- Fresh fears surrounding China, cautious mood ahead of multiple catalysts from elsewhere also challenge Mexican Peso pair bears.
USD/MXN licks its wounds near 18.60 as it bounces off the weekly low during early Tuesday, teasing the first positive performance in four. It’s worth noting, however, that the Mexican Peso (MXN) pair remains near the multi-month low of 18.50 marked in February.
That said, the pair’s latest rebound could be linked to the US Dollar’s U-turn from the intraday low as market players rush for risk safety ahead of the key US Consumer Price Index (CPI) for January. Adding strength to the rebound are the hawkish statements from the Federal Reserve (Fed) officials and China concerns, not to forget anxiety ahead of the employment and growth numbers from the Eurozone and the UK.
While portraying the mood, the S&P 500 Futures print mild losses around 4,140, following the biggest daily jump of the month. That said, the US 10-year Treasury bond yields drop nearly two basis points to 3.69% at the latest, after reversing from a one-month high the previous day. It should be noted that the US Dollar Index (DXY) remains pressured while equities in the Asia-Pacific region trade mixed at the latest.
On Monday, Fed Governor Michelle Bowman said that the Federal Reserve will need to continue to raise interest rates in order to get them to a level high enough to bring inflation back down to the central bank's target rate, per Reuters. On the same line, Philadelphia Federal Reserve President Patrick Harker pushed back the chatters of a Fed rate cut during 2023 while crossing wires in the weekend. However, the policymaker did mention, “Fed not likely to cut this year but may be able to in 2024 if inflation starts ebbing," per Reuters.
The hawkish Fed talks join the fresh Sino-American tension over the spying attempts via the balloons to weigh on sentiment and put a floor under the USD/MXN prices. “US Congress will take a bipartisan look at unidentified aerial objects that have made their way into U.S. and Canadian airspace, and why they were not found sooner,” said US Senate Majority Leader Chuck Schumer. It’s worth noting that a US Military General previously ruled out odds favoring the likely hand of China in the “unidentified objects” which were shot down during the weekend.
Apart from what was mentioned above, the absence of the Mexican data also allows the USD/MXN pair to pare the Banxico-inflicted wounds.
It should be observed that the last week’s surprise 0.50% rate hike from Banxico has been pleasing the USD/MXN as traders await the US CPI, expected 6.2% YoY versus 6.5%.
Also read: US Consumer Price Index Preview: US Dollar vulnerable to violent crash, every 0.1% in Core CPI matters
Technical analysis
Unless crossing a one-week-old descending resistance line, around 18.70 by the press time, USD/MXN remains vulnerable to refreshing the yearly low of 18.50, marked earlier in February.
| Raw materials | Closed | Change, % |
|---|---|---|
| Silver | 21.985 | -0.01 |
| Gold | 1853.79 | -0.55 |
| Palladium | 1567.88 | 1.49 |
- USD/JPY bounces off intraday low, keeps extends pullback from five-week high.
- RSI’s retreat from overbought conditions joins double top bearish formation to favor sellers.
- 200-HMA, triangle’s support line probe bears even as MACD signals hint at further downside.
USD/JPY prints mild losses around the intraday low of 131.90 as the Japanese government officially nominates Kazuo Ueda to become the next Bank of Japan (BoJ) Governor on early Tuesday.
In doing so, the Yen pair extends the early-day pullback from the previous weekly to surrounding 132.90 and forms “Double tops”, a bearish chart pattern. Also justifying the USD/JPY pair’s latest weakness is the RSI (14) line that took a U-turn from the overbought conditions, not to forget the bearish MACD signals.
With this, the quote is likely to decline toward the 200-Hour Moving Average (HMA) level surrounding 131.00. However, an upward-sloping support line from February 02, forming part of the short-term triangle, could challenge the pair sellers around 130.30 afterward.
In a case where the USD/JPY drops below 130.30, the 130.00 round figure may act as a validation point for the quote’s further downside.
Alternatively, recovery moves remain elusive unless trading below the double tops surrounding 132.90. Also acting as the upside filter is the 133.00 round figure.
Following that, a run-up towards the previous monthly peak surrounding 134.80 can’t be ruled out.
USD/JPY: Hourly chart
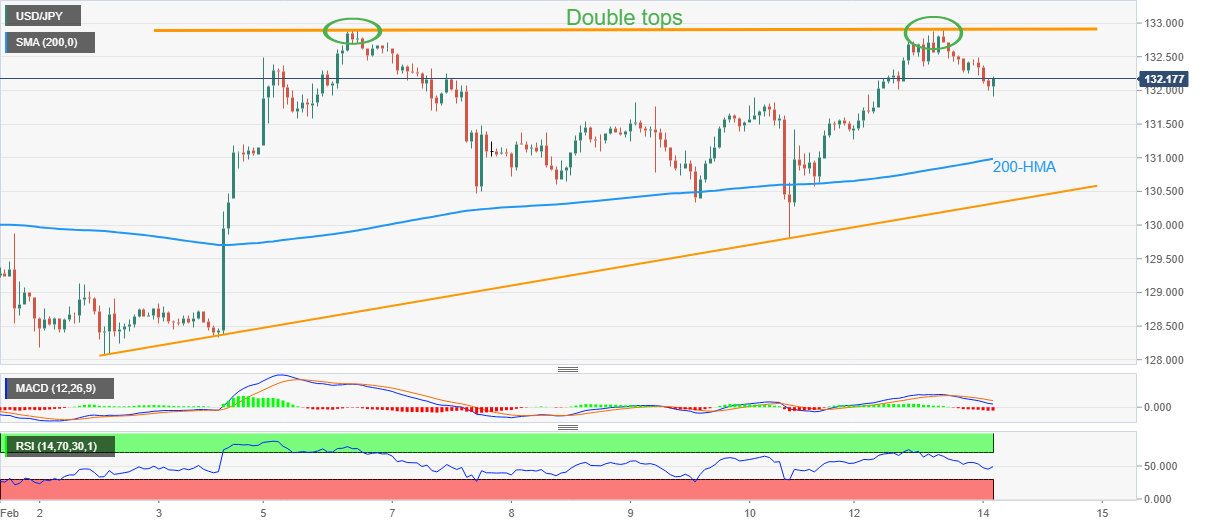
Trend: Further downside expected
The PBOC is expected to increase the quota of its Medium-term Lending Facility (MLF) in February as it looks to ensure a stable economic rebound, China Securities News reported on Tuesday.
Additional takeaways
“The expectation of a higher MLF quota is strong, but PBOC policy will be influenced by factors such as the demand for physical credit, the speed of cash circulation, the rebalancing of deposits between institutions, and the effects of peak tax season in February.”
“The decline in market interest rates in recent days is mainly due to the central bank's increase in open market operations to meet institutional liquidity needs and stabilize market expectations.”
Citing a document submitted to parliament on Tuesday, Reuters reported that the Japanese Government nominated Kazuo Ueda to become the next Bank of Japan (BoJ)governor.
Ueda would succeed Haruhiko Kuroda, whose term ends on April 8, the document showed.
The Japanese Cabinet also nominated Former Financial Services Agency (FSA) chief Ryozo Himino and career central banker and BoJ executive Shinichi Uchida as the two deputy governors. Their term will start on March 20.
Market reaction
As the above news was well priced in, it failed to move the needle around the USD/JPY pair. The major is trading at 132.02, down 0.27% on the day, as of writing.
- NZD/USD pares the biggest daily gains in three weeks after downbeat NZ data.
- RBNZ inflation expectations dropped to 3.3% versus 3.62% prior.
- Sluggish sentiment ahead of key data/events joins hopes of firmer US inflation to weigh on Kiwi price.
NZD/USD takes offers to refresh intraday low near 0.6330 as New Zealand data disappoints Kiwi buyers during early Tuesday. In doing so, the quote also justifies the mildly offbeat mood, as well as hawkish hopes from the US Federal Reserve (Fed) ahead of the US Consumer Price Index (CPI) for January.
Reserve Bank of New Zealand’s (RBNZ) Inflation Expectations for the first quarter (Q1) of 2023 pushed back the policy hawks by showing 3.3% figures versus 3.62% prior. It’s worth noting that the lesser-than-expected New Zealand (NZ) Food Price Index for January, 1.7% MoM versus 2.2% market consensus and 1.1% prior, also weigh on the NZD/USD prices.
Above all, the market’s anxiety before the key data/events and the fresh fears surrounding China seem to exert downside pressure on the Kiwi pair.
Downbeat prints of the US inflation expectations contrast with the hawkish Fed speak to challenge the market moves. On the same line, hopes of positive surprise from the US inflation and fresh US-China jitters add strength to the mild pessimism.
That said, the US inflation expectations, as per the 10-year and 5-year breakeven inflation rates from the St. Louis Federal Reserve (FRED) eased from monthly highs to 2.31% and 2.44% at the latest. Even so, Fed Governor Michelle Bowman said on Monday that the Federal Reserve will need to continue to raise interest rates in order to get them to a level high enough to bring inflation back down to the central bank's target rate, per Reuters. Before him, Philadelphia Federal Reserve President Patrick Harker pushed back the chatters of a Fed rate cut during 2023. However, the policymaker did mention, “Fed not likely to cut this year but may be able to in 2024 if inflation starts ebbing.”
On a different page, “US Congress will take a bipartisan look at unidentified aerial objects that have made their way into U.S. and Canadian airspace, and why they were not found sooner,” said US Senate Majority Leader Chuck Schumer. It’s worth noting that a US Military General previously ruled out odds favoring the likely hand of China in the “unidentified objects” which were shot down during the weekend.
Amid these plays, the S&P 500 Futures print mild losses around 4,140, following the biggest daily jump of the month. That said, the US 10-year Treasury bond yields drop nearly two basis points to 3.69% at the latest, after reversing from a one-month high the previous day. It should be noted that the US Dollar Index (DXY) remains pressured while equities in the Asia-Pacific region trade mixed at the latest.
Looking forward, NZD/USD traders should pay attention to the US CPI for January, expected 6.2% YoY versus 6.5% prior, as markets do expect upside surprise amid year-start moves but the early signals haven’t been so impressive.
Also read: US Consumer Price Index Preview: US Dollar vulnerable to violent crash, every 0.1% in Core CPI matters
Technical analysis
Multiple failures to cross the 50-DMA, around 0.6375 by the press time, directs NZD/USD towards the monthly low surrounding 0.6270.
- Gold price is getting set for the key event this week.
- US Consumer Price Index's countdown has begun.
Gold decoupled from the US Dollar's trajectory on Monday, sinking at the same time as the greenback as investors get set for this week's key event in the US Consumer Price Index. However, if the CPI data were to be a dovish outcome, then the Gold price stands to benefit and should the bears be in the market heading into the data, a short squeeze could eventuate as illustrated below.
The price is currently on the front side of the bearish trend following the breakout of the symmetrical triangle on Monday as the following analysis illustrates:
Gold H1 charts
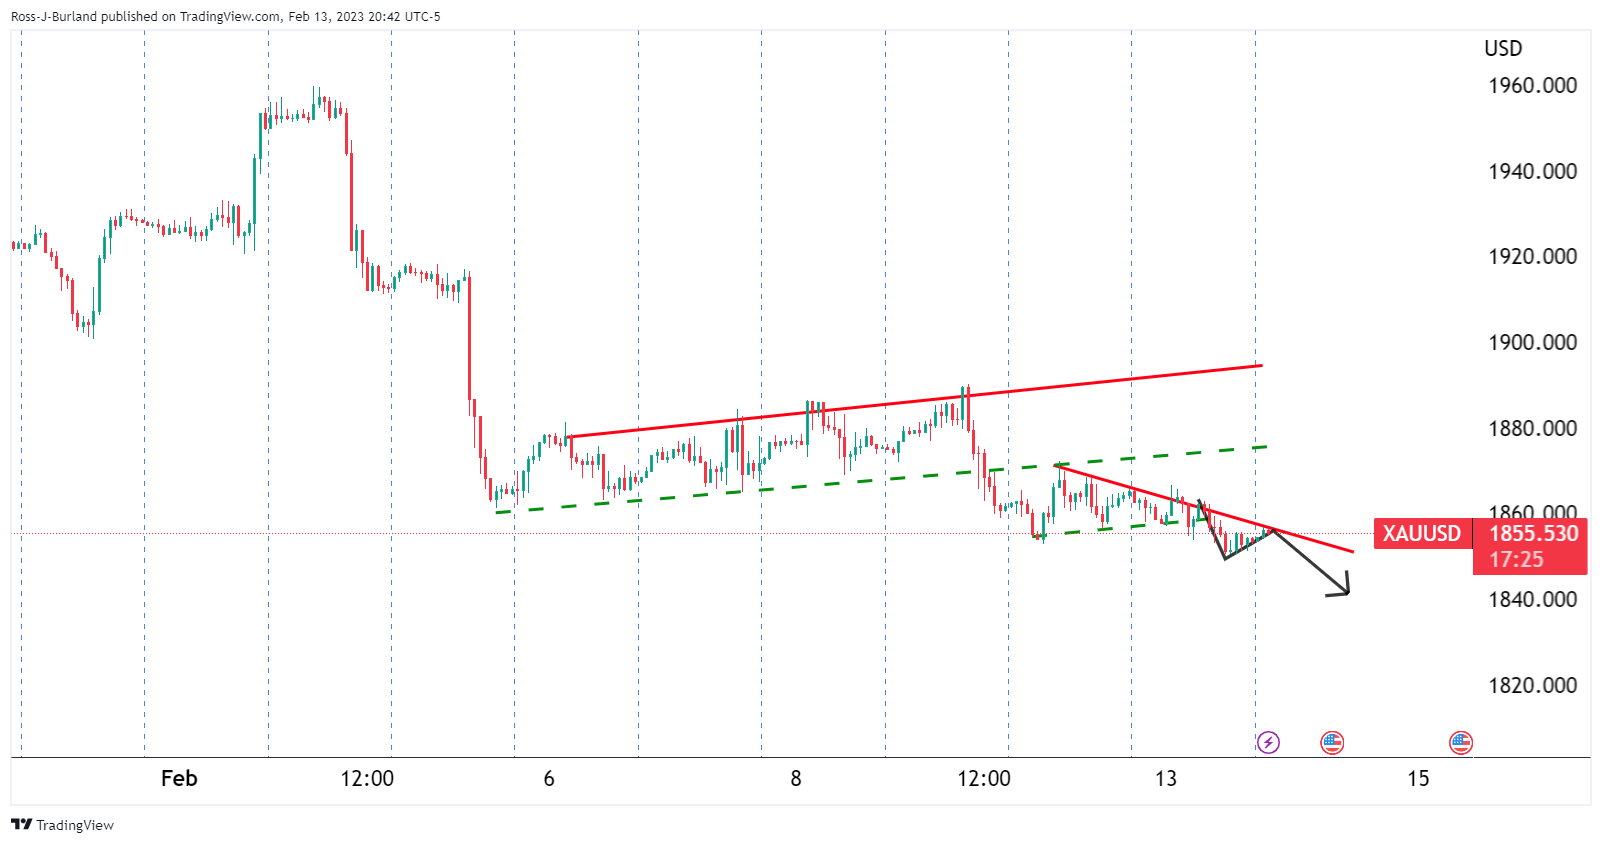
Zoomed in ...
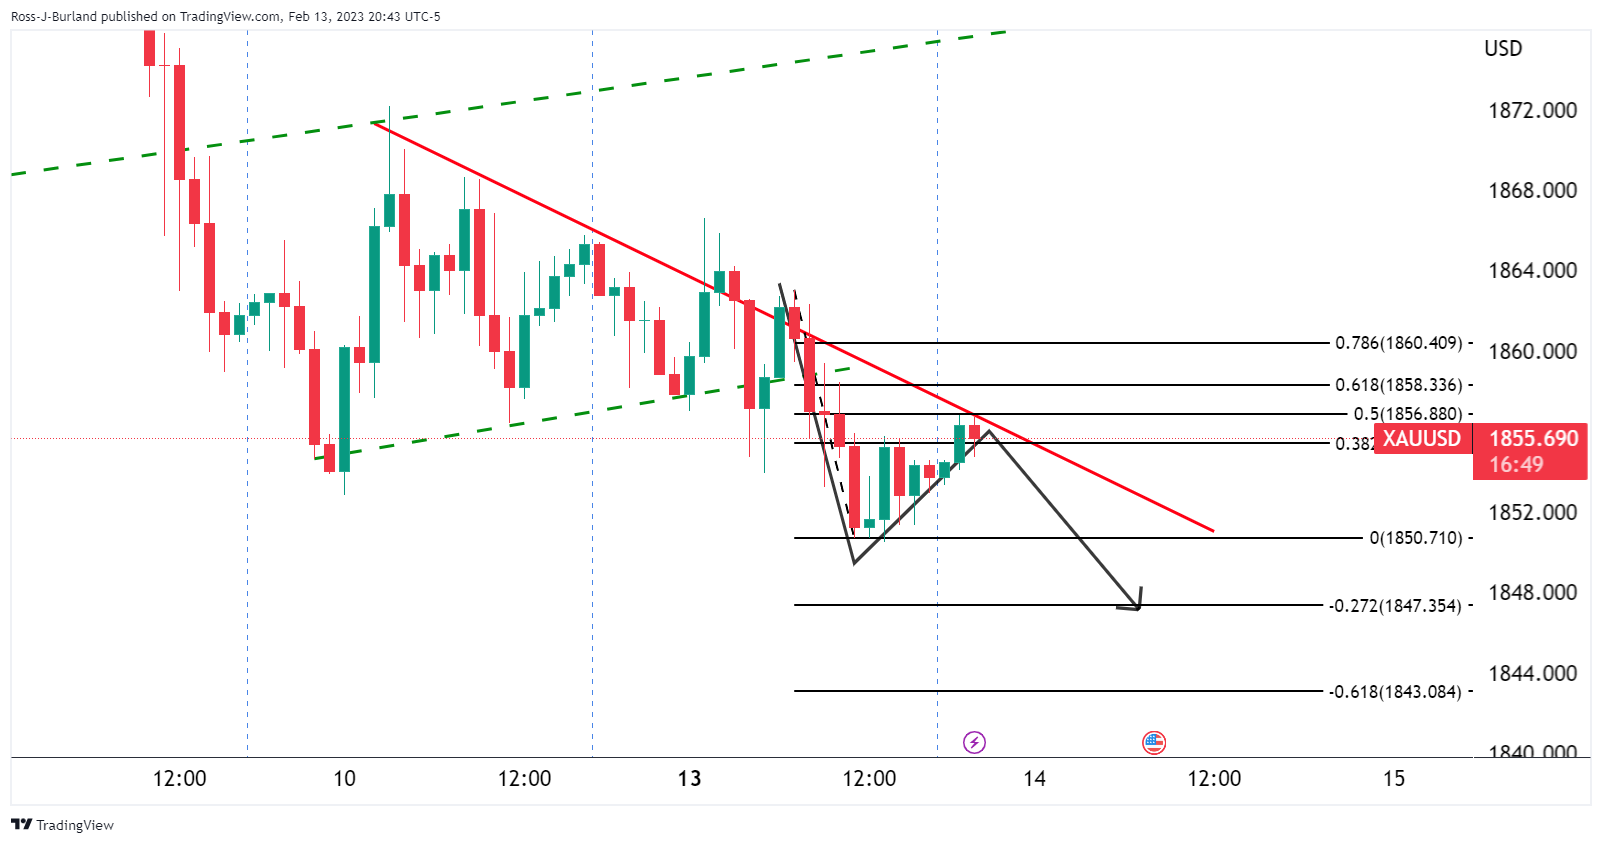
Gold dovish and hawkish biases on US CPI
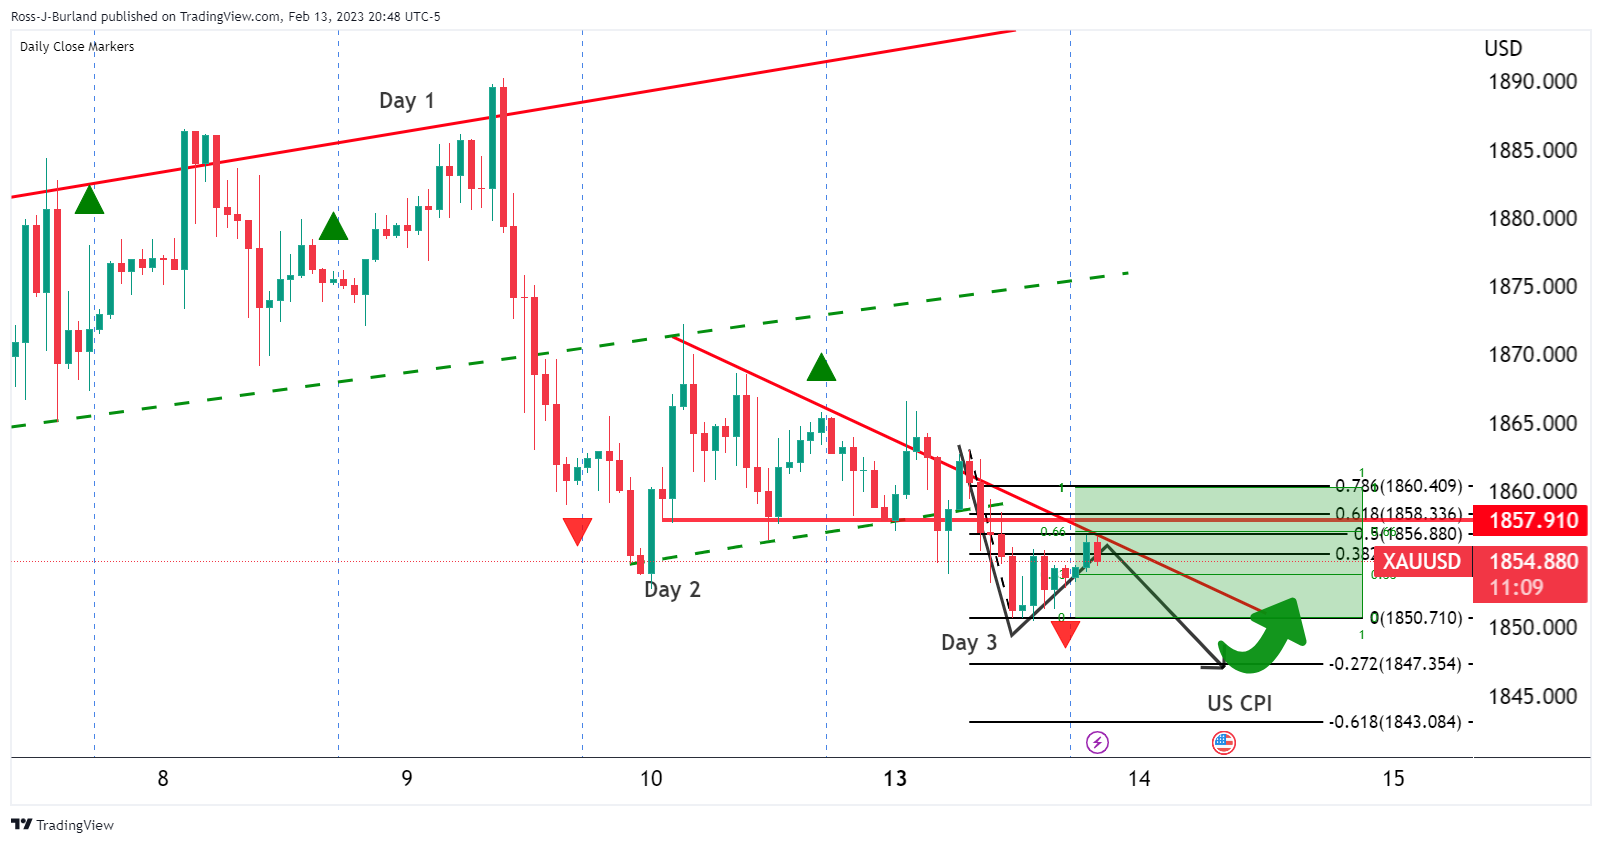
The price is currently on the front side of the bearish trend following the breakout of the symmetrical triangle on Monday. The move was a continuation of shorts from Thursday's sell-off, Day 1 shorts. The market has since picked up more supply and tested down low in the 100 pip box near $1,850.
There are prospects of a move lower from the 50% mean reversion of the prior bearish impulse while on the front side of the dynamic resistance and ahead of the US CPI data. A target for the bulls would be the opening balance highs near $1,865.
Meanwhile, on an uber-hawkish outcome of the data, the $1,825 target is exposed on a break of $1,850:
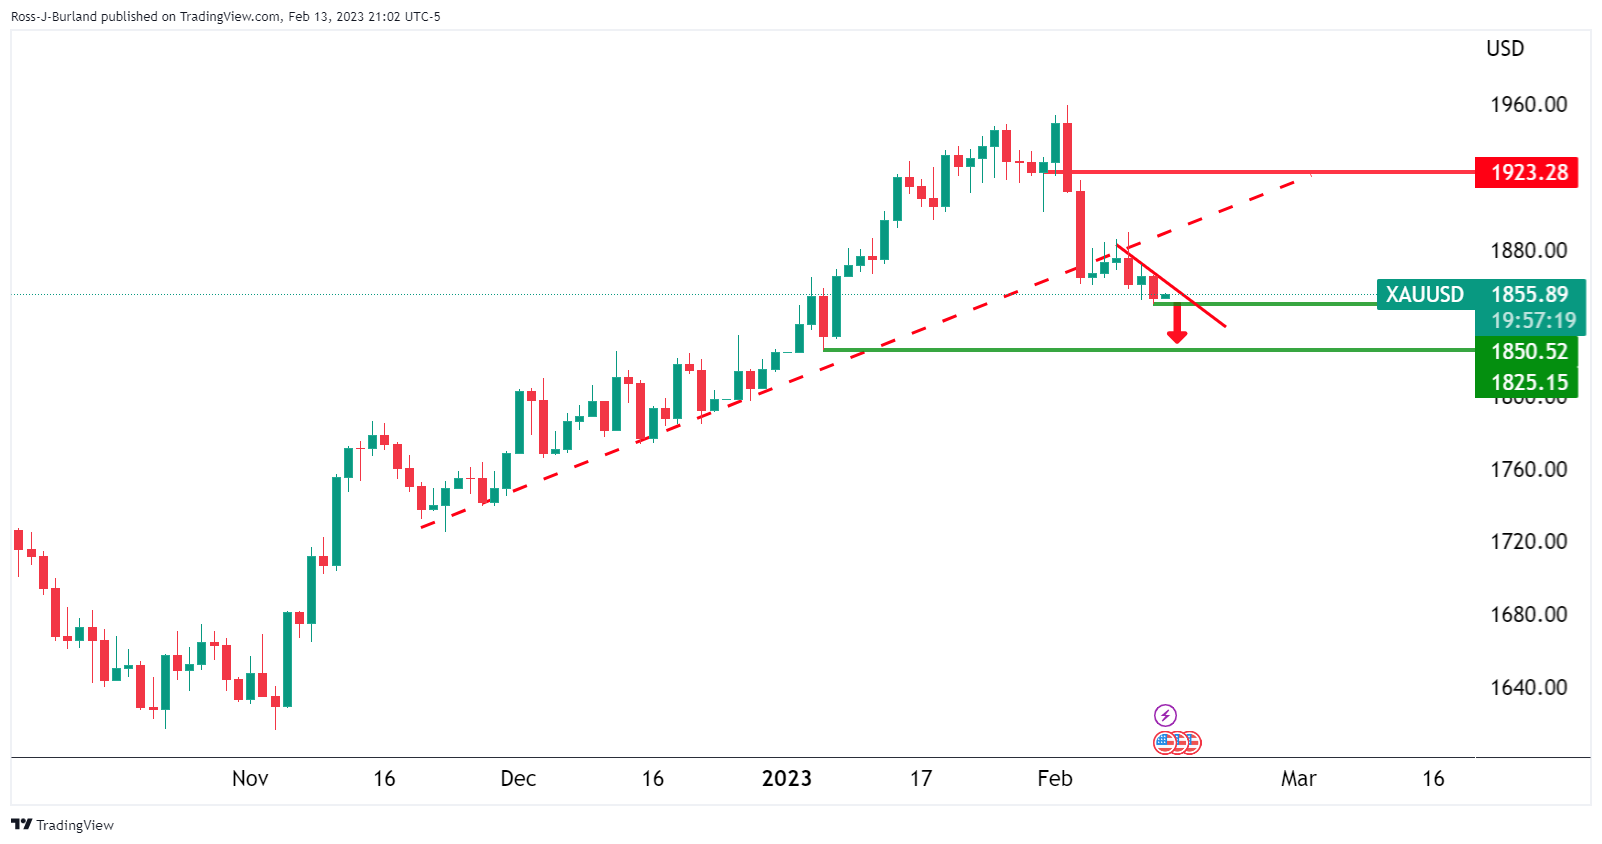
If this were to play out off the bat, it would complete that prior analysis thesis as posted over the past few weeks in a running commentary on the market structure:
-
Chart of the Week: XAU/USD trapped bulls into the Fed and NFP
-
Chart of the Week: XAU/USD breakout traders triggered in, bear traps being laid down
-
Chart of the Week: How much can the bulls milk in the short squeeze?
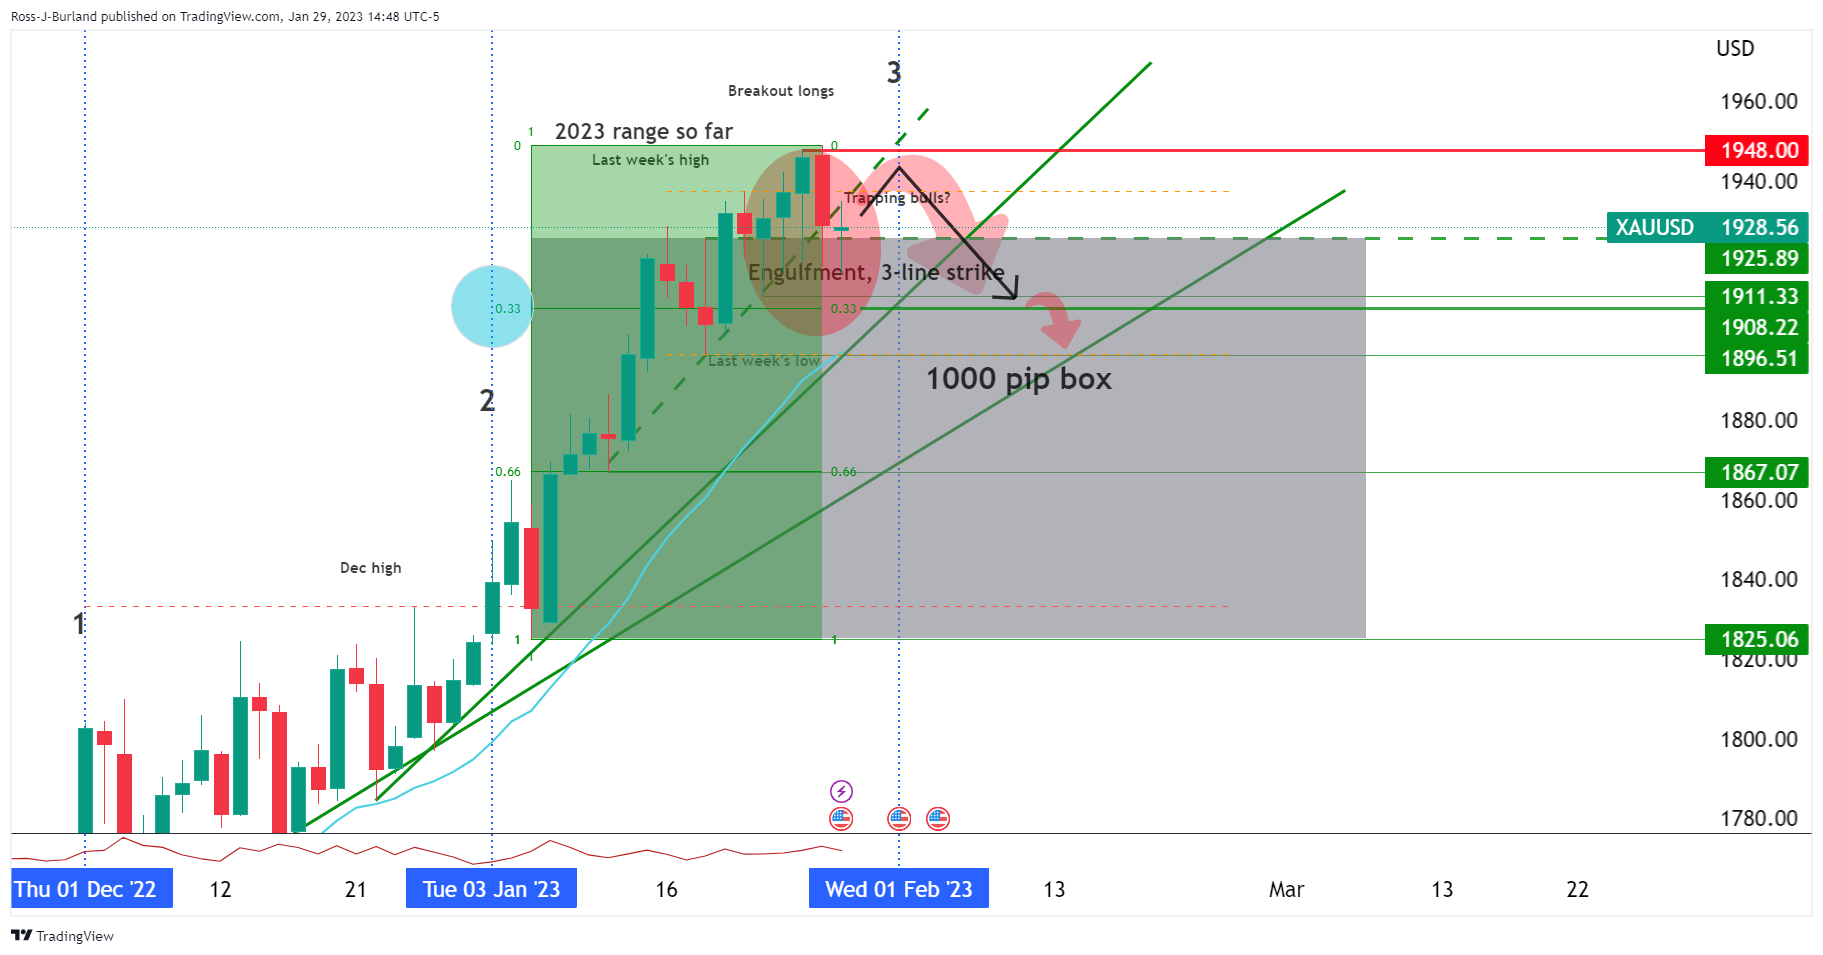
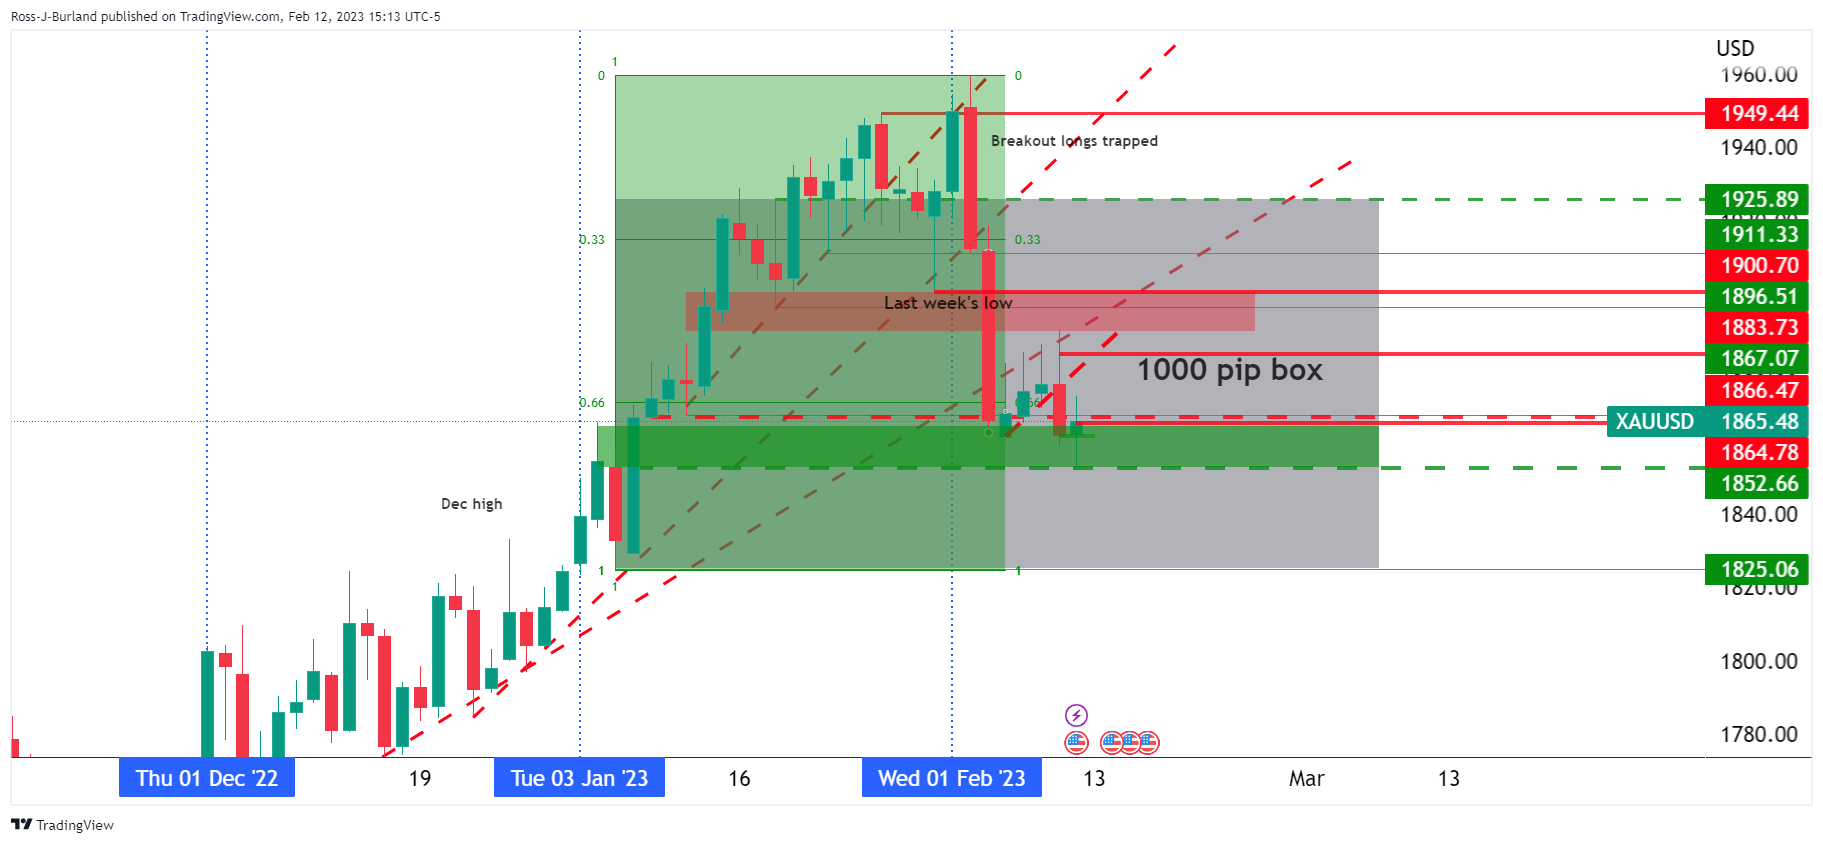
According to the latest monetary conditions survey, conducted by the Reserve Bank of New Zealand (RBNZ) showed on Tuesday, New Zealand's (NZ) inflation expectations are seen moderating across the time curve in the first quarter of 2023.
Two-year inflation expectations, seen as the time frame when RBNZ policy action will filter through to prices, eased further to 3.30% from 3.62% previous.
NZ Q1 2023 average one-year inflation expectations edged a tad higher to 5.11% vs. 5.08% seen in the fourth quarter of the last year.
- Market sentiment remains cautious as traders await US CPI for January.
- Hopes of upside surprise, hawkish Fed talks probe the previous optimism.
- S&P 500 Futures seesaw after the biggest daily jump of February.
- US 10-year Treasury bond yields remain depressed following a U-turn from monthly peak.
Markets depict the typical pre-data anxiety as traders await the all-important US Consumer Price Index (CPI) for January during early Tuesday. Adding to the lack of trading momentum could be the cautious mood ahead of multiple key releases from Japan, Europe and the UK.
While portraying the mood, the S&P 500 Futures print mild losses around 4,140, following the biggest daily jump of the month. That said, the US 10-year Treasury bond yields drop nearly two basis points to 3.69% at the latest, after reversing from a one-month high the previous day. It should be noted that the US Dollar Index (DXY) remains pressured while equities in the Asia-Pacific region trade mixed at the latest.
Other than the anxiety ahead of crucial catalysts, downbeat prints of the US inflation expectations contrasts with the hawkish Fed speak to also challenge the market moves. On the same line, hopes of positive surprise from the US inflation and fresh US-China jitters add strength to the mild pessimism.
On Monday, Fed Governor Michelle Bowman said that the Federal Reserve will need to continue to raise interest rates in order to get them to a level high enough to bring inflation back down to the central bank's target rate, per Reuters. Before him, Philadelphia Federal Reserve President Patrick Harker pushed back the chatters of a Fed rate cut during 2023. However, the policymaker did mention, “Fed not likely to cut this year but may be able to in 2024 if inflation starts ebbing.”
Elsewhere, the US inflation expectations, as per the 10-year and 5-year breakeven inflation rates from the St. Louis Federal Reserve (FRED) eased from monthly highs to 2.31% and 2.44% at the latest.
On a different page, “US Congress will take a bipartisan look at unidentified aerial objects that have made their way into U.S. and Canadian airspace, and why they were not found sooner,” said US Senate Majority Leader Chuck Schumer. It’s worth noting that a US Military General previously ruled out odds favoring the likely hand of China in the “unidentified objects” which were shot down during the weekend.
Looking forward, the year-start optimism and revival of work contracts seem to keep central bank hawks hopeful as the US inflation data looms. However, the US CPI for January bears the downbeat YoY forecast of 6.2% versus 6.5% and can favor the risk-takers in case of either matching or declining below expectations.
As markets brace for the US Consumer Price Index (CPI) for January, multiple analysts rolled out their say on the key inflation data. Among them, Goldman Sachs and the ace editor of the Wall Street Journal (WSJ) Nick Timiraos gained major attention as both suggest a surprise uptick in the US CPI for January, mainly due to the year-start consolidation of the move.
WSJ’s Timiraos cited the Federal Reserve’s (Fed) research paper titled, “Residual Seasonality in Core Consumer Price Inflation: An Update,” to justify his expectations stating, “Core inflation has generally come in higher in the first of the year than the second half of the year.”
GS, on the same line, mentioned that their economists have argued that inflation readings might be stronger at the start of the year because a disproportionate number of prices are reset at the start of the year, and firms might set contract rates higher than usual in the current environment.
It should be noted that the firms’ actions of inflation contract prices were termed as a more prolonged overshoot of the Fed's inflation aim.
GS also cites the latest market responses to data surprises as somewhat more symmetric.
If the January inflation data fail to "rise to the occasion," then the macro backdrop could continue to push towards Dollar depreciation,” said GS.
Also read: US Consumer Price Index Preview: US Dollar vulnerable to violent crash, every 0.1% in Core CPI matters
- GBP/USD is hovering near the edge of the Symmetrical Triangle pattern for a breakout.
- Economic events such as the US Inflation and the UK employment data might keep Cable volatile.
- The RSI (14) is oscillating in the bullish range of 60.00-80.00, which indicates that the upside momentum is already active.
The GBP/USD pair has refreshed its day’s high above the critical resistance of 1.2150 in the Asian session. The Cable has picked strength amid the improved risk appetite of investors after they digested the United States inflation-inspired anxiety.
S&P500 futures are displaying a subdued performance after a bullish Monday, portraying a minor caution amid overall positive sentiment. The US Dollar Index (DXY) has further dropped below 102.85, showing a sheer decline in the safe-haven’s appeal. The Pound Sterling will display a power-pack action after the release of the United Kingdom employment data.
GBP/USD is hovering near the edge of the Symmetrical Triangle chart pattern formed on an hourly scale. The upward-sloping trendline of the aforementioned chart pattern is placed from February 7 low at 1.1961 while the downward-sloping trendline is plotted from February 3 high at 1.2264.
Advancing 20-period Exponential Moving Average (EMA) at 1.2118, adds to the upside filters.
The Relative Strength Index (RSI) (14) is oscillating in the bullish range of 60.00-80.00, which indicates that the upside momentum is already active.
A confident breakout of the Symmetrical Triangle above February 9 high at 1.2192 will trigger the volatility expansion, which will drive the asset toward February 3 high at 1.2264. A breach of the latter will expose the asset to the round-level resistance of 1.2300.
On the contrary, a decline in the Cable below February 9 low at 1.2057 will drag the asset toward January 3 low at 1.1900 followed by horizontal support placed from January 6 low around 1.1841.
GBP/USD hourly chart
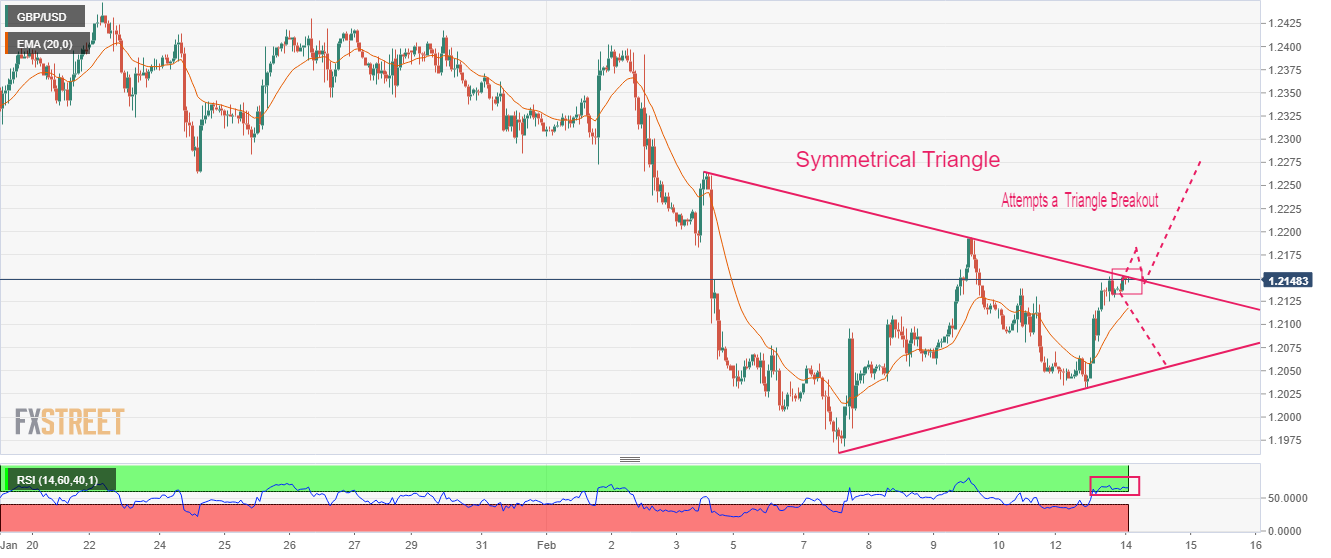
Japan's economy minister Goto has crossed the wires and stated that Japan will seek labour market reform in order to achieve structural wage growth.
Key comments
GDP data showed Japan's economy recovering gradually.
Will take necessary policy response without hesitation with close eye on economic, price developments.
Achieving sustained wage growth is best way to combat rising inflation.
Will pursue labour market reform to achieve structural wage growth.
Companies' investment appetite has not cooled, nominal spending at record high levels.
See rising inflation and global slowdown as risks but not too pessimistic about japan's economy.
Must execute scheduled spending package, supplementary budget first and then if neeeded, will consider additional steps.
Japan GDP
Japan's economy grew an annualised 0.6% in the final three months of 2022, government data showed on Tuesday, bouncing back from the previous quarter's contraction as the return of inbound tourists offset a slowdown in capital expenditure and exports, Reuters explained. USD/JPY rose initially on the data but is sinking again at the time of writing and marking fresh lows for the day of 132.07.
- USD/CAD remains sidelined around one-week low, pauses two-day losing streak.
- US Dollar stays depressed while tracking a pullback in the Treasury bond yields.
- WTI defends previous day’s U-turn from 12-day top amid hopes of more US SPR releases.
USD/CAD portrays the market’s cautious mood as traders keep their eyes on the US Consumer Price Index (CPI) for January during early Tuesday. In doing so, the Loonie pair holds lower grounds near 1.3330 following a two-day downtrend.
That said, the quote’s latest weakness could be linked to the US Dollar’s failure to defend the previous weekly gains amid downbeat US Treasury bond yields. However, the softer price of Oil, Canada’s key export, joins the hawkish Federal Reserve (Fed) comments to tease USD/CAD bulls.
WTI crude oil remains depressed at around $79.50 amid the fears of more releases of the US Strategic Petroleum Reserves (SPR). With this, the black gold ignores the previous chatters suggesting an output crunch due to Russia’s threat of cutting production and the hopes of more energy demand, as conveyed by Organization of the Petroleum Exporting Countries (OPEC) Secretary-General Haitham Al Ghais.
Elsewhere, Fed Governor Michelle Bowman said that the Federal Reserve will need to continue to raise interest rates in order to get them to a level high enough to bring inflation back down to the central bank's target rate, per Reuters. Before him, Philadelphia Federal Reserve President Patrick Harker pushed back the chatters of a Fed rate cut during 2023. However, the policymaker did mention, “Fed not likely to cut this year but may be able to in 2024 if inflation starts ebbing.”
It should be noted that the easing of the US inflation expectations from the multi-day high seemed to have weighed on the US Treasury bond yields and the US Dollar of late. That said, the 10-year and 5-year breakeven inflation rates from the St. Louis Federal Reserve (FRED) eases from monthly highs to 2.31% and 2.44% at the latest.
While portraying the mood, S&P 500 Futures print mild gains while Wall Street closed in green and weighed on the US Dollar. That said, the US 10-year Treasury bond yields drop nearly two basis points to 3.69% at the latest.
Looking ahead, USD/CAD traders should closely observe the US CPI data as the recent Federal Reserve (Fed) comments appear light when suggesting more rate hikes. Also, the Fed policy pivot talks aren’t far from the table and hence any disappointment from the US inflation numbers won’t hesitate to propel the Loonie pair further toward the south. Also important to watch is the Oil price.
Technical analysis
Unless crossing the 50-DMA hurdle surrounding 1.3480, the USD/CAD is on the way to test an upward-sloping support line from the mid-November 2022, close to 1.3270 at the latest.
In recent trade today, the People’s Bank of China (PBOC) set the yuan at 6.8136 vs. the prior close of 6.8190.
About the fix
China maintains strict control of the yuan’s rate on the mainland.
The onshore yuan (CNY) differs from the offshore one (CNH) in trading restrictions, this last one is not as tightly controlled.
Each morning, the People’s Bank of China (PBOC) sets a so-called daily midpoint fix, based on the yuan’s previous day's closing level and quotations taken from the inter-bank dealer.
- WTI bears will be nervous to hold on to positions ahead of US CPI if bulls move in between now and then.
- Bears otherwise seek a break of $79.00 that opens the risk of a move towards Day 1 longs near $76.50.
West Texas Intermediate, WTI, crude oil rallied on Monday, climbing from early weakness to be sold off in New York at the highs of the day into demand again. The follow-through took the black gold to fresh cycle highs for another sell-off later in the day for a lower close.
However, we have length still in the market that is vulnerable to another sell-off as the bears chip away at the trendline as illustrated below. For the opening sessions, Asia and London, there are prospects of a move into the shorts from up high and that could result in a thesis for a bearish head and shoulders pattern:
WTI H1 chart
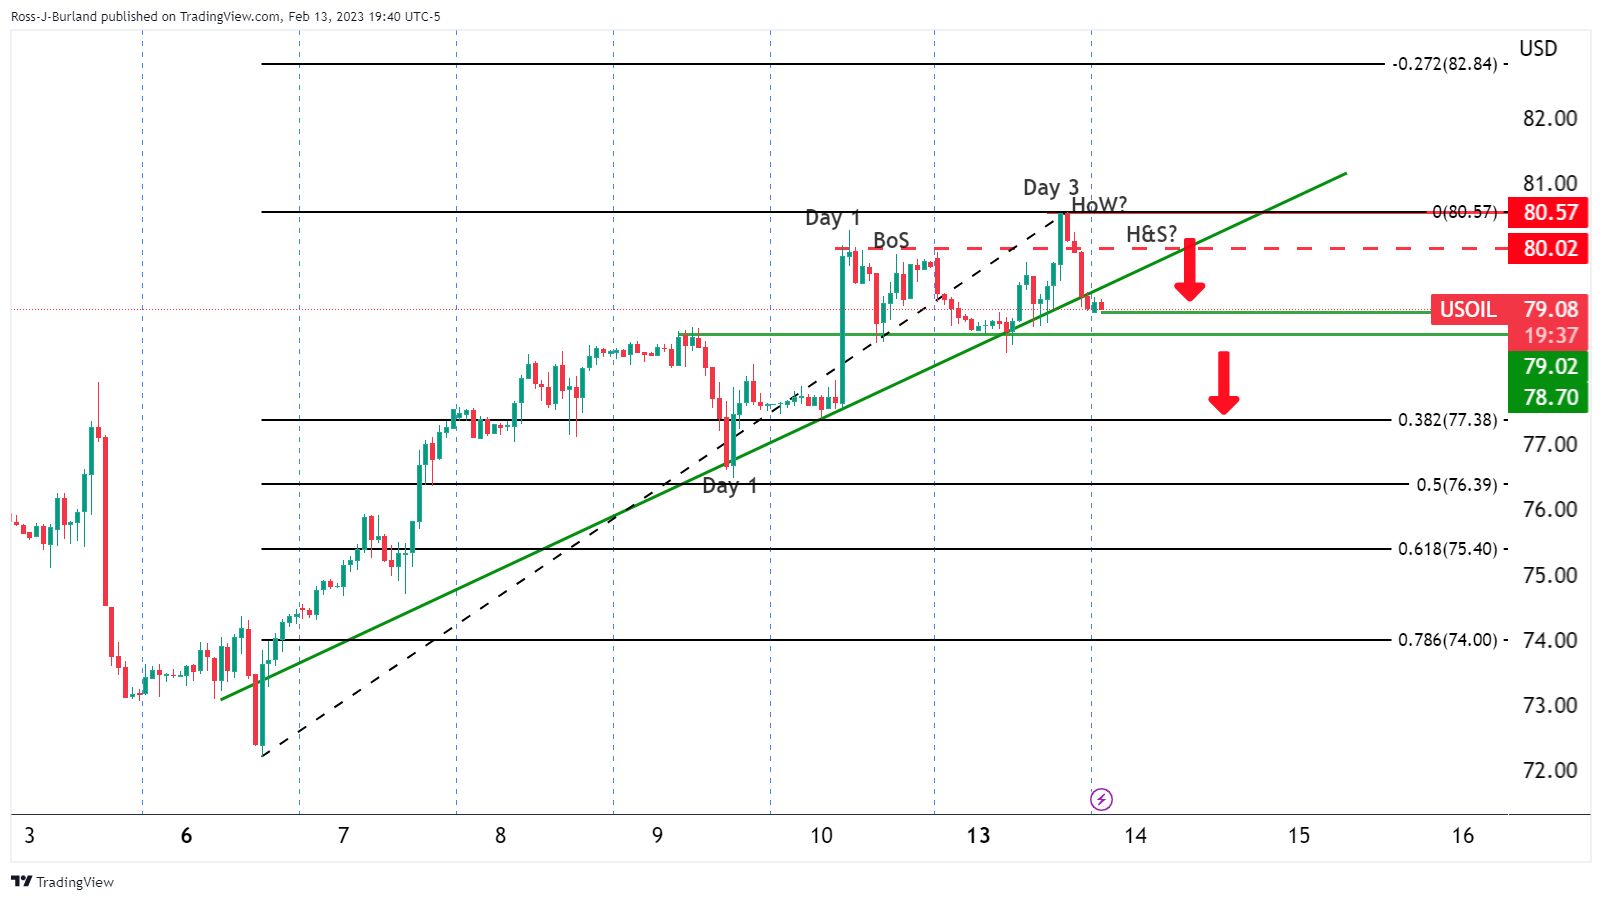
At this juncture, traders will be watchful of jumping the gun and breaks of structure near $79.00 could be met with demand again from the bulls. After all, critical data is scheduled for the day ahead with the US Consumer Price Index and investors could well be sitting on the sidelines ahead of the data.
Bears will be nervous to hold on to positions that could be squeezed by the bulls ahead of the data ultimately fuelling an exodus of shorts. However, if there is no resistance from the bulls, a break of $79.00 opens risk of a move towards Day 1 longs near $76.50 in a downside continuation of Monday's bearish close:
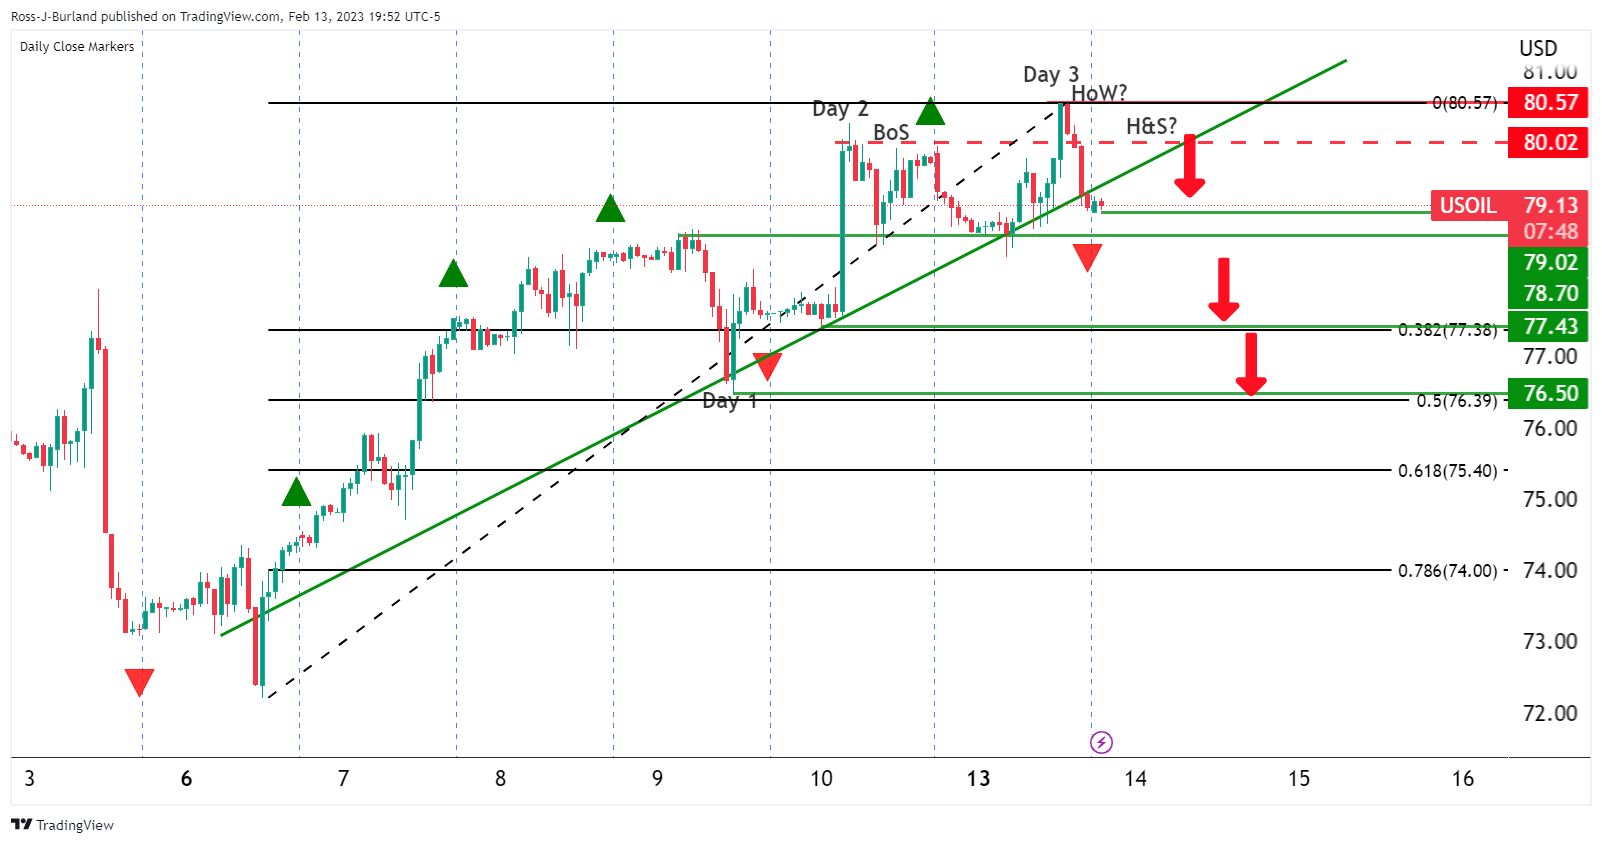
- AUD/USD bulls take a breather after posting the biggest daily gains in a week.
- Market sentiment remains cautiously optimistic ahead of the key US inflation data.
- Australia’s NAB Business Conditions, Business Confidence improved in January.
- US Dollar pullback ahead of US CPI joins hope of upbeat Aussie job numbers, hawkish RBA talks to favor pair buyers.
AUD/USD seesaws around 0.6970-60 as it lacks upside momentum amid cautious markets during the early hours of all-important Tuesday. While portraying the pre-data anxiety, the Aussie pair fails to cheer the upbeat prints of the National Australia Bank’s (NAB) monthly sentiment data.
Australia’s NAB Business Confidence rose to 6.0 in January, from -1.0 prior and 1.0 expected while the NAB Business Conditions rallied to 18.0 compared to 8.0 expected and 12.0 prior. It’s worth noting that Australia’s Westpac Consumer Confidence, flashed earlier in Asia, dropped to -6.9% for February versus 5.0% prior.
It’s worth noting, however, that the US Dollar’s positioning for the Consumer Price Index (CPI) for January and softer Treasury bond yields join firmer equities to put a floor under the AUD/USD prices. Alternatively, hawkish Fed talks and the market’s doubts over the Reserve Bank of Australia’s (RBA) hawkish concerns seem to cap the Aussie pair’s run-up ahead of all-important US inflation numbers.
On Monday, Fed Governor Michelle Bowman said that the Federal Reserve will need to continue to raise interest rates in order to get them to a level high enough to bring inflation back down to the central bank's target rate, per Reuters. Before him, Philadelphia Federal Reserve President Patrick Harker pushed back the chatters of a Fed rate cut during 2023. However, the policymaker did mention, “Fed not likely to cut this year but may be able to in 2024 if inflation starts ebbing.” His comments were mostly in line with Fed Chair Jerome Powell’s cautious optimism and exerted downside pressure on the US Dollar.
At home, the RBA appeared hawkish but the quarterly statement from the Aussie statement raise doubts on the more rate lifts as it downplays inflation forecasts, which in turn challenged the AUD/USD bulls.
Elsewhere, S&P 500 Futures print mild gains while Australia’s ASX 200 rises 0.35% on a day by the press time, which in turn follows Wall Street’s gains and favors the AUD/USD bulls.
Looking ahead, AUD/USD traders should pay attention to the US CPI data as the recent Federal Reserve (Fed) comments appear light when suggesting more rate hikes. Also, the Fed policy pivot talks aren’t far from the table and hence any disappointment from the US inflation numbers won’t hesitate to propel the Aussie pair further toward the north.
Technical analysis
A clear upside break of the eight-day-old descending resistance line, now support around 0.6920, keeps AUD/USD buyers hopeful as they approach the 21-DMA hurdle surrounding the 0.7000 psychological magnet.
- EUR/GBP is looking for a cushion around 0.8830 as Pound Sterling is expected to remain under downward pressure.
- The European Commission has upwardly revised Eurozone’s growth forecast and has trimmed inflation projections.
- An increase in the UK’s labor cost index will create more troubles for the Bank of England.
The EUR/GBP pair is building an intermediate cushion around 0.8830 in the Tokyo session. The asset is expected to display volatile moves ahead as investors are awaiting the release of the United Kingdom employment report for January month. The cross displayed a volatility contraction on Monday despite the European Commission's (EC) revised growth forecast and inflation projections for the Eurozone.
In its quarterly publication, the EC revised the economic growth forecast to 0.9% in 2023 from 0.3% previously anticipated and is projecting an unchanged growth for CY2024 at 1.5%. While the inflation forecast for 2023 has trimmed to 5.6% YoY from the 6.1% expected earlier. The think tank sees inflation at 2.5% in 2024, down from the previous estimate of 2.6%.
Falling energy prices and easing supply-chain bottlenecks have resulted in downside projections for Eurozone inflation. However, further interest rate hikes by the European Central Bank look possible as the inflation rate is critically far from the desired rate of 2%. ECB Vice-President Luis de Guindos said on Monday, “rate increases beyond March are to depend on data,” which indicates that a 50 basis point (bps) interest rate hike by ECB President Christine Lagarde is certain.
On the economic front, the Eurozone preliminary Gross Domestic Product (GDP) for a quarterly and annual basis are expected similar to its former releases at 0.1% and 1.9% respectively. This indicates that the Eurozone economy has not seen a recession in CY2022.
Meanwhile, the Pound Sterling bulls will remain on the tenterhooks ahead of the United Kingdom employment data. The Unemployment Rate is seen unchanged at 3.7%. Investors will be laser-focused on the Average Earnings data excluding bonuses, which is expected to increase to 6.5%. This might create more troubles for the Bank of England (BoE), which is struggling to gain an upper hand in the battle against firmer inflation.
For long-term guidance on the Pound Sterling, Economists at Rabobank expect the British Pound to remain under downward pressure over the coming months. “Currently, the UK is the only G7 economy not to have recovered its pre-pandemic levels. In addition to weak growth, its fundamentals are characterized by high inflation, low productivity, weak investment growth, post-Brexit trade frictions, and a current account deficit.”
| Index | Change, points | Closed | Change, % |
|---|---|---|---|
| NIKKEI 225 | -243.66 | 27427.32 | -0.88 |
| Hang Seng | -26 | 21164.42 | -0.12 |
| KOSPI | -17.03 | 2452.7 | -0.69 |
| ASX 200 | -15.9 | 7417.8 | -0.21 |
| FTSE 100 | 65.1 | 7947.6 | 0.83 |
| DAX | 89.36 | 15397.34 | 0.58 |
| CAC 40 | 78.86 | 7208.59 | 1.11 |
| Dow Jones | 376.66 | 34245.93 | 1.11 |
| S&P 500 | 46.83 | 4137.29 | 1.14 |
| NASDAQ Composite | 173.67 | 11891.79 | 1.48 |
- EUR/USD extends the previous day’s rebound from five-week low, grinds higher of late.
- Sustained break of descending triangle, upbeat oscillators favor buyers to target 200-SMA.
- Sellers need validation from 1.0650 to retake control.
EUR/USD grinds near the intraday high of 1.0736 while stretching the week-start rebound from the multi-day low to early Tuesday. In doing so, the major currency pair justifies the previous day’s upside break of a two-week-old descending triangle.
Adding strength to the upside bias are the bullish MACD signals and the firmer RSI (14), not overbought.
With this, the EUR/USD buyers are on the way to the 200-bar Simple Moving Average (SMA), around 1.0780 by the press time. However, multiple hurdles could challenge the pair’s further upside near 1.0800 and 1.0870 afterward.
In a case where the EUR/USD pair remains firmer past 1.0870, a three-week-old horizontal resistance area near 1.0930-40 will be crucial for the buyers to cross if they wish to keep the reins.
On the flip side, the pullback moves remain elusive unless the quote stays beyond the stated triangle’s top line, near 1.0680 at the latest.
Even if the EUR/USD pair declines below 1.0680, the lower line of the triangle, close to 1.0650, could act as the last defense of the buyers.
Overall, EUR/USD is likely to remain firmer as crucial statistics from the Eurozone and the US loom. However, the upside room appears limited.
Also read: EUR/USD grinds higher past 1.0700 as traders brace for EU Q4 GDP, US inflation
EUR/USD: Four-hour chart
Trend: Further upside expected
- NZD/USD is oscillating around 0.6360 ahead of the US Inflation data.
- The Fed is bound to hike interest rates to strengthen its defense against stubborn inflation.
- New Zealand’s monthly Food Price Index has dropped to 1.7% from the consensus of 2.2%.
The NZD/USD pair is demonstrating back-and-forth moves around 0.6360 in the Asian session. The Kiwi asset has turned sideways after a perpendicular upside move as investors are awaiting the release of the United States Consumer Price Index (CPI) data for fresh impetus. The asset is expected to display a power-pack action as any surprise move by the US inflation figure will trigger immense volatility.
The risk profile is extremely positive as risk-sensitive assets like S&P500 displayed solid upside moves on Monday. Investors digested the upside inflation risk as the Federal Reserve (Fed) is bound to hike interest rates to strengthen its defense against stubborn inflation. The US Dollar Index (DXY) is developing its auction below 103.00 as the improved risk appetite of the market participants has trimmed the safe-haven appeal. Meanwhile, the 10-year US Treasury Yields have lost some strength and have dropped to near 3.70%.
The recovery move from the risk-perceived currencies is indicating that investors are not expecting any surprise move from the US inflation. The catalyst that forced street smarts to revise their projections for inflation was the upbeat labor market data. However, consumer spending and the extent of economic activities are still in declining stage. Therefore the inflation figures could land near the estimates.
Analysts at RBC Economics expect CPI growth to edge down to 6.2% in January from 6.5% in December (YoY). Food price growth likely also continued to slow, albeit from very high levels. By contrast, we expect energy price growth to tick up for the first time in 7 months – though to an 8% rate that is still well below a June peak of 42%. We look for core inflation to slow further in January, coming in at 5.4% YoY, down from 5.7% in December. All told, recent inflation reports have pointed to a relatively broadly-based easing in price pressures.”
Meanwhile, the New Zealand Dollar is awaiting the release of the Inflation Expectations (Q1) by the Reserve Bank of New Zealand (RBNZ). The RBNZ could trim its inflation expectations as monthly inflation numbers slowed in December. Also, the Unemployment Rate rose to 3.4% in the fourth quarter of 2022. In early Asia, Statistics New Zealand reported the monthly Food Price Index (Jan) at 1.7%, lower than the consensus of 2.2% but higher than the former release of 1.1%.
| Pare | Closed | Change, % |
|---|---|---|
| AUDUSD | 0.69664 | 0.7 |
| EURJPY | 141.991 | 1.24 |
| EURUSD | 1.07243 | 0.4 |
| GBPJPY | 160.713 | 1.47 |
| GBPUSD | 1.21384 | 0.67 |
| NZDUSD | 0.63596 | 0.81 |
| USDCAD | 1.33322 | -0.1 |
| USDCHF | 0.91937 | -0.34 |
| USDJPY | 132.401 | 0.83 |
- USD/JPY bounces off intraday low, reverses pullback from five-week high on Japan data.
- Preliminary readings of Japan’s Q4 GDP rose 0.2% versus 0.5% expected, -0.2% prior.
- Pullback in yields, US Dollar ahead of the key US CPI also weigh on Yen prices.
- Japanese government’s official announcements of BoJ leadership awaited as Kazuo Ueda appears a challenge to YCC.
USD/JPY justifies softer-than-expected Japan growth numbers as it flirts with the intraday low near 132.30 during early Tuesday. Even so, the Yen pair remains indecisive amid the market’s anxiety ahead of the key US Consumer Price Index (CPI) for January, as well as the Japanese government’s public nominations for the Bank of Japan (BoJ) board.
As per Japan’s preliminary readings of the fourth quarter (Q4) Gross Domestic Product (GDP) data, the Asian economy reversed the previous 0.2% contraction with the same quarterly growth figures. However, the GDP Deflator rose to 1.1% versus -0.3% expected and prior during the stated period. Following the data, the USD/JPY pair bounced off its intraday low before reversing to 132.25 by the press time.
Also read: Japan GDP: Japan's economy grew an annualised of just 0.6%, Yen's a touch weaker
While an improvement in Japan's GDP favors the Yen sellers, the fears of hawkish BoJ and a retreat in the US Treasury bond yields ahead of the key US data seem to exert downside pressure on the USD/JPY prices of late.
Earlier on Tuesday, Bloomberg came out with an analysis suggesting further challenges to the Bank of Japan’s (BoJ) easy money policy during the incoming Kazuo Ueda’s reign. It’s worth noting that Ueda previously defended the current monetary policy in his latest public speech. That said, the Japanese government is up for formally announcing their nominations for the BoJ leadership on Tuesday, making Bloomberg’s piece important for the USD/JPY pair traders.
Elsewhere, the US 10-year Treasury bond yields remain depressed at around 3.70% after reversing from a five-week high the previous day. The pullback in yields contrasts with the hawkish Federal Reserve (Fed) talks as Fed Governor Michelle Bowman said that the Federal Reserve will need to continue to raise interest rates in order to get them to a level high enough to bring inflation back down to the central bank's target rate, per Reuters. Before him, Philadelphia Federal Reserve President Patrick Harker pushed back the chatters of a Fed rate cut during 2023. However, the policymaker did mention, “Fed not likely to cut this year but may be able to in 2024 if inflation starts ebbing.” His comments were mostly in line with the previous weekly statements from Fed Chair Jerome Powell signaling cautious optimism and defending the US Dollar bulls, despite the latest pullback.
It should be observed that the US Dollar Index (DXY) remains pressured towards 103.00 as traders brace for the US CPI amid downbeat expectations from the inflation data, mainly due to the softer prints of the US inflation expectations. The latest 10-year and 5-year breakeven inflation rates from the St. Louis Federal Reserve (FRED) grind near monthly highs, close 2.31% and 2.44% at the latest.
Amid these plays, S&P 500 Futures print mild gains while Japan’s Nikkei 225 rises 0.85% on a day by the press time.
Moving on, the Japanese government announcement and the US CPI for January, expected 6.2% YoY versus 6.5% prior, will be crucial for the USD/JPY traders to watch for clear directions.
Also read: US Consumer Price Index Preview: US Dollar vulnerable to violent crash, every 0.1% in Core CPI matters
Technical analysis
USD/JPY needs decisive break of the 40-pips trading range between the 50-DMA and a five-week-old resistance line, around 132.00 and 132.40, to entertain traders. That said, oscillators are in favor of the bulls.
© 2000-2026. All rights reserved.
This site is managed by Teletrade D.J. LLC 2351 LLC 2022 (Euro House, Richmond Hill Road, Kingstown, VC0100, St. Vincent and the Grenadines).
The information on this website is for informational purposes only and does not constitute any investment advice.
The company does not serve or provide services to customers who are residents of the US, Canada, Iran, The Democratic People's Republic of Korea, Yemen and FATF blacklisted countries.
Making transactions on financial markets with marginal financial instruments opens up wide possibilities and allows investors who are willing to take risks to earn high profits, carrying a potentially high risk of losses at the same time. Therefore you should responsibly approach the issue of choosing the appropriate investment strategy, taking the available resources into account, before starting trading.
Use of the information: full or partial use of materials from this website must always be referenced to TeleTrade as the source of information. Use of the materials on the Internet must be accompanied by a hyperlink to teletrade.org. Automatic import of materials and information from this website is prohibited.
Please contact our PR department if you have any questions or need assistance at pr@teletrade.global.
