- Analytics
- News and Tools
- Market News
CFD Markets News and Forecasts — 13-02-2022
- USD/CAD snaps two-day uptrend, justifies bearish candlestick formation.
- Downbeat Momentum line, short-term bearish chart pattern also keeps sellers hopeful.
- 100-SMA, channel’s support lure bears, bulls need validation from January’s top.
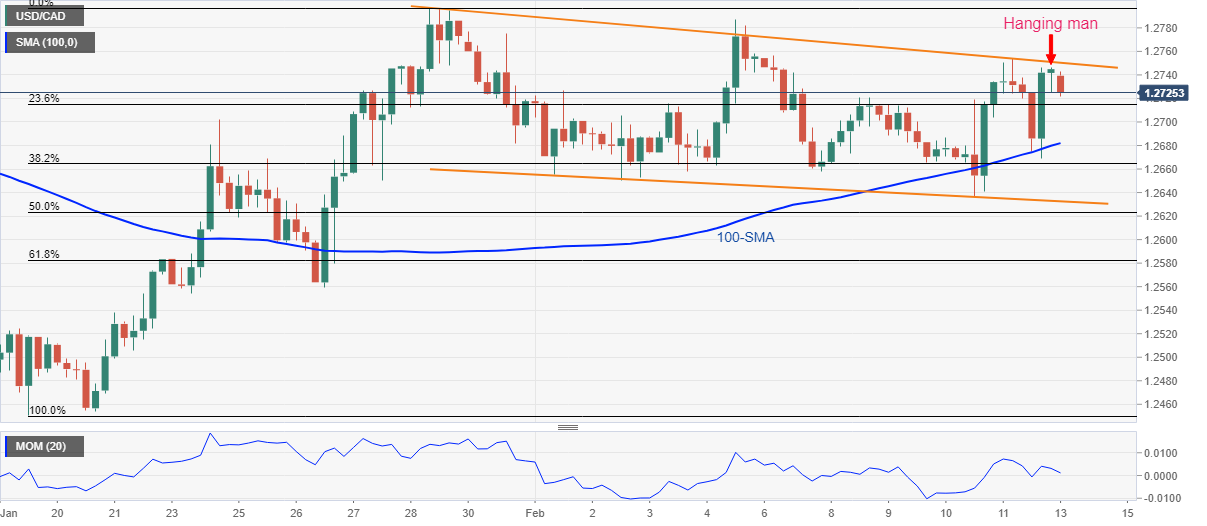
USD/CAD consolidates recent gains inside a bearish channel formation, stepping back from the resistance line to 1.2730 during Monday’s Asian session.
In doing so, the Loonie pair justifies the late Friday’s ‘Hanging man’ candlestick, as well as the Momentum line’s retreat, to register daily losses for the first time in three.
With this, USD/CAD prices are likely to extend the latest pullback towards the 100-SMA level near 1.2680.
However, the lower line of the stated two-week-old descending trend channel, near 1.2630, will restrict the pair’s further weakness, if not then the late January’s swing low around 1.2560 should return to the charts.
On the flip side, the channel’s resistance line near 1.2750 and late January’s peak around 1.2800 will restrict short-term upside moves of the USD/CAD pair.
Following that, the last monthly top near 1.2815 will be the key as a break of which will direct USD/CAD bulls towards the 1.3000 psychological magnet.
USD/CAD: Four-hour chart
Trend: Pullback expected
- Gold consolidates the biggest daily jump in four months.
- Friday’s risk-off mood dragged yields and fuelled USD, gold prices amid escalating concerns over Russia-Ukraine war.
- Easing chatters over Fed’s 50bp rate-hike in March also weighed on bond coupons and will be watched in FOMC Minutes.
- Gold Weekly Forecast: Is gold finally regaining its inflation-hedge status?
Gold (XAU/USD) prices seesaw around the three-month high flashed the previous day, taking rounds to $1,860 during Monday’s quiet Asian session.
The yellow metal rallied the most since October 2021 on Friday after receding probabilities over Fed’s 0.50% rate-hike, backed by softer US data, joined widespread fears of Russia’s immediate invasion of Ukraine.
The CME FedWatch Tool suggests around 50-50 chances of 50 basis points (bps) of a Fed-rate-hike in March versus a 0.25% move. Previously, especially after the US Consumer Price Index (CPI) release, the market was almost certain of a higher boost to the rates. That said, the preliminary readings of the US Michigan Consumer Sentiment for February eased from 67.2 to 61.7 on Friday.
Elsewhere, the US warned over Moscow’s preparations for immediate war with Ukraine and urged all of its citizens to leave Kyiv. The UK and Eurozone policymakers also cited Russian preparations for an immediate war. However, the AFP News recently quoted Russian Leader Vladimir Putin saying to his French counterpart Emanuel Macron that Ukraine invasion claims are 'provocative speculation’.
Amid these plays, the US 10-year Treasury yields dropped over 11.0 basis points (bps) while Wall Street benchmarks also witnessed heavy losses due to the risk-aversion wave. The sour sentiment could also be witnessed by S&P 500 Futures that drop 0.15% intraday at the latest.
Looking forward, gold traders may await more clues from the Russia-Ukraine story and Fed’s rate-hike concerns for near-term direction. As a result, this week’s FOMC Minutes will be a crucial event to watch while also keeping eyes on geopolitics for fresh impulse.
Read: New Geopolitical Threats for 2022: Is Gold in Danger Too?
Technical analysis
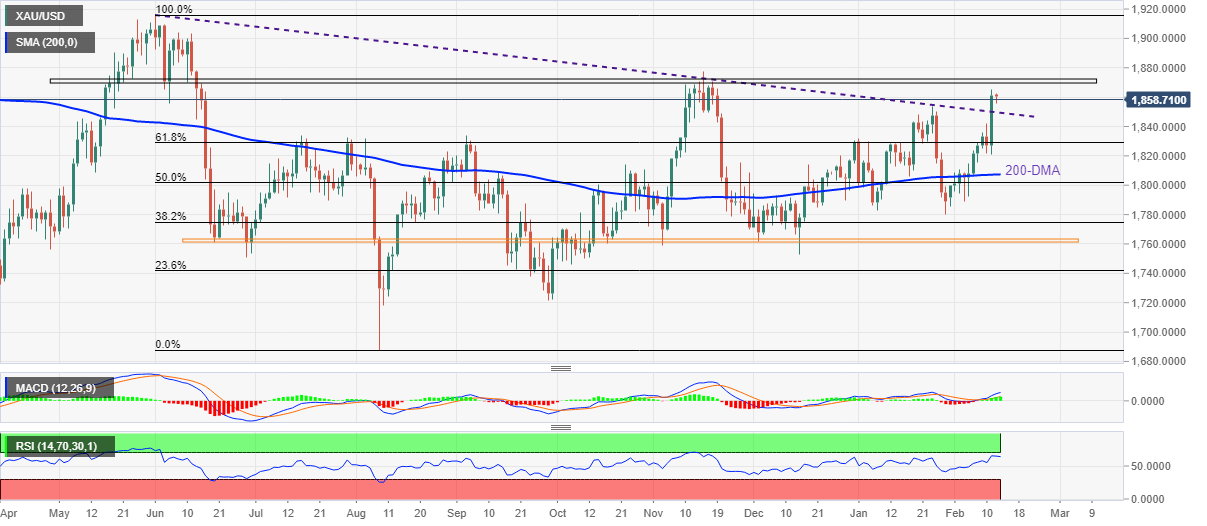
On Friday, gold prices portrayed the biggest daily jump in four months as buyers cheered escalating geopolitical tensions surrounding Russia, as well as inflation woes.
The run-up not only registered a fresh high of 2022 but also crossed a downward sloping trend line from June. Given the upbeat RSI and MACD conditions supporting the gold buyers, the latest upside has legs to run ahead.
However, a horizontal area comprising multiple levels marked since May, near $1,873, will be a crucial upside barrier for the metal to cross ahead of targeting the $1,900 threshold.
Should gold buyers keep reins past $1,900, the mid-2021 high surrounding $1,917 will be in focus.
Alternatively, an upward sloping trend line from February 03 close to $1,821 and the 200-DMA level of $1,807 restricts short-term declines of gold.
In a case where gold prices drop below $1,807, the $1,800 round figure and $1,760 will be on the seller’s radar.
Gold: Daily chart
Trend: Further upside expected
“Investors are wrong to bet on eurozone interest rates rising in June, predicting policymakers will be careful to avoid ‘killing off the recovery’,” said Irish Central Bank Head and European Central Bank (ECB) member Gabriel Makhlouf per the Financial Times (FT).
Key quotes
‘The path to normalization’ of eurozone monetary policy had become clearer, after inflation hit a record high in the bloc while unemployment dropped to an all-time low.
The European Central Bank could stop its net bond purchases in June or a few months later, and would only raise rates after that.
The idea that we could hike interest rates in June looks very unrealistic to me.
I certainly think there’s a bit of difference between the calendar we’re working to and the one some market participants may have in mind.
I’m reasonably confident net asset purchases will end this year.
The question is what is the pace at which my foot sits on the accelerator, and am I talking about June or am I talking about the third quarter.
There are similarities between where we are today and 2011, but there are also differences and we need to make sure that our assessment is putting the current high headline numbers [of inflation] into a broader context.
Market reaction
Given the increased calls from the ECB policymakers to wait for the rate hikes, versus the hawkish Fedspeak, not to forget the Russia-linked risk-off mood, the EUR/USD pair remains pressured around 1.1345 during Monday’s Asian session.
Read: EUR/USD Price Analysis: Stays defensive above 1.1330 support confluence
- EUR/USD bears take a breather after posting the biggest daily loss in two weeks.
- Convergence of 21-DMA, 50-DMA restricts short-term downside amid receding bullish bias of MACD.
- Bulls remain away until the quote stays below 1.1485.
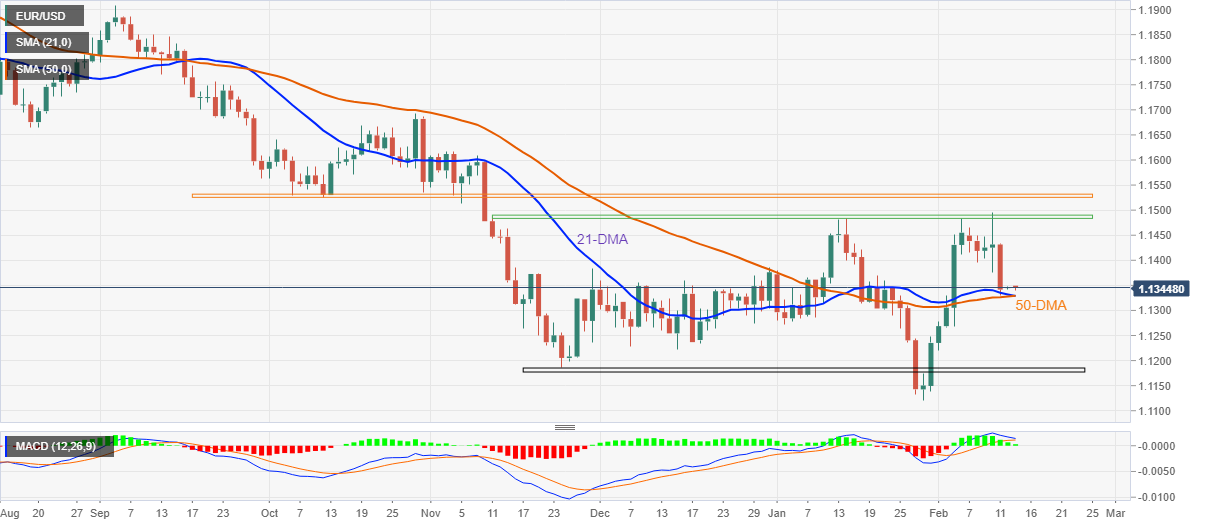
EUR/USD remains on the back foot during the early Asian session on Monday, despite recent inaction around 1.1340-45.
That said, the major currency pair dropped the most in two weeks the previous day while extending Thursday’s pullback from 1.1485-90 horizontal area established since November 11, 2021.
However, a joint of the 21-DMA and 50-DMA restricts the immediate downside of the stated currency pair.
Given the downbeat MACD conditions and the quote’s inability to cross important resistance zone, EUR/USD prices are likely to break the 1.1330 support confluence.
Following that, the 1.1300 threshold and the 1.1230 support levels may entertain EUR/USD bears before an 11-week-old horizontal area near 1.1180 challenges the further downside.
Alternatively, a clear upside past 1.1485 isn’t a green card to the EUR/USD bulls as another resistance zone comprising October 2021 lows near 1.1530 will challenge the pair’s upside momentum.
Should the pair prices rally beyond 1.1530, the odds of witnessing a rally towards an October high near 1.1695 can’t be ruled out.
EUR/USD: Daily chart
Trend: Further weakness expected
- NZD/USD remains pressured after two consecutive days of negative daily performance.
- Risk-off mood weighed on the Kiwi pair, Fed, Russia acted as the key catalysts.
- New Zealand Food Price Index rose in January, RBNZ rate hike eyed for next week.
- Slower start to the week comprising FOMC minutes, qualitative news will be crucial.
NZD/USD begins the week on a softer footing near 0.6645, fading the corrective pullback from intraday low following a two-day decline.
In doing so, the Kiwi pair battles the risk of the Russia-Ukraine war amid uncertainty over the pace of rate hikes by the US Federal Reserve (Fed) and the Reserve Bank of New Zealand (RBNZ).
The quote bears managed to take a breather during mid-Friday as probabilities of the Fed’s 0.50% rate hike in March eased following the softer US data. However, stark warning of a Ukraine-Russia war by the US propelled risk-off mood and the US dollar, while allowing the US Treasury yields to trim some of the latest gains.
Read: The call between Biden and Putin has ended, markets on high alert with finger over the panic button
That said, the CME FedWatch Tool suggests around 50-50 chances of 50 basis points (bps) of a Fed-rate-hike in March versus a 0.25% move. Previously, especially after the US Consumer Price Index (CPI) release, the market was almost certain of a higher boost to the rates.
Read: Week Ahead on Wall Street (SPY) (QQQ): CPI sets equities up for more losses and 50bps hike
Talking about the data, the preliminary readings of the US Michigan Consumer Sentiment for February eased from 67.2 to 61.7 on Friday. Following the data, ANZ said, “This confidence series has not been this low since the GFC and that is despite the current strength in the jobs market. Inflation expectations were in line with expectations, and imply consumers see inflation remaining elevated above the Fed’s 2% target in the near, medium and longer run.”
At home, New Zealand’s Food Price Index for January rose past 0.4% expected and 0.6% prior readings to 2.7% MOM whereas the Business NZ PSI for the said month eased below 49.7 to 45.9.
Given the downbeat data and risk-aversion wave, short-term NZD/USD weakness becomes imperative. However, the odds of a rate hike in next week’s RBNZ may keep the Kiwi pair afloat. “The RBNZ MPS next week is the next major risk event locally, and that will almost certainly be punctuated by volatility, given that market expectations are split about a 25bp or 50bp hike (odds are roughly 5:3 respectively),” said ANZ.
Technical analysis
A clear downside break of the two-week-old ascending trend line directs NZD/USD prices towards the last swing lows near 0.6590 before highlighting January’s bottom close to 0.6530 for bears.
Alternatively, the support-turned-resistance line and the 21-DMA, near 0.6660, restrict the Kiwi pair’s recovery moves ahead of the monthly high near 0.6735.
- AUD/USD under pressure due to US warnings of a Russian invasion.
- Bears testing critical support structure and eys on the hourly supportive trendline.
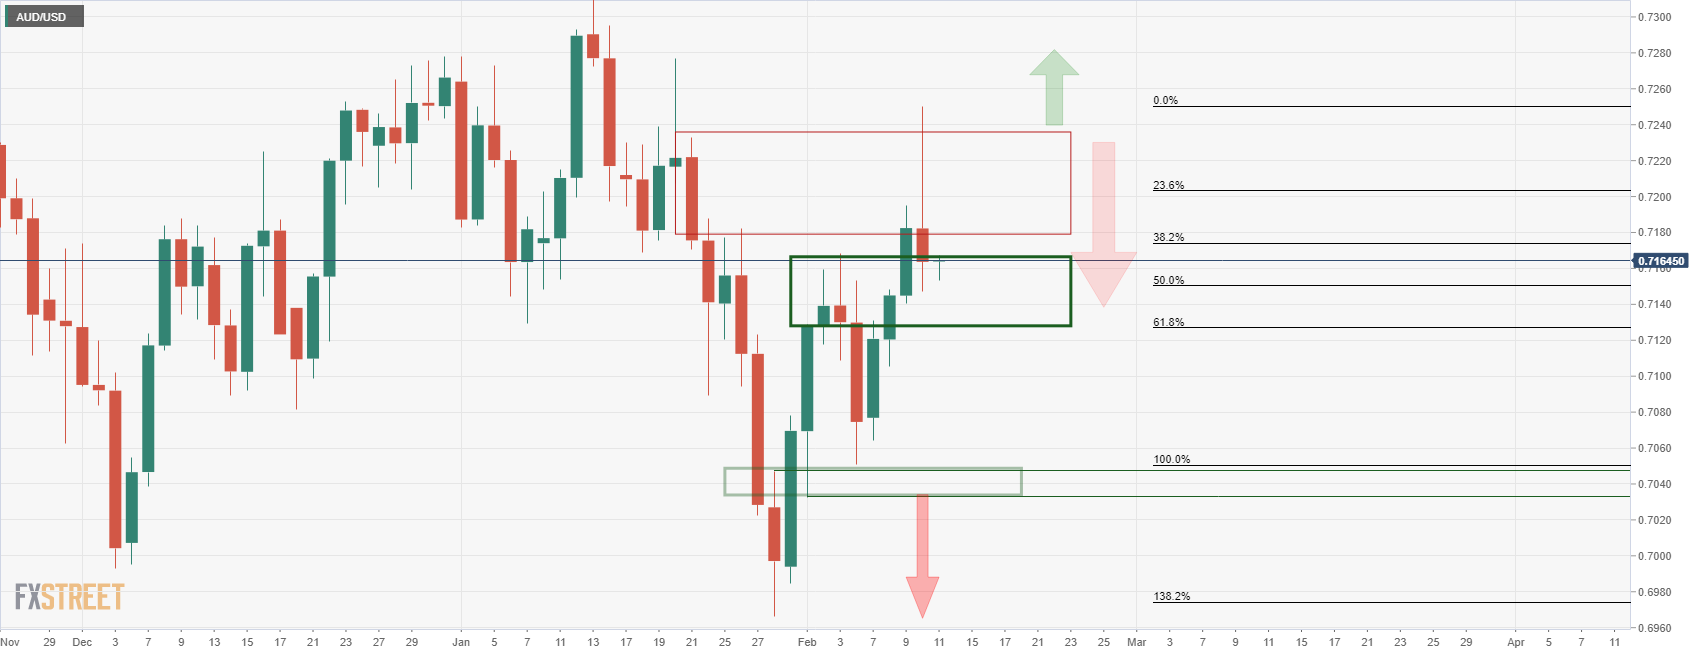
AUD/USD ended Friday on the backfoot following news that the US warned its citizens to leave Ukraine within 48 hours due to Russian invasion risks. Oil prices, equities and risk aversion have been the driving force behind the sell-off in the Aussie while the inflationary supply shocks keep coming. AUD/USD ended lower by 0.50% as well to 0.7130, with its bullish campaign potentially coming to a swift end at this juncture.
AUD/USD prior analysis
AUD/USD live market
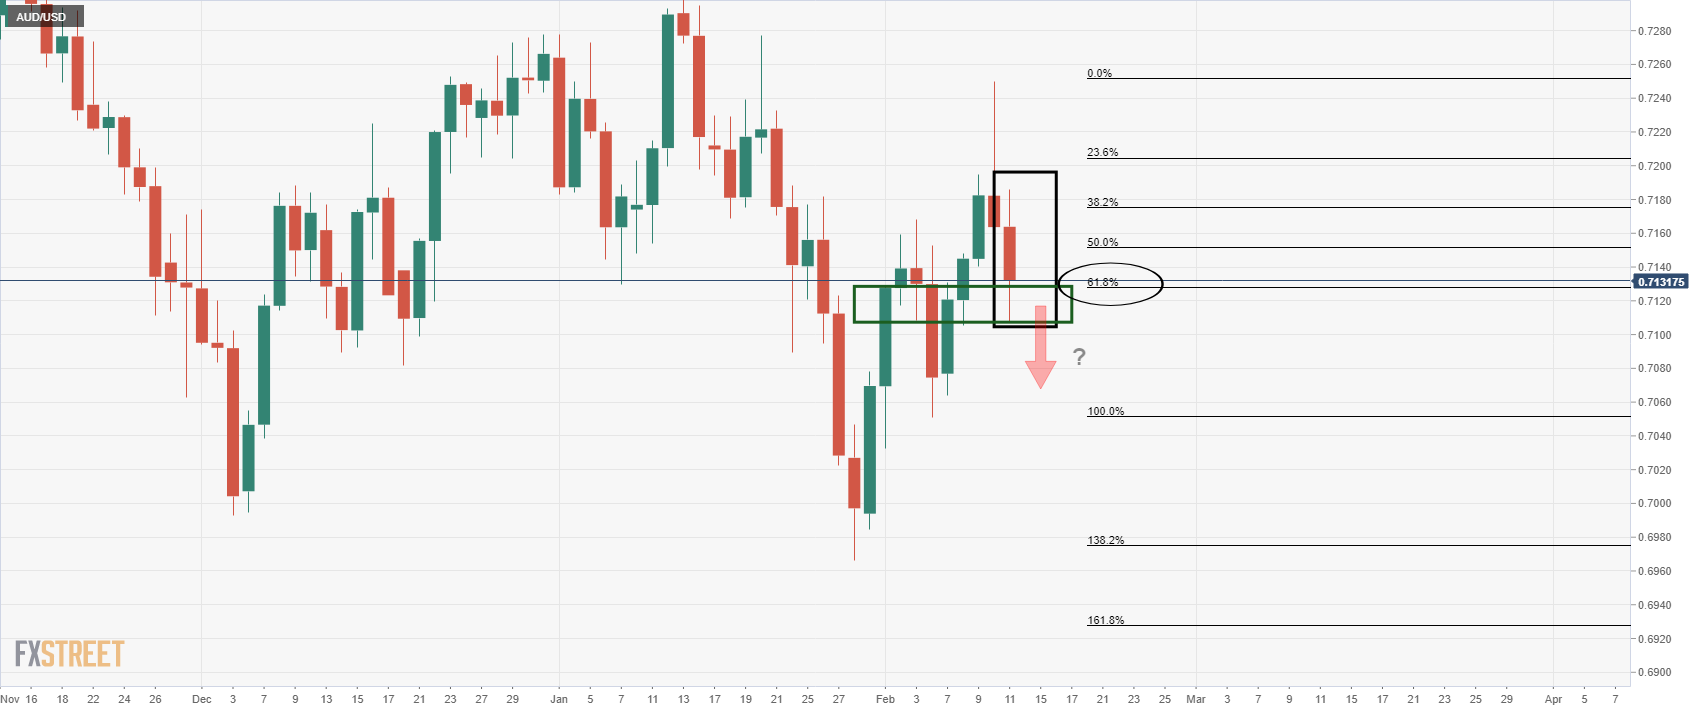
Eyes are on a break below the 61.8% Fibonacci retracement level. Meanwhile, the 1-hour chart will be eyed for the potential of a knee-jerk relief rally to start the week:
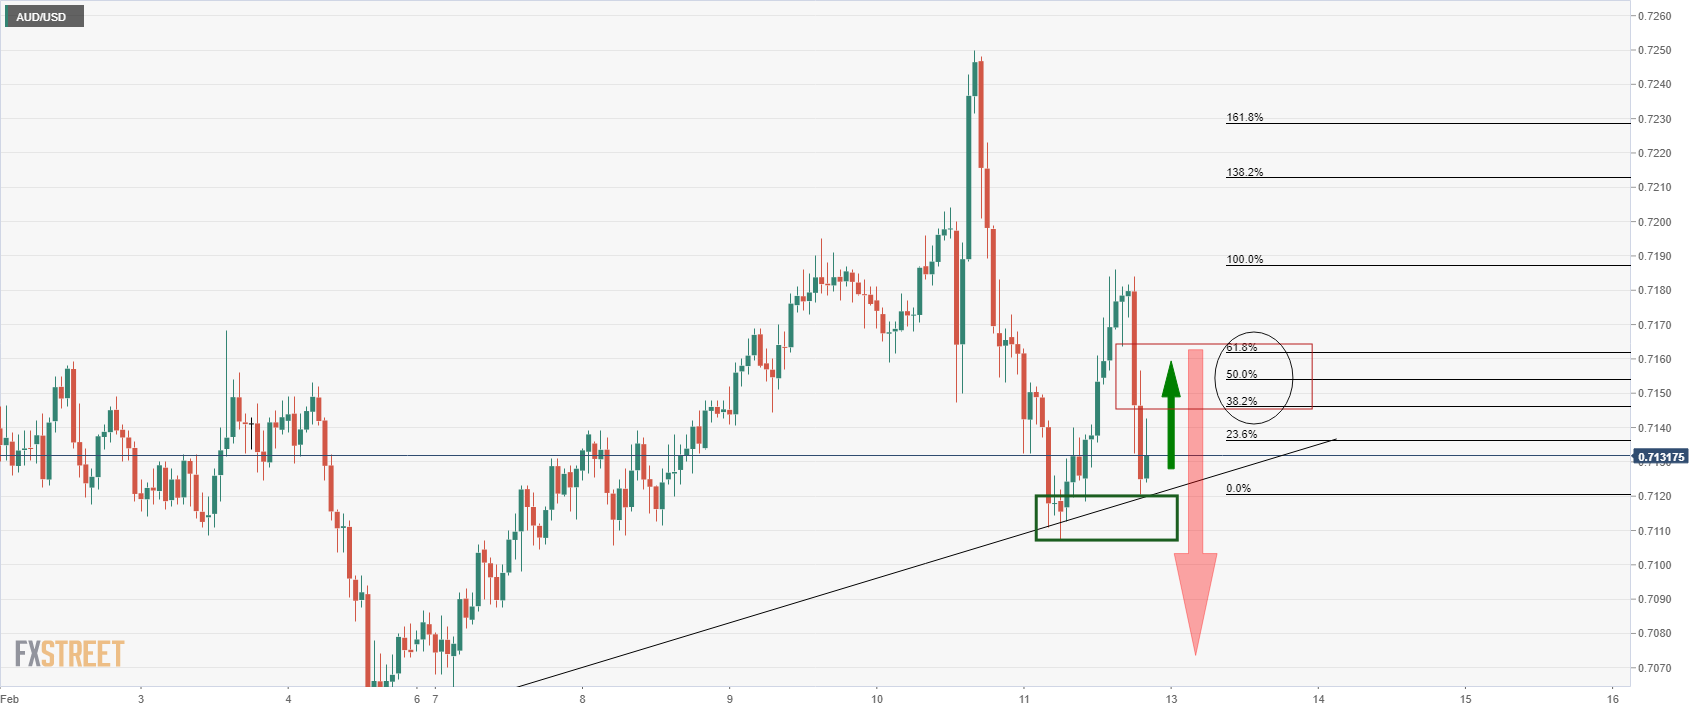
However, the risks remain high and this should leave the Aussie vulnerable for further downside with eyes on the trendline resistance as illustrated above.
© 2000-2026. All rights reserved.
This site is managed by Teletrade D.J. LLC 2351 LLC 2022 (Euro House, Richmond Hill Road, Kingstown, VC0100, St. Vincent and the Grenadines).
The information on this website is for informational purposes only and does not constitute any investment advice.
The company does not serve or provide services to customers who are residents of the US, Canada, Iran, The Democratic People's Republic of Korea, Yemen and FATF blacklisted countries.
Making transactions on financial markets with marginal financial instruments opens up wide possibilities and allows investors who are willing to take risks to earn high profits, carrying a potentially high risk of losses at the same time. Therefore you should responsibly approach the issue of choosing the appropriate investment strategy, taking the available resources into account, before starting trading.
Use of the information: full or partial use of materials from this website must always be referenced to TeleTrade as the source of information. Use of the materials on the Internet must be accompanied by a hyperlink to teletrade.org. Automatic import of materials and information from this website is prohibited.
Please contact our PR department if you have any questions or need assistance at pr@teletrade.global.


