- Analytics
- News and Tools
- Market News
CFD Markets News and Forecasts — 13-01-2025
President-elect Donald Trump's economic advisers are discussing slowly ramping up tariffs month by month, a gradual approach aimed at boosting negotiating leverage while mitigating the upside inflation risk, according to people familiar with the matter.
One idea suggests implementing a series of escalating tariffs, increasing by about 2% to 5% a month, and would rely on executive authorities under the International Emergency Economic Powers Act, Bloomberg reported, citing people familiar with the matter.
Market reaction
The US Dollar Index (DXY) is trading 0.23% lower on the day at 109.36 as of writing.
US Dollar FAQs
The US Dollar (USD) is the official currency of the United States of America, and the ‘de facto’ currency of a significant number of other countries where it is found in circulation alongside local notes. It is the most heavily traded currency in the world, accounting for over 88% of all global foreign exchange turnover, or an average of $6.6 trillion in transactions per day, according to data from 2022. Following the second world war, the USD took over from the British Pound as the world’s reserve currency. For most of its history, the US Dollar was backed by Gold, until the Bretton Woods Agreement in 1971 when the Gold Standard went away.
The most important single factor impacting on the value of the US Dollar is monetary policy, which is shaped by the Federal Reserve (Fed). The Fed has two mandates: to achieve price stability (control inflation) and foster full employment. Its primary tool to achieve these two goals is by adjusting interest rates. When prices are rising too quickly and inflation is above the Fed’s 2% target, the Fed will raise rates, which helps the USD value. When inflation falls below 2% or the Unemployment Rate is too high, the Fed may lower interest rates, which weighs on the Greenback.
In extreme situations, the Federal Reserve can also print more Dollars and enact quantitative easing (QE). QE is the process by which the Fed substantially increases the flow of credit in a stuck financial system. It is a non-standard policy measure used when credit has dried up because banks will not lend to each other (out of the fear of counterparty default). It is a last resort when simply lowering interest rates is unlikely to achieve the necessary result. It was the Fed’s weapon of choice to combat the credit crunch that occurred during the Great Financial Crisis in 2008. It involves the Fed printing more Dollars and using them to buy US government bonds predominantly from financial institutions. QE usually leads to a weaker US Dollar.
Quantitative tightening (QT) is the reverse process whereby the Federal Reserve stops buying bonds from financial institutions and does not reinvest the principal from the bonds it holds maturing in new purchases. It is usually positive for the US Dollar.
- USD/CAD edges lower to around 1.4355 in Tuesday’s early Asian session.
- A rise in crude oil prices boosts the commodity-linked Loonie.
- The stronger-than-expected US December NFP dampened the outlook for Fed rate cuts, which might lift the USD.
The USD/CAD pair weakens to near 1.4355 during the early Asian session on Tuesday. A rise in crude oil prices amid further US sanctions to Russian oil underpins the commodity-linked Canadian Dollar (CAD) against the Greenback. Later on Tuesday, the US Producer Price Index (PPI) for December will take center stage.
Crude oil prices extend the rally to the highest in four months following the introduction of a fresh package of sanctions against Russia by the Biden administration. This, in turn, provides some support to the Loonie and acts as a headwind for the pair. It's worth noting that Canada is the largest oil exporter to the United States (US), and higher crude oil prices tend to have a positive impact on the CAD value.
On the other hand, the prospect of fewer interest rate cuts by the US Federal Reserve (Fed) this year might boost the Greenback. Friday’s data showed US job growth unexpectedly accelerated in December and the Unemployment Rate fell to 4.1%, supporting the case for delaying the easing cycle this year. Markets are now pricing in one rate cut from the Fed in 2025, down from roughly two quarter-point cuts priced at the start of the year.
Canadian Dollar FAQs
The key factors driving the Canadian Dollar (CAD) are the level of interest rates set by the Bank of Canada (BoC), the price of Oil, Canada’s largest export, the health of its economy, inflation and the Trade Balance, which is the difference between the value of Canada’s exports versus its imports. Other factors include market sentiment – whether investors are taking on more risky assets (risk-on) or seeking safe-havens (risk-off) – with risk-on being CAD-positive. As its largest trading partner, the health of the US economy is also a key factor influencing the Canadian Dollar.
The Bank of Canada (BoC) has a significant influence on the Canadian Dollar by setting the level of interest rates that banks can lend to one another. This influences the level of interest rates for everyone. The main goal of the BoC is to maintain inflation at 1-3% by adjusting interest rates up or down. Relatively higher interest rates tend to be positive for the CAD. The Bank of Canada can also use quantitative easing and tightening to influence credit conditions, with the former CAD-negative and the latter CAD-positive.
The price of Oil is a key factor impacting the value of the Canadian Dollar. Petroleum is Canada’s biggest export, so Oil price tends to have an immediate impact on the CAD value. Generally, if Oil price rises CAD also goes up, as aggregate demand for the currency increases. The opposite is the case if the price of Oil falls. Higher Oil prices also tend to result in a greater likelihood of a positive Trade Balance, which is also supportive of the CAD.
While inflation had always traditionally been thought of as a negative factor for a currency since it lowers the value of money, the opposite has actually been the case in modern times with the relaxation of cross-border capital controls. Higher inflation tends to lead central banks to put up interest rates which attracts more capital inflows from global investors seeking a lucrative place to keep their money. This increases demand for the local currency, which in Canada’s case is the Canadian Dollar.
Macroeconomic data releases gauge the health of the economy and can have an impact on the Canadian Dollar. Indicators such as GDP, Manufacturing and Services PMIs, employment, and consumer sentiment surveys can all influence the direction of the CAD. A strong economy is good for the Canadian Dollar. Not only does it attract more foreign investment but it may encourage the Bank of Canada to put up interest rates, leading to a stronger currency. If economic data is weak, however, the CAD is likely to fall.
- GBP/USD spun in a quick circle on Monday, dipping to new lows but returning to flat.
- GBP bullish sentiment is able to recover near-term losses, but not much else.
- UK and US inflation data due this week to provide plenty of ammunition for traders.
GBP/USD churned as markets rebalance their interest rate expectations through the rest of the year, sending Cable to a fresh 15-month low and tapping the 1.2100 handle before reversing the day’s losses and ending close to where it started at 1.2230.
It’s a quiet start to the week, but a crescendo of inflation data on both the US and UK side of the economic calendar will give traders plenty of material to chew through as they try to nail down a rate differential forecast heading through the first quarter. The Federal Reserve (Fed) is broadly expected to stand pat on interest rates through the first half of the year, while the Bank of England (BoE) is expected to have to choose between holding steady on interest rates in the face of still-high inflation, or risking an inflationary spark in order to shore up the UK’s floundering economy with further rate cuts.
US Producer Price Index (PPI) figures kick the week’s meaningful data docket off on Tuesday, which is expected to rise to 3.7% YoY in December versus the previous 3.4%. Wednesday brings UK Consumer Price Index (CPI) inflation which is also expected to accelerate in the near-term, forecast to rise to 0.4% MoM versus the previous 0.1%.
US CPI inflation, also due on Wednesday, is forecast to tick higher to 2.8% from 2.7%, and US Retail Sales activity is slated for Thursday, with UK Retail Sales rounding out the high-impact data docket for this week.
GBP/USD price forecast
GBP/USD continues to grind out a bearish path down the charts, with the pair exploring its lowest bids in over a year. Although bidding pressure is stepping in on swing lows, it’s getting hard not to notice that those swing lows continue to pierce through old technical levels on a regular basis.
The next key technical barrier to further declines will be late 2023’s technical support zone just north of 1.2000.
GBP/USD daily chart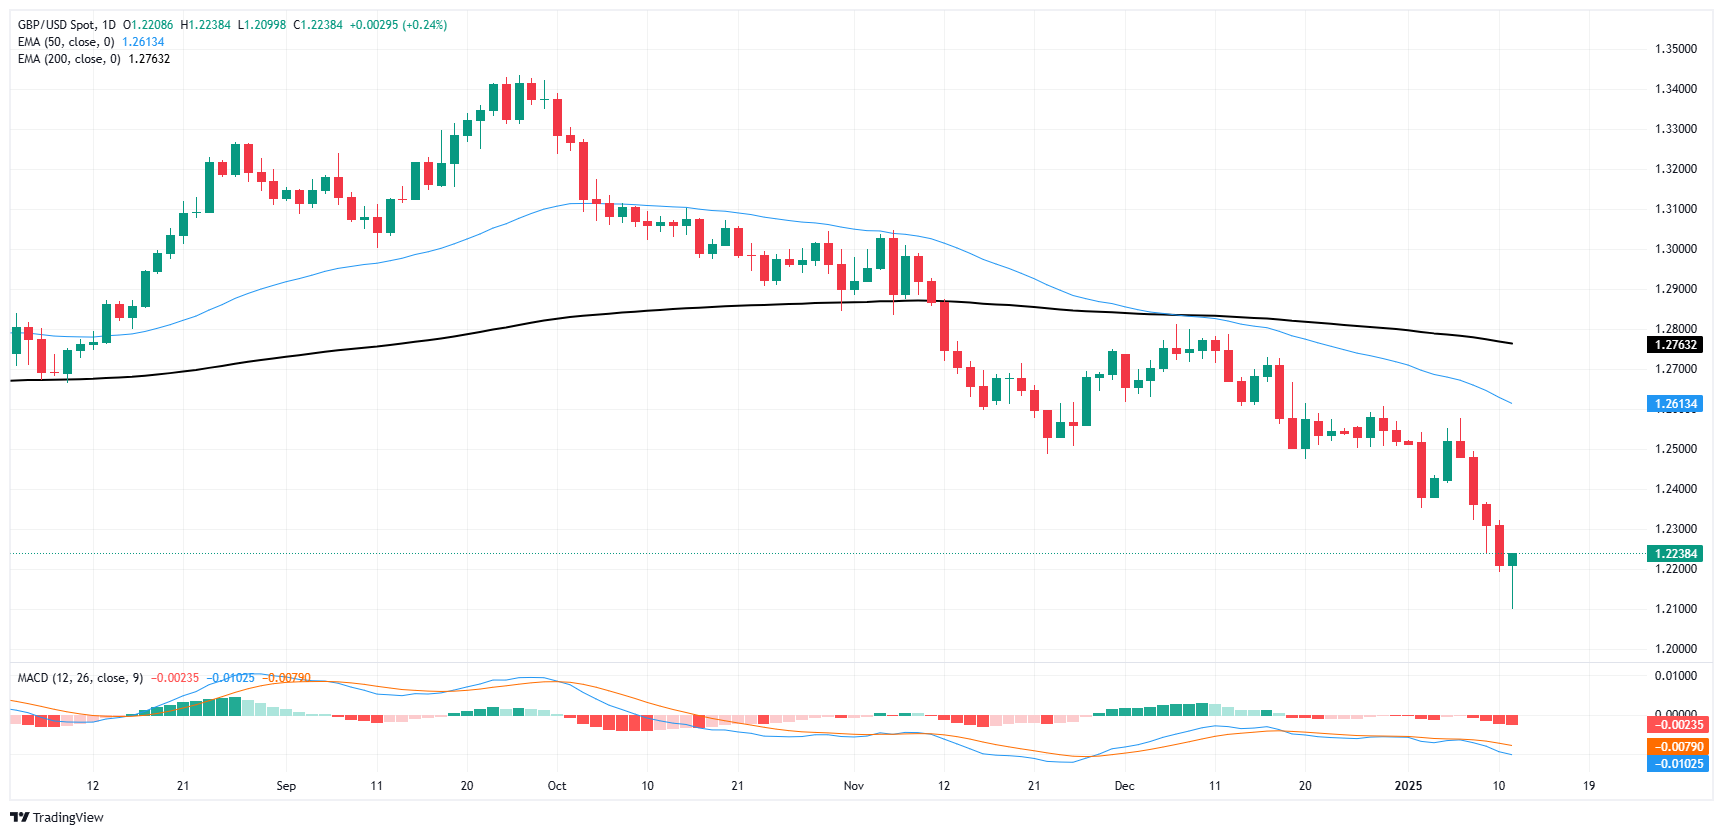
Pound Sterling FAQs
The Pound Sterling (GBP) is the oldest currency in the world (886 AD) and the official currency of the United Kingdom. It is the fourth most traded unit for foreign exchange (FX) in the world, accounting for 12% of all transactions, averaging $630 billion a day, according to 2022 data. Its key trading pairs are GBP/USD, also known as ‘Cable’, which accounts for 11% of FX, GBP/JPY, or the ‘Dragon’ as it is known by traders (3%), and EUR/GBP (2%). The Pound Sterling is issued by the Bank of England (BoE).
The single most important factor influencing the value of the Pound Sterling is monetary policy decided by the Bank of England. The BoE bases its decisions on whether it has achieved its primary goal of “price stability” – a steady inflation rate of around 2%. Its primary tool for achieving this is the adjustment of interest rates. When inflation is too high, the BoE will try to rein it in by raising interest rates, making it more expensive for people and businesses to access credit. This is generally positive for GBP, as higher interest rates make the UK a more attractive place for global investors to park their money. When inflation falls too low it is a sign economic growth is slowing. In this scenario, the BoE will consider lowering interest rates to cheapen credit so businesses will borrow more to invest in growth-generating projects.
Data releases gauge the health of the economy and can impact the value of the Pound Sterling. Indicators such as GDP, Manufacturing and Services PMIs, and employment can all influence the direction of the GBP. A strong economy is good for Sterling. Not only does it attract more foreign investment but it may encourage the BoE to put up interest rates, which will directly strengthen GBP. Otherwise, if economic data is weak, the Pound Sterling is likely to fall.
Another significant data release for the Pound Sterling is the Trade Balance. This indicator measures the difference between what a country earns from its exports and what it spends on imports over a given period. If a country produces highly sought-after exports, its currency will benefit purely from the extra demand created from foreign buyers seeking to purchase these goods. Therefore, a positive net Trade Balance strengthens a currency and vice versa for a negative balance.
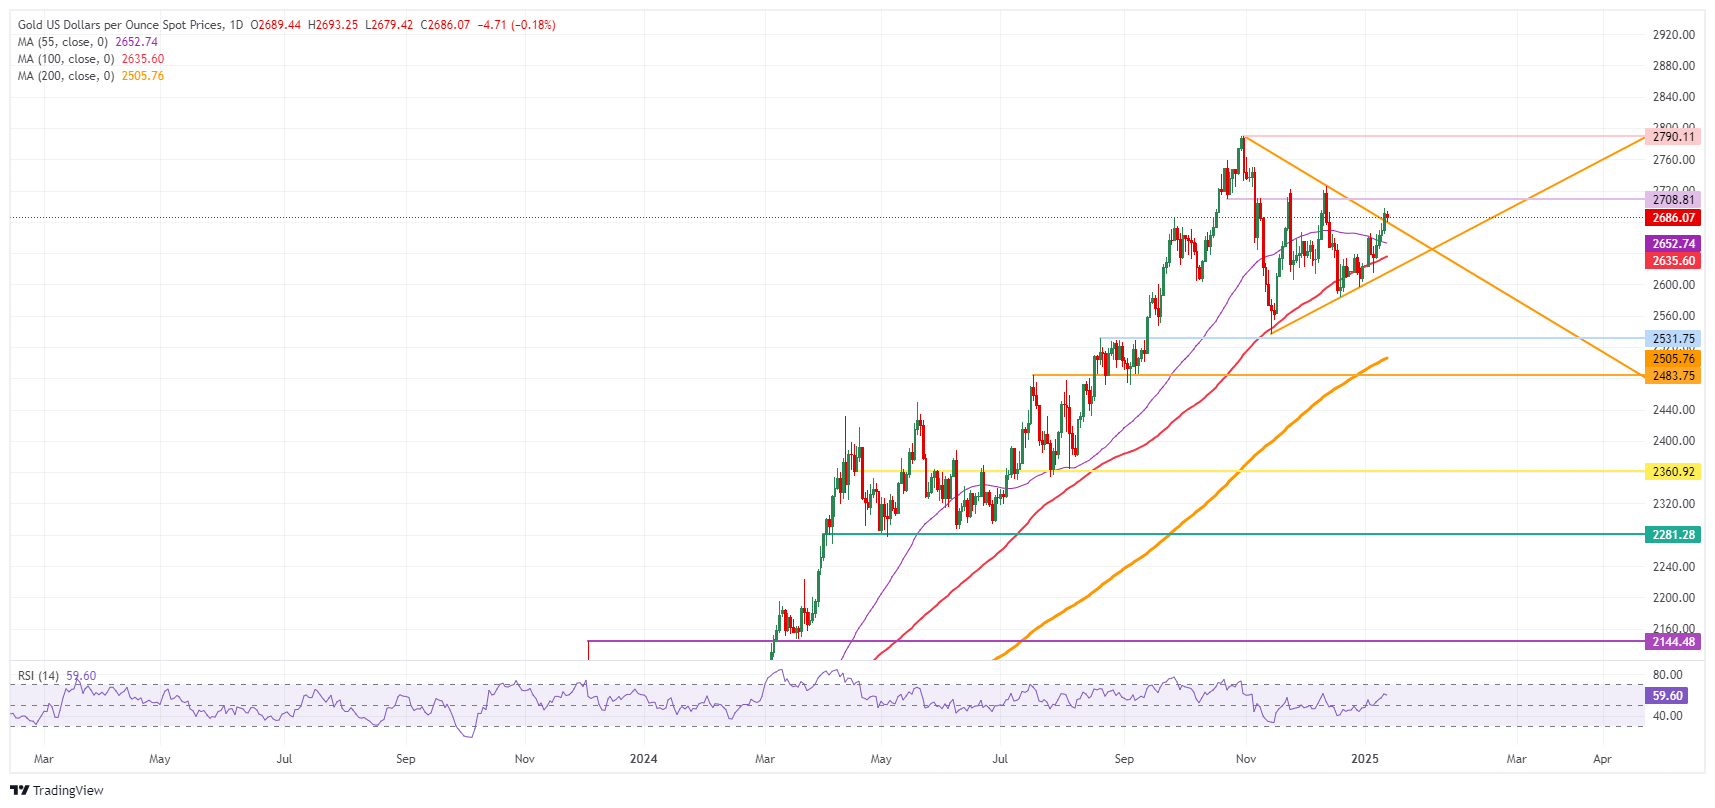
- Gold slides as DXY cleared 110.00 for the first time since November 2023.
- Traders trimmed Fed rate cut odds, after US jobs data, CPI eyed.
- XAU/USD sellers eye $2,650 and 100-day SMA near $2,630.
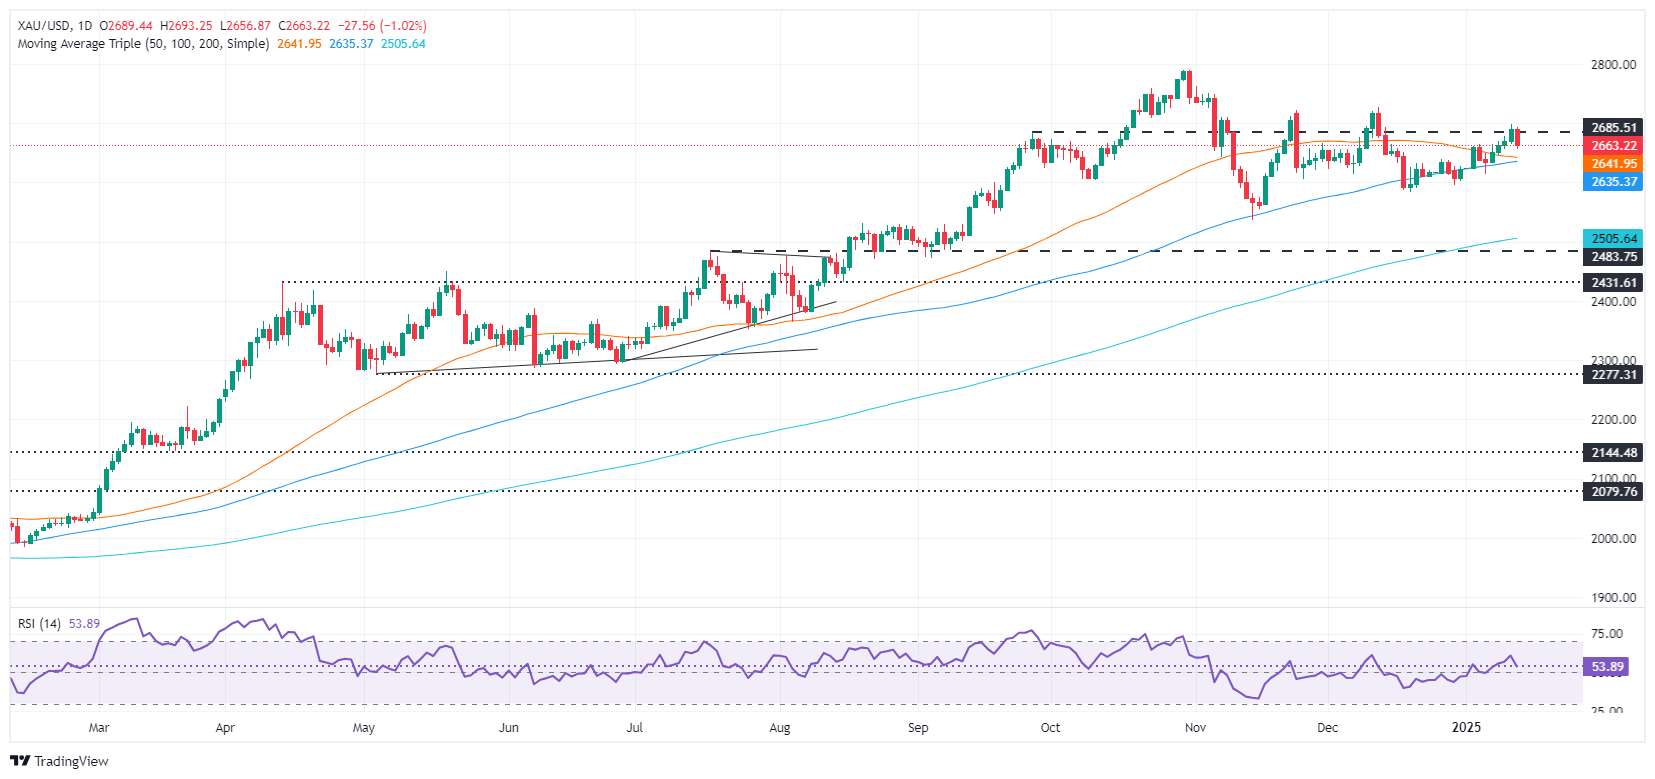
Gold price retreats during the North American session as traders seeking safety bought the Greenback as United States (US) Treasury bond yields rose to their highest level since November 2023. At the time of writing, the XAU/USD trades at $2,657 after failing to clear $2,700, down 1.20%.
A scarce economic docket on Monday keeps investors digesting the latest US Nonfarm Payrolls figures for December. Although the economy has fared better than expected, with figures rising by 256K exceeding forecasts of 160K and November's 212K, traders are eyeing the release of US inflation data.
On Wednesday, the Consumer Price Index (CPI) for December will be announced, with estimates at around 2.8% YoY, up from November 2.7%. The Core CPI, which excludes volatile items, is projected to remain unchanged at 3.3% YoY, unchanged from the latest three-months readings.
Inflation data could shifttraders expectations of Fed easing. Meanwhile, money market futures data has shown that most investors are expecting just 25 basis points of easing, leaving the fed funds interbank rate at 4.00%, down from the current 4.25% - 4.50% range.
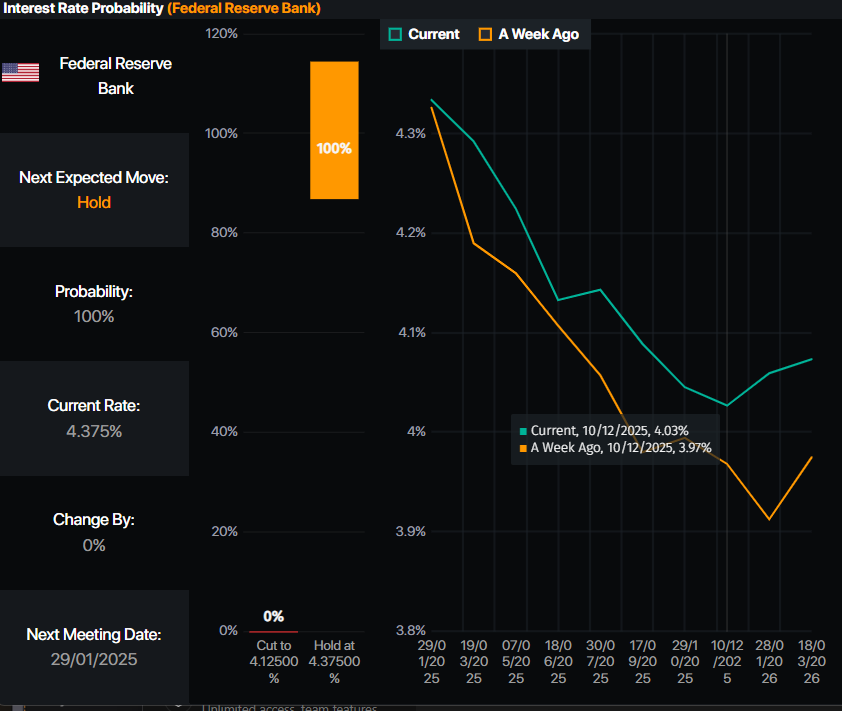
Federal Reserve - Interest rate probability. Source: Prime-Market Terminal
Meanwhile, US Treasury bond yields cling to minimal gains, while the Greenback, after breaking the 110.00 mark, has retraced below the latter but it remains in the green.
Bullion prices are also taking a hit amid good news of a possible deal that could end Gaza's war, via Reuters, citing an official briefed on the matter.
In seven days, US President-elect Donald Trump will be sworn as the 47th President. The financial markets are awaiting its first executive orders, with some speculation growing that he would impose the first tariffs. Recently he said that he has to do something regarding trade with Mexico and Canada.
In the US, key data releases include inflation figures on the producer and consumer sides, alongside Retail Sales and jobless claims for the week ending January 11.
Daily digest market movers: Gold price falls as US Dollar advances
- Gold price faces headwinds amid high US real yields, which rise three and a half basis points by two bps to 2.30%. At the same time, the US 10-year T-note yield soared seven and a half bps to 4.767%.
- The US Dollar rose sharply to multi-month highs according to the US Dollar Index (DXY). The DXY hit 110.17 before trimming gains and is at 109.85, up 0.20%.
- The US 10-year Treasury bond yields rises two basis points, up at 4.786%.
- Easing expectations of the Federal Reserve continued to edge lower. The December Fed funds futures contract is pricing in 30 basis points of easing.
XAU/USD technical outlook: Gold price clings above $2,650 despite retracing
Gold's uptrend halted on Monday as a 'bearish-engulfing' pattern emerges in the daily chart, an indication that sellers are gathering some momentum. This is slightly confirmed by the Relative Strength Index (RSI), which despite remaining bullish, edges down towards its neutral level. Hence, in the short term further downside is seen.
If XAU/USD drops below $2,650, the next support would be the 50-day Simple Moving Average (SMA) at $2,643, followed by the 100-day SMA at $2,633.
On the other hand, if XAU/USD reclaims $2,700, the next resistance would be the December 12 high of $2,726 and the all-time high (ATH) at $2,790.
Gold FAQs
Gold has played a key role in human’s history as it has been widely used as a store of value and medium of exchange. Currently, apart from its shine and usage for jewelry, the precious metal is widely seen as a safe-haven asset, meaning that it is considered a good investment during turbulent times. Gold is also widely seen as a hedge against inflation and against depreciating currencies as it doesn’t rely on any specific issuer or government.
Central banks are the biggest Gold holders. In their aim to support their currencies in turbulent times, central banks tend to diversify their reserves and buy Gold to improve the perceived strength of the economy and the currency. High Gold reserves can be a source of trust for a country’s solvency. Central banks added 1,136 tonnes of Gold worth around $70 billion to their reserves in 2022, according to data from the World Gold Council. This is the highest yearly purchase since records began. Central banks from emerging economies such as China, India and Turkey are quickly increasing their Gold reserves.
Gold has an inverse correlation with the US Dollar and US Treasuries, which are both major reserve and safe-haven assets. When the Dollar depreciates, Gold tends to rise, enabling investors and central banks to diversify their assets in turbulent times. Gold is also inversely correlated with risk assets. A rally in the stock market tends to weaken Gold price, while sell-offs in riskier markets tend to favor the precious metal.
The price can move due to a wide range of factors. Geopolitical instability or fears of a deep recession can quickly make Gold price escalate due to its safe-haven status. As a yield-less asset, Gold tends to rise with lower interest rates, while higher cost of money usually weighs down on the yellow metal. Still, most moves depend on how the US Dollar (USD) behaves as the asset is priced in dollars (XAU/USD). A strong Dollar tends to keep the price of Gold controlled, whereas a weaker Dollar is likely to push Gold prices up.
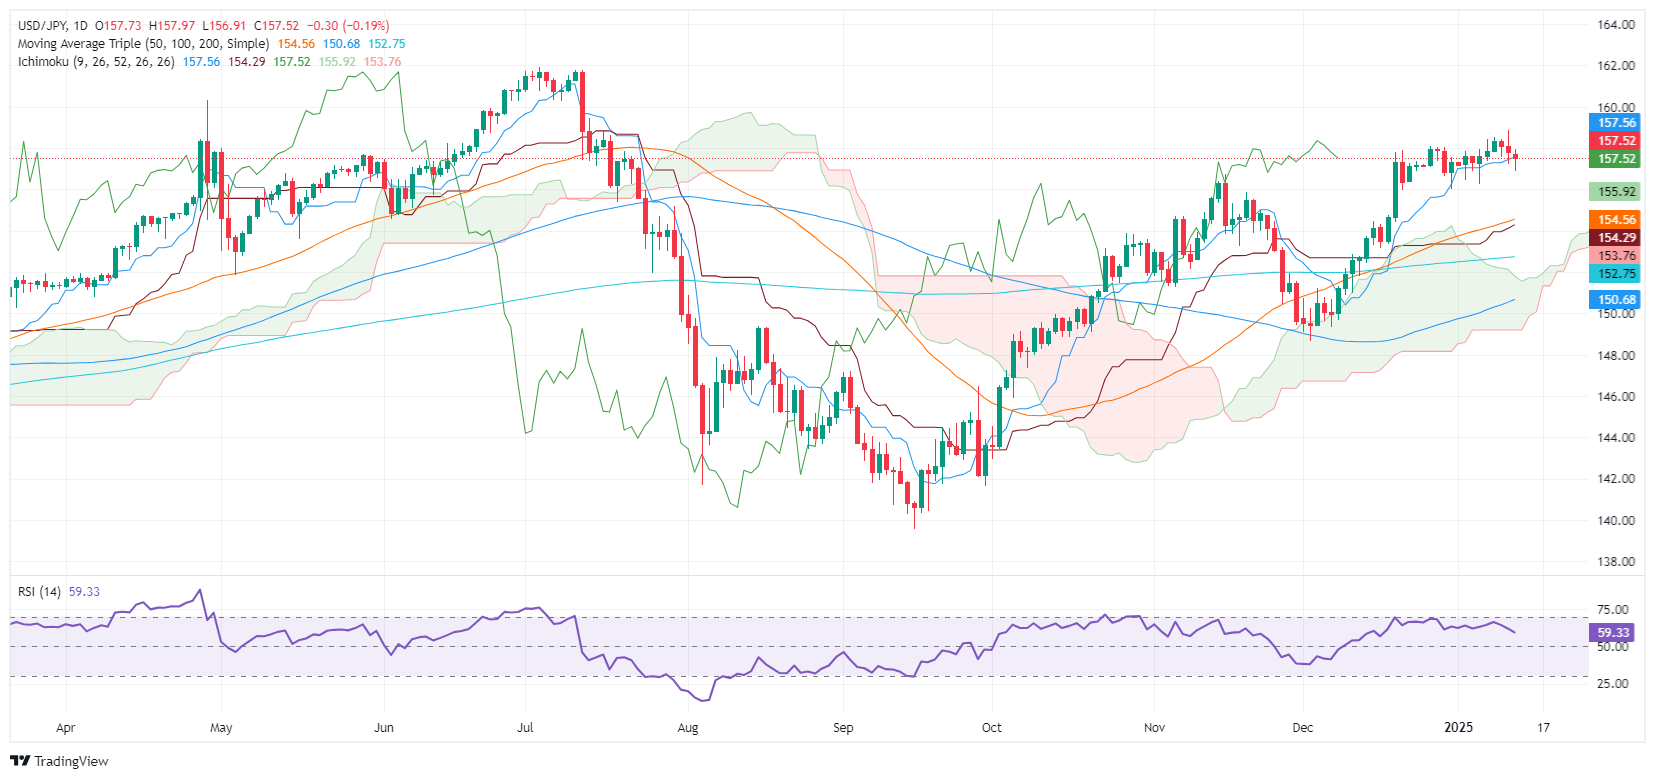
- USD/JPY hovers at the mid-range of the 157.00-158.00, set to finish in the red.
- Uptrend's extension lies above 158.00 and 158.88, but BoJ intervention fears loom.
- A drop below the Tenkan-sen, opens the door towards 157.00.
The US Dollar losses some ground against the Japanese Yen on Monday amid a bank holiday in Japan as the USD/JPY shrugged off a rise in the US 10-year T-note yield. At the time of writing, the pair trades at 157.54, down by 0.11%.
USD/JPY Price Forecast: Technical outlook
The USD/JPY daily chart remains upward biased, but faces strong resistance at 158.00, amid fears that the Bank of Japan (BoJ) might intervene in the Forex markets. Momentum favors further upside, after the 50-day Simple Moving Average (SMA) at 154.58 crossed above the 200-day SMA, forming a 'golden cross,' implying that further upside is seen.
For a bullish continuation, the USD/JPY first ceiling level would be the 158.00 figure followed by the January 10 peak hit following US NFP data on Friday at 158.88. A breach of the latter will expose 159.00.
If USD/JPY tumbles below Tenkan-sen, the next support would be the January 6 low of 156.24, followed by the December 31 pivot low of 156.02.
USD/JPY Price Chart - Daily
Japanese Yen PRICE Today
The table below shows the percentage change of Japanese Yen (JPY) against listed major currencies today. Japanese Yen was the strongest against the US Dollar.
| USD | EUR | GBP | JPY | CAD | AUD | NZD | CHF | |
|---|---|---|---|---|---|---|---|---|
| USD | -0.25% | -0.20% | -0.11% | -0.13% | -0.23% | -0.31% | -0.16% | |
| EUR | 0.25% | 0.07% | 0.11% | 0.13% | 0.02% | -0.06% | 0.13% | |
| GBP | 0.20% | -0.07% | 0.10% | 0.07% | -0.04% | -0.13% | 0.04% | |
| JPY | 0.11% | -0.11% | -0.10% | 0.06% | -0.15% | -0.22% | -0.04% | |
| CAD | 0.13% | -0.13% | -0.07% | -0.06% | -0.14% | -0.17% | 0.01% | |
| AUD | 0.23% | -0.02% | 0.04% | 0.15% | 0.14% | -0.08% | 0.08% | |
| NZD | 0.31% | 0.06% | 0.13% | 0.22% | 0.17% | 0.08% | 0.17% | |
| CHF | 0.16% | -0.13% | -0.04% | 0.04% | -0.01% | -0.08% | -0.17% |
The heat map shows percentage changes of major currencies against each other. The base currency is picked from the left column, while the quote currency is picked from the top row. For example, if you pick the Japanese Yen from the left column and move along the horizontal line to the US Dollar, the percentage change displayed in the box will represent JPY (base)/USD (quote).
- NZD/JPY slips to 87.55 on Monday, underscoring a cautious mood in the market.
- RSI hovers at 40 in negative territory, declining mildly and hinting at persistent bearish undertones.
- MACD histogram prints flat red bars, suggesting subdued momentum despite buyers’ resilience.
The NZD/JPY pair edged lower at the start of the week, dipping to approximately 87.55. Price action remains confined to a sideways channel between 89.00 and 87.00, reflecting a market stalemate as both bulls and bears appear to resist a decisive breakout. Although buyers are attempting to absorb selling pressure, sentiment remains cautious in the face of waning momentum signals.
From a technical perspective, the Relative Strength Index (RSI) sits in negative territory at 40, indicating that sellers have yet to relinquish their advantage. Meanwhile, the Moving Average Convergence Divergence (MACD) histogram shows flat red bars, illustrating a lack of follow-through on either side. Until the pair breaks clear of its prevailing range, short-term direction may remain muted.
Looking ahead, support remains anchored around the 87.00 zone, with a dip below that level potentially exposing the 86.50 handle. On the upside, a close above 89.00 would be needed to shift the pair’s short-term bias more convincingly in favor of the bulls, targeting the 89.50–90.00 area for any subsequent advance.
NZD/JPY daily chart
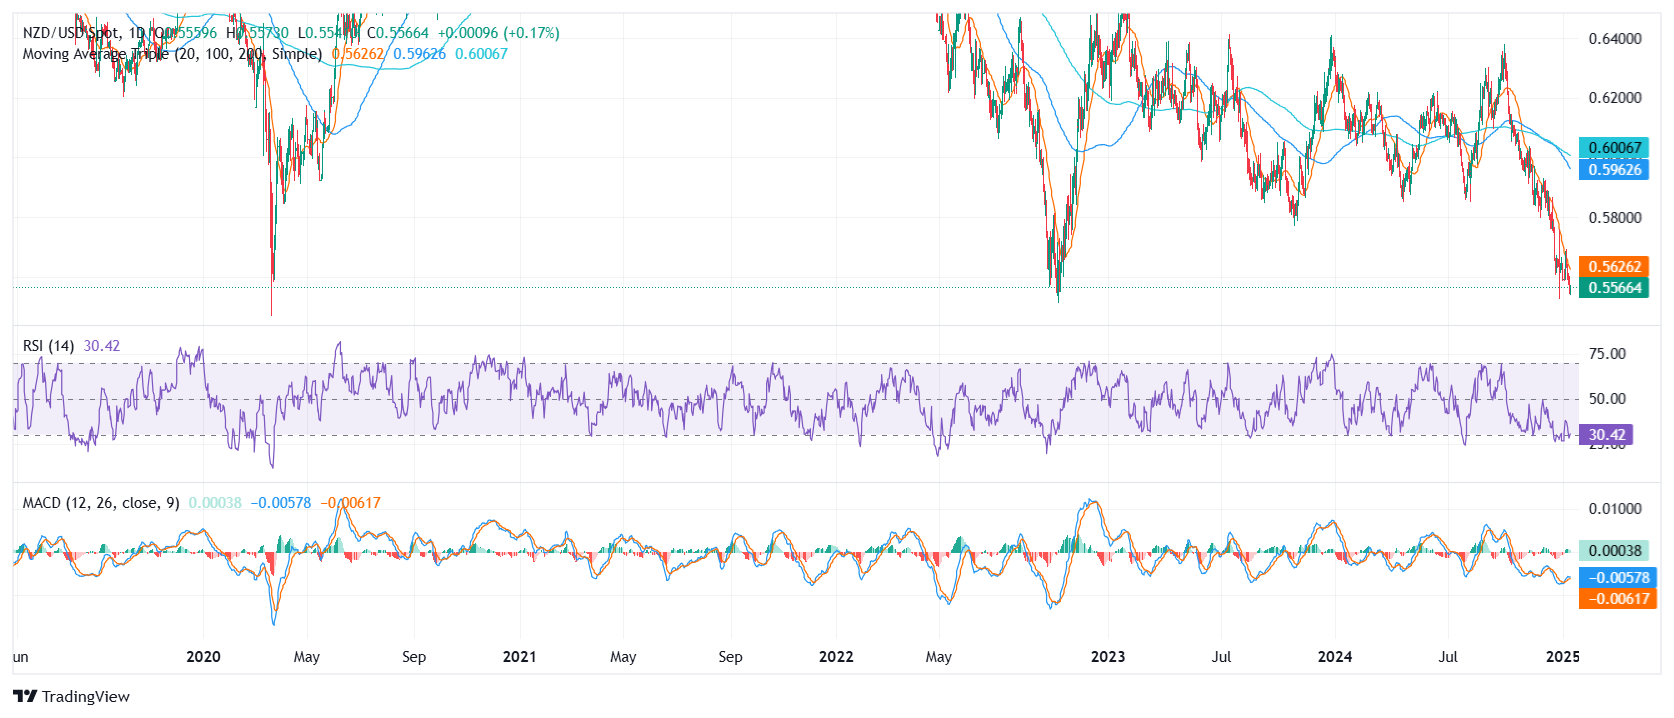
- NZD/USD inches higher to 0.5560 on Monday, briefly lifting from its lowest levels since October 2022.
- RSI stands at 31 and is mildly declining, hinting that oversold conditions persist.
The NZD/USD pair attempted a minor rebound on Monday, climbing to around 0.5560 and offering a temporary respite from its recent sharp decline. Despite this uptick, the pair remains hovering near multi-year lows, reflecting the broader downbeat sentiment that has dominated trading for several sessions.
Technically, the Relative Strength Index (RSI) is poised at 31 and shows signs of further deterioration, indicating that bearish forces still hold the upper hand. Meanwhile, the Moving Average Convergence Divergence (MACD) histogram is losing momentum in the green zone, reinforcing the notion that buyers may lack the strength for a sustainable turnaround.
Looking ahead, a failure to extend beyond 0.5600 could see sellers regain traction, potentially driving the pair toward the 0.5530 support region. On the flip side, reclaiming and consolidating above 0.5600 might provide a glimmer of hope for bulls, setting sights on 0.5650 as the next resistance hurdle to overcome.
NZD/USD daily chart

- AUD/USD recovers to 0.6160 on Monday, up 0.16%.
- US Dollar strength remains intact following robust NFP report.
- RBA’s dovish hints keep the Aussie under pressure.
The Australian Dollar managed to regain the smile and leave behind four consecutive daily retracements on Monday, gathering some traction soon after hitting lows not seen since April 2020 near 0.6130. Despite the mild uptick, the currency remains weighed down by strong US employment data and a cautious outlook from the Reserve Bank of Australia (RBA).
Daily digest market movers: Aussie gains some ground after a stellar US jobs report
- The US Bureau of Labor Statistics reported 256,000 new jobs last month, beating the 160,000 forecast; November’s figure was revised from 227,000 to 212,000.
- The Unemployment Rate dropped to 4.1%, while Average Hourly Earnings decreased from 4% to 3.9%.
- Traders now expect the Federal Reserve to cut rates only once in 2025, boosting US Dollar momentum. In addition, the US economic calendar will feature December’s Consumer Price Index figures, which might set the pair’s dynamics.
- The US 10-year Treasury yield soared to near 4.80%, while the US Dollar Index (DXY) touched 109.96, its highest level since November 2022.
- The Aussie remains under pressure due to RBA’s dovish stance and soft Australian fundamentals, compounded by worries over China’s slowing economy.
AUD/USD technical outlook: Gains remain fragile as oversold signals persist
The AUD/USD rose by 0.16% to 0.6160 on Monday, attempting to stabilize near the lowest level since April 2020. The Relative Strength Index (RSI) hovers at 32, indicating a near-oversold condition but showing a modest improvement.
Meanwhile, the Moving Average Convergence Divergence (MACD) histogram prints rising red bars, suggesting that bearish momentum has softened yet not fully reversed. Although the pair has managed to stop the bleeding, lingering headwinds including a strong US Dollar and RBA rate-cut speculation continue to cloud the outlook.
Australian Dollar FAQs
One of the most significant factors for the Australian Dollar (AUD) is the level of interest rates set by the Reserve Bank of Australia (RBA). Because Australia is a resource-rich country another key driver is the price of its biggest export, Iron Ore. The health of the Chinese economy, its largest trading partner, is a factor, as well as inflation in Australia, its growth rate and Trade Balance. Market sentiment – whether investors are taking on more risky assets (risk-on) or seeking safe-havens (risk-off) – is also a factor, with risk-on positive for AUD.
The Reserve Bank of Australia (RBA) influences the Australian Dollar (AUD) by setting the level of interest rates that Australian banks can lend to each other. This influences the level of interest rates in the economy as a whole. The main goal of the RBA is to maintain a stable inflation rate of 2-3% by adjusting interest rates up or down. Relatively high interest rates compared to other major central banks support the AUD, and the opposite for relatively low. The RBA can also use quantitative easing and tightening to influence credit conditions, with the former AUD-negative and the latter AUD-positive.
China is Australia’s largest trading partner so the health of the Chinese economy is a major influence on the value of the Australian Dollar (AUD). When the Chinese economy is doing well it purchases more raw materials, goods and services from Australia, lifting demand for the AUD, and pushing up its value. The opposite is the case when the Chinese economy is not growing as fast as expected. Positive or negative surprises in Chinese growth data, therefore, often have a direct impact on the Australian Dollar and its pairs.
Iron Ore is Australia’s largest export, accounting for $118 billion a year according to data from 2021, with China as its primary destination. The price of Iron Ore, therefore, can be a driver of the Australian Dollar. Generally, if the price of Iron Ore rises, AUD also goes up, as aggregate demand for the currency increases. The opposite is the case if the price of Iron Ore falls. Higher Iron Ore prices also tend to result in a greater likelihood of a positive Trade Balance for Australia, which is also positive of the AUD.
The Trade Balance, which is the difference between what a country earns from its exports versus what it pays for its imports, is another factor that can influence the value of the Australian Dollar. If Australia produces highly sought after exports, then its currency will gain in value purely from the surplus demand created from foreign buyers seeking to purchase its exports versus what it spends to purchase imports. Therefore, a positive net Trade Balance strengthens the AUD, with the opposite effect if the Trade Balance is negative.
- The Canadian Dollar (CAD) struggled to find direction on Monday.
- Canada’s labor market printed well above expectations last week.
- The debate facing Loonie traders is whether the BoC will continue to cut rates.
The Canadian Dollar (CAD) continues to tread water near multi-year lows against the US Dollar, with Loonie traders waylaid by a rate-cutting Bank of Canada (BoC) threatening to tip the CAD’s rate differential against the Greenback even further into the low end. Loonie traders are getting a breather after last week’s labor figures on both sides of the 49th parallel, but the BoC’s trajectory on rates is still pointed down at a faster and further pace than the US Federal Reserve (Fed).
It’s a low-tier showing on the Canadian side of the economic calendar this week; Canada printed an upswell in net job additions in December, but now the overall focus of the data docket, and investor attention spans will shift squarely onto US inflation figures throughout the trading week.
Daily digest market movers: Canadian Dollar churns as CAD traders weigh BoC outlook
- The Canadian Dollar flattened on Monday as flows dry up.
- The BoC slashed interest rates five times in 2024, dragging its main reference rate from 5.0% to 3.25%, and more cuts are on the cards in 2025, albeit at a slower pace.
- Meanwhile, the Fed is broadly expected to hold steady on rates for the time being.
- A swath of US inflation data is due this week, keeping investor focus squarely on Greenback flows.
- US inflation pressures are simmering in the background, keeping the Fed at bay.
Canadian Dollar price forecast
As the Canadian Dollar holds on the weak side, USD/CAD is bumping into multi-year highs and churning at the 1.4400 handle. Loonie traders remain unable to push the CAD back into a technical recovery, but further Greenback gains appear to be constrained by wider market flows.
USD/CAD is still buried deep in bull country, with price action holding well north of the 200-day Exponential Moving Average (EMA) rising into 1.3900. The immediate barrier to a Loonie bull run will be USD/CAD dropping back below 1.4300, while an upside break into 1.4500 will set Greenback buyers on the path to another leg higher.
USD/CAD daily chart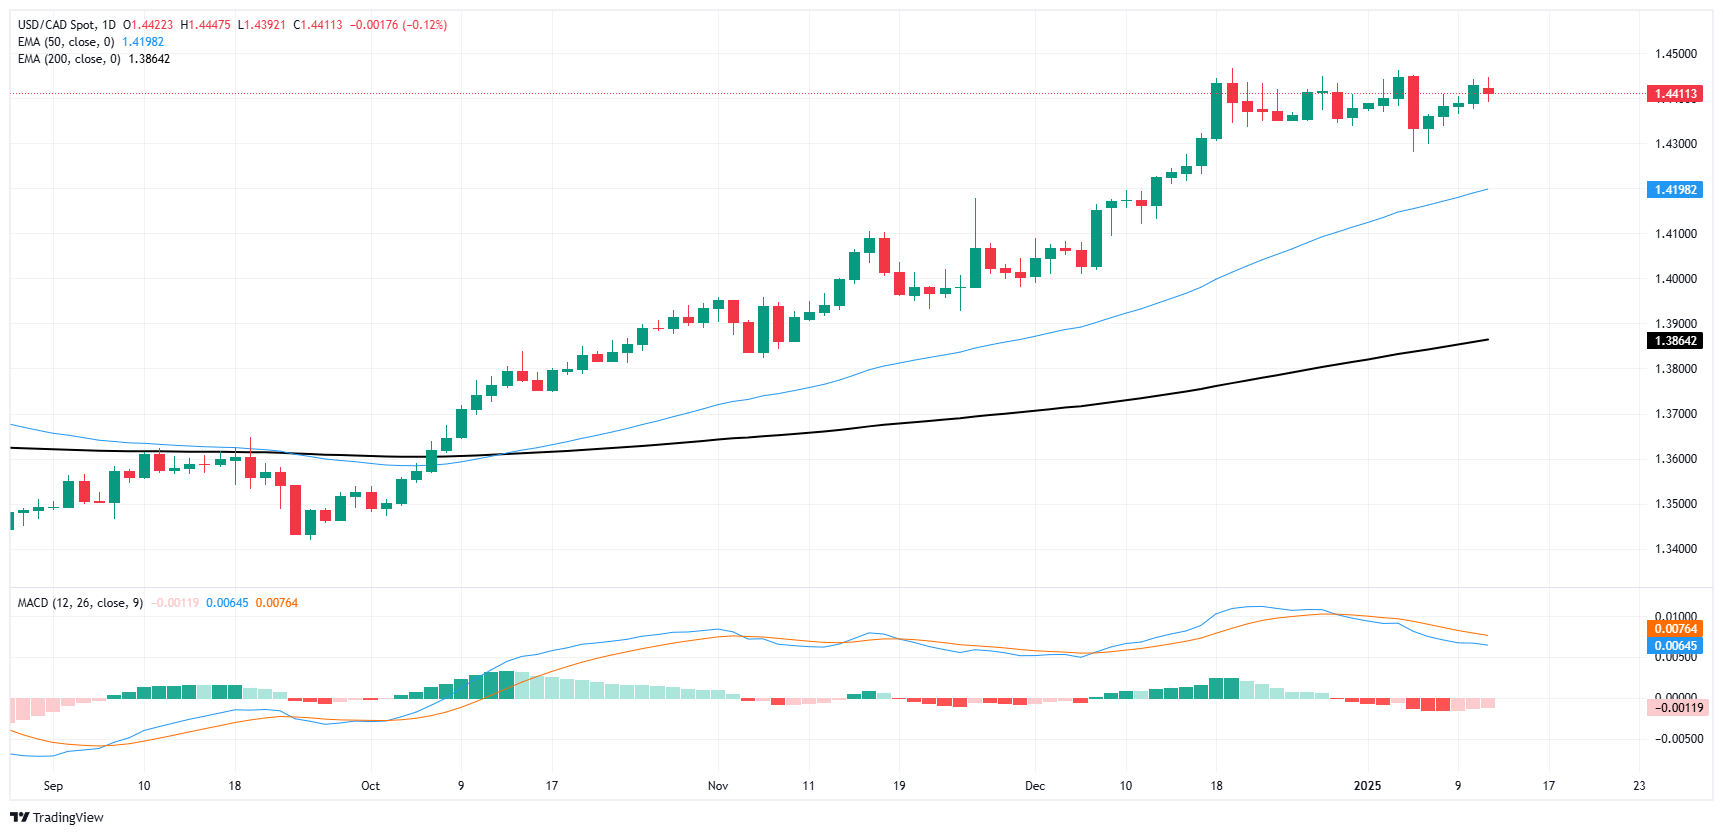
Canadian Dollar FAQs
The key factors driving the Canadian Dollar (CAD) are the level of interest rates set by the Bank of Canada (BoC), the price of Oil, Canada’s largest export, the health of its economy, inflation and the Trade Balance, which is the difference between the value of Canada’s exports versus its imports. Other factors include market sentiment – whether investors are taking on more risky assets (risk-on) or seeking safe-havens (risk-off) – with risk-on being CAD-positive. As its largest trading partner, the health of the US economy is also a key factor influencing the Canadian Dollar.
The Bank of Canada (BoC) has a significant influence on the Canadian Dollar by setting the level of interest rates that banks can lend to one another. This influences the level of interest rates for everyone. The main goal of the BoC is to maintain inflation at 1-3% by adjusting interest rates up or down. Relatively higher interest rates tend to be positive for the CAD. The Bank of Canada can also use quantitative easing and tightening to influence credit conditions, with the former CAD-negative and the latter CAD-positive.
The price of Oil is a key factor impacting the value of the Canadian Dollar. Petroleum is Canada’s biggest export, so Oil price tends to have an immediate impact on the CAD value. Generally, if Oil price rises CAD also goes up, as aggregate demand for the currency increases. The opposite is the case if the price of Oil falls. Higher Oil prices also tend to result in a greater likelihood of a positive Trade Balance, which is also supportive of the CAD.
While inflation had always traditionally been thought of as a negative factor for a currency since it lowers the value of money, the opposite has actually been the case in modern times with the relaxation of cross-border capital controls. Higher inflation tends to lead central banks to put up interest rates which attracts more capital inflows from global investors seeking a lucrative place to keep their money. This increases demand for the local currency, which in Canada’s case is the Canadian Dollar.
Macroeconomic data releases gauge the health of the economy and can have an impact on the Canadian Dollar. Indicators such as GDP, Manufacturing and Services PMIs, employment, and consumer sentiment surveys can all influence the direction of the CAD. A strong economy is good for the Canadian Dollar. Not only does it attract more foreign investment but it may encourage the Bank of Canada to put up interest rates, leading to a stronger currency. If economic data is weak, however, the CAD is likely to fall.
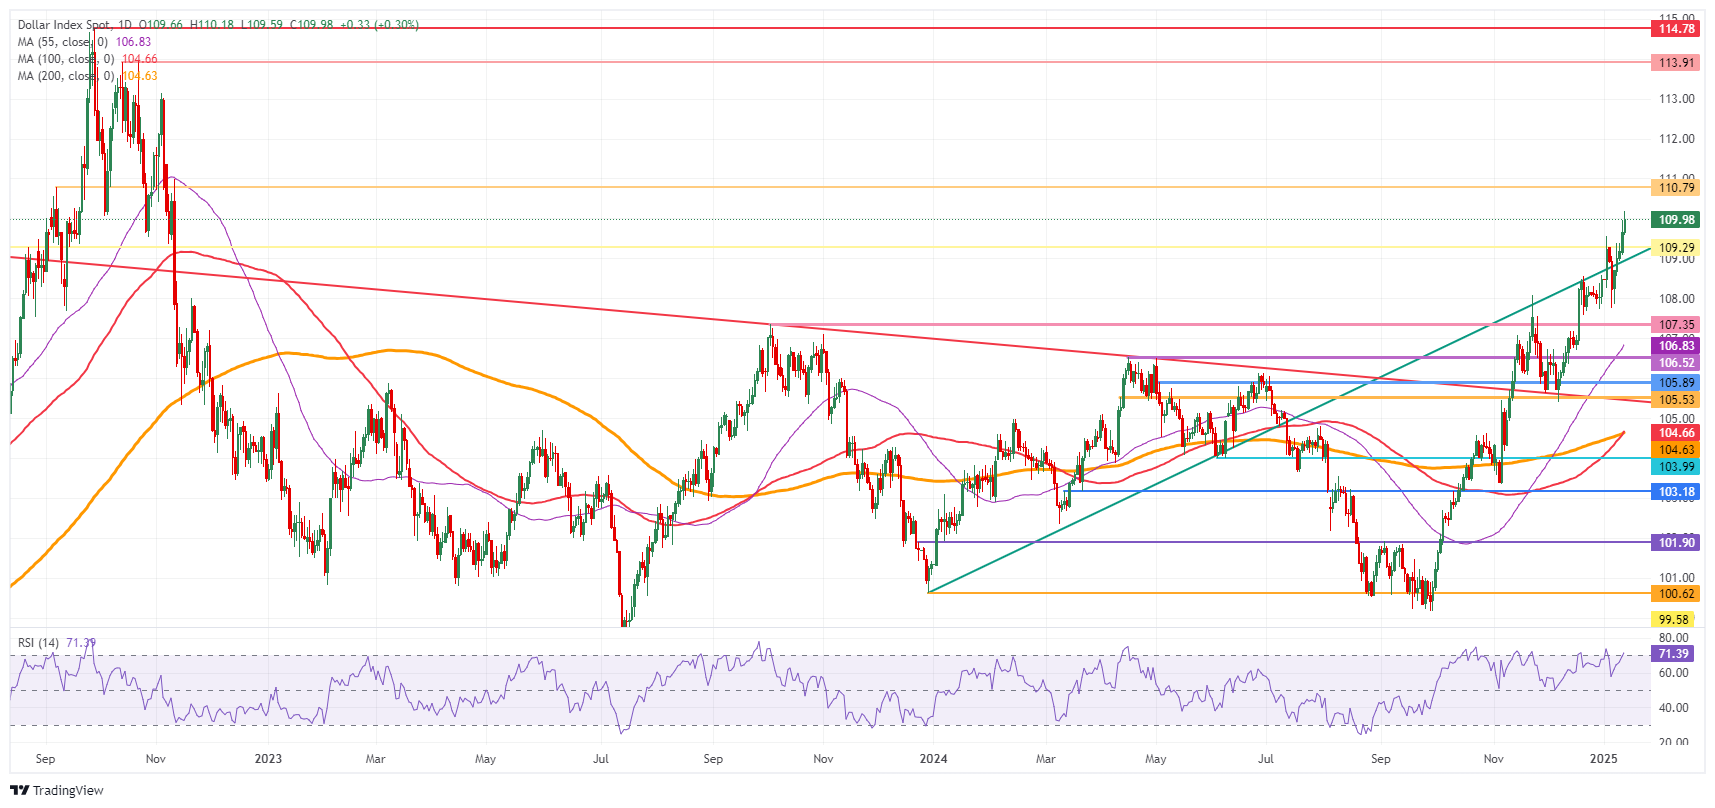
The Greenback added to recent gains and rose to fresh cycle highs backed by investors’ repricing of fewer (if any at all) interest rate cuts by the Federal Reserve this year.
Here is what you need to know on Tuesday, January 14:
The US Dollar Index (DXY) surpassed the 110.00 hurdle for the first time since November 2022, amid higher yields and speculation of just only one interest rate reduction by the Fed in the current year. The Producer Prices will take centre stage, seconded by the NFIB Business Optimism Index, and the RCM/TIPP Economic Optimism Index. In addition, the Fed’s Schmid and Williams are expected to speak.
EUR/USD performed poorly and extended its bearish trend to the sub-1.0200 region against the backdrop of persistent upside pressure in the US Dollar. The speech by the ECB’s Lane will be the sole event on the euro calendar.
GBP/USD kept its downtrend well in place, revisiting the area below 1.2100 although managing to regain some balance afterwards. The BoE’s Breeden is due to speak.
USD/JPY clinched its third consecutive daily pullback on the back of extra appreciation of the Japanese Yen. The Eco Watchers Survey, Bank Lending figures and Current Account results are expected on the Japanese docket. In addition, the BoJ’s Himino is due to speak.
AUD/USD attempted a humble bounce after four days in a row of losses, although it remained under pressure and close to the 0.6100 region. The Westpac Consumer Confidence Index will be released along with final Building Permits and Private House Approvals.
Prices of the American WTI extended their auspicious monthly rebound and trespassed the $78.00 mark per barrel on further US sanctions to Russian oil.
Prices of Gold gave away part of their recent multi-day advance following the stronger Greenback and speculation of just one interest rate cut by the Fed this year. By the same token, Silver prices deflated to five-day lows, breaching the key support at the $30.00 mark per ounce.
- Ongoing strength in the US labor market fuels expectations of a more restrictive Federal Reserve policy path in 2025.
- Investors rotate into the Greenback as elevated Treasury yields attract global capital, driving the US Dollar Index to fresh cycle peaks.
- Markets anticipate the Fed to maintain its 4.25%-4.50% rate range this month, postponing further cuts as inflation concerns persist.
The US Dollar Index (DXY), which measures the value of the USD against a basket of currencies, sees gains for a fifth straight session on Monday against nearly every major G20 peer. Markets are rebalancing for a more restrictive Federal Reserve (Fed) policy in 2025 after the most recent US employment report.
The DXY briefly touched 110.00 and seeks consolidation at these elevated levels as the Greenback retains its bullish footing given the solid Nonfarm Payrolls (NFP) data last Friday and the Fed’s cautious approach to easing viewed in last week’s Meeting Minutes.
Daily digest market movers: US Dollar sees gains on a solid NFP report
- Strong US data and hawkish Fed officials continue pushing the US Dollar to new cycle highs with robust December NFP figures underscoring labor market resilience.
- December Nonfarm Payrolls grew by 256,000, eclipsing the 160,000 consensus, while the Unemployment Rate ticked down to 4.1%. Wage inflation decelerated slightly to 3.9% YoY.
- New York Fed’s Nowcast points to Q4 growth at 2.4% SAAR, up from 1.9% last week, while Q1 estimates rose to 2.7% from 2.2%. The Atlanta Fed GDPNow model tracks Q4 near 2.7%.
- Fed set to hold rates steady this month as policymakers note diminished urgency for additional cuts, citing continued labor market and growth momentum through 2025.
- Consumer Price Index from December is due this week, and its outcome will dictate the market’s price dynamics as well as Fed rate bets.
DXY technical outlook: Index approaches 110.00, flashing overbought signals
The US Dollar Index has surged to its highest level since November 2022, briefly testing the 110.00 threshold. Momentum indicators are nearing overbought territory, suggesting a possible near-term pause or shallow pullback. Still, strong labor figures and a hawkish Fed bias reinforce the US Dollar’s bullish trajectory. Should profit-taking intensify, support may emerge around the 108.50–109.00 zone, providing a buffer for the ongoing uptrend.
US Dollar FAQs
The US Dollar (USD) is the official currency of the United States of America, and the ‘de facto’ currency of a significant number of other countries where it is found in circulation alongside local notes. It is the most heavily traded currency in the world, accounting for over 88% of all global foreign exchange turnover, or an average of $6.6 trillion in transactions per day, according to data from 2022. Following the second world war, the USD took over from the British Pound as the world’s reserve currency. For most of its history, the US Dollar was backed by Gold, until the Bretton Woods Agreement in 1971 when the Gold Standard went away.
The most important single factor impacting on the value of the US Dollar is monetary policy, which is shaped by the Federal Reserve (Fed). The Fed has two mandates: to achieve price stability (control inflation) and foster full employment. Its primary tool to achieve these two goals is by adjusting interest rates. When prices are rising too quickly and inflation is above the Fed’s 2% target, the Fed will raise rates, which helps the USD value. When inflation falls below 2% or the Unemployment Rate is too high, the Fed may lower interest rates, which weighs on the Greenback.
In extreme situations, the Federal Reserve can also print more Dollars and enact quantitative easing (QE). QE is the process by which the Fed substantially increases the flow of credit in a stuck financial system. It is a non-standard policy measure used when credit has dried up because banks will not lend to each other (out of the fear of counterparty default). It is a last resort when simply lowering interest rates is unlikely to achieve the necessary result. It was the Fed’s weapon of choice to combat the credit crunch that occurred during the Great Financial Crisis in 2008. It involves the Fed printing more Dollars and using them to buy US government bonds predominantly from financial institutions. QE usually leads to a weaker US Dollar.
Quantitative tightening (QT) is the reverse process whereby the Federal Reserve stops buying bonds from financial institutions and does not reinvest the principal from the bonds it holds maturing in new purchases. It is usually positive for the US Dollar.
- USD/MXN climbs 0.43% as US employment strength dampens hopes for imminent Fed rate reductions, boosting the Greenback.
- 10-year US Treasury yield hits a high of 4.801%, adding pressure on emerging market currencies like the Mexican Peso.
- Economic forecasts are bleak for Mexico with potential recession and credit rating concerns despite some positive industrial data.
The Mexican Peso prolongs its agony against the US Dollar, dropping for the fifth consecutive session on Monday amid a risk-off impulse following a robust US employment report that might deter the US Federal Reserve (Fed) from cutting interest rates. The USD/MXN trades at 20.80, up 0.43%.
Market participants remain risk-averse after last week’s Nonfarm Payrolls (NFP) report for December showed a jump in hiring. Consequently, the Greenback advanced as traders grew less optimistic that the Fed would lower interest rates anytime soon. Besides this, US Treasury yields remained elevated with the 10-year T-note reaching 4.801% for the first time since November 2023.
Mexico's economic docket remains absent, yet industrial production has improved in monthly and annual figures. However, the economy is not out of the woods yet. Former Deputy Finance Minister Alejandro Werner said in an article by El Economista that the Mexican economy would enter a recession this year and could lose its investment-grade status before 2027.
This week, Mexico's docket will feature Gross Fixed Investment and Retail Sales reports. In the US, key data releases include inflation figures on the producer and consumer sides, alongside Retail Sales and jobless claims for the week ending January 11.
Daily digest market movers: Mexican Peso drops as traders flee to safety
- The Mexican Peso weakened last Friday after December’s NFP said the US economy added over 256K employees to the workforce. Estimates were around 160K, and November's figures were revised to 212K from 227K.
- The Unemployment Rate slipped to 4.1%, and Average Hourly Earnings dropped below 4%.
- Although money markets expect the Fed to cut rates once, Wednesday's US inflation data will be crucial. Elevated readings would confirm investors' speculation that rates will be held through 2025. Otherwise, they could adjust their expectations.
- Last week, Banco de Mexico (Banxico) revealed December's meeting minutes. The minutes showed that inflation continues to trend lower, suggesting that the easing cycle might continue. Banxico's Governing board stated that "larger downward adjustments could be considered in some meetings."
- Mexico's central bank improved the inflation outlook due to the headline and core inflation progress. Officials acknowledged that services inflation decreased and expect CPI to converge to its 3% goal in Q3 2026.
- The Fed's latest Meeting Minutes showed that despite reducing rates, some policymakers supported keeping the fed funds rate unchanged as worries had grown that inflation risks were skewed to the upside.
- Consequently, they adopted a more gradual approach as Fed officials opened the door to slowing the pace of interest rate cuts.
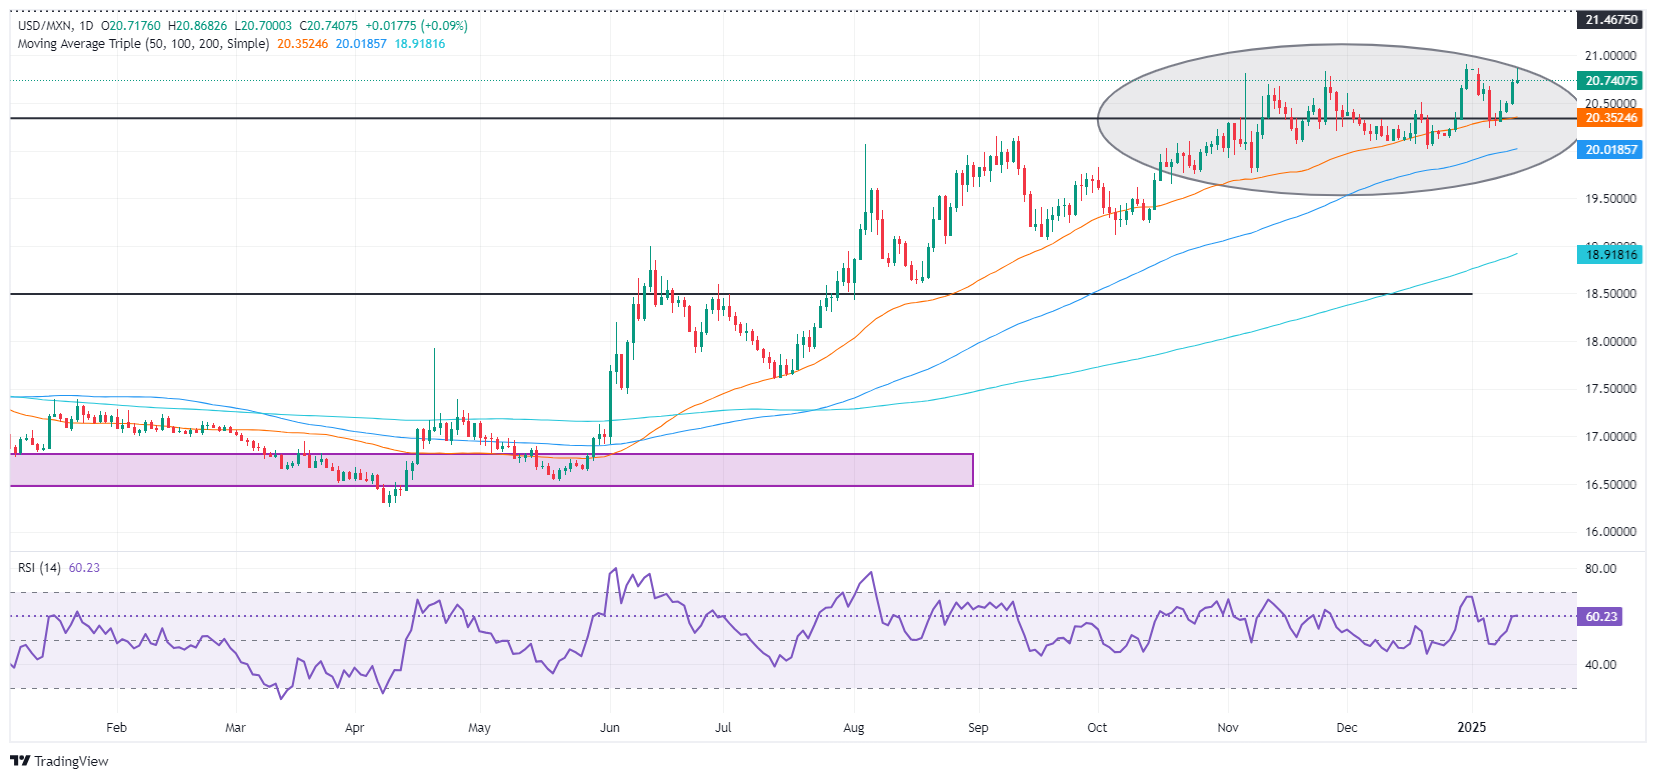
USD/MXN technical outlook: Mexican Peso plunges as USD/MXN rises above 20.75
The USD/MXN uptrend remains intact. Traders had turned bullish on the US Dollar to the detriment of the Peso. If the Peso remains bid, they could test the current year-to-date (YTD) peak of 20.90. If surpassed, the next stop would be the March 8, 2022 high of 21.46, ahead of 21.50 and the 22.00 psychological level.
Conversely, if USDMXN drops below 20.50, this will expose the 50-day Simple Moving Average (SMA) at 20.30. Once surpassed the next stop is the psychological 20.00 level, followed by the 100-day SMA at 19.96.
Mexican Peso FAQs
The Mexican Peso (MXN) is the most traded currency among its Latin American peers. Its value is broadly determined by the performance of the Mexican economy, the country’s central bank’s policy, the amount of foreign investment in the country and even the levels of remittances sent by Mexicans who live abroad, particularly in the United States. Geopolitical trends can also move MXN: for example, the process of nearshoring – or the decision by some firms to relocate manufacturing capacity and supply chains closer to their home countries – is also seen as a catalyst for the Mexican currency as the country is considered a key manufacturing hub in the American continent. Another catalyst for MXN is Oil prices as Mexico is a key exporter of the commodity.
The main objective of Mexico’s central bank, also known as Banxico, is to maintain inflation at low and stable levels (at or close to its target of 3%, the midpoint in a tolerance band of between 2% and 4%). To this end, the bank sets an appropriate level of interest rates. When inflation is too high, Banxico will attempt to tame it by raising interest rates, making it more expensive for households and businesses to borrow money, thus cooling demand and the overall economy. Higher interest rates are generally positive for the Mexican Peso (MXN) as they lead to higher yields, making the country a more attractive place for investors. On the contrary, lower interest rates tend to weaken MXN.
Macroeconomic data releases are key to assess the state of the economy and can have an impact on the Mexican Peso (MXN) valuation. A strong Mexican economy, based on high economic growth, low unemployment and high confidence is good for MXN. Not only does it attract more foreign investment but it may encourage the Bank of Mexico (Banxico) to increase interest rates, particularly if this strength comes together with elevated inflation. However, if economic data is weak, MXN is likely to depreciate.
As an emerging-market currency, the Mexican Peso (MXN) tends to strive during risk-on periods, or when investors perceive that broader market risks are low and thus are eager to engage with investments that carry a higher risk. Conversely, MXN tends to weaken at times of market turbulence or economic uncertainty as investors tend to sell higher-risk assets and flee to the more-stable safe havens.
- The Dow Jones is looking to pare recent losses, but topside momentum remains limited.
- Investors are pivoting out of popular tech rally favorites, dragging equity markets lower.
- The Dow is keeping on-balance as investors rotate into non-tech darlings.
The Dow Jones Industrial Average (DJIA) avoided most of Monday’s broad-market declines as investors reaffirmed their bullish outlook on the long-run tech sector rally. The Dow gained roughly 100 points to kick off the trading week, while the other major equity indexes shed weight.
Investor hopes for continued rate cuts from the Federal Reserve (Fed) have been swirling the drain since the start of the new trading year, and last Friday’s bumper Nonfarm Payrolls (NFP) sealed the deal on the Fed being in no rush to deliver more rate reductions. With a bumping US workforce and inflation pressures continuing to simmer in the background, there is little reason for the Fed to race into further moves on rates. To their credit, Fed policymakers have been warning markets for over a year that neutral rates have definitely moved higher since the pandemic and near-zero rate days of the early 2010s, and now it looks like that fact is finally taking hold in investors’ minds.
A fresh batch of US inflation figures are due this week: US Producer Price Index (PPI) inflation is due on Tuesday, and the Consumer Price Index (CPI) is slated for Wednesday. Both figures are expected to tick upwards in the near term, which could further undermine rate cut hopes. Retail Sales figures for December will land on Thursday, and the figure is expected to shift lower but remain in healthy consumer spending territory.
Dow Jones news
Despite a broad-market pullback out of tech stock, over half of the Dow Jones is testing into the high side on Monday, with gains being led by a fresh bout of bidding in Unitedhealth Group (UNH), which is recovering from a December bear run that dragged the health sector stock down from record highs above $600. UNH is up over 4% at the time of writing, breaking above $543 per share.
On the low side, Nvidia (NVDA) just can’t catch a break, declining another 2.3% and trading south of $133 per share. Forecasters of tech sector stocks, which are hinged entirely around the AI tech craze, have decided that Nvidia will miss out on future earnings in the AI space as competitors sweep in and take market share from the chipmaker. The fact that the AI tech space is entirely dependent on a massive pipeline of investment funds with little to no revenue to speak of is only a minor factor as traders focus on companies situated to service the exorbitant spending habits of large-scale data modelers driving the AI space.
The US is also expected to further curb exports of Nvidia-produced silicon wafers in a bid to limit market access to high-grade computing chips by foreign opponents to the US, further crimping Nvidia flows. Further adding to Nvidia's issues, a "glitchy" server rack problem is leading the usual NVDA customers to hold off on large-scale acquisitions of server computing solutions until Nvidia is able to push a newer version, crimping near-term sales of business services.
Dow Jones price forecast
The Dow Jones is catching a thin bid on Monday, pushing back upwards after a decline into the 42,000 handle. The major equity index has drifted nearly 7.5% top-to-bottom into the bearish side after tapping record peaks just above 45,000.
Despite recent bear moves, the Dow Jones is still holding north of the 200-day Exponential Moving Average (EMA), but only just. The Dow is due for a bit of a breather after outpacing the long-run moving average since November of 2023, and closing in the green for ten of the last thirteen straight months.
Dow Jones daily chart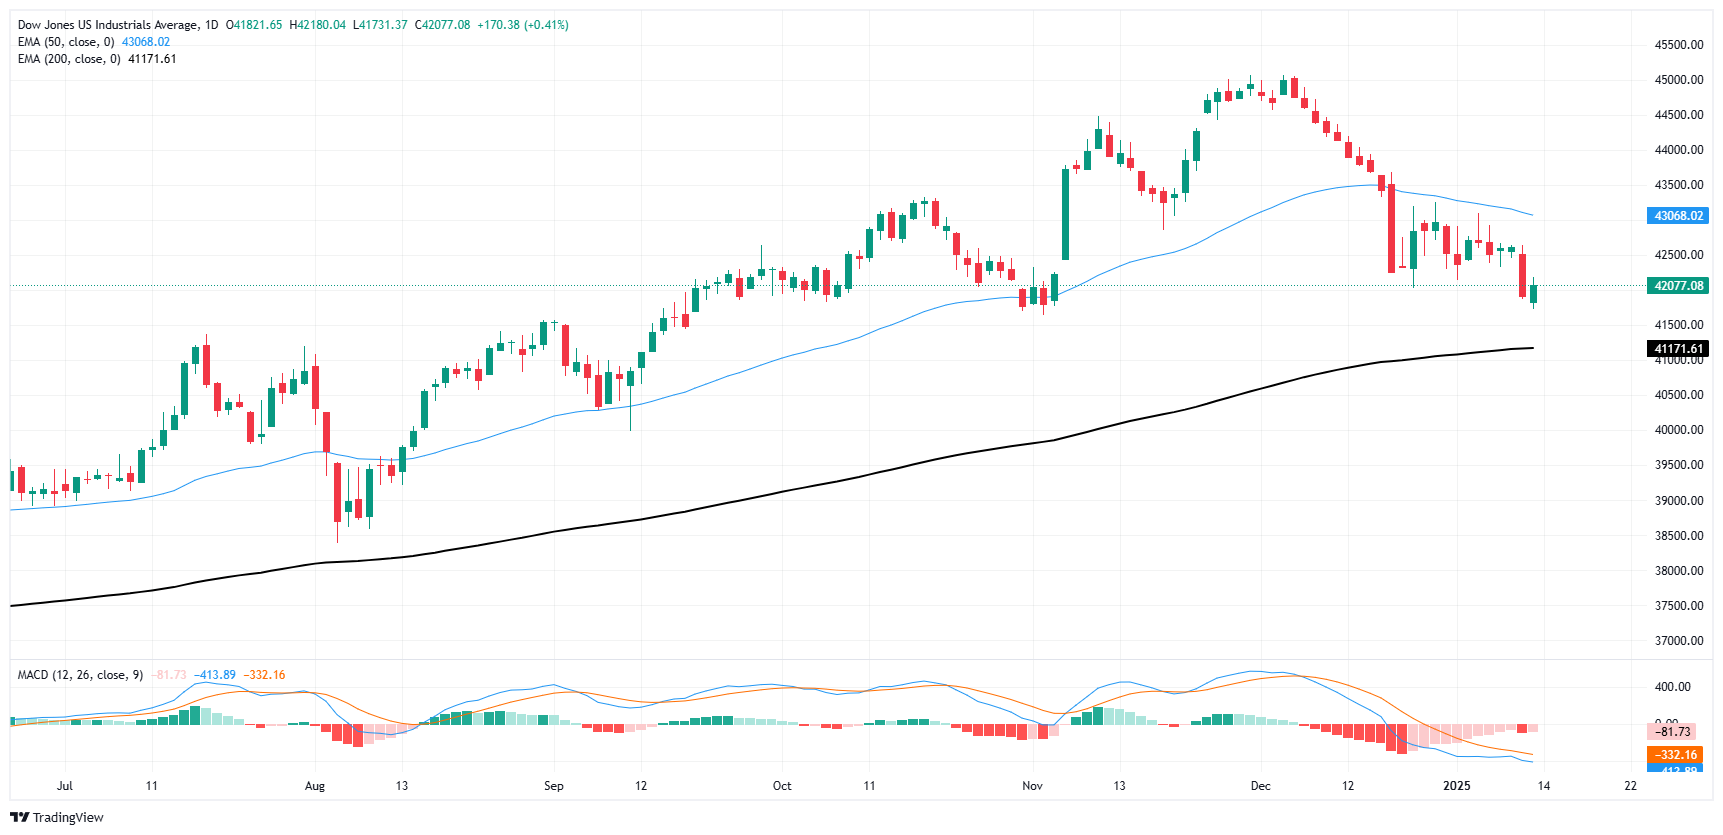
Dow Jones FAQs
The Dow Jones Industrial Average, one of the oldest stock market indices in the world, is compiled of the 30 most traded stocks in the US. The index is price-weighted rather than weighted by capitalization. It is calculated by summing the prices of the constituent stocks and dividing them by a factor, currently 0.152. The index was founded by Charles Dow, who also founded the Wall Street Journal. In later years it has been criticized for not being broadly representative enough because it only tracks 30 conglomerates, unlike broader indices such as the S&P 500.
Many different factors drive the Dow Jones Industrial Average (DJIA). The aggregate performance of the component companies revealed in quarterly company earnings reports is the main one. US and global macroeconomic data also contributes as it impacts on investor sentiment. The level of interest rates, set by the Federal Reserve (Fed), also influences the DJIA as it affects the cost of credit, on which many corporations are heavily reliant. Therefore, inflation can be a major driver as well as other metrics which impact the Fed decisions.
Dow Theory is a method for identifying the primary trend of the stock market developed by Charles Dow. A key step is to compare the direction of the Dow Jones Industrial Average (DJIA) and the Dow Jones Transportation Average (DJTA) and only follow trends where both are moving in the same direction. Volume is a confirmatory criteria. The theory uses elements of peak and trough analysis. Dow’s theory posits three trend phases: accumulation, when smart money starts buying or selling; public participation, when the wider public joins in; and distribution, when the smart money exits.
There are a number of ways to trade the DJIA. One is to use ETFs which allow investors to trade the DJIA as a single security, rather than having to buy shares in all 30 constituent companies. A leading example is the SPDR Dow Jones Industrial Average ETF (DIA). DJIA futures contracts enable traders to speculate on the future value of the index and Options provide the right, but not the obligation, to buy or sell the index at a predetermined price in the future. Mutual funds enable investors to buy a share of a diversified portfolio of DJIA stocks thus providing exposure to the overall index.
- EUR/USD declines on Monday, settling near 1.0210 as its losing streak stretches to five days.
- RSI drops to 32, hovering close to oversold territory, while the MACD histogram prints rising red bars.
- The pair dives below 1.0250, marking the lowest level since November 2022 and signaling persistent bearish pressure.
EUR/USD extended its downward spiral on Monday, shedding another 0.39% to settle near 1.0210. This marks the fifth consecutive session of losses, with the pair continuously probing fresh lows not seen since November 2022. Sellers appear firmly in control, as the recent slide shows little sign of abating, despite mounting oversold signals.
On the technical front, the Relative Strength Index (RSI) has slipped to 32, teetering on the edge of oversold territory. Meanwhile, the Moving Average Convergence Divergence (MACD) histogram exhibits rising red bars, underscoring the intensifying negative momentum. These readings point to a market that is ripe for a potential correction, yet the absence of convincing buyer interest thus far keeps the overall outlook biased to the downside.
Looking ahead, immediate support is pegged around the 1.0200 handle, with a further drop potentially exposing the 1.0150 region. In contrast, an upward retracement might face resistance near 1.0250, and any break above 1.0300 could spark a short-term relief rally.
EUR/USD daily chart

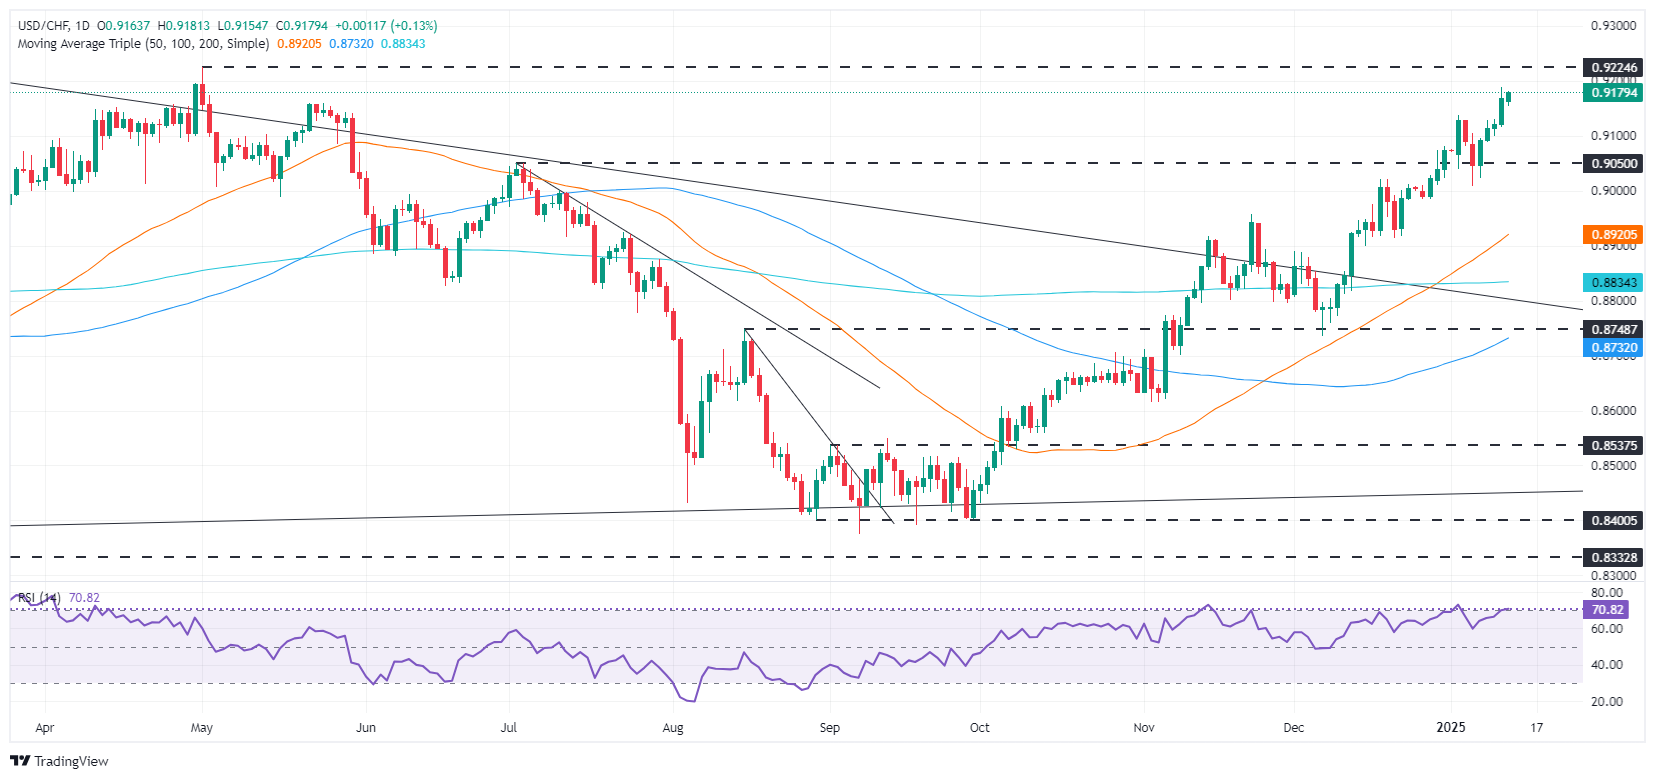
- USD/CHF gains 0.25%, bolstered by reduced expectations of Federal Reserve easing after strong December job figures.
- 'Golden Cross' formation in the 50-day and 200-day SMA signals potential uptrend continuation with targets at 0.9224 and 0.9300.
- Key downside risks loom if USD/CHF falls below 0.9200, with critical support at the 0.9136 and 0.9007 levels.
The Swiss Franc extended its losses for the fourth straight day against the US Dollar in the aftermath of a strong US Nonfarm Payrolls report in December. Consequently, investors trimmed the chances of additional easing by the Federal Reserve, a tailwind for the USD/CHF, which trades at 0.9177, up 0.25%.
USD/CHF Price Forecast: Technical outlook
From a daily standpoint, the USD/CHF uptrend is intact as the pair carved a successive series of higher highs and higher lows. Additionally, the 50-day Simple Moving Average (SMA) crossed above the 200-day (SMA), forming a 'golden cross' indicating further upside.
If USD/CHF clears 0.9200, this could pave the way to test the April 2024 peak of 0.9224. On further strength, 0.9250 is next, followed by the 0.9300 figure.
Conversely, if sellers drag the exchange rate below 0.9200, the first support would be the January 2 swing high of 0.9136, ahead of 0.9100. A breach of the latter will expose the January 6 daily low of 0.9007.
USD/CHF Price Chart - Daily
Swiss Franc FAQs
The Swiss Franc (CHF) is Switzerland’s official currency. It is among the top ten most traded currencies globally, reaching volumes that well exceed the size of the Swiss economy. Its value is determined by the broad market sentiment, the country’s economic health or action taken by the Swiss National Bank (SNB), among other factors. Between 2011 and 2015, the Swiss Franc was pegged to the Euro (EUR). The peg was abruptly removed, resulting in a more than 20% increase in the Franc’s value, causing a turmoil in markets. Even though the peg isn’t in force anymore, CHF fortunes tend to be highly correlated with the Euro ones due to the high dependency of the Swiss economy on the neighboring Eurozone.
The Swiss Franc (CHF) is considered a safe-haven asset, or a currency that investors tend to buy in times of market stress. This is due to the perceived status of Switzerland in the world: a stable economy, a strong export sector, big central bank reserves or a longstanding political stance towards neutrality in global conflicts make the country’s currency a good choice for investors fleeing from risks. Turbulent times are likely to strengthen CHF value against other currencies that are seen as more risky to invest in.
The Swiss National Bank (SNB) meets four times a year – once every quarter, less than other major central banks – to decide on monetary policy. The bank aims for an annual inflation rate of less than 2%. When inflation is above target or forecasted to be above target in the foreseeable future, the bank will attempt to tame price growth by raising its policy rate. Higher interest rates are generally positive for the Swiss Franc (CHF) as they lead to higher yields, making the country a more attractive place for investors. On the contrary, lower interest rates tend to weaken CHF.
Macroeconomic data releases in Switzerland are key to assessing the state of the economy and can impact the Swiss Franc’s (CHF) valuation. The Swiss economy is broadly stable, but any sudden change in economic growth, inflation, current account or the central bank’s currency reserves have the potential to trigger moves in CHF. Generally, high economic growth, low unemployment and high confidence are good for CHF. Conversely, if economic data points to weakening momentum, CHF is likely to depreciate.
As a small and open economy, Switzerland is heavily dependent on the health of the neighboring Eurozone economies. The broader European Union is Switzerland’s main economic partner and a key political ally, so macroeconomic and monetary policy stability in the Eurozone is essential for Switzerland and, thus, for the Swiss Franc (CHF). With such dependency, some models suggest that the correlation between the fortunes of the Euro (EUR) and the CHF is more than 90%, or close to perfect.
- AUD/USD ticks higher to near 0.6150 as the AUD gains even though RBA dovish bets swell.
- The Fed is expected to deliver only one interest rate reduction this year.
- Investors await the US inflation and the Australian employment data for December.
The AUD/USD pair moves higher to near 0.6150 in Monday’s North American session. The Aussie pair gains even though the US Dollar (USD) outperforms a majority of its peers as traders have trimmed Federal Reserve (Fed) dovish bets after the release of the upbeat United States (US) Nonfarm Payrolls (NFP) data for December.
The US Dollar Index (DXY), which tracks the Greenback’s value against six major currencies, posts a fresh over two-year high above 110.00.
The US NFP report showed that demand for workers remained robust. Also, the Unemployment Rate decelerated. This scenario is favorable for the US Dollar as it weighs on Fed dovish bets.
Analysts at Macquarie expect the Fed to cut borrowing rates only once this year, with the current interest rate cycle bottoming in the range of 4.00%-4.25%. The projection of only one interest rate reduction is lower than the two, which Fed officials collectively anticipated in the latest Summary of Economic Projections (SEP) dot plot.
The next trigger for the US Dollar is the Consumer Price Index (CPI) data for December, which will be released on Wednesday.
Meanwhile, investors have underpinned the Australian Dollar (AUD) against the USD even though traders price in a roughly 75% chance of a rate cut by the Reserve Bank of Australia (RBA) in February’s policy meeting.
On the economic front, investors will focus on the Australian employment data for December, which will be released on Thursday. The employment report is expected to show that the economy added 15K workers, fewer than 35.6K in November.
Australian Dollar FAQs
One of the most significant factors for the Australian Dollar (AUD) is the level of interest rates set by the Reserve Bank of Australia (RBA). Because Australia is a resource-rich country another key driver is the price of its biggest export, Iron Ore. The health of the Chinese economy, its largest trading partner, is a factor, as well as inflation in Australia, its growth rate and Trade Balance. Market sentiment – whether investors are taking on more risky assets (risk-on) or seeking safe-havens (risk-off) – is also a factor, with risk-on positive for AUD.
The Reserve Bank of Australia (RBA) influences the Australian Dollar (AUD) by setting the level of interest rates that Australian banks can lend to each other. This influences the level of interest rates in the economy as a whole. The main goal of the RBA is to maintain a stable inflation rate of 2-3% by adjusting interest rates up or down. Relatively high interest rates compared to other major central banks support the AUD, and the opposite for relatively low. The RBA can also use quantitative easing and tightening to influence credit conditions, with the former AUD-negative and the latter AUD-positive.
China is Australia’s largest trading partner so the health of the Chinese economy is a major influence on the value of the Australian Dollar (AUD). When the Chinese economy is doing well it purchases more raw materials, goods and services from Australia, lifting demand for the AUD, and pushing up its value. The opposite is the case when the Chinese economy is not growing as fast as expected. Positive or negative surprises in Chinese growth data, therefore, often have a direct impact on the Australian Dollar and its pairs.
Iron Ore is Australia’s largest export, accounting for $118 billion a year according to data from 2021, with China as its primary destination. The price of Iron Ore, therefore, can be a driver of the Australian Dollar. Generally, if the price of Iron Ore rises, AUD also goes up, as aggregate demand for the currency increases. The opposite is the case if the price of Iron Ore falls. Higher Iron Ore prices also tend to result in a greater likelihood of a positive Trade Balance for Australia, which is also positive of the AUD.
The Trade Balance, which is the difference between what a country earns from its exports versus what it pays for its imports, is another factor that can influence the value of the Australian Dollar. If Australia produces highly sought after exports, then its currency will gain in value purely from the surplus demand created from foreign buyers seeking to purchase its exports versus what it spends to purchase imports. Therefore, a positive net Trade Balance strengthens the AUD, with the opposite effect if the Trade Balance is negative.
- USD/CAD trades subduedly as the Canadian Dollar outperforms on upbeat domestic employment data for December.
- The US Dollar remains firm as traders pare Fed dovish bets after upbeat US NFP data.
- Investors await the US inflation data for December for more interest rate guidance.
The USD/CAD pair edges lower to near 1.440 in Monday’s North American session. The Loonie pair ticks lower as the Canadian Dollar (CAD) exhibits strength after Canada’s surprisingly upbeat labor market data weighed on market expectations for the Bank of Canada (BoC) to continue reducing interest rates at a larger-than-usual pace of 50 basis points (bps).
The Canadian employment report showed a robust addition of laborforce alongwith a sharp decline in the jobless rate. However, a one-time good employment report appears to be insufficient to allow the BoC to pause its policy-easing cycle.
The Loonie pair falls marginally even though the US Dollar (USD) extends its winning streak for the fifth trading session on Monday and posts a fresh over two-year high, with the US Dollar Index (DXY) rising above 110.00.
The Greenback performs strongly as traders expect that the Federal Reserve’s (Fed) current interest rate cut cycle has paused for now. According to the CME FedWatch tool, the central bank is expected to keep interest rates in the current range of 4.25%-4.50% in the January, March, and May policy meetings. Meanwhile, traders are divided for the policy meeting in June.
Market participants have pared Fed dovish bets on the back of upbeat United States (US) Nonfarm Payrolls (NFP) data for December. The data showed that labor demand was surprisingly stronger than November’s reading. The Unemployment rate came in lower at 4.1% than estimates and the former release of 4.2%.
Investors should brace for more volatility in market expectations for the Fed’s monetary policy outlook as the US Consumer Price Index (CPI) data for December is lined up for release on Wednesday. Recent commentaries from Fed officials have indicated that they are concerned about a slowdown in progress in the disinflation trend.
Canadian Dollar FAQs
The key factors driving the Canadian Dollar (CAD) are the level of interest rates set by the Bank of Canada (BoC), the price of Oil, Canada’s largest export, the health of its economy, inflation and the Trade Balance, which is the difference between the value of Canada’s exports versus its imports. Other factors include market sentiment – whether investors are taking on more risky assets (risk-on) or seeking safe-havens (risk-off) – with risk-on being CAD-positive. As its largest trading partner, the health of the US economy is also a key factor influencing the Canadian Dollar.
The Bank of Canada (BoC) has a significant influence on the Canadian Dollar by setting the level of interest rates that banks can lend to one another. This influences the level of interest rates for everyone. The main goal of the BoC is to maintain inflation at 1-3% by adjusting interest rates up or down. Relatively higher interest rates tend to be positive for the CAD. The Bank of Canada can also use quantitative easing and tightening to influence credit conditions, with the former CAD-negative and the latter CAD-positive.
The price of Oil is a key factor impacting the value of the Canadian Dollar. Petroleum is Canada’s biggest export, so Oil price tends to have an immediate impact on the CAD value. Generally, if Oil price rises CAD also goes up, as aggregate demand for the currency increases. The opposite is the case if the price of Oil falls. Higher Oil prices also tend to result in a greater likelihood of a positive Trade Balance, which is also supportive of the CAD.
While inflation had always traditionally been thought of as a negative factor for a currency since it lowers the value of money, the opposite has actually been the case in modern times with the relaxation of cross-border capital controls. Higher inflation tends to lead central banks to put up interest rates which attracts more capital inflows from global investors seeking a lucrative place to keep their money. This increases demand for the local currency, which in Canada’s case is the Canadian Dollar.
Macroeconomic data releases gauge the health of the economy and can have an impact on the Canadian Dollar. Indicators such as GDP, Manufacturing and Services PMIs, employment, and consumer sentiment surveys can all influence the direction of the CAD. A strong economy is good for the Canadian Dollar. Not only does it attract more foreign investment but it may encourage the Bank of Canada to put up interest rates, leading to a stronger currency. If economic data is weak, however, the CAD is likely to fall.
- The US Dollar trades in the green against nearly every major G20 peer.
- Markets reposition for a more restrictive Fed policy in 2025 after the most recent US employment report.
- The US Dollar Index (DXY) surges to 110.00, looking for consolidation at these upper levels.
The US Dollar Index (DXY), which tracks the Greenback’s value against six major currencies, edges higher for the fifth straight day and trades around 110.00, at levels not seen since November 2022, on Monday. The move comes after markets catch up with the recent Nonfarm Payrolls report for December, released on Friday, and adjusted to the new narrative that the Federal Reserve (Fed) would be more restrictive and keep rates steady for longer, with chances for several interest rate cuts in 2025 diminishing.
The US economic calendar is rather calm in the run-up to the Consumer Price Index (CPI) release on Wednesday and Retail Sales on Thursday. At least this Monday will be a very quiet start, with just a few smaller bond auctions on the agenda. Meanwhile, traders can assess their next moves ahead of President-elect Donald Trump's inauguration next week.
Daily digest market movers: Counting down
- At 16:30 GMT, the US Treasury will allocate a 3-month and a 6-month bill.
- At 19:00 GMT, the December Budget Statement will be released. The deficit is expected to shrink to $62 billion from $367 billion.
- Equities are taking over the negative tone from Asia. Besides Japan being closed, all other major indices are trading in red numbers.
- The CME FedWatch Tool projects a 97.3% chance that interest rates will be kept unchanged at current levels in the January meeting. Expectations are for the Federal Reserve (Fed) to remain data-dependent with uncertainties that could influence the inflation path once President-elect Donald Trump takes office on January 20.
- US yields are softening slightly. The 10-year benchmark is at 4.780%, off the fresh nine-month high of 4.798% seen in Asian trading on Monday.
US Dollar Index Technical Analysis: Is it all priced in?
The US Dollar Index (DXY) is in the last seven days before President-elect Donald Trump takes office. With the changing market narrative towards a longer and more restrictive Fed monetary policy going forward, chances that the Fed might not even cut at all in 2025 could be very plausible. In that case, the ramifications for the Greenback would be that the US Dollar Index would surge even further.
On the upside, the 110.00 psychological barrier needs to be held, and a consolidation must be seen above it for the rally to move higher. Further up, 110.79 remains the next big upside level to hit. Once beyond there, it is quite a stretch to 113.91, the double top from October 2022.
On the downside, the first downside barrier is 107.35, which has now turned into support. The next level that might halt any selling pressure is 106.52, with the 55-day Simple Moving Average (SMA) at 106.83 reinforcing above this region of support.
US Dollar Index: Daily Chart
US Dollar FAQs
The US Dollar (USD) is the official currency of the United States of America, and the ‘de facto’ currency of a significant number of other countries where it is found in circulation alongside local notes. It is the most heavily traded currency in the world, accounting for over 88% of all global foreign exchange turnover, or an average of $6.6 trillion in transactions per day, according to data from 2022. Following the second world war, the USD took over from the British Pound as the world’s reserve currency. For most of its history, the US Dollar was backed by Gold, until the Bretton Woods Agreement in 1971 when the Gold Standard went away.
The most important single factor impacting on the value of the US Dollar is monetary policy, which is shaped by the Federal Reserve (Fed). The Fed has two mandates: to achieve price stability (control inflation) and foster full employment. Its primary tool to achieve these two goals is by adjusting interest rates. When prices are rising too quickly and inflation is above the Fed’s 2% target, the Fed will raise rates, which helps the USD value. When inflation falls below 2% or the Unemployment Rate is too high, the Fed may lower interest rates, which weighs on the Greenback.
In extreme situations, the Federal Reserve can also print more Dollars and enact quantitative easing (QE). QE is the process by which the Fed substantially increases the flow of credit in a stuck financial system. It is a non-standard policy measure used when credit has dried up because banks will not lend to each other (out of the fear of counterparty default). It is a last resort when simply lowering interest rates is unlikely to achieve the necessary result. It was the Fed’s weapon of choice to combat the credit crunch that occurred during the Great Financial Crisis in 2008. It involves the Fed printing more Dollars and using them to buy US government bonds predominantly from financial institutions. QE usually leads to a weaker US Dollar.
Quantitative tightening (QT) is the reverse process whereby the Federal Reserve stops buying bonds from financial institutions and does not reinvest the principal from the bonds it holds maturing in new purchases. It is usually positive for the US Dollar.
- USD/JPY drops to near 157.30 even though the US Dollar posts a fresh two-year high.
- Traders pare Fed dovish bets on the back of upbeat US NFP data for December.
- Deepening risk-aversion sentiment has improved the JPY’s safe-haven appeal.
The USD/JPY pair slumps to near 157.30 in Monday’s European session. The asset drops even though the US Dollar (USD) performs strongly, suggesting sheer strength in the Japanese Yen (JPY). The US Dollar Index (DXY), which tracks the Greenback’s value against six major currencies, refreshes a more-than-two-year high above 110.00.
The Greenback strengthens as market experts have revised down expectations for the number of interest rate cuts this year. Analysts at Macquarie expect the Fed to cut borrowing rates only once this year, with the current interest rate cycle bottoming in the range of 4.00%-4.25%. On the contrary, Fed officials collectively anticipated two interest rate cuts this year in the latest dot plot.
Market participants have dialed back Fed dovish bets after the release of Friday’s upbeat United States (US) Nonfarm Payrolls (NFP) data for December. The NFP report showed that labor demand remained robust, and unemployment decelerated unexpectedly.
This week, investors will focus on the US Consumer Price Index (CPI) data for December, which will be published on Wednesday. Market participants will pay close attention to the inflation data as Fed policymakers have lately shown concerns over a slowdown in the progress of inflationary pressures declining toward the central bank’s target of 2%.
Meanwhile, the safe-haven appeal of the Yen has strengthened amid global uncertainty. A sharp sell-off in equities globally has been observed amid risk-aversion mood with US President-elect Donald Trump returning to the White House on January 20.
Also, growing expectations of more interest rate hikes from the Bank of Japan (BoJ) have strengthened the Japanese currency. Traders expect the BoJ to raise its borrowing rates in the March meeting.
US Dollar FAQs
The US Dollar (USD) is the official currency of the United States of America, and the ‘de facto’ currency of a significant number of other countries where it is found in circulation alongside local notes. It is the most heavily traded currency in the world, accounting for over 88% of all global foreign exchange turnover, or an average of $6.6 trillion in transactions per day, according to data from 2022. Following the second world war, the USD took over from the British Pound as the world’s reserve currency. For most of its history, the US Dollar was backed by Gold, until the Bretton Woods Agreement in 1971 when the Gold Standard went away.
The most important single factor impacting on the value of the US Dollar is monetary policy, which is shaped by the Federal Reserve (Fed). The Fed has two mandates: to achieve price stability (control inflation) and foster full employment. Its primary tool to achieve these two goals is by adjusting interest rates. When prices are rising too quickly and inflation is above the Fed’s 2% target, the Fed will raise rates, which helps the USD value. When inflation falls below 2% or the Unemployment Rate is too high, the Fed may lower interest rates, which weighs on the Greenback.
In extreme situations, the Federal Reserve can also print more Dollars and enact quantitative easing (QE). QE is the process by which the Fed substantially increases the flow of credit in a stuck financial system. It is a non-standard policy measure used when credit has dried up because banks will not lend to each other (out of the fear of counterparty default). It is a last resort when simply lowering interest rates is unlikely to achieve the necessary result. It was the Fed’s weapon of choice to combat the credit crunch that occurred during the Great Financial Crisis in 2008. It involves the Fed printing more Dollars and using them to buy US government bonds predominantly from financial institutions. QE usually leads to a weaker US Dollar.
Quantitative tightening (QT) is the reverse process whereby the Federal Reserve stops buying bonds from financial institutions and does not reinvest the principal from the bonds it holds maturing in new purchases. It is usually positive for the US Dollar.
- Gold price halts winning streak on Monday as markets catch up on the Nonfarm Payrolls release.
- Traders and investors remain cautious and favor safe-haven assets such as Gold and the US Dollar.
- Gold to test support before continuing its rally again.
Gold’s price (XAU/USD) takes a step back and halts its four-day winning streak on Monday as markets catch up and reprice the recent US Nonfarm Payrolls release. The report further confirms the narrative that the Federal Reserve (Fed) might keep its policy rate higher for longer. While higher borrowing costs are typically negative for the non-interest-bearing precious metal, investors are bracing for more volatility ahead of President-elect Donald Trump’s return to the White House on January 20.
On the economic data front, there is a relatively calm trading day ahead, with the dust settling further after the recent US Nonfarm Payrolls release. This Monday, the US Treasury will allocate some short-term bonds to the market.
Daily digest market movers: Time to settle
- Operations at Wilton Resources’ Ciemas Gold Project in Indonesia remained suspended due to the continued power outage amid heavy rainfall caused by the La Nina phenomenon, according to a Friday press release, Bloomberg reports.
- The Indonesian unit, Masmindo Dwi Area, picked Macmahon as the mining services contractor for the Awak Mas gold project in South Sulawesi, according to an exchange filing, Bloomberg reports. The contract is valued at A$463 million over seven years and is expected to start in mid-2025.
- At 16:30 GMT, three-month and six-month bills are due to be auctioned by the US Treasury.
- The US 10-year benchmark rate trades at 4.782% at the time of writing on Monday, a touch lower than the peak at opening in Asia near 4.796%.
- At 21:30 GMT, the Commodity Futures Trading Commission (CFTC) will release the Gold NC Net Positions. A forecast is not available, but the previous positioning was at $247,300. The report provides information on the size and direction of the positions taken across all maturities, participants primarily based in Chicago and New York futures markets. Forex traders focus on "non-commercial" or speculative positions to determine whether a trend remains healthy or not, as well as market sentiment towards a certain asset.
Technical Analysis: Critical moment
Gold has broken through a strong pennant formation, which was mentioned several times last week. Despite all the headwinds from higher yields and a stronger US Dollar (USD), the Bullion was able to still power through. Now support nearby needs to hold to avoid the Gold price from falling back into the pennant and resulting in a false break with the risk of more downside at hand.
On the downside, the descending trend line near $$2,678 should hold as support to avoid re-entry in the pennant formation. The 55-day Simple Moving Average (SMA) at $2,652 is the next support after it saw a daily close above it on Wednesday. Further down, the 100-day SMA at $2,635 is the next in line.
On the upside, $2,708 is the next pivotal level to look out for. Once that level is cleared, though still quite far off, $2,790 is the key upside level, which would be a fresh all-time high.
XAU/USD: Daily Chart
Gold FAQs
Gold has played a key role in human’s history as it has been widely used as a store of value and medium of exchange. Currently, apart from its shine and usage for jewelry, the precious metal is widely seen as a safe-haven asset, meaning that it is considered a good investment during turbulent times. Gold is also widely seen as a hedge against inflation and against depreciating currencies as it doesn’t rely on any specific issuer or government.
Central banks are the biggest Gold holders. In their aim to support their currencies in turbulent times, central banks tend to diversify their reserves and buy Gold to improve the perceived strength of the economy and the currency. High Gold reserves can be a source of trust for a country’s solvency. Central banks added 1,136 tonnes of Gold worth around $70 billion to their reserves in 2022, according to data from the World Gold Council. This is the highest yearly purchase since records began. Central banks from emerging economies such as China, India and Turkey are quickly increasing their Gold reserves.
Gold has an inverse correlation with the US Dollar and US Treasuries, which are both major reserve and safe-haven assets. When the Dollar depreciates, Gold tends to rise, enabling investors and central banks to diversify their assets in turbulent times. Gold is also inversely correlated with risk assets. A rally in the stock market tends to weaken Gold price, while sell-offs in riskier markets tend to favor the precious metal.
The price can move due to a wide range of factors. Geopolitical instability or fears of a deep recession can quickly make Gold price escalate due to its safe-haven status. As a yield-less asset, Gold tends to rise with lower interest rates, while higher cost of money usually weighs down on the yellow metal. Still, most moves depend on how the US Dollar (USD) behaves as the asset is priced in dollars (XAU/USD). A strong Dollar tends to keep the price of Gold controlled, whereas a weaker Dollar is likely to push Gold prices up.
- Silver price tumbles to near $30.00 as US bond yields rise after traders pare Fed dovish bets.
- US bond yields surge after the release of the surprisingly upbeat US NFP data for December.
- The overall outlook of the Silver price remains upbeat amid risk-off market sentiment.
Silver price (XAG/USD) falls sharply to near $30.00 after failing to extend its upside above the key hurdle of $30.60 in Monday’s European session. The white metal weakens as the US bond yields strengthens, with market participants reassessing their expectations for the Federal Reserve’s (Fed) monetary policy outlook after the release of the United States (US) Nonfarm Payrolls (NFP) data for December.
10-year US Treasury yields post fresh yearly high to near 4.80% as traders have pared Fed dovish bets after the release of the surprisingly upbeat labor market data. Higher yields on interest-bearing assets weigh on non-yielding assets, such as Silver, as they result in higher opportunity costs for them. The US Dollar Index (DXY), which tracks the Greenback’s value against six major currencies, posts a fresh two-year high above 110.00.
According to the CME FedWatch tool, the Fed is expected to keep interest rates unchanged in the current range of 4.25%-4.50% atleast in the next three policy meetings.
Meanwhile, the broader outlook of the Silver price remains firm as the market sentiment is bearish amid uncertainty over the incoming trade policies under the administration of US President-elect Donald Trump. The appeal of non-yielding assets strengthens in a highly uncertain environment.
This week, investors will focus on the US Consumer Price Index (CPI) data for December, which will be published on Wednesday.
Silver technical analysis
Silver price continues to face selling pressure near the 50-day Exponential Moving Average (EMA), which trades near $30.35. The white metal remains below the upward-sloping trendline around $30.50 on a daily timeframe, which is plotted from the February 29 low of $22.30
The 14-day Relative Strength Index (RSI) oscillates inside the 40.00-60.00 range, suggesting a sideways trend.
Looking down, the September low of $27.75 would act as key support for the Silver price. On the upside, the December 12 high of $32.33 would be the barrier.
Silver daily chart
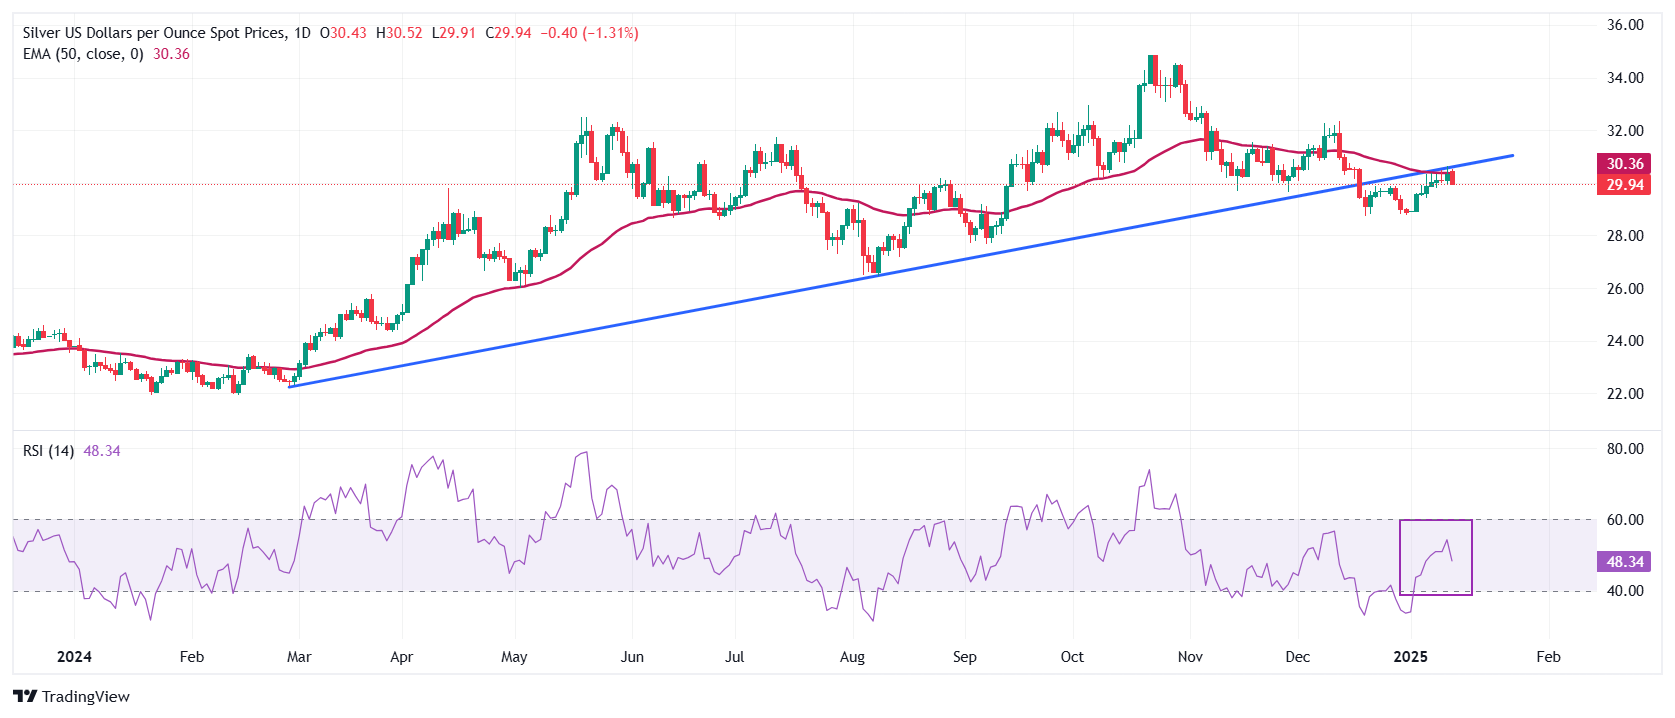
Silver FAQs
Silver is a precious metal highly traded among investors. It has been historically used as a store of value and a medium of exchange. Although less popular than Gold, traders may turn to Silver to diversify their investment portfolio, for its intrinsic value or as a potential hedge during high-inflation periods. Investors can buy physical Silver, in coins or in bars, or trade it through vehicles such as Exchange Traded Funds, which track its price on international markets.
Silver prices can move due to a wide range of factors. Geopolitical instability or fears of a deep recession can make Silver price escalate due to its safe-haven status, although to a lesser extent than Gold's. As a yieldless asset, Silver tends to rise with lower interest rates. Its moves also depend on how the US Dollar (USD) behaves as the asset is priced in dollars (XAG/USD). A strong Dollar tends to keep the price of Silver at bay, whereas a weaker Dollar is likely to propel prices up. Other factors such as investment demand, mining supply – Silver is much more abundant than Gold – and recycling rates can also affect prices.
Silver is widely used in industry, particularly in sectors such as electronics or solar energy, as it has one of the highest electric conductivity of all metals – more than Copper and Gold. A surge in demand can increase prices, while a decline tends to lower them. Dynamics in the US, Chinese and Indian economies can also contribute to price swings: for the US and particularly China, their big industrial sectors use Silver in various processes; in India, consumers’ demand for the precious metal for jewellery also plays a key role in setting prices.
Silver prices tend to follow Gold's moves. When Gold prices rise, Silver typically follows suit, as their status as safe-haven assets is similar. The Gold/Silver ratio, which shows the number of ounces of Silver needed to equal the value of one ounce of Gold, may help to determine the relative valuation between both metals. Some investors may consider a high ratio as an indicator that Silver is undervalued, or Gold is overvalued. On the contrary, a low ratio might suggest that Gold is undervalued relative to Silver.
Silver prices (XAG/USD) fell on Monday, according to FXStreet data. Silver trades at $30.09 per troy ounce, down 0.81% from the $30.34 it cost on Friday.
Silver prices have increased by 4.15% since the beginning of the year.
| Unit measure | Silver Price Today in USD |
|---|---|
| Troy Ounce | 30.09 |
| 1 Gram | 0.97 |
The Gold/Silver ratio, which shows the number of ounces of Silver needed to equal the value of one ounce of Gold, stood at 89.22 on Monday, up from 88.70 on Friday.
Silver FAQs
Silver is a precious metal highly traded among investors. It has been historically used as a store of value and a medium of exchange. Although less popular than Gold, traders may turn to Silver to diversify their investment portfolio, for its intrinsic value or as a potential hedge during high-inflation periods. Investors can buy physical Silver, in coins or in bars, or trade it through vehicles such as Exchange Traded Funds, which track its price on international markets.
Silver prices can move due to a wide range of factors. Geopolitical instability or fears of a deep recession can make Silver price escalate due to its safe-haven status, although to a lesser extent than Gold's. As a yieldless asset, Silver tends to rise with lower interest rates. Its moves also depend on how the US Dollar (USD) behaves as the asset is priced in dollars (XAG/USD). A strong Dollar tends to keep the price of Silver at bay, whereas a weaker Dollar is likely to propel prices up. Other factors such as investment demand, mining supply – Silver is much more abundant than Gold – and recycling rates can also affect prices.
Silver is widely used in industry, particularly in sectors such as electronics or solar energy, as it has one of the highest electric conductivity of all metals – more than Copper and Gold. A surge in demand can increase prices, while a decline tends to lower them. Dynamics in the US, Chinese and Indian economies can also contribute to price swings: for the US and particularly China, their big industrial sectors use Silver in various processes; in India, consumers’ demand for the precious metal for jewellery also plays a key role in setting prices.
Silver prices tend to follow Gold's moves. When Gold prices rise, Silver typically follows suit, as their status as safe-haven assets is similar. The Gold/Silver ratio, which shows the number of ounces of Silver needed to equal the value of one ounce of Gold, may help to determine the relative valuation between both metals. Some investors may consider a high ratio as an indicator that Silver is undervalued, or Gold is overvalued. On the contrary, a low ratio might suggest that Gold is undervalued relative to Silver.
(An automation tool was used in creating this post.)
- The Pound Sterling faces a sharp sell-off as rising borrowing costs for the UK government could force the administration to cut public spending.
- Surprisingly upbeat US NFP data has forced traders to pare dovish Fed bets.
- Investors await the UK-US inflation data for December, which will be released on Wednesday.
The Pound Sterling (GBP) extends its losing streak against its major peers at the start of the week. The British currency continues to face selling pressure as soaring yields on United Kingdom (UK) 30-year gilts deepen concerns over the nation’s economic outlook.
30-year UK gilt yields roar to near 5.47%, the highest level since 1998. Market experts view the surge in gilt yields as partly driven by the uncertainty over incoming trade policies by United States (US) President-elect Donald Trump, who is set to enter the White House on January 20, and the UK’s heavy reliance on foreign financing to address their funds’ demand for domestic spending.
"The more a country relies on foreign financing for its domestic debt issuance, the more exposed it is to the global environment," Deutsche Bank said and added that from the perspective of external flows, the UK is one of the “most vulnerable in the G10".
Soaring UK government’s borrowing costs have jeopardized Chancellor of the Exchequer Rachel Reeves’s decision to fund day-to-day spending through tax receipts and cut public spending. However, UK Treasury Minister Darren Jones clarified at the House of Commons on Thursday that the government's decision to only borrow for investment was "non-negotiable”.
Going forward, the next trigger for the Pound Sterling will be the UK Consumer Price Index (CPI) data for December, which will be released on Wednesday. The consumer inflation data will significantly influence market speculation about the Bank of England’s (BoE) monetary policy outlook. Currently, UK rate futures show that traders pare BoE dovish bets and see a 44 basis points (bps) interest rate reduction this year against the 50 bps recorded last week.
Daily digest market movers: Pound Sterling weakens against US Dollar ahead of UK-US inflation data
- The Pound Sterling posts a fresh yearly low to near 1.2120 against the US Dollar (USD) on Monday. The GBP/USD pair weakens as the US Dollar strengthens as traders pare Federal Reserve (Fed) dovish bets this year after the release of the surprisingly robust US Nonfarm Payrolls (NFP) data for December.
- The US Dollar Index (DXY), which gauges the Greenback’s value against six major currencies, moves higher to a more-than-two-year high near 110.00. The US NFP report showed that labor demand remained strong and the Unemployment Rate decelerated, easing fears of a slowdown in the job market, which forced Fed policymakers to pivot to a policy-easing cycle with a larger-than-usual pace of 50 basis points (bps) in September.
- Analysts at Macquarie expect the Fed to cut borrowing rates only once this year, with the current interest rate cycle bottoming in the range of 4.00%-4.25%.
- This week, investors will focus on the US Producer Price Index (PPI) and Consumer Price Index (CPI) data for December, which will be published on Tuesday and Wednesday, respectively. Signs of stubborn inflation data would further weigh on the Fed’s dovish bets.
Technical Analysis: Pound Sterling posts fresh yearly low near 1.2120
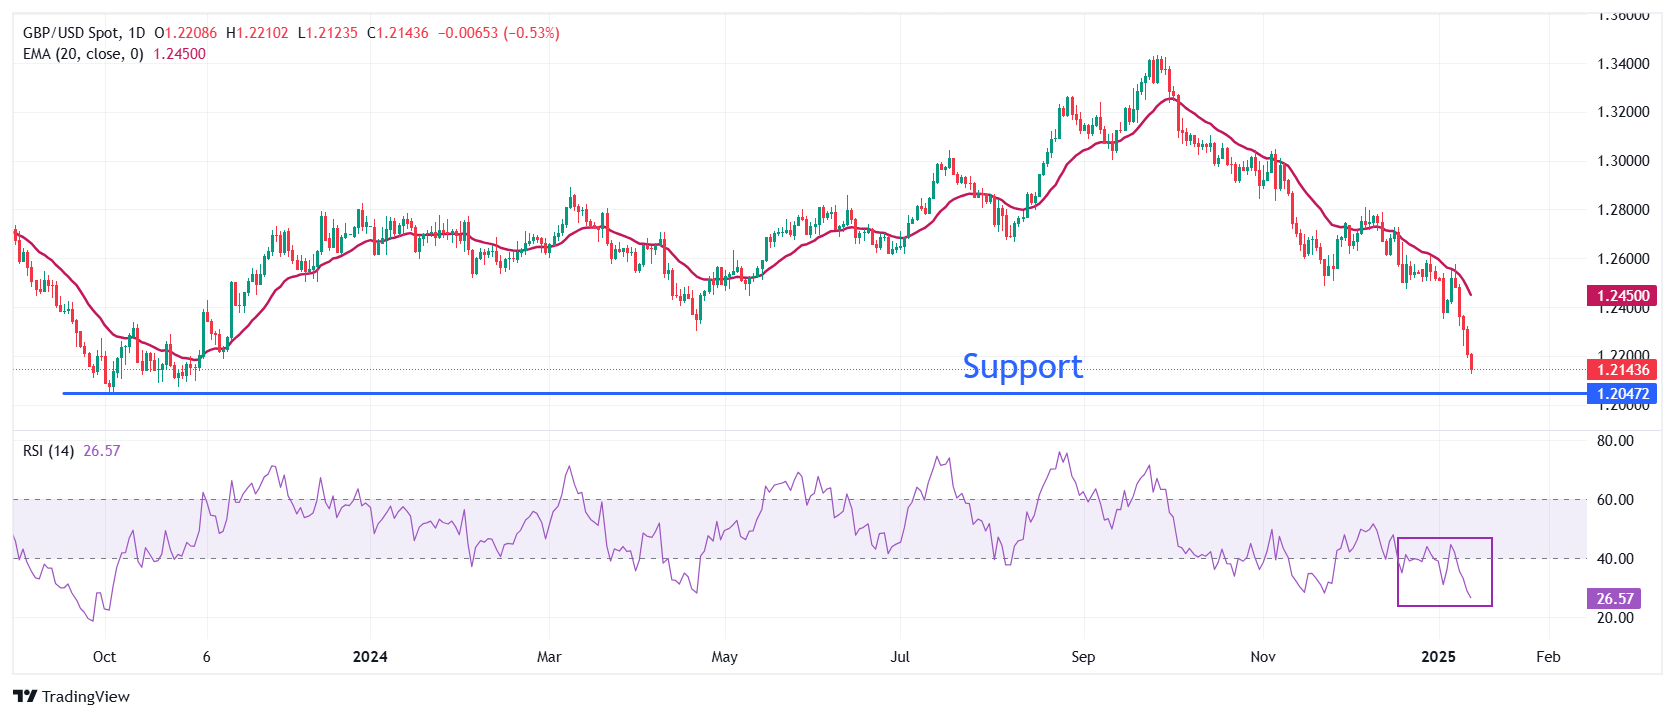
The Pound Sterling refreshes its more-than-a-year low to near 1.2120 against the US Dollar in Monday’s European session. The selling pressure in the GBP/USD pair was triggered after the pair broke below the January 2 low of 1.2350.
Vertically declining 20-day Exponential Moving Average (EMA) near 1.2450 suggests that the near-term trend is extremely bearish.
The 14-day Relative Strength Index (RSI) slides to nearly 26.70, the lowest since October 2023. This scenario suggests a strong bearish momentum. However, a slight recovery cannot be ruled out as the momentum oscillator is in oversold territory.
Looking down, the pair is expected to find support near the October 2023 low of 1.2050. On the upside, the 20-day EMA will act as key resistance.
Pound Sterling FAQs
The Pound Sterling (GBP) is the oldest currency in the world (886 AD) and the official currency of the United Kingdom. It is the fourth most traded unit for foreign exchange (FX) in the world, accounting for 12% of all transactions, averaging $630 billion a day, according to 2022 data. Its key trading pairs are GBP/USD, also known as ‘Cable’, which accounts for 11% of FX, GBP/JPY, or the ‘Dragon’ as it is known by traders (3%), and EUR/GBP (2%). The Pound Sterling is issued by the Bank of England (BoE).
The single most important factor influencing the value of the Pound Sterling is monetary policy decided by the Bank of England. The BoE bases its decisions on whether it has achieved its primary goal of “price stability” – a steady inflation rate of around 2%. Its primary tool for achieving this is the adjustment of interest rates. When inflation is too high, the BoE will try to rein it in by raising interest rates, making it more expensive for people and businesses to access credit. This is generally positive for GBP, as higher interest rates make the UK a more attractive place for global investors to park their money. When inflation falls too low it is a sign economic growth is slowing. In this scenario, the BoE will consider lowering interest rates to cheapen credit so businesses will borrow more to invest in growth-generating projects.
Data releases gauge the health of the economy and can impact the value of the Pound Sterling. Indicators such as GDP, Manufacturing and Services PMIs, and employment can all influence the direction of the GBP. A strong economy is good for Sterling. Not only does it attract more foreign investment but it may encourage the BoE to put up interest rates, which will directly strengthen GBP. Otherwise, if economic data is weak, the Pound Sterling is likely to fall.
Another significant data release for the Pound Sterling is the Trade Balance. This indicator measures the difference between what a country earns from its exports and what it spends on imports over a given period. If a country produces highly sought-after exports, its currency will benefit purely from the extra demand created from foreign buyers seeking to purchase these goods. Therefore, a positive net Trade Balance strengthens a currency and vice versa for a negative balance.
- WTI attracts strong follow-through buying amid worries about tightening global supply.
- Technical buying above the very important 200-day SMA contributes to the momentum.
- Hawkish Fed expectations underpin the USD, which might cap gains for Crude Oil prices.
West Texas Intermediate (WTI) US Crude Oil prices build on Friday's strong move up and gain follow-through positive traction for the third straight day on Monday. The upward trajectory remains uninterrupted through the first half of the European session and lifts the commodity to the $77.60 area, or its highest level since October 8 in the last hour.
The US imposed tougher sanctions against Russia's oil industry, targeting nearly 200 vessels of the so-called shadow fleet and fueling worries about tighter supplies. Adding to this, speculations that US President-elect Donald Trump's administration may tighten sanctions against flows from Iran in the coming months turn out to be key factors that continue pushing Crude Oil prices higher at the start of a new week.
Apart from this, the ongoing positive momentum could further be attributed to technical buying following Friday's acceptance above the very important 200-day Simple Moving Average (SMA) for the first time since August 2024. That said, a slightly overbought Relative Strength Index (RSI) on the daily chart might hold back bullish traders from placing fresh bets around Crude Oil prices and cap any further appreciation.
Moreover, sustained US Dollar (USD) buying, bolstered by hawkish Federal Reserve (Fed) expectations, could act as a headwind for the USD-denominated commodity. Investors now seem convinced that the US central bank will pause its rate-cutting cycle later this month and the bets were reaffirmed by the upbeat US Nonfarm Payrolls (NFP) report on Friday. This keeps the US Treasury bond yields elevated and underpins the USD.
WTI Oil FAQs
WTI Oil is a type of Crude Oil sold on international markets. The WTI stands for West Texas Intermediate, one of three major types including Brent and Dubai Crude. WTI is also referred to as “light” and “sweet” because of its relatively low gravity and sulfur content respectively. It is considered a high quality Oil that is easily refined. It is sourced in the United States and distributed via the Cushing hub, which is considered “The Pipeline Crossroads of the World”. It is a benchmark for the Oil market and WTI price is frequently quoted in the media.
Like all assets, supply and demand are the key drivers of WTI Oil price. As such, global growth can be a driver of increased demand and vice versa for weak global growth. Political instability, wars, and sanctions can disrupt supply and impact prices. The decisions of OPEC, a group of major Oil-producing countries, is another key driver of price. The value of the US Dollar influences the price of WTI Crude Oil, since Oil is predominantly traded in US Dollars, thus a weaker US Dollar can make Oil more affordable and vice versa.
The weekly Oil inventory reports published by the American Petroleum Institute (API) and the Energy Information Agency (EIA) impact the price of WTI Oil. Changes in inventories reflect fluctuating supply and demand. If the data shows a drop in inventories it can indicate increased demand, pushing up Oil price. Higher inventories can reflect increased supply, pushing down prices. API’s report is published every Tuesday and EIA’s the day after. Their results are usually similar, falling within 1% of each other 75% of the time. The EIA data is considered more reliable, since it is a government agency.
OPEC (Organization of the Petroleum Exporting Countries) is a group of 12 Oil-producing nations who collectively decide production quotas for member countries at twice-yearly meetings. Their decisions often impact WTI Oil prices. When OPEC decides to lower quotas, it can tighten supply, pushing up Oil prices. When OPEC increases production, it has the opposite effect. OPEC+ refers to an expanded group that includes ten extra non-OPEC members, the most notable of which is Russia.
European Central Bank (ECB) policymaker Boris Vujčić said on Monday that the “ECB is unlikely to accelerate rate cuts.”
Additional quotes
Cutting faster would need a more significant departure from out projections.
Gradual moves are best amid uncertainty.
Near-term market bets are justified.
Market reaction
These comments fail to lift the Euro, as EUR/USD remains 0.19% lower on the day near 1.0215, as of writing.
- NZD/USD could test the descending channel’s lower boundary at 0.5540 level.
- The 14-day RSI remains below the 30 level, suggesting a bullish divergence.
- The initial resistance appears around the nine-day EMA at the 0.5596 level.
The NZD/USD pair continues its losing streak that began on January 7, trading around 0.5550 during the European hours on Monday. The technical analysis of the daily chart indicates a persistent bearish bias as the pair trades near the lower boundary of a descending channel.
The 14-day Relative Strength Index (RSI) remains below the 30 level, signaling oversold conditions that may prompt a corrective bounce. However, if the RSI continues to hover near the 30 mark, it could further strengthen bearish sentiment.
Additionally, the NZD/USD pair remains below the 14- and nine-day Exponential Moving Averages (EMAs), reflecting weak short-term price momentum and suggesting that downward pressure is likely to persist.
Regarding its support, the NZD/USD pair trades near the lower edge of its descending channel at the 0.5540 level, with the next support at 0.5526—its lowest point since October 2022, reached on December 25.
The NZD/USD pair may find its initial resistance at the nine-day EMA at 0.5596 level, followed by the 14-day EMA at 0.5615 level. A break above this level could improve the short-term price momentum and support the pair to test the descending channel’s upper boundary at the psychological level of 0.5700 level.
NZD/USD: Daily Chart
New Zealand Dollar PRICE Today
The table below shows the percentage change of New Zealand Dollar (NZD) against listed major currencies today. New Zealand Dollar was the weakest against the Japanese Yen.
| USD | EUR | GBP | JPY | CAD | AUD | NZD | CHF | |
|---|---|---|---|---|---|---|---|---|
| USD | 0.22% | 0.62% | -0.28% | -0.04% | -0.07% | 0.10% | -0.15% | |
| EUR | -0.22% | 0.39% | -0.43% | -0.19% | -0.14% | -0.06% | -0.29% | |
| GBP | -0.62% | -0.39% | -0.82% | -0.58% | -0.52% | -0.44% | -0.67% | |
| JPY | 0.28% | 0.43% | 0.82% | 0.24% | 0.15% | 0.24% | 0.14% | |
| CAD | 0.04% | 0.19% | 0.58% | -0.24% | -0.07% | 0.12% | -0.04% | |
| AUD | 0.07% | 0.14% | 0.52% | -0.15% | 0.07% | 0.04% | -0.15% | |
| NZD | -0.10% | 0.06% | 0.44% | -0.24% | -0.12% | -0.04% | -0.23% | |
| CHF | 0.15% | 0.29% | 0.67% | -0.14% | 0.04% | 0.15% | 0.23% |
The heat map shows percentage changes of major currencies against each other. The base currency is picked from the left column, while the quote currency is picked from the top row. For example, if you pick the New Zealand Dollar from the left column and move along the horizontal line to the US Dollar, the percentage change displayed in the box will represent NZD (base)/USD (quote).
- EUR/GBP extends its upward momentum as the Pound Sterling struggles amid mounting concerns over stagflation in the UK.
- The Pound Sterling faces challenges as a 30-year UK gilt yield has climbed to 5.36%, its highest level since 1998.
- ECB Lane indicated that further rate cuts are probable as the central bank seeks to avoid a slowdown in economy.
EUR/GBP extends its strength for the fourth consecutive day, trading near 0.8410 during Monday’s European session. The cross gains traction as the Pound Sterling (GBP) continues to underperform, weighed down by concerns over stagflation in the United Kingdom (UK) amid persistent inflation and stagnant economic growth.
A recent surge in UK government bond yields has sparked worries about the country's fiscal health. The 30-year UK gilt yield has climbed to 5.36%, its highest level since 1998, intensifying challenges for Chancellor of the Exchequer Rachel Reeves and further dampening sentiment around the GBP.
Investors have been offloading UK gilts, driven by fears of mounting debt, sluggish growth, and inflation risks. These concerns contribute to the GBP’s relative weakness, supporting a bullish outlook for the EUR/GBP cross.
In the Eurozone, growing expectations of further policy easing by the European Central Bank (ECB) weigh on the Euro and limiting the upside of the EUR/GBP cross. Traders adopt caution amid uncertainty that protectionist policies under US President-elect Donald Trump's administration will lead to a global trade war, diminishing the appeal of risk-sensitive assets like the Euro.
Speaking at the Asian Financial Forum (AFF) 2025 on Monday, ECB Chief Economist Philip Lane stated that additional interest rate cuts are likely as the central bank aims to prevent the economy from slowing down excessively. Lane emphasized the importance of adopting a balanced approach, being "neither too aggressive nor too cautious" in policymaking this year.
At the same event, ECB policymaker Olli Rehn highlighted the need for Europe to avoid being caught off guard by a potential trade war, stressing that the European Union (EU) should not bear the brunt of tariffs. Rehn also supported the continuation of rate cuts, considering them a prudent course of action.
Euro PRICE Today
The table below shows the percentage change of Euro (EUR) against listed major currencies today. Euro was the strongest against the British Pound.
| USD | EUR | GBP | JPY | CAD | AUD | NZD | CHF | |
|---|---|---|---|---|---|---|---|---|
| USD | 0.22% | 0.47% | -0.14% | 0.02% | -0.05% | 0.05% | -0.06% | |
| EUR | -0.22% | 0.22% | -0.31% | -0.14% | -0.13% | -0.12% | -0.20% | |
| GBP | -0.47% | -0.22% | -0.54% | -0.35% | -0.36% | -0.34% | -0.43% | |
| JPY | 0.14% | 0.31% | 0.54% | 0.16% | 0.02% | 0.05% | 0.07% | |
| CAD | -0.02% | 0.14% | 0.35% | -0.16% | -0.12% | 0.02% | -0.02% | |
| AUD | 0.05% | 0.13% | 0.36% | -0.02% | 0.12% | -0.01% | -0.07% | |
| NZD | -0.05% | 0.12% | 0.34% | -0.05% | -0.02% | 0.01% | -0.10% | |
| CHF | 0.06% | 0.20% | 0.43% | -0.07% | 0.02% | 0.07% | 0.10% |
The heat map shows percentage changes of major currencies against each other. The base currency is picked from the left column, while the quote currency is picked from the top row. For example, if you pick the Euro from the left column and move along the horizontal line to the US Dollar, the percentage change displayed in the box will represent EUR (base)/USD (quote).
- USD/CAD extends its winning streak as traders expect the Fed to keep interest rates steady in January.
- US Nonfarm Payrolls increased by 256K in December, exceeding expected 160K and November’s figure of 212K.
- The downside of the commodity-linked CAD could be restrained due to higher Oil prices.
USD/CAD continues to gain ground for the fifth successive day, trading around 1.4440 during the European hours on Monday. However, the USD/CAD pair appreciated as the US Dollar (USD) strengthened as the robust US labor market data for December will likely reinforce the US Federal Reserve's (Fed) stance to keep interest rates steady in January.
The US Dollar Index (DXY), which tracks the US Dollar’s (USD) performance against six major currencies, reached to 109.98, the highest level since November 2022, during the Asian hours on Monday. Additionally, higher yields are contributing support for the Greenback, with 2-year and 10-year US Treasury bond yields standing at 4.41% and 4.79%, respectively, at the time of writing.
Data from the US Bureau of Labor Statistics (BLS), released on Friday, reported that Nonfarm Payrolls (NFP) increased by 256K in December, significantly exceeding market expectations of 160K and surpassing the revised November figure of 212K (previously reported as 227K). Moreover, the US Unemployment Rate edged down to 4.1% in December from 4.2% in November. However, annual wage inflation, measured by the change in Average Hourly Earnings, dipped slightly to 3.9% from 4% in the prior reading.
Additionally, the risk-sensitive Canadian Dollar (CAD) faces downward pressure amid growing concerns over President-elect Donald Trump's promises to impose tariffs on imports. "We are assuming that Trump implements tariffs on Canada this year, which is likely to weigh on the loonie," said Stephen Brown, Deputy Chief North America Economist at Capital Economics. On Sunday, Canadian Prime Minister Justin Trudeau stated that while the government is not seeking a trade war with the new administration, it will have to respond if the US imposes tariffs on Canadian goods.
However, the commodity-linked CAD may limit its losses as rising Oil prices provide support, given Canada’s position as the largest Oil exporter to the United States (US). West Texas Intermediate (WTI) extends its rally for the third consecutive session, trading near $77.00 per barrel, just below the $77.46 mark reached on Monday, the highest level since October 8. Crude Oil prices continue to rise amid heightened concerns over potential supply disruptions driven by new US sanctions on Russia's Oil industry.
Canadian Dollar FAQs
The key factors driving the Canadian Dollar (CAD) are the level of interest rates set by the Bank of Canada (BoC), the price of Oil, Canada’s largest export, the health of its economy, inflation and the Trade Balance, which is the difference between the value of Canada’s exports versus its imports. Other factors include market sentiment – whether investors are taking on more risky assets (risk-on) or seeking safe-havens (risk-off) – with risk-on being CAD-positive. As its largest trading partner, the health of the US economy is also a key factor influencing the Canadian Dollar.
The Bank of Canada (BoC) has a significant influence on the Canadian Dollar by setting the level of interest rates that banks can lend to one another. This influences the level of interest rates for everyone. The main goal of the BoC is to maintain inflation at 1-3% by adjusting interest rates up or down. Relatively higher interest rates tend to be positive for the CAD. The Bank of Canada can also use quantitative easing and tightening to influence credit conditions, with the former CAD-negative and the latter CAD-positive.
The price of Oil is a key factor impacting the value of the Canadian Dollar. Petroleum is Canada’s biggest export, so Oil price tends to have an immediate impact on the CAD value. Generally, if Oil price rises CAD also goes up, as aggregate demand for the currency increases. The opposite is the case if the price of Oil falls. Higher Oil prices also tend to result in a greater likelihood of a positive Trade Balance, which is also supportive of the CAD.
While inflation had always traditionally been thought of as a negative factor for a currency since it lowers the value of money, the opposite has actually been the case in modern times with the relaxation of cross-border capital controls. Higher inflation tends to lead central banks to put up interest rates which attracts more capital inflows from global investors seeking a lucrative place to keep their money. This increases demand for the local currency, which in Canada’s case is the Canadian Dollar.
Macroeconomic data releases gauge the health of the economy and can have an impact on the Canadian Dollar. Indicators such as GDP, Manufacturing and Services PMIs, employment, and consumer sentiment surveys can all influence the direction of the CAD. A strong economy is good for the Canadian Dollar. Not only does it attract more foreign investment but it may encourage the Bank of Canada to put up interest rates, leading to a stronger currency. If economic data is weak, however, the CAD is likely to fall.
- EUR/USD slumps to near 1.0200 as the US Dollar remains firm on expectations that the Fed will cut interest rates only once this year.
- Traders pare Fed dovish bets after upbeat US NFP data for December.
- ECB’s Lane supports more rate cuts to ensure the Eurozone doesn’t grow too slowly.
EUR/USD slides to a fresh over two-year low to near 1.0200 at the start of the week. The major currency pair weakens as the US Dollar (USD) performs strongly amid soaring bond yields. The US Dollar Index (DXY), which tracks the Greenback’s value against six major currencies, jumps to near 110.00, the highest level seen in over two years. 10-year US Treasury yields trade close to a fresh yearly high at around 4.75%
US bond yields rallied amid growing speculation that the current policy-easing cycle by the Federal Reserve (Fed) has paused for now. Fed dovish bets squeezed after the release of the upbeat United States (US) Nonfarm Payrolls (NFP) data for December on Friday. Fresh payrolls were surprisingly higher than November’s reading, and the Unemployment Rate decelerated.
"Given a resilient labor market, we now think the Fed cutting cycle is over," Bank of America (BofA) said in a note. The BofA added that the economic activity is “robust,” and sees “little reason for additional easing”. The bank also noted that risks to inflation have skewed to the upside.
According to the CME FedWatch tool, the Fed is unlikely to cut interest rates before its June policy meeting.
This week, investors will pay close attention to the US Producer Price Index (PPI) and the Consumer Price Index (CPI) data for December, which will be published on Tuesday and Wednesday, respectively.
Daily digest market movers: EUR/USD declines as risk-off mood weighs on Euro
- EUR/USD faces selling pressure due to dismal market sentiment, which has weighed heavily on the Euro (EUR). Investors have become risk-averse amid uncertainty that protectionist policies under US President-elect Donald Trump's administration will lead to a global trade war, diminishing the appeal of risk-perceived assets.
- Donald Trump is considering a declaration of national economic emergency that will allow him to construct a new tariff plan on legal grounds. In the election campaign, Trump threatened that the European Union (EU) would have to “pay a big price” for not buying “enough American exports”.
- Domestically, firm expectations of more policy-easing from the European Central Bank (ECB) keep the Euro on the back foot. In a "policy dialogue" at the Asian Financial Forum (AFF) 2025 on Monday, ECB Chief Economist Philip Lane said that more interest rate cuts from the central bank are likely as they need to make sure that the economy does not grow “too slowly”. Lane added that the ECB needs to choose the middle path of being “neither too aggressive nor too cautious” this year.
Technical Analysis: EUR/USD posts fresh two-year low at 1.0200
EUR/USD declines to near the key support on the weekly chart, plotted from the September 2022 high of 1.0200. The outlook for the major currency pair is broadly bearish as the 20-week Exponential Moving Average (EMA) at 1.0580 is declining.
The 14-week Relative Strength Index (RSI) slides below 30.00, indicating a strong downside momentum.
Looking down, the pair could find support near the round level of 1.0100. Conversely, the January 6 high of 1.0437 will be the key barrier for the Euro bulls.
Euro FAQs
The Euro is the currency for the 19 European Union countries that belong to the Eurozone. It is the second most heavily traded currency in the world behind the US Dollar. In 2022, it accounted for 31% of all foreign exchange transactions, with an average daily turnover of over $2.2 trillion a day. EUR/USD is the most heavily traded currency pair in the world, accounting for an estimated 30% off all transactions, followed by EUR/JPY (4%), EUR/GBP (3%) and EUR/AUD (2%).
The European Central Bank (ECB) in Frankfurt, Germany, is the reserve bank for the Eurozone. The ECB sets interest rates and manages monetary policy. The ECB’s primary mandate is to maintain price stability, which means either controlling inflation or stimulating growth. Its primary tool is the raising or lowering of interest rates. Relatively high interest rates – or the expectation of higher rates – will usually benefit the Euro and vice versa. The ECB Governing Council makes monetary policy decisions at meetings held eight times a year. Decisions are made by heads of the Eurozone national banks and six permanent members, including the President of the ECB, Christine Lagarde.
Eurozone inflation data, measured by the Harmonized Index of Consumer Prices (HICP), is an important econometric for the Euro. If inflation rises more than expected, especially if above the ECB’s 2% target, it obliges the ECB to raise interest rates to bring it back under control. Relatively high interest rates compared to its counterparts will usually benefit the Euro, as it makes the region more attractive as a place for global investors to park their money.
Data releases gauge the health of the economy and can impact on the Euro. Indicators such as GDP, Manufacturing and Services PMIs, employment, and consumer sentiment surveys can all influence the direction of the single currency. A strong economy is good for the Euro. Not only does it attract more foreign investment but it may encourage the ECB to put up interest rates, which will directly strengthen the Euro. Otherwise, if economic data is weak, the Euro is likely to fall. Economic data for the four largest economies in the euro area (Germany, France, Italy and Spain) are especially significant, as they account for 75% of the Eurozone’s economy.
Another significant data release for the Euro is the Trade Balance. This indicator measures the difference between what a country earns from its exports and what it spends on imports over a given period. If a country produces highly sought after exports then its currency will gain in value purely from the extra demand created from foreign buyers seeking to purchase these goods. Therefore, a positive net Trade Balance strengthens a currency and vice versa for a negative balance.
Here is what you need to know on Monday, January 13:
Risk-off flows extended into Asian trading on Monday as investors digested Friday’s US labor market report, gearing up for the Consumer Price Index (CPI) data due later in the week.
The US Bureau of Labor Statistics (BLS) published the NFP report on Friday, which showed that the economy created 256,000 jobs in December against November’s 227,000 job gains and the expected 160,000 figure. The Unemployment Rate unexpectedly fell to 4.1%, compared to a steady reading of 4.2% expected in the reported period.
Following the US jobs report, markets are pricing in only one Fed rate cut, expecting the central bank to wait until at least June to reduce its policy rate, the CME Group’s FedWatch Tool shows.
Markets remain wary of increased hawkish sentiment surrounding the path of the US Federal Reserve's (Fed) interest rates in the face of the upcoming policies from US President-elect Donald Trump, which are seen as inflationary. Expectations of higher inflation and borrowing costs sent the US Treasury bond yields through the roof on Friday, with the US Dollar (USD) following suit.
The demand for the USD remains unabated early Monday as investors continue to run for cover due to the policy uncertainty in the Trump 2.0 era and the global bond market turmoil. The benchmark US 10-year Treasury bond yields are at their highest level since November 2023, eyeing a 5.0% key level retest.
US Dollar PRICE Today
The table below shows the percentage change of US Dollar (USD) against listed major currencies today. US Dollar was the strongest against the British Pound.
| USD | EUR | GBP | JPY | CAD | AUD | NZD | CHF | |
|---|---|---|---|---|---|---|---|---|
| USD | 0.28% | 0.58% | -0.31% | 0.09% | 0.08% | 0.15% | -0.00% | |
| EUR | -0.28% | 0.28% | -0.51% | -0.13% | -0.06% | -0.10% | -0.20% | |
| GBP | -0.58% | -0.28% | -0.80% | -0.41% | -0.34% | -0.35% | -0.47% | |
| JPY | 0.31% | 0.51% | 0.80% | 0.38% | 0.31% | 0.31% | 0.30% | |
| CAD | -0.09% | 0.13% | 0.41% | -0.38% | -0.04% | 0.06% | -0.01% | |
| AUD | -0.08% | 0.06% | 0.34% | -0.31% | 0.04% | -0.05% | -0.13% | |
| NZD | -0.15% | 0.10% | 0.35% | -0.31% | -0.06% | 0.05% | -0.12% | |
| CHF | 0.00% | 0.20% | 0.47% | -0.30% | 0.00% | 0.13% | 0.12% |
The heat map shows percentage changes of major currencies against each other. The base currency is picked from the left column, while the quote currency is picked from the top row. For example, if you pick the US Dollar from the left column and move along the horizontal line to the Japanese Yen, the percentage change displayed in the box will represent USD (base)/JPY (quote).
Across the FX board, the Pound Sterling remains the weakest as GBP/USD hangs near fresh 14-month lows of 1.2126. Broad risk-aversion, the UK bond market instability and expectations of the Bank of England (BoE)-Fed policy divergence exacerbate the pair’s pain.
EUR/USD trades close to 1.0200, posting moderate losses in early European trading. The latest dovish commentary from the European Central Bank (ECB) Chief Economist Phillip Lane exerts downside pressure on the main currency pair. Lane said that “more easing from the Bank is likely.” ECB policymaker Olli Rehn noted that it makes sense to continue with rate cuts.
AUD/USD consolidates near four-year lows of 0.6131, unable to benefit from China’s efforts to stabilize the Yuan and strong Chinese trade data. China Foreign Exchange Committee (CFXC) vowed to support the Chinese Yuan in a meeting held in Beijing under the guidance of the People’s Bank of China (PBOC) on Monday. Meanwhile, China's trade surplus hit a record $992 billion in 2024, driven by a 21% rise in exports worth $3.6 trillion.
USD/JPY retreated from near 158.00, currently in the red below 157.50. Risk-off mood and BoJ rate hike hopes help put a fresh bid under the Japanese Yen despite a broadly firmer Greenback.
USD/CAD remains better bid near 1.4450, with upside attempts capped by rising Oil prices. WTI oil price flirts with three-month highs near $77.50 following the US Treasury’s imposition of sanctions on Russian oil supply on Friday.
Gold buyers take a breather at a four-week peak just shy of $2,700. Gold price stalls its four-day uptrend as traders could resort to profit-taking ahead of the inflation test.
- GBP/JPY tests the lower boundary of the descending channel at 190.80 level.
- The 14-day RSI declines toward the 30 level, reinforcing the persistent bearish bias.
- The nine-day EMA at 194.52 appears as the primary resistance.
The GBP/JPY cross extends its losing streak for the fifth consecutive day, trading around 191.00 during the early European hours on Monday. An analysis of the daily chart indicates that the price movement within the descending channel pattern is intensifying, which points to a strengthening bearish bias.
The 14-day Relative Strength Index (RSI), a key momentum indicator, holds falls toward the 30 level, reinforcing the ongoing bearish momentum. Moreover, the GBP/JPY cross trades below both the nine-day and 14-day Exponential Moving Averages (EMAs), further suggesting weaker short-term price momentum.
On the downside, the GBP/JPY cross tests the lower boundary of the descending channel at 190.80 level. A break below this pattern would reinforce the bearish bias and put pressure on the currency cross to approach its four-month low at 188.09, which was recorded on December 3, 2024.
The GBP/JPY cross could find primary resistance at the nine-day EMA at 194.52, followed by the 194.99 level. A break above the latter, which is aligned with the psychological level of 195.00, would improve the short-term price momentum and support the pair to approach the descending channel’s upper boundary at the 198.00 level.
GBP/JPY: Daily Chart
British Pound PRICE Today
The table below shows the percentage change of British Pound (GBP) against listed major currencies today. British Pound was the weakest against the Japanese Yen.
| USD | EUR | GBP | JPY | CAD | AUD | NZD | CHF | |
|---|---|---|---|---|---|---|---|---|
| USD | 0.30% | 0.62% | -0.28% | 0.09% | 0.08% | 0.15% | 0.01% | |
| EUR | -0.30% | 0.29% | -0.55% | -0.15% | -0.08% | -0.09% | -0.21% | |
| GBP | -0.62% | -0.29% | -0.84% | -0.44% | -0.38% | -0.39% | -0.49% | |
| JPY | 0.28% | 0.55% | 0.84% | 0.39% | 0.31% | 0.32% | 0.33% | |
| CAD | -0.09% | 0.15% | 0.44% | -0.39% | -0.05% | 0.05% | 0.00% | |
| AUD | -0.08% | 0.08% | 0.38% | -0.31% | 0.05% | -0.05% | -0.11% | |
| NZD | -0.15% | 0.09% | 0.39% | -0.32% | -0.05% | 0.05% | -0.11% | |
| CHF | -0.01% | 0.21% | 0.49% | -0.33% | -0.01% | 0.11% | 0.11% |
The heat map shows percentage changes of major currencies against each other. The base currency is picked from the left column, while the quote currency is picked from the top row. For example, if you pick the British Pound from the left column and move along the horizontal line to the US Dollar, the percentage change displayed in the box will represent GBP (base)/USD (quote).
- USD/CHF traes in positive territory for the fifth consecutive day round 0.9170 in Monday’s early European session.
- The stronger US December employment report supports the USD.
- Trump policy risks and safe-haven flows could boost the CHF.
The USD/CHF pair gathers strength to near 0.9170 during the early European session on Monday, bolstered by the firmer US Dollar (USD). The upbeat US employment report supported the Federal Reserve's (Fed) cautious stance, creating a tailwind for the pair. Investors await the US December Producer Price Index (PPI) data for fresh impetus, which is due later on Tuesday.
The Greenback extends its upside following a report that showed the US created more jobs than expected in December, supporting expectations that the Fed will pause its rate-cutting cycle at its January policy meeting. The CME FedWatch tool indicated the financial markets expect the Fed to keep its benchmark overnight interest rate unchanged in the 4.25%-4.50% range at its January meeting. The US central bank has lowered its policy rate by 100 basis points (bps) since starting its easing cycle in September 2024.
On the Swiss front, the economic uncertainties surrounding President-elect Donald Trump's administration's policies, along with the geopolitical tensions in the Middle East could boost the safe-haven flows, benefiting the Swiss Franc (CHF) against the USD. Israeli strikes continued throughout Gaza, including attacks near Gaza City, Nuseirat, and Bureij. Two attacks were also reported in the Houmin Valley in southern Lebanon, according to Lebanon’s National News Agency.
Swiss Franc FAQs
The Swiss Franc (CHF) is Switzerland’s official currency. It is among the top ten most traded currencies globally, reaching volumes that well exceed the size of the Swiss economy. Its value is determined by the broad market sentiment, the country’s economic health or action taken by the Swiss National Bank (SNB), among other factors. Between 2011 and 2015, the Swiss Franc was pegged to the Euro (EUR). The peg was abruptly removed, resulting in a more than 20% increase in the Franc’s value, causing a turmoil in markets. Even though the peg isn’t in force anymore, CHF fortunes tend to be highly correlated with the Euro ones due to the high dependency of the Swiss economy on the neighboring Eurozone.
The Swiss Franc (CHF) is considered a safe-haven asset, or a currency that investors tend to buy in times of market stress. This is due to the perceived status of Switzerland in the world: a stable economy, a strong export sector, big central bank reserves or a longstanding political stance towards neutrality in global conflicts make the country’s currency a good choice for investors fleeing from risks. Turbulent times are likely to strengthen CHF value against other currencies that are seen as more risky to invest in.
The Swiss National Bank (SNB) meets four times a year – once every quarter, less than other major central banks – to decide on monetary policy. The bank aims for an annual inflation rate of less than 2%. When inflation is above target or forecasted to be above target in the foreseeable future, the bank will attempt to tame price growth by raising its policy rate. Higher interest rates are generally positive for the Swiss Franc (CHF) as they lead to higher yields, making the country a more attractive place for investors. On the contrary, lower interest rates tend to weaken CHF.
Macroeconomic data releases in Switzerland are key to assessing the state of the economy and can impact the Swiss Franc’s (CHF) valuation. The Swiss economy is broadly stable, but any sudden change in economic growth, inflation, current account or the central bank’s currency reserves have the potential to trigger moves in CHF. Generally, high economic growth, low unemployment and high confidence are good for CHF. Conversely, if economic data points to weakening momentum, CHF is likely to depreciate.
As a small and open economy, Switzerland is heavily dependent on the health of the neighboring Eurozone economies. The broader European Union is Switzerland’s main economic partner and a key political ally, so macroeconomic and monetary policy stability in the Eurozone is essential for Switzerland and, thus, for the Swiss Franc (CHF). With such dependency, some models suggest that the correlation between the fortunes of the Euro (EUR) and the CHF is more than 90%, or close to perfect.
- Silver price drifts lower to around $30.20 in Monday’s early European session.
- The stronger USD and elevated US bond yields exert some selling pressure on the white metal.
- Safe-haven demand might cap the downside for Silver price.
The Silver price (XAG/USD) attracts some sellers to near $30.20 during the early European session on Monday. The strengthening of the Greenback and rising US bond yields weigh on the USD-denominated commodity price.
The expectation of a slower pace of rate cuts from the US Federal Reserve (Fed) this year amid sticky inflation and the strong labor market in the US economy might drag the white metal lower in the near term. The US Bureau of Labor Statistics (BLS) reported on Friday that Nonfarm Payrolls (NFP) rose by 256,000 in December versus 212,000 prior, better than the estimations of 160,000. Additionally, the Unemployment Rate ticked lower to 4.1% in December from 4.2% in November.
On Friday, Fed St. Louis President Alberto Musalem highlighted greater caution is warranted in reducing interest rates, adding that the risk that inflation might get stuck between 2.5% and 3% had increased by the time of December’s meeting.
Nonetheless, safe-haven flows due to uncertainties around President-elect Donald Trump’s policies might help limit the Silver price’s losses. Additionally, a record industrial demand, including applications in electronics, electric vehicles, and solar panels, is expected to push total demand to 1.21 billion ounces despite a 16% drop in physical investment, supporting the Silver price.
Silver FAQs
Silver is a precious metal highly traded among investors. It has been historically used as a store of value and a medium of exchange. Although less popular than Gold, traders may turn to Silver to diversify their investment portfolio, for its intrinsic value or as a potential hedge during high-inflation periods. Investors can buy physical Silver, in coins or in bars, or trade it through vehicles such as Exchange Traded Funds, which track its price on international markets.
Silver prices can move due to a wide range of factors. Geopolitical instability or fears of a deep recession can make Silver price escalate due to its safe-haven status, although to a lesser extent than Gold's. As a yieldless asset, Silver tends to rise with lower interest rates. Its moves also depend on how the US Dollar (USD) behaves as the asset is priced in dollars (XAG/USD). A strong Dollar tends to keep the price of Silver at bay, whereas a weaker Dollar is likely to propel prices up. Other factors such as investment demand, mining supply – Silver is much more abundant than Gold – and recycling rates can also affect prices.
Silver is widely used in industry, particularly in sectors such as electronics or solar energy, as it has one of the highest electric conductivity of all metals – more than Copper and Gold. A surge in demand can increase prices, while a decline tends to lower them. Dynamics in the US, Chinese and Indian economies can also contribute to price swings: for the US and particularly China, their big industrial sectors use Silver in various processes; in India, consumers’ demand for the precious metal for jewellery also plays a key role in setting prices.
Silver prices tend to follow Gold's moves. When Gold prices rise, Silver typically follows suit, as their status as safe-haven assets is similar. The Gold/Silver ratio, which shows the number of ounces of Silver needed to equal the value of one ounce of Gold, may help to determine the relative valuation between both metals. Some investors may consider a high ratio as an indicator that Silver is undervalued, or Gold is overvalued. On the contrary, a low ratio might suggest that Gold is undervalued relative to Silver.
FX option expiries for Jan 13 NY cut at 10:00 Eastern Time via DTCC can be found below.
EUR/USD: EUR amounts
- 1.0200 3.9b
- 1.0250 2.5b
- 1.0300 5.1b
- 1.0310 2.4b
- 1.0375 3.4b
GBP/USD: GBP amounts
- 1.2375 1.2b
USD/JPY: USD amounts
- 156.50 460m
- 158.00 931m
USD/CHF: USD amounts
- 0.8890 539m
AUD/USD: AUD amounts
- 0.6335 608m
USD/CAD: USD amounts
- 1.4410 540m
- The US Dollar Index climbs as the latest employment report reinforces the Fed's decision to keep rates steady in January.
- Higher yields on US Treasury bonds are contributing support for the US Dollar.
- US Nonfarm Payrolls increased by 256K in December, exceeding expected 160K and November’s figure of 212K.
The US Dollar Index (DXY), which tracks the US Dollar’s (USD) performance against six major currencies, reached 109.98, the highest level since November 2022, during the Asian hours on Monday. The Greenback strengthened as the robust US labor market data for December will likely reinforce the US Federal Reserve's (Fed) stance to keep interest rates steady in January.
Additionally, Friday's strong US jobs data led to a surge in US yields, with the 2-year and 10-year US Treasury bond yields standing at 4.38% and 4.76%, respectively, at the time of writing. Higher yields are contributing support for the US Dollar.
Data from the US Bureau of Labor Statistics (BLS), released on Friday, reported that Nonfarm Payrolls (NFP) increased by 256K in December, significantly exceeding market expectations of 160K and surpassing the revised November figure of 212K (previously reported as 227K). Moreover, the US Unemployment Rate edged down to 4.1% in December from 4.2% in November. However, annual wage inflation, measured by the change in Average Hourly Earnings, dipped slightly to 3.9% from 4% in the prior reading.
The latest FOMC Meeting Minutes indicated that policymakers agree that the process could take longer than previously anticipated due to recent hotter-than-expected readings on inflation and the effects of potential changes in trade and immigration policy under President-elect Trump’s administration.
In an interview with the Wall Street Journal, St. Louis Federal Reserve President Alberto Musalem suggested that greater caution is warranted in reducing interest rates. Musalem added that the risk that inflation might get stuck between 2.5% and 3% had increased by the time of last month’s meeting, per Reuters.
Federal Reserve Board of Governors member Michelle Bowman added her voice to a chorus of Fed speakers last week as policymakers work double-duty to try and smooth over market reactions to a much tighter pace of rate cuts in 2025 than many market participants had previously anticipated.
US Dollar FAQs
The US Dollar (USD) is the official currency of the United States of America, and the ‘de facto’ currency of a significant number of other countries where it is found in circulation alongside local notes. It is the most heavily traded currency in the world, accounting for over 88% of all global foreign exchange turnover, or an average of $6.6 trillion in transactions per day, according to data from 2022. Following the second world war, the USD took over from the British Pound as the world’s reserve currency. For most of its history, the US Dollar was backed by Gold, until the Bretton Woods Agreement in 1971 when the Gold Standard went away.
The most important single factor impacting on the value of the US Dollar is monetary policy, which is shaped by the Federal Reserve (Fed). The Fed has two mandates: to achieve price stability (control inflation) and foster full employment. Its primary tool to achieve these two goals is by adjusting interest rates. When prices are rising too quickly and inflation is above the Fed’s 2% target, the Fed will raise rates, which helps the USD value. When inflation falls below 2% or the Unemployment Rate is too high, the Fed may lower interest rates, which weighs on the Greenback.
In extreme situations, the Federal Reserve can also print more Dollars and enact quantitative easing (QE). QE is the process by which the Fed substantially increases the flow of credit in a stuck financial system. It is a non-standard policy measure used when credit has dried up because banks will not lend to each other (out of the fear of counterparty default). It is a last resort when simply lowering interest rates is unlikely to achieve the necessary result. It was the Fed’s weapon of choice to combat the credit crunch that occurred during the Great Financial Crisis in 2008. It involves the Fed printing more Dollars and using them to buy US government bonds predominantly from financial institutions. QE usually leads to a weaker US Dollar.
Quantitative tightening (QT) is the reverse process whereby the Federal Reserve stops buying bonds from financial institutions and does not reinvest the principal from the bonds it holds maturing in new purchases. It is usually positive for the US Dollar.
- GBP/USD continues losing ground for the fifth straight day and drops to over a one-year low.
- Stagflation fears and UK fiscal concerns continue to weigh on the GBP amid a bullish US Dollar.
- A slightly oversold RSI on the daily chart warrants some caution for aggressive bearish traders.
The GBP/USD pair remains under heavy selling pressure for the fifth straight day and dives to its lowest level since November 2023, around the 1.2125 region during the Asian session on Monday. Moreover, the fundamental backdrop seems tilted in favor of bearish traders, though slightly oversold conditions on the daily chart warrant some caution before positioning for further losses.
Investors remain concerned about the risk of stagflation in the UK. This, along with the anxiety about the UK's fiscal health, turn out to be key factors contributing to the British Pound's (GBP) relative underperformance. Apart from this, the underlying strong bullish sentiment surrounding the US Dollar (USD), bolstered by firming expectations that the Federal Reserve (Fed) will pause its rate-cutting cycle, validates the negative outlook for the GBP/USD pair.
From a technical perspective, the Relative Strength Index (RSI) on the daily chart has dropped below the 30 mark, making it prudent to wait for some near-term consolidation or a modest rebound before the next leg down. Any attempted recovery, however, might confront resistance and remain capped near the 1.2200 mark. That said, some follow-through buying beyond the Asian session top, around the 1.2210 area, could trigger a short-covering move.
The GBP/USD pair might then accelerate the positive move towards the 1.2245-1.2250 intermediate hurdle before aiming to reclaim the 1.2300 round figure. The latter should act as a key pivotal point, which if cleared decisively could negate the negative bias and shift the near-term bias in favor of bullish traders.
Meanwhile, the downward trajectory seems strong enough to drag the GBP/USD pair further towards testing sub-1.2100 levels, or the November 2023 low. Acceptance below the said handle could make spot prices vulnerable to decline further towards October 2023 through, around the 1.2035 region, en route to the 1.2000 psychological mark.
GBP/USD daily chart

US Dollar PRICE Today
The table below shows the percentage change of US Dollar (USD) against listed major currencies today. US Dollar was the strongest against the British Pound.
| USD | EUR | GBP | JPY | CAD | AUD | NZD | CHF | |
|---|---|---|---|---|---|---|---|---|
| USD | 0.29% | 0.56% | -0.24% | 0.12% | 0.20% | 0.18% | 0.06% | |
| EUR | -0.29% | 0.25% | -0.47% | -0.11% | 0.06% | -0.05% | -0.14% | |
| GBP | -0.56% | -0.25% | -0.73% | -0.35% | -0.21% | -0.30% | -0.39% | |
| JPY | 0.24% | 0.47% | 0.73% | 0.35% | 0.36% | 0.28% | 0.31% | |
| CAD | -0.12% | 0.11% | 0.35% | -0.35% | 0.04% | 0.06% | 0.03% | |
| AUD | -0.20% | -0.06% | 0.21% | -0.36% | -0.04% | -0.13% | -0.18% | |
| NZD | -0.18% | 0.05% | 0.30% | -0.28% | -0.06% | 0.13% | -0.09% | |
| CHF | -0.06% | 0.14% | 0.39% | -0.31% | -0.03% | 0.18% | 0.09% |
The heat map shows percentage changes of major currencies against each other. The base currency is picked from the left column, while the quote currency is picked from the top row. For example, if you pick the US Dollar from the left column and move along the horizontal line to the Japanese Yen, the percentage change displayed in the box will represent USD (base)/JPY (quote).
- EUR/USD loses traction to near 1.0215 in Monday’s early European session, down 0.30% on the day.
- The US labor market data boost the USD and act as a headwind for the pair.
- The ECB's dovish bets contribute to the EUR’s downside.
The EUR/USD pair trades in negative territory for the fifth consecutive day around 1.0215 during the early Asian session on Monday. The US Dollar (USD) gathered strength on the upbeat US employment data for December, which is likely to support the US Federal Reserve's (Fed) stance to keep interest rates steady in January.
The US job growth unexpectedly rose in December while the unemployment rate fell to 4.1%, supporting the Greenback. Markets expect the Fed to hold the interest rate at the January meeting, with futures pricing after the employment report swinging to the expectation of just one rate cut this year. According to the CME FedWatch tool, traders have priced in odds of a single cut increased to 68.5% after the jobs report.
"The solid nonfarm payroll gain and decent earnings growth will keep the U.S. economic expansion on a sturdy foundation to start the year, and that will likely keep the Fed on the sidelines at the January meeting,” noted Scott Anderson, chief U.S. economist at BMO Capital Markets.
Across the pond, the dovish expectations from the European Central Bank (ECB) might weigh on the Euro (EUR) against the USD. Investors anticipate four interest rate reductions by the ECB, which are expected to occur at each meeting by summer. ECB policymaker François Villeroy said on Wednesday that while price pressures were projected to rise slightly in December, interest rates would continue progressing toward the neutral rate “without a slowdown in the pace by summer.”
Euro FAQs
The Euro is the currency for the 19 European Union countries that belong to the Eurozone. It is the second most heavily traded currency in the world behind the US Dollar. In 2022, it accounted for 31% of all foreign exchange transactions, with an average daily turnover of over $2.2 trillion a day. EUR/USD is the most heavily traded currency pair in the world, accounting for an estimated 30% off all transactions, followed by EUR/JPY (4%), EUR/GBP (3%) and EUR/AUD (2%).
The European Central Bank (ECB) in Frankfurt, Germany, is the reserve bank for the Eurozone. The ECB sets interest rates and manages monetary policy. The ECB’s primary mandate is to maintain price stability, which means either controlling inflation or stimulating growth. Its primary tool is the raising or lowering of interest rates. Relatively high interest rates – or the expectation of higher rates – will usually benefit the Euro and vice versa. The ECB Governing Council makes monetary policy decisions at meetings held eight times a year. Decisions are made by heads of the Eurozone national banks and six permanent members, including the President of the ECB, Christine Lagarde.
Eurozone inflation data, measured by the Harmonized Index of Consumer Prices (HICP), is an important econometric for the Euro. If inflation rises more than expected, especially if above the ECB’s 2% target, it obliges the ECB to raise interest rates to bring it back under control. Relatively high interest rates compared to its counterparts will usually benefit the Euro, as it makes the region more attractive as a place for global investors to park their money.
Data releases gauge the health of the economy and can impact on the Euro. Indicators such as GDP, Manufacturing and Services PMIs, employment, and consumer sentiment surveys can all influence the direction of the single currency. A strong economy is good for the Euro. Not only does it attract more foreign investment but it may encourage the ECB to put up interest rates, which will directly strengthen the Euro. Otherwise, if economic data is weak, the Euro is likely to fall. Economic data for the four largest economies in the euro area (Germany, France, Italy and Spain) are especially significant, as they account for 75% of the Eurozone’s economy.
Another significant data release for the Euro is the Trade Balance. This indicator measures the difference between what a country earns from its exports and what it spends on imports over a given period. If a country produces highly sought after exports then its currency will gain in value purely from the extra demand created from foreign buyers seeking to purchase these goods. Therefore, a positive net Trade Balance strengthens a currency and vice versa for a negative balance.
- Gold price kicks off the week on a softer note and pulls back from a one-month top set on Friday.
- Hawkish Fed expectations, elevated US bond yields and a bullish USD weigh on the precious metal.
- The risk-off mood could offer support to the safe-haven XAU/USD pair and help limit further losses.
Gold price (XAU/USD) attracts some sellers during the Asian session on Monday and for now, seems to have snapped a four-day winning streak to the $2,700 neighborhood, or a one-month high touched on Friday. The upbeat US Nonfarm Payrolls (NFP) report reinforced market expectations that the Federal Reserve (Fed) will pause its rate-cutting cycle later this month. This keeps the US Treasury bond yields elevated near their highest level in over a year and the US Dollar (USD) near a two-year peak, which, in turn, exerts some pressure on the non-yielding yellow metal.
Meanwhile, hawkish Fed expectations, along with persistent geopolitical tensions, dampen investors' appetite for riskier assets. This is evident from a weaker tone around the equity markets and should offer some support to the safe-haven Gold price. Hence, it will be prudent to wait for strong follow-through selling before confirming that the XAU/USD's move-up witnessed over the past three weeks or so has run its course and positioning for any meaningful corrective decline. Investors now look forward to this week's release of the US inflation figures for some meaningful impetus.
Gold price drifts lower as upbeat US NFP reaffirms bets that the Fed will slow its rate-cutting cycle
- The US Bureau of Labor Statistics (BLS) reported on Friday that Nonfarm Payrolls rose by 256,000 in December, well above the 212,000 in the previous month and market expectations for a reading of 160,000.
- Other details of the report showed that the Unemployment Rate unexpectedly ticked lower to 4.1% from 4.2% and annual wage inflation, as measured by the change in the Average Hourly Earnings, declined to 3.9%.
- This comes on top of the Federal Reserve's (Fed) hawkish shift in December and dampens hopes for further interest rate cuts by the US central bank, pushing the US Treasury bond yields and the US Dollar higher.
- The yield on the benchmark 10-year US government bond has spiked to its highest level since late 2023, while the USD Index, which tracks the Greenback against a basket of currencies, shot to over a two-year peak.
- Elevated US bond yields and a bullish USD act as a headwind for the Gold price on Monday, though the risk-off mood lends some support to the safe-haven bullion and helps limit any meaningful corrective slide.
- The Office of Foreign Assets Control (OFAC) said on Friday that the US and the UK administration imposed tougher sanctions against Russia's oil industry, targeting nearly 200 vessels of the so-called shadow fleet.
- The Russian Defence Ministry said on Sunday that Russian forces have carried out strikes on Ukrainian military airfields, personnel and vehicles in 139 locations using its air force, drones, missiles and artillery.
- In an apparent violation of the ceasefire agreement between Israel and Hezbollah, more Israeli strikes have been reported in Lebanon. Moreover, Israeli strikes continued across Gaza amid renewed ceasefire talks.
Gold price technical setup supports prospects for the emergence of some dip-buying at lower levels
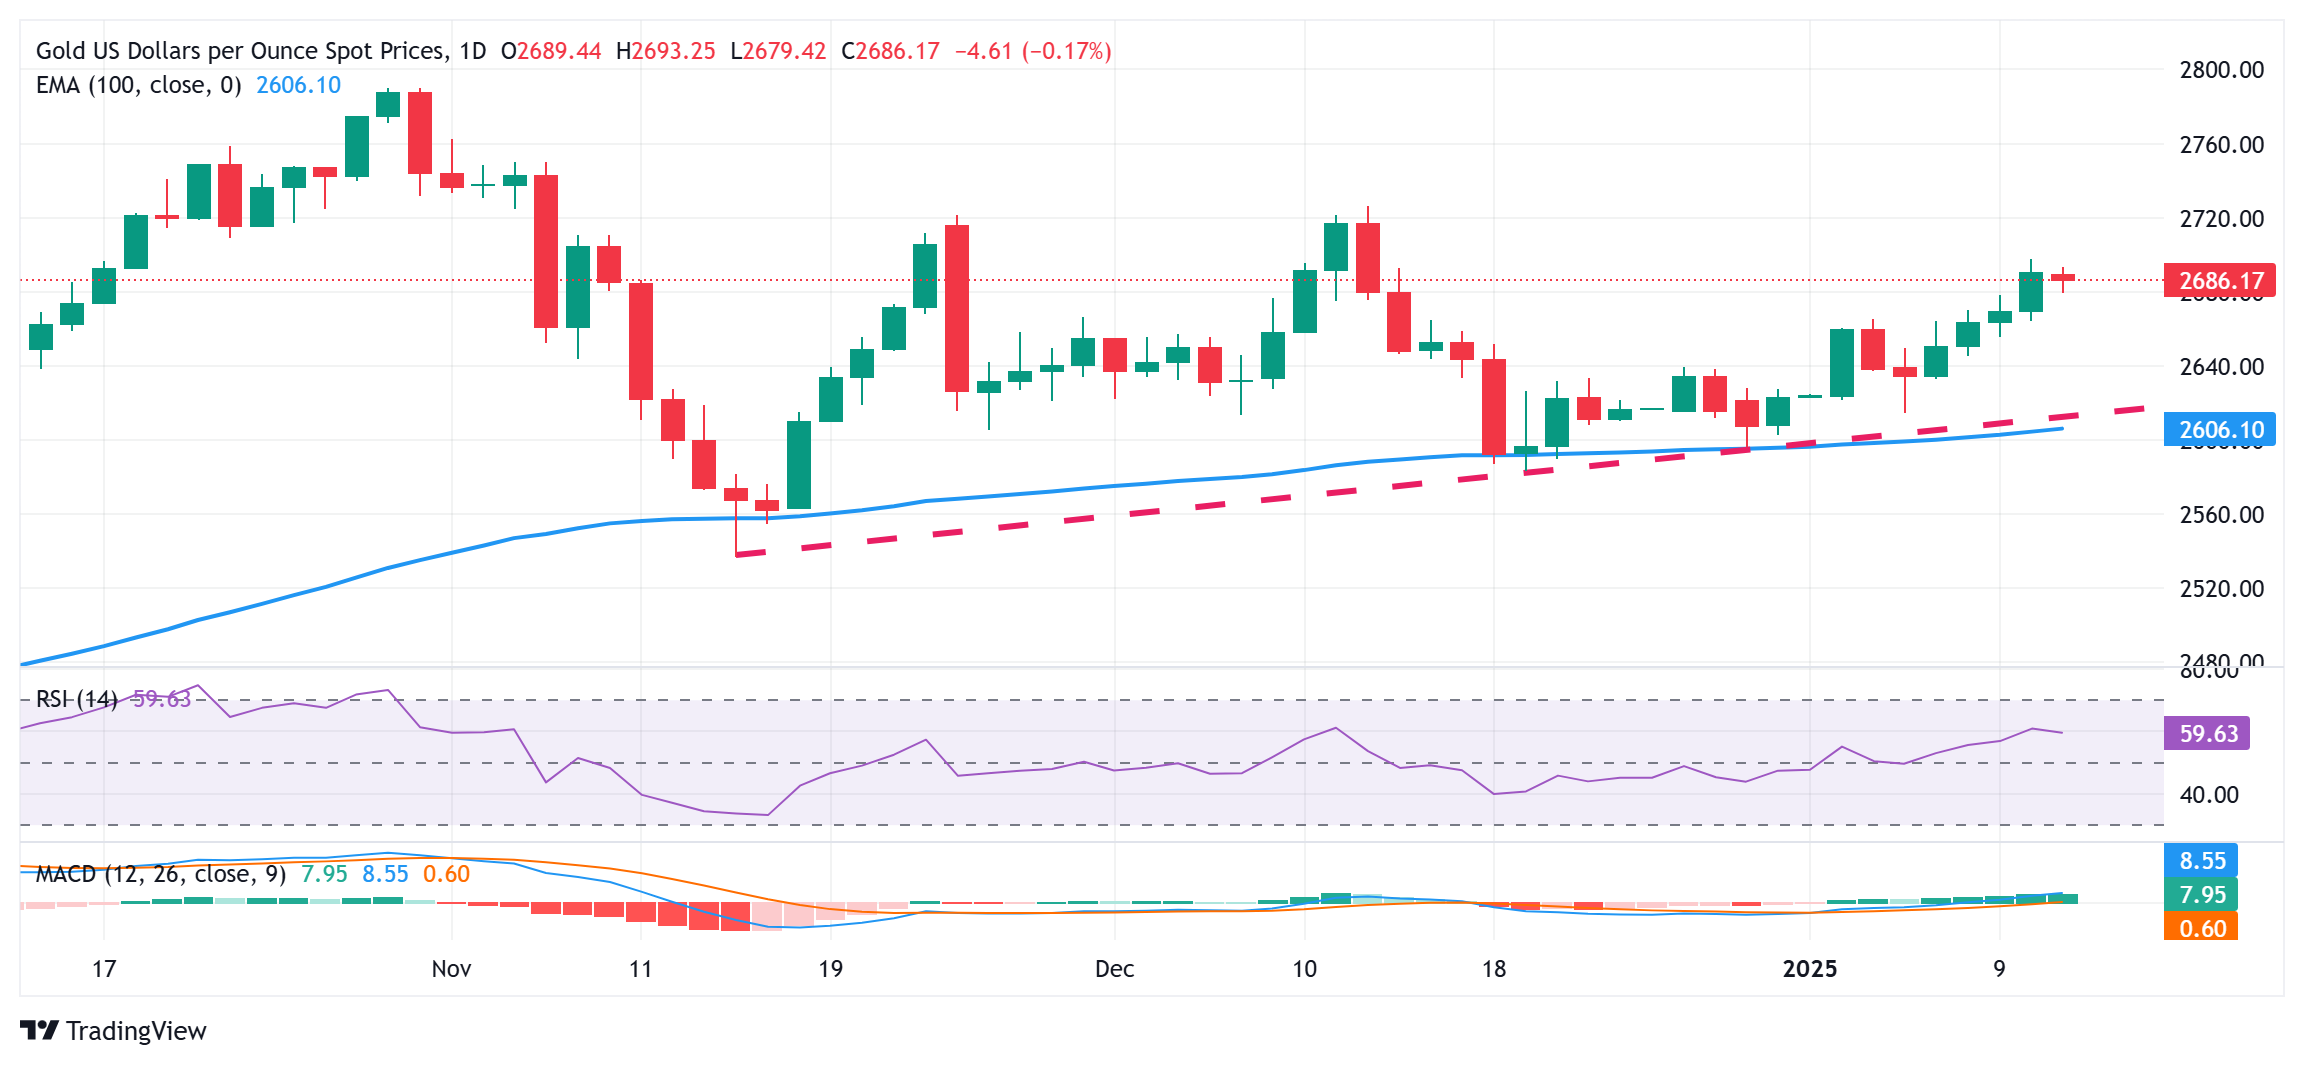
From a technical perspective, any further slide is likely to attract fresh buyers and find decent support near the $2,665-2,664 area. A convincing break below, however, could make the Gold price vulnerable to accelerate the downfall towards the $2,635 region. The downward trajectory could extend further towards the $2,605 confluence, comprising the 100-day Exponential Moving Average (SMA) and a multi-week-old ascending trend-line support.
On the flip side, bulls might now wait for a sustained strength beyond the $2,700 mark before placing fresh bets. Given that oscillators on the daily chart have been gaining positive traction and are still far from being in the overbought territory, the Gold price might then climb to the $2,715 region en route to the $2,730-2,732 area and the $2,746-2,748 supply zone.
Gold FAQs
Gold has played a key role in human’s history as it has been widely used as a store of value and medium of exchange. Currently, apart from its shine and usage for jewelry, the precious metal is widely seen as a safe-haven asset, meaning that it is considered a good investment during turbulent times. Gold is also widely seen as a hedge against inflation and against depreciating currencies as it doesn’t rely on any specific issuer or government.
Central banks are the biggest Gold holders. In their aim to support their currencies in turbulent times, central banks tend to diversify their reserves and buy Gold to improve the perceived strength of the economy and the currency. High Gold reserves can be a source of trust for a country’s solvency. Central banks added 1,136 tonnes of Gold worth around $70 billion to their reserves in 2022, according to data from the World Gold Council. This is the highest yearly purchase since records began. Central banks from emerging economies such as China, India and Turkey are quickly increasing their Gold reserves.
Gold has an inverse correlation with the US Dollar and US Treasuries, which are both major reserve and safe-haven assets. When the Dollar depreciates, Gold tends to rise, enabling investors and central banks to diversify their assets in turbulent times. Gold is also inversely correlated with risk assets. A rally in the stock market tends to weaken Gold price, while sell-offs in riskier markets tend to favor the precious metal.
The price can move due to a wide range of factors. Geopolitical instability or fears of a deep recession can quickly make Gold price escalate due to its safe-haven status. As a yield-less asset, Gold tends to rise with lower interest rates, while higher cost of money usually weighs down on the yellow metal. Still, most moves depend on how the US Dollar (USD) behaves as the asset is priced in dollars (XAU/USD). A strong Dollar tends to keep the price of Gold controlled, whereas a weaker Dollar is likely to push Gold prices up.
European Central Bank (ECB) policymaker Olli Rehn is speaking as part of a "policy dialogue" at the Asian Financial Forum (AFF) 2025, being held in Hong Kong on Monday.
Key quotes
Europe must not get caught off guard by a trade war.
EU should not take hits because of tariffs.
European Central Bank (ECB) Chief Economist Phillip Lane is speaking as part of a "policy dialogue" at the Asian Financial Forum (AFF) 2025, being held in Hong Kong on Monday.
Key quotes
The European economy is still recovering from the pandemic.
ECB baseline for Europe is a recovery.
Expect consumption to improve in 2025.
More easing from the Bank is likely.
Market reaction
EUR/USD has come under renewed selling pressure and attacks 1.0200 on these above comments, losing 0.26% on the day.
Euro PRICE Today
The table below shows the percentage change of Euro (EUR) against listed major currencies today. Euro was the weakest against the Japanese Yen.
| USD | EUR | GBP | JPY | CAD | AUD | NZD | CHF | |
|---|---|---|---|---|---|---|---|---|
| USD | 0.33% | 0.63% | -0.22% | 0.14% | 0.23% | 0.19% | 0.07% | |
| EUR | -0.33% | 0.28% | -0.48% | -0.12% | 0.04% | -0.08% | -0.17% | |
| GBP | -0.63% | -0.28% | -0.78% | -0.40% | -0.25% | -0.36% | -0.44% | |
| JPY | 0.22% | 0.48% | 0.78% | 0.35% | 0.37% | 0.27% | 0.30% | |
| CAD | -0.14% | 0.12% | 0.40% | -0.35% | 0.04% | 0.04% | 0.02% | |
| AUD | -0.23% | -0.04% | 0.25% | -0.37% | -0.04% | -0.15% | -0.19% | |
| NZD | -0.19% | 0.08% | 0.36% | -0.27% | -0.04% | 0.15% | -0.08% | |
| CHF | -0.07% | 0.17% | 0.44% | -0.30% | -0.02% | 0.19% | 0.08% |
The heat map shows percentage changes of major currencies against each other. The base currency is picked from the left column, while the quote currency is picked from the top row. For example, if you pick the Euro from the left column and move along the horizontal line to the US Dollar, the percentage change displayed in the box will represent EUR (base)/USD (quote).
- WTI price reached $77.46, a level not seen since October 8, on Monday.
- Oil prices have surged amid escalating concerns over potential supply disruptions triggered by US sanctions on Russia's oil industry.
- US Treasury targeted producers Gazprom Neft and Surgutneftegas, disrupting Russia's ability to supply Oil to China and India.
West Texas Intermediate (WTI) Oil price extends its gains for the third consecutive session, hovering around $77.00 per barrel, near $77.46—levels not seen since October 8—during the Asian trading hours on Monday. Crude Oil prices continue to climb amid growing concerns over potential supply disruptions triggered by new US sanctions on Russian Oil.
On Friday, the US Treasury introduced broader sanctions on Russian Oil, targeting producers Gazprom Neft and Surgutneftegas, as well as 183 vessels involved in transporting Russian Oil. These restrictions are expected to significantly disrupt Russia's ability to supply Oil to key markets like China and India, compelling these countries to explore alternatives in regions such as the Middle East, Africa, and the Americas.
RBC Capital analysts, as reported by Reuters, noted in a statement, "The new Russian sanctions from the outgoing administration represent a net addition to at-risk supply, introducing more uncertainty to the first-quarter outlook." The latest round of sanctions targets ships involved in 1.5 million barrels per day of seaborne Russian crude oil activity on average in 2024. This includes 750,000 bpd of exports to China and 350,000 bpd to India.
Additionally, Oil demand has risen following a stronger-than-expected US jobs report released on Friday, which signaled economic strength. In recent weeks, crude prices have been further supported by increased winter energy demand, declining US inventories, and speculation surrounding the policies of President-elect Donald Trump's incoming administration.
WTI Oil FAQs
WTI Oil is a type of Crude Oil sold on international markets. The WTI stands for West Texas Intermediate, one of three major types including Brent and Dubai Crude. WTI is also referred to as “light” and “sweet” because of its relatively low gravity and sulfur content respectively. It is considered a high quality Oil that is easily refined. It is sourced in the United States and distributed via the Cushing hub, which is considered “The Pipeline Crossroads of the World”. It is a benchmark for the Oil market and WTI price is frequently quoted in the media.
Like all assets, supply and demand are the key drivers of WTI Oil price. As such, global growth can be a driver of increased demand and vice versa for weak global growth. Political instability, wars, and sanctions can disrupt supply and impact prices. The decisions of OPEC, a group of major Oil-producing countries, is another key driver of price. The value of the US Dollar influences the price of WTI Crude Oil, since Oil is predominantly traded in US Dollars, thus a weaker US Dollar can make Oil more affordable and vice versa.
The weekly Oil inventory reports published by the American Petroleum Institute (API) and the Energy Information Agency (EIA) impact the price of WTI Oil. Changes in inventories reflect fluctuating supply and demand. If the data shows a drop in inventories it can indicate increased demand, pushing up Oil price. Higher inventories can reflect increased supply, pushing down prices. API’s report is published every Tuesday and EIA’s the day after. Their results are usually similar, falling within 1% of each other 75% of the time. The EIA data is considered more reliable, since it is a government agency.
OPEC (Organization of the Petroleum Exporting Countries) is a group of 12 Oil-producing nations who collectively decide production quotas for member countries at twice-yearly meetings. Their decisions often impact WTI Oil prices. When OPEC decides to lower quotas, it can tighten supply, pushing up Oil prices. When OPEC increases production, it has the opposite effect. OPEC+ refers to an expanded group that includes ten extra non-OPEC members, the most notable of which is Russia.
Gold prices fell in India on Monday, according to data compiled by FXStreet.
The price for Gold stood at 7,455.15 Indian Rupees (INR) per gram, down compared with the INR 7,467.92 it cost on Friday.
The price for Gold decreased to INR 86,954.76 per tola from INR 87,104.32 per tola on friday.
| Unit measure | Gold Price in INR |
|---|---|
| 1 Gram | 7,455.15 |
| 10 Grams | 74,550.39 |
| Tola | 86,954.76 |
| Troy Ounce | 231,884.70 |
FXStreet calculates Gold prices in India by adapting international prices (USD/INR) to the local currency and measurement units. Prices are updated daily based on the market rates taken at the time of publication. Prices are just for reference and local rates could diverge slightly.
Gold FAQs
Gold has played a key role in human’s history as it has been widely used as a store of value and medium of exchange. Currently, apart from its shine and usage for jewelry, the precious metal is widely seen as a safe-haven asset, meaning that it is considered a good investment during turbulent times. Gold is also widely seen as a hedge against inflation and against depreciating currencies as it doesn’t rely on any specific issuer or government.
Central banks are the biggest Gold holders. In their aim to support their currencies in turbulent times, central banks tend to diversify their reserves and buy Gold to improve the perceived strength of the economy and the currency. High Gold reserves can be a source of trust for a country’s solvency. Central banks added 1,136 tonnes of Gold worth around $70 billion to their reserves in 2022, according to data from the World Gold Council. This is the highest yearly purchase since records began. Central banks from emerging economies such as China, India and Turkey are quickly increasing their Gold reserves.
Gold has an inverse correlation with the US Dollar and US Treasuries, which are both major reserve and safe-haven assets. When the Dollar depreciates, Gold tends to rise, enabling investors and central banks to diversify their assets in turbulent times. Gold is also inversely correlated with risk assets. A rally in the stock market tends to weaken Gold price, while sell-offs in riskier markets tend to favor the precious metal.
The price can move due to a wide range of factors. Geopolitical instability or fears of a deep recession can quickly make Gold price escalate due to its safe-haven status. As a yield-less asset, Gold tends to rise with lower interest rates, while higher cost of money usually weighs down on the yellow metal. Still, most moves depend on how the US Dollar (USD) behaves as the asset is priced in dollars (XAU/USD). A strong Dollar tends to keep the price of Gold controlled, whereas a weaker Dollar is likely to push Gold prices up.
(An automation tool was used in creating this post.)
- Australian Dollar received support as the China Foreign Exchange Committee pledged to support the Chinese Yuan.
- China's trade surplus widened in December, with the Trade Balance reaching 104.84 billion and Exports increasing by 10.7% YoY.
- The US Dollar Index remains near 109.97, its highest level since November 2022, driven by strong US labor data.
The Australian Dollar (AUD) pauses its four-day losing streak against the US Dollar (USD) on Monday, stabilizing near its lowest level since April 2020. The AUD found some support from China's recent stimulus measures, helping the AUD/USD pair stage a modest recovery. Given the close trading relationship between Australia and China, any changes in China's economic conditions could significantly influence Australian markets.
The China Foreign Exchange Committee (CFXC) pledged to support the Chinese Yuan during a meeting in Beijing on Monday, held under the guidance of the People’s Bank of China (PBOC). Separately, the PBOC and the State Administration of Foreign Exchange (SAFE), China’s FX regulator, announced an increase in the macro-prudential adjustment parameter for cross-border financing from 1.5 to 1.75, effective January 13, 2025.
China's trade surplus grew in December, with the Trade Balance reaching $104.84 billion, surpassing the expected $99.8 billion and the previous balance of $97.44 billion. Exports rose by 10.7% year-over-year, exceeding the forecasted 7.3% and the previous 6.7%. Meanwhile, Imports increased by 1% year-over-year, against the expected decline of 1.5% and the prior 3.9% fall.
The AUD also received support after the release of the TD-MI Inflation Gauge, which climbed by 0.6% month-over-month in December, a significant acceleration from the 0.2% increase recorded in November, reaching its highest level since December 2023. On an annual basis, the Inflation Gauge rose by 2.6%, down from the previous 2.9% increase.
The Aussie Dollar faces downward pressure as markets now price in a 75% probability of a rate cut by the Reserve Bank of Australia (RBA) next month. Investors are expected to closely monitor Australian employment data, set to be released later this week, for additional clarity on the RBA's policy outlook.
Australian Dollar could resume its decline amid increased hawkish mood surrounding Fed
- The US Dollar Index (DXY), which tracks the US Dollar’s performance against six major currencies, remains above 109.50, close to the highest since November 2022. The Greenback strengthened as the robust US labor market data for December will likely reinforce the US Federal Reserve's (Fed) stance to keep interest rates steady in January.
- Friday's strong US jobs data led to a surge in US yields, with the 2-year and 10-year US Treasury bond yields standing at 4.38% and 4.76%, respectively, at the time of writing.
- Data from the US Bureau of Labor Statistics (BLS), released on Friday, reported that Nonfarm Payrolls (NFP) increased by 256K in December, significantly exceeding market expectations of 160K and surpassing the revised November figure of 212K (previously reported as 227K).
- The US Unemployment Rate edged down to 4.1% in December from 4.2% in November. However, annual wage inflation, measured by the change in Average Hourly Earnings, dipped slightly to 3.9% from 4% in the prior reading.
- The latest FOMC Meeting Minutes indicated that policymakers agree that the process could take longer than previously anticipated due to recent hotter-than-expected readings on inflation and the effects of potential changes in trade and immigration policy under President-elect Trump’s administration.
- Federal Reserve Board of Governors member Michelle Bowman added her voice to a chorus of Fed speakers this week as policymakers work double-duty to try and smooth over market reactions to a much tighter pace of rate cuts in 2025 than many market participants had previously anticipated.
- Kansas Fed President Jeffrey Schmid made headlines on Thursday, stating that most of the Federal Reserve's mandated targets have recently been achieved. Schmid emphasized the need to reduce the Fed's balance sheet, suggesting that interest rate policy is approaching its long-term equilibrium. He noted that any future rate cuts should be gradual and guided by economic data.
- ANZ Job Advertisements increased by 0.3% month-over-month in December, recovering from a revised 1.8% decline in November. This improvement indicates that the labor market remains resilient despite elevated interest rates.
- People's Bank of China (PBOC) Governor Pan Gongsheng stated on Monday that "interest rate and reserve requirement ratio (RRR) tools will be utilized to maintain ample liquidity." Gongsheng reaffirmed China's plans to increase the fiscal deficit and emphasized that China will continue to be a driving force for the global economy.
- Australia's monthly Consumer Price Index (CPI) rose 2.3% year-over-year in November, surpassing the market forecast of 2.2% and marking an increase from the 2.1% rise seen in the previous two months. This is the highest reading since August. However, the figure remains within the RBA’s target range of 2–3% for the fourth consecutive month, aided by the ongoing impact of the Energy Bill Relief Fund rebate.
Australian Dollar moves below 0.6150; bullish divergence seen on RSI
The AUD/USD pair trades around 0.6160 on Monday, maintaining a bearish outlook as it continues to move within a descending channel on the daily chart. The 14-day Relative Strength Index (RSI) is at the 30 level, signaling an oversold condition and suggesting a potential upward correction soon.
In terms of support, the AUD/USD pair could test the lower boundary of the descending channel near the 0.5950 level.
Immediate resistance is found near the nine-day Exponential Moving Average (EMA) at 0.6196, followed by the 14-day EMA at 0.6214. A stronger resistance lies at the upper boundary of the descending channel, around 0.6230.
AUD/USD: Daily Chart
Australian Dollar PRICE Today
The table below shows the percentage change of Australian Dollar (AUD) against listed major currencies today. Australian Dollar was the strongest against the British Pound.
| USD | EUR | GBP | JPY | CAD | AUD | NZD | CHF | |
|---|---|---|---|---|---|---|---|---|
| USD | 0.23% | 0.51% | -0.22% | 0.11% | 0.00% | -0.04% | 0.04% | |
| EUR | -0.23% | 0.25% | -0.37% | -0.07% | -0.09% | -0.21% | -0.11% | |
| GBP | -0.51% | -0.25% | -0.65% | -0.31% | -0.34% | -0.46% | -0.36% | |
| JPY | 0.22% | 0.37% | 0.65% | 0.33% | 0.16% | 0.05% | 0.27% | |
| CAD | -0.11% | 0.07% | 0.31% | -0.33% | -0.14% | -0.15% | 0.01% | |
| AUD | -0.01% | 0.09% | 0.34% | -0.16% | 0.14% | -0.16% | -0.02% | |
| NZD | 0.04% | 0.21% | 0.46% | -0.05% | 0.15% | 0.16% | 0.10% | |
| CHF | -0.04% | 0.11% | 0.36% | -0.27% | -0.01% | 0.02% | -0.10% |
The heat map shows percentage changes of major currencies against each other. The base currency is picked from the left column, while the quote currency is picked from the top row. For example, if you pick the Australian Dollar from the left column and move along the horizontal line to the US Dollar, the percentage change displayed in the box will represent AUD (base)/USD (quote).
Australian Dollar FAQs
One of the most significant factors for the Australian Dollar (AUD) is the level of interest rates set by the Reserve Bank of Australia (RBA). Because Australia is a resource-rich country another key driver is the price of its biggest export, Iron Ore. The health of the Chinese economy, its largest trading partner, is a factor, as well as inflation in Australia, its growth rate and Trade Balance. Market sentiment – whether investors are taking on more risky assets (risk-on) or seeking safe-havens (risk-off) – is also a factor, with risk-on positive for AUD.
The Reserve Bank of Australia (RBA) influences the Australian Dollar (AUD) by setting the level of interest rates that Australian banks can lend to each other. This influences the level of interest rates in the economy as a whole. The main goal of the RBA is to maintain a stable inflation rate of 2-3% by adjusting interest rates up or down. Relatively high interest rates compared to other major central banks support the AUD, and the opposite for relatively low. The RBA can also use quantitative easing and tightening to influence credit conditions, with the former AUD-negative and the latter AUD-positive.
China is Australia’s largest trading partner so the health of the Chinese economy is a major influence on the value of the Australian Dollar (AUD). When the Chinese economy is doing well it purchases more raw materials, goods and services from Australia, lifting demand for the AUD, and pushing up its value. The opposite is the case when the Chinese economy is not growing as fast as expected. Positive or negative surprises in Chinese growth data, therefore, often have a direct impact on the Australian Dollar and its pairs.
Iron Ore is Australia’s largest export, accounting for $118 billion a year according to data from 2021, with China as its primary destination. The price of Iron Ore, therefore, can be a driver of the Australian Dollar. Generally, if the price of Iron Ore rises, AUD also goes up, as aggregate demand for the currency increases. The opposite is the case if the price of Iron Ore falls. Higher Iron Ore prices also tend to result in a greater likelihood of a positive Trade Balance for Australia, which is also positive of the AUD.
The Trade Balance, which is the difference between what a country earns from its exports versus what it pays for its imports, is another factor that can influence the value of the Australian Dollar. If Australia produces highly sought after exports, then its currency will gain in value purely from the surplus demand created from foreign buyers seeking to purchase its exports versus what it spends to purchase imports. Therefore, a positive net Trade Balance strengthens the AUD, with the opposite effect if the Trade Balance is negative.
- NZD/USD stages a modest recovery from a multi-year low touched on Friday.
- The uptick lacks any obvious catalyst and runs the risk of fizzling out quickly.
- Hawkish Fed expectations continue to underpin the USD and cap spot prices.
The NZD/USD pair kicks off the new week on a positive note and for now, seems to have snapped a four-day losing streak to its lowest level since October 2022 touched on Friday. Spot prices stick to modest intraday gains around the 0.5565 area and move little following the release of China's Trade Balance data.
The Customs General Administration of China reported that the trade surplus widened to CNY752.91 billion in December from the previous figure of CNY692.8 billion in the wake of a 10.9% YoY jump in exports. Additional details of the report revealed that the country’s imports rose by 1.3% YoY in the same period vs. 1.2% registered in November. The market reaction, however, turns out to be muted amid concerns about a fragile economy, which, in turn, keeps a lid on any meaningful appreciation for antipodean currencies, including the Kiwi.
The US Dollar (USD), on the other hand, stands tall near its highest level in over two years amid growing acceptance that the Federal Reserve (Fed) will pause its rate-cutting cycle later this month. The expectations were reinforced by Friday's upbeat US Nonfarm Payrolls (NFP) report, which showed that the economy added 256,000 in December compared to 212,000 previous and market expectations for a reading of 160,000. Adding to this, the Unemployment Rate unexpectedly edged lower to 4.1% from 4.2% registered in November.
Meanwhile, hawkish Fed expectations, along with geopolitical risks, temper investors' appetite for riskier assets. This is evident from a generally weaker tone around the equity markets, which further seems to act as a tailwind for the safe-haven buck and contribute to capping the risk-sensitive Kiwi. Adding to this, bets for a more aggressive policy easing by the Reserve Bank of New Zealand (RBNZ) warrant some caution before confirming that the NZD/USD pair has formed a near-term bottom and positioning for additional gains.
Economic Indicator
Trade Balance CNY
The Trade Balance released by the General Administration of Customs of the People’s Republic of China is a balance between exports and imports of total goods and services. A positive value shows trade surplus, while a negative value shows trade deficit. It is an event that generates some volatility for the CNY. As the Chinese economy has influence on the global economy, this economic indicator would have an impact on the Forex market. In general, a high reading is seen as positive (or bullish) CNY, while a low reading is seen as negative (or bearish) for the CNY.
Read more.Last release: Mon Jan 13, 2025 03:00
Frequency: Monthly
Actual: 752.91B
Consensus: -
Previous: 692.8B
China's Trade Balance for December, in Chinese Yuan (CNY) terms, came in at CNY752.91 billion, expanding from the previous figure of CNY692.8 billion.
Exports climbed by 10.9% YoY in December vs. 1.5% in November. The country’s imports rose by 1.3% YoY in the same period vs. 1.2% registered previously.
In US Dollar (USD) terms, China’s trade surplus expanded in December.
Trade Balance came in at +104.84B versus +99.8B expected and +97.44B previous.
Exports (YoY): 10.7% vs. 7.3% expected and 6.7% previous.
Imports (YoY): 1% vs. -1.5% expected and -3.9% last.
Additional takeaways
China January-December USD-denominated Exports +5.9% YoY.
China January-December USD-denominated Imports +1.1% YoY.
China's December Trade Surplus with the US was $33.5B vs. $29.81B in November.
China’s 2024 Trade Surplus with the US stood at $361.03 billion.
FX implications
AUD/USD holds recovery gains above 0.6150 after strong China’s trade data. The pair is adding 0.10% on the day to trade near 0.6157, as of writing.
Australian Dollar FAQs
One of the most significant factors for the Australian Dollar (AUD) is the level of interest rates set by the Reserve Bank of Australia (RBA). Because Australia is a resource-rich country another key driver is the price of its biggest export, Iron Ore. The health of the Chinese economy, its largest trading partner, is a factor, as well as inflation in Australia, its growth rate and Trade Balance. Market sentiment – whether investors are taking on more risky assets (risk-on) or seeking safe-havens (risk-off) – is also a factor, with risk-on positive for AUD.
The Reserve Bank of Australia (RBA) influences the Australian Dollar (AUD) by setting the level of interest rates that Australian banks can lend to each other. This influences the level of interest rates in the economy as a whole. The main goal of the RBA is to maintain a stable inflation rate of 2-3% by adjusting interest rates up or down. Relatively high interest rates compared to other major central banks support the AUD, and the opposite for relatively low. The RBA can also use quantitative easing and tightening to influence credit conditions, with the former AUD-negative and the latter AUD-positive.
China is Australia’s largest trading partner so the health of the Chinese economy is a major influence on the value of the Australian Dollar (AUD). When the Chinese economy is doing well it purchases more raw materials, goods and services from Australia, lifting demand for the AUD, and pushing up its value. The opposite is the case when the Chinese economy is not growing as fast as expected. Positive or negative surprises in Chinese growth data, therefore, often have a direct impact on the Australian Dollar and its pairs.
Iron Ore is Australia’s largest export, accounting for $118 billion a year according to data from 2021, with China as its primary destination. The price of Iron Ore, therefore, can be a driver of the Australian Dollar. Generally, if the price of Iron Ore rises, AUD also goes up, as aggregate demand for the currency increases. The opposite is the case if the price of Iron Ore falls. Higher Iron Ore prices also tend to result in a greater likelihood of a positive Trade Balance for Australia, which is also positive of the AUD.
The Trade Balance, which is the difference between what a country earns from its exports versus what it pays for its imports, is another factor that can influence the value of the Australian Dollar. If Australia produces highly sought after exports, then its currency will gain in value purely from the surplus demand created from foreign buyers seeking to purchase its exports versus what it spends to purchase imports. Therefore, a positive net Trade Balance strengthens the AUD, with the opposite effect if the Trade Balance is negative.
- The Indian Rupee gains momentum in Monday’s Asian session.
- The likely RBI intervention supports the INR; firmer USD, foreign outflows, higher oil prices might weigh on the local currency.
- India’s December CPI inflation data will be the highlight on Monday.
The Indian Rupee (INR) recovers some lost ground on Monday after reaching a record low in the previous session. The routine interventions by the Reserve Bank of India (RBI) by offering US Dollar (USD) might have helped limit the INR’s losses.
The stronger-than-expected US employment data on Friday reinforced expectations that the US Federal Reserve (Fed) might not cut interest rates as aggressively this year. This, in turn, might provide some support to the Greenback and exert some selling pressure on the local currency. Additionally, heavy outflows from domestic equities, hawkish remarks from the Fed and a rise in crude oil prices could drag the INR lower, as India is the world's third-largest oil consumer.
Later on Monday, traders will keep an eye on India’s Consumer Price Index (CPI), which is expected to show an increase of 5.3% YoY in December. On the US docket, the Monthly Budget Statement will be released.
Indian Rupee rebounds, upside potentially limited as RBI might ditch quasi-peg
- The Indian Rupee may fall past 90 per Dollar this year as the monetary authority prepares to ditch the currency’s implicit quasi-peg to the USD, according to Gavekal Research.
- The US Nonfarm Payrolls (NFP) rose by 256K in December, compared to a 212K increase (revised from 227K) seen in November, according to the US Bureau of Labor Statistics (BLS) on Friday. This reading came in stronger than the 160K expected by a wide margin.
- The Unemployment Rate in the US ticked lower to 4.1% in December from 4.2% in November. The Average Hourly Earnings declined to 3.9% in December versus 4.0% prior.
- Fed Chicago President Austan Goolsbee said on Friday that if conditions are stable and there is no uptick in inflation, with full employment, the interest rates should go down, per Reuters.
- Fed St. Louis President Alberto Musalem highlighted greater caution is warranted in reducing interest rates, adding that the risk that inflation might get stuck between 2.5% and 3% had increased by the time of last month’s meeting.
USD/INR’s uptrend remains in play, overbought RSI warrants caution for bulls
The Indian Rupee trades on a positive note on the day. The stronger uptrend of the USD/INR remains in place, with the pair holding above the key 100-day Exponential Moving Average (EMA) on the daily timeframe. However, the 14-day Relative Strength Index (RSI) moves beyond the 70.00 mark, indicating the overbought condition. This suggests that further consolidation is on the cards.
The first upside barrier for USD/INR emerges at an all-time high of 86.15. Consistent trading above this level could draw in enough demand to 86.50.
On the flip side, the initial support level for the pair is seen at 85.85, the low of January 10. If bears are taking the upper hand, this could be followed by a drop to 85.65, the low of January 7, followed by the 85.00 psychological support level.
Indian Rupee FAQs
The Indian Rupee (INR) is one of the most sensitive currencies to external factors. The price of Crude Oil (the country is highly dependent on imported Oil), the value of the US Dollar – most trade is conducted in USD – and the level of foreign investment, are all influential. Direct intervention by the Reserve Bank of India (RBI) in FX markets to keep the exchange rate stable, as well as the level of interest rates set by the RBI, are further major influencing factors on the Rupee.
The Reserve Bank of India (RBI) actively intervenes in forex markets to maintain a stable exchange rate, to help facilitate trade. In addition, the RBI tries to maintain the inflation rate at its 4% target by adjusting interest rates. Higher interest rates usually strengthen the Rupee. This is due to the role of the ‘carry trade’ in which investors borrow in countries with lower interest rates so as to place their money in countries’ offering relatively higher interest rates and profit from the difference.
Macroeconomic factors that influence the value of the Rupee include inflation, interest rates, the economic growth rate (GDP), the balance of trade, and inflows from foreign investment. A higher growth rate can lead to more overseas investment, pushing up demand for the Rupee. A less negative balance of trade will eventually lead to a stronger Rupee. Higher interest rates, especially real rates (interest rates less inflation) are also positive for the Rupee. A risk-on environment can lead to greater inflows of Foreign Direct and Indirect Investment (FDI and FII), which also benefit the Rupee.
Higher inflation, particularly, if it is comparatively higher than India’s peers, is generally negative for the currency as it reflects devaluation through oversupply. Inflation also increases the cost of exports, leading to more Rupees being sold to purchase foreign imports, which is Rupee-negative. At the same time, higher inflation usually leads to the Reserve Bank of India (RBI) raising interest rates and this can be positive for the Rupee, due to increased demand from international investors. The opposite effect is true of lower inflation.
- The Japanese Yen attracts safe-haven flows and strengthens for the third straight day.
- The BoJ rate hike uncertainty might hold back the JPY bulls from placing fresh bets.
- Hawkish Fed expectations underpin the USD and lend support to the USD/JPY pair.
The Japanese Yen (JPY) ticks higher against its American counterpart for the third successive day on Monday and moves away from a multi-month low touched last week. The risk-off impulse – as depicted by a weaker tone around the equity markets – turns out to be a key factor underpinning the safe-haven JPY. However, doubts over the BoJ's rate hike plans should cap gains for the JPY.
The broadening inflationary pressure in Japan keeps the door open for another BoJ rate hike in January or March. That said, some investors are betting that the BoJ may wait until April to seek confirmation that strong wage momentum will carry over into the spring negotiations. Furthermore, the recent widening of the US-Japan yield differential could also contribute to capping the JPY.
Apart from this, the underlying bullish sentiment surrounding the US Dollar (USD), bolstered by expectations that the Federal Reserve (Fed) will pause its rate-cutting cycle, should act as a tailwind for the USD/JPY pair. In the absence of any relevant economic releases, the mixed fundamental backdrop warrants caution before positioning for any further JPY appreciating move.
Japanese Yen draws support from the global flight to safety mode; lacks bullish conviction
- A mix of geopolitical tensions and rate jitters temper investors' appetite for riskier assets, which, in turn, benefits traditional safe-haven assets and drives flows towards the Japanese Yen for the third straight day on Monday.
- The Office of Foreign Assets Control (OFAC) said on Friday that the US and the UK administration imposed tougher sanctions against Russia's oil industry, targeting nearly 200 vessels of the so-called shadow fleet.
- The Russian Defence Ministry said on Sunday that Russian forces have carried out strikes on Ukrainian military airfields, personnel and vehicles in 139 locations using its air force, drones, missiles and artillery.
- In an apparent violation of the ceasefire agreement between Israel and Hezbollah, more Israeli strikes have been reported in Lebanon. Moreover, Israeli strikes continued across Gaza amid renewed ceasefire talks.
- The US Bureau of Labor Statistics (BLS) reported on Friday that Nonfarm Payrolls rose by 256,000 in December compared to 212,000 in the previous month and market expectations for a reading of 160,000.
- Other details showed that the Unemployment Rate unexpectedly edged lower to 4.1% from 4.2%, while annual wage inflation, as measured by the change in the Average Hourly Earnings, declined to 3.9%.
- The upbeat US jobs report reinforced market expectations that the Federal Reserve will pause its rate-cutting cycle at its upcoming policy meeting later this month amid lingering inflation and political uncertainty.
- This, in turn, pushed the US Dollar to over a two-year peak and the US Treasury yields to the highest in over a year, widening the US-Japan yield differential, which should cap the upside for the lower-yielding JPY.
- The market focus now shifts to the release of the US Producer Price Index (PPI) and the US Consumer Price Index (CPI) on Tuesday and Wednesday, respectively, which will play a key role in influencing the USD/JPY pair.
USD/JPY might continue to attract some dip-buyers; 156.00 holds the key for bulls

From a technical perspective, Friday's low, around the 157.20-157.20 region, could offer immediate support ahead of the 157.00 mark and the 156.80-156.75 support zone. Any further weakness could be seen as a buying opportunity near last week's swing low, around the 156.25-156.20 area. This should help limit the downside for the USD/JPY pair near the 156.00 mark, which if broken decisively might shift the near-term bias in favor of bearish traders and pave the way for deeper losses.
On the flip side, the Asian session high, around the 158.00 neighborhood, now seems to act as an immediate hurdle ahead of the 158.45-158.50 region and the 158.85-158.90 zone, or the multi-month peak touched on Friday. Some follow-through buying beyond the 159.00 mark will be seen as a fresh trigger for bulls and lift the USD/JPY pair towards the next relevant hurdle near mid-159.00s en route to the 160.00 psychological mark.
Japanese Yen FAQs
The Japanese Yen (JPY) is one of the world’s most traded currencies. Its value is broadly determined by the performance of the Japanese economy, but more specifically by the Bank of Japan’s policy, the differential between Japanese and US bond yields, or risk sentiment among traders, among other factors.
One of the Bank of Japan’s mandates is currency control, so its moves are key for the Yen. The BoJ has directly intervened in currency markets sometimes, generally to lower the value of the Yen, although it refrains from doing it often due to political concerns of its main trading partners. The BoJ ultra-loose monetary policy between 2013 and 2024 caused the Yen to depreciate against its main currency peers due to an increasing policy divergence between the Bank of Japan and other main central banks. More recently, the gradually unwinding of this ultra-loose policy has given some support to the Yen.
Over the last decade, the BoJ’s stance of sticking to ultra-loose monetary policy has led to a widening policy divergence with other central banks, particularly with the US Federal Reserve. This supported a widening of the differential between the 10-year US and Japanese bonds, which favored the US Dollar against the Japanese Yen. The BoJ decision in 2024 to gradually abandon the ultra-loose policy, coupled with interest-rate cuts in other major central banks, is narrowing this differential.
The Japanese Yen is often seen as a safe-haven investment. This means that in times of market stress, investors are more likely to put their money in the Japanese currency due to its supposed reliability and stability. Turbulent times are likely to strengthen the Yen’s value against other currencies seen as more risky to invest in.
An official at China Customs said on Monday that “there is still big room for China's import growth this year.”
Additional headlines
China's 2024 imports value at CNY18.39 trillion.
China’s 2024 Yuan-denominated imports +2.3% YoY.
China’s 2024 Yuan-denominated exports +7.1% YoY.
China's imports were impacted by global commodities price changes in the second half of 2024.
Some countries' 'politicization of economic and trade issues' and 'abuse of export controls' also impacted China's imports last year.
We will roll out more targeted measures at proper time to stabilise trade.
China's trade surplus out of GDP is at a reasonable level.
No matter how the external environment changes, China will firmly push forward opening up.
China firmly opposes trade protectionism.
Despite rising uncertainties and challenges in external environment, we are sure China's exports will show resilience and vitality in 2025.
The so-called china's overcapacity does not exist, not matter looking it from china's comparative advantages or global market demand.
The repetitive hype-up of china's overcapacity in fact is cracking down on china's development.
Australian Dollar PRICE Today
The table below shows the percentage change of Australian Dollar (AUD) against listed major currencies today. Australian Dollar was the strongest against the Canadian Dollar.
| USD | EUR | GBP | JPY | CAD | AUD | NZD | CHF | |
|---|---|---|---|---|---|---|---|---|
| USD | 0.02% | 0.18% | -0.17% | 0.01% | -0.22% | -0.17% | -0.03% | |
| EUR | -0.02% | 0.14% | -0.13% | 0.05% | -0.10% | -0.14% | 0.03% | |
| GBP | -0.18% | -0.14% | -0.25% | -0.09% | -0.25% | -0.28% | -0.11% | |
| JPY | 0.17% | 0.13% | 0.25% | 0.15% | -0.15% | -0.17% | 0.12% | |
| CAD | -0.01% | -0.05% | 0.09% | -0.15% | -0.27% | -0.19% | 0.04% | |
| AUD | 0.22% | 0.10% | 0.25% | 0.15% | 0.27% | -0.06% | 0.14% | |
| NZD | 0.17% | 0.14% | 0.28% | 0.17% | 0.19% | 0.06% | 0.17% | |
| CHF | 0.03% | -0.03% | 0.11% | -0.12% | -0.04% | -0.14% | -0.17% |
The heat map shows percentage changes of major currencies against each other. The base currency is picked from the left column, while the quote currency is picked from the top row. For example, if you pick the Australian Dollar from the left column and move along the horizontal line to the US Dollar, the percentage change displayed in the box will represent AUD (base)/USD (quote).
| Raw materials | Closed | Change, % |
|---|---|---|
| Silver | 30.385 | 0.92 |
| Gold | 2688.6 | 0.68 |
| Palladium | 942.53 | 1.45 |
People's Bank of China (PBOC) Governor Pan Gongsheng said on Monday that “interest rate and RRR tools will be utilized to maintain ample liquidity.”
Additional comments
Reaffirms China plans to increase the fiscal deficit.
China will remain a driving force for the global economy.
Policy focus should shift towards investment and consumption.
Challenges persist in China's economic development.
Emphasis will be placed on boosting residents' consumption demand.
China's real estate market is reaching a new equilibrium.
Will significantly increase China's national foreign exchange reserve allocation in Hong Kong.
Will support Hong Kong monetary authority to use exchange funds to replenish the offshore Renminbi market.
- EUR/USD depreciates as strong US labor data bolster expectations that the Fed will maintain its current interest rate levels.
- US Nonfarm Payrolls increased by 256K in December, exceeding expected 160K and November’s figure of 212K.
- Traders expect the ECB to implement four rate cuts, likely to be announced at each meeting leading up to summer.
EUR/USD remains subdued for the fifth consecutive session, holding its position around 1.0240 during the Asian trading hours. The pair faces challenges as the US Dollar (USD) strengthens following stronger-than-expected job growth in the United States (US) for December.
Data from the US Bureau of Labor Statistics (BLS), released on Friday, reported that Nonfarm Payrolls (NFP) increased by 256K in December, significantly exceeding market expectations of 160K and surpassing the revised November figure of 212K (previously reported as 227K).
Additionally, the Unemployment Rate edged down to 4.1% in December from 4.2% in November. However, annual wage inflation, measured by the change in Average Hourly Earnings, dipped slightly to 3.9% from 4% in the prior reading.
The robust US labor market data for December will likely reinforce the US Federal Reserve's (Fed) stance to keep interest rates steady in January, supporting the Greenback against other currencies. According to the CME FedWatch Tool, financial markets anticipate the Fed will maintain its benchmark overnight interest rate in the 4.25%-4.50% range during its January 28-29 meeting.
Additionally, the Euro (EUR) faces headwinds as traders anticipate four interest rate cuts by the European Central Bank (ECB), which are expected to occur at each meeting by summer. ECB policymakers appear comfortable with these dovish expectations, as inflationary pressures in the Eurozone remain largely under control.
On Wednesday, ECB policymaker and Bank of France Governor François Villeroy noted that while price pressures were projected to rise slightly in December, interest rates would continue progressing toward the neutral rate “without a slowdown in the pace by summer,” provided upcoming data confirm that the “pullback in price pressures won’t persist.”
Euro FAQs
The Euro is the currency for the 19 European Union countries that belong to the Eurozone. It is the second most heavily traded currency in the world behind the US Dollar. In 2022, it accounted for 31% of all foreign exchange transactions, with an average daily turnover of over $2.2 trillion a day. EUR/USD is the most heavily traded currency pair in the world, accounting for an estimated 30% off all transactions, followed by EUR/JPY (4%), EUR/GBP (3%) and EUR/AUD (2%).
The European Central Bank (ECB) in Frankfurt, Germany, is the reserve bank for the Eurozone. The ECB sets interest rates and manages monetary policy. The ECB’s primary mandate is to maintain price stability, which means either controlling inflation or stimulating growth. Its primary tool is the raising or lowering of interest rates. Relatively high interest rates – or the expectation of higher rates – will usually benefit the Euro and vice versa. The ECB Governing Council makes monetary policy decisions at meetings held eight times a year. Decisions are made by heads of the Eurozone national banks and six permanent members, including the President of the ECB, Christine Lagarde.
Eurozone inflation data, measured by the Harmonized Index of Consumer Prices (HICP), is an important econometric for the Euro. If inflation rises more than expected, especially if above the ECB’s 2% target, it obliges the ECB to raise interest rates to bring it back under control. Relatively high interest rates compared to its counterparts will usually benefit the Euro, as it makes the region more attractive as a place for global investors to park their money.
Data releases gauge the health of the economy and can impact on the Euro. Indicators such as GDP, Manufacturing and Services PMIs, employment, and consumer sentiment surveys can all influence the direction of the single currency. A strong economy is good for the Euro. Not only does it attract more foreign investment but it may encourage the ECB to put up interest rates, which will directly strengthen the Euro. Otherwise, if economic data is weak, the Euro is likely to fall. Economic data for the four largest economies in the euro area (Germany, France, Italy and Spain) are especially significant, as they account for 75% of the Eurozone’s economy.
Another significant data release for the Euro is the Trade Balance. This indicator measures the difference between what a country earns from its exports and what it spends on imports over a given period. If a country produces highly sought after exports then its currency will gain in value purely from the extra demand created from foreign buyers seeking to purchase these goods. Therefore, a positive net Trade Balance strengthens a currency and vice versa for a negative balance.
- USD/CAD gathers strength to near 1.4425 in Monday’s Asian session.
- The Fed’s cautious stance and Trump tariff threats support the USD.
- Higher crude oil prices might boost the commodity-linked Loonie.
The USD/CAD pair extends its upside to near 1.4430 during the Asian trading hours on Monday. The potential US trade tariffs drag the Canadian Dollar (CAD) lower against the Greenback. However, the optimism around a likely change in Canadian government and a rise in crude oil prices might cap the downside for CAD.
The upbeat US employment report supported the US Federal Reserve’s (Fed) cautious stance toward rate cuts this year, supporting the USD. The US Nonfarm Payrolls (NFP) rose by 256K in December versus 212K prior (revised from 227K), the US Bureau of Labor Statistics (BLS) reported Friday. This reading came in above the market consensus of 160K. Additionally, the Unemployment Rate edged lower to 4.1% in December from 4.2% in November.
Furthermore, the mounting fears that pledges by President-elect Donald Trump to impose tariffs on imports might could undermine the CAD. ”We are assuming that Trump hits Canada with tariffs this year, which is likely to weigh on the loonie," said Stephen Brown, deputy chief North America economist at Capital Economics.
On Sunday, Canadian Prime Minister Justin Trudeau said that the government isn’t looking for a trade war with the new administration but will have to retaliate if the US puts tariffs on Canadian products. Meanwhile, higher crude oil prices could lift the CAD. It's worth noting that Canada is the largest oil exporter to the United States (US), and higher crude oil prices tend to have a positive impact on the CAD value.
Canadian Dollar FAQs
The key factors driving the Canadian Dollar (CAD) are the level of interest rates set by the Bank of Canada (BoC), the price of Oil, Canada’s largest export, the health of its economy, inflation and the Trade Balance, which is the difference between the value of Canada’s exports versus its imports. Other factors include market sentiment – whether investors are taking on more risky assets (risk-on) or seeking safe-havens (risk-off) – with risk-on being CAD-positive. As its largest trading partner, the health of the US economy is also a key factor influencing the Canadian Dollar.
The Bank of Canada (BoC) has a significant influence on the Canadian Dollar by setting the level of interest rates that banks can lend to one another. This influences the level of interest rates for everyone. The main goal of the BoC is to maintain inflation at 1-3% by adjusting interest rates up or down. Relatively higher interest rates tend to be positive for the CAD. The Bank of Canada can also use quantitative easing and tightening to influence credit conditions, with the former CAD-negative and the latter CAD-positive.
The price of Oil is a key factor impacting the value of the Canadian Dollar. Petroleum is Canada’s biggest export, so Oil price tends to have an immediate impact on the CAD value. Generally, if Oil price rises CAD also goes up, as aggregate demand for the currency increases. The opposite is the case if the price of Oil falls. Higher Oil prices also tend to result in a greater likelihood of a positive Trade Balance, which is also supportive of the CAD.
While inflation had always traditionally been thought of as a negative factor for a currency since it lowers the value of money, the opposite has actually been the case in modern times with the relaxation of cross-border capital controls. Higher inflation tends to lead central banks to put up interest rates which attracts more capital inflows from global investors seeking a lucrative place to keep their money. This increases demand for the local currency, which in Canada’s case is the Canadian Dollar.
Macroeconomic data releases gauge the health of the economy and can have an impact on the Canadian Dollar. Indicators such as GDP, Manufacturing and Services PMIs, employment, and consumer sentiment surveys can all influence the direction of the CAD. A strong economy is good for the Canadian Dollar. Not only does it attract more foreign investment but it may encourage the Bank of Canada to put up interest rates, leading to a stronger currency. If economic data is weak, however, the CAD is likely to fall.
China Foreign Exchange Committee (CFXC) vowed to support the Chinese Yuan in a meeting held in Beijing under the guidance of the People’s Bank of China (PBOC) on Monday.
Key takeaways
The meeting discussed resolutely keeping the yuan exchange rate basically stable and at balanced levels
To increase forex market resilience, strengthen forex market.
Measures announced to correct pro-cyclical market activities, deal with behaviors disrupting market orders, prevent exchange rate overshooting risks.
In a separate effort, the PBOC and the State Administration of Foreign Exchange (SAFE/ China’s FX regulator) have raised the macro-prudential adjustment parameter for cross-border financing from 1.5 to 1.75, effective January 13, 2025.
Market reaction
The Australian Dollar draws some support from Chinese stimulus efforts, staging a comeback in the AUD/USD pair from four-year troughs. The pair is currently trading 0.21% higher on the day at 0.6161.
Australian Dollar FAQs
One of the most significant factors for the Australian Dollar (AUD) is the level of interest rates set by the Reserve Bank of Australia (RBA). Because Australia is a resource-rich country another key driver is the price of its biggest export, Iron Ore. The health of the Chinese economy, its largest trading partner, is a factor, as well as inflation in Australia, its growth rate and Trade Balance. Market sentiment – whether investors are taking on more risky assets (risk-on) or seeking safe-havens (risk-off) – is also a factor, with risk-on positive for AUD.
The Reserve Bank of Australia (RBA) influences the Australian Dollar (AUD) by setting the level of interest rates that Australian banks can lend to each other. This influences the level of interest rates in the economy as a whole. The main goal of the RBA is to maintain a stable inflation rate of 2-3% by adjusting interest rates up or down. Relatively high interest rates compared to other major central banks support the AUD, and the opposite for relatively low. The RBA can also use quantitative easing and tightening to influence credit conditions, with the former AUD-negative and the latter AUD-positive.
China is Australia’s largest trading partner so the health of the Chinese economy is a major influence on the value of the Australian Dollar (AUD). When the Chinese economy is doing well it purchases more raw materials, goods and services from Australia, lifting demand for the AUD, and pushing up its value. The opposite is the case when the Chinese economy is not growing as fast as expected. Positive or negative surprises in Chinese growth data, therefore, often have a direct impact on the Australian Dollar and its pairs.
Iron Ore is Australia’s largest export, accounting for $118 billion a year according to data from 2021, with China as its primary destination. The price of Iron Ore, therefore, can be a driver of the Australian Dollar. Generally, if the price of Iron Ore rises, AUD also goes up, as aggregate demand for the currency increases. The opposite is the case if the price of Iron Ore falls. Higher Iron Ore prices also tend to result in a greater likelihood of a positive Trade Balance for Australia, which is also positive of the AUD.
The Trade Balance, which is the difference between what a country earns from its exports versus what it pays for its imports, is another factor that can influence the value of the Australian Dollar. If Australia produces highly sought after exports, then its currency will gain in value purely from the surplus demand created from foreign buyers seeking to purchase its exports versus what it spends to purchase imports. Therefore, a positive net Trade Balance strengthens the AUD, with the opposite effect if the Trade Balance is negative.
On Monday, the People’s Bank of China (PBoC) set the USD/CNY central rate for the trading session ahead at 7.1885 as compared to Friday's fix of 7.1891 and 7.3442 Reuters estimates.
- GBP/USD struggles to register any meaningful recovery and seems vulnerable to slide further.
- Stagflation fears and UK fiscal concerns continue to weigh on the GBP amid a bullish USD.
- The upbeat US jobs data reinforced hawkish Fed bets and pushed the USD to a two-year top.
The GBP/USD pair enters a bearish consolidation phase at the start of a new week and languishes near its lowest level since November 2023 touched on Friday, around the 1.2200 mark during the Asian session. Moreover, the fundamental backdrop seems tilted in favor of bearish traders and suggests that the path of least resistance for spot prices remains to the downside.
The British Pound (GBP) continues with its relative underperformance in the wake of concerns over stagflation in the UK amid stubborn inflation and stalling growth. Furthermore, the recent rise in the UK government bond yields has raised anxiety about the UK’s fiscal health, which is seen as another factor undermining the GBP and validates the negative outlook for the GBP/USD pair amid a bullish US Dollar (USD).
In fact, the USD Index (DXY), which tracks the Greenback against a basket of currencies, shot to over a two-year top on Friday in reaction to the upbeat US jobs data. The Nonfarm Payrolls (NFP) report showed that the US economy added 256K jobs in December, surpassing even the most optimistic estimates, while the Unemployment Rate unexpectedly dipped to 4.1%, reinforcing hawkish Federal Reserve (Fed) expectations.
Investors now seem convinced that the Fed will pause its rate-cutting cycle at its policy meeting later this month and are also pricing in the possibility of an interest rate hike later this year. The outlook remains supportive of elevated US Treasury bond yields, which, along with the risk-off impulse, supports prospects for a further appreciating move for the safe-haven buck and additional losses for the GBP/USD pair.
That said, a slightly oversold Relative Strength Index (RSI) on the daily chart makes it prudent to wait for some consolidation or a modest bounce before positioning for the next leg of a downfall. Nevertheless, the GBP/USD pair seems vulnerable to weaken further towards testing sub-1.2100 levels, or the November 2023 swing low, in the absence of any relevant economic data from the UK or the US.
Pound Sterling FAQs
The Pound Sterling (GBP) is the oldest currency in the world (886 AD) and the official currency of the United Kingdom. It is the fourth most traded unit for foreign exchange (FX) in the world, accounting for 12% of all transactions, averaging $630 billion a day, according to 2022 data. Its key trading pairs are GBP/USD, also known as ‘Cable’, which accounts for 11% of FX, GBP/JPY, or the ‘Dragon’ as it is known by traders (3%), and EUR/GBP (2%). The Pound Sterling is issued by the Bank of England (BoE).
The single most important factor influencing the value of the Pound Sterling is monetary policy decided by the Bank of England. The BoE bases its decisions on whether it has achieved its primary goal of “price stability” – a steady inflation rate of around 2%. Its primary tool for achieving this is the adjustment of interest rates. When inflation is too high, the BoE will try to rein it in by raising interest rates, making it more expensive for people and businesses to access credit. This is generally positive for GBP, as higher interest rates make the UK a more attractive place for global investors to park their money. When inflation falls too low it is a sign economic growth is slowing. In this scenario, the BoE will consider lowering interest rates to cheapen credit so businesses will borrow more to invest in growth-generating projects.
Data releases gauge the health of the economy and can impact the value of the Pound Sterling. Indicators such as GDP, Manufacturing and Services PMIs, and employment can all influence the direction of the GBP. A strong economy is good for Sterling. Not only does it attract more foreign investment but it may encourage the BoE to put up interest rates, which will directly strengthen GBP. Otherwise, if economic data is weak, the Pound Sterling is likely to fall.
Another significant data release for the Pound Sterling is the Trade Balance. This indicator measures the difference between what a country earns from its exports and what it spends on imports over a given period. If a country produces highly sought-after exports, its currency will benefit purely from the extra demand created from foreign buyers seeking to purchase these goods. Therefore, a positive net Trade Balance strengthens a currency and vice versa for a negative balance.
- Gold price loses ground to around $2,690 in Monday’s early Asian session.
- The upbeat US job report and surging USD weigh on the Gold price.
- Trump's policy uncertainty and geopolitical risks might cap the downside for the precious metal.
Gold price (XAU/USD) trades with mild losses near $2,690 on the stronger US Dollar (USD) broadly during the early Asian session on Monday. However, the safe-haven demand due to uncertainty surrounding the President-elect Donald Trump administration's policies might help limit the Gold’s losses.
The stronger-than-expected US employment data on Friday reinforced expectations that the US Federal Reserve (Fed) might not cut interest rates as aggressively this year. This, in turn, weighs on the non-yielding asset. Traders expect the Fed to cut interest rates by just 30 basis points (bps) over the course of this year, compared with cuts worth about 45 bps before the NFP report.
On the other hand, Trump's policy risks boosting the Gold price, a traditional safe-haven asset. "Gold is still acting resilient in the face of a much stronger-than-expected jobs report ... One of the factors that's been supporting gold is this uncertainty that we've seen going into the (U.S. presidential) inauguration," said David Meger, director of metals trading at High Ridge Futures.
Additionally, the escalating geopolitical tensions in the Middle East and the ongoing Russia-Ukraine conflict might contribute to the precious metal downside. Israeli strikes continued throughout Gaza, including attacks near Gaza City, Nuseirat, and Bureij. Two attacks were also reported in the Houmin Valley in southern Lebanon, according to Lebanon’s National News Agency.
Gold FAQs
Gold has played a key role in human’s history as it has been widely used as a store of value and medium of exchange. Currently, apart from its shine and usage for jewelry, the precious metal is widely seen as a safe-haven asset, meaning that it is considered a good investment during turbulent times. Gold is also widely seen as a hedge against inflation and against depreciating currencies as it doesn’t rely on any specific issuer or government.
Central banks are the biggest Gold holders. In their aim to support their currencies in turbulent times, central banks tend to diversify their reserves and buy Gold to improve the perceived strength of the economy and the currency. High Gold reserves can be a source of trust for a country’s solvency. Central banks added 1,136 tonnes of Gold worth around $70 billion to their reserves in 2022, according to data from the World Gold Council. This is the highest yearly purchase since records began. Central banks from emerging economies such as China, India and Turkey are quickly increasing their Gold reserves.
Gold has an inverse correlation with the US Dollar and US Treasuries, which are both major reserve and safe-haven assets. When the Dollar depreciates, Gold tends to rise, enabling investors and central banks to diversify their assets in turbulent times. Gold is also inversely correlated with risk assets. A rally in the stock market tends to weaken Gold price, while sell-offs in riskier markets tend to favor the precious metal.
The price can move due to a wide range of factors. Geopolitical instability or fears of a deep recession can quickly make Gold price escalate due to its safe-haven status. As a yield-less asset, Gold tends to rise with lower interest rates, while higher cost of money usually weighs down on the yellow metal. Still, most moves depend on how the US Dollar (USD) behaves as the asset is priced in dollars (XAU/USD). A strong Dollar tends to keep the price of Gold controlled, whereas a weaker Dollar is likely to push Gold prices up.
| Index | Change, points | Closed | Change, % |
|---|---|---|---|
| NIKKEI 225 | -414.69 | 39190.4 | -1.05 |
| Hang Seng | -176.6 | 19064.29 | -0.92 |
| KOSPI | -6.12 | 2515.78 | -0.24 |
| ASX 200 | -35.1 | 8294.1 | -0.42 |
| DAX | -102.31 | 20214.79 | -0.5 |
| CAC 40 | -59.24 | 7431.04 | -0.79 |
| Dow Jones | -696.75 | 41938.45 | -1.63 |
| S&P 500 | -91.21 | 5827.04 | -1.54 |
| NASDAQ Composite | -317.25 | 19161.63 | -1.63 |
| Pare | Closed | Change, % |
|---|---|---|
| AUDUSD | 0.61454 | -0.79 |
| EURJPY | 161.697 | -0.71 |
| EURUSD | 1.0244 | -0.53 |
| GBPJPY | 192.656 | -0.93 |
| GBPUSD | 1.22062 | -0.8 |
| NZDUSD | 0.55563 | -0.73 |
| USDCAD | 1.44293 | 0.25 |
| USDCHF | 0.9169 | 0.6 |
| USDJPY | 157.836 | -0.15 |


© 2000-2026. All rights reserved.
This site is managed by Teletrade D.J. LLC 2351 LLC 2022 (Euro House, Richmond Hill Road, Kingstown, VC0100, St. Vincent and the Grenadines).
The information on this website is for informational purposes only and does not constitute any investment advice.
The company does not serve or provide services to customers who are residents of the US, Canada, Iran, The Democratic People's Republic of Korea, Yemen and FATF blacklisted countries.
Making transactions on financial markets with marginal financial instruments opens up wide possibilities and allows investors who are willing to take risks to earn high profits, carrying a potentially high risk of losses at the same time. Therefore you should responsibly approach the issue of choosing the appropriate investment strategy, taking the available resources into account, before starting trading.
Use of the information: full or partial use of materials from this website must always be referenced to TeleTrade as the source of information. Use of the materials on the Internet must be accompanied by a hyperlink to teletrade.org. Automatic import of materials and information from this website is prohibited.
Please contact our PR department if you have any questions or need assistance at pr@teletrade.global.
transfers