- Analytics
- News and Tools
- Market News
CFD Markets News and Forecasts — 12-07-2024
- AUD/JPY declines to 107.10 while holding just above the 20-day SMA support.
- A bearish outlook looms for the next few sessions, following a substantial dip from Thursday.
In Friday's trading session, a downward turn was observed for the AUD/JPY pair as it dipped by 0.23% to reach 107.10. This indicative decline marks a notable shift from the previous session's buoyancy, which saw the pair above the 109.00 mark. Present circumstances suggest a bearish outlook for the next few sessions, as it turns evident that the sellers have found their footing.
The daily Relative Strength Index (RSI) for the AUD/JPY marked a significant dip from Thursday's 79 to 54, drifting even near into negative territory. This trend shift hints at a weakening upward momentum, potentially signifying more bearish days ahead. In concert with this, the Moving Average Convergence Divergence (MACD) demonstrates rising red bars.
AUD/JPY daily chart
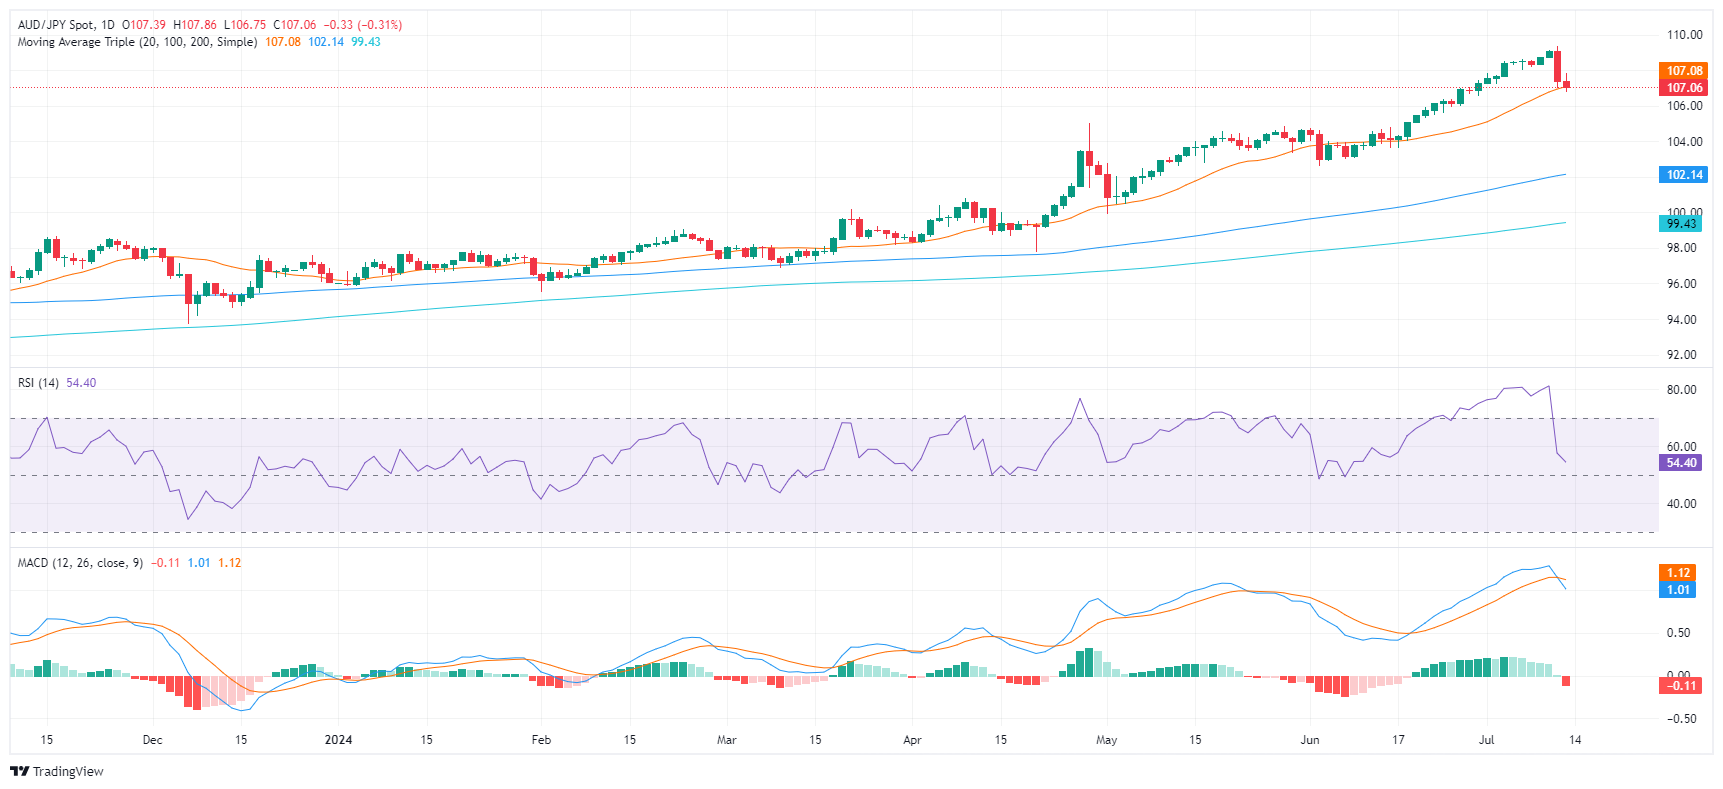
Looking at the broader perspective, the AUD/JPY still displays signs of possible bearish sentiment, given its position just slightly above the 20-day SMA support at 107.10. In case of further downward action, immediate support levels at 107.00 and 106.00 are key areas to watch. However, to avert further potential losses, buyers must target a recovery that extends towards the 108.00 barrier.
- EUR/USD climbed into a five-week peak amid broad-market Greenback selling.
- US PPI inflation rose faster than expected in June, but investors pin hopes on rate cuts.
- ECB rate cut looms ahead next week, US Retail Sales due next Tuesday.
Broad-market hopes for an accelerated pace of rate cuts from the US Federal Reserve (Fed) reached a fever pitch on Friday despite a notable upswing in US Producer Price Index (PPI) wholesale inflation. The Fiber extended into a third straight week of gains as investor risk appetite gets pinned to the ceiling.
Forecasting the Coming Week: Fed rate cut bets and the ECB should rule the sentiment
June’s core Producer Price Index (PPI) for wholesale inflation in the US rose to 3.0% YoY, surpassing the expected 2.5%. The previous period's figure was adjusted upward to 2.6% from the initial 2.3%. Despite the notable increase in producer-level inflation, market focus has shifted to the earlier decrease in Consumer Price Index (CPI) inflation, raising expectations for a rate cut.
The CME's FedWatch tool indicates a significant likelihood of a quarter-point rate cut at the Federal Open Market Committee's (FOMC) meeting on September 18. Rate traders are currently factoring in at least three rate cuts by 2024, more than the one or two cuts projected by the Fed by December.
Economic Indicator
Producer Price Index ex Food & Energy (YoY)
The Producer Price Index ex Food & energy released by the Bureau of Labor statistics, Department of Labor measures the average changes in prices in primary markets of the US by producers of commodities in all states of processing. Those volatile products such as food and energy are excluded in order to capture an accurate calculation. Generally speaking, a high reading is seen as positive (or bullish) for the USD, whereas a low reading is seen as negative (or bearish).
Read more.Last release: Fri Jul 12, 2024 12:30
Frequency: Monthly
Actual: 3%
Consensus: 2.5%
Previous: 2.3%
Source: US Bureau of Labor Statistics
In other US economic data released on Friday, the University of Michigan's Consumer Sentiment Index survey dropped to a seven-month low of 66.0, falling short of the expected increase to 68.5. This reflects increasing discouragement among US consumers about the economic outlook. Additionally, the University of Michigan's 5-year Consumer Inflation Expectations decreased slightly in July to 2.9% from the previous 3.0%. Long-term consumer inflation expectations remain significantly higher than the Fed's target annual inflation rate of 2.0%
US Retail Sales figures are on the docket for next Tuesday, and Euro traders will be buckling down for the wait to next week’s latest rate call from the European Central Bank (ECB), slated for early next Thursday. The ECB recently delivered a quarter-point rate trim in early June, but odds of a follow-up cut are looking unlikely, and markets are broadly forecasting a cautious hold in July.
Euro PRICE This week
The table below shows the percentage change of Euro (EUR) against listed major currencies this week. Euro was the strongest against the New Zealand Dollar.
| USD | EUR | GBP | JPY | CAD | AUD | NZD | CHF | |
|---|---|---|---|---|---|---|---|---|
| USD | -0.62% | -1.35% | -1.74% | -0.07% | -0.50% | 0.31% | -0.19% | |
| EUR | 0.62% | -0.53% | -0.81% | 0.89% | 0.28% | 1.30% | 0.77% | |
| GBP | 1.35% | 0.53% | -0.33% | 1.44% | 0.81% | 1.79% | 1.30% | |
| JPY | 1.74% | 0.81% | 0.33% | 1.71% | 1.29% | 2.26% | 1.64% | |
| CAD | 0.07% | -0.89% | -1.44% | -1.71% | -0.46% | 0.37% | -0.08% | |
| AUD | 0.50% | -0.28% | -0.81% | -1.29% | 0.46% | 0.98% | 0.49% | |
| NZD | -0.31% | -1.30% | -1.79% | -2.26% | -0.37% | -0.98% | -0.48% | |
| CHF | 0.19% | -0.77% | -1.30% | -1.64% | 0.08% | -0.49% | 0.48% |
The heat map shows percentage changes of major currencies against each other. The base currency is picked from the left column, while the quote currency is picked from the top row. For example, if you pick the Euro from the left column and move along the horizontal line to the US Dollar, the percentage change displayed in the box will represent EUR (base)/USD (quote).
EUR/USD technical outlook
EUR/USD has chalked in a third straight week of gains, closing Friday a hair above the 1.0900 handle. The pair has risen 2.3% from late June’s swing low into 1.0666, and intraday price action is poised for a clash with technical resistance from June’s early peaks near 1.0920.
Fiber broken out of the topside of a rough descending channel on daily candlesticks. Despite closing in the green for all but two of the last twelve consecutive trading days, bullish momentum is poised to run out of gas and could see a bearish pullback to the 200-day Exponential Moving Average (EMA) at 1.0797.
EUR/USD hourly chart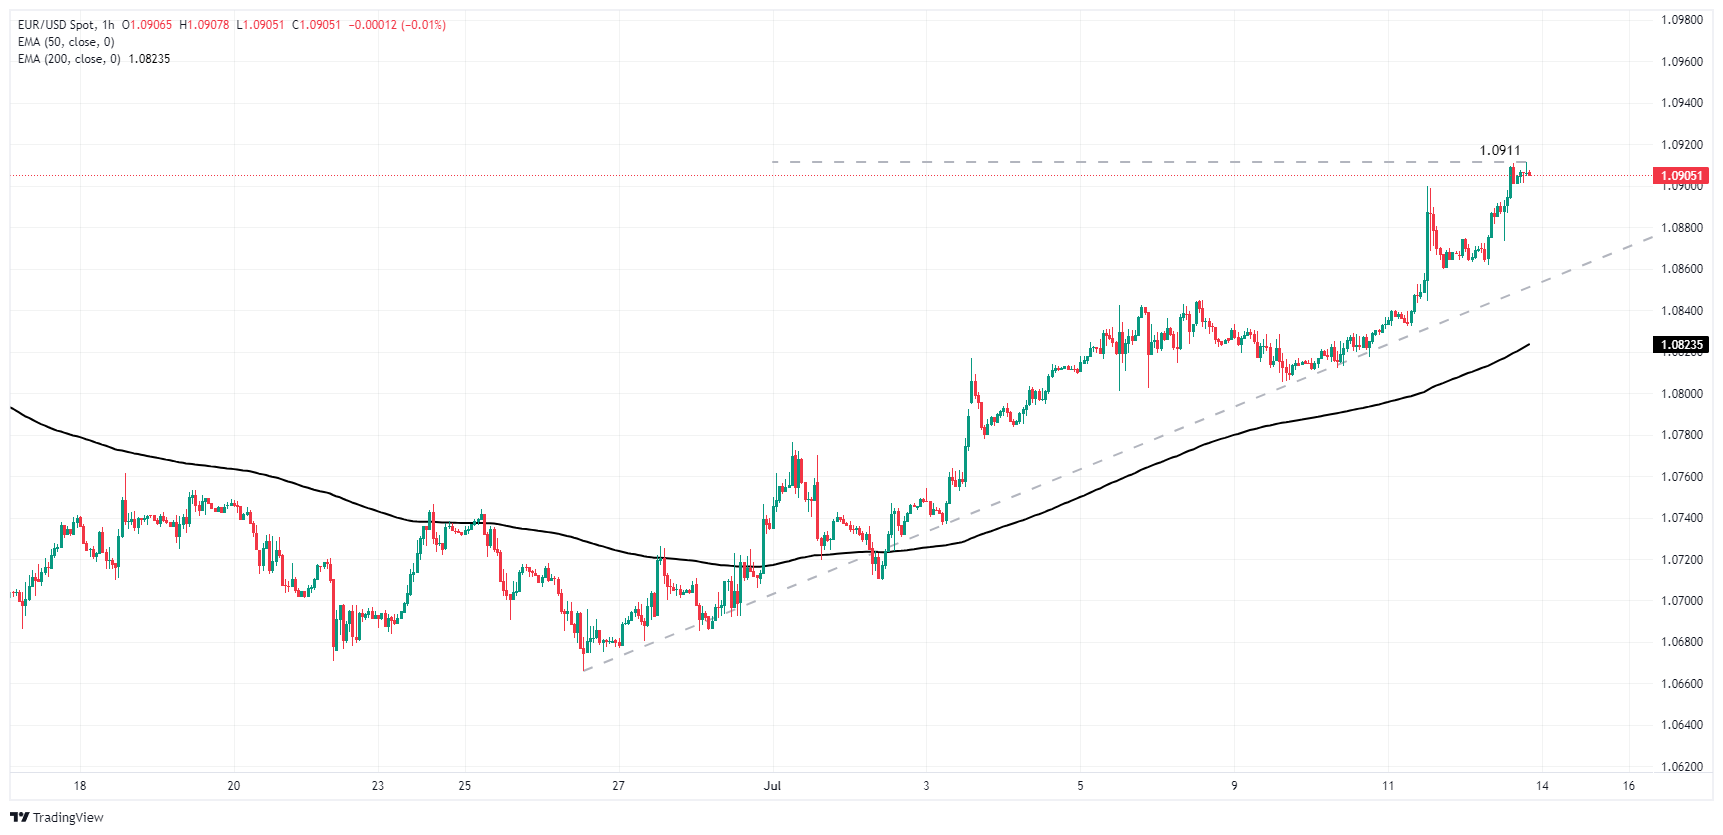
EUR/USD daily chart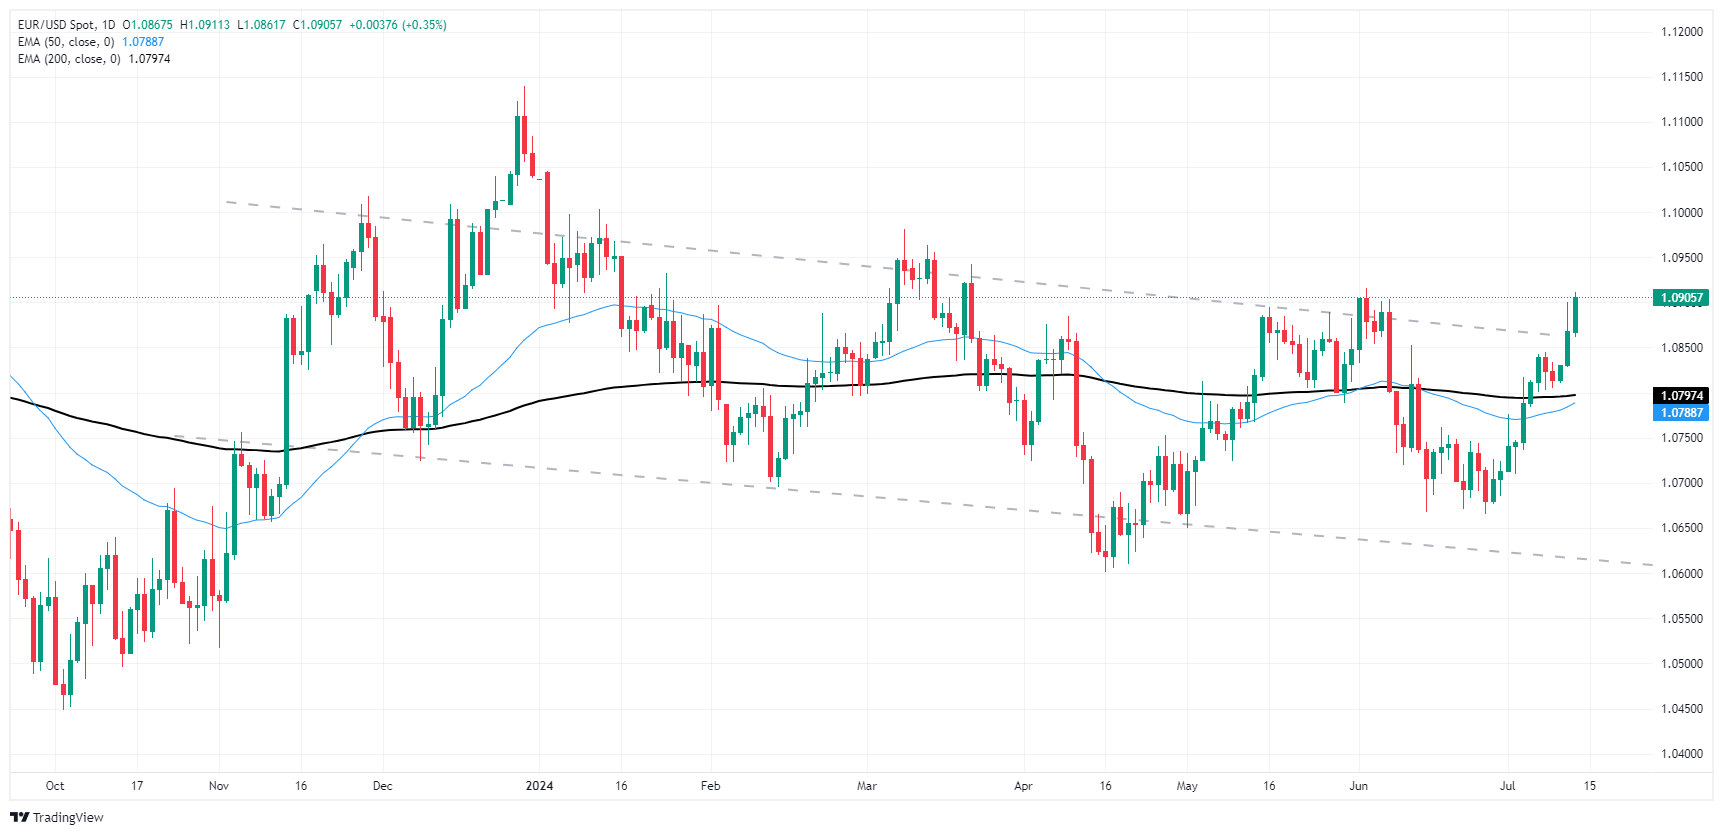
Euro FAQs
The Euro is the currency for the 20 European Union countries that belong to the Eurozone. It is the second most heavily traded currency in the world behind the US Dollar. In 2022, it accounted for 31% of all foreign exchange transactions, with an average daily turnover of over $2.2 trillion a day. EUR/USD is the most heavily traded currency pair in the world, accounting for an estimated 30% off all transactions, followed by EUR/JPY (4%), EUR/GBP (3%) and EUR/AUD (2%).
The European Central Bank (ECB) in Frankfurt, Germany, is the reserve bank for the Eurozone. The ECB sets interest rates and manages monetary policy. The ECB’s primary mandate is to maintain price stability, which means either controlling inflation or stimulating growth. Its primary tool is the raising or lowering of interest rates. Relatively high interest rates – or the expectation of higher rates – will usually benefit the Euro and vice versa. The ECB Governing Council makes monetary policy decisions at meetings held eight times a year. Decisions are made by heads of the Eurozone national banks and six permanent members, including the President of the ECB, Christine Lagarde.
Eurozone inflation data, measured by the Harmonized Index of Consumer Prices (HICP), is an important econometric for the Euro. If inflation rises more than expected, especially if above the ECB’s 2% target, it obliges the ECB to raise interest rates to bring it back under control. Relatively high interest rates compared to its counterparts will usually benefit the Euro, as it makes the region more attractive as a place for global investors to park their money.
Data releases gauge the health of the economy and can impact on the Euro. Indicators such as GDP, Manufacturing and Services PMIs, employment, and consumer sentiment surveys can all influence the direction of the single currency. A strong economy is good for the Euro. Not only does it attract more foreign investment but it may encourage the ECB to put up interest rates, which will directly strengthen the Euro. Otherwise, if economic data is weak, the Euro is likely to fall. Economic data for the four largest economies in the euro area (Germany, France, Italy and Spain) are especially significant, as they account for 75% of the Eurozone’s economy.
Another significant data release for the Euro is the Trade Balance. This indicator measures the difference between what a country earns from its exports and what it spends on imports over a given period. If a country produces highly sought after exports then its currency will gain in value purely from the extra demand created from foreign buyers seeking to purchase these goods. Therefore, a positive net Trade Balance strengthens a currency and vice versa for a negative balance.
- Silver retreats over 2% yet holds above $30.78 'double bottom' neckline.
- Downward momentum noted, but RSI in bullish range hints at potential rebound.
- Key support at $30.50; further levels at $30.00 and $29.82/79 zone.
- Resistance points at $31.00, $31.75, $32.15, aiming for the YTD high of $32.51.
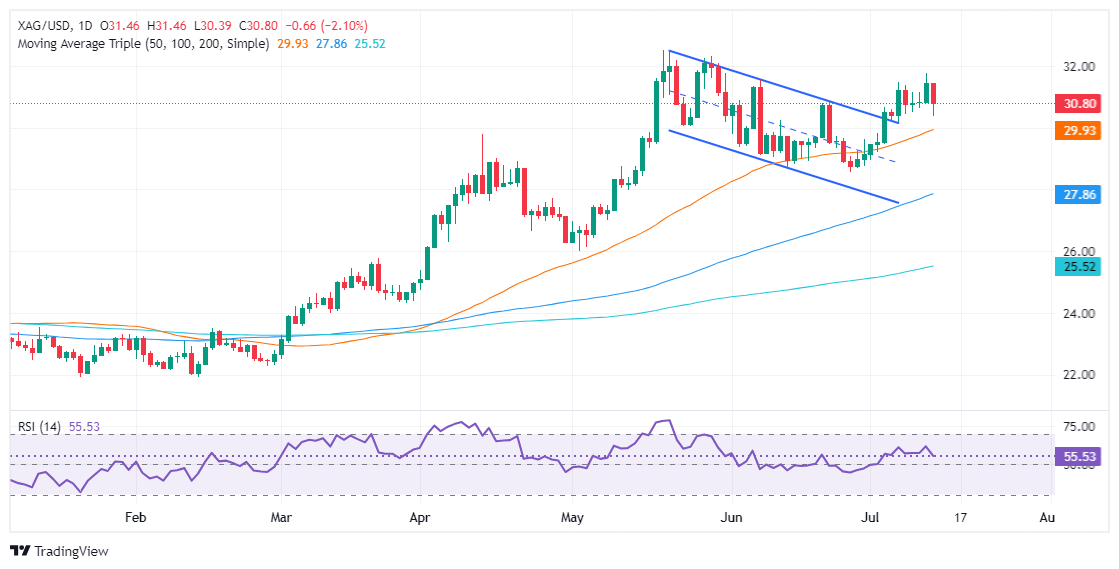
Silver price reversed course and registered losses of more than 2% on Friday, though it remained above the ‘double bottom’ neckline, keeping the short-term uptrend alive. At the time of writing, the XAG/USD trades at $30.78 after hitting a daily high of $31.43.
XAG/USD Price Analysis: Technical outlook
Silver’s daily chart depicts the grey metal’s uptrend is in play, but Friday's price action hints that sellers stepped in aggressively, achieving a daily close near Thursday’s open at $30.79.
Momentum tilted to the downside, as depicted by the Relative Strength Index (RSI), which aimed lower but stood in bullish territory. Hence, XAG/USD could be headed for a pullback before the uptrend continues.
If XAG/USD drops below the psychological $30.50 figure, that could drive the spot price toward the $30.00 level. Once cleared, the next stop would be the confluence of the April 12 high and the 50-day moving average (DMA) at $29.82/79.
On the flip side, the XAG/USD first resistance would be $31.00. Once cleared, the next resistance would be $31.75, followed by the $32.00 psychological figures. Once surpassed, the May 29 peak of $32.15 emerges, ahead of the year-to-date (YTD) high at $32.51. Further gains are seen above the latter.
XAG/USD Price Action – Daily Chart
Silver FAQs
Silver is a precious metal highly traded among investors. It has been historically used as a store of value and a medium of exchange. Although less popular than Gold, traders may turn to Silver to diversify their investment portfolio, for its intrinsic value or as a potential hedge during high-inflation periods. Investors can buy physical Silver, in coins or in bars, or trade it through vehicles such as Exchange Traded Funds, which track its price on international markets.
Silver prices can move due to a wide range of factors. Geopolitical instability or fears of a deep recession can make Silver price escalate due to its safe-haven status, although to a lesser extent than Gold's. As a yieldless asset, Silver tends to rise with lower interest rates. Its moves also depend on how the US Dollar (USD) behaves as the asset is priced in dollars (XAG/USD). A strong Dollar tends to keep the price of Silver at bay, whereas a weaker Dollar is likely to propel prices up. Other factors such as investment demand, mining supply – Silver is much more abundant than Gold – and recycling rates can also affect prices.
Silver is widely used in industry, particularly in sectors such as electronics or solar energy, as it has one of the highest electric conductivity of all metals – more than Copper and Gold. A surge in demand can increase prices, while a decline tends to lower them. Dynamics in the US, Chinese and Indian economies can also contribute to price swings: for the US and particularly China, their big industrial sectors use Silver in various processes; in India, consumers’ demand for the precious metal for jewellery also plays a key role in setting prices.
Silver prices tend to follow Gold's moves. When Gold prices rise, Silver typically follows suit, as their status as safe-haven assets is similar. The Gold/Silver ratio, which shows the number of ounces of Silver needed to equal the value of one ounce of Gold, may help to determine the relative valuation between both metals. Some investors may consider a high ratio as an indicator that Silver is undervalued, or Gold is overvalued. On the contrary, a low ratio might suggest that Gold is undervalued relative to Silver.
- NZD/USD gains momentum resuming back above the 20-day SMA.
- Bulls attempt to maintain control after Thursday's recovery transitioned the technical outlook towards a slightly bullish sentiment.
On Friday's session, the NZD/USD demonstrated renewed strength after recovering from a period of decline, resulting in a rise to around 0.6120.
Daily technical indicators present a cautiously optimistic picture. The Relative Strength Index (RSI) currently stands at 52 in positive territory. This rise signifies a strengthening bullish momentum, however, the market is still far from confirming a positive outlook. The Moving Average Convergence Divergence (MACD) prints decreasing red bars, indicative of slowing bearish momentum.
NZD/USD daily chart
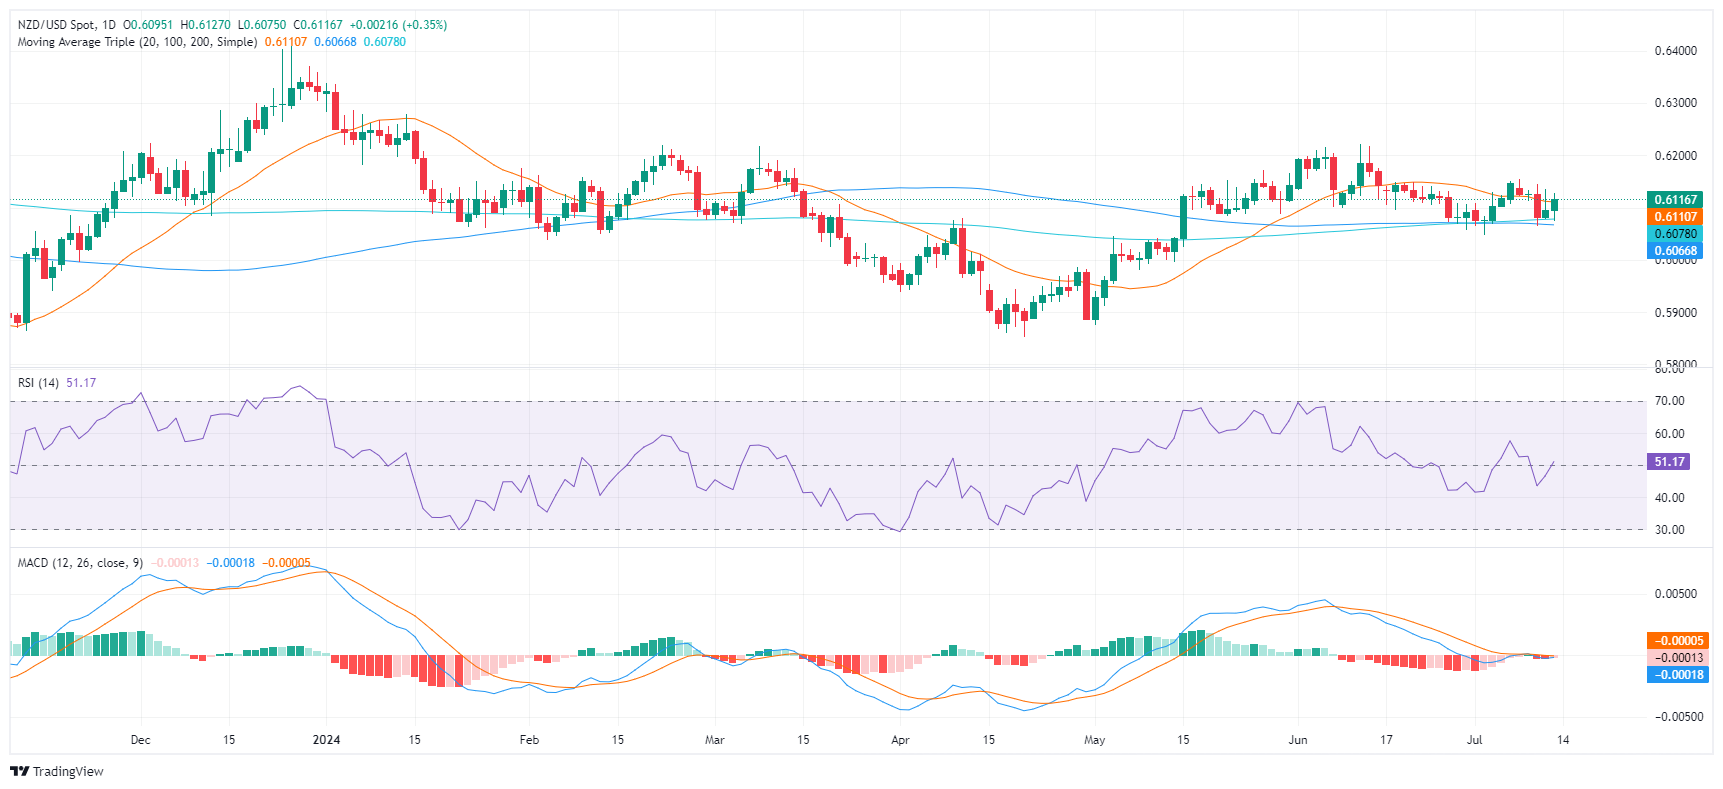
On the upside, bulls will face a challenge at 0.6150 and 0.6200. Achieving a decisive close above these levels would signal a further establishment of control towards the bulls.
Downward, the first line of defense lies at the convergence of the 100 and 200-day SMAs at 0.6070. A bearish turn below this level would incline the outlook back to the bearish side, potentially triggering a corrective slide towards 0.6050 and then to the 0.6030 support levels.
- GBP/USD approaches 1.3900 for the first time in a year.
- US PPI producer-level inflation rose faster than expected in June.
- Despite inflation risks, markets have pinned hopes on a September rate cut.
GBP/USD wrapped up Friday on the high side of a two-week rally as the US Dollar broadly buckles under the weight of investors dog-piling into hopes of getting a rate cut from the Federal Reserve (Fed) in September. Markets are shrugging off an unexpected uptick in Producer Price Index (PPI) wholesale inflation, which accelerated faster than expected in June and could put pressure on key Fed inflation metrics looking forward.
Forecasting the Coming Week: Fed rate cut bets and the ECB should rule the sentiment
In June, the core Producer Price Index (PPI) for wholesale inflation in the US accelerated to 3.0% year-over-year, exceeding the expected 2.5%. Additionally, the previous period's figure was revised upward to 2.6% from the initial 2.3%. Despite the significant increase in producer-level inflation, the market's attention has turned to the decrease in Consumer Price Index (CPI) inflation earlier in the week, leading to heightened expectations of a rate cut.
According to the CME's FedWatch tool, there is a significant probability of a quarter-point rate cut at the Federal Open Market Committee's (FOMC) meeting on September 18. Rate traders are also currently pricing in at least three rate cuts in total for 2024, which is more than the one or two cuts projected by the Fed by December.
Economic Indicator
Producer Price Index ex Food & Energy (YoY)
The Producer Price Index ex Food & energy released by the Bureau of Labor statistics, Department of Labor measures the average changes in prices in primary markets of the US by producers of commodities in all states of processing. Those volatile products such as food and energy are excluded in order to capture an accurate calculation. Generally speaking, a high reading is seen as positive (or bullish) for the USD, whereas a low reading is seen as negative (or bearish).
Read more.Last release: Fri Jul 12, 2024 12:30
Frequency: Monthly
Actual: 3%
Consensus: 2.5%
Previous: 2.3%
Source: US Bureau of Labor Statistics
In other US economic data released on Friday, the University of Michigan's Consumer Sentiment Index survey dropped to a seven-month low of 66.0, falling short of the expected increase to 68.5. This reflects increasing discouragement among US consumers about the economic outlook. Additionally, the University of Michigan's 5-year Consumer Inflation Expectations decreased slightly in July to 2.9% from the previous 3.0%. It's worth noting that long-term consumer inflation expectations remain significantly higher than the Fed's target annual inflation rate of 2.0%.
Coming up next week, the Sterling will face down the UK’s own Consumer Price Index (CPI) inflation release, slated for next Wednesday. UK labor data and Retail Sales will follow up in the back half of the week, and on the Greenback side, US Retail Sales will drop earlier in the week on Tuesday.
British Pound PRICE This week
The table below shows the percentage change of British Pound (GBP) against listed major currencies this week. British Pound was the strongest against the New Zealand Dollar.
| USD | EUR | GBP | JPY | CAD | AUD | NZD | CHF | |
|---|---|---|---|---|---|---|---|---|
| USD | -0.61% | -1.32% | -1.78% | -0.07% | -0.50% | 0.31% | -0.19% | |
| EUR | 0.61% | -0.52% | -0.86% | 0.86% | 0.27% | 1.27% | 0.77% | |
| GBP | 1.32% | 0.52% | -0.37% | 1.41% | 0.79% | 1.79% | 1.30% | |
| JPY | 1.78% | 0.86% | 0.37% | 1.74% | 1.32% | 2.29% | 1.68% | |
| CAD | 0.07% | -0.86% | -1.41% | -1.74% | -0.48% | 0.38% | -0.09% | |
| AUD | 0.50% | -0.27% | -0.79% | -1.32% | 0.48% | 1.00% | 0.50% | |
| NZD | -0.31% | -1.27% | -1.79% | -2.29% | -0.38% | -1.00% | -0.49% | |
| CHF | 0.19% | -0.77% | -1.30% | -1.68% | 0.09% | -0.50% | 0.49% |
The heat map shows percentage changes of major currencies against each other. The base currency is picked from the left column, while the quote currency is picked from the top row. For example, if you pick the British Pound from the left column and move along the horizontal line to the US Dollar, the percentage change displayed in the box will represent GBP (base)/USD (quote).
GBP/USD technical outlook
Cable rallied back into 12-month highs on Friday, extending into a second straight week of firm gains and inching back toward the 1.3000 handle. GBP/USD has risen nearly 3% in July, climbing from the month’s early swing low to 1.2615.
GBP/USD has closed in the green for all but two of the last twelve consecutive trading days as the pair vaults upwards from the 200-day Exponential Moving Average (EMA) at 1.2620. Bulls will be looking to drag bids into 2023’s peak of 1.3142, while bearish pressure will be looking to drag price action back to the 50-day EMA at 1.2715.
GBP/USD hourly chart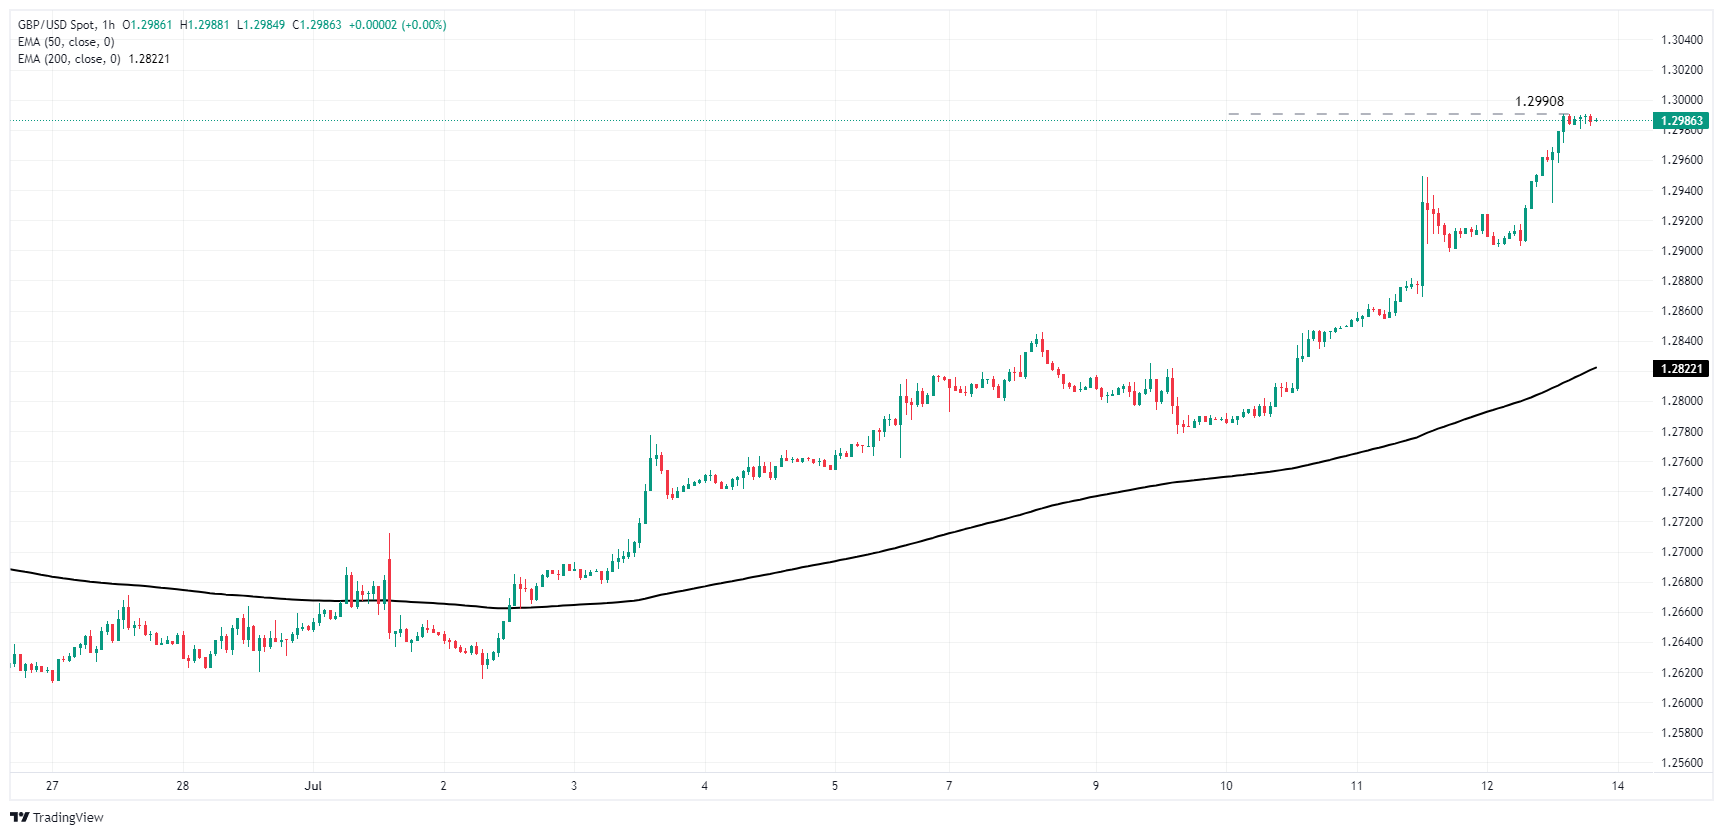
GBP/USD daily chart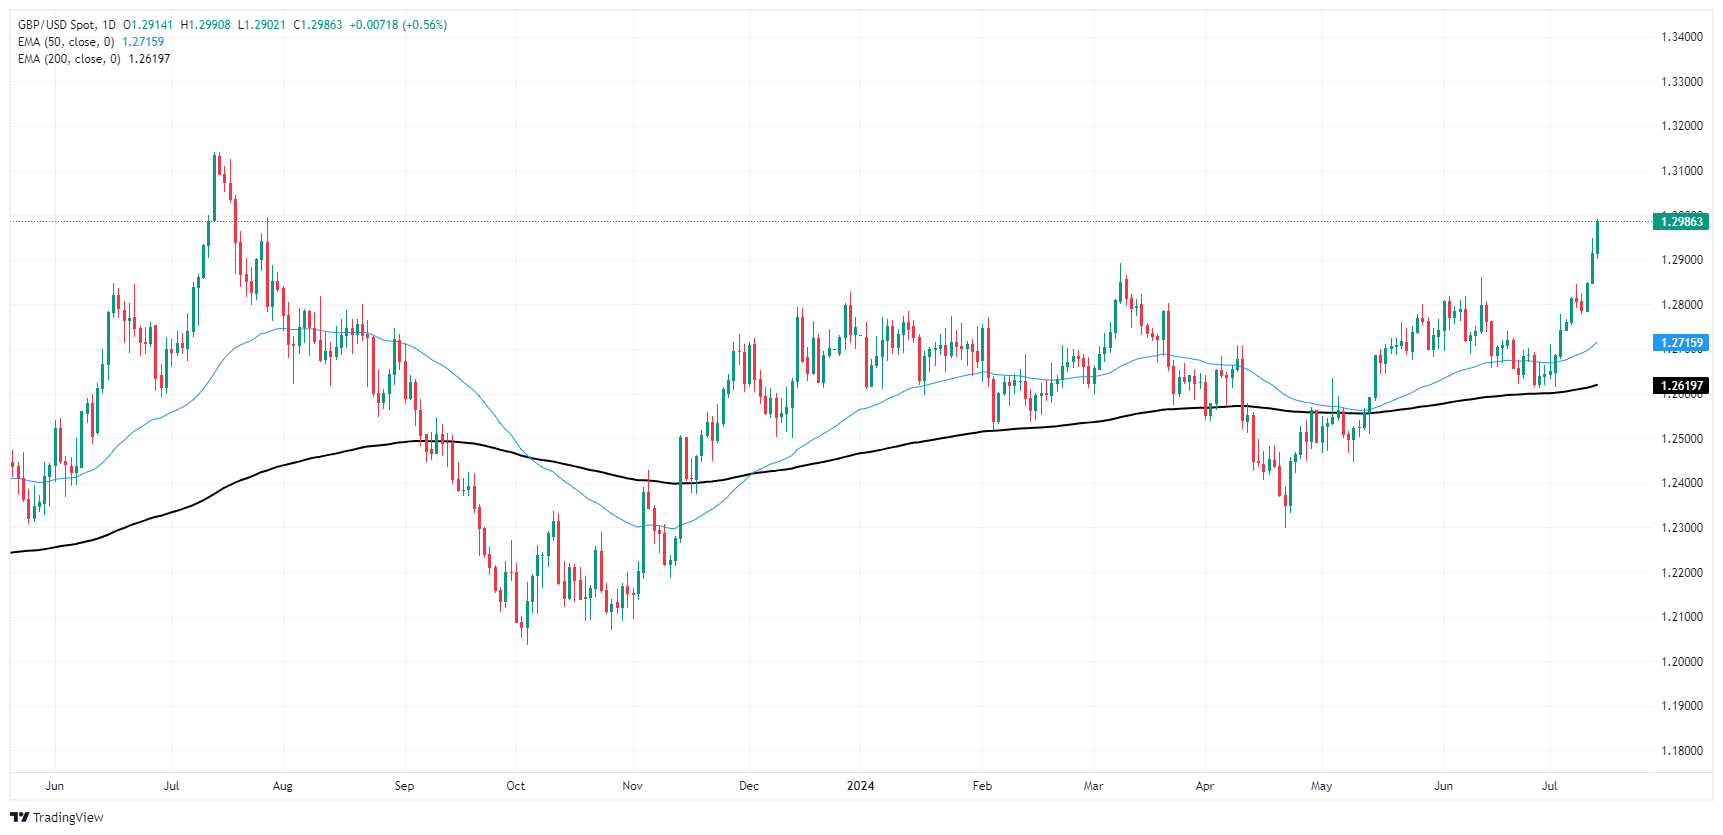
Pound Sterling FAQs
The Pound Sterling (GBP) is the oldest currency in the world (886 AD) and the official currency of the United Kingdom. It is the fourth most traded unit for foreign exchange (FX) in the world, accounting for 12% of all transactions, averaging $630 billion a day, according to 2022 data. Its key trading pairs are GBP/USD, aka ‘Cable’, which accounts for 11% of FX, GBP/JPY, or the ‘Dragon’ as it is known by traders (3%), and EUR/GBP (2%). The Pound Sterling is issued by the Bank of England (BoE).
The single most important factor influencing the value of the Pound Sterling is monetary policy decided by the Bank of England. The BoE bases its decisions on whether it has achieved its primary goal of “price stability” – a steady inflation rate of around 2%. Its primary tool for achieving this is the adjustment of interest rates. When inflation is too high, the BoE will try to rein it in by raising interest rates, making it more expensive for people and businesses to access credit. This is generally positive for GBP, as higher interest rates make the UK a more attractive place for global investors to park their money. When inflation falls too low it is a sign economic growth is slowing. In this scenario, the BoE will consider lowering interest rates to cheapen credit so businesses will borrow more to invest in growth-generating projects.
Data releases gauge the health of the economy and can impact the value of the Pound Sterling. Indicators such as GDP, Manufacturing and Services PMIs, and employment can all influence the direction of the GBP. A strong economy is good for Sterling. Not only does it attract more foreign investment but it may encourage the BoE to put up interest rates, which will directly strengthen GBP. Otherwise, if economic data is weak, the Pound Sterling is likely to fall.
Another significant data release for the Pound Sterling is the Trade Balance. This indicator measures the difference between what a country earns from its exports and what it spends on imports over a given period. If a country produces highly sought-after exports, its currency will benefit purely from the extra demand created from foreign buyers seeking to purchase these goods. Therefore, a positive net Trade Balance strengthens a currency and vice versa for a negative balance.
- NZD/JPY continued its significant decline in Friday's session.
- The bearish activity remains with the pair below the crucial 20-day SMA, suggesting persistent control by the bears.
- Indicators in negative terrain now signal a bearish short-term outlook for the pair.
During Friday's trading session, the NZD/JPY pair continued its substantial drop from Thursday, recording a further loss of 0.20% and settling at 96.65. The pair remains well below the 20-day Simple Moving Average (SMA) of 97.80, reinforcing the bearish outlook in the short term.
The daily chart signals sustained negative conditions. The Relative Strength Index (RSI) improved slightly from Thursday's session but still remains in the negative territory at 40, indicating a continued declining market momentum. The Moving Average Convergence Divergence (MACD) concurs with this scenario, printing rising red bars indicative of rising selling activity.
NZD/JPY daily chart
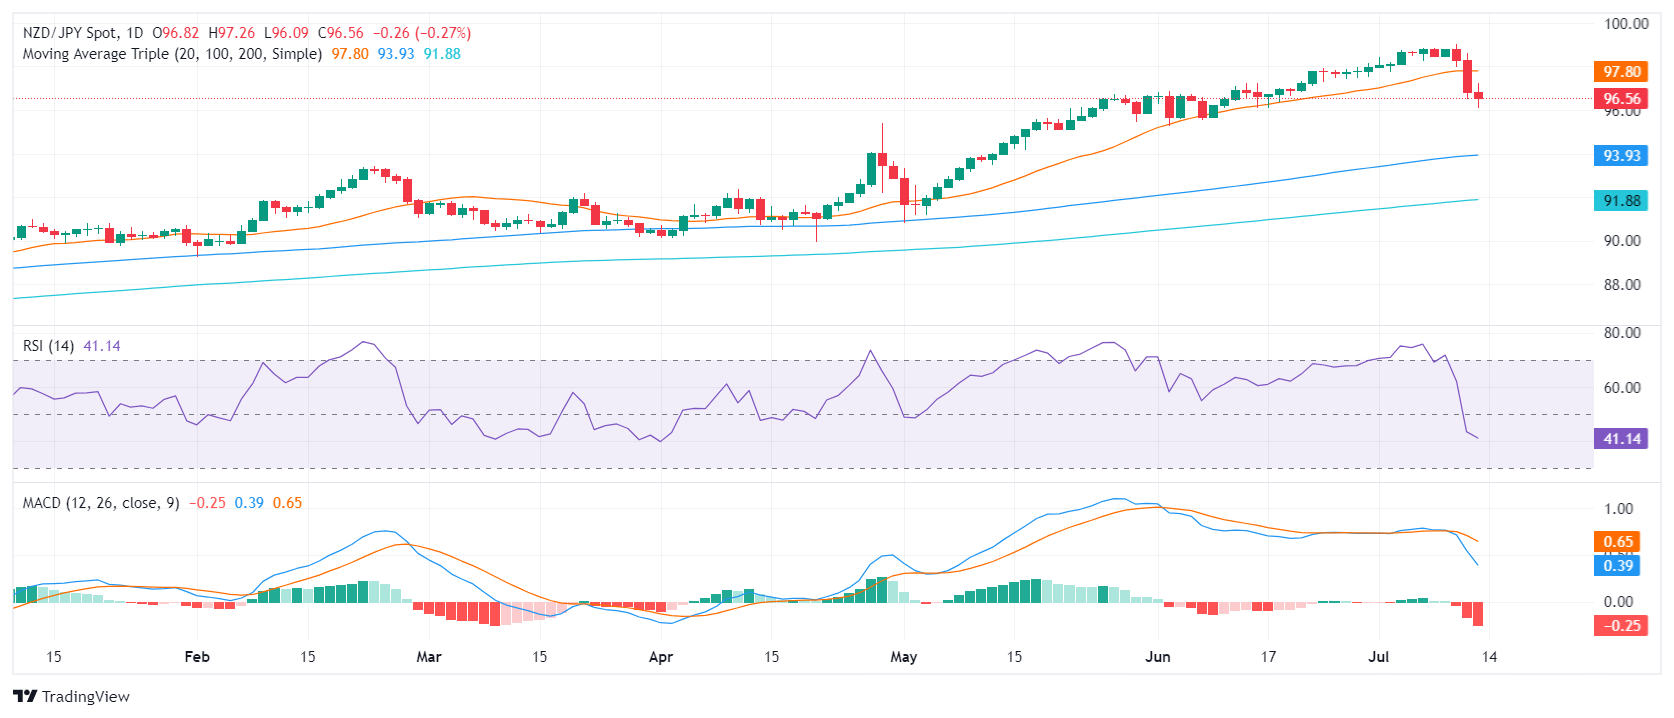
Bearing in mind the bearish momentum, immediate support levels lie at 96.50 96.00, and 95.50. Breaking these points would further validate the bearish perspective. On the other hand, resistance encounters are expected at past support levels of 97.00, 97.70 (20-day SMA), and the critical level of 98.00.
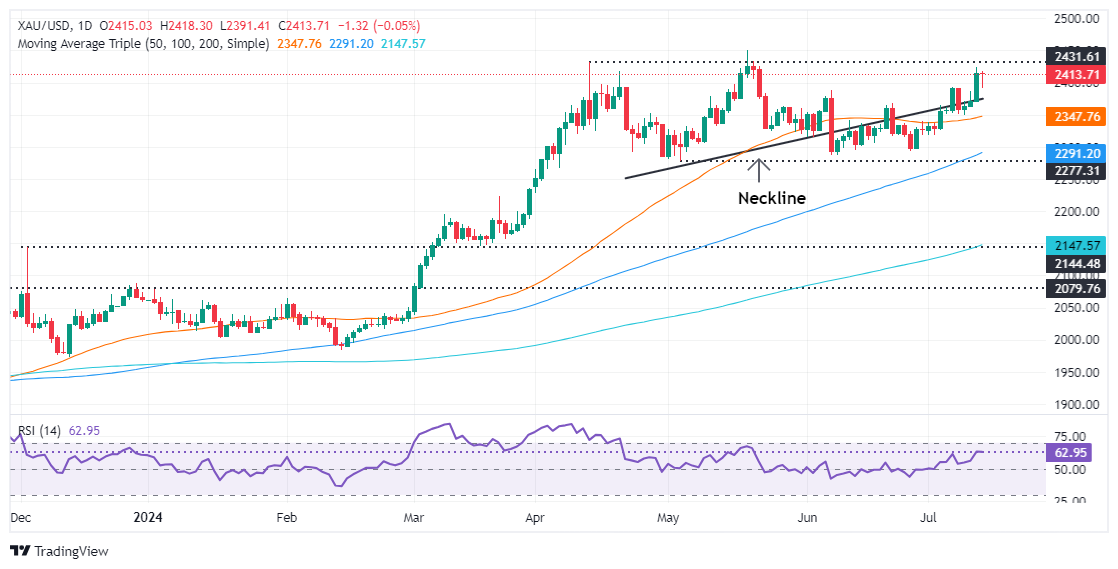
- Gold price sticks to key support level, set for third consecutive weekly gain on Fed rate cut expectations.
- US PPI rises above estimates; University of Michigan Consumer Sentiment drops, inflation expectations moderate.
- CME FedWatch Tool indicates 94% chance of September rate cut; US Dollar Index falls over 0.40% to 104.09.
Gold’s price clung above $2,400 on Friday after hitting a daily low of $2,391. The golden metal is set to extend its gains for the third consecutive week on speculation that the Federal Reserve (Fed) might begin its easing cycle in September. Data from the US Department of Labor showed that factory prices rose above estimates, though they failed to underpin the Greenback, a tailwind for the precious metal.
The XAU/USD trades at $2,415, virtually unchanged. The US Bureau of Labor Statistics on Friday revealed that the Producer Price Index (PPI) jumped modestly in June, above analysts’ estimates. The University of Michigan Consumer Sentiment preliminary July reading deteriorated, but inflation expectations have tempered.
According to the CME FedWatch Tool, traders are pricing a 94% chance that the Fed might cut rates a quarter of a percentage point in September.
Hence, US Treasury bond yields are dropping, a tailwind for the non-yielding metal, which benefits from low yields. The US 10-year Treasury note coupon is yielding 4.19%, two basis points below its opening price.
Sources cited by Barron’s stated, “Inflation is coming down, but it is not going to disappear. Gold and gold miners are attractive inflation hedges.”
Meanwhile, Fed officials have remained cautious regarding monetary policy shifts. Chicago Fed President Goolsbee noted that recent inflation data is "favorable" and could shorten the Fed's journey toward its inflation goals.
St. Louis Fed President Alberto Musalem stated that the current interest rate level is appropriate for the current conditions and expects the economy to grow between 1.5% and 2% this year.
Meanwhile, the US Dollar Index (DXY), which tracks the Greenback against a basket of six currencies, plummeted more than 0.40% to 104.09.
Daily digest market movers: Gold price flatlines post US PPI
- June US Producer Price Index (PPI) increased by 0.2% MoM, exceeding the expected 0.1% and higher than May's 0%. Core PPI rose by 0.4% MoM, surpassing the forecast of 0.2%.
- On an annual basis, PPI ticked up from 2.4% to 2.6%, beating the forecast of 2.3%. Underlying inflation increased to 3%, up from 2.6%.
- UoM Consumer Sentiment dropped from 68.2 in June to 66.0 in July. Inflation expectations for one year were as expected at 2.9%, down from 3%.
- US Dollar Index (DXY), which tracks the value of a basket of six currencies against the US Dollar, fell more than 0.30% to 104.12.
- According to the CME FedWatch Tool, the odds of a September rate cut are 88%, up from 85% on Thursday.
- December 2024 fed funds rate futures contract implies that the Fed will ease policy by 49 basis points (bps) toward the end of the year, up from 39 a day ago.
- Bullion prices retreated slightly due to the People's Bank of China (PBoC) decision to halt gold purchases in June, as it did in May. By the end of June, China held 72.80 million troy ounces of the precious metal.
Technical analysis: Gold buyers take a respite, Gold price hovers above $2,400
Gold price consolidates above $2,400 for the second straight day after decisively breaking the Head-and-Shoulders neckline. Momentum favors buyers, though as depicted by the flat Relative Strength Index (RSI), they’re taking a respite before testing higher prices.
That said, the path of least resistance is to the upside. The XAU/USD’s first resistance would be the year-to-date high of $2,450, ahead of the $2,500 mark. Conversely, if Gold slides below the $2,400 figure, the next demand zone will be July 5 high at $2,392. If cleared, XAU/USD would continue to $2,350.
Gold FAQs
Gold has played a key role in human’s history as it has been widely used as a store of value and medium of exchange. Currently, apart from its shine and usage for jewelry, the precious metal is widely seen as a safe-haven asset, meaning that it is considered a good investment during turbulent times. Gold is also widely seen as a hedge against inflation and against depreciating currencies as it doesn’t rely on any specific issuer or government.
Central banks are the biggest Gold holders. In their aim to support their currencies in turbulent times, central banks tend to diversify their reserves and buy Gold to improve the perceived strength of the economy and the currency. High Gold reserves can be a source of trust for a country’s solvency. Central banks added 1,136 tonnes of Gold worth around $70 billion to their reserves in 2022, according to data from the World Gold Council. This is the highest yearly purchase since records began. Central banks from emerging economies such as China, India and Turkey are quickly increasing their Gold reserves.
Gold has an inverse correlation with the US Dollar and US Treasuries, which are both major reserve and safe-haven assets. When the Dollar depreciates, Gold tends to rise, enabling investors and central banks to diversify their assets in turbulent times. Gold is also inversely correlated with risk assets. A rally in the stock market tends to weaken Gold price, while sell-offs in riskier markets tend to favor the precious metal.
The price can move due to a wide range of factors. Geopolitical instability or fears of a deep recession can quickly make Gold price escalate due to its safe-haven status. As a yield-less asset, Gold tends to rise with lower interest rates, while higher cost of money usually weighs down on the yellow metal. Still, most moves depend on how the US Dollar (USD) behaves as the asset is priced in dollars (XAU/USD). A strong Dollar tends to keep the price of Gold controlled, whereas a weaker Dollar is likely to push Gold prices up.
- Dow Jones climbed 450 points to set a fresh all-time peak above 40,200.00.
- Markets are broadly shrugging off an acceleration of US PPI wholesale inflation.
- US consumer sentiment surveys worsened, but 5-year inflation expectations eased.
The Dow Jones Industrial Average (DJIA) soared over 450 points on Friday as markets pile back into renewed hopes for rate cuts from the Federal Reserve (Fed) in September even as US Producer Price Index (PPI) wholesale inflation accelerated faster than expected in June. Markets have entirely buried the needle on rate cut forecasts, pricing in three rate cuts in 2024 and a 95% chance of a rate trim on September 18.
June’s US core PPI wholesale inflation accelerated to 3.0% YoY, entirely eclipsing the forecast 2.5%, and the previous period’s print also saw an upside revision to 2.6% from the initial 2.3%. Despite the sharp uptick in producer-level inflation, markets are instead refocusing on a decline in Consumer Price Inflation (CPI) inflation earlier in the week in order to lean firmly into rate cut hopes.
According to the CME’s FedWatch tool, rate market bets of at least a quarter-point rate trim at the Federal Open Market Committee’s (FOMC) September 18 rate call. Rate traders are also now pricing in at least three rate cuts in total for 2024, a step above the Fed’s own projected one or two rate cuts by December.
Elsewhere in US data on Friday, the University of Michigan’s Consumer Sentiment Index survey stumbled to a seven-month low of 66.0 from the previous 68.2, undercutting the forecast uptick to 68.5 as US consumers turn increasingly discouraged about the economic outlook. UoM 5-year Consumer Inflation Expectations eased slightly in July, ticking down to 2.9% from the previous 3.0%, but markets are putting significant effort into ignoring how much higher long-run consumer inflation expectations are compared to the Fed’s target annual inflation rate of 2.0%.
Dow Jones news
Dow Jones soared on Friday, rising a scorching 450 points and is set to chalk in one of the index’s best three-day performances for the year. All but four of the Dow Jones’ constituent securities are in the green on Friday, with losses led by JPMorgan Chase & Co. (JPM), which declined -0.94% to $205.50 per share. Despite posting better-than-expected second-quarter earnings, the stock is still sliding after trading into all-time highs ahead of Q2 earnings. JPM notched in QoQ profits of 18.1 billion, bringing EPS to $6.12, handily beating the forecast estimates of $5.88.
On the high side, Intel Corp. (INTC) rose nearly 5%, climbing over $35.00 per share as the AI market rush continues. Intel Chief Technology Officer Greg Lavender noted recently that he anticipates Intel to reach $1 billion in annual subscription revenue from AI-related cloud computing subscriptions by fiscal year end of 2027. While the growth projection in AI services revenue is nothing short of stellar, and is helping to bolster Intel stock even higher, the figure is still dwarfed by Intel’s main semiconductor business, which routinely pulls in revenue in excess of $50 billion annually.
Dow Jones technical outlook
Dow Jones tapped into a fresh all-time high of 40,260.24 on Friday, climbing over 400 points as broader markets surge higher. DJIA climbed over a full percent through the last session of the trading week, and the Dow Jones is now up over 6% from the last notable swing low into the 38,000.00 handle in late May.
The Dow Jones index, posting fresh record peak bids, is now up 6.82% in 2024, and has climbed an impressive 24.59% from the index’s swing low into 32,300.00 in late 2023. Daily candles are trading well above the 200-day Exponential Moving Average (EMA) at 37,733.00, and bidders will be looking to put distance between bids and the nearest technical floor priced in at the 50-day EMA near 39,095.00.
Dow Jones five minute chart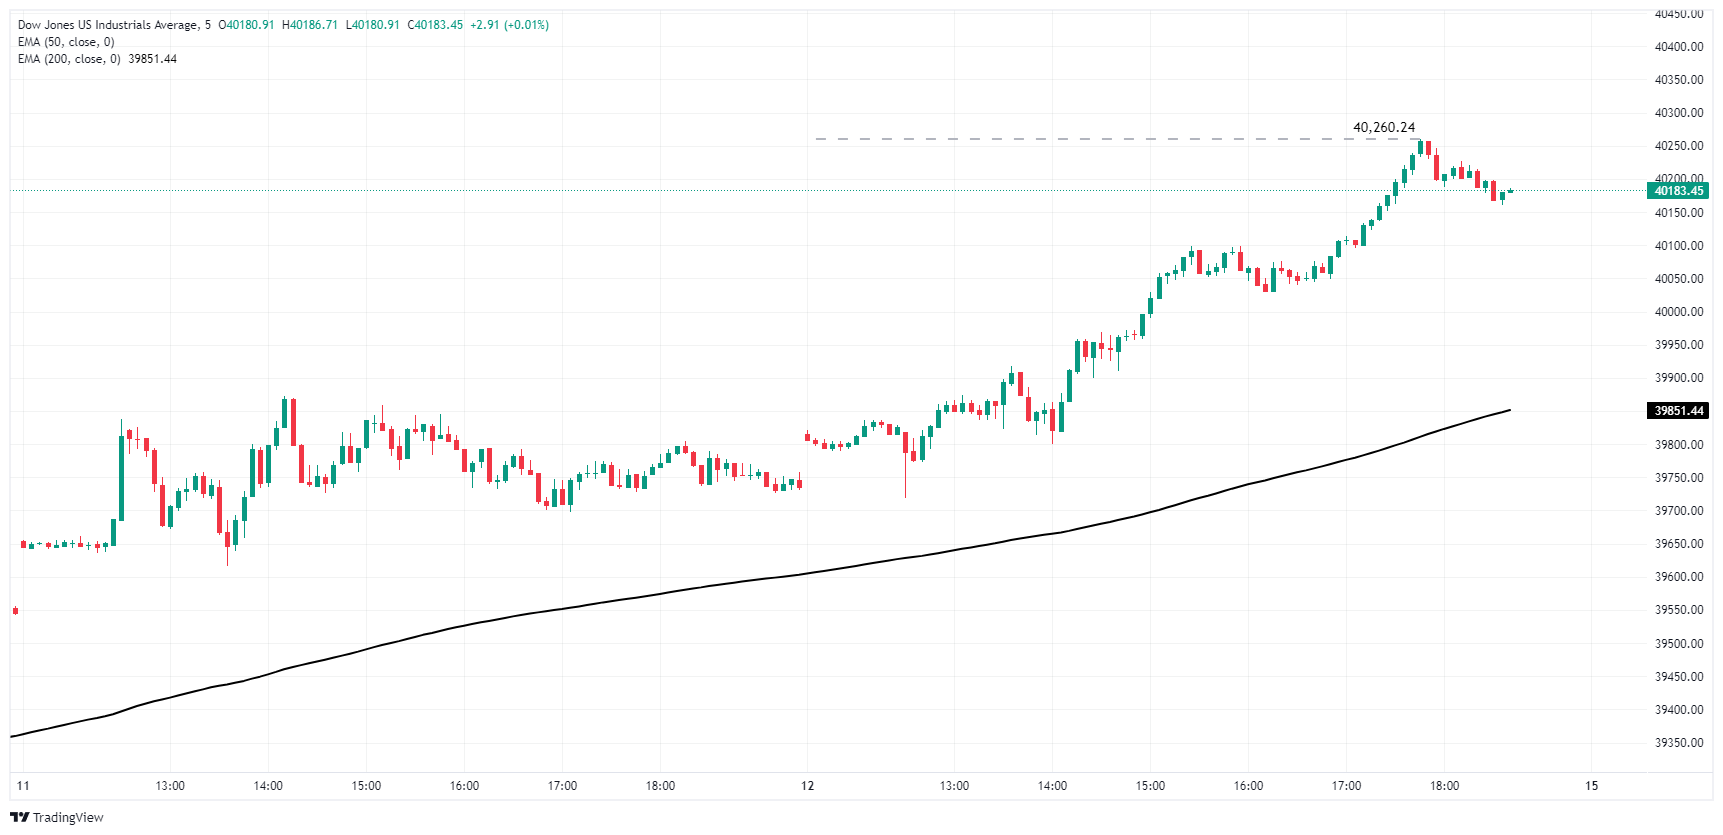
Dow Jones daily chart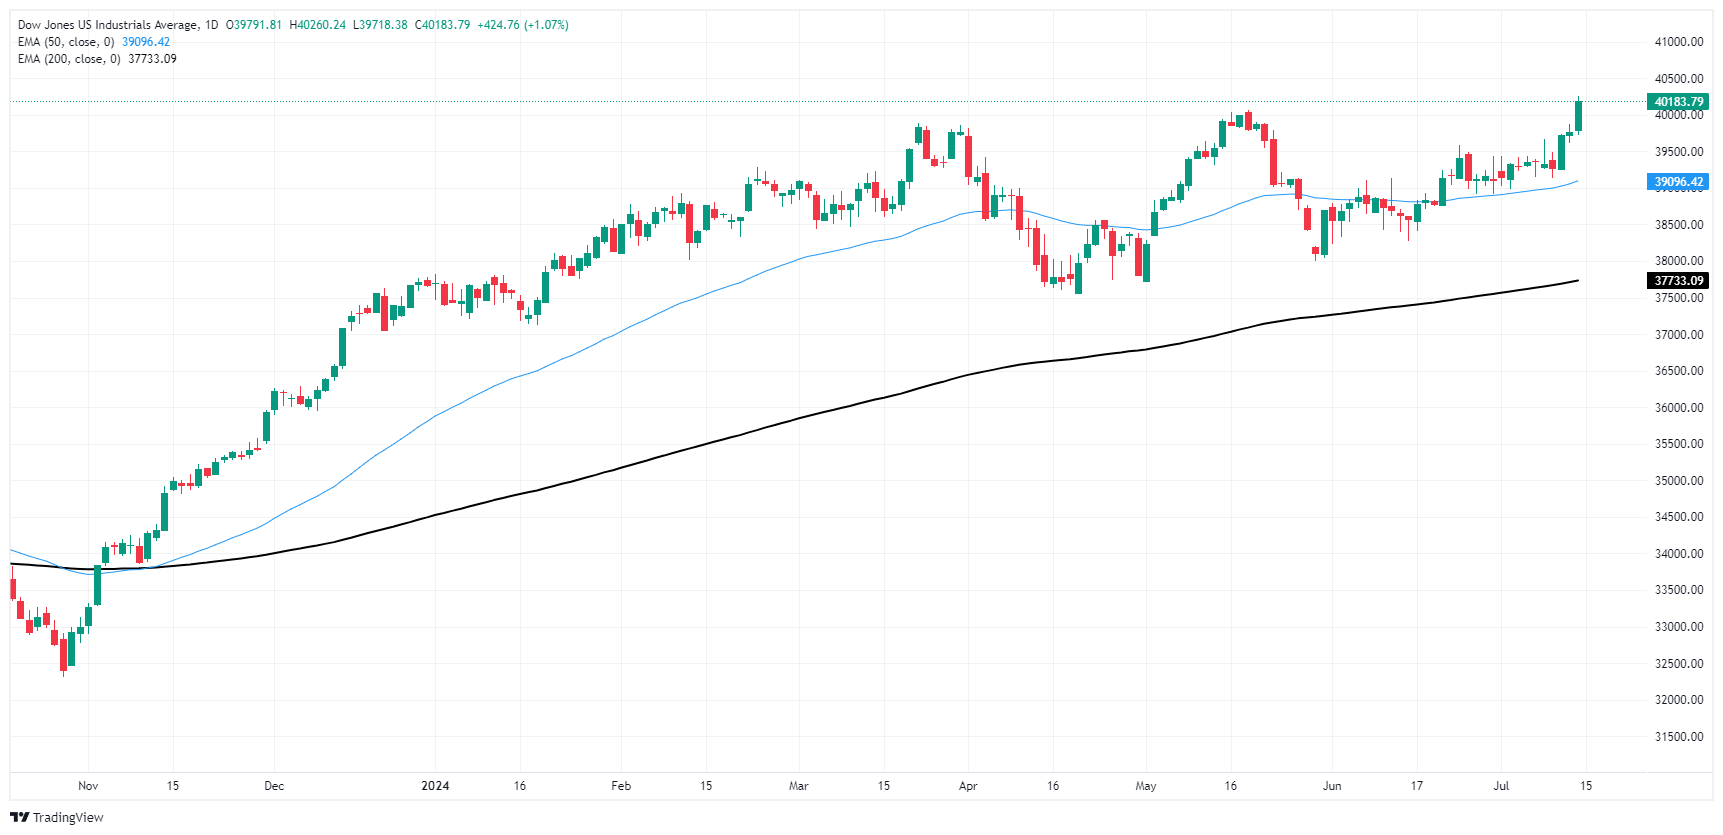
Dow Jones FAQs
The Dow Jones Industrial Average, one of the oldest stock market indices in the world, is compiled of the 30 most traded stocks in the US. The index is price-weighted rather than weighted by capitalization. It is calculated by summing the prices of the constituent stocks and dividing them by a factor, currently 0.152. The index was founded by Charles Dow, who also founded the Wall Street Journal. In later years it has been criticized for not being broadly representative enough because it only tracks 30 conglomerates, unlike broader indices such as the S&P 500.
Many different factors drive the Dow Jones Industrial Average (DJIA). The aggregate performance of the component companies revealed in quarterly company earnings reports is the main one. US and global macroeconomic data also contributes as it impacts on investor sentiment. The level of interest rates, set by the Federal Reserve (Fed), also influences the DJIA as it affects the cost of credit, on which many corporations are heavily reliant. Therefore, inflation can be a major driver as well as other metrics which impact the Fed decisions.
Dow Theory is a method for identifying the primary trend of the stock market developed by Charles Dow. A key step is to compare the direction of the Dow Jones Industrial Average (DJIA) and the Dow Jones Transportation Average (DJTA) and only follow trends where both are moving in the same direction. Volume is a confirmatory criteria. The theory uses elements of peak and trough analysis. Dow’s theory posits three trend phases: accumulation, when smart money starts buying or selling; public participation, when the wider public joins in; and distribution, when the smart money exits.
There are a number of ways to trade the DJIA. One is to use ETFs which allow investors to trade the DJIA as a single security, rather than having to buy shares in all 30 constituent companies. A leading example is the SPDR Dow Jones Industrial Average ETF (DIA). DJIA futures contracts enable traders to speculate on the future value of the index and Options provide the right, but not the obligation, to buy or sell the index at a predetermined price in the future. Mutual funds enable investors to buy a share of a diversified portfolio of DJIA stocks thus providing exposure to the overall index.
- AUD/USD remains at highest level since January near 0.6800.
- Hot PPI data didn’t stop the pair in its upward trend.
- Monetary policy divergence between RBA and Fed stir the pair.
The Australian Dollar (AUD) upheld its positive trajectory against the USD in Friday's session, rising by 0.30% to 0.6780. The AUD resumed its gains with market participants adjusting their stakes on the Federal Reserve (Fed) after the release of US inflation figures. Hot Producer Price Index (PPI) figures form the US didn’t trigger a recovery in the Greenback.
The Reserve Bank of Australia (RBA) is poised to be among the last G10 nations' central banks to initiate rate cuts, a factor that could extend the AUD's gains.
Daily market movers: AUD may extend gains as RBA delays cuts and markets grow confident in a more dovish Fed
- On the economic data front, the Producer Price Index (PPI) for final demand in the US rose 2.6% YoY in June, according to data published by the US Bureau of Labor Statistics on Friday.
- This result was higher than the forecasted 2.3%, surpassing the previous 2.2% rise in May. Core PPI also exceeded market expectations at 3%.
- However, sentiment data from the University of Michigan came in below expectation at 66.0, compared to the predicted 68.5 and the previous 68.2.
- CME Fedwatch Tool predicts more than 80% chance for 25 bps cut in September.
- On the other hand, speculation is growing that RBA might delay the global rate-cutting cycle or even raise interest rates again as a result of high inflation in Australia. This view compels RBA to maintain its hawkish stance.
- Furthermore, China, one of Australia's closest trade partners, has announced its Trade Balance data for June showing a trade surplus of $99.05 billion, a significant increase from the previous figure of $82.62 billion.
Technical analysis: AUD/USD maintains highs, signs of looming correction
The AUD/USD maintains a bullish stance, retaining the heights reached in January. However, the Relative Strength Index (RSI) and Moving Average Convergence Divergence (MACD) indicate that they are nearing overbought terrain, suggesting a possible impending correction.
Buyers are looking to maintain the 0.6760-0.6780 range and surpass the 0.6800 area if possible. Conversely, the 0.6670, 0.6650 and 0.6630 levels are set as support ranges in case of a correction.
Australian Dollar FAQs
One of the most significant factors for the Australian Dollar (AUD) is the level of interest rates set by the Reserve Bank of Australia (RBA). Because Australia is a resource-rich country another key driver is the price of its biggest export, Iron Ore. The health of the Chinese economy, its largest trading partner, is a factor, as well as inflation in Australia, its growth rate and Trade Balance. Market sentiment – whether investors are taking on more risky assets (risk-on) or seeking safe-havens (risk-off) – is also a factor, with risk-on positive for AUD.
The Reserve Bank of Australia (RBA) influences the Australian Dollar (AUD) by setting the level of interest rates that Australian banks can lend to each other. This influences the level of interest rates in the economy as a whole. The main goal of the RBA is to maintain a stable inflation rate of 2-3% by adjusting interest rates up or down. Relatively high interest rates compared to other major central banks support the AUD, and the opposite for relatively low. The RBA can also use quantitative easing and tightening to influence credit conditions, with the former AUD-negative and the latter AUD-positive.
China is Australia’s largest trading partner so the health of the Chinese economy is a major influence on the value of the Australian Dollar (AUD). When the Chinese economy is doing well it purchases more raw materials, goods and services from Australia, lifting demand for the AUD, and pushing up its value. The opposite is the case when the Chinese economy is not growing as fast as expected. Positive or negative surprises in Chinese growth data, therefore, often have a direct impact on the Australian Dollar and its pairs.
Iron Ore is Australia’s largest export, accounting for $118 billion a year according to data from 2021, with China as its primary destination. The price of Iron Ore, therefore, can be a driver of the Australian Dollar. Generally, if the price of Iron Ore rises, AUD also goes up, as aggregate demand for the currency increases. The opposite is the case if the price of Iron Ore falls. Higher Iron Ore prices also tend to result in a greater likelihood of a positive Trade Balance for Australia, which is also positive of the AUD.
The Trade Balance, which is the difference between what a country earns from its exports versus what it pays for its imports, is another factor that can influence the value of the Australian Dollar. If Australia produces highly sought after exports, then its currency will gain in value purely from the surplus demand created from foreign buyers seeking to purchase its exports versus what it spends to purchase imports. Therefore, a positive net Trade Balance strengthens the AUD, with the opposite effect if the Trade Balance is negative.
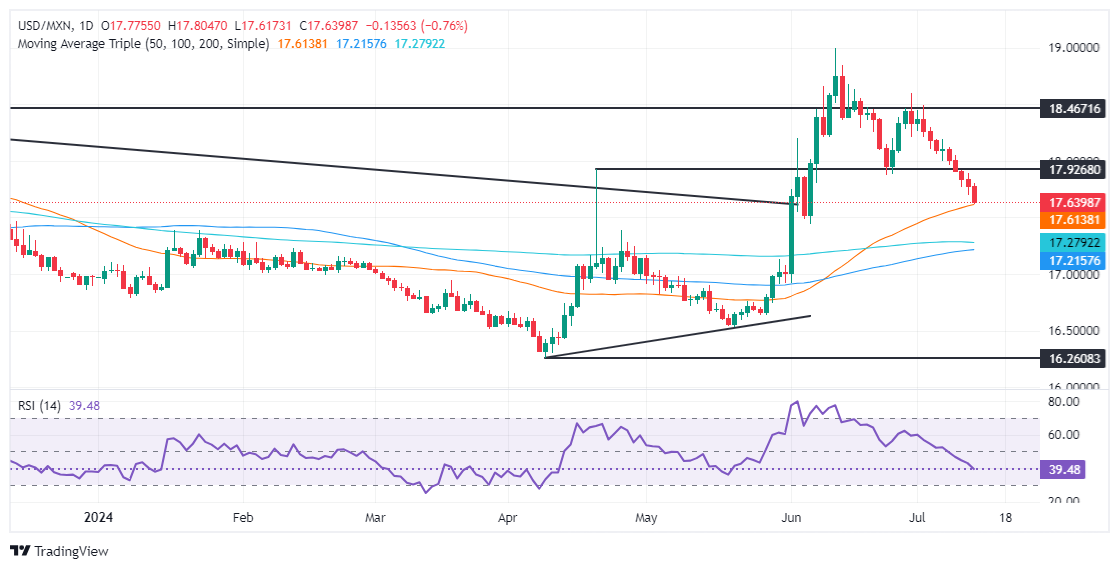
- Mexican Peso extends gains as USD/MXN reaches 17.68 after hitting five-week low of 17.62.
- Mexico’s Industrial Production rebounds in May, indicating resilience amid economic slowdown.
- Banxico minutes suggest potential rate adjustments, while US producer inflation rises and consumer sentiment deteriorates.
The Mexican Peso extended its rally for the ninth consecutive trading day against the Greenback on Friday following the release of Mexico’s Industrial Product figures and June’s US inflation data on the producer side. The USD/MXN trades at 17.68, refreshing five-week lows of 17.62.
Despite the annual weakening, Mexico’s Industrial Production showed resilience by recovering in May, following April’s plunge in monthly figures. This recovery underscores a positive outlook amidst the country’s ongoing economic slowdown.
In the meantime, the latest Bank of Mexico (Banxico) minutes revealed that the disinflation process has evolved and may spark discussions to adjust interest rates at upcoming meetings. The board acknowledged the labor market's strength, yet stated that growth has shown signs of weakness.
Meanwhile, Jose Luis Ortega, CIO of Black Rock Mexico, commented that inflation in Mexico wouldn’t return to Banxico’s 3% goal by the end of 2025. He added that Banxico’s easing cycle will be gradual, though adjustments will continue.
Across the border, further inflation data revealed by the US Bureau of Labor Statistics (BLS) showed that prices paid by producers picked up above economists' estimates, while US Consumer Sentiment revealed by the University of Michigan (UoM) deteriorated.
In the meantime, Federal Reserve (Fed) officials grabbed the headlines and remained cautious in regard to monetary policy shifts. Chicago Fed President Goolsbee said that recent inflation data is “favorable” and might shorten the Fed’s last mile on inflation.
St. Louis Fed President Alberto Musalem said that the current interest rate level is appropriate for current conditions and sees the economy growing between 1.5% and 2% this year.
Daily digest market movers: Mexican Peso prolongs its gains, despite Banxico's dovish tilt
- Banxico board members project growth to be lower than expected, as Mexico’s economic activity has been weak since the end of 2023. Most policymakers mentioned that inflation will converge toward the target in the last quarter 2025.
- They added that services inflation does not show a clear downward trend, which was one of the reasons for keeping rates unchanged at the June meeting.
- Mexico’s Industrial Production (IP) in May came at 0.7% MoM, higher than April’s -0.4% and estimates of 0.4%. In the 12 months to May, IP was 1%, which fell sharply from 5.1% in April and missed the 1.2% projected.
- Mexico’s June inflation figures were higher than expected due to a rise in food prices when most economists expect Banxico to resume lowering interest rates.
- June US Producer Price Index (PPI) expanded by 0.2% MoM, higher than the 0.1% expected and above May’s 0%. Core PPI was hotter than the 0.2% foreseen, at 0.4% MoM.
- Annually based, PPI ticked up from 2.4% to 2.6%, above forecasts of 2.3%. Underlying inflation was 3%, up from 2.6%.
- UoM Consumer Sentiment declined from 68.2 in June to 66.0 in July. Inflation expectations for one year came as expected at 2.9%, down from 3%.
- US Dollar Index (DXY), which tracks the value of a basket of six currencies against the US Dollar, tumbled more than 0.30% and is down at 104.12.
- According to the CME FedWatch Tool data, the odds for a September cut are 88%, up from 85% on Thursday.
Technical analysis: Mexican Peso capitalizes USD weakness as USD/MXN drops below 17.70
The USD/MXN continues to slip further, with traders eyeing a test of the 17.50 psychological level. Momentum remains on the seller's side, as depicted by the Relative Strength Index (RSI), though key support levels in the exotic pair will be tested soon.
If USD/MXN drops below 17.60, the next support would be the confluence of the December 5 high and the 50-day Simple Moving Average (SMA) near 17.56/60, followed by the 200-day SMA at 17.28. Further losses would test the 100-day SMA at 17.20.
Conversely, USD/MXN buyers need to clear the June 24 cycle low of 17.87, which has turned into resistance, before challenging the 18.00 figure. Further upside potential is seen above the July 5 high at 18.19, followed by the June 28 high of 18.59, allowing buyers to aim for the YTD high of 18.99.
Mexican Peso FAQs
The Mexican Peso (MXN) is the most traded currency among its Latin American peers. Its value is broadly determined by the performance of the Mexican economy, the country’s central bank’s policy, the amount of foreign investment in the country and even the levels of remittances sent by Mexicans who live abroad, particularly in the United States. Geopolitical trends can also move MXN: for example, the process of nearshoring – or the decision by some firms to relocate manufacturing capacity and supply chains closer to their home countries – is also seen as a catalyst for the Mexican currency as the country is considered a key manufacturing hub in the American continent. Another catalyst for MXN is Oil prices as Mexico is a key exporter of the commodity.
The main objective of Mexico’s central bank, also known as Banxico, is to maintain inflation at low and stable levels (at or close to its target of 3%, the midpoint in a tolerance band of between 2% and 4%). To this end, the bank sets an appropriate level of interest rates. When inflation is too high, Banxico will attempt to tame it by raising interest rates, making it more expensive for households and businesses to borrow money, thus cooling demand and the overall economy. Higher interest rates are generally positive for the Mexican Peso (MXN) as they lead to higher yields, making the country a more attractive place for investors. On the contrary, lower interest rates tend to weaken MXN.
Macroeconomic data releases are key to assess the state of the economy and can have an impact on the Mexican Peso (MXN) valuation. A strong Mexican economy, based on high economic growth, low unemployment and high confidence is good for MXN. Not only does it attract more foreign investment but it may encourage the Bank of Mexico (Banxico) to increase interest rates, particularly if this strength comes together with elevated inflation. However, if economic data is weak, MXN is likely to depreciate.
As an emerging-market currency, the Mexican Peso (MXN) tends to strive during risk-on periods, or when investors perceive that broader market risks are low and thus are eager to engage with investments that carry a higher risk. Conversely, MXN tends to weaken at times of market turbulence or economic uncertainty as investors tend to sell higher-risk assets and flee to the more-stable safe havens.
- The Canadian Dollar backslid on Friday as CAD traders retreat for the weekend.
- Canada revealed another sharp contraction in new building permits.
- US PPI wholesale inflation accelerated, but markets are trying to shrug it off.
The Canadian Dollar (CAD) shed weight on Friday, falling to the bottom as one of the poorest-performing major currencies for the last session of the trading week. Broader markets are shaking off an unexpected acceleration of US Producer Price Index (PPI) wholesale inflation, instead focusing on cooling Consumer Price Index (CPI) inflation from earlier in the week.
Canada posted 2024’s second-steepest contraction in Building Permits in May, hobbling the CAD further and setting the Canadian Dollar up to churn on the low side as traders await next Tuesday’s Canadian CPI inflation print.
Daily digest market movers: Canadian Dollar stumbles on bad housing data
- Canadian Building Permits contracted 12.2% in May, the second-steepest decline in 2024.
- US core PPI wholesale inflation accelerated notably in June, rising to 3.0% YoY compared to the expected 2.5%.
- The previous period’s print was also revised higher to 2.6% from the initial 2.3%.
- MoM core US PPI rose 0.4% MoM, double the forecast 0.2% while the previous month’s print was likewise revised upwards to 0.3% from the initial 0.0%.
- The University of Michigan Consumer Sentiment Index for July declined to a seven-month low of 66.0 from the previous 68.2, reversing the forecast uptick to 68.5.
- Despite the upswing in producer-level inflation, markets are broadly leaning into the bullish side, focusing on Thursday’s cooler-than-expected CPI inflation print.
Technical analysis: USD/CAD swamped out in near-term midrange
The Canadian Dollar (CAD) is one of the poorest-performing currencies on Friday, shedding weight across the board and struggling to develop any meaningful momentum against the US Dollar. USD/CAD is stuck in a lurch just above the 1.3600 handle, and threatening to spiral out into a longer-running consolidation phase as the pair finds little reason to push too far in either direction.
Intraday bidding remains capped below the 200-hour Exponential Moving Average (EMA) at 1.3640, and tests to the low side are unable to find a foothold below 1.3600. Daily candlesticks are bolstered by the 200-day EMA at 1.2594, keeping a lid on downside pressure while a supply zone priced in above 1.3750 caps off any bullish attempts.
USD/CAD hourly chart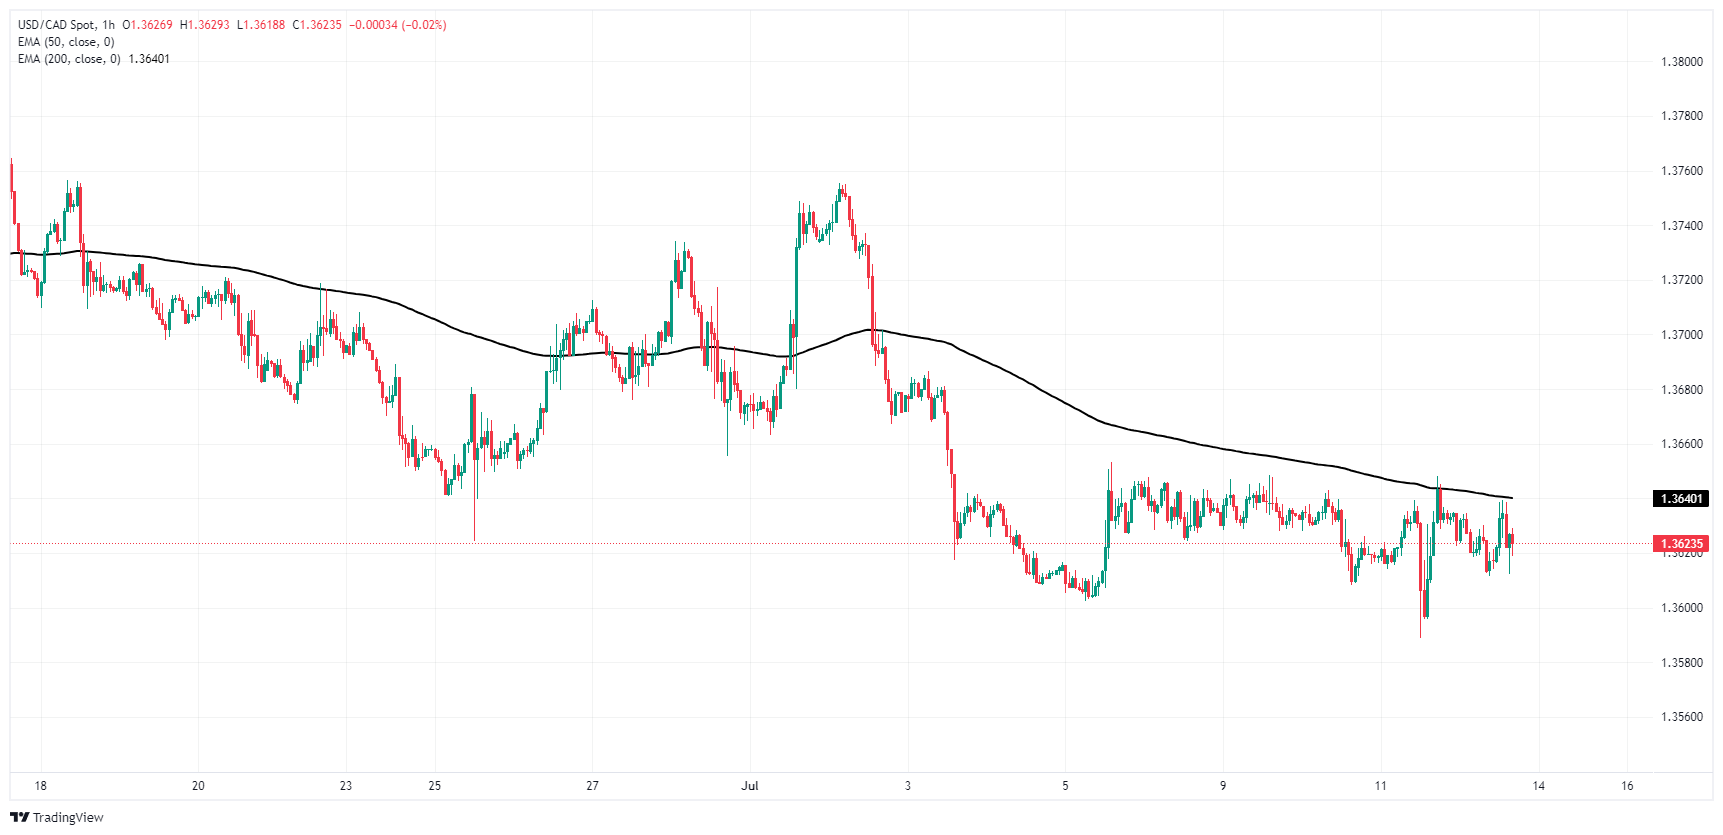
USD/CAD daily chart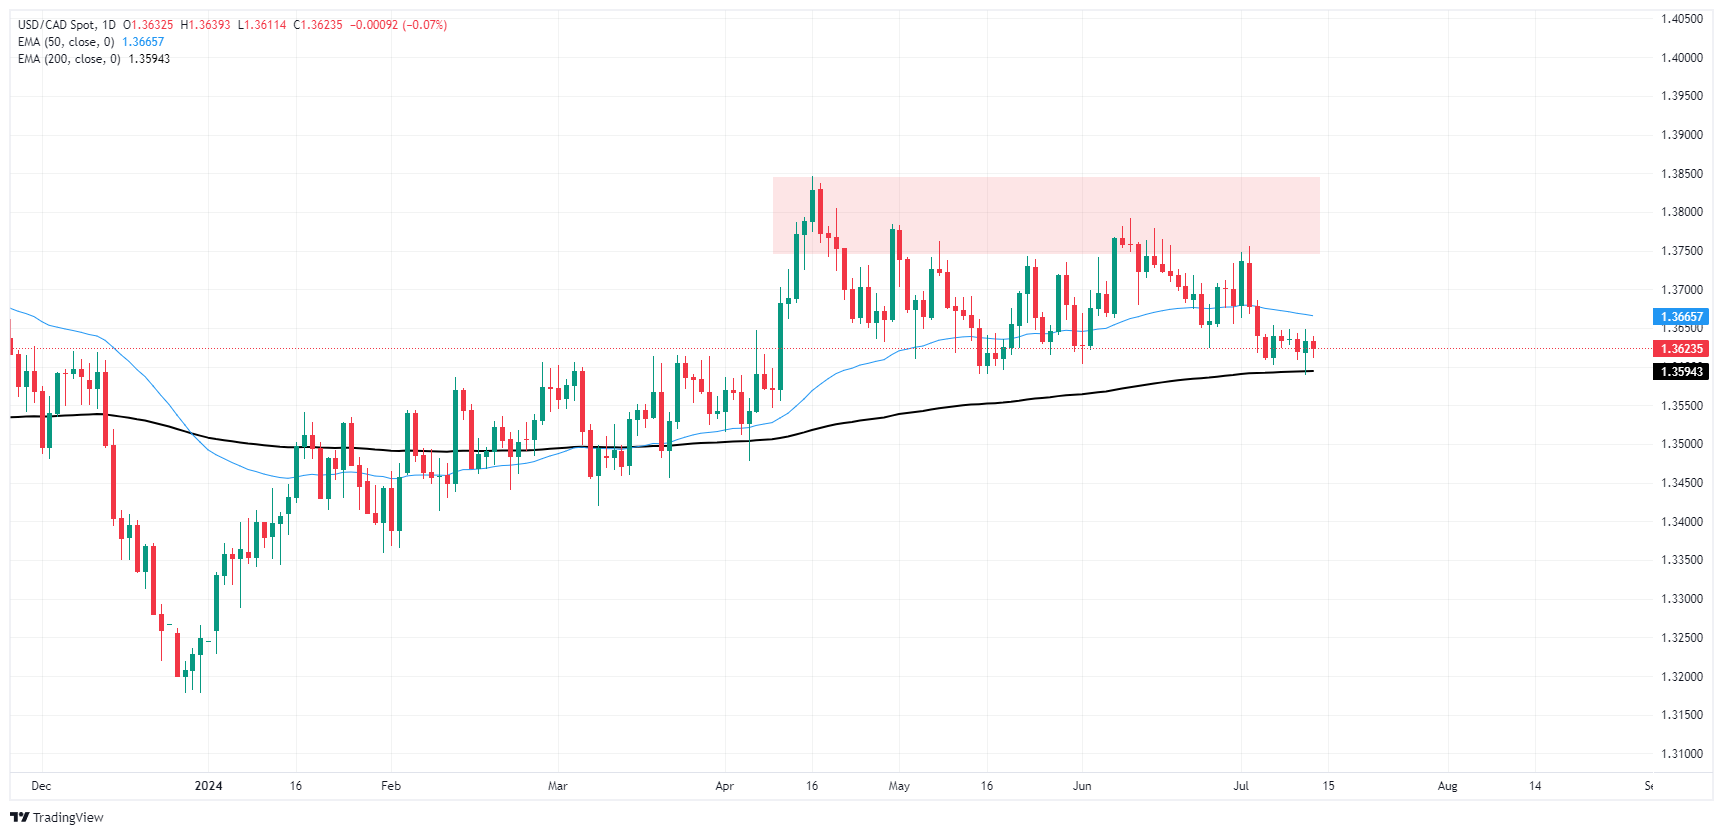
Canadian Dollar FAQs
The key factors driving the Canadian Dollar (CAD) are the level of interest rates set by the Bank of Canada (BoC), the price of Oil, Canada’s largest export, the health of its economy, inflation and the Trade Balance, which is the difference between the value of Canada’s exports versus its imports. Other factors include market sentiment – whether investors are taking on more risky assets (risk-on) or seeking safe-havens (risk-off) – with risk-on being CAD-positive. As its largest trading partner, the health of the US economy is also a key factor influencing the Canadian Dollar.
The Bank of Canada (BoC) has a significant influence on the Canadian Dollar by setting the level of interest rates that banks can lend to one another. This influences the level of interest rates for everyone. The main goal of the BoC is to maintain inflation at 1-3% by adjusting interest rates up or down. Relatively higher interest rates tend to be positive for the CAD. The Bank of Canada can also use quantitative easing and tightening to influence credit conditions, with the former CAD-negative and the latter CAD-positive.
The price of Oil is a key factor impacting the value of the Canadian Dollar. Petroleum is Canada’s biggest export, so Oil price tends to have an immediate impact on the CAD value. Generally, if Oil price rises CAD also goes up, as aggregate demand for the currency increases. The opposite is the case if the price of Oil falls. Higher Oil prices also tend to result in a greater likelihood of a positive Trade Balance, which is also supportive of the CAD.
While inflation had always traditionally been thought of as a negative factor for a currency since it lowers the value of money, the opposite has actually been the case in modern times with the relaxation of cross-border capital controls. Higher inflation tends to lead central banks to put up interest rates which attracts more capital inflows from global investors seeking a lucrative place to keep their money. This increases demand for the local currency, which in Canada’s case is the Canadian Dollar.
Macroeconomic data releases gauge the health of the economy and can have an impact on the Canadian Dollar. Indicators such as GDP, Manufacturing and Services PMIs, employment, and consumer sentiment surveys can all influence the direction of the CAD. A strong economy is good for the Canadian Dollar. Not only does it attract more foreign investment but it may encourage the Bank of Canada to put up interest rates, leading to a stronger currency. If economic data is weak, however, the CAD is likely to fall.
- US Dollar continues losing ground in light of weak CPI figures and UoM data.
- Markets still foresee a September rate cut.
- Despite hot PPI data, US Treasury yields are falling, diminishing allure of USD.
The US Dollar Index (DXY) remains weak on Friday, sitting at April lows. This is largely a response to the soft US Consumer Price Index (CPI) figures on Thursday, combined with softer University of Michigan (UoM) sentiment data, both supporting the prospect of a Federal Reserve (Fed) rate cut in September.
Although the market's confidence in a pending rate cut is growing, Fed officials have maintained a careful approach, emphasizing their dependence on rigorous data analysis before initiating such substantial changes.
Daily digest market movers: DXY wanes despite rising PPI
- US Producer Price Index (PPI) for final demand rose to 2.6% YoY in June, an increase from 2.2% last month, as revealed by the US Bureau of Labor Statistics (BLS) on Friday. This outcome exceeded market expectations of 2.3%.
- Annual core PPI increased by 3% during the same period, surpassing both the previous month's rise and the anticipated market figure of 2.3%.
- On a monthly basis, PPI and core PPI escalated by 0.2% and 0.4%, respectively.
- Despite positive PPI data, soft CPI figures and softer UoM sentiment data (reported at 66.0 versus the forecast of 68.5 and the previous value of 68.2) continue to bolster the argument for a September rate cut.
- CME FedWatch Tool now shows an 86% probability of a 25-basis-point cut in September, and some investors bet on a 50-basis-point cut
DXY technical outlook: Bearish sentiment worsens as DXY breaches 200-day SMA
The DXY Index's breach of its 200-day Simple Moving Average (SMA) has intensified the negative outlook for the USD, with indicators including the Relative Strength Index (RSI) and the Moving Average Convergence Divergence (MACD) still deep in a negative trajectory.
The index now trades at its lowest level since April, amplifying the bearish sentiment. But after losing more than 0.80% in just two sessions, a slight upward correction may be possible. However, the overall technical outlook remains bearish.
US Dollar FAQs
The US Dollar (USD) is the official currency of the United States of America, and the ‘de facto’ currency of a significant number of other countries where it is found in circulation alongside local notes. It is the most heavily traded currency in the world, accounting for over 88% of all global foreign exchange turnover, or an average of $6.6 trillion in transactions per day, according to data from 2022. Following the second world war, the USD took over from the British Pound as the world’s reserve currency. For most of its history, the US Dollar was backed by Gold, until the Bretton Woods Agreement in 1971 when the Gold Standard went away.
The most important single factor impacting on the value of the US Dollar is monetary policy, which is shaped by the Federal Reserve (Fed). The Fed has two mandates: to achieve price stability (control inflation) and foster full employment. Its primary tool to achieve these two goals is by adjusting interest rates. When prices are rising too quickly and inflation is above the Fed’s 2% target, the Fed will raise rates, which helps the USD value. When inflation falls below 2% or the Unemployment Rate is too high, the Fed may lower interest rates, which weighs on the Greenback.
In extreme situations, the Federal Reserve can also print more Dollars and enact quantitative easing (QE). QE is the process by which the Fed substantially increases the flow of credit in a stuck financial system. It is a non-standard policy measure used when credit has dried up because banks will not lend to each other (out of the fear of counterparty default). It is a last resort when simply lowering interest rates is unlikely to achieve the necessary result. It was the Fed’s weapon of choice to combat the credit crunch that occurred during the Great Financial Crisis in 2008. It involves the Fed printing more Dollars and using them to buy US government bonds predominantly from financial institutions. QE usually leads to a weaker US Dollar.
Quantitative tightening (QT) is the reverse process whereby the Federal Reserve stops buying bonds from financial institutions and does not reinvest the principal from the bonds it holds maturing in new purchases. It is usually positive for the US Dollar.
Speculative investors’ short Japanese Yen (JPY) positions are close to a record. USDJPY could see bouts of pullbacks if US data continues to point to a soft landing, UBS FX strategists note.
Short Yen positions are close to a record
“The Japanese Yen jumped as much as 3% against the US Dollar (USD) after the US CPI print pushed the Treasury yield lower, and as Japanese officials appeared to have conducted another round of intervention with yen purchases.”
“While we only expect US-Japan yield differentials to narrow more meaningfully by year-end, we advise against chasing USD/JPY higher or taking JPY loan exposure. Given that speculative investors’ short Yen positions are close to a record, we think that USDJPY could see bouts of pullbacks if US data continues to point to a soft landing.”
“For investors with existing short USDJPY trades, we favor using short-term pullbacks to reduce or exit these positions.”
The Australian Dollar (AUD) should appreciate against the US Dollar (USD) and the New Zealand Dollar (NZD) amid sticky core inflation, UBS FX strategists note.
AUD to turn bullish against USD and NZD
“Following the stronger-than-expected inflation data for May, we think a robust labor report and higher quarterly CPI for the second quarter will likely lead to a rate hike by the Reserve Bank of Australia (RBA) in August. This underpins our recommendation to sell the downside price risks of AUD/USD.”
“We also see an opportunity to go long the AUD versus NZD, as the Reserve Bank of New Zealand (RBNZ) made a surprise pivot this week noting deteriorating economic activity and easing inflation.”
“We now expect the RBNZ to cut rates in August, instead of November, and believe the NZD may underperform other G10 currencies.”
Swiss National Bank (SNB) seems to be near the end of its easing cycle, and the Swiss Franc (CHF) should appreciate against both the US Dollar (USD) and the Euro (EUR), UBS FX analysts note.
USD/CHF to fall back toward 0.87
“We believe the Swiss National Bank (SNB) policy rate is now closer to its terminal value after two cuts this year amid a decrease in underlying inflationary pressure, with one final cut likely in September.”
“This means the CHF should appreciate against both the US dollar and EUR over the next 12 months as the Fed and the European Central Bank (ECB) ramp up monetary policy easing.”
“The narrowing rate differential between the US and Switzerland should allow USD/CHF to fall back toward 0.87, from around 0.896 at present, while political uncertainty and fiscal consolidation in Europe should support safe-haven flows to the franc.”
The US dollar (USD) came under further pressure after the consumer price index for June showed underlying inflation rising at its slowest pace in three years. The Dollar Index (DXY), which tracks the Greenback against six major currencies, fell as much as 0.9% on Thursday right after the data release, though it rebounded slightly during Asia morning trade on Friday, UBS FX analysts note.
USD to trend lower to 103–104 in the coming days
“With headline CPI registering the first monthly decline (–0.1%) since December 2022, and the core measure advancing by the smallest in three years (+0.1%), the report added to confidence that a pivot from the Federal Reserve is getting closer. It is also the latest in a series of soft data that have weighed on the US dollar in recent weeks. Since late June, the DXY index has fallen 1.4%.
“The door now appears wide open for the Federal Reserve (Fed) to begin cutting interest rates, in our view. We expect Fed to use the FOMC meeting at the end of the month to signal that it is prepared to cut at the September meeting as long as the data continues on its recent trend. This means that the USD should continue to trend lower to 103–104 in the coming days.”
“We continue to advocate selling USD upside for a yield pickup in the coming months, as market expectations of a deeper Fed rate-cutting cycle and fears about the size of the US fiscal deficit are headwinds for the greenback in the near future and over the long term.”
- GBP/USD rises, with eyes on the crucial 1.3000 mark.
- Bullish technical outlook continues; RSI suggests potential for more gains, nearing overbought territory.
- Support levels to watch if rejection happens: 1.2900, 1.2894 (March 8 peak), and 1.2860 (June 12 high).
The Pound Serling rallied sharply against the US Dollar on Friday, up by more than 0.50% even though US inflation data on the producer front was slightly higher than expected, contrary to consumer prices revealed on Thursday. The GBP/USD trades at 1.2981 after bouncing off daily lows of 1.2901.
GBP/USD Price Analysis: Technical outlook
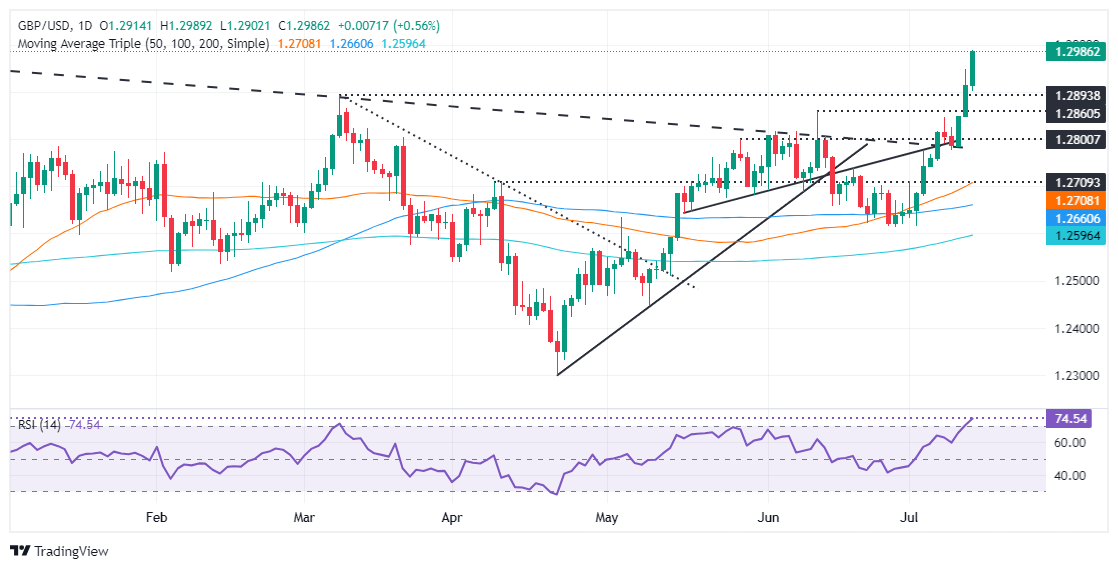
The uptrend on the GBP/USD continues, as it hits a new year-to-date (YTD) high and targets last year’s July 27 high of 1.2995, which is an inch of the 1.3000 figure.
From a momentum standpoint, bulls are in charge. The Relative Strength Index (RSI), despite being at overbought conditions due to aggressive price action, hasn’t reached the most extreme level used by traders, 80. Hence, there is some room to spare, and the 1.3000 would be up for grabs.
A rejection at the 1.3000 mark could pave the way for range-bound trading within the 1.2900-1.3000 range. However, a fall below 1.2900 would lay the path to test the March 8 peak turned support at 1.2894, ahead of June 12’s high at 1.2860.
GBP/USD Price Action – Daily Chart
British Pound PRICE Today
The table below shows the percentage change of British Pound (GBP) against listed major currencies today. British Pound was the strongest against the US Dollar.
| USD | EUR | GBP | JPY | CAD | AUD | NZD | CHF | |
|---|---|---|---|---|---|---|---|---|
| USD | -0.31% | -0.55% | -0.66% | -0.04% | -0.37% | -0.39% | -0.18% | |
| EUR | 0.31% | -0.23% | -0.29% | 0.26% | -0.06% | -0.09% | 0.11% | |
| GBP | 0.55% | 0.23% | -0.06% | 0.49% | 0.16% | 0.13% | 0.33% | |
| JPY | 0.66% | 0.29% | 0.06% | 0.57% | 0.28% | 0.23% | 0.45% | |
| CAD | 0.04% | -0.26% | -0.49% | -0.57% | -0.32% | -0.36% | -0.16% | |
| AUD | 0.37% | 0.06% | -0.16% | -0.28% | 0.32% | -0.03% | 0.17% | |
| NZD | 0.39% | 0.09% | -0.13% | -0.23% | 0.36% | 0.03% | 0.21% | |
| CHF | 0.18% | -0.11% | -0.33% | -0.45% | 0.16% | -0.17% | -0.21% |
The heat map shows percentage changes of major currencies against each other. The base currency is picked from the left column, while the quote currency is picked from the top row. For example, if you pick the British Pound from the left column and move along the horizontal line to the US Dollar, the percentage change displayed in the box will represent GBP (base)/USD (quote).
Gold (XAU/USD) traded strong Thursday, commodity trading advisors (CTAs) are unwinding a portion of their length. As for Silver (XAG/USD) top Shanghai Futures Exchange (SHFE) funds promptly reduced their net position by 9k lots, TDS commodity traders note.
Asian demand is set to remain strong
“Despite the strong move yesterday in Gold, CTAs are unwinding a portion of their length, needing to see prices comfortably above $2,437/oz to add back more length. While some money managers may be taking profits near all-time highs, the below-expected inflation data and softer employment data bolstered expectations of a September start to the Fed cutting cycle.”
“The first evidence of renewed interest is starting to show as ETF positions continue to rise in July, after June saw the first monthly increase since May 2023. While Chinese Gold reserves were flat for a second consecutive month amid their noted pause in buying, top traders on the SHFE have added back to their net positions, highlighting Asian demand is set to remain strong.”
“As for Silver, after the noted sizable build in positioning, top SHFE funds promptly reduced their net position by 9k lots overnight, while CTAs could also turn sellers below $30.78/oz.”
Base metals have held strong as stimulus optimism gets baked in, however there’s an increasing level of bearishness on the ground in China, TDS com
Base metals see their longs liquidated
“With the upcoming plenum in China gaining plenty of market focus, base metals have held strong as stimulus optimism gets baked in. However, our tracking of top Shanghai Futures Exchange (SHFE) traders highlights an increasing level of bearishness on the ground in China.”
“Traders add nearly 5k lots short and liquidated longs in Copper, seeing their net short position grow to roughly the largest it has been since the start of the year. Likewise, in Aluminium, Chinese traders have added 8k lots short and cut longs, seeing their position flip net short after holding a notable long position. Zinc also saw a heavy 8k lots worth of long liquidations.”
“Pressures are building on the industrial metals as our gauge of global commodity demand continues to weaken. Any disappointment on potential Chinese stimulus will likely see continued liquidations of bloated positioning. As upside momentum fails to manifest, CTAs have turned recent sellers of the Red Metal, while Aluminium could also be in the crosshairs in the near-term.”
- NZD/USD gains to near 0.6120 as the US Dollar faces severe selling pressure.
- The US Dollar declines as Fed rate-cut bets soar.
- Weak Business NZ PMI boosts RBNZ’s rate-cut hopes.
The NZD/USD pair moves higher to 0.6120 in Friday’s New York session. The Kiwi asset gains as the US Dollar (USD) remains in the bearish trajectory due to strong expectations that the Federal Reserve (Fed) will start reducing interest rates from the September meeting.
The US Dollar Index (DXY), which tracks the Greenback’s value against six major currencies, slumps to near the crucial support of 104.00. Meanwhile, the market sentiment remains cheerful amid firm Fed rate cut prospects. The S&P 500 has posted significant gains in the opening session, exhibiting strong risk-appetite of investors. 10-year US Treasury yields have retreated to near 4.19%.
According to the CME FedWatch tool, 30-day Federal Fund Futures pricing data shows that rate cuts in September is a done deal. The data also shows that the central bank will cut interest rates further in November or December meeting.
The expectations for Fed rate cuts have been propelled by cooling inflationary pressures. The United States (US) Consumer Price Index (CPI) report for June showed that progress in the disinflation process has resumed after a one-time blip in the first quarter.
On the contrary, US Producer Price Index (PPI) rose at a stronger pace than expected in June. Annually, headline and core PPI accelerated to 2.6% and 3.0%, respectively.
On the Asia-Pacific front, the New Zealand Dollar (NZD) remains weak due to poor Business NZ PMI data for June. The PMI data came in at 41.1, contracted significantly from the prior release of 46.6. This has dampened the NZ economic outlook and has improved expectations of early rate cuts by the Reserve Bank of New Zealand (RBNZ).
Economic Indicator
Business NZ PMI
The Business NZ Performance of Manufacturing Index (PMI), released by Business NZ on a monthly basis, is a leading indicator gauging business activity in New Zealand’s manufacturing sector. The data is derived from surveys of senior executives at private-sector companies. Survey responses reflect the change, if any, in the current month compared to the previous month and can anticipate changing trends in official data series such as Gross Domestic Product (GDP), industrial production or employment.The index varies between 0 and 100, with levels of 50.0 signaling no change over the previous month. A reading above 50 indicates that the manufacturing economy is generally expanding, a bullish sign for the New Zealand Dollar (NZD). Meanwhile, a reading below 50 signals that activity among goods producers is generally declining, which is seen as bearish for NZD.
Read more.Last release: Thu Jul 11, 2024 22:30
Frequency: Monthly
Actual: 41.1
Consensus: -
Previous: 47.2
Source: Business NZ
- USD/CAD remains in a tight range above 1.3600 despite US PPI turning out hotter than expected.
- Market speculation for Fed rate cuts in September remains firm.
- The weak Canadian job market boosts prospects of more rate cuts by the BoC.
The USD/CAD pair doesn’t move much from its current range above 1.3600 in Friday’s American session even though the United States (US) Bureau of Labor Statistics (BLS) has reported that the producer inflation rose at a faster-than-expected pace in June.
The Producer Price Index (PPI) report showed that the core factory-gate inflation grew at a robust pace of 3.0% than the estimates of 2.5% and the prior release of 2.6%, upwardly revised from 2.3%. Also, the underlying inflation rose strongly by 0.4% from the consensus of 0.2% and the former reading of 0.3%, upwardly revised from its unchanged position.
Hotter-than-expected producer inflation has raised doubts over strong market speculation for the Federal Reserve (Fed) to begin reducing interest rates from the September meeting, which were prompted by softer-than-projected consumer inflation and easing labor market strength.
The US Dollar Index (DXY), which tracks the Greenback’s value against six major currencies, has declined further to near 104.00. The opening of the S&P 500 on a positive note indicates a higher risk appetite of market participants. 10-year US Treasury yields surrender their intraday gains and fall back to near 4.20%.
Meanwhile, the Canadian Dollar remains on the backfoot amid expectations that the Bank of Canada (BoC) will cut interest rates again. Market speculation for back-to-back rate cuts by the BoC rose due to weak Canadian labor market conditions. The BoC started reducing its key borrowing rate from the June meeting after maintaining a restrictive interest rate framework for more than two years.
Canadian Dollar FAQs
The key factors driving the Canadian Dollar (CAD) are the level of interest rates set by the Bank of Canada (BoC), the price of Oil, Canada’s largest export, the health of its economy, inflation and the Trade Balance, which is the difference between the value of Canada’s exports versus its imports. Other factors include market sentiment – whether investors are taking on more risky assets (risk-on) or seeking safe-havens (risk-off) – with risk-on being CAD-positive. As its largest trading partner, the health of the US economy is also a key factor influencing the Canadian Dollar.
The Bank of Canada (BoC) has a significant influence on the Canadian Dollar by setting the level of interest rates that banks can lend to one another. This influences the level of interest rates for everyone. The main goal of the BoC is to maintain inflation at 1-3% by adjusting interest rates up or down. Relatively higher interest rates tend to be positive for the CAD. The Bank of Canada can also use quantitative easing and tightening to influence credit conditions, with the former CAD-negative and the latter CAD-positive.
The price of Oil is a key factor impacting the value of the Canadian Dollar. Petroleum is Canada’s biggest export, so Oil price tends to have an immediate impact on the CAD value. Generally, if Oil price rises CAD also goes up, as aggregate demand for the currency increases. The opposite is the case if the price of Oil falls. Higher Oil prices also tend to result in a greater likelihood of a positive Trade Balance, which is also supportive of the CAD.
While inflation had always traditionally been thought of as a negative factor for a currency since it lowers the value of money, the opposite has actually been the case in modern times with the relaxation of cross-border capital controls. Higher inflation tends to lead central banks to put up interest rates which attracts more capital inflows from global investors seeking a lucrative place to keep their money. This increases demand for the local currency, which in Canada’s case is the Canadian Dollar.
Macroeconomic data releases gauge the health of the economy and can have an impact on the Canadian Dollar. Indicators such as GDP, Manufacturing and Services PMIs, employment, and consumer sentiment surveys can all influence the direction of the CAD. A strong economy is good for the Canadian Dollar. Not only does it attract more foreign investment but it may encourage the Bank of Canada to put up interest rates, leading to a stronger currency. If economic data is weak, however, the CAD is likely to fall.
- USD/CHF is correcting back after the rally in late June and early July.
- It is currently unfolding the wave C of an ABC corrective pattern.
USD/CHF is declining in what looks like the wave C of a three-wave ABC correction. The correction is from the rally that took place between the June 18 lows at 0.8827 up to the July 3 peak at 0.9051.
USD/CHF Daily Chart
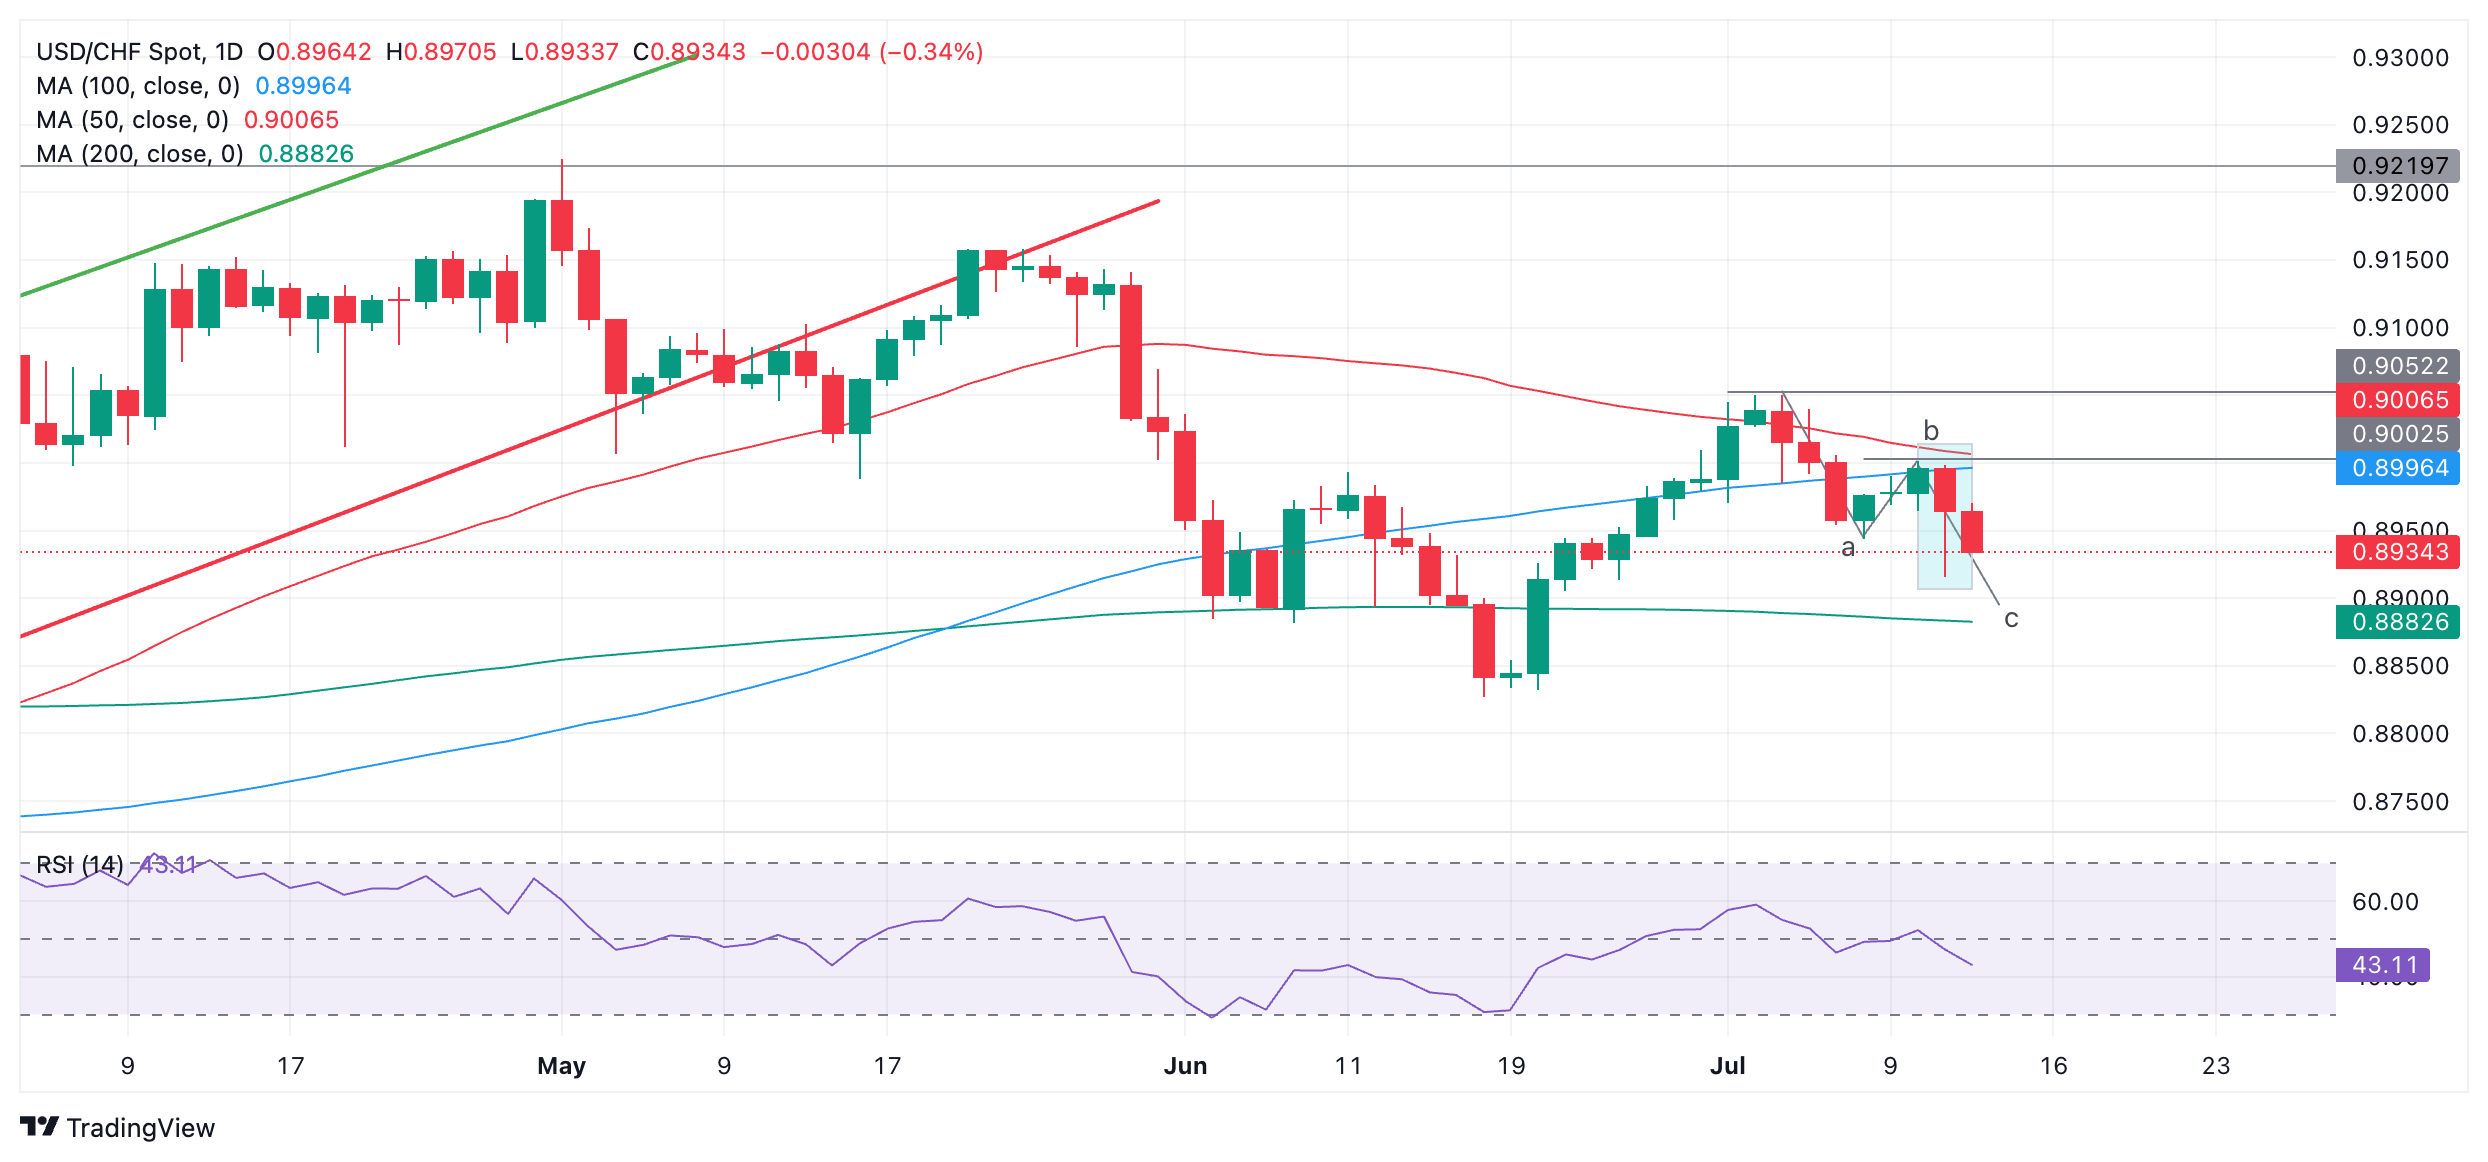
The pair has not yet reached the end of wave C and could still fall further, however, it has reached the conservative target for C, which is the Fibonacci 0.618 ratio of the length of wave A.
If USD/CHF falls further it could find support at the 200-day Simple Moving Average (SMA) at 0.8883.
Alternatively, a close above the July 10 high and the 50-day SMA at 0.9007 would probably signal a reversal higher, with the next target at 0.9051, the July 3 high.
- Producer inflation in the US rose at a stronger pace than expected in June.
- US Dollar Index stays below 104.50 following the PPI data.
The Producer Price Index (PPI) for final demand in the US rose 2.6% on a yearly basis in June, the data published by the US Bureau of Labor Statistics showed on Friday. This reading followed the 2.2% increase recorded in May and came in above the market expectation of 2.3%.
The annual core PPI rose 3% in the same period, coming in above April's increase and the market expectation of 2.3% and 2.5%, respectively. On a monthly basis, the PPI increased 0.2%, while the core PPI rose 0.4%.
Market reaction
The US Dollar Index edged slightly higher with the immediate reaction to the producer inflation data and was last seen losing 0.12% on the day at 104.37.
The Dollar index (DXY) is trading lower for the third straight day near 104.32 as markets digest the double whammy of good inflation data and surprise BOJ intervention, BBH FX strategists note.
DXY trades lower near 104.32
“DXY is trading lower for the third straight day near 104.32 after good US inflation data and surprise Bank of Japan (BOJ) intervention. The BOJ did not get much bang for the buck as USD/JPY has already recouped nearly half of yesterday’s losses and trading back above 159. The Euro (EUR) is trading higher near $1.0890 against the US Dollar, while the Pound Sterling (GBP) is trading higher near $1.2960.”
“Recent softness in the U.S. data is challenging our view that the backdrop of persistent inflation and robust growth in the U.S. remains largely in place. Indeed, more Fed officials are voicing concern about labor market weakness.”
“However, we continue to believe that weaker data in many of the major economies will feed into more dovish central banks, underscoring that the relative story should continue to support the dollar.”
- The US Dollar trades mixed on the quote board on Friday.
- Markes digest the recent disinflationary CPI print while Biden drops the ball at a crucial moment.
- The US Dollar index stabilizes after its sharp decline on Thursday.
The US Dollar (USD) trades very mixed on Friday, with markets looking for direction as a clear rotation is taking place in the equity markets. With an interest rate cut from the US Federal Reserve (Fed) being a near certainty in September, investors are shifting away from the big tech names and are heading into smaller stocks and blue chips that represent more niche sectors that should see demand pick up with more disposable income freed up once rates get cut. Meanwhile, concerns about US President Joe Biden increased after he called Russian President Vladimir Putin to Ukraine President Volodymyr Zelensky during a high-stakes NATO summit, which could mean the final straw for some of his financial donors.
On the economic front, a nice schedule ahead with the Producer Price Index (PPI) for June, where traders can assess if prices for producers and resellers are on the same disinflationary path as for the Consumer Price Index (CPI). Later this Friday, the University of Michigan will release its preliminary readings for July on Consumer Sentiment and inflation expectations. Expect some choppy action, with further easing numbers that might clash with Dollar bulls.
Daily digest market movers: Now it gets tricky
- US President Joe Biden dropped the ball in what several media outlets deemed as the make-or-break moment for the President. Unfortunately, President Biden dropped the ball yet again by calling Vice President Trump to his Vice President Camilla Harris and mixing up Ukraine President Volodymyr Zelensky with Russian President Vladimir Putin. It was painful to watch them shaking hands just after President Biden made the mistake.
- At 12:30 GMT, June’s Producer Price Index (PPI) numbers will come out:
- Monthly headline PPI is expected to tick up to 0.1% from -0.2%.
- Monthly core PPI should also tick up to 0.2% from 0.0%.
- Annual headline PPI is expected to increase marginally to 2.3% from 2.2%.
- Annual core CPI is expected to grow by 2.5% from 2.3%.
- At 14:00 GMT, the University of Michigan will release its preliminary reading for July:
- Consumer Sentiment is expected to tick up to 68.5 from 68.2.
- 5-year consumer inflation expectations are expected to remain at 3%.
- Equity markets are seeing some sector rotation from investors now that a rate cut in September looks to be inevitable. Big tech stocks are seeing profit taking, while small and blue chips are seeing inflows. European equities are up near 0.50% on the day, while US futures are mildly in the red.
- The CME Fedwatch Tool is broadly backing a rate cut in September. The odds now stand at 86.4% for a 25-basis-point cut. A rate pause stands at a 7.5% chance, while a 50-basis-point rate cut has a slim 6.2% possibility.
- The US 10-year benchmark rate trades at 4.22%, after dipping to a fresh low for 2024 on Thursday in the CPI aftermath.
US Dollar Index Technical Analysis: DXY fell as much like Biden dropped the ball
The US Dollar Index (DXY) fell through several floors on Thursday in the aftermath of the CPI. Although a recovery took place right at the end of the trading session, pressure could come in again should PPI numbers also be in disinflation. Expect another pullback towards 104.00 with possibly a break lower in case Dollar bulls give up their position and cut their losses.
On the upside, a long road to recovery awaits. First up is the 100-day Simple Moving Average (SMA) near 104.81, just ahead of two heavy resistance levels, with the green ascending trend line in the chart below now as resistance near 104.95 and the 55-day SMA at 105.10. In case the DXY can puddle its way through all of that, 105.53 is the next upside level to look out for.
On the downside, the weak spot has been identified now at 103.99/104.00. Expect to see pressure mounting on that level with each test. Certainly, when the DXY bounces off that level each time, the bounces' highs would become smaller until the support gives way. Further down, a chunky decline is expected before finding the next vital support near 103.18.
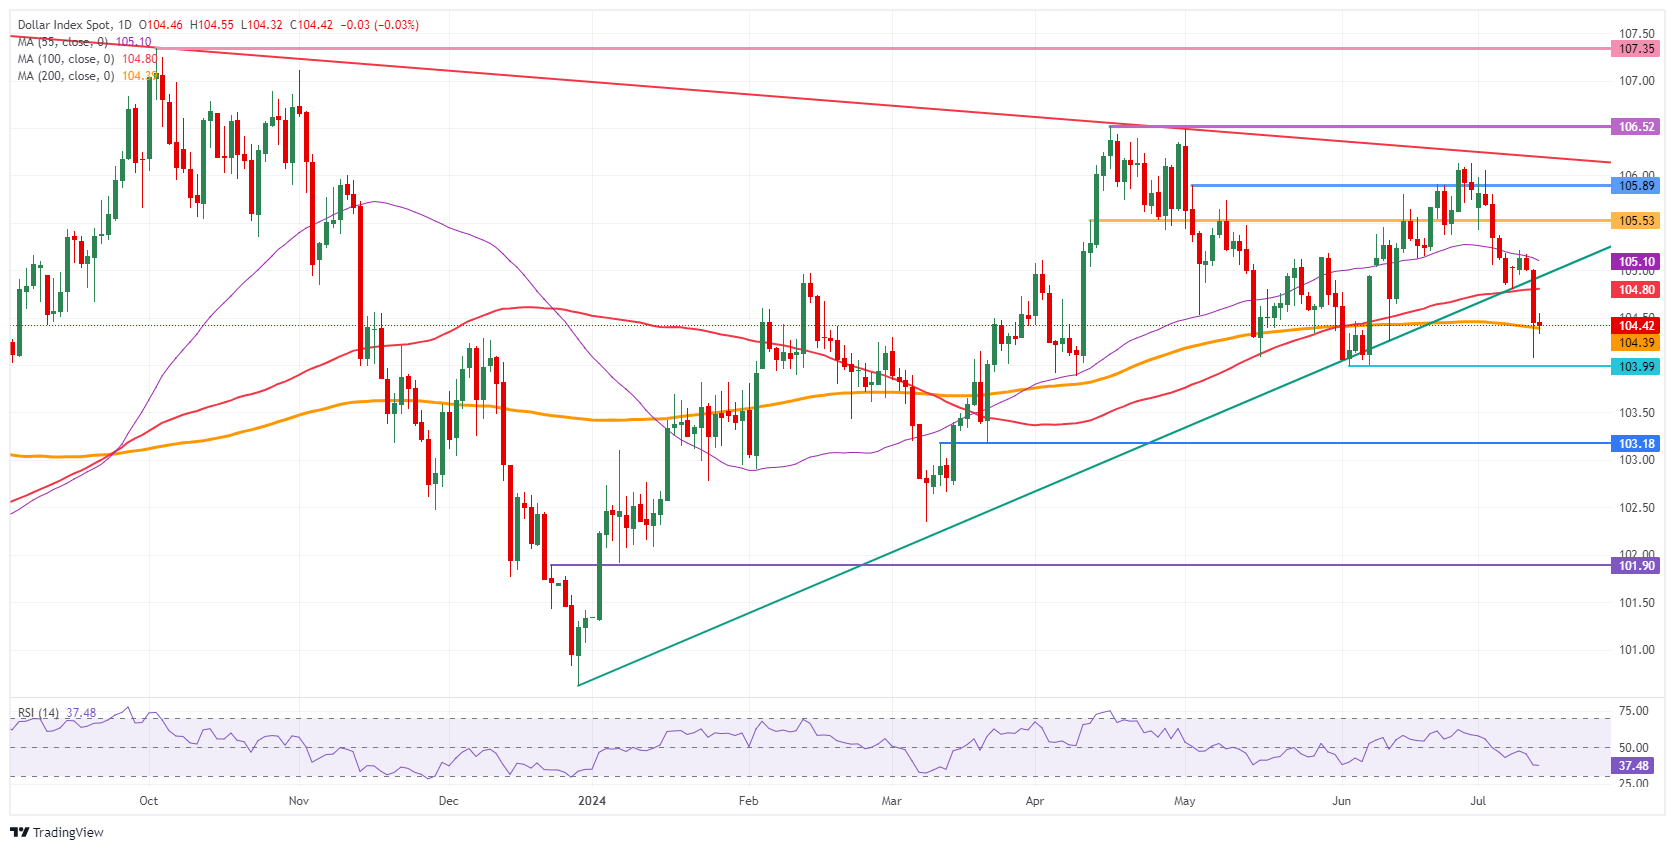
US Dollar Index: Daily Chart
US Dollar FAQs
The US Dollar (USD) is the official currency of the United States of America, and the ‘de facto’ currency of a significant number of other countries where it is found in circulation alongside local notes. It is the most heavily traded currency in the world, accounting for over 88% of all global foreign exchange turnover, or an average of $6.6 trillion in transactions per day, according to data from 2022. Following the second world war, the USD took over from the British Pound as the world’s reserve currency. For most of its history, the US Dollar was backed by Gold, until the Bretton Woods Agreement in 1971 when the Gold Standard went away.
The most important single factor impacting on the value of the US Dollar is monetary policy, which is shaped by the Federal Reserve (Fed). The Fed has two mandates: to achieve price stability (control inflation) and foster full employment. Its primary tool to achieve these two goals is by adjusting interest rates. When prices are rising too quickly and inflation is above the Fed’s 2% target, the Fed will raise rates, which helps the USD value. When inflation falls below 2% or the Unemployment Rate is too high, the Fed may lower interest rates, which weighs on the Greenback.
In extreme situations, the Federal Reserve can also print more Dollars and enact quantitative easing (QE). QE is the process by which the Fed substantially increases the flow of credit in a stuck financial system. It is a non-standard policy measure used when credit has dried up because banks will not lend to each other (out of the fear of counterparty default). It is a last resort when simply lowering interest rates is unlikely to achieve the necessary result. It was the Fed’s weapon of choice to combat the credit crunch that occurred during the Great Financial Crisis in 2008. It involves the Fed printing more Dollars and using them to buy US government bonds predominantly from financial institutions. QE usually leads to a weaker US Dollar.
Quantitative tightening (QT) is the reverse process whereby the Federal Reserve stops buying bonds from financial institutions and does not reinvest the principal from the bonds it holds maturing in new purchases. It is usually positive for the US Dollar.
It appears that Japan’s Ministry of Finance has tweaked the FX intervention strategy. USD/JPY dropped around 2% after the soft US CPI print yesterday, considerably more than any other USD cross, and the surge in JPY futures volumes seemed consistent with FX intervention, ING’s FX analyst Francesco Pesole notes.
Unexpected intervention in the Japan
“Japan’s top currency official Masato Kanda refused to admit that the MoF had stepped into the market but there have since been at least two reports citing internal sources that suggest intervention. If true, data at the end of the month will confirm this speculation. For now, given the rather unusual drop in USD/JPY, we’ll run with the assumption the MoF did intervene yesterday.”
“That would mark a change in Japan’s FX intervention strategy. Remember, that at the end of April, the MoF started intervening before a Federal Reserve (Fed) meeting, which has proven to be largely unsuccessful beyond the very near term. Now it looks like the MoF waited to take advantage of a USD-negative market event to boost the yen via intervention.”
“The US CPI release was good news for the Yen (JPY) regardless of unconfirmed FX intervention as there is a path ahead for USD/JPY to trade lower on a shrinking USD:JPY rate gap. At the same time, FX intervention lowers the chances of the Bank of Japan hiking in July to support the JPY, and it may still take time before USD/JPY can enter a sustainable downtrend.”
- The Mexican Peso trades mixed in key pairs after the release of the Banxico June meeting Minutes.
- The Peso is higher against the US Dollar but is down versus the Pound Sterling.
- USD/MXN is falling to a target at the end of the wave C of a Measured Move pattern.
The Mexican Peso (MXN) trades mixed in its major pairs on Friday as markets digest recent market-moving data. MXN is up against the US Dollar (USD) and the Euro (EUR) but marginally down against the Pound Sterling (GBP), which gained support after the release of solid UK Gross Domestic Product (GDP) data on Thursday.
A surprise drop in the US Consumer Price Index (CPI) for June and the release of the Minutes of the Bank of Mexico (Banxico) June meeting are further factors impacting Mexican Peso pairs as the weekend approaches.
At the time of writing, one US Dollar (USD) buys 17.73 Mexican Pesos, EUR/MXN trades at 19.31, and GBP/MXN at 22.97.
Mexican Peso remains supported despite rate-cut dissenter
The Mexican Peso trades variably in its key pairs on Friday after the release of the Minutes of the Banxico June policy meeting.
The Peso is holding up despite a change in the distribution of voting at the meeting that suggests interest-rate cuts are on their way.
The Minutes showed that one dissenter (Banxico Deputy Governor Omar Mejía) voted for an interest rate cut of 0.25%, compared to no one voting for a cut at the previous May meeting.
The ten key takeaways from the Minutes are as follows:
- The majority of members agreed that Mexico’s economic activity continued to exhibit the weakness observed since the end of 2023.
- Looking ahead, the balance of risks for the economy were biased to the downside.
- Most members indicated that “private consumption has remained strong in Mexico.”
- One member made the point that “there is the risk that private investment will continue losing dynamism, considering the tight financial conditions and the environment of greater uncertainty generated by financial volatility in Mexico, as well as by the upcoming electoral process in the United States.”
- All members noted the employment market continued to be strong but added it had also “shown some signs of moderation,” which compared to more unequivocal phrasing from the May Minutes.
- The June Minutes stated that headline inflation rose due to non-core effects whilst core inflation had continued to fall – the same as in May.
- There was less emphasis on the impact of high services sector inflation, although, “Some members mentioned that services inflation remains above 5%. One member pointed out that it registered 5.19% in the first fortnight of June.”
- That said, the Minutes stated that the balance of risks to the inflationary outlook remained to the upside, and “Most members highlighted as an upward risk the persistence of core inflation, especially of its services component.”
- The inflationary impact of the recent depreciation of the Peso had been offset by lower economic activity.
- Most members expect headline inflation will converge with Banxico’s 3.0% target in Q4 2025.
Technical Analysis: USD/MXN continues steady decline
USD/MXN continues declining in what is likely the wave C of a falling Measured Move pattern that has formed since the June 12 high.
USD/MXN Daily Chart
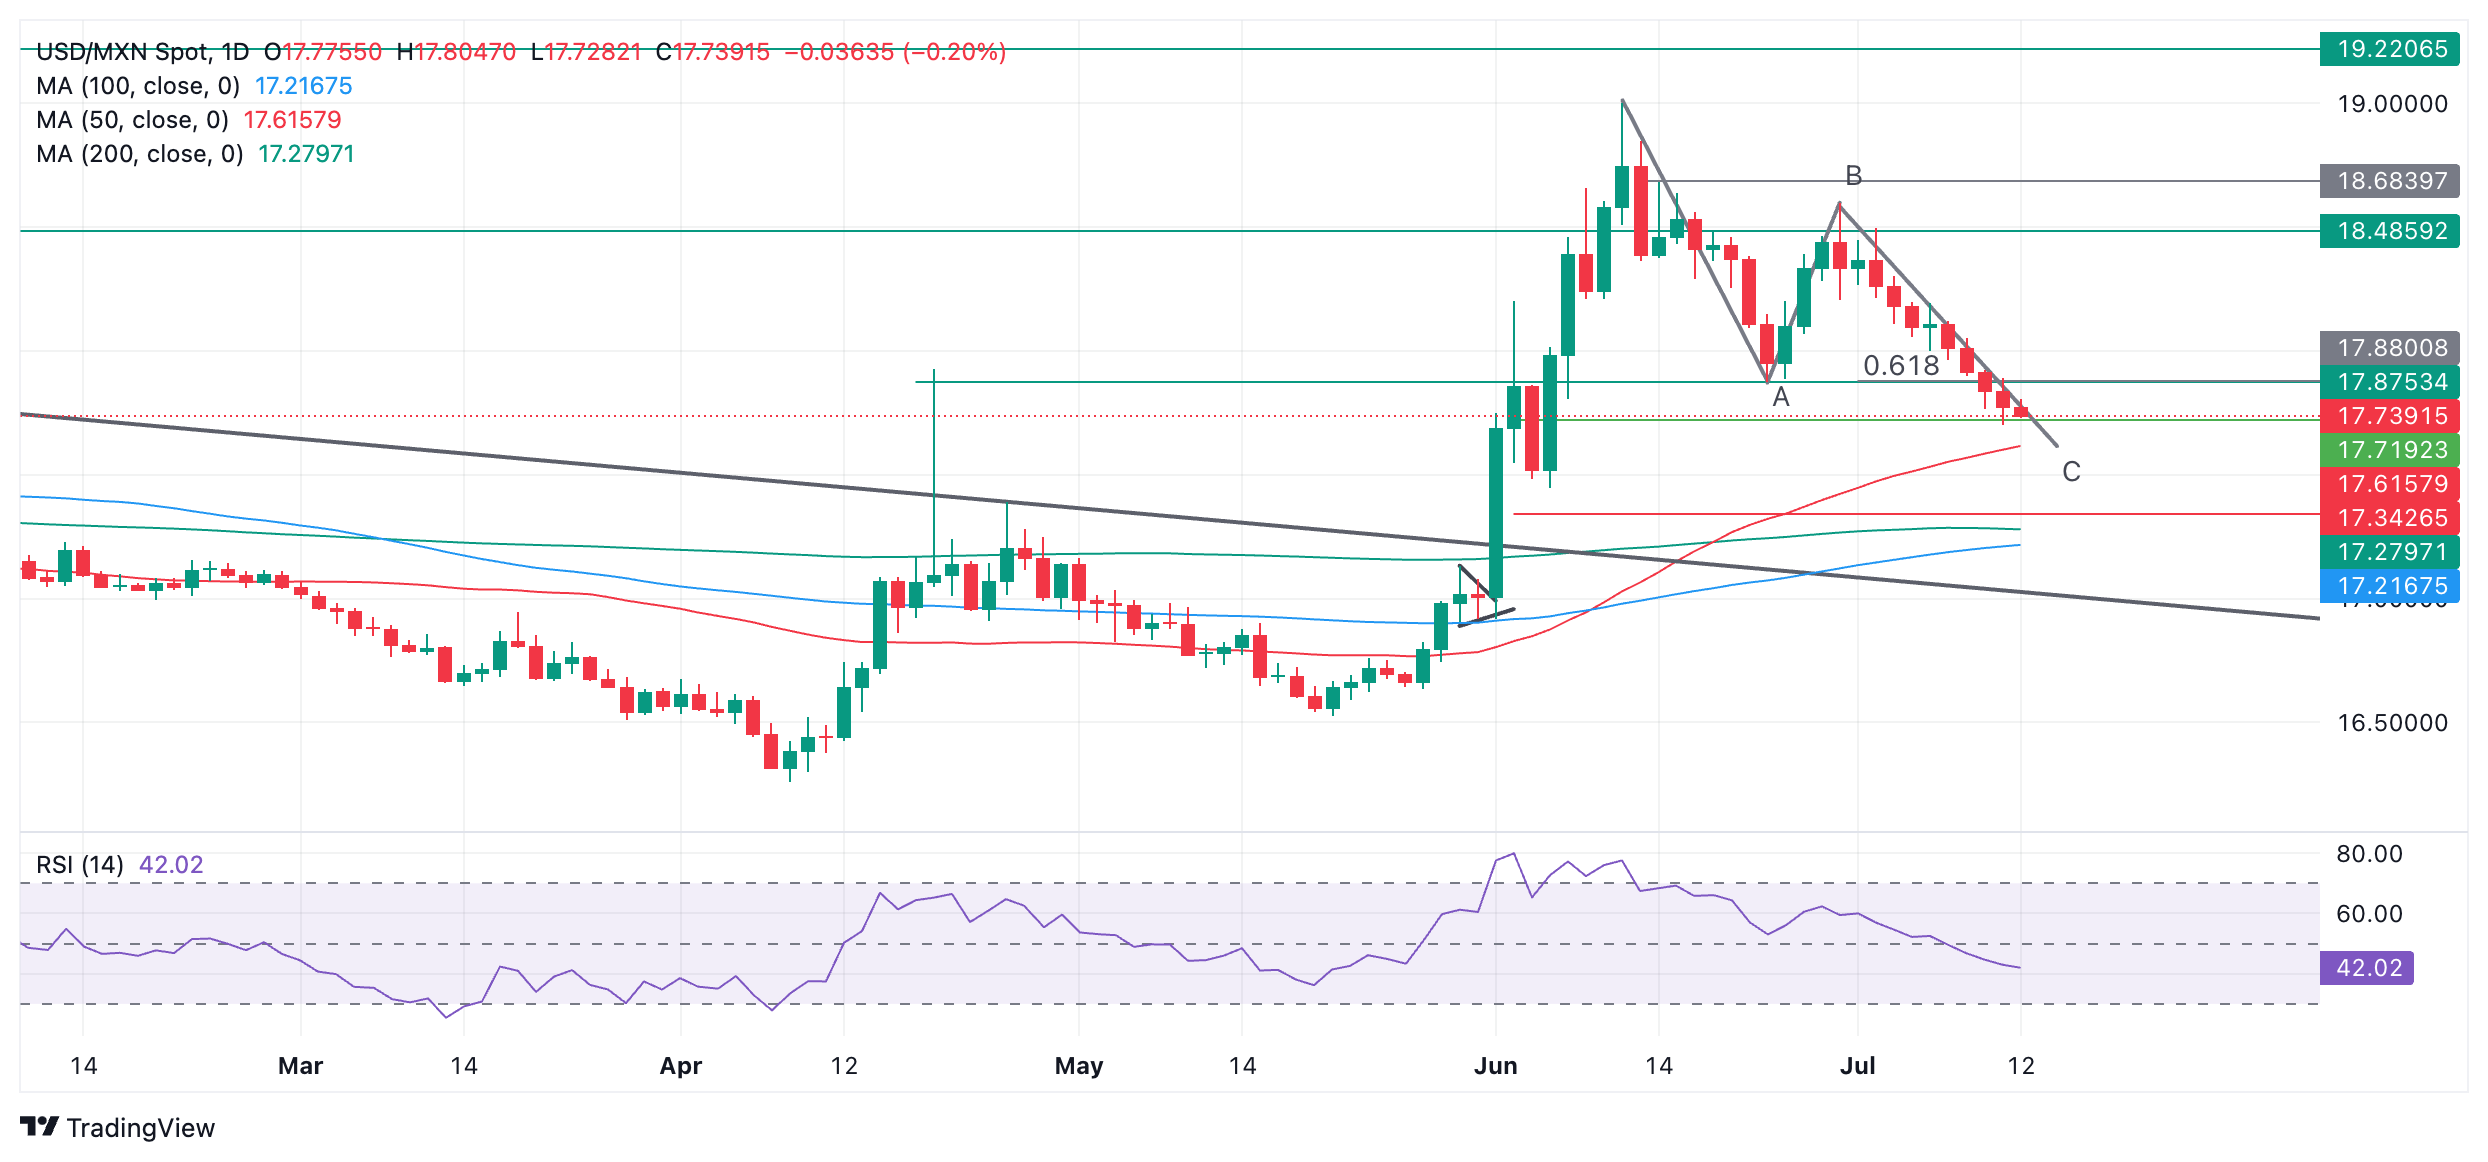
Measured Moves (MM) are large, three-wave zig-zags in which the end of wave C can be estimated with some degree of reliability using the length of wave A as a guide. C is usually equals A or, at least, a Fibonacci ratio of A.
USD/MXN has already reached the conservative target for wave C, calculated as the 0.618 Fibonacci ratio of the length of wave A. Given that the pair has reached this lesser target, there is a risk it may reverse and start recovering.
A break below 17.70 (July 12 low), however, would reinvigorate bears and probably lead to a move down to the target at the end of wave C, at roughly the level of the 50-day Simple Moving Average (SMA) situated at 17.60.
Meanwhile, the direction of the medium and long-term trends remain in doubt.
Economic Indicator
Gross Domestic Product (MoM)
The Gross Domestic Product (GDP), released by the Office for National Statistics on a monthly and quarterly basis, is a measure of the total value of all goods and services produced in the UK during a given period. The GDP is considered as the main measure of UK economic activity. The MoM reading compares economic activity in the reference month to the previous month. Generally, a rise in this indicator is bullish for the Pound Sterling (GBP), while a low reading is seen as bearish.
Read more.Last release: Thu Jul 11, 2024 06:00
Frequency: Monthly
Actual: 0.4%
Consensus: 0.2%
Previous: 0%
Source: Office for National Statistics
EUR/USD is now entirely driven by the US Dollar (USD) leg as French political risk has now been sidelined while waiting for news on coalition talks. The Euro (EUR) can still ‘enjoy the silence’. That can probably remain the case for a few more days, ING’s FX analyst Francesco Pesole notes.
EUR/USD is set to test 1.0900 soon
“EUR/USD is driven by the USD leg as French political risk has now been sidelined. EUR can still ‘enjoy the silence’. That can probably remain the case for a few more days.”
“Beyond the very short term, we still believe markets can grow impatient with the French political stalemate and start to price back in a degree of fiscal risk into the euro, effectively putting a lid on EUR/USD. On the domestic macro side, things remain very quiet today before next week’s action, which includes the European Central Bank (ECB) meeting.”
“For now, lingering downside risks for the dollar mean EUR/USD could take another shot at breaking above 1.0900 soon.”
- AUD/USD remains firm as the US Dollar weakens due to easing price pressures.
- Soft US inflation data for June boosts Fed rate-cut prospects.
- The Australian Dollar will dance to the tunes of the outcome of China’s third plenum meeting.
The AUD/USD pair rises after a mild correction to near 0.6755 in Friday’s European session. The Aussie asset aims to recapture the round-level resistance of 0.6800 as the US Dollar (USD) is under severe pressure due to growing speculation for the Federal Reserve (Fed) to start lowering interest rates from the September meeting.
The expectations for Fed rate cuts swell after the United States (US) Consumer Price Index (CPI) report for June signalled that progress in disinflation has resumed after stalling in the first quarter of this year. Annually, the headline inflation decelerated at a faster pace to 3.0% and the core CPI, which excludes volatile food and energy items, unexpectedly declined to 3.3%.
According to the CME FedWatch tool, a rate cut in September appears certain. Also, one more rate cut is expected in the November or December meeting.
Rising prospects of early rate cuts have weighed heavily on the US Dollar. The US Dollar Index (DXY), which tracks the Greenback’s value against six major currencies, declines to near 104.35.
Meanwhile, the markets sentiment remains favorable for risk-sensitive assets. S&P 500 futures have posted nominal gains in European trading hours. Going forward, investors will focus on the US Producer Price Index (PPI) data for June, which will be published at 12:30 GMT.
On the Aussie front, investors await four-day China’s third plenum meeting, which is scheduled for next week. China’s Communist Party is expected to take measures to boost the real estate and manufacturing sectors. Being a proxy for China’s economic growth, strong fiscal spending announcements will strengthen the Australian Dollar (AUD). On the contrary, signs of lower fiscal spending than expected will do the opposite.
Economic Indicator
Consumer Price Index ex Food & Energy (YoY)
Inflationary or deflationary tendencies are measured by periodically summing the prices of a basket of representative goods and services and presenting the data as the Consumer Price Index (CPI). CPI data is compiled on a monthly basis and released by the US Department of Labor Statistics. The YoY reading compares the prices of goods in the reference month to the same month a year earlier. The CPI Ex Food & Energy excludes the so-called more volatile food and energy components to give a more accurate measurement of price pressures. Generally speaking, a high reading is bullish for the US Dollar (USD), while a low reading is seen as bearish.
Read more.Last release: Thu Jul 11, 2024 12:30
Frequency: Monthly
Actual: 3.3%
Consensus: 3.4%
Previous: 3.4%
Source: US Bureau of Labor Statistics
The US Federal Reserve has a dual mandate of maintaining price stability and maximum employment. According to such mandate, inflation should be at around 2% YoY and has become the weakest pillar of the central bank’s directive ever since the world suffered a pandemic, which extends to these days. Price pressures keep rising amid supply-chain issues and bottlenecks, with the Consumer Price Index (CPI) hanging at multi-decade highs. The Fed has already taken measures to tame inflation and is expected to maintain an aggressive stance in the foreseeable future.
The US CPI hit the US dollar across the board yesterday. The June US CPI report showed a convincing slowdown in inflation yesterday. Inflation data supports the argument that the Federal Reserve (Fed) can start loosening monetary policy this quarter, ING’s FX analyst Francesco Pesole notes.
DXY may retest the June 104.0 lows
“The USD took a hit after the CPI release, which was exacerbated by Japanese FX intervention that propped up the Yen (JPY). However, the move gradually faded in the broader FX space. That is, in our view, a symptom of how investors remain reluctant to jump into a broad-based USD decline despite encouraging data.”
“That may be due to the lingering political uncertainty in the eurozone and the perceived higher chances of a Trump re-election. As we pointed out in our monthly FX update, we expect investors to be selective in FX this summer.”
“Today, PPI figures may move the market given a lot of the components feed into the Fed's favourite PCE measure of inflation. University of Michigan surveys are the other highlights of the day. We think another leg lower in the USD is possible given markets' growing conviction on Fed easing, and DXY could retest the June 104.0 lows.”
- Oil prices edge higher for the third straight day on Friday.
- Traders see both bearish and bullish elements in the mix, which could see Oil prices close off this week flat.
- The US Dollar Index trades above 104.00 after its steep decline on Thursday.
Oil prices are being torn in half, with several bearish and bullish elements in the balance. Although Oil started the week on the back foot, it is possibly on track to minimize the incurred losses for this week and might even be flat overall by Friday’s close. The question will be how much front running will take place this summer ahead of the initial interest rate cut by the US Federal Reserve (Fed) expected in September and assumptions that demand will boom on the back of that.
Meanwhile, the US Dollar Index (DXY), which tracks the performance of the US Dollar against six major currencies, is building on its road to recovery after the meltdown it went through on Thursday after US Consumer Price Index (CPI) data for June showed a pickup in disinflation. Markets scrambled to lock in an interest rate cut for September, which means the value of the US Dollar had to be adjusted because of the rate differential with other currencies getting narrower. On Friday, traders will be looking if the producer side of the economic system is seeing disinflation picking up as well with June’s Producer Price Index (PPI) release.
At the time of writing, Crude Oil (WTI) trades at $82.34 and Brent Crude at $85.54
Oil news and market movers: China imports steady
- Bloomberg reports that China’s Oil imports remained steady throughout June despite local lacklustre demand. That was different for Liquified Natural Gas (LNG), where imports declined substantially for the same period.
- The Port of Houston is fully reopened, with vessel traffic back to normal on Thursday, Reuters reports. The Port was shut down after Hurricane Beryl passed through the region at the beginning of the week.
- Oil futures have seen a pickup in demand since Thursday, with traders positioning for a surge in demand near September, when the Fed is expected to cut interest rates. Currently postponed construction projects should be set to restart again, according to Reuters.
- The Wall Street Journal reports that the International Energy Administration revised down its recent 2025 forecast. Supply is set to swell with OPEC unwinding its production cuts, while demand is set to decline from 1 million to 980,000 barrels per day. This would leave the Oil markets with a surplus supply .
Oil Technical Analysis: The comeback kid
Oil prices are in the green for a third day in a row, and should the recovery pick up a little bit on Friday, the performance could close off flat and avoid a weekly loss. For next week, if Crude can pull off a daily close above the green ascending trend line in the chart below, that would be a bullish signal for traders. Expect to see more investors pile into Crude futures once Fed officials confirm timing for September looks fine for an initial interest rate cut.
On the upside, the July high near $84.00 is the first near-resistance level to look for. Once beyond that, a new high for June and July will be printed as Crude prices stretch higher. The Relative Strength Index (RSI) is already at 58 and will overheat quite quickly, with $87.12, the 2024 high, still within reach.
On the downside, the big belt of Simple Moving Averages (SMA) should work now as support and no longer allow any moves below it. That means the 100-day SMA at $80.32, the 55-day SMA at $79.26, and the 200-day SMA at $78.46 should avoid any dips below $78.00. Should those levels not hold, another drop back to $75 could occur.
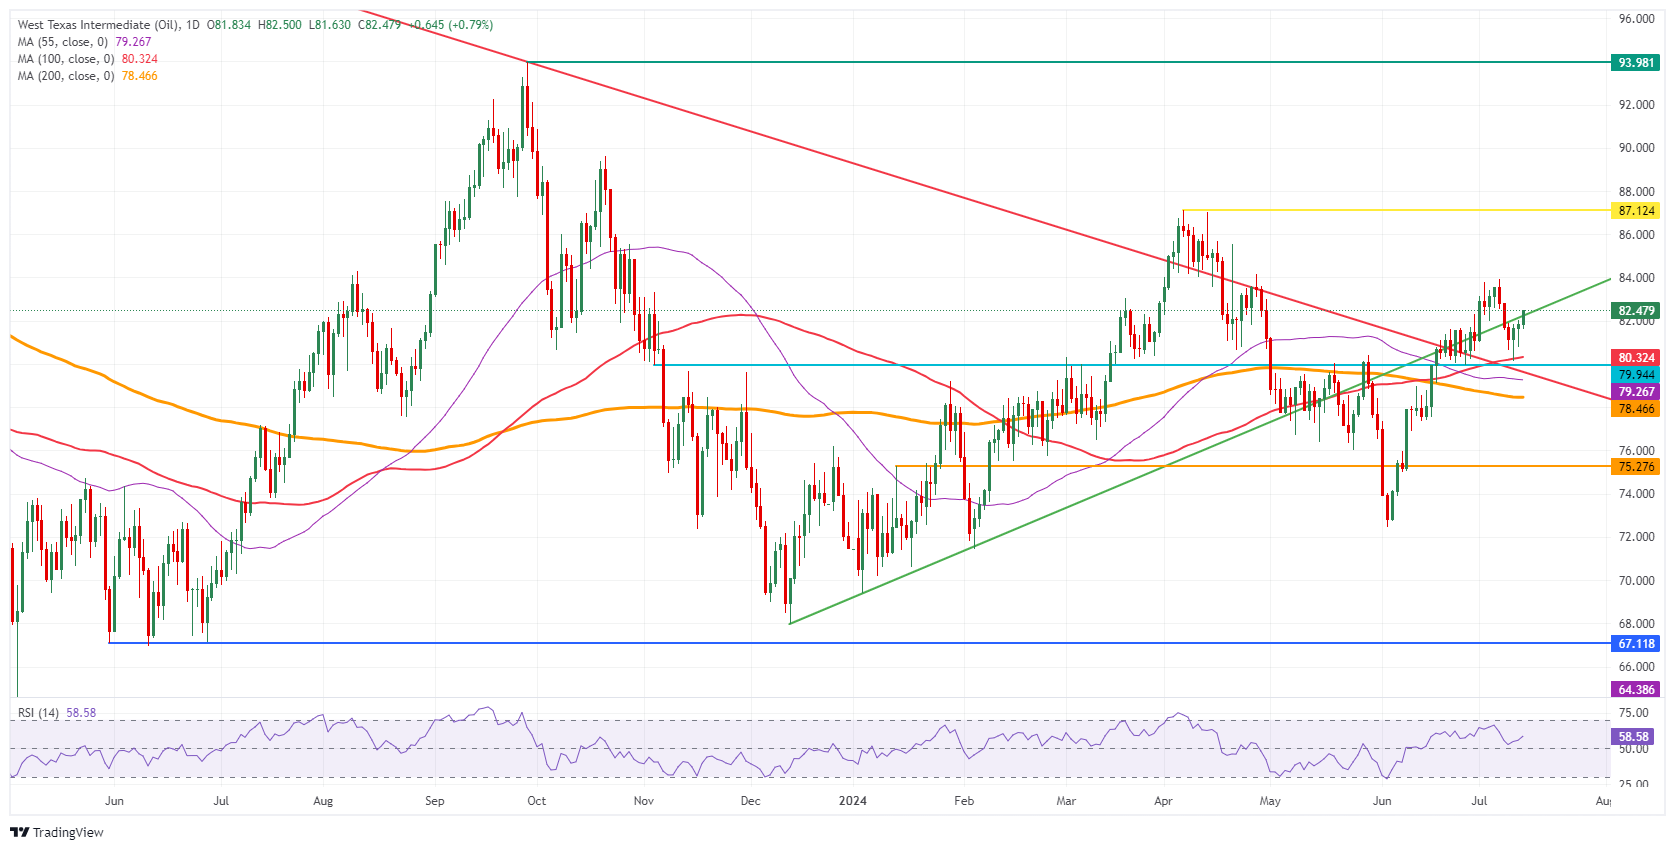
US WTI Crude Oil: Daily Chart
Brent Crude Oil FAQs
Brent Crude Oil is a type of Crude Oil found in the North Sea that is used as a benchmark for international Oil prices. It is considered ‘light’ and ‘sweet’ because of its high gravity and low sulfur content, making it easier to refine into gasoline and other high-value products. Brent Crude Oil serves as a reference price for approximately two-thirds of the world's internationally traded Oil supplies. Its popularity rests on its availability and stability: the North Sea region has well-established infrastructure for Oil production and transportation, ensuring a reliable and consistent supply.
Like all assets supply and demand are the key drivers of Brent Crude Oil price. As such, global growth can be a driver of increased demand and vice versa for weak global growth. Political instability, wars, and sanctions can disrupt supply and impact prices. The decisions of OPEC, a group of major Oil-producing countries, is another key driver of price. The value of the US Dollar influences the price of Brent Crude Oil, since Oil is predominantly traded in US Dollars, thus a weaker US Dollar can make Oil more affordable and vice versa.
The weekly Oil inventory reports published by the American Petroleum Institute (API) and the Energy Information Agency (EIA) impact the price of Brent Crude Oil. Changes in inventories reflect fluctuating supply and demand. If the data shows a drop in inventories it can indicate increased demand, pushing up Oil price. Higher inventories can reflect increased supply, pushing down prices. API’s report is published every Tuesday and EIA’s the day after. Their results are usually similar, falling within 1% of each other 75% of the time. The EIA data is considered more reliable, since it is a government agency.
OPEC (Organization of the Petroleum Exporting Countries) is a group of 13 Oil producing nations who collectively decide production quotas for member countries at twice-yearly meetings. Their decisions often impact Brent Crude Oil prices. When OPEC decides to lower quotas, it can tighten supply, pushing up Oil prices. When OPEC increases production, it has the opposite effect. OPEC+ refers to an expanded group that includes ten extra non-OPEC members, the most notable of which is Russia.
The ECB is in no rush. In June, President Lagarde would not confirm that the rate cut signalled the start of the ‘dialling back restrictiveness’ phase of the rates cycle. As such, we expect the ECB to leave policy unchanged at the next Governing Council meeting on 17-18 July, Deutsche Bank macro analysts note.
ECB to leave policy unchanged in July
“The ECB is not on a pre-determined path. We expect the ECB to avoid explicit guidance again in July. The underlying direction of travel should nevertheless be clear. As inflation converges towards target, the restrictive monetary policy stance will unwind further. However, the ECB does not want to commit to when and how much it will cut. It wants to be led by the data.”
“Our baseline remains two more 25bp cuts in 2024, in September and December. A cut in September is not a done deal. Recent data suggest the ECB staff need to revise the near-term inflation outlook higher. However, a cut in September remains the most likely outcome. We continue to see the terminal rate in a landing zone of 2.00-2.50% in late-25/early-26.”
“We expect President Lagarde to be guarded in her responses to direct questions on France, saying that the ECB is attentive to what is happening in markets at all points in time and that euro area member states have agreed a fiscal framework with which they are expected to comply.”
A hold is widely expected for the July ECB meeting. The meeting will not offer much action for the Euro (EUR), and we’re biased towards a weaker EUR, TDS macro strategists note.
FX portfolios are biased towards a weaker EUR
“A hold is widely expected for the July meeting, in line with ECB speak and roughly in-line data. We do not believe the GC thinks a softer tone is needed to keep a September cut on the table. Instead, we expect language to be roughly unchanged relative to June.”
“We don't think the July ECB meeting will offer much action for the EUR. However, we think that G10FX, especially the likes of EUR and the Pound Sterling (GBP), are getting back to attractive fade levels. For medium-term investors, we think 1.09 is a great entry level to fade and, more tactically, we like EUR funded carry trades through July and early August.”
“Our thematic FX portfolios are biased towards a weaker EUR, underscoring shorts in the growth, carry, equity, and risk baskets. EUR is also rich to our short-term value signal (HFFV) and we continue to expect a break below 1.05 in H2.”
Silver prices (XAG/USD) fell on Friday, according to FXStreet data. Silver trades at $30.80 per troy ounce, down 2.08% from the $31.46 it cost on Thursday.
Silver prices have increased by 29.45% since the beginning of the year.
| Unit measure | Silver Price Today in USD |
|---|---|
| Troy Ounce | 30.80 |
| 1 Gram | 0.99 |
The Gold/Silver ratio, which shows the number of ounces of Silver needed to equal the value of one ounce of Gold, stood at 78.07 on Friday, up from 76.77 on Thursday.
Silver FAQs
Silver is a precious metal highly traded among investors. It has been historically used as a store of value and a medium of exchange. Although less popular than Gold, traders may turn to Silver to diversify their investment portfolio, for its intrinsic value or as a potential hedge during high-inflation periods. Investors can buy physical Silver, in coins or in bars, or trade it through vehicles such as Exchange Traded Funds, which track its price on international markets.
Silver prices can move due to a wide range of factors. Geopolitical instability or fears of a deep recession can make Silver price escalate due to its safe-haven status, although to a lesser extent than Gold's. As a yieldless asset, Silver tends to rise with lower interest rates. Its moves also depend on how the US Dollar (USD) behaves as the asset is priced in dollars (XAG/USD). A strong Dollar tends to keep the price of Silver at bay, whereas a weaker Dollar is likely to propel prices up. Other factors such as investment demand, mining supply – Silver is much more abundant than Gold – and recycling rates can also affect prices.
Silver is widely used in industry, particularly in sectors such as electronics or solar energy, as it has one of the highest electric conductivity of all metals – more than Copper and Gold. A surge in demand can increase prices, while a decline tends to lower them. Dynamics in the US, Chinese and Indian economies can also contribute to price swings: for the US and particularly China, their big industrial sectors use Silver in various processes; in India, consumers’ demand for the precious metal for jewellery also plays a key role in setting prices.
Silver prices tend to follow Gold's moves. When Gold prices rise, Silver typically follows suit, as their status as safe-haven assets is similar. The Gold/Silver ratio, which shows the number of ounces of Silver needed to equal the value of one ounce of Gold, may help to determine the relative valuation between both metals. Some investors may consider a high ratio as an indicator that Silver is undervalued, or Gold is overvalued. On the contrary, a low ratio might suggest that Gold is undervalued relative to Silver.
(An automation tool was used in creating this post.)
- Silver price tumbles to near $30.70 as investors turn cautious ahead of China’s third plenum.
- Firm speculation for Fed rate cuts in September keeps the Silver price outlook firm.
- Investors await the US PPI data for more guidance on interest rates.
Silver price (XAG/USD) plummets to near $30.70 from a six-week high of $31.80 in Friday’s European session. The white metal weakens as investors turn cautious ahead of China’s third plenum meeting, which is scheduled for next week.
Top members of the ruling Communist Party are expected to announce policies favoring a boost to real estate and activities in the manufacturing sector and measures to prompt consumer spending. A larger-than-expected boost for fiscal spending in the world’s second-largest nation would propel Silver’s demand outlook. The industrial demand of the white metal has increased significantly in sectors like automobiles and green hydrogen etc.
Meanwhile, the broader outlook of the Silver price remains firm as the recent United States (US) Consumer Price Index (CPI) report for June has confirmed that price pressures are on course to return to the desired rate of 2%. Signs of resumption in the disinflation process have prompted expectations of early rate cuts by the Federal Reserve (Fed) Traders have raised bets significantly in favor of the Fed to begin reducing interest rates from the September meeting.
Rising expectations for Fed rate cuts have weighed heavily on the US Dollar (USD) and bond yields. The US Dollar Index (DXY), which tracks the Greenback’s value against six major currencies, falls to 104.35. 10-year US Treasury yields rebound to near 4.22% but have fallen vertically from 4.30%.
In Friday’s session, investors will focus on the US Producer Price Index (PPI) data for June, which will be published at 12:30 GMT.
Silver technical analysis
Silver price trades sideways in a narrow range around $31.00, suggesting a sharp volatility contraction. The overall trend remains bullish as it has turned sideways after a decisive breakout of the Bullish Flag chart formation on a four-hour timeframe.
The 50-period Exponential Moving Average (EMA) near $30.65 continues to provide support to the Silver price bulls.
The 14-period Relative Strength Index (RSI) fails to break above 60.00. A decisive break above the same would push the momentum toward the upside.
Silver four-hour chart
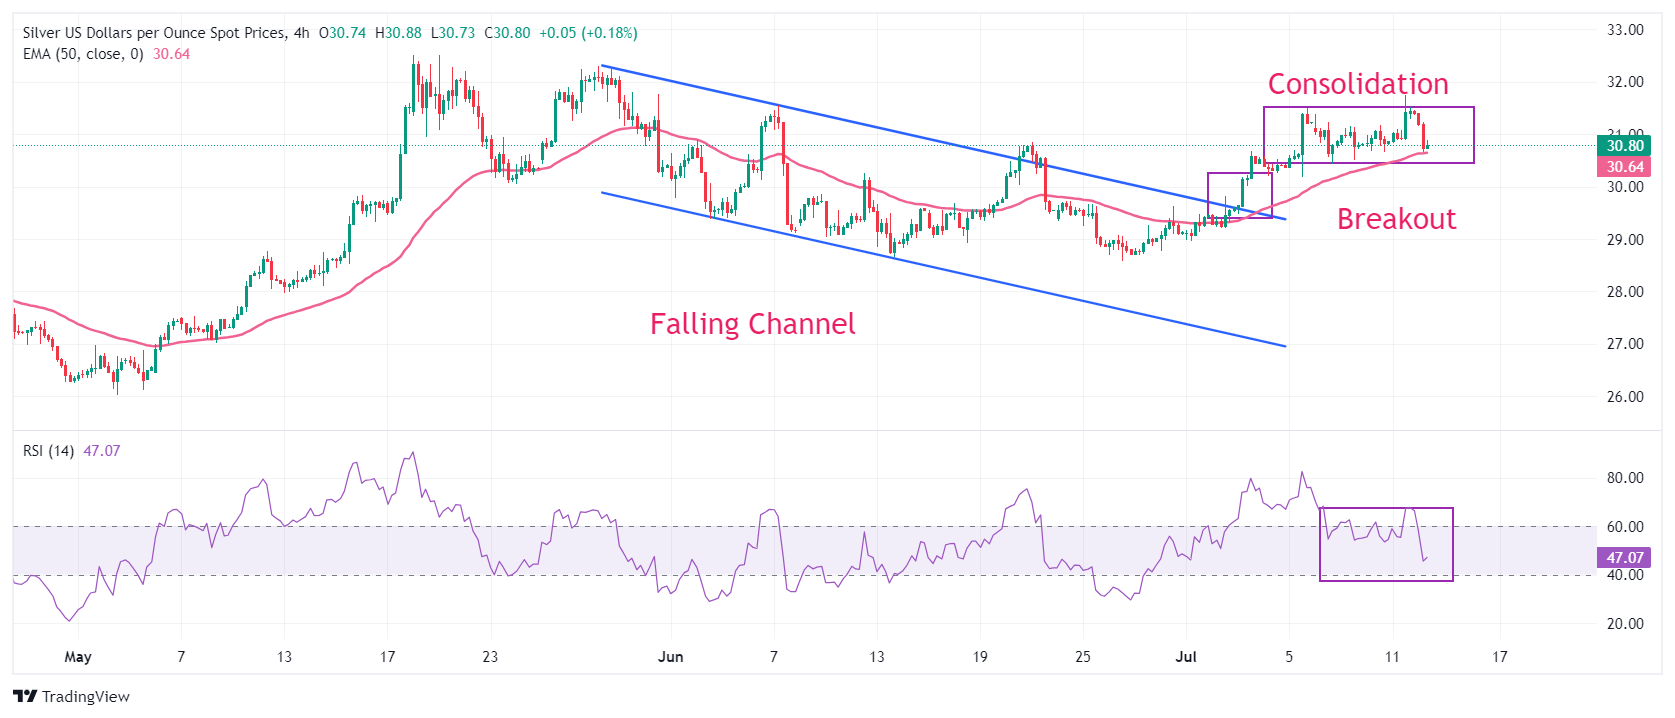
Silver FAQs
Silver is a precious metal highly traded among investors. It has been historically used as a store of value and a medium of exchange. Although less popular than Gold, traders may turn to Silver to diversify their investment portfolio, for its intrinsic value or as a potential hedge during high-inflation periods. Investors can buy physical Silver, in coins or in bars, or trade it through vehicles such as Exchange Traded Funds, which track its price on international markets.
Silver prices can move due to a wide range of factors. Geopolitical instability or fears of a deep recession can make Silver price escalate due to its safe-haven status, although to a lesser extent than Gold's. As a yieldless asset, Silver tends to rise with lower interest rates. Its moves also depend on how the US Dollar (USD) behaves as the asset is priced in dollars (XAG/USD). A strong Dollar tends to keep the price of Silver at bay, whereas a weaker Dollar is likely to propel prices up. Other factors such as investment demand, mining supply – Silver is much more abundant than Gold – and recycling rates can also affect prices.
Silver is widely used in industry, particularly in sectors such as electronics or solar energy, as it has one of the highest electric conductivity of all metals – more than Copper and Gold. A surge in demand can increase prices, while a decline tends to lower them. Dynamics in the US, Chinese and Indian economies can also contribute to price swings: for the US and particularly China, their big industrial sectors use Silver in various processes; in India, consumers’ demand for the precious metal for jewellery also plays a key role in setting prices.
Silver prices tend to follow Gold's moves. When Gold prices rise, Silver typically follows suit, as their status as safe-haven assets is similar. The Gold/Silver ratio, which shows the number of ounces of Silver needed to equal the value of one ounce of Gold, may help to determine the relative valuation between both metals. Some investors may consider a high ratio as an indicator that Silver is undervalued, or Gold is overvalued. On the contrary, a low ratio might suggest that Gold is undervalued relative to Silver.
Some policymakers had initially left the door ajar to a follow-up cut in July. That door is now shut tight. Incoming data do not require urgent rate cuts; in fact, these data should urge further caution as economic growth and credit are picking up again, Rabobank’s senior macro strategist Bas van Geffen notes.
Incoming data urge caution
“Incoming data do not warrant a follow-up rate cut at this juncture. Rather, they urge caution. This view is widely shared, and virtually no one expects a policy change next week.”
“The ECB’s projections may be too benign. That will not prevent another rate cut in September, but we see upside risks to our deposit rate forecast further out.”
The global election calendar looks lighter ahead, after a record H1 that delivered multiple surprises. The November US election is now center stage given its global geopolitical and economic importance. We also look at the implications of various other elections around the world in the coming year, Senior Economist and Global Geopolitical Strategist at Standard Chartered Philippe Dauba-Pantanacce notes.
2024 is one of the biggest election years in history
“2024 is the biggest election year in history. It has already brought multiple surprises and market shocks, including unexpected election outcomes in Mexico and India and snap elections in France. The electoral calendar will be less busy in the 12 months ahead. The November US election is dominating attention given its high global stakes; we also focus on 14 other upcoming elections, mostly in emerging markets.”
“’High-stakes’ elections – which we define as having an uncertain outcome, significant political (and in some cases geopolitical) implications, and/or the potential to move markets – will take place in Venezuela, Moldova, Sri Lanka, Ghana and the Philippines, as well as the US. In many cases, a confluence of populist movements and economic and political tensions is raising the election stakes.”
“Other elections will be watched for their importance to wider geopolitical developments (Algeria, Tunisia), the implications for debt restructuring and foreign investment in their debt markets (Sri Lanka, Ghana), or, in the case of Austria and Romania, their implications for the broader EU. Elections are also scheduled in Rwanda, Jordan, Mozambique and Botswana over the next 12 months.”
- EUR/USD gains as soft US inflation reading boosts Fed rate-cut prospects.
- A rate-cut move by the Fed in September appears to be a done deal.
- The defeat of the far right has waned immediate risks of widening the French financial crisis.
EUR/USD rises to near 1.0880 in Friday’s European session. The major currency pair strengthens as fears of a financial crisis in the Eurozone’s second-largest nation diminished, and easing expectations of subsequent interest rate cuts by the European Central Bank (ECB) next week have improved the Euro’s outlook.
Immediate risks of a widening financial crisis in France have waned as Marine Le Pen’s far-right National Rally failed to maintain dominance over other parties. Economists were worried that the far right could boost fiscal spending if it came into power. However, uncertainty over the new fiscal policy framework remains high due to the expected coalition of French President Emmanuel Macron's centrist alliance and the left wing, also known as the New Popular Front, led by Jean-Luc Mélenchon.
Meanwhile, expectations for the ECB's subsequent rate cuts have diminished as officials see price pressures remaining close to their current levels for the entire year. ECB policymakers have refrained from committing a pre-defined rate-cut path as they worry that an aggressive policy expansion could revamp price pressures again.
Daily digest market movers: EUR/USD rises as far right’s defeat improves Euro’s outlook
- EUR/USD moves higher and trades close to a fresh monthly high at 1.0900, posted on Thursday. The near-term outlook of the shared currency pair strengthens as investors expect that an interest rate cut by the Federal Reserve (Fed) in the September meeting is a done deal.
- According to the CME FedWatch tool, the central bank is certain to cut interest rates in September and is also expected to deliver a subsequent rate cut in the November or December meeting. The expectations for Fed rate cuts have been prompted by the United States (US) Consumer Price Index (CPI) data for June, published on Thursday, which indicated that the disinflation process has resumed after a hiatus in the first quarter of this year.
- Annual core inflation, which is generally considered by Fed officials for decision-making on interest rates as it excludes volatile food and energy items, unexpectedly decelerated to 3.3%. Economists expected the underlying inflation to have increased steadily by 3.4%. The headline inflation rose to 3.0%, the lowest reading in a year, due to easing energy prices and rentals. Monthly headline inflation deflated by 0.1% after remaining unchanged in May.
- Cooling US inflationary pressures and easing labor market conditions have increased Fed officials’ confidence that inflation is on course to return to the desired rate of 2%. San Francisco Fed President Mary Daly said on Thursday that a slowdown in inflationary pressures is a “welcome relief” and bolsters the case for lower interest rates. However, the timing remains a matter of debate, Reuters reported.
- Improving Fed rate cut expectations is an unfavorable situation for the US Dollar (USD). The US Dollar Index (DXY), which tracks the Greenback’s value against six major currencies, seems vulnerable near 104.40.
- Meanwhile, investors await the US Producer Price Index (PPI) data for June, which will be published at 12:30 GMT. Producer inflation is expected to have grown at a higher pace on a monthly as well as annual basis.
Technical Analysis: EUR/USD sets to deliver triangle breakout
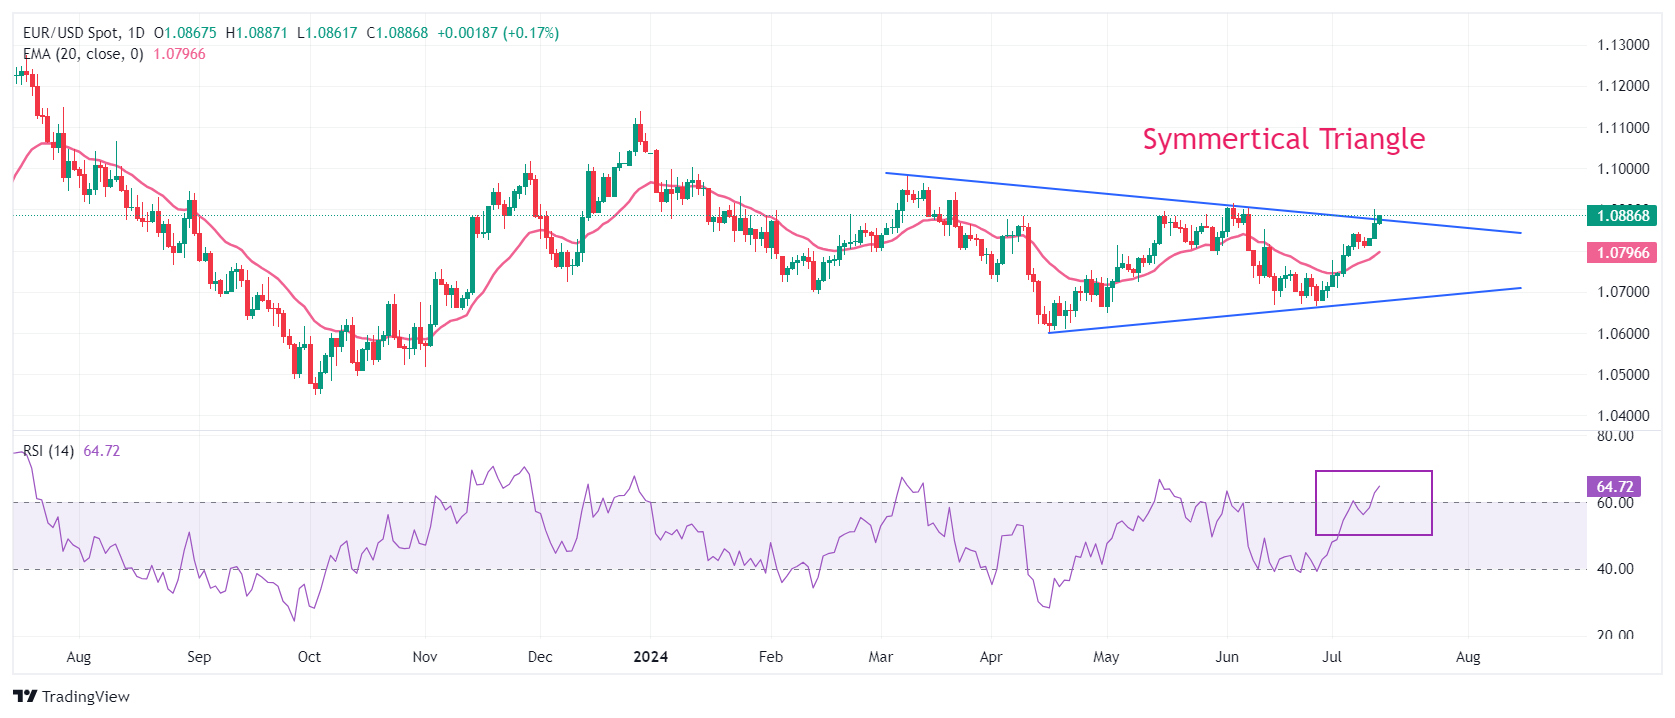
EUR/USD gathers strength to deliver a breakout of the Symmetrical Triangle formation on the daily timeframe. The major currency pair hovers near the downward-sloping border of the above-mentioned chart pattern around 1.0880, which is plotted from the March 8 high at 1.0980. The upward-sloping border of the triangle formation is marked from the April 16 low around 1.0620.
Advancing 20-day Exponential Moving Average (EMA) near 1.0800 suggests that the near-term trend is bullish.
The 14-day Relative Strength Index (RSI) establishes into the bullish range of 60.00-80.00, indicating that momentum has leaned to the upside.
Euro FAQs
The Euro is the currency for the 20 European Union countries that belong to the Eurozone. It is the second most heavily traded currency in the world behind the US Dollar. In 2022, it accounted for 31% of all foreign exchange transactions, with an average daily turnover of over $2.2 trillion a day. EUR/USD is the most heavily traded currency pair in the world, accounting for an estimated 30% off all transactions, followed by EUR/JPY (4%), EUR/GBP (3%) and EUR/AUD (2%).
The European Central Bank (ECB) in Frankfurt, Germany, is the reserve bank for the Eurozone. The ECB sets interest rates and manages monetary policy. The ECB’s primary mandate is to maintain price stability, which means either controlling inflation or stimulating growth. Its primary tool is the raising or lowering of interest rates. Relatively high interest rates – or the expectation of higher rates – will usually benefit the Euro and vice versa. The ECB Governing Council makes monetary policy decisions at meetings held eight times a year. Decisions are made by heads of the Eurozone national banks and six permanent members, including the President of the ECB, Christine Lagarde.
Eurozone inflation data, measured by the Harmonized Index of Consumer Prices (HICP), is an important econometric for the Euro. If inflation rises more than expected, especially if above the ECB’s 2% target, it obliges the ECB to raise interest rates to bring it back under control. Relatively high interest rates compared to its counterparts will usually benefit the Euro, as it makes the region more attractive as a place for global investors to park their money.
Data releases gauge the health of the economy and can impact on the Euro. Indicators such as GDP, Manufacturing and Services PMIs, employment, and consumer sentiment surveys can all influence the direction of the single currency. A strong economy is good for the Euro. Not only does it attract more foreign investment but it may encourage the ECB to put up interest rates, which will directly strengthen the Euro. Otherwise, if economic data is weak, the Euro is likely to fall. Economic data for the four largest economies in the euro area (Germany, France, Italy and Spain) are especially significant, as they account for 75% of the Eurozone’s economy.
Another significant data release for the Euro is the Trade Balance. This indicator measures the difference between what a country earns from its exports and what it spends on imports over a given period. If a country produces highly sought after exports then its currency will gain in value purely from the extra demand created from foreign buyers seeking to purchase these goods. Therefore, a positive net Trade Balance strengthens a currency and vice versa for a negative balance.
US consumer price inflation details continue to suggest that US rate cuts are overdue, UBS macro analyst Paul Donovan notes.
US faces deflation, China’s exports stronger than imports
“US consumer price inflation details continue to suggest that US rate cuts are overdue. Harmonized inflation slowed again (to 1.85% y/y). Durable goods prices are falling at the most aggressive rate in two decades. Most sectors experience deflation somewhere in the US. Slowing of the fantasy owners’ equivalent rent has no direct effect on consumer spending power.”
“US producer price inflation is due today. Remember that less than half the price a consumer pays reflects the price of a good at the factory gate, so the direct relationship to consumer prices is limited. Auto insurance is worth looking at—the producer price measure is used to calculate the PCE deflator, and auto insurance is a lot lower on this metric than in consumer prices.”
“Assorted final Eurozone consumer price figures, and German wholesale prices are unlikely to excite markets. China’s June imports were weak, keeping alive questions about domestic demand. Exports were stronger—though the anomaly of US trade persists. China’s exports to the US are almost 16% higher than US imports from China.”
Data released by the Bank of Japan (BoJ) on Friday showed that Japanese authorities may have spent JPY3.37 trillion to JPY3.57 trillion on July 11 to stem the rapid decline in the local currency, per Reuters.
No further details are provided about the same.
Market reaction
At the time of writing, USD/JPY keeps its range above 159.00, little changed by the above data findings.
Japanese Yen FAQs
The Japanese Yen (JPY) is one of the world’s most traded currencies. Its value is broadly determined by the performance of the Japanese economy, but more specifically by the Bank of Japan’s policy, the differential between Japanese and US bond yields, or risk sentiment among traders, among other factors.
One of the Bank of Japan’s mandates is currency control, so its moves are key for the Yen. The BoJ has directly intervened in currency markets sometimes, generally to lower the value of the Yen, although it refrains from doing it often due to political concerns of its main trading partners. The current BoJ ultra-loose monetary policy, based on massive stimulus to the economy, has caused the Yen to depreciate against its main currency peers. This process has exacerbated more recently due to an increasing policy divergence between the Bank of Japan and other main central banks, which have opted to increase interest rates sharply to fight decades-high levels of inflation.
The BoJ’s stance of sticking to ultra-loose monetary policy has led to a widening policy divergence with other central banks, particularly with the US Federal Reserve. This supports a widening of the differential between the 10-year US and Japanese bonds, which favors the US Dollar against the Japanese Yen.
The Japanese Yen is often seen as a safe-haven investment. This means that in times of market stress, investors are more likely to put their money in the Japanese currency due to its supposed reliability and stability. Turbulent times are likely to strengthen the Yen’s value against other currencies seen as more risky to invest in.
- EUR/GBP extends its losing streak as the Pound Sterling displays strength due to stable political conditions in the UK.
- This unexpected growth in the UK economy has diminished the likelihood of a BoE’s August rate cut.
- The Euro may gain ground on the back of reduced concerns about a French financial crisis.
EUR/GBP continues its losing streak for the third successive session, trading around 0.8410 during the European hours on Friday. The Pound Sterling (GBP) shows significant strength against its major peers following the outright victory of Keir Starmer’s Labour Party in the parliamentary elections, leading to the most stable political conditions in the United Kingdom (UK).
The outlook for the British Pound has improved, as a stable government results in predictable fiscal policies, attracting significant foreign inflows. Additionally, the UK's new Chancellor, Rachel Reeves, pledges to stimulate growth and investment with a major focus on the supply side due to the limited scope of government spending.
In May, the UK Gross Domestic Product (GDP) expanded by 0.4% month-over-month, surpassing market expectations of a 0.2% increase. This unexpected growth has diminished the likelihood of an August rate cut by the Bank of England (BoE). Additionally, the Bank of England Chief Economist Huw Pill emphasized that although a rate cut remains a possibility, concerns persist regarding high service prices and wage growth, according to Reuters.
In Europe, the Euro has found support amid easing concerns of a French financial crisis following Marine Le Pen's far-right National Rally's inability to maintain dominance over French President Emmanuel Macron's centrist alliance and the left-wing New Popular Front led by Jean-Luc Melenchon.
In addition to reduced fears of a French financial crisis, diminishing expectations of consecutive rate cuts by the European Central Bank (ECB) have stabilized the Euro's demand. Traders are scaling back bets on ECB back-to-back rate cuts as policymakers hesitate to commit to a specific path of rate reductions, concerned that an aggressive approach could reignite inflationary pressures.
UOB Group FX analysts Quek Ser Leang and Peter Chia suggest the EUR/USD pair is likely to trade within a range of 1.0845 to 1.0900. They anticipate continued upward movement in the Euro, though achieving 1.0915 may take some time.
Full article: EUR/USD may rise to 1.0915 in short term – UOB Group
Euro FAQs
The Euro is the currency for the 20 European Union countries that belong to the Eurozone. It is the second most heavily traded currency in the world behind the US Dollar. In 2022, it accounted for 31% of all foreign exchange transactions, with an average daily turnover of over $2.2 trillion a day. EUR/USD is the most heavily traded currency pair in the world, accounting for an estimated 30% off all transactions, followed by EUR/JPY (4%), EUR/GBP (3%) and EUR/AUD (2%).
The European Central Bank (ECB) in Frankfurt, Germany, is the reserve bank for the Eurozone. The ECB sets interest rates and manages monetary policy. The ECB’s primary mandate is to maintain price stability, which means either controlling inflation or stimulating growth. Its primary tool is the raising or lowering of interest rates. Relatively high interest rates – or the expectation of higher rates – will usually benefit the Euro and vice versa. The ECB Governing Council makes monetary policy decisions at meetings held eight times a year. Decisions are made by heads of the Eurozone national banks and six permanent members, including the President of the ECB, Christine Lagarde.
Eurozone inflation data, measured by the Harmonized Index of Consumer Prices (HICP), is an important econometric for the Euro. If inflation rises more than expected, especially if above the ECB’s 2% target, it obliges the ECB to raise interest rates to bring it back under control. Relatively high interest rates compared to its counterparts will usually benefit the Euro, as it makes the region more attractive as a place for global investors to park their money.
Data releases gauge the health of the economy and can impact on the Euro. Indicators such as GDP, Manufacturing and Services PMIs, employment, and consumer sentiment surveys can all influence the direction of the single currency. A strong economy is good for the Euro. Not only does it attract more foreign investment but it may encourage the ECB to put up interest rates, which will directly strengthen the Euro. Otherwise, if economic data is weak, the Euro is likely to fall. Economic data for the four largest economies in the euro area (Germany, France, Italy and Spain) are especially significant, as they account for 75% of the Eurozone’s economy.
Another significant data release for the Euro is the Trade Balance. This indicator measures the difference between what a country earns from its exports and what it spends on imports over a given period. If a country produces highly sought after exports then its currency will gain in value purely from the extra demand created from foreign buyers seeking to purchase these goods. Therefore, a positive net Trade Balance strengthens a currency and vice versa for a negative balance.
The US Dollar (USD) could test 7.2550 first before stabilisation is likely; the next support at 7.2400 is unlikely to come under threat, UOB Group FX analysts Quek Ser Leang and Peter Chia note.
USD to trade lower towards 7.2400
24-HOUR VIEW: “We did not anticipate USD to drop sharply yesterday, as it closed lower by 0.34% (7.2673). While the sharp drop appears to be overdone, USD could test 7.2550 first before stabilisation is likely. The next support at 7.2400 is unlikely to come under threat. Resistance is at 7.2750; a breach of 7.2800 would mean that the weakness has stabilised.”
1-3 WEEKS VIEW: “We have expected USD to trade between 7.2700 and 7.3100 since last Thursday (04 Jul, spot at 7.3000). After trading in a quiet manner for a few days, USD plummeted and dropped to a low of 7.2584 yesterday. Downward momentum is building, and USD is likely to trade with a downward bias towards 7.2400. The downward bias is intact as long as USD remains below 7.2910.”
- Gold is pulling back after the stellar gains made on Thursday following the surprise fall in the US inflation rate in June.
- Cooling inflation implies a greater chance that interest rates will fall, making non-interest-bearing Gold more attractive.
- XAU/USD takes on a range-bound aspect as it climbs back up to the all-time highs.
Gold (XAU/USD) pulls back on Friday after a blowout rally on Thursday following the release of US inflation data. The precious metal trades down by almost half a percent to just above $2,400 during the European session as short-term traders take profit or back and fill the previous day’s irrational exuberance.
Gold breaks out higher after US inflation data release
Gold surged after the release of the US Consumer Price Index (CPI) data for June showed a slowdown in inflation, thereby increasing bets that the Federal Reserve (Fed) will start to cut interest rates sooner than previously thought.
Markets now fully price in a 0.25% cut of the Fed Funds rate in September and over 0.60% of cuts by the end of the year, from 0.50% previously. This, in turn, increases the attractiveness of Gold as an investment by reducing the opportunity cost of holding a non-interest-bearing investment.
Thursday’s data showed US headline inflation cooling to 3.0% year-on-year in June, below estimates of 3.1% and the previous month's 3.3%.
On a monthly basis, CPI fell by 0.1% in June – the biggest outright decline in prices since May 2020 during the Covid-19 pandemic, according to Deutsche Bank’s Global Head of Macro Research, Jim Reid.
Meanwhile, core CPI – which excludes volatile food and energy components – slowed to 3.3%, falling below expectations of 3.4% from 3.4% previously. On a 3-month annualized basis, moreover, core inflation is now just above the Fed’s 2.0% target.
Hopes were raised “that it wasn’t simply one good month. In fact, on a 3-month annualized basis, core CPI is up just +2.1% now, which is the lowest since March 2021,” said Deutsche Bank’s Reid.
Thursday’s CPI data – especially for the last three months – suggests the Fed must now be very close to cutting interest rates. When Fed Chairman Jerome Powell was asked by a lawmaker at his two-day testimony to Congress this week whether the Fed would wait until PCE inflation had fallen to its 2.0% target before cutting interest rates, Powell answered that that would be leaving it too late, because “inflation has a certain momentum.”
This, and Powell’s expressed concerns regarding the state of the employment market, which showed the Unemployment Rate rising to 4.1% in June’s Nonfarm Payrolls figures, might indicate further pressure to cut interest rates – in order to stimulate jobs growth. In fact, Powell said unemployment was the thing “keeping him awake at night”, during his testimony.
That said, the chances of the Fed cutting rates at its July 30-31 meeting remain low, with September now the first viable date, according to economists at Brown Brothers Harriman (BBH).
“Even another month of improved inflation data won’t get the Fed to cut this month. After the July 30-31 meeting, the Fed will see July and August readings for jobs, CPI, PPI, and retail sales and the July PCE reading ahead of the September 17-18 FOMC meeting. By that point, the Fed should have a much better idea of where the economy is going and will feel more comfortable making an explicit policy pivot,” said Dr. Win Thin, Global Head of Markets Strategy at BBH.
Technical Analysis: Gold rallies toward all-time-high
Gold is rallying within a range, approaching its May 20 all-time high of $2,450. Rather than forming a topping pattern as was previously possible, Gold may now be in a sideways consolidation – a pause within a broader uptrend.
XAU/USD Daily Chart
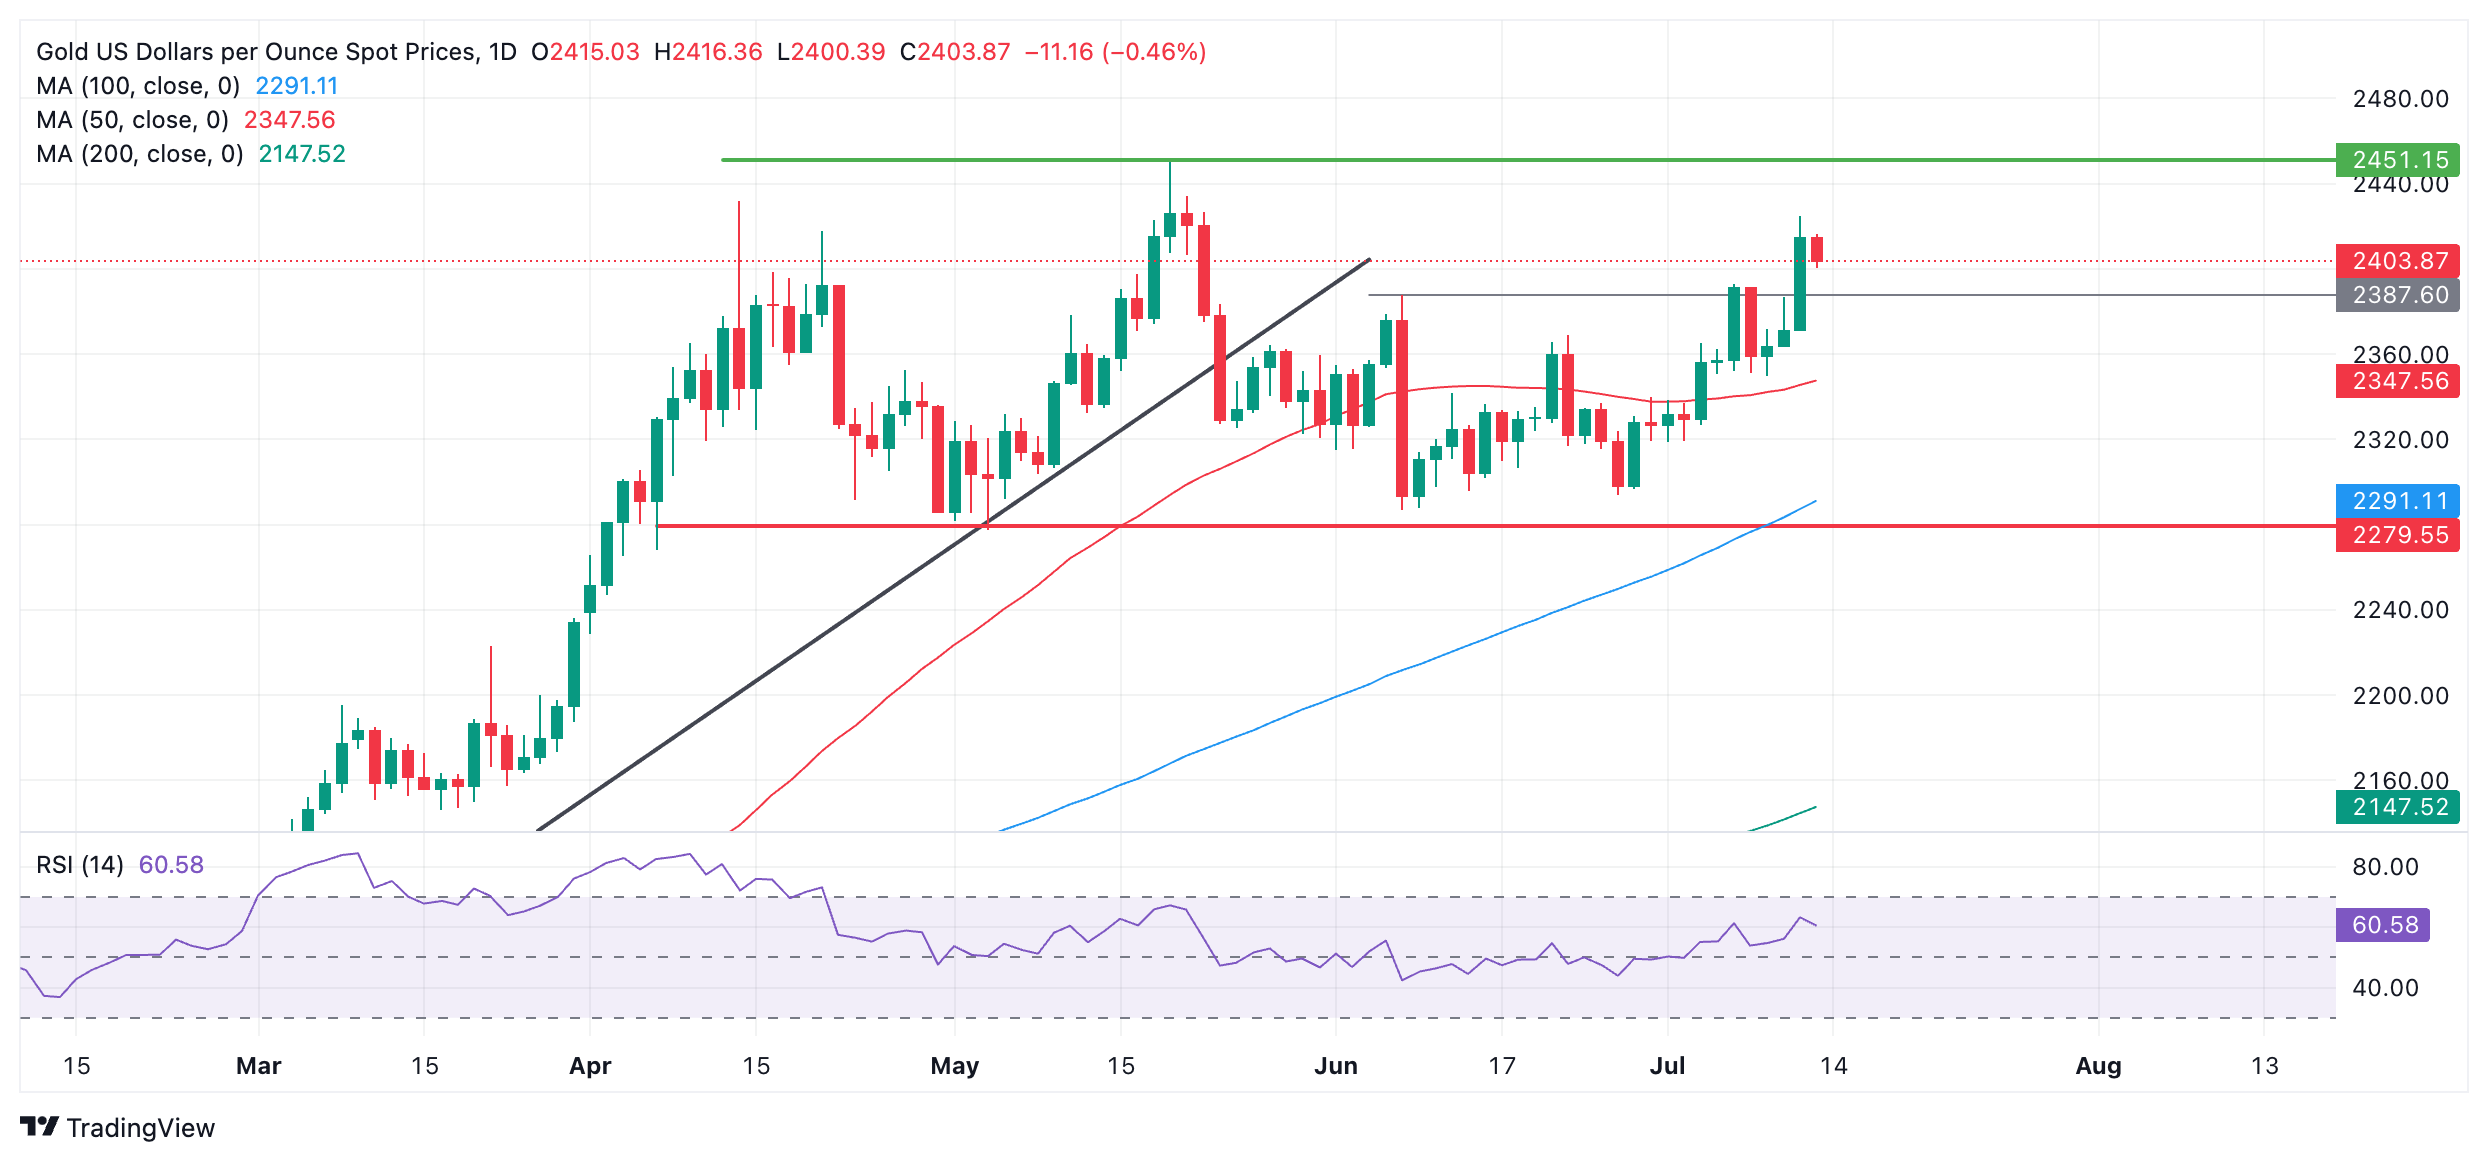
On a short-term trend basis, Gold appears to be in a sideways trend as it extends a leg higher within a range that has unfolded since April. The sideways trend has a floor at roughly $2,280 and a ceiling at $2,450.
Since the break above the June 7 peak of $2,388 last Friday, the precious metal has received bullish confirmation, unlocking the next upside target at the $2,451 all-time high.
In the long term, Gold remains in an uptrend, suggesting odds favor an eventual breakout to the upside of the range.
A decisive break above the $2,450 high – which is also the range ceiling – would unlock a target at $2,555, calculated by extrapolating the 0.618 Fibonacci ratio of the height of the range higher.
Economic Indicator
Consumer Price Index (YoY)
Inflationary or deflationary tendencies are measured by periodically summing the prices of a basket of representative goods and services and presenting the data as The Consumer Price Index (CPI). CPI data is compiled on a monthly basis and released by the US Department of Labor Statistics. The YoY reading compares the prices of goods in the reference month to the same month a year earlier.The CPI is a key indicator to measure inflation and changes in purchasing trends. Generally speaking, a high reading is seen as bullish for the US Dollar (USD), while a low reading is seen as bearish.
Read more.Last release: Thu Jul 11, 2024 12:30
Frequency: Monthly
Actual: 3%
Consensus: 3.1%
Previous: 3.3%
Source: US Bureau of Labor Statistics
The US Federal Reserve has a dual mandate of maintaining price stability and maximum employment. According to such mandate, inflation should be at around 2% YoY and has become the weakest pillar of the central bank’s directive ever since the world suffered a pandemic, which extends to these days. Price pressures keep rising amid supply-chain issues and bottlenecks, with the Consumer Price Index (CPI) hanging at multi-decade highs. The Fed has already taken measures to tame inflation and is expected to maintain an aggressive stance in the foreseeable future.
The US Dollar (USD) could continue to trade in a volatile manner between 157.30 and 160.00. Scope for USD to continue to weaken; it is too early to determine if the significant support at 155.50 will come into view, UOB Group FX analysts Quek Ser Leang and Peter Chia note.
Near-term bias is on the downside below 161.00
24-HOUR VIEW: “The extreme volatility yesterday was surprising, as USD nosedived to 157.41 before snapping back up, closing sharply lower at 158.80 (-1.78%). The wild swings have resulted in a mixed outlook, and USD could continue to trade in a volatile manner. Expected range for today, 157.30/160.00.”
1-3 WEEKS VIEW: “Yesterday (11 Jul, spot at 161.55), we indicated that while upward momentum is building, USD ‘has to break and close above 162.00 before a sustained advance is likely.’ We added, ‘the likelihood of USD breaking clearly above 162.00 is not high for now, but it will remain intact as long as 160.60 is not breached.’ However, USD not only broke below 160.60, but it also plunged to a low of 157.41. While the outsized decline suggests there is scope for JPY to continue to weaken, it is too early to determine if the significant support level at 155.50 will come into view. All in all, the near-term bias is on the downside, as long as USD remains below 161.00.”
The New Zealand Dollar (NZD) is expected to trade in a 0.6065/0.6130 range, UOB Group FX analysts Quek Ser Leang and Peter Chia note.
NZD to break above 0.6130 in due time
24-HOUR VIEW: “Two days ago, NZD plunged to a low of 0.6060. Yesterday, we indicated that ‘the sharp drop appears to be overdone, and NZD is unlikely to weaken further.’ We expected NZD to trade in a range between 0.6070 and 0.6115.’ Instead of trading in a range, NZD popped to a high of 0.6134 before pulling back, closing at 0.6094 (+0.19%). The brief advance did not result in any increase in momentum. Today, we expect NZD to trade in a 0.6065/0.6130 range.”
1-3 WEEKS VIEW: “Yesterday (11 Jul, spot at 0.6090), we indicated that ‘downward momentum has increased somewhat. We were of the view that NZD could ‘edge lower, but the prospect of it breaking below 0.6045 is not high for now.’ In NY trade, NZD rose briefly above our ‘strong resistance’ level of 0.6130 (high of 0.6134). The breach of 0.6130 indicates that the tentative buildup in downward momentum has faded. The current price movements are likely part of a range trading phase, probably between 0.6045 and 0.6155.”
Instead of strengthening further, the Australian Dollar (AUD) is likely to trade in a 0.6740/0.6785 range instead. Room for AUD to continue to rise, but it has to surpass 0.6800 before further advance can be expected, UOB Group FX analysts Quek Ser Leang and Peter Chia note.
AUD has to surpass 0.6800 to continue growing
24-HOUR VIEW: “While we expected AUD to strengthen yesterday, we indicated that ‘any advance is unlikely to reach 0.6800.’ AUD subsequently rose, but it came close to reaching 0.6800 (high has been 0.6799). AUD pulled back from the high and closed slightly higher (0.6760, +0.19%). The pullback in overbought conditions suggest that instead of strengthening further today, AUD is likely to trade in 0.6740/0.6785 range instead.”
1-3 WEEKS VIEW: “We turned positive in AUD early last week. In our most recent narrative from Monday (08 Jul, spot at 0.6745), we highlighted that ‘increasing upward momentum suggests AUD is likely to continue to rise to 0.6800.’ Yesterday, AUD rose to within one pip of 0.6800, reaching a high of 0.6799. While there is room for AUD to continue to rise, it has to surpass 0.6800 before further advance can be expected. Given the overbought conditions, it remains to be seen if AUD can break above 0.6800 in the next few days. Overall, only a breach of 0.6725 (‘strong support’ level was at 0.6700 yesterday) would indicate that the AUD strength has come to an end.”
Overbought advance in the Pound Sterling (GBP) could extend to 1.2970 before a pullback can be expected. Risk remains on the upside; overbought conditions suggest 1.3000 might not come into view so soon, UOB Group FX analysts Quek Ser Leang and Peter Chia note.
Upside risk intact above 1.2855
24-HOUR VIEW: “While we expected GBP to break above 1.2860 yesterday, we were of the view that ‘the next major resistance at 1.2900 is unlikely to come into view.’ The anticipated GBP strength exceeded our expectations, as it soared to a high of 1.2949. Despite being overbought, the advance in GBP could extend to 1.2970 before a pullback can be expected. The next major resistance at 1.3000 is unlikely to come into view. Should GBP break below 1.2880 (minor support at 1.2900), it would mean that the current upward pressure has eased.”
1-3 WEEKS VIEW: “Last Thursday (04 Jul, spot at 1.2745), we indicated that ‘the risk for GBP has shifted to the upside.’ After GBP rose, in our update from yesterday (11 Jul, spot at 1.2845), we pointed out that ‘the price action continues to suggest upside risk, and the next level to monitor is 1.2900.’ GBP broke above 1.2900 in a hurry as it soared, reaching a high of 1.2949 in NY trade. While the risk remains on the upside, overbought conditions suggest 1.3000 might not come into view so soon. The upside risk is intact as long as 1.2855 (‘strong support’ level was at 1.2775 yesterday) is not breached.”
The Euro (EUR) is likely to trade in a range, probably between 1.0845 and 1.0900. EUR is expected to continue to rise, but it might take a while before 1.0915 comes into view, UOB Group FX analysts Quek Ser Leang and Peter Chia note.
Upside risk is intact while above 1.0825
24-HOUR VIEW: “We highlighted yesterday that ‘the risk for today appears to be tilted to the upside, but it remains to be seen if EUR can break clearly above the major resistance at 1.0850.’ We added, ‘if there is a clear break of 1.0850, EUR could continue to rise, but the next major resistance at 1.0915 is unlikely to come into view for now.’ EUR subsequently broke above 1.0850 and soared to 1.0899. EUR closed at 1.0865 (+0.32%). The sharp and rapid rise appears to be overdone, and EUR is unlikely to rise much further. Today, EUR is more likely to trade in a range, probably between 1.0845 and 1.0900.”
1-3 WEEKS VIEW: “Last Thursday (04 Jul, spot at 1.0785), we indicated that ‘while the increase in momentum suggests further EUR strength, it is too early to determine if it can reach the major resistance at 1.0850.’ After EUR rose, we indicated on Monday (08 Jul, spot at 1.0825) that ‘the risk of EUR breaking above 1.0850 has increased, albeit moderately.’ Yesterday, EUR broke above 1.0850, reaching a high of 1.0899. We continue to expect EUR to rise, even though severely overbought conditions suggest it might take a couple of days before 1.0915 comes into view. The upside risk is intact as long as 1.0825 (‘strong support’ level previously was at 1.0780 yesterday) is not breached.”
- USD/CAD edges lower as the commodity-linked CAD finds support from higher Oil prices.
- WTI price appreciates as cooling US inflation data has raised speculation of a Fed rate cut in September.
- Chicago Fed President Austan Goolsbee stated that the US economy appears to be on track to achieve 2% inflation.
USD/CAD retraces its gains from the previous session, trading around 1.3620 during the European hours on Friday. The commodity-linked Canadian Dollar (CAD) finds support from the higher crude Oil prices, given the fact Canada is the biggest Oil exporter to the United States (US).
West Texas Intermediate (WTI) Oil price extends its winning streak for the third session, trading around $82.20 per barrel at the time of writing. Crude Oil prices received support as softer-than-expected US Consumer Price Index (CPI) data for June has raised speculation of a potential Federal Reserve (Fed) rate cut in September. Lower borrowing costs support the US economy, the largest Oil consumer in the world, which in turn boosts crude Oil demand.
In June, the US Consumer Price Index (CPI) decreased by 0.1% month-over-month, reaching its lowest level in over three years. The core CPI, which excludes volatile food and energy prices, rose by 3.3% year-over-year, compared to May's increase of 3.4%, matching expectations. Meanwhile, the core CPI increased by 0.1% MoM, below the expected and prior rise of 0.2%.
On policy front, Federal Reserve Bank of Chicago President Austan Goolsbee said on Thursday that the US economy appears to be on track to achieve 2% inflation. This suggests Goolsbee is gaining confidence that the time for cutting interest rates may soon be approaching. He also stated "My view is, this is what the path to 2% looks like," according to Reuters.
In Canada, the Unemployment Rate increased to 6.4% in June, the highest since January 2022, with the economy losing 1,400 jobs. This has heightened the likelihood of the Bank of Canada (BoC) implementing further interest rate cuts to boost economic growth. Consequently, the yield on Canadian 10-year government bond dropped to about 3.4%, reflecting dovish expectations from the BoC.
Traders await the Michigan Consumer Sentiment Index and US Producer Price Index (PPI) data, due on Friday, to gain further impetus on the US economy. On Loonie’s front, May’s Building Permits (MoM) will be eyed.
Canadian Dollar FAQs
The key factors driving the Canadian Dollar (CAD) are the level of interest rates set by the Bank of Canada (BoC), the price of Oil, Canada’s largest export, the health of its economy, inflation and the Trade Balance, which is the difference between the value of Canada’s exports versus its imports. Other factors include market sentiment – whether investors are taking on more risky assets (risk-on) or seeking safe-havens (risk-off) – with risk-on being CAD-positive. As its largest trading partner, the health of the US economy is also a key factor influencing the Canadian Dollar.
The Bank of Canada (BoC) has a significant influence on the Canadian Dollar by setting the level of interest rates that banks can lend to one another. This influences the level of interest rates for everyone. The main goal of the BoC is to maintain inflation at 1-3% by adjusting interest rates up or down. Relatively higher interest rates tend to be positive for the CAD. The Bank of Canada can also use quantitative easing and tightening to influence credit conditions, with the former CAD-negative and the latter CAD-positive.
The price of Oil is a key factor impacting the value of the Canadian Dollar. Petroleum is Canada’s biggest export, so Oil price tends to have an immediate impact on the CAD value. Generally, if Oil price rises CAD also goes up, as aggregate demand for the currency increases. The opposite is the case if the price of Oil falls. Higher Oil prices also tend to result in a greater likelihood of a positive Trade Balance, which is also supportive of the CAD.
While inflation had always traditionally been thought of as a negative factor for a currency since it lowers the value of money, the opposite has actually been the case in modern times with the relaxation of cross-border capital controls. Higher inflation tends to lead central banks to put up interest rates which attracts more capital inflows from global investors seeking a lucrative place to keep their money. This increases demand for the local currency, which in Canada’s case is the Canadian Dollar.
Macroeconomic data releases gauge the health of the economy and can have an impact on the Canadian Dollar. Indicators such as GDP, Manufacturing and Services PMIs, employment, and consumer sentiment surveys can all influence the direction of the CAD. A strong economy is good for the Canadian Dollar. Not only does it attract more foreign investment but it may encourage the Bank of Canada to put up interest rates, leading to a stronger currency. If economic data is weak, however, the CAD is likely to fall.
China will hold its third plenum on 15-18 Jul. There is little anticipation of new stimulus measures at this meeting, but markets will be on the lookout for fiscal and tax reforms, strategies to counter increasing protectionism from the US and EU, UOB Group Economist Ho Woei Chen notes.
Much anticipation for the upcoming third plenum
“China will hold its third plenum on 15-18 Jul. With President Xi remaining at the helm, his economic policies to develop ‘new quality productive forces’, promote dual circulation and common prosperity will continue to drive his economic reform strategies.”
“Although the near-term stabilization of growth is also expected to be discussed, there is little anticipation of new stimulus measures at this meeting.”
“Markets will be on the lookout for fiscal and tax reforms, strategies to counter increasing protectionism from the US and EU, promotion of the domestic private sector and housing market development.”
Here is what you need to know on Friday, July 12:
The US Dollar (USD) suffered large losses against its major rivals on Thursday following June inflation data. After dropping to its weakest level in over a month near 104.00, the USD Index staged a rebound in the late American session and entered a consolidation phase at around 104.50 early Friday. The US economic calendar will feature Producer Price Index (PPI) data for June and the University of Michigan's preliminary Consumer Sentiment Index for July.
US Dollar PRICE This week
The table below shows the percentage change of US Dollar (USD) against listed major currencies this week. US Dollar was the weakest against the Japanese Yen.
| USD | EUR | GBP | JPY | CAD | AUD | NZD | CHF | |
|---|---|---|---|---|---|---|---|---|
| USD | -0.32% | -0.89% | -0.91% | -0.16% | -0.24% | 0.60% | -0.02% | |
| EUR | 0.32% | -0.37% | -0.26% | 0.48% | 0.24% | 1.24% | 0.64% | |
| GBP | 0.89% | 0.37% | 0.08% | 0.88% | 0.61% | 1.64% | 1.01% | |
| JPY | 0.91% | 0.26% | -0.08% | 0.74% | 0.68% | 1.67% | 0.93% | |
| CAD | 0.16% | -0.48% | -0.88% | -0.74% | -0.13% | 0.78% | 0.16% | |
| AUD | 0.24% | -0.24% | -0.61% | -0.68% | 0.13% | 1.02% | 0.38% | |
| NZD | -0.60% | -1.24% | -1.64% | -1.67% | -0.78% | -1.02% | -0.61% | |
| CHF | 0.02% | -0.64% | -1.01% | -0.93% | -0.16% | -0.38% | 0.61% |
The heat map shows percentage changes of major currencies against each other. The base currency is picked from the left column, while the quote currency is picked from the top row. For example, if you pick the US Dollar from the left column and move along the horizontal line to the Japanese Yen, the percentage change displayed in the box will represent USD (base)/JPY (quote).
The US Bureau of Labor Statistics announced on Thursday that annual inflation in the US, as measured by the change in the Consumer Price Index, softened to 3% in June from 3.3% in May. On a monthly basis, the CPI declined by 0.1%. The core CPI, which excludes volatile food and energy prices, rose 3.3% on a yearly basis following the 3.4% increase recorded in May. Following these readings, the USD came under heavy selling pressure. The negative shift seen in risk mood later in the day, however, helped the currency erase some of its losses. US stock index futures trade mixed in the European session, while the benchmark 10-year US Treasury bond yield holds steady at around 4.2% after losing nearly 2% on Thursday.
EUR/USD gathered bullish momentum and tested 1.0900 during the American trading hours on Thursday. After meeting resistance at this level, the pair corrected lower but managed to stabilize above 1.0850. At the time of press, EUR/USD was moving sideways at around 1.0870.
GBP/USD extended its weekly rally and reached its highest level in nearly a year near 1.2950 on Thursday. The pair stays in a consolidation phase above 1.2900 in the European morning on Friday.
USD/JPY declined sharply after the US inflation data and lost nearly 2% on a daily basis. The severity of the pair's decline caused markets to wonder whether there was an intervention. Early Friday, USD/JPY holds steady above 159.00.
Gold benefited from falling US Treasury bond yields and the broad-based USD weakness on Thursday, reaching its highest level since late May above $2,420. XAU/USD edges lower early Friday but holds above $2,400.
Economic Indicator
Producer Price Index (YoY)
The Producer Price Index released by the Bureau of Labor statistics, Department of Labor measures the average changes in prices in primary markets of the US by producers of commodities in all states of processing. Changes in the PPI are widely followed as an indicator of commodity inflation. Generally speaking, a high reading is seen as positive (or bullish) for the USD, whereas a low reading is seen as negative (or bearish).
Read more.Next release: Fri Jul 12, 2024 12:30
Frequency: Monthly
Consensus: 2.3%
Previous: 2.2%
Source: US Bureau of Labor Statistics
- The Pound Sterling holds strength against the US Dollar as Fed rate cuts become appropriate for this year.
- Softer-than-expected US inflation boosts hopes of Fed rate cuts in September.
- The UK economy grew at a faster pace of 0.4% in May, beating consensus of 0.2%.
The Pound Sterling (GBP) clings to gains slightly above the round level of 1.2900 against the US Dollar (USD) in Friday’s London session. The GBP/USD pair rose to a fresh annual high at 1.2950 after softer-than-expected United States (US) Consumer Price Index (CPI) data for June boosted expectations of rate cuts by the Federal Reserve (Fed). Traders bet that the Fed will start reducing interest rates from the September meeting.
The US CPI report showed that annual headline and core inflation, which strips off volatile food and energy prices, decelerated to 3% and 3.3%, respectively. On month, the headline inflation deflated for the first time in four years, prompted confidence that price pressures are on course to return to the desired rate of 2% and high inflationary pressures in the first quarter were a one-time blip.
Softer-than-expected inflation readings have weighed heavily on the US Dollar and boosted Fed officials' confidence that the disinflation process has resumed. The US Dollar Index (DXY), which tracks the Greenback’s value against six major currencies, remains on the backfoot below 104.50.
On Thursday, San Francisco Fed Bank President Mary Daly said recent cooler inflation readings and easing labor market conditions have made one or two rate cuts appropriate for this year.
In Friday’s session, investors will focus on June’s US Producer Price Index (PPI) data, which will be published at 12:30 GMT. Economists expect that headline and core producer inflation accelerated in June on a monthly as well as annual basis.
Daily digest market movers: Pound Sterling strengthens on improved UK economic outlook
- The Pound Sterling displays sheer strength against its major peers on Friday. The British currency strengthens as the outright victory of Keir Starmer’s Labour Party in parliamentary elections has resulted in the most stable political conditions in the United Kingdom (UK) economy among G-7 nations.
- The outlook for the Pound Sterling has improved, as a stable government results in predictable fiscal policies, which will attract significant foreign inflows. Also, the UK's new Chancellor, Rachel Reeves, pledges to stimulate growth and investment with a major focus on the supply side due to the limited scope of government spending.
- Apart from that, the improved economic outlook and diminished expectations for the Bank of England (BoE) to begin reducing interest rates in August have boosted the Pound Sterling’s appeal. The monthly Gross Domestic Product (GDP) data for May came in higher at 0.4% from the estimates of 0.2% and an unchanged position in April. This has also raised doubts about whether the BoE should pivot to policy normalization in September.
- BoE policymakers hesitate to support early rate cuts as wage growth is roughly double than what is needed to be consistent for achieving price stability. On Wednesday, BoE policymaker Catherine Mann warned that the decline in the annual headline inflation to the 2% target was merely a “touch and go”. She warned that inflation could rise again and remain above the desired rate for the rest of the year.
Technical Analysis: Pound Sterling breaks out of inverted H&S formation
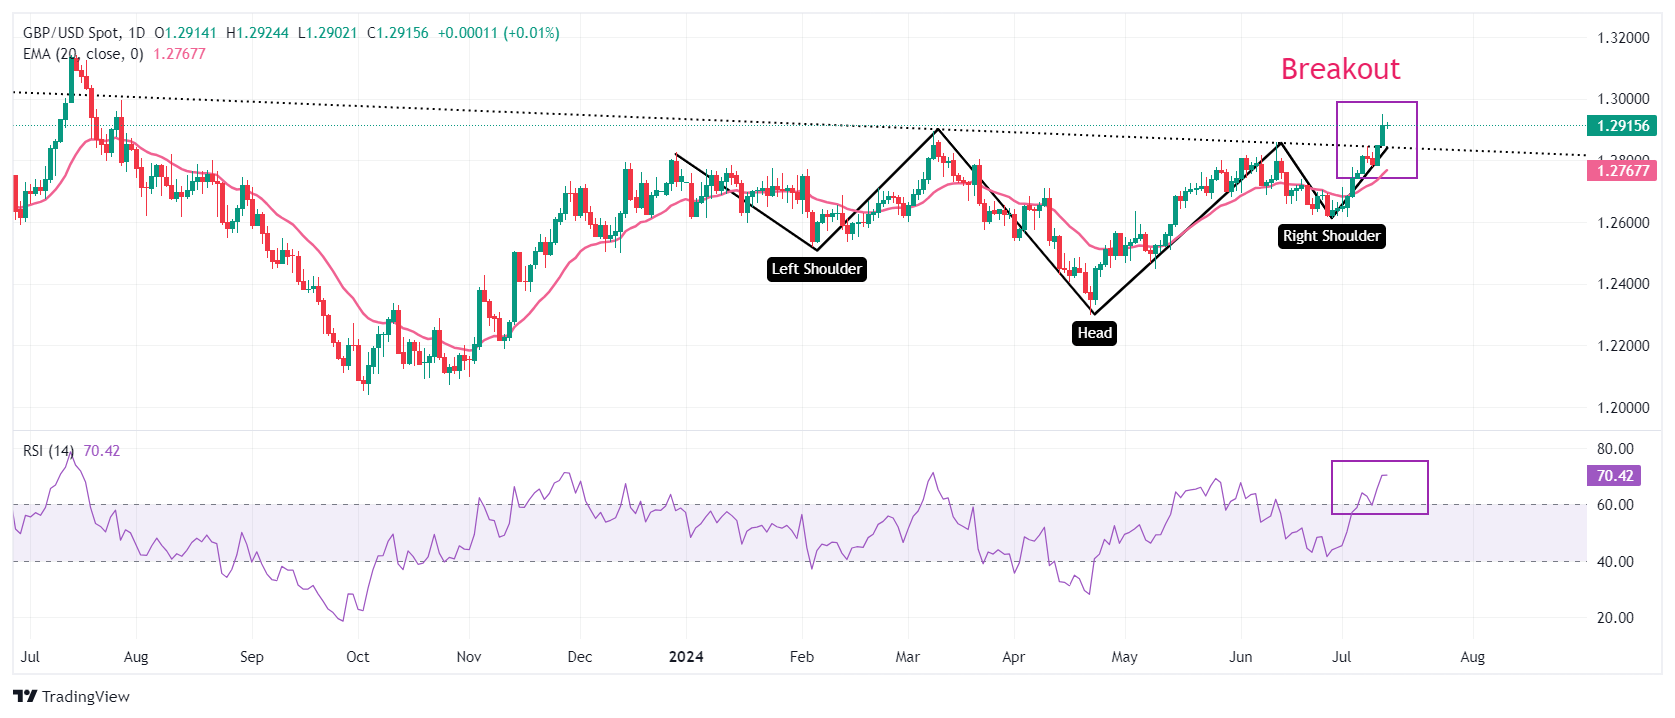
The Pound Sterling posts a fresh annual high at 1.2950 against the US Dollar on Thursday. The GBP/USD pair strengthens after a breakout of an inverted Head and Shoulder (H&S) pattern formed on a daily timeframe. The neckline of the above-mentioned chart pattern is plotted near 1.2850, and a breakout of the H&S formation results in a bullish reversal.
Advancing 20-day Exponential Moving Average (EMA) near 1.2766 suggests that the near-term trend is bullish.
The 14-day Relative Strength Index (RSI) established into the bullish range of 60.00-80.00, indicating that the momentum has leaned to the upside.
Pound Sterling FAQs
The Pound Sterling (GBP) is the oldest currency in the world (886 AD) and the official currency of the United Kingdom. It is the fourth most traded unit for foreign exchange (FX) in the world, accounting for 12% of all transactions, averaging $630 billion a day, according to 2022 data. Its key trading pairs are GBP/USD, aka ‘Cable’, which accounts for 11% of FX, GBP/JPY, or the ‘Dragon’ as it is known by traders (3%), and EUR/GBP (2%). The Pound Sterling is issued by the Bank of England (BoE).
The single most important factor influencing the value of the Pound Sterling is monetary policy decided by the Bank of England. The BoE bases its decisions on whether it has achieved its primary goal of “price stability” – a steady inflation rate of around 2%. Its primary tool for achieving this is the adjustment of interest rates. When inflation is too high, the BoE will try to rein it in by raising interest rates, making it more expensive for people and businesses to access credit. This is generally positive for GBP, as higher interest rates make the UK a more attractive place for global investors to park their money. When inflation falls too low it is a sign economic growth is slowing. In this scenario, the BoE will consider lowering interest rates to cheapen credit so businesses will borrow more to invest in growth-generating projects.
Data releases gauge the health of the economy and can impact the value of the Pound Sterling. Indicators such as GDP, Manufacturing and Services PMIs, and employment can all influence the direction of the GBP. A strong economy is good for Sterling. Not only does it attract more foreign investment but it may encourage the BoE to put up interest rates, which will directly strengthen GBP. Otherwise, if economic data is weak, the Pound Sterling is likely to fall.
Another significant data release for the Pound Sterling is the Trade Balance. This indicator measures the difference between what a country earns from its exports and what it spends on imports over a given period. If a country produces highly sought-after exports, its currency will benefit purely from the extra demand created from foreign buyers seeking to purchase these goods. Therefore, a positive net Trade Balance strengthens a currency and vice versa for a negative balance.
- NZD/USD remains stable as traders await key economic data from the United States (US).
- The Business NZ Manufacturing PMI fell to 41.1 in June, marking the 15th consecutive month of contraction.
- The US Consumer Price Index declined by 0.1% MoM in June, marking its lowest level in over three years.
NZD/USD hovers around 0.6100 in early European trading hours on Friday as investors react to New Zealand’s weak PMI data. The Business NZ Manufacturing PMI dropped to 41.1 in June from 47.2 in May. This has marked the 15th consecutive month of contraction and the third lowest value for a non-COVID lockdown month. Additionally, traders are awaiting the Michigan Consumer Sentiment Index and the US Producer Price Index (PPI), both due on Friday, for further insights into the US economy.
The NZD/USD pair received support from softer-than-expected US Consumer Price Index (CPI) data for June has heightened expectations of a potential Federal Reserve (Fed) rate cut in September. The core CPI, which excludes volatile food and energy prices, rose by 3.3% year-over-year in June, compared to May's increase of 3.4% and the same expectation. Meanwhile, the core CPI increased by 0.1% month-over-month, against the expected and prior rise of 0.2%.
Additionally, Federal Reserve Bank of Chicago President Austan Goolsbee said on Thursday that the US economy appears to be on track to achieve 2% inflation. This suggests Goolsbee is gaining confidence that the time for cutting interest rates may soon be approaching. He also stated "My view is, this is what the path to 2% looks like," according to Reuters.
Earlier this week, the Reserve Bank of New Zealand (RBNZ) maintained its cash rate at 5.5% on Wednesday, as expected. However, it suggested potential rate cuts in August if inflation declines as anticipated. The New Zealand Dollar (NZD) might come under pressure due to the RBNZ's dovish monetary policy statement.
New Zealand Dollar FAQs
The New Zealand Dollar (NZD), also known as the Kiwi, is a well-known traded currency among investors. Its value is broadly determined by the health of the New Zealand economy and the country’s central bank policy. Still, there are some unique particularities that also can make NZD move. The performance of the Chinese economy tends to move the Kiwi because China is New Zealand’s biggest trading partner. Bad news for the Chinese economy likely means less New Zealand exports to the country, hitting the economy and thus its currency. Another factor moving NZD is dairy prices as the dairy industry is New Zealand’s main export. High dairy prices boost export income, contributing positively to the economy and thus to the NZD.
The Reserve Bank of New Zealand (RBNZ) aims to achieve and maintain an inflation rate between 1% and 3% over the medium term, with a focus to keep it near the 2% mid-point. To this end, the bank sets an appropriate level of interest rates. When inflation is too high, the RBNZ will increase interest rates to cool the economy, but the move will also make bond yields higher, increasing investors’ appeal to invest in the country and thus boosting NZD. On the contrary, lower interest rates tend to weaken NZD. The so-called rate differential, or how rates in New Zealand are or are expected to be compared to the ones set by the US Federal Reserve, can also play a key role in moving the NZD/USD pair.
Macroeconomic data releases in New Zealand are key to assess the state of the economy and can impact the New Zealand Dollar’s (NZD) valuation. A strong economy, based on high economic growth, low unemployment and high confidence is good for NZD. High economic growth attracts foreign investment and may encourage the Reserve Bank of New Zealand to increase interest rates, if this economic strength comes together with elevated inflation. Conversely, if economic data is weak, NZD is likely to depreciate.
The New Zealand Dollar (NZD) tends to strengthen during risk-on periods, or when investors perceive that broader market risks are low and are optimistic about growth. This tends to lead to a more favorable outlook for commodities and so-called ‘commodity currencies’ such as the Kiwi. Conversely, NZD tends to weaken at times of market turbulence or economic uncertainty as investors tend to sell higher-risk assets and flee to the more-stable safe havens.
- USD/CHF trades in negative territory near 0.8960 for the second consecutive day on Friday.
- Traders raised their bets on Fed rate cuts in September after the softer-than-expected June US CPI inflation report.
- The speculation that the SNB will cut further interest rates might cap the pair’s downside.
The USD/CHF pair trades on a weaker note around 0.8960 during the early European session on Friday. The downtick of the pair is backed by the softer US Dollar (USD) after US consumer prices unexpectedly fell in June. Investors will take more cues from the US June Producer Price Index (PPI) and the preliminary July Michigan Consumer Sentiment gauge for fresh impetus, which is due later on Friday.
The US CPI dropped 0.1% MoM in June after being unchanged in May, according to the Bureau of Labor Statistics on Thursday. This figure registered the lowest monthly reading since May 2020. Meanwhile, the annual CPI rose 3% YoY in the same report period, the lowest reading in a year. The softer inflation reading spurred the expectation that the Federal Reserve (Fed) would cut the interest rate in the coming months.
Chicago Fed President Austan Goolsbee said early Friday that the latest inflation data was “excellent,” adding that the reports provided proof that the Fed is on track to meet its 2% target. Meanwhile, St Louis Fed President Alberto Musalem marked "encouraging further progress" toward the Fed inflation target. San Francisco Fed President Mary Daly noted that the cooling of price pressures bolsters the case for cutting rates, even if the timing remains a matter for debate. The Greenback edges lower amid the growing speculation of a Fed rate cut this year, with traders seeing a nearly 85% chance of easing in September, according to CME Group’s FedWatch Tool.
On the Swiss front, geopolitical tensions, political uncertainty in the US and Europe, and concerns about the global economic slowdown might boost safe-haven assets like the Swiss Franc (CHF). However, the speculation that the Swiss National Bank (SNB) will cut further interest rates might exert some selling pressure on the CHF.
Swiss Franc FAQs
The Swiss Franc (CHF) is Switzerland’s official currency. It is among the top ten most traded currencies globally, reaching volumes that well exceed the size of the Swiss economy. Its value is determined by the broad market sentiment, the country’s economic health or action taken by the Swiss National Bank (SNB), among other factors. Between 2011 and 2015, the Swiss Franc was pegged to the Euro (EUR). The peg was abruptly removed, resulting in a more than 20% increase in the Franc’s value, causing a turmoil in markets. Even though the peg isn’t in force anymore, CHF fortunes tend to be highly correlated with the Euro ones due to the high dependency of the Swiss economy on the neighboring Eurozone.
The Swiss Franc (CHF) is considered a safe-haven asset, or a currency that investors tend to buy in times of market stress. This is due to the perceived status of Switzerland in the world: a stable economy, a strong export sector, big central bank reserves or a longstanding political stance towards neutrality in global conflicts make the country’s currency a good choice for investors fleeing from risks. Turbulent times are likely to strengthen CHF value against other currencies that are seen as more risky to invest in.
The Swiss National Bank (SNB) meets four times a year – once every quarter, less than other major central banks – to decide on monetary policy. The bank aims for an annual inflation rate of less than 2%. When inflation is above target or forecasted to be above target in the foreseeable future, the bank will attempt to tame price growth by raising its policy rate. Higher interest rates are generally positive for the Swiss Franc (CHF) as they lead to higher yields, making the country a more attractive place for investors. On the contrary, lower interest rates tend to weaken CHF.
Macroeconomic data releases in Switzerland are key to assessing the state of the economy and can impact the Swiss Franc’s (CHF) valuation. The Swiss economy is broadly stable, but any sudden change in economic growth, inflation, current account or the central bank’s currency reserves have the potential to trigger moves in CHF. Generally, high economic growth, low unemployment and high confidence are good for CHF. Conversely, if economic data points to weakening momentum, CHF is likely to depreciate.
As a small and open economy, Switzerland is heavily dependent on the health of the neighboring Eurozone economies. The broader European Union is Switzerland’s main economic partner and a key political ally, so macroeconomic and monetary policy stability in the Eurozone is essential for Switzerland and, thus, for the Swiss Franc (CHF). With such dependency, some models suggest that the correlation between the fortunes of the Euro (EUR) and the CHF is more than 90%, or close to perfect.
FX option expiries for July 12 NY cut at 10:00 Eastern Time, via DTCC, can be found below.
- EUR/USD: EUR amounts
- 1.0650 1.8b
- 1.0690 1.1b
- 1.0695 873m
- 1.0700 896m
- 1.0800 1.7b
- 1.0850 2.4b
- 1.0900 934m
- USD/JPY: USD amounts
- 158.80 501m
- 160.00 1.2b
- 160.50 1.2b
- 162.00 988m
- GBP/USD: GBP amounts
- 1.2850 831m
- USD/CHF: USD amounts
- 0.8900 636m
- 0.9000 588m
- AUD/USD: AUD amounts
- 0.6620 647m
- 0.6715 493m
- 0.6770 591m
- 0.6800 668m
- USD/CAD: USD amounts
- 1.3630 1.1b
- 1.3645 639m
- 1.3650 674m
Gold prices fell in India on Friday, according to data compiled by FXStreet.
The price for Gold stood at 6,465.21 Indian Rupees (INR) per gram, down compared with the INR 6,485.48 it cost on Thursday.
The price for Gold decreased to INR 75,408.89 per tola from INR 75,645.38 per tola a day earlier.
| Unit measure | Gold Price in INR |
|---|---|
| 1 Gram | 6,465.21 |
| 10 Grams | 64,652.06 |
| Tola | 75,408.89 |
| Troy Ounce | 201,090.50 |
FXStreet calculates Gold prices in India by adapting international prices (USD/INR) to the local currency and measurement units. Prices are updated daily based on the market rates taken at the time of publication. Prices are just for reference and local rates could diverge slightly.
Gold FAQs
Gold has played a key role in human’s history as it has been widely used as a store of value and medium of exchange. Currently, apart from its shine and usage for jewelry, the precious metal is widely seen as a safe-haven asset, meaning that it is considered a good investment during turbulent times. Gold is also widely seen as a hedge against inflation and against depreciating currencies as it doesn’t rely on any specific issuer or government.
Central banks are the biggest Gold holders. In their aim to support their currencies in turbulent times, central banks tend to diversify their reserves and buy Gold to improve the perceived strength of the economy and the currency. High Gold reserves can be a source of trust for a country’s solvency. Central banks added 1,136 tonnes of Gold worth around $70 billion to their reserves in 2022, according to data from the World Gold Council. This is the highest yearly purchase since records began. Central banks from emerging economies such as China, India and Turkey are quickly increasing their Gold reserves.
Gold has an inverse correlation with the US Dollar and US Treasuries, which are both major reserve and safe-haven assets. When the Dollar depreciates, Gold tends to rise, enabling investors and central banks to diversify their assets in turbulent times. Gold is also inversely correlated with risk assets. A rally in the stock market tends to weaken Gold price, while sell-offs in riskier markets tend to favor the precious metal.
The price can move due to a wide range of factors. Geopolitical instability or fears of a deep recession can quickly make Gold price escalate due to its safe-haven status. As a yield-less asset, Gold tends to rise with lower interest rates, while higher cost of money usually weighs down on the yellow metal. Still, most moves depend on how the US Dollar (USD) behaves as the asset is priced in dollars (XAU/USD). A strong Dollar tends to keep the price of Gold controlled, whereas a weaker Dollar is likely to push Gold prices up.
(An automation tool was used in creating this post.)
- EUR/USD may extend its upside as the daily chart analysis shows a bullish inclination.
- The pair may face a potential resistance near a three-month high at 1.0915.
- The lower boundary of the ascending channel around 1.0830 level could act as immediate support.
EUR/USD continues its winning streak for the third successive day, trading around 1.0870 during the Asian hours on Friday. The EUR/USD pair found support as the US Dollar (USD) weakened following softer-than-expected US Consumer Price Index (CPI) data in June. This has increased expectations of a potential Federal Reserve (Fed) rate cut in September.
The technical analysis of the daily chart shows a bullish inclination, with the pair moving within an ascending channel. Furthermore, the 14-day Relative Strength Index (RSI), a momentum indicator, is above the level of 50, confirming the bullish trend for the EUR/USD pair. Continued upward movement could reinforce the pair's bullish bias.
The EUR/USD pair faces potential resistance near a three-month high at 1.0915. Further barrier appears around the upper boundary of the ascending channel around 1.0960. A breakthrough above this level could lead the pair to explore the region around the psychological level of 1.1000.
On the downside, initial support for EUR/USD lies near the lower boundary of the ascending channel around the 1.0830 level, followed by the nine-day Exponential Moving Average (EMA) at the level of 1.0822.
A breach below the latter might increase downward pressure, targeting support around the key level of 1.0670, potentially serving as a rebound support level.
EUR/USD: Daily Chart
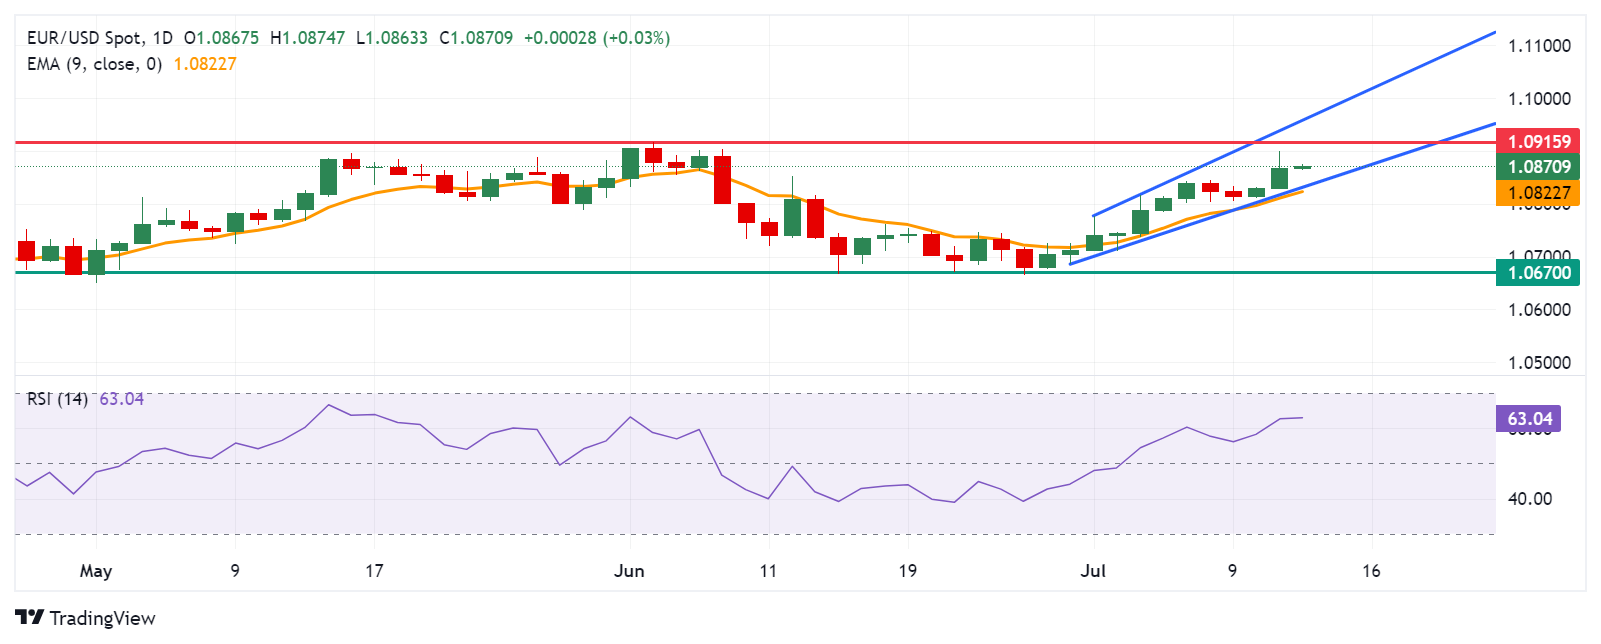
Euro PRICE Today
The table below shows the percentage change of Euro (EUR) against listed major currencies today. Euro was the strongest against the Japanese Yen.
| USD | EUR | GBP | JPY | CAD | AUD | NZD | CHF | |
|---|---|---|---|---|---|---|---|---|
| USD | -0.03% | 0.01% | 0.11% | -0.08% | -0.14% | -0.10% | -0.03% | |
| EUR | 0.03% | 0.04% | 0.19% | -0.06% | -0.12% | -0.08% | -0.03% | |
| GBP | -0.01% | -0.04% | 0.14% | -0.11% | -0.17% | -0.13% | -0.07% | |
| JPY | -0.11% | -0.19% | -0.14% | -0.26% | -0.28% | -0.26% | -0.19% | |
| CAD | 0.08% | 0.06% | 0.11% | 0.26% | -0.05% | -0.02% | 0.03% | |
| AUD | 0.14% | 0.12% | 0.17% | 0.28% | 0.05% | 0.04% | 0.10% | |
| NZD | 0.10% | 0.08% | 0.13% | 0.26% | 0.02% | -0.04% | 0.07% | |
| CHF | 0.03% | 0.03% | 0.07% | 0.19% | -0.03% | -0.10% | -0.07% |
The heat map shows percentage changes of major currencies against each other. The base currency is picked from the left column, while the quote currency is picked from the top row. For example, if you pick the Euro from the left column and move along the horizontal line to the US Dollar, the percentage change displayed in the box will represent EUR (base)/USD (quote).
- GBP/USD consolidates the previous day’s strong move up to a one-year peak.
- Rebounding US bond yields revive the USD demand and cap gains for the pair.
- Reduced August BoE rate cut bets should help limit any meaningful downfall.
The GBP/USD pair seesaws between tepid gains/minor losses around the 1.2900 mark during the Asian session on Friday and remains well within the striking distance of a one-year peak touched the previous day.
The US Dollar (USD) attracts some buyers in the wake of a goodish pickup in the US Treasury bond yields and moves away from a nearly three-month low touched the previous day, which, in turn, acts as a headwind for the GBP/USD pair. Meanwhile, the softer US consumer inflation figures released on Thursday boosted market bets for an imminent start of the Federal Reserve's (Fed) rate-cutting cycle in September. This might keep a lid on any meaningful upside for the US bond yields. Apart from this, the prevalent risk-on environment might hold back traders from placing aggressive bullish bets around the safe-haven buck.
The British Pound (GBP), on the other hand, continues to draw support from Thursday's data showing that Britain's economy grew more quickly than expected, by 0.4% in May. This comes on top of the recent comments by the Bank of England (BoE) policymakers and dashed hopes for a rate cut in August. In fact, the BoE MPC member Catherine Mann said on Wednesday that until there is some deceleration in services prices, she is not in favor of cutting interest rates. Adding to this, BoE Chief Economist Huw Pill noted that there is still some work to do before the domestic persistent component of inflation is gone.
The aforementioned fundamental backdrop seems tilted firmly in favor of bulls and suggests that the path of least resistance for the GBP/USD pair is to the upside. Hence, any meaningful corrective decline might still be seen as a buying opportunity and is more likely to remain limited. Nevertheless, spot prices remain on track to end in the green for the third successive week. Traders now look forward to the release of the US Producer Price Index (PPI) and the University of Michigan Consumer Sentiment survey, due later during the North American session, for short-term opportunities on the last day of the week.
Pound Sterling FAQs
The Pound Sterling (GBP) is the oldest currency in the world (886 AD) and the official currency of the United Kingdom. It is the fourth most traded unit for foreign exchange (FX) in the world, accounting for 12% of all transactions, averaging $630 billion a day, according to 2022 data. Its key trading pairs are GBP/USD, aka ‘Cable’, which accounts for 11% of FX, GBP/JPY, or the ‘Dragon’ as it is known by traders (3%), and EUR/GBP (2%). The Pound Sterling is issued by the Bank of England (BoE).
The single most important factor influencing the value of the Pound Sterling is monetary policy decided by the Bank of England. The BoE bases its decisions on whether it has achieved its primary goal of “price stability” – a steady inflation rate of around 2%. Its primary tool for achieving this is the adjustment of interest rates. When inflation is too high, the BoE will try to rein it in by raising interest rates, making it more expensive for people and businesses to access credit. This is generally positive for GBP, as higher interest rates make the UK a more attractive place for global investors to park their money. When inflation falls too low it is a sign economic growth is slowing. In this scenario, the BoE will consider lowering interest rates to cheapen credit so businesses will borrow more to invest in growth-generating projects.
Data releases gauge the health of the economy and can impact the value of the Pound Sterling. Indicators such as GDP, Manufacturing and Services PMIs, and employment can all influence the direction of the GBP. A strong economy is good for Sterling. Not only does it attract more foreign investment but it may encourage the BoE to put up interest rates, which will directly strengthen GBP. Otherwise, if economic data is weak, the Pound Sterling is likely to fall.
Another significant data release for the Pound Sterling is the Trade Balance. This indicator measures the difference between what a country earns from its exports and what it spends on imports over a given period. If a country produces highly sought-after exports, its currency will benefit purely from the extra demand created from foreign buyers seeking to purchase these goods. Therefore, a positive net Trade Balance strengthens a currency and vice versa for a negative balance.
- Silver price trades in negative territory around $31.25 in Friday’s early Asian session, down 0.75% on the day.
- The rate cut hopes by the Fed and safe-haven flows add sparkle to Silver.
- Firmer US Dollar demand and the Fed’s hawkish stance might cap the white metal’s upside.
Silver price (XAG/USD) attracts some sellers near $31.25, snapping the three-day winning streak during the early European trading hours on Friday. The white metal trims gains amid the modest rebound of the Greenback. However, the downside might be limited as traders raise their bets on the Federal Reserve (Fed) rate cut in September.
The US Bureau of Labor Statistics (BLS) revealed on Thursday that the US Consumer Price Index (CPI) increased 3.0% YoY in June, compared to a rise of 3.3% in May, This figure was below the market consensus of 3.1%. On a monthly basis, the CPI declined 0.1% MoM in June, the lowest level in more than three years.
Financial markets saw a nearly 85% chance of a Fed rate cut in September, up from the 73% seen before the CPI report, according to CME Group’s FedWatch Tool. The growing hopes for rate cuts from US central bank is due to recently softer US inflation data and weaker Services Purchasing Managers Index (PMI).
Additionally, geopolitical risks and political uncertainty in the US and Europe might boost the safe-haven flows, which benefit the Silver. Also, the concerns about global economic slowdown also lift the white metal as traders find safe destinations to place their funds.
On the other hand, the renewed Greenback demand and the hawkish message from Fed officials might drag the Silver price lower. Fed Chair Jerome Powell emphasized on Wednesday before the US House Financial Services Committee that it would not be appropriate to cut the policy rate until they gain greater confidence in inflation heading sustainably towards the Fed’s 2% target.
Silver FAQs
Silver is a precious metal highly traded among investors. It has been historically used as a store of value and a medium of exchange. Although less popular than Gold, traders may turn to Silver to diversify their investment portfolio, for its intrinsic value or as a potential hedge during high-inflation periods. Investors can buy physical Silver, in coins or in bars, or trade it through vehicles such as Exchange Traded Funds, which track its price on international markets.
Silver prices can move due to a wide range of factors. Geopolitical instability or fears of a deep recession can make Silver price escalate due to its safe-haven status, although to a lesser extent than Gold's. As a yieldless asset, Silver tends to rise with lower interest rates. Its moves also depend on how the US Dollar (USD) behaves as the asset is priced in dollars (XAG/USD). A strong Dollar tends to keep the price of Silver at bay, whereas a weaker Dollar is likely to propel prices up. Other factors such as investment demand, mining supply – Silver is much more abundant than Gold – and recycling rates can also affect prices.
Silver is widely used in industry, particularly in sectors such as electronics or solar energy, as it has one of the highest electric conductivity of all metals – more than Copper and Gold. A surge in demand can increase prices, while a decline tends to lower them. Dynamics in the US, Chinese and Indian economies can also contribute to price swings: for the US and particularly China, their big industrial sectors use Silver in various processes; in India, consumers’ demand for the precious metal for jewellery also plays a key role in setting prices.
Silver prices tend to follow Gold's moves. When Gold prices rise, Silver typically follows suit, as their status as safe-haven assets is similar. The Gold/Silver ratio, which shows the number of ounces of Silver needed to equal the value of one ounce of Gold, may help to determine the relative valuation between both metals. Some investors may consider a high ratio as an indicator that Silver is undervalued, or Gold is overvalued. On the contrary, a low ratio might suggest that Gold is undervalued relative to Silver.
- The Japanese Yen edges lower as the US Dollar improves due to higher Treasury yields.
- Japanese Chief Cabinet Secretary Yoshimasa Hayashi has expressed readiness to utilize all available measures concerning forex matters.
- Fed’s Goolsbee stated that the US economy appears to be on track to achieve 2% inflation.
The Japanese Yen (JPY) trims its gains as the US Dollar (USD) strengthens, buoyed by improved Treasury yields. However, the JPY's volatility is anticipated to persist amid speculation of intervention by Japanese authorities following weaker-than-anticipated US Consumer Price Index (CPI) figures.
Japanese Chief Cabinet Secretary Yoshimasa Hayashi stated his readiness to employ all available measures regarding forex. Hayashi noted that the Bank of Japan (BoJ) would determine the specifics of monetary policy. He expects that the BoJ will implement appropriate measures to sustainably and steadily achieve the 2% price target, reported by Reuters on Friday.
The Bank of Japan (BoJ) could raise interest rates at its upcoming July meeting. This expectation bolstered the JPY, contributing to a decline in the USD/JPY pair.
Daily Digest Market Movers: Japanese Yen experiences fluctuations amid intervention threats
- On Friday, Japanese Finance Minister Shunichi Suzuki emphasized that rapid foreign exchange (FX) movements are undesirable. Suzuki refrained from commenting on FX intervention and declined to address media reports regarding Japan's FX rate checks, as reported by Reuters.
- Federal Reserve Bank of Chicago President Austan Goolsbee said on Thursday that the US economy appears to be on track to achieve 2% inflation. Goolsbee stated "My view is, this is what the path to 2% looks like," according to Reuters.
- The US Consumer Price Index (CPI) declined by 0.1% month-over-month in June, marking its lowest level in over three years. The headline CPI increased by 3.0% MoM in June, down from a 3.3% rise in May and below the market consensus of 3.1%.
- The core CPI, which excludes volatile food and energy prices, rose by 3.3% year-over-year in June, compared to May's increase of 3.4% and the same expectation. Meanwhile, the core CPI increased by 0.1% month-over-month, against the expected and prior reading of 0.2%.
- Peter Boockvar, chief financial officer at US-based Bleakley Financial Group, said that the Yen's weakness will trigger the BoJ to "react sooner rather than later," per Reuters.
- Reuters reported on Wednesday, citing unnamed sources, the Bank of Japan will likely trim this year's economic growth forecast and project inflation will stay around its 2% target in coming years at its meeting this month.
- Federal Reserve Chairman Jerome Powell highlighted the urgent need to monitor the deteriorating labor market on Wednesday. Additionally, Powell expressed confidence in the downward trend of inflation, following his remarks on Tuesday that emphasized the necessity of further data to strengthen confidence in the inflation outlook.
- According to a Bloomberg report on Tuesday, the Bank of Japan is conducting three in-person meetings with banks, securities firms, and financial institutions over the next few days. These meetings aim to assess a feasible pace for scaling back its purchases of Japanese Government Bonds.
Technical Analysis: USD/JPY rebounds toward 159.50
USD/JPY trades around 159.30 on Friday. The daily chart analysis shows a weakening bullish bias as it breached the lower boundary of an ascending channel pattern. Additionally, the 14-day Relative Strength Index (RSI) was slightly below the 50 level, indicating a decline in the momentum of the pair's price.
The USD/JPY pair may find initial support near the psychological level of 109.00. A break below this level could reinforce bearish sentiment, potentially prompting a revisit to June's low near 104.55.
On the upside, immediate resistance is seen around the 21-day Exponential Moving Average (EMA) at 109.82, followed by the lower boundary of the ascending channel near 109.95. A return to within the ascending channel would likely improve sentiment for the USD/JPY pair, potentially targeting the upper boundary of the channel around the 113.20 level.
USD/JPY: Daily Chart
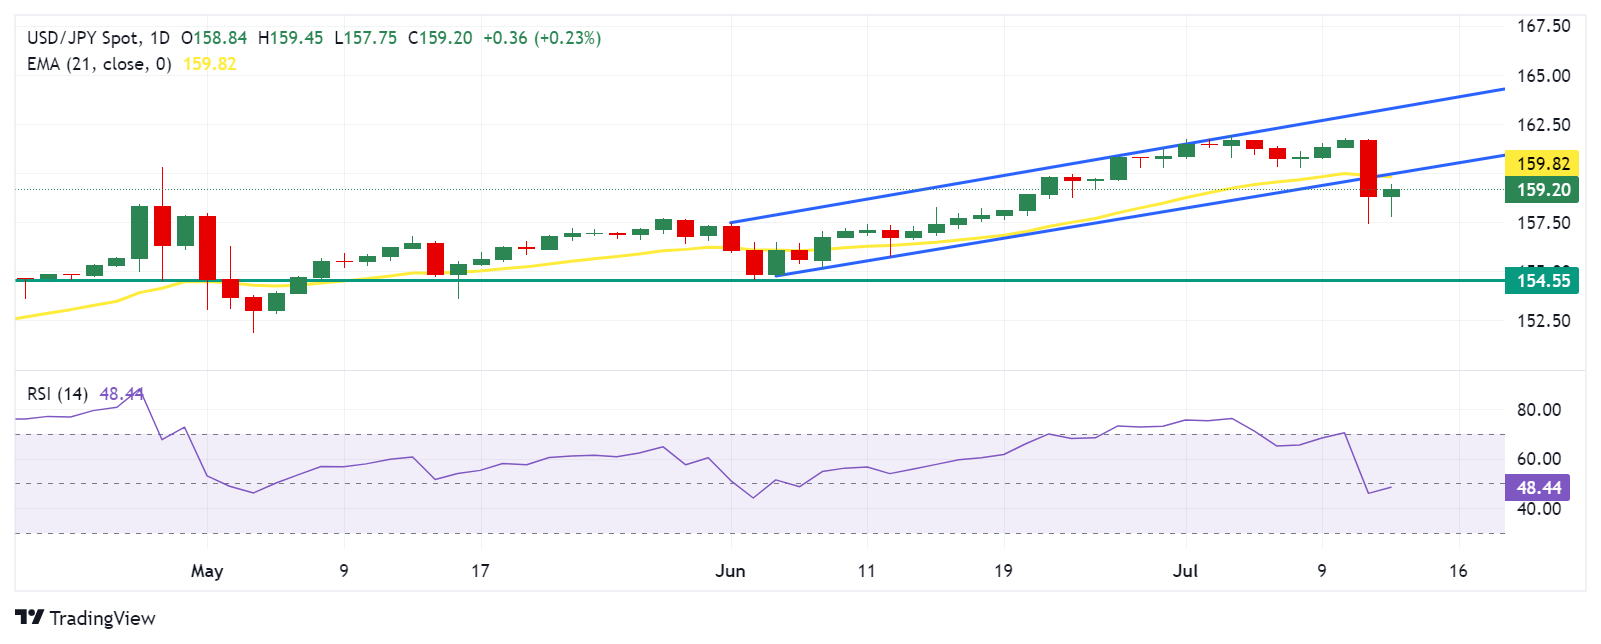
Japanese Yen PRICE Today
The table below shows the percentage change of Japanese Yen (JPY) against listed major currencies today. Japanese Yen was the weakest against the Australian Dollar.
| USD | EUR | GBP | JPY | CAD | AUD | NZD | CHF | |
|---|---|---|---|---|---|---|---|---|
| USD | -0.03% | 0.02% | 0.14% | -0.08% | -0.15% | -0.10% | 0.03% | |
| EUR | 0.03% | 0.05% | 0.21% | -0.06% | -0.16% | -0.07% | 0.02% | |
| GBP | -0.02% | -0.05% | 0.16% | -0.12% | -0.19% | -0.13% | -0.04% | |
| JPY | -0.14% | -0.21% | -0.16% | -0.28% | -0.31% | -0.28% | -0.16% | |
| CAD | 0.08% | 0.06% | 0.12% | 0.28% | -0.07% | -0.02% | 0.07% | |
| AUD | 0.15% | 0.16% | 0.19% | 0.31% | 0.07% | 0.05% | 0.15% | |
| NZD | 0.10% | 0.07% | 0.13% | 0.28% | 0.02% | -0.05% | 0.11% | |
| CHF | -0.03% | -0.02% | 0.04% | 0.16% | -0.07% | -0.15% | -0.11% |
The heat map shows percentage changes of major currencies against each other. The base currency is picked from the left column, while the quote currency is picked from the top row. For example, if you pick the Japanese Yen from the left column and move along the horizontal line to the US Dollar, the percentage change displayed in the box will represent JPY (base)/USD (quote).
Japanese Yen FAQs
The Japanese Yen (JPY) is one of the world’s most traded currencies. Its value is broadly determined by the performance of the Japanese economy, but more specifically by the Bank of Japan’s policy, the differential between Japanese and US bond yields, or risk sentiment among traders, among other factors.
One of the Bank of Japan’s mandates is currency control, so its moves are key for the Yen. The BoJ has directly intervened in currency markets sometimes, generally to lower the value of the Yen, although it refrains from doing it often due to political concerns of its main trading partners. The current BoJ ultra-loose monetary policy, based on massive stimulus to the economy, has caused the Yen to depreciate against its main currency peers. This process has exacerbated more recently due to an increasing policy divergence between the Bank of Japan and other main central banks, which have opted to increase interest rates sharply to fight decades-high levels of inflation.
The BoJ’s stance of sticking to ultra-loose monetary policy has led to a widening policy divergence with other central banks, particularly with the US Federal Reserve. This supports a widening of the differential between the 10-year US and Japanese bonds, which favors the US Dollar against the Japanese Yen.
The Japanese Yen is often seen as a safe-haven investment. This means that in times of market stress, investors are more likely to put their money in the Japanese currency due to its supposed reliability and stability. Turbulent times are likely to strengthen the Yen’s value against other currencies seen as more risky to invest in.
- AUD/JPY stages a goodish recovery from a two-week low touched earlier this Friday.
- The emergence of fresh selling around the JPY is seen as a key factor lending support.
- The technical setup warrants caution before positioning for any further intraday gains.
The AUD/JPY cross attracts some dip-buyers near the 106.75 region, or a two-week trough touched during the Asian session on Friday and stalls the previous day's retracement slide from its highest level since May 1991. The intraday move-up is sponsored by a combination of factors and lifts spot prices to the 107.70 region, or a fresh daily peak in the last hour.
The Japanese Yen (JPY) meets with a fresh supply in the absence of any concrete evidence that Japanese authorities stepped into the FX market to support the domestic currency. Apart from this, the underlying strong bullish sentiment across the global equity markets undermines the safe-haven JPY and benefits the risk-sensitive Aussie, which further draws support from bets that the Reserve Bank of Australia (RBA) could raise rates again.
Meanwhile, Chinese data released this Friday showed that the trade surplus, in Chinese Yuan terms, widened to CNY703.73 billion from the previous figure of CNY586.40 billion. Additional details of the report revealed that exports rose 10.7% YoY in June vs. 11.2% seen in May, while the country’s imports dropped 0.6% YoY during the reported month vs. the 5.2% previous. This, however, does little to provide any impetus to the AUD/JPY cross.
From a technical perspective, spot prices, so far, have been struggling to build on the strength beyond the 38.2% Fibonacci retracement level of the downfall from the overnight swing high. Moreover, oscillators on hourly charts are still holding in the negative territory and warrant some caution for bullish traders. A sustained strength beyond the said barrier, however, should pave the way for a further intraday appreciating move.
The AUD/JPY cross might then aim to reclaim the 108.00 mark, which now coincides with the 50% Fibo. level. Some follow-through buying will suggest that the corrective pullback has run its course and set the stage for the resumption of the uptrend witnessed over the past month or so.
On the flip side, the 107.35 area, or the 23.6% Fibo. level now seems to protect the immediate downside ahead of the 107.00 mark and the Asian session low, around the 106.75 region. A convincing break below will be seen as a fresh trigger for bearish traders, making the AUD/JPY cross vulnerable to accelerate the fall further towards the 106.50-106.40 intermediate support en route to the 106.00 mark and the 105.65 region.
AUD/JPY 1-hour chart
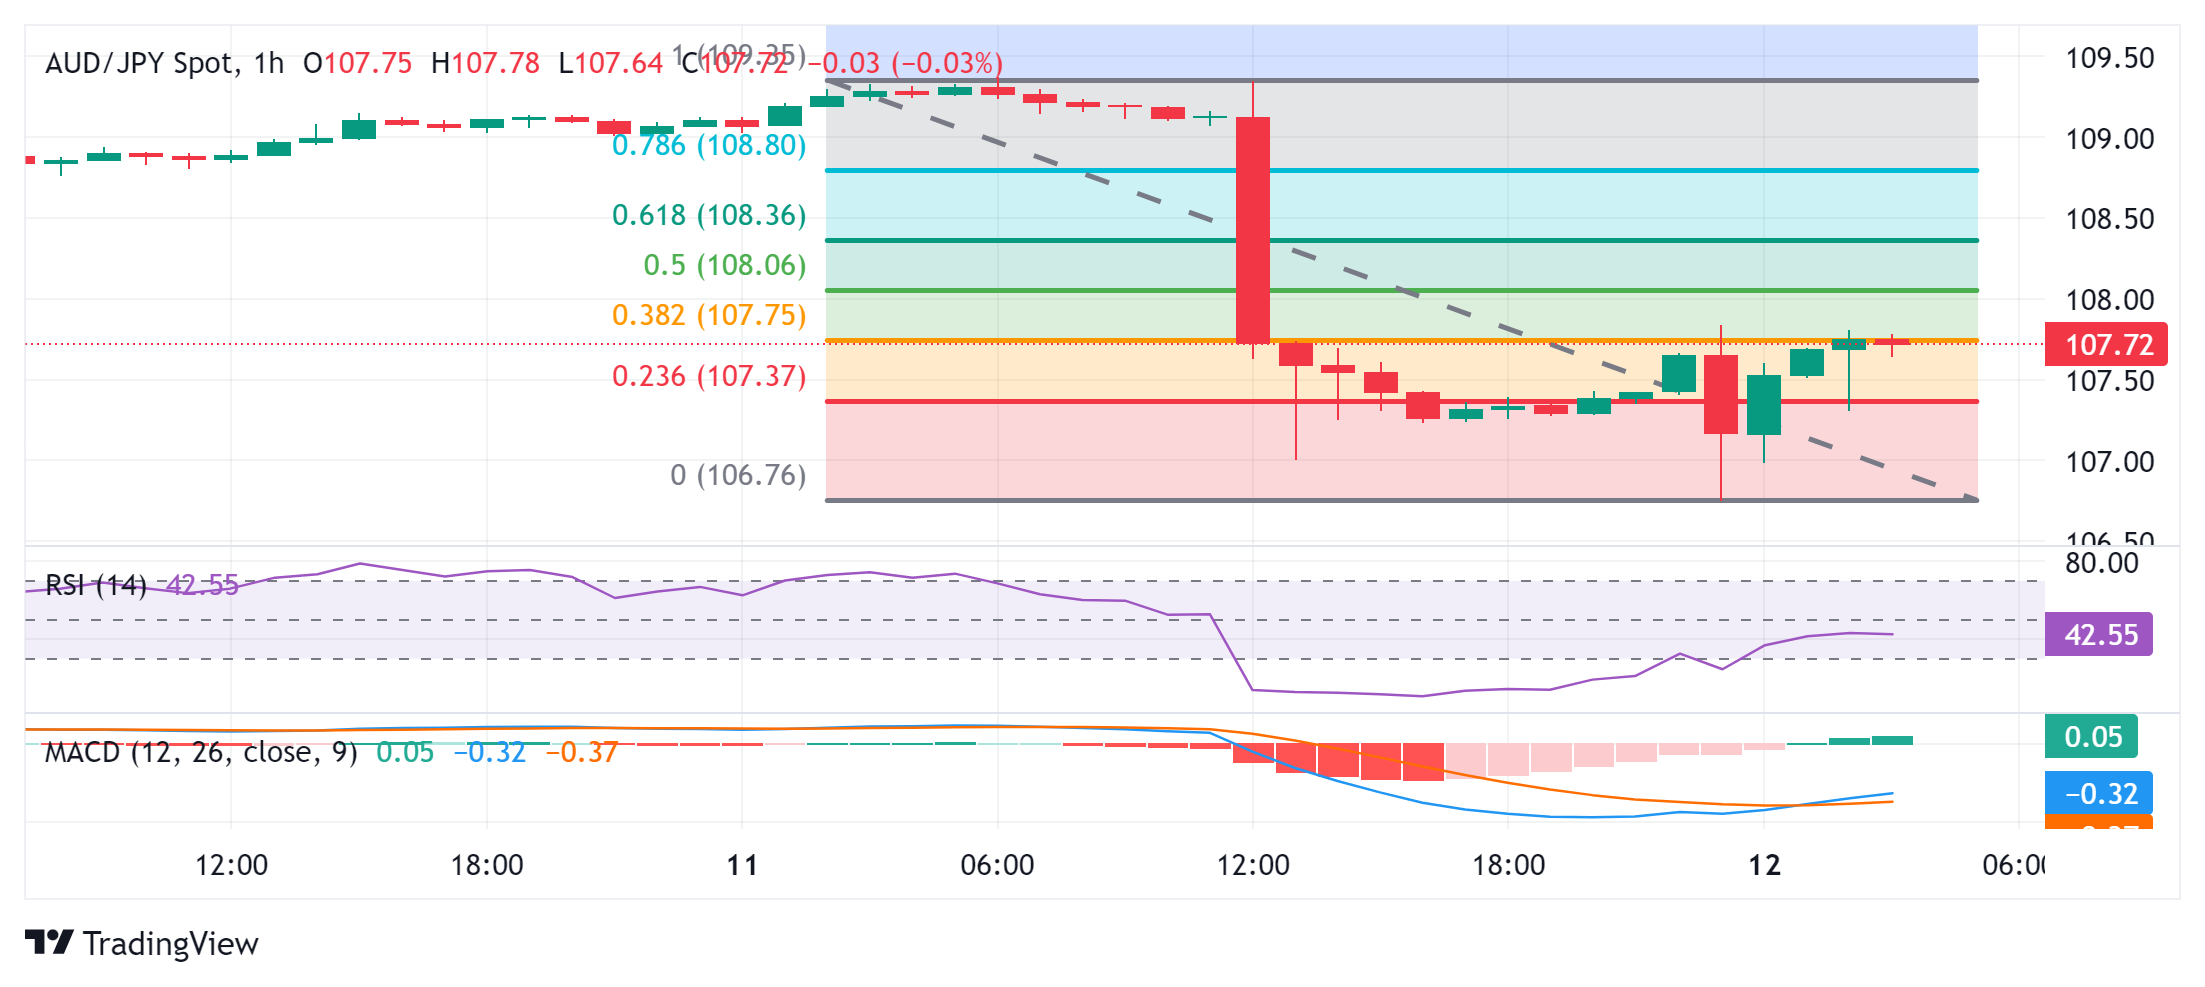
Economic Indicator
Trade Balance CNY
The Trade Balance released by the General Administration of Customs of the People’s Republic of China is a balance between exports and imports of total goods and services. A positive value shows trade surplus, while a negative value shows trade deficit. It is an event that generates some volatility for the CNY. As the Chinese economy has influence on the global economy, this economic indicator would have an impact on the Forex market. In general, a high reading is seen as positive (or bullish) CNY, while a low reading is seen as negative (or bearish) for the CNY.
Read more.Last release: Fri Jul 12, 2024 03:00
Frequency: Monthly
Actual: 703.73B
Consensus: -
Previous: 586.4B
China's Trade Balance for June, in Chinese Yuan terms, came in at CNY703.73 billion, widening from the previous figure of CNY586.40 billion.
Exports climbed 10.7% YoY in June vs. 11.2% seen in May. The country’s imports dropped 0.6% YoY in the same period vs. 5.2% recorded previously.
In US Dollar terms, China’s trade surplus expanded in June.
Trade Balance came in at +99.05B versus +85B expected and +82.62B previous.
Exports (YoY): 8.6% vs. 8.0% expected and 7.6% previous.
Imports (YoY): -2.3% vs. 2.8% expected and 1.8% last.
Additional takeaways
China Jan-June USD-denominated exports +3.6% YoY.
China Jan-June USD-denominated Imports +2.0% YoY.
China Jan-June trade balance +$435B.
FX implications
AUD/USD recovers slightly on the widening China’s trade surplus. The pair is up 0.07% on the day, trading at 0.6763, at the time of writing.
Australian Dollar FAQs
One of the most significant factors for the Australian Dollar (AUD) is the level of interest rates set by the Reserve Bank of Australia (RBA). Because Australia is a resource-rich country another key driver is the price of its biggest export, Iron Ore. The health of the Chinese economy, its largest trading partner, is a factor, as well as inflation in Australia, its growth rate and Trade Balance. Market sentiment – whether investors are taking on more risky assets (risk-on) or seeking safe-havens (risk-off) – is also a factor, with risk-on positive for AUD.
The Reserve Bank of Australia (RBA) influences the Australian Dollar (AUD) by setting the level of interest rates that Australian banks can lend to each other. This influences the level of interest rates in the economy as a whole. The main goal of the RBA is to maintain a stable inflation rate of 2-3% by adjusting interest rates up or down. Relatively high interest rates compared to other major central banks support the AUD, and the opposite for relatively low. The RBA can also use quantitative easing and tightening to influence credit conditions, with the former AUD-negative and the latter AUD-positive.
China is Australia’s largest trading partner so the health of the Chinese economy is a major influence on the value of the Australian Dollar (AUD). When the Chinese economy is doing well it purchases more raw materials, goods and services from Australia, lifting demand for the AUD, and pushing up its value. The opposite is the case when the Chinese economy is not growing as fast as expected. Positive or negative surprises in Chinese growth data, therefore, often have a direct impact on the Australian Dollar and its pairs.
Iron Ore is Australia’s largest export, accounting for $118 billion a year according to data from 2021, with China as its primary destination. The price of Iron Ore, therefore, can be a driver of the Australian Dollar. Generally, if the price of Iron Ore rises, AUD also goes up, as aggregate demand for the currency increases. The opposite is the case if the price of Iron Ore falls. Higher Iron Ore prices also tend to result in a greater likelihood of a positive Trade Balance for Australia, which is also positive of the AUD.
The Trade Balance, which is the difference between what a country earns from its exports versus what it pays for its imports, is another factor that can influence the value of the Australian Dollar. If Australia produces highly sought after exports, then its currency will gain in value purely from the surplus demand created from foreign buyers seeking to purchase its exports versus what it spends to purchase imports. Therefore, a positive net Trade Balance strengthens the AUD, with the opposite effect if the Trade Balance is negative.
- EUR/JPY attracts some dip-buyers on Friday and recovers over 150 pips from a two-week low.
- The uptick is exclusively sponsored by the emergence of fresh selling around the Japanese Yen.
- Intervention fears and political uncertainty in France might keep a lid on any meaningful gains.
The EUR/JPY cross stages a goodish bounce from a two-week low touched during the Asian session this Friday and climbs back above the 173.00 round-figure mark in the last hour. Spot prices, for now, seem to have stalled a sharp retracement slide from the 175.40-175.45 area, or the highest level since 1992 set on Thursday amid the emergence of fresh selling around the Japanese Yen (JPY).
The overnight market reaction to speculation that Japanese authorities might have stepped into the FX market to lift the domestic currency fades rather quickly in the absence of any concrete evidence of intervention. This, along with the underlying strong bullish sentiment surrounding the equity markets, undermines the safe-haven JPY and is seen as a key factor that assists the EUR/JPY cross to attract fresh buyers on the last day of the week.
That said, the uncertainty surrounding the formation and composition of France's new government might hold back traders from placing aggressive bullish bets around the shared currency. Apart from this, bets that the Bank of Japan (BoJ) may raise interest rates and that Japanese authorities will eventually intervene to support the JPY should keep a lid on any meaningful appreciating move for the EUR/JPY cross, warranting some caution for bearish traders.
In fact, Japan's Chief Cabinet Secretary Yoshimasa Hayashi said on Friday that it is important for currencies to move in a stable manner reflecting fundamentals and that he is ready to take all possible means on forex. Furthermore, Japanese Finance Minister Shunichi Suzuki reiterated that rapid FX moves are undesirable. Hence, it will be prudent to wait for strong follow-through buying before positioning for the resumption of the recent well-established uptrend.
Japanese Yen FAQs
The Japanese Yen (JPY) is one of the world’s most traded currencies. Its value is broadly determined by the performance of the Japanese economy, but more specifically by the Bank of Japan’s policy, the differential between Japanese and US bond yields, or risk sentiment among traders, among other factors.
One of the Bank of Japan’s mandates is currency control, so its moves are key for the Yen. The BoJ has directly intervened in currency markets sometimes, generally to lower the value of the Yen, although it refrains from doing it often due to political concerns of its main trading partners. The current BoJ ultra-loose monetary policy, based on massive stimulus to the economy, has caused the Yen to depreciate against its main currency peers. This process has exacerbated more recently due to an increasing policy divergence between the Bank of Japan and other main central banks, which have opted to increase interest rates sharply to fight decades-high levels of inflation.
The BoJ’s stance of sticking to ultra-loose monetary policy has led to a widening policy divergence with other central banks, particularly with the US Federal Reserve. This supports a widening of the differential between the 10-year US and Japanese bonds, which favors the US Dollar against the Japanese Yen.
The Japanese Yen is often seen as a safe-haven investment. This means that in times of market stress, investors are more likely to put their money in the Japanese currency due to its supposed reliability and stability. Turbulent times are likely to strengthen the Yen’s value against other currencies seen as more risky to invest in.
- The Indian Rupee weakens in Friday’s early Asian session.
- The renewed demand for US Dollar and recovery of crude oil prices undermine the INR.
- India’s Consumer Price Index (CPI) and US Producer Price Index (PPI) for June will be the highlights on Friday.
The Indian Rupee (INR) loses traction on Friday amid the modest recovery of the US Dollar (USD). The demand for the Greenback from state-run banks and local importers limits the INR’s potential gains. Additionally, the rebound of crude oil prices also exerts some selling pressure on the local currency as India is the third largest consumer of crude oil in the world, after the United States and China.
On the other hand, the positive trends in the Indian stock market, sustained foreign inflows, and India’s strong macroeconomic growth might underpin the INR. Also, the rising expectation of the US Federal Reserve (Fed) rate cut in September after the softer US inflation data is likely to weigh on the USD and cap the upside for the USD/INR pair in the near term.
Later on Friday, Investors will keep an eye on the Indian Consumer Price Index (CPI) data, which is expected to show an increase of 4.8% in June. Also, the Industrial Production and Manufacturing Output will be released. On the US docket, the US June Producer Price Index (PPI) and the preliminary July Michigan Consumer Sentiment gauge will be published.
Daily Digest Market Movers: Indian Rupee remains sensitive to multiple headwinds
- The International Monetary Fund (IMF) estimates that shifting employment into construction, services, and manufacturing might boost India's GDP growth by 0.2 to 0.5 percentage points.
- The US Consumer Price Index (CPI) rose 3.0% on a yearly basis in June, compared to a rise of 3.3% in May. This reading came in below the market consensus of 3.1%, according to the US Bureau of Labor Statistics (BLS) on Thursday. On a monthly basis, the CPI declined 0.1% MoM in June, the lowest level in more than three years.
- The annual core CPI, which excludes volatile food and energy prices, climbed 3.3% YoY in June, below the forecast and May's increase of 3.4%. The figure was up 0.1% on a monthly basis.
- Federal Reserve Bank of Chicago President Austan Goolsbee expressed on Friday that the recent inflation report was “excellent,” adding that the reports provided proof that the central bank is on track to meet its 2% target.
- Federal Reserve Bank of San Francisco President Mary Daly acknowledged improving inflation figures on Thursday. Daly expects further easing in both price pressures and the labor market to warrant interest rate cuts.
- Financial markets saw nearly 85% odds of a Fed rate cut in September, up from the 70% chance seen before the CPI report. Two rate cuts are anticipated this year.
Technical analysis: USD/INR goes into consolidation in the near term
The Indian Rupee trades weaker on the day. According to the daily chart, the USD/INR pair keeps the bullish vibe unchanged above the key 100-day Exponential Moving Average (EMA). The 14-day Relative Strength Index (RSI) holds in bullish territory above the 50-midline, suggesting that the EMA support is likely to hold rather than break. However, in the shorter term, the pair has remained inside its month-long range since March 21.
Any follow-through buying above the upper boundary of the trading range at 83.65 could lead to a retest of the all-time high of 83.75. Extended gains will see a rally to the 84.00 psychological barrier.
Sustained trading below the 100-day EMA at 83.37 could pave the way to the 83.00 round mark. The next downside target is seen at 82.82, a low of January 12.
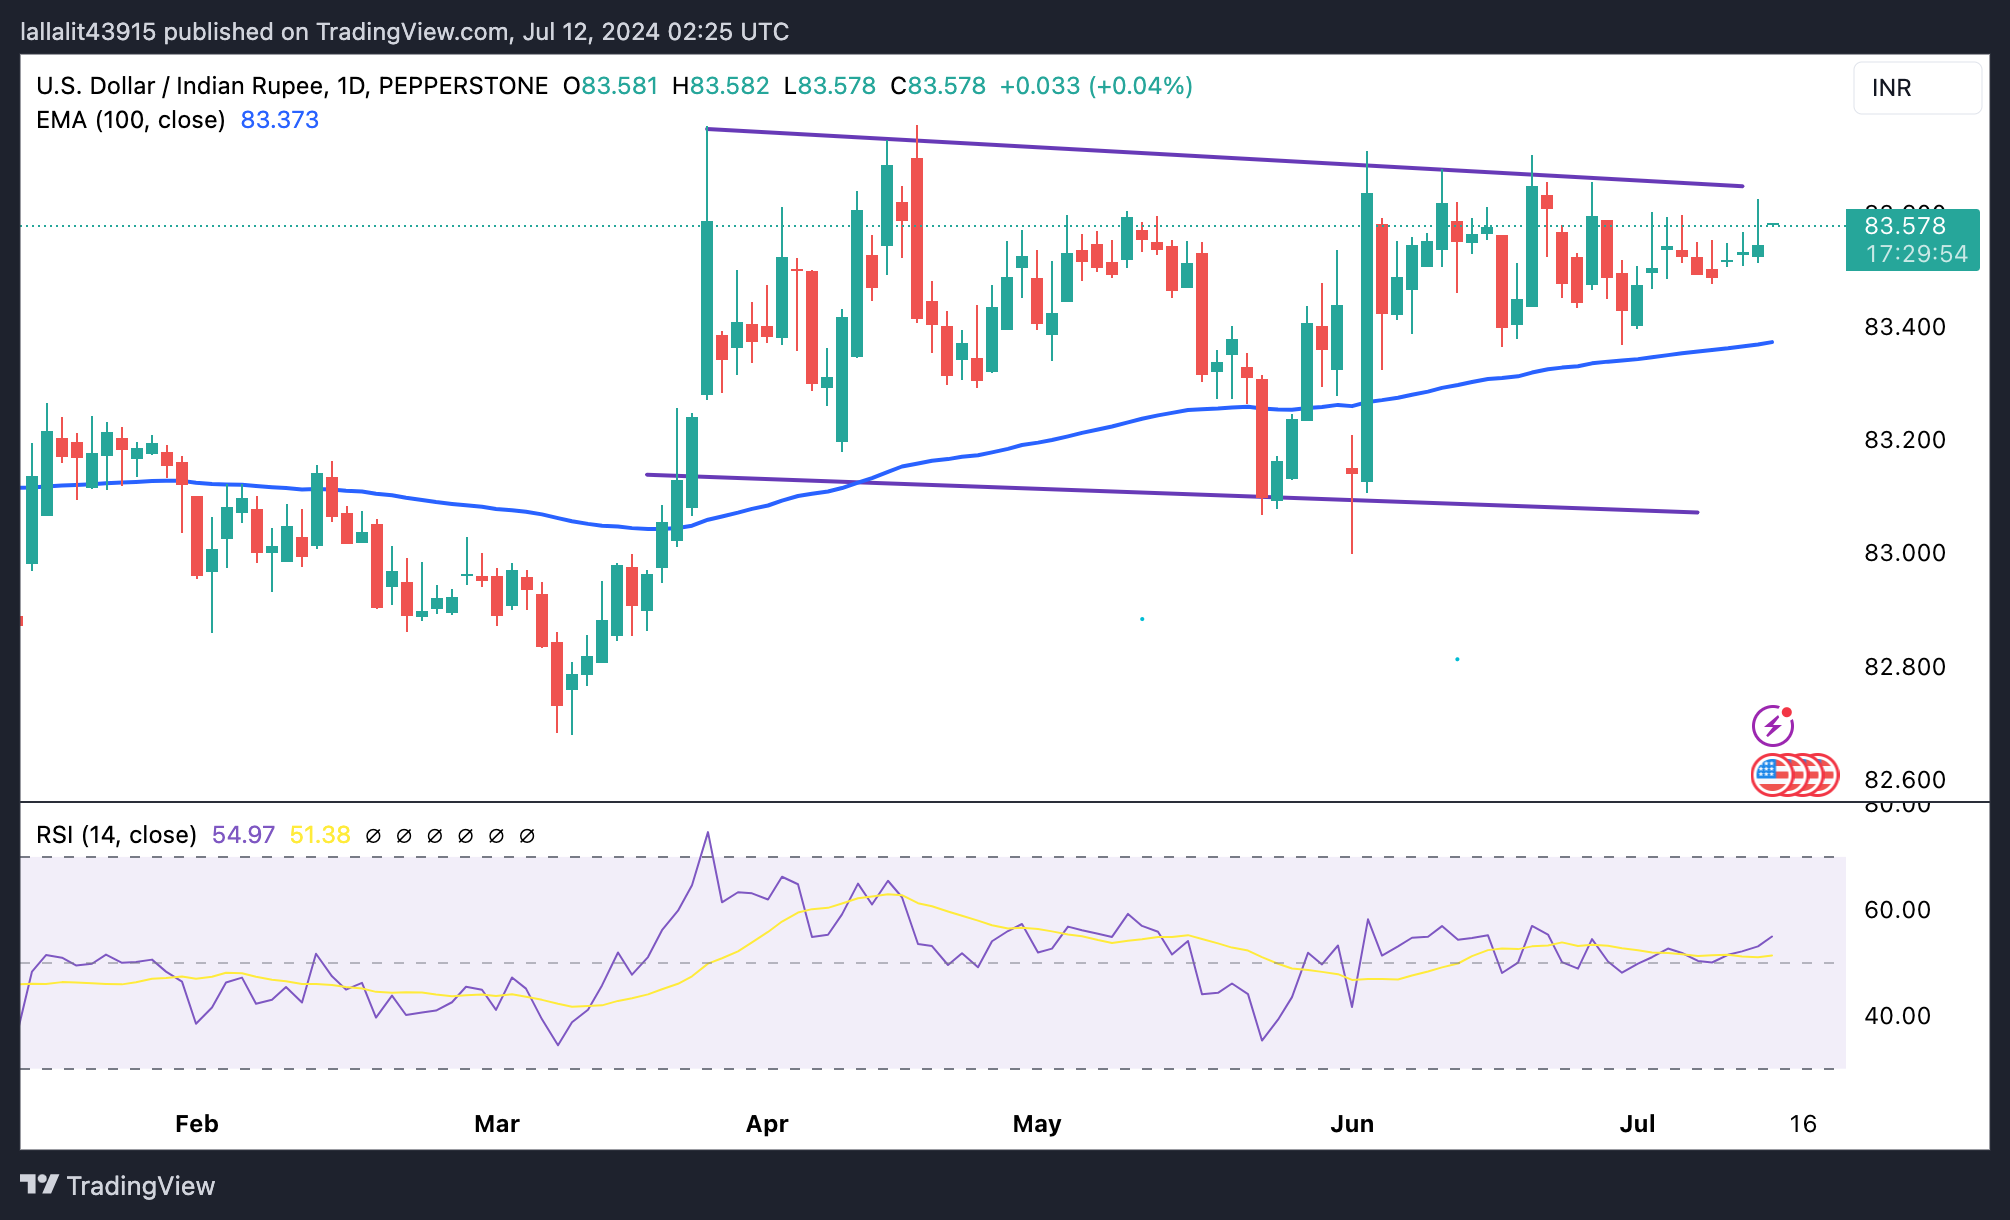
US Dollar price today
The table below shows the percentage change of US Dollar (USD) against listed major currencies today. US Dollar was the strongest against the Japanese Yen.
| USD | EUR | GBP | CAD | AUD | JPY | NZD | CHF | |
| USD | 0.07% | 0.14% | 0.06% | 0.15% | 0.71% | 0.02% | 0.09% | |
| EUR | -0.07% | 0.05% | -0.02% | 0.11% | 0.56% | -0.06% | 0.00% | |
| GBP | -0.14% | -0.07% | -0.08% | 0.06% | 0.53% | -0.11% | -0.05% | |
| CAD | -0.05% | 0.01% | 0.08% | 0.12% | 0.61% | -0.03% | 0.03% | |
| AUD | -0.15% | -0.12% | -0.06% | -0.14% | 0.47% | -0.17% | -0.13% | |
| JPY | -0.72% | -0.68% | -0.55% | -0.64% | -0.51% | -0.64% | -0.57% | |
| NZD | -0.04% | 0.04% | 0.11% | 0.03% | 0.16% | 0.61% | 0.05% | |
| CHF | -0.09% | -0.01% | 0.05% | -0.02% | 0.11% | 0.56% | -0.05% |
The heat map shows percentage changes of major currencies against each other. The base currency is picked from the left column, while the quote currency is picked from the top row. For example, if you pick the Euro from the left column and move along the horizontal line to the Japanese Yen, the percentage change displayed in the box will represent EUR (base)/JPY (quote).
Indian Rupee FAQs
The Indian Rupee (INR) is one of the most sensitive currencies to external factors. The price of Crude Oil (the country is highly dependent on imported Oil), the value of the US Dollar – most trade is conducted in USD – and the level of foreign investment, are all influential. Direct intervention by the Reserve Bank of India (RBI) in FX markets to keep the exchange rate stable, as well as the level of interest rates set by the RBI, are further major influencing factors on the Rupee.
The Reserve Bank of India (RBI) actively intervenes in forex markets to maintain a stable exchange rate, to help facilitate trade. In addition, the RBI tries to maintain the inflation rate at its 4% target by adjusting interest rates. Higher interest rates usually strengthen the Rupee. This is due to the role of the ‘carry trade’ in which investors borrow in countries with lower interest rates so as to place their money in countries’ offering relatively higher interest rates and profit from the difference.
Macroeconomic factors that influence the value of the Rupee include inflation, interest rates, the economic growth rate (GDP), the balance of trade, and inflows from foreign investment. A higher growth rate can lead to more overseas investment, pushing up demand for the Rupee. A less negative balance of trade will eventually lead to a stronger Rupee. Higher interest rates, especially real rates (interest rates less inflation) are also positive for the Rupee. A risk-on environment can lead to greater inflows of Foreign Direct and Indirect Investment (FDI and FII), which also benefit the Rupee.
Higher inflation, particularly, if it is comparatively higher than India’s peers, is generally negative for the currency as it reflects devaluation through oversupply. Inflation also increases the cost of exports, leading to more Rupees being sold to purchase foreign imports, which is Rupee-negative. At the same time, higher inflation usually leads to the Reserve Bank of India (RBI) raising interest rates and this can be positive for the Rupee, due to increased demand from international investors. The opposite effect is true of lower inflation.
- WTI price receives support as easing inflation data has heightened expectations of a Fed rate cut in September.
- The US Consumer Price Index declined by 0.1% MoM in June, marking its lowest level in more than three years.
- US gasoline demand reached 9.4 million barrels per day, the highest level for the Independence Day holiday week since 2019.
West Texas Intermediate (WTI) Oil price trades around $81.80 per barrel during Asian hours on Friday. Crude Oil prices have found support as softer-than-expected US Consumer Price Index (CPI) data for June has heightened expectations of a potential Federal Reserve (Fed) rate cut in September. Lower borrowing costs support the US economy, the largest Oil consumer in the world, which in turn boosts crude Oil demand.
The US Consumer Price Index (CPI) declined by 0.1% month-over-month in June, marking its lowest level in more than three years. The core CPI, which excludes volatile food and energy prices, rose by 3.3% year-over-year in June, compared to May's increase of 3.4% and the same expectation. Meanwhile, the core CPI increased by 0.1% month-over-month, against the expected and prior rise of 0.2%.
Federal Reserve Bank of Chicago President Austan Goolsbee said on Thursday that the US economy appears to be on track to achieve 2% inflation. This suggests Goolsbee is gaining confidence that the time for cutting interest rates may soon be approaching. He also stated "My view is, this is what the path to 2% looks like," according to Reuters.
According to government data cited by Reuters, US gasoline demand reached 9.4 million barrels per day (bpd) in the week ending July 5, the highest level for the Independence Day holiday week since 2019. Jet fuel demand, on a four-week average basis, was at its strongest since January 2020. This robust fuel demand has prompted US refineries to increase activity and draw from crude Oil stockpiles, thereby supporting prices.
WTI Oil FAQs
WTI Oil is a type of Crude Oil sold on international markets. The WTI stands for West Texas Intermediate, one of three major types including Brent and Dubai Crude. WTI is also referred to as “light” and “sweet” because of its relatively low gravity and sulfur content respectively. It is considered a high quality Oil that is easily refined. It is sourced in the United States and distributed via the Cushing hub, which is considered “The Pipeline Crossroads of the World”. It is a benchmark for the Oil market and WTI price is frequently quoted in the media.
Like all assets, supply and demand are the key drivers of WTI Oil price. As such, global growth can be a driver of increased demand and vice versa for weak global growth. Political instability, wars, and sanctions can disrupt supply and impact prices. The decisions of OPEC, a group of major Oil-producing countries, is another key driver of price. The value of the US Dollar influences the price of WTI Crude Oil, since Oil is predominantly traded in US Dollars, thus a weaker US Dollar can make Oil more affordable and vice versa.
The weekly Oil inventory reports published by the American Petroleum Institute (API) and the Energy Information Agency (EIA) impact the price of WTI Oil. Changes in inventories reflect fluctuating supply and demand. If the data shows a drop in inventories it can indicate increased demand, pushing up Oil price. Higher inventories can reflect increased supply, pushing down prices. API’s report is published every Tuesday and EIA’s the day after. Their results are usually similar, falling within 1% of each other 75% of the time. The EIA data is considered more reliable, since it is a government agency.
OPEC (Organization of the Petroleum Exporting Countries) is a group of 13 Oil-producing nations who collectively decide production quotas for member countries at twice-yearly meetings. Their decisions often impact WTI Oil prices. When OPEC decides to lower quotas, it can tighten supply, pushing up Oil prices. When OPEC increases production, it has the opposite effect. OPEC+ refers to an expanded group that includes ten extra non-OPEC members, the most notable of which is Russia.
| Raw materials | Closed | Change, % |
|---|---|---|
| Silver | 31.425 | 1.98 |
| Gold | 241.426 | 1.79 |
| Palladium | 993.17 | 0.51 |
- Gold price drifts lower and reverses a part of Thursday’s softer US CPI-inspired positive move.
- An uptick in the US bond yields revives the USD demand and exerts pressure on the XAU/USD.
- Rising September Fed rate cut bets should act as a tailwind for the metal and help limit losses.
Gold price (XAU/USD) rallied to the $2,424-2,425 area on Thursday, or its highest level since May 22 in reaction to another tame US inflation report, which boosted expectations that the Federal Reserve (Fed) will cut interest rates in September. That said, a modest rebound in the US Treasury bond yields helps revive the US Dollar (USD) demand and prompts some selling around the non-yielding yellow metal during the Asian session on Friday. Apart from this, the underlying bullish sentiment surrounding the equity markets turns out to be another factor driving flows away from the safe-haven precious metal.
Gold price, for now, seems to have snapped a three-day winning streak, though any meaningful downfall still seems elusive in the wake of growing acceptance that the Fed will start its rate-cutting cycle sooner rather than later. Furthermore, geopolitical risks, political uncertainty in the US and Europe, along with concerns about a global economic slowdown, should continue to act as a tailwind for the XAU/USD. Traders now look forward to the release of the US Producer Price Index (PPI) and the University of Michigan Consumer Sentiment survey for a fresh impetus later during the North American session.
Daily Digest Market Movers: Gold price might continue to draw support from Fed rate cut bets
- Gold price surged past the $2,400 mark on Thursday following the release of the softer-than-expected US consumer inflation figures, which lifted bets for a September interest rate cut by the Federal Reserve.
- The US Bureau of Labor Statistics (BLS) reported that the headline Consumer Price Index (CPI) dipped in June for the first time in more than four years and the yearly rate decelerated to 3% from 3.3% in May.
- Meanwhile, the core CPI, which excludes volatile food and energy prices, was up 0.1% during the reported month and rose 3.3% YoY, also missing consensus estimates and the 3.4% increase registered in May.
- Investors were quick to react and are now pricing in over a 90% chance that the Fed will lower borrowing costs at the September monetary policy meeting, as indicated by the CME Group's FedWatch Tool.
- Furthermore, the December 2024 fed funds rate futures contract implies that the US central bank will cut policy rates by 49 basis points (bps) toward the end of the year, up from 39 bps a day ago.
- San Francisco Fed President Mary Daly acknowledged improving inflation figures and said that the economy looks to be on a path where one or two rate cuts this year would be more or less appropriate.
- Separately, St. Louis Fed President Alberto Musalem noted that recession risks remain low, and the disinflation process is ongoing, though policymakers would like to see more progress.
- Meanwhile, the yield on the benchmark 10-year US government bond tumbled to its lowest level since March, dragging the US Dollar to a three-month trough and providing a strong boost to the yellow metal.
- This overshadowed the better-than-expected release of the US Initial Jobless Claims, which fell to 222K for the week ending July 6 as compared to expectations for a reading of 236K and the 239K previous.
- The XAU/USD, however, struggles to capitalize on the overnight strong move up amid a modest USD uptick during the Asian session on Friday, though the fundamental backdrop favors bullish traders.
Technical Analysis: Gold price could aim to retest all-time peak, around $2,450 touched in May
From a technical perspective, the overnight sustained breakout through the $2,400 mark was seen as a fresh trigger for bullish traders. Moreover, oscillators on the daily chart have been gaining positive traction and are still away from being in the overbought territory. This further validates the near-term positive outlook for the Gold price, suggesting that any meaningful slide might be seen as a buying opportunity and remain limited.
Some follow-through selling below the $2.388-2.387 horizontal resistance breakpoint, now turned support, could drag the XAU/USD towards the $2,358 region with some intermediate support near the $2,372-2,371 area. On the flip side, the overnight swing high, around the $2,425 region now seems to act as an immediate hurdle, above which the Gold price is more likely to aim back towards challenging the all-time peak, around the $2,450 region touched in May.
Gold FAQs
Gold has played a key role in human’s history as it has been widely used as a store of value and medium of exchange. Currently, apart from its shine and usage for jewelry, the precious metal is widely seen as a safe-haven asset, meaning that it is considered a good investment during turbulent times. Gold is also widely seen as a hedge against inflation and against depreciating currencies as it doesn’t rely on any specific issuer or government.
Central banks are the biggest Gold holders. In their aim to support their currencies in turbulent times, central banks tend to diversify their reserves and buy Gold to improve the perceived strength of the economy and the currency. High Gold reserves can be a source of trust for a country’s solvency. Central banks added 1,136 tonnes of Gold worth around $70 billion to their reserves in 2022, according to data from the World Gold Council. This is the highest yearly purchase since records began. Central banks from emerging economies such as China, India and Turkey are quickly increasing their Gold reserves.
Gold has an inverse correlation with the US Dollar and US Treasuries, which are both major reserve and safe-haven assets. When the Dollar depreciates, Gold tends to rise, enabling investors and central banks to diversify their assets in turbulent times. Gold is also inversely correlated with risk assets. A rally in the stock market tends to weaken Gold price, while sell-offs in riskier markets tend to favor the precious metal.
The price can move due to a wide range of factors. Geopolitical instability or fears of a deep recession can quickly make Gold price escalate due to its safe-haven status. As a yield-less asset, Gold tends to rise with lower interest rates, while higher cost of money usually weighs down on the yellow metal. Still, most moves depend on how the US Dollar (USD) behaves as the asset is priced in dollars (XAU/USD). A strong Dollar tends to keep the price of Gold controlled, whereas a weaker Dollar is likely to push Gold prices up.
Japanese Finance Minister Shunichi Suzuki said on Friday that “rapid FX moves undesirable.”
Further comments
Desirable for forex to move stably.
No comment on FX intervention.
Won't comment on media reports that Japan conducted FX rate checks.
- The Australian Dollar declines possibly due to risk aversion on Friday.
- The AUD may limit its downside due to rising expectations of the RBA maintaining a hawkish stance.
- Fed’s Goolsbee stated that the US economy appears to be on track to achieve 2% inflation.
The Australian Dollar (AUD) continues to retreat on Friday after reaching a six-month high of 0.6798 in the previous session. The AUD/USD pair found support as the US Dollar (USD) weakened following softer-than-expected US Consumer Price Index (CPI) data in June. This has increased expectations of a potential Federal Reserve (Fed) rate cut in September.
The AUD may limit its downside as speculation grows that the Reserve Bank of Australia (RBA) might delay the global rate-cutting cycle or even raise interest rates again. Persistently high inflation in Australia prompts the RBA to maintain a hawkish stance.
The US Dollar (USD) remains subdued amid lower US Treasury yields. Investors in the fed funds futures market have increased their bets on a rate cut by the US Federal Reserve starting in September. According to CME Group’s FedWatch Tool, markets are now pricing in nearly 89% odds of a rate cut at the September Fed meeting, up from 73% on Wednesday.
Daily Digest Market Movers: Australian Dollar edges lower due to risk aversion
- Federal Reserve Bank of Chicago President Austan Goolsbee said on Thursday that the US economy appears to be on track to achieve 2% inflation. This suggests Goolsbee is gaining confidence that the time for cutting interest rates may soon be approaching. He also stated "My view is, this is what the path to 2% looks like," Goolsbee said, according to Reuters.
- The US Consumer Price Index (CPI) declined by 0.1% month-over-month in June, marking its lowest level in more than three years. On a yearly basis, the headline CPI increased by 3.0% in June, down from a 3.3% rise in May and below the market consensus of 3.1%.
- The core CPI, which excludes volatile food and energy prices, rose by 3.3% year-over-year in June, compared to May's increase of 3.4% and the same expectation. Meanwhile, the core CPI increased by 0.1% month-over-month, against the expected and prior reading of 0.2%.
- Australia's Consumer Inflation Expectations for July came in at 4.3%, slightly lower than the previous reading of 4.4%.
- Federal Reserve Board Governor Lisa Cook stated on Wednesday, "My baseline forecast...is that inflation will continue to move toward target over time, without much further rise in unemployment," according to Reuters.
- On Wednesday, Fed Chair Jerome Powell emphasized the need to closely monitor the labor market, noting that it has significantly deteriorated. Additionally, Powell expressed confidence in the downward movement of inflation.
- On Tuesday, Fed Chair Jerome Powell answered questions before the Senate Banking Committee on the first day of his Congressional testimony. Powell stated, "More good data would strengthen our confidence in inflation." He emphasized that a "policy rate cut is inappropriate until the Fed gains greater confidence that inflation is headed sustainably toward 2%." He also noted that "first-quarter data did not support the greater confidence in the inflation path that the Fed needs to cut rates."
Technical Analysis: Australian Dollar hovers around 0.6750
The Australian Dollar trades around 0.6760 on Friday. The analysis of the daily chart shows that the AUD/USD pair consolidates within an ascending channel, indicating a bullish bias. Furthermore, the 14-day Relative Strength Index (RSI) remains above the 50 level, confirming the ongoing bullish momentum.
The AUD/USD pair may retest the upper boundary of the ascending channel at approximately 0.6790 and the psychological level of 0.6800.
On the downside, the AUD/USD pair may find support around the 50-day Exponential Moving Average (EMA) at 0.6698. Further support appears around the lower boundary of the ascending channel at 0.6680. A break below this level could push the pair toward the throwback support around 0.6590.
AUD/USD: Daily Chart
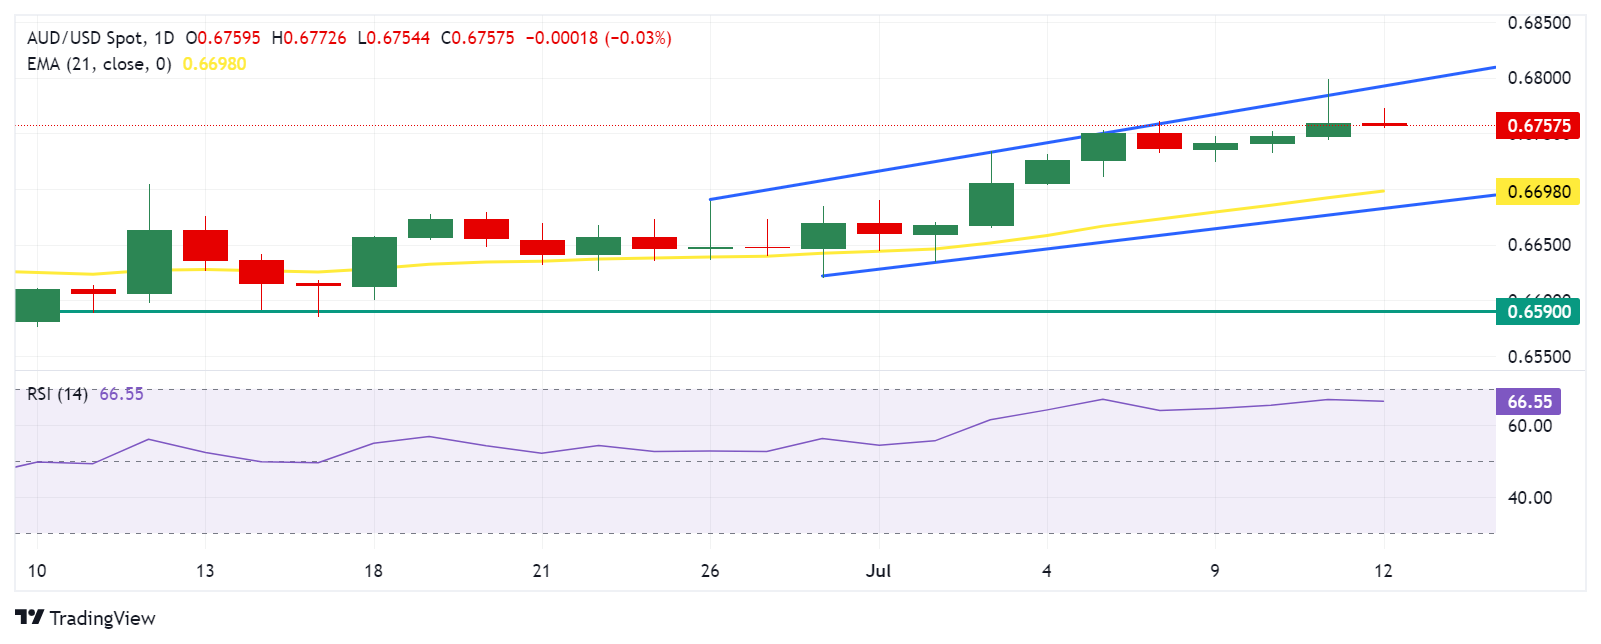
Australian Dollar PRICE Today
The table below shows the percentage change of Australian Dollar (AUD) against listed major currencies today. Australian Dollar was the weakest against the US Dollar.
| USD | EUR | GBP | JPY | CAD | AUD | NZD | CHF | |
|---|---|---|---|---|---|---|---|---|
| USD | 0.00% | 0.06% | 0.22% | 0.00% | 0.04% | 0.15% | 0.02% | |
| EUR | -0.00% | 0.06% | 0.26% | -0.00% | 0.02% | 0.14% | -0.01% | |
| GBP | -0.06% | -0.06% | 0.18% | -0.07% | -0.05% | 0.07% | -0.08% | |
| JPY | -0.22% | -0.26% | -0.18% | -0.26% | -0.20% | -0.09% | -0.23% | |
| CAD | -0.00% | 0.00% | 0.07% | 0.26% | 0.03% | 0.14% | -0.01% | |
| AUD | -0.04% | -0.02% | 0.05% | 0.20% | -0.03% | 0.12% | -0.03% | |
| NZD | -0.15% | -0.14% | -0.07% | 0.09% | -0.14% | -0.12% | -0.14% | |
| CHF | -0.02% | 0.00% | 0.08% | 0.23% | 0.00% | 0.03% | 0.14% |
The heat map shows percentage changes of major currencies against each other. The base currency is picked from the left column, while the quote currency is picked from the top row. For example, if you pick the Australian Dollar from the left column and move along the horizontal line to the US Dollar, the percentage change displayed in the box will represent AUD (base)/USD (quote).
RBA FAQs
The Reserve Bank of Australia (RBA) sets interest rates and manages monetary policy for Australia. Decisions are made by a board of governors at 11 meetings a year and ad hoc emergency meetings as required. The RBA’s primary mandate is to maintain price stability, which means an inflation rate of 2-3%, but also “..to contribute to the stability of the currency, full employment, and the economic prosperity and welfare of the Australian people.” Its main tool for achieving this is by raising or lowering interest rates. Relatively high interest rates will strengthen the Australian Dollar (AUD) and vice versa. Other RBA tools include quantitative easing and tightening.
While inflation had always traditionally been thought of as a negative factor for currencies since it lowers the value of money in general, the opposite has actually been the case in modern times with the relaxation of cross-border capital controls. Moderately higher inflation now tends to lead central banks to put up their interest rates, which in turn has the effect of attracting more capital inflows from global investors seeking a lucrative place to keep their money. This increases demand for the local currency, which in the case of Australia is the Aussie Dollar.
Macroeconomic data gauges the health of an economy and can have an impact on the value of its currency. Investors prefer to invest their capital in economies that are safe and growing rather than precarious and shrinking. Greater capital inflows increase the aggregate demand and value of the domestic currency. Classic indicators, such as GDP, Manufacturing and Services PMIs, employment, and consumer sentiment surveys can influence AUD. A strong economy may encourage the Reserve Bank of Australia to put up interest rates, also supporting AUD.
Quantitative Easing (QE) is a tool used in extreme situations when lowering interest rates is not enough to restore the flow of credit in the economy. QE is the process by which the Reserve Bank of Australia (RBA) prints Australian Dollars (AUD) for the purpose of buying assets – usually government or corporate bonds – from financial institutions, thereby providing them with much-needed liquidity. QE usually results in a weaker AUD.
Quantitative tightening (QT) is the reverse of QE. It is undertaken after QE when an economic recovery is underway and inflation starts rising. Whilst in QE the Reserve Bank of Australia (RBA) purchases government and corporate bonds from financial institutions to provide them with liquidity, in QT the RBA stops buying more assets, and stops reinvesting the principal maturing on the bonds it already holds. It would be positive (or bullish) for the Australian Dollar.
Japanese Chief Cabinet Secretary Yoshimasa Hayashi said on Friday that he is “ready to take all possible means on forex.”
Additional quotes
No comment on FX intervention.
Won't comment on forex levels.
Important for currencies to move in stable manner reflecting fundamentals.
Rapid FX moves undesirable.
Closely watching FX moves.
Up to the Bank of Japan (BoJ) to decide details of monetary policy.
Expect BoJ to take appropriate monetary policy to sustainably, stably achieve 2% price target.
Will work closely with the BoJ.
Market reaction
After the highly-anticipated Japan’s intervention in the forex market on Thursday, USD/JPY witnessed wild swings again in the early Asian session, suggesting another intervention attempt. At the time of writing, USD/JPY is adding 0.25% on the day to trade near 159.20.
- USD/JPY gains ground around 159.10 in Friday’s early Asian session, up 0.19% on the day.
- Traders raised their bets on Fed rate cuts in September after the softer US June CPI inflation.
- Further possible FX intervention from Japanese authorities might support the JPY and cap the pair’s upside.
The USD/JPY pair holds positive ground near 159.10 after bouncing off a nearly three-week low of 157.41 during the early Asian trading hours on Friday. The upside for the pair might be limited amid the fear of further foreign exchange (FX) intervention by Japanese officials. Traders will monitor the US June Producer Price Index (PPI) and the preliminary July Michigan Consumer Sentiment gauge, which are due later on Friday.
The lowest Consumer Price Index (CPI) reading in more than three years has triggered the possibility that the Federal Reserve (Fed) would lower rates starting in September. The US CPI inflation was softer than expected in June, with annualized headline CPI inflation easing to 3.0% YoY from the previous reading of 3.3%. Meanwhile, the monthly CPI inflation dropped 0.1% MoM in June from last month’s flat 0.0% and below the market consensus of 0.1%.
Fed Chair Jerome Powell acknowledged the progress on price pressures, but he was not yet ready to declare inflation. However, Powell added that "more good data" would open the door for rate cuts. Financial markets saw a nearly 85% odds of a Fed rate cut in September, up from the 70% chance seen before the CPI report. Two rate cuts are anticipated this year.
The Japanese Yen (JPY) gained traction in the previous session amid speculation that Japanese authorities might step into the FX market to support its currency. Early Friday, Japan's top currency diplomat, Masato Kanda, stated that the recent move of the JPY is somewhat rapid and he will take appropriate measures on FX if needed. The further possible intervention from officials is likely to support the JPY and act as a headwind for USD/JPY for the time being.
Japanese Yen FAQs
The Japanese Yen (JPY) is one of the world’s most traded currencies. Its value is broadly determined by the performance of the Japanese economy, but more specifically by the Bank of Japan’s policy, the differential between Japanese and US bond yields, or risk sentiment among traders, among other factors.
One of the Bank of Japan’s mandates is currency control, so its moves are key for the Yen. The BoJ has directly intervened in currency markets sometimes, generally to lower the value of the Yen, although it refrains from doing it often due to political concerns of its main trading partners. The current BoJ ultra-loose monetary policy, based on massive stimulus to the economy, has caused the Yen to depreciate against its main currency peers. This process has exacerbated more recently due to an increasing policy divergence between the Bank of Japan and other main central banks, which have opted to increase interest rates sharply to fight decades-high levels of inflation.
The BoJ’s stance of sticking to ultra-loose monetary policy has led to a widening policy divergence with other central banks, particularly with the US Federal Reserve. This supports a widening of the differential between the 10-year US and Japanese bonds, which favors the US Dollar against the Japanese Yen.
The Japanese Yen is often seen as a safe-haven investment. This means that in times of market stress, investors are more likely to put their money in the Japanese currency due to its supposed reliability and stability. Turbulent times are likely to strengthen the Yen’s value against other currencies seen as more risky to invest in.
Federal Reserve Bank of Chicago President Austan Goolsbee on Friday marked the latest inflation report as “excellent.” Goolsbee further stated that the reports prove that the central bank is on track to meet its 2% target.
Key quotes
June CPI report 'excellent,' improvement on shelter inflation 'profoundly encouraging’.
I think this is what the path to 2% looks like.
As inflation falls, leaving Fed policy rate steady means Fed is tightening policy.
The reason to tighten policy would be if economy is overheating.
We are not overheating.
Labor market is cooling, still strong.
It doesn't feel like the beginning of a recession.
Financial conditions are pretty restrictive.
I don't like tying our hands on policy decisions.
Need to decide when to cut rates, not trying to figure out a rate path for next seven months.
Market reaction
The US Dollar Index (DXY) is trading unchanged on the day at 104.45, as of writing.
Fed FAQs
Monetary policy in the US is shaped by the Federal Reserve (Fed). The Fed has two mandates: to achieve price stability and foster full employment. Its primary tool to achieve these goals is by adjusting interest rates. When prices are rising too quickly and inflation is above the Fed’s 2% target, it raises interest rates, increasing borrowing costs throughout the economy. This results in a stronger US Dollar (USD) as it makes the US a more attractive place for international investors to park their money. When inflation falls below 2% or the Unemployment Rate is too high, the Fed may lower interest rates to encourage borrowing, which weighs on the Greenback.
The Federal Reserve (Fed) holds eight policy meetings a year, where the Federal Open Market Committee (FOMC) assesses economic conditions and makes monetary policy decisions. The FOMC is attended by twelve Fed officials – the seven members of the Board of Governors, the president of the Federal Reserve Bank of New York, and four of the remaining eleven regional Reserve Bank presidents, who serve one-year terms on a rotating basis.
In extreme situations, the Federal Reserve may resort to a policy named Quantitative Easing (QE). QE is the process by which the Fed substantially increases the flow of credit in a stuck financial system. It is a non-standard policy measure used during crises or when inflation is extremely low. It was the Fed’s weapon of choice during the Great Financial Crisis in 2008. It involves the Fed printing more Dollars and using them to buy high grade bonds from financial institutions. QE usually weakens the US Dollar.
Quantitative tightening (QT) is the reverse process of QE, whereby the Federal Reserve stops buying bonds from financial institutions and does not reinvest the principal from the bonds it holds maturing, to purchase new bonds. It is usually positive for the value of the US Dollar.
Japan's top currency diplomat, Masato Kanda, who will instruct the BoJ to intervene, when he judges it necessary, said on Friday that the recent move of the Japanese Yen (JPY) is somewhat rapid and he will take appropriate measures on foreign exchange (FX) if needed.
Key quotes
Recent yen moves are somewhat rapid.
Will take appropriate action on forex if needed.
Did not comment whether intervened FX market.
Can't think if government officials commented on forex intervention
Yen moved 5% in the past month, which is significant.
It is natural to think recent forex moves were driven by speculators.
Weak Yen pushes up import costs, which would hurt people's lives.
Undesirable if excessive forex moves triggered by speculators hurt people's lives.
Market reaction
At the time of writing, USD/JPY was trading at 158.87, gaining 0.02% on the day.
Japanese Yen FAQs
The Japanese Yen (JPY) is one of the world’s most traded currencies. Its value is broadly determined by the performance of the Japanese economy, but more specifically by the Bank of Japan’s policy, the differential between Japanese and US bond yields, or risk sentiment among traders, among other factors.
One of the Bank of Japan’s mandates is currency control, so its moves are key for the Yen. The BoJ has directly intervened in currency markets sometimes, generally to lower the value of the Yen, although it refrains from doing it often due to political concerns of its main trading partners. The current BoJ ultra-loose monetary policy, based on massive stimulus to the economy, has caused the Yen to depreciate against its main currency peers. This process has exacerbated more recently due to an increasing policy divergence between the Bank of Japan and other main central banks, which have opted to increase interest rates sharply to fight decades-high levels of inflation.
The BoJ’s stance of sticking to ultra-loose monetary policy has led to a widening policy divergence with other central banks, particularly with the US Federal Reserve. This supports a widening of the differential between the 10-year US and Japanese bonds, which favors the US Dollar against the Japanese Yen.
The Japanese Yen is often seen as a safe-haven investment. This means that in times of market stress, investors are more likely to put their money in the Japanese currency due to its supposed reliability and stability. Turbulent times are likely to strengthen the Yen’s value against other currencies seen as more risky to invest in.
| Index | Change, points | Closed | Change, % |
|---|---|---|---|
| NIKKEI 225 | 392.03 | 42224.02 | 0.94 |
| Hang Seng | 360.66 | 17832.33 | 2.06 |
| KOSPI | 23.36 | 2891.35 | 0.81 |
| ASX 200 | 72.8 | 7889.6 | 0.93 |
| DAX | 127.34 | 18534.56 | 0.69 |
| CAC 40 | 53.58 | 7627.13 | 0.71 |
| Dow Jones | 32.39 | 39753.75 | 0.08 |
| S&P 500 | -49.37 | 5584.54 | -0.88 |
| NASDAQ Composite | -364.04 | 18283.41 | -1.95 |
| Pare | Closed | Change, % |
|---|---|---|
| AUDUSD | 0.6758 | 0.14 |
| EURJPY | 172.694 | -1.36 |
| EURUSD | 1.08656 | 0.31 |
| GBPJPY | 205.175 | -1.2 |
| GBPUSD | 1.29111 | 0.48 |
| NZDUSD | 0.60949 | 0.24 |
| USDCAD | 1.36317 | 0.1 |
| USDCHF | 0.89601 | -0.34 |
| USDJPY | 158.911 | -1.67 |


© 2000-2026. All rights reserved.
This site is managed by Teletrade D.J. LLC 2351 LLC 2022 (Euro House, Richmond Hill Road, Kingstown, VC0100, St. Vincent and the Grenadines).
The information on this website is for informational purposes only and does not constitute any investment advice.
The company does not serve or provide services to customers who are residents of the US, Canada, Iran, The Democratic People's Republic of Korea, Yemen and FATF blacklisted countries.
Making transactions on financial markets with marginal financial instruments opens up wide possibilities and allows investors who are willing to take risks to earn high profits, carrying a potentially high risk of losses at the same time. Therefore you should responsibly approach the issue of choosing the appropriate investment strategy, taking the available resources into account, before starting trading.
Use of the information: full or partial use of materials from this website must always be referenced to TeleTrade as the source of information. Use of the materials on the Internet must be accompanied by a hyperlink to teletrade.org. Automatic import of materials and information from this website is prohibited.
Please contact our PR department if you have any questions or need assistance at pr@teletrade.global.
transfers