- Analytics
- News and Tools
- Market News
CFD Markets News and Forecasts — 11-09-2024
- GBP/USD tallied another day of losses falling below 1.3050.
- US CPI came in mixed and markets reduced the odds of a 50 bps cut.
- Earlier in the session the UK reported weak GDP figures.
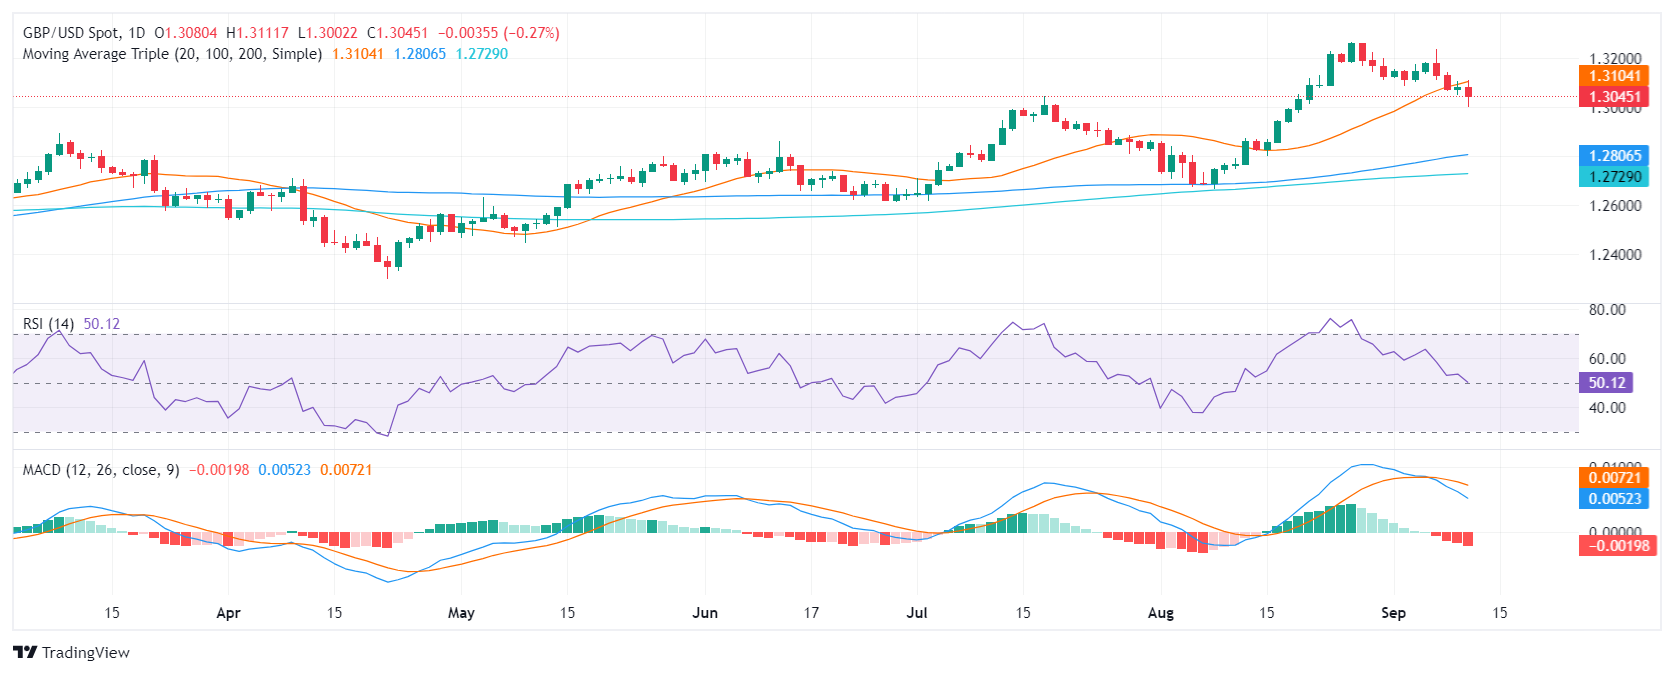
The GBP/USD pair remains under pressure, trading near 1.3045 as the market reacted to the latest US inflation data. Economic activity released during the European session seems to have added pressure on the pound.
While the headline inflation declined, annual core CPI, which excludes volatile food and energy prices, remained unchanged at 3.2% in August, in line with market expectations. However, on a monthly basis, both CPI and core CPI rose by 0.2% and 0.3%, respectively, exceeding market forecasts. The data has led traders to reduce the odds of a 50-basis-point rate cut by the Federal Reserve and the market is now pricing in an 85% chance of a 25-basis-point cut.
What weakened the GBP was the report of soft Gross Domestic Product (GDP) releases during the European sessions. Despite this, leading indicators point to a potential rebound in UK economic activity, suggesting that the Bank of England is unlikely to cut rates by more than the currently anticipated 50 basis points by year-end, which could provide some support for the GBP.
GBP/USD Technical Outlook
The GBP/USD pair's decline to 1.3045 reflects deepening bearish pressure, with key technical indicators like the Relative Strength Index (RSI) pointing down near 50 and the Moving Average Convergence Divergence (MACD) firmly positioned in negative territory. This suggests that bearish sentiment could persist in the short term especially if the RSI breaks the 50 barrier.
- EUR/USD dips after US Core CPI rises 0.3% MoM, reinforcing Fed rate cut expectations of 25 bps.
- ECB expected to cut rates by 25 bps this week amid slowing EU economic data and Germany’s inflation drop to 1.9% YoY.
- ECB’s post-September monetary policy decisions could become more complex as inflation components remain sticky.
The Euro is set to end Wednesday’s session with minuscule losses against the Greenback, dropping 0.04% after the latest US inflation report showed that the core Consumer Price Index (CPI) stalled in August. The EUR/USD trades at 1.1014 after hitting a daily high of 1.1055.
EUR/USD slips as traders await ECB's upcoming rate decision
Wall Street ended the session on the front foot, while the Greenback finished firm on the back of an uptick in the US Core Consumer Price Index (CPI). August’s Core CPI rose 0.3%, MoM, up from 0.2% in the previous month, exceeding estimates. The rest of the inflation figures, namely headlines in annual and monthly statistics and yearly core CPI, were aligned with estimates.
The EUR/USD decline was capped by the European Central Bank (ECB) monetary policy decision looming, as the pair touched a daily low of 1.1001, bouncing immediately toward the 1.1010-1.1020 area.
Another reason that weighed on the EUR/USD was that money market futures traders trimmed their bets for a 50 basis points (bps) Fed rate cut next week, from around 40% to 15%, while 25 bps increased from 66% to 85%.
The Eurozone (EU) economic docket will feature the ECB’s decision ahead of the week. The ECB is expected to cut rates by 25 bps after Germany’s inflation hit 1.9% YoY, while PMI readings suggest an ongoing economic slowdown. Despite that, ECB hawks are expected to push back as some inflation components are stickier than expected.
Regarding forward guidance, sources cited by Reuters noted that the ECB’s monetary policy decisions after September would be more complicated.
Across the pond, the US economic docket will feature the release of the latest Initial Jobless Claims report for the week ending September 7, along with the release of the Producer Price Index (PPI).
EUR/USD Price Forecast: Technical outlook
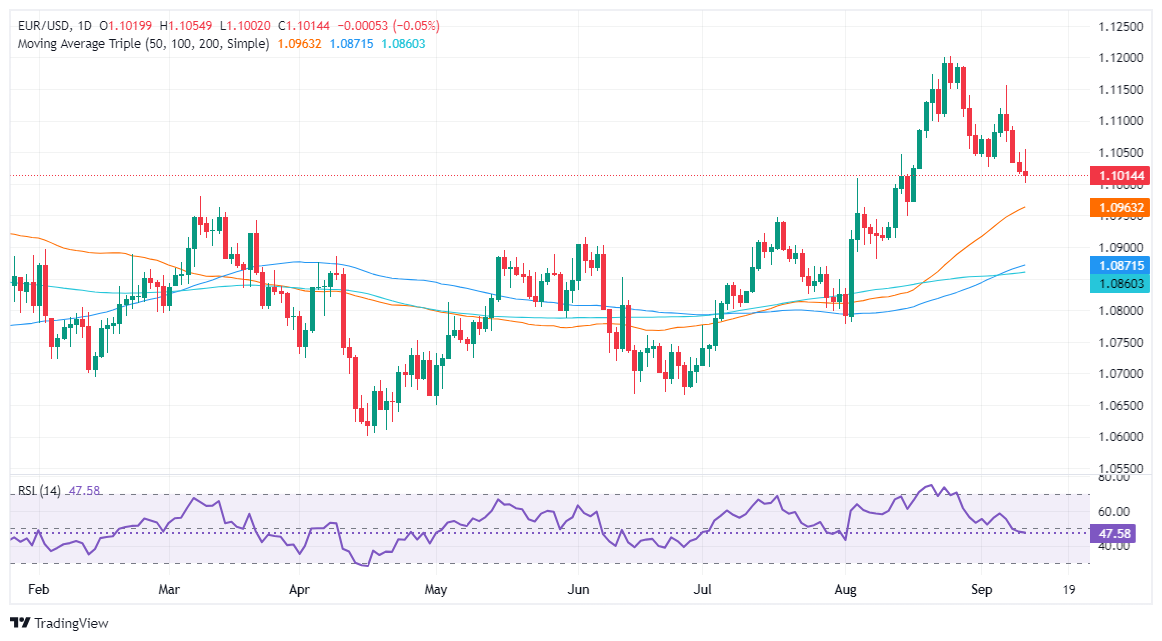
The EUR/USD is neutrally biased, though it remains above the 1.1000 figure, which is ahead of the ECB’s decision. The momentum shifted to bearish, as seen in the Relative Strength Index (RSI), though its slope aims upward.
If the EUR/USD rallies past the September 11 peak at 1.1054, that would sponsor a move to the 1.1100 mark. Conversely, if the pair tumbles below 1.1000, the bulls’ first line of defense would be the 50-day moving average (DMA) at 1.0967, followed by the July 17 swing high turned support at 1.0948.
Euro PRICE Today
The table below shows the percentage change of Euro (EUR) against listed major currencies today. Euro was the strongest against the US Dollar.
| USD | EUR | GBP | JPY | CAD | AUD | NZD | CHF | |
|---|---|---|---|---|---|---|---|---|
| USD | -0.02% | -0.01% | -0.09% | -0.03% | -0.03% | 0.00% | -0.03% | |
| EUR | 0.02% | 0.00% | -0.05% | 0.00% | -0.01% | 0.02% | -0.02% | |
| GBP | 0.01% | -0.00% | 0.00% | -0.00% | -0.02% | 0.01% | -0.02% | |
| JPY | 0.09% | 0.05% | 0.00% | 0.03% | 0.02% | 0.02% | 0.02% | |
| CAD | 0.03% | -0.01% | 0.00% | -0.03% | 0.00% | 0.01% | -0.02% | |
| AUD | 0.03% | 0.01% | 0.02% | -0.02% | -0.00% | 0.03% | 0.01% | |
| NZD | -0.00% | -0.02% | -0.01% | -0.02% | -0.01% | -0.03% | -0.05% | |
| CHF | 0.03% | 0.02% | 0.02% | -0.02% | 0.02% | -0.01% | 0.05% |
The heat map shows percentage changes of major currencies against each other. The base currency is picked from the left column, while the quote currency is picked from the top row. For example, if you pick the Euro from the left column and move along the horizontal line to the US Dollar, the percentage change displayed in the box will represent EUR (base)/USD (quote).
- The NZD/JPY pair has been moving lower and broke below the key support of 87.50.
- A break below 87.00 could open the doors to a further decline towards 86.00.
The NZD/JPY pair has resumed its decline on Wednesday after failing to hold the 87.50 area. The pair is now testing the support level of 87.00, and a break below this level could open the doors to a further decline. In the meantime, indicators show that the sellers are in command.
The Relative Strength Index (RSI) is nearing the oversold area while the MACD is printing red bars, indicating that selling pressure is still strong and that the pair is likely to continue to decline.
NZD/JPY daily chart
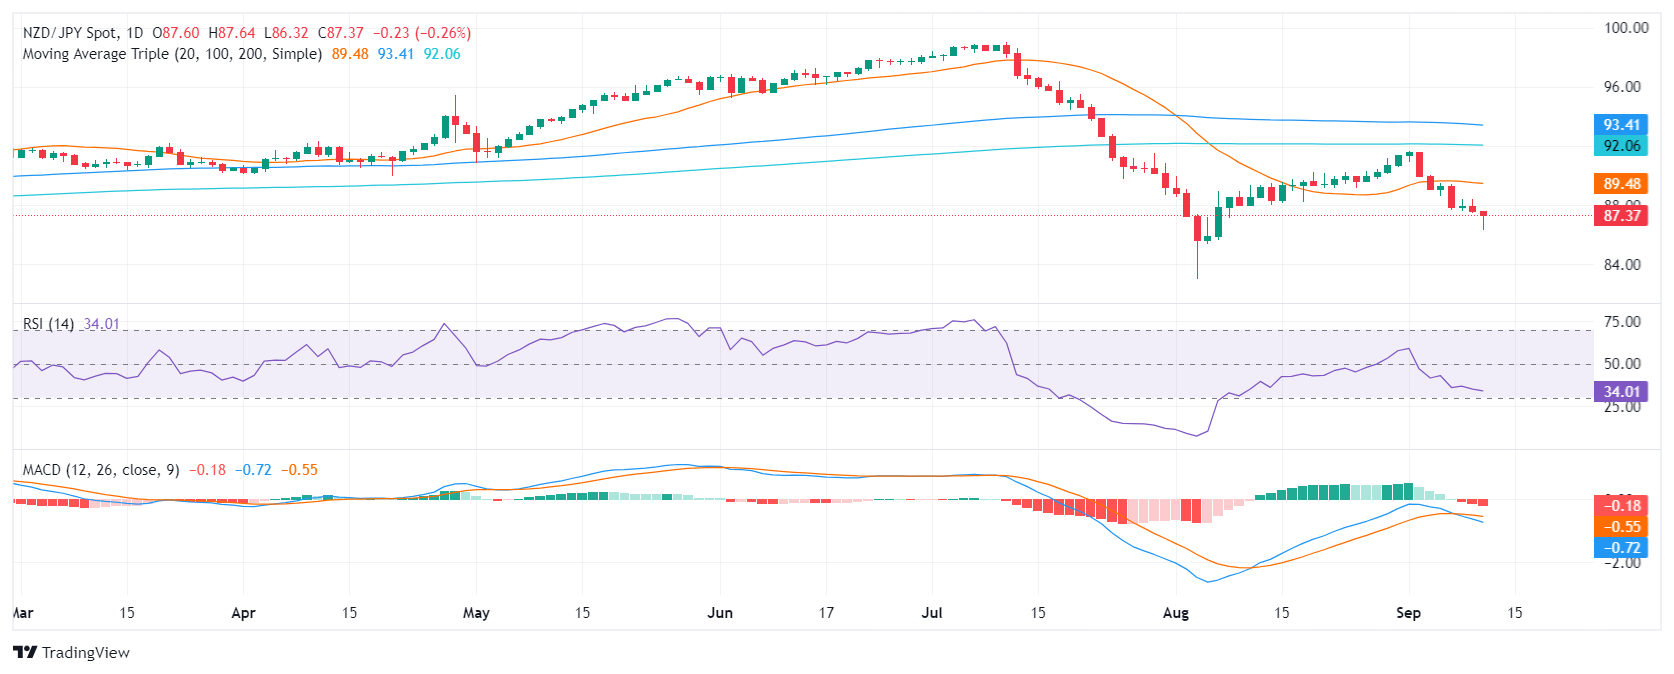
Overall, the technical picture for the NZD/JPY pair is bearish. The pair is showing strong signs of a downtrend, with the RSI in an oversold area and with the MACD printing red bars. Supports to the downside are located at 87.00, 86.500, and 86.00 while resistances are seen at 87.50, 88.00, and 89.00.
- Gold retreats from a daily high of $2,529 after US inflation data boosts odds of a 25 bps Fed rate cut.
- Rising US Treasury yields and a stronger US Dollar weigh on the non-yielding metal with the 10-year T-note climbing to 3.655%.
- CME FedWatch Tool shows 71% chance of a 25 bps cut.
Gold fell late in the North American session, down by 0.18%, after hitting a daily peak of $2,529. US inflation data prompted traders to cut longs in the non-yielding metal due to increasing odds that the Federal Reserve (Fed) will kick off its easing cycle with a 25-basis-point (bps) interest rate cut. The XAU/USD trades at $2,511.
Sentiment remains positive after the US Bureau of Labor Statistics revealed August’s Consumer Price Index (CPI). Monthly headline inflation remained unchanged, while the monthly core, which excludes food and energy, ticked up a tenth.
Market participants pushed US Treasury yields higher amid fears that the Fed could be dissuaded from cutting interest rates by 50 basis points (bps) and instead might opt for 25 bps next week.
The US 10-year Treasury rose to 3.655%, up by one and a half bps. The Greenback was bolstered after the news, hitting a daily high of 101.82, according to the US Dollar Index (DXY). At the time of writing, the DXY is virtually unchanged at 101.68.
Investors had trimmed their odds for a 50 bps Fed rate cut, according to the CME FedWatch Tool. The chances are at 29%, while 25 bps lie at 71%.
The Presidential debate between Vice President Kamala Harris and former President Donald Trump was won by Harris, according to a CNN poll.
In the geopolitical space, US Secretary of State Anthony Blinken and the UK’s David Lammy heightened concerns that the US and UK could grant Ukraine the ability to use weapons from Western nations to strike inside Russia.
Daily digest market moves: Gold price drops following US CPI release
- US Bureau of Labor Statistics’ CPI data revealed that headline inflation for August dipped from 2.9% to 2.6% YoY) as expected.
- However, US core CPI, which excludes volatile items and is considered a more accurate inflation gauge, remained unchanged at 3.2% YoY. On a monthly basis, core CPI rose from 0.2% to 0.3%, while headline CPI stood at 0.2% MoM.
- Data from the Chicago Board of Trade suggests the Fed is now expected to cut at least 98 basis points this year, down from 108 basis points a day ago, according to the December 2024 fed funds rate futures contract.
- Last Friday, Fed officials were dovish. New York Fed President John Williams said that cutting rates will help keep the labor market balanced, while Governor Christopher Waller said that “the time has come” to ease policy.
- Chicago Fed President Austan Goolsbee was dovish, saying policymakers have an “overwhelming” consensus to reduce borrowing costs.
- It is worth noting that Fed officials entered their blackout period ahead of the Federal Open Market Committee (FOMC) monetary policy meeting.
- Data from the Chicago Board of Trade indicates that the Fed is anticipated to cut at least 98 bps this year, based on the fed funds rate futures contract for December 2024.
Technical outlook: Gold price clings to $2,500 despite posting losses
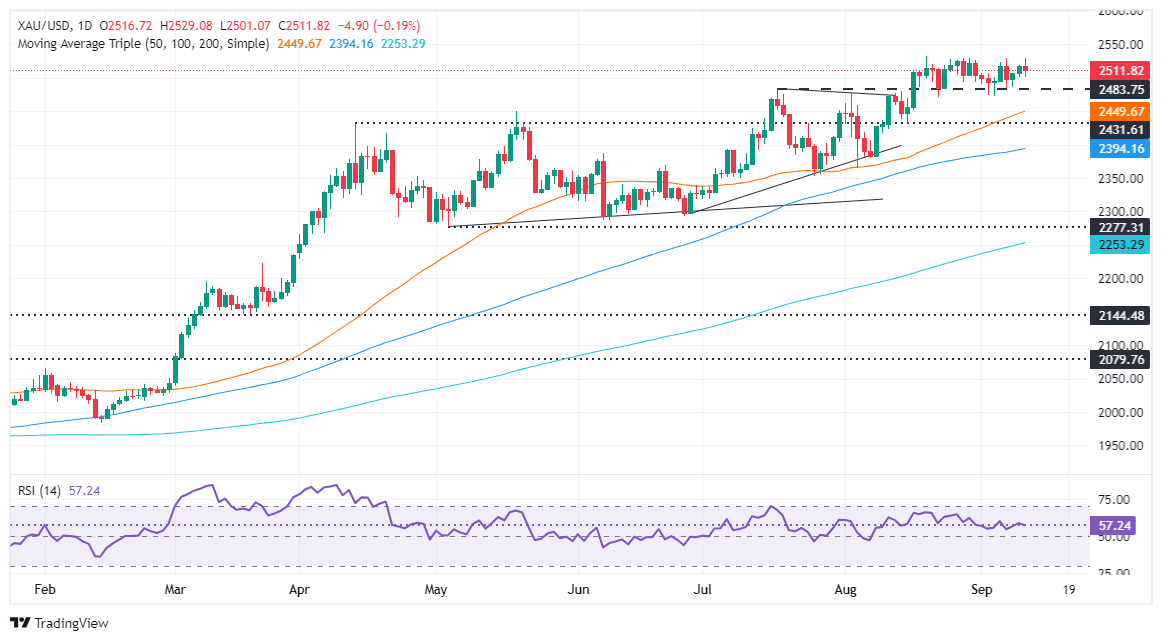
Gold price is subdued, consolidated within the $2,500 to $2,531 area. Even though momentum remains bullish, as depicted by the Relative Strength Index (RSI), it is flat above its neutral line, indicating that neither buyers nor sellers are in control.
If XAU/USD clears the all-time high of $2,531, the next resistance would be the $2,550 mark. Once hurdled, the next stop would be the psychological $2,600 figure.
Conversely, if Gold price slides below $2,500, the next support would be the August 22 low at $2,470. On further weakness, the next demand zone would be the confluence of the May 20 high, which turned into support, and the 50-day Simple Moving Average (SMA) between $2,450 and $2,440.
Gold FAQs
Gold has played a key role in human’s history as it has been widely used as a store of value and medium of exchange. Currently, apart from its shine and usage for jewelry, the precious metal is widely seen as a safe-haven asset, meaning that it is considered a good investment during turbulent times. Gold is also widely seen as a hedge against inflation and against depreciating currencies as it doesn’t rely on any specific issuer or government.
Central banks are the biggest Gold holders. In their aim to support their currencies in turbulent times, central banks tend to diversify their reserves and buy Gold to improve the perceived strength of the economy and the currency. High Gold reserves can be a source of trust for a country’s solvency. Central banks added 1,136 tonnes of Gold worth around $70 billion to their reserves in 2022, according to data from the World Gold Council. This is the highest yearly purchase since records began. Central banks from emerging economies such as China, India and Turkey are quickly increasing their Gold reserves.
Gold has an inverse correlation with the US Dollar and US Treasuries, which are both major reserve and safe-haven assets. When the Dollar depreciates, Gold tends to rise, enabling investors and central banks to diversify their assets in turbulent times. Gold is also inversely correlated with risk assets. A rally in the stock market tends to weaken Gold price, while sell-offs in riskier markets tend to favor the precious metal.
The price can move due to a wide range of factors. Geopolitical instability or fears of a deep recession can quickly make Gold price escalate due to its safe-haven status. As a yield-less asset, Gold tends to rise with lower interest rates, while higher cost of money usually weighs down on the yellow metal. Still, most moves depend on how the US Dollar (USD) behaves as the asset is priced in dollars (XAU/USD). A strong Dollar tends to keep the price of Gold controlled, whereas a weaker Dollar is likely to push Gold prices up.
- Australian Dollar is rising against the US Dollar after the latest US inflation data showed a decline in the CPI.
- RBA’s Hunter spoke about Australia's labor market, highlighting that it is still tight relative to full employment.
- As the RBA remains hawkish, the AUD/USD pair’s upside is open.
The AUD/USD rose by 0.25% to 0.6670 on Wednesday as markets reacted to the release of US inflation data and comments from the Reserve Bank of Australia (RBA). The US Consumer Price Index (CPI) showed a decline in the annual rate of price increases, raising hopes that the Federal Reserve (Fed) may slow the pace of interest rate hikes.
In the face of a complex economic outlook, the Reserve Bank of Australia's (RBA) aggressive stance against high inflation has tempered market expectations. With inflation remaining elevated, investors now anticipate a more gradual easing of monetary policy, forecasting only a 0.25% interest rate reduction by 2024.
Daily digest market movers: Australian Dollar gains on US CPI figures and RBA signals
- RBA Assistant Governor Sarah Hunter's comments supported the RBA's case against near-term policy rate cuts, which boosted the AUD. Hunter commented that the labor market is still tight relative to full employment, which reiterated the bank’s hawkish stance.
- On the US side, CPI declined to 2.5% YoY, below the consensus estimate of 2.7% and the previous reading of 2.9%.
- Core CPI, which excludes volatile food and energy prices, rose 3.2% YoY, matching the market expectation and July's increase.
- On a monthly basis, the CPI increased 0.2%, while the core CPI rose above consensus to 0.3%.
- Money market futures traders have slashed the odds for a 50 bps rate cut by the Fed to 15% and increased the probability of a 25 bps cut to 85%.
- Despite its hawkish stance, the RBA is likely to join the global easing cycle later this year due to weak underlying economic activity and lower inflation pressure.
- If the Fed and RBA policies align, the Aussie may see further downside.
AUD/USD technical outlook: Pair faces a mixed outlook while indicators recover
The pair is trading in a mixed outlook, according to the Relative Strength Index (RSI), Moving Average Convergence Divergence (MACD) and price action. The RSI is rising sharply, this implies that buying pressure is recovering while it still remains in negative terrain. The MACD is decreasing and red. This generally suggests that selling pressure is losing strength.
The pair is facing some resistance at 0.6700. A break above this level could lead to further gains toward 0.6740. On the downside, support can be found at 0.6660 and 0.6620. A break below these levels could see the pair falling toward 0.6600.
Australian Dollar FAQs
One of the most significant factors for the Australian Dollar (AUD) is the level of interest rates set by the Reserve Bank of Australia (RBA). Because Australia is a resource-rich country another key driver is the price of its biggest export, Iron Ore. The health of the Chinese economy, its largest trading partner, is a factor, as well as inflation in Australia, its growth rate and Trade Balance. Market sentiment – whether investors are taking on more risky assets (risk-on) or seeking safe-havens (risk-off) – is also a factor, with risk-on positive for AUD.
The Reserve Bank of Australia (RBA) influences the Australian Dollar (AUD) by setting the level of interest rates that Australian banks can lend to each other. This influences the level of interest rates in the economy as a whole. The main goal of the RBA is to maintain a stable inflation rate of 2-3% by adjusting interest rates up or down. Relatively high interest rates compared to other major central banks support the AUD, and the opposite for relatively low. The RBA can also use quantitative easing and tightening to influence credit conditions, with the former AUD-negative and the latter AUD-positive.
China is Australia’s largest trading partner so the health of the Chinese economy is a major influence on the value of the Australian Dollar (AUD). When the Chinese economy is doing well it purchases more raw materials, goods and services from Australia, lifting demand for the AUD, and pushing up its value. The opposite is the case when the Chinese economy is not growing as fast as expected. Positive or negative surprises in Chinese growth data, therefore, often have a direct impact on the Australian Dollar and its pairs.
Iron Ore is Australia’s largest export, accounting for $118 billion a year according to data from 2021, with China as its primary destination. The price of Iron Ore, therefore, can be a driver of the Australian Dollar. Generally, if the price of Iron Ore rises, AUD also goes up, as aggregate demand for the currency increases. The opposite is the case if the price of Iron Ore falls. Higher Iron Ore prices also tend to result in a greater likelihood of a positive Trade Balance for Australia, which is also positive of the AUD.
The Trade Balance, which is the difference between what a country earns from its exports versus what it pays for its imports, is another factor that can influence the value of the Australian Dollar. If Australia produces highly sought after exports, then its currency will gain in value purely from the surplus demand created from foreign buyers seeking to purchase its exports versus what it spends to purchase imports. Therefore, a positive net Trade Balance strengthens the AUD, with the opposite effect if the Trade Balance is negative.
What you need to take care of on Thursday, September 12:
Financial markets turned risk-averse after the United States (US) released the August Consumer Price Index (CPI). The US Bureau of Labor Statistics reported that the annual CPI rose 2.5% YoY, easing from the previous 2.9%. Also, the core annual figure matched the July one and expectations by printing at 3.2%. However, the monthly core increase was higher than anticipated, hitting 0.3%-
Despite US CPI figures being broadly aligned with expectations, financial markets rushed into safety, as investors pretty much discarded an upcoming Federal Reserve (Fed) 50 basis points rate cut when it meets next week. Policymakers are now expected to gradually loosen the monetary policy, with a 25 bps trim fully priced in.
Stock markets turned sharply south, with US indexes posting sharp losses following US data. Still, Wall Street changed course ahead of the close, with only the Dow Jones Industrial Average holding in the red.
US Treasury yields, in the meantime, reached fresh 52-week lows ahead of the US CPI, bouncing just modestly afterwards. The 10-year Treasury note currently yields 1 bps more than the 2-year note, suggesting recession-related fears remain limited.
The EUR/USD pair hovers around 1.1020, while GBP/USD met buyers around 1.3000 and now changes hands at around 1.3050. Commodity-linked currencies made the most out of stocks’ bounce, with the AUD/USD pair pressuring intraday highs in the 0.6670 region and the USD/CAD trading at daily lows in the 1.3560 price zone.
The USD/JPY pair fell to 140.70 early on Wednesday, a fresh 2024 low. By the end of the day, the pair recovered and stands well above the 142.00 mark. The Swiss Franc also gave up ahead of the daily close, and USD/CHF stands at around 0.8500.
Gold flirted with the $2,500 mark in the peak of risk aversion, recovering afterwards to settle at around $2,515.
Thursday’s macroeconomic calendar will include Australian September Consumer Inflation Expectations, previously at 4.5%, the United States Producer Price Index (PPI) and the European Central Bank (ECB) monetary policy decision. The ECB is widely anticipated to cut the three main interest rates by 25 bps each.
US Dollar PRICE Today
The table below shows the percentage change of US Dollar (USD) against listed major currencies today. US Dollar was the strongest against the Swiss Franc.
| USD | EUR | GBP | JPY | CAD | AUD | NZD | CHF | |
|---|---|---|---|---|---|---|---|---|
| USD | -0.01% | 0.24% | -0.16% | -0.30% | -0.28% | 0.20% | 0.48% | |
| EUR | 0.01% | 0.26% | -0.14% | -0.27% | -0.22% | 0.22% | 0.49% | |
| GBP | -0.24% | -0.26% | -1.14% | -0.54% | -0.54% | -0.04% | 0.23% | |
| JPY | 0.16% | 0.14% | 1.14% | -0.12% | -0.13% | 0.35% | 0.63% | |
| CAD | 0.30% | 0.27% | 0.54% | 0.12% | 0.00% | 0.50% | 0.76% | |
| AUD | 0.28% | 0.22% | 0.54% | 0.13% | -0.00% | 0.43% | 0.77% | |
| NZD | -0.20% | -0.22% | 0.04% | -0.35% | -0.50% | -0.43% | 0.27% | |
| CHF | -0.48% | -0.49% | -0.23% | -0.63% | -0.76% | -0.77% | -0.27% |
The heat map shows percentage changes of major currencies against each other. The base currency is picked from the left column, while the quote currency is picked from the top row. For example, if you pick the US Dollar from the left column and move along the horizontal line to the Japanese Yen, the percentage change displayed in the box will represent USD (base)/JPY (quote).
- Mexican Senate passes controversial judicial reform, but Peso recovers as investors focus on potential Fed easing cycle.
- USD/MXN drops 1.63% with investors pricing in an 85% chance of a 25 bps rate cut at the Fed's September meeting.
- US inflation data raises doubts over a 50 bps rate cut, while the US economic docket featuring PPI and consumer sentiment may influence USD/MXN.
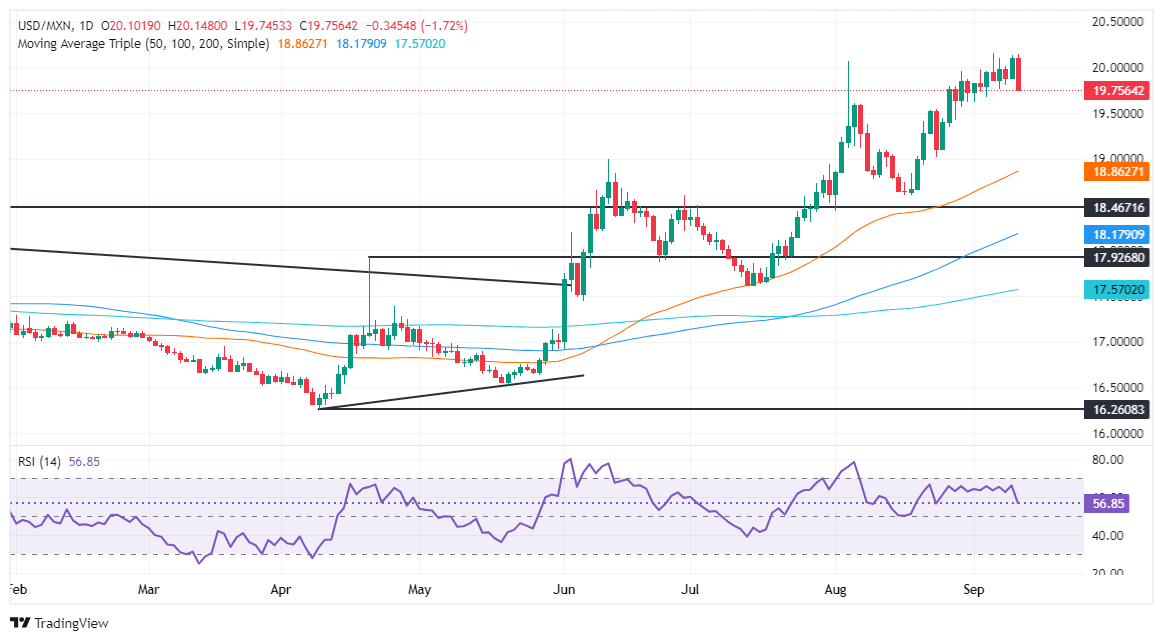
The Mexican Peso staged a recovery against the US Dollar on Wednesday as investors shrugged off Mexico’s Senate passing of a controversial reform that threatens the state of law. Expectations that the Federal Reserve (Fed) will begin its easing cycle next week keep the Peso on the front foot. The USD/MXN trades at 19.75, down by 1.63%.
Mexico’s economic docket revealed that Industrial Production in July was lower than expected based on monthly figures, while it expanded on an annual basis. Political tensions heightened after the Mexican Senate voted to approve the judiciary reform with 86 votes in favor and 41 against.
Now that the bill has been approved, it will be sent to 32 state congresses. For the reform to become law in the Mexican Constitution, it would need the approval of 17 congresses.
Across the border, data from the US Bureau of Labor Statistics dampened traders' hopes for the Fed's 50-basis-point (bps) rate cut. Inflation in the US remains within reach of the US central bank target, yet core figures on MoM figures rose.
This bolstered the Greenback, though the uptick was short-lived. The US Dollar Index (DXY), which tracks the performance of the buck’s value against a basket of peers, is virtually unchanged at 101.70, up 0.05% following the CPI release.
Meanwhile, sources cited by Bloomberg said that if the Fed doesn’t cut 50 bps in September, it will do so in November, according to Krishna Guha of Evercore.
Money market futures traders slashed the odds for a 50 bps cut to 15%, while chances for 25 bps jumped to 85%, via the CME FedWatch Tool data.
The Mexican docket will be empty for the rest of the week. In the US, the schedule will feature jobs data, the Producer Price Index (PPI), and consumer sentiment data in the US, which could move the needle in the USD/MXN pair.
Daily digest market movers: Mexican Peso strengthens after judicial reform approval in Senate
- Mexico’s Industrial Production in July dipped from 0.4% to 0.2% MoM. On an annual basis, production increased by 2.1%, crushing projections for a 1.1% jump and improving from a -0.7% contraction.
- Mexico’s inflation in August dipped below 5% on headline figures on an annual basis, while core inflation stood firm near 4% YoY.
- September’s Citibanamex Survey showed that Banxico is expected to lower rates to 10.25% in 2024 and to 8.25% in 2025. The USD/MXN exchange rate is forecast to end 2024 at 19.50 and 2025 at 19.85.
- The US Bureau of Labor Statistics’ CPI data revealed that August’s headline inflation dipped from 2.9% to 2.6% YoY as expected.
- Still, US core CPI, which excludes volatile items and is sought as a realistic inflation gauge, stalled at 3.2% YoY. In monthly figures, core CPI increased from 0.2% to 0.3%, while headline CPI stood at 0.2% MoM.
- Data from the Chicago Board of Trade suggests the Fed will cut at least 98 basis points this year, up from 108 a day ago, according to the fed funds rate futures contract for December 2024.
USD/MXN technical outlook: Mexican Peso soars as USD/MXN tumbles below 19.80
The USD/MXN uptrend is intact, although the pair edges lower following the approval of the judicial reform. The pair hit a new weekly low of 19.74, though some buyers entered the market after the dip to the latter.
The Relative Strength Index (RSI) is mixed as the indicator is bullish, but the slope suggests that sellers are gathering steam as the RSI aims for the 50-neutral line. Hence, in the short term, the exotic pair is tilted to the downside.
If USD/MXN stays below 20.00, the first support will be 19.50. A breach of the latter will expose the August 23 swing low of 19.02 before giving way to sellers eyeing a test of the 50-day Simple Moving Average (SMA) at 18.85.
Conversely, the USD/MXN must clear the psychological 20.00 figure for a bullish continuation. If surpassed, the next ceiling level would be the YTD high at 20.22. On further strength, the pair could challenge the daily high of September 28, 2022, at 20.57. If those two levels are surrendered, the next stop would be the swing high at 20.82 on August 2, 2022, ahead of 21.00.
Mexican Peso FAQs
The Mexican Peso (MXN) is the most traded currency among its Latin American peers. Its value is broadly determined by the performance of the Mexican economy, the country’s central bank’s policy, the amount of foreign investment in the country and even the levels of remittances sent by Mexicans who live abroad, particularly in the United States. Geopolitical trends can also move MXN: for example, the process of nearshoring – or the decision by some firms to relocate manufacturing capacity and supply chains closer to their home countries – is also seen as a catalyst for the Mexican currency as the country is considered a key manufacturing hub in the American continent. Another catalyst for MXN is Oil prices as Mexico is a key exporter of the commodity.
The main objective of Mexico’s central bank, also known as Banxico, is to maintain inflation at low and stable levels (at or close to its target of 3%, the midpoint in a tolerance band of between 2% and 4%). To this end, the bank sets an appropriate level of interest rates. When inflation is too high, Banxico will attempt to tame it by raising interest rates, making it more expensive for households and businesses to borrow money, thus cooling demand and the overall economy. Higher interest rates are generally positive for the Mexican Peso (MXN) as they lead to higher yields, making the country a more attractive place for investors. On the contrary, lower interest rates tend to weaken MXN.
Macroeconomic data releases are key to assess the state of the economy and can have an impact on the Mexican Peso (MXN) valuation. A strong Mexican economy, based on high economic growth, low unemployment and high confidence is good for MXN. Not only does it attract more foreign investment but it may encourage the Bank of Mexico (Banxico) to increase interest rates, particularly if this strength comes together with elevated inflation. However, if economic data is weak, MXN is likely to depreciate.
As an emerging-market currency, the Mexican Peso (MXN) tends to strive during risk-on periods, or when investors perceive that broader market risks are low and thus are eager to engage with investments that carry a higher risk. Conversely, MXN tends to weaken at times of market turbulence or economic uncertainty as investors tend to sell higher-risk assets and flee to the more-stable safe havens.
- US Dollar Index remains unchanged following the release of mixed inflation data.
- Inflation in the US declined to 2.5% on an annual basis in August.
- Annual core CPI remained steady at 3.2% in August.
- The market reaction includes a higher probability of a 25-basis-point cut by the Fed.
The US Dollar Index (DXY), a measure of the value of the USD against a basked of six other currencies, lost its ground after the release of mixed inflation data for August. Despite a decline in the overall inflation rate to 2.5% on an annual basis, the core Consumer Price Index (CPI) remained steady at 3.2%, indicating persistent inflationary pressures. This data has dampened expectations of a 50-basis-point interest rate cut by the Federal Reserve (Fed) in September, increasing the likelihood of a more modest 25-basis-point reduction.
Based on economic indicators, the US economy remains robust, surpassing expectations. While the market anticipates further monetary relaxation, it is essential to temper expectations. The current growth trajectory is unlikely to warrant such aggressive easing measures. It is crucial to adopt a balanced approach, acknowledging both the economy's strength and the need for cautious optimism in decision-making.
Daily digest market movers: DXY shrugs off weak sentiment data on the back of hawkish bets
- Annual US CPI inflation eased to 2.5% in August from 2.9% in July, marking the lowest level since April 2018.
- Annual core CPI, excluding volatile food and energy prices, remained unchanged at 3.2% in August, as expected.
- Monthly CPI increased 0.2%, while core CPI was up 0.3%, both above market expectations.
- As a reaction, the US Dollar is seen flat as traders reduced odds for a 50-basis-point rate cut by the Fed, now pricing in an 85% chance of a 25-basis-point cut.
Daily digest market movers: DXY shrugs off weak sentiment data on the back of hawkish bets
Technical analysis for the DXY index shows that indicators are currently in a negative territory but seem to have flattened. However, the index managed to regain the 20-day Simple Moving Average (SMA) at around 101.60 on Tuesday, which improved the short-term outlook.
The Relative Strength Index (RSI) and the Moving Average Convergence Divergence (MACD) are both flat in negative terrain, which suggests that there is no bearish threat. That being said, on Wednesday, the upside appeared to be limited, but buyers have more room to continue advancing.
Key support levels include 101.60, 101.30 and 101.00, while resistance levels include 101.80, 102.00 and 102.30.
US Dollar FAQs
The US Dollar (USD) is the official currency of the United States of America, and the ‘de facto’ currency of a significant number of other countries where it is found in circulation alongside local notes. It is the most heavily traded currency in the world, accounting for over 88% of all global foreign exchange turnover, or an average of $6.6 trillion in transactions per day, according to data from 2022. Following the second world war, the USD took over from the British Pound as the world’s reserve currency. For most of its history, the US Dollar was backed by Gold, until the Bretton Woods Agreement in 1971 when the Gold Standard went away.
The most important single factor impacting on the value of the US Dollar is monetary policy, which is shaped by the Federal Reserve (Fed). The Fed has two mandates: to achieve price stability (control inflation) and foster full employment. Its primary tool to achieve these two goals is by adjusting interest rates. When prices are rising too quickly and inflation is above the Fed’s 2% target, the Fed will raise rates, which helps the USD value. When inflation falls below 2% or the Unemployment Rate is too high, the Fed may lower interest rates, which weighs on the Greenback.
In extreme situations, the Federal Reserve can also print more Dollars and enact quantitative easing (QE). QE is the process by which the Fed substantially increases the flow of credit in a stuck financial system. It is a non-standard policy measure used when credit has dried up because banks will not lend to each other (out of the fear of counterparty default). It is a last resort when simply lowering interest rates is unlikely to achieve the necessary result. It was the Fed’s weapon of choice to combat the credit crunch that occurred during the Great Financial Crisis in 2008. It involves the Fed printing more Dollars and using them to buy US government bonds predominantly from financial institutions. QE usually leads to a weaker US Dollar.
Quantitative tightening (QT) is the reverse process whereby the Federal Reserve stops buying bonds from financial institutions and does not reinvest the principal from the bonds it holds maturing in new purchases. It is usually positive for the US Dollar.
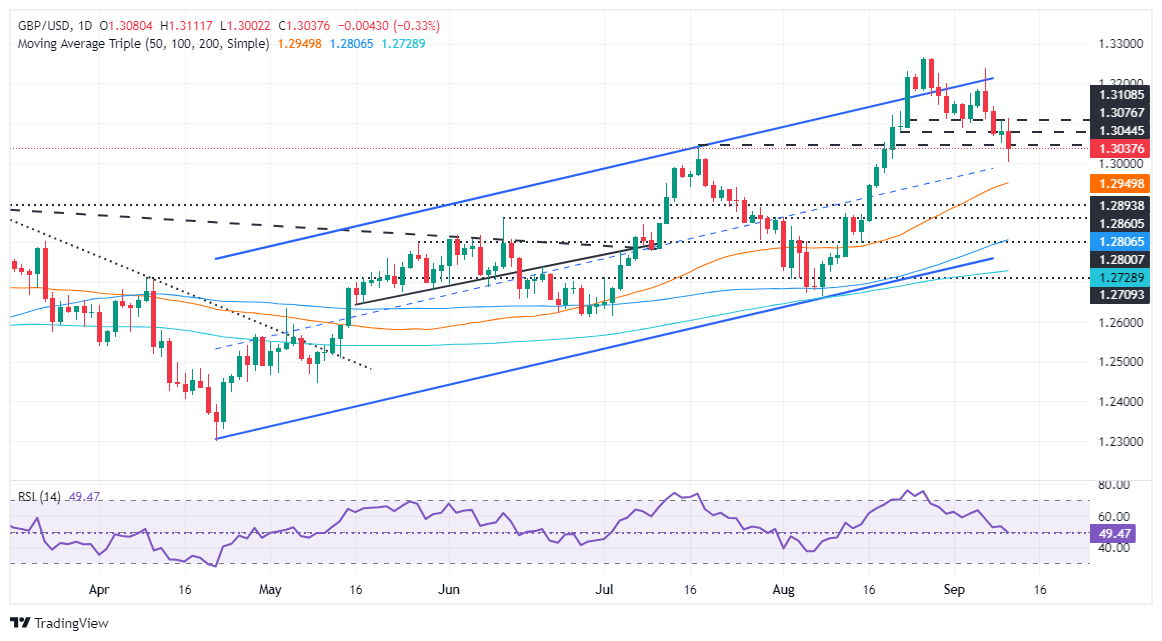
- GBP/USD drops below the 20-DMA, with sellers gaining near-term control as RSI nears a break below 50.
- Key support lies at 1.3044 (July 17 peak), with further downside risks toward 1.2995 (50-DMA) and 1.2894 (March 8 high).
- Buyers need to hold above 1.3150 for a recovery, targeting resistance at 1.3111 and the psychological level of 1.3200.
The Pound Sterling dropped during the North American session, down 0.30% after UK data showed the economy is slowing down. This and a pick-up in US inflation weighed on the GBP/USD, which trades at 1.3035 after reaching a daily high of 1.3111.
GBP/USD Price Forecast: Technical outlook
The uptrend remains intact, but the GBP/USD drop below the 20-day moving average (DMA) gives sellers an edge in the near term.
The Relative Strength Index (RSI) clings to the bullish side, but a break below the 50-neutral line looms, which could accelerate the downfall and threaten to clear key support levels.
If GBP/USD clears 1.3050, the first support would be the July 17 peak at 1.3044. On further weakness, the pair might drop to the 50-DMA at 1.2995. A breach of the latter will expose the March 8 daily high at 1.2894.
Conversely, if buyers hold the spot price above 1.3150, that could pave the way for a recovery. The first resistance would be 1.3111, followed by the 1.3150 psychological level, ahead of cracking the 1.3200 figure.
GBP/USD Price Action – Daily Chart
Pound Sterling FAQs
The Pound Sterling (GBP) is the oldest currency in the world (886 AD) and the official currency of the United Kingdom. It is the fourth most traded unit for foreign exchange (FX) in the world, accounting for 12% of all transactions, averaging $630 billion a day, according to 2022 data. Its key trading pairs are GBP/USD, aka ‘Cable’, which accounts for 11% of FX, GBP/JPY, or the ‘Dragon’ as it is known by traders (3%), and EUR/GBP (2%). The Pound Sterling is issued by the Bank of England (BoE).
The single most important factor influencing the value of the Pound Sterling is monetary policy decided by the Bank of England. The BoE bases its decisions on whether it has achieved its primary goal of “price stability” – a steady inflation rate of around 2%. Its primary tool for achieving this is the adjustment of interest rates. When inflation is too high, the BoE will try to rein it in by raising interest rates, making it more expensive for people and businesses to access credit. This is generally positive for GBP, as higher interest rates make the UK a more attractive place for global investors to park their money. When inflation falls too low it is a sign economic growth is slowing. In this scenario, the BoE will consider lowering interest rates to cheapen credit so businesses will borrow more to invest in growth-generating projects.
Data releases gauge the health of the economy and can impact the value of the Pound Sterling. Indicators such as GDP, Manufacturing and Services PMIs, and employment can all influence the direction of the GBP. A strong economy is good for Sterling. Not only does it attract more foreign investment but it may encourage the BoE to put up interest rates, which will directly strengthen GBP. Otherwise, if economic data is weak, the Pound Sterling is likely to fall.
Another significant data release for the Pound Sterling is the Trade Balance. This indicator measures the difference between what a country earns from its exports and what it spends on imports over a given period. If a country produces highly sought-after exports, its currency will benefit purely from the extra demand created from foreign buyers seeking to purchase these goods. Therefore, a positive net Trade Balance strengthens a currency and vice versa for a negative balance.
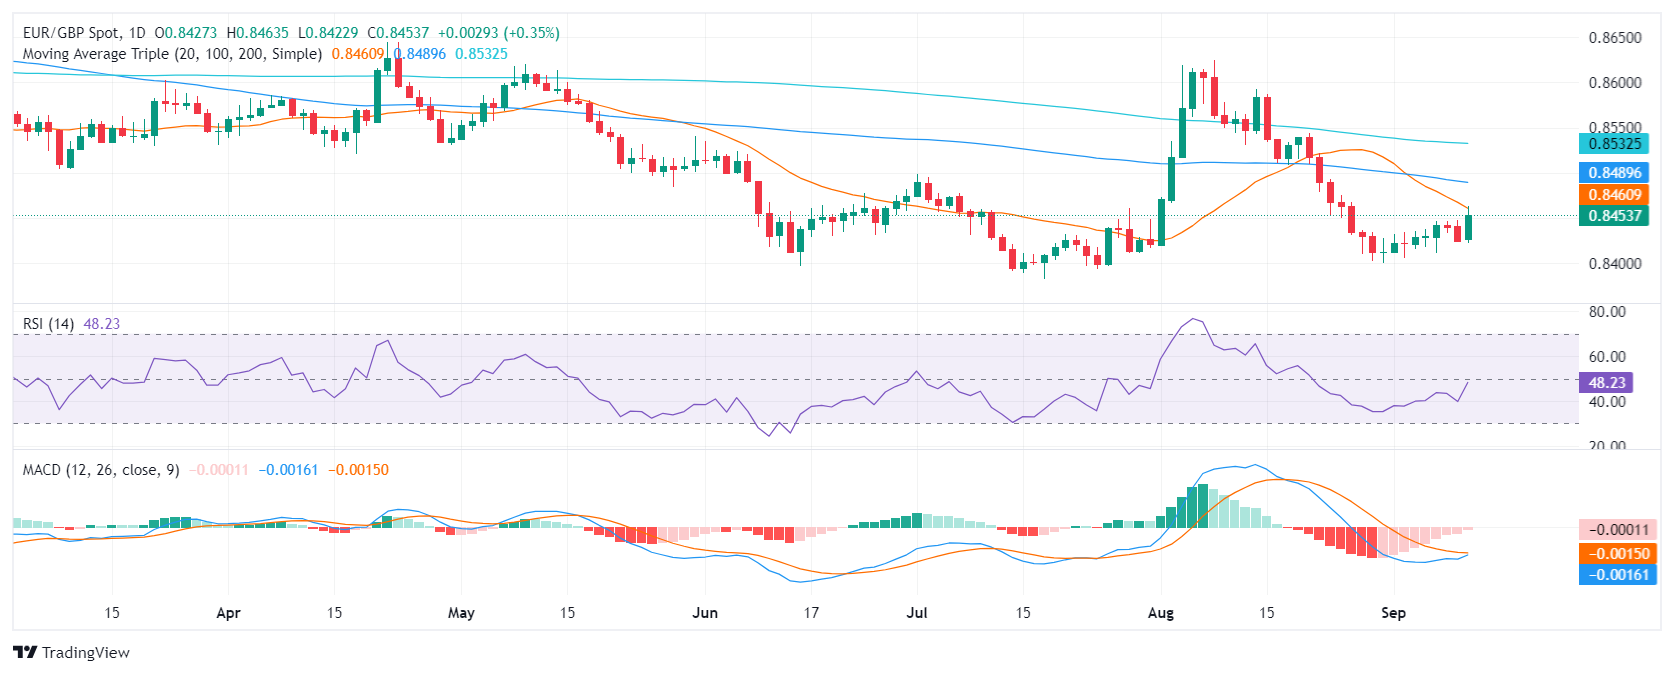
- Technical indicators suggest a shift in momentum toward positive territory
- RSI rises near 50, indicating a recovery in buying pressure.
- MACD continues printing decreasing red bars.
In Wednesday's session, when the EUR/GBP broke out and saw 0.40% gains to rise near 0.8450. While bulls made a huge step, they still have more work to do to confirm a recovery.
The Relative Strength Index (RSI) has moved back towards the 50 midpoint, signaling that buying pressure is recovering. This is supported by the flattening of the Moving Average Convergence Divergence (MACD) histogram, with the red bars decreasing and the histogram moving closer to the zero line. This suggests a potential shift in momentum toward positive territory.
However, the overall outlook remains cautious as the choppy and price action in recent candles suggests consolidation for the pair. While the pair has been holding above the 0.8400 support level, the next resistance level to watch is 0.8460 at the 20-day Simple Moving Average (SMA) and a break above could confirm a recovery.
EUR/GBP daily chart
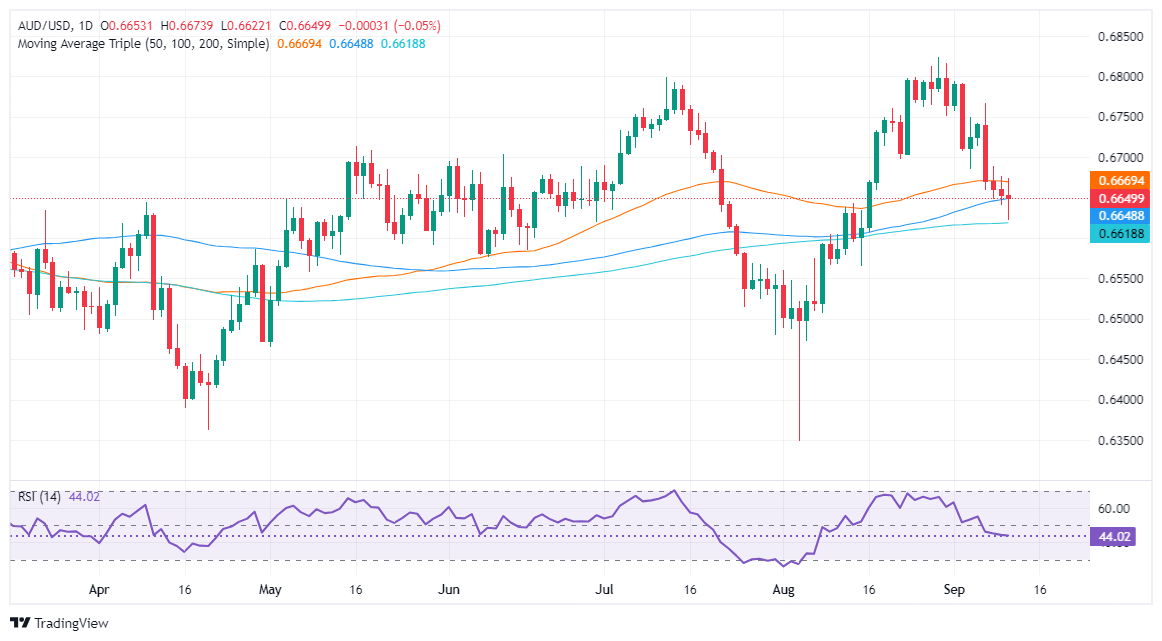
- AUD/USD pulls back as US CPI report indicates core inflation steady at 3.2% YoY, dampening prospects for a 50-bps Fed rate cut.
- Money market futures now forecast an 85% likelihood of a 25-bps rate cut at the next Fed meeting.
- RBA Assistant Governor notes the Australian labor market is tight yet balanced, with the AUD poised for further US data releases this week.
The Australian Dollar dropped during the North American session after the latest US Consumer Price Index (CPI) report, which witnessed an uptick in prices. Market participants that priced in a larger Federal Reserve rate cut trimmed their bets, sponsoring a leg-up in the US Dollar. The AUD/USD trades at 0.6627 after hitting a daily high of 0.6673.
AUD/USD falls to 0.6627 as rising US core inflation dims hopes for larger Fed rate cut
Data from the US Bureau of Labor Statistics (BLS) revealed that August’s headline inflation dipped from 2.9% to 2.6% YoY as expected. Still, the core, which excludes volatile items and is sought as a realistic inflation gauge, stalled at 3.2% YoY. In monthly figures, core CPI edged up from 0.2% to 0.3% while CPI stood at 0,2% MoM.
After the report, money market futures traders slashed the odds for 50 basis points (bps) cut to 15%, while chances for a 25-bps jumped to 85%, via data from the CME FedWatch Tool.
This underpinned the Greenback and weighed on the AUD/USD, which extended its losses to a daily low of 0.6622 before recovering some ground.
In the meantime, the US Dollar Index (DXY), which measures the buck’s performance against six currencies, held to minuscule gains of 0.02% at 10168.
Earlier in the Asian session, Reserve Bank of Australia (RBA) Assistant Governor Sarah Hunter delivered hawkish-tilted remarks, saying the labor market remains tight relative to full employment, but has moved into better balance since late 2022. Hunted stated the economy is moving through a turning point.
What to watch?
The Aussie economic docket will be empty for the remainder of the week. On Thursday, the US schedule will feature the Producer Price Index (PPI) and Initial Jobless Claims for the week ending September 7. On Friday, the University of Michigan Consumer Sentiment is awaited.
AUD/USD Price Forecast: Technical outlook
The AUD/USD has dropped below the 50- and 100-day moving averages (DMAs) at 0.6667 and 0.6647, opening the door to challenge the 200-DMA at 0.6616. If sellers push prices below the latter, look for further losses. First, they need to crack 0.6600, and the next stop would be the August 15 low of 0.6560.
Conversely, if buyers stepped in and pushed prices above the current week’s peak of 0.6689, look for a test of 0.6700.
Australian Dollar PRICE Today
The table below shows the percentage change of Australian Dollar (AUD) against listed major currencies today. Australian Dollar was the strongest against the British Pound.
| USD | EUR | GBP | JPY | CAD | AUD | NZD | CHF | |
|---|---|---|---|---|---|---|---|---|
| USD | 0.05% | 0.42% | -0.65% | -0.11% | 0.06% | 0.43% | 0.28% | |
| EUR | -0.05% | 0.37% | -0.73% | -0.15% | 0.06% | 0.37% | 0.23% | |
| GBP | -0.42% | -0.37% | -1.14% | -0.53% | -0.37% | 0.00% | -0.14% | |
| JPY | 0.65% | 0.73% | 1.14% | 0.57% | 0.71% | 1.08% | 0.94% | |
| CAD | 0.11% | 0.15% | 0.53% | -0.57% | 0.16% | 0.53% | 0.38% | |
| AUD | -0.06% | -0.06% | 0.37% | -0.71% | -0.16% | 0.30% | 0.23% | |
| NZD | -0.43% | -0.37% | -0.00% | -1.08% | -0.53% | -0.30% | -0.14% | |
| CHF | -0.28% | -0.23% | 0.14% | -0.94% | -0.38% | -0.23% | 0.14% |
The heat map shows percentage changes of major currencies against each other. The base currency is picked from the left column, while the quote currency is picked from the top row. For example, if you pick the Australian Dollar from the left column and move along the horizontal line to the US Dollar, the percentage change displayed in the box will represent AUD (base)/USD (quote).
Crude oil prices at $70/bbl may well feel overdone, but there are no signs of a turnaround in the demand sentiment just yet, TDS Senior Commodity Strategist Daniel Ghali notes.
Market's undertone is not supportive for a sustainable rebound
“The cross-section of commodities returns tells a bleaker picture of commodity demand, with no signs of a recovery despite the strength implied by risk markets. For energy markets, however, the risk is two-fold as slowing demand not only weighs on prices through its traditional implications, but also implies that the substantial amount of supply risk premia embedded into prices should be eroded further.”
“The OPEC+ group of producers' decision to delay their planned supply increases has not been sufficient to put a halt to this trend, and further slowing in global demand risks catalyzing a more substantial repricing in this context. CTAs may well be on the bid, but the market's undertone is not yet supportive for a sustainable rebound.”
USD/JPY bounces off almost-yearly lows following the release of US inflation data.
The data shows inflation falling at a broadly expected pace but reduces the probability of a 50 bps rate cut from the Fed.
JPY is supported by comments from BoJ’s Nakagawa hinting that an interest rate hike is in the pipeline.
USD/JPY recovers to trade just below 141.00 after dipping to a new nine-month low on Wednesday. The rebound comes following the release of US inflation data.
The US data lleads to an appreciation in the US Dollar (USD) amid prospects of a more measured approach to easing from the Federal Reserve (Fed), whilst the Japanese Yen (JPY) trades overall firm after comments from a Bank of Japan (BoJ) official suggested an interest rate hike was closer at hand than previously thought.
US consumer prices mostly rose in line with expectations in August although the annual change in the headline Consumer Price Index (CPI) did undershoot economists’ expectations by a point, revealing a rise of 2.5% instead of the 2.6% forecast, according to data from the US Bureau of Labor Statistics on Wednesday.
Core CPI (ex food and energy) also rose as expected but monthly core CPI rose by a higher-than-expected 0.3% suggesting some stubbornness in core prices, which analysts put down to sticky dwelling prices.
The data indicated that inflation remains sufficiently high for the Fed not to implement a "jumbo" 50 basis points (bps) cut at its next meeting, but rather adopt a more measured approach instead. The probabilities of a 50 bps (0.50%) cut at the September 17-18 Fed meeting fell to only 15% after the release, from around 27% before. A 25 bps (0.25%) cut, meanwhile, remains fully priced in, according to the CME FedWatch tool.
“Overall, inflation appears to have been successfully tamed but, with housing inflation still refusing to moderate as quickly as hoped, it hasn’t been completely vanquished. Under those circumstances, we expect the Fed to take a measured approach to cutting interest rates,” remarked Paul Ashworth, Chief North America Economist at Capital Economics.
With the chances of the larger cut in US interest rates diminishing, the USD strengthened and USD/JPY rose. Relatively higher interest rate expectations are usually supportive of a currency because they lead to higher foreign capital inflows.
The Japanese Yen (JPY), meanwhile, trades firm after comments from BoJ Board member Junko Nakagawa recently hinted at another rate hike. Japan’s Labor Cash earnings for July also exceeded expectations, which continue to support the case for further normalization of BoJ policy.
“Nakagawa emphasized that the BoJ would adjust policy if economic projections materialize, signaling that Japan’s low real rates may need tightening sooner than expected,” said Saxo Bank in a research note on Wednesday.
- GBP/USD falls after the release of US CPI data shows headline inflation falling but core remaining stubbornly high.
- The data suggests the Fed will take a cautious approach to easing and probably cut rates by 25 not 50 bps.
- GBP is pressured after UK GDP comes out flat in July and misses estimates.
GBP/USD is trading marginally lower in the 1.3060s on Wednesday after the release of US inflation data leads to an appreciation in the US Dollar (USD) amid prospects of a more measured approach to easing from the Federal Reserve (Fed) whilst the Pound Sterling (GBP) loses ground following the release of flat economic growth data.
US consumer prices rose more or less in line with expectations, although the annual change in the headline Consumer Price Index (CPI) did undershoot economists’ expectations by a point, coming out at 2.5% instead of the 2.6% forecast, according to data from the US Bureau of Labor Statistics on Wednesday.
Core CPI (ex food and energy) also rose as expected but monthly core CPI rose by a higher-than-expected 0.3% suggesting some stubbornness in core prices, which analysts say comes from sticky dwelling inflation.
Although the data was mixed, it showed inflation remaining sufficiently high for the Fed not to want to slash interest rates at its next meeting but rather adopt a more measured approach. The probabilities of a “jumbo” 50 basis points (bps) cut at the September 17-18 Fed meeting fell to only 15% after the release, from around 27% before. A 25 bps (0.25%) cut remains fully priced in.
“Overall, inflation appears to have been successfully tamed but, with housing inflation still refusing to moderate as quickly as hoped, it hasn’t been completely vanquished. Under those circumstances, we expect the Fed to take a measured approach to cutting interest rates,” remarked Paul Ashworth, Chief North America Economist at Capital Economics.
With the chances of the larger cut in US interest rates dwindling, the USD strengthened (GBP/USD fell), since relatively higher interest rate expectations are usually supportive of a currency because they lead to higher foreign capital inflows.
Data out of the UK, meanwhile, painted a negative picture of the economic outlook for the country, weighing on Cable. The Gross Domestic Product (GDP) growth rate in July failed to rise (0.0%) when economists had expected a 0.2% increase, according to data from the Office of National Statistics (ONS) on Wednesday. Industrial and manufacturing production both came out below-expectations, with the former falling 0.8% month-over-month and negative 1.2% annually in July, and the latter declining 1.0% and 1.3% respectively.
The Pound Sterling (GBP) is little changed and underperforming on the session as a result, Scotiabank’s Chief FX Strategist Shaun Osborne notes.
GBP gains are capped in the low 1.31 area
“UK GDP was flat in July (below expectations of a 0.2% rise) and rose 0.5 in the July quarter (a little below forecasts of 0.6%). Details were generally softer than expected or outright weak (manufacturing).”
“The data suggest some slowing in growth momentum after a more positive H1 but do not alter near-term prospects for the BoE, with markets continuing to price in the low risk (4-5bps) of a rate cut this month.”
“Soft price action intraday continues to cap GBP gains in the low 1.31 area. More range trading seems likely in the short run, with trend signals at very weak and neutral levels. Support is 1.3050/60. Resistance is 1.3115.”
The Canadian Dollar (CAD) is moderately firmer on the session as the USD slips back under 1.36 to the high 1.35s, Scotiabank’s Chief FX Strategist Shaun Osborne notes.
CAD holds in upper 1.35 area
“Factors have turned a little less supportive for the CAD over the past week and slumping terms of trade amid weaker commodity prices are a headwind for the CAD. The CAD’s minor gains today are at odds with my fair value model which indicates an estimated equilibrium for spot at 1.3657.”
“Intraday trends hinge largely on external developments—US data outcomes, equity markets—with no domestic data on tap. US CPI came in lower than expected, so USD/CAD traded back above 1.36.”
“Short-term price signals suggest the USD’s push higher has stalled but with minor losses holding in the 1.3585 area—the 200- day MA and USD resistance earlier this week—the near-term trend higher remains intact. The USD will need to trade back under 1.3545 to alter near-term trend dynamics at this point I think. Otherwise, corrective USD gains risk extending deeper into the mid/upper 1.36s.”
- Crude Oil resides near the annual low after being unable to significantly bounce higher on Monday.
- Markets struggle to digest the OPEC report, which might be too optimistic about the demand for 2025.
- The US Dollar Index trades below 101.50 after Kamala Harris was called for victory in the overnight presidential debate.
Crude Oil’s price jumps near 1.5% and recovers above $66.80 on Wednesday. The positive trading day is very welcome for the much-battered commodity, which at one point faced nearly 10% losses for September and reached its lowest level since May 4, 2023, on Tuesday. The decline to $64.75 unfolded after the latest monthly Organization of the Petroleum Exporting Countries (OPEC) report showed on Tuesday that the OPEC was very positive on its demand forecast and mentioned that only a few ten thousand barrels per day reduction would be enough to limit oversupply and meet forecasted demand.
The US Dollar Index (DXY), which tracks the performance of the US Dollar (USD) against a basket of currencies, is easing since Vice President Kamala Harris was labelled victor in the overnight presidential debate against former US President Donald Trump. However, the focus is shifting to the US Consumer Price Index (CPI) release for August. The number bears a big importance, with markets still unsure whether to lock in a 25- or 50-basis point interest rate cut from the US Federal Reserve (Fed) next week.
At the time of writing, Crude Oil (WTI) trades at $66.78 and Brent Crude at $70.47
Oil news and market movers: OPEC report deemed too optimistic
- The Energy Information Administration (EIA) also released its monthly Oil outlook and saw US demand plateauing while markets will remain in deficit due to the OPEC output cuts, according to Bloomberg reports.
- The American Petroleum Institute (API) reported a drawdown by 2.79 million barrels in its recent stockpile change of Crude Oil number on Tuesday. There was a small build of 0.7 million expected.
- At 14:30 GMT, the EIA will publish its weekly Crude Stockpile Change for the week ending September 6. A build of 0.9 million is expected following the previous draw of 6.873 million barrels.
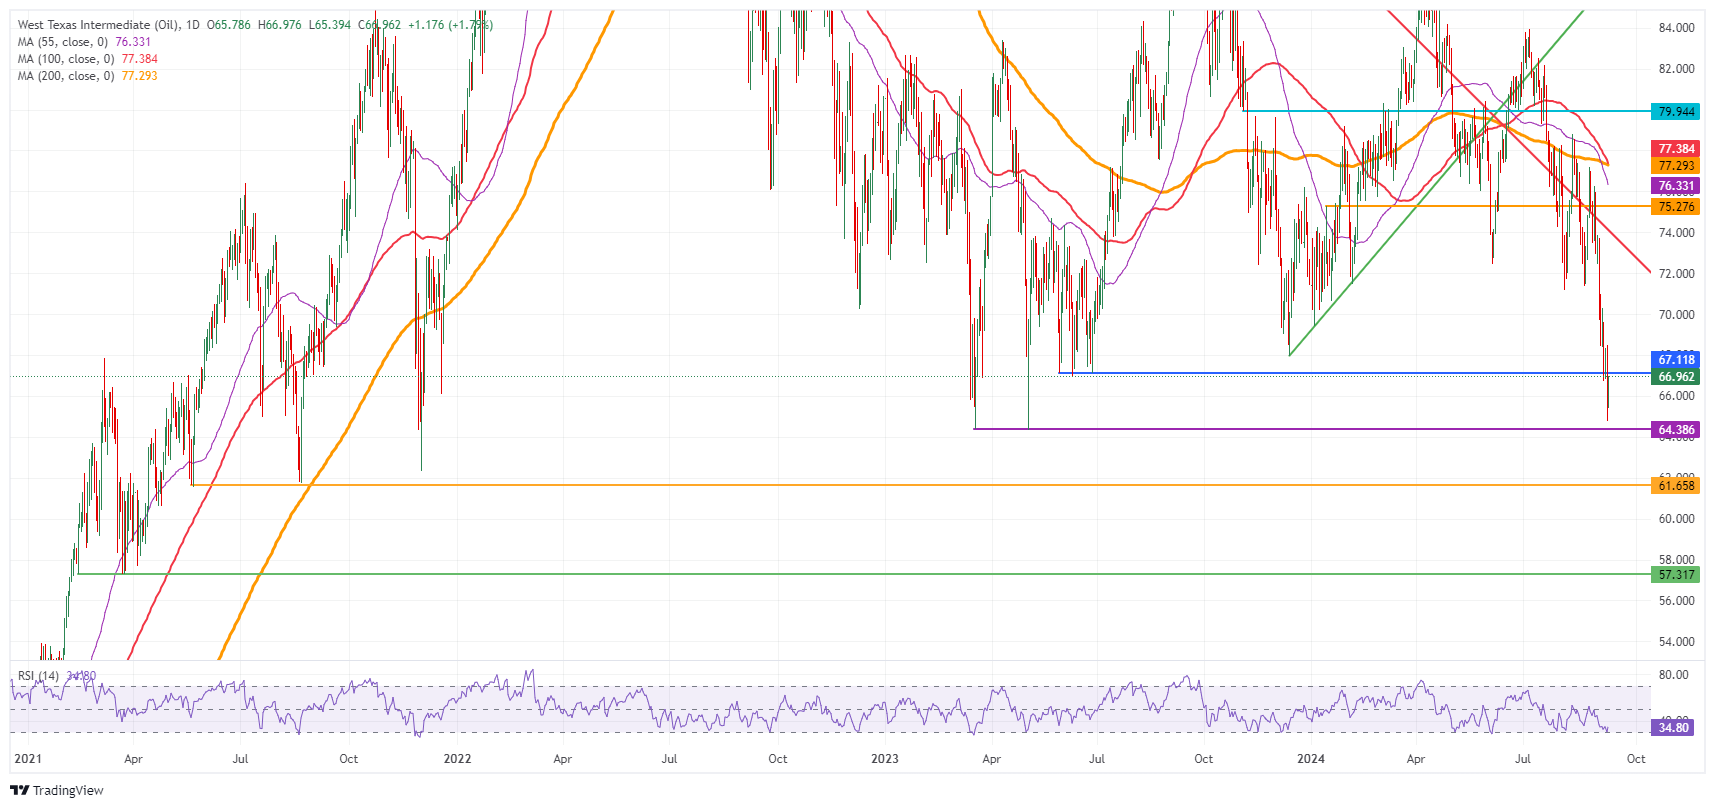
Oil Technical Analysis: Here comes the dead-cat
Crude Oil has cracked under pressure after markets saw the small cuts in forecasted demand from OPEC not really being in lie with reality. Recent data reveals an economic slowdown globally, with easing demand from the biggest market takers: China and the US. With this dislocation between OPEC’s projections and the economic reality, any upside moves are expected to remain short-lived as long as current supply and demand imbalances remain at hand.
There is a long road to recovery before heading back above $70. First up is $66.91, which acts as resistance now after it lost its place as a support. Once that level gets reclaimed, $70.00 gets back on the table with $71.20 as the first level to look out for. Ultimately, a return to $75.27 is still possible, but would come with a seismic shift or disruption in current balances.
The next level further down the line is $64.38, the low from March and May 2023. Should that level face a second test and snap, $61.65 becomes a target, with of course $60.00 as a psychologically big figure just below it, at least tempting to be tested.
US WTI Crude Oil: Daily Chart
Brent Crude Oil FAQs
Brent Crude Oil is a type of Crude Oil found in the North Sea that is used as a benchmark for international Oil prices. It is considered ‘light’ and ‘sweet’ because of its high gravity and low sulfur content, making it easier to refine into gasoline and other high-value products. Brent Crude Oil serves as a reference price for approximately two-thirds of the world's internationally traded Oil supplies. Its popularity rests on its availability and stability: the North Sea region has well-established infrastructure for Oil production and transportation, ensuring a reliable and consistent supply.
Like all assets supply and demand are the key drivers of Brent Crude Oil price. As such, global growth can be a driver of increased demand and vice versa for weak global growth. Political instability, wars, and sanctions can disrupt supply and impact prices. The decisions of OPEC, a group of major Oil-producing countries, is another key driver of price. The value of the US Dollar influences the price of Brent Crude Oil, since Oil is predominantly traded in US Dollars, thus a weaker US Dollar can make Oil more affordable and vice versa.
The weekly Oil inventory reports published by the American Petroleum Institute (API) and the Energy Information Agency (EIA) impact the price of Brent Crude Oil. Changes in inventories reflect fluctuating supply and demand. If the data shows a drop in inventories it can indicate increased demand, pushing up Oil price. Higher inventories can reflect increased supply, pushing down prices. API’s report is published every Tuesday and EIA’s the day after. Their results are usually similar, falling within 1% of each other 75% of the time. The EIA data is considered more reliable, since it is a government agency.
OPEC (Organization of the Petroleum Exporting Countries) is a group of 13 Oil producing nations who collectively decide production quotas for member countries at twice-yearly meetings. Their decisions often impact Brent Crude Oil prices. When OPEC decides to lower quotas, it can tighten supply, pushing up Oil prices. When OPEC increases production, it has the opposite effect. OPEC+ refers to an expanded group that includes ten extra non-OPEC members, the most notable of which is Russia.
EUR/USD is slightly firmer, with spot pricing marked up in a reflection of the generally soft tone of the USD, Scotiabank’s Chief FX Strategist Shaun Osborne notes.
Scope for gains remains limited ahead of ECB Thursday
“The Euro (EUR) is unlikely to shine ahead of Thursday’s ECB policy decision. A 25bps rate cut is expected and fully priced in but the outlook for rates that is perhaps more important for the near-term direction of rates. Markets are pricing in 64bps of total easing between now and the end of the year. That is a little quicker than the one cut per quarter pace that the ECB seems to be operating on.”
“Intraday price action suggests a low/ reversal formed around this week’s 1.1015 low (bullish “morning star” pattern on the 6- hour chart). But gains have stalled in the mid-1.10s and short-term trend momentum signals are still reading bearish for the EUR. Gains through 1.1070/75 would give the EUR a little more intraday momentum. Key short-term support is 1.1015 now.”
- Silver is unfolding a bullish leg within a range.
- Upside is helped by bullish convergence between price and momentum.
Silver (XAG/USD) is trading inside a broad range that stretches from the $26s to the $30s. Within that range it is oscillating within the confines of a smaller consolidation between roughly $27.70 and $29.20.
Silver 4-hour Chart
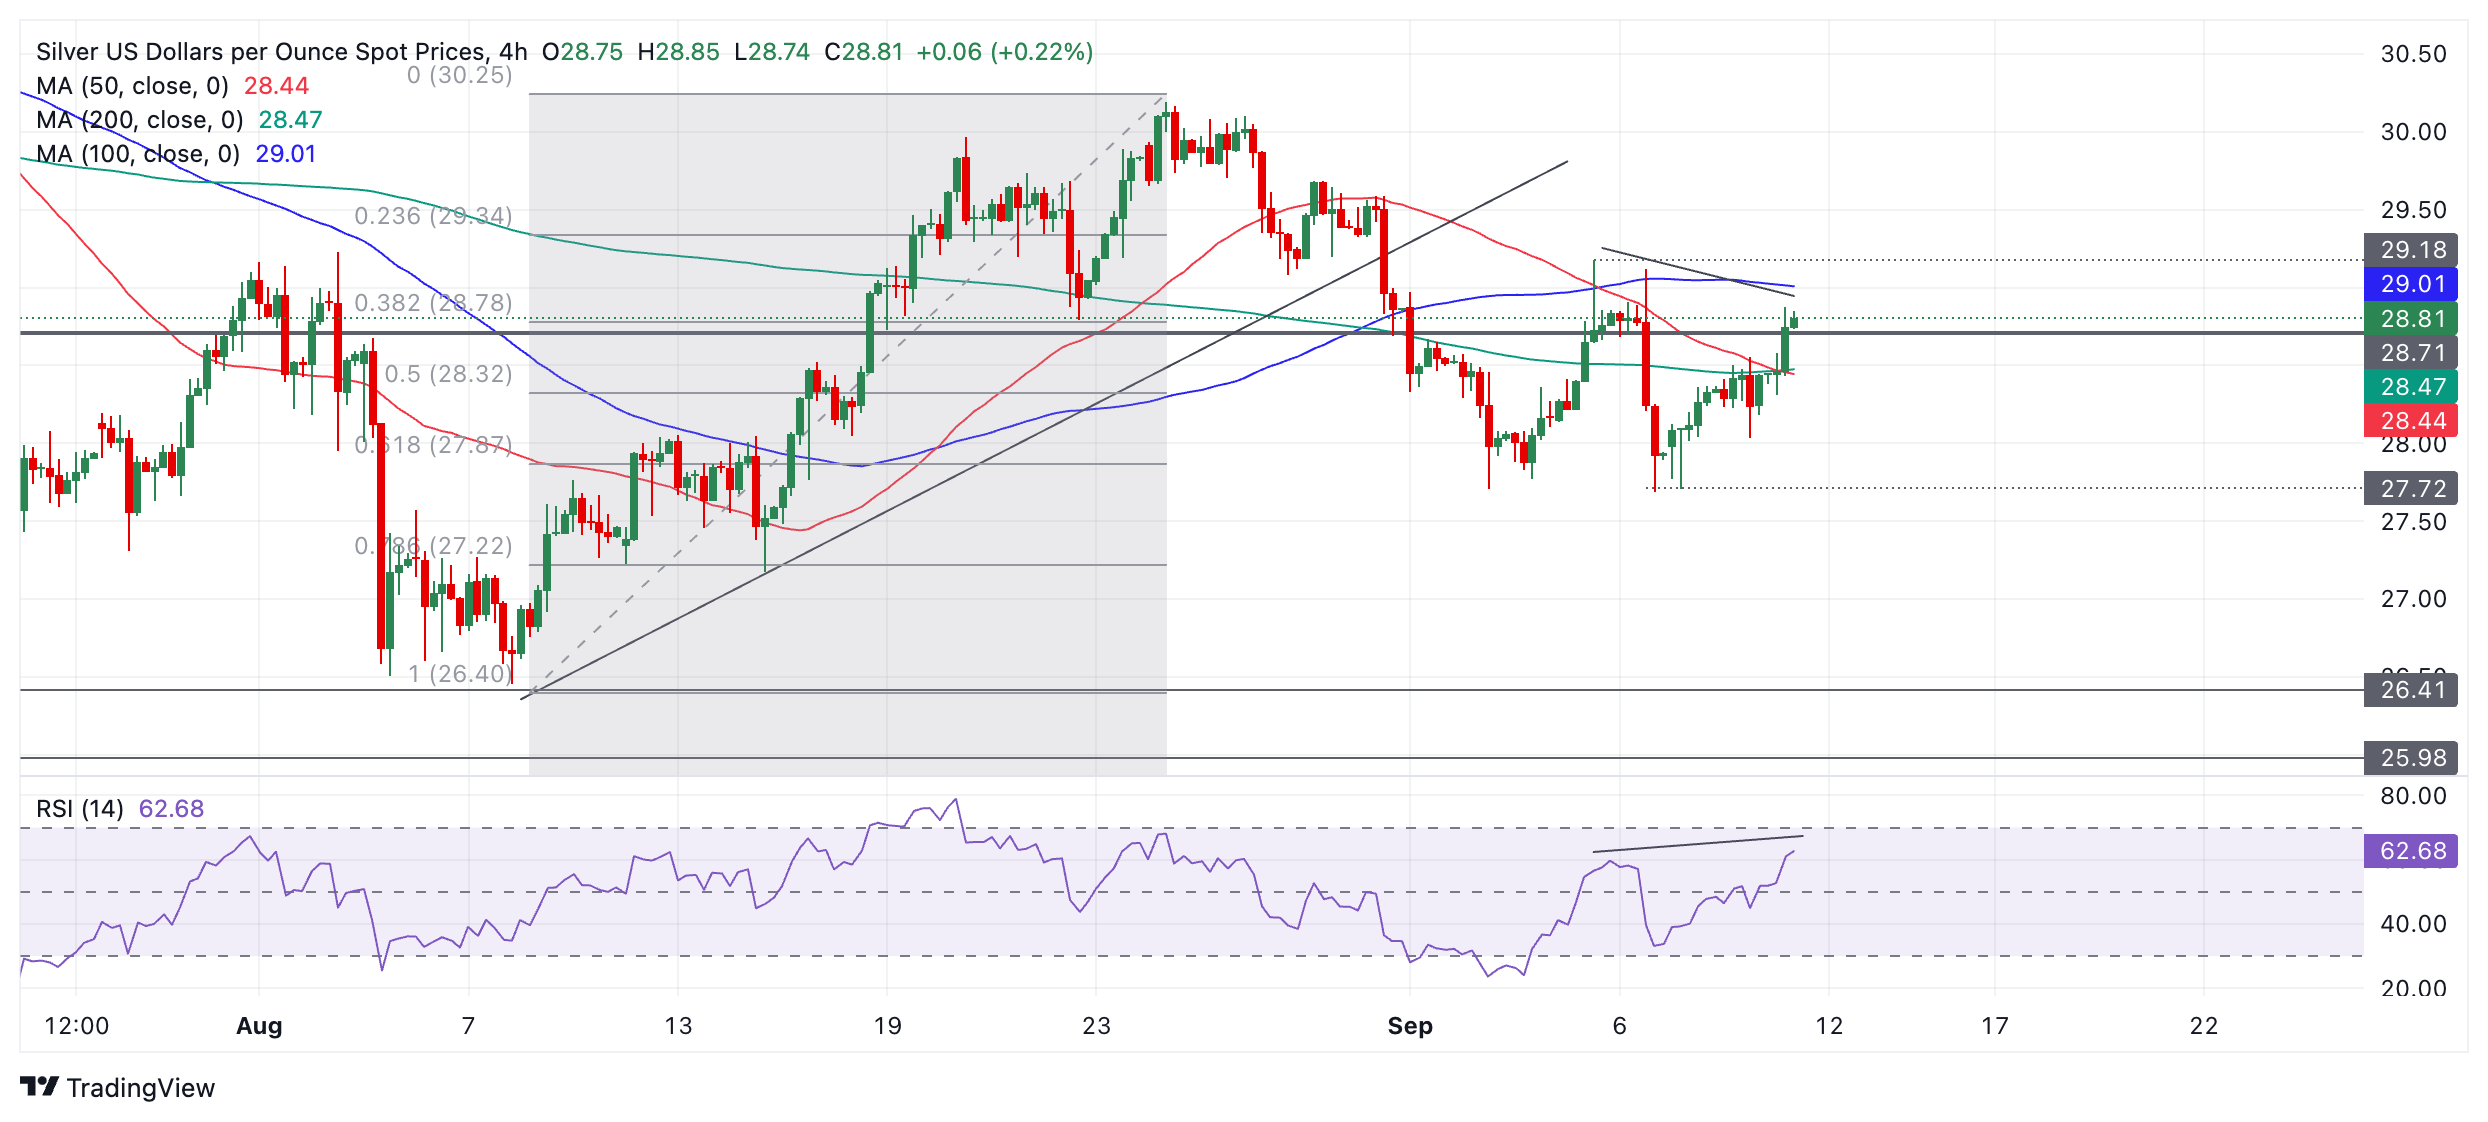
Silver is currently trading in the $28.80s as it unfolds an up leg towards the ceiling of the mini range. It will probably continue higher until it reaches about $29.18 (September 5 high).
The up move from the September 6 swing low is accompanied by a bullish convergence with the Relative Strength Index (RSI) momentum indicator. The price is lower than it was on September 5 but the RSI is higher. This indicates the current up leg is accompanied by bullish conviction.
After it reaches the top of this mini-range there is a possibility it could rotate and start moving back down towards the $27.70 floor.
Alternatively a decisive break higher would indicate a bullish continuation. Such a move would probably reach about $30.10 and the ceiling of the broader range. The target is calculated by taking the 0.618 Fibonacci extension of the height of the smaller range and extrapolating it higher, which is the standard technical method for forecasting a range breakout.
Since it is such a dominant topic this morning, there’s no point in completely ignoring the debate between the US presidential candidates. However, the effect on the currency market was minimal at best, Commerzbank’s Head of FX and Commodity Research Ulrich Leuchtmann notes.
The effect on the currency market is minimal at best
“As I write this, the US Dollar (USD) is trading no weaker than 0.2% against the G10 average than it was last night. And even this mini-reaction is more likely a consequence of the yen strength (see above) than USD-idiosyncratic. AUD and NZD lost similarly. Of course, it is not irrelevant who will be living in the White House from next year on.”
“However, it is becoming increasingly clear that it is not as easy as many had hoped: to take 2016 as a model. At the time, Trump's victory triggered USD strength. At the margin, this may also be the effect this time. However, in the event of a Trump victory, there would also be USD-negative risks: that he might this time (better prepared) significantly damage the Fed's independence, that he might damage the USD's dominance by wanting to impose it on other countries (instead of accepting that it is the result of uncoordinated decisions by countless traders and investors).”
“Even if we could already predict the outcome of the election today, it would be completely unclear what the appropriate USD reaction would be. And so, it is only logical that the market cannot agree on a clear reaction to today's debate.”
The USD is trading defensively, Scotiabank’s Chief FX Strategist Shaun Osborne notes.
USD trades broadly lower
“US yields continue to retreat, with 2Y yields slipping to a two-year low today, as US equity futures trade in the red. Losses in US yields—and the USD—picked up in overnight trade around the US presidential debate which VP Harris appears to have won. Markets may also be front running this morning’s US inflation data to some extent. US CPI data for August are expected to show some further moderation in headline prices but stalled progress on core measures.”
“Headline CPI is forecast to rise 0.2% M/M and 2.5% over the year (down from 2.9% in July—note Scotia is a little higher than consensus at 2.6%). Core prices are also forecast to rise 0.2% in the month but remain at 3.2% over the year. A modest upside surprise is unlikely to move markets significantly, with the Fed’s attention clearly on the labour market. Price action suggests markets may be concerned by the risk of weaker data which would likely result in markets pricing back in some risk of a more aggressive Fed rate cut next week.”
“The JPY is out-performing on the session, boosted by lower US yields and comments from BoJ board member Nakagawa who remarked that the central bank will continue to adjust policy if the economy develops in line with projections. Lower US yields and narrower US/Japan spreads are supportive of a firmer JPY broadly, with the exchange rate now showing a stronger—and more typical—correlation with (10Y) spreads than earlier this year. Spot looks to be heading for a test of major support just under 140. More broadly, a low close for the DXY today will tilt near-term technical risks towards renewed softness.”
The US Dollar (USD) is likely to trade with a downward bias; the probability of it breaking the significant support at 140.80 is not high, UOB Group FX analysts Quek Ser Leang and Peter Chia note.
Probability of it breaking below 140.80 is not high
24-HOUR VIEW: “We expected USD to trade in a range between 142.40 and 144.00 yesterday. USD then traded in a 142.18/143.71 range, closing on a soft note at 142.43 (-0.53%). Downward momentum is beginning to build, but not enough to suggest the start of a sustained decline. However, as long as 143.30 (minor resistance is at 142.70) is not breached, USD is likely to edge lower, potentially breaking below July’s low of 141.66. The significant support level at 140.80 is unlikely to come under threat.”
1-3 WEEKS VIEW: “We continue to hold the same view as from Monday (09 Sep, spot at 142.65). As highlighted, we expect USD to trade with a downward bias. However, given the tentative buildup in momentum, the probability of USD breaking the significant support level at 140.80 is not high. To maintain the buildup in momentum, USD must not breach the ‘strong resistance’ at 144.00 (no change in level).”
- USD/JPY has broken to new lows, indicating a possible reversal in the long-term trend.
- The move lacks momentum, however, and risks running out of energy before a pull back higher.
USD/JPY has made a bearish break below the key August 5 lows. Although the move down lacks momentum the break could be indicative of a long-term trend reversal.
USD/JPY Daily Chart
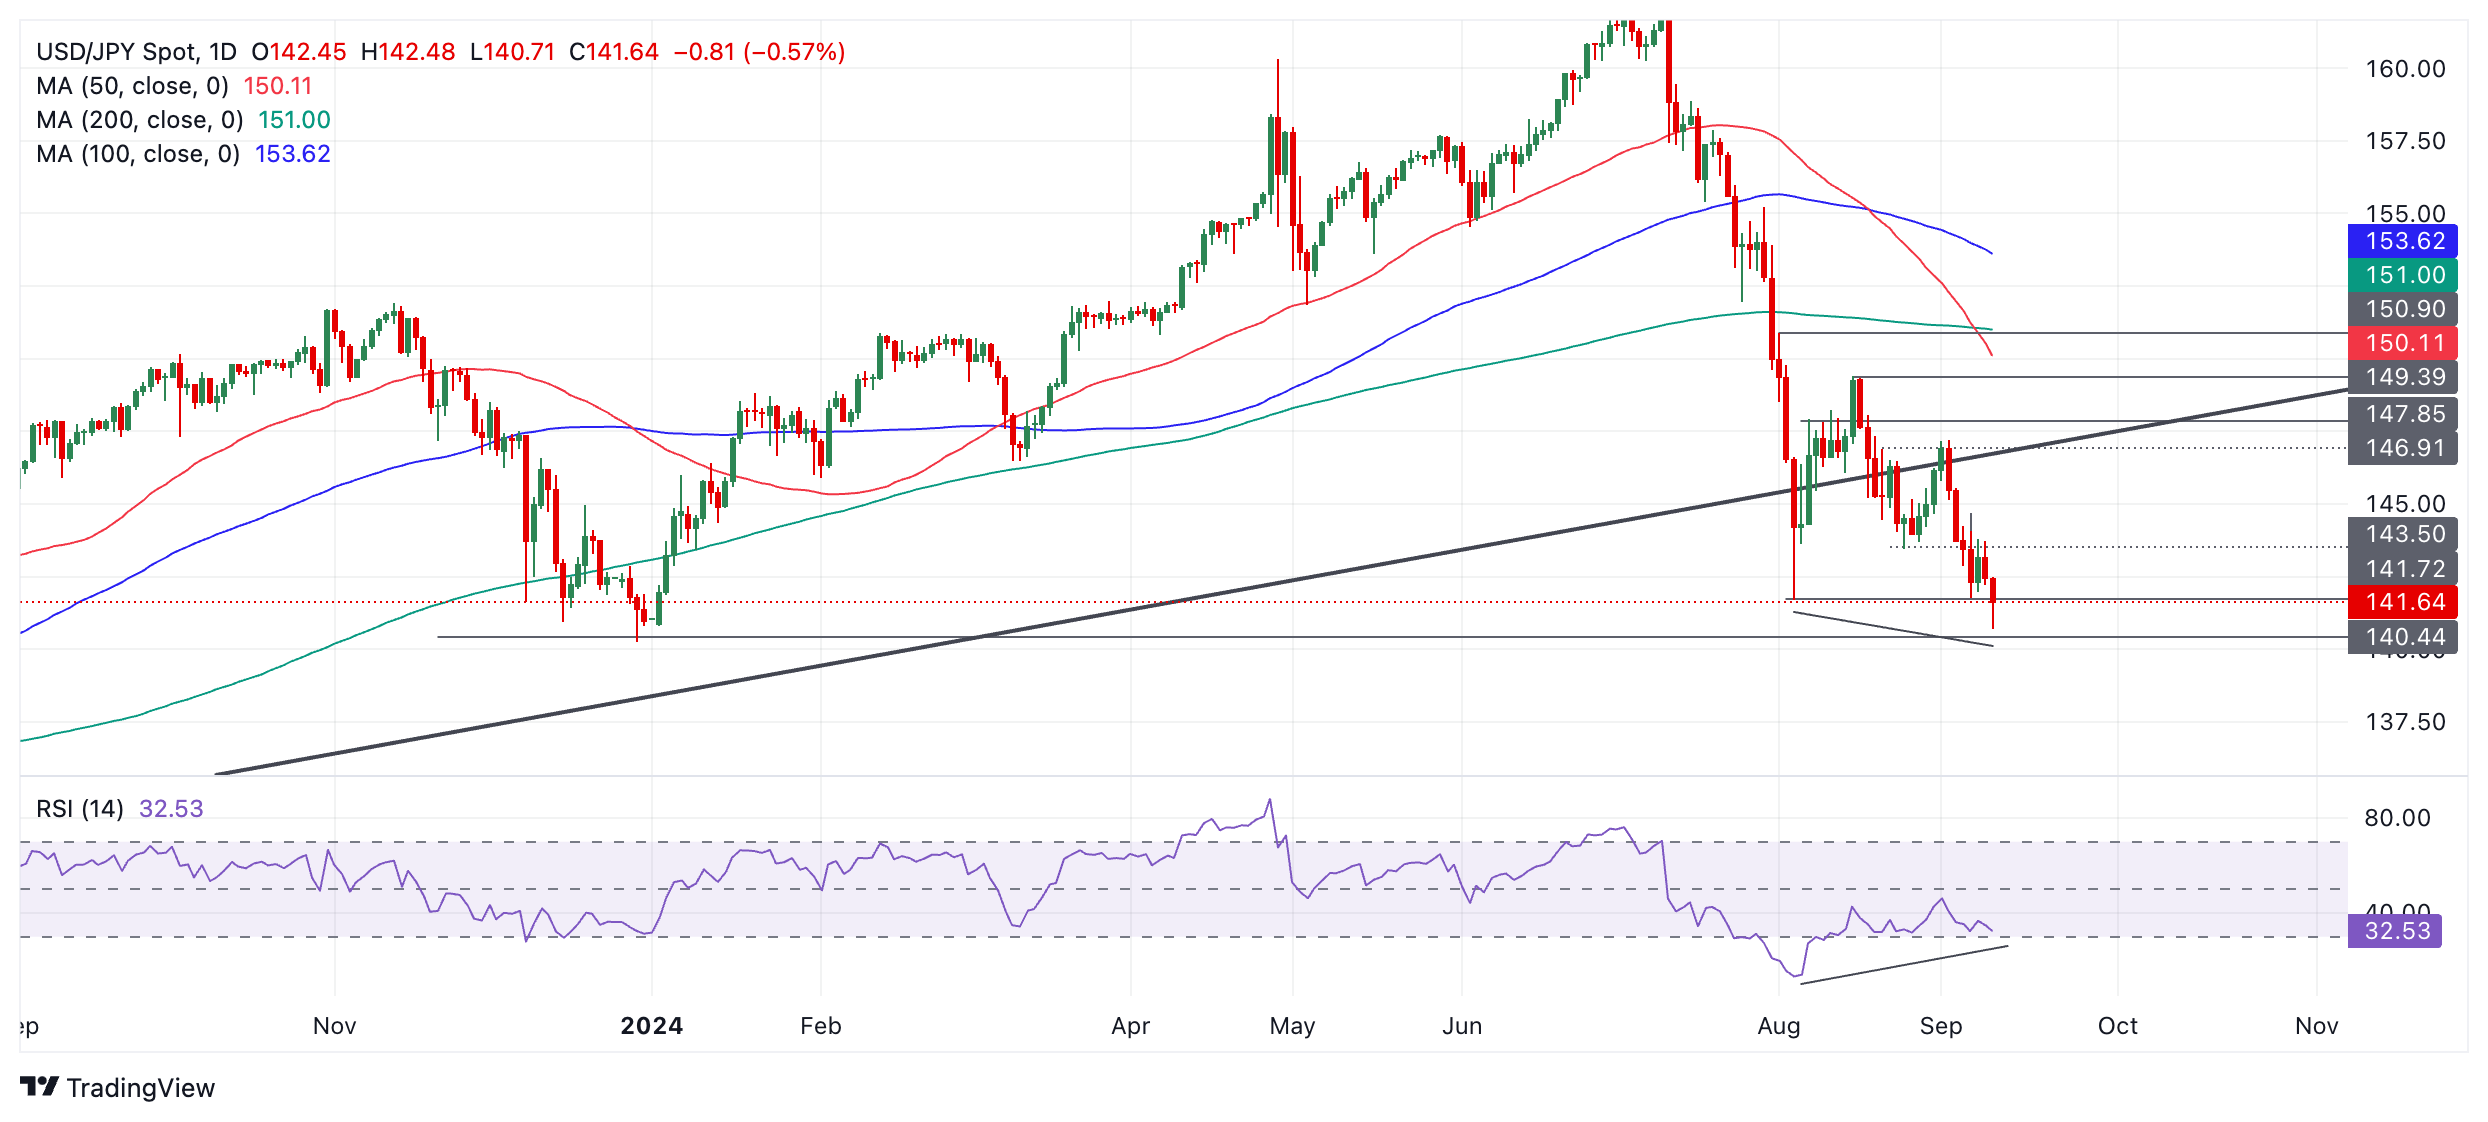
The pair has already broken below a major multi-year trendline, suggesting the long-term uptrend has been undermined. The break below the August 5 lows confirms it might have reversed. Given it is a principle of technical analysis theory that “the trend is your friend” such a break increases the odds of more downside evolving in the future.
Strong support comes in at 140.25 (December 2023 low), however, and this could slow the pair’s descent. A break below that level too, would provide even more confirmatory evidence of a reversal in the trend. Such a break might see price fall to the next target at 137.24 (July 2023 low).
USD/JPY is showing bullish convergence between the price and the Relative Strength Index (RSI). At the August 5 bottom, the RSI was in the oversold zone, now even though price has sunk to a lower low, RSI has not.
This could be a sign that the move down lacks bearish conviction and suggests a risk of a rebound higher.
- The US Dollar edges lower on Wednesday after markets labelled Harris as the winner of Tuesday’s presidential election debate.
- US CPI data for August is the last point for the Fed to take into account before next week’s decision.
- The US Dollar Index falls back below 101.50 and could extend decline if US inflation comes lower than expected.
The US Dollar (USD) eases a touch on Wednesday, with several news correspondents commenting that Vice President Kamala Harris has won the presidential election debate between her and former US President Donald Trump. The victory is a very small one though, not a landslide at all. Expectations are that Kamala Harris will now gain some points in the polls, though it will still remain a close call towards the November 5 elections.
On the economic data front, the US Consumer Price Index (CPI) release for August will focus all the attention for this week. Markets see this as the last data point for the US Federal Reserve (Fed) and its Federal Open Market Committee (FOMC) to make their interest rate decision next week. A softer CPI release would open the door for a 50 basis point rate cut, while a steady or stronger CPI number might limit the outcome to only a 25 basis point rate cut.
Daily digest market movers: 25 or 50 bps rate cut?
- A CNN poll revealed that 63% of the viewers saw Harris as the winner of the presidential election debate, Bloomberg reported.
- At 11:00 GMT, the Mortgage Bankers Association will release its weekly Mortgage Applications number for the week ending September 6. Prior week, there was a rise of 1.6%, with no forecast available.
- At 12:30 GMT, the US Consumer Price Index (CPI) for August will be released:
- Monthly Headline CPI inflation is expected to remain stable at 0.2%.
- Yearly Headline CPI inflation is expected to ease to 2.6% from 2.9%.
- Monthly Core CPI inflation should remain at 0.2%.
- Yearly Core CPI inflation is expected to remain at 3.2%.
- At 17:00 GMT, the US Treasury will allocate 10-year notes.
- Equities are struggling, with Asian equities already closing with losses often more than 1% on Wednesday. European equities are in the red, though less than 0.5%. Meanwhile US Futures are down by 0.5% on average.
- The CME Fedwatch Tool shows a 67.0% chance of a 25 basis points (bps) interest rate cut by the Fed on September 18 against a 33.0% chance for a 50 bps cut. For the meeting on November 7, another 25 bps cut (if September is a 25 bps cut) is expected by 27.2%, while there is a 53.2% chance that rates will be 75 bps (25 bps + 50 bps) and a 19.6% probability of rates being 100 (25 bps + 75 bps) basis points lower.
- The US 10-year benchmark rate trades at 3.61%, a fresh 15 month low at levels not seen since mid-June 2023.
US Dollar Index Technical Analysis: Range trading 2.0
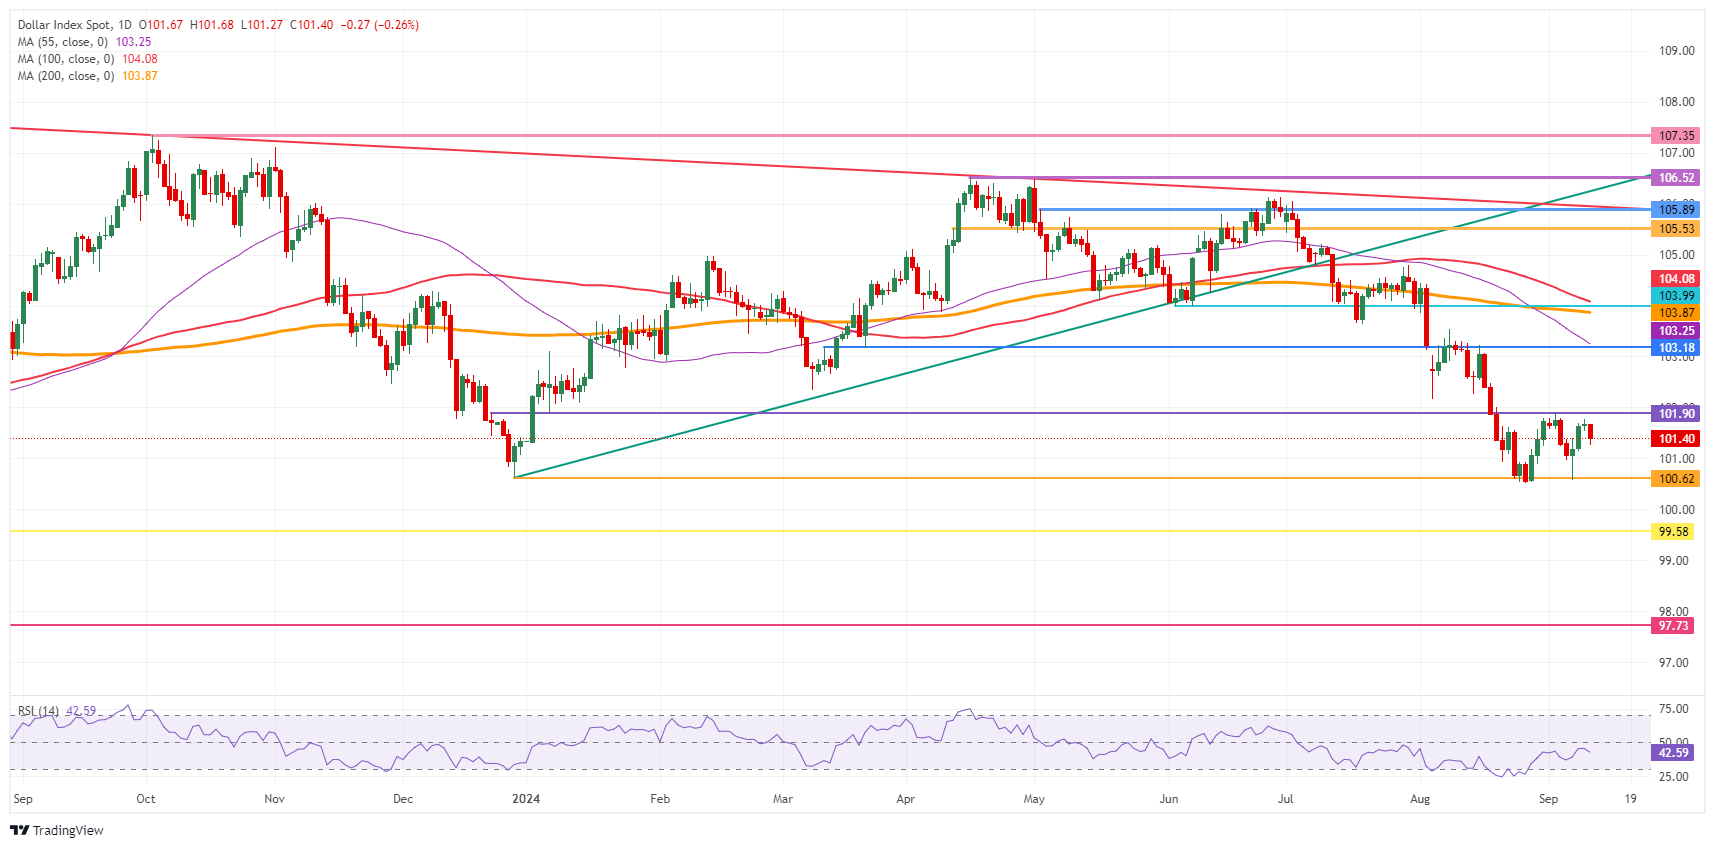
The US Dollar Index (DXY) is stuck in a range between 101.90 on the upside to 100.62 on the downside since September began. Markets are still awaiting clarity from US data on whether the Fed’s interest rate cut next week will be a 25 or a 50 basis point. Expect the US CPI release on Wednesday to give some more clarity or even an answer on that question.
The first resistance at 101.90 is getting ready for a second test after its rejection last week. Further up, a steep 1.2% uprising would be needed to get the index to 103.18. The next tranche up is a very misty one, with the 55-day Simple Moving Average (SMA) at 103.40, followed by the 200-day SMA at 103.89, just ahead of the big 104.00 round level.
On the downside, 100.62 (the low from December 28) holds strong and has already made the DXY rebound four times in recent weeks. Should it break, the low from July 14, 2023, at 99.58, will be the ultimate level to look out for. Once that level gives way, early levels from 2023 are coming in near 97.73.
US Dollar Index: Daily Chart
US Dollar FAQs
The US Dollar (USD) is the official currency of the United States of America, and the ‘de facto’ currency of a significant number of other countries where it is found in circulation alongside local notes. It is the most heavily traded currency in the world, accounting for over 88% of all global foreign exchange turnover, or an average of $6.6 trillion in transactions per day, according to data from 2022. Following the second world war, the USD took over from the British Pound as the world’s reserve currency. For most of its history, the US Dollar was backed by Gold, until the Bretton Woods Agreement in 1971 when the Gold Standard went away.
The most important single factor impacting on the value of the US Dollar is monetary policy, which is shaped by the Federal Reserve (Fed). The Fed has two mandates: to achieve price stability (control inflation) and foster full employment. Its primary tool to achieve these two goals is by adjusting interest rates. When prices are rising too quickly and inflation is above the Fed’s 2% target, the Fed will raise rates, which helps the USD value. When inflation falls below 2% or the Unemployment Rate is too high, the Fed may lower interest rates, which weighs on the Greenback.
In extreme situations, the Federal Reserve can also print more Dollars and enact quantitative easing (QE). QE is the process by which the Fed substantially increases the flow of credit in a stuck financial system. It is a non-standard policy measure used when credit has dried up because banks will not lend to each other (out of the fear of counterparty default). It is a last resort when simply lowering interest rates is unlikely to achieve the necessary result. It was the Fed’s weapon of choice to combat the credit crunch that occurred during the Great Financial Crisis in 2008. It involves the Fed printing more Dollars and using them to buy US government bonds predominantly from financial institutions. QE usually leads to a weaker US Dollar.
Quantitative tightening (QT) is the reverse process whereby the Federal Reserve stops buying bonds from financial institutions and does not reinvest the principal from the bonds it holds maturing in new purchases. It is usually positive for the US Dollar.
Today, the markets will learn from the U.S. Bureau of Labor Statistics how consumer prices in the U.S. developed in August. A few months ago, this release was the most important news of the month for FX traders. When the Fed's main concern was to combat the inflation shock, this figure was the most revealing for how the Fed sets the key interest rate and thus the carry-on USD positions, Commerzbank’s Head of FX and Commodity Research Ulrich Leuchtmann notes.
A muted market reaction to data surprises is expected
“The fight against inflation has seemingly been won. In the last three months, core consumer price inflation was a meager 1.6% (annualized) – well below levels that would be compatible with the Fed's target (see figure above). Even if the BLS publication for August were to show a value above the Fed target (for core CPI: more than approx. +0.2% month-on-month or more than +3.2% year-on-year), contrary to analysts' expectations, this would not be cause for renewed inflation fears.”
“Higher than expected US inflation is actually USD-negative news. If the domestic purchasing power of the greenback erodes faster than expected, then per se this indicates an erosion of USD purchasing power on the currency market, i.e. a weaker dollar. Surprisingly high inflation only becomes positive if the Fed expectations change disproportionately, i.e. if the future discounted interest rate advantage of the dollar grows by more than the purchasing power of the dollar falls.”
“Just a few months ago, the USD – fundamentally justified at the time – rose sharply when inflation was surprisingly high and fell sharply when inflation was surprisingly low. The market reaction can at best adjust peu à peu. This argument may support some back-and-forth after data releases and probably a muted market reaction to data surprises. But it does not (yet) support a change in direction.”
Aug export growth accelerated to 8.7% y/y (Bloomberg est: 6.6%, Jul: 7.0%) in USDterms and 8.4% y/y in CNY-terms (Jul: 6.5%), UOB Group economist Ho Woei Chen notes.
Positive headline exports but weaker imports raised caution
“China reported stronger export growth in Aug but outlook was weighed by flat import growth and emerging signs of weaker external demand.”
“In volume terms, China’s commodities demand has remained resilient despite signs of slowing economic momentum. Imports of refined petroleum products, LPG and soya beans strengthened noticeably in Aug. Imports of iron and copper moderated compared to the year-ago period, which is indicative of weaker construction activity.”
“The low base effect is likely to continue to support both the export and import growth for the rest of the year. We expect China’s export and import growth in 2024 at 5.0% (2023: -4.6%) and 4.5% (2023: -5.5%) respectively.”
- EUR/USD is rising as the US Dollar weakens following the Trump-Harris televised debate.
- The consensus was that Vice President Kamala Harris came out better after the debate.
- USD is falling because of the lower chance Trump will be able to implement Dollar-friendly policies.
EUR/USD is exchanging hands in the 1.1040s, trading higher on Wednesday amid a broad-based weakening in the US Dollar (USD) following the Trump-Harris televised presidential election debate.
Most analysts agree that Vice President Kamala Harris came out on top during the debate, and a recent poll from the BBC showed that she is ahead with 47% versus former President Donald Trump’s 43%.
The US Dollar (USD) is weakening – and as a result EUR/USD is rising – because one of Trump’s policies is to protect the US Dollar’s status as the world’s reserve currency. This includes penalizing countries who refuse to trade in USD by imposing tariffs on their goods. The policy is a response to the growing influence of the BRICS trading bloc and its policy of de-dollarizing the global economy.
EUR/USD rises as investors debate chance of jumbo Fed rate cut
EUR/USD is further strengthening as investors continue to see a sizable chance of the US Federal Reserve (Fed) cutting interest rates by a larger-than-standard 50 basis points (bps) at its next meeting on September 17-18. Whilst a 25 bps (0.25%) cut is already expected, the probabilities of a larger 50 bps “jumbo cut” currently stand at around 30% according to the CME FedWatch tool, which bases its predictions on the price of 30-day fed funds futures. A double-dose 50 bps cut would weigh on USD by reducing foreign capital inflows, but would be bullish for EUR/USD.
US inflation data on tap
Wednesday sees the release of US Consumer Price Index (CPI) data for August, which would normally influence Fed rate-cut expectations. However, analysts vary in the extent to which they expect the data to have an impact – some say inflation has fallen so low now that it is irrelevant.
“The (CPI) figure is no longer as overwhelmingly important as it was a few months ago,” says Ulricht Leutchmann, FX Analyst at Commerzbank. “The fight against inflation has seemingly been won. In the last three months, core consumer price inflation was a meager 1.6% (annualized) – well below levels that would be compatible with the Fed's target,” he adds.
Elias Haddad, Senior Markets Strategist at Brown Brothers Harriman (BBH), however, says: “Higher than expected US inflation in August can reduce the probability of a jumbo Fed funds rate cut in September and underpin a firmer USD.”
Deutsche Bank’s Jim Reid, meanwhile, makes the point that an important deflationary factor is the steep fall in crude Oil prices over recent days, with WTI crude Oil now trading in the mid $60s per barrel. “From the Fed’s perspective, one trend that’s helping to remove inflationary pressures has been the sharp decline in Oil prices over recent weeks,” he says in his “Early Morning Reid.”
ECB meeting in focus
EUR/USD upside is likely to be limited, however, by growth concerns in the Eurozone. Germany, in particular, is suffering from a much-publicized slowdown in manufacturing, especially in its key automobile sector, due to foreign competition.
The European Central Bank (ECB) is scheduled to conclude its policy meeting on Thursday, and the consensus expectation is for the bank to announce a 25 bps cut to its deposit facility rate in order to help stimulate growth. The deposit facility rate (DFR) is the rate it pays banks on the money they deposit with the ECB. Such a cut would bring it down from 3.75% to 3.50%.
Given the ECB has already announced plans to narrow the spread between the DFR and the main refinancing operations rate (MRO) from 50 bps to 15 bps (from September 18 onwards), the implication is that it will also slash the MRO – its headline rate – at Thursday’s meeting. Given the MRO currently sits at 4.25%, narrowing the spread with the DFR to only 15 bps would imply cutting the MRO by 0.60% to bring it down to 3.65%.
Although the changes have already been telegraphed to the market, there is still a risk the Euro could weaken after the announcement. However, it is the updated macroeconomic projections that could provide the most volatility, with a risk the ECB could cut its growth forecasts. Such a move would weigh on EUR/USD.
“Sluggish Eurozone economic activity suggests the risk is the ECB tweaks lower its inflation and real GDP growth forecasts. This can lead to a downward adjustment to Eurozone interest rate expectations against EUR,” says Elias Haddad, Senior Markets Strategist at Brown Brothers Harriman (BBH).
Technical Analysis: EUR/USD continues posting lower lows
EUR/USD has broadly declined since peaking at 1.1202 on August 26. Despite a reaction higher between September 3-6, the pair has continued posting lower lows, most recently on Wednesday, when it fell to 1.1017. The pair is, therefore, probably in a downtrend and, since “the trend is your friend,” it could be argued the odds favor lower prices to come, although the downtrend is not strong.
EUR/USD 4-hour Chart
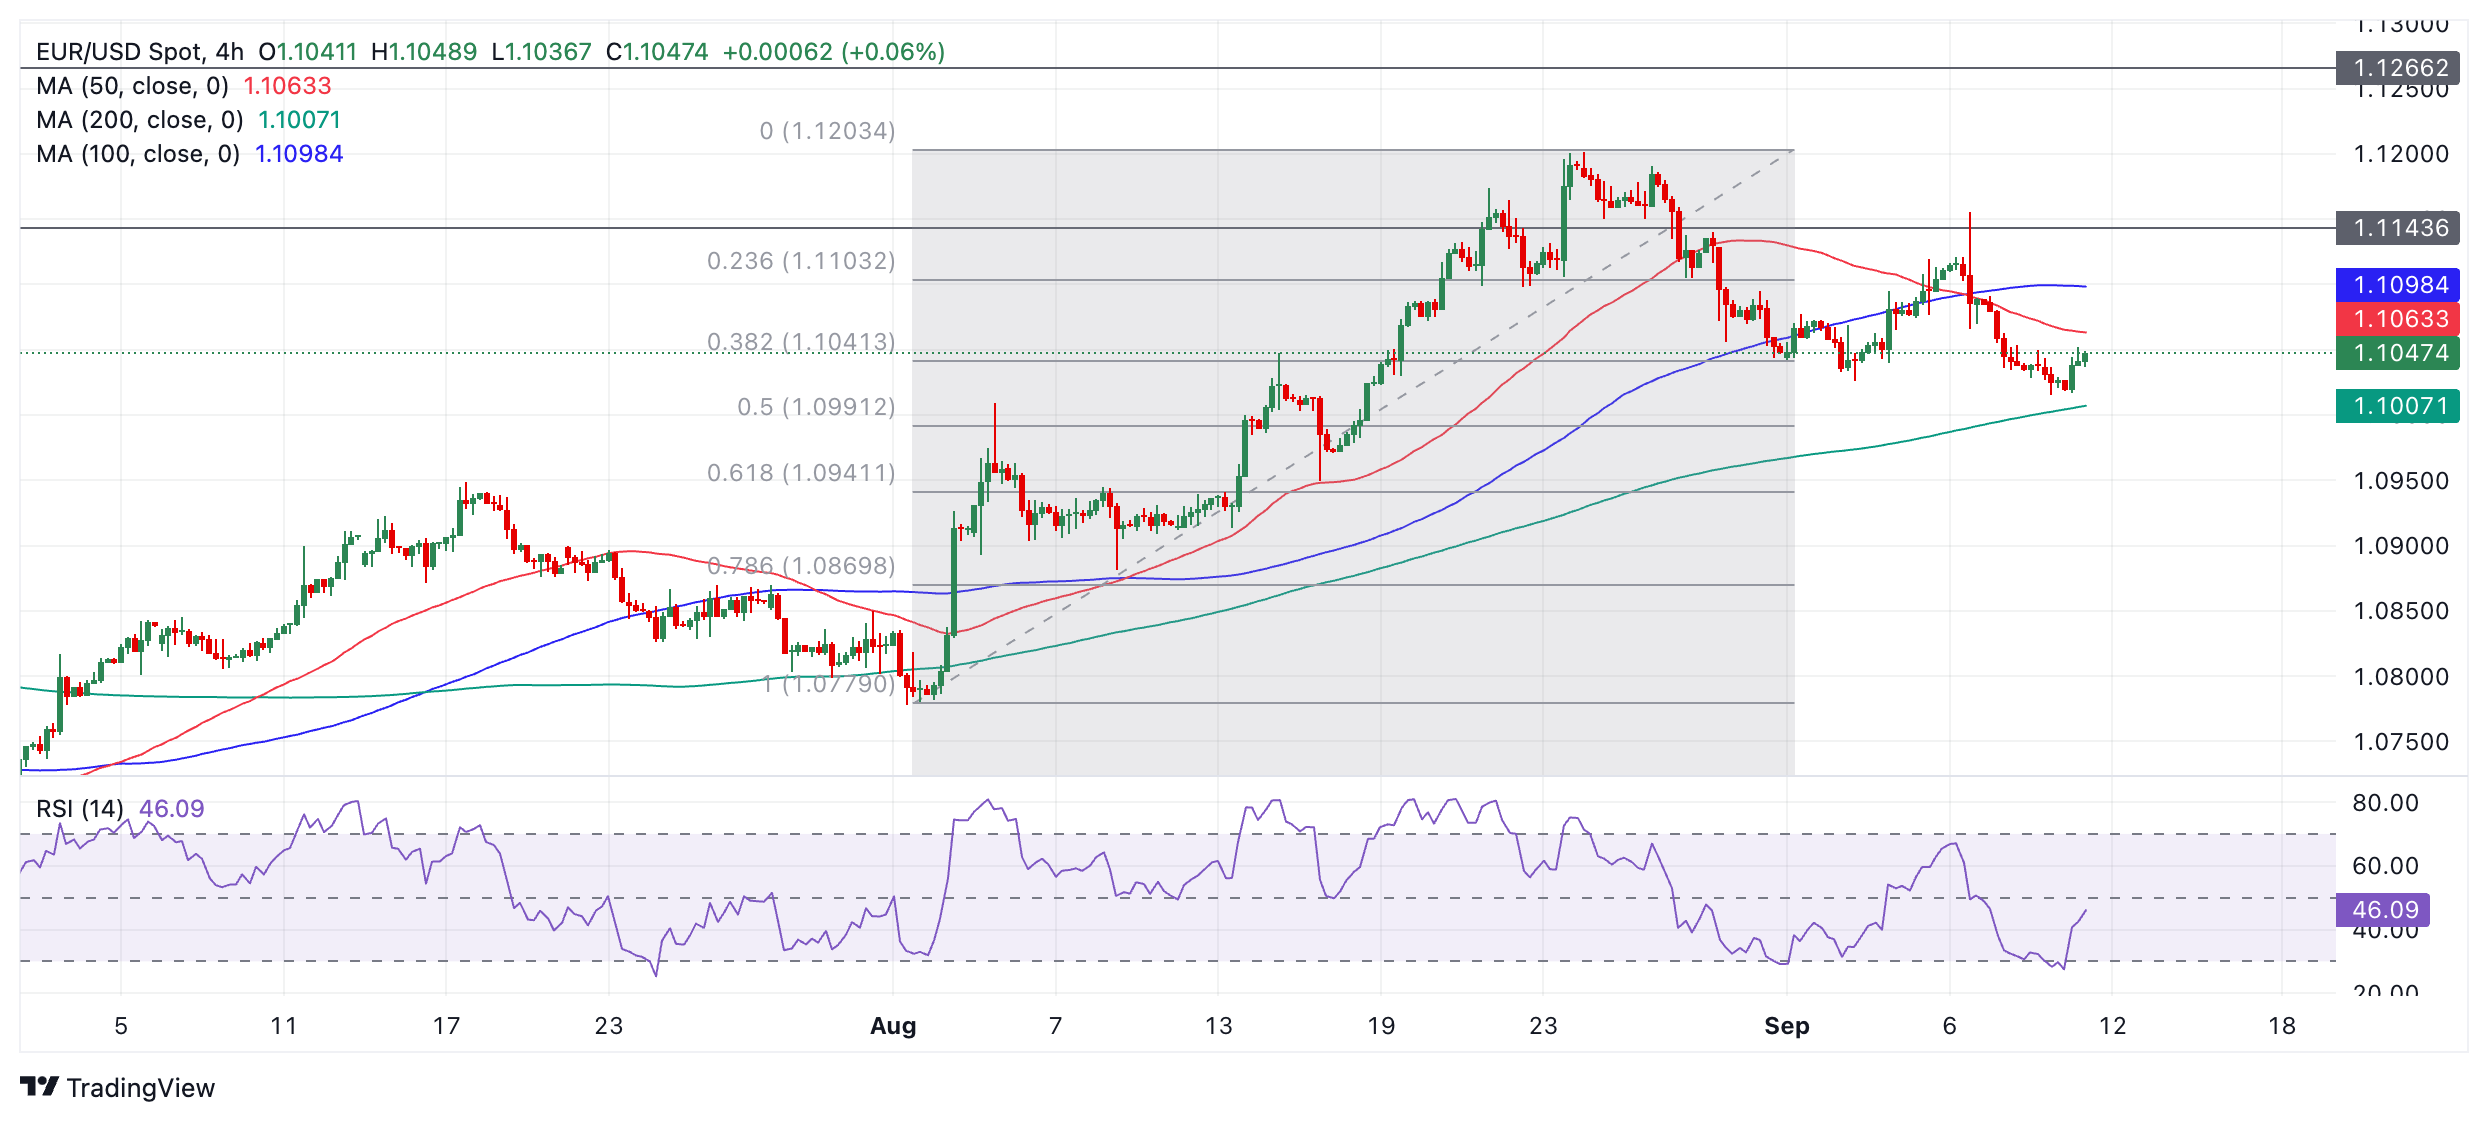
A break below 1.1017 would provide added confirmation of more downside, although it is now not far until the price reaches 1.1000 – a whole number and key psychological support level.
Further weakness could see the pair fall to the Fibonacci 0.618 retracement of the August rally at 1.0941, where it would also likely find firm support.
At the same time, risks of a recovery remain. The Relative Strength Index (RSI), for example, has risen sharply from the overbought zone, giving a buy signal, and it is still possible the pair could recover back up to the 1.1150 line of key resistance highs, if the counter-trend reaction currently underway persists.
Economic Indicator
Consumer Price Index (YoY)
Inflationary or deflationary tendencies are measured by periodically summing the prices of a basket of representative goods and services and presenting the data as The Consumer Price Index (CPI). CPI data is compiled on a monthly basis and released by the US Department of Labor Statistics. The YoY reading compares the prices of goods in the reference month to the same month a year earlier.The CPI is a key indicator to measure inflation and changes in purchasing trends. Generally speaking, a high reading is seen as bullish for the US Dollar (USD), while a low reading is seen as bearish.
Read more.Next release: Wed Sep 11, 2024 12:30
Frequency: Monthly
Consensus: 2.6%
Previous: 2.9%
Source: US Bureau of Labor Statistics
The US Federal Reserve has a dual mandate of maintaining price stability and maximum employment. According to such mandate, inflation should be at around 2% YoY and has become the weakest pillar of the central bank’s directive ever since the world suffered a pandemic, which extends to these days. Price pressures keep rising amid supply-chain issues and bottlenecks, with the Consumer Price Index (CPI) hanging at multi-decade highs. The Fed has already taken measures to tame inflation and is expected to maintain an aggressive stance in the foreseeable future.
USD/SGD’s rebound post-NFP last Fri stumbled at 21-DMA, OCBC FX strategist Frances Cheung and Christopher Wong note.
Waiting for US CPI later this evening
“Broader decline in UST yields, USD and the JPY strength this morning saw USD/SGD eased lower. S$NEER was last estimated at ~1.91% above our model-implied mid, with model implied spot lower bound at 1.3010. With S$NEER close to its lower bound, the room for further downside in USD/SGD may be limited intra-day.”
“However, if broader USD takes another leg lower, then the implied lower bound of USD/SGD can be lower. Pair was last at 1.3025. Daily momentum is mild bullish while RSI fell. Consolidation likely near recent lows as markets await FOMC decision next week.”
“Support at 1.30, 1.2953 (recent low). Resistance at 1.3065 (21-DMA), 1.3160 levels (23.6% fibo retracement of 2024 high to low). We watch US CPI later this evening.”
Provided that New Zealand Dollar (NZD) remains below 0.6185, there is a chance for it to test 0.6115. A sustained break below this level appears unlikely. In the longer run, A break of 0.6115 could lead to a deeper pullback towards 0.6085, UOB Group FX analysts Quek Ser Leang and Peter Chia note.
A deeper pullback towards 0.6085 is possible
24-HOUR VIEW: “We expected NZD to break 0.6115 yesterday. Our expectation did not materialise, as NZD traded in a 0.6129/0.6164 range, closing largely unchanged (0.6150, +0.08%). Despite the relatively quiet price action, the underlying tone appears soft. Today, provided that NZD remains below 0.6185, there is a chance for NZD to test 0.6115 before a recovery can be expected. A sustained break below this level seems unlikely for now.”
1-3 WEEKS VIEW: “On Monday (09 Sep, spot at 0.6170), we indicated that ‘the corrective pullback in NZD could reach 0.6115.’ Yesterday (10 Sep, spot at 0.6140), we indicated that ‘a break of 0.6115 could lead to a deeper pullback towards 0.6085.’ We added, ‘to maintain the momentum, NZD must not break above 0.6205 (‘strong resistance’ level). Our view remains unchanged.”
USD/JPY fell sharply this morning after comments from BoJ’s Nakagama added to policy normalisation bias, OCBC FX strategist Frances Cheung and Christopher Wong note.
Risks skewed to the downside
“The drop in USD/JPY may also have triggered stop-sell orders, resulting in the fairly sharp move to trade below 141.50 low. He said that real rates are at very low level and that BoJ will continue to adjust the degree of easing if the economy and prices perform in line with expectations. Overnight, USD/JPY had already traded heavy, alongside the decline in UST yields, which may be taking cues from the precipitous drop in oil prices.”
“We reiterate that FedBoJ policy shifts and growing pace of normalisation can bring about faster narrowing of UST-JGB yield differentials and this should continue to underpin the broader direction of travel for USD/JPY to the downside. Pair was last seen at 141.80. Daily momentum is not showing a clear bias for now while RSI fell.”
“Death cross earlier formed with 50-DMA cutting 200-DMA to the downside. Risks skewed to the downside. Support at 141.50 (Aug, Sep low). Break below puts 140.20. Resistance at 143.70, 145 (21-DMA) and 146.40 (23.6% fibo retracement of Jul high to Aug low).”
Concerns over softening global demand have so far outweighed any benefits from lower US rates and Latam currencies remain under pressure. The currencies of Colombia, Brazil and to a lesser degree Mexico are getting hit by lower energy prices and investors in the region will have to take a firm view on how far and fast this correction in crude oil prices can extend, ING’s FX strategist Chris Turner notes.
Little respite for Latam currencies this month
“In addition, local negative stories continue to undermine Mexico's peso and Brazil's real. The potential passage of judicial reforms is still weighing on the peso. In Brazil, the next significant event risk (beyond US politics) will be the selic rate decision on 18 September.”
“It seems the market is pricing and needs a hawkish hike from Brazil's central bank. Any reference to "gradualism" or an unclear path on the extent of the tightening cycle could hit the real and call on the central bank to again intervene in the 5.65 area.”
“All in all, we see little respite for Latam currencies this month, even though the Fed will be cutting.”
The Australian Dollar (AUD) is expected to trade in a sideways range of 0.6630/0.6670. In the longer run, AUD is likely to edge lower to 0.6620, UOB Group FX analysts Quek Ser Leang and Peter Chia note.
AUD is likely to edge lower to 0.6620
24-HOUR VIEW: “Yesterday, we held the view that AUD “is likely to weaken further, even though the major support at 0.6620 is likely out of reach.” Our view did not turn out, as AUD traded sideways between 0.6642 and 0.6677, closing at 0.6653 (-0.12%). There has been no increase in either downward or upward momentum, and further sideways trading seems likely. Expected range for today: 0.6630/0.6670.”
1-3 WEEKS VIEW: “Our most recent narrative was from Monday (09 Sep, spot at 0.6675), wherein AUD ‘is likely to edge lower to 0.6620.’ We will continue to hold the same view as long as 0.6715 (no change in ‘strong resistance’ level) is not breached. Looking ahead, a clear break below 0.6620 will shift the focus to 0.6580.”
USD fell, tracking UST yields lower. While the lead-up to first Fed cut can see USD decline, the subsequent price action for the USD post-first fed cut can vary, as seen from past rate cut cycles. USD’s performance is dependent on the market dynamics and growth environment when Fed cut cycle gets underway, OCBC FX strategist Frances Cheung and Christopher Wong note.
US CPI report is on tap
“If Fed rate cuts were in response to one of those major crisis or major global event risks such as GFC, then safe-haven proxy can typically outperform. These include JPY, CHF and to some extent, USD. However, if Fed cut was more a case of policy normalization, non-recessionary driven and that growth outside-US continues to trudge along (nothot-not-cold), then the USD can underperform. And given that our macro assumption has soft landing as the central base case scenario, our expectations is for the USD to underperform its peers.”
“But in the short term, there are reasons to be just slightly cautious, given that USD shorts may seem a touch crowded and there may still be lingering concerns on growth for Euro-area and China in the near term. Any signs of weak growth and/or equity market softness will be sufficient for USD short squeeze to continue. And in terms of data releases this week, China’s activity data will be released on Sat while ECB Lagarde’s press conference post-ECB decision (Thu) may offer some views on Euro-area activity.”
“For the day, US CPI report is on tap (830pm SGT). The data can still marginally matter to USD. Core CPI is expected to hold steady at 3.2%. A softer print should weigh on USD but any upside surprise would provide the catalyst for another round of USD short squeeze. We still see 2-way risks for USD in the near term. DXY was last at 101.51. Daily momentum is mild bullish but rise in RSI moderated. Support at 100.50 levels. Decisive break puts next support at 99.60. Resistance at 101.70 (21 DMA), 102.20 (23.6% fibo retracement of 2023 high to 2024 low).”
Silver prices (XAG/USD) rose on Wednesday, according to FXStreet data. Silver trades at $28.77 per troy ounce, up 1.29% from the $28.41 it cost on Tuesday.
Silver prices have increased by 20.91% since the beginning of the year.
| Unit measure | Silver Price Today in USD |
|---|---|
| Troy Ounce | 28.77 |
| 1 Gram | 0.93 |
The Gold/Silver ratio, which shows the number of ounces of Silver needed to equal the value of one ounce of Gold, stood at 87.67 on Wednesday, down from 88.60 on Tuesday.
Silver FAQs
Silver is a precious metal highly traded among investors. It has been historically used as a store of value and a medium of exchange. Although less popular than Gold, traders may turn to Silver to diversify their investment portfolio, for its intrinsic value or as a potential hedge during high-inflation periods. Investors can buy physical Silver, in coins or in bars, or trade it through vehicles such as Exchange Traded Funds, which track its price on international markets.
Silver prices can move due to a wide range of factors. Geopolitical instability or fears of a deep recession can make Silver price escalate due to its safe-haven status, although to a lesser extent than Gold's. As a yieldless asset, Silver tends to rise with lower interest rates. Its moves also depend on how the US Dollar (USD) behaves as the asset is priced in dollars (XAG/USD). A strong Dollar tends to keep the price of Silver at bay, whereas a weaker Dollar is likely to propel prices up. Other factors such as investment demand, mining supply – Silver is much more abundant than Gold – and recycling rates can also affect prices.
Silver is widely used in industry, particularly in sectors such as electronics or solar energy, as it has one of the highest electric conductivity of all metals – more than Copper and Gold. A surge in demand can increase prices, while a decline tends to lower them. Dynamics in the US, Chinese and Indian economies can also contribute to price swings: for the US and particularly China, their big industrial sectors use Silver in various processes; in India, consumers’ demand for the precious metal for jewellery also plays a key role in setting prices.
Silver prices tend to follow Gold's moves. When Gold prices rise, Silver typically follows suit, as their status as safe-haven assets is similar. The Gold/Silver ratio, which shows the number of ounces of Silver needed to equal the value of one ounce of Gold, may help to determine the relative valuation between both metals. Some investors may consider a high ratio as an indicator that Silver is undervalued, or Gold is overvalued. On the contrary, a low ratio might suggest that Gold is undervalued relative to Silver.
(An automation tool was used in creating this post.)
GBP/USD traded above 1.310 as European currencies moderately benefitted from Harris being the perceived winner of the debate, but is struggling to hold on to gains this morning after some softer-than-expected monthly UK GDP figures, ING’s FX strategist Francesco Pesole notes.
ECB meeting can favour a near-term EUR/GBP leg higher
“July’s growth came in at 0.0% MoM versus an expected 0.2%, and industrial production remained weak at -1.2% versus a -0.1% consensus. This probably throws some cold water on the recent notion of UK “exceptionalism”, especially when compared to the eurozone, but equally is no game changer for the Bank of England at this stage.”
“We are seeing EUR/GBP having bottomed out for now and finding some tentative support. We think tomorrow’s ECB meeting can favour a near-term leg higher, and a chance to move back to 0.850 by the end of September.”
The US presidential debate did not generate any shockwave for EUR/USD, but gave enough short-term support to the pair to send it back to 1.105 after a soft session yesterday, ING’s FX strategist Francesco Pesole notes.
EUR/USD may be back to 1.110
“The next few days will help shape the FX reaction to the debate more clearly, but we have been generally positive on EUR/USD staying supported into the US election and the rising perceived probability of Harris winning is endorsing this view.”
“Looking at this week, EUR/USD will still be entirely driven by US events today as US CPI is released and markets may place more US election trades on, but tomorrow will all be about the ECB meeting. A 25bp rate cut is nearly guaranteed, but as discussed in our ECB Cheat Sheet, there is room for EUR/USD to trade higher on the back of a hawkish repricing in front-end EUR rates.”
“By the end of the week, the net effect of the presidential debate, US CPI, and the ECB announcement could have sent EUR/USD back to 1.110 in our view.”
- USD/MXN depreciates as the US Dollar faces challenges ahead of CPI data release.
- The upcoming US inflation report may provide insights into the scale of the Fed rate cut in September.
- Financial institutions expressed concerns that proposed judicial reforms could undermine judicial independence and deter foreign investment.
USD/MXN retraces its recent gains from the previous session, trading around 20.00 during Wednesday’s European hours. This downside of the pair is attributed to the subdued US Dollar (USD) amid decreasing Treasury yields.
Traders await the US Consumer Price Index (CPI) data scheduled to be released later in the North American hours. This upcoming US inflation report may offer fresh cues regarding the potential magnitude of the Federal Reserve's (Fed) interest rate cut in September. Moreover, the recent US labor market report has cast doubt on the possibility of an aggressive Fed interest rate cut.
According to the CME FedWatch Tool, markets are fully anticipating at least a 25 basis point (bps) rate cut by the Federal Reserve at its September meeting. The likelihood of a 50 bps rate cut has slightly decreased to 31.0%, down from 38.0% a week ago.
The Mexican Peso (MXN) is under downward pressure due to concerns over judicial reforms and dovish expectations for the Bank of Mexico (Banxico). Investor sentiment has been weakened by a judicial reform bill passed by Mexico's lower house on September 4, which proposes electing judges rather than appointing them.
Financial institutions like Morgan Stanley and Julius Baer have raised concerns that this reform could be a threat to judicial independence and foreign investment. Both have issued warnings about the potential for credit downgrades, reflecting heightened risks to Mexico's economic stability.
On Monday, the latest Consumer Price Index (CPI) data showed that Mexican inflation was weaker than anticipated, boosting the likelihood that the Bank of Mexico (Banxico) will cut interest rates at its September meeting.
Kimberley Sperrfechter, an analyst at Capital Economics, noted that the latest inflation data and the possibility of a Federal Reserve rate cut next week "indicate that Banxico is on track to lower its policy rate by another 25 basis points in September."
Mexican Peso FAQs
The Mexican Peso (MXN) is the most traded currency among its Latin American peers. Its value is broadly determined by the performance of the Mexican economy, the country’s central bank’s policy, the amount of foreign investment in the country and even the levels of remittances sent by Mexicans who live abroad, particularly in the United States. Geopolitical trends can also move MXN: for example, the process of nearshoring – or the decision by some firms to relocate manufacturing capacity and supply chains closer to their home countries – is also seen as a catalyst for the Mexican currency as the country is considered a key manufacturing hub in the American continent. Another catalyst for MXN is Oil prices as Mexico is a key exporter of the commodity.
The main objective of Mexico’s central bank, also known as Banxico, is to maintain inflation at low and stable levels (at or close to its target of 3%, the midpoint in a tolerance band of between 2% and 4%). To this end, the bank sets an appropriate level of interest rates. When inflation is too high, Banxico will attempt to tame it by raising interest rates, making it more expensive for households and businesses to borrow money, thus cooling demand and the overall economy. Higher interest rates are generally positive for the Mexican Peso (MXN) as they lead to higher yields, making the country a more attractive place for investors. On the contrary, lower interest rates tend to weaken MXN.
Macroeconomic data releases are key to assess the state of the economy and can have an impact on the Mexican Peso (MXN) valuation. A strong Mexican economy, based on high economic growth, low unemployment and high confidence is good for MXN. Not only does it attract more foreign investment but it may encourage the Bank of Mexico (Banxico) to increase interest rates, particularly if this strength comes together with elevated inflation. However, if economic data is weak, MXN is likely to depreciate.
As an emerging-market currency, the Mexican Peso (MXN) tends to strive during risk-on periods, or when investors perceive that broader market risks are low and thus are eager to engage with investments that carry a higher risk. Conversely, MXN tends to weaken at times of market turbulence or economic uncertainty as investors tend to sell higher-risk assets and flee to the more-stable safe havens.
The Pound Sterling (GBP) could retest the 1.3050 level before a more sustained rebound is likely. In the longer run, GBP is expected to weaken further; the next level to watch is 1.3000, UOB Group FX analysts Quek Ser Leang and Peter Chia note.
May target 1.3000 below 1.3050
24-HOUR VIEW: “We indicated yesterday that GBP ‘is likely to continue to weaken, potentially to 1.3035.’ However, GBP fell less than expected to 1.3049, rebounding to close largely unchanged (1.3080, +0.05%). While downward momentum is beginning to slow, GBP could retest the 1.3050 level before a more sustained rebound is likely. The major support at 1.3000 is unlikely to come under threat. Resistance is at 1.3105, followed by 1.3120.”
1-3 WEEKS VIEW: “We highlighted two days ago (09 Sep, spot at 1.3130) that GBP ‘could drift lower, possibly reaching 1.3050.’ Yesterday (10 Sep, spot at 1.3070), we highlighted that GBP ‘is expected to weaken further and the next level to watch is 1.3000.’ In NY trade, GBP fell to a low of 1.3049. From here, as long as 1.3140 (no change in ‘strong resistance’ level from yesterday) is not breached, we will continue to hold the same view.”
Donald Trump and Kamala Harris debated for more than 90 minutes yesterday over a number of key issues including abortion rights, immigration policy and the economy. Unlike the first presidential debate between Trump and Biden, where the latter came out as clearly defeated, this one was not interpreted as ending in any ‘knock out’ win. However, markets seem to have awarded Harris a victory on points, and a CNN poll showed 63% of voters thought Harris won the debate, ING’s FX strategist Francesco Pesole notes.
Trump win can keep a lid on USD gains
“In FX, a Trump win is associated with a stronger dollar, which is trading on the soft side across the board. In the EM space, Asian currencies are the best performers, which is a clear indication of Trump trades being scaled back. Interestingly, USD/CNY is only modestly lower and two key China proxy trades (AUD and NZD) are lagging other G10 currencies.”
“That may be a consequence of Harris opposing Trump’s universal tax plans but still sounding determined to maintain protectionism pressure on China. CEE currencies and the high-beta NOK are also moderately stronger, which could be associated with lower geopolitical risks associated with Russia-Ukraine under Harris. More details on FX sensitivity to US election topics can be found in our US election guide for the FX market.”
An extension of the presidential debate fallout in markets will get mixed up with the impact of the August inflation report today. The risks do appear slightly tilted to the upside for the dollar, as markets may lean even more in favour of a 25bp cut next week on a consensus (or above) figure, and may instead require a 0.1% MoM figure to push the pricing closer to 50bp. Crucially, 0.1% does not guarantee a 50bp cut in September. However, as highlighted above, lower perceived chances of a Trump win can keep a lid on USD gains, and barring a substantial CPI upside surprise, DXY may struggle to make its way back to 102.0 before the FOMC.
- AUD/USD attracts some buyers near the 100-day SMA support amid renewed USD weakness.
- A positive risk tone further benefits the Aussie and remains supportive of the intraday uptick.
- The lack of follow-through buying warrants caution for bulls ahead of the key US CPI report.
The AUD/USD pair manages to defend the 100-day Simple Moving Average (SMA) support and attracts some buyers near the 0.6645 region on Wednesday. Spot prices maintain the bid tone near the 0.6660-0.6665 area through the early European session and for now, seem to have snapped a three-day losing streak to over a three-week low touched on Tuesday.
The US Dollar (USD) struggles to capitalize on its gains registered over the past three days and retreats from the vicinity of the monthly peak amid dovish Federal Reserve (Fed) expectations. Apart from this, a positive tone around the European equity markets is seen undermining the safe-haven Greenback and benefiting the risk-sensitive Australian Dollar (AUD). This turns out to be a key factor offering some support to the AUD/USD pair, though the intraday uptick lacks bullish conviction.
Investors prefer to wait for the release of the latest US consumer inflation figures for cues about the Fed's rate-cut path, which will play a key role in influencing the USD price dynamics and provide a fresh directional impetus to the AUD/USD pair. Any further signs of cooling inflation would lift bets for a larger, 50 basis points rate cut by the Fed in September and weigh heavily on the buck. Meanwhile, the reaction to a stronger US CPI print is likely to be limited, suggesting more USD weakness.
The aforementioned fundamental backdrop supports prospects for a further near-term appreciating move for the AUD/USD pair amid the Reserve Bank of Australia's (RBA) hawkish stance. That said, it will still be prudent to wait for strong follow-through buying before confirming that the recent corrective pullback from a multi-month peak, around the 0.6825 region touched in August has run its course and placing aggressive bullish bets around the currency pair.
Economic Indicator
Consumer Price Index (YoY)
Inflationary or deflationary tendencies are measured by periodically summing the prices of a basket of representative goods and services and presenting the data as The Consumer Price Index (CPI). CPI data is compiled on a monthly basis and released by the US Department of Labor Statistics. The YoY reading compares the prices of goods in the reference month to the same month a year earlier.The CPI is a key indicator to measure inflation and changes in purchasing trends. Generally speaking, a high reading is seen as bullish for the US Dollar (USD), while a low reading is seen as bearish.
Read more.Next release: Wed Sep 11, 2024 12:30
Frequency: Monthly
Consensus: 2.6%
Previous: 2.9%
Source: US Bureau of Labor Statistics
The US Federal Reserve has a dual mandate of maintaining price stability and maximum employment. According to such mandate, inflation should be at around 2% YoY and has become the weakest pillar of the central bank’s directive ever since the world suffered a pandemic, which extends to these days. Price pressures keep rising amid supply-chain issues and bottlenecks, with the Consumer Price Index (CPI) hanging at multi-decade highs. The Fed has already taken measures to tame inflation and is expected to maintain an aggressive stance in the foreseeable future.
- Gold trades close to its $2,531 all-time-high amid expectations of the Fed cutting interest rates and a weak US Dollar.
- The size of the Fed’s cut at its September meeting will impact Gold.
- US CPI data on Wednesday could influence the Fed’s decision.
Gold (XAU/USD) cycles back up towards the top of its three-week range, trading just shy of $2,530 on Wednesday. The precious metal keeps oscillating as investors debate the size of the cut the Federal Reserve (Fed) will make to interest rates at its September 17-18 meeting. Whilst a standard 25 basis points (bps) – or 0.25% – cut is now to be expected, some believe the Fed could opt for a larger 50 bps cut. The latter would boost the attractiveness of Gold in comparison with other assets because it is a non-interest-paying asset.
Friday’s mixed US NonFarm Payrolls release failed to settle the interest-rate-cut-size question. On Wednesday, US Consumer Price Index (CPI) data for August would normally be expected to heavily influence Fed expectations. However, analysts vary in the extent to which they expect the data to have an impact this time – some say inflation has fallen so low now that it is irrelevant.
“The (CPI) figure is no longer as overwhelmingly important as it was a few months ago,” says Ulricht Leutchmann, FX Analyst at Commerzbank. “The fight against inflation has seemingly been won. In the last three months, core consumer price inflation was a meager 1.6% (annualized) – well below levels that would be compatible with the Fed's target,” he adds.
On the other hand, Elias Haddad, Senior Markets Strategist at Brown Brothers Harriman (BBH), says: “Higher than expected US inflation in August can reduce the probability of a jumbo Fed funds rate cut in September and underpin a firmer USD.”
Deutsche Bank’s Jim Reid, meanwhile, makes the point that an important deflationary factor is the steep fall in crude Oil prices over recent days, with WTI crude Oil now trading in the mid $60s per barrel. “From the Fed’s perspective, one trend that’s helping to remove inflationary pressures has been the sharp decline in Oil prices over recent weeks,” he says in his “Early Morning Reid.”
Gold helped higher by weaker US Dollar
Gold is gaining further uplift from a weaker US Dollar (USD), to which it is negatively correlated (the yellow metal is mostly priced and traded in USD).
The Greenback is being dragged down by the outcome of the Trump-Harris presidential election debate. According to most analysts, Vice President Kamala Harris came out on top, so the market is discounting former President Donald Trump’s policies to maintain the US Dollar as the world’s reserve currency by penalizing countries who refuse to use it with tariffs.
That said, the effect is likely to be counterbalanced given the former president is also known to advocate for a weaker Dollar because it helps US exports.
On the geopolitical risk front, Israel continues bombing civilian areas in Gaza, and protests by the populace calling for a ceasefire so hostages can be released appear to be falling on deaf ears. The attack on the Al-Mawasi camp, which killed dozens at the start of the week, has drawn condemnation from the international community and snuffed out US efforts at brokering a ceasefire deal.
In the other hotspot, the news of a Ukrainian drone attack on Moscow has probably only ratcheted up tensions, which, if anything, might be increasing safe-haven demand for Gold.
Technical Analysis: Gold targets top-of-range and all-time-highs
Gold (XAU/USD) rises towards the top of its sideways range. It is now closing in on the all-time high of $2,531. A break above would extend the precious metal’s uptrend.
XAU/USD 4-hour Chart
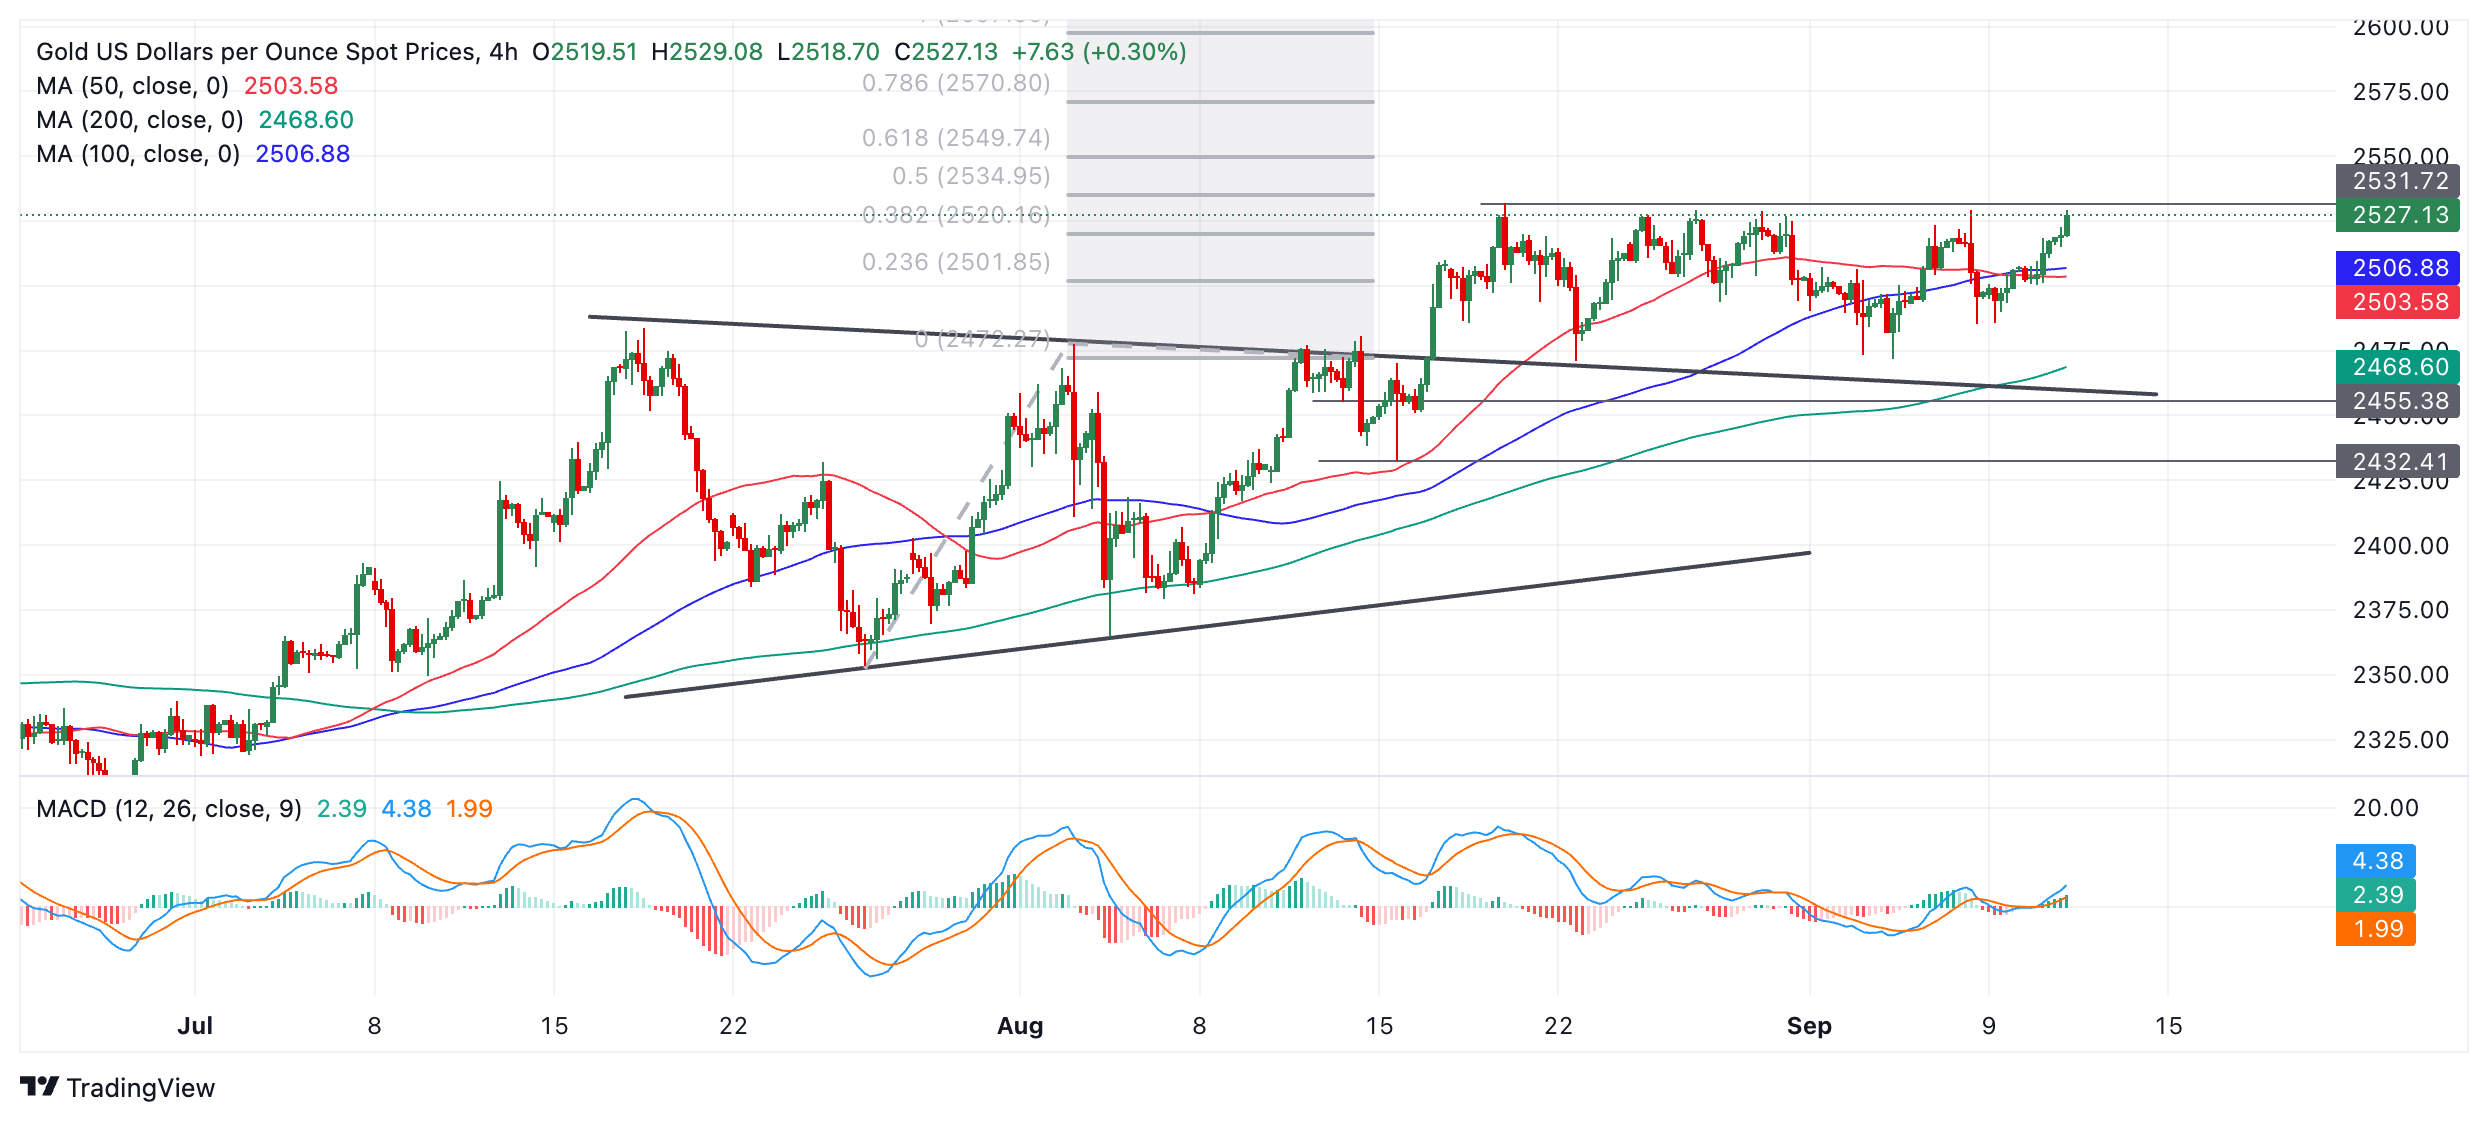
Alternatively, it is quite possible the yellow metal will continue trading up and down within its multi-week range between the $2,480s and the $2,531 record high.
The longer-term trend for Gold is bullish, however, and since “the trend is your friend,” this increases the odds of an eventual breakout higher materializing.
The precious metal has an as-yet unreached bullish target at $2,550, generated after the original breakout from the July-August range on August 14. It will probably finally reach its goal in the end, assuming the uptrend survives.
A break above the August 20 all-time high of $2,531 would provide more confirmation of a continuation higher toward the $2,550 target.
If Gold closes below $2,460, however, it would change the picture and bring the bullish bias into question.
Economic Indicator
Consumer Price Index (YoY)
Inflationary or deflationary tendencies are measured by periodically summing the prices of a basket of representative goods and services and presenting the data as The Consumer Price Index (CPI). CPI data is compiled on a monthly basis and released by the US Department of Labor Statistics. The YoY reading compares the prices of goods in the reference month to the same month a year earlier.The CPI is a key indicator to measure inflation and changes in purchasing trends. Generally speaking, a high reading is seen as bullish for the US Dollar (USD), while a low reading is seen as bearish.
Read more.Next release: Wed Sep 11, 2024 12:30
Frequency: Monthly
Consensus: 2.6%
Previous: 2.9%
Source: US Bureau of Labor Statistics
The US Federal Reserve has a dual mandate of maintaining price stability and maximum employment. According to such mandate, inflation should be at around 2% YoY and has become the weakest pillar of the central bank’s directive ever since the world suffered a pandemic, which extends to these days. Price pressures keep rising amid supply-chain issues and bottlenecks, with the Consumer Price Index (CPI) hanging at multi-decade highs. The Fed has already taken measures to tame inflation and is expected to maintain an aggressive stance in the foreseeable future.
Scope for the Euro (EUR) to test 1.0995 before the risk of recovery increases. In the linger run, EUR is likely to continue to weaken; the next level to watch below 1.0995 is at 1.0960, UOB Group FX analysts Quek Ser Leang and Peter Chia note.
Set to fall to 1.0960 below 1.0995
24-HOUR VIEW: “Yesterday, we held the view that EUR could break below last week’s low of 1.1025. We were also of the view that ‘the next support at 1.0995 could be out of reach for now.’ We were not wrong as EUR dropped to 1.1014 before closing at 1.1019 (-0.14%). While downward momentum has only increased slightly, there is scope for EUR to test 1.0995 before the risk of a recovery increases. The next major support at 1.0960 is unlikely to come under threat. Resistance levels are at 1.1045 and 1.1065.”
1-3 WEEKS VIEW: “Two days ago (09 Sep, spot at 1.1085), we highlighted that EUR could retest the 1.1025 level. Yesterday (10 Sep, spot at 1.1035), we indicated that ‘if EUR breaks below 1.1025, it could decline further to 1.0995.’ EUR then fell, reaching a low of 1.1014. While there has been no significant increase in momentum, EUR is likely to continue to weaken. The next level to watch below 1.0995 is at 1.0960. Overall, only a breach of 1.1085 (‘strong resistance’ level was at 1.1105 yesterday) would mean that EUR is not weakening further.”
- GBP/JPY depreciates due to hawkish sentiment surrounding the BoJ’s policy stance.
- BoJ’s Nagakawa said that the central bank may reconsider its tapering plan.
- UK GDP showed zero growth in July, reinforcing the odds of a BoE 25 basis points rate cut in November.
GBP/JPY extends its downside for the second successive day, trading around 185.00 during the European session on Wednesday. The Japanese Yen (JPY) gains ground following the remarks from Bank of Japan (BoJ) board member Junko Nagakawa.
BoJ board member Nagakawa stated that the central bank may adjust the extent of its monetary easing if the economy and prices align with its projections. Despite the rate hike in July, real interest rates remain deeply negative, and accommodative monetary conditions persist. Should long-term rates surge, the BoJ may reconsider its tapering plan during its policy meetings, as necessary.
In the United Kingdom (UK), the UK GDP showed no growth in July, following a stagnation in June, according to the latest data released by the Office for National Statistics (ONS) on Wednesday. This fell short of the market forecast, which anticipated 0.2% growth for the month. Meanwhile, the Index of Services for July posted a 0.6% increase on a three-month rolling basis, down from June’s 0.8% figure.
No growth in the economy reinforces expectations of a possible quarter-point rate cut by the Bank of England (BoE) in November. Some traders are also pricing in the possibility of an additional rate cut in December.
Additionally, the UK Total Trade Balance showed that the deficit widened to £7.514 billion in July, up from £5.324 billion in June, marking the largest trade gap since April. Imports fell to a four-month low of £77.12 billion, while Exports dropped to a 25-month low of £69.60 billion.
Inflation FAQs
Inflation measures the rise in the price of a representative basket of goods and services. Headline inflation is usually expressed as a percentage change on a month-on-month (MoM) and year-on-year (YoY) basis. Core inflation excludes more volatile elements such as food and fuel which can fluctuate because of geopolitical and seasonal factors. Core inflation is the figure economists focus on and is the level targeted by central banks, which are mandated to keep inflation at a manageable level, usually around 2%.
The Consumer Price Index (CPI) measures the change in prices of a basket of goods and services over a period of time. It is usually expressed as a percentage change on a month-on-month (MoM) and year-on-year (YoY) basis. Core CPI is the figure targeted by central banks as it excludes volatile food and fuel inputs. When Core CPI rises above 2% it usually results in higher interest rates and vice versa when it falls below 2%. Since higher interest rates are positive for a currency, higher inflation usually results in a stronger currency. The opposite is true when inflation falls.
Although it may seem counter-intuitive, high inflation in a country pushes up the value of its currency and vice versa for lower inflation. This is because the central bank will normally raise interest rates to combat the higher inflation, which attract more global capital inflows from investors looking for a lucrative place to park their money.
Formerly, Gold was the asset investors turned to in times of high inflation because it preserved its value, and whilst investors will often still buy Gold for its safe-haven properties in times of extreme market turmoil, this is not the case most of the time. This is because when inflation is high, central banks will put up interest rates to combat it. Higher interest rates are negative for Gold because they increase the opportunity-cost of holding Gold vis-a-vis an interest-bearing asset or placing the money in a cash deposit account. On the flipside, lower inflation tends to be positive for Gold as it brings interest rates down, making the bright metal a more viable investment alternative.
- USD/CAD retreats from a multi-week top and is weighed down by a combination of factors.
- Rebounding Oil prices underpin the Loonie and exert pressure amid renewed USD selling.
- The downside seems limited as traders keenly await the release of the crucial US CPI report.
The USD/CAD pair struggles to capitalize on the overnight breakout momentum through the very important 200-day Simple Moving Average (SMA) and retreats from a nearly three-week top, around the 1.3615 area touched earlier this Wednesday. Spot prices extend the steady intraday descent through the first half of the European session and drop to the 1.3590-1.3585 region, or a fresh daily low in the last hour.
Crude Oil prices rallied around 1.75% and moved away from the lowest level since May 2023 touched on Tuesday amid concerns about supply disruption in the wake of Hurricane Francine in the United States (US). This is seen underpinning the commodity-linked Loonie, which, along with the emergence of fresh US Dollar (USD) selling, turn out to be key factors exerting downward pressure on the USD/CAD pair.
That said, hopes for additional interest rate cuts by the Bank of Canada (BoC), bolstered by Friday's disappointing Canadian jobs data, should keep a lid on any meaningful appreciating move for the Canadian Dollar (CAD). Apart from this, reduced bets for a larger interest rate cut by the Federal Reserve (Fed), along with a softer risk tone, could offer support to the safe-haven buck and limit losses for the USD/CAD pair.
Traders also seem reluctant and might prefer to wait for the release of the crucial US Consumer Price Index (CPI) report before placing fresh directional bets. Hence, it will be prudent to wait for strong follow-through selling before confirming that the USD/CAD pair's recent recovery from the 1.3440 region, or a multi-month low touched in August has run its course and positioning for a further depreciating move.
Canadian Dollar FAQs
The key factors driving the Canadian Dollar (CAD) are the level of interest rates set by the Bank of Canada (BoC), the price of Oil, Canada’s largest export, the health of its economy, inflation and the Trade Balance, which is the difference between the value of Canada’s exports versus its imports. Other factors include market sentiment – whether investors are taking on more risky assets (risk-on) or seeking safe-havens (risk-off) – with risk-on being CAD-positive. As its largest trading partner, the health of the US economy is also a key factor influencing the Canadian Dollar.
The Bank of Canada (BoC) has a significant influence on the Canadian Dollar by setting the level of interest rates that banks can lend to one another. This influences the level of interest rates for everyone. The main goal of the BoC is to maintain inflation at 1-3% by adjusting interest rates up or down. Relatively higher interest rates tend to be positive for the CAD. The Bank of Canada can also use quantitative easing and tightening to influence credit conditions, with the former CAD-negative and the latter CAD-positive.
The price of Oil is a key factor impacting the value of the Canadian Dollar. Petroleum is Canada’s biggest export, so Oil price tends to have an immediate impact on the CAD value. Generally, if Oil price rises CAD also goes up, as aggregate demand for the currency increases. The opposite is the case if the price of Oil falls. Higher Oil prices also tend to result in a greater likelihood of a positive Trade Balance, which is also supportive of the CAD.
While inflation had always traditionally been thought of as a negative factor for a currency since it lowers the value of money, the opposite has actually been the case in modern times with the relaxation of cross-border capital controls. Higher inflation tends to lead central banks to put up interest rates which attracts more capital inflows from global investors seeking a lucrative place to keep their money. This increases demand for the local currency, which in Canada’s case is the Canadian Dollar.
Macroeconomic data releases gauge the health of the economy and can have an impact on the Canadian Dollar. Indicators such as GDP, Manufacturing and Services PMIs, employment, and consumer sentiment surveys can all influence the direction of the CAD. A strong economy is good for the Canadian Dollar. Not only does it attract more foreign investment but it may encourage the Bank of Canada to put up interest rates, leading to a stronger currency. If economic data is weak, however, the CAD is likely to fall.
Here is what you need to know on Wednesday, September 11:
The US Dollar (USD) stays under selling pressure early Wednesday as markets gear up for key inflation data. The US Bureau of Labor Statistics will release Consumer Price Index (CPI) data for August. Later in the day, the US Treasury will hold a 10-year note auction.
Following a bullish start to the week, the USD Index stays on the back foot in the European morning and was last seen losing nearly 0.3% on the day. Falling US Treasury bond yields and the sharp decline seen in the USD/JPY pair seems to be making it difficult for USD to hold its ground. At the time of press, the benchmark 10-year US Treasury bond yield was at its lowest level since June 2023 near 3.6%. On a yearly basis, the CPI is forecast to rise 2.6%, at a softer pace than the 2.9% increase recorded in July.
US Dollar PRICE Today
The table below shows the percentage change of US Dollar (USD) against listed major currencies today. US Dollar was the weakest against the Japanese Yen.
| USD | EUR | GBP | JPY | CAD | AUD | NZD | CHF | |
|---|---|---|---|---|---|---|---|---|
| USD | -0.25% | -0.09% | -0.78% | -0.15% | -0.19% | -0.07% | -0.26% | |
| EUR | 0.25% | 0.16% | -0.52% | 0.12% | 0.10% | 0.19% | -0.01% | |
| GBP | 0.09% | -0.16% | -0.70% | -0.05% | -0.11% | 0.02% | -0.16% | |
| JPY | 0.78% | 0.52% | 0.70% | 0.66% | 0.58% | 0.69% | 0.52% | |
| CAD | 0.15% | -0.12% | 0.05% | -0.66% | -0.06% | 0.08% | -0.13% | |
| AUD | 0.19% | -0.10% | 0.11% | -0.58% | 0.06% | 0.08% | -0.05% | |
| NZD | 0.07% | -0.19% | -0.02% | -0.69% | -0.08% | -0.08% | -0.19% | |
| CHF | 0.26% | 0.00% | 0.16% | -0.52% | 0.13% | 0.05% | 0.19% |
The heat map shows percentage changes of major currencies against each other. The base currency is picked from the left column, while the quote currency is picked from the top row. For example, if you pick the US Dollar from the left column and move along the horizontal line to the Japanese Yen, the percentage change displayed in the box will represent USD (base)/JPY (quote).
Bank of Japan (BoJ) board member Junko Nagakawa said on Wednesday that the BoJ is likely to adjust the degree of monetary easing if the economy and prices move in line with their projections. "Even after the July rate hike, real interest rates remain deeply negative, and accommodative monetary conditions are maintained," Nagakawa added. Following these remarks, USD/JPY is trading at its weakest level since January below 141.50, losing more than 0.7% on the day.
Gold benefits from falling US Treasury bond yields on Wednesday and rises toward $2,530. XAU/USD set an all-time-high at $2,531 on August 20.
After closing in negative territory for three consecutive trading days, EUR/USD stages a rebound in the early European session and was last seen trading near 1.1050.
The UK's Office for National Statistics reported earlier in the day that Industrial Production and Manufacturing Production contracted by 0.8% and 1%, respectively, on a monthly basis in July. Other data from the UK showed that the monthly Gross Domestic Product (GDP) was unchanged in July. GBP/USD struggles to gather recovery momentum after these data releases and trades slightly below 1.3100.
Inflation FAQs
Inflation measures the rise in the price of a representative basket of goods and services. Headline inflation is usually expressed as a percentage change on a month-on-month (MoM) and year-on-year (YoY) basis. Core inflation excludes more volatile elements such as food and fuel which can fluctuate because of geopolitical and seasonal factors. Core inflation is the figure economists focus on and is the level targeted by central banks, which are mandated to keep inflation at a manageable level, usually around 2%.
The Consumer Price Index (CPI) measures the change in prices of a basket of goods and services over a period of time. It is usually expressed as a percentage change on a month-on-month (MoM) and year-on-year (YoY) basis. Core CPI is the figure targeted by central banks as it excludes volatile food and fuel inputs. When Core CPI rises above 2% it usually results in higher interest rates and vice versa when it falls below 2%. Since higher interest rates are positive for a currency, higher inflation usually results in a stronger currency. The opposite is true when inflation falls.
Although it may seem counter-intuitive, high inflation in a country pushes up the value of its currency and vice versa for lower inflation. This is because the central bank will normally raise interest rates to combat the higher inflation, which attract more global capital inflows from investors looking for a lucrative place to park their money.
Formerly, Gold was the asset investors turned to in times of high inflation because it preserved its value, and whilst investors will often still buy Gold for its safe-haven properties in times of extreme market turmoil, this is not the case most of the time. This is because when inflation is high, central banks will put up interest rates to combat it. Higher interest rates are negative for Gold because they increase the opportunity-cost of holding Gold vis-a-vis an interest-bearing asset or placing the money in a cash deposit account. On the flipside, lower inflation tends to be positive for Gold as it brings interest rates down, making the bright metal a more viable investment alternative.
- USD/JPY continues to lose ground due to hawkish sentiment surrounding the BoJ’s policy stance.
- BoJ’s Nagakawa stated that the bank may adjust the degree of its monetary easing if the economy and inflation come as projected.
- CME FedWatch Tool suggests full pricing of at least a 25 basis point Fed rate cut in September.
USD/JPY loses ground for the second consecutive day, trading around 141.20 during the Asian hours on Wednesday. The Japanese Yen (JPY) remains solid following the remarks from Bank of Japan (BoJ) board member Junko Nagakawa.
BoJ board member Nagakawa stated that the central bank may adjust the extent of its monetary easing if the economy and prices align with its projections. Despite the rate hike in July, real interest rates remain deeply negative, and accommodative monetary conditions persist. Should long-term rates surge, the BoJ may reconsider its tapering plan during its policy meetings, as necessary.
The downside of the USD/JPY pair is also driven by the contrasting monetary policies of the Bank of Japan and the US Federal Reserve, which has been encouraging the unwinding of carry trades and boosting demand for the Japanese. BoJ Governor Kazuo Ueda reiterated the central bank's commitment to continue raising interest rates, provided the Japanese economy meets the bank’s forecasts through FY2025.
US Dollar (USD) remains subdued as the Treasury yields continue to decline ahead of the US Consumer Price Index (CPI) data scheduled to be released later in the North American hours. The upcoming inflation report may offer fresh cues regarding the potential magnitude of the Federal Reserve's (Fed) interest rate cut in September. Moreover, the recent US labor market report has cast doubt on the possibility of an aggressive Fed interest rate cut.
According to the CME FedWatch Tool, markets are fully anticipating at least a 25 basis point (bps) rate cut by the Federal Reserve at its September meeting. The likelihood of a 50 bps rate cut has slightly decreased to 31.0%, down from 38.0% a week ago.
Japanese Yen FAQs
The Japanese Yen (JPY) is one of the world’s most traded currencies. Its value is broadly determined by the performance of the Japanese economy, but more specifically by the Bank of Japan’s policy, the differential between Japanese and US bond yields, or risk sentiment among traders, among other factors.
One of the Bank of Japan’s mandates is currency control, so its moves are key for the Yen. The BoJ has directly intervened in currency markets sometimes, generally to lower the value of the Yen, although it refrains from doing it often due to political concerns of its main trading partners. The current BoJ ultra-loose monetary policy, based on massive stimulus to the economy, has caused the Yen to depreciate against its main currency peers. This process has exacerbated more recently due to an increasing policy divergence between the Bank of Japan and other main central banks, which have opted to increase interest rates sharply to fight decades-high levels of inflation.
The BoJ’s stance of sticking to ultra-loose monetary policy has led to a widening policy divergence with other central banks, particularly with the US Federal Reserve. This supports a widening of the differential between the 10-year US and Japanese bonds, which favors the US Dollar against the Japanese Yen.
The Japanese Yen is often seen as a safe-haven investment. This means that in times of market stress, investors are more likely to put their money in the Japanese currency due to its supposed reliability and stability. Turbulent times are likely to strengthen the Yen’s value against other currencies seen as more risky to invest in.
- GBP/USD attracts buyers for the second straight day amid a modest USD weakness.
- The intraday uptick loses steam following the disappointing release of UK macro data.
- The downside seems limited as traders await the release of the crucial US CPI report.
The GBP/USD pair builds on the overnight modest bounce from the 1.3050-1.3045 region, or over a three-week trough and gains some follow-through positive traction for the second successive day on Wednesday. Spot prices, however, struggle to capitalize on the move beyond the 1.3100 mark and retreat a few pips in the last hour following the release of the UK macro data.
The UK Office for National Statistics reported that the economic growth remained flat for the second straight month in July as compared to expectations for a modest 0.2% growth. Moreover, the UK Industrial and Manufacturing Production unexpectedly shrank during the reported month. This comes on top of a slowdown in the UK wage growth, which lifts bets for more interest rate cuts by the Bank of England (BoE) and undermines the British Pound (GBP).
The US Dollar (USD), on the other hand, attracts some sellers and for now, seems to have snapped a three-day winning streak back closer to the monthly peak amid dovish Federal Reserve (Fed) expectations. This, in turn, offers some support to the GBP/USD pair and helps limit the downside for the GBP/USD pair. Traders also seem reluctant to place aggressive bets and prefer to wait on the sidelines ahead of the release of the US consumer inflation figures.
The crucial US Consumer Price Index (CPI) report should influence market expectations about the size of the rate cut by the Fed at its upcoming policy meeting on September 17-18. This, in turn, will play a key role in driving the USD demand in the near term and provide some meaningful impetus to the GBP/USD pair. Nevertheless, the aforementioned fundamental backdrop warrants some caution before positioning for a further appreciating move for the currency pair.
Economic Indicator
Gross Domestic Product (MoM)
The Gross Domestic Product (GDP), released by the Office for National Statistics on a monthly and quarterly basis, is a measure of the total value of all goods and services produced in the UK during a given period. The GDP is considered as the main measure of UK economic activity. The MoM reading compares economic activity in the reference month to the previous month. Generally, a rise in this indicator is bullish for the Pound Sterling (GBP), while a low reading is seen as bearish.
Read more.Last release: Wed Sep 11, 2024 06:00
Frequency: Monthly
Actual: 0%
Consensus: 0.2%
Previous: 0%
Source: Office for National Statistics
- UK GDP comes in at 0% MoM in July vs. 0.2% forecast.
- GBP/USD battles 1.3100 after the UK data.
The UK economy showed no growth over the month in July after stalling in June, the latest data published by the Office for National Statistics (ONS) showed on Wednesday. The market forecast was for a 0.2% growth in the reported period.
Meanwhile, the Index of services (July) came in at 0.6% 3M/3M vs. June’s 0.8% print.
Other data from the UK showed that the monthly Industrial Production and Manufacturing Production fell 0.8% and 1.0%, respectively, in July. Both readings surprised markets to the downside.
Separately, the UK Goods Trade Balance came in at GBP-20.003 billion MoM in July vs. GBP-18.1 billion expected and GBP-18.894 billion prior.
Market reaction to the UK data
The Pound Sterling is unperturbed by the UK economic data. At the press time, GBP/USD is trading 0.16% higher on the day near 1.3100.
British Pound PRICE Today
The table below shows the percentage change of British Pound (GBP) against listed major currencies today. British Pound was the strongest against the New Zealand Dollar.
| USD | EUR | GBP | JPY | CAD | AUD | NZD | CHF | |
|---|---|---|---|---|---|---|---|---|
| USD | -0.23% | -0.15% | -0.86% | -0.10% | -0.08% | 0.06% | -0.40% | |
| EUR | 0.23% | 0.08% | -0.64% | 0.15% | 0.21% | 0.30% | -0.17% | |
| GBP | 0.15% | -0.08% | -0.74% | 0.05% | 0.06% | 0.21% | -0.26% | |
| JPY | 0.86% | 0.64% | 0.74% | 0.79% | 0.79% | 0.92% | 0.46% | |
| CAD | 0.10% | -0.15% | -0.05% | -0.79% | 0.01% | 0.16% | -0.32% | |
| AUD | 0.08% | -0.21% | -0.06% | -0.79% | -0.01% | 0.08% | -0.33% | |
| NZD | -0.06% | -0.30% | -0.21% | -0.92% | -0.16% | -0.08% | -0.46% | |
| CHF | 0.40% | 0.17% | 0.26% | -0.46% | 0.32% | 0.33% | 0.46% |
The heat map shows percentage changes of major currencies against each other. The base currency is picked from the left column, while the quote currency is picked from the top row. For example, if you pick the British Pound from the left column and move along the horizontal line to the US Dollar, the percentage change displayed in the box will represent GBP (base)/USD (quote).
FX option expiries for Sept 11 NY cut at 10:00 Eastern Time, via DTCC, can be found below.
EUR/USD: EUR amounts
- 1.1000 1.3b
- 1.1025 929m
- 1.1050 833m
- 1.1075 726m
- 1.1200 506m
GBP/USD: GBP amounts
- 1.2760 478m
USD/JPY: USD amounts
- 142.50 913m
- 145.00 1.1b
USD/CHF: USD amounts
- 0.8600 748m
- 0.8640 555m
AUD/USD: AUD amounts
- 0.6610 1.1b
- 0.6625 750m
- 0.6825 848m
USD/CAD: USD amounts
- 1.3510 590m
- 1.3625 639m
NZD/USD: NZD amounts
- 0.6065 2.2b
- USD/CHF extends its downside ahead of the release of US CPI data on Wednesday.
- CME FedWatch Tool suggests full pricing of at least a 25 basis point Fed rate cut in September.
- The upside of the Swiss Franc could be limited due to the rising odds of another SNB rate cut soon.
USD/CHF continues to lose ground, trading around 0.8430 during the Asian hours on Wednesday. US Dollar (USD) faces challenges as the Treasury yields continue to decline ahead of the US Consumer Price Index (CPI) data scheduled to be released later in the North American hours.
The upcoming inflation report may offer fresh cues regarding the potential magnitude of the Federal Reserve's (Fed) interest rate cut in September. Moreover, the recent US labor market report has cast doubt on the possibility of an aggressive Fed interest rate cut.
According to the CME FedWatch Tool, markets are fully anticipating at least a 25 basis point (bps) rate cut by the Federal Reserve at its September meeting. The likelihood of a 50 bps rate cut has slightly decreased to 31.0%, down from 38.0% a week ago.
Federal Reserve (Fed) Bank of Chicago President Austan Goolsbee remarked on Friday that Fed officials are starting to align with the broader market's sentiment that a policy rate adjustment by the US central bank is imminent, according to CNBC.
FXStreet’s FedTracker, which uses a custom AI model to evaluate Fed officials' speeches on a dovish-to-hawkish scale from 0 to 10, rated Goolsbee's comments as dovish, assigning them a score of 3.2.
In Switzerland, inflation fell to a five-month low, increasing speculation about the possibility of another rate cut by the Swiss National Bank (SNB) in the near future. Traders are expected to closely monitor any speeches from SNB members this week, as there are no major economic releases scheduled.
Swiss Franc FAQs
The Swiss Franc (CHF) is Switzerland’s official currency. It is among the top ten most traded currencies globally, reaching volumes that well exceed the size of the Swiss economy. Its value is determined by the broad market sentiment, the country’s economic health or action taken by the Swiss National Bank (SNB), among other factors. Between 2011 and 2015, the Swiss Franc was pegged to the Euro (EUR). The peg was abruptly removed, resulting in a more than 20% increase in the Franc’s value, causing a turmoil in markets. Even though the peg isn’t in force anymore, CHF fortunes tend to be highly correlated with the Euro ones due to the high dependency of the Swiss economy on the neighboring Eurozone.
The Swiss Franc (CHF) is considered a safe-haven asset, or a currency that investors tend to buy in times of market stress. This is due to the perceived status of Switzerland in the world: a stable economy, a strong export sector, big central bank reserves or a longstanding political stance towards neutrality in global conflicts make the country’s currency a good choice for investors fleeing from risks. Turbulent times are likely to strengthen CHF value against other currencies that are seen as more risky to invest in.
The Swiss National Bank (SNB) meets four times a year – once every quarter, less than other major central banks – to decide on monetary policy. The bank aims for an annual inflation rate of less than 2%. When inflation is above target or forecasted to be above target in the foreseeable future, the bank will attempt to tame price growth by raising its policy rate. Higher interest rates are generally positive for the Swiss Franc (CHF) as they lead to higher yields, making the country a more attractive place for investors. On the contrary, lower interest rates tend to weaken CHF.
Macroeconomic data releases in Switzerland are key to assessing the state of the economy and can impact the Swiss Franc’s (CHF) valuation. The Swiss economy is broadly stable, but any sudden change in economic growth, inflation, current account or the central bank’s currency reserves have the potential to trigger moves in CHF. Generally, high economic growth, low unemployment and high confidence are good for CHF. Conversely, if economic data points to weakening momentum, CHF is likely to depreciate.
As a small and open economy, Switzerland is heavily dependent on the health of the neighboring Eurozone economies. The broader European Union is Switzerland’s main economic partner and a key political ally, so macroeconomic and monetary policy stability in the Eurozone is essential for Switzerland and, thus, for the Swiss Franc (CHF). With such dependency, some models suggest that the correlation between the fortunes of the Euro (EUR) and the CHF is more than 90%, or close to perfect.
Bank of Japan (BoJ) board member Junko Nagakawa is back on the wires on Wednesday, noting that “Japan's economy is on track based on data out since the previous meeting in July.”
Additional quotes
Hard to pin down precise level of Japan's neutral rate.
Important to look at how economy, inflation react to change in short-term interest rate.
Markets remain unstable.
When markets are volatile, we need to look at what is behind such moves.
Hard to comment on timing of next rate hike.
- Silver attracts buyers for the third straight day and touches a fresh weekly top on Wednesday.
- The lack of any follow-through buying and mixed technical oscillators warrant caution for bulls.
- A sustained strength beyond the $29.00 mark is needed to support prospects for further gains.
Silver (XAG/USD) trades with a mild positive bias for the third straight day on Wednesday, albeit lacks bullish conviction and is currently placed around the $28.45 region, just below the weekly high touched during the Asian session.
From a technical perspective, the white metal is holding above the 23.6% Fibonacci retracement level of the August-September slide and looking to build on the momentum beyond the 200-period Simple Moving Average (SMA) on the 4-hour chart. Given that oscillators on the said chart have just started gaining positive traction, though are yet to confirm a bullish bias on the daily chart. Hence, the XAG/USD is more likely to confront stiff resistance near the $28.95-$29.00 confluence – comprising the 50% Fibo. level and the 100-period SMA on the 4-hour chart.
A sustained strength beyond, however, will be seen as a fresh trigger for bullish traders and pave the way for some meaningful appreciating move. The subsequent move up has the potential to lift the XAG/USD beyond the 61.8% Fibo. level resistance near the $29.25 region, towards the $29.65 area, or the 78.6% Fibo. level. The momentum could extend further towards reclaiming the $30.00 psychological mark, above which bulls might aim to challenge the August monthly swing high, around the $30.20 zone.
On the flip side, the $28.25 region, or the 23.6% Fibo. level is likely to protect the immediate downside ahead of the $28.00 mark. A convincing break below could make the XAG/USD vulnerable to weaken further below the $27.70-$27.65 zone, towards the next relevant support near the $27.20 region en route to the $27.00 mark. Some follow-through selling might then expose the August monthly swing low, around the $26.40-$26.35 area, before the white metal eventually drops to the $26.00 round figure.
Silver 4-hour chart
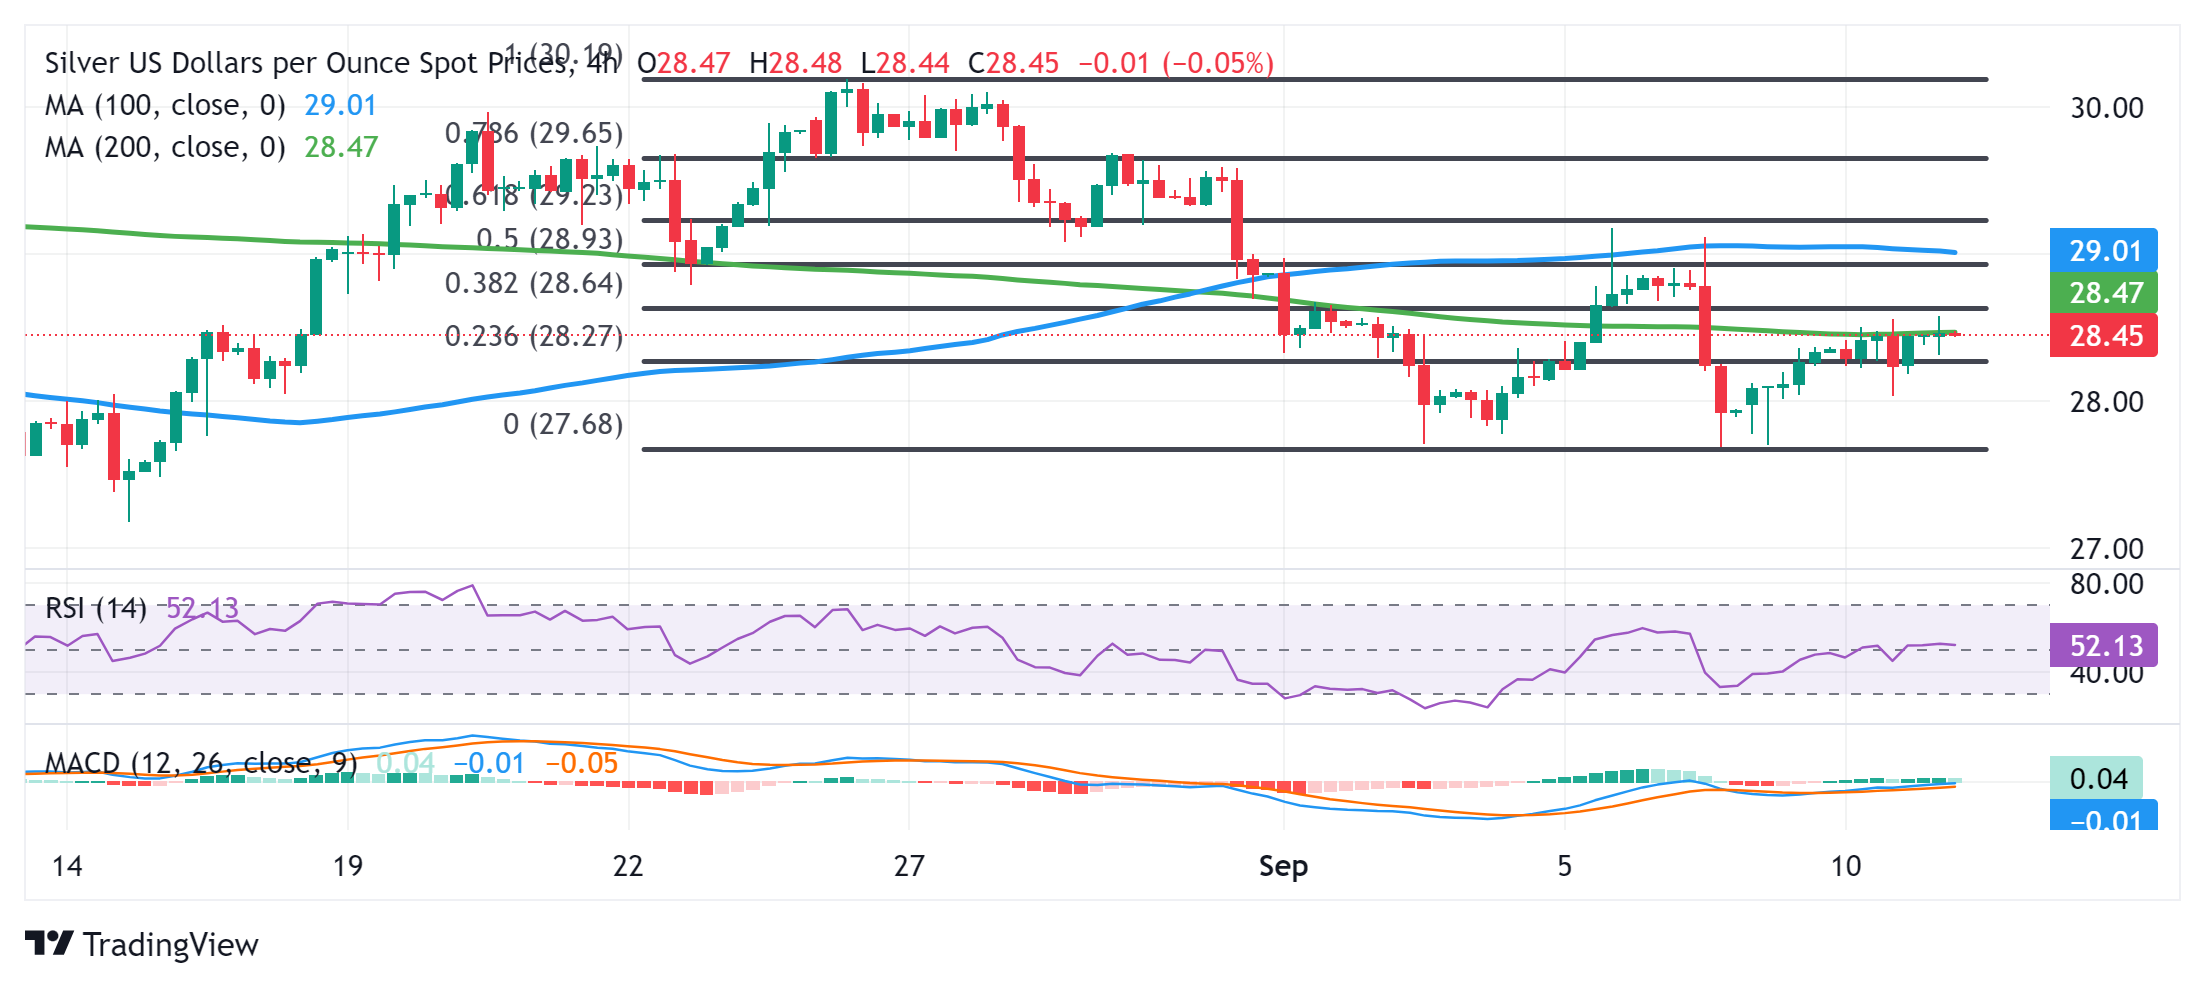
Silver FAQs
Silver is a precious metal highly traded among investors. It has been historically used as a store of value and a medium of exchange. Although less popular than Gold, traders may turn to Silver to diversify their investment portfolio, for its intrinsic value or as a potential hedge during high-inflation periods. Investors can buy physical Silver, in coins or in bars, or trade it through vehicles such as Exchange Traded Funds, which track its price on international markets.
Silver prices can move due to a wide range of factors. Geopolitical instability or fears of a deep recession can make Silver price escalate due to its safe-haven status, although to a lesser extent than Gold's. As a yieldless asset, Silver tends to rise with lower interest rates. Its moves also depend on how the US Dollar (USD) behaves as the asset is priced in dollars (XAG/USD). A strong Dollar tends to keep the price of Silver at bay, whereas a weaker Dollar is likely to propel prices up. Other factors such as investment demand, mining supply – Silver is much more abundant than Gold – and recycling rates can also affect prices.
Silver is widely used in industry, particularly in sectors such as electronics or solar energy, as it has one of the highest electric conductivity of all metals – more than Copper and Gold. A surge in demand can increase prices, while a decline tends to lower them. Dynamics in the US, Chinese and Indian economies can also contribute to price swings: for the US and particularly China, their big industrial sectors use Silver in various processes; in India, consumers’ demand for the precious metal for jewellery also plays a key role in setting prices.
Silver prices tend to follow Gold's moves. When Gold prices rise, Silver typically follows suit, as their status as safe-haven assets is similar. The Gold/Silver ratio, which shows the number of ounces of Silver needed to equal the value of one ounce of Gold, may help to determine the relative valuation between both metals. Some investors may consider a high ratio as an indicator that Silver is undervalued, or Gold is overvalued. On the contrary, a low ratio might suggest that Gold is undervalued relative to Silver.
- EUR/USD gains ground ahead of the US inflation data release scheduled on Wednesday.
- The US Dollar depreciates as Treasury bonds extend decline amid rising odds of a Fed rate cut in September.
- Traders anticipate that the ECB will implement a 25 basis points rate cut at Thursday's meeting.
EUR/USD breaks its three-day losing streak, trading around 1.1050 during Wednesday’s Asian session. The upside of the EUR/USD pair is attributed to the subdued US Dollar (USD) ahead of the US Consumer Price Index (CPI) data scheduled to be released later in the North American hours. This inflation report may offer fresh cues regarding the potential magnitude of the Federal Reserve's (Fed) interest rate cut in September.
The US Dollar (USD) faces challenges as the US Treasury yields continue to decline. The US Dollar Index (DXY), which measures the value of the US Dollar against six other major currencies, halts its three-day winning streak. The DXY trades around 101.40 with 2-year and 10-year yields on US Treasury bonds standing at 3.57% and 3.62%, respectively, at the time of writing.
However, last week’s US labor market report raised uncertainty over the likelihood of an aggressive interest rate cut by the Federal Reserve (Fed) at its September meeting. According to the CME FedWatch Tool, markets are fully anticipating at least a 25 basis point (bps) rate cut by the Federal Reserve at its September meeting. The likelihood of a 50 bps rate cut has slightly decreased to 31.0%, down from 38.0% a week ago.
The Euro received downward pressure from the recent German inflation data. Harmonized Index of Consumer Prices (HICP) maintained a 2.0% year-on-year increase in August, in line with expectations. The monthly index showed a steady decline of 0.2%, also as forecasted. Similarly, the Consumer Price Index (CPI) remained stable at 1.9% year-on-year in August, meeting market expectations.
Traders anticipate that the European Central Bank (ECB) will lower interest rates to 4.0% by implementing a 25 basis points rate cut at its upcoming policy meeting on Thursday.
Euro FAQs
The Euro is the currency for the 20 European Union countries that belong to the Eurozone. It is the second most heavily traded currency in the world behind the US Dollar. In 2022, it accounted for 31% of all foreign exchange transactions, with an average daily turnover of over $2.2 trillion a day. EUR/USD is the most heavily traded currency pair in the world, accounting for an estimated 30% off all transactions, followed by EUR/JPY (4%), EUR/GBP (3%) and EUR/AUD (2%).
The European Central Bank (ECB) in Frankfurt, Germany, is the reserve bank for the Eurozone. The ECB sets interest rates and manages monetary policy. The ECB’s primary mandate is to maintain price stability, which means either controlling inflation or stimulating growth. Its primary tool is the raising or lowering of interest rates. Relatively high interest rates – or the expectation of higher rates – will usually benefit the Euro and vice versa. The ECB Governing Council makes monetary policy decisions at meetings held eight times a year. Decisions are made by heads of the Eurozone national banks and six permanent members, including the President of the ECB, Christine Lagarde.
Eurozone inflation data, measured by the Harmonized Index of Consumer Prices (HICP), is an important econometric for the Euro. If inflation rises more than expected, especially if above the ECB’s 2% target, it obliges the ECB to raise interest rates to bring it back under control. Relatively high interest rates compared to its counterparts will usually benefit the Euro, as it makes the region more attractive as a place for global investors to park their money.
Data releases gauge the health of the economy and can impact on the Euro. Indicators such as GDP, Manufacturing and Services PMIs, employment, and consumer sentiment surveys can all influence the direction of the single currency. A strong economy is good for the Euro. Not only does it attract more foreign investment but it may encourage the ECB to put up interest rates, which will directly strengthen the Euro. Otherwise, if economic data is weak, the Euro is likely to fall. Economic data for the four largest economies in the euro area (Germany, France, Italy and Spain) are especially significant, as they account for 75% of the Eurozone’s economy.
Another significant data release for the Euro is the Trade Balance. This indicator measures the difference between what a country earns from its exports and what it spends on imports over a given period. If a country produces highly sought after exports then its currency will gain in value purely from the extra demand created from foreign buyers seeking to purchase these goods. Therefore, a positive net Trade Balance strengthens a currency and vice versa for a negative balance.
- The US Consumer Price Index is forecast to rise 2.6% YoY in August, at a softer pace than July’s 2.9% increase.
- Annual core CPI inflation is expected to hold steady at 3.2%.
- The inflation data could alter the odds of a 50 bps Fed rate cut in September and rock the US Dollar.
The Bureau of Labor Statistics (BLS) will publish the highly anticipated Consumer Price Index (CPI) inflation data from the United States (US) for August on Wednesday at 12:30 GMT.
The US Dollar (USD) braces for intense volatility, as any surprises from the US inflation report could significantly impact the market’s pricing of the Federal Reserve (Fed) interest rate cut expectations in September.
What to expect in the next CPI data report?
Inflation in the US, as measured by the CPI, is expected to increase at an annual rate of 2.6% in August, down from the 2.9% rise reported in July. The core CPI inflation, which excludes volatile food and energy prices, is seen to stay unchanged at 3.2% in the same period.
Meanwhile, the CPI and the core CPI are both forecast to rise 0.2% on a monthly basis, matching July’s increase.
Previewing the August inflation report, “we expect core CPI prices to remain largely under control in August, printing a fourth consecutive gain under 0.2% m/m. Services inflation will play a key role owing to cooling shelter prices,” said TD Securities analysts in a weekly report. “Headline inflation likely also stayed subdued with energy prices returning to deflation. Our unrounded core CPI forecast at 0.14% m/m suggests larger risks toward a rounded 0.2% increase.”
Following several soft inflation readings in a row, Federal Reserve policymakers made it clear that they will shift their focus to the labor market amid growing signs of a cooldown. “We have a little more tolerance for an upside surprise on CPI as the longer arc shows inflation coming down,” Chicago Fed President Austan Goolsbee said recently.
How could the US Consumer Price Index report affect EUR/USD?
The market anticipation of a 50 basis points Fed rate cut in September will be put to the test when September inflation data is released.
Following the mixed August jobs report, the probability of the Fed lowering the policy rate by 50 bps at the upcoming meeting declined below 30% from nearly 50% earlier in the month, according to the CME Group FedWatch Tool. The US Bureau of Labor Statistics announced on Friday that Nonfarm Payrolls rose 142,000 in August. This reading followed the 89,000 (revised from 114,000) increase recorded in July and fell short of the market forecast of 160,000. On a positive note, the Unemployment Rate edged lower to 4.2% from 4.3% in July and the annual wage inflation, as measured by the change in the Average Hourly Earnings, rose to 3.8% from 3.6%.
The market positioning suggests that it will take a significant miss in the CPI data for investors to reconsider a large rate reduction next week. In case the monthly core CPI comes in at 0% or in negative territory, the immediate reaction could revive expectations for a 50 bps cut and trigger a US Dollar (USD) selloff. On the other hand, an increase of 0.3%, or stronger, could confirm a 25 bps cut and help the USD stay resilient against its rivals. However, the fact that such a rate decision is already strongly priced in shows that the USD doesn’t have a lot of room on the upside.
Eren Sengezer, European Session Lead Analyst at FXStreet, offers a brief technical outlook for EUR/USD and explains: “EUR/USD’s near-term technical picture highlights a lack of buyer interest. The pair stays well below the 20-day Simple Moving Average (SMA) and the Relative Strength Index stays near 50.”
“EUR/USD could face first support at 1.1000, where the Fibonacci 38.2% retracement of the two-month-long uptrend that started in late June is located. Below this level, the 50-day SMA and the Fibonacci 50% retracement form the next support area at 1.0950-1.0930. On the other side, in case the pair clears 1.1070-1.1080 (Fibonacci 23.6% retracement, 20-day SMA) resistance, it could target 1.1200 (end-point of the uptrend) and 1.1275 (July 18, 2023, high) next.”
Fed FAQs
Monetary policy in the US is shaped by the Federal Reserve (Fed). The Fed has two mandates: to achieve price stability and foster full employment. Its primary tool to achieve these goals is by adjusting interest rates. When prices are rising too quickly and inflation is above the Fed’s 2% target, it raises interest rates, increasing borrowing costs throughout the economy. This results in a stronger US Dollar (USD) as it makes the US a more attractive place for international investors to park their money. When inflation falls below 2% or the Unemployment Rate is too high, the Fed may lower interest rates to encourage borrowing, which weighs on the Greenback.
The Federal Reserve (Fed) holds eight policy meetings a year, where the Federal Open Market Committee (FOMC) assesses economic conditions and makes monetary policy decisions. The FOMC is attended by twelve Fed officials – the seven members of the Board of Governors, the president of the Federal Reserve Bank of New York, and four of the remaining eleven regional Reserve Bank presidents, who serve one-year terms on a rotating basis.
In extreme situations, the Federal Reserve may resort to a policy named Quantitative Easing (QE). QE is the process by which the Fed substantially increases the flow of credit in a stuck financial system. It is a non-standard policy measure used during crises or when inflation is extremely low. It was the Fed’s weapon of choice during the Great Financial Crisis in 2008. It involves the Fed printing more Dollars and using them to buy high grade bonds from financial institutions. QE usually weakens the US Dollar.
Quantitative tightening (QT) is the reverse process of QE, whereby the Federal Reserve stops buying bonds from financial institutions and does not reinvest the principal from the bonds it holds maturing, to purchase new bonds. It is usually positive for the value of the US Dollar.
Gold prices remained broadly unchanged in India on Wednesday, according to data compiled by FXStreet.
The price for Gold stood at 6,800.32 Indian Rupees (INR) per gram, broadly stable compared with the INR 6,794.06 it cost on Tuesday.
The price for Gold was broadly steady at INR 79,317.59 per tola from INR 79,244.54 per tola a day earlier.
| Unit measure | Gold Price in INR |
|---|---|
| 1 Gram | 6,800.32 |
| 10 Grams | 68,002.92 |
| Tola | 79,317.59 |
| Troy Ounce | 211,513.70 |
FXStreet calculates Gold prices in India by adapting international prices (USD/INR) to the local currency and measurement units. Prices are updated daily based on the market rates taken at the time of publication. Prices are just for reference and local rates could diverge slightly.
Gold FAQs
Gold has played a key role in human’s history as it has been widely used as a store of value and medium of exchange. Currently, apart from its shine and usage for jewelry, the precious metal is widely seen as a safe-haven asset, meaning that it is considered a good investment during turbulent times. Gold is also widely seen as a hedge against inflation and against depreciating currencies as it doesn’t rely on any specific issuer or government.
Central banks are the biggest Gold holders. In their aim to support their currencies in turbulent times, central banks tend to diversify their reserves and buy Gold to improve the perceived strength of the economy and the currency. High Gold reserves can be a source of trust for a country’s solvency. Central banks added 1,136 tonnes of Gold worth around $70 billion to their reserves in 2022, according to data from the World Gold Council. This is the highest yearly purchase since records began. Central banks from emerging economies such as China, India and Turkey are quickly increasing their Gold reserves.
Gold has an inverse correlation with the US Dollar and US Treasuries, which are both major reserve and safe-haven assets. When the Dollar depreciates, Gold tends to rise, enabling investors and central banks to diversify their assets in turbulent times. Gold is also inversely correlated with risk assets. A rally in the stock market tends to weaken Gold price, while sell-offs in riskier markets tend to favor the precious metal.
The price can move due to a wide range of factors. Geopolitical instability or fears of a deep recession can quickly make Gold price escalate due to its safe-haven status. As a yield-less asset, Gold tends to rise with lower interest rates, while higher cost of money usually weighs down on the yellow metal. Still, most moves depend on how the US Dollar (USD) behaves as the asset is priced in dollars (XAU/USD). A strong Dollar tends to keep the price of Gold controlled, whereas a weaker Dollar is likely to push Gold prices up.
(An automation tool was used in creating this post.)
- The Indian Rupee remains stable amid rising speculation of RBI interventions in open FX markets.
- Lower crude Oil prices favor the INR as India is the world’s third-largest Oil consumer and importer.
- The US Dollar depreciates as the Treasury yields continue to decline ahead of the Consumer Price Index data.
The USD/INR pair remains confined in a range around 84.00 level on Wednesday. Traders speculate potential interventions by the Reserve Bank of India (RBI) in the open FX market to support the Indian Rupee (INR) and prevent it from weakening beyond the 84.00 level.
The Indian Rupee gained support against the US Dollar (USD) due to falling crude Oil prices. This could alleviate downward pressure on the INR, as India, the world’s third-largest Oil consumer and importer, stands to benefit from lower import costs. Concerns about weakening global demand led Brent crude futures to drop to their lowest level of $64.75 per barrel since December 2021.
The US Dollar (USD) faces challenges as the US Treasury yields continue to decline ahead of the US Consumer Price Index (CPI) data scheduled to be released later in the North American hours. This inflation report may offer fresh cues regarding the potential magnitude of the Federal Reserve's (Fed) interest rate cut in September.
Daily Digest Market Movers: Indian Rupee consolidates amid rising speculation of RBI interventions
- According to the CME FedWatch Tool, markets are fully anticipating at least a 25 basis point (bps) rate cut by the Federal Reserve at its September meeting. The likelihood of a 50 bps rate cut has slightly decreased to 31.0%, down from 38.0% a week ago.
- The first US presidential debate between former President Donald Trump and Democratic nominee Kamala Harris in Pennsylvania began with a critical focus on the economy, inflation, and economic policies. Trump remarked, "We have a terrible economy. We have inflation that is probably the worst in history. This has been a disaster for people."
- On Tuesday, Reuters reported that six Indian bankers indicated that investors are urging the Indian federal government to increase the issuance of short-term and green bonds and to restart auctions for floating-rate bonds. These recommendations were discussed during a series of meetings about the government’s borrowing strategy for the latter half of the fiscal year.
- Chicago Fed President Austan Goolsbee remarked on Friday that Fed officials are starting to align with the broader market's sentiment that a policy rate adjustment by the US central bank is imminent, according to CNBC. FXStreet’s FedTracker, which uses a custom AI model to evaluate Fed officials' speeches on a dovish-to-hawkish scale from 0 to 10, rated Goolsbee's comments as dovish, assigning them a score of 3.2.
- India's FX Reserves reached a record high of $683.99 billion as of August 30, up from $681.69 billion previously. This surge is largely due to a substantial influx of foreign exchange into the Indian economy, spurred by robust economic growth and the long-anticipated inclusion of Indian assets in JPMorgan's major emerging market debt index, which has enhanced foreign investment.
- “The Composite PMI for India continued to show strong growth in August, driven by accelerated business activity in the service sector, which experienced its fastest expansion since March. This growth was largely fuelled by an increase in new orders, particularly domestic orders,” said Pranjul Bhandari, Chief India Economist at HSBC.
Technical Analysis: USD/INR hovers below 84.00, upper boundary of the symmetrical triangle
The Indian Rupee trades around 84.00 on Wednesday. An analysis of the daily chart shows that the USD/INR pair is consolidating within a symmetrical triangle pattern, which suggests reduced volatility and a period of consolidation. Nevertheless, the 14-day Relative Strength Index (RSI) remains above 50, signaling a bullish trend.
On the downside, the nine-day Exponential Moving Average (EMA) at 83.92 could act as immediate support, coinciding with the lower boundary of the symmetrical triangle near 83.90. A drop below this level might signal a bearish shift, potentially exerting downward pressure on the USD/INR pair and pushing it toward the six-week low at 83.72.
On the resistance side, the USD/INR pair is testing the upper boundary of the symmetrical triangle near the 84.00 level. A breakout above this point could drive the pair toward the all-time high of 84.14, recorded on August 5.
USD/INR: Daily Chart
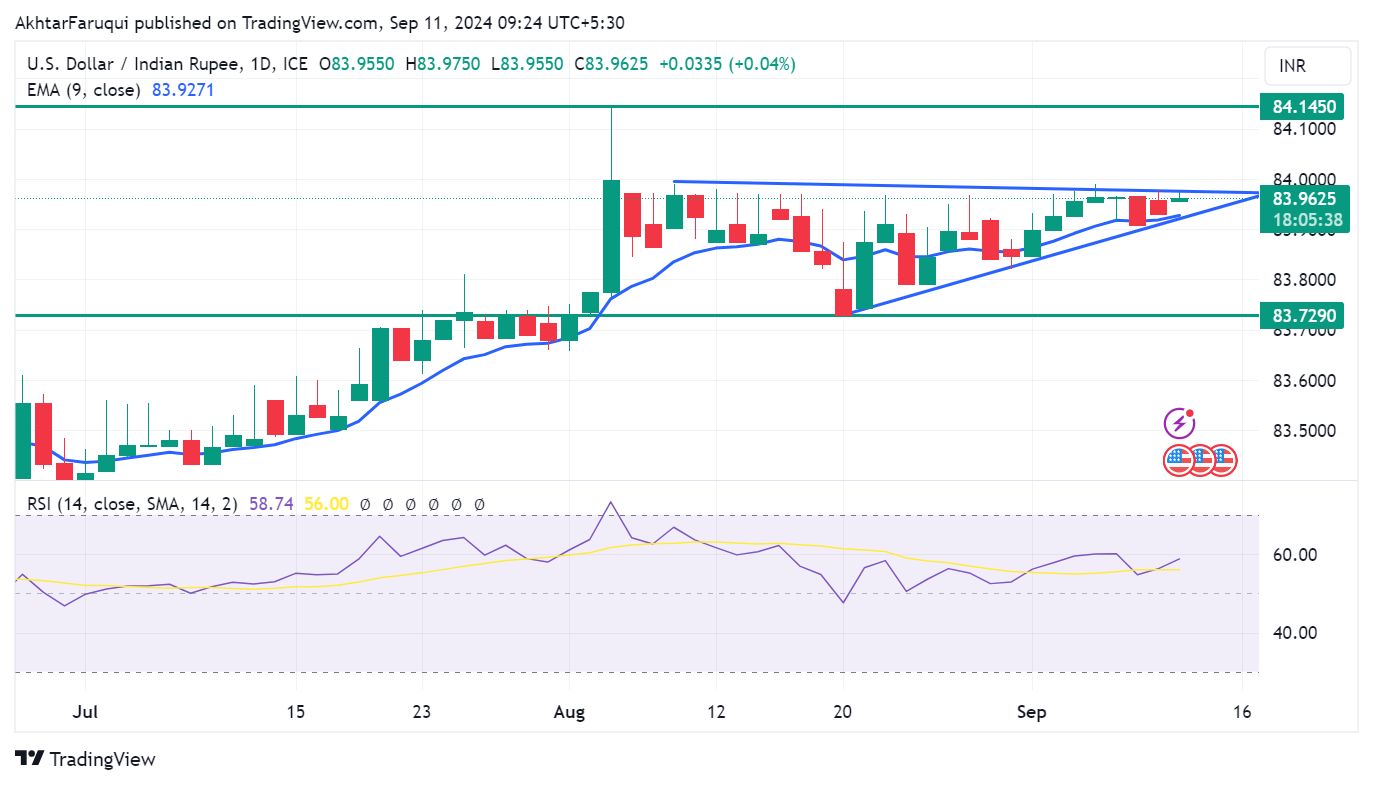
Indian Rupee FAQs
The Indian Rupee (INR) is one of the most sensitive currencies to external factors. The price of Crude Oil (the country is highly dependent on imported Oil), the value of the US Dollar – most trade is conducted in USD – and the level of foreign investment, are all influential. Direct intervention by the Reserve Bank of India (RBI) in FX markets to keep the exchange rate stable, as well as the level of interest rates set by the RBI, are further major influencing factors on the Rupee.
The Reserve Bank of India (RBI) actively intervenes in forex markets to maintain a stable exchange rate, to help facilitate trade. In addition, the RBI tries to maintain the inflation rate at its 4% target by adjusting interest rates. Higher interest rates usually strengthen the Rupee. This is due to the role of the ‘carry trade’ in which investors borrow in countries with lower interest rates so as to place their money in countries’ offering relatively higher interest rates and profit from the difference.
Macroeconomic factors that influence the value of the Rupee include inflation, interest rates, the economic growth rate (GDP), the balance of trade, and inflows from foreign investment. A higher growth rate can lead to more overseas investment, pushing up demand for the Rupee. A less negative balance of trade will eventually lead to a stronger Rupee. Higher interest rates, especially real rates (interest rates less inflation) are also positive for the Rupee. A risk-on environment can lead to greater inflows of Foreign Direct and Indirect Investment (FDI and FII), which also benefit the Rupee.
Higher inflation, particularly, if it is comparatively higher than India’s peers, is generally negative for the currency as it reflects devaluation through oversupply. Inflation also increases the cost of exports, leading to more Rupees being sold to purchase foreign imports, which is Rupee-negative. At the same time, higher inflation usually leads to the Reserve Bank of India (RBI) raising interest rates and this can be positive for the Rupee, due to increased demand from international investors. The opposite effect is true of lower inflation.
- GBP/USD attracts some buyers on Wednesday amid a modest USD decline.
- The fundamental backdrop warrants before placing aggressive bullish bets.
- Traders might also prefer to wait for the release of the crucial US CPI report.
The GBP/USD pair regains positive traction during the Asian session on Wednesday and climbs to a fresh daily peak, closer to the 1.3100 round-figure mark in the last hour. Spot prices, however, remain below the overnight swing high, warranting some caution before positioning for any meaningful recovery from a three-week low, around the 1.3050-1.3045 region touched the previous day.
The US Dollar (USD) stalls its positive trend witnessed over the past three days and retreats from the vicinity of the monthly top amid the prospects for an imminent start of the Federal Reserve's (Fed) policy-easing cycle in September. This, in turn, is seen as a key factor lending some support to the GBP/USD pair. That said, a generally weaker tone around the equity markets could help limit losses for the Greenback and cap the currency pair amid bets that the Bank of England (BoE) will announce more interest rate cuts this year.
The UK Office for National Statistics (ONS) reported on Tuesday that the number of people claiming unemployment-related benefits increased by 23.7K in August as compared to the 102.3K previous and well below the 95.5K expected. Adding to this, the ILO Unemployment Rate expectedly ticked lower from 4.2% to 4.1% in the three months to July. That said, a slowdown in the UK wage growth was seen as positive news for inflation and might provide the UK central bank with increased confidence regarding cutting interest rates further.
Traders might also refrain from placing aggressive bullish bets around the British Pound (GBP) ahead of the UK data dump, including the monthly GDP print, and the latest US consumer inflation figures. The crucial US Consumer Price Index (CPI) report will play a key role in influencing market expectations about the Fed's rate-cut path. This, in turn, will drive the USD demand in the near term and provide a fresh directional impetus to the GBP/USD pair.
Economic Indicator
Gross Domestic Product (MoM)
The Gross Domestic Product (GDP), released by the Office for National Statistics on a monthly and quarterly basis, is a measure of the total value of all goods and services produced in the UK during a given period. The GDP is considered as the main measure of UK economic activity. The MoM reading compares economic activity in the reference month to the previous month. Generally, a rise in this indicator is bullish for the Pound Sterling (GBP), while a low reading is seen as bearish.
Read more.Next release: Wed Sep 11, 2024 06:00
Frequency: Monthly
Consensus: 0.2%
Previous: 0%
Source: Office for National Statistics
- EUR/JPY drifts lower for the second successive day and drops to over a one-month low.
- A softer risk tone, along with BoJ rate hike bets, boosts the JPY and exerts some pressure.
- Dovish ECB expectations contribute to the slide and support prospects for further losses.
The EUR/JPY cross attracts sellers for the second successive day on Wednesday and drops to the 158.20 area, or its lowest level since August 5 during the Asian session. Spot prices, however, manage to recover a few pips in the last hour and currently trade around the mid-158.00s, still down nearly 0.30% for the day amid some follow-through buying around the Japanese Yen (JPY).
Investors turn cautious ahead of the release of the crucial US consumer inflation figures later this Wednesday, which will play a key role in influencing expectations about the Federal Reserve's (Fed) rate-cut path. This is evident from a generally weaker tone around the equity markets and drives some haven flows towards the JPY. Adding to this, hawkish remarks by Bank of Japan (BoJ) board member Junko Nagakawa provide an additional boost to the JPY and exert downward pressure on the EUR/JPY cross.
Nagakawa noted that even after the July rate hike, real interest rates remain deeply negative, and accommodative monetary conditions are maintained. She added that the BoJ is likely to adjust the degree of monetary easing if the economy and prices move in line with its projection. In contrast, the European Central Bank (ECB) is almost certain to lower rates again at its September meeting on Thursday amid declining inflation in the Eurozone. This further contributes to the offered tone surrounding the EUR/JPY cross.
The JPY bulls, meanwhile, seem rather unaffected by a Reuters monthly poll, which showed that business confidence at big Japanese manufacturers sank to a seven-month low of 4 in September, down sharply from 10 in the previous month. Adding to this, the mood at non-manufacturers fell for a third consecutive month, to a one-year-low, suggesting a gloomy sentiment. This, however, does little to lend any support to the EUR/JPY cross, suggesting that the near-term bias remains tilted firmly in favor of bearish traders.
Japanese Yen PRICE Today
The table below shows the percentage change of Japanese Yen (JPY) against listed major currencies today. Japanese Yen was the strongest against the New Zealand Dollar.
| USD | EUR | GBP | JPY | CAD | AUD | NZD | CHF | |
|---|---|---|---|---|---|---|---|---|
| USD | -0.11% | -0.04% | -0.41% | -0.01% | 0.04% | 0.11% | -0.21% | |
| EUR | 0.11% | 0.07% | -0.30% | 0.12% | 0.20% | 0.22% | -0.09% | |
| GBP | 0.04% | -0.07% | -0.37% | 0.04% | 0.07% | 0.15% | -0.16% | |
| JPY | 0.41% | 0.30% | 0.37% | 0.40% | 0.43% | 0.49% | 0.19% | |
| CAD | 0.00% | -0.12% | -0.04% | -0.40% | 0.04% | 0.12% | -0.20% | |
| AUD | -0.04% | -0.20% | -0.07% | -0.43% | -0.04% | 0.01% | -0.22% | |
| NZD | -0.11% | -0.22% | -0.15% | -0.49% | -0.12% | -0.01% | -0.30% | |
| CHF | 0.21% | 0.09% | 0.16% | -0.19% | 0.20% | 0.22% | 0.30% |
The heat map shows percentage changes of major currencies against each other. The base currency is picked from the left column, while the quote currency is picked from the top row. For example, if you pick the Japanese Yen from the left column and move along the horizontal line to the US Dollar, the percentage change displayed in the box will represent JPY (base)/USD (quote).
- Gold price climbs to a fresh weekly top and draws support from a combination of factors.
- The cautious market mood benefits the safe-haven XAU/USD amid a modest USD downtick.
- Traders refrain from placing aggressive bets ahead of the release of the crucial US CPI report.
Gold price (XAU/USD) attracts some buyers for the third straight day on Wednesday and touches a fresh weekly high, around the $2.520-2,521 region during the Asian session. The commodity, however, remains confined in a multi-week-old trading range as traders await the release of the latest US consumer inflation figures due later today. The crucial data will influence market expectations about the size of the rate cut by the Federal Reserve (Fed) at the September 17-18 policy meeting and determine the next leg of a directional move for the non-yielding yellow metal.
In the meantime, the prospects for an imminent start of the Fed's policy easing cycle fail to assist the US Dollar (USD) to build on its positive move witnessed over the past three days and act as a tailwind for the Gold price. Meanwhile, investors turn cautious heading into the key data risk, which is evident from a generally weaker tone around the equity markets. This is seen as another factor lending some support to the safe-haven precious metal. Bullish traders, however, need to wait for strength beyond the $2,525 supply zone before positioning for any further appreciating move.
Daily Digest Market Movers: Gold price traders await US inflation data before positioning for further gains
- Asian stocks were off to a shaky start on Wednesday as investors gear up for the crucial US inflation data, which, in turn, drives some haven flows towards the Gold price.
- The headline US Consumer Price Index (CPI) is expected to have risen 0.2% in August and the yearly rate is seen decelerating from 2.9% to 2.6%, or the lowest since 2021.
- Meanwhile, the core CPI, which excludes volatile food and energy prices, is anticipated to come in at 0.2% and hold steady at a 3.2% YoY rate during the reported month.
- Any further signs of cooling inflation would increase market bets for a more aggressive policy easing by the Federal Reserve and bode well for the non-yielding yellow metal.
- In contrast, the reaction to a stronger CPI print is more likely to be limited as investors seem convinced that the US central bank will start lowering borrowing costs in September.
- According to the CME FedWatch Tool, the markets are currently pricing in a 67% chance of a 25-basis-points rate cut at the next FOMC policy meeting on September 17-18.
- Meanwhile, the first debate between Democratic Vice President Kamala Harris and Republican Presidential candidate Donald Trump did little to impact the market sentiment.
Technical Outlook: Gold price needs to break above a short-term trading range for bulls to regain control
From a technical perspective, any subsequent move up might continue to confront some resistance near the $2,525-2,526 supply zone. The said area marks the top boundary of a multi-week-old trading range and should act as a key pivotal point. Some follow-through buying, leading to a subsequent strength beyond the $2,532 area or the all-time peak, will be seen as a fresh trigger for bullish traders. Given that oscillators on the daily chart are holding in positive territory and are still away from being in the overbought zone, the Gold price might then resume its recent well-established uptrend.
On the flip side, the $2,500 psychological mark now seems to protect the immediate downside ahead of the $2,485 area and the $2,470 horizontal zone. The latter represents the trading range support, which if broken decisively might prompt some technical selling and pave the way for deeper losses. The Gold price might then accelerate the fall towards the 50-day Simple Moving Average (SMA) support, currently pegged near the $2,450-2,449 area, before eventually dropping to sub-$2,400 levels, or the 100-day SMA.
Gold FAQs
Gold has played a key role in human’s history as it has been widely used as a store of value and medium of exchange. Currently, apart from its shine and usage for jewelry, the precious metal is widely seen as a safe-haven asset, meaning that it is considered a good investment during turbulent times. Gold is also widely seen as a hedge against inflation and against depreciating currencies as it doesn’t rely on any specific issuer or government.
Central banks are the biggest Gold holders. In their aim to support their currencies in turbulent times, central banks tend to diversify their reserves and buy Gold to improve the perceived strength of the economy and the currency. High Gold reserves can be a source of trust for a country’s solvency. Central banks added 1,136 tonnes of Gold worth around $70 billion to their reserves in 2022, according to data from the World Gold Council. This is the highest yearly purchase since records began. Central banks from emerging economies such as China, India and Turkey are quickly increasing their Gold reserves.
Gold has an inverse correlation with the US Dollar and US Treasuries, which are both major reserve and safe-haven assets. When the Dollar depreciates, Gold tends to rise, enabling investors and central banks to diversify their assets in turbulent times. Gold is also inversely correlated with risk assets. A rally in the stock market tends to weaken Gold price, while sell-offs in riskier markets tend to favor the precious metal.
The price can move due to a wide range of factors. Geopolitical instability or fears of a deep recession can quickly make Gold price escalate due to its safe-haven status. As a yield-less asset, Gold tends to rise with lower interest rates, while higher cost of money usually weighs down on the yellow metal. Still, most moves depend on how the US Dollar (USD) behaves as the asset is priced in dollars (XAU/USD). A strong Dollar tends to keep the price of Gold controlled, whereas a weaker Dollar is likely to push Gold prices up.
- NZD/USD pares its intraday losses ahead of the release of US Consumer Price Index data.
- The lower US Treasury yields put downward pressure on the US Dollar.
- Morgan Stanley's Robin Xing emphasizes the greater need for China to implement stimulus measures to overcome the debt-deflation challenge.
NZD/USD trims its intraday losses, trading around 0.6150 during the Asian session on Wednesday. The US Dollar (USD) faces challenges as the US Treasury yields continue to decline ahead of the US Consumer Price Index (CPI) data scheduled to be released later in the North American hours. This inflation report may offer fresh cues regarding the potential magnitude of the Federal Reserve's (Fed) interest rate cut in September.
The US Dollar Index (DXY), which measures the value of the US Dollar against six other major currencies, halts its three-day winning streak. The DXY trades around 101.40 with 2-year and 10-year yields on US Treasury bonds standing at 3.57% and 3.62%, respectively, at the time of writing.
However, last week’s US labor market report raised uncertainty over the likelihood of an aggressive interest rate cut by the Federal Reserve (Fed) at its September meeting. According to the CME FedWatch Tool, markets are fully anticipating at least a 25 basis point (bps) rate cut by the Federal Reserve at its September meeting. The likelihood of a 50 bps rate cut has slightly decreased to 31.0%, down from 38.0% a week ago.
Morgan Stanley's Chief China Economist, Robin Xing, stated that China is undoubtedly experiencing deflation, likely in the second stage of the process. Xing noted that Japan's experience suggests that the longer deflation persists, the greater the need for China to implement significant stimulus measures to overcome the debt-deflation challenge, per Business Standard. Any change in the Chinese economy could impact the Kiwi markets as both countries are close trade partners.
UOB Group FX strategists Quek Ser Leang and Peter Chia observed that the New Zealand Dollar (NZD) could potentially break below 0.6115, though it is highly unlikely that the support at 0.6085 will come into play. They also noted that as long as the NZD remains below 0.6220, a break below 0.6150 is possible.
Read the full article: NZD/USD can break below 0.6115 – UOB Group
New Zealand Dollar FAQs
The New Zealand Dollar (NZD), also known as the Kiwi, is a well-known traded currency among investors. Its value is broadly determined by the health of the New Zealand economy and the country’s central bank policy. Still, there are some unique particularities that also can make NZD move. The performance of the Chinese economy tends to move the Kiwi because China is New Zealand’s biggest trading partner. Bad news for the Chinese economy likely means less New Zealand exports to the country, hitting the economy and thus its currency. Another factor moving NZD is dairy prices as the dairy industry is New Zealand’s main export. High dairy prices boost export income, contributing positively to the economy and thus to the NZD.
The Reserve Bank of New Zealand (RBNZ) aims to achieve and maintain an inflation rate between 1% and 3% over the medium term, with a focus to keep it near the 2% mid-point. To this end, the bank sets an appropriate level of interest rates. When inflation is too high, the RBNZ will increase interest rates to cool the economy, but the move will also make bond yields higher, increasing investors’ appeal to invest in the country and thus boosting NZD. On the contrary, lower interest rates tend to weaken NZD. The so-called rate differential, or how rates in New Zealand are or are expected to be compared to the ones set by the US Federal Reserve, can also play a key role in moving the NZD/USD pair.
Macroeconomic data releases in New Zealand are key to assess the state of the economy and can impact the New Zealand Dollar’s (NZD) valuation. A strong economy, based on high economic growth, low unemployment and high confidence is good for NZD. High economic growth attracts foreign investment and may encourage the Reserve Bank of New Zealand to increase interest rates, if this economic strength comes together with elevated inflation. Conversely, if economic data is weak, NZD is likely to depreciate.
The New Zealand Dollar (NZD) tends to strengthen during risk-on periods, or when investors perceive that broader market risks are low and are optimistic about growth. This tends to lead to a more favorable outlook for commodities and so-called ‘commodity currencies’ such as the Kiwi. Conversely, NZD tends to weaken at times of market turbulence or economic uncertainty as investors tend to sell higher-risk assets and flee to the more-stable safe havens.
| Raw materials | Closed | Change, % |
|---|---|---|
| Silver | 28.39 | 0.14 |
| Gold | 251.668 | 0.4 |
| Palladium | 971.38 | 2.7 |
The first US presidential debate between former President Donald Trump and Democratic nominee Kamala Harris in Pennsylvania is underway and has failed to trigger any significant market reaction so far. The debate is conducted and televised by ABC News.
The debate began with the critical question about the economy, inflation and economic policies. Donald Trump said, "we have a terrible economy. We have inflation that is probably the worst in the history. This has been a disaster for people.”
Harris slammed Trump by responding, "Trump left us the worst employment since the great depression. He left us the worst attack on democracy since civil war. The former president intends to implement the detailed and dangerous plan called Project 2025.”
"I have nothing do with Project 2025. Everybody knows I'm an open book and what I'm gonna do," rebuttals Donald Trump.
Donald Trump attacked Kamala Harris and the Biden administration over illegal migration into the US. Trump said: "She is destroying this country. We will become Venezuela on steroids if she becomes president.”
On Middle East conflict between Gaza and Hamas, Trump said the conflict would have "never started" if he were still president. "I will get that settled and fast," he says, adding that the Russia-Ukraine war will also end when he is re-elected.
Harris responded, "This war must end.” "It must end immediately,” she added. Harris goes on to call for a ceasefire, and eventually, a two-state solution to "rebuild Gaza".
Kamala Harris and Donald Trump appear to be neck-and-neck, with the latest polls showing Trump leading Harris 48% to 47% nationally.
US Dollar meets fresh supply
The US Dollar has come under fresh selling pressure against its major currency rivals, mainly driven by the USD/JPY slide following BoJ Nagakawa’s comments. The debate seems to have a little to no impact on the FX space. At the time of writing, the US Dollar Index is down 0.19% on the day to trade near 101.45.
US Dollar PRICE Today
The table below shows the percentage change of US Dollar (USD) against listed major currencies today. US Dollar was the weakest against the Japanese Yen.
| USD | EUR | GBP | JPY | CAD | AUD | NZD | CHF | |
|---|---|---|---|---|---|---|---|---|
| USD | -0.17% | -0.10% | -0.51% | -0.06% | -0.07% | 0.03% | -0.28% | |
| EUR | 0.17% | 0.08% | -0.33% | 0.13% | 0.16% | 0.20% | -0.10% | |
| GBP | 0.10% | -0.08% | -0.43% | 0.04% | 0.02% | 0.12% | -0.18% | |
| JPY | 0.51% | 0.33% | 0.43% | 0.48% | 0.45% | 0.53% | 0.24% | |
| CAD | 0.06% | -0.13% | -0.04% | -0.48% | -0.02% | 0.08% | -0.23% | |
| AUD | 0.07% | -0.16% | -0.02% | -0.45% | 0.02% | 0.04% | -0.20% | |
| NZD | -0.03% | -0.20% | -0.12% | -0.53% | -0.08% | -0.04% | -0.30% | |
| CHF | 0.28% | 0.10% | 0.18% | -0.24% | 0.23% | 0.20% | 0.30% |
The heat map shows percentage changes of major currencies against each other. The base currency is picked from the left column, while the quote currency is picked from the top row. For example, if you pick the US Dollar from the left column and move along the horizontal line to the Japanese Yen, the percentage change displayed in the box will represent USD (base)/JPY (quote).
- The AUD/USD pair remains stable following the remarks from the RBA’s Assistant Governor (Economics), Sarah Hunter.
- RBA’s Sarah Hunter noted that elevated rates are suppressing demand, which is expected to lead to a mild economic downturn.
- Donald Trump argued that the fees he intends to impose on imports would not lead to higher prices in the US.
The AUD/USD pair holds its position on Wednesday, following remarks from the Reserve Bank of Australia's (RBA) Assistant Governor for Economics, Sarah Hunter. However, the Australian Dollar's (AUD) losses may be appreciated as RBA Governor Michele Bullock maintained a hawkish outlook last week, emphasizing that it is too soon to consider rate cuts with elevated inflation.
RBA’s Assistant Governor Sarah Hunter noted that high interest rates are dampening demand, contributing to what is expected to be a mild economic downturn. Hunter also highlighted that the labor market remains tight compared to full employment levels, with employment growth likely to continue but at a slower pace than population growth, per Reuters.
Read more: RBA’s Hunter: Easing in labour market similar to past mild downturns
The AUD/USD pair encountered pressure as the US Dollar gained strength following a recent US labor market report, which cast doubt on the possibility of an aggressive interest rate cut by the Federal Reserve (Fed) at its upcoming September meeting.
During the US Presidential Debate, Donald Trump argued that the fees he plans to impose on imports will not result in higher prices for Americans. He stated, "Who’s going to have higher prices in China and all of the countries that have been ripping us off for years."
Daily Digest Market Movers: Australian Dollar consolidates amid rising risk-off mood
- According to the CME FedWatch Tool, markets are fully anticipating at least a 25 basis point (bps) rate cut by the Federal Reserve at its September meeting. The likelihood of a 50 bps rate cut has slightly decreased to 31.0%, down from 38.0% a week ago.
- Morgan Stanley's Chief China Economist, Robin Xing, stated that China is undoubtedly experiencing deflation, likely in the second stage of the process. Xing noted that Japan's experience suggests that the longer deflation persists, the greater the need for China to implement significant stimulus measures to overcome the debt-deflation challenge, per Business Standard.
- Australia's Westpac Consumer Confidence fell by 0.5% month-on-month in September, swinging from a 2.8% gain in August.
- China's Trade Balance reported a trade surplus of CNY 649.34 billion for August, increasing from the previous reading of CNY 601.90 billion. Meanwhile, China's Exports (CNY) increased by 8.4% year-on-year, following the previous rise of 6.5%.
- RBC Capital Markets now expects the Reserve Bank of Australia to implement a rate cut at its February 2025 meeting, earlier than its previous forecast of May 2025. Despite inflation in Australia remaining elevated above the RBA's target, slower economic growth is not considered a sufficient reason for a rate cut this year.
- The US Bureau of Labor Statistics (BLS) reported that Nonfarm Payrolls (NFP) added 142,000 jobs in August, below the forecast of 160,000 but an improvement from July’s downwardly revised figure of 89,000. Meanwhile, the Unemployment Rate fell to 4.2%, as expected, down from 4.3% in the previous month.
- Federal Reserve (Fed) Bank of Chicago President Austan Goolsbee remarked on Friday that Fed officials are starting to align with the broader market's sentiment that a policy rate adjustment by the US central bank is imminent, according to CNBC. FXStreet’s FedTracker, which uses a custom AI model to evaluate Fed officials' speeches on a dovish-to-hawkish scale from 0 to 10, rated Goolsbee's comments as dovish, assigning them a score of 3.2.
Technical Analysis: Australian Dollar hovers around 0.6650, followed by the lower boundary of descending channel
The AUD/USD pair trades near 0.6650 on Wednesday, with technical analysis of the daily chart indicating that the pair remains within a descending channel, signaling a bearish bias. The 14-day Relative Strength Index (RSI) is also below the 50 level, further confirming the ongoing bearish trend.
On the downside, the AUD/USD pair may target the lower boundary of the descending channel around 0.6620. A break below this level could reinforce the bearish outlook, potentially pushing the pair toward the throwback support zone around 0.6575.
On the upside, the AUD/USD pair may encounter resistance around the nine-day Exponential Moving Average (EMA) at 0.6693, followed by the upper boundary of the descending channel near 0.6740. A break above this upper boundary could reduce the bearish bias, potentially paving the way for the pair to retest its seven-month high of 0.6798, last reached on July 11.
AUD/USD: Daily Chart
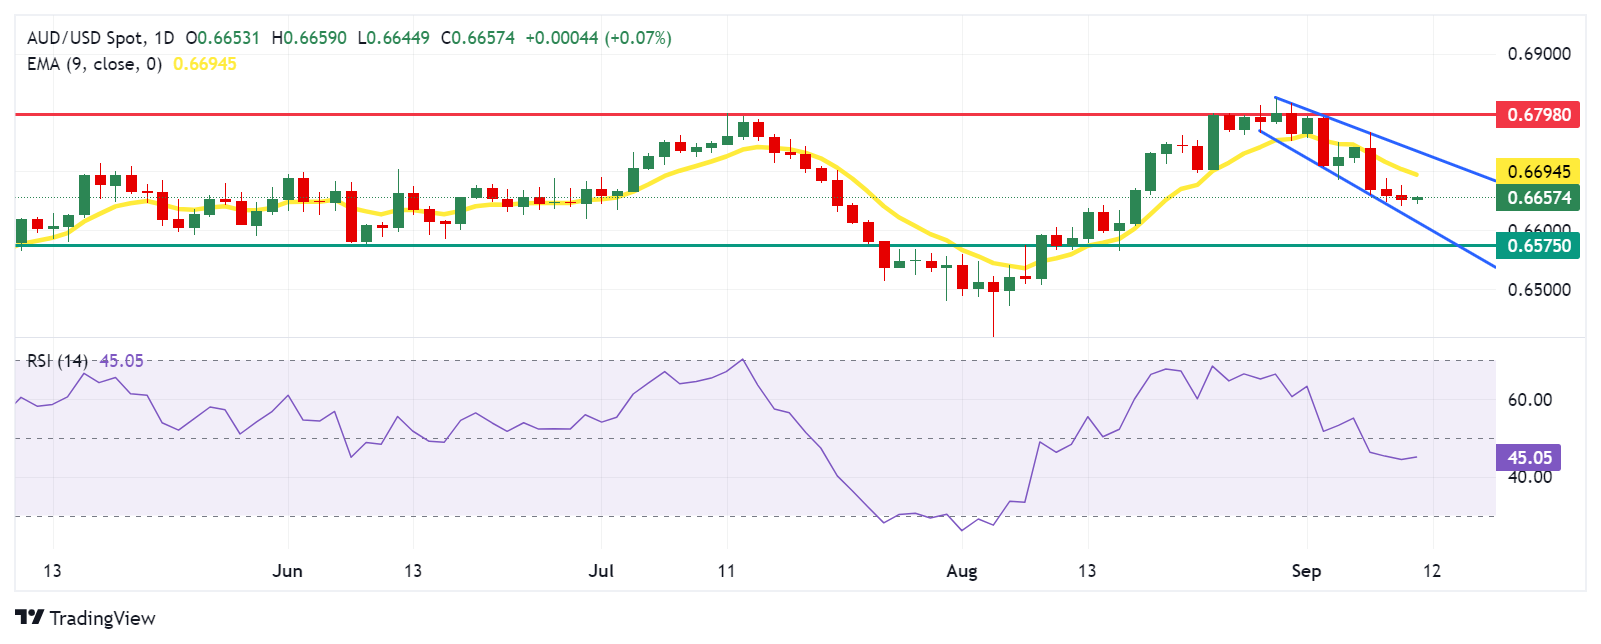
Australian Dollar PRICE Today
The table below shows the percentage change of Australian Dollar (AUD) against listed major currencies today. Australian Dollar was the strongest against the US Dollar.
| USD | EUR | GBP | JPY | CAD | AUD | NZD | CHF | |
|---|---|---|---|---|---|---|---|---|
| USD | -0.15% | -0.08% | -0.37% | -0.06% | -0.08% | 0.02% | -0.22% | |
| EUR | 0.15% | 0.08% | -0.20% | 0.11% | 0.13% | 0.17% | -0.06% | |
| GBP | 0.08% | -0.08% | -0.30% | 0.02% | -0.00% | 0.09% | -0.14% | |
| JPY | 0.37% | 0.20% | 0.30% | 0.34% | 0.30% | 0.38% | 0.16% | |
| CAD | 0.06% | -0.11% | -0.02% | -0.34% | -0.03% | 0.07% | -0.17% | |
| AUD | 0.08% | -0.13% | 0.00% | -0.30% | 0.03% | 0.03% | -0.13% | |
| NZD | -0.02% | -0.17% | -0.09% | -0.38% | -0.07% | -0.03% | -0.23% | |
| CHF | 0.22% | 0.06% | 0.14% | -0.16% | 0.17% | 0.13% | 0.23% |
The heat map shows percentage changes of major currencies against each other. The base currency is picked from the left column, while the quote currency is picked from the top row. For example, if you pick the Australian Dollar from the left column and move along the horizontal line to the US Dollar, the percentage change displayed in the box will represent AUD (base)/USD (quote).
Australian Dollar FAQs
One of the most significant factors for the Australian Dollar (AUD) is the level of interest rates set by the Reserve Bank of Australia (RBA). Because Australia is a resource-rich country another key driver is the price of its biggest export, Iron Ore. The health of the Chinese economy, its largest trading partner, is a factor, as well as inflation in Australia, its growth rate and Trade Balance. Market sentiment – whether investors are taking on more risky assets (risk-on) or seeking safe-havens (risk-off) – is also a factor, with risk-on positive for AUD.
The Reserve Bank of Australia (RBA) influences the Australian Dollar (AUD) by setting the level of interest rates that Australian banks can lend to each other. This influences the level of interest rates in the economy as a whole. The main goal of the RBA is to maintain a stable inflation rate of 2-3% by adjusting interest rates up or down. Relatively high interest rates compared to other major central banks support the AUD, and the opposite for relatively low. The RBA can also use quantitative easing and tightening to influence credit conditions, with the former AUD-negative and the latter AUD-positive.
China is Australia’s largest trading partner so the health of the Chinese economy is a major influence on the value of the Australian Dollar (AUD). When the Chinese economy is doing well it purchases more raw materials, goods and services from Australia, lifting demand for the AUD, and pushing up its value. The opposite is the case when the Chinese economy is not growing as fast as expected. Positive or negative surprises in Chinese growth data, therefore, often have a direct impact on the Australian Dollar and its pairs.
Iron Ore is Australia’s largest export, accounting for $118 billion a year according to data from 2021, with China as its primary destination. The price of Iron Ore, therefore, can be a driver of the Australian Dollar. Generally, if the price of Iron Ore rises, AUD also goes up, as aggregate demand for the currency increases. The opposite is the case if the price of Iron Ore falls. Higher Iron Ore prices also tend to result in a greater likelihood of a positive Trade Balance for Australia, which is also positive of the AUD.
The Trade Balance, which is the difference between what a country earns from its exports versus what it pays for its imports, is another factor that can influence the value of the Australian Dollar. If Australia produces highly sought after exports, then its currency will gain in value purely from the surplus demand created from foreign buyers seeking to purchase its exports versus what it spends to purchase imports. Therefore, a positive net Trade Balance strengthens the AUD, with the opposite effect if the Trade Balance is negative.
Bank of Japan (BoJ) board member Junko Nagakawa said on Wednesday that the” BoJ is likely to adjust the degree of monetary easing if economy and prices move in line with its projection.”
Additional quotes
Even after July rate hike, real interest rates remain deeply negative, and accommodative monetary conditions are maintained.
If long-term rates spike, BoJ could review its taper plan at its policy meeting as needed.
There is no big change to Japan's economic fundamentals including record profits at Japan firms.
When considering adjusting degree of monetary easing further, we will scrutinize market developments after July rate hike and how that affects economy, prices.
Market reaction
At the time of writing, USD/JPY licks its wounds near 141.80, down 0.42% on the day.
On Wednesday, the People’s Bank of China (PBOC) set the USD/CNY central rate for the trading session ahead at 7.1182, as against the previous day's fix of 7.1136 and 7.1198 Reuters estimates.
- USD/JPY drifts lower for the second straight day and slides back closer to a one-month low.
- The divergent BoJ-Fed policy expectations turn out to be a key factor exerting some pressure.
- Traders seem reluctant to place aggressive bets ahead of the release of the key US CPI report.
The USD/JPY pair remains under some selling pressure for the second successive day on Wednesday, albeit finds some support near the 142.00 mark and recovers a few pips in the last hour. Spot prices currently trade around the 142.30 region, well within the striking distance of a one-month low touched last week.
This downfall is sponsored by the divergent monetary policies between the Bank of Japan (BoJ) and the Federal Reserve (Fed), which continues to prompt the unwinding of carry trades and driving flows towards the Japanese Yen (JPY). In fact, BoJ Governor Kazuo Ueda reaffirmed the commitment to keep raising interest rates if the Japanese economy meets the central bank’s economic forecasts through FY2025.
In contrast, the markets have fully priced in a 25 basis points (bps) interest rate cut by the Fed at its upcoming policy meeting on September 17-18. This, in turn, fails to assist the US Dollar (USD) to capitalize on its gains registered over the past three days. Apart from this, the cautious market mood is seen benefitting the JPY's relative safe-haven status and exerting some downward pressure on the USD/JPY pair.
The aforementioned fundamental backdrop favors bearish traders and suggests that the path of least resistance for spot prices is to the downside. Investors, however, might prefer to wait for the release of the crucial US Consumer Price Index (CPI) report for cues about the Fed's rate-cut path. This will play a key role in influencing the near-term USD price dynamics and provide a fresh directional impetus to the USD/JPY pair.
Japanese Yen FAQs
The Japanese Yen (JPY) is one of the world’s most traded currencies. Its value is broadly determined by the performance of the Japanese economy, but more specifically by the Bank of Japan’s policy, the differential between Japanese and US bond yields, or risk sentiment among traders, among other factors.
One of the Bank of Japan’s mandates is currency control, so its moves are key for the Yen. The BoJ has directly intervened in currency markets sometimes, generally to lower the value of the Yen, although it refrains from doing it often due to political concerns of its main trading partners. The current BoJ ultra-loose monetary policy, based on massive stimulus to the economy, has caused the Yen to depreciate against its main currency peers. This process has exacerbated more recently due to an increasing policy divergence between the Bank of Japan and other main central banks, which have opted to increase interest rates sharply to fight decades-high levels of inflation.
The BoJ’s stance of sticking to ultra-loose monetary policy has led to a widening policy divergence with other central banks, particularly with the US Federal Reserve. This supports a widening of the differential between the 10-year US and Japanese bonds, which favors the US Dollar against the Japanese Yen.
The Japanese Yen is often seen as a safe-haven investment. This means that in times of market stress, investors are more likely to put their money in the Japanese currency due to its supposed reliability and stability. Turbulent times are likely to strengthen the Yen’s value against other currencies seen as more risky to invest in.
Reserve Bank of Australia (RBA) Assistant Governor (Economic) Sarah Hunter was out with some comments during the Asian session on Wednesday, saying that high rates are slowing demand in what should be a mild economic downturn.
Key Quotes:
- The labour market is still tight relative to full employment.
- The labour market has moved towards better balance since late 2022.
- Easing in the labour market similar to past mild downturns.
- Some slowing in labour demand will occur via a drop in average hours.
- Expect employment to continue to rise but at a slower pace than population.
- Space for vacancies to fall further without a sharp rise in unemployment.
- Surprised by the strength in the participation rate, including peer economies.
- The outlook is highly uncertain, and our forecasts are likely to be wrong in some way.
- There were signs that the easing in the labour market had started to flow through to wage growth, which was likely past its peak and set to slow further.
Market Reaction:
The AUD/USD pair moves little and remains confined in a range around mid-0.6600s, or the 100-day SMA as traders keenly await the release of the US Consumer Price Index (CPI) report before placing directional bets.
| Index | Change, points | Closed | Change, % |
|---|---|---|---|
| NIKKEI 225 | -56.59 | 36159.16 | -0.16 |
| Hang Seng | 37.13 | 17234.09 | 0.22 |
| KOSPI | -12.5 | 2523.43 | -0.49 |
| ASX 200 | 23.8 | 8011.9 | 0.3 |
| DAX | -177.64 | 18265.92 | -0.96 |
| CAC 40 | -17.71 | 7407.55 | -0.24 |
| Dow Jones | -92.63 | 40736.96 | -0.23 |
| S&P 500 | 24.47 | 5495.52 | 0.45 |
| NASDAQ Composite | 141.28 | 17025.88 | 0.84 |
| Pare | Closed | Change, % |
|---|---|---|
| AUDUSD | 0.66531 | -0.17 |
| EURJPY | 156.928 | -0.65 |
| EURUSD | 1.1019 | -0.18 |
| GBPJPY | 186.263 | -0.46 |
| GBPUSD | 1.30797 | 0.03 |
| NZDUSD | 0.6148 | 0.02 |
| USDCAD | 1.36087 | 0.4 |
| USDCHF | 0.84689 | -0.26 |
| USDJPY | 142.414 | -0.46 |


© 2000-2026. All rights reserved.
This site is managed by Teletrade D.J. LLC 2351 LLC 2022 (Euro House, Richmond Hill Road, Kingstown, VC0100, St. Vincent and the Grenadines).
The information on this website is for informational purposes only and does not constitute any investment advice.
The company does not serve or provide services to customers who are residents of the US, Canada, Iran, The Democratic People's Republic of Korea, Yemen and FATF blacklisted countries.
Making transactions on financial markets with marginal financial instruments opens up wide possibilities and allows investors who are willing to take risks to earn high profits, carrying a potentially high risk of losses at the same time. Therefore you should responsibly approach the issue of choosing the appropriate investment strategy, taking the available resources into account, before starting trading.
Use of the information: full or partial use of materials from this website must always be referenced to TeleTrade as the source of information. Use of the materials on the Internet must be accompanied by a hyperlink to teletrade.org. Automatic import of materials and information from this website is prohibited.
Please contact our PR department if you have any questions or need assistance at pr@teletrade.global.
transfers