- Analytics
- News and Tools
- Market News
CFD Markets News and Forecasts — 11-02-2022
- The S&P 500, the Dow Jones, and the Nasdaq Composite fell between 1.43% and 3.07%.
- Ukraine/Russia conflict escalation points towards a Russia’n invasion as reported by US press, confirmed by the US Security Advisor.
- Market sentiment was dismal, as safe-haven flows like gold, the USD, and the yen dominated the end of the week.
- Western Texas Intermediate finished the week above $93.10 per barrel as geopolitical tensions arose.
On Friday, US equities dropped sharply as recent geopolitical chatter linked to the Ukraine – Russia conflict. US news sources said that a Russian invasion of Ukraine was imminent, spurred a flight to safe-haven assets.
As the New York session ends, the S&P 500 drops 2.05%, at 4,410.85. The Dow Jones Industrial falls some 1.45%, at 34,729.63, and the tech-heavy Nasdaq Composite slides 3.17%, sits at 14.230.95.
Sector-wise, energy (boosted by rising oil prices) and utilities advance 2.79% and 0.01% each, while the biggest losers are technology, consumer discretionary, and communications, sliding 3.01%, 2.82%, and 2.54%, respectively.
US press wires report that Russia decided to invade Ukraine
Around 18:30 GMT, according to a PBS NewsHour reporter, “the US believes that Russian President Vladimir Putin has decided to invade Ukraine and already communicated those plans to the Russian military. Two Biden administration officials said they expect the invasion to begin as soon as next week.”
The reporter continued “that US defense officials anticipate a “horrific, bloody campaign” that begins with two days of bombardment and electronic warfare, followed by an invasion, with the possible goal of regime change. Reportedly, the North Atlantic Council was briefed on the new intel today.”
The US National Security Advisor confirms the rumors
Later in the day, rumors were confirmed by National Security Advisor Jake Sullivan. He said, “we are in the window where a Russian invasion of Ukraine could begin at any time and could happen during the Beijing winter Olympics.” Furthermore, he added that “the US continues to see signs of escalation at the border, and would respond decisively should Russia invade.”
Jake Sullivan urged all Americans in Ukraine to leave “as soon as feasible.” Moreover, Sullivan said, “we are not saying Putin has made a final decision, but Russia now has all forces it needs to conduct a major military action, but he did clarify a false flag operation is also possible by Russia.”
As Wall Street closed, it crossed the wires the news that the US President Joe Biden and Russia’s Vladimir Putin would talk over the phone on Saturday, per Via citing the Kremlin.
Putting the geopolitical jitters aside, the greenback got bid, with the US Dollar Index, advancing close to 0.50%, reclaiming 96.05, linked to safe-haven flows. US Treasury yields fell in the bond market, led by the 10-year yield down eleven basis points, below 2% at 1.916%, a tailwind for precious metals.
At the same time, gold rises 2% exchanges hands at $1864.44 a troy ounce, while US crude oil benchmark, WTI, hit $93.10 per barrel amid revived Ukraine invasion concerns going into the weekend.
In the FX Market, the EUR/USD got hammered by the crisis, trading at 1.1345, while the GBP/USD barely unchanged at 1.3550 got a boost from higher UK’s GDP numbers. Concerning safe-haven pairs, the USD/JPY failed to cling to the 116.00 figure influenced by safe-haven flows, trades at 115.31, while the USD/CHF finished at 0.9243.
- WTI has ebbed back to the low $93.00s after spiking to the $94.60s on reports a Russian invasion of Ukraine is imminent.
- US National Security Advisor Sullivan pushed back against an earlier report that the admin thought Russia would invade next week.
- If Russia does attack next week as US press reported, many traders would expect a swift move above $100.
Front-month WTI futures saw an abrupt surge in recent trade from around the $92.00 per barrel level to as high as the $94.60s to print fresh highs since September 2014. The spike occurred as traders upped the amount of geopolitical risk premia embedded in oil prices in response to US press reporting that the US administration believes Russia President Vladimir Putin to have decided on invading Ukraine. The assault, according to PBS NewsHour, was to begin next week with a bombardment campaign and cyberattacks ahead of a ground invasion, perhaps with the intention to install a puppet regime.
WTI has since ebbed back to the low $93.00s after US National Security Advisor Jake Sullivan spoke to the press and pushed back against the PBS report. US intelligence has does not yet think Putin has made a final decision on whether to invade, he said, but urged Americans to get out of Ukraine while they can. The UK and EU are withdrawing embassy staff, separate reports suggested, while the US is mulling reducing numbers.
At current levels around $93.00 per barrel, despite now being more than $1.50 below earlier session highs, WTI is trading with on-the-day gains of about $3.0, which would mark the best such one-day performance since early December 2021. WTI is also now on course to end the week about $1.0 higher, stretching its winning streak to eight consecutive weeks. Next week, the theme of Russian military action against Ukraine will remain the dominant driver of price action. If PBS was right and Russia does attack, most traders would expect to see WTI swiftly move above $100 per barrel amid uncertainty as to the fate of Russia’s more than 6M barrels per day in oil exports.
US National Security Advisor Jake Sullivan pushed back against the earlier report via PBS that the US believes Russia President Vladimir Putin had decided to order an invasion of Ukraine. He said the report "does not accurately capture" what US intelligence believes, saying that they don't think a final decision has been made yet, though such a decision may come soon.
- EUR/JPY has been under intense selling pressure in recent trade as reports suggest Russia may invade Ukraine next week.
- The pair has slumped all the way to the 130.70 area and is down about 1.4% on the day.
- That would mark its worst one-day performance since March 2020.
EUR/JPY slumped to session lows well below the 131.00 level in recent trade as market participants dumped their euros and piled into the yen on reports that Russia is set to invade Ukraine as soon as next week. The PBS NewsHour reporter who broke the news on Twitter said that Russian President Vladimir Putin had already decided to invade and communicated plans to the Russian military. In the immediate aftermath of the reports breaking, news emerged that the UK and EU will be evacuating embassy staff and are urging citizens to leave as soon as possible. The US is also reported to be looking at reducing embassy staff and removing its observers to the OSCE mission to Ukraine.
EUR/JPY now trades in the 130.70 area, down some 1.4% on the day, putting the pair on course for its worst one-day performance since March 2020. The euro is being dumped given its economic vulnerability to a significant reduction in Russian gas imports, upon which the continent is reliant for its energy consumption. The yen is being bought as a result of its typical safe-haven status. EUR/JPY may well dip back to pre-hawkish ECB meeting levels under 130.00 next week and, if war begins, could head towards Q4 2021 lows in the 127.50 regions.
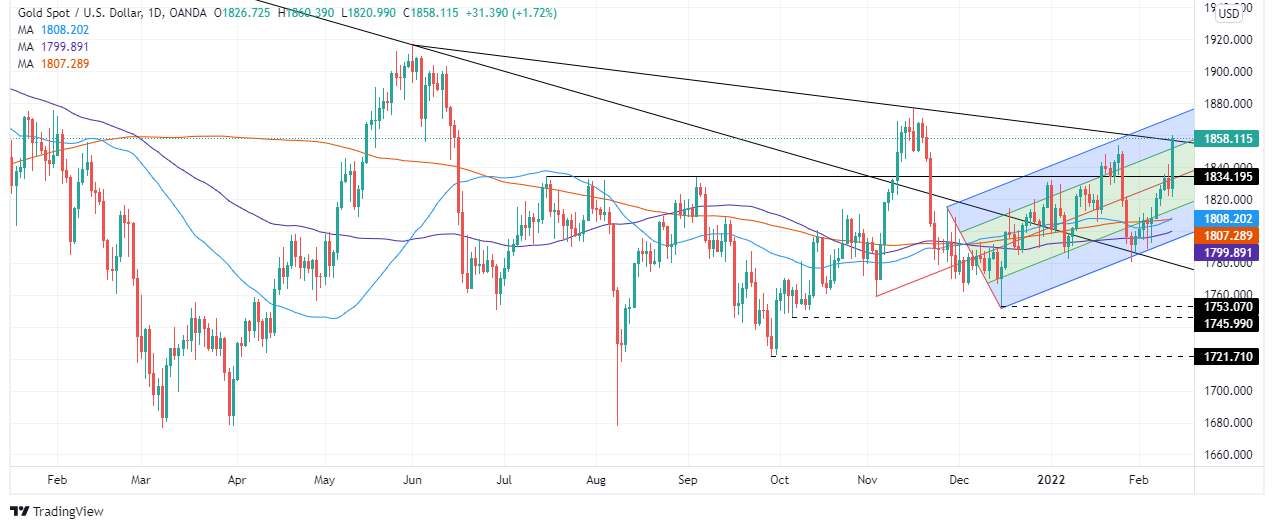
- Geopolitical developments sent the yellow metal skyrocketing above $1,860.
- XAU/USD threatens to break a nine-month-old downslope trendline around $1,850-60.
Gold (XAU/USD) approaches the weekend on the right foot, up 2.36% in the week at press time. At the time of writing, XAU/USD is trading at $1,850. Since around 18:30 GMT, geopolitical developments concerning the Ukraine – Russia conflicts spurred a jump of $20 since 18:35GMT from $1,840 to $1,860.
According to a PBS NewsHour reporter, “the US believes that Russian President Vladimir Putin has decided to invade Ukraine and already communicated those plans to the Russian military. Two Biden administration officials said they expect the invasion to begin as soon as next week.”
The reporter continued “that US defense officials anticipate a “horrific, bloody campaign” that begins with two days of bombardment and electronic warfare, followed by an invasion, with the possible goal of regime change. Reportedly, the North Atlantic Council was briefed on the new intel today.”
Putting this aside, the financial market mood is dismal, as US equities trade in the red, while the greenback underpinned by US Treasury yields up, climbs 0.28%, at 95.85.
Friday’s US economic docket was light in the North American session. The University of Michigan Consumer Sentiment Index for February came at 61.7, lower than the 67.5 estimated and trailed the January 67.2 figure. Concerning inflation expectations for 1 and 5 years, consumers expect it at 5.0% and 3.1%, respectively.
On Thursday, the St. Louis Fed President, James Bullard, on an interview with Bloomberg, said that he favors 1% of rate increases to the Federal Funds Rate (FFR) by July 1st. When asked about a 50 bps increase in the March meeting, he said he does not want to “prejudge that meeting.”
XAU/USD Price Forecast: Technical outlook
The XAU/USD is neutral biased, but geopolitical issues sent the yellow-metal surging towards a nine-month-old downslope trendline, around $1850-60 region, which, if it gives way, would expose the November 16th, 2021 high at $1,877, followed by June 1st, 2021 daily high at $1,916.61.
US National Security Advisor Jake Sullivan said on Friday that we are in the window where a Russian invasion of Ukraine could begin at any time and could happen during the Beijing winter Olympics, according to Reuters. The US continues to see signs of escalation at the border, he continued, saying that the US is ready to respond decisively should Russia invade. The response, Sullivan added, would include sanctions and changes to NATO force posture and, as a result, Russia's power would be diminished, not enhanced, by an invasion. Sullivan urged all Americans to leave within the next 24-48 hours.
Market Reaction
The risk-off reaction as a result of the news that an invasion could occur as soon as next week has continued in recent trade.
The US believes that Russian President Vladimir Putin has decided to invade Ukraine and already communicated those plans to the Russian military, said a PBS NewsHour reporter on Twitter. Two Biden administration officials said they expect the invasion to begin as soon as next week. The reporter continued that US defense officials anticipate a "horrific, bloody campaign" that begins with two days of bombardment and electronic warfare, followed by an invasion, with the possible goal of regime change. Reportedly, the North Atlantic Council was briefed on the new intel today.
The reports emerge shortly after the UK government advised against all travel to Ukraine and urged all British nationals to leave the nation as soon as possible while commercial means are still available. The UK government has also taken the decision to further withdraw embassy staff from Kyiv. Shortly after the UK made this announcement, the news emerged that the EU staff are also being evacuated, while the US is discussing the possibility of reducing staff numbers. The US will also pull its observers from the OSCE mission to Ukraine, sources told CNN.
Market Reaction
In reaction to the latest reports, markets have seen a classic "risk-off" move. Safe-haven assets such as gold and US bonds have been in demand, with the precious metal rallying from around $1840 to the $1850 area. The US 10-year yield, meanwhile, is now back below 2.0% and down about 4bps on the day from previously closer to 2.03%. Meanwhile, risk assets like equities have been experiencing sharp selling in recent trade, with the S&P 500 now down 1.3% and back below its 200-Day Moving Average at 4450, having previously traded above 4500.
In G10 currency markets, the euro has been hit the worst, likely due to the Eurozone's economic exposure to high gas prices (it depends on Russian imports for about 30% of gas consumption). Generally, risk-sensitive currencies in the G10 are also fairing badly while the yen is now doing the best and at the top of the performance table. The Russian rouble, meanwhile, has now depreciated by roughly 3.0% on the day versus the US dollar and is on course for its worst one day performance since March 2020.
- The shared currency ends the week lower, as the EUR/USD is down 0.48% in the week.
- German inflation came as expected, while US UoM Consumer Sentiment fell short of forecasts.
- ECB Lagarde’s pushed back against raising rates, while Fed’s Bullard eyes 1% increases by July 1st.
The EUR/USD seesaws around the 1.1400 figure as European traders get ready for the weekend amid a risk-off market mood. At the time of writing, the EUR/USD is trading at 1.1401.
The Friday session witnessed the EUR/USD fluctuating up and down, with a lack of direction, after some ECB and Fed speaking. Also, during the European session, German inflation figures for January were reported. The German HICP and the CPI increased by 5.1% and 4.9%y/y, both readings in line with expectations, causing a jump from the daily lows towards 1.1390, a 20-pip jump.
Meanwhile, the US economic docket is light in the North American session, with the University of Michigan Consumer Sentiment Index for February reported at 61.7, lower than the 67.5 estimated and trailed the January 67.2 figure. Concerning inflation expectations for 1 and 5 years, consumers expect it at 5.0% and 3.1%, respectively.
The EUR/USD bounced on the release towards the 1.1410 area, retreating afterward, and through the remainder of the day, is seesawing around the 1.1400 figure.
Central bank divergence could favor the greenback vs. the euro
Now that the macroeconomic data is in the rearview mirror, some ECB and Fed speaking entertained EUR/USD traders in the last two days.
On Thursday, ECB President Christine Lagarde said that raising rates would not solve any of the current problems and that they [ECB] don’t want to choke the recovery, and emphasized that she is confident inflation will fall back in the course of the year.
Across the pond, the St. Louis Fed President, James Bullard, on an interview with Bloomberg, said that he favors 1% of rate increases to the Federal Funds Rate (FFR) by July 1st. When asked about a 50 bps increase in the March meeting, he said he does not want to “prejudge that meeting.”
Therefore, the central bank policy divergence could witness some USD strength to the detriment of the EUR. It could be possible that the EUR/USD might be headed to the 1.1250-1.1350 area on a mean reversion reaction once Lagarde’s dovishness got back on the aforementioned headlines.
- GBP/USD is set to end the week near 1.3600 having bounced nearly 100 pips from intra-day lows.
- The pair was aided by not as bad as feared UK economic data, but was unreactive to bad UoM figures.
- Traders will have plenty of UK/US data to watch next week, as well as Fed speak and Fed minutes.
GBP/USD looks set to end Friday trade with gains of about 0.3%, making it amongst the best performing G10 currencies on the session, after not as bad as feared Q4 GDP and December activity data released during early European trade. The pair’s upside seems to have run out of steam at the 1.3600 level as FX flows die down ahead of the weekend, but GBP/USD nonetheless trades nearly 100 pips higher versus earlier session lows just above 1.3500.
Data out next week will play an important role in determining BoE tightening expectations for 2022 (currently, roughly a further 150bps of tightening is expected). The latest labour market data will be released on Tuesday and market participants will get a first look at how the UK labour market performed during the rapid spread of Omicron. January CPI data will then be released on Wednesday ahead of January Retail Sales figures on Friday.
Much weaker than anticipated US University of Michigan Consumer Sentiment survey data, which showed sentiment deteriorating to its worst levels since 2011, did not impact the pair much given that it isn’t seen as likely to deter Fed tightening. GBP/USD is thus on course to end the week around 0.5% higher, marking a second successive week of gains, during which time it has rallied about 1.8% from January lows.
It's unlikely that stronger than expected data next week could bolster BoE tightening expectations to be any more hawkish than they already are. Indeed, many analysts suspect the BoE will deliver far less tightening in 2022 than currently priced into money markets with the economy set to hit multiple speed bumps from Q2 onwards. These include tax hikes, energy price hikes and the prospect of higher borrowing costs and might dissuade the BoE from tightening so aggressively in H2 as inflation levels pull back from the more than 7.0% levels expected in April.
Meanwhile, the US calendar is dominated by Fed speak and the minutes of the last meeting, as well as January Retail Sales and Producer Price Inflation. GBP/USD may remain choppy as investors weigh up the outlook for BoE/Fed policy divergence and how the latest data/central bank releases (and commentary) influence this outlook. Technicians will note support in the 1.3500 area and resistance between 1.3600-1.3650.
As a result of the last European Central Bank meeting, analysts at Rabobank revised EUR/USD forecasts to the upside. Now they expect the pair to drop to 1.11 by mid-year down from their previous target of 1.10
Key Quotes:
“We have moderated our EUR/USD forecasts in light of the hawkish pivot at the ECB’s February policy meeting. However, we don’t see the USD’s bull run as being over yet. Previously, we were forecasting that EUR/USD would drop to 1.10 by mid-year as the Fed’s tightening commenced. In light of the ECB’s hawkish tilt we have revised this forecast up moderately to 1.11.”
“We have also brought forward our medium-term projections for the recovery in EUR/USD. We now forecast EUR/USD at 1.15 on a 1-year view from a previous forecast of 1.12.”
- The USD/JPY is barely flat during the day, as market mood conditions remain mixed.
- US Treasury yields advance, led by the 10-year above the 2% mark.
- USD/JPY bias is tilted upwards as USD buyers attack 116.00, followed by the YTD high.
The USD/JPY barely falls during the North American session, following Thursday’s volatile trading day, which witnessed the US economy printing a 7.5% inflation rate, the largest since 1982. As a result, US Treasury yields led by the 10-year note, pushed above the 2% mark, while the greenback seesawed, with the US Dollar Index, rising towards 96.00, falling to daily lows at 95.40s, to finally finish 0.25% up near 95.79. At the time of writing, the USD/JPY is trading at 115.88, down 0.14%.
On Thursday, St. Louis Federal Reserve President James Bullard crossed the wires. He said that he favors 1% of rate increases to the Federal Funds Rate (FFR) by July 1st. When asked about a 50 bps increase in the March meeting, he said he does not want to “prejudge that meeting.”
The Bank of Japan (BoJ) announced that it would purchase an unlimited amount of 10-year Japanese Government Bunds (JGBs) on February 14th, at 0.25%, to keep control of the Yield curve.
Sources cited by Reuters said that “By announcing its plan days in advance, the BOJ sought to discourage players from testing the 0.25% line and pre-empt any breach of that level - without actually having to purchase JGBs.”
In the meantime, the US 10-year Treasury yield reclaims the 2.03% threshold, almost flat a tailwind for the USD/JPY, which trimmed its 0.11% losses, down to 0.08%.
An absent Japan economic docket left USD/JPY players adrift to US macroeconomic data. On the US front, the University of Michigan Consumer Sentiment Index fell to 61.7, the lowest level since October 2011. Regarding inflation expectations for 1-year, rose to 5%, from 4.9% in January.
USD/JPY Price Forecasts: Technical outlook
The USD/JPY maintains the bullish bias in place. The upbreak of a one-month-old trendline accelerated the move towards 116.00, which was broken on Thursday, would be the first support level, as USD bulls prepare an attack towards the YTD high at 116.35.
That said, the USD/JPY first resistance would be 116.0. Breach of the latter would expose the YTD high at 116.35, followed by a challenge of a 24-month-old downslope trendline around 117.00. A clear break of that ceiling level would pave the way towards January 2017 swing high at 118.61.
- Gold rises back above $1830, could post the highest week close since November.
- US dollar drops across the board after Thursday’s rally.
Gold rose further during the American session and climbed to $1836, reaching a fresh daily high. It remains near the top with a bullish tone. The upside move started after finding support again above $1820.
If XAU/USD ends at current levels, it will post the highest weekly close since November, with a gain of around $20.
Gold holding so far despite yields
The extreme volatility on Thursday proves that the road to the upside is bumpy and vulnerable for gold. Gold is holding relatively well, considering that yields on Thursday reached fresh multi-year highs. Although, yields look to warrant sharp and quick corrections.
Many analysts warn the outlook for gold is negative taking into account that US yields will continue to rise. But if gold holds at current levels, it could reflect some underlying strength.
Support at $1820
From a technical perspective, in the short-term, the immediate support stands at $1820; a break lower would point to a deeper slide toward $1800. A daily close below $1790 should point to further losses and to a potential decline toward $1750.
On the upside, the next barrier is seen at $1845/50. If XAU/USD rises above, the next target is seen at $1870.
Technical levels
Is gold finally regaining its inflation-hedge status? This week’s action suggests that the precious metal could be regaining its status as an inflation hedge and the technical outlook doesn’t show a buildup in bearish momentum, FXStreet’s Eren Sengezer reports.
Markets await FOMC Minutes to confirm or deny a 50 bps hike in March
“In case markets continue to price in an aggressive policy tightening, the US Dollar Index could gather bullish momentum and make it difficult for gold to extend its rally. Even if XAU/USD loses its traction, this week’s action showed that the yellow metal’s losses are likely to remain limited.”
“Investors will pay close attention to comments from Fed officials and look for confirmation of a 50 bps rate hike in March. Another leg higher in the 10-year US T-bond yield could cause gold bulls to move to the sidelines. On the other hand, a correction in yields should open the door for further gains in XAU/USD.”
“In order to target $1,850 (static level), gold needs to start using $1,830 as support and clear the interim resistance that seems to have formed at $1,840.”
“On the downside, $1,820 (20-day SMA, Fibonacci 38.2% retracement) aligns as the first support level. A daily close below that level could open the door for additional losses toward $1,810 (50-day SMA, 200-day SMA).”
See – Gold Price Forecast: XAU/USD to trade at $1,800 towards the end of Q1 2022 – ANZ
- USD/CHF is trading flat just above 0.9250, unmoved by the latest weaker than expected UoM sentiment data.
- Dollar bulls may be disappointed by the lack of post-hot CPI data upside, amid fears front-loaded tightening will hit growth.
Much weaker than expected University of Michigan Consumer survey data, which revealed sentiment to have broadly deteriorated to its worst levels since 2011, failed to shift USD/CHF out of intra-day ranges, with the pair for now remaining supported above 0.9250. The pair is currently trading flat, having come close to but failed to test 0.9300 for a second successive session. Dollar bulls might be disappointed at the lack of follow-through in terms of post-hot US Consumer Price Inflation data upside, despite the hawkish shift in Fed tightening expectations and subsequent sharp rise in yields across the US curve.
The US dollar’s reluctance to stage a more meaningful rally, which for USD/CHF would likely look like a move above 0.9300 and a test of H2 2021 and 2022 highs around 0.9350, has perplexed analysts. Some have pointed to the pronounced, ongoing flattening of the US yield curve which on Friday saw the 2-year 10-year spread drop to its lowest in over 18 months at under 40bps. A flatter curve is seen by many as indicative of softer long-term growth expectations.
The hawkish shift in Fed tightening expectations of recent months has been the major driver of the flattening and likely speaks to a fear that by tightening rates earlier and more aggressively, the Fed may cap long-term growth prospects. This fear may be the major factor holding USD/CHF back from moving up a gear and charging back above 0.9300. For the pair to challenge post-pandemic highs in the upper 0.9400s, long-term US yields are likely going to need to see further upside and thus the US curve perhaps steepens a little to reflect greater confidence in long-term US growth.
- Mexican peso among top performers the day after Banxico rate hike.
- USD/MXN having worst week since early December.
The USD/MXN is falling on Friday, erasing all of Thursday’s gains. It is trading at 20.39, at the lowest level of the day, on its way to the lowest daily close in a month the day after a new rate hike from Banxico.
The US dollar is lost momentum on Friday after rising sharply on Thursday on the back of CPI data and comments from Fed’s Bullard about the pace of rate hikes. Also emerging market currencies are recovering helped by a recovery in equity prices in Wall Street.
The Mexican peso is among the top performers on Friday. On Thursday the Bank of Mexico hiked the key interest rate by 50 bp to 6% as expected. One member of the board dissented, asking for a smaller hike. Banxico rose inflation forecast, keeping the doors open to another rate hike at the next meeting March 24.
“The Governing Board may be increasingly concerned with the developments in inflation expectations, though there was little material change in the forward looking component of their policy statement. This leaves some degree of uncertainty as to the probability of an equivalent hike at the next meeting, though we see that the dissent from Esquivel is now for a hike (of only 25bps), which leads us to believe that we'll get a further 50bps hike”, explained analysts at TD Securities.
The Mexican peso did not react to the upside on Thursday after Banxico but is gaining momentum on Friday. The USD/MXN peaked at 20.63 before turning to the downside. The consolidation below 20.40 could lead to a test of the 200-day moving average that stands at 20.32. On the upside, a break above 20.70 should strengthen the dollar.
Technical levels
The US 10-year bond yield has hit 2%. It may well pause here in a narrow range around 2% for a bit, but beyond that analysts at ING view a rise to the 2.25% area as likely, as the real rate journies out of deep negative territory.
What the Fed does in March matters hugely
“We think the US 10yr is heading for 2.25%. Then, a Fed that delivers 50bp in March is more likely to be getting ahead of the curve which would help contain the 10yr cycle peak to the 2.25% area.”
“A tame 25bp hike with no bite could leave the market at least pondering a path towards 3% on the 10yr. We may not even get close, but on the table it is.”
- A mixed market mood did not stop the NZD from advancing vs. a “firmer” greenback.
- Fed’s Bullard favors a 50 bps rate hike and would like 1% increases by July 1. – BBG.
- NZD/USD Technical Outlook: The path of least resistance is tilted to the downside, as the uptrend stalled near the 50-DMA.
As market players get ready for the weekend, risk-off market mood looms the financial markets, to the detriment of the risk-sensitive New Zealand dollar. However, the NZD/USD so far hangs to its gains, trading at 0.6688 at the time of writing.
On Thursday, a hotter US inflation report spurred a jump in US Treasury yields, with the 10-year moving above the 2% threshold while US equities sold off. At the same time, the US Dollar pared some of its earlier losses, while the NZD/USD seesawed, closing 0.15% down in the day.
Friday’s story is slightly different. US Treasury yields, even though higher, ease a tone, with the 10-year down three basis points at 1.996%. Europan stock indices are mixed, while US equity futures are trending up. In the FX complex, the greenback is firm, with the DXY up 0.27%, at 95.76.
St. Louis Fed Preident James Bullard favors a 1% FFR by July 1
Meanwhile, ST. Louis Fed President James Bullard crossed the wires on Thursday, following the release of US CPI. Bullard said that based on the US CPI figure, he favors a 1% rate increase “in the bag” by July 1. When asked about a 50 bps increase by the March meeting, he said, “I [he] just don’t want to prejudge that meeting. There was a time when the committee would have reacted to something like this by just having a meeting right now and doing 25 basis points right now.”
Finally, Bullard added that he expects the balance-sheet runoff to start in the second quarter.
The economic docket is light on the day. The New Zealand docket featured the Business NZ PMI for January came at 52.1, shorter than the “revised” 53.8. Across the pond, the US docket featured the University of Michigan Consumer Sentiment Index (Prel) for February, which came at 61.7 vs. 67.5 estimated, also trailing the 67.2 of January. Further, Inflationary expectations rose to 5%, up from a previous 4.9%.
NZD/USD Price Forecast: Technical outlook
The NZD/USD so far in the week remains positive, +1.10%, but stalled its uptrend near the 50-day moving average (DMA) at 0.6742. Thursday’s price action left an inverted hammer candlestick, suggesting that selling pressure mounted around the 0.6700-30 area and will be challenging to overcome by NZD bulls.
Therefore, the NZD/USD path of least resistance is tilted downwards. The NZD/USD first support would be February 9 daily low at 0.6640. Breach of the latter would expose the February 4 swing low at 0.6588, followed by the January 28 low at 0.6529.
- USD/TRY extends the boring mood around 13.50.
- Turkey End Year CPI Forecast revised up to 34.06%.
- Turkey Retail Sales contracted 2.7% MoM in December.
The Turkish lira gives away part of the recent gains and now pushes USD/TRY to the 13.50 region, posting decent gains for the day.
USD/TRY remains side-lined around 13.50/60
USD/TRY advances modestly after three consecutive daily pullbacks, always against the backdrop of the broader consolidative phase well in place since mid-January.
The lira sheds some ground despite results in the domestic docket fell on the positive camp on Friday. Indeed, the Current Account deficit widened less than forecast to $3.84B in December, while the End Year CPI Forecast ticked higher to 34.06% in February (from 29.75%). In addition, Retail Sales contracted at a monthly 2.7% in December and expanded 15.5% from a year earlier.
In the meantime, Turkish finmin N.Nebati defended once again the new economic model based on prioritizing exports and production in a context of lower borrowing costs. He also pledged to bring inflation to single digits (by May 2023) and keep the currency stable, while preventing further dollarization of the economy.
The Turkish central bank (CBRT) will meet on February 17 and consensus expects the One-Week Repo Rate to remain unchanged at 14.00%.
What to look for around TRY
The pair keeps its multi-week consolidative theme well in place, always within the 13.00-14.00 range. While skepticism keeps running high over the effectiveness of the ongoing scheme to promote the de-dollarization of the economy – thus supporting the inflows into the lira - the reluctance of the CBRT to change the (collision?) course and the omnipresent political pressure to favour lower interest rates in the current context of rampant inflation and (very) negative real interest rates are a sure recipe to keep the domestic currency under pressure for the time being.
Key events in Turkey this week: End Year CPI Forecast, Current Account, Industrial Production, Retail Sales (Friday).
Eminent issues on the back boiler: Progress (or lack of it) of the government’s new scheme oriented to support the lira via protected time deposits. Constant government pressure on the CBRT vs. bank’s credibility/independence. Bouts of geopolitical concerns. Much-needed structural reforms. Growth outlook vs. progress of the coronavirus pandemic. Earlier Presidential/Parliamentary elections?
USD/TRY key levels
So far, the pair is advancing 0.44% at 13.6296 and a drop below 13.3226 (55-day SMA) would expose 13.2327 (monthly low Feb.1) and finally 12.7523 (2022 low Jan.3). On the other hand, the next up barrier lines up at 13.9319 (2022 high Jan.10) followed by 18.2582 (all-time high Dec.20) and then 19.0000 (round level).
- UoM's Consumer Sentiment Index fell to its lowest since October 2011 at 61.7 in February, a much larger than expected drop.
- FX markets did not see any notable reaction to the latest poor data.
According to the University of Michigan's preliminary February Consumer survey, the Consumer Sentiment Index fell to 61.7 in February, well below expectations for a slight rise to 67.5 from 67.2 in January. That marked the lowest such reading since October 2011. The Current Conditions Index fell to 68.5 from 72.0 in January versus forecasts for a small rise to 73.0, its lowest reading since August 2011. The Consumer Expectations Index fell to 57.4 from 64.1 in January, it's lowest such reading since November 2011. The one-year Inflation Expectations Index rose to its highest since July 2008 at 5.0% from 4.9% in January.
Market Reaction
Poor Consumer Sentiment data has failed to shift the dial for the US dollar, with the DXY continuing to trade sideways in the 95.80s, where it trades broadly flat on the session.
GBP/USD holds modest gains. But economists at Scotiabank expect the cable to slide towards the 1.34 level as the market is too aggressive pricing the next hikes by the Bank of England (BoE).
Governor Bailey is in favour of a measured approach in hiking
“We think markets are set to be disappointed as Governor Bailey and Pill, the bank’s chief economist, are in favour of a more measured approach in hiking.”
“The 2% BoE rate that markets are seeing by end-2022 is also excessive, we think, as it could have too much of a dampening impact on demand-side dynamics.”
“The GBP is at risk of a test of 1.34 soon as markets re-price some of these lofty expectations.”
- Wall Street trades largely in the green on Friday, with the S&P 500 currently about 0.4% higher in the 4520s.
- Uncertainty over the Fed’s monetary tightening plans will remain the main driver ahead of the bank’s next policy decision.
Wall Street started Friday’s session positive, with the S&P 500 at the time of writing trading in the 4520s and up about 0.4%, having found support around 4500. While the index saw a sharp pullback on Thursday and is about 1.5% below earlier weekly highs, it still remains on course to end the week slightly in the green. Technicians might note that the index appears to have forged out a mid-4400s to 4600 ish range since the start of February. Some traders might be tempted to play this range in the near term as they await more clarity on central bank policy.
US government bond yields took a breather after Thursday’s post-hot-US inflation data/hawkish Fed commentary surge, with the 10-year yield dropping 2bps back to the 2.0% level, easing pressure on duration-sensitive equity market sectors. As such, big tech and growth names, the biggest losers on Thursday, were close to flat on Friday. The Nasdaq 100 was subsequently trading about 0.2% higher near the 14.75K level and despite a more than 2.0% pullback from earlier weekly highs, remains on course to end the week broadly flat. The Dow, meanwhile, was trading about 0.5% higher in the 35.4K area and on course for a small weekly gain of about 0.9%.
The major equity market theme remains the timing and pace of Fed monetary tightening. In wake of Thursday’s January inflation figures, which showed the headline rate of US Consumer Price Inflation hitting a near-40 year high at 7.5%, as well as hawkish comments from Fed policymaker James Bullard, who called for 100bps of tightening by July, a 50bps hike in February has become the market’s base case. But some analysts have pushed back against this notion, citing more cautious commentary from other Fed policymakers in wake of the CPI data. This uncertainty is likely to keep equities choppy in the coming weeks ahead of the Fed’s next meeting.
EUR/USD dips under 1.14. A weekly close below this level would leave the pair at risk of suffering further falls as the technical picture worsen, economists at Scotiabank report.
1.14 stands as key resistance
“1.14 stands as key resistance; 1.1420 and the mid-figure zone follow.”
“The EUR may still be maintaining the outlines of a bullish flag pattern and a breakout toward a test of 1.16 is still in the cards, but a close under 1.14 on the week leaves the technical picture looking less positive.”
“Below 1.1370, support is the mid-figure area and the 50-day MA of 1.1328.”
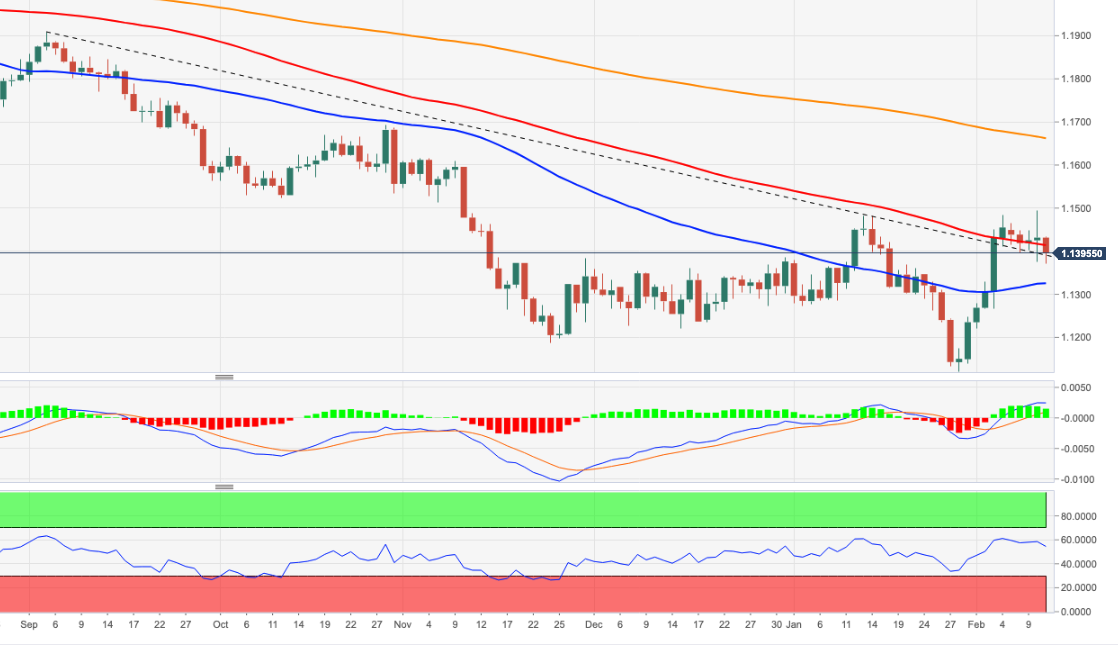
- EUR/USD comes under pressure after recent tops near 1.1500.
- The 5-month support line holds the downside around 1.1390.
EUR/USD reverses the recent strength and dropped to fresh lows around 1.1370, managing to rebound afterwards.
In the meantime, further gains in the pair remains on the table while above the 5-month line in the 1.1390 area. Above this zone, EUR/USD should be able to attempt another visit to the 2022 high at 1.1494 (February 4) just ahead of the 200-week SMA at 1.1496. Between 1.1500 and 1.1600 there are no resistance levels of note, leaving the October 2021 top at 1.1692 as a potential longer-term target.
In the longer run, the negative outlook remains in place while below the key 200-day SMA at 1.1660.
EUR/USD daily chart
The S&P 500 has seen a more decisive rejection of key resistance at 4591/95. Analysts at Credit Suisse expect to see an important cap here in line with theirr broader 4200/4600 ranging view, looking for a retest and then break below key price and 200-day moving average support (DMA) at 4453/51.
Broader risk to turn lower again in line with a 4200/4600 ranging view
“S&P 500 has seen a fresh and what looks to be decisive rejection of key flagged resistance at 4591/95. With the market also still below its falling 63-DMA at 4623, our bias remains to view recent strength as corrective only and for this to remain a major barrier and for the broader risk to then turn lower again in line with our broader 4200/4600 ranging view.”
“Key support stays seen at the 200-day average and price pivot at 4453/51. A close below here should add weight to our view to mark a more important turn lower with support then seen next at 4414/09 ahead of 4365 and eventually we think a retest of 4223/13.”
“Resistance is seen at 4533 initially, with 4591/95 ideally continuing to cap. A close above the 63-day average at 4623 would instead suggest the recovery can extend further with resistance seen next 4663/65 and potentially the 78.6% retracement of the January sell-off at 4691.”
- Spot silver dipped back towards $23.00 on Friday, a second day of losses after Thursday’s hot US CPI.
- The data prompted a further hawkish shift in Fed tightening bets and a surge in US bond yields.
- Traders also cited hawkish comments from Fed’s Bullard as weighing on silver, though some think markets might be over-interpreting his remarks.
Spot silver’s (XAG/USD) sharp-post hot US Consumer Price Inflation (CPI) data reversal from highs in the upper $23.00s per troy ounce continued on Friday, with spot prices dropping back to test the $23.00 level. At one point, the precious metal dipped as low as the $22.80s, but has since bounced to trade near the big figure, down about 0.7% or roughly 15 cents on the day. Thursday’s hot CPI, which saw the headline YoY rate of US inflation hit 7.5%, its highest since 1982, sparked a further hawkish shift in market-based measures of expectations for Fed tightening in 2022.
This shift was exaccerbated by hawkish remarks from St Louis Fed President James Bullard, who after the data on Thursday remarked that he wanted to see 100bps of tightening by the start of H2 2022. According to US money market-implied probability, a 50bps rate hike in March is now strongly the base case, while 175bps of tightening are expected by end-2022. Higher interest rates damped the appeal of non-yielding assets such as silver, hence its no surprise to see prices move lower over the past two days.
But some analysts think that markets have gone too far in pricing near-term Fed tightening and placed too much weight on Bullard’s remarks. In a recently published article, CNBC’s Steve Liesman articulated this viewpoint, arguing that, despite hot inflation, the Fed is likely to take a measured approach to rate hikes (i.e. 25bps at a time). He cited remarks from Fed policymakers Mary Daly, Thomas Barkin and Raphael Bostic in wake of the inflation data which push-back against the idea of a 50bps move.
The dollar’s failure to rebound substantially this week may be a reflection of fears that the Fed might not live up to the market’s very hawkish expectations for policy tightening. The DXY remains stuck under 96.00, helping XAG/USD remain on course for a weekly gain of about 2.5%, despite the sharp rise in yields across the US curve this week. Dollar weakness/silver resilience may also reflect recent flattening of the US yield curve, which is suggestive of a weakening economic outlook. The 2-year 10-year spread recently fell under 40bps for the first time in over 18 months.
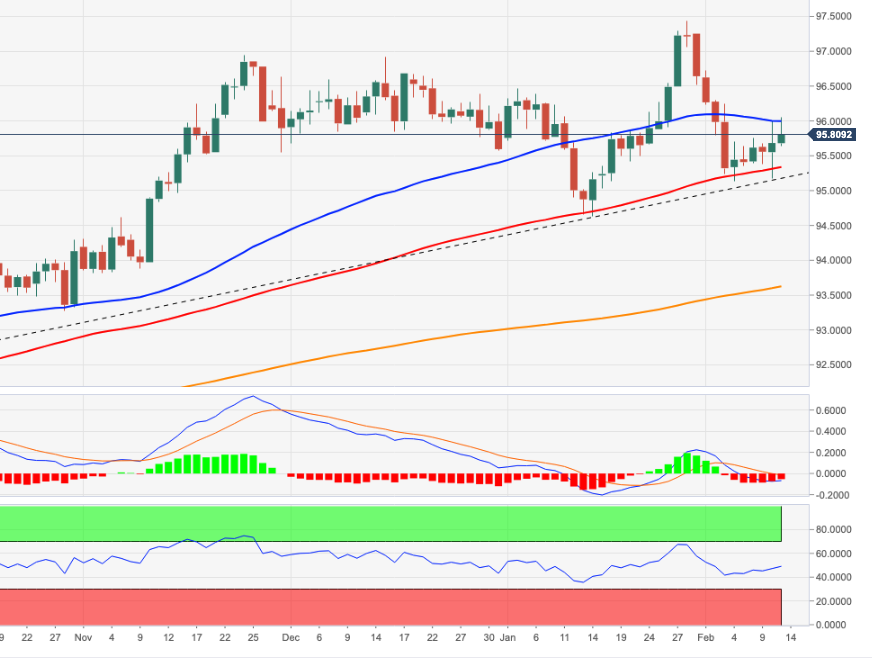
- DXY extends the recovery in the second half of the week.
- The index faltered once again around the 96.00 region.
DXY now alternates gains with losses after failing to surpass the key barrier at 96.00 earlier in the session.
The inability of the index to garner convincing upside traction, ideally in the short term, could prompt sellers to return to the market. That scenario should force the dollar to initially retest the so far monthly low at 95.13 (February 4) ahead of the 2022 low at 94.62 (January 14).
In the near term, the 5-month line near 95.20 is expected to hold the downside for the time being. Looking at the broader picture, the longer-term positive stance in the dollar remains unchanged above the 200-day SMA at 93.59.
DXY daily chart
- AUD/SUD attracted some dip-buying near the 0.7100 mark on Friday amid modest USD pullback.
- Retreating US bond yields turned out to be a key factor that prompted some intraday USD selling.
- The cautious market mood, hawkish Fed expectations should limit the USD losses and cap the pair.
The AUD/USD pair recovered its intraday losses and climbed to a fresh daily high, around the 0.7170 region during the early North American session.
The pair attracted fresh buying near the 0.7100 mark on Friday and for now, seems to have stalled the overnight sharp retracement slide from a three-week high, around the 0.7250 region. As investors digested Thursday's release of red-hot US consumer inflation figures, the US dollar witnessed some intraday selling amid modest pullback in the US Treasury bond yields. This, in turn, was seen as a key factor behind the AUD/USD pair's goodish intraday bounce of over 60 pips.
The upside, however, remains capped amid the prevalent cautious market mood, which acted as a headwind for the perceived riskier aussie. Apart from this, the prospects for a faster policy tightening by the Fed should help limit the downside for the US bond yields and the buck. This warrants caution before placing fresh bullish bets around the AUD/USD pair and positioning for the resumption of the recent strong recovery move from the lowest level since June 2020.
The red-hot US CPI report on Thursday reinforced market expectations that the Fed would adopt a more aggressive policy stance to combat high inflation. Adding to this, St. Louis Fed President James Bullard called for a 100 bps rate hike over the next three FOMC policy meetings. This boosted bets for a 50 bps rate hike in March, which, in turn, favours the USD bulls and supports prospects for the emergence of fresh selling around the AUD/USD pair at higher levels.
Nevertheless, the pair remains on track to post the second successive weekly gains. Traders now look forward to the release of the Prelim University of Michigan US Consumer Sentiment Index. This, along with the US bond yields, will influence the USD price dynamics and provide some impetus to the AUD/USD pair. Apart from this, traders will take cues from the broader market risk sentiment to grab some short-term opportunities on the last day of the week.
Technical levels to watch
- WTI prices are up on Friday and back above $91.00, though remain set for their first weekly decline in eight.
- US/Iran negotiations, Fed tightening fears and pressure on the Saudis/UAE to pump more is holding back the bull market.
Oil prices trade high on the final trading day of the week, with front-month WTI futures having moved back to the north of the $91.00 level in recent trade. At current levels around $91.20 per barrel, WTI trade with on-the-day gains of slightly more than $1.0, though prices have remained within Thursday’s intra-day $89.00-$91.70ish range. Market commentators are citing a bullish monthly report from the Internation Energy Agency (IEA), which upgraded its 2022 demand forecast by 800K barrels per day (BPD). This was in part due to revisions to historical data, but markets took as a bullish sign given that the OPEC+ monthly report this week was also bullish on the demand recovery in 2022.
The IEA now expects oil demand to rise by 3.2M BPD by the end of 2022 versus the end of 2021, taking daily consumption to a record high 100.6M barrels. Despite the bullish forecasts, WTI still looks set to end the week slightly more than 50 cents lower. That would mark the first weekly decline for WTI in eight. Though prices have been well supported by dip-buying in the $88.00-$89.00 area, profit-taking after WTI hit seven-year highs above $92.00 per barrel last week has kept trade rangebound.
Analysts are citing a few worries/themes that are preventing a continuation of oil’s recent bullish run. Firstly, indirect US/Iran talks recommenced this week spurring the usual chatter about a potential deal being reached and north of 1M BPD in Iranian exports coming back online (there are no signs a deal is any closer, however). Secondly, as evidence of OPEC+'s struggles to keep up with their own output quota hikes builds, pressure is growing on the Saudis and UAE to make up for the shortfall.
The IEA’s report on Friday said that OPEC+ was underproducing relative to its allowed output under the current agreement by 900K BPD. The Agency called on Saudi Arabia and the UAE (the two OPEC+ nations with the sparest output capacity) to increase output in the short term. Finally, some traders are citing the dent to global equity market sentiment on Thursday after much hotter than expected US inflation figures stoked Fed tightening bets as weighing on risk appetite sensitive crude oil markets.
USD/CAD completed a bullish “key reversal day” on Thursday. Analysts at Credit Suisse expect the pair to see further gains towards the 1.2813/15 highs.
Upside bias while above 1.2638/32
“Resistance is seen at 1.2788 initially, above which should see strength back to the 1.2813/15 highs. Above here can add momentum to the rally, with resistance then seen next at 1.2848/54 and eventually back at the 1.2952/64 December high, which may prove a tough barrier again.”
“Support at 1.2638/32 now needs to hold to maintain an immediate upside bias in the broader range. Below can see a retreat back to 1.2581, but with 1.2560/54 ideally holding. More important support though is still seen at the 200-day average and uptrend at 1.2526/07.”
USD/JPY staged a strong move higher on Thursday. Analysts at Credit Suisse look for an eventual clear break above key price and trend resistance at 116.35/80 for a test of the 2018 highs at 118.61/66.
Initial support seen at 115.74
“Strength has already extended to retest the January YTD high and long-term downtrend from April 1990 at 116.35/80. Whilst a fresh rejection from here should be allowed for, we continue to look for an eventual clear break, with resistance seen next at the 2018 highs at 118.61/66.”
“A fresh pause would be expected to be seen at 118.61/66, but with a move toward the “measured base objective” at 122.90/123.00 expected over the longer-term.”
“Support is seen at 115.74 initially, then 115.55/45, with 115.32 ideally holding to keep the immediate risk higher.”
- USD/CAD witnessed fresh selling on Friday and was pressured by a combination of factors.
- An intraday uptick in crude oil prices underpinned the loonie and exerted some pressure.
- Retreating US bond yields weighed on the USD and also contributed to the intraday selling.
The USD/CAD pair extended its steady intraday descent through the mid-European session and slipped below the 1.2700 mark in the last hour.
A combination of factors failed to assist the USD/CAD pair to capitalize on its early uptick and prompted fresh selling in the vicinity of the weekly high, around the 1.2750 region. A fresh leg up in crude oil prices underpinned the commodity-linked loonie. Apart from this, modest US dollar pullback from over one-week high touched on Friday exerted some pressure on the major.
Oil prices continued drawing support from hopes that global supply would remain tight amid the post-pandemic recovery in fuel demand. In fact, the IEA raised its 2022 demand forecast by 800,000 bpd. This, along with the conflict between Russia and the West over Ukraine, helped offset concerns of a possible rise in supplies from Iran and acted as a tailwind for black gold.
On the other hand, the US Treasury bond yields retreated from the overnight post-US CPI swing high and attracted some sellers around the USD. This was seen as another factor that contributed to the USD/CAD pair's intraday pullback of over 50 pips. That said, the prospects for a faster policy tightening by the Fed should help limit any downside for the greenback and the major.
Investors now seem convinced that the Fed would adopt a more aggressive policy stance to combat high inflation and have been pricing in the possibility of a 50 bps rate hike in March. The market bets were further boosted by more hawkish comments from St. Louis Fed President James Bullard, calling for 100 basis points over the next three FOMC policy meetings.
Hence, it will be prudent to wait for a strong follow-through selling before positioning for deeper losses. Traders now look forward to the release of the Prelim University of Michigan US Consumer Sentiment Index. This, along with the US bond yields, will influence the USD. Apart from this, oil price dynamics might provide some impetus to the USD/CAD pair.
Technical levels to watch
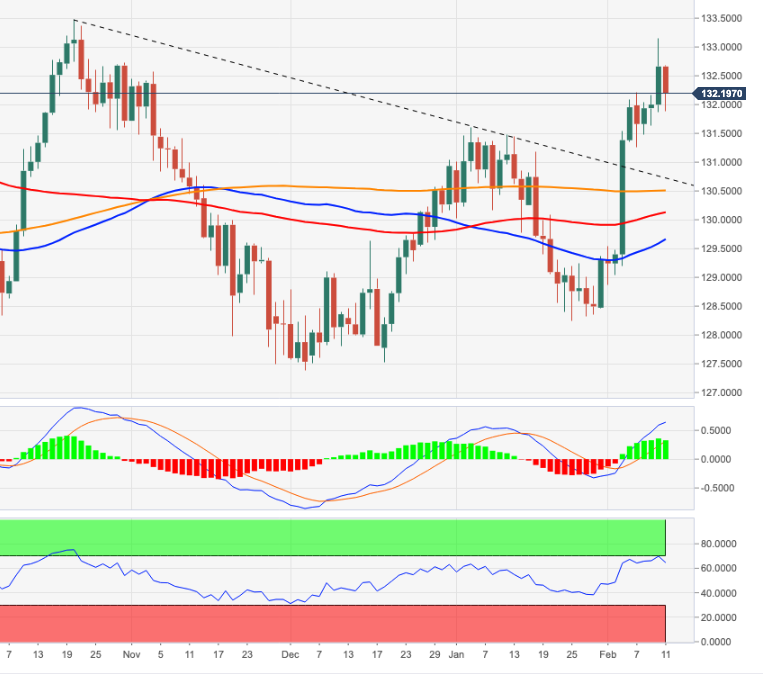
- EUR/JPY retreats from Thursday’s new YTD highs past 133.00.
- Sellers might drag the cross to as low as the 131.60 area.
EUR/JPY partially reverses the recent advance to fresh tops further north of the 133.00 barrier (February 10).
Considering the recent price action, the ongoing corrective decline carries the potential to extend to the monthly high at 131.60 (January 5), which should offer initial contention. If breached, then the focus of attention should gyrate to a probable visit to the always relevant 200-day SMA, today at 130.47.
In the longer run, and while above the 200-day SMA, the outlook for the cross is expected to remain constructive.
EUR/JPY daily chart
- Technical selling on the break of a descending triangle and “dovish” comments from ECB’s Lagarde sent EUR/GBP back under 0.8400.
- As UK growth outlook fears mount, traders mull the prospect of tigther ECB policy, has EUR/GBP become a “buy-on-dips”?
EUR/GBP broke below a short-term descending triangle on Friday as the euro weakened on further dovish sounding rhetoric from ECB President Christine Lagarde and as pound sterling saw some relief after not as bad as feared December GDP figures. Though the pair had been consistently posting lower highs since the start of the week, support at 0.8410 had been holding firm. That support broke during the late Asia Pacific session/early European session trade, with EUR/GBP having now dipped back below the 0.8400 level to hit fresh lows since last Thursday.
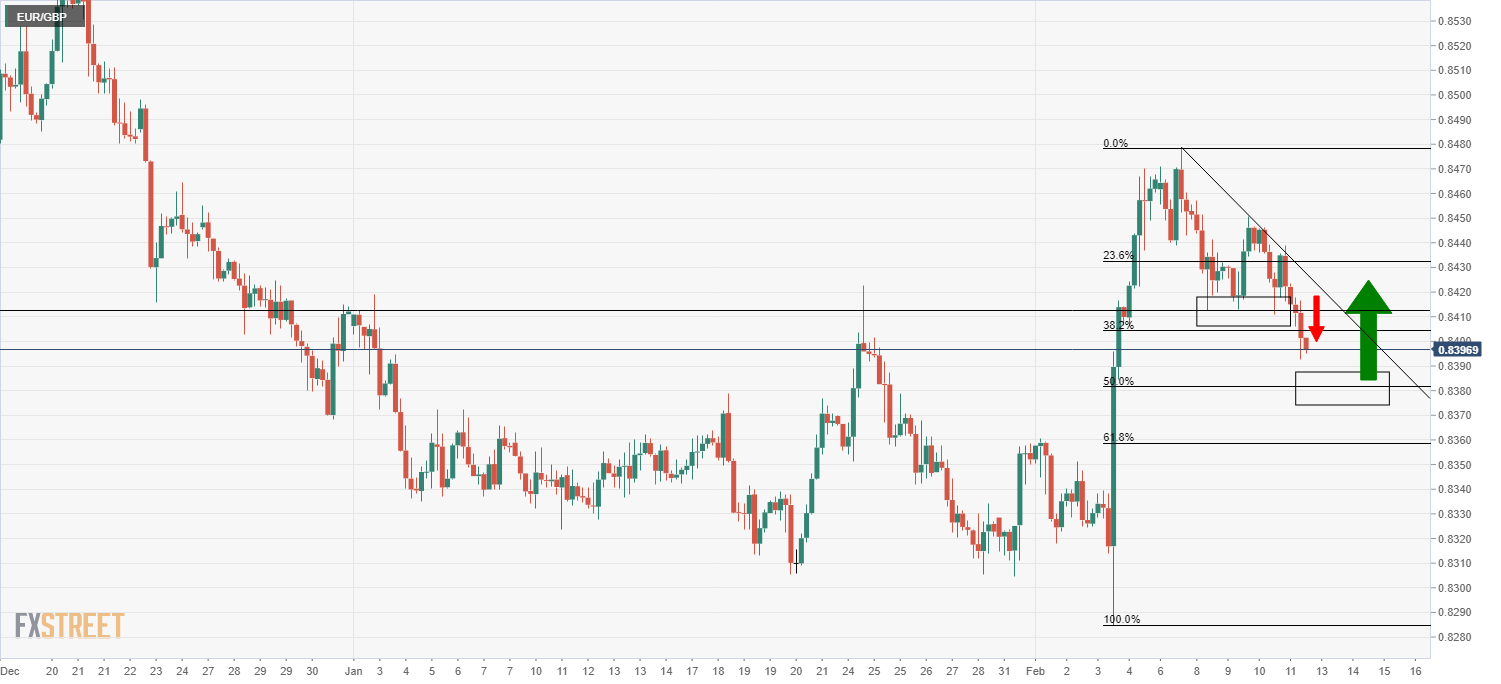
The recent move lower also saw EUR/GBP break below support in the form of its 50-Day Moving Average at 0.8410. Short-term bearish speculators may now target a test of the 21DMA at 0.8370. But the outlook for a return to multi-year lows pre-last week’s hawkish ECB meeting is weakened, some strategists have said. Whilst the BoE has/is expected to continue front loading monetary tightening, analysts fear this is very much “in the price” for sterling now. While money markets are priced for as much as another 150bps of tightening this year from the bank, analysts are fretting about the weak outlook for UK growth from Q2 onwards.
“The (UK) recovery will probably lose momentum in the course of the year” analysts at Commerzbank noted. “High inflation, tax increases in April and the BoE's interest rate hikes are a burden on the economy” they continued. The British Chambers of Commerce agrees. Its head of economics Suren Thiru stated that “the UK economy is facing a materially weaker 2022 as the crippling burden of rising inflation, soaring energy bills and higher taxes on consumers and businesses dampens activity.”
While these fears may continue to dampen the appeal of the pound, ECB President Christine Lagarde’s latest more dovish-leaning remarks have failed to dampen speculation that the ECB will accelerate its QE taper and start hiking interest rates in Q4. Reuters reported on Friday that, according to trading sources and industry data, investors are “piling” into derivatives linked to a rising euro. Analysts at Citibank told Reuters that the mentality of the euro as a “funding” currency is beginning to disappear. “The ECB decision was a game-changer for the euro” they noted, adding that “while we don't expect the euro and rest of the world yield differential to shrink dramatically, it is a big change in sentiment”.
The net result might be that EUR/GBP has finally become a “buy on dips” rather than a “sell on rallies”, at least as far as longer-term swing traders are concerned. The 50% Fibonnaci retracement back from this week’s multi-week highs in the upper 0.8400s to last week’s sub-0.8300 lows at 0.8380 might well be such a level where traders are enticed to buy the pullback. The rest of Friday’s session ought to be quiet amid a thin data calendar and pre-weekend low liquidity.
- Gold reversed an intraday dip and stalled the overnight pullback from over a two-week high.
- The risk-off mood was seen as a key factor that acted as a tailwind for the safe-haven metal.
- Retreating US bond yields prompted some USD selling and further benefitted the commodity.
- Rising bets for a 50 bps Fed rate hike in March should hold back bulls from placing fresh bets.
Gold attracted some dip-buying near the $1,821 region on Friday and for now, seems to have stalled the previous day's retracement slide from over a two-week high. Against the backdrop of geopolitical risks, a generally weaker tone around the equity markets acted as a tailwind for the safe-haven XAU/USD. Apart from this, concerns about the continuous rise in the US consumer prices further benefitted the precious metal's status as a hedge against inflation. In fact, data released on Thursday showed that the headline US CPI accelerated to a 40-year high in January.
The red-hot US inflation reinforced expectations that the Fed would adopt a more aggressive policy response to combat high inflation and bets for a 50 bps rate hike in March. Adding to this, St. Louis Fed President James Bullard called for 100 bps rate hikes over the next three FOMC policy meetings. This, in turn, pushed the yield on the benchmark 10-year US government bond beyond the 2% threshold for the first time since mid-2019. Adding to this, the 2-year note, which is highly sensitive to rate hike expectations, climbed to its highest level since January 2020.
The US bond yields, however, retreated a bit from the aforementioned highs, which prompted some intraday US dollar selling. This, in turn, was seen as a key factor that extended some support to the dollar-denominated commodity, though the uptick lacked bullish conviction. The prospects for a faster policy tightening continued acting as a headwind for the non-yielding gold and warrants some caution for aggressive bullish traders. Hence, it will be prudent to wait for a strong follow-through buying before positioning for the resumption of a two-week-old bullish trend.
Nevertheless, the metal has now moved into the positive territory and was last seen hovering near the daily high, just above the $1,830 level. Market participants now look forward to the US economic docket, featuring the release of the Prelim University of Michigan US Consumer Sentiment Index. This, along with the US bond yields, will influence the USD price dynamics and provide some impetus to gold prices. Apart from this traders will take cues from the broader market risk sentiment for some short-term opportunities around the XAU/USD on the last day of the week.
Technical outlook
From a technical perspective, any subsequent move up is likely to confront some resistance near the $1,832-$1,833 region ahead of the overnight swing high, around the $1,842 area. Some follow-through buying has the potential to push gold prices back towards the January swing high, around the $1,853 area. The latter nears a downward-sloping trend-line resistance, extending from June 2021. A convincing breakthrough will be seen as a fresh trigger for bullish traders and set the stage for a further near-term appreciating move for the metal.
On the flip side, weakness back below the $1,825 level might continue to attract some buying and remain limited near the $1,818 horizontal support. This is followed by the very important 200-day SMA, currently around the $1,807 region, which if broken decisively will negate any positive bias and shift the bias in favour of bearish trades. Gold would then turn vulnerable to weaken further below the $1,800 mark and test the next relevant support near the $1,790 region before eventually dropping to 2020 low, around the $1,780 area.
Gold daily chart
-637801793294677068.png)
Levels to watch
UOB Group’s Economist Ho Woei Chen, CFA, comments on the US-China Phase One Trade deal.
Key Takeaways
“We estimate that China has met around 61% of the goods purchase target and only 52% for services in 2020-21 under the Phase One trade agreement.”
“The structural imbalances have remained. US’ goods trade deficit with China widened to US$355.30 bn in 2021, up 14.5% from US$310.26 bn in 2020. This was the highest trade deficit since the record high of US$418.23 bn in 2018 before the trade tensions were ratcheted up.”
“China has lost market share in the US amidst the trade tensions even as it remained the largest import source for the US.”
“There is an avenue for bilateral evaluation and a process for dispute resolution under the agreement. For now, both sides have not announced any concrete steps for follow-up actions to address the shortfall in Phase One or a new trade deal but US-China trade relations will undoubtedly be marked by the race for technology supremacy in the coming years.”
The Central Bank of Russia announced on Friday that it raised its policy rate by 100 basis points to 9.5% from 8.5%. This decision came in line with the market expectation.
Key takeaways from policy statement
"Key rate decisions will be made taking into account actual and expected inflation movements relative to the target and economic developments over the forecast horizon as well as risks posed by domestic and external conditions and the reaction of financial markets."
"If the situation develops in line with the baseline forecast, the Bank of Russia holds open the prospect of a further key rate increase at its upcoming meetings."
"The Bank of Russia’s monetary policy stance is aimed to return inflation to 4%."
"Based on the Bank of Russia's forecast, given the monetary policy stance, annual inflation will reduce to 5.0-6.0% in 2022 to return to the target in the middle of 2023."
Market reaction
The USD/RUB pair showed no immediate reaction to this announcement and was last seen posting small losses on the day at 75.1010.
UOB Group’s Economist Enrico Tanuwidjaja reviews the latest monetary policy decision by the Bank Indonesia (BI).
Key Takeaways
“BI kept rates unchanged at its Feb meeting at 3.5%.”
“150bps RR hike is expected to start in March, to 5.0% from curent level of 3.5%.”
“We keep our view for BI to start hiking in mid-2022 to reach 4.5% by the end of this year.”
- EUR/USD regains downside traction and revisits 1.1370.
- The greenback looks bid across the board on mixed US yields.
- Final Germany CPI came at 4.9% YoY, 0.4% MoM in January.
The European currency extends the selling bias for the second session in a row and drags EUR/USD to the area of multi-session lows around 1.1370 on Friday.
EUR/USD weaker post-US CPI
After Thursday’s volatile session - where EUR/USD clocked new monthly peaks in levels just shy of 1.1500 the figure - sellers appear to have returned to the market and force the pair to shed more than a cent so far at the end of the week.
While market participants continue to digest the recent multi-decade high in US inflation in January, the mixed tone in yields in the US money markets see the short end of the curve extending gains and retesting the 1.60% mark vs. small retracements in both the belly and the long end. In Germany, yields of the key 10y Bund ease below 0.27% after trespassing the 0.31% on Thursday.
In the domestic calendar, Germany final CPI rose 4.9% in the year to January and 0.4% from a month earlier.
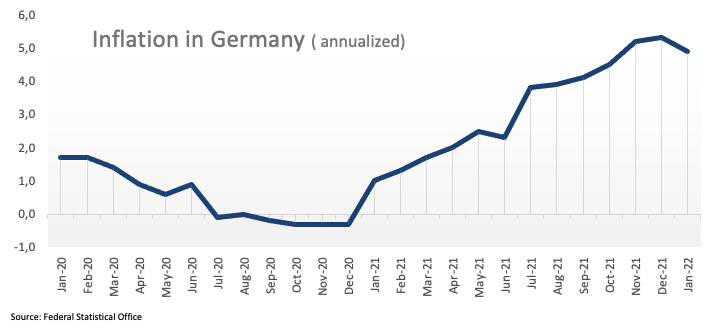
Across the pond, the only release of note will be the advanced Consumer Sentiment print for the current month.
What to look for around EUR
EUR/USD could not sustain the post-US CPI raise to the vicinity of the 1.1500 barrier, sparking a corrective move well south of 1.1400 soon afterwards and on the back of the renewed and quite strong bias towards the US dollar. Despite the ongoing knee-jerk, the improvement in the pair’s outlook appears underpinned by fresh speculation of a potential interest rate hike by the ECB at some point by year end, higher German yields, persevering elevated inflation and a decent pace of the economic activity and other key fundamentals in the region
Key events in the euro area this week: Germany Final January CPI (Friday).
Eminent issues on the back boiler: Asymmetric economic recovery post-pandemic in the euro area. Speculation of ECB tightening/tapering later in the year. Presidential elections in France in April. Geopolitical concerns from the Russia-Ukraine conflict.
EUR/USD levels to watch
So far, spot is retreating 0.35% at 1.1388 and faces the next up barrier at 1.1494 (2022 high Feb.10) followed by 1.1496 (200-week SMA) and finally 1.1660 (200-day SMA). On the other hand, a break below 1.1370 (weekly low Feb.11) would target 1.1325 (55-day SMA) en route to 1.1121 (2022 low Jan.28).
- GBP/USD attracted dip-buying on Friday and reversed a dip back closer to the weekly low.
- Retreating US bond yields kept a lid on the USD gains and acted as a tailwind for the major.
- Rising bets for a 50 bps Fed rate hike in March should underpin the USD and cap the upside.
The GBP/USD pair recovered its early lost ground and was last seen trading in the neutral territory, around mid-1.3500s.
The pair witnessed some selling during the first half of the trading on Friday and dropped to the lower end of its weekly trading range amid a strong follow-through US dollar buying. Expectations that the Fed will tighten its monetary policy at a faster pace to combat high inflation continued acting as a tailwind for the greenback and exerted pressure on the GBP/USD pair.
The red-hot US consumer inflation figures released on Thursday reinforced market bets for a 50 bps Fed rate hike move in March. St. Louis Fed President James Bullard added to market speculations and called for 100 bps rate hikes over the next three FOMC policy meetings. This, along with a generally weaker tone around the equity markets, underpinned the safe-haven greenback.
The GBP/USD pair had a rather muted reaction to the release of mixed UK macro data, which showed that the economy expanded by 1% during the fourth quarter of 2021 as against 1.1% anticipated. Separately, the UK Industrial/Manufacturing Production and a larger than estimated traded deficit did little to impress bullish traders or provide any impetus to the GBP/USD pair.
That said, retreating US Treasury bond yields capped gains for the greenback and once again assisted the GBP/USD pair to attract some buying ahead of the 1.3500 psychological mark. The said handle should act as a pivotal point for short-term traders, which if broken decisively will set the stage for an extension of the previous day's sharp pullback from a three-week high.
Market participants now look forward to the US economic docket, featuring the release of the Prelim University of Michigan US Consumer Sentiment Index. This, along with the US bond yields and the broader market risk sentiment, will influence the USD price dynamics and produce some short-term trading opportunities around the GBP/USD pair.
Technical levels to watch
- AUD/USD witnessed heavy selling on Friday and moved further away from a three-week high.
- Rising bets for a 50 bps Fed rate hike continued underpinning the USD and exerted pressure.
- The risk-off mood also contributed to driving flows away from the perceived riskier aussie.
The AUD/USD pair recovered a few pips from the daily low and was last seen trading around the 0.7130-0.7125 region, still down over 0.50% for the day.
The pair extended the overnight sharp pullback from the vicinity of mid-0.7200s, or a three-week high and witnessed heavy follow-through selling on the last day of the week. The US dollar gained strong positive traction and remained well supported by firming expectations for a faster policy tightening by the Fed. This, along with the risk-off impulse, further weighed on the perceived riskier aussie and contributed to the heavily offered tone surrounding the AUD/USD pair.
The red-hot US consumer inflation figures released on Thursday reinforced speculations that the Fed will adopt a more aggressive policy stance and bets for a 50 bps rate hike in March. Adding to this, St. Louis Fed President James Bullard called for 100 bps rate hikes over the next three FOMC policy meetings. This, in turn, pushed the yield on the benchmark 10-year US government bond beyond the 2.0% threshold for the first time since August 2019 and underpinned the buck.
The selloff in the bond markets triggered a fresh bout of the global risk-aversion trade, which was evident from a generally weaker tone across the equity markets. This, in turn, forced investors to take refuge in traditional safe-haven assets and further benefitted the greenback. However, retreating US bond yields capped gains for the USD and assisted the AUD/USD pair to find some support near the 0.7100 round-figure mark, though the attempted recovery lacked follow-through.
Market participants now look forward to the US economic docket, featuring the release of the Prelim University of Michigan US Consumer Sentiment Index. This, along with the US bond yields, will drive the USD demand and provide a fresh impetus to the AUD/USD pair. Traders will further take cues from the broader market risk sentiment to grab some short-term opportunities.
Technical levels to watch
GBP/USD has managed to regain its traction before testing 1.3500. But as FXStreet’s Eren Sengezer notes, the pound stays vulnerable and needs to break above 1.3560 to alleviate downside pressure.
1.3520 aligns as the next bearish target
“In order to push higher toward 1.3600 (psychological level) and 1.3620 (static level), the pair needs to rise above 1.3560 (Fibonacci 23.6% retracement level of the latest uptrend) and start using that level as support.”
“On the downside, 1.3520 (Fibonacci 38.2% retracement, 100-period SMA) aligns as the next bearish target. In case a four-hour candle closes below that level, additional losses toward 1.3500 (psychological level, Fibonacci 50 retracement) and 1.3460 (Fibonacci 61.8% retracement) could be witnessed.”
EUR/RUB has pulled back after touching interim hurdle of 90.70/91.00. A break under 84.70/40 would open up the possibility of a deeper fall to 82.60, economists at Société Générale report.
Bounce towards last week's high of 87.80 on the cards while 84.40 holds
“The pair is now close to support of 84.70/84.40, the 61.8% retracement from October. Only if this gets violated will there be a risk of an extended pullback towards projections of 82.60.”
“Defending 84.40, a bounce is not ruled out towards last week's high of 87.80.”
USD/JPY has climbed above 116 for the first time since early January. Economists at Société Générale expect the pair to grind higher towards 117.10/117.40 on a break above 116.35.
Initial support located at 115.50
“Daily MACD has crossed above its trigger and is within positive territory which denotes upward momentum is still prevalent.”
“The pair is now once again probing the recent peak at 116.35. Signals of deeper downtrend are not yet visible. Beyond 116.35, the uptrend looks poised to extend towards next projections of 117.10/117.40 which is also the upper band of the channel since December.”
“Peak of November at 115.50 is first support.”
The 6.3400-6.3805 range is expected to prevail in USD/CNH for the time being, commented FX Strategists at UOB Group.
Key Quotes
24-hour view: “We expected USD to trade between 6.3590 and 6.3740 yesterday. USD subsequently traded within a wider range than expected (6.3520/6.3690) before closing largely unchanged at 6.3634 (+0.03%). Despite closing largely unchanged, the underlying tone appears to have firmed somewhat and USD could edge higher from here. That said, any advance is expected to face solid resistance at 6.3750. Support is at 6.3600 followed by 6.3550.”
Next 1-3 weeks: “There is no change in our view from Monday (07 Feb, spot at 6.3600). We continue to view the current movement as part of a consolidation phase and expect USD to trade between 6.3400 and 6.3805 for now.”
- DXY adds to Thursday’s post-CPI gains and revisits 96.00.
- US yields seem to be taking a breather after recent tops.
- Flash Consumer Sentiment gauge next of note in the docket.
The greenback, when tracked by the US Dollar Index (DXY), extends the post-US CPI rebound to the area just above the 96.00 barrier at the end of the week.
US Dollar Index bolstered by higher yields
The index advances for the second session in a row on Friday, although a convincing move above the 96.00 hurdle still looks elusive for USD bulls.
Following a very volatile session on Thursday, the dollar seems to have finally broken above its recent consolidative mood and shifted the attention to the 96.00 mark and beyond, always on the back of the strong rebound in US yields after inflation rose to its highest pace in the last 40 years in January (+7.5%).
The bull flattening of the US curve saw yields of the 2y note climbing to the vicinity of 1.65% level for the first time since December 2019, with the belly surpassing the 2.00% mark – levels last traded back in August 2019 – and the 30y note clocking 9-month peaks just above 2.35%.

Further support for the buck in past hours came after St.Louis Fed J.Bullard (new hawk?, voter) favoured a 100 bps interest rate hike by July. Supporting his idea, and following CME Group’s FedWatch tool, the probability of a 50 bps rate hike at the March meeting is now close to 95% (from nearly 34% just a week ago).
In the US data sphere, the salient event on Friday will be the advanced gauge of the Consumer Sentiment tracked by the U-Mich Index.
What to look for around USD
Higher-than-expected US inflation figures lent extra oxygen to the greenback and propelled DXY back above the 96.00 yardstick. However, the extent and duration of this improvement in the dollar remains to be seen, as much of the current elevated inflation narrative was already priced in by market participants as well as the probability (bigger now) of a 50 bps rate hike by the Fed (instead of the more conventional 25 bps move). Looking at the longer run, and while the constructive outlook for the greenback appears well in place for the time being, recent hawkish messages from the BoE and the ECB carry the potential to undermine the expected move higher in the dollar in the next months.
Key events in the US this week: Flash Consumer Sentiment (Friday).
Eminent issues on the back boiler: Fed’s rate path this year. US-China trade conflict under the Biden administration. Debt ceiling issue. Escalating geopolitical effervescence vs. Russia and China.
US Dollar Index relevant levels
Now, the index is gaining 0.12% at 95.90 and a break above 96.05 (weekly high Feb.11) would open the door to 97.44 (2022 high Jan.28) and finally 97.80 (high Jun.30 2020). On the flip side, the next down barrier emerges at 95.17 (weekly low Feb.10) followed by 95.13 (weekly low Feb.4) and then 94.62 (2022 low Jan.14).
- USD/CHF regained positive traction on Friday and inched back closer to the overnight swing high.
- Rising bets for a 50 bps Fed rate hike in March underpinned the buck and remained supportive.
- The risk-off impulse benefitted the safe-haven CHF and kept a lid on any further gains for the pair.
The USD/CHF pair maintained its bid tone through the first half of the European session and was last seen trading just a few pips below the daily high, around the 0.9275 region.
Following the overnight pullback from the vicinity of the 0.9300 mark, the USD/CHF pair caught fresh bids on Friday and inched back closer to the weekly high amid a broad-based US dollar strength. Firming expectations for a faster policy tightening by the Fed turned out to be a key factor that continued underpinning the greenback.
The US CPI report released on Thursday reinforced speculations that the Fed will adopt an aggressive policy stance to combat high inflation and boosted bets for a 50 bps rate hike in March. Moreover, St. Louis Fed President James Bullard said that the US central bank should hike rates by 100 basis points over the next three meetings.
This, in turn, pushed the yield on the benchmark 10-year US government bond beyond the 2% threshold for the first time since mid-2019. Adding to this, the 2-year note, which is highly sensitive to rate hike expectations, climbed to its highest level since January 2020, which further acted as a tailwind for the buck and the USD/CHF pair.
That said, the risk-off impulse – as depicted by a sea of red across the global equity markets – benefitted the Swiss franc's safe-haven status and capped the upside for the USD/CHF pair. Hence, it will be prudent to wait for some follow-through buying beyond the 0.9300 mark before positioning for any further appreciating move.
Market participants now look forward to the release of the Prelim University of Michigan US Consumer Sentiment Index. This, along with the US bond yields, will influence the USD price dynamics. Traders will further take cues from the broader market risk sentiment to grab some short-term opportunities around the USD/CHF pair.
Technical levels to watch
- GBP/JPY witnessed some selling on Friday and extended the overnight modest pullback.
- The risk-off impulse benefitted the JPY’s relative safe-haven status and exerted pressure.
- The BoE-BoJ policy divergence should help limit any meaningful downfall for the cross.
The GBP/JPY cross remained depressed through the early European session and was last seen trading just a few pips above the daily low, around the 157.00 mark.
The cross extended the overnight modest pullback from the 158.00 round figure, or the highest level since October 2021 and witnessed some selling during the first half of the trading on Friday. The risk-off impulse in the markets underpinned the Japanese yen's relative safe-haven status and exerted some pressure on the GBP/JPY cross.
Growing market acceptance that the Fed will adopt a more aggressive policy response to combat high inflation triggered a fresh bout of the global risk aversion trade. This was evident from a sea of red across the equity markets, which, in turn, forced investors to take refuge in traditional safe-haven assets and benefitted the JPY.
On the other hand, the British pound was weighed down by a broad-based US dollar strength and failed to gain any respite from mixed UK macro releases. The UK Office of National Statistics reported that the economy contracted less than anticipated, by 0.2% in December, and expanded by 1% during Q4 2021 as against expectations for the 1.1% increase.
Separately, the UK Industrial/Manufacturing Production figures and a larger than estimated traded deficit did little to impress traders or provide any impetus to the GBP/JPY cross. The downside, however, remains cushioned, at least for now, amid the divergence between the Bank of England and the Bank of Japan monetary policy outlooks.
It is worth recalling that the BoE raised its benchmark interest rate by 25 bps last week – marking the first back-to-back hike since 2004. Adding to this, four out of nine MPC members voted for a more aggressive 50 bps hike in borrowing costs. Conversely, the BoJ has repeatedly said that it would retain its ultra-loose monetary policy.
The fundamental backdrop still seems tilted in favour of bullish traders. This, in turn, warrants some caution before confirming that the recent strong move up from the 200-day SMA has run out of steam. That said, tensions over the Northern Ireland protocol of the Brexit agreement might hold back traders from placing fresh bullish bets around the GBP/JPY cross.
Technical levels to watch
Since the start of 2022, equity investors have been worried about tightening monetary policies and there has been a marked downward correction in equity markets. But economists at Natixis believe investors should remain bullish about equities for several reasons.
Central banks’ moderate reaction to inflation
“Given the multiplication of their objectives, central banks cannot react strongly to inflation. The market’s scenario of real long-term interest rates remaining persistently negative is therefore reasonable, which is obviously positive by driving up equity valuations and making a rotation from equities into bonds unconscionable for investors.”
Income distribution still favours earnings
“Despite faster wage growth, income distribution is still skewed in favour of earnings. The consensus scenario of earnings per share growth remaining relatively rapid is therefore also reasonable.”
Cash holdings are still large
“Cash holdings are still abnormally large, so the portfolio rotation from cash to equities is not over.”
EUR/USD has dropped below 1.1400 on renewed dollar strength. As FXStreet’s Eren Sengezer notes, the next bearish target aligns at 1.1350.
1.1400 is the immediate resistance
“As long as sellers continue to defend 1.1400 (psychological level, Fibonacci 23.6% of the latest uptrend), EUR/USD could extend its slide toward 1.1350 (200-period SMA on the four-hour chart, Fibonacci 38.2% retracement). Below that level, 1.1320 (100-period SMA) aligns as the next support before 1.1300 (psychological level, Fibonacci 50% retracement).”
“1.1400 is the immediate resistance before 1.1420 (20-period SMA) and 1.1480 (static level).”
See: EUR/USD to slump toward 1.1310 on a tough day for risk assets – ING
There will be a lot of focus today on the Central Bank of Russia's (CBR) monetary policy decision. Economists at ING doubt that the CBR meeting will make much material difference to the rouble. They expect USD/RUB to slide towards 73.25 next week in absence of new geopolitical tensions.
100bp rate hike looks discounted
“We expect a 100bp rate hike, upward revisions to CPI and hawkish guidance which could leave open the door for another 50-100bp rate hike. On another day, this could all be very positive for the rouble. However, tensions surrounding Russia's military ambitions will probably leave investors reluctant to hold long RUB positions over the weekend.”
“Some are also arguing that the CBR could today announce a resumption of the FX buying programme for the budget rule. However, a bull case could develop for the rouble into next week should the CBR choose to delay the FX buying programme until a much clearer geopolitical picture has emerged. And it would not be a surprise for the RUB to strengthen next week as some speculated over the departure of Russian forces from Belarus were military exercises to end on schedule 20 Feb.”
“Barring any major new developments this weekend, USD/RUB could make a run at 73.25 next week.”
EUR/USD has seen a wild ride over the last 24 hours. A tough day for risk assets could drag the pair down to the 1.1350 level and even lower to 1.1310, economists at ING report.
EUR/USD may see a 1.12-1.15 range for quite a while
“Continued EUR/USD volatility within ranges looks likely – we could see 1.12-1.15 for quite a while.”
“A tough day for risk assets marginally favours a further correction in EUR/USD today to 1.1350 and potentially 1.1310.”
In light of the recent price action, USD/JPY could now be poised to advance further and visit the 116.65 level in the next weeks, suggested FX Strategists at UOB Group.
Key Quotes
24-hour view: “The sudden and rapid surge in USD to 116.33 and the subsequent rapid pullback came as a surprise (we were expecting sideway-trading). Despite the rapid pullback from the high, the underlying tone still appears to be a tad firm. That said, a sustained rise above the major resistance at 116.35 is unlikely (next resistance is at 116.60). Support is at 115.90 followed by 115.70.”
Next 1-3 weeks: “Yesterday (10 Feb, spot at 115.45), we highlighted that while upward momentum has improved somewhat, USD has to break 115.80 before a sustained advance can be expected. We added, ‘looking ahead, the next resistance above 115.80 is at 116.10 followed by 116.35’. We did not expect the sped-up price actions where USD surged to a high of 116.33. Upward momentum has improved further and a clear break of 116.35 is likely to lead to further USD advance to 116.65. On the downside, a breach of 115.40 (‘strong support’ level was at 115.00) yesterday would indicate that the current upward pressure has eased.”
According to flash data from CME Group for natural gas futures markets, open interest shrank for the fourth session in a row on Thursday, this time by nearly 8.5K contracts. Volume dropped as well, now by around 93.8K contracts amidst the erratic performance seen as of late.
Natural Gas appears supported around $3.80
Prices of natural gas retreated further on Thursday and closed below the $4.00 mark per MMBtu for the first time since January 21. The negative price action was accompanied by shrinking open interest and volume, leaving the door open to a probable bounce in the very near term. Against this, the $3.80 region still emerges as a decent contention.
Following the European Central Bank’s (ECB) February meeting, the aussie printed lows against the euro since September 2021. AUD softness may persist into March, with fresh lows since August 2021 likely, but analysts at Westpac expect the aussie to recover in the second quarter.
ECB change of tune vs RBA and return of equity jitters suggests AUD softness
“The RBA’s comparatively dovish rhetoric and jittery equity markets suggest A$ softness persists into March, with fresh euro highs since August 2021 quite possible.”
“By Q2, we expect EUR/AUD to fade to the 1.54-1.56 area, as Australian growth accelerates into a likely August RBA rate rise.”
In opinion of FX Strategists at UOB Group, the upside momentum in AUD/USD could be losing momentum, signalling that further consolidation could be in store in the very near term.
Key Quotes
24-hour view: “Our expectations for AUD to ‘trade sideways between 0.7150 and 0.7200’ yesterday were incorrect as it soared to 0.7249 before plummeting back down. AUD traded on a soft note during early Asian hours and the risk is on the downside. That said, any weakness is unlikely to break the major support at 0.7110. Resistance is at 0.7175 followed by 0.7210.”
Next 1-3 weeks: “Yesterday (10 Feb, spot at 0.7180), we highlighted that upward momentum is beginning to build but AUD has to close above 0.7200 before a sustained advance is likely. We did not anticipate the surge to 0.7249 during NY session and the subsequent sharp drop (AUD closed at 0.7169, -0.17%). The build-up in momentum has dissipated. The outlook appears neutral and AUD could trade within a broad range of 0.7055/0.7240 for now.”
- USD/CAD gained traction for the second straight day and was supported by a combination of factors.
- Weaker oil prices undermined the loonie and provided a modest lift amid a broad-based USD strength.
- Rising bets for a 50 bps Fed rate hike in March, the risk-off impulse benefitted the safe-haven buck.
The USD/CAD pair maintained its offered tone through the early European session and was last seen hovering near the top end of its weekly trading range, just below mid-1.2700s.
A combination of supporting factors assisted the USD/CAD pair to build on the overnight solid rebound from an over two-week low and gain traction for the second successive day on Friday. A softer tone around crude oil prices undermined the loonie and remained supportive of the move amid a broad-based US dollar strength.
As investors await the outcome of US-Iran talks, expectations that the revival of the 2015 nuclear agreement could return more than 1 million barrels per day of Iranian oil in the markets weighed on the black gold. Apart from this, the risk-off impulse prompted traders to lighten their bullish bets around the commodity.
Meanwhile, the USD continued drawing support from rising bets for a 50 bps Fed rate hike in March, reaffirmed by Thursday's red-hot US consumer inflation figures. Adding to this, St. Louis Fed President James Bullard said that the US central bank should hike rates by 100 basis points over the next three meetings.
Growing acceptance that the Fed will adopt a more aggressive policy response to combat high inflation tempered investors' appetite for riskier assets. This was evident from a weaker tone around the equity markets, which was seen as another factor that benefitted the safe-haven buck and extended support to the USD/CAD pair.
The fundamental backdrop seems tilted firmly in favour of bullish traders and supports prospects for additional gains for the USD/CAD pair. That said, it will still be prudent to wait for sustained strength beyond last week's swing high, around the 1.2785 region before positioning for any further near-term appreciating move.
Market participants now look forward to the release of the Prelim University of Michigan US Consumer Sentiment Index. This, along with the US bond yields, will influence the USD. Traders will further take cues from oil price dynamics for some short-term opportunities around the USD/CAD pair on the last day of the week.
Technical levels to watch
CME Group’s preliminary prints for crude oil futures markets noted traders added around 5.7K contracts to their open interest positions on Thursday, resuming the uptrend following Wednesday’s small pullback. In the same direction, volume rose for the second straight session, now by around 56.3K contracts.
WTI remains capped by $93.00 and above
Prices of the barrel of WTI charted another inconclusive session on Thursday amidst increasing volatility. The price action was in tandem with rising open interest and volume, indicative that extra range bound trading appears likely at least in the very near term.
In addition to the European Central Bank's (ECB) recent hawkish pivot, economists at Rabobank see positioning as supporting the EUR’s recovery. However, this does not mean that the shared currency is guaranteed to have an easy ride in the coming months.
EUR/USD seen at 1.15 on a one-year view
“We think the market has priced in too much ECB tightening on a one-ear view and see the EUR as vulnerable in the coming weeks if money market rates backtrack.”
“The weight of long USD positions is likely to continue limiting the USD’s upside potential in the coming months. That said, given that the US’s inflationary cycle is so much further developed than that of the Eurozone, we don’t see the USD’s bull run as being over yet.”
“Previously, we were forecasting that EUR/USD would drop to 1.10 by mid-year as the Fed’s tightening commenced. In light of the ECB’s hawkish tilt, we have revised this forecast up moderately to 1.11 and brought forward our medium-term projections for the EUR’s recovery. We now forecast EUR/USD at 1.15 on a one-year view from a previous forecast of 1.12.”
Here is what you need to know on Friday, February 11:
The dollar outperformed its rivals on Thursday as US Treasury bond yields surged higher after the data from the US showed the annual Consumer Price Index climbed to a new four-decade high of 7.5% in January. The University of Michigan's flash February Consumer Sentiment Index will be featured in the US economic docket on Friday. Ahead of the weekend, the FOMC will submit its semi-annual Monetary Policy Report to Congress.
The CME Group's FedWatch Tool shows that markets are pricing a 90% probability of a 50 basis points (bps) rate hike in March. The benchmark 10-year US Treasury bond yield, which gained nearly 5% on Thursday, is sitting at its highest level since August 2019 above 2%. Meanwhile, St Louis Fed President James Bullard told Bloomberg News that he would prefer a 50 bps hike in March and added that he would want the Fed to raise its policy rate by 100 bps by July. Heightened expectations for an aggressive policy tightening weighed heavily on stocks, the Nasdaq Composite lost more than 2%, the S&P 500 fell 1.8% and the CBOE Volatility Index (VIX) surged nearly 20%.
January inflation scorches US markets: Fed cornered on rate increases.
EUR/USD stays under bearish pressure below 1.1400 in the early European session. The data from Germany showed that the Harmonized Index of Consumer Prices in January was up 5.1% on a yearly basis, matching the advance estimate and the market expectation.
GBP/USD is edging lower toward 1.3500 following mixed data releases. The UK's ONS reported that the GDP expanded by 1% in the fourth quarter, compared to analysts' estimate of 1.1%. Meanwhile, Industrial Production and Manufacturing Production grew by 0.4% and 1.3%, respectively, in 2021.
USD/JPY climbed above 116 for the first time since early January and seems to have gone into a consolidation phase.
Gold advanced to its strongest level in two weeks above $1,840 on Thursday but ended up closing the day in the negative territory amid rising US T-bond yields. XAU/USD stays on the back foot early Friday and pushes lower toward $1,820.
The risk-averse market environment hurt cryptocurrencies on Thursday and Bitcoin lost 2%. BTC/USD trades in the red near $43,000 in the early European morning. Ethereum erased 5% on Thursday and was last seen testing $3,000 support.
Cable’s potential upside now looks somewhat trimmed, giving way to further consolidation in the short term instead, noted FX Strategists at UOB Group.
Key Quotes
24-hour view: “Our view from yesterday where the ‘bias is on the downside’ for GBP was incorrect as it whipsawed between 1.3524 and 1.3643. The rapid pullback from the high of 1.3643 during NY session appears to have room to extend but a clear break of 1.3500 is unlikely (there is another support at 1.3515). On the upside, a breach of 1.3605 (minor resistance is at 1.3580) would indicate that the current mild downward pressure has eased.”
Next 1-3 weeks: “Since the start of the week, we have held the view that there is a slim chance for GBP to push higher to 1.3645. Yesterday (10 Feb, spot at 1.3535), we highlighted that the chance for GBP to push higher to 1.3645 has diminished considerably. GBP subsequently dropped to 1.3524, surged to within a couple of pips of 1.3645 (high of 1.3643) before plummeting back down. The chance of GBP moving clearly above 1.3645 has dissipated but GBP does not appear to be ready to move lower in a sustained manner. From here, GBP is likely trade between 1.3450 and 1.3650.”
Open interest in gold futures markets rose for the fourth consecutive session on Thursday, this time by around 10.3K contracts considering advanced figures from CME Group. In the same line, volume remained choppy and went up markedly by around 102.5K contracts.
Gold stays supported around $1,800
Gold prices reversed the spike to fresh 2-week highs past $1,840 and ended the session on the defensive on Thursday. The volatile session was on the back of rising open interest and volume, which is supportive of further correction in the very near term. The critical $1,800 mark remains a solid contention area for the time being.
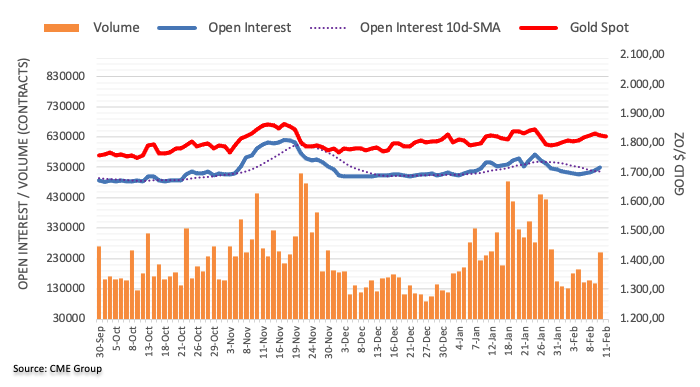
Britain’s industrial sector continued its gradual recovery in December, the latest UK industrial and manufacturing production data published by Office for National Statistics (ONS) showed on Friday.
Manufacturing output arrived at 0.2% MoM in December versus 0.1% expectations and 0.7% booked in November while total industrial output came in at 0.3% vs. 0.1% expected and 0.7% last.
On an annualized basis, the UK manufacturing production figures came in at 1.3% in December, beating expectations of 1.7%. Total industrial output rose by 0.4% in the final month of the year against a 0.6% reading expected and the previous -0.2% print.
Separately, the UK goods trade balance numbers were published, which arrived at GBP-12.534 billion in December versus GBP-12.50 billion expectations and GBP-11.337 billion last. Total trade balance (non-EU) came in at GBP-7.876 billion in December versus GBP-5.665 billion previous.
Related reads
GBP/USD flirts with daily low around 1.3520-25 area, moves little post-UK macro data
UK Preliminary GDP misses estimates with 1.0% QoQ in Q4
- GBP/USD witnessed some selling on Friday amid a broad-based USD strength.
- The prospects for a faster policy tightening by the Fed underpinned the buck.
- Mixed UK macro releases did little to impress bullish traders or lend support.
The GBP/USD pair remained depressed near the daily low, around the 1.3515-1.3520 region and had a rather muted reaction to the UK macro releases.
The pair witnessed some selling on the last day of the week and extended the overnight sharp pullback from the vicinity of mid-1.3600s, or a three-week high amid a broad-based US dollar strength. Growing market acceptance that the Fed would adopt a more aggressive policy response to contain stubbornly high inflation continued acting as a tailwind for the buck.
In fact, the latest US consumer inflation figures released on Thursday boosted market bets for a 50 bps Fed rate hike in March. Adding to this, St. Louis Fed President James Bullard said that the US central bank should hike rates by 100 basis points over the next three meetings. Apart from this, the risk-off mood further benefitted the safe-haven greenback.
With the USD price dynamics turning out to be an exclusive driver, the GBP/USD pair failed to gain any respite from mixed UK economic data. The UK Office of National Statistics reported that the economy contracted less than anticipated, by 0.2% in December, and expanded by 1% during the fourth quarter of 2021 as against market expectations for the 1.1% increase.
Separately, the UK Industrial/Manufacturing Production figures and a larger than estimated traded deficit did little to lend any support to the British pound or lend any support to the GBP/USD pair. Moving ahead, traders now look forward to the Prelim University of Michigan US Consumer Sentiment Index for some impetus later during the early North American session.
Technical levels to watch
FX Strategists at UOB Group now see EUR/USD navigating the 1.1340-1.1500 range in the next weeks.
Key Quotes
24-hour view: “While we highlighted yesterday that the recent consolidation phase ‘appears to be drawing to a close’, the subsequent wild swings came as a surprise. EUR initially plummeted to 1.1373 before lifting to crack the strong resistance at 1.1485 (high has been 1.1495). The advance was however short-lived as EUR plummeted back down to end the day little changed at 1.1427 (+0.04%). The wild swings have resulted in a mixed outlook and EUR could continue to trade in a choppy manner, likely between 1.1370 and 1.1470.”
Next 1-3 weeks: “We have held the same view since Monday (07 Feb, spot at 1.1450) where the recent rally in EUR has to break the major resistance at 1.1485 before a move to 1.1520 can be expected. EUR swung wildly yesterday but while it moved above 1.1485, the advance was short-lived as it dropped sharply after touching a high of 1.1495. The risk of EUR moving to 1.1520 has dissipated. The outlook is mixed and EUR is likely to trade between 1.1340 and 1.1500 for now.”
- Quarterly GDP for the UK expanded by 1.0% in Q4 vs. 1.1% expected.
- UK GDP arrived at -0.2% MoM in December vs. -0.6% expected.
- GBP/USD is little changed around 1.3525 on mixed UK GDP.
The British economy expanded by 1.0% QoQ in the fourth quarter of 2021 when compared to a 1.1% growth seen in Q3 and 1.1% expectations. On an annualized basis, the Kingdom’s GDP arrived at 6.5% in Q4 vs. 6.4% expected and 6.8% prior.
The UK GDP monthly release showed that the economy contracted in December, coming in at -0.2% vs. -0.6% expected and 0.9% previous.
Meanwhile, the Index of services (December) arrived at 1.2% 3M/3M and 1.3% prior.
Market reaction
The cable keeps its range around 1.3525 on the mixed UK growth numbers. The spot is down 0.24% on the day.
About UK GDP
The Gross Domestic Product released by the National Statistics is a measure of the total value of all goods and services produced by the UK. The GDP is considered as a broad measure of the UK economic activity. Generally speaking, a rising trend has a positive effect on the GBP, while a falling trend is seen as negative (or bearish).
Gold price consolidates US inflation-led losses, as the dust settles. However, the downside appears limited, according to FXStreet’s Dhwani Mehta.
Golden cross, bullish RSI could keep the downside capped
“Gold has room to extend the correction to the horizontal 21-Daily Moving Average (DMA) at $1,819 if Thursday’s low of $1,822 gives way. Further down, the February 8 low of $1,815 will be on sellers’ radars. The downside, however, appears limited as the golden cross remains in play while the 14-day Relative Strength Index (RSI) still holds above the central line.”
“The 50-DMA pierced through the 200-DMA from below on Thursday, confirming a golden cross on the said time frame.”
“On the upside, immediate resistance is seen at the round level of $1,830, above which Wednesday’s high of $1,836 will be probed. Acceptance above the latter will call for a retest of the two-week highs above $1,840.”
See – Gold Price Forecast: XAU/USD to break under $1,745 and start a sustained downtrend in July – TDS
- EUR/JPY snaps three-day uptrend while reversing from late October highs, descending trend line from June.
- RSI pullback from overbought territory also favors further consolidation of gains.
- Previous support, 200-DMA could lure bears, bulls need to cross October highs for conviction.
EUR/JPY justifies the market’s risk-off mood by breaking the 132.00 threshold heading into Friday’s European session.
In doing so, the cross-currency pair takes a U-turn from a multi-day high, as well as a descending trend line from June.
The pullback moves also gain support from the RSI line that recently eased from overbought territory, suggesting further declines on the card.
As a result, EUR/JPY traders can expect further downside towards the January month’s high near 131.60.
However, the previous resistance line from October and the 200-DMA, respectively around 130.70 and 130.50, will challenge the pair sellers afterward. Also acting as a downside filter is the 130.00 round figure.
Alternatively, the aforementioned resistance line from June, near 132.95, will restrict the immediate upside of the EUR/JPY prices.
Following that, the 133.00 round figure and October’s peak of 133.48 will challenge the pair buyers.
EUR/JPY: Daily chart
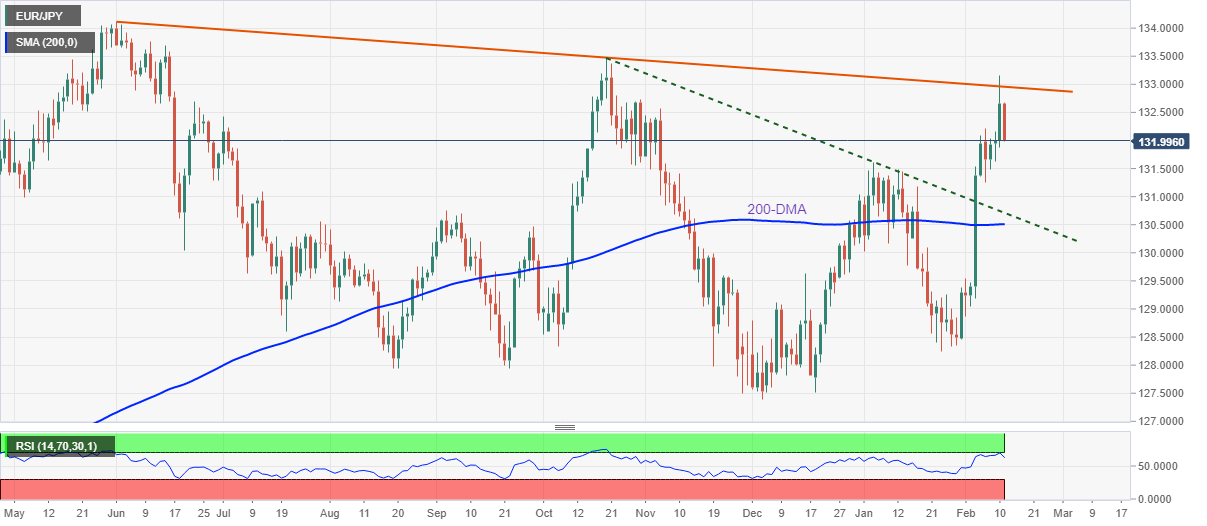
Trend: Further weakness expected
One-month risk reversal (RR) of NZD/USD, a gauge of calls to puts, prints the biggest daily fall since January 28 during early Friday, per data source Reuters.
While the latest daily RR prints -0.076 figures to please the bears, the weekly number is still positive, up for the second consecutive week around +0.049.
The mismatch between the daily and weekly readings could be justified by the Reserve Bank of New Zealand’s (RBNZ) latest survey that portrays hawkish hopes among the business houses. However, the four-decade high US inflation data challenges the NZD/USD bulls as markets place high bets on the 0.50% rate hike concerns for March.
While tracking the immediate options markets signals, coupled with the broad risk-off mood favoring the US dollar, NZD/USD refreshes intraday low near 0.6630 by breaking an upward sloping support line from January 28.
That said, risk-off mood can keep NZD/USD directed towards the yearly low near 0.6530, with 0.6590 acting as immediate support. However, the odds of a 0.25% RBNZ rate hike in February may restrict the kiwi pair’s weakness in the upcoming days.
Read: NZD/USD struggles in the face of a stronger US dollar despite hot RBNZ inflation expectations
- AUD/USD extends Thursday’s pullback from three-week high, recently refreshed intraday low.
- Bearish MACD signals join downside break of 50-SMA, two-week-old support line to hint at further weakness.
- 200-SMA, recent highs add to the upside filters.
AUD/USD takes offers to refresh intraday low around 0.7110, down 0.70% on a heading into Friday’s European session.
In doing so, the Aussie pair breaks 50-SMA and an upward sloping trend line from January 28.
Given the bearish MACD signals favoring the pair’s latest weakness, further losses remain on the table.
As a result, AUD/USD sellers eye an ascending support line from February 01, near 0.7080 by the press time, as immediate support.
Following that, the 23.6% Fibonacci retracement (Fibo.) of January’s declines, around 0.7050, will precede the 0.7000 threshold on the bear’s radar.
Meanwhile, recovery moves remain elusive below the 200-SMA level of 0.7173. Also challenging the AUD/USD buyers is the 61.8% Fibo. level and the latest high, respectively around 0.7185 and 0.7250.
In a case where the Aussie bulls cross the 0.7250 hurdle, a run-up towards January’s top surrounding 0.7315 can’t be ruled out.
AUD/USD: Four-hour chart
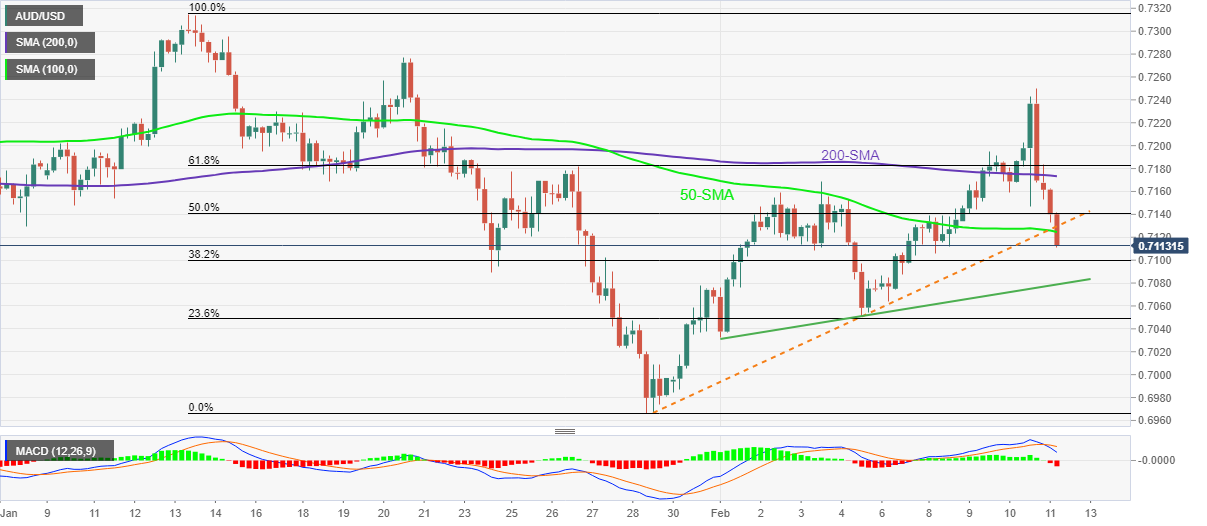
Trend: Further losses expected
- Gold price licks its wounds, in the aftermath of hotter US inflation.
- US yields stabilize at higher levels, as DXY rockets on more Fed rate hike bets.
- Gold price suffers from US inflation-led blow, downside appears limited.
The US Federal Reserve (Fed) is now expected to hike rates by 50-basis points (bps) in March while delivering over four rate increases this year, as the inflation rate hit fresh 40-year highs at 7.5% YoY. Heightening expectations of hefty and faster Fed lift-offs could keep gold price undermined. However, a pause in the US Treasury yields rally may offer support to gold bulls. Further, a bunch of healthy support levels on gold’s technical graphs could also help cushion the downside.
Read: US yields jump after inflation soars to its biggest rise in forty years
Gold Price: Key levels to watch
The Technical Confluences Detector shows that the gold price is holding above the previous day’s low of $1,822.
The next critical support is envisioned at $1,819, which is the convergence of the SMA100 four-hour, pivot point one-week R1 and pivot point one-day S1.
A breach of the latter will expose the downside towards $1,815, where the previous week’s low, SMA200 four-hour and SMA50 four-hour meet.
The last line of defense for gold bulls is aligned at $1,809, the confluence of the SMA50 one-day, Fibonacci 38.2% one-month and Fibonacci 23.6% one-week.
On the upside, acceptance above the Fibonacci 61.8% one-month at $1,826 is critical to initiating a meaningful recovery towards $1,831 – the SMA5 four-hour.
Further up, the Fibonacci 61.8% one-day at $1,835 will challenge the bearish commitments. The next stop for bulls is seen at the pivot point one-day R1 at $1,839.
Here is how it looks on the tool
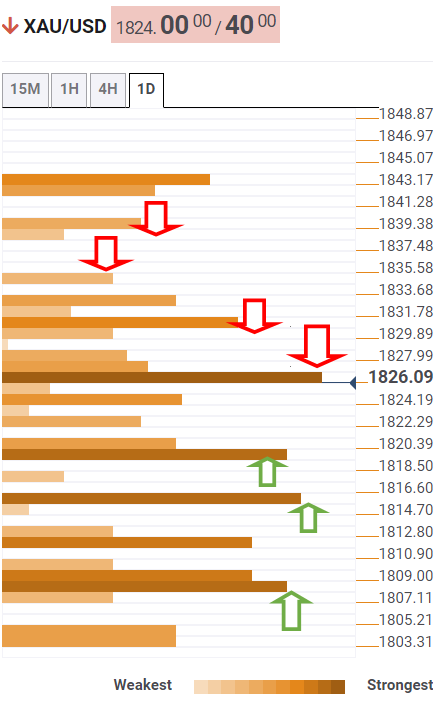
About Technical Confluences Detector
The TCD (Technical Confluences Detector) is a tool to locate and point out those price levels where there is a congestion of indicators, moving averages, Fibonacci levels, Pivot Points, etc. If you are a short-term trader, you will find entry points for counter-trend strategies and hunt a few points at a time. If you are a medium-to-long-term trader, this tool will allow you to know in advance the price levels where a medium-to-long-term trend may stop and rest, where to unwind positions, or where to increase your position size.
- Asia-Pacific markets track US futures to portray reflation fears, Fed rate-hike woes amid Japan’s off.
- US 10-year Treasury yields stay firm around 2.5-year top, justifies four-decade high CPI.
- Fed speakers jostle over 0.50% rate hike, South Korea prepares to challenge bond market moves.
- RBNZ survey hints at February rate hike, RBA’s Lowe shrugs off push towards lifting the rates.
Fears of monetary policy contraction weigh on the Asia-Pacific markets during Friday as US Treasury yields remain firm at a multi-month high.
The US 10-year Treasury yields crossed 2.0% for the first time since July 2019 after the US Consumer Price Index (CPI) for January refreshed a four-decade high with a 7.5% YoY figure, versus 7.3% expected and 7.0% prior. The benchmark T-bond yields currently seesaw around 2.035%. Also portraying the risk-off mood is the 0.84% intraday loss of S&P 500 Futures by the press time.
At home, MSCI’s index of Asia-Pacific shares ex-Japan drops 0.80% at the latest while Japan celebrates National Foundation Day.
Following that inflation data, St. Louis Fed President James Bullard went a step farther while supporting 100 bps rate hikes by July and for the balance sheet reduction to start in the second quarter, which in turn strengthened the US Treasury yields. On the contrary, Federal Reserve Bank of Richmond President Thomas Barkin tried to tame the bulls while saying that he would have to be convinced of a 'screaming need' for a 50 bps hike.
Even so, Reserve Bank of Australia (RBA) Governor Philip Lowe tried to defend the Aussie equity buyers while turning down hopes of a rate hike in his testimony. Though, Australia’s benchmark equity index ASX 200 drops 1.0% by the press time amid broad risk-off mood.
Elsewhere, the Reserve Bank of New Zealand (RBNZ) announced its survey of business for February 2022 while saying that the “Official Cash Rate (OCR) expectations continue to rise in the short and medium-term.” This joins the downbeat US stock futures and Wall Street performance to drown NZX 50, down 2.35% intraday at the latest.
Furthermore, the South Korean government and Bank of Korea (BOK) joined hands to battle the bond move but the KOSPI remains 0.90% down intraday by the press time. On the same line are the stocks in China and India while Indonesia’s IDX Composite drops 0.30% by the time of writing.
It should be noted that the risk-off mood favors the US Dollar Index (DXY) to refresh the weekly top while also weighing on the crude and gold prices.
Read: US Treasury yields hover around 2.5-year high, S&P 500 Futures drop 0.50% amid risk-off mood
- Silver extends pullback from two-week low, justifies weekly support break.
- Bearish MACD hints at further downside but bears need validation from $23.00.
- Buyers must cross 38.2% Fibonacci retracement to retake control.
Silver (XAG/USD) prices remain on the back foot for the second consecutive day, following the pullback from the 12-day top.
That said, the bright metal drops 0.60% intraday as bears attack the 200-SMA level near $23.00 by the press time.
Given the sustained break of the weekly support line, now resistance around $23.35, coupled with the bearish MACD signals, silver prices are likely to remain weak.
However, the quote needs to conquer the $23.00 support near the 200-SMA and 61.8% Fibonacci retracement (Fibo.) of early January 2022 upside.
During the quote’s weakness past $23.00, $22.80 and $22.30 may entertain XAG/USD bears before directing them to January’s bottom of $21.95.
On the contrary, an upside clearance of the previous support, near $23.35, isn’t enough for the metal buyer’s welcome as 38.2% Fibo. close to $23.65 becomes an additional upside filter to watch.
Following that, $24.10 and $24.30 may test silver bulls ahead of directing them to the last monthly peak of $24.70.
Silver: Four-hour chart
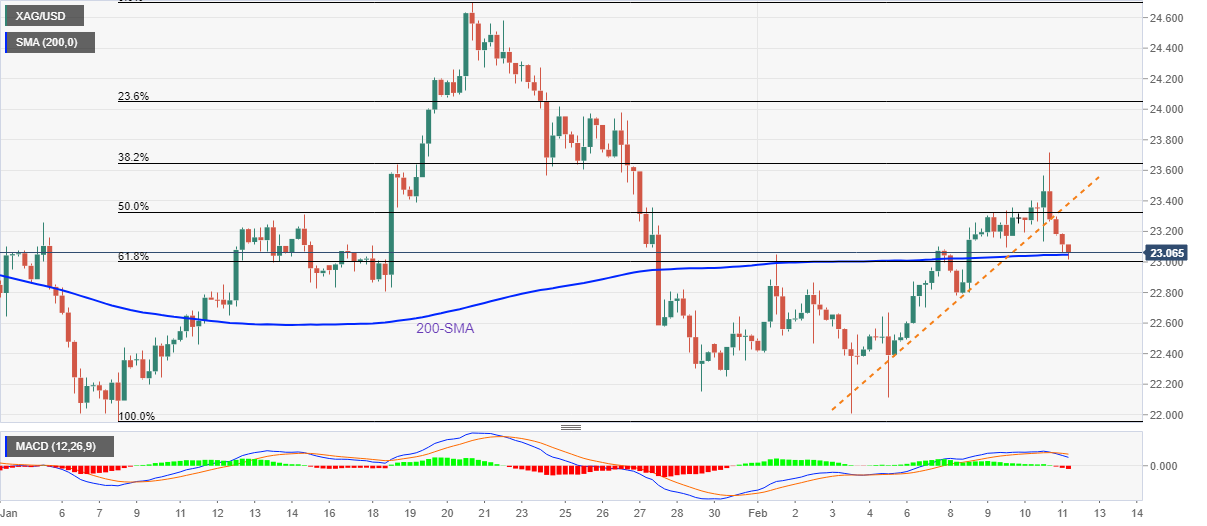
Trend: Further weakness expected
- EUR/USD bears attack weekly bottom surrounding 1.1375, prints biggest daily loss in a fortnight.
- Yields stay firmer around 2.5-year high on hawkish Fedspeak, US inflation.
- ECB’s Lagarde, other risk catalysts also exert downside pressure.
- German HICP data, US Michigan Consumer Sentiment will decorate calendar but risk catalysts are the key.
EUR/USD takes offers to refresh intraday low around 1.1375, also poking weekly bottom during early Friday morning in Europe.
In doing so, the major currency pair prints the heaviest daily fall in over two weeks as the US Dollar Index (DXY) cheers the market’s rush for risk-safety amid strong Treasury yields and challenges to sentiment emanating from Russia, China. Also weighing on the quote are the comments from European Central Bank (ECB) President Christine Lagarde who keeps rejecting rate hike concerns.
That said, the DXY renews weekly top to 96.03 during the latest run-up tracking the firmer US bond coupons.
It’s worth noting that the US 10-year Treasury yields crossed 2.0% for the first time since July 2019 after the US Consumer Price Index (CPI) for January refreshed a four-decade high with a 7.5% YoY figure, versus 7.3% expected and 7.0% prior. The benchmark T-bond yields currently seesaw around 2.035%.
Following that inflation data, St. Louis Fed President James Bullard went a step farther while supporting 100 bps rate hikes by July and for the balance sheet reduction to start in the second quarter, which in turn strengthened the US Treasury yields. On the contrary, Federal Reserve Bank of Richmond President Thomas Barkin tried to tame the bulls while saying that he would have to be convinced of a 'screaming need' for a 50 bps hike.
ECB’s Lagarde also propelled EUR/USD prices while saying, “Raising the European Central Bank's main interest rate now would not bring down record-high eurozone inflation and only hurt the economy.”
Elsewhere, US President Joe Biden confirmed the earlier notice from the US Statement Department to all citizens to leave Ukraine “right now” during an interview with NBC News. On the same line were fears of US-North Korea tussles as the hermit kingdom refrains from the global push towards dumping the missile tests.
To sum up, EUR/USD bears are likely to keep reins with eyes on the German Harmonized Index of Consumer Price (HICP) for January, expected to match the first estimations of 5.1% YoY, for immediate direction. Following that, the preliminary readings of the US Michigan Consumer Sentiment Index for February, expected 67.5 versus 67.2 prior, will be important data. Though, major attention will be given to Fedspeak and yields.
Technical analysis
A clear pullback from a three-month-old horizontal resistance near 1.1485 direct EUR/USD bears toward the 50-DMA level surrounding 1.1330.
The UK Economic Data Overview
The British economic calendar is all set to entertain the cable traders during early Friday, at 07:00 GMT, with the preliminary GDP figures for Q4 2021. Also increasing the importance of that time are monthly GDP figures for December, Trade Balance, Manufacturing Production and Industrial Production details for the stated period.
Having witnessed a 6.8% YoY jump in economic activities during the previous quarter, market players will be interested in the first estimation of the Q4 GDP figures, expected 6.4% YoY, to back the BOE’s rate hikes. That said, market consensus doesn’t back any change in the quarterly figure of 1.1%.
On the other hand, the GBP/USD traders also eye the Index of Services (3M/3M) for the same period, 1.3% prior, for further insight.
Meanwhile, Manufacturing Production, which makes up around 80% of total industrial production, is expected to ease to 0.1% MoM in December versus 1.1% prior. Further, the total Industrial Production is expected to weaken to 0.1% MoM from 1.1% previous readouts.
Considering the yearly figures, the Industrial Production for December is expected to have risen to 0.6% versus 0.1% previous while the Manufacturing Production is also anticipated to have strengthened to 1.7% in the reported month versus 0.4% last.
Separately, the UK Goods Trade Balance will be reported at the same time and is expected to show a deficit of £7.65 billion versus a £5.665 billion deficit reported in the last month.
How could affect GBP/USD?
GBP/USD remains on the back foot around 1.3530, down 0.15% intraday, as the US dollar bulls cheer the multi-month high US Consumer Price Index (CPI) and strong US Treasury yields. Also weighing on the cable prices are the fears concerning Brexit ahead of the key talks between UK Foreign Secretary Liz Truss and European Commission Vice-President Maros Sefcovic.
That said, UK Q4 GDP bears downbeat forecasts and chatters over the Bank of England’s (BOE) more rate hikes are on the table, which in turn keeps the GBP/USD pair on bull’s radar. However, Brexit talks and the US dollar strength may test the quote’s upside momentum.
While considering this, FXStreet’s Yohay Elam said,
Quarterly GDP releases tend to have more impact than monthly ones, and uncertainty about the BOE's next policy moves adds to potential volatility. In conclusion, there is more room for an upside surprise than a downside one.
Ahead of the release, Westpac said,
GDP growth for the UK should remain robust in Q4, although the emergence of omicron in December is a source of downside risk (market f/c: 1.1%qtr; 6.4%yr). The UK’s trade balance will likely remain volatile in December as COVID-19 and Brexit continue to induce trade instability (market f/c: -£400mn).
Technically, a monthly resistance line near 1.3580 restricts short-term GBP/USD upside whereas the 100-DMA challenges the bears around 1.3500. However, MACD and RSI have recently pushed back the bulls.
Key notes
GBP/USD teases bears around 1.3550, Brexit talks, UK Q4 GDP eyed
UK GDP Preview: GBP/USD buy opportunity? Low expectations for December open door to upside surprise
About the UK Economic Data
The Gross Domestic Product released by the Office for National Statistics (ONS) is a measure of the total value of all goods and services produced by the UK. The GDP is considered as a broad measure of the UK economic activity. Generally speaking, a rising trend has a positive effect on the GBP, while a falling trend is seen as negative (or bearish).
The Manufacturing Production released by the Office for National Statistics (ONS) measures the manufacturing output. Manufacturing Production is significant as a short-term indicator of the strength of UK manufacturing activity that dominates a large part of total GDP. A high reading is seen as positive (or bullish) for the GBP, while a low reading is seen as negative (or bearish).
The trade balance released by the Office for National Statistics (ONS) is a balance between exports and imports of goods. A positive value shows trade surplus, while a negative value shows trade deficit. It is an event that generates some volatility for the GBP.
- USD/CAD grinds higher, extends the previous day’s bounce from 12-day low.
- OPEC’s demand forecast, risk-off mood weigh on oil prices.
- US Treasury yields seesaw around 2.5-year high after inflation data escalated bond selling.
- US data, Fedspeak will be in focus, Russia-Ukraine headlines eyed as well.
USD/CAD remains on the front foot for the second consecutive day, picking up bids to 1.2740 during the late Asian session on Friday.
The loonie pair took a U-turn from the two-week low, also rose the most in a week, the previous day as markets reacted to the multi-year high US inflation data. Adding to the pair’s strength is the downbeat oil prices, Canada’s main export item.
The US Consumer Price Index (CPI) for January rallied to over a four-decade high with a 7.5% YoY figure, versus 7.3% expected and 7.0% prior.
Although the hot inflation figures were already expected, St. Louis Fed President James Bullard went a step farther while supporting 100 bps rate hikes by July and for the balance sheet reduction to start in the second quarter. Fed’s Bullard also cited the potential for 50 basis points (bps) of Fed rate hike in March. His comments added strength to the Fed rate hike concerns and propelled the US 10-year Treasury yields above 2.0% for the first time since July 2019, around 2.035% at the latest.
It’s worth noting, however, that Federal Reserve Bank of Richmond President Thomas Barkin tried to tame the bulls while saying that he would have to be convinced of a 'screaming need' for a 50 bps hike.
Elsewhere, WTI stays pressured around intraday low, down 0.60% on a day near $88.45. In doing so, the black gold justifies the US dollar’s negative correlation with the commodities while paying little heed to the geopolitical issues surrounding Russia. Also weighing on oil prices is the latest Organization of the Petroleum Exporting Countries (OPEC) oil demand forecast wherein it kept hopes of 4.15 million barrels per day (bpd) energy demand unchanged.
Given the risk-off mood and firmer Treasury yields, the US Dollar Index (DXY) remains firmer around 96.00, poking weekly high of late, which in turn keep USD/CAD buyers hopeful.
Moving on, the US Michigan Consumer Sentiment Index for February, expected 67.5 versus 67.2 prior, will decorate the calendar but traders will pay more attention to the risk catalysts mentioned above for clear direction.
Technical analysis
A clear upside break of the 50-DMA level surrounding 1.2710 directs USD/CAD buyers to a downward sloping resistance line from December 23, 2021, close to 1.2775-80 by the press time. That said, upbeat MACD and RSI also signal the pair’s further upside.
- USD/INR bulls are taking the lead on a stronger US dollar.
- US CPI has driven Fed sentiment into the markets and expectaitons of a hawkish 2022.
USD/INR is attemtion to break higher with the US dollar the strongest of the major currencies followind the US Consumer price Index data on Thursday that caused hightened concerns in financial markets.
Stongly hawkish comments from Federal Reserve's James Bullard ave also underpinned the sentiment for a 50bps rate hike in March. The aggressive comments from Bullard have sent US Treasury yields higher after he said the data had made him "dramatically" more hawkish.
Bullard now wants a full percentage point of interest rate hikes by July 1. He even said that the Fed could raise rates at inter-meetings. Consequently, contracts traded at CME Group priced in an 88% chance of a 50 basis point hike in March and a nearly 95% chance of at least 100 basis points by June.
Nevertheless, from a technciak point of view, there is a W-formaiton on the USD/INR daily chart as follows:
USD/INR daily chart
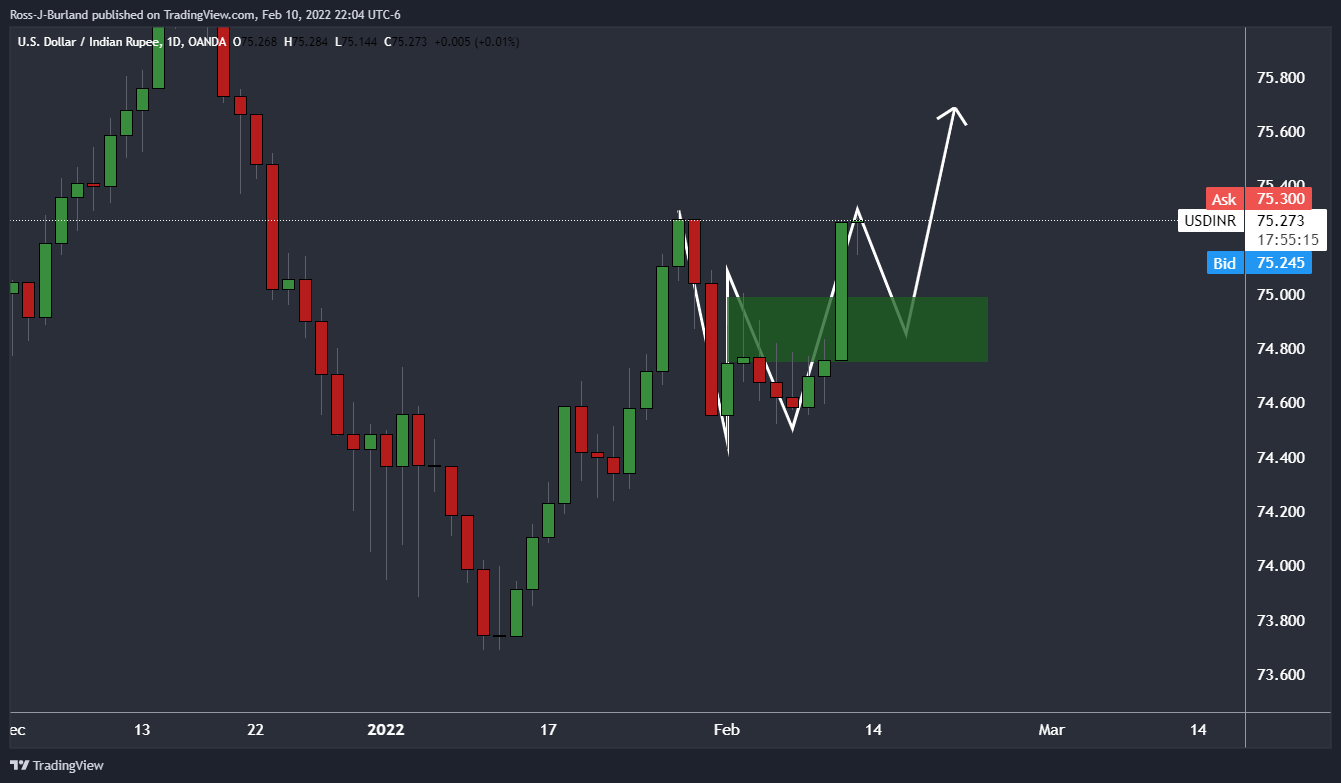
This is a reversion patter that coud lead to a restest of the neckline prior to any significant upide breakout. Traders could anticipate a breakdown in price and hourly support as follows:
USD/INR H1 chart
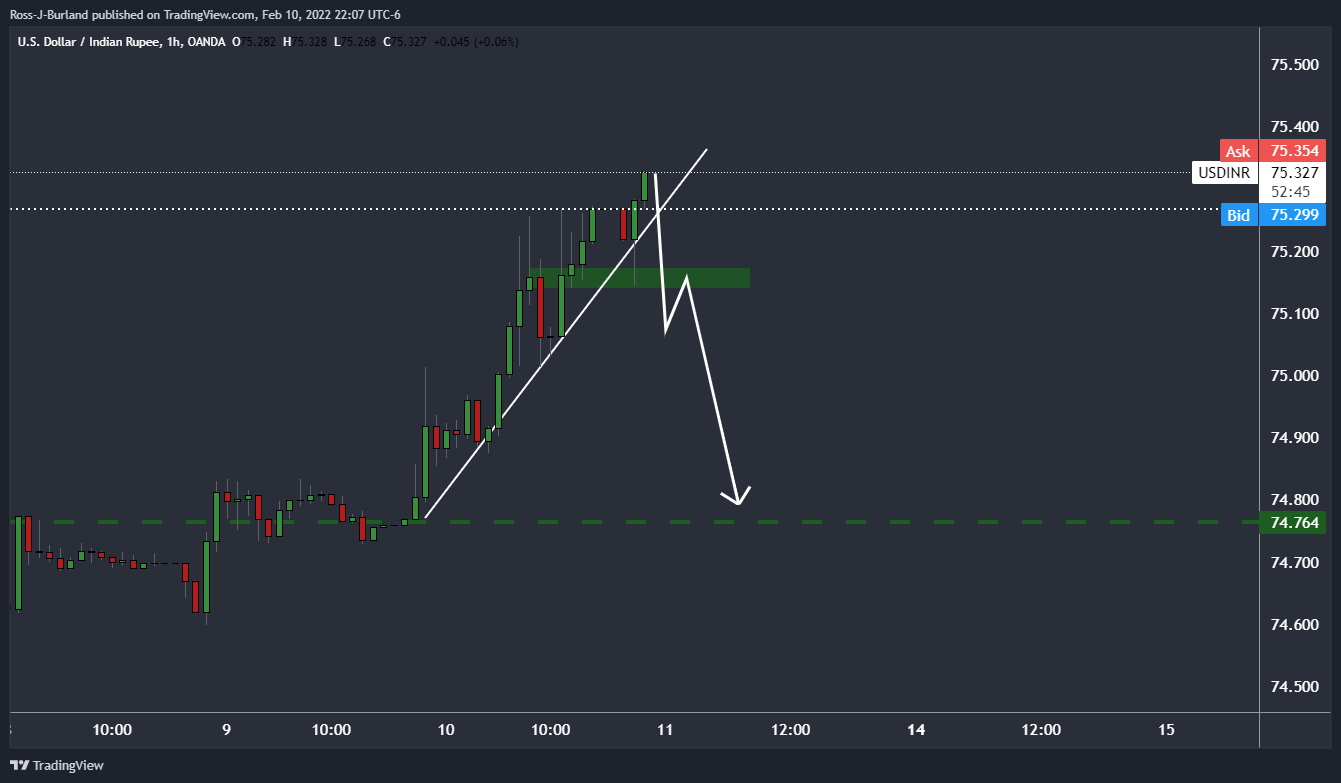
Nevertheless, while sentiment is for a more hawkish outcome from the Fed in 2022, the US dollar would be expected to reain underpinned. This would be expected to lead to a higher USD/INR on a longer term basis:
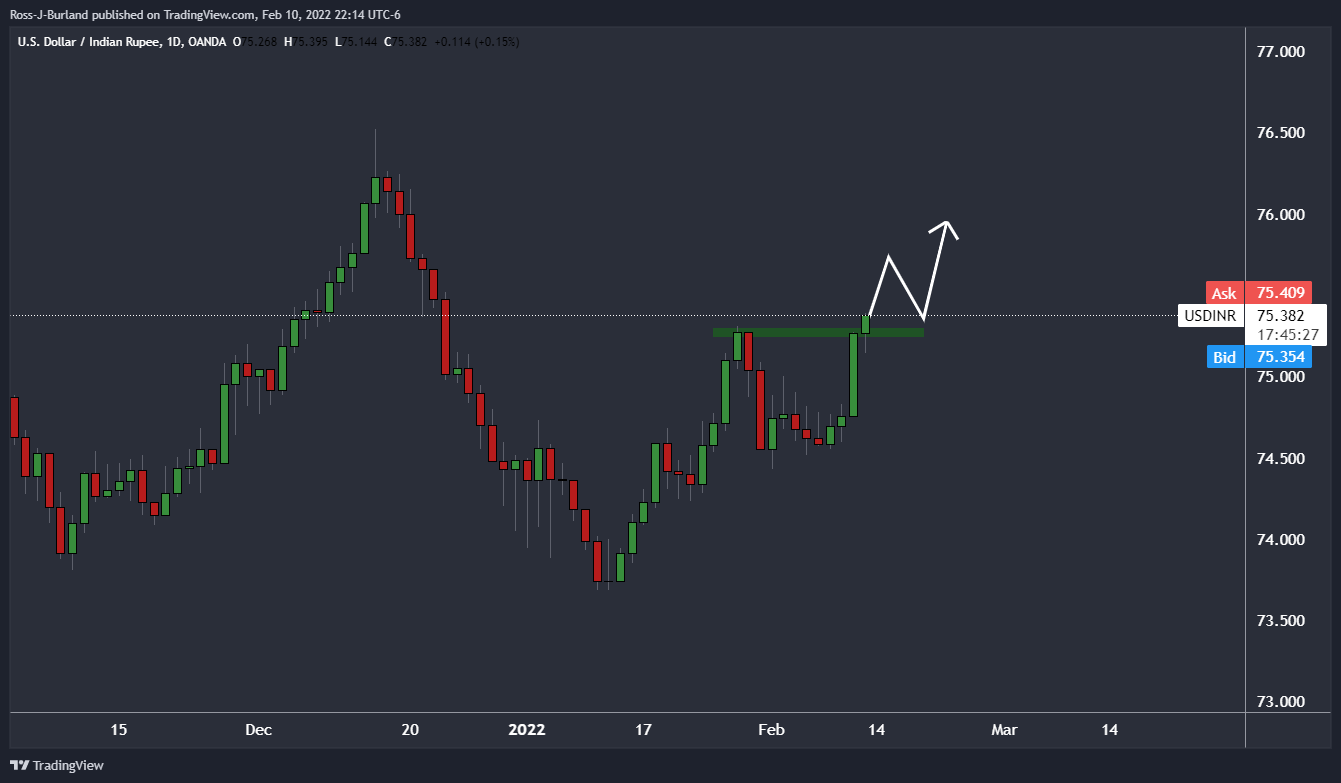
- USD/CHF is stuck in familiar ranges despite a firmer US dollar on US CPI data.
- Trades will monitor the macro inflation story and for any change of sentiment surrounding the SNB and ECB.
At 0.9265, USD/CHF is a touch higher in Asia share markets fell on Friday. The risk-off mood echos that on Wall Street following the concerning US inflation data. Uber hawkish comments from Federal Reserve's James Bullard ave also underpinned the sentiment for a 50bps rate hike in March, or even sooner in a possible emergence Federal Open Market Committee meeting.
The aggressive comments from Bullard have sent US Treasury yields higher after he said the data had made him "dramatically" more hawkish and now wants a full percentage point of interest rate hikes by July 1. He even said that the Fed could raise rates at inter-meetings. Consequently, contracts traded at CME Group priced in an 88% chance of a 50 basis point hike in March and a nearly 95% chance of at least 100 basis points by June.
Stocks reacted in kind with the Dow Jones Industrial Average tumbling 1.47%, the S&P 500 losing 1.81%. The Nasdaq Composite also fell losing 2.1%. Meanwhile, MSCI's broadest index of Asia-Pacific shares outside Japan was down 0.76%. Japanese markets were closed for a holiday but will potentially be weighed by the macro inflationary risk sentiment when they return on Monday.
Meanwhile, the Swiss franc has been one of the least affected by the US data. While traders were quick to assume that the inflation risks were not isolated to the US, the medium-term inflation expectations remain well-anchored in Switzerland and in any case CPI inflation is still below the Swiss National bank's target. This is in contrast to the situation in many other G10 economies. With that being said, for USD/CHF, there is a bullish trend on the longer-term charts. Continued hawkish sentiment around the Fed would be expected to underpin the greenback and continue to support USD/CHF.
What may serve as a driver for the swiss, other than geopolitical risks such as Russia for its safe-haven allure, could be the divergence, or convergence, between the European Central Bank and the Fed. Last week the ECB opened the door to a rate hike later in 2022 as inflation risks rose. This had a profound effect on the forex space, lifting the euro and weighing heavily on the greenback. However, it was dialled down by less hawkish comments from the ECB's governor the following Monday which stripped the euro of its gains. Considering the correlation between CHF and EUR, the highest of the majors for the close ties between the eurozone and Switzerland, traders will monitor the ECB for updates to any monetary policy tightening in the eurozone.
- US 10-year Treasury yields keep post-Inflation gains around multi-day high.
- S&P 500 Futures, Asia-Pacific shares remain pressured as monetary policy contraction looms.
- US warning over Russia attack, fresh fears from North Korea and concerning Sino-American trade ties also challenge the sentiment.
- Fedspeak, US consumer sentiment data will be important for near-term directions.
Market sentiment sours during Friday’s Asian session as traders fear faster run-up to the rate hikes at the major central banks. Also weighing on the risk appetite are chatters surrounding Russia, China and North Korea.
While portraying the mood, the US 10-year Treasury yields remain firmer around the highest levels since July 2019, up one basis point at 2.035% by the press time. Further, the S&P 500 Future dropped 0.50% at the latest and the Asia-Pacific shares are also mostly down amid market fears from multiple catalysts.
Although nearly five-decade high US inflation stole the show on Thursday and drowned US equities, they aren’t the only hawks on the street as RBNZ also cited upbeat concerns while Banxico raised rates as well.
That said, the US Consumer Price Index (CPI) for January rallied to a nearly five-decade high with a 7.5% YoY figure, versus 7.3% expected and 7.0% prior.
Although the hot inflation figures were already expected, St. Louis Fed President James Bullard went a step farther while supporting 100 bps rate hikes by July and for the balance sheet reduction to start in the second quarter. Fed’s Bullard also cited the potential for 50 basis points (bps) of Fed rate hike in March.
Following that, Federal Reserve Bank of Richmond President Thomas Barkin said that the US economy will likely return past the pre-covid trend this quarter. Though, Fed’s Barkin wasn’t as hawkish as Bullard while saying that he would have to be convinced of a 'screaming need' for a 50 bp hike.
Elsewhere, the Reserve Bank of New Zealand (RBNZ) said that Official Cash Rate (OCR) expectations continue to rise in the short and medium-term, per survey of expectations business February 2022. It’s worth noting that the central bank of Mexico announced a 0.50% rate hike the previous day.
On a different page, US President Joe Biden confirmed the earlier notice from the US Statement Department to all citizens to leave Ukraine “right now” during an interview with NBC News. On the same line were fears of US-North Korea tussles as the hermit kingdom refrains from the global push towards dumping the missile tests. Furthermore, recently increasing US-China trade tussle also contributes to the risk-off mood.
Moving on, market players will pay major attention to the comments from the Fed policymakers to determine odds of a 0.50% rate hike in March. Also important is the US Michigan Consumer Sentiment Index for February, expected 67.5 versus 67.2 prior.
Read: Forex Today: Inflation in the eye of the storm
Analysts at Morgan Stanley remain bearish on the Kiwi dollar even as a Reserve Bank of New Zealand (RBNZ) rate hike is already priced in by the market.
Key quotes
"We maintain a bearish bias on NZD on crosses and continue to see AUD/NZD upside to 1.08. The theme of overtightening in NZ, we think, is continuing to show initial signs with this week's mixed softer-than-expected employment gains, perhaps reflecting further trends to come.”
"While the RBNZ may strike a hawkish tone at its upcoming meeting on 23 February, we think this is already in the price, and thus risk/reward suggests a bias toward it underwhelming market expectations."
- NZD/USD bears are lurking in an attempt to take on the daily trendline support.
- A Doji candle followed by a daily engulfing could signal more to come from the bears in the days ahead.
- RBNZ inflation extensions are at a 31-year high, but US CPI trumps at a 40 year high already.
At 0.6658, NZD/USD is 0.17% lower on the day as the greenback continues to dominate the top spot on the forex leader board. On an hourly basis, the US dollar is leading while the commodity currencies are the laggards.
In recent trade, the Reserve bank of New Zealand released its Two-Year Inflation Expectations:
- RBNZ: OCR expectations continue to rise in the short and medium-term
- Q1: 3.27% (prev 2.96%).
- OCR expectations continue to rise in the short and medium-term.
- One year ahead CPI Inflation expectations rose to a 31-year high of 4.40%.
- Unemployment expectations reach all-time lows.
- House price expectations responses show uncertainty in the housing market.
''CPI inflation pressures are set to remain strong in the near term, and that should be reflected in rent and food prices out next wee,'' analysts at ANZ Bank reported earlier 'But the housing market is slowing, as REINZ housing data should confirm. This should take some heat out of the CPI in time.''
Meanwhile, this has failed to move the needle and the markets are instead consolidating the volatility from overnight when the US Consumer Price Index arrived hot, causing two-way price action in the New York day. the data was accompanied by very hawkish comments from James Bullard, a voting member at the Federal Reserve.
His rhetoric unleashed a wave of bets on aggressive rate hikes. Bullard told Bloomberg he'd like to see 100 basis points of hikes by July and that inter-meeting rate hikes could be considered. This has led some Fd watchers to talk of a rate rise before the March meeting. Rates futures have shifted to price a better-than-even chance of a 50 bp hike next month and more than 160 bps of tightening by the end of the year.
Thursday data showed US Consumer Price Index was up 7.5% year-on-year in January, a fourth straight month above 6% and slightly higher than economists' forecasts for a 7.3% rise. Consequently, US Treasury yields leapt and the dollar jumped to a five-week high of 116.34 yen. The kiwi was bod for part of the day on a flight to commodities but turned on a dime when Bullard came on the scene and has been under pressure ever since. New Zealand dollars each dropped about 0.3% in morning trade.
NZD/USD techncial analysis
As per the prior analysis, whereby it was noted: ''NZD/USD bulls are taking charge in a significant correction,'' that was moving ''in on old lows near 0.67 the figure and towards the neckline of the M-formation near 0.6733,'' the price reached the target on Thursday. This resided between the 50% mean reversion and the 61.8% ratio as follows:
NZD/USD prior and live analysis
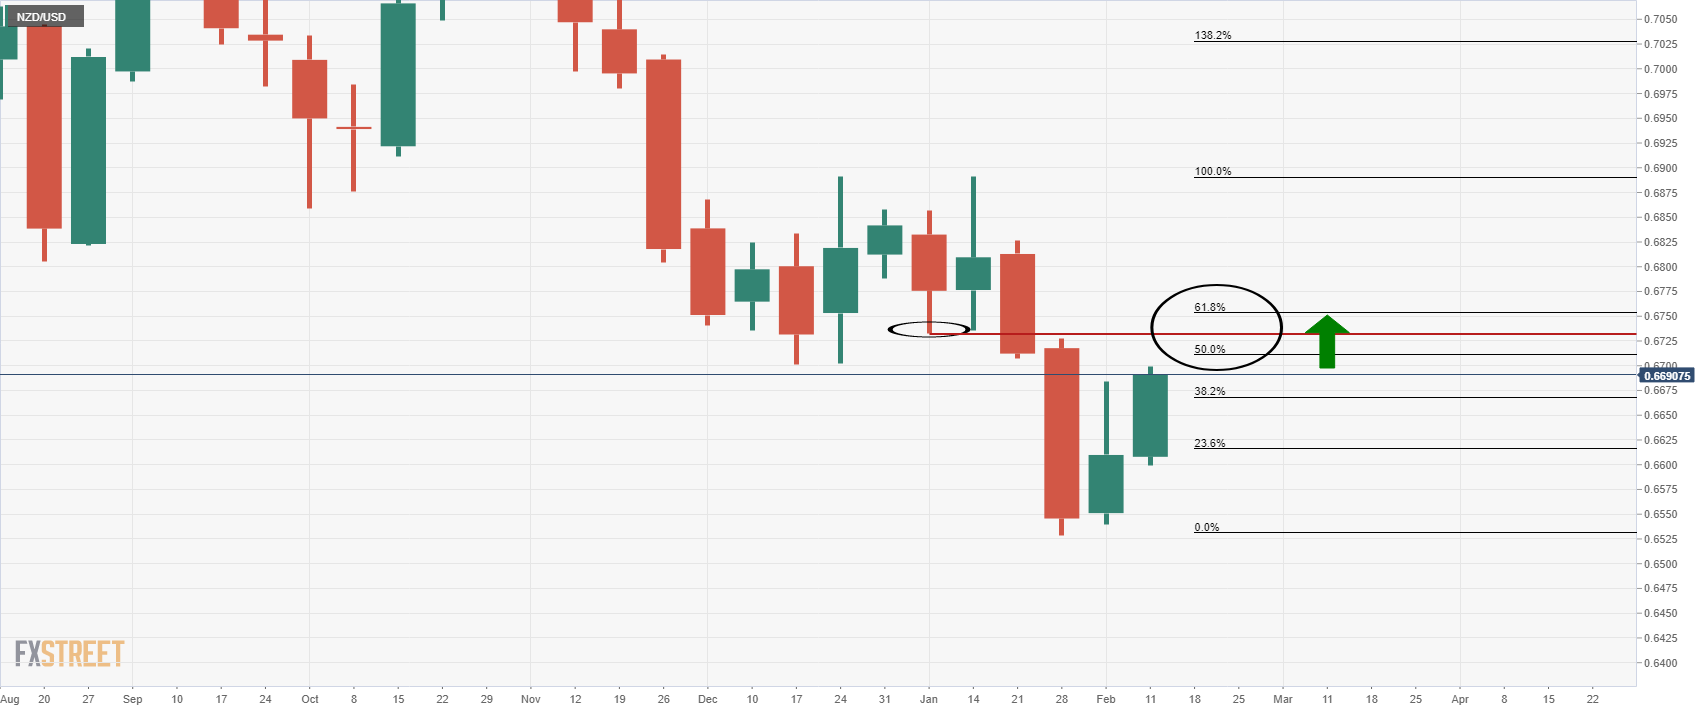
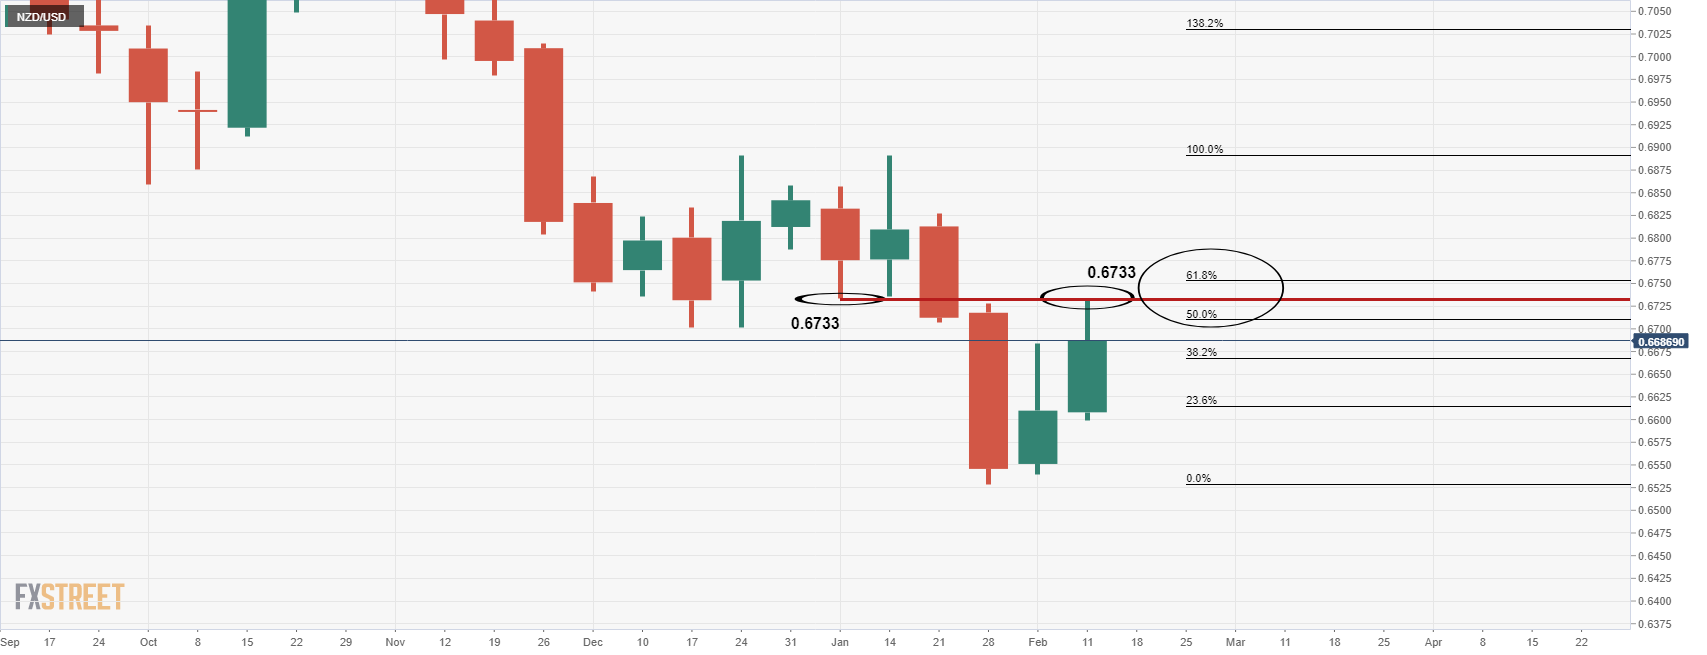
NZD/USD daily chart
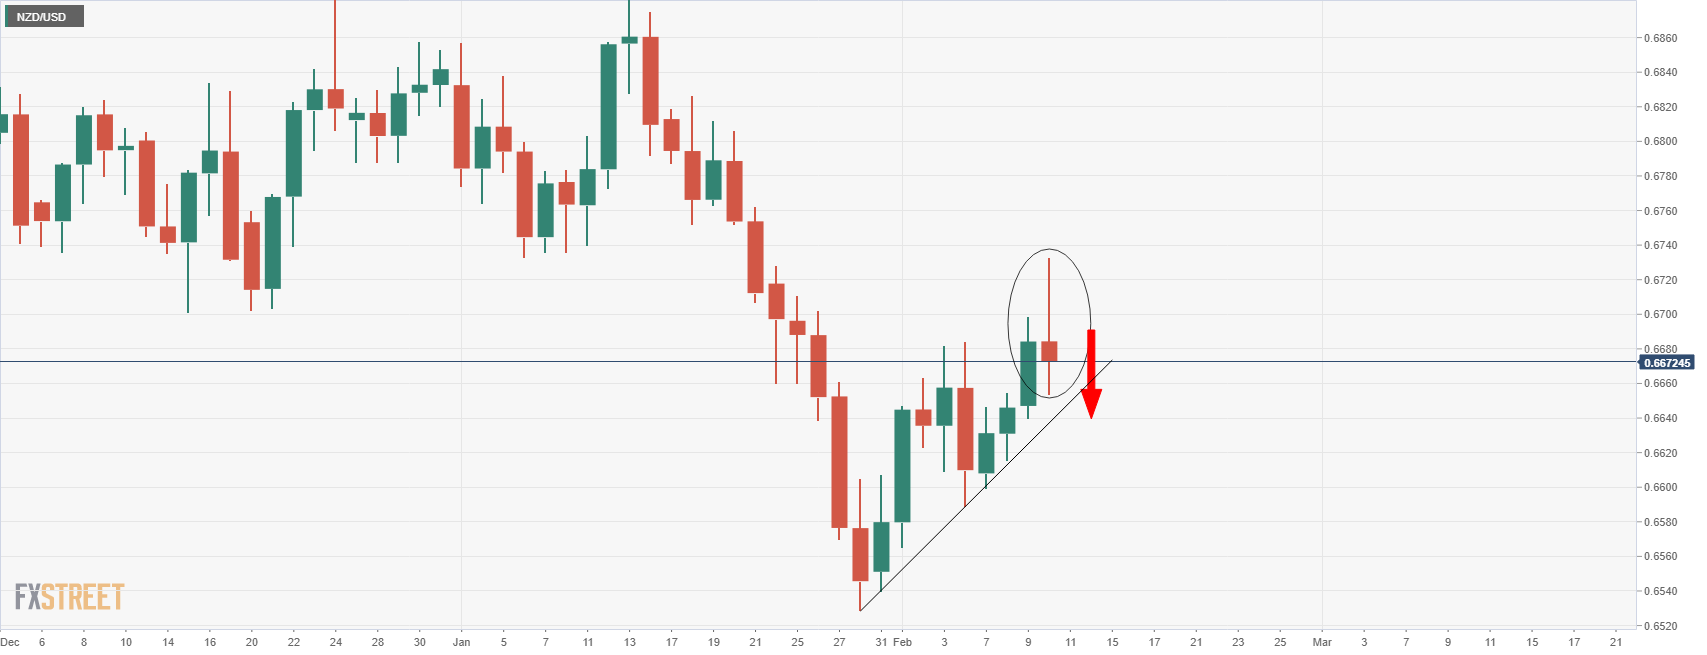
The Doji candle, if followed by a bearish close on Friday, could set the case for a downside continuation for next week's business:
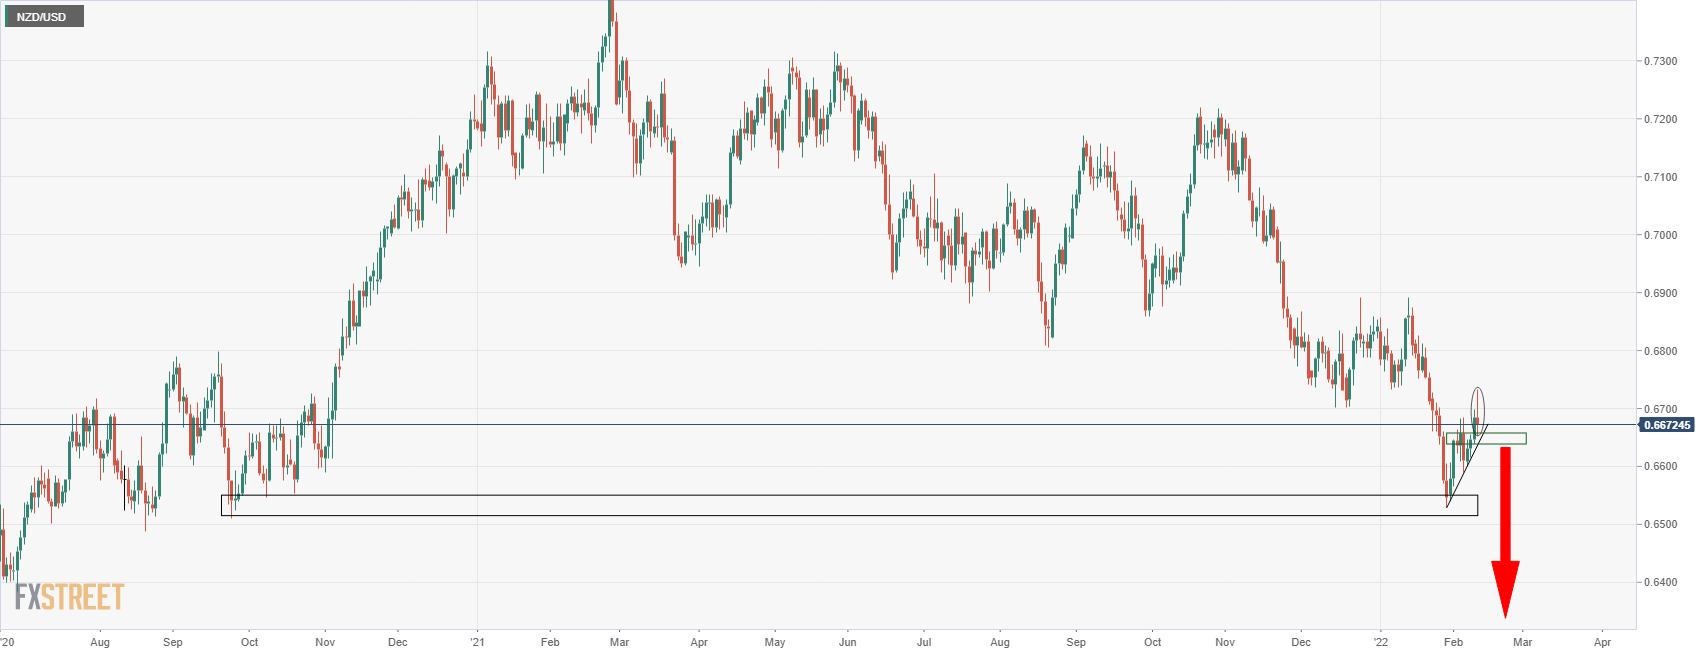
- WTI remains on the back foot despite escalating geopolitical fears.
- US President Biden urges citizens to leave Ukraine urgently on “increased threats of Russian military action”.
- OPEC keeps oil demand forecasts unchanged, conveyed lag in the supply increases.
- Firmer yields, hawkish Fedspeak keeps greenback strong, US data eyed.
WTI stays pressured around intraday low, down 0.60% on a day near $88.45 during Friday’s Asian session. In doing so, the black gold justifies the US dollar’s negative correlation with the commodities while paying little heed to the geopolitical issues surrounding Russia.
That said, the US Dollar Index (DXY) keeps the previous day’s gains, backed by the jump in the headline inflation data that propelled Fed rate hike concerns, around 95.80 by the press time.
On the other hand, the US 10-year Treasury yields remain firmer around the highest levels since July 2019, up one basis point at 2.035% by the press time. However, the S&P 500 Future dropped 0.50% at the latest and portrays the market’s risk-off mood, which seems to weigh on the oil prices.
A five-decade high US Consumer Price Index data for January, to 7.5% YoY figure versus 7.3% expected and 7.0% prior, seems to propel the yields on concerns over the 50 basis points (bps) of a Fed rate-hike in March. The upbeat expectations were recently backed by St. Louis Fed President James Bullard and Federal Reserve Bank of Richmond President Thomas Barkin.
Elsewhere, US President Joe Biden confirmed the earlier notice from the US Statement Department to all citizens to leave Ukraine “right now” during an interview with NBC News. On the same line were fears of US-North Korea tussles as the hermit kingdom refrains from the global push towards dumping the missile tests.
Alternatively, the Organization of the Petroleum Exporting Countries (OPEC) announced in its latest monthly report that it left the 2022 world oil demand growth forecast unchanged at 4.15 million barrels per day (bpd), as reported by Reuters. The OPEC report also stated, “OPEC's oil output rose by 64,000 bpd in January to 27.98 million bpd, lagging pledged increase under OPEC+ deal."
It should be noted that the recently increasing US-China trade tussle also challenges the oil prices and hence should also be watched for near-term directions.
For intraday, the preliminary readings of the US Michigan Consumer Sentiment Index for February, expected 67.5 versus 67.2 prior, will be important data. Though, major attention will be given to Fedspeak and yields.
Technical analysis
Thursday’s Doji candlestick keeps WTI crude oil sellers hopeful to test the 21-DMA level of $86.80.
South Korea's government and the central bank agreed Friday, they will need to buy more government bonds if needed to stabilize the local bond market and cooperate to curb growing inflationary pressure amid surging energy costs.
Key takeaways from a joint statement
"We will closely cooperate to operate fiscal, monetary and financial policies in a concerted manner to harmonize various policy goals.”
"Volatility could increase related to interest rates, foreign exchanges and cross-border capital flows, and asset prices could fall. This could cause negative spillover into household debt, the self-employed and the non-banking sector.”
Market reaction
On the above announcement, the South Korean won (KRW) found fresh bids, knocking down USD/KRW to fresh daily lows of $1,198.89, marginally lower on the day.
| Raw materials | Closed | Change, % |
|---|---|---|
| Brent | 91.37 | -0.31 |
| Silver | 23.19 | -0.41 |
| Gold | 1826.74 | -0.33 |
| Palladium | 2252.25 | -1.24 |
- DXY stays firmer around intraday top, up for the second consecutive day.
- Sustained trading beyond 100-DMA, 15-week-old support line joins firmer Momentum to keep buyers hopeful.
US Dollar Index (DXY) holds on to the post-inflation gains around 95.90, up 0.20% intraday during Friday’s Asian session.
In doing so, the greenback gauge keeps Thursday’s bounce from a multi-day-old support line and the 100-DMA amid the firmer Momentum line.
That said, the 50-DMA level surrounding 96.00 restricts the DXY’s immediate upside ahead of early January’s peak near 96.50. However, a horizontal area comprising tops marked since November, near 96.90-95, precedes the 97.00 threshold to become a tough nut for the bulls.
Alternatively, the 100-DMA and an upward sloping trend line from October, respectively near 95.30 and 95.20, limit short-term declines of the US Dollar Index.
It should be noted, though, that the DXY weakness past 95.20 will make it vulnerable to test January’s low near 94.60.
Overall, US Dollar Index remains on the firmer footing toward the short-term key horizontal hurdle.
DXY: Daily chart
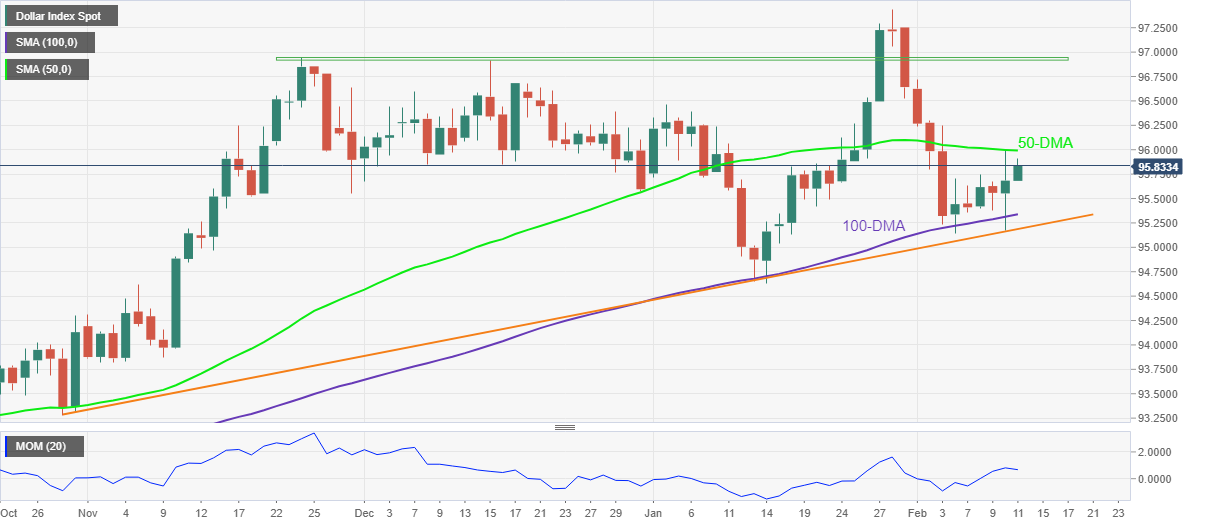
Trend: Further upside expected
The Reserve Bank of New Zealand (RBNZ) announces its survey of expectations business February 2022, citing that the “Official Cash Rate (OCR) expectations continue to rise in the short and medium-term.”
Read: RBNZ Survey: NZ inflation expectations jump in Q1, Kiwi unfazed
Additional takeaways
Feb 2022 survey of expectations found business’ OCR expectations continued to rise in the short, medium and long term.
In medium term OCR was expected to continue rising though there was significant variation on size of those increases.
Mean OCR expectation for end of current quarter was 1.05 showing that most respondents expected to see single rate hike from current level of 0.75.
The mean estimate for the OCR one year ahead was 2.11.
Mean two year ahead OCR expectations were higher at 2.47.
The mean OCR expectation for ten years increased by 30 basis points to 2.37.
Market reaction
NZD/USD was last seen changing hands at 0.6660, down 0.13% on the day.
- EUR/USD remains on the back foot around weekly low.
- US Treasury yields refreshed 2.5-year high after US CPI rallied to almost five decade top.
- ECB’s Lagarde rules out faster rate hikes, Fedspeak stays hawkish despite Barkin’s cautious statements.
- German inflation, US Michigan Consumer Sentiment Index will decorate the calendar.
EUR/USD licks its wounds near 1.1400, keeping the previous day’s pullback from a three-month high during Friday’s Asian session.
That said, the US Consumer Price Index (CPI) and comments from various Fed speakers weighed on the pair before European Central Bank (ECB) President Christine Lagarde’s statements. However, the latest comments from Fed Richmond President Thomas Barkin seem to help the major currency pair in trimming intraday losses to 0.30% by the press time.
On Thursday, the US Consumer Price Index (CPI) for January rallied to a nearly five-decade high with a 7.5% YoY figure, versus 7.3% expected and 7.0% prior.
Although the hot inflation figures were already expected, St. Louis Fed President James Bullard went a step farther while supporting 100 bps rate hikes by July and for the balance sheet reduction to start in the second quarter. Fed’s Bullard also cited the potential for 50 basis points (bps) of Fed rate hike in March.
Following that, Federal Reserve Bank of Richmond President Thomas Barkin said that the US economy will likely return past the pre-covid trend this quarter. Though, Fed’s Barkin wasn’t as hawkish as Bullard while saying that he would have to be convinced of a 'screaming need' for a 50 bp hike.
While Fedspeak was moderate, if not strongly bullish, comments from ECB’s Lagarde cited more reasons to believe that the regional central bank won’t be in the bull’s club soon. ECB’s Lagarde said, “Raising the European Central Bank's main interest rate now would not bring down record-high eurozone inflation and only hurt the economy.”
Against this backdrop, the US 10-year Treasury yields remain firmer around the highest levels since July 2019, up one basis point at 2.035%, while the S&P 500 Future drop 0.30% at the latest.
Given the widening gap between the Fed’s hawkish tone and the ECB’s refrain from rising rates, EUR/USD prices are likely to remain depressed. However, today’s German Harmonized Index of Consumer Price (HICP) for January, expected to match the first estimations of 5.1% YoY, will offer immediate direction to the pair. Following that, the preliminary readings of the US Michigan Consumer Sentiment Index for February, expected 67.5 versus 67.2 prior, may entertain the pair traders.
Technical analysis
Failures to cross a three-month-old horizontal resistance near 1.1485 direct EUR/USD bears toward the 50-DMA level surrounding 1.1330.
New Zealand's (NZ) inflation expectations are seen gaining upside momentum across the time curve in the first quarter of 2022, the latest monetary conditions survey conducted by the Reserve Bank of New Zealand (RBNZ) showed on Friday.
Two-year inflation expectations, seen as the time frame when RBNZ policy action will filter through to prices, rose to 3.27% from 2.96% last.
NZ Q1 average 1-yr inflation expectations jumped to 4.40% vs. 3.70% seen in the fourth quarter. The gauge hit the highest level in 31 years.
Kiwi little changed
The ongoing acceleration in the NZ inflation expectations failed to cheer kiwi bulls, keeping NZD/USD under pressure near 0.6660.
At the time of writing, the kiwi is trading at 0.6656, down 0.19% on the day.
The Reserve Bank of Australia's Philip Lowe has stated that it is plausible if the economy tracks to our forecasts rate hike will be on agenda later this year.
He says that there is no evidence economy is overstimulated at the moment.
He explained that they are going to wait until seeing evidence that inflation has picked up in a sustainable way and that he hopes over time real interest rates return to positive territory.
His comments during a testimony at a virtual hearing before the House of Representatives Standing Committee on Economics are being scrutinised for an insight as to when the RBA will start to raise rates.
His testimony comes shortly after very hawkish rhetoric from a voting member of the Federal Open Market Committee, James Bullard, who said that the Fed could consider hiking rates at an Inter-meeting.
Traders are treading very carefully around the sentiment in markets but do expect the RBA to follow suit sooner than previously communicated by the central bank.
AUD/USD technical analysis
At the time of writing, the US dollar is bid and the Aussie is under pressure, falling below a key area of support, support highlighted in the prior analysis as follows:
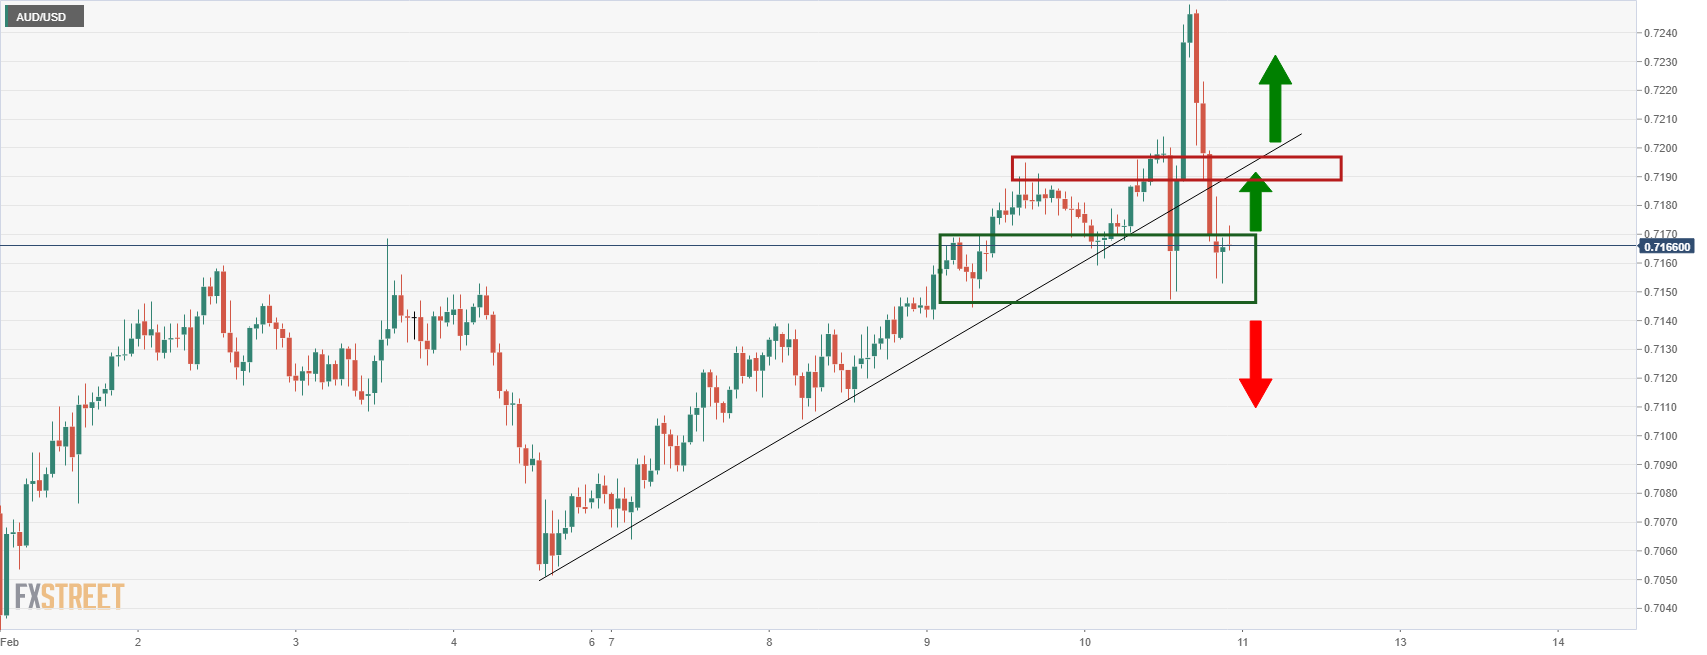
AUD/USD live market
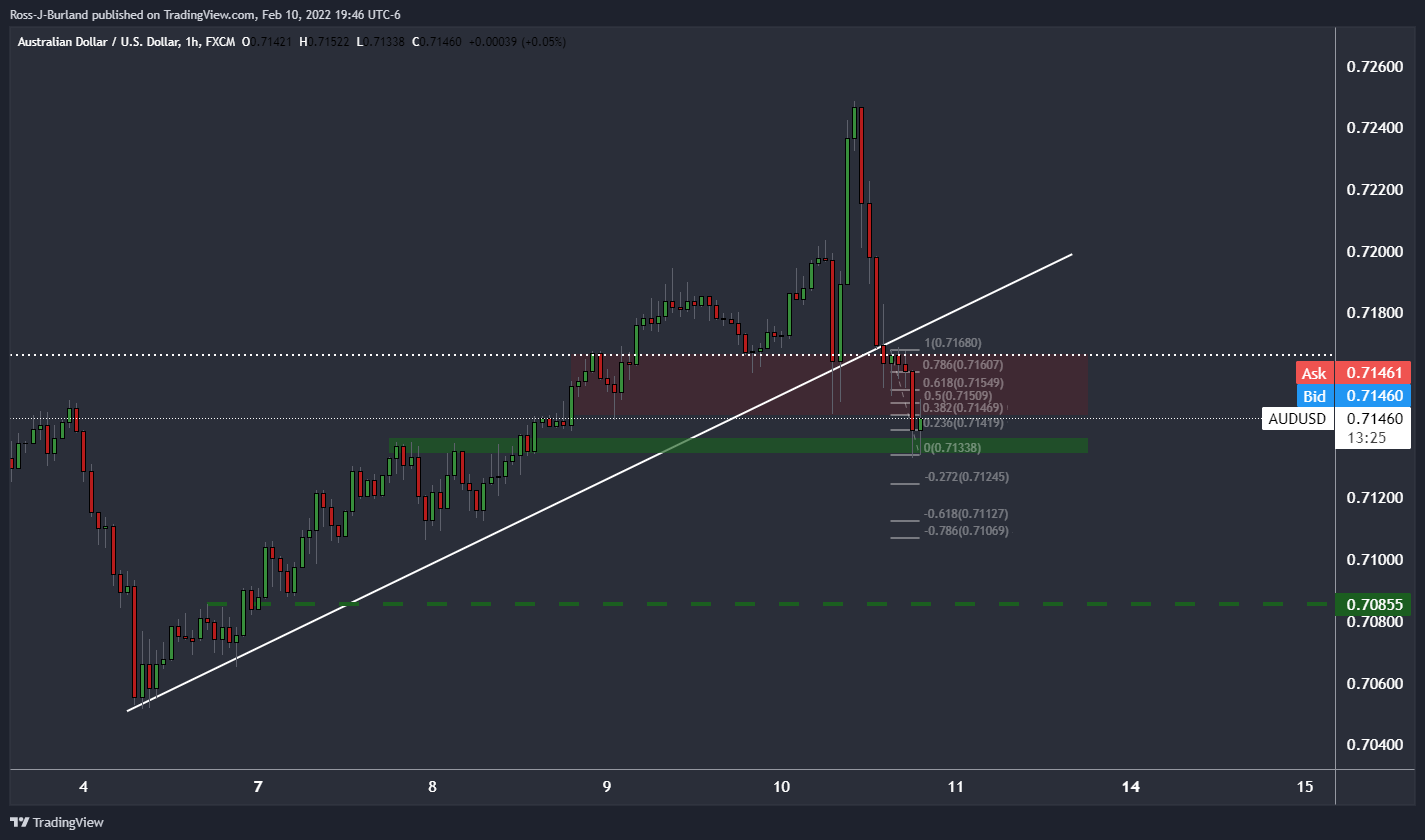
- GBP/USD remains on the back foot around intraday low, keeps previous day’s pullback from three-week top.
- UK’s Truss, EU’s Sefcovic to discuss Brexit, chatters over UK’s new offer on Northern Ireland keep pair buyers hopeful.
- UK PM Johnson battles ‘Partygate’ problems, Britain eases more activity restrictions.
- Preliminary readings of UK Q4 GDP, US Michigan Consumer Sentiment Index for February will be crucial.
GBP/USD pares intraday losses around 1.3550 but keeps the previous day’s pullback from a multi-day high during Friday’s Asian session.
The cable pair cheered US dollar weakness to rise to the highest levels since January 20 but strong US Treasury yields and cautious sentiment ahead of the key data/events seems to have weighed on the quote of late. Also on the negative side were recently upbeat comments from the Fed speakers and political drama in the UK.
Former Tory Prime Minister (PM) Sir John Major recently criticized the current PM Boris Johnson’s ‘Partygate’ scandal while condemning him as “a lawbreaker whose disregard for honesty and ministerial standards risks undermining the UK’s long-term democratic future,” per The Guardian. Following that, UK PM Johnson terms these claims as ‘demonstrably untrue’.
On the other hand, chatters go wild that the UK will propose new terms to overcome the deadlock relating to the Northern Ireland (NI) border. “Liz Truss, UK foreign secretary, is to make new proposals to break the deadlock over post-Brexit trading arrangements in Northern Ireland on Friday, saying that resolving the row with the EU was ‘an absolute priority,’” said the Financial Times (FT). It’s worth noting that UK’s Truss will meet European Commission vice-president Maros Sefcovic for Brexit discussions on Friday.
Elsewhere, the UK dashes more virus-led activity restrictions with easing covid figures. “Case numbers in the last seven days have fallen 25% compared with the previous seven days, while deaths have fallen 20% on the same measure,” said Reuters.
It’s worth noting that the markets turned volatile after the US inflation numbers and the same pushed the Fed speakers to reiterate their hawkish bias, which in turn propelled the US Treasury yields and helped the US Dollar to stay firmer.
US bond coupons refreshed multi-day high the previous day after the US Consumer Price Index (CPI) for January rallied to a nearly five-decade high with a 7.5% YoY figure, versus 7.3% expected and 7.0% prior.
That said, St. Louis Fed President James Bullard went a step farther while supporting 100 bps rate hikes by July and for the balance sheet reduction to start in the second quarter. However, Federal Reserve Bank of Richmond President Thomas Barkin said that the US economy will likely return past the pre-covid trend this quarter. Though, Fed’s Barkin wasn’t as hawkish as Bullard.
Other than the aforementioned catalysts, escalating fears of a Russia-Ukraine war and the US-China trade tussles also weigh on the GBP/USD prices, by way of USD’s safe-haven appeal.
Against this backdrop, the US 10-year Treasury yields remain firmer around the highest levels since July 2019, up one basis point at 2.035% by the press time. However, the S&P 500 Future drop 0.50% at the latest.
Looking forward, first readings of the UK’s fourth quarter (Q4) GDP will be crucial for GBP/USD prices as a firmer print will justify the Bank of England’s (BOE) recent rate hikes, defending them from allegations of late performance. Market expectations suggest headline numbers to remain unchanged at 1.1% QoQ while easing to 6.4% YoY versus 6.8% prior. Following that, the preliminary readings of the US Michigan Consumer Sentiment Index for February, expected 67.5 versus 67.2 prior, may entertain the pair traders.
Technical analysis
A monthly resistance line near 1.3580 restricts short-term GBP/USD upside whereas the 100-DMA challenges the bears around 1.3500. However, MACD and RSI have recently pushed back the bulls.
| Time | Country | Event | Period | Previous value | Forecast |
|---|---|---|---|---|---|
| 02:00 (GMT) | New Zealand | Expected Annual Inflation 2y from now | Quarter I | 2.96% | |
| 04:00 (GMT) | Australia | Consumer Inflation Expectation | February | 4.4% | |
| 07:00 (GMT) | Germany | CPI, m/m | January | 0.5% | 0.4% |
| 07:00 (GMT) | Germany | CPI, y/y | January | 5.3% | 4.9% |
| 07:00 (GMT) | United Kingdom | Manufacturing Production (YoY) | December | 0.4% | 1.7% |
| 07:00 (GMT) | United Kingdom | Manufacturing Production (MoM) | December | 1.1% | 0.1% |
| 07:00 (GMT) | United Kingdom | Industrial Production (MoM) | December | 1% | 0.1% |
| 07:00 (GMT) | United Kingdom | Industrial Production (YoY) | December | 0.1% | 0.6% |
| 07:00 (GMT) | United Kingdom | Business Investment, q/q | Quarter IV | -2.5% | |
| 07:00 (GMT) | United Kingdom | Business Investment, y/y | Quarter IV | 2.6% | |
| 07:00 (GMT) | United Kingdom | Total Trade Balance | December | 0.626 | |
| 07:00 (GMT) | United Kingdom | GDP, q/q | Quarter IV | 1.1% | 1.1% |
| 07:00 (GMT) | United Kingdom | GDP m/m | December | 0.9% | -0.6% |
| 07:00 (GMT) | United Kingdom | GDP, y/y | Quarter IV | 6.8% | 6.4% |
| 07:00 (GMT) | United Kingdom | GDP, y/y | December | 8.0% | 6.3% |
| 07:30 (GMT) | Switzerland | Consumer Price Index (MoM) | January | -0.1% | 0% |
| 07:30 (GMT) | Switzerland | Consumer Price Index (YoY) | January | 1.5% | 1.5% |
| 09:00 (GMT) | France | IEA Oil Market Report | |||
| 13:00 (GMT) | United Kingdom | NIESR GDP Estimate | January | 1.2% | |
| 15:00 (GMT) | U.S. | Reuters/Michigan Consumer Sentiment Index | February | 67.2 | 67.5 |
| 18:00 (GMT) | U.S. | Baker Hughes Oil Rig Count | February | 497 |
In recent trade today, the People’s Bank of China (PBOC) set the yuan (CNY) at 6.3681 vs. the estimated 6.3665 and the previous 6.3599.
About the fix
China maintains strict control of the yuan’s rate on the mainland.
The onshore yuan (CNY) differs from the offshore one (CNH) in trading restrictions, this last one is not as tightly controlled.
Each morning, the People’s Bank of China (PBOC) sets a so-called daily midpoint fix, based on the yuan’s previous day closing level and quotations taken from the inter-bank dealer.
- AUD/USD takes offers to refresh intraday low, extends pullback from three-week high.
- Multi-year high US inflation, upbeat Fedspeak propels yields on rate hike concerns.
- RBA’s Lowe keeps turning down hopes of rate hike in his testimony.
- Geopolitics/trade fears also favor sellers, US Michigan Consumer Sentiment Index will decorate calendar.
AUD/USD remains on the back foot for the second consecutive day by refreshing intraday low to 0.7132 during Friday’s Asian session. In doing so, the Aussie pair justifies multiple negatives to print the 0.35% daily loss at the latest.
Comments from Reserve Bank of Australia (RBA) Governor Philip Lowe can be cited as the biggest burden for the AUD/USD prices of late. Despite accepting the inflation fears and portraying cautious optimism over economic growth, RBA’s Lowe kept rejecting rate hike concerns during a testimony at a virtual hearing before the House of Representatives Standing Committee on Economics.
Read: RBA Lowe: Big deviation between what we expect to do on rates and what markets expect
Strong prints of the US Treasury yields and downbeat S&P 500 Futures also act as the key negative for the AUD/USD pair. That said, the US 10-year Treasury yields remain firmer around the highest levels since July 2019, up one basis point at 2.035%, whereas the S&P 500 Future drop 0.50% by the press time.
US bond coupons refreshed multi-day high the previous day after the US Consumer Price Index (CPI) for January rallied to a nearly five-decade high with a 7.5% YoY figure, versus 7.3% expected and 7.0% prior.
Also fueling the US T-bond yields are comments from the Fed policymakers. St. Louis Fed President James Bullard went a step farther while supporting 100 bps rate hikes by July and for the balance sheet reduction to start in the second quarter. Following that, Federal Reserve Bank of Richmond President Thomas Barkin said that the US economy will likely return past the pre-covid trend this quarter. Though, Fed’s Barkin wasn’t as hawkish as Bullard.
On a different page, US President Joe Biden confirmed the recent notice from the US Statement Department to all citizens to leave Ukraine right now during an interview with NBC News. Further, US-China trade tussles are also on the spike as Washington discusses sanctions for Beijing due to the Dragon nation’s failure to meet Phase 1 deal targets.
To sum up, AUD/USD has multiple reasons to extend the latest downside amid a light calendar in Asia. However, the preliminary readings of the US Michigan Consumer Sentiment Index for February, expected 67.5 versus 67.2 prior, may entertain the pair traders afterward.
Technical analysis
Having stepped back from the 100-DMA, around 0.7250 at the attest, AUD/USD prices battle a two-week-old support line near 0.7130.
Given the receding bullish bias of the MACD, coupled with the pullback from the key DMA, the pair is likely to extend recent losses towards the yearly bottom around 0.6965.
The Reserve Bank of Australia's Philip Lowe has stated that there is a ''big deviation between what we expect to do on rates and what markets expect.''
His comments during a testimony at a virtual hearing before the House of Representatives Standing Committee on Economics are being scrutinised for an insight as to when the RBA will start to raise rates.
However, in earlier comments, he said that it is ''plausible we could raise rates later this year depending on the economy.''
He added that he hasn't said rates won't go up.
His testimony comes shortly after very hawkish rhetoric from a voting member of the Federal Open Market Committee, James Bullard, who said that the Fed could consider hiking rates at an Inter-meeting.
Traders are treading very carefully around the sentiment in markets but do expect the RBA to follow suit sooner than previously communicated by the central bank.
AUD/USD technical analysis
At the time of writing, the US dollar is bid and the Aussie is under pressure, falling below a key area of support, support highlighted in the prior analysis as follows:

AUD/USD live market
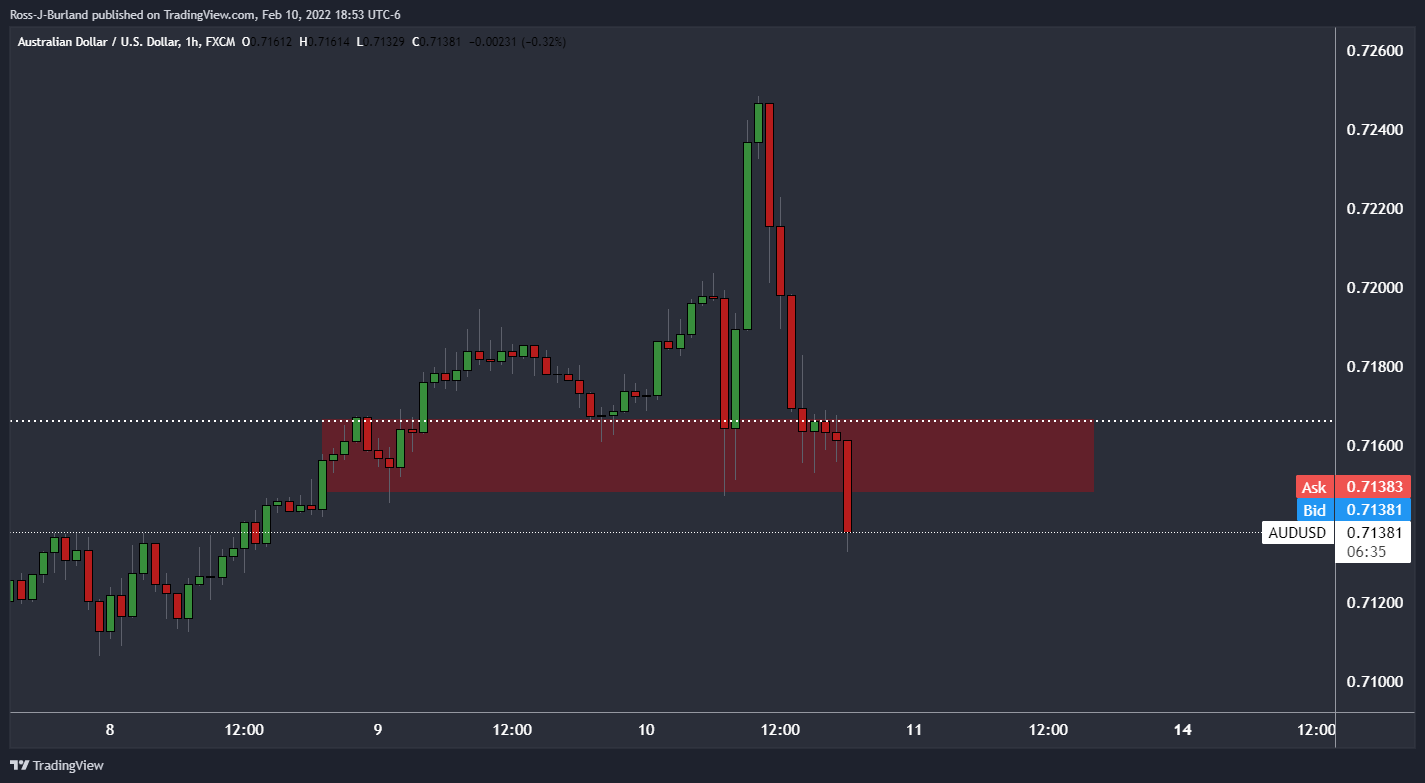
The prior support would now be expected to act as resistance on restest and that could lead to further supply before the week is out.
- USD/JPY picks up bids to refresh daily top, on the way to five-week high.
- Hot US inflation figures propelled yields to fresh 2.5 years’ high, Fedspeak also contributes to the move.
- Fed’s Bullard, Barkin keep buyers hopeful, markets place heavy bets on 0.50% rate hike in March.
- Geopolitical, trade risks join Japan’s covid struggle to portray risk-off mood, US Michigan Consumer Sentiment eyed.
USD/JPY remains on the front foot around a five-week high, up 0.08% intraday near 116.15 amid the mid-Asian session. In doing the risk barometer pair extend the previous day’s moves amid an off in Japan.
The yen pair jumped to the highest since early January the previous day following the US Treasury yields’ rally post-inflation data. The up-moves also gained support from the hawkish Fed commentary and geopolitical/trade fears that weighed on the US bonds. Additionally, escalating covid woes in Japan add to the yen’s weakness and so do the Bank of Japan’s (BOJ) refrain from leaving easy money policies.
On Thursday, the US Consumer Price Index (CPI) for January rallied to a nearly five-decade high with a 7.5% YoY figure, versus 7.3% expected and 7.0% prior.
Although the hot inflation figures were already expected, St. Louis Fed President James Bullard went a step farther while supporting 100 bps rate hikes by July and for the balance sheet reduction to start in the second quarter. Fed’s Bullard also cited the potential for 50 basis points (bps) of Fed rate hike in March.
Following that, Federal Reserve Bank of Richmond President Thomas Barkin said that the US economy will likely return past the pre-covid trend this quarter. Though, Fed’s Barkin wasn’t as hawkish as Bullard.
Elsewhere, US President Joe Biden confirmed the recent notice from the US Statement Department to all citizens to leave Ukraine right now during an interview with NBC News. Further, US-China trade tussles are also on the spike as Washington discusses sanctions for Beijing due to the Dragon nation’s failure to meet Phase 1 deal targets.
At home, Japan’s government officially announced a three-week extension to the quasi-emergency for Tokyo and 12 other prefectures the previous day. This may be the case that seems to push the Bank of Japan (BOJ) policymakers to refrain from the hawkish messages and keep easy money on the table.
Amid these plays, the US 10-year Treasury yields remain firmer around the highest levels since July 2019, up one basis point at 2.035% by the press time. However, the S&P 500 Future drop 0.50% at the latest.
Technical analysis
A clear upside break of the 116.35 level, comprising the multi-month high marked in January, becomes necessary for the USD/JPY buyers to aim for the 117.00. Following that, an upward sloping trend line from November, close to 117.15, will challenge the upside momentum.
It’s worth noting that the nearly overbought RSI conditions on the daily chart challenge the USD/JPY pair’s further upside.
- Gold is under pressure in Asia as the bears step in and bulls back the US dollar.
- US CPI is the highest in 40-years and the Fed is now expected to act in kind.
Trading in a tight $3.50c/oz range in Asia Friday, with Japan out on holiday, gold, XAU/USD, is flat on the day so far following a lively day on Wall Street following the hot US inflation data. Gold is trading near $1,825 at the time of writing and is oscillating at the foot of the bearish daily close from Thursday's business.
US CPI highest in 40-years
The January Consumer Price Index data was showing a 7.5% YoY lift in prices which spooked markets on Thursday. On a core basis, inflation lifted 6.0% YoY after gaining 0.6% during January. Both the core and headline inflation were stronger than expected. The data added to the view of some investors that the Federal Reserve may need to act aggressively to curb rising inflation.
Fed's James Bullard now wants a full percentage point of interest rate hikes over the next three central bank policy meetings. He even said the Fed could rate hike san inter-meetings and some Fed watchers have taken that to mean that there could be an emergency meeting and subsequent rate hike before the March meeting.
As a consequence major US stock indexes ended sharply lower and Asia follows suit. The Nasdaq was falling more than 2% when the US 10-Year Treasury yield touched 2% for the first time since August 2019. The dollar index (DXY), a gauge of the greenback's value against six major currencies, jumped 0.5% but ended almost flat as currency markets accounted for the macro inflation outlook and started to position into commodity currencies also. AUD/USD rallied to test 0.72 the figure on the notion that commodity prices would climb. However, the bulls have met a wall of supply there and the price is falling below a key 0.7150 level in Asia as the US dollar starts to attract buyers again here in Asia.
''Ultimately, we expect that macro headwinds will catalyze a breakdown in price,'' analysts at TD Securities had to say on their outlook for gold prices. ''Our ChartVision framework further supports our view, suggesting that a break below $1750/oz by July 2022 would be consistent with a sustained downtrend in the yellow metal.''
Gold technical analysis
Staying with the pre-US CPI analysis from the prior sessions, the outlook is bearish.
Gold prior analysis
In the chart below, it was shown that the price has reached the neckline of the M-formation to the rounded down $1,828.
This mattered because this is an area of liquidity that could lead to supply entering the market which would typically cap the price. This leaves the focus on the downside which leaves the $1,811 vulnerable:
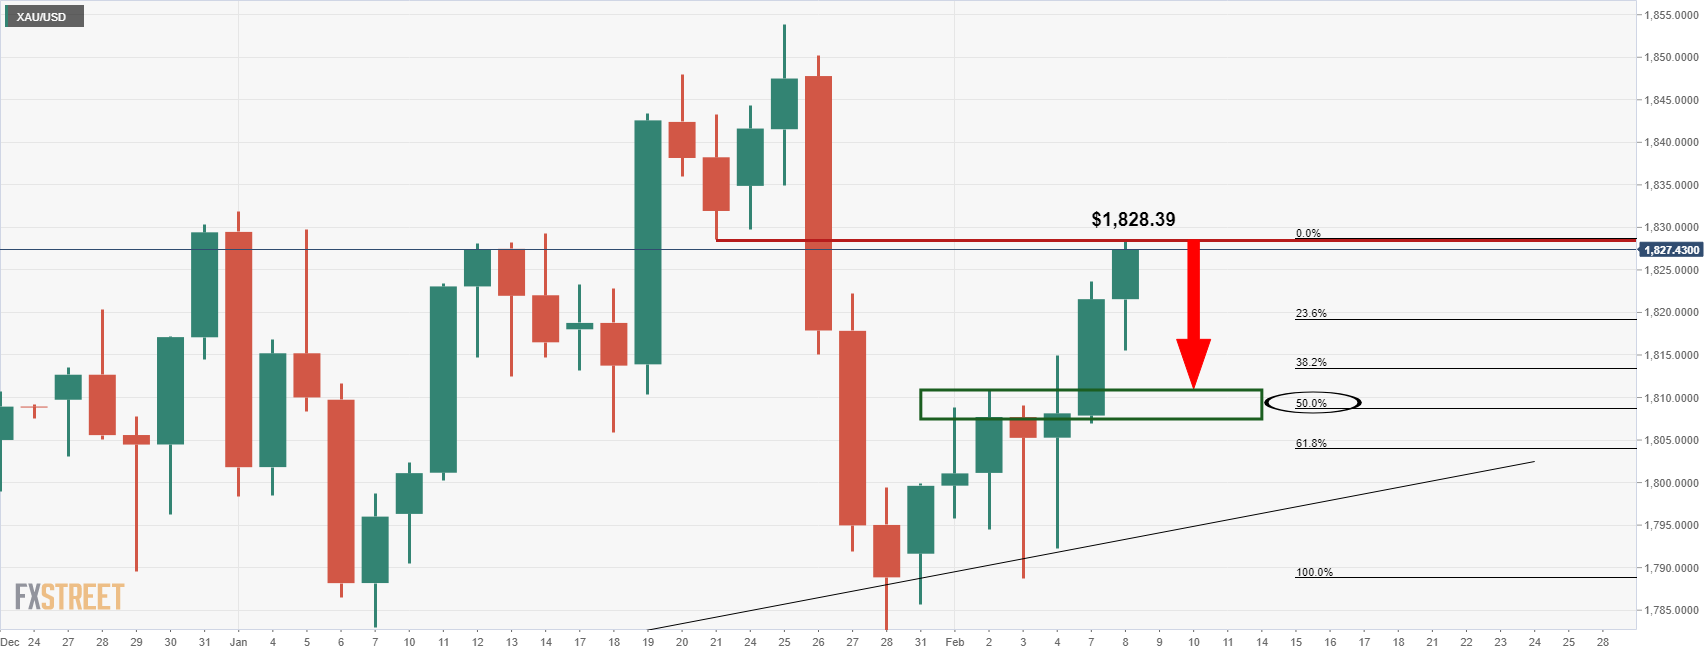
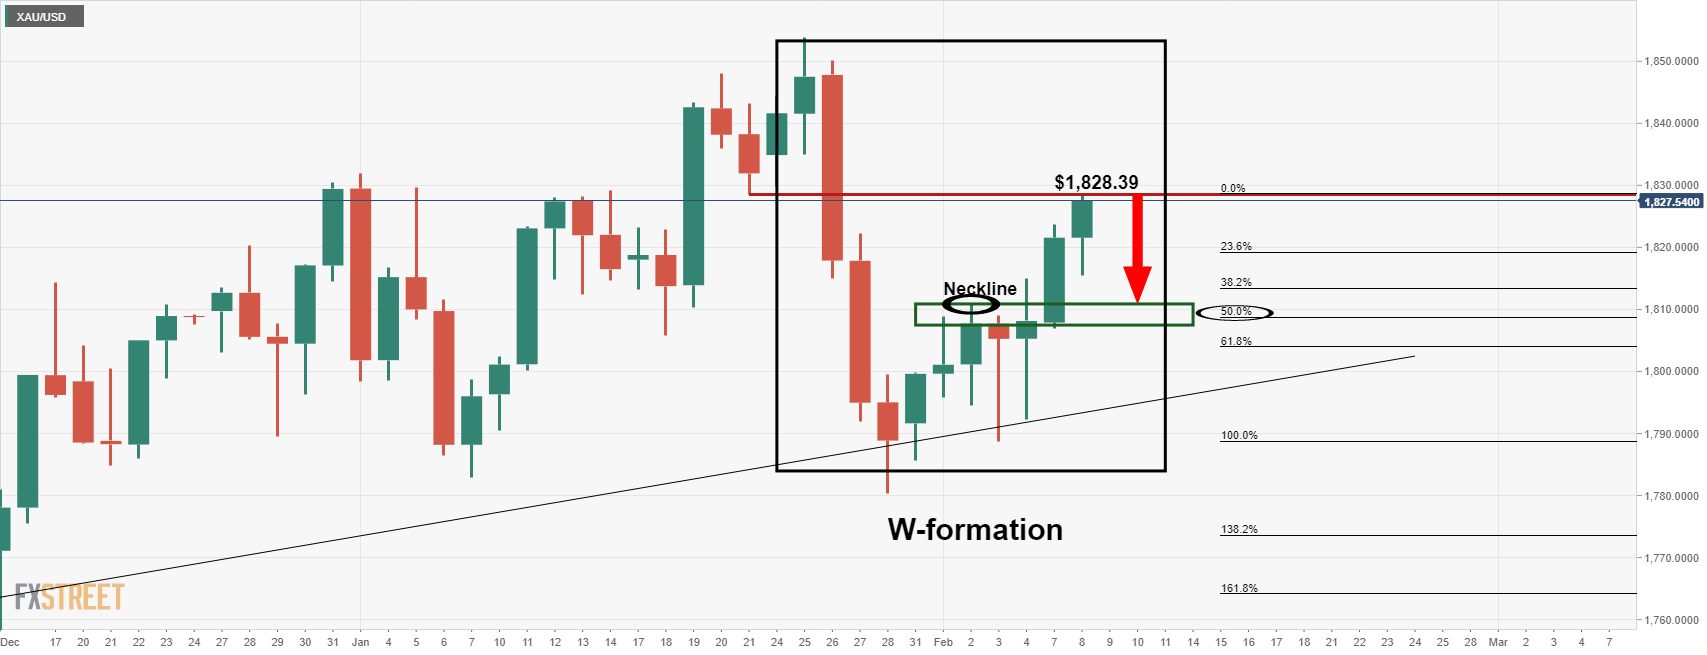
It was stated that the W-formation's neckline aligned near a 50% mean reversion of the prior bullish impulse in an ''area'' between $1,811 and $1,808 where the bears could be looking to target.
Gold live market
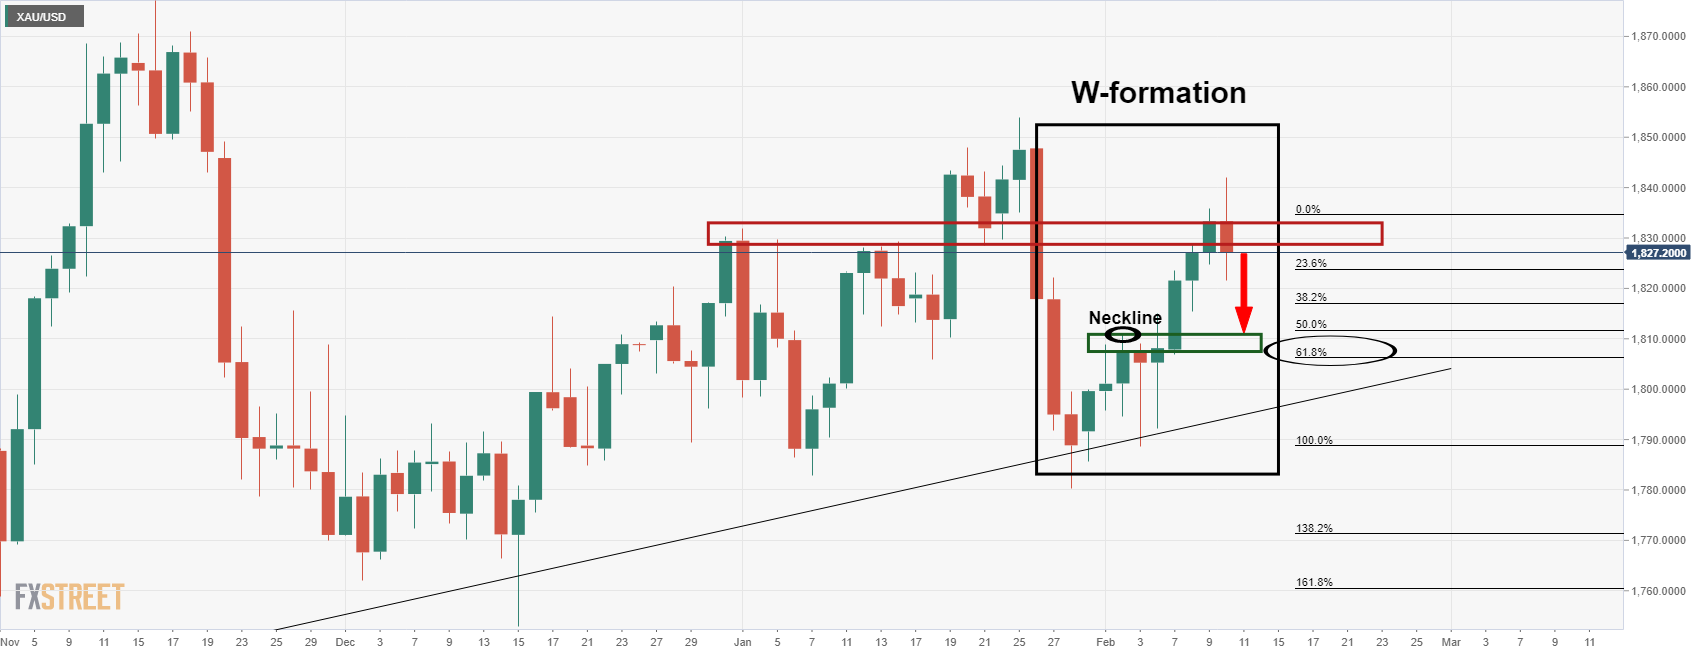
| Pare | Closed | Change, % |
|---|---|---|
| AUDUSD | 0.7168 | -0.16 |
| EURJPY | 132.571 | 0.44 |
| EURUSD | 1.14287 | 0.05 |
| GBPJPY | 157.282 | 0.61 |
| GBPUSD | 1.3559 | 0.18 |
| NZDUSD | 0.66749 | -0.09 |
| USDCAD | 1.27214 | 0.39 |
| USDCHF | 0.92528 | 0.13 |
| USDJPY | 115.997 | 0.42 |
- AUD/JPY steadies below key support after stepping back from five-week high.
- Bullish MACD keeps buyers hopeful, 200-DMA is the key support.
AUD/JPY stays pressured around an intraday low of 83.00 during Friday’s Asian session, following a pullback from the three-week top.
The profit-booking move could be linked to the cross-currency pair’s inability to cross a downward sloping trend line from November 2021.
However, the pair’s sustained trading above the 200-DMA, around 82.40 by the press time, joins the bullish MACD signals to keep AUD/JPY buyers hopeful.
Hence, the latest weakness in the pair could drag it towards the stated DMA support of 82.40 but any further weakness can tease the sellers.
Also acting as a downside filter is an ascending support line from January 28 around 82.15 and the 82.00 threshold.
Should the quote drops below 82.00, AUD/JPY bears won’t regret challenging January’s low near 80.35.
Meanwhile, AUD/JPY bulls need a daily closing beyond the aforementioned resistance line from November 2021, around 83.25 by the press time.
Following that, 61.8% Fibonacci retracement of November-December declines, near 83.45, will act as an additional challenge for the pair’s upside targeting January’s high of 84.30.
Overall, AUD/JPY prices may witness further pullback but a downtrend is far away.
AUD/JPY: Daily chart

Trend: Bullish
Federal Reserve's Thomas Barkin, following the Thursday inflation data, is speaking and said that the economy will likely return past the pre-covid trend this quarter
Barkin said that it's hard to know if we will return to a stable world of the 2010s, or not and he hopes ''we can get rates back to pre-pandemic levels relatively quickly.''
His comments come as the US continues to print the highest inflation readings in 40 years which could see the Federal Reserve deliver the highest rate hike in 20 years at the March meeting, or even before in an emergency meeting.
US CPI running hottest in 40-years
The January data was showing a 7.5% YoY lift in prices which spooked markets on Thursday. On a core basis, inflation lifted 6.0% YoY after gaining 0.6% during January.
Both the core and headline inflation were stronger than expected and was a concern to Fed's James Bullard, who wants a full percentage point of interest rate hikes over the next three central bank policy meetings. He even said the Fed could rate hike san inter-meetings and some Fed watchers have taken that to mean that there could be an emergency meeting and subsequent rate hike before the March meeting.
© 2000-2026. All rights reserved.
This site is managed by Teletrade D.J. LLC 2351 LLC 2022 (Euro House, Richmond Hill Road, Kingstown, VC0100, St. Vincent and the Grenadines).
The information on this website is for informational purposes only and does not constitute any investment advice.
The company does not serve or provide services to customers who are residents of the US, Canada, Iran, The Democratic People's Republic of Korea, Yemen and FATF blacklisted countries.
Making transactions on financial markets with marginal financial instruments opens up wide possibilities and allows investors who are willing to take risks to earn high profits, carrying a potentially high risk of losses at the same time. Therefore you should responsibly approach the issue of choosing the appropriate investment strategy, taking the available resources into account, before starting trading.
Use of the information: full or partial use of materials from this website must always be referenced to TeleTrade as the source of information. Use of the materials on the Internet must be accompanied by a hyperlink to teletrade.org. Automatic import of materials and information from this website is prohibited.
Please contact our PR department if you have any questions or need assistance at pr@teletrade.global.


