- Analytics
- News and Tools
- Market News
CFD Markets News and Forecasts — 10-07-2024
- EUR/USD extended a recovery from the early week’s slump toward 1.0800.
- Rate cut expectations continue to drive broader market flows.
- EU data remains thin, US inflation figures to be key print for the week.
EUR/USD found some room on the high side on Wednesday, getting pushed up the charts by broad-market Greenback selling. Market sentiment has firmly recovered and leaned into renewed rate cut expectations after Federal Reserve (Fed) Chairman Jerome Powell gave his own version of a dovish appearance while giving two-day testimony to US Congressional committees. EU data remains thin outside of final German Harmonized Index of Consumer Prices (HICP) inflation slated for Thursday, and markets will be pivoting to face a double-header of key US inflation data due on Thursday and Friday.
Forex Today: Gearing up for US CPI
German final HICP inflation numbers are due during Thursday’s European market session, but little change is expected and the annualized figure for June is broadly expected to hold steady at 2.5%.
The markets, eager for a rate cut, interpreted Fed Chair Powell's appearances before Congressional committees as dovish this week. Powell cautiously acknowledged recent progress on inflation, prompting a recovery in risk appetite as investors once again hope for a rate cut in September. Investors will be watching for lower-than-expected US CPI inflation on Thursday, with the median market forecast expecting annualized core CPI inflation in June to remain at 3.4%.
Further US inflation data is scheduled for release on Friday, including the core US Producer Price Index (PPI) wholesale inflation. The index is expected to increase to 2.5% YoY from the previous 2.3%, which could impact broad-market rate cut expectations.
Euro PRICE Today
The table below shows the percentage change of Euro (EUR) against listed major currencies today. Euro was the strongest against the Canadian Dollar.
| USD | EUR | GBP | JPY | CAD | AUD | NZD | CHF | |
|---|---|---|---|---|---|---|---|---|
| USD | -0.01% | -0.03% | -0.05% | -0.02% | -0.06% | -0.09% | -0.05% | |
| EUR | 0.01% | -0.01% | -0.02% | 0.02% | -0.03% | -0.06% | -0.03% | |
| GBP | 0.03% | 0.00% | -0.02% | 0.02% | -0.03% | -0.07% | -0.01% | |
| JPY | 0.05% | 0.02% | 0.02% | 0.02% | -0.01% | -0.08% | 0.00% | |
| CAD | 0.02% | -0.02% | -0.02% | -0.02% | -0.06% | -0.10% | -0.03% | |
| AUD | 0.06% | 0.03% | 0.03% | 0.01% | 0.06% | -0.04% | 0.02% | |
| NZD | 0.09% | 0.06% | 0.07% | 0.08% | 0.10% | 0.04% | 0.06% | |
| CHF | 0.05% | 0.03% | 0.00% | -0.01% | 0.03% | -0.02% | -0.06% |
The heat map shows percentage changes of major currencies against each other. The base currency is picked from the left column, while the quote currency is picked from the top row. For example, if you pick the Euro from the left column and move along the horizontal line to the US Dollar, the percentage change displayed in the box will represent EUR (base)/USD (quote).
EUR/USD technical outlook
EUR/USD gave a thin intraday recovery, but bullish momentum remains on the anemic side and bids are struggling to make further headway while weighed down by a near-term ceiling around 1.0840.
Daily candlesticks continue to get squeezed between the upper bound of a rough descending channel and the 200-day Exponential Moving Average (EMA) at 1.0790. Without a definitive bullish break into fresh topside chart territory, price action is likely to get swamped out and begin making a fresh leg lower.
EUR/USD hourly chart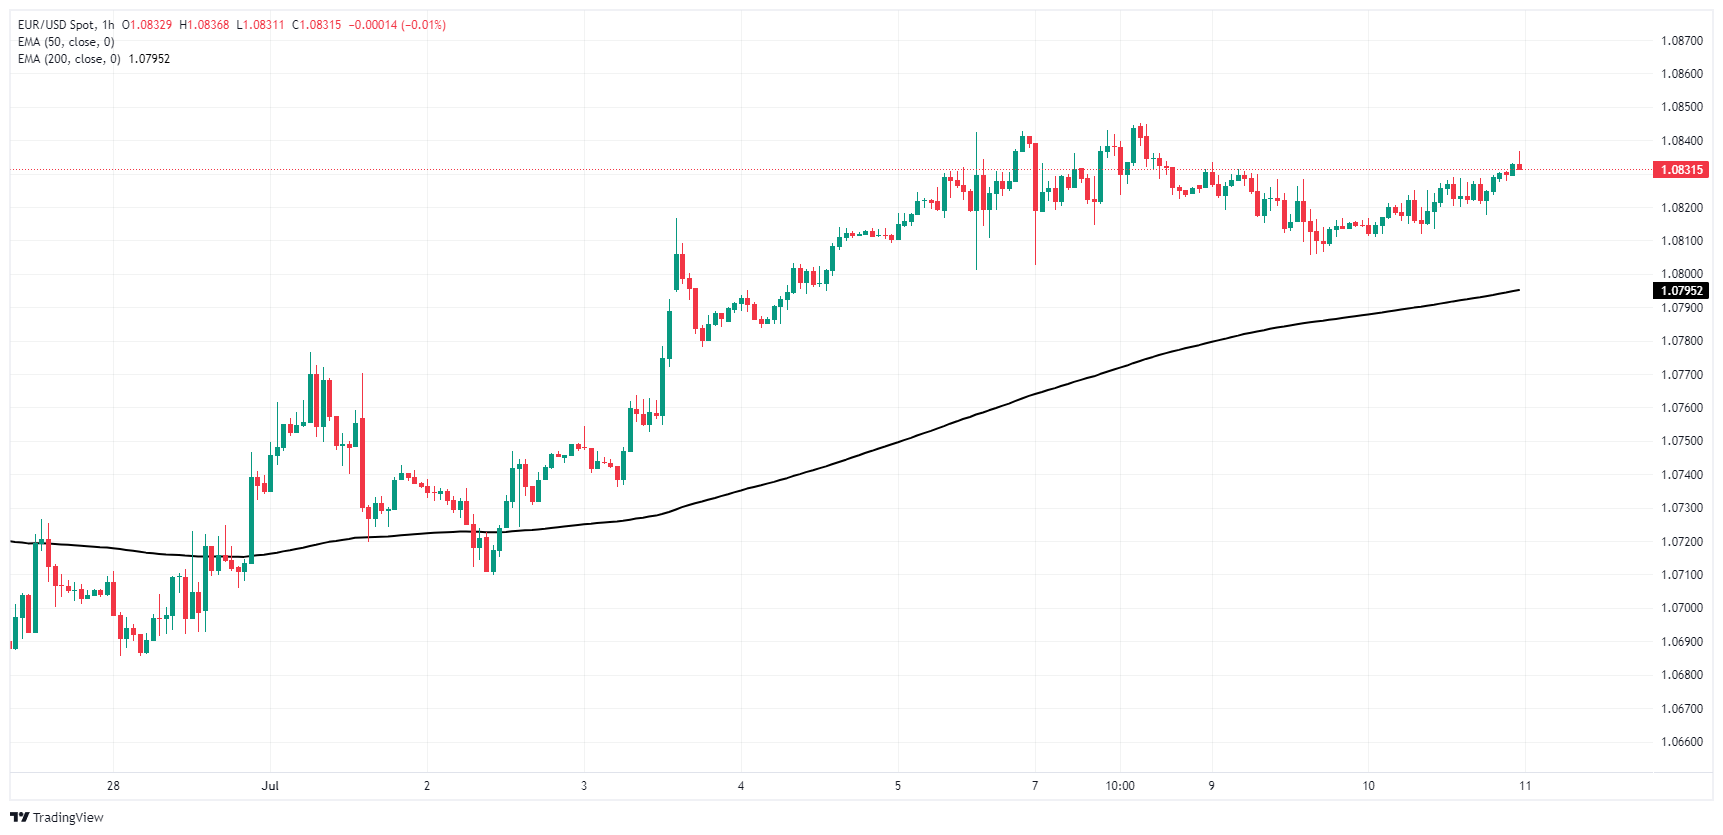
EUR/USD daily chart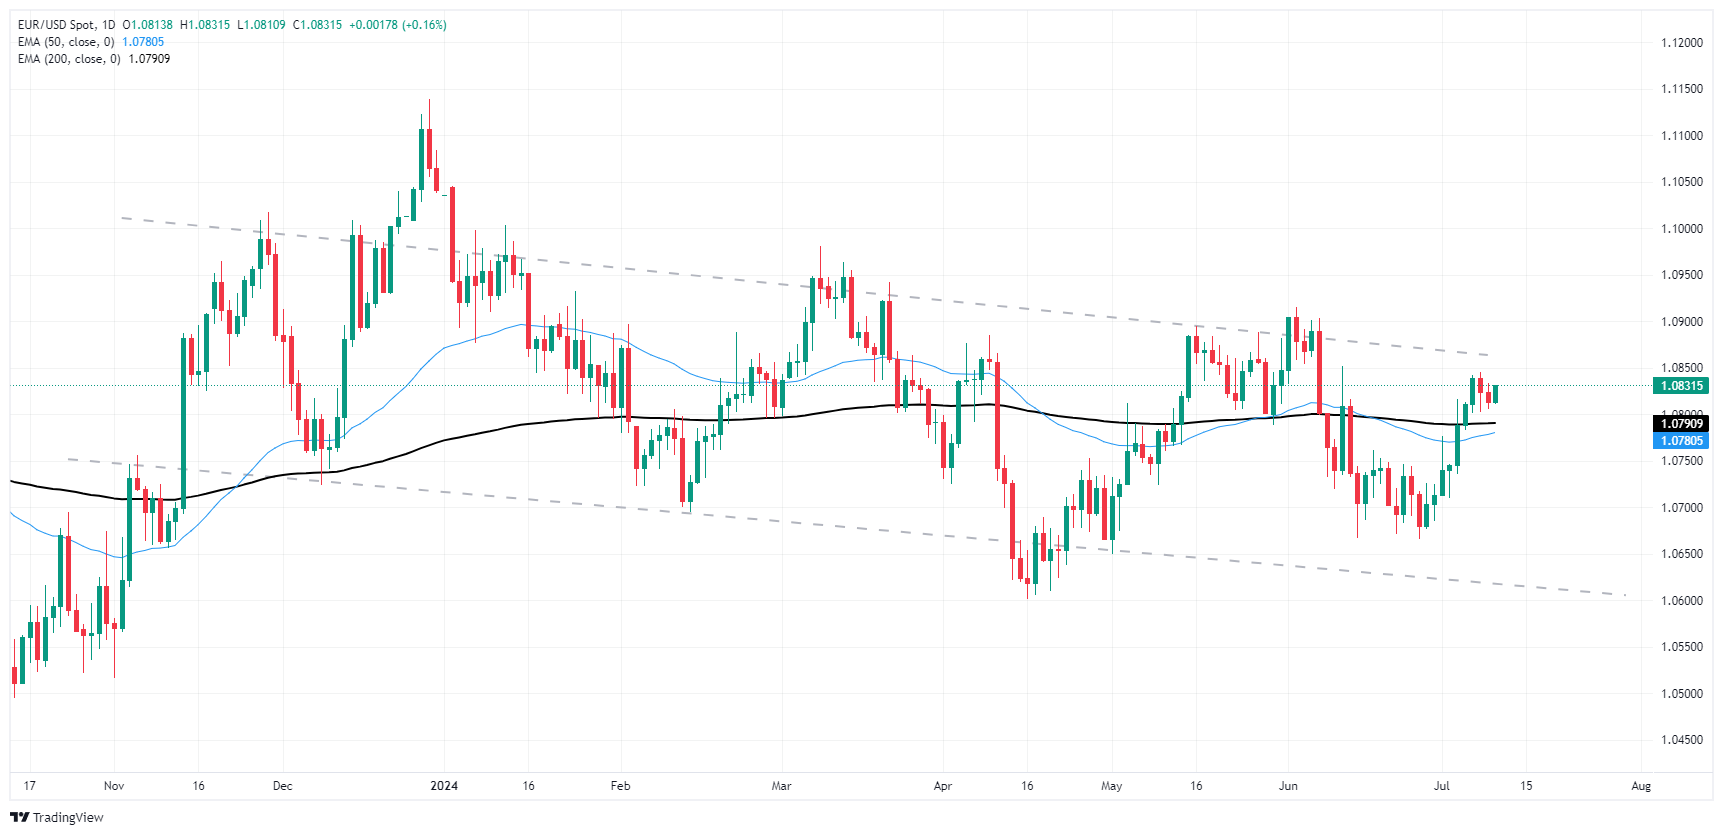
Euro FAQs
The Euro is the currency for the 20 European Union countries that belong to the Eurozone. It is the second most heavily traded currency in the world behind the US Dollar. In 2022, it accounted for 31% of all foreign exchange transactions, with an average daily turnover of over $2.2 trillion a day. EUR/USD is the most heavily traded currency pair in the world, accounting for an estimated 30% off all transactions, followed by EUR/JPY (4%), EUR/GBP (3%) and EUR/AUD (2%).
The European Central Bank (ECB) in Frankfurt, Germany, is the reserve bank for the Eurozone. The ECB sets interest rates and manages monetary policy. The ECB’s primary mandate is to maintain price stability, which means either controlling inflation or stimulating growth. Its primary tool is the raising or lowering of interest rates. Relatively high interest rates – or the expectation of higher rates – will usually benefit the Euro and vice versa. The ECB Governing Council makes monetary policy decisions at meetings held eight times a year. Decisions are made by heads of the Eurozone national banks and six permanent members, including the President of the ECB, Christine Lagarde.
Eurozone inflation data, measured by the Harmonized Index of Consumer Prices (HICP), is an important econometric for the Euro. If inflation rises more than expected, especially if above the ECB’s 2% target, it obliges the ECB to raise interest rates to bring it back under control. Relatively high interest rates compared to its counterparts will usually benefit the Euro, as it makes the region more attractive as a place for global investors to park their money.
Data releases gauge the health of the economy and can impact on the Euro. Indicators such as GDP, Manufacturing and Services PMIs, employment, and consumer sentiment surveys can all influence the direction of the single currency. A strong economy is good for the Euro. Not only does it attract more foreign investment but it may encourage the ECB to put up interest rates, which will directly strengthen the Euro. Otherwise, if economic data is weak, the Euro is likely to fall. Economic data for the four largest economies in the euro area (Germany, France, Italy and Spain) are especially significant, as they account for 75% of the Eurozone’s economy.
Another significant data release for the Euro is the Trade Balance. This indicator measures the difference between what a country earns from its exports and what it spends on imports over a given period. If a country produces highly sought after exports then its currency will gain in value purely from the extra demand created from foreign buyers seeking to purchase these goods. Therefore, a positive net Trade Balance strengthens a currency and vice versa for a negative balance.
Federal Reserve Board Governor Lisa Cook spoke on "Global Inflation and Monetary Policy Challenges" before the 2024 Australian Conference of Economists on late Thursday. Cook said that inflation in the US should continue to fall without a significant further rise in the unemployment rate, per Reuters.
Key quotes
My baseline forecast...is that inflation will continue to move toward target over time, without much further rise in unemployment,
More likely when policy easing began with inflation already close to target and when there was a relatively firm growth backdrop.
In the U.S., what I have seen so far appears to be consistent with a soft landing: Inflation has fallen significantly from its peak, and the labor market has gradually cooled but remains strong.
Market reaction
The US Dollar Index (DXY) is trading 0.02% lower on the day at 104.99, as of writing.
Fed FAQs
Monetary policy in the US is shaped by the Federal Reserve (Fed). The Fed has two mandates: to achieve price stability and foster full employment. Its primary tool to achieve these goals is by adjusting interest rates. When prices are rising too quickly and inflation is above the Fed’s 2% target, it raises interest rates, increasing borrowing costs throughout the economy. This results in a stronger US Dollar (USD) as it makes the US a more attractive place for international investors to park their money. When inflation falls below 2% or the Unemployment Rate is too high, the Fed may lower interest rates to encourage borrowing, which weighs on the Greenback.
The Federal Reserve (Fed) holds eight policy meetings a year, where the Federal Open Market Committee (FOMC) assesses economic conditions and makes monetary policy decisions. The FOMC is attended by twelve Fed officials – the seven members of the Board of Governors, the president of the Federal Reserve Bank of New York, and four of the remaining eleven regional Reserve Bank presidents, who serve one-year terms on a rotating basis.
In extreme situations, the Federal Reserve may resort to a policy named Quantitative Easing (QE). QE is the process by which the Fed substantially increases the flow of credit in a stuck financial system. It is a non-standard policy measure used during crises or when inflation is extremely low. It was the Fed’s weapon of choice during the Great Financial Crisis in 2008. It involves the Fed printing more Dollars and using them to buy high grade bonds from financial institutions. QE usually weakens the US Dollar.
Quantitative tightening (QT) is the reverse process of QE, whereby the Federal Reserve stops buying bonds from financial institutions and does not reinvest the principal from the bonds it holds maturing, to purchase new bonds. It is usually positive for the value of the US Dollar.
- USD/JPY edges lower to 161.55 in Thursday’s early Asian session.
- Fed’s Powell gave a cautious nod to recent progress on inflation.
- The growing speculation that BoJ will hike in the July meeting boosts the JPY.
The USD/JPY pair trades on a softer note around 161.55, snapping the three-day winning streak on Thursday during the early Asian session. The pair edges lower amid the decline of the US Dollar (USD) broadly. Investors will take more cues from the US Consumer Price Index (CPI) data for June, which is due on Thursday. The Federal Reserve’s (Fed) Raphael Bostic is set to speak.
Fed Chair Jerome Powell acknowledged the progress on inflation, yet Powell stated that it would not be appropriate to cut the policy rate until they gain greater confidence in inflation heading sustainably towards the Fed’s 2% target.
Traders anticipate the US Fed to maintain the benchmark interest rate in the 5.25% to 5.5% range in its next meeting on July 30-31. The US CPI inflation report on Thursday will be closely watched, and further progress on inflation could lead to key changes in their policy statement that pave the way for a September rate cut.
On the other hand, the higher speculation that the Bank of Japan (BoJ) will be forced to raise interest rates at its July meeting provides some support to the Japanese Yen (JPY). Peter Boockvar, chief financial officer at US-based Bleakley Financial Group, said that the Yen's weakness will trigger the BoJ to "react sooner rather than later."
Japanese Yen FAQs
The Japanese Yen (JPY) is one of the world’s most traded currencies. Its value is broadly determined by the performance of the Japanese economy, but more specifically by the Bank of Japan’s policy, the differential between Japanese and US bond yields, or risk sentiment among traders, among other factors.
One of the Bank of Japan’s mandates is currency control, so its moves are key for the Yen. The BoJ has directly intervened in currency markets sometimes, generally to lower the value of the Yen, although it refrains from doing it often due to political concerns of its main trading partners. The current BoJ ultra-loose monetary policy, based on massive stimulus to the economy, has caused the Yen to depreciate against its main currency peers. This process has exacerbated more recently due to an increasing policy divergence between the Bank of Japan and other main central banks, which have opted to increase interest rates sharply to fight decades-high levels of inflation.
The BoJ’s stance of sticking to ultra-loose monetary policy has led to a widening policy divergence with other central banks, particularly with the US Federal Reserve. This supports a widening of the differential between the 10-year US and Japanese bonds, which favors the US Dollar against the Japanese Yen.
The Japanese Yen is often seen as a safe-haven investment. This means that in times of market stress, investors are more likely to put their money in the Japanese currency due to its supposed reliability and stability. Turbulent times are likely to strengthen the Yen’s value against other currencies seen as more risky to invest in.
- GBP/USD pushed back into the high end after Fed nods at inflation progress.
- BoE rate cut expectations also tick higher.
- Key US inflation data looms ahead.
GBP/USD rallied on Wednesday, clipping into a four-week peak after broad-market expectations of future rate cuts reignited following Federal Reserve (Fed) Chairman Jerome Powell’s wrap-up of the two-day Semi-Annual Monetary Policy Report. UK data is limited to mid-tier Industrial Production figures on Thursday, but looming US Consumer Price Index (CPI) inflation will draw plenty of investor eyes during Thursday’s American market session.
Forex Today: Gearing up for US CPI
Rate-cut-hungry markets decided that Fed Chair Powell’s appearances before Congressional committees was close enough to dovish this week, with Powell giving a cautious nod to recent progress on inflation. Risk appetite has recovered as investors lean back into hopes for a September rate cut, and investors will be looking for an undershoot of US CPI inflation on Thursday, with median market forecasts expecting annualized core CPI inflation in June to hold steady at 3.4%.
Powell speech: We see current Fed policy as restrictive
GBP traders are leaning into bets of an August rate cut from the Bank of England (BoE) despite cautious tones from several BoE policymakers on Wednesday, and UK Industrial Production figures earlier Thursday will be a key bellwether for rate cut hopes. UK Industrial Production is expected to recover to 0.2% MoM from the previous decline of -0.9%.
BoE's Mann: We need to see sustained slower service inflation
Further US inflation data is due on Friday, with core US Producer Price Index (PPI) wholesale inflation expected to tick upwards to 2.5% YoY from the previous 2.3%, which could pose a stumbling block to broad-market rate cut hopes.
British Pound PRICE Today
The table below shows the percentage change of British Pound (GBP) against listed major currencies today. British Pound was the strongest against the US Dollar.
| USD | EUR | GBP | JPY | CAD | AUD | NZD | CHF | |
|---|---|---|---|---|---|---|---|---|
| USD | -0.04% | -0.04% | -0.06% | -0.03% | -0.07% | -0.12% | -0.04% | |
| EUR | 0.04% | 0.02% | -0.04% | 0.02% | -0.02% | -0.07% | 0.00% | |
| GBP | 0.04% | -0.02% | -0.02% | 0.00% | -0.03% | -0.08% | 0.01% | |
| JPY | 0.06% | 0.04% | 0.02% | 0.03% | -0.00% | -0.09% | 0.03% | |
| CAD | 0.03% | -0.02% | -0.01% | -0.03% | -0.06% | -0.10% | -0.01% | |
| AUD | 0.07% | 0.02% | 0.03% | 0.00% | 0.06% | -0.06% | 0.04% | |
| NZD | 0.12% | 0.07% | 0.08% | 0.09% | 0.10% | 0.06% | 0.10% | |
| CHF | 0.04% | -0.01% | -0.01% | -0.03% | 0.00% | -0.04% | -0.10% |
The heat map shows percentage changes of major currencies against each other. The base currency is picked from the left column, while the quote currency is picked from the top row. For example, if you pick the British Pound from the left column and move along the horizontal line to the US Dollar, the percentage change displayed in the box will represent GBP (base)/USD (quote).
GBP/USD technical outlook
Cable’s bullish resurgence on Wednesday has left bids buried deep in a supply zone priced in above the 1.2800 handle, and price action is stretched thin on the high side. A downside recovery could send price back to the 200-day Exponential Moving Average (EMA) near 1.2600, and the burden of preventing a swing low into familiar technical levels will see bulls working double duty to try and chalk in a meaningful higher low on daily candlesticks.
GBP/USD hourly chart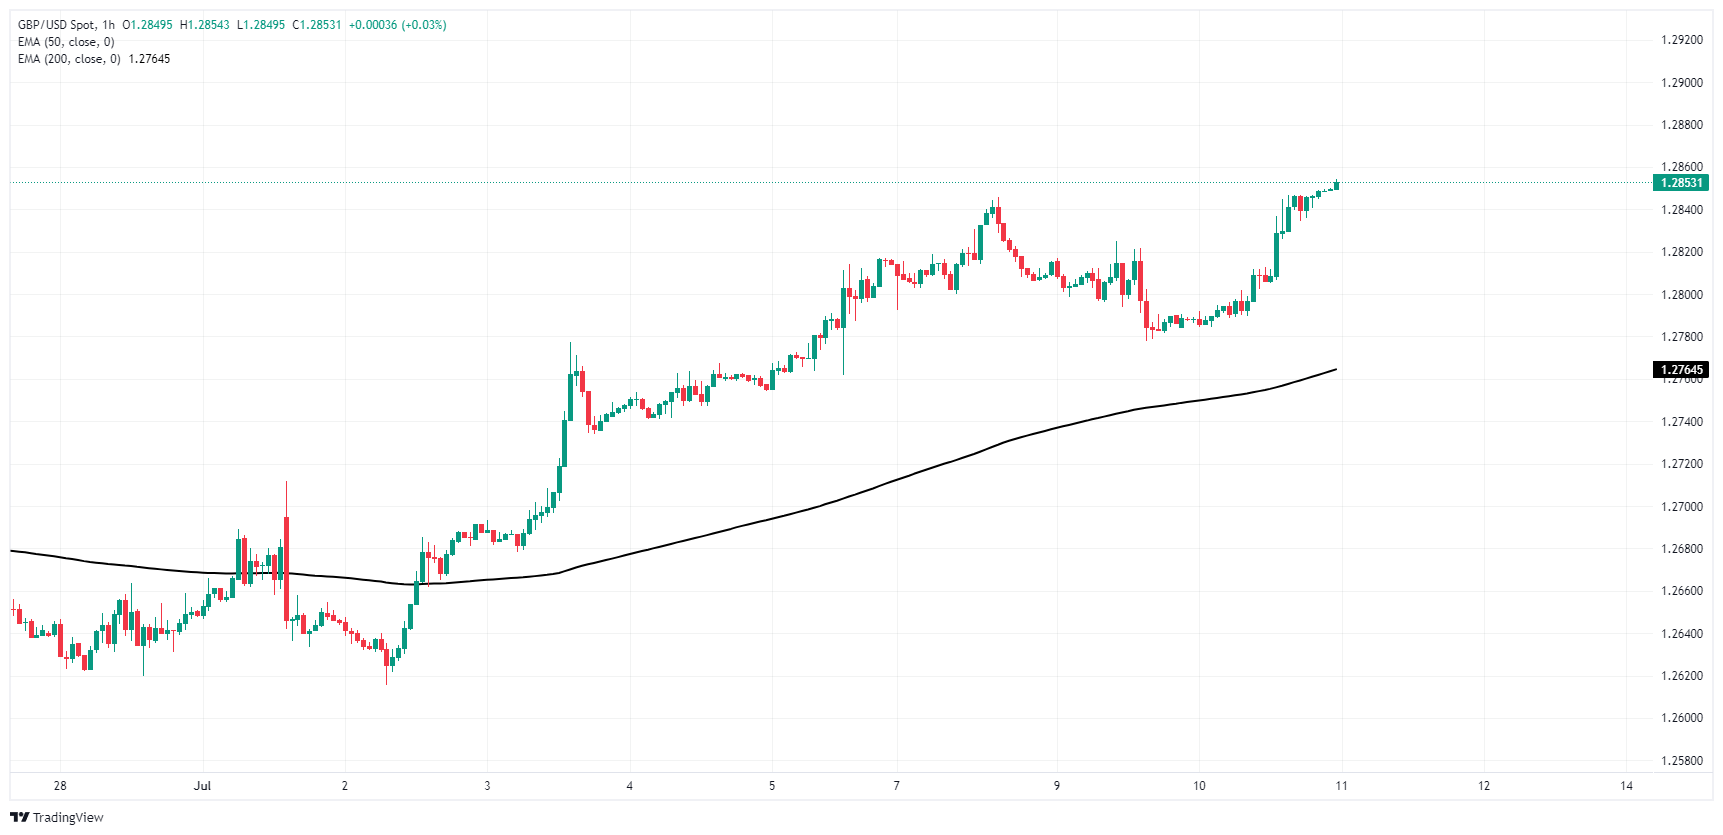
GBP/USD daily chart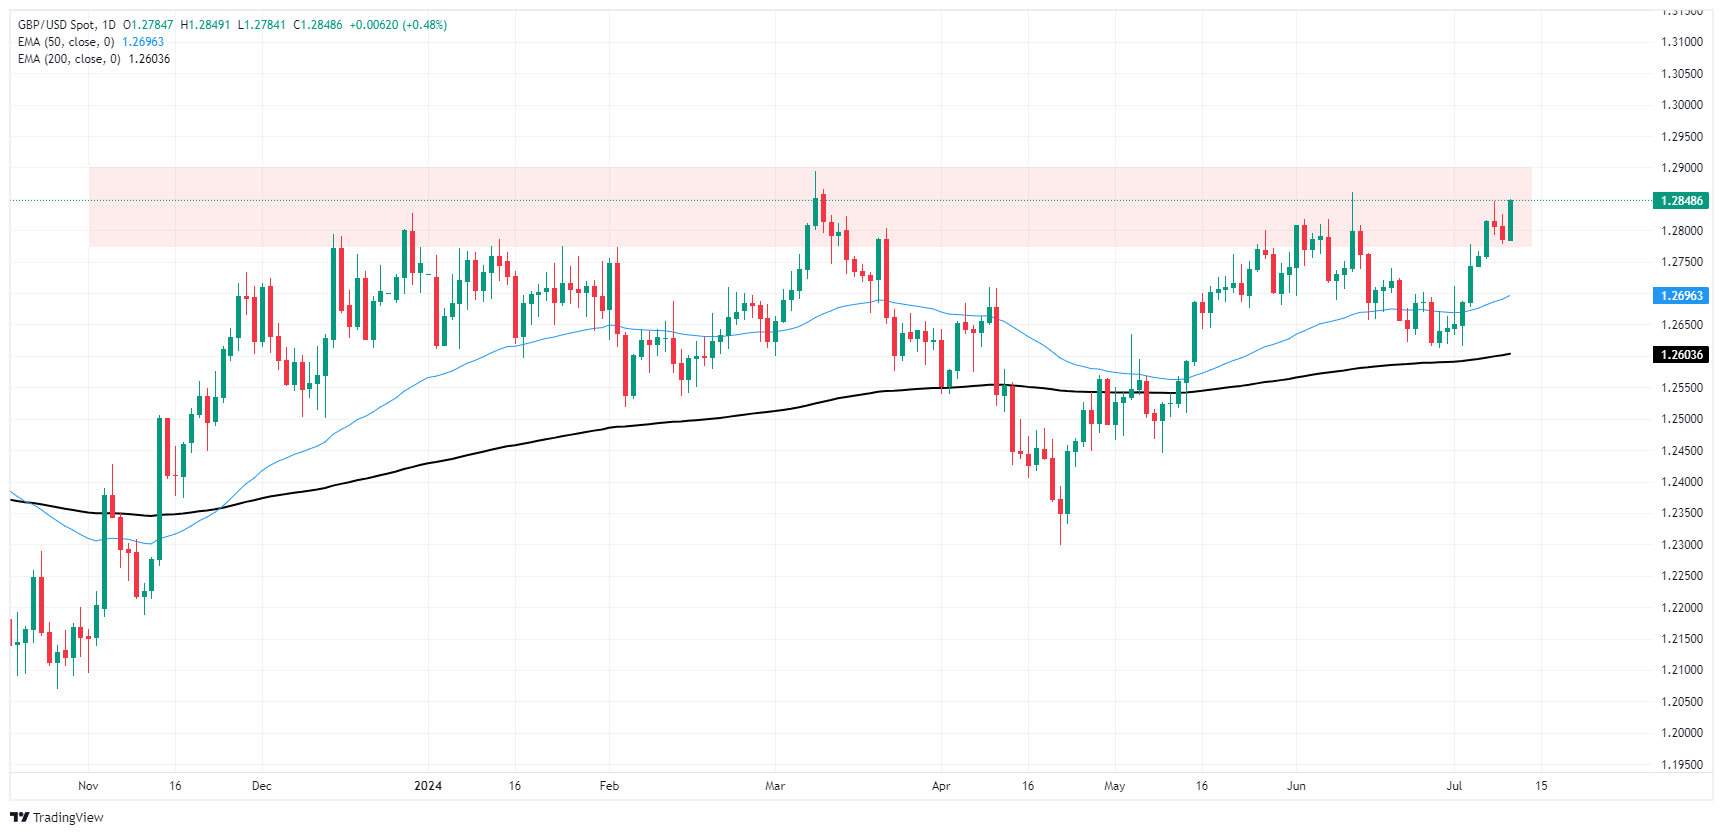
Pound Sterling FAQs
The Pound Sterling (GBP) is the oldest currency in the world (886 AD) and the official currency of the United Kingdom. It is the fourth most traded unit for foreign exchange (FX) in the world, accounting for 12% of all transactions, averaging $630 billion a day, according to 2022 data. Its key trading pairs are GBP/USD, aka ‘Cable’, which accounts for 11% of FX, GBP/JPY, or the ‘Dragon’ as it is known by traders (3%), and EUR/GBP (2%). The Pound Sterling is issued by the Bank of England (BoE).
The single most important factor influencing the value of the Pound Sterling is monetary policy decided by the Bank of England. The BoE bases its decisions on whether it has achieved its primary goal of “price stability” – a steady inflation rate of around 2%. Its primary tool for achieving this is the adjustment of interest rates. When inflation is too high, the BoE will try to rein it in by raising interest rates, making it more expensive for people and businesses to access credit. This is generally positive for GBP, as higher interest rates make the UK a more attractive place for global investors to park their money. When inflation falls too low it is a sign economic growth is slowing. In this scenario, the BoE will consider lowering interest rates to cheapen credit so businesses will borrow more to invest in growth-generating projects.
Data releases gauge the health of the economy and can impact the value of the Pound Sterling. Indicators such as GDP, Manufacturing and Services PMIs, and employment can all influence the direction of the GBP. A strong economy is good for Sterling. Not only does it attract more foreign investment but it may encourage the BoE to put up interest rates, which will directly strengthen GBP. Otherwise, if economic data is weak, the Pound Sterling is likely to fall.
Another significant data release for the Pound Sterling is the Trade Balance. This indicator measures the difference between what a country earns from its exports and what it spends on imports over a given period. If a country produces highly sought-after exports, its currency will benefit purely from the extra demand created from foreign buyers seeking to purchase these goods. Therefore, a positive net Trade Balance strengthens a currency and vice versa for a negative balance.
- USD/CAD trades on a weaker note around 1.3615 in Thursday’s early Asian session.
- Fed’s Powell said the central bank will cut rates when ready, regardless of the political calendar.
- A rise in Canada's Unemployment Rate has prompted the BoC to consider cutting interest rates in July, ING analyst said.
The USD/CAD pair remains under selling pressure near 1.3615 during the early Asian session on Thursday. Meanwhile, the USD Index (DXY) extends its consolidation above the 105.00 hurdle as traders await the key US inflation report. The US Consumer Price Index (CPI) data for June is due on Thursday, along with the weekly Initial Jobless Claims and speeches by the Federal Reserve’s (Fed) Raphael Bostic.
Fed Chair Jerome Powell responded to questions before the House Financial Services Committee on Wednesday. Powell said that the central bank will make interest rate decisions based on the data, the incoming data, the evolving outlook, and the balance of risks, and not in consideration of political factors.
He further stated that the Fed won't wait until US inflation slows to its 2% target before it cuts interest rates. The probability of the Fed leaving the policy rate unchanged in September stood at nearly 25% following this event, according to the CME FedWatch Tool.
On the Loonie front, the decline of crude oil prices might undermine the commodity-linked Canadian Dollar (CAD) as Canada is the major crude oil exporter to the United States.
Furthermore, ING’s FX analyst Francesco Pesole said that a rise in the Canadian Unemployment rate has put a July Bank of Canada (BoC) rate cut on the table. The financial markets have priced in 16 basis points (bps) of easing for July.
Canadian Dollar FAQs
The key factors driving the Canadian Dollar (CAD) are the level of interest rates set by the Bank of Canada (BoC), the price of Oil, Canada’s largest export, the health of its economy, inflation and the Trade Balance, which is the difference between the value of Canada’s exports versus its imports. Other factors include market sentiment – whether investors are taking on more risky assets (risk-on) or seeking safe-havens (risk-off) – with risk-on being CAD-positive. As its largest trading partner, the health of the US economy is also a key factor influencing the Canadian Dollar.
The Bank of Canada (BoC) has a significant influence on the Canadian Dollar by setting the level of interest rates that banks can lend to one another. This influences the level of interest rates for everyone. The main goal of the BoC is to maintain inflation at 1-3% by adjusting interest rates up or down. Relatively higher interest rates tend to be positive for the CAD. The Bank of Canada can also use quantitative easing and tightening to influence credit conditions, with the former CAD-negative and the latter CAD-positive.
The price of Oil is a key factor impacting the value of the Canadian Dollar. Petroleum is Canada’s biggest export, so Oil price tends to have an immediate impact on the CAD value. Generally, if Oil price rises CAD also goes up, as aggregate demand for the currency increases. The opposite is the case if the price of Oil falls. Higher Oil prices also tend to result in a greater likelihood of a positive Trade Balance, which is also supportive of the CAD.
While inflation had always traditionally been thought of as a negative factor for a currency since it lowers the value of money, the opposite has actually been the case in modern times with the relaxation of cross-border capital controls. Higher inflation tends to lead central banks to put up interest rates which attracts more capital inflows from global investors seeking a lucrative place to keep their money. This increases demand for the local currency, which in Canada’s case is the Canadian Dollar.
Macroeconomic data releases gauge the health of the economy and can have an impact on the Canadian Dollar. Indicators such as GDP, Manufacturing and Services PMIs, employment, and consumer sentiment surveys can all influence the direction of the CAD. A strong economy is good for the Canadian Dollar. Not only does it attract more foreign investment but it may encourage the Bank of Canada to put up interest rates, leading to a stronger currency. If economic data is weak, however, the CAD is likely to fall.
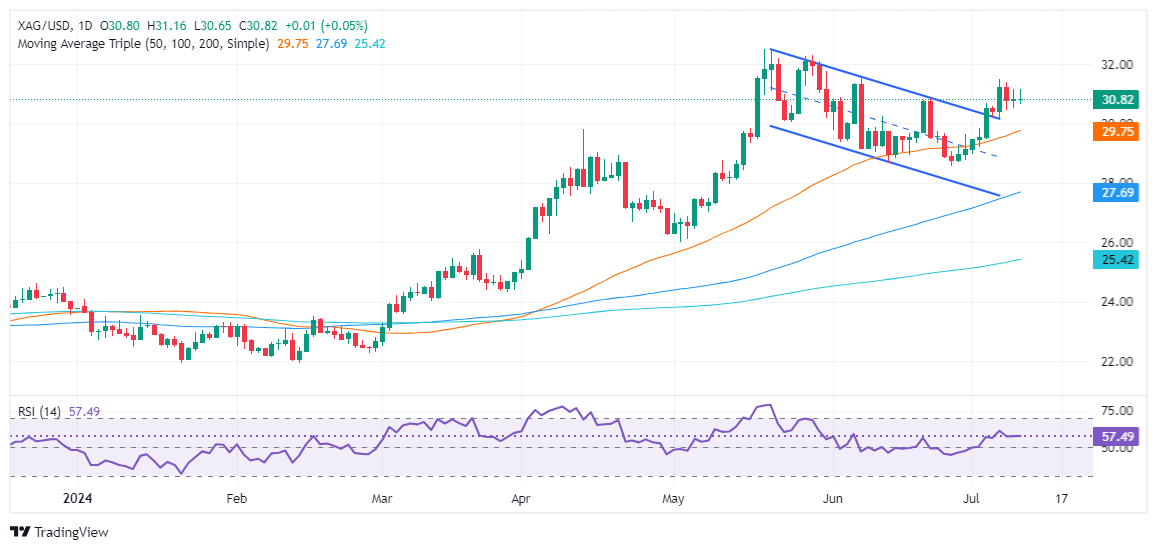
- Silver consolidates within $30.50-$31.00 range, trades at $30.80, up 0.11%.
- RSI indicates bullish momentum, but flat slope suggests buyers are cautious.
- Key resistance at $31.00, July 5 high of $31.49; support at $30.50 and $30.18, with critical level around $29.78/74.
The grey metal registered minimal gains on Wednesday as Silver has been consolidating within the $30.50-$31.00 range since Tuesday. Even though US Treasury yields edged lower along with the US Dollar, XAG/USD was unable to capitalize on it and traded at $30.80, up 0.11%.
XAG/USD Price Analysis: Technical outlook
The XAG/USD trades subdued as shown by the daily chart, fully confirmed by momentum as depicted by the Relative Strength Index (RSI). Even though RSI is bullish, the slope turned flat, an indication that buyers remain at bay. That said, Silver’s spot price remains above the ‘double bottom’ chart pattern neckline, hinting that an uptrend continuation is on the cards.
If XAG/USD clears the $31.00 psychological level, the first resistance would be the July 5 high at $31.49, followed by the May 29 high at $32.29. Once surpassed, the year-to-date (YTD) high at $32.51 would be up for grabs.
On the other hand, if sellers stepped in and dragged prices below $30.50, the first support would be the July 5 low of $30.18. If cleared, the next stop would be the confluence of the April 12 peak turned support and the 50-day moving average (DMA) at around $29.78/74.
XAG/USD Price Action – Daily Chart
Silver FAQs
Silver is a precious metal highly traded among investors. It has been historically used as a store of value and a medium of exchange. Although less popular than Gold, traders may turn to Silver to diversify their investment portfolio, for its intrinsic value or as a potential hedge during high-inflation periods. Investors can buy physical Silver, in coins or in bars, or trade it through vehicles such as Exchange Traded Funds, which track its price on international markets.
Silver prices can move due to a wide range of factors. Geopolitical instability or fears of a deep recession can make Silver price escalate due to its safe-haven status, although to a lesser extent than Gold's. As a yieldless asset, Silver tends to rise with lower interest rates. Its moves also depend on how the US Dollar (USD) behaves as the asset is priced in dollars (XAG/USD). A strong Dollar tends to keep the price of Silver at bay, whereas a weaker Dollar is likely to propel prices up. Other factors such as investment demand, mining supply – Silver is much more abundant than Gold – and recycling rates can also affect prices.
Silver is widely used in industry, particularly in sectors such as electronics or solar energy, as it has one of the highest electric conductivity of all metals – more than Copper and Gold. A surge in demand can increase prices, while a decline tends to lower them. Dynamics in the US, Chinese and Indian economies can also contribute to price swings: for the US and particularly China, their big industrial sectors use Silver in various processes; in India, consumers’ demand for the precious metal for jewellery also plays a key role in setting prices.
Silver prices tend to follow Gold's moves. When Gold prices rise, Silver typically follows suit, as their status as safe-haven assets is similar. The Gold/Silver ratio, which shows the number of ounces of Silver needed to equal the value of one ounce of Gold, may help to determine the relative valuation between both metals. Some investors may consider a high ratio as an indicator that Silver is undervalued, or Gold is overvalued. On the contrary, a low ratio might suggest that Gold is undervalued relative to Silver.
- NZD/USD faced heav losses, breaching the previously held 20-day SMA support, now resistance.
- The technical outlook transitions towards a bearish sentiment, following Wednesday's sharp decline.
- Bears broke the 20-day SMA and are eyeing the strong support formed by the convergence of the 100 and 200-day SMAs near 0.6070.
On Wednesday, the NZD/USD dropped, losing more than 0.70% to 0.6080, obliterating its support at the 20-day Simple Moving Average (SMA), which was regained last week and tainted the outlook with red.
As for the daily technical indicators, the Relative Strength Index (RSI) is currently at 43, showing a downward trajectory, indicating a considerable decrease in buying momentum compared to Tuesday's close at 52. The Moving Average Convergence Divergence (MACD) printed a fresh red bar, suggesting an increasing bearish momentum.
NZD/USD daily chart
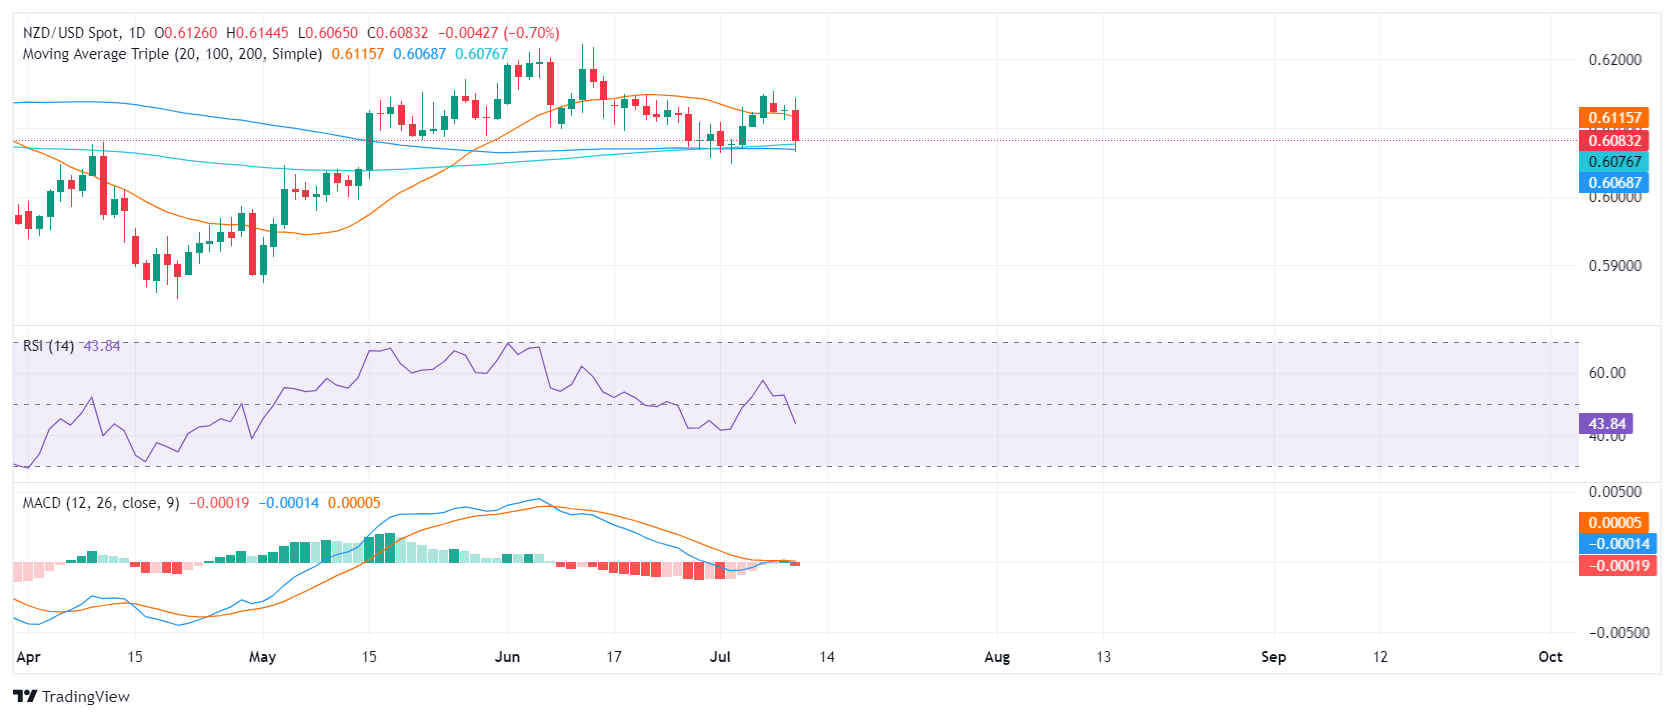
In terms of resistance for bulls to recover, the immediate challenge lies at the 0.6115 level (20-day SMA) now turned into resistance, and then at 0.6150. A decisive close above these levels will be crucial to negate the recent bearish momentum and might assist bulls in making a fresh attempt to reclaim control.
On the downside, immediate support is near the crucial convergence of 100 and 200-day SMAs at 0.6070. A conclusive break below this level could affirm the negative outlook, triggering a deeper corrective slide towards 0.6050 and then the 0.6030 support levels.
- GBP/JPY gained 0.72% on Wednesday as Yen continues to plummet.
- Thin data leaves central bank talkers as the driver of market sentiment.
- BoE remains captive to inflation data looking forward.
GBP/JPY continues to grind out fresh 16-year highs in unrelenting Yen pressure, and the Guppy found a new peak above 207.80 on Wednesday. A lack of notable data from Japan leaves the Yen at the bottom of a very deep rate differential hole, and a bounce in market hopes for a rate cut from the Bank of England (BoE) gave the Pound Sterling a leg up across the board.
Despite cautionary statements from two BoE policymakers on Wednesday, the warning tones weren’t cautious enough, and markets bolstered the GBP on expectations of a BoE rate cut in August. UK inflation has made plenty of progress since peaking in the double digits, price growth remains a key stumbling block for the UK’s central bank.
Coming up on Thursday, UK Industrial and Manufacturing Production figures for May will either help or hinder rate cut hopes. MoM Industrial Production is expected to rebound to 0.2% from the previous -0.9% contraction, while Manufacturing Production is forecast to recover to 0.4% from the previous -1.4% decline.
Read more from BoE:
BoE's Mann: We need to see sustained slower service inflation
BoE's Pill: Open question whether time for cutting rates is now upon us
GBP/JPY technical outlook
The Guppy continues to break into fresh highs on the charts, shattering any technical resistance before it even gets the chance to finish forming. The pair is already on pace to chalk in another firmly green weekly candle, and GBP/JPY has seen a week-on-week gain for all but one of the last nine consecutive trading weeks.
GBP/JPY hourly chart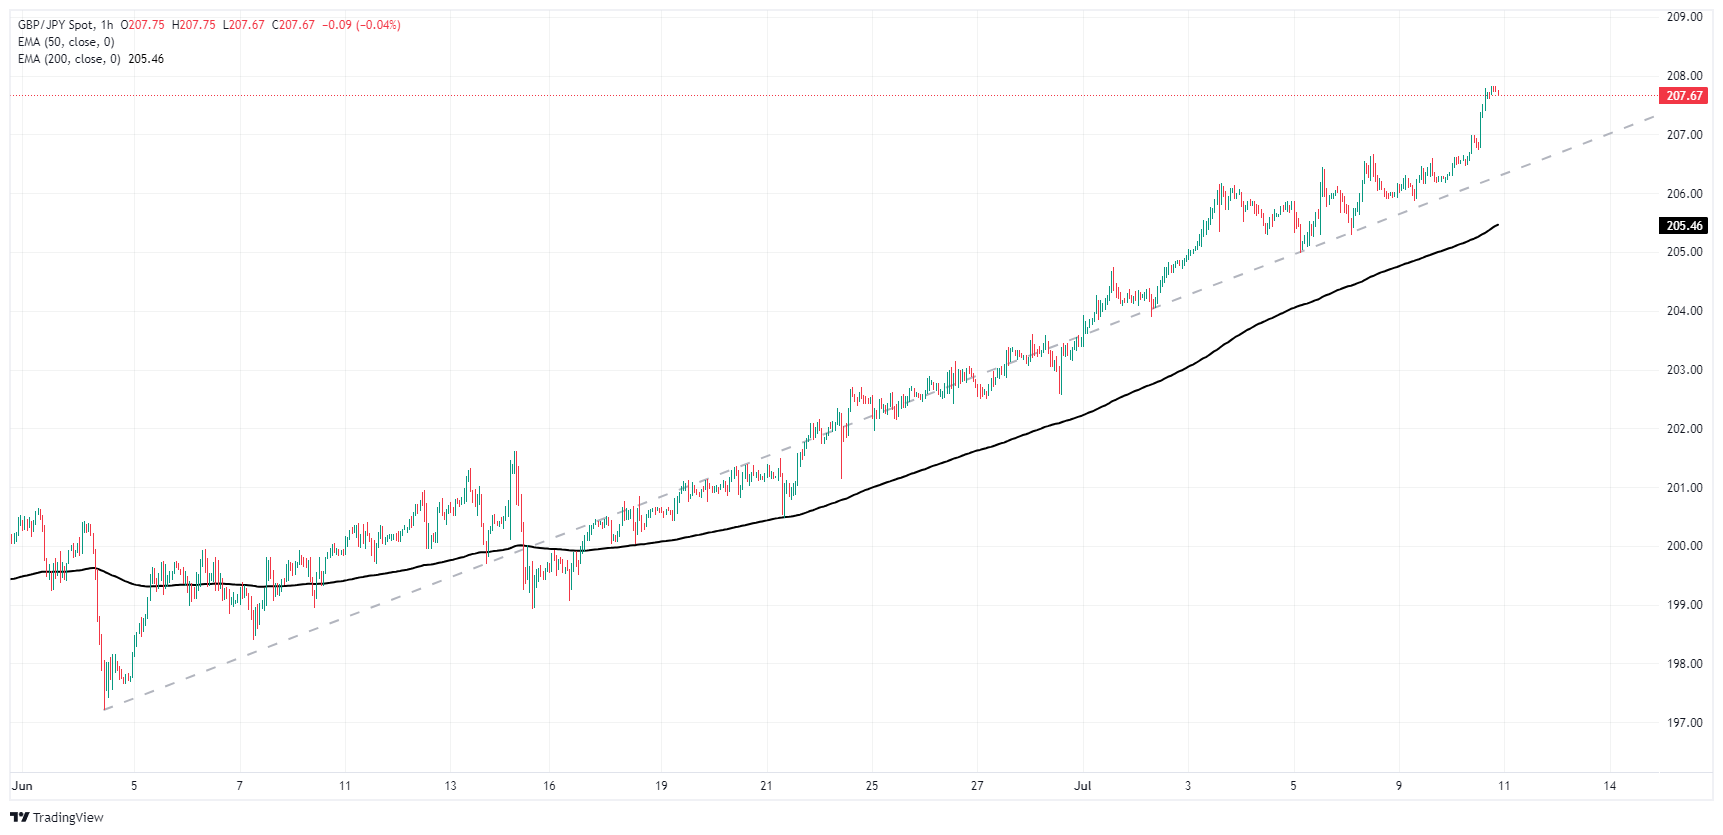
GBP/JPY daily chart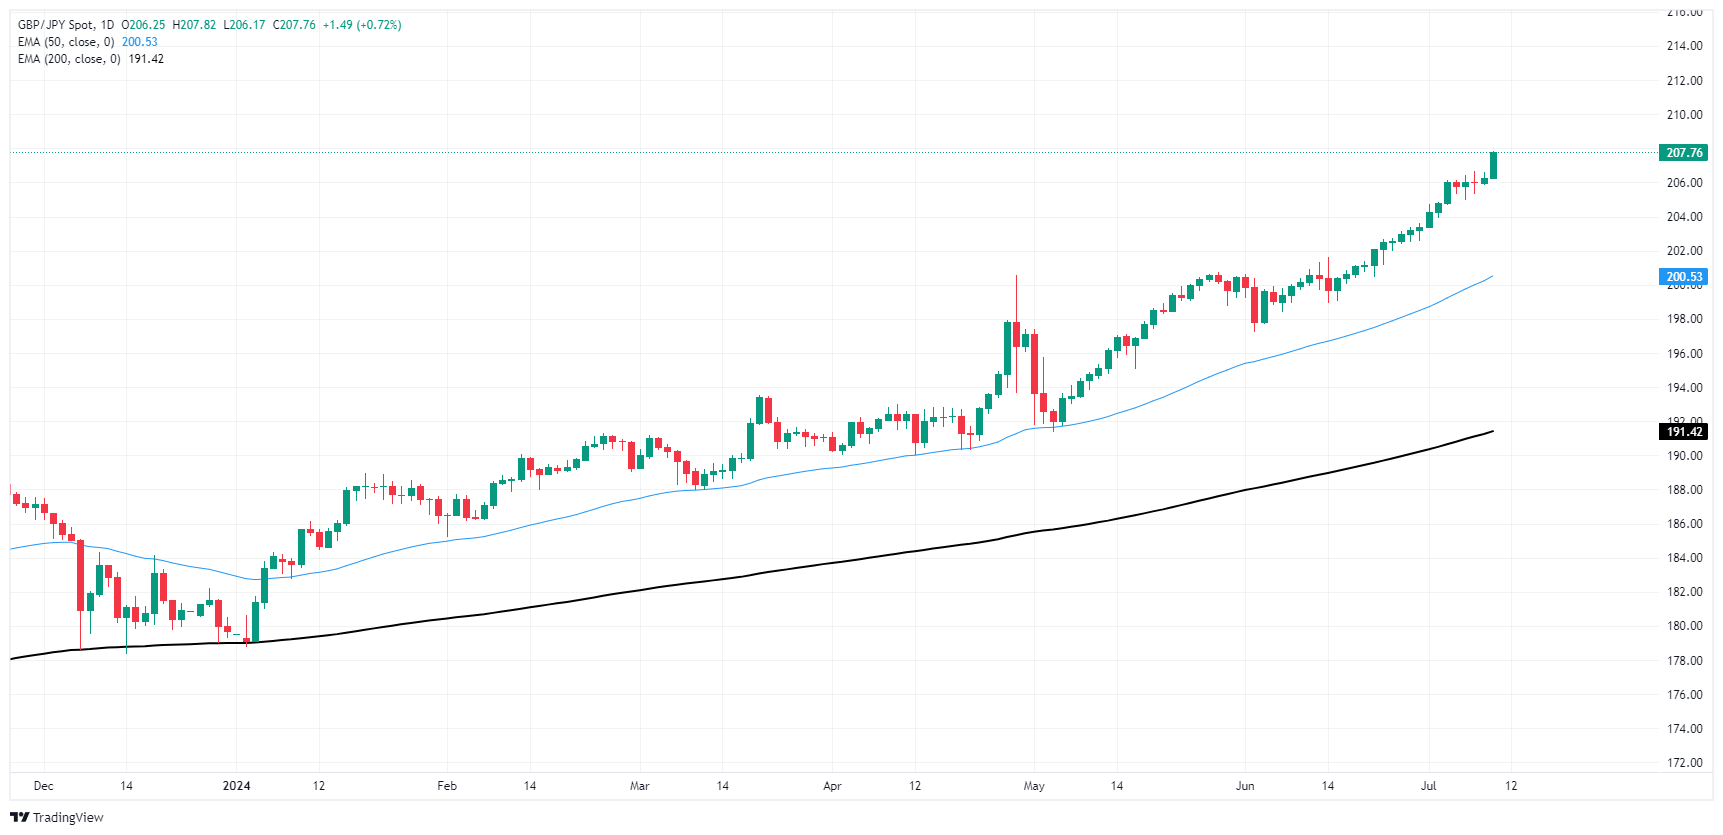
Japanese Yen FAQs
The Japanese Yen (JPY) is one of the world’s most traded currencies. Its value is broadly determined by the performance of the Japanese economy, but more specifically by the Bank of Japan’s policy, the differential between Japanese and US bond yields, or risk sentiment among traders, among other factors.
One of the Bank of Japan’s mandates is currency control, so its moves are key for the Yen. The BoJ has directly intervened in currency markets sometimes, generally to lower the value of the Yen, although it refrains from doing it often due to political concerns of its main trading partners. The current BoJ ultra-loose monetary policy, based on massive stimulus to the economy, has caused the Yen to depreciate against its main currency peers. This process has exacerbated more recently due to an increasing policy divergence between the Bank of Japan and other main central banks, which have opted to increase interest rates sharply to fight decades-high levels of inflation.
The BoJ’s stance of sticking to ultra-loose monetary policy has led to a widening policy divergence with other central banks, particularly with the US Federal Reserve. This supports a widening of the differential between the 10-year US and Japanese bonds, which favors the US Dollar against the Japanese Yen.
The Japanese Yen is often seen as a safe-haven investment. This means that in times of market stress, investors are more likely to put their money in the Japanese currency due to its supposed reliability and stability. Turbulent times are likely to strengthen the Yen’s value against other currencies seen as more risky to invest in.
- NZD/JPY saw a moderate decline, but buyers successfully kept the 20-day SMA of 97.80.
- Bears got momentum from RBNZ’s dovish decision.
- Indicators are scaping overbought conditions so the pair might enter in a consolidation phase.
During Wednesday's trading session, the NZD/JPY pair experienced a 0.40% decline to land at 98.30. Although it grappled with sellers' pressure, the bulls managed to defend the key 20-day Simple Moving Average (SMA) of 97.80.
On the daily chart, the Relative Strength Index (RSI) value now stands at 61. Compared with Tuesday's overbought reading of 72, the RSI is noticeably lower, signaling potential relief from overbought conditions. This drop indicates a shift from the previous bullish momentum and may suggest a pullback. The Moving Average Convergence Divergence (MACD) now displays a fresh red bar, indicating lesser buying momentum, which aligns with the possible pullback scenario.
NZD/JPY daily chart
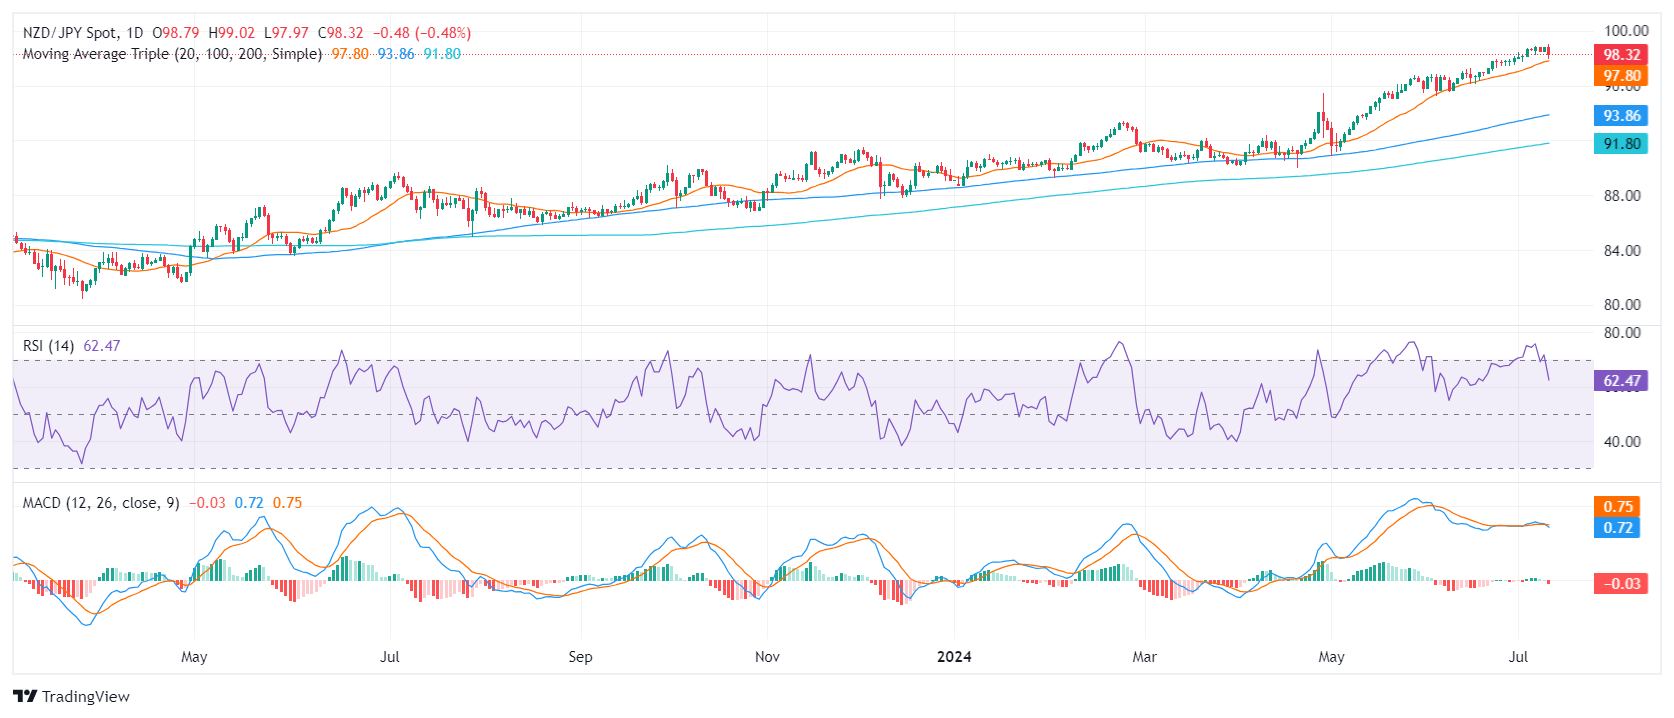
Gearing towards a possible downward correction, immediate support is seen around the 97.70 (20-day SMA) and 97.00 markers.
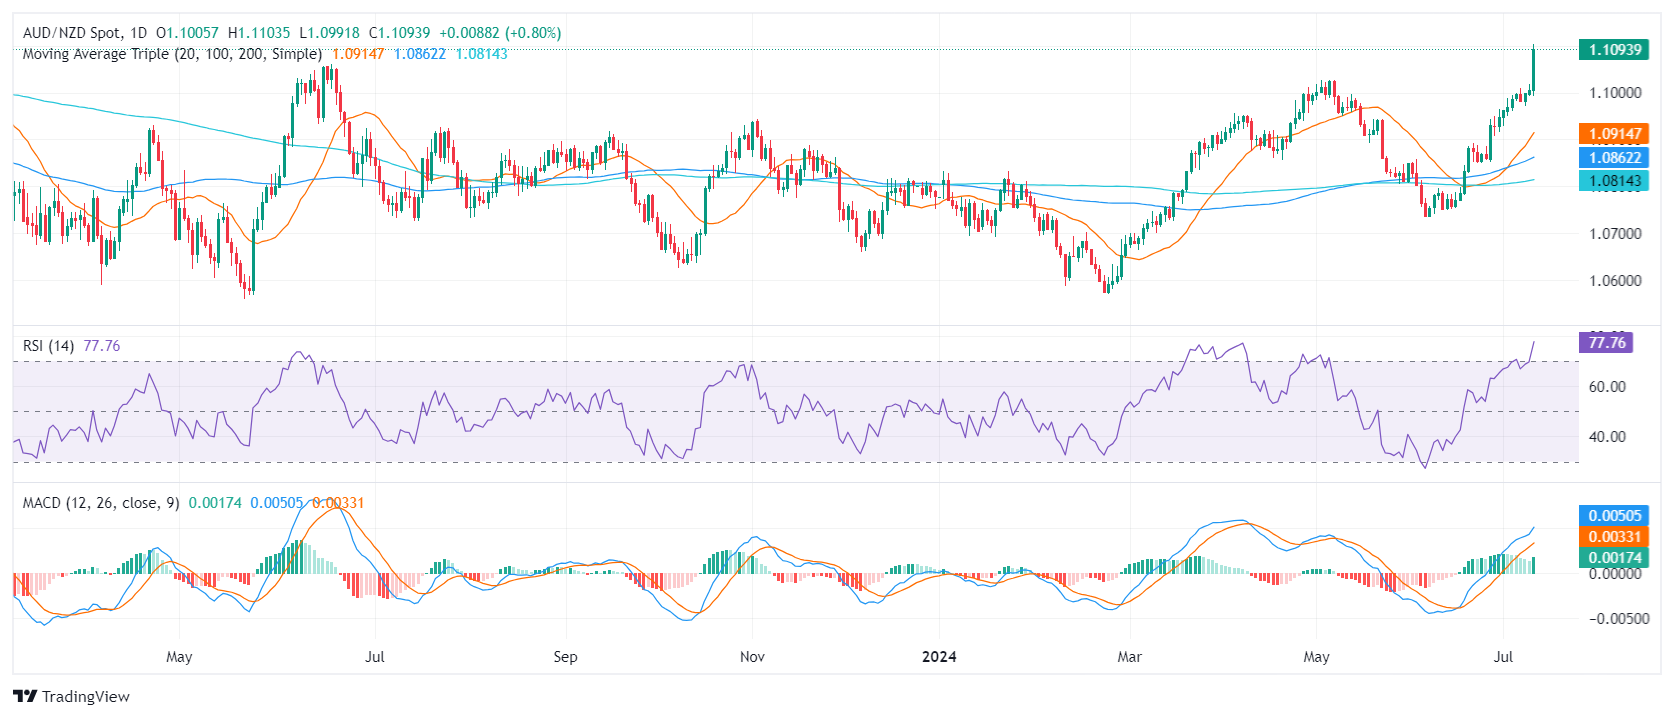
- AUD/NZD witnessed a significant rise to 1.1090, to multi-year highs.
- The RBNZ kept rates steady at 5.5%, signaling a willingness to ease sooner rather than later.
- RBA and RBNZ policy discrepancies might favor the AUD.
On Wednesday, the AUD/NZD rose to a fresh high since 2022, in reaction to the Reserve Bank of New Zealand (RBNZ) decision.
The RBNZ, as expected, kept the Official Cash Rate (OCR) anchored at 5.50%, but hinted at potential rate cuts in the near future. The RBNZ highlighted the signs of easing inflation persistence and the expectation of headline CPI returning to target in the second half of the year. Moreover, it addressed the impact of tight policy measures on the economy and deviated from the May 22 meeting where Governor Orr confessed that a hike was a "real consideration".
Following the decision, a rate cut is now priced in October, with the market pricing in nearly 60% odds of an earlier cut in August. On the other hand, while the Reserve Bank of Australia (RBA) seriously considers a hike, the pair may see more upside.
AUD/NZD technical analysis
In the short-term, the AUD/NZD maintains a bullish momentum due to the recent rally but overbought conditions seen in the Relative Strength Index (RSI) and the Moving Average Convergence Divergence (MACD) indicate that a correction may be imminent.
Support levels have moved and now stand at 1.1050, 1.1000, and 1.0950. The next challenge for buyers is to reach and retain the 1.1100 target point.
AUD/NZD daily chart
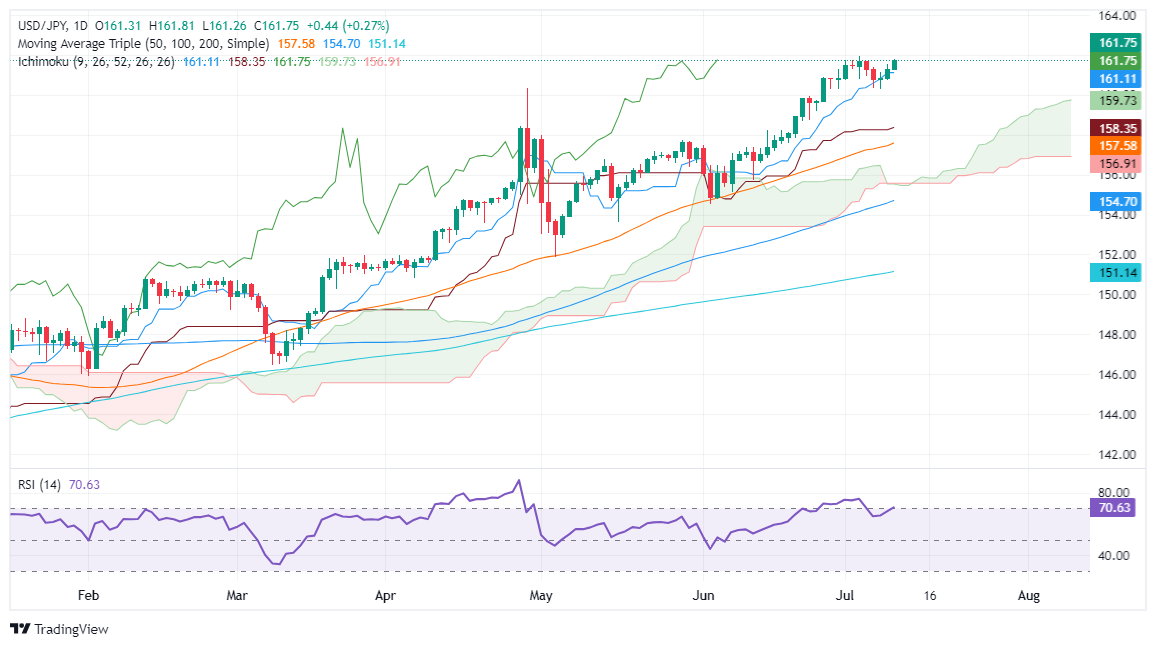
- USD/JPY gains over 0.30%, buoyed by Powell's stance against rate cuts without clear disinflation.
- Technicals hint at resistance near the 162.00 mark; RSI approaches overbought territory.
- Support levels to monitor: 161.10 (Tenkan-Sen), 160.73 (July 9 low), 160.26 (July 8 low) if bears take over.
The USD/JPY stretched its advance to three consecutive days and registered gains of more than 0.30% due to Fed Chair Jerome Powell sticking to the script. He said that lowering the fed funds rate is not an option unless there is progress in the disinflation process. The pair trades at 161.77, approaching the year-to-date (YTD) high of 161.95.
USD/JPY Price Analysis: Technical outlook
From a technical standpoint, the USD/JPY uptrend remains intact, though sellers could emerge at around the psychological 162.00 resistance level.
The momentum indicates a buyer-dominated market; the Relative Strength Index (RSI) hovers near overbought conditions. This could hinder the bulls' drive to lift the USD/JPY exchange rate or pave the way for consolidation.
If USD/JPY decisively clears 162.00, the next resistance would be 163.00, and the November 1986 high of 164.87.
Conversely, if bears stepped in and dragged prices below the Tekan-Sen at 161.10, it could exacerbate a deeper pullback. The next support would be the July 9 low of 160.73, followed by the latest cycle low of July 8 low of 160.26. If those two levels are surpassed, the USD/JPY could be set for a drop to 160.00 and below.
USD/JPY Price Action – Daily Chart
Japanese Yen FAQs
The Japanese Yen (JPY) is one of the world’s most traded currencies. Its value is broadly determined by the performance of the Japanese economy, but more specifically by the Bank of Japan’s policy, the differential between Japanese and US bond yields, or risk sentiment among traders, among other factors.
One of the Bank of Japan’s mandates is currency control, so its moves are key for the Yen. The BoJ has directly intervened in currency markets sometimes, generally to lower the value of the Yen, although it refrains from doing it often due to political concerns of its main trading partners. The current BoJ ultra-loose monetary policy, based on massive stimulus to the economy, has caused the Yen to depreciate against its main currency peers. This process has exacerbated more recently due to an increasing policy divergence between the Bank of Japan and other main central banks, which have opted to increase interest rates sharply to fight decades-high levels of inflation.
The BoJ’s stance of sticking to ultra-loose monetary policy has led to a widening policy divergence with other central banks, particularly with the US Federal Reserve. This supports a widening of the differential between the 10-year US and Japanese bonds, which favors the US Dollar against the Japanese Yen.
The Japanese Yen is often seen as a safe-haven investment. This means that in times of market stress, investors are more likely to put their money in the Japanese currency due to its supposed reliability and stability. Turbulent times are likely to strengthen the Yen’s value against other currencies seen as more risky to invest in.
A vacillating session saw the Greenback extend its weekly consolidation amidst erratic performance in the risk complex, as investors evaluated another congressional testimony by Chair Powell prior to the publication of US CPI data.
Here is what you need to know on Thursday, July 11:
The USD Index (DXY) kept the vacillating mood just above the 105.00 hurdle amidst muted US yields. The release of US Inflation Rate takes centre stage on July 11 seconded by weekly Initial Jobless Claims and speeches by the Fed’s Cook and Bostic.
EUR/USD improved marginally and left behind a negative first half of the week, revisiting the 1.0830 region on Wednesday. The final Inflation Rate in Germany is expected on July 11.
GBP/USD maintained its bullish bias past the 1.2800 level on the back of hawkish comments from BoE officials and some mild selling pressure in the Greenback. A busy UK docket on July 11 features GDP readings, Construction Output, Balance of Trade, Industrial Production, Manufacturing Production, and the NIESR Monthly GDP Tracker.
USD/JPY extended its weekly recovery further, opening the door to an imminent test of the 2024 high near 162. Weekly Foreign Bond Investment figures and Machinery Orders will be in the limelight in Japan on July 11.
AUD/USD showed some lack of confidence to advance further, moving into a consolidative phase always above 0.6700 instead. The Consumer Inflation Expectations tracked by the Melbourne Institute are due on July 11.
WTI prices set aside three sessions in a row of losses and staged a mild comeback above the $82.00 mark per barrel.
Gold prices added to Tuesday’s gains and flirted with the $2,390 mark per ounce troy on the back of the lack of direction in the US Dollar and muted yields. Silver prices navigated a tight range near the $31.00 region per ounce.
- Gold surges amid growing expectations of Fed rate cuts in September.
- US 10-year Treasury yield drops to 4.288%, while US Dollar Index falls below 105.00.
- Inflows into Gold ETFs support the metal, with eyes now on US June inflation data and economic indicators.
Gold price escalated on Wednesday for back-to-back days amid growing speculation that the Federal Reserve (Fed) could begin to slash higher interest rates at the September meeting. Consequently, US Treasury bond yields and the Greenback fell, a tailwind for the golden metal. The XAU/USD trades at $2,372, up by more than 0.30%.
Falling US Treasury bond yields and a soft US Dollar bolstered the non-yielding metal. The US 10-year benchmark note coupon dropped one-and-a-half basis points (bps) to 4.288%, while the US Dollar Index (DXY) trended below the 105.00 mark, losing 0.06%.
In his appearance at the US House of Representatives, Fed Chair Jerome Powell repeated most of his remarks revealed at a US Senate committee on Tuesday. He acknowledged the progress on inflation, yet Powell stated the board is not confident that lowering rates will help prices reach the 2% goal.
Despite ongoing pullbacks, Gold remains underpinned by a second consecutive month of inflows into Gold exchange-traded funds (EFTs) in June, driven by additions to holdings by Europe and Asia-listed funds.
With Fed Chair Powell's semi-annual testimony in the rearview mirror, investors eye the release of US June inflation figures on Thursday. That, Initial Jobless Claims and the University of Michigan Consumer Sentiment data will set Gold’s direction.
Daily digest market movers: Gold price escalates on Fed rate cut hopes
- US CPI is expected to decrease from 3.3% to 3.1% annually in June, while core inflation is projected to remain steady at 3.4% YoY.
- According to the consensus, Initial Jobless Claims for the week ending July 6 are expected to increase from 238K to 240K.
- July Consumer Sentiment is forecast to improve to 68.5, up from 68.2 in June, according to the consensus.
- Bullion prices retreated somewhat due to the People’s Bank of China’s (PBoC) decision to halt Gold purchases in June as it did in May. China held 72.80 million troy ounces of the precious metal at the end of June.
- According to data from the CME FedWatch Tool, investors are pricing in 71% odds of a Fed rate cut in September, up from 70% on Tuesday.
- December 2024 fed funds rate futures contract implies that the Fed will ease policy by 39 basis points (bps) toward the end of the year.
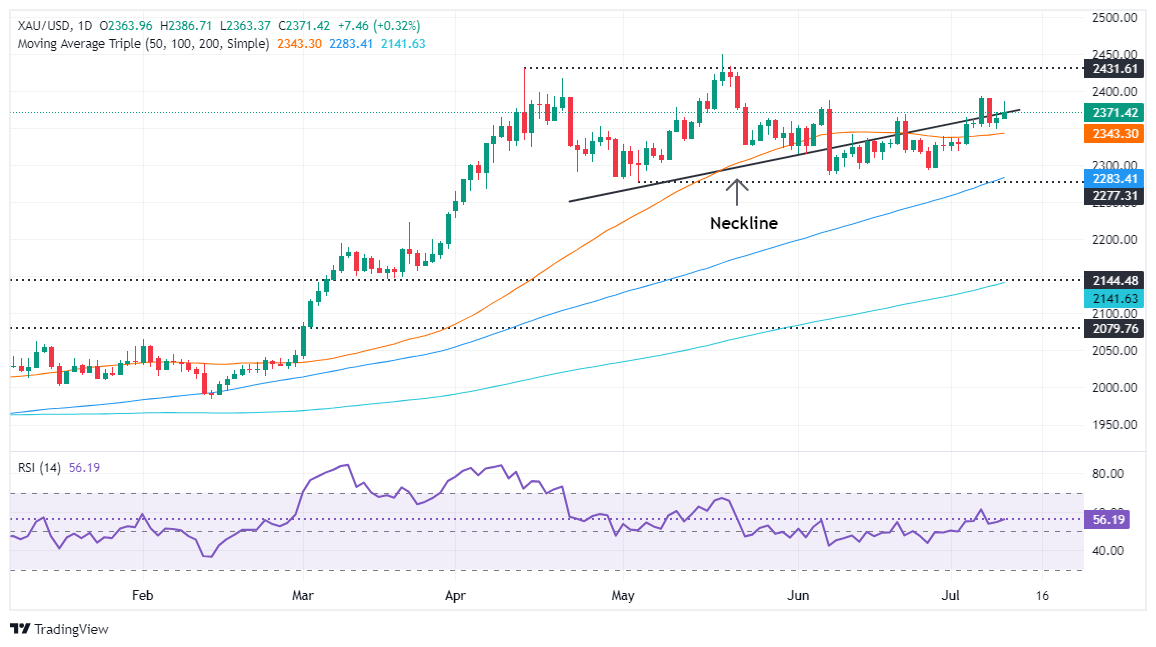
Technical analysis: Gold price consolidates around $2,370
Despite forming a bearish Harami candlestick pattern after breaching the Head-and-Shoulders neckline, Gold has resumed its ongoing uptrend yet remains shy of hitting weekly highs set on Monday at $2,391 a troy ounce.
Momentum shifted in favor of buyers as shown by the Relative Strength Index (RSI), which remains bullish above the 50-neutral line and aims upward.
Hence, the path of least resistance is to the upside. The XAU/USD first resistance would be the July 5 high at $2,392, followed by the $2,400 figure. A further upside is seen, with the next resistance lying at the year-to-date high of $2,450, ahead of the $2,500 mark.
Conversely, if XAU/USD slumps below $2,350, the golden metal might decline to the $2,300 level. If this support fails, the next demand zone would be the May 3 low of $2,277, followed by the March 21 high of $2,222.
Gold FAQs
Gold has played a key role in human’s history as it has been widely used as a store of value and medium of exchange. Currently, apart from its shine and usage for jewelry, the precious metal is widely seen as a safe-haven asset, meaning that it is considered a good investment during turbulent times. Gold is also widely seen as a hedge against inflation and against depreciating currencies as it doesn’t rely on any specific issuer or government.
Central banks are the biggest Gold holders. In their aim to support their currencies in turbulent times, central banks tend to diversify their reserves and buy Gold to improve the perceived strength of the economy and the currency. High Gold reserves can be a source of trust for a country’s solvency. Central banks added 1,136 tonnes of Gold worth around $70 billion to their reserves in 2022, according to data from the World Gold Council. This is the highest yearly purchase since records began. Central banks from emerging economies such as China, India and Turkey are quickly increasing their Gold reserves.
Gold has an inverse correlation with the US Dollar and US Treasuries, which are both major reserve and safe-haven assets. When the Dollar depreciates, Gold tends to rise, enabling investors and central banks to diversify their assets in turbulent times. Gold is also inversely correlated with risk assets. A rally in the stock market tends to weaken Gold price, while sell-offs in riskier markets tend to favor the precious metal.
The price can move due to a wide range of factors. Geopolitical instability or fears of a deep recession can quickly make Gold price escalate due to its safe-haven status. As a yield-less asset, Gold tends to rise with lower interest rates, while higher cost of money usually weighs down on the yellow metal. Still, most moves depend on how the US Dollar (USD) behaves as the asset is priced in dollars (XAU/USD). A strong Dollar tends to keep the price of Gold controlled, whereas a weaker Dollar is likely to push Gold prices up.
- Dow Jones climbed to 39,500.00 as markets read between the lines.
- Fed Chair Powell wraps up two-day Congressional testimony.
- Markets look ahead to key US inflation data later in the week.
The Dow Jones Industrial Average (DJIA) climbed on Wednesday, testing above 39,500.00 as equity markets stepped back into a risk-on stance. Rate cut hopes continue to underpin broader market flows, and investors have recovered their footing and brushed off an overall cautious tone from Federal Reserve (Fed) Chairman Jerome Powell.
Fed Chair Powell wrapped up the second of a two-day appearance before US Congressional committees on Wednesday, with the head of the US central bank sticking close to a familiar script across both days. While giving a nod of the head to overall progress on inflation, and admitting that the Fed isn’t going to wait until inflation hits the 2% annual target, Fed Chair Powell remains firmly planted in a cautious stance. While the Fed won’t be waiting for inflation to hit the overall target, Fed officials still want further evidence that inflation will eventually hit 2% before delivering rate cuts.
According to the CME’s FedWatch Tool, rate markets still have hopes firmly pinned on a September rate cut, with interest rate traders pricing in 75% odds of at least a quarter-point trim to the fed funds rate on September 18.
With the Fed entrenched in a wait for further signs of easing inflation, markets will be firmly focused on US inflation figures due this week. US Consumer Price Index (CPI) inflation is slated for Thursday, with US Producer Price Index (PPI) wholesale inflation due on Friday. Rate-cut-hungry investors may be set up for disappointment with June’s annualized core CPI expected to hold steady at 3.4%, and Friday’s YoY core PPI expected to actually tick higher to 2.5% from the previous 2.3%.
Dow Jones news
The Dow Jones firmly shook off cautious tones on Wednesday, rallying to a daily high of 39,526.17 and climbing around 200 points. Over two-thirds of the index is in the green for the day, with Honeywell International Inc. (HON) leading the charge, climbing 1.4% on Wednesday but closely followed by megacap companies including Amgen Inc. (AMGN), Home Depot Inc. (HD), Apple Inc. (AAPL), and McDonald’s Corp. (MCD). On the low side, Visa Inc. (V) fell to the bottom of the board, backsliding -1.8% to $260.61 per share.
Dow Jones technical outlook
The Dow Jones has given a choppy two-day performance, climbing a full percentage point bottom-to-top from Tuesday’s lows near 39,130.00. Bullish momentum is poised for a breakout of recent consolidation as price action gets squeezed between the 50-day Exponential Moving Average (EMA) near 39,000.00 and a supply zone priced in near the 40,000.00 major price handle.
Dow Jones five minute chart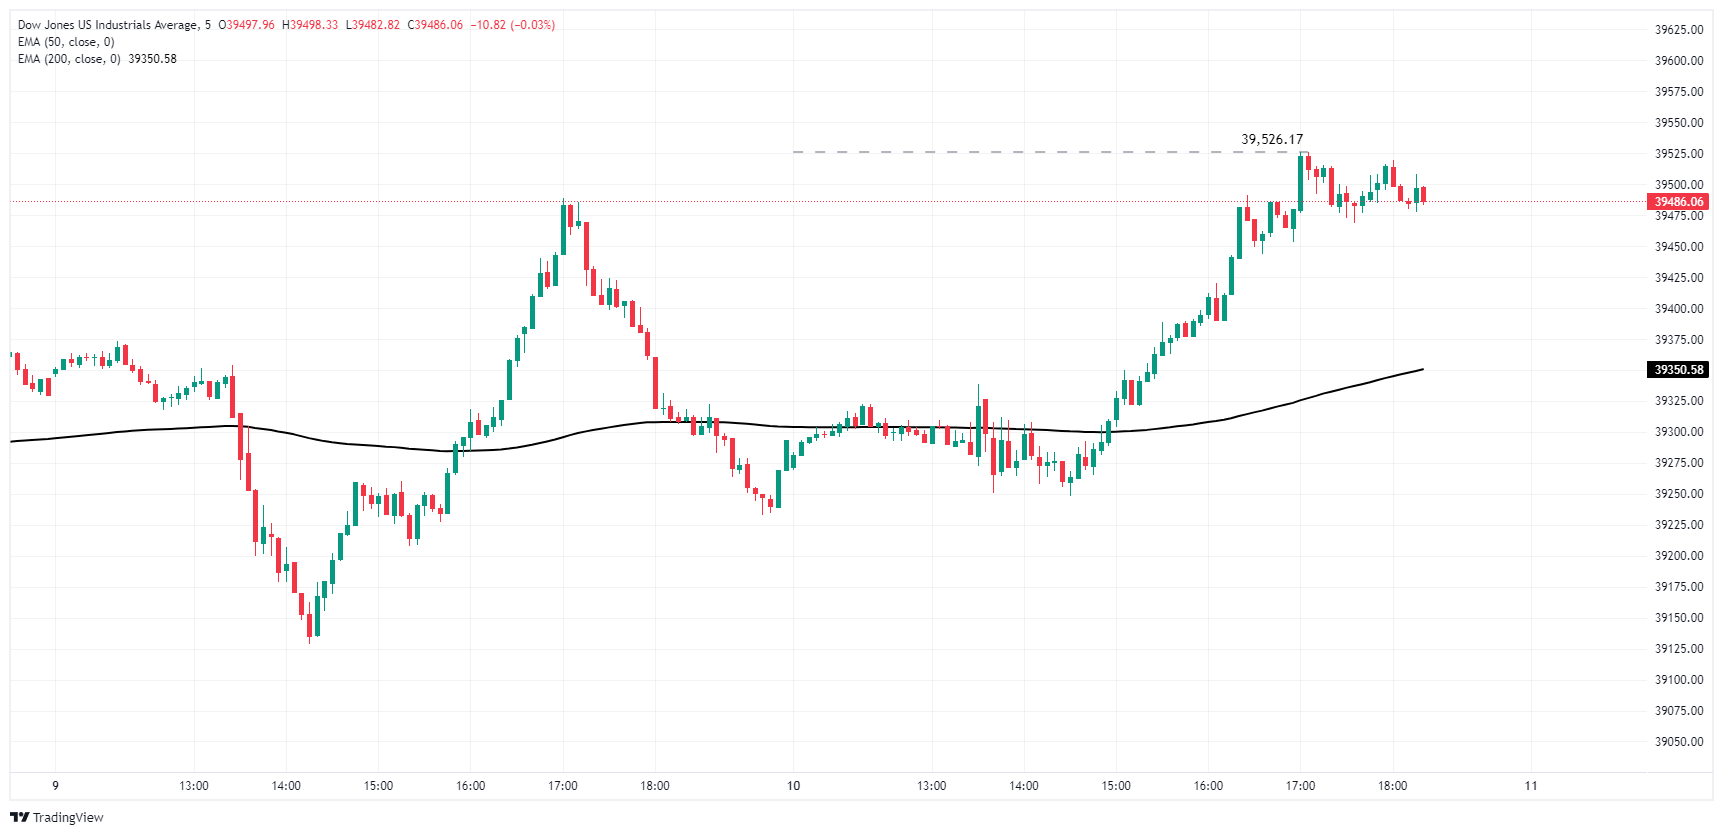
Dow Jones daily chart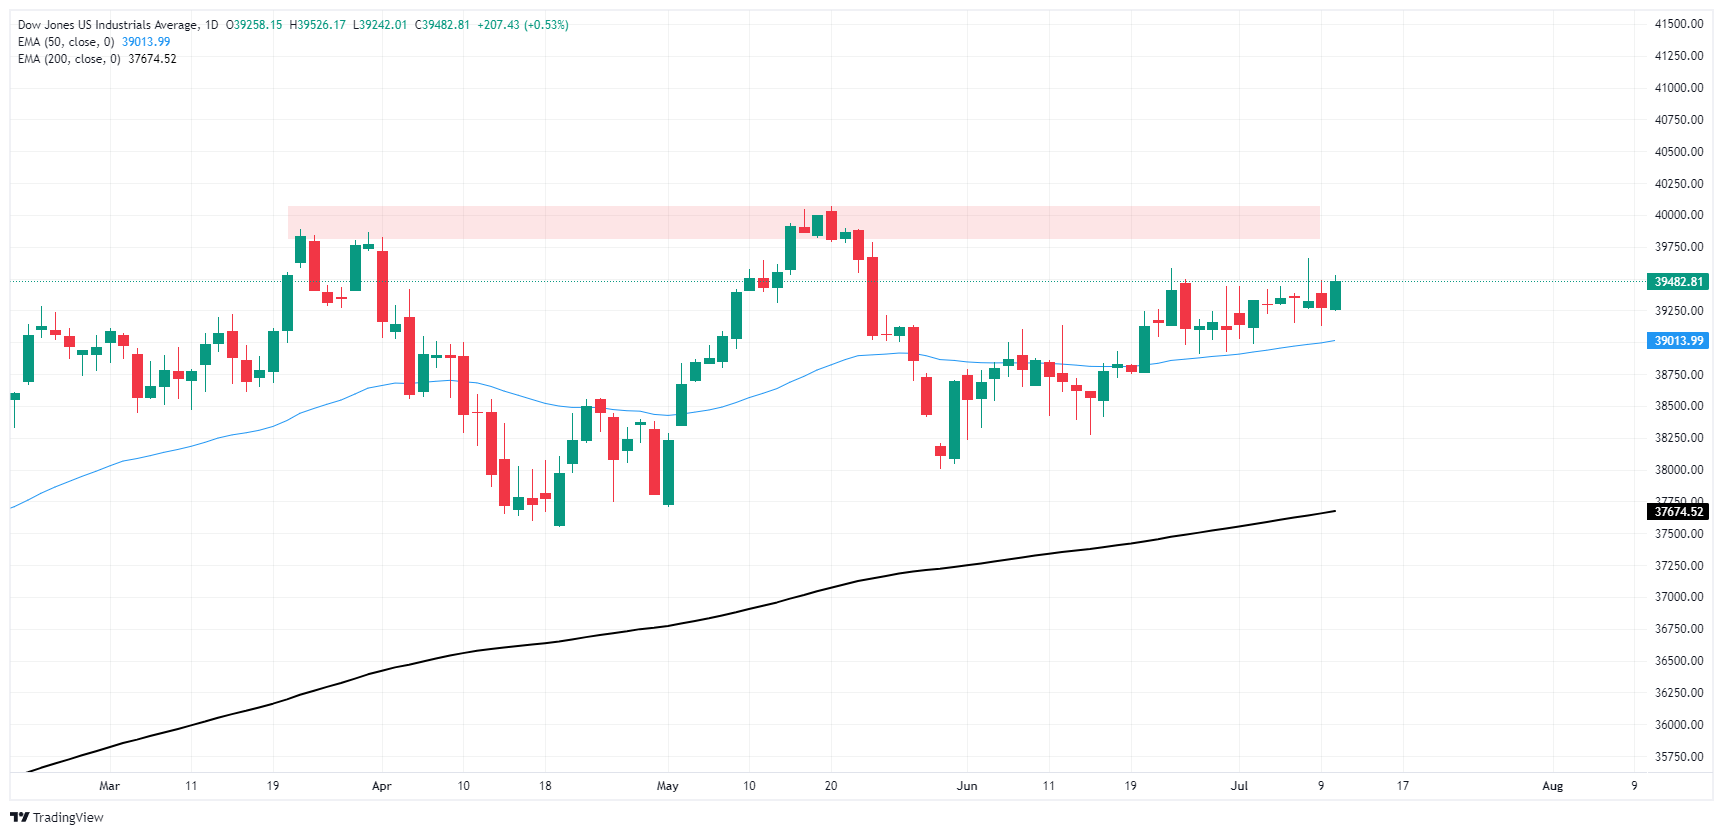
Dow Jones FAQs
The Dow Jones Industrial Average, one of the oldest stock market indices in the world, is compiled of the 30 most traded stocks in the US. The index is price-weighted rather than weighted by capitalization. It is calculated by summing the prices of the constituent stocks and dividing them by a factor, currently 0.152. The index was founded by Charles Dow, who also founded the Wall Street Journal. In later years it has been criticized for not being broadly representative enough because it only tracks 30 conglomerates, unlike broader indices such as the S&P 500.
Many different factors drive the Dow Jones Industrial Average (DJIA). The aggregate performance of the component companies revealed in quarterly company earnings reports is the main one. US and global macroeconomic data also contributes as it impacts on investor sentiment. The level of interest rates, set by the Federal Reserve (Fed), also influences the DJIA as it affects the cost of credit, on which many corporations are heavily reliant. Therefore, inflation can be a major driver as well as other metrics which impact the Fed decisions.
Dow Theory is a method for identifying the primary trend of the stock market developed by Charles Dow. A key step is to compare the direction of the Dow Jones Industrial Average (DJIA) and the Dow Jones Transportation Average (DJTA) and only follow trends where both are moving in the same direction. Volume is a confirmatory criteria. The theory uses elements of peak and trough analysis. Dow’s theory posits three trend phases: accumulation, when smart money starts buying or selling; public participation, when the wider public joins in; and distribution, when the smart money exits.
There are a number of ways to trade the DJIA. One is to use ETFs which allow investors to trade the DJIA as a single security, rather than having to buy shares in all 30 constituent companies. A leading example is the SPDR Dow Jones Industrial Average ETF (DIA). DJIA futures contracts enable traders to speculate on the future value of the index and Options provide the right, but not the obligation, to buy or sell the index at a predetermined price in the future. Mutual funds enable investors to buy a share of a diversified portfolio of DJIA stocks thus providing exposure to the overall index.
- AUD made mild gains on Wednesday against the USD.
- Markets are still deciphering Jerome Powell's cautious stance, which limits traction for USD.
- RBA's hawkish stance provides stable support for Aussie.
The Australian Dollar (AUD) continued its positive trend against the USD on Wednesday, mildly rising near 0.6750. Despite no significant pertinent events down the line for the Australian financial scene this week, the pair still maintains its stronghold, with the AUD continuing its recent gains. On the US side, markets await clues on the Federal Reserve’s (Fed) plans.
The Reserve Bank of Australia (RBA) is set to be among the last G10 nations' central banks to initiate rate cuts, a factor that boosts the AUD.
Updated daily market movers: AUD holds ground after Powell’s words
- Jerome Powell on Wednesday emphasized the need to pay elevated attention to the labor market, citing that it has significantly deteriorated.
- In addition, he expressed a degree of confidence regarding the downward movement of inflation.
- He stated that achieving price stability without hurting employment is achievable but didn't provide a specific inflation or unemployment figure as a benchmark for deciding on rate cuts.
- US CPI figures, coming on Thursday, will be crucial. The headline is projected to decrease slightly to 3.1% YoY, while the core is anticipated to remain steady at 3.4% YoY.
- On the RBA's side, markets bet on nearly a 50% chance of a hike in September or November. On the Fed's side, investors are confident in an 80% likelihood of a cut in September.
Technical analysis: AUD/USD’s gains continue, consolidation expected
The AUD/USD continues on a rising trajectory, resulting in the pair making gains on Wednesday. The outlook remains positive with indicators including the Relative Strength Index (RSI) and Moving Average Convergence Divergence (MACD) holding strong in deep positive territory.
Following the pair's performance hitting its highest since January, the trend hints at an optimistic outlook. However, traders appear to be keeping an eye on consolidating these gains, which is limiting the upside.
Support levels to monitor are at 0.6670, 0.6650 and 0.6630 in case of a correction.
Australian Dollar FAQs
One of the most significant factors for the Australian Dollar (AUD) is the level of interest rates set by the Reserve Bank of Australia (RBA). Because Australia is a resource-rich country another key driver is the price of its biggest export, Iron Ore. The health of the Chinese economy, its largest trading partner, is a factor, as well as inflation in Australia, its growth rate and Trade Balance. Market sentiment – whether investors are taking on more risky assets (risk-on) or seeking safe-havens (risk-off) – is also a factor, with risk-on positive for AUD.
The Reserve Bank of Australia (RBA) influences the Australian Dollar (AUD) by setting the level of interest rates that Australian banks can lend to each other. This influences the level of interest rates in the economy as a whole. The main goal of the RBA is to maintain a stable inflation rate of 2-3% by adjusting interest rates up or down. Relatively high interest rates compared to other major central banks support the AUD, and the opposite for relatively low. The RBA can also use quantitative easing and tightening to influence credit conditions, with the former AUD-negative and the latter AUD-positive.
China is Australia’s largest trading partner so the health of the Chinese economy is a major influence on the value of the Australian Dollar (AUD). When the Chinese economy is doing well it purchases more raw materials, goods and services from Australia, lifting demand for the AUD, and pushing up its value. The opposite is the case when the Chinese economy is not growing as fast as expected. Positive or negative surprises in Chinese growth data, therefore, often have a direct impact on the Australian Dollar and its pairs.
Iron Ore is Australia’s largest export, accounting for $118 billion a year according to data from 2021, with China as its primary destination. The price of Iron Ore, therefore, can be a driver of the Australian Dollar. Generally, if the price of Iron Ore rises, AUD also goes up, as aggregate demand for the currency increases. The opposite is the case if the price of Iron Ore falls. Higher Iron Ore prices also tend to result in a greater likelihood of a positive Trade Balance for Australia, which is also positive of the AUD.
The Trade Balance, which is the difference between what a country earns from its exports versus what it pays for its imports, is another factor that can influence the value of the Australian Dollar. If Australia produces highly sought after exports, then its currency will gain in value purely from the surplus demand created from foreign buyers seeking to purchase its exports versus what it spends to purchase imports. Therefore, a positive net Trade Balance strengthens the AUD, with the opposite effect if the Trade Balance is negative.
- Mexican Peso strengthens for seventh session with USD/MXN down 0.44%, sparked by high inflation.
- Banxico Deputy Governor Borja adopts neutral stance, despite emphasizing that policy is restrictive.
- Banxico’s minutes to address disinflation forces, growth disappointments, and potential downside risks in upcoming meeting.
The Mexican Peso extended its rally for the seventh consecutive session on Wednesday after inflation got close to 5%, which might deter the Bank of Mexico (Banxico) from easing policy at the upcoming monetary policy meeting in August. Therefore, the USD/MXN continued to edge lower and traded at 17.83, a loss of 0.44%.
Mexico’s inflation, as measured by the Consumer Price Index (CPI), was higher than expected in June, hitting 4.98%, above estimates of 4.84%. This triggered a reaction amongst Banxico’s policymakers with Deputy Governor Jonathan Heath writing on X that June’s inflation data was “very worrying.”
Recently, Deputy Governor Galia Borja said, “It's prudent not to make hasty decisions” regarding monetary policy. She’s adopted a more neutral stance, adding that officials must be patient, though she added that the current policy is “undoubtedly restrictive.”
On Thursday, Banxico will reveal its latest monetary policy minutes. Analysts at JP Morgan wrote, “We expect the minutes to elaborate on both disinflation forces and some of the upside risks embedded in the ongoing MXN re-adjustment, and the forces behind growth disappointments.”
They added that Banxico’s board is expected to acknowledge the “underwhelming growth dynamics and downgraded its growth outlook—now openly underscoring downside risks to economic activity.”
Across the border, Federal Reserve (Fed) Chair Jerome Powell appeared at the US House of Representatives and repeated some of Tuesday’s words that the disinflation process is evolving and that the risks of achieving the dual mandate have become more balanced. He added that Fed officials needed good inflation data to lower borrowing costs and that neutral rates must have moved up “at least in the short term.”
Daily digest market movers: Mexican Peso rockets due to high inflation
- According to the National Statistics Agency (INEGI), Mexico’s June inflation figures were higher than expected due to a rise in food prices when most economists expect Banxico to resume lowering interest rates.
- Mexico’s CPI rose from 4.69% YoY to 4.98% in June, while core CPI dipped from 4.21% to 4.13% annually, exceeding the estimated 4.15%.
- Despite the rise in inflation, Capital Economics analysts estimate that the Mexican central bank could cut rates at the August meeting.
- On Monday, the New York Federal Reserve revealed that consumer inflation expectations were lowered from 3.2% to 3% for one year.
- US CPI is foreseen dropping from 3.3% to 3.1% in the 12 months to June, while underlying inflation is projected to stay firm at 3.4% YoY.
- US Dollar Index (DXY), which tracks the value of a basket of six currencies against the US Dollar, advances some 0.16% and is up at 105.17.
- According to the CME FedWatch Tool data, the odds for a September cut are 72%, up from 70% on Tuesday.
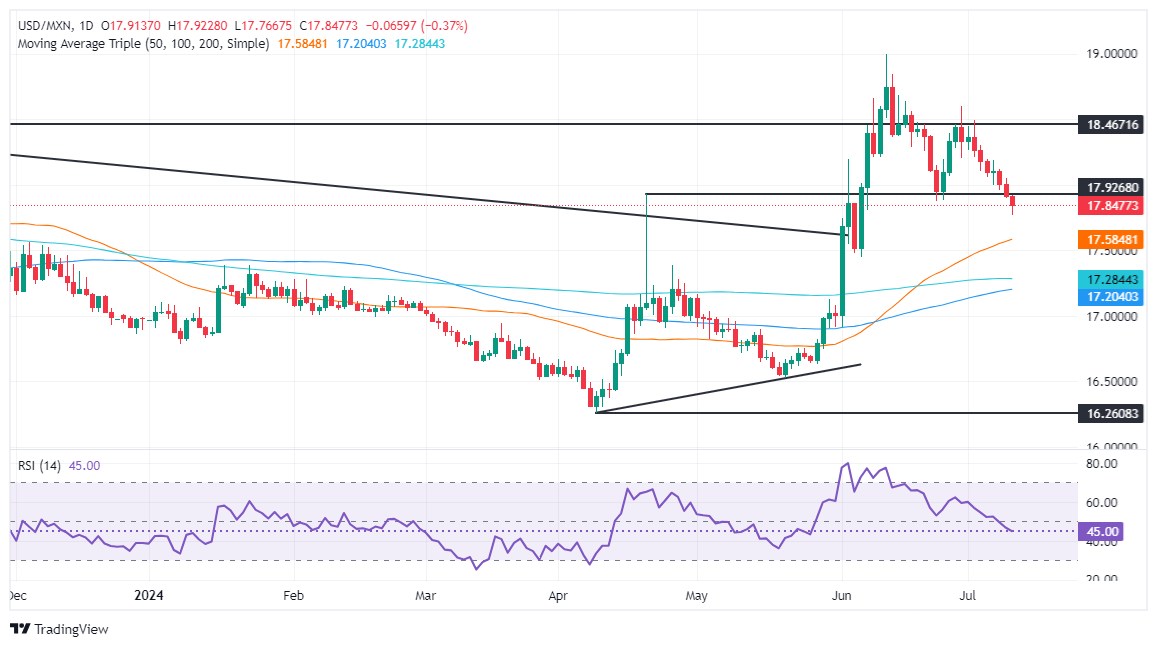
Technical analysis: Mexican Peso appreciates sharply as USD/MXN falls below 17.85
The USD/MXN continued to extend its losses past June 24, the latest cycle low of 17.87, which could pave the way for a deeper correction. Momentum has abruptly shifted in bears’ favor, an indication that sellers will drive the exotic pair price action lower.
If the downtrend continued, the next support would be the confluence of the December 5 high and the 50-day Simple Moving Average (SMA) at around 17.56/57, followed by the 200-day SMA at 17.26. The next floor level would be the 100-day SMA at 17.19.
For a bullish resumption, USD/MXN must surpass 18.10, followed by a rally above the June 28 high of 18.59, allowing buyers to challenge the YTD high of 18.99. Conversely, sellers will need to push the pair below 18.00, which could extend the decline toward the December 5 high-turned-support at 17.56, followed by the 50-day SMA at 17.37.
Mexican Peso FAQs
The Mexican Peso (MXN) is the most traded currency among its Latin American peers. Its value is broadly determined by the performance of the Mexican economy, the country’s central bank’s policy, the amount of foreign investment in the country and even the levels of remittances sent by Mexicans who live abroad, particularly in the United States. Geopolitical trends can also move MXN: for example, the process of nearshoring – or the decision by some firms to relocate manufacturing capacity and supply chains closer to their home countries – is also seen as a catalyst for the Mexican currency as the country is considered a key manufacturing hub in the American continent. Another catalyst for MXN is Oil prices as Mexico is a key exporter of the commodity.
The main objective of Mexico’s central bank, also known as Banxico, is to maintain inflation at low and stable levels (at or close to its target of 3%, the midpoint in a tolerance band of between 2% and 4%). To this end, the bank sets an appropriate level of interest rates. When inflation is too high, Banxico will attempt to tame it by raising interest rates, making it more expensive for households and businesses to borrow money, thus cooling demand and the overall economy. Higher interest rates are generally positive for the Mexican Peso (MXN) as they lead to higher yields, making the country a more attractive place for investors. On the contrary, lower interest rates tend to weaken MXN.
Macroeconomic data releases are key to assess the state of the economy and can have an impact on the Mexican Peso (MXN) valuation. A strong Mexican economy, based on high economic growth, low unemployment and high confidence is good for MXN. Not only does it attract more foreign investment but it may encourage the Bank of Mexico (Banxico) to increase interest rates, particularly if this strength comes together with elevated inflation. However, if economic data is weak, MXN is likely to depreciate.
As an emerging-market currency, the Mexican Peso (MXN) tends to strive during risk-on periods, or when investors perceive that broader market risks are low and thus are eager to engage with investments that carry a higher risk. Conversely, MXN tends to weaken at times of market turbulence or economic uncertainty as investors tend to sell higher-risk assets and flee to the more-stable safe havens.
Bank of England (BoE) Monetary Policy Committee member Catherine Mann noted on Wednesday that overall progress on inflation has been "touch-and-go", and warned of a potential rebound in headline inflation figures.
Key highlights
The supply side of the economy is growing very slowly, I still see labour market tightness.
Wage growth is still far away from being constistent with the inflation target.
We need to see sustained slower service inflation.
Until I see some deceleration in services prices, I'm not in a position to cut.
The 2% inflation we see now is a touch and go, it will be above 2% for the rest of the year, that matters for my decision making.
- The Canadian Dollar found thin gains on Wednesday.
- Canada market flows remain thin, and no meaningful CAD data is on the docket.
- US inflation figures due later in the week remain the key risk event.
The Canadian Dollar (CAD) edged higher on Wednesday, bolstered more by a general uptick in broad-market risk appetite and a bullish reversal in Crude Oil than anything related to a shift in CAD sentiment. Federal Reserve (Fed) Chairman Jerome Powell made his second of two appearances in as many days before US Congressional financial committees, delivering the Fed’s latest Semi-Annual Monetary Policy Report.
Canada has had a quiet week on the economic calendar, and the trend of data-less CAD trading is set to continue until next week’s Canadian inflation print set for next Tuesday, with Canadian Retail Sales far-flung to next Friday. In the meantime, a key print in US inflation figures will dominate market flows this week, with US Consumer Price Index (CPI) inflation and Producer Price Index (PPI) wholesale inflation slated for this Thursday and Friday, respectively.
Daily digest market movers: Canadian Dollar softly bolstered by step-up in market risk appetite
- CAD traders are settled in for the long wait for Canadian CPI inflation numbers due next week.
- Data-light CAD finds support from rising Crude Oil bids on Wednesday plus a general improvement in investor sentiment during the midweek market session.
- Fed Chair Powell stuck close to his familiar script during his two-day testimony before US Congressional committees while delivering the Fed’s latest Monetary Policy Report.
- Fed Chair Powell noted that while the Fed still wants more confidence that inflation will ease to the US central bank’s 2% annual inflation target, that doesn’t necessarily mean the Fed will wait until inflation has hit 2% to begin easing rates.
- However, Fed Chair Powell warned that despite easing inflation and a softening labor market, housing and shelter inflation remains a concern.
- According to the CME’s FedWatch Tool, rate traders are still leaning fully into a September rate cut, with markets pricing in at least a 25 basis point trim to the fed funds rate on September 18.
- Jerome Powell Speech: Chairman testifies before House Financial Services Committee
Canadian Dollar PRICE Today
The table below shows the percentage change of Canadian Dollar (CAD) against listed major currencies today. Canadian Dollar was the strongest against the New Zealand Dollar.
| USD | EUR | GBP | JPY | CAD | AUD | NZD | CHF | |
|---|---|---|---|---|---|---|---|---|
| USD | -0.12% | -0.47% | 0.21% | -0.17% | -0.09% | 0.71% | 0.17% | |
| EUR | 0.12% | -0.33% | 0.35% | -0.04% | 0.01% | 0.81% | 0.28% | |
| GBP | 0.47% | 0.33% | 0.71% | 0.31% | 0.34% | 1.15% | 0.60% | |
| JPY | -0.21% | -0.35% | -0.71% | -0.37% | -0.32% | 0.45% | -0.08% | |
| CAD | 0.17% | 0.04% | -0.31% | 0.37% | 0.07% | 0.87% | 0.31% | |
| AUD | 0.09% | -0.01% | -0.34% | 0.32% | -0.07% | 0.79% | 0.24% | |
| NZD | -0.71% | -0.81% | -1.15% | -0.45% | -0.87% | -0.79% | -0.54% | |
| CHF | -0.17% | -0.28% | -0.60% | 0.08% | -0.31% | -0.24% | 0.54% |
The heat map shows percentage changes of major currencies against each other. The base currency is picked from the left column, while the quote currency is picked from the top row. For example, if you pick the Canadian Dollar from the left column and move along the horizontal line to the US Dollar, the percentage change displayed in the box will represent CAD (base)/USD (quote).
Technical analysis: Canadian Dollar dragged slightly higher by broader market forces
The Canadian Dollar (CAD) traded a step higher than the US Dollar (USD) on Wednesday, up a thin sixth of a percent against the Greenback. The CAD softened around three-tenths of one percent against the bullish Pound Sterling (GBP), and the Canadian Dollar benefits from broad-market selling pressure forcing the New Zealand Dollar (NZD) lower. The CAD is up nearly nine-tenths of one percent against the NZD on Wednesday.
USD/CAD continues to churn just above 1.3600, but near-term short pressure has pushed the USD lower against the CAD, sending the pair down from intraday consolidation near 1.3640. Daily candlesticks continue to drift down toward the 200-day Exponential Moving Average (EMA) at 1.3590 as bids get squeezed between the long-term moving average and a supply zone priced in above 1.3750.
USD/CAD hourly chart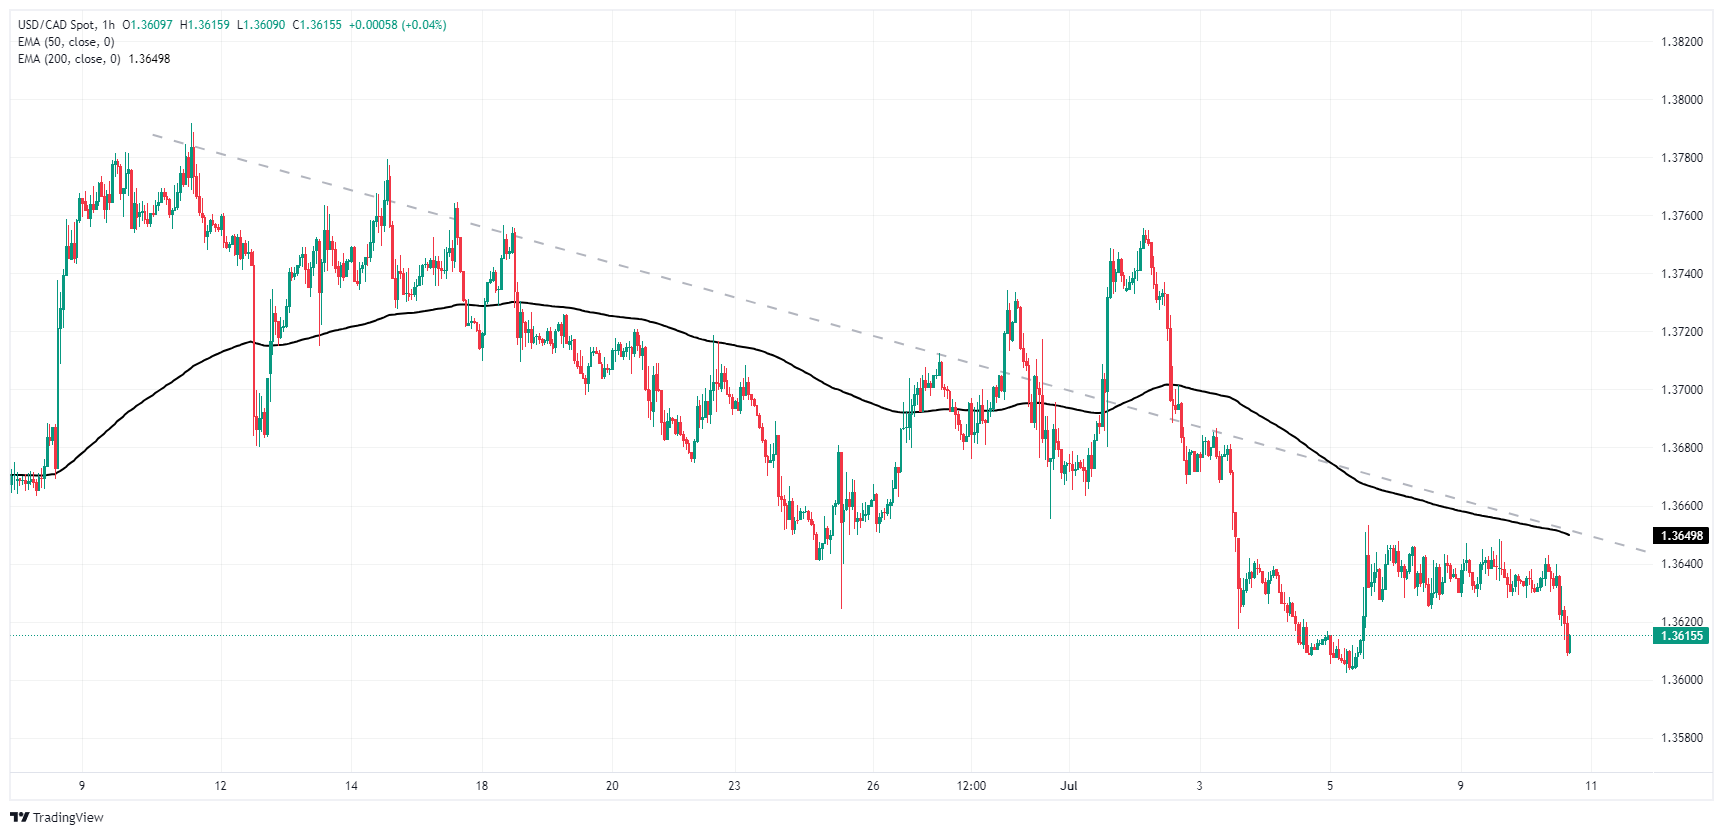
USD/CAD daily chart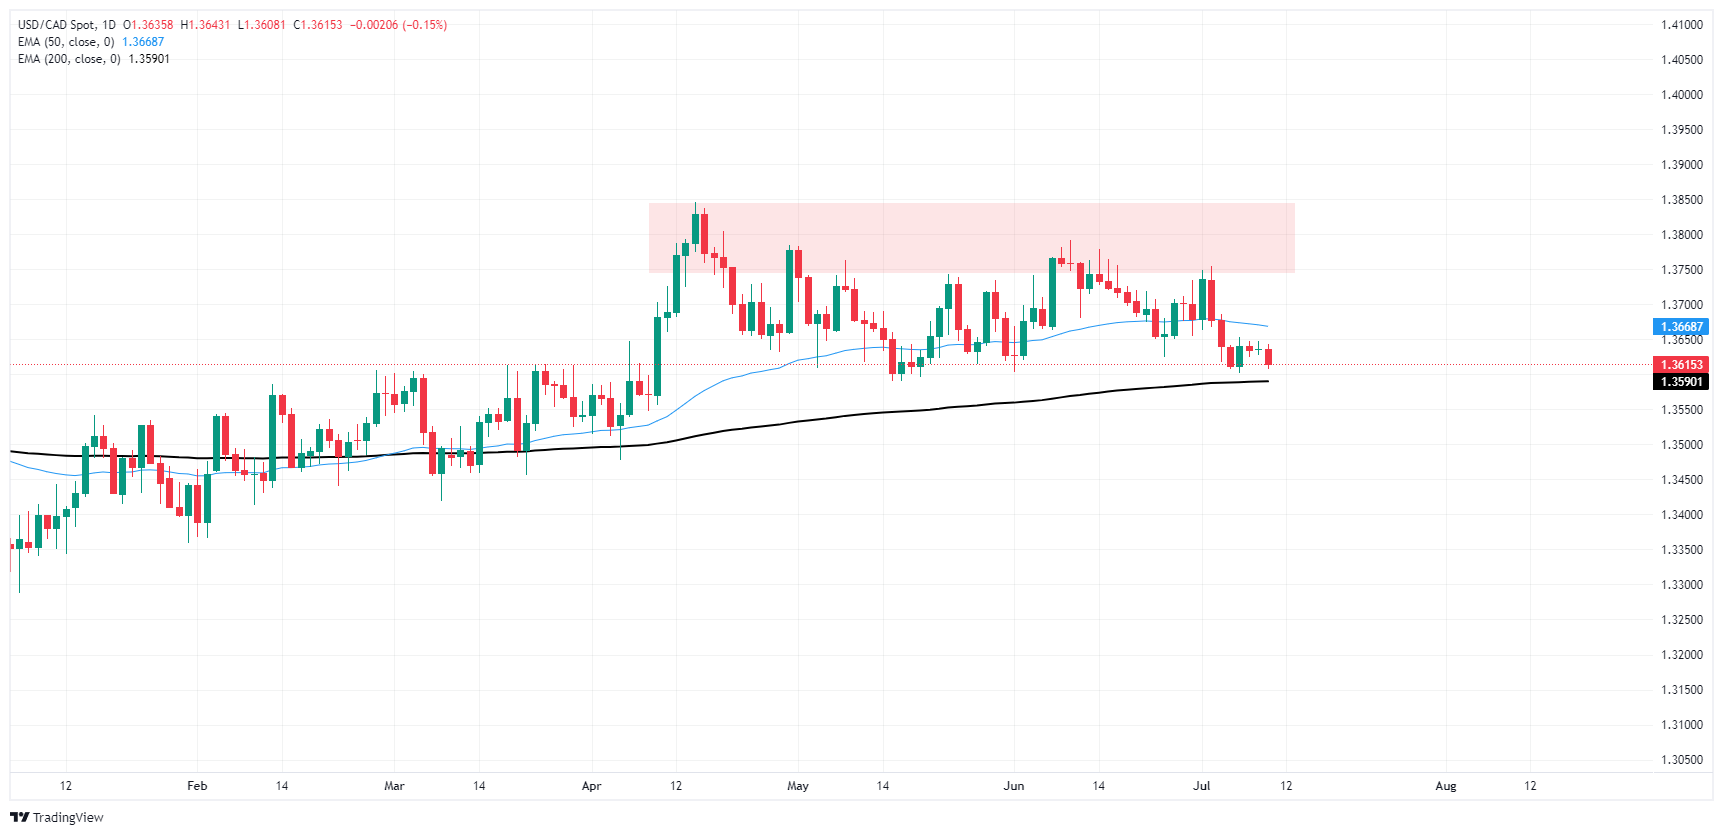
Canadian Dollar FAQs
The key factors driving the Canadian Dollar (CAD) are the level of interest rates set by the Bank of Canada (BoC), the price of Oil, Canada’s largest export, the health of its economy, inflation and the Trade Balance, which is the difference between the value of Canada’s exports versus its imports. Other factors include market sentiment – whether investors are taking on more risky assets (risk-on) or seeking safe-havens (risk-off) – with risk-on being CAD-positive. As its largest trading partner, the health of the US economy is also a key factor influencing the Canadian Dollar.
The Bank of Canada (BoC) has a significant influence on the Canadian Dollar by setting the level of interest rates that banks can lend to one another. This influences the level of interest rates for everyone. The main goal of the BoC is to maintain inflation at 1-3% by adjusting interest rates up or down. Relatively higher interest rates tend to be positive for the CAD. The Bank of Canada can also use quantitative easing and tightening to influence credit conditions, with the former CAD-negative and the latter CAD-positive.
The price of Oil is a key factor impacting the value of the Canadian Dollar. Petroleum is Canada’s biggest export, so Oil price tends to have an immediate impact on the CAD value. Generally, if Oil price rises CAD also goes up, as aggregate demand for the currency increases. The opposite is the case if the price of Oil falls. Higher Oil prices also tend to result in a greater likelihood of a positive Trade Balance, which is also supportive of the CAD.
While inflation had always traditionally been thought of as a negative factor for a currency since it lowers the value of money, the opposite has actually been the case in modern times with the relaxation of cross-border capital controls. Higher inflation tends to lead central banks to put up interest rates which attracts more capital inflows from global investors seeking a lucrative place to keep their money. This increases demand for the local currency, which in Canada’s case is the Canadian Dollar.
Macroeconomic data releases gauge the health of the economy and can have an impact on the Canadian Dollar. Indicators such as GDP, Manufacturing and Services PMIs, employment, and consumer sentiment surveys can all influence the direction of the CAD. A strong economy is good for the Canadian Dollar. Not only does it attract more foreign investment but it may encourage the Bank of Canada to put up interest rates, leading to a stronger currency. If economic data is weak, however, the CAD is likely to fall.
- US Dollar slips slightly under impact of Jerome Powell's fresh words.
- Investors keenly await June’s CPI data release on Thursday for clear guidance.
- If CPI comes in soft on Thursday, USD is poised for further downside.
On Thursday, despite Powell's cautious stance at his visit to the House Financial Services Committee, the US Dollar (measured by the DXY index) saw minor downturns and fell to 105.00. Powell's reluctance toward immediate rate cuts and his hints at an ongoing assessment of data-driven indicators have kept the markets on edge.
Signs of disinflation in the US economic outlook have emerged, and the market confidence in the September rate cut remains strong. However, Federal Reserve (Fed) officials including Chair Jerome Powell continue to tread carefully, underlining their inclination toward data-dependent decisions rather than hastened action in implementing rate cuts.
Daily digest market movers: DXY down as markets continue assessing Powell’s sentiment
- Highlight of Wednesday were the words of Fed ChairPowell to the House Financial Services Committee.
- However, his testimony before the House did not provide any significant or fresh influences.
- Powell expressed the need to be watchful over the labor market, noting visible softening in the sector.
- He suggested that inflation might be moving toward lower levels but also mentioned his cautious optimism about it sustaining the 2% target. He also mentioned that he doesn't hold a specific inflation number pertaining to decisions on future cuts.
- Expectations from Thursday's Consumer Price Index (CPI) continue to be significant. Projections depict the headline sinking two tenths to 3.1% YoY, while core inflation is expected to stay steady at 3.4% YoY.
- Market sentiment indicates less than 10% chance of July rate cut, while betting odds for a September cut hover around 80%, according to the CME FedWatch Tool.
DXY technical outlook: Index sees some decline, DXY above 100-day SMA is a good sign
From a technical viewpoint, DXY seems to have slipped into a negative terrain, indicated by both the Relative Strength Index (RSI) and the Moving Average Convergence Divergence (MACD) showing negative signs. Nevertheless, despite the minor setback on Wednesday, the DXY managed to stay above its 100-day Simple Moving Average (SMA), cushioning the impact of declines.
The subsequent support levels at 104.50 and 104.30 also continue to be staunch barriers against further drops. On the flip side, to regain momentum buyers must recover the 105.50 level to retest the 106.00 threshold.
US Dollar FAQs
The US Dollar (USD) is the official currency of the United States of America, and the ‘de facto’ currency of a significant number of other countries where it is found in circulation alongside local notes. It is the most heavily traded currency in the world, accounting for over 88% of all global foreign exchange turnover, or an average of $6.6 trillion in transactions per day, according to data from 2022. Following the second world war, the USD took over from the British Pound as the world’s reserve currency. For most of its history, the US Dollar was backed by Gold, until the Bretton Woods Agreement in 1971 when the Gold Standard went away.
The most important single factor impacting on the value of the US Dollar is monetary policy, which is shaped by the Federal Reserve (Fed). The Fed has two mandates: to achieve price stability (control inflation) and foster full employment. Its primary tool to achieve these two goals is by adjusting interest rates. When prices are rising too quickly and inflation is above the Fed’s 2% target, the Fed will raise rates, which helps the USD value. When inflation falls below 2% or the Unemployment Rate is too high, the Fed may lower interest rates, which weighs on the Greenback.
In extreme situations, the Federal Reserve can also print more Dollars and enact quantitative easing (QE). QE is the process by which the Fed substantially increases the flow of credit in a stuck financial system. It is a non-standard policy measure used when credit has dried up because banks will not lend to each other (out of the fear of counterparty default). It is a last resort when simply lowering interest rates is unlikely to achieve the necessary result. It was the Fed’s weapon of choice to combat the credit crunch that occurred during the Great Financial Crisis in 2008. It involves the Fed printing more Dollars and using them to buy US government bonds predominantly from financial institutions. QE usually leads to a weaker US Dollar.
Quantitative tightening (QT) is the reverse process whereby the Federal Reserve stops buying bonds from financial institutions and does not reinvest the principal from the bonds it holds maturing in new purchases. It is usually positive for the US Dollar.
Crude oil's resilience has seen Commodity Trading Advisors (CTAs) add back their notable length in WTI. The impact to oil supply from hurricane Beryl was less than expected, TDS analysts note.
CTAs add back their notable length in WTI
“Crude oil's resilience has seen CTAs add back their notable length in WTI, and for now, it is likely these funds will hold onto their position unless prices sink below the key $80/bbl region which has held strong since the revival of the supply risk premia tied to Middle East tensions and an early start to what experts are suggesting will be a busy hurricane season.”
“However, with that said, we highlight that the risk premia associated with Middle East tensions tends to quickly erode without an escalation to a broader conflict, and with systematic flows hitting elevated long levels, the lack of persistent buying is likely to soon weigh on the market should the risk premia ease.”
“Meanwhile, the impact to oil supply from hurricane Beryl was less than expected, adding further downward pressure to the market.”
In the industrial metals complex Commodity Trading Advisors (CTAs) have turned sellers of Zinc, Lead and Nickel, while Copper sees a continuation of the early week rally, TDS commodity analysts note.
Copper grows, other metals sell off
“In the industrial metals complex CTAs have turned sellers of Zinc, Lead and Nickel. Meanwhile, the failure of Copper to see a continuation of the early week rally is seeing the selling trigger creep closer to market yet again, with the first key downside momentum trigger sitting at $9,598/t.
“After briefly covering shorts and building a small net long position, top traders on the Shanghai Futures Exchange (SHFE) have once again liquidated positions, bringing the red metal into a net short territory again.”
“With our gauge of global commodity demand continuing to weaken, while depressed premiums and surging inventories in the Middle Kingdom argue against fundamental tightness, there are plenty of potential catalysts that could still see prices ease once again.”
Higher chances of Trump winning in November means trouble for the China-sensitive Australian Dollar (AUD) in the longer run. The Reserve Bank of Australia (RBA) is perhaps facing the worst inflation issue in G10, ING’s FX strategist Francesco Pesole notes.
AUD still has room to run this summer
“Higher chances of Trump winning in November spell trouble for the China-sensitive AUD in the longer run. But the tactical picture hinges much more on US macro and domestic central banks.”
“The RBA is perhaps facing the worst inflation issue in G10, with consistently hot monthly CPI prints taking it closer to another hike. 31 July will be the decisive day: 2Q CPI data are out, and if they surprise on the upside, we think the RBA will hike in August.”
“Even if another hike can be averted, the prospect of cuts is increasingly remote. Given our view that markets will reward currencies with hawkish central banks, AUD still has room to run this summer, before the US election becomes too close to ignore.”
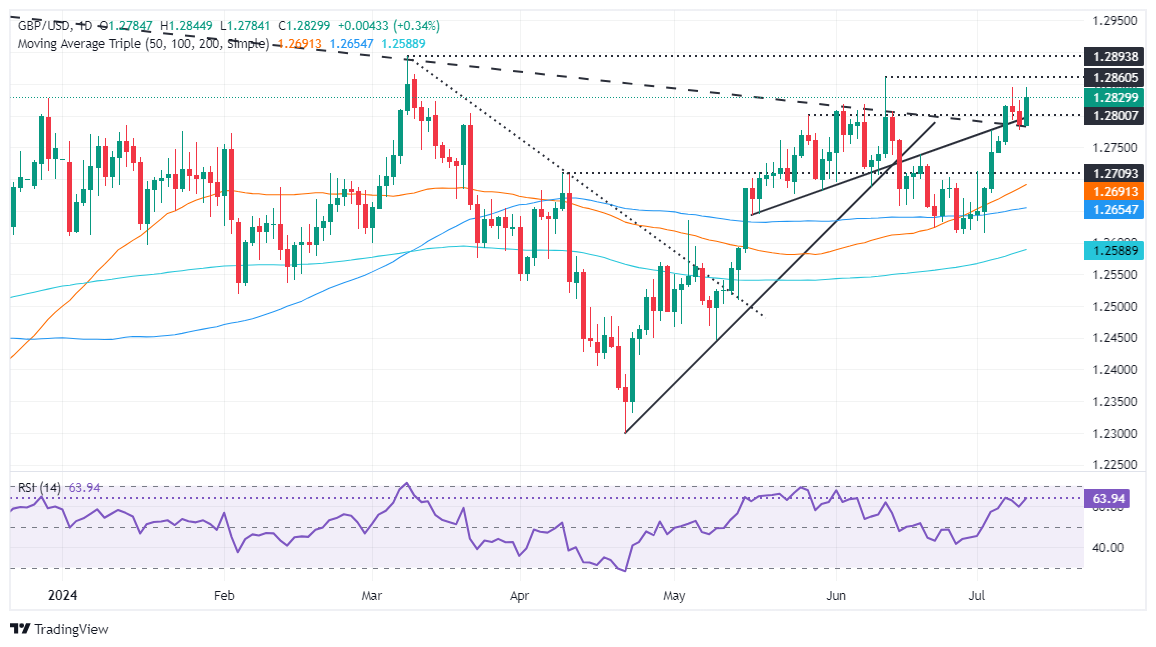
- GBP/USD rises to 1.2842, boosted by BoE's Huw Pill's caution against basing policy on single data points.
- Bullish momentum intact, targeting June 12 high of 1.2861 and YTD high of 1.2894.
- Key support levels: 1.2800, 1.2755/70, and 1.2690 (50-day moving average) for potential reversals.
The Pound Sterling resumed its uptrend on Wednesday and rallied sharply on Bank of England Chief Economist Huw Pill's remarks that the Monetary Policy Committee (MPC) should be cautious in seeing a single piece of data as a trigger for policy reassessment. Hence, the GBP/USD trades at 1.2842, posting gains of 0.44%.
GBP/USD Price Analysis: Technical outlook
From a technical standpoint, the GBP/USD resumed its uptrend after bouncing off weekly lows set on Tuesday of around 1.2779, with buyers stepping in and lifting the exchange rate. Momentum favors buyers, as depicted by the Relative Strength Index (RSI), and the pair might test the year-to-date (YTD) high in the near term.
The GBP/USD first resistance would be the June 12 high at 1.2861. Once cleared the next stop will be the YTD high at 1.2894, followed by the 1.2900 figure and the 1.3000 mark.
Conversely, if GBP/USD shifts negatively and drops below 1.2800, the first support would be the confluence of two support trendlines at around 1.2755/70, followed by the 50-day moving average (DMA) at 1.2690. A change of trend is seen once the pair tumbles below the June 27 cycle low of 1.2612.
GBP/USD Price Action – Daily Chart
Pound Sterling FAQs
The Pound Sterling (GBP) is the oldest currency in the world (886 AD) and the official currency of the United Kingdom. It is the fourth most traded unit for foreign exchange (FX) in the world, accounting for 12% of all transactions, averaging $630 billion a day, according to 2022 data. Its key trading pairs are GBP/USD, aka ‘Cable’, which accounts for 11% of FX, GBP/JPY, or the ‘Dragon’ as it is known by traders (3%), and EUR/GBP (2%). The Pound Sterling is issued by the Bank of England (BoE).
The single most important factor influencing the value of the Pound Sterling is monetary policy decided by the Bank of England. The BoE bases its decisions on whether it has achieved its primary goal of “price stability” – a steady inflation rate of around 2%. Its primary tool for achieving this is the adjustment of interest rates. When inflation is too high, the BoE will try to rein it in by raising interest rates, making it more expensive for people and businesses to access credit. This is generally positive for GBP, as higher interest rates make the UK a more attractive place for global investors to park their money. When inflation falls too low it is a sign economic growth is slowing. In this scenario, the BoE will consider lowering interest rates to cheapen credit so businesses will borrow more to invest in growth-generating projects.
Data releases gauge the health of the economy and can impact the value of the Pound Sterling. Indicators such as GDP, Manufacturing and Services PMIs, and employment can all influence the direction of the GBP. A strong economy is good for Sterling. Not only does it attract more foreign investment but it may encourage the BoE to put up interest rates, which will directly strengthen GBP. Otherwise, if economic data is weak, the Pound Sterling is likely to fall.
Another significant data release for the Pound Sterling is the Trade Balance. This indicator measures the difference between what a country earns from its exports and what it spends on imports over a given period. If a country produces highly sought-after exports, its currency will benefit purely from the extra demand created from foreign buyers seeking to purchase these goods. Therefore, a positive net Trade Balance strengthens a currency and vice versa for a negative balance.
British Pound PRICE Today
The table below shows the percentage change of British Pound (GBP) against listed major currencies today. British Pound was the strongest against the New Zealand Dollar.
| USD | EUR | GBP | JPY | CAD | AUD | NZD | CHF | |
|---|---|---|---|---|---|---|---|---|
| USD | -0.09% | -0.35% | 0.19% | -0.14% | -0.03% | 0.74% | 0.20% | |
| EUR | 0.09% | -0.25% | 0.32% | -0.03% | 0.05% | 0.81% | 0.29% | |
| GBP | 0.35% | 0.25% | 0.56% | 0.23% | 0.30% | 1.06% | 0.52% | |
| JPY | -0.19% | -0.32% | -0.56% | -0.31% | -0.24% | 0.49% | -0.03% | |
| CAD | 0.14% | 0.03% | -0.23% | 0.31% | 0.10% | 0.85% | 0.30% | |
| AUD | 0.03% | -0.05% | -0.30% | 0.24% | -0.10% | 0.75% | 0.20% | |
| NZD | -0.74% | -0.81% | -1.06% | -0.49% | -0.85% | -0.75% | -0.54% | |
| CHF | -0.20% | -0.29% | -0.52% | 0.03% | -0.30% | -0.20% | 0.54% |
The heat map shows percentage changes of major currencies against each other. The base currency is picked from the left column, while the quote currency is picked from the top row. For example, if you pick the British Pound from the left column and move along the horizontal line to the US Dollar, the percentage change displayed in the box will represent GBP (base)/USD (quote).
Jerome Powell, Chairman of the US Federal Reserve (Fed), delivers the Semi-Annual Monetary Policy Report and responds to questions before the House Financial Services Committee on the second day of his Congressional testimony.
Key takeaways
"We see current Fed policy as restrictive."
"The neutral interest rate must have moved up at least in the short term."
"We know we have to adapt bank stress tests over time."
"Main thing is to get it right on bank capital proposal."
Fed FAQs
Monetary policy in the US is shaped by the Federal Reserve (Fed). The Fed has two mandates: to achieve price stability and foster full employment. Its primary tool to achieve these goals is by adjusting interest rates. When prices are rising too quickly and inflation is above the Fed’s 2% target, it raises interest rates, increasing borrowing costs throughout the economy. This results in a stronger US Dollar (USD) as it makes the US a more attractive place for international investors to park their money. When inflation falls below 2% or the Unemployment Rate is too high, the Fed may lower interest rates to encourage borrowing, which weighs on the Greenback.
The Federal Reserve (Fed) holds eight policy meetings a year, where the Federal Open Market Committee (FOMC) assesses economic conditions and makes monetary policy decisions. The FOMC is attended by twelve Fed officials – the seven members of the Board of Governors, the president of the Federal Reserve Bank of New York, and four of the remaining eleven regional Reserve Bank presidents, who serve one-year terms on a rotating basis.
In extreme situations, the Federal Reserve may resort to a policy named Quantitative Easing (QE). QE is the process by which the Fed substantially increases the flow of credit in a stuck financial system. It is a non-standard policy measure used during crises or when inflation is extremely low. It was the Fed’s weapon of choice during the Great Financial Crisis in 2008. It involves the Fed printing more Dollars and using them to buy high grade bonds from financial institutions. QE usually weakens the US Dollar.
Quantitative tightening (QT) is the reverse process of QE, whereby the Federal Reserve stops buying bonds from financial institutions and does not reinvest the principal from the bonds it holds maturing, to purchase new bonds. It is usually positive for the value of the US Dollar.
Bank of England (BoE) Chief Economist Huw Pill said on Wednesday that it's an open question whether the time for cutting the interest rate is upon them, per Reuters.
Additional takeaways
"Some work to do before domestic persistent component of inflation is gone."
"I'm reluctant to be drawn on whether I'm cautious or not about cutting rates, important to get balance right."
"Uncertainty about wage behaviour in UK unlikely to disappear soon, policy decisions need to be robust to this."
Market reaction
GBP/USD edged higher following these comments and was last seen gaining 0.4% on the day at 1.2835.
The latest hiring contraction and rise in unemployment to 6.2% in Canada has put a July Bank of Canada rate cut on the table, ING’s FX analyst Francesco Pesole notes.
CAD to continue to underperform
“Our latest forecast saw Bank of Canada cuts in September, October and December. But the latest hiring contraction and rise in unemployment to 6.2% has put a July cut on the table.”
“Markets are pricing in 16bp of easing for July: we think the deciding factor will be the June inflation report on 16 July, after May’s figures came in a bit higher than expected.”
“Still, market pricing for total BoC easing in 2024 looks conservative: 55bp versus our call for 75bp. There is therefore ample room for dovish repricing along the way. We think CAD will continue to underperform other commodity currencies due the domestic story and its lower sensitivity to a decline in USD rates.”
Japan’s verbal interventions are ineffective. Periods of quiet volatility may continue to push USD/JPY higher, with a new line in the sand for intervention now close to 165, ING’s FX analyst Francesco Pesole notes.
BoJ verbal interventions bare no effect
“Observing the Yen’s most recent demise, it is clear that Japan’s verbal interventions are ineffective. Despite some softer US data, speculative selling pressure on the Yen remains elevated.”
“Periods of quiet volatility may continue to push USD/JPY higher, with a new line in the sand for intervention now close to 165, in our view. Crucially, large FX sales in 2Q proved to be only a temporary solution, meaning more pressure on the BoJ to hike.”
“Markets are pricing in 6bp for the 31 July Bank of Japan meeting. We are more hawkish, narrowly favouring a 15bp July hike and another move by year-end. The BoJ can help the Yen, although our bearish USD/JPY profile primarily relies on Fed cuts.”
The Reserve Bank of New Zealand surprised markets with a dovish tilt in communication as it kept rates on hold at 5.50% overnight, ING’s FX strategist Francesco Pesole notes.
Next week’s CPI report to help reverse NZD losses
“The Bank displayed greater confidence on disinflation in the statement, stating that “restrictive monetary policy has significantly reduced consumer price inflation” and that the Committee expects headline CPI to return to the 1-3% target range in the second half of this year. Incidentally, there were multiple mentions of slowdown in the economy and the labour market.”
“Our forecasts included one rate cut by the RBNZ in the fourth quarter this year, but we admit today’s statement tilts the balance towards at least two (60bp are priced in by year-end). Policymakers must have looked at some convincing evidence of upcoming disinflation to change their messaging today, but we continue to see some substantial upside risks to their non-tradable inflation forecasts.”
“An upside surprise at next week’s second quarter CPI report could help reverse NZD losses, and we remain generally positive on NZD this summer.”
- USD/JPY has resumed its short-term uptrend after a pullback.
- The pair could rise up to match the July 3 high at 161.95.
USD/JPY has continued recovering after finding support at 160.26, the July 8 low and bouncing. The pair has since established a new sequence of higher highs and higher lows on the 4-hour chart, indicative of the start of a short-term uptrend. Given “the trend is your friend” the odds now favor a continuation higher.
USD/JPY 4-hour Chart
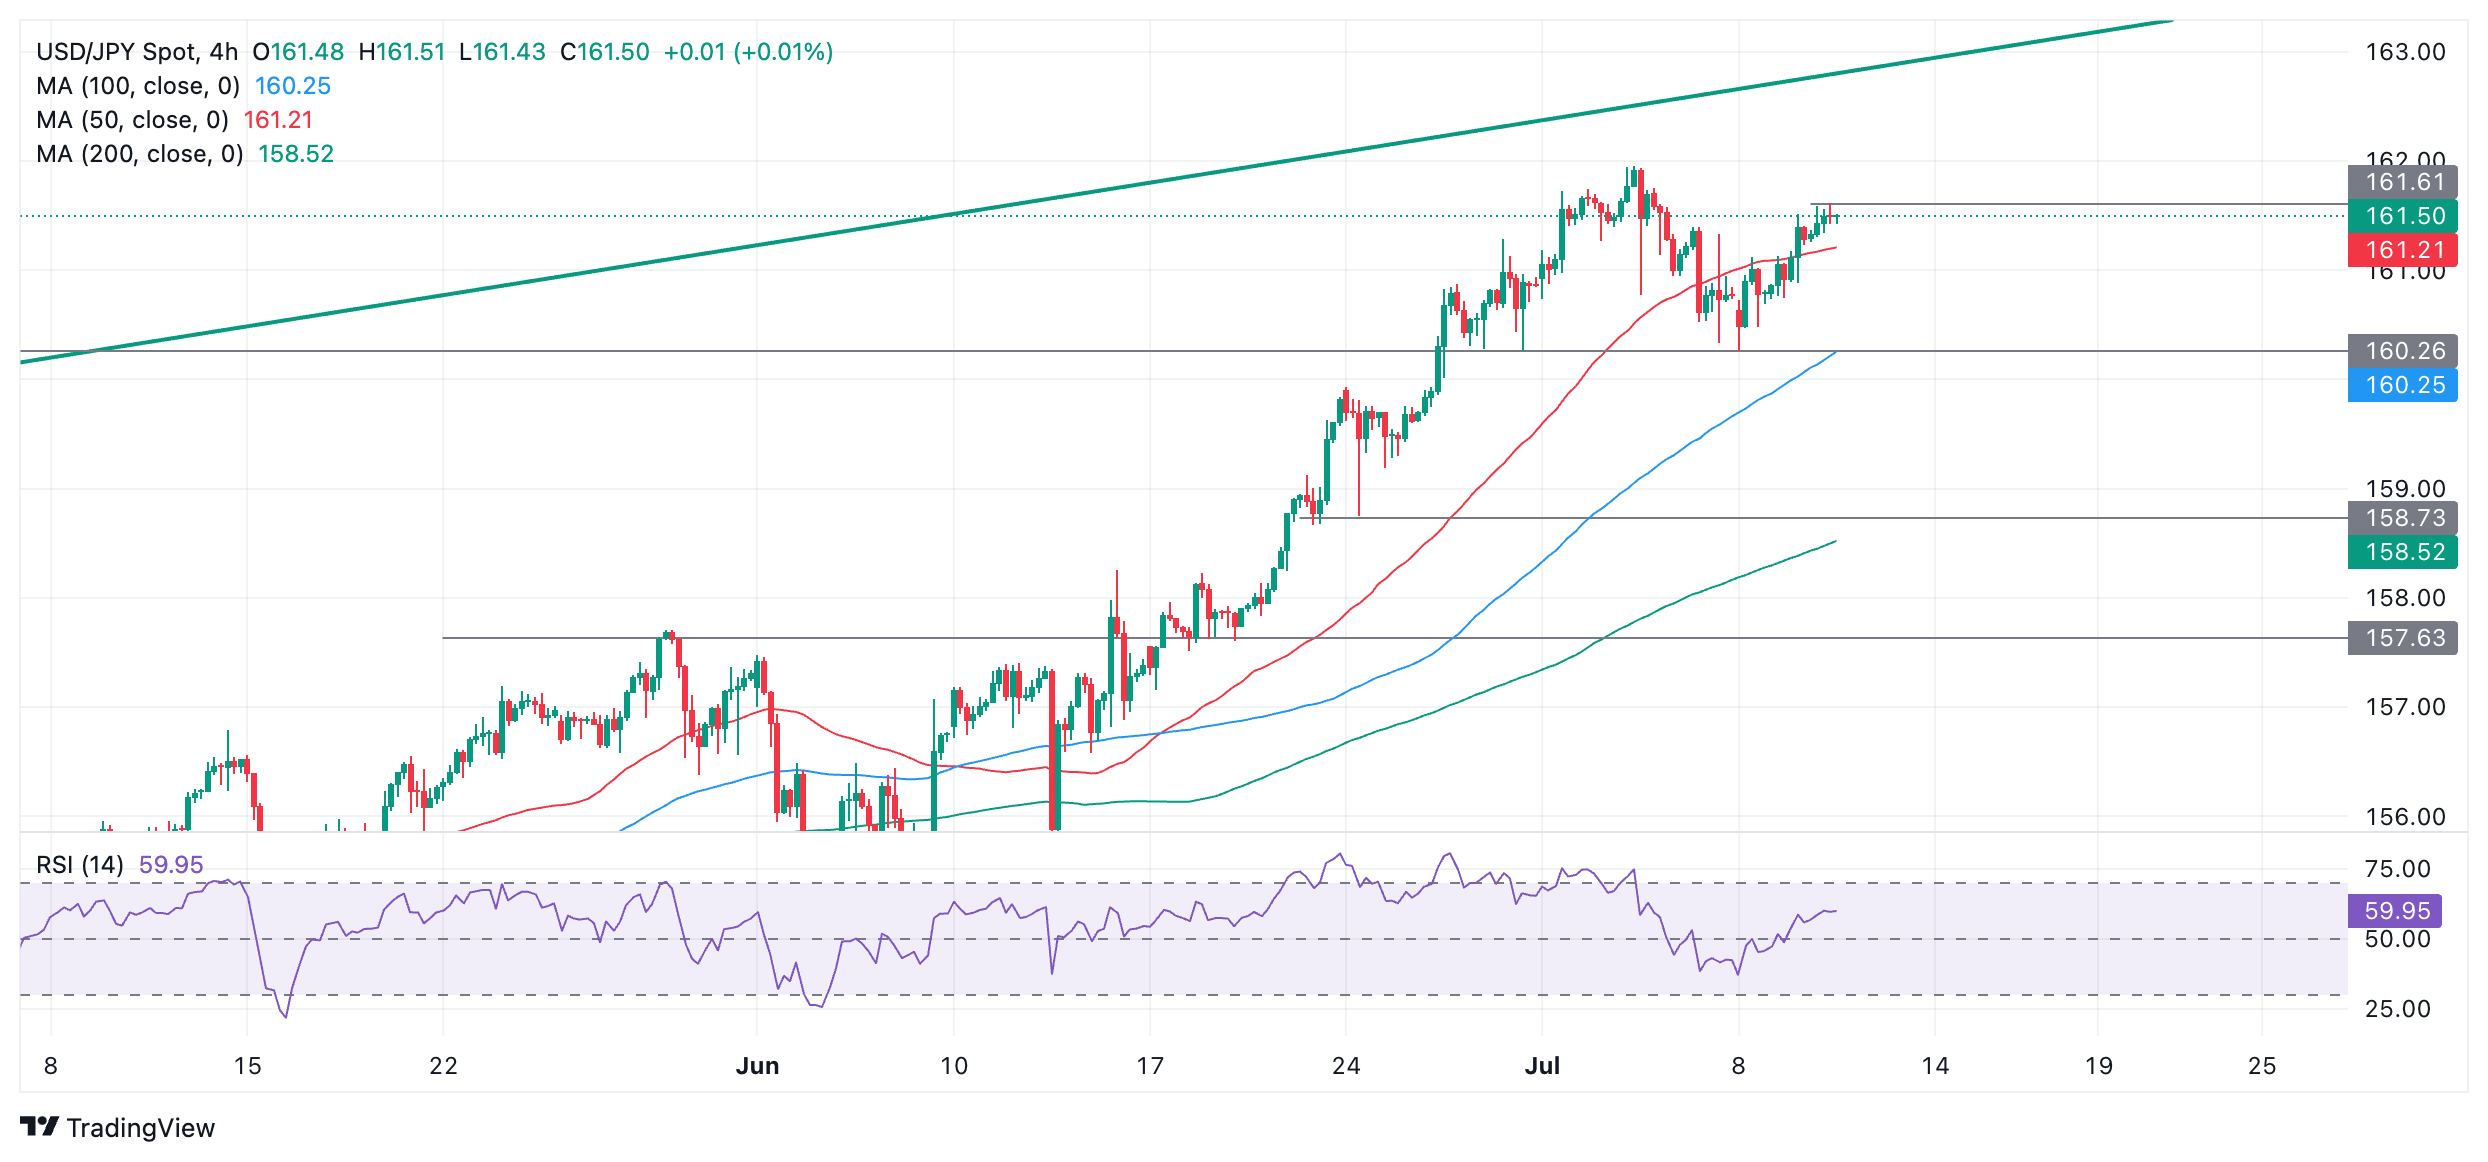
USD/JPY is also in an uptrend on an intermediate and long-term time frame, further supporting a bullish outlook.
A break above 161.61 would signify more upside to the next target at 161.95 (the July 3 high). A break above that level would establish a higher high and provide further bullish confirmation. Such a move would probably reach the 162.70s initially, at the top of the rising channel, where it would again meet resistance.
- Silver is forming a Symmetrical Triangle, or Bull Pennant continuation pattern with bullish implications for price.
- It is also probably rising up in the final wave C of a Measured Move price pattern, also with bullish expectations.
- MACD is poised to rise higher after crossing the zero-line.
Silver (XAG/USD) has formed a price pattern after its recent rally, which saw it break out of its falling channel.
The price pattern could either be a Symmetrical Triangle (ST) pattern, or perhaps a Bull Pennant continuation pattern; the first has slightly bullish connotations, the second has stronger bullish implications.
Silver Daily Chart
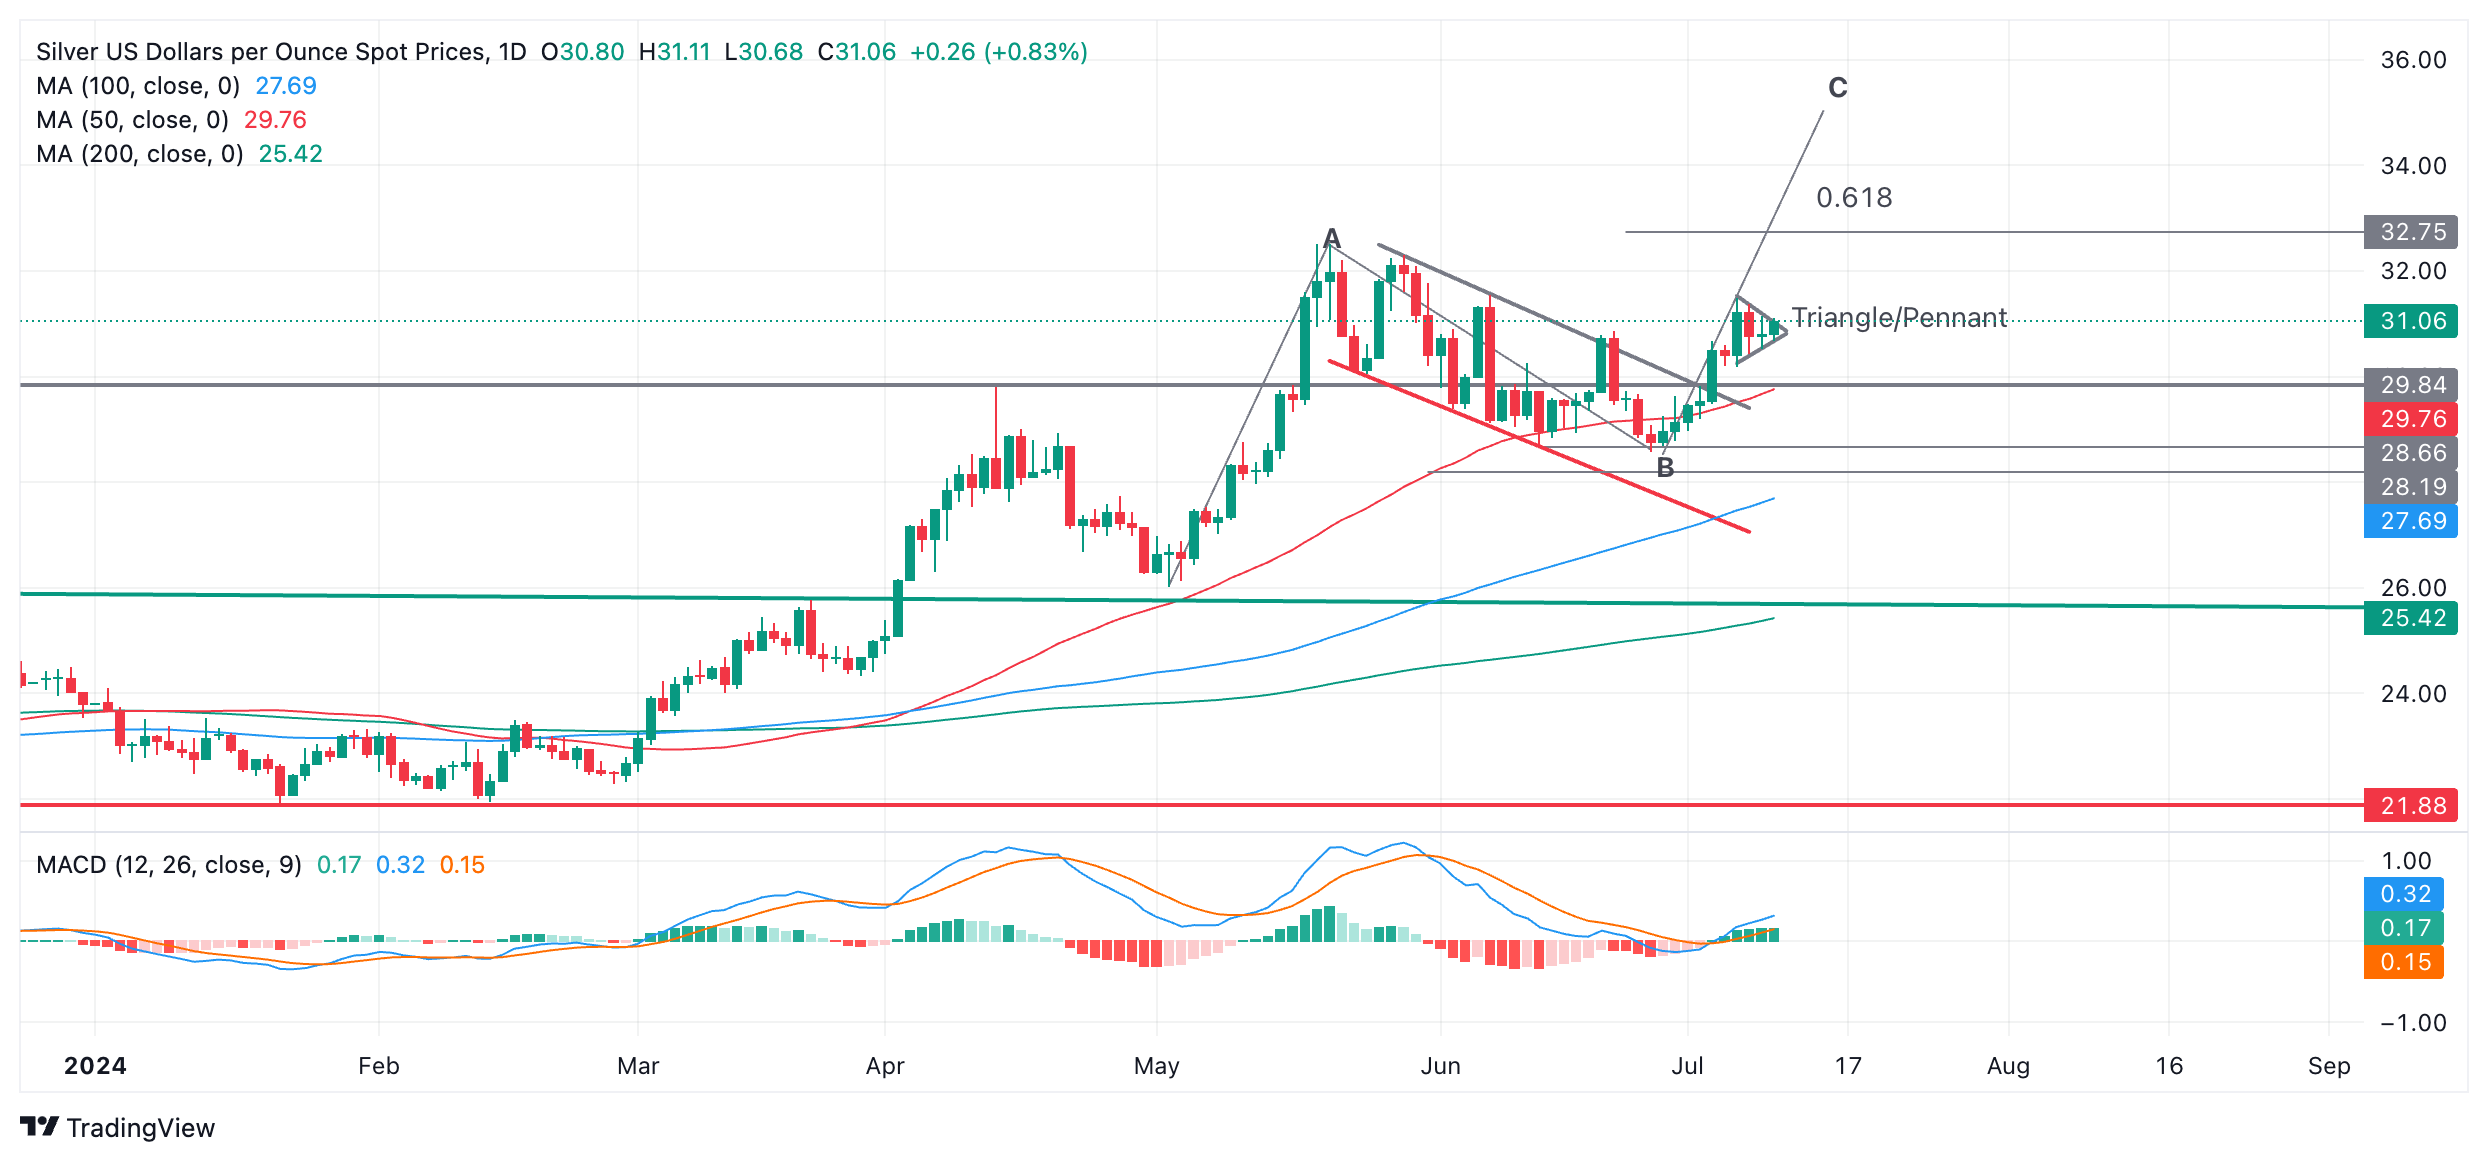
More broadly Silver is also probably in the process of rising up in the final wave C of a three-wave Measured Move (MM), with a final price target substantially higher than the current market level.
STs do not give a hint of the direction of the breakout but it is usually in the direction of the prior trend. Bull Pennants, however, are bullish and strongly suggest higher prices to come.
MMs are like large zig-zags composed of three waves, sometimes labeled A,B and C.
As Silver price is currently rising up in wave C it is likely to go higher, either till it reaches the end of wave C or, more conservatively $32.75 ( calculated as the 0.618 extrapolation of wave A). If it reaches the end of C it could rally to $35.00.
A break above the top of the ST/Pennant at $31.49 would provide confirmation of the next leg higher.
The Moving Average Convergence Divergence (MACD) momentum indicator has crossed above the zero line and looks poised to continue higher, with bullish implications for price.
- USD/CHF trades back and forth below 0.9000 with US inflation in focus.
- US core inflation is estimated to have risen steadily in June.
- Easing Swiss inflation has boosted expectations of more SNB rate cuts.
The USD/CHF pair trades sideways slightly below the psychological resistance of 0.9000 in Wednesday’s European session. The Swiss Franc asset struggles for a direction as investors await the United States (US) Consumer Price Index (CPI) data for June, which will be published on Thursday.
The US CPI report is expected to show that the core CPI, which excludes volatile food and energy prices, rose steadily by 0.2% and 3.4% on monthly and an annual basis. Monthly headline inflation is expected to have grown by 0.1% after remaining unchanged previously. While the annual figure is estimated to have decelerated to 3.1% from May’s reading of 3.3%.
A scenario in which price pressures remain sticky or hot would ease expectations for rate cuts in September. On the contrary, soft numbers will boost them.
Meanwhile, the near-term appeal of the Swiss Franc remains uncertain as cooling inflationary pressures have boosted expectations of more rate cuts by the Swiss National Bank (SNB). Swiss annual CPI rose at a slower pace of 1.3% in June from estimates and the prior release of 1.4%.
USD/CHF trades in a Falling Channel chart pattern on a daily timeframe in which each pullback is considered as selling opportunity by market participants. The Swiss Franc asset finds cushion near 200-day Exponential Moving Average (EMA) around 0.8950, suggesting that a bullish long-trend is intact.
The 14-day Relative Strength Index (RSI) oscillates in the 40.00-60.00 range, suggesting indecisiveness among investors.
Going forward, a decisive upside above June 3 high at 0.9036will drive the asset towards May 28 low at 0.9086, followed by May 30 high at 0.9140.
On the flip side, the asset would expose to downside if it breaks below June 4 low of 0.8900. This would drag the asset towards March 21 low at 0.8840 and the round-level support of 0.8800.
USD/CHF daily chart
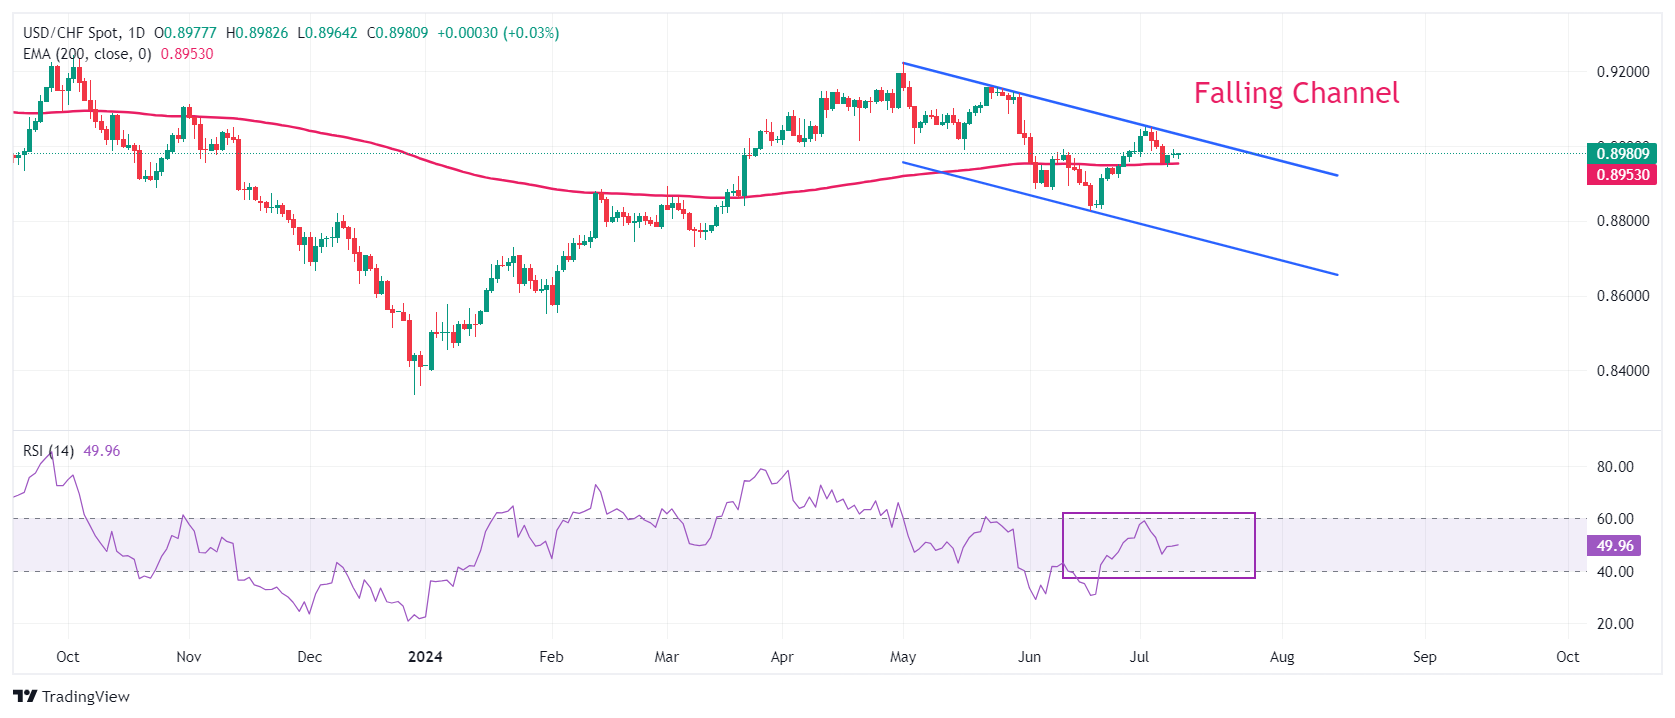
Swiss Franc FAQs
The Swiss Franc (CHF) is Switzerland’s official currency. It is among the top ten most traded currencies globally, reaching volumes that well exceed the size of the Swiss economy. Its value is determined by the broad market sentiment, the country’s economic health or action taken by the Swiss National Bank (SNB), among other factors. Between 2011 and 2015, the Swiss Franc was pegged to the Euro (EUR). The peg was abruptly removed, resulting in a more than 20% increase in the Franc’s value, causing a turmoil in markets. Even though the peg isn’t in force anymore, CHF fortunes tend to be highly correlated with the Euro ones due to the high dependency of the Swiss economy on the neighboring Eurozone.
The Swiss Franc (CHF) is considered a safe-haven asset, or a currency that investors tend to buy in times of market stress. This is due to the perceived status of Switzerland in the world: a stable economy, a strong export sector, big central bank reserves or a longstanding political stance towards neutrality in global conflicts make the country’s currency a good choice for investors fleeing from risks. Turbulent times are likely to strengthen CHF value against other currencies that are seen as more risky to invest in.
The Swiss National Bank (SNB) meets four times a year – once every quarter, less than other major central banks – to decide on monetary policy. The bank aims for an annual inflation rate of less than 2%. When inflation is above target or forecasted to be above target in the foreseeable future, the bank will attempt to tame price growth by raising its policy rate. Higher interest rates are generally positive for the Swiss Franc (CHF) as they lead to higher yields, making the country a more attractive place for investors. On the contrary, lower interest rates tend to weaken CHF.
Macroeconomic data releases in Switzerland are key to assessing the state of the economy and can impact the Swiss Franc’s (CHF) valuation. The Swiss economy is broadly stable, but any sudden change in economic growth, inflation, current account or the central bank’s currency reserves have the potential to trigger moves in CHF. Generally, high economic growth, low unemployment and high confidence are good for CHF. Conversely, if economic data points to weakening momentum, CHF is likely to depreciate.
As a small and open economy, Switzerland is heavily dependent on the health of the neighboring Eurozone economies. The broader European Union is Switzerland’s main economic partner and a key political ally, so macroeconomic and monetary policy stability in the Eurozone is essential for Switzerland and, thus, for the Swiss Franc (CHF). With such dependency, some models suggest that the correlation between the fortunes of the Euro (EUR) and the CHF is more than 90%, or close to perfect.
- USD/CAD is probably beginning a new up leg within a range.
- The MACD has crossed over its signal line adding further credence to the bullish thesis.
- A mini Bull Flag may also have formed at the range lows.
USD/CAD has been trading in a range since the start of May. At first it looked like the pair had formed a Symmetrical Triangle pattern but the pattern failed to evolve.
The pair’s lack of directionality means the short-term trend is probably now sideways. Given the “trend is your friend” the odds favor a continuation of USD/CAD’s sideways oscillations.
USD/CAD 4-hour Chart
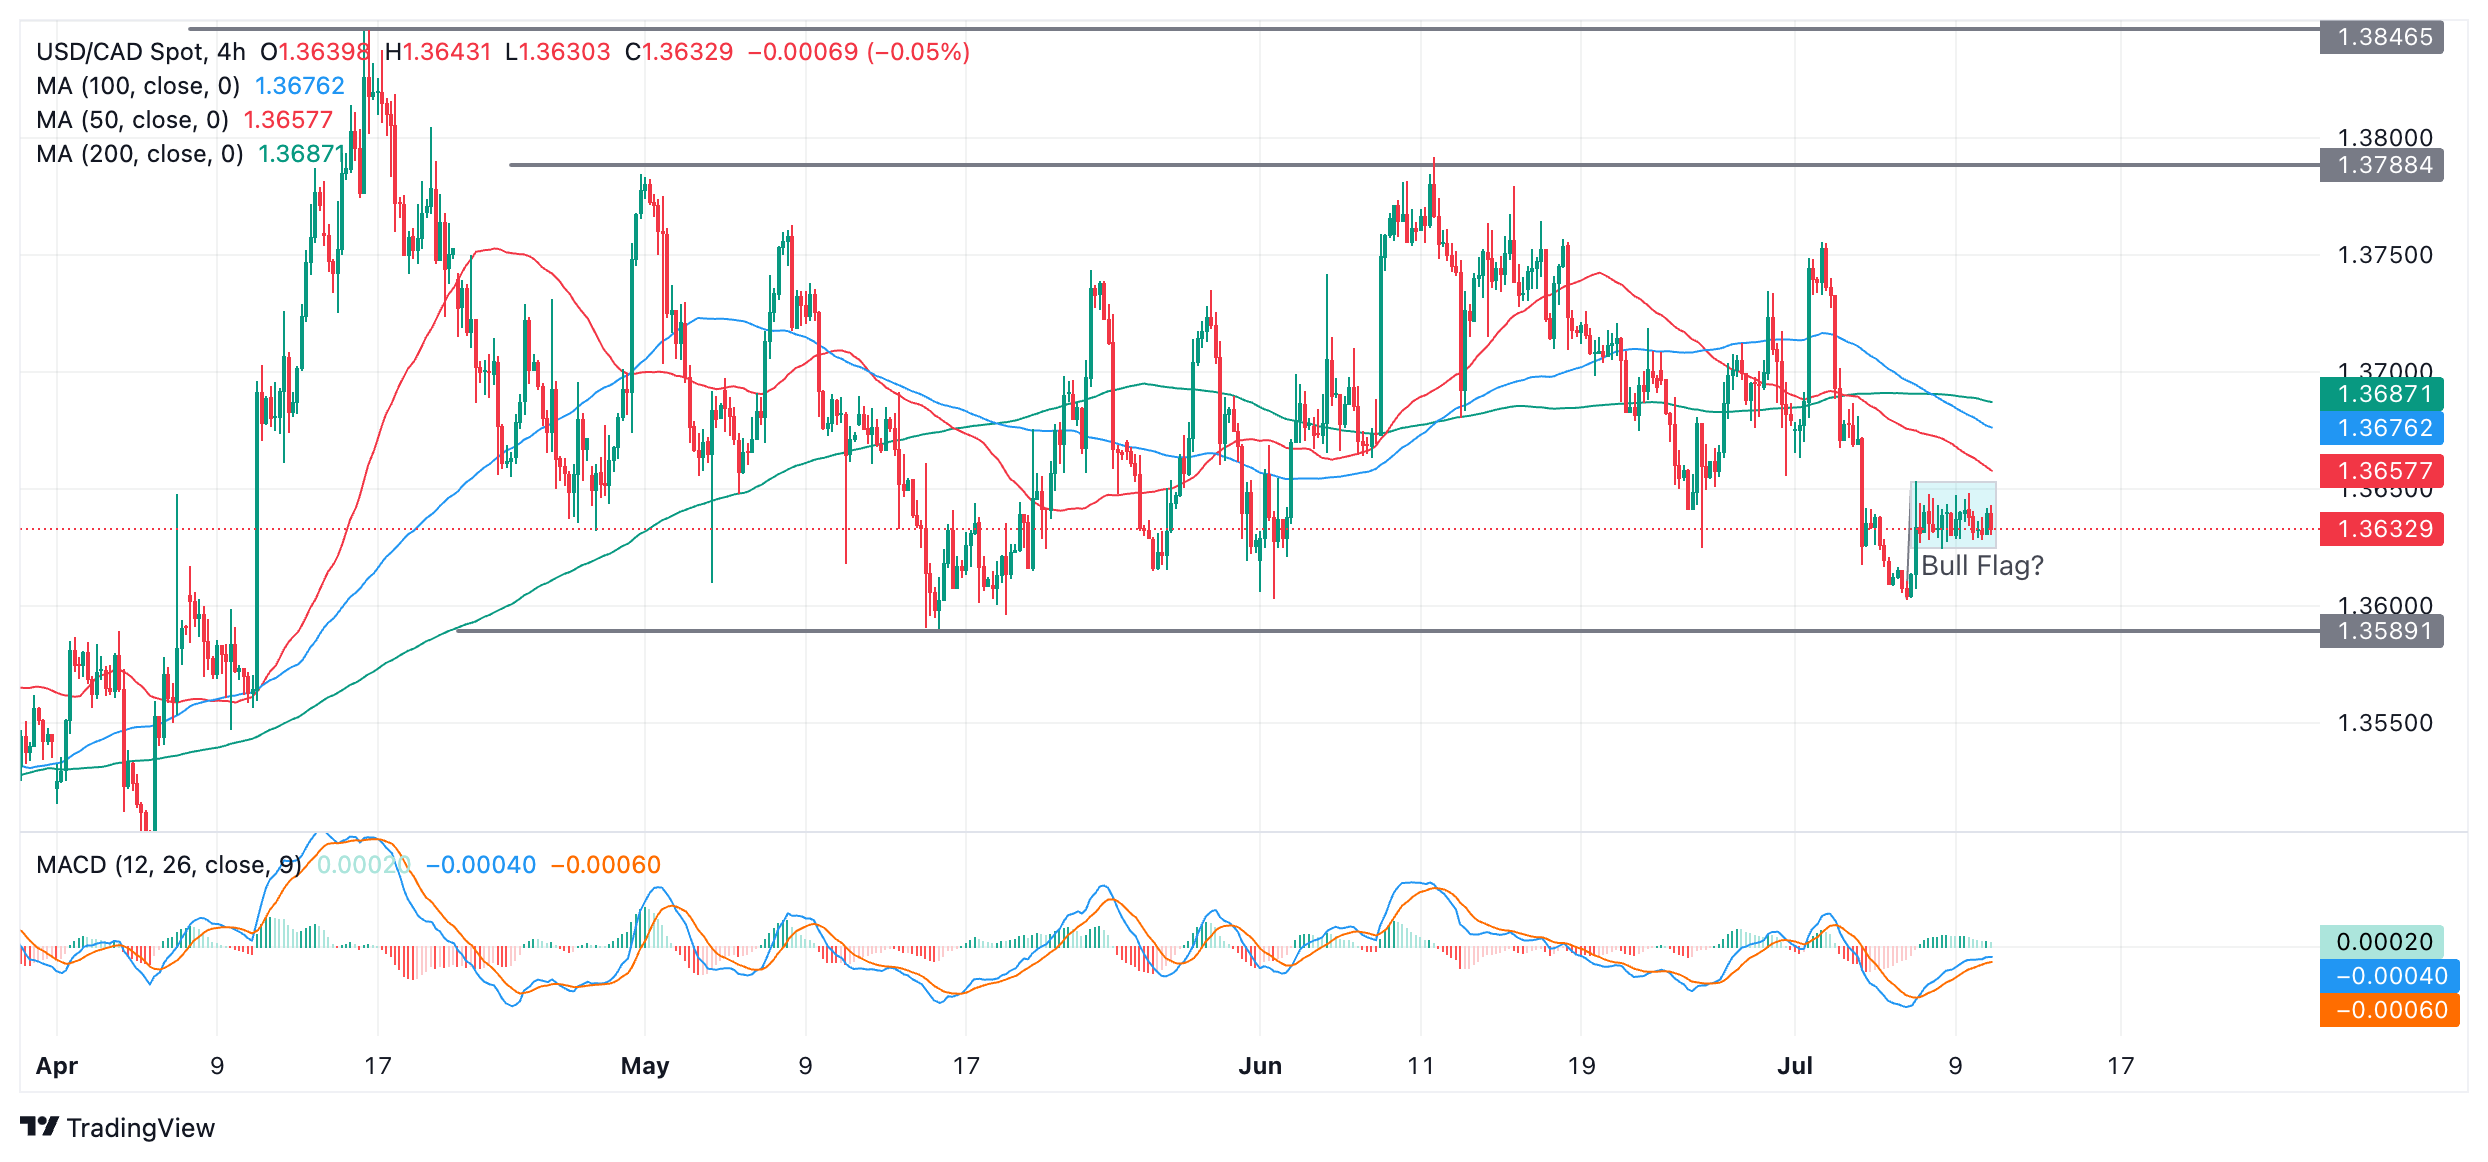
More recently USD/CAD has found support near the range’s floor at roughly 1.3589 and bounced. As it is in a sideways trend it will probably start moving up towards the range ceiling now at roughly 1.3788.
The Moving Average Convergence Divergence (MACD) indicator crossed above its red signal line on July 5 after the initial bounce. This is a bullish sign and suggests the next leg higher within the range is about to unfold. Note how in the past, crossovers of the MACD and signal line coincided with price turns within the range.
USD/CAD has been trading in a mini-sideways consolidation (light blue shaded area on chart above) since July 5. This might be the “flag square” part of a small Bull Flag Pattern. Such a pattern promises further upside if price breaks out of the top of the rectangular consolidation phase. The target for the follow-through higher after the breakout is situated at 1.3764, the length of the initial bounce or “flag pole” extrapolated higher.
Global currency volatility has continued to drop rapidly as markets await developments on eurozone and US politics, as well as on the data side. The proximity to Thursday’s pivotal CPI release in the US may also be behind this week’s cautious trading in FX, ING’s FX strategist Francesco Pesole notes.
US Dollar to remain flat ahead of Friday’s CPI report
“Today, Federal Reserve Chair Jerome Powell faces House policymakers for his second testimony, after yesterday’s Senate appearance had few repercussions on markets. Powell’s prepared remarks focused on two-way risks, reiterating the need for more data input to justify monetary easing. So, more of the same rhetoric from Powell, who’s happy with keeping markets relatively quiet.”
“The US Democratic Party revolt against President Joe Biden appears to have been fully sidelined by markets. Predict index of Biden’s probability of being the party's candidate in November has bounced back from 40% to 60% after recent signs that the internal push to replace him may indeed be insufficient.”
“We expect FX volatility to remain low today, a development that can favour an additional short-term recovery in high carry currencies like MXN and BRL, while keeping the pressure high on the funding yen. The dollar may remain broadly flat into tomorrow’s CPI.”
- The US Dollar turns flat this week and trades relatively steady at current levels.
- Traders will feast on no less than four Fed speakers on Wednesday.
- The US Dollar index hovers around 105.00 and is looking for direction.
The US Dollar (USD) trades sideways and is stuck in a tight range in most currency pairs on Wednesday. As such, that should not come as a surprise as the semi-annual testimony from US Federal Reserve (Fed) Chairman Jerome Powell before Congress on Tuesday did not bear any special comments or new angles that markets have not priced in yet. It could have been a tape recorder replaying the latest Fed rate decision, with the bottom line remaining the same: Powell wants to keep rates steady for longer as he is afraid to start cutting too soon.
On the economic front, no real data springs out, though it will instead be the side events that will draw up all the attention. With a 10-year Note auction, it is an ideal moment to see how the benchmark tenor will be behaving and how the appetite for American debt is now in the bond market. Add in there no less than three Fed members, besides Fed Chairman Powell, who is heading to Congress again this Wednesday, and it looks to be a rather Fed-driven day.
Daily digest market movers: Summer breeze
- At 11:00 GMT, the weekly Mortgage Applications data for the week ending on July 5 has been released by the Mortgage Bankers Association (MBA). Last week, a slight decrease of 2.6% was noted, with another decline by 0.2% for this week.
- May’s Wholesale Inventories data will come out at 16:00 GMT. Expectations are for a steady 0.6%.
- At 17:00 GMT, the US Treasury will allocate a 10-year Note in the market.
- Several Fed speakers are lined up on Wednesday:
- At 14:00 GMT, Federal Reserve Chair Jerome Powell testifies before Congress, providing a broad overview of the economy and monetary policy.
- Federal Reserve Governor Michelle Bowman and Federal Reserve Bank of Chicago President Austan Goolsbee will give the opening remarks at the Fed Listens in Chicago, United States, at 18:30 GMT.
- Federal Reserve Governor Lisa Cook delivers a speech titled ‘Global Inflation and Monetary Policy Challenges’ at the 2024 Australian Conference of Economists in Adelaide, Australia, at 22:30 GMT.
- Equity markets are a bit mixed, looking for direction with no real outliers in the European session.
- The CME Fedwatch Tool is broadly backing a rate cut in September despite recent comments from Fed officials. The odds now stand at 70.0% for a 25-basis-point cut. A rate pause stands at a 26.7% chance, while a 50-basis-point rate cut has a slim 3.3% possibility.
- The US 10-year benchmark rate trades at 4.28%, near its weekly low.
US Dollar Index Technical Analysis: Same story, different day
The US Dollar Index (DXY) is yet again looking for direction with no substantial moves, even after Fed Chairman Powell's comments on Tuesday. Fatigue is creeping into the Dollar, with markets looking for any different message Powell might deliver. The continuous message that interest rates should remain steady, that they are data-dependent, and that cutting borrowing costs too early might be counterproductive is starting to push investors out of the Greenback.
On the upside, the 55-day Simple Moving Average (SMA) at 105.16 remains the first resistance. Should that level be reclaimed again, 105.53 and 105.89 are the following nearby pivotal levels. The red descending trend line in the chart below at around 106.23 and April’s peak at 106.52 could come into play should the Greenback rally substantially.
On the downside, the risk of a nosedive move is increasing, with only the double support at 104.80, which is the confluence of the 100-day SMA and the green ascending trend line from December 2023, still in place. Should that double layer give way, the 200-day SMA at 104.41 is the gatekeeper that should catch the DXY and avoid further declines. Further down, the correction could head to 104.00 as an initial stage.
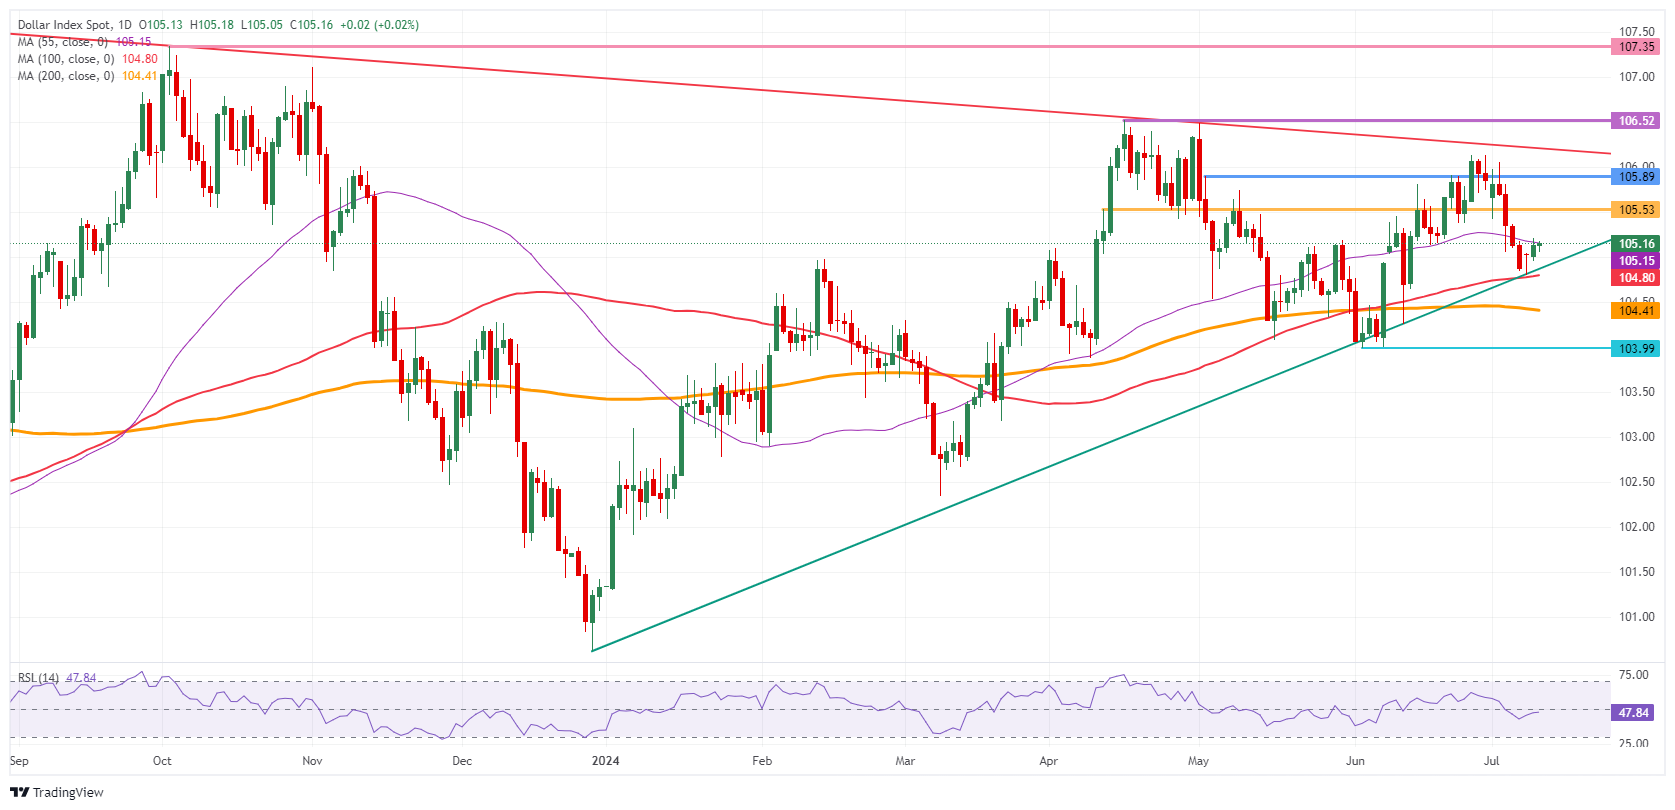
US Dollar Index: Daily Chart
US Dollar FAQs
The US Dollar (USD) is the official currency of the United States of America, and the ‘de facto’ currency of a significant number of other countries where it is found in circulation alongside local notes. It is the most heavily traded currency in the world, accounting for over 88% of all global foreign exchange turnover, or an average of $6.6 trillion in transactions per day, according to data from 2022. Following the second world war, the USD took over from the British Pound as the world’s reserve currency. For most of its history, the US Dollar was backed by Gold, until the Bretton Woods Agreement in 1971 when the Gold Standard went away.
The most important single factor impacting on the value of the US Dollar is monetary policy, which is shaped by the Federal Reserve (Fed). The Fed has two mandates: to achieve price stability (control inflation) and foster full employment. Its primary tool to achieve these two goals is by adjusting interest rates. When prices are rising too quickly and inflation is above the Fed’s 2% target, the Fed will raise rates, which helps the USD value. When inflation falls below 2% or the Unemployment Rate is too high, the Fed may lower interest rates, which weighs on the Greenback.
In extreme situations, the Federal Reserve can also print more Dollars and enact quantitative easing (QE). QE is the process by which the Fed substantially increases the flow of credit in a stuck financial system. It is a non-standard policy measure used when credit has dried up because banks will not lend to each other (out of the fear of counterparty default). It is a last resort when simply lowering interest rates is unlikely to achieve the necessary result. It was the Fed’s weapon of choice to combat the credit crunch that occurred during the Great Financial Crisis in 2008. It involves the Fed printing more Dollars and using them to buy US government bonds predominantly from financial institutions. QE usually leads to a weaker US Dollar.
Quantitative tightening (QT) is the reverse process whereby the Federal Reserve stops buying bonds from financial institutions and does not reinvest the principal from the bonds it holds maturing in new purchases. It is usually positive for the US Dollar.
The French election resulted in a hung parliament, a somewhat unintuitively pro-market result. The Euro (EUR) still faces downside risks during tricky coalition talks and given longer-term fiscal concerns, ING’s FX strategist Francesco Pesole notes.
EUR/USD is set for some selling this summer
“The French election resulted in a hung parliament, a somewhat unintuitively pro-market result. But given fiscal concerns, markets had a preference for Marine Le Pen’s alliance over the left-wing group to win more seats. The euro still faces downside risks during tricky coalition talks and given longer-term fiscal concerns.”
“So, if you are searching for a star performer, look elsewhere than the euro. Aside from political uncertainty, eurozone activity surveys are starting to lose steam; and an ECB that relies on its own (optimistic) inflation projections can still cut twice in 2024.”
“We believe any US-macro-driven rally close to 1.10 will offer opportunities for strategic EUR/USD selling this summer.”
USD/CNY weakened over the past month from around 7.25 to 7.27. Another month of soft data has increased the odds of easing in the next few months, ING’s FX analysts note.
USD/CNY weakens in the past month
“USD/CNY weakened over the past month from around 7.25 to 7.27, reflecting capital outflows amid market weakness and broader dollar strength. The People’s Bank of China (PBOC) usage of the counter-cyclical factor hit a new high in July.”
“Another month of soft data has increased the odds of easing in the next few months. However, the PBOC also announced it would start borrowing bonds to sell and try to cool the government bond rally. The net impact on yields is unclear.”
“We are adjusting our CNY forecasts weaker as yield differentials will remain unfavourable until the Fed starts easing.”
- The Mexican Peso is rising after the release of broadly inflationary data suggests interest rates might remain elevated.
- Relatively high interest rates in Mexico, at 11.00%, are drawing foreign capital inflows, supporting MXN.
- USD/MXN has broken below the key June 24 low at 17.87.
The Mexican Peso (MXN) continues appreciating in its key pairs on Wednesday after the release of Mexican macroeconomic data on Tuesday showed continued signs of inflationary pressures in the economy.
An overall beneficial backdrop due to carry flows is further supporting the Peso because of the attractiveness to foreign investors of the relatively high interest rates on offer in Mexico (11.00%).
The carry trade is an operation in which investors borrow in a currency where interest rates are low (like the Yen) and bank the money in a currency where interest rates are high (like MXN). The difference between the interest payments on the loan and the interest paid on the deposit (or bond) renders the profit, all other things being equal.
At the time of writing, one US Dollar (USD) buys 17.81 Mexican Pesos, EUR/MXN trades at 19.27, and GBP/MXN at 22.81.
Mexican Peso recovers on inflationary data
The Mexican Peso is recovering as investors mull recent macroeconomic data that showed Mexican inflation broadly rising in June.
The Headline Inflation rate in Mexico came out at 0.38% on a month-on-month basis, beating the 0.24% expected by economists and higher than the negative 0.19% of May, according to data from INEGI.
Core Inflation for June, which excludes volatile food and energy components, came out at 0.22%, falling below the 0.24% estimated by economists but above the 0.17% in May.
The 12-month Inflation rate in June, meanwhile, came out at 4.98%, which was higher than the 4.84% expected by economists and the 4.69% previously.
The slower increase in core inflation could be critical in terms of the outlook for interest rates in Mexico, according to investor advisor service of Capital Economics.
“Core inflation edged down last month. While there’s still a lot of uncertainty around the next rate decision in August, we think that the easing of core price pressures, alongside the weak run of activity data and the rebound in the Peso leave an August rate cut in play,” says Kimberley Sperrfechter, Emerging Markets Economist at Capital Economics.
Assuming the Banxico does go ahead and cut interest rates in August, this could have a negative impact on the Peso.
Technical Analysis: USD/MXN breaches key June 24 low
USD/MXN breaks below the key June 24 line-in-the-sand low at 17.87.
USD/MXN Daily Chart
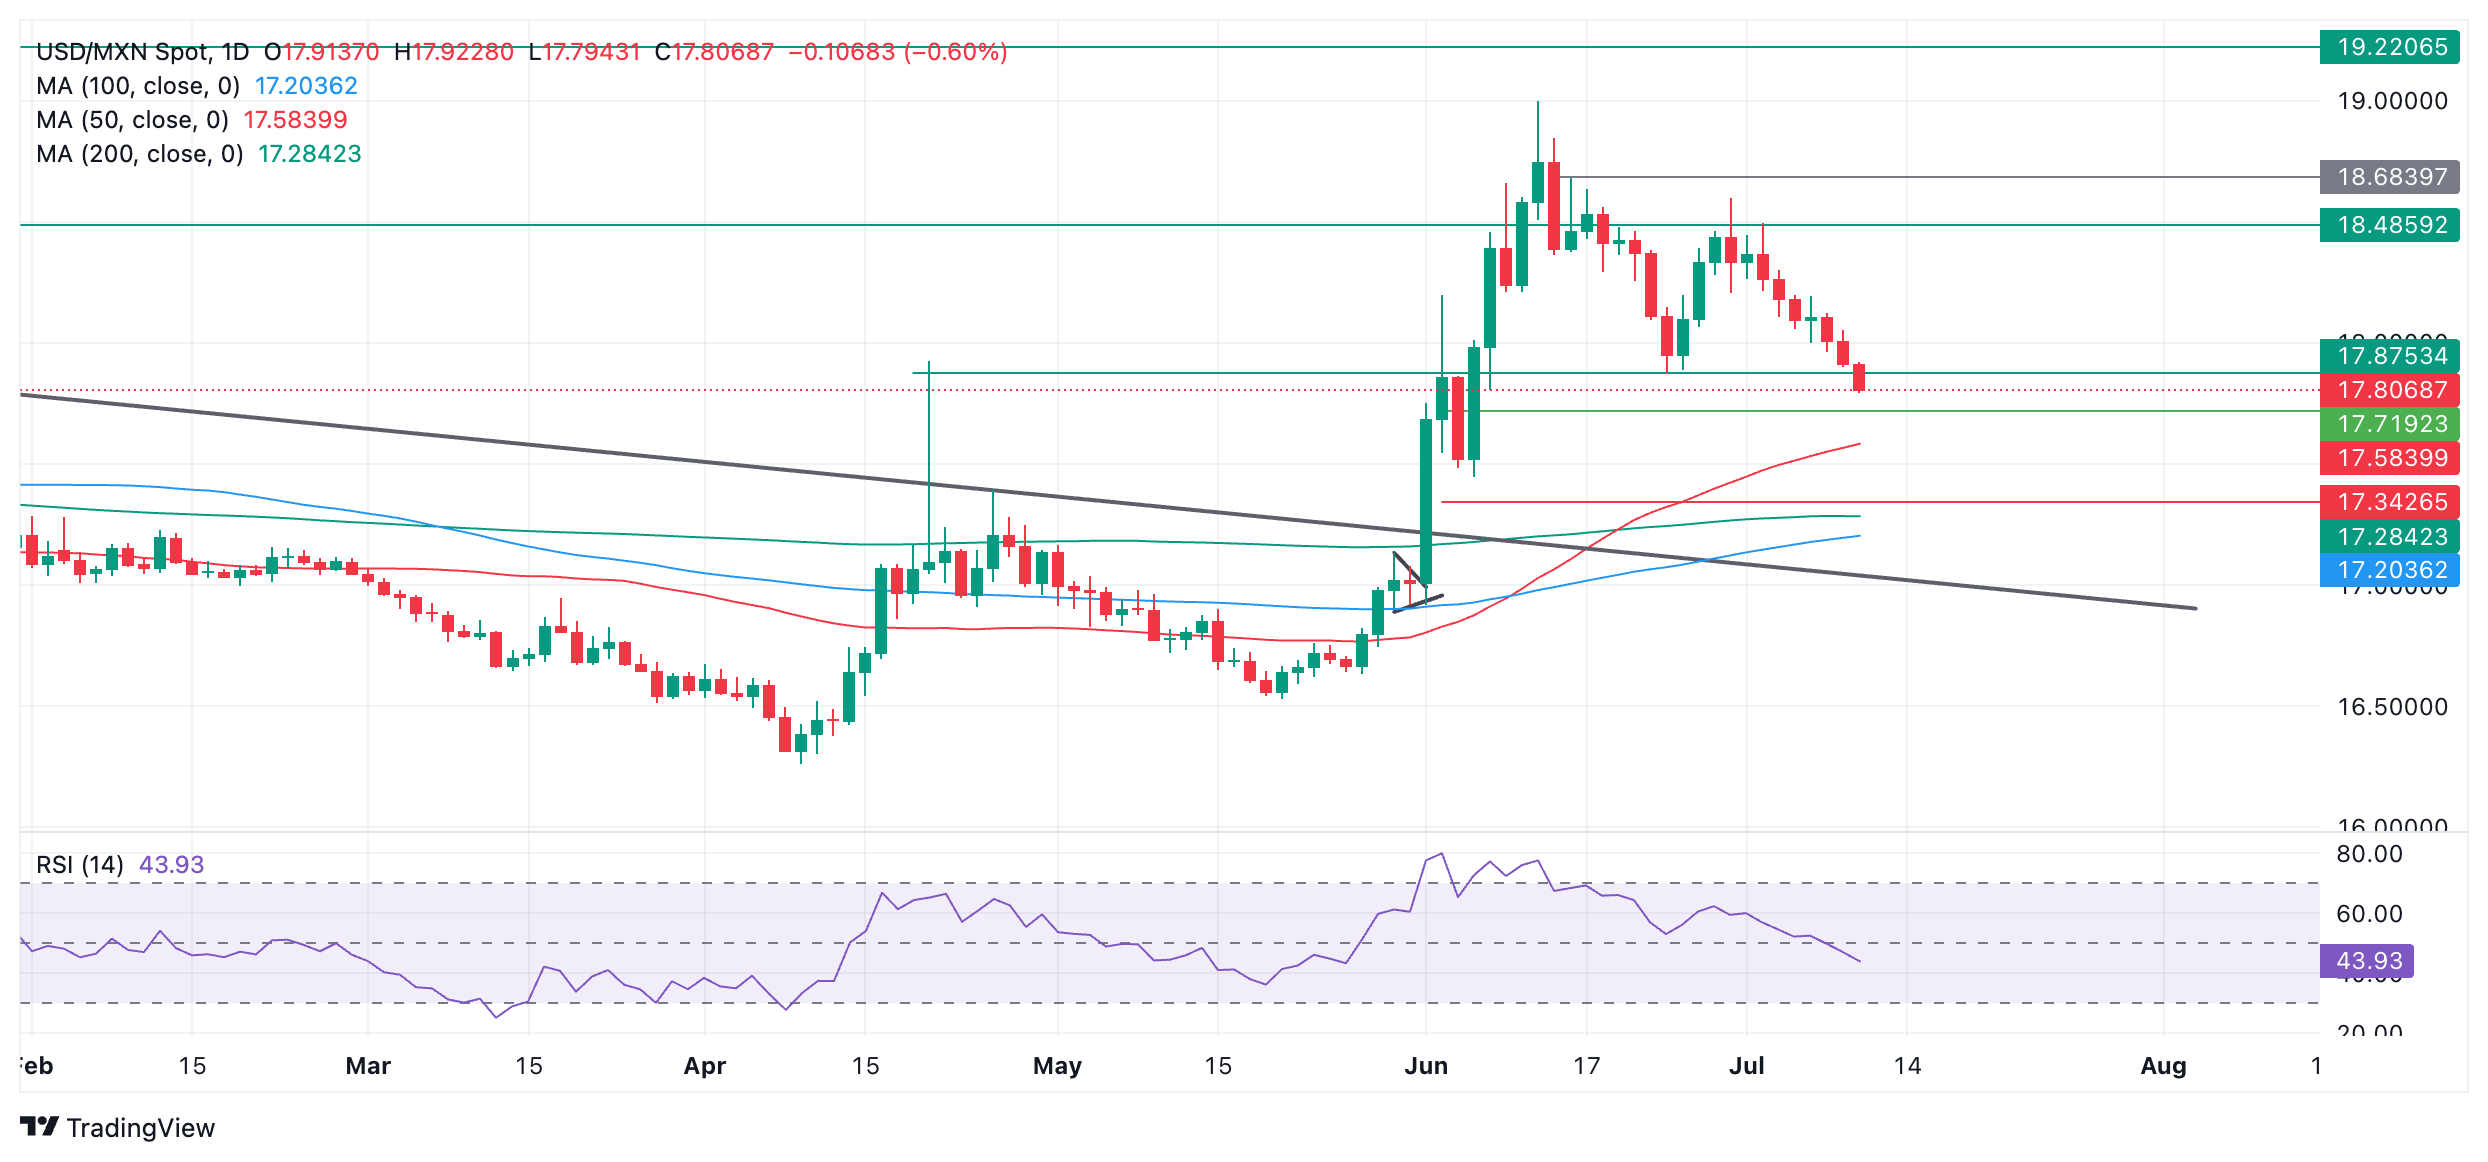
The break is so far on an intraday basis. A decisive break below 17.87, would reconfirm the down-trending bias, with the next target lying at 17.50 (50-day Simple Moving Average).
A decisive break would be one accompanied by a long red candle that closed near its low or three red candles in a row that broke below the level.
As things stand, the short-term trend is bearish, and the “the trend is your friend” adage suggests the odds favor an extension lower.
The direction of the medium and long-term trends, meanwhile, remain in doubt.
Economic Indicator
12-Month Inflation
The 12-month inflation index released by the Bank of Mexico is a measure of price movements by the comparison between the retail prices of a representative shopping basket of goods and services. The purchase power of Mexican Peso is dragged down by inflation. The inflation index is a key indicator since it is used by the central bank to set interest rates. Generally speaking, a high reading is seen as positive (or bullish) for the Mexican Peso, while a low reading is seen as negative (or Bearish).
Read more.Last release: Tue Jul 09, 2024 12:00
Frequency: Monthly
Actual: 4.98%
Consensus: 4.84%
Previous: 4.69%
Source: National Institute of Statistics and Geography of Mexico
- Natural Gas is steady and trades sideways in a tight range.
- Traders are looking for good news out of Freeport, where production should reopen.
- The US Dollar index trades flat above 105.00 and looks for direction after a boring Powell speech.
Natural Gas price (XNG/USD) is unable to extend the bounce it triggered on Monday and trades steady in a tight range on Wednesday. The more than ten-day correction finally snapped after Natural Gas reached a pivotal level at $2.29 and has been afloat since then. Traders are on the lookout for any news from the Freeport production plant in the US after storm Beryl forced to reduce production sharply to only 20%, creating uncertainty about Gas deliveries for Europe and other parts of the world.
Meanwhile, the US Dollar Index (DXY), which tracks the Greenback’s value against six major currencies, is also having some issues. US Federal Reserve (Fed) Chairman Jerome Powell was unable to deliver anything new in his semi-annual testimony before the US Congress. Traders are facing boredom in hearing the same repeated message again that it is too early to cut interest rates.
Natural Gas is trading at $2.37 per MMBtu at the time of writing.
Natural Gas news and market movers: All eyes on US exports
- Traders are looking for clues about whether the Freeport plant in Texas can reopen back in full after it had to reduce production due to storm Beryl passing in the region, according to Reuters.
- China demand might remain curbed at current Gas prices, with Chinese traders only interested in buying contracts below $2.00, according to Bloomberg.
- Newsbase reports that the US Treasury Department has extended authorization to export and re-export Liquefied Petroleum Gas (LPG) to Venezuela until July 8, 2025.
Natural Gas Technical Analysis: More is needed for a bounce
Natural Gas price has bounced right off the support level FXStreet mentioned in previous articles at $2.29 on Monday, with the 100-day Simple Moving Average (SMA) alongside the green ascending trend line in the chart below as support. The bounce, though, is not really playing out as Gas prices are rather going sideways. Markets will await a catalyst to either retest that support again or send Gas prices higher.
The 200-day SMA is the first force to reckon with on the upside, near $2.51, closely followed by the 55-day SMA at $2.62. Once back above, the pivotal level near $3.08 (March 6, 2023, high) remains key resistance after its false break last week.
On the other hand, the support level, which could mean some buying opportunities, is $2.29, the 100-day SMA that falls in line with the ascending trend line since mid-February. In case that level does not hold as support, look for the pivotal level near $2.13, which has acted as a cap and floor in the past.
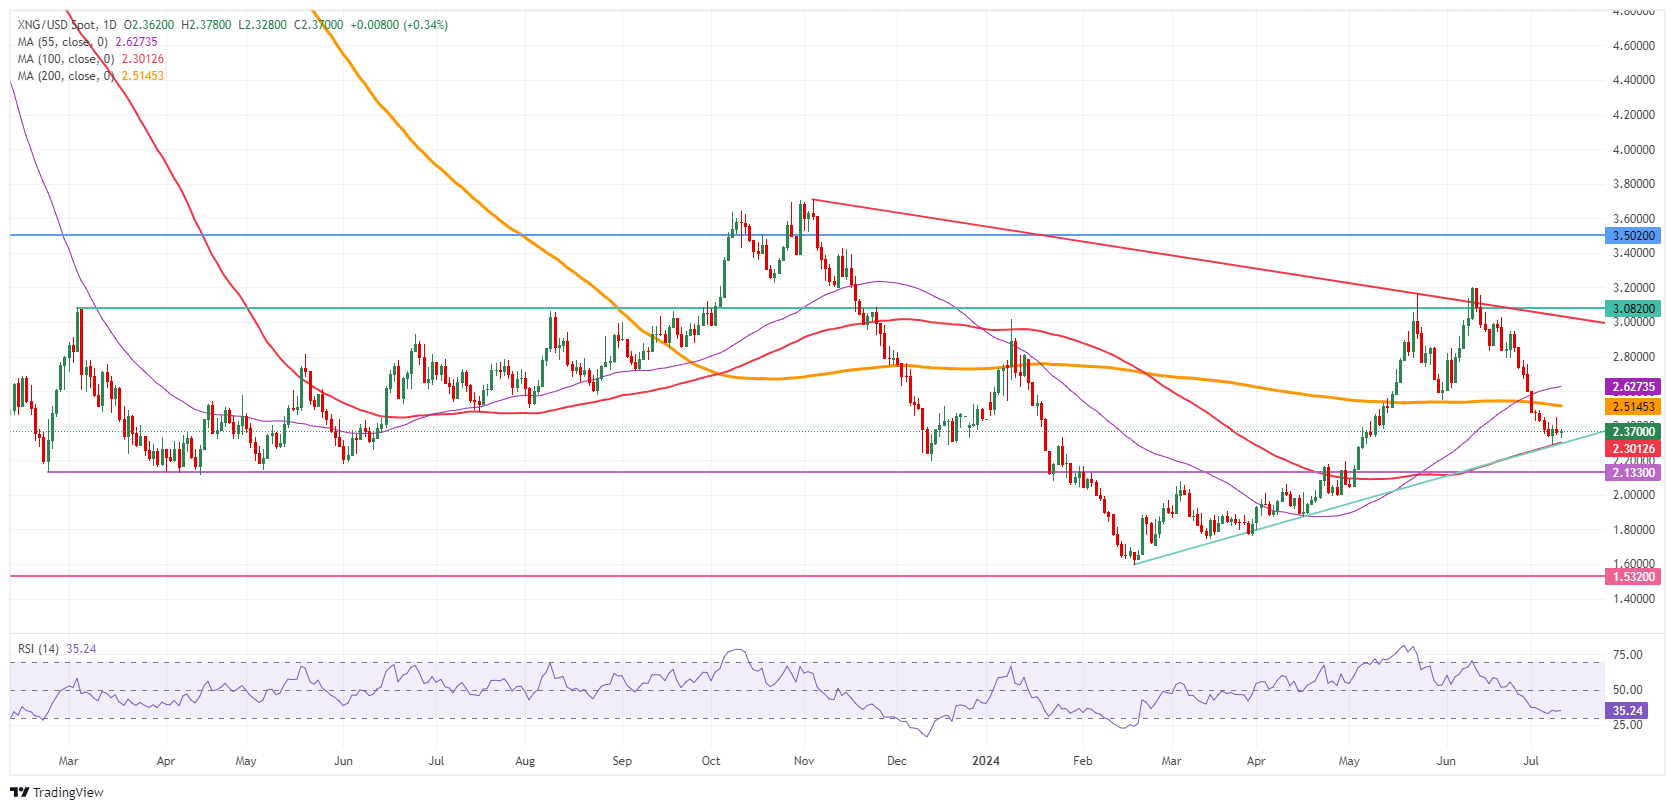
Natural Gas: Daily Chart
Natural Gas FAQs
Supply and demand dynamics are a key factor influencing Natural Gas prices, and are themselves influenced by global economic growth, industrial activity, population growth, production levels, and inventories. The weather impacts Natural Gas prices because more Gas is used during cold winters and hot summers for heating and cooling. Competition from other energy sources impacts prices as consumers may switch to cheaper sources. Geopolitical events are factors as exemplified by the war in Ukraine. Government policies relating to extraction, transportation, and environmental issues also impact prices.
The main economic release influencing Natural Gas prices is the weekly inventory bulletin from the Energy Information Administration (EIA), a US government agency that produces US gas market data. The EIA Gas bulletin usually comes out on Thursday at 14:30 GMT, a day after the EIA publishes its weekly Oil bulletin. Economic data from large consumers of Natural Gas can impact supply and demand, the largest of which include China, Germany and Japan. Natural Gas is primarily priced and traded in US Dollars, thus economic releases impacting the US Dollar are also factors.
The US Dollar is the world’s reserve currency and most commodities, including Natural Gas are priced and traded on international markets in US Dollars. As such, the value of the US Dollar is a factor in the price of Natural Gas, because if the Dollar strengthens it means less Dollars are required to buy the same volume of Gas (the price falls), and vice versa if USD strengthens.
Third Plenum meeting is going to happen next week. The discussion around reviving the property market and consumer sentiment will be its main topic, Societe Generale FX strategists note.
Retreat from 7.30 for USD/CNH may be short-lived
“Soft inflation data in China overnight reinforces our view that consumer sentiment in the mainland economy remains weak.”
“The discussion around reviving the property market and consumer sentiment will be the main topic at the Third Plenum meeting next week.”
“The consequences of subdued economic growth means the retreat from 7.30 for USD/CNH may be short-lived. Our EM colleagues pencil appreciation of the pair towards 7.45 by year-end.”
Jerome Powell, Chairman of the US Federal Reserve (Fed), delivered the Semi-Annual Monetary Policy Report and responded to questions before the Senate Banking Committee on the first day of his Congressional testimony.
USD/BRL up move has stalled near the upper limit of an ascending channel at 5.70, Societe Generale FX strategists note.
USD/BRL moves towards 5.30
“USD/BRL up move has stalled near the upper limit of an ascending channel at 5.70.”
“Daily MACD recorded multiyear high denoting an overstretched uptrend. The pair has embarked on a deeper pullback after this test. The 50-DMA near 5.30/5.28 is a potential support zone.”
“Defence of the MA could lead to continuation in up move. Recent gap levels near 5.55 which is also the 50% retracement of recent down move is near term hurdle.”
AUD/NZD eyes a move beyond 1.1100 and could inch higher towards next projections of 1.1175 and 1.1250, Societe Generale FX strategists note.
A sustained break above 1.1100 is possible
“AUD/NZD has experienced an accelerated up move recently and is now challenging the upper band of the range within which it has evolved since last year at 1.1100; this is also the 61.8% retracement from 2022.”
“Daily MACD is within positive territory and above its trigger line denoting prevalence of upward momentum.”
“A move beyond 1.1100 will confirm a breakout from a multi-month range. In such a scenario, AUD/NZD could inch higher towards next projections of 1.1175 and 1.1250. The low achieved earlier this week near 1.0990/1.0925 is important support near term.”
Federal Reserve (Fed) Jerome Powell told the Senate banking committee that cutting rates too early would be bad, but cutting rates too late would also be bad. China’s consumer price inflation inches back toward deflation and politics continues to create long-term noise, UBS macro strategist Paul Donovan Suggest.
Politics and Central Bank comments drive the market
“Perhaps Federal Reserve Chair Powell has opened an economics book (possibly ‘How the world really works—the economy’). Powell told the Senate banking committee that cutting rates too early would be bad, but cutting rates too late would also be bad. Unfortunately, the Fed Chair insisted that more ‘good data’ was required to induce a rate cut.”
“China’s consumer price inflation inched back toward deflation in spite of strong pork prices. The implication is that expectations of domestic policy support will continue. We hear from BoE Chief Economist Pill today. Chief economists’ remarks should always be heard with reverential attention, but with speculation about UK rate cuts Pill’s comments assume even more importance.”
“Politics continues to create noise. France’s caretaker government can do little to produce fiscal stability, and coalition negotiations are meandering. NATO’s summit puts US President Biden’s competence under international scrutiny. These issues are not market moving in the short term, but matter in the long term.”
- AUD/USD trades sideways with US Inflation in focus.
- Fed Powell cited concerns over easing US labor market strength.
- The RBA is expected to leave interest rates unchanged for the entire year.
The AUD/USD pair stays in a tight range near 0.6750 in Wednesday’s European session. The Aussie asset turns sideways as investors have sidelined with focus on the United States (US) Consumer Price Index (CPI) data for June, which will be published on Thursday.
The inflation data will provide cues about when the Federal Reserve (Fed) will start reducing interest rates. Meanwhile, market sentiment remains firm as investors see the Fed reducing interest rates in September meeting a done deal due to easing US labor market conditions. S&P 500 futures have posted some gains in European trading hours. The US Dollar Index (DXY), which tracks the Greenback’s value against six major currencies, hovers near 105.00.
On Tuesday, Fed Chair Jerome Powell said in the semi-annual Congressional testimony on Tuesday that escalated inflation has not remained the only risk to Fed’s dual mandate. Powell cautioned about easing US labor market strength as the US is no longer an overheated economy.
Latest US Nonfarm Payrolls data also showed a slowing trend in job demand, a rise in the Unemployment Rate to its highest in more than two years and expected slowdown in Average Hourly Earnings, a wage growth measure.
On the Aussie front, growing speculation that the Reserve Bank of Australia (RBA) will be the last to join the global rate-cutting cycle has kept the Australian Dollar (AUD) on the front foot. The RBA is expected to keep its Official Cash Rate (OCR) at its current levels for the entire year due to reversed disinflation process, prompted by strong consumer spendings.
Australian Dollar FAQs
One of the most significant factors for the Australian Dollar (AUD) is the level of interest rates set by the Reserve Bank of Australia (RBA). Because Australia is a resource-rich country another key driver is the price of its biggest export, Iron Ore. The health of the Chinese economy, its largest trading partner, is a factor, as well as inflation in Australia, its growth rate and Trade Balance. Market sentiment – whether investors are taking on more risky assets (risk-on) or seeking safe-havens (risk-off) – is also a factor, with risk-on positive for AUD.
The Reserve Bank of Australia (RBA) influences the Australian Dollar (AUD) by setting the level of interest rates that Australian banks can lend to each other. This influences the level of interest rates in the economy as a whole. The main goal of the RBA is to maintain a stable inflation rate of 2-3% by adjusting interest rates up or down. Relatively high interest rates compared to other major central banks support the AUD, and the opposite for relatively low. The RBA can also use quantitative easing and tightening to influence credit conditions, with the former AUD-negative and the latter AUD-positive.
China is Australia’s largest trading partner so the health of the Chinese economy is a major influence on the value of the Australian Dollar (AUD). When the Chinese economy is doing well it purchases more raw materials, goods and services from Australia, lifting demand for the AUD, and pushing up its value. The opposite is the case when the Chinese economy is not growing as fast as expected. Positive or negative surprises in Chinese growth data, therefore, often have a direct impact on the Australian Dollar and its pairs.
Iron Ore is Australia’s largest export, accounting for $118 billion a year according to data from 2021, with China as its primary destination. The price of Iron Ore, therefore, can be a driver of the Australian Dollar. Generally, if the price of Iron Ore rises, AUD also goes up, as aggregate demand for the currency increases. The opposite is the case if the price of Iron Ore falls. Higher Iron Ore prices also tend to result in a greater likelihood of a positive Trade Balance for Australia, which is also positive of the AUD.
The Trade Balance, which is the difference between what a country earns from its exports versus what it pays for its imports, is another factor that can influence the value of the Australian Dollar. If Australia produces highly sought after exports, then its currency will gain in value purely from the surplus demand created from foreign buyers seeking to purchase its exports versus what it spends to purchase imports. Therefore, a positive net Trade Balance strengthens the AUD, with the opposite effect if the Trade Balance is negative.
Silver prices (XAG/USD) rose on Wednesday, according to FXStreet data. Silver trades at $30.99 per troy ounce, up 0.60% from the $30.80 it cost on Tuesday.
Silver prices have increased by 30.23% since the beginning of the year.
| Unit measure | Silver Price Today in USD |
|---|---|
| Troy Ounce | 30.99 |
| 1 Gram | 1.00 |
The Gold/Silver ratio, which shows the number of ounces of Silver needed to equal the value of one ounce of Gold, stood at 76.58 on Wednesday, down from 76.74 on Tuesday.
Silver FAQs
Silver is a precious metal highly traded among investors. It has been historically used as a store of value and a medium of exchange. Although less popular than Gold, traders may turn to Silver to diversify their investment portfolio, for its intrinsic value or as a potential hedge during high-inflation periods. Investors can buy physical Silver, in coins or in bars, or trade it through vehicles such as Exchange Traded Funds, which track its price on international markets.
Silver prices can move due to a wide range of factors. Geopolitical instability or fears of a deep recession can make Silver price escalate due to its safe-haven status, although to a lesser extent than Gold's. As a yieldless asset, Silver tends to rise with lower interest rates. Its moves also depend on how the US Dollar (USD) behaves as the asset is priced in dollars (XAG/USD). A strong Dollar tends to keep the price of Silver at bay, whereas a weaker Dollar is likely to propel prices up. Other factors such as investment demand, mining supply – Silver is much more abundant than Gold – and recycling rates can also affect prices.
Silver is widely used in industry, particularly in sectors such as electronics or solar energy, as it has one of the highest electric conductivity of all metals – more than Copper and Gold. A surge in demand can increase prices, while a decline tends to lower them. Dynamics in the US, Chinese and Indian economies can also contribute to price swings: for the US and particularly China, their big industrial sectors use Silver in various processes; in India, consumers’ demand for the precious metal for jewellery also plays a key role in setting prices.
Silver prices tend to follow Gold's moves. When Gold prices rise, Silver typically follows suit, as their status as safe-haven assets is similar. The Gold/Silver ratio, which shows the number of ounces of Silver needed to equal the value of one ounce of Gold, may help to determine the relative valuation between both metals. Some investors may consider a high ratio as an indicator that Silver is undervalued, or Gold is overvalued. On the contrary, a low ratio might suggest that Gold is undervalued relative to Silver.
(An automation tool was used in creating this post.)
China’s CPI rose at a weaker-than-expected pace in June. Amid further easing by the PBOC, it is expected that the 1Y loan prime rate (LPR) will fall to 3.20% by end-4Q24 (current 3.45%), UOB Group Economist Ho Woei Chen notes.
PBOC's 1Y loan prime rate to fall to 3.20%
“China’s CPI rose at a weaker-than-expected pace in Jun. PPI deflation eased to its smallest pace in 17 months due mainly to base effect.”
“We lower our price expectation for this year. Our revised forecast for CPI is at 0.3% (from 0.7%) and PPI at -1.3% (from -1.0%) for 2024.”
“Amid further easing by the PBOC, we expect the 1Y loan prime rate (LPR) to fall to 3.20% by end-4Q24 (current 3.45%). We also think there is a possibility of another 50 bps cut to the reserve requirement ratio (RRR) in 2H24.”
The US Dollar (USD) is likely to consolidate in a range between 1.3490 and 1.3520. While momentum has not increased much, USD is likely to head lower towards the significant support level at 1.3460, UOB Group FX strategists Quek Ser Leang and Peter Chia note.
USD is likely to head lower towards 1.3460
24-HOUR VIEW: “We noted yesterday that ‘the current price action appears to be part of a consolidation, likely between 1.3485 and 1.3515.’ USD subsequently traded in a narrower range than expected (1.3492/1.3515), closing largely unchanged at 1.3505 (+0.04%). Flat momentum indicators continue to suggest consolidation, likely between 1.3490 and 1.3520.”
1-3 WEEKS VIEW: “USD traded in a quiet manner yesterday, and there is not much to add to our update from Monday (08 Jul, spot at 1.3490). As highlighted, while USD declined last Friday, downward momentum has not increased much. However, USD is likely to head lower towards the significant support level at 1.3460. At this time, it is too early to determine if USD can break clearly below this level. The risk of USD breaking below 1.3460 will remain intact as long as 1.3535 (no change in ‘strong resistance’ level) is not breached.”
- Silver price appreciates due to concerns over escalation of the Middle East conflict.
- Israeli forces deepened their offensive operations in northern and central Gaza on Wednesday.
- Fed Chair Powell stated that first-quarter data did not support increased confidence in the inflation trajectory.
Silver price (XAG/USD) gains ground for the second successive session, trading around $31.00 per troy ounce during the European hours on Tuesday. The upside of the safe-haven Silver is driven by concerns over a potential escalation of the Middle East conflict. Israeli forces continued their offensive in northern and central Gaza on Wednesday, following an airstrike on a tent encampment, according to Reuters.
The militant group Hamas reported that the renewed Israeli campaign killed over 60 Palestinians across the enclave on Tuesday. This could derail efforts to secure a ceasefire in the Gaza war, with talks scheduled to resume in Doha on Wednesday.
Traders anticipate the second semi-annual testimony by Federal Reserve Chairman Jerome Powell and speeches by the Fed’s Michelle Bowman and Austan Goolsbee on Wednesday. Additionally, attention will be on the US Consumer Price Index (CPI) data, set to be released on Thursday. The Core CPI is forecasted to remain steady at 3.45% year-over-year in June. Meanwhile, the monthly Core CPI is also expected to remain consistent at 0.2%.
The price of the non-yielding assets like Silver could face challenges as Fed Chair Jerome Powell reiterated the Fed's cautious stance during the testimony before the US Congress on Tuesday. Powell stated, "First-quarter data did not support the greater confidence in the inflation path that the Fed needs to cut rates."
Powell also emphasized that a "policy rate cut is inappropriate until the Fed gains greater confidence that inflation is headed sustainably toward 2%." The policymaker noted that "First-quarter data did not support the greater confidence in the inflation path that the Fed needs to cut rates."
Silver FAQs
Silver is a precious metal highly traded among investors. It has been historically used as a store of value and a medium of exchange. Although less popular than Gold, traders may turn to Silver to diversify their investment portfolio, for its intrinsic value or as a potential hedge during high-inflation periods. Investors can buy physical Silver, in coins or in bars, or trade it through vehicles such as Exchange Traded Funds, which track its price on international markets.
Silver prices can move due to a wide range of factors. Geopolitical instability or fears of a deep recession can make Silver price escalate due to its safe-haven status, although to a lesser extent than Gold's. As a yieldless asset, Silver tends to rise with lower interest rates. Its moves also depend on how the US Dollar (USD) behaves as the asset is priced in dollars (XAG/USD). A strong Dollar tends to keep the price of Silver at bay, whereas a weaker Dollar is likely to propel prices up. Other factors such as investment demand, mining supply – Silver is much more abundant than Gold – and recycling rates can also affect prices.
Silver is widely used in industry, particularly in sectors such as electronics or solar energy, as it has one of the highest electric conductivity of all metals – more than Copper and Gold. A surge in demand can increase prices, while a decline tends to lower them. Dynamics in the US, Chinese and Indian economies can also contribute to price swings: for the US and particularly China, their big industrial sectors use Silver in various processes; in India, consumers’ demand for the precious metal for jewellery also plays a key role in setting prices.
Silver prices tend to follow Gold's moves. When Gold prices rise, Silver typically follows suit, as their status as safe-haven assets is similar. The Gold/Silver ratio, which shows the number of ounces of Silver needed to equal the value of one ounce of Gold, may help to determine the relative valuation between both metals. Some investors may consider a high ratio as an indicator that Silver is undervalued, or Gold is overvalued. On the contrary, a low ratio might suggest that Gold is undervalued relative to Silver.
The US Dollar (USD) is expected to trade in a range, probably between 7.2820 and 7.2950, or at least in a wider range between 7.2700 and 7.3100 for the time being, UOB Group FX strategists Quek Ser Leang and Peter Chia note.
USD eyes to break above 7.2950
24-HOUR VIEW: “USD continues to trade in a quiet manner yesterday, between 7.2869 and 7.2931. The traded range was narrower than our expected range of 7.2820/7.2950. The quiet price action provides no fresh clues. Today, we continue to expect USD to trade in a range between 7.2820 and 7.2950.”
1-3 WEEKS VIEW: “Last Thursday (04 Jul, spot at 7.3000), we highlighted that the recent buildup of upward momentum had largely dissipated. We were of the view that the current price movements are likely part of a consolidation, and we expected USD to trade between 7.2700 and 7.3100 or the time being. There is no change in our view.”
The US Dollar (USD) is likely to edge higher; any advance is unlikely to break above 161.80. USD strength from the middle of last month has come to an end; for the time being, it is likely to trade in a 159.40/161.80 range, UOB Group FX strategists Quek Ser Leang and Peter Chia note.
All eyes on 161.80
24-HOUR VIEW: “Our view for USD to trade sideways between 160.30 and 161.30 yesterday was incorrect. USD rose to a high of 161.51, closing at 161.31 (+0.31%). There has been a slight increase in momentum. Today, USD is likely to edge higher, but any advance is unlikely to break above the major resistance at 161.80. On the downside, should USD break below 160.70 (minor support is at 161.00), it would mean that the mild upward pressure has faded.”
1-3 WEEKS VIEW: “Our update from Monday (08 Jul, spot at 160.65) still stands. As highlighted, the USD strength from the middle of last month has come to an end. The current price movements are likely part of a range trading phase. For the time being, USD is likely to trade between 159.40 and 161.80.”
- NZD/USD plunges to near 0.6070 as the RBNZ delivers a dovish interest rate guidance.
- The RBNZ sees inflation returning to the 1%-3% range in the second quarter this year.
- Investors await the US inflation data for fresh cues on the rate-cut timeframe.
The NZD/USD pair slides vertically to near 0.6070 in Wednesday’s European session. The Kiwi asset faces an intense sell-off as the Reserve Bank of New Zealand (RBNZ) unexpectedly delivered a dovish guidance on interest rates with keeping the Official Cash Rate (OCR) steady at 5.5%, as expected.
The RBNZ opened doors for rate cuts amid easing consumer inflation expectations. The central bank favored for keeping the monetary policy framework restrictive but the extent of restrictiveness will be eased. Over the inflation outlook, the RBNZ sees price pressures returning in the desired range of 1%-3% in the second half of this year.
Meanwhile, the market sentiment remains firm as investors expect that the Federal Reserve (Fed) will start reducing interest rates from the September meeting. S&P 500 futures have posted decent gains in European trading hours. 10-year US Treasury yields fall to near 4.29% as Fed Chair Jerome Powell signaled in his semi-annual Congressional testimony on Tuesday that escalated inflation is not only risk for the central bank with an easing trend in job demand.
Fed Powell said, "Labor market conditions have cooled considerably compared to where they were two years ago," and added that the US “is no longer an overheated economy,” Reuters reported.
Easing US economic outlook is unfavorable for the US Dollar (USD). The US Dollar Index (DXY), which tracks the Greenback’s value against six major currencies, struggles to extend recovery above 105.20.
Going forward, investors will focus on the United States (US) Consumer Price Index (CPI) data for June, which will be published on Thursday. The core CPI, which excludes volatile food and energy prices, is estimates to have grown steadily on monthly as well as annual basis.
New Zealand Dollar FAQs
The New Zealand Dollar (NZD), also known as the Kiwi, is a well-known traded currency among investors. Its value is broadly determined by the health of the New Zealand economy and the country’s central bank policy. Still, there are some unique particularities that also can make NZD move. The performance of the Chinese economy tends to move the Kiwi because China is New Zealand’s biggest trading partner. Bad news for the Chinese economy likely means less New Zealand exports to the country, hitting the economy and thus its currency. Another factor moving NZD is dairy prices as the dairy industry is New Zealand’s main export. High dairy prices boost export income, contributing positively to the economy and thus to the NZD.
The Reserve Bank of New Zealand (RBNZ) aims to achieve and maintain an inflation rate between 1% and 3% over the medium term, with a focus to keep it near the 2% mid-point. To this end, the bank sets an appropriate level of interest rates. When inflation is too high, the RBNZ will increase interest rates to cool the economy, but the move will also make bond yields higher, increasing investors’ appeal to invest in the country and thus boosting NZD. On the contrary, lower interest rates tend to weaken NZD. The so-called rate differential, or how rates in New Zealand are or are expected to be compared to the ones set by the US Federal Reserve, can also play a key role in moving the NZD/USD pair.
Macroeconomic data releases in New Zealand are key to assess the state of the economy and can impact the New Zealand Dollar’s (NZD) valuation. A strong economy, based on high economic growth, low unemployment and high confidence is good for NZD. High economic growth attracts foreign investment and may encourage the Reserve Bank of New Zealand to increase interest rates, if this economic strength comes together with elevated inflation. Conversely, if economic data is weak, NZD is likely to depreciate.
The New Zealand Dollar (NZD) tends to strengthen during risk-on periods, or when investors perceive that broader market risks are low and are optimistic about growth. This tends to lead to a more favorable outlook for commodities and so-called ‘commodity currencies’ such as the Kiwi. Conversely, NZD tends to weaken at times of market turbulence or economic uncertainty as investors tend to sell higher-risk assets and flee to the more-stable safe havens.
Further range trading seems likely, probably in a range of 0.6725/0.6755. Increasing upward momentum suggests the Australian Dollar (AUD) is likely to continue to rise to 0.6800, UOB Group FX strategists Quek Ser Leang and Peter Chia note.
All eyes on the 0.6800 mark
24-HOUR VIEW: “AUD traded between 0.6724 and 0.6747 yesterday, narrower than our expected range of 0.6720/0.6755. AUD closed largely unchanged at 0.6741 (+0.06%). Further range trading seems likely, probably in a range of 0.6725/0.6755.”
1-3 WEEKS VIEW: “We continue to hold the same as Monday (08 Jul, spot at 0.6745). As highlighted, increasing upward momentum suggests AUD is likely to continue to rise to 0.6800. Overall, only a breach of 0.6690 (no change in ‘strong support’ level from yesterday) would indicate that the AUD strength that started early last week has come to an end.”
- EUR/USD holds gains tight range above 1.0800 due to multiple tailwinds.
- Fed Powell’s caution on the US labor market pushes the US Dollar on the backfoot.
- The Euro gains as the far right’s defeat eases upside risks to widening French financial crisis.
EUR/USD turns sideways around 1.0800 in Wednesday’s European session after a modest corrective move from an almost four-week high of 1.0850. The major currency pair shifts to the sidelines as investors await the United States (US) Consumer Price Index (CPI) data for June, which will be published on Thursday.
Economists expect that core inflation, which excludes volatile food and energy items, grew steadily by 0.2% and 3.4% on a monthly and annual basis, respectively, in June. Annual headline inflation is estimated to have decelerated to 3.1% from May’s reading of 3.3%, while the monthly figure is expected to have grown by 0.1% after remaining unchanged previously.
The inflation data will provide cues as to whether current expectations that the Federal Reserve (Fed) will start reducing interest rates from the September meeting are appropriate.
Meanwhile, Fed Chair Jerome Powell signaled in his commentaries at the semi-annual Congressional testimony on Tuesday that rate cuts are not appropriate until policymakers gain significant confidence that inflation is on course to return to the desired rate of 2%.
However, Powell warned about easing US economic strength as the labor market loses momentum. Powell said "Labor market conditions have cooled considerably compared to where they were two years ago," and added that the US “is no longer an overheated economy.”
Daily digest market movers: EUR/USD gains as ECB’s subsequent rate-cut bets ease
- EUR/USD holds onto gains above 1.0800, inspired by a weak US Dollar (USD) and a decent recovery in the Euro, as the Marine Le Pen-led far-right National Rally fails to gain an absolute majority in French elections. The US Dollar Index (DXY), which tracks the Greenback’s value against six major currencies, faces pressure to extend recovery above 105.20.
- The far-right misses an outright majority despite leading in the first round, resulting in diminished fears of a widening French financial crisis. However, uncertainty about fiscal adjustments and the distribution of ministries remains high as the economy will be administered by a coalition government. Economists expect French President Emmanuel Macron's centrist alliance will join hands with the left wing, also known as the New Popular Front, led by Jean-Luc Mélenchon.
- Meanwhile, sliding expectations of subsequent rate cuts by the European Central Bank (ECB) keep the Euro on the front foot. ECB policymakers continue to refrain from committing to a pre-defined rate-cut path, with fears that an aggressive policy expansionary stance could reverse the disinflation process.
- On Tuesday, ECB governing council member and Governor of the Bank of Italy Fabio Panetta said the central bank could gradually reduce interest rates without any hiatus to slowing inflationary pressures. Panetta added that policy tightening done in the past is still impacting demand, output, and inflation.
Technical Analysis: EUR/USD steadies above 1.0800
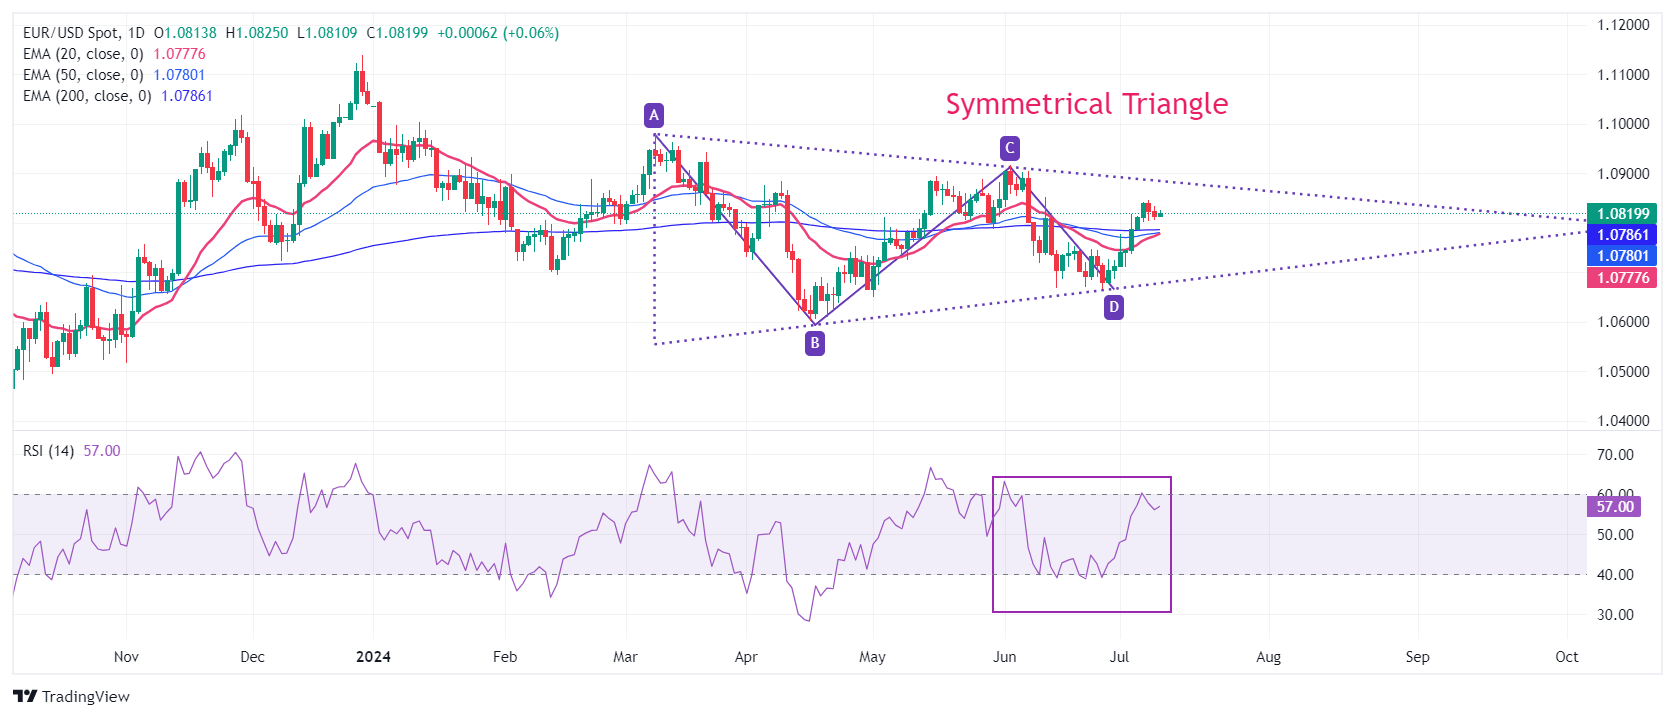
EUR/USD trades in a tight range slightly above the round-level support of 1.0800 as investors stay on the sidelines ahead of the US CPI report for June. The major currency pair stabilizes above the 20-day and 50-day Exponential Moving Averages (EMAs), which trade around 1.0750 and 1.0770, respectively. The overall trend of the shared currency pair has also strengthened as it has jumped above the 200-day EMA, which trades around 1.0800.
A Symmetrical Triangle formation on the daily timeframe exhibits a sharp volatility contraction, which indicates low volume and narrow ticks.
The 14-day Relative Strength Index (RSI) reaches 60.00. Should the bullish momentum be triggered if it breaks above 60.00?
Euro FAQs
The Euro is the currency for the 20 European Union countries that belong to the Eurozone. It is the second most heavily traded currency in the world behind the US Dollar. In 2022, it accounted for 31% of all foreign exchange transactions, with an average daily turnover of over $2.2 trillion a day. EUR/USD is the most heavily traded currency pair in the world, accounting for an estimated 30% off all transactions, followed by EUR/JPY (4%), EUR/GBP (3%) and EUR/AUD (2%).
The European Central Bank (ECB) in Frankfurt, Germany, is the reserve bank for the Eurozone. The ECB sets interest rates and manages monetary policy. The ECB’s primary mandate is to maintain price stability, which means either controlling inflation or stimulating growth. Its primary tool is the raising or lowering of interest rates. Relatively high interest rates – or the expectation of higher rates – will usually benefit the Euro and vice versa. The ECB Governing Council makes monetary policy decisions at meetings held eight times a year. Decisions are made by heads of the Eurozone national banks and six permanent members, including the President of the ECB, Christine Lagarde.
Eurozone inflation data, measured by the Harmonized Index of Consumer Prices (HICP), is an important econometric for the Euro. If inflation rises more than expected, especially if above the ECB’s 2% target, it obliges the ECB to raise interest rates to bring it back under control. Relatively high interest rates compared to its counterparts will usually benefit the Euro, as it makes the region more attractive as a place for global investors to park their money.
Data releases gauge the health of the economy and can impact on the Euro. Indicators such as GDP, Manufacturing and Services PMIs, employment, and consumer sentiment surveys can all influence the direction of the single currency. A strong economy is good for the Euro. Not only does it attract more foreign investment but it may encourage the ECB to put up interest rates, which will directly strengthen the Euro. Otherwise, if economic data is weak, the Euro is likely to fall. Economic data for the four largest economies in the euro area (Germany, France, Italy and Spain) are especially significant, as they account for 75% of the Eurozone’s economy.
Another significant data release for the Euro is the Trade Balance. This indicator measures the difference between what a country earns from its exports and what it spends on imports over a given period. If a country produces highly sought after exports then its currency will gain in value purely from the extra demand created from foreign buyers seeking to purchase these goods. Therefore, a positive net Trade Balance strengthens a currency and vice versa for a negative balance.
The Pound Sterling (GBP) is likely to trade in a sideways range of 1.2770/1.2820. Risk for GBP remains on the upside; the level to watch is 1.2860, UOB Group FX strategists Quek Ser Leang and Peter Chia note.
The level to watch is 1.2860
24-HOUR VIEW: “Two days ago, GBP rose to 1.2846 and then pulled back. Yesterday, we highlighted that ‘conditions remain overbought; this, combined with signs of slowing momentum suggests GBP is unlikely to strengthen further.’ We were of the view that GBP ‘is more likely to trade in sideways range of 1.2780/1.2840.’ Our view of sideways trading was not wrong, even though GBP traded in a narrower range of 1.2778/1.2821. Further sideways trading seems likely. However, the slightly softened underlying tone suggests a lower range of 1.2770/1.2820.”
1-3 WEEKS VIEW: “Our update from Monday (08 Jul, spot at 1.2805) is still valid. As indicated, the risk for GBP remains on the upside, and the level to watch is 1.2860. On the downside if GBP breaks below 1.2750 (no change in ‘strong support’ level), it would mean that the upside risk from last Thursday has faded.”
The Euro (EUR) is expected to continue to trade in a range, probably between 1.0800 and 1.0840. Risk of EUR breaking above 1.0850 has increased, albeit moderately, UOB Group FX strategists Quek Ser Leang and Peter Chia note.
Next level to watch above 1.0850 is 1.0915
24-HOUR VIEW: “Yesterday, we pointed out that ‘momentum indicators are turning flat,’ and we expected EUR to trade in a 1.0795/1.0845 range. EUR then traded in a relatively narrow range between 1.0804 and 1.0833, closing at 1.0812 (-0.09%). The quiet price action provides no fresh clues, and we continue to expect EUR to trade in a range, probably between 1.0800 and 1.0840.”
1-3 WEEKS VIEW: “Last Thursday (04 Jul, spot at 1.0785), we indicated that ‘while the increase in momentum suggests further EUR strength, it is too early to determine if it can reach the major resistance at 1.0850.’ After EUR rose, we indicated on Monday (08 Jul, spot at 1.0825) that ‘the risk of EUR breaking above 1.0850 has increased, albeit moderately.’ EUR traded in a quiet manner yesterday, and there is no change in our view. Overall, only a breach of 1.0770 (no change in ‘strong support’ level from yesterday) would indicate that the current upward pressure has faded. Looking ahead, the next level to watch above 1.0850 is 1.0915.”
- Powell makes signs that the Fed is weighing a rate cut but is too shy to name a date.
- The uncertainty dampens volatility for the interest-rate-sensitive precious metal.
- Gold edges higher as global central bank buying remains buoyant despite PBoC’s absence.
Gold (XAU/USD) is edging higher on Wednesday, continuing to recover after the PBoC-related sell-off on Monday.
This comes after data emerged showing that worldwide central bank demand for Gold remains buoyant. This has balanced out the negative impact of the news that the largest consumer of Gold, the People’s Bank of China (PBoC), stopped buying the precious metal in June – extending its parsimony for another month after it also closed its wallet in May – following an 18-month buying spree.
Gold rises despite Powell’s reluctance to name a date
Gold shrugged off Federal Reserve (Fed) Chairman Jerome Powell’s testimony to the Senate Banking Committee on Tuesday, in which he refused to give a date for a first interest-rate cut, saying instead that the Fed would adopt a data-dependent approach to interest rates.
Investors had been hoping for more concrete details of when the Fed would cut interest rates, and Powell’s mute retrenchment ought to have weakened Gold more than it did. The reason for this is that delays in cutting rates might mean borrowing costs stay elevated for longer – a negative for Gold as it keeps the opportunity cost of holding the precious metal high. Gold is a non-interest-bearing asset, which becomes less attractive to investors if they can earn higher interest elsewhere.
At the same time, Powell did make some statements that acted as an antidote. For example, he acknowledged progress had been made on inflation and discounted the possibility of rate hikes. He also said there was a balance of risks to waiting too long (to cut interest rates) or acting too soon, suggesting a finely balanced situation.
Gold stays bid on news other central banks are buying
Gold keeps its shine on Wednesday, trading in the $2,370s. The yellow metal finds upside momentum after it emerged that, despite the PBoC ceasing to increase its reserves, other major central banks were still buying substantial amounts of Gold.
“Other central banks continue to participate, with India's central bank buying more than nine tons of Gold in June, the National Bank of Poland increasing its Gold reserves by four tons and the Czech National Bank showing that its Gold reserves rose by some two tons in June. With these central banks continuing to build Gold positions, it is quite evident that the official sector is much broader than just the PBoC,” said Bert Melek, Head of Commodity Strategy at TD Securities.
To sum up, it is unlikely China’s absence from the market will prevent the commodity from rising to TD’s target of $2,475 in Q1 of 2025, according to TD’s Malek.
Technical Analysis: Gold continues slow recovery
Gold is recovering for the second day in a row after it formed a bearish two-bar reversal pattern (green-shaded rectangle in the chart below) at the top of the early-July move. This pattern forms after a long green-up day is followed by a long red-down day of a similar length and size. It can be a sign of a short-term reversal.
XAU/USD Daily Chart
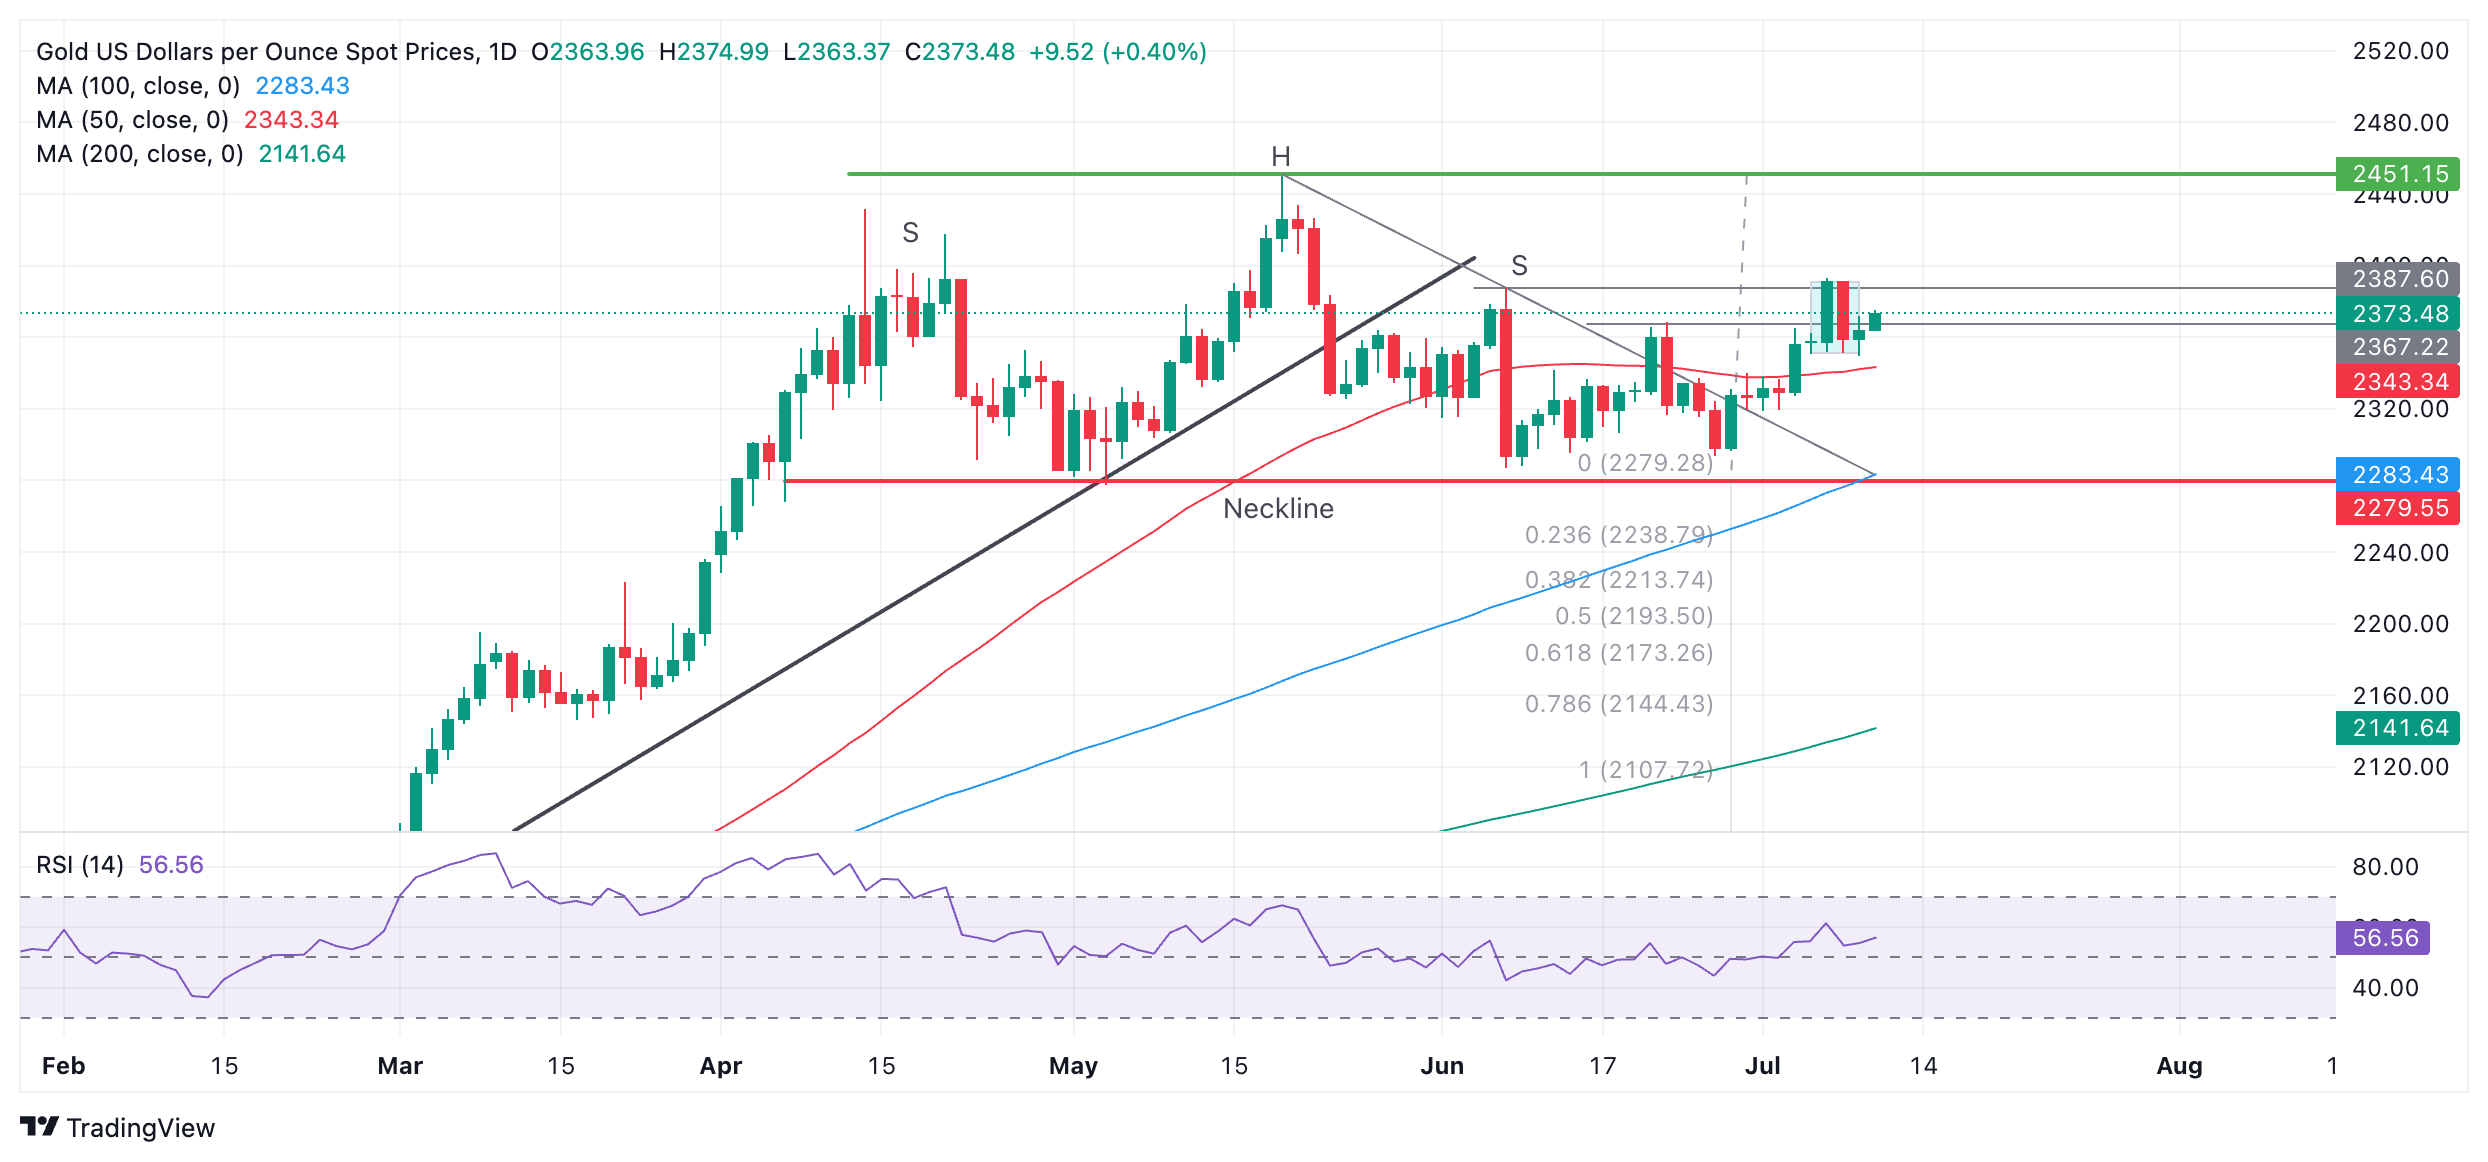
The outlook is unclear. There is a risk Gold could pull back to the 50-day Simple Moving Average (SMA) at $2,343.
That said, the break above the downward trendline on June 27 turned the tables for the precious metal, establishing a more bullish outlook.
If Gold breaks above Friday’s peak of $2,393, it will continue the sequence of higher highs and probably unlock the next target at the $2,451 all-time high.
The bearish Head & Shoulders (H&S) topping pattern that formed from April to June has been invalidated by the recent recovery. However, there is still a chance – albeit much reduced – that a more complex topping pattern may have formed instead.
If a complex pattern has formed in place of the H&S, and the price breaks below the pattern’s neckline at $2,279, a reversal lower may still be possible with a conservative target at $2,171, the 0.618 ratio of the height of the pattern extrapolated lower.
The trend is now sideways in both the short and medium term. In the long term, Gold remains in an uptrend.
Gold FAQs
Gold has played a key role in human’s history as it has been widely used as a store of value and medium of exchange. Currently, apart from its shine and usage for jewelry, the precious metal is widely seen as a safe-haven asset, meaning that it is considered a good investment during turbulent times. Gold is also widely seen as a hedge against inflation and against depreciating currencies as it doesn’t rely on any specific issuer or government.
Central banks are the biggest Gold holders. In their aim to support their currencies in turbulent times, central banks tend to diversify their reserves and buy Gold to improve the perceived strength of the economy and the currency. High Gold reserves can be a source of trust for a country’s solvency. Central banks added 1,136 tonnes of Gold worth around $70 billion to their reserves in 2022, according to data from the World Gold Council. This is the highest yearly purchase since records began. Central banks from emerging economies such as China, India and Turkey are quickly increasing their Gold reserves.
Gold has an inverse correlation with the US Dollar and US Treasuries, which are both major reserve and safe-haven assets. When the Dollar depreciates, Gold tends to rise, enabling investors and central banks to diversify their assets in turbulent times. Gold is also inversely correlated with risk assets. A rally in the stock market tends to weaken Gold price, while sell-offs in riskier markets tend to favor the precious metal.
The price can move due to a wide range of factors. Geopolitical instability or fears of a deep recession can quickly make Gold price escalate due to its safe-haven status. As a yield-less asset, Gold tends to rise with lower interest rates, while higher cost of money usually weighs down on the yellow metal. Still, most moves depend on how the US Dollar (USD) behaves as the asset is priced in dollars (XAU/USD). A strong Dollar tends to keep the price of Gold controlled, whereas a weaker Dollar is likely to push Gold prices up.
- The commodity-linked CAD struggles as Crude Oil price continues its losing streak for the fourth successive day.
- WTI price extends its losses due to the diminished impact of Hurricane Beryl.
- Fed Chair Powell stated, "First-quarter data did not support the greater confidence in the inflation path."
USD/CAD holds its gains, trading around 1.3640 during the early European hours on Wednesday. The weakening of the commodity-linked Canadian Dollar (CAD) could be attributed to lower crude Oil prices, given the fact that Canada is the biggest Oil exporter to the United States (US).
West Texas Intermediate (WTI) Oil price trades around $80.30 per barrel at the time of writing. This drop in Oil prices is attributed to the diminished impact of Hurricane Beryl. The storm affected a major Oil-producing region in Texas but caused less damage than initially expected by the markets.
Oil and gas companies resumed some operations on Tuesday. Several ports reopened, and most producers and facilities began ramping up output. However, some facilities sustained damage, and power had not yet been fully restored, according to Reuters.
Additionally, Oil prices may face challenges due to weak consumer demand in China, the world's top crude importer. China's Consumer Price Index (CPI) data showed an annual increase of 0.2% in June, down from a 0.3% rise in May, falling short of the market's forecast of a 0.4% increase. Monthly, inflation declined by 0.2% in June, compared to the previous and expected decline of 0.1%.
Moreover, Federal Reserve Chairman Jerome Powell's testimony before the US Congress on Tuesday. Powell acknowledged improving inflation data but reiterated the Fed's cautious stance. The higher rate would negatively impact the economy of the United States, the largest Oil consumer.
Fed Chair Powell stated, "More good data would strengthen our confidence in inflation." He also noted that "first-quarter data did not support the greater confidence in the inflation path that the Fed needs to cut rates."
Traders anticipate the second semi-annual testimony by Fed Chair Jerome Powell and speeches by the Fed’s Michelle Bowman and Austan Goolsbee on Wednesday. Additionally, attention will be on the US Consumer Price Index (CPI) data, set to be released on Thursday.
Canadian Dollar FAQs
The key factors driving the Canadian Dollar (CAD) are the level of interest rates set by the Bank of Canada (BoC), the price of Oil, Canada’s largest export, the health of its economy, inflation and the Trade Balance, which is the difference between the value of Canada’s exports versus its imports. Other factors include market sentiment – whether investors are taking on more risky assets (risk-on) or seeking safe-havens (risk-off) – with risk-on being CAD-positive. As its largest trading partner, the health of the US economy is also a key factor influencing the Canadian Dollar.
The Bank of Canada (BoC) has a significant influence on the Canadian Dollar by setting the level of interest rates that banks can lend to one another. This influences the level of interest rates for everyone. The main goal of the BoC is to maintain inflation at 1-3% by adjusting interest rates up or down. Relatively higher interest rates tend to be positive for the CAD. The Bank of Canada can also use quantitative easing and tightening to influence credit conditions, with the former CAD-negative and the latter CAD-positive.
The price of Oil is a key factor impacting the value of the Canadian Dollar. Petroleum is Canada’s biggest export, so Oil price tends to have an immediate impact on the CAD value. Generally, if Oil price rises CAD also goes up, as aggregate demand for the currency increases. The opposite is the case if the price of Oil falls. Higher Oil prices also tend to result in a greater likelihood of a positive Trade Balance, which is also supportive of the CAD.
While inflation had always traditionally been thought of as a negative factor for a currency since it lowers the value of money, the opposite has actually been the case in modern times with the relaxation of cross-border capital controls. Higher inflation tends to lead central banks to put up interest rates which attracts more capital inflows from global investors seeking a lucrative place to keep their money. This increases demand for the local currency, which in Canada’s case is the Canadian Dollar.
Macroeconomic data releases gauge the health of the economy and can have an impact on the Canadian Dollar. Indicators such as GDP, Manufacturing and Services PMIs, employment, and consumer sentiment surveys can all influence the direction of the CAD. A strong economy is good for the Canadian Dollar. Not only does it attract more foreign investment but it may encourage the Bank of Canada to put up interest rates, leading to a stronger currency. If economic data is weak, however, the CAD is likely to fall.
- USD/CHF loses ground, snapping the three-day winning streak around 0.8970 on Wednesday.
- Fed’s Powell noted that the central bank is moving closer to feeling comfortable about interest rate cuts.
- Political uncertainties and geopolitical risks might boost the safe-haven asset like the CHF.
The USD/CHF pair trims gains near 0.8970 during the early European session on Wednesday. The downward momentum of the pair is supported by the softer Greenback after Jerome Powell's Semiannual Monetary Policy Report on Wednesday.
The US Federal Reserve Chair Jerome Powell indicated the central bank is moving closer to feeling comfortable about interest rate cuts. He further stated that evidence of cooler inflation and that more "good data" could open the door to interest rate cuts.
The financial market is now pricing in 74% odds of a Fed rate cut in September, up from 71% last Friday, according to data from the CME FedWatch Tool. However, the Federal Open Market Committee (FOMC) members at their June meeting indicated just one cut this year. The expectation of a Fed rate cut might exert some selling pressure on the US Dollar (USD) in the near term.
Traders will focus on the weaker Greenback ahead of the US Consumer Price Index (CPI) inflation data on Thursday will be the highlights this week. The US CPI is estimated to show a rise of 3.1% YoY in June, compared to a 3.3% rise in May. Core inflation is projected to remain steady at 3.4% YoY in June.
On the Swiss front, the signs of cooler inflationary pressures in Switzerland might fuel the Swiss National Bank (SNB) to continue cutting interest rates further, which is likely to exert some selling pressure on the Swiss Franc (CHF). Nonetheless, the downside of CHF might be limited amid political uncertainties in France and geopolitical tensions in the Middle East.
Swiss economy FAQs
Switzerland is the ninth-largest economy measured by nominal Gross Domestic Product (GDP) in the European continent. Measured by GDP per capita – a broad measure of average living standards –, the country ranks among the highest in the world, meaning that it is one the richest countries globally. Switzerland tends to be in the top spots in global rankings about living standards, development indexes, competitiveness or innovation.
Switzerland is an open, free-market economy mainly based on the services sector. The Swiss economy has a strong export sector, and the neighboring European Union (EU) is its main trading partner. Switzerland is a leading exporter of watches and clocks, and hosts leading firms in the food, chemicals and pharmaceutical industries. The country is considered to be an international tax haven, with significantly low corporate and income tax rates compared with its European neighbors.
As a high-income country, the growth rate of the Swiss economy has diminished over the last decades. Still, its political and economic stability, its high education levels, top-tier firms in several industries and its tax-haven status have made it a preferred destination for foreign investment. This has generally benefited the Swiss Franc (CHF), which has historically kept relatively strong against its main currency peers. Generally, a good performance of the Swiss economy – based on high growth, low unemployment and stable prices – tends to appreciate CHF. Conversely, if economic data points to weakening momentum, CHF is likely to depreciate.
Switzerland isn’t a commodity exporter, so in general commodity prices aren’t a key driver of the Swiss Franc (CHF). However, there is a slight correlation with both Gold and Oil prices. With Gold, CHF’s status as a safe-haven and the fact that the currency used to be backed by the precious metal means that both assets tend to move in the same direction. With Oil, a paper released by the Swiss National Bank (SNB) suggests that the rise in Oil prices could negatively influence CHF valuation, as Switzerland is a net importer of fuel.
Here is what you need to know on Wednesday, July 10:
Major currency pairs continue to trade in familiar ranges midweek as investors' search for the next catalyst continues. Later in the day, Federal Reserve (Fed) Chairman Jerome Powell will deliver the Semi-Annual Monetary Policy Report and respond to questions before the House Financial Services Committee in the second day of his Congressional testimony. Several other Fed policymakers will also be delivering speeches during the American trading hours.
US Dollar PRICE This week
The table below shows the percentage change of US Dollar (USD) against listed major currencies this week. US Dollar was the strongest against the New Zealand Dollar.
| USD | EUR | GBP | JPY | CAD | AUD | NZD | CHF | |
|---|---|---|---|---|---|---|---|---|
| USD | 0.17% | 0.14% | 0.39% | -0.10% | 0.04% | 0.74% | 0.12% | |
| EUR | -0.17% | 0.18% | 0.54% | 0.05% | 0.03% | 0.92% | 0.30% | |
| GBP | -0.14% | -0.18% | 0.33% | -0.11% | -0.15% | 0.74% | 0.11% | |
| JPY | -0.39% | -0.54% | -0.33% | -0.49% | -0.34% | 0.50% | -0.22% | |
| CAD | 0.10% | -0.05% | 0.11% | 0.49% | 0.09% | 0.84% | 0.23% | |
| AUD | -0.04% | -0.03% | 0.15% | 0.34% | -0.09% | 0.89% | 0.25% | |
| NZD | -0.74% | -0.92% | -0.74% | -0.50% | -0.84% | -0.89% | -0.63% | |
| CHF | -0.12% | -0.30% | -0.11% | 0.22% | -0.23% | -0.25% | 0.63% |
The heat map shows percentage changes of major currencies against each other. The base currency is picked from the left column, while the quote currency is picked from the top row. For example, if you pick the US Dollar from the left column and move along the horizontal line to the Japanese Yen, the percentage change displayed in the box will represent USD (base)/JPY (quote).
In his prepared remarks, Powell told the Senate Banking Committee on Tuesday that more good data would strengthen their confidence on inflation, repeating that it will not be appropriate to reduce the policy rate until they have more confidence. Commenting on the latest jobs report, "the most recent labor market data sent a pretty clear signal that the labor market has cooled considerably," he noted. These remarks failed to trigger a noticeable market reaction. The US Dollar Index closed with marginal gains, while major equity indexes in the US ended the day little changed.
During the Asian trading hours, the data from China showed that the Consumer Price Index declined by 0.2% on a monthly basis in June, bringing the annual CPI inflation rate down to 0.2% from 0.3% in May. In the meantime, the Reserve Bank of New Zealand announced that it left the policy rate unchanged at 5.5% as widely expected. The RBNZ said in its policy statement that there are signs suggesting that inflation persistence will ease in line with the fall in capacity pressures and business pricing intentions. NZD/USD turned south following this event and was last seen trading below 0.6100, where it was down more than 0.5% on a daily basis.
EUR/USD registered small losses on Tuesday but managed to hold comfortably above 1.0800. Early Wednesday, the pair trades marginally higher on the day at around 1.0820.
GBP/USD edged lower on Tuesday and ended the day below 1.2800. The pair clings to small gains near this level in the European morning.
Following Monday's sharp decline, Gold staged a technical correction and posted small gains on Tuesday. XAU/USD struggles to gather bullish momentum on Wednesday but remains afloat above $2,370.
USD/JPY edged higher after finding support near 161.00 and closed in positive territory on Tuesday. The pair holds its ground to start the European session and trades at around 161.50.
Fed FAQs
Monetary policy in the US is shaped by the Federal Reserve (Fed). The Fed has two mandates: to achieve price stability and foster full employment. Its primary tool to achieve these goals is by adjusting interest rates. When prices are rising too quickly and inflation is above the Fed’s 2% target, it raises interest rates, increasing borrowing costs throughout the economy. This results in a stronger US Dollar (USD) as it makes the US a more attractive place for international investors to park their money. When inflation falls below 2% or the Unemployment Rate is too high, the Fed may lower interest rates to encourage borrowing, which weighs on the Greenback.
The Federal Reserve (Fed) holds eight policy meetings a year, where the Federal Open Market Committee (FOMC) assesses economic conditions and makes monetary policy decisions. The FOMC is attended by twelve Fed officials – the seven members of the Board of Governors, the president of the Federal Reserve Bank of New York, and four of the remaining eleven regional Reserve Bank presidents, who serve one-year terms on a rotating basis.
In extreme situations, the Federal Reserve may resort to a policy named Quantitative Easing (QE). QE is the process by which the Fed substantially increases the flow of credit in a stuck financial system. It is a non-standard policy measure used during crises or when inflation is extremely low. It was the Fed’s weapon of choice during the Great Financial Crisis in 2008. It involves the Fed printing more Dollars and using them to buy high grade bonds from financial institutions. QE usually weakens the US Dollar.
Quantitative tightening (QT) is the reverse process of QE, whereby the Federal Reserve stops buying bonds from financial institutions and does not reinvest the principal from the bonds it holds maturing, to purchase new bonds. It is usually positive for the value of the US Dollar.
- The Pound Sterling exhibits strength against the US Dollar as Fed’s Powell sees softness in the US labor market strength.
- The Fed chief did not guide any specific rate-cut path.
- UK GDP for May and US Inflation for June have come under the spotlight.
The Pound Sterling (GBP) edges higher against the US Dollar (USD) in Wednesday’s early London session after a mild correction from almost a four-week high of 1.2850 this week. The broader appeal of the GBP/USD pair remains firm amid strong speculation that the Federal Reserve (Fed) will start reducing interest rates during the September meeting.
The odds for the Fed pivoting to policy normalization remain firm even though Fed Chair Jerome Powell reiterated in his semi-annual Congressional testimony on Tuesday, refrained from providing any specific rate-cut path for this year. Powell argued in favor of maintaining interest rates at their current levels for long until they get evidence that inflation will return to the desired rate of 2%.
What was unexpected from Fed Powell’s commentary before Congress is his acknowledgement that the United States (US) economy is no longer overheated, with cooling job market conditions. Powell said that the labor market has moderated to where it was before pandemic-era.
Now that risks have become two-sided, a rate-cut move by the Fed in September appears to be a done deal. For more clarity, investors will focus on the US Consumer Price Index (CPI) report for June, which will be published on Thursday. The report is expected to show that the core inflation, which strips off volatile food and energy items, grew steadily by 0.2% and 3.4% on a monthly and annual basis, respectively. Annual headline inflation is estimated to have decelerated to 3.1% from May’s reading of 3.3%, while the monthly figure is expected to have barely grown after remaining unchanged.
A scenario in which price pressures remain sticky or hot would ease expectations for rate cuts in September. On the contrary, soft numbers will boost them.
Daily Digest Market Movers: Pound Sterling remains firm with UK GDP in focus
- The Pound Sterling performs strongly against its major peers due to multiple tailwinds. The British currency strengthens as the outright victory of the United Kingdom (UK) Keir Starmer-led Labour Party in parliamentary elections against Rishi Sunak-led Conservative Party has brought political stability to the economy. The uncertainty over the Bank of England (BoE) rate-cut path has deepened after hawkish guidance from BoE policymaker Jonathan Haskel.
- On Monday, Jonathan Haskel, who has been amongst major hawks, said no to a rate cut in August as inflation in the labor market is still higher due to strong wage growth. Haskel said, "I would rather hold rates until there is more certainty that underlying inflationary pressures have subsided sustainably," Reuters reported.
- On the contrary, financial markets currently expect that the BoE will begin cutting its key rates from the August meeting. The expectations for BoE rate cuts in August have been prompted by the return of the annual headline inflation to bank’s target of 2%.
- Meanwhile, investors shift focus to the monthly Gross Domestic Product (GDP) and factory data for May, which will be published on Thursday. Economists expect that the economy expanded by 0.2% after remaining unchanged in April. Industrial and Manufacturing Production are expected to have grown on a monthly and annual basis after declining in April.
Technical Analysis: Pound Sterling aims to hold 1.2800
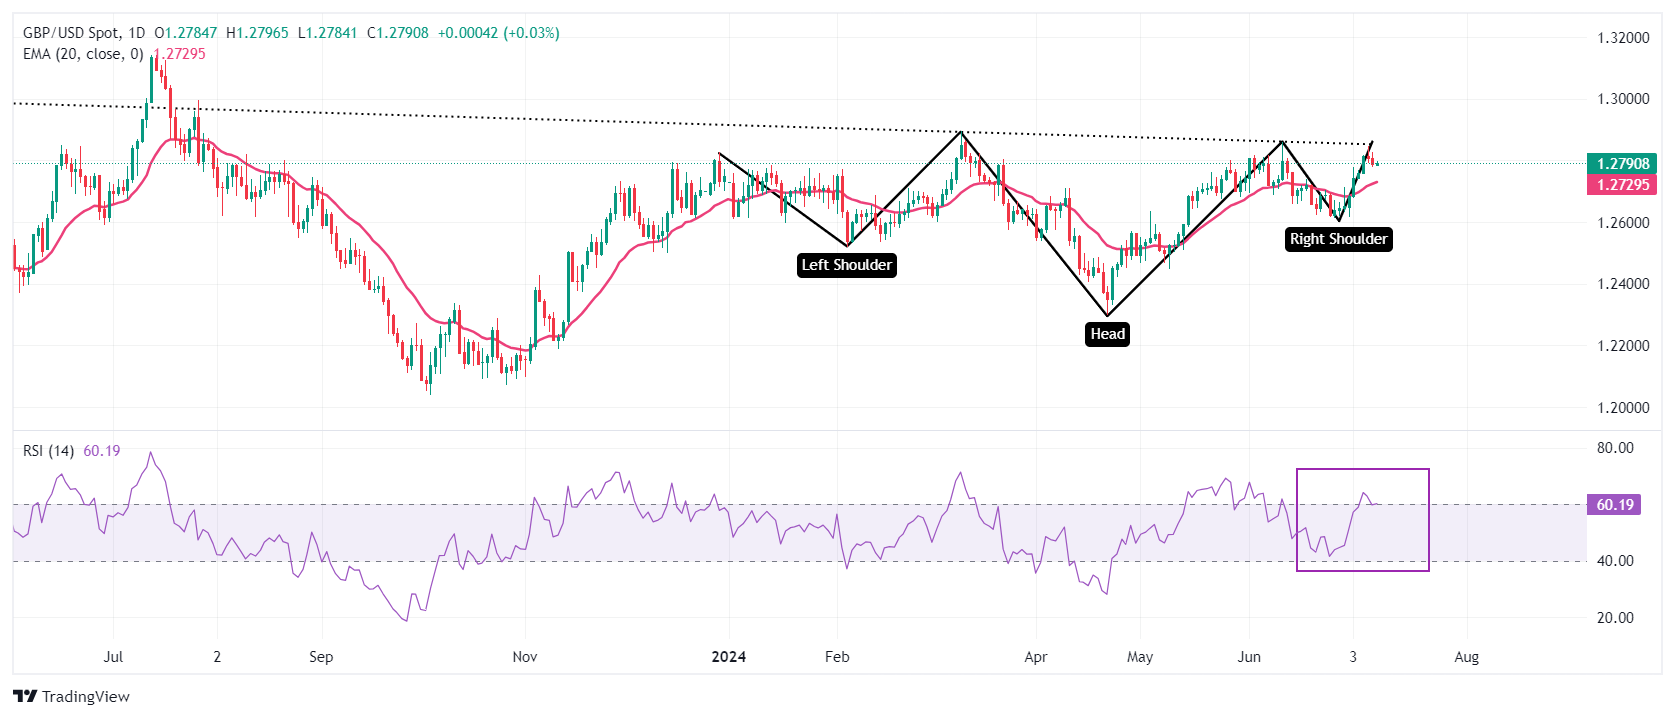
The Pound Sterling aims to hold the key figure of 1.2800 against the US Dollar. The GBP/USD pair gathers strength for a decisive breakout of the Inverted Head and Shoulder (H&S) chart formation on a daily timeframe whose neckline is plotted near 1.2850. A breakout of the H&S formation results in a bullish reversal.
Advancing 20-day Exponential Moving Average (EMA) near 1.2730, suggests that the near-term trend is bullish.
The 14-day Relative Strength Index (RSI) climbs into the bullish range of 60.00-80.00. A sustained move above the same will keep the momentum towards the upside.
Pound Sterling FAQs
The Pound Sterling (GBP) is the oldest currency in the world (886 AD) and the official currency of the United Kingdom. It is the fourth most traded unit for foreign exchange (FX) in the world, accounting for 12% of all transactions, averaging $630 billion a day, according to 2022 data. Its key trading pairs are GBP/USD, aka ‘Cable’, which accounts for 11% of FX, GBP/JPY, or the ‘Dragon’ as it is known by traders (3%), and EUR/GBP (2%). The Pound Sterling is issued by the Bank of England (BoE).
The single most important factor influencing the value of the Pound Sterling is monetary policy decided by the Bank of England. The BoE bases its decisions on whether it has achieved its primary goal of “price stability” – a steady inflation rate of around 2%. Its primary tool for achieving this is the adjustment of interest rates. When inflation is too high, the BoE will try to rein it in by raising interest rates, making it more expensive for people and businesses to access credit. This is generally positive for GBP, as higher interest rates make the UK a more attractive place for global investors to park their money. When inflation falls too low it is a sign economic growth is slowing. In this scenario, the BoE will consider lowering interest rates to cheapen credit so businesses will borrow more to invest in growth-generating projects.
Data releases gauge the health of the economy and can impact the value of the Pound Sterling. Indicators such as GDP, Manufacturing and Services PMIs, and employment can all influence the direction of the GBP. A strong economy is good for Sterling. Not only does it attract more foreign investment but it may encourage the BoE to put up interest rates, which will directly strengthen GBP. Otherwise, if economic data is weak, the Pound Sterling is likely to fall.
Another significant data release for the Pound Sterling is the Trade Balance. This indicator measures the difference between what a country earns from its exports and what it spends on imports over a given period. If a country produces highly sought-after exports, its currency will benefit purely from the extra demand created from foreign buyers seeking to purchase these goods. Therefore, a positive net Trade Balance strengthens a currency and vice versa for a negative balance.
FX option expiries for July 10 NY cut at 10:00 Eastern Time, via DTCC, can be found below
- EUR/USD: EUR amounts
- 1.0645 956m
- 1.0650 2b
- 1.0760 839m
- 1.0770 1.4b
- 1.0775 1.3b
- 1.0795 755m
- 1.0875 1b
- 1.0900 1.3b
- USD/JPY: USD amounts
- 159.50 1.9b
- 160.00 2.8b
- 161.00 835m
- 161.20 695m
- 161.50 1.2b
- AUD/USD: AUD amounts
- 0.6750 427m
- 0.6770 1b
- 0.6810 716m
- USD/CAD: USD amounts
- 1.3660 568m
- 1.3665 438m
- NZD/USD: NZD amounts
- 0.6175 435m
- 0.6300 505m
Gold prices rose in India on Wednesday, according to data compiled by FXStreet.
The price for Gold stood at 6,359.17 Indian Rupees (INR) per gram, up compared with the INR 6,345.91 it cost on Tuesday.
The price for Gold increased to INR 74,172.44 per tola from INR 74,017.45 per tola a day earlier.
| Unit measure | Gold Price in INR |
|---|---|
| 1 Gram | 6,359.17 |
| 10 Grams | 63,591.98 |
| Tola | 74,172.44 |
| Troy Ounce | 197,792.50 |
FXStreet calculates Gold prices in India by adapting international prices (USD/INR) to the local currency and measurement units. Prices are updated daily based on the market rates taken at the time of publication. Prices are just for reference and local rates could diverge slightly.
Gold FAQs
Gold has played a key role in human’s history as it has been widely used as a store of value and medium of exchange. Currently, apart from its shine and usage for jewelry, the precious metal is widely seen as a safe-haven asset, meaning that it is considered a good investment during turbulent times. Gold is also widely seen as a hedge against inflation and against depreciating currencies as it doesn’t rely on any specific issuer or government.
Central banks are the biggest Gold holders. In their aim to support their currencies in turbulent times, central banks tend to diversify their reserves and buy Gold to improve the perceived strength of the economy and the currency. High Gold reserves can be a source of trust for a country’s solvency. Central banks added 1,136 tonnes of Gold worth around $70 billion to their reserves in 2022, according to data from the World Gold Council. This is the highest yearly purchase since records began. Central banks from emerging economies such as China, India and Turkey are quickly increasing their Gold reserves.
Gold has an inverse correlation with the US Dollar and US Treasuries, which are both major reserve and safe-haven assets. When the Dollar depreciates, Gold tends to rise, enabling investors and central banks to diversify their assets in turbulent times. Gold is also inversely correlated with risk assets. A rally in the stock market tends to weaken Gold price, while sell-offs in riskier markets tend to favor the precious metal.
The price can move due to a wide range of factors. Geopolitical instability or fears of a deep recession can quickly make Gold price escalate due to its safe-haven status. As a yield-less asset, Gold tends to rise with lower interest rates, while higher cost of money usually weighs down on the yellow metal. Still, most moves depend on how the US Dollar (USD) behaves as the asset is priced in dollars (XAU/USD). A strong Dollar tends to keep the price of Gold controlled, whereas a weaker Dollar is likely to push Gold prices up.
(An automation tool was used in creating this post.)
- EUR/USD drifts higher to 1.0818 on Wednesday.
- The constructive outlook remains intact above the 100-EMA, with a bullish RSI,
- The first upside barrier is seen at 1.0843, initial support level is located at 1.0800-1.0810 regions.
The EUR/USD pair trades on a stronger note around 1.0818 on Wednesday during the early European session. The modest uptick of the pair is bolstered by the weaker Greenback The US Consumer Price Index (CPI) inflation data on Thursday will be the highlights for this week.
Technically, the positive outlook of the major pair remains intact as it holds above the key 100-period Exponential Moving Average (EMA) on the 4-hour chart. The path of least resistance is to the upside, as the Relative Strength Index (RSI) stands in bullish territory near 57.0.
The immediate resistance level for EUR/USD will emerge at 1.0843, the upper boundary of the Bollinger Band. Any follow-through buying above this level will see a rally to 1.0885, a high of May 15. The next hurdle is seen at 1.0915, a high of June 4.
On the flip side, the potential support level is located at the 1.0800-1.0810 zone, representing the lower limit of the Bollinger Band and psychological figure. Further south, the next contention level to watch is 1.0790, the 100-period EMA. A breach of this level will pave the way to 1.0710, a low of July 2.
EUR/USD 4-hour chart
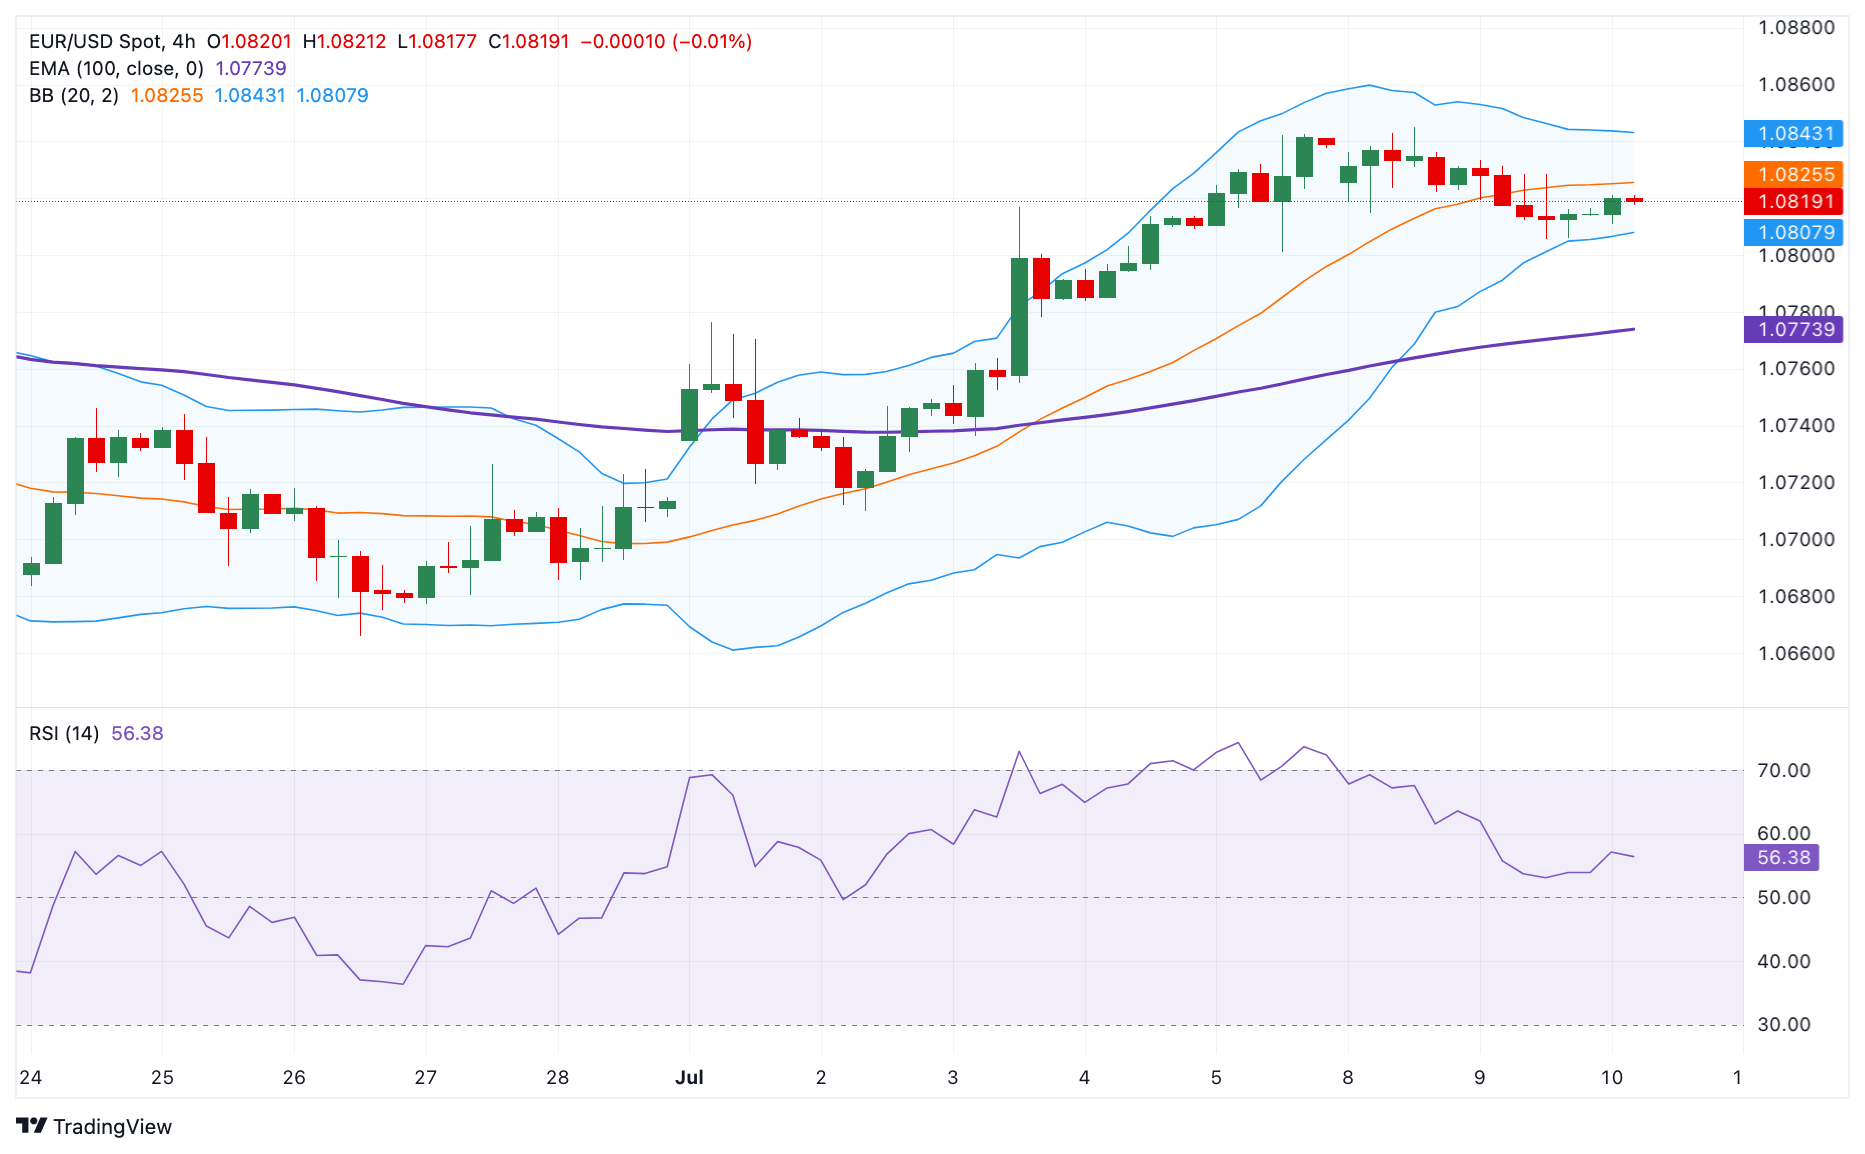
Euro FAQs
The Euro is the currency for the 20 European Union countries that belong to the Eurozone. It is the second most heavily traded currency in the world behind the US Dollar. In 2022, it accounted for 31% of all foreign exchange transactions, with an average daily turnover of over $2.2 trillion a day. EUR/USD is the most heavily traded currency pair in the world, accounting for an estimated 30% off all transactions, followed by EUR/JPY (4%), EUR/GBP (3%) and EUR/AUD (2%).
The European Central Bank (ECB) in Frankfurt, Germany, is the reserve bank for the Eurozone. The ECB sets interest rates and manages monetary policy. The ECB’s primary mandate is to maintain price stability, which means either controlling inflation or stimulating growth. Its primary tool is the raising or lowering of interest rates. Relatively high interest rates – or the expectation of higher rates – will usually benefit the Euro and vice versa. The ECB Governing Council makes monetary policy decisions at meetings held eight times a year. Decisions are made by heads of the Eurozone national banks and six permanent members, including the President of the ECB, Christine Lagarde.
Eurozone inflation data, measured by the Harmonized Index of Consumer Prices (HICP), is an important econometric for the Euro. If inflation rises more than expected, especially if above the ECB’s 2% target, it obliges the ECB to raise interest rates to bring it back under control. Relatively high interest rates compared to its counterparts will usually benefit the Euro, as it makes the region more attractive as a place for global investors to park their money.
Data releases gauge the health of the economy and can impact on the Euro. Indicators such as GDP, Manufacturing and Services PMIs, employment, and consumer sentiment surveys can all influence the direction of the single currency. A strong economy is good for the Euro. Not only does it attract more foreign investment but it may encourage the ECB to put up interest rates, which will directly strengthen the Euro. Otherwise, if economic data is weak, the Euro is likely to fall. Economic data for the four largest economies in the euro area (Germany, France, Italy and Spain) are especially significant, as they account for 75% of the Eurozone’s economy.
Another significant data release for the Euro is the Trade Balance. This indicator measures the difference between what a country earns from its exports and what it spends on imports over a given period. If a country produces highly sought after exports then its currency will gain in value purely from the extra demand created from foreign buyers seeking to purchase these goods. Therefore, a positive net Trade Balance strengthens a currency and vice versa for a negative balance.
- Silver price trades sideways around $31.00 as investors await the US Inflation report for June.
- Fed Powell signaled that the labor market strength appears to be easing.
- Silver price holds the Falling Channel breakout.
Silver price (XAG/USD) trades sideways near $31.00 in Wednesday’s Asian session. The white metal consolidates even though the commentary from Federal Reserve (Fed) Chair Jerome Powell, in his semi-annual Congressional testimony on Wednesday, indicated that risks to the Fed’s dual mandate are finely balanced.
Fed Powell acknowledged that labor market conditions are no tighter enough that was experienced after mammoth liquidity infusion in pandemic era. On inflation, Powell commented that the Fed has made some progress in inflation in recent months and more good data would bolster the case for looser monetary policy, Reuters reported.
However, Powell still not delivered any timeframe for rate cuts but his commentary has kept strength in market expectations for the Fed to begin reducing interest rates from September intact.
Meanwhile, the US Dollar (USD) has remained under pressure ahead of the United States (US) Consumer Price Index (CPI) report for June, which will be published on Thursday. The US Dollar Index (DXY), which tracks the Greenback’s value against six major currencies, gains ground above the almost four-week low of 104.85.10-year US Treasury yields and consolidates around 4.30%.
Silver technical analysis
Silver price extends its upside to near $31.00 after a breakout of the Falling Channel formation on a four-hour timeframe. An upside break of the above-mentioned chart pattern results in a bullish reversal. Upward-sloping 20-day Exponential Moving Average (EMA) at $30.70, exhibits a bullish trend.
The 14-period Relative Strength Index (RSI) shifts into the bullish range of 60.00-80.00, indicating that momentum has shifted to the upside.
Silver four-hour chart
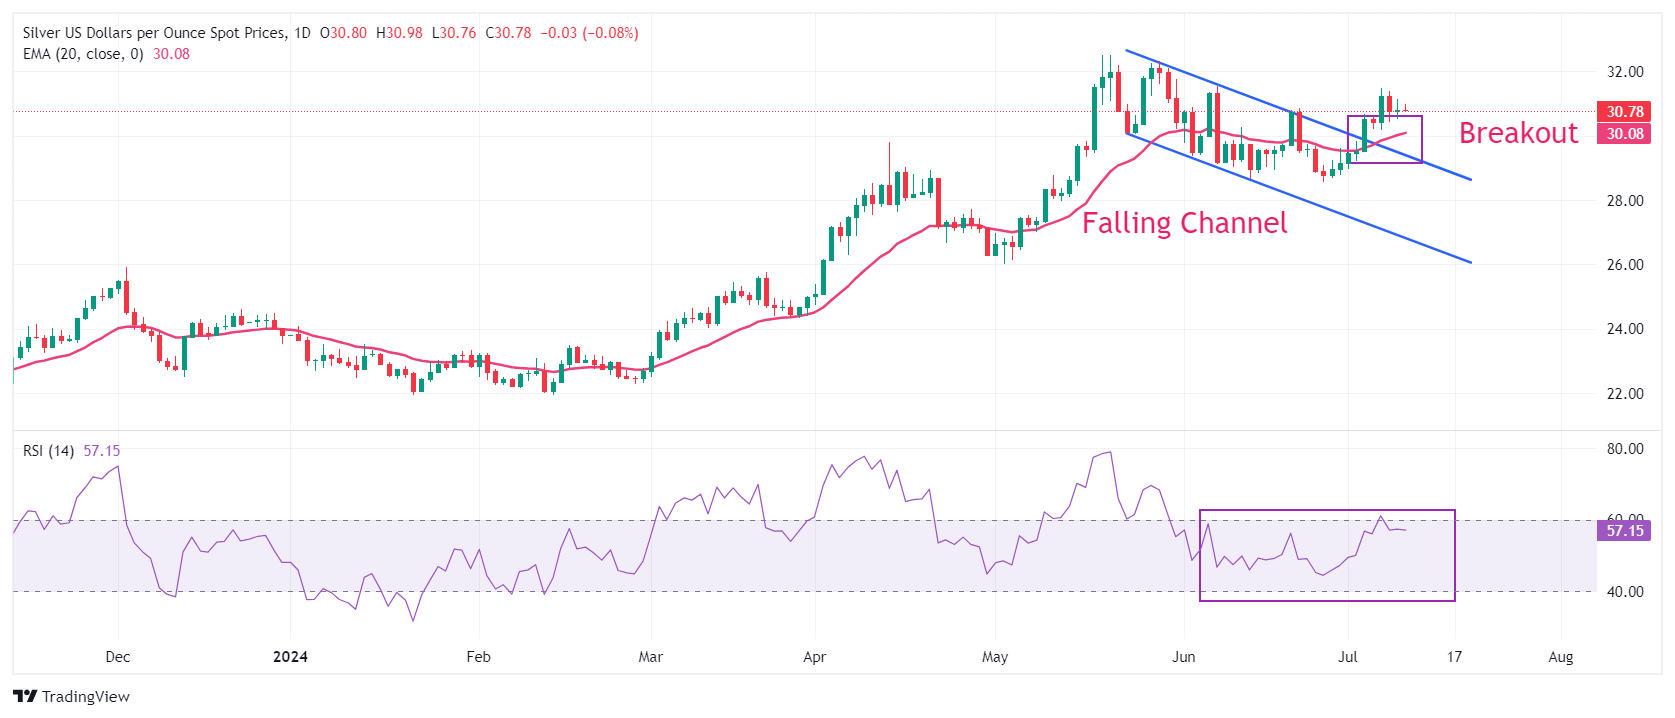
Silver FAQs
Silver is a precious metal highly traded among investors. It has been historically used as a store of value and a medium of exchange. Although less popular than Gold, traders may turn to Silver to diversify their investment portfolio, for its intrinsic value or as a potential hedge during high-inflation periods. Investors can buy physical Silver, in coins or in bars, or trade it through vehicles such as Exchange Traded Funds, which track its price on international markets.
Silver prices can move due to a wide range of factors. Geopolitical instability or fears of a deep recession can make Silver price escalate due to its safe-haven status, although to a lesser extent than Gold's. As a yieldless asset, Silver tends to rise with lower interest rates. Its moves also depend on how the US Dollar (USD) behaves as the asset is priced in dollars (XAG/USD). A strong Dollar tends to keep the price of Silver at bay, whereas a weaker Dollar is likely to propel prices up. Other factors such as investment demand, mining supply – Silver is much more abundant than Gold – and recycling rates can also affect prices.
Silver is widely used in industry, particularly in sectors such as electronics or solar energy, as it has one of the highest electric conductivity of all metals – more than Copper and Gold. A surge in demand can increase prices, while a decline tends to lower them. Dynamics in the US, Chinese and Indian economies can also contribute to price swings: for the US and particularly China, their big industrial sectors use Silver in various processes; in India, consumers’ demand for the precious metal for jewellery also plays a key role in setting prices.
Silver prices tend to follow Gold's moves. When Gold prices rise, Silver typically follows suit, as their status as safe-haven assets is similar. The Gold/Silver ratio, which shows the number of ounces of Silver needed to equal the value of one ounce of Gold, may help to determine the relative valuation between both metals. Some investors may consider a high ratio as an indicator that Silver is undervalued, or Gold is overvalued. On the contrary, a low ratio might suggest that Gold is undervalued relative to Silver.
- The Japanese Yen struggles as the US Dollar gains momentum after Fed Chair Jerome Powell's testimony on Tuesday.
- The Bank of Japan is poised to assess a viable strategy for scaling back its government bond purchases.
- Powell stated that a rate cut is not appropriate until the Fed gains confidence that inflation is moving toward 2%.
The Japanese Yen (JPY) depreciates for the third successive session on Wednesday. The rise in the USD/JPY pair is driven by the strengthening US Dollar (USD), which gained momentum after Federal Reserve Chairman Jerome Powell's testimony before the US Congress on Tuesday. Powell noted improved inflation figures but maintained the Fed's cautious approach.
The Bank of Japan (BoJ) may raise interest rates during its July meeting and unveil plans to taper its bond purchases. On Tuesday, Japan's Finance Minister Shunichi Suzuki underscored the significance of maintaining fiscal discipline to bolster confidence in long-term fiscal health. Suzuki also mentioned monitoring closely the discussions at the BoJ meeting concerning the bond market, as reported by Reuters.
Traders anticipate several key events in the financial markets. These include Fed Chair Jerome Powell's second semi-annual testimony, speeches by Fed officials Michelle Bowman and Austan Goolsbee, and the release of US Consumer Price Index (CPI) data scheduled for Thursday.
Daily Digest Market Movers: Japanese Yen declines due to the hawkish stance of Fed’s Powell
- Japan's Producer Price Index (YoY) rose by 2.9% in June, accelerating from an upwardly revised 2.6% increase in the previous month, in line with market expectations. This marks the 41st consecutive month of rise in producer inflation and represents the highest level since August 2023.
- Fed Chair Jerome Powell stated in his Congressional testimony on Tuesday, "More good data would strengthen our confidence in inflation." Powell emphasized that a "Policy rate cut is not appropriate until the Fed gains greater confidence that inflation is headed sustainably toward 2%." He also noted that "first-quarter data did not support the greater confidence in the inflation path that the Fed needs to cut rates."
- According to a Bloomberg report on Tuesday, the Bank of Japan is conducting three in-person meetings with banks, securities firms, and financial institutions over the next few days. The purpose of these meetings is to assess a feasible pace for scaling back its purchases of Japanese Government Bonds.
- The Japanese Yen struggles due to overseas asset purchases by Japanese individuals through the newly revamped tax-free investment scheme, the Nippon Individual Savings Account (NISA) program. According to Nikkei Asia, the scale of these purchases is expected to exceed the country's trade deficit during the first half of this year.
- Japan’s Ministry of Finance reported on Monday that Japanese investment trust management companies and asset management firms bought ¥6.16 trillion ($38 billion) more in offshore equities and investment fund shares than they sold during the first six months of the year.
- On Monday, the Bank of Japan (BOJ) maintained its economic assessment for five of Japan's nine regions in its latest 'Sakura Report'. The assessment for two regions was raised, while it was lowered for another two regions in the report released on Monday. Regarding price trends, the BoJ noted that many regions report wage hikes spreading among smaller firms.
Technical Analysis: USD/JPY rises to near 161.50
USD/JPY trades around 161.50 on Wednesday. The pair is maintaining its upward trajectory within an ascending channel pattern, suggesting a bullish bias according to daily chart analysis. Adding to this bullish outlook, the 14-day Relative Strength Index (RSI) remains above the 50 level, reinforcing the strength of the upward trend.
Looking ahead, the USD/JPY pair may target a critical resistance level near 162.70, positioned at the upper boundary of the ascending channel. A successful breakout above this level could bolster bullish sentiment, potentially propelling the pair toward the psychological resistance at 163.00.
On the downside, initial support for the USD/JPY pair is anticipated around the 21-day Exponential Moving Average (EMA) at 159.96. A breach below this level might exert pressure, prompting a test of the lower boundary of the ascending channel around 159.60. Further decline below this channel support could lead the pair toward the vicinity of June's low at 154.55.
USD/JPY: Daily Chart
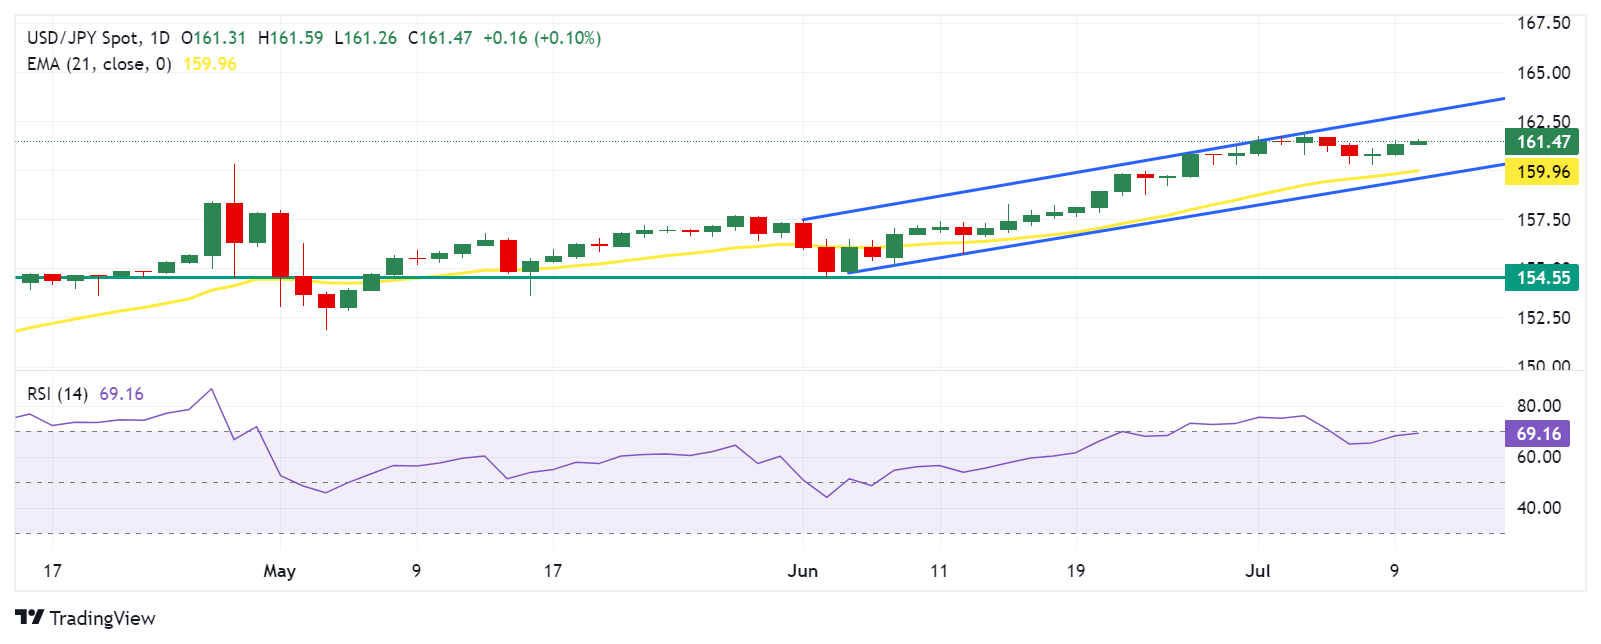
Japanese Yen PRICE Today
The table below shows the percentage change of Japanese Yen (JPY) against listed major currencies today. Japanese Yen was the weakest against the British Pound.
| USD | EUR | GBP | JPY | CAD | AUD | NZD | CHF | |
|---|---|---|---|---|---|---|---|---|
| USD | -0.06% | -0.08% | 0.08% | -0.06% | -0.05% | 0.59% | -0.02% | |
| EUR | 0.06% | 0.00% | 0.14% | 0.02% | 0.00% | 0.63% | 0.03% | |
| GBP | 0.08% | -0.01% | 0.14% | 0.02% | -0.01% | 0.62% | 0.01% | |
| JPY | -0.08% | -0.14% | -0.14% | -0.12% | -0.14% | 0.45% | -0.14% | |
| CAD | 0.06% | -0.02% | -0.02% | 0.12% | 0.00% | 0.62% | -0.00% | |
| AUD | 0.05% | -0.00% | 0.00% | 0.14% | 0.00% | 0.62% | 0.00% | |
| NZD | -0.59% | -0.63% | -0.62% | -0.45% | -0.62% | -0.62% | -0.61% | |
| CHF | 0.02% | -0.03% | -0.01% | 0.14% | 0.00% | -0.00% | 0.61% |
The heat map shows percentage changes of major currencies against each other. The base currency is picked from the left column, while the quote currency is picked from the top row. For example, if you pick the Japanese Yen from the left column and move along the horizontal line to the US Dollar, the percentage change displayed in the box will represent JPY (base)/USD (quote).
Bank of Japan FAQs
The Bank of Japan (BoJ) is the Japanese central bank, which sets monetary policy in the country. Its mandate is to issue banknotes and carry out currency and monetary control to ensure price stability, which means an inflation target of around 2%.
The Bank of Japan has embarked in an ultra-loose monetary policy since 2013 in order to stimulate the economy and fuel inflation amid a low-inflationary environment. The bank’s policy is based on Quantitative and Qualitative Easing (QQE), or printing notes to buy assets such as government or corporate bonds to provide liquidity. In 2016, the bank doubled down on its strategy and further loosened policy by first introducing negative interest rates and then directly controlling the yield of its 10-year government bonds.
The Bank’s massive stimulus has caused the Yen to depreciate against its main currency peers. This process has exacerbated more recently due to an increasing policy divergence between the Bank of Japan and other main central banks, which have opted to increase interest rates sharply to fight decades-high levels of inflation. The BoJ’s policy of holding down rates has led to a widening differential with other currencies, dragging down the value of the Yen.
A weaker Yen and the spike in global energy prices have led to an increase in Japanese inflation, which has exceeded the BoJ’s 2% target. Still, the Bank judges that the sustainable and stable achievement of the 2% target has not yet come in sight, so any sudden change in the current policy looks unlikely.
- GBP/USD struggles as the US Dollar improves due to the cautious stance of Fed Chair Powell.
- Fed Chair Powell stated, "First-quarter data did not support the greater confidence in the inflation path."
- BoE policymaker Jonathan Haskel stressed maintaining steady interest rates until there is greater certainty that inflationary pressures have subsided.
GBP/USD remains tepid for the second consecutive day, trading around 1.2780 during the Asian session on Wednesday. The decline of the GBP/USD pair can be attributed to the strengthening US Dollar (USD), which has gained momentum following Federal Reserve Chairman Jerome Powell's testimony before the US Congress on Tuesday. Powell acknowledged improving inflation data but reiterated the Fed's cautious stance.
Fed Chair Jerome Powell stated, "More good data would strengthen our confidence in inflation." Powell emphasized that a "policy rate cut is inappropriate until the Fed gains greater confidence that inflation is headed sustainably toward 2%." He also noted that "first-quarter data did not support the greater confidence in the inflation path that the Fed needs to cut rates."
Traders anticipate the second semi-annual testimony by Fed Chair Jerome Powell and speeches by the Fed’s Michelle Bowman and Austan Goolsbee on Wednesday. Additionally, attention will be on the US Consumer Price Index (CPI) data, set to be released on Thursday.
In the United Kingdom (UK), Bank of England (BoE) policymaker Jonathan Haskel has recommended maintaining current interest rates due to persistent price pressures in the job market. Haskel emphasized, "I prefer to keep rates steady until we see more assurance that underlying inflationary pressures have truly diminished," according to Reuters.
The Pound Sterling (GBP) has shown subdued movement against major currencies as attention turns toward upcoming economic indicators. Specifically, investors are anticipating the release of the UK's monthly Gross Domestic Product (GDP) and May's factory data, scheduled for publication on Thursday.
BoE FAQs
The Bank of England (BoE) decides monetary policy for the United Kingdom. Its primary goal is to achieve ‘price stability’, or a steady inflation rate of 2%. Its tool for achieving this is via the adjustment of base lending rates. The BoE sets the rate at which it lends to commercial banks and banks lend to each other, determining the level of interest rates in the economy overall. This also impacts the value of the Pound Sterling (GBP).
When inflation is above the Bank of England’s target it responds by raising interest rates, making it more expensive for people and businesses to access credit. This is positive for the Pound Sterling because higher interest rates make the UK a more attractive place for global investors to park their money. When inflation falls below target, it is a sign economic growth is slowing, and the BoE will consider lowering interest rates to cheapen credit in the hope businesses will borrow to invest in growth-generating projects – a negative for the Pound Sterling.
In extreme situations, the Bank of England can enact a policy called Quantitative Easing (QE). QE is the process by which the BoE substantially increases the flow of credit in a stuck financial system. QE is a last resort policy when lowering interest rates will not achieve the necessary result. The process of QE involves the BoE printing money to buy assets – usually government or AAA-rated corporate bonds – from banks and other financial institutions. QE usually results in a weaker Pound Sterling.
Quantitative tightening (QT) is the reverse of QE, enacted when the economy is strengthening and inflation starts rising. Whilst in QE the Bank of England (BoE) purchases government and corporate bonds from financial institutions to encourage them to lend; in QT, the BoE stops buying more bonds, and stops reinvesting the principal maturing on the bonds it already holds. It is usually positive for the Pound Sterling.
- AUD/NZD gains momentum around 1.1075 in Wednesday’s Asian session, up 0.63% on the day.
- The RBNZ maintained the Official Cash Rate (OCR) unchanged at 5.50% at its July meeting on Wednesday, as widely expected.
- The RBA’s hawkish stance lifts the Aussie against the Kiwi.
The AUD/NZD cross attracts some buyers near 1.1075 during the Asian trading hours on Wednesday. The cross gains momentum after the Reserve Bank of New Zealand (RBNZ) kept its cash rate unchanged in its July monetary policy meeting.
The New Zealand Dollar (NZD) edges lower as the RBNZ decided to keep the Official Cash Rate (OCR) steady at 5.50%, as widely expected by the markets. This marked the eighth consecutive meeting with no change in rates. According to the Minutes of the RBNZ interest rate meeting, the board notes a risk that domestically driven inflation could be more persistent in the near term. The central bank expected headline inflation to return to within the 1 to 3 % target range in the second half of this year. Meanwhile, New Zealand swaps imply 25 basis points (bps) of RBNZ rate cuts for October versus 16 bps before the RBNZ statement.
Elsewhere, the weaker Chinese economic data exerts some selling pressure on the China-proxy Kiwi. China’s Consumer Price Index (CPI) increased 0.2% YoY in June, compared to a rise of 0.3% in May, below the consensus of 0.4%. On a monthly basis, the CPI inflation arrived at -0.2% MoM in June versus the previous reading of a 0.1% decline, worse than the -0.1% expected.
On the Aussie front, the hawkish stance of the Reserve Bank of Australia (RBA) provides some support to the Australian Dollar (AUD). The recent hotter inflation data spurred the expectation that the RBA would raise a 25 bps rate in the September 24 meeting.
RBNZ FAQs
The Reserve Bank of New Zealand (RBNZ) is the country’s central bank. Its economic objectives are achieving and maintaining price stability – achieved when inflation, measured by the Consumer Price Index (CPI), falls within the band of between 1% and 3% – and supporting maximum sustainable employment.
The Reserve Bank of New Zealand’s (RBNZ) Monetary Policy Committee (MPC) decides the appropriate level of the Official Cash Rate (OCR) according to its objectives. When inflation is above target, the bank will attempt to tame it by raising its key OCR, making it more expensive for households and businesses to borrow money and thus cooling the economy. Higher interest rates are generally positive for the New Zealand Dollar (NZD) as they lead to higher yields, making the country a more attractive place for investors. On the contrary, lower interest rates tend to weaken NZD.
Employment is important for the Reserve Bank of New Zealand (RBNZ) because a tight labor market can fuel inflation. The RBNZ’s goal of “maximum sustainable employment” is defined as the highest use of labor resources that can be sustained over time without creating an acceleration in inflation. “When employment is at its maximum sustainable level, there will be low and stable inflation. However, if employment is above the maximum sustainable level for too long, it will eventually cause prices to rise more and more quickly, requiring the MPC to raise interest rates to keep inflation under control,” the bank says.
In extreme situations, the Reserve Bank of New Zealand (RBNZ) can enact a monetary policy tool called Quantitative Easing. QE is the process by which the RBNZ prints local currency and uses it to buy assets – usually government or corporate bonds – from banks and other financial institutions with the aim to increase the domestic money supply and spur economic activity. QE usually results in a weaker New Zealand Dollar (NZD). QE is a last resort when simply lowering interest rates is unlikely to achieve the objectives of the central bank. The RBNZ used it during the Covid-19 pandemic.
| Raw materials | Closed | Change, % |
|---|---|---|
| Silver | 30.79 | 0.06 |
| Gold | 236.375 | 0.2 |
| Palladium | 982.42 | -2.9 |
- NZD/USD depreciates as the RBNZ keeps the Official Cash Rate (OCR) unchanged at 5.50% in its July meeting.
- The New Zealand Dollar struggles after the release of soft Consumer Price Index data from close trading partner China.
- The US Dollar appreciated after Fed’s Powell stated that a rate cut is not appropriate until the greater confidence of inflation slows down.
NZD/USD loses ground, trading around 0.6100 during Asian trading hours on Wednesday. This drop is driven by an interest rate decision by the Reserve Bank of New Zealand (RBNZ). RBNZ has opted to keep the Official Cash Rate (OCR) unchanged at 5.50% in its July monetary policy meeting, marking the eighth consecutive meeting with no change.
The New Zealand Dollar (NZD) faces pressure following the release of soft Consumer Price Index (CPI) data from China, a key trading partner. Chinese CPI rose 0.2% YoY in June, down from a 0.3% increase in May. Market expectations had projected a 0.4% increase for the period. Chinese CPI inflation fell by 0.2% month-over-month in June, compared to a 0.1% decline in May, which was below the anticipated 0.1% decrease.
The US Dollar (USD) received support after the Federal Reserve (Fed) Chairman Jerome Powell’s testimony before the US Congress on Tuesday. Despite acknowledging improving inflation figures, the Fed remains firmly cautious. Powell answered questions before the Senate Banking Committee on the first day of his Congressional testimony on Tuesday.
Fed Chair Jerome Powell stated, "More good data would strengthen our confidence in inflation." Powell emphasized that a "policy rate cut is not appropriate until the Fed gains greater confidence that inflation is headed sustainably toward 2%." He also noted that "first-quarter data did not support the greater confidence in the inflation path that the Fed needs to cut rates."
Traders are anticipating the second semi-annual testimony by Fed Chair Jerome Powell, as well as speeches by the Fed’s Michelle Bowman and Austan Goolsbee. Additionally, attention will be on the US Consumer Price Index (CPI) data, set to be released on Thursday.
Economic Indicator
RBNZ Interest Rate Decision
The Reserve Bank of New Zealand (RBNZ) announces its interest rate decision after its seven scheduled annual policy meetings. If the RBNZ is hawkish and sees inflationary pressures rising, it raises the Official Cash Rate (OCR) to bring inflation down. This is positive for the New Zealand Dollar (NZD) since higher interest rates attract more capital inflows. Likewise, if it reaches the view that inflation is too low it lowers the OCR, which tends to weaken NZD.
Read more.Last release: Wed Jul 10, 2024 02:00
Frequency: Irregular
Actual: 5.5%
Consensus: 5.5%
Previous: 5.5%
Source: Reserve Bank of New Zealand
The Reserve Bank of New Zealand (RBNZ) holds monetary policy meetings seven times a year, announcing their decision on interest rates and the economic assessments that influenced their decision. The central bank offers clues on the economic outlook and future policy path, which are of high relevance for the NZD valuation. Positive economic developments and upbeat outlook could lead the RBNZ to tighten the policy by hiking interest rates, which tends to be NZD bullish. The policy announcements are usually followed by Governor Adrian Orr’s press conference.
- The Indian Rupee edges lower in Wednesday’s Asian session.
- The renewed US Dollar demand might weigh on the local currency, while sustained Indian foreign inflows could underpin the INR.
- Fed Chair Jerome Powell’s second testimony will be in the spotlight on Wednesday.
The Indian Rupee (INR) trades on a weaker note on Wednesday amid the modest rebound of the US Dollar (USD). The persistent Greenback demand from local importers might continue to limit the local currency’s gains. However, sustained Indian foreign inflows, a positive economic outlook, and the fastest macroeconomic growth among large economies might all contribute to the INR's upside.
Traders will focus on the second semi-annual testimony by Federal Reserve (Fed) Chair Jerome Powell on Wednesday. The attention will shift to the US Consumer Price Index (CPI) inflation data on Thursday. The US CPI is projected to show an increase of 3.1% YoY in June, while core inflation is projected to remain steady at 3.4% YoY. Any dovish comments from the Fed’s Powell or signs of softer inflation in the US might exert some selling pressure on the Greenback.
Daily Digest Market Movers: Indian Rupee weakens despite India’s optimistic outlook
- The Reserve Bank of India said on Monday that the country added 46.7 million jobs in the fiscal year ended March, the highest since 1981-1982.
- India’s central bank added $5.6 billion in Gold reserves in the June quarter, with foreign currency assets increasing by $1.9 billion and the value of gold in reserves rising by $3.8 billion. As of June 28, India's foreign currency reserves were at $652 billion.
- Fed Chair Jerome Powell said in testimony Tuesday to Congress that the case for interest rate cuts is becoming stronger as the most recent inflation data showed some modest further progress.
- Powell added that "more good data" could open the door to interest rate cuts. He noted that holding interest rates too high for too long could jeopardize economic growth.
- Powell's remarks have helped push up the chance of a September rate cut by the Fed to above 75%, up from 71% before the US employment data last Friday, according to the CME's FedWatch tool.
Technical analysis: USD/INR remains in consolidative mode in the near term
The Indian Rupee trades softer on the day. The bullish bias of the USD/INR pair continues as the pair holds above the key 100-day Exponential Moving Average (EMA) on the daily chart.
In the shorter term, further consolidation looks favorable as the pair has remained stuck within a familiar trading range since March 21. Additionally, the 14-day Relative Strength Index (RSI) showed neutral momentum, hovering around the 50-midline.
Sustained upside momentum could lift USD/INR to 83.65, the upper boundary of the trading range. A break above this level could attract some buying interest to the all-time high of 83.75 en route to the 84.00 psychological barrier.
On the flip side, the 100-day EMA at 83.36 acts as an initial support level for the pair. Extended losses will expose the 83.00 round mark, followed by 82.82, a low of January 12.
US Dollar price today
The table below shows the percentage change of US Dollar (USD) against listed major currencies today. US Dollar was the strongest against the New Zealand Dollar.
| USD | EUR | GBP | CAD | AUD | JPY | NZD | CHF | |
| USD | 0.00% | -0.01% | 0.02% | 0.04% | 0.12% | 0.42% | 0.04% | |
| EUR | 0.00% | -0.01% | 0.01% | 0.05% | 0.11% | 0.41% | 0.04% | |
| GBP | -0.01% | 0.00% | 0.02% | 0.05% | 0.12% | 0.43% | 0.05% | |
| CAD | -0.02% | -0.01% | -0.01% | 0.03% | 0.11% | 0.48% | 0.03% | |
| AUD | -0.04% | -0.06% | -0.05% | -0.04% | 0.08% | 0.38% | 0.00% | |
| JPY | -0.12% | -0.10% | -0.11% | -0.10% | -0.04% | 0.31% | -0.07% | |
| NZD | -0.42% | -0.42% | -0.43% | -0.41% | -0.38% | -0.31% | -0.38% | |
| CHF | -0.05% | -0.04% | -0.05% | -0.03% | 0.00% | 0.07% | 0.38% |
The heat map shows percentage changes of major currencies against each other. The base currency is picked from the left column, while the quote currency is picked from the top row. For example, if you pick the Euro from the left column and move along the horizontal line to the Japanese Yen, the percentage change displayed in the box will represent EUR (base)/JPY (quote).
Indian Rupee FAQs
The Indian Rupee (INR) is one of the most sensitive currencies to external factors. The price of Crude Oil (the country is highly dependent on imported Oil), the value of the US Dollar – most trade is conducted in USD – and the level of foreign investment, are all influential. Direct intervention by the Reserve Bank of India (RBI) in FX markets to keep the exchange rate stable, as well as the level of interest rates set by the RBI, are further major influencing factors on the Rupee.
The Reserve Bank of India (RBI) actively intervenes in forex markets to maintain a stable exchange rate, to help facilitate trade. In addition, the RBI tries to maintain the inflation rate at its 4% target by adjusting interest rates. Higher interest rates usually strengthen the Rupee. This is due to the role of the ‘carry trade’ in which investors borrow in countries with lower interest rates so as to place their money in countries’ offering relatively higher interest rates and profit from the difference.
Macroeconomic factors that influence the value of the Rupee include inflation, interest rates, the economic growth rate (GDP), the balance of trade, and inflows from foreign investment. A higher growth rate can lead to more overseas investment, pushing up demand for the Rupee. A less negative balance of trade will eventually lead to a stronger Rupee. Higher interest rates, especially real rates (interest rates less inflation) are also positive for the Rupee. A risk-on environment can lead to greater inflows of Foreign Direct and Indirect Investment (FDI and FII), which also benefit the Rupee.
Higher inflation, particularly, if it is comparatively higher than India’s peers, is generally negative for the currency as it reflects devaluation through oversupply. Inflation also increases the cost of exports, leading to more Rupees being sold to purchase foreign imports, which is Rupee-negative. At the same time, higher inflation usually leads to the Reserve Bank of India (RBI) raising interest rates and this can be positive for the Rupee, due to increased demand from international investors. The opposite effect is true of lower inflation.
- The Australian Dollar depreciates as the US Dollar gains ground after Fed Chair Powell’s testimony before the US Congress on Tuesday.
- China’s CPI declined by 0.2% in June, compared to a 0.1% decline in May.
- Fed Chair Powell emphasized that a rate cut is not appropriate until the Fed gains confidence that inflation is moving toward 2%.
The Australian Dollar (AUD) losses its recent gains on Wednesday. The drop in the AUD/USD pair is due to the strengthening of the US Dollar (USD) following Federal Reserve (Fed) Chairman Jerome Powell’s testimony before the US Congress on Tuesday. Despite acknowledging improving inflation figures, the Fed remains firmly cautious.
China’s Consumer Price Index (CPI) rose at an annual rate of 0.2% in June, down from a 0.3% rise in May. The market had forecasted a 0.4% increase for the period. On a monthly basis, Chinese CPI inflation declined by 0.2% in June, compared to a 0.1% decline in May, which came in below the expected decline of 0.1%.
Traders are anticipating the second semi-annual testimony by Fed Chair Jerome Powell, as well as speeches by the Fed’s Michelle Bowman and Austan Goolsbee. Additionally, attention will be on the US Consumer Price Index (CPI) data, set to be released on Thursday.
Market forecasts generally predict that the annualized US core CPI for the year ending in June will remain steady at 3.4%, while headline CPI inflation is expected to increase to 0.1% month-over-month in June, compared to the previous flat reading of 0.0%.
Daily Digest Market Movers: Australian Dollar declines due to hawkish remarks from Fed’s Powell
- Fed Chair Jerome Powell answered questions before the Senate Banking Committee on the first day of his Congressional testimony on Tuesday. Powell stated, "More good data would strengthen our confidence in inflation." He emphasized that a "policy rate cut is not appropriate until the Fed gains greater confidence that inflation is headed sustainably toward 2%." He also noted that "first-quarter data did not support the greater confidence in the inflation path that the Fed needs to cut rates."
- Australia’s 10-year government bond yield hold steady at around 4.4% as investors digest mixed domestic data. Consumer sentiment fell in July following a rise in June, reflecting household concerns over persistent inflation and the potential for further interest rate increases by the Reserve Bank of Australia (RBA). Meanwhile, business confidence rose to its highest level since January 2023.
- Australia's Westpac Consumer Confidence dropped by 1.1% in July, reversing the 1.7% increase seen in June. This marks the fifth decline in 2024, driven by ongoing worries about high inflation, elevated interest rates, and a sluggish economy.
- US Nonfarm Payrolls (NFP) increased by 206,000 in June, following a rise of 218,000 in May. This figure surpassed the market expectation of 190,000.
- The US Unemployment Rate edged up to 4.1% in June from 4.0% in May. Meanwhile, Average Hourly Earnings decreased to 3.9% year-over-year in June from the previous reading of 4.1%, aligning with market expectations.
Technical Analysis: Australian Dollar hovers around 0.6750
The Australian Dollar trades around 0.6740 on Wednesday. The analysis of the daily chart shows that the AUD/USD pair consolidates within an ascending channel, indicating a bullish bias. Additionally, the 14-day Relative Strength Index (RSI) remains above the 50 level, confirming the bullish momentum.
The AUD/USD pair may test the upper boundary of the ascending channel at approximately 0.6775. If it breaks through this level, the pair could aim for the psychological level of 0.6800.
On the downside, the AUD/USD pair may find support around the lower boundary of the ascending channel at 0.6670, with additional support near the 50-day Exponential Moving Average (EMA) at 0.6642. A break below this level could push the pair toward throwback support around 0.6590.
AUD/USD: Daily Chart
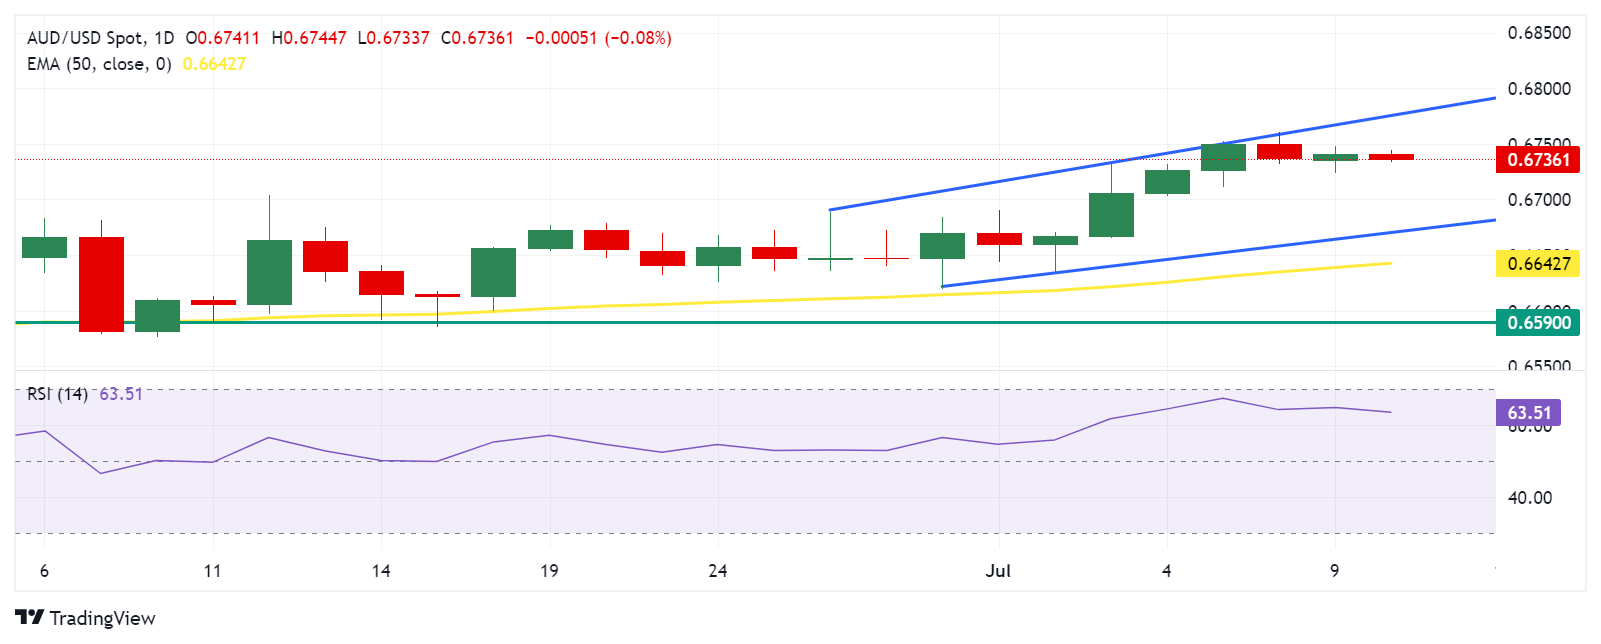
Australian Dollar PRICE Today
The table below shows the percentage change of Australian Dollar (AUD) against listed major currencies today. Australian Dollar was the weakest against the New Zealand Dollar.
| USD | EUR | GBP | JPY | CAD | AUD | NZD | CHF | |
|---|---|---|---|---|---|---|---|---|
| USD | 0.00% | -0.02% | 0.13% | -0.03% | 0.05% | -0.04% | 0.06% | |
| EUR | -0.01% | -0.01% | 0.14% | 0.01% | 0.03% | -0.07% | 0.04% | |
| GBP | 0.02% | 0.01% | 0.14% | 0.01% | 0.04% | -0.05% | 0.04% | |
| JPY | -0.13% | -0.14% | -0.14% | -0.14% | -0.10% | -0.23% | -0.12% | |
| CAD | 0.03% | -0.01% | -0.01% | 0.14% | 0.07% | -0.04% | 0.04% | |
| AUD | -0.05% | -0.03% | -0.04% | 0.10% | -0.07% | -0.11% | -0.02% | |
| NZD | 0.04% | 0.07% | 0.05% | 0.23% | 0.04% | 0.11% | 0.09% | |
| CHF | -0.06% | -0.04% | -0.04% | 0.12% | -0.04% | 0.02% | -0.09% |
The heat map shows percentage changes of major currencies against each other. The base currency is picked from the left column, while the quote currency is picked from the top row. For example, if you pick the Australian Dollar from the left column and move along the horizontal line to the US Dollar, the percentage change displayed in the box will represent AUD (base)/USD (quote).
Interest rates FAQs
Interest rates are charged by financial institutions on loans to borrowers and are paid as interest to savers and depositors. They are influenced by base lending rates, which are set by central banks in response to changes in the economy. Central banks normally have a mandate to ensure price stability, which in most cases means targeting a core inflation rate of around 2%. If inflation falls below target the central bank may cut base lending rates, with a view to stimulating lending and boosting the economy. If inflation rises substantially above 2% it normally results in the central bank raising base lending rates in an attempt to lower inflation.
Higher interest rates generally help strengthen a country’s currency as they make it a more attractive place for global investors to park their money.
Higher interest rates overall weigh on the price of Gold because they increase the opportunity cost of holding Gold instead of investing in an interest-bearing asset or placing cash in the bank. If interest rates are high that usually pushes up the price of the US Dollar (USD), and since Gold is priced in Dollars, this has the effect of lowering the price of Gold.
The Fed funds rate is the overnight rate at which US banks lend to each other. It is the oft-quoted headline rate set by the Federal Reserve at its FOMC meetings. It is set as a range, for example 4.75%-5.00%, though the upper limit (in that case 5.00%) is the quoted figure. Market expectations for future Fed funds rate are tracked by the CME FedWatch tool, which shapes how many financial markets behave in anticipation of future Federal Reserve monetary policy decisions.
China’s Consumer Price Index (CPI) rose at an annual pace of 0.2% in June, compared to a 0.3% increase in May. The market forecast was for a 0.4% growth in the reported period.
Chinese CPI inflation came in at -0.2% MoM in June versus May’s 0.1% decline, worse than the -0.1% expected.
China’s Producer Price Index (PPI) fell 0.8% YoY in June, as against the previous drop of 1.4%. The data matched the market expectations of -0.8%.
Market reaction to China’s inflation data
AUD/USD is little affected by the mixed Chinese inflation data, losing 0.04% on the day to trade near 0.6635, as of writing.
Australian Dollar FAQs
One of the most significant factors for the Australian Dollar (AUD) is the level of interest rates set by the Reserve Bank of Australia (RBA). Because Australia is a resource-rich country another key driver is the price of its biggest export, Iron Ore. The health of the Chinese economy, its largest trading partner, is a factor, as well as inflation in Australia, its growth rate and Trade Balance. Market sentiment – whether investors are taking on more risky assets (risk-on) or seeking safe-havens (risk-off) – is also a factor, with risk-on positive for AUD.
The Reserve Bank of Australia (RBA) influences the Australian Dollar (AUD) by setting the level of interest rates that Australian banks can lend to each other. This influences the level of interest rates in the economy as a whole. The main goal of the RBA is to maintain a stable inflation rate of 2-3% by adjusting interest rates up or down. Relatively high interest rates compared to other major central banks support the AUD, and the opposite for relatively low. The RBA can also use quantitative easing and tightening to influence credit conditions, with the former AUD-negative and the latter AUD-positive.
China is Australia’s largest trading partner so the health of the Chinese economy is a major influence on the value of the Australian Dollar (AUD). When the Chinese economy is doing well it purchases more raw materials, goods and services from Australia, lifting demand for the AUD, and pushing up its value. The opposite is the case when the Chinese economy is not growing as fast as expected. Positive or negative surprises in Chinese growth data, therefore, often have a direct impact on the Australian Dollar and its pairs.
Iron Ore is Australia’s largest export, accounting for $118 billion a year according to data from 2021, with China as its primary destination. The price of Iron Ore, therefore, can be a driver of the Australian Dollar. Generally, if the price of Iron Ore rises, AUD also goes up, as aggregate demand for the currency increases. The opposite is the case if the price of Iron Ore falls. Higher Iron Ore prices also tend to result in a greater likelihood of a positive Trade Balance for Australia, which is also positive of the AUD.
The Trade Balance, which is the difference between what a country earns from its exports versus what it pays for its imports, is another factor that can influence the value of the Australian Dollar. If Australia produces highly sought after exports, then its currency will gain in value purely from the surplus demand created from foreign buyers seeking to purchase its exports versus what it spends to purchase imports. Therefore, a positive net Trade Balance strengthens the AUD, with the opposite effect if the Trade Balance is negative.
The People’s Bank of China (PBOC) set the USD/CNY central rate on Wednesday at 7.1342, as against the previous day's fix of 7.1310 and 7.2711 Reuters estimates.
- The Gold price holds positive ground in Wednesday’s early Asian session.
- Rising Fed rate cut bets continue to lift the yellow metal.
- The PBoC refrained from buying gold for a consecutive month, limits XAU/USD upside.
The Gold price (XAU/USD) trades with mild gains on Wednesday during the early Asian session. The growing speculation that the US Federal Reserve (Fed) is likely to start cutting rates as early as September continues to support the non-yielding metal. Furthermore, political uncertainties within Europe and globally might boost Gold price, a traditional safe-haven asset.
On the other hand, the pause of China's central bank Gold purchases for a second consecutive month might prompt traders to reduce bullish bets in the yellow metal as China is the world's largest gold consumer. Investors will keep an eye on the second semi-annual testimony by Federal Reserve (Fed) Chair Jerome Powell on Wednesday, along with speeches by the Fed's Michelle Bowman and Austan Goolsbee. On Thursday, the US Consumer Price Index (CPI) inflation data will be closely monitored. This data might offer more clarity on the US interest rate path.
Daily Digest Market Movers: Gold price gains ground amid rising Fed rate cut bets
- China held its gold reserves steady for the second month in a row in June, after an 18-month period of purchases. Official data from China’s central bank shows its gold reserves holdings at 2,264 tonnes.
- Federal Reserve (Fed) Chair Jerome Powell said in testimony Tuesday to Congress that the most recent inflation data showed some modest further progress and "more good data" could open the door to interest rate cuts.
- Powell emphasized that the central bank will continue to make decisions on monetary policy meeting by meeting, adding that holding interest rates too high for too long could jeopardize economic growth.
- Powell further stated that inflation readings over the first three months of this year did not boost Fed officials’ confidence that inflation was coming under control.
- Financial markets are now pricing in 74% odds of a Fed rate cut in September, up from 71% last Friday, according to data from the CME FedWatch tool.
Technical Analysis: Gold price holds bullish in the longer term
The gold price trades on a stronger note on the day following the break above the descending channel. The precious metal maintains its uptrend above the key 100-day Exponential Moving Average (EMA) on the daily timeframe. The upward momentum is also supported by the 14-day Relative Strength Index (RSI), which stands in the bullish zone around 55.0.
The crucial resistance level for yellow metal will emerge at the $2,400 psychological level. The next hurdle is seen at $2,432, a high of April 12. Sustained trading above this level could set XAU/USD for a potential retest of the all-time high of $2,450.
On the other hand, sustained trading below $2,340, the former resistance level, could draw in enough bearish demand to head $2,318, a low of July 1. The next contention level to watch is $2,274, the 100-day EMA.
US Dollar price today
The table below shows the percentage change of US Dollar (USD) against listed major currencies today. US Dollar was the weakest against the New Zealand Dollar.
| USD | EUR | GBP | CAD | AUD | JPY | NZD | CHF | |
| USD | 0.00% | -0.01% | -0.01% | 0.01% | 0.04% | -0.06% | 0.01% | |
| EUR | 0.00% | 0.00% | 0.00% | 0.02% | 0.05% | -0.06% | 0.01% | |
| GBP | 0.00% | 0.00% | 0.00% | 0.02% | 0.05% | -0.05% | 0.01% | |
| CAD | 0.00% | 0.01% | 0.01% | 0.03% | 0.06% | -0.04% | 0.02% | |
| AUD | -0.01% | -0.04% | -0.02% | -0.03% | 0.03% | -0.07% | -0.02% | |
| JPY | -0.04% | -0.05% | -0.04% | -0.07% | 0.00% | -0.09% | -0.04% | |
| NZD | 0.07% | 0.05% | 0.04% | 0.04% | 0.07% | 0.11% | 0.06% | |
| CHF | -0.01% | -0.01% | -0.01% | -0.02% | 0.01% | 0.03% | -0.07% |
The heat map shows percentage changes of major currencies against each other. The base currency is picked from the left column, while the quote currency is picked from the top row. For example, if you pick the Euro from the left column and move along the horizontal line to the Japanese Yen, the percentage change displayed in the box will represent EUR (base)/JPY (quote).
Gold FAQs
Gold has played a key role in human’s history as it has been widely used as a store of value and medium of exchange. Currently, apart from its shine and usage for jewelry, the precious metal is widely seen as a safe-haven asset, meaning that it is considered a good investment during turbulent times. Gold is also widely seen as a hedge against inflation and against depreciating currencies as it doesn’t rely on any specific issuer or government.
Central banks are the biggest Gold holders. In their aim to support their currencies in turbulent times, central banks tend to diversify their reserves and buy Gold to improve the perceived strength of the economy and the currency. High Gold reserves can be a source of trust for a country’s solvency. Central banks added 1,136 tonnes of Gold worth around $70 billion to their reserves in 2022, according to data from the World Gold Council. This is the highest yearly purchase since records began. Central banks from emerging economies such as China, India and Turkey are quickly increasing their Gold reserves.
Gold has an inverse correlation with the US Dollar and US Treasuries, which are both major reserve and safe-haven assets. When the Dollar depreciates, Gold tends to rise, enabling investors and central banks to diversify their assets in turbulent times. Gold is also inversely correlated with risk assets. A rally in the stock market tends to weaken Gold price, while sell-offs in riskier markets tend to favor the precious metal.
The price can move due to a wide range of factors. Geopolitical instability or fears of a deep recession can quickly make Gold price escalate due to its safe-haven status. As a yield-less asset, Gold tends to rise with lower interest rates, while higher cost of money usually weighs down on the yellow metal. Still, most moves depend on how the US Dollar (USD) behaves as the asset is priced in dollars (XAU/USD). A strong Dollar tends to keep the price of Gold controlled, whereas a weaker Dollar is likely to push Gold prices up.
| Index | Change, points | Closed | Change, % |
|---|---|---|---|
| NIKKEI 225 | 799.47 | 41580.17 | 1.96 |
| Hang Seng | -0.83 | 17523.23 | -0 |
| KOSPI | 9.62 | 2867.38 | 0.34 |
| ASX 200 | 66.5 | 7829.7 | 0.86 |
| DAX | -235.86 | 18236.19 | -1.28 |
| CAC 40 | -118.79 | 7508.66 | -1.56 |
| Dow Jones | -52.82 | 39291.97 | -0.13 |
| S&P 500 | 4.13 | 5576.98 | 0.07 |
| NASDAQ Composite | 25.55 | 18429.29 | 0.14 |
| Pare | Closed | Change, % |
|---|---|---|
| AUDUSD | 0.67411 | 0.07 |
| EURJPY | 174.419 | 0.2 |
| EURUSD | 1.08135 | -0.1 |
| GBPJPY | 206.231 | 0.13 |
| GBPUSD | 1.2787 | -0.17 |
| NZDUSD | 0.61241 | -0.02 |
| USDCAD | 1.36324 | -0.03 |
| USDCHF | 0.89753 | -0.02 |
| USDJPY | 161.274 | 0.29 |


© 2000-2026. All rights reserved.
This site is managed by Teletrade D.J. LLC 2351 LLC 2022 (Euro House, Richmond Hill Road, Kingstown, VC0100, St. Vincent and the Grenadines).
The information on this website is for informational purposes only and does not constitute any investment advice.
The company does not serve or provide services to customers who are residents of the US, Canada, Iran, The Democratic People's Republic of Korea, Yemen and FATF blacklisted countries.
Making transactions on financial markets with marginal financial instruments opens up wide possibilities and allows investors who are willing to take risks to earn high profits, carrying a potentially high risk of losses at the same time. Therefore you should responsibly approach the issue of choosing the appropriate investment strategy, taking the available resources into account, before starting trading.
Use of the information: full or partial use of materials from this website must always be referenced to TeleTrade as the source of information. Use of the materials on the Internet must be accompanied by a hyperlink to teletrade.org. Automatic import of materials and information from this website is prohibited.
Please contact our PR department if you have any questions or need assistance at pr@teletrade.global.
transfers