- Analytics
- News and Tools
- Market News
CFD Markets News and Forecasts — 10-06-2024
- EUR/USD extended into a two-day tumble as Greenback resurges.
- Thin economic calendar on Tuesday leaves the way open for Fed fears.
- Markets to look for signs of Fed weakness heading into midweek inflation print.
EUR/USD trimmed into the low side after a steep correction extended from Friday through Monday, dragging the pair down -1.57% peak-to-trough and the Fiber is once again testing bids near 1.0750.
EU Parliamentary elections hobbled the Euro heading into the new trading week as bumpy parliament shuffling poses a near-term risk for policymaking, weighing heavily on the Euro. A thin calendar on the EU side except for Final German Harmonized Index of Consumer Prices (HICP) figures early Wednesday leaves the Fiber exposed as broader markets pivot to face the upcoming Federal Reserve (Fed) rate call and an update to the Fed’s own dot plot summary of interest rate projections.
According to the CME’s FedWatch Tool, rate markets are pricing in a 51% chance that the Fed will hold on rates in September after rate cut hopes were knocked firmly back last week. With the Fed’s upcoming update to its “dot plot” of interest rate expectations on the docket this Wednesday, investors will be racing to see what Fed policymakers expect looking forward.
Wednesday also brings an update to US Consumer Price Index (CPI) inflation. Median market forecasts expect headline CPI inflation to cool to 0.1% MoM, with Core CPI Inflation expected to tick down to 3.5% from 3.6% YoY.
EUR/USD technical outlook
The Fiber is stuck in near 1.0770 after a steep decline from Friday’s action near 1.0900. An overextended decline through near-term consolidation, and a bidding rebound could pare back losses back above the 1.0800 handle.
A two-day backslide has dragged EUR/USD back below the 200-day Exponential Moving Average (EMA) at 1.0806, and near-term corrections will run aground of descending trendlines from 2024’s peak bids near 1.1140.
EUR/USD hourly chart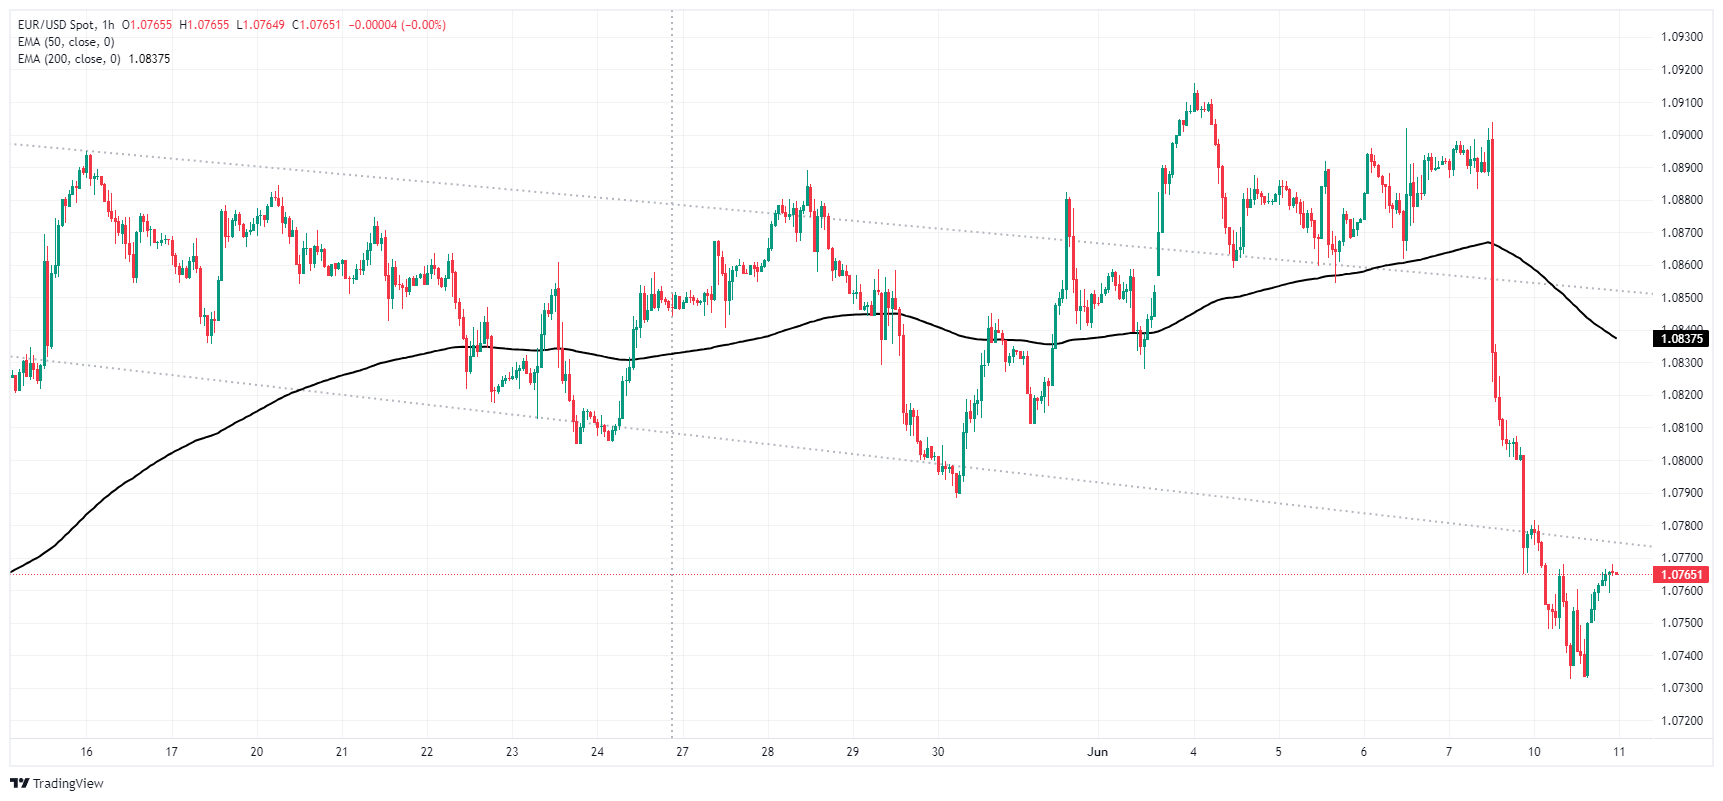
EUR/USD daily chart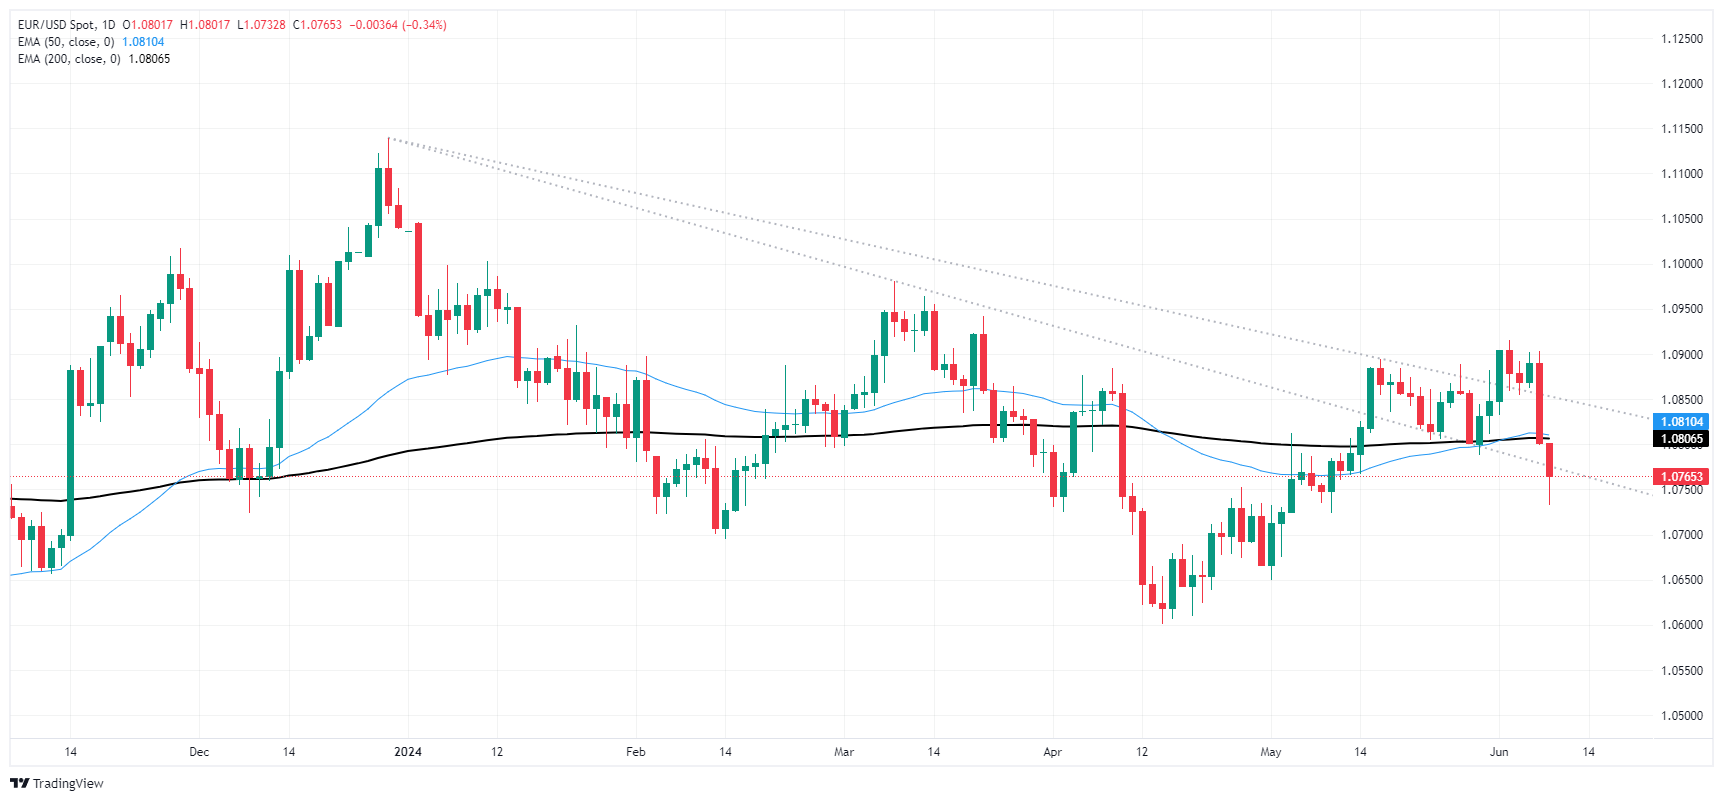
- GBP/USD trades with a mild bearish bias around 1.2730 amid the softer US dollar on Tuesday.
- Investors will closely monitor the UK employment for fresh impetus, which is expected to remain contracted in May.
- The stronger US employment data last week has triggered the odds that Fed will delay its rate cuts this year.
The GBP/USD pair trades with mild losses near 1.2730 during the early Asian session on Tuesday. Traders might prefer to wait on the sidelines ahead of the release of the UK employment report, which is due later in the day. In the meantime, the lower bets of the US Federal Reserve's (Fed) rate cuts this year are likely to boost the US Dollar and cap the upside for the pair.
The employment growth in the UK has been contracting last few months and it is likely to continue in May, making it easier for the Bank of England (BoE) to start lowering the borrowing costs. However, Average Earnings, a measure of wage growth, remains high and it might convince the central bank to delay its easing cycle this year. Any signs of stronger employment market data could underpin the Pound Sterling (GBP) in the near term.
The employment data in the United States last week has spurred speculation that the Fed will keep rates higher for longer. This stronger data has provided some support to the Greenback in the previous sessions. Futures traders are now pricing in nearly 47% odds of a rate cut for the September meeting, down from 68% before the NFP data, according to the CME FedWatch tool.
The US Consumer Price Index (CPI) inflation data on Wednesday will be crucial as the Fed officials have emphasized in recent weeks that they will wait for more evidence of inflation data before cutting the interest rate. The US headline CPI figure is expected to show an increase of 3.4% YoY in May, while the core CPI is estimated to rise 3.5% YoY in the same report period. The Fed will announce its interest rate decision and update the Summary of Economic Projections (SEP) after the release of CPI reports. The hawkish tone from the Fed might lift the USD and create a headwind for GBP/USD.
- Daily chart indicators reveal a slight recovery from the latest bearish movements of the pair.
- Signs of a bullish pivot are emerging, intimating a potential decrease in bearish pressure or a hiccup in the consolidation phase.
- The pair contacts the crucial 20-day SMA at 103.90, which recently began to act as a resistance.
On Monday, the AUD/JPY pair showed signs of stabilizing and rebounded to 103.80, near the 20-day Simple Moving Average (SMA). This could indicate a potential easing of the downward momentum that followed last week's consolidation phase.
Turning attention to the daily Relative Strength Index (RSI) analysis, the index currently stands at 52. Compared to earlier readings, a notable increase suggests the pair's momentum may have taken a bullish turn in the near term. Furthermore, the Moving Average Convergence Divergence (MACD) continues to chart flat red bars, indicating a flattening negative momentum.
AUD/JPY daily chart
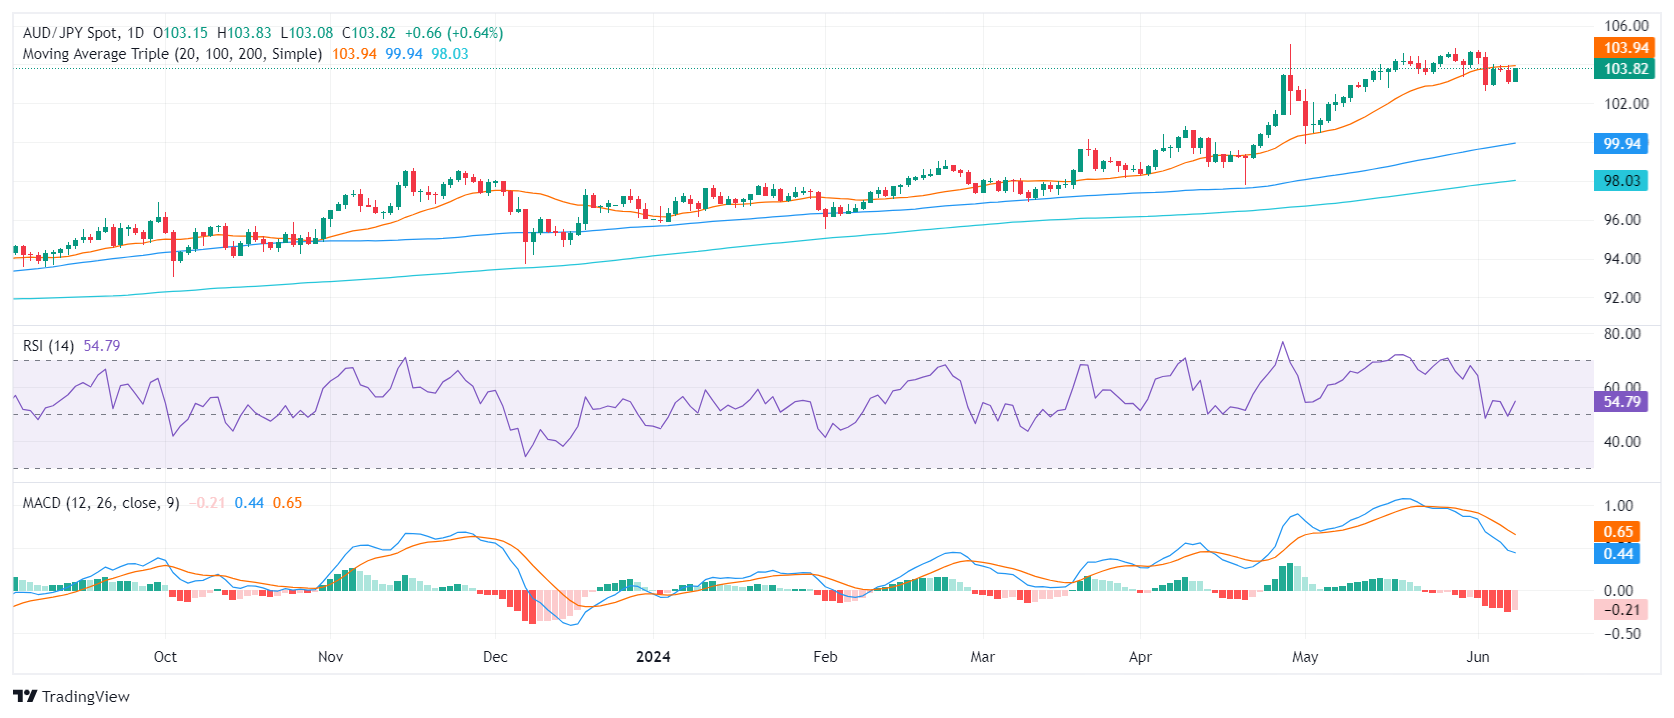
If the pair succumbs to further losses, the 100 and 200-day SMAs provide solid support platforms at around 99.80 and 97.98 respectively. If a bullish reaction propels the pair above the currently challenging 20-day SMA at 103.90, and towards the 105.00 level, significant resistance is to be expected. However, if these resistance barriers hold firm, the AUD/JPY pair may prolong its consolidation stage.
In conclusion, the AUD/JPY pair has encountered strong support at 103.00, indicated by its recent recovery to 103.80 on Monday. This could suggest a potential easing of the bearish pressure unless the pair is able to break through the 20-day SMA of 103.90.
- Silver recovers to $29.74, up from $29.14 low, yet remains under the $30.00 threshold.
- Double top pattern hints at possible further declines; first support seen at $29.00.
- Closing above $30.05 might test upper resistance, although current trends suggest continued price pressure.
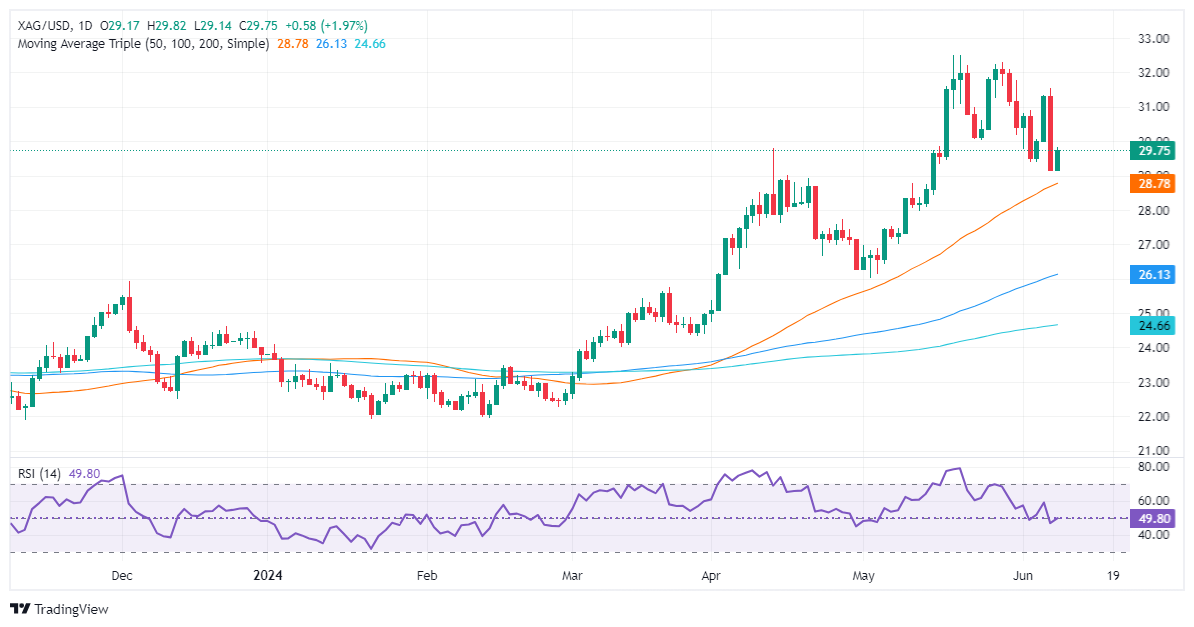
Silver price trims some of its losses from last Friday, yet it remains under pressure as US Treasury bond yields along the short and long end of the curve rise. The XAG/USD trades at $29.74, gains some 2% after bouncing off daily lows of $29.14, still below the $30.00 a troy ounce value.
XAG/USD Price Analysis: Technical outlook
Silver’s double top chart pattern remains, hinting that spot prices could tumble lower. XAG/USD price fell below the May 24 low of $30.05, confirming the ‘double top’ chart pattern.
That said, the XAG/USD first support would be the $29.00 mark, followed by the June 7 low of $29.12. A breach of the latter opened the door for a drop below $29.00, followed by the May 18, 2021, high of $28.74, followed by the June 10, 2021, high of $28.34. Up next would be the ‘double top’ objective at $27.80.
Conversely, if XAG/USD aims upwards and registers a daily close above $29.00, that would pave the way to challenge the May 24 low, turning resistance at $30.05; buyers are struggling to reclaim $30.00, paving the way for further downside.
XAG/USD Price Action – Daily Chart
- GBP/JPY pinned to 200.00 handle in rough price action.
- Japan GDP disappointment gives way to BOJ rate call on Friday.
- UK labor figures due Wednesday, unemployment claims expected to rise.
GBP/JPY continues to churn around 200.00 in choppy intraday action on Monday, extending a near-term consolidation phase as both currencies grapple with disappointment in economic data.
Japanese Gross Domestic Product (GDP) growth declined in Q1, contracting -0.5% QoQ. Easing economic figures will make it even more difficult for the Bank of Japan (BoJ) to unglue itself from a hyper-easy monetary policy stance, and investors will be focusing down the BoJ’s rate call and policy statement due early Friday.
UK labor data is due in the Tuesday market session, and markets are expecting an uptick in monthly Claimant Count Change figures in May. Median market forecasts expect a rise to 10.2K from the previous 8.9K. The ILO Unemployment Rate is expected to hold steady at 4.3% for the three-month period through April, while investors will be keeping a close eye on the 3-month Employment Change through April which last showed a -177K contraction in UK employed positions.
GBP/JPY technical outlook
Hourly candles have turned into a sideways affair, driving into a rough consolidation pattern around the 200-hour Exponential Moving Average (EMA) at 199.38. The pair recovered from a recent dip to June’s lows near 197.50, but the Guppy still remains down from multi-decade highs above 200.60.
GBP/JPY hourly chart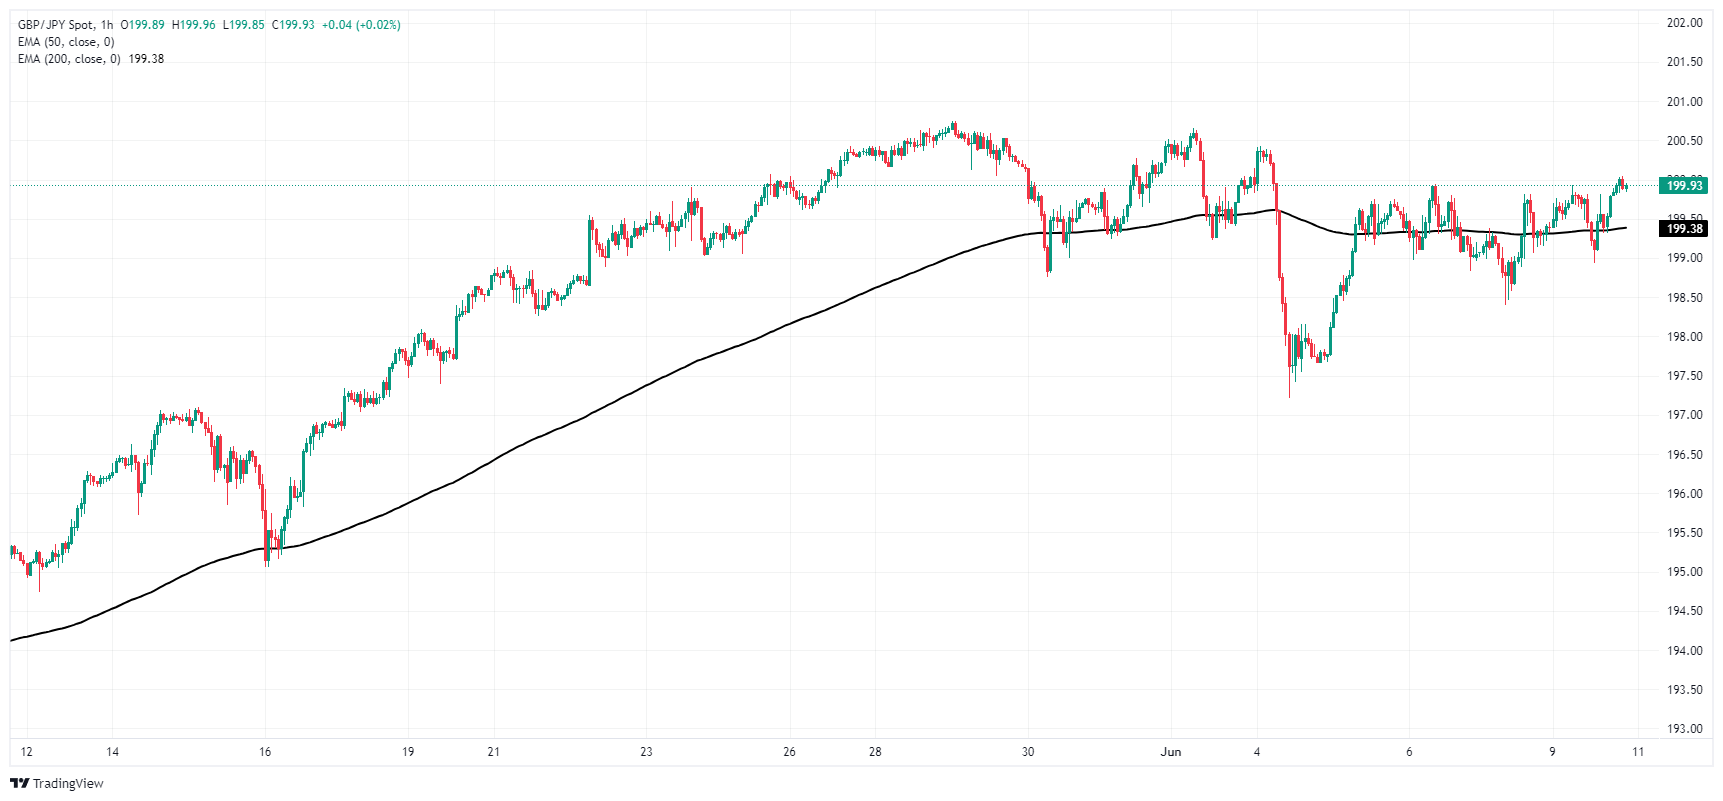
GBP/JPY daily chart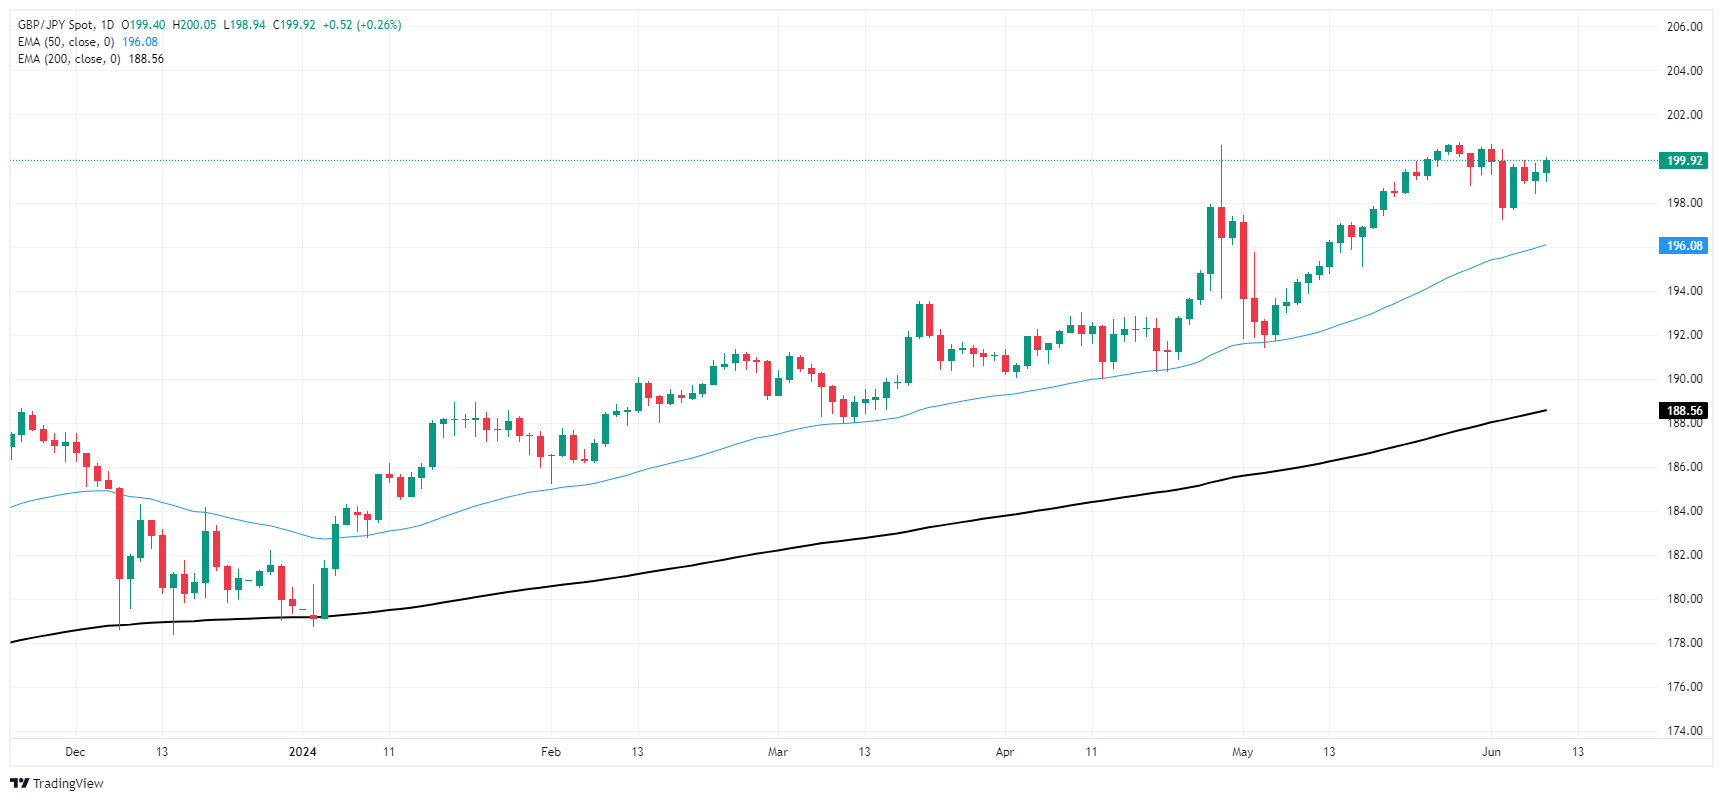
- USD/JPY trades at 157.03, up 0.16%, driven by robust US employment figures.
- Technical outlook shows bullish momentum with potential gains towards 158.00 and beyond.
- Key support levels lie around 155.69/52 and 50-DMA at 155.11 if the pair dips below 156.00.
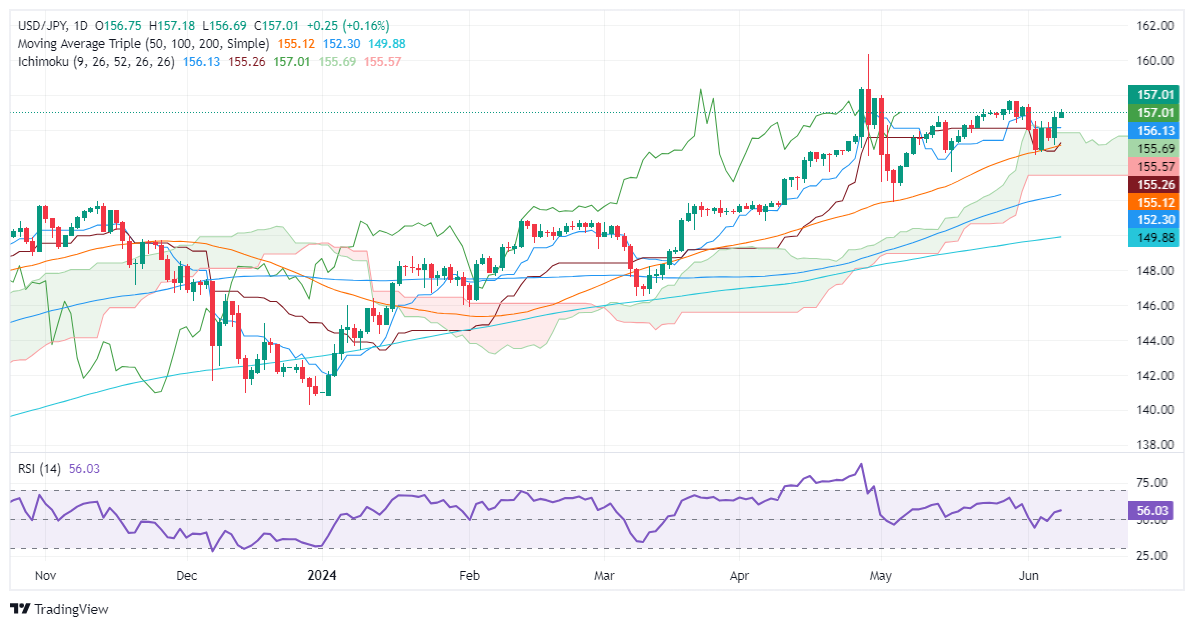
The USD/JPY jumped above the 157.00 figure on Monday, following last week’s stronger-than-expected employment data. Estimates that May’s inflation would likely remain high, with data pending to be released on Wednesday, ahead of the Federal Reserve’s monetary policy decision, drive the Greenback higher. The pair trades at 157.03, up 0.16%.
USD/JPY Price Analysis: Technical outlook
From a daily chart perspective, the USD/JPY remains consolidated with a slight upward tilt. The pair has climbed above the Ichimoku Cloud (Kumo), signaling buyers' strength. Momentum has turned bullish, but the pair may experience increased volatility due to potential intervention by Japanese authorities.
Should the USD/JPY clear the 157.00 figure, further gains lie ahead. Once cleared, the next stop would be 158.00. Further strength might see the pair reaching the April 26 high of 158.44 and then the year-to-date (YTD) high of 160.32.
Conversely, if the USD/JPY falls below 156.00, the first support level would be at the Senkou Span A and B confluence around 155.69/52, followed by the 50-day moving average (DMA) at 155.11. A breach of this level would expose the bottom of the Ichimoku Cloud (Kumo) around 153.40/50.
USD/JPY Price Action – Daily Chart
- The daily RSI remains settled in the negative territory, with the daily MACD displaying flat red bars reflecting stable bearish momentum.
- The pair finds steady support near 168.00, stabilizing at 168.80 beyond the session's low at 168.15.
- The prevalent bullish trend is sustained by the fortitude of the 100- and 200-day SMAs.
On Monday, the EUR/JPY pair experienced an initial fall to 168.15 before stabilizing at 168.80, which seems to affirm the fortification of the support level around 168.00. Although an effort to recover the short-term 20-day SMA is needed to avert further descent, the 168.00 barrier would likely act as a fallback for the bulls if market pressure intensifies.
The Relative Strength Index (RSI) on the daily chart now reads 47, preserving its position in the negative area, which implies a slightly bearish market disposition. The daily Moving Average Convergence Divergence (MACD) retains flat red bars, marking a steady bearish momentum. This could perhaps signal a consolidation phase prior to any substantial shifts.
EUR/JPY daily chart
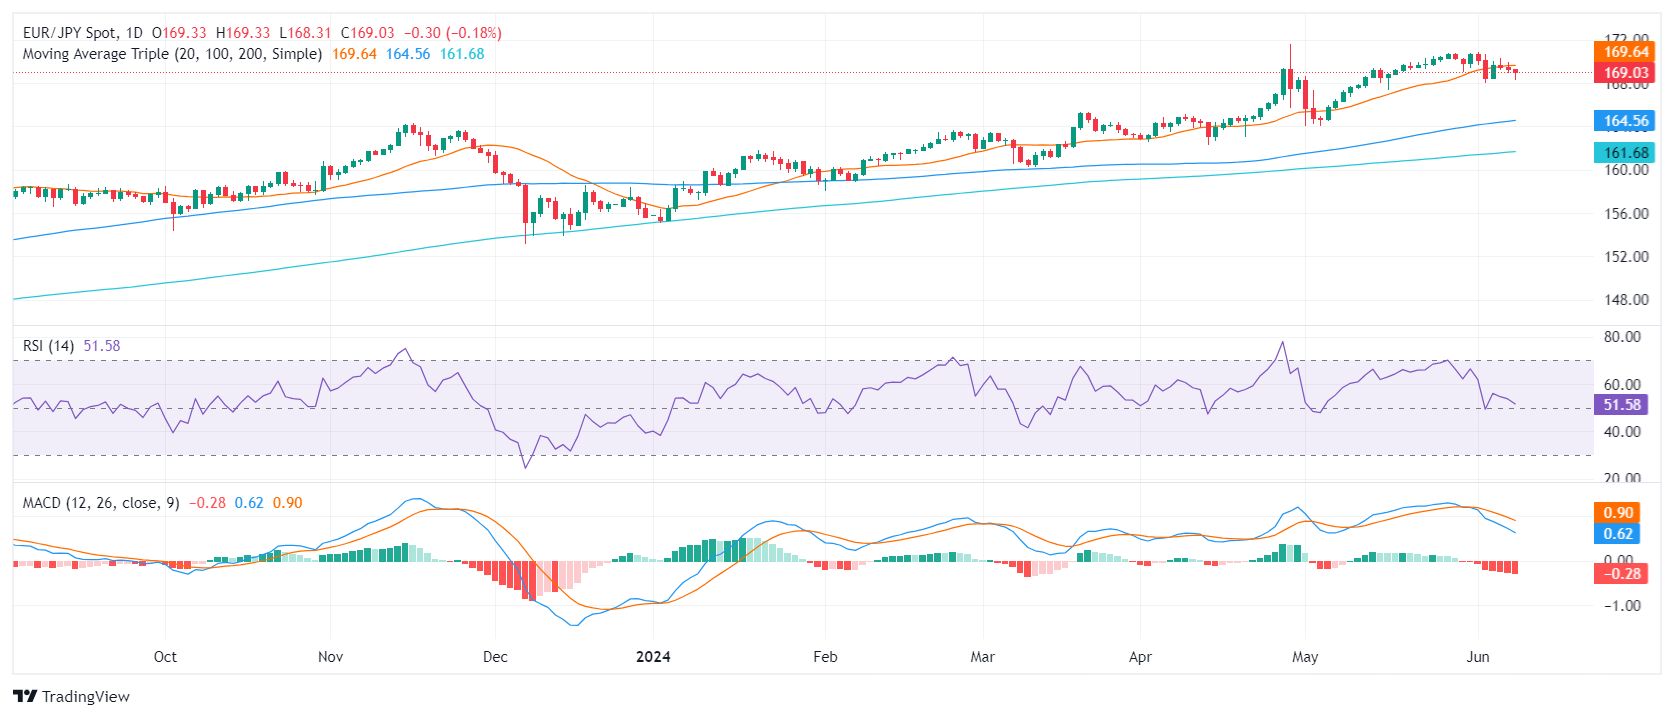
On the other hand, the broader bullish tendency in the EUR/JPY persists. The robust support rendered by the 100- and 200-day Simple Moving Averages (SMAs), located around 164.00 and 161.00 correspondingly, remains a strong fortification against extensive bearish movements. Hence, despite the mild bearish undertones of recent sessions, these fluctuations are possibly corrective rather than indicative of any sweeping alterations in the prevailing trend.
- WTI added $2.50 per barrel on Monday as energy markets pile back in.
- Crude Oil markets are hoping for a surge in summer gasoline demand.
- Fresh week-on-week barrel counts from API and EIA will be watched closely.
West Texas Intermediate (WTI) US Crude Oil continued a determined recovery to kick off the trading week, with WTI bids crossing $77.50 per barrel and setting a fresh June high as energy traders pile back into fresh bullish bets of a flood of demand sopping up oversupplied Crude Oil markets.
Crude Oil markets tumbled into fresh multi-month lows in recent weeks after the Organization of the Petroleum Exporting Countries (OPEC) announced a phasing out of voluntary production caps for its extended network of non-member ally states, OPEC+. OPEC and its consortium have been limiting output through 2023 and 2024 in an effort to stem the tide of global overcapacity, but crimped output limits have been hitting OPEC+ nations in their government budgets, which rely on Crude Oil sales to balance their books.
The planned phasing out of OPEC+ caps in conjunction with an expected uptick in gasoline demand that has failed to materialize at several junctures has left Crude Oil markets battered. Energy traders are seeing renewed hopes of an uptick in fossil fuel usage as the US heads into the summer months on the back of summertime driving season and increased cooling demand.
Crude Oil traders will also be on the lookout for updated barrel counts this week from the American Petroleum Institute (API) and the Energy Information Administration (EIA), both of which noted another upswing in raw barrel supply counts. The API dishes out their latest Weekly Crude Oil Stocks for the week ended July 7 on Tuesday, followed by the EIA’s Crude Oil Stocks Change for the same period on Wednesday.
Economic Indicator
API Weekly Crude Oil Stock
API’s Weekly Statistical Bulletin (WSB) has reported total U.S. and regional data relating to refinery operations and the production of the four major petroleum products: motor gasoline, kerosene jet fuel, distillate (by sulfur content), and residual fuel oil. These products represent more than 85% of total petroleum industry.
Read more.Next release: Tue Jun 11, 2024 20:30
Frequency: Weekly
Consensus: -
Previous: 4.052M
Source: American Petroleum Institute
Economic Indicator
EIA Crude Oil Stocks Change
The EIA Crude Oil stockpiles report is a weekly measure of the change in the number of barrels in stock of crude oil and its derivates, and it's released by the Energy Information Administration. This report tends to generate large price volatility, as oil prices impact on worldwide economies, affecting the most, commodity related currencies such as the Canadian dollar. Despite it has a limited impact among currencies, this report tends to affect the price of oil itself, and, therefore, had a more notorious impact on WTI crude futures.
Read more.Next release: Wed Jun 12, 2024 14:30
Frequency: Weekly
Consensus: -
Previous: 1.233M
WTI technical outlook
US Crude Oil is up over 3% on Monday, seeing its best single-day performance since early January as WTI bids cross back over $77.50 per barrel. Price action still remains on the low side of the 200-day Exponential Moving Average (EMA) at $78.76, but remains up 8.6% in 2024.
Bidders might run out of gas quickly as WTI retraces into a near-term congestion zone above $76.50, and a leg lower could be on the cards if sellers return before prices recover the key $80.00 per barrel technical handle.
WTI hourly chart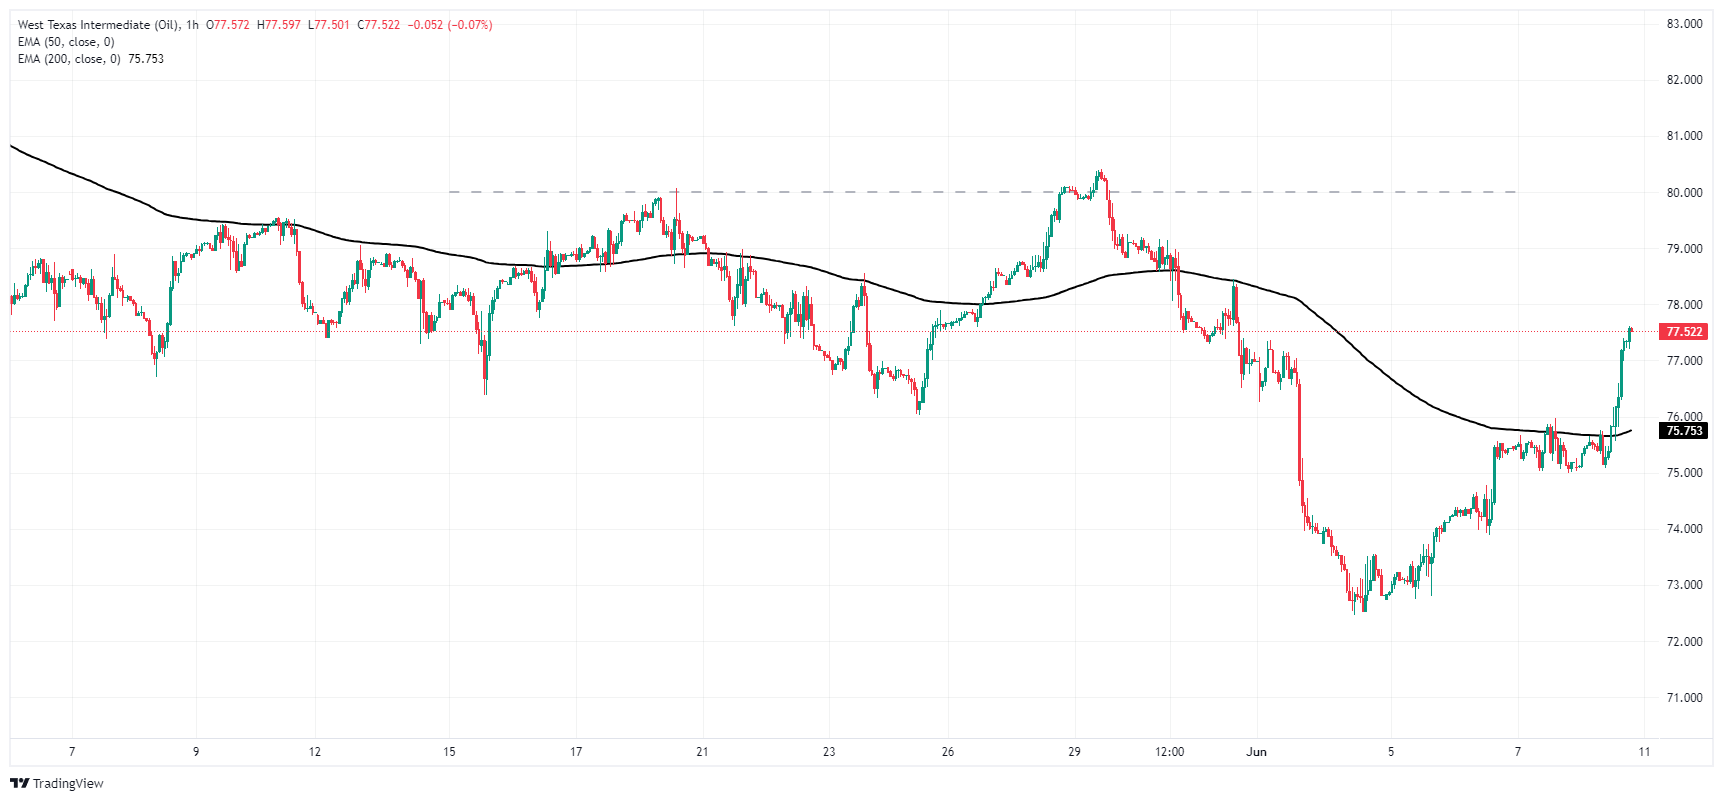
WTI daily chart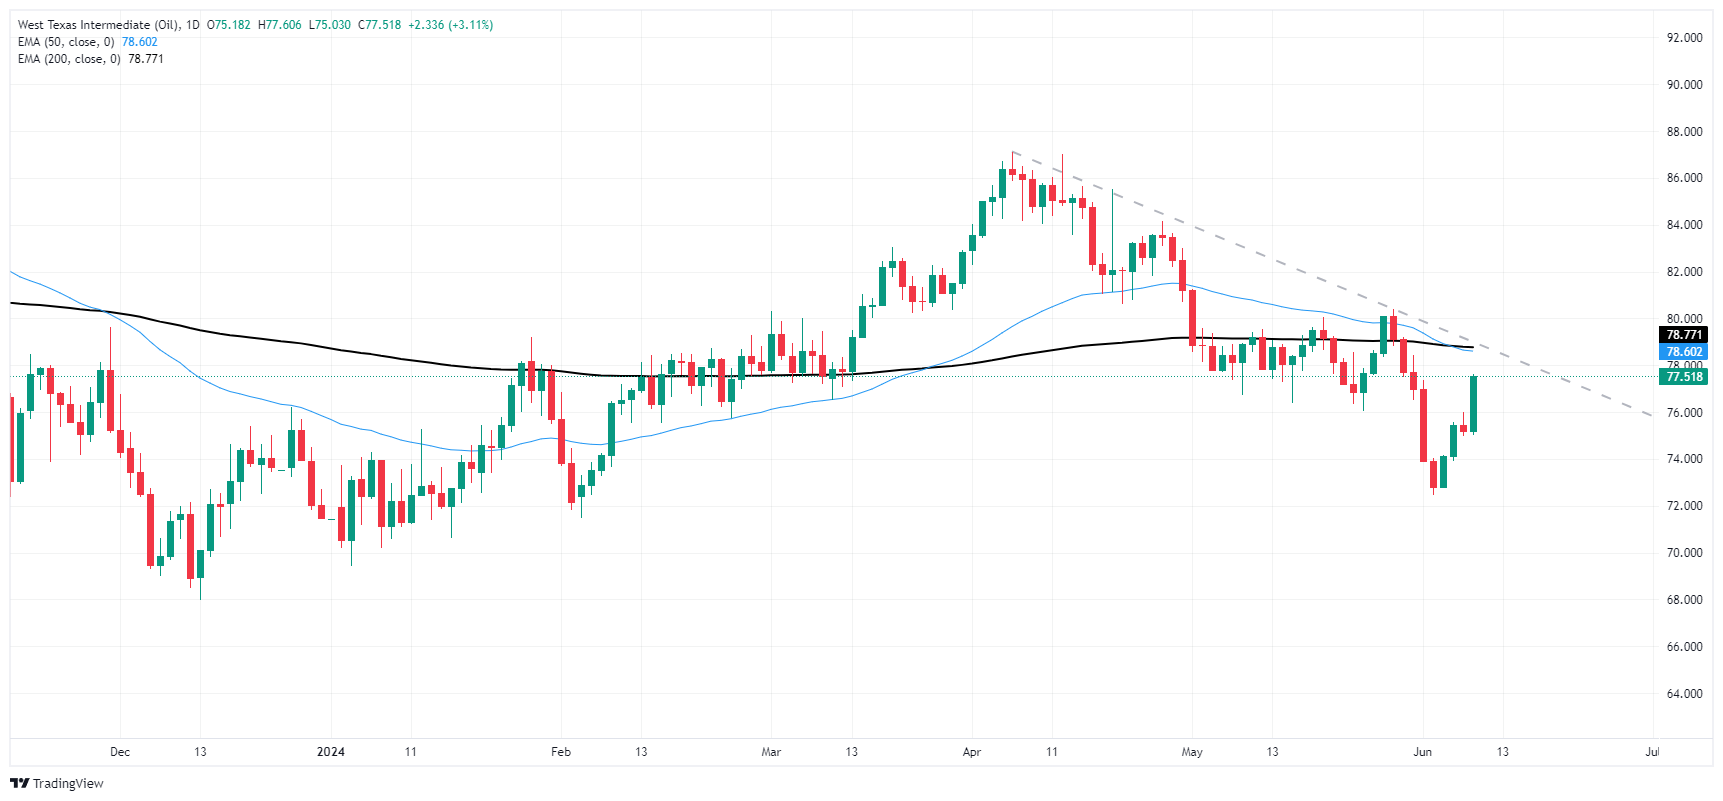
Extra gains in the US Dollar came from an unexpected resurgence of effervescence in the political arena on the old continent as investors evaluated the results from the European parliamentary elections on June 9.
Here is what you need to know on Tuesday, June 11:
The USD Index (DXY) started the week on a strong foot and advanced to multi-week tops past the 105.00 barrier. On June 11, the NFIB Business Optimism Index is only due.
EUR/USD traded heavily on the defensive and visited the 1.0730 region on the back of the resurgence of political concerns following the European parliamentary elections on Sunday. Absent data releases on the euro docket on June 11, the focus of attention will likely be on speeches by the ECB’s Busch, Lane and Elderson.
GBP/USD managed to partially reverse Friday’s strong retracement, reclaiming the 1.2700 barrier with certain conviction. The UK’s labour market report will be unveiled on June 11.
USD/JPY climbed to five-day highs north of the 157.00 yardstick in response to the marked uptrend in the dollar and mixed US yields. The Japanese docket includes Machinery Tool Orders on June 11.
AUD/USD bounced vigorously and surpassed the 0.6600 mark, recouping part of the ground lost on Friday’s intense sell-off. On June 11 comes the NAB Business Confidence index.
Prices of WTI advanced further and flirted with the $78.00 mark per barrel on auspicious forecasts ahead of the kickstart of the US driving season.
Prices of Gold left behind part of Friday’s pronounced decline and reclaimed the area above the $2,300 mark per troy ounce with eyes already set upon US CPI data and the FOMC gathering. Silver followed suit and remained on track to retest the key $30.00 mark per ounce following the steep pullback seen in the previous session.
- Gold trims some of last week’s losses, posts gains of over 0.50% despite USD strength.
- US Nonfarm Payrolls report shows resilient labor market with 272,000 jobs added.
- Upcoming US inflation data and Fed decisions are likely to impact Gold's future trajectory.
Gold posted solid gains on Monday, rising more than 0.50% as US Treasury yields climbed. Although the yellow metal exchanged hands above last week’s low of $2,277, it is on the defensive amid broad US Dollar strength ahead of the release of crucial US economic data. The XAU/USD trades at $2,311 at the time of writing.
Last week’s US Nonfarm Payrolls for May showed that the labor market remains resilient even though previous reports showed that it was cooling. Nevertheless, 272,000 jobs were created, more than the estimated 185,000. In the same report, the Unemployment Rate rose, while Average Hourly Earnings increased slightly.
Given the backdrop, this week’s inflation report in the US would be crucial. Most analysts estimate inflation to remain at familiar levels, which could reaffirm the Federal Reserve’s (Fed) rhetoric of keeping interest rates “higher for longer.” On the other hand, a reacceleration could prompt Fed officials to adjust their rhetoric, which could pave the way for further losses to the non-yielding metal.
After the US inflation data is released, the Fed will announce its monetary policy decision and update the Summary of Economic Projections (SEP). Any hawkish tilts in the message or the dot plot could trigger volatility among market participants.
In the meantime, the US 10-year Treasury note yield edges up three-and-a-half basis points to 4.47%, a headwind for the yellow metal. Consequently, the DXY, an index of the US Dollar against six other currencies, increased 0.23% to 105.17.
Daily digest market movers: Gold price recovers after strong US jobs report
- News that the People’s Bank of China paused its 18-month bullion buying spree weighed on the precious metal. “Holdings of the precious metal by the PBOC held steady at 72.80 million troy ounces for May,” according to MarketWatch.
- Upcoming US CPI report for May is expected to show headline inflation at 3.4% YoY, while core CPI is foreseen dipping from 3.6% to 3.5% YoY.
- Last week, employment data in the United States spurred speculation that the Fed will keep rates higher for longer.
- Last week’s US data decreased the odds for a Fed rate cut in September, according to the CME FedWatch Tool, from above 50% to 46.7%.
- December’s 2024 fed funds futures contract hints that investors expect 28 basis points of rate cuts by the Fed throughout the year.
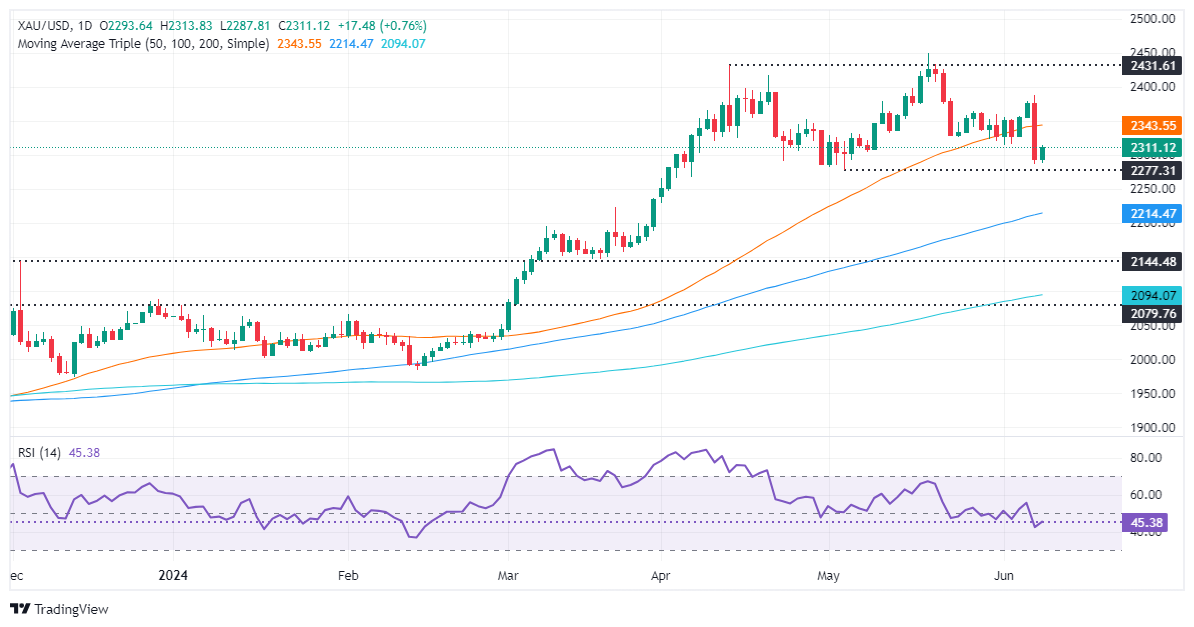
Technical analysis: Gold price climbs, hovers around $2,310
Gold price consolidates above $2,300, even though a Head-and-Shoulders chart pattern emerged. Momentum shifted bearishly as shown by the Relative Strength Index (RSI), which has pierced below the 50-midline, an indication that sellers are in charge.
Therefore, further Gold weakness and sellers could push the spot price below $2,300. Once cleared, the next stop would be the May 3 low of $2,277, followed by the March 21 high of $2,222. Further losses lie beneath with buyers’ next line of defense at around the $2,200 figure.
On the flip side, if Gold buyers lift prices above $2,350, look for a consolidation in the $2,350-$2,380 area.
Gold FAQs
Gold has played a key role in human’s history as it has been widely used as a store of value and medium of exchange. Currently, apart from its shine and usage for jewelry, the precious metal is widely seen as a safe-haven asset, meaning that it is considered a good investment during turbulent times. Gold is also widely seen as a hedge against inflation and against depreciating currencies as it doesn’t rely on any specific issuer or government.
Central banks are the biggest Gold holders. In their aim to support their currencies in turbulent times, central banks tend to diversify their reserves and buy Gold to improve the perceived strength of the economy and the currency. High Gold reserves can be a source of trust for a country’s solvency. Central banks added 1,136 tonnes of Gold worth around $70 billion to their reserves in 2022, according to data from the World Gold Council. This is the highest yearly purchase since records began. Central banks from emerging economies such as China, India and Turkey are quickly increasing their Gold reserves.
Gold has an inverse correlation with the US Dollar and US Treasuries, which are both major reserve and safe-haven assets. When the Dollar depreciates, Gold tends to rise, enabling investors and central banks to diversify their assets in turbulent times. Gold is also inversely correlated with risk assets. A rally in the stock market tends to weaken Gold price, while sell-offs in riskier markets tend to favor the precious metal.
The price can move due to a wide range of factors. Geopolitical instability or fears of a deep recession can quickly make Gold price escalate due to its safe-haven status. As a yield-less asset, Gold tends to rise with lower interest rates, while higher cost of money usually weighs down on the yellow metal. Still, most moves depend on how the US Dollar (USD) behaves as the asset is priced in dollars (XAU/USD). A strong Dollar tends to keep the price of Gold controlled, whereas a weaker Dollar is likely to push Gold prices up.
- AUD/USD rebounded on Monday as sellers took a breather.
- All eyes are now on Wednesday’s session where the US releases inflation figures and the Fed makes its interest rate decision.
- There won’t be any economic highlights in Monday’s session.
On Monday, the AUD/USD pair experienced a slight rebound toward the 0.6605 area as sellers took profits after Friday’s sharp downward movements. This week will be pivotal as the Federal Reserve (Fed) meets on Wednesday, the same day when the US releases inflation data from May.
On the Australian side, economic activity is seeing some signs of weakness, but the Reserve Bank of Australia (RBA) is expected to be the last G10 country central bank to cut rates as it awaits further evidence of inflation coming down. On the US side, the economic outlook remains strong after the stellar Nonfarm Payrolls (NFP) report on Friday, which demonstrated a strong labor market.
Daily Digest Market Movers: AUD/USD faces pressure as traders await CPI and Fed decision
- On the US side, markets await Consumer Price Index (CPI) data from May to be released on Wednesday
- Federal Reserve (Fed) is also meeting on Wednesday, and it's expected to hold rates at 5.5%. Fresh economic projections will also be watched
- On the RBA’s side, it remains focused on curbing inflation despite signs of slowing growth
- Market participants are closely monitoring upcoming economic indicators and RBA statements for clues on the AUD/USD pair's direction
Technical analysis: AUD/USD maintains support despite retracement
Following Friday’s drop of 1.20%, the Relative Strength Index (RSI) stands below 50, supporting the bearish sentiment, while the Moving Average Convergence Divergence (MACD) prints red bars, indicating growing selling pressure.
However, the positive outlook remains unchanged as the pair holds above the 100 and 200-day SMAs at around 0.6550.
Australian Dollar FAQs
One of the most significant factors for the Australian Dollar (AUD) is the level of interest rates set by the Reserve Bank of Australia (RBA). Because Australia is a resource-rich country another key driver is the price of its biggest export, Iron Ore. The health of the Chinese economy, its largest trading partner, is a factor, as well as inflation in Australia, its growth rate and Trade Balance. Market sentiment – whether investors are taking on more risky assets (risk-on) or seeking safe-havens (risk-off) – is also a factor, with risk-on positive for AUD.
The Reserve Bank of Australia (RBA) influences the Australian Dollar (AUD) by setting the level of interest rates that Australian banks can lend to each other. This influences the level of interest rates in the economy as a whole. The main goal of the RBA is to maintain a stable inflation rate of 2-3% by adjusting interest rates up or down. Relatively high interest rates compared to other major central banks support the AUD, and the opposite for relatively low. The RBA can also use quantitative easing and tightening to influence credit conditions, with the former AUD-negative and the latter AUD-positive.
China is Australia’s largest trading partner so the health of the Chinese economy is a major influence on the value of the Australian Dollar (AUD). When the Chinese economy is doing well it purchases more raw materials, goods and services from Australia, lifting demand for the AUD, and pushing up its value. The opposite is the case when the Chinese economy is not growing as fast as expected. Positive or negative surprises in Chinese growth data, therefore, often have a direct impact on the Australian Dollar and its pairs.
Iron Ore is Australia’s largest export, accounting for $118 billion a year according to data from 2021, with China as its primary destination. The price of Iron Ore, therefore, can be a driver of the Australian Dollar. Generally, if the price of Iron Ore rises, AUD also goes up, as aggregate demand for the currency increases. The opposite is the case if the price of Iron Ore falls. Higher Iron Ore prices also tend to result in a greater likelihood of a positive Trade Balance for Australia, which is also positive of the AUD.
The Trade Balance, which is the difference between what a country earns from its exports versus what it pays for its imports, is another factor that can influence the value of the Australian Dollar. If Australia produces highly sought after exports, then its currency will gain in value purely from the surplus demand created from foreign buyers seeking to purchase its exports versus what it spends to purchase imports. Therefore, a positive net Trade Balance strengthens the AUD, with the opposite effect if the Trade Balance is negative.
- Dow Jones sticks close to Monday’s opening bids in thin action.
- Markets looking for a recovery after NFP Friday hangover.
- Wednesday brings US CPI update, Fed rate call and interest rate expectations.
The Dow Jones Industrial Average (DJIA) is churning chart paper on Monday, paddling around 38,750.00 as investors look for a reason to recover footing after last Friday’s Nonfarm Payrolls (NFP) rout that saw broad-market rate cut hopes wither on the vine.
Investors will be buckling down for the wait to Wednesday’s latest showing from the Federal Reserve (Fed). The Fed is broadly expected to stand pat on interest rates this week, but markets will be scrambling to see the updates to the Fed’s “dot plot”, or summary of interest rate projections.
US Consumer Price Index (CPI) inflation figures are also due on Wednesday. Investors are hoping that MoM headline CPI inflation will ease to 0.1% from 0.3%, but Core CPI is forecast to hold flat at 0.3% MoM.
Dow Jones news
The DJIA is mixed on Monday, with about half of its securities in the green and the other half falling back slightly. Walmart Inc. (WMT) is rising to the top of the pile, climbing 1.37% on Monday to $66.78 per share as investors lean into the retailer, confident that Walmart’s pivot into online retail and targeting higher-income individuals will increase market share.
On the low side, Visa Inc. (V) fell -1.53% on Monday, declining to $274.39 per share on the day. Visa is facing downward pressure after investors noted that insiders have been dumping Visa shares over the last year, with very little buying activity. Visa insiders currently own about 0.05% of the entire company, which is an incredibly low ratio for people who operate at the management level.
Dow Jones technical outlook
The Dow Jones is looking for a foothold on Monday, holding above 38,700.00 despite a lack of upwards momentum. The major index is still down from Friday’s peaks near 39,100.00, and June’s near-term bullish rebound could be coming under threat.
The Dow Jones is still steeply off of record highs above 40,000.00, but a demand zone below 38,000.00 is providing firm long-term bullish pressure, keeping the index elevated well above the 200-day Exponential Moving Average (EMA) at 37,318.74.
Dow Jones five minute chart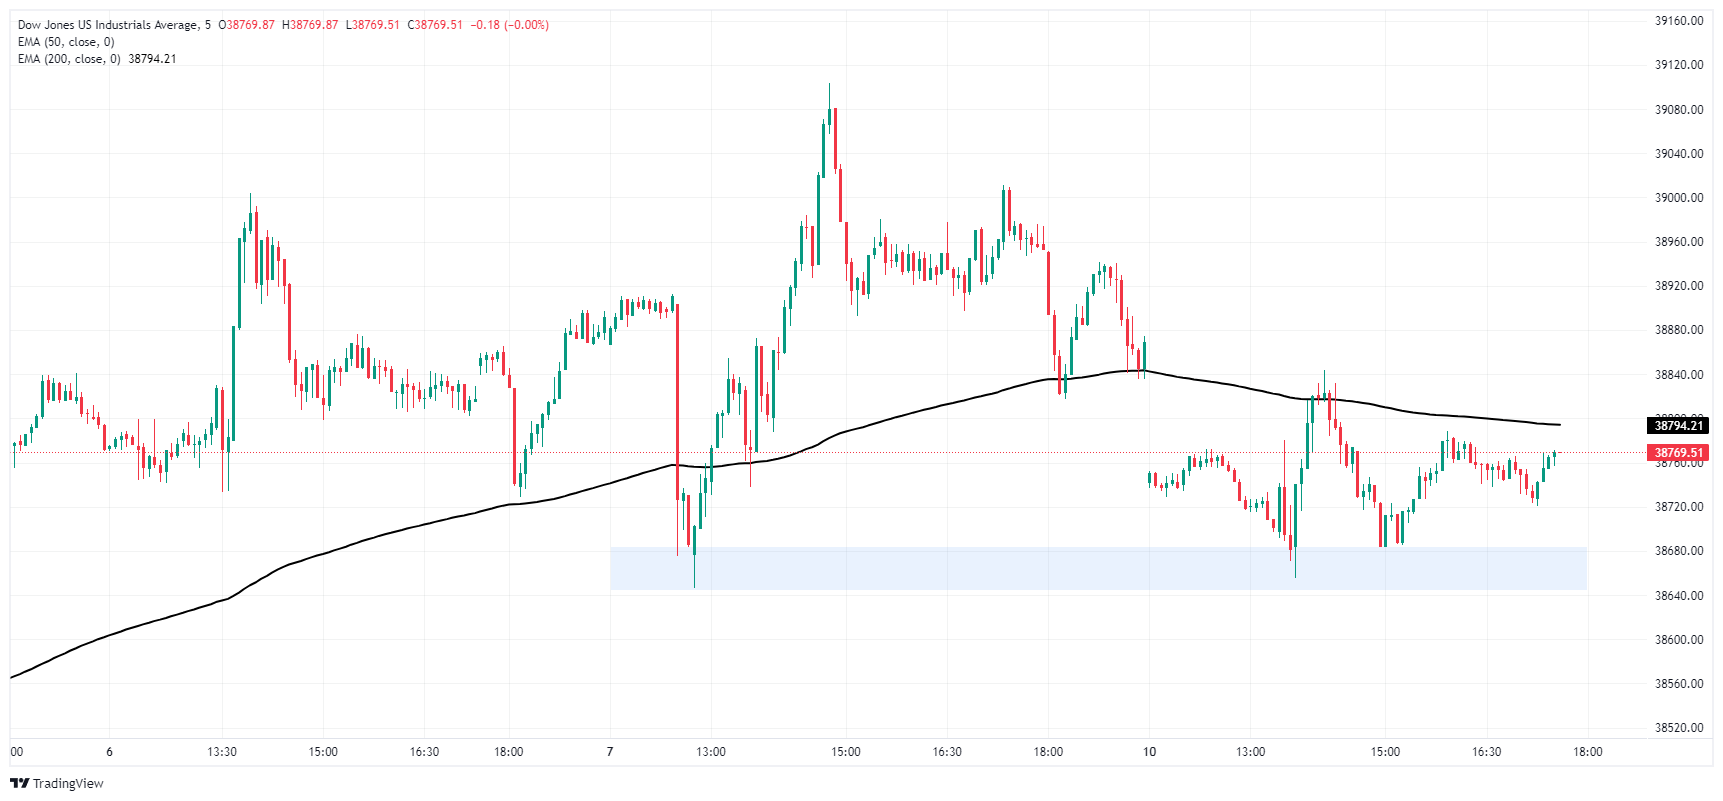
Dow Jones daily chart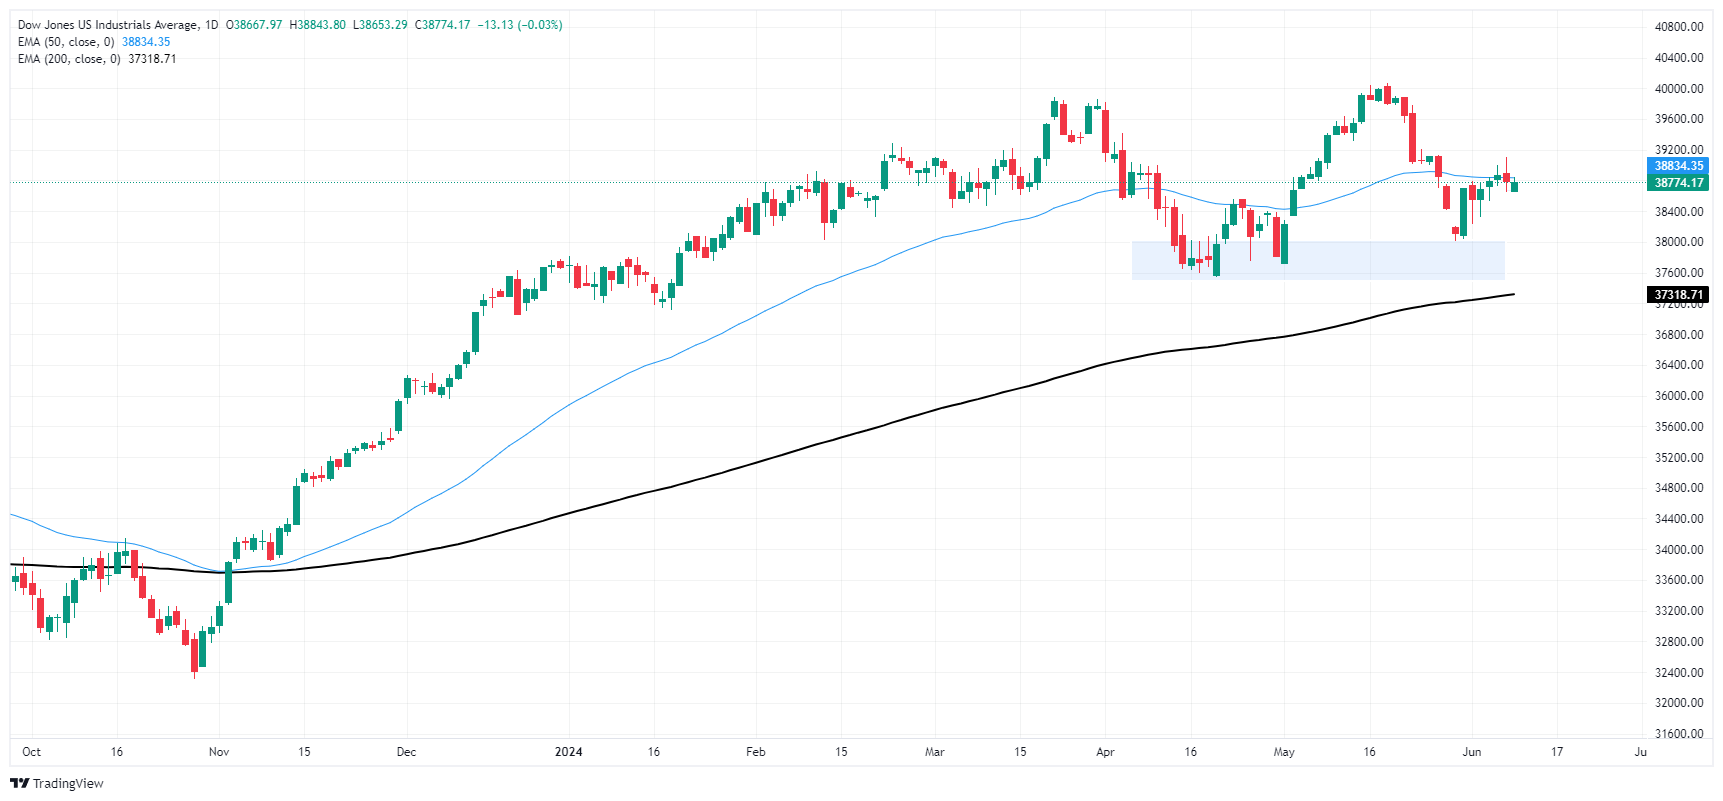
Dow Jones FAQs
The Dow Jones Industrial Average, one of the oldest stock market indices in the world, is compiled of the 30 most traded stocks in the US. The index is price-weighted rather than weighted by capitalization. It is calculated by summing the prices of the constituent stocks and dividing them by a factor, currently 0.152. The index was founded by Charles Dow, who also founded the Wall Street Journal. In later years it has been criticized for not being broadly representative enough because it only tracks 30 conglomerates, unlike broader indices such as the S&P 500.
Many different factors drive the Dow Jones Industrial Average (DJIA). The aggregate performance of the component companies revealed in quarterly company earnings reports is the main one. US and global macroeconomic data also contributes as it impacts on investor sentiment. The level of interest rates, set by the Federal Reserve (Fed), also influences the DJIA as it affects the cost of credit, on which many corporations are heavily reliant. Therefore, inflation can be a major driver as well as other metrics which impact the Fed decisions.
Dow Theory is a method for identifying the primary trend of the stock market developed by Charles Dow. A key step is to compare the direction of the Dow Jones Industrial Average (DJIA) and the Dow Jones Transportation Average (DJTA) and only follow trends where both are moving in the same direction. Volume is a confirmatory criteria. The theory uses elements of peak and trough analysis. Dow’s theory posits three trend phases: accumulation, when smart money starts buying or selling; public participation, when the wider public joins in; and distribution, when the smart money exits.
There are a number of ways to trade the DJIA. One is to use ETFs which allow investors to trade the DJIA as a single security, rather than having to buy shares in all 30 constituent companies. A leading example is the SPDR Dow Jones Industrial Average ETF (DIA). DJIA futures contracts enable traders to speculate on the future value of the index and Options provide the right, but not the obligation, to buy or sell the index at a predetermined price in the future. Mutual funds enable investors to buy a share of a diversified portfolio of DJIA stocks thus providing exposure to the overall index.
- Mexican Peso erased its earlier losses yet remains fragile after hitting 14-month low of 18.65 earlier.
- Political turmoil in Europe and Mexico's domestic reforms contribute to emerging market currency volatility.
- USD/MXN traders focus on upcoming US CPI data and FOMC decision, expected to trigger volatility in the pair.
The Mexican Peso stabilized against the US Dollar on Monday, following remarks from outgoing President Andres Manuel Lopez Obrador. Nevertheless, Morena’s Party leader Mario Delgado insisted on AMLO’s reforms submitted in February of 2024, a headwind for the emerging market currency. Therefore, the USD/MXN trades at around 18.41, printing modest gain of 0.04%.
Risk appetite seems to have deteriorated amid political turmoil in Europe, triggering a flight to safety and hurting emerging market currencies. The Greenback remains firm against a basket of six currencies while traders await the Federal Open Market Committee (FOMC) interest rate decision on Wednesday.
Back to Mexico’s domestic issues, Mexican President AMLO stated that he will not ask the incoming president to hurry the passage of constitutional reforms. That has calmed the financial markets following last week’s remarks of President AMLO and Morena’s Mexican Congress leader Ignacio Mier, with both stating they would pass the judicial reform and the disappearance of autonomous bodies.
Earlier, the Mexican Peso hit a 14-month low as the USD/MXN reached 18.65 before reversing its course.
Last Thursday, Mexico's President-elect Claudia Sheinbaum said that “no decision had been made on a package of constitutional reforms put forward by [the] outgoing president,” via Reuters.
USD/MXN traders should know that the pair will be extremely sensitive and volatile amid political uncertainty in Mexico.
Aside from politics, Mexico’s economic docket will feature Industrial Production for April. Across the border, on Wednesday, US Consumer Price Index (CPI) data from May is expected to remain stickier, ahead of the Federal Reserve’s (Fed) monetary policy decision.The latest US data suggests that the Fed will keep rates unchanged and adhere to its “higher for longer” mantra.
Daily digest market movers: Mexican Peso halts its freefall as AMLO’s backpedals
- AMLO’s proposals submitted to Mexican Congress in February 2024 include a reform of the Supreme Court, which proposes that the Supreme Court's ministers be elected by popular vote; electoral reform, which seeks to have INE councilors elected by popular vote and reduce multi-membership; and reform of autonomous bodies, which entails the dissolution of the transparency body.
- Mexican Peso depreciation could weigh on the Bank of Mexico's (Banxico) decision to ease policy, even though last month’s core inflation slowed. Therefore, keeping interest rates higher could prompt deceleration in the economy and increase the odds of a recession.
- Morgan Stanley noted that if Mexico’s upcoming government and Congress adopted an unorthodox agenda, it would undermine Mexican institutions and be bearish for the Mexican Peso, which could weaken to 19.20.
- Last week’s US data decreased the odds for a Fed rate cut in September, according to the CME FedWatch Tool, from above 50% to 46.7%.
- December’s 2024 fed funds futures contract hints that investors expect 28 basis points of rate cuts by the Fed throughout the year.
Technical analysis: Mexican Peso appreciates, but the bias shifted bearish
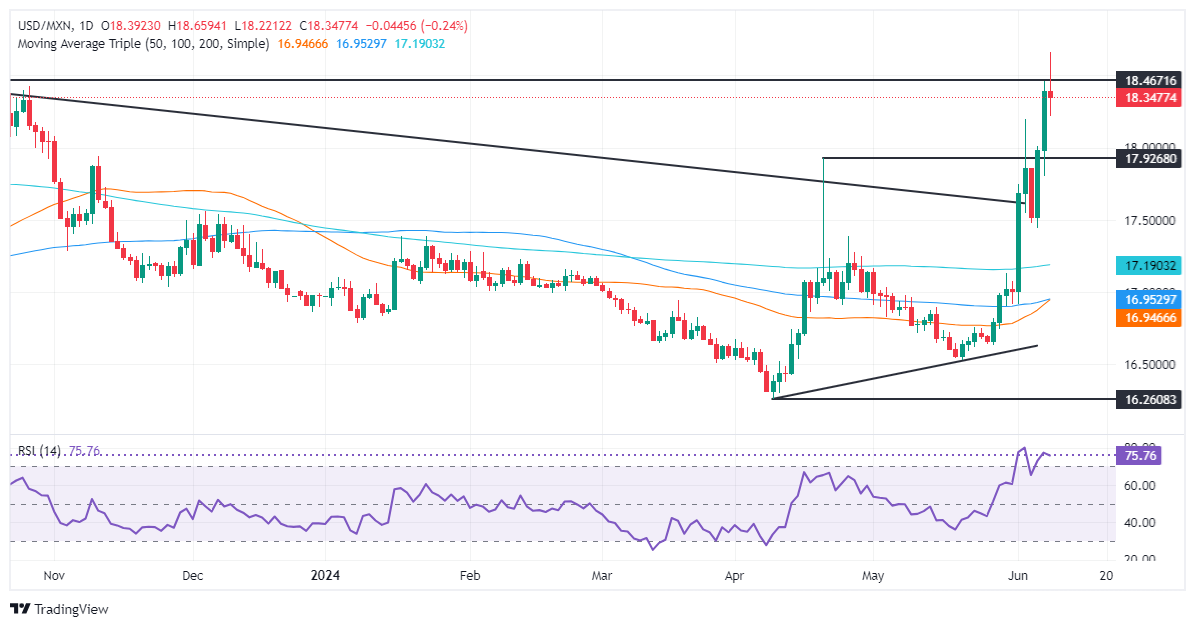
The USD/MXN remains bullishly biased even though the rally stalled after hitting a multi-month high of 18.65, which sponsored a leg down toward the current exchange rate. Last Friday, I wrote, "a fifth daily close above a four-year-old downslope resistance trendline drawn from all-time highs (ATH) at around $25.77, which was broken on Monday. That could be the last nail in the coffin for the Mexican Peso's strength.”
That was achieved, and the pair pushed toward 18.65, yet buyers are taking a respite before extending their gains. That said, the USD/MXN's next resistance would be the October 6 high of 18.48, followed by today’s high of 18.65. Once cleared, the next stop would be the psychological 19.00 figure. Overhead resistance levels lie ahead, like the March 20, 2023, high of 19.23, followed by the psychological 20.00 mark.
On the other hand, sellers need to push the USD/MXN back below the April 19 high of 18.15 if they would like to keep the pair within the 18.00-18.15 trading range.
Mexican Peso FAQs
The Mexican Peso (MXN) is the most traded currency among its Latin American peers. Its value is broadly determined by the performance of the Mexican economy, the country’s central bank’s policy, the amount of foreign investment in the country and even the levels of remittances sent by Mexicans who live abroad, particularly in the United States. Geopolitical trends can also move MXN: for example, the process of nearshoring – or the decision by some firms to relocate manufacturing capacity and supply chains closer to their home countries – is also seen as a catalyst for the Mexican currency as the country is considered a key manufacturing hub in the American continent. Another catalyst for MXN is Oil prices as Mexico is a key exporter of the commodity.
The main objective of Mexico’s central bank, also known as Banxico, is to maintain inflation at low and stable levels (at or close to its target of 3%, the midpoint in a tolerance band of between 2% and 4%). To this end, the bank sets an appropriate level of interest rates. When inflation is too high, Banxico will attempt to tame it by raising interest rates, making it more expensive for households and businesses to borrow money, thus cooling demand and the overall economy. Higher interest rates are generally positive for the Mexican Peso (MXN) as they lead to higher yields, making the country a more attractive place for investors. On the contrary, lower interest rates tend to weaken MXN.
Macroeconomic data releases are key to assess the state of the economy and can have an impact on the Mexican Peso (MXN) valuation. A strong Mexican economy, based on high economic growth, low unemployment and high confidence is good for MXN. Not only does it attract more foreign investment but it may encourage the Bank of Mexico (Banxico) to increase interest rates, particularly if this strength comes together with elevated inflation. However, if economic data is weak, MXN is likely to depreciate.
As an emerging-market currency, the Mexican Peso (MXN) tends to strive during risk-on periods, or when investors perceive that broader market risks are low and thus are eager to engage with investments that carry a higher risk. Conversely, MXN tends to weaken at times of market turbulence or economic uncertainty as investors tend to sell higher-risk assets and flee to the more-stable safe havens.
European Central Bank (ECB) President Christine Lagarde noted that interest rates aren't hard-locked to a steady path of declines, warning markets that expectations of time-dependent rate cuts isn't helpful to the ECB's goals.
Key highlights
Interest rates are not necessarily on a linear-declining path, there might be periods when we hold.
It is possible ECB will hold rates for longer than a single meeting.
Time-dependent guidance on rates not helpful.
I am keen to see the evolution of labour costs and corporate profits.
- USD extends its previous profits, continuing on a winning streak.
- US economy still shows strength, May's Consumer Price Index remains focal point.
- Fed's projections for the economy will be closely watched on Wednesday, but decision is expected to be a hold.
On Monday, the US Dollar Index (DXY) saw a hike, moving further up toward the 105.23 area, following the streak from Friday's rally. Despite some initial fluctuations, the broader perspective of the robust US economy remains strong, thus hinting at maintaining the USD gains.
Market participants are still keeping their focus mostly on the Consumer Price Index (CPI) for May and the Federal Reserve (Fed) meeting, both on Wednesday. As Monday's session didn't offer any major highlights, investors' eyes are glued to these upcoming events. The anticipated data along with the decision will provide a clearer image of the inflation rate and the potential changes in the monetary policy trajectory.
Daily digest market movers: DXY gains momentum, awaiting Wednesday's session
- Core CPI data prediction for May is currently at a slight slowdown to 3.5% YoY, while the overall inflation is expected to stand firm at 3.4%.
- Fed is presumed to retain interest rates at 5.5% in the June 15-16 meeting. Any deviation in this forecast could cause significant shifts in market activity.
- The Summary of Economic Projections and comments by Fed Chairman Jerome Powell should be key in understanding the economic future more comprehensively.
DXY technical analysis: Dollar Index recovers to positive ground post previous surge
The DXY Index has not only managed to stay afloat but has also recovered to a stronger position on the chart. The index stands above the 20, 100 and 200-day Simple Moving Averages (SMA), reinforcing the bullish outlook.
Additionally, the Relative Strength Index (RSI) manages to stay over 50, backing up the bullish sentiment further. The Moving Average Convergence Divergence (MACD) indicates the presence of increased demand at its current levels.
Fed FAQs
Monetary policy in the US is shaped by the Federal Reserve (Fed). The Fed has two mandates: to achieve price stability and foster full employment. Its primary tool to achieve these goals is by adjusting interest rates. When prices are rising too quickly and inflation is above the Fed’s 2% target, it raises interest rates, increasing borrowing costs throughout the economy. This results in a stronger US Dollar (USD) as it makes the US a more attractive place for international investors to park their money. When inflation falls below 2% or the Unemployment Rate is too high, the Fed may lower interest rates to encourage borrowing, which weighs on the Greenback.
The Federal Reserve (Fed) holds eight policy meetings a year, where the Federal Open Market Committee (FOMC) assesses economic conditions and makes monetary policy decisions. The FOMC is attended by twelve Fed officials – the seven members of the Board of Governors, the president of the Federal Reserve Bank of New York, and four of the remaining eleven regional Reserve Bank presidents, who serve one-year terms on a rotating basis.
In extreme situations, the Federal Reserve may resort to a policy named Quantitative Easing (QE). QE is the process by which the Fed substantially increases the flow of credit in a stuck financial system. It is a non-standard policy measure used during crises or when inflation is extremely low. It was the Fed’s weapon of choice during the Great Financial Crisis in 2008. It involves the Fed printing more Dollars and using them to buy high grade bonds from financial institutions. QE usually weakens the US Dollar.
Quantitative tightening (QT) is the reverse process of QE, whereby the Federal Reserve stops buying bonds from financial institutions and does not reinvest the principal from the bonds it holds maturing, to purchase new bonds. It is usually positive for the value of the US Dollar.
- Canadian Dollar mostly mixed on Monday, flat against USD.
- Canada mostly absent from economic calendar this week.
- Speech from BoC Macklem due in the midweek market session.
The Canadian Dollar (CAD) is holding flat against the Greenback to kick off another trading week as momentum in the CAD space remains thin. Markets are still recovering from Friday’s jobs report, and volatility remains high despite a lack of momentum.
Canada is functionally absent from the economic calendar on Monday with strictly low-tier data on offer throughout the week. A speech from Bank of Canada (BoC) Governor Tiff Macklem will be released on Wednesday when the BoC head participates in a panel discussion ironically titled “Overcoming Economic Volatility”. However, the BoC Governor’s words are likely to be overshadowed by a US Consumer Price Index (CPI) and Federal Reserve (Fed) rate call double-header also due on Wednesday.
Daily digest market movers: Data-light CAD goes with the flows
- The Canadian Dollar is holding flat against its closest peer, the US Dollar, on a data-deprived Monday as the Friday NFP hangover continues.
- Investors are looking ahead to key US inflation data due on Wednesday, as well as the Fed’s update to its interest rate projections for the next few years.
- The NY Fed published a consumer survey on Monday that revealed consumers still don’t feel great about the long-term inflation outlook.
- Median NY Fed survey results showed that consumer one-year inflation expectations ticked down to 3.2% from the previous 3.3%, but five-year inflation expectations rose to 3.0% from the previous 2.8%.
- BoC”s Macklem is expected to get drowned out on Wednesday by shifts in Fed rate expectations.
Canadian Dollar PRICE Today
The table below shows the percentage change of Canadian Dollar (CAD) against listed major currencies today. Canadian Dollar was the strongest against the Euro.
| USD | EUR | GBP | JPY | CAD | AUD | NZD | CHF | |
|---|---|---|---|---|---|---|---|---|
| USD | 0.44% | -0.12% | 0.08% | 0.00% | -0.42% | -0.28% | -0.08% | |
| EUR | -0.44% | -0.21% | -0.14% | -0.18% | -0.58% | -0.46% | -0.28% | |
| GBP | 0.12% | 0.21% | 0.20% | 0.03% | -0.37% | -0.25% | -0.07% | |
| JPY | -0.08% | 0.14% | -0.20% | -0.06% | -0.56% | -0.45% | -0.12% | |
| CAD | -0.00% | 0.18% | -0.03% | 0.06% | -0.39% | -0.28% | -0.10% | |
| AUD | 0.42% | 0.58% | 0.37% | 0.56% | 0.39% | 0.13% | 0.31% | |
| NZD | 0.28% | 0.46% | 0.25% | 0.45% | 0.28% | -0.13% | 0.18% | |
| CHF | 0.08% | 0.28% | 0.07% | 0.12% | 0.10% | -0.31% | -0.18% |
The heat map shows percentage changes of major currencies against each other. The base currency is picked from the left column, while the quote currency is picked from the top row. For example, if you pick the Canadian Dollar from the left column and move along the horizontal line to the US Dollar, the percentage change displayed in the box will represent CAD (base)/USD (quote).
Technical analysis: Canadian Dollar shuffles in place, USD/CAD stuck just below 1.3800
The Canadian Dollar (CAD) is giving a firmly mixed performance on Monday, holding flat against the US Dollar (USD) as a lack of momentum plagues the key CAD pairing. The CAD gained around a quarter of a percent against the Euro (EUR), but shed four-tenths of one percent against the Australian Dollar (AUD).
USD/CAD is hung up on thin chart movement just beneath the 1.3800 handle. The pair’s topside push from last Friday failed to extend into another day of gains, but sellers have been unable to regain control.
The 1.3780 level is the target for intraday buyers to beat, while short positions will need to accumulate enough pressure to drive bids back to the 1.3700 handle. A lack of trend is plaguing USD/CAD with the pair up 3.9% in 2024 but remaining down from the year’s peak bids at 1.3846 set back in mid-April.
USD/CAD hourly chart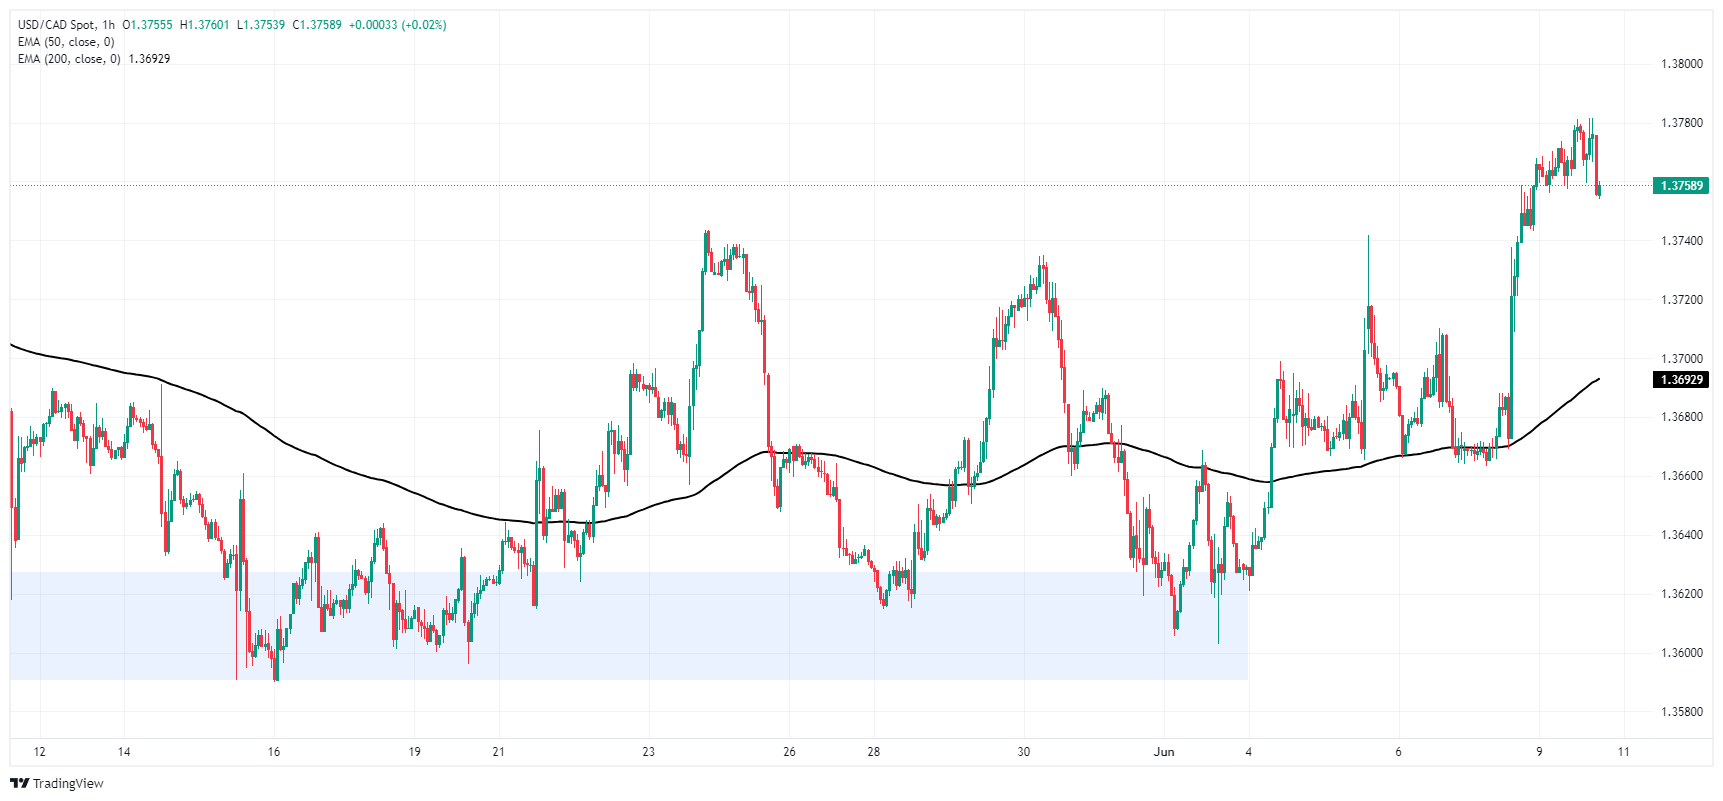
USD/CAD daily chart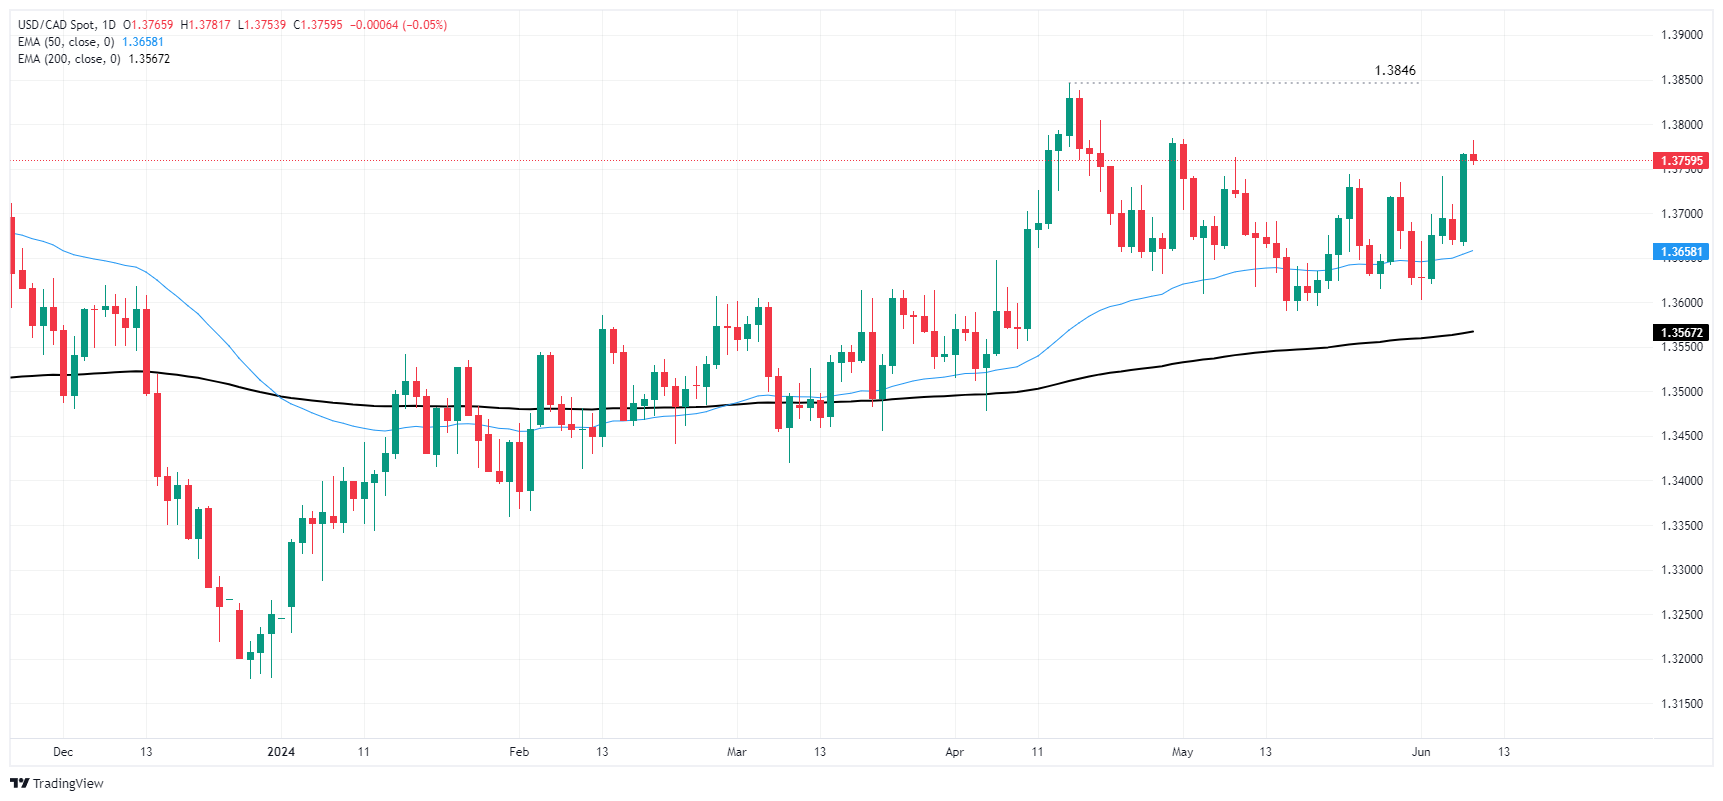
Canadian Dollar FAQs
The key factors driving the Canadian Dollar (CAD) are the level of interest rates set by the Bank of Canada (BoC), the price of Oil, Canada’s largest export, the health of its economy, inflation and the Trade Balance, which is the difference between the value of Canada’s exports versus its imports. Other factors include market sentiment – whether investors are taking on more risky assets (risk-on) or seeking safe-havens (risk-off) – with risk-on being CAD-positive. As its largest trading partner, the health of the US economy is also a key factor influencing the Canadian Dollar.
The Bank of Canada (BoC) has a significant influence on the Canadian Dollar by setting the level of interest rates that banks can lend to one another. This influences the level of interest rates for everyone. The main goal of the BoC is to maintain inflation at 1-3% by adjusting interest rates up or down. Relatively higher interest rates tend to be positive for the CAD. The Bank of Canada can also use quantitative easing and tightening to influence credit conditions, with the former CAD-negative and the latter CAD-positive.
The price of Oil is a key factor impacting the value of the Canadian Dollar. Petroleum is Canada’s biggest export, so Oil price tends to have an immediate impact on the CAD value. Generally, if Oil price rises CAD also goes up, as aggregate demand for the currency increases. The opposite is the case if the price of Oil falls. Higher Oil prices also tend to result in a greater likelihood of a positive Trade Balance, which is also supportive of the CAD.
While inflation had always traditionally been thought of as a negative factor for a currency since it lowers the value of money, the opposite has actually been the case in modern times with the relaxation of cross-border capital controls. Higher inflation tends to lead central banks to put up interest rates which attracts more capital inflows from global investors seeking a lucrative place to keep their money. This increases demand for the local currency, which in Canada’s case is the Canadian Dollar.
Macroeconomic data releases gauge the health of the economy and can have an impact on the Canadian Dollar. Indicators such as GDP, Manufacturing and Services PMIs, employment, and consumer sentiment surveys can all influence the direction of the CAD. A strong economy is good for the Canadian Dollar. Not only does it attract more foreign investment but it may encourage the Bank of Canada to put up interest rates, leading to a stronger currency. If economic data is weak, however, the CAD is likely to fall.
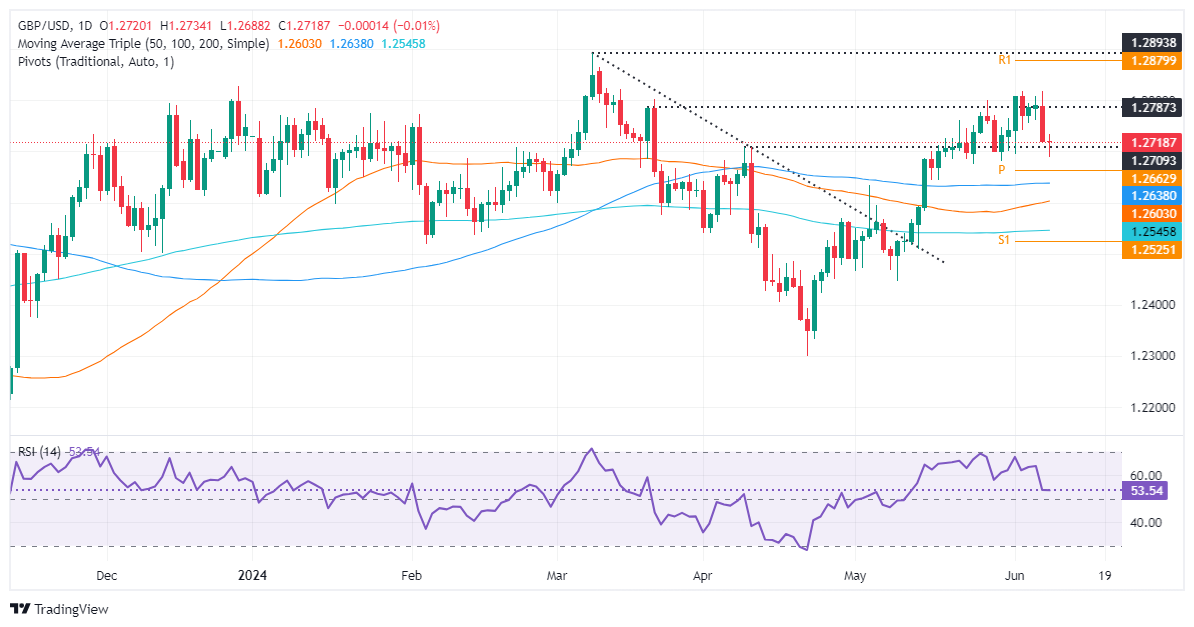
- GBP/USD slightly down for the second session in a row.
- Technicals indicate losing buyer momentum as RSI approaches the 50-midline.
- A drop below 1.2700 could push GBP/USD towards key moving averages near 1.2686 and potentially lower.
- Upside seen above 1.2750, with buyers eyeing 1.2800.
The British Pound extended its losses for the second consecutive trading session against the US Dollar, following last Friday’s stellar jobs report from the US, which triggered the likelihood of a less dovish Federal Reserve. That and uncertainty on the upcoming Fed’s meeting would keep Cable pressured. Therefore, the GBP/USD trades at 1.2713, down 0.01%
GBP/USD Price Analysis: Technical outlook
After struggling at around 1.2800 with key technical resistance levels, the GBP/USD tumbled below 1.2700 and printed a new seven-day low of 1.2687 before recovering some ground.
Although momentum still favors buyers, the Relative Strength Index (RSI) dropped sharply towards crossing the 50-midline, hinting that buyers are losing momentum. Nevertheless, Monday’s price action seems to form a ‘dragonfly doji,’ a bullish candlestick.
If GBP/USD reclaims 1.2750, it will be possible to challenge the June 7 high of 1.2813. Once cleared, the next resistance line will be 1.2850, followed by 1.2900.
Conversely, if GBP/USD prints a daily close below 1.2700, that would sponsor a leg-down toward the confluence of the 100-day moving average (DMA) at around 1.2686, ahead of the 50 and 200-DMAs each at 1.2602 and 1.2543, respectively.
GBP/USD Price Action – Daily Chart
- EUR/JPY tumbles to 168.50 as the Eurozone’s political uncertainty weakens the Euro’s appeal.
- French Macron called for a snap election after exit polls showed significant seats for Bardella-led Far-right.
- The BoJ may opt for reducing asset purchases as a step towards policy-normalization.
The EUR/JPY pair falls sharply to 168.50 in Monday’s New York session as political uncertainty in the Eurozone prompted by French President Emmanuel Macron’s decision of dissolving parliament and calling for a snap election weighed heavily on the Euro.
The decision came after exit polls for European parliamentary elections indicated that Marine Le Pen’s far-right National Rally (RN) scored 32%-33% seats under the leadership of the party’s president, Jordan Bardella, which was more than double from Macron’s centrist list. This has triggered upside risks to change in government, which spawns uncertainty over the continuation of current fiscal policies.
Meanwhile, the absence of support for subsequent interest-rate cuts by European Central Bank (ECB) policymakers has failed to offer some cushion to the weak Euro. In the European session, ECB policymaker and Slovakian central bank Governor Peter Kazimir also said that the central bank should not rush into another rate cut as progress in disinflation appears to be bumpy in the next few months.
ECB policymakers worry that wage growth will continue to remain firm, which could boost consumer spending and slow the progress in inflation declining to the bank’s target. Meanwhile, a weak Euro is also expected to spur inflationary pressures by making Eurozone exports competitive in the global market.
On the Tokyo front, investors await the Bank of Japan’s (BoJ) monetary policy decision, which will be announced on Friday. The BoJ is expected to leave interest rates at their current levels but reduce asset purchases to maintain progress towards policy normalization.
On the economic front, revised estimates of Japan’s Q1 Gross Domestic Product (GDP) showed that the economy contracts at a slower pace of 1.8% from preliminary estimates of 2.0% on an annualized basis.
- USD/JPY holds strength near 157.00 as the US Dollar strengthens ahead of the Fed’s policy.
- Traders pare Fed rate-cut bets quickly after strong US NFP report.
- The BoJ is expected to shrink its asset purchase towards easing policy further.
The USD/JPY pair trades in a limited range around 157.00 in Monday’s American session. The asset turns sideways after a strong recovery that was driven by strong United States (US) Nonfarm Payrolls (NFP) for May, which highlighted robust labor demand and strong wage growth.
The report also offset significant Federal Reserve (Fed) rate-cut bets for the September meeting, which were prompted by weaker-than-expected US JOLTS Job Openings data for April and ADP Employment Change data for May. Currently, the CME FedWatch tool shows that 30-day Fed Funds futures pricing data suggest a 47% chance that interest rate will be lower than the current level in September, significantly down from the 59.6% recorded a week ago.
Meanwhile, investors shift focus to the US Consumer Price Index (CPI) data for May and the Fed’s interest rate policy, which are scheduled for Wednesday.
Investors see the Fed keeping interest rates unchanged in the range of 5.25%-5.50% for the seventh straight time and delivering hawkish guidance. Fed policymakers want to see inflation declining for months to be sure about rate cuts.
The market sentiment turns risk-averse as investors see the Fed delaying rate cuts later to November or December meeting. The S&P 500 opens on a negative note as the Fed is expected to deliver only one rate-cut this year. 10-year US Treasury yields jump to 4.45%. The US Dollar Index (DXY), which tracks the Greenback’s value against six major currencies, jumps to near 105.30.
In Tokyo, investors shift focus to the Bank of Japan’s (BoJ) monetary policy decision, which will be announced on Friday. The BoJ is expected to progress further towards policy easing by reducing the scale of bond purchases.
- Silver is declining steadily on the intraday charts suggesting a short-term bear trend bias at work.
- The precious metal is currently pulling back up to resistance from the bottom of a mini-range.
- It will probably roll-over and begin descending again as the pattern of lower lows continues.
Silver (XAG/USD) is in a step decline on the four-hour chart after piercing below the bottom of a mini-range it formed after peaking in mid-May.
The precious metal fell to a new low at $29.12, at the level of the 200 Simple Moving Average (SMA) following the release of market-moving data on Friday.
Silver 4-hour Chart
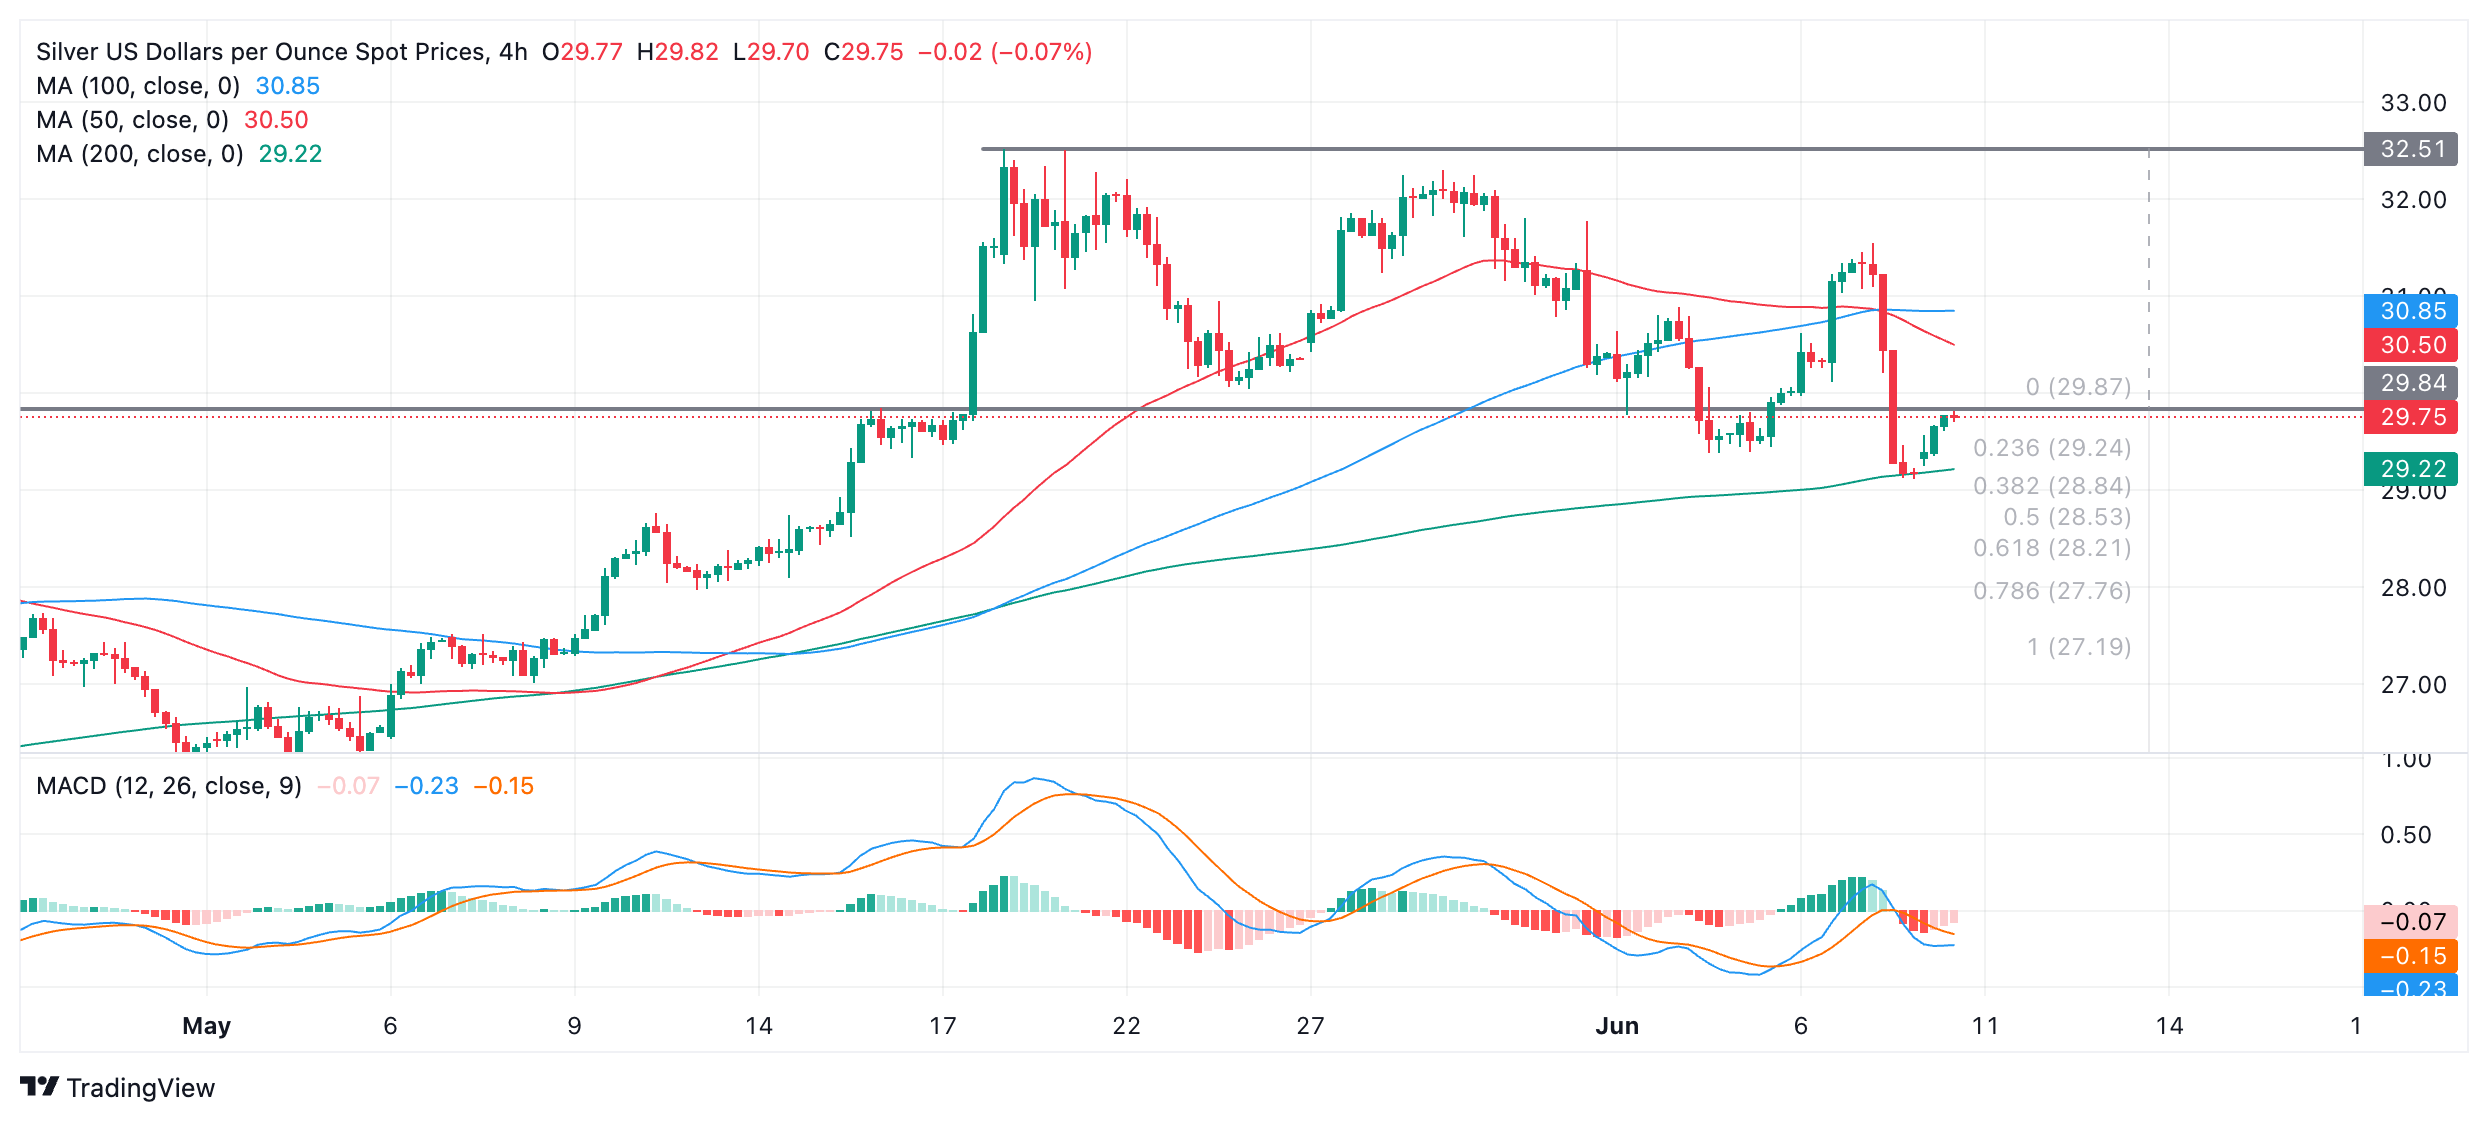
It has since pulled back up to resistance from the floor of the range. On balance Silver looks bearish in the short-term and the price will probably roll-over and continue down.
A break below $29.12 (June 7 low) would confirm a lower low and probably a move down to an initial target at $28.21. This is the 0.618 Fibonacci ratio of the height of the range extrapolated lower, the normal method for establishing targets after breakouts from ranges. Further bearishness could see Silver even reach as low as $27.19, the 100% extrapolation of the height of the range lower.
Alternatively a move above the $31.55 lower high would bring the bearish short-term bias into doubt and suggest the possibility of a recovery back up to the range high at $32.51.
- USD/CAD aims to recapture 1.3800 amid firm US Dollar.
- A sharp decline in Fed rate-cut bets boosts the US Dollar’s appeal.
- Investors look for fresh cues about BoC’s subsequent rate cuts.
The USD/CAD pair clings to gains near 1.3770 in Monday’s New York session. The Loonie asset aims to extend upside as the US Dollar (USD) remains firm due to diminished Federal Reserve (Fed) rate-cut bets for the September meeting.
Traders pares Fed rate-cut bets swiftly after the strong United States (US) Nonfarm Payrolls (NFP) report for May eliminated fears of normalizing labor market conditions. The report showed that labor demand remained robust across all sectors and wage growth was stronger-than-expected.
Investors are now expecting that the Fed will cut interest rates once this year, either in November or December. For more cues over the interest rate outlook, investors will pay close attention to the US Consumer Price Index (CPI) data for May and the Fed’s monetary policy, which are scheduled for Wednesday.
Annual core inflation, which excludes volatile food and energy prices, is estimated to have decelerated to 3.5% from April’s reading of 3.6%. In the same period, headline inflation is expected to have grown steadily by 3.4%.
The Fed is widely anticipated to maintain interest rates steady in the range of 5.25%-5.50% with a hawkish outlook as the last mile for inflation to return to the desired rate of 2% appears to be stickier.
On the Canadian Dollar front, investors await the speech from Bank of Canada (BoC) Governor Tiff Macklem, which is scheduled for Wednesday. BoC Macklem will provide more cues about whether the central bank will announce subsequent rate cuts. Last week, the BoC lowered its key borrowing rates for the first time in four years.
- The US Dollar rallies on all fronts, with antipodes as outliers.
- Markets are trembling with fear after the EU election result forced Macron to call for snap elections.
- The US Dollar Index pops above 105.00 and hits a fresh four-week high.
The US Dollar (USD) edges higher and extends its rally on Monday following upbeat May Nonfarm Payrolls data on Friday. The main driver for the second leg higher comes from European elections over the weekend, where the Far Right parties gain ground in the European Union (EU). The results in France were even so devastating for French President Emmanuel Macron and his ruling coalition that he called snap elections for June 30 and the run-off on July 7.
On the economic front, it is a very calm start to the week. On Wednesday, the focus will be on the US Consumer Price Index (CPI) release for May and on the US Federal Open Market Committee (FOMC), which will decide on the Federal Reserve’s (Fed) monetary policy interest rate and will release a fresh dot plot and economic projections.
Daily digest market movers: US to digest European election results
- On Sunday, the European election results were released with some key takeaways:
- French President Emmanuel Macron saw his party coming in third, way behind the two parties that won the most votes. This forced President Macron to call for snap elections.
- In Italy, the Far Right’s current leading Prime Minister Giorgia Meloni’s party won another substantial amount of votes and further cemented the Far Right gains for her government in Italy.
- The US Treasury will have its work on Monday with three bond allocations:
- At 15:30 GMT, a 3-month and a 6-month bill will be released.
- At 17:00 GMT, a 3-year bond will be auctioned.
- Equities are in the red across the board, especially in Europe. The Euro Stoxx 50, the European equity benchmark, is falling over 1%. US equity futures are just slightly in the red.
- There has been a sharp shift in the Fed rate cut expectations for September. The CME FedWatch tool shows that 30-Day Fed Funds futures pricing data suggest a 49% chance that interest rate will be lower than the current level in September, significantly down from the 59.6% recorded a week ago.
- The benchmark 10-year US Treasury Note prints a fresh seven-day high at 4.46%.
US Dollar Index Technical Analysis: If and only if
The US Dollar Index (DXY) has snapped some crucial technical levels in its run higher over the past two days. Trading even above the 55-day Simple Moving Average (SMA) at 105.04 on Monday, it will be key to see if this level can hold as support by Wednesday when a rather hawkish Fed might lay out the plan for the DXY to jump back to 106.00. That would mean even a possibility for a fresh 2024 high, depending on the message US Fed Chairman Jerome Powell delivers to markets.
On the upside, there are some technical or pivotal levels to watch out for. The first is 105.52, a pivotal level that held support during most of April. Next comes at 105.88, which triggered a rejection at the start of May and will likely play its role as resistance again. The biggest challenge remains at 105.51, the year-to-date high marked on April 16.
On the downside, a trifecta of SMA’s is now playing as support. First, and very close, is the 55-day SMA at 105.04. A touch lower, near 104.45, both the 100-day and the 200-day SMA are forming a double layer of protection to support any declines in the US Dollar Index. Should this area be broken down, look for 104.00 to salvage the situation.
US Dollar FAQs
The US Dollar (USD) is the official currency of the United States of America, and the ‘de facto’ currency of a significant number of other countries where it is found in circulation alongside local notes. It is the most heavily traded currency in the world, accounting for over 88% of all global foreign exchange turnover, or an average of $6.6 trillion in transactions per day, according to data from 2022. Following the second world war, the USD took over from the British Pound as the world’s reserve currency. For most of its history, the US Dollar was backed by Gold, until the Bretton Woods Agreement in 1971 when the Gold Standard went away.
The most important single factor impacting on the value of the US Dollar is monetary policy, which is shaped by the Federal Reserve (Fed). The Fed has two mandates: to achieve price stability (control inflation) and foster full employment. Its primary tool to achieve these two goals is by adjusting interest rates. When prices are rising too quickly and inflation is above the Fed’s 2% target, the Fed will raise rates, which helps the USD value. When inflation falls below 2% or the Unemployment Rate is too high, the Fed may lower interest rates, which weighs on the Greenback.
In extreme situations, the Federal Reserve can also print more Dollars and enact quantitative easing (QE). QE is the process by which the Fed substantially increases the flow of credit in a stuck financial system. It is a non-standard policy measure used when credit has dried up because banks will not lend to each other (out of the fear of counterparty default). It is a last resort when simply lowering interest rates is unlikely to achieve the necessary result. It was the Fed’s weapon of choice to combat the credit crunch that occurred during the Great Financial Crisis in 2008. It involves the Fed printing more Dollars and using them to buy US government bonds predominantly from financial institutions. QE usually leads to a weaker US Dollar.
Quantitative tightening (QT) is the reverse process whereby the Federal Reserve stops buying bonds from financial institutions and does not reinvest the principal from the bonds it holds maturing in new purchases. It is usually positive for the US Dollar.
- AUD/USD looks vulnerable to breaking out of the bottom of a range and declining substantially lower.
- The steepness of the sell-off on Friday is a further bearish sign.
- It is in a sideways trend, however, so there is also a possibility of a recovery within the range.
AUD/USD has broken below the floor of a short-term range before pulling up. It looks poised to extend its fall, declining to substantial targets below.
That said, the pair is probably in a sideways trend which given “the trend is your friend” could extend. This suggests there is a risk of a recovery back inside the range and the unfolding of an up leg towards the range ceiling in the 0.6680s.
AUD/USD 4-hour Chart
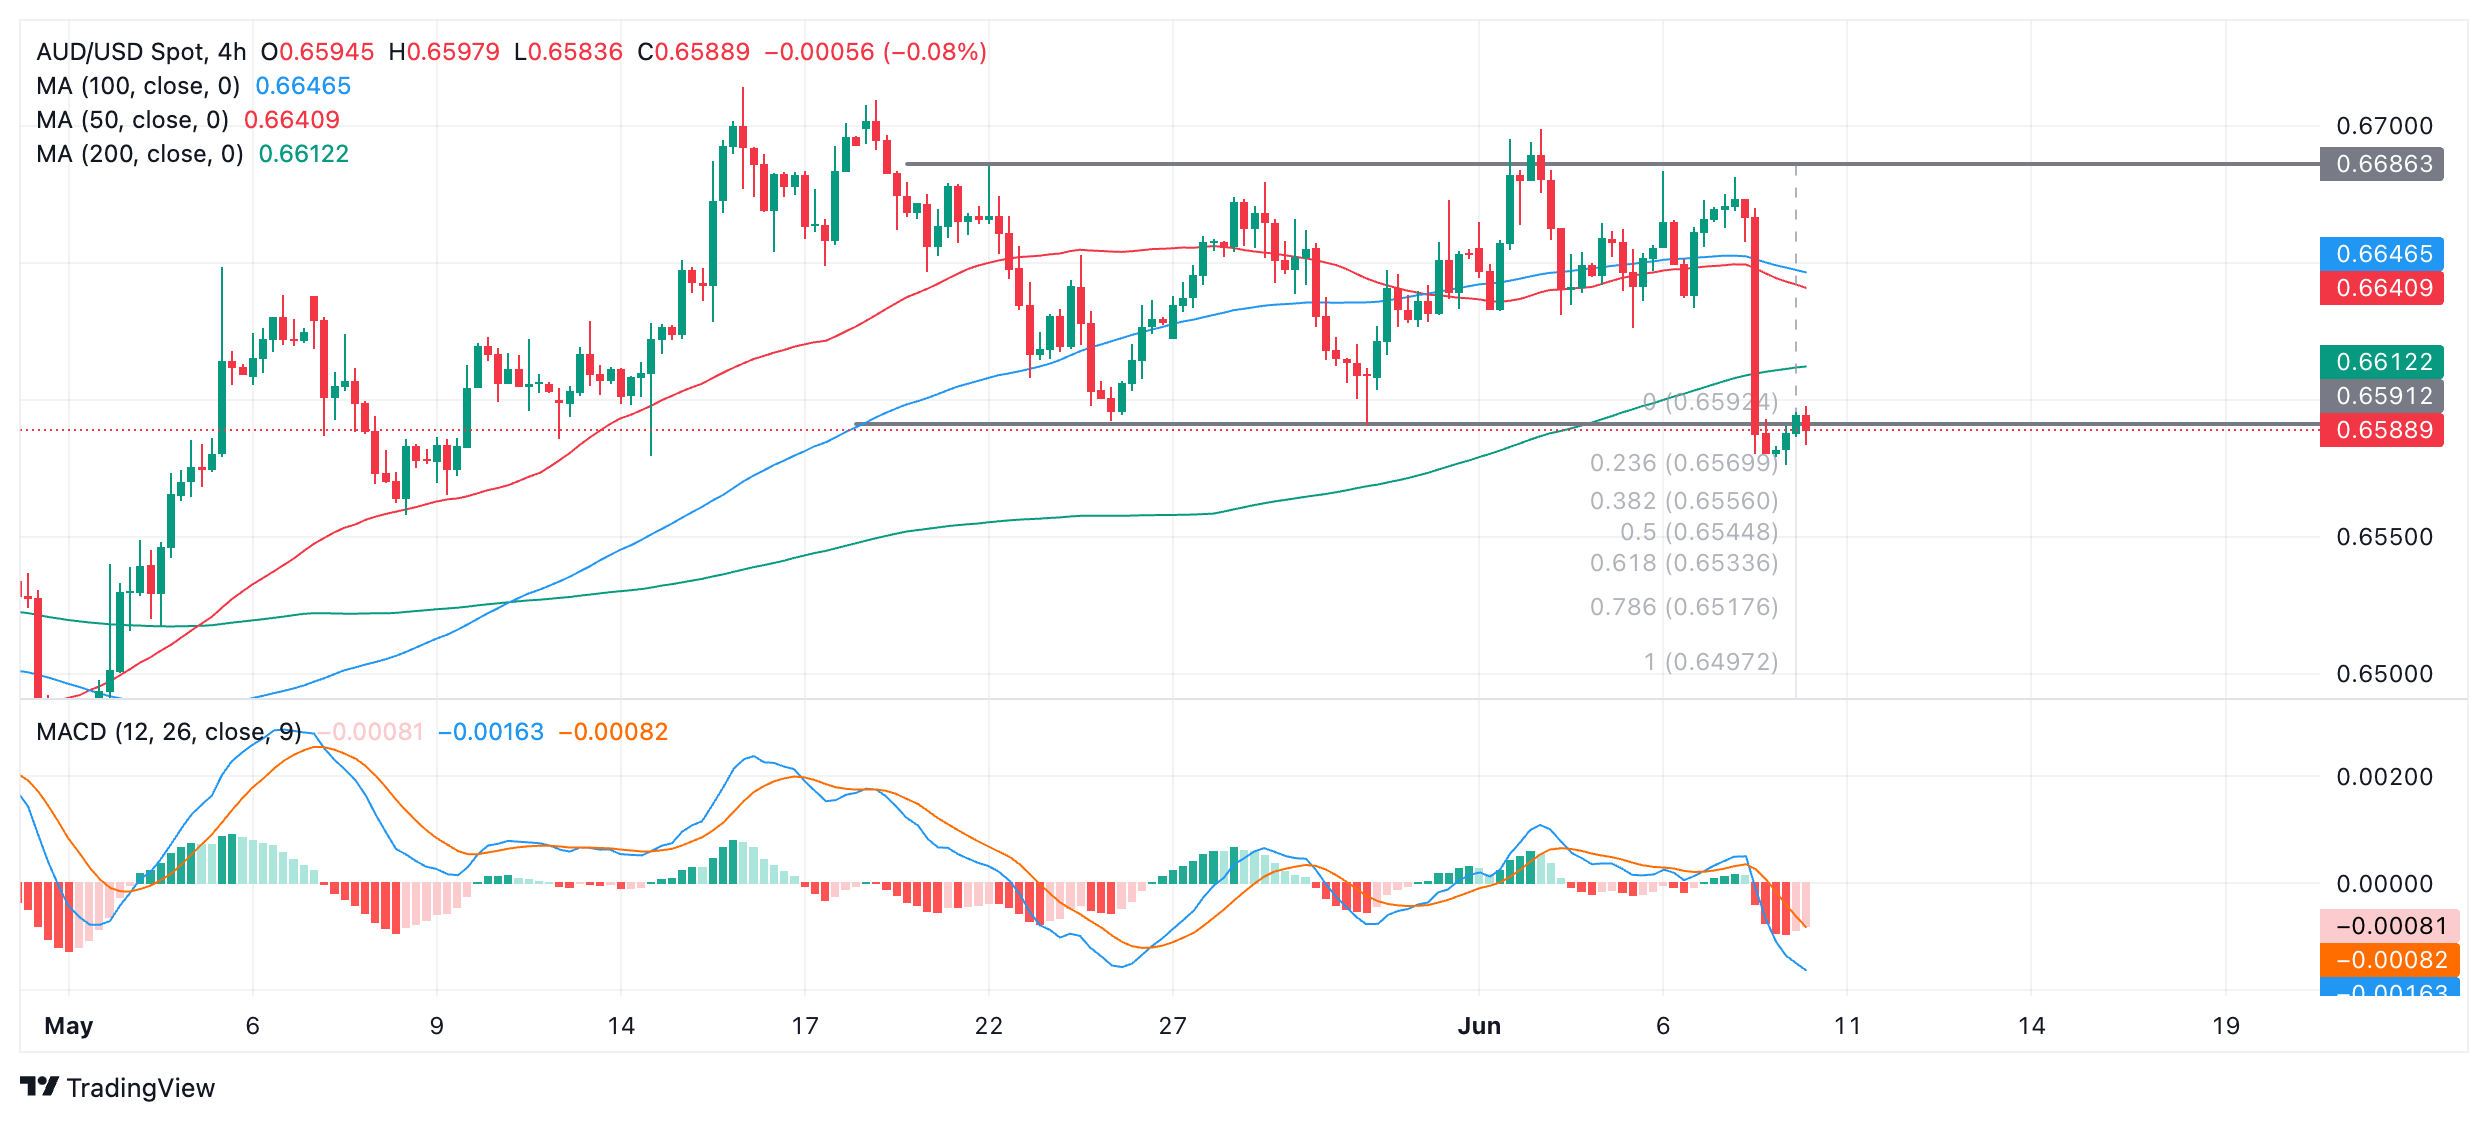
AUD/USD is at a critical turning point. It has pierced the bottom of a range after a steep decline and is vulnerable to further weakness. A break below the 0.6579 low of June 7 would confirm the bearish hypothesis and indicate a likely decline to an initial target at 0.6534. The target is generated using the technical analysis method of using the height of the range and extrapolating it by a Fibonacci 0.618 ratio lower.
At the same time there is still a possibility the pair could recover and unfold a new up leg back up to the range highs. There are no signs from price action, however, that this is happening yet. A break above the 200 Simple Moving Average (SMA) at 0.6612 would provide added confirmation such a move was unfolding.
It would add confirmatory evidence to the bullish hypothesis if a new up leg was accompanied by the Moving Average Convergence Divergence (MACD) indicator crossing back above the red signal line.
- Gold pauses and consolidates following a steep sell-off on Friday.
- US employment data showed more people joined the workforce in May, and wages rose higher than expected.
- The data makes it less likely the US Federal Reserve will cut interest rates in September, reducing Gold's attractiveness to investors.
Gold (XAU/USD) price takes a breather in the European session on Monday after sliding almost three and a half percentage points on Friday after the release of better-than-expected US Nonfarm Payrolls (NFP) data. The yellow metal trades in the $2,290s amid a mixed market mood.
The rosy wage-and-employment picture painted by the US employment data on Friday suggested a radical reappraisal of US interest-rate expectations, with the Federal Reserve (Fed) now expected to maintain interest rates elevated for longer. This, in turn, had an immediate bearish effect on Gold by raising the opportunity cost of holding the non-yielding precious metal, making it less attractive to investors.
Gold weakens after US employment data recalibrates interest-rate expectations
Gold price resumed its short-term bearish tone at the end of last week after the US NFP data showed a higher-than-forecast 272K rise in the number of new workers joining the economy in May, beating economists’ estimates of 185K and rising from a downwardly revised 165K in April.
Not only did payrolls beat expectations, but the data also showed Average Hourly Earnings rising by 4.1% YoY in May, more than the 3.9% forecast and the upwardly revised 4.0% in April. This suggests workers are earning more, which could push up spending and, in turn, inflation.
The market’s expectations that the Fed will cut interest rates in September fell to just over 50% after the release of the NFP from 67% previously, according to the CME FedWatch tool, which bases its estimates on 30-day US Fed Fund Futures pricing data.
That said, Gold price is supported by the different outlook for global interest-rate expectations, which remain depressed. The Bank of Canada (BoC) cut its overnight rate by 0.25% to 4.75% last week, as did the European Central Bank (ECB). The release of lower inflation data in Switzerland has prompted speculation the Swiss National Bank (SNB) could also cut interest rates at its June 20 meeting following an initial cut in March.
Gold traders will now be looking for further cues on price direction at the Federal Reserve June meeting, which concludes on Wednesday, as well as the US Consumer Price Index (CPI) data for May out earlier on the same day.
Asian passion for Gold abates
Gold was further pressured at the end of last week following the release of official data showing that the People’s Bank of China (PBoC) had halted buying of more Gold in May, ending an 18-month buying spree for the central bank.
The data followed strong buying in April that saw China Gold reserves at the PBoC hit an all-time high, accounting for 4.9% of total reserves, and following 18 consecutive months of growth.
Technical Analysis: Gold pauses during sell-off
Gold price broke below the $2,315 range low on Friday and hit an initial downside target at $2,303, generated by the original trendline break in May. This target was at the 0.618 Fibonacci ratio of the length of the move prior to the trendline break, “a,” extrapolated lower as “b” (see chart below).
The next target, which has also almost been met, is at about $2,285, the 100% extrapolation of “a”. A stronger move down could see Gold meet support at $2,279 (late April-early May swing low).
XAU/USD 4-hour Chart
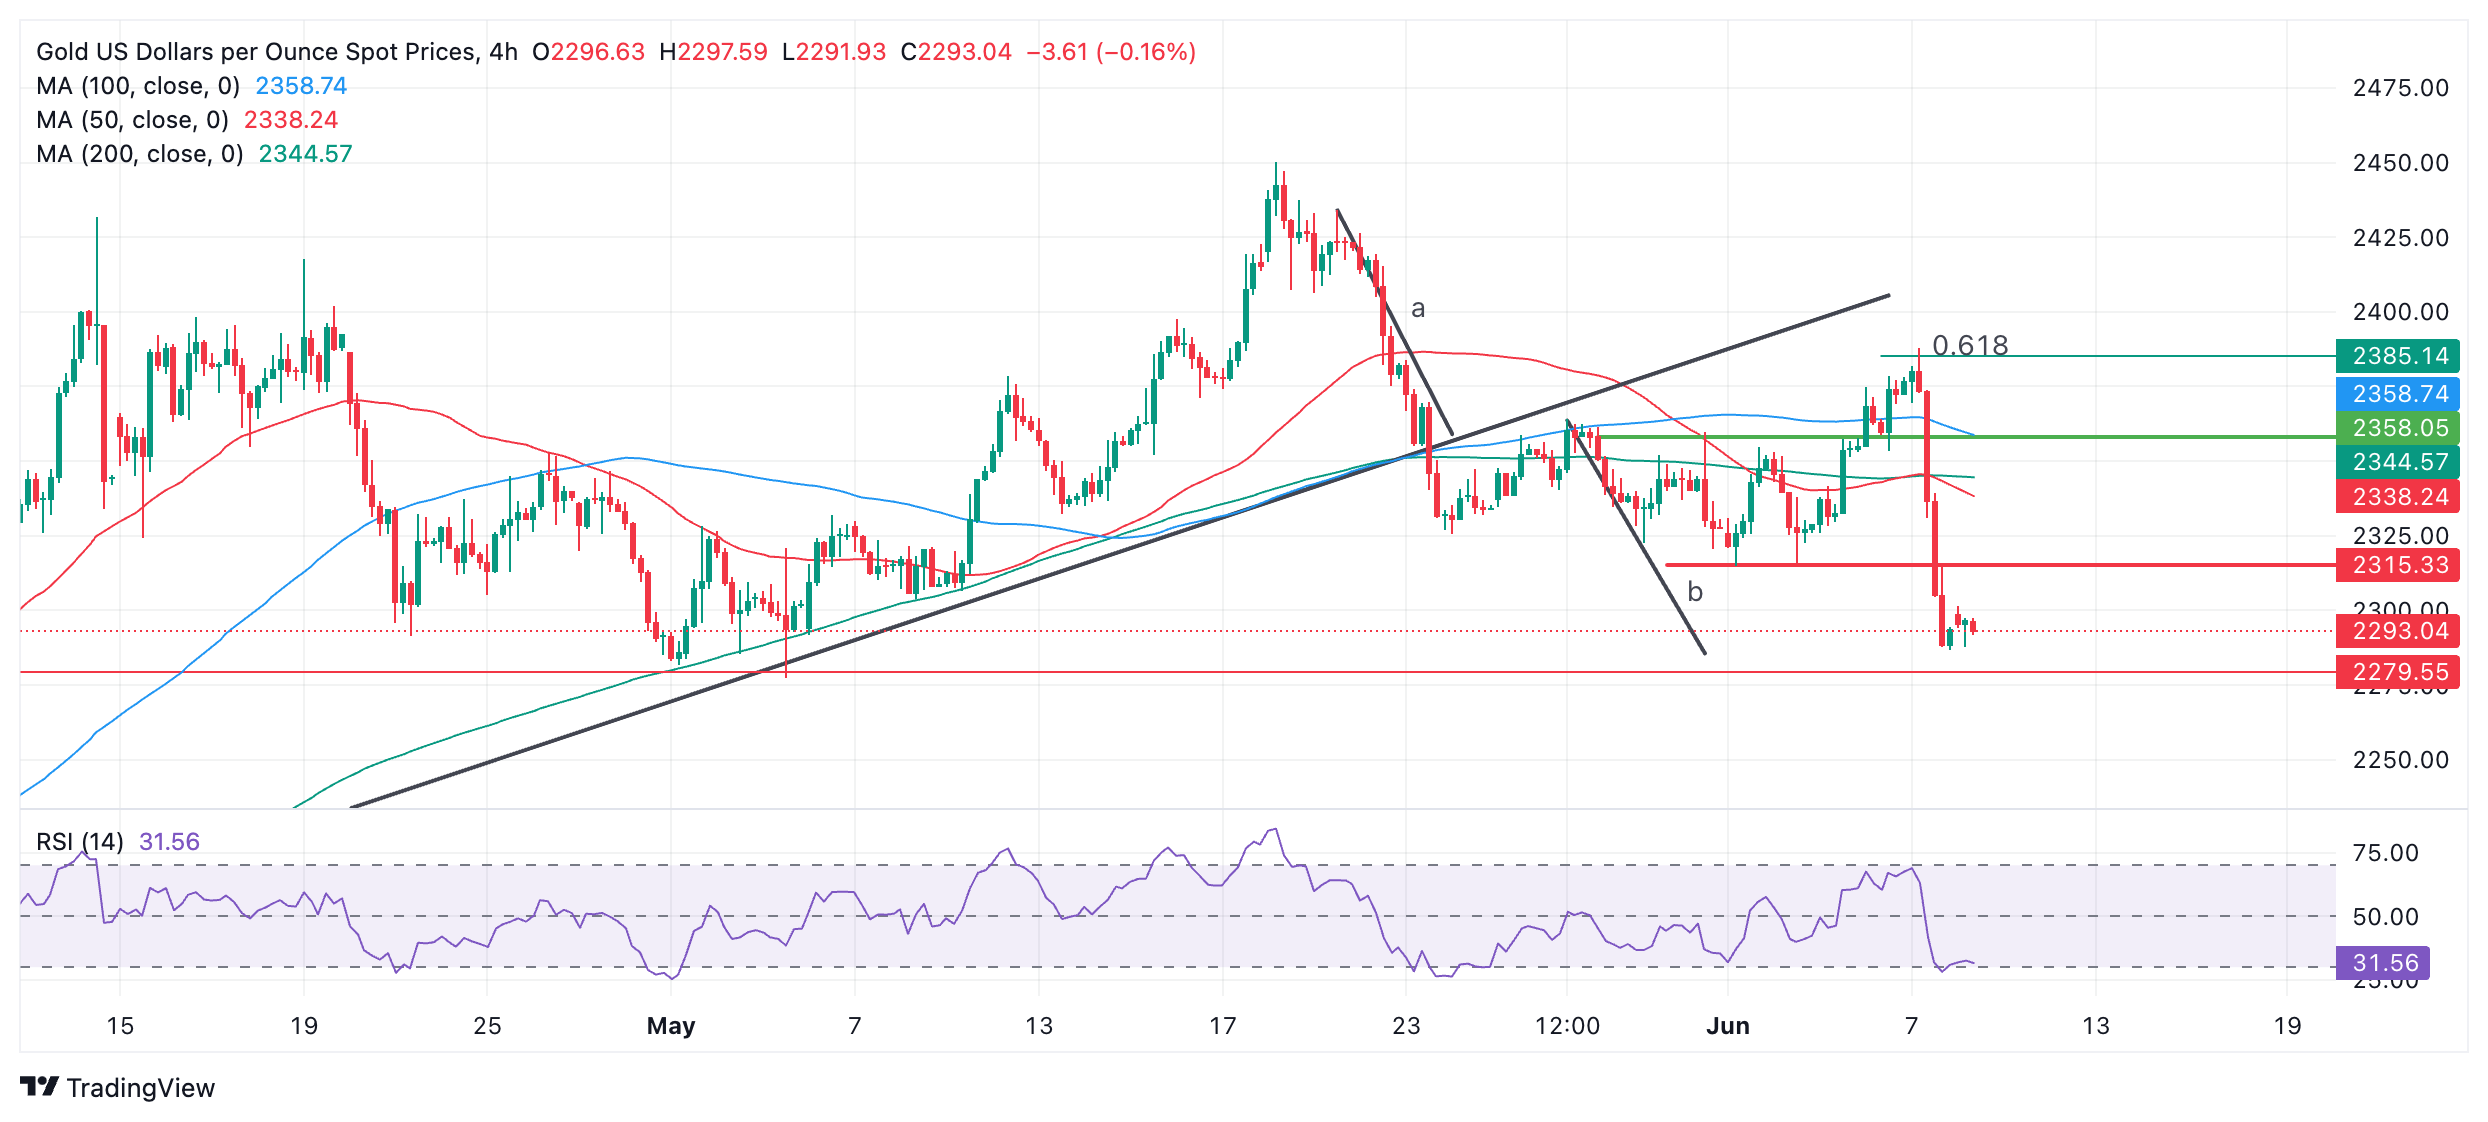
The Relative Strength Index (RSI) indicator has briefly dipped into the oversold region before exiting and rising back above 30.00, indicating the possibility Gold may pullback in the short-term. However, such is the strength of the prior down move that Gold is likely to resume moving lower once the pullback completes.
Despite short-term weakness, the precious metal’s medium and long-term trends are still bullish, and the risk of a recovery remains high.
Economic Indicator
Nonfarm Payrolls
The Nonfarm Payrolls release presents the number of new jobs created in the US during the previous month in all non-agricultural businesses; it is released by the US Bureau of Labor Statistics (BLS). The monthly changes in payrolls can be extremely volatile. The number is also subject to strong reviews, which can also trigger volatility in the Forex board. Generally speaking, a high reading is seen as bullish for the US Dollar (USD), while a low reading is seen as bearish, although previous months' reviews and the Unemployment Rate are as relevant as the headline figure. The market's reaction, therefore, depends on how the market assesses all the data contained in the BLS report as a whole.
Read more.Last release: Fri Jun 07, 2024 12:30
Frequency: Monthly
Actual: 272K
Consensus: 185K
Previous: 175K
Source: US Bureau of Labor Statistics
America’s monthly jobs report is considered the most important economic indicator for forex traders. Released on the first Friday following the reported month, the change in the number of positions is closely correlated with the overall performance of the economy and is monitored by policymakers. Full employment is one of the Federal Reserve’s mandates and it considers developments in the labor market when setting its policies, thus impacting currencies. Despite several leading indicators shaping estimates, Nonfarm Payrolls tend to surprise markets and trigger substantial volatility. Actual figures beating the consensus tend to be USD bullish.
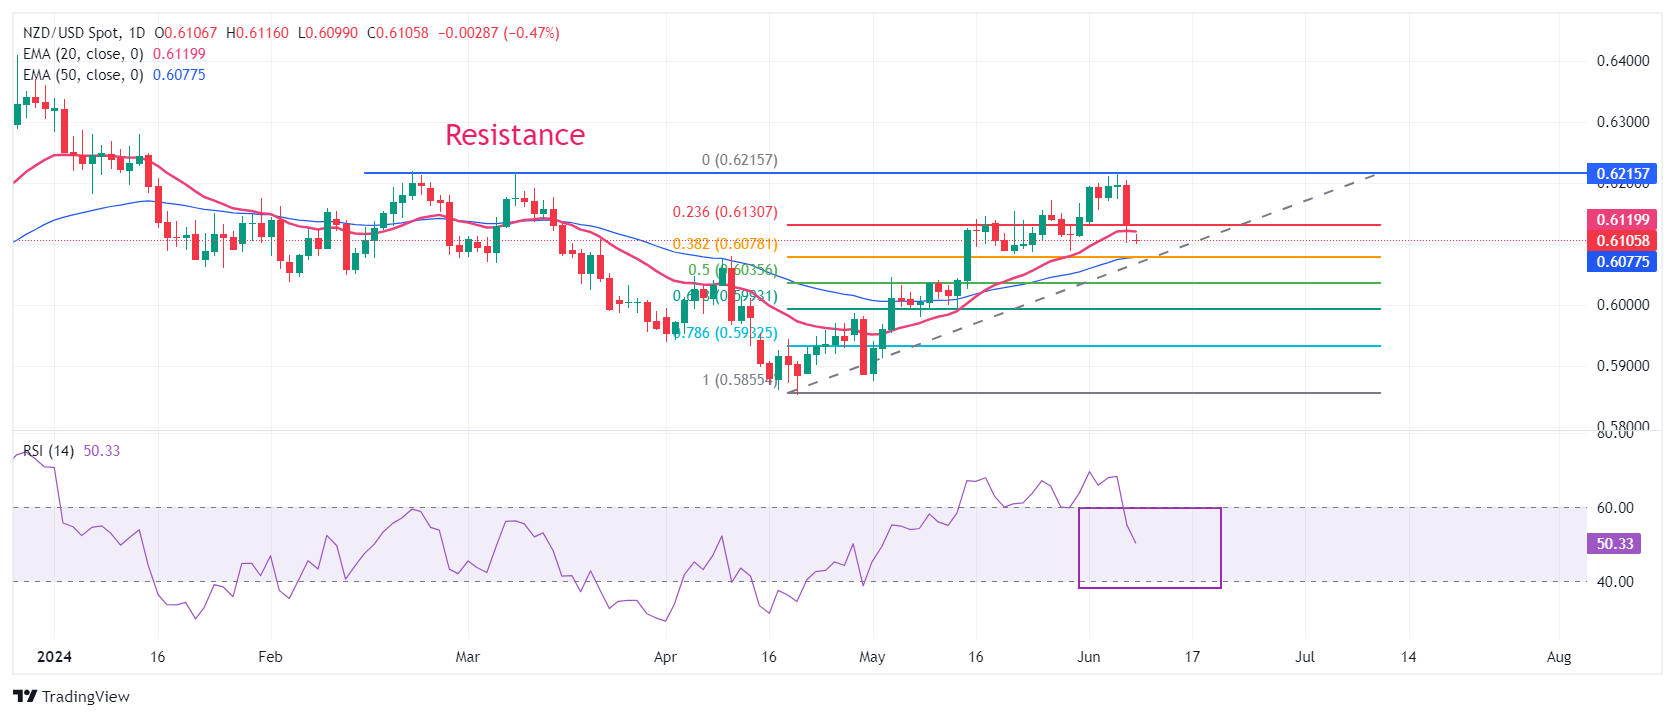
- NZD/USD falls sharply to 0.6100 as waned Fed rate-cut hopes weakens market sentiment.
- The market mood turns cautions as the Fed is expected to keep interest rates steady with a hawkish outlook.
- A slowdown in NZ’s disinflation progress has pushed RBNZ’s rate-cut expectations beyond 2024.
The NZD/USD pair struggles to gain ground near the round-level support of 0.6100 in Monday’s European session. The Kiwi asset falls on the backfoot as the US Dollar (USD) strengthened after the United States (US) Nonfarm Payrolls (NFP) report for May indicated a robust labor demand and strong wage growth, which diminished expectations for the Federal Reserve (Fed) to start easing the monetary policy from the September meeting.
The US Dollar Index (DXY), which tracks the Greenback’s value against six major currencies, rises to an almost monthly high near 105.45.
Meanwhile, uncertainty among investors ahead of the US Consumer Price Index (CPI) data for May and the Fed’s monetary policy decision, which are scheduled for Wednesday, has also boosted the US Dollar’s demand. The market sentiment turns risk-averse as investors expect that the Fed would argue in favor of keeping interest rates at their current levels until they get evidence that price pressures will sustainably return to the desired rate of 2%,
On the Kiwi front, investors continue to reaffirm expectations in the Reserve Bank of New Zealand (RBNZ) holding its key Official Cash Rate (OCR) at their current levels beyond 2024 amid absence of signs indicating progress in the disinflation process.
NZD/USD drops after facing selling pressure near the horizontal resistance plotted from February 22 high at 0.6219. The Kiwi asset declines toward the 38.2% Fibonacci retracement support (plotted from the April 19 low of 0.5851 to the June 6 high at 0.6216) at 0.6076. The pair has slipped below the 20-day Exponential Moving Average (EMA), which trades around 0.6120. While the 50-day EMA near 0.6076 still acts as a support for the New Zealand Dollar bulls.
The 14-period Relative Strength Index (RSI) has slipped into the 40.00-60.00 range, suggesting that the upside momentum has faded. However, the bullish bias remains intact.
An upside move above June 6 high at 0.6216 will drive the asset January 15 high near 0.6250, followed by January 12 high near 0.6280.
On the contrary, fresh downside would appear if the asset breaks below April 4 high around 0.6050 This would drag the asset towards the psychological support of 0.6000 and April 25 high at 0.5969.
NZD/USD daily chart
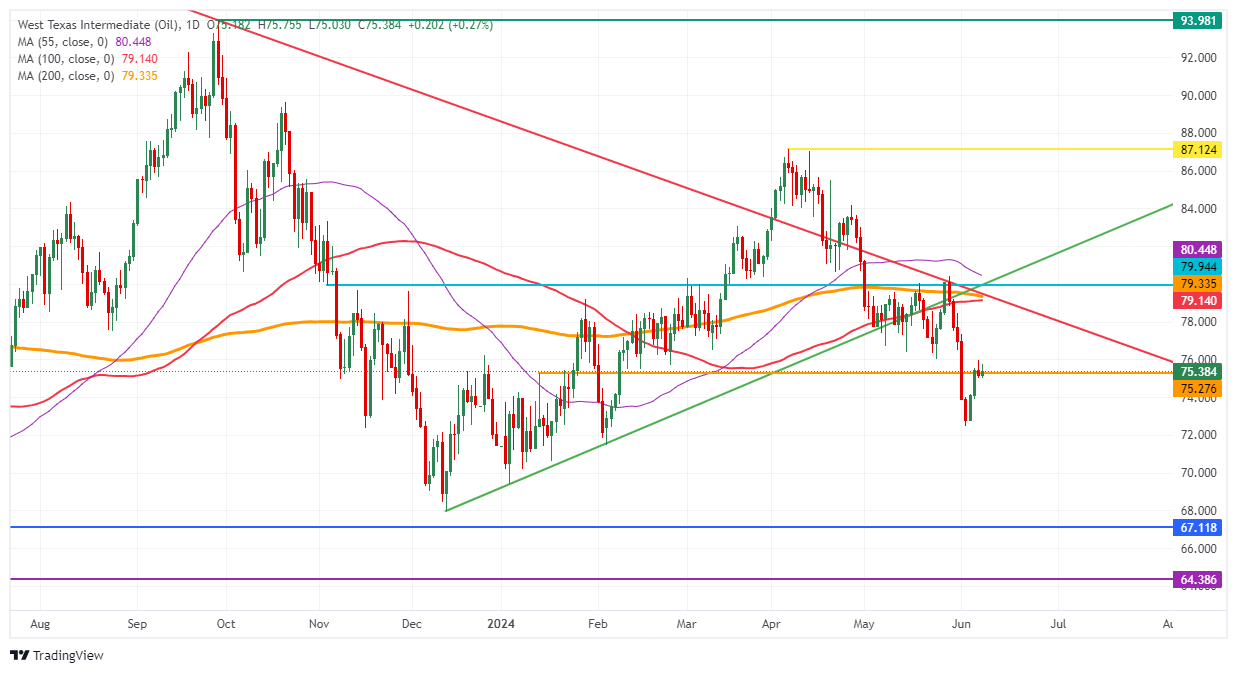
- Oil is unable to keep its head decisively above the pivotal level of $75.27.
- Investors are in a wait-and-see mode ahead of Wednesday’s US CPI and Fed decision.
- The US Dollar Index trades above 105.00 after the European elections showed an advance of far right parties.
Oil prices look bleak on Monday, with the West Texas Intermediate (WTI) benchmark trading broadly steady, after elections in the European Union showed an advance from far-right parties. Even though the centre parties held their ground, the far right gained presence in the Parliament, making it more likely that coalition talks head into gridlock, delaying reforms and decision-taking on economic development that would spark up demand for Oil. Apart from the EU elections, investors are keeping their powder dry ahead of Wednesday, when the US CPI report will be published and the US Federal Reserve will likely give further clues on the timing for a first interest-rate cut.
Meanwhile, the US Dollar Index (DXY) is trading above 105.00 after rallying higher on Friday driven by the stellar performance in the Nonfarm Payrolls numbers. The uncertainty stemming from the European election results added fuel to the fire in favor of a higher US Dollar, but until Wednesday the Greenback is expected to trade sideways.
At the time of writing, Crude Oil (WTI) trades at $75.22 and Brent Crude at $79.52
Oil news and market movers: Another discount from Aramco
- Saudi Aramco is cutting Oil prices for July for the Asian markets. A softer demand outlook in the region is the main driver for the cut, according to Bloomberg.
- Oil prices might decline further for this week, according to Polymerupdate.com, with the demand-supply outlook from OPEC, EIA and IEA as main drivers together with the US Federal Reserve rate decision.
- The outlook for Oil remains bullish, according to Goldman Sachs’ head Commodity Strategist Daan Struyven. Struyven sees Brent hitting $86 per barrel by the third quarter over solid summer demand, Bloomberg reports.
- Iraq is set to reach a final deal with Kurdistan to restart Oil exports.
Oil Technical Analysis: OPEC+ is not the Fed or ECB
Oil prices are heading towards the Fed rate decision in a depressed state following their near 10% slide lower last week (from last week’s high to last week’s low). With uncertainties on the horizon in Europe and sluggish demand in the US – where the Fed might keep rates steady for longer – all eyes look to Asia. This triggers an overload in offer from the Middle East to the region with price cuts, as seen by Saudi Aramco.
Looking up, the pivotal level near $75.27 needs to be recovered firmly first before aiming for the key Simple 100-day and 200-day Simple Moving Averages (SMA) at $79.14 and $79.33, respectively. Next, the 55-day Simple Moving Average (SMA) at $80.44 is level with a lot of resistance where any recovery rally could pause. Once broken through there, the road looks quite open to head to $87.12.
The $76.00 marker is still acting as a resistance with the $75.27 level playing a crucial role if traders still want to have an option to head back to $80.00. However, risks are skewed towards another leg lower should sluggish demand during the summer prevail and send Oil further down, all the way to $68.00, below $70.00.
US WTI Crude Oil: Daily Chart
WTI Oil FAQs
WTI Oil is a type of Crude Oil sold on international markets. The WTI stands for West Texas Intermediate, one of three major types including Brent and Dubai Crude. WTI is also referred to as “light” and “sweet” because of its relatively low gravity and sulfur content respectively. It is considered a high quality Oil that is easily refined. It is sourced in the United States and distributed via the Cushing hub, which is considered “The Pipeline Crossroads of the World”. It is a benchmark for the Oil market and WTI price is frequently quoted in the media.
Like all assets, supply and demand are the key drivers of WTI Oil price. As such, global growth can be a driver of increased demand and vice versa for weak global growth. Political instability, wars, and sanctions can disrupt supply and impact prices. The decisions of OPEC, a group of major Oil-producing countries, is another key driver of price. The value of the US Dollar influences the price of WTI Crude Oil, since Oil is predominantly traded in US Dollars, thus a weaker US Dollar can make Oil more affordable and vice versa.
The weekly Oil inventory reports published by the American Petroleum Institute (API) and the Energy Information Agency (EIA) impact the price of WTI Oil. Changes in inventories reflect fluctuating supply and demand. If the data shows a drop in inventories it can indicate increased demand, pushing up Oil price. Higher inventories can reflect increased supply, pushing down prices. API’s report is published every Tuesday and EIA’s the day after. Their results are usually similar, falling within 1% of each other 75% of the time. The EIA data is considered more reliable, since it is a government agency.
OPEC (Organization of the Petroleum Exporting Countries) is a group of 13 Oil-producing nations who collectively decide production quotas for member countries at twice-yearly meetings. Their decisions often impact WTI Oil prices. When OPEC decides to lower quotas, it can tighten supply, pushing up Oil prices. When OPEC increases production, it has the opposite effect. OPEC+ refers to an expanded group that includes ten extra non-OPEC members, the most notable of which is Russia.
European Central Bank (ECB) policymaker and Bundesbank Chief Joachim Nagel warned on Monday that “we must be cautious about future rate moves.”
Further comments
Rates are on a mountain ridge, not a peak.
We still have to find the right point for a further descent.
Uncertainty about future economic and price trend remains high.
Market reaction
EUR/USD is paying little heed to these comments, losing 0.56% on the day to trade near 1.0740, as of writing.
ECB FAQs
The European Central Bank (ECB) in Frankfurt, Germany, is the reserve bank for the Eurozone. The ECB sets interest rates and manages monetary policy for the region. The ECB primary mandate is to maintain price stability, which means keeping inflation at around 2%. Its primary tool for achieving this is by raising or lowering interest rates. Relatively high interest rates will usually result in a stronger Euro and vice versa. The ECB Governing Council makes monetary policy decisions at meetings held eight times a year. Decisions are made by heads of the Eurozone national banks and six permanent members, including the President of the ECB, Christine Lagarde.
In extreme situations, the European Central Bank can enact a policy tool called Quantitative Easing. QE is the process by which the ECB prints Euros and uses them to buy assets – usually government or corporate bonds – from banks and other financial institutions. QE usually results in a weaker Euro. QE is a last resort when simply lowering interest rates is unlikely to achieve the objective of price stability. The ECB used it during the Great Financial Crisis in 2009-11, in 2015 when inflation remained stubbornly low, as well as during the covid pandemic.
Quantitative tightening (QT) is the reverse of QE. It is undertaken after QE when an economic recovery is underway and inflation starts rising. Whilst in QE the European Central Bank (ECB) purchases government and corporate bonds from financial institutions to provide them with liquidity, in QT the ECB stops buying more bonds, and stops reinvesting the principal maturing on the bonds it already holds. It is usually positive (or bullish) for the Euro.
- EUR/GBP falls to 0.8450 as the Euro is weighed down by the Eurozone’s political uncertainty.
- French President Emmanuel Macron called for a snap election.
- The next move in the Pound Sterling will be guided by the UK’s Employment data for quarter-to-April.
The EUR/GBP pair declined to a 20-month low near 0.8450 in Monday’s European session. The cross fell on its face after French President Emmanuel Macron's unexpected call for a snap election spooks the Eurozone’s political stability, resulting in significant selling pressure on the Euro overall.
The unexpected move by French Macron came after exit polls showed record seats of Marine Le Pen’s far-right National Rally (RN) in European parliamentary elections under the leadership of the party’s president, Jordan Bardella. Far-right seats were more than double from Macron’s centrist list at 32%-33%.
On the monetary policy front, European Central Bank (ECB) policymakers appear uncomfortable considering subsequent rate cuts as they cautioned about inflation remaining stubborn ahead. On Friday, ECB policymaker and President of the Deutsche Bundesbank Joachim Nagel warned that inflation could become sticky, especially in the service sector, due to firm wage growth prospects.
In addition to ECB Nagel, ECB policymaker Robert Holzmann, who didn’t vote for a rate cut in last week’s monetary policy when the Deposit Facility Rate was lowered for the first time in five years, cautioned that inflation could increase again if the Fed maintains a hawkish stance for a longer period.
Meanwhile, the Pound Sterling will dance to the tunes of the United Kingdom’s (UK) Employment data for the February-April period, which will be published on Tuesday. The ILO Unemployment Rate is estimated to have remained steady at 4.3%.
Investors will also pay attention to Average Earnings (excluding and including bonuses), which are expected to grow steadily. Stable wage growth would dampen market speculation about Bank of England (BoE) rate cuts.
- The Pound Sterling drops to 1.2700 as delayed Fed interest rate-cut prospects dampen market sentiment.
- The strong US NFP report for May hit market speculation for Fed rate cuts.
- This week, investors will focus on UK Employment, US CPI and the Fed’s policy decision.
The Pound Sterling (GBP) seems vulnerable against the US Dollar (USD) near the round-level support of 1.2700 in Monday’s London session. The GBP/USD pair weakens as the market sentiment turns downbeat after investors decreased their bets that leaned towards the Federal Reserve (Fed) to start reducing interest rates from the September meeting.
The CME FedWatch tool shows that 30-Day Fed Funds futures pricing data suggest a 47% chance that interest rate will be lower than the current level in September, significantly down from the 59.6% recorded a week ago.
Investors were hopeful that the Fed would commence lowering its key borrowing rates from September in the first four days of the last week. Their confidence was driven by weaker-than-expected United States (US) JOLTS Job Openings for April and ADP Employmnet Change data for May. However, robust labor demand and upbeat wage growth indicated by the US Nonfarm Payrolls (NFP) report for May published on Friday spooked their confidence. Strong labor market conditions suggest a stubborn inflation outlook, which would force Fed policymakers to prefer maintaining the current interest rate framework for a longer period.
Daily digest market movers: Pound Sterling struggles to gain ground ahead of key events
- The Pound Sterling exhibits weakness against the US Dollar as market speculation about the Fed’s interest rate path suggests that there will be only one rate cut for the entire year, in the November or December meeting. Expectations for the number of Fed rate cuts have declined to one from two after the US NFP report remained stronger than expected. The US Dollar Index (DXY), which tracks the Greenback’s value against six major currencies, rises further to 105.30.
- The next move in the US Dollar and the Pound Sterling will be guided by the US Consumer Price Index (CPI) data for May and the Fed’s monetary policy decision on Wednesday, and the United Kingdom (UK) Employment data for the February-April period on Tuesday.
- US annual core inflation, which strips off volatile food and energy prices, is estimated to have decelerated to 3.5% from the prior release of 3.6%, with headline figures growing steadily by 3.4%. Monthly headline CPI is expected to have risen at a slower pace of 0.2% from April’s reading of 0.3%, with core inflation maintaining the current pace of 0.3%.
- Meanwhile, the Fed is widely anticipated to hold interest rates steady in the range of 5.25%-5.50% for the seventh time in a row. In the press conference after the Fed’s policy decision, Fed Chair Jerome Powell may argue to keep interest rates higher until they get confidence that inflation will sustainably decline to the desired target rate of 2%.
- According to the consensus, the UK Employmnet report will show that the Unemployment Rate remained steady at 4.3%. Investors will also focus on Average Earnings, a measure of wage inflation that dictates consumer spending and is estimated to have grown steadily compared to the previous period. Bank of England (BoE) policymakers will keenly focus on the wage inflation measure, as it is a major driver of service inflation that has remained a key barrier for price pressures to return to the desired rate of 2%.
Technical Analysis: Pound Sterling holds the 61.8% Fibonacci retracement support
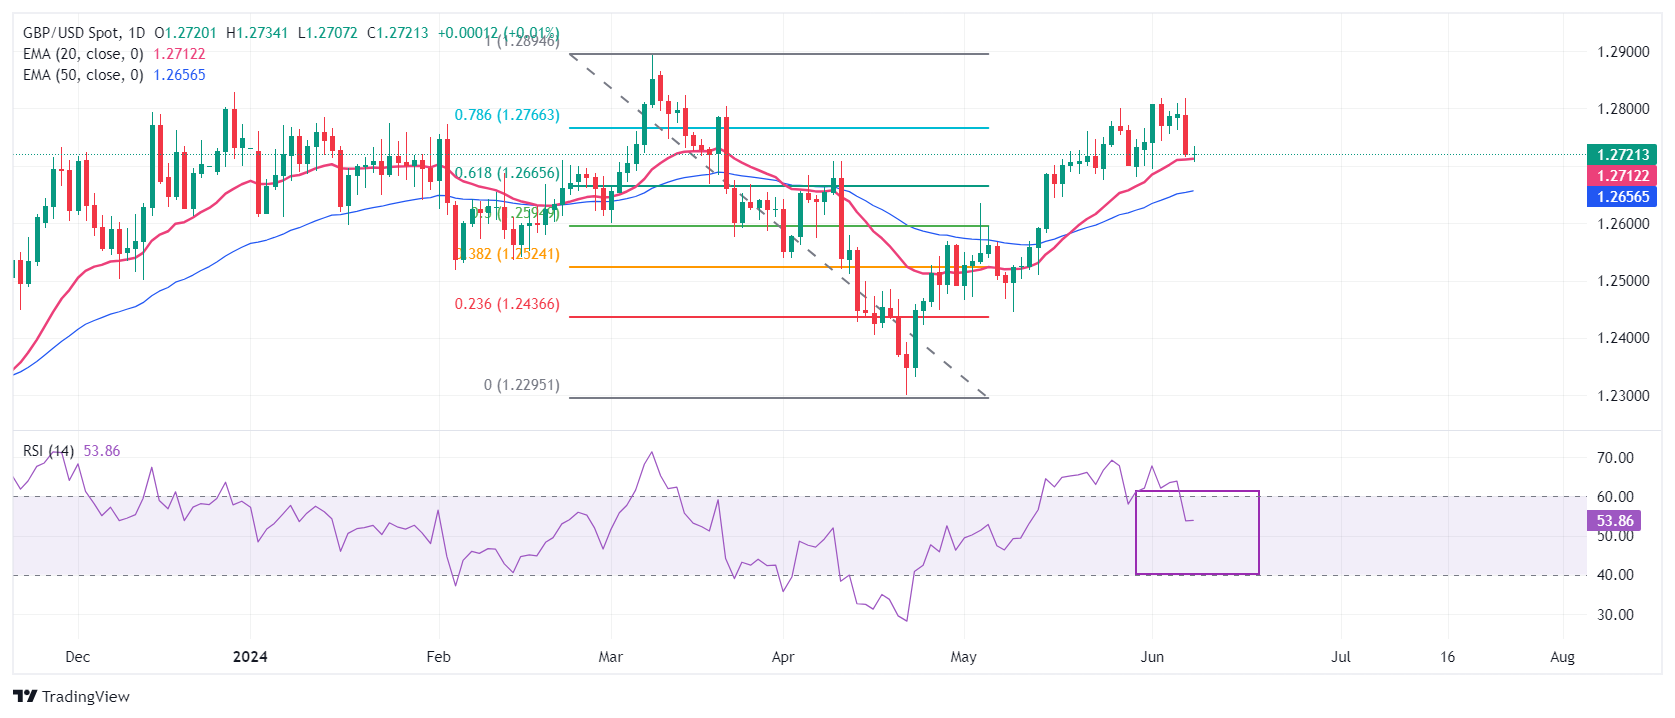
The Pound Sterling hovers near 1.2700 against the US Dollar after falling sharply from the round-level resistance of 1.2800. The GBP/USD pair falls but still holds the 61.8% Fibonacci retracement support (plotted from the March 8 high of 1.2900 to the April 22 low at 1.2300) at 1.2665.
The Cable retraces to the 20-day Exponential Moving Average (EMA), which trades near 1.2710. The 50-day EMA is still sloping higher, suggesting that the overall trend remains bullish.
The 14-period Relative Strength Index (RSI) has shifted into the 40.00-60.00 range, suggesting that the upside momentum has faded. However, the bullish bias remains intact.
Pound Sterling FAQs
The Pound Sterling (GBP) is the oldest currency in the world (886 AD) and the official currency of the United Kingdom. It is the fourth most traded unit for foreign exchange (FX) in the world, accounting for 12% of all transactions, averaging $630 billion a day, according to 2022 data. Its key trading pairs are GBP/USD, aka ‘Cable’, which accounts for 11% of FX, GBP/JPY, or the ‘Dragon’ as it is known by traders (3%), and EUR/GBP (2%). The Pound Sterling is issued by the Bank of England (BoE).
The single most important factor influencing the value of the Pound Sterling is monetary policy decided by the Bank of England. The BoE bases its decisions on whether it has achieved its primary goal of “price stability” – a steady inflation rate of around 2%. Its primary tool for achieving this is the adjustment of interest rates. When inflation is too high, the BoE will try to rein it in by raising interest rates, making it more expensive for people and businesses to access credit. This is generally positive for GBP, as higher interest rates make the UK a more attractive place for global investors to park their money. When inflation falls too low it is a sign economic growth is slowing. In this scenario, the BoE will consider lowering interest rates to cheapen credit so businesses will borrow more to invest in growth-generating projects.
Data releases gauge the health of the economy and can impact the value of the Pound Sterling. Indicators such as GDP, Manufacturing and Services PMIs, and employment can all influence the direction of the GBP. A strong economy is good for Sterling. Not only does it attract more foreign investment but it may encourage the BoE to put up interest rates, which will directly strengthen GBP. Otherwise, if economic data is weak, the Pound Sterling is likely to fall.
Another significant data release for the Pound Sterling is the Trade Balance. This indicator measures the difference between what a country earns from its exports and what it spends on imports over a given period. If a country produces highly sought-after exports, its currency will benefit purely from the extra demand created from foreign buyers seeking to purchase these goods. Therefore, a positive net Trade Balance strengthens a currency and vice versa for a negative balance.
- AUD/JPY gains ground as RBA expects to increase policy rates if inflation doesn’t return to the 1%-3% range.
- The Australian Dollar gained support as Trade Surplus widened A$6,548 million (US$4,321.68 million) in May.
- Japan’s GDP Annualized showed that Japan’s economy contracted by 1.8% in Q1, against the expected decline of 2.0%.
AUD/JPY retraces its recent losses, trading around 103.50 during the European session on Monday. The Australian Dollar (AUD) gains ground due to the hawkish sentiment surrounding the Reserve Bank of Australia (RBA). Last week, RBA Governor Michele Bullock indicated that the central bank is prepared to increase interest rates if the Consumer Price Index (CPI) does not return to the target range of 1%-3%, according to NCA NewsWire.
The Australian Dollar gained support as market sentiment improved following the country’s Trade Balance release on Friday. Australia’s Trade Surplus widened to A$6,548 million (US$4,321.68 million) in May, surpassing the expected A$5,500 million and April's balance of A$5,024 million. This improvement can be attributed to a 7.2% month-on-month plunge in imports in May, reversing April’s 4.2% increase, while exports fell by 2.5% following a previous decline of 0.6%.
Meanwhile, China’s imports rose by 1.8% year-on-year to USD 219.73 billion in May, missing market estimates of a 4.2% increase and significantly down from April's 8.4% rise. Any change in China's economy could impact the Australian market due to the close trade relationship between the two countries.
In Japan, the mixed data released on Monday could limit the downside of the Japanese Yen. The Gross Domestic Product (GDP) Annualized showed that Japan’s economy contracted less than expected in the first quarter. Japan’s GDP Annualized contracted by 1.8% in the first quarter, compared to a previous decline of 2.0%, slightly exceeding market forecasts of a 1.9% decrease. Meanwhile, GDP (QoQ) shrank by 0.5%, matching the flash data.
Silver prices (XAG/USD) rose on Monday, according to FXStreet data. Silver trades at $29.64 per troy ounce, up 1.61% from the $29.17 it cost on Friday.
Silver prices have increased by 16.37% since the beginning of the year.
| Unit measure | Today Price |
|---|---|
| Silver price per troy ounce | $29.64 |
| Silver price per gram | $0.95 |
The Gold/Silver ratio, which shows the number of troy ounces of Silver needed to equal the value of one troy ounce of Gold, stood at 77.40 on Monday, down from 78.63 on Friday.
Investors might use this ratio to determine the relative valuation of Gold and Silver. Some may consider a high ratio as an indicator that Silver is undervalued – or Gold is overvalued – and might buy Silver or sell Gold accordingly. Conversely, a low ratio might suggest that Gold is undervalued relative to Silver.
Silver FAQs
Silver is a precious metal highly traded among investors. It has been historically used as a store of value and a medium of exchange. Although less popular than Gold, traders may turn to Silver to diversify their investment portfolio, for its intrinsic value or as a potential hedge during high-inflation periods. Investors can buy physical Silver, in coins or in bars, or trade it through vehicles such as Exchange Traded Funds, which track its price on international markets.
Silver prices can move due to a wide range of factors. Geopolitical instability or fears of a deep recession can make Silver price escalate due to its safe-haven status, although to a lesser extent than Gold's. As a yieldless asset, Silver tends to rise with lower interest rates. Its moves also depend on how the US Dollar (USD) behaves as the asset is priced in dollars (XAG/USD). A strong Dollar tends to keep the price of Silver at bay, whereas a weaker Dollar is likely to propel prices up. Other factors such as investment demand, mining supply – Silver is much more abundant than Gold – and recycling rates can also affect prices.
Silver is widely used in industry, particularly in sectors such as electronics or solar energy, as it has one of the highest electric conductivity of all metals – more than Copper and Gold. A surge in demand can increase prices, while a decline tends to lower them. Dynamics in the US, Chinese and Indian economies can also contribute to price swings: for the US and particularly China, their big industrial sectors use Silver in various processes; in India, consumers’ demand for the precious metal for jewellery also plays a key role in setting prices.
Silver prices tend to follow Gold's moves. When Gold prices rise, Silver typically follows suit, as their status as safe-haven assets is similar. The Gold/Silver ratio, which shows the number of ounces of Silver needed to equal the value of one ounce of Gold, may help to determine the relative valuation between both metals. Some investors may consider a high ratio as an indicator that Silver is undervalued, or Gold is overvalued. On the contrary, a low ratio might suggest that Gold is undervalued relative to Silver.
(An automation tool was used in creating this post.)
European Central Bank (ECB) policymaker and Slovakian central bank Governor Peter Kazimir said Monday, the central bank “should not rush into another rate cut,” adding that the ECB “should sit out the summer.“
Additional comments
Sept will be pivotal month as lot of new data are published by then.
Inflation beast not yet broken, price pressures can resurface.
Disinflation will be bumpy but confident ECB moving towards target.
Market reaction
The Euro fails to find any impetus from the ECB official’s comments, keeping EUR/USD 0.38% lower on the day at 1.0758 due to renewed Euro area political tensions.
- Eurozone investors’ morale keeps improving in June.
- EUR/USD holds losses below 1.0800 despite the upbeat Eurozone data.
The Eurozone Sentix Investor Confidence Index improved from -3.6 in May to 0.3 in June, the latest survey showed on Monday, rising for the eighth consecutive month.
The Expectations Index in the Eurozone rose from 7.8 in the previous month to 10.0 in June.
The index on the Current Situation also increased to -26.3 in June from -33.5 in May.
Key takeaways
“Importantly, the index on expectations saw a rise, increasing from 7.8 in May to 10.0 in June, "providing some encouragement that the trend may continue in the coming weeks.”
"Germany's economy would have to send out a signal to generate more momentum. However, this signal has yet to materialize.”
"The stabilization of the German economy is only making moderate progress.”
Market reaction to the Eurozone Sentix data
EUR/USD is consolidating losses near 1.0760 despite the encouraging Eurozone data. As of writing, EUR/USD is down 0.38% on the day.
- USD/CAD could test the upper boundary of the rising channel around the level of 1.3775.
- The momentum indicator 14-day RSI suggests an emergence of a bullish bias.
- A break below the 21-day EMA could lead the pair to test the lower threshold of the rising channel around the level of 1.3640.
USD/CAD holds its position around 1.3760 during the early European session on Monday following the recent gains recorded in the previous trading day. Analysis of the daily chart suggests an emergence of a bullish bias for the USD/CAD pair, as it moves within the rising channel pattern.
Moreover, the momentum indicator 14-day Relative Strength Index (RSI) is positioned above the 50 level. The Moving Average Convergence Divergence (MACD) indicator suggests a confirmation of the bullish bias for the pair as the MACD line is positioned above the centerline, it shows divergence above the signal line.
The USD/CAD pair tests the upper boundary of the rising channel around the level of 1.3775, followed by the key barrier at the psychological level of 1.3800. A breakthrough above the latter level could provide support for the pair to explore the region April’s high of 1.3846.
On the downside, the USD/CAD pair could find key support around the 21-day Exponential Moving Average (EMA) of 1.3684 level. A break below this level could exert pressure on the pair to navigate the region around the lower threshold of the rising channel around the level of 1.3640, followed by the throwback support at 1.3590.
USD/CAD: Daily Chart
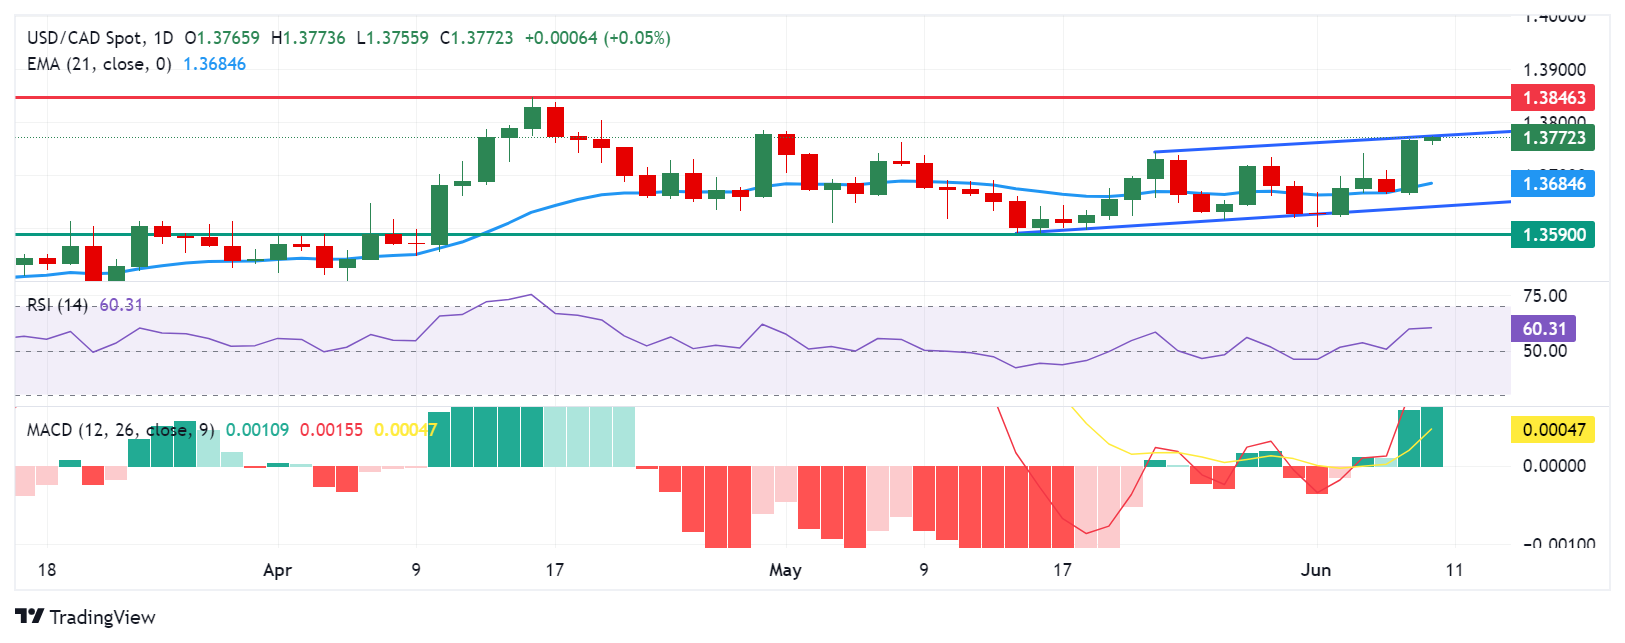
Here is what you need to know on Monday, June 10:
The US Dollar (USD) preserves its strength, while the Euro struggles to find demand at the beginning of the week as markets assess the preliminary results of the European Parliament election. Sentix Investor Confidence for June will be the only data featured in the European economic docket on Monday. The US economic calendar will not offer any high-impact data releases ahead of Wednesday's key Consumer Price Index (CPI) figures and the Federal Reserve's monetary policy announcements.
US Dollar PRICE Last 7 days
The table below shows the percentage change of US Dollar (USD) against listed major currencies last 7 days. US Dollar was the strongest against the Canadian Dollar.
| USD | EUR | GBP | JPY | CAD | AUD | NZD | CHF | |
|---|---|---|---|---|---|---|---|---|
| USD | 0.78% | 0.14% | -0.22% | 1.00% | 0.84% | 0.36% | -0.72% | |
| EUR | -0.78% | -0.60% | -1.00% | 0.21% | -0.06% | -0.42% | -1.51% | |
| GBP | -0.14% | 0.60% | -0.32% | 0.82% | 0.61% | 0.13% | -0.91% | |
| JPY | 0.22% | 1.00% | 0.32% | 1.20% | 1.10% | 0.73% | -0.34% | |
| CAD | -1.00% | -0.21% | -0.82% | -1.20% | -0.19% | -0.63% | -1.72% | |
| AUD | -0.84% | 0.06% | -0.61% | -1.10% | 0.19% | -0.36% | -1.47% | |
| NZD | -0.36% | 0.42% | -0.13% | -0.73% | 0.63% | 0.36% | -1.13% | |
| CHF | 0.72% | 1.51% | 0.91% | 0.34% | 1.72% | 1.47% | 1.13% |
The heat map shows percentage changes of major currencies against each other. The base currency is picked from the left column, while the quote currency is picked from the top row. For example, if you pick the US Dollar from the left column and move along the horizontal line to the Japanese Yen, the percentage change displayed in the box will represent USD (base)/JPY (quote).
Strong labor market data from the US triggered a rally in the US Treasury bond yields and provided a boost to the USD. The benchmark 10-year US yield gained more than 3% on Friday and the USD Index rose 0.8% to end the week in positive territory. Early Monday, the USD Index continues to push higher and was last seen trading at its highest level since mid-May slightly above 105.20. Meanwhile, US stock index futures trade modestly lower on the day after posting small losses on Friday.
The US Bureau of Labor Statistics reported that Nonfarm Payrolls rose 272,000 in May. This reading followed the 165,000 increase recorded in April and surpassed the market expectation of 185,000 by a wide margin. Additionally, the annual wage inflation, as measured by the change in the Average Hourly Earnings, rose 4.1%, coming in above analysts' estimate of 3.9%.
According to the preliminary results, the European People's Party became the clear winner, gaining 8 seats to secure a total of 184 seats in the European Parliament. In Germany, the main opposition conservative party, CDU, received 30% of the vote, while the far-right Alternative for Germany (AfD) party got nearly 16% of the vote to surpass Chancellor Olaf Scholz’s SPD. Populist prime minister Giorgia Meloni’s far-right Brothers of Italy took 29% of the vote in Italy and the far-right Freedom Party (FPÖ) in Austria won with 25.5%. French President Emmanuel Macron said that far-right parties in Europe were "progressing across the continent" and called for a snap election after National Rally won 31.5% of the vote against the Besoin d'Europe alliance's - including President Macron's Renaissance - 14.5%.
Euro Stoxx 50 is down more than 1% in the early European session, Germany's DAX 30 is losing 0.6% and France's CAC 40 Index is falling more than 1.5%. In the meantime, the Euro is struggling to hold its ground against its rivals, with EUR/USD trading deep in negative territory slightly above 1.0750.
EUR/USD declines to one-month low amid Eurozone's political uncertainty.
After falling sharply on Friday, GBP/USD holds steady above 1.2700 in the European morning. The UK's Office for National Statistics will release employment data on Tuesday.
USD/JPY gained more than 0.7% on Friday but seems to be having a difficult time gathering bullish momentum on Monday. At the time of press, the pair was trading marginally higher on the day at around 157.00.
Japanese Yen remains subdued, US Dollar advances due to risk aversion.
Gold lost over 3% on Friday and registered one of its biggest daily losses of the year. The broad-based US Dollar strength, rallying US yields and news of China's central bank halting Gold purchases into its reserves for the first time in 18 months weighed heavily on XAU/USD. In the European morning on Monday, Gold trades slightly below $2,300.
Gold price attracts some sellers near one-month low amid firmer US Dollar.
Risk sentiment FAQs
In the world of financial jargon the two widely used terms “risk-on” and “risk off'' refer to the level of risk that investors are willing to stomach during the period referenced. In a “risk-on” market, investors are optimistic about the future and more willing to buy risky assets. In a “risk-off” market investors start to ‘play it safe’ because they are worried about the future, and therefore buy less risky assets that are more certain of bringing a return, even if it is relatively modest.
Typically, during periods of “risk-on”, stock markets will rise, most commodities – except Gold – will also gain in value, since they benefit from a positive growth outlook. The currencies of nations that are heavy commodity exporters strengthen because of increased demand, and Cryptocurrencies rise. In a “risk-off” market, Bonds go up – especially major government Bonds – Gold shines, and safe-haven currencies such as the Japanese Yen, Swiss Franc and US Dollar all benefit.
The Australian Dollar (AUD), the Canadian Dollar (CAD), the New Zealand Dollar (NZD) and minor FX like the Ruble (RUB) and the South African Rand (ZAR), all tend to rise in markets that are “risk-on”. This is because the economies of these currencies are heavily reliant on commodity exports for growth, and commodities tend to rise in price during risk-on periods. This is because investors foresee greater demand for raw materials in the future due to heightened economic activity.
The major currencies that tend to rise during periods of “risk-off” are the US Dollar (USD), the Japanese Yen (JPY) and the Swiss Franc (CHF). The US Dollar, because it is the world’s reserve currency, and because in times of crisis investors buy US government debt, which is seen as safe because the largest economy in the world is unlikely to default. The Yen, from increased demand for Japanese government bonds, because a high proportion are held by domestic investors who are unlikely to dump them – even in a crisis. The Swiss Franc, because strict Swiss banking laws offer investors enhanced capital protection.
- The Mexican Peso fell over 8.0% in its key pairs last week as a result of election volatility.
- The Peso further weakens after a speech by outgoing president Obrador argues radical reforms are required to cure endemic corruption.
- USD/MXN keeps marching higher and now trades well above 18.00.
The Mexican Peso (MXN) makes a marginal recovery on Monday after losing over 8.0% in the previous week in its most heavily traded pairs. The slight bounce is probably driven by bears covering their shorts and taking profits after the outsized move in the previous week.
All the votes have been counted for the Mexican election and reveal that the Morena party has won a supermajority in the Congress, as expected, but are two seats short of one in the Senate. Morena and its allies won 372 of the 500 seats in the Congress and 83 of the 128 seats in the Senate, according to Reuters.
The result will still enable President-elect Claudia Sheinbaum’s administration to push through a controversial package of reforms that are rattling markets and leading to a depreciation of the Peso. However, they will have to win over some opposition senators to get their reforms through both houses.
USD/MXN is 18.34 at the time of writing, EUR/MXN is trading at 19.75 and GBP/MXN at 23.34.
Mexican Peso weakens after AMLO tirade
The Mexican Peso’s post-election sell-off gained fresh momentum on Friday on the back of comments from the outgoing President Andres Manuel Lopez Obrador (AMLO) during his daily morning press conference.
It was essential to push through reforms of the judiciary and dissolve autonomous bodies, like the INAI – the government’s transparency agency – because, in the words of AMLO, “The judicial power is hijacked, the service is taken over by a minority of those at the top. I have already said it here, and they know it very well. It is even shameful, but there are ministers who are like employees of large corporations,” according to El Financiero.
Inflation data, also out at the end of last week, was mixed, showing a rise in headline inflation to 4.69% YoY in May from 4.65% in April, but a fall in core inflation to 4.21% YoY from 4.37%.
Technical Analysis: USD/MXN marches ever higher
USD/MXN – the value of one US Dollar in Mexican Pesos – pushes above the 18.00 mark and peaks at 18.46, close to the 18.49 of October 2023.
USD/MXN Daily Chart
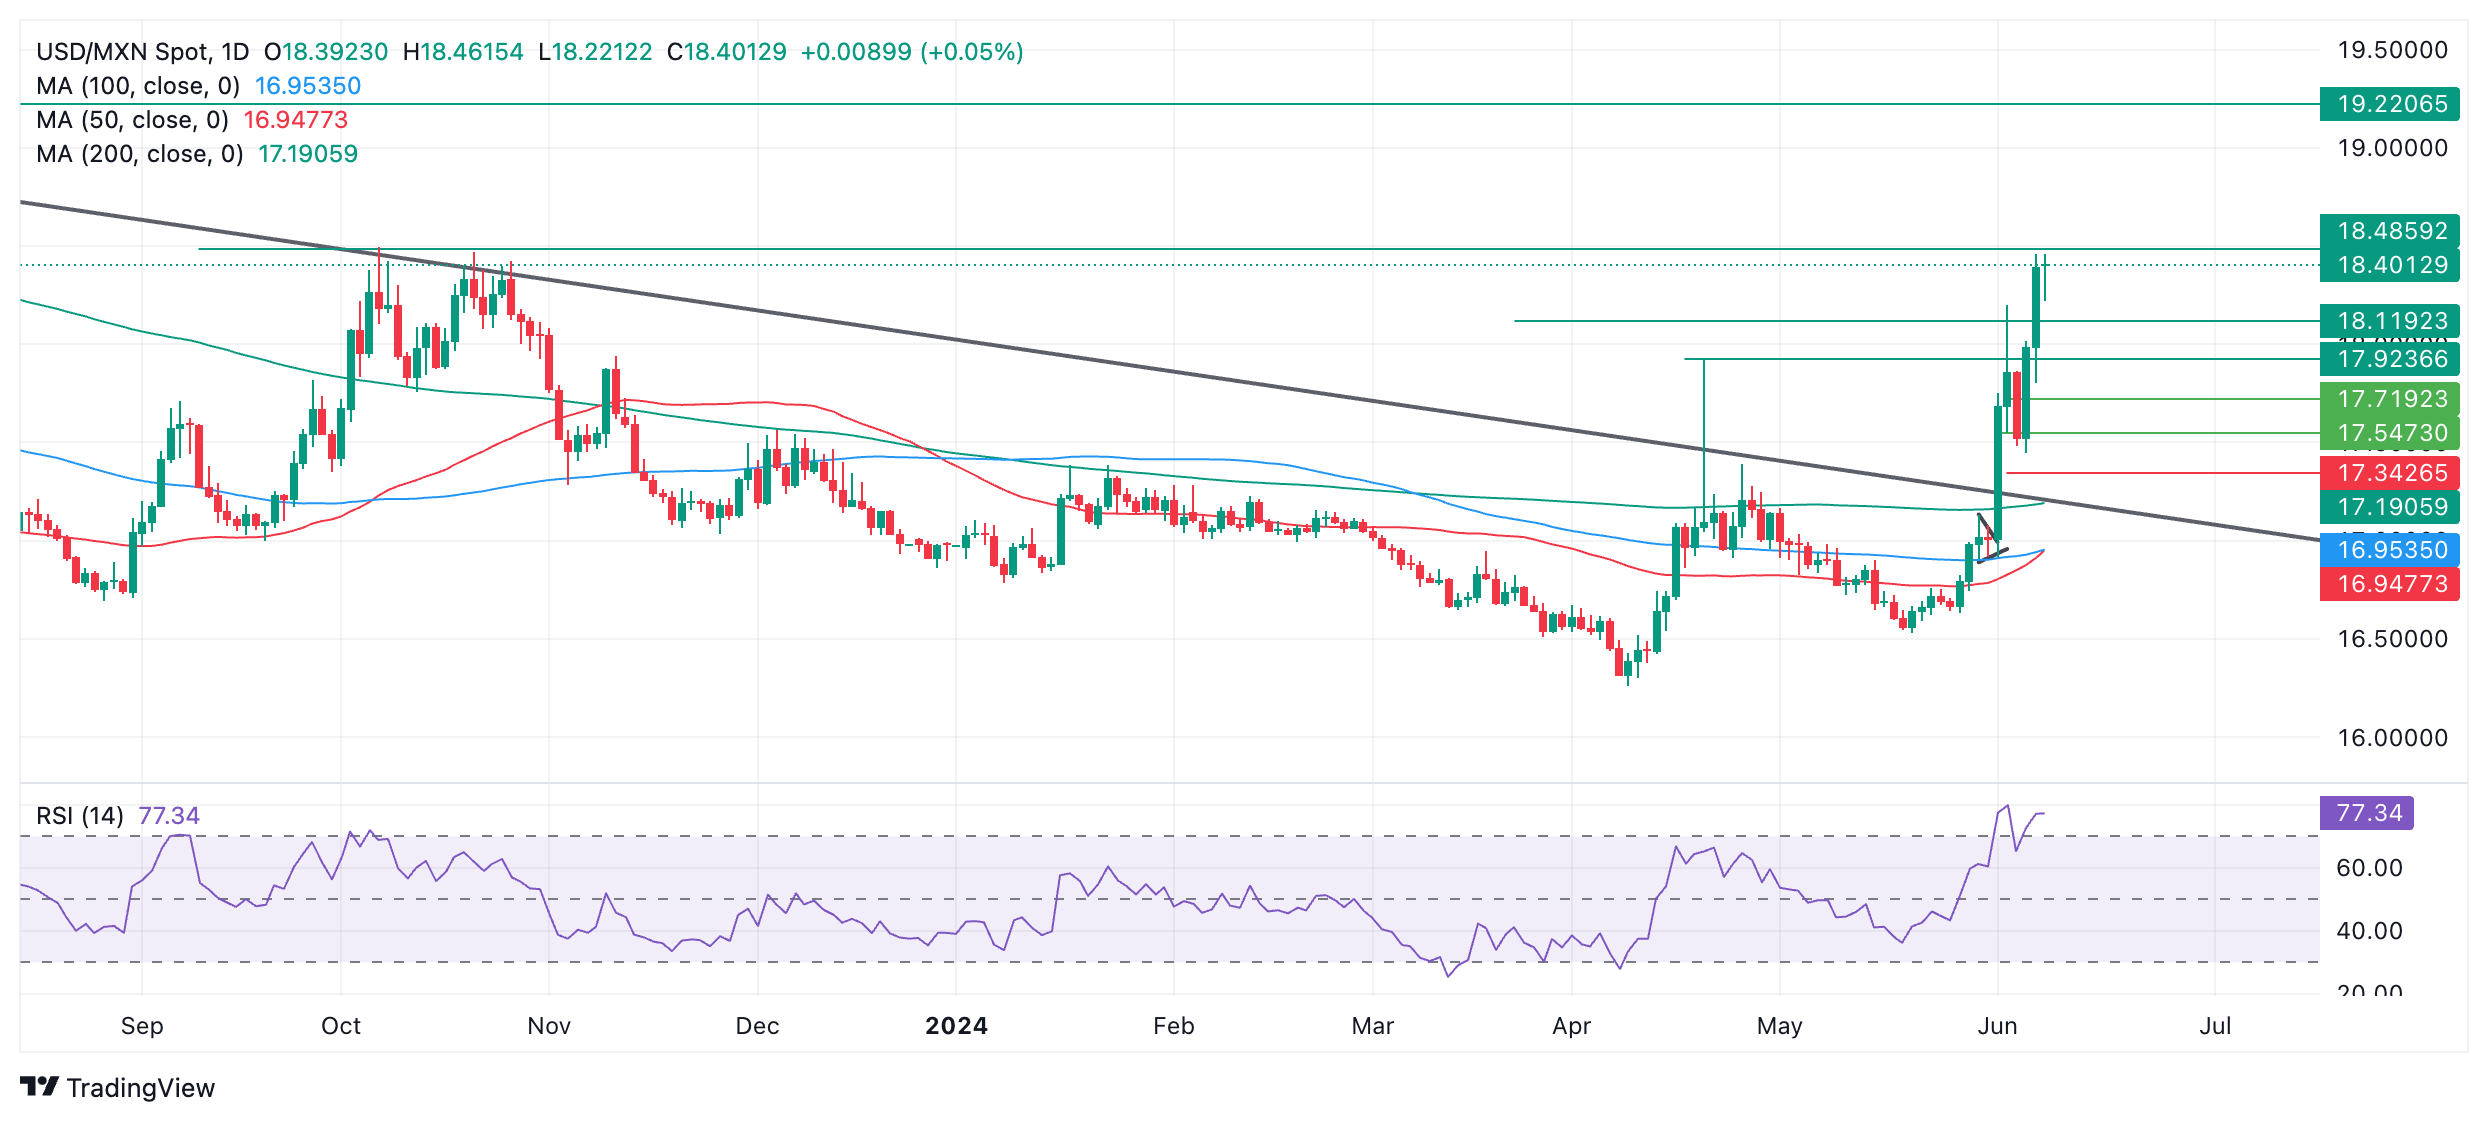
The extension higher suggests the short and intermediate-term trends are bullish, and given that “the trend is your friend”, price is likely to continue rising.
The pair is now close to touching the key resistance level at 18.49, the October 2023 highs. A break above that level will probably see it go even higher, with the next target potentially situated at 19.22 (March 2023 high).
The long-term trend is probably still bearish, suggesting moderate background risks continue.
Mexican Peso FAQs
The Mexican Peso (MXN) is the most traded currency among its Latin American peers. Its value is broadly determined by the performance of the Mexican economy, the country’s central bank’s policy, the amount of foreign investment in the country and even the levels of remittances sent by Mexicans who live abroad, particularly in the United States. Geopolitical trends can also move MXN: for example, the process of nearshoring – or the decision by some firms to relocate manufacturing capacity and supply chains closer to their home countries – is also seen as a catalyst for the Mexican currency as the country is considered a key manufacturing hub in the American continent. Another catalyst for MXN is Oil prices as Mexico is a key exporter of the commodity.
The main objective of Mexico’s central bank, also known as Banxico, is to maintain inflation at low and stable levels (at or close to its target of 3%, the midpoint in a tolerance band of between 2% and 4%). To this end, the bank sets an appropriate level of interest rates. When inflation is too high, Banxico will attempt to tame it by raising interest rates, making it more expensive for households and businesses to borrow money, thus cooling demand and the overall economy. Higher interest rates are generally positive for the Mexican Peso (MXN) as they lead to higher yields, making the country a more attractive place for investors. On the contrary, lower interest rates tend to weaken MXN.
Macroeconomic data releases are key to assess the state of the economy and can have an impact on the Mexican Peso (MXN) valuation. A strong Mexican economy, based on high economic growth, low unemployment and high confidence is good for MXN. Not only does it attract more foreign investment but it may encourage the Bank of Mexico (Banxico) to increase interest rates, particularly if this strength comes together with elevated inflation. However, if economic data is weak, MXN is likely to depreciate.
As an emerging-market currency, the Mexican Peso (MXN) tends to strive during risk-on periods, or when investors perceive that broader market risks are low and thus are eager to engage with investments that carry a higher risk. Conversely, MXN tends to weaken at times of market turbulence or economic uncertainty as investors tend to sell higher-risk assets and flee to the more-stable safe havens.
Gold prices rose in India on Monday, according to data compiled by FXStreet.
The price for Gold stood at 6,159.77 Indian Rupees (INR) per gram, up INR 1.58 compared with the INR 6,158.18 it cost on Friday.
The price for Gold increased to INR 71,846.33 per tola from INR 71,827.84 per tola.
| Unit measure | Gold Price in INR |
|---|---|
| 1 Gram | 6,159.77 |
| 10 Grams | 61,598.49 |
| Tola | 71,846.33 |
| Troy Ounce | 191,592.00 |
FXStreet calculates Gold prices in India by adapting international prices (USD/INR) to the local currency and measurement units. Prices are updated daily based on the market rates taken at the time of publication. Prices are just for reference and local rates could diverge slightly.
Global Market Movers: Comex Gold price struggles to lure buyers amid reduced Fed rate cut bets, bullish USD
- The upbeat US employment details released on Friday fueled speculations that the Federal Reserve could delay the start of the rate-cutting cycle, which, in turn, is seen capping the upside for the non-yielding Comex Gold price.
- The headline NFP showed that the US economy added 272K jobs in May as compared to the 185K anticipated and the previous month's upwardly revised 175K, overshadowing an uptick in the unemployment rate to 4.0%.
- Furthermore, Average Hourly Earnings surpassed consensus estimates and increased by 4.1% during the 12 months through May, which might push up prices and require the Fed to keep interest rates higher for longer.
- The yield on the benchmark 10-year US government bond jumped to 4.45% after the data, while the rate-sensitive 2-year yield remains close to 5.0%, underpinning the US Dollar and acting as a headwind for the XAU/USD.
- Meanwhile, the People's Bank of China (PBoC) snapped 18 months of continuous Gold buying in May, raising concern about decreasing demand for the bullion in one of the world’s biggest buyers and favoring bearish traders.
- Investors, however, prefer to wait on the sidelines ahead of this week's release of the latest US consumer inflation figures and the highly-anticipated FOMC monetary policy decision on Wednesday before placing directional bets.
- The chances of a rate cut in September fell to around 50% following the US jobs data, from around 70% on Thursday, and the markets are now pricing in just one cut of 25 basis points this year, either in November or December.
- Hence, investors will look for fresh signals on when the Fed will begin cutting interest rates amid the still resilient US economy, which will play a key role in determining the next leg of a directional move for the commodity.
Gold FAQs
Gold has played a key role in human’s history as it has been widely used as a store of value and medium of exchange. Currently, apart from its shine and usage for jewelry, the precious metal is widely seen as a safe-haven asset, meaning that it is considered a good investment during turbulent times. Gold is also widely seen as a hedge against inflation and against depreciating currencies as it doesn’t rely on any specific issuer or government.
Central banks are the biggest Gold holders. In their aim to support their currencies in turbulent times, central banks tend to diversify their reserves and buy Gold to improve the perceived strength of the economy and the currency. High Gold reserves can be a source of trust for a country’s solvency. Central banks added 1,136 tonnes of Gold worth around $70 billion to their reserves in 2022, according to data from the World Gold Council. This is the highest yearly purchase since records began. Central banks from emerging economies such as China, India and Turkey are quickly increasing their Gold reserves.
Gold has an inverse correlation with the US Dollar and US Treasuries, which are both major reserve and safe-haven assets. When the Dollar depreciates, Gold tends to rise, enabling investors and central banks to diversify their assets in turbulent times. Gold is also inversely correlated with risk assets. A rally in the stock market tends to weaken Gold price, while sell-offs in riskier markets tend to favor the precious metal.
The price can move due to a wide range of factors. Geopolitical instability or fears of a deep recession can quickly make Gold price escalate due to its safe-haven status. As a yield-less asset, Gold tends to rise with lower interest rates, while higher cost of money usually weighs down on the yellow metal. Still, most moves depend on how the US Dollar (USD) behaves as the asset is priced in dollars (XAU/USD). A strong Dollar tends to keep the price of Gold controlled, whereas a weaker Dollar is likely to push Gold prices up.
(An automation tool was used in creating this post.)
- USD/CHF remains firm near 0.8970 as waning Fed rate-cut prospects boost the US Dollar’s appeal.
- The Fed is expected to maintain a hawkish narrative on the interest rate guidance due to slower progress in disinflation.
- The SNB will be less likely to continue the rate-cut spell on June 20.
The USD/CHF pair clings to gains near 0.8970 in Monday’s early European session. The Swiss Franc asset remains firm as the US Dollar (USD) strengthens after traders unwind Federal Reserve (Fed) rate-cut bets for the September meeting.
Dovish prospects for the Fed’s September policy meeting diminished significantly after the US Nonfarm Payrolls (NFP) report for May showed that the labor demand remained robust and wage growth was stronger than expected. The maintenance of interest rates at their current levels by the Fed is favorable when labor market conditions appear to be strong.
Meanwhile, a sharp decline in Fed rate-cut bets has turned market sentiment risk-averse. S&P 500 futures have posted some losses in the early London session. The US Dollar Index (DXY) jumps to an almost four-week high near 105.27. 10-year US Treasury yields extend their upside to 4.45%.
Going forward, investors will focus on the US Consumer Price Index (CPI) data for May and the Fed’s interest rate policy, which are scheduled for Wednesday. Annual core inflation that strips off volatile food and energy prices is estimated to have decelerated to 3.5% from the prior release of 3.6%, with headline figures growing steadily by 3.4%.
The Fed is expected to remain status quo for the seventh time in a row. Investors will keenly focus on Fed’s guidance on the interest rates, which is likley to be hawkish as progress in the disinflation process appears to be slowed.
On the Swiss front, market expectations for the Swiss National Bank’s (SNB) rate-cut path will drive the next move in the Swiss Franc. The SNB is less-likely to deliver a subsequent interest rate-cut on June 20 though inflatuon remains beow the 2% threshold. Earlier, SNB Chairman Thomas J. Jordan cautioned about small upside risks to inflation expectations, which have been prompted by weak Swiss Franc that has made Swiss exports competitive in the global market.
- EUR/USD weakens to 1.0750 on Monday amid multiple headwinds.
- Euro tumbles as French President Emmanuel Macron calls for a snap election, which triggers political uncertainty.
- Strong US labor market data diminishes Fed rate-cut bets, which boosts the US Dollar’s appeal.
EUR/USD extends its decline to 1.0750 on Monday. The major currency pair weakens as political uncertainty in the Eurozone after French President Emmanuel Macron call for a snap election weighed heavily on the Euro. Macron’s unexpected move on Sunday evening came after exit polls indicated that Marine Le Pen’s far-right National Rally (RN) scored 32%-33% seats in European parliamentary elections under the leadership of the party’s president, Jordan Bardella, which was more than double from Macron’s centrist’s list.
After the dramatic announcement of a snap election, Macron added: “I have confidence in our democracy, in letting the sovereign people have their say. I’ve heard your message, your concerns, and I won’t leave them unanswered”, The Guardian reported. However, there could be potential consequences if Macron’s party faces more losses than forecasted by exit polls, which could deepen uncertainty over the Euro’s outlook.
On the monetary policy front, European Central Bank (ECB) policymaker and President of the Deutsche Bundesbank Joachim Nagel warned about a stubborn inflation outlook, especially in the service sector, due to strong wage growth. Worries about inflation becoming sticky suggest that the policy-easing campaign would be slow.
ECB President Christine Lagarde already said in the monetary policy press conference after cutting the central bank’s Deposit Facility Rate by 25 basis points (bps) to 3.75% that the bank is not committing to any specific interest-rate path and will remain data-dependent as inflation could remain bumpy in next few months.
Daily digest market movers: EUR/USD weakens amid uncertainty ahead of US CPI and Fed monetary policy
- EUR/USD tumbles to 1.0750 due to weak Euro amid political uncertainty and firm US Dollar (USD) as strong United States (US) labor market data has diminished market expectations for the Federal Reserve (Fed) to start reducing interest rates from their current levels in the September meeting. The US Dollar Index (DXY), which tracks the Greenback’s value against six major currencies, extends recovery to an almost four-week high near 105.30.
- The CME FedWatch tool shows that 30-Day Fed Funds futures pricing data suggest a 47% chance that interest rate will be lower than the current level in September, significantly down from the 59.6% recorded a week ago.
- The US Nonfarm Payrolls (NFP) report for May showed on Friday that fresh recruitments came in at 272K, higher than expectations of 185K and the prior release of 165K. Labor demand remaining stronger than expected continues to buy more time for Fed policymakers to maintain their current interest rate framework.
- Average Hourly Earnings data, a measure of wage inflation that dictates households’ spending, came higher than expected. Annual wage inflation measures accelerated to 4.1% in May from the consensus of 3.9% and April’s read of 4.0%. On a month-on-month basis, wage inflation measures rose strongly by 0.4% from the estimates of 0.3% and the former release of 0.2%.
- Meanwhile, investors shift their focus to the US Consumer Price Index (CPI) data for May and the Fed’s monetary policy decision, which are scheduled for Wednesday. The Fed is widely anticipated to maintain interest rates steady in the range of 5.25%-5.50% with a hawkish outlook as the last mile for inflation to return to the desired rate of 2% appears to be stickier.
Technical Analysis: EUR/USD falls inside Triangle after a fakeout
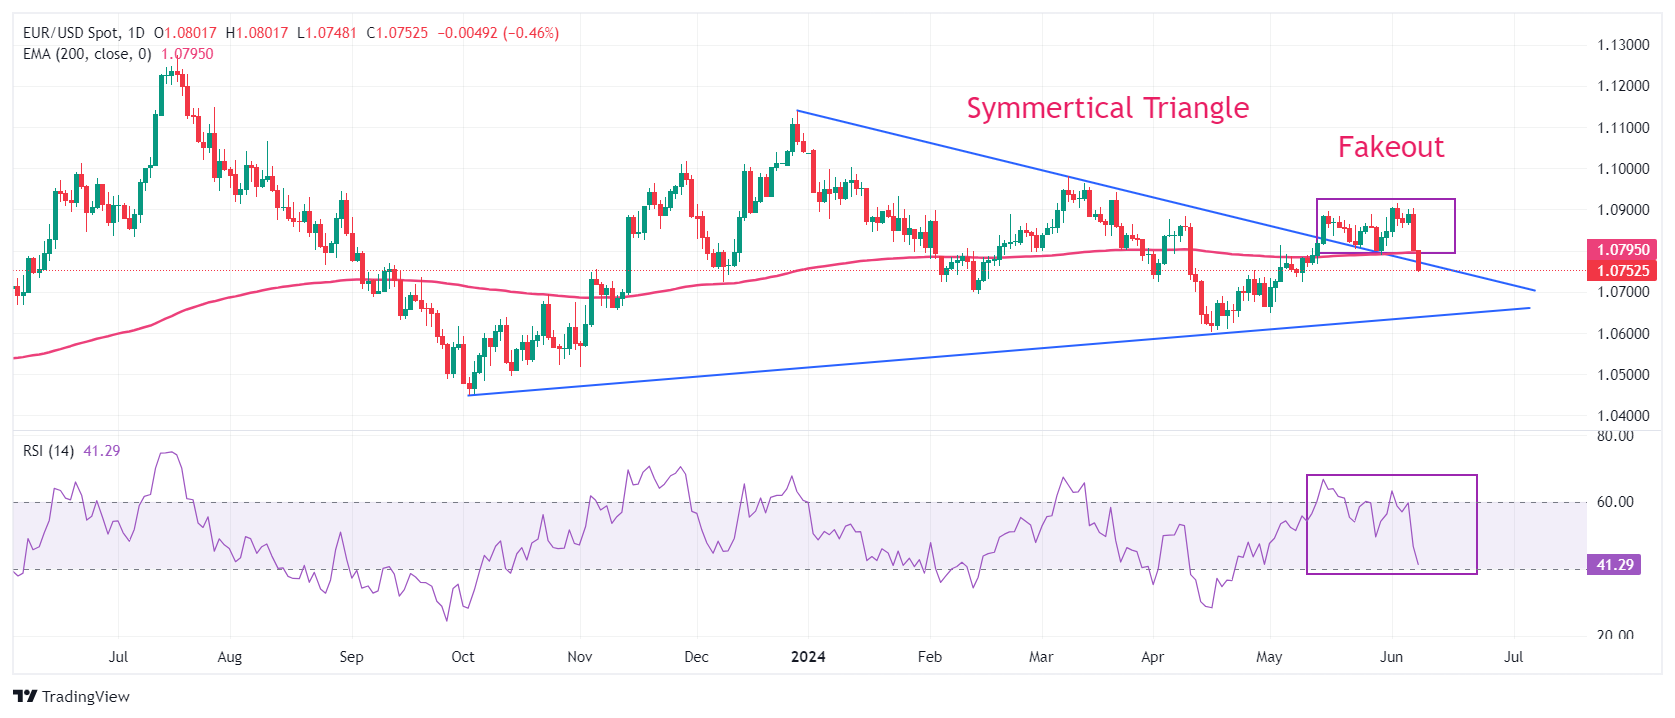
EUR/USD returns inside the Symmetrical Triangle formation on a daily timeframe after failing to hold the breakout move, suggesting that the move was fake and the overall trend has turned bearish. The major currency pair is expected to find support near the upward-sloping trendline of the above-mentioned chart pattern, plotted from October 3, 2023, low at 1.0448, near 1.0636.
The pair’s long-term outlook has also turned negative as it drops below the 200-day Exponential Moving Average (EMA), which trades around 1.0800.
The 14-period Relative Strength Index (RSI) falls sharply to 40.00. A decisive break below that level would trigger a bearish momentum.
Euro FAQs
The Euro is the currency for the 20 European Union countries that belong to the Eurozone. It is the second most heavily traded currency in the world behind the US Dollar. In 2022, it accounted for 31% of all foreign exchange transactions, with an average daily turnover of over $2.2 trillion a day. EUR/USD is the most heavily traded currency pair in the world, accounting for an estimated 30% off all transactions, followed by EUR/JPY (4%), EUR/GBP (3%) and EUR/AUD (2%).
The European Central Bank (ECB) in Frankfurt, Germany, is the reserve bank for the Eurozone. The ECB sets interest rates and manages monetary policy. The ECB’s primary mandate is to maintain price stability, which means either controlling inflation or stimulating growth. Its primary tool is the raising or lowering of interest rates. Relatively high interest rates – or the expectation of higher rates – will usually benefit the Euro and vice versa. The ECB Governing Council makes monetary policy decisions at meetings held eight times a year. Decisions are made by heads of the Eurozone national banks and six permanent members, including the President of the ECB, Christine Lagarde.
Eurozone inflation data, measured by the Harmonized Index of Consumer Prices (HICP), is an important econometric for the Euro. If inflation rises more than expected, especially if above the ECB’s 2% target, it obliges the ECB to raise interest rates to bring it back under control. Relatively high interest rates compared to its counterparts will usually benefit the Euro, as it makes the region more attractive as a place for global investors to park their money.
Data releases gauge the health of the economy and can impact on the Euro. Indicators such as GDP, Manufacturing and Services PMIs, employment, and consumer sentiment surveys can all influence the direction of the single currency. A strong economy is good for the Euro. Not only does it attract more foreign investment but it may encourage the ECB to put up interest rates, which will directly strengthen the Euro. Otherwise, if economic data is weak, the Euro is likely to fall. Economic data for the four largest economies in the euro area (Germany, France, Italy and Spain) are especially significant, as they account for 75% of the Eurozone’s economy.
Another significant data release for the Euro is the Trade Balance. This indicator measures the difference between what a country earns from its exports and what it spends on imports over a given period. If a country produces highly sought after exports then its currency will gain in value purely from the extra demand created from foreign buyers seeking to purchase these goods. Therefore, a positive net Trade Balance strengthens a currency and vice versa for a negative balance.
- GBP/USD struggles to gain ground around 1.2715 in Monday’s early European session.
- The pair keeps the negative vibe below the 100-period EMA, with bearish RSI indicator on the 4-hour chart.
- The first downside target is seen in the 1.2700–1.2701 zone; the next upside barrier is located at 1.2795.
The GBP/USD pair trades in negative territory for the second consecutive day near 1.2715 during the early European session on Monday. The stronger US Dollar (USD) broadly drags the major pair lower. Investors await the UK Employment data on Tuesday for fresh impetus, including Claimant Count Change, Employment Change, and Average Earnings data. Any evidence of more layoffs in the UK economy might trigger the expectations of early rate cuts from the Bank of England (BoE) and might weigh on the Pound Sterling (GBP).
According to the 4-hour chart, the outlook of GBP/USD turns bearish as it holds below the key 100-period Exponential Moving Average (EMA). The downward momentum is supported by the Relative Strength Index (RSI), which stands around 37.00, indicating the path of least resistance is to the downside.
A decisive break below the lower limit of the Bollinger Band and psychological level at the 1.2700-1.2710 region will pave the way to 1.2681, a low of May 30. Further south, the next contention level is seen at 1.2645, a low of May 17, followed by the 1.2600 round mark.
The major pair should resume the upside if it crosses above the 100-period EMA at 1.2723. The next upside barrier for GBP/USD will emerge at 1.2795, a low of June 5. Any follow-through buying will expose 1.2809, a high of June 6, and finally the upper boundary of the Bollinger Band at 1.2831.
GBP/USD 4-hour chart
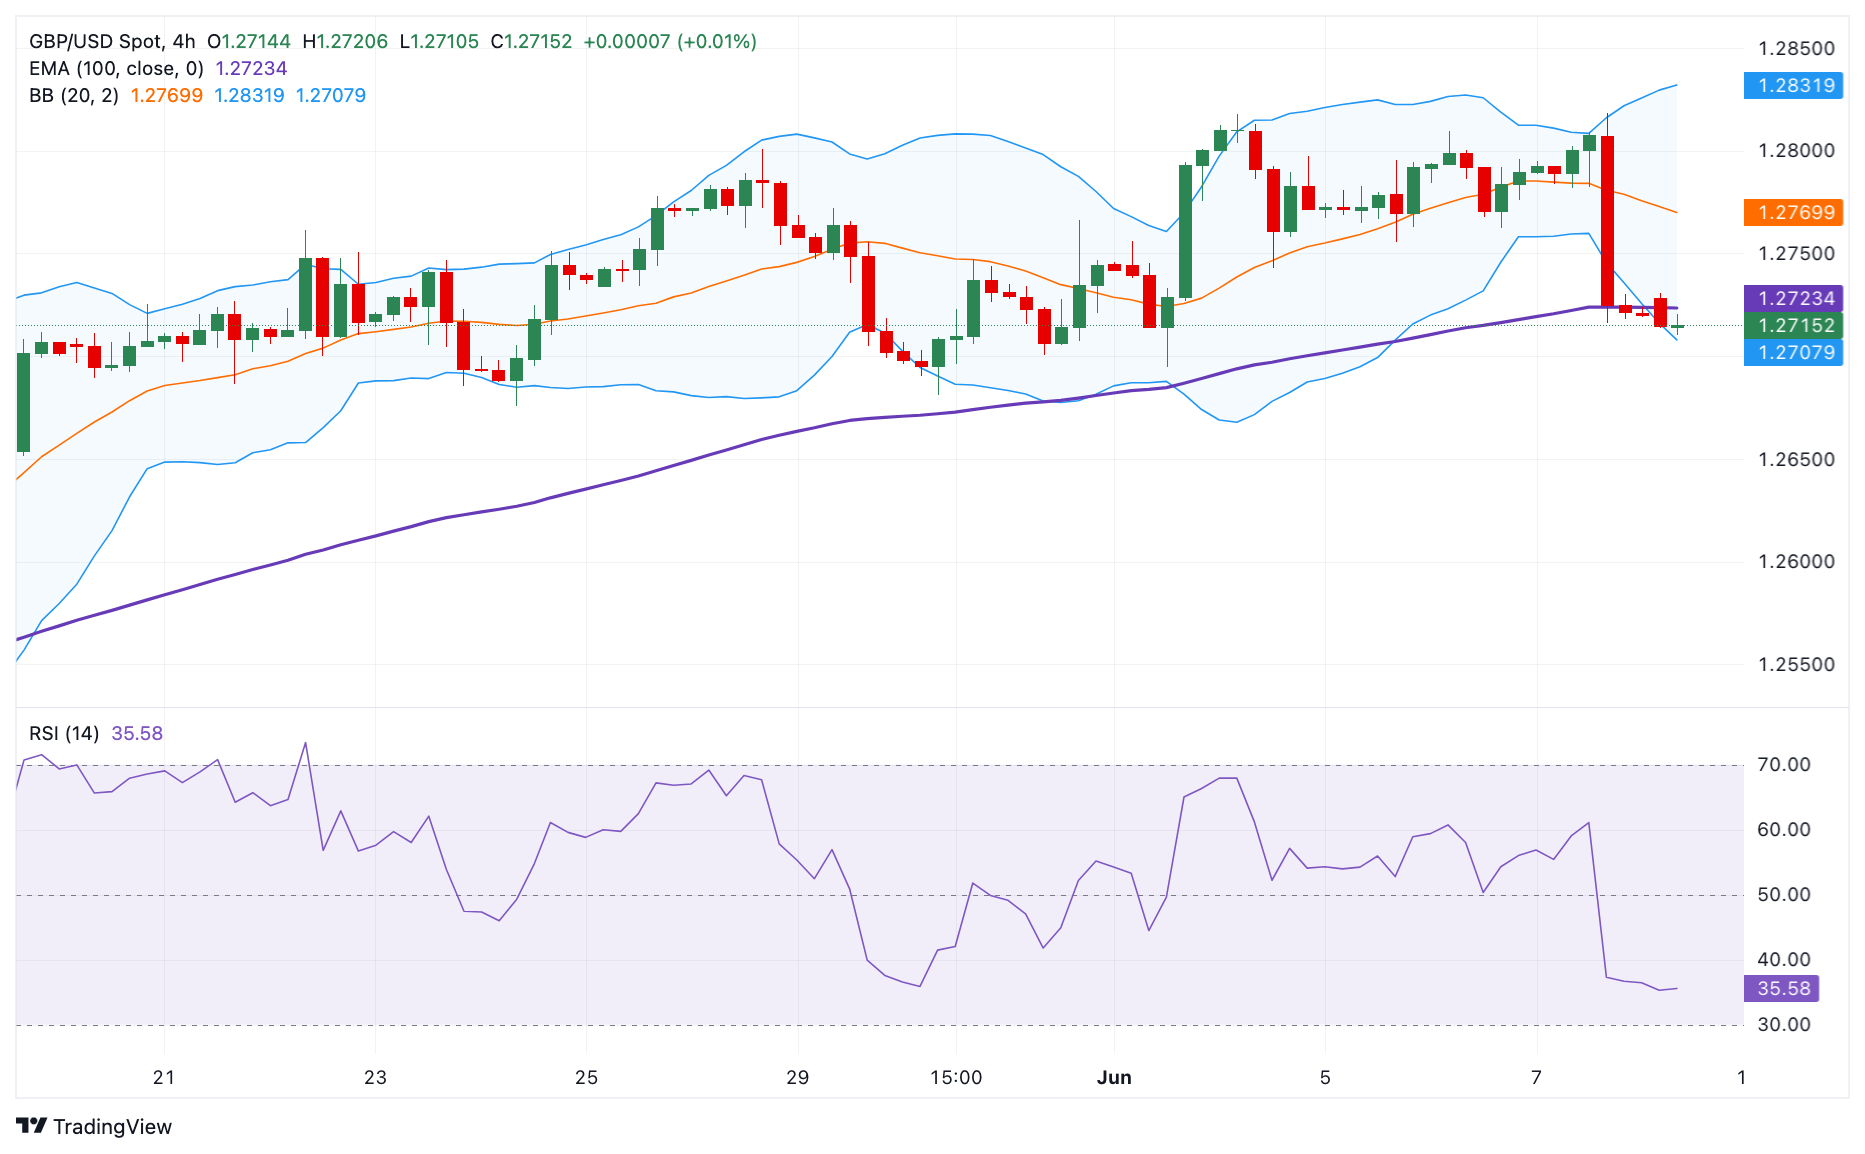
FX option expiries for June 10 NY cut at 10:00 Eastern Time, via DTCC, can be found below
- EUR/USD: EUR amounts
- 1.0685 1.1b
- 1.0760 570m
- 1.0775 1.1b
- 1.0800 961m
- 1.0850 834m
- 1.0875 580m
- 1.0900 1.7b
- USD/JPY: USD amounts
- 155.95 540m
- 156.15 405m
- USD/CHF: USD amounts
- 0.8900 529m
- 0.9000 600m
- 0.9080 583m
- AUD/USD: AUD amounts
- 0.6590 728m
- 0.6600 904m
- USD/CAD: USD amounts
- 1.3625 720m
- 1.3680 639m
- 1.3750 610m
- 1.3880 695m
- Silver price rebounds from a three-week low of $29.11 recorded on Friday.
- Non-yielding Silver struggled as the probability of a Fed rate cut in September decreased compared to the previous week.
- Rabobank suggested that the Fed may cut rates in September and December, more likely because of a deteriorating economy.
Silver price recovers the previous session's losses, trading around $29.50 per troy ounce during Monday's Asian hours. The better-than-expected US employment data released on Friday has caused traders to delay their expectations of a Fed rate cut. This sentiment has put pressure on non-yielding assets like Silver.
According to the US Bureau of Labor Statistics (BLS), May's US Nonfarm Payrolls (NFP) increased by 272,000, up from 165,000 in April. The stronger employment data has attracted buyers to the US Dollar (USD), which has dampened the demand for Silver by making the commodity more expensive for buyer countries using other currencies.
The US Dollar Index (DXY), which measures the value of the US Dollar (USD) against six major currencies, continues to rise due to higher US Treasury yields. The DXY extends gains to near 105.20 with 2-year and 10-year yields on US Treasury bonds standing at 4.88% and 4.44%, respectively, at the time of writing.
A strong US jobs report could cause the Federal Reserve to keep higher rates for an extended period. According to the CME FedWatch Tool, the probability of a Fed rate cut of at least 25 basis points in September has decreased to nearly 48.0%, down from 54.8% a week ago.
However, Rabobank suggested in its report that the Fed may cut rates in September and December, more likely because of a deteriorating economy. This is because they think that the US economy is entering a stagflationary phase with persistent inflation and an economic slowdown that is likely to end in a mild recession later this year.
- EUR/JPY trades in negative territory for three straight days in Monday’s early European session, down 0.28% on the day.
- France’s President Macron announced the snap election after a crushing loss to French far right in EU vote.
- Japan’s Gross Domestic Product (GDP) shrank by 0.5% QoQ in Q1, in line with the consensus.
The EUR/JPY cross extends the decline near 168.85 during the early European session on Monday. The Euro (EUR) attracts some sellers amid the uncertainty over the political scenario in France.
France's President Emmanuel Macron has dissolved the country's parliament and announced a snap election after exit polls indicated that his Renaissance party would be defeated by the far-right opposition in European parliamentary elections on Sunday, according to CNN. The political uncertainty surrounding the Eurozone's second-biggest economy drags the EUR lower and creates a headwind for EUR/JPY.
The European Central Bank (ECB) cut interest rates by 25 basis points (bps) at its June meeting last week. The ECB governing council stated that it “will continue to follow a data-dependent and meeting-by-meeting approach to determining the appropriate level and duration of restriction.?
On the JPY’s front, the recent Japanese economic data came in mixed on Monday. Japan’s Cabinet Office reported that the nation’s Gross Domestic Product (GDP) shrank by 0.5% QoQ in the first quarter (Q1) compared to the previous reading and the consensus of -0.5%. Meanwhile, the GDP Annualized contracted by 1.8% in Q1, compared to a previous contraction of 2.0%, better than the estimation of -1.9%.
Apart from this, Japan’s 10-year government bond (JGB) yield edges higher to 1.029% ahead of the Bank of Japan’s (BoJ) monetary policy meeting on Friday. The BoJ is expected to keep its interest rate steady, but the central bank officials might likely consider reducing their massive debt holdings. “If they change the amount now and heighten volatility, it will be difficult for the bank to raise interest rates to normalize policy,” said Takashi Fujiwara, chief fund manager at the fixed-income department at Resona Asset Management Co.
- NZD/USD lost ground due to rising hawkish sentiment surrounding the Fed.
- CME FedWatch Tool suggested the probability of a Fed rate cut in September has decreased compared to the previous week.
- The US Dollar (USD) extends its gains due to the rising US Treasury yields.
NZD/USD remains tepid following the decline in the previous session, trading around 0.6110 during the Asian hours on Monday. The US Dollar (USD) regained its strength from the better-than-expected US employment data released on Friday, which has caused expectations of the Federal Reserve (Fed) delaying rate cuts. This has put pressure on the NZD/USD pair.
The rise in US Treasury yields bolsters the strength of the US Dollar as a strong US jobs report would bolster a hawkish stance from the Federal Reserve. The CME FedWatch Tool indicates that the likelihood of a Fed rate cut in September by at least 25 basis points has decreased to nearly 48.0%, down from 54.8% a week earlier.
In its report, Rabobank proposed that the Federal Reserve might reduce rates in September and December, primarily due to a worsening economy rather than advancements in inflation control. Their analysis suggests that the US economy is transitioning into a stagflationary phase characterized by ongoing inflation and an economic deceleration, potentially culminating in a mild recession later this year.
On the Kiwi front, the New Zealand Dollar (NZD) has been underpinned by the country's relatively high interest rates, despite economic challenges. The Reserve Bank of New Zealand (RBNZ) is anticipated to uphold a steady policy stance until at least mid-2025, aiming for a comprehensive evaluation of data.
However, the NZ Herald reported last week that New Zealand’s Finance Minister, Nicola Willis, emphasized that the 2024 budget would not prolong higher interest rates, despite concerns from economists that it might complicate the RBNZ's endeavors to curb inflation.
- USD/CAD oscillates in a narrow band and is influenced by a combination of diverging forces.
- Traders scaled back September Fed rate cut bets after the upbeat US NFP, boosting the USD.
- An uptick in Crude Oil prices underpins the Loonie and keeps a lid on further gains for the pair.
The USD/CAD pair struggles to capitalize on the post-NFP move up and seesaws between tepid gains/minor losses, just above mid-1.3700s during the Asian session on Monday. The subdued price action is influenced by a combination of diverging forces, though the fundamental backdrop seems tilted in favor of bullish traders.
The US Dollar (USD) climbs to a nearly four-week high in the wake of expectations that the Federal Reserve (Fed) will keep rates higher for longer amid the still resilient US economy, bolstered by Friday's stronger-than-expected US jobs data. The hawkish bets, meanwhile, remain supportive of elevated US Treasury bond yields, which, along with the cautious market mood, acts as a tailwind for the safe-haven Greenback and the USD/CAD pair.
Meanwhile, Crude Oil prices regained some positive traction and look to build on last week's bounce from a four-month low amid comments by OPEC ministers that they would not increase supply if prices remained weak. This, in turn, is seen underpinning the commodity-linked Loonie and capping the USD/CAD pair. Traders also seem reluctant to place aggressive directional bets ahead of this week's US macro data and central bank event risk.
The latest US consumer inflation figures are due for release on Wednesday and will be followed by the outcome of the highly anticipated FOMC monetary policy decision. This will help investors determine the likely timing when the Fed will begin its rate-cutting cycle, which should influence the USD. In the meantime, speculations about another rate reduction by the Bank of Canada (BoC) next month might act as a tailwind for the USD/CAD pair.
- The Japanese Yen lost ground as US Dollar advanced on robust jobs data.
- The mixed Japanese data may limit the downside of the JPY.
- Japan’s 10-year government bond yield moves above 1.01% ahead of the BoJ policy meeting on Friday.
The Japanese Yen (JPY) edges lower for the successive second trading day on Monday. The USD/JPY pair experienced support as the US Dollar (USD) regained its strength following the better-than-expected US employment data released on Friday.
Japan released mixed data on Monday, which could limit the downside of the Japanese Yen. Gross Domestic Product Annualized showed that Japan’s economy contracted less than expected in the first quarter. Meanwhile, GDP (QoQ) shrank in Q1, matching flash data.
The US Dollar Index (DXY), which measures the value of the US Dollar (USD) against six major currencies, continues to rise due to higher US Treasury yields. A strong US jobs report is expected to support a hawkish stance from the Federal Reserve. According to the CME FedWatch Tool, the probability of a Fed rate cut of at least 25 basis points in September has decreased to nearly 48.0%, down from 54.8% a week ago.
Daily Digest Market Movers: Japanese Yen depreciates after solid US labor data
- Japan’s Gross Domestic Product (GDP) Annualized contracted by 1.8% in the first quarter, compared to a previous decline of 2.0%. The figures slightly exceeded market forecasts of a 1.9% decrease. Meanwhile, Japan's GDP (QoQ) shrank by 0.5%, in line with the flash data.
- Japan’s 10-year government bond yield moves above 1.01% ahead of the Bank of Japan’s (BoJ) policy meeting on Friday. The central bank is expected to maintain its current interest rates, while traders are closely watching for any potential reduction in the bank’s monthly bond purchases.
- Rabobank suggested in its report that the Federal Reserve may cut rates in September and December, more likely because of a deteriorating economy than because of progress on inflation. This is because they think that the US economy is entering a stagflationary phase with persistent inflation and an economic slowdown that is likely to end in a mild recession later this year.
- According to the US Bureau of Labor Statistics (BLS) on Friday, May's US Nonfarm Payrolls (NFP) increased by 272,000, up from 165,000 in April. The wage inflation, as measured by the Average Hourly Earnings, rose 4.1% YoY in May from 4.0% (revised from 3.9%) in April, above the market consensus of 3.9%.
- Japanese Finance Minister Shunichi Suzuki stated on Friday that he will take action against excessive currency volatility when necessary and will assess the effectiveness of intervention. Suzuki emphasized the importance of maintaining market trust in public finances, mentioning that there is no fund limit for FX intervention, according to Reuters.
- Japanese Foreign Reserves released by the Ministry of Finance for May, dropped significantly to $1,231 billion in May from $1,279 billion. This has marked the lowest level since February 2023, as the government conducted foreign exchange intervention operations to defend the JPY.
- According to Reuters, while speaking to parliament on Thursday, Bank of Japan (BoJ) Governor Kazuo Ueda stated that inflation expectations are gradually rising but have yet to reach 2%. Ueda said, "We are still scrutinizing market developments since the March decision. As we proceed in exiting our massive monetary stimulus, it's appropriate to reduce bond purchases."
Technical Analysis: USD/JPY hovers around 157.00
USD/JPY trades around 157.10 on Monday. Analysis of the daily chart indicates a bullish bias as the pair consolidates within a rising channel pattern. Furthermore, the 14-day Relative Strength Index (RSI) is positioned above the 50 level, suggesting a tendency toward upward movement.
A key barrier is evident at the psychological level of 158.00. A breakthrough above this level could exert support to lead the USD/JPY pair to navigate the area around the upper boundary nearing at the level of 158.60. The further resistance appears at the level of 160.32, its highest level in over thirty years.
On the downside, the lower threshold of the rising channel around the level of 154.90 appears as the key support, aligned with the 50-day Exponential Moving Average (EMA) of 154.86. A break below this level could increase pressure on the USD/JPY pair, potentially leading it toward the throwback support region around 152.80.
USD/JPY: Daily Chart
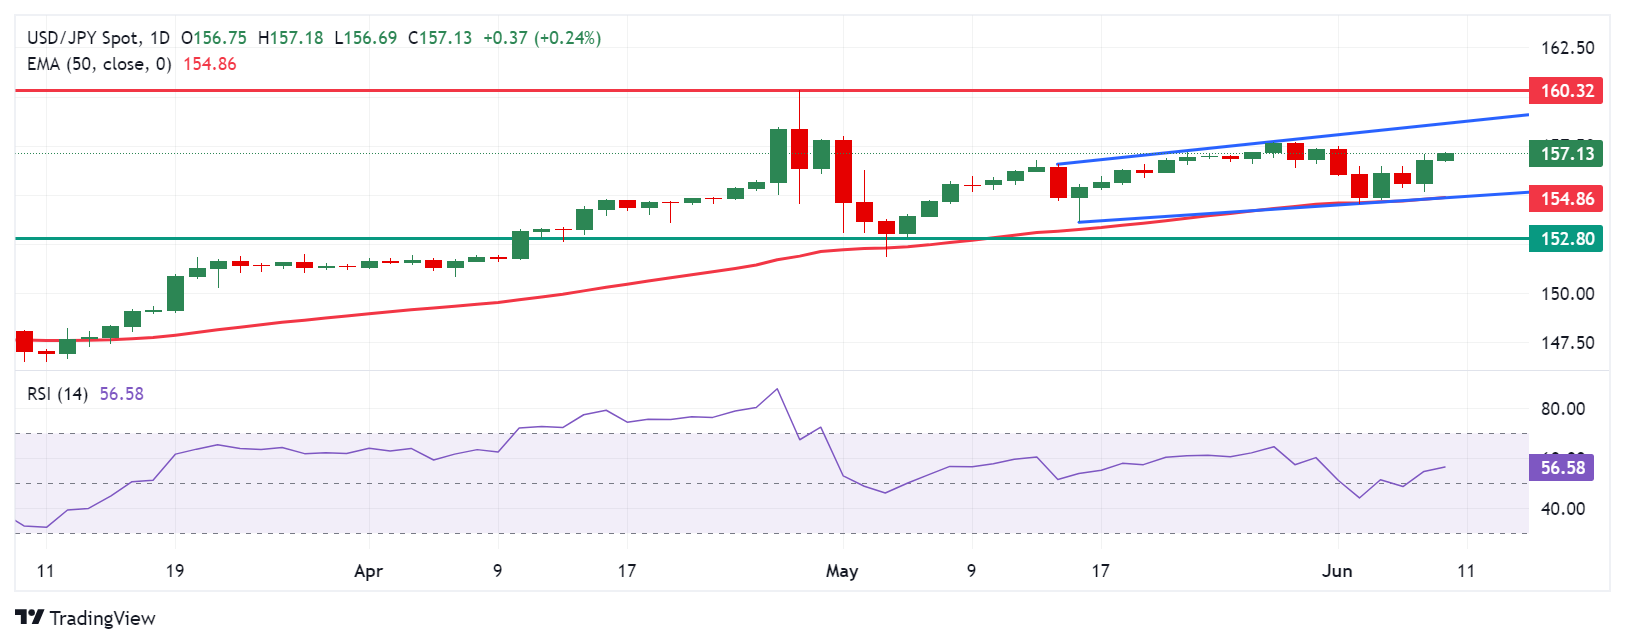
Japanese Yen price today
The table below shows the percentage change of the Japanese Yen (JPY) against listed major currencies today. Japanese Yen was the weakest against the Australian Dollar.
| USD | EUR | GBP | CAD | AUD | JPY | NZD | CHF | |
| USD | 0.12% | 0.07% | 0.05% | -0.10% | 0.18% | -0.02% | 0.17% | |
| EUR | -0.10% | -0.05% | -0.07% | -0.21% | 0.08% | -0.13% | 0.06% | |
| GBP | -0.08% | 0.05% | -0.03% | -0.17% | 0.11% | -0.10% | 0.10% | |
| CAD | -0.05% | 0.07% | 0.02% | -0.14% | 0.16% | -0.05% | 0.11% | |
| AUD | 0.12% | 0.24% | 0.18% | 0.14% | 0.28% | 0.08% | 0.26% | |
| JPY | -0.20% | -0.06% | -0.12% | -0.15% | -0.31% | -0.23% | -0.01% | |
| NZD | 0.02% | 0.13% | 0.08% | 0.05% | -0.09% | 0.21% | 0.17% | |
| CHF | -0.17% | -0.05% | -0.09% | -0.11% | -0.26% | 0.03% | -0.18% |
The heat map shows percentage changes of major currencies against each other. The base currency is picked from the left column, while the quote currency is picked from the top row. For example, if you pick the Euro from the left column and move along the horizontal line to the Japanese Yen, the percentage change displayed in the box will represent EUR (base)/JPY (quote).
Japanese Yen FAQs
The Japanese Yen (JPY) is one of the world’s most traded currencies. Its value is broadly determined by the performance of the Japanese economy, but more specifically by the Bank of Japan’s policy, the differential between Japanese and US bond yields, or risk sentiment among traders, among other factors.
One of the Bank of Japan’s mandates is currency control, so its moves are key for the Yen. The BoJ has directly intervened in currency markets sometimes, generally to lower the value of the Yen, although it refrains from doing it often due to political concerns of its main trading partners. The current BoJ ultra-loose monetary policy, based on massive stimulus to the economy, has caused the Yen to depreciate against its main currency peers. This process has exacerbated more recently due to an increasing policy divergence between the Bank of Japan and other main central banks, which have opted to increase interest rates sharply to fight decades-high levels of inflation.
The BoJ’s stance of sticking to ultra-loose monetary policy has led to a widening policy divergence with other central banks, particularly with the US Federal Reserve. This supports a widening of the differential between the 10-year US and Japanese bonds, which favors the US Dollar against the Japanese Yen.
The Japanese Yen is often seen as a safe-haven investment. This means that in times of market stress, investors are more likely to put their money in the Japanese currency due to its supposed reliability and stability. Turbulent times are likely to strengthen the Yen’s value against other currencies seen as more risky to invest in.
- Indian Rupee trades flat on Monday amid the stronger US Dollar.
- The lower bets on the Fed rate cuts and Indian foreign outflows might underpin the pair.
- The Indian and US Consumer Price Index (CPI) for May will be due on Wednesday.
Indian Rupee (INR) trades on a flat note on Monday despite the rebound of Greenback. The positive outlook of India's resilient economy and financial stability could provide some support to the INR. However, the robust US employment data for May pared back rate cut expectations from the Federal Open Market Committee (FOMC) might boost the US Dollar (USD) against the INR. Additionally, foreign investors have net sold Indian shares worth 422.81 billion rupees since March, contributing to the Indian Rupee's weakening.
Investors will monitor the formation of the new government as Narendra Modi was sworn in Sunday for a third consecutive term as India’s Prime Minister. India’s Consumer Price Index (CPI) will be released on Wednesday. On the US docket, the CPI inflation report will be published on Wednesday ahead of the FOMC rate decision on Thursday.
Daily Digest Market Movers: Indian Rupee trades sideways amid mixed sentiment
- The Indian rupee is stable and inexpensive compared to its emerging market peers, making it a favorite for carry traders, said David Hauner, head of global EM fixed-income strategy at Bank of America.
- The Reserve Bank of India’s (RBI) Monetary Policy Committee (MPC) kept the repo rate unchanged at 6.5% in its June meeting.
- The RBI revised upwards the GDP growth projection for the current fiscal year to 7.2% from 7.0% on rising private consumption and revival of demand in rural areas.
- RBI governor Shaktikanta Das said that although India has contained inflation while keeping its economy growing, food inflation remains a concern.
- The Labor Department showed on Friday that the US economy created far more jobs than expected in May, which dampened the expectation that the US Fed will start cutting interest rates in September.
- The US Nonfarm Payrolls (NFP) climbed 272,000 in May from a 165,000 increase (revised from 175,000) in April and came in above the forecast of 185,000, the Labor Department showed on Friday.
- The Unemployment Rate ticked up to 4.0% in May from 3.9% in April. Meanwhile, wage inflation, as measured by the Average Hourly Earnings, rose 4.1% YoY in May from 4.0% (revised from 3.9%) in April, above the market consensus of 3.9%.
- Futures traders are now pricing in nearly 49% odds of a rate cut for the September meeting, down from 68% before the NFP data, according to the CME FedWatch tool.
Technical analysis: USD/INR keeps the bullish picture above the 100-day EMA
The Indian Rupee trades stronger on the day. The bullish outlook of the USD/INR pair remains intact above the descending trend channel upper boundary and the key 100-day Exponential Moving Average (EMA) on the daily chart. Further consolidation mode looks favorable since the 14-day Relative Strength Index (RSI) hovers lower towards the 50-midline.
Stronger bullish momentum past 83.55 (high of June 5) might lift the pair up to 83.72 (high of April 17) en route to the 84.00 major psychological mark
On the other hand, the resistance-turned-support level and the 100-day EMA at the 83.30–83.35 region act as an initial support level for USD/INR. Any follow-through selling might drag the pair to the 83.00 round level, followed by 82.78 (low of January 15).
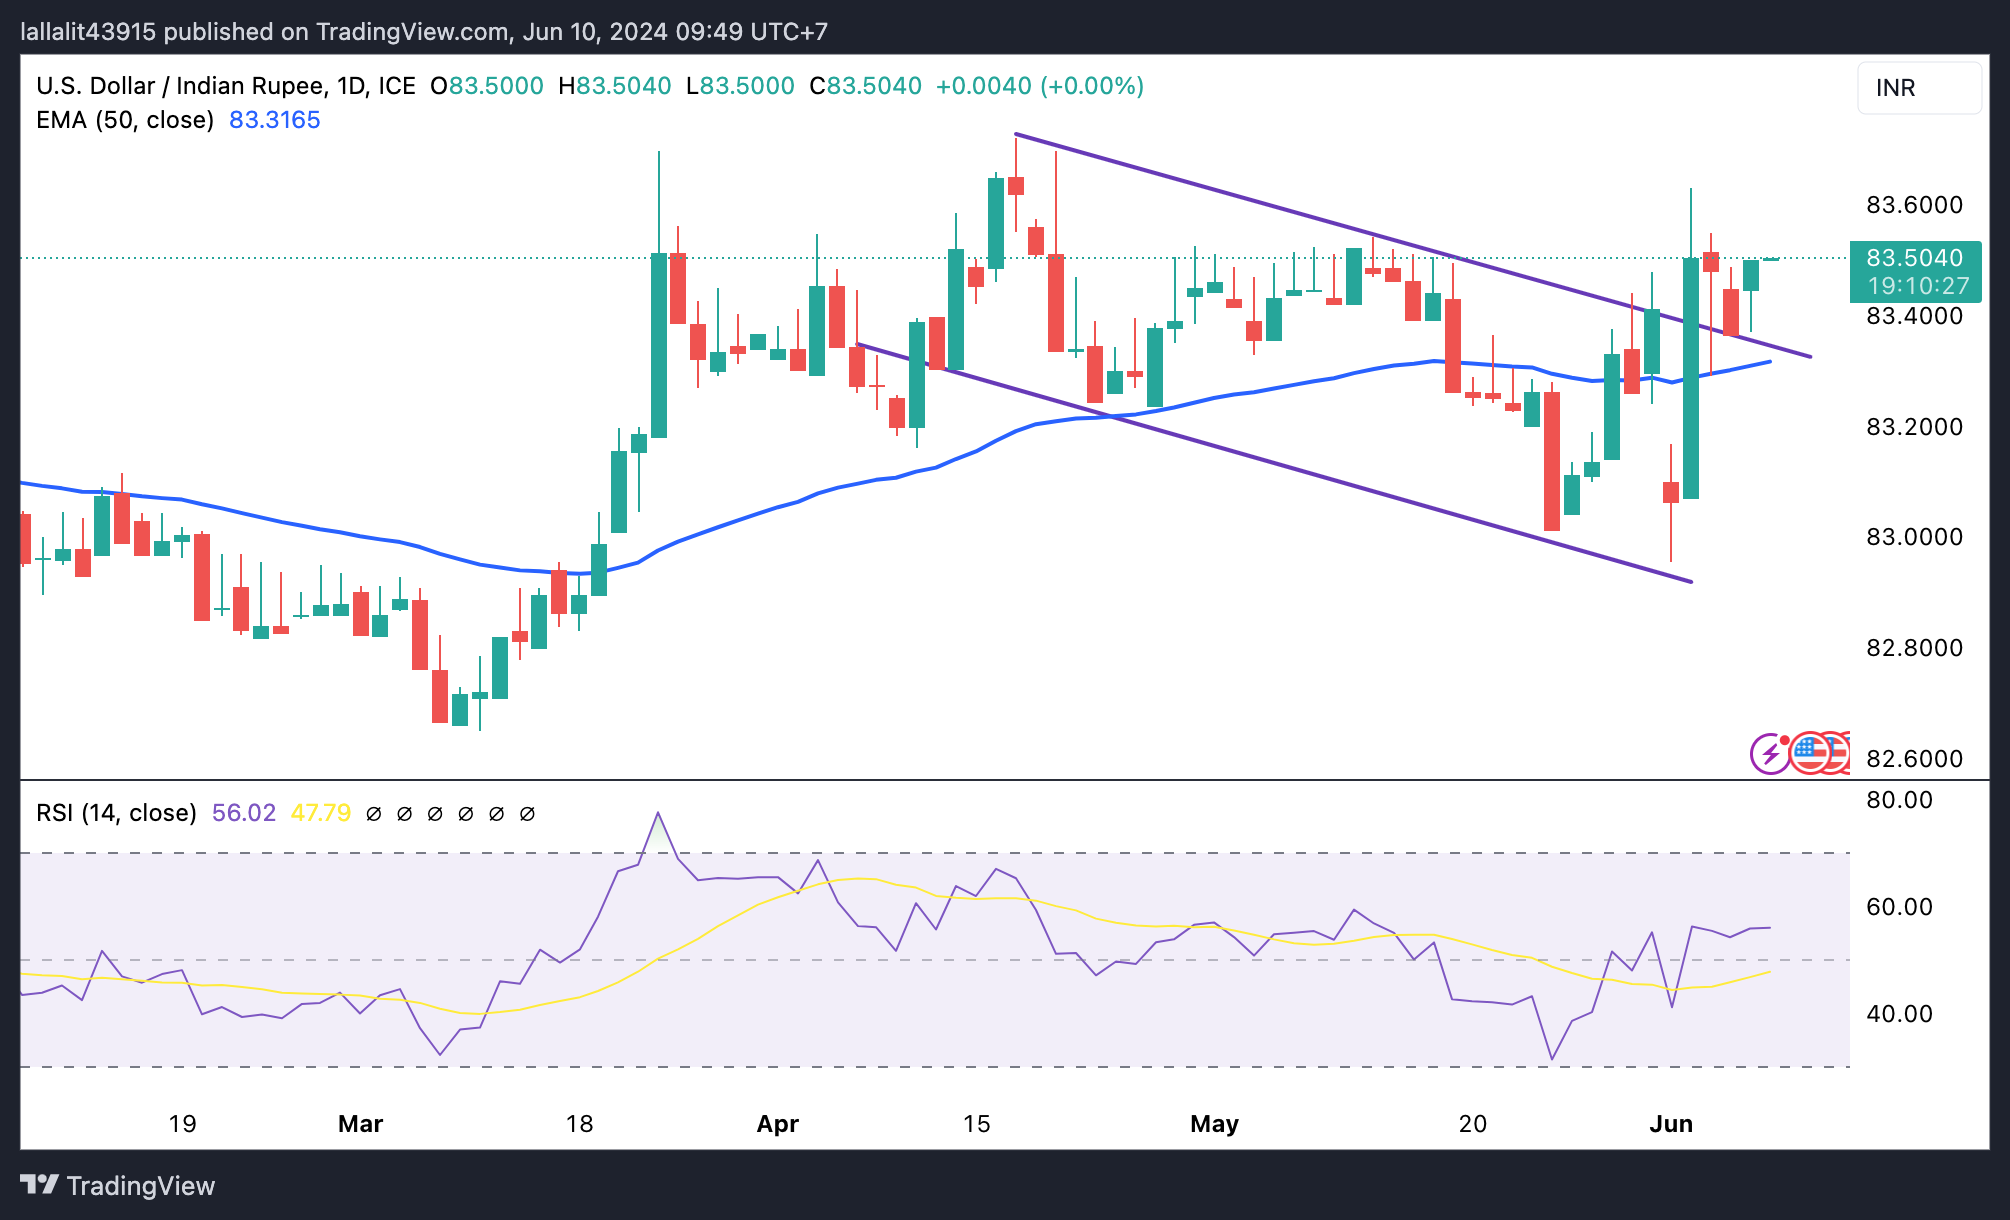
US Dollar price today
The table below shows the percentage change of US Dollar (USD) against listed major currencies today. US Dollar was the weakest against the Australian Dollar.
| USD | EUR | GBP | CAD | AUD | JPY | NZD | CHF | |
| USD | 0.10% | 0.06% | 0.03% | -0.10% | 0.10% | -0.01% | 0.15% | |
| EUR | -0.09% | -0.04% | -0.07% | -0.21% | 0.00% | -0.12% | 0.05% | |
| GBP | -0.07% | 0.04% | -0.03% | -0.17% | 0.03% | -0.09% | 0.09% | |
| CAD | -0.04% | 0.07% | 0.03% | -0.14% | 0.08% | -0.05% | 0.11% | |
| AUD | 0.12% | 0.24% | 0.19% | 0.14% | 0.20% | 0.09% | 0.27% | |
| JPY | -0.08% | 0.03% | -0.02% | -0.06% | -0.19% | -0.11% | 0.05% | |
| NZD | 0.02% | 0.11% | 0.07% | 0.04% | -0.08% | 0.11% | 0.17% | |
| CHF | -0.14% | -0.05% | -0.08% | -0.12% | -0.25% | -0.05% | -0.15% |
The heat map shows percentage changes of major currencies against each other. The base currency is picked from the left column, while the quote currency is picked from the top row. For example, if you pick the Euro from the left column and move along the horizontal line to the Japanese Yen, the percentage change displayed in the box will represent EUR (base)/JPY (quote).
Indian Rupee FAQs
The Indian Rupee (INR) is one of the most sensitive currencies to external factors. The price of Crude Oil (the country is highly dependent on imported Oil), the value of the US Dollar – most trade is conducted in USD – and the level of foreign investment, are all influential. Direct intervention by the Reserve Bank of India (RBI) in FX markets to keep the exchange rate stable, as well as the level of interest rates set by the RBI, are further major influencing factors on the Rupee.
The Reserve Bank of India (RBI) actively intervenes in forex markets to maintain a stable exchange rate, to help facilitate trade. In addition, the RBI tries to maintain the inflation rate at its 4% target by adjusting interest rates. Higher interest rates usually strengthen the Rupee. This is due to the role of the ‘carry trade’ in which investors borrow in countries with lower interest rates so as to place their money in countries’ offering relatively higher interest rates and profit from the difference.
Macroeconomic factors that influence the value of the Rupee include inflation, interest rates, the economic growth rate (GDP), the balance of trade, and inflows from foreign investment. A higher growth rate can lead to more overseas investment, pushing up demand for the Rupee. A less negative balance of trade will eventually lead to a stronger Rupee. Higher interest rates, especially real rates (interest rates less inflation) are also positive for the Rupee. A risk-on environment can lead to greater inflows of Foreign Direct and Indirect Investment (FDI and FII), which also benefit the Rupee.
Higher inflation, particularly, if it is comparatively higher than India’s peers, is generally negative for the currency as it reflects devaluation through oversupply. Inflation also increases the cost of exports, leading to more Rupees being sold to purchase foreign imports, which is Rupee-negative. At the same time, higher inflation usually leads to the Reserve Bank of India (RBI) raising interest rates and this can be positive for the Rupee, due to increased demand from international investors. The opposite effect is true of lower inflation.
- Gold languishes near a multi-week low touched on Friday amid reduced Fed rate cut bets.
- The stronger US NFP report suggests that the Fed might delay starting its rate-cutting cycle.
- The focus shifts to the US consumer inflation figures and the FOMC decision on Wednesday.
Gold price (XAU/USD) kicks off the new week on a subdued note and consolidates near its lowest level in over a month, below the $2,300 mark touched in the aftermath of blowout US monthly jobs data. The popularly known Nonfarm Payrolls (NFP) report showed that the world's largest economy created a lot more jobs than expected in May, forcing investors to scale back their bets for a September interest rate cut by the Federal Reserve (Fed). This keeps the US Treasury bond yields elevated and lifts the US Dollar (USD) to a nearly one-month high, which, in turn, is seen acting as a headwind for the non-yielding yellow metal.
Adding to this, reports that the People's Bank of China (PBoC) paused gold purchases to its reserves in May, ending a massive buying spree that ran for 18 months, further seem to undermine the Gold price. That said, a cautious market mood lends some support to the safe-haven XAU/USD and helps limit deeper losses. Traders also seem reluctant to place aggressive directional bets ahead of this week's key US data and central bank event risk – the release of the latest US consumer inflation figures and the outcome of the two-day FOMC policy meeting on Wednesday. This, in turn, warrants caution before positioning for further losses.
Daily Digest Market Movers: Gold price is undermined by hawkish Fed expectations, stronger USD
- The upbeat US employment details released on Friday fueled speculations that the Federal Reserve could delay the start of the rate-cutting cycle, which, in turn, is seen capping the upside for the non-yielding Gold price.
- The headline NFP showed that the US economy added 272K jobs in May as compared to the 185K anticipated and the previous month's upwardly revised 175K, overshadowing an uptick in the unemployment rate to 4.0%.
- Furthermore, Average Hourly Earnings surpassed consensus estimates and increased by 4.1% during the 12 months through May, which might push up prices and require the Fed to keep interest rates higher for longer.
- The yield on the benchmark 10-year US government bond jumped to 4.45% after the data, while the rate-sensitive 2-year yield remains close to 5.0%, underpinning the US Dollar and acting as a headwind for the XAU/USD.
- Meanwhile, the People's Bank of China (PBoC) snapped 18 months of continuous Gold buying in May, raising concern about decreasing demand for the bullion in one of the world’s biggest buyers and favoring bearish traders.
- Investors, however, prefer to wait on the sidelines ahead of this week's release of the latest US consumer inflation figures and the highly-anticipated FOMC monetary policy decision on Wednesday before placing directional bets.
- The chances of a rate cut in September fell to around 50% following the US jobs data, from around 70% on Thursday, and the markets are now pricing in just one cut of 25 basis points this year, either in November or December.
- Hence, investors will look for fresh signals on when the Fed will begin cutting interest rates amid the still resilient US economy, which will play a key role in determining the next leg of a directional move for the commodity.
Technical Analysis: Gold price seems vulnerable to decline further, 50-day SMA breakdown in play
From a technical perspective, Friday's close below the 50-day Simple Moving Average (SMA) and a subsequent breakdown through the $2,300 mark could be seen as a fresh trigger for bearish traders. Moreover, oscillators on the daily chart have been gaining negative traction and suggest that the path of least resistance for the Gold price is to the downside. Some follow-through selling below the $2,285 horizontal support will reaffirm the bearish outlook and expose the next relevant support near the $2,254-2,253 region. The downward trajectory could extend further towards the $2,225-2,220 area en route to the $2,200 round figure.
On the flip side, any attempted recovery might now confront stiff resistance near the $2,325 horizontal zone ahead of the 50-day SMA support breakpoint, currently pegged near the $2,343-2,344 region. This is followed by the $2,360-2,362 supply zone, which if cleared decisively should allow the Gold price to retest last week’s swing high, around the $2,387-2,388 area and reclaim the $2,400 mark. A sustained strength beyond the latter will negate any near-term negative bias and pave the way for some meaningful near-term appreciating move.
Gold FAQs
Gold has played a key role in human’s history as it has been widely used as a store of value and medium of exchange. Currently, apart from its shine and usage for jewelry, the precious metal is widely seen as a safe-haven asset, meaning that it is considered a good investment during turbulent times. Gold is also widely seen as a hedge against inflation and against depreciating currencies as it doesn’t rely on any specific issuer or government.
Central banks are the biggest Gold holders. In their aim to support their currencies in turbulent times, central banks tend to diversify their reserves and buy Gold to improve the perceived strength of the economy and the currency. High Gold reserves can be a source of trust for a country’s solvency. Central banks added 1,136 tonnes of Gold worth around $70 billion to their reserves in 2022, according to data from the World Gold Council. This is the highest yearly purchase since records began. Central banks from emerging economies such as China, India and Turkey are quickly increasing their Gold reserves.
Gold has an inverse correlation with the US Dollar and US Treasuries, which are both major reserve and safe-haven assets. When the Dollar depreciates, Gold tends to rise, enabling investors and central banks to diversify their assets in turbulent times. Gold is also inversely correlated with risk assets. A rally in the stock market tends to weaken Gold price, while sell-offs in riskier markets tend to favor the precious metal.
The price can move due to a wide range of factors. Geopolitical instability or fears of a deep recession can quickly make Gold price escalate due to its safe-haven status. As a yield-less asset, Gold tends to rise with lower interest rates, while higher cost of money usually weighs down on the yellow metal. Still, most moves depend on how the US Dollar (USD) behaves as the asset is priced in dollars (XAU/USD). A strong Dollar tends to keep the price of Gold controlled, whereas a weaker Dollar is likely to push Gold prices up.
- The Australian Dollar remains tepid as robust US labor data would bolster a hawkish stance from the Fed.
- The Australian Dollar may limit its downside due to the hawkish sentiment surrounding the RBA.
- The US Dollar (USD) extends its gains due to the appreciated US Treasury yields.
The Australian Dollar (AUD) remains soft on Monday following the decline in the previous session. The US Dollar (USD) regained its strength from the better-than-expected US employment data released on Friday, which has caused traders to delay their expectations of a Federal Reserve’s (Fed) rate cuts. This has put pressure on the AUD/USD pair.
The Australian Dollar may limit its downside due to the hawkish sentiment surrounding the Reserve Bank of Australia (RBA). Last week, RBA Governor Michele Bullock indicated that the central bank is prepared to increase interest rates if the Consumer Price Index (CPI) does not return to the target range of 1%-3%, according to NCA NewsWire.
The US Dollar (USD) extends its gains due to the appreciation in US Treasury yields as a strong US jobs report would bolster a hawkish stance from the Federal Reserve. The CME FedWatch Tool indicates that the likelihood of a Fed rate cut in September by at least 25 basis points has decreased to nearly 48.0%, down from 54.8% a week earlier.
Daily Digest Market Movers: Australian Dollar remains calm till further indication on Fed policy
- Rabobank suggested in its report that the Federal Reserve may cut rates in September and December, more likely because of a deteriorating economy than because of progress on inflation. This is because they think that the US economy is entering a stagflationary phase with persistent inflation and an economic slowdown that is likely to end in a mild recession later this year.
- According to the US Bureau of Labor Statistics (BLS) on Friday, May's US Nonfarm Payrolls (NFP) increased by 272,000, up from 165,000 in April. The wage inflation, as measured by the Average Hourly Earnings, rose 4.1% YoY in May from 4.0% (revised from 3.9%) in April, above the market consensus of 3.9%.
- The National Bureau of Statistics of China reported on Friday that Trade Surplus widened to $82.62 billion year-over-year in May, surpassing the expected balance of $73.00 billion and the previous balance of $65.55 billion. Meanwhile, imports rose by 1.8% from the prior year to USD 219.73 billion in May, missing market estimates of 4.2% while experiencing a significant decrease from April's 8.4% rise. Any change in China's economy could impact the Australian market as both countries are close trade partners.
- On Friday, Australia's Trade Balance widened to A$6,548 ($4,321.68) million MoM in May, exceeding the expected A$5,500 million and April's balance of A$5,024 million. Imports plunged by 7.2% MoM in May, swinging from April’s 4.2% increase. Exports shrank 2.5% following the previous decline of 0.6%.
- On Thursday, Initial Jobless Claims showed the number of people claiming unemployment benefits in the US increased by 8,000 to 229,000 for the week ending May 31, surpassing market expectations of 220,000. This marks the highest reading since the eight-month high of 232,000 recorded in early May.
Technical Analysis: Australian Dollar holds ground above 0.6550
The Australian Dollar trades around 0.6580 on Monday. Analysis of the daily chart suggests a weakening bullish bias for the AUD/USD pair, as it has fallen below the lower boundary of an ascending channel pattern. This is corroborated by the 14-day Relative Strength Index (RSI), which is positioned slightly below the 50 level.
The key support appears at the major level of 0.6550, followed by the significant level of 0.6500. A break below the latter could exert pressure on the AUD/USD pair to navigate the area around the throwback support at 0.6470.
On the upside, the 21-day Exponential Moving Average (EMA) at 0.6625 appears as the key barrier, aligned with the lower boundary of the ascending channel around the level of 0.6635. A return into the ascending channel pattern could reinforce the bullish bias and lead the AUD/USD pair to target the psychological level of 0.6700, followed by May’s high of 0.6714.
AUD/USD: Daily Chart
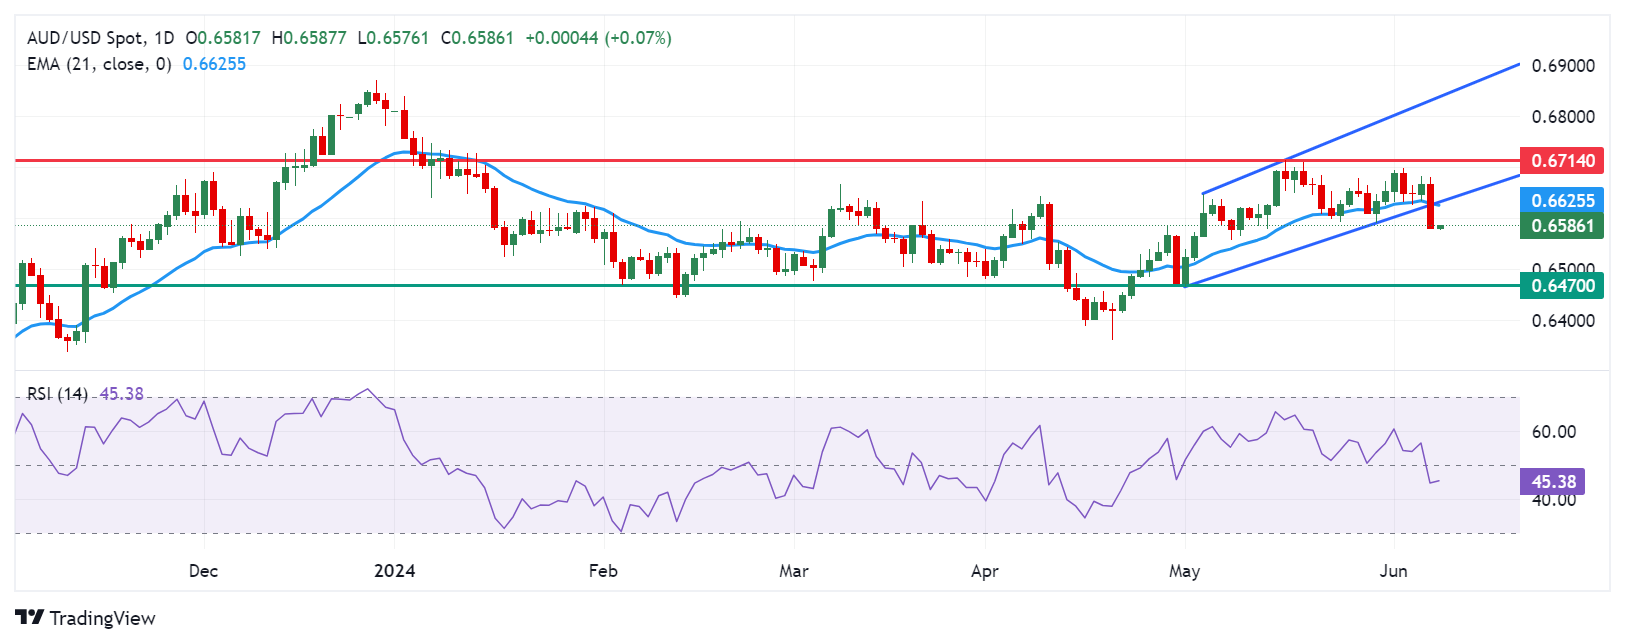
Australian Dollar price today
The table below shows the percentage change of the Australian Dollar (AUD) against listed major currencies today. The Australian Dollar was the weakest against the New Zealand Dollar.
| USD | EUR | GBP | CAD | AUD | JPY | NZD | CHF | |
| USD | 0.06% | 0.04% | 0.04% | -0.06% | 0.09% | 0.02% | 0.09% | |
| EUR | -0.06% | -0.01% | -0.03% | -0.12% | 0.03% | -0.04% | 0.03% | |
| GBP | -0.06% | 0.02% | -0.01% | -0.11% | 0.05% | -0.04% | 0.05% | |
| CAD | -0.04% | 0.02% | 0.01% | -0.09% | 0.06% | -0.02% | 0.06% | |
| AUD | 0.07% | 0.14% | 0.11% | 0.09% | 0.15% | 0.06% | 0.14% | |
| JPY | -0.08% | -0.04% | -0.04% | -0.05% | -0.16% | -0.07% | 0.00% | |
| NZD | -0.03% | 0.04% | 0.02% | 0.02% | -0.07% | 0.07% | 0.07% | |
| CHF | -0.08% | -0.04% | -0.05% | -0.06% | -0.15% | 0.02% | -0.05% |
The heat map shows percentage changes of major currencies against each other. The base currency is picked from the left column, while the quote currency is picked from the top row. For example, if you pick the Euro from the left column and move along the horizontal line to the Japanese Yen, the percentage change displayed in the box will represent EUR (base)/JPY (quote).
Australian Dollar FAQs
One of the most significant factors for the Australian Dollar (AUD) is the level of interest rates set by the Reserve Bank of Australia (RBA). Because Australia is a resource-rich country another key driver is the price of its biggest export, Iron Ore. The health of the Chinese economy, its largest trading partner, is a factor, as well as inflation in Australia, its growth rate and Trade Balance. Market sentiment – whether investors are taking on more risky assets (risk-on) or seeking safe-havens (risk-off) – is also a factor, with risk-on positive for AUD.
The Reserve Bank of Australia (RBA) influences the Australian Dollar (AUD) by setting the level of interest rates that Australian banks can lend to each other. This influences the level of interest rates in the economy as a whole. The main goal of the RBA is to maintain a stable inflation rate of 2-3% by adjusting interest rates up or down. Relatively high interest rates compared to other major central banks support the AUD, and the opposite for relatively low. The RBA can also use quantitative easing and tightening to influence credit conditions, with the former AUD-negative and the latter AUD-positive.
China is Australia’s largest trading partner so the health of the Chinese economy is a major influence on the value of the Australian Dollar (AUD). When the Chinese economy is doing well it purchases more raw materials, goods and services from Australia, lifting demand for the AUD, and pushing up its value. The opposite is the case when the Chinese economy is not growing as fast as expected. Positive or negative surprises in Chinese growth data, therefore, often have a direct impact on the Australian Dollar and its pairs.
Iron Ore is Australia’s largest export, accounting for $118 billion a year according to data from 2021, with China as its primary destination. The price of Iron Ore, therefore, can be a driver of the Australian Dollar. Generally, if the price of Iron Ore rises, AUD also goes up, as aggregate demand for the currency increases. The opposite is the case if the price of Iron Ore falls. Higher Iron Ore prices also tend to result in a greater likelihood of a positive Trade Balance for Australia, which is also positive of the AUD.
The Trade Balance, which is the difference between what a country earns from its exports versus what it pays for its imports, is another factor that can influence the value of the Australian Dollar. If Australia produces highly sought after exports, then its currency will gain in value purely from the surplus demand created from foreign buyers seeking to purchase its exports versus what it spends to purchase imports. Therefore, a positive net Trade Balance strengthens the AUD, with the opposite effect if the Trade Balance is negative.
| Raw materials | Closed | Change, % |
|---|---|---|
| Silver | 29.136 | -7 |
| Gold | 2292.7 | -3.52 |
| Palladium | 911.63 | -1.72 |
Following the European Union (EU) elections, French President Emmanuel Macron announced on Sunday snap elections in an unprecedented move.
Macron said he would dissolve parliament and call new legislative elections after exit polls showed his alliance suffered a heavy defeat in European elections to Marine Le Pen’s far-right National Rally (RN) party.
Addressing the nation, he said lower house elections would be called for June 30, with a second-round vote on July 7.
Macron said, “this is an essential time for clarification. I have heard your message, your concerns and I will not leave them unanswered … France needs a clear majority to act in serenity and harmony.”
“Far-right parties… are progressing everywhere in the continent. It is a situation to which I cannot resign myself,” he said.
This comes after Macron warned Thursday that the EU risked being "blocked" by a big far-right presence in the European Parliament after this week's elections.
Market reaction
Renewed uncertainty over the political scenario in France undermines the Euro, dragging EUR/USD 0.26% lower on the day to trade near 1.0770.
Euro FAQs
The Euro is the currency for the 20 European Union countries that belong to the Eurozone. It is the second most heavily traded currency in the world behind the US Dollar. In 2022, it accounted for 31% of all foreign exchange transactions, with an average daily turnover of over $2.2 trillion a day. EUR/USD is the most heavily traded currency pair in the world, accounting for an estimated 30% off all transactions, followed by EUR/JPY (4%), EUR/GBP (3%) and EUR/AUD (2%).
The European Central Bank (ECB) in Frankfurt, Germany, is the reserve bank for the Eurozone. The ECB sets interest rates and manages monetary policy. The ECB’s primary mandate is to maintain price stability, which means either controlling inflation or stimulating growth. Its primary tool is the raising or lowering of interest rates. Relatively high interest rates – or the expectation of higher rates – will usually benefit the Euro and vice versa. The ECB Governing Council makes monetary policy decisions at meetings held eight times a year. Decisions are made by heads of the Eurozone national banks and six permanent members, including the President of the ECB, Christine Lagarde.
Eurozone inflation data, measured by the Harmonized Index of Consumer Prices (HICP), is an important econometric for the Euro. If inflation rises more than expected, especially if above the ECB’s 2% target, it obliges the ECB to raise interest rates to bring it back under control. Relatively high interest rates compared to its counterparts will usually benefit the Euro, as it makes the region more attractive as a place for global investors to park their money.
Data releases gauge the health of the economy and can impact on the Euro. Indicators such as GDP, Manufacturing and Services PMIs, employment, and consumer sentiment surveys can all influence the direction of the single currency. A strong economy is good for the Euro. Not only does it attract more foreign investment but it may encourage the ECB to put up interest rates, which will directly strengthen the Euro. Otherwise, if economic data is weak, the Euro is likely to fall. Economic data for the four largest economies in the euro area (Germany, France, Italy and Spain) are especially significant, as they account for 75% of the Eurozone’s economy.
Another significant data release for the Euro is the Trade Balance. This indicator measures the difference between what a country earns from its exports and what it spends on imports over a given period. If a country produces highly sought after exports then its currency will gain in value purely from the extra demand created from foreign buyers seeking to purchase these goods. Therefore, a positive net Trade Balance strengthens a currency and vice versa for a negative balance.
- WTI price gains ground due to speculation of a Fed rate cut in September.
- Crude Oil prices may struggle as a strong US jobs report would bolster a hawkish stance from the Fed.
- Concerns about a supply surplus have grown as OPEC+ decided to reverse voluntary cuts gradually.
West Texas Intermediate (WTI) Oil price recovers the previous session's losses, trading around $75.30 per barrel during Monday's Asian trading hours. This increase in crude Oil prices is largely due to speculation that the US Federal Reserve (Fed) may cut interest rates in September.
However, better-than-expected US employment data released on Friday has caused traders to delay their expectations of a Fed rate cut. According to the US Bureau of Labor Statistics (BLS), May's US Nonfarm Payrolls (NFP) increased by 272,000, up from 165,000 in April. The stronger employment data has attracted buyers to the US Dollar (USD), which has put downward pressure on Oil prices by making the commodity more expensive for buyer countries using other currencies.
Crude Oil prices may face pressure if borrowing costs remain high for an extended period, which would negatively impact Oil demand. A strong US jobs report would bolster a hawkish stance from the Federal Reserve. The CME FedWatch Tool indicates that the likelihood of a Fed rate cut in September by at least 25 basis points has decreased to nearly 48.0%, down from 54.8% a week earlier.
Additionally, concerns over a potential supply surplus of Oil have increased as the Organization of the Petroleum Exporting Countries and its allies (OPEC+) decided to gradually unwind voluntary cuts from eight member countries starting in October. By December, more than 500,000 barrels per day (bpd) are expected to re-enter the market, with a total of 1.8 million bpd returning by June 2025.
- GBP/USD trades with mild gains near 1.2725 despite the firmer US Dollar on Monday.
- The US economy created more jobs than expected in May, which dampened the expectation of Fed rate cuts in September.
- The stronger US employment report pared back Fed rate cut expectation, weighing on the Greenback.
The GBP/USD pair recovers some lost ground around 1.2725 during the early Asian trading hours on Monday. The upside of GBP/USD might be limited amid the lower bets of the US Federal Reserve (Fed) rate cuts this year after the stronger-than-expected US Nonfarm Payrolls (NFP) data. Investors will closely watch the UK employment data for May, which is due on Tuesday. On the US docket, the Consumer Price Index (CPI) and Federal Reserve (Fed) interesting that decision this week will be in the spotlight.
On Friday, the US Nonfarm Payrolls rose 272,000 in May from a 165,000 increase in April, above the market consensus of 185,000. Meanwhile, the Unemployment Rate ticked up to 4.0% in May from 3.9% in April. The Average Hourly Earnings climbed 4.1% YoY in May from 4.0% in April (revised from 3.9%), better than the estimate of 3.9%, according to the US Bureau of Labor Statistics.
The robust US employment report pared back rate cut expectations from the Federal Reserve (Fed) on Thursday. Futures traders see almost no chance of a rate cut before September, according to data from CME Group. The higher-for-longer US rate mantra is likely to support the US Dollar (USD) for the time being.
On the other hand, the UK Employment data on Tuesday, including Claimant Count Change, Employment Change, and Average Earnings data. Any signs of more layoffs could trigger the expectation of early rate cuts by the Bank of England (BoE) and undermine the Pound Sterling (GBP).
- EUR/USD drops to a multi-week low and is pressured by a combination of factors.
- The upbeat US NFP tempers Fed rate cut bets and continues to underpin the USD.
- Increasing political uncertainty weighs on the Euro and contributes to the decline.
The EUR/USD pair remains under some selling pressure for the second straight day and drops to over a three-week low during the Asian session on Monday. Spot prices currently trade around the 1.0775 region and seem vulnerable to extending the post-NFP breakdown momentum through the 100-day Simple Moving Average (SMA).
The Labor Department's closely watched monthly employment report showed that the US economy added 272K jobs in May as compared to the 185K anticipated and the previous month's upwardly revised 175K. Adding to this, Average Hourly Earnings surpassed consensus estimates and increased by 4.1% during the 12 months through May, overshadowing an uptick in the jobless rate to 4.0%.
Nevertheless, the data forced investors to scale back their expectations about an imminent rate cut by the Federal Reserve (Fed) in September and kept the US Treasury bond yields elevated. This, along with the cautious mood around the equity markets, is seen underpinning the safe-haven US Dollar (USD) and turning out to be a key factor exerting some downward pressure on the EUR/USD pair.
The shared currency, on the other hand, is undermined by an aggregated exit poll, which indicated that Eurosceptic nationalists made the biggest gains in European Parliament elections in the Sunday vote. Furthermore, French President Emmanuel Macron's decision to call snap elections later this month increases political uncertainty in the Eurozone's second-biggest economy and favors Euro bears.
This, in turn, suggests that the path of least resistance for the EUR/USD pair is to the downside, though traders might refrain from placing aggressive directional bets ahead of the crucial FOMC policy decision on Wednesday. Heading into the key central bank event risk, traders will confront the release of the latest US consumer inflation figures, which will drive the USD and provide some meaningful impetus.
The People's Bank of China (PBOC) paused gold purchases to its reserves in May, ending a massive buying spree that ran for 18 months, according to Bloomberg.
China’s central bank has been one of the biggest gold buyers for years, steadily stocking up bullion since 2022 amid rising geopolitical tensions. China held 72.80 million troy ounces of gold at the end of May, which remained constant from the end of April, the data showed. The value of China’s gold reserves increased to $170.96 billion at the end of May from $167.96 billion in April.
Market reaction
At the time of press, Gold price (XAU/USD) was up 0.12% on the day at $2,296.
Gold FAQs
Gold has played a key role in human’s history as it has been widely used as a store of value and medium of exchange. Currently, apart from its shine and usage for jewelry, the precious metal is widely seen as a safe-haven asset, meaning that it is considered a good investment during turbulent times. Gold is also widely seen as a hedge against inflation and against depreciating currencies as it doesn’t rely on any specific issuer or government.
Central banks are the biggest Gold holders. In their aim to support their currencies in turbulent times, central banks tend to diversify their reserves and buy Gold to improve the perceived strength of the economy and the currency. High Gold reserves can be a source of trust for a country’s solvency. Central banks added 1,136 tonnes of Gold worth around $70 billion to their reserves in 2022, according to data from the World Gold Council. This is the highest yearly purchase since records began. Central banks from emerging economies such as China, India and Turkey are quickly increasing their Gold reserves.
Gold has an inverse correlation with the US Dollar and US Treasuries, which are both major reserve and safe-haven assets. When the Dollar depreciates, Gold tends to rise, enabling investors and central banks to diversify their assets in turbulent times. Gold is also inversely correlated with risk assets. A rally in the stock market tends to weaken Gold price, while sell-offs in riskier markets tend to favor the precious metal.
The price can move due to a wide range of factors. Geopolitical instability or fears of a deep recession can quickly make Gold price escalate due to its safe-haven status. As a yield-less asset, Gold tends to rise with lower interest rates, while higher cost of money usually weighs down on the yellow metal. Still, most moves depend on how the US Dollar (USD) behaves as the asset is priced in dollars (XAU/USD). A strong Dollar tends to keep the price of Gold controlled, whereas a weaker Dollar is likely to push Gold prices up.
| Index | Change, points | Closed | Change, % |
|---|---|---|---|
| NIKKEI 225 | -19.58 | 38683.93 | -0.05 |
| Hang Seng | -109.85 | 18366.95 | -0.59 |
| KOSPI | 33.17 | 2722.67 | 1.23 |
| ASX 200 | 38.2 | 7860 | 0.49 |
| DAX | -95.4 | 18557.27 | -0.51 |
| CAC 40 | -38.32 | 8001.8 | -0.48 |
| Dow Jones | -87.18 | 38798.99 | -0.22 |
| S&P 500 | -5.97 | 5346.99 | -0.11 |
| NASDAQ Composite | -39.99 | 17133.13 | -0.23 |
- Gold price remains on the defensive around $2,295 in Friday’s early Asian session.
- The US economy added 272K jobs in May, above expectations of 185K new roles.
- The Chinese central bank paused gold purchases in May after 18 months of buying.
Gold price (XAU/USD) trims losses near $2,295 despite the stronger US Dollar (USD) on Monday during the early Asian session. The yellow metal edges lower to one-month lows on Friday amid lower bets on US Federal Reserve (Fed) rate cuts this year and bearish sentiment fueled by news indicating that China paused gold purchases in May after 18 months of buying.
The US employment data came in better than expected and prompted traders to push back the expected timing of Fed rate cuts. On Friday, the US Nonfarm Payrolls (NFP) for May rose 272K from a 165K increase in April (revised from 175K), according to the US Bureau of Labor Statistics (BLS). Meanwhile, the Unemployment Rate increased to 4.0% in May from 3.9% in April. The US Dollar (USD) attracts some buyers in response to the stronger data and weighs on the gold price as it makes bullion more expensive for overseas buyers.
The gold market is seeing a bit of liquidation, along with other metals since the data shows the US economy is quite robust and the Fed may delay that first rate cut, said Blue Line Futures chief market strategist, Phillip Streible. The financial markets are now pricing in nearly 49% odds of a rate cut for the September meeting, down from 68% before the NFP data, according to the CME FedWatch tool.
Furthermore, the People's Bank of China (PBOC), one of the world’s biggest gold buyers for years, snapped 18 months of continuous gold buying in May as the price hit record highs in April and May, per Bloomberg. The concern about decreasing demand for gold exerted some selling pressure on the precious metal.
China held 72.80 million troy ounces of gold at the end of May, which remained constant from the end of April, the data showed. Meanwhile, the value of China’s gold reserves increased to $170.96 billion at the end of May from $167.96 billion in April.
| Pare | Closed | Change, % |
|---|---|---|
| AUDUSD | 0.65818 | -1.3 |
| EURJPY | 169.312 | -0.09 |
| EURUSD | 1.08019 | -0.83 |
| GBPJPY | 199.415 | 0.2 |
| GBPUSD | 1.27223 | -0.55 |
| NZDUSD | 0.61043 | -1.53 |
| USDCAD | 1.37653 | 0.72 |
| USDCHF | 0.89662 | 0.81 |
| USDJPY | 156.749 | 0.76 |


© 2000-2026. All rights reserved.
This site is managed by Teletrade D.J. LLC 2351 LLC 2022 (Euro House, Richmond Hill Road, Kingstown, VC0100, St. Vincent and the Grenadines).
The information on this website is for informational purposes only and does not constitute any investment advice.
The company does not serve or provide services to customers who are residents of the US, Canada, Iran, The Democratic People's Republic of Korea, Yemen and FATF blacklisted countries.
Making transactions on financial markets with marginal financial instruments opens up wide possibilities and allows investors who are willing to take risks to earn high profits, carrying a potentially high risk of losses at the same time. Therefore you should responsibly approach the issue of choosing the appropriate investment strategy, taking the available resources into account, before starting trading.
Use of the information: full or partial use of materials from this website must always be referenced to TeleTrade as the source of information. Use of the materials on the Internet must be accompanied by a hyperlink to teletrade.org. Automatic import of materials and information from this website is prohibited.
Please contact our PR department if you have any questions or need assistance at pr@teletrade.global.
transfers