- Analytics
- News and Tools
- Market News
CFD Markets News and Forecasts — 09-10-2024
- USD/CAD edges higher to near 1.3710 in Thursday’s early Asian session.
- Fed Minutes said a 50 bps rate cut was backed by the majority of officials.
- Lower crude oil prices weigh on the commodity-linked Loonie.
The USD/CAD pair trades with mild gains to around 1.3710 despite the stronger US Dollar (USD) during the early Asian session on Thursday. The rising bets of 25 basis points (bps) by the US Federal Reserve (Fed) in November might provide some support to the pair ahead of the key US Consumer Price Index (CPI) data on Thursday.
The Open Market Committee (FOMC) Minutes from the September meeting released on Wednesday indicated a “substantial majority” of policymakers supported the outsize cut, but also suggested there was robust debate over the decision. However, "some" participants favored only a quarter-point cut, while "a few others" mentioned they could have supported that decision as well.
On Wednesday, Boston Fed President Susan Collins said that with inflation trends growing weaker, it is very probable that the Fed can deliver more interest rate reductions. Meanwhile, Boston Fed President Susan Collins noted, “I saw an initial 50-basis-point rate reduction as prudent in this context, recognizing that monetary policy remains in restrictive territory.”
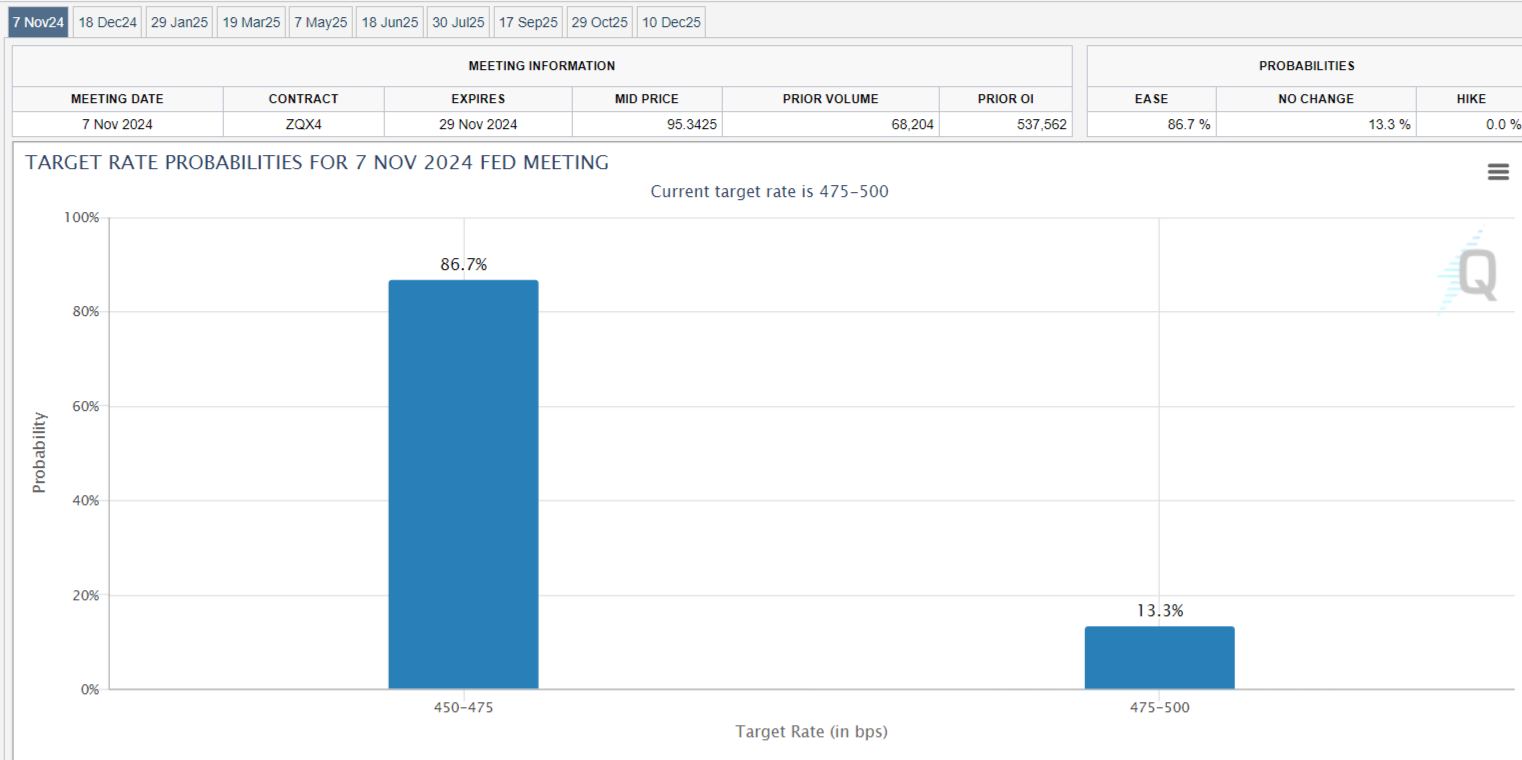
Investors now see the Fed lowering interest rates by a quarter point in November instead of a jumbo rate cut, followed by a similar move in December. This, in turn, could lift the Greenback against the Canadian Dollar (CAD) in the near term. The markets have priced in nearly an 80% chance of 25 basis points (bps) Fed rate cuts in November, up from 31.1% last week, according to the CME FedWatch Tool.
On the Loonie front, the decline of crude oil prices could exert some selling pressure on the commodity-linked CAD as Canada is the largest oil exporter to the United States. On Friday, traders will take more cues from the Canadian job report for September, including the Unemployment Rate and Net Change in Employment. If the report shows a stronger-than-expected outcome, this could help limit the CAD’s losses.
Canadian Dollar FAQs
The key factors driving the Canadian Dollar (CAD) are the level of interest rates set by the Bank of Canada (BoC), the price of Oil, Canada’s largest export, the health of its economy, inflation and the Trade Balance, which is the difference between the value of Canada’s exports versus its imports. Other factors include market sentiment – whether investors are taking on more risky assets (risk-on) or seeking safe-havens (risk-off) – with risk-on being CAD-positive. As its largest trading partner, the health of the US economy is also a key factor influencing the Canadian Dollar.
The Bank of Canada (BoC) has a significant influence on the Canadian Dollar by setting the level of interest rates that banks can lend to one another. This influences the level of interest rates for everyone. The main goal of the BoC is to maintain inflation at 1-3% by adjusting interest rates up or down. Relatively higher interest rates tend to be positive for the CAD. The Bank of Canada can also use quantitative easing and tightening to influence credit conditions, with the former CAD-negative and the latter CAD-positive.
The price of Oil is a key factor impacting the value of the Canadian Dollar. Petroleum is Canada’s biggest export, so Oil price tends to have an immediate impact on the CAD value. Generally, if Oil price rises CAD also goes up, as aggregate demand for the currency increases. The opposite is the case if the price of Oil falls. Higher Oil prices also tend to result in a greater likelihood of a positive Trade Balance, which is also supportive of the CAD.
While inflation had always traditionally been thought of as a negative factor for a currency since it lowers the value of money, the opposite has actually been the case in modern times with the relaxation of cross-border capital controls. Higher inflation tends to lead central banks to put up interest rates which attracts more capital inflows from global investors seeking a lucrative place to keep their money. This increases demand for the local currency, which in Canada’s case is the Canadian Dollar.
Macroeconomic data releases gauge the health of the economy and can have an impact on the Canadian Dollar. Indicators such as GDP, Manufacturing and Services PMIs, employment, and consumer sentiment surveys can all influence the direction of the CAD. A strong economy is good for the Canadian Dollar. Not only does it attract more foreign investment but it may encourage the Bank of Canada to put up interest rates, leading to a stronger currency. If economic data is weak, however, the CAD is likely to fall.
Federal Reserve Bank of San Francisco President Mary Daly said on Wednesday that she "fully" supported the Fed's half of a percentage-point interest-rate cut last month. Daly further stated that one or two more rate cuts this year are likely if the economy evolves as she expects, per Reuters.
Key quotes
Fully supported half-point rate cut.
Quite confident we are on path to 2% inflation.
We are at full employment.
With policy rate steady, real rate was rising.
Rising real rate was a recipe for overtightening and injuring the labor market.
Rate cut was a recalibration, to rightsize rates for the economy.
Size of September rate cut does not say anything about pace or size of next cuts.
Two or one more cut this year is what is likely.
We will watch data, monitor labor market and inflation.
We will make more or fewer adjustments to rates as necessary.
I do not want to see further slowing in the labor market.
Most firms are seeing a hybrid work situation, not a return to a 5-day-in-the-office situation.
I am not worried about accelerating inflation.
I was more worried about injuring the labor market.
Will watch inflation data carefully.
Little evidence that balance sheet expansion has much of a direct effect on inflation.
We are coming near the inflation target but not satisfied, no victory declared.
Balance sheet is coming down to more normalised levels.
Market reaction
The US Dollar Index (DXY) is trading 0.01% lower on the day at 102.90, as of writing.
Fed FAQs
Monetary policy in the US is shaped by the Federal Reserve (Fed). The Fed has two mandates: to achieve price stability and foster full employment. Its primary tool to achieve these goals is by adjusting interest rates. When prices are rising too quickly and inflation is above the Fed’s 2% target, it raises interest rates, increasing borrowing costs throughout the economy. This results in a stronger US Dollar (USD) as it makes the US a more attractive place for international investors to park their money. When inflation falls below 2% or the Unemployment Rate is too high, the Fed may lower interest rates to encourage borrowing, which weighs on the Greenback.
The Federal Reserve (Fed) holds eight policy meetings a year, where the Federal Open Market Committee (FOMC) assesses economic conditions and makes monetary policy decisions. The FOMC is attended by twelve Fed officials – the seven members of the Board of Governors, the president of the Federal Reserve Bank of New York, and four of the remaining eleven regional Reserve Bank presidents, who serve one-year terms on a rotating basis.
In extreme situations, the Federal Reserve may resort to a policy named Quantitative Easing (QE). QE is the process by which the Fed substantially increases the flow of credit in a stuck financial system. It is a non-standard policy measure used during crises or when inflation is extremely low. It was the Fed’s weapon of choice during the Great Financial Crisis in 2008. It involves the Fed printing more Dollars and using them to buy high grade bonds from financial institutions. QE usually weakens the US Dollar.
Quantitative tightening (QT) is the reverse process of QE, whereby the Federal Reserve stops buying bonds from financial institutions and does not reinvest the principal from the bonds it holds maturing, to purchase new bonds. It is usually positive for the value of the US Dollar.
Federal Reserve Bank of Boston President Susan Collins said on Wednesday that it was “prudent” for Fed officials to lower rates by a half percentage point in September as inflation eases and the economy becomes more vulnerable to shocks, per Bloomberg.
Key quotes
“I saw an initial 50-basis-point rate reduction as prudent in this context, recognizing that monetary policy remains in restrictive territory,”
“Further adjustments will likely be needed.”
"I will stress that policy is not on a pre-set path and will remain carefully data dependent, adjusting as the economy evolves.”
"The recent data, including September's unexpectedly robust jobs report, bolster my assessment that the labor market remains in a good place overall – neither too hot nor too cold,”
"It will be important to preserve the currently healthy labor market conditions," she said, noting that it would "require economic activity continuing to grow close to trend, which is my baseline outlook.”
Market reaction
The US Dollar Index (DXY) is trading 0.01% lower on the day at 102.90, as of writing.
Fed FAQs
Monetary policy in the US is shaped by the Federal Reserve (Fed). The Fed has two mandates: to achieve price stability and foster full employment. Its primary tool to achieve these goals is by adjusting interest rates. When prices are rising too quickly and inflation is above the Fed’s 2% target, it raises interest rates, increasing borrowing costs throughout the economy. This results in a stronger US Dollar (USD) as it makes the US a more attractive place for international investors to park their money. When inflation falls below 2% or the Unemployment Rate is too high, the Fed may lower interest rates to encourage borrowing, which weighs on the Greenback.
The Federal Reserve (Fed) holds eight policy meetings a year, where the Federal Open Market Committee (FOMC) assesses economic conditions and makes monetary policy decisions. The FOMC is attended by twelve Fed officials – the seven members of the Board of Governors, the president of the Federal Reserve Bank of New York, and four of the remaining eleven regional Reserve Bank presidents, who serve one-year terms on a rotating basis.
In extreme situations, the Federal Reserve may resort to a policy named Quantitative Easing (QE). QE is the process by which the Fed substantially increases the flow of credit in a stuck financial system. It is a non-standard policy measure used during crises or when inflation is extremely low. It was the Fed’s weapon of choice during the Great Financial Crisis in 2008. It involves the Fed printing more Dollars and using them to buy high grade bonds from financial institutions. QE usually weakens the US Dollar.
Quantitative tightening (QT) is the reverse process of QE, whereby the Federal Reserve stops buying bonds from financial institutions and does not reinvest the principal from the bonds it holds maturing, to purchase new bonds. It is usually positive for the value of the US Dollar.
- The Canadian Dollar fell further on Wednesday, shedding another half of a percent.
- Canada remains hamstrung on the economic calendar until Friday’s labor print.
- Analysts expect another 50 bps rate cut from the BoC.
The Canadian Dollar (CAD) backslid again on Wednesday, shedding another percent against the Greenback. The US Dollar continues to gain ground across the board, with a notable lack of broad-market CAD bullishness sending the Loonie into multi-week lows.
Canada remains largely absent from the economic calendar for most of this week, leaving what few CAD traders remain at the table to sit and wait for Friday’s Canadian labor update. Global financial markets continue to hinge their outlook entirely on central bank action, and the Bank of Canada (BoC) is widely expected to undermine the Canadian Dollar once more with another outsized rate cut believed to be in the pipe.
Daily digest market movers
- The CAD has declined for all but two of the last ten consecutive trading days, falling two and a quarter percent against the Greenback.
- USD/CAD has risen to its highest bids since mid-August after rallying from a 33-week low near 1.3400.
- Canadian labor figures slated for Friday are expected to show a still-sluggish pace of job creation in September, forecast to come in at only 27K compared to the previous month’s 22.1K.
- The Canadian Unemployment Rate is also expected to tick up in September to 6.7% from 6.6%.
- According to some Canadian banking analysts, the BoC is expected to deliver another rate cut for 50 bps on October 23rd.
Canadian Dollar price forecast
USD/CAD has been in a clear bullish uptrend since mid-September, piercing several major technical levels, including the 200-day Exponential Moving Average (EMA) at the 1.3600 handle. With such a one-sided bullish pattern baked into daily candlesticks, price action traders may be looking for a retracement below 1.3650 before loading up on further USD/CAD long positions to push the pair into another leg higher.
USD/CAD daily chart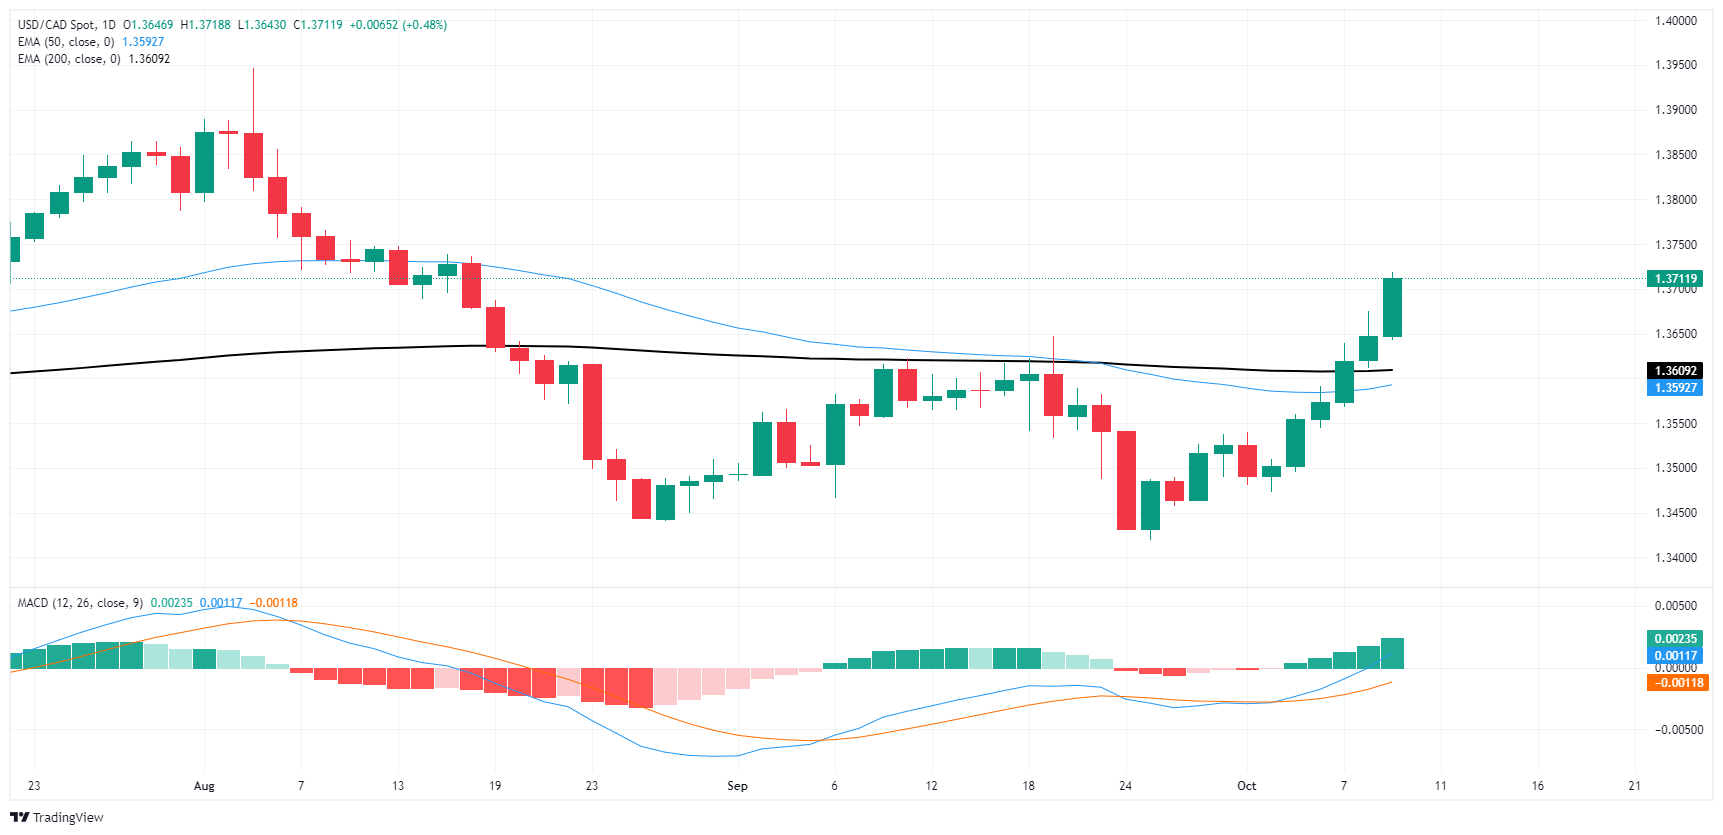
Canadian Dollar FAQs
The key factors driving the Canadian Dollar (CAD) are the level of interest rates set by the Bank of Canada (BoC), the price of Oil, Canada’s largest export, the health of its economy, inflation and the Trade Balance, which is the difference between the value of Canada’s exports versus its imports. Other factors include market sentiment – whether investors are taking on more risky assets (risk-on) or seeking safe-havens (risk-off) – with risk-on being CAD-positive. As its largest trading partner, the health of the US economy is also a key factor influencing the Canadian Dollar.
The Bank of Canada (BoC) has a significant influence on the Canadian Dollar by setting the level of interest rates that banks can lend to one another. This influences the level of interest rates for everyone. The main goal of the BoC is to maintain inflation at 1-3% by adjusting interest rates up or down. Relatively higher interest rates tend to be positive for the CAD. The Bank of Canada can also use quantitative easing and tightening to influence credit conditions, with the former CAD-negative and the latter CAD-positive.
The price of Oil is a key factor impacting the value of the Canadian Dollar. Petroleum is Canada’s biggest export, so Oil price tends to have an immediate impact on the CAD value. Generally, if Oil price rises CAD also goes up, as aggregate demand for the currency increases. The opposite is the case if the price of Oil falls. Higher Oil prices also tend to result in a greater likelihood of a positive Trade Balance, which is also supportive of the CAD.
While inflation had always traditionally been thought of as a negative factor for a currency since it lowers the value of money, the opposite has actually been the case in modern times with the relaxation of cross-border capital controls. Higher inflation tends to lead central banks to put up interest rates which attracts more capital inflows from global investors seeking a lucrative place to keep their money. This increases demand for the local currency, which in Canada’s case is the Canadian Dollar.
Macroeconomic data releases gauge the health of the economy and can have an impact on the Canadian Dollar. Indicators such as GDP, Manufacturing and Services PMIs, employment, and consumer sentiment surveys can all influence the direction of the CAD. A strong economy is good for the Canadian Dollar. Not only does it attract more foreign investment but it may encourage the Bank of Canada to put up interest rates, leading to a stronger currency. If economic data is weak, however, the CAD is likely to fall.
- Silver remains above $30.12 despite losses of over 0.30%, with downside risks looming after Tuesday’s sharp 3.28% drop.
- Momentum favors sellers, with the next key support levels at $30.12 and the psychological $30.00 mark.
- Buyers need to reclaim $30.50 to target $31.00, with a break above $31.77 necessary to shift the bias back to the upside.
Silver consolidated at around the weekly lows on Wednesday, posting losses of over 0.30%, but it remains above the October 8 daily low of $30.12 late in the North American session. At the time of writing, the XAG/USD trades at $30.61, sponsored by higher US Treasury bond yields following the release of the latest FOMC meeting minutes.
The minutes showed some officials were looking for a 25 basis points rate cut at the September meeting. According to the minutes, officials agreed that the larger cut approved at the meeting shouldn’t be a sign of concern over the economic outlook or viewed as a signal that the Fed was prepared to rapidly lower interest rates.
XAG/USD Price Forecast: Technical outlook
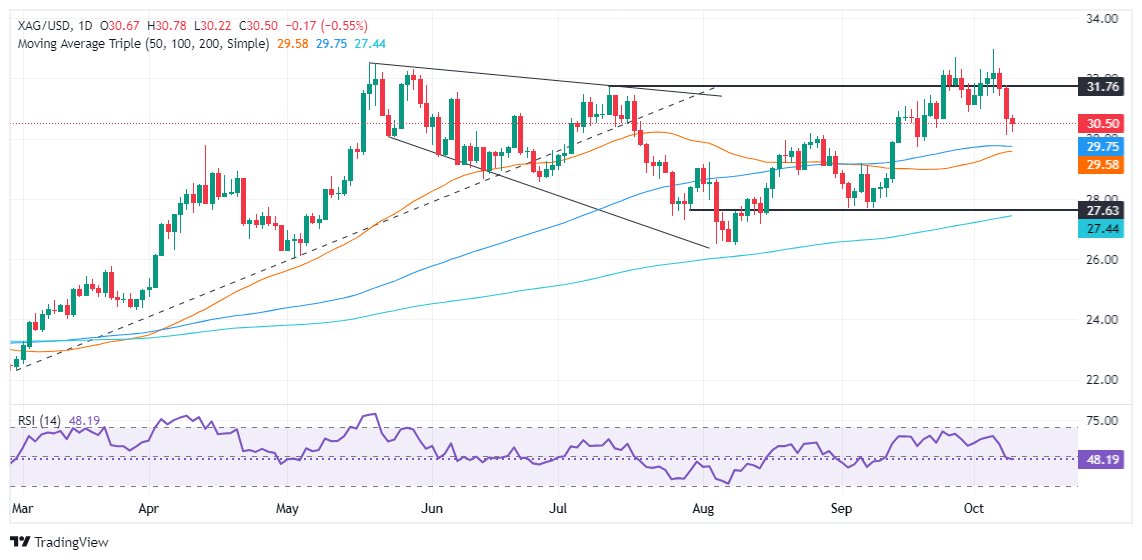
Silver price stopped its downfall following Tuesday’s over 3.28% loss. Although this could open the door for some consolidation, downside risks remain.
Momentum is still favoring sellers, according to the Relative Strength Index (RSI). With that said, the path of least resistance in the short term is tilted to the downside.
The XAG/USD's next support will be $30.12. Once broken, sellers could challenge the psychological figure of $30.00. If surpassed, the confluence of the 100 and 50-day moving averages (DMAs) would be up next at $29.73 and $29.53, respectively.
Conversely, if XAG/USD buyers move in and push prices above $30.50, they could lift the grey’s metal price toward $31.00. However, to shift the bias to upward, they must clear the $31.77 October 8 peak.
XAG/USD Price Action – Daily Chart
Silver FAQs
Silver is a precious metal highly traded among investors. It has been historically used as a store of value and a medium of exchange. Although less popular than Gold, traders may turn to Silver to diversify their investment portfolio, for its intrinsic value or as a potential hedge during high-inflation periods. Investors can buy physical Silver, in coins or in bars, or trade it through vehicles such as Exchange Traded Funds, which track its price on international markets.
Silver prices can move due to a wide range of factors. Geopolitical instability or fears of a deep recession can make Silver price escalate due to its safe-haven status, although to a lesser extent than Gold's. As a yieldless asset, Silver tends to rise with lower interest rates. Its moves also depend on how the US Dollar (USD) behaves as the asset is priced in dollars (XAG/USD). A strong Dollar tends to keep the price of Silver at bay, whereas a weaker Dollar is likely to propel prices up. Other factors such as investment demand, mining supply – Silver is much more abundant than Gold – and recycling rates can also affect prices.
Silver is widely used in industry, particularly in sectors such as electronics or solar energy, as it has one of the highest electric conductivity of all metals – more than Copper and Gold. A surge in demand can increase prices, while a decline tends to lower them. Dynamics in the US, Chinese and Indian economies can also contribute to price swings: for the US and particularly China, their big industrial sectors use Silver in various processes; in India, consumers’ demand for the precious metal for jewellery also plays a key role in setting prices.
Silver prices tend to follow Gold's moves. When Gold prices rise, Silver typically follows suit, as their status as safe-haven assets is similar. The Gold/Silver ratio, which shows the number of ounces of Silver needed to equal the value of one ounce of Gold, may help to determine the relative valuation between both metals. Some investors may consider a high ratio as an indicator that Silver is undervalued, or Gold is overvalued. On the contrary, a low ratio might suggest that Gold is undervalued relative to Silver.
- USD/JPY breaks key resistance, trading at 149.31, as high US yields and dovish PM comments support the pair.
- The Relative Strength Index (RSI) suggests room for further upside, with the August 15 high of 149.39 and 150.00 as the next targets.
- Key support lies at 147.35, with sellers aiming to push the pair below the Ichimoku Cloud at 146.40-60 and the Tenkan-Sen at 145.50.
The USD/JPY rallied and pushed above 149.00 for the first time since mid-August, sponsored by the jump in US Treasury yields due to their close positive correlation with the pair. This and dovish comments from incoming PM Ishiba sponsored a leg-up in the pair, which trades at 149.31.
USD/JPY Price Forecast: Technical outlook
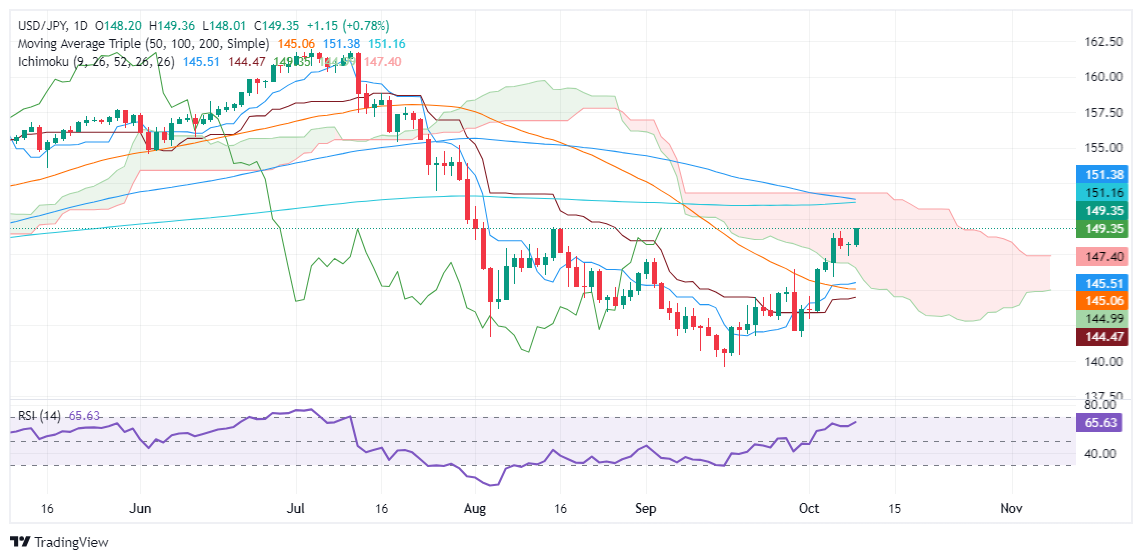
The USD/JPY is neutral to upward biased after clearing key resistance levels like the 50-day moving average (DMA) and entering the Ichimoku Cloud (Kumo).
Momentum hints that buyers remain in charge via the Relative Strength Index (RSI). It should be said that the RSI is still far from being overbought, an indication that the pair could extend its gains.
If USD/JPY extends its gains above the August 15 high of 149.39, the 150.00 figure will be exposed. On further strength, the pair could challenge the 200-DMA at 151.39.
On the other hand, sellers will need to drive the USD/JPY below the latest cycle low according to the daily chart, being the October 8 low of 147.35. Once surpassed, the pair could challenge the bottom of the Kumo at 146.40-60, ahead of the Tenkan-Sen at 145.50.
USD/JPY Price Action – Daily Chart
Japanese Yen FAQs
The Japanese Yen (JPY) is one of the world’s most traded currencies. Its value is broadly determined by the performance of the Japanese economy, but more specifically by the Bank of Japan’s policy, the differential between Japanese and US bond yields, or risk sentiment among traders, among other factors.
One of the Bank of Japan’s mandates is currency control, so its moves are key for the Yen. The BoJ has directly intervened in currency markets sometimes, generally to lower the value of the Yen, although it refrains from doing it often due to political concerns of its main trading partners. The BoJ ultra-loose monetary policy between 2013 and 2024 caused the Yen to depreciate against its main currency peers due to an increasing policy divergence between the Bank of Japan and other main central banks. More recently, the gradually unwinding of this ultra-loose policy has given some support to the Yen.
Over the last decade, the BoJ’s stance of sticking to ultra-loose monetary policy has led to a widening policy divergence with other central banks, particularly with the US Federal Reserve. This supported a widening of the differential between the 10-year US and Japanese bonds, which favored the US Dollar against the Japanese Yen. The BoJ decision in 2024 to gradually abandon the ultra-loose policy, coupled with interest-rate cuts in other major central banks, is narrowing this differential.
The Japanese Yen is often seen as a safe-haven investment. This means that in times of market stress, investors are more likely to put their money in the Japanese currency due to its supposed reliability and stability. Turbulent times are likely to strengthen the Yen’s value against other currencies seen as more risky to invest in.
- Gold declined as Fed Minutes revealed a “substantial majority” backed a 50 bps cut, while some preferred 25 bps.
- CME FedWatch Tool shows lower odds of a 25 bps cut, down to 75.9%, with rising expectations for a rate pause.
- US 10-year Treasury yield rises to 4.062%, supporting the US Dollar.
- Traders await Thursday's CPI data for further direction on inflation and Fed policy.
Gold extended its losses for the sixth consecutive day after the Federal Reserve (Fed) revealed its September Meeting Minutes. The Minutes showed that the “substantial majority” of the Federal Open Market Committee (FOMC) backed a 50-basis-point (bps) cut. Despite this, the XAU/USD trades within familiar levels near $2,610, down over 0.37%.
The FOMC’s Minutes showed that some officials would’ve preferred a 25 bps cut, though all participants favored lowering interest rates. Regarding the Fed’s dual mandate in both cases, almost all officials saw inflation risks tilted to the downside, while risks to the labor market were on the upside.
Following the data, the CME FedWatch Tool shows odds for a 25 bps interest rate cut were lowered from 85.2% a day ago to 75.9%. This means that some market participants positioned themselves toward the Fed holding rates unchanged, with odds at 24.1%, up from 14.8% on Tuesday.
US Treasury yields continued to rise with the US 10-year Treasury note at 4.062%, up five and a half bps. This underpinned the Greenback, which according to the US Dollar Index (DXY) is up 0.42% at 102.90, its highest level since mid-August 2024.
Now, traders' focus shifts to Thursday's release of the US Consumer Price Index (CPI). Estimates suggest that inflation will continue to aim lower. Nevertheless, if inflation comes in higher than estimates, it will open the door for a pause on the Fed’s easing cycle.
The US economic schedule for the week will feature US inflation, US jobs data and Fed speakers.
Daily digest market movers: Gold prices pressured by FOMC’s Minutes ahead of US CPI
- The US CPI is expected to decrease from 2.5% to 2.3% YoY. Monthly CPI is projected to come at 0.1%, down from 0.2%.
- Core CPI is foreseen to remain unchanged compared to August’s figure at 3.2% YoY. The September figure is estimated to dip from 0.3% to 0.2% MoM.
- Other data will reveal the Initial Jobless Claims for the week ending October 5. Projections suggest that 230K new people applied for unemployment benefits, above the prior reading of 225K.
- After Friday's NFP report, Fed officials are more cautious. Vice-Chair Philip Jefferson said his approach is "meeting by meeting" and data-driven. Boston Fed President Susan Collins expects more rate cuts, also based on incoming data.
- Following the last US jobs report, recession fears faded. Therefore, most Wall Street banks like Citi, JPMorgan and Bank of America revised their November Fed call from a 50 to 25 bps rate cut.
- Meanwhile, the People’s Bank of China (PBoC) halted its Bullion purchases for the fifth month. China’s reserves were unchanged as they stood at 72.8 million troy ounces at the end of last month.
XAU/USD technical analysis: Gold price slips as sellers eye support underneath $2,650
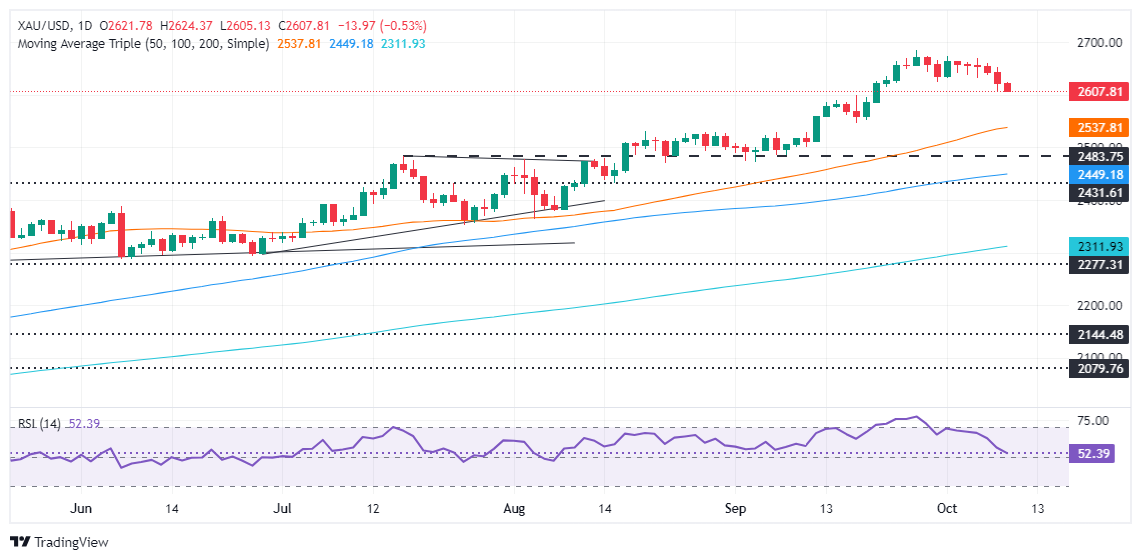
Gold prices extended losses below $2,630 and dropped to a daily low of $2,605 as traders digested the FOMC’s September Meeting Minutes.
Short-term momentum is bearish even though the Relative Strength Index (RSI) shows mixed readings and stands in bullish territory.
XAU/USD has tumbled below $2,620. A breach of $2,600 will expose the psychological $2,550 mark ahead of the 50-day Simple Moving Average (SMA) at $2,537. Once these levels are surpassed, the $2,500 figure is up next.
Conversely, if Gold aims higher and reclaims $2,650, it will pave the way to challenge $2,670 ahead of the YTD high of $2,685.
Gold FAQs
Gold has played a key role in human’s history as it has been widely used as a store of value and medium of exchange. Currently, apart from its shine and usage for jewelry, the precious metal is widely seen as a safe-haven asset, meaning that it is considered a good investment during turbulent times. Gold is also widely seen as a hedge against inflation and against depreciating currencies as it doesn’t rely on any specific issuer or government.
Central banks are the biggest Gold holders. In their aim to support their currencies in turbulent times, central banks tend to diversify their reserves and buy Gold to improve the perceived strength of the economy and the currency. High Gold reserves can be a source of trust for a country’s solvency. Central banks added 1,136 tonnes of Gold worth around $70 billion to their reserves in 2022, according to data from the World Gold Council. This is the highest yearly purchase since records began. Central banks from emerging economies such as China, India and Turkey are quickly increasing their Gold reserves.
Gold has an inverse correlation with the US Dollar and US Treasuries, which are both major reserve and safe-haven assets. When the Dollar depreciates, Gold tends to rise, enabling investors and central banks to diversify their assets in turbulent times. Gold is also inversely correlated with risk assets. A rally in the stock market tends to weaken Gold price, while sell-offs in riskier markets tend to favor the precious metal.
The price can move due to a wide range of factors. Geopolitical instability or fears of a deep recession can quickly make Gold price escalate due to its safe-haven status. As a yield-less asset, Gold tends to rise with lower interest rates, while higher cost of money usually weighs down on the yellow metal. Still, most moves depend on how the US Dollar (USD) behaves as the asset is priced in dollars (XAU/USD). A strong Dollar tends to keep the price of Gold controlled, whereas a weaker Dollar is likely to push Gold prices up.
The Greenback rose further and reached new multi-week highs supported by higher yields and rising speculation of a 25 bps rate cut by the Fed in November, all ahead of the publication of the key US CPI on Thursday.
Here is what you need to know on Thursday, October 10:
The US Dollar Index (DXY) advanced markedly and came just short of the key barrier at 103.00. The release of the US Inflation Rate takes centre stage seconded by the usual Initial Jobless Claims. In addition, the Fed’s Daly and Cook are due to speak.
EUR/USD’s decline picked up extra pace and sent the pair to fresh multi-week lows near 1.0930. Retail Sales in Germany will be the salient event on the old continent seconded by the ECB Accounts.
GBP/USD seems to have met some decent contention in the mid-1.3000s against the backdrop of a stronger US Dollar. The RICS House Price Balance will be released.
USD/JPY maintained the weekly bullish stance and reclaimed the 149.00 barrier and beyond amidst gains in the Greenback and higher US yields. Bank Lending figures are next on tap, followed by weekly Foreign Bond Investment and Producer Prices.
AUD/USD clinched its fifth consecutive daily pullback and challenged the key support at 0.6700 the figure. Inflation Expectations are due along with the final Building Permits and Private House Approvals.
Prices of WTI added to Tuesday’s decline and briefly tested multi-day lows near $71.60 per barrel amidst geopolitical tension, Chinese demand concerns and the weekly build of US crude oil inventories.
Gold prices retreated further and put the key $2,600 mark per ounce troy to the test amidst a firm US Dollar, rising yields and increasing bets of a Fed’s 25 bps rate cut in November. Silver prices dropped for the third straight day, although they managed well to keep business above the $30.00 mark per ounce.
- The market has priced out any more jumbo cuts and now expects 25 bps cuts in both November and December.
- FOMC Minutes showed no additional guidance, Fed members remain data-dependent.
- Markets will eye CPI readings on Thursday.
TheUS Dollar Index (DXY), which measures the value of the USD against a basket of six currencies, is gaining against almost all of its competitors as markets assess the Federal Open Market Committee’s (FOMC) September Meeting Minutes. The Minutes showed that Fed members agreed not to lock themselves into an aggressive easing path.
Despite signs of moderation in the US economy, pockets of resilience remain. This mixed outlook has prompted the Federal Reserve (Fed) to adopt a data-driven approach in determining the pace of its monetary policy, which was confirmed by the release of the September Minutes.
Daily digest market movers: DXY up after FOMC Minutes, but CPI will be key
- Market has adjusted expectations for Fed easing with jumbo cuts priced out and 25 bps cuts expected in both November and December.
- Despite strong economic data, markets still price in 125 bps of easing over the next 12 months, indicating that further adjustment is needed.
- Economic momentum remains strong with little expected slowdown into 2025.
- Markets are gearing up for Thursday’s inflation readings from the Consumer Price Index (CPI) for September.
- Moreover, September FOMC Minutes showed no additional insights and confirmed that the Fed will take a gradual approach regarding the pace of easing.
- In that sense, the USD will remain sensible to economic reports and CPI readings.
DXY technical outlook: Momentum surges as bulls take the reins
The Relative Strength Index (RSI) and Moving Average Convergence Divergence (MACD) indicators both signal strong bullish momentum, suggesting the potential for further upside. While the short-term outlook has improved, the broader trend remains bearish due to the prevailing red signals.
Key support levels are identified at 102.30, 102.00 and 101.80, while significant resistance levels are seen at 103.00, 103.50 and 104.00.
US Dollar FAQs
The US Dollar (USD) is the official currency of the United States of America, and the ‘de facto’ currency of a significant number of other countries where it is found in circulation alongside local notes. It is the most heavily traded currency in the world, accounting for over 88% of all global foreign exchange turnover, or an average of $6.6 trillion in transactions per day, according to data from 2022. Following the second world war, the USD took over from the British Pound as the world’s reserve currency. For most of its history, the US Dollar was backed by Gold, until the Bretton Woods Agreement in 1971 when the Gold Standard went away.
The most important single factor impacting on the value of the US Dollar is monetary policy, which is shaped by the Federal Reserve (Fed). The Fed has two mandates: to achieve price stability (control inflation) and foster full employment. Its primary tool to achieve these two goals is by adjusting interest rates. When prices are rising too quickly and inflation is above the Fed’s 2% target, the Fed will raise rates, which helps the USD value. When inflation falls below 2% or the Unemployment Rate is too high, the Fed may lower interest rates, which weighs on the Greenback.
In extreme situations, the Federal Reserve can also print more Dollars and enact quantitative easing (QE). QE is the process by which the Fed substantially increases the flow of credit in a stuck financial system. It is a non-standard policy measure used when credit has dried up because banks will not lend to each other (out of the fear of counterparty default). It is a last resort when simply lowering interest rates is unlikely to achieve the necessary result. It was the Fed’s weapon of choice to combat the credit crunch that occurred during the Great Financial Crisis in 2008. It involves the Fed printing more Dollars and using them to buy US government bonds predominantly from financial institutions. QE usually leads to a weaker US Dollar.
Quantitative tightening (QT) is the reverse process whereby the Federal Reserve stops buying bonds from financial institutions and does not reinvest the principal from the bonds it holds maturing in new purchases. It is usually positive for the US Dollar.
- Mexican Peso on the defensive as September inflation aims toward Banxico’s 3% goal.
- Banxico is expected to lower rates further after cutting to 10.50% in September, with additional easing projected by the end of 2024.
- Traders await the release of the Fed’s September meeting minutes and Thursday’s US CPI report as US Treasury yields and the Dollar rise.
The Mexican peso depreciated against the US Dollar on Wednesday following an inflation report that opened the door for further easing by the Bank of Mexico (Banxico). Traders are also eyeing the release of the Federal Reserve’s (Fed) September Meeting Minutes, awaiting clues about the monetary policy path. The USD/MXN trades at 19.40, up over 0.40%.
Mexico’s inflation edged lower in September, according to the Instituto Nacional de Estadistica Geografia e Informatica (INEGI). Headline and Core Consumer Price Index (CPI) readings came below estimates and trended toward hitting Banxico's 3% plus or minus 1% goal.
The USD/MXN aimed higher as the data hints that Banxico could be more aggressive on its easing cycle. On Monday, Banxico Governor Victoria Rodriguez said the governing board may consider larger cuts to its benchmark rate as she spoke to Reuters.
Banxico lowered rates to 10.50% in September and is expected to ease at least an additional 50 basis points (bps) toward the end of 2024. The following meetings will be on November 14 and December 19.
The Fed’s September 17-18 Meeting Minutes are awaited in the US and will appear in the afternoon session. Fed Governor Michele Bowman was the lonely dissenter in voting for a 25 bps rate cut. According to Brown Brothers Harriman analysts, “The minutes may reveal that other Fed officials were resistant to a 50 bp before being convinced to vote with the majority.”
Following last Friday's Nonfarm Payrolls (NFP) report, Fed officials adopted a more cautious stance. On Tuesday, Vice-Chairman Philip Jefferson said he remains data-dependent and that his approach will be meeting by meeting. Boston Fed President Susan Collins said further cuts are likely needed, but they would be data-driven.
In the meantime, the US Dollar Index (DXY), which tracks the buck’s performance against the other six currencies, climbs 0.37% to 102.85, underpinned by the jump in US Treasury yields.
Daily digest market movers: Mexican Peso tumbles following inflation report
- Last Thursday, Mexico’s Supreme Court voted eight to three to "consider a constitutional challenge to the controversial judicial overhaul enacted last month," which would allow the election of judges and Supreme Court magistrates through electoral vote.
- Mexico’s CPI in September dipped from 4.99% to 4.58% YoY, exceeding estimates of 4.62%. Monthly inflation was 0.05%, below projections of 0.1%.
- Core CPI expanded by 3.91% YoY, below forecasts of 3.95%. Monthly core inflation was 0.28%, up from 0.22% but below estimates of 0.32%.
- According to Banxico’s poll, the central bank is projected to lower rates by 50 bps to 10% for the remainder of 2024. Meanwhile, the USD/MXN exchange rate will end at around 19.69.
- Mexico’s economy is projected to grow by 1.45% in 2024, lower than August’s 1.57%.
- Data from the Chicago Board of Trade (CBOT) via the December fed funds rate futures contract shows investors estimate 48 bps of easing by the Fed toward the end of 2024.
- Market participants have disregarded a 50 bps cut. The odds of a 25 bps cut are 81.4%, while the chances for holding rates unchanged are at 18.6%, according to the CME FedWatch Tool data.
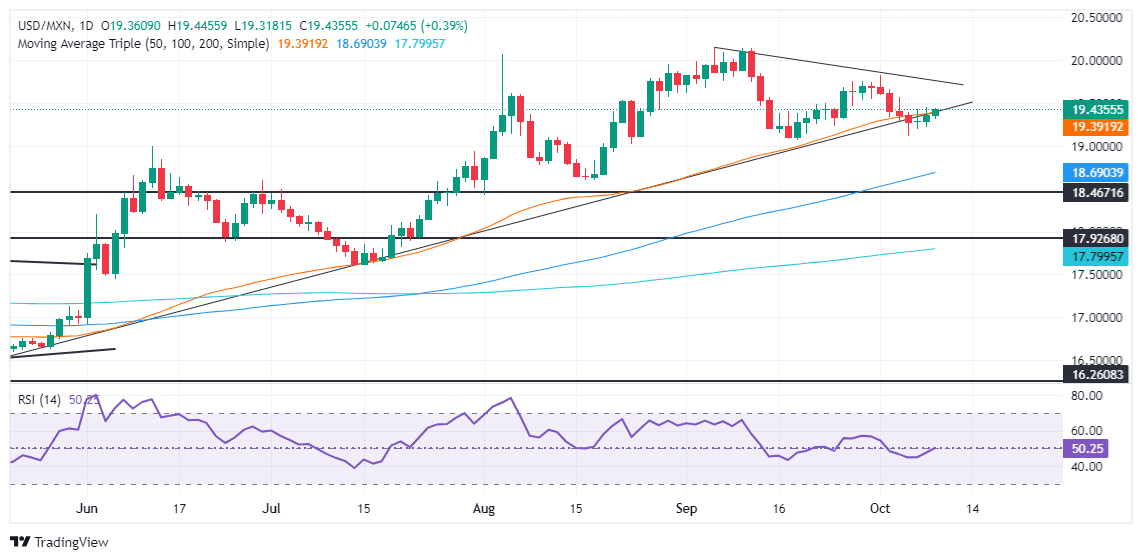
USD/MXN technical outlook: Mexican Peso extends losses as USD/MXN jumps above 19.40
The USD/MXN regained the 50-day Simple Moving Average (SMA) at 19.37, which could open the door for further upside. Momentum favors buyers as depicted by the Relative Strength Index’s (RSI) bullish reading. Therefore, the exotic pair is headed to the upside.
If USD/MXN clears the psychological 19.50 level, look for buyers driving the exchange rate toward the October 1 daily high of 19.82, ahead of 20.00. Up next would be the YTD peak of 20.22.
For a bearish resumption, if USD/MXN drops below the October 4 wing low of 19.10, the 19.00 figure will be exposed. Once broken, the next support would be the 100-day SMA at 18.64.
Mexican Peso FAQs
The Mexican Peso (MXN) is the most traded currency among its Latin American peers. Its value is broadly determined by the performance of the Mexican economy, the country’s central bank’s policy, the amount of foreign investment in the country and even the levels of remittances sent by Mexicans who live abroad, particularly in the United States. Geopolitical trends can also move MXN: for example, the process of nearshoring – or the decision by some firms to relocate manufacturing capacity and supply chains closer to their home countries – is also seen as a catalyst for the Mexican currency as the country is considered a key manufacturing hub in the American continent. Another catalyst for MXN is Oil prices as Mexico is a key exporter of the commodity.
The main objective of Mexico’s central bank, also known as Banxico, is to maintain inflation at low and stable levels (at or close to its target of 3%, the midpoint in a tolerance band of between 2% and 4%). To this end, the bank sets an appropriate level of interest rates. When inflation is too high, Banxico will attempt to tame it by raising interest rates, making it more expensive for households and businesses to borrow money, thus cooling demand and the overall economy. Higher interest rates are generally positive for the Mexican Peso (MXN) as they lead to higher yields, making the country a more attractive place for investors. On the contrary, lower interest rates tend to weaken MXN.
Macroeconomic data releases are key to assess the state of the economy and can have an impact on the Mexican Peso (MXN) valuation. A strong Mexican economy, based on high economic growth, low unemployment and high confidence is good for MXN. Not only does it attract more foreign investment but it may encourage the Bank of Mexico (Banxico) to increase interest rates, particularly if this strength comes together with elevated inflation. However, if economic data is weak, MXN is likely to depreciate.
As an emerging-market currency, the Mexican Peso (MXN) tends to strive during risk-on periods, or when investors perceive that broader market risks are low and thus are eager to engage with investments that carry a higher risk. Conversely, MXN tends to weaken at times of market turbulence or economic uncertainty as investors tend to sell higher-risk assets and flee to the more-stable safe havens.
- The Dow Jones added three-quarters of a percent on Wednesday, climbing over 300 points.
- Equities are staging a rebound after the week’s early declines.
- Stocks weigh wholesale inventories data and Fedspeak ahead of latest FOMC Meeting Minutes.
The Dow Jones Industrial Average (DJIA) rallied another 300 points on Wednesday, extending a bullish turnaround after an early-week decline that briefly dragged the major equity index back below 42,000. The midweek market session sees investors hitting the bids despite a low-weighted print August Wholesale Inventories, and a lukewarm appearance from Federal Reserve (Fed) Bank of Dallas President Lorie Logan.
US Wholesale Inventories grew by less than expected, rising a scant 0.1% versus the expected hold at July’s figure of 0.2%. However, there was a mixed print between the numbers: while non-durable goods inventories decreased, falling 0.1% versus the anticipated 0.5% uptick. Meanwhile, durable goods inventories rose much faster than expected, climbing 0.3% versus the previous month’s 0.1% as US consumers dedicate more of their consumption to non-durable goods and eschew investment in long-life purchases.
Dallas Fed President Lorie Logan hit newswires early Wednesday, trying to draw investor focus back to ongoing inflation risks that still loom in the darkness. Despite rate-cut-hungry markets clamoring for more rate cuts to follow up September’s jumbo 50 bps rate trim, Dallas Fed President Logan noted that economic growth that continues to clock in above forecasts poses a very real risk to inflation. While US inflation has made significant progress toward the Fed’s 2% annual target, price growth in key core categories continues to run hotter than expected.
The Federal Open Market Committee’s (FOMC) Meeting Minutes from the September rate call are due later in the US market session; while little new is expected from the document, investors will no doubt be pouring over the Fed’s internal communications about rate expectations. Traders will be looking to glean further clues from how the Fed feels about further rate cuts through the year, despite a steady stream of tepid talking points from various Fed officials in recent days.
Rate markets are currently pricing in a perfectly pedestrian 25 bps rate cut in November. However, according to the CME’s FedWatch Tool, rate traders still see a 15% chance that the Fed may not move rates at all on November 7.
Dow Jones news
Equity markets rolled over into full bull mode on Wednesday, with all but four of the Dow Jones’ constituent equities finding room in the green during the US market session. IBM (IBM) rallied over 2% to climb into $238 per share, with Nike (NKE) hot on its heels, rising a comparable 2% and clipping above $82.50 per share.
On the low side, Boeing (BA) continues to struggle with an ongoing worker strike. Things became more complicated for the battered aerospace company after the Boeing workers’ union rejected a recent proposal.
Dow Jones price forecast
The Dow Jones continues to outpace its own averages, grinding out chart paper north of the 50-day Exponential Moving Average (EMA) and sticking close to record highs. Price action stuck close to late September’s peak bids, and a bearish pullback that essentially went nowhere has momentum indicators poised for another flip into buy signals.
The Dow Jones remains up roughly 6.25% from September’s swing low into the 40,000 major handle, with intraday action churning just above 42,000. The major equity index has returned 12.75% YTD, with half of those gains from September alone.
Dow Jones daily chart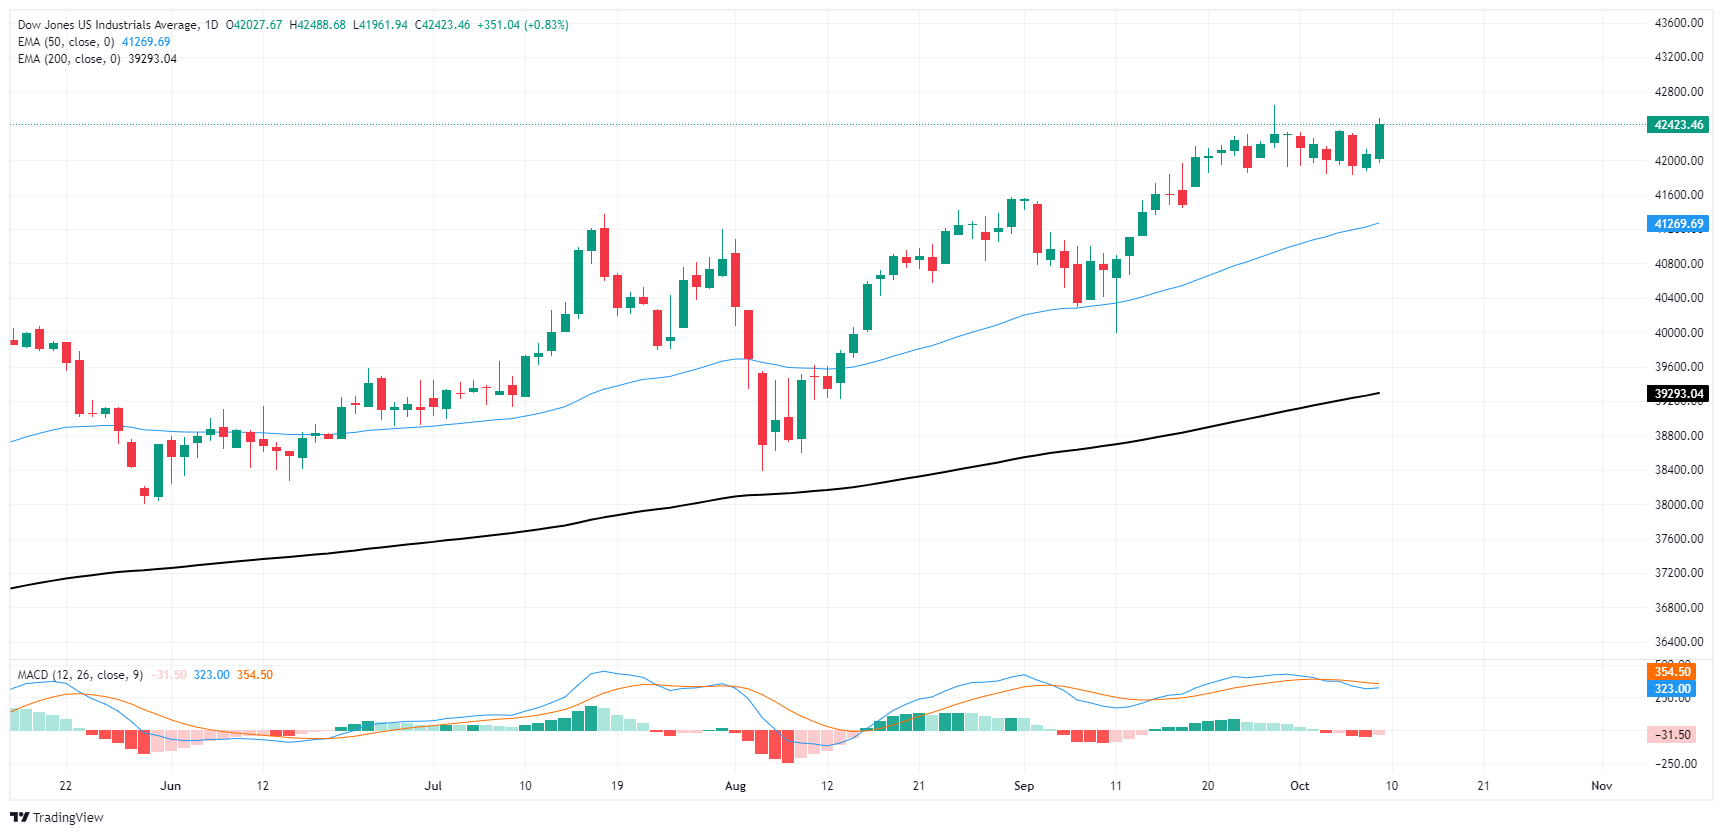
Dow Jones FAQs
The Dow Jones Industrial Average, one of the oldest stock market indices in the world, is compiled of the 30 most traded stocks in the US. The index is price-weighted rather than weighted by capitalization. It is calculated by summing the prices of the constituent stocks and dividing them by a factor, currently 0.152. The index was founded by Charles Dow, who also founded the Wall Street Journal. In later years it has been criticized for not being broadly representative enough because it only tracks 30 conglomerates, unlike broader indices such as the S&P 500.
Many different factors drive the Dow Jones Industrial Average (DJIA). The aggregate performance of the component companies revealed in quarterly company earnings reports is the main one. US and global macroeconomic data also contributes as it impacts on investor sentiment. The level of interest rates, set by the Federal Reserve (Fed), also influences the DJIA as it affects the cost of credit, on which many corporations are heavily reliant. Therefore, inflation can be a major driver as well as other metrics which impact the Fed decisions.
Dow Theory is a method for identifying the primary trend of the stock market developed by Charles Dow. A key step is to compare the direction of the Dow Jones Industrial Average (DJIA) and the Dow Jones Transportation Average (DJTA) and only follow trends where both are moving in the same direction. Volume is a confirmatory criteria. The theory uses elements of peak and trough analysis. Dow’s theory posits three trend phases: accumulation, when smart money starts buying or selling; public participation, when the wider public joins in; and distribution, when the smart money exits.
There are a number of ways to trade the DJIA. One is to use ETFs which allow investors to trade the DJIA as a single security, rather than having to buy shares in all 30 constituent companies. A leading example is the SPDR Dow Jones Industrial Average ETF (DIA). DJIA futures contracts enable traders to speculate on the future value of the index and Options provide the right, but not the obligation, to buy or sell the index at a predetermined price in the future. Mutual funds enable investors to buy a share of a diversified portfolio of DJIA stocks thus providing exposure to the overall index.
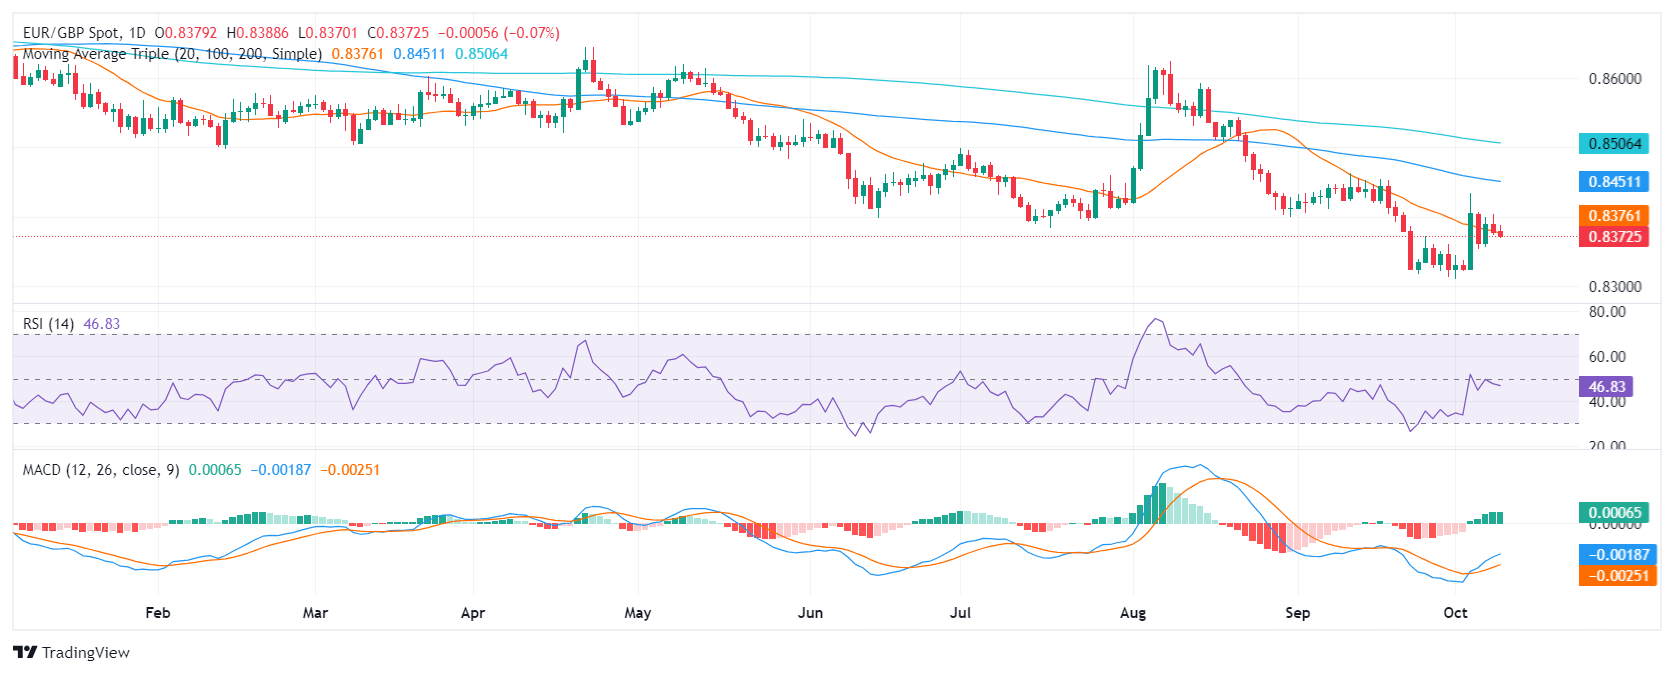
- Overall, the EUR/GBP consolidates sideways with no clear trend.
- RSI suggests rising selling pressure, while MACD indicates declining buying pressure in the short term.
- Bulls failed to defend the 20-day SMA which wornsed the outlook
The EUR/GBP pair trades around 0.8380, consolidating sideways and displaying no clear trend. In addition, the cross lost the 20-day Simple Moving Average (SMA) which might a downwards leg.
The technical indicators present that the bulls are backing off. The Relative Strength Index (RSI) is at 46 in negative territory and declining, indicating rising selling pressure. The Moving Average Convergence Divergence (MACD) presents a decreasing green histogram, suggesting declining buying pressure.
Bullish pressure can prevail if the price can break through the resistance level of 0.8400 and firmly hold above the 20-day Simple Moving Average (SMA). If that happens, the EUR/GBP pair could rise to 0.8450 or even 0.8500. On the other hand, a decline below the support level of 0.8320 could lead to further declines below 0.8300.
EUR/GBP daily chart
Earth to macro funds. There is no magical reason why Fed cuts have to led to higher Gold prices, TDS’ Senior Commodity Strategist Daniel Ghali notes.
Gap risk is elevated
“Ultimately, Gold markets are a function of buyers and sellers, and our suite of advanced positioning analytics is screaming for caution on several fronts. Macro fund positioning is now at its highest levels on record, slightly surpassing levels printed in the weeks that followed the Brexit referendum. There are nearly no directional money manager shorts remaining.”
“Shanghai traders are still holding onto their record length, but Chinese investors now have several alternatives at their fingertips and currency devaluation fears have abated. Asian physical traders are on a buyer's strike. Central bank buying activity has ground down to its lowest levels in the last five years. Consensus is unanimously bullish.”
“Recent price action has been a function of limited selling activity, which potentially points to a liquidity vacuum given the challenge to Western positions from US rates markets and the broad dollar.”
- GBP/USD consolidates within the 1.3060-1.3140 range, with sellers maintaining control after last week's US jobs report boosted the Greenback.
- The pair is downward biased after falling below the 50-DMA, with key support at the September 11 low of 1.3001 and the 100-DMA at 1.2935.
- A break above 1.3100 could signal a reversal, with resistance at 1.3200, followed by the October 3 peak of 1.3269.
The British Pound lost some ground against the Greenback on Wednesday as traders await minutes of the Federal Reserve’s last meeting and US inflation data on Thursday. At the time of writing, the GBP/USD trades at 1.3070, below its opening price by 0.26%.
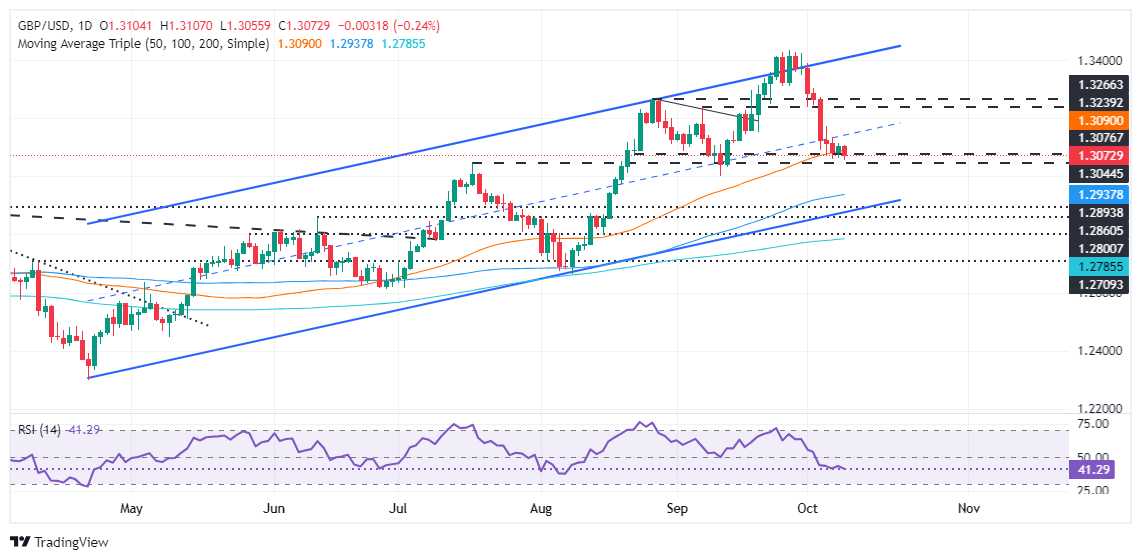
GBP/USD Price Forecast: Technical outlook
The GBP/USD has consolidated within the 1.3060-1.3140 range for the last three days. The lack of a catalyst keeps market players uncertain, though last week’s US jobs report boosted the Greenback, which reached levels last seen in August 2024.
Momentum hints that sellers are in charge, as portrayed by the bearish reading of the Relative Strength Index (RSI).
In the short term, the pair is downward biased. The drop below the 50-day moving average (DMA) at 1.3087 opened the door for further losses. However, if sellers want to remain in charge, they must drive the exchange rate to the September 11 swing low of 1.3001. If that level is cleared, the 100-DMA at 1.2935 would be up for grabs, followed by the 200-DMA at 1.2784.
Conversely, if GBP/USD reclaims 1.3100 and rallies above 1.3200, it would open the door for further upside. The next resistance would be October 3 peak at 1.3269, followed by the October 2 high at 1.3305.
GBP/USD Price Action – Daily Chart
British Pound PRICE Today
The table below shows the percentage change of British Pound (GBP) against listed major currencies today. British Pound was the strongest against the New Zealand Dollar.
| USD | EUR | GBP | JPY | CAD | AUD | NZD | CHF | |
|---|---|---|---|---|---|---|---|---|
| USD | 0.31% | 0.24% | 0.66% | 0.30% | 0.49% | 1.35% | 0.25% | |
| EUR | -0.31% | -0.08% | 0.33% | -0.04% | 0.22% | 0.99% | -0.08% | |
| GBP | -0.24% | 0.08% | 0.41% | 0.08% | 0.29% | 1.08% | -0.00% | |
| JPY | -0.66% | -0.33% | -0.41% | -0.33% | -0.14% | 0.69% | -0.42% | |
| CAD | -0.30% | 0.04% | -0.08% | 0.33% | 0.19% | 1.03% | -0.07% | |
| AUD | -0.49% | -0.22% | -0.29% | 0.14% | -0.19% | 0.81% | -0.29% | |
| NZD | -1.35% | -0.99% | -1.08% | -0.69% | -1.03% | -0.81% | -1.09% | |
| CHF | -0.25% | 0.08% | 0.00% | 0.42% | 0.07% | 0.29% | 1.09% |
The heat map shows percentage changes of major currencies against each other. The base currency is picked from the left column, while the quote currency is picked from the top row. For example, if you pick the British Pound from the left column and move along the horizontal line to the US Dollar, the percentage change displayed in the box will represent GBP (base)/USD (quote).
The Pound Sterling (GBP) is trading marginally lower on the day, reflecting the generally soft tone of the major currencies against the USD, Scotiabank’s Chief FX Strategist Shaun Osborne notes.
GBP consolidates in tight
“GBP is trading a bit lower on the day. GBP snap higher in the cross last week as bargain hunters fade EURGBP gains to the 0.84 area.”
“Cable is carving out a flat consolidation range on the intraday chart between 1.3060/1.3110. That is helping stabilize short-term trends but the broader undertone in GBPUSD remains negative, with a test of 1.30 support the main risk ahead.”
“Weakness below 1.30 on a sustained basis would increase chances of a deeper drop back to 1.27/1.28.”
- USD/JPY clings to gains near 149.00 with FOMC minutes on the horizon.
- The US core CPI is expected to have grown at a steady pace of 3.2% in September.
- The Japanese Yen will be influenced by the PPI data for September.
The USD/JPY pair remains firm near a seven-week high around 149.00 in Wednesday’s North American session. The asset exhibits strength ahead of the Federal Open Market Committee (FOMC) minutes for the September meeting, which will be published at 18:00 GMT.
In the policy meeting, the Fed reduced its key borrowing rates by 50 basis points (bps) to 4.75%-5.00%. This was the first dovish decision by the Fed in more than two-and-a-half years as officials were worried about deteriorating labor demand with increasing confidence that inflation would return sustainably to the bank’s target of 2%.
Meanwhile, the US Dollar (USD) performs strongly as market participants are not expecting the Fed to cut interest rates again by 50 bps in November. The US Dollar Index (DXY), which gauges Greenback’s value against six major currencies, posts a fresh seven-week high near 102.80.
Investors will pay close attention to the FOMC minutes to get views of all officials about the likely interest rate action in the last quarter of the year. According to the CME FedWatch tool, traders have priced in two rate cuts of 25 bps in each of the remaining two meetings this year.
Going forward, the major trigger for the US Dollar will be the US Consumer Price Index (CPI) data for September, which will be published on Thursday. The core CPI -which excludes volatile food and energy prices – is estimated to have grown steadily by 3.2%.
On the Tokyo front, investors will focus on Japan’s Producer Price Index (PPI) data for September, which will be published on Thursday. Prices of goods and services at factory gates are estimated to have risen at a slower pace of 2.3% from 2.5% in August. Signs of producer inflation remaining persistent would prompt expectations of more hikes by the Bank of Japan (BoJ).
Fed FAQs
Monetary policy in the US is shaped by the Federal Reserve (Fed). The Fed has two mandates: to achieve price stability and foster full employment. Its primary tool to achieve these goals is by adjusting interest rates. When prices are rising too quickly and inflation is above the Fed’s 2% target, it raises interest rates, increasing borrowing costs throughout the economy. This results in a stronger US Dollar (USD) as it makes the US a more attractive place for international investors to park their money. When inflation falls below 2% or the Unemployment Rate is too high, the Fed may lower interest rates to encourage borrowing, which weighs on the Greenback.
The Federal Reserve (Fed) holds eight policy meetings a year, where the Federal Open Market Committee (FOMC) assesses economic conditions and makes monetary policy decisions. The FOMC is attended by twelve Fed officials – the seven members of the Board of Governors, the president of the Federal Reserve Bank of New York, and four of the remaining eleven regional Reserve Bank presidents, who serve one-year terms on a rotating basis.
In extreme situations, the Federal Reserve may resort to a policy named Quantitative Easing (QE). QE is the process by which the Fed substantially increases the flow of credit in a stuck financial system. It is a non-standard policy measure used during crises or when inflation is extremely low. It was the Fed’s weapon of choice during the Great Financial Crisis in 2008. It involves the Fed printing more Dollars and using them to buy high grade bonds from financial institutions. QE usually weakens the US Dollar.
Quantitative tightening (QT) is the reverse process of QE, whereby the Federal Reserve stops buying bonds from financial institutions and does not reinvest the principal from the bonds it holds maturing, to purchase new bonds. It is usually positive for the value of the US Dollar.
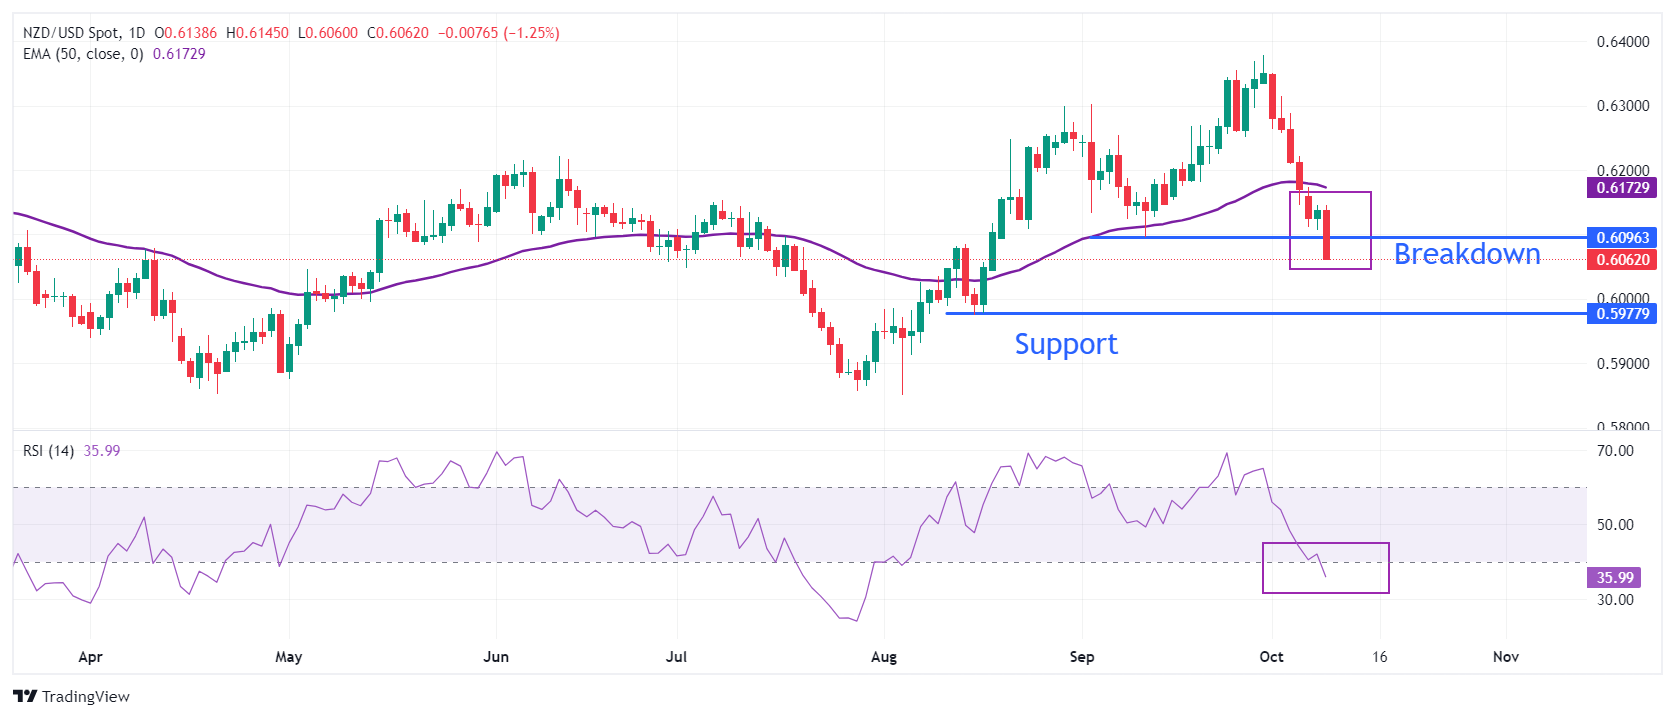
- NZD/USD plummets below 0.6100 as the RBNZ reduced its OCR further by 50 bps to 4.75%.
- The RBNZ was expected to deliver a hefty rate cut amid weak growth prospects.
- Investors await the FOMC minutes for fresh cues on the interest rate outlook.
The NZD/USD pair faces an intense sell-off and slides below the round-level support of 0.6100 in Wednesday’s North American session. The Kiwi pair plunges as the Reserve Bank of New Zealand (RBNZ) has cut its Official Cash Rate (OCR) by 50 basis points (bps) to 4.75%.
The RBNZ was expected to deliver a larger-than-usual interest rate cut due to softening labor market conditions and subdued growth. Market participants expect the RBNZ to reduce interest rates at a similar pace again in November.
Meanwhile, dismal market sentiment due to Middle East risks has also dampened the appeal of risk-sensitive assets. The US Dollar Index (DXY), which tracks the Greenback’s value against six major currencies, climbs to near 102.70.
The US Dollar strengthens as traders have priced out the scenario of the Federal Reserve (Fed) to reduce interest rates again by 50 bps in November. The Fed started the policy-easing cycle with a sizeable cut of 50 bps in September. Meanwhile, investors await Federal Open Market Committee (FOMC) Minutes for the September meeting, which will be published at 18:00 GMT.
NZD/USD weakens after breaking below the horizontal support plotted from the September 11 low of 0.6100 on a daily timeframe. The overall trend of the Kiwi pair has become bearish as it has formed a lower swing low. The asset is also trading below the 50-day Exponential Moving Average (EMA), which trades around 0.6173.
The 14-day Relative Strength Index (RSI) slides below 40.00, suggesting that a bearish momentum has been triggered.
More downside is highly likely towards the psychological support of 0.6000 and the August 15 low of 0.5974.
On the flip side, a reversal move above the October 8 high of 0.6146 will drive the asset towards the 50-day EMA at 0.6173 and the October 4 high near 0.6220.
NZD/USD daily chart
Economic Indicator
RBNZ Interest Rate Decision
The Reserve Bank of New Zealand (RBNZ) announces its interest rate decision after its seven scheduled annual policy meetings. If the RBNZ is hawkish and sees inflationary pressures rising, it raises the Official Cash Rate (OCR) to bring inflation down. This is positive for the New Zealand Dollar (NZD) since higher interest rates attract more capital inflows. Likewise, if it reaches the view that inflation is too low it lowers the OCR, which tends to weaken NZD.
Read more.Last release: Wed Oct 09, 2024 01:00
Frequency: Irregular
Actual: 4.75%
Consensus: 4.75%
Previous: 5.25%
Source: Reserve Bank of New Zealand
The Reserve Bank of New Zealand (RBNZ) holds monetary policy meetings seven times a year, announcing their decision on interest rates and the economic assessments that influenced their decision. The central bank offers clues on the economic outlook and future policy path, which are of high relevance for the NZD valuation. Positive economic developments and upbeat outlook could lead the RBNZ to tighten the policy by hiking interest rates, which tends to be NZD bullish. The policy announcements are usually followed by Governor Adrian Orr’s press conference.
Dallas Federal Reserve Bank President Lorie Logan argued on Wednesday that she had supported last month's substantial interest-rate cut but favoured smaller reductions going forward. She highlighted that there were "still real" upside risks to inflation and pointed to "meaningful uncertainties" surrounding the economic outlook.
Key Quotes
'More gradual path' on rate cuts is likely appropriate from here.
Upside risks to inflation mean the Fed should not rush to reduce rates.
Lowering the policy rate gradually would allow time to judge how restrictive monetary policy may or may not be.
Normalizing policy gradually also allows fed to 'best balance' labour market risks.
Policy not 'preset,' Fed must remain nimble.
Supported the Fed's decision to begin normalizing policy by cutting the policy rate.
Less restrictive policy will help avoid cooling the labour market more than necessary.
Progress on inflation has been broad-based; the labour market has cooled, remains healthy.
Inflation, labour market 'within striking distance' of Fed's goals.
Recent trends in inflation for housing, other core services 'encouraging,' expect to come down over time.
US economy is 'strong and stable' but there are 'meaningful uncertainties' around outlook.
Spending, economic growth that's stronger than forecast poses upside risk to inflation.
Unwarranted further easing in financial conditions could also push demand out of balance with supply.
'Neutral' Fed funds rate is uncertain; structural economic changes mean it may be higher than pre-pandemic.
Remain attentive to inflation risks from supply chains, geopolitics, and port strikes.
As labor market has cooled, we face more risk it will cool beyond what is needed to return inflation to 2%.
- The Minutes of the Fed’s September 17-18 policy meeting will be published on Wednesday.
- Details of Jerome Powell and co’s decision to trim interest rates by 50 basis points taking centre stage.
- The US Dollar Index may correct lower with the news, but the bullish path is right around the corner.
The Minutes of the US Federal Reserve’s (Fed) September 17-18 monetary policy meeting will be published on Wednesday at 18:00 GMT. Policymakers loosened the monetary policy for the first time in over four years and surprised market players with a 50 basis points (bps) interest rate cut. The decision spurred speculation officials were concerned about the economic progress and hinted at more aggressive trims.
Jerome Powell and co decided to cut rates in the September meeting
The Federal Open Market Committee (FOMC) took action after acknowledging progress towards its inflation goal. “In light of the progress on inflation and the balance of risks, the Committee decided to lower the target range for the federal funds rate by 1/2 percentage point to 4-3/4 to 5 percent,” the statement reads. However, officials also noted that “job gains have slowed, and the unemployment rate has moved up but remains low.”
The announcement was not a complete surprise, given that Powell and co somehow anticipated the decision to start trimming interest rates. What came as a surprise was the larger-than-anticipated trim, given that market participants were mostly anticipating a 25 bps cut, with only Fed Governor Michelle Bowman calling for a quarter-point cut instead.
As usual, policymakers repeated that future decisions will be made meeting by meeting based on macroeconomic data.
Meanwhile, Fed Chair Jerome Powell poured cold water on speculation the large cut came amid concerns about economic progress. In the press conference that followed the announcement, Powell said he does not see anything in the economy suggesting the likelihood of a downturn, adding that the growth rate is solid, inflation is coming down, and the labor market is “still at very solid levels.”
“We’re trying to achieve a situation where we restore price stability without the kind of painful increase in unemployment that has come sometimes with disinflation,” Powell added.
As a result, the focus shifted to employment. Tepid data released throughout September fueled speculation that the central bank would deliver another 50 bps cut when it meets in November. The US Dollar (USD) came under persistent selling pressure while stock markets cheered cheaper money.
Things changed in the first days of October. The September Nonfarm Payrolls (NFP) report released by the Bureau of Labor Statistics (BLS) showed the economy added a whopping 254,000 new jobs in the month, while the Unemployment Rate unexpectedly eased to 4.1% from 4.2% in August. Those figures clearly indicate a strong labor market, reducing concerns about it.
As a result, market players dropped bets of a 50 bps cut in November, with the odds for a 25 bps currently standing at around 85%, according to the CME FedWatch Toll.
When will FOMC Minutes be released, and how could it affect the US Dollar?
The FOMC will release the minutes of the September 17-18 policy meeting at 18:00 GMT on Wednesday. The document may explain the decision and hint at future action, but at this point, it may be old news. The NFP report indeed overshadowed any pre-release speculation about the state of the labor market.
With inflation coming down, economic growth, and solid employment-related data, it seems that the United States (US) is in the right spot to allow the Fed to reduce rates at a maybe slower but steady pace.
The Minutes will likely show that policymakers are willing to reduce the interest rate further in November, although the extent of such a cut will depend on upcoming macroeconomic data.
In fact, the US will publish the September Consumer Price Index (CPI) on Thursday, and the figures will probably have a broader impact on future Fed decisions, and hence the USD, rather than the FOMC Minutes.
Generally speaking, the more dovish the document, the more pressure there would be on the Greenback, while hawkish words should support the USD.
From a technical perspective, Valeria Bednarik, Chief Analyst at FXStreet, notes: “The US Dollar Index (DXY) seems comfortable above the 102.00 mark after flirting with the 100.00 mark in September. The overall technical stance is bullish, although another leg north is needed to confirm a sustained advance in time.”
“From a technical point of view, the DXY may correct towards 102.00 ahead of the announcement, with near-term support in the 101.90 region. Nevertheless, the daily chart shows that technical indicators hold well into positive territory, with the Momentum indicator still heading firmly north, reflecting buyers’ interest. At the same time, the DXY has overcome its 20 Simple Moving Average (SMA), which gains upward traction at around 101.20, a key dynamic support area. Finally, the 100 and 200 SMAs hold well above 103.00, limiting the mid-term bullish potential.”
Bednarik adds: “The DXY needs to conquer the 103.00 mark to extend gains at a solid pace, with the next resistance area at around 103.80. Once beyond the latter, an unlikely scenario post-FOMC Minutes, the index will enter a clearer bullish path.”
Economic Indicator
FOMC Minutes
FOMC stands for The Federal Open Market Committee that organizes 8 meetings in a year and reviews economic and financial conditions, determines the appropriate stance of monetary policy and assesses the risks to its long-run goals of price stability and sustainable economic growth. FOMC Minutes are released by the Board of Governors of the Federal Reserve and are a clear guide to the future US interest rate policy.
Read more.Next release: Wed Oct 09, 2024 18:00
Frequency: Irregular
Consensus: -
Previous: -
Source: Federal Reserve
Minutes of the Federal Open Market Committee (FOMC) is usually published three weeks after the day of the policy decision. Investors look for clues regarding the policy outlook in this publication alongside the vote split. A bullish tone is likely to provide a boost to the greenback while a dovish stance is seen as USD-negative. It needs to be noted that the market reaction to FOMC Minutes could be delayed as news outlets don’t have access to the publication before the release, unlike the FOMC’s Policy Statement.
Fed FAQs
Monetary policy in the US is shaped by the Federal Reserve (Fed). The Fed has two mandates: to achieve price stability and foster full employment. Its primary tool to achieve these goals is by adjusting interest rates. When prices are rising too quickly and inflation is above the Fed’s 2% target, it raises interest rates, increasing borrowing costs throughout the economy. This results in a stronger US Dollar (USD) as it makes the US a more attractive place for international investors to park their money. When inflation falls below 2% or the Unemployment Rate is too high, the Fed may lower interest rates to encourage borrowing, which weighs on the Greenback.
The Federal Reserve (Fed) holds eight policy meetings a year, where the Federal Open Market Committee (FOMC) assesses economic conditions and makes monetary policy decisions. The FOMC is attended by twelve Fed officials – the seven members of the Board of Governors, the president of the Federal Reserve Bank of New York, and four of the remaining eleven regional Reserve Bank presidents, who serve one-year terms on a rotating basis.
In extreme situations, the Federal Reserve may resort to a policy named Quantitative Easing (QE). QE is the process by which the Fed substantially increases the flow of credit in a stuck financial system. It is a non-standard policy measure used during crises or when inflation is extremely low. It was the Fed’s weapon of choice during the Great Financial Crisis in 2008. It involves the Fed printing more Dollars and using them to buy high grade bonds from financial institutions. QE usually weakens the US Dollar.
Quantitative tightening (QT) is the reverse process of QE, whereby the Federal Reserve stops buying bonds from financial institutions and does not reinvest the principal from the bonds it holds maturing, to purchase new bonds. It is usually positive for the value of the US Dollar.
ECB VP Villeroy said the central bank will very probably lower rates at next week’s policy decision, in keeping with his and other policymakers’ comments that have made a 25bps cut all but certain (and all but priced in) for the 17th, Scotiabank’s Chief FX Strategist Shaun Osborne notes.
EUR off earlier low
“Wider short term yield spreads versus the US have effectively undercut the EUR in recent weeks and largely explain spot’s slide from the 1.12 highs. The EUR retains a soft undertone but a further shift in yields/spreads may be needed to drive more losses absent fresh drivers for FX (such as the US election) in the coming weeks.”
“Bearish—The minor consolidation on spot seen over the course of the week so far appears to be breaking down bearishly for the EUR, tilting risks towards more losses. While spot remains below 1.10, the breakdown trigger for the 1.12 double top pattern, broader risks are tilted towards a dip to the low 1.08s.”
This afternoon, European time, the Mexican inflation figures for September will be released, Commerzbank’s FX analyst Michael Pfister notes.
The core rate is likely to be more decisive
“The consensus is for a fairly significant decline in the headline rate, and only a slight decline in the core rate (both year-on-year). To put this into perspective, it should be noted that we will not see particularly high base effects, i.e. the expected decline is more likely due to lower (new) inflationary pressures in September.”
“Looking at this new inflationary pressure, it is quite understandable that the headline rate is falling more than the core rate, given the decline in oil prices in September. With oil prices already on the rise again amid geopolitical concerns, Banxico is likely to see through this decline in its next decision. The core rate is likely to be more decisive.”
“And the slight decline expected here should probably only be seen as a first step in the right direction - and thus not allow a fundamental reassessment of Banxico's approach. Rather, it should continue to lay the groundwork for further rate cuts, but there is no need for major reductions. Or to put it another way: even after these inflation figures, nothing much should change at Banxico.”
The CAD retains a soft undertone, Scotiabank’s Chief FX Strategist Shaun Osborne notes.
CAD remains under pressure on soft commodities
“Spot continues to trade well above out FV estimate (1.3581 today) but variables (such as softer commodities/terms of trade) are edging against the CAD somewhat which will likely keep the CAD tone defensive for now. There are no Canadian data reports due ahead of Friday’s employment report which may help settle expectations for the BoC policy at this month’s meeting.”
“Swaps are sitting on the 25/50 fence with 35bps priced in. Yesterday, former BoC Governor Beaudry suggested the Bank should cut 50bps at the upcoming meeting. The USD retains a firm undertone on the intraday and daily charts. The USD rise from last week’s low has barely paused and looks a little stretched on the intraday studies.”
“But, having pushed above the September peak and with intraday and daily DMI oscillators aligned supportively for the USD, a deeper push into the 1.36/1.38 congestion zone appears likely. Support is 1.3620.”
All three CE3 currencies had suffered heavy drops during the risk off move in recent weeks. The most volatile among these – the Hungarian forint – breached the key 400 level versus the euro, while the Polish zloty rose from around 4.27 a week ago to 4.31 at the end of last week. All three currencies now appear to be stabilising, or even recovering, as the risk spike is fading – EUR/HUF has descended below 400 – one significant indication that the risk spike could be fading was the renewed fall in the oil price, Commerzbank’s FX analyst Tatha Ghose notes.
Koruna possesses the lowest beta among the CE3 currencies
“Today, we take a look from the point of view of the Czech koruna. The koruna possesses the lowest beta among the CE3 currencies and hence, may be expected to decline the least as a result of a common market fall. We see in the left-hand figure below that this was indeed the case – the koruna fell the least. At the same time, the chart confirms the correlated nature of the move, overall. This also means that the koruna will rebound probably the least as the market further rallies.”
“Another interesting analysis agrees with this conclusion. In the right-hand side figure below, we plot a rolling beta for the EUR/CZK exchange rate. The indicator measures the proportion of variation in the EUR/CZK exchange rate which can be explained by a regression against a basket of peers. This calculation is carried out using a rolling window, which therefore produces the plotted indicator and not just one static number.”
“During major global developments, such as after covid in 2020, the indicator naturally rose to high levels. This indicator has risen recently, but not to the high levels seen during major upheavals. For the koruna, it stands at just around 0.2, which represents mild sensitivity to global forces. This is good news from the point of view of risk. On the one hand, this limits the koruna’s upside in the event of continued recovery. We forecast EUR/CZK to return gradually towards 25.15 level over the coming quarter.”
The US Dollar (USD) retains a firm undertone, Scotiabank’s Chief FX Strategist Shaun Osborne notes.
USD remains firm, holds near recent peaks
“The DXY made a marginal new high—above Friday’s peak—a little earlier today before easing back but it’s still a case of the market’s revised rate outlook and firmer market-driven rates providing the essential support for a firm, and perhaps firmer still, dollar overall. The risk mood is a little soft today as Chinese shares flounder on fading stimulus hopes. US equity futures are lower on rates and regulatory concerns.”
“The DXY is trading close to estimated fair value (based on index-weighted 2Y spreads) which may suggest limited scope for additional gains absent a further shift in yields or spreads. But seasonality is positive for the DXY in October and November and technical pointers still suggest scope for the DXY to recover more of its H2 decline (towards the 103/104 range potentially).”
“It’s another light day of calendar risk. US data points are limited to Wholesale Inventories and the FOMC Minutes—which may look a little dovish but which have perhaps been surpassed by recent events. There is a 10Y bond reopening and a fair bit more comment from Fed speakers over the session (Bostic, Jefferson and Daly are the voters among them).”
- Crude Oil consolidates after a downbeat Tuesday with more than 4% losses.
- Markets are assessing the situation in the Middle East, and President Biden is set to speak to Israel’s Prime Minister Netanyahu.
- The US Dollar Index swings up and recovers initial weekly losses.
Crude Oil finds some support and stabilzes on Wednesday after over 4% correction the previous day when Israel refrained from responding firmly to the recent attacks from Iran. Israel has been halted by United States (US) President Joe Biden, who asked not to attack Iranian oil fields and vital infrastructure. With a call between US President Biden and Israel’s Prime Minister Benjamin Netanyahu later this Wednesday, a risk for a large strike is still a present danger that could get priced in very quickly.
The US Dollar Index (DXY), which tracks the performance of the Greenback against six other currencies, is recovering its earlier poor performance from the beginning of this week. On Wednesday, markets await the publication of the September meeting's Federal Open Market Committee (FOMC) Minutes, as traders will be able to get more information on the main drivers for the big 50 basis points rate cut and what this could mean going forward.
At the time of writing, Crude Oil (WTI) trades at $73.40 and Brent Crude at $77.36
Oil news and market movers: Supply is healthy despite tensions
- The American Petroleum Institute (API) reported a build of 10.9 million barrels on the week ending October 4, compared to the smaller 1.95 million barrels expected and following the drawdown of 1.5 million barrels the previous week.
- At 14:30 GMT, the Energy Information Administration (EIA) will release the Crude Oil stockpile change for the week ending October 4. Expectations are for a small build of 2.0 million barrels compared to the build of 3.889 million barrels the previous week.
- Angola Oil exports are set to pick up, with the company stepping up efforts to increase output from existing developments, Equinor reports. The company exports around 175,000 barrels per day, Bloomberg reports.
- Pemex stated that it shut down oil platforms and crude-exporting terminals in the Gulf of Mexico due to Hurricane Milton. The storm is approaching Florida’s west coast on Wednesday, where flooding and high winds are expected to inflict widespread damage and put lives at risk, Bloomberg reports.
Oil Technical Analysis: Wash out for bulls
Crude Oil price has been purified from opportunistic traders that have been piling into the price action with bets on a further escalation in the Middle East. Several stop losses from traders have been filled, and some consolidation might be seen in the coming days. Expect some easing and sideways movement, with support being tested around $72.60.
Monday’s false break is to be ignored, as the move was fully paired back on Tuesday. It means that current pivotal levels on the upside are still valid: the red descending trendline in the chart below, and the 100-day Simple Moving Average (SMA) at $75.67 just hovering above it, makes that region very difficult to surpass. Once holding above there, the 200-day SMA at $77.16 should refute any further upticks as it did in early trading on Tuesday.
On the downside, old resistances have turned into supports. First is the 55-day SMA at $72.62, which acts as a potential first line of defence in case of any retreat. A bit further down, $71.46 (the February 5 low) comes into play as second support before looking back to the $70.00 big figure and $67.11 as ultimate support for traders to buy the dip.
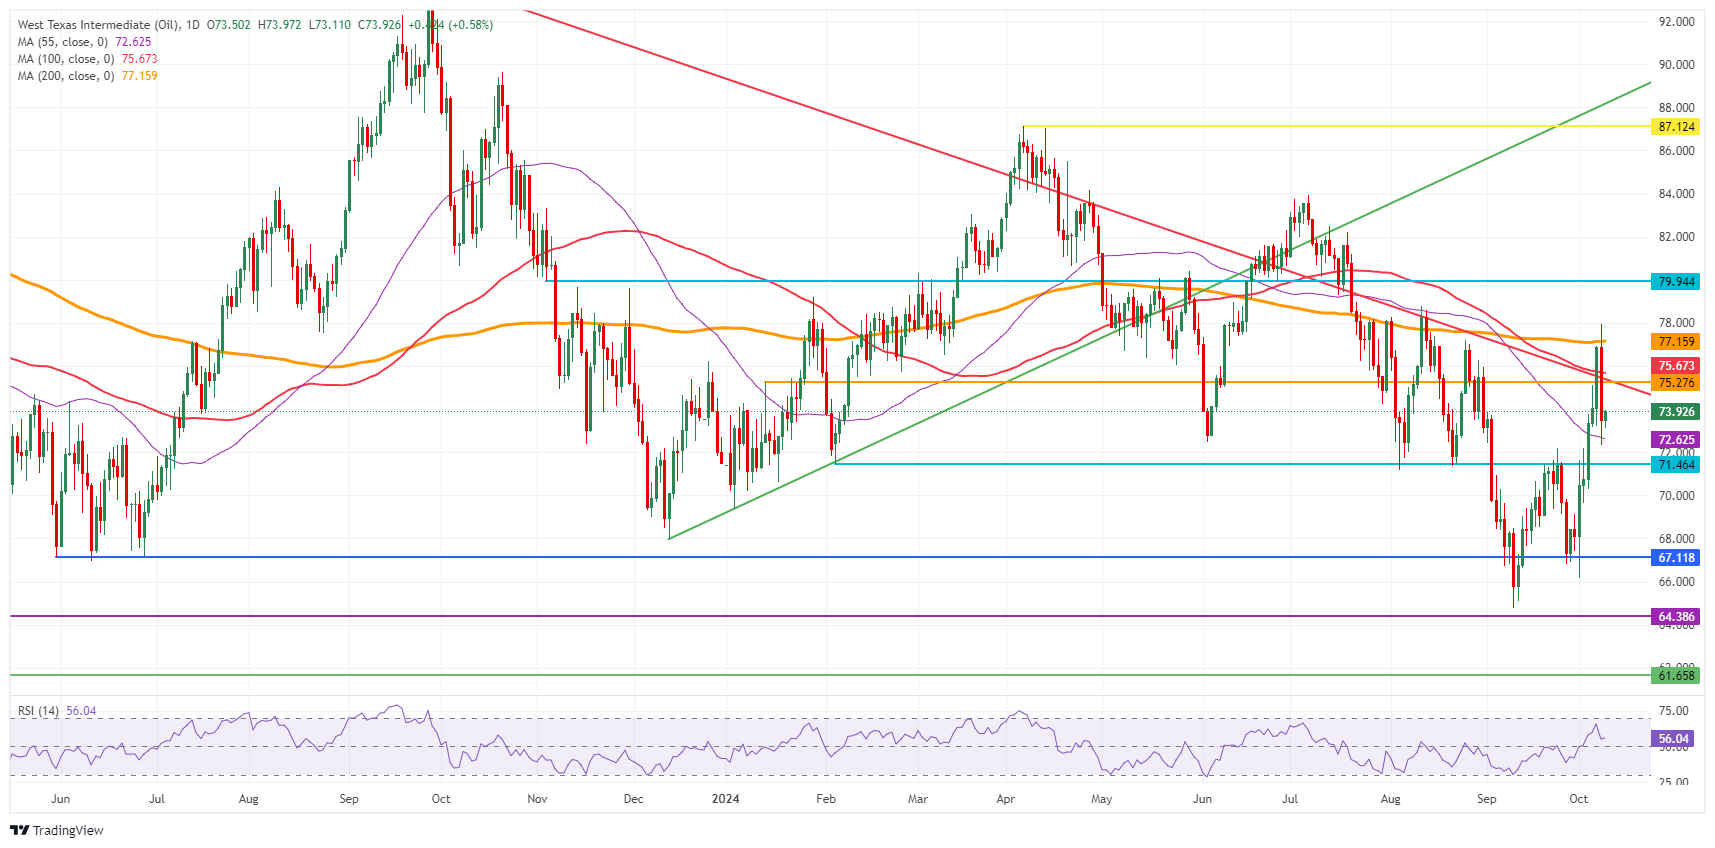
US WTI Crude Oil: Daily Chart
WTI Oil FAQs
WTI Oil is a type of Crude Oil sold on international markets. The WTI stands for West Texas Intermediate, one of three major types including Brent and Dubai Crude. WTI is also referred to as “light” and “sweet” because of its relatively low gravity and sulfur content respectively. It is considered a high quality Oil that is easily refined. It is sourced in the United States and distributed via the Cushing hub, which is considered “The Pipeline Crossroads of the World”. It is a benchmark for the Oil market and WTI price is frequently quoted in the media.
Like all assets, supply and demand are the key drivers of WTI Oil price. As such, global growth can be a driver of increased demand and vice versa for weak global growth. Political instability, wars, and sanctions can disrupt supply and impact prices. The decisions of OPEC, a group of major Oil-producing countries, is another key driver of price. The value of the US Dollar influences the price of WTI Crude Oil, since Oil is predominantly traded in US Dollars, thus a weaker US Dollar can make Oil more affordable and vice versa.
The weekly Oil inventory reports published by the American Petroleum Institute (API) and the Energy Information Agency (EIA) impact the price of WTI Oil. Changes in inventories reflect fluctuating supply and demand. If the data shows a drop in inventories it can indicate increased demand, pushing up Oil price. Higher inventories can reflect increased supply, pushing down prices. API’s report is published every Tuesday and EIA’s the day after. Their results are usually similar, falling within 1% of each other 75% of the time. The EIA data is considered more reliable, since it is a government agency.
OPEC (Organization of the Petroleum Exporting Countries) is a group of 12 Oil-producing nations who collectively decide production quotas for member countries at twice-yearly meetings. Their decisions often impact WTI Oil prices. When OPEC decides to lower quotas, it can tighten supply, pushing up Oil prices. When OPEC increases production, it has the opposite effect. OPEC+ refers to an expanded group that includes ten extra non-OPEC members, the most notable of which is Russia.
As expected, the Reserve Bank of New Zealand (RBNZ) increased its pace of interest rate cuts this morning, this time lowering its benchmark interest rate by 50 basis points to 4.75 percent, following the surprise initial cut of 25 basis points in August, Commerzbank’s FX analyst Michael Pfister notes.
Monetary policy is likely to remain highly restrictive
“Although no new forecasts were released with this decision, the RBNZ made it clear in its statement where the focus is now: New Zealand's real economy is now weakening significantly, while confidence has increased that inflation will return to target in the near term.”
“Despite the expected rate cut, the Kiwi has weakened significantly in early trading. This is not surprising, as the statement sounds quite dovish and opens the door for another larger rate cut of 50 basis points. For the next decision at the end of November, quarterly inflation, which will be released next week, is likely to be the main factor.”
“In its most recent forecasts, the RBNZ assumed that it would fall significantly and that year-on-year inflation would not be far from the middle of the RBNZ's target range of 1-3 percent. If this is the case, monetary policy is likely to remain highly restrictive, so there is much to suggest that another large 50 basis point rate cut is on the cards after today's decision.”
The US Dollar (USD) could continue to trade in a range, likely between 7.0530 and 7.0930. In the longer run, current price movements are likely part of a range trading phase; USD is likely to trade between 7.0300 and 7.1200, UOB Group Quek Ser Leang and Peter Chia note.
USD may fall towards 7.0530
24-HOUR VIEW: “We expected USD to trade in a 7.0590/7.0800 range yesterday. While USD traded in a wider range between 7.0466 and 7.0846, it closed little changed at 7.0745 (+0.03%). There has been no increase in either upward or downward momentum, and USD could continue to trade in a range today, likely between 7.0530 and 7.0930.”
1-3 WEEKS VIEW: “After USD surged last Friday, we indicated on Monday (07 Oct, spot at 7.0900) that ‘while further USD strength is not ruled out, it remains to be seen if it can maintain the rapid pace of advance.’ We also indicated that ‘the level to monitor is 7.1200, and in order to maintain the rapid buildup of momentum, USD must not break below 7.0500.’ Yesterday (Tuesday), USD broke below 7.0500 as it dropped to a low of 7.0466. The buildup in momentum has faded. The current price movements are likely part of a range trading phase. For the time being, USD is expected to trade between 7.0300 and 7.1200.”
- The US Dollar trades in the green against nearly every G10 currency on Wednesday.
- Chinese markets are selling off again for the second day in a row on weak Golden Week numbers.
- The US Dollar Index trades above 102.50 and looks to be on its way to 103.00.
The US Dollar (USD) is tying up with gains again with markets still having concerns over China. Recent Chinese data released on domestic activity during the Golden Week revealed that there has been less spending as anticipated. This keeps concerns on China’s economic activity – both domestic and international – high on the bulletin board.
The economic calendar is again a very light one for this Wednesday. Besides a few light data points such as the Wholesale Inventories for August, the main event will be the release of the Federal Open Market Committee (FOMC) Minutes, curtailing the latest Federal Reserve rate decision in September. Markets will get to see the reasoning behind the 50 basis points rate cut and what it means for the November rate decision.
Daily digest market movers: China being dead weight this week
- Concerns on China are still keeping markets in a choke hold. Chinese equities are still selling off with the Hang Seng Index down near 1.5% at the closing bell. The Shanghai Composite fell over 7%.
- At 11:00 GMT, the Mortgage Bankers Association will release the weekly Mortgage Applications Index. Previous week showed a contraction by 1.3%. No forecast available.
- At 14:00 GMT, August Wholesale Inventories are due. Expectations are for a steady 0.2% growth as seen in July.
- Two Fed speakers on the docket this Wednesday:
- Around 16:30 GMT Federal Reserve Vice Chair Phillip Jefferson (a neutral FOMC member according to FXStreet’s Fed Tracker) delivers a speech at an event organized by the Charlotte Economics Club in Charlotte, North Carolina.
- At 22:00 GMT, Federal Reserve Bank of San Francisco President Mary Daly (also neutral according to the Fed Tracker) participates in a moderated conversation and a Q&A session at Boise State University.
- The US Treasury is heading to markets to auction a 10-year Note at 17:00 GMT.
- European equities are looking for direction, and are trying to push back against the negative drag from the Chinese sell-off, which has been restricted to just Chinese indices this Wednesday. US stock futures are down, less than a quarter of a percentage.
- The CME Fedwatch Tool shows an 88.6% chance of a 25 basis point (bps) interest rate cut at the next Fed meeting on November 7, while 11.4% is pricing in no rate cut. Chances for a 50 bps rate cut have been fully priced out now.
- The US 10-year benchmark rate trades at 4.02%, the highest level since mid-August.
US Dollar Index Technical Analysis: USD, the comeback kid
The US Dollar Index (DXY) is setting the record straight, back at the high of September and looks set to head higher. With a very chunky area of several pivotal levels just above 103.00, the question is how far this rally can go. Taking into account the Relative Strength Index (RSI), a test at 103.18 looks possible, but 104.00 looks to be out of the question.
The psychological 103.00 is the first level to tackle on the upside. Further up, the chart identifies 103.18 as the very final resistance level for this week. Once above there, a very choppy area emerges, with the 100-day Simple Moving Average (SMA) at 103.30, the 200-day SMA at 103.76, and the pivotal 103.99-104.00 levels in play.
On the downside, the 55-day SMA at 101.96 is the first line of defence, backed by the 102.00 round level and the pivotal 101.90 as support to catch any bearish pressure and trigger a bounce. If that level does not work out, 100.62 also acts as support. Further down, a test of the year-to-date low of 100.16 should take place before more downside. Finally, and that means giving up the big 100.00 level, the July 14, 2023, low at 99.58 comes into play.
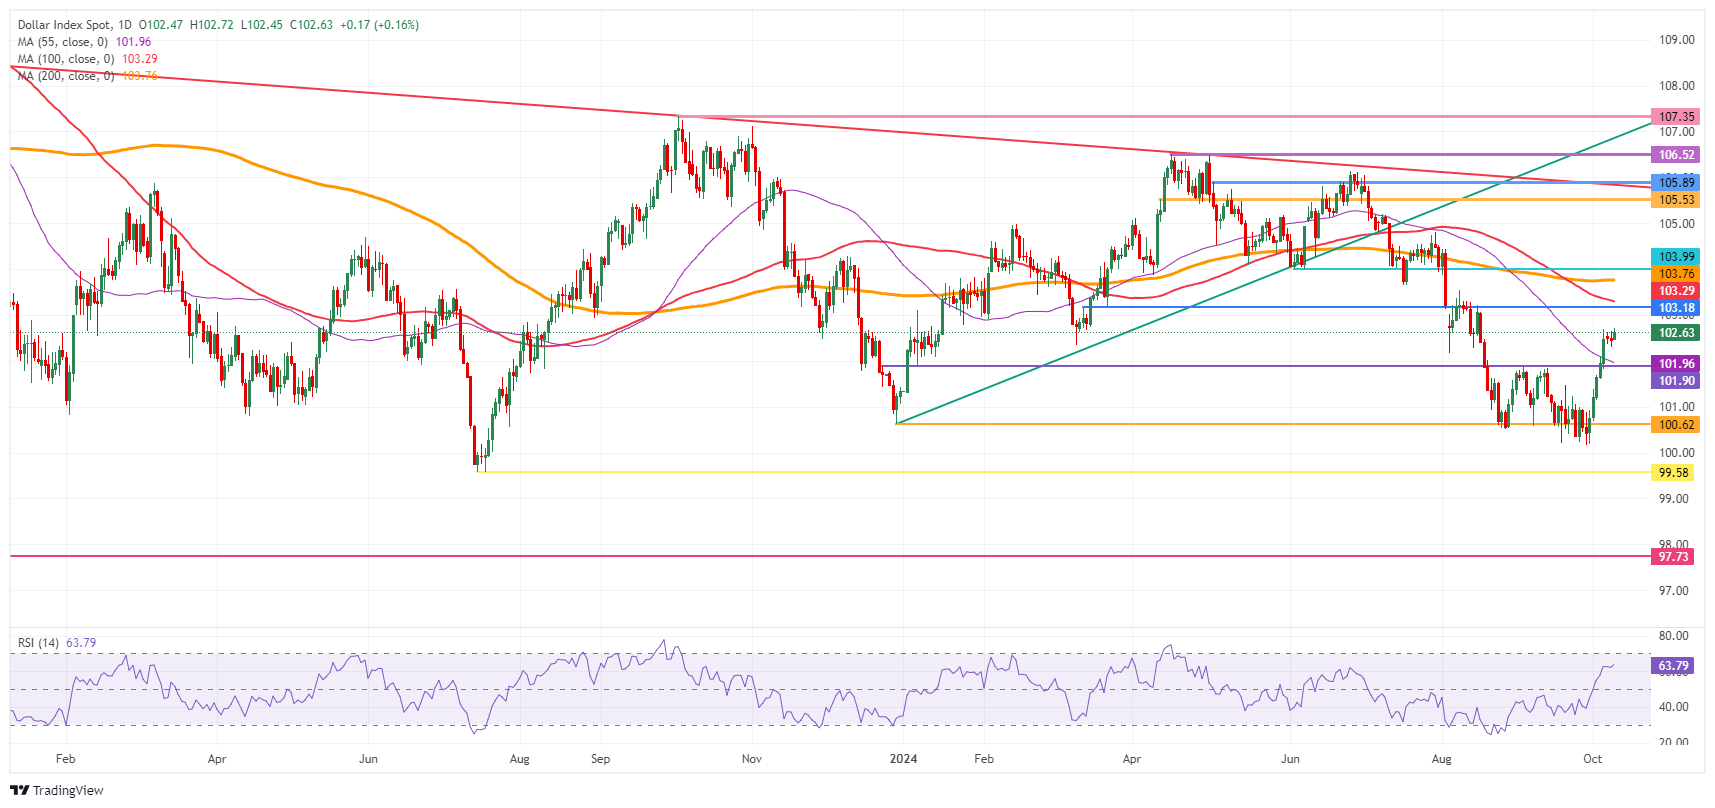
US Dollar Index: Daily Chart
US Dollar FAQs
The US Dollar (USD) is the official currency of the United States of America, and the ‘de facto’ currency of a significant number of other countries where it is found in circulation alongside local notes. It is the most heavily traded currency in the world, accounting for over 88% of all global foreign exchange turnover, or an average of $6.6 trillion in transactions per day, according to data from 2022. Following the second world war, the USD took over from the British Pound as the world’s reserve currency. For most of its history, the US Dollar was backed by Gold, until the Bretton Woods Agreement in 1971 when the Gold Standard went away.
The most important single factor impacting on the value of the US Dollar is monetary policy, which is shaped by the Federal Reserve (Fed). The Fed has two mandates: to achieve price stability (control inflation) and foster full employment. Its primary tool to achieve these two goals is by adjusting interest rates. When prices are rising too quickly and inflation is above the Fed’s 2% target, the Fed will raise rates, which helps the USD value. When inflation falls below 2% or the Unemployment Rate is too high, the Fed may lower interest rates, which weighs on the Greenback.
In extreme situations, the Federal Reserve can also print more Dollars and enact quantitative easing (QE). QE is the process by which the Fed substantially increases the flow of credit in a stuck financial system. It is a non-standard policy measure used when credit has dried up because banks will not lend to each other (out of the fear of counterparty default). It is a last resort when simply lowering interest rates is unlikely to achieve the necessary result. It was the Fed’s weapon of choice to combat the credit crunch that occurred during the Great Financial Crisis in 2008. It involves the Fed printing more Dollars and using them to buy US government bonds predominantly from financial institutions. QE usually leads to a weaker US Dollar.
Quantitative tightening (QT) is the reverse process whereby the Federal Reserve stops buying bonds from financial institutions and does not reinvest the principal from the bonds it holds maturing in new purchases. It is usually positive for the US Dollar.
Inflation expectations in the euro area have collapsed. At one point, the market was only expecting inflation of just over 1.5% in a year's time – well below the ECB's inflation target. However, this was probably only a brief excursion into such low territory. In the past few days, expectations have corrected again, and in a year's time, inflation is now expected to be around the level seen at the end of August, Commerzbank’s FX analyst Michael Pfister notes.
Real economy is the key factor for further interest rate cuts
“Correction is likely to be driven mainly by the sharp rise in the price of oil. Last week, the price of oil rose by almost $8 per barrel on the back of rising geopolitical tensions in the Middle East, which explains the rise in inflation expectations quite well. The link is also understandable: when the oil price rises, so does inflation. And now the oil price is roughly back to the level seen at the end of August.”
“Interest rate expectations have indeed corrected in recent days, but not during the period of the stronger oil price increase. During this period, rate expectations remained rather unchanged. Rate expectations only corrected after Friday's surprising payrolls, after which the market priced out a rate cut of around 25 bps. However, this tends to affect the long end; for the next 2-4 meetings, a rate cut at each meeting seems to remain the base case.”
“Inflation expectations did not rise due to the payrolls, but were driven by the oil price. At the same time, interest rate expectations were not corrected due to higher inflation expectations, but only due to the US payrolls. The market now seems to have fully bought into the story that the real economy, rather than inflation, is the key factor for further interest rate cuts.”
The Reserve Bank of New Zealand (RBNZ) decided to reduce the official cash rate (OCR) by 50 bps to 4.75%. In the accompanying media release, the RBNZ flagged that the ‘Committee agreed that it is appropriate to cut the OCR by 50 basis points to achieve and maintain low and stable inflation, while seeking to avoid unnecessary instability in output, employment, interest rates, and the exchange rate’, UOB Group economist Lee Sue Ann notes.
RBNZ decides to reduce the official cash rate
“The Reserve Bank of New Zealand (RBNZ) slashed its official cash rate (OCR) from 5.25% to 4.75% earlier today, marking its second straight reduction since it unexpectedly cut in August. The RBNZ said then, that the pace of further easing will depend on how confident it is about a low inflation environment.”
“We had already anticipated the RBNZ to continue easing. However, we were looking for a 25bps cut today, with the view that the RBNZ will not have received 3Q24 data on growth, inflation nor employment since the 25 bps cut in August.”
“Our current view is for a further 175 bps of rate cuts to a terminal rate close to 3.00% by this time next year. And we are keeping to our view of a 25 bps cut at the next monetary policy meeting on 27 Nov. However, we will be relooking at our forecasts following the release of 3Q24 CPI data on 16 October.”
Further range trading appears likely, albeit in a higher range of 147.50/148.70. In the longer run, the US Dollar (USD) is expected to continue to rise, potentially breaking above 149.40, UOB Group Quek Ser Leang and Peter Chia note.
Can potentially break above 149.40
24-HOUR VIEW: “We highlighted yesterday that USD ‘appears to have entered a range trading phase,’ and we expected it to trade between 147.00 and 148.80. USD subsequently traded in a 147.33/148.37 range, closing largely unchanged at 148.19 (+0.01%). While further range trading appears likely, the slightly firmed underlying tone suggests a higher range of 147.50/148.70.”
1-3 WEEKS VIEW: “On Monday (07 Oct, spot at 148.60), we highlighted that USD ‘is expected to continue to rise, potentially breaking above 149.40.’ We added, ‘should USD break below 146.40 (‘strong support’ level), it would indicate that it is not rising further.’ Our view remains valid.”
The UK press is starting to reach a fever pitch with its speculation over what Chancellor Rachel Reeves will present in her first budget on 30 October, ING’s FX analyst Chris Turner notes.
Correction towards the 1.29 area seems probable
“Critics argue that the budget should have been presented earlier, which would have prevented this policy void from being filled by other news. Investors remain on the lookout for any signs that the UK Gilt market is becoming nervous again about potential spending plans.”
“True the 10-year Gilt-Bund spread has widened 25-30bp over the last month, although that may be as much down to miserable eurozone data than anything else. Equally, the five-year UK sovereign CDS has barely budged from a very tight 21bp – suggesting that there has not been a risk premium going into UK asset markets.”
“That said, it is becoming increasingly clear that the US Dollar (USD) will now stay a little stronger into US elections in November. This means we have not seen the lows for GBP/USD. A correction towards the 1.29 area seems probable in the coming weeks.”
The New Zealand Dollar (NZD) still seems weak; it remains to be seen if it has enough momentum to reach the next major support at 0.6075, UOB Group Quek Ser Leang and Peter Chia note.
NZD can reach the next major support at 0.6075
24-HOUR VIEW: “NZD fell sharply on Monday. Yesterday (Tuesday), we highlighted that ‘the decline has not stabilised, but severely oversold suggests any decline is probably part of a lower trading range of 0.6105/0.6165.’ NZD then traded between 0.6113 and 0.6169, closing at 0.6126 (- 0.55%). Tentative signs of slowing momentum combined with the still oversold conditions suggest NZD is likely to trade in a range today, expected to be between 0.6110 and 0.6165.”
1-3 WEEKS VIEW: “Our update from yesterday (07 Oct, spot at 0.6125) is still valid. As highlighted, while NZD still seems weak, it remains to be seen if NZD has enough momentum to reach the next major support at 0.6075. Overall, only a breach of 0.6195 (no change in ‘strong resistance’ from yesterday) would mean that the NZD weakness from the middle of last week has stabilised.”
- GBP/USD remains below 1.3100 as traders brace for the FOMC Minutes.
- Upbeat US labor market data has diminished risks of an economic slowdown.
- Investors expect the BoE to cut interest rates again by 25 bps.
The GBP/USD pair trades with caution below the crucial resistance of 1.3100 in Wednesday’s London session. The Cable remains under pressure as the US Dollar (USD) extends its upside, with traders pricing out another Federal Reserve (Fed) 50 basis points (bps) interest rate cut in November.
The market sentiment remains risk-averse amid escalating tensions between Israel and Iran. S&P 500 futures have posted some losses in European trading hours. The US Dollar Index (DXY), which tracks the Greenback’s value against six major currencies, strives to rally further above 102.70.
Market participants are not expecting the Fed to reduce interest rates again with a larger-than-usual pace of 50 bps as risks of a United States (US) economic slowdown have diminished after the release of the upbeat labor market data for September, which showed robust job growth and stronger-than-expected wage growth momentum.
In Wednesday’s session, investors will focus on the Federal Open Market Committee (FOMC) minutes for the September meeting, which will be published at 18:00 GMT. In the policy meeting, Fed officials unanimously voted to reduce interest rates by 50 basis points (bps) to 4.75%-5.00%, except Fed Governor Michelle Bowman, who supported a usual rate cut of 25 bps.
In the United Kingdom (UK) region, the Pound Sterling (GBP) will be guided by market expectations for the Bank of England’s (BoE) interest rate outlook for the remainder of the year. The BoE is expected to cut interest rates again by 25 bps in one of its two meetings remaining this year. On the economic front, investors will focus on the monthly Gross Domestic Product (GDP) and the factory data for August, which will be published on Friday.
Economic Indicator
FOMC Minutes
FOMC stands for The Federal Open Market Committee that organizes 8 meetings in a year and reviews economic and financial conditions, determines the appropriate stance of monetary policy and assesses the risks to its long-run goals of price stability and sustainable economic growth. FOMC Minutes are released by the Board of Governors of the Federal Reserve and are a clear guide to the future US interest rate policy.
Read more.Next release: Wed Oct 09, 2024 18:00
Frequency: Irregular
Consensus: -
Previous: -
Source: Federal Reserve
Minutes of the Federal Open Market Committee (FOMC) is usually published three weeks after the day of the policy decision. Investors look for clues regarding the policy outlook in this publication alongside the vote split. A bullish tone is likely to provide a boost to the greenback while a dovish stance is seen as USD-negative. It needs to be noted that the market reaction to FOMC Minutes could be delayed as news outlets don’t have access to the publication before the release, unlike the FOMC’s Policy Statement.
Crude oil prices fell throughout Tuesday from China’s disappointing stimulus announcement eclipsing fears of a broader conflict in the Middle East, DBS’ FX strategist Philip Wee notes.
Brent erases Monday’s 3.7% rise
“Returning from its Golden Week holiday, the Shanghai Composite Index opened 10% higher in anticipation of more fiscal stimulus. However, the gains were trimmed to 4.6% when the outcome fell short of expectations.”
“Brent fell 4.6% to $77.18/barrel, erasing Monday’s 3.7% rise to 80.93. While oil prices have risen from the year’s low, they are still below levels a year ago, another reason why the Fed is not overly worried about inflation.”
EUR/USD is showing no inclination to trade back above 1.10, ING’s FX analyst Chris Turner notes.
Threat of higher oil prices is a large euro negative
“Normally we would argue that the prospect of fresh Chinese fiscal stimulus would be a euro positive – given the eurozone's relatively large share of exports to GDP. However, the Middle East situation and the threat of higher oil prices is a large euro negative and one which will hold the euro back this month.”
“We are disappointed that the EUR/USD rally stalled at 1.12 this Autumn and instead, 1.08 seems far more probable than a retest of 1.12. We continue to flat-line our multi-quarter EUR/USD forecasts at 1.10 until the outcome of November's US presidential election is known.”
“There is very little on the eurozone calendar today and while EUR/USD may press 1.10 on the back of this morning's news out of China – the Ministry of Finance will brief on fiscal policy this Saturday – we suspect sellers to emerge there.”
The Australian Dollar (AUD) is expected to trade in a range between 0.6725 and 0.6780. In the longer run, AUD is expected to continue to weaken, albeit likely at a slower pace. The next level to watch is 0.6700, UOB Group Quek Ser Leang and Peter Chia note.
The next level to watch is 0.6700
24-HOUR VIEW: “After AUD fell sharply two days ago, we indicated yesterday that ‘while the weakness has not stabilised, severely oversold conditions suggest any further decline is likely part of a lower trading range of 0.6735/0.6785.’ We added, ‘a sustained break below 0.6735 appears unlikely, and the major support at 0.6700 is unlikely to come into view.’ AUD subsequently weakened more than expected to 0.6715 before rebounding to close at 0.6747 (-0.17%). Slowing downward momentum combined with oversold conditions suggests that the weakness in AUD has likely stabilised. In other words, AUD is expected to trade in a range today, probably between 0.6725 and 0.6780.”
1-3 WEEKS VIEW: “We indicated yesterday (08 Oct, spot at 0.6755) that AUD is ‘is expected to continue to weaken, albeit at a slower pace.’ We added, ‘the next level to watch is 0.6700.’ AUD then fell to 0.6715 before recovering. Short-term downward momentum has slowed to an extent, but provided that 0.6800 (‘strong resistance’ level was at 0.6825 yesterday) is not breached, there is still a chance for AUD to drop to 0.6700. A breach of the ‘strong resistance’ would mean that the weakness in AUD that started late last week has ended.”
Fed officials looked past last Friday’s better-than-expected US jobs data and affirmed the two cuts pencilled in previous month’s Summary of Economic Projections, DBS’ FX strategist Philip Wee notes.
Fed Minutes are on their way
“Today’s FOMC Minutes should echo New York Fed President John Williams’ confidence that inflation was moving towards the 2% target because the US economy and the labour market were getting back in balance, allowing interest rates to move towards a neutral setting.”
“Minneapolis Fed President Neel Kashkari estimated the neutral rate to be close to 3%, where we see the Fed Funds Rate falling to next year from today’s 5%.”
Silver prices (XAG/USD) broadly unchanged on Wednesday, according to FXStreet data. Silver trades at $30.67 per troy ounce, broadly unchanged 0.01% from the $30.67 it cost on Tuesday.
Silver prices have increased by 28.89% since the beginning of the year.
| Unit measure | Silver Price Today in USD |
|---|---|
| Troy Ounce | 30.67 |
| 1 Gram | 0.99 |
The Gold/Silver ratio, which shows the number of ounces of Silver needed to equal the value of one ounce of Gold, stood at 85.34 on Wednesday, down from 85.48 on Tuesday.
Silver FAQs
Silver is a precious metal highly traded among investors. It has been historically used as a store of value and a medium of exchange. Although less popular than Gold, traders may turn to Silver to diversify their investment portfolio, for its intrinsic value or as a potential hedge during high-inflation periods. Investors can buy physical Silver, in coins or in bars, or trade it through vehicles such as Exchange Traded Funds, which track its price on international markets.
Silver prices can move due to a wide range of factors. Geopolitical instability or fears of a deep recession can make Silver price escalate due to its safe-haven status, although to a lesser extent than Gold's. As a yieldless asset, Silver tends to rise with lower interest rates. Its moves also depend on how the US Dollar (USD) behaves as the asset is priced in dollars (XAG/USD). A strong Dollar tends to keep the price of Silver at bay, whereas a weaker Dollar is likely to propel prices up. Other factors such as investment demand, mining supply – Silver is much more abundant than Gold – and recycling rates can also affect prices.
Silver is widely used in industry, particularly in sectors such as electronics or solar energy, as it has one of the highest electric conductivity of all metals – more than Copper and Gold. A surge in demand can increase prices, while a decline tends to lower them. Dynamics in the US, Chinese and Indian economies can also contribute to price swings: for the US and particularly China, their big industrial sectors use Silver in various processes; in India, consumers’ demand for the precious metal for jewellery also plays a key role in setting prices.
Silver prices tend to follow Gold's moves. When Gold prices rise, Silver typically follows suit, as their status as safe-haven assets is similar. The Gold/Silver ratio, which shows the number of ounces of Silver needed to equal the value of one ounce of Gold, may help to determine the relative valuation between both metals. Some investors may consider a high ratio as an indicator that Silver is undervalued, or Gold is overvalued. On the contrary, a low ratio might suggest that Gold is undervalued relative to Silver.
(An automation tool was used in creating this post.)
The European Central Bank (ECB) policymaker Martins Kazaks spoke on the central bank’s interest rate outlook on Wednesday, having said that “data points to October interest rate cut” on Tuesday.
“Rate cuts are necessary as the economy is weak,” Kazaks said.
Market reaction
EUR/USD keeps the red near 1.0960 on these comments, awaiting the Minutes of the US Federal Reserve (Fed) September policy meeting later on Wednesday.
ECB FAQs
The European Central Bank (ECB) in Frankfurt, Germany, is the reserve bank for the Eurozone. The ECB sets interest rates and manages monetary policy for the region. The ECB primary mandate is to maintain price stability, which means keeping inflation at around 2%. Its primary tool for achieving this is by raising or lowering interest rates. Relatively high interest rates will usually result in a stronger Euro and vice versa. The ECB Governing Council makes monetary policy decisions at meetings held eight times a year. Decisions are made by heads of the Eurozone national banks and six permanent members, including the President of the ECB, Christine Lagarde.
In extreme situations, the European Central Bank can enact a policy tool called Quantitative Easing. QE is the process by which the ECB prints Euros and uses them to buy assets – usually government or corporate bonds – from banks and other financial institutions. QE usually results in a weaker Euro. QE is a last resort when simply lowering interest rates is unlikely to achieve the objective of price stability. The ECB used it during the Great Financial Crisis in 2009-11, in 2015 when inflation remained stubbornly low, as well as during the covid pandemic.
Quantitative tightening (QT) is the reverse of QE. It is undertaken after QE when an economic recovery is underway and inflation starts rising. Whilst in QE the European Central Bank (ECB) purchases government and corporate bonds from financial institutions to provide them with liquidity, in QT the ECB stops buying more bonds, and stops reinvesting the principal maturing on the bonds it already holds. It is usually positive (or bullish) for the Euro.
- Gold price drops further as fading Fed 50 bps rate cut bets strengthened the US Dollar’s appeal.
- The downside in Gold price is expected to be limited due to geopolitical tensions.
- Investors await the FOMC Minutes and the US inflation data for September.
Gold price (XAU/USD) extends its losing streak for the sixth consecutive trading day on Wednesday. The precious metal has been battered by the upbeat US Dollar (USD), which has strengthened as traders are pricing out another Federal Reserve (Fed) larger-than-usual interest rate cut of 50 basis points (bps) in their next meeting in November.
The US Dollar Index (DXY), which tracks the Greenback’s value against six major currencies, has extended its upside to near 102.70. An appreciation in the US Dollar makes investment in the Gold price an expensive bet for investors.
Meanwhile, 10-year US Treasury yields drop to near 4.02% in Wednesday’s European session but is close to a more than two-month high. Higher yields on interest-bearing assets increase the opportunity cost of holding an investment in non-yielding assets, such as Gold.
Traders have priced out Fed large rate cut bets as upbeat United States (US) Nonfarm Payrolls (NFP) data for September reduced the risk of an economic slowdown. The US job report showed that labor demand remained robust, the Unemployment Rate decelerated, and wage growth was stronger than expected.
However, the downside in Gold price is expected to remain limited due to escalating tensions in the Middle East region. The war between Israel and Iran-backed-Hezbollah intensified after the former killed Hezbollah leader Hassan Nasrallah and his subsequent replacements. Historically, the appeal of precious metals, such as Gold, improved amid geopolitical woes.
Daily digest market movers: Gold price drops as US Dollar extends upside
- Gold price is expected to remain on tenterhooks with investors focusing on the Federal Open Market Committee (FOMC) Minutes of the September meeting, which will be published at 18:00 GMT. The FOMC Minutes will provide a detailed explanation behind the hefty rate cut and fresh cues about inflation and the economic outlook.
- In September’s meeting, the Federal Reserve started the policy-easing cycle after maintaining a restrictive policy stance for more than two and a half years. Fed officials almost unanimously (with only Michelle Bowman dissenting) voted for a sizable rate cut of 50 bps as they were more concerned about reviving job growth, with confidence that inflation is on track to return sustainably to the bank’s target of 2%.
- This week, investors will pay close attention to the US Consumer Price Index (CPI) data for September, which will be released on Thursday. Economists estimate the annual core CPI – which excludes volatile food and energy prices – to have grown steadily by 3.2%. Annual headline CPI is expected to have decelerated further to 2.3% from 2.5% in August.
- The inflation data will significantly influence market expectations for the Fed’s interest rate outlook for the remainder of the year. According to the CME FedWatch tool, 30-day Federal Fund Futures pricing data shows that there will be a 25-bps interest rate cut in each of the two meetings remaining this year.
Technical Analysis: Gold price falls to near $2,610
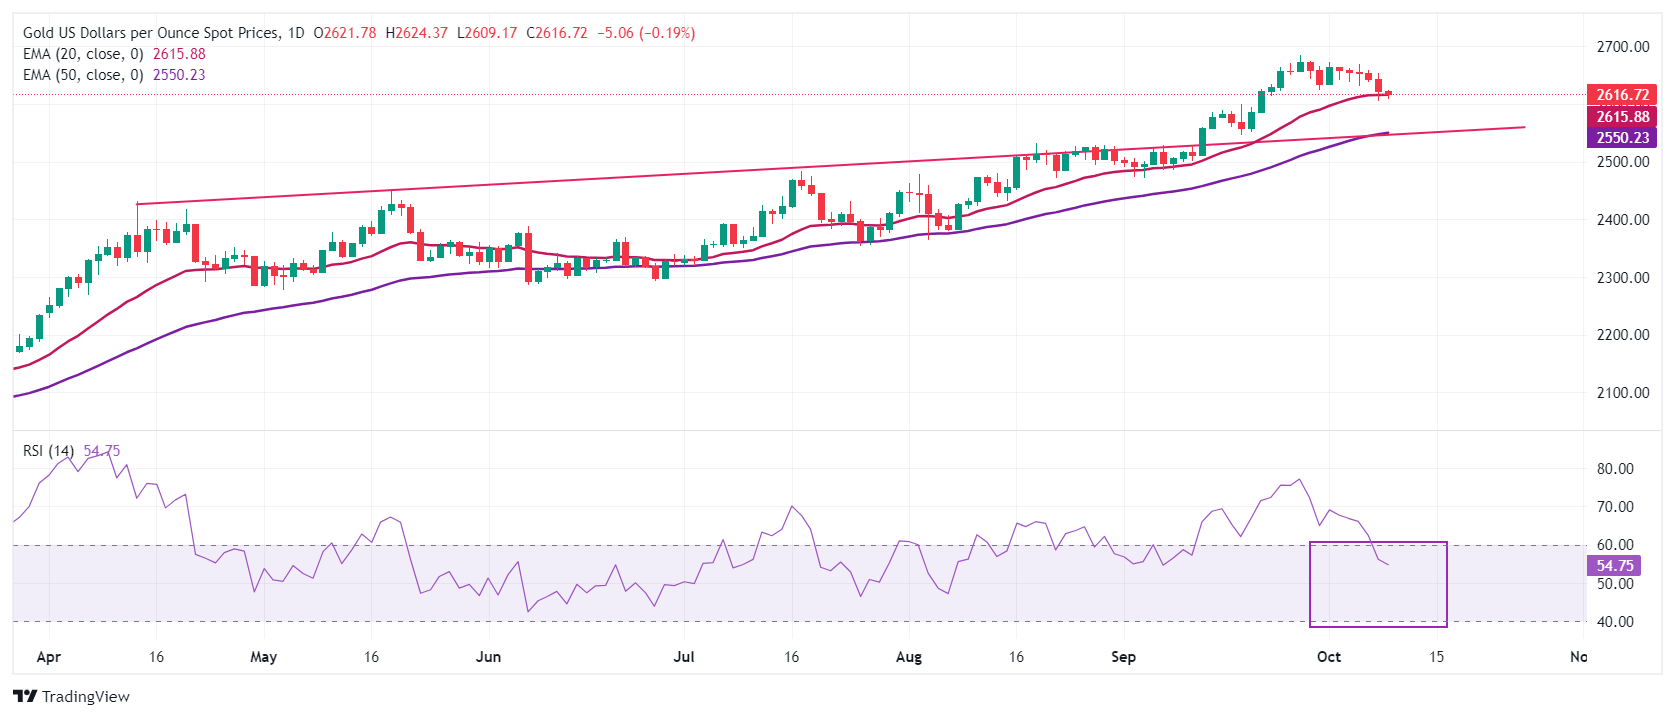
Gold price extends its correction to near $2,610 from its all-time high of $2,685 as profit-booking remains intact. However, the overall trend of the Gold price remains bullish as the 20- and 50-day Exponential Moving Averages (EMAs) at $2,615 and $2,550, respectively, are sloping higher.
Upward-sloping trendline from the April 12 high of $2,431.60 will act as major support for the Gold price bulls.
The 14-day Relative Strength Index (RSI) falls into the 40.00-60.00 range, suggesting a weakening of momentum. However, the upside trend remains intact.
Gold FAQs
Gold has played a key role in human’s history as it has been widely used as a store of value and medium of exchange. Currently, apart from its shine and usage for jewelry, the precious metal is widely seen as a safe-haven asset, meaning that it is considered a good investment during turbulent times. Gold is also widely seen as a hedge against inflation and against depreciating currencies as it doesn’t rely on any specific issuer or government.
Central banks are the biggest Gold holders. In their aim to support their currencies in turbulent times, central banks tend to diversify their reserves and buy Gold to improve the perceived strength of the economy and the currency. High Gold reserves can be a source of trust for a country’s solvency. Central banks added 1,136 tonnes of Gold worth around $70 billion to their reserves in 2022, according to data from the World Gold Council. This is the highest yearly purchase since records began. Central banks from emerging economies such as China, India and Turkey are quickly increasing their Gold reserves.
Gold has an inverse correlation with the US Dollar and US Treasuries, which are both major reserve and safe-haven assets. When the Dollar depreciates, Gold tends to rise, enabling investors and central banks to diversify their assets in turbulent times. Gold is also inversely correlated with risk assets. A rally in the stock market tends to weaken Gold price, while sell-offs in riskier markets tend to favor the precious metal.
The price can move due to a wide range of factors. Geopolitical instability or fears of a deep recession can quickly make Gold price escalate due to its safe-haven status. As a yield-less asset, Gold tends to rise with lower interest rates, while higher cost of money usually weighs down on the yellow metal. Still, most moves depend on how the US Dollar (USD) behaves as the asset is priced in dollars (XAU/USD). A strong Dollar tends to keep the price of Gold controlled, whereas a weaker Dollar is likely to push Gold prices up.
The US Dollar (USD) is staying relatively bid as the market digests the factors that have driven it 2% higher this month. These have largely been the intensifying conflict in the Middle East and September's surprisingly strong US jobs report, ING’s FX analyst Chris Turner notes.
DXY can continue to press 102.60 with risks to 103.35
“The risk of an oil shock on the back of Israeli retaliation against Iran is clearly a stagflationary one for the global economy and has already seen the US 2-10 year Treasury curve bear flatten by 20bp since late September. Bearish flattening of the curve is dollar-positive and normally sees the activity currencies hit the most. Yes, the dollar is the strongest G10 currency since late September followed by the defensive Swiss franc, but the third strongest is the Australian dollar.”
“Today, there is little data of note but tonight sees the release of the September FOMC minutes when the Fed cut 50bp. The market has already scaled back around 30bp from the 2024 Fed easing cycle over the last few weeks but equally we doubt investors are in the mood to re-price an aggressive Fed easing cycle just yet.”
“Additionally, the risk of a 0.3% month-on-month September core CPI release could also prove a mild dollar positive. In short, there are not enough factors to call for a lower dollar in the near term and DXY can continue to press 102.60 with risks to 103.35.”
The Pound Sterling (GBP) is expected to trade in a sideways range of 1.3065/1.3135. In the longer run, price action suggests further GBP weakness; the next major support at 1.3000 may not come into view so soon, UOB Group Quek Ser Leang and Peter Chia note.
Moving slowly towards 1.3065
24-HOUR VIEW: “We expected GBP to edge lower yesterday, but we held the view that ‘any decline is likely limited to a test of 1.3050.’ Our view did not materialise, as after dipping briefly to 1.3065 in London trade, GBP traded sideways for the rest of the sessions. Momentum indicators are turning flat. Today, we expect GBP to trade in a sideways range of 1.3065/1.3135.”
1-3 WEEKS VIEW: “We have held a negative view in GBP since the middle of last week. In our most recent narrative from two days ago (07 Oct, spot at 1.3130), we indicated that “although the recent price action suggests further GBP weakness, conditions are oversold, and the next major support at 1.3000 may not come into so soon.” We will continue to hold the same view, as long as 1.3185 (no change in ‘strong resistance’ level from yesterday) is not breached.”
The Dollar Index (DXY) ended Tuesday barely changed at 102.54 after trading below and above Monday’s range of 102.37-102.62, DBS’ FX strategist Philip Wee notes.
The Fed is trying to get its ‘balanced’ message across
“DXY initially fell to a low of 102.29 during the Asian session and rose to 102.64 during the European session before ending the US session at 102.54.”
“Despite the futures market withdrawing bets for another 50 bps cut at next month’s FOMC meeting, the US Treasury 2Y yield eased, for the first time in five sessions, by 3.7 bps to 3.958% after failing to break above 4% on Monday.”
- USD/CAD gains positive traction for the sixth successive day amid renewed USD buying.
- The overnight slump in Oil prices undermines the Loonie and lends support to the pair.
- Traders now look forward to the release of the FOMC minutes for a short-term impetus.
The USD/CAD pair scales higher for the sixth successive day on Wednesday and climbs to the 1.3670-1.3675 area, or its highest level since August 19 during the first half of the European session amid renewed US Dollar (USD) buying.
Following a brief consolidation over the past two days, the USD attracts fresh buyers amid firming expectations that the Federal Reserve (Fed) will go slow on interest rate cuts. In fact, traders are currently pricing in over an 85% chance that the US central bank will lower borrowing costs by 25 basis points in November amid signs of a still resilient labor market. This allows the yield on the benchmark 10-year US government bond to hold above the 4.0% threshold, which lifts the USD to its highest level since August 16 and continues to act as a tailwind for the USD/CAD pair.
Meanwhile, news of a possible ceasefire between Lebanon's Hezbollah and Israel lowered the geopolitical risk premium in the markets. This led to the overnight slump in Crude Oil prices, which, along with bets for a jumbo interest rate cut by the Bank of Canada (BoC) later this month, undermines the commodity-linked Loonie and boosts the USD/CAD pair amid some follow-through technical buying above the 200-day Simple Moving Average (SMA).
Moving ahead, investors now look forward to the release of the FOMC meeting minutes, due later during the North American session. This, along with the US Consumer Price Index (CPI) and the US Producer Price Index (PPI) on Thursday and Friday, respectively, will be looked upon for cues about the Fed's rate-cut path. This, in turn, will drive the USD demand in the near term. Apart from this, Canadian monthly employment details on Friday should provide some meaningful impetus to the USD/CAD pair and help in determining the next leg of a directional move.
Economic Indicator
FOMC Minutes
FOMC stands for The Federal Open Market Committee that organizes 8 meetings in a year and reviews economic and financial conditions, determines the appropriate stance of monetary policy and assesses the risks to its long-run goals of price stability and sustainable economic growth. FOMC Minutes are released by the Board of Governors of the Federal Reserve and are a clear guide to the future US interest rate policy.
Read more.Next release: Wed Oct 09, 2024 18:00
Frequency: Irregular
Consensus: -
Previous: -
Source: Federal Reserve
Minutes of the Federal Open Market Committee (FOMC) is usually published three weeks after the day of the policy decision. Investors look for clues regarding the policy outlook in this publication alongside the vote split. A bullish tone is likely to provide a boost to the greenback while a dovish stance is seen as USD-negative. It needs to be noted that the market reaction to FOMC Minutes could be delayed as news outlets don’t have access to the publication before the release, unlike the FOMC’s Policy Statement.
European Central Bank (ECB) policymaker and Slovakian central bank Governor Peter Kazimir said on Wednesday that he is not convinced that they should decide on the policy on the basis of one good inflation figure, per Reuters.
"Key information will be in December," Kazimir further added and reiterated that it is important for them to have certainty that they will not have to revise their policy steps later.
Market reaction
These comments failed to trigger a noticeable reaction in EUR/USD. At the time of press, EUR/USD was down 0.22% on the day at 1.0955.
The Euro (EUR) is likely to trade in a sideways range of 1.0950/1.1000. In the longer run, further EUR weakness appears likely; the next two support levels to monitor are 1.0935 and 1.0900, UOB Group Quek Ser Leang and Peter Chia note.
Next two support levels to monitor are 1.0935 and 1.0900
24-HOUR VIEW: “Yesterday, we expected EUR to ‘continue to trade sideways, expected to be in a 1.0950/1.1000 range.’ Our view of sideways trading was not wrong, even though EUR traded in a narrower range between 1.0960 and 1.0996. EUR closed largely unchanged at 1.0980 (+0.05%). Momentum indicators are most flat, and we continue to expect EUR to trade in a sideways range of 1.0950/1.1000.”
1-3 WEEKS VIEW: “Our update from two days ago (07 Oct, spot at 1.0970) still stands. As highlighted, after the sharp drop last Friday, further EUR weakness appears likely. The next two support levels to monitor are 1.0935 and 1.0900. Should EUR break above 1.1045 (no change in ‘strong resistance’ level from yesterday), it would mean that the EUR weakness a week ago has ended.”
- AUD/USD trades with negative bias for the fifth straight day amid a modest USD strength.
- Disappointment over China’s stimulus update exerts additional pressure on the Aussie.
- Traders now look to FOMC minutes for short-term impetus ahead of US inflation figures.
The AUD/USD pair attracts fresh sellers following an intraday uptick to the 0.6760 area and drifts into negative territory for the fifth straight day on Wednesday. Spot prices drop to the 0.6725-0.6720 region during the first half of the European session, closer to over a three-week low touched on Tuesday, with bears flirting with the 50-day Simple Moving Average (SMA).
The Australian Dollar (AUD) continues to be undermined by the disappointment over China's stimulus update, which, along with a modest US Dollar (USD) uptick, exerts some downward pressure on the AUD/USD pair. China's National Development and Reform Commission stated on Tuesday that the economy is facing more complex internal and external environments and also fell short of announcing any new major stimulus plans. This, to a larger extent, overshadowed a relatively hawkish minutes from the Reserve Bank of Australia's (RBA) September meeting.
Meanwhile, investors have been paring bets for a more aggressive policy easing by the Federal Reserve (Fed) and an oversized interest rate cut in November amid signs of a still resilient US labor market. This keeps the yield on the benchmark 10-year US government bond elevated above the 4% threshold and the USD Index (DXY), which tracks the Greenback against a basket of currencies, close to a seven-week high touched last Friday. Apart from this, a generally weaker tone around the equity markets benefits the safe-haven buck and weighs on the risk-sensitive Aussie.
The fundamental backdrop supports prospects for an extension of the AUD/USD pair's recent retracement slide from the highest level since February 2023, around the 0.6940-0.6945 region touched last month. Bearish traders, however, seem reluctant and prefer to wait for more cues about the Fed's rate-cut path before placing fresh bets. Hence, the market focus will glued to the release of the FOMC meeting minutes later this Wednesday, which will be followed by the US Consumer Price Index (CPI) and the Producer Price Index (PPI) on Thursday and Friday, respectively.
US Dollar PRICE Today
The table below shows the percentage change of US Dollar (USD) against listed major currencies today. US Dollar was the strongest against the New Zealand Dollar.
| USD | EUR | GBP | JPY | CAD | AUD | NZD | CHF | |
|---|---|---|---|---|---|---|---|---|
| USD | 0.18% | 0.18% | 0.25% | 0.17% | 0.25% | 0.93% | -0.02% | |
| EUR | -0.18% | 0.00% | 0.05% | -0.03% | 0.12% | 0.70% | -0.21% | |
| GBP | -0.18% | -0.00% | 0.06% | 0.00% | 0.11% | 0.71% | -0.22% | |
| JPY | -0.25% | -0.05% | -0.06% | -0.06% | 0.02% | 0.67% | -0.29% | |
| CAD | -0.17% | 0.03% | -0.00% | 0.06% | 0.09% | 0.74% | -0.20% | |
| AUD | -0.25% | -0.12% | -0.11% | -0.02% | -0.09% | 0.62% | -0.32% | |
| NZD | -0.93% | -0.70% | -0.71% | -0.67% | -0.74% | -0.62% | -0.94% | |
| CHF | 0.02% | 0.21% | 0.22% | 0.29% | 0.20% | 0.32% | 0.94% |
The heat map shows percentage changes of major currencies against each other. The base currency is picked from the left column, while the quote currency is picked from the top row. For example, if you pick the US Dollar from the left column and move along the horizontal line to the Japanese Yen, the percentage change displayed in the box will represent USD (base)/JPY (quote).
Here is what you need to know on Wednesday, October 9:
The action in financial markets remain choppy midweek, with investors' search for the next catalyst continues. The US economic calendar will feature Wholesale Inventories data for August. Later in the day, the US Treasury will hold a 10-year note auction and the Federal Reserve (Fed) will publish the minutes of the September policy meeting.
US Dollar PRICE This week
The table below shows the percentage change of US Dollar (USD) against listed major currencies this week. US Dollar was the strongest against the New Zealand Dollar.
| USD | EUR | GBP | JPY | CAD | AUD | NZD | CHF | |
|---|---|---|---|---|---|---|---|---|
| USD | 0.08% | 0.22% | -0.10% | 0.73% | 0.92% | 1.17% | -0.22% | |
| EUR | -0.08% | 0.19% | -0.16% | 0.68% | 0.82% | 1.08% | -0.33% | |
| GBP | -0.22% | -0.19% | -0.39% | 0.50% | 0.63% | 0.92% | -0.40% | |
| JPY | 0.10% | 0.16% | 0.39% | 0.83% | 1.01% | 1.21% | -0.08% | |
| CAD | -0.73% | -0.68% | -0.50% | -0.83% | 0.22% | 0.43% | -0.94% | |
| AUD | -0.92% | -0.82% | -0.63% | -1.01% | -0.22% | 0.30% | -1.10% | |
| NZD | -1.17% | -1.08% | -0.92% | -1.21% | -0.43% | -0.30% | -1.33% | |
| CHF | 0.22% | 0.33% | 0.40% | 0.08% | 0.94% | 1.10% | 1.33% |
The heat map shows percentage changes of major currencies against each other. The base currency is picked from the left column, while the quote currency is picked from the top row. For example, if you pick the US Dollar from the left column and move along the horizontal line to the Japanese Yen, the percentage change displayed in the box will represent USD (base)/JPY (quote).
The US Dollar (USD) Index, which tracks the USD's valuation against a basket of six major currencies, closed the second consecutive day virtually unchanged on Tuesday. The index edges slightly higher and stays above 102.50 in the European morning on Wednesday. The risk-averse market environment seems to be helping the USD hold its ground. At the time of press, US stock index futures were down between 0.2% and 0.4% on the day. Meanwhile, China's Shanghai Composite Index fell nearly 7% and Hong Kong's Hang Seng Index lost over 1% after Reuters reported that China’s Finance Ministry is set to roll out a 2 trillion Yuan fiscal stimulus package on October 12.
Following its October policy meeting, the Reserve Bank of New Zealand (RBNZ) decided to lower the policy rate by 50 basis points (bps) to 4.75% from 5.25%. In its policy statement, "the New Zealand economy is now in a position of excess capacity, encouraging price- and wage-setting to adjust to a low-inflation economy," the RBNZ noted. NZD/USD came under heavy bearish pressure in the Asian trading hours and was last seen trading at its lowest level since Mid-August below 0.6100.
Following Tuesday's recovery attempt, EUR/USD stays on the back foot early Wednesday and retreats toward 1.0950.
GBP/USD registered small gains on Tuesday but failed to stabilize above 1.3100. The pair was last seen trading modestly lower on the day near 1.3080.
USD/JPY closed the day flat on Tuesday but started to stretch higher in the Asian session on Wednesday. As of writing, the pair was up 0.3% on the day at 148.60.
Following a bearish start to the week, Gold extended its slide and touched its lowest level in over two weeks near $2,600 on Tuesday. Although XAU/USD erased a small portion of its daily losses later in the American session, it failed to gather recovery momentum. In the European morning, Gold trades in the red at around $2,610.
RBNZ FAQs
The Reserve Bank of New Zealand (RBNZ) is the country’s central bank. Its economic objectives are achieving and maintaining price stability – achieved when inflation, measured by the Consumer Price Index (CPI), falls within the band of between 1% and 3% – and supporting maximum sustainable employment.
The Reserve Bank of New Zealand’s (RBNZ) Monetary Policy Committee (MPC) decides the appropriate level of the Official Cash Rate (OCR) according to its objectives. When inflation is above target, the bank will attempt to tame it by raising its key OCR, making it more expensive for households and businesses to borrow money and thus cooling the economy. Higher interest rates are generally positive for the New Zealand Dollar (NZD) as they lead to higher yields, making the country a more attractive place for investors. On the contrary, lower interest rates tend to weaken NZD.
Employment is important for the Reserve Bank of New Zealand (RBNZ) because a tight labor market can fuel inflation. The RBNZ’s goal of “maximum sustainable employment” is defined as the highest use of labor resources that can be sustained over time without creating an acceleration in inflation. “When employment is at its maximum sustainable level, there will be low and stable inflation. However, if employment is above the maximum sustainable level for too long, it will eventually cause prices to rise more and more quickly, requiring the MPC to raise interest rates to keep inflation under control,” the bank says.
In extreme situations, the Reserve Bank of New Zealand (RBNZ) can enact a monetary policy tool called Quantitative Easing. QE is the process by which the RBNZ prints local currency and uses it to buy assets – usually government or corporate bonds – from banks and other financial institutions with the aim to increase the domestic money supply and spur economic activity. QE usually results in a weaker New Zealand Dollar (NZD). QE is a last resort when simply lowering interest rates is unlikely to achieve the objectives of the central bank. The RBNZ used it during the Covid-19 pandemic.
- EUR/USD struggles to sustain above 1.0950 as the US Dollar performs strongly ahead of the FOMC Minutes.
- Traders have priced out Fed large rate cut bets for November.
- The ECB is expected to reduce interest rates by 50 bps in the last quarter of the year.
EUR/USD skates on thin ice near the eight-week low of 1.0950 in Wednesday’s European session. The major currency pair stays under pressure as the US Dollar (USD) gathers strength to extend its previous week’s rally further, with the US Dollar Index (DXY) hovering near a seven-week high around 102.60.
The appeal of the US Dollar has strengthened as traders have priced out expectations for the Federal Reserve (Fed) to reduce interest rates again by 50 basis points (bps) in November. Traders were forced to unwind Fed large rate cut bets as the upbeat United States (US) Nonfarm Payrolls (NFP) report for September diminished downside risks to economic growth and consumer spending. Also, dismal market sentiment due to Middle East tensions has improved the Greenback’s appeal as a safe haven.
Financial market participants expect the Fed to cut interest rates by 25 bps in the remaining two policy meetings this year at the time of writing, according to the CME FedWatch tool.
In Wednesday’s session, investors will pay close attention to the Federal Open Market Committee (FOMC) Minutes of the September meeting, which will be released at 18:00 GMT. The FOMC Minutes will convey the views of all officials on the interest rate and the economic outlook. In the September meeting, all members unanimously voted to start the policy-easing cycle with a 50-bps rate cut, except Fed Governor Michelle Bowman who favored a smaller reduction of 25 bps.
Going forward, the major trigger for the US Dollar will be the US Consumer Price Index (CPI) and the Producer Price Index (PPI) data for September, which will be published on Thursday and Friday, respectively.
Daily digest market movers: EUR/USD sees more downside amid firm US Dollar
- The Euro (EUR) faces selling pressure as traders have priced in more rate cuts by the European Central Bank (ECB). The ECB is expected to cut its Deposit Facility Rate further by 50 bps to 3% by the year-end, suggesting that there will be a rate cut of 25 bps in each of the two policy meetings scheduled for next week and in December.
- The ECB has already reduced its key borrowing rates by 50 bps this year as officials have remained confident that inflation will return to the bank’s target of 2% in 2025. Market expectations for the ECB to cut interest rates further have been prompted by the declining trend in price pressures and the economic vulnerability in the Eurozone.
- ECB policymaker and Governor of the Greek Central Bank Yannis Stournaras has also backed two more rate cuts in each of the remaining meetings this year and emphasized the need to reduce them further in 2025 as inflation continues to decelerate, in his comments in an interview with Financial Times published on Wednesday. His comments also indicated that price pressures are declining faster than what the ECB forecasted in September.
Technical Analysis: EUR/USD remains below 1.1000
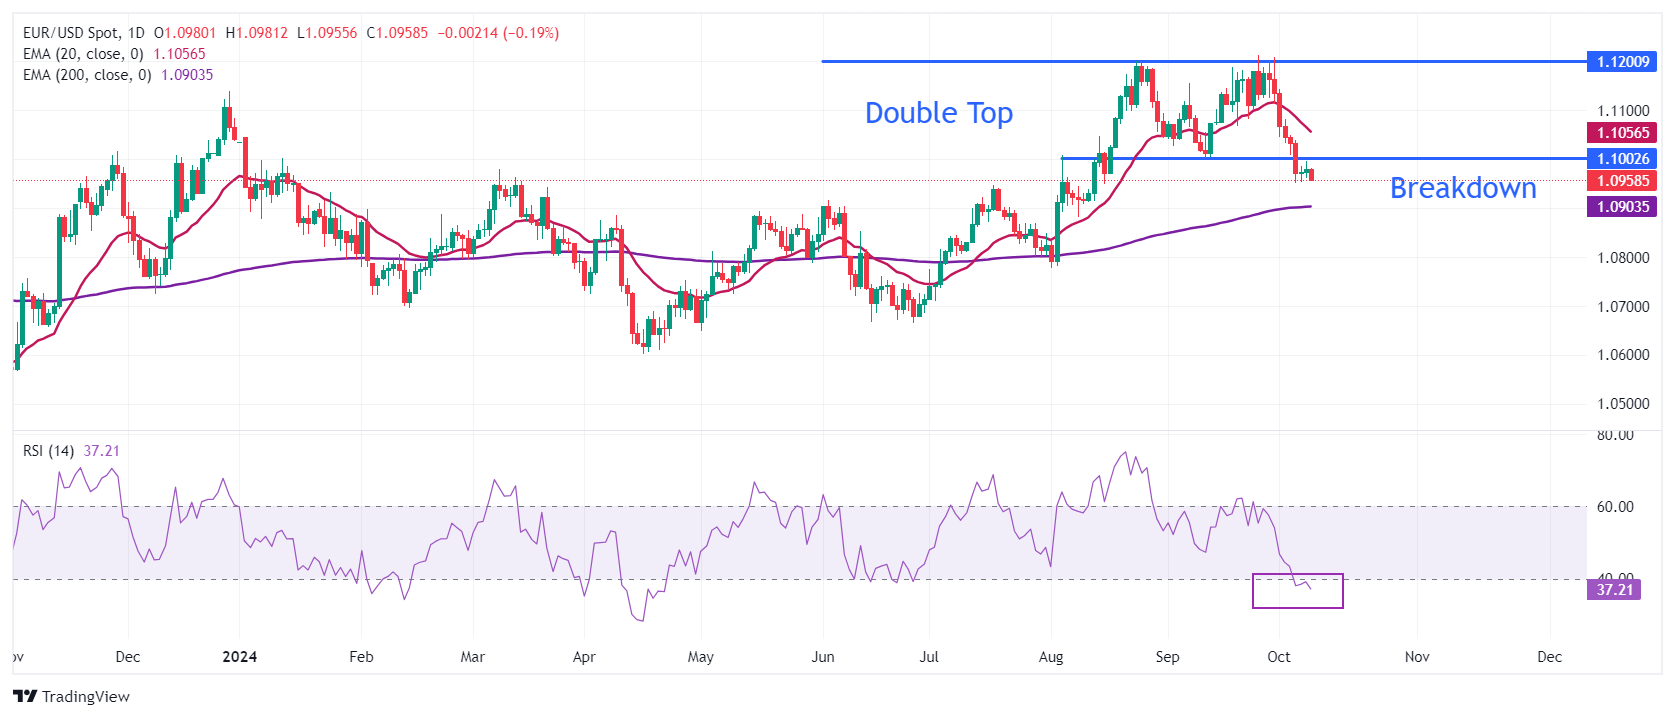
EUR/USD struggles to gain ground near the immediate support of 1.0950. The major currency pair stays on the backfoot as it has delivered a breakdown of the Double Top chart pattern formation on a daily timeframe. The above-mentioned chart pattern was triggered after the shared currency pair broke below the September 11 low of 1.1000.
The 14-day Relative Strength Index (RSI) settles inside the bearish range of 20.00-40.00, suggesting more weakness ahead for EUR/USD.
Looking down, the pair is expected to find support near the 200-day EMA around 1.0900. On the upside, the 20-day EMA at 1.1090 and the September high around 1.1200 will be major resistance zones.
Euro FAQs
The Euro is the currency for the 19 European Union countries that belong to the Eurozone. It is the second most heavily traded currency in the world behind the US Dollar. In 2022, it accounted for 31% of all foreign exchange transactions, with an average daily turnover of over $2.2 trillion a day. EUR/USD is the most heavily traded currency pair in the world, accounting for an estimated 30% off all transactions, followed by EUR/JPY (4%), EUR/GBP (3%) and EUR/AUD (2%).
The European Central Bank (ECB) in Frankfurt, Germany, is the reserve bank for the Eurozone. The ECB sets interest rates and manages monetary policy. The ECB’s primary mandate is to maintain price stability, which means either controlling inflation or stimulating growth. Its primary tool is the raising or lowering of interest rates. Relatively high interest rates – or the expectation of higher rates – will usually benefit the Euro and vice versa. The ECB Governing Council makes monetary policy decisions at meetings held eight times a year. Decisions are made by heads of the Eurozone national banks and six permanent members, including the President of the ECB, Christine Lagarde.
Eurozone inflation data, measured by the Harmonized Index of Consumer Prices (HICP), is an important econometric for the Euro. If inflation rises more than expected, especially if above the ECB’s 2% target, it obliges the ECB to raise interest rates to bring it back under control. Relatively high interest rates compared to its counterparts will usually benefit the Euro, as it makes the region more attractive as a place for global investors to park their money.
Data releases gauge the health of the economy and can impact on the Euro. Indicators such as GDP, Manufacturing and Services PMIs, employment, and consumer sentiment surveys can all influence the direction of the single currency. A strong economy is good for the Euro. Not only does it attract more foreign investment but it may encourage the ECB to put up interest rates, which will directly strengthen the Euro. Otherwise, if economic data is weak, the Euro is likely to fall. Economic data for the four largest economies in the euro area (Germany, France, Italy and Spain) are especially significant, as they account for 75% of the Eurozone’s economy.
Another significant data release for the Euro is the Trade Balance. This indicator measures the difference between what a country earns from its exports and what it spends on imports over a given period. If a country produces highly sought after exports then its currency will gain in value purely from the extra demand created from foreign buyers seeking to purchase these goods. Therefore, a positive net Trade Balance strengthens a currency and vice versa for a negative balance.
- USD/CHF gains ground to near 0.8575 in Wednesday’s early European session.
- Reduced bets of a jumbo Fed rate cut in November support the USD ahead of the FOMC Minutes.
- The escalating Middle East geopolitical tensions might cap the pair’s upside.
The USD/CHF pair trades on a stronger note to around 0.8575 during the early European session on Wednesday. The firmer US Dollar (USD) amid diminishing odds for more aggressive rate cuts by the Federal Reserve (Fed) underpins the pair. The release of the Federal Open Market Committee (FOMC) Minutes will take center stage later on Wednesday.
The stronger-than-expected jobs report last Friday lifts the Greenback and had markets tempering the expected scale of upcoming interest rate reductions. Boston Fed President Susan Collins stated that as inflation trends weaken, it is quite likely that the Fed will cut the interest rates further. Meanwhile, Atlanta Fed President Raphael Bostic stated that the jobs market is not showing signs of weakness, adding that despite significant progress on inflation, overall price figures have not yet hit target levels.
Later this week, traders will shift their attention to the US Consumer Price Index (CPI) inflation report on Thursday, which might offer some hints about the future Fed easing cycle. The headline CPI is expected to see an increase of 2.3% YoY in September, while the core CPI is estimated to see a rise of 3.2% YoY during the same period. Any signs of easing inflation might weigh on the USD and cap the upside for USD/CHF.
Hezbollah's senior leader said on Tuesday that it supports attempts to achieve a ceasefire in Lebanon, marking the first time the group has officially accepted a truce and not conditioned it on stopping the war in Gaza, per CNN. A possible ceasefire between Hezbollah and Israel alleviated fears of a wider war in the Middle East. However, the negative development surrounding geopolitical risks in the region could boost the safe-haven flows, benefiting the Swiss Franc (CHF).
Swiss Franc FAQs
The Swiss Franc (CHF) is Switzerland’s official currency. It is among the top ten most traded currencies globally, reaching volumes that well exceed the size of the Swiss economy. Its value is determined by the broad market sentiment, the country’s economic health or action taken by the Swiss National Bank (SNB), among other factors. Between 2011 and 2015, the Swiss Franc was pegged to the Euro (EUR). The peg was abruptly removed, resulting in a more than 20% increase in the Franc’s value, causing a turmoil in markets. Even though the peg isn’t in force anymore, CHF fortunes tend to be highly correlated with the Euro ones due to the high dependency of the Swiss economy on the neighboring Eurozone.
The Swiss Franc (CHF) is considered a safe-haven asset, or a currency that investors tend to buy in times of market stress. This is due to the perceived status of Switzerland in the world: a stable economy, a strong export sector, big central bank reserves or a longstanding political stance towards neutrality in global conflicts make the country’s currency a good choice for investors fleeing from risks. Turbulent times are likely to strengthen CHF value against other currencies that are seen as more risky to invest in.
The Swiss National Bank (SNB) meets four times a year – once every quarter, less than other major central banks – to decide on monetary policy. The bank aims for an annual inflation rate of less than 2%. When inflation is above target or forecasted to be above target in the foreseeable future, the bank will attempt to tame price growth by raising its policy rate. Higher interest rates are generally positive for the Swiss Franc (CHF) as they lead to higher yields, making the country a more attractive place for investors. On the contrary, lower interest rates tend to weaken CHF.
Macroeconomic data releases in Switzerland are key to assessing the state of the economy and can impact the Swiss Franc’s (CHF) valuation. The Swiss economy is broadly stable, but any sudden change in economic growth, inflation, current account or the central bank’s currency reserves have the potential to trigger moves in CHF. Generally, high economic growth, low unemployment and high confidence are good for CHF. Conversely, if economic data points to weakening momentum, CHF is likely to depreciate.
As a small and open economy, Switzerland is heavily dependent on the health of the neighboring Eurozone economies. The broader European Union is Switzerland’s main economic partner and a key political ally, so macroeconomic and monetary policy stability in the Eurozone is essential for Switzerland and, thus, for the Swiss Franc (CHF). With such dependency, some models suggest that the correlation between the fortunes of the Euro (EUR) and the CHF is more than 90%, or close to perfect.
Reuters reported on Wednesday that China’s Finance Ministry is set to roll out a 2 trillion Yuan fiscal stimulus package on October 12.
The fiscal stimulus will be announced to support economic growth so that they can achieve a 5% Gross Domestic Product (GDP) target for the year.
The Ministry is considering issuing special bonds worth 2 trillion Yuan ($283.43 billion).
Market reaction
AUD/USD is paring losses to trade at 0.6740 on these above headlines, still down 0.08% on the day.
Australian Dollar FAQs
One of the most significant factors for the Australian Dollar (AUD) is the level of interest rates set by the Reserve Bank of Australia (RBA). Because Australia is a resource-rich country another key driver is the price of its biggest export, Iron Ore. The health of the Chinese economy, its largest trading partner, is a factor, as well as inflation in Australia, its growth rate and Trade Balance. Market sentiment – whether investors are taking on more risky assets (risk-on) or seeking safe-havens (risk-off) – is also a factor, with risk-on positive for AUD.
The Reserve Bank of Australia (RBA) influences the Australian Dollar (AUD) by setting the level of interest rates that Australian banks can lend to each other. This influences the level of interest rates in the economy as a whole. The main goal of the RBA is to maintain a stable inflation rate of 2-3% by adjusting interest rates up or down. Relatively high interest rates compared to other major central banks support the AUD, and the opposite for relatively low. The RBA can also use quantitative easing and tightening to influence credit conditions, with the former AUD-negative and the latter AUD-positive.
China is Australia’s largest trading partner so the health of the Chinese economy is a major influence on the value of the Australian Dollar (AUD). When the Chinese economy is doing well it purchases more raw materials, goods and services from Australia, lifting demand for the AUD, and pushing up its value. The opposite is the case when the Chinese economy is not growing as fast as expected. Positive or negative surprises in Chinese growth data, therefore, often have a direct impact on the Australian Dollar and its pairs.
Iron Ore is Australia’s largest export, accounting for $118 billion a year according to data from 2021, with China as its primary destination. The price of Iron Ore, therefore, can be a driver of the Australian Dollar. Generally, if the price of Iron Ore rises, AUD also goes up, as aggregate demand for the currency increases. The opposite is the case if the price of Iron Ore falls. Higher Iron Ore prices also tend to result in a greater likelihood of a positive Trade Balance for Australia, which is also positive of the AUD.
The Trade Balance, which is the difference between what a country earns from its exports versus what it pays for its imports, is another factor that can influence the value of the Australian Dollar. If Australia produces highly sought after exports, then its currency will gain in value purely from the surplus demand created from foreign buyers seeking to purchase its exports versus what it spends to purchase imports. Therefore, a positive net Trade Balance strengthens the AUD, with the opposite effect if the Trade Balance is negative.
FX option expiries for Oct 9 NY cut at 10:00 Eastern Time, via DTCC, can be found below.
EUR/USD: EUR amounts
- 1.0900 482m
- 1.1000 790m
- 1.1275 395m
USD/JPY: USD amounts
- 144.75 1.4b
- 147.00 960m
AUD/USD: AUD amounts
- 0.6625 648m
USD/CAD: USD amounts
- 1.3535 420m
- 1.3550 301m
NZD/USD: NZD amounts
- 0.6050 751m
- 0.6250 666m
European Central Bank (ECB) Governing Council member and Bank of France President, François Villeroy de Galhau, commented on the central bank’s next policy move on Wednesday.
“A decrease in ECB rates is very likely due to weak economic growth,” he said.
Market reaction
EUR/USD is trading 0.07% lower on the day at 1.0971, as of writing.
Euro PRICE Today
The table below shows the percentage change of Euro (EUR) against listed major currencies today. Euro was the weakest against the US Dollar.
| USD | EUR | GBP | JPY | CAD | AUD | NZD | CHF | |
|---|---|---|---|---|---|---|---|---|
| USD | 0.08% | 0.08% | 0.24% | 0.04% | -0.04% | 0.67% | 0.13% | |
| EUR | -0.08% | -0.00% | 0.15% | -0.07% | -0.08% | 0.55% | 0.03% | |
| GBP | -0.08% | 0.00% | 0.16% | -0.03% | -0.08% | 0.56% | 0.02% | |
| JPY | -0.24% | -0.15% | -0.16% | -0.19% | -0.27% | 0.42% | -0.16% | |
| CAD | -0.04% | 0.07% | 0.03% | 0.19% | -0.07% | 0.62% | 0.05% | |
| AUD | 0.04% | 0.08% | 0.08% | 0.27% | 0.07% | 0.66% | 0.10% | |
| NZD | -0.67% | -0.55% | -0.56% | -0.42% | -0.62% | -0.66% | -0.56% | |
| CHF | -0.13% | -0.03% | -0.02% | 0.16% | -0.05% | -0.10% | 0.56% |
The heat map shows percentage changes of major currencies against each other. The base currency is picked from the left column, while the quote currency is picked from the top row. For example, if you pick the Euro from the left column and move along the horizontal line to the US Dollar, the percentage change displayed in the box will represent EUR (base)/USD (quote).
- GBP/USD attracts fresh sellers on Wednesday and is pressured by a combination of factors.
- The GBP continues to be weighed down by BoE Governor Bailey’s dovish remarks last week.
- Reduced bets for a jumbo Fed rate cut underpin the USD and contribute to the pair’s slide.
The GBP/USD pair struggles to capitalize on the previous day's modest recovery gains and meets with a fresh supply during the Asian session on Wednesday. Spot prices currently trade around the 1.3085-1.3080 area and remain within the striking distance of a nearly four-week low touched on Monday.
The British Pound (GBP) continues with its relative underperformance in the wake of market conviction that the Bank of England (BoE) might be heading towards speeding up its rate-cutting cycle. The bets were lifted by BoE Governor Andrew Bailey's dovish remarks last week, saying that there was a chance that the central bank could become a bit more aggressive in cutting rates if there's further good news on inflation. This, in turn, is seen as a key factor exerting downward pressure on the GBP/USD pair.
The US Dollar (USD), on the other hand, stands tall near a seven-week high touched last week amid diminishing odds for a more aggressive policy easing by the Federal Reserve (Fed). In fact, the markets are currently pricing in over an 85% chance that the Fed will lower borrowing costs by 25 basis points (bps) in November. Moreover, escalating geopolitical tensions in the Middle East and the disappointment over China's stimulus update underpins the buck, contributing to the offered tone surrounding the GBP/USD pair.
The aforementioned fundamental backdrop suggests that the path of least resistance for spot prices is to the downside. Bearish traders, however, might refrain from placing aggressive bets and prefer to wait for the release of the FOMC meeting minutes later during the US session. Apart from this, the US Consumer Price Index (CPI) and the Producer Price Index (PPI) on Thursday and Friday, respectively, will influence the USD price dynamics and help in determining the next leg of a directional move for the GBP/USD pair.
BoE FAQs
The Bank of England (BoE) decides monetary policy for the United Kingdom. Its primary goal is to achieve ‘price stability’, or a steady inflation rate of 2%. Its tool for achieving this is via the adjustment of base lending rates. The BoE sets the rate at which it lends to commercial banks and banks lend to each other, determining the level of interest rates in the economy overall. This also impacts the value of the Pound Sterling (GBP).
When inflation is above the Bank of England’s target it responds by raising interest rates, making it more expensive for people and businesses to access credit. This is positive for the Pound Sterling because higher interest rates make the UK a more attractive place for global investors to park their money. When inflation falls below target, it is a sign economic growth is slowing, and the BoE will consider lowering interest rates to cheapen credit in the hope businesses will borrow to invest in growth-generating projects – a negative for the Pound Sterling.
In extreme situations, the Bank of England can enact a policy called Quantitative Easing (QE). QE is the process by which the BoE substantially increases the flow of credit in a stuck financial system. QE is a last resort policy when lowering interest rates will not achieve the necessary result. The process of QE involves the BoE printing money to buy assets – usually government or AAA-rated corporate bonds – from banks and other financial institutions. QE usually results in a weaker Pound Sterling.
Quantitative tightening (QT) is the reverse of QE, enacted when the economy is strengthening and inflation starts rising. Whilst in QE the Bank of England (BoE) purchases government and corporate bonds from financial institutions to encourage them to lend; in QT, the BoE stops buying more bonds, and stops reinvesting the principal maturing on the bonds it already holds. It is usually positive for the Pound Sterling.
Gold prices fell in India on Wednesday, according to data compiled by FXStreet.
The price for Gold stood at 7,063.98 Indian Rupees (INR) per gram, down compared with the INR 7,076.99 it cost on Tuesday.
The price for Gold decreased to INR 82,392.87 per tola from INR 82,544.62 per tola a day earlier.
| Unit measure | Gold Price in INR |
|---|---|
| 1 Gram | 7,063.98 |
| 10 Grams | 70,639.79 |
| Tola | 82,392.87 |
| Troy Ounce | 219,715.30 |
FXStreet calculates Gold prices in India by adapting international prices (USD/INR) to the local currency and measurement units. Prices are updated daily based on the market rates taken at the time of publication. Prices are just for reference and local rates could diverge slightly.
Gold FAQs
Gold has played a key role in human’s history as it has been widely used as a store of value and medium of exchange. Currently, apart from its shine and usage for jewelry, the precious metal is widely seen as a safe-haven asset, meaning that it is considered a good investment during turbulent times. Gold is also widely seen as a hedge against inflation and against depreciating currencies as it doesn’t rely on any specific issuer or government.
Central banks are the biggest Gold holders. In their aim to support their currencies in turbulent times, central banks tend to diversify their reserves and buy Gold to improve the perceived strength of the economy and the currency. High Gold reserves can be a source of trust for a country’s solvency. Central banks added 1,136 tonnes of Gold worth around $70 billion to their reserves in 2022, according to data from the World Gold Council. This is the highest yearly purchase since records began. Central banks from emerging economies such as China, India and Turkey are quickly increasing their Gold reserves.
Gold has an inverse correlation with the US Dollar and US Treasuries, which are both major reserve and safe-haven assets. When the Dollar depreciates, Gold tends to rise, enabling investors and central banks to diversify their assets in turbulent times. Gold is also inversely correlated with risk assets. A rally in the stock market tends to weaken Gold price, while sell-offs in riskier markets tend to favor the precious metal.
The price can move due to a wide range of factors. Geopolitical instability or fears of a deep recession can quickly make Gold price escalate due to its safe-haven status. As a yield-less asset, Gold tends to rise with lower interest rates, while higher cost of money usually weighs down on the yellow metal. Still, most moves depend on how the US Dollar (USD) behaves as the asset is priced in dollars (XAU/USD). A strong Dollar tends to keep the price of Gold controlled, whereas a weaker Dollar is likely to push Gold prices up.
(An automation tool was used in creating this post.)
- Silver attracts some sellers for the third successive day on Wednesday.
- The technical setup supports prospects for a further depreciating move.
- Any attempted recovery is likely to remain capped near the $31.00 mark.
Silver (XAG/USD) struggles to capitalize on the overnight bounce from the vicinity of the $30.00 psychological mark, or a three-week low and trades with a negative bias for the third successive day on Wednesday. The white metal is currently placed just above the mid-$30.00s and seems vulnerable to prolonging its retracement slide from the highest level since December 2012 touched last week.
From a technical perspective, the recent repeated failures to find acceptance above the $32.00 mark constitute the formation of a bearish multiple-tops pattern on the daily chart. Moreover, oscillators on the daily chart have started gaining negative traction and validate the near-term bearish outlook for the XAG/USD. Hence, a subsequent slide below the $30.00 mark, towards testing the next relevant support near the $29.75-$29.60 confluence, looks like a distinct possibility.
The latter comprises the 100-day Simple Moving Average (SMA) and the 50-day SMA, which if broken decisively should pave the way for a further near-term depreciating move. The XAG/USD might then accelerate the fall towards the $29.00 mark and eventually drop to the $28.60-$28.50 support zone.
On the flip side, any attempted recovery might now confront immediate resistance and remain capped near the $31.00 mark. That said, a sustained move beyond could trigger a short-covering move and lift the XAG/USD to the $31.55 hurdle en route to the $31.75-$31.80 region and the $32.00 mark. This is followed by the $32.25 supply zone, above which the white metal could aim to challenge the multi-year peak and make a fresh attempt to conquer the $33.00 round figure.
Silver daily chart
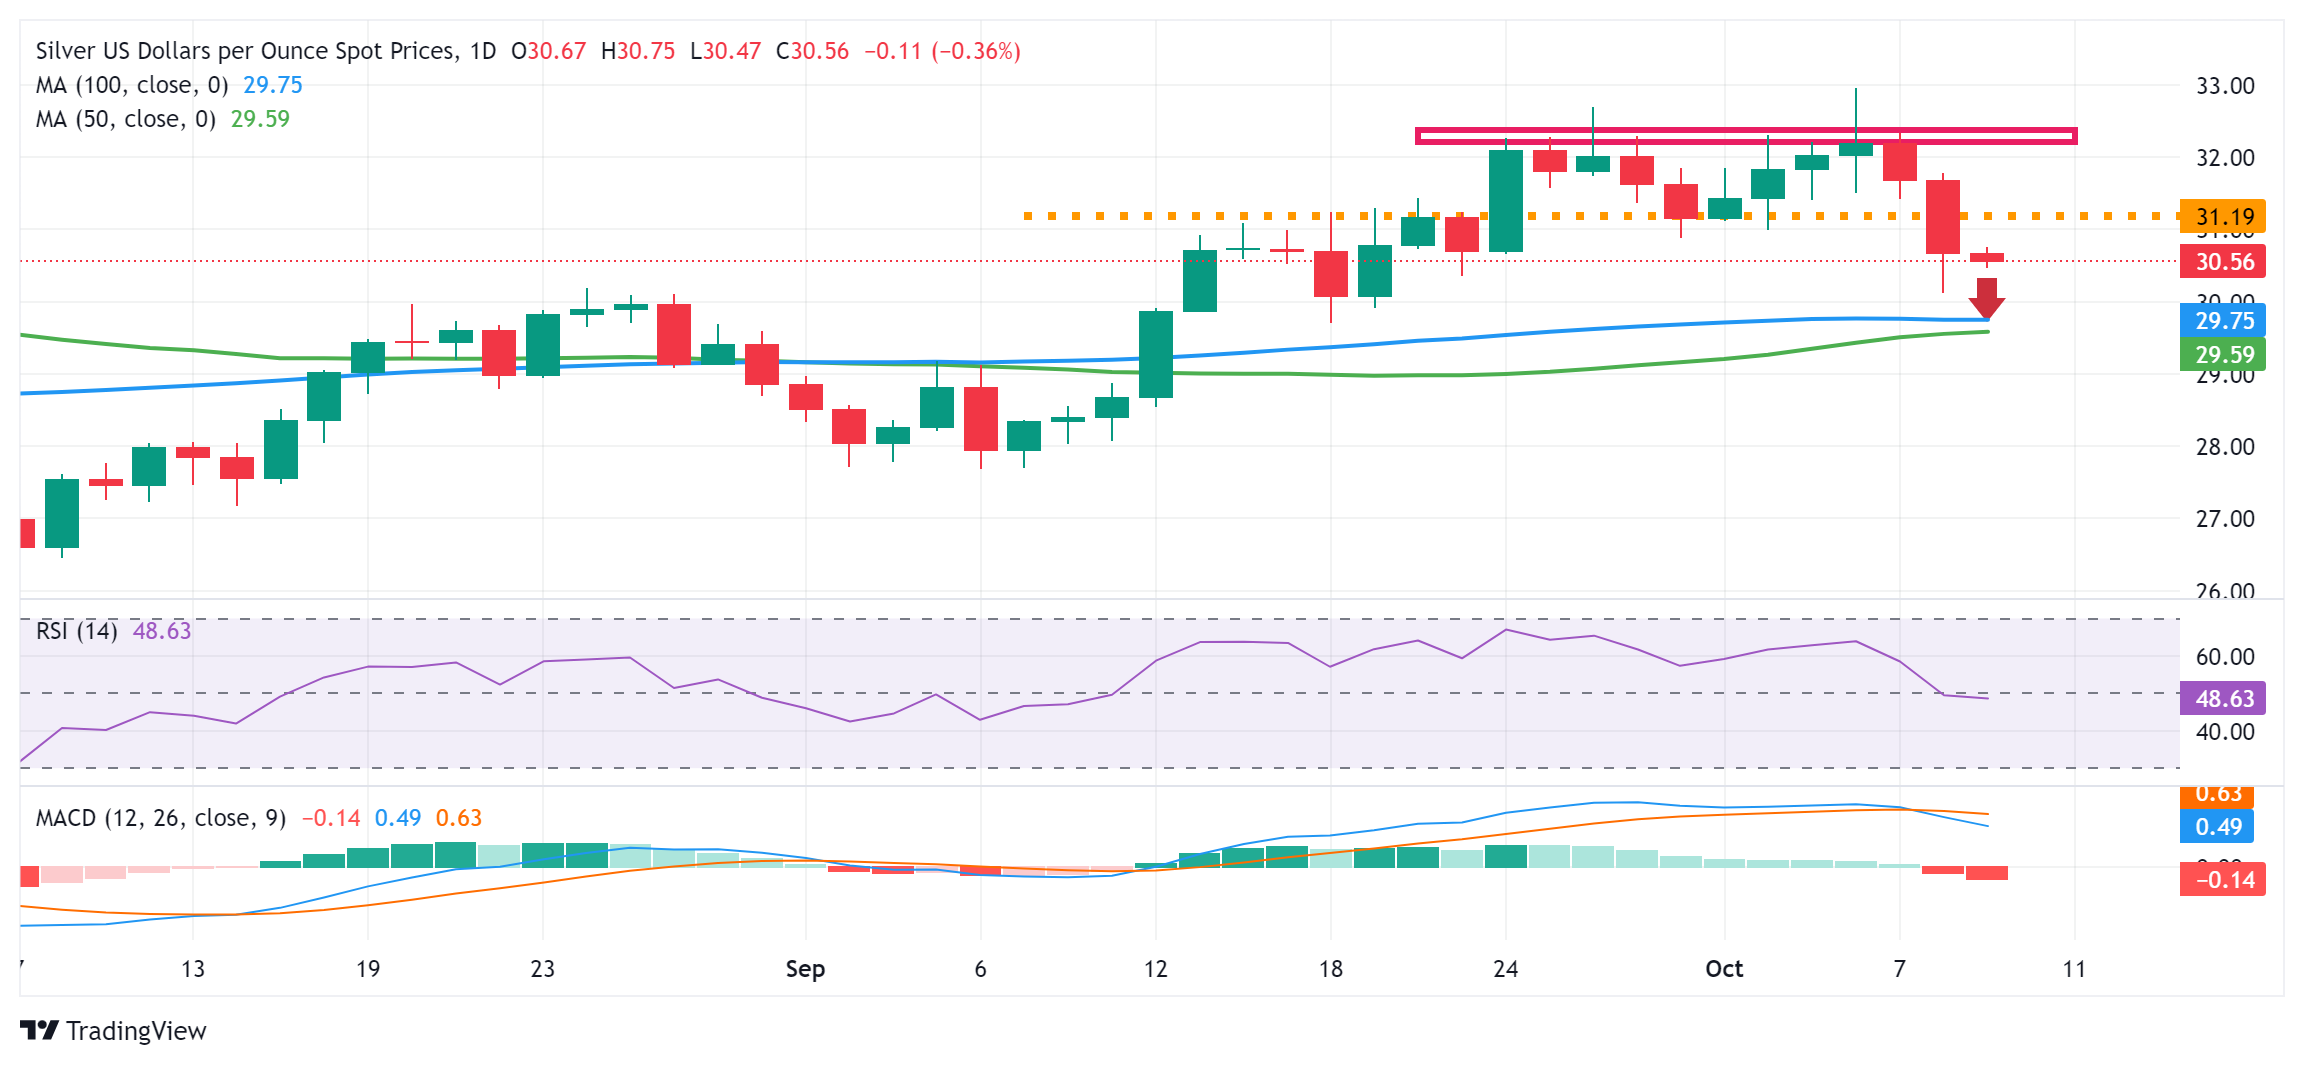
Silver FAQs
Silver is a precious metal highly traded among investors. It has been historically used as a store of value and a medium of exchange. Although less popular than Gold, traders may turn to Silver to diversify their investment portfolio, for its intrinsic value or as a potential hedge during high-inflation periods. Investors can buy physical Silver, in coins or in bars, or trade it through vehicles such as Exchange Traded Funds, which track its price on international markets.
Silver prices can move due to a wide range of factors. Geopolitical instability or fears of a deep recession can make Silver price escalate due to its safe-haven status, although to a lesser extent than Gold's. As a yieldless asset, Silver tends to rise with lower interest rates. Its moves also depend on how the US Dollar (USD) behaves as the asset is priced in dollars (XAG/USD). A strong Dollar tends to keep the price of Silver at bay, whereas a weaker Dollar is likely to propel prices up. Other factors such as investment demand, mining supply – Silver is much more abundant than Gold – and recycling rates can also affect prices.
Silver is widely used in industry, particularly in sectors such as electronics or solar energy, as it has one of the highest electric conductivity of all metals – more than Copper and Gold. A surge in demand can increase prices, while a decline tends to lower them. Dynamics in the US, Chinese and Indian economies can also contribute to price swings: for the US and particularly China, their big industrial sectors use Silver in various processes; in India, consumers’ demand for the precious metal for jewellery also plays a key role in setting prices.
Silver prices tend to follow Gold's moves. When Gold prices rise, Silver typically follows suit, as their status as safe-haven assets is similar. The Gold/Silver ratio, which shows the number of ounces of Silver needed to equal the value of one ounce of Gold, may help to determine the relative valuation between both metals. Some investors may consider a high ratio as an indicator that Silver is undervalued, or Gold is overvalued. On the contrary, a low ratio might suggest that Gold is undervalued relative to Silver.
- The Indian Rupee trades flat in Wednesday’s early European session.
- RBI’s MPC decided to keep the repo rate unchanged at 6.5% in its October meeting on Wednesday.
- Lower crude oil prices and potential RBI’s foreign exchange intervention might underpin the INR.
- Investors await the FOMC Minutes, which is due on Wednesday.
The Indian Rupee (INR) trades on a flat note on Wednesday. The Reserve Bank of India (RBI) Governor Shaktikanta Das announced its fourth bi-monthly monetary policy statement on Thursday. The Indian central bank maintained the status quo on the repo rate at 6.50% for the tenth consecutive meeting. However, the RBI Monetary Policy Committee (MPC) changed the policy stance to neutral from withdrawal of accommodation. The INR flat lines in immediate reaction to the rate decision.
A decline in crude oil prices, stronger Asian currencies and likely foreign exchange intervention from the RBI might provide some support to the INR. On the other hand, outflows from local equities and renewed US Dollar (USD) demand might cap the upside for the local currency. Later on Wednesday, the Federal Reserve's (Fed) September meeting minutes will be in the spotlight.
Daily Digest Market Movers: Indian Rupee remains steady after RBI rate decision
- RBI kept CPI Inflation estimate for FY25 unchanged at 4.5%, while maintain the Gross Domestic Product (GDP) growth estimates for FY25 at 7.2%.
- RBI Governor Shaktikanta Das stated that India’s growth story remains intact. There is a need for greater vigilance on inflation.
- RBI Deputy Governor Michael Patra said that the central bank wants to see off the current hump in inflation before considering next move on rates.
- RBI kept CPI Inflation estimate for FY25 unchanged at 4.5%, while maintaining the Gross Domestic Product (GDP) growth estimates for FY25 at 7.2%.
- “A rise in oil prices coinciding with dollar strength has increased inflation risks in India and put pressure on the rupee, such that the RBI has had to undertake significant FX intervention in recent days," noted J.P. Morgan analysts on Tuesday.
- India’s foreign exchange reserves rose to a record-breaking $704.89 billion as of September 27, marking an increase of $12.5 billion, according to the RBI.
- Federal Reserve Vice Chair Philip Jefferson said on Tuesday that risks to the central bank’s employment and inflation goals are now closer to equal, per Bloomberg.
- Boston Fed President Susan Collins noted on Tuesday that with inflation trends growing weaker, it is very probable that the Fed can deliver more interest rate cuts.
- The markets have priced in nearly an 87% chance of 25 basis points (bps) Fed rate cuts in November, up from 31.1% last week, according to the CME FedWatch Tool.
Technical Analysis: USD/INR’s positive outlook prevails
The Indian Rupee trades flat on the day. The USD/INR pair keeps the bullish vibe above the descending trend line and the key 100-day Exponential Moving Average (EMA) on the daily timeframe. The path of least resistance level appears to the upside as the 14-day Relative Strength Index (RSI) is located above the midline near 55.70.
The key resistance level for USD/INR emerges near the upper boundary of the rectangle and a psychological mark of 84.00. Further north, the next upside barrier is seen at the all-time high of 84.15, followed by 84.50.
On the flip side, the resistance-turned-support level at 83.90 acts as an initial support level for USD/INR. Extended losses could expose the 100-day EMA at 83.67. Any follow-through selling could see a drop to 83.00, representing the round mark and the low of May 24.
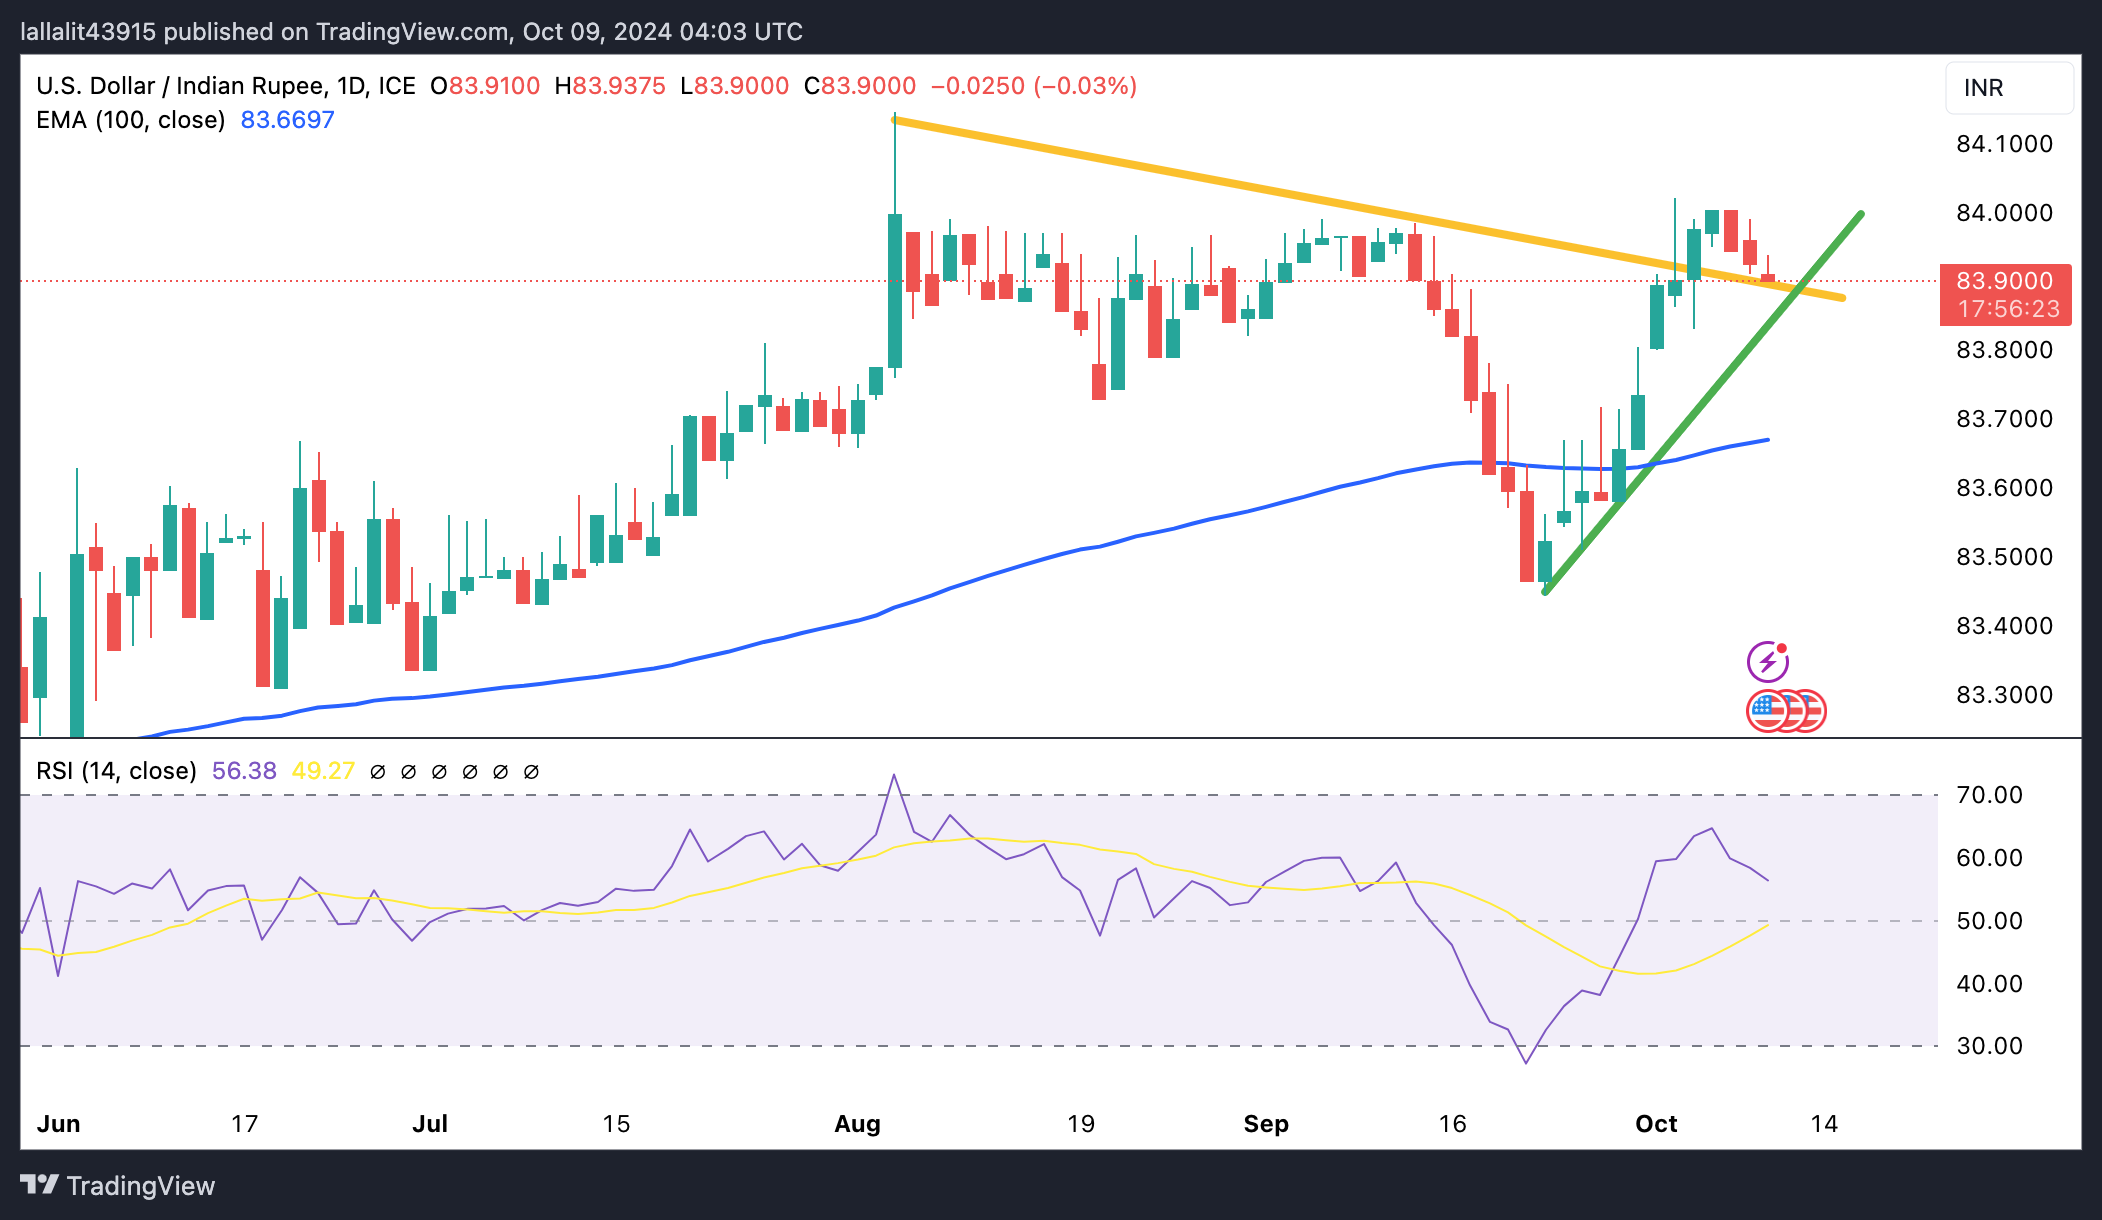
Interest rates FAQs
Interest rates are charged by financial institutions on loans to borrowers and are paid as interest to savers and depositors. They are influenced by base lending rates, which are set by central banks in response to changes in the economy. Central banks normally have a mandate to ensure price stability, which in most cases means targeting a core inflation rate of around 2%. If inflation falls below target the central bank may cut base lending rates, with a view to stimulating lending and boosting the economy. If inflation rises substantially above 2% it normally results in the central bank raising base lending rates in an attempt to lower inflation.
Higher interest rates generally help strengthen a country’s currency as they make it a more attractive place for global investors to park their money.
Higher interest rates overall weigh on the price of Gold because they increase the opportunity cost of holding Gold instead of investing in an interest-bearing asset or placing cash in the bank. If interest rates are high that usually pushes up the price of the US Dollar (USD), and since Gold is priced in Dollars, this has the effect of lowering the price of Gold.
The Fed funds rate is the overnight rate at which US banks lend to each other. It is the oft-quoted headline rate set by the Federal Reserve at its FOMC meetings. It is set as a range, for example 4.75%-5.00%, though the upper limit (in that case 5.00%) is the quoted figure. Market expectations for future Fed funds rate are tracked by the CME FedWatch tool, which shapes how many financial markets behave in anticipation of future Federal Reserve monetary policy decisions.
- Gold price trades with a negative bias for the sixth straight day amid smaller Fed rate cut bets.
- Hopes of a possible Hezbollah-Israel ceasefire further undermine the safe-haven commodity.
- Traders look to the FOMC minutes for short-term impetuses ahead of the US inflation figures.
Gold price (XAU/USD) remains under some selling pressure for the sixth successive day on Wednesday and is currently placed just above a three-week low, around the $2,605-2,604 region touched the previous day. The US Dollar (USD) stands tall near a seven-week top as traders continue to pare their bets for another oversized interest rate cut by the Federal Reserve (Fed). This, along with news of a possible ceasefire between Lebanon's Hezbollah and Israel, turn out to be key factors undermining the commodity.
The downtick could further be attributed to some technical selling after the previous day's breakdown through the $2,630 support, marking the lower boundary of a short-term trading range. Traders, however, might refrain from placing aggressive bearish bets around the Gold price and opt to move to the sidelines ahead of the release of the FOMC meeting minutes. Apart from this, the US Consumer Price Index (CPI) and the Producer Price Index (PPI) should provide a fresh impetus to the non-yielding yellow metal.
Daily Digest Market Movers: Gold price hangs near multi-week low as USD draws support from less dovish Fed expectations
- The US Dollar held steady near a multi-week top touched last Friday amid diminishing odds for a more aggressive policy easing by the Federal Reserve, which dragged the Gold price below the $2,630 pivotal support on Tuesday.
- According to the CME Group's FedWatch Tool, investors are now pricing in over an 85% chance of a 25-basis-points Fed rate cut move at the November meeting and a 50 bps reduction in borrowing costs by the end of this year.
- New York Fed President John Williams said on Tuesday that it will be appropriate again to bring interest rates down over time and that September's 50bps rate cut should now be seen as the rule of how we act in the future.
- Separately, Fed Governor Adriana Kugler said that approach to any policy decision will continue to be data dependent and that he will support additional rate cuts if progress on inflation continues as expected.
- Furthermore, Boston Fed President Susan Collins noted that current monetary policy is helping to cool inflation, but the US economy and labor markets still appear strong, and core inflation still remains elevated.
- Meanwhile, Fed Vice Chair Philip Jefferson said that economic activity continues to grow at a solid pace, while inflation has eased substantially and the labor market has cooled from its formerly overheated state.
- The yield on the benchmark 10-year US government bond holds steady above the 4% threshold, which continues to exert some pressure on the non-yielding bullion for the sixth successive day on Wednesday.
- On the geopolitical front, Iran-backed Hezbollah hinted on Tuesday that it may be open to a ceasefire and notably omitted the end of the Gaza war as a condition for halting the conflict on the Lebanon-Israel border.
- Investors now look to the September FOMC meeting minutes for cues about the future rate-cut path, ahead of the US consumer inflation figures and the US Producer Price Index on Thursday and Friday, respectively.
Technical Outlook: Gold price bears have the upper hand while below $2,630 trading range support breakpoint
From a technical perspective, the overnight breakdown through the $2,630 support, or the lower boundary of a short-term trading range, could be seen as a fresh trigger for bearish traders. That said, oscillators on the daily chart – though have been losing traction – are yet to confirm a negative bias. Hence, it will be prudent to wait for some follow-through selling and acceptance below the $2,600 mark before positioning for further losses. The Gold price might then extend the corrective slide towards the next relevant support near the $2,560 zone en route to the $2,535-2,530 region and the $2,500 psychological mark.
On the flip side, the trading range support breakpoint, around the $2,630-2,635 region, now seems to act as an immediate hurdle. Any subsequent move up could be seen as a selling opportunity and remain capped near the $2,657-2,658 horizontal barrier. A sustained strength beyond has the potential to lift the Gold price to the $2,670-$2,672 supply zone, above which bulls might aim to challenge the all-time high, around the $2,685-2,686 zone touched in September. This is closely followed by the $2,700 mark, which if cleared will set the stage for an extension of a well-established multi-month-old uptrend.
Interest rates FAQs
Interest rates are charged by financial institutions on loans to borrowers and are paid as interest to savers and depositors. They are influenced by base lending rates, which are set by central banks in response to changes in the economy. Central banks normally have a mandate to ensure price stability, which in most cases means targeting a core inflation rate of around 2%. If inflation falls below target the central bank may cut base lending rates, with a view to stimulating lending and boosting the economy. If inflation rises substantially above 2% it normally results in the central bank raising base lending rates in an attempt to lower inflation.
Higher interest rates generally help strengthen a country’s currency as they make it a more attractive place for global investors to park their money.
Higher interest rates overall weigh on the price of Gold because they increase the opportunity cost of holding Gold instead of investing in an interest-bearing asset or placing cash in the bank. If interest rates are high that usually pushes up the price of the US Dollar (USD), and since Gold is priced in Dollars, this has the effect of lowering the price of Gold.
The Fed funds rate is the overnight rate at which US banks lend to each other. It is the oft-quoted headline rate set by the Federal Reserve at its FOMC meetings. It is set as a range, for example 4.75%-5.00%, though the upper limit (in that case 5.00%) is the quoted figure. Market expectations for future Fed funds rate are tracked by the CME FedWatch tool, which shapes how many financial markets behave in anticipation of future Federal Reserve monetary policy decisions.
- The Japanese Yen attracts some sellers amid uncertainty over additional BoJ rate hikes.
- Hopes for a possible Hezbollah-Israel ceasefire further undermine the safe-haven JPY.
- Intervention fears cap USD/JPY amid subdued USD demand ahead of FOMC minutes.
The Japanese Yen (JPY) drifts lower against its American counterpart on Wednesday and moves back closer to its lowest level since August 16 touched earlier this week. Data published on Tuesday showed that Japan's real wages fell in August after two months of gains in wages, while household spending also declined, raising doubts about the strength of private consumption and a sustained economic recovery. This comes on top of blunt comments on monetary policy by Japan's new Japanese Prime Minister and fuels uncertainty over the Bank of Japan's (BoJ) plans for additional rate hikes, which, in turn, is seen weighing on the JPY.
Furthermore, news of a possible Hezbollah-Israel ceasefire undermined demand for the safe-haven JPY. The US Dollar (USD), on the other hand, approaches a seven-week high touched last Friday on the back of reduced bets for a more aggressive policy easing by the Federal Reserve (Fed). This, in turn, lifts the USD/JPY pair beyond the mid-148.00s heading into the European session. It, however, remains to be seen if bulls can capitalize on the move amid fears that Japanese authorities will intervene to support the domestic currency and ahead of the release of the FOMC meeting minutes later during the North American session.
Daily Digest Market Movers: Japanese Yen approaches weekly low as traders scale back bets for more BoJ rate hikes
- According to the government data released on Tuesday, real wages in Japan – the world's fourth-largest economy – fell 0.6% and household spending declined by 1.9% in August from the same month a year earlier.
- This, along with comments from Japan's Prime Minister Shigeru Ishiba, saying that the country is not in an environment for more rate increases, could derail the Bank of Japan's rate-hike plans in the coming months.
- Israeli forces made new incursions in the south of Lebanon on Tuesday, raising the risk of a full-blown war in the Middle East, though the fears eased after Iran-backed Hezbollah left the door open for a negotiated ceasefire.
- Japan's Finance Minister Katsunobu Kato said earlier this week that the government would monitor how rapid currency moves could potentially impact the economy and would take action if necessary.
- The Reuters Tankan monthly poll showed on Wednesday that Japanese manufacturers turned more confident about business conditions in October and the sentiment index rose from 4 in September to 7 this month.
- The survey, however, indicated that Japanese manufacturers remained wary about the pace of China's economic recovery and the service sector's mood eased, reflecting patchy economic conditions in Japan.
- The US Dollar extends its consolidative price move near a seven-week top amid diminishing odds for a more aggressive policy easing by the Federal Reserve and does little to influence the USD/JPY pair.
- Traders now look forward to the release of September FOMC meeting minutes for some impetus, ahead of the US Consumer Price Index and the Producer Price Index on Thursday and Friday, respectively.
Technical Outlook: USD/JPY needs to find acceptance above the 149.00 mark for bulls to seize near-term control
From a technical perspective, the emergence of some dip-buying on Tuesday comes on the back of last week's move beyond the 50-day Simple Moving Average (SMA) for the first time since mid-July and favors bullish traders. Moreover, spot prices now seem to have found acceptance above the 148.00 mark, or the 38.2% Fibonacci retracement level of the July-September downfall. This, along with the fact that oscillators on the daily chart have been gaining positive traction, suggests that the path of least resistance for the USD/JPY pair is to the upside. Any further move up, however, might confront some resistance near the 148.70 zone ahead of the 149.00 round figure. Some follow-through buying beyond the weekly top, around the 149.10-149.15 region, will reaffirm the positive outlook and allow the pair to reclaim the 150.00 psychological mark.
On the flip side, the overnight swing low, around the 147.35-147.30 region, now seems to protect the immediate downside ahead of the 147.00 mark. A convincing break below the latter could drag the USD/JPY pair to the 146.45 intermediate support en route to the 146.00-145.90 region and the 145.00 confluence support. The latter comprises the 50-day SMA and the 23.6% Fibo. level, which if broken decisively will suggest that the recent recovery from the vicinity of mid-139.00s, or a 14-month low has run its course and shift the near-term bias in favor of bearish traders.
Economic Indicator
FOMC Minutes
FOMC stands for The Federal Open Market Committee that organizes 8 meetings in a year and reviews economic and financial conditions, determines the appropriate stance of monetary policy and assesses the risks to its long-run goals of price stability and sustainable economic growth. FOMC Minutes are released by the Board of Governors of the Federal Reserve and are a clear guide to the future US interest rate policy.
Read more.Next release: Wed Oct 09, 2024 18:00
Frequency: Irregular
Consensus: -
Previous: -
Source: Federal Reserve
Minutes of the Federal Open Market Committee (FOMC) is usually published three weeks after the day of the policy decision. Investors look for clues regarding the policy outlook in this publication alongside the vote split. A bullish tone is likely to provide a boost to the greenback while a dovish stance is seen as USD-negative. It needs to be noted that the market reaction to FOMC Minutes could be delayed as news outlets don’t have access to the publication before the release, unlike the FOMC’s Policy Statement.
- AUD/USD edges lower to around 0.6740 in Wednesday’s Asian session.
- Firmer USD and lack of more Chinese major stimulus weigh on the pair.
- The FOMC Minutes will be closely watched on Wednesday.
The AUD/USD pair extends its decline to near 0.6740 during the Asian session on Wednesday. The stronger US Dollar (USD) and disappointment over additional China stimulus measures continue to undermine the pair.
According to the RBA September Meeting Minutes released on Tuesday, the board members discussed scenarios for lowering and raising interest rates in the future. RBI Deputy Governor Andrew Hauser said the Australian central bank will act when inflation stops being high and sticky, adding that lowering inflation is a significant task and they are not completed yet.
The comments from the National Development and Reform Commission press conference exert some selling pressure on the China-proxy Australian Dollar (AUD). Chinese officials disappoint traders without more major stimulus.
On the other hand, traders reduce their bets on the Federal Reserve (Fed) rate cut in September, which lifts the USD broadly. According to the CME FedWatch Tool, the markets have priced in nearly an 87% chance of 25 basis points (bps) Fed rate cuts in November, up from 31.1% last week.
Fed Vice Chair Philip Jefferson said on Tuesday the US central bank's 50 bps interest-rate cut in September was aimed at keeping the labor market strong even as inflation continues to ease.
Looking ahead, investors await the Federal Open Market Committee (FOMC) Minutes. The attention will shift to the US Consumer Price Index (CPI) for September on Thursday. However, if the inflation report shows softer than expected outcome, it could drag the Greenback lower and create a tailwind for AUD/USD.
Australian Dollar FAQs
One of the most significant factors for the Australian Dollar (AUD) is the level of interest rates set by the Reserve Bank of Australia (RBA). Because Australia is a resource-rich country another key driver is the price of its biggest export, Iron Ore. The health of the Chinese economy, its largest trading partner, is a factor, as well as inflation in Australia, its growth rate and Trade Balance. Market sentiment – whether investors are taking on more risky assets (risk-on) or seeking safe-havens (risk-off) – is also a factor, with risk-on positive for AUD.
The Reserve Bank of Australia (RBA) influences the Australian Dollar (AUD) by setting the level of interest rates that Australian banks can lend to each other. This influences the level of interest rates in the economy as a whole. The main goal of the RBA is to maintain a stable inflation rate of 2-3% by adjusting interest rates up or down. Relatively high interest rates compared to other major central banks support the AUD, and the opposite for relatively low. The RBA can also use quantitative easing and tightening to influence credit conditions, with the former AUD-negative and the latter AUD-positive.
China is Australia’s largest trading partner so the health of the Chinese economy is a major influence on the value of the Australian Dollar (AUD). When the Chinese economy is doing well it purchases more raw materials, goods and services from Australia, lifting demand for the AUD, and pushing up its value. The opposite is the case when the Chinese economy is not growing as fast as expected. Positive or negative surprises in Chinese growth data, therefore, often have a direct impact on the Australian Dollar and its pairs.
Iron Ore is Australia’s largest export, accounting for $118 billion a year according to data from 2021, with China as its primary destination. The price of Iron Ore, therefore, can be a driver of the Australian Dollar. Generally, if the price of Iron Ore rises, AUD also goes up, as aggregate demand for the currency increases. The opposite is the case if the price of Iron Ore falls. Higher Iron Ore prices also tend to result in a greater likelihood of a positive Trade Balance for Australia, which is also positive of the AUD.
The Trade Balance, which is the difference between what a country earns from its exports versus what it pays for its imports, is another factor that can influence the value of the Australian Dollar. If Australia produces highly sought after exports, then its currency will gain in value purely from the surplus demand created from foreign buyers seeking to purchase its exports versus what it spends to purchase imports. Therefore, a positive net Trade Balance strengthens the AUD, with the opposite effect if the Trade Balance is negative.
- The New Zealand Dollar edges lower in Wednesday’s early European session.
- RBNZ cut the interest rate by 50 bps to 4.75% as anticipated.
- The September FOMC Minutes will be in the spotlight on Wednesday.
The New Zealand Dollar (NZD) loses momentum to near the lowest level since mid-August on Wednesday. The Reserve Bank of New Zealand (RBNZ) decided to cut the Official Cash Rate (OCR) by 50 basis points (bps) from 5.25% to 4.75% at its October meeting, as widely expected. The Kiwi attracts some sellers in an immediate reaction to the interest rate decision. Additionally, Chinese officials disappoint traders without more major stimulus. This, in turn, drags the proxy-China NZD lower against the Greenback as China is a major trading partner to New Zealand.
Moving on, traders will keep an eye on the Federal Open Market Committee (FOMC) Minutes later on Wednesday. On Thursday, the attention will shift to the US Consumer Price Index (CPI) data for September. In case the report shows a softer-than-expected outcome, this could weigh on the USD and help limit the pair’s losses.
Daily Digest Market Movers: New Zealand Dollar remains weak after RBNZ interest rate decision
- According to the RBNZ Monetary Policy Statement (MPS), the committee assesses that annual consumer price inflation is within its 1 to 3% inflation target range.
- The Committee agreed that it is appropriate to cut the OCR by 50 basis points to achieve and maintain low and stable inflation while seeking to avoid unnecessary instability in output, employment, interest rates, and the exchange rate, noted the RBNZ MPS.
- Federal Reserve (Fed) Vice Chair Philip Jefferson said on Tuesday the US central bank's 50 basis points (bps) interest rate cut in September was aimed at keeping the labor market strong even as inflation continues to ease, per Reuters.
- Atlanta Fed President Raphael Bostic stated on Tuesday that the jobs market is not showing signs of weakness, adding that despite significant progress on inflation, overall price figures have not yet hit target levels.
- New York Fed president John Williams said he strongly supported a rate cut by 50 basis points (bps) last meeting and that the two additional 25 bps reduction this year is a “pretty reasonable representation of a base case,” per Reuters.
Technical Analysis: New Zealand Dollar resumes downside bias
The New Zealand Dollar weakens on the day. The NZD/USD pair continues its downtrend as it crosses below the key 100-day Exponential Moving Average (EMA) and is poised to break below the ascending trend channel on the daily chart. The downward momentum is supported by the 14-day Relative Strength Index (RSI), which stands below the midline near 41.10, supporting the sellers in the near term.
A decisive break below the lower limit of the trend channel of 0.6135 could pave the way to the 0.6000 psychological level. Sustained trading below this level could lead to a drop towards 0.5974, the low of August 15.
On the upside, the 100-day EMA at 0.6142 acts as an immediate resistance level for the pair. Extended gains will see a rally to 0.6254, the high of September 6. The additional upside filter to watch is 0.6300, a round figure, en route to 0.6365, the upper boundary of the trend channel.
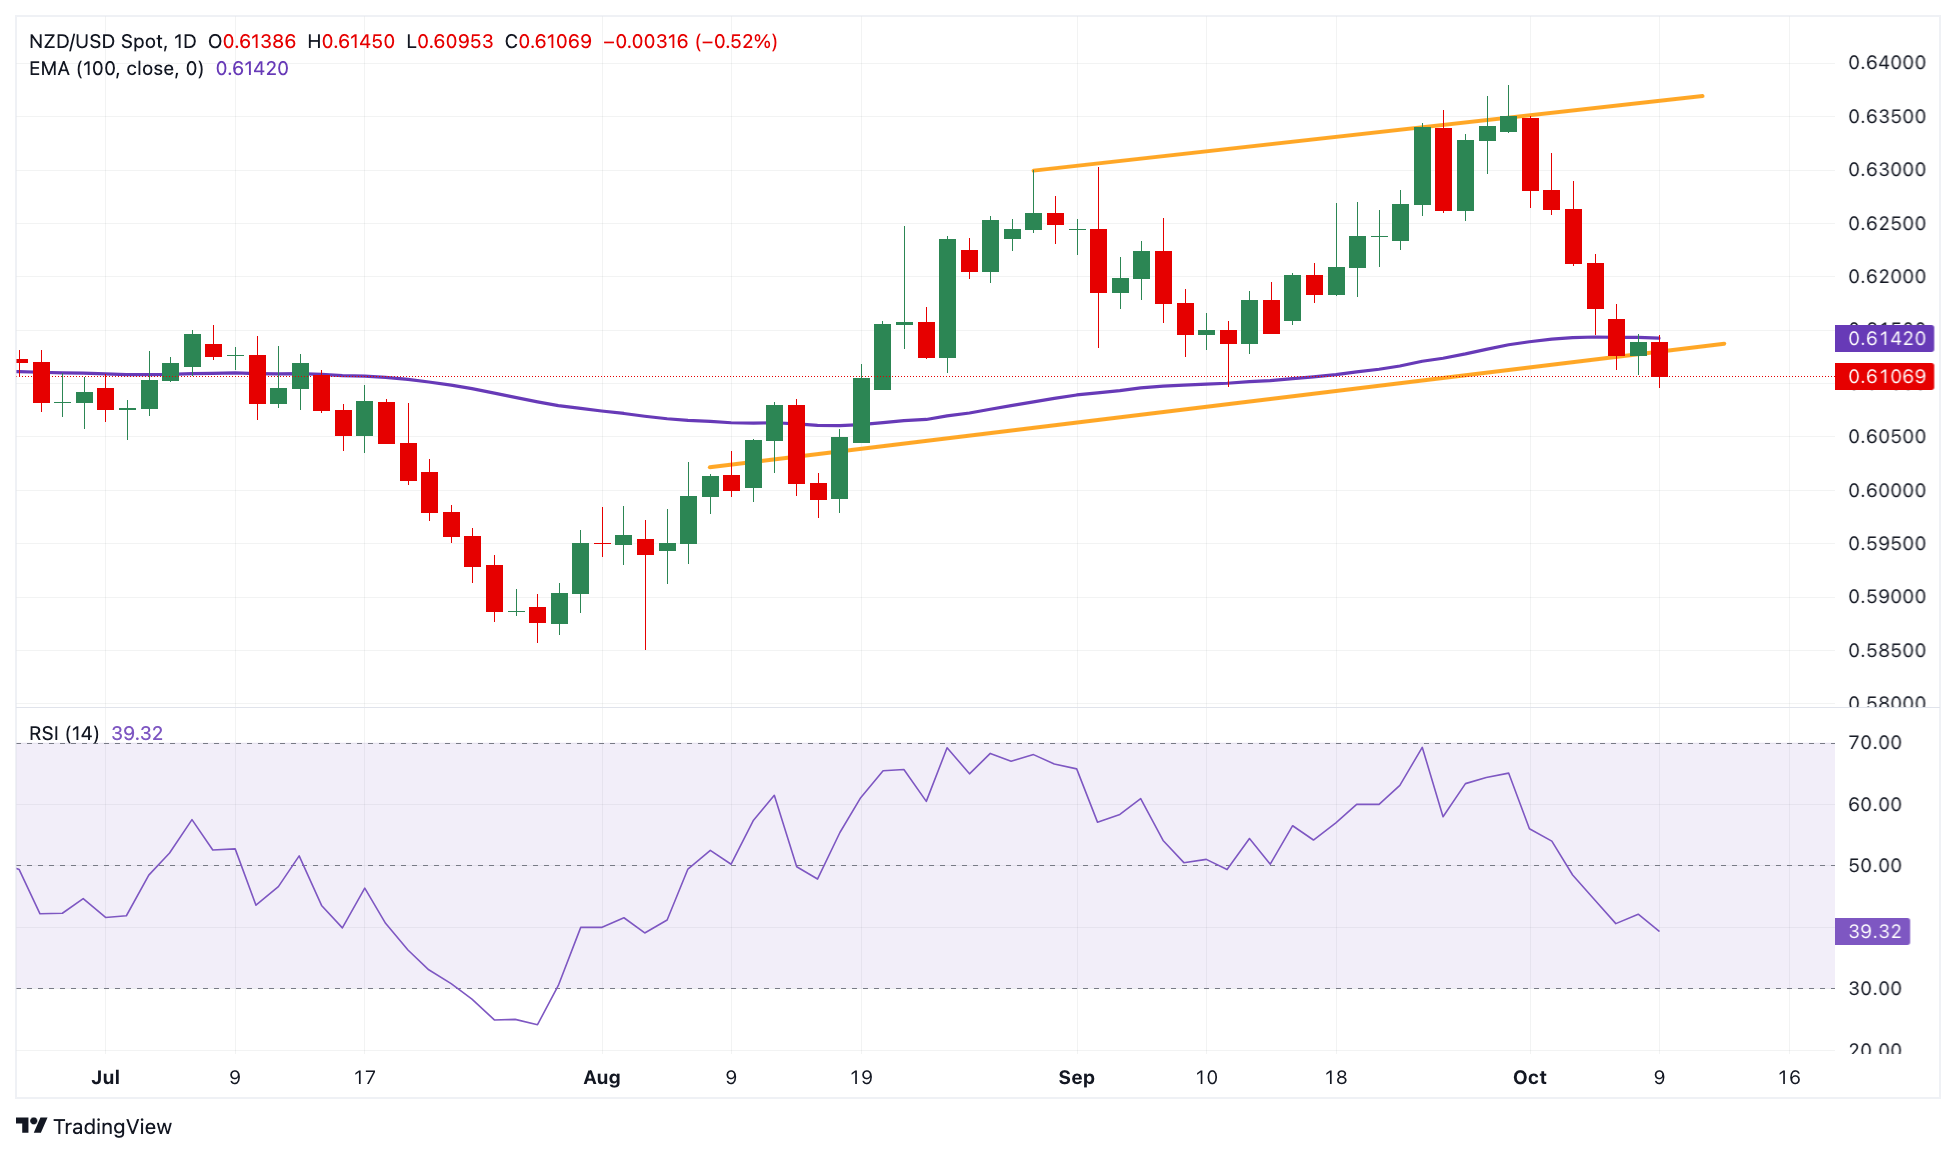
New Zealand Dollar FAQs
The New Zealand Dollar (NZD), also known as the Kiwi, is a well-known traded currency among investors. Its value is broadly determined by the health of the New Zealand economy and the country’s central bank policy. Still, there are some unique particularities that also can make NZD move. The performance of the Chinese economy tends to move the Kiwi because China is New Zealand’s biggest trading partner. Bad news for the Chinese economy likely means less New Zealand exports to the country, hitting the economy and thus its currency. Another factor moving NZD is dairy prices as the dairy industry is New Zealand’s main export. High dairy prices boost export income, contributing positively to the economy and thus to the NZD.
The Reserve Bank of New Zealand (RBNZ) aims to achieve and maintain an inflation rate between 1% and 3% over the medium term, with a focus to keep it near the 2% mid-point. To this end, the bank sets an appropriate level of interest rates. When inflation is too high, the RBNZ will increase interest rates to cool the economy, but the move will also make bond yields higher, increasing investors’ appeal to invest in the country and thus boosting NZD. On the contrary, lower interest rates tend to weaken NZD. The so-called rate differential, or how rates in New Zealand are or are expected to be compared to the ones set by the US Federal Reserve, can also play a key role in moving the NZD/USD pair.
Macroeconomic data releases in New Zealand are key to assess the state of the economy and can impact the New Zealand Dollar’s (NZD) valuation. A strong economy, based on high economic growth, low unemployment and high confidence is good for NZD. High economic growth attracts foreign investment and may encourage the Reserve Bank of New Zealand to increase interest rates, if this economic strength comes together with elevated inflation. Conversely, if economic data is weak, NZD is likely to depreciate.
The New Zealand Dollar (NZD) tends to strengthen during risk-on periods, or when investors perceive that broader market risks are low and are optimistic about growth. This tends to lead to a more favorable outlook for commodities and so-called ‘commodity currencies’ such as the Kiwi. Conversely, NZD tends to weaken at times of market turbulence or economic uncertainty as investors tend to sell higher-risk assets and flee to the more-stable safe havens.
The People’s Bank of China (PBoC) set the USD/CNY central rate for the trading session ahead on Wednesday at 7.0568, as compared to the previous day's fix of 7.0709 and 7.0565 Reuters estimates.
- AUD/NZD witnessed a dramatic turnaround from a one-week trough touched this Wednesday.
- The RBNZ announced a 50-bps rate cut, which weighs heavily on the NZD and boosts the cross.
- Disappointment over China’s stimulus update undermines the AUD and might cap further gains.
The AUD/NZD cross rebounds from a one-week low touched during the Asian session on Wednesday and the buying interest picks up pace after the Reserve Bank of New Zealand (RBNZ) announced its policy decision. Spot prices rallied to the 1.1050 area in the last hour, closer to the highest level since August 16 touched earlier this week and seem poised to appreciate further.
As was anticipated, the RBNZ lowered the Official Cash Rate (OCR) by 50 basis points (bps) to 4.75% at the conclusion of the October meeting. In the accompanying policy statement, the central bank noted that excess capacity has dampened inflation expectations, and price and wage changes are now more consistent with a low-inflation environment. This raises the possibility of more rate cuts in the coming months, which, in turn, weighs heavily on the New Zealand Dollar (NZD) and provides a goodish lift to the AUD/NZD cross.
The Australian Dollar (AUD), on the other hand, struggles to lure buyers and languishes near a multi-month low against the US Dollar (USD) amid the disappointment over China's stimulus update on Tuesday. This might hold back traders from placing aggressive bullish bets around the AUD/NZD cross and cap any further gains. That said, some follow-through buying beyond the 1.1060 area could trigger a fresh bounce of a short-covering move and set the stage for an extension of the move-up witnessed over the past two weeks or so.
Economic Indicator
RBNZ Interest Rate Decision
The Reserve Bank of New Zealand (RBNZ) announces its interest rate decision after its seven scheduled annual policy meetings. If the RBNZ is hawkish and sees inflationary pressures rising, it raises the Official Cash Rate (OCR) to bring inflation down. This is positive for the New Zealand Dollar (NZD) since higher interest rates attract more capital inflows. Likewise, if it reaches the view that inflation is too low it lowers the OCR, which tends to weaken NZD.
Read more.Last release: Wed Oct 09, 2024 01:00
Frequency: Irregular
Actual: 4.75%
Consensus: 4.75%
Previous: 5.25%
Source: Reserve Bank of New Zealand
The Reserve Bank of New Zealand (RBNZ) holds monetary policy meetings seven times a year, announcing their decision on interest rates and the economic assessments that influenced their decision. The central bank offers clues on the economic outlook and future policy path, which are of high relevance for the NZD valuation. Positive economic developments and upbeat outlook could lead the RBNZ to tighten the policy by hiking interest rates, which tends to be NZD bullish. The policy announcements are usually followed by Governor Adrian Orr’s press conference.
- WTI attracts some sellers near $73.35 in Wednesday’s early Asian session.
- The possible Hezbollah-Israel ceasefire, ongoing concerns about China’s demand could undermine the WTI price.
- The rising Middle East geopolitical risks might cap the upside for WTI.
West Texas Intermediate (WTI), the US crude oil benchmark, is trading around $73.35 on Wednesday. The WTI price edges lower on the report of a possible ceasefire between Hezbollah and Israel. However, the fears of a potential attack on Iranian oil infrastructure might cap its downside.
Investors have reduced their war-risk bets as the lack of further escalation alleviated fears of oil supply disruption in the Middle East. This, in turn, weighs on the WTI price on the day. Israel Defence Minister Yoav Gallant will meet with US Secretary of Defence Lloyd Austin at the Pentagon on Wednesday to discuss security developments in the Middle East.
Meanwhile, the development surrounding geopolitical tension in the region will be closely watched. The fears that Israel might be targeting Iran's oil industry in retaliation for Tehran's ballistic missile attack could lift the black gold price.
US crude oil inventories rose more than expected last week. According to the American Petroleum Institute (API), crude oil stockpiles in the United States for the week ending October 4 rose by 10.9 million barrels, compared to a fall of 1.5 million barrels in the previous week. The market consensus estimated that stocks would increase by only 1.95 million barrels.
The disappointment that Chinese officials did not announce any new stimulus measures at a press briefing Tuesday contributes to the WTI’s downside as China is the world’s largest crude importer. “Ongoing concerns about China’s demand persist due to the lack of stimulus, while the Middle East conflict has not led to any supply disruptions,” said Svetlana Tretyakova, senior oil market analyst at Rystad Energy.
WTI Oil FAQs
WTI Oil is a type of Crude Oil sold on international markets. The WTI stands for West Texas Intermediate, one of three major types including Brent and Dubai Crude. WTI is also referred to as “light” and “sweet” because of its relatively low gravity and sulfur content respectively. It is considered a high quality Oil that is easily refined. It is sourced in the United States and distributed via the Cushing hub, which is considered “The Pipeline Crossroads of the World”. It is a benchmark for the Oil market and WTI price is frequently quoted in the media.
Like all assets, supply and demand are the key drivers of WTI Oil price. As such, global growth can be a driver of increased demand and vice versa for weak global growth. Political instability, wars, and sanctions can disrupt supply and impact prices. The decisions of OPEC, a group of major Oil-producing countries, is another key driver of price. The value of the US Dollar influences the price of WTI Crude Oil, since Oil is predominantly traded in US Dollars, thus a weaker US Dollar can make Oil more affordable and vice versa.
The weekly Oil inventory reports published by the American Petroleum Institute (API) and the Energy Information Agency (EIA) impact the price of WTI Oil. Changes in inventories reflect fluctuating supply and demand. If the data shows a drop in inventories it can indicate increased demand, pushing up Oil price. Higher inventories can reflect increased supply, pushing down prices. API’s report is published every Tuesday and EIA’s the day after. Their results are usually similar, falling within 1% of each other 75% of the time. The EIA data is considered more reliable, since it is a government agency.
OPEC (Organization of the Petroleum Exporting Countries) is a group of 12 Oil-producing nations who collectively decide production quotas for member countries at twice-yearly meetings. Their decisions often impact WTI Oil prices. When OPEC decides to lower quotas, it can tighten supply, pushing up Oil prices. When OPEC increases production, it has the opposite effect. OPEC+ refers to an expanded group that includes ten extra non-OPEC members, the most notable of which is Russia.


© 2000-2025. All rights reserved.
This site is managed by Teletrade D.J. LLC 2351 LLC 2022 (Euro House, Richmond Hill Road, Kingstown, VC0100, St. Vincent and the Grenadines).
The information on this website is for informational purposes only and does not constitute any investment advice.
The company does not serve or provide services to customers who are residents of the US, Canada, Iran, The Democratic People's Republic of Korea, Yemen and FATF blacklisted countries.
Making transactions on financial markets with marginal financial instruments opens up wide possibilities and allows investors who are willing to take risks to earn high profits, carrying a potentially high risk of losses at the same time. Therefore you should responsibly approach the issue of choosing the appropriate investment strategy, taking the available resources into account, before starting trading.
Use of the information: full or partial use of materials from this website must always be referenced to TeleTrade as the source of information. Use of the materials on the Internet must be accompanied by a hyperlink to teletrade.org. Automatic import of materials and information from this website is prohibited.
Please contact our PR department if you have any questions or need assistance at pr@teletrade.global.
transfers