- Analytics
- News and Tools
- Market News
CFD Markets News and Forecasts — 09-02-2022
- WTI holds on to the bounce off weekly low, grinds higher of late.
- MACD teases bears but multiple supports to the south keep buyers hopeful.
- One-week-old resistance guards immediate upside ahead of recently flashed eight-year high.
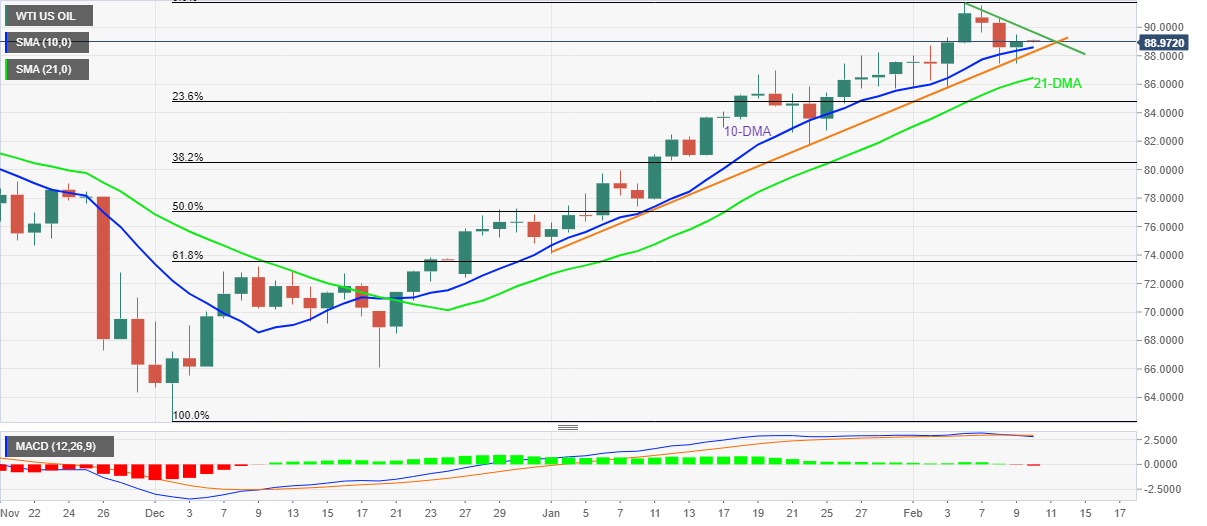
WTI keeps the previous day’s bounce from short-term key supports around $89.00 during Thursday’s Asian session.
In doing so, the black gold grinds higher towards the weekly resistance line, near $89.65 at the latest.
Although a clear rebound from the 10-DMA and an upward sloping trend line from January 03, 2022, keeps buyers hopeful to overcome the immediate resistance surrounding $89.65, MACD teases bears and hints at a bumpy road ahead.
As a result, the $90.00 threshold will act as an extra filter to the north before directing the WTI crude oil prices towards the latest multi-month high of $91.77.
Should the black gold remains firmer past $91.77, the September 2014 peak of $95.90 will be in focus.
Alternatively, pullback moves may initially target the 10-DMA and the stated support line, respectively near $88.60 and $88.25, before directing sellers towards the 21-DMA level of $86.45.
In a case where the quote drops below $86.45, an extended pullback towards the late January swing lows near $81.70 can’t be ruled out.
WTI: Daily chart
Trend: Pullback expected
US inflation expectations, as measured by the 10-year breakeven inflation rate per the St. Louis Federal Reserve (FRED) data, add to the market’s anxiety over the US inflation data ahead of key Consumer Price Index (CPI) figures for January.
Read: US Inflation Preview: Core CPI above 6% could spark next dollar rally
The inflation precursor grind higher past the three-month low marked in late January, with the latest moves mostly steady around 2.42%.
It should be noted, however, that the White House (WH) earlier signaled an increase in the YoY figures before WH Adviser Brian Deese said that he sees reason to think that factors boosting inflation will moderate over time.
Amid these plays, US Treasury yields ease from the highest in 2.5 years while Wall Street remains firmer amid the upbeat performance of technology shares and earnings.
That said, the market’s reflation fear is the main driver of late and any surprise reduction in the headlines US CPI for January, expected 7.3% YoY versus 7.0% prior, may add to the latest risk-on mood.
- GBP/USD struggles between 21-DMA and 100-DMA after easing from monthly resistance line.
- Downbeat Momentum line keeps sellers hopeful to test the key Fibonacci retracement levels.
- Buyers remain cautious til prices stay below 200-DMA.
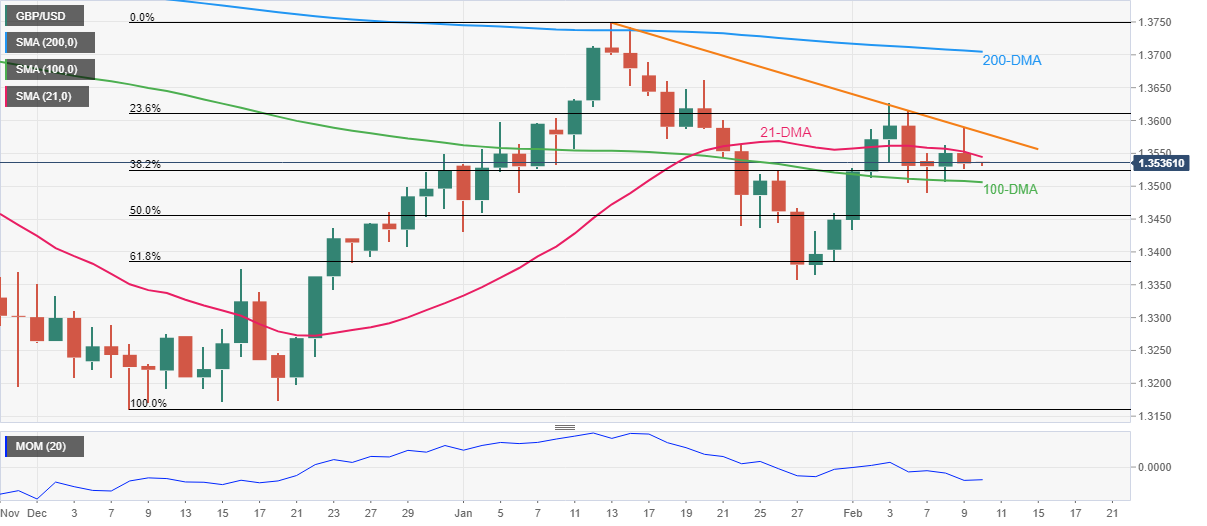
GBP/USD seesaws around 1.3535-40 during Thursday’s Asian session, following a pullback from a one-month-old descending resistance line the previous day.
In doing so, the cable pair stays within the weekly range between the 21-DMA and 100-DMA. However, the recently downbeat Momentum line favors sellers.
That said, a clear downside break of the 100-DMA level near 1.3500 becomes necessary for the GBP/USD sellers to take entries.
Following that, the 50% and 61.8% Fibonacci retracement of December-January run-up, respectively around 1.3450 and 1.3385, will be in focus.
Also acting as a downside filter is the previous monthly low around 1.3355.
On the contrary, the 21-DMA and aforementioned resistance line, close to 1.3545 and 1.3585 in that order, guard the GBP/USD pair’s short-term upside.
Following that, the recent swing high near 1.3630 may offer an intermediate halt before fueling prices towards the 200-DMA level surrounding 1.3705.
GBP/USD: Daily chart
Trend: Further weakness expected
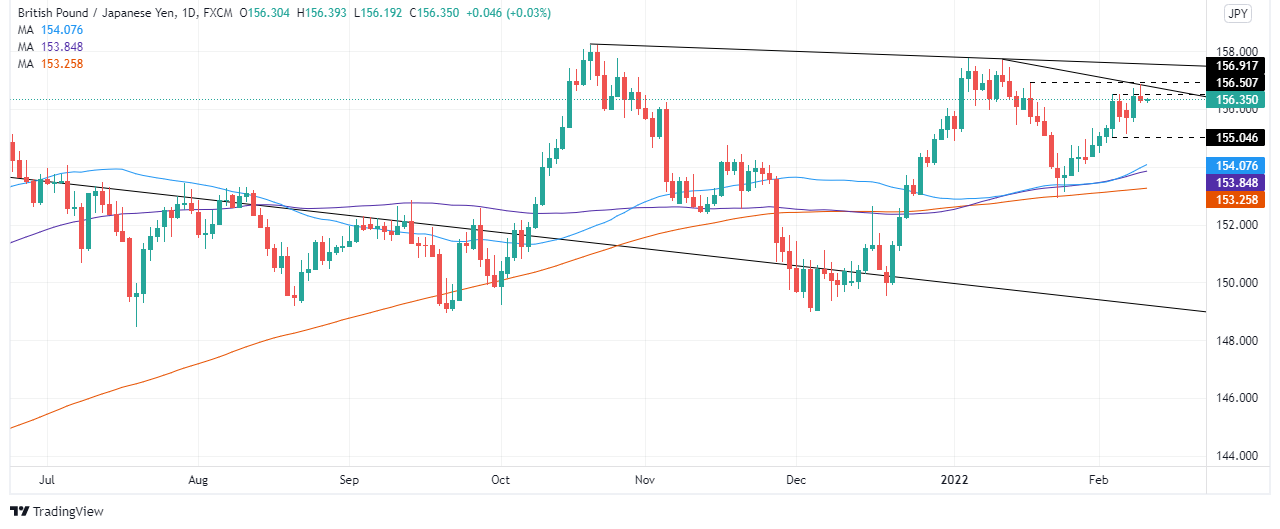
- The GBP/JPY bulls failure at 156.60 will keep the cross-currency pair within the 154.30-156.50 range.
- GBP/JPY Technical Outlook: Neutral biased as depicted by trendless daily moving averages (DMAs) despite being located below the spot price.
The GBP/JPY is subdued amid a positive market mood on the Wednesday trading session, weighed by the GBP/USD, which is also confined to familiar ranges ahead of the critical January US inflation report unveiled on Thursday. At the time of writing, the GBP/JPY is trading at 156.39.
Financial markets mood is upbeat, portrayed by US equities finishing in the green. Meanwhile, Asian stock futures point to a higher open, carrying on the North American session mood.
In the FX complex, risk-sensitive currencies posted gains led by antipodeans, the CAD, and the EUR, while the British pound was the weakest in the day, down 0.02%.
GBP/JPY Price Forecast: Technical outlook
The GBP/JPY is subdued in a narrow trading range. In the middle of the European session, threatened of breaking the top of the 154.30-156.50 range, but failure to print a daily close above the aforementioned exposed the GBP/JPY to selling pressure.
Upward, the GBP/JPY first resistance would be the January 18 daily high at 156.90. If the GBP bulls crack that level, the next resistance would be the January 12 daily high at 157.70, followed by the November 2021 swing highs at 158.22.
Contrarily, the GBP/JPY first buying zone would be 156.00. Breach of the latter would expose the February 7 daily low at 155.13, followed by February 3 155.04.
- NZD/USD grinds higher around fortnight top, pauses three-day uptrend.
- Upbeat market sentiment, softer USD helped buyers of late.
- White House triggered fears of higher US inflation, NZ PM Ardern tried to ignore protesters at Parliament.
- US CPI for January becomes the key data to watch for clear market direction.
NZD/USD struggles to extend the previous three-day uptrend, easing to 0.6680 during the early Thursday morning in Asia.
The market’s cautious sentiment ahead of the US Consumer Price Index (CPI) joins the mixed statements from the White House (WH) and New Zealand politics to test the bulls of late. Before that, the broad weakness of the US dollar and risk-on mood helped the Kiwi pair to remain firmer, by tracking the gains of the AUD/USD and equities.
WH conveyed expectations of a higher YoY inflation figure while also saying, “Its irrelevant month on month number will continue trending lower the rest of the year.” Following that, WH Economic Adviser Brian Deese said that he sees reason to think that factors boosting inflation will moderate over time.
The mixed comments on inflation add to the market’s anxiety ahead of crucial US inflation data and challenge the buyers of riskier assets like commodities and Antipodeans.
At home, New Zealand (NZ) Prime Minister Jacinda Ardern tried to tame the doubts over the government’s popularity as many protesters staged dislike for a push towards masks and vaccines at the Parliament. “Protesters at Parliament do not represent most of the country's views and evicting them from Parliament is a decision for police,” said NZ PM Ardern per NZ Herald.
It’s worth noting that the doubts over the US-China trade ties, as signaled by Washington’s communication of Beijing’s inability to match the Phase 1 trade deal target, joined the Russia-Ukraine tussles to test the NZD/USD bulls as well.
Previously, markets cheered upbeat performance of equities and commodities, as well as the US dollar weakness, to print gains amid mixed signals and a light calendar. It should be observed that Cleveland Fed President Loretta Mester supported the March rate hike while Atlanta Federal Reserve President Raphael Bostic told CNBC on Wednesday he is hopeful that they will start to see a decline in inflation. Fed’s Bostic also said, "Leaning toward the need for a fourth interest rate increase in 2022."
Looking forward, NZD/USD may consolidate recent gains during the pre-CPI caution. However, the bear’s performance will depend upon the US inflation data.
Read: US Consumer Price Index January Preview: Is this inflation different?
Technical analysis
Although a two-week-old ascending trend line joins firmer MACD to keep NZD/USD buyers hopeful, 21-DMA and December 2021 low, respectively around 0.6690 and 0.6700, challenge the quote’s immediate upside. Alternatively, sellers may take entries on witnessing a clear downside break of the stated support line, near 0.6640 at the latest.
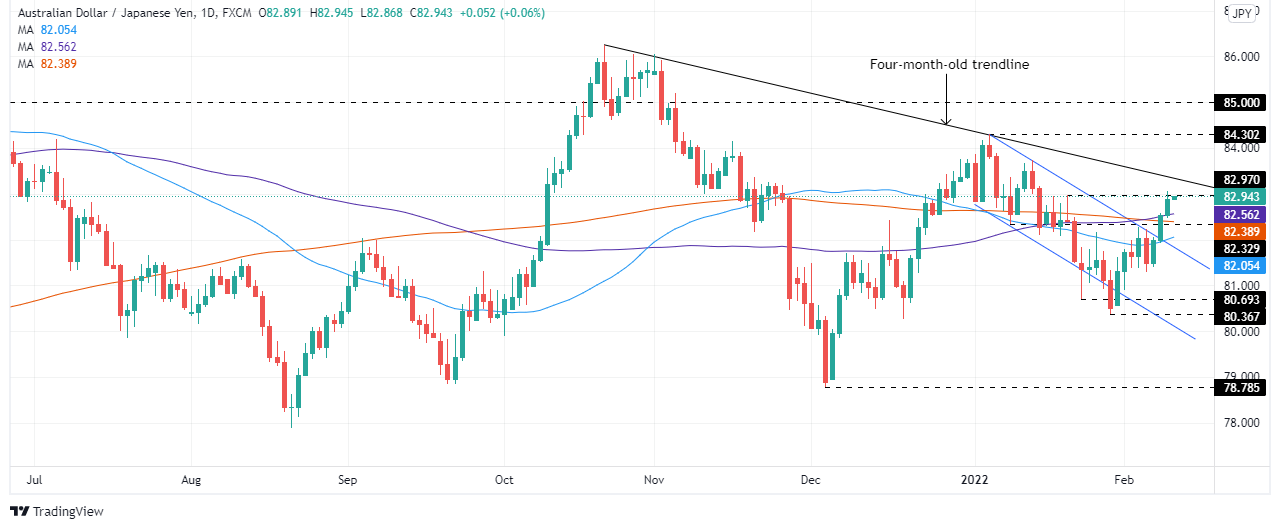
- The Australian dollar continues its weekly rally vs. the Japanese yen, up 1.79% in the week.
- US equity indices finished Wednesday’s trading session with gains between 0.86% and 2.10%.
- AUD/JPY Technical Outlook: An upside break above 83.00 could pave the way towards 85.00.
The AUD/JPY extends its gains during the week rallies for the third straight day, taking advantage of an upbeat market mood. At the time of writing, the AUD/JPY is trading at 82.97.
Wall Street finished Wednesday’s trading session with gains, portraying the market player’s sentiment. The Nasdaq Composite rose 2.10%, up to 15.056.96, followed by the S&P 500, which jumped 1.45% towards 4,587.18, and the Dow Jones Industrial advanced 0.86%, closed at 35,768.06.
In the FX complex, risk-sensitive currencies posted gains led by antipodeans (NZD and AUD), the CAD, and the EUR, while safe-haven peers slid.
AUD/JPY Price Forecast: Technical outlook
On Tuesday’s article mentioned that “the AUD/JPY broke a bullish flag to the upside, though the 100-DMA capped the move.” Nevertheless, on Wednesday, AUD bulls reclaimed the 100-day moving average (DMA) at 82.56, sending the AUD/JPY near the 83.00 figure. Furthermore, a daily close above the aforementioned has been confirmed, confirming the shift to a neutral-bullish bias.
The AUD/JPY first resistance will be the 83.00 figure. An upside break would expose the four-month-old downslope trendline around the 83.25-40 range, followed by the January 5 daily high at 84.30 and then the 85.00 psychological figure.
On the flip side, failure at 83.00 could pave the way for further downward pressure in the cross-currency pair. The first support would be 82.00, extending the drop top-trendline of the bullish flag, viewed as a false breakout. A crackdown of the 82.00 mark would expose January 24 daily low at 80.69, followed by January 28 at 80.36.
Following the White House (WH) expectations of an upbeat inflation figure on YoY, Reuters conveyed comments from WH Economic Adviser Brian Deese from an online event hosted by the Council on Foreign Relations.
The diplomat’s initial statement was, “Reaching agreement with the U.S. Congress on a package of climate and social spending will be a challenge, but the Biden administration remains upbeat it can be done.”
Additional comments
US seeing strong labor market recovery, about 60% of decline due to pandemic has been recovered.
Sees opportunity to make 'lot of progress' on returning those not in labor force due to family care obligations.
Biden administration remains optimistic about getting 'something meaningful done' with congress on climate, social spending package.
If the proposals were fully paid for, as intended by the Biden administration, the spending package would not have a net impact on aggregate demand or inflation.
FX implications
The news tried to placate inflation fears but the pre-CPI mood in the market weighed on risk barometers like AUD/USD during the early hours of Thursday’s Asian session.
That said, the Aussie pair pauses three-day uptrend around 0.7180 by the press time.
- AUR/USD bears eye a trip to the 38.2% ratio for the coming sessions
- Bulls need to hold the fort on the hourly time frame.
EUR/USD bulls have been trying to hold the fort but the downside is opening up, slowly. The US key event in the Consumer Price Index will be critical in this regard and it could be a slow grind into the event at this point. Nevertheless, there are bearish short-term structures that are noted on the hourly chart that guards the bigger picture's downside prospects as follows:
EUR/USD daily chart
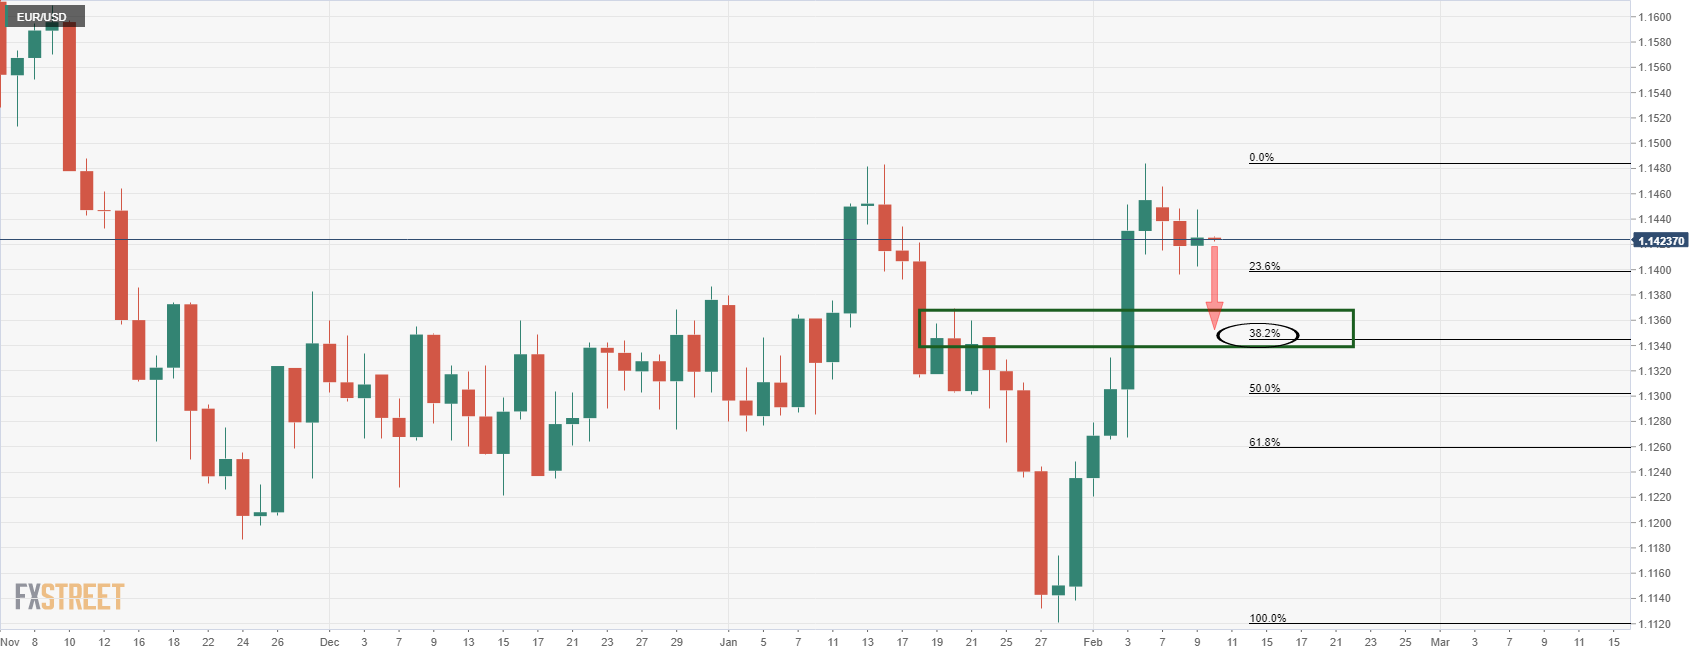
The bears look for a move to the old resistance looking left which has a confluence with the 38.2% ratio near to the 1.1350 level. From a lower time frame perspective, the bears can look for bearish structure as follows:
EUR/USD H1 chart
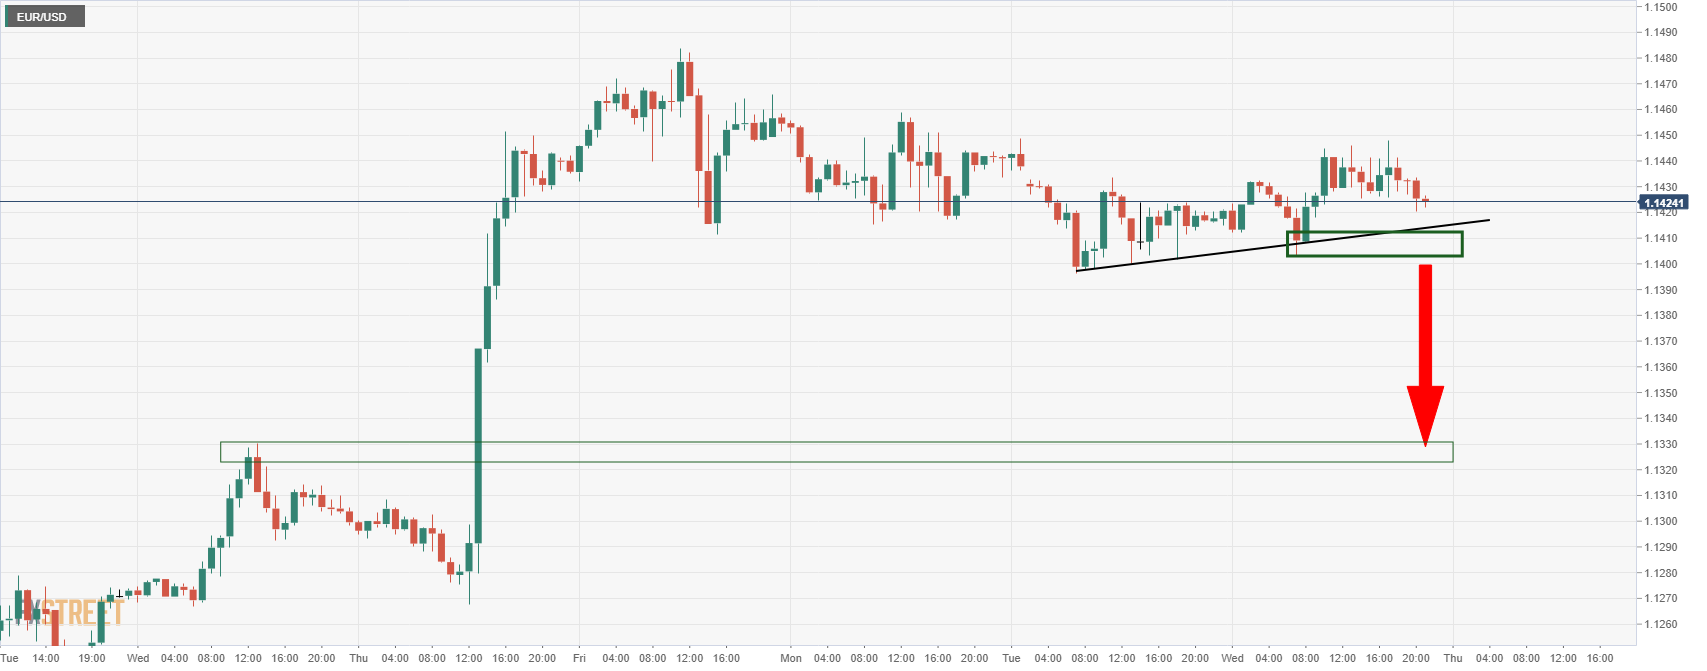
A break of the trendline support and should te horizontal support around 1.14 the figure proves robust on a retest, 1.1330 is a compelling hourly old swing high that could be targeted.
- AUD/USD bulls are in control as pull away into critical resistance.
- A break of 0.7200 will be a significant technical development.
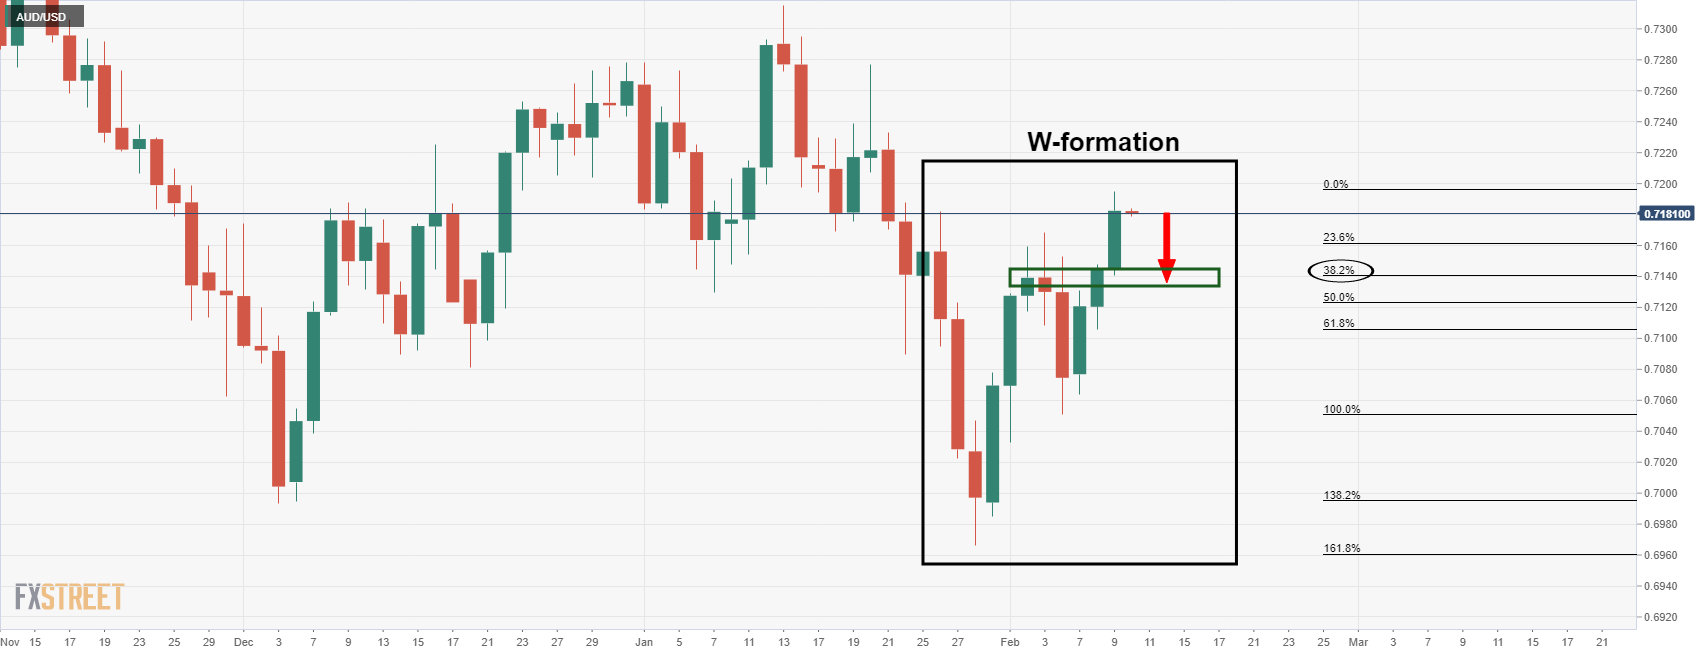
The bulls have started to crack a significant amount of the critical supply area on the daily chart, ploughing through heavy volumes between 0.7180/90 area with eyes on 0.72 the figure:
AUD/USD daily chart
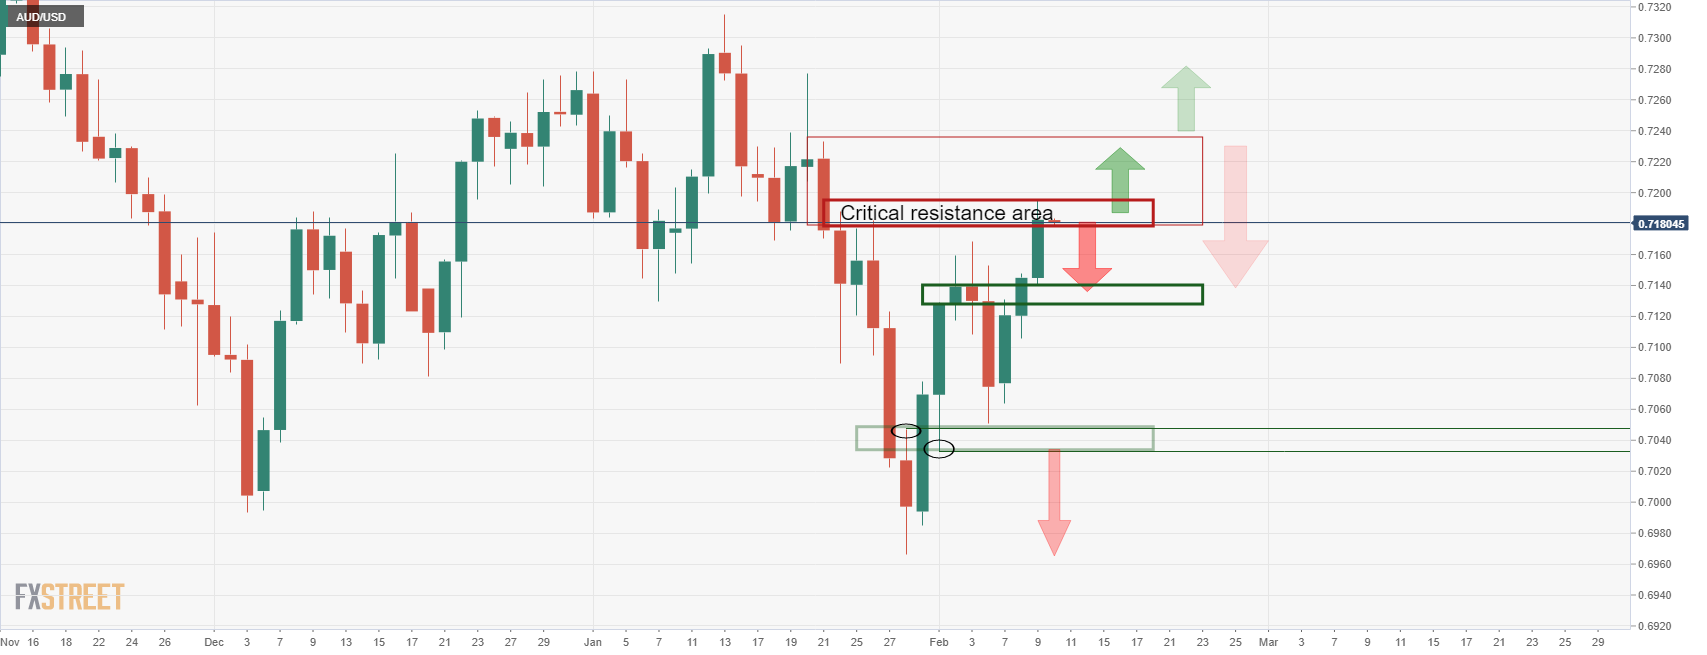
The bulls are firmly rooted in the critical resistance area following Wednesday's strong advance. A push beyond 0.72 the figure with a daily close could spell disaster for trapped bears.
However, the W-formation could hamstring the bulls and the 38.2% ratio is compelling as it currently meets with the neckline of the formation.
- EUR/GBP bulls take control as markets get set for the US CPI key event.
- ECB and BoE sentiment continues to drive the cross.
EUR/GBP is heading into the last hour of Wall Street on a strong footing ahead of the countdown into US Consumer Price Index which could be a trigger for the US dollar with implications for the euro and the EUR/GBP cross.
Meanwhile, at 0.8442, EUR/GBP is higher by some 0.23% having climbed from a low of 0.8413 and reaching a high of 0.8450 on the day. The euro managed to save face on the back of semi-conflicting central bank chatter. The European Central Bank board member Isabel Schnabel said on Wednesday that the ECB may need to raise interest rates on the back of higher energy prices.
This followed attempts to downplay the hawkishness of the ECB meeting by governor Christine Lagarde at the start of the week. Lagarde argued that any adjustment to monetary policy will be "gradual" and the ECB would remain "data-dependent" while assessing the implications for the medium-term inflation outlook.
Meanwhile deep uncertainty about the future path of the Bank of England’s monetary policy. The Bank of England Chief Economist Huw Pill spoke on Wednesday and said that it was reasonable for central banks to withdraw from providing detailed guidance on the policy outlook as prospects for the economy were not clear cut.
This rhymes with the message from last week's meeting where although the BoE hiked by 0.25bps, the Governor of The Old Lady, Andrew Bailey, warned markets not to take for granted the BoE was embarking on a long series of rate hikes. nevertheless, money markets are still pricing in a 25 bps rate increase in March and 125 bps by December 2022.
Meanwhile, the US CPI data on Thursday has the potential to move the needle in the forex market. ''If those readings come in hot, it could be the trigger for the next leg higher in U.S. yields and likely push the 10-year above 2% for the first time since August 2019,'' analysts at Brown Brothers Harriman warned. ''Fed tightening expectations would also pick up and likely push the short end of the US curve higher, which would support the dollar.''
On Friday, UK Gross Domestic Product data will be eyed. ''We look for UK GDP to contract 0.8% m/m in December, thus bringing GDP below its pre-COVID level once again,'' analysts at TD Securities explained.
''Manufacturing likely declined 0.3% MoM, while we expect the services sector to contract 0.9% MoM, in part driven by voluntary COVID measures and a substantial amount of people isolating due to the Omicron surge, but also due to a fade in consumer demand.''
- In the last week, the EUR gained 400-pips after ECB’s Lagarde failed to push back a rate hike in 2022.
- Central bank monetary policy divergence favors the NZD vs. the EUR.
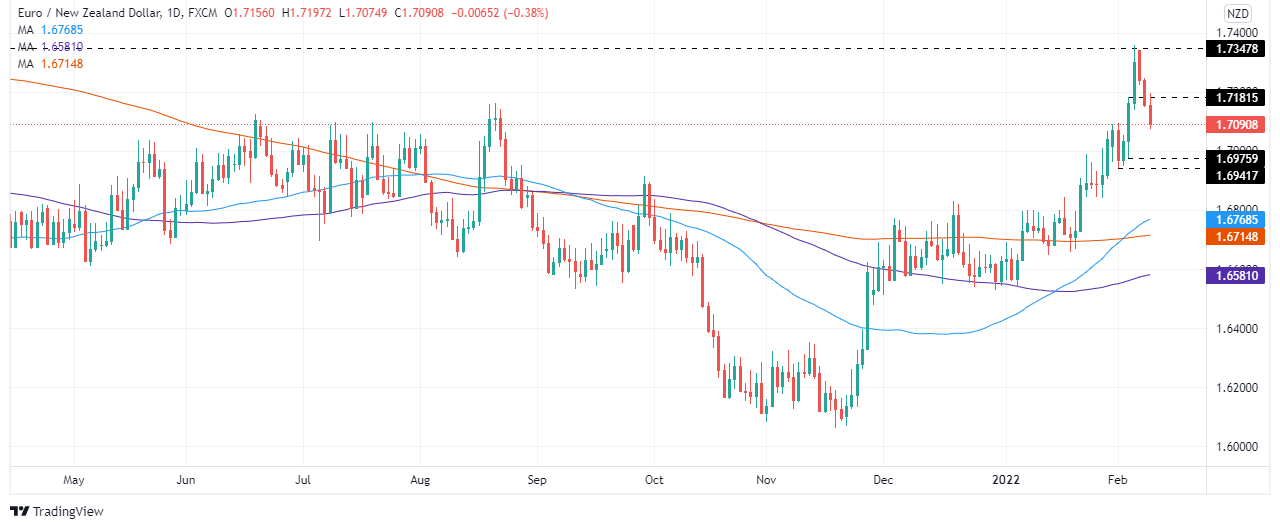
- EUR/NZD Technical Outlook: Neutral, but a daily close below 1.7094, might send the pair tumbling towards 1.6940.
The EUR/NZD extends its losses to three consecutive days, following some ECB speaking that calmed the markets, as STIR futures have priced in 50 basis points of rate hikes of the ECB by the end of 2022. At the time of writing, the EUR/NZD cross-currency is trading at 1.7088.
Last Thursday, the European Central Bank (ECB) decided to keep its monetary policy unchanged. However, during the press conference, ECB’s President Christine Lagarde did not push back against hiking interest rates in 2022, as she did in previous monetary policy meetings.
The divergence between the RBNZ and the ECB bolstered the NZD
Market players perceived that as a hawkish pivot by the ECB, sending the EUR/USD rallying, breaking 1.1300 and 1.1400 on its way towards 1.1480s. Concerning the EUR/NZD, the pair rallied from 1.6960s towards 1.7357 regardless of the Reserve Bank of New Zealand (RBNZ), which already began tightening conditions with 50 bps of rate hikes in 2021.
Therefore, due to the RBNZ tightening monetary policy conditions with its Overnight Cash Rate (OCR) at 0.75% as of today, while the ECB’s deposit rate at 0% favors the prospects of a lower EUR/NZD pair.
EUR/NZD Price Forecast: Technical outlook
In the overnight session for North American traders, the EUR/NZD was rejected by the 100-hour simple moving average (SMA) at 1.7199, sending the pair tumbling during the rest of the day, breaking the 1.7100 figure on its way down.
That said, the EUR/NZD first support would be the February 3 daily high previous resistance-now-support at 1.7094. Breach of the latter would expose the February 3 daily low at 1.6974, followed by February 1 1.6940.
What you need to know on Thursday, February 10:
Easing government bond yields weighed on the American dollar, which anyway ended the day mixed across the FX board.
The yield on the US 10-year Treasury note stands at around 1.93%, down from its weekly peak at 1.97%.
The GBP/USD pair is unchanged on a daily basis trading at around 1.3525, while the EUR/USD pivots around 1.1430. Commodity-linked currencies were the best performers, as AUD/USD trades in the 0.7180 price zone, while USD/CAD fell to 1.2670. BOC’s Governor Tiff Macklem spoke in the Canadian Chamber of Commerce and highlighted the role of supply-chain issues on higher inflation. He said he was confident issues may soon recede, although the current truckers’ conflict may add to disruptions.
Gold peaked at $1,835.81 a troy ounce, ending the day nearby. Crude oil prices ended the day little changed, with WTI trading at $89.40 a barrel.
The White House warned about soaring inflation, one day ahead of the release of the January Consumer Price Index.
Global indexes closed in the green, with Wall Street posting substantial gains amid a bounce in the tech sector and solid earnings reports.
Cardano price screams “buy” ahead of bullish breakout
Like this article? Help us with some feedback by answering this survey:
- Gold braces the July 2021 swing highs around $1,834 as the market prepares for US inflation.
- US Treasuries slide led by the 10-year benchmark note down at 1.923%.
- XAU/USD Technical Outlook: Neutral, unless it breaks above $1,834, which would shift the bias to neutral-bullish.
Gold (XAU/USD) rallies in the New York session taking advantage of a catalyst, alongside falling US Treasury yields, ahead of the US inflation report. At press time, XAU/USD is trading at $1834.61, advancing close to 0.50%.
Financial markets sentiment is upbeat, as reflected by equity markets. The global bond sell-off stopped as the US Department of Labour would reveal January’s inflation report on Thursday, widely expected by market players. That said, on Wednesday, US Treasuries yields are dropping led by the 10-year benchmark note down three basis points, sitting at 1.923%
Fed’s Mester expects a hike in March meeting
In the meantime, a light US economic docket left XAU/USD traders waiting for Fed speaking and market sentiment. Earlier, Cleveland’s Fed President Loretta Mester (voter 2022) said that she “expects inflation will moderate but would remain above 2% this year and next.” Worth noting that Mester supports a rate increase in March, followed by future rate hikes, which the economy will guide.
That said, market players prepare ahead of the US Consumer Price Index for January, to be released on Thursday. Estimations for the headline CPI lie at 7.3%, while Core CPI is foreseen at 5.9%.
Worth mentioning that analysts at TD securities expect inflation to “slow significantly in 2022, and fiscal stimulus fades and supply constraints ease, but for now, the data remain strong.” TD analysts’ estimates for January’s inflation are headline CPI at 7.2%, while core CPI at 5.8%. In the meantime, for the remainder of the year, TD analysts expect headline CPI to recede to 2.9% y/y in Q4 of 2022 while excluding volatile items, also called core CPI, at 3.0% y/y in Q4 of 2022.
XAU/USD Price Forecast: Technical outlook
On Wednesday, XAU/USD broke the central line of Pitchfork’s channel at $1,830, exposing July 2021 swing high at $1,834. Nevertheless, that price level has been unsuccessfully tested four times, though, by the end of November 2021, it was broken when XAU/USD reached $1,877 before retracing its gains towards $1753.
XAU/USD first resistance would be $1,834. A daily close above would expose the January 25 high at $1,853, followed by a nine-month-old downslope trendline around $1,860.
On the flip side, XAU/USD’s first support would be Pitchfork’s central line, around $1,820. Breach of the latter would expose the confluence of the 50 and 200-DMA around $1,806, followed by the 100-DMA at $1,798.
- The NZD bulls have moved in on old weekly lows.
- US CPI will be eyed for the next potential catalyst.
At 0.6690, NZD/USD is higher by 0.62% on the day as the North American session winds down and traders prepare for Thursday's key US Consumer Price Index event. The kiwi has travelled from a low of 0.6641 and reached a high of 0.6697 in mid-day US trade.
As analysts at ANZ Bank pointed out, ''the strong rally in the AUD overnight helped lift the Kiwi, with the former buoyed by gains in metals and a bounce in generalised market risk appetite.'' However, the analysts argued that ''in the context of moves seen last year, the NZD’s rally of around a cent off last Friday’s lows was pretty tame.''
''Bond yields are rising in unison globally, and that’s causing FX volatility rather than directionality, with the markets unsure whether it likes rate hikes (they should dampen inflation) or don’t (they might slow growth and weigh on asset prices).''
There has been a void of domestic drivers for the kiwi and the focus for this week stays with the US and global inflation story as a whole. As the old adage goes, when the US sneezes, the rest of the world catches a cold. Therefore, Thursday's CPI data could be one that moves the needle in forex if it surprises one way or the other.
''US CPI data tonight is important and will help settle the debate as to whether the Fed will lift off with a 25bp or 50bp hike. But it’s not clear the latter would actually benefit the USD,'' the analysts at ANZ Bank argued.
However, given how the greenback has been weighed by US rates taking a breather, This may be the calm before the storm. ''If those readings come in hot, it could be the trigger for the next leg higher in U.S. yields and likely push the 10-year above 2% for the first time since August 2019,'' analysts at Brown Brothers Harriman warned. ''Fed tightening expectations would also pick up and likely push the short end of the US curve higher, which would support the dollar.''
NZD/USD technical analysis
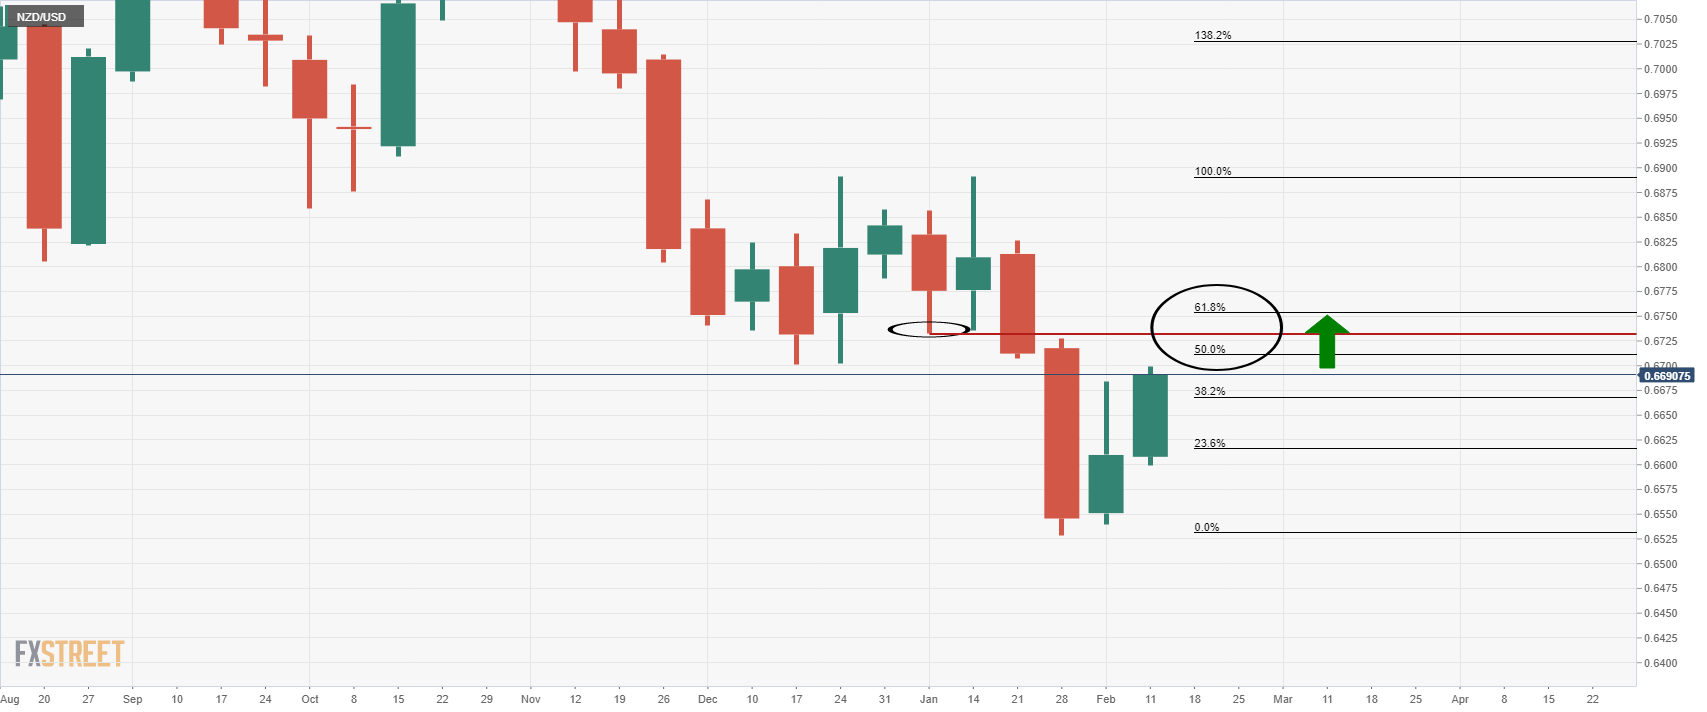
NZD/USD bulls are taking charge in a significant correction that is moving on old lows near 0.67 teh figure and towards the neckline of the M-formation near 0.6733. This resides between the 50% mean reversion and the 61.8% ratio.
The GDPNow model estimate for real GDP growth (seasonally adjusted annual rate) in the first quarter of 2022 is 0.7 percent on February 9, unchanged from February 8 after rounding.
''After this morning’s wholesale trade release from the US Census Bureau, the nowcast of the contribution of inventory investment to first-quarter real GDP growth decreased from -2.40 percentage points to -2.41 percentage points.
The next GDPNow update is Wednesday, February 16.''
Ahead of tomorrows key US Consumer Price Index data scheduled for New York's morning session, the White House says tomorrow's inflation data will show high year-on-year figure.
More to come...
- USD/CAD is trading technically heavy, but inverse H&S offers solace for the bulls.
- Today's lows could be important in this regard while 1.2610 will be the last defence.
USD/CAD has been offered on the day but is running into a very important area of support. From a short-term perspective, the price is printing an overextended M-formation on the hourly chart:
USD/CAD H1 chart
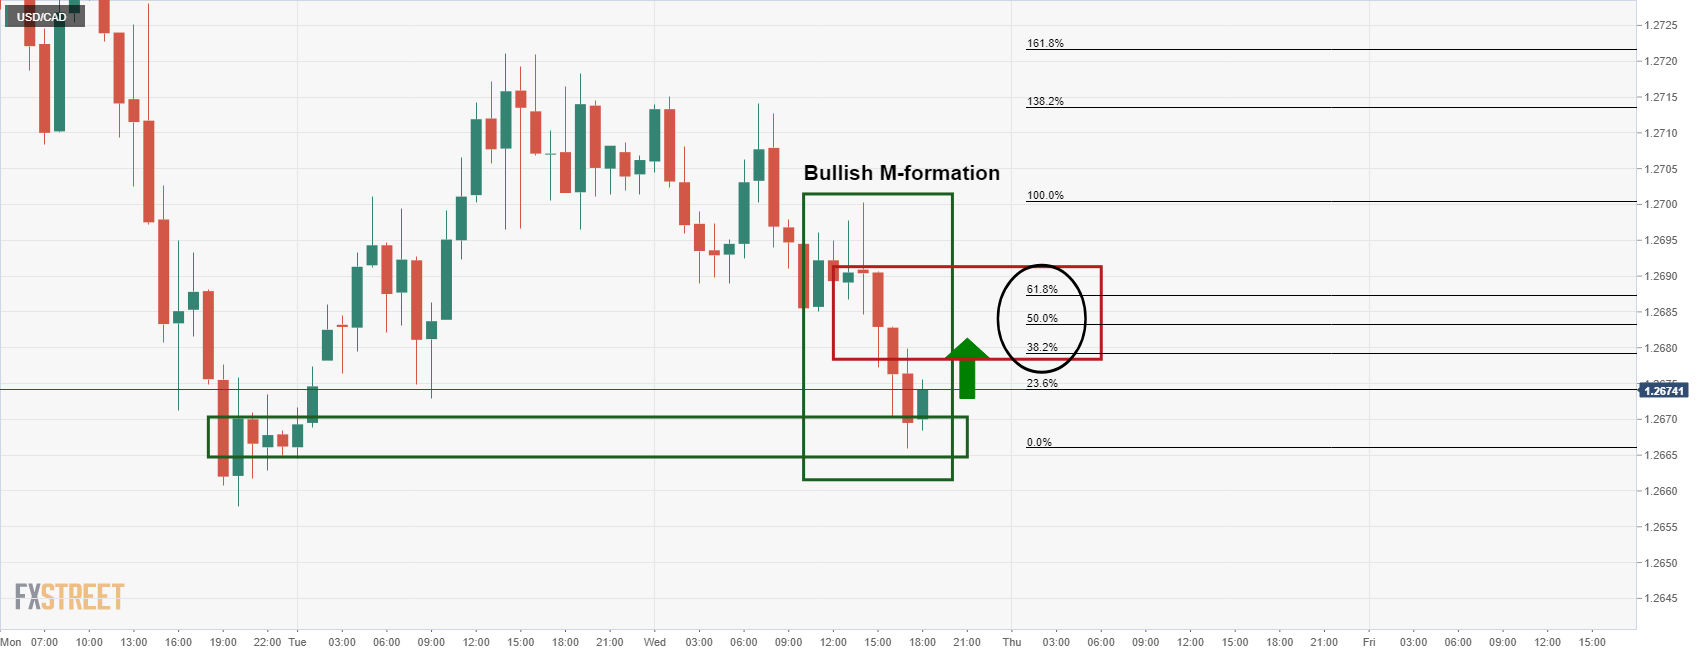
The bulls are moving in as profits are taken off the table before the close of the North America session as traders will be keen to be square in the run-up to the critical US Consumer Price Index event in Thursday's morning New York trade. This raises prospects of a correction into the neckline of the M-formation where bulls can target the 1.2680's, namely the 38.2%, 50% and 61.8% ratios.
USD/CAD daily chart
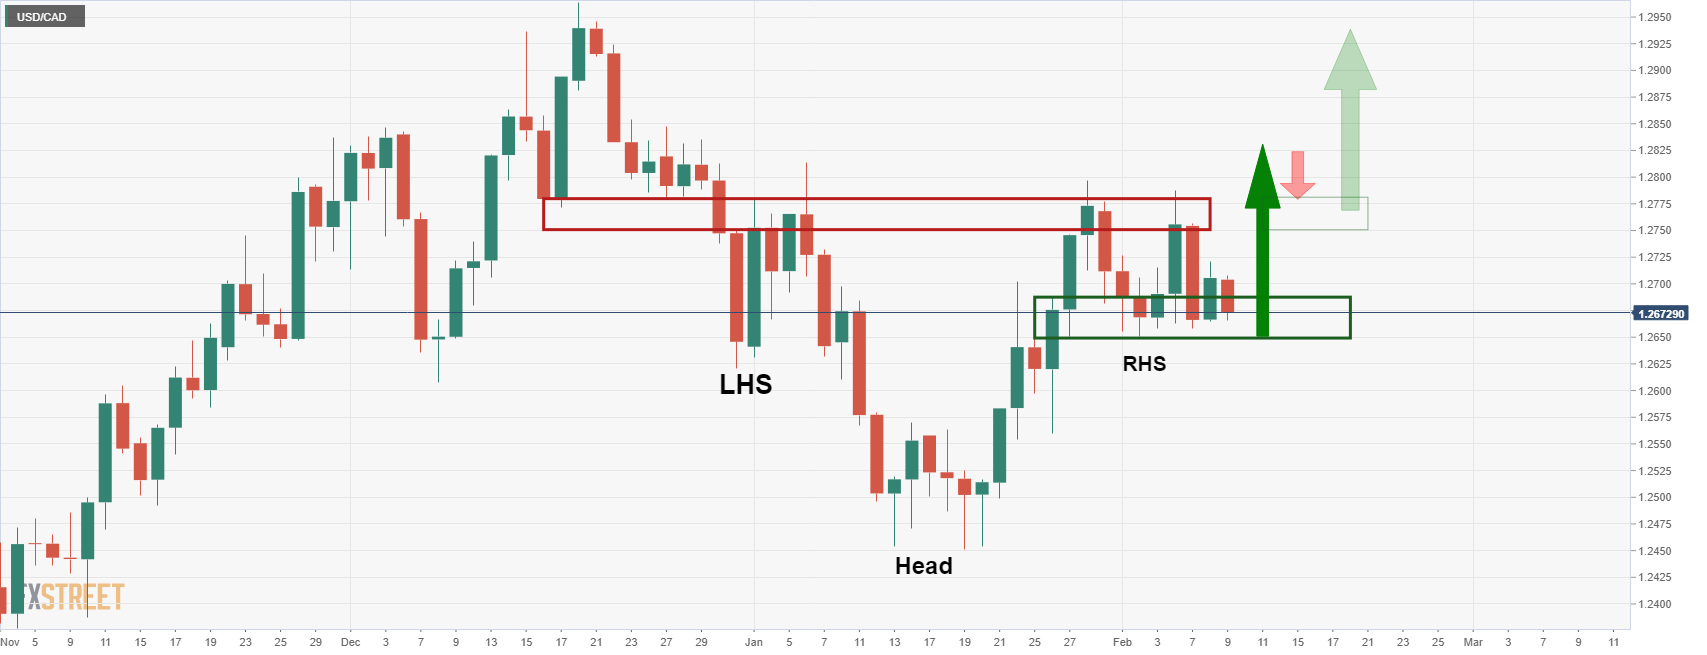
Meanwhile, as per the prior analysis, USD/CAD Price Analysis: Bulls failed to break out, but Inverse H&S could now be the ticket, there is the case for the upside given the inverse H&S.
Therefore, it will be imperative that the shorter-term time frame support structures hold up under the current pressure. Today's lows could be important in this regard. 1.2610 will be the last defence otherwise.
- The GBP/USD is flat in a subdued session as investors prepare for the US inflation report.
- Risk-sensitive currencies rise, while the greenback drops 0.13% against its peers.
- GBP/USD Technical Outlook: Neutral biased unless GBP bulls reclaim the 200-DMA at 1.3700.
The British pound remains subdued on Wednesday during the New York session, so far up 0.02% in the day. At the time of writing, the GBP/USD is trading at 1.3539. Financial markets mood is positive, as European equity indices finished in the green. Across the pond, US equity indices led by the heavy tech Nasdaq Composite record gains between 0.74% and 1.47%.
In the FX complex, risk-sensitive currencies led by the antipodeans and the CAD rise, followed by the EUR and safe-haven peers. The greenback extends its losses during the day, with the US Dollar Index (DXY), a gauge of the buck’s value against a basket of six currencies, losses 0.13%, down at 95.51.
In the bond market, US Treasury yields recede from weekly highs. In the case of the 10-year T-note yield, it retraces after reaching 1.97%, a level last seen in 2019. The 10-year T-note is at 1.922% at press time, down three basis points in the session as market participants get ready for Thursday’s release of US inflation figures.
A light US economic docket left GBP/USD traders adrift to Fed speaking and market sentiment. At press time, Cleveland’s Fed President Loretta Mester (voter 2022) said that she “expects inflation will moderate but would remain above 2% this year and next.” Worth noting that Mester supports a rate increase in March, followed by future rate hikes, which the economy will guide.
GBP/USD Price Forecast: Technical outlook
The GBP/USD is neutral biased, regardless of trading above the 50 and the 100-day moving average (DMAs) lying at 1.3448 and 1.3505, each. However, the presence of the 200-DMA at 1.3702 keeps GBP/USD bears in charge unless a challenge to the abovementioned level is launched.
Upwards, the GBP/USD resistance levels would be the 1.3600 figure, followed by February’s three high at .13622, and then the five-month-old downslope trendline that passes near the 200-DMA at 1.3700.
Contrarily, the GBP/USD first support would be the 100-DMA at 1.3505. Breach of the latter would expose the 50-DMA at 1.3448 and then the 1.3400 figure.
Loretta J. Mester, president and CEO of the Federal Reserve Bank of Cleveland, is crossing the wires and has stated that there's a strong case to start reducing accommodation and she supports rate increase in March.
Key comments
Says future rate increases will be guided by the economy.
Says if inflation is not coming down by the middle of the year then the Fed will need to remove accommodation at a faster pace.
Says her view is the fed can move considerably faster to shrink balance sheet than it has in the past
Says fed will be careful with balance sheet plan to not disrupt financial markets.
Says having inflation be under control is going to help the fed sustain the expansion.
Says she doesn't see a compelling case to start with a 50 bp rate increase.
Says that is something the committee is going to have to talk about and decide.
Says each meeting is going to be in play.
Mester says she suspects the fed will need to get interest rates above neutral but doesn't see an immediate need to do that.
Says the balance sheet is not the Fed's primary policy tool.
Says she expects the fed will set the balance sheet on a path to reduce it and use the Fed funds rate as the main policy tool.
Says as balance sheet runs down that will remove some accommodation.
Sales of MBS would need to be done carefully to not disrupt the markets.
Says Fed is still talking about what the actual balance sheet plan would look like.
Says Fed would not necessarily sell mortgage-backed securities from the start.
Says active sales would come later.
Says it's important the fed return to a primary treasury portfolio.
Says with the economy doing well it's time to start reducing the balance sheet.
Says her view on bond sales might change as time goes on.
US dollar on the backfoot
The US dollar is on the backfoot in New York trade as measured by the DXY index against a basket of currencies. It is losing some 0.23% at the time of writing.
The Bank of Canada's governor, Tiff Macklem, is speaking live to the Canadian chamber of commerce. The global supply chain problems may have peaked, he states, for which he blames for higher inflation. He says, however, that Canadians should expect a rising path of interest rates.
Key comments
Covid recovery phase is chance to make long overdue gains in Canadian productivity.
Productivity growth is vital to economic growth, increasing wages without raising unit labour costs.
US capital has moved to higher-productivity sectors in larger amounts than in Canada, ‘has been more nimble’.
Expect that business investment will grow faster in Canada than in US.
Some evidence global supply chain problems may have peaked.
- Eyes on USD/CAD as BOC Governor Macklem responds to questions on economy
Watch live: BoC governor Macklem
Macklem speaks live to the Canadian chamber of commerce.
USD/CAD technical update
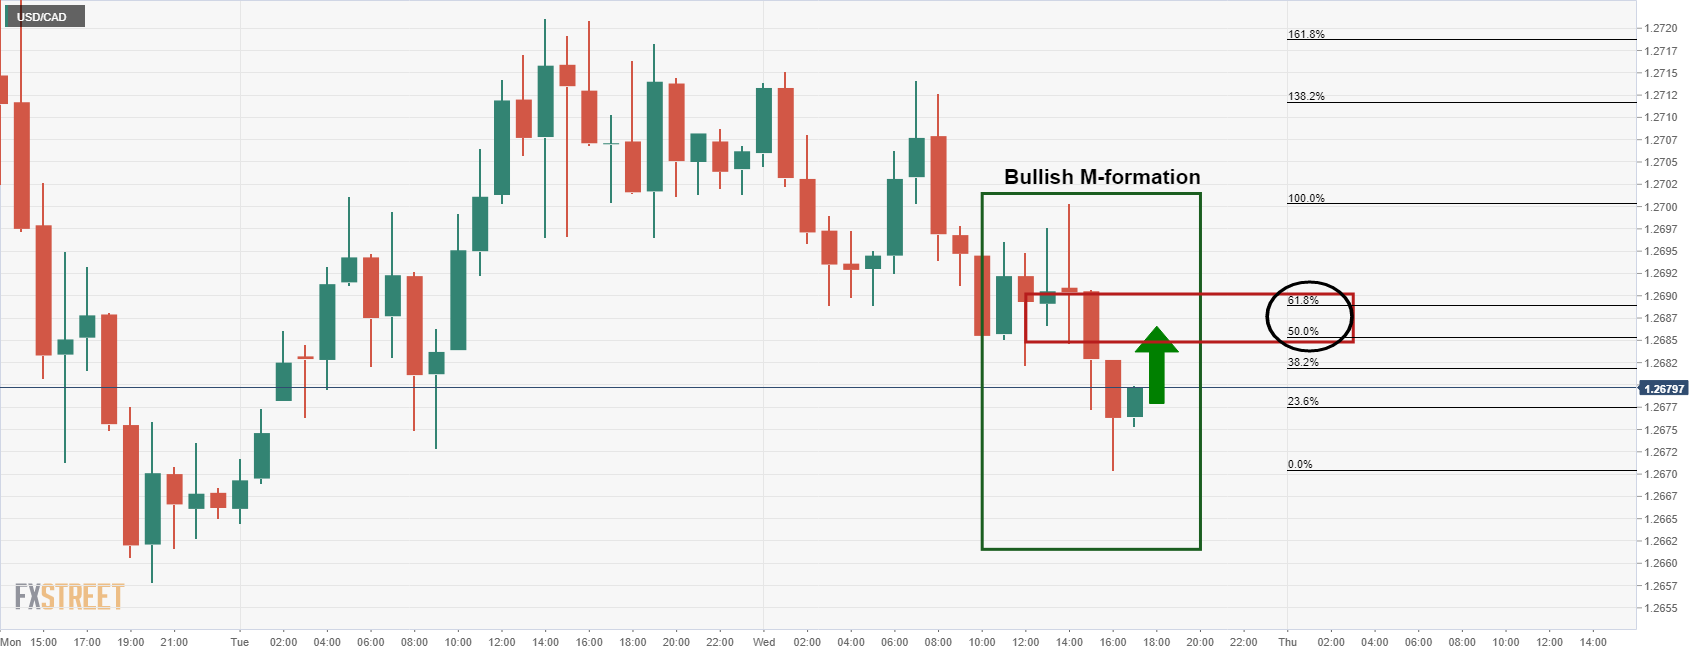
The price of USD/CAD is in an hourly corrective phase as the US dollar firms in the New York mid-day session. The M-formation is a bullish reversion pattern where the price has a high probability of moving in on the neckline of the formation. In this case, the 50% mean reversion target is located near 1.2680.
- Broad US dollar weakness across the board weighed on the USD/JPY pair.
- Falling US Treasury yields and demand for riskier assets keep the USD/JPY subdued.
- USD/JPY Technical Outlook: Remains upward biased ahead of the US CPI for January.
On Wednesday, the USD/JPY retreats from weekly highs ahead of the release of US inflation figures, alongside the slip of US Treasury yields. At the time of writing, the USD/JPY is trading at 115.44, down 0.08%.
Financial markets mood is positive, as shown by European and US equity indices printing gains. The US 10-year Treasury yield is dipping three basis points, to sit at 1.925%, while the US Dollar Index drops 0.20%, currently at 95.44.
USD/JPY Price Forecast: Technical outlook
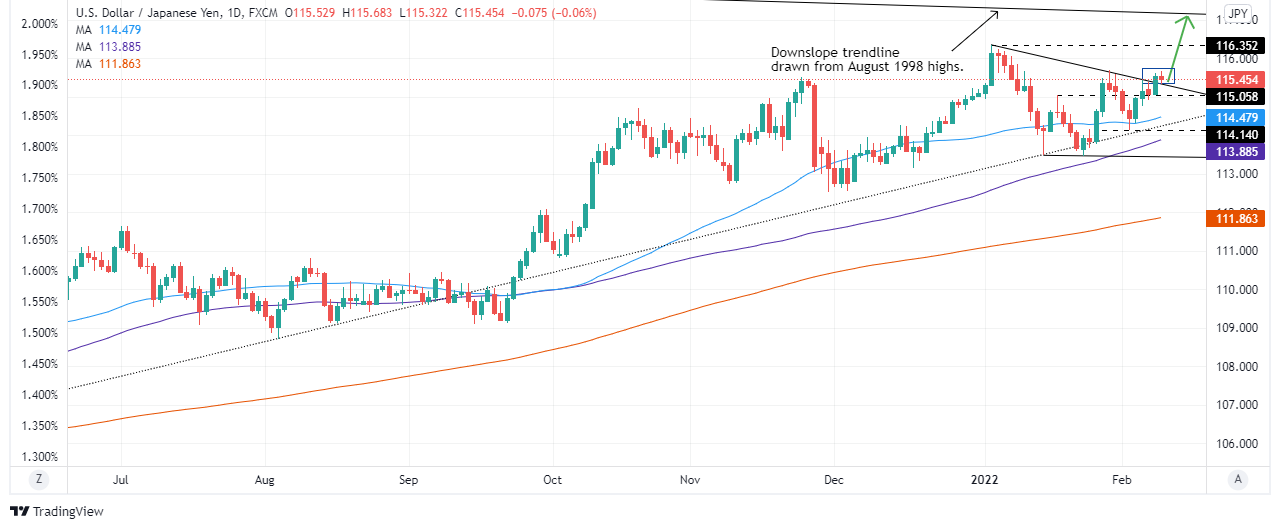
In the overnight session for North American traders, the pair reached a daily high at 115.68, followed by a drop to the downslope one-month-old resistance/support trendline that passes around the 115.25-35 area. Even though the USD/JPY retreated to the abovementioned trendline, the pair remained above it, confirming the upward bias.
That said, the USD/JPY first resistance would be 116.00. Breach of the latter could pave the way for further gains and expose a 24-year-old downslope trendline drawn from August 1998, swing highs that pass around 117.00. An upward break would expose the January 2017 swing high at 118.61.
- EUR/USD manages to remain above 1.1400, with a modest bullish bias.
- US dollar weaker amid a retreat in yields and risk appetite.
The EUR/USD is moving sideways between 1.1425 and 1.1445 on Wednesday with a bullish bias, on the back of a weaker greenback across the board and amid tightening expectations from the European Central Bank.
DXY and yields down, stock up
The US Dollar Index (DXY) is falling 0.20% on Wednesday affected by the decline in US yields that moved away of multi-month highs. The US 10-year stands at 1.92% and the 30-year at 2.22%. Also higher equity prices weigh on the dollar. In Wall Street the Dow Jones again 0.82% and the Nasdaq 1.53%.
Market participants await Thursday US CPI reading. The index is expected to have climbed in January to 7.3% (annual rate). The numbers will likely influence on market expectations about the Federal Reserve’s policy.
The EUR/USD is up more than 150 pips from the level it had a week ago on the back of a change in tightening expectation from the ECB. The rally found resistance at the January top at 1.1480/85. The mentioned area continues to be a key level that if broken would clear the way for 1.1500 and more.
In the very short-term while above 1.1425, the intraday bullish bias is likely to remain in place. A slide below would expose again 1.1400. The next support below stands at 1.1370/80, the last defense to the current positive short-term outlook for the euro.
Technical levels
- On Wednesday, XAG/USD failed to capitalize on broad US dollar weakness across the board.
- US inflation report looms as financial assets begin to trade in narrow ranges.
- XAG/USD Technical Outlook: Neutral-upward biased that would need the confirmation of a daily close above the 100-DMA.
Silver (XAG/USD) faces strong resistance around the 100-DMA at $23.20, snapping three days of gains, barely dropping 0.04% in the New York session. At the time of writing is trading at $23.15. The market mood in the financial markets, ahead of Thursday’s US inflation report, is optimistic.
Meanwhile, US Treasury yields slid some after reaching new YTD highs led by the US 10-year T-note, down three basis points, sitting at 1.94%. At the same time, US 10-year TIPS yield, a proxy for real yields, which correlate4 inversely with precious metal prices, dips to -0.495%. It is worth noting that despite the fall in nominal and real yields, XAG/USD has been unable to capitalize, probably due to profit-taking, ahead of a volatile Thursday.
A light US economic docket would only feature Fed speakers throughout the day. Federal Reserve Governor Michell Bowman and Cleveland’s Fed President Loretta Mester would cross the wires at 15:30 GMT and 17:00 GMT, respectively. Both policymakers could shed light ahead of January’s Consumer Price Index (CPI) release.
Analysts at TD securities expect inflation to “slow significantly in 2022, and fiscal stimulus fades and supply constraints ease, but for now, the data remain strong.” TD analysts’ estimates for January’s inflation are headline CPI at 7.2%, while core CPI at 5.8%.
Furthermore, noted that “For headline CPI, we forecast 2.9% y/y in 22Q4, down from 6.7% y/y in 21Q4. For core CPI, we forecast 3.0% y/y in 22Q4, down from 5.0% y/y in 21Q4. For the core PCE index, we forecast 2.5% y/y in 22Q4, down from 4.6% y/y in 21Q4.”
XAG/USD Price Forecast: Technical outlook
Silver is neutral-upward biased, but failure at the 100-DMA at $23.20 could exert downward pressure on the non-yielding metal.
That said, XAG/USD’s first support would be $23.00. Breach of the latter exposes the 50-DMA at $22.82, followed by a two-month-old upslope trendline that passes around the $22.65-75 area, which once broken, can challenge January 28 swing low at $22.15.
- Crude oil stocks tumble unexpectedly last week by 4.756M barrels.
- Crude oil price rise after inventory data, WTI hits fresh daily highs above $89.00.
Commercial crude oil inventories in the US dropped by 4.756 million barrels in the week ending February 5, a weekly report published by the US Energy Information Administration (EIA) revealed on Wednesday. Market consensus pointed to an increase in crude oil stocks.
Distillate stocks saw a smaller than expected decline of 929K barrels (forecasts were for a 1.7M barrel build). Gasoline stocks also dropped unexpectedly by 1.644M against market consensus of a 1.623M increase.
Market Reaction
WTI rose after the report hitting fresh daily highs above $89.00.
Isabel Schnabel, member of the Executive Board of the European Central Bank (ECB), mentioned during a Twitter session of Q&A that rising interest rates would not lower energy prices. She added that if current inflation “threatens to lead to a de-anchoring of inflation expectations, we may still need to respond”. According to her, inflation will remain high for longer than anticipated.
Additional takeaways:
“Asset purchases under the PEPP are guided by the ECB’s capital key. In the event of renewed market fragmentation related to the pandemic, PEPP reinvestments can be adjusted flexibly across time, asset classes and jurisdictions at any time.”
“Raising rates would not lower energy prices. But if high current inflation threatens to lead to a de-anchoring of inflation expectations, we may still need to respond, as our mandate is to preserve price stability.”
“Inflation will remain high for longer than anticipated. There is a risk that inflation continues to rise in the near term but it is likely to gradually decline towards the end of this year. There remains high uncertainty around the inflation outlook.”
- USD/TRY extends further its consolidation theme near 13.60.
- Turkey 10y bond yields drop further and approach 21%.
- Turkey Unemployment Rate next on tap on Thursday.
USD/TRY navigates a narrow range around the usual 13.50/60 band on Wednesday.
USD/TRY stays range bound, looks to CBRT
USD/TRY remains side-lined around the familiar 13.50/60 region for yet another session on Wednesday, extending the muted price action that kicked in in mid-January.
In the meantime, the lira appears vigilant and follows the recent developments from a series of meetings between finmin N.Nebati with investors in London.
Nebati outlined Ankara’s plans for a stable currency amidst an economic programme based on low borrowing rates (?), prevent further dollarization of the economy and bring inflation to single digits by mid-2023.
The Turkish finmin also said the government is expected to announce a scheme to motivate households to convert holdings of gold into the domestic currency.
What to look for around TRY
The pair keeps its multi-week consolidative theme well in place, always within the 13.00-14.00 range. While skepticism keeps running high over the effectiveness of the ongoing scheme to promote the de-dollarization of the economy – thus supporting the inflows into the lira - the reluctance of the CBRT to change the (collision?) course and the omnipresent political pressure to favour lower interest rates in the current context of rampant inflation and (very) negative real interest rates are a sure recipe to keep the domestic currency under pressure for the time being.
Key events in Turkey this week: Unemployment Rate (Thursday) - End Year CPI Forecast, Current Account, Industrial Production, Retail Sales (Friday).
Eminent issues on the back boiler: Progress (or lack of it) of the government’s new scheme oriented to support the lira via protected time deposits. Constant government pressure on the CBRT vs. bank’s credibility/independence. Bouts of geopolitical concerns. Much-needed structural reforms. Growth outlook vs. progress of the coronavirus pandemic. Earlier Presidential/Parliamentary elections?
USD/TRY key levels
So far, the pair is advancing 0.26% at 13.5825 and a drop below 13.3494 (55-day SMA) would expose 13.2327 (monthly low Feb.1) and finally 12.7523 (2022 low Jan.3). On the other hand, the next up barrier lines up at 13.9319 (2022 high Jan.10) followed by 18.2582 (all-time high Dec.20) and then 19.0000 (round level).
- The Australian dollar dominates the week vs. the greenback, reaffirming its neutral-upward bias.
- The economic docket would feature Fed speakers in the day as traders get ready for US CPI.
- AUD/USD Technical Outlook: The pair is neutral biased unless it reclaims the 100-DMA at 0.7248.
The AUD/USD print gains for the third straight day, so far up 1.5% in the week as market players prepare for Thursday’s US inflation figures. At the time of writing, the AUD/USD is trading at 0.7185.
Wednesday’s economic docket is light, except for Fed speakers Michelle Bowman and Loretta Mester, leaving AUD/USD’s traders adrift of market sentiment plays or positioning ahead of new financial data. On Thursday, January’s US Consumer Price Index (CPI) is foreseen at 7.3%. The so-called Core CPI, excluding volatile items like food and energy, is estimated at 5.9%, both readings annually based.
During the week, John Edwards, a former Reserve Bank of Australia (RBA) member, said that the RBA could raise rates four times in quick succession late in 2022. The last week, RBA Governor Philip Lowe “conceded” that tightening of monetary policy was a “plausible scenario.” Nevertheless, he emphasized, as noted in the Statement of Monetary Policy as well and in the press conference, that the beard is prepared to be “patient.”
Earlier in the Asian session, the Australian economic docket featured the Westpac Consumer Confidence Index for February at 100.2, lower than the 102.2 reported in January. On Thursday, Building Permits for December is estimated to increase by 8.2%.
AUD/USD Price Forecast: Technical outlook
The AUD/USD is neutral biased, as shown by the daily moving averages (DMAs). At press time, the AUD/USD is trading above the 50-DMA, which sits at 0.7163, but seems far from the 100-DMA at 0.7248, which intersects with a three-month-old downslope trendline around that area.
However, a daily close above the 50-DMA would expose 0.7200 as the following resistance level. Once that gives way, then and only then, AUD bulls would challenge the 100-DMA. A breach of the latter would expose the January 13 daily high 8-pips short of the 0.7300 figure.
EUR/GBP holds a base and a bullish “reversal week”. Analysts at Credit Suisse view the setback as temporary ahead of further strength to the 200-day moving average (DMA) at 0.8515.
Key support seen at 0.8362
“With a base and a large bullish ‘reversal week’ established following the successful defense of key long-term support at 0.8281/17, this is seen as a temporary pullback for now ahead of a fresh move higher to retest 0.8471/80. Beyond here can then clear the way for a test of what we expect to be tougher resistance at the 200-DMA at 0.8512/15, with a cap expected here at first.
“Support is seen at the 0.8412/04 initially, then 0.8394, with 0.8362 ideally holding to see an immediate upside bias maintained.”
EUR/USD continues to trade in a narrow 1.1400-1.1450 channel. Analysts at Scotiabank spot a technical pattern that could imply a move towards the 1.16 level.
Support past 1.1400/90 is 1.1370
“EUR price action is forming a bullish flag pattern that could see it break out toward a test of 1.16.”
“Resistance past the mid-figure zone is 1.1484 followed by 1.1515/25 (the lows of Oct/Nov).”
“Support past 1.1400/90 is 1.1370, the mid-1.13s, and the 50-day MA at 1.1324.”
USD/CAD trades modestly lower below the 1.27 level. The pair remains out of reach of key support at 1.2650 – removal of which would open up 1.26, economists at Scotiabank report.
Key resistance seen at 1.28
“A break under 1.2650 should see spot push back to the 1.25 area.”
“Resistance is 1.2720/30 and (key) 1.2800.”
EUR/CHF maintains its base above 1.0514. Analysts at Credit Suisse view the pullback from 1.0621/26 – the 38.2% retracement of its entire 2021/2022 fall – as temporary ahead of a test of its 200-day moving average (DMA) at 1.0699.
Support at 1.0494 to hold for strength back to 1.0699
“With a base in place above the 1.0514 January high, which itself is on the back of loss of momentum ahead of long-term support at 1.0254/35, this is seen as a temporary setback.”
“Above 1.0574 should clear the way for a retest of 1.0621/26. With weekly MACD momentum also having turned higher though, we look for a break above here in due course for a move to test the 200-DMA, currently placed at 1.0699.”
“Support is seen at 1.0538 initially, then the ‘neckline’ to the base at 1.0514/11 with support at 1.0494 ideally holding.”
- EUR/USD reverses two sessions in a row with losses.
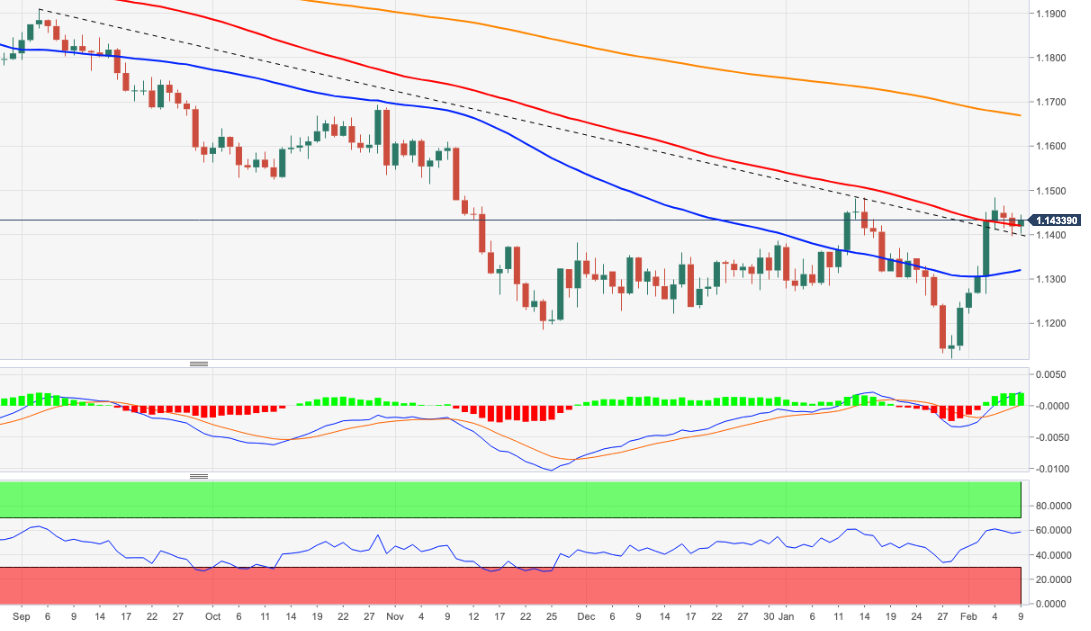
- The 5-month support line holds the downside near 1.1400.
EUR/USD regains the smile and returns to the positive territory near 1.1440 on Wednesday.
In the meantime, further gains in the pair remains on the table while above the 5-month line in the 1.1400 neighbourhood. Beyond this area, EUR/USD should be able to attempt another visit to the 2022 high at 1.14834 (February 4) just ahead of the 200-week SMA, today at 1.1496. Between 1.1500 and 1.1600 there are no resistance levels of note, leaving the October 2021 top at 1.1692 as a potential longer-term target.
In the longer run, the negative outlook remains in place while below the key 200-day SMA at 1.1667.
EUR/USD daily chart
- USD/CAD struggled to capitalize on the overnight gains amid modest USD weakness.
- Retreating US bond yields turned out to be a key factor that weighed on the buck.
- A softer tone around oil prices undermined the loonie and helped limit deeper losses.
The USD/CAD pair remained on the defensive through the early North American session and was last seen trading with modest intraday losses, just below the 1.2700 mark.
A sharp pullback in the US Treasury bond yields, along with the risk-on impulse prompted some selling around the safe-haven US dollar. This, in turn, failed to assist the USD/CAD pair to capitalize on the overnight bounce from the 1.2450 support area. The downside, however, remains cushioned in the wake of a fresh leg down in crude oil prices, which tend to undermine the commodity-linked loonie.
Apart from this, expectations that the Fed would adopt a more aggressive policy response to contain stubbornly high inflation acted as a tailwind for the greenback and the USD/CAD pair. In fact, the markets have been pricing in the possibility of a 50 bps Fed rate hike move in March. Hence, the focus will remain glued to the release of the latest US consumer inflation figures on Thursday.
On the other hand, the Canadian dollar was pressured by softer crude oil prices. Traders opted to lighten their bullish bets around the commodity amid expectations that the revival of the 2015 nuclear deal could return more than 1 million barrels per day of Iranian oil in the markets. This, in turn, was seen as another factor that should extend support to the USD/CAD pair and limit losses.
In the absence of any major market-moving economic releases, the US bond yields will drive the USD demand. Traders will further take cues from the official report on the US crude inventories by Energy Information Administration, which will influence oil price dynamics. This, along with the Bank of Canada Governor Tiff Macklem's speech should provide some impetus to the USD/CAD pair.
Technical levels to watch
"Financial markets have come to expect a lot of guidance from central banks on where rates are heading," Bank of England Chief Economist Huw Pill said on Wednesday, as reported by Reuters.
"As we move back to a more normal monetary policy situation, it's natural for central banks to withdraw from detailed guidance," Pill added. "I am not going to give any specific view of what the yield curve should look like. It does not make sense to pre-empt market pricing judgements."
Market reaction
GBP/USD continues to trade in the positive territory above 1.3570 following these comments.
Atlanta Federal Reserve President Raphael Bostic told CNBC on Wednesday he is hopeful that they will start to see a decline in inflation, as reported by Reuters.
Additional takeaways
"Projecting 3% PCE inflation for the year."
"Leaning toward the need for a fourth interest rate increase in 2022."
"Would like to see the balance sheet reduced pretty significantly and for reductions to start soon."
"Fed decisions and signals sent this year will go a long way to address inflation."
"Thinking only about 25 bps hikes right now though, all options on the table."
"Seeing US growth comfortably through 2022 and 2023; much would have to happen for Fed policy to constrain growth."
Market reaction
The US Dollar Index stays under modest bearish pressure following these comments and was last seen losing 0.15% on the day at 95.48.
USD/JPY remains on the defensive on Wednesday. But in the view of analysts at Credit Suisse, a break above 115.69 should confirm the completion of a bullish continuation pattern for a resumption of the core uptrend back to 116.35/70.
Above 115.69 should see the sideways range resolved higher
“Key near-term resistance stays seen at the recent high at 115.69, above which can see a bullish continuation pattern complete to turn the trend higher again for a retest of the high and long-term downtrend from April 1990 at 116.35/70. Whilst a fresh rejection from here should be allowed for, we continue to look for an eventual clear break, with resistance seen next at 118.61/66.”
“Support is seen at 115.23 initially, with the 13-day ema and price support at 115.05/114.92 now ideally holding to keep the immediate risk higher. Below can see a retreat back to the 55-day average at 114.46/42.”
Bank of England Chief Economist Huw Pill said on Wednesday that a case can be made for a measured rather than an activist approach to policy decisions, as reported by Reuters.
Additional takeaways
"Must focus on more persistent developments in the data that have lasting implications for the outlook for price stability."
That is what I would label a ‘steady handed’ approach to monetary policy."
"Since September, BOE has consistent, measured and resolute set of actions intended to rebalance the stance of monetary policy and address the inflationary pressures."
"We have signalled that more is to come in the coming months if the path sketched out in our February forecast plays out."
"Equally we have flagged that the outlook for bank rate beyond the coming months is uncertain, reflecting the two-sided risks to inflation."
"Decision to vote for 25 bp hike rather than 50 bp decision was finely balanced for me as an individual voter on the MPC."
"I am sceptical of efforts to return bank rate quickly to some pre-defined neutral level or terminal rate."
"Such an approach risks increasing inflation and output volatility if the policy is miscalibrated."
"Better to adopt a more measured and data-dependent approach, which learns from how the economy responds to each step taken rather than pre-commits to a concept surrounded by uncertainty."
"Unusually large policy steps may validate a market narrative that bank policy is either foot-to-the-floor on the accelerator or foot-to-the-floor with the brake."
"I would certainly not wish to rule out changes in bank rate of more than the usual 25bp in all circumstances."
"Given the inflationary pressures we currently face, I can certainly understand why colleagues on the MPC voted for a 50bp hike last week."
"Restricting ourselves to a 25bp now – albeit with the prospect of more to come in the coming months – is an investment in containing market expectations of aggressive activism."
Market reaction
The GBP/USD pair edged slightly lower from session highs after these comments and was last seen trading at 1.3565, where it was up 0.18% on a daily basis.
EUR/JPY extends its high-level consolidation following the rally to the 78.6% retracement of the Q4 2021 fall at 132.18. This stays seen as a temporary breather ahead of further strength to the top of the eight-month downtrend channel from June last year at 132.92/98, in the view of analysts at Credit Suisse.
Support is seen at 130.50
“EUR/JPY is seeing a high-level pause following its strong move higher. This stays seen as a temporary pause only following the break above its downtrend from last October and more importantly its January highs.
“We continue to look for a clear break above 132.18 in due course to see strength extend to 132.58 next ahead of what we expect to be tougher resistance at the top of the eight-month downtrend channel from June last year at 132.92/98. We expect this to remain a tougher barrier.”
“Support stays seen at 131.47/44 initially, then 131.21 ahead of the back of the broken uptrend at 130.83. An immediate upside bias though should be maintained whilst above the recent reaction low and 200-day average at 130.50.”
Long-term interest rates have been low since the subprime crisis. Analysts at Natixis look at the three mechanisms that keep long-term interest rates low.
Why are long-term interest rates low?
“Risky asset prices are very high, which reinforces the need to buy risk-free bonds to stabilise the level of portfolio risk.”
“Investors are buying more and more illiquid assets, which they can offset by also holding more liquid government bonds.”
“As public debt ratios are high, there is strong pressure on central banks not to allow long-term interest rates to rise, which is what investors expect.”
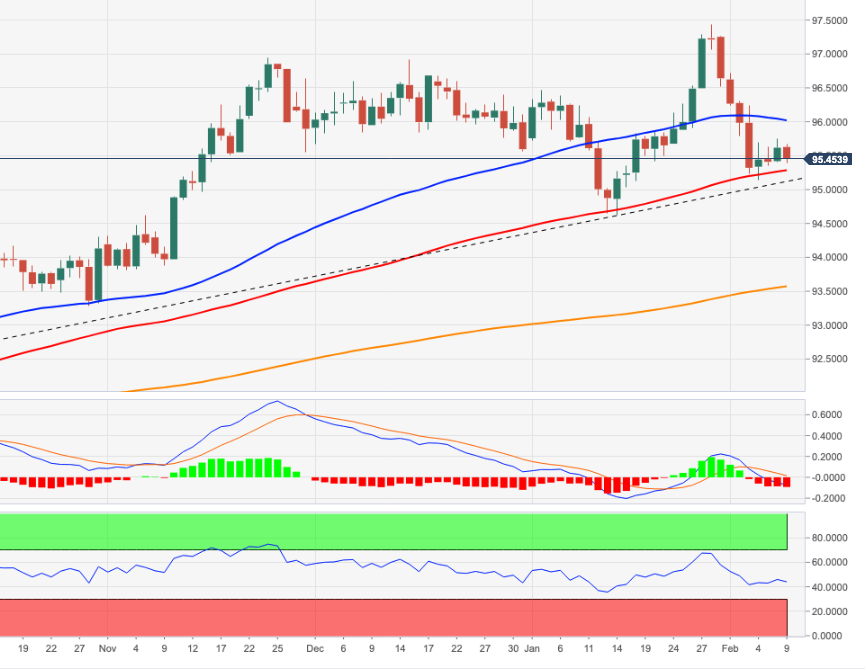
- DXY comes under downside pressure near 95.40 on Wednesday.
- Below 95.13 comes the YTD low near 94.60.
DXY fades Tuesday’s uptick and resumes the downside, dropping as low as the 95.30 region so far midweek.
The inability of the index to garner convincing upside traction, ideally in the short term, could prompt sellers to return to the market. That scenario should force the dollar to initially retest the so far monthly low at 95.13 (February 4) ahead of the 2022 low at 94.62 (January 14).
In the near term, the 5-month line in the 95.10/15 band is expected to hold the downside for the time being. Looking at the broader picture, the longer-term positive stance in the dollar remains unchanged above the 200-day SMA at 93.54.
DXY daily chart
- GBP/USD gained strong positive traction on Wednesday and shot to a fresh weekly high.
- Retreating US bond yields undermined the USD and remained supportive of the move.
- Traders might be reluctant to place aggressive bullish bets ahead of the US CPI report.
The GBP/USD pair maintained its strong bid tone heading into the North American session and was last seen trading near the weekly high, just below the 1.3600 mark.
Following the two-way/directionless price moves witnessed over the past two trading sessions, the GBP/USD pair caught fresh bids on Wednesday and was supported by modest US dollar weakness. A sharp pullback in the US Treasury bond yields, along with the risk-on impulse turned out to be key factors that undermined the safe-haven greenback.
Apart from this, the intraday positive move could further be attributed to some technical buying above the 1.3550-1.3555 horizontal resistance. It, however, remains to be seen if bulls are able to capitalize on the upward trajectory or opt to lighten their bets ahead of the latest US consumer inflation figures, scheduled for release on Thursday.
It is worth recalling that the markets have been pricing in a more aggressive policy response by the Fed to combat stubbornly high inflation and anticipate a 50 bps rate hike in March. Hence, the US CPI report will play a key role in determining the Fed's policy outlook, which will influence the USD and provide a fresh directional impetus to the GBP/USD pair.
In the meantime, the US bond yields and the broader market risk sentiment will continue to play a key role in driving the USD demand. This, in turn, should provide some impetus to the GBP/USD pair and allow traders to grab some short-term opportunities amid absent relevant market-moving economic releases, either from the UK or the US.
Technical levels to watch
British Prime Minister Boris Johnson said on Wednesday that they will trigger Article 16 if the European Union doesn't show common sense on the Northern Ireland protocol, as reported by Reuters.
Commenting on the UK COVID situation, "Provided the current encouraging trends in the data continue, it is my expectation that we will be able to end the last remaining domestic restrictions, including the legal requirement to self-isolate if you test positive, a full month early," Johson said.
Market reaction
The GBP/USD pair clings to its daily gains following these comments and was last seen rising 0.25% on the day at 1.3575.
Economist at UOB Group Enrico Tanuwidjaja and Yari Mayaseti comment on the latest GDP figures in Indonesia.
Key Takeaways
“Indonesia’s economy expanded by 5.02% y/y in 4Q21, a notable increase from previous quarter which grew by 3.51% y/y and above the market consensus of 4.90%. Sequentially, Indonesia’s economy advanced by 1.06% q/q in 4Q21. Acceleration of the vaccination process and significantly lower COVID-19 cases have allowed for the economy to be reopened more durably during the Sep-Dec 2021 period, lifting growth above expectations. Overall, the economy grew 3.7% in 2021, higher than our forecast of 3.5%.”
“From the expenditure side, 4Q21 economic growth was well supported by the rise in government expenditure, investments as well as net exports of goods and service that grew by 33.00% q/q, 4.96% q/q and 3.90% q/q respectively. In terms of sectoral view, economic growth is mostly supported by 5 sectors that include manufacturing, agriculture, wholesale and retail, construction as well as mining and quarrying. Meanwhile, health and social services as well as transport and storage also expanded in 4Q21.”
“Higher than expected 4Q21 growth was also well reflected in the mobility indicator level that recently rose compared to the pre-pandemic level as well as the strengthening of Indonesia’s Purchasing Manager Index (PMI) that reached 53.5 in Dec 2021, a slight decline from 53.9 in Nov 2021.”
“Going forward, we believe that economic recovery will continue in 2022, as domestic demand (household and government consumption as well as investment demand) is likely to continue to expand respectably while contribution of exports is likely to remain strong, albeit more so in 1H22. On balance of all accounts, we are forecasting 2022 baseline growth forecast within a range of 4.7% to 5.3%.”
- NZD/USD gained traction for the third successive day and shot to a two-week high on Wednesday.
- The risk-on impulse in the markets was seen as a key factor that benefitted the perceived riskier kiwi.
- Retreating US bond yields undermined the USD and remained supportive of the ongoing move up.
The NZD/USD pair scaled higher through the mid-European session and shot to a two-week high, around the 0.6690 region in the last hour.
A combination of supporting factors assisted the NZD/USD pair to build on this week's positive move from the 0.6600 mark and gain traction for the third successive day on Wednesday. Moderation of the US Treasury bond yields prompted some US dollar selling. This, along with the risk-on impulse, further benefitted the perceived riskier kiwi and remained supportive of the momentum.
That said, growing market acceptance that the Fed will tighten its monetary policy at a faster pace than anticipated should act as a tailwind for the US bond yields and limit losses for the greenback. In fact, the market has been pricing in the possibility of a 50 bps rate hike by the US central bank in March amid worries about the persistent rise in inflationary pressures.
Hence, the market focus will remain glued to the release of the US CPI report on Thursday, which might determine the Fed's near-term policy outlook and influence the USD price dynamics. Heading into the key data risk, traders might refrain from placing aggressive bets, which, in turn, could cap the upside for the NZD/USD pair amid absent market-moving economic releases.
In the meantime, the US bond yields will continue to play a key role in driving the USD demand and provide some impetus to the NZD/USD pair. Apart from this, traders might take cues from the broader market risk sentiment to grab some short-term opportunities around the major.
Technical levels to watch
- EUR/JPY adds to Tuesday’s gains and approaches the YTD peak.
- Further upside now targets the mid-132.00s near term.
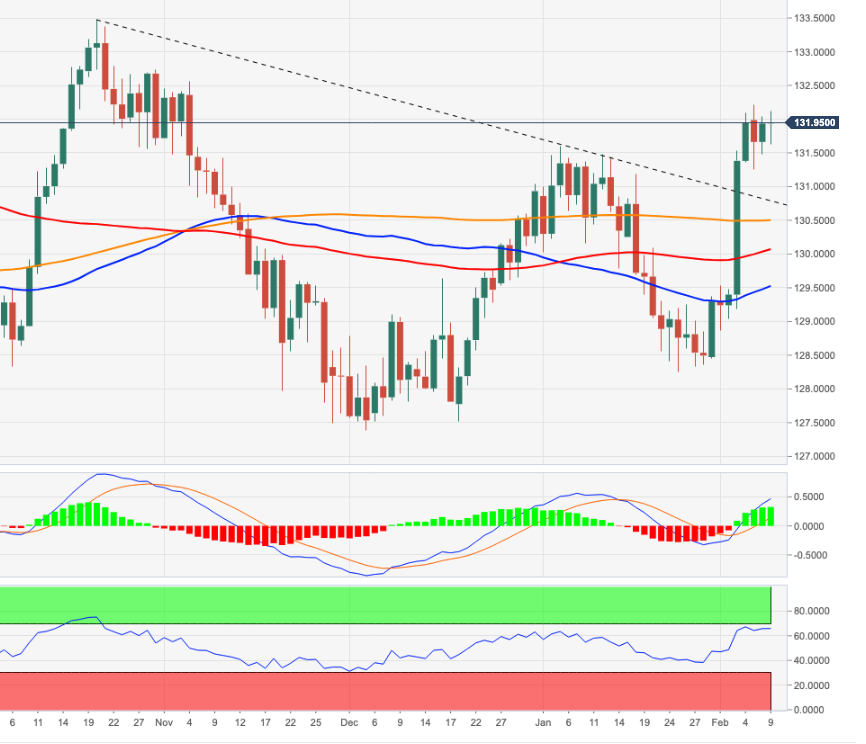
EUR/JPY extends the upside momentum further north of the 132.00 mark midweek, advancing for the second session in a row at the same time.
In light of the recent price action, further gains in the cross look likely in the short-term horizon. That said, the surpass of the YTD high at 132.16 (February 7) should open the door to 132.53 (high November 4) seconded by 132.91 (high October 29) and finally the October 2021 peak at 133.48 (October 20).
In the near term, further upside remains on the table while above the 3-month support line, today near 130.80. In the longer run, and while above the 200-day SMA at 130.46, the outlook for the cross is expected to remain constructive.
EUR/JPY daily chart
- Silver now seems to have entered a bullish consolidation phase near a two-week high.
- Bulls might wait for sustained move beyond the $23.45 area before placing fresh bets.
- Weakness below the $23.00 mark could attract some dip-buying and remain limited.
Silver was seen oscillating in a range around the $23.15-$23.30 region through the first half of the European session and consolidated its recent gains to a two-week high.
From a technical perspective, the XAG/USD, so far, has struggled to gain momentum beyond the 100-day SMA resistance. This is closely followed by the $23.40-$23.45 horizontal resistance, which should now act as a pivotal point for short-term traders.
Oscillators on the daily chart have just started moving into the positive territory, though lacked strong momentum. Hence, it will be prudent to wait for sustained strength beyond the aforementioned barrier before positioning for any further gains.
The XAG/USD could then accelerate the positive move and aim towards reclaiming the $24.00 round-figure mark. The momentum could further get extended and allow bulls to challenge the YTD high, around the $24.70 area touched on January 20.
On the flip side, the $23.00 mark now seems to protect the immediate downside ahead of the overnight swing low, around the $22.75 region and mid-$22.00s. Some follow-through selling would negate the positive bias and make the XAG/USD vulnerable.
The next relevant support is pegged near the $22.00 mark, which if broken decisively will shift the bias firmly in favour of bearish traders. This, in turn, should pave the way for a slide towards the double-bottom support, around the $21.40 zone.
Silver daily chart
-637799994239409405.png)
Levels to watch
In an interview with Die Zeit newspaper, European Central Bank's Governing Council and Bundesbank President Joachim Nagel said that he would advocate normalizing monetary policy if the inflation picture doesn't change by March, as reported by Reuters.
Additional takeaways
"Expecting German inflation to rise significantly above 4% in 2022."
"The economic costs of acting too late are significantly higher than acting early."
"First step would be to end bond purchases, then rates could already rise in 2022."
"Would support stronger rules for government debt in Europe, with fewer exemptions."
Market reaction
EUR/USD edged slightly higher on these comments and was last seen rising 0.15% on the day at 1.1432.
As economists at Citibank note, the Bank of Japan (BoJ) is one of the last bastions of central bank dovishness. Subsequently, the Japanese yen is set to depreciate against both the US dollar and the euro.
Japanese political considerations to place limits on the extent of yen weakness
“We do not expect BoJ to review its policy parameters (YCC and cash target) anytime soon and not until after Governor Kuroda’s term in the BoJ expires in April 2023. This should retain yen’s bias to weaken against both USD and EUR.”
“The Japanese still retain USD denominated assets but we also note the rising cost of FX funding for JPY-denominated investors buying US paper following the re-pricing of the FOMC outlook. This creates more of an incentive for JPY-denominated investors to take the FX risk when buying USD assets which could potentially add to the upward bias in USD/JPY (and EUR/JPY).”
“PM Kishida is known to be less keen on a weaker yen than his predecessors. And given the rising price of imported crude oil, the new PM may begin to sense some need for correcting JPY’s depreciation as one way to shore up longer-term support for his administration. But this would probably argue more for a limit to the extent of yen weakness (to the 118.00 area) than an outrightly stronger JPY.”
See: USD/JPY should trade at 117.50, bullish bias over the coming weeks – Credit Agricole
GBP/USD has been edging higher since finding support near 1.3500. As FXStreet’s Eren Sengezer notes, the pound eyes 1.3600 as the next bullish target.
Cable pierces near-term resistance at 1.3560
“GBP/USD is trading slightly above 1.3560, the Fibonacci 23.6% retracement level of the latest uptrend. If buyers manage to defend this level, the pair could push higher toward 1.3600 (psychological level) and 1.3620 (static level) afterwards.”
“On the downside, the 200-period SMA forms dynamic support at 1.3540 before 1.3520 (Fibonacci 38.2% retracement) and 1.3500 (psychological level, 50-period SMA, 100-period SMA, Fibonacci 50% retracement).”
USD/JPY trades with modest losses but the downside seems limited. Economists at Credit Agricole CIB Research believe the pair is still undervalued as it should trade around the 117.50 level.
Higher US-T yields and a steepening UST curve imply the USD should be stronger
“While higher UST yields and a steepening UST curve imply the USD should also be stronger, it continues to struggle even against the JPY. Indeed, USD/JPY is judged as undervalued relative to its short-term fundamentals and should be trading around 117.50."
“10Y JGB yields are trading above 0.20% and near the top of the BoJ's tolerance band for the yield's deviation from the central bank's 0% target. Some of the rise in JGB yields is due to the rise in global yields in general, but is also in part due to the market pricing in some chance of the BoJ adjusting its YCC and moving in 10Y JGB target to a shorter tenor such as the 5Y JGB yield."
See: USD/JPY to soar towards 120 on US T-bond yields rising above the key 2% mark – SocGen
- Gold price pauses as bulls take a breather ahead of the US inflation data.
- Treasury yields and risk sentiment remain the key drivers impacting gold price.
- Gold has room to rise amid inflation fears and bull cross.
Gold price is treading water on Wednesday while sitting at the highest levels in roughly two weeks near $1,830. The pullback in the US Treasury yields from two-and-a-half year highs fuelled a drop in the dollar across its main peers, limiting the retreat in gold price. The further upside, however, remains capped by the risk-on market mood, thanks to the Wall Street tech boost.
In absence of significant US macro data, gold price will continue to track the yields’ price action, as investors keep an eye on the Russia-Ukraine geopolitical developments. Cleveland Fed Chief Loretta Mester’s speech and 10-year Treasuries auction will be awaited as well for any fresh impulse on gold trading but the reaction could be limited ahead of Thursday’s all-important US inflation data,
Read: Gold prices surge ahead of key inflation data – What’s next?
Gold Price: Key levels to watch
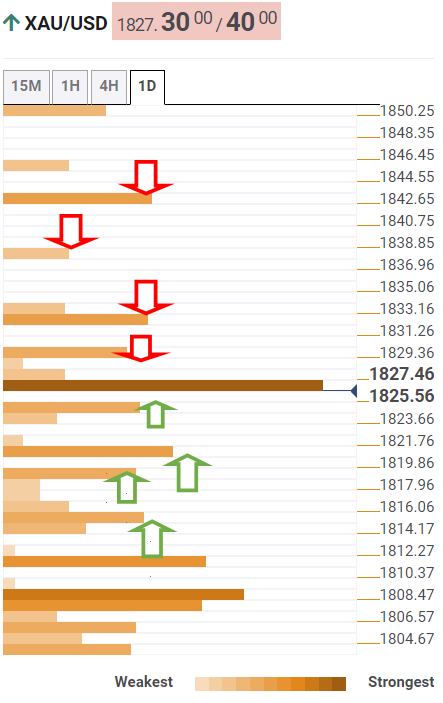
The Technical Confluences Detector shows that the gold price is yearning for acceptance above powerful resistance at $1,826, which is the convergence of the Fibonacci 23.6% one-day, Fibonacci 61.8% one-month and SMA5 four-hour.
The next bullish target is placed at the previous day’s high of $1,829, above which fresh buying opportunities will emerge towards $1,832, the confluence of the pivot point one-day R1 and pivot point one-week R2.
Further up, the pivot point one-day R2 at $1,837 will challenge the bearish commitments en-route $1,843, where the pivot point one-month R1 aligns.
On the flip side, immediate support is seen at the Fibonacci 38.2% one-day at $1,824, below which sellers will gear up for a test of $1,820.
That level is the point of intersection of the Fibonacci 61.8% one-day and pivot point one-week R1.
The additional declines will seek a test of a dense cluster of healthy support levels around $1,815, where the SMA200 four-hour, the previous week’s high and SMA5 one-day coincide.
Here is how it looks on the tool
About Technical Confluences Detector
The TCD (Technical Confluences Detector) is a tool to locate and point out those price levels where there is a congestion of indicators, moving averages, Fibonacci levels, Pivot Points, etc. If you are a short-term trader, you will find entry points for counter-trend strategies and hunt a few points at a time. If you are a medium-to-long-term trader, this tool will allow you to know in advance the price levels where a medium-to-long-term trend may stop and rest, where to unwind positions, or where to increase your position size.
UOB Group’s Senior Economist Julia Goh and Economist Loke Siew Ting review the latest labour market results in the Malaysian economy.
Key Takeaways
“Malaysia’s labour market conditions continued to improve for five months in a row in Dec 2021, with the unemployment rate inching lower to a 21-month low of 4.2% (from 4.3% in Nov), matching our year-end estimate. Both the labour force participation rate and hiring also breached a new record high at 69.0% (Nov: 68.9%) and 15.65m (Nov: 15.61m) respectively.”
“The record high employment was thanks to higher employment in services, manufacturing, and construction sectors. This fully cushioned the contractions in agriculture, and mining & quarrying sectors since Aug 2020.”
“We reiterate our view that Malaysia’s labour market recovery remains on track. However, the momentum of gains may soften in 2022. Our channel checks suggest ongoing challenges posed by the pandemic to businesses particularly related to rising costs amid a cautious outlook. Rising vaccination rates (including booster doses) and ongoing government policy support are key to underpin the labour market recovery. We maintain our end-2022 jobless rate forecast at 3.6%.”
- A combination of factors assisted AUD/USD to gain traction for the third successive day.
- The risk-on impulse benefitted the perceived riskier aussie amid modest USD weakness.
- The upside potential seems limited as investors await the key US CPI report on Thursday.
The AUD/USD pair maintained its bid tone through the first half of the European session and was last seen trading near a two-week high, around the 0.7165-0.7170 region.
The pair built on its positive move witnessed since the beginning of this week and gained follow-through traction for the third successive day on Wednesday. The risk-on impulse in the markets benefitted the perceived riskier aussie and remained supportive amid modest US dollar weakness.
A softer tone surrounding the US Treasury bond yields weighed on the USD. That said, rising bets for a 50 bps Fed rate hike in March should limit the downside for the US bond yields and the buck. This, in turn, warrants some caution before placing aggressive bullish bets around the AUD/USD pair.
Investors seem convinced that the Fed would adopt a more aggressive policy response to contain high inflation. Hence, the focus will remain on the US CPI report, due on Thursday, which will influence the near-term USD price dynamics and provide a fresh directional impetus to the AUD/USD pair.
In the meantime, the US bond yields would continue to play a key role in driving the USD demand amid absent relevant market moving economic releases. Apart from this, traders will take cues from the broader market risk sentiment to grab some short-term opportunities around the AUD/USD pair.
Technical levels to watch
- USD/CAD oscillated in a narrow trading band through the first half of the European session.
- Softer crude oil prices undermined the loonie and extended some support to the major.
- Modest USD weakness acted as a headwind and kept a lid on any meaningful gains.
The USD/CAD pair lacked any firm intraday direction and seesawed between tepid gains/minor losses, around the 1.2700 mark through the first half of the European session.
A combination of diverging forces failed to assist the USD/CAD pair to capitalize on the previous day's bounce from the 1.2450 area and led to subdued/range-bound price action on Wednesday. Expectations that the revival of an international nuclear agreement could return more than 1 million barrels per day of Iranian oil in the markets weighed on crude oil prices. This, in turn, undermined the commodity-linked loonie and acted as a tailwind for the major, though modest US dollar weakness capped the upside, at least for the time being.
A softer tone surrounding the US Treasury bond yields turned out to be a key factor that kept the USD bulls on the defensive. That said, speculations for a faster policy tightening by the Fed should limit the downside for the US bond yields. Investors seem convinced that the Fed would adopt a more aggressive policy response to combat stubbornly high inflation and have been pricing in the possibility of a 50 bps Fed rate hike in March. This supports prospects for the emergence of some USD dip-buying, which should extend support to the USD/CAD pair.
Bulls, however, seemed reluctant to place aggressive bets and preferred to wait on the sidelines ahead of the release of the latest US consumer inflation figures on Thursday. In the meantime, the US bond yields will continue to play a key role in influencing the USD amid absent relevant market moving economic releases. This, along with oil price dynamics, should provide some impetus to the USD/CAD pair and allow traders to grab short-term opportunities.
Technical levels to watch
Following the meeting of the “Weimar Triangle”, Germany's permanent representative to the European Union (EU) Sebastian Fischer tweeted out, citing that Germany, France and Poland urge Russia to de-escalate the tensions around the Ukrainian border.
Fischer tweeted: “Germany, France and Poland call on #Russia to de-escalate the situation at the Ukrainian border + engage in a meaningful dialogue on security on the European continent. Any further military aggression by Russia against #Ukraine will have massive consequences + severe costs.”
The "Weimar Triangle" is, loosely, a grouping of Poland, Germany, and France, according to Wikipedia.
Market reaction
As the US and its NATO allies seek to de-escalate the Russia-Ukraine tensions, the S&P 500 futures take that in its stride, gaining 0.60% on the day.
Meanwhile, EUR/USD consolidates around 1.1425 amid a calm before the US inflation storm.
Enrico Tanuwidjaja, Economist at UOB Group, reviews the latest FX reserves results in Indonesia.
Key Takeaways
“Indonesia’s foreign exchange reserves decreased to USD141.3bn in Jan 2022; down by USD3.6bn from the previous month.”
“The decrease of reserve assets in Jan was attributable to the repayment of the government’s external debt and the decrease in foreign exchange placement in Bank Indonesia to anticipate foreign exchange liquidity needs in line with the recovery in economic activity.”
“Bank Indonesia views that the official reserve assets will remain adequate, along with several accommodative policies to support long-term economic recovery.”
- EUR/USD regains some poise and retakes the 1.1430 zone.
- German 1py Bund yields ease a tad from recent peaks.
- German trade surplus shrank to €6.8B in December.
Following two consecutive daily pullbacks, EUR/USD regains the smile and advances to the 1.1430 zone midweek.
EUR/USD looks to USD, yields
EUR/USD resumes the upside and leaves behind the recent bearish move following 2022 tops past 1.1480 (February 4). The near-term positive view in spot stays so far underpinned by the 5-month line, today around 1.1400.
In the meantime, the performance of yields on both sides of the Atlantic continues to dictate the price action in the pair along with tightening prospects from both the Federal Reserve and the European Central Bank, all against the backdrop of the persevering elevated inflation.
In the domestic docket, the German trade surplus shrank to €6.8B in December (from €10.9B), while the Current Account surplus increased to €23.9B, also in December. In Italy, Industrial Production figures are expected later.
In the NA session, usual weekly Mortgage Applications are due seconded by Wholesale Inventories, while Cleveland Fed L.Mester (voter, hawkish) is also due to speak.
What to look for around EUR
EUR/USD appears to be decently supported in the 1.1400 neighbourhood for the time being. The optimism around spot seems threatened by the recovery in the greenback, which has particularly regained traction after US Nonfarm Payrolls surprised to the upside in January. The now improved outlook in the pair looks bolstered by prospects of a potential interest rate hike by the ECB at some point by year end, higher German yields, elevated inflation in the region and a decent pace of the rebound in the economic activity and other key fundamentals.
Key events in the euro area this week: Germany Balance of Trade (Wednesday) - Germany Final January CPI (Friday).
Eminent issues on the back boiler: Asymmetric economic recovery post-pandemic in the euro area. Speculation of ECB tightening/tapering later in the year. Presidential elections in France in April. Geopolitical concerns from the Russia-Ukraine conflict.
EUR/USD levels to watch
So far, spot is gaining 0.08% at 1.1423 and faces the next up barrier at 1.1483 (2022 high Feb.4) followed by 1.1496 (200-week SMA) and finally 1.1667 (200-day SMA). On the other hand, a break below 1.1319 (55-day SMA) would target 1.1121 (2022 low Jan.28) en route to 1.1100 (round level).
EUR/SEK is at risk of suffering further falls on a break under 10.34. In this case, the 200-day moving average (DMA) at 10.20 would be exposed, economists at Société Générale report.
An initial pullback is underway
“Having formed a high near 10.56, an initial pullback is underway. Upper limit of the rectangle pattern at 10.34 which is also the 61.8% retracement from January is first support.”
“If the 10.34 mark gets violated, there will be a risk of a deeper down move. In such a scenario, next potential support levels would be at 10.29 and the 200-DMA near 10.20.”
EUR/USD is retracing recent gains after retesting January peak of 1.1485. While the pair holds the 1.1315/1.1260 area, a bounce towards 1.1525/1.1590 is on the cards, economists at Société Générale report.
Daily Ichimoku cloud at 1.1315/1.1260 is near-term support
“Daily Ichimoku cloud at 1.1315/1.1260 is near-term support. Defending this, the bounce could persist.”
“Next potential hurdle is at 1.1525/1.1590, the low of October.”
The hawkish stance of central banks is the headwind for gold investments but geopolitical conflicts could enhance the safe-haven appeal of the yellow metal. All in all, strategists at ANZ Bank expect XAU/USD to hover around $1,800 by the end of the first quarter.
A stronger USD is a headwind but elevated inflation could mitigate the impact
“The backdrop for gold is deteriorating as central banks become more hawkish. However, elevated inflation and geopolitical risk are partially offsetting the impact of tightening monetary policies.”
“Retail investments and physical offtake have been resilient. We believe gold will trade at $1,800/oz towards the end of Q1 2022.”
See – Gold Price Forecast: XAU/USD to break under $1,745 and start a sustained downtrend in July – TDS
- GBP/USD gained some positive traction on Wednesday amid modest USD weakness.
- A softer tone surrounding the US bond yields acted as a headwind for the greenback.
- Fresh Brexit-related tensions should keep a lid on any meaningful gains for the major.
The GBP/USD pair held on to its modest intraday gains through the early European session and was last seen trading just a few pips below the weekly high, around mid-1.3500s.
The pair gained some positive traction on Thursday and might now be looking to build on this week's bounce from sub-1.3500 levels amid modest US dollar weakness. A softer tone surrounding the US Treasury bond yields kept the USD bulls on the defensive, though rising bets for a 50 bps Fed rate hike in March should limit losses.
Investors seem convinced that the Fed would adopt an aggressive policy response to combat persistent high inflation, which was evident from the recent run-up in the US bond yields. In fact, the yield on the benchmark 10-year US government bond shot back closer to the 2.0% threshold, or its highest level since August 2019 on Tuesday.
Moreover, the 2-year and 5-year notes – which are highly sensitive to rate hike expectations – rose to the highest level since February 2020 and July 2019, respectively. This, in turn, supports prospects for the emergence of some USD dip-buying and keep a lid on any meaningful upside for the GBP/USD pair, at least for the time being.
Investors might also be reluctant to place aggressive bets and prefer to wait on the sidelines ahead of Thursday's release of the latest US consumer inflation figures. Apart from this, tensions over the Northern Ireland Protocol of the Brexit agreement should further undermine the British pound and cap gains for the GBP/USD pair.
Hence, it will be prudent to wait for a strong follow-through buying before positioning for any further gains. In the absence of any relevant market-moving economic releases, the US bond yields will play a key role in influencing the USD demand. This, in turn, should produce some short-term trading opportunities around the GBP/USD pair.
Technical levels to watch
USD/CAD hit a low of 1.2457 on January 20 and a high of 1.2809 on January 6. The pair is expected to move in a range between 1.24-1.30 in February, analysts at Mizuho Bank report.
Oil set to move between the upper-$70 and upper-$80
“The US dollar will be bought if expectations for US rate hikes rise and some comments prompt speculation that rates will be lifted at faster pace. The greenback might also be supported by the results of economic indicators and the USD/CAD would well rise close to around 1.29 in February.”
“WTI prices look set to continue climbing as supply falls on the deteriorating situation in Ukraine and political uncertainty in the Middle East. Even if geopolitical risk eases, OPEC Plus output adjustments will stop crude oil prices falling sharply, with prices set to move between the upper-$70-upper-$80/barrel range in February.”
“The US dollar is likely to remain bullish on the whole this month, but the Canadian dollar will be supported by high crude oil prices, so the USD/CAD pair will probably move between 1.24-1.30 this month.”
The Indonesian rupiah continued depreciating against the US dollar to its monthly low by temporarily reaching the lower-IDR 14,400 level on January 31. In February, market participants should be cautious of the possibility for the IDR to depreciate against the USD, economists at Mizuho Bank report.
Market participants should remain cautious about the rise of interest rates in the US
“Market participants should remain careful, as the trade balance that had been supporting the demand to buy the Indonesian rupiah could fall in the times ahead, also because crude oil prices have been rising.”
“The policy interest rate of the US will be soon raised, which is another source of uncertainty in the Indonesian rupiah market.”
“The International Monetary Fund (IMF) released a report to give warning to the direct purchase of government bonds by the central bank of Indonesia. Furthermore, the number of covid cases has been increasing again in Indonesia, and this was most likely caused by the spread of the omicron variant. These factors could keep the Indonesian rupiah from appreciating in the times ahead.”
“It is possible for the USD/IDR to reach the 14,500 level.”
UOB Group’s FX Strategists see USD/CNH still navigating the 6.3400-6.3805 range in the next weeks.
Key Quotes
24-hour view: “Our expectations for USD to ‘trade sideways between 6.3500 and 6.3700’ yesterday were incorrect as it popped to a high of 6.3760 before dropping back down to end the day little changed at 6.3658 (+0.08%). Upward momentum has barely improved and a sustained advance above 6.3760 is unlikely. For today, USD is more likely to trade sideways between 6.3620 and 6.3760.”
Next 1-3 weeks: “There is no change in our view from Monday (07 Feb, spot at 6.3600). We continue to view the current movement as part of a consolidation phase and expect USD to trade between 6.3400 and 6.3805 for now.”
EUR/USD continues to trade in narrow ranges. Economists at ING think there will be two event risks for the euro today. The first will be the 1 release of the European Commission's winter forecasts. The second event risk is the Twitter Q&A from ECB's Isabel Schabel.
Schnabel and EC forecasts in focus
“The focus will be on how aggressively EC revises up its 2023 CPI forecast and what that may mean for the crucial ECB inflation forecasts released on 10 March. Any substantial revision well above 2.0% could give the euro a little lift today.”
“ECB's Isabel Schabel was one of the first of the ECB to publicly say that inflation risks were tilted to the upside. Similarly hawkish comments later today could help nudge EUR/USD back towards the 1.1460/80 area.”
“EUR/USD should remain supported near 1.1400 today.”
- DXY looks for direction around 95.60/70 on Wednesday.
- US yields see some correction following recent peaks.
- Mortgage Applications, Wholesale Inventories, Fed’s Mester next on tap.
The greenback looks to extend the weekly recovery to the 95.60/70 band when gauged by the US Dollar Index (DXY) on Wednesday.
US Dollar Index focuses on data, yields
The index looks to add to Tuesday’s gains amidst some inconclusive price action in the 95.60/70 band so far on Wednesday, all amidst some corrective downside in US yields following recent peaks.
Indeed, US yields seem to be taking a breather early in Europe, although they keep the trade in the upper end of the recent range supported by rising speculation of a tighter lift-off by the Federal Reserve at the March FOMC event.

In the US data space, usual weekly MBA Mortgage Applications are due seconded by December’s Wholesale Inventories and the speech by Cleveland Fed L.Mester (voter, hawkish).
What to look for around USD
The dollar regained some poise in the wake of the healthy results from the Nonfarm Payrolls for the month of January. While the constructive outlook for the greenback remains well in place for the time being, recent hawkish messages from the BoE and the ECB carry the potential to slow the pace of a move higher in the index in the next months. The view of a stronger dollar remains, in the meantime, underpinned by higher yields, persistent elevated inflation, supportive Fedspeak and the solid pace of the US economic recovery.
Key events in the US this week: Wholesale Inventories, MBA Mortgage Applications (Wednesday) - CPI, Initial Claims (Thursday) - Flash Consumer Sentiment (Friday).
Eminent issues on the back boiler: Fed’s rate path this year. US-China trade conflict under the Biden administration. Debt ceiling issue. Escalating geopolitical effervescence vs. Russia and China.
US Dollar Index relevant levels
Now, the index is gaining 0.02% at 95.64 and a break above 96.04 (55-day SMA) would open the door to 97.44 (2022 high Jan.28) and finally 97.80 (high Jun.30 2020). On the flip side, the next down barrier emerges at 95.20 (200-week SMA) followed by 95.13 (weekly low Feb.4) and then 94.62 (2022 low Jan.14).
The aussie has fallen against all but the kiwi in the G10 so far this year. And with March set for lift-off from the Fed, economists expect to see some further weakness versus the USD, driving the AUD/USD towards the 0.69 level.
AUD/USD rallies to stall at 0.72
“US inflation at 7% and unemployment at 4% have markets pricing a risk of a 50bp Fed hike in March. This should underpin the US dollar despite occasional wobbles, helping cap AUD/USD rallies around 0.72.”
“While 10yr AU-US yields spreads are range-bound, the 2yr continues to trend in the US dollar’s favour.”
“A strong US dollar, somewhat dovish RBA and skittish equities suggest multi-week risks for a return to the 0.69 handle or (briefly) lower, but the aussie should be on more solid footing in Q2.”
Gold resists breaking bull-market-era trendline. Strategists at TD Securities expect the yellow metal to trend lower on removal of $1,745 by July.
Ongoing position squeeze will prove mild
“The set-up is in gold ripe for another position squeeze, with participants including turning bearish following the decisively hawkish Fed meeting, only to find substantial volume on the bid keeping prices from breaking below their bull-market-era trendline support. This time, however, the bar is high for a substantial squeeze, suggesting macro headwinds will ultimately weigh on gold.”
“A break below $1,745/oz by July would establish a sustained downtrend in the yellow metal.”
“While official central bank holdings do not show a sustained trend of purchases, this cohort appears most likely to have been on the bid in recent weeks. However, Shanghai length is vulnerable following Chinese New Year, while a CTA positioning squeeze is also unlikely to lend further support given the bar for a buying program is elevated.”
After reaching multi-decade highs of 27.60 per US dollar in mid-January, over the last three weeks, TWD has weakened 0.7% against the greenback. Analysts at Credit Suisse think USD/TWD will trade higher in a 27.50-28.00 range.
A rush for hedging can add additional USD/TWD selling pressure
“The prospects of Fed hikes and intervention by CBC suggest the key 27.50 in USDTWD will not break in the next six months.”
“Since Fed hawkishness and US rates volatility is set to continue as global FX markets’ main theme, we think USD/TWD will trade higher in a 27.50-28.00 range in Q1 as Taiwan life insurers increase unhedged exposure to USD assets.”
“If export flows push USD/TWD back towards 27.50, a rush for hedging can add additional USD/TWD selling pressure.”
- USD/JPY witnessed two-way price moves during the first half of the trading on Wednesday.
- Softer US bond yields kept the USD bulls on the defensive and capped the upside for the pair.
- The risk-on impulse undermined the safe-haven JPY and helped limit any meaningful decline.
The USD/JPY pair remained on the defensive through the early European session and was last seen trading with modest intraday losses, just below the 115.50 region.
The pair witnessed some intraday selling on Wednesday and retreated over 35 pips from the 115.65-115.70 area, or the high touched on January 28, though the pullback lacked follow-through. A downtick in the US Treasury bond yields undermined the US dollar and exerted some pressure on the USD/JPY pair. The downside, however, remained cushioned amid the risk-on impulse in the markets, which tends to weigh on the safe-haven Japanese yen.
The yield on the benchmark 10-year US government US Treasury bond yields moved away from the highest level since August 2019 touched on Tuesday and kept the USD bulls on the defensive. That said, rising bets for a 50 bps Fed rate hike in March should act as a tailwind for the US bond yields and the greenback. This, in turn, was seen as a key factor that assisted the USD/JPY pair to find decent support near the 115.30 region.
Investors seem convinced that the US central bank would adopt a more aggressive policy response to combat stubbornly high inflation. Hence, the market focus will remain glued to the release of the US CPI report on Thursday, which could influence the Fed's near-term policy outlook. This, in turn, would play a key role in driving the near-term USD demand and help determine the next leg of a directional move for the USD/JPY pair.
In the meantime, traders are likely to take cues from the US bond yields and the USD price dynamics amid absent relevant market moving economic releases from the US. Apart from this, the broader market risk sentiment will also be looked upon for some short-term trading opportunities around the USD/JPY pair.
Technical levels to watch
EUR/USD is expected to move downward to 1.10 this year and start to recover towards 1.15 next year and finally reach the 1.20 level by 2024, economists at the Bank of America Merrill Lynch report.
Euro set to depreciate against the US dollar in 2022
“On balance, we still expect the risks to be to the downside for EUR/USD this year and to the upside next year.”
“We have been forecasting EUR/USD at 1.10 this year, 1.15 next year and 1.20 (lower end of long-term equilibrium range) in 2024. Although getting the timing right of such a path will be difficult, we stick with it for now.”
Bank Indonesia (BI) will hold its monthly governor board meeting on February 9-10. Here you can find the expectations as forecast by the economists and researchers of five major banks regarding the upcoming central bank's decision.
BI is set to stand pat this month but the central bank is expected to start rising rates faster than thought.
ING
“BI is expected to hold rates steady. We expect BI Governor Perry Warjiyo to consider tightening policy sooner rather than later, especially with inflation creeping back to its target. In our view, the trigger points for an earlier-than-anticipated reversal instance would be accelerating inflation coupled with depreciation pressure on the Indonesian rupiah linked to Fed tightening. We consequently forecast a modest rate increase from BI as early as 2Q.”
ANZ
“The timing of BI’s first rate hike will depend on the market reaction to the US Fed’s policy normalisation. As things stand, we don’t expect BI to hike its policy rate but the odds of an earlier-than-expected lift-off have risen.”
Standard Chartered
“We expect BI to keep the policy rate unchanged at 3.5% to anchor IDR stability and inflation expectations while keeping macroprudential policy accommodative to support growth. We believe BI will continue to calibrate monetary policy, including market intervention and interest rate policy, to maintain IDR and bond market stability amid more hawkish Fed policy normalisation and increasing domestic inflation. While inflation may only exceed the middle of BI’s target range of 2-4% in Q3, we think there is a risk of BI hiking rates earlier, in response to the Fed’s move should it trigger significant pressure on the currency. We see the first rate hike in Q3, but acknowledge the risk of an earlier hike in Q2 due to expectations of a more hawkish Fed move. Besides inflation, we think BI will watch real interest rates and 10Y government bond yield spreads with the US and EM peers to maintain IDR asset attractiveness.”
TDS
“BI could signal a less dovish tone as it adopts a ‘preemptive’ stance which raises the risk of an earlier rate hike. However, virus cases are rising while inflation is still relatively contained giving room for BI to stay patient.”
SocGen
“Surging Omicron cases are likely to make the central bank stay on hold and continue to support the nascent recovery until it can no longer afford to do so. The central bank is planning its first step towards liquidity draining via a 150bp Rupiah Reserve Requirement (RRR) hike on 1 March, we, therefore, expect BI to eventually hike the policy rate in 2Q22. For the time being, we think that the central bank will likely retain its existing accommodative stance and keep the policy rate unchanged at 3.5% in February to avoid inflicting any growth shock on the economy as Omicron rages.”
Economists at Credit Suisse continue to think that USD/ZAR is exposed mainly to upside due to hawkish Fed policy risk but lower their target slightly to 16.00 in absence of an obvious short-term catalyst.
USD/ZAR target slightly cut to 16.00
“We lower our short-term USD/ZAR target to 16.00 (from 16.30 previously).”
“We still think USD/ZAR is exposed mainly to upside risk because we suspect the Fed’s tone is likely to continue to shift in a hawkish direction. Under these conditions, a rise in USD/ZAR back to early-January high of around 16.09 looks likely to us.”
“We will most likely re-assess our USD/ZAR target in case USD/ZAR falls sustainably below the 15.00 mark.”
Further gains in USD/JPY are likely once 115.80 is surpassed, noted FX Strategists at UOB Group.
Key Quotes
24-hour view: “Yesterday, we expected USD to strengthen but we were of the view that ‘any advance in USD is unlikely to break 115.50’. The anticipated USD strength exceeded our expectations as USD rose to 115.62. Despite the advance, upward momentum has not improved by all that much and USD is unlikely to advance much further. For today, USD is more likely to trade sideways between 115.25 and 115.70.”
Next 1-3 weeks: “We highlighted on Monday (07 Feb, spot at 115.20) that the outlook for USD is mixed and we expected it to trade between 114.55 and 115.80. USD rose to a high of 115.62 and upward momentum has improved somewhat. However, USD has to break 115.80 before a sustained advance can be expected. The chance of USD breaking 115.80 is not high for now but it would remain intact as long as the ‘strong support’ level at 114.80 is not breached.”
Considering flash data from CME Group for natural gas futures markets, open interest shrank for the second straight session on Tuesday, now by nearly 24K contracts. Volume followed suit and resume the downside, this time by more than 106K contracts.
Natural Gas looks supported by the 200-day SMA ($4.20).
Tuesday’s small gains in prices of natural gas was accompanied by shrinking open interest and volume, leaving the idea for further retracements on the table for the time being. Extra losses are expected on a convincing breakdown of the 200-day SMA around the $4.20 mark per MMBtu.
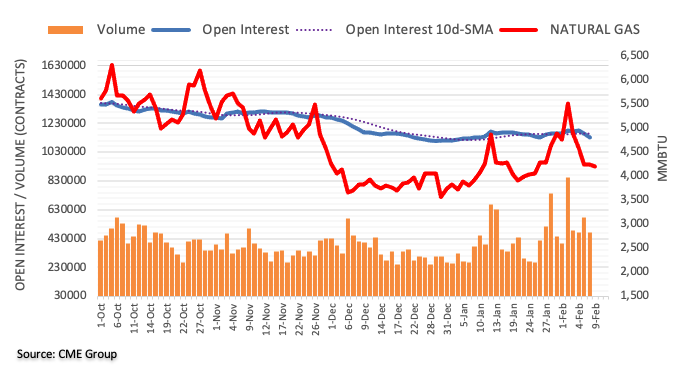
Gold price is sitting at the highest levels in nine days near the $1,830 barrier on Wednesday. As FXStreet’s Dhwani Mehta notes, XAU/USD has more room to rise.
Strong support seen around $1,817
“Gold is in an upside consolidative mode, prepping up for a fresh leg up once the $1,830 round level is cleared. The next bullish target is seen at the horizontal trendline resistance at $1,835. Further up, bulls will challenge a powerful hurdle of around $1,848.
“$1,820 could limit any retracement, below which strong support around $1,817 will test the bullish commitments. The latter is the confluence of the horizontal 100-SMA and upward-pointing 21-SMA. Sellers will then target the horizontal 200-SMA support at $1,814.”
- Gold touched a two-week high on Thursday, albeit lacked any follow-through buying.
- The risk-on impulse in the markets capped the metal amid hawkish Fed expectations.
- Traders also refrained from placing aggressive bets ahead of the US CPI on Thursday.
Gold now seems to have entered a bullish consolidation phase and oscillated in a narrow trading band around the $1,825-$1,830 region, or a two-week high touched earlier this Wednesday. Concerns about the persistent rise in consumer prices turned out to be a key factor that continued benefitting the metal's status as a hedge against inflation. Apart from this, modest US dollar weakness extended some support to the dollar-denominated commodity and acted as a tailwind for spot prices. That said, elevated US Treasury bond yields, bolstered by rising bets for a 50 bps Fed rate hike in March, capped gains for the non-yielding yellow metal.
Investors seem convinced that the Fed would adopt a more aggressive monetary policy response to combat stubbornly high inflation. The bets were reinforced by Friday's blockbuster US jobs report (NFP), which, in turn, pushed the yield on the benchmark 10-year US government bond to its highest level since August 2019 on Tuesday. Adding to this, the 2-year and 5-year notes – which are highly sensitive to rate hike expectations – rose to the highest level since February 2020 and July 2019, respectively. Hence, the market focus will remain glued to the release of the US CPI report on Thursday, warranting caution before placing directional bets.
In the meantime, the risk-on impulse – as depicted by a bullish sentiment around the global equity markets – could keep a lid on any meaningful upside for the safe-haven gold. In the absence of any major market-moving economic releases from the US, the US bond yields will influence the USD price dynamics and provide some impetus to the XAU/USD. Apart from this, traders will take cues from the broader market risk sentiment to grab some short-term opportunities on Wednesday.
Technical outlook
From a technical perspective, the recent bounce from the lowest level since December 16, paused near the 61.8% Fibonacci retracement level of the $1,854-$1,780 downfall. Given that technical indicators on the daily chart have just started moving into the positive territory, sustained strength beyond will be seen as a fresh trigger for bullish traders. Gold could then surpass an intermediate hurdle near the $1,842 region and accelerate the momentum to retest 2022 high, around the $1,853-$1,854 region touched on January 25.
On the flip side, any meaningful pullback now seems to find decent support near the 50% Fibo. level, around the $1,818 region. This is closely followed by the overnight swing low, around the $1,815 area, below which gold could slide further towards the $1,808-$1,806 confluence. The latter comprises the 38.2% Fibo. level and the very important 200-day SMA. A convincing break below will negate any near-term positive bias and prompt some technical selling. The XAU/USD would then turn vulnerable to break below the $1,800 mark and slide further towards last week’s swing low, around the $1,788 area en-route the YTD low, around the $1,780 level.
Gold daily chart
-637799868521839664.png)
Levels to watch
- Palladium drops for the fifth consecutive day, fades bounce off 200-DMA.
- Pullback from nine-month-old resistance line, bearish MACD signals favor sellers.
Palladium (XPD/USD) remains on the back foot around $2,235, down 0.70% intraday during the five-day south-run.
In doing so, the precious metal fades Monday’s bounce off 200-DMA while refreshing intraday low heading into European session on Wednesday.
As the bearish MACD signals and the metal’s failure to stay beyond a downward sloping trend line from May joins failures to rebound from the key moving average, XPD/USD bears are likely to keep the reins.
That said, the 200-DMA level of $2,186 offers short-term key support ahead of directing the sellers toward a three-week-old support line, near $2,069.
However, the $2,000 psychological magnet and the 100-DMA level surrounding $1,975 will question the quote’s weakness below the stated trend line.
Meanwhile, recovery moves may initially battle the aforementioned resistance line from May, near $2,335, a break of which will direct palladium buyers to January’s peak of $2,415.
Following that, the 61.8% Fibonacci retracement of the May-December 2021 downturn, near $2,460, will be in focus.
Palladium: Daily chart

Trend: Further weakness expected
According to FX Strategists at UOB Group, AUD/USD could now trade within the 0.7070/0.7200 range in the next weeks.
Key Quotes
24-hour view: “We expected AUD to ‘trade sideways within a range of 0.7100/0.7140’ yesterday. AUD subsequently traded between 0.7107 and 0.7147 before settling on a firm note at 0.7146 (+0.28%). The improved underlying tone suggests AUD is likely to trade with an upward bias for today. However, any advance is expected to face solid resistance at 0.7170. The major resistance at 0.7200 is not expected to come into the picture. Support is at 0.7130 followed by 0.7115.”
Next 1-3 weeks: “On Monday (07 Feb, spot at 0.7075), we held the view that AUD is under mild downward pressure and is likely to trade with a downward bias and test 0.7015. Yesterday (08 Feb), AUD rebounded and took out our ‘strong resistance’ level at 0.7140. The break of the ‘strong resistance’ level indicates that the mild downward pressure has dissipated. From here, AUD is likely to trade sideways for a period of time, expected to be within a range of 0.7070/0.7200.”
FX option expiries for February 9 NY cut at 10:00 Eastern Time, via DTCC, can be found below.
- EUR/USD: EUR amounts
- 1.1295-05 420m
- 1.1310-20 667m
- 1.1350-55 515m
- 1.1450 265m
- 1.1475 200m
- 1.1550 216m
- USD/JPY: USD amounts
- 113.75-80 575m
- 114.00 456m
- 114.50-55 850m
- 115.00 725m
- 115.20-30 600m
- 115.34-35 410m
- 115.50 491m
- 115.60 326m
- 115.75-80 1.4b
- 116.00 292m
- 116.50 350m
- 117.00 491m
- AUD/USD: AUD amounts
- 0.7150-55 310m
- 0.7160-70 890m
- USD/CAD: USD amounts
- 1.2675-85 556m
- 1.2720-30 855m
- 1.2760 250m
- AUD/JPY: AUD amounts
- 80.62 300m
- 80.80-80.90 780m
CME Group’s preliminary readings for crude oil futures markets noted traders added around 8.4K contracts to their open interest positions on Tuesday, recording the fifth consecutive daily build. Volume, instead, partially reversed the previous drop and increased by nearly 164K contracts.
WTI could retest the $86.78 level
Prices of the WTI added to the bearish mood seen at the beginning of the week on Tuesday. The corrective downside was in tandem with rising open interest, opening the door to potential further decline in the very near term. That said, the so far monthly low at $86.78 (February 3) emerges as the next magnet for oil bears. The sharp drop in volume, in the meantime, could spark some bouts of consolidation at the same time.
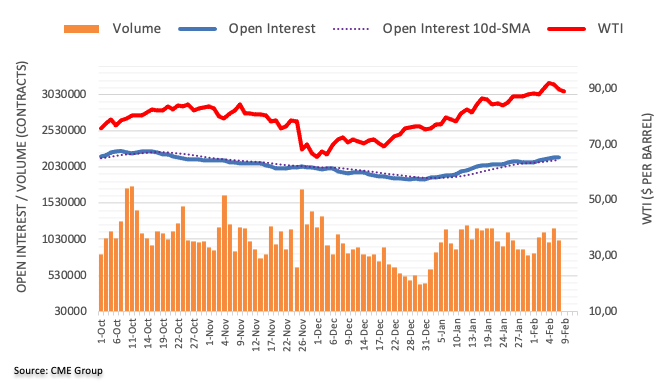
A likelihood of an abrupt slowdown in the European Central Bank’s (ECB) stimulus programme and aggressive monetary policy tightening spook investors, as they foresee a turmoil in the Italian and Greek bonds markets, the Financial Times carried a story on Wednesday, citing analysts.
Key takeaways
“Government debt across the currency bloc has tumbled since last week’s ECB meeting when president Christine Lagarde declined to rule out the possibility of a rise in interest rates this year as the central bank battles record-high inflation.”
“For bond investors, that prospect is particularly concerning because the ECB has repeatedly stressed that it will wind down its vast bond purchasing programmes before lifting rates.”
If the central bank hurries to the exit, investors may once again choose to focus on the daunting debt loads of Italy and Greece, worth around 160 percent and 200 percent of gross domestic product respectively.”
Related reads
ECB's Villeroy: Market reaction to the ECB meeting may have been too strong
EUR/USD faces further gains above 1.1485 – UOB
In opinion of FX Strategists at UOB Group, cable could still surpass the 1.3600 barrier in the short-term horizon.
Key Quotes
24-hour view: “GBP traded between 1.3509 and 1.3557 yesterday, narrower than our expected sideway-trading range of 1.3500/1.3570. The price actions offer no fresh clues and GBP could continue to trade sideways. Expected range for today, 1.3515/1.3575.”
Next 1-3 weeks: “Our view from Monday (07 Feb, spot at 1.3530) still stands. As highlighted, while upward momentum is beginning to wane, there is chance, albeit not a high one for GBP to make one more push higher to 1.3645. However, a breach of 1.3470 (‘strong support’ level) would indicate that the risk of another leg higher has dissipated.”
Here is what you need to know on Wednesday, February 9:
Major currency pairs continue to fluctuate in relatively tight ranges mid-week amid a lack of high-tier data releases and fundamental drivers. The US Dollar Index is moving sideways near 95.50 after posting small gains on Tuesday and investors await the 10-year US Treasury note auction ahead of Thursday's critical inflation data.
The market mood remains upbeat in the early European session with US stock index futures rising between 0.3% and 0.5%. The benchmark 10-year US T-bond yield, which climbed to its highest level since August 2019 at 1.97% on Tuesday, is down more than 1% at 1.94% early Wednesday.
Easing concerns over a military conflict between Russia and Ukraine seem to be allowing risk flows to remain in control of markets. Crude oil prices continue to edge lower and the barrel of West Texas Intermediate (WTI) is posting small losses near $89.50 after losing more than 2% on Tuesday. On a separate note, Bloomberg reported earlier in the day that China fell over 33% short of its purchase commitments for goods in the Phase-1 trade deal with the US.
EUR/USD briefly dipped below 1.1400 on Tuesday but managed to end the day above that level. There won't be any high-tier macroeconomic data releases from the euro area and the pair is likely to stay in a consolidation phase.
GBP/USD closed virtually unchanged on Tuesday and continues to move sideways near 1.3550 heading into the European session on Wednesday.
AUD/USD continues to inch higher and trades above 0.7150 after closing the first two trading days of the week in the positive territory. The data from Australia showed that the Westpac Consumer Confidence improved to -1.3% in February from -2% in January.
Gold stretched higher and now trades at its strongest level in two weeks above $1,820.
USD/JPY seems to have lost its bullish momentum near 115.50 after gaining 50 pips on Tuesday. Retreating US Treasury bond yields are limiting the pair's upside.
Bitcoin rose above $45,000 for the first time in more than a month on Tuesday but erased a large portion of its daily gains before closing at $44,000. At the time of press, BTC/USD was down modestly at $43,700. Ethereum snapped a five-day winning streak on Tuesday but continues to trade above $3,000.
Open interest in gold futures markets rose for the second session in a row on Tuesday, now by around 3.7K contracts according to advanced figures from CME Group. In the same line, volume resumed the upside and went up by around 7.3K contracts.
Gold now targets the 2022 high at $1,853
Gold prices extended the upside momentum on Tuesday amidst rising open interest and volume, which is supportive of the continuation of the uptrend in the very near term at least. That said, the next target of note for the precious metal comes at the YTD high at $1,853 (January 25).
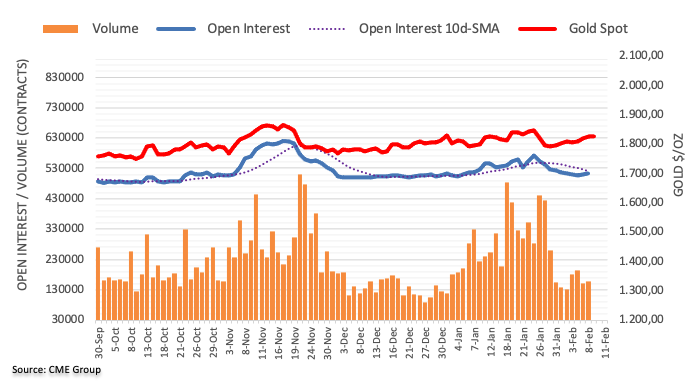
- AUD/USD remains above 200-EMA for the first time in three weeks.
- Bullish MACD signals add to the upside bias but monthly resistance line tests buyers.
- Short-term support line to test bears during fresh declines.
AUD/USD remains above the 200-EMA for the first time since late January, despite a recent pullback from a fortnight high ahead of Wednesday’s European session. That said, the Aussie pair eases to 0.7157, up 0.15% intraday at the latest.
Not only the pair’s ability to stay beyond 200-EMA, bullish MACD signals and a one-week-old upward trajectory, portrayed by an immediate support line, also keep AUD/USD buyers hopeful.
However, a descending resistance line from January 13, near 0.7175, guards the quote’s immediate upside ahead of directing it to the 0.7200 threshold.
During the AUD/USD upside past 0.7200, highs marked during January 20 and January 13, respectively around 0.7280 and 0.7315, will lure the buyers.
Alternatively, the weekly support line around 0.7130 will challenge intraday sellers of the pair during the fresh declines.
Also acting as a downside filter is a two-week-long rising trend line, close to 0.7095, a break of which will welcome AUD/USD sellers.
AUD/USD: Four-hour chart
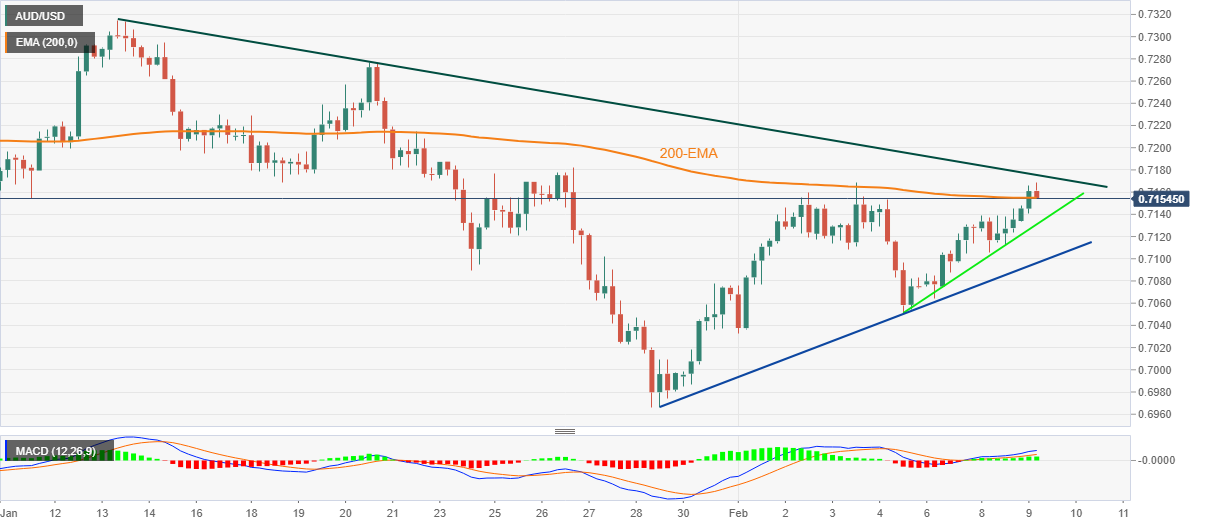
Trend: Further upside expected
EUR/USD needs to clear 1.1485 to allow for a potential move to 1.1520 in the near term, suggested FX Strategists at UOB Group.
Key Quotes
24-hour view: “We expected EUR to ‘consolidate and trade within a range of 1.1405/1.1465’ yesterday. EUR subsequently traded between 1.1394 and 1.1448 before closing at 1.1414 (-0.24%). Momentum indicators are mostly neutral and EUR is likely to trade sideways for today, expected to be between 1.1390 and 1.1445.”
Next 1-3 weeks: “On Monday (07 Feb, spot at 1.1450), we highlighted that overbought shorter-term conditions could lead to a couple of days of consolidation first. We added, ‘as long as 1.1360 is not breached, the recent rally could extend further but EUR has to break the major resistance at 1.1485 before a move to 1.1520 can be expected’. There is no change in our view for now as EUR consolidated for the past couple of days. That said, the shorter-term underlying tone has softened somewhat and EUR has to head higher within these 1 to 2 days or the odds for a break of 1.1485 would diminish quickly.”
- USD/IDR prints three-day downtrend, recently pressured around intraday low.
- Indonesia FinMin Indrawati expects fiscal deficit to shrink to 4.0% of GDP in 2022.
- US dollar weakness and optimism in Asia-Pacific markets also favor sellers ahead of Thursday’s key US inflation data.
USD/IDR remains depressed near the intraday low of $14,356 while portraying a three-day downtrend heading into Wednesday’s European session.
In doing so, the Indonesian Rupiah (IDR) pair cheers upbeat comments from Finance Minister (FinMin) Sri Mulyani Indrawati while also cheering the broad US dollar weakness amid a quiet session.
“Indonesia's fiscal deficit is expected to narrow further this year to near 4% of its gross domestic product, compared with an initial forecast of a 4.85% gap, its finance minister told an investment forum on Wednesday,” said Reuters.
The news also quotes Indonesia FinMin Indrawati while mentioning that she expected tax laws passed by parliament late last year to provide more revenue for the state coffers, allowing Indonesia to "restore fiscal space" and prepare for any potential shocks. It’s worth noting that Reuters also said, “Last year's fiscal deficit was 4.65% of GDP, much smaller than the government's expected 5.7% deficit.”
That said, US Dollar Index (DXY) drops 0.08% intraday around 95.55 at the latest as the US Treasury yields retreated from the multi-day high during early Asia, downbeat of late. That said, the US 10-year Treasury yields jumped to the highest levels since July 2019 the previous day before recently easing to 1.945%. The bond coupon eased even after San Francisco Fed President Mary Daly favored the March rate hike in her latest speech. The policymaker additionally mentioned, “Fed can't be overly aggressive on rate increases,” while saying, “US inflation could get worse before it gets better.”
Moving on, comments from Fed Cleveland President Loretta J. Mester may offer intermediate directions ahead of Thursday’s US CPI data.
Technical analysis
Multiple failures to stay beyond $14,400 direct USD/IDR bears towards the 200-DMA level of $14,331.
Bank of Japan (BOJ) board member Toyoaki Nakamura is back on the wires now, via Reuters, urging a patient stance on the current easy policy until wages begin to rise sustainably.
Additional comments
Unlike US. and Europe, consumer inflation and wage growth remain low.
Japan has not seen conditions fall in place yet to tweak its easy policy.
Expect Japan firms to gradually pass on rising costs to households.
If wages begin to rise sustainably, that would put Japan closer to the situation in US, Europe.
Raising rates now would deprive firms of funds needed to push up wages.
Japan likely won't see pent-up demand emerge in current quarter, though it will materialize once pandemic subsides.
Hope pent-up demand emerges in Japan around the holiday-studded golden week in May.
Dollar/yen moves have been quite stable in the past two years.
Market reaction
USD/JPY is currently trading at 115.46, down 0.06% on the day, unperturbed by these above comments. The pair remains at the mercy of the action in the US Treasury yields.
- USD/CAD takes offers to refresh intraday low, prints the biggest weekly fall in five.
- WTI crude oil pauses previous declines amid softer USD, upbeat API data.
- Fed’s Mester, BOC’s Macklem will be observed for intraday direction ahead of US CPI.
USD/CAD pokes intraday low around 1.2690, down 0.11% on a day heading into Wednesday’s European session. In doing so, the loonie pair reverses the previous day’s recovery moves and is bracing for the biggest weekly fall since early January.
Broad US dollar weakness could be linked to the quote’s latest weakness. On the same line is a pause in the WTI crude oil declines after a two-day downtrend. As oil becomes Canada’s key export item, any positive moves weigh on the USD/CAD prices.
US 10-year Treasury yields retreat to 1.945%, down 1.5 basis points (bps) after rising to the highest levels since July 2019 the previous day. The bond coupon eased even after San Francisco Fed President Mary Daly favored the March rate hike in her latest speech. The policymaker additionally mentioned, “Fed can't be overly aggressive on rate increases,” while saying, “US inflation could get worse before it gets better.”
On the other hand, headlines conveying an explosion in Abu Dhabi and cautious optimism conveyed by US Health Expert Anthony Fauci, as well as Weekly Crude Oil Stock by the American Petroleum Institute (API), favor oil prices of late.
Talking about data, the US Goods and Services Trade Balance improved in December but Canadian International Merchandise Trade disappointed during the stated month, per the data released on Tuesday.
It should be noted that the market’s cautious optimism ahead of Thursday’s US Consumer Price Index (CPI) also favors the USD/CAD. For intraday moves, comments from Bank of Canada (BOC) Governor Tiff Macklem and Fed Cleveland President Loretta J. Mester will be important to watch.
Technical analysis
A convergence of the 50-DMA and 38.2% Fibonacci retracement (Fibo.) of October-December 2021 upside challenges the USD/CAD pair’s immediate upside around 1.2710. However, bullish MACD signals and the Loonie pair’s ability to stay beyond 1.2655-50 horizontal area for nearly two weeks keep the buyers hopeful to overcome the immediate hurdle. Hence, the pair is likely to remain sidelined between 1.2650 and 1.2710.
One-month risk reversal (RR) of USD/TRY, a gauge of calls to puts, braces for the sixth weekly decline, the longest bearish stretch since April, ahead of Wednesday’s European session.
That said, the weekly figures came in as -0.050 as per the latest data from Reuters. The daily RR, however, remains clueless after snapping the two-day declines the previous day.
It’s worth noting that the options market keeps a bearish bias for the USD/TRY but the charts aren’t favoring the sellers.
On the chart, USD/TRY remains sidelined between a three-week-old horizontal line and 50-DMA, respectively near $13.70 and $13.45.
Read: USD/TRY climbs to multi-day highs near 13.70
- Markets in Asia-Pacific region remains firmer as softer yields join firmer stock futures.
- Easing fears over Russia-Ukraine tussles battle the US-China trade jitters amid mostly quiet Asian session.
- Fed/ECB speakers refrained from harsh comments over inflation of late.
- Fedspeak, second-tier data may entertain traders but US CPI is the key.
Asian equities remain firmer heading into Wednesday’s European session as risk appetite improved on a pullback in the US Treasury yields and receding fears of the Russia-Ukraine war.
Read: SP500 - NASDAQ- Russell 200 - Elliott Wave trading strategies: Building long positions today?
That said, Reuters quotes French President Emmanuel Macron as the first Western leader to cite the possibility of de-establishing geopolitical fears. However, the UK and the US aren’t on the supporting side and hence the jitters could continue testing market sentiment.
Elsewhere, US 10-year Treasury yields jumped to the highest levels since July 2019 the previous day before recently easing to 1.945%. The bond coupon eased even after San Francisco Fed President Mary Daly favored the March rate hike in her latest speech. The policymaker additionally mentioned, “Fed can't be overly aggressive on rate increases,” while saying, “US inflation could get worse before it gets better.”
Amid these plays, MSCI’s index of Asia-Pacific shares outside Japan rises 1.50% intraday whereas Japan’s Nikkei 225 adds over 1.0% by the press time. Stocks in Japan benefit from concerns, raised by Bloomberg, over the Bank of Japan’s shift to tighter monetary policies considering covid fears in Tokyo and Governor Haruhiko Kuroda’s favor for easy money.
Shares in China and Hong Kong lead the bull-run even as the Sino-American trade tussles escalate. The up-moves could be linked to China State Funds’ support to equities.
Further, shares in South Korea, Indonesia and India also track other counterparts in Asia as markets await headline US inflation data amid mixed comments from the Fed and ECB policymakers of late.
It should be noted that the US Dollar Index (DXY) pares recent gains while prices of gold and crude cheer the USD pullback.
Read: US T-bond yields tease multi-year top, S&P 500 Futures print mild gains amid inflation concerns
- USD/CHF pares intraday losses inside a 40-pip weekly trading range.
- Firmer Momentum line, multiple supports keep buyers hopeful.
USD/CHF picks up bids to trim intraday losses around 0.9245 ahead of Wednesday’s European session.
In doing so, the Swiss currency pair remains firmer on a weekly basis while staying inside a one-week-old trading area.
That said, the quote’s latest rebound eyes the stated range’s upper line, around 0.9260 but any further upside will be challenged by multiple lows marked during late January around 0.9300.
Should the USD/CHF prices rally beyond 0.9300, a run-up towards the last month’s peak of 0.9343 can’t be ruled out.
Alternatively, an upward sloping trend line from January 24 joins the aforementioned range’s lower line to highlights 0.9225 as the short-term key support.
Following that, 100-SMA and 200-SMA, respectively near 0.9215 and 0.9190, will challenge the USD/CHF pair.
Also acting as a downside filter is the monthly low near 0.9180-75.
To sum up, the gradually rising Momentum line and multiple challenges for the USD/CHF bears make it easier for the bulls to keep reins.
USD/CHF: Four-hour chart
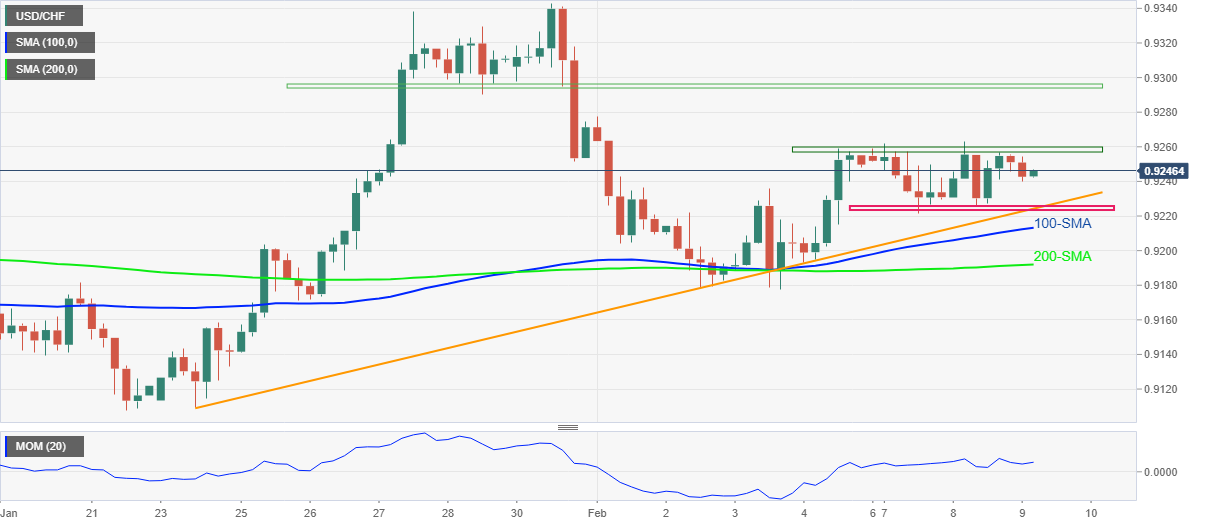
Trend: Further recovery expected
- EUR/USD snaps two-day downtrend but stays negative on weekly, grinds higher around intraday top of late.
- US Treasury yields retreat from the highest levels since July 2019, Fed’s Daly placates inflation fears.
- ECB’s Villeroy criticized hawkish reaction to the latest monetary policy verdict.
- Fed Cleveland President’s speech, German trade numbers may offer intraday moves.
EUR/USD struggles to keep intraday gains, recently taking rounds to 1.1430 during early Wednesday morning in Europe.
Even so, the major currency pair remains firmer for the first time in three days as the US dollar follows the Treasury yields amid a quiet session.
That said, US Dollar Index (DXY) drops 0.12% intraday around 95.50 at the latest as the US Treasury yields retreat from the multi-day high flashed the previous day.
It’s worth noting that the market’s indecision over the next moves of the European Central Bank (ECB) and the US Federal Reserve (Fed), due to the inflation concerns, seem to have probed the EUR/USD pair’s recent advances.
US 10-year Treasury yields jumped to the highest levels since July 2019 the previous day before recently easing to 1.945%. The bond coupon eased even after San Francisco Fed President Mary Daly favored the March rate hike in her latest speech. The policymaker additionally mentioned, “Fed can't be overly aggressive on rate increases,” while saying, “US inflation could get worse before it gets better.”
At home, European Central Bank (ECB) governing council member and Bank of France's head Francois Villeroy de Galhau said on Tuesday that the market reaction to last week's ECB meeting may have been too strong. The latest words from the ECB policymaker copy the early-week comment from ECB President Christine Lagarde who took a U-turn from rate-hike concerns.
It’s worth noting that covid optimism seems to have favored the EUR/USD buyers while portraying a corrective pullback. Earlier in the day, US President’s Chief Medical Adviser Dr. Anthony Fauci said, per the Financial Times (FT), “The US is heading out of the ‘full-blown’ pandemic phase of Covid-19.”
Looking forward, German trade numbers for January will join the Fedspeak to direct intraday moves ahead of the weekly key data/events scheduled for publication on Thursday. Among them, quarterly economic forecasts from the European Commission and the US Consumer Price Index (CPI) will be crucial to watch.
Technical analysis
Failures to cross a three-month-old horizontal hurdle surrounding 1.1485 keep directing EUR/USD bears towards a 21-DMA level near 1.1340, a break of which will confirm short-term bearish bias towards 1.1360.
Market chatter is centred around the bond market and how close the US 10-year yields are to the psychological 2% level. Global central bank sentiment is taking the forex market for a slow dull ride, but so far, nobody is really talking about the elephant in the room, Russia.
The Ukraine crisis was dominating the press at the start of the year and February, but tension soon died down last week when Vladimir Putin accused the US of trying to goad Russia into a conflict. Russia has denied any plans to invade Ukraine,
Speaking after talks with Hungarian Prime Minister Viktor Orban in Moscow, Mr Putin said: "It seems to me that the United States is not so much concerned about the security of Ukraine... but its main task is to contain Russia's development. In this sense, Ukraine itself is just a tool to reach this goal."
Markets have regarded the escalation over Ukraine as premature and that a diplomatic path is a more likely outcome. However, Russia had already assembled more than 100,000 troops near its borders. More recently, Russian warships have sailed toward the Black Sea on Tuesday, stoking alarm among the US and European security officials who warned that the final capabilities for a large-scale assault on Ukraine appeared to be falling into place.
This could start to get some traction this week as the market tires of waiting for the outcome of the Federal Reserve meeting in March.
- GBP/USD benefits from softer USD, picks up bids during two-day run-up.
- Yields retreat from 2.5-year high amid mixed concerns over inflation.
- UK PM Johnson’s mini-shuffle hints to overcome Brexit deadlock, UK PAC criticizes Brexit.
- Speeches from BOE Chief Economist Huw Phill, Fed Cleveland President Loretta J. Mester will be observed for intermediate clues.
GBP/USD extends the previous day’s rebound from 100-SMA towards 1.3600 during early Wednesday morning in Europe. That said, the cable pair cheers softer US dollar to pick up bids to 1.3565 by the press time.
US Dollar Index (DXY) prints the biggest daily loss in a week, down 0.12% intraday around 95.50 at the latest, as the US Treasury yields retreat from the multi-day high flashed the previous day.
US 10-year Treasury yields jumped to the highest levels since July 2019 the previous day before recently easing to 1.945%. The bond coupon eased even after San Francisco Fed President Mary Daly favored the March rate hike in her latest speech. The policymaker additionally mentioned, “Fed can't be overly aggressive on rate increases,” while saying, “US inflation could get worse before it gets better.”
On the other hand, UK PM Johnson’s cabinet reshuffle raised doubts over his political power despite suggesting faster Brexit progress. “Boris Johnson put Jacob Rees-Mogg in charge of delivering the benefits of Brexit in a mini-reshuffle of ministers that sought to shore up the U.K. prime minister’s support within the ruling Conservative Party.”
Also portraying the Brexit woes is the latest report from the UK’s Public Accounts Committee (PAC). “Brexit has had a ‘clear impact’ on Britain's trade volumes and new border arrangements have added ‘costs’ to UK business,” said the report.
It should be noted, however, that the “first week-on-week fall in England and Wales (covid-led) deaths so far this year,” per The Guardian keeps buyers hopeful.
Looking forward, GBP/USD traders will pay close attention to the comments from the BOE and the Fed policymakers as inflation is the hot topic. Should BOE’s Phill fail to convince the markets of a recent rate hike, the cable pair may witness a pullback.
Technical analysis
The GBP/USD pair’s successful trading beyond the 100-DMA level near 1.3505 directs the quote towards a three-week-old resistance line near 1.3595.
- USD/INR reverses Tuesday’s rebound from weekly bottom, remains inside short-term trading range.
- Bullish divergence on RSI challenges monthly support break ahead of Thursday’s key RBI meeting.
USD/INR takes a U-turn from the weekly top, refreshing intraday low near 74.67 during Wednesday’s Asian session.
In doing so, the Indian rupee (INR) pair cheers late January’s downside break of an upward sloping support line, now resistance near 75.35 by the pres time.
However, bullish RSI divergence and a slow grind between the 50-SMA and 200-SMA challenge USD/INR traders.
That said, the USD/INR pair traders need to overcome the immediate 74.75-50 trading range to please momentum traders.
Though, higher-long on RSI and prices test could test USD/INR bears below 74.50 support level around the 74.00 threshold.
On the flip side, a clear upside break of 74.75 will direct the quote towards the support-turned-resistance line of 75.35.
Following that, USD/INR bulls may need validation from the 61.8% Fibonacci retracement of December-January moves, around 75.50, before eyeing the 76.00 round figure.
USD/INR: Four-hour chart
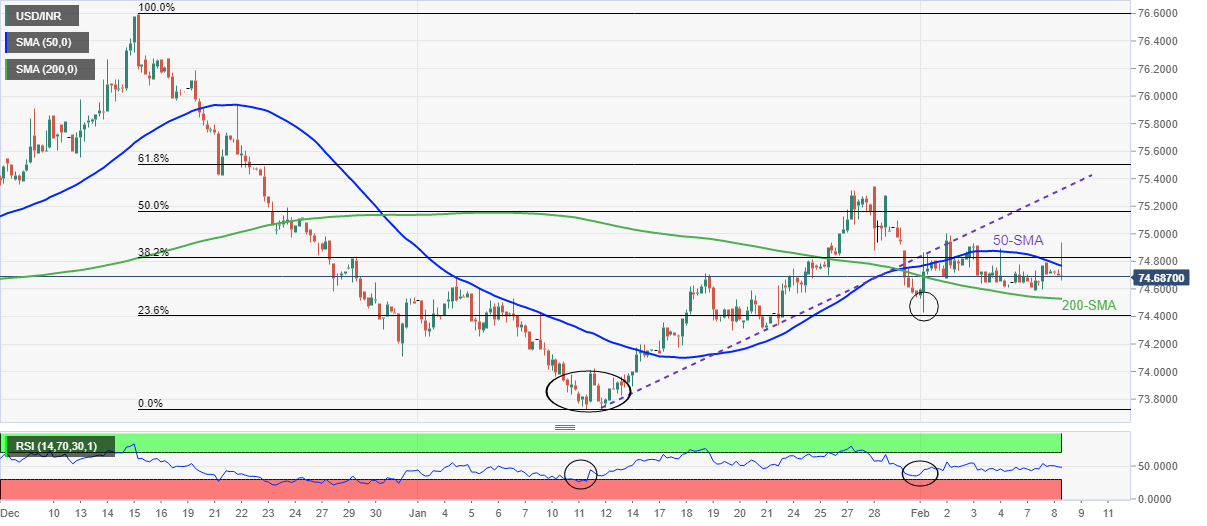
Trend: Sideways
- AUD/USD bulls stay in charge but face a wall of resistance.
- The US CPI data this week will be key.
AUD/USD is inching higher on Wednesday in Asia. At 0.7158, the pair is up 0.16% after climbing from a low of 0.7142 to a high of 0.7159. This follows an overnight session where the AUD drifted sideways in a choppy day as risk assets digested fresh multi-year highs for US yields ahead of US CPI tomorrow.
Nevertheless, The Australian and New Zealand dollars are better bid today as investors priced in the risk of more aggressive action from a chorus of central banks, sending local bond yields to three-year peaks. Yields on Aussie 10-years have surged 25 basis points in four sessions to hit 2.10%, and briefly reached their highest since March 2019 at 2.157%.
As for the US curve and US dollar, the 10-year Treasury yield surged as high as 1.97% on Tuesday for the first time since Nov. 2019. The yield on the two-year note, which is more sensitive to interest rate expectations, reached 1.347 for the first time since February 2020.
Markets are pricing in more than a 70% chance of a 25 basis point hike and a nearly 30% chance for a 50 basis point hike when US policymakers meet in March, according to CME's FedWatch Tool, as Reuters reported in a note earlier today. The dollar index (DXY) has also edged 0.02% higher to 95.614, after jumping from the 2-1/2-week low of 95.136 reached Friday. It touched the highest since June 2020 at 97.441 at the end of last month.
Meanwhile, net AUD short positions declined for the third week. They remain elevated despite a dovish tilt from the RBA. However, in the spot market, markets have moved to price in more moves by the RBA. Reuters reports that a ''first move to 0.25% is implied by June, while in the past week futures have added in a fifth hike for this year to reach 1.25%. Further increases to 2.5% are priced in by July 2023.''
''We think RBA is closer to their inflation objectives and could well afford to signal a more hawkish stance given the recent better data outturns,'' analysts at TD Securities argued.
AUD/USD technical analysis
As per the new York session's analysis, AUD/USD Price Analysis: Bears could start to emerge soon, eyes on the H1 0.7105 swing lows, the bulls are coming up for air but will need to break through some heavy volumes into the 0.7180 area and overcome another critical daily resistance:
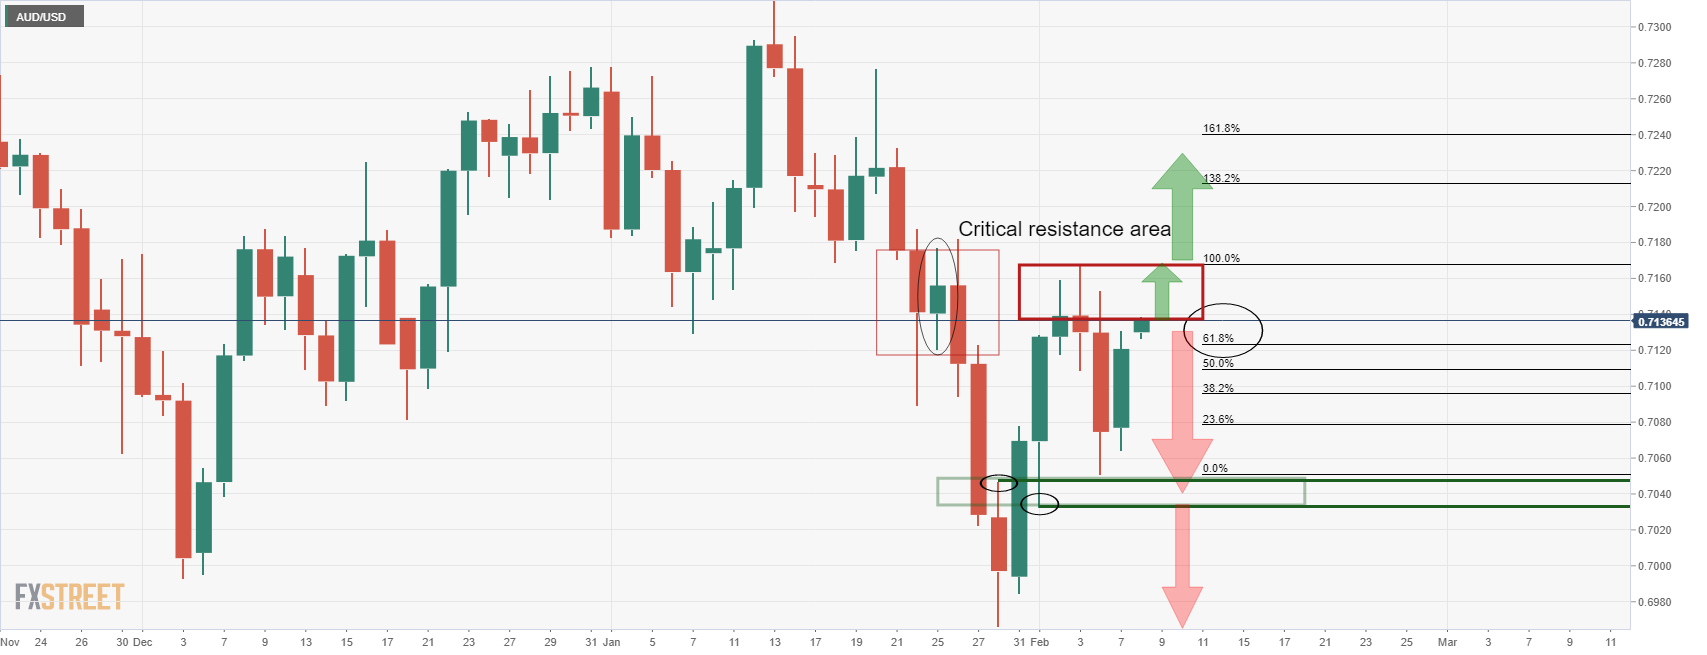
From an hourly perspective:
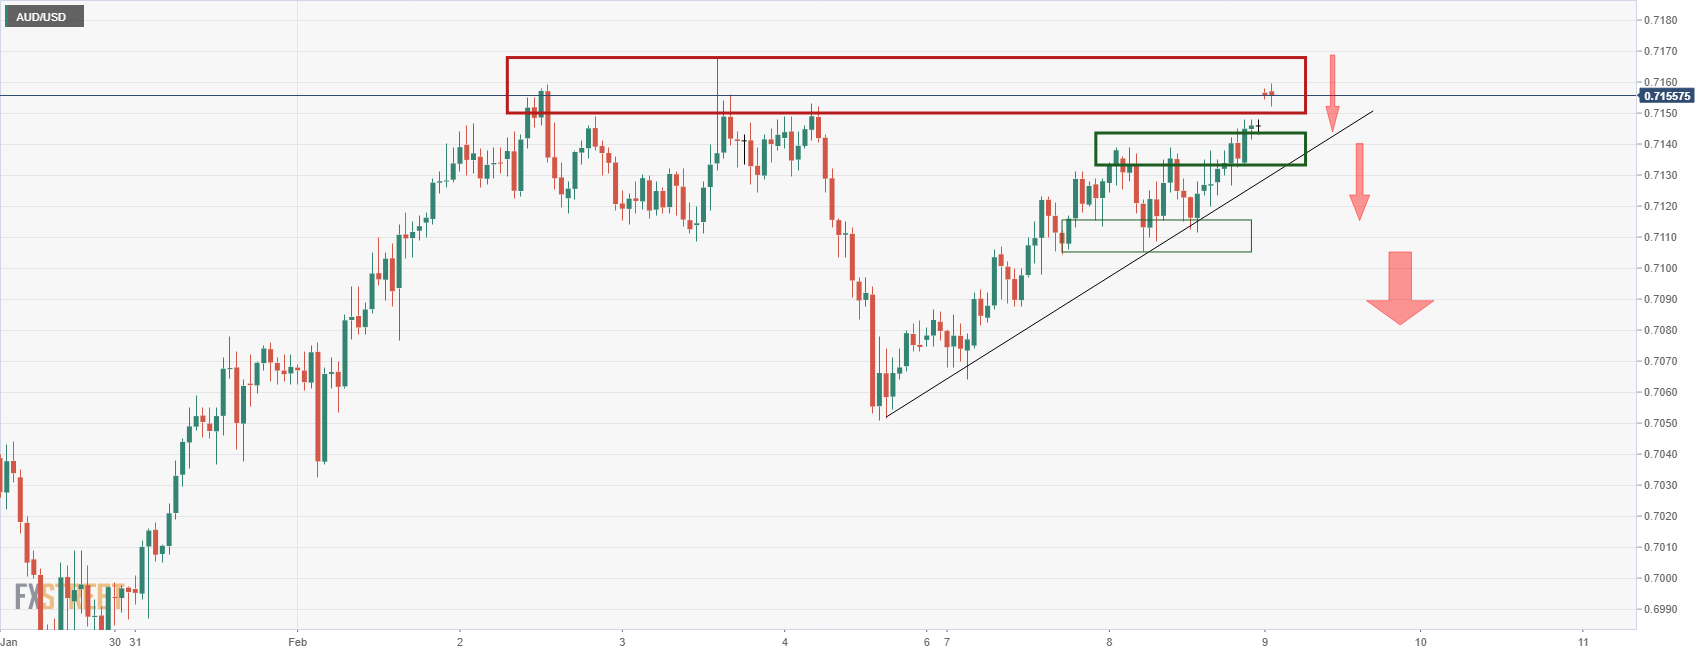
China won't see capital outflow even though the US Federal Reserve (Fed) is more likely to raise interest rate starting in March, the Economic Information Daily reported, citing analysts.
Key takeaways
“The yuan has stayed strong and the higher interest rate offered by China will prevent an exodus of foreign capital.”
“Yuan assets are still attractive as they are more independent from other global markets, offering investors an option to diversify risks.”
“China's higher economic growth and supply chain advantage as well as the financial market opening will help keep capital movement stable.”
Related reads
- China falls short of trade-deal purchase commitments with the US
- China has more policies in reserve to support growth – Securities journal
- GBP/JPY consolidates the previous day’s gains around three-week top as yields ease from 2.5-year high.
- Brexit, political jitters in the UK joins Japan’s covid woes to challenge short-term pair moves.
- Comments from BOE Chief Economist Phill, market’s anxiety ahead of US CPI should be observed.
GBP/JPY pares weekly gains to 156.50 during a sluggish Asian session on Wednesday.
The cross-currency pair’s latest moves could be linked to the retreat in the global Treasury yields and market anxiety ahead of Thursday’s US inflation data, as well as the UK politics.
US 10-year Treasury yields jumped to the highest levels since July 2019 the previous day before recently easing to 1.945%. The bond coupon eased even after San Francisco Fed President Mary Daly favored the March rate hike in her latest speech. The policymaker additionally mentioned, “Fed can't be overly aggressive on rate increases,” while saying, “US inflation could get worse before it gets better.”
Elsewhere, the looming risk of a Russian invasion of Ukraine and the US-China trade tussles join Brexit and political woes in the UK to challenge the GBP/JPY moves. On the same line were covid fears in Japan.
Kyodo News said, “Tokyo and 12 other prefectures currently under a COVID-19 quasi-state of emergency have requested an extension to the measure set to end this weekend, the prefectural governments said Tuesday.”
On the other hand, UK PM Johnson’s cabinet reshuffle raised doubts even as Bloomberg said, “put Jacob Rees-Mogg in charge of delivering the benefits of Brexit in a mini-reshuffle of ministers that sought to shore up the U.K. prime minister’s support within the ruling Conservative Party.”
It’s worth noting that the latest report from the UK’s Public Accounts Committee (PAC) highlights Brexit disappointment ahead of the key talks on Friday. “Brexit has had a ‘clear impact’ on Britain's trade volumes and new border arrangements have added ‘costs’ to UK business,” said the report.
Moving on, a speech from Bank of England (BOE) Chief Economist Huw Pil will be crucial for short-term GBP/JPY moves while major attention will be given to the yields and gilts, with eyes on the US Consumer Price Index (CPI) for January.
Technical analysis
Unless declining back below a convergence of the 10-DMA and 21-DMA, around 155.50, GBP/JPY buyers remain hopeful to attack a downward sloping resistance line from late October, near 157.05 at the latest.
| Raw materials | Closed | Change, % |
|---|---|---|
| Brent | 91.21 | -1.55 |
| Silver | 23.188 | 0.76 |
| Gold | 1826.04 | 0.26 |
| Palladium | 2243.26 | -0.84 |
Analysts at Goldman Sachs note that the prospect of agreement on Iran’s nuclear deal is a coin toss, which sees Brent oil if sanctions are lifted this year.
Key quotes
“We currently only expect a 50% probability of a deal in Dec-22 and a 50% probability that Iran will remain sanctioned through 2023.”
“A deal with Iran next month that would allow for a 3Q22 return of Iranian volumes to the market would represent up to $7/bbl downside risk relative to our above-consensus $105/bbl 2023 Brent forecast.”
But “would not derail our view for structurally higher prices.”
- WTI crude oil bounces off weekly low towards $89.00 on geopolitics, API inventory data
- Silver prices take the bids to refresh multi-day highs during four-day uptrend.
- Clear upside past 100-DMA joins recently improving MACD to favor buyers.
- Key Fibonacci retracement levels may test bulls on the way to 200-DMA.
- Monthly horizontal support becomes key support to watch.
Silver (XAG/USD) extends the previous three-day run-up towards $23.50 during Wednesday’s Asian session. That said, the quote prints 0.25% intraday gains with $23.26 as a price by the press time.
The bright metal’s latest rise could be linked to the 100-DMA breakout and the MACD conditions that tease bulls.
Moving on, the 50% and 61.8% Fibonacci retracement (Fibo.) levels of November-December 2021 declines, respectively around $23.40 and $23.90, could challenge the XAG/USD buyers.
However, the $24.00 threshold and the 200-DMA level of $24.40 will be tough nuts to crack for the commodity bulls.
Alternatively, pullback moves may remain elusive beyond the 100-DMA level of $23.20, a break of which will direct silver prices towards the 38.2% and 23.6% Fibo. levels, close to $22.90 and $22.35 in that order.
Following that, XAG/USD bears will have a tough time breaking a one-month-old horizontal support zone around $22.00.
Silver: Daily chart
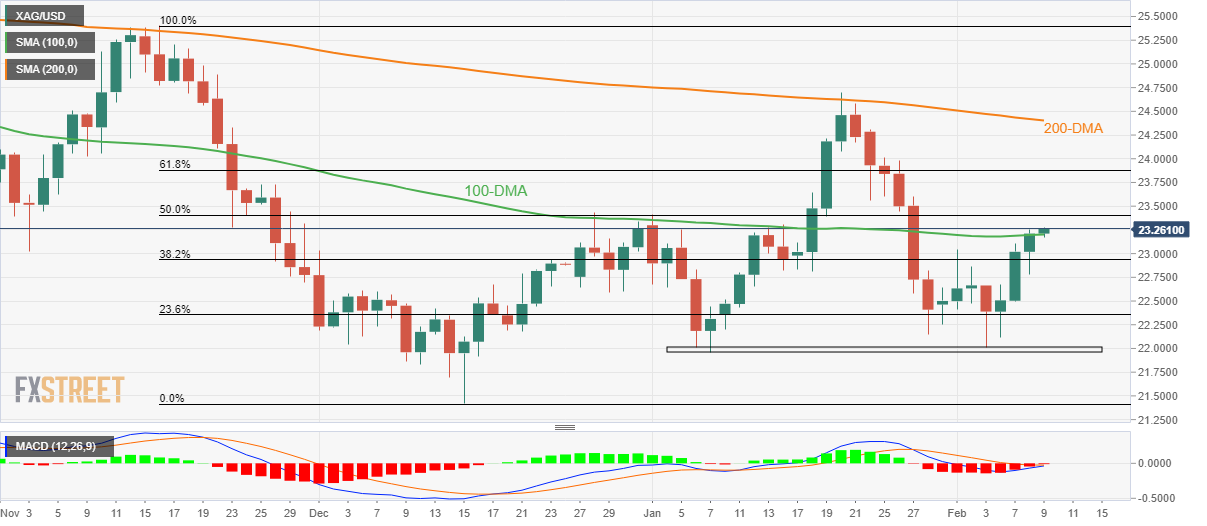
Trend: Further upside expected
- Bears will be keen to pile in at a discount between 1.1450/80.
- The daily 38.2% ratio aligns with the old resistance structure where bulls could be lurking.
As per the prior analysis from the New York session, EUR/USD Price Analysis: Bears challenge bulls and are moving in, 1.1330/50's eyed, the price is meeting a critical resistance area and the bias is with the bears:
EUR/USD H1 chart
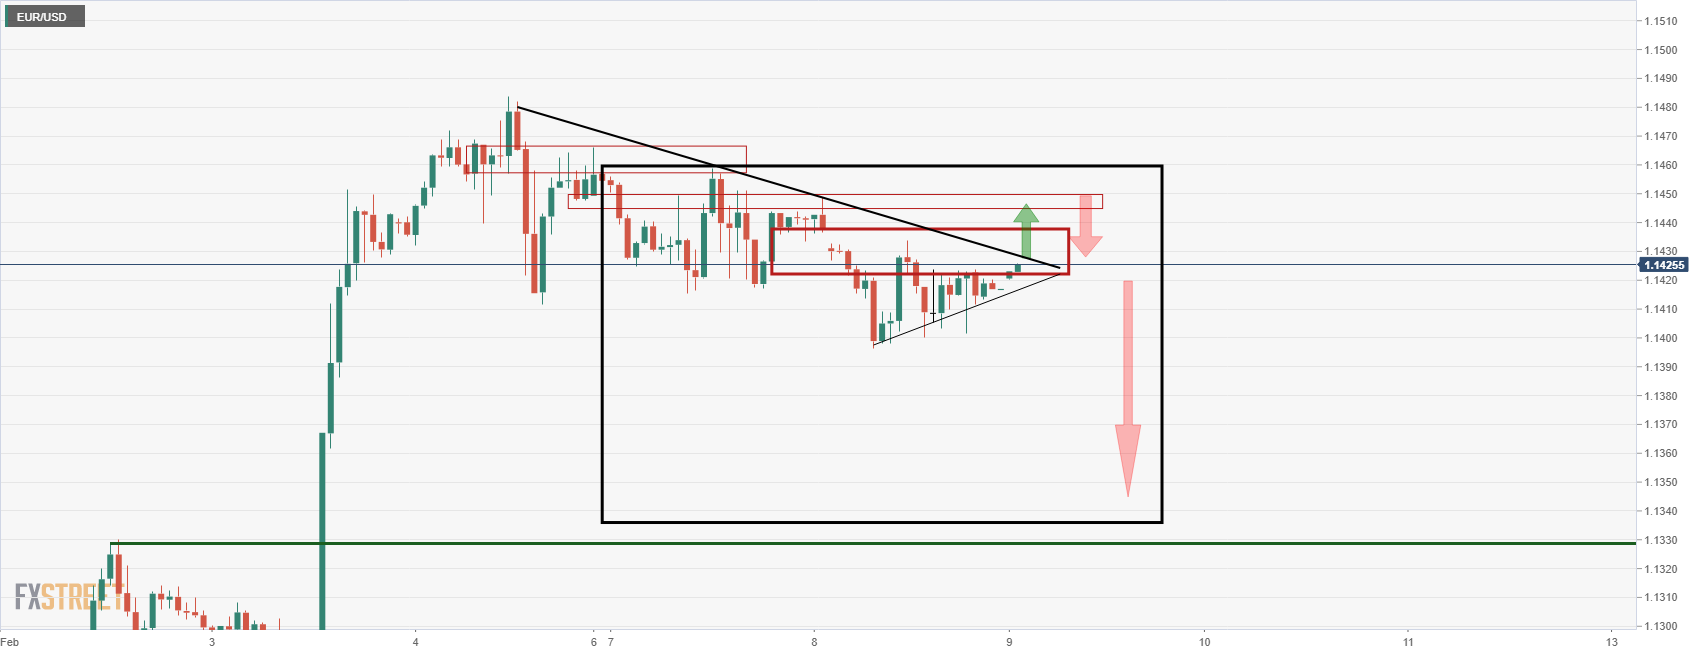
The bulls are taking the lead at the moment, but they are up against a wall of resistance, not least, the hourly chart's descending trendline as illustrated above. Even on a break of there, the bulls will likely run into supply between the 1.1450's and 1.1480's.
EUR/USD daily chart
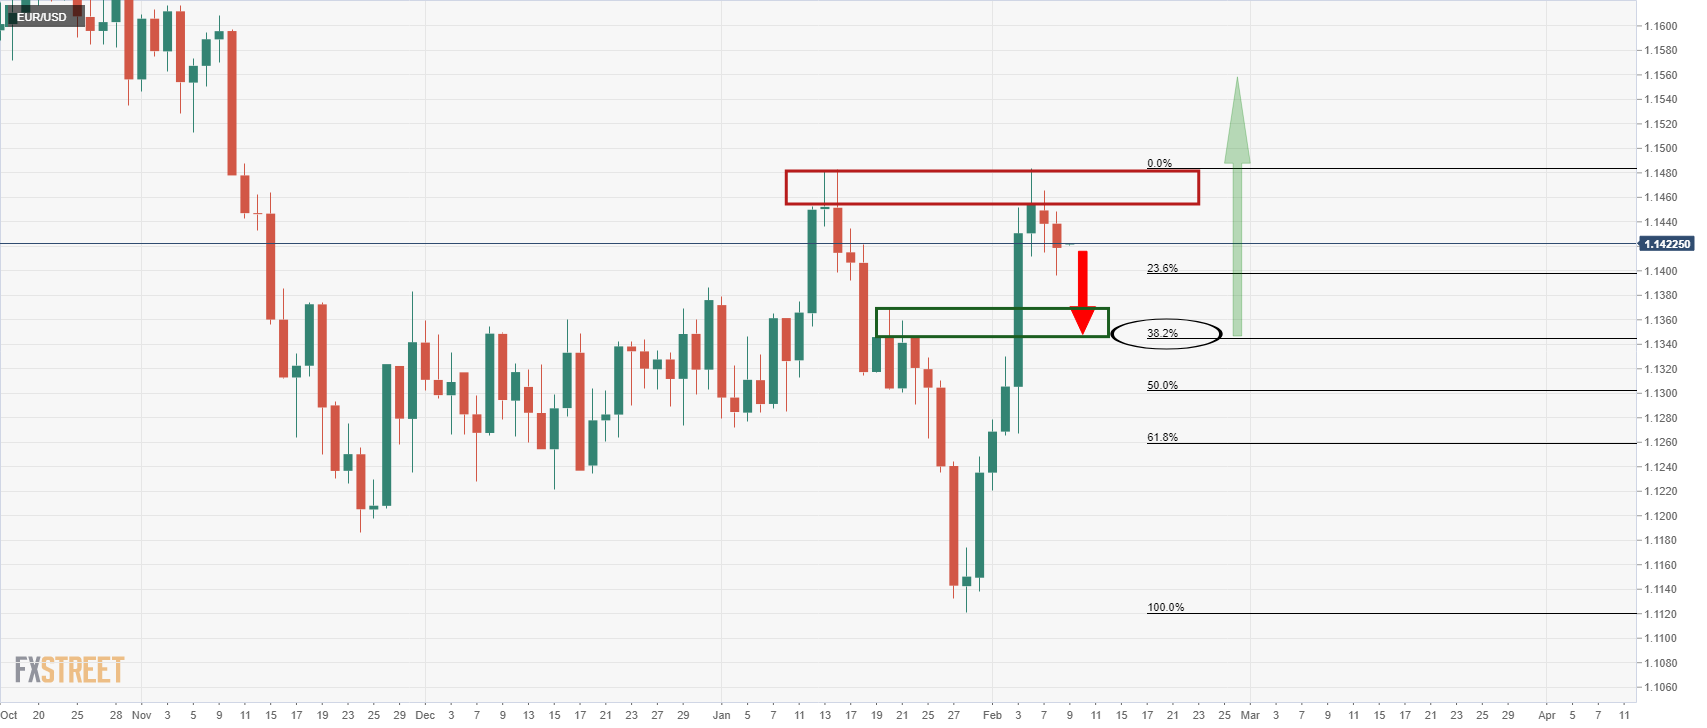
From a daily perspective, the correction has some way to go still and the 38.2% ratio aligns with the old resistance structure, expected to draw in the price for a test of bidding appetite.
Amid tensions resurfacing between the US and China on the trade and diplomatic front, a Bloomberg News analysis of data shared by the Commerce Department’s Census Bureau on Tuesday showed that Beijing fell over 33% short of its purchase commitments for goods in the trade deal with Washington.
Key Details
“The dragon nation bought 62.9% of the extra goods that it had promised as part of $200 billion in purchases in the so-called phase one deal in the two years through the end of 2021.”
“Energy was the area where China most missed its targets.”
China “was closest to achieving its targets for agricultural goods, meeting about 83% of its commitments.”
“In manufacturing goods, the nation bought less than 65% of the amount promised.”
China had pledged to buy the extra $200 billion in US agriculture, energy, manufactured goods and services over the 2017 level in the two years through the end of 2021.
Separately, Bob Menendez, the chair of the Senate Foreign Relations Committee said Tuesday, the US should sanction China over its treatment of the Uyghur Muslims.
Key quotes
“It is unconscionable that in the in the 21st century, we have concentration camps anywhere in the world.”
“And what is happening to the Uyghurs -- ethnic Muslims in China -- is outrageous.”
“The Chinese government’s treatment of the Uyghurs in the Xinjiang region “needs the condemnation, not just of the United States, but of the rest of the world and should be sanctioned.”
“Beijing’s treatment of Tibet, Hong Kong, and “threats to Taiwan” are behavior that could be sanctioned.”
Market reaction
Despite the latest signs of discomfort once again between the world’s two largest economies, AUD/USD is sustaining its rebound above 0.7150 while the S&P 500 futures advance 0.17% on the day.
The aussie was last seen trading at 0.7157, up 0.18% so far.
- US 10-year Treasury yields retreat from July 2019 peak, S&P 500 Futures track Wall Street gains.
- Covid optimism joins comments from Fed’s Daly to trigger market consolidation.
- Traders remain cautious ahead of Thursday’s US inflation data due to Fed’s rate hike fears.
Market sentiment struggles to carry the recent momentum during the mid-Asian session on Wednesday.
That said, the yields retreat and the S&P 500 Futures also struggle to extend early-day gains amid mixed concerns over reflation fears, not to forget trade/political woes.
San Francisco Fed President Mary Daly favored the March rate hike in her latest speech. The policymaker additionally mentioned, “Fed can't be overly aggressive on rate increases,” while saying, “US inflation could get worse before it gets better.”
It’s worth noting that the US 10-year Treasury yields jumped to the highest levels since July 2019 the previous day before recently easing to 1.945%. Further, the S&P 500 Futures print mild gains around 4,520 but struggles of late.
Also contributing to the gold’s upside momentum is the looming risk of a Russian invasion of Ukraine and the US-China trade tussles. On the same line are the latest comments from the Chinese Communist Party (CCP) that was quoted in the South China Morning Post (SCMP) as saying, “China should ‘support and guide’ the healthy development of capital, and prevent the ‘barbaric growth of capital.’”
Earlier in the day, US President’s Chief Medical Adviser Dr. Anthony Fauci said, per the Financial Times (FT), “The US is heading out of the ‘full-blown’ pandemic phase of Covid-19.”
It’s worth noting that worsening virus woes in Japan and Hong Kong added to the challenges for market sentiment.
Looking forward, comments from Fed Cleveland President Loretta J. Mester may offer intermediate directions ahead of Thursday’s US CPI data. Firmer inflation figures will reignite Fed rate-hike concerns and may add strength to the US Treasury yields, which in turn could challenge riskier assets like equities, commodities and Antipodeans.
Read: Currencies range bound as bond prices continue to rise
The Bank of Japan's board member Seiji Nakamura said that Japan's economy is showing clearer signs of a pick-up and it is to be expected for Japan's economy to recover ahead as the impact of a pandemic and supply constraints gradually subside.
The board member said Japan's consumer inflation is likely to accelerate as the impact of cellphone fee cuts drops off.
However, it was also stated that the BoJ will patiently maintain powerful monetary easing to achieve 2% inflation target.
Additional comments
BoJ ready to take appropriate steps as needed with eye on impact of pandemic on economy.
Investment to cope with climate change among small, medium-sized firms may increase more than expected.
- DXY fades corrective pullback from three-week low, consolidates biggest daily gains in a fortnight.
- Bearish chart pattern, steady RSI favor sellers to aim for further downside.
- 61.8% Fibonacci retracement, 200-SMA adds to the upside filters.
US Dollar Index (DXY) refreshes intraday low around 95.60 while paring the previous day’s gains inside a rising wedge bearish chart pattern amid Wednesday’s Asian session.
That said, steady RSI and sustained trading below the 200-SMA also keep DXY bears hopeful.
However, a clear downside break of the stated wedge’s support line, near 95.55 at the latest, becomes necessary for the sellers to tighten grips.
Following that, the previous resistance line from late January, near 95.20, may offer an intermediate halt during the fall targeting the last month’s bottom surrounding 94.60.
Meanwhile, the corrective pullback may initially attack 61.8% Fibonacci retracement of January’s upside near 95.70 before challenging the wedge’s resistance line near 95.80.
Also challenging short-term DXY upside is the 200-SMA level of 95.91, a break of which will recall bulls targeting a horizontal area from January 25, near 96.25.
DXY: Four-hour chart
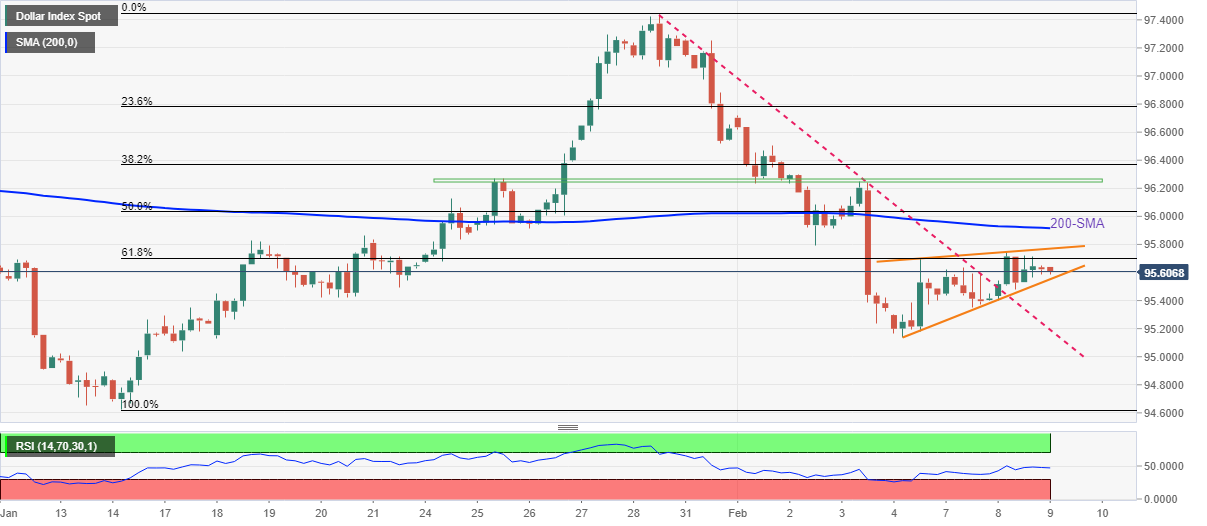
Trend: Further weakness expected
| Time | Country | Event | Period | Previous value | Forecast |
|---|---|---|---|---|---|
| 06:00 (GMT) | Japan | Prelim Machine Tool Orders, y/y | January | 40.5% | |
| 07:00 (GMT) | Germany | Current Account | December | 18.9 | |
| 07:00 (GMT) | Germany | Trade Balance (non s.a.), bln | December | 12 | |
| 15:00 (GMT) | U.S. | Wholesale Inventories | December | 1.4% | 2.1% |
| 15:30 (GMT) | U.S. | Crude Oil Inventories | February | -1.046 | 0.369 |
| 17:00 (GMT) | U.S. | FOMC Member Mester Speaks | |||
| 17:00 (GMT) | Canada | BOC Gov Tiff Macklem Speaks |
In recent trade today, the People’s Bank of China (PBOC) set the yuan (CNY) at 6.3653 vs. the estimate of 6.3654, the previous 6.3569 and last close of 6.3660.
About the fix
China maintains strict control of the yuan’s rate on the mainland.
The onshore yuan (CNY) differs from the offshore one (CNH) in trading restrictions, this last one is not as tightly controlled.
Each morning, the People’s Bank of China (PBOC) sets a so-called daily midpoint fix, based on the yuan’s previous day closing level and quotations taken from the inter-bank dealer.
- USD/JPY fades bounce off intraday low, seesaws around one-month-old horizontal resistance.
- Bond yields struggle to keep recent rally as inflation-linked anxiety escalates, Fed’s Daly favor March rate hike.
- Covid conditions worsen in Japan, BOJ’s easy money policies doubted amid reflation fears.
- Fedspeak, risk catalyst may offer intermediate moves ahead of US CPI.
USD/JPY struggles to carry the previous day’s biggest daily jump as short-term key resistance challenge bulls around 114.50.
The yen pair jumped the most in over a week the previous day as Treasury yields rallied across the board. However, mixed comments from US Federal Reserve (Fed) officials and anxiety over inflation, not to forget trade/political fears, seem to challenge the USD/JPY bulls of late.
San Francisco Fed President Mary Daly favored the March rate hike in her latest speech. However, the Fed policymaker also said, “Fed can't be overly aggressive on rate increases.”
Following the speech, the US 10-year Treasury yields retreat from a three-year high while the bound coupons in Japan also eased. “The rising tide of worldwide yields has reached Japan, pushing 5-year and 10-year rates to the highest levels since 2016. The moves suggest that sooner or later the central bank will have to back up its message with actions instead of words,” Bloomberg said previously.
Also contributing to the gold’s upside momentum is the looming risk of a Russian invasion of Ukraine and the US-China trade tussles. On the same line are the latest comments from the Chinese Communist Party (CCP) that was quoted in the South China Morning Post (SCMP) as saying, “China should ‘support and guide’ the healthy development of capital, and prevent the ‘barbaric growth of capital.’”
Earlier in the day, US President’s Chief Medical Adviser Dr. Anthony Fauci said, per the Financial Times (FT), “The US is heading out of the ‘full-blown’ pandemic phase of Covid-19.”
At home, Kyodo News said, “Tokyo and 12 other prefectures currently under a COVID-19 quasi-state of emergency have requested an extension to the measure set to end this weekend, the prefectural governments said Tuesday.”
Global markets turn anxious after the latest risk-on mood as traders await Thursday’s US Consumer Price Index (CPI) data.
Read: Higher energy prices will make inflation spin out of control
Technical analysis
Sustained trading beyond the 12-day-old ascending trend line and 21-DMA, near 114.65 at the latest, joins bullish MACD signals to favor buyers around one-month-old horizontal resistance near 115.70.
San Francisco Federal Reserve Bank President Mary Daly said on Tuesday that ''inflation in the United States could get worse before it gets better, but it will get better.''
In an interview with CNN, Daly also said she doesn't expect the inflation rate to decline to 2% by the end of the year.
She said that she is in favour of raising rates in March but argued that the Fed cannot be overly aggressive on rate increases.
The comments have firmed hawkish sentiment around the Fed and the US dollar stands to benefit in a pre-covid era:
-
Post-covid era emerges, but markets already knew it
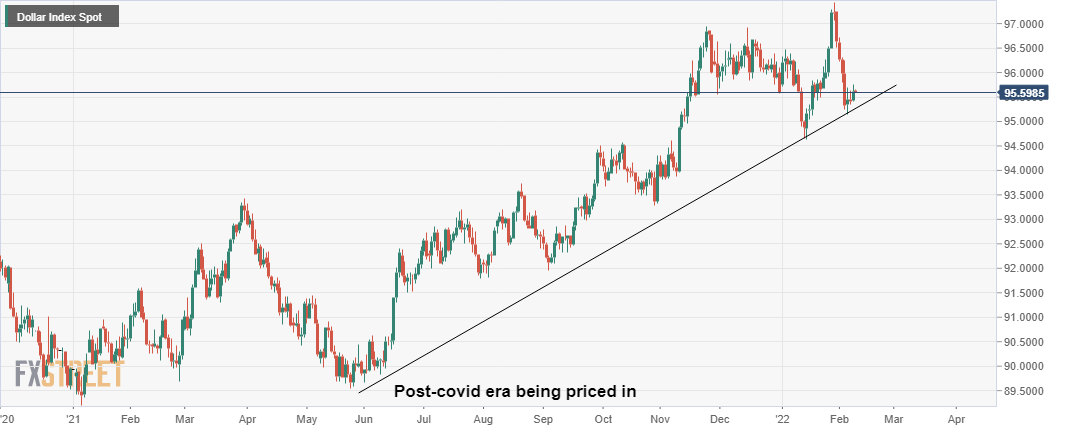
There is a Coronavirus headline doing the rounds in Asia that at first glance, the retail forex market might want to jump into pro-risk apatite currencies, such as the British pound or Aussie dollar:
‘Full blown’ pandemic phase of covid nearly over in the US, declares Fauci - FT
However, this has failed to move the needle in financial markets. The Aussie is flat, GBP/USD also but at least gold is moving in the right direction, shedding bids back towards the New York early morning resistance.
The markets have been trading as if it were a post-covid era ever since the Federal Reserve started to hint at the withdrawal of monetary policy support in the mid to latter part of 2021. The Delta variant did not faze the US central bank's chairman, Jerome Powell, despite the quadrupling of daily coronavirus infections in the summertime.
Instead, both the markets and the Fed were optimistic with the ''progress on vaccinations and strong policy support'', as well as the ''indicators of economic activity and employment'' that had ''continued to strengthen," quoting what the central bank had said in its 2021 June statement.
Nevertheless, these are the type of headlines that will double down the prospects of a faster pace of tightening and potentially play out in robust yields which would be expected to underpin the greenback for the foreseeable future.
US dollar daily chart
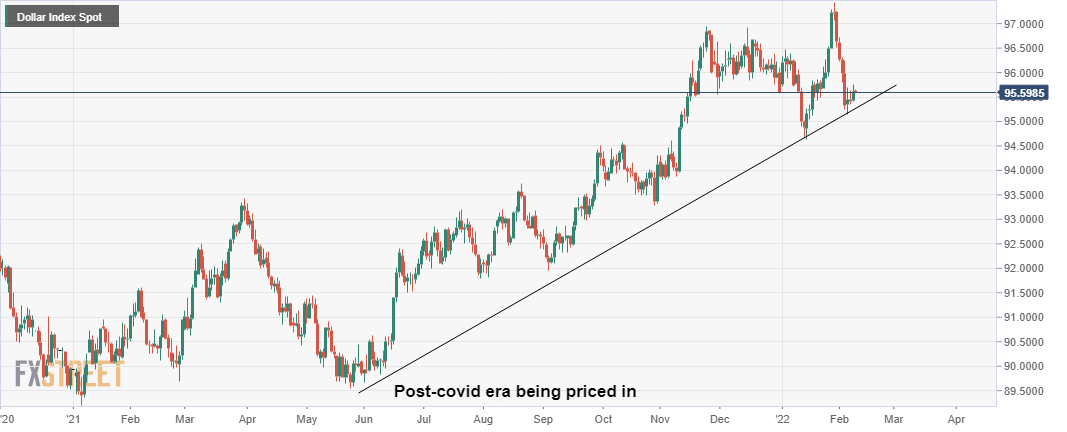
- Gold retreats from two-week high, challenges three-day uptrend amid quiet session.
- Mixed concerns over inflation, Fed’s next move and geopolitics direct traders towards traditional safe-haven.
- US CPI becomes crucial amid a mismatch between inflation expectations and Fed rate-hike expectations.
- Gold Price Forecast: Bulls defying a critical Fibonacci resistance level
Gold (XAU/USD) buyers seem running out of steam after three consecutive days of the uptrend to the fortnight high, easing to $1,825 during Wednesday’s Asian session.
In doing so, the yellow metal portrays the market’s anxiety ahead of the key US Consumer Price Index (CPI) data amid multi-month high Treasury yields and sluggish US inflation expectations.
The benchmark US 10-year Treasury yields stay firmer around 1.956% following the previous day’s run-up to the highest levels since late 2019. On the contrary, US inflation expectations, as measured by the 10-year breakeven inflation rate per the St. Louis Federal Reserve (FRED) data, remain sluggish around a three-month low flashed during late January, recently around 2.42%.
That said, global traders remain anxious over the January inflation figures following the Fed’s upbeat performance. However, another player in the bull’s league, namely the European Central Bank (ECB), tried placating the reflation fears of late.
Also contributing to the gold’s upside momentum is the looming risk of a Russian invasion of Ukraine and the US-China trade tussles. On the same line are the latest comments from the Chinese Communist Party (CCP) that was quoted in the South China Morning Post (SCMP) as saying, “China should ‘support and guide’ the healthy development of capital, and prevent the ‘barbaric growth of capital.’”
It’s worth observing that the positive comments from Dr. Anthony Fauci, a leading US health expert, underpin the market’s optimism. However, reflation fears get the first hand charge and challenge covid-led optimism to favor gold prices. “The US is heading out of the “full-blown” pandemic phase of Covid-19, the US President’s Chief Medical Adviser said,” per the Financial Times (FT).
Amid these plays, Wall Street offered another positive day and the S&P 500 Futures also trade positive at the latest but the US Dollar Index (DXY) struggles to extend recovery moves.
Looking forward, risk catalysts and Fedspeak will direct short-term XAU/USD moves ahead of Thursday’s US inflation.
Technical analysis
Gold stays firmer inside the weekly bullish trend channel, recently easing from the top amid firmer RSI and MACD signals. Also favoring the upside bias is the metal’s successful trading beyond the 100 and 200 SMAs.
However, the previous support line from December 2021 precedes the stated channel’s upper line to challenge immediate advances of gold prices around $1,825-27.
Following that, a five-week-old horizontal area surrounding $1,829-32 will be a tough nut to crack for gold buyers, a break of which will open doors for a rally towards January’s peak surrounding $1,853.
Meanwhile, the 200-SMA and 100-SMA, respectively around $1,817 and $1,814, restrict short-term declines of the precious metal before directing gold sellers toward the channel’s support line, around $1,814 by the press time.
It’s worth noting, however, that gold’s downside past $1,814 will make it vulnerable to test the previous month’s low near $1,780 with the $1,800 threshold likely acting as an intermediate halt.
Gold: Four-hour chart
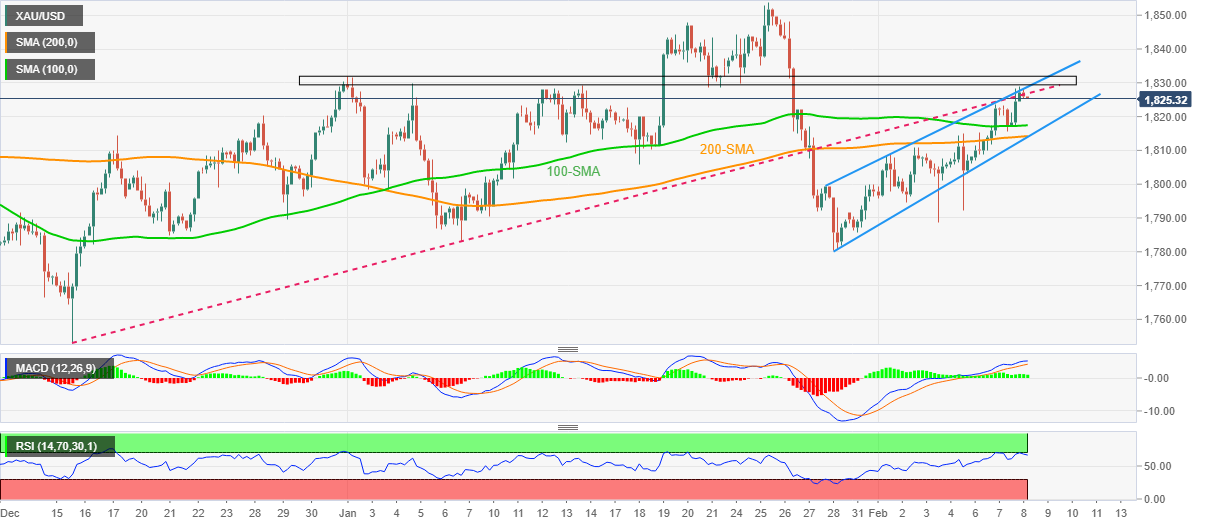
Trend: Further upside expected
- GBP/USD bulls are testing critical resistance.
- A break of the 1.3520's will be significant for the medium term.
GBP/USD is sitting pretty above key technical support across the daily, 4-hour and 1-hour charts. The market structure, however, has something to offer both the bears and the bulls and the following analysis illustrates the bias one way or the other.
GBP/USD daily chart
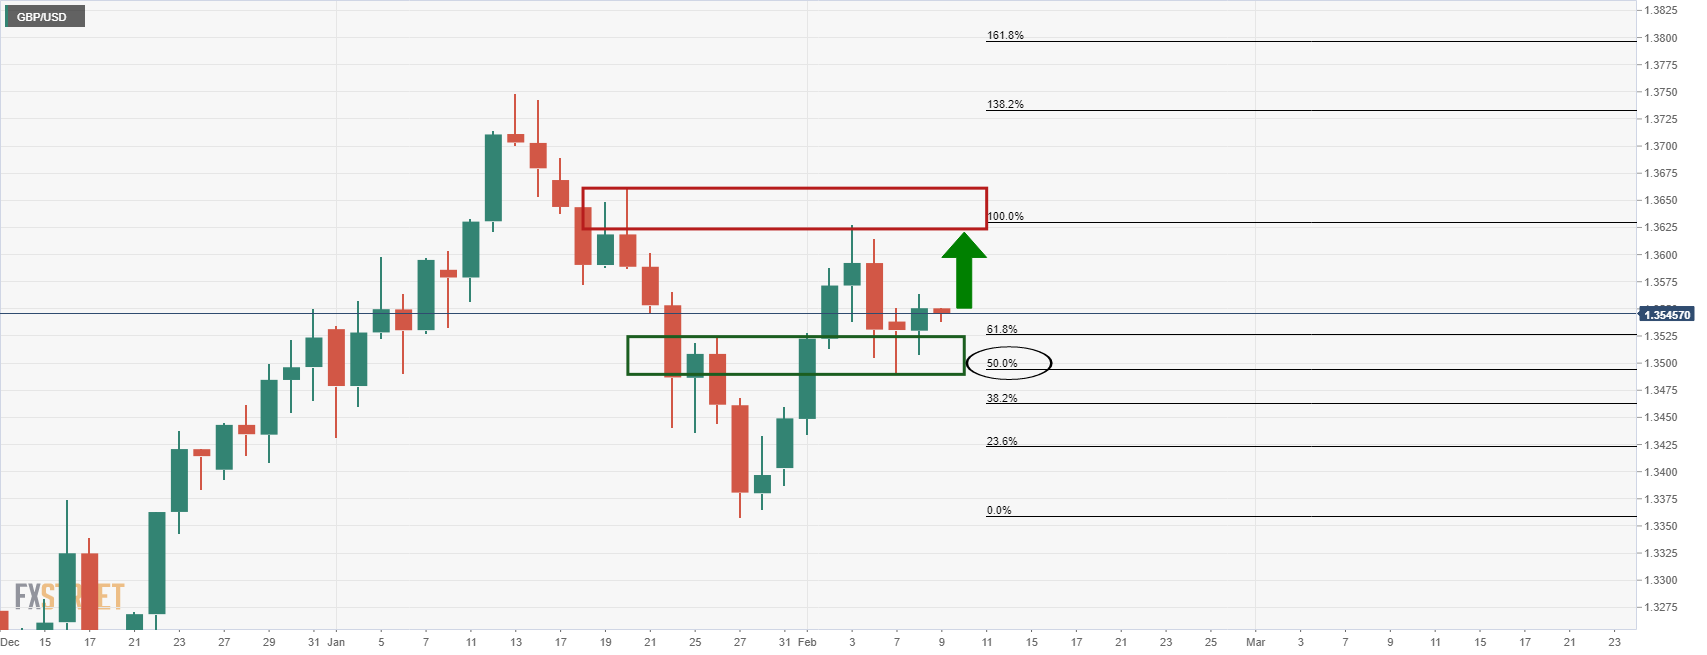
The daily chart shows that the price support at the neckline of the W-formation and after retracement back to the 50% mean reversion level, the bulls have moved back in there is a focus on an extension higher.
GBP/USD 4H chart
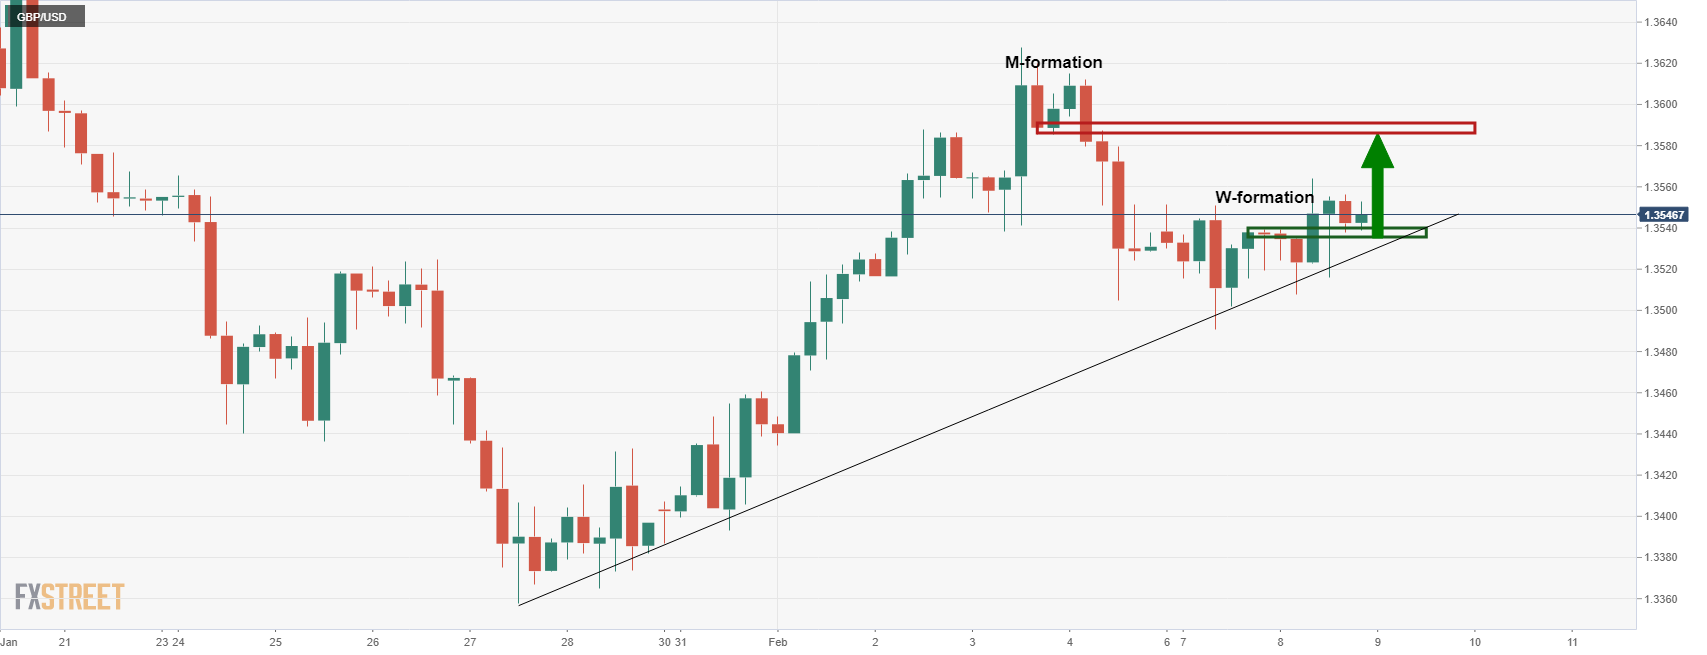
GBP/USD H1 chart
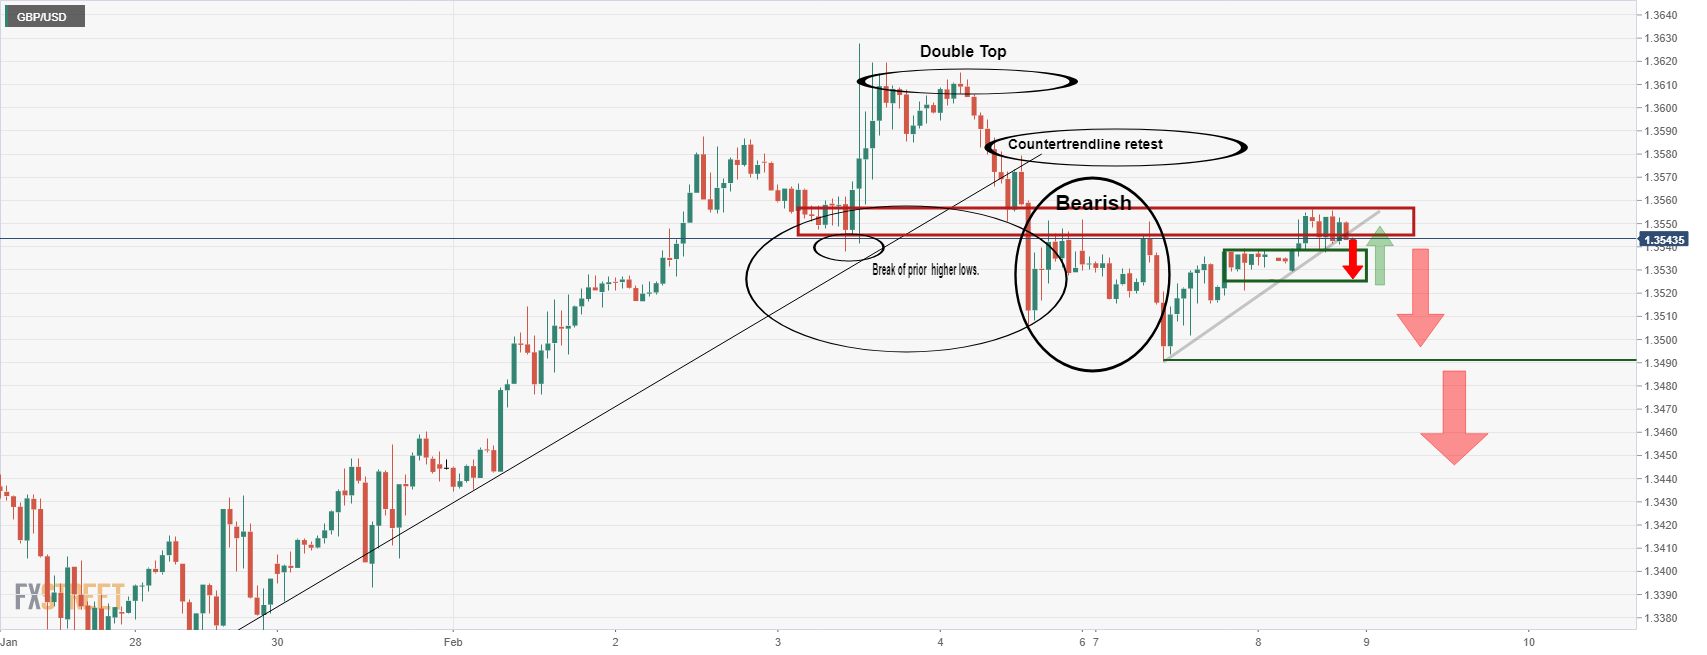
However, from the 1-hour chart, we can see that the price is actually breaking down following the break of the prior higher lows at around 1.3540. The price has since moved back into liquidity near 1.3550's. This could be the ticket for a considerable pivot to the downside and the 1.3520's then the 1.3490's will be eyed.
GBP/USD downside outlook, daily chart
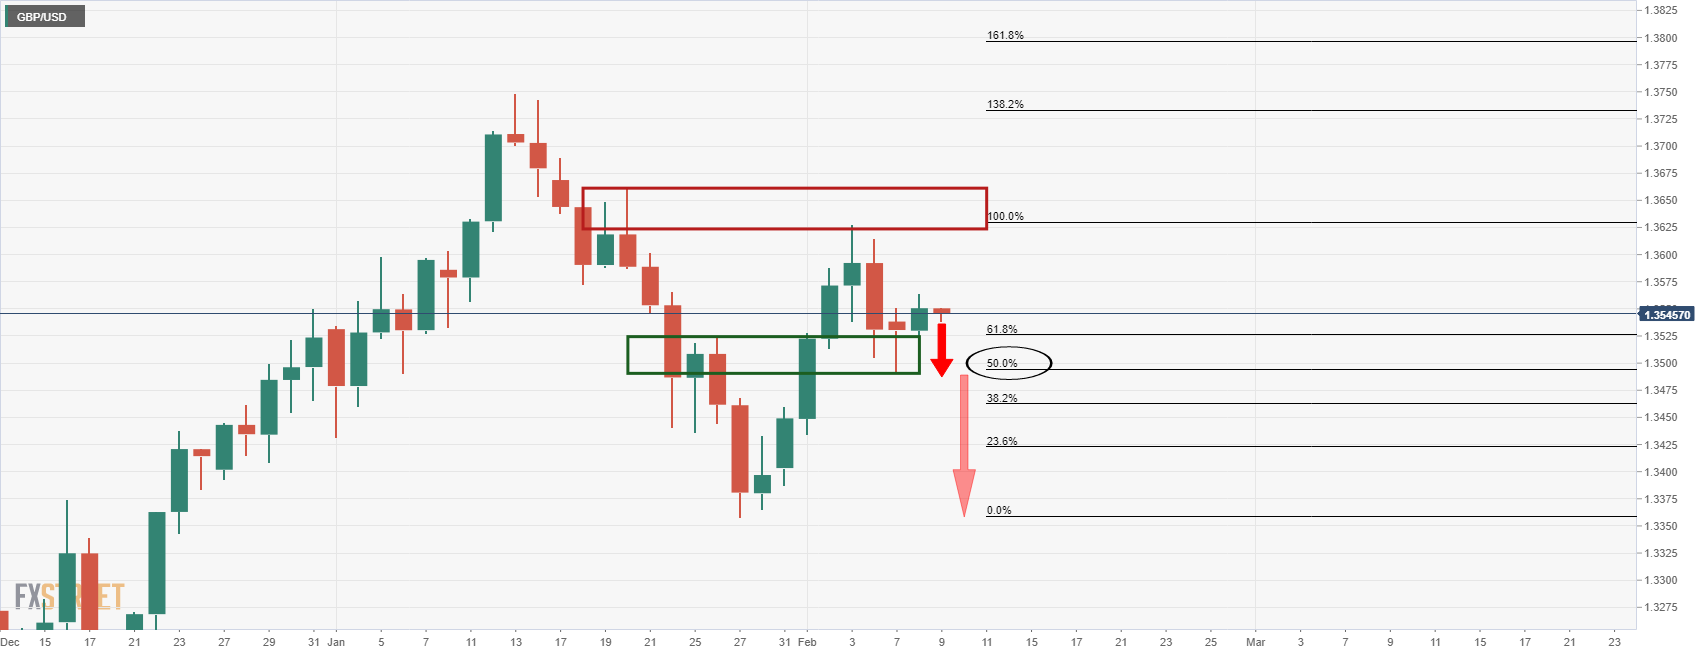
| Pare | Closed | Change, % |
|---|---|---|
| AUDUSD | 0.71466 | 0.28 |
| EURJPY | 131.91 | 0.19 |
| EURUSD | 1.14171 | -0.2 |
| GBPJPY | 156.532 | 0.49 |
| GBPUSD | 1.35465 | 0.09 |
| NZDUSD | 0.66472 | 0.21 |
| USDCAD | 1.27037 | 0.29 |
| USDCHF | 0.92511 | 0.17 |
| USDJPY | 115.541 | 0.42 |
- NZD/USD struggles between monthly and three-week-old descending trend lines.
- Bullish cross of the MACD line, sustained trading above 10-DMA favor buyers.
- Early January lows, 50-DMA could lure bulls, weekly horizontal support limit pullback moves.
NZD/USD bulls fail to cheer the one-month-old trend line breakout near 0.6650 during the third positive day amid Wednesday’s Asian session.
Although bullish MACD signals and clear trading beyond the 10-DMA keeps NZD/USD buyers hopeful, a sustained run-up beyond the descending trend line from January 18, around 0.6655, becomes necessary to justify the recent breakout of the monthly resistance line.
Following that, early January month’s low and 50-DMA, respectively near 0.6735 and 0.6750, will be in focus.
Alternatively, pullback moves remain elusive beyond the resistance-turned-support line near 0.6645.
Also restricting short-term NZD/USD declines is the 10-DMA and one-week-long horizontal area, around 0.6615 and 0.6605, in that order.
To sum up, NZD/USD grinds higher amid a quiet Asian session, with buyers having an upper hand.
NZD/USD: Daily chart
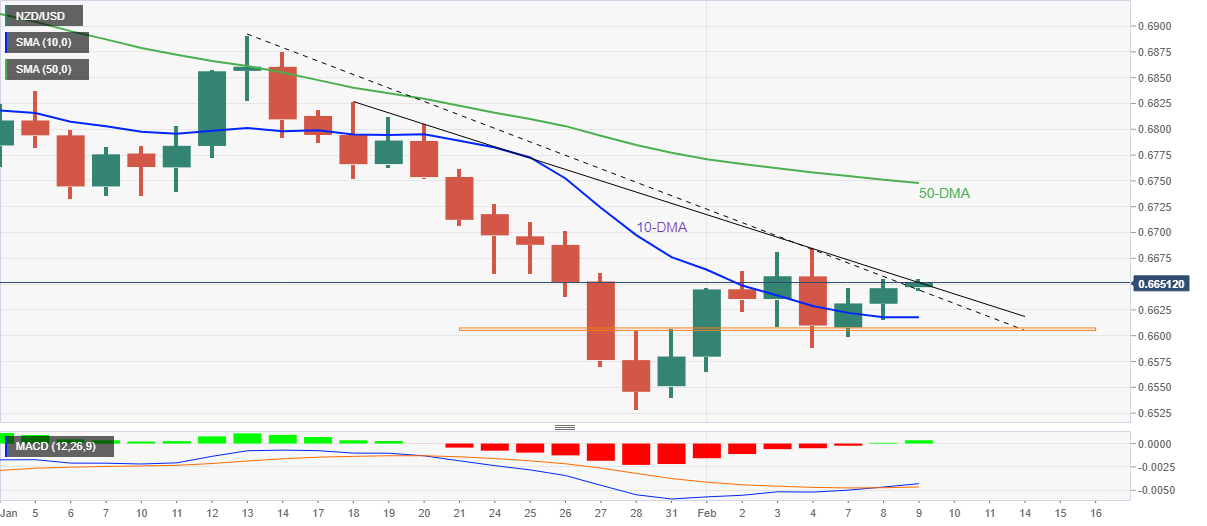
Trend: Further upside expected
© 2000-2024. All rights reserved.
This site is managed by Teletrade D.J. LLC 2351 LLC 2022 (Euro House, Richmond Hill Road, Kingstown, VC0100, St. Vincent and the Grenadines).
The information on this website is for informational purposes only and does not constitute any investment advice.
The company does not serve or provide services to customers who are residents of the US, Canada, Iran, The Democratic People's Republic of Korea, Yemen and FATF blacklisted countries.
Making transactions on financial markets with marginal financial instruments opens up wide possibilities and allows investors who are willing to take risks to earn high profits, carrying a potentially high risk of losses at the same time. Therefore you should responsibly approach the issue of choosing the appropriate investment strategy, taking the available resources into account, before starting trading.
Use of the information: full or partial use of materials from this website must always be referenced to TeleTrade as the source of information. Use of the materials on the Internet must be accompanied by a hyperlink to teletrade.org. Automatic import of materials and information from this website is prohibited.
Please contact our PR department if you have any questions or need assistance at pr@teletrade.global.
