- Analytics
- News and Tools
- Market News
CFD Markets News and Forecasts — 08-05-2024
Japan's top currency diplomat, Masato Kanda, who will instruct the BoJ to intervene, when he judges it necessary, said on Thursday that he will take appropriate action if it’s necessary. However, he declined to comment on foreign exchange (FX) intervention.
Key quotes
“Declines to comment on intervention.”
“Is prepared for currency intervention at any time.”
“Does not comment on intervention speculation.”
“Denies discussing intervention.”
Market reaction
At the time of writing, USD/JPY was trading at 155.57, adding 0.03% on the day.
Japanese Yen FAQs
The Japanese Yen (JPY) is one of the world’s most traded currencies. Its value is broadly determined by the performance of the Japanese economy, but more specifically by the Bank of Japan’s policy, the differential between Japanese and US bond yields, or risk sentiment among traders, among other factors.
One of the Bank of Japan’s mandates is currency control, so its moves are key for the Yen. The BoJ has directly intervened in currency markets sometimes, generally to lower the value of the Yen, although it refrains from doing it often due to political concerns of its main trading partners. The current BoJ ultra-loose monetary policy, based on massive stimulus to the economy, has caused the Yen to depreciate against its main currency peers. This process has exacerbated more recently due to an increasing policy divergence between the Bank of Japan and other main central banks, which have opted to increase interest rates sharply to fight decades-high levels of inflation.
The BoJ’s stance of sticking to ultra-loose monetary policy has led to a widening policy divergence with other central banks, particularly with the US Federal Reserve. This supports a widening of the differential between the 10-year US and Japanese bonds, which favors the US Dollar against the Japanese Yen.
The Japanese Yen is often seen as a safe-haven investment. This means that in times of market stress, investors are more likely to put their money in the Japanese currency due to its supposed reliability and stability. Turbulent times are likely to strengthen the Yen’s value against other currencies seen as more risky to invest in.
- GBP/USD trades on a softer note near 1.2495 in Thursday’s early Asian session.
- Fed’s Collins emphasized the need to stay higher for longer, as it will take longer than previously thought to bring inflation down.
- The BoE is widely expected to keep its policy rate unchanged at 5.25% on Thursday.
The GBP/USD pair remains on the defensive around 1.2495 on Thursday during the early Asian session. Greenback edges higher for the third consecutive day, which weighs on the major pair. Traders turn to cautious mode ahead of the Bank of England (BoE) interest rate decision later in the day, with no change in rate expected. Also, the US weekly Initial Jobless Claims are due on Thursday, followed by the Federal Reserve’s (Fed) Mary Daly speech.
The Fed officials have offered some cues amid the absence of US top-tier economic data releases earlier this week. On Wednesday, Boston Fed President Susan Collins said it will take longer than previously thought to bring inflation down to the 2% target, emphasizing that the rate will likely stay higher for longer. New York Fed president John Williams and Minneapolis Fed president Neel Kashkari also showed that they favor holding rates at current levels for longer. These hawkish comments from the Fed policymakers provide some support for the US Dollar (USD) and create a tailwind for the GBP/USD pair.
The FOMC committee decided to keep interest rates unchanged last week. The hotter-than-expected US inflation data has kept officials from lowering borrowing costs. Financial markets see under two cuts this year, from as many as six seen at the beginning of 2024.
On the other hand, the BoE is likely to keep the key rate of interest unchanged at 5.25% at its May meeting on Thursday. However, the downward trajectory of the UK’s inflation has triggered speculation that the BoE might cut its rate before the US Fed. Investors will take more cues from the BoE’s Bailey and Pill speeches on Thursday. In the event that the BoE policymakers continue their dovish stance, the Pound Sterling (BoE) might face further depreciation.
- European markets to be thin on Thursday holiday.
- Economic calendar limited on both sides of the Atlantic.
- Broader markets continue to churn on rate cut expectations.
EUR/USD is reverting to the near-term mean, stuck near 1.0750 and stuck firmly in the week’s opening trading range. European market flows are set to be thin on Thursday with German and French markets shuttered for the Ascension Day holiday, and US data is set to be strictly mid-tier until Friday’s University of Michigan Consumer Sentiment Index.
Markets will be on the lookout for speeches from European Central Bank (ECB) policymakers, but ECB officials are broadly expected to avoid rocking the boat amidst holiday-constrained market flows. US Initial Jobless Claims for the week ended May 3 is expected during Thursday’s US market session, and markets are forecasting a slight uptick to week-on-week new jobless benefits claims to 210K from the previous week’s 208K.
This week’s key data release will be Friday’s US UoM Consumer Sentiment Index, which is expected to ease to 7.0 for the month of May, down slightly from the previous print’s 77.2. The UoM’s consumer outlook survey hit a two-and-a-half year high in March as the US economy continues to outperform market hopes for easing conditions to push the Federal Reserve (Fed) towards rate cuts.
EUR/USD technical outlook
EUR/USD continues to drift towards median bids, pulling closer to the 200-hour Exponential Moving Average (EMA) at 1.0734. The pair found thin bids early Wednesday, setting an intraday high of 1.0757 before flubbing bullish momentum and ending the day near 1.0750.
Daily candles reveal a bearish technical rejection firming up as EUR/USD gets pulled down after failing to break above the 200-day EMA at 1.0788. The pair’s near-term peak sits at 1.0813, and a continuation to the downside leaves the pair exposed to a decline to the last swing low into the 1.0600 handle.
EUR/USD hourly chart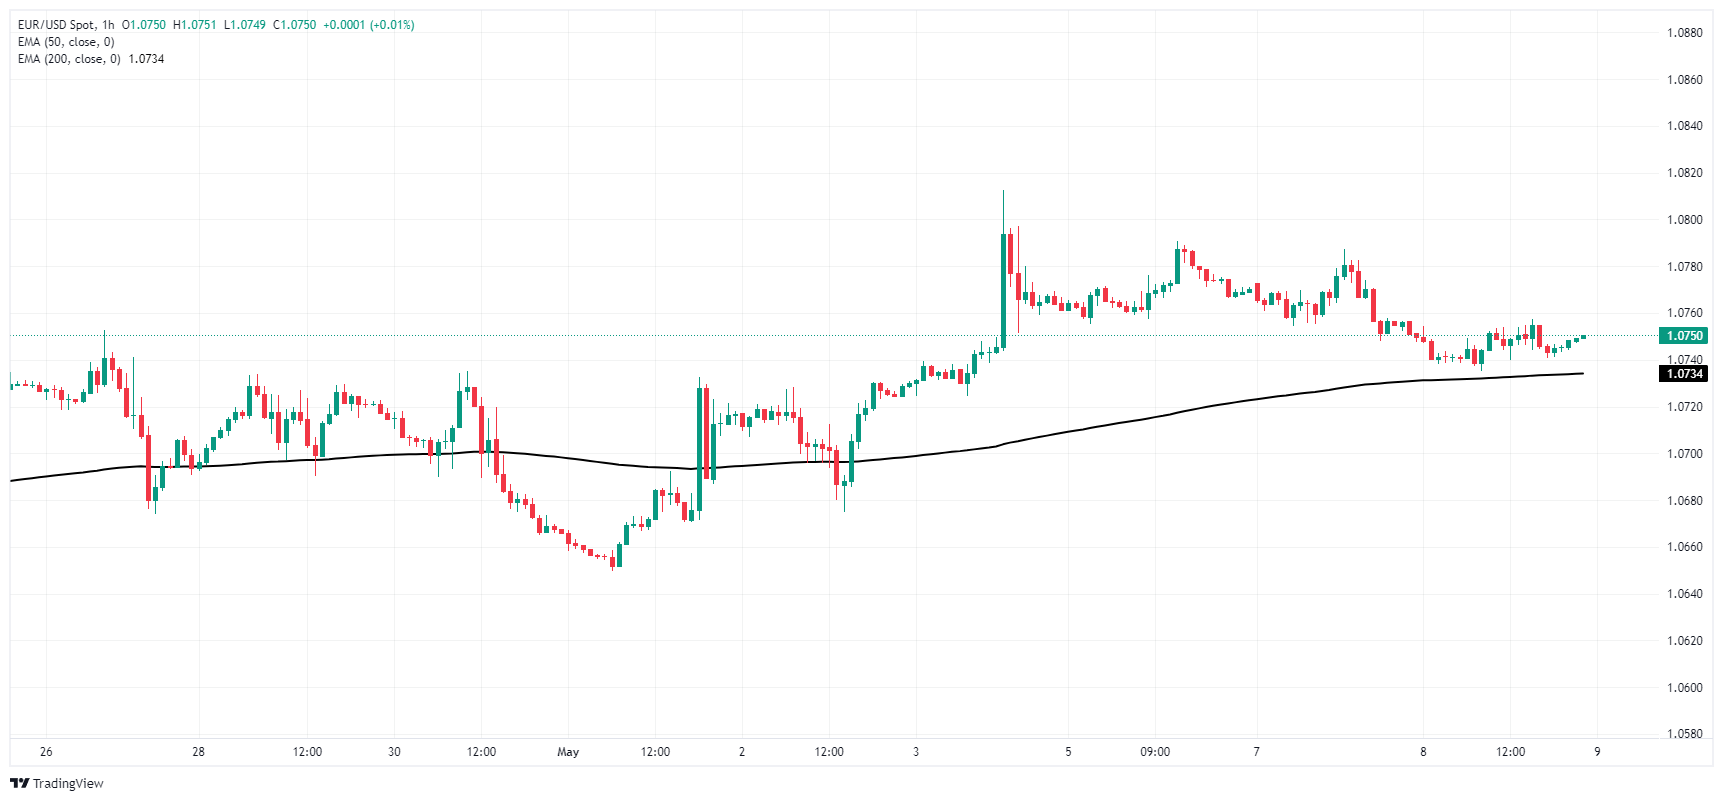
EUR/USD daily chart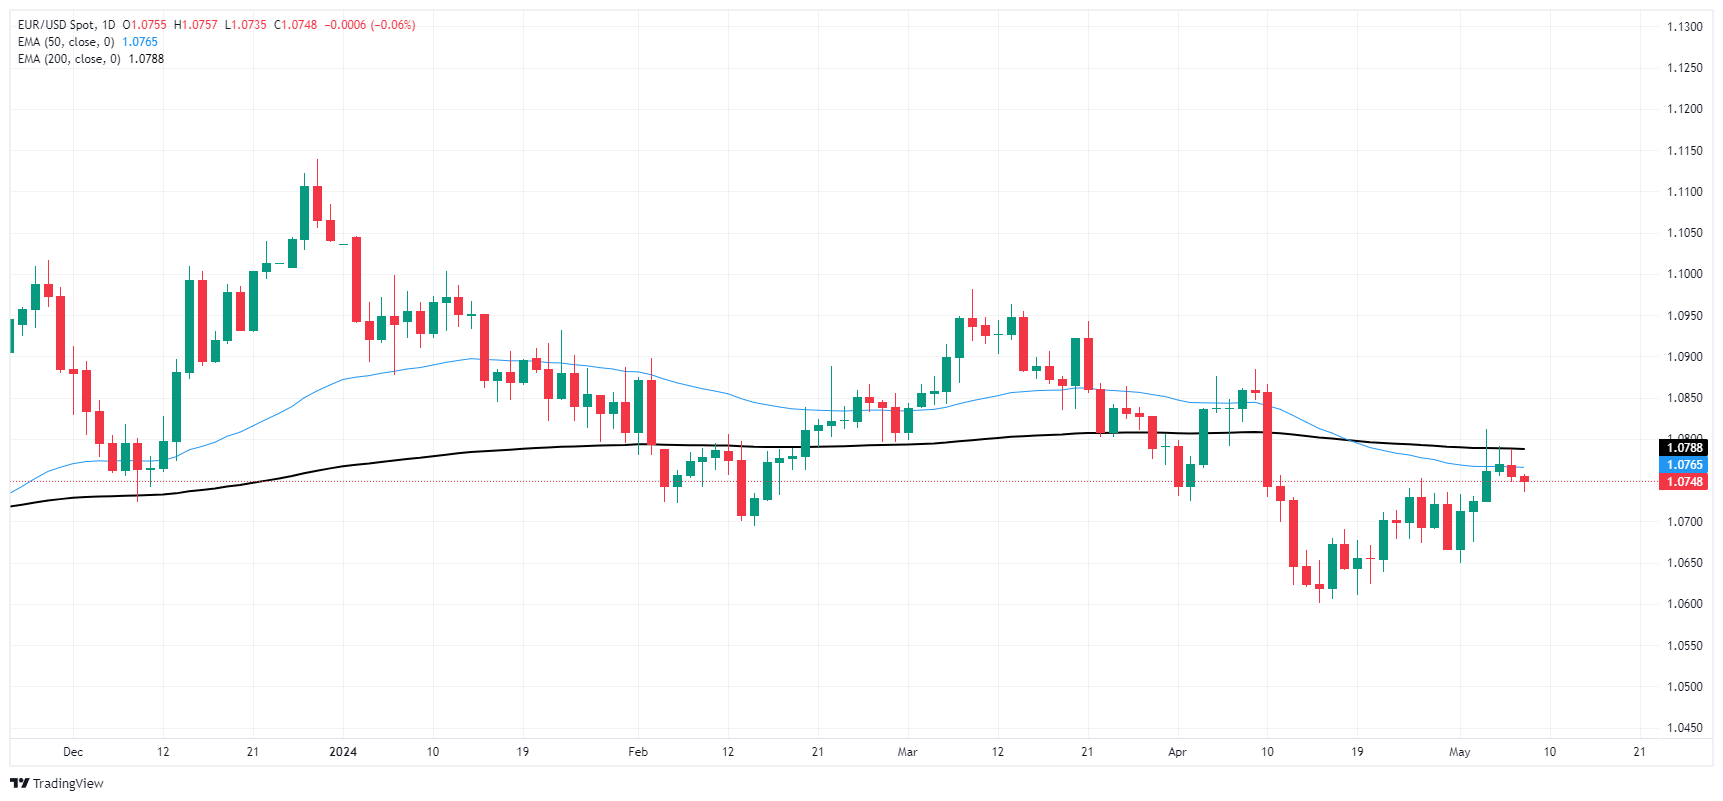
- AUD/USD drops 0.26%, pressured by higher US Treasury yields and risk aversion, contributing to a 0.70% two-day decline.
- RBA keeps rates steady; nuanced inflation comments lead to negative market reaction for AUD/USD.
- US Fed caution echoed by Boston Fed President Susan Collins, warning against premature rate cuts amid September cut expectations.
The Australian Dollar extended its losses against the US Dollar for the second straight day, as higher US Treasury bond yields underpinned the Greenback. On Wednesday, the AUD/USD lost 0.26% as market participants turned risk-averse ahead of the release of further US data during the rest of the week, followed by next week’s inflation report. As the Asian session begins, the pair trades at 0.6577, virtually unchanged.
AUD/USD dips amid rising US yields and cautious market sentiment ahead of key economic data releases.
The financial markets remain strictly focused on when the major central banks would ease policy. on Tuesday, the Reserve Bank of Australia (RBA) decided to keep rates unchanged, though slightly tweaked their statement, mentioning that inflation is indeed cooling. Despite adding that “the Board is not ruling anything in or out,” AUD/USD traders punished the Aussie Dollar, as it has lost close to 0.70% in the last two days.
RBA’s Governor Michele Bullock maintained a balanced tone at the press conference. Regarding rates, she mentioned that "we might have to raise, we might not," indicating the board's contemplation of rate hikes at this meeting.
On the US front, Federal Reserve officials continued to cross the newswires. Boston Fed President Susan Collins stated that she expects demand to slow down to bring inflation to the Fed’s 2% goal. She added that there are risks of cutting rates “too soon” and mentioned that the current policy is well-positioned and that it is “moderately restrictive.”
Regarding interest rate expectations, the swaps market has largely discounted any further RBA rate hikes over the next six months, with a decrease priced in for the subsequent six months.
On the US front. the CME FedWatch Tool shows that odds for a quarter-percentage-point cut in September by the Fed increased from 55% last week to 85% as of writing.
AUD/USD Price Analysis: Technical outlook
From a daily chart perspective, the pair is neutral to upward biased, though buyers need to surpass the latest cycle high seen at 0.6667 the March 8 high, which could exacerbate a rally toward 0.6700. Once cleared, the next resistance level would be the December 28 high at 0.6871. On the other hand, if sellers push prices below the 100-day moving average (DMA) at 0.6577, subsequent losses are awaited. The next demand level would be the 50-DMA at 0.6535, followed by the 200-DMA at 0.6515.
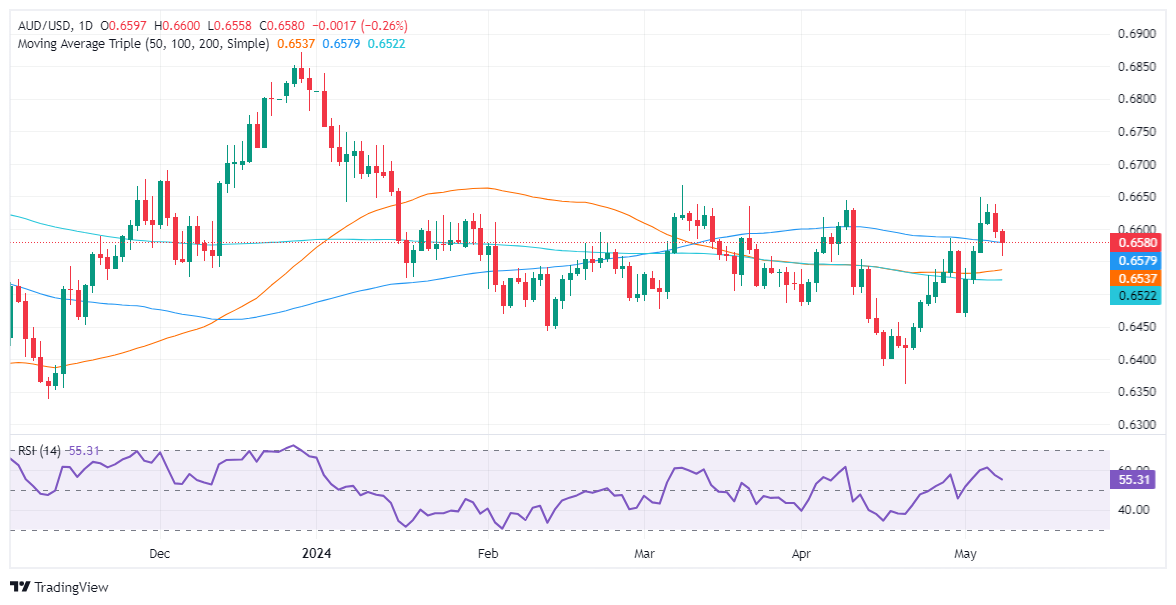
- Indicators on the daily chart shows decelerating bullish momentum.
- The RSI on the hourly chart indicates fluctuating buying and selling pressures, despite its position in the positive zone.
- For bulls to avoid losses, they must defend the key 20-day SMA.
The NZD/USD pair maintains a strong bearish bias despite recent upward movements as buyers seem to have stalled at around 0.6000 and struggle to gain further ground while momentum wanes.
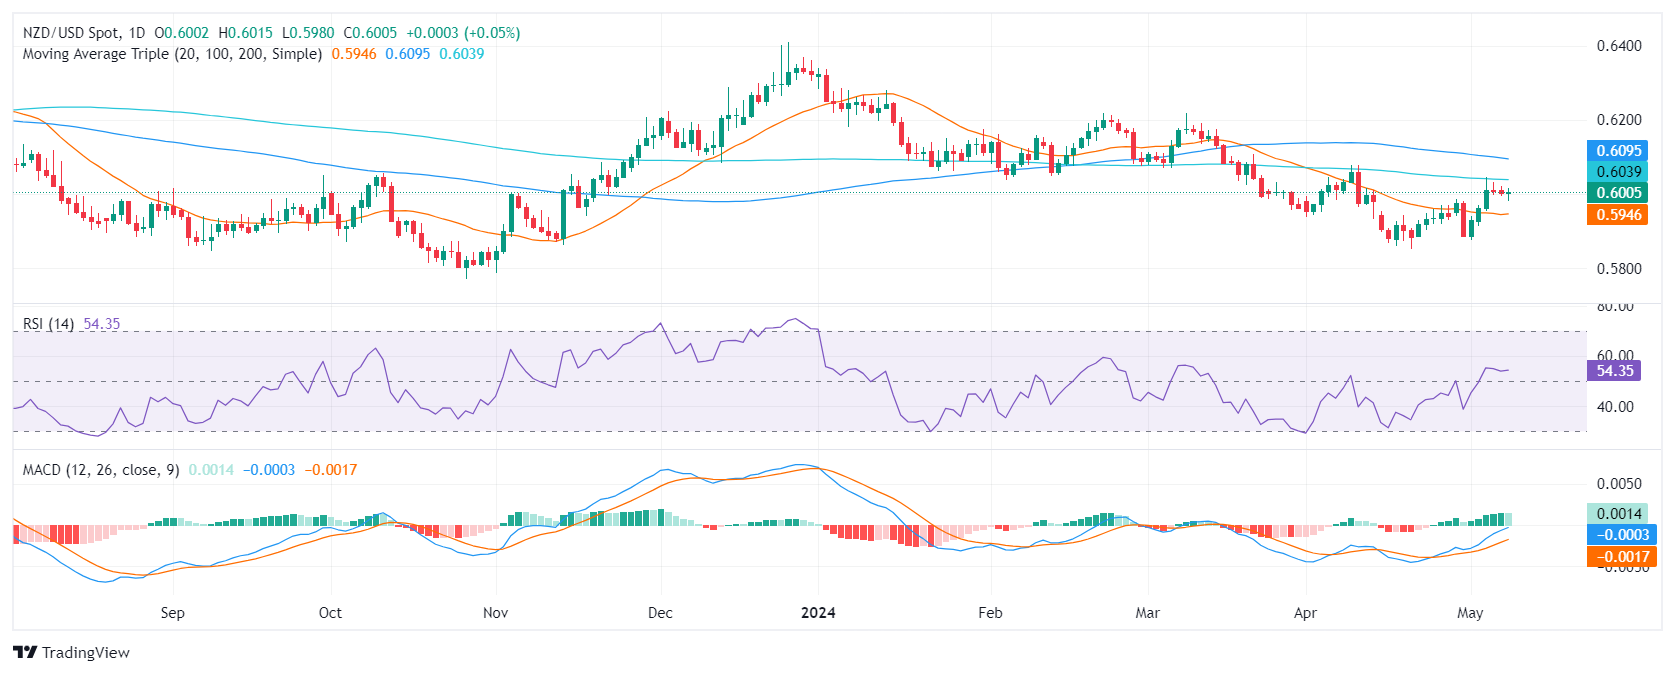
On the daily chart, technical indicators suggest a decelerating positive momentum for the pair while the prevailing downtrend persists. The Relative Strength Index (RSI) shows a positive trend after a slow ascend from the oversold region. However, the Moving Average Convergence Divergence (MACD) histogram reveals a transition towards diminishing green bars, indicating a decelerating bullish momentum.
NZD/USD daily chart
Contrastingly, the hourly RSI sits at 54. Although this is still in the positive territory, it is marginally edging lower. The past few hours have witnessed noticeable fluctuations, signaling varied buying and selling pressures. The hourly chart's MACD registers a decrease in green bars, implying receding positive momentum.
NZD/USD hourly chart
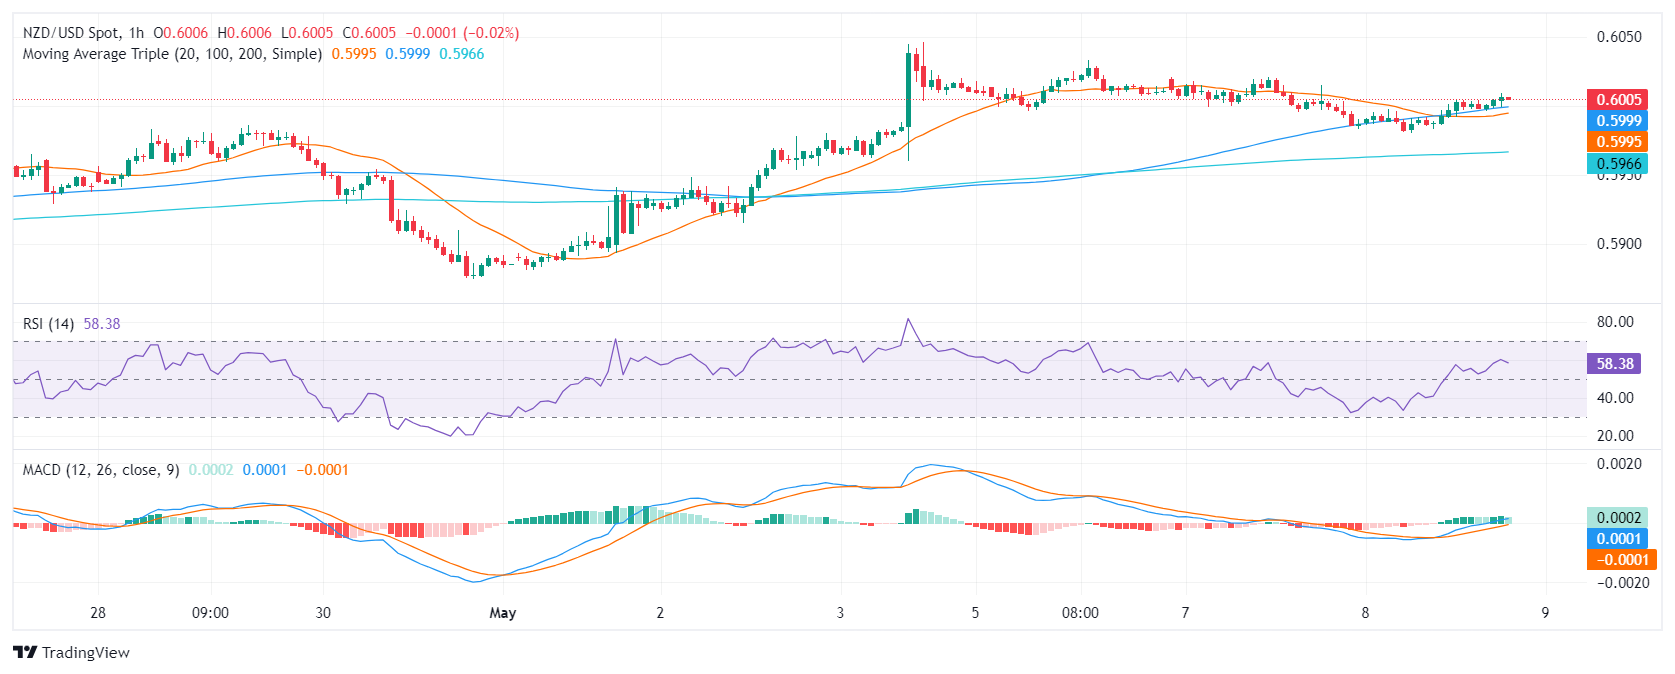
Broadening the perspective further reveals that the NZD/USD is caught in a downtrend as it lies beneath the 100 and 200-day Simple Moving Averages (SMA). That being said, its position above the 20-day average still gives some light to the bulls as it hints at a short-term positive outlook. In summary, the technical indicators of the NZD/USD pair suggest a slowing positive momentum on both the daily and hourly charts, while the prevailing downtrend continues.
- USD/JPY found further gains as Yen recedes post-”Yentervention”.
- US consumer sentiment survey results due on Friday.
- BoJ remains tight-lipped on FX market interventions.
USD/JPY drifted higher on Wednesday, marking in a third straight day of easy gains as the pair pares away recent losses from two suspected “Yenterventions” by the Bank of Japan (BoJ). The Yen has battled back from multi-decade lows, but progress is limited as the JPY resumes deflating across the board.
The US economic data docket is fairly light this week, with only mid-tier data on the offering until Friday’s University of Michigan Consumer Sentiment Index. The UoM’s indexed survey of consumer economic expectations for May is expected to tick down to 76.0 MoM compared to the previous month’s 77.2. The UoM Consumer Sentiment Survey hit a two-and-a-half year high of 79.4 in March.
The BoJ has gone to great lengths to neither confirm nor deny that the Japanese central bank undertook two separate currency interventions on behalf of the Japanese Yen (JPY) last week, but market participants noted that BoJ market operation reporting wildly overshot estimates, with the BoJ overspending on miscellaneous financing operations by around nine billion Yen in the first half of last week.
The economic calendar remains relatively thin for the rest of the week, and USD/JPY traders will be looking ahead to a fresh round of inflation figures from the US next week, as well as Japan’s latest Gross Domestic Product (GDP) growth figures due early next Thursday.
USD/JPY technical outlook
USD/JPY has climbed back over the 200-hour Exponential Moving Average (EMA) at 155.04 in the mid-week market session, ticking into a fresh high near 155.70 and set for a run at the 156.00 handle. The pair has risen around 2.5% unimpeded from last week’s swing low below 152.00.
USD/JPY closed on a third consecutive trading day in the green on Wednesday, and despite possible “Yenterventions”, the pair found technical support from the 50-day EMA at 152.72 and continues to trade well into bull country. The pair is up over 10% for the year.
USD/JPY hourly chart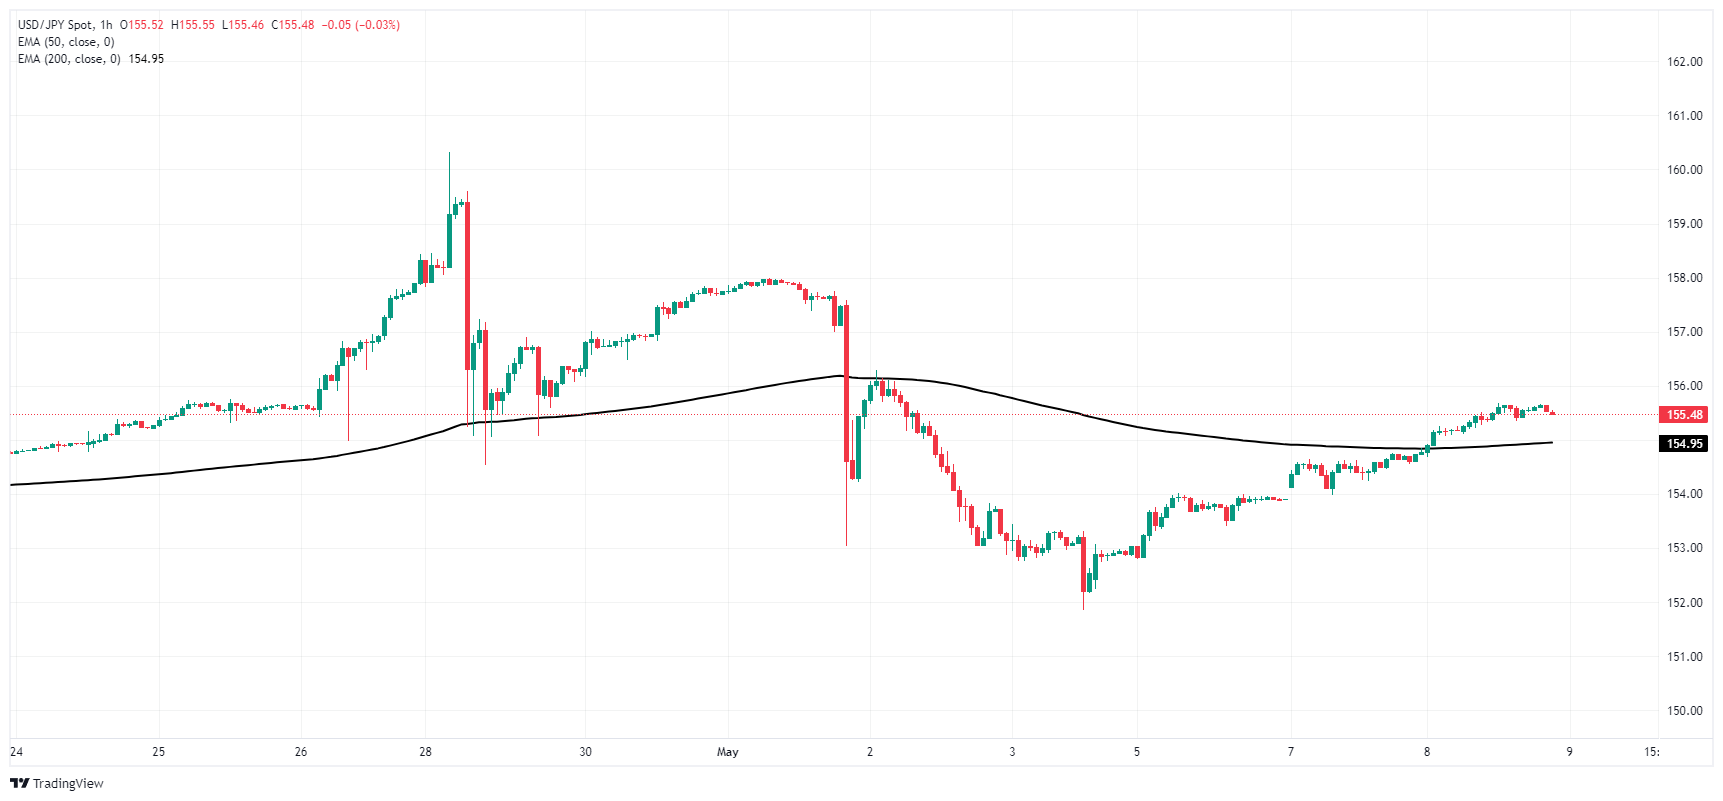
USD/JPY daily chart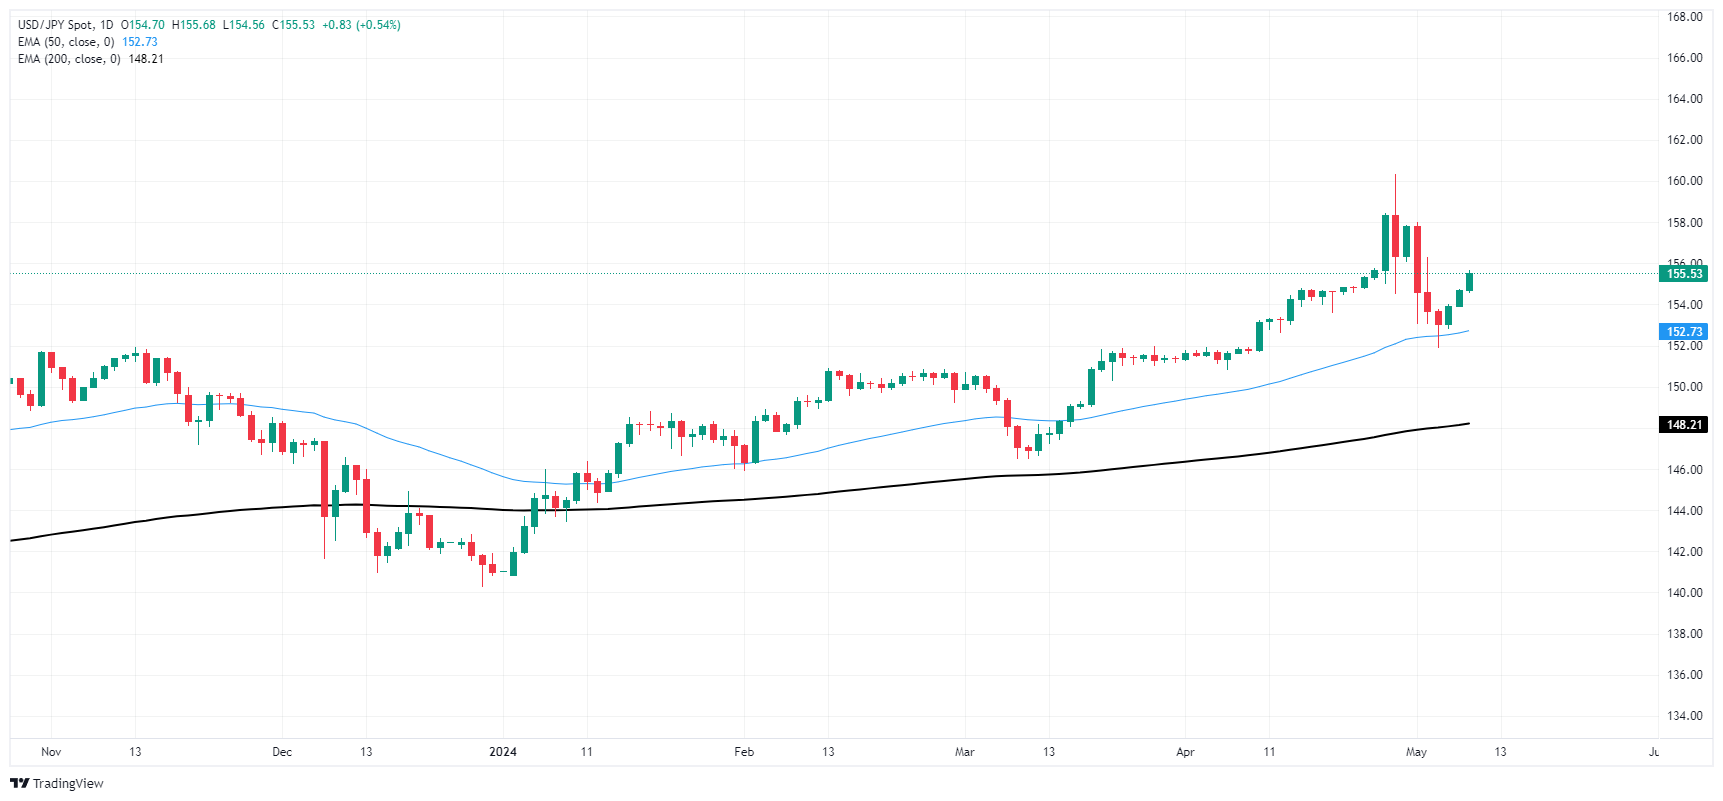
New Zealand's Finance Minister Nicola Willis gave speech notes ahead of Thursday's Pacific market session regarding New Zealand's latest budget notes. NZ Finance Minister Willis noted that New Zealand's economic situation continues to deteriorate, putting significant pressure on both New Zealanders and the NZ government's abilities to operate.
Key highlights
The economic situation is challenging for government books.
Growth forecasts keep getting worse.
It won't be a big-spending budget, this is a time for restraint but not austerity.
Tax relief will be meaningful, but modest.
Tax cuts won't add to inflation.
Manager of the System Open Market Account (SOMA) at the New York Federal Reserve (Fed) Roberto Perli noted during prepared remarks on Wednesday that the Fed's recent announcement to slow the pace of Fed balance sheet run-off should reduce prospects for market stress.
According to NY Fed SOMA Perli, the Fed's decision to slow the pace of balance sheet shrinkage represents an "important and prudent step" in managing an uncertain process that could stress money markets.
Key highlights
The balance sheet wind down process has been smooth.
Recent signs of money market volatility are not a concern.
The Fed has tools to deal with unexpected money market stress.
The final destination for the Fed's balance sheet remains unknown right now.
- Silver rebounds from $27.00, rising 0.38% amid increased buying interest.
- Remains bullish, trading between Fibonacci levels of $24.33 and $29.78.
- To gain further, needs to surpass 38.2% Fibonacci level at $27.70, targeting $28.00 and beyond.
Silver price registers modest gains despite rising US Treasury bond yields and a strong US Dollar. The grey metal dipped to $27.00 but climbed as buyers stepped in. The XAG/USD trades at $27.33, up by 0.38%.
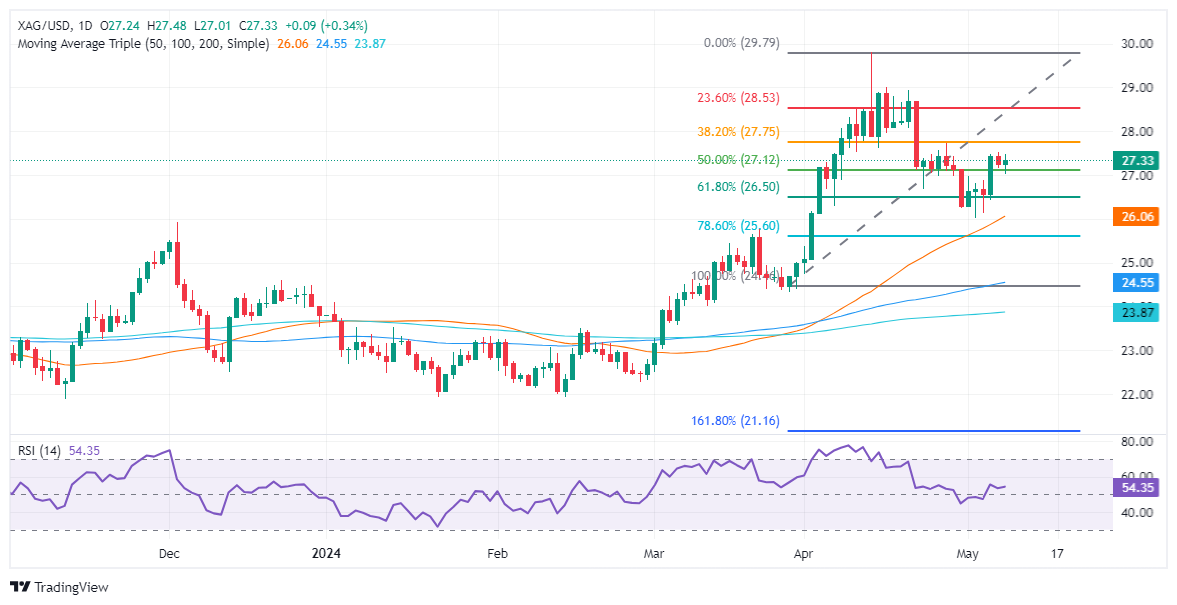
XAG/USD Price Analysis: Technical outlook
Silver remains upward biased, and it remains trading within the 50% and 38.2% Fibonacci retracements, drawn from the latest cycle low and high, each at $24.33 and $29.78, respectively.
The Relative Strength Index (RSI) is in bullish territory, indicating that momentum favors bulls. However, from a price action standpoint, buyers need to clear the 38.2% Fib retracement at $27.70 to challenge year-to-date (YTD) highs. Once surpassed, the next key resistance level would be the $28.00 psychological figure, followed by the 23.6% Fib retracement at $28.49 ahead of $29.00.
On the flip side, if sellers want to push prices lower, they must drag prices below the 50% Fib retracement at $27.05. Once done, sellers must clear $27.00, followed by the confluence of the May 2 low and the 50-day moving average (DMA) at $26.02/08.
XAG/USD Price Action – Daily Chart
- Indicators on the daily chart show a consistent rise in bullish momentum.
- On the hourly chart, the RSI reflects a more volatile picture with general positivity, yet the MACD shows a lack of sustained buying traction.
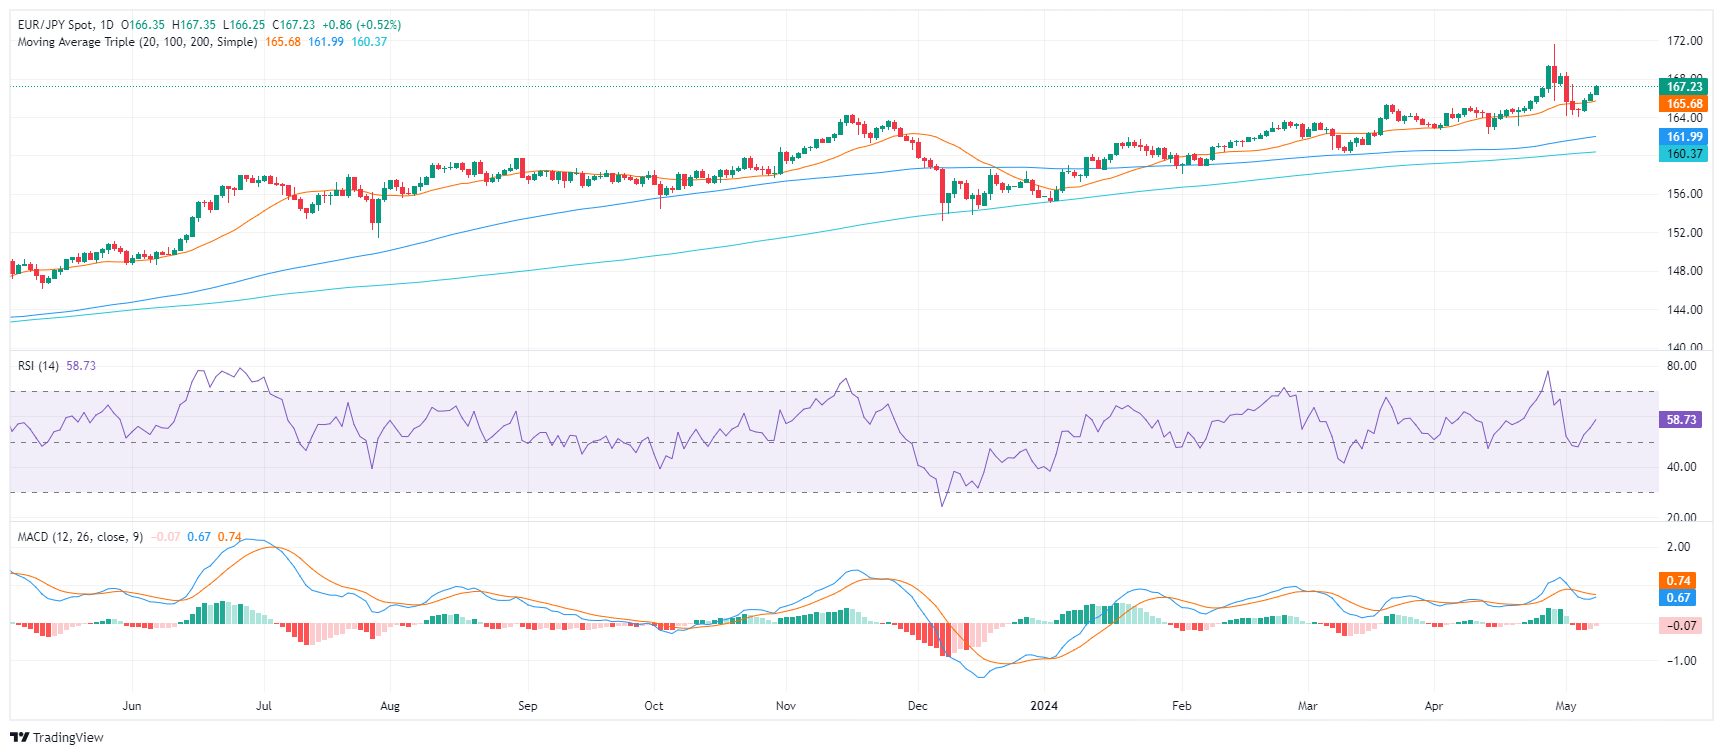
The EUR/JPY pair continues to exhibit strong momentum, displaying gains of 0.55% on Wednesday. With buyers maintaining dominance, the pair remains steadfast above its key Simple Moving Averages (SMAs) in both the short and long term, indicating the potential for a further upward move. The latest downward movements may have been only corrective as bears lacked the conviction to hold the pair below the 20-day SMA and buyers recovered ground.
On the daily chart, the Relative Strength Index (RSI) reveals a positive trend. The most recent value of 58 suggests that buyers have been dominating the market while the Moving Average Convergence Divergence (MACD) histogram shows green bars, indicating a consistent rise in positive momentum.
EUR/JPY daily chart
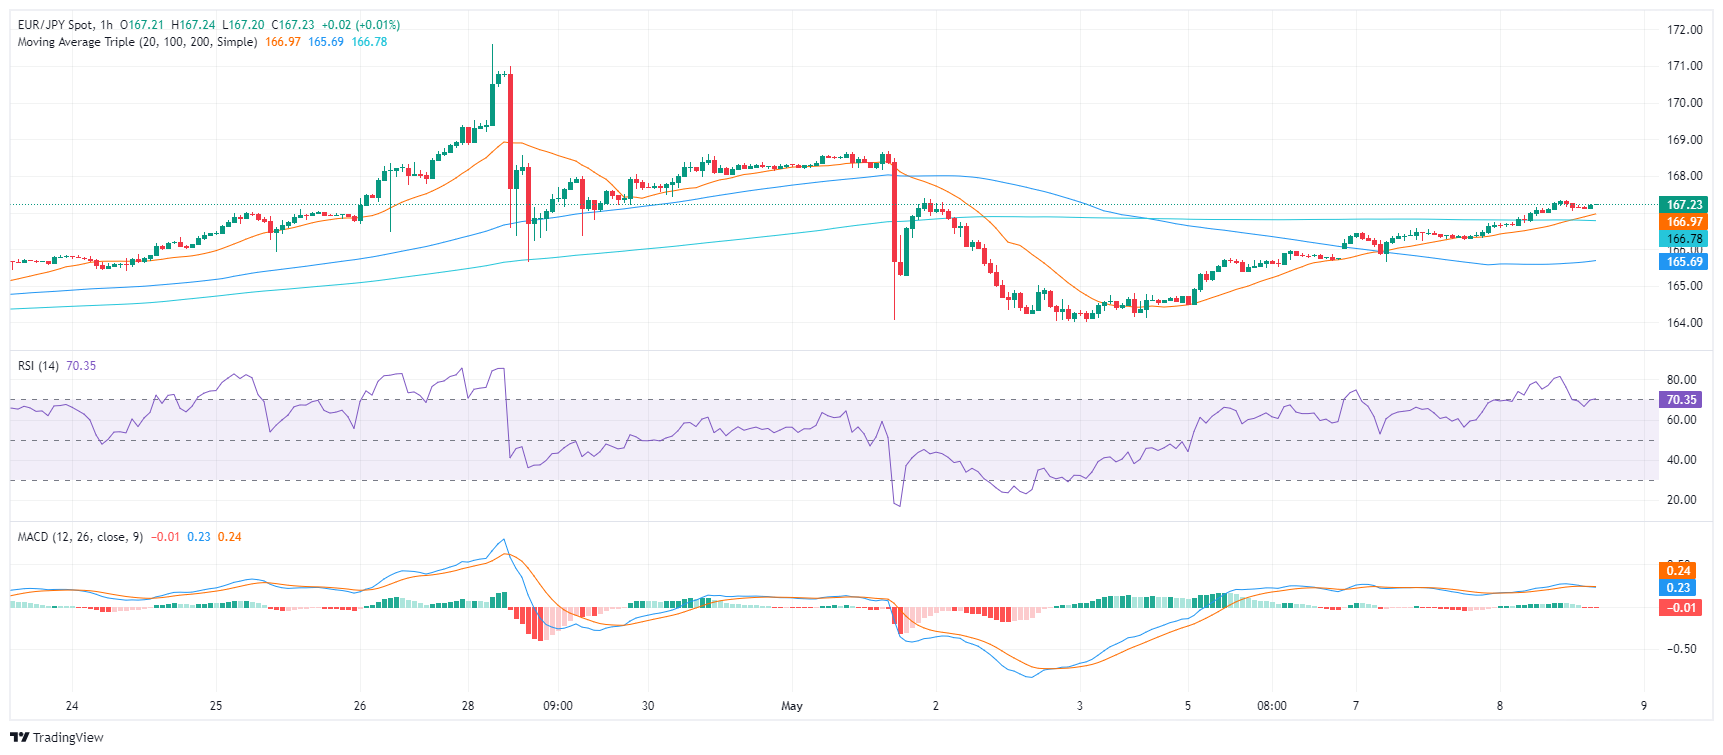
Shifting the focus to the hourly RSI, a more volatile picture is displayed. Values have fluctuated, generally remaining positive, with the latest reading at 69 near the overbought terrain. Whereas, the hourly MACD has registered flat red bars, indicating a lack of positive momentum in recent hours as investors seems to be taking profits.
EUR/JPY hourly chart
Reflecting on the broad spectrum, the EUR/JPY is currently positioned above its Simple Moving Average (SMA) across the 20, 100, and 200-days. This indicates a strong upward momentum in both the short-term and long-term periods.
In conclusion, the daily and hourly technical indicators and a notable position above the SMA suggest an overall bullish outlook for the pair. However, the contrast in the hourly MACD with the daily trends urges traders to exercise caution as buyers may take their foot off the gas ahead of the Asian session which would pave the way for some downside.
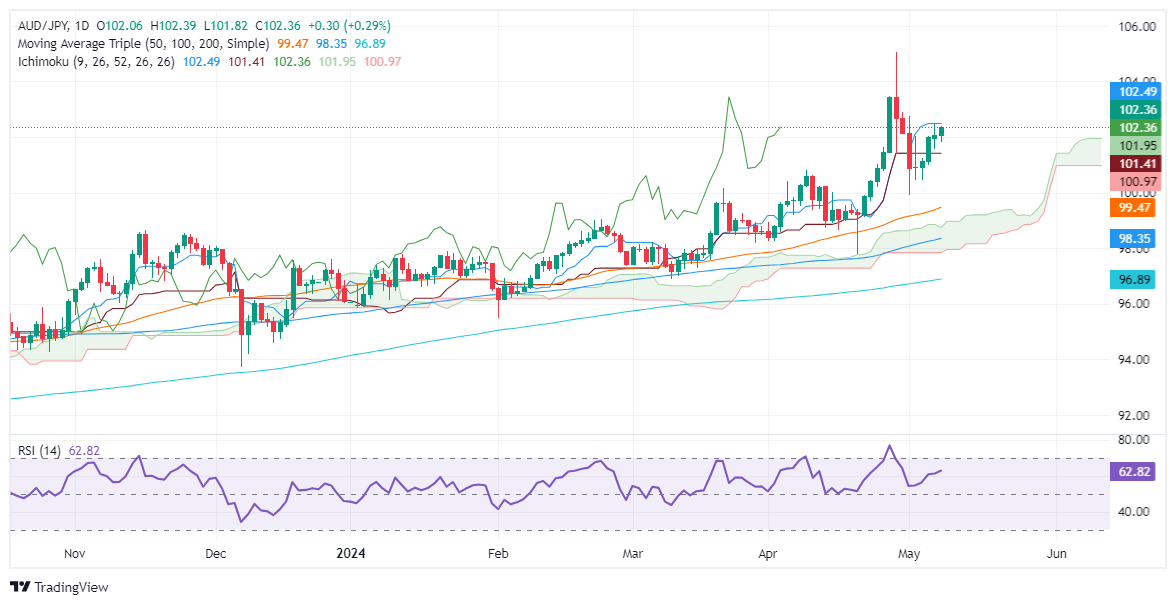
- AUD/JPY up 0.30%, showing bullish momentum for potential rise beyond 102.35.
- Bullish RSI indicates room for growth before hitting overbought conditions.
- Key levels: Resistance at Tenkan-Sen (102.42) and support at Kijun-Sen (101.36).
The AUD/JPY extends its gains for the fifth day in a row, climbs 0.30%, and trades at 102.35. Market sentiment remains upbeat, which usually weighs on the Japanese Yen (JPY) safe-haven appeal, which remains the laggard in the Forex markets against other peers.
AUD/JPY Price Analysis: Technical outlook
After reaching a year-to-date (YTD) high at 104.95, the AUD/JPY retreated towards 100.00, following a confirmed intervention by the Bank of Japan (BoJ). Since then, the pair has extended its gains, though it faces solid resistance at the Tenkan-Sen at 102.42.
Momentum favors buyers, with the Relative Strength Index (RSI) standing at bullish territory, aiming upwards with enough room before hitting overbought territory.
If AUD/JPY buyers want to re-test the YTD high, they must clear the Tenkan-Sen. Once surpassed, the 103.00 figure would emerge as the next stop, ahead of testing April’s 26 high at 103.47. Up next would be 104.00, followed by the YTD high.
On the other hand, buyers' failure to crack the Tenkan-Sen can pave the way for sellers to step in and push prices lower. The first support would be the 102.00 mark, followed by the Kijun-Sen at 101.36. Further losses are seen at the May 3 low at 100.45, followed by the 100.00 figure.
AUD/JPY Price Action – Daily Chart
- GBP/JPY finds fresh highs after “Yenterventions” knocked pair lower.
- BoE rate call around the corner, UK GDP on Friday.
- BoE expected to hold rates steady, Gov Bailey speech anticipated.
GBP/JPY is slowly grinding its way back up the chart after a pair of suspected “Yenterventions” by the Bank of Japan (BoJ), but thus far no official statements have been forthcoming. The Bank of England (BoE) delivers its latest rate call in the upcoming Thursday London market session, and the bank is expected to vote in an overwhelming majority to hold rates steady.
The BoE is forecast to vote 8-to-1 in favour of holding rates steady at the UK central bank’s meeting this week, with Dr. Swati Dhingra expected to be the lone voter for an early rate cut, in-line with the voting results from the BoE’s previous meeting. Dr. Dhingra, an external member of the BoE’s Monetary Policy Committee (MPC), has been adamant that the UK central bank is drastically underestimating downside risks to the UK economy. A speech from BoE Governor Andrew Bailey will be delivering a speech 30 minutes after the MPC’s rate call.
Effects of suspected BoJ 'Yenterventions' are draining away
The BoJ is broadly believed to have stepped into global FX markets last week on two separate occasions after the Yen rose sharply last Monday and Tuesday. The BoJ remains tight-lipped on central bank operations to prop up the battered Yen (JPY), but BoJ operations reporting shows the Japanese central bank overspent on miscellaneous market operations by around nine billion Yen last week.
This Friday will round out the trading week with an update on UK Gross Domestic Product (GDP) growth. Q1 UK GDP is expected to rebound to 0.4% QoQ after the previous quarter’s -0.3% decline.
GBP/JPY technical outlook
The Guppy is up around 1.6% from the recent bottom near 191.50 after the BoJ’s suspected “Yenterventions” as markets test the Japanese central bank’s resolve. The pair has clawed its way back above the 200-hour Exponential Moving Average (EMA) at 193.94.
Despite a harsh knockdown that dragged the GBP/JPY down from a 34-year peak near 200.60, the pair is still firmly bullish, up over 8% from the year’s opening bids near 179.50.
GBP/JPY hourly chart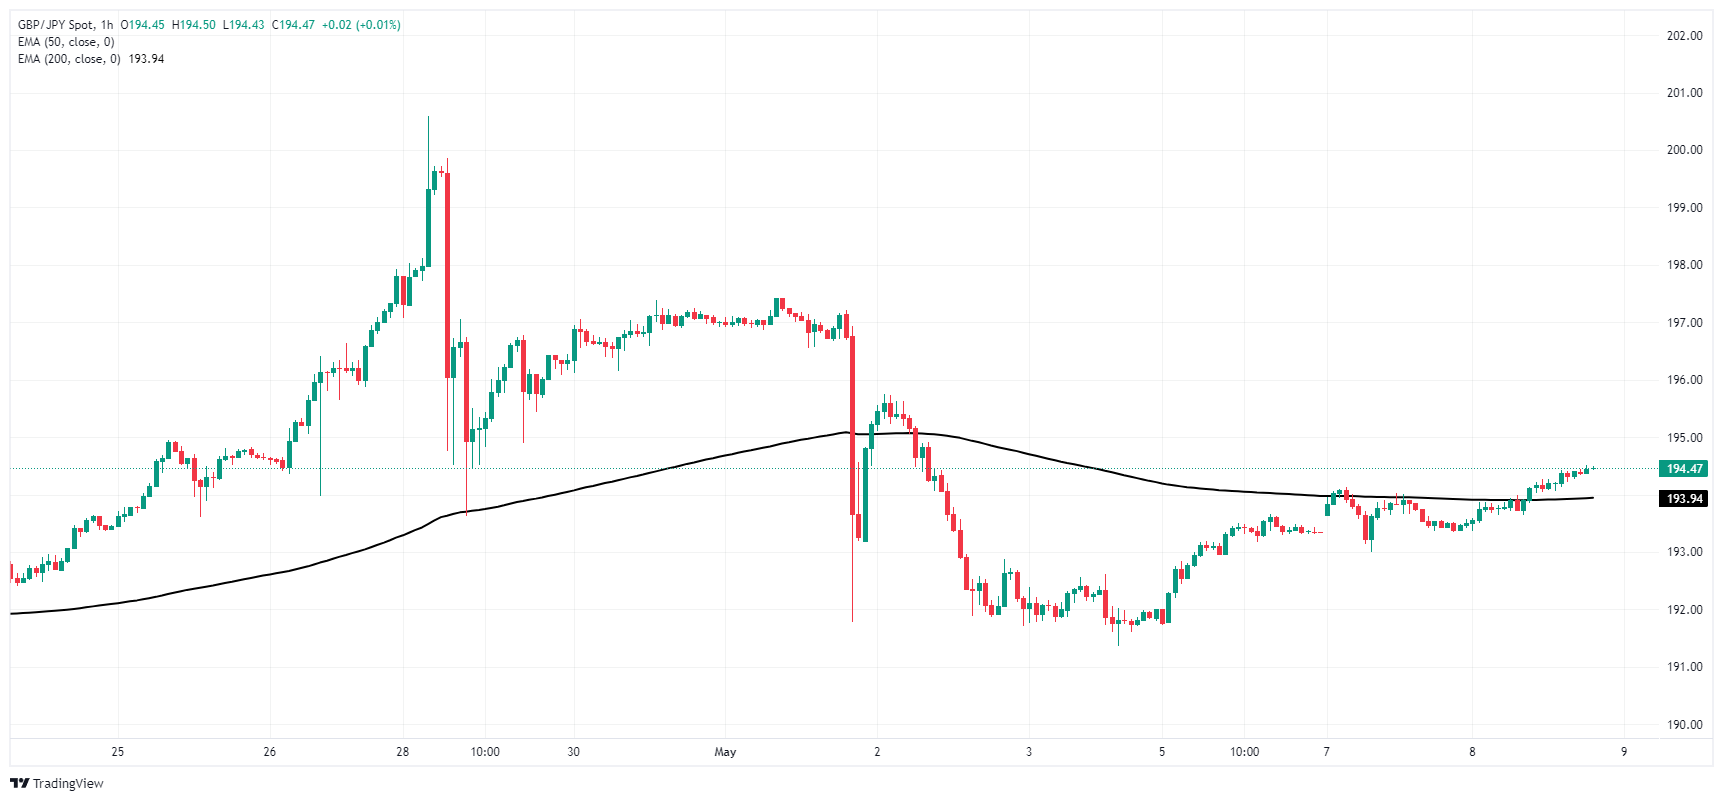
GBP/JPY daily chart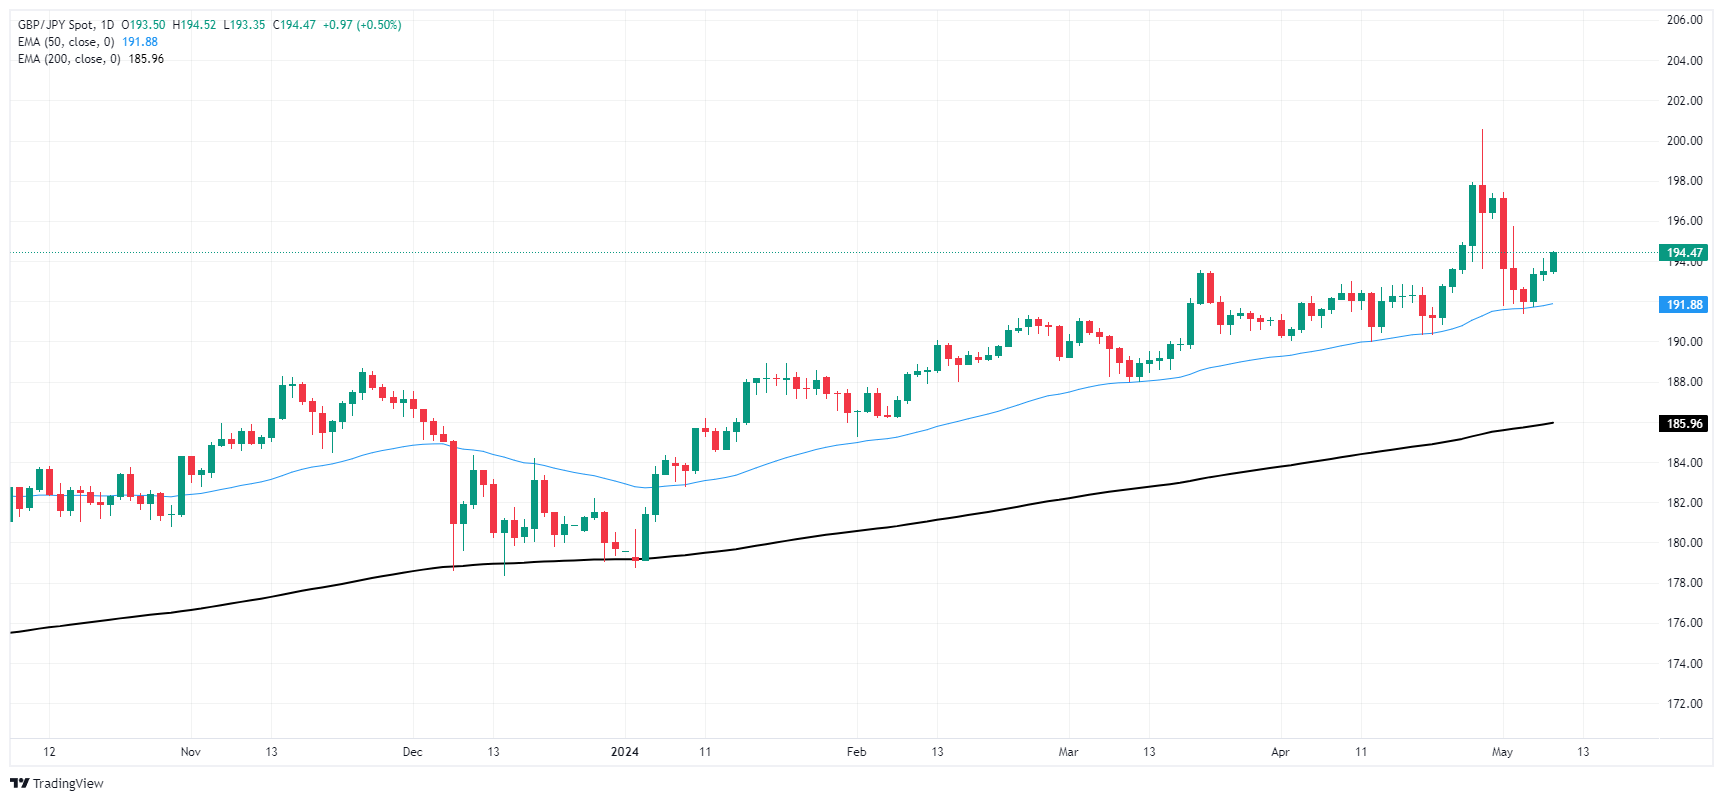
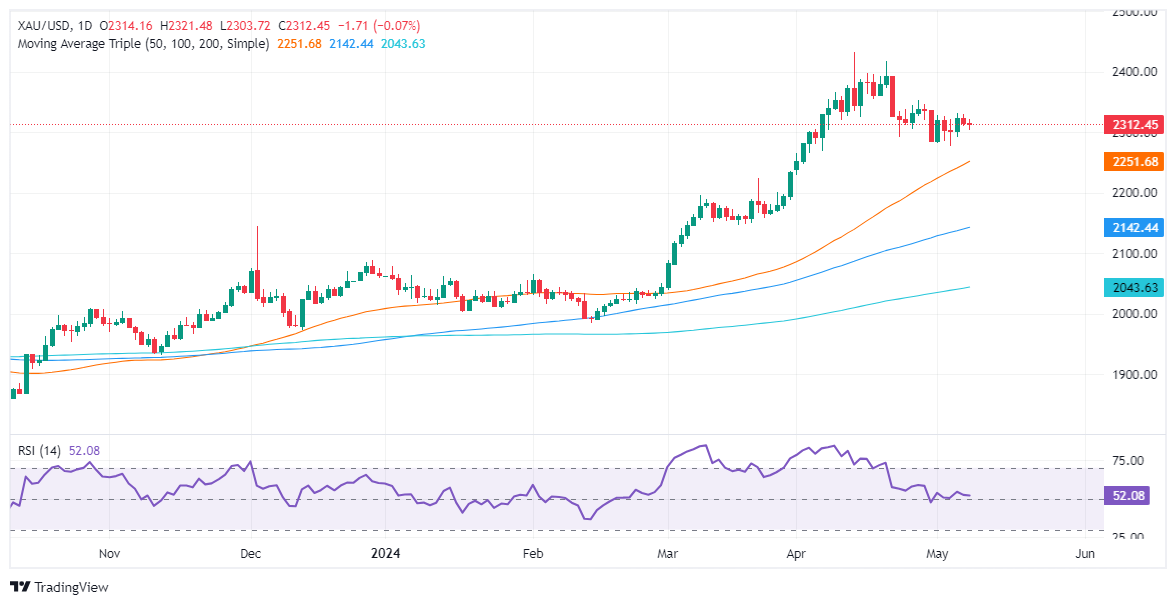
- Gold trades steadily above $2,300, minor shift despite rising US Treasury yields and strong USD.
- Focus on upcoming US data: unemployment claims, University of Michigan Consumer Sentiment, Fed speeches.
- China's central bank boosts Gold reserves for 18th consecutive month, reflecting continued demand amid global economic uncertainty.
Gold price hovers around familiar levels on Wednesday during the North American session amid rising US Treasury yields and a strong US dollar. The economic docket in the United States remains scarce, with traders awaiting unemployment claims on Thursday, followed by the University of Michigan (UoM) Consumer Sentiment survey on Friday.
The XAU/USD trades at $2,312, down a minimal 0.02% and virtually unchanged. During the week, market players remained laser-focused on speeches by Federal Reserve (Fed) officials amid growing speculation that the US central bank would lower interest rates. Lower interest rates usually benefit the golden metal, which remains trading above the $2,300 threshold.
Boston Fed President Susan Collins said she expects demand to slow down to bring inflation to 2%, adding that there are risks of cutting rates “too soon.” She said that the current policy is well-positioned and that it is “moderately restrictive.”
The latest US employment report was softer than expected, reigniting fears that the economy would be weighed down and spur faster-than-expected rate cuts. This followed last Wednesday’s Fed decision to hold rates, in which the Fed acknowledged that the dual mandate risks had become more balanced.
Meanwhile, physical demand continues as reports emerged that China’s central bank continued to stock up its Gold inventories, adding 1.9 metric tonnes for 18 straight months of expanding its reserves.
Daily digest market movers: Gold price tumbles below $2,320 as US yields climb
- Gold prices fell amid lower US Treasury yields and a strong US Dollar. The US 10-year Treasury note is yielding 4.49%, up seven basis points (bps) from its opening level. The US Dollar Index (DXY), which tracks the Greenback's performance against six other currencies, is up 0.16% to 105.55.
- Last Friday, April's US NFP missed estimates and trailed March's figures. The Institute for Supply Management (ISM) PMIs in the manufacturing and services sectors entering contractionary territory might undermine the US Dollar, a tailwind for the golden metal.
- Nevertheless, recent hawkish comments by Minneapolis Fed President Neel Kashkari, who said that the Fed might stay put on interest rates and opened the door to raising the fed funds rate if inflation doesn’t resume its downtrend, bolstered the Greenback.
- Gold has advanced more than 12% so far in 2024, courtesy of expectations that major central banks will begin to reduce rates. Renewed fears that the Middle East conflict could resume between Israel and Hamas can sponsor a leg up in XAU/USD prices.
- According to Reuters, the People’s Bank of China (PBoC) continued to accumulate Gold for the 18th straight month, adding 60,000 troy ounces to its reserves amid higher prices.
- Following the US NFP data release, the CME FedWatch Tool shows that odds for a quarter-percentage-point cut in September increased from 55% before the report to 85%.
- After the data release, Fed rate cut probabilities increased with traders expecting 36 basis points of rate cuts toward the end of the year.
Technical analysis: Gold price stays bullish despite slumping below $2,320
Gold is upwardly biased despite registering modest losses. Momentum still favors buyers as the Relative Strength Index (RSI) remains in bullish territory. That would benefit Gold buyers who could “buy the dip.”
XAU/USD buyers need to clear the April 26 high, the latest cycle high at $2,352, if they want to remain hopeful of challenging all-time highs. A breach of the latter will expose the $2,400 figure, followed by the April 19 high at $2,417 and the all-time high of $2,431.
Conversely, further losses are seen if Gold slides beneath the $2,300 mark. The next support would be the 50-day Simple Moving Average (SMA) at $2,249.
Gold FAQs
Gold has played a key role in human’s history as it has been widely used as a store of value and medium of exchange. Currently, apart from its shine and usage for jewelry, the precious metal is widely seen as a safe-haven asset, meaning that it is considered a good investment during turbulent times. Gold is also widely seen as a hedge against inflation and against depreciating currencies as it doesn’t rely on any specific issuer or government.
Central banks are the biggest Gold holders. In their aim to support their currencies in turbulent times, central banks tend to diversify their reserves and buy Gold to improve the perceived strength of the economy and the currency. High Gold reserves can be a source of trust for a country’s solvency. Central banks added 1,136 tonnes of Gold worth around $70 billion to their reserves in 2022, according to data from the World Gold Council. This is the highest yearly purchase since records began. Central banks from emerging economies such as China, India and Turkey are quickly increasing their Gold reserves.
Gold has an inverse correlation with the US Dollar and US Treasuries, which are both major reserve and safe-haven assets. When the Dollar depreciates, Gold tends to rise, enabling investors and central banks to diversify their assets in turbulent times. Gold is also inversely correlated with risk assets. A rally in the stock market tends to weaken Gold price, while sell-offs in riskier markets tend to favor the precious metal.
The price can move due to a wide range of factors. Geopolitical instability or fears of a deep recession can quickly make Gold price escalate due to its safe-haven status. As a yield-less asset, Gold tends to rise with lower interest rates, while higher cost of money usually weighs down on the yellow metal. Still, most moves depend on how the US Dollar (USD) behaves as the asset is priced in dollars (XAU/USD). A strong Dollar tends to keep the price of Gold controlled, whereas a weaker Dollar is likely to push Gold prices up.
- USD/SEK maintains gains exceeding 0.40%, underscoring the Dollar's continued firmness during Wednesday's session.
- The Riksbank sports a dovish view, trimming rates as forecasted, coupled with indications of more rate cuts in the second half of this year.
- Fed hawks are stepping in and challenging the dovish narrative.
The USD/SEK pair is trading higher at 10.55, marking a significant gain from a low of 10.45 last week. This uptick comes on the back of the monetary policy divergences between the Federal Reserve (Fed) and Riksbank. On the one hand, the Fed’s officials are turning hawkish. On the other hand, Riksbank, with a more dovish stance, has started to cut rate cuts and may undertake additional reductions in the second half of the year if the present economic conditions prevail.
After cutting rates to 3.75%, Governor Thedeen expressed a sense of caution, suggesting that a rate cut in June is improbable given the existing circumstances. He emphasized the concern regarding the weakening of the Swedish Krona (SEK), indicating that it needs to be taken into account. As for now, market expectations anticipate a total of 75 basis points of rate cuts over the next 12 months.
On the US side, recent dovish bets have been given up by investors, and the start of the easing cycle of the Fed is being priced in to start in November.
USD/SEK technical analysis
On the daily chart, the Relative Strength Index (RSI) for the USD/SEK pair resides within the positive territory after recovering from a dip into the negative domain. The MACD histogram sheds more light on the scenario, with progressively decreasing red bars showcasing a slowdown in negative momentum.
USD/SEK daily chart
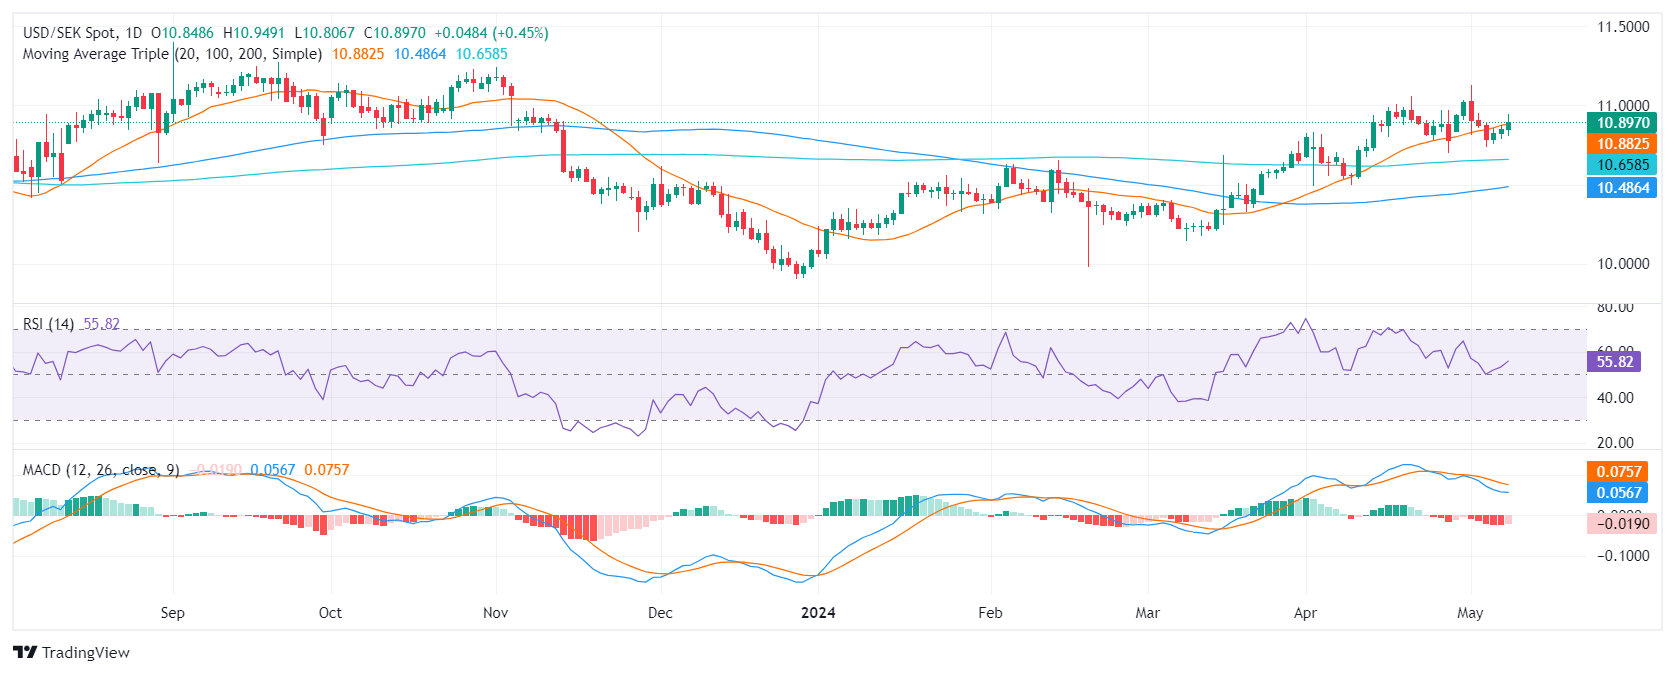
In regard to the Simple Moving Averages (SMAs), the USD/SEK pair has reclaimed territory above the pivotal 20-day SMA. This escape from the bears not only illustrates evidence of buyers stepping in to restore short-term sentiment but also signals a potential shift in momentum. When observing the larger picture, the pair maintains a position above the 100 and 200-day SMAs, illustrating a solid long-term trend in favor of the bulls.
- Dow Jones looks for gains as other indexes recede.
- A quiet, data-thin Wednesday leaves investors looking ahead.
- Fed outlook remains key focal point for markets.
The Dow Jones Industrial Average (DJIA) recovered from an early dip during the American trading session, climbing to an intraday high near 39,000.00 as the major equity index breaks away from the crowd. The other US indexes are down during the midweek market session with a thin economic calendar delivering little of note.
Fedspeak continues to lead investors around by the nose as market participants continue to hope for an accelerated pace of Federal Reserve (Fed) rate cuts. Multiple officials from the central bank have delivered moderating messages this week, with policymakers cautioning that rate cuts are beholden to continued progress on inflation and a loosening in the US’ tight labor market.
Read more:
Fed Collins: The job market is coming to a better balance
Fed Kashkari: Fed will hold rates where they are if we need to
Inflation continues to plague the Fed’s outlook on rate cuts, with rate cut hopes further vexed by a still-tight labor market that continues to add jobs at a healthy pace and an unemployment rate well below the structural level. Fedspeak has been increasingly dominating market flows as central planners grapple with financial markets that have steadily overextended hopes of rate cuts.
At current cut, the CME’s FedWatch Tool shows rate markets are pricing in a first quarter-point cut in September, with rate traders seeing 71% odds of two rate cuts by the end of 2024.
Dow Jones news
Around a third of the 30 securities comprising the Dow Jones are lower on Wednesday. Intel Corp. (INTC) backslid around 3% on the day after the tech company revised its forward guidance after The US Department of Commerce revoked an export license for China-based Huawei. Intel now expects first-quarter earnings to fall below $13 billion.
Cisco Systems Inc. (CSCO) rose 1.6% on the day, gaining three-quarters of a point to trade at $48.03 per share. Cisco is closely followed by Amgen Inc. (AMGN) which gained 1.22% and traded near $304.00 per share as the company gets closer to bringing their latest cancer-fighting drug to market.
Dow Jones technical outlook
The Dow Jones Industrial Average is taking a run at the 39,000.00 handle on Wednesday as equities look for a bullish foothold amidst thin market volumes. The Dow Jones is up around a third of a percent on the day, and bidders are looking to build out a floor after breaking through near-term technical resistance near 38,970.00.
The Dow Jones is on pace for a fifth consecutive gainer, climbing from the last swing low into 37,600.00. The index is trading well above the 200-day Exponential Moving Average (EMA) at 36,863.68. Despite gains, the Dow Jones is still trading on the low side of the major equity index’s recent all-time highs just shy of the 40,000.00 price point.
DJIA five-minute chart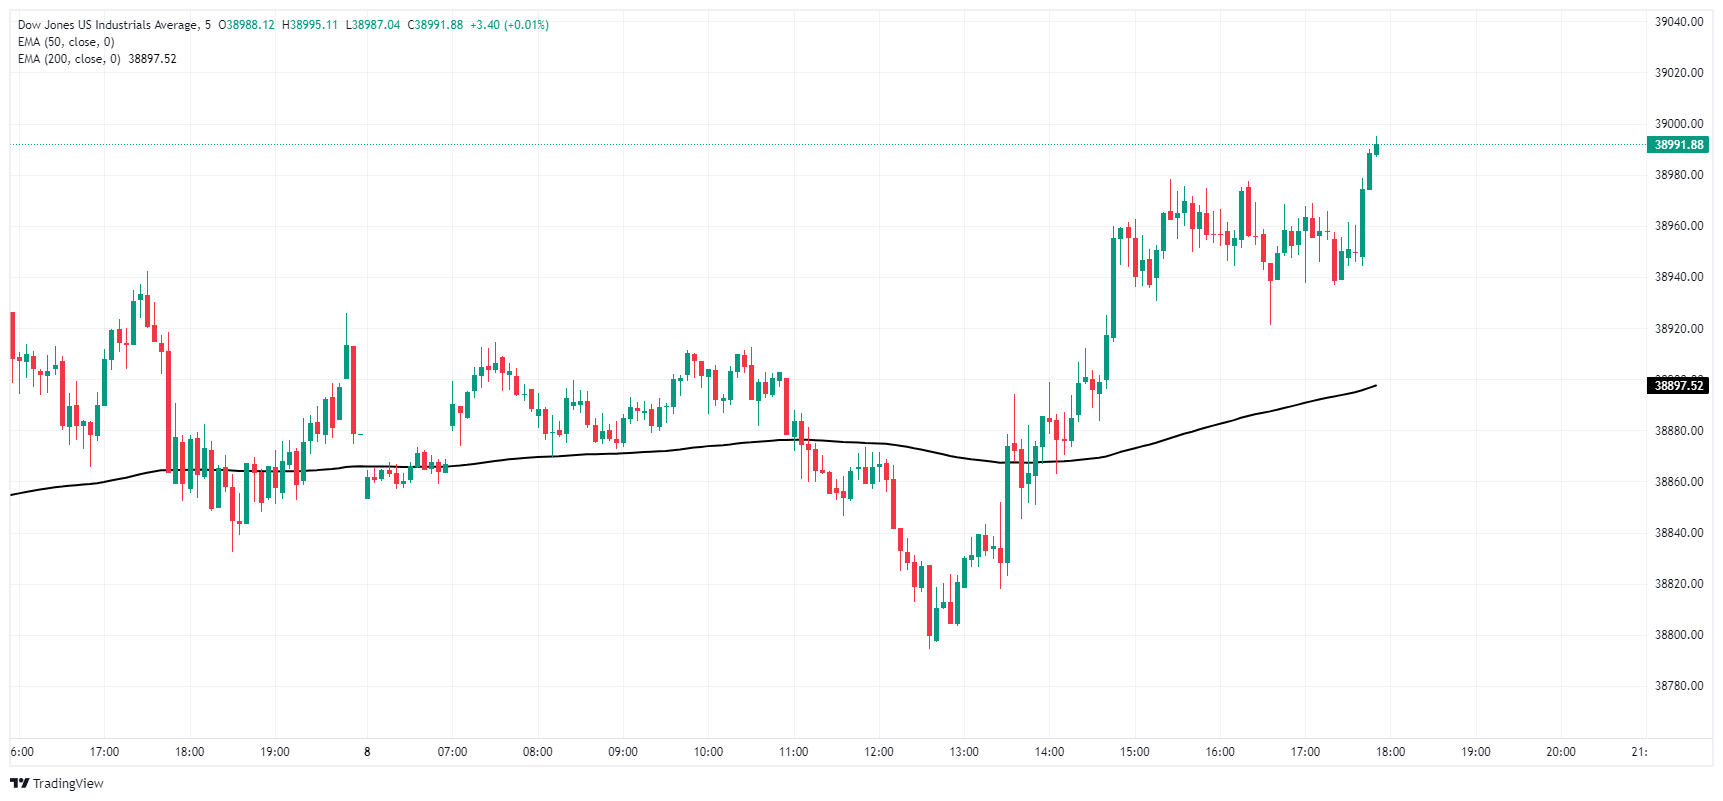
DJIA daily chart
Dow Jones FAQs
The Dow Jones Industrial Average, one of the oldest stock market indices in the world, is compiled of the 30 most traded stocks in the US. The index is price-weighted rather than weighted by capitalization. It is calculated by summing the prices of the constituent stocks and dividing them by a factor, currently 0.152. The index was founded by Charles Dow, who also founded the Wall Street Journal. In later years it has been criticized for not being broadly representative enough because it only tracks 30 conglomerates, unlike broader indices such as the S&P 500.
Many different factors drive the Dow Jones Industrial Average (DJIA). The aggregate performance of the component companies revealed in quarterly company earnings reports is the main one. US and global macroeconomic data also contributes as it impacts on investor sentiment. The level of interest rates, set by the Federal Reserve (Fed), also influences the DJIA as it affects the cost of credit, on which many corporations are heavily reliant. Therefore, inflation can be a major driver as well as other metrics which impact the Fed decisions.
Dow Theory is a method for identifying the primary trend of the stock market developed by Charles Dow. A key step is to compare the direction of the Dow Jones Industrial Average (DJIA) and the Dow Jones Transportation Average (DJTA) and only follow trends where both are moving in the same direction. Volume is a confirmatory criteria. The theory uses elements of peak and trough analysis. Dow’s theory posits three trend phases: accumulation, when smart money starts buying or selling; public participation, when the wider public joins in; and distribution, when the smart money exits.
There are a number of ways to trade the DJIA. One is to use ETFs which allow investors to trade the DJIA as a single security, rather than having to buy shares in all 30 constituent companies. A leading example is the SPDR Dow Jones Industrial Average ETF (DIA). DJIA futures contracts enable traders to speculate on the future value of the index and Options provide the right, but not the obligation, to buy or sell the index at a predetermined price in the future. Mutual funds enable investors to buy a share of a diversified portfolio of DJIA stocks thus providing exposure to the overall index.
Another constructive session saw the Greenback gather extra steam and advance to three-day peaks on Wednesday, propped up by the equally firm rebound in US yields as well as the steady conviction of interest rate cuts by the Fed later in the year.
Here is what you need to know on Thursday, May 9:
The USD Index (DXY) edged higher and extended its breakout of the 105.00 barrier, helped by the upbeat tone in US yields across the curve and the generalized selling bias in the risk complex. On May 9, the usual weekly Initial Jobless Claims are due, seconded by the Fed’s Daly.
Further gains in the US Dollar kept the price action around EUR/USD depressed for the second session in a row on Wednesday. Absent releases on the euro docket, the focus of attention will be on comments by the ECB's Mc Caul, Cipollone, and de Guindos on May 9.
GBP/USD remained on the defensive, although it managed to bounce off multi-session lows near 1.2470 prior to the BoE’s interest rate decision on Thursday. The BoE is widely expected to keep its policy rate unchanged on May 9. In addition, BoE’s Bailey and Pill are due to speak.
There was no respite to the selling pressure in the Japanese yen, which eventually lifted USD/JPY to five-day highs north of the 155.00 hurdle. On May 9, weekly Foreign Bond Investment readings are due along with the BoJ Summary of Opinions and the preliminary prints of the Coincident Index and the Leading Economic Index.
AUD/USD succumbed to the increasing buying impetus in the greenback, revisiting multi-day lows near 0.6560. The next data release in Oz will be the Wage Price Index on May 15.
Prices of WTI kept their consolidative fashion in the lower end of the recent range, always below the key $80.00 mark per barrel.
Gold prices ended the session barely changing around the $2,300 zone per troy ounce amidst the better tone in the Dollar and higher US yields. Its cousin Silver faded Tuesday’s pullback, although the bullish move struggled to surpass the $27.50 region.
- Mexican Peso dips, USD/MXN rises 0.12% as market eyes key economic data and Banxico rate decision.
- Anticipated April inflation drop may prompt Banxico to consider cutting rates from 11.00% to 10.75%.
- US Fed officials, including Susan Collins and Neel Kashkari, urge caution in rate policy, impacting cross-border sentiment.
The Mexican Peso remains on the defensive against the US Dollar on Wednesday as investors brace for the Bank of Mexico (Banxico) monetary policy decision on Thursday. Before that, April’s inflation in Mexico is expected to dip in headline and core figures, which could weigh on the central bank’s decision. The USD/MXN trades at 16.91, gains 0.12%.
Data revealed during the week suggests that Mexico’s economy remains solid. This could prompt Banxico’s Governing Council members to evaluate the chance of slashing rates from around 11.00% to 10.75% at the next meeting. Nevertheless, market participants expect Banxico to remain on hold, with Bank of America’s analysts foreseeing at least four more rate cuts, which could drive the main reference interest rate to 10.00% in 2024.
Elsewhere, Federal Reserve (Fed) officials continued to grab headlines across the border. Boston Fed President Susan Collins said she expects demand to slow down to bring inflation to 2%, adding that there are risks of cutting rates “too soon.” She said that the current policy is well-positioned and that it is “moderately restrictive.”
On Tuesday, Minnesota Fed President Neel Kashkari said that rates would stay put for an extended period, adding that if rates need to be raised, they will do so.
Daily digest market movers: Mexican Peso appreciates ahead of busy schedule
- Last week, Banxico’s April poll showed that private economists estimate inflation to end the year at 4.2% in 2024, underlying prices at 4.1%, and the economy to grow by 2.25%. Regarding the USD/MXN, analysts revised their projections downward from 18.10 to 17.
- Mexico’s economic calendar will feature the release of the Consumer Price Index (CPI) for April, estimated at 0.18% MoM, below March’s reading. In the twelve months to April, the CPI is foreseen climbing from 4.42% to 4.63%.
- Most bank analysts predict that Banxico will keep interest rates steady with a unanimous decision expected from the Governing Council. However, future meetings are anticipated to be more contentious, potentially leading to divided votes. This expectation arises from comments by two Deputy Governors, Irene Espinosa and Jonathan Heath, who have stated that inflation is still elevated, necessitating that interest rates stay at higher levels.
- The softer-than-expected US jobs data has heightened the likelihood that the Fed may reduce interest rates later in the year. April,Nonfarm Payrolls showed an addition of only 175,000 workers, falling short of expectations and significantly below March's revised figure of 315,000.
- Fed officials acknowledged that risks to achieving its dual mandate on employment and inflation “moved toward better balance over the past year,” which signals that if labor market data is weak, it could pave the way for cutting rates.
- Data from the futures market see odds for a quarter percentage point Fed rate cut in September at 86%, versus 55% ahead of last week’sFOMC decision.
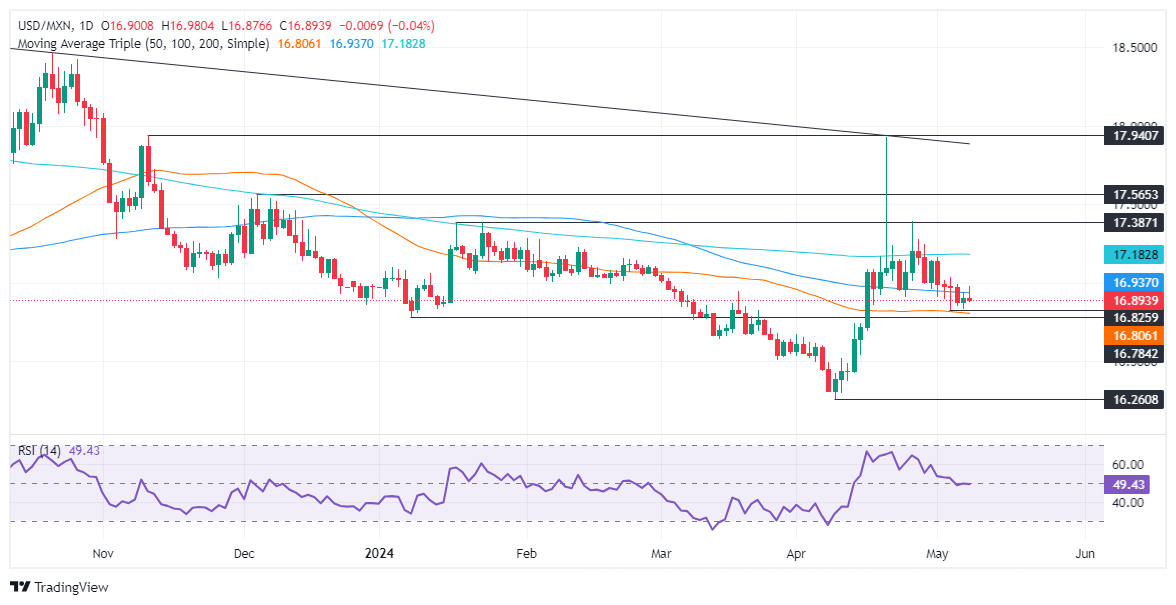
Technical analysis: Mexican Peso treads water as USD/MXN clings to 16.90
The USD/MXN downtrend remains in place, as stir resistance lies above the current exchange rate. Even though the Relative Strength Index (RSI) suggests that buyers are gathering momentum, they must clear key supply zones before the pair turns bullish.
The first resistance would be the 100-day Simple Moving Average (SMA) at 16.93, followed by the 17.00 mark. Once cleared, the next supply level would be the 200-day Simple Moving Average at 17.17, followed by the January 23 swing high of 17.38 and the year-to-date high of 17.92.
On the other hand, If USD/MXN tumbles below the 50-day Simple Moving Average (SMA) at 16.80, that could pave the way to challenge the 2023 low of 16.62, followed by the current year-to-date low of 16.25.
Mexican Peso FAQs
The Mexican Peso (MXN) is the most traded currency among its Latin American peers. Its value is broadly determined by the performance of the Mexican economy, the country’s central bank’s policy, the amount of foreign investment in the country and even the levels of remittances sent by Mexicans who live abroad, particularly in the United States. Geopolitical trends can also move MXN: for example, the process of nearshoring – or the decision by some firms to relocate manufacturing capacity and supply chains closer to their home countries – is also seen as a catalyst for the Mexican currency as the country is considered a key manufacturing hub in the American continent. Another catalyst for MXN is Oil prices as Mexico is a key exporter of the commodity.
The main objective of Mexico’s central bank, also known as Banxico, is to maintain inflation at low and stable levels (at or close to its target of 3%, the midpoint in a tolerance band of between 2% and 4%). To this end, the bank sets an appropriate level of interest rates. When inflation is too high, Banxico will attempt to tame it by raising interest rates, making it more expensive for households and businesses to borrow money, thus cooling demand and the overall economy. Higher interest rates are generally positive for the Mexican Peso (MXN) as they lead to higher yields, making the country a more attractive place for investors. On the contrary, lower interest rates tend to weaken MXN.
Macroeconomic data releases are key to assess the state of the economy and can have an impact on the Mexican Peso (MXN) valuation. A strong Mexican economy, based on high economic growth, low unemployment and high confidence is good for MXN. Not only does it attract more foreign investment but it may encourage the Bank of Mexico (Banxico) to increase interest rates, particularly if this strength comes together with elevated inflation. However, if economic data is weak, MXN is likely to depreciate.
As an emerging-market currency, the Mexican Peso (MXN) tends to strive during risk-on periods, or when investors perceive that broader market risks are low and thus are eager to engage with investments that carry a higher risk. Conversely, MXN tends to weaken at times of market turbulence or economic uncertainty as investors tend to sell higher-risk assets and flee to the more-stable safe havens.
- Canadian Dollar rebounds after previous day’s downside.
- Canada is absent from the economic calendar on Wednesday.
- BoC’s Macklem due Thursday to deliver latest Financial System Review.
The Canadian Dollar (CAD) rebounded across broader markets on Wednesday, regaining ground lost in the previous sessions. Markets remain thin as traders await meaningful data and watch for talking points from Federal Reserve (Fed) officials.
Canada is entirely absent from Wednesday’s data docket, leaving CAD at the mercy of broader market flows. Bank of Canada (BoC) Governor Tiff Macklem will make an appearance on Thursday while delivering the BoC’s Financial System Review in Ottawa.
Daily digest market movers: Quiet markets give CAD room to recover lost ground
- Canadian Dollar squeezes out scant gains across the board on quiet Wednesday.
- Fedspeak remains a key risk to market sentiment as Fed officials try to soothe the idea of higher rates for longer over market sentiment.
- [Fed Collins: The job market is coming to a better balance] (https://www.fxstreet.com/news/fed-collins-the-job-market-is-coming-to-a-better-balance-202405081555)
- Thursday’s BoC Financial System Review headed by BoC Gov Macklem will allow CAD traders to look closer at what the BoC is watching in the Canadian economy.
- Friday will close out the trading week with Canadian labor figures. The Canadian Unemployment Rate is expected to tick up to 6.2% in April from 6.1%, while Net Change in Employment is expected to show 18.8K net jobs added over the month of April compared to the previous -2.2K decline.
Technical analysis: Canadian Dollar claws back lost ground, but momentum remains tepid
The Canadian Dollar (CAD) is broadly firmer on Wednesday, gaining half a percent against the Japanese Yen (JPY) and has stepped a fifth of a percent higher against the Australian Dollar (AUD). Elsewhere, gains remain thin with the CAD stepping up around a tenth of a percent against the Pound Sterling (GBP) and the US Dollar (USD).
The Canadian Dollar’s rebound on Wednesday drags the USD/CAD down, pricing in a near-term fumble of the 1.3760 level. The pair is returning to the 200-hour Exponential Moving Average (EMA) near 1.3700, building out a rough congestion pattern.
Daily candles still hold bullish territory above the 200-day EMA at 1.3541, but repeated failures to retake the last swing high near 1.3850 leave the USD/CAD exposed to a pullback into familiar levels.
USD/CAD hourly chart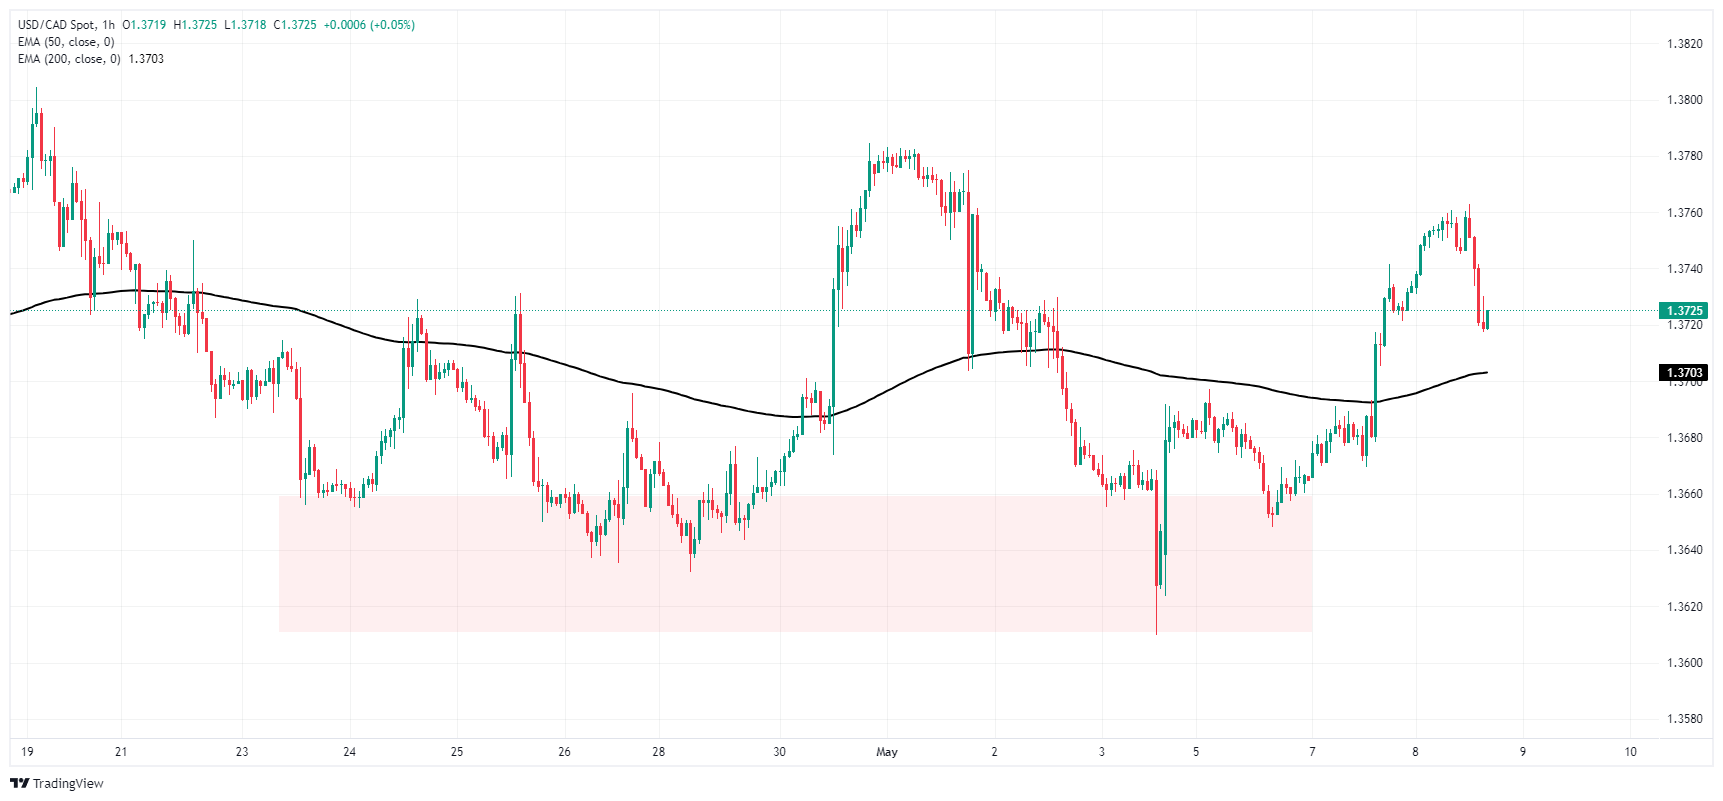
USD/CAD daily chart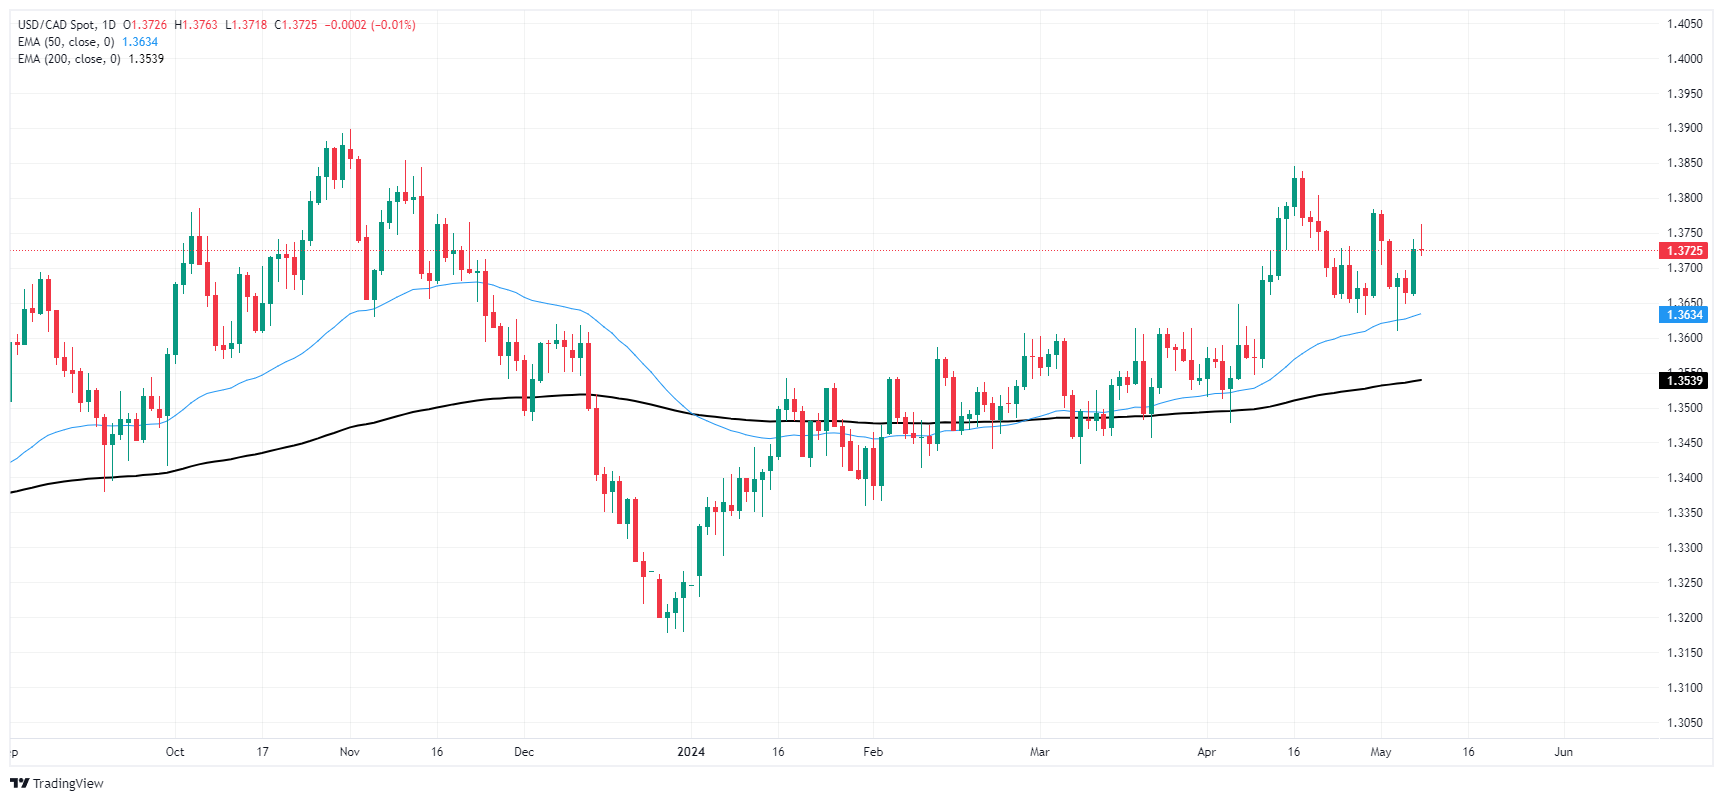
Canadian Dollar FAQs
The key factors driving the Canadian Dollar (CAD) are the level of interest rates set by the Bank of Canada (BoC), the price of Oil, Canada’s largest export, the health of its economy, inflation and the Trade Balance, which is the difference between the value of Canada’s exports versus its imports. Other factors include market sentiment – whether investors are taking on more risky assets (risk-on) or seeking safe-havens (risk-off) – with risk-on being CAD-positive. As its largest trading partner, the health of the US economy is also a key factor influencing the Canadian Dollar.
The Bank of Canada (BoC) has a significant influence on the Canadian Dollar by setting the level of interest rates that banks can lend to one another. This influences the level of interest rates for everyone. The main goal of the BoC is to maintain inflation at 1-3% by adjusting interest rates up or down. Relatively higher interest rates tend to be positive for the CAD. The Bank of Canada can also use quantitative easing and tightening to influence credit conditions, with the former CAD-negative and the latter CAD-positive.
The price of Oil is a key factor impacting the value of the Canadian Dollar. Petroleum is Canada’s biggest export, so Oil price tends to have an immediate impact on the CAD value. Generally, if Oil price rises CAD also goes up, as aggregate demand for the currency increases. The opposite is the case if the price of Oil falls. Higher Oil prices also tend to result in a greater likelihood of a positive Trade Balance, which is also supportive of the CAD.
While inflation had always traditionally been thought of as a negative factor for a currency since it lowers the value of money, the opposite has actually been the case in modern times with the relaxation of cross-border capital controls. Higher inflation tends to lead central banks to put up interest rates which attracts more capital inflows from global investors seeking a lucrative place to keep their money. This increases demand for the local currency, which in Canada’s case is the Canadian Dollar.
Macroeconomic data releases gauge the health of the economy and can have an impact on the Canadian Dollar. Indicators such as GDP, Manufacturing and Services PMIs, employment, and consumer sentiment surveys can all influence the direction of the CAD. A strong economy is good for the Canadian Dollar. Not only does it attract more foreign investment but it may encourage the Bank of Canada to put up interest rates, leading to a stronger currency. If economic data is weak, however, the CAD is likely to fall.
- In a quiet week, Fed’s hawks are keeping the US Dollar afloat.
- Fed officials ask for patience to let monetary policy do its job.
- US Treasury bond yields recover somewhat on Wednesday.
The US Dollar Index (DXY) is currently trading with mild gains at 105.45. This gain can be partially attributed to the cautious remarks of members of the Federal Reserve (Fed), who highlighted that rates will be kept high as long as they need to be to bring down inflation. Other than that, there won’t be any relevant highlight from the US economy until next week when the US will release Consumer Price Index (CPI) data from April.
The US economy faces uncertainty with Fed Chair Jerome Powell acknowledging inflation persists uncomfortably high despite easing significantly in the past year. The Fed's stance has turned hawkish as the latest weak Nonfarm Payrolls report seems to have not convinced the bank that the job is done yet. However, if data continues coming in soft, the cuts will eventually come.
Daily digest market movers: DXY holds its ground on hawkish Fed bets, higher US Treasury yields
- Hawkish sentiments are emerging inside the Fed, casting doubt over the neutral rate level and pointing out potential prompts to adjust interest rates if needed, such as a resilient housing market and ascending inflation.
- Projections suggest a budding shift, indicating that the persistent strength of the US economy might elevate the median neutral rate in the future.
- Markets predict only a 10% probability of a rate cut at June's meeting. These probabilities reduce slightly over time with a projected 30% probability for a cut in July (down from 40%) and an 80% chance for September (down from 90%). A rate cut in November, however, remains fully priced in.
- US Treasury bond yields depict a scattered picture but are higher overall. The 2-year yield trades at 4.82%, mildly down while the yields for both 5-year and 10-year bonds, residing at 4.48% and 4.47%, respectively, show a slight upward inclination.
DXY technical analysis: DXY struggles amid reduced buying momentum, swing inclined toward sellers in the short term
The indicators on the daily chart reflect a rather unsettled scenario for the Dollar Index. The Relative Strength Index (RSI) is lying flat in positive territory, indicating a lack of clear momentum in either direction. Moreover, the Moving Average Convergence Divergence (MACD) exhibits flat red bars, which shows that sellers remain steady.
In addition, the presence of the DXY beneath the 20-day Simple Moving Average (SMA) suggests that bears have managed some control, with the currency struggling to regain ground. Despite the sellers' efforts, the Index remains above the 100 and 200-day Simple Moving Averages (SMAs), implying that bulls maintain dominance in the overall trend.
US Dollar FAQs
The US Dollar (USD) is the official currency of the United States of America, and the ‘de facto’ currency of a significant number of other countries where it is found in circulation alongside local notes. It is the most heavily traded currency in the world, accounting for over 88% of all global foreign exchange turnover, or an average of $6.6 trillion in transactions per day, according to data from 2022. Following the second world war, the USD took over from the British Pound as the world’s reserve currency. For most of its history, the US Dollar was backed by Gold, until the Bretton Woods Agreement in 1971 when the Gold Standard went away.
The most important single factor impacting on the value of the US Dollar is monetary policy, which is shaped by the Federal Reserve (Fed). The Fed has two mandates: to achieve price stability (control inflation) and foster full employment. Its primary tool to achieve these two goals is by adjusting interest rates. When prices are rising too quickly and inflation is above the Fed’s 2% target, the Fed will raise rates, which helps the USD value. When inflation falls below 2% or the Unemployment Rate is too high, the Fed may lower interest rates, which weighs on the Greenback.
In extreme situations, the Federal Reserve can also print more Dollars and enact quantitative easing (QE). QE is the process by which the Fed substantially increases the flow of credit in a stuck financial system. It is a non-standard policy measure used when credit has dried up because banks will not lend to each other (out of the fear of counterparty default). It is a last resort when simply lowering interest rates is unlikely to achieve the necessary result. It was the Fed’s weapon of choice to combat the credit crunch that occurred during the Great Financial Crisis in 2008. It involves the Fed printing more Dollars and using them to buy US government bonds predominantly from financial institutions. QE usually leads to a weaker US Dollar.
Quantitative tightening (QT) is the reverse process whereby the Federal Reserve stops buying bonds from financial institutions and does not reinvest the principal from the bonds it holds maturing in new purchases. It is usually positive for the US Dollar.
Federal Reserve Bank of Boston President Susan Collins emphasized that the US economy requires a period of moderation as a means to reattain the central bank's 2% inflation target.
Key Quotes
Demand will need to slow to get inflation to 2%.
Fed policy well positioned for current outlook.
Monetary policy is ‘moderately’ restrictive.
There are risks to cutting rates too soon.
Doesn’t expect productivity jump to be persistent.
Firm well positioned to absorb faster wage growth.
Recent inflation setbacks are not a surprise.
Optimistic fed can get 2% inflation in reasonable time frame.
Economy robust, job market coming into better balance.
- GBP/USD falls 0.20% as market anticipates Bank of England's policy decision.
- Technically, the pair shows a downward trend, supported at 1.2467 but remains under seller pressure with a bearish RSI.
- If GBP/USD exceeds 1.2500, resistance may occur at 200-DMA (1.2543), 1.2594, and May 3 high of 1.2634.
In early trading on Wednesday, the Pound Sterling resumed its downtrend against the US Dollar, as the Greenback remained the strongest currency against other peers. Despite printing losses, Cable remains at familiar levels, ahead of the Bank of England (BoE) monetary policy decision. The GBP/USD trades at 1.2483, down 0.20%.
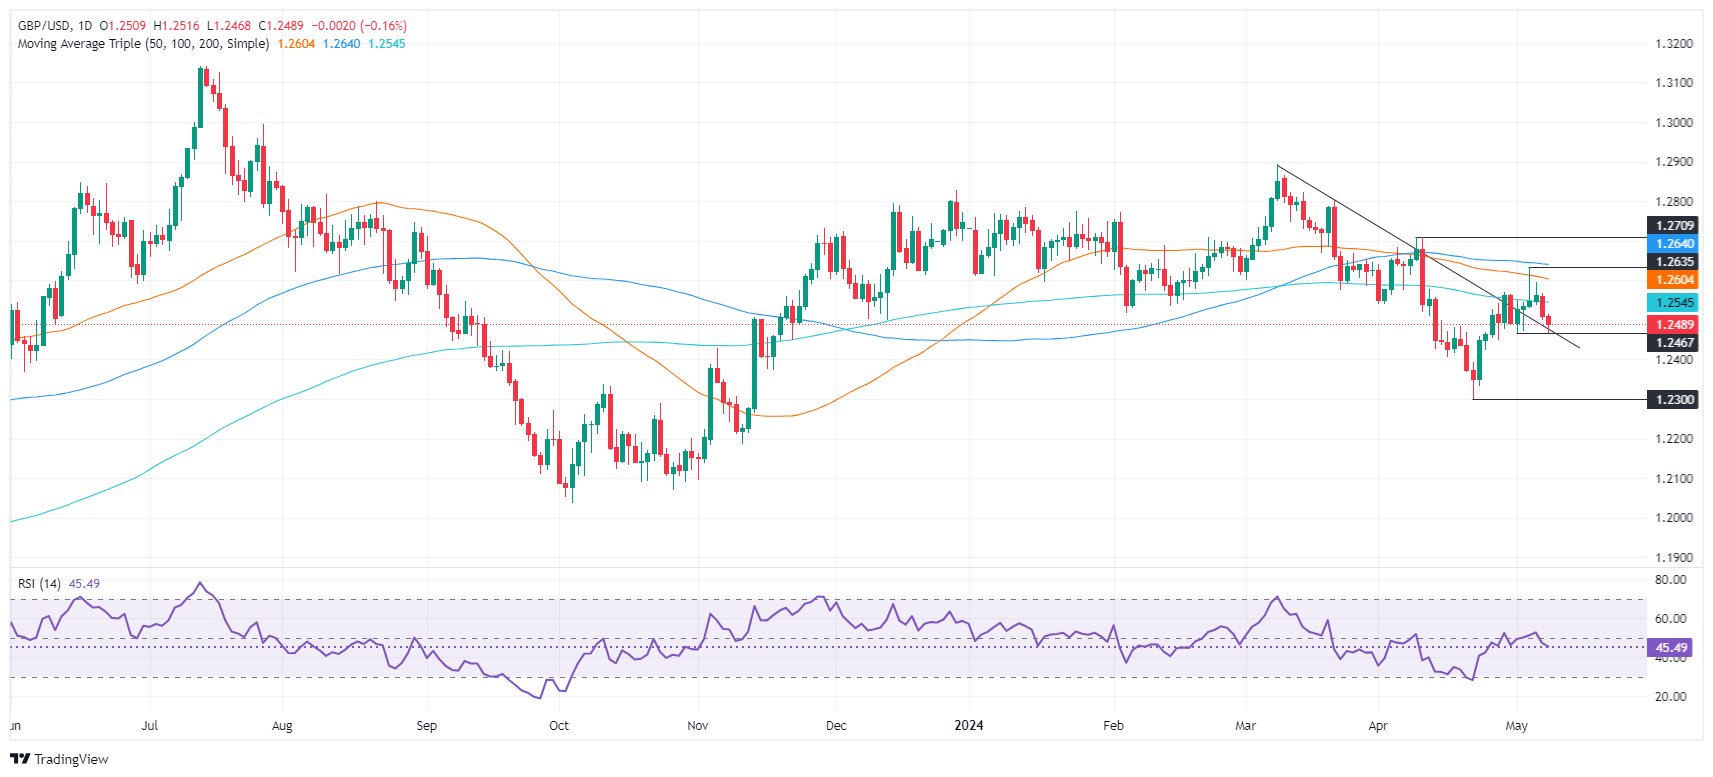
GBP/USD Price Analysis: Technical outlook
The GBP/USD is biased downward, though it failed to crack a support trendline at around the day’s low of 1.2467, which could have opened the door for further losses. Despite the bounce, momentum is still favoring sellers, with the Relative Strength Index (RSI) standing at bearish territory, with its slope aiming down.
In the event of GBP/USD clearing the 1.2500 psychological level, the next resistance would be the 200-day moving average (DMA) at 1.2543. Once cleared, the next stop would be intermediate resistance at the May 6 high at 1.294, followed by the latest cycle high seen at 1.2634, the May 3 high.
GBP/USD Price Action – Daily Chart
- NZD/USD faces selling pressure above 0.6000 as US Dollar recovers.
- Fed Kashkari doesn’t see interest rate cuts this year.
- Investors see the RBNZ reducing interest rates from October.
The NZD/USD pair faces pressure above the psychological figure of 0.6000 in Wednesday’s New York session. Downside pressure on the Kiwi asset is driven by risk-averse market sentiment and a recovery in the US Dollar.
The S&P 500 opens on a bearish note, suggesting a weak risk-appetite of investors. 10-year US Treasury yields recover to 4.49% as Minneapolis Federal Reserve (Fed) Bank President Neel Kashkari sounded hawkish in his commentary over the interest rate guidance on Tuesday. The US Dollar Index (DXY) holds strength near intraday’s high around 105.50
Neel Kashkari emphasized the need to keep interest rates at their current levels for the entire year. Kashkari wants to see multiple positive inflation readings to build confidence that inflation is on course to return to the desired rate of 2%.
The New Zealand Dollar has posted a modest decline as investors see the Reserve Bank of New Zealand (RBNZ) shifting to interest rate cuts from the October meeting. Earlier, investors anticipated that the RBNZ would look for rate cuts in 2025.
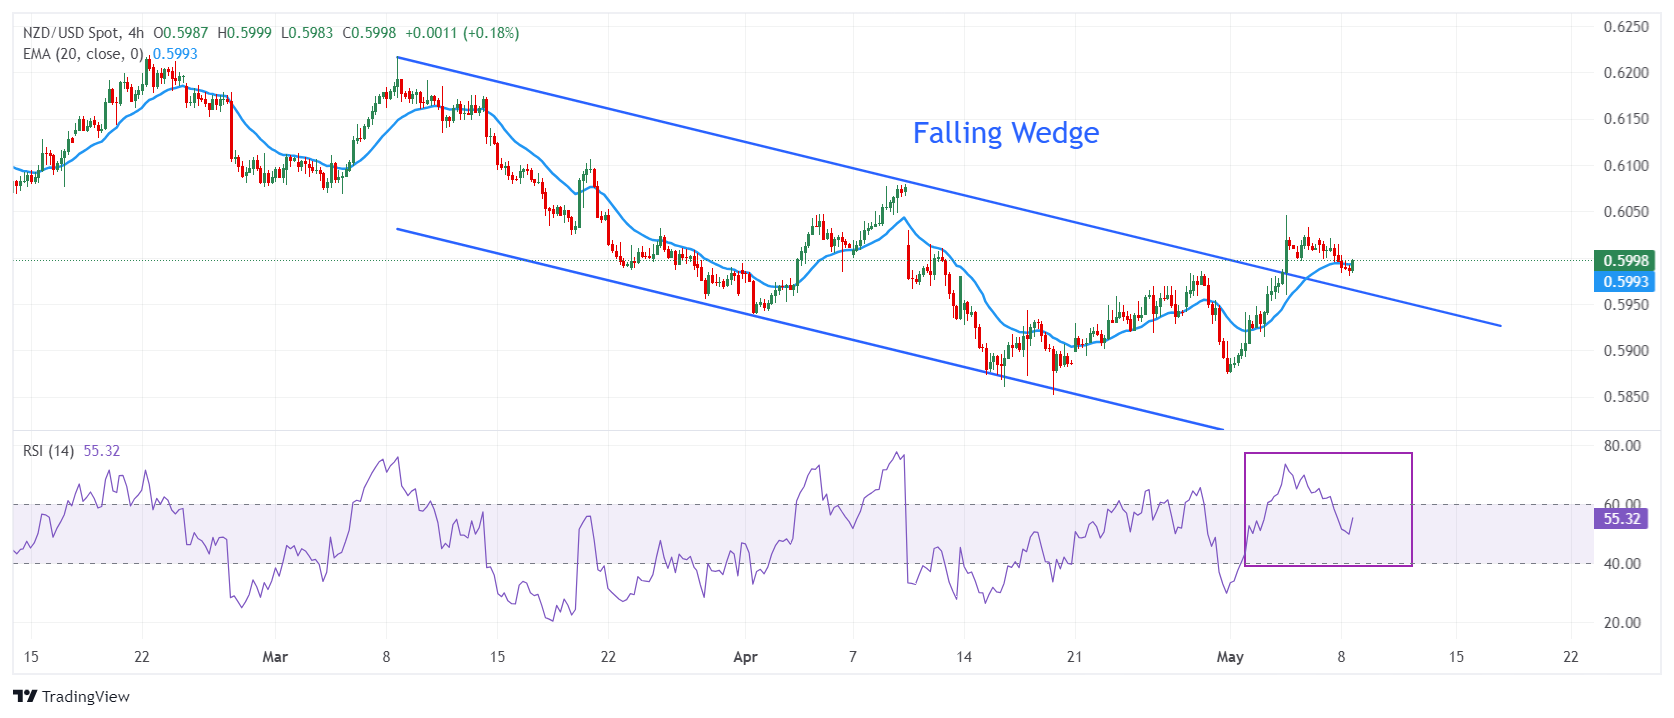
NZD/USD holds gains posted after a breakout of the Falling Wedge formation on a four-hour timeframe. A breakout of the above-mentioned chart pattern exhibits a bullish reversal. The 20-period Exponential Moving Average (EMA) near 0.6000 continues to offer support to the New Zealand Dollar bulls.
The 14-period Relative Strength Index (RSI) hovers inside the 40.00-60.00 range. A decisive break above 60.00 will trigger a bullish momentum.
An upside above April 4 high around 0.6050 will drive the asset towards the round-level resistance of 0.6100 and February 9 high of 0.6160.
On the contrary, a fresh downside would appear if the asset breaks below the April 16 low at 0.5860. This would drag the asset toward 8 September 2023 low at 0.5847, followed by the round-level support of 0.5900.
NZD/USD four-hour chart
- AUD/USD hits hard due to US Dollar’s recovery and dismal market sentiment.
- Fed Kashkari sees interest rates remaining steady by the year-end.
- RBA Bullock doesn’t see the need to hike interest rates again.
The AUD/USD pair witnesses an intense sell-off and falls to 0.6560 in Wednesday’s early American session due to multiple headwinds. A sharp recovery in the US Dollar and weakness in the Australian Dollar due to less-hawkish interest rate guidance from the Reserve Bank of Australia (RBA) after keeping them unchanged at 4.35% have weighed on the Aussie asset.
The market sentiment turns downbeat as investors remain uncertain over the Federal Reserve’s (Fed) rate-cut timing. The S&P 500 opens on a negative note, exhibiting a decline in investors’ risk appetite. 10-year US Treasury yields recovered to 4.48% after Minneapolis Federal Reserve (Fed) Bank President Neel Kashkari raised concerns over stalled progress in the disinflation process as it favours interest rates remaining at their current levels for the entire year.
The US Dollar Index (DXY) advances to 105.50 as Neel Kashkari said he wants to see multiple positive inflation readings to build confidence that inflation is progressively declining to the 2% target. He added that weakness in the job market could justify the need for a rate cut.
Due to the absence of top-tier United States economic data, investors will focus on speeches from policymakers: Fed Vice Chair Philip Jefferson, President of the Federal Reserve Bank of Boston Susan Collins and Fed Governor Lisa Cook to project the next move in the US Dollar.
Meanwhile, the Australian Dollar remains under pressure after the RBA’s less-hawkish commentary on the interest rate outlook. In the press conference, RBA Governor Michele Bullock ruled out expectations of more rate hikes despite recent price pressures exceeding expectations. Bullock said, “I don't think we necessarily have to tighten again.” He added, “We believe rates are at the right level to get inflation back to target.”
European Central Bank (ECB) policymaker Robert Holzmann said on Wednesday that he doesn't see a reason to cut key interest rates "too quickly or too strongly," per Reuters.
Meanwhile, ECB policymaker Pierre Wunsch argued that costs of keeping a too tight policy for too long seem to outweigh the cost of easing prematurely. "There is room to cut 50 basis points but when will depend on data," Wunsch added.
Market reaction
These comments don't seem to be impacting the Euro's valuation in a noticeable way. At the time of press, the EUR/USD pair was virtually unchanged on the day at 1.0750.
- The US Dollar outperforms against most major Asian peers on Wednesday.
- Traders are gearing up for back-to-back Fed speakers lined up.
- The US Dollar Index trades around 105.50 and is making this week’s net performance a positive one.
The US Dollar (USD) extends gains on Wednesday, picking up momentum against most Asian peers. Leading the decline in Asian pairs is the Japanese Yen (USD/JPY) which is breaking above 155.00 and has already erased literally half of the move that took place with the interventions from the Japanese government. Markets seem to be testing Japanese authorities again to see if they will intervene ahead of 160.00, or on the contrary, will get the chance to fully erase the decline after last week’s intervention.
On Wednesday, All eyes will be on US Federal Reserve officials with three speakers lined up. Federal Reserve Vice Chair Philip Jefferson will speak around 15:00 GMT in a discussion at Exploring Careers in Economics. Federal Reserve Bank of Boston President Susan Collins will hold a speech to MIT Sloan students around 15:45 GMT. Last but not least important: Federal Reserve Governor Lisa Cook will discuss the Fed’s latest semi-annual Financial Stability Report around 17:30 GMT. Juicy detail: Both Fed’s Jefferson and Cook are Federal Open Market Committee (FOMC) voters for this year.
Daily digest market movers: One eye on USD/JPY
- During the Asia-Pacific (APAC) trading session, both Bank of Japan governor Kazuo Ueda and Japanese Minister of Finance Shunichi Suzuki made comments on the Japanese Yen.
- BoJ President Ueda said that monetary policy is not controlling forex.
- Finance Minister Suzuki contradicted that stance by saying that more actions will be needed if excessive moves occur again, adding that there is no line in the sand and interventions could take place at any moment or level, Bloomberg reported.
- This Wednesday kicks off around 11:00 GMT with the weekly Mortgage Bankers Association release of the Mortgage Applications survey for May 3. Mortgage applications declined 2.3% the previous week.
- Around 14:00 GMT, Wholesale Inventories data for March are set to be released. The preliminary reading points to a 0.4% decrease and economists expect it to be confirmed.
- The US Treasury is auctioning one of the benchmark notes: a 10-year auction at 17:00 GMT. Previous level was around 4.56% with the 10-year US Note trading at 4.47%.
- As mentioned in the above paragraph, a set of Fed speakers taking the stage this Wednesday:
- Fed’s Vice Chair Philip Jefferson will speak around 15:00 GMT.
- Fed’s Boston President Susan Collins is expected to speak around 15:45 GMT.
- Fed Governor Lisa Cook will discuss the Fed’s latest semi-annual Financial Stability Report in DC at 17:30 GMT.
- A red day is in the making in Asian equity markets after comments from Bank of Japan governor Kazuo Ueda and Japanese Minister of Finance Shunichi Suzuki. Both the Japanese Nikkei and Topix indexes closed over 1.5% in the red. Europe is trading flat while US futures are looking for direction.
- The CME Fedwatch Tool suggests a 91.1% probability that June will still see no change to the Federal Reserve's fed fund rate. Odds of a rate cut in July are also out of the cards, while for September the tool shows a 49.0% chance that rates will be 25 basis points lower than current levels.
- The benchmark 10-year US Treasury Note trades around 4.47%, in the middle of Monday’s range.
US Dollar Index Technical Analysis: It is not over yet
The US Dollar Index (DXY) is heading back in a bit of push-and-pull from what we saw earlier this year. Traders are keeping a half eye on the USD/JPY and should have it easy to time when the DXY will roll over or steam on higher. With the opposing comments from the BoJ and Ministry of Finance of Japan, markets are set to challenge if USD/JPY can head back to 160.00, which means some more US Dollar strength could be on the horizon.
On the upside, 105.52 (a pivotal level since April 11) needs to be recovered through a daily close above this level before targeting the April 16 high at 106.52 for a third time. Further up and above the 107.00 round level, the DXY index could meet resistance at 107.35, the October 3 high.
On the downside, the 55-day and the 200-day Simple Moving Averages (SMAs) at 104.54 and 104.25, respectively, should provide ample support. If those levels are unable to hold, the 100-day SMA near 103.89 is the next best candidate.
US Dollar FAQs
The US Dollar (USD) is the official currency of the United States of America, and the ‘de facto’ currency of a significant number of other countries where it is found in circulation alongside local notes. It is the most heavily traded currency in the world, accounting for over 88% of all global foreign exchange turnover, or an average of $6.6 trillion in transactions per day, according to data from 2022. Following the second world war, the USD took over from the British Pound as the world’s reserve currency. For most of its history, the US Dollar was backed by Gold, until the Bretton Woods Agreement in 1971 when the Gold Standard went away.
The most important single factor impacting on the value of the US Dollar is monetary policy, which is shaped by the Federal Reserve (Fed). The Fed has two mandates: to achieve price stability (control inflation) and foster full employment. Its primary tool to achieve these two goals is by adjusting interest rates. When prices are rising too quickly and inflation is above the Fed’s 2% target, the Fed will raise rates, which helps the USD value. When inflation falls below 2% or the Unemployment Rate is too high, the Fed may lower interest rates, which weighs on the Greenback.
In extreme situations, the Federal Reserve can also print more Dollars and enact quantitative easing (QE). QE is the process by which the Fed substantially increases the flow of credit in a stuck financial system. It is a non-standard policy measure used when credit has dried up because banks will not lend to each other (out of the fear of counterparty default). It is a last resort when simply lowering interest rates is unlikely to achieve the necessary result. It was the Fed’s weapon of choice to combat the credit crunch that occurred during the Great Financial Crisis in 2008. It involves the Fed printing more Dollars and using them to buy US government bonds predominantly from financial institutions. QE usually leads to a weaker US Dollar.
Quantitative tightening (QT) is the reverse process whereby the Federal Reserve stops buying bonds from financial institutions and does not reinvest the principal from the bonds it holds maturing in new purchases. It is usually positive for the US Dollar.
- Gold price is slightly up near $2,315 even though the US Dollar recovers sharply.
- Worsening Middle East tensions keep the downside in the Gold price supported.
- The US Dollar recovers after Fed Kashkari’s hawkish guidance on interest rates.
Gold price (XAU/USD) struggles for a direction in Wednesday’s London session. The precious metal is stuck in a tight range slightly above the crucial support of $2,300.
The yellow metal is up marginally by 0.10% despite a strong recovery in the US Dollar. Generally, the appeal for dollar-denominated Gold weakens when the US Dollar rises. The US Dollar Index (DXY), which tracks the Greenback’s value against six major currencies, recovers to 105.50. A hawkish guidance from Minneapolis Federal Reserve (Fed) Bank President Neel Kashkari on interest rates, delivered on Tuesday, boosted the US Dollar’s appeal.
Neel Kashkari said he wants to see multiple positive inflation readings, which could build confidence that inflation is on course to return to the desired rate of 2%, before moving to a policy normalization stance. Kashkari supported keeping interest rates steady for the entire year as progress in the disinflation process has stalled due to the strong housing market.
No progress in speculation for a ceasefire between Israel and Palestine has kept the Gold price well-supported. Israel is looking to extend its military activities to Rafah, the southern part of Gaza, where it believes that displaced Palestinians have been sheltered.
The expectations of an Israel-Palestine truce soften after Israel denied the ceasefire proposal, which was agreed by Palestine. Historically, worsening geopolitical tensions improve demand for safe-haven assets, such as Gold.
Gold technical analysis
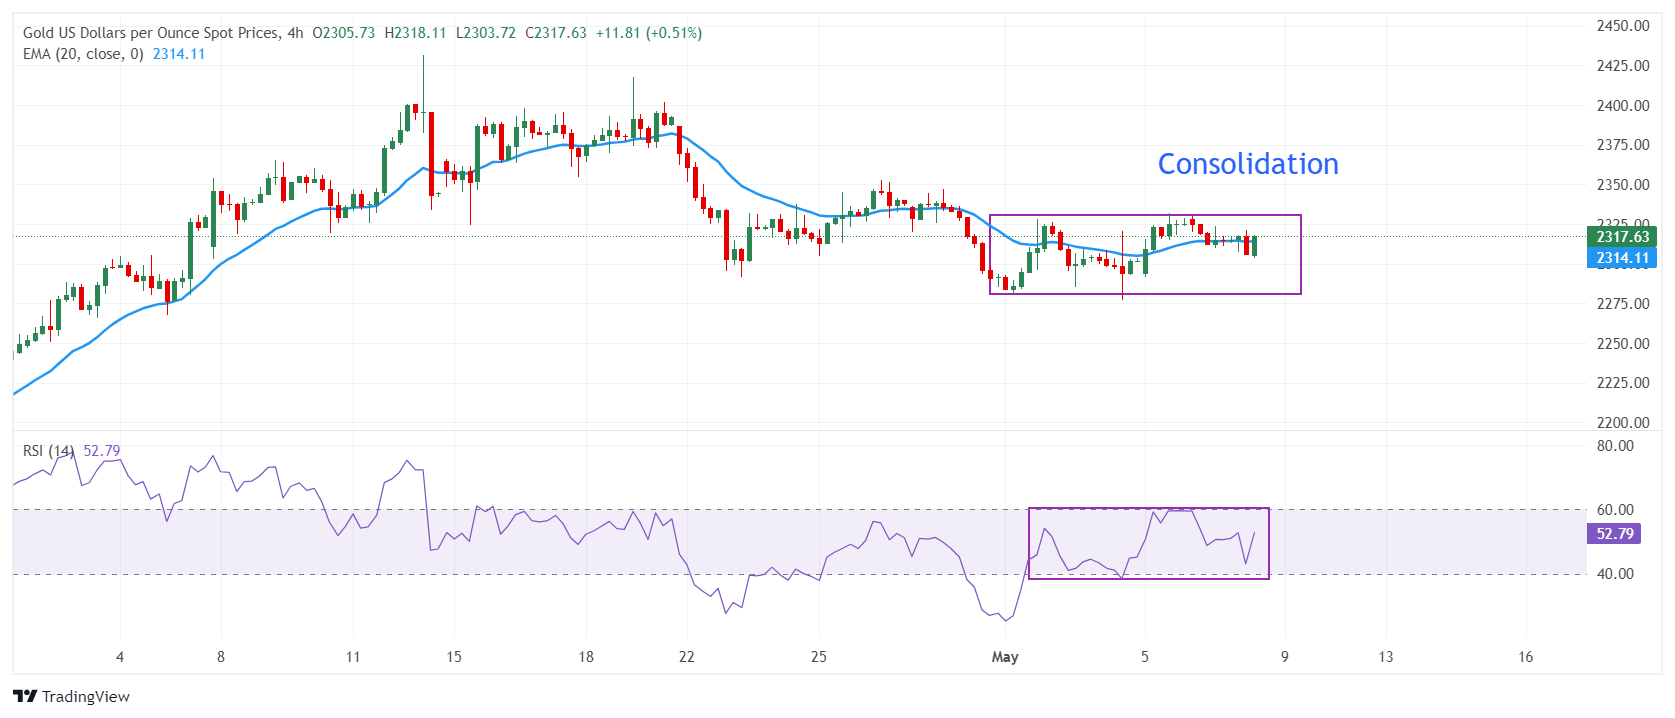
Gold price is rangebound in the $2,280-2,330 region for more than a week, exhibiting indecisiveness among market participants. The precious metal remains sticky to the 20-period Exponential Moving Average (EMA) around $2,314.60, which suggests a consolidation ahead.
The 14-period Relative Strength Index (RSI) oscillates in the 40.00-60.00 range, indicating a sharp volatility contraction.
Gold four-hour chart
- Oil continues losing ground after surprise comments from Iran about increasing output.
- WTI Oil snaps below $78 and looks set to head to $75.
- The US Dollar Index ticks up with help from the Japanese Yen and market uncertainty.
Oil prices sank more than 1.5% in Wednesday’s European session, with West Texas Intermediate (WTI) US crude prices reaching their lowest levels in almost two months. Markets are not responding well to the headline that Iran plans to add between 300,000 and 400,000 barrels per day in its production for this year, reported by Bloomberg on Wednesday. The confirmation came from Iranian Oil Minister Javad Owji on state TV, and means mayhem for the next OPEC meeting, where prolonging production cuts is the topic of discussion.
Meanwhile, the US Dollar Index (DXY) is grinding higher this week, posting gains for a third consecutive day, in joint cooperation with the USD/JPY pair, where the Japanese Yen (JPY) has already devalued half the move it gained on the Japanese interventions over the past two weeks. The underlying bullish tone around the US Dollar (USD) might continue to weigh on Crude Oil prices
Crude Oil (WTI) trades at $77.01 and Brent Crude at $81.92 at the time of writing.
Oil news and market movers: Iran against OPEC
- The American Petroleum Institute (API) reported on Tuesday that US Crude Inventories built by 509,000 barrels the week ending on May 3. The derivatives such as Cushing, Gasoline, and Distillates all saw buildings in their segments as well, Bloomberg reports.
- The Energy Information Administration (EIA) issued a note on Wednesday saying that it sees the Oil market remaining balanced for 2024, pointing to non-OPEC countries filling in the gap of OPEC’s production cuts, Reuters reports.
- Bloomberg Intelligence reporters Will Hares and Salih Yilmaz said in a note on Wednesday that OPEC+ (Organization of the Petroleum Exporting Countries and allies) has reason enough to prolong its production cuts, seeing the recent decline in Oil prices from $87.12 on April 5 to $77.01 on Wednesday.
Oil Technical Analysis: Cooling down in an uptrend
Oil prices are cooling down further as the risk of interruptions in Oil production from the Middle East isn’t taking place. As traders look to be fed up with pricing in a risk premium for something that is still not happening, this sees some capitulation in the Oil price where only $75.28 looks to be only solid support level left refraining from Oil to dip to $70.00.
Still, a turnaround could occur once Oil prices recover back above $78.07, with the 100-day Simple Moving Average (SMA) and the green ascending trend line from December acting as support. Next on the upside, the 200-day SMA at $79.76 and the 55-day SMA at $81.12 are the levels to watch for some profit-taking. In the longer term, $87.12 remains the big level on the upside.
On the downside, the pivotal level at $75.28 is the last solid line in the sand that could end this decline. If this level is unable to hold, expect to see an accelerated selloff towards $72.00 and $70.00. That would mean that all gains for 2024 are given up and Oil could test $68, the December 13 low.

US WTI Crude Oil: Daily Chart
WTI Oil FAQs
WTI Oil is a type of Crude Oil sold on international markets. The WTI stands for West Texas Intermediate, one of three major types including Brent and Dubai Crude. WTI is also referred to as “light” and “sweet” because of its relatively low gravity and sulfur content respectively. It is considered a high quality Oil that is easily refined. It is sourced in the United States and distributed via the Cushing hub, which is considered “The Pipeline Crossroads of the World”. It is a benchmark for the Oil market and WTI price is frequently quoted in the media.
Like all assets, supply and demand are the key drivers of WTI Oil price. As such, global growth can be a driver of increased demand and vice versa for weak global growth. Political instability, wars, and sanctions can disrupt supply and impact prices. The decisions of OPEC, a group of major Oil-producing countries, is another key driver of price. The value of the US Dollar influences the price of WTI Crude Oil, since Oil is predominantly traded in US Dollars, thus a weaker US Dollar can make Oil more affordable and vice versa.
The weekly Oil inventory reports published by the American Petroleum Institute (API) and the Energy Information Agency (EIA) impact the price of WTI Oil. Changes in inventories reflect fluctuating supply and demand. If the data shows a drop in inventories it can indicate increased demand, pushing up Oil price. Higher inventories can reflect increased supply, pushing down prices. API’s report is published every Tuesday and EIA’s the day after. Their results are usually similar, falling within 1% of each other 75% of the time. The EIA data is considered more reliable, since it is a government agency.
OPEC (Organization of the Petroleum Exporting Countries) is a group of 13 Oil-producing nations who collectively decide production quotas for member countries at twice-yearly meetings. Their decisions often impact WTI Oil prices. When OPEC decides to lower quotas, it can tighten supply, pushing up Oil prices. When OPEC increases production, it has the opposite effect. OPEC+ refers to an expanded group that includes ten extra non-OPEC members, the most notable of which is Russia.
- USD/CAD rises to 1.3750, capitalized on the US Dollar’s recovery.
- Fed Kashkari sees progress in disinflation stalling due to the strong housing market.
- Investors await the Canadian Employment data for fresh guidance.
The USD/CAD pair advances to the crucial resistance of 1.3750 in Wednesday’s European session. The Loonie asset strengthens as the US Dollar recovers losses induced by Federal Reserve (Fed) Chair Jerome Powell’s slight less-hawkish guidance on interest rates than expected after the monetary policy decision last week in which he remains leaned towards reducing interest rates this year.
The US Dollar Index (DXY), which tracks the Greenback’s value against six major currencies, extends recovery to 105.50. Due to the light United States economic calendar, investors are projecting the next move in the US Dollar on the basis of Fed Policymakers’ speeches.
On Tuesday, Minneapolis Federal Reserve (Fed) Bank President Neel Kashkari on Tuesday. Neel Kashkari cited concerns over stalling progress in disinflation due to housing market strength and warned that interest rates are needed to remain where they are possibly for the entire year.
This week, the Canadian Dollar will be guided by the Employment data for April, which will be published on Friday. The Canadian job market is estimated to have expanded by fresh 20K payrolls against a drawdown of 2.2K. The Unemployment Rate is anticipated to have risen to 6.2% from 6.1%. The labor market data will significantly influence the Bank of Canada’s (BoC) interest rate outlook.
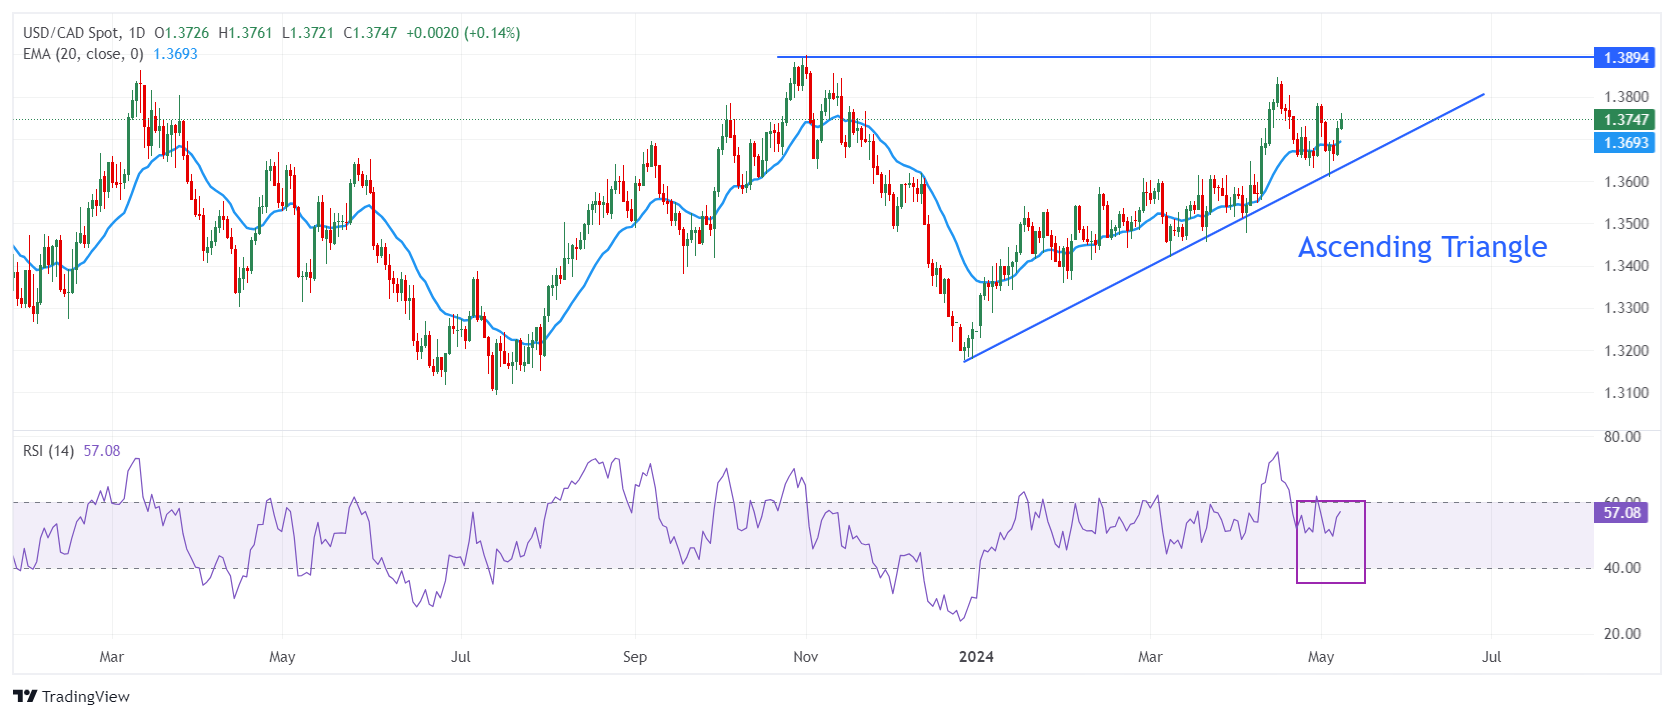
USD/CAD recovers strongly after discovering buying interest near the upward-sloping border of the Ascending Triangle formation on a daily timeframe, which is plotted from December 27 low at 1.3178. The horizontal resistance of the above-mentioned chart pattern is placed from November 1 high around 1.3900.
The 20-day Exponential Moving Average (EMA) near 1.3700 continues to provide support to the US Dollar bulls.
The 14-period Relative Strength Index (RSI) oscillates in the 40.00-60.00 range, suggesting indecisiveness among investors.
Fresh buying opportunity would emerge if the asset breaks above April 30 high at 1.3785. This would drive the asset towards April 17 high at 1.3838, followed by the round-level resistance of 1.3900.
In an alternate scenario, a breakdown below May 3 low around 1.3600 will expose the asset to the April 9 low around 1.3547 and the psychological support of 1.3500.
USD/CAD daily chart
- EUR/USD comes down slightly to 1.0740 as the US Dollar rises amid a light US economic calendar.
- The ECB is expected to opt for cutting interest rates in June.
- Fed’s Kashkari sees no rate cuts this year due to the strong housing market.
EUR/USD is slightly down to 1.0740 in Wednesday’s European session. The major currency pair drops as the US Dollar rises as comments from central bank officials become the main market movers in the absence of top-tier economic data in the Eurozone and the United States.
Investors underpinned the Euro against the US Dollar in the past few trading sessions as speculation for the Federal Reserve (Fed) pivoting to interest-rate cuts strengthened due to weak US economic data. However, the Euro struggles to hold strength amid firm expectations that the European Central Bank (ECB) will cut rates before the Fed.
Financial markets see the ECB starting to cut interest rates from the June meeting. Price pressures in the Eurozone economy are on course to return to the 2% target, and service inflation started softening after remaining steady at 4.0% for straight five months. A slew of ECB policymakers remain comfortable with interest rates coming down from June, provided there are no surprises. Also, the ECB is expected to cut interest rates three times this year, more than the Fed, which will widen the policy divergence between both central banks.
Daily digest market movers: EUR/USD edges down as US Dollar extends recovery
- EUR/USD comes under pressure as the US Dollar rebounds, recovering losses inspired by the Federal Reserve’s less hawkish guidance on interest rates than feared and weak US economic data for April. The US Dollar Index (DXY), which tracks the Greenback’s value against six major currencies, advances to 105.60.
- Last week, Fed Chair Jerome Powell said after the monetary policy meeting that further policy tightening is not in the picture. His comments signalled that he continues to lean towards rate cuts this year. However, Powell acknowledged that progress in the disinflation process appears to be stalling.
- The US Nonfarm Payrolls (NFP) report for April showed that fewer jobs were added in April, and the Unemployment Rate rose to 3.9%. Average Earnings slowed more than expected, which pointed to a softening inflation outlook. The Services PMI fell below the 50.0 threshold, which separates expansion from contraction. The service sector's output fell to 49.4, missing estimates of 52.0 by a wide margin.
- Contrary to Powell’s intent of remaining hopeful for rate cuts, Minneapolis Federal Reserve (Fed) Bank President Neel Kashkari said on Tuesday that he sees interest rates remaining at their current levels for the entire year. Stalling progress in the disinflation process due to the strong housing market turned Kashkari hawkish on the interest rate outlook.
- The impact of Kashkari’s hawkish guidance on interest rates on speculation for the Fed to start reducing interest rates from the September meeting is expected to remain subdued as he is a non-voting member until 2026. The CME FedWatch tool shows that there is a 65% chance for interest rates to reduce from their current levels in September. The probability of the Fed lowering rates in September has increased from the 53% recorded a week ago.
Technical Analysis: EUR/USD fails to recapture 1.0800
EUR/USD falls after failing to recapture the round-level resistance of 1.0800. The shared currency pair exhibits a sharp volatility contraction due to a Symmetrical Triangle formation on the daily time frame. The upward-sloping border of the triangle pattern is plotted from the October 3 low at 1.0448, and the downward-sloping border is placed from the December 28 high around 1.1140.
The 14-period Relative Strength Index (RSI) oscillates inside the 40.00-60.00 range, suggesting indecisiveness among market participants.
The asset trades above the 20-day Exponential Moving Average (EMA) near 1.0723, suggesting that the near-term outlook is bullish.
Euro FAQs
The Euro is the currency for the 20 European Union countries that belong to the Eurozone. It is the second most heavily traded currency in the world behind the US Dollar. In 2022, it accounted for 31% of all foreign exchange transactions, with an average daily turnover of over $2.2 trillion a day. EUR/USD is the most heavily traded currency pair in the world, accounting for an estimated 30% off all transactions, followed by EUR/JPY (4%), EUR/GBP (3%) and EUR/AUD (2%).
The European Central Bank (ECB) in Frankfurt, Germany, is the reserve bank for the Eurozone. The ECB sets interest rates and manages monetary policy. The ECB’s primary mandate is to maintain price stability, which means either controlling inflation or stimulating growth. Its primary tool is the raising or lowering of interest rates. Relatively high interest rates – or the expectation of higher rates – will usually benefit the Euro and vice versa. The ECB Governing Council makes monetary policy decisions at meetings held eight times a year. Decisions are made by heads of the Eurozone national banks and six permanent members, including the President of the ECB, Christine Lagarde.
Eurozone inflation data, measured by the Harmonized Index of Consumer Prices (HICP), is an important econometric for the Euro. If inflation rises more than expected, especially if above the ECB’s 2% target, it obliges the ECB to raise interest rates to bring it back under control. Relatively high interest rates compared to its counterparts will usually benefit the Euro, as it makes the region more attractive as a place for global investors to park their money.
Data releases gauge the health of the economy and can impact on the Euro. Indicators such as GDP, Manufacturing and Services PMIs, employment, and consumer sentiment surveys can all influence the direction of the single currency. A strong economy is good for the Euro. Not only does it attract more foreign investment but it may encourage the ECB to put up interest rates, which will directly strengthen the Euro. Otherwise, if economic data is weak, the Euro is likely to fall. Economic data for the four largest economies in the euro area (Germany, France, Italy and Spain) are especially significant, as they account for 75% of the Eurozone’s economy.
Another significant data release for the Euro is the Trade Balance. This indicator measures the difference between what a country earns from its exports and what it spends on imports over a given period. If a country produces highly sought after exports then its currency will gain in value purely from the extra demand created from foreign buyers seeking to purchase these goods. Therefore, a positive net Trade Balance strengthens a currency and vice versa for a negative balance.
Bank of Japan (BoJ) Governor Kazuo Ueda said on Wednesday that rapid, one-sided falls in the Japanese Yen are undesirable and negative for the Japanese economy, per Reuters.
Key takeaways
"Won't comment specifically on recent fx moves."
"Important for fx moves to reflect fundamentals."
"Impact of fx moves vary depending on size, sector of companies."
"Fx moves are among important factors that affect economy, prices."
"If risk of weak yen affecting trend inflation significantly is high, we may need to respond with monetary policy."
"We must be mindful that impact of weak yen on inflation may increase as corporate wage, price-setting behavior changes."
Market reaction
These comments failed to trigger a significant reaction in USD/JPY. At the time of press, the pair was up 0.4% on the day at 155.33.
Silver prices (XAG/USD) fell on Wednesday, according to FXStreet data. Silver trades at $27.14 per troy ounce, down 0.36% from the $27.24 it cost on Tuesday.
Silver prices have increased by 6.56% since the beginning of the year.
| Unit measure | Today Price |
|---|---|
| Silver price per troy ounce | $27.14 |
| Silver price per gram | $0.87 |
The Gold/Silver ratio, which shows the number of troy ounces of Silver needed to equal the value of one troy ounce of Gold, stood at 85.07 on Wednesday, up from 84.96 on Tuesday.
Investors might use this ratio to determine the relative valuation of Gold and Silver. Some may consider a high ratio as an indicator that Silver is undervalued – or Gold is overvalued – and might buy Silver or sell Gold accordingly. Conversely, a low ratio might suggest that Gold is undervalued relative to Silver.
(An automation tool was used in creating this post.)
Silver FAQs
Silver is a precious metal highly traded among investors. It has been historically used as a store of value and a medium of exchange. Although less popular than Gold, traders may turn to Silver to diversify their investment portfolio, for its intrinsic value or as a potential hedge during high-inflation periods. Investors can buy physical Silver, in coins or in bars, or trade it through vehicles such as Exchange Traded Funds, which track its price on international markets.
Silver prices can move due to a wide range of factors. Geopolitical instability or fears of a deep recession can make Silver price escalate due to its safe-haven status, although to a lesser extent than Gold's. As a yieldless asset, Silver tends to rise with lower interest rates. Its moves also depend on how the US Dollar (USD) behaves as the asset is priced in dollars (XAG/USD). A strong Dollar tends to keep the price of Silver at bay, whereas a weaker Dollar is likely to propel prices up. Other factors such as investment demand, mining supply – Silver is much more abundant than Gold – and recycling rates can also affect prices.
Silver is widely used in industry, particularly in sectors such as electronics or solar energy, as it has one of the highest electric conductivity of all metals – more than Copper and Gold. A surge in demand can increase prices, while a decline tends to lower them. Dynamics in the US, Chinese and Indian economies can also contribute to price swings: for the US and particularly China, their big industrial sectors use Silver in various processes; in India, consumers’ demand for the precious metal for jewellery also plays a key role in setting prices.
Silver prices tend to follow Gold's moves. When Gold prices rise, Silver typically follows suit, as their status as safe-haven assets is similar. The Gold/Silver ratio, which shows the number of ounces of Silver needed to equal the value of one ounce of Gold, may help to determine the relative valuation between both metals. Some investors may consider a high ratio as an indicator that Silver is undervalued, or Gold is overvalued. On the contrary, a low ratio might suggest that Gold is undervalued relative to Silver.
- The Pound Sterling dips slightly below 1.2500 due to multiple headwinds.
- Investors expect UK interest rates to remain steady at 5.25% with less-hawkish BoE’s guidance on interest rates.
- Fed’s Kashkari supports keeping interest rates steady for the entire year.
The Pound Sterling (GBP) slips below the psychological support of 1.2500 against the US Dollar (USD) in Wednesday’s London session. The GBP/USD pair faces a sell-off due to multiple headwinds, such a sharp recovery in the US Dollar and uncertainty ahead of the Bank of England’s (BoE) interest rate decision, which will be announced on Thursday.
Interest rates in the United Kingdom are expected to remain steady at 5.25% for the sixth time in a row. However, the BoE could turn slightly dovish on the interest rate outlook as policymakers are confident that the headline inflation could have returned to the desired rate of 2% in April, according to comments from BoE Governor Andrew Bailey in the annual Spring Meeting hosted by the International Monetary Fund (IMF) last month.
Financial markets anticipate that the BoE will start reducing interest rates from the June meeting. Traders price in 53 basis points (bps) of easing this year, implying at least two quarter-point cuts, having previously fully priced only one rate cut after inflation data last month showed prices slowed by less than expected in March, Reuters reported. The expectations for the same strengthened after Andrew Bailey said in the last monetary policy meeting that speculation for two or three rate cuts this year is reasonable.
Daily digest market movers: Pound Sterling falls while US Dollar extends recovery
- The Pound Sterling extends its correction slightly below the psychological support of 1.2500 against the US Dollar. The appeal for risk-perceived assets weakens after hawkish guidance on United States interest rates by Minneapolis Federal Reserve (Fed) Bank President Neel Kashkari on Tuesday.
- Kashkari cited concerns over stalling progress in disinflation due to housing market strength and warned that interest rates need to remain where they are possibly for the entire year. For a rate cut, Kashkari emphasized that he wants to see multiple positive inflation readings, which could build confidence that inflation is on course to return to the desired rate of 2%. He added that weakness in the job market could also justify a rate cut.
- Kashkari’s hawkish interest rate outlook has improved the appeal for the US Dollar, with the US Dollar Index (DXY)—which tracks the Greenback’s value against six major currencies—extending its upside to 105.50. The USD Index recovers the majority of losses linked with weak US Nonfarm Payrolls (NFP) and ISM Services PMI data for April.
- The speculation that the Fed will reduce interest rates from their current levels in the September meeting remains firm. The CME FedWatch tool shows that traders see two rate cuts this year.
- This week, investors will focus majorly on speeches from Fed policymakers to predict the next move in the US Dollar due to the absence of top-tier US economic data. On Wednesday, Fed Vice Chair Philip Jefferson, President of the Federal Reserve Bank of Boston Susan Collins and Fed Governor Lisa Cook are lined up to provide interest rate guidance.
Technical Analysis: Pound Sterling drops below 1.2500
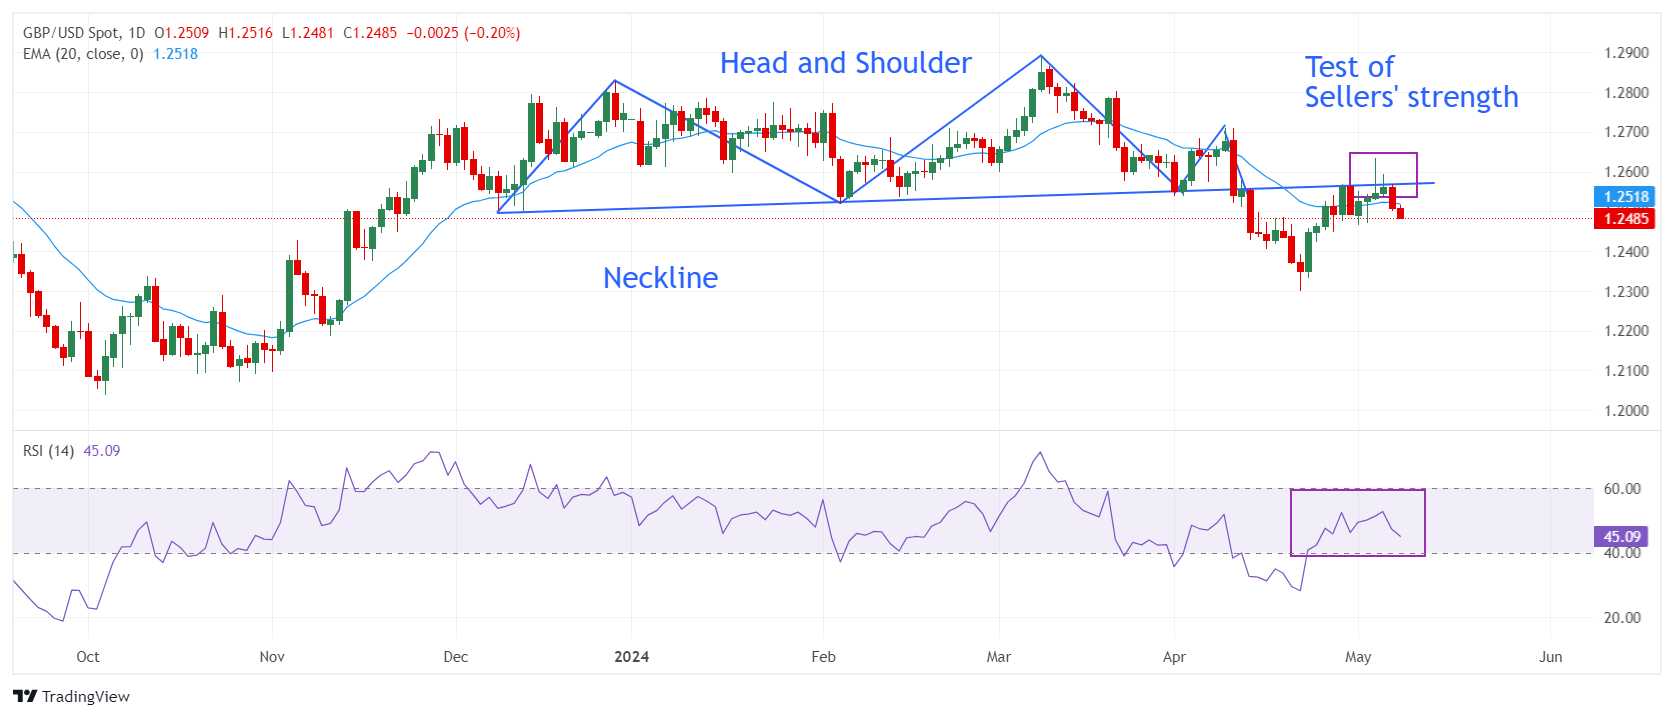
The Pound Sterling falls slightly below the psychological support of 1.2500. The GBP/USD pair is under pressure after facing strong resistance above the neckline of the Head and Shoulder (H&S) chart pattern formed on a daily timeframe. On April 12, the pair suffered an intense sell-off after breaking below the neckline of the H&S pattern plotted from December 8 low around 1.2500.
Investors tend to turn cautious about the near-term outlook as the Cable fails to sustain above the 20-day Exponential Moving Average (EMA), which trades at around 1.2520.
The 14-period Relative Strength Index (RSI) oscillates in the 40.00-60.00 range, suggesting indecisiveness among market participants.
Pound Sterling FAQs
The Pound Sterling (GBP) is the oldest currency in the world (886 AD) and the official currency of the United Kingdom. It is the fourth most traded unit for foreign exchange (FX) in the world, accounting for 12% of all transactions, averaging $630 billion a day, according to 2022 data. Its key trading pairs are GBP/USD, aka ‘Cable’, which accounts for 11% of FX, GBP/JPY, or the ‘Dragon’ as it is known by traders (3%), and EUR/GBP (2%). The Pound Sterling is issued by the Bank of England (BoE).
The single most important factor influencing the value of the Pound Sterling is monetary policy decided by the Bank of England. The BoE bases its decisions on whether it has achieved its primary goal of “price stability” – a steady inflation rate of around 2%. Its primary tool for achieving this is the adjustment of interest rates. When inflation is too high, the BoE will try to rein it in by raising interest rates, making it more expensive for people and businesses to access credit. This is generally positive for GBP, as higher interest rates make the UK a more attractive place for global investors to park their money. When inflation falls too low it is a sign economic growth is slowing. In this scenario, the BoE will consider lowering interest rates to cheapen credit so businesses will borrow more to invest in growth-generating projects.
Data releases gauge the health of the economy and can impact the value of the Pound Sterling. Indicators such as GDP, Manufacturing and Services PMIs, and employment can all influence the direction of the GBP. A strong economy is good for Sterling. Not only does it attract more foreign investment but it may encourage the BoE to put up interest rates, which will directly strengthen GBP. Otherwise, if economic data is weak, the Pound Sterling is likely to fall.
Another significant data release for the Pound Sterling is the Trade Balance. This indicator measures the difference between what a country earns from its exports and what it spends on imports over a given period. If a country produces highly sought-after exports, its currency will benefit purely from the extra demand created from foreign buyers seeking to purchase these goods. Therefore, a positive net Trade Balance strengthens a currency and vice versa for a negative balance.
Gold prices fell in India on Wednesday, according to data from India's Multi Commodity Exchange (MCX).
Gold price stood at 71,405 Indian Rupees (INR) per 10 grams, down INR 120 compared with the INR 71,525 it cost on Tuesday.
As for futures contracts, Gold prices decreased to INR 70,962 per 10 gms from INR 71,136 per 10 gms.
Prices for Silver futures contracts decreased to INR 82,429 per kg from INR 82,794 per kg.
| Major Indian city | Gold Price |
|---|---|
| Ahmedabad | 73,895 |
| Mumbai | 73,675 |
| New Delhi | 73,805 |
| Chennai | 73,900 |
| Kolkata | 73,835 |
Global Market Movers: Comex Gold price remains firm amid the uncertainties
- Minneapolis Fed Bank President Neel Kashkari said on Tuesday that it is too early to declare that inflation has stalled out, and the Fed might cut interest rates this year if price pressures ease.
- Richmond Fed President Thomas Barkin said the current level of interest rates is restrictive enough to cool the economy and bring inflation back to the 2% target.
- Financial markets are now pricing in nearly 50 basis points (bps) of rate cuts from the Fed this year, including a 65.7% odds of a rate cut of at least 25 bps in September, according to CME's FedWatch Tool.
- The preliminary University of Michigan Consumer Sentiment Index will be released on Friday, which is estimated to drop from 77.2 in April to 76.0 in May.
- Israeli troops launched strikes on Gaza's southernmost city. Even though Hamas agreed to a ceasefire proposal on Monday, Israel said the conditions did not meet its demands, as per the New York Times.
- The People’s Bank of China (PBoC) added 60,000 troy ounces of gold to its reserves in April, extending the period of consecutive purchases to 18 months.
(An automation tool was used in creating this post.)
Gold FAQs
Gold has played a key role in human’s history as it has been widely used as a store of value and medium of exchange. Currently, apart from its shine and usage for jewelry, the precious metal is widely seen as a safe-haven asset, meaning that it is considered a good investment during turbulent times. Gold is also widely seen as a hedge against inflation and against depreciating currencies as it doesn’t rely on any specific issuer or government.
Central banks are the biggest Gold holders. In their aim to support their currencies in turbulent times, central banks tend to diversify their reserves and buy Gold to improve the perceived strength of the economy and the currency. High Gold reserves can be a source of trust for a country’s solvency. Central banks added 1,136 tonnes of Gold worth around $70 billion to their reserves in 2022, according to data from the World Gold Council. This is the highest yearly purchase since records began. Central banks from emerging economies such as China, India and Turkey are quickly increasing their Gold reserves.
Gold has an inverse correlation with the US Dollar and US Treasuries, which are both major reserve and safe-haven assets. When the Dollar depreciates, Gold tends to rise, enabling investors and central banks to diversify their assets in turbulent times. Gold is also inversely correlated with risk assets. A rally in the stock market tends to weaken Gold price, while sell-offs in riskier markets tend to favor the precious metal.
The price can move due to a wide range of factors. Geopolitical instability or fears of a deep recession can quickly make Gold price escalate due to its safe-haven status. As a yield-less asset, Gold tends to rise with lower interest rates, while higher cost of money usually weighs down on the yellow metal. Still, most moves depend on how the US Dollar (USD) behaves as the asset is priced in dollars (XAU/USD). A strong Dollar tends to keep the price of Gold controlled, whereas a weaker Dollar is likely to push Gold prices up.
- AUD/JPY could continue its winning streak due to improved risk appetite.
- The Australian Dollar depreciated due to the less hawkish RBA despite higher inflation in March.
- The Japanese Yen struggles despite the potential for intervention by Japanese authorities.
AUD/JPY hovers around 102.00 during the European session on Wednesday. The Australian Dollar (AUD) declined following the Reserve Bank of Australia (RBA)'s decision to keep its interest rate at 4.35% on Tuesday, which added pressure on the AUD/JPY cross. Investor sentiment tilted towards a potentially more hawkish stance from the RBA, especially after March's unexpected surge in Australian monthly inflation, contrasting with market forecasts of stagnation.
Furthermore, RBA Governor Michele Bullock underscored the importance of remaining vigilant regarding inflation risks. Bullock expressed confidence that current interest rates are appropriately positioned to guide inflation back into the target range of 2-3% in the latter half of 2025 and toward the midpoint by 2026. Nonetheless, the RBA acknowledged a recent halt in progress toward curbing inflation, maintaining its forward guidance of "not ruling anything in or out."
The Japanese Yen (JPY) experienced appreciation last week amidst speculation surrounding potential intervention by Japanese authorities. According to Reuters, data from the Bank of Japan (BoJ) indicated that Japanese authorities may have allocated approximately ¥6.0 trillion on April 29 and ¥3.66 trillion on May 1 to bolster the JPY. However, these interventions were only able to offer temporary relief, given the substantial interest rate differentials between Japan and the United States (US).
The Japanese Yen faces challenges despite prevalent warnings from Japanese authorities regarding extreme currency fluctuations. Finance Minister Shunich Suzuki reiterated the caution that authorities stand ready to address excessive foreign exchange volatility. While the Bank of Japan (BoJ) Governor Kazuo Ueda highlighted the need to evaluate the impact of Yen movements on inflation to guide policy decisions.
FX option expiries for May 8 NY cut at 10:00 Eastern Time, via DTCC, can be found below
- EUR/USD: EUR amounts
- 1.0640 488m
- 1.0680 440m
- 1.0750 946m
- 1.0775 464m
- 1.0825 1.1b
- 1.0900 546m
- GBP/USD: GBP amounts
- 1.2500 460m
- 1.2750 409m
- EUR/GBP: EUR amounts
- 0.8400 450m
- 0.8580 449m
- USD/JPY: USD amounts
- 153.75 835m
- 154.50 490m
- 155.60 583m
- AUD/USD: AUD amounts
- 0.6500 643m
- 0.6600 980m
- USD/CAD: USD amounts
- 1.3450 1b
- 1.3750 400m
- 1.3760 350m
- USD/JPY extends winning streak amid hawkish sentiment surrounding the Fed’s stance on monetary policy.
- Fed's Kashkari anticipates the prolonging of elevated rates and suggests that further rate hikes are not entirely ruled out.
- The Japanese Yen depreciated despite the potential for intervention by Japanese authorities.
USD/JPY trades around 155.30 during the early European session on Wednesday, marking a third consecutive day of gains. The US Dollar (USD) gained ground due to the possibility of the Federal Reserve's (Fed) prolonging higher interest rates. Furthermore, hawkish remarks from Minneapolis Fed President Neel Kashkari have strengthened the Greenback, thereby underpinning the USD/JPY pair.
As reported by Reuters on Tuesday, President Kashkari's remarks, imply an anticipation of unchanged interest rates for a considerable period. While the likelihood of rate hikes is low, they are not entirely discounted.
According to Bloomberg, Richmond Federal Reserve (Fed) President Thomas Barkin remarked on Monday that elevated interest rates could likely restrain economic growth in the United States (US). However, higher interest rates can help alleviate inflationary pressures, bringing them closer to the central bank's 2% target.
Last week, the Japanese Yen (JPY) saw appreciation amid speculations of potential intervention by Japanese authorities. Reuters reported data from the Bank of Japan (BoJ) suggesting that Japanese authorities may have allocated approximately ¥6.0 trillion on April 29 and ¥3.66 trillion on May 1 to support the JPY. However, these interventions could only provide temporary relief, given the significant interest rate differentials between Japan and the United States (US).
Despite continued warnings from Japanese authorities against extreme currency movements, the Japanese Yen depreciated. Finance Minister Shunich Suzuki reiterated the warning that authorities are prepared to respond to excessive foreign exchange volatility, while Bank of Japan (BoJ) Governor Kazuo Ueda stated that they will assess the impact of Yen movements on inflation to inform policy decisions.
- USD/CHF trades with a mild positive bias around 0.9085 on Wednesday.
- The Fed's Kashkari comments have dampened hopes for potential interest rate cuts this year, lifting the Greenback.
- The uncertainties surrounding ceasefire talks between Israel and Hamas might boost the CHF and cap the pair’s upside.
The USD/CHF pair posts modest gains near 0.9085 during the early European trading hours on Wednesday. The recovery of the US Dollar (USD) is bolstered by hawkish remarks from Federal Reserve (Fed) officials, which dampen hopes for potential interest rate cuts in 2024. Market participants will keep an eye on the speeches from the Fed’s Philip Jefferson, Susan Collins, and Lisa Cook later on Wednesday.
Minneapolis Federal Reserve President Neel Kashkari delivered some hawkish comments on Tuesday, which lifted the Greenback broadly. Kashkari noted that it is too early to declare that inflation has stalled out, and the Fed might cut interest rates this year if price pressures continue to ease.
Traders lower their bets on Fed rate cuts this year, with a 65.7% chance of a rate cut of at least 25 basis points (bps) in September, according to CME's FedWatch Tool. Investors will take more cues from the first reading of the US University of Michigan Consumer Sentiment Index on Friday, which is projected to ease to 76.0 in May from the previous reading of 77.2.
On the Swiss front, ceasefire talks between Israel and Hamas remain uncertain. Israel's war cabinet agreed to continue the military attack against Hamas, with Israeli forces striking Gaza's southernmost city. Even though Hamas agreed to a cease-fire plan on Monday, Israel said the agreement did not meet its conditions, according to the New York Times. The rising geopolitical tensions in the Middle East might boost safe-haven flows and benefit the Swiss Franc (CHF) against the USD.
Here is what you need to know on Wednesday, May 8:
The US Dollar (USD) stays resilient against its rivals early Wednesday after posting marginal gains on Tuesday. The US economic calendar will feature weekly MBA Mortgage Applications and Wholesale Inventories for March. Meanwhile, market participants will remain focused on comments from Federal Reserve (Fed) policymakers. Additionally, the US Treasury will hold a 10-year note auction later in the American session.
The mixed action in Wall Street's main indexes and some hawkish remarks from Minneapolis Federal Reserve President Neel Kashkari helped the USD find demand in the second half of the day on Tuesday. After closing in positive territory, the USD Index continued to edge higher in the Asian session on Wednesday and was last seen rising nearly 0.2% on the day above 105.50. In the European morning, US stock index futures trade modestly lower and the benchmark 10-year US Treasury bond yield clings to small gains while staying below 4.5%.
US Dollar PRICE This week
The table below shows the percentage change of US Dollar (USD) against listed major currencies this week. US Dollar was the strongest against the Euro.
| USD | EUR | GBP | JPY | CAD | AUD | NZD | CHF | |
|---|---|---|---|---|---|---|---|---|
| USD | -0.20% | -0.48% | -1.43% | -0.61% | -0.49% | -0.36% | -0.47% | |
| EUR | 0.20% | -0.19% | -1.10% | -0.35% | -0.08% | -0.08% | -0.18% | |
| GBP | 0.48% | 0.19% | -0.95% | -0.15% | 0.10% | 0.11% | 0.03% | |
| JPY | 1.43% | 1.10% | 0.95% | 0.81% | 0.94% | 1.09% | 0.94% | |
| CAD | 0.61% | 0.35% | 0.15% | -0.81% | 0.00% | 0.26% | 0.20% | |
| AUD | 0.49% | 0.08% | -0.10% | -0.94% | -0.00% | -0.01% | -0.02% | |
| NZD | 0.36% | 0.08% | -0.11% | -1.09% | -0.26% | 0.01% | -0.06% | |
| CHF | 0.47% | 0.18% | -0.03% | -0.94% | -0.20% | 0.02% | 0.06% |
The heat map shows percentage changes of major currencies against each other. The base currency is picked from the left column, while the quote currency is picked from the top row. For example, if you pick the US Dollar from the left column and move along the horizontal line to the Japanese Yen, the percentage change displayed in the box will represent USD (base)/JPY (quote).
During the Asian trading hours, Bank of Japan (BoJ) Governor Kazuo Ueda said that the monetary policy was aimed at impaction inflation, rather than the exchange rate of the Japanese Yen. "The Bank of Japan may need to respond via monetary policy if such impact for yen moves affects trend inflation," Ueda added. After closing the first two trading days of the week in the green, USD/JPY continued to edge higher despite these comments and was last seen trading above 155.00.
EUR/USD closed in negative territory on Tuesday and snapped a four-day winning streak. The pair stays on the back foot early Wednesday and trades below 1.0750.
GBP/USD fell nearly 0.5% on Tuesday and extended its slide to below 1.2500 midweek. On Thursday, the Bank of England will announce monetary policy decisions.
Gold failed to build on Monday's recovery gains and closed below $2,320 on Tuesday. XAU/USD stays relatively quiet early Wednesday and stays near Tuesday's closing level.
Gold price gains momentum, despite a firmer US Dollar.
AUD/USD came under bearish pressure on Tuesday as the Reserve Bank of Australia (RBA) adopted a cautious tone with regards to further tightening after leaving policy settings unchanged. The pair stretches lower on Wednesday and was last seen trading below 0.6600.
Australian Dollar extends losses amid less hawkish stance from the RBA.
Fed FAQs
Monetary policy in the US is shaped by the Federal Reserve (Fed). The Fed has two mandates: to achieve price stability and foster full employment. Its primary tool to achieve these goals is by adjusting interest rates. When prices are rising too quickly and inflation is above the Fed’s 2% target, it raises interest rates, increasing borrowing costs throughout the economy. This results in a stronger US Dollar (USD) as it makes the US a more attractive place for international investors to park their money. When inflation falls below 2% or the Unemployment Rate is too high, the Fed may lower interest rates to encourage borrowing, which weighs on the Greenback.
The Federal Reserve (Fed) holds eight policy meetings a year, where the Federal Open Market Committee (FOMC) assesses economic conditions and makes monetary policy decisions. The FOMC is attended by twelve Fed officials – the seven members of the Board of Governors, the president of the Federal Reserve Bank of New York, and four of the remaining eleven regional Reserve Bank presidents, who serve one-year terms on a rotating basis.
In extreme situations, the Federal Reserve may resort to a policy named Quantitative Easing (QE). QE is the process by which the Fed substantially increases the flow of credit in a stuck financial system. It is a non-standard policy measure used during crises or when inflation is extremely low. It was the Fed’s weapon of choice during the Great Financial Crisis in 2008. It involves the Fed printing more Dollars and using them to buy high grade bonds from financial institutions. QE usually weakens the US Dollar.
Quantitative tightening (QT) is the reverse process of QE, whereby the Federal Reserve stops buying bonds from financial institutions and does not reinvest the principal from the bonds it holds maturing, to purchase new bonds. It is usually positive for the value of the US Dollar.
- EUR/JPY gains traction near 166.65 in Wednesday's early European session.
- The cross resumes its uptrend above the key EMA; RSI indicator holds in bullish territory.
- The first upside barrier will emerge at 167.20; the initial support level is located at 165.90.
The EUR/JPY cross trades on a positive note for three straight days around 166.65 on Wednesday during the early European session. The Bank of Japan (BoJ) Governor Kazuo Ueda said on Wednesday that the Japanese central bank may take monetary policy action if yen moves have a big impact on inflation. Meanwhile, Japanese Finance Minister Shunichi Suzuki stated that rapid foreign exchange movements are undesirable. Suzuki declined to comment on whether the US has agreed on Japan's FX intervention.
From a technical perspective, EUR/JPY resumes its uptrend as the cross holds above the key 100-period Exponential Moving Averages (EMA) on the four-hour chart. Additionally, the Relative Strength Index (RSI) stands in bullish territory around 58, indicating that further upside looks favorable for the time being.
The upper boundary of the Bollinger Band at 167.20 acts as an immediate resistance level for the cross. Further north, the next hurdle is located at the 168.00 psychological figure, en route to a high of April 30 at 168.61. Any follow-through buying above the latter will see a rally to a yearly high of 2007 at 168.95.
On the downside, the initial support level for EUR/JPY is seen near the 100-period EMA at 165.90. A decisive break below this level will see a drop to a low of May 6 at 165.50, followed by the lower limit of the Bollinger Band at 164.08.
EUR/JPY four-hour chart

- NZD/USD continues to lose ground due to the sentiment of the Fed prolonging higher interest rates.
- The higher US Treasury yields contribute support for the US Dollar.
- The Kiwi market seems unsettled in anticipation of critical data releases from its primary trading partner, China.
NZD/USD trades around 0.5990 during the Asian session on Wednesday, marking a second consecutive day of losses. This decline is likely influenced by the Federal Reserve's (Fed) sentiment of maintaining higher interest rates for an extended period. Furthermore, hawkish remarks from Minneapolis Fed President Neel Kashkari have strengthened the US Dollar, thereby exerting downward pressure on the NZD/USD pair.
President Kashkari's comments suggest an expectation for rates to remain unchanged for a significant duration, as reported by Reuters. Although the probability of rate hikes is low, it's not entirely ruled out.
The US Dollar Index (DXY), which gauges the performance of the US Dollar (USD) against six major currencies, edges higher to near 105.50. The higher US Treasury yields provide support for the Greenback. The 2-year and 10-year yields on US Treasury bonds stand at 4.84% and 4.47%, respectively, by the press time.
Last week, signals from the Reserve Bank of New Zealand (RBNZ) indicated an intention to postpone any move toward monetary easing until 2025, citing higher-than-anticipated inflation pressures in the first quarter. This stance could offer support for the New Zealand Dollar (NZD).
Moreover, the Kiwi market appears unsettled ahead of crucial data releases from its primary trading partner, China. This includes Thursday's Trade Balance data for April and Consumer Price Index readings on Saturday.
In New Zealand, growing concerns regarding the domestic economy have surfaced, particularly following a warning from the Organization for Economic Co-operation and Development (OECD) that Wellington is experiencing lower productivity growth due to inadequate competition, notably in the supermarket sector.
Japanese Finance Minister Shunichi Suzuki said on Wednesday that rapid foreign exchange (FX) movements are undesirable. However, Suzuki declined to comment on whether the US has agreed on Japan's FX intervention.
Key quotes
“Disorderly FX movements negatively impact the economy.”
“Cannot comment on whether the US has agreed on Japan's FX intervention.”
“FX influenced by more than just US-Japan rate difference.”
“BoJ should handle monetary policy.”
“BOJ's government bond purchases are a component of their monetary policy.”
“Will monitoring the effects of increasing interest rates on the economy.”
“Concerned about rising rates leading to fiscal rigidity.”
“Will appropriately run fiscal policy to maintain trust.”
“Will not comment on FX levels.”
“Important for currencies to move in a stable manner, reflecting fundamentals.”
Weak yen has positive and negative aspects.”
Market reaction
At the time of writing, USD/JPY is trading 0.32% higher on the day to trade at 155.20.
Japanese Yen FAQs
The Japanese Yen (JPY) is one of the world’s most traded currencies. Its value is broadly determined by the performance of the Japanese economy, but more specifically by the Bank of Japan’s policy, the differential between Japanese and US bond yields, or risk sentiment among traders, among other factors.
One of the Bank of Japan’s mandates is currency control, so its moves are key for the Yen. The BoJ has directly intervened in currency markets sometimes, generally to lower the value of the Yen, although it refrains from doing it often due to political concerns of its main trading partners. The current BoJ ultra-loose monetary policy, based on massive stimulus to the economy, has caused the Yen to depreciate against its main currency peers. This process has exacerbated more recently due to an increasing policy divergence between the Bank of Japan and other main central banks, which have opted to increase interest rates sharply to fight decades-high levels of inflation.
The BoJ’s stance of sticking to ultra-loose monetary policy has led to a widening policy divergence with other central banks, particularly with the US Federal Reserve. This supports a widening of the differential between the 10-year US and Japanese bonds, which favors the US Dollar against the Japanese Yen.
The Japanese Yen is often seen as a safe-haven investment. This means that in times of market stress, investors are more likely to put their money in the Japanese currency due to its supposed reliability and stability. Turbulent times are likely to strengthen the Yen’s value against other currencies seen as more risky to invest in.
- USD/CAD appreciates due to the prevalent hawkish sentiment surrounding the Fed to prolong its higher interest rate.
- Fed’s Kashkari believes interest rates to stay unchanged for an extended period.
- The lower WTI price weakens the Canadian Dollar as Canada is the largest Oil exporter to the US.
The USD/CAD pair continues to advance for the second consecutive session, hovering around 1.3750 during the Asian trading hours on Wednesday. This upward movement is attributed to the stronger US Dollar (USD), fueled by the prevailing hawkish sentiment surrounding the Federal Reserve (Fed) and expectations of sustained higher interest rates. Additionally, comments from Minneapolis Fed President Neel Kashkari on Tuesday contributed to the strength of the USD by suggesting a potential for rate hikes.
According to Reuters, President Kashkari stated that the most likely scenario is for interest rates to remain unchanged for an extended period. Although rate hikes are not the primary expectation, they are not entirely ruled out.
Meanwhile, the Canadian Dollar (CAD) weakened against the US Dollar, influenced by the strength of the latter impacting crude Oil prices, thereby affecting the USD/CAD pair. This correlation holds significance due to Canada's position as the largest Oil exporter to the United States (US).
West Texas Intermediate (WTI) crude Oil price extends losses for the second consecutive day, trading around $77.80 per barrel, by the press time. Oil traders will shift their focus to the US Crude Oil Stocks Change due later on Wednesday. Energy Information Administration (EIA) is expected to report a decline in a weekly measure of the change in the number of barrels in stock of crude Oil and its derivates.
Furthermore, despite higher-than-expected Ivey Purchasing Managers Index (PMI) figures from Canada, the CAD failed to gain traction. Canada's seasonally-adjusted Ivey PMI for April climbed to 63.0 from 57.5, surpassing the forecast of 58.1. This marked the ninth consecutive monthly increase, reaching its highest level in two years.
Looking ahead, Thursday's Financial System Review from the Bank of Canada (BoC) is anticipated to prompt market movements. The Financial System Review provides a detailed assessment of developments in the financial system and an analysis of policy directions within the financial sector.
- Gold price extends its decline amid the renewed USD demand on Wednesday.
- Investors place lower bets on the potential Fed interest rate cuts in 2024.
- The Fed’s (Fed) Philip Jefferson, Susan Collins, and Lisa Cook are scheduled to speak later on Wednesday.
Gold price (XAU/USD) attracts some sellers on the firmer US Dollar (USD) during the Asian trading hours on Wednesday. The hawkish remarks from Federal Reserve (Fed) officials dampen hopes for potential interest rate cuts in 2024 despite weaker-than-expected US employment reports in April. Nonetheless, safe-haven demand, fueled by geopolitical tensions and uncertainty, as well as ongoing central bank purchases, might contribute to a rally in gold.
Later on Wednesday, the Federal Reserve’s (Fed) Philip Jefferson, Susan Collins, and Lisa Cook are set to speak. The hawkish remarks from the Fed policymakers might lift the Greenback and weigh on the USD-denominated gold. Gold traders will monitor the consumer sentiment reading from the University of Michigan on Friday.
Daily Digest Market Movers: Gold price edges lower after Fed’s comments
- Minneapolis Fed Bank President Neel Kashkari said on Tuesday that it is too early to declare that inflation has stalled out, and the Fed might cut interest rates this year if price pressures ease.
- Richmond Fed President Thomas Barkin said the current level of interest rates is restrictive enough to cool the economy and bring inflation back to the 2% target.
- Financial markets are now pricing in nearly 50 basis points (bps) of rate cuts from the Fed this year, including a 65.7% odds of a rate cut of at least 25 bps in September, according to CME's FedWatch Tool.
- The preliminary University of Michigan Consumer Sentiment Index will be released on Friday, which is estimated to drop from 77.2 in April to 76.0 in May.
- Israeli troops launched strikes on Gaza's southernmost city. Even though Hamas agreed to a ceasefire proposal on Monday, Israel said the conditions did not meet its demands, as per the New York Times.
- The People’s Bank of China (PBoC) added 60,000 troy ounces of gold to its reserves in April, extending the period of consecutive purchases to 18 months.
Technical Analysis: Gold price maintains a constructive stance in the longer term
The gold price trades softer on the day. However, the positive outlook of the yellow metal in the longer term remains unchanged as XAU/USD is above the key 100-day Exponential Moving Average (EMA) with an upward slope.
In the near term, the gold price has been stuck within a descending trend channel since mid-April. The modest bearish stance is confirmed by the 14-day Relative Strength Index (RSI), which holds below the 50 midline.
The $2,300 psychological round figure will be the first downside target for XAU/USD. Any follow-through selling below this level will expose the lower limit of a descending trend channel at $2,260. A bearish breakout of the mentioned level will pave the way to a low of April 1 at $2,228, followed by the $2,200 round mark.
On the upside, the immediate barrier will emerge near a high of May 6 at $2,232. The next hurdle is located near the confluence of the upper boundary of a descending trend channel and a high of April 26 at the $2,350–$2,355 region. The additional upside filter to watch is the $2,400 round mark, en route to an all-time high near $2,432.
US Dollar price today
The table below shows the percentage change of US Dollar (USD) against listed major currencies today. US Dollar was the strongest against the Japanese Yen.
| USD | EUR | GBP | CAD | AUD | JPY | NZD | CHF | |
| USD | 0.08% | 0.09% | 0.13% | 0.22% | 0.29% | 0.12% | 0.06% | |
| EUR | -0.09% | 0.01% | 0.03% | 0.14% | 0.20% | 0.04% | -0.02% | |
| GBP | -0.09% | -0.01% | 0.03% | 0.13% | 0.20% | 0.03% | -0.04% | |
| CAD | -0.12% | -0.04% | -0.02% | 0.10% | 0.16% | 0.00% | -0.06% | |
| AUD | -0.22% | -0.14% | -0.13% | -0.09% | 0.06% | -0.10% | -0.18% | |
| JPY | -0.27% | -0.20% | -0.21% | -0.17% | -0.05% | -0.14% | -0.24% | |
| NZD | -0.12% | -0.04% | -0.03% | 0.01% | 0.10% | 0.17% | -0.07% | |
| CHF | -0.05% | 0.02% | 0.04% | 0.07% | 0.17% | 0.24% | 0.07% |
The heat map shows percentage changes of major currencies against each other. The base currency is picked from the left column, while the quote currency is picked from the top row. For example, if you pick the Euro from the left column and move along the horizontal line to the Japanese Yen, the percentage change displayed in the box will represent EUR (base)/JPY (quote).
Gold FAQs
Gold has played a key role in human’s history as it has been widely used as a store of value and medium of exchange. Currently, apart from its shine and usage for jewelry, the precious metal is widely seen as a safe-haven asset, meaning that it is considered a good investment during turbulent times. Gold is also widely seen as a hedge against inflation and against depreciating currencies as it doesn’t rely on any specific issuer or government.
Central banks are the biggest Gold holders. In their aim to support their currencies in turbulent times, central banks tend to diversify their reserves and buy Gold to improve the perceived strength of the economy and the currency. High Gold reserves can be a source of trust for a country’s solvency. Central banks added 1,136 tonnes of Gold worth around $70 billion to their reserves in 2022, according to data from the World Gold Council. This is the highest yearly purchase since records began. Central banks from emerging economies such as China, India and Turkey are quickly increasing their Gold reserves.
Gold has an inverse correlation with the US Dollar and US Treasuries, which are both major reserve and safe-haven assets. When the Dollar depreciates, Gold tends to rise, enabling investors and central banks to diversify their assets in turbulent times. Gold is also inversely correlated with risk assets. A rally in the stock market tends to weaken Gold price, while sell-offs in riskier markets tend to favor the precious metal.
The price can move due to a wide range of factors. Geopolitical instability or fears of a deep recession can quickly make Gold price escalate due to its safe-haven status. As a yield-less asset, Gold tends to rise with lower interest rates, while higher cost of money usually weighs down on the yellow metal. Still, most moves depend on how the US Dollar (USD) behaves as the asset is priced in dollars (XAU/USD). A strong Dollar tends to keep the price of Gold controlled, whereas a weaker Dollar is likely to push Gold prices up.
- The Australian Dollar lost ground after the RBA’s policy decision to keep its interest rate unchanged.
- The Australian Central Bank maintained its forward guidance of "not ruling anything in or out."
- The US Dollar appreciated due to sentiment of the Fed prolonging higher interest rates.
The Australian Dollar (AUD) has plunged following the Reserve Bank of Australia (RBA)'s decision to maintain its interest rate at 4.35% on Tuesday. Investors sentiment leaned toward a potentially more hawkish stance from the RBA, particularly after last week's inflation data surpassed expectations. However, the RBA acknowledged that recent advancements in curbing inflation have halted, maintaining its forward guidance of "not ruling anything in or out."
The Australian monthly inflation surged in March, contrary to market expectations of stagnation. Additionally, the RBA Governor Michele Bullock emphasized the importance of remaining vigilant regarding inflation risks. Bullock believes that current interest rates are appropriately set to steer inflation back towards its target range of 2-3% in the second half of 2025, and to the midpoint in 2026.
The US Dollar Index (DXY), which gauges the performance of the US Dollar (USD) against six major currencies, gains ground due to the sentiment of the Federal Reserve’s (Fed) maintaining higher interest rates for longer. Additionally, the hawkish comments from Minneapolis Fed President Neel Kashkari have bolstered the US Dollar, consequently weakening the AUD/USD pair.
President Kashkari indicated that the prevailing expectation is for rates to stay steady for a considerable duration. Although the likelihood of rate hikes is minimal, it's not entirely dismissible, as per a Reuters report.
Daily Digest Market Movers: Australian Dollar depreciates due to dovish RBA
- Australia's 10-year government bond yield dipped toward 4.3%, marking its lowest point in a fortnight. This decline occurred as the RBA opted to keep the cash rate unchanged. The absence of any overtly hawkish signals, which many market participants were expecting, contributed to the subdued reaction.
- The ASX 200 Index extended its upward trend for the fifth consecutive session following the Reserve Bank of Australia's less hawkish stance after the Tuesday policy decision. Significant increases were observed among key players in the index, including Commonwealth Bank, Wesfarmers, and Woodside Energy.
- Societe Generale has released a note regarding the Reserve Bank of Australia, emphasizing their view that the RBA's optimism regarding economic growth is misplaced. The institution anticipates a downturn in economic growth in Australia, with the potential for surprises on the downside. They attribute this forecast partly to the prevalent effects of RBA rate hikes filtering into the economy.
- The latest US Nonfarm Payrolls report highlights a notable deceleration from the robust pace seen in the first quarter, falling short of the average monthly increase observed over the past year.
- The Judo Bank Australia Composite Purchasing Managers Index (PMI) declined in April, indicating a slightly slower growth in Australian private sector output. The growth in business activity was mainly confined to the service sector while manufacturing output continued to decrease.
- According to forecasts by analysts at Commonwealth Bank and Westpac, the RBA’s interest rate is expected to peak at its highest point at 4.35% in November 2023, then decrease to 3.10% by December 2025.
Technical Analysis: Australian Dollar moves below 0.6600
The Australian Dollar trades around 0.6570 on Wednesday. The pair consolidates within a symmetrical triangle pattern, with the 14-day Relative Strength Index (RSI) above the 50-level, suggesting a bullish bias.
The AUD/USD pair could potentially find the barrier at the psychological level of 0.6600, followed by the upper boundary near the major support level of 0.6650. A breakthrough above this level might prompt the pair to revisit March’s high of 0.6667, followed by the psychological level of 0.6700.
On the downside, the AUD/USD pair may encounter immediate support at the nine-day Exponential Moving Average (EMA) at 0.6564. If the pair breaks below the EMA, it could face further pressure to navigate the region around the lower boundary of the symmetrical triangle around the level of 0.6465.
AUD/USD: Daily Chart
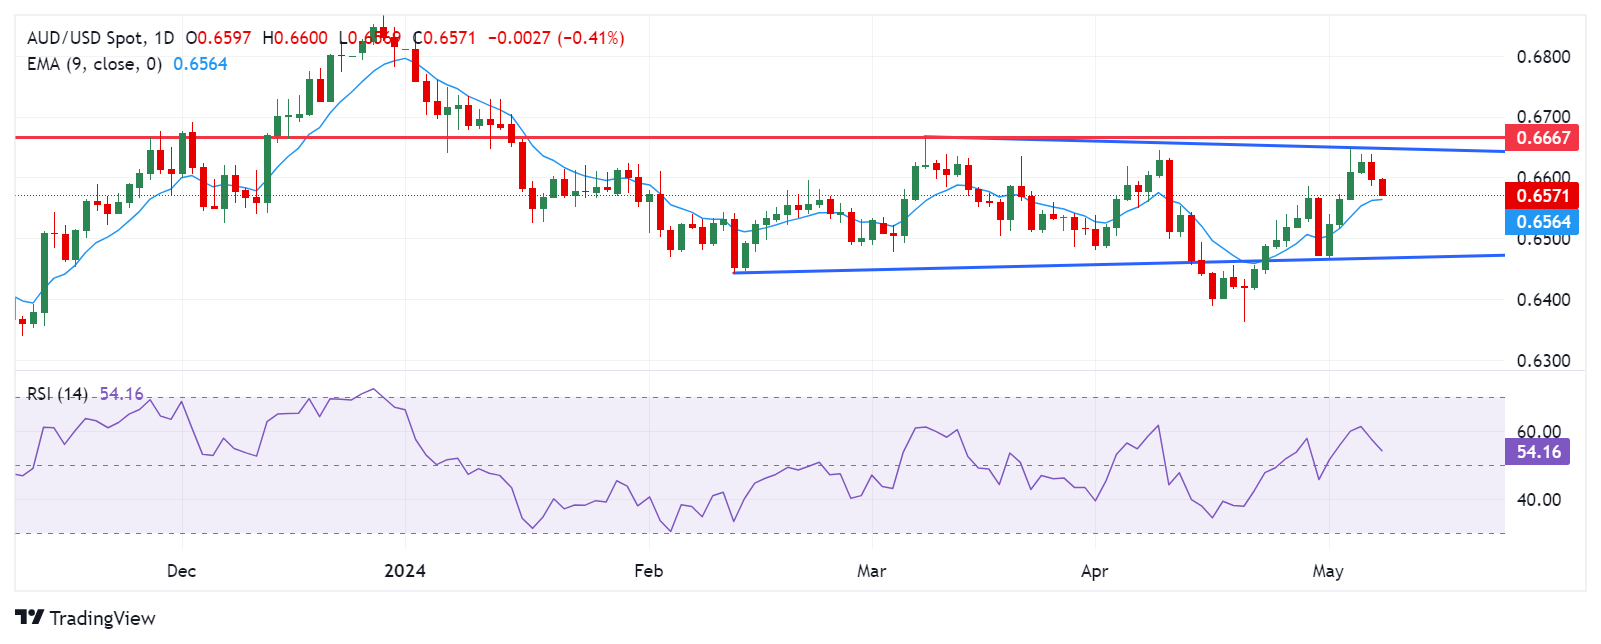
Australian Dollar price today
The table below shows the percentage change of the Australian Dollar (AUD) against listed major currencies today. The Australian Dollar was the weakest against the US Dollar.
| USD | EUR | GBP | CAD | AUD | JPY | NZD | CHF | |
| USD | 0.10% | 0.12% | 0.11% | 0.25% | 0.32% | 0.20% | 0.08% | |
| EUR | -0.10% | 0.02% | 0.01% | 0.15% | 0.23% | 0.10% | -0.03% | |
| GBP | -0.12% | -0.02% | -0.01% | 0.13% | 0.21% | 0.08% | -0.05% | |
| CAD | -0.12% | -0.01% | 0.02% | 0.14% | 0.22% | 0.09% | -0.03% | |
| AUD | -0.26% | -0.16% | -0.14% | -0.15% | 0.06% | -0.06% | -0.20% | |
| JPY | -0.32% | -0.22% | -0.21% | -0.22% | -0.09% | -0.13% | -0.26% | |
| NZD | -0.20% | -0.10% | -0.08% | -0.09% | 0.05% | 0.13% | -0.14% | |
| CHF | -0.06% | 0.03% | 0.05% | 0.04% | 0.18% | 0.26% | 0.13% |
The heat map shows percentage changes of major currencies against each other. The base currency is picked from the left column, while the quote currency is picked from the top row. For example, if you pick the Euro from the left column and move along the horizontal line to the Japanese Yen, the percentage change displayed in the box will represent EUR (base)/JPY (quote).
Australian Dollar FAQs
One of the most significant factors for the Australian Dollar (AUD) is the level of interest rates set by the Reserve Bank of Australia (RBA). Because Australia is a resource-rich country another key driver is the price of its biggest export, Iron Ore. The health of the Chinese economy, its largest trading partner, is a factor, as well as inflation in Australia, its growth rate and Trade Balance. Market sentiment – whether investors are taking on more risky assets (risk-on) or seeking safe-havens (risk-off) – is also a factor, with risk-on positive for AUD.
The Reserve Bank of Australia (RBA) influences the Australian Dollar (AUD) by setting the level of interest rates that Australian banks can lend to each other. This influences the level of interest rates in the economy as a whole. The main goal of the RBA is to maintain a stable inflation rate of 2-3% by adjusting interest rates up or down. Relatively high interest rates compared to other major central banks support the AUD, and the opposite for relatively low. The RBA can also use quantitative easing and tightening to influence credit conditions, with the former AUD-negative and the latter AUD-positive.
China is Australia’s largest trading partner so the health of the Chinese economy is a major influence on the value of the Australian Dollar (AUD). When the Chinese economy is doing well it purchases more raw materials, goods and services from Australia, lifting demand for the AUD, and pushing up its value. The opposite is the case when the Chinese economy is not growing as fast as expected. Positive or negative surprises in Chinese growth data, therefore, often have a direct impact on the Australian Dollar and its pairs.
Iron Ore is Australia’s largest export, accounting for $118 billion a year according to data from 2021, with China as its primary destination. The price of Iron Ore, therefore, can be a driver of the Australian Dollar. Generally, if the price of Iron Ore rises, AUD also goes up, as aggregate demand for the currency increases. The opposite is the case if the price of Iron Ore falls. Higher Iron Ore prices also tend to result in a greater likelihood of a positive Trade Balance for Australia, which is also positive of the AUD.
The Trade Balance, which is the difference between what a country earns from its exports versus what it pays for its imports, is another factor that can influence the value of the Australian Dollar. If Australia produces highly sought after exports, then its currency will gain in value purely from the surplus demand created from foreign buyers seeking to purchase its exports versus what it spends to purchase imports. Therefore, a positive net Trade Balance strengthens the AUD, with the opposite effect if the Trade Balance is negative.
| Raw materials | Closed | Change, % |
|---|---|---|
| Silver | 27.226 | -0.74 |
| Gold | 2313.89 | -0.49 |
| Palladium | 971.56 | 0.22 |
The People’s Bank of China (PBoC) set the USD/CNY central rate for the trading session ahead on Wednesday at 7.1016 as compared to the previous day's fix of 7.1002 and 7.2202 Reuters estimates.
- WTI prices remained slightly on the defensive near $78.00 on Wednesday.
- The easing fear of oil supply disruption caps the upside of black gold for the time being.
- Saudi Arabia has increased oil prices to Asian customers, including China.
Western Texas Intermediate (WTI), the US crude oil benchmark, is trading around $78.00 on Wednesday. The black gold edges lower due to a stronger US Dollar (USD) and signs of easing supply concerns. Oil traders will shift their focus to the EIA Crude Oil stockpiles report due later on Wednesday.
Ceasefire talks between Israel and Hamas are still uncertain. Israel's war cabinet voted to continue the military attack on Hamas, and Israeli troops launched strikes on Gaza's southernmost city. Even though Hamas agreed to a ceasefire proposal on Monday, Israel said the conditions did not meet its demands, as per the New York Times. Any signs of escalating geopolitical risks in the Middle East could lead to a sharp increase in oil prices, according to the EIA. On the one hand, the easing fear of an oil supply disruption might drag WTI prices lower.
On Tuesday, the American Petroleum Institute (API) revealed that US crude inventories for the week ending May 3 rose by 509,000 barrels from a build of 4.9M barrels in the previous week. The market consensus estimated that stocks would decrease by 1.43M barrels. A rise in US crude oil stock exerts some selling pressure on black gold prices, as it’s typically a sign of weak demand.
On the other hand, Saudi Arabia raised the price of its crude sold to Asia, Northwest Europe, and the Mediterranean in June on the back of a strong demand outlook this summer. The increase is in line with Saudi Arabia’s efforts to keep prices up as the prospect of conflict in the Middle East fades, according to Bloomberg.
- EUR/USD continues to lose ground due to the hawkish sentiment of the Fed prolonging elevated policy rates.
- Fed’s Kashkari said that the most likely scenario is for interest rates to stay unchanged for an extended period.
- Eurozone Retail Sales marked the most significant increase in March since September 2022, indicating strength in the consumer sector.
EUR/USD extends its losses for the second successive session, trading around 1.0750 during the Asian session on Wednesday. The US Dollar (USD) gains ground due to the expectations of the Federal Reserve’s (Fed) prolonging higher interest rates. However, the softer US labor data from the last week has reignited hopes for potential interest rate cuts by the Federal Reserve (Fed) in 2024.
On Tuesday, hawkish comments from Minneapolis Fed President Neel Kashkari have bolstered the US Dollar, consequently weakening the EUR/USD pair. Kashkari said that the most probable scenario is for rates to remain unchanged for an extended period. However, if disinflation returns or a significant weakening in the job market occurs, rate cuts could be considered. While raising rates is not the most likely outcome, it cannot be entirely ruled out, as per a Reuters report.
On Monday, Bloomberg reported Richmond Fed President Thomas Barkin saying that increasing interest rates would probably limit economic growth in the United States (US). However, Barkin noted that higher interest rates would assist in curbing inflationary pressures, bringing them into closer alignment with the central bank's 2% target.
In the Eurozone, Retail Sales (MoM) surged by 0.8% in March, rebounding from the upwardly revised 0.3% decline in February. This exceeded the expected increase of 0.6%. It marked the most significant increase in retail activity since September 2022, indicating strength in the European consumer sector. Additionally, Retail Sales (YoY) increased by 0.7% compared to the revised 0.5% drop in February. This indicates the first growth in retail since September 2022, signaling a positive shift in consumer spending trends.
The European Central Bank (ECB) is expected to begin reducing borrowing costs in June. As reported by the Business Standard, Chief Economist Philip Lane of the ECB said that recent data have strengthened his belief that inflation is edging closer to the 2% target. While many ECB officials appear to support easing measures next month, President Christine Lagarde has not suggested further cuts at this point.
| Index | Change, points | Closed | Change, % |
|---|---|---|---|
| NIKKEI 225 | 599.03 | 38835.1 | 1.57 |
| Hang Seng | -98.93 | 18479.37 | -0.53 |
| KOSPI | 57.73 | 2734.36 | 2.16 |
| ASX 200 | 110.9 | 7793.3 | 1.44 |
| DAX | 254.84 | 18430.05 | 1.4 |
| CAC 40 | 79.04 | 8075.68 | 0.99 |
| Dow Jones | 31.99 | 38884.26 | 0.08 |
| S&P 500 | 6.96 | 5187.7 | 0.13 |
| NASDAQ Composite | -16.69 | 16332.56 | -0.1 |
Bank of Japan (BoJ) Governor Kazuo Ueda spoke in the Japanese parliament on Tuesday. Ueda warned of the potential need for policy response due to foreign exchange impacts and he will closely monitor recent currency fluctuations.
Key quotes
“Monetary policy is aimed at impacting inflation, not the yen rate.”
“Will examine the impact of the movement of the yen on the economy.”
“FX moves could have a big impact on the economy and prices, and so the impact of FX volatility could be bigger than in the past.”
“BoJ does not seek to directly control FX rates with monetary policy.”
“FX moves are among various factors that affect the economy and prices.”
“Weak yen pushes up import costs, has an impact on the economy in other ways, such as via demand.”
“To adjust easing as per rising price trend.”
The Bank of Japan may need to respond via monetary policy if such impact for yen moves affects trend inflation.”
“We expect trend inflation to gradually head towards 2%.”
“We will adjust monetary policy as appropriate if trend inflation heads toward 2% as we project, or if we see the risk of inflation overshooting our forecast.”
Market reaction
At the time of writing, USD/JPY is trading 0.05% higher on the day to trade at 154.77.
Bank of Japan FAQs
The Bank of Japan (BoJ) is the Japanese central bank, which sets monetary policy in the country. Its mandate is to issue banknotes and carry out currency and monetary control to ensure price stability, which means an inflation target of around 2%.
The Bank of Japan has embarked in an ultra-loose monetary policy since 2013 in order to stimulate the economy and fuel inflation amid a low-inflationary environment. The bank’s policy is based on Quantitative and Qualitative Easing (QQE), or printing notes to buy assets such as government or corporate bonds to provide liquidity. In 2016, the bank doubled down on its strategy and further loosened policy by first introducing negative interest rates and then directly controlling the yield of its 10-year government bonds.
The Bank’s massive stimulus has caused the Yen to depreciate against its main currency peers. This process has exacerbated more recently due to an increasing policy divergence between the Bank of Japan and other main central banks, which have opted to increase interest rates sharply to fight decades-high levels of inflation. The BoJ’s policy of holding down rates has led to a widening differential with other currencies, dragging down the value of the Yen.
A weaker Yen and the spike in global energy prices have led to an increase in Japanese inflation, which has exceeded the BoJ’s 2% target. Still, the Bank judges that the sustainable and stable achievement of the 2% target has not yet come in sight, so any sudden change in the current policy looks unlikely.
| Pare | Closed | Change, % |
|---|---|---|
| AUDUSD | 0.65968 | -0.42 |
| EURJPY | 166.285 | 0.33 |
| EURUSD | 1.07555 | -0.14 |
| GBPJPY | 193.377 | 0.03 |
| GBPUSD | 1.25081 | -0.43 |
| NZDUSD | 0.60028 | -0.11 |
| USDCAD | 1.37248 | 0.44 |
| USDCHF | 0.90823 | 0.23 |
| USDJPY | 154.602 | 0.46 |
Japanese Finance Minister Shunichi Suzuki said on Wednesday that he will closely monitors currency fluctuations with a sense of urgency. Suzuki further stated that he will take all necessary measures to prevent the weak Japanese Yen (JPY).
Key quotes
“Watching FX movement with a sense of urgency.”
“Won't comment on FX levels.”
“Rapid FX moves are undesirable.”
“Important for currencies to move in a stable manner reflecting fundamentals.”
“Will take a thorough response on FX.”
Market reaction
At the time of writing, USD/JPY is trading 0.03% higher on the day to trade at 154.73.
Bank of Japan FAQs
The Bank of Japan (BoJ) is the Japanese central bank, which sets monetary policy in the country. Its mandate is to issue banknotes and carry out currency and monetary control to ensure price stability, which means an inflation target of around 2%.
The Bank of Japan has embarked in an ultra-loose monetary policy since 2013 in order to stimulate the economy and fuel inflation amid a low-inflationary environment. The bank’s policy is based on Quantitative and Qualitative Easing (QQE), or printing notes to buy assets such as government or corporate bonds to provide liquidity. In 2016, the bank doubled down on its strategy and further loosened policy by first introducing negative interest rates and then directly controlling the yield of its 10-year government bonds.
The Bank’s massive stimulus has caused the Yen to depreciate against its main currency peers. This process has exacerbated more recently due to an increasing policy divergence between the Bank of Japan and other main central banks, which have opted to increase interest rates sharply to fight decades-high levels of inflation. The BoJ’s policy of holding down rates has led to a widening differential with other currencies, dragging down the value of the Yen.
A weaker Yen and the spike in global energy prices have led to an increase in Japanese inflation, which has exceeded the BoJ’s 2% target. Still, the Bank judges that the sustainable and stable achievement of the 2% target has not yet come in sight, so any sudden change in the current policy looks unlikely.


© 2000-2026. All rights reserved.
This site is managed by Teletrade D.J. LLC 2351 LLC 2022 (Euro House, Richmond Hill Road, Kingstown, VC0100, St. Vincent and the Grenadines).
The information on this website is for informational purposes only and does not constitute any investment advice.
The company does not serve or provide services to customers who are residents of the US, Canada, Iran, The Democratic People's Republic of Korea, Yemen and FATF blacklisted countries.
Making transactions on financial markets with marginal financial instruments opens up wide possibilities and allows investors who are willing to take risks to earn high profits, carrying a potentially high risk of losses at the same time. Therefore you should responsibly approach the issue of choosing the appropriate investment strategy, taking the available resources into account, before starting trading.
Use of the information: full or partial use of materials from this website must always be referenced to TeleTrade as the source of information. Use of the materials on the Internet must be accompanied by a hyperlink to teletrade.org. Automatic import of materials and information from this website is prohibited.
Please contact our PR department if you have any questions or need assistance at pr@teletrade.global.
transfers