- Analytics
- News and Tools
- Market News
CFD Markets News and Forecasts — 08-02-2022
- AUD/USD remains sidelined after two-day uptrend to refresh weekly top.
- Australia Westpac Consumer Confidence improved in February but marked the third monthly negative print.
- Risk appetite stays weak even as equities, gold remain firmer.
- Concerns over US inflation, geopolitics become major catalysts, Aussie Consumer Inflation Expectations are important too.
AUD/USD hovers around 0.7140-50 during the initial Asian session on Wednesday, following a two-day uptrend, as market players search for fresh clues amid cautious optimism.
The recently mixed feelings among the traders could be linked to strong US Treasury yields and anxiety ahead of the US Consumer Price Index (CPI) data. Also challenging the pair buyers are the latest headlines conveying the Sino-American trade tussles and China’s readiness to tame disorderly growth of capital.
That said, Australia’s Westpac Consumer Confidence for February improved to -1.3% versus -2.0% previous readouts. Even so, the figures marked a third consecutive monthly fall.
Elsewhere, the Chinese Communist Party (CCP) was quoted in the South China Morning Post (SCMP) as saying, “China should ‘support and guide’ the healthy development of capital, and prevent the ‘barbaric growth of capital.’ The same should challenge the equity buyers as the yields are up.
Concerning the US Treasury yields, Reuters said, “The yield on the 10-year note reached 1.97%, its highest level since Nov 7, 2019, as investors await inflation data on Thursday. Expectations are for the January consumer price index to show a 0.5% increase after a 0.6% rise in the prior month, with the year-over-year reading expected to show a 7.3% climb.”
It’s worth noting that White House Press Secretary Jen Psaki conveyed China’s lack of performance over the Phase 1 deal trade terms, which in turn challenges the AUD/USD bulls due to Australia’s trade links with Beijing.
On the contrary, the US dollar’s downbeat performance, despite the latest rebound, joins firmer Wall Street benchmarks and gold prices to favor the AUD/USD bulls.
Moving on, risk catalysts will direct short-term AUD/USD moves ahead of Thursday’s US inflation and Australia Consumer Inflation Expectations for February, expected 4.5% versus 4.4% prior.
Technical analysis
50-DMA joins a two-week-old descending trend line to highlight 0.7160-65 as the short-term key resistance. However, firmer MACD and RSI conditions hint at further upside until the quote drops below the weekly support line near 0.7095.
- EUR/USD remains on the back foot for the third consecutive day.
- US 10-year Treasury yields rally to three-year high, Wall Street benchmarks closed positive.
- ECB’s Villeroy joins the bear’s league by criticizing hawkish reaction at the latest meeting.
- German trade numbers will entertain traders but US CPI, EC Economic Forecasts are the key.
EUR/USD holds lower ground near 1.1415 during a quiet Asian session on Wednesday, after stepping back from a three-month high in the last two days.
The pair’s latest weakness could be linked to the higher US Treasury yields and downbeat comments from the European Central Bank (ECB) policymakers.
“The yield on the 10-year note reached 1.97%, its highest level since Nov 7, 2019, as investors await inflation data on Thursday. Expectations are for the January consumer price index to show a 0.5% increase after a 0.6% rise in the prior month, with the year-over-year reading expected to show a 7.3% climb,” said Reuters.
On the other hand, European Central Bank (ECB) governing council member and Bank of France's head Francois Villeroy de Galhau said on Tuesday that the market reaction to last week's ECB meeting may have been too strong.
It’s worth noting that an escalation in the risk concerning the Russia-Ukraine war and the market’s anxiety ahead of the US Consumer Price Index (CPI) data for January, as well as the European Commission’s quarterly economic forecasts, up for publishing on Thursday, also weigh on the EUR/USD prices of late.
On the contrary, firmer equities and the US dollar’s failure to track firmer bond yields seem to challenge the EUR/USD sellers ahead of the key day.
Ahead of the crucial catalysts, markets remain bearish on the major currency pair. “On balance, we still expect the risks to be to the downside for EURUSD this year and to the upside next year. We have been forecasting EURUSD at 1.10 this year, 1.15 next year and 1.20 (lower end of long-term equilibrium range) in 2024. Although getting the timing right of such a path will be difficult, we stick with it for now,” said Bank of America (BofA).
For now, German trade numbers for January will join the Fedspeak to direct intraday moves ahead of the key data/events.
Read: Forex Today: Tension mounts ahead of US inflation data
Technical analysis
Failures to cross a three-month-old horizontal hurdle surrounding 1.1485 seem to direct EUR/USD bears towards a 21-DMA level near 1.1340.
- USD/CAD struggles to extend recovery moves from fortnight-long horizontal support.
- Bullish MACD signals keep buyers hopeful to poke the monthly resistance line.
- Convergence of 100-DMA, 50% Fibonacci retracement offers strong support.
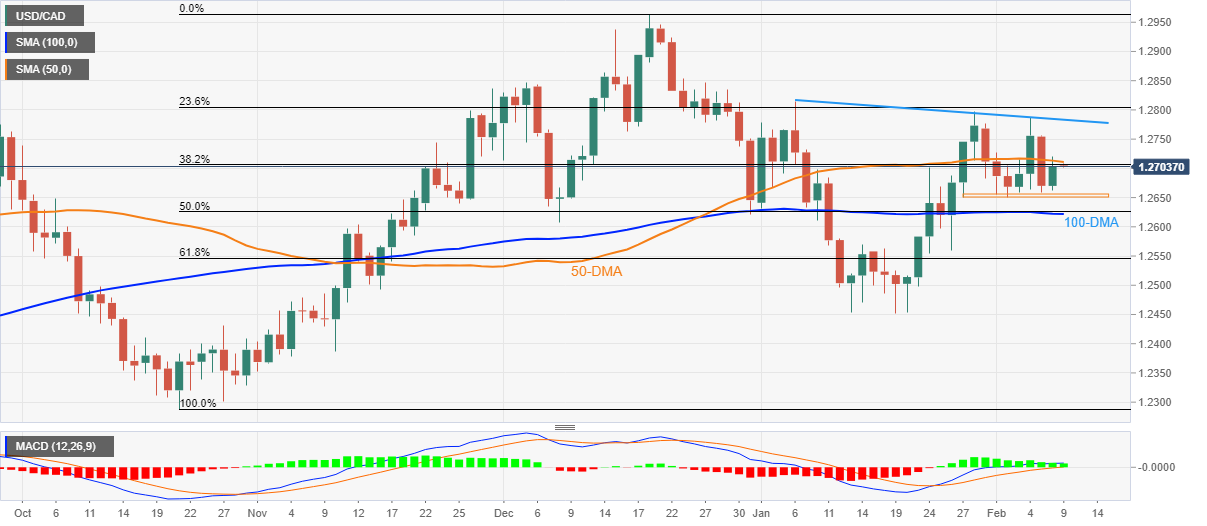
USD/CAD buyers flirt with a short-term key hurdle surrounding 1.2700 during Wednesday’s Asian session, following the bounce off a two-week-old horizontal support zone.
A convergence of the 50-DMA and 38.2% Fibonacci retracement (Fibo.) of October-December 2021 upside challenges the USD/CAD pair’s immediate upside around 1.2710.
However, bullish MACD signals and the Loonie pair’s ability to stay beyond 1.2655-50 horizontal area for nearly two weeks keep the buyers hopeful to overcome the immediate hurdle.
Following that, a downward sloping trend line from early January, near 1.2785, will be in focus as a break which will direct USD/CAD bulls towards crossing the 1.2800 threshold.
Meanwhile, a downside break of the 1.2650 support will again highlight the 1.2625-20 support confluence, comprising the 100-DMA and 50% Fibo.
Should the quote’s drop below 1.2620, the mid-January’s swing high near 1.2570 may offer an intermediate halt during the fall targeting the yearly low of 1.2453.
USD/CAD: Daily chart
Trend: Further recovery expected
- The AUD/JPY upside breaks confirm a bullish flag as bulls regain control above the 82.00 mark.
- AUD/JPY Technical Outlook: Despite being upward biased, would need a daily close above the 100-DMA to cement the uptrend.
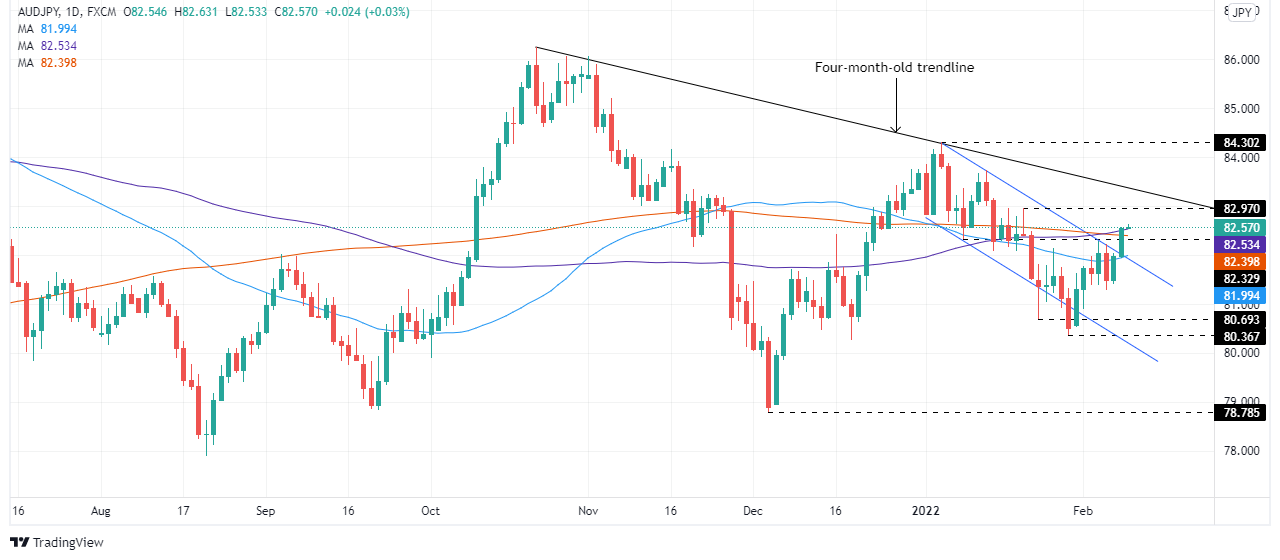
The AUD/JPY breaks upward, above the 100 and the 200-day moving averages (DMAs), at 82.53 and 82.40, respectively. At the time of writing, the AUD/JPY cross-currency is trading at 82.56.
The market sentiment is upbeat. US equity indices ended in the green, while Asian stock futures point to a higher open. The risk-sensitive AUD was bolstered in the FX complex, while the JPY was the laggard on the Tuesday session, courtesy of the rise in US T-bond yields, with the 10-year yield, at 1.965%.
AUD/JPY Price Forecast: Technical outlook
The AUD/JPY broke a bullish flag to the upside, though the 100-DMA capped the move. However, the long-real body of Tuesday’s price action suggests that the uptrend could accelerate towards fresh daily highs, even opening the door for a challenge of the YTD high.
That said, the AUD/JPY first resistance would be January 20 daily high at 82..97. Breach of the latter would expose a four-month-old downslope trendline around the 83.25-40 range, followed by the psychological 84.00 figure.
Contrarily, failure to reclaim 83.00 could pave the way for further losses in the AUD/JPY pair. The first support would be 82.00, pushing the price below the top-trendline of the bullish flag, viewed as a false breakout. A crackdown of the 82.00 mark would expose January 24 daily low at 80.69, followed by January 28 at 80.36.
Early Wednesday morning in Asia, Reuters came out with the news conveying the passage of intermediate US government funding bill.
“A bipartisan majority of the U.S. House of Representatives on Tuesday voted to extend temporary funding for the federal government through March 11 to avoid agency shutdowns when existing money expires at midnight on Feb. 18,” said the news initially before announcing the final passage.
More to come…
- WTI pares recent losses after a two-day downtrend refreshed weekly bottom.
- Concerns surrounding Abu Dhabi, Russia joined hopes of overcoming virus woes to trigger the rebound in oil prices.
- API Weekly Crude Oil Stock rose dropped below -1.645M prior.
- EIA inventories, risk catalysts will be watched for fresh clues.
WTI crude oil sellers lick their wounds near $88.70 by the end of Tuesday’s settlement, recently bounced off weekly low.
The black gold’s weakness over the last two days could be considered as profit booking moves near the multi-day high, as well as recent trade tussles between the US and China. However, surprise draw in the industry reports of oil stockpile joins escalating fears of Moscow’s attack on Ukraine to underpin the commodity’s latest rebound. On the same line were headlines conveying an explosion in Abu Dhabi and cautious optimism conveyed by US Centers for Disease Control and Prevention (CDC) Director Dr. Rochelle Walensky.
Weekly Crude Oil Stock by the American Petroleum Institute (API) dropped to -2.025M versus -1.645M previous readouts for the week ended on February 04.
Elsewhere, concerns over one or two rocket-fired explosions in Abu Dhabi also helped oil prices to recover before the blast was termed as cylinder-blast by local media.
On the same line were hopes of witnessing easy covid infections by US CDC Director Walensky while extending the mask mandate. “Walensky said she is ‘cautiously optimistic’ COVID-19 cases in the United States will fall below crisis levels, ‘I don't think we're there right now,’” said Reuters.
Furthermore, the US and the UK stay firm to take harsh measures on Russia if it invades Ukraine but Moscow isn’t stepping back. US President Joe Biden will talk to French leader Emmanuel Macron on Wednesday over the issue.
It should be noted that the fears of the Fed’s faster rate hike and cautious mood ahead of the US Consumer Price Index (CPI) also challenged oil prices but firmer equities and gold defended bulls of late.
Moving on, official oil inventory data from the US Energy Information Administration, expected 0.647M versus -1.047M, will be important for the WTI crude oil prices. However, major attention will be given to risk catalysts for fresh impulse.
Technical analysis
WTI crude oil takes a U-turn from a five-week-old ascending trend line, backed by RSI’s pullback from overbought territory, which in turn suggests the oil benchmark’s run-up to regain the $90.00 threshold.
- AUD/USD bulls are challenging the bear's commitments a critical area of resistance.
- The weekly bears are eyeing a break of 0.7105, then 0.7050 for a test to 0.7000.
AUD/USD has continued to chip into the daily resistance ahead of what could now start to shape up to be a more volatile number of days ahead. The US dollar is going to be under scrutiny in the next 72 hours as markets get set for inflation data and start second-guessing the Federal Reserve's moves in Mach. From a technical standpoint, that leaves the downside vulnerable while the price remains below the 0.7180's as follows:
AUD/USD daily chart
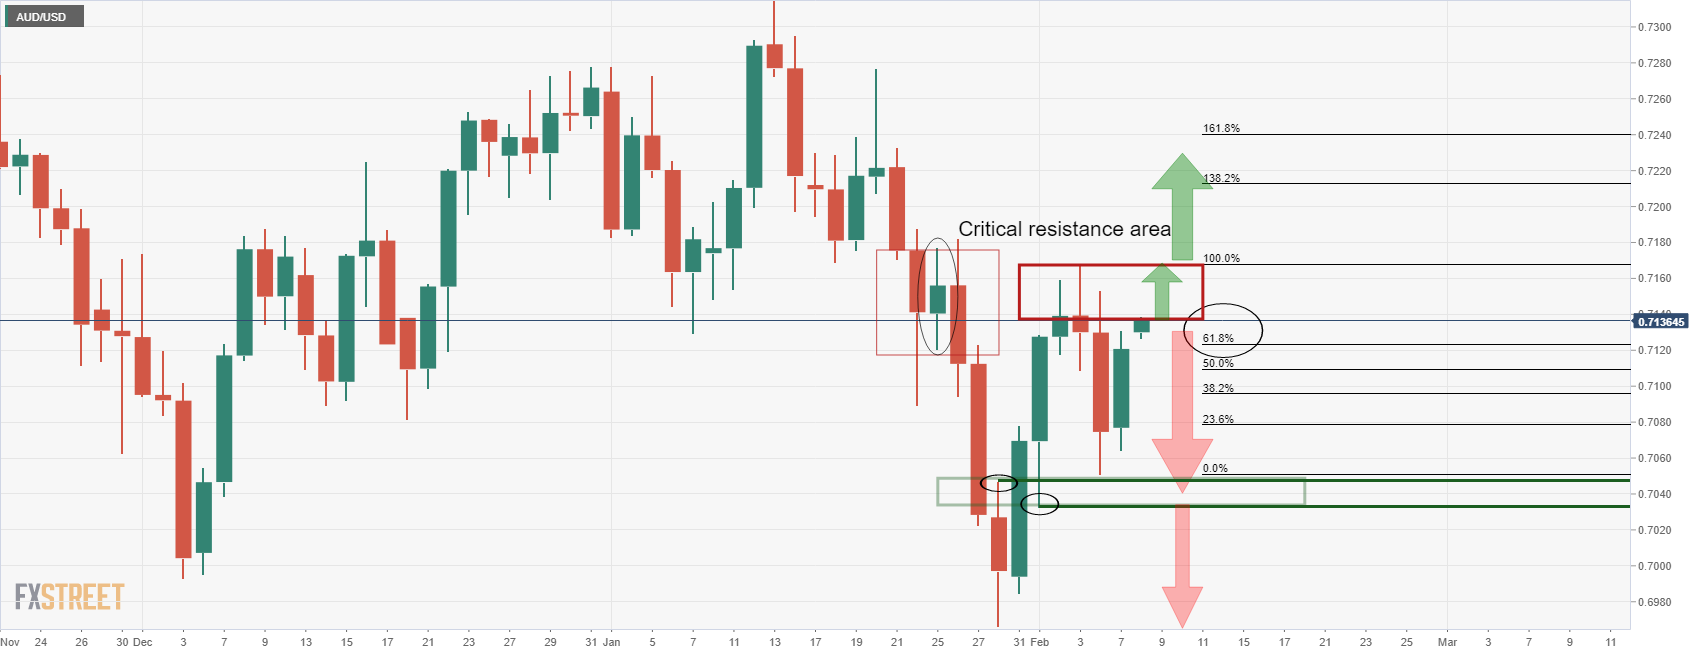
The price is fairly bid above the 61.8% ratio but sellers may emerge soon if the bulls fail to take out the critical resistance area near 0.7180. A move lower will likely see 0.7050 in the near future that guards 0.70 the figure as per the weekly chart's downside initial target:
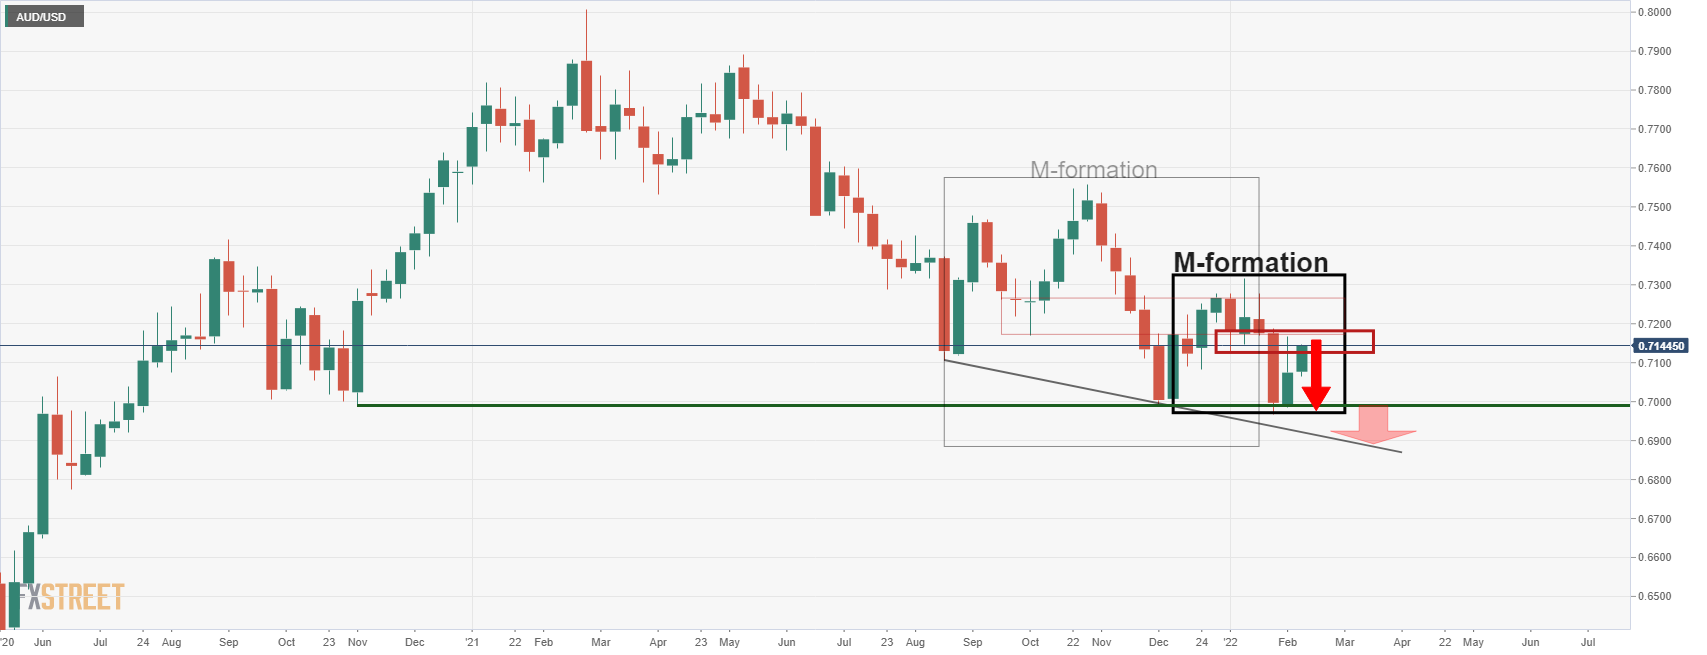
AUD/USD H1 chart
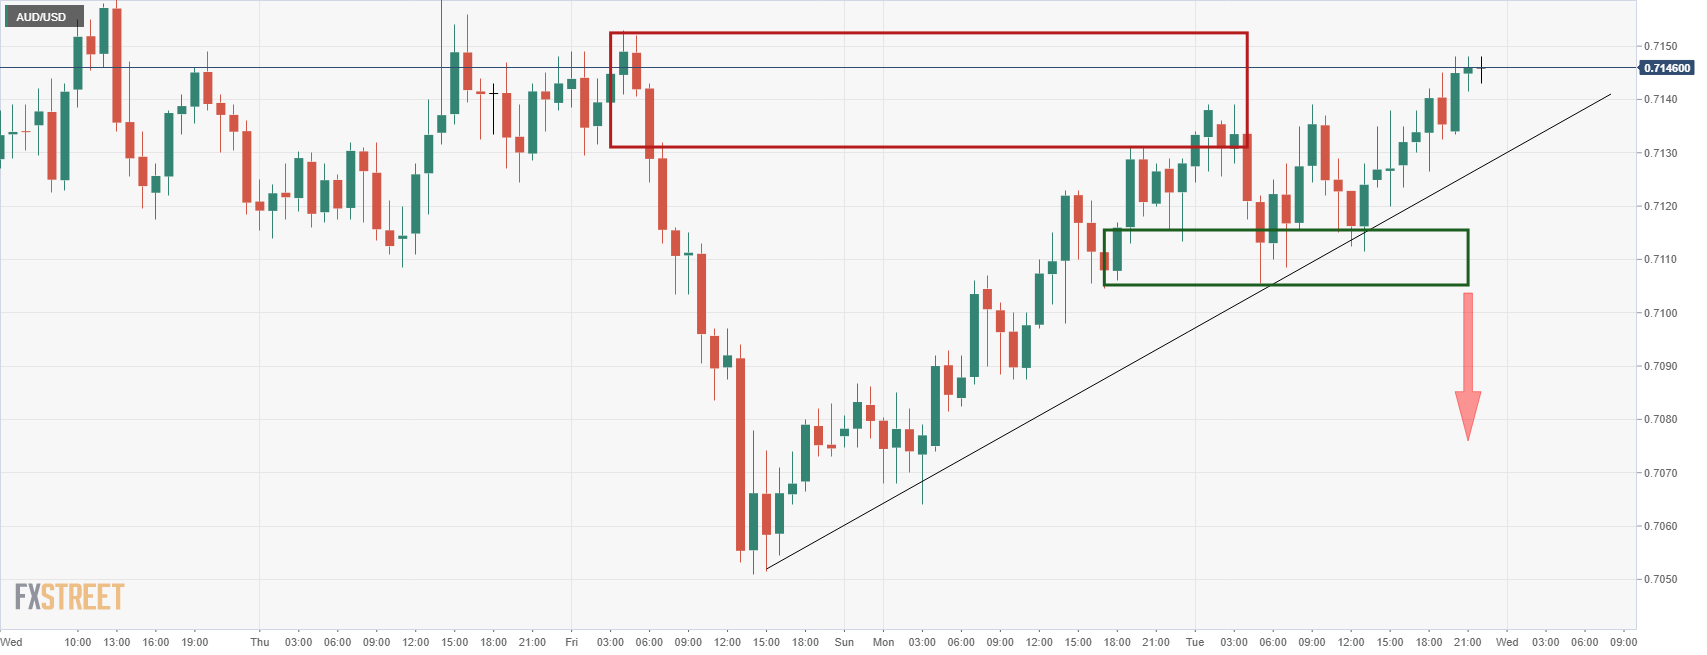
From an hourly perspective, the H1 0.7105 swing lows will be key. Bbelow there, the flood gates could open up for the bears.
- On Tuesday, the GBP/CAD climbs 0.40% as WTI fall below $90.00.
- Central bank divergence between the BoE and BoC bolstered the GBP, as rates increased in the UK.
- GBP/CAD is neutral subject to a breakout either way; caution is warranted.
The GBP/CAD pares some of its Monday’s losses during the North American session, climbing 0.39%. At the time of writing, the GBP/CAD is trading at 1.7208. The British pound recovered some ground vs. the Canadian dollar, courtesy of lower oil prices which weighed on the latter, as US crude oil benchmark WTI slid under the $90.00 per barrel.
Risk-on market mood, keep the British pound in the right, foot alongside some risk-sensitive currencies like the antipodeans and the Canadian dollar. However, the Loonie was hurt by oil prices, while the GBP got a lift-up on the last week, as the Bank of England hiked rates by 25 basis points.
The GBP/CAD narrative lies on the central bank divergence. In the last two meetings, the Bank of England hiked 40 bps and left bank rates at 0.50%. Meanwhile, on its last monetary policy, the Bank of Canada (BoC) chose to keep rates unchanged, even though STIR markets priced in an 80% chance of increasing rates from 0.25% to 0.50%.
Therefore, the GBP/CAD is upward biased, but in the last two days have witnessed a fall from weekly highs, weighed by political issues in the UK that looms the possible resignation of British Prime Minister Boris Johnson.
GBP/CAD Price Forecast: Technical outlook
That said, the GBP/CAD seesawed in the week, between the 1.7130-1.7260 range. On Tuesday, the pair bounced off the weekly lows as the GBP/CAD slide stalled at the 200-day moving average (DMA) at 1.7145.
The GBP/CAD is neutral biased, subject towards a breakout upwards or downwards. However, on the downside lie the 100 and the 50-DMA around 1.7081 and 1.7038, which would be difficult to overcome if crude oil prices keep headed south.
Upwards, the GBP/CAD resistance levels ahead are February 7 daily high at 1.7274, followed by 1.7308. On the flip side, the 1.7200 figure is the first support, which, once broken, would expose the 200-DMA at 1,7145, followed by 1.7100.
- NZD/USD bulls in control and eye significant market structure ahead.
- US dollar could come back into vouge as the US CPI looms.
NZD/USD is heading into the early Asian shift higher by some 0.24% and has travelled from a low of 0.6627 to a high of 0.6653 on the day so far. The bulls are in charge as they take ut a critical level of daily resistance this week with eyes on a run towards the Feb highs near 0.6680 as illustrated below.
Meanwhile, all the action was once again centred on bond markets, with the bellwether US 10yr Treasury bond at yet another post-COVID high, as analysts at ANZ Bank highlighted. The US yields are indeed pushing up key technical levels which, if broken, could send the yields over the key psychological threshold of 2% this week.
The US dollar stands to gain on a correction in the euro as well which is falling under pressure. Sentiment surrounding the European Central Bank was dialled back at the star of the week yet the hawks continue to circle over the Federal Reserve. In the lead up to March's Federal meeting, exceptionally positive US labour data last week, in the form of Nonfarm Payrolls, has put extra focus on this week's Consumer Price Index.
The data could cement expectations on whether the Federal Reserve will raise interest rates by a 25 basis point or a 50 basis point at a March review. Money markets are now pricing in more than a 60% probability of a 50 bps rate hike. As a consequence, the US dollar could be in the running for a significant correction in the forex space with the 96 mark in focus as the DXY index.
However, ''currency markets aren’t really responding to rising bond yields, and one reason for that is they are rising in unison globally. And being a quiet week locally, there is little to differentiate the Kiwi,'' analysts at ANZ Bank explained.
Looking ahead, the markets are going to be looking into the US inflation story on the back of the US Consumer Price Index on Thursday.
''There is genuine nervousness ahead of it, with the street forecasting a pick-up to an incredible 7.3%,'' analysts at ANZ Bank said. ''It all speaks to heavy going, so to speak, and as we noted in our NZD Update yesterday, there are crosscurrents aplenty and volatility looks like it might trump directionality in 2022. Hang on to your hats!''
NZD/USD technical analysis
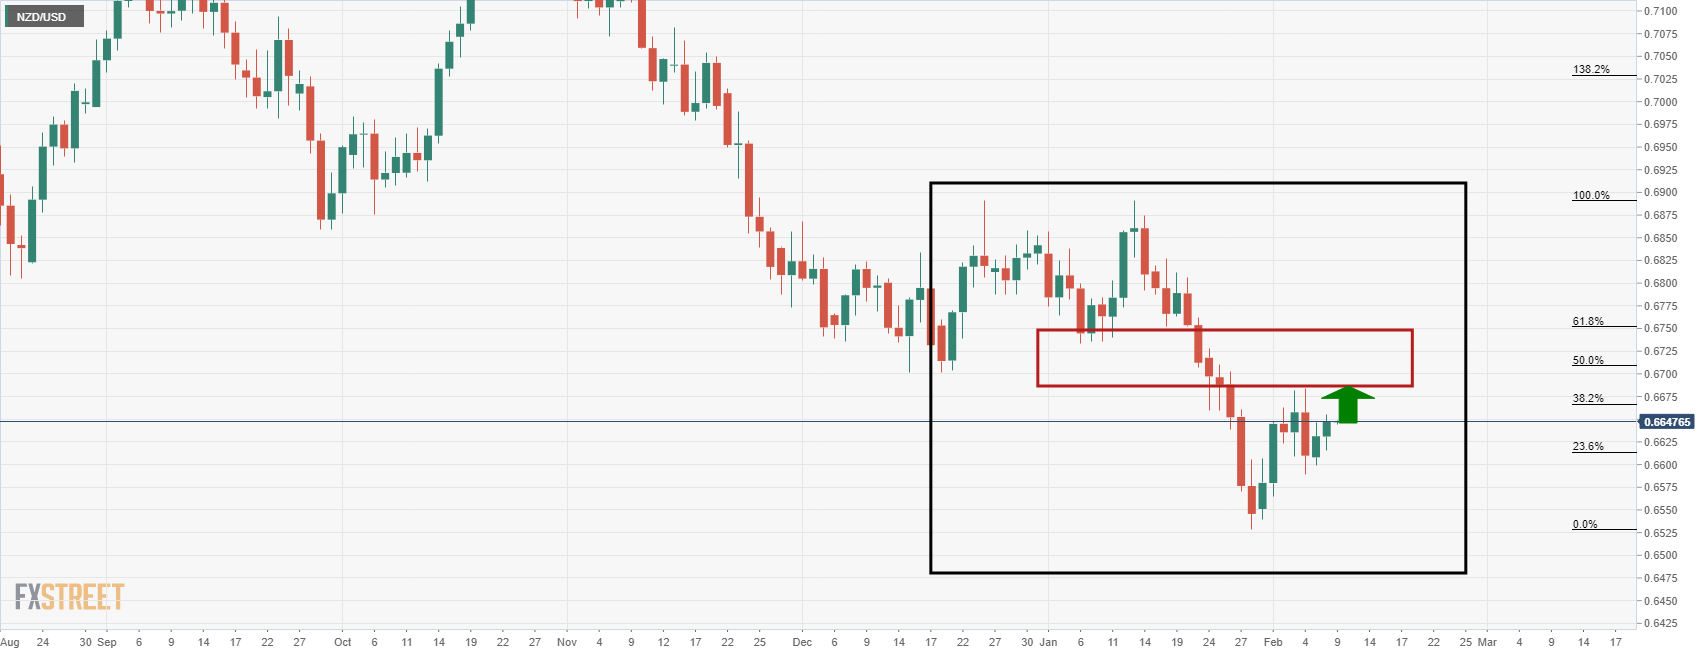
NZD/USD bulls are looking into the Feb. highs on the daily chart that meet with the weekly 38.2% ratio:
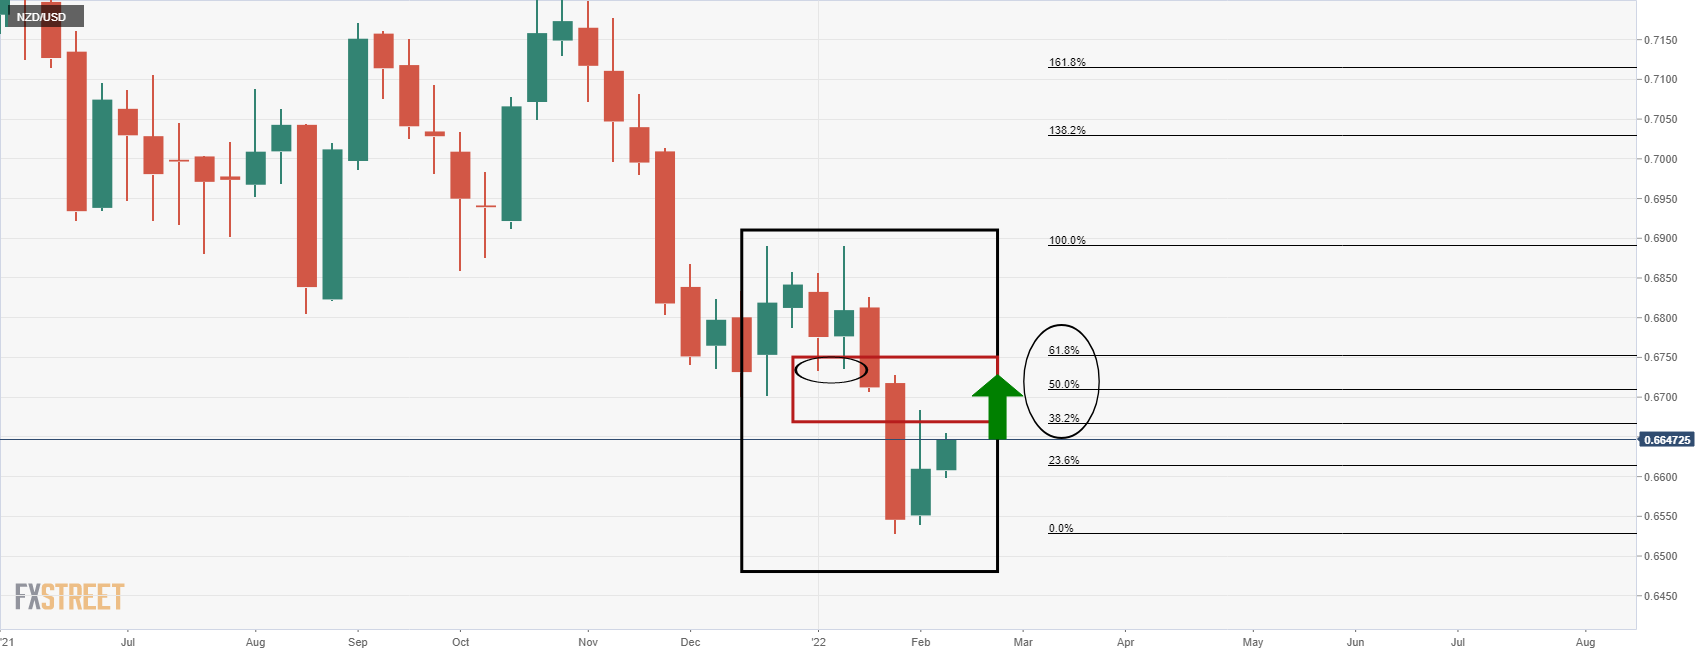
A break there opens the prospects of a run to the M-formation's neckline and through a 50% mean reversion.
- EUR/CHF consolidated in the mid-1.0500s on Tuesday, finding support ahead of the 1.0520 area but unable to test 1.0600 again.
- A more dovish tone to ECB rhetoric this week versus last has taken the sting out of ECB tightening bets.
EUR/CHF consolidated in the mid-1.0500s on Tuesday, with buying interest coming into play upon a dip back towards support in the form of the earlier 2022 highs around 1.0520 mark. Meanwhile, the pair was never able to muster a meaningful push back towards earlier weekly highs at 1.0600 reached in the immediate aftermath of the ECB’s hawkish shift last week. That can likely be explained by the fact that, this week, ECB speakers have sought to strike a more balanced tone in order to push back against what ECB’s Francois Villeroy de Galhau on Tuesday said was an over-the-top market reaction last week.
ECB members, including President Christine Lagarde herself, have sought to emphasise that the bank might be headed towards policy tightening, and that could mean a hike later this year, but would not rush to conclusions. Meanwhile, Lagarde and others were keen to emphasise that while policy normalisation is on the table (i.e. returning rates to “neutral”), policy tightening (raisine rates above “neutral”) most certainly is not. This week’s rhetoric has taken the sting out of market pricing, which was implying the possibility of a rate move as soon as July.
EUR/CHF will be watching a speech from the ECB’s Chief Economist Philip Lane on Thursday, where he will likely echo, or might even take a more dovish line, than Lagarde. Further dovishness may continue to dent the euro and that might mean EUR/CHF continues to pull back from earlier weekly highs and actually tests support at 1.0520.
Longer-term, if the now expected ECB hawkish shift in its inflation forecasts and rate guidance is forthcoming at the March meeting, that might argue for a higher EUR/CHF. That would certainly make the SNB happy. But continued higher inflation in the Eurozone versus low inflation Switzerland means that as the value of each euro is eroded at a faster pace than each Swiss franc, the medium-term direction for the pair may continue to be lower.
- Spot silver has pushed back into the $23.20s as precious metals continue to shrug off the headwind of higher yields.
- As US CPI looms, and may spur fresh Fed tightening bets, silver is trading over 3.0% higher on the week.
Spot silver (XAG/USD) prices pushed convincingly back above the $23.00 level on Tuesday, after attracting buyers amid an earlier session pullback to the 50-Day Moving Average in the $22.80s. At current levels, XAG/USD trades about 0.9% higher on the day in the $23.20s and close to its 21-Day Moving Average, with spot silver prices shrugging off a slightly strong buck and rise in US bond yields. US yields were up by a similar margin across the curve on Tuesday (3-5bps), with the 10-year hitting 1.97% for the first time since August 2019, though not managing a clean break above resistance in the form of Q4 2019 highs in the 1.96% area.
The move higher in nominal yields was in part driven by a rise in real yields that would typically be a negative for non-yielding inflation hedge precious metals like silver. Higher real yields represent 1) a rise in the opportunity cost of holding non-yielding assets and 2) a cheaper alternative form of inflation protection. But the negative correlation between the likes of silver and yields has been weaker as of late, perplexing analysts.
Some have said inflation concerns remain elevated as energy prices continue to surge and amid worries the Fed is “behind the curve”. Others have cited geopolitical concerns as driving safe-haven demand (though certainly not into bonds). Either way, as US Consumer Price Inflation data, which may well push US yields ever higher if it spurs further Fed tightening bets, looms, XAG/USD is trading up over 3.0% higher on the week. That marks a more than 5.5% rebound from last week’s lows at $22.00, which marked a double bottom for the year.
- US inflation data and UK GDP will be key for GBP/USD this week.
- Bears eye the 1.3520 horizontal support that could be the last defence before a test of 1.3490 swing lows.
At 1.3559, GBP/USD is up on the day by 11% and has travelled from a low of 1.3507 to score a high of 1.3564 on the day so far. Nevertheless, the greenback is being eyed for prospects of a bid given the perkiness in US yields and the anticipation of US nfla5ion data this Thursday.
The US dollar stands to gain on a correction in the euro and in continued hawkish sentiment surrounding the Federal Reserve. In the lead up to March's Federal meeting, exceptionally positive US labour data last week, in the form of Nonfarm Payrolls, has put extra focus on this week's Consumer Price Index that has been forecasted at a four-decade high 7.3%.
The data could cement expectations on whether the Federal Reserve will raise interest rates by a 25 basis point or a 50 basis point at a March review. Money markets are now pricing in more than a 60% probability of a 50 bps rate hike. As a consequence, the US dollar could be in the running for a significant correction in the forex space with the 96 mark in focus as the DXY index. This will ultimately weigh on the pound and leave 1.3490 vulnerable in a breakdown of technical structure as illustrated in the technical analysis below.
Meanwhile, however, given the widening interest rate differentials between the pound and other major currencies, such as the euro, GBP bears could be hard pushed to run away with it for the time being. In this regard, this week's UK Gross Domestic Product will be a key event for sterling this Friday.
The data, expected by analysts at TD Securities to contract by 0.8% MoM in December, thus bringing GDP below its pre-COVID level once again, will be the first major event after last week's Bank of England interest rate decision.
While the Bank of England delivered a quarter-point hike last week as widely expected, a split vote came as a surprise, as four of the nine Monetary Policy Committee members wanted a 50 basis points move. This leaves the bulls in good stead for the time being. Money markets are now pricing in another 127 bps of hikes over the remainder of the year.
GBP/USD technical analysis
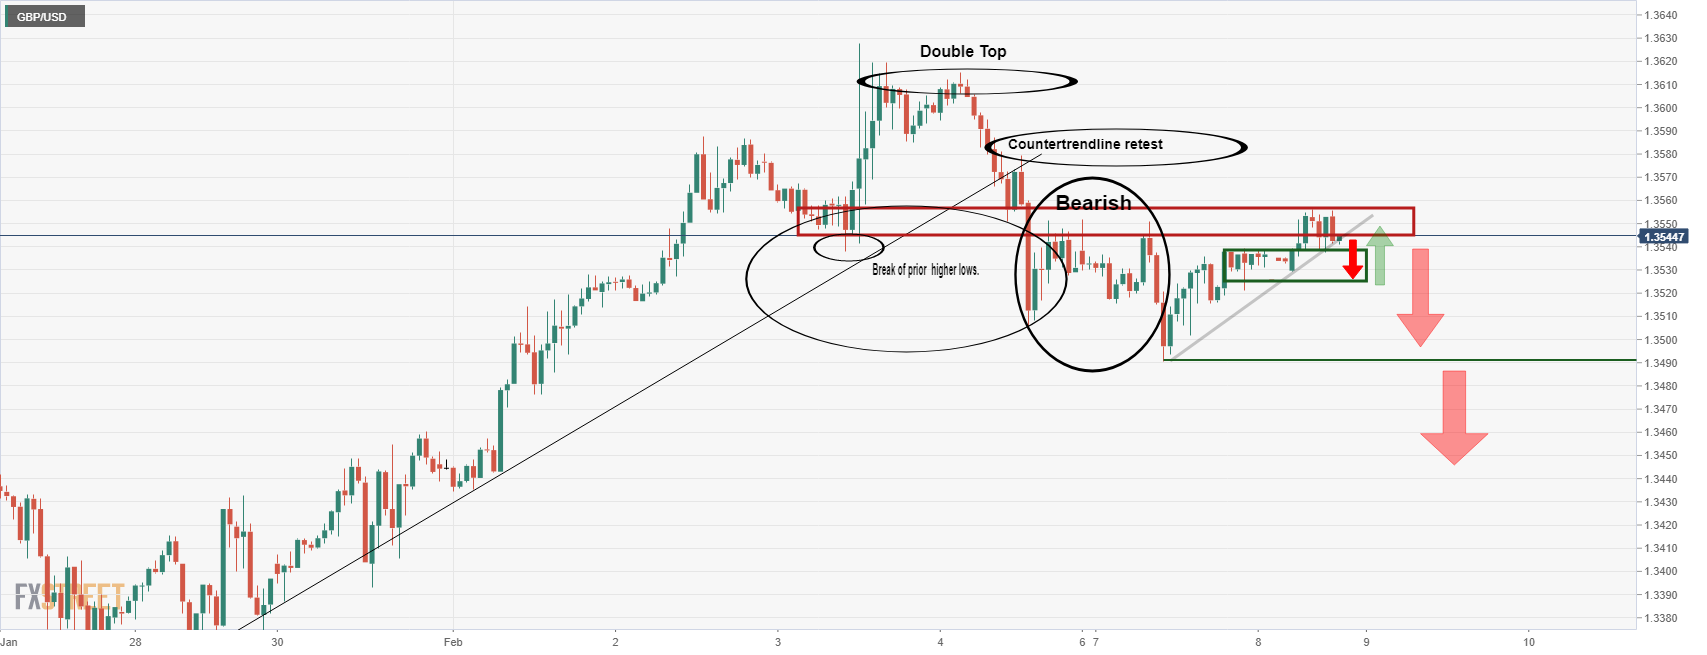
As the hourly chart illustrates, the bulls are attempting to take on the resistance area but without conviction so far. Should they fail at this juncture, the bears will be encouraged to be involved at a discount and will eye a break of the 1.3520 horizontal support that could be the last defence before a test of 1.3490 swing lows.
- AUD/USD has been ebbing higher but remains capped under 0.7150 and within recent ranges.
- Analysts have cited favourable price action in the base metals space and in global equities as benefitting the Aussie.
- The pair will likely remain fairly subdued, however, ahead of key US CPI data on Thursday.
It’s been a pretty quiet session for AUD/USD, with the pair ebbing higher and remaining support above 0.7100, but unable to test resistance at 0.7150. As things stand, the pair is about 0.2% higher on the day and continues to trade within last Friday’s ranges, though has pared the entirety of last Friday’s post-strong US jobs data drop back to the 0.7050 area.
Analysts have cited favourable price action in the base metals space as benefitting the material export-dependent Aussie, as well as favourable conditions in the global equity space. But any meaningful break, say, above last week’s highs in the 0.7160s, will likely have to wait until after Thursday’s US inflation data, where the YoY rate of Consumer Price Inflation is seen rising 7.3% YoY.
FX strategists have said that even an in line with expectations reading could bolster Fed tightening bets, underpinning the US dollar. That suggests the more likely direction for AUD/USD may instead be a break back under 0.7100 and toward’s last Friday’s lows just above 0.7050. Chatter about the potential timeline of RBA tightening also remains a key theme for AUD/USD, after former RBA board member John Edwards said on Tuesday that he thinks the bank might hike four times this year starting in August.
The RBA is yet to indicate plans to tighten that soon. Analysts at Westpac say they “stick to the view that the A$ should remain capped by the $0.7140/70 level given the very different stance that the RBA is maintaining versus a wide range of other central banks”. However, they continue, “we would look to use weakness towards $0.70 as an opportunity to buy for strength later in the year” he added, noting strong prices for Australia's major commodities.
What you need to know on Wednesday, February 9:
Major pairs continued lacking certain directional strength and held within limited intraday ranges on Tuesday. The greenback found some strength in soaring government bond yields, as that on the US 10-year Treasury note reached 1.97%. However, yields’ strength was barely enough to prevent the dollar from plummeting.
The EUR/USD pair briefly pierced the 1.1400 level but ended the day in the 1.1410 price zone. Comments from the European Central Bank member Francois Villeroy put some pressure on the shared currency by the end of the day, as he noted that the market may have overreacted to President Christine Lagarde’s words last week.
UK Prime Minister Boris Johnson reshuffled its cabinet. Jacob Rees-Mogg has become the new Brexit Minister, while Mark Spencer replaced him as leader of the Commons. Chris Heaton-Harris becomes the new chief whip, while Paymaster General Michael Ellis would take on the additional role of minister for the Cabinet Office. The decision comes in the middle of the lockdown parties’ scandal, which menaces Johnson’s leadership. GBP/USD trades around 1.3550.
The AUD/USD pair is up for a second consecutive day trading in the 0.7140 region. The USD/CAD pair edged higher and currently hovers around 1.2700, as lower oil prices undermined demand for the Canadian dollar. The greenback posted modest gains against safe-haven CHF and JPY.
Gold surged to a fresh two-week high of $1,828.36 a troy ounce, holding nearby at the end of the day. Meanwhile, WTI trades at $89.80 a barrel.
Market players keep waiting for January US inflation figures to be out on Thursday.
Top 3 Price Prediction Bitcoin, Ethereum, XRP: Crypto profit-taking starts before new uptrend
Like this article? Help us with some feedback by answering this survey:
- EUR/USD bears stay in control and eyes are on a significant retracement.
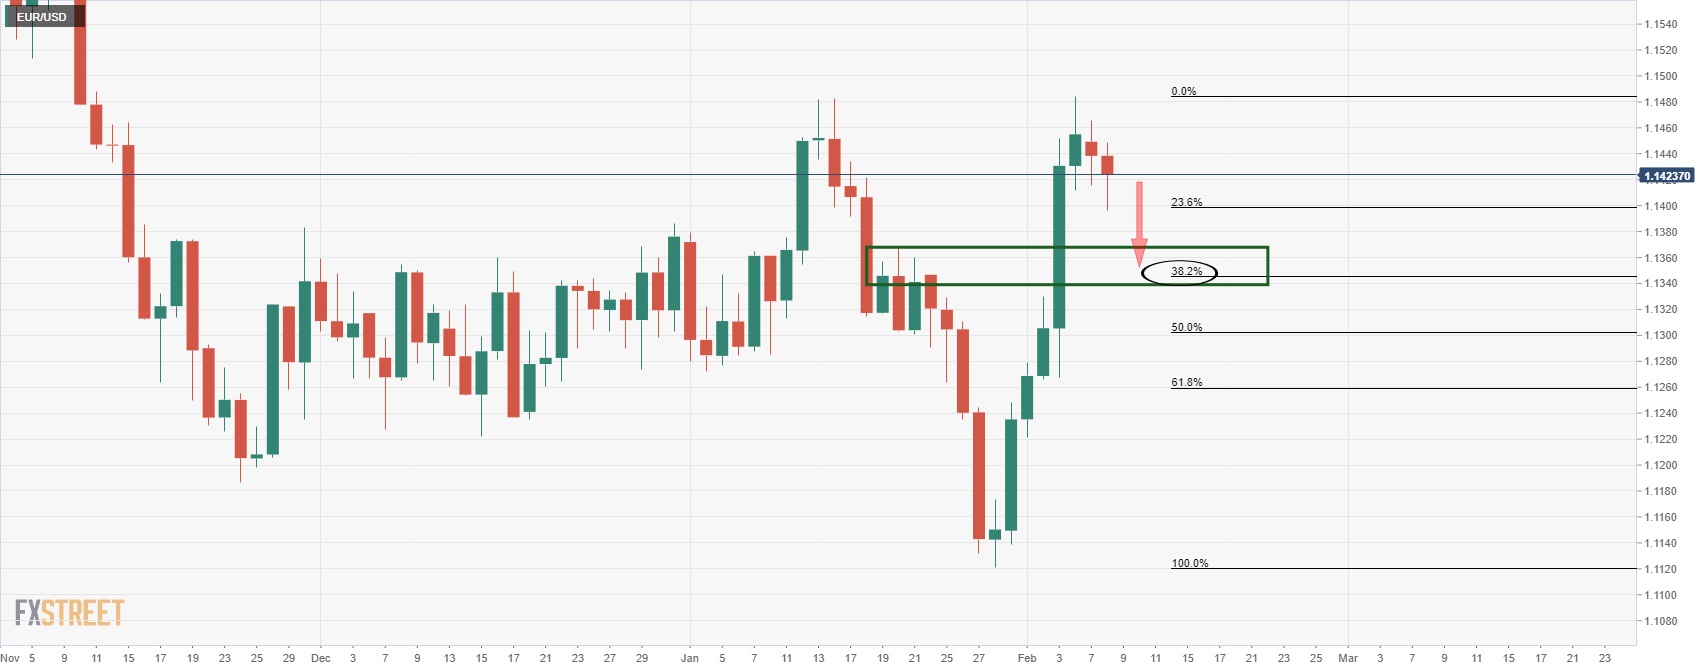
- The daily time frame's 38.2% ratio is located at 1.1345.
As per the prior analysis, EUR/USD: Bulls firming, eyes on M-formation neckline before 1.1410 break, the price remains pressured with a bias to the downside from both the hourly and daily perspectives.
EUR/USD prior analysis, H1 chart
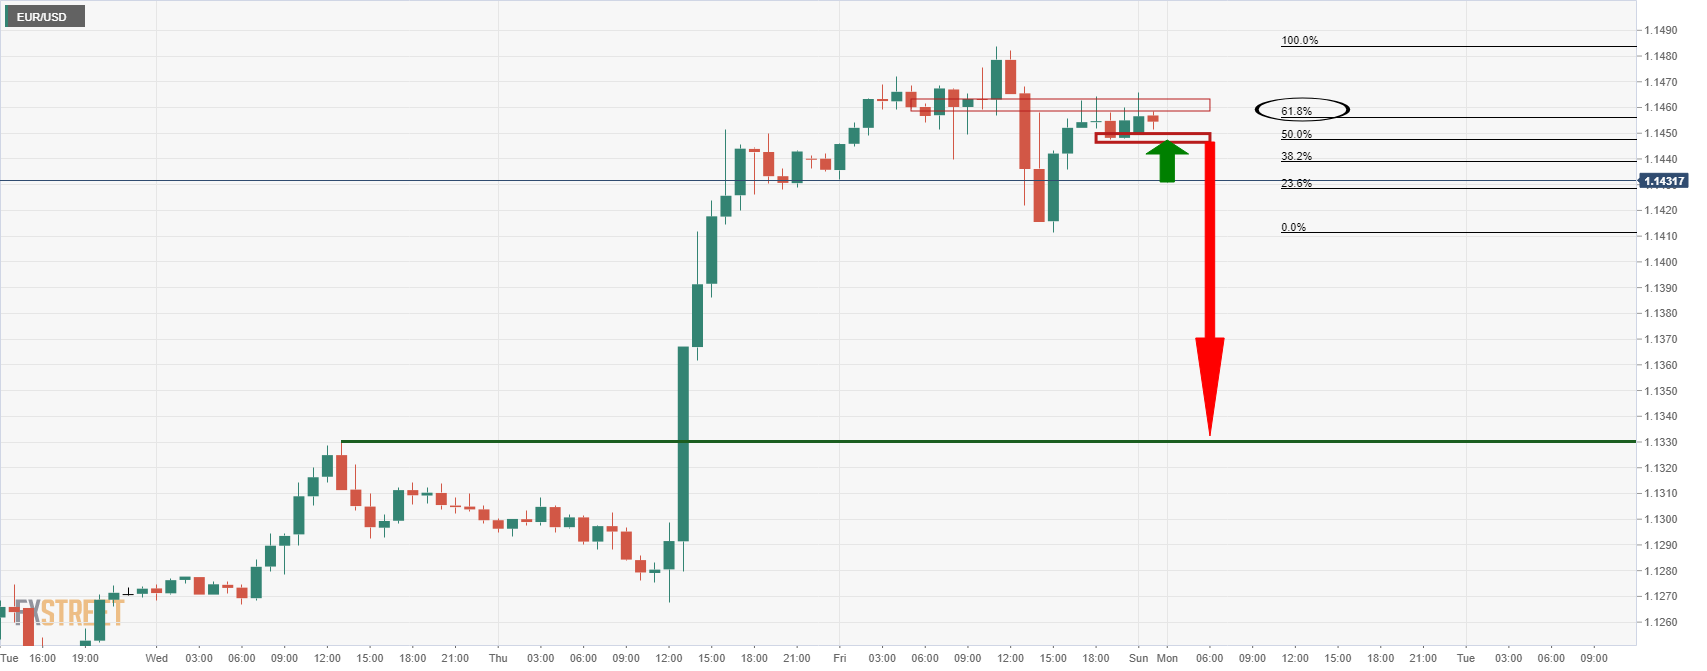
As illustrated, from an hourly time frame basis, the price was expected to remain under pressure following the bull's last attempts into resistance.
EUR/USD live market
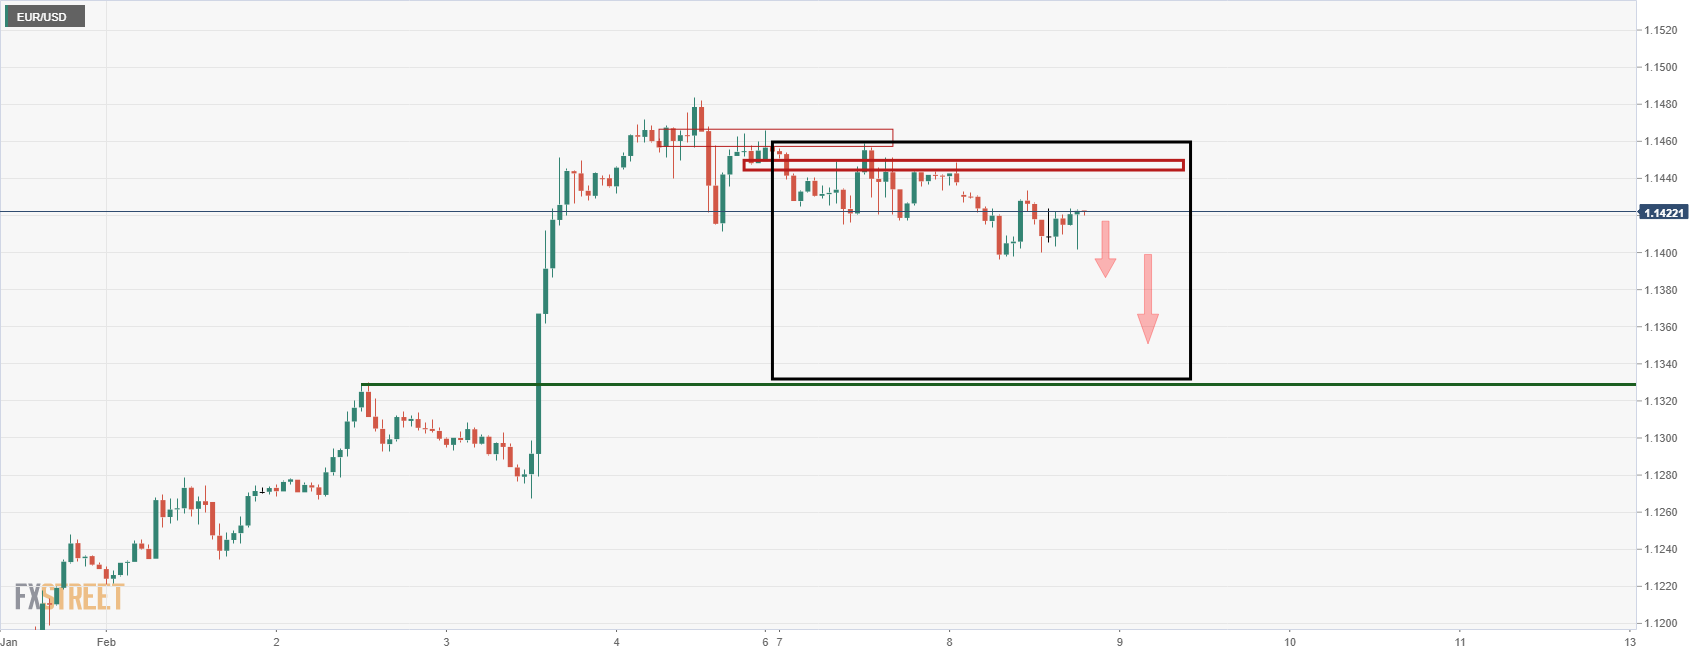
As can be seen, the price has respected the forecasted trajectory below resistance and would be expected to continue lower in the coming week. On a daily basis, the 38.2% Fibonacci retracement levels have a confluence with the prior structure on a closing basis as follows:
- The USD/CAD pares Monday’s losses as WTI plunges below $90.00.
- The US 10-year Treasury yield reached a new high at 1.97%.
- USD/CAD Technical Outlook: A daily close above the 50-DMA would expose the YTD high at 1.2813.
In the New York session, the USD/CAD trim Monday’s losses and reclaims the 1.2700 figure as the Canadian dollar weakens, as oil prices fall, a headwind for the Loonie. At the time of writing, the USD/CAD is trading at 1.2702.
Falling oil prices weigh on the CAD
On Tuesday’s, Western Texas Intermediate (WTI), the US crude oil benchmark, falls more than 2%, as it moves beneath $90.00 per barrel. Alongside oil factors, the Canadian Trade Balance for December printed a deficit of C$0.14 billion when expectations were of a surplus of C$2.5 billion, hurt the prospects of the Loonie. Additionally, US T-bond yields skyrocketing in the session, led by the 10-year benchmark note reaching a daily high at 1.97%, boosted the greenback.
Fundamentally speaking, the narrative of the central banks’ worldwide tightening conditions keeps markets trendless. Money markets futures expectations of the Federal Reserve, analysts estimate five hikes to the Federal Funds Rates (FFR) by the end of 2022.
In the meantime, USD/CAD traders get ready for Thursday’s US inflation figures. The Consumer Price Index (CPI) for January is expected at 7.3% while excluding volatile items like energy and food called Core CPI, which is foreseen at 5.5%.
USD/CAD Price Forecast: Technical outlook
The USD/CAD is upward biased but faces resistance at the 50-day moving average (DMA) at 1.2708. The pair consolidated around the 1.2650-1.2760 area, amid the lack of catalyst as market participants assess economic conditions.
However, once USD bulls reclaimed 1.2700, that would open the door for a test of the 50-DMA. A breach of the latter would expose the February 4 daily high at 1.2786. An upward break would send the USD/CAD higher towards the January 6 high at 1.2813.
- EUR/JPY continued to trade within recent intra-day ranges on Tuesday, remaining support above January’s highs in the 131.60 area.
- The euro saw momentary weakness as ECB’s Villeroy pushed back against the post-ECB meeting market reaction.
- Ahead, the pair will be focus on US inflation data on Thursday for any read across to FX markets.
EUR/JPY has continued to trade within recent ranges on Tuesday, undulating between the 131.50-132.00 levels, meaning the price action has remained well contained within Monday’s 131.20-132.20ish ranges. FX markets continue to trade in a broadly subdued manner, with EUR/JPY happy to consolidate recent gains after its big post-hawkish ECB push to multi-month highs in the latter part of last week. For now, support in the form of the early January high at 131.60 continues to prove an attractive long entry point for intra-day speculators.
Recent comments from ECB governing council member and Bank of France head Francois Villeroy de Galhau, who said that last week’s post-ECB rate decision market reaction may have been too strong, resulted in momentary euro weakness. His comments come after a more measured tone on the prospect for monetary policy tightening from ECB President Christine Lagarde and other ECB policymakers this week, undermining the case for further short-term euro upside.
Nonetheless, as Eurozone yields continue to trade with an upside bias in tandem with their US counterparts and broader risk appetite remains resilient in the run-up to Thursday’s US consumer inflation report, EUR/JPY may remain supported in the short-term. Should the upcoming US inflation report surprise to the upside, subsequent Fed tightening fears could weigh on market sentiment and give the yen a boost, which could set EUR/JPY back later this week.
European Central Bank governing council member and Bank of France head Francois Villeroy de Galhau said on Tuesday that the market reaction to last week's ECB meeting may have been too strong.
Market Reaction
This may have been a reference to money market pricing that jumped forward to pricing a possibility of an ECB hike as soon as July, rather than a reference to currency markets. Nonetheless, the euro did see some momentary weakness, with EUR/USD dipping back towards session lows in the 1.1400 area to probe session lows.
- For gold's next move, all eyes turn to the US dollar and CPI later this week.
- CTA trend followers could add to outflows should prices close below $1800/oz.
At $1,827, gold, XAU/USD is higher on the day by 0.40%. The price has moved from a low of $1,815.49 to reach a high of $1,828.40 so far. Overall, it's a slow start to the week and there is a lack of volatility on the forex space which means the US dollar is stuck around opening levels for the week as traders await key inflation data on Thursday.
However, benchmark US 10-year Treasury yields are pushing up key technical levels which, if broken, could send the yields over the key psychological threshold of 2% this week. This is supporting the greenback on Tuesday. DXY is over 0.2% higher, which is an index that measures the US dollar vs. a basket of rival major currencies. The index has ranged between 95.398 and 95.75.
Looking ahead, with gold at a critical juncture, as illustrated on the charts below, analysts at TD Securities explain, that at first glance, 'the set-up is in gold ripe for another position squeeze, as several participants including TD Securities have established tactical short gold positions.
They explained that this is following the decisively hawkish Fed meeting, only to find substantial volume on the bid keeping prices from breaking below their bull-market-era trendline support. ''This time'', they argue, however, ''the bar is high for a substantial squeeze, suggesting macro headwinds will ultimately weigh on gold.''
''. It remains to be seen whether central bank purchases might be playing a substantial role in keeping gold prices from breaking lower, but shorts are unlikely to feel much pain as the data continues to point to little speculative interest for the yellow metal. Conversely, CTA trend followers could add to outflows should prices close below $1800/oz.''
Gold technical analysis
As per the prior analysis, and this week's, Gold, Chart of the Week: Bulls take on the 38.2% Fibo, now eye the 61.8% golden ratio, the price has finally moved on the 61.8% ratio as follows:
Gold, prior analysis
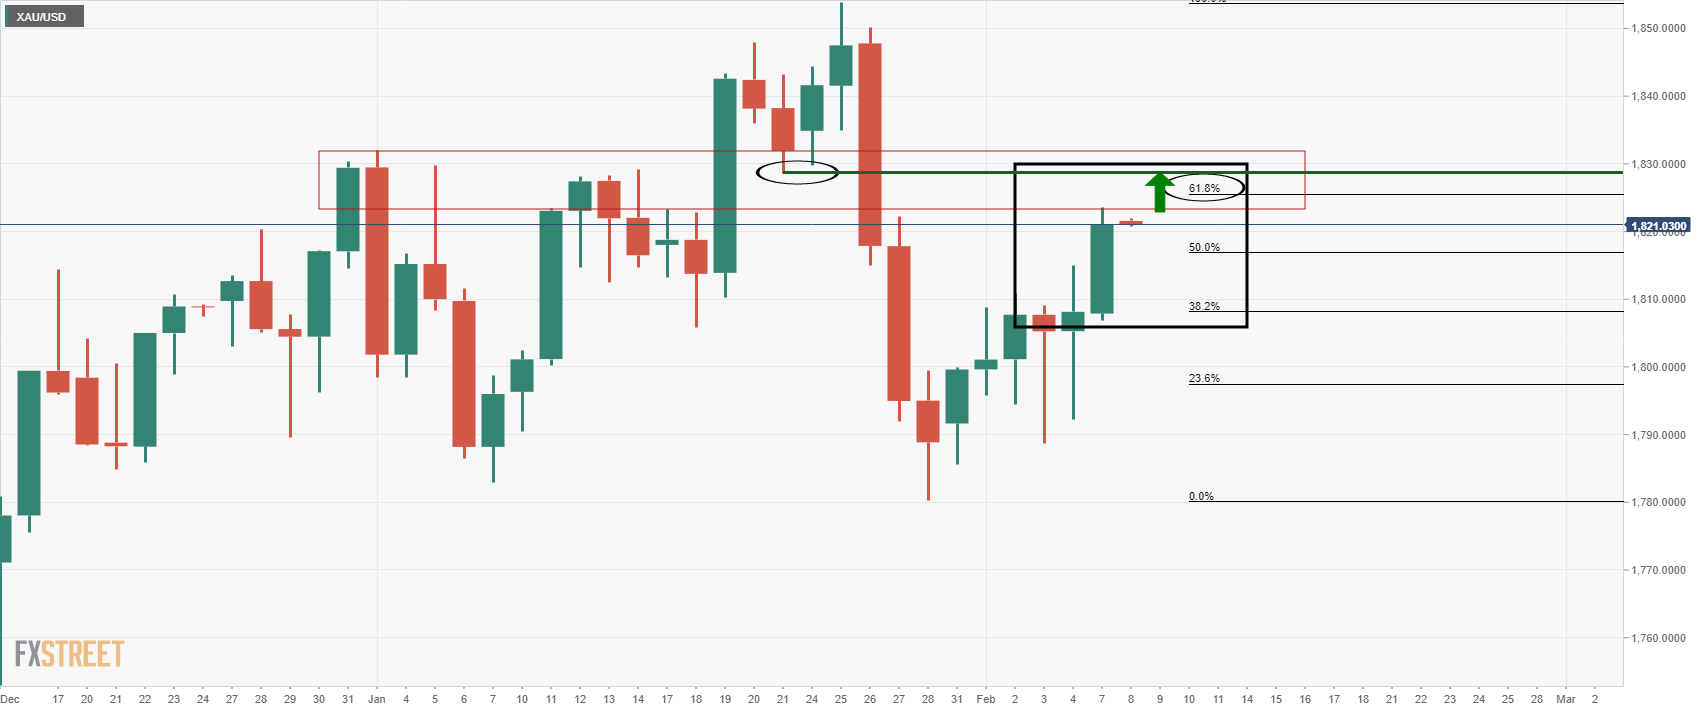
''While there are no direct confluences at a specific price target between the neckline of the M-formation and the 61.8% ratio, the area between the two mile-stones near $1,830 will be expected to offer firm resistance.''
Gold live market
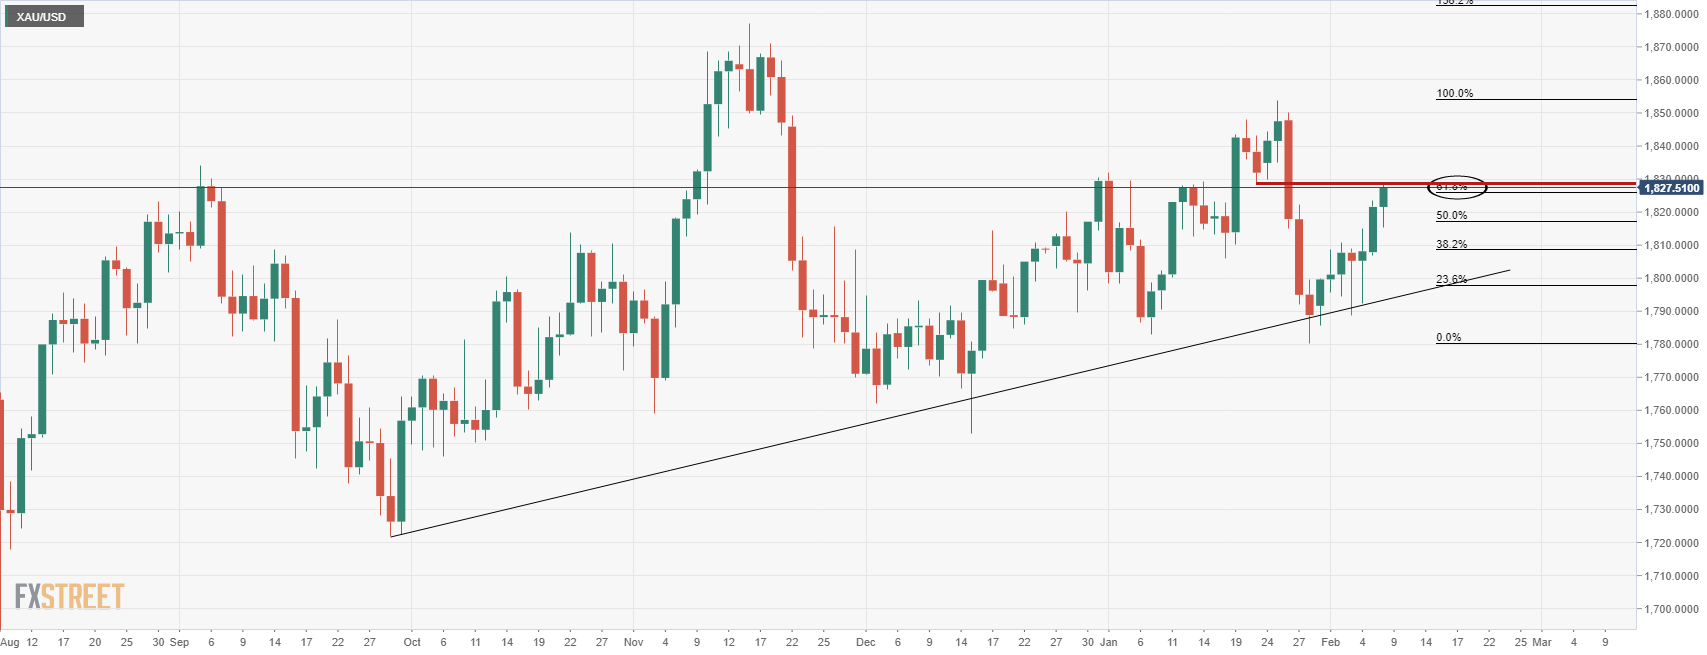
As illustrated, the bulls have moved in on the 61.8% ratio. What now?
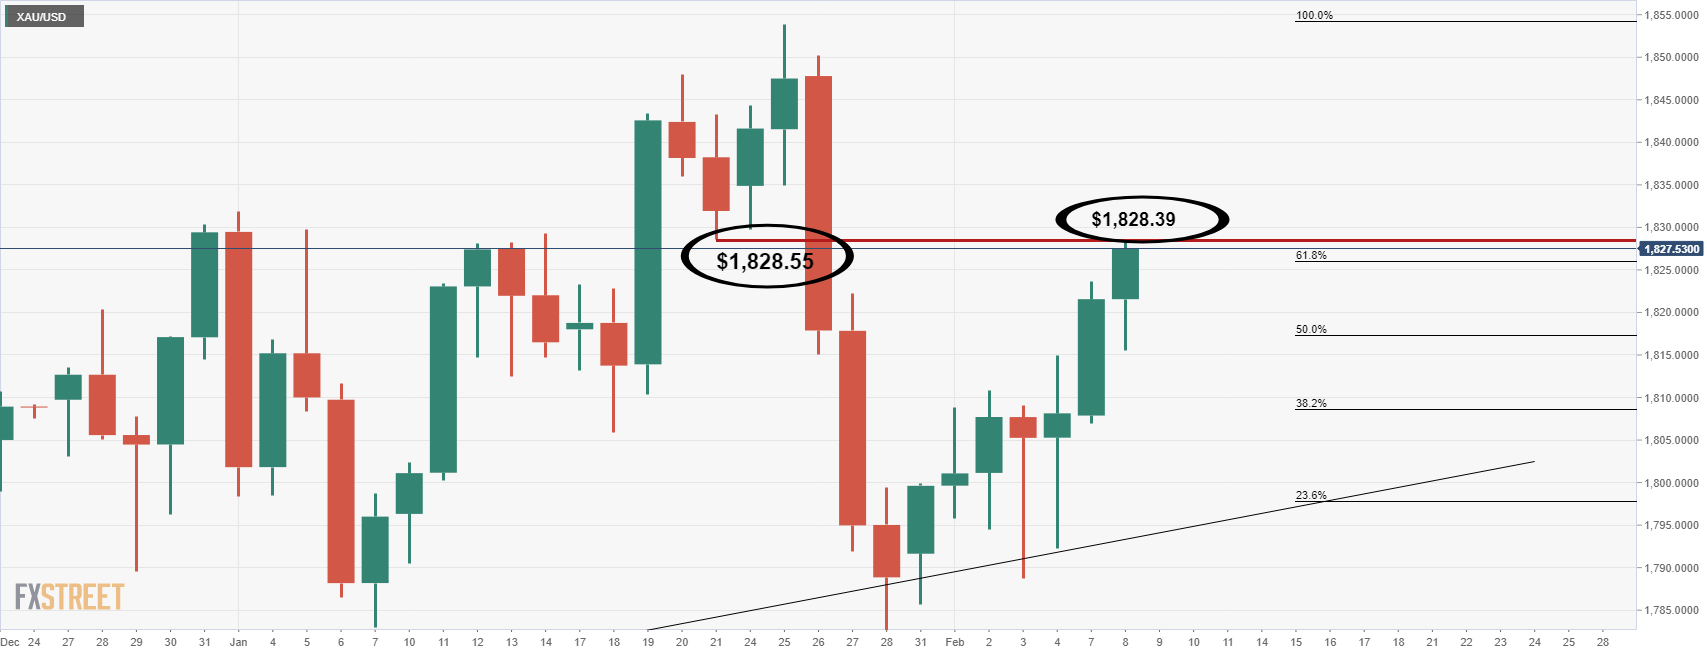
In the chart below, we see that the price has reached the neckline of the M-formation to the rounded down $1,828. This matters because this is an area of liquidity that could lead to supply entering the market which would typically cap the price. This leaves the focus on the downside which leaves the $1,811 vulnerable:
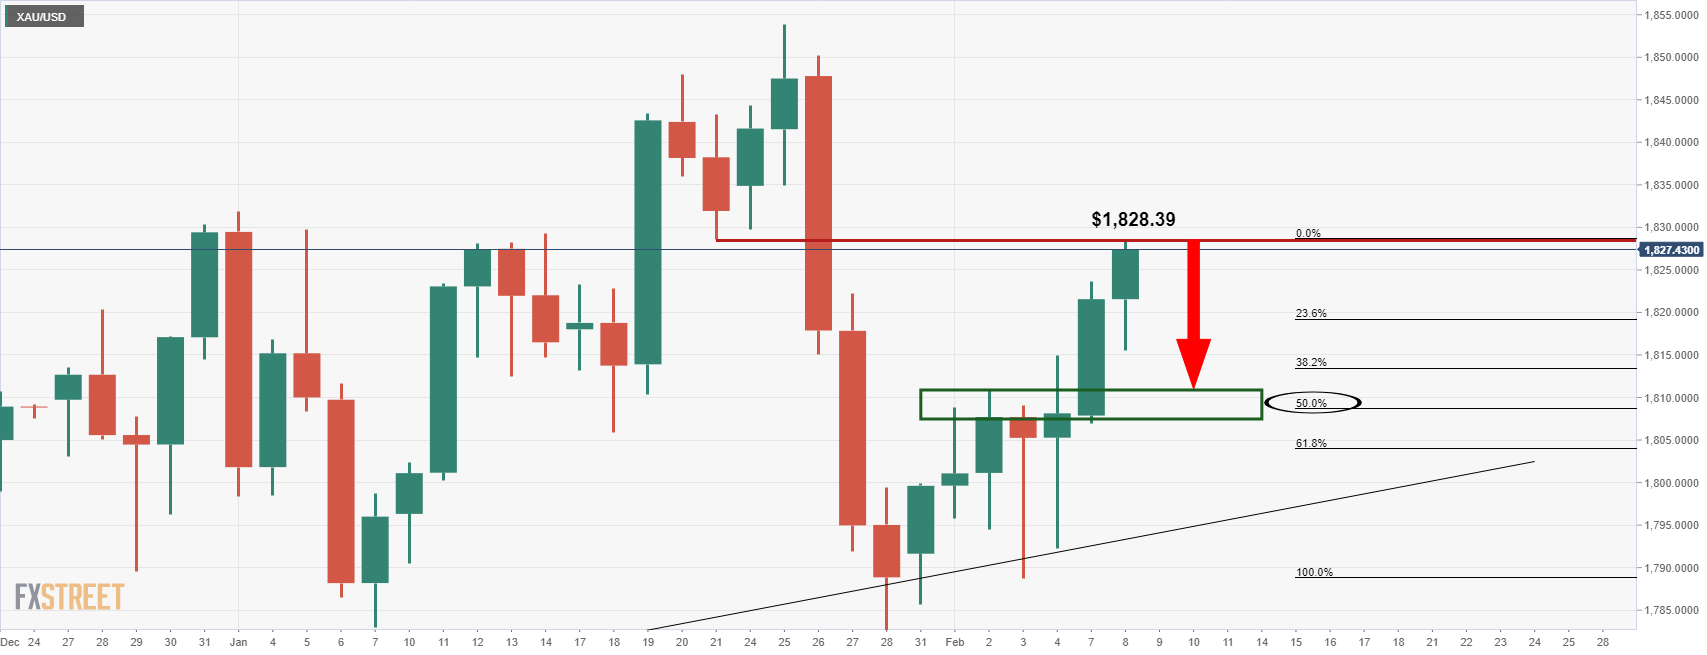
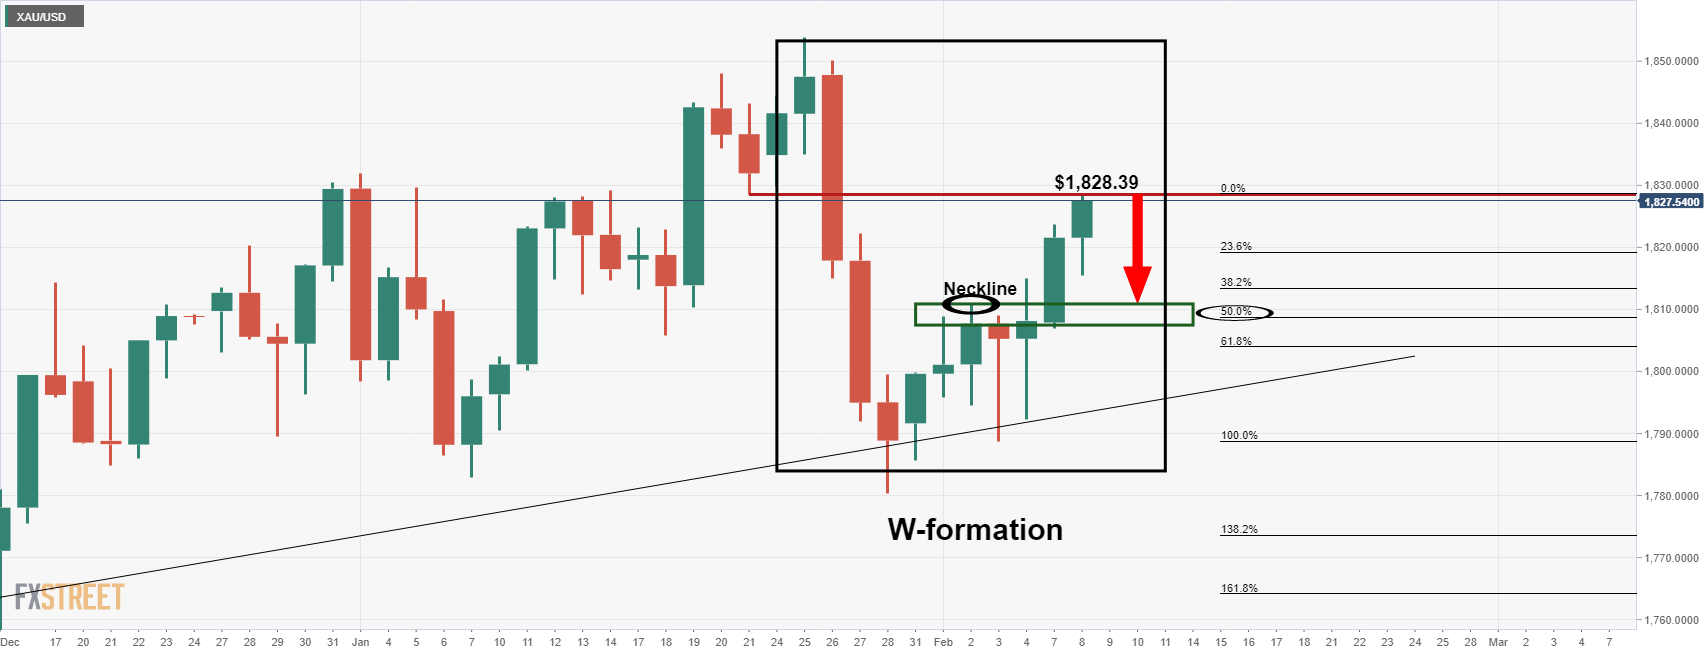
The W-formation's neckline aligns, albeit not perfectly to the US dollar, with a 50% mean reversion of the prior bullish impulse, so this is an ''area'' between $1,811 and $1,808 that the bears could be looking to target.
With all that being said, there is every possibility that the bulls will stay in control which exposes $1,850 on consecutive daily closes above the current highs. On the other hand, the bears will be monitoring for topping formations on both the daily and lower times frame charts at this juncture.
- GBP/JPY bulls break above 156.50, top of the 154.30-156.50 range.
- The market sentiment is upbeat, but the FX market is mixed.
- GBP/JPY Technical Outlook: A daily close above 156.50 would add upward pressure on the pair.
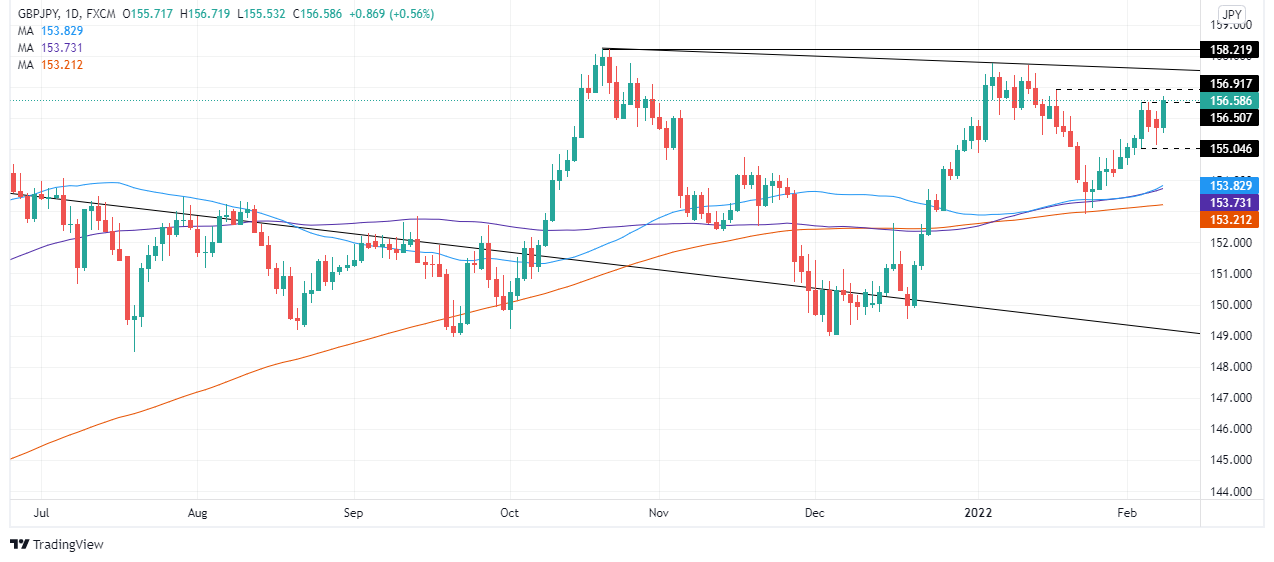
The GBP/JPY eyes to break the 154.30-156.50 range as risk-sentiment improves during the New York session. At the time of writing, the GBP/JPY is trading at 156.58.
In the FX complex, the market mood is mixed. Risk-sensitive currencies rise, led by the AUD, NZD, and GBP, while the safe-haven CHF and USD advance. In the case of the JPY is getting hammered throughout the session.
GBP/JPY Price Forecast: Technical outlook
The GBP/JPY broke above the top of the trading range during the session, but it would need a daily close above to cement its bullish case further. The daily moving averages reside well beneath the spot price, suggesting upward bias.
On Monday’s article, I noted that “GBP/JPY traders may wait on the sidelines, expecting a breakout of the 154.30-156.50 trading range.”
That said, the GBP/JPY first resistance would be January 18 daily high at 156.90. Once the level gives way, the next resistance would be the January 12 daily high at 157.70, followed by the November 2021 swing highs at 158.22.
On the flip side, the GBP/JPY first support would be 156.00. A breach of the latter would expose the February 7 daily low at 155.13, followed by February 3 155.04.
- S&P 500 rose back above 4500 on Tuesday but remains within recent ranges ahead of US CPI later this week.
- Any upside surprise could add further momentum to the recent rise in yields, potentially pressuring big tech/growth names.
The S&P 500 rose back above the 4500 level on Tuesday, up about 0.5% versus Monday’s close in the 4480s, though the index has remained well within the 4470-4540ish ranges that have prevailed since last Thursday. Market commentators cited underwhelming Q4 earnings results from Pfizer, whose year ahead forecast for vaccine and anti-viral pill sales disappointed, and pre-US Consumer Price Inflation data “jitters” as keeping equities locked within recent ranges.
Traders also noted further downside in Meta Platforms (Facebook) as weighing on broad market sentiment, with FB shares down another 1.0% to take losses since last week’s earnings to more than 30%. Billionaire investor Peter Thiel stepped down from the company's board, news which traders said weighed on the share price.
The Nasdaq 100 has seen similar trading conditions, undulating between the 14.5-14.8K levels for a fourth consecutive session. On Tuesday, the index trades about 0.9% higher around 14.7K. The Dow managed to push marginally above its last Friday/Monday ranges and is eyeing a retest of the 35.5K level, up about 0.8% on the day. The CBOE S&P 500 Volatility Index fell below the 22.00 level for the first time since last Wednesday.
Calm trading conditions reflect the fact that investors are nervous to place any big bets ahead of Thursday’s US inflation release, which has been billed as this week’s main event. The headline YoY rate should surpass 7.0% and the risk is that markets interpret this as increasing the likelihood that the Fed hikes rates by 50bps in March and embarks on more aggressive tightening throughout the duration of 2022.
Further Fed tightening bets could add further momentum to the move higher in long-term US bond yields, with the 10-year already nearing 2.0% for the first time since August 2019. This could weigh heavily on tech/growth names, much of whose valuation depends on expectations for future earnings growth rather than present earnings, thus leaving valuations vulnerable to a rise in opportunity cost (for which yields are a proxy).
Beyond March, analysts at Wells Fargo expect the European Central Bank (ECB) to start raising its Deposit Rate shortly after it completes its net bond purchases. They see an initial 25 bps Deposit Rate hike in December 2022 and another 25 bps hike in March 2023. They consider the divergence between the ECB and the Federal Reserve to weigh on EUR/USD over the medium-term.
Key Quotes:
“Beyond March (…), we expect the European Central Bank will take the opportunity to start moving its Deposit Rate away from negative territory by late 2022. Specifically, we now forecast an initial 25 bps Deposit Rate increase to -0.25% at the December 2022 announcement, with another 25 bps hike to 0.00% to follow at the March 2023 announcement. Beyond March next year, we expect the Eurozone economic environment will be one of moderate growth and slowing core CPI inflation, but perhaps still above 2% at that time. Accordingly, we expect the ECB will continue raising interest rates beyond March 2023, though at a reduced pace. Specifically, we also forecast 10 bps Deposit rate increases at each of the June 2023, September 2023 and December 2023 meetings, which would see the Deposit rate end next year at +0.30%.”
“Although we believe the ECB will adjust its interest rate stance more rapidly than we previously forecast, it will lag behind the pace of rate hikes from the Federal Reserve, and also fall slightly short of the pace of ECB rate hikes currently priced in by market participants. Accordingly, we still view this more timely path for ECB interest rate increases as consistent with moderate weakness in the EUR/USD exchange rate over the medium-term.”
- USD/MXN found support above 20.50 and also at the 20-day SMA.
- Bias skewed to the upside, limited at the moment by 20.70.
- Mexican peso to strengthen with a break under 20.50.
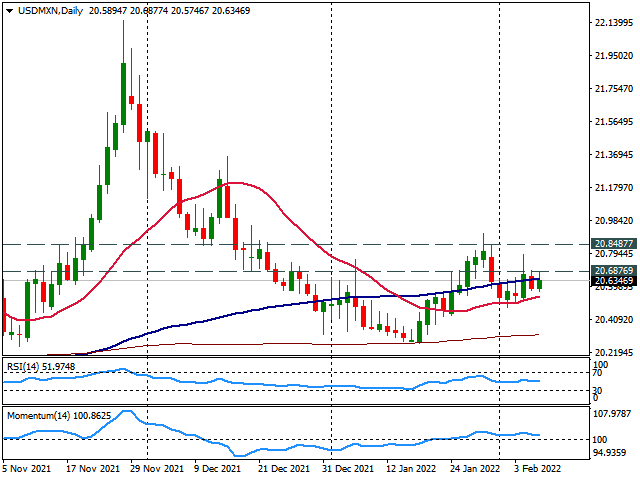
The USD/MXN is rising on Tuesday as it hovers around 20.60. During the last sessions, it has been consolidating after being unable to hold above 20.70.
The bias in the short-term term is biased to the upside but gains seem limited while under 20.70. A close above could open the doors to 20.85/90, the next resistance and last protection to 21.00.
The bullish tone will be negated with a decline under the 20.50/55 support area that contains a horizontal line and also the 20-day simple moving average. A break lower would target 20.40. The next support is seen at 20.35 and the 200-day moving average at 20.30.
USD/MXN daily chart
- The USD/JPY advances sharply during the day some 0.45%.
- A mixed market mood keeps investors uneasy amid global central banks tightening conditions.
- USD/JPY is upward biased as USD bulls get ready to test a 24-year-old downslope trendline.
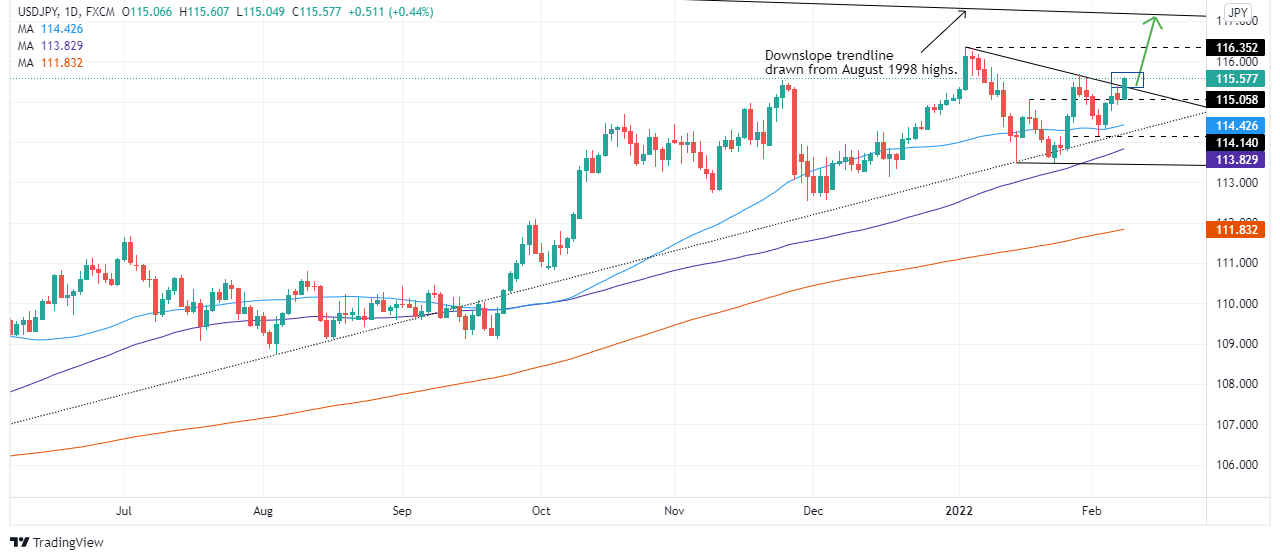
Tuesday’s price action of USD/JPY appears to be breaking a one-month-old downslope resistance trendline, drawn from January highs, which rejected Monday’s upward move, sending the pair towards its daily low under 115.00. At the time of writing, the USD/JPY is trading at 115.59.
The financial market’s mood seesaws as investors move in turbulent waters. Global central bank tightening monetary policy conditions and rising global bond yields keep market participants nervous.
US Treasury yields keep heading north as the New York session progresses. The US 10-year Treasury yield rises sharply and closes to the 1.97% threshold, weighing on the USD/JPY pair, which is closely correlated to it.
Analysts at Société Générale noted that “if we are going to see 10-year Note yields break 2% and the market price in a higher terminal Fed Funds rate (which seems highly likely) then USD/JPY 116 is going to break again and a move towards 120 will follow.”
USD/JPY Price Forecast: Technical outlook
The USD/JPT daily chart depicts the pair as upward biased. The daily moving averages (DMAs) reside well below the spot price, while the Relative Strength Index R(RSI=
The upward break mentioned in the first paragraph, confirmed by a daily close in those levels, would open the door for a test of the 2022 YTD high at 116.35. Breach of the latter could pave the way for further gains and expose a 24-year-old downslope trendline drawn from August 1998, swing highs which pass around 117.00. An upward break would expose the January 2017 swing high at 118.61.
- GBP/USD continues to trade in subdued fashion in fitting with the broader FX market feel in the 1.3550 area.
- A key fib retracement in the 1.3550s is capping the price action whilst 1.3500 is acting as support.
- FX markets are in wait-and-see mode ahead of this week’s US CPI report.
In fitting with the broadly subdued start to the week in global FX markets as traders await key US Consumer Price Inflation data that could influence Fed tightening expectations on Thursday, GBP/USD has remained contained in the 1.3550 area. Indeed, as was the case on Monday, the presence of the 50% Fibonacci retracement back from the 2022 high at 1.3750 to the 2022 low at 1.3350 in the 1.3550s is again capping the price action. Meanwhile, dips back towards 1.3500 continue to attract buying interest.
Last week’s hawkish BoE surprise, where four out of nine rate-setters voted for a larger 50bps hike (while the majority voted for a 25bps hike) has not given sterling lasting support. GBP/USD was unable to hold above 1.3600 in wake of the BoE’s meeting before then being knocked back into the low 1.3500s by a strong US labour market report that pumped Fed tightening bets.
Focus on the impending cost of living crisis in the UK is likely the main factor keeping sterling capped. Taxes and energy prices are set to rise in Q2 all while inflation continues to eat away at incomes, undermining expectations for how high the BoE’s terminal rate will eventually be. Bank of America said on Tuesday that its measure of UK household confidence in their personal finances fell to its lowest since the bank began its survey in 2017.
The failure to rally post-last week’s hawkish BoE surprise suggests downside risks for GBP/USD going forward, if the US dollar can recover from recent positioning-related weakness. A break below support at 1.3500 could open the door to a drop back towards 1.3400 and the next area of key support in the mid-1.3300s in the form of last month’s lows.
The 10-year US Treasury bond yields are about to break above 2.00%. In this case, the USD/JPY pair is set trend higher towards 116.00 ahead of 120.00 over the coming weeks, economists at Société Générale report.
The yen seems bound to remain cheap and get cheaper
“If we are going to see 10-year Note yields break 2% and the market price in a higher terminal Fed Funds rate (which seems highly likely) then USD/JPY 116 is going to break again and a move towards 120 will follow.”
“For now, and all the more so given the price of oil and other commodities, the yen seems bound to remain cheap and get cheaper. USD/JPY can trundle to 120 and interruptions on days of higher volatility are likely to be temporary.”
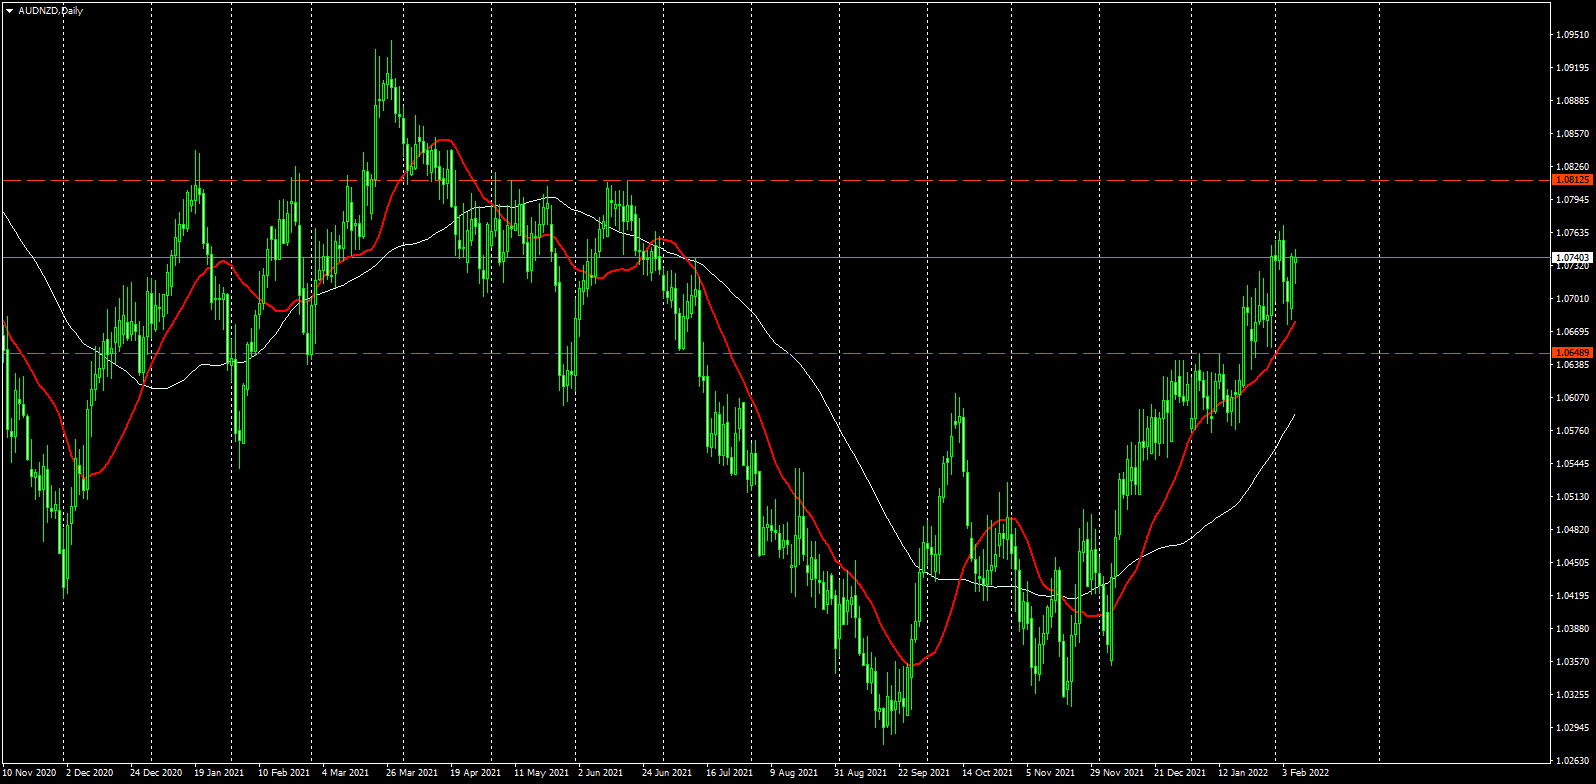
- The aussie holds a bullish bias virus the kiwi.
- The next target of AUD/NZD is seen at 1.0810 (May and June highs).
- Slide under 1.0650 to weaken the cross.
The AUD/NZD is rising modestly on Tuesday, as it continues to approach last week highs. The cross rebounded at the 20-day simple moving average an also before the 1.0650 critical support.
The main trend continues to point to the upside and no clear signs of a correction or a consolidation are seen at the moment. A firm break above 1.0750 would continue to keep the aussie on track for its next target at 1.0810. A break above 1.0820 on a daily close basis should point to more gains. If the cross fails to break soon above 1.0750, a correction seems likely.
On the flip side the firs support stands at the 20-day SMA at 1.0675. Below comes the 1.0645/50 zone, a close below should put the aussie under pressure and favor a decline under 1.0600. The next support stands a t 1.0570.
AUD/NZD daily chart
The tug of war between the Federal Reserve (Fed) and the European Central Bank (ECB) will be decisive for EUR/USD this year. Economists continue to expect renewed dollar strength in 202, but also expecting a repricing of the euro towards the end of the year and more sustained euro dominance next year.
The Fed to start on a quarterly hike path
“The Fed is set to hike rates four times this year by 25bp, starting in March, followed by further four hikes in 2023. A decision to allow the balance sheet to contract will be taken during the summer.”
“We expect the ECB to decide in March to stop net bond purchases around the end of August. 25bp rate hikes will follow in December 2022, March 2023 and September 2023.”
“EUR/USD is set to bottom at 1.10 later this year and climb to 1.18 by the end of next year.”
“Long bond yields are expected to climb further, but the curve to flatten from current levels by the end of the forecast horizon.”
- NZD/USD is consolidating under 0.6650 and well within recent intra-day ranges ahead of key US CPI data.
- A firmer-than-expected reading might trigger a further build-up of hawkish Fed bets, analysts have warned.
- In this case, NZD/USD bears would be eyeing tests of support at 0.6590 and 0.6530.
NZD/USD has continued its pattern of stabilisation within recent ranges on Tuesday, trading for the most part just under 0.6650 and well within last Friday’s 0.6670-0.6590ish ranges. Broader macro risk appetite has been fairly directionless since last Friday, making for subdued FX market trade, with the focus firmly on incoming US Consumer Price Inflation (CPI) figures on Thursday. A firmer-than-expected reading might trigger a further build-up of hawkish Fed bets, analysts have warned, which could weigh on crosses like NZD/USD.
Support in the form of last Friday’s post-strong US job report lows just under 0.6600 and last month’s multi-month lows in the 0.6530s are the most obvious levels of support being watched by the bears. In the scenario of a hot US CPI report, these may well be tested, but ahead of then, trading conditions are likely to remain subdued/rangebound. The kiwi is unlikely to get much domestic impetus, though Wednesday's quarterly inflation expectations release is worth watching in the context of an RBNZ that is expected to continue hiking rates aggressively this year.
To the upside, notable levels of resistance in the 0.6680s and then at 0.6700 are worth keeping an eye on. Even if Wednesday’s inflation data does boost hawkish RBNZ bets, it remains far to soon to say that NZD/USD has snapped its negative run over the past few months. While the pair is up more than 1.5% from the late January lows on US dollar profit-taking, it continues to trade about 8% below its Q4 2021 highs.
- During the North American session, silver grinds higher 0.54%.
- A mixed market mood keeps the greenback on the right foot, though it fails to weigh on the precious metals complex.
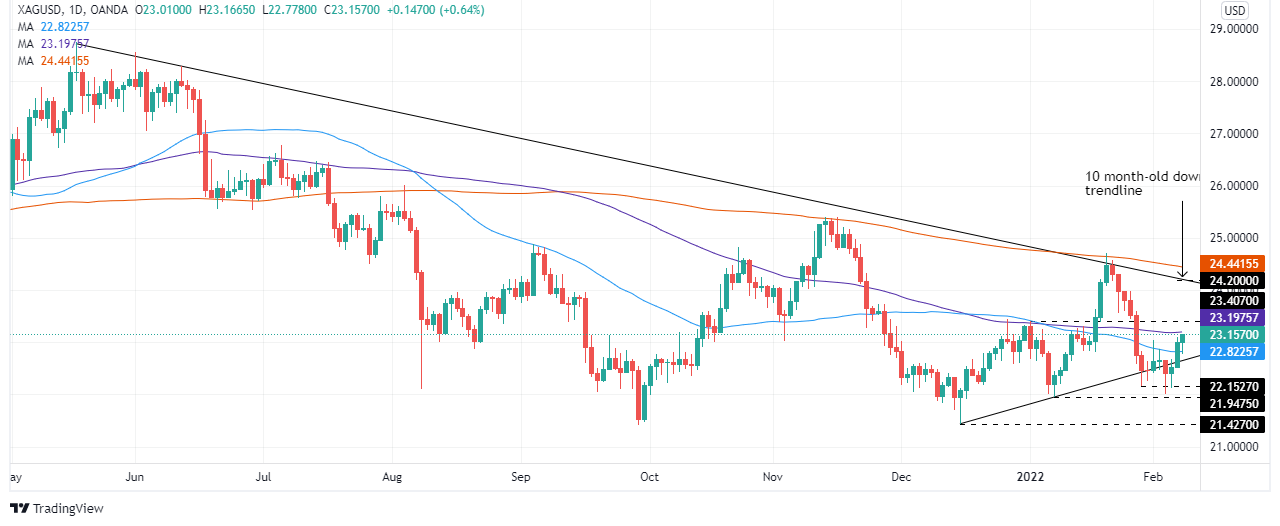
- XAG/USD daily close above $23.00 keeps silver neutral-bullish biased, as XAG buyers get ready to challenge the 100-DMA.
After Monday’s 2% rally, the white metal consolidated, though clinging to $23.00. At the time of writing, XAG/USD is trading at $23.12. So far in the week, silver is up close to 2%, but the upward move stalled ahead of challenging the 100-day moving average (DMA) at $23.19.
Overall, US dollar strength surrounds the financial markets, as shown by US Treasury yields. The US T-bond 10-year benchmark note is at 1.96%, rises four and a half basis points, a headwind for the non-yielding metal. Meanwhile, US 10-year TIPS yield, a proxy for real yields, climbs four basis points, up to -0.448%, weighing on the prices of precious metals.
In the meantime, the US Dollar Index, a gauge of the greenback’s value against a basket of peers, rises 0.22%, up at 95.61.
The lack of catalyst keeps investors focused on tightening monetary policy and inflation in the US central bank. On Thursday, the Labor Department will reveal the Consumer Price Index (CPI) for January, widely expected to rise to 7.3%, leaving December’s 7% behind. Excluding volatile items, like food and energy, the so-called Core-CPI is foreseen at 5.9%, both readings on an annual basis.
The US economic docket featured the Trade Balance for December, which came at $-80.7 B, better than the $-83 billion estimated. Exports increased $4 B more than the $224.7 B in December, while Imports also grew to $308.9 B, from $304 B.
XAG/USD Price Forecast: Technical outlook
On Monday, XAG/USD broke above the 50-day moving average (DMA), but it faced strong resistance at the $23.00 figure. Nevertheless, the rally broke four resistance levels on its way up, as XAG bulls get ready for a challenge of the 100-DMA at $23.19.
Silver is neutral-bullish biased. A breach of the 100-DMA could send the non-yielding metal upwards. The first resistance would be January 3 high at $23.40, followed by a tenth-month-old downslope trendline, around the $24.00-$24.20 range.
- USD/TRY extends the advance to the 13.70 region.
- News cited a positive meeting between finmin Nebati and investors.
- Turkey 10y reference bond yields hover around 21.50%.
The Turkish lira depreciates further and pushes USD/TRY to fresh multi-session peaks near 13.70 on Tuesday.
USD/TRY maintains its consolidation well in place
USD/TRY challenges the upper end of the range prevailing since mid-January around 13.70 amidst the firmer note in the US dollar and the persistent decline in yields of the Turkey 10y bond.
On the latter, yields navigate the area of monthly lows around 21.50% after climbing as high as the 22.40% zone at the beginning of February.
The lira, in the meantime, seems to have exacerbated the decline after inflation figures rose to 48.69% in the year to January, the highest level in the last 20 years.
On another front, the Turkish Current Account deficit is seen at around $15B in 2021 according to a Reuters poll released on Monday. The result, however, is lower than the government’s $21B estimated.
In the meantime, the meeting between finmin N.Nebati and investors in London appears to have yielded a positive outcome. At the meeting, the unorthodox Turkish economic policy and a planned bond sale took centre stage amidst recent data suggesting that Turkey’s FX reserves rose by $5-6B during last week. Nebati also suggested that the rise in inflation in the country follows reasons that foreigners cannot understand culturally. (wait… what?)
What to look for around TRY
The pair keeps the multi-session consolidative theme well in place, always within the 13.00-14.00 range. While skepticism keeps running high over the effectiveness of the ongoing scheme to promote the de-dollarization of the economy – thus supporting the inflows into the lira - the reluctance of the CBRT to change the (collision?) course and the omnipresent political pressure to favour lower interest rates in the current context of rampant inflation and (very) negative real interest rates are a sure recipe to keep the domestic currency under pressure for the time being.
Key events in Turkey this week: Unemployment Rate (Thursday) - End Year CPI Forecast, Current Account, Industrial Production, Retail Sales (Friday).
Eminent issues on the back boiler: Progress (or lack of it) of the government’s new scheme oriented to support the lira via protected time deposits. Constant government pressure on the CBRT vs. bank’s credibility/independence. Bouts of geopolitical concerns. Much-needed structural reforms. Growth outlook vs. progress of the coronavirus pandemic. Earlier Presidential/Parliamentary elections?
USD/TRY key levels
So far, the pair is advancing 0.44% at 13.6296 and a drop below 13.3226 (55-day SMA) would expose 13.2327 (monthly low Feb.1) and finally 12.7523 (2022 low Jan.3). On the other hand, the next up barrier lines up at 13.9319 (2022 high Jan.10) followed by 18.2582 (all-time high Dec.20) and then 19.0000 (round level).
GBP/USD has managed to bounce off the 1.3500/10 area again to a test of the mid-figure zone that is somewhat limiting upside. A berak above here would clear the path to enjoy further gains, econmists at Scotiabank report.
Support after 1.3490/00 is around 1.3475
“Cable’s rejection of the 1.35 area over the past three days points to a resumption of its gains since late-Jan, but it may have to break more firmly over 1.3550 to negate the downward pressure of the past few days.”
“After the mid-figure zone, ~1.3585 is resistance followed by the 1.36 area and then 1.3615/20.”
“Support after 1.3490/00 is ~1.3475 and the 1.3450 zone.”
EUR/USD has tested the 1.14 level as rate speculation cools. Economists at Scotiabank expect the pair to plummet towards 1.10 once it becomes clearer that the European Central Bank will only marginally hike in 2022.
Break under 1.14 to open up the 1.13 level
“We think the ECB is set to disappoint markets looking for 50bps in hikes this year, and we see EUR gains reversing toward 1.10 once it becomes clearer that the bank will only marginally hike in 2022 (if at all).”
“A clearer EUR decline under 1.14 would open the door to a sharp reversal of its Thursday jump that would set 1.13 in its sights. Intermediate support is ~1.1350 and ~1.1330.”
- WTI dipped on Tuesday amid profit-taking though has recovered from session lows near $89.00 back above the $90.00 level.
- Analysts cited chatter about a potential US/Iran deal on nuclear and French President Macron’s Moscow visit as weighing on prices.
Front-month WTI futures pulled back from close to seven-year highs on Tuesday, at one point dropping as low as the $89.00 per barrel mark, but subsequently recovering back to the north of the $90.00 handle. At current levels, WTI still trades lower by about $1.50 on the session, with traders citing profit-taking ahead of the resumption of indirect US/Iran talks regarding a potential return to the 2015 nuclear pact. Chatter has been building in recent days about what a deal might mean for oil markets.
A return to the old nuclear pact would see US sanctions on Iranian oil exports eased, allowing the country to release a glut of oil stores and increase exports by as much as 1M barrels per day (about 1% of global daily demand). But analysts caution oil traders not to get ahead of themselves in forecasting a breakthrough in talks, which have not yielded anything so far despite eight rounds of negotiations since April 2021.
Another factor weighing on oil markets, market analysts said on Tuesday, is modest dialing down of West/Russia tensions following French President Emmanuel Macron’s visit to Moscow on Monday. The French President said his meeting helped prevent further escalation of tensions, though no broader deal to end the Russia/Ukraine crisis was reached (as expected).
Ahead, oil traders will be keeping one eye on weekly US oil inventory figures, with the private API numbers out later on Tuesday ahead of the official US government figures on Wednesday. Analysts are estimating that inventories rose by 700K barrels in the week ending last Friday, a week when the US was hit by a strong winter storm.
- USD/CHF witnessed two-way price moves on Tuesday before stabilizing in the neutral territory.
- Elevated US bond yields acted as a tailwind for the USD and helped limit any meaningful slide.
- Signs of stability in the equity markets undermined the safe-haven CHF and extended support.
The USD/CHF pair seesawed between tepid gains/minor losses through the early North American session and was last seen trading in the neutral territory, just below mid-0.9200s.
Having climbed to a one-week high, the USD/CHF pair witnessed some intraday selling and touched a daily low, around the 0.9225 area during the latter part of the European session. However, a combination of factors acted as a tailwind and helped limit the downside. Signs of stability in the equity markets undermined the safe-haven Swiss franc and extended some support amid modest US dollar strength.
The greenback drew some support from a fresh leg up in the US Treasury bond yields, bolstered by the prospects for a faster policy tightening by the Fed. In fact, the markets have been pricing in the possibility of a 50 bps rate hike at the March FOMC meeting. This, in turn, pushed the yield on the benchmark 10-year US government bond back closer to the 2% threshold and benefitted the greenback.
That said, the USD/CHF pair, so far, has struggled to gain any meaningful traction as investors seemed reluctant to place aggressive bets ahead of Thursday's release of the US consumer inflation figures. The latest US CPI report could play a key role in determining the Fed's near-term policy outlook, which, in turn, will drive the USD demand and provide a fresh directional impetus to the USD/CHF pair.
In the meantime, the US bond yields will continue to influence the USD price dynamics and provide some impetus to the USD/CHF pair. Apart from this, traders will take cues from the broader market risk sentiment to grab some short-term opportunities amid absent relevant market moving economic releases from the US.
Technical levels to watch
The Federal Reserve (Fed) is hawkish and preparing to deploy monetary tightening tools through higher rates and balance sheet roll-off. This leaves scope for further gains in USD, economists at Citibank report.
More room for USD to gain
“We expect at least 4 Fed hikes in 2022 and 3 in 2023 with QT likely to begin in July 2022.”
“The bottom line is that a Fed which is removing liquidity versus an ECB/BoJ which are still adding liquidity is likely to keep USD elevated medium-term.”
EUR/USD has shied away from testing the 1.1485 area. Economists at Rabobank expect the pair to trade below this level but the shared currency could find support from the European Central Bank (ECB) hawkish tilt.
EUR/USD has the potential to end the year at a more robust level
“In the near-term, we see risk that EUR/USD continues to shy away from breaking about the 1.1485 area with the USD finding support from US inflationary fears.”
“The ECB’s tilt will have awakened EUR bulls and strengthened the view that EUR/USD has the potential to end the year at a more robust level.”
- Canada posted a surprise trade deficit of C$ 0.14B in December versus forecasts for a healthy C$ 2.5B surplus.
- The loonie did not see any reaction to the latest not as good as expected Canadian trade figures.
Canada posted a surprise trade deficit of C$ 0.14B in December against expectations for a trade surplus of C$ 2.5B, data from Statistics Canada showed on Tuesday. That marked a sharp decline from November's C$ 2.47B trade surplus. The surprise deficit was driven by a small decline in monthly exports to C$ 57.61B from C$ 58.15B the month prior, while monthly imports jumped to C$57.75B from C$55.68B the month prior.
Market Reaction
The loonie did not see any reaction to the latest not as good as expected Canadian trade figures.
- The US trade balance rose to $80.7B in December, a little less than expected.
- FX market did not see any reaction to the latest US trade data.
The US Goods and Services trade deficit rose to $80.7B in the month of December, a smaller than expected rise from $79.33B the month prior, according to data from the Bureau of Economic Analysis and the US Census Bureau on Tuesday. The trade deficit had been expected to rise to $83B. Exports rose to $228.10B in December from $224.7B the month prior, while imports rose to $308.9B from $304B the month prior. The US/China trade deficit widened to $36.15B from $32.32B in November.
Market Reaction
FX market did not see any reaction to the latest US trade data.
- EUR/USD adds to Monday’s weakness and retreats to 1.1400.
- The 5-month support line emerges around 1.1400.
EUR/USD accelerates the weekly leg lower and puts the 1.1400 yardstick to the test on Tuesday.
If the pair break below the 5-month line around the 1.1400 zone it could allow for the selling pressure to pick up pace and attempt a move to the temporary contention at the 55-day SMA at 1.1315. The breach of the latter exposes another visit to the 2022 low near 1.1120 (January 28).
While above this 5-month line, further upside in the pair remains likely in the near term at least. In the longer run, the negative outlook remains in place while below the key 200-day SMA at 1.1670.
- A goodish pickup in the USD demand prompted some selling around AUD/USD on Tuesday.
- Hawkish Fed expectations, elevated US bond yields continued acting as a tailwind for the USD.
- Signs of stability in the equity markets could help limit losses for the perceived riskier aussie.
The AUD/USD pair traded with a mild negative bias during the early North American session and was last seen hovering just a few pips above the daily low, around the 0.7115 area.
Having found some support ahead of the 0.7100 mark, the AUD/USD pair attracted some intraday buying on Tuesday, albeit struggled to capitalize on the move beyond the 0.7135-0.7140 region. Elevated US Treasury bond yields underpinned the US dollar, which, in turn, was seen as a key factor that acted as a headwind for the major.
In fact, the 2-year and 5-year US government bonds held steady near the highest level since February 2020 and July 2019, respectively, amid expectations for a faster policy tightening by the Fed. Adding to this, the yield on the benchmark 10-year note shot closer to the 2% threshold and provided an intraday lift to the buck.
It is worth mentioning that investors now seem convinced that the Fed will respond more aggressively to combat high inflation and have been pricing in a 50 bps rate hike in March. Hence, the market focus will remain glued to the release of the US CPI report on Thursday, which might influence the Fed's near-term policy outlook.
In the meantime, signs of stability in the equity markets might hold back traders from placing fresh bullish bets around the safe-haven buck. This, in turn, should lend some support to the perceived riskier aussie and help limit any meaningful slide for the AUD/USD pair amid absent market-moving economic data from the US.
Technical levels to watch
- Spot gold prices are consolidating in the $1820 area, just below earlier weekly highs, as focus turns to US CPI.
- US yields and the US dollar are a little higher this morning, weighing on XAU/USD a tad.
- But the spot metal continues to perform well on the week, as analysts cite ongoing geopolitical uncertainty as supportive.
Spot gold (XAU/USD) prices have come off the boil following Monday’s decent push higher and are for now consolidating in the $1820 area, down about 0.1% on the session, after topping out this week around $1823. US yields have turned higher again on Tuesday and the US dollar is gaining as the euro gives back some of last week’s post-hawkish ECB gains, which isnt helpful to the precious metal, though it still trades about 0.5% up on the week.
Gold’s resilience in recent weeks to higher US yields has baffled some. “"It's hard to say exactly why gold continues to see so much support” analysts at OANDA told Reuters. “The unstable environment in the markets may be feeding some of the safe-haven appeal,” they continued, adding “it's more likely to be inflation anxiety”. Others have cited the ongoing uncertain geopolitical backdrop as Russia continues to amass troops on its border to Ukraine.
Ahead, gold traders will be closely watching the release of US Consumer Price Inflation data for January this Thursday, which is expected to show the headline YoY rate rising to 7.3%, which would be the highest since 1982. Reuters says that a “robust inflation figure could increase pressure on the Fed for faster tightening and raise the opportunity cost of holding non-yielding bullion”.
- EUR/USD continues to ebb lower post-Lagarde’s more measures tone, though has found decent support at the 1.1400 level.
- Focus is on US CPI data on Thursday, which (if hot) could pump Fed tightening expectations, potentially weighing on EUR/USD.
EUR/USD has been trading with a negative bias in wake of Monday’s more measured remarks from ECB President Christine Lagarde that have taken the sting out of the hawkish repricing of ECB tightening expectations that boosted the euro last week. EUR/USD continues to ebb lower from last Friday’s multi-month highs in the 1.1480s and is down a further 0.2% on Tuesday to trade in near-1.1420, though the pair did find decent support at the 1.1400 level.
For reference, Lagarde on Monday said that while the current outlook did warrant policy normalisation with inflation expected to remain stable around 2.0% in the medium-term, there is no need for major policy tightening. Other ECB members have sung a similar tune, with ECB governing council member Pablo Hernandez de Cos on Tuesday saying that any ECB move “has to be gradual”.
Looking ahead, EUR/USD should be wary of US Goods Trade Balance figures out at 1330GMT on Tuesday. However, the massive and seemingly ever-expanding US trade deficit has in recent years played second fiddle to central bank policy divergence (Fed vs rest of G10) as an FX market/USD driver. The main US data focus this week is Consumer Price Inflation data out on Thursday, which analysts say could increase pressure on the Fed to tighten monetary policy at a faster rate.
If that were to be the case, that could boost the dollar versus the euro and risks sending EUR/USD back under 1.1400. Indeed, whilst markets are now pricing more ECB tightening in 2022 (about 50bps) than this time last week, that is still substantially less tightening than is expected from the Fed (well over 100bps). EUR/USD failure to break convincingly above January’s highs in the upper 1.1400s and subsequent double top formation thus may prove a bearish near-term signal.
Economist at UOB Group Barnabas Gan assesses the latest Retail Sales figures in Singapore.
Key Takeaways
“Singapore’s retail sales surged 6.7% y/y (+2.3% m/m sa) in Dec 2021, surprising market estimates for a milder growth of 4.6%. Accounting for the latest data, Singapore’s retail sales rose 11.1% for the whole of 2021.”
“The retail sales index was supported by strong receipts in both durable and consumer discretionary expenditure. Notably, online retail sales in value terms rose to its highest since Dec 2017, while the return of tourism-related demand could have supported overall retail sales as well.”
“The continued expansion Dec’s retail sales point towards a resilient recovery environment for Singapore’s retail sector. For 2022, retail sales performance will depend on the recovery of Singapore’s domestic economy and the gradual reopening of its borders. Barring the exacerbation of COVID-19-related risks in Singapore and around the region, we pencil retail sales to expand by 6.0% in 2022.”
- USD/CAD regained positive traction on Tuesday and was supported by a combination of factors.
- Retreating oil prices undermined the loonie and extended support amid modest USD strength.
- The mixed fundamental backdrop might cap any further gains ahead of the US CPI on Thursday.
The USD/CAD pair maintained its bid tone heading into the North American session and was last seen trading near the daily high, just above the 1.2700 mark.
A combination of factors assisted the USD/CAD pair to catch fresh bids on Tuesday and recover a part of the overnight losses back closer to the 1.2450 support zone. Crude oil prices pulled away from the seven-year high touched last Friday and undermined the commodity-linked loonie. Apart from this, modest US dollar strength acted as a tailwind for the major.
Expectations that the revival of the 2015 international nuclear agreement could return more than 1 million barrels per day of Iranian oil – equating to more than 1% of global supply – in the markets. This, in turn, prompted traders to lighten their bullish bets ahead of the indirect talks between the United States and Iran, due to resume in Vienna on Tuesday.
On the other hand, the greenback drew some support from a fresh leg up in the US Treasury bond yields, bolstered by speculations for a faster policy tightening by the Fed. In fact, the markets have been pricing in the possibility of a full 50 bps rate hike at the March FOMC meeting amid worries about stubbornly high inflationary pressures.
This, in turn, pushed the yield on the benchmark 10-year US government bond well within the striking distance of the 2.0% threshold. Adding to this, the 2-year and 5-year notes – which are highly sensitive to rate hike expectations – held steady near the highest level since February 2020 and July 2019, respectively, and underpinned the greenback.
Hence, the market focus will remain glued to the release of the US consumer inflation figures on Thursday. The US CPI report will determine the Fed's near-term policy outlook and help determine the next leg of a directional move for the USD/CAD pair. In the meantime, traders might prefer to wait on the sidelines and refrain from placing aggressive bets.
Moreover, hopes that global supply would remain tight amid the post-pandemic recovery in fuel demand, along with the conflict between Russia and the West over Ukraine should limit losses for oil prices. This, in turn, should lend some support to the Canadian dollar and further contribute to capping the USD/CAD pair amid absent market-moving economic data.
Technical levels to watch
- DXY meets decent resistance around 95.70 on Tuesday.
- Another drop to the YTD low near 94.60 is not ruled out.
DXY leaves behind Monday’s downtick and resumes the upside, although the 95.70 region has emerged as quite a decent hurdle so far.
The inability of the index to resume the upside on a sustainable note could prompt sellers to return to the market. That scenario should expose the dollar to retest the so far monthly low at 95.13 (February 4). The loss of this level could motivate the 2022 low at 94.62 (January 14) to start emerging on the horizon.
In the near term, the 5-month line near 95.10 is expected to hold the downside for the time being. Looking at the broader picture, the longer-term positive stance in the dollar remains unchanged above the 200-day SMA at 93.52.
Economist at UOB Group Ho Woei Chen, CFA, reviews the latest inflation results in South Korea.
Key Takeaways
“South Korea’s headline and core inflation were both above expectations in Jan. Although the headline inflation is expected to moderate due to a high comparison base, it will likely fall within the BOK’s 2% target only in 4Q22. We expect inflation to average 2.6% in 2022, exceeding the decade-high of 2.5% in 2021.”
“We still foresee another 50bps interest rate hike to 1.75% by end-2022, likely by 25 bps each in 2Q and 3Q.”
“Resilient external demand continued to buoy the outlook for South Korea’s manufacturing and exports, consistent with gains in raw materials and intermediate goods imports as well as further improvement in Markit South Korea manufacturing PMI to 6-month high of 52.8 in Jan from 51.9 in Dec.”
“Thus far, the impact of the extended social curbs has been relatively muted as consumer confidence rebounded in Jan.”
- EUR/JPY resumes the upside following Monday’s pullback.
- Immediate to the upside comes the 2022 high at 132.16.
EUR/JPY came under some selling pressure following new YTD highs past 132.00 the figure at the beginning of the week.
In light of the recent price action, further gains in the cross look likely in the short-term horizon. That said, the surpass of the YTD high at 132.16 (February 7) should open the door to 132.53 (high November 4) seconded by 132.91 (high October 29) and finally the October 2021 peak at 133.48 (October 20).
In the near term, further upside remains on the table while above the 3-month support line, today around 130.80. In the longer run, and while above the 200-day SMA at 1304645, the outlook for the cross is expected to remain constructive.
- A combination of supporting factors pushed USD/JPY to over a one-week high on Tuesday.
- A fresh leg up in the US bond yields boosted the USD and provided a goodish lift to the pair.
- Widening of the US-Japan yield spread, a positive risk tone undermined the safe-haven JPY.
The USD/JPY pair trimmed a part of its intraday gains and was last seen trading around the 115.30 region, still up over 0.15% for the day.
Following the overnight downtick, the USD/JPY pair caught fresh bids and shot to over a one-week high during the early part of the trading on Tuesday. This marked the third day of a positive move in the previous four and was sponsored by a combination of factors – a goodish pickup in the US dollar demand and a fresh leg up in the US Treasury bond yields.
Investors now seem convinced that the Fed will tighten its monetary policy at a faster pace and have been pricing in the possibility of a 50 bps rate hike in March. The market bets were reaffirmed by Friday's mostly upbeat US monthly employment details, which pointed to the underlying strength in the labour market that should support the economic growth.
This was reinforced by the fact that the yield on the 2-year and 5-year US government bonds – which are sensitive to rate hike expectations – shot to the highest level since February 2020 and July 2019, respectively. Adding to this, the benchmark 10-year bond yield jumped closer to the 2.0% threshold, widening the US-Japanese government bond yield spread.
The Bank of Japan is expected to step in to defend its 0% target for the 10-year JGB, which remains within the implicit 50 bps band set as part of an ultra-easy monetary policy. This, along with a positive tone around the equity markets, undermined the safe-haven Japanese yen and should continue to act as a tailwind for the USD/JPY pair, at least for now.
The fundamental backdrop seems tilted firmly in favour of bullish traders and supports prospects for a further near-term appreciating move for the USD/JPY pair. That said, traders seemed reluctant to place aggressive bets ahead of Thursday's release of the US inflation figures. This, in turn, seemed to be the only factor that capped the upside for the major.
There isn't any major market-moving economic data due for release from the US on Tuesday, leaving the USD at the mercy of the USD price dynamics. Apart from this, traders will take cues from the broader market risk sentiment to grab some short-term opportunities around the USD/JPY pair.
Technical levels to watch
Senior Economist at UOB Group Alvin Liew comments on the recently published US Nonfarm Payrolls for the month of January.
Key Takeaways
“There were two major upside surprises in the Jan 2022 US employment report: employment gain of 467,000 and a wage spike of 5.7% y/y, both well above market expectations.”
“However, unemployment rate edged up to 4% in Jan (Dec: 3.9%) as labor force participation rate rose by 0.3ppts to 62.2%.”
“The jobs market continued to make rapid improvements with a strong start to 2022 despite the wave of Omicron-variant infections, but the strong wage growth reflected the difficulties of hiring and inflation worries.”
- GBP/USD attracted some dip-buying on Tuesday, though lacked strong follow-through.
- Rising US bond yields provided a strong lift to the USD and capped any further upside.
- Fresh tensions over the NI protocol also acted as a headwind for sterling and the major.
The GBP/USD pair rallied nearly 50 pips from the early European session low and shot to a fresh daily high, around mid-1.3500s in the last hour.
The pair attracted some dip-buying in the vicinity of the key 1.3500 psychological mark on Tuesday and is now looking to build on the overnight bounce from a four-day low. The uptick lacked any obvious fundamental catalyst and runs the risk of fizzling out rather quickly amid a goodish pickup in the US dollar demand.
Expectations that the Fed would tighten its policy at a faster pace triggered a fresh leg up in the US Treasury bond yields and underpinned the greenback. In fact, the markets are pricing in a 50 bps rate hike in March, which, in turn, pushed the yield on the benchmark 10-year US government bond closer to the 2.0% threshold.
Moreover, the yield on the 2-year and 5-year notes – which are sensitive to rate hike expectations – jumped to the highest level since February 2020 and July 2019, respectively. That said, a recovery in the risk sentiment – as depicted by a positive tone around the equity markets – capped gains for the safe-haven USD.
On the other hand, tensions over the Northern Ireland protocol of the Brexit agreement could undermine sterling and keep a lid on any further upside for the GBP/USD pair. In the recent development, a German official said on Thursday that Britain should respect post-Brexit trade rules or else face consequences.
Hence, it will be prudent to wait for a strong follow-through buying before positioning for any meaningful gains amid absent relevant market-moving economic releases, either from the UK or the US. Investors might also refrain from placing aggressive bets ahead of Thursday's US CPI report and key UK macro data on Friday.
Technical levels to watch
Russia and France failed to strike a deal at this stage but French President Emmanuel Macron's proposals for de-escalating tensions contained rational grains that can be the basis for further work, a Kremlin spokesperson said on Tuesday, per Reuters.
Additional takeaways
"Russian forces will return to their bases in Russia after Belarus drills."
"Putin did not give Macron a precise date for when Russian forces would leave Belarus after drills."
"Media reports that Putin promised Macron not to carry out new military initiatives near Ukraine are not right."
"A lot will depend on how Macron's talk with Ukraine and NATO goes."
"De-escalation around Ukraine is needed."
Market reaction
These comments don't seem to be having a significant impact on risk sentiment. As of writing, the S&P Futures were trading flat on the day.
In 2021, the prices of all commodities rose sharply: energy, metals and food, construction materials, etc. Analysts at Natixis see four likely lasting causes of the rise in commodity prices.
What accounts for the pressures in commodity markets?
“The shift in the structure of demand of course entails higher consumption of energy and other commodities. It results from working from home, the development of e-commerce and the production of equipment for the energy transition.”
“The problem that arises is that if the energy transition strategy leads to a faster reduction in the supply of fossil fuels than the reduction in demand for fossil fuels, then fossil fuel prices will remain very high.”
“The energy transition will lead to a considerable increase in demand for the necessary raw materials, such as copper and nickel for electrical grids, and nickel, lithium and copper for electric batteries. There is talk of a 40-fold increase in global consumption of lithium and cobalt in 20 years.”
“The abundance of global liquidity is conducive to speculative position taking in commodities.”
- AUD/USD attracted dip-buying near the 0.7100 mark on Tuesday, though lacked any follow-through.
- A recovery in the risk sentiment was seen as a key factor that benefitted the perceived riskier aussie.
- A fresh leg up in the US bond yields boosted the USD and might keep a lid on any meaningful gains.
The AUD/USD pair seesawed between tepid gains/minor losses through the early European session and was last seen trading in the neutral territory, around the 0.7130 region.
Following the previous day's brief pause, the US dollar was back in demand on Tuesday and is now looking to build on the post-NFP recovery from a two-and-half week low. This, in turn, was seen as a key factor that prompted some intraday selling around the AUD/USD pair, though the early downtick found support ahead of the 0.7100 mark.
The USD drew support from a fresh leg up in the US Treasury bond yields, bolstered by the prospects for a faster policy tightening by the Fed. In fact, the markets have been pricing in the possibility of a full 50 bps rate hike at the March FOMC policy meeting, which, in turn, pushed the US bond yields higher and underpinned the greenback.
That said, a recovery in the global risk sentiment – as depicted by a positive tone around the equity markets – extended some support to the perceived riskier aussie. Traders also seemed reluctant to place aggressive bets and might prefer to wait on the sidelines ahead of Thursday's release of the latest US consumer inflation figures.
In the meantime, the US bond yields will continue to play a key role in influencing the USD price dynamics amid absent relevant market moving economic releases. This, along with the broader market risk sentiment, could provide some impetus to the AUD/USD pair and allow traders to grab some short-term opportunities.
Technical levels to watch
European Central Bank (ECB) Governing Council member and Spanish central bank chief Pablo Hernandez de Cos said Tuesday, “risks to inflation are tilted to the upside in the short term.”
Additional comments
Recent data on inflation has shown surprising upwards trends both in inflation and core inflation.
Level of uncertainty around inflation is very high also due to geopolitical risks.
More than ever it is necessary to keep all options open on monetary policy.
We stick to our sequencing starting first with first tapering.
Next move on monetary policy is clear but will be gradual and depend on data.
- Gold price retreats from weekly highs as firmer Treasury yields lift the USD.
- Hawkish Fed expectations limit gold’s upside despite inflation worries.
- Gold bulls have the upper hand, $1,810 confluence holds the key.
Gold price is on the back foot on Tuesday after witnessing back-to-back rallies following the stunning US employment data. The renewed uptick in the US Treasury yields is boosting the demand for the greenback across the board, weighing on the non-yielding gold. Although looming US-Russian tensions over Ukraine and Sino-American tensions could help put a floor under the bright metal. Looking ahead, attention remains on the US inflation data due for release later this week for fresh insights on Fed’s tightening plans.
Read: Gold back to inflection point
Gold Price: Key levels to watch
The Technical Confluences Detector shows that the gold price retracement is challenging the critical support area near $1,818, where the Fibonacci 38.2% one-day converges with the SMA100 four-hour.
If that support is breached then sellers will aim for the previous week’s high at $1,815.
The pivot point one-day S1 at $1,811 will come to the rescue of bulls should the pullback extend in gold price.
The last resort for buyers is seen at $1,809, strong support comprising of the Fibonacci 23.6% one-week, Fibonacci 38.2% one-month and SMA5 one-day.
On the flip side, immediate upside needs validation above the confluence of the pivot point one-week R1 and Fibonacci 23.6% one-day at $1,821.
The next critical resistance is placed at the weekly highs of $1,824, above which the Fibonacci 61.8% one-month at $1,826 could be tested.
A fresh upswing will kick in above the latter, opening doors towards $1,830 – pivot point one-day R1.
Here is how it looks on the tool
About Technical Confluences Detector
The TCD (Technical Confluences Detector) is a tool to locate and point out those price levels where there is a congestion of indicators, moving averages, Fibonacci levels, Pivot Points, etc. If you are a short-term trader, you will find entry points for counter-trend strategies and hunt a few points at a time. If you are a medium-to-long-term trader, this tool will allow you to know in advance the price levels where a medium-to-long-term trend may stop and rest, where to unwind positions, or where to increase your position size.
GBP/USD has been moving in a tight channel since the beginning of the week. As FXStreet’s Eren Sengezer notes, the pair needs to move out of the 1.3500-1.3560 band to determine its next direction.
Sellers to take action in case 1.3500 support fails
“On the downside, 1.3520 (Fibonacci 38.2% retracement level of the latest uptrend) aligns as interim support before 1.3500 (psychological level, 50-period SMA, Fibonacci 50% retracement). In case a four-hour candle closes below the latter, cable could stretch lower toward 1.3460 (Fibonacci 61.8% retracement).”
“In order to regain its bullish momentum and target 1.3600 (psychological level), GBP/USD needs to rise above 1.3560 (Fibonacci 23.6% retracement) and starts using that level as support.”
UOB Group’s Senior Economist Julia Goh and Economist Loke Siew Ting assess the latest inflation figures in the Philippines.
Key Takeaways
“Following rebasing exercise to 2018, the Philippines’ headline inflation eased to a 14-month low of 3.0% y/y in Jan, from a downwardly revised 3.2% in Dec 2021 (previous: 3.6%). It came in line with our estimate (3.1%) but higher than Bloomberg consensus (2.8%).”
“Despite the adoption of the 2018 base year resulting in a significant easing of the full-year inflation rate since 2019, upside risks to inflation remain from prolonged global supply chain bottlenecks, elevated global oil prices, expected currency weakness, adverse weather, petitions for transport fare hikes, and expiry of tariffs on pork imports. We continue to expect inflation to stay above the mid-point of BSP’s 2.0%-4.0% target range for the greater part of the year, bringing the 2022 full-year inflation rate to 3.5% (2021: revised down to 3.9% from 4.5% previously).”
“With inflation expected to stay within BSP’s target range through 2022 and the growth outlook still subject to downside risks, we believe that BSP will continue to keep a patient hand on its policy levers in 1H22. The Monetary Board will meet for the first time this year on 17 Feb to assess its monetary policy stance.”
- EUR/USD comes under extra pressure near 1.1400.
- Higher US yields sustain the recovery in the US dollar.
- Yields of the German 10y Bund recede from recent tops.
The single currency extends the weekly leg lower and now drags EUR/USD to the 1.1400 neighbourhood on turnaround Tuesday.
EUR/USD remains capped by 1.1480
EUR/USD extends the pessimism witnessed at the beginning of the trading week and now put the 1.1400 level to the test amidst the moderate recovery in the sentiment surrounding the US dollar.
Indeed, US yields keep marching higher and navigate in the upper end of the recent range, as market participants continue to favour a more aggressive Fed’s tightening vs. the ECB, all following the latest US Payrolls results and the hawkish tilt at the ECB event.
In the German cash markets, yields of the 10y benchmark Bund now shed some ground after hitting fresh tops around 0.25% for the first time since January 2019. The drop in spot is reflected by the pick-up in the US-German yield spread to past the 170 pts following recent 3-month lows around 167 pts (February 4).
Nothing worth mentioning data wise in the euro area on Tuesday, while trade balance figures and the IBD/TIPP Index and the NFIB Index are all due across the pond.
What to look for around EUR
EUR/USD now faces some downside pressure following recent peaks close to 1.1500 the figure. The optimism around spot seems threatened by the recovery in the greenback, which has particularly regained traction after US Nonfarm Payrolls surprised to the upside in January. The now improved outlook in the pair looks bolstered by prospects of a potential interest rate hike by the ECB at some point by year end, higher German yields, elevated inflation in the region and a decent pace of the rebound in the economic activity and other key fundamentals.
Key events in the euro area this week: Germany Balance of Trade (Wednesday) - Germany Final January CPI (Friday).
Eminent issues on the back boiler: Asymmetric economic recovery post-pandemic in the euro area. Speculation of ECB tightening/tapering later in the year. Presidential elections in France in April. Geopolitical concerns from the Russia-Ukraine conflict.
EUR/USD levels to watch
So far, spot is retreating 0.32% at 1.1405 and faces the next up barrier at 1.1483 (2022 high Feb.4) followed by 1.1496 (200-week SMA) and finally 1.1670 (200-day SMA). On the other hand, a break below 1.1315 (55-day SMA) would target 1.1121 (2022 low Jan.28) en route to 1.1100 (round level).
USD/MXN recently reached the 200-day moving average (DMA) near 20.25/20.10 which is a crucial support zone. Economists at Société Générale expect the pair to rebound from here and head towards 21.00.
USD/MXN to extend its slide on removal of 20.25/20.10
“A short-term bounce is likely towards 21.00 and 21.35/21.44, the 61.8% retracement of the down move.”
“Only if 20.25/20.10 breaks will there be a risk for extended down move.”
The up move on the EUR/SEK pair should persist towards September 2020 levels of 10.66/10.68, in the opinion of economists at Société Générale.
Critical support lacated at 10.20
“EUR/SEK looks poised to head higher towards September 2020 levels of 10.66/10.68.”
“Lower band of the pattern at 10.20 is crucial support.”
As in 2021, the Canadian dollar remains range-bound against a strong greenback. Economists at the Bank of Montreal expect the USD/CAD to edge lower towards 1.2350 by end-2022.
Elevated commodity prices to underpin the loonie
“Support from surging oil prices and the first string of current account surpluses in 13 years has been offset by the chance of the Fed outrunning the Bank of Canada to catch up with higher U.S. inflation.”
“We look for the loonie to appreciate moderately to US$0.81 (C$1.235) by year-end, supported by elevated commodity prices.”
See: USD/CAD to tank towards 1.20 as BoC outpace the Fed hiking rates – NBF
EUR/CHF has staged a sharp rebound from 1.0300. Analysts at Société Générale expect the pair to challenge the 200-day moving average (DMA) at 1.07 as support at 1.0420 holds.
Short-term support located at 1.0420
“1.0420, the 61.8% retracement of recent bounce is short-term support.”
“Defending the 1.0420 mark, the pair could revisit 200-DMA at 1.0700.”
India’s Monetary Policy Committee (MPC) meeting has been scheduled by a day to February 8-10. Here are the expectations as forecast by the economists and researchers of five major banks regarding the upcoming central bank's decision.
The Reserve Bank of India (RBI) is expected to hold its repo rate steady but several economists are expecting an increase in the reverse repo rate.
ING
“Though they are not expected to raise the policy repo rate (4.0% currently), there is an outside chance that they do. The latest Union Budget released was quite expansionary, and bond spreads widened out on the back of it. Throw in some toppy inflation numbers and a decent growth backdrop and it is clear that we are nearing a rate hike – if not this month, then soon. The RBI already raised the cash reserve ratio last year, and it could continue that process of unwinding emergency stimulus and liquidity measures by raising the reverse repo rate to narrow the corridor with the repo rate even if the policy repo rate is left unchanged.”
SocGen
“Despite the unmistakable global trend towards monetary policy normalisation, we believe the RBI is likely to swim in the opposite direction and keep the policy rate steady at 4.0% at its upcoming meeting while using every tool in the box to calm nerves and hold back surging yields.”
ANZ
“We do not expect any policy rate action (repo rate at 4.00%) apart from a 40bp hike in the reverse repo rate to 3.75%, reverting the repo-reverse repo corridor to its pre-pandemic width. Yet, the central bank may not be able to hold off for longer – we expect the first 25bp rate hike at the April meeting.”
TDS
“We expect the RBI to keep its policy repo rate on hold at 4.00% but hike its reverse repo rate by 40bp to 3.75% in order to narrow the corridor between both rates. While a reverse repo rate hike may on the margin be positive for INR, we think the impact will be limited and short-lived.”
Standard Chartered
“We expect the RBI to initiate policy normalisation via a 25bps hike to the reverse repo rate, while the repo rate is likely to be kept unchanged at 4%. We see complete normalisation of the policy corridor (the gap between the repo and reverse repo rate) by a total 40bps by April. We continue to expect the MPC to hike the repo rate by 75bps between August and December on elevated inflation concerns (flagged by global central banks recently) amid higher commodity prices and supply issues. We expect growth projections to be kept unchanged, while inflation forecasts may be raised marginally, though recent trends indicate inflation in line with the Q4-FY22 (ending March 2022) estimate of 5.7% (our estimate: 6%). We will closely watch for policy guidance and any further steps towards liquidity normalisation (via VRRRs), along with efforts to support the bond market (via Operation Twist/held to maturity limit hike).”
EUR/PLN broke below a multi-month ascending trend line resulting in an extension of pullback that started at 4.7400 in November. Economists at Société Générale expect the pair to extend its slide towards 4.4580 and 4.4360 on a break under 4.50/4.48.
Break above late January peak of 4.6000 crucial for short-term rebound
“The pair is gradually dipping towards the interim support zone of 4.5000/4.4800 representing the low of last September and the lower limit of the channel drawn since 2020. This is a crucial level. If this gets violated, there would be a risk of a deeper downtrend towards projections of 4.4580 and 4.4360.”
“A break above late January peak of 4.6000 will be essential for short-term rebound.”
Comments from European Central Bank President Christine Lagarde emphasized on being gradual and sequenced in policy adjustment. That it was not an outright push-back could be interpreted as a hawkish sign, in the view of economists at OCBC Bank.
EUR/USD to test the 1.1480/00 zone this week
“Comments from ECB’s Lagarde to the EU Parliament emphasized on being ‘gradual’ in policy adjustment and the sequence of ending asset purchases first. Overall, this can be seen as some substantiation from Lagarde. At least there was no clear push-back – and that should be taken as sufficiently hawkish for the market. .”
“EUR-bulls may well be emboldened to test the 1.1480/00 zone this week.”
UOB Group’s FX Strategists noted further consolidation is expected in USD/CNH in the next weeks.
Key Quotes
24-hour view: “Yesterday, we highlighted that ‘momentum indicators are mostly neutral’ and we expected USD to ‘trade sideways between 6.3500 and 6.3700’. While our view for sideway-trading was not wrong, USD traded within a narrower range than expected (6.3576/6.3689). The quiet price actions offer no further clues and we continue to expect USD to trade sideways. Expected range for today, 6.3500/6.3700.”
Next 1-3 weeks: “There is no change in our view from yesterday (07 Feb, spot at 6.3600). We continue to view the current movement as part of a consolidation phase and expect USD to trade between 6.3400 and 6.3805 for now.”
- Silver witnessed some selling on Tuesday and eroded a part of the overnight strong gains.
- A convincing break below the $22.40 support zone would pave the way for further losses.
- Bulls might wait for sustained strength beyond the $23.00 mark before placing fresh bets.
Silver struggled to find acceptance above the $23.00 mark, or capitalize on the previous day's strong gains to over one-week high and witnessed some selling on Tuesday. The intraday downfall extended through the early European session and dragged the white metal to a fresh daily low, around the $22.80-$22.75 region in the last hour.
Looking at the technical picture, the latest leg up from the vicinity of the $22.00 mark faltered ahead of the 100-day SMA. The mentioned barrier, currently around the $23.20 area, is followed by the $23.40-$23.45 horizontal resistance. The latter should act as a pivotal point for traders and help determine the near-term trend for the XAG/USD.
Meanwhile, technical indicators on the daily chart – though have been recovering from lower levels – are yet to confirm a bullish bias for the XAG/USD. This, in turn, warrants some caution before confirming that the recent sharp rejection slide from the 200-day SMA has run its course and positioning for any further appreciating move.
From current levels, any subsequent slide is likely to find immediate support near the $22.65 region ahead of the $22.40 area, which if broken would expose the $22.00 round figure. Sustained weakness below should pave the way for a further decline and drag the XAG/USD towards challenging the double-bottom support, around the $21.40 zone.
On the flip side, bulls are likely to wait for a convincing break through the $23.45 hurdle before positioning for any further gains. The XAG/USD might then accelerate the momentum towards reclaiming the $24.00 mark. The momentum could further get extended and allow bulls to challenge the YTD high, around the $24.70 area touched on January 20.
Silver daily chart
-637799054183623743.png)
Technical levels to watch
- DXY reverses Monday’s downtick and retakes 95.70 and above.
- Higher US yields support the move higher in the dollar.
- Trade Balance, NFIB Index, IBD/TIPP Index next on tap.
The greenback fades the pessimism seen at the beginning of the trading week and resumes the upside to the 95.70/75 band when tracked by the US Dollar Index (DXY) on turnaround Tuesday.
US Dollar Index up on yields, Fed
Following Friday’s lows in the vicinity of 95.10, the index embarked on a corrective upside with the immediate target at the 96.00 barrier so far. The reversion of the January-February sharp selloff comes on the back of the relentless move higher in US yields.
Indeed, the latest Payrolls figures added to the rising speculation of a more aggressive lift-off by the Federal Reserve as soon as at the March FOMC event, although this view contrasts with opinions of some Fed’s rate-setters, who feel more inclined to a more gradual start of the normalization of the monetary conditions (25 bps hike vs. 50 bps hike).
In the meantime, yields in the short end of the curve approach the 1.35% level for the first time since February 2020, the 10y benchmark note surpasses 1.95% - levels last traded in August 2019 – and the 30y note flirts with the 2.25% region, an area last visited in June 2021.
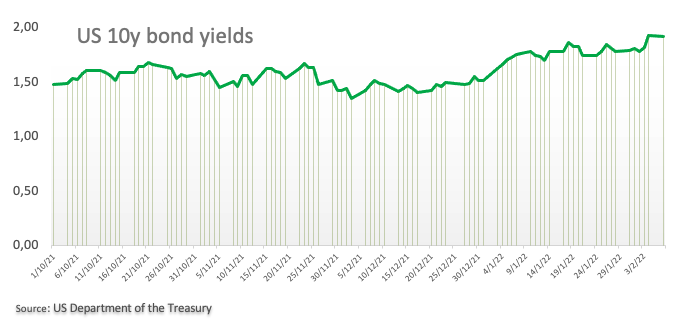
In the US docket, Balance of Trade figures are due later seconded in relevance by the NFIB Business Optimism Index and the IBD/TIPP Economic Optimism Index.
What to look for around USD
The dollar regained some poise in the wake of the healthy results from the Nonfarm Payrolls for the month of January. While the constructive outlook for the greenback remains well in place for the time being, recent hawkish messages from the BoE and the ECB carry the potential to slow the pace of a move higher in the index in the next months. The view of a stronger dollar remains, in the meantime, underpinned by higher yields, persistent elevated inflation, supportive Fedspeak and the solid pace of the US economic recovery.
Key events in the US this week: Balance of Trade (Tuesday) - Wholesale Inventories, MBA Mortgage Applications (Wednesday) - CPI, Initial Claims (Thursday) - Flash Consumer Sentiment (Friday).
Eminent issues on the back boiler: Fed’s rate path this year. US-China trade conflict under the Biden administration. Debt ceiling issue. Escalating geopolitical effervescence vs. Russia and China.
US Dollar Index relevant levels
Now, the index is gaining 0.09% at 95.56 and a break above 96.07 (55-day SMA) would open the door to 97.44 (2022 high Jan.28) and finally 97.80 (high Jun.30 2020). On the flip side, the next down barrier emerges at 95.13 (weekly low Feb.4) seconded by 95.00 (round level) and then 94.62 (2022 low Jan.14).
EUR/JPY is pushing higher, following last Thursday’s hawkish European Central Bank (ECB) policy meeting. Benjamin Wong, strategist at DBS Bank, EUR/JPY to remain in a bullish run up towards 135.19, a major obstacle level.
Weekly chart’s support continues to anchor support at 129.88
“EUR/JPY now trades above the 200-day moving average (DMA) at 130.49 and the trendline resistance trailing from October 2021’s 133.48 peak (130.90). Further advances eye next the intermediate resistance linking up 134.13-133.48 at 132.99.”
“Support is generally rising as the cross assails its January 131.60 highs, and is now pinned at 129.88 (Tenkan support) from a weekly chart perspective.”
“Momentum is picking up, and EUR/JPY’s first obstacle rests with overhead resistance trailing back to February 2018’s 137.50 peak that axes with a 133.48 resistance. Beyond that, 134.42 (61.8% Fibonacci retracement of 149.78-109.57 (December 2014 peak to June 2016 lows)) comes into play. And just higher a 1.764% price extension at 135.19 – this remains a major obstacle level.”
Good fundamentals, despite last week’s grim jobs figures, are likely generating some support for the loonie. Economists at ING expect the USD/CAD pair to stabilise around 1.2600.
BoC to deliver six 25bp increases by the end of 2022
“We think that markets are currently weighing the fundamental picture for the loonie, finding it still attractive, especially considering the recent CAD underperformance.”
“We doubt that the Bank of Canada’s tightening plans have been derailed by January’s jobs data, and we forecast six 25bp increases by the end of 2022. This should offer support to the loonie down the road: for now, we expect USD/CAD to stabilise around 1.2600.”
EUR/USD has continued to edge lower after snapping a five-day winning streak on Monday. As FXStreet’s Eren Sengezer notes, a deeper correction toward 1.1350 is possible.
10-year US Treasury bond yield is closing in on 2%
“The benchmark 10-year US Treasury bond yield is rising toward the key 2% mark, helping the dollar find demand. The US Dollar Index could extend its rebound in case the 10-year yield rises above that level and further weigh on EUR/USD.”
“In case EUR/USD falls below 1.1400 (psychological level, Fibonacci 23.6% of the latest uptrend) and starts using that level as resistance, it could target 1.1350 (Fibonacci 38.2% retracement) next. The 200-period SMA on the four-hour chart aligns as the next support at 1.1330.”
“On the upside, resistances could be seen at 1.1480 (static level), 1.1500 (psychological level, static level) and 1.1550 (static level).”
AUD/USD stays quiet above 0.7100 after rising decisively on Monday. Analysts at OCBC spots immediate resistance at the 55-day moving average (DMA) at 0.7163.
AUD benefitted from an upcoming relaxation of border controls and firm data
“AUD/USD saw upside impetus on the back of the quarantine-free travel announcement and a set of firmer than expected retail sales data on Monday.”
“Near-term prospects for the pair is choppy at best.”
“Immediate resistance at the 55-DMA (0.7163), against first support at 0.7050.”
2021 was a “bad” year for the kiwi. But having fallen from a high of 0.746 in January 2021 to a low of 0.653 in December, economists at ANZ Bank think it will fare better in 2022. The NZD/USD pair is expected to climb gradually to 0.70 by year-end.
Downgraded forecast for the NZD by a few cents
“Our forecasts do call for gradual NZD/USD strength over 2022, but we are no longer as bullish as we were and have recently downgraded our track.”
“We now see NZD/USD topping out at 0.70 at year-end, down from 0.72 in our earlier forecasts. But if US growth and inflation continue to surprise to the upside, even 0.70 might be a challenge.”
The loonie has lost some feathers since the beginning of the year. Despite the uncertainty created by the latest COVID-19 variant, analysts at the National Bank of Canada remain comfortable with their current forecast of USD/CAD 1.20 in 2022.
BoC to outpace the Fed
“With headline CPI inflation approaching 5%, the current backdrop remains favourable for a Bank of Canada rate hike in March.”
“We expect the BoC to outpace the Fed by 5 to 4 in terms of rate hikes this year to end the year at 1.50% (vs. 1.25% in the US.).”
“Despite the uncertainty created by the latest COVID variant, we remain comfortable with our current forecast of a CAD1.20 rate for the US dollar in 2022.”
- NZD/USD struggled to capitalize on its early uptick amid a strong pickup in the USD demand.
- A fresh leg up in the US bond yields turned out to be a key factor that underpinned the USD.
- A softer risk tone also benefitted the safe-haven buck and capped the perceived riskier kiwi.
The NZD/USD pair surrendered its modest intraday gains and retreated to the lower end of its daily trading range, around the 0.6630 region during the early European session.
The pair built on the previous day's positive move and gained some follow-through traction during the first half of the trading on Tuesday, though resurgent US dollar demand capped the upside. The prospects for a faster policy tightening by the Fed triggered a fresh leg up in the US Treasury bond yields. This, in turn, was seen as a key factor that provided a strong boost to the greenback.
In fact, the markets have been pricing in the possibility of a full 50 bps rate hike at the March FOMC meeting and pushed the yield on the benchmark 10-year US government bond closer to the 2% threshold. Adding to this, the yield on the 2-year and 5-year US notes – which are highly sensitive to rate hike expectations – rose to the highest level since February 2020 and July 2019, respectively.
Apart from this, the prevalent cautious mood – as depicted by a softer tone around the equity markets – further benefitted the safe-haven greenback and acted as a headwind for the perceived riskier kiwi. The downside, however, seems cushioned, at least for the time being, as investors might refrain from placing aggressive bets ahead of Thursday's release of the latest US consumer inflation figures.
The US CPI report would determine the Fed's policy outlook and provide a fresh directional impetus to the NZD/USD pair. In the meantime, the US bond yields will play a key role in influencing the USD price dynamics amid absent relevant economic releases from the US. Apart from this, the broader market risk sentiment would produce short-term trading opportunities around the NZD/USD pair.
Technical levels to watch
USD/JPY is trading at its highest level in more than a week at 115.50, supported by rising US T-bond yields. Economists at OCBC Bank expect the pair to test the 116.00 level.
USD/JPY to re-establish its correlation with yield differentials
“Our bias remains positive on yield differential arguments for now, barring any excessive downside moves on the risk markets.”
“Our bias is for the pair to edge higher. A move towards 116.00 for the USD/JPY should not be explicitly ruled out.”
The situation for the euro is far from being simple. Economists at the National Bank of Canada maintain their view of sideways trading for the first half of the year with the possibility of some appreciation if the situation in Ukraine cools and as the pressure mounts for the normalization of monetary policy in the common currency area.
Rate hike expectations have moved up
“We maintain that the risk of a Russian invasion in Ukraine is unlikely now but remain wary of volatility created by ambiguity. A clean resolution would likely translate into lower prices for energy and a more risk-on attitude by markets. In such situation, the euro could see some appreciation.”
“Trades are now betting Christine Lagarde could fold as soon as July of this year. We think this may be premature and diverges from her statement made on February third which mentioned slowdown risks for the first quarter of the year and overaching caution. Still, Largarde’s tone has started to shift and combined with the risk os sticky inflation could materialze into a rake hike by year-end.”
“We maintain our view of sideways trading for the first half of the year with the possibility of some appreciation if the situation in Ukraine cools and as the pressure mounts for the normalization of monetary policy in the common currency area.”
The unanticipated strong rebound in Philippine economic activity is uneven, with domestic demand surging and the contribution from external trade concomitantly dwindling. The widening warrants a recalibration of fiscal and monetary policies but there are hitherto no indications of a shift in the policy stance. Economists at ANZ Bank forecast USD/PHP at 52.50 by end-2022.
Growing imbalance
“The domestic demand-driven recovery has been stronger than anticipated. At the same time, it is resulting in a rapid deterioration in the trade and current account positions. Unless fiscal and monetary policies respond in a timely manner, the peso will need to bear the brunt of this deterioration.”
“There has hitherto been no indication that monetary policy will respond to the external position whereas fiscal policy may prove to be intractable in the short-term.”
“We forecast USD/PHP to end 2022 at 52.50 with risks to the upside.”
WTI Crude Oil bulls are accumulating energy for a new surge. As FXStreet’s Analyst Yohay Elam notes, the trend remains to the upside, eyeing $91.80 (recent high) and then $94 and $95.30 (Fibonacci levels).
Fibonacci levels offer a peek into the next peaks
“Support is at the recent low of $190.10, followed by $88.80, a swing high from last week, and then $87, aswing high from late January.”
“Once this consolidation phase concludes, bulls may take over, pushing oil prices to the recent high of $91.80 – the recent peak – then followed by $94, which is the 138.2% Fibonacci line when drawing a Fibonacci retracement from the cushion of $85.85 to $91.80. Further above, $95.30 is the 161.8% Fibonacci level.”
- USD/CHF shot to a one-week high on Tuesday amid a goodish pickup in the USD demand.
- Expectations for a 50 bps rate hike in March, rising US bond yields underpinned the USD.
- The cautious market mood could benefit the safe-haven CHF and cap gains for the major.
The USD/CHF pair built on its steady intraday ascent and climbed to a one-week high, further beyond mid-0.9200s during the early European session.
Following the overnight modest downtick, the USD/CHF pair regained positive traction on Tuesday and is now looking to build on last week's solid bounce from the 0.9175 region. The momentum was sponsored by a goodish pickup in demand for the US dollar, which drew some support from a fresh leg up in the US Treasury bond yields. That said, the prevalent cautious market mood could underpin the safe-haven Swiss franc and act as a headwind for the pair.
The markets have been speculating that the Fed will adopt a more aggressive policy response to combat rising inflation and priced in the possibility of a 50 bps rate hike in March. This, in turn, pushed the yield on the benchmark 10-year US government bond closer to the 2.0% threshold. Adding to this, the yield on the 2-year and 5-year notes rose to the highest level since February 2020 and July 2019, respectively, and benefitted the greenback.
It, however, remains to be seen if bulls are able to capitalize on the move or prefer to move on the sidelines ahead of Thursday's release of the latest US consumer inflation figures. The US CPI report would determine the Fed's policy outlook and provide a fresh directional impetus to the USD/CHF pair. Hence, it will be prudent to wait for a strong follow-through buying before traders start positioning for an extension of a one-week-old uptrend.
Heading into the data risks, the US bond yields will continue to play a key role in influencing the USD price dynamics. This, along with the broader market risk sentiment, would be looked upon for some short-term trading opportunities around the USD/CHF pair.
Technical levels to watch
USD/JPY is forecast to extend the consolidation within the 114.55-115.80 range in the next weeks, suggested FX Strategists at UOB Group.
Key Quotes
24-hour view: “Our expectations for USD to ‘test 115.50’ yesterday did not materialize as it traded within a range of 114.90/115.37 before closing largely unchanged at 115.12 (-0.07%). The underlying tone still appears to be a tad firm and the bias is tilted to the upside. That said, any advance in USD is unlikely to 115.50. Support is at 115.00 followed by 114.80.”
Next 1-3 weeks: “Our view from yesterday (08 Feb, spot at 115.20) still stands. As highlighted, the outlook is mixed and USD is likely to trade between 114.55 and 115.80 for now. Looking ahead, the upside risk appears to be greater but USD has to break 115.80 first before a sustained advance is likely.”
Considering advanced prints from CME Group for natural gas futures markets, open interest shrank by more than 21K contracts at the beginning of the week, reversing the previous daily build. On the other hand, volume went up by around 109.2K contracts after two consecutive daily drops.
Natural Gas looks supported by the 200-day SMA
Prices of natural gas extended the leg lower on Monday and revisited the 200-day SMA around $4.20, where also sits the 200-day SMA. The daily drop was on the back of shrinking open interest, which is indicative that a deeper pullback looks out of favour for the time being.
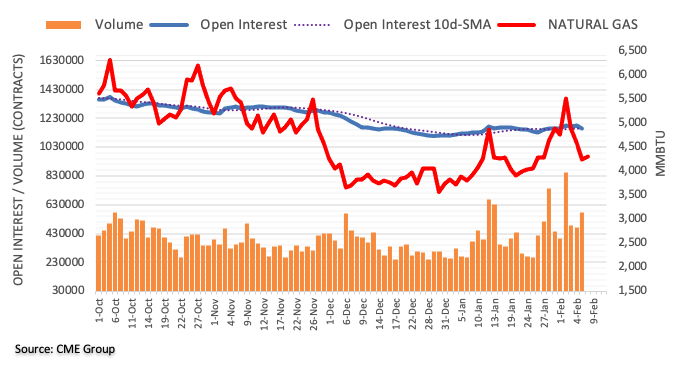
Here is what you need to know on Tuesday, February 8:
The benchmark 10-year US Treasury bond yield continues its march toward the key 2% mark early Tuesday, helping the greenback preserve strength against its major rivals. December Trade Balance, NIFB Business Optimism Index and the IBD/TIPP Economic Optimism Index data will be featured in the US economic docket in the second half of the day. Meanwhile, US stocks futures are trading in the negative territory after posting modest losses on Monday.
Crude oil prices seem to have gone into a consolidation phase following last week's upsurge. The barrel of West Texas Intermediate (WTI), which touched its highest level since September 2014 at $93.13 on Friday, was last seen trading flat on the day near $91.50. Talks on bringing back the 2015 Iran nuclear deal is set to continue in Vienna on Tuesday.
WTI Crude Oil bulls accumulating energy for a new surge, levels to watch.
EUR/USD is edging lower toward 1.1400 on renewed dollar strength and European Central Bank President Christine Lagarde's comments. While speaking before the EU Parliament, Lagarde said that there were no signs of inflation measurably exceeding the 2% target in the medium term. "We need more than ever to maintain flexibility and optionality in the conduct of monetary policy," Lagarde repeated.
GBP/USD closed flat after testing 1.3500 on Monday and continues to trade in a very narrow range on Tuesday.
USD/JPY is trading at its highest level in more than a week at 115.50, supported by rising US T-bond yields.
Gold advanced to its strongest level in 10 days above $1,820 on Monday. XAU/USD is having a tough time gathering bullish momentum early Tuesday.
AUD/USD stays quiet above 0.7100 after rising decisively on Monday. During the Asian trading hours, the data published by the National Australia Bank showed that Business Confidence Index improved to 3 in January from -12 in December.
Bitcoin keeps its footing after breaking above $40,000 and was last seen rising more than 2% on a daily basis at $44,750. Ethereum is trading at its highest level since January to at $3,180, rising more than 1% on the day.
Gold’s recent bounce from the $1,780 area, or the lowest level since December 16, stalled just ahead of the 61.8% Fibonacci level of the fall. As FXStreet’s Haresh Menghani notes, a break above this level, around $1,825, would clear the path to enjoy further gains.
$1,810 confluence holds the key
“The 61.8% Fibonacci level around the $1,825 region is followed by the $1,830-$1832 supply zone, which if cleared decisively would be seen as a fresh trigger for bullish traders. XAU/USD might then accelerate the momentum back towards testing the January swing high, around the $1,853 area.”
“Any meaningful slide is likely to find decent support near the $1,810-$1,809 confluence. A convincing break below would make gold vulnerable to slide further below the $1,800 mark, towards testing the 23.6% Fibo. level, around the $1,796-$1,795 region, and the $1,790 support.”
- GBP/USD drosp for third consecutive day amid broad USD strength, Brexit woes.
- US Treasury bond yields renew multi-day high amid market’s indecision ahead of Thursday’s US CPI, trade/political fears.
- DUP hints at continued political deadlock in Northern Ireland, British Science in limbo amid no talks over EU funding.
- UK PM Johnson is under fresh political pressure after Labour Party leader got hackled by mob.
GBP/USD bounces off intraday low to 1.3520 during the three-day downtrend ahead of Tuesday’s London open.
Firmer US Treasury yields underpin US dollar strength, which in turn weigh on the cable pair of late. Also acting as a bearish catalyst is the recently escalating Brexit fears ahead of Friday’s key talks between UK Foreign Secretary Liz Truss and European Commission Vice President Maros Sefcovic.
The US 10-year Treasury yields rose around three basis points (bps) to refresh the two-year high near 1.95% whereas the five-year counterpart added four bps to renew the 18-month peak of 1.8050% by the press time. That said, the US Dollar Index (DXY) rose 0.20% to 95.60 at the latest.
Hawkish concerns over the US Federal Reserve’s (Fed) March meeting join geopolitical tension surrounding Russia-Ukraine and the Sino-American trade tussles to back the US bond yields. Alternatively, the market’s indecision ahead of Thursday’s US Consumer Price Index (CPI) data and cautious optimism over covid conditions seem to challenge the US bond sellers.
Elsewhere, the Politico conveyed hints of further political tensions in Northern Ireland (NI), due to Brexit, while quoting the UK region’s Agriculture Minister Edwin Poots. “The Democratic Unionist Party (DUP) won’t allow Northern Ireland’s power-sharing government to be revived unless the European Union abandons its requirement for checks on British goods arriving here,” said the news.
On the same line were comments from the British Science Minister George Freeman who admitted lack of progress on talks over EU funding as NI and fishing consume all the Brexit talk time.
It’s worth noting that The Guardian’s news conveying fresh challenges for UK PM Boris Johnson, due to hardships for Labour Leader Keir Starmer, also weigh on the GBP/USD prices. “Keir Starmer has been rescued by the police from a mob of angry anti-vaxx and anti-lockdown protesters,” said The Guardian.
That said, GBP/USD traders may witness further weakness amid firmer USD on upbeat yields, with eyes on the US Goods and Services Trade Balance for December, expected $-83B versus $-80.2B. However, major attention will be given to the late week’s Brexit talks, UK Q4 GDP and the US CPI.
Technical analysis
GBP/USD dropped to a one-week low on Monday before taking a U-turn from 1.3490, which in turn portrays the two-week-old rising channel formation. Adding to the bullish is the recently steady MACD line in the positive territory.
That said, the pair’s further upside will initially aim for the 1.3600 threshold before challenging 23.6% Fibonacci retracement (Fibo.) of the December-January upside, near 1.3615.
Alternatively, 50-SMA and the support line of the stated bullish channel together offer strong short-term support near 1.3490, a break of which will highlight 50% and 61.8% Fibo. levels for GBP/USD bears, respectively around 1.3460 and 1.3390.
Trade ties between the world's two largest economies are likely to remain on back burner as China focuses on Winter Olympics and prepares for upcoming 'two sessions' legislative meetings, the South China Morning Post (SCMP) reported, citing Doug Barry, Communications Vice-President with the US-China Business Council, a 265-member advocacy group in Washington.
Key quotes
"I'm sure both sides are looking at various things they can do ratchet up pressure on the other.”
“Each side could raise import tariffs while flagship American companies could face heat in Congress to tone down business in China.”
“Trade ties will wobble for a while as China is focused on the Olympics and the upcoming two sessions legislative meetings in March.”
This comes after the US Commerce Department said Monday, it had added 33 Chinese entities to its so-called 'unverified list', which requires US exporters to go through more procedures before shipping goods to the entities.
Read: AUD/USD sellers attack 0.7100 on trade/political fears, upbeat US Treasury yields
- USD/CAD regained positive traction on Tuesday and reversed a part of the overnight losses.
- Rising US bond yields helped revive the USD demand and extended some support to the pair.
- Crude oil prices consolidated below the seven-year high and did little to influence the loonie.
The USD/CAD pair traded with a positive bias heading into the European session and was last seen trading near the daily high, just below the 1.2700 mark.
The pair once again found some support and attract fresh buying in the vicinity of the 1.2655-1.2650 support zone amid a goodish pickup in the US dollar demand on Tuesday. Speculations that the Fed would adopt a more aggressive policy response to contain stubbornly high inflation triggered a fresh leg up in the US Treasury bond yields and underpinned the greenback.
In fact, the markets have been pricing in the possibility of a full 50 bps rate hike at the March FOMC meeting. The bets were further boosted by Friday's mostly upbeat US employment details, which pointed to the underlying strength in the labour market. This, in turn, pushed the yield on the benchmark 10-year US government bond back closer to the 2.0% threshold.
Apart from this, the prevalent cautious mood – as depicted by a softer tone around the equity markets – also benefitted the greenback's relative safe-haven status. That said, the recent bullish run in crude oil prices to a seven-year high continued lending some support to the commodity-linked loonie and kept a lid on any meaningful gains for the USD/CAD pair.
Nevertheless, the pair has now recovered a part of the previous day's slump and remains at the mercy of the USD price dynamics. In the absence of any major market-moving economic releases from the US, the US bond yields will continue to influence the USD demand. This, along with oil price dynamics, should provide some meaningful impetus to the USD/CAD pair.
Technical levels to watch
In opinion of FX Strategists at UOB Group, NZD/USD is expected to navigate between 0.6545 and 0.6685 in the next weeks.
Key Quotes
24-hour view: “We expected the ‘rapid decline in NZD to extend’ yesterday. However, NZD traded between 0.6602 and 0.6640 before settling on a firm note at 0.6635 (+0.29%). The improved underlying tone suggests NZD could drift higher but any advance is not expected to break the major resistance at 0.6685 (there is another resistance at 0.6660). On the downside, a breach of 0.6605 (minor support is at 0.6620) would indicate that the current mild upward pressure has eased.”
Next 1-3 weeks: “There is no change in our view from yesterday (07 Feb, spot at 0.6605). As highlighted, the current movement is viewed as part of a consolidation phase and NZD is likely to trade between 0.6545 and 0.6685 for now.”
CME Group’s flash data for crude oil futures markets noted traders added nearly 8.5K contracts to their open interest positions on Monday, extending the uptrend for the fourth session in a row. Volume followed suit and resumed the upside following the previous pullback, this time by around 196.8K contracts.
WTI: Next on the downside comes $88.00
The rally in crude oil prices seems to be taking a breather so far this week after hitting fresh cycle tops last Friday. Monday’s downtick was in tandem with rising open interest and volume, which is supportive of extra pullbacks in the very near term at least. Against this, the $88.00 region emerges as the next support of note in case of further decline in WTI.
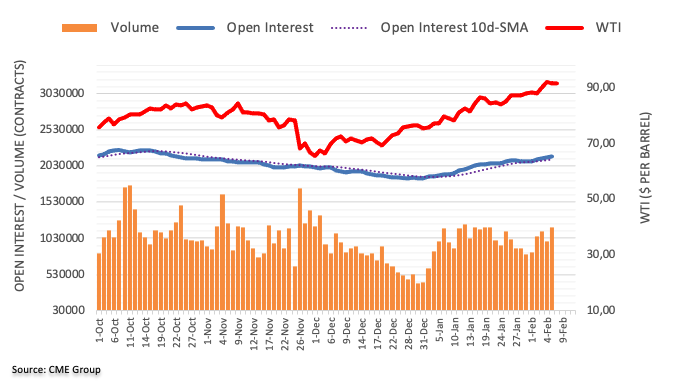
According to FX Strategists at UOB Group, further upside in GBP/USD seems to be losing momentum in the near term.
Key Quotes
24-hour view: “We highlighted yesterday that GBP ‘could dip below 1.3500 first before stabilization is likely’. We added, ‘the next support at 1.3470 is unlikely to come under threat’. Our view was not wrong as GBP dipped to 1.3492 before rebounding. The current movement is viewed as part of a consolidation phase and GBP is likely to trade sideways for today, expected to be between 1.3500 and 1.3570.”
Next 1-3 weeks: “We continue to hold the same view as from yesterday (07 Feb, spot at 1.3530). As highlighted, while upward momentum is beginning to wane, there is chance, albeit not a high one for GBP to make one more push higher to 1.3645. However, a breach of 1.3470 (‘strong support’ level) would indicate that the risk of another leg higher has dissipated.”
Open interest in gold futures markets increased by around 1.1K contracts at the beginning of the week for the first time since January 26 according to preliminary figures from CME Group. Volume, instead, reversed two daily builds in a row and shrank by more than 41K contracts.
Gold targets the 2022 high at $1,853
Gold started the week on a positive note and retested the $1,820 area. The uptick was amidst rising open interest, allowing for the continuation of the upside with immediate target at the YTD peak at $1,853 (January 25). The moderate decline in volume could prompt some very near-term consolidation ahead of further gains, in the meantime.
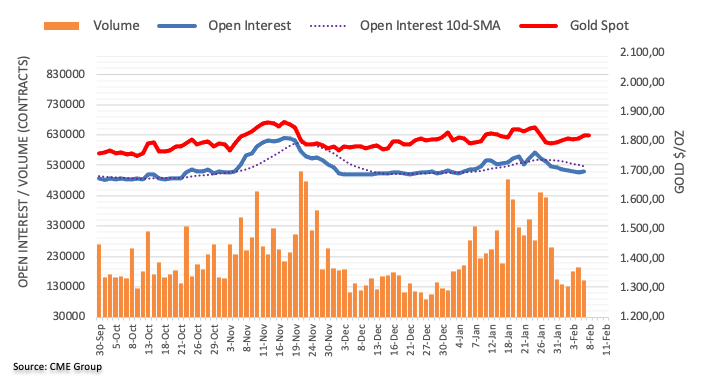
- USD/CHF stays firmer around intraday high, crosses 200-HMA.
- Upbeat oscillators join HMA break to direct bulls towards weekly resistance line.
- 100-HMA, immediate rising support line also challenges bears.
USD/CHF remains on the front foot around the intraday high of 0.9254, cheering the upside break of 200-HMA, ahead of Tuesday’s European session.
In addition to the 200-HMA breakout, upbeat RSI and MACD also favor the Swiss currency (CHF) pair buyers to aim for a one-week-old resistance line, around 0.9260 by the press time.
Should USD/CHF bulls overcome the 0.9260 hurdle, the upward trajectory will aim for the monthly high of 0.9277 ahead of challenging the 23.6% Fibonacci retracement (Fibo.) of late January’s upside moves, near 0.9290.
Alternatively, the 200-HMA level of 0.9250 restricts the immediate downside of the USD/CHF prices during fresh pullback.
Following that, an upward sloping trend line from Friday, around 0.9230, will be crucial to watch for the pair sellers. Also acting as a downside filter is the 100-HMA level of 0.9220.
In a case where USD/CHF prices decline below 0.9220, the recent swing low around 0.9175 should return to the charts.
USD/CHF: Hourly chart
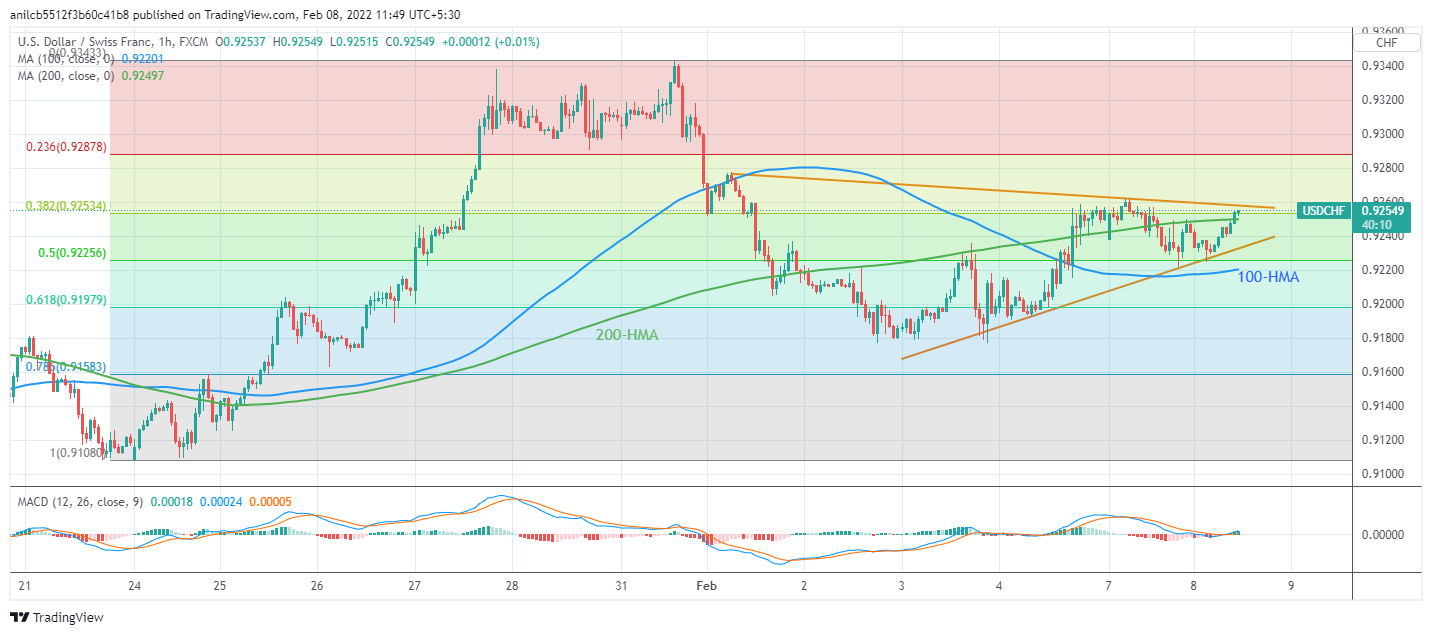
Trend: Further upside expected
FX Strategists at UOB Group expect further gains in EUR/USD once 1.1485 is cleared in the next weeks.
Key Quotes
24-hour view: “We expected EUR to ‘consolidate and trade within a range of 1.1410/1.1475’ yesterday. Our view for consolidation was not wrong even though EUR traded within a narrower range than expected (1.1413/1.1467). Flattish momentum suggests EUR could continue to consolidate. Expected range for today, 1.1405/1.1465.”
Next 1-3 weeks: “Our view from yesterday (07 Feb, spot at 1.1450) still stands. As highlighted, overbought shorter-term conditions could lead to a couple of days of consolidation first but as long as 1.1360 (no change in ‘strong support’ level from yesterday) is not breached, the recent rally could extend further. However, EUR has to break the major resistance at 1.1485 before a move to 1.1520 can be expected.”
- AUD/USD takes offers to refresh intraday low, reverses week-start recovery moves.
- Fears of US trade sanctions on China, Russia-Ukraine tussles join fresh two-year high of US T-bond yields to favor bears.
- US trade numbers, risk catalysts to offer intermediate halts, US CPI is the key.
AUD/USD refreshes intraday low around 0.7100, down 0.15% intraday as risk-off mood gains momentum heading into Tuesday’s European session.
The firmer US Treasury yields gain major attention while seeking clues for the Aussie pair’s latest weakness. That said, the US 10-year Treasury yields rose around three basis points (bps) to refresh the two-year high near 1.95% whereas the five-year counterpart added four bps to renew the 18-month peak of 1.8050% at the latest.
Also weighing on the AUD/USD prices could be grim concerns over the US-China trade relations, due to Australia’s close trading relations with Beijing. While portraying the trade pessimism in China, Reuters said, “China's blue-chip index slumped to a 19-month low on Tuesday, with new-energy vehicle stocks leading the losses, as investors fretted over the prospect of the U.S. government adding more Chinese entities to the export control list.”
Elsewhere, fears of Russia-Ukraine war battles US-Japan trade optimism, as well as covid fears in Hong Kong and Tokyo, to confuse market players and underpin US dollar demand amid broad hawkish concerns for the Fed’s March rate hike.
Against this backdrop, US stock future print mild losses around 4,470 at the latest while stocks in the Asia-Pacific region drift lower.
Looking forward, risk catalysts will join the US Goods and Services Trade Balance for December, expected $-83B versus $-80.2B, to direct intraday moves.
Technical analysis
Failures to cross the 50-DMA level surrounding 0.7165 direct AUD/USD sellers towards a fortnight-old support line near 0.7080.
- USD/JPY extends bounce off 10-DMA to battle nearby key hurdle, bullish MACD signals add to the upside bias.
- Two-week-old support line, 50-DMA adds to the downside filters.
USD/JPY takes the bids to refresh intraday high near 115.50, also piercing a five-week-old resistance line heading into Tuesday’s European session.
The yen pair’s successful trading above 10-DMA, as well as bullish MACD signals, is likely to help buyers overcome the immediate hurdle surrounding 115.45 on a daily closing basis.
Following that, the late January peak surrounding 115.70 may test the upside momentum before directing USD/JPY bulls to the 116.00 threshold.
Should the pair buyers remain dominant past-116.00, the previous month’s high near 116.35 will be in focus.
Alternatively, the 10-DMA level of 115.00 restricts short-term USD/JPY downside ahead of a fortnight-old support line near 114.55.
It should be noted, however, that the quote’s weakness below 114.55 will be challenged by the 50-DMA level of 114.45, a break of which will welcome USD/JPY bears.
USD/JPY: Daily chart

Trend: Further upside expected
- Asia-Pacific shares trade mixed as Sino-American trade tussles battle US-Japan optimism and covid headlines amid quiet session.
- Foreign outflows from Asian equities jumped to seven-month high in January.
- China’s blue-chip index hits 19-month low on fears of US sanctions, New Zealand witnesses harsh vaccine protests.
- Mixed Aussie data shrug off RBA rate hike concerns to favor ASX bulls, Indian markets remain mildly offered.
Markets in the Asia-Pacific region print cautious sentiment during early Tuesday on fresh US-China trade fears, as well as firmer US Treasury yields.
The US 10-year Treasury yields rose around three basis points (bps) to refresh the two-year high near 1.95% whereas the five-year counterpart added four bps to renew the 18-month peak of 1.8050% at the latest.
On the other hand, the Sino-American trade tussles escalate as the US conveyed China’s inability to match Phase 1 commitments. “China's blue-chip index slumped to a 19-month low on Tuesday, with new-energy vehicle stocks leading the losses, as investors fretted over the prospect of the U.S. government adding more Chinese entities to the export control list,” said Reuters in this regard.
Amid these plays, MSCI’s index of Asia-Pacific shares ex-Japan drop half a percent while Japan’s Nikkei 225 added 0.30% intraday by the press time.
Talking about data, Japan’s Overall Household Spending dropped to -0.20% YoY in December versus +0.3% forecast and -1.3% prior. On the same line were Current Account details for December, ¥-370.8B versus market consensus of ¥73.5B and ¥897.3B previous readouts. Though, the Trade Balance - BOP Basis improved to ¥-318.7B from ¥-431.3B during the stated month.
Elsewhere, National Australia Bank’s (NAB) Business Conditions and Business Confidence for January marked mixed figures with the Business Conditions easing to 3 versus a forecast of 4 and 8 previous. On the other hand, the NAB Business Confidence recovered from -12 to 3, versus 0 forecast.
On a different page, escalating vaccine protests in New Zealand test NZX 50 bulls whereas a seven-month high outflow of the foreign equities from Asian stocks challenge the overall market sentiment in the bloc.
It should be noted that the US Dollar Index (DXY) benefits from firmer yields whereas the commodities print losses at the latest.
Moving on, market players await Thursday’s European Commission Economic Forecasts and the US Consumer Price Index (CPI) for better understanding. Though, the aforementioned risk catalysts and the US Goods and Services Trade Balance for December, expected $-83B versus $-80.2B, may offer intermediate directives.
Read: US T-bond yields, S&P 500 Futures print mild gains amid cautious optimism
- USD/TRY extends week-start rebound towards short-term key hurdle to the north.
- Firmer RSI, successful trading above weekly support and 100-SMA keep buyers hopeful.
USD/TRY stays on the front foot around a one-week high, up 0.20% intraday near $13.62 while rising for the second consecutive day ahead of Tuesday’s European session.
Upbeat RSI conditions and a clear follow of the ascending trend line from January 31 favor the Turkish lira (TRY) pair buyers.
However, the pair bulls need to cross a downward sloping trend line from January 17, near $13.65, to extend the run-up.
Following that, the late January’s top surrounding $13.70 may challenge the USD/TRY bulls before directing them to the $14.00 threshold.
Meanwhile, pullback moves remain elusive beyond the weekly support, around $13.58 at the latest.
Adding to the downside filters is the convergence of the 100-SMA and 38.2% Fibonacci retracement (Fibo.) near $13.50.
Overall, USD/TRY is up for consolidating recent losses but needs validation from $13.65.
USD/TRY: Four-hour chart
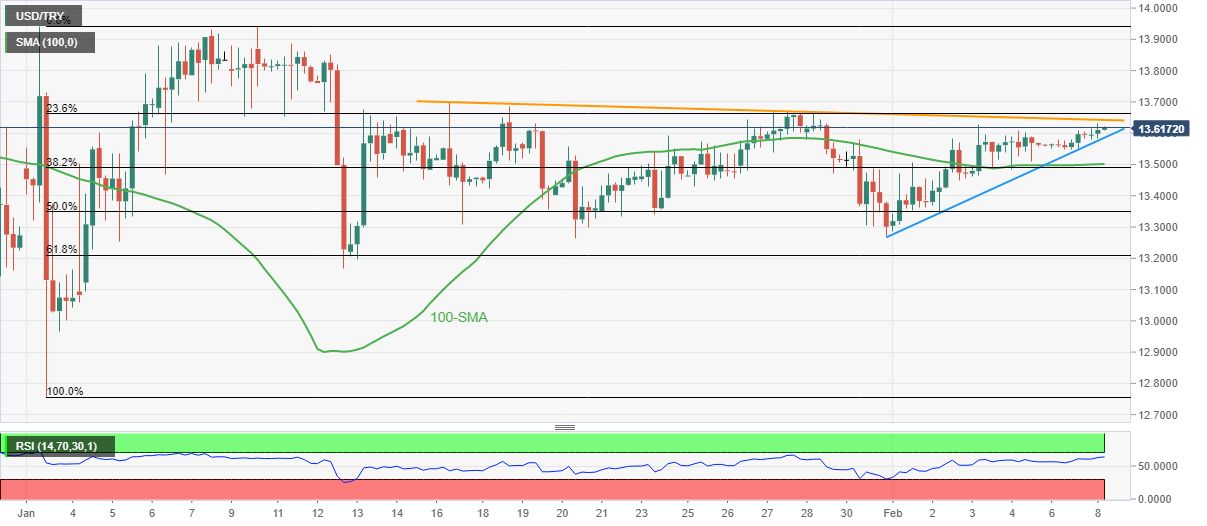
Trend: Further recovery expected
- EUR/USD extends pullback from two-month high, remains pressured for the second consecutive day.
- ECB’s Lagarde step back from hawkish rhetoric on inflation, Kazaks also rejected July rate hike concerns.
- USD tracks firmer yields amid mixed sentiment relating trade, politics and Fed’s next move ahead of the key US CPI.
- US trade numbers to direct intraday moves, risk catalysts are more important.
EUR/USD holds onto the week-start bearish bias, mildly offered around 1.1420 during early Tuesday morning in Europe.
Monday’s dovish comment from ECB President Christine Lagarde poured cold water on the face of EUR/USD bulls. “There is no need for big monetary policy tightening in the eurozone as inflation is set to fall back and could stabilize around 2%, European Central Bank President Christine Lagarde said on Monday,” per Reuters. On the same line were comments from Latvian Central Bank Governor, as well as the ECB policymaker Martins Kazaks who said, “The European Central Bank (ECB) could end its stimulus programme earlier than planned but it is unlikely to raise its main interest rate in July as investors are expecting,” said Reuters.
The US dollar rebound, backed by the firmer Treasury yields, could also be linked to the EUR/USD weakness.
It’s worth noting that a downbeat performance of German Industrial Production in December battled upbeat Euro area Sentix investor confidence for February but couldn’t recall the EUR/USD buyers.
On a broader front, receding US inflation expectations challenge increasing odds of a 0.50% Fed rate-hike in March and test the US dollar bulls. On the same line are the market’s recent cautious optimism backed by the covid-linked headlines and US-Japan trade news.
However, indecision over the Russia-Ukraine conditions joins Sino-American tussles to challenge the greenback sellers.
Amid these plays, the US 10-year Treasury yields added two basis points to 1.936%, close to the highest levels since late 2020, while the US stock future print mild gains around 4,485 at the latest. That said, the benchmark US T-bond coupons eased from a two-year high the previous day while Wall Street marked sluggish closing.
It should be noted that the market players await Thursday’s European Commission Economic Forecasts and the US Consumer Price Index (CPI) for better understanding. Though, the aforementioned risk catalysts and the US Goods and Services Trade Balance for December, expected $-83B versus $-80.2B, may offer intermediate directives.
Technical analysis
EUR/USD sellers need a daily closing below the 100-DMA level of 1.1420 to keep the controls and aim for the 50-DMA level surrounding 1.1325.
However, sustained trading beyond the 100-DMA and hidden bullish RSI divergence on the daily chart keep buyers hopeful to attack a three-month-old horizontal resistance area near 1.1480-85.
- EUR/JPY bulls sitting in at the daily consolidation waiting for a catalyst.
- US dollar and ECB's Lagarde steal the euros thunder.
EUR/JPY rallied at the start of this month from a low of 128.42 to score a high of 132.16 from where it now consolidates, probing bears in for a counter trade as profits are taken off the table at the start of a quiet week.
In the euro's favour, the ECB has left the door open for a rate hike later in 2022 should inflation risks rise last week. However, President Christine Lagarde has turned down the heat and explained that there is no need for big monetary policy tightening in the eurozone. She said inflation is set to decline and could stabilize around the ECB's target of 2%.
Meanwhile, the US jobs data from Friday also dented the euro's dominance this week. The dollar has found support, helped by US Treasury yields that rose after far better-than-expected jobs data on Friday. ''Markets have now priced in a one-in-three chance the Fed might hike by a full 50 basis points in March, and reasonable chance rates will reach 1.5% by year-end,'' Reuters noted.
In other news, “The United States and Japan on Monday announced a deal to remove Trump-era tariffs from about 1.25 million metric tons of Japanese steel imports annually after Washington granted similar access for European Union steelmakers last year,” said Reuters during late Tuesday morning in Asia.
- US, Japan reach deal to cut tariffs on Japanese steel, fight excess output
- USD/INR snaps three-day downtrend near one-week low, recently easing from intraday top.
- Foreign outflows from Asian equities jump to seven-month high in January, US T-bond yields stay firmer around two-year peak.
- Mixed concerns over Wednesday’s RBI rate decisions, covid updates also challenge INR bulls.
- Light calendar, cautious mood ahead of Thursday’s US CPI limit market moves.
USD/INR bears take a breather around weekly bottom near 74.65 during initial Indian trading on Tuesday.
While the broad US dollar weakness could be linked to the Indian rupee (INR) pair’s previous gains, the latest rebound can well be linked to the cautious mood ahead of Wednesday’s Reserve Bank of India (RBI) monetary policy meeting. Also challenging the USD/INR bears are the firmer US Treasury yields and inflation fears, not to forget trade-political jitters, amid a light calendar.
A strong outflow of the foreign funds from Asian equity markets in January could also be held responsible for the pair’s recent recovery moves. A report on Reuters relied on Refinitiv data to point at the highest foreign fund outflow since July 2021. “cross-border investors sold Asian equities worth a net $8.41 billion in South Korea, Taiwan, the Philippines, Vietnam, Indonesia and India in the last month, according to Refinitiv data,” said the news.
On the other hand, indecision over the Fed’s next moves and contrasting statements concerning the US-China trade relation, as well as Ukraine-Russia tussles, underpin the US Treasury yields’ rebound amid a quiet Asian session.
While portraying the mood, the US 10-year Treasury yields added two basis points to 1.936%, close to the highest levels since late 2020, while the US stock future print mild gains around 4,485 at the latest. That said, the benchmark US T-bond coupons eased from a two-year high the previous day while Wall Street marked sluggish closing.
It should be noted, that the recovery in covid conditions in India contrasts with Japan and Hong Kong, which in turn tests INR bulls of late. As per the latest official figures, the active COVID-19 cases and daily infections are at a one-month low.
Moving on, USD/INR traders will pay close attention to the RBI’s verdict for short-term direction. “India's central bank is expected to hold its repo rate steady on Thursday but several economists are expecting an increase in the reverse repo rate as part of a process to reduce surplus liquidity poured into markets earlier in the pandemic,” said Reuters.
For intraday moves, the US Goods and Services Trade Balance for December, expected $-83B versus $-80.2B, will join risk catalysts for near-term directions.
Technical analysis
USD/INR recovery depends upon a clear upside break of the 100-DMA, near 74.75 by the press time, failing to cross the same will direct bears towards the 200-DMA level of 74.28.
- It is calm out there but the bulls are in charge, for now.
- AUD is catching a bid in Asia, with prospects of the RBA moving to action later in the year.
At 1.0735, AUD/NZD has been pressured in recent trade, albeit holding within the sideways hourly channel in quiet market conditions following a firm move to the upside at the start of the week. The cross rallied from a low of 1.0659 to a high of 1.0748 and is capped here for now.
The Aussie has benefitted from some hawkish sentiment coming through the wires of late as it plays catch up to the kiwi that has dominated in recent times. The divergence between the two central banks exists, but the gap is a tough narrower despite the dovish tilt at the last Reserve Bank of Australia meeting.
The February board meeting delivered the cash rate at 0.1% and pushed back against the notion that a rate hike was urgent. However, as expected, the bank was ending its bond purchase (money printing or QE) program this month which was accompanied by some upbeat commentary. This has led to some economists calling for hikes towards the end of 2022.
-
Former RBA Edwards: RBA could raise interest rates four times in quick succession late in 2022
For instance, Economist John Edwards, who once sat on the policy-setting board of the Reserve Bank of Australia, said in an interview earlier today that the RBA could raise interest rates four times in quick succession late in 2022.
Mr. Edwards warns that the cautious plod of the RBA could end quickly. Meanwhile, analysts at ANZ bank explained that they ''think the RBA’s wages outlook is too pessimistic which lies behind our expectation that the RBA will begin raising the cash rate in the second half of 2022.'' Westpac’s view remains for the RBA to raise the cash rate to 0.25% in August and to 0.50% in October.
As for the kiwi, there is plenty out there for the Reserve Bank of New Zealand to start taking action and to lift the OCR. ''While higher interest rates are normally a positive, it’s less so when other countries are also raising rates. Additionally, fears of a “hard landing” and housing market vulnerabilities are weighing on the NZD,'' analysts at ANZ bank argued.
The analysts have noted that the NZD is being buffeted by opposing cross-currents. ''Commodity prices are booming and the recovery remains robust. Annual inflation has risen sharply (to 4.9%) and the unemployment rate has fallen to a modern-era record low of 3.2%.''
''While we recently downgraded our forecasts for the NZD and AUD by a few cents, both are expected to appreciate from here, but to a lesser degree, with the NZD expected to climb gradually to 0.70 by year-end.''
Analysts at Goldman Sachs revised down their forecasts for the Australian and Kiwi dollar to range-bound in their latest client note.
Key quotes
"Last week, we placed our AUD and NZD forecasts under review as inflation and labor market data in Australia surprised to the upside and our economists pulled forward their forecast for RBA lift off to November 2022.
While our monetary policy outlook remains more dovish than market pricing and the RBA emphasized patience following its February meeting, we see the risks as skewed towards more rapid tightening getting priced. This contrasts with RBNZ pricing, which already exceeds our estimate of the terminal rate.
Recent upward revisions to our iron ore outlook also argue for more AUD upside than we had originally anticipated. All that said, we expect more hawkish Fed pricing and concerns about the risk backdrop to remain headwinds to AUD strength for now.
As a result, we are revising our forecasts to show less NZD outperformance on the AUD/NZD cross and a more range-bound path for both vs USD, including a mark-to-market following a USD move higher on net over the past few weeks.
We now see AUD/USD at $0.70, $0.70 & $0.71 in 3-, 6- and 12-months (vs $0.74, $0.73 & $0.71 previously) and NZD/USD at $0.66, $0.66 & $0.67 in 3, 6- and 12-months (vs $0.71, $0.71 & $0.70 previously)."
- Gold buyers jostle with short-term key hurdle following the biggest daily gains in three weeks.
- Sustained trading beyond 200-DMA joins RSI, MACD conditions to keep buyers hopeful.
- Market’s cautious optimism helps gold buyers amid light calendar ahead of US CPI, trade, geopolitics can entertain short-term traders.
- Gold Price Forecast: Bulls in the driver’s seat, eyeing $1,825.60
Gold (XAU/USD) grinds higher during the three-day uptrend, poking the previous support around $1,820 during Tuesday’s Asian session.
The yellow metal jumped the most since late January the previous day as downbeat prints of US inflation expectations, portrayed by the 10-year breakeven inflation rate per the St. Louis Federal Reserve (FRED) data, challenge the hawkish Fed concerns.
Also recently underpinning the gold’s upside momentum are the receding fears surrounding the imminent Russia-Ukraine war and optimism concerning the US-Japan steel trades.
However, worsening covid woes in Japan and Hong Kong, not to forget the US-China trade tussles, challenge the market optimism.
“Hong Kong Chief Executive Carrie Lam is set to discuss further restrictions at an Executive Council meeting on Tuesday after a record number of new coronavirus infections were reported, with cases doubling every three days,” said Bloomberg. On the other hand, Japan’s Tokyo is up for extending the virus-led quasi-emergency towards early March amid record daily infections.
Against this backdrop, the US 10-year Treasury yields added two basis points to 1.936%, close to the highest levels since late 2020, while the US stock future print mild gains around 4,485 at the latest. That said, the benchmark US T-bond coupons eased from a two-year high the previous day while Wall Street marked sluggish closing.
Additionally, stocks in the Asia-Pacific region also grind higher to portray slightly positive market sentiment while the US Dollar Index (DXY) struggles around a multi-day low as traders await clear signals on the Fed’s next move.
While the US inflation data will be crucial for the short-term gold moves, today’s US Goods and Services Trade Balance for December, expected $-83B versus $-80.2B, can offer intraday directions. However, major attention will be given to risk catalysts.
Read: Do not expect volatility to ease as US CPI is due this week
Technical analysis
Gold extends late January’s rebound from 61.8% Fibonacci retracement (Fibo.) of September-November 2021 upside to regain its place above the 200-DMA.
As the receding bearish bias of MACD and gradually improving RSI line back the bullion’s run-up beyond the 200-DMA, a support-turned-resistance line from December 15, 2021, near $1,825, challenges immediate upside.
Also acting as the key short-term upside hurdle is a five-week-old horizontal area between $1,828-32, a break of which will give the command to gold buyers aiming for a fresh 2022 peak, beyond the latest $1,853.
Alternatively, the 200-DMA level of $1,806 and the $1,800 threshold may test short-term pullbacks of gold prices.
Following that, the 61.8% and 78.6% Fibo. levels near $1,780 and $1,753 respectively will lure the bears.
However, a clear downside past $1,753 won’t hesitate to challenge September 2021 low near $1,721.
Gold: Daily chart
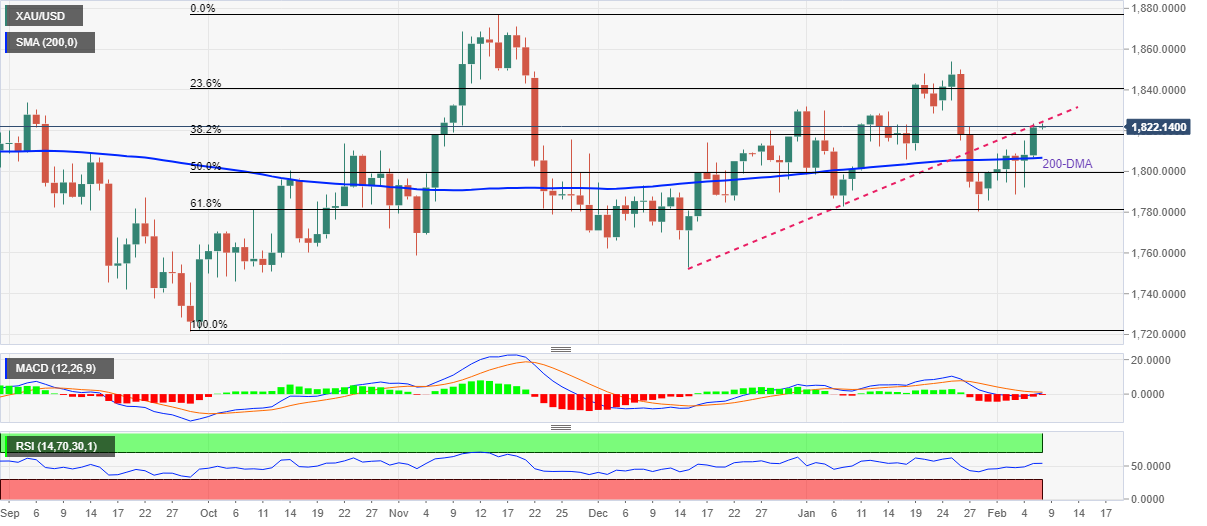
Trend: Further recovery expected
| Raw materials | Closed | Change, % |
|---|---|---|
| Brent | 92.93 | -0.15 |
| Silver | 23.008 | 1.99 |
| Gold | 1820.5 | 0.67 |
| Palladium | 2261.75 | -1.18 |
The People’s Bank of China (PBOC) could roll out more monetary policy measures to support the economic growth, the China Securities Journal said in a column citing experts' opinions.
Key takeaways
“China still has more room to tweak its monetary policies to aid growth even after the cuts to reserve ratios and interest rates, but it will use its abundant policy reserve at the "right time and rhythm.”
“With overall demand weak, the government first needs policies that generate immediate impacts, such as technological and urban infrastructure investment.”
“These measures will optimize the economic structure in the longer term.”
- NZD/USD grinds higher around intraday, keeps the previous day’s recovery moves.
- Firmer RSI, successful bounce off short-term horizontal area and 50-SMA keep buyers hopeful.
- 13-day-old descending trend line, 100-SMA will challenge recovery moves.
NZD/USD extends the week-start gains towards 0.6650, up 0.15% intraday near 0.6640 during Tuesday’s Asian session.
The Kiwi pair recently paid a little heed to the comments from the Reserve Bank of New Zealand (RBNZ) Governor Adrian Orr to stay beyond a week-long horizontal support zone, not to forget the 50-SMA, amid a firmer RSI line.
It’s worth noting, however, that the NZD/USD bulls need validation from a fortnight-old descending resistance line near 0.6665, as well as the 100-SMA level of 0.6675, to extend the latest rebound.
On the contrary, pullback moves remain elusive until the quote stays beyond the stated horizontal support region near 0.6590-95.
That said, the 50-SMA level of 0.6610 will test the NZD/USD pair’s immediate downside.
In a case where the pair drops below 0.6590, January’s low of 0.6529 and the 0.6500 threshold will be on the bear’s radar.
NZD/USD: Four-hour chart
08022022-637798838966279258.png)
Trend: Further upside expected
- USD/CAD registers another bounce off 50-day EMA to consolidate recent losses.
- Firmer yields, DXY underpin corrective pullback as oil buyers take a breather.
- Headlines concerning Russia, China and Canadian politics may entertain intraday traders ahead of US, Canada trade numbers.
USD/CAD licks its wounds around 1.2675 during the mid-Asian session on Tuesday, following the heaviest daily fall in four weeks.
Cautious optimism in the market joins pullback in prices of Canada’s main export item WTI crude oil to underpin the latest rebound. However, mixed concerns and cautious sentiment ahead of the December month trade numbers from the US and Canada seem to test the Loonie pair’s corrective pullback of late.
That said, WTI crude oil prices extend the previous day’s pullback from a multi-day high, down 0.4% intraday around $90.00 by the press time. In doing so, the black gold seems to justify the recent pause in the US Treasury yields, after easing from a two-year top on Monday. Also challenging the oil traders are the Sino-American trade tussles and recently downbeat China data. It should be noted, however, that the risk of a Russia-Ukraine war and fears of the OPEC+ members’ inability to meet production hike targets keep the energy buyers hopeful.
Elsewhere, truckers’ protests in Canada and US-China trade tussles also seem to help the USD/CAD buyers amid a sluggish Asian session.
Against this backdrop, the US 10-year Treasury yields rose 1.6 basis points to 1.93%, close to the highest levels since late 2020, while the US stock future print mild gains around 4,485 at the latest. That said, the benchmark US T-bond coupons eased from a two-year high the previous day while Wall Street marked sluggish closing. Additionally, stocks in the Asia-Pacific region also grind higher to portray slightly positive market sentiment.
Looking forward, the US Goods and Services Trade Balance for December, expected $-83B versus $-80.2B, will precede Canada’s International Merchandise Trade for the stated month, expected $2.62B against $3.13B, to entertain intraday traders of the USD/CAD pair. However, major attention will be given to the risk catalysts and Thursday’s US Consumer Price Index for January.
Technical analysis
Sustained trading beyond the 50-day EMA, around 1.2665 by the press time, keeps USD/CAD buyers hopeful to mark another battle with the six-week-old resistance line near 1.2785.
- GBP/USD is sideways in Asia as markets consolidate ahead of catalysts later in the week.
- UK GDP and US CPI could move the needle in financial markets.
GBP/USD is flat on the session and has moved within a range of 1.3520 and 1.3539 on the session so far after it dipped under 1.3500 in European markets before returning to 1.3535 thereafter. It's been one of those starts to the week where there is no momentum one way or the other as the markets digest the events of the prior week and await the next catalyst.
The US dollar and the euro both eased and the pound was able to recover from the initial offer following a hawkish surprise from the European Central Bank last week and in US Nonfarm Payrolls. The ECB has left the door open for a rate hike later in 2022 should inflation risks rise. However, President Christine Lagarde calmed market expectations when she told a European Parliament hearing that there is no need for big monetary policy tightening in the eurozone. She said inflation is set to decline and could stabilize around the ECB's target of 2%.
Meanwhile, Friday's Nonfarm Payrolls data was showing an unexpected jump in US jobs created in January. This supported a bid in the greenback initially before it soon fizzled out into the close and moved sideways for the opening sessions of this week.
Looking ahead, the markets will turn to the US Consumer Price Index that is slated for Thursday. Domestically, UK Gross Domestic Product is on the cards as a potential catalyst for the pound. ''We look for UK GDP to contract 0.8% MoM in December, thus bringing GDP below its pre-COVID level once again,'' analysts at TD Securities said,
''Manufacturing likely declined 0.3% MoM, while we expect the services sector to contract 0.9% MoM, in part driven by voluntary COVID measures and a substantial amount of people isolating due to the Omicron surge, but also due to a fade in consumer demand.''
Analysts at Bank of America (BofA) justify their outlook on seven rate hikes by the US Federal Reserve (Fed) this year.
Key quotes
“Rapidly rising wages as a key factor in their projection of seven interest rate rises to come in 2022:
7*0.25% increases in 2022
4*0.25% to follow in 2023.”
“If I’m the Fed, I’m getting more nervous that it’s not just a few outliers.”
“If I were the Fed chair ... I would have raised rates early in the fall. When we get this broad-based increase and it starts making its way to wages, you’re behind the curve and you need to start moving.”
- GBP/JPY stays firmer around intraday high, snaps two-day downtrend.
- Bullish chart pattern, sustained trading beyond key SMAs keep buyers hopeful.
- MACD conditions challenge the upside momentum, monthly high adds to the upside filters.
GBP/JPY consolidates recent gains as it pokes the bull flag’s resistance around 156.00, up 0.18% intraday during Tuesday’s Asian session.
In doing so, the cross-currency pair justifies the sustained trading above 200 and 100 SMAs inside a bullish chart pattern. It’s worth noting, however, that the MACD signals do challenge GBP/JPY bears.
Hence, a clear upside break of the 156.15 level becomes necessary for the pair buyers to keep reins.
Following that, the monthly high near 156.50 will validate the run-up towards the theoretical target near 162.00.
During the run-up tops marked in January 2022 and October 2021, respectively around 157.70-75 and 158.20-25, will act as buffers.
Meanwhile, pullback moves may initially challenge the 200-SMA and the 100-SMA levels, around 155.45 and 155.05 in that order.
Though, the lower line of the stated flag, close to 155.00, will challenge the GBP/JPY bears afterward.
GBP/JPY: Four-hour chart
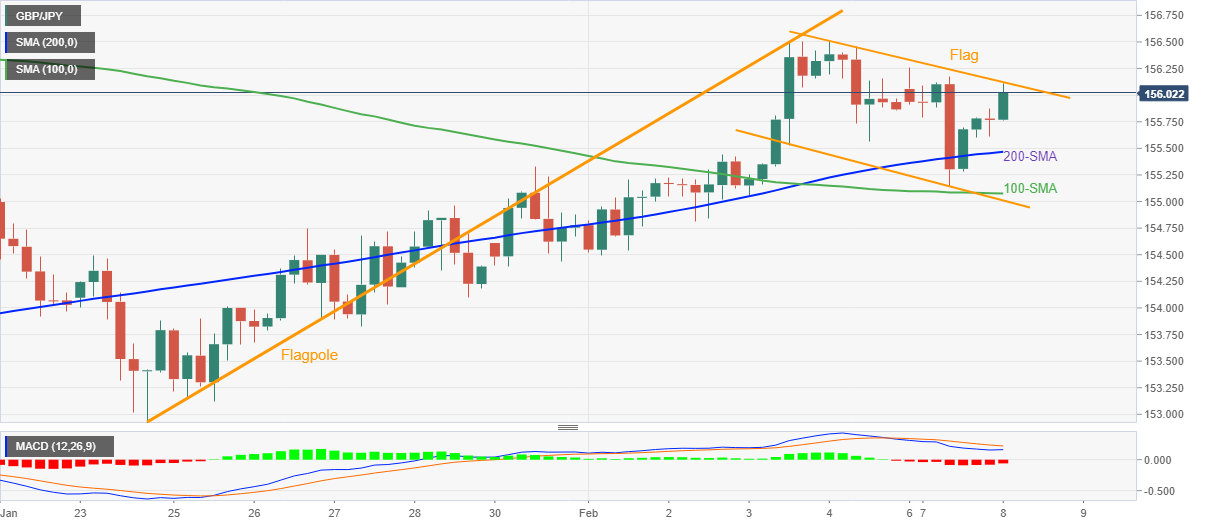
Trend: Further upside expected
Economist John Edwards, who once sat on the policy-setting board of the Reserve Bank of Australia said in an interview earlier today that the RBA could raise interest rates four times in quick succession late in 2022.
Edwards, who is given plenty of press time when it comes to his insights into the RBA's thinking, explained that given the current upward trajectory of the economy, slow and incremental hikes could be on the table considering that ''there is no point in one increase.'' If this were the case, this implies a cash rate of 1% by the end of the year.
Mr. Edwards warns that the cautious plod of the RBA could end quickly.
However, the RBA doesn’t expect growth in the Wage Price Index to reach 3% until mid-2023, and as such, the market has concluded that there will be no immanant hawkish from the bank which leaves the currency on the back foot.
''We think the RBA’s wages outlook is too pessimistic which lies behind our expectation that the RBA will begin raising the cash rate in the second half of 2022,'' analysts at ANZ Bank recently argued. Westpac’s view remains for the RBA to raise the cash rate to 0.25% in August and to 0.50% in October.
As for AUD/USD, it is continuing with its hourly advance on the session, printing fresh highs of 0.7137.
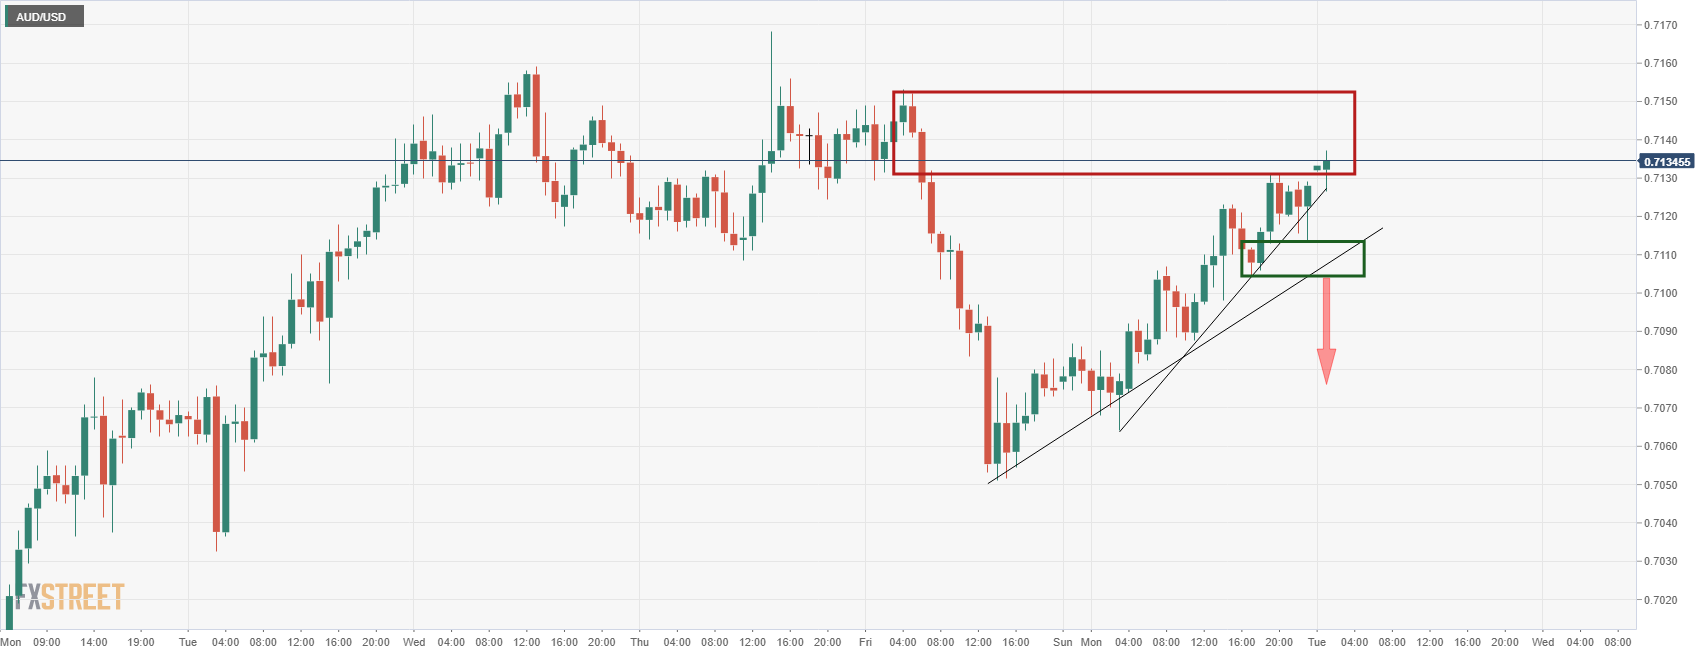
| Time | Country | Event | Period | Previous value | Forecast |
|---|---|---|---|---|---|
| 00:30 (GMT) | Australia | National Australia Bank's Business Confidence | January | -12 | |
| 05:00 (GMT) | Japan | Eco Watchers Survey: Current | January | 56.4 | |
| 05:00 (GMT) | Japan | Eco Watchers Survey: Outlook | January | 49.4 | |
| 07:45 (GMT) | France | Trade Balance, bln | December | -9.73 | |
| 13:30 (GMT) | Canada | Trade balance, billions | December | 3.13 | 2.5 |
| 13:30 (GMT) | U.S. | International Trade, bln | December | -80.2 | -83 |
| 23:30 (GMT) | Australia | Westpac Consumer Confidence | February | 102.2 |
- US 10-year Treasury yields reverse pullback from two-year high, S&P 500 Futures print snap three-day downtrend.
- Mixed trade, geopolitical concerns join a light calendar to overcome recent market fears led by major central banks.
- US inflation data will be crucial, risk catalysts, US trade numbers may entertain intraday traders.
Market sentiment turns cautiously optimistic during Tuesday’s Asian session, following the risk-off week.
The latest improvement in the mood could be linked to the slightly easy tone of Russian President Vladimir Putin and positive trade developments between the US and Japan. On the same line is the recent print of the US inflation expectations, per the 10-year, breakeven inflation rate per the St. Louis Federal Reserve (FRED) data, which in turn challenges Fed hawks and recede fears of faster contraction of the easy money policies.
Alternatively, the harsh tone of the political leaders from the US and the UK keeps the risk of a Russia-Ukraine war on the table, which in turn challenges the risk appetite. Additionally, worsening covid woes in Japan and Hong Kong, not to forget the US-China trade tussles, challenge the market optimism.
“Hong Kong Chief Executive Carrie Lam is set to discuss further restrictions at an Executive Council meeting on Tuesday after a record number of new coronavirus infections were reported, with cases doubling every three days,” said Bloomberg. On the other hand, Japan’s Tokyo is up for extending the virus-led quasi-emergency towards early March amid record daily infections.
It’s worth noting that China’s return from a week-long holiday, coupled with a readiness to infuse markets at home and battle the hawkish major central banks, added to the risk-on mood.
Amid these plays, the US 10-year Treasury yields rose 1.6 basis points to 1.93%, close to the highest levels since late 2020, while the US stock future print mild gains around 4,485 at the latest. That said, the benchmark US T-bond coupons eased from a two-year high the previous day while Wall Street marked sluggish closing. Additionally, stocks in the Asia-Pacific region also grind higher to portray slightly positive market sentiment.
Looking forward, risk catalysts may entertain market players ahead of the US Goods and Services Trade Balance for December, expected $-83B versus $-80.2B. However, major attention will be given to Thursday’s key US Consumer Price Index (CPI).
Read: Do not expect volatility to ease as US CPI is due this week
In recent trade today, the People’s Bank of China (PBOC) set the yuan (CNY) at 6.3569 vs the estimated 6.3543 and previous 6.3580.
About the fix
China maintains strict control of the yuan’s rate on the mainland.
The onshore yuan (CNY) differs from the offshore one (CNH) in trading restrictions, this last one is not as tightly controlled.
Each morning, the People’s Bank of China (PBOC) sets a so-called daily midpoint fix, based on the yuan’s previous day closing level and quotations taken from the inter-bank dealer.
EUR/USD pauses the previous day’s pullback from a three-month high around 1.1445-50 during Tuesday’s Asian session.
In doing so, the major currency pair seems to benefit from the market’s risk-on mood while ignoring the recent rebound in the US Treasury yields and downbeat signals from the options market.
That said, one-month risk reversal (RR) on EUR/USD, a measure of the spread between the call and put prices dropped for the first time in six days to -0.1000 at the latest, by the end of Monday’s North American session per data source Reuters.
While the risk-on mood can be linked to the cautious optimism over the US-Japan trade deal and Russia-Ukraine issues, fears of hawkish central bank actions challenge the EUR/USD buyers. Moving on, US Goods and Services Trade Balance for December, expected $-83B versus $-80.2B, may offer intermediate clues to the EUR/USD ahead of Thursday’s key US Consumer Price Index (CPI).
Read: EUR/USD Price Analysis: 100-DMA defends bulls around 1.1450
- AUD/USD bulls move in on a critical resistance structure.
- Eyes are on the weekly M-formation's neckline.
AUD/USD bulls are taking charge in the Asian session and are printing fresh hourly highs for the week's business so far:
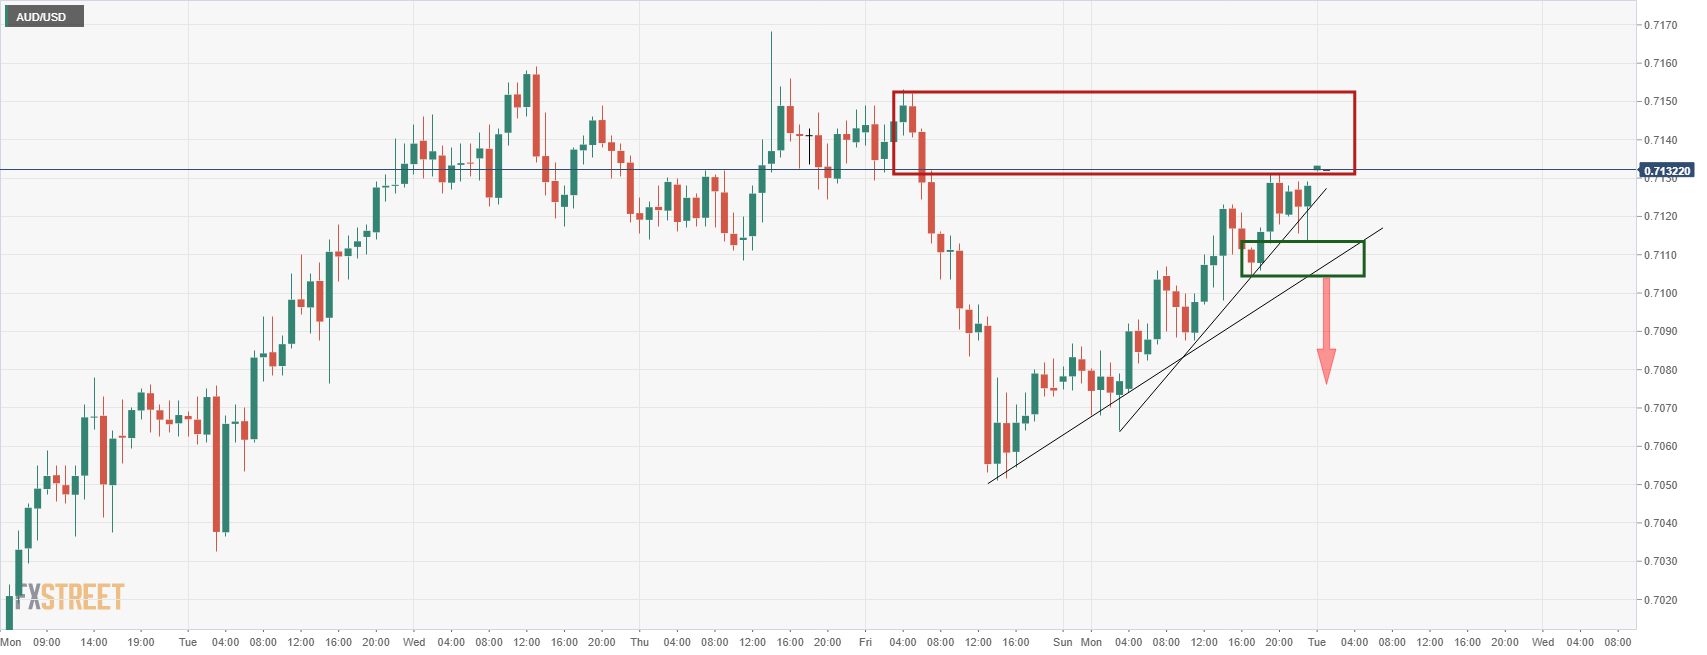
Meanwhile, as per the prior analysis, AUD/USD Price Analysis: Bears sink their teeth into US Nonfarm Payrolls, we have seen mitigation taking place on the daily charts. The bears will not need to show up if the downside thesis is going to play out in the near future.
AUD/USD prior analysis
At the start of the week's price analysis, it was stated that there was the potential for the mitigation of the markdown and the imbalance thereof: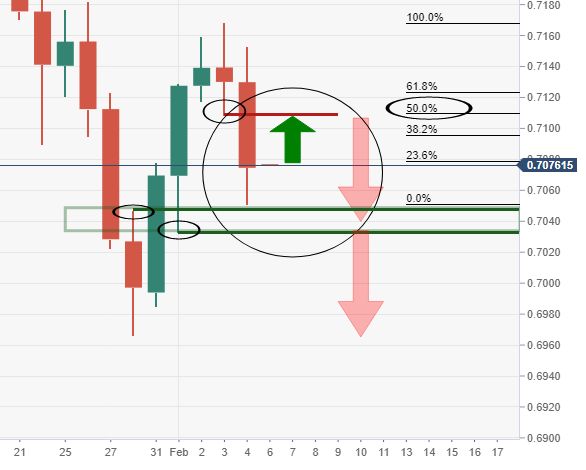
This has played out, but the bulls have run with it and taken on the 61.8% retracement of the prior bearish impulse:
AUD/USD live market
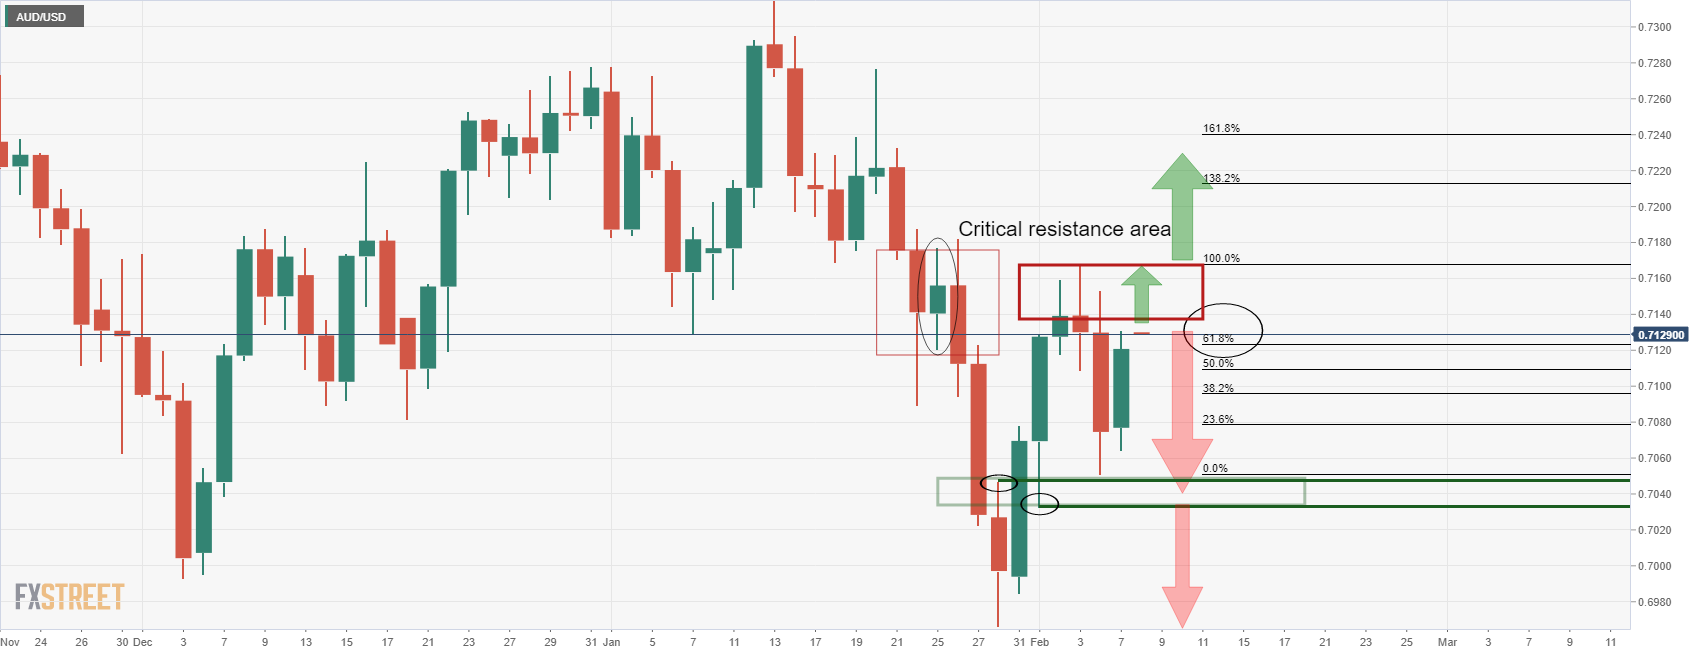
AUD/USD weekly chart
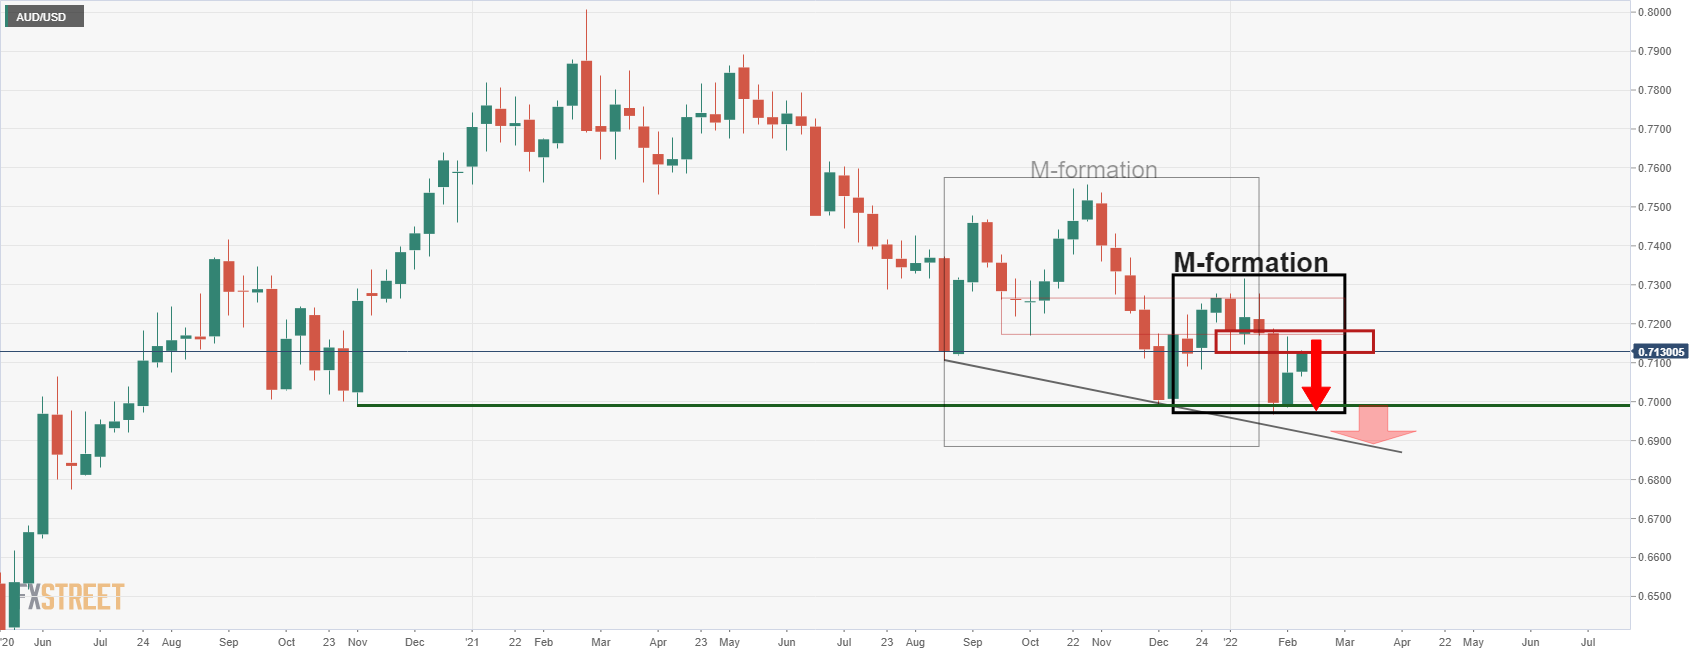
The bears will be lurking now and if they commit, then the completion of the M-formation's retracement to the neckline on the weekly chart will tilt the bias back into the bear's hands once again.
- DXY seesaws between previous support line from May and 100-DMA.
- 14-week-old support line adds to the downside filter.
- Sluggish Momentum hints at further grinding towards the north.
US Dollar Index (DXY) holds onto the previous day’s bounce off 100-DMA around 95.40 during Tuesday’s Asian session.
Even so, the greenback gauge needs to cross the support-turned-resistance line from May 25, 2021, near 95.70, which challenges the quote’s immediate upside.
Although the Momentum line tests the buyers, the quote’s ability to stay beyond short-term key supports, namely the 100-DMA level of 95.25 and the multi-day-old support line close to the 95.00 threshold, keeps DXY bulls hopeful.
That said, the US Dollar Index run-up beyond 95.70 will aim for the 96.00 round figure ahead of the challenging November 2021 peak near 97.00.
It’s worth mentioning that the quote’s rise past 97.00 won’t hesitate to challenge January’s peak of 97.44.
On the contrary, a downside break of 95.00 will strength bearish impulsive and hit 2022 low near 94.60. Adding to the downside filters is the October 2021 peak surrounding 94.55.
DXY: Daily chart
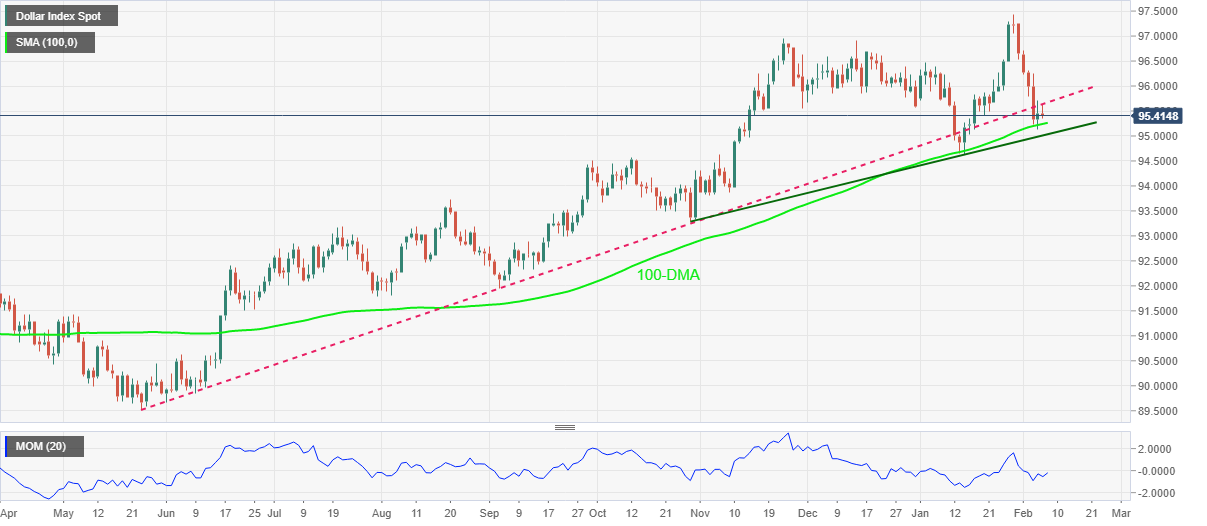
Trend: Further rebound expected
- USD/JPY reverses the previous day’s losses, picks up bids to refresh intraday high of late.
- US 10-year Treasury yields regain upside momentum, equities dwindle.
- Japan's economics came in mixed, covid-led measures likely to extend in Tokyo.
- Trade, geopolitical headlines entertain traders ahead of second-tier US data.
USD/JPY takes the bids to refresh intraday high around 115.20, consolidating the week-start losses as Tokyo opens for Tuesday.
The yen pair’s recent run-up could be linked to the cautious optimism in the market, as well as recovery in the US bond coupons after a sluggish start. It’s worth noting that mixed data at home and virus woes challenge the recent advances ahead of the US trade numbers.
The US 10-year Treasury yields rose 1.1 basis points to 1.92%, close to the highest levels since late 2020, while the US stock future print mild gains around 4,485 at the latest. That said, the benchmark US T-bond coupons eased from a two-year high the previous day while Wall Street marked sluggish closing.
Talking about data, Japan’s Overall Household Spending dropped to -0.20% YoY in December versus +0.3% forecast and -1.3% prior. On the same line were Current Account details for December, ¥-370.8B versus market consensus of ¥73.5B and ¥897.3B previous readouts. Though, the Trade Balance - BOP Basis improved to ¥-318.7B from ¥-431.3B during the stated month.
It’s worth noting that the US-Japan talks over easing Trump-era steel tariffs and Russia’s recently confirmatory tone add to the bullish bias of the risk-barometer pair.
On the contrary, the US-China trade tussles and fears of the hawkish Fed challenge market’s optimism, underpinning the US dollar and the USD/JPY prices. “China-US trade faces new threats in 2022, with no new deal in sight,” said the South China Morning Post (SCMP).
Also read:
Moving on, the US Goods and Services Trade Balance for December, expected $-83B versus $-80.2B, may offer intermediate clues to the USD/JPY prices ahead of Thursday’s key US Consumer Price Index (CPI).
Read: Do not expect volatility to ease as US CPI is due this week
Technical analysis
A bearish spinning top candlestick on the daily play challenges USD/JPY buyers below the one-month-old resistance line near 115.35.
- USD/CAD bulls need to move in at this juncture or face significant risks of a downside breakout.
- The inverse H&S thesis is on the verge of breaking down and 1.2610/20 could be critical in this regard.
The price is stalling at previous H1 wick lows that have a confluence between the 38.2% Fibonacci retracement level and 50% mean reversion of prior bearish impulse.
USD/CAD H1 chart
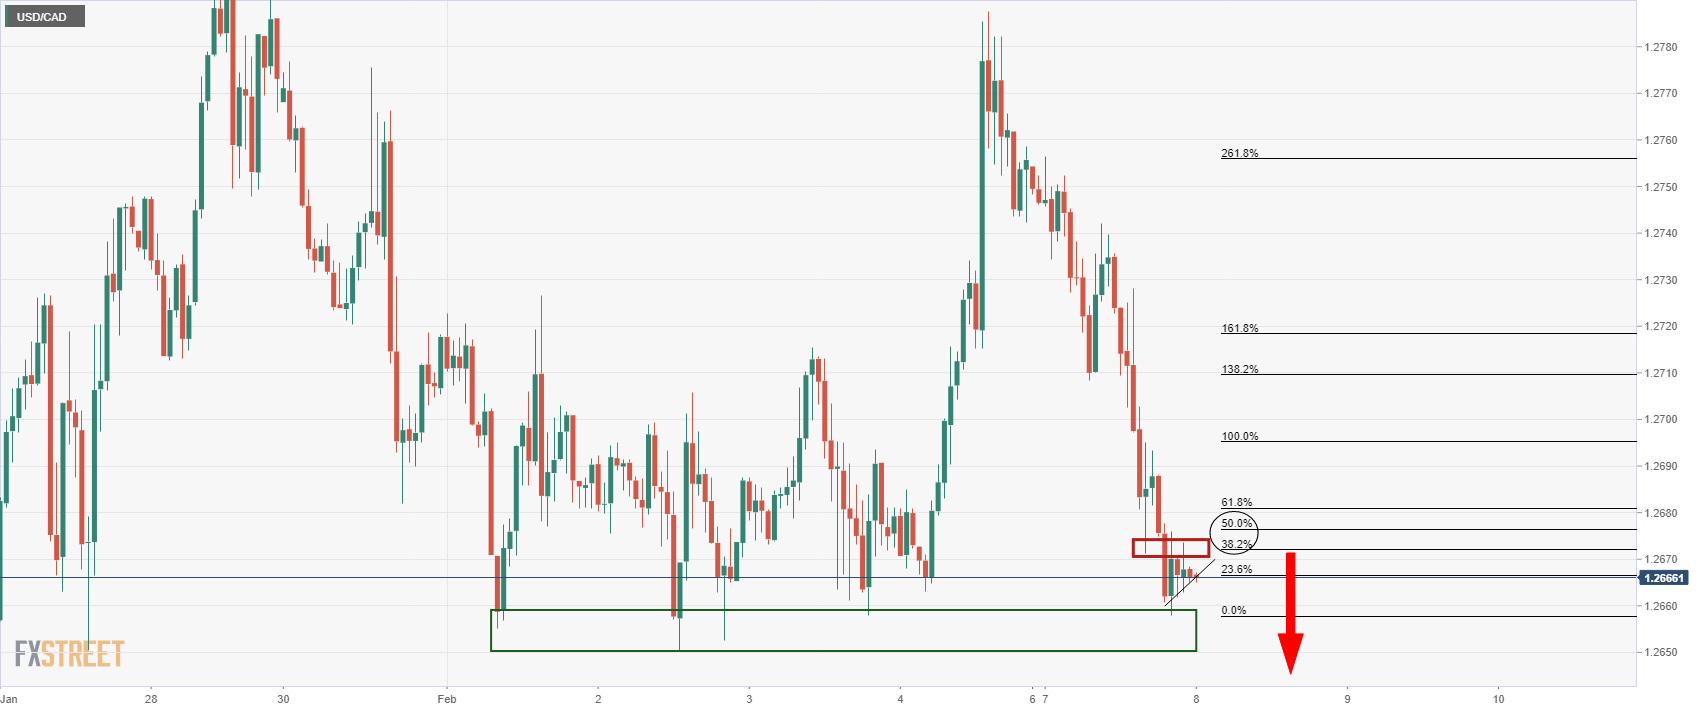
If bears commit, then the prospects of a meanwhile continuation for the sessions ahead open risk to test below 1.2650. 1.2580 will then be eyed:
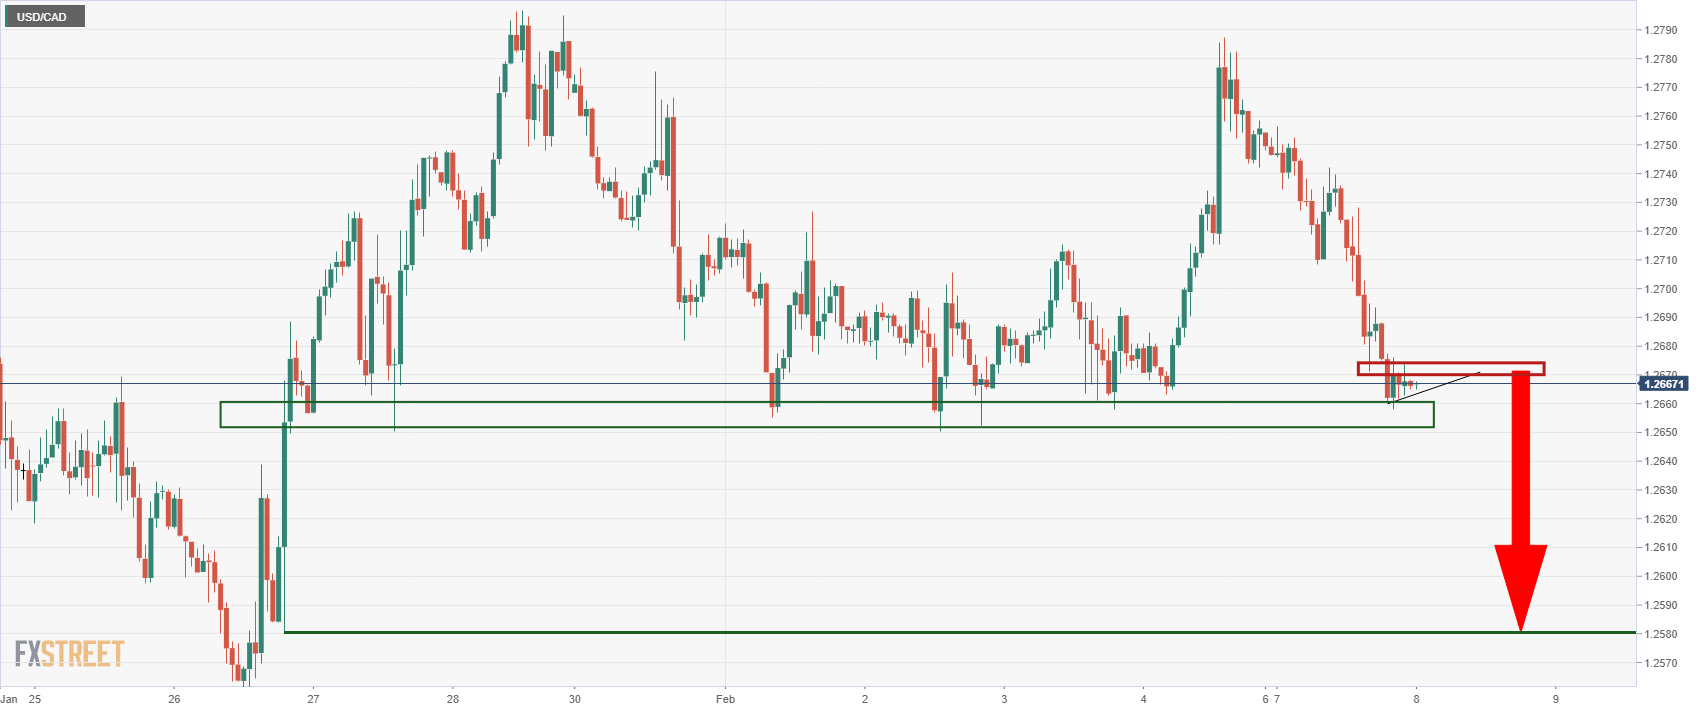
USD/CAD longerterm outlook
Meanwhile, as per the prior analysis, USD/CAD Price Analysis: Bulls failed to break out, but Inverse H&S could now be the ticket, there is the case for the upside as follows:
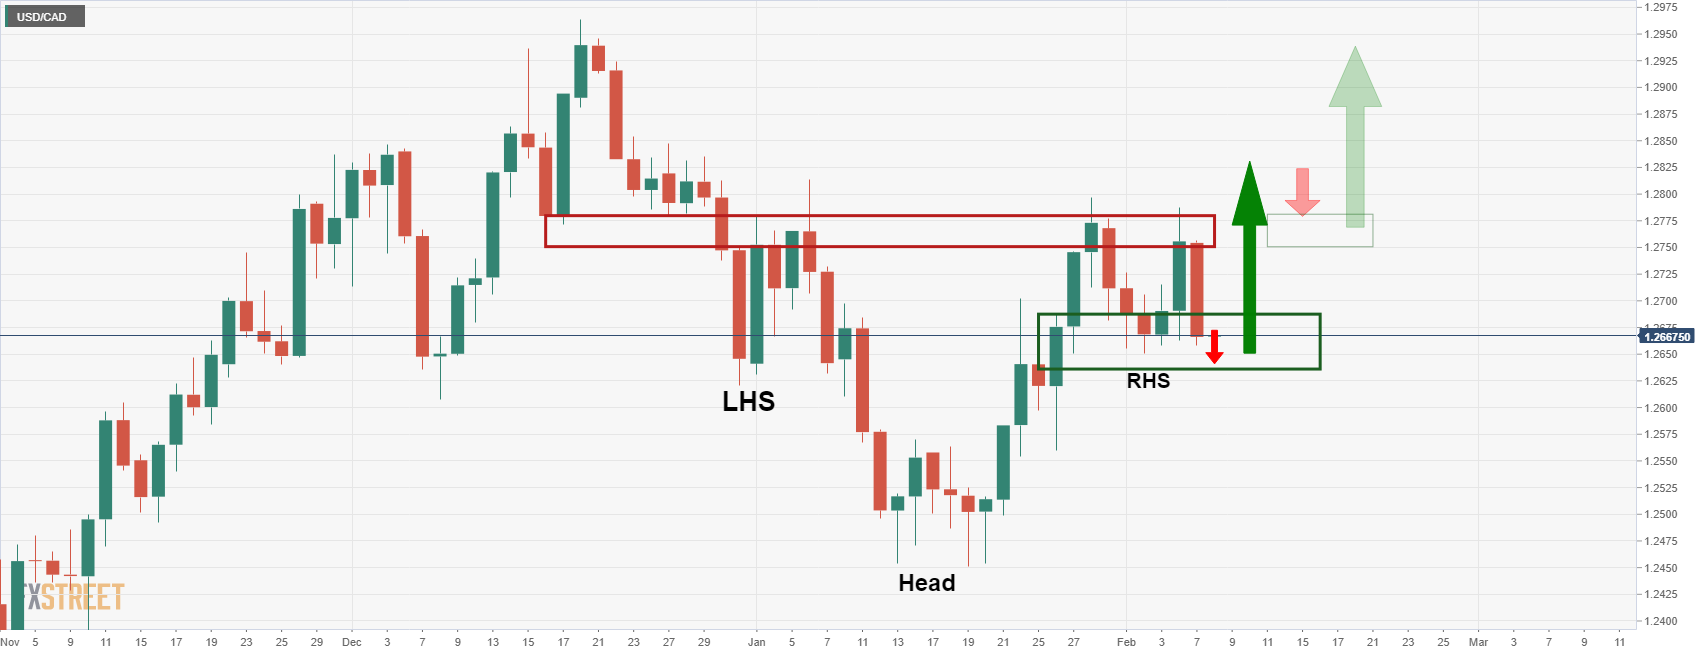
Therefore, it will be imperative that the shorter-term time frame support structures hold up under the current pressure. 1.2610/20 could be important in this regard.
| Pare | Closed | Change, % |
|---|---|---|
| AUDUSD | 0.71224 | 0.61 |
| EURJPY | 131.652 | -0.31 |
| EURUSD | 1.14392 | -0.15 |
| GBPJPY | 155.766 | -0.15 |
| GBPUSD | 1.35348 | -0 |
| NZDUSD | 0.66325 | 0.31 |
| USDCAD | 1.26674 | -0.63 |
| USDCHF | 0.92353 | -0.16 |
| USDJPY | 115.09 | -0.15 |
Morgan Stanley (MS) conveyed bullish bias for the Euro currency, also shared a hawkish view for the European Central Bank (ECB) monetary policy meeting in March, during the latest analysis.
MS initially said, “We turn bullish on the EUR in the wake of the hawkish ECB meeting and recommend long EUR versus USD, JPY, and GBP,” while matching most market consensus.
However, the investment bank cites inflation concerns to hope for a hawkish ECB outcome in March. “Firming inflation seems to have prompted elevated concern from ECB policymakers (who expressed "unanimous concern" about inflation), and it seems increasingly likely that the ECB will hawkishly recalibrate policy at its March meeting," said MS.
While the ECB is a bit far, the European Commission’s Economic Growth Forecasts, up for publishing on Thursday, together with the US Consumer Price Index (CPI) data, will be crucial for short-term EUR/USD moves.
Read: EUR/USD Price Analysis: 100-DMA defends bulls around 1.1450
© 2000-2026. All rights reserved.
This site is managed by Teletrade D.J. LLC 2351 LLC 2022 (Euro House, Richmond Hill Road, Kingstown, VC0100, St. Vincent and the Grenadines).
The information on this website is for informational purposes only and does not constitute any investment advice.
The company does not serve or provide services to customers who are residents of the US, Canada, Iran, The Democratic People's Republic of Korea, Yemen and FATF blacklisted countries.
Making transactions on financial markets with marginal financial instruments opens up wide possibilities and allows investors who are willing to take risks to earn high profits, carrying a potentially high risk of losses at the same time. Therefore you should responsibly approach the issue of choosing the appropriate investment strategy, taking the available resources into account, before starting trading.
Use of the information: full or partial use of materials from this website must always be referenced to TeleTrade as the source of information. Use of the materials on the Internet must be accompanied by a hyperlink to teletrade.org. Automatic import of materials and information from this website is prohibited.
Please contact our PR department if you have any questions or need assistance at pr@teletrade.global.
