- Analytics
- News and Tools
- Market News
CFD Markets News and Forecasts — 07-03-2022
- GBP/JPY remains pressured around 11-week low even as bears take a breather after three-day downtrend.
- Clear break of 18-month-old support line joins bearish MACD signals and sustained trading below 200-DMA to favor sellers.
- Late 2021 lows on the bear’s radar, buyers need validation from the monthly resistance line.
GBP/JPY struggles to defend 151.00, steady near the lowest levels since late December during Tuesday’s Asian session.
The cross-currency pair refreshed the multi-day low the previous day while extending the last week’s downside break of an ascending support line from September 2020, now a resistance line around 152.40.
Adding strength to the bearish bias are the downbeat MACD signals and the pair’s sustained trading below the 200-DMA, as well as a one-month-old resistance line.
That said, GBP/JPY bears are on the way to challenge late 2021 lows around 149.00. However, lows marked during late July and February of the last year, respectively around 148.45 and 147.40, will challenge the pair’s further downside.
Meanwhile, the previous support from late 2020 challenges the quote’s recovery moves near 152.40.
Following that, the 200-DMA and a descending trend line from February 10, near 153.40 and 154.65 in that order, will challenge the GBP/USD buyers before giving back control to them.
GBP/JPY: Daily chart
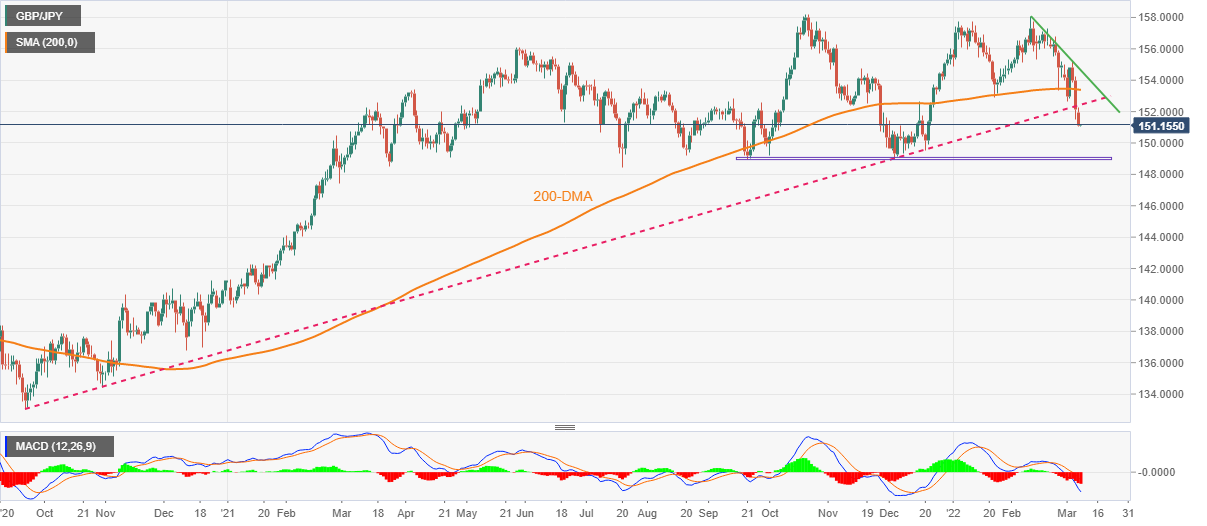
Trend: Further weakness expected
- Silver picks up bids to reverse the previous day’s pullback from eight-month high.
- Ukraine-Russia headlines propel rush to risk-safety, EU’s resistance in banning Russian oil imports triggered earlier pullback.
- Wall Street closed in the red, yields rebound while the US dollar remains firmer.
- Further upside can’t be ruled out as geopolitics fan inflation fears.
Although a pullback from multi-day top probed silver (XAG/USD) buyers the previous day, the bright metal begins Tuesday’s Asian session trading on a front foot around $25.60 as geopolitical fears from Ukraine extend the risk-aversion wave.
Silver prices rose to the highest since July 2021 the previous day as risks to the global supply chain emanating from Ukraine-Russia tussles escalated as the US intends to go ahead with banning Moscow’s oil. However, a lack of support from the European Union (EU) and the bloc’s emphasis on other means to punish Moscow for its invasion of Ukraine seems to have triggered the profit-booking mood afterward.
On the same line was a halt in Russian fire in selected Ukrainian cities, as well as a restart of the human corridor after a two-day break.
Even so, “Ukrainian officials said a Russian airstrike hit a bread factory in northern Ukraine on Monday, killing at least 13 civilians, while talks between Kyiv and Moscow made little progress towards easing the conflict,” said Reuters.
It’s worth noting that the US Treasury yields recovered from a two-month low while the Wall Street benchmarks closed in the red and the US Dollar Index (DXY) also cheered the risk-off mood.
As inflation fears push global central banks towards faster rate hikes, the traditional safe-havens are likely to remain in the demand. That said, the XAG/USD bulls may keep their eyes on this week’s US Consumer Price Index (CPI) data amid indecision over the Fed’s 0.50% rate-hike, even as a 0.25% uplift is almost given.
Technical analysis
Unless trading beyond the November 2021 tops surrounding $25.40, XAG/USD remains capable of challenging the 61.8% Fibonacci retracement of the May-September 2021 downside, near $26.00.
- USD/CAD eyes on 1.2880 on long liquidations in WTI.
- The underlying risk-aversion theme has strengthened the greenback against the loonie.
- US CPI numbers and Canada’s Employment Change data will decorate the economic calendar this week.
The USD/CAD pair has witnessed a firmer rally on Monday as the West Texas Intermediate (WTI) oil pares gains on the intraday bullish opening gap. The pair has activated buyers after overstepping 1.2800 and is aiming to recapture February 24 high at 1.2876.
Earlier, WTI was skyrocketing on expected prohibition of Russian oil imports to the US and its allies. US President Joe Biden initially decided to isolate the Kremlin on its invasion of Ukraine and a ban on the import of oil from Russia. It was likely that other allies would follow the footprints of the US. However, Germany, being the biggest buyer of Russian crude oil, rejected plans to ban energy imports.
The statement from German Chancellor Olaf Scholz that “Germany is accelerating its plans to expand its use of alternative energy sources but cannot halt imports of Russian energy overnight” has barricaded the rally in the oil prices. This has strengthened the greenback against the loonie.
Adding to the oil plunge, the loonie has been hammered amid broader risk-aversion in the market. The US dollar index (DXY) has climbed above 99.00 on rising bets over a significant hawkish stance in interest rate decision by the Federal Reserve (Fed) in its March monetary policy meeting.
Although the headlines from the Russia-Ukraine war will dictate the likely action in the pair, investors will also focus on the US Consumer Price Index (CPI) data, which is due on Thursday. While Canada’s docket will report the Employment Change data on Friday.
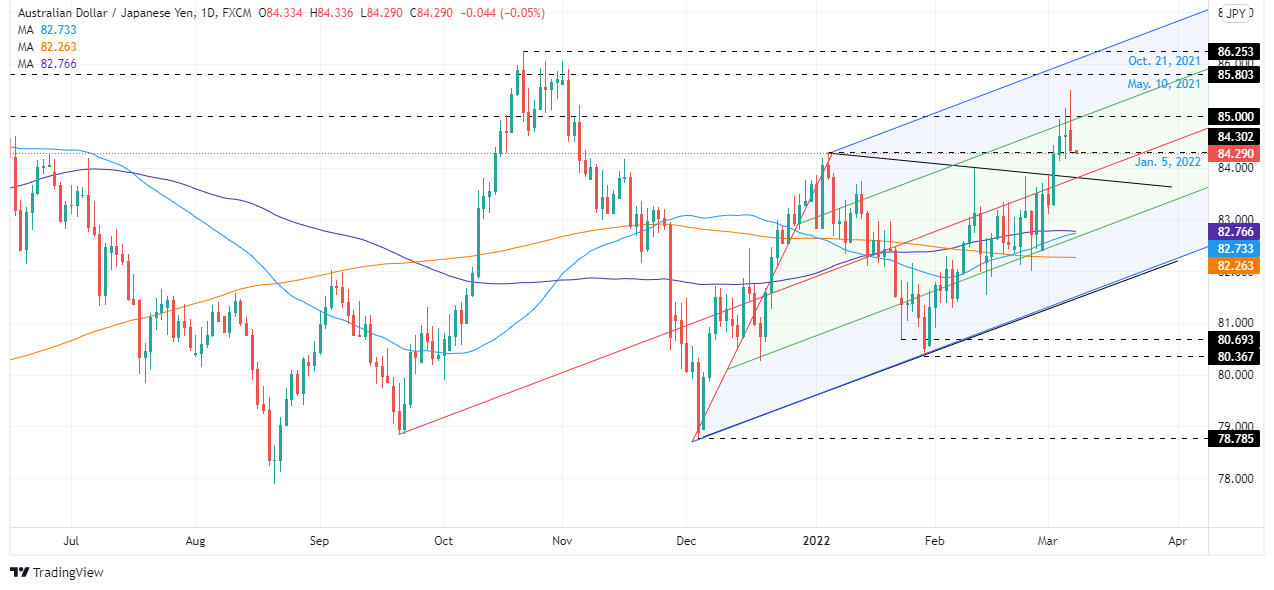
- The Australian dollar remains in a solid-uptrend vs. the yen, but the market sentiment significantly influences the pair.
- AUD/JPY is upward biased might consolidate in the near term around 84.30-85.25.
- AUD/JPY would remain bullish above 83.00; otherwise could turn bearish due to the closeness of the 50 and 100-day moving averages (DMAs) near the former.
The AUD/JPY was eyeing a solid beginning of the week, reaching a YTD high at 85.50, but a swing in market mood, which previously was ignored by market participants, spurred a 120-pip plunge from daily highs to the daily low around 84.30. At 84.36, the AUD/JPY reflects the risk-aversion in the financial markets, as negotiations between Russia-Ukraine do not abate the conflict.
Monday’s global equity markets finished in a blood bath, with losses between 0.44% and 3.88%. In the FX space, the greenback is the gainer, followed closely by the JPY, which recovered late in the New York session.
AUD/JPY Price Forecast: Technical outlook
The price action in the AUD/JPY depicts the pair as upward biased, though Monday’s rally stalling at 85.50 illustrates exhaustion in the uptrend, though so far is achieving to record the daily close above previous two-day lows. The Average True Range (ATR) of the cross-currency pair is 97 pips, so that would keep the AUD/JPY in consolidation around the 84.30-85.25 area.
If that scenario plays out, the AUD/JPY first resistance would be Pitchfork’s mid-line between the top and the 50% parallel line, around 85.00. Breach of the latter would expose 85.25, followed by 85.50, and next to the confluence of May 10. 2021, and Pitchfork’s top trendline around 85.80-86.00.
On the flip side, it would turn bearish in the near term if AUD/JPY trades below 83.00.
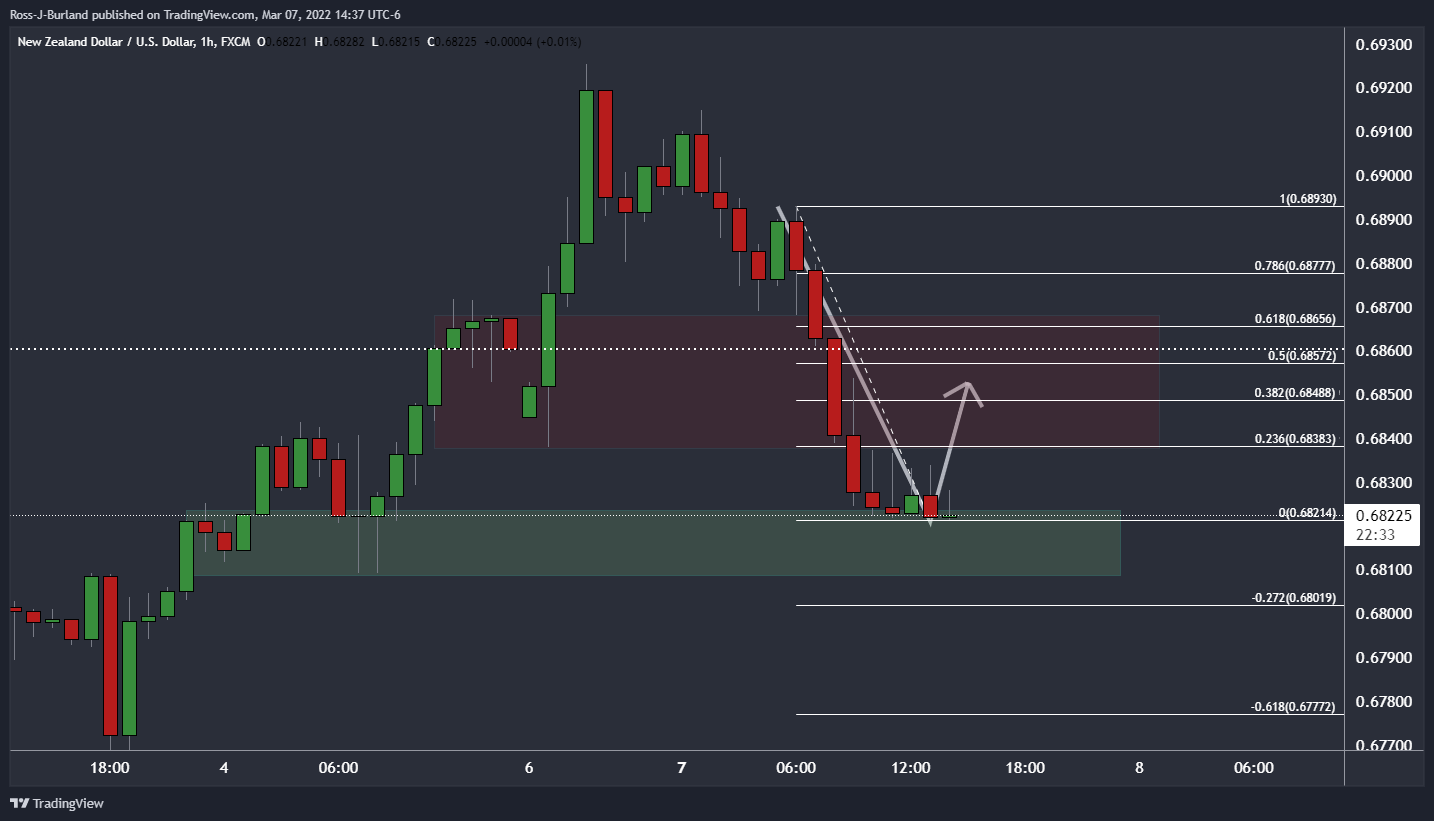
- NZD/USD bulls move in at the lows of the day and a correction into 0.6850 could be on the cards.
- The US dollar was on the verge of a test into 100 DXY as US yields recover.
NZD/USD's sell-off is decelerating in late New York after falling some 0.55% on the day. The bulls are moving in on what might be regarded as a bargain near the lows of the day at 0.6821. It has been a US yields/dollar and oil story at the start of the week.
The greenback has rallied to almost just half a point shy of 100.00 on the DXY index as investors look for a safe haven, backed by the promising central bank divergence in the Federal Reserve meeting net week. US yields have recovered some lost ground as well which benefitted the US dollar.
''Risk sentiment remains fragile, there is still plenty of water to flow under the proverbial bridge, and more volatility seems likely,'' analysts at ANZ bank argued,
''But to the extent that the RBNZ had no choice but to head off inflation risks with hikes, and with NZ interest rates already top-of-the pack, that should be beneficial for the NZD. But it’s a messy situation, and we do of course have signs of real fatigue in the domestic economy.''
The commodity sector is strong and therefore, the antipode and the CAD are likely to remain well supported for the while that uncertainty prevails over how sanctions will impact Russia and the commodities markets. Oil prices are at the core of the risk-off sentiment with WTI opening at USD130/bbl on concerns about sanctions being placed on Russian energy.
NZD/USD H1 chart
- GBP/USD broke below key long-term support (the 2021 lows) on Monday and is now probing the 1.3100 level.
- As global commodity prices continue to spike amid the ongoing Russo-Ukraine conflict, stagflation fears are particularly acute in Europe.
- Recent events have also clouded the outlook for BoE tightening more than for the Fed.
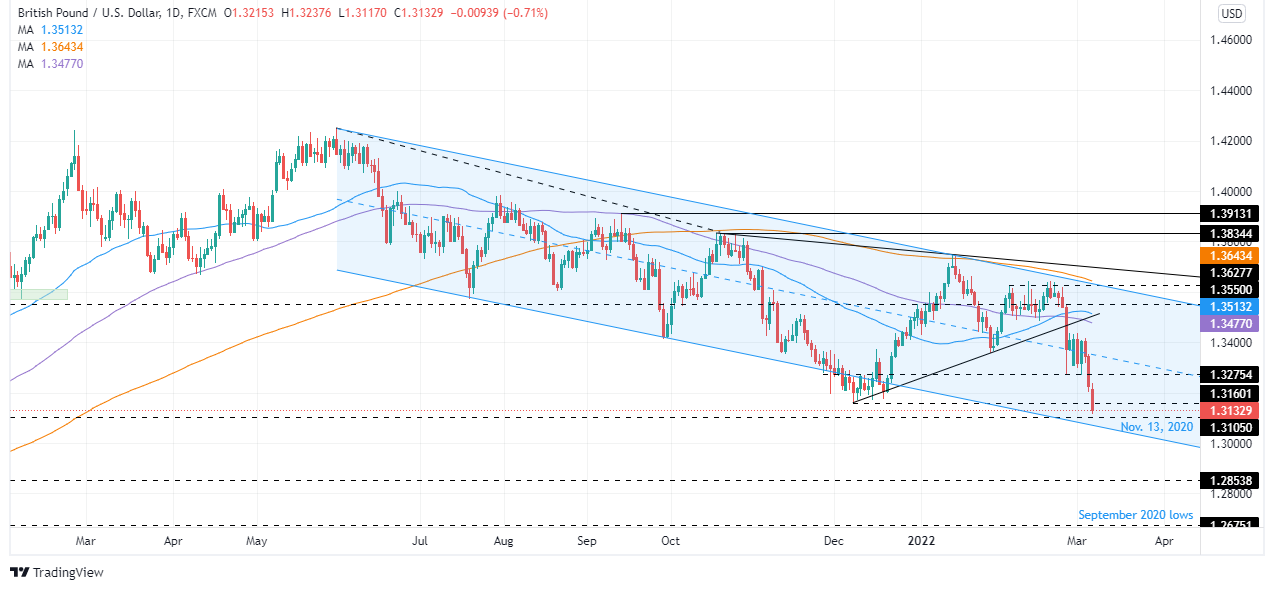
GBP/USD broke below a key level of support in the form of the 2021 lows in the 1.3160 area on Monday as the US dollar enjoyed broader strength versus all of its G10 counterparts. The bearish breakout that also saw cable drop below a key December 2020 low around 1.3140 saw the pair accelerate to the downside and it is now probing the 1.3100 handle. At current levels, GBP/USD trades just shy of 1.0% lower on the day, taking its losses since over the past two sessions to roughly 1.8% and its losses on the month to 2.3%.
Considering its only March 7, that’s quite a big move on the month already and could just be the tip of the iceberg. In less than two weeks, Russia’s invasion of Ukraine and the subsequent Western sanction response has triggered a melt-up in global commodity prices and thus fears of stagflation that are particularly acute in Europe. That probably goes some way towards explaining why the major European G10 currencies have been the underperformers so far this month.
As market participants scramble to reassess their outlooks for the global economy and central bank policy, risks seem tilted towards further GBP/USD losses. Given the US economy is less vulnerable to the negative growth impact of the Russo-Ukraine conflict but still struggling with multi-decade high inflation, the Fed looks to be on autopilot towards hiking interest rates back to neutral in the coming quarters/years. While the UK economy also already faces elevated inflation (which will only get worse given recent events in Ukraine), it was already facing (even prior to recent events) a cost-of-living crisis from Q2 onwards.
There can be no such certitude that the BoE will press ahead with lifting rates back towards neutral. The prospect of a UK environment of prolonger stagflation and low BoE interest rates (and subsequently massively low real rates) is a toxic one for GBP. From a technical perspective, the next two major areas of support are around the 1.2850 and 1.2675 areas. The coming weeks may well see both tested.
- EUR/JPY bears have been in control as oil prices skyrocket, but the euro is starting to stablise.
- Bulls are facing a wall of resistance and the price is moving back into support.
- ECB will meet this week with no changes expected.
EUR/JPY has been on the backfoot at the start of this week as the euro fell for the biggest three-day drop in two years as the price of oil takes to the moon. Due to the contagion of the invasion of the Russian Ukraine, there are going to be serious questions about Europe’s energy security for the European Central bank that meets this week.
A few weeks ago, market chatter had been around the potential for a shift in policy at the bank. However, the economic implications for the eurozone will most likely see the ECB stay on a path of maximum flexibility at this juncture. Therefore, no changes are to be expected.
ECB will be taking into account oil prices
The price of oil has been a head turner and a major factor in the euro's decline. The world economy is based on $100bbls oil and it was not imagined that we could be seeing the likes of $130 or the risks of even double for what central banks had been accounting for. For Europe, Russia is a key provider of energy and provides 25% of the EU's crude and 40% of its natural gas.
However, the EU has agreed to phase out dependency on Russian energy according to an EU draft statement from a summit. The Biden administration is also willing to move ahead with a ban on Russian oil imports into the United States even without the participation of allies in Europe. UK oil hit a high of $138 this week.
Overall, the euro is expected to stay on the back foot due to the divergence between the ECB and Federal Reserve. This puts a focus on EUR/USD below 1.0800, consequently, leaving EUR/JPY vulnerable to further declines. However, at this particular juncture, the euro is accumulating a bid in what might be considered a bargain by short term intraday traders seeking to cash in shorter-term moves in the euro. 125.00/20 is going to be a key support area for the cross.
EUR/JPY H1 chart
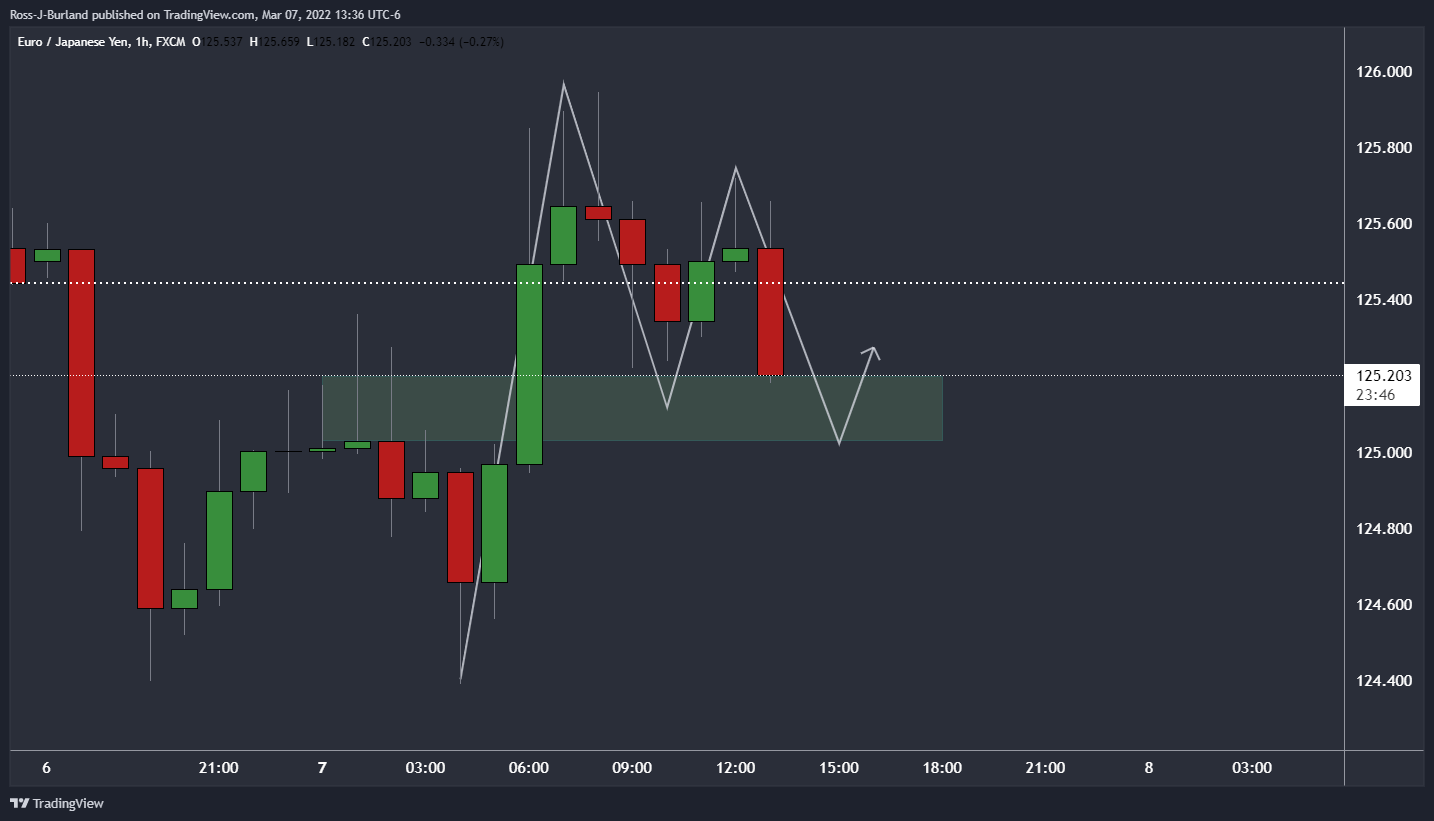
As drawn above the price is on the verge of a test into the support area which would be expected to equate into an M-formation, potentially leaving the price in consolidation for the day ahead.
- EUR/USD now depends on where the price of oil goes next.
- The Fed and ECB divergence is priced in but the ECB will be a key event this week.
EUR/USD is down some 0.45% on the day but the euro is attempting to recover in an accumulation of the latest daily bearish sell-off. EUR/USD positioning inched higher in the week ending 1 March, despite mounting pressure on European currencies on the back of the Russia-Ukraine conflict. However, a long squeeze of those positions would be expected in the next report, underlying the potential longevity of weakness in the euro for the foreseeable future.
The Russian invasion of Ukraine and questions about Europe’s energy security will be a key theme for the European Central Bank this week as the war in Ukraine has made the economic outlook for the eurozone extremely uncertain. No changes are to be expected at the meeting, although some would have expected them a few weeks ago.
The economic implications for the eurozone due to the war will require the ECB to maintain maximum flexibility for its road to normalisation. There may be mention that should everything goes well, net asset purchases can still end in the third quarter. With that being said, there is no telling what the road ahead will be like in what is a very fluid situation. The divergence between the ECB and Federal Reserve is favouring the greenback which leaves 1.0800 vulnerable.
The week is absent of Fed speakers due to the media embargo ahead of next week’s FOMC meeting, but the market is fully priced for a 25 bp hike on March 16 as the start of the tightening cycle. ''Looking ahead, 150 bp of tightening is priced in over the next 12 months, followed by another 25 bp in the following 12 months that would see the Fed Funds rate peak near 1.75%,'' analysts at Brown Brothers Harriman said.
''We continue to believe that the terminal rate will have to be much higher than this, but the Ukraine crisis has pushed Fed tightening expectations lower. January consumer credit is the only US data report today and is expected at $24.5 bln vs. $18.9 bln in December.''
Euro traders are glued to the price of oil
Meanwhile, markets are fixated on the price of oil which is a driver for risk in the forex space and the euro has been suffering for it given the eurozone dependency on Russian oil, coal & gas. However, the EU has agreed to phase out dependency on Russian energy according to an EU draft statement from a summit. The Biden administration is also willing to move ahead with a ban on Russian oil imports into the United States even without the participation of allies in Europe. US oil is currently trading at $120bbls.
The consensus is that the higher prices pose less threat to the Us than it does to the Eurozone. While Russian crude represents only 3% of domestic energy imports, for Europe, Russia is a key provider. Russia provides 25% of the EU's crude and 40% of its natural gas.
- The USD/CHF surges near 1% during the New York session.
- A risk-off market mood keeps the US dollar as the most sought safe-haven asset, the DXY above 99.00.
- USD/CHF Technical Outlook: Approaches an eleven-month-old downslope trendline around 0.9275-0.9300.
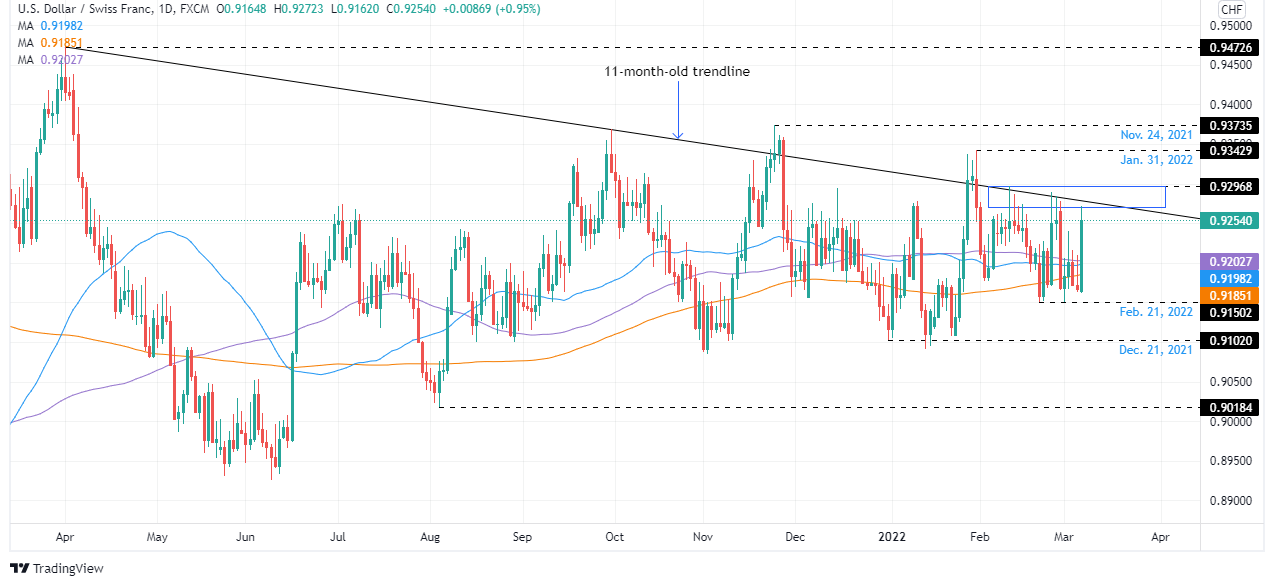
USD/CHF reversed last week’s 1% losses so far on Monday’s North American session, bouncing of 0.9160s, lows reaching a daily high at 0.9272, to then settling at the time of writing, at 0.9256, for a 1% gain. Market player’s focus remains in Eastern Europe, as the third round of talks was underway. Late in the week, Foreign Ministers of Ukraine/Russia would meet in Turkey on Thursday.
In the meantime, Russia/Ukraine hostilities persist; the US Dollar Index, a gauge of the greenback’s value vs. its peers, reached a YTD high at 99.418, but at press time sits at 99.152 for a 0.66% gain.
During the overnight session for North American traders, the USD/CHF rallied once the Asian Pacific session began, followed by a consolidation around 0.9200, rallying afterward towards 0.9272, retreating to current levels.
USD/CHF Price Forecast: Technical outlook
The USD/CHF keeps neutral biased, but it is approaching an eleven-month-old downslope trendline around the 0.9275-0.9300. Nevertheless, the USD/CHF unsuccessfully tested the 0.9265-95 area on seven previous occasions, making it a problematic resistance level to overcome.
That said, the USD/CHF first resistance would be 0.9270-90 region. Breach of the latter would expose the abovementioned trendline. Once is cleared, the next resistance would be January 31 daily high at 0.9343, followed by November 24, 2021, high at 0.9373.
- USD/JPY moved back towards 115.50 on Monday as US yields and commodity prices rose, favouring the buck over the yen.
- The pair remains well within recent ranges, with both currencies receiving a bid related to Ukraine war uncertainties.
- Aside from geopolitics, US inflation data on Thursday is one key risk event to keep an eye on.
As US yields rise to reflect the inflationary impulse of the recent commodity price rally and as FX markets continue to favour the currencies of countries that are net commodity exporters, the US dollar is ruling the roost. Though JPY is by no means one of the worse performing G10 currencies amid a safe-haven bid triggered by underperformance in global equities, its vulnerability as a net commodity/energy importer in the current environment means USD/JPY is advancing. The pair probed but was not able to break above, the 115.50 level on Monday, and at current levels in the 115.30s is about 0.5% higher on the day. That means most of Friday’s 0.6% drop from near 115.50 to as far as the 114.60s has been erased.
Traders won’t be reading too much into Monday’s intra-day price action for USD/JPY. Unlike other USD majors (like GBP/USD and EUR/USD), USD/JPY did not breach any key levels. Rather, the pair has remained well within the bounds of the 114.50-115.80ish range that has prevailed for the last slightly more than three weeks. Geopolitical developments and the readthrough of the commodities will this week likely remain the main driver in FX markets, suggesting further upside risk to the pair. US Consumer Price Inflation data for February will also be closely scrutinised just in case it comes in much hotter than expected and rebuilds the case for a 50bps Fed rate hike later in the month (not the market’s base case at the moment).
Ahead, as the war in Ukraine rumbles on and the risk that it escalates into a broader European conflict escalates, both USD and JPY are likely to remain in demand versus most G10 pairs. But the backdrop of elevated and potentially still rising commodity prices, plus a Fed that seems (for now) intent on raising rates at least back to neutral, suggests the dollar may be the more attractive safe-haven of the two. Perhaps that means that in the coming weeks, USD/JPY can move back to challenge annual highs in the 116.30s.
- Mexican peso among worst performers across the board on Monday.
- USD/MXN breaks above 21.00 for the first time in two months.
The USD/MXN jumped on Monday above 21.00 and peaked during the European session at 21.26, the highest intraday level since December 15. The Mexican peso is among the worst performers, hit by risk aversion.
Equities across the globe are falling on Monday. After a brief recovery, main stock indices at Wall Street are approaching daily lows. The Dow Jones is falling by 1.33% and the S&P 500 1.55%. The war in Ukraine continues to be the key driver.
At the beginning of the trading week, crude oil prices jumped almost 10% after the US said on Sunday it is looking to ban energy imports from Russia. Fears about the impact of the war on the world economy triggered a new fly to safety, hitting some emerging market currencies. The Russian ruble is suffering a record decline, losing more than 20% of its value. The USD/RUB rose above 150.00 during the last hour and is up 24%.
Economic data is likely to be offset by war headlines. Still investors will look into inflation numbers from Mexico and the US to be released on Wednesday and Thursday, respectively.
The USD/MXN holds a clear bullish bias. To the north, it faces a strong resistance area around 21.25/30; a break higher should clear the way to more gains. To the downside, now 20.95/21.00 is the immediate support, followed by 20.80.
Technical levels
- The British pound extends its monthly losses, down close to 2%.
- A dampened market mood spurred demand for safe-haven assets, where the dollar is “king.”
- GBP/USD Technical Outlook: Breach of 1.3100 would expose November 2, 2020, lows at 1.2853.
Update:
UK’s Prime Minister Boris Johnson is crossing the wires; he said that the UK “Can not simply close down the use of oil and gas overnight, even from Russia.”
The GBP/USD reacted, plummeting from 1.3170, the original price of the article, towards the 1.3110s area.
End of Update
GBP/USD grinds lower at the beginning of the week for the third consecutive trading day amid a mixed mood in financial markets. Around 1.3170s, the British pound reflects the appetite for safe-haven peers like the US dollar, blamed on the escalation of the Russia-Ukraine conflict and the possibility of the US weighing on banning oil imports from Russia.
During the weekend, the US Secretary of State Blinken said the US and allies are in active discussions regarding a Russian oil import ban, and reports later stated the “US is weighing acting without allies on a ban of Russian oil imports, although the timing and scope of any ban is still fluid,” according to Bloomverg.
Meanwhile, at Monday’s Asia Pacific open, oil futures reacted to the headlines, as Brent oil crude surged above $139 a barrel, while US Crude oil rose to near $130. Furthermore, gold rose above $2,000 for the first time since August 2020, while Asian equity indices ended with losses. At press time, the market sentiment shifted to risk-off, as European stock indexes remained in the red, while US equity indices opened with losses.
In the FX space, the story is different. The buck remains king, gaining against most G8 currencies. The US Dollar Index (DXY) reached a new YTD high at 99.42, though it retreated to near 98.92, up 0.28% at the time of writing. Safe-haven peers like the CHF and the JPY are getting hammered, losing between 0.94% and 0.51%.
Apart from this, US upbeat employment figures on Friday and the advance of US Treasury yields underpinned the US dollar.
An absent economic docket from the UK and the US cut GBP/USD adrift to pure market sentiment plays. In this context, the GBP/USD would extend its fall due to its risk-sensitive nature.
GBP/USD Price Forecast: Technical outlook
The GBP/USD is downward biased and stays within a descending channel, approaching its bottom-trendline, located around the 1.3080-1.3100 area. It is worth noting that the 50-day Moving Average (DMA) is about to cross below the 100-DMA, located each at 1.3513/1.3477, respectively, which could exacerbate a further leg-down towards September 2020 lows around 1.2675.
The GBP/USD's first support would be November 13, 2020, with lows at 1.3105. A breach of the latter would expose the 1.3000 figure, followed by November 2, 2020, lows at 1.2853.
Energy markets have surged dramatically higher again. Brent Oil has pulled back sharply to the low $120s but unless a close below $118, a break above the $147.50 record high posted in July 2008 is expected, strategists at Credit Suisse report.
Close below $118.05 needed to suggest an exhaustion peak
“Although a sharp intraday setback has been seen, we need to see a close below the lower end of the price gap from this morning at $118.05 to suggest we may have seen an exhaustion peak.”
“Above $147.50/$150 and we see resistance next at $158.17 and then the $164/170 zone. Beyond here and we see little in the way until $200.”
- USD/RUB reaches new all-time high near 145.00.
- Geopolitics keeps the Russian currency under heavy pressure.
- Markets’ attention remains on the Russia-Ukraine talks.
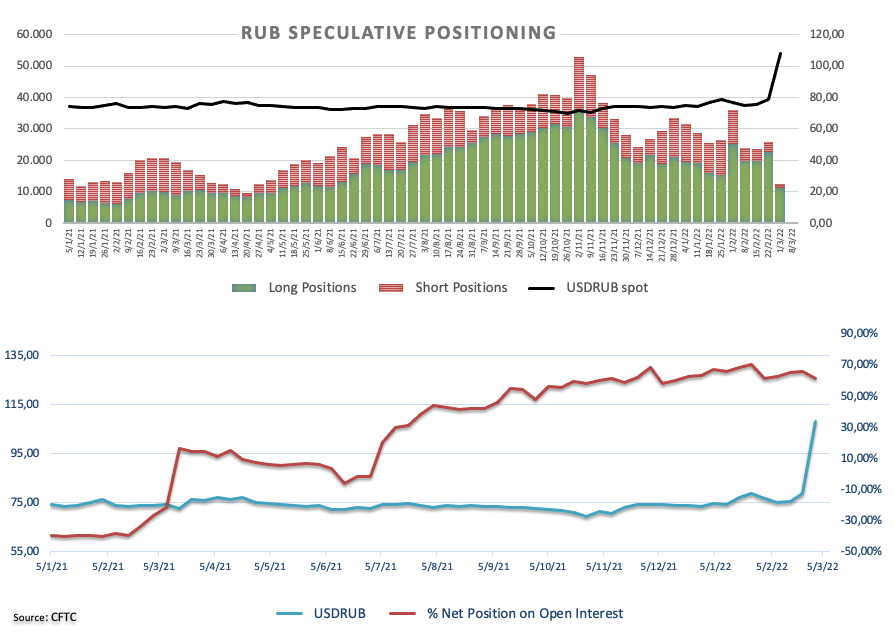
The Russian ruble depreciates further vs. the greenback and lifts USD/RUB to fresh all-time highs near the 145.00 barrier at the beginning of the week.
USD/RUB stronger on geopolitics
USD/RUB extends the rally further on Monday following the intensification of the Russia-Ukraine military conflict.
The ruble losses further ground despite Germany appearing to have declined to impose sanctions on Russian energy and in light of the much-expected round of talks between Russian and Ukrainian officials due later in the day.
On another front, the sentiment around the Russian currency already showed some signs of deterioration after the weekly positioning report by the CFTC showed net longs retreated to multi-week lows around 9.6K contracts in the week to March 1.
Later in the session, Russian annualized GDP figures are due, like if anyone would care...
USD/RUB levels to watch
So far, the pair is up 17.92% at 145.90 and faces the next hurdle at… Mars? On the downside, a breach of 122.25 (high Mar.2) would expose 90.00 (monthly high Feb.24) and finally 75.12 (55-day SMA).
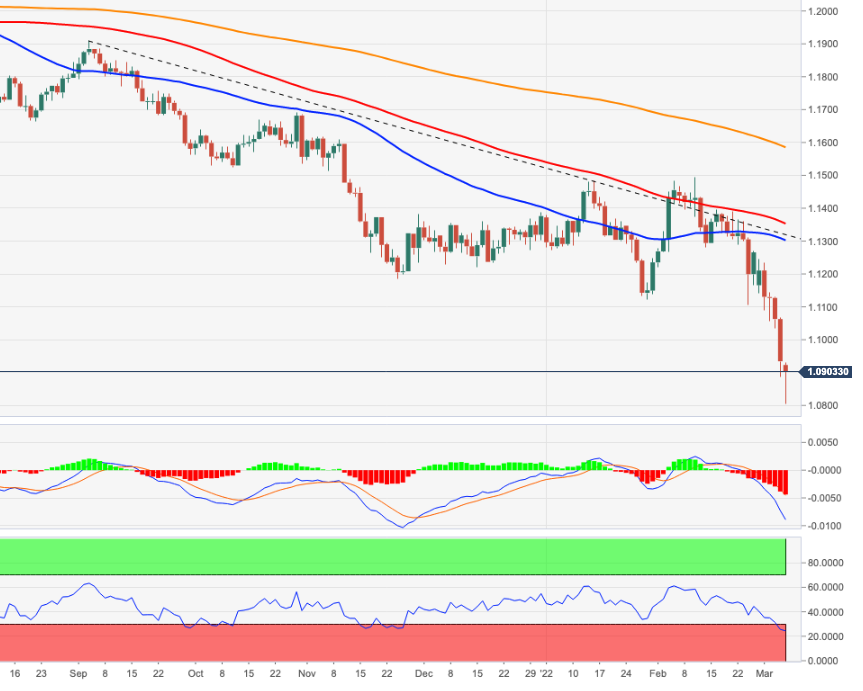
EUR/USD slumps to 1.08. Economists at Scotiabank expect the wolrd’s most popular currency pair to challenge the 2020 low of 1.0636.
Price action points to a break of support at 1.08
“The EUR’s sharp decline over the past week has placed its 2020 low of 1.0636 in its sights, with limited signs of a meaningful correction from sharply oversold levels on the RSI (most oversold since Feb 2020, currently).”
“Price action points to a break of support at 1.08 that is followed by 1.0700/25 before the mid 1.06s to then target 1.05.”
“Resistance is 1.09 followed by the mid-figure area and then 1.10.”
- EUR/USD plummets to the 1.0800 zone on Monday.
- Next on the downside emerges the 1.0770 area.
EUR/USD sinks to levels last traded in late May 2020 in the boundaries of the 1.0800 neighbourhood at the beginning of the week.
In light of the ongoing price action, there is the palpable risk for the continuation of the downtrend, at least in the very near term. That said, if spot breaches the so far 2022 low at 1.0805 (March 7) then there are no support levels of significance until the 1.0770 region, where the May 2020 are located (May 7,14).
The negative outlook for EUR/USD is expected to remain unchanged while below the key 200-day SMA, today at 1.1583.
EUR/USD daily chart
Further downside in USD/MYR carries the potential to revisit the 4.1620 support, in opinion of Quek Ser Leang at UOB Group’s Global Economics & Markets Research.
Key Quotes
“Our view for USD/MYR to strengthen last week was incorrect as it slumped to a low of 4.1700 last Friday. While downward momentum has not improved by much, there is room for USD/MYR to test the major support at 4.1620 (next support at 4.1370 is not expected to come into the picture).”
“At this stage, a sustained decline below this level is unlikely. Resistance is at 4.1900 followed by 4.2000.”
EUR/CHF has reached parity and a short pause here looks likely. Nevertheless, analysts at Credit Suisse see scope for a move to 0.9839/30 post this pause.
A short-term pause is likely
“We expect a temporary pause, with the market already rebounding this morning and threatening a small bullish ‘hammer’. Nevertheless, our core outlook stays negative and a closing break below 1.0000 in due course would open up the next major support zone now seen at 0.9839/30.”
“Near-term resistance moves substantially lower to 1.0049/58. A break above here would reinforce the case for a short-term pause, with the next near-term resistance at 1.0141. Only above 1.0235/64 would point to a more sustainable floor though.”
- Silver has pulled back to trade roughly flat on the day in the $25.70 area having been above $26.00 earlier.
- News of talks between the Russian and Ukrainian foreign ministers in Turkey on Thursday triggered some profit-taking.
- But with de-escalation unlikely, recent macro trends are likely to continue, meaning higher silver remains a good bet.
After hitting its highest levels since mid-July 2021 to the north of the $26.00 per troy ounce mark, spot silver (XAG/USD) prices have pulled back sharply and now trade with only very modest on the day gains of roughly 0.1%. In early European trade, the precious metal had been trading as much as 1.7% higher, with analysts/traders citing the surprise news that the Russian and Ukrainian Foreign Ministers are set to meet in Turkey on Thursday as driving the pullback. Chatter over the weekend about potential Western bans on Russian energy exports, coupled with generalised concerns about the global economic impact of the Russo-Ukraine war and the risk it might escalate into a wider nuclear conflict has supported silver recently.
Traders have been buying the precious metal as a hedge against inflation and economic weakness, so naturally, any news that suggests de-escalation might be on the cards (like Thursday’s talks in Turkey) has the potential to trigger profit-taking. However, rhetoric from the Kremlin on Monday suggests Russia’s demands on Ukraine for a ceasefire and peace remain maximalist (i.e. not something the Ukraine government will accept), suggesting the prospect for agreement on Thursday or before is slim. As geopolitics remains in the driving seat as far as macro sentiment is concerned and amid a quiet economic calendar on Monday, talks between a Ukrainian and Russian delegation at 1600GMT (allegedly) will be the main event of the day.
For now, XAG/USD is finding support at last week’s highs in the $25.70 area. If this support hold, that would be taken as a bullish near-term sign. Seeing as silver has now cleared $26.00 once already this week, the prospect for a renewed push higher towards resistance in the $27.00 looks good, so long as recent macro trends (higher energy and other commodity prices, lower equities) continue. With little prospect of de-escalation of the intense war going on in Ukraine right now, that seems a good bet.
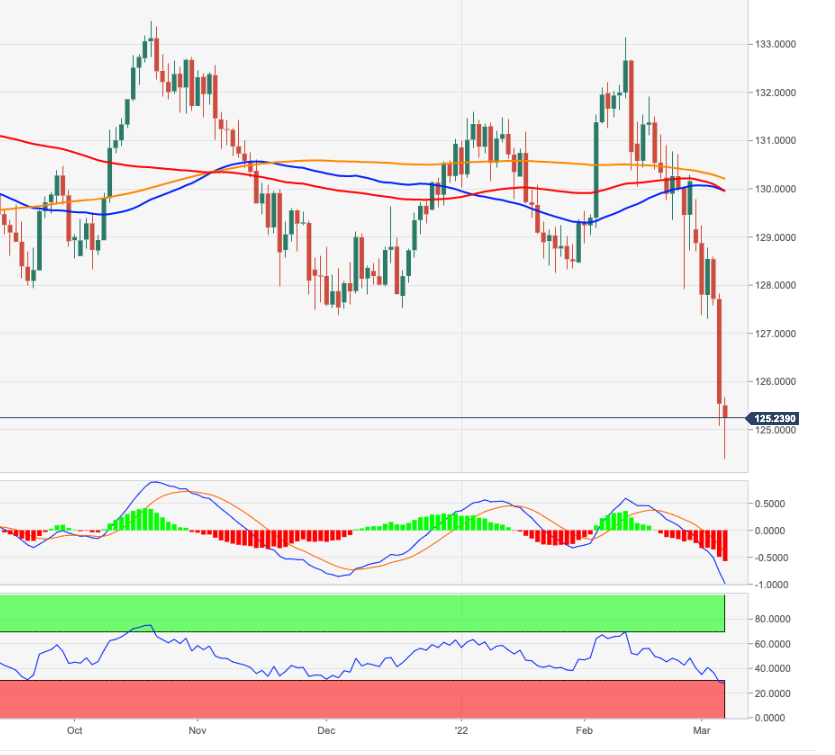
- EUR/JPY collapses to the 124.40 region on Monday.
- The next target comes at the 122.80 zone (November 2020).
The leg lower in EUR/JPY gathers extra steam and revisits the 124.40 zone at the beginning of the week.
The breakdown of the 125.00 yardstick has opened the door to further retracements in the near term, with minor contention seen at 122.84 (November 19 low). If cleared, then the cross is expected to meet the next support of note at the October 2020 low at 121.61 (October 30).
While below the 200-day SMA, today at 130.16, the outlook for the cross is expected to remain negative.
EUR/JPY daily chart
A Kremlin spokesman told Reuters on Monday that Russia will finish the demilitarization of Ukraine.
"Ukraine must amend the constitution and reject claims to enter any bloc, must recognise Crimea as Russian, and Donetsk and Lugansk as independent states," the spokesman added. "If these conditions are met, then Russian military action will stop in a moment."
Market reaction
These comments don't seem to be having a noticeable impact on market sentiment. As of writing, the US Dollar Index up 0.65% on a daily basis at 99.15.
- GBP/USD remained under heavy selling pressure for the third successive day on Monday.
- The global flight to safety continued benefitting the safe-haven USD and exerting pressure
- Technical selling below the 1.3200 mark further contributed to the downward trajectory.
The GBP/USD pair continued losing ground through the mid-European session and dropped to the lowest level since December 2020, around the 1.3140 region in the last hour.
The pair added to last week's heavy losses and witnessed some follow-through selling for the third successive day on Monday amid an extension of the recent strong US dollar rally. Investors continued to dump riskier assets in the wake of a further escalation in the Russia-Ukraine conflict. This, in turn, boosted demand for traditional safe-haven assets and pushed the USD to its highest level since May 2020.
In the latest development, US Secretary of State Antony Blinken said that the Biden administration was in discussions with European governments about banning imports of Russian crude and natural gas. This has led to a sharp rise in prices of crude oil prices and stoked fears of a major inflationary shock for the global economy. This was seen as another factor that took its toll on the already weaker risk sentiment.
Apart from this, Friday's mostly upbeat US monthly employment details and an uptick in the US Treasury bond yields further underpinned the greenback. The downward trajectory took along some short-term trading stops placed near the 1.3200 round figure. Hence, the decline could further be attributed to some technical selling. A subsequent break below the 2021 low might have already set the stage for further losses.
There isn't any major market-moving economic data due for release on Monday, either from the UK or the US, leaving the GBP/USD pair at the mercy of the USD price dynamics. This, in turn, suggests that the market focus remains on the incoming geopolitical headlines ahead of the third round of the Russia-Ukraine ceasefire talks.
Technical levels to watch
Gold price has risen to $2,000 for the first time since August 2020 as the new week of trading gets underway. Safe-haven assets are set to continue to find demand amid Russia-Ukraine jitters, economists at Commerzbank report.
Seeking refuge in gold
“The situation in Ukraine is escalating ever further: Russian President Putin said at the weekend that the economic sanctions imposed by the West were tantamount to a declaration of war. Given this backdrop, investors are likely to continue to seek refuge in the safe haven that is gold.”
“Only marginal attention was paid to the fact that the US labour market is still very robust, as reported on Friday, and that many new jobs were created in February. As the labour market is becoming increasingly tight, which is driving up the inflation risks, the US Fed will presumably raise interest rates next week. In our opinion, a rate hike of 25 basis points should no longer come as any surprise.”
Copper is now heading towards previous peak of $10740/10850. A move beyond this area would open up additional gains towards $11700, then $12160, strategists at Société Générale report.
Near-term supports located at $10200 and $9460
“Weekly MACD is anchored within positive territory which denotes the upward momentum is prevalent.”
“Multi-month trend line at $10200 and $9460 are near-term supports.”
“Beyond $10740/10850, next objectives are located at the upper limit of a multiyear channel near $11700 and projections of $12160.”
Despite this year's gains, economists at UBS think the rally in commodity prices has further to run. Subsequently, they have raised their Brent Crude Oil forecasts to $125 for June from $95.
Disrupted Russian exports will likely, with a delay, trigger production shut-ins
“Russian energy exports are, at present, exempt from global sanctions, but exports have nevertheless been disrupted. This is the result of self-sanctioning by Russian crude buyers in fear of future sanctions or for reputational reasons. Given limited Russian storage capacity, these disruptions will likely, with a delay, also trigger production shut-ins.”
“With Russian oil exports and production in the process of being disrupted, we are lifting our Brent crude forecasts to $125/bbl for June, $115/bbl for September, and $105/bbl for December and March 2023 (previously $95, 95, 100, 100/bbl).”
GBP/USD has declined toward key 1.3160 support early Monday. Next bearish target for the pair is located at 1.3120, FXStreet’s Eren Sengezer reports.
Additional losses are likely in case the 1.3160 level turns into resistance
“GBP/USD's downtrend that started in May 2021 ended at 1.3160 in December, highlighting the significance of this level. In case this support turns into resistance, the next bearish target aligns at 1.3120 (static level) ahead of 1.3100 (psychological level).”
“On the upside, the first resistance could be seen at 1.3200 (psychological level) before 1.3250 (static level) and 1.3270 (static level).”
EUR/USD is now challenging potential support of 1.0840/1.0820 representing an ascending trend line connecting lows of 2017 and 2020. A break below here would open up additional losses towards 1.07, then 2020 low near 1.0635, economists at Société Générale report.
Support 1.0820, resistance 1.0980
“The down move is a bit stretched however signals of a meaningful rebound are still awaited.”
“1.0980, the 23.6% retracement from February and 1.1120 are near-term resistances.”
“Failure to hold 1.0820 could mean persistence in decline towards 1.0700 with next support at 2020 low near 1.0635.”
- AUD/USD surged past the 0.7400 mark and shot to a fresh YTD high on Monday.
- A blowout rally in commodities continued benefitting the resources-linked aussie.
- The prevalent risk-off mood capped gains for the pair amid sustained USD buying.
The AUD/USD pair retreated a few pips from the fresh YTD high touched earlier this Monday and was last seen hovering near the 0.7400 mark, still up over 0.60% for the day.
The pair prolonged its recent bullish trajectory and gained some follow-through traction on the first day of a new week amid the recent monster gains in commodity prices. The worsening situation in Ukraine, along with increasing Western sanctions on Russia have been fueling fears about supply crunches of key raw materials. This, in turn, was seen as a key factor that continued benefitting the resources-linked Australian dollar.
The AUD/USD pair shot to the highest level since November 2021, though a combination of factors held back bullish traders from placing fresh bets, at least for the time being. A further escalation in the Russia-Ukraine conflict weighed heavily on the global risk sentiment, which was evident from an extended sell-off in the equity markets. This, in turn, drove flows towards the safe-haven US dollar and capped the AUD/USD pair.
The greenback was further supported by Friday's mostly upbeat US monthly jobs report, showing that the economy added 678K jobs in February and the unemployment rate fell to 3.8% from 4.0% in January. Meanwhile, investors now seem convinced that the Fed would adopt a less aggressive policy stance to combat stubbornly high inflation. This might keep a lid on any further gains for the USD and act as a tailwind for the AUD/USD pair.
Even from a technical perspective, last week's sustained breakthrough the very important 200-day SMA and an over one-year-old descending trend-line add credence to the positive outlook. Hence, any meaningful pullback is more likely to attract fresh buying at lower levels and remain limited amid absent relevant economic releases.
Technical levels to watch
- Gold price rallies as the Russia-Ukraine crisis gets entrenched, triggers oil shock.
- Gold bulls are gearing up to regain the upside towards $2,020 and beyond.
- Gold price risks a correction before next upswing kicks in above $2,000.
A new week begins but nothing changes on the geopolitical front, as Russia’s resolve to invade Ukraine gets firmer while the US looks to isolate Russia completely by banning oil imports. As the Ukrainian crisis deepens, the market sentiment remains roiled, facing a double whammy from soaring oil prices. Investors take shelter in the traditional safe-haven gold, in the face of raging energy inflation and its impact on global economic growth. All eyes remain on geopolitics and oil prices for fresh trading opportunities in gold price.
Read: US weighs acting without allies on ban of Russian oil imports
Gold Price: Key levels to watch
The Technical Confluences Detector shows that gold price has recovered ground once again above $1,995 strong resistance, where the pivot point one-month R1, pivot point one-week R1 and the previous high four-hour.
The pivot point one-day R2 at $1,998 will guard the immediate upside, above which buyers will retest the multi-month highs at $2,001.
On buying resurgence, gold price could advance towards the Bollinger Band one-hour Upper at $2,007 before resuming storming towards $2,022.
That level is the confluence of the pivot point one-week R2 and pivot point one-day R3.
The next resistance is aligned at the pivot point one-day R3 at $1,964. Should buyers regain a strong foothold above the latter, then a rally for a retest of 13-month highs of $1,975 cannot be ruled out.
Gold bulls will then gear up for a fresh upswing to conquer the $2,000 mark.
On the flip side, fierce support is seen at $1,982, where the pivot point one-day R1 coincides with the SMA5 four-hour.
The previous month’s high of $1,975 will be tested once again if the correction picks up pace. The last line of defense for gold bulls is the daily lows of $1,972.
Here is how it looks on the tool
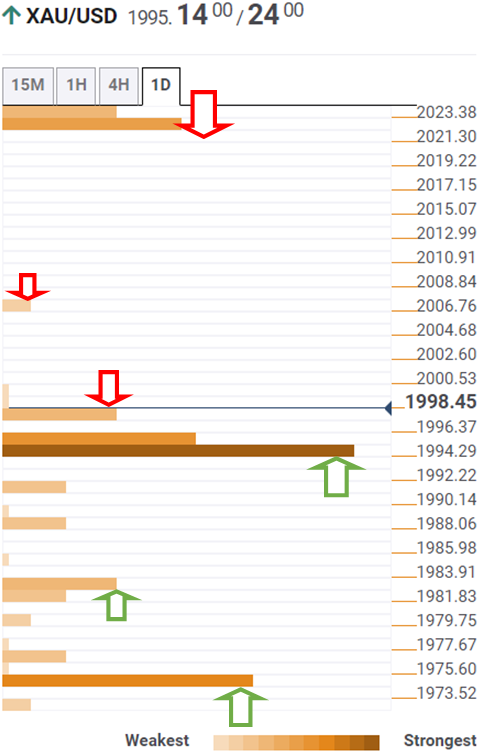
About Technical Confluences Detector
The TCD (Technical Confluences Detector) is a tool to locate and point out those price levels where there is a congestion of indicators, moving averages, Fibonacci levels, Pivot Points, etc. If you are a short-term trader, you will find entry points for counter-trend strategies and hunt a few points at a time. If you are a medium-to-long-term trader, this tool will allow you to know in advance the price levels where a medium-to-long-term trend may stop and rest, where to unwind positions, or where to increase your position size.
- DXY remains well bid around 99.00 on geopolitical jitters.
- US yields regain some composure across the curve on Monday.
- Markets’ attention remains focused on developments from Ukraine.
The greenback, in terms of the US Dollar Index (DXY), extends the rally further and surpasses the 99.00 barrier at the beginning of the week.
US Dollar Index stronger on risk aversion
The acute upside in the greenback remains well and sound for the third session in a row and reaches levels last traded back in late May 2020 on Monday.
The continuation of the rally in the buck remains well underpinned by the worsening conditions in the Russia-Ukraine military conflict and the solid sentiment surrounding the risk aversion.
Furthermore, the move higher in the dollar so far comes in tandem with a tepid rebound in US yields following the recent weakness and the sharp flattening, which was in turn motivated by the solid buying interest seen in bonds.

In the US data space, the only release will be January’s Consumer Credit Change.
What to look for around USD
The index clocked new cycle peaks beyond the 99.00 barrier at the beginning of the week, always in response to increasing geopolitical concerns in Ukraine. The persevering bias towards the safe haven universe is predicted to keep supporting the dollar and the rest of its peers in the current context for the time being. Also supportive of the stronger buck appears the current elevated inflation narrative, the start of the Fed’s normalization of its monetary conditions later this month and the solid performance of the US economy. In the longer run, the renewed hawkish views from the BoE and the ECB carry the potential to undermine the expected move higher in the dollar.
Key events in the US this week: Consumer Credit Change (Monday) – Balance of Trade, Wholesale Inventories (Tuesday) – MBA Mortgage Applications (Wednesday) – CPI, Core CPI, Initial Claims, Monthly Budget Statement, Fed Quarterly Financial Accounts (Thursday) – Flash Consumer Sentiment (Friday).
Eminent issues on the back boiler: Escalating geopolitical effervescence vs. Russia and China. Fed’s rate path this year. US-China trade conflict under the Biden administration.
US Dollar Index relevant levels
Now, the index is gaining 0.44% at 98.94 and a break above 99.21 (2022 high Mar.7) would open the door to 99.97 (high May 25 2020) and finally 100.00 (psychological mark). On the flip side, the next down barrier emerges at 97.44 (monthly high Jan.28) followed by 96.17 (55-day SMA) and then 95.67 (weekly low Feb.16).
- USD/CHF regained positive traction on Monday amid an extension of the recent strong USD rally.
- The Russia-Ukraine conflict continued benefitting the USD’s status as the global reserve currency.
- Bulls now await sustained break through a one-week-old trading range before placing fresh bets.
The USD/CHF pair held on to its strong intraday gains through the early European session and was last seen trading near the daily high, around the 0.9215-0.9220 region.
The pair attracted fresh buying on the first day of a new week and for now, seems to have snapped two successive days of the losing streak amid an extension of the recent strong US dollar rally. A further escalation in the Russia-Ukraine conflict turned out to be a key factor that continued benefitting the greenback's status as the global reserve currency.
In fact, Russian forces intensified attacks on Ukraine and increasing Western sanctions also did little to deter Russia’s aggression. Moreover, attempts at a ceasefire to allow civilians to evacuate from the besieged city of Mariupol also seems to have failed. Adding to this, Russian President Vladimir Putin warned that the war in Ukraine would continue.
This, along with modestly upbeat US monthly employment details released on Friday, pushed the key USD Index to its highest level since May 2020. The headline NFP print showed that the US economy added 678K jobs in February, smashing expectations for a reading of 400K. Furthermore, the unemployment rate fell more than anticipated, to 3.8% from 4.0% in January.
The worsening situation in Ukraine should continue to act as a tailwind for the greenback and supports prospects for a further near-term appreciating move for the USD/CHF pair. That said, the recent range-bound price moves witnessed over the past one week or so points to indecision among traders, warranting caution before placing aggressive bullish bets.
In the absence of any major market-moving economic releases from the US, the incoming headline surrounding the Russia-Ukraine saga will continue to drive the USD demand. This, in turn, might provide some impetus to the USD/CHF pair and allow traders to grab some short-term opportunities.
Technical levels to watch
EUR/USD has dropped to its weakest level since May 2020 at 1.0820 at the start of the week but the pair has managed to stage a modest rebound. However, euro recovery attempts are set to remain short-lived, FXStreet’s Eren Sengezer reports.
Euro is unlikely to extend recovery against the greenback
“Sadly, the latest developments suggest that a de-escalation of the Ukraine crisis is nowhere near in sight and EUR/USD should remain on the back foot with the dollar holding its ground.”
“Despite the latest recovery attempt, the Relative Strength Index (RSI) indicator on the four-hour chart stays below 30, showing that the pair is still technically oversold.”
“In case the pair tries to extend its correction, it is likely to meet resistance at 1.0900 (psychological level), 1.0950 (static level) and 1.1000 (psychological level).”
“On the downside, the first bearish target aligns at 1.0820 (22-month low) before 1.0800 (psychological level) and 1.0770 (static level).”
See: EUR/USD could fall to 1.00-1.05 as Ukraine conflict poses immediate threat to euroarea – ANZ
Compared with other asset markets and, in particular, commodities, movements in G10 FX since the Russian invasion of Ukraine have been more contained. That said, the emerging patterns reflect the urgency and disruption that the war has created. Consequently, economists at Rabobank have brought forward their targets for AUD/USD, slashed their one-month forecasts for EUR/USD and EUR/CHF and lowered the expectations for EUR/GBP.
Euro to remain under pressure
“Although the market has pared back its expectations of RBA rate hikes this year in reflection of the Ukraine crisis, investors are still looking for lift-off in the latter part of this year. We have brought forward our 0.74 target for AUD/USD to a three-month view from year-end.”
“We have revised our EUR/USD target sharply lower to 1.06 on a one-month view, though there is scope for stabilisation around 1.08 in three-month. In step with this, we have also lowered our expectations for EUR/CHF to 0.98 on a one-month view.”
“Since the UK’s energy supplies are more diversified than Germany’s we expect GBP to remain moderately more resilient than the EUR and have also adjusted our EUR/GBP forecasts lower to 0.81 on a one-month view.”
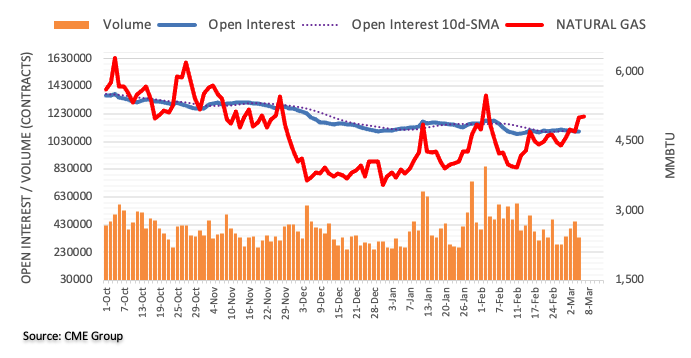
Advanced figures from CME Group noted open interest in natural gas futures markets rose by just 167 contracts on Friday after three consecutive daily pullbacks. On the other hand, volume reversed four daily builds and went down by nearly 118K contracts.
Natural Gas now looks to $5.60
Prices of natural gas climbed further on Friday amidst a small uptick in open interest, which suggests the likelihood of further upside in the short-term horizon. That said, the next up barrier of note now comes at the 2022 high at $5.57 per MMBtu (February 2).
The Canadian dollar has held up relatively well against the US dollar and most other currencies since the start of Russia's invasion of Ukraine. What could be the driving force behind a significant appreciation of the CAD? Economists at the National Bank of Canada take a look at the possible scenarios which would be positive for the loonie.
The upcoming federal budget could be positive for the loonie
“According to our model, the CAD remains significantly undervalued against the USD.”
“What could be the driving force behind a significant appreciation of the loonie? The easing of tensions in Ukraine would certainly help. A drop in commodity prices would follow, but the improved outlook for global economic growth would encourage investors to reduce their exposure to the USD.”
“The upcoming federal budget could be positive for CAD if Ottawa unveils an ambitious tax credit program to encourage carbon capture, utilization and storage (CCS/CCUS).”
How low could EUR/USD go? The pair has decisively broken below 1.10 and economists at ING believe that the pair could fall as low as 1.05.
Will the ECB intervene?
“Support levels seem to be around the 1.0760/70 area and then the March 2020 lows of 1.0640 – but probably at times like these, big figures of e.g. 1.0500 become more relevant.”
“There is a continental war on and the ECB would not want to get involved in an ineffective intervention campaign. Were things to get out of hand, we would think coordinated G5 intervention to support EUR/USD would be more likely than ECB's own account intervention. But that may not occur until closer to parity.”
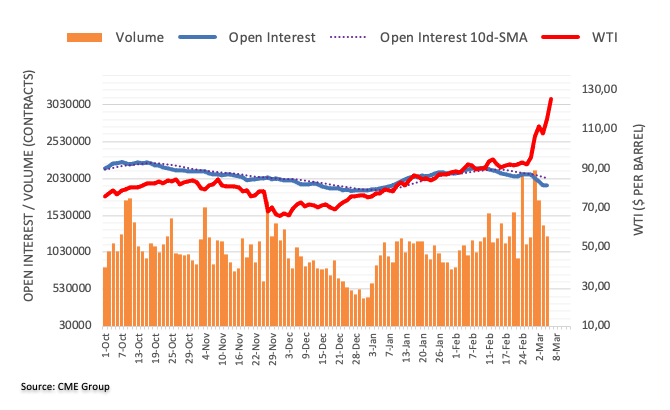
Considering preliminary readings from CME Group for crude oil futures markets, traders scaled their open interest positions for yet another session at the end of last week, now by nearly 12K contracts. Volume followed suit and shrank by around 135.5K contracts, reaching the third consecutive daily drop.
WTI: Next stop… the moon?
Geopolitical tensions pushed prices of the barrel of WTI further north on Friday. The move higher, however, was on the back of shrinking open interest and volume, opening the door to a near-term correction. This view is also reinforced by the extreme overbought condition of the commodity.
Gold price has shot through the roof in a bid to retest the $2,000 level, extending its last week's uptrend. Bur as FXStreet’s Dhwanie Mehta notes, XAU/USD risks a correction before the next upswing kicks in above $2,000.
Overbought conditions on the 4H chart warrant cautious for gold bulls
“Having confirmed an upside breakout from a symmetrical triangle formation on the four-hour chart last Friday, gold is on track to achieve its pattern target at $2,034, as bulls briefly recapture the $2,000 mark. XAU/USD, however, could see an extension of the ongoing corrective downside, as the Relative Strength Index (RSI) on the said time frame is trading well within the overbought territory.”
“Further retracement in gold will call for a test of the previous month’s high of $1,975, below which the $1,950 psychological barrier could come into play. The next relevant downside target is seen at the upward-sloping 21-Simple Moving Average (SMA) at $1,946.”
In opinion of FX Strategists at UOB Group, further downside in GBP/USD should meet strong support in the 1.3160 region in the short term.
Key Quotes
24-hour view: “While we expected GBP to weaken last Friday, we were of the view that ‘the major support at 1.3250 is unlikely to come under threat’. The subsequent weakness exceeded our expectations by a wide margin as GBP plunged by 0.88% (NY close of 1.3227). Further weakness is not ruled but oversold conditions suggest that any decline is expected to encounter solid support at 1.3160 (the low in 2021). Resistance is at 1.3255 followed by 1.3280.”
Next 1-3 weeks: “More than a week ago (25 Feb, spot at 1.3380), we highlighted that GBP could weaken further but there is a major support at 1.3250. GBP subsequently traded mostly sideways and in our latest narrative from last Friday (04 Mar, spot at 1.3330), we noted that ‘downward momentum still appears to be lackluster but there is still chance for GBP to decline to 1.3250’. GBP subsequently cracked 1.3250 as it dropped to a low of 1.3202. Downward momentum has improved and the risk is still on the downside. That said, there is another major support at 1.3160. On the upside, a breach the ‘strong resistance’ at 1.3330 (level was at 1.3420 last Friday) would indicate that the downside risk has dissipated. Looking ahead, the next support below 1.3160 is at 1.3100.”
FX Strategists noted EUR/USD now shifted the attention to a probable test of the 1.0805 level in the near term.
Key Quotes
24-hour view: “Last Friday, we highlighted that ‘rapidly improving downward momentum suggests EUR could break the major support at 1.1000’. We added, ‘the next support below this level is at 1.0965’. While our view for a weaker EUR was not wrong, we did not anticipate the outsized sell-off as it nose-dived by 1.25% (NY close of 1.0926), its biggest 1-day drop since Mar 2020. EUR extended its decline during early Asian hours and further decline appears likely. The next support is a major level at 1.0805. Resistance is at 1.0895 followed by 1.0925.”
Next 1-3 weeks: “In our latest narrative from last Friday (04 Mar, spot at 1.1025), we highlighted the vulnerability of EUR and indicated that ‘a break of 1.1000 could potentially lead to further sharp decline in EUR as the next support level of note is at 1.1900’. Our view was not wrong as EUR nose-dived to 1.0884 before extending its decline during early Asian hours. EUR is still clearly weak and the next level to focus on is at 1.0805. This is a long-term support and a clear breach of this level could lead to further downward acceleration (next support is at 1.0740). The risk for further weakness is intact as long as EUR does not move above 1.1000 (‘strong resistance’ level was at 1.1125 last Friday). On a shorter-term note, 1.0925 is already a rather solid resistance level.”
Saudi Arabia hikes the April official selling prices (OSPs) for crude for its Asian buyers by more than $2 a barrel, with some grades hitting all-time highs, as global oil price soar amid escalating Russia-Ukraine crisis.
-
US weighs acting without allies on ban of Russian oil imports – Bloomberg
Key takeaways
“Record Saudi crude prices come on the back of an expected rise in Middle East oil demand as surging spot premiums and freight rates put supplies from Europe, Africa and the Americas out of Asia's reach.”
“The world's top oil exporter lifted its April OSP to Asia for its flagship Arab Light crude to $4.95 a barrel versus the average of DME Oman and Platts Dubai crude prices, up $2.15 from March, Saudi Aramco said late on Friday.”
“Saudi Aramco set the Arab Light OSP to Northwestern Europe at plus $1.60 per barrel versus ICE Brent, an increase of $1.70 compared with March and to the United States at plus $3.45 per barrel over ASCI (Argus Sour Crude Index), an increase of $1 over the previous month.”
Read: WTI climbs above 161.8% Fibo Extension at $119.40, $147.30 eyed
- USD/JPY snaps two-day downtrend, recently picking up bids to print mild intraday gains.
- Interfax hints at a pause in Russian fires, opening of humanitarian corridors in several Ukrainian cities.
- US Treasury yields pare early Asian session losses, stock futures, Asian equities remain on the back foot.
- US eyes unilateral move to ban oil imports from Russia.
USD/JPY prints mild gains around 115.00 heading into Monday’s European session. In doing so, the yen pair prints daily gain for the first time in three days by the press time.
Although the quote’s risk-barometer status contradicts the latest gains, headlines from Russian media Interfax seem to have offered a pause to the market’s risk-aversion.
The news states, “Russian military to hold fire, open humanitarian corridors in several Ukrainian cities at 10:00 MSK (07:00 GMT) on Monday. The halt in the evacuation and invasion of Kyiv has recently roiled the market’s appetite.
The same pushed the Western leaders to discuss banning oil imports from Russia wherein the US sounds aggressive as Bloomberg hints at the unilateral move without allies.
The risk-off mood underpins the US dollar’s safe-haven demand and drowns Japan’s Nikkei 225 to a 16-month low. That said, the US 10-year Treasury yields recover from intraday low to 1.70% at the latest.
Other than the sour sentiment, increasing odds of the faster Fed-rate-hike and recently firmer US jobs report for February also favor USD/JPY bulls.
Moving on, headlines concerning Russia-Ukraine tussles will be the key for USD/JPY prices while monthly US inflation will also be important for near-term trade direction.
Technical analysis
USD/JPY remains sidelined between the 100-DMA level surrounding 114.45 and a three-week-old resistance line, close to 115.65 at the latest.
- USD/RUB extends previous two-week uptrend to renews all-time high.
- Moody’s cut Russia rating to Ca amid rise in default risk.
- Fears of the Western ban on import of Moscow’s oil, no ceasefire fears underpin rubble weakness of late.
- Russian central bank contrasts Fed, US CPI eyed for near-term direction but risk catalysts are the key.
USD/RUB remains on the front foot around an all-time high of 138.50, up for the third consecutive week, as market players expect further hardships for the Russian ruble amid geopolitical tussles with Ukraine.
That said, the quote’s latest upside takes clues from Moody’s downgrade of Russia’s credit rating to Ca on Sunday, the second-lowest rung of its rating ladder, per Reuters. The rating agency cited, “Severe concerns around Russia's willingness and ability to pay its debt obligations,” as the key catalyst for the latest rating cut.
“On Sunday, the central bank said Russian creditors and those from countries that had not joined in with sanctioning the country would be paid in roubles at the exchange rate prevailing at the time of payment,” said Reuters. The news also adds, “Moody's said default risks had increased, and that foreign bondholders were likely to recoup only part of their investment.”
Elsewhere, Bloomberg said that the US weighs acting without allies on the ban of Russian oil imports whereas UK Defense Chief Admiral Sir Tony Radakin signaled further casualties in Kyiv. The Army leader believed, per The Times, “Russia could ‘turn up the violence’ with ‘more indiscriminate killing and more indiscriminate violence’ in response to resistance.”
Amid these plays, the US dollar and the bonds cheer market’s rush to risk-safety while the S&P 500 Futures drop around 1.5%.
It’s worth noting that Friday’s firmer prints of US jobs report for February and hawkish comments from Chicago Fed President and FOMC member Charles Evans also underpin USD strength and propel the USD/RUB prices.
That said, USD/RUB bulls will keep their eyes on the risk catalysts for fresh impulse while this week’s US Consumer Price Index (CPI) data for February will act as an extra directive for the pair traders to watch.
Technical analysis
USD/RUB bulls flirt with fire as prices print fresh high despite the overbought RSI conditions, which in turn hints at risk of heavy fall should the quote witness slightly positive news. Even so, bears remain cautious until the quote drops below the previous record high around 86.00, marked during January 2016.
- Gold buyers keep reins around August 2020 levels, posted the biggest weekly jump since July 2021 at the latest.
- US braces for Russian oil import ban even without allies, UK Defense Chief hints at further violence in Kyiv.
- US inflation data will be crucial this week as upbeat jobs report helped Fed hawks to roar before the silent period.
- Gold powers towards record high, NEM closed last gap, what's ahead?
Despite recently easing from the $2,000 threshold, gold (XAU/USD) prices remain on the front foot around a 19-month high as traders seek risk-safety amid the ongoing Russia-Ukraine jitters. That said, the quote eases to $1,988, up 1.0% on a day, while heading into Monday’s European session.
The yellow metal refreshed multi-day high earlier in Asia as risk-off escalated on the weekend news suggesting Russia’s intensified military invasion of Ukraine. On the same line were comments from the West suggesting an oil import ban from Russia. Further, UK Defense Chief Admiral Sir Tony Radakin also signaled further casualties in Kyiv as he believed, per The Times, “Russia could ‘turn up the violence’ with ‘more indiscriminate killing and more indiscriminate violence’ in response to resistance.”
Recently, Bloomberg said that the US weighs acting without allies on the ban of Russian oil imports.
While portraying the risk-off mood, S&P 500 Futures drop 1.30% whereas the US 10-year Treasury yields fall 2.5 basis points (bps) to 1.69% to portray the heavy risk-off mood.
It’s worth noting that Russia’s stand as the world’s third-biggest oil producer adds to the global supply crunch and strengthens commodities additionally.
As a result, gold buyers are likely to keep reins but the pullback moves can’t be ruled out should this week’s US inflation figures favor the faster Fed rate-hikes. That said, the US Nonfarm Payrolls (NFP) rose by 678K, well above the median forecast of a 400K figure and upwardly revised 484K prior during February. On the same line, the Unemployment Rate dropped to 3.8% versus 4.0% previous readings and 3.9% expected during the aforementioned month. Following the data release, Chicago Fed President and FOMC member Charles Evans mentioned, per Reuters, “The US central bank is on track to raising rates this year, though it may be ‘more than I think is essential to do so at every policy-setting meeting.”
Technical analysis
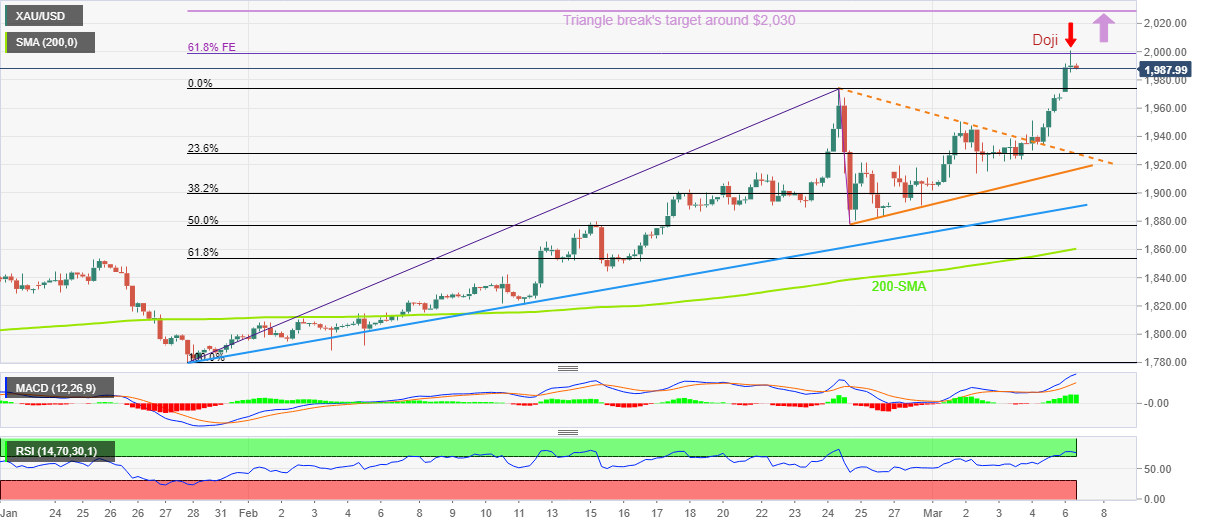
Gold prices justify the latest bearish Doji on the four-hour chart while retreating from multi-day high amid overbought RSI conditions.
However, pullback moves remain elusive until the quote defies the last week’s triangle breakout, by declining below the previous resistance line of $1,928.
Ahead of that, February’s peak of $1,967 may also challenge the XAU/USD pullback.
In a case where gold prices drop below $1,928, the $1,900 threshold and an ascending support line from late January near $1,890 will test bears before giving them controls. Also acting as a downside filter is the 200-SMA level of $1,860.
Alternatively, the 61.8% Fibonacci Expansion (FE) of January-February moves, near the $2,000 psychological magnet, tests the metal’s immediate upside ahead of the theoretical target of the last week’s triangle breakout near $2,030. Following that, the August 2020 peak near $2,077 will be in focus.
Gold: Four-hour chart
Trend: Further upside expected
- NZD/USD is looking to capture 0.7000 despite the headwinds of the risk-aversion theme.
- The DXY has faced long liquidations above 99.00.
- The rising bets over a 50 bps rate hike by the Fed has failed to strengthen the greenback against the kiwi.
The NZD/USD pair looks to climb near 0.7000 as the antipodeans are outperforming the mighty greenback on rising commodity prices. The major has opened near Friday’s value area high at 0.6846 and has extended gains after overstepping Friday’s high at 0.6872. The asset is trading around 0.5% above Friday’s close at the press time.
NZD/USD has continued its three-day winning streak on upbeat commodity prices. The kiwi has been underpinned against the greenback despite rising expectations of a 50 basis point interest rate hike in March’s monetary policy meeting. Stronger-than-expected US Nonfarm Payrolls data on Friday and expectations of soaring inflation data later this week have backed an aggressive monetary policy stance next week.
It is worth noting that the Reserve Bank of New Zealand (RBNZ) has raised its official cash rate (OCR) by 75 basis points (bps) in the last five months. The RBNZ is continuously tightening the leakage of liquidity to contain the roaring inflation. This is also the major driver that has been supporting the kiwi to perform strongly against the mighty greenback despite the broad risk-aversion theme in the market.
It is likely expected that firmer commodity prices will continue to support the kiwi as the Russia-Ukraine war will keep on escalating. Russian leader Vladimir Putin seems not interested in any diplomatic solution and is resorting to war to fulfill Russia’s demands.
Meanwhile, the US dollar index (DXY) is struggling to sustain above 99.00 amid the long liquidations after a strong upside move.
This week, the US Consumer Price Index (CPI) data on Thursday will keep the investors on their toes. While, the kiwi docket will report the Business NZ PMI data, which is expected to land at 54.5 against the prior print of 52.1.
- USD/INR retreats from multi-day as an upward sloping resistance line from April 2021 challenge buyers.
- Overbought RSI highlights 2021 peak as nearby support but bears need cautious until witnessing clear break of 75.60.
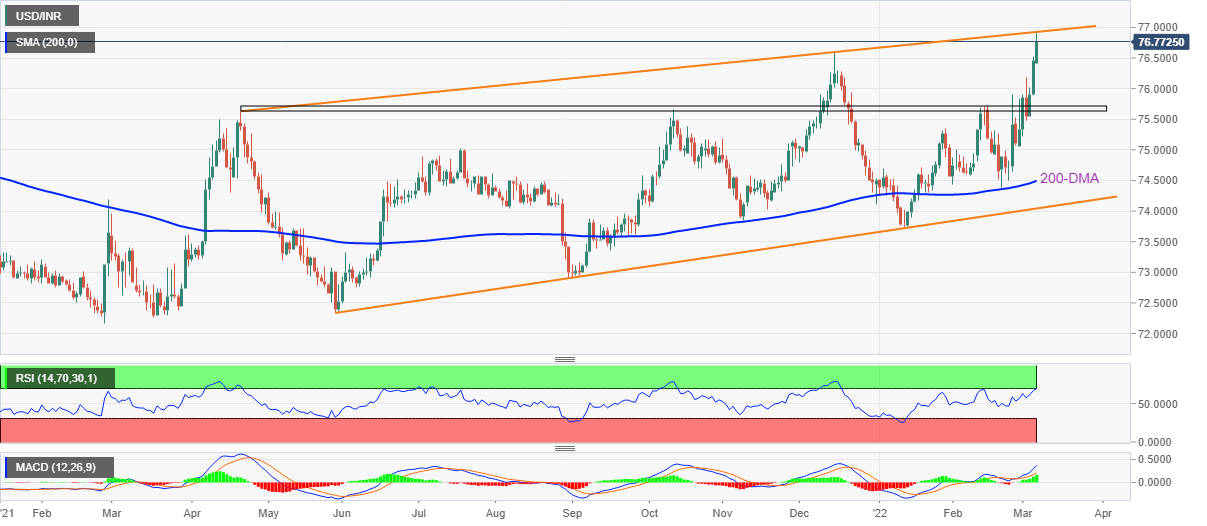
USD/INR bulls take a breather around the highest levels since April 2020, recently easing to 76.70 during the initial Indian session on Monday.
In doing so, the Indian rupee (INR) pair steps back from an upward sloping trend line from April 2021 amid overbought RSI conditions.
However, pullback moves remain elusive beyond the December 2021 high of 76.60.
Even so, a horizontal area comprising multiple levels marked during the last 10 months, near 75.60-70, appears a tough nut to crack for the pair bears.
Following that, a downward trajectory towards the 200-DMA and the ascending support line from May 2021, respectively near 74.50 and 74.00, will be in focus.
Alternatively, upside momentum remains capped until crossing the rising trend line resistance, around 76.95.
Following that, the 77.00 threshold, also comprising April 2020 peak, will act as an extra hurdle to the north prior to directing USD/INR bulls to a fresh record high towards the 80.00 round figure.
USD/INR: Daily chart
Trend: Pullback expected
China's Trade Balance for the period January-February, in Yuan terms, came in at CNY738.8 billion versus CNY407.53 expected and CNY604.69 billion last.
The exports rose by 13.6% last month vs. 19.1% expected and 17.3% previous.
Imports increased by 12.3% vs. 21.3% expected and 16% prior.
more to come ....
“Commodity price stability is critical to the economy, many measures previously used to stabilize prices in 2021,” Ning Jizhe, Deputy Head of the National Development and Reform Commission (NDRC) said on Monday.
Additional takeaways
Able to achieve consumer price inflation target in 2022.
Will step up efforts to stabilize domestic grain prices.
Will widen market access for foreign investors.
Will speed up launch of key foreign investment projects.
Oil, coal, LNG and grain prices are very high at the moment, creating a challenge to stabilize prices, but we are confident that we can.
China will not resort to flood-like stimulus.
China will be able to avoid side-effects of economic policies to support growth.
Will enhance policy coordination, speed up policies favourable for growth, avoid policies with contractionary effects.
China's economy resilient despite rising uncertainties caused by the Ukraine crisis.
Related reads
- Ukraine crisis intensifies, euro is hammered as oil soars, gold hits $2,000/oz
- AUD/USD renews four-month high above 0.7400 amid inflation, Ukraine fears
| Raw materials | Closed | Change, % |
|---|---|---|
| Brent | 118.57 | 4.61 |
| Silver | 25.596 | 1.52 |
| Gold | 1968.05 | 1.6 |
| Palladium | 2991.9 | 7.94 |
- AUD/USD takes the bids to refresh multi-day top, up for the fourth consecutive day.
- Geopolitical tensions fuel price pressure, which in turn helps commodities and Antipodeans.
- Fears of further escalation of Russian military invasion of Ukraine recently weighed on the sentiment.
- RBA’s Lowe, US CPI are the key data/events of the week, risk catalysts keep driver’s seat.
AUD/USD bulls keep reins at the highest levels since November 2021, despite recently making rounds to 0.7440 of late, as the ongoing Russia-Ukraine jitters propel commodity prices during Monday’s Asian session.
Read: Breaking: Gold surges and breaches $2,000/oz
In doing so, the risk-barometer pair seems to lose its identity while rising amid sour sentiment and ignoring firmer US fundamentals that propel the King dollar.
Starting with the Ukraine headlines, US House Speaker Nancy Pelosi recently said, “House is "exploring" legislation to ban the import of Russian oil.” Earlier in the day, UK Defense Chief Admiral Sir Tony Radakin believed, per The Times, “Russia could ‘turn up the violence’ with ‘more indiscriminate killing and more indiscriminate violence’ in response to resistance.”
Additionally, comments from Japan Prime Minister Fumio Kishida who said, “China and Russia are increasing their military collaboration,” per Reuters, joined the news of the further invasion of Moscow towards Kyiv to weigh on the sentiment and propel the DXY.
On Friday, the headline Nonfarm Payrolls (NFP) rose by 678K, well above the median forecast of a 400K figure and upwardly revised 484K prior. On the same line, the Unemployment Rate dropped to 3.8% versus 4.0% previous readings and 3.9% expected. Following the data release, Chicago Fed President and FOMC member Charles Evans mentioned, per Reuters, “The US central bank is on track to raising rates this year, though it may be ‘more than I think is essential to do so at every policy-setting meeting.”
Elsewhere, Australia’s ANZ Job Advertisements for February rose past -0.3% prior readings to 8.4% during February and offered additional support to the AUD/USD bulls.
That said, S&P 500 Futures drop 1.60% whereas the US 10-year Treasury yields fall five basis points (bps) to 1.67% to portray the heavy risk-off mood. Additionally portraying the mood are the red prints of Nikkei 225 and ASX 200, losing 3.4% and 1.6% by the press time in that order.
Looking forward, comments from the RBA Governor Philip Lowe and the US Consumer Price Index (CPI) for February may entertain AUD/USD bulls during the week. However, nothing more important than geopolitical headlines.
Technical analysis
Successful trading beyond the 200-DMA, around 0.7320 by the press time, directs AUD/USD buyers towards October 2021 peak surrounding 0.7560.
The price of gold has just hit $2,000 in fast markets at the open of the week.
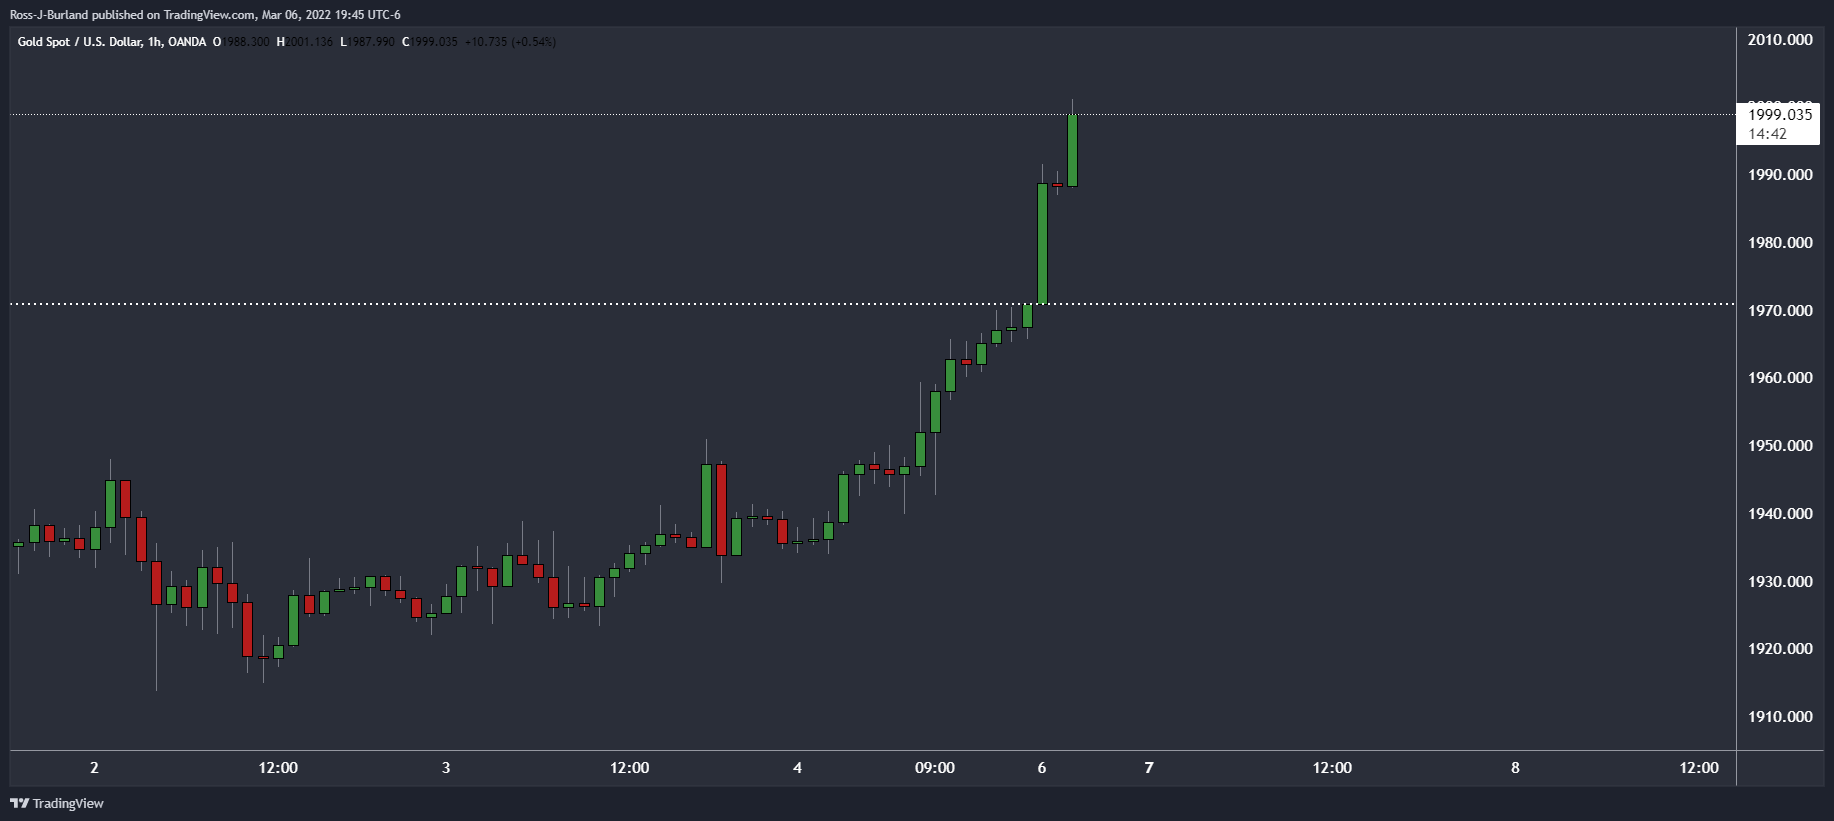
The driver is oil and fears of global stagflation. Oil has surged 10% on Monday with the risk of the US and European ban on Russian products. There are also delays in Iranian talks. Brent was quoted $12.73 higher at $130.84, while US crude rose $9.92 to $125.60.
At the time of writing, it is being reported that US House Speaker Nancy Pelosi is exploring legislation that would ban Russian oil imports. This was a theme that roiled markets at the open. More on this here:
-
Secretary of State Blinken: US is “looking” at banning Russian oil and gas, but need permission from EU
Pelosi said last Thursday that she supports banning Russian oil imports to the US. Biden has been reluctant to curb Russian oil shipments to the US or slap on energy sanctions with prices already hitting the pockets of US citizens. However, the sanction has already been backed by wide numbers of Republicans and an increasing number of Democrats.
Commodity prices in general are having their strongest start to any year since 1915. Among the many movers last week, nickel rose 19%, aluminium 15%, zinc 12%, and copper 8%, while wheat futures surged 60% and corn 15%.
This makes this week's US Consumer Price Index a key event for markets whereby an annual growth at 7.9%, and the core measure at 6.4% is feared ahead of the European Central Bank meeting this week and the Federal Reserve next week. The divergence between the two banks is fuelling the bid for the greenback which is competing with the price of gold as they both take to the moon.
| Time | Country | Event | Period | Previous value | Forecast |
|---|---|---|---|---|---|
| 00:30 (GMT) | Australia | ANZ Job Advertisements (MoM) | February | -0.3% | |
| 06:45 (GMT) | Switzerland | Unemployment Rate (non s.a.) | February | 2.6% | 2.5% |
| 07:00 (GMT) | United Kingdom | Halifax house price index | February | 0.3% | |
| 07:00 (GMT) | United Kingdom | Halifax house price index 3m Y/Y | February | 9.7% | |
| 07:00 (GMT) | Germany | Retail sales, real adjusted | January | -5.5% | 1.8% |
| 07:00 (GMT) | Germany | Retail sales, real unadjusted, y/y | January | 0% | 9.8% |
| 07:00 (GMT) | Germany | Factory Orders s.a. (MoM) | January | 2.8% | 1% |
| 08:00 (GMT) | Switzerland | Foreign Currency Reserves | February | 947.15 | |
| 20:00 (GMT) | U.S. | Consumer Credit | January | 18.9 | 23.8 |
| 23:30 (GMT) | Japan | Labor Cash Earnings, YoY | January | -0.2% | |
| 23:50 (GMT) | Japan | Current Account, bln | January | -370.8 | -880.2 |
In recent trade today, the People’s Bank of China (PBOC) set the yuan (CNY) at 6.3478 vs the previous fix of 6.3288 and the previous close of 6.3210.
About the fix
China maintains strict control of the yuan’s rate on the mainland.
The onshore yuan (CNY) differs from the offshore one (CNH) in trading restrictions, this last one is not as tightly controlled.
Each morning, the People’s Bank of China (PBOC) sets a so-called daily midpoint fix, based on the yuan’s previous day closing level and quotations taken from the inter-bank dealer.
- AUD/USD is approaching toward the trendline placed from 0.8008 on firmer RSI (14).
- The pair has overstepped the 38.2% Fibo retracement, which adds to the upside filters.
- Bears can take charge if the major slips below 200-EMA low at 0.7300.
The AUD/USD pair continues its three-day winning streak on Monday after a subdued opening. The major has breached Friday’s highest traded price at 0.7381 and is approaching towards the trendline placed from February 25, 2021, high at 0.8008.
On the daily scale, AUD/USD has established a bullish bias after overstepping the 38.2% Fibonacci retracement at 0.7364, which is placed from February 25 high at 0.8008 to January 28 low at 0.6966. The major is comfortable holding above 50-period and 200-period Exponential Moving Averages (EMA), which are trading near 0.7210 and 0.7300 respectively, and add to the upside filters.
The Relative Strength Index (RSI) (14) has crossed 60.00 after oscillating in a range of 40.00-60.00, which indicates a trigger for a fresh rally after a brief consolidation.
From the observations of a bullish range shift in the RSI oscillator and has surpassed 38.2% Fibo retracement, a bullish momentum going forward is very much on cards. To elevate gains, bulls need to violate November 08 high at 0.7432. Breach of 0.7432 will send the pair towards 50% Fibonacci retracement at 0.7487 and October 28 high at 0.7557.
On the flip side, bulls can lose confidence if the major slips below 200-EMA low at 0.7300. This will drag the pair towards the 50-EMA at 0.7227 and February 24 low at 0.7094.
AUD/USD daily chart
-637822114428624566.png)
- USD/JPY bounces off seven-day low to print mild intraday gains.
- UK Defense Chief believes that Russia could “turn up the violence”, Japan PM Kishida said that China-Russia increasing military collaboration.
- US jobs report, Fed’s Evans also favor the bulls amid sluggish session.
USD/JPY consolidates recent losses around 115.00 as risk-off mood underpins the US dollar’s safe-haven demand during Monday’s Asian session. The risk-barometer pair also gets weighed by the hawkish comments from Fed policymakers and strong US jobs report.
An ongoing Russian invasion shows the failure of the Kyiv-Moscow peace talks as Russian President Vladimir Putin sounds determined to fight until winning over Ukraine. The speculations gain support from the latest comments of UK Defense Chief Admiral Sir Tony Radakin, shared by The Times. The news mentioned that Russia’s lead forces have been “decimated” and it is not inevitable that it will succeed in taking over Ukraine. However, the Defense Chief also believed, per the news, “Russia could ‘turn up the violence’ with ‘more indiscriminate killing and more indiscriminate violence’ in response to resistance.”
On the same line were comments from Japan Prime Minister Fumio Kishida who said, “China and Russia are increasing their military collaboration.”
It should be noted that the US jobs report on Friday came in too strong for February and Fed’s Evans spread hawkish words before the Fed’s silent period began. That said, the headline Nonfarm Payrolls (NFP) rose by 678K, well above the median forecast of a 400K figure and upwardly revised 484K prior. On the same line, the Unemployment Rate dropped to 3.8% versus 4.0% previous readings and 3.9% expected.
Elsewhere, Fed’s Evans said, “The U.S. central bank is on track to raising rates this year, though it may be ‘more than I think is essential to do so at every policy-setting meeting.”
While portraying the risk-off mood, Wall Street closed in the red and the US 10-year Treasury yields also posted the biggest weekly loss since mid-2020 by the end of Friday. It should be noted that the S&P 500 Futures drop over 1.0% by the press time.
Looking forward, Risk catalysts and the US Consumer Price Index for February will be crucial for the USD/JPY pair traders to watch.
Technical analysis
USD/JPY is likely to continue trading sideways until either breaking the 100-DMA level surrounding 114.45 or a three-week-old resistance line, close to 115.65 at the latest.
| Pare | Closed | Change, % |
|---|---|---|
| AUDUSD | 0.73731 | 0.61 |
| EURJPY | 125.454 | -1.8 |
| EURUSD | 1.09228 | -1.29 |
| GBPJPY | 152.037 | -1.34 |
| GBPUSD | 1.32376 | -0.8 |
| NZDUSD | 0.68634 | 0.93 |
| USDCAD | 1.27258 | 0.42 |
| USDCHF | 0.91765 | 0.03 |
| USDJPY | 114.852 | -0.52 |
- EUR/CHF holds onto the bearish bias around multi-year low after posting the biggest weekly loss since January 2015.
- Sustained break of five-year-old trend line, bearish MACD keeps sellers hopeful.
- Oversold RSI challenges further downside, 50-SMA adds to the upside filters.
Having begun the week’s trading with a downside gap to 0.9985, EUR/CHF remains on the back foot around the lowest levels since early 2015 during Monday’s Asian session.
The cross-currency pair printed the biggest weekly losses since January 2015 at the latest before hitting the parity during the week-start trading.
That said, the quote’s downside could be attributed to the broad risk-off mood and a clear break of previously key support lines from April 2020 and early 2017, respectively around 1.0420 and 1.0285 by the press time.
Also favoring the sellers are the bearish MACD conditions and an ongoing war between Russia and Ukraine.
As a result, EUR/CHF has a further downside towards testing the year 2015 bottom surrounding 0.9725. However, the oversold RSI may challenge the bear afterward.
EUR/CHF: Monthly chart
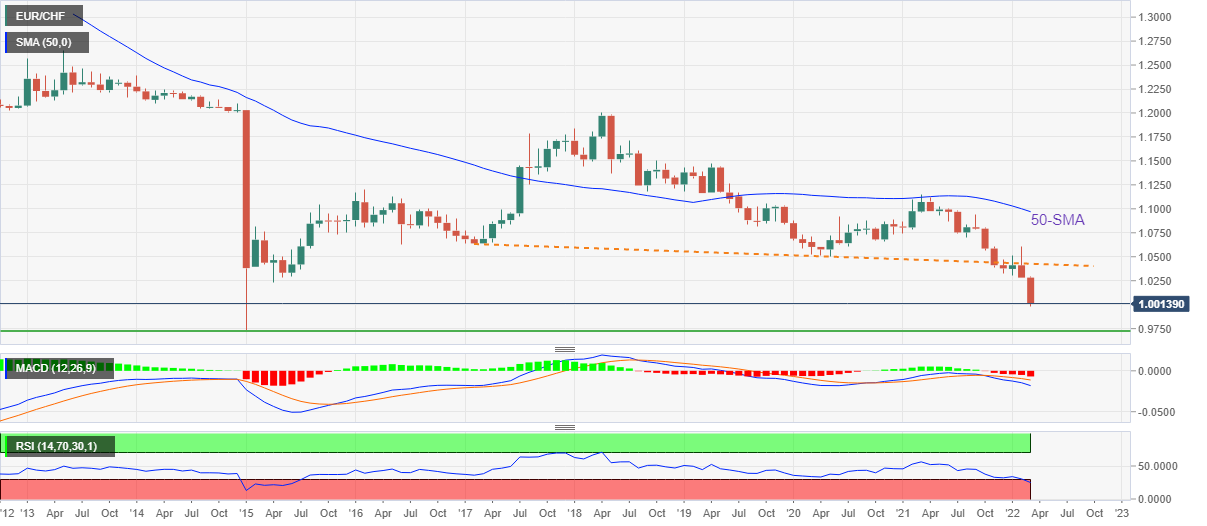
On the contrary, recovery moves beyond the 1.0420 support-turned-resistance level, will need validation from a six-month-old descending trend line on the weekly chart to challenge 50-SMA on the monthly formation, around 1.0550 and 1.0970 in that order.
EUR/CHF: Weekly chart
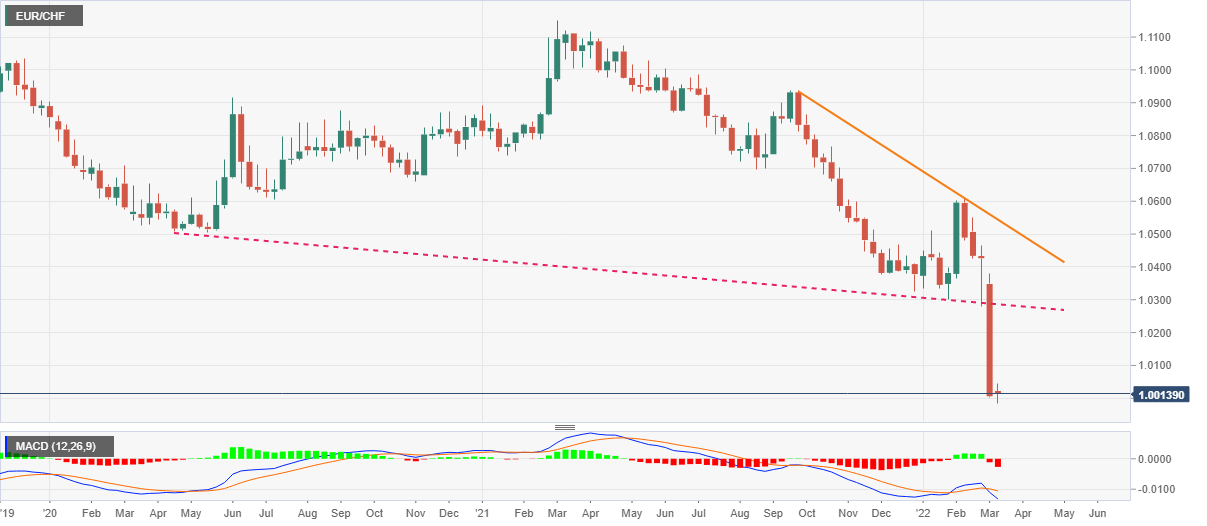
© 2000-2026. All rights reserved.
This site is managed by Teletrade D.J. LLC 2351 LLC 2022 (Euro House, Richmond Hill Road, Kingstown, VC0100, St. Vincent and the Grenadines).
The information on this website is for informational purposes only and does not constitute any investment advice.
The company does not serve or provide services to customers who are residents of the US, Canada, Iran, The Democratic People's Republic of Korea, Yemen and FATF blacklisted countries.
Making transactions on financial markets with marginal financial instruments opens up wide possibilities and allows investors who are willing to take risks to earn high profits, carrying a potentially high risk of losses at the same time. Therefore you should responsibly approach the issue of choosing the appropriate investment strategy, taking the available resources into account, before starting trading.
Use of the information: full or partial use of materials from this website must always be referenced to TeleTrade as the source of information. Use of the materials on the Internet must be accompanied by a hyperlink to teletrade.org. Automatic import of materials and information from this website is prohibited.
Please contact our PR department if you have any questions or need assistance at pr@teletrade.global.
