- Analytics
- News and Tools
- Market News
CFD Markets News and Forecasts — 07-02-2022
- WTI remains on the back foot after easing from eight-year high on Monday.
- French-Russia talks sound optimistic but UK PM Johnson’s comments seem to keep the risk of a war alive.
- US Goods Trade Balance, weekly private inventory data will decorate calendar.
- Headlines surrounding US-China trade deal may also entertain oil traders.
WTI crude oil prices extend the previous day’s pullback from a multi-day high, declining towards $90.00 during Tuesday’s Asian session.
In doing so, the black gold seems to justify the recent pause in the US Treasury yields, after easing from a two-year top on Monday. Also challenging the oil traders are the Sino-American trade tussles and recently downbeat China data. It should be noted, however, that the risk of a Russia-Ukraine war and fears of the OPEC+ members’ inability to meet production hike targets keep the energy buyers hopeful.
The US 10-year Treasury yields steady around 1.92%, close to the highest levels since late 2020, while the US stock future print mild gains around 4,485 at the latest.
That said, the French-Russian talks over Ukraine managed to refrain from any major negatives while the tone of Russian President Vladimir Putin seemed a bit confirmative. However, UK PM Boris Johnson showed readiness to take harsh measures and kept the geopolitical risks of a war on the table.
Elsewhere, the US conveyed dissatisfaction with China’s performance on the Phase 1 trade deal the previous day whereas Beijing’s downbeat Caixin Services PMI for January added to the bearish impulse. Furthermore, hawkish central bank scenario and indecision OPEC+ performance also tested oil bulls of late.
Moving on, the WTI crude oil traders will pay attention to the US Goods and Services Trade Balance for December, expected $-83B versus $-80.2B, for fresh impulse. Also important will be the industry stockpile report of the API Weekly Crude Oil Stock, prior -1.6445M, for the week ended on February 04.
Technical analysis
Monday’s bearish spinning top candlestick hints at further consolidation of oil gains towards a two-week-old ascending trend line near $87.20. However, WTI crude oil buyers remain hopeful until witnessing a daily closing below October 2021 top surrounding $85.00.
- The non-yielding metal advanced despite the US 10-year Treasury yield clung above the 1.90% threshold.
- US inflation expectations grind lower as shown by FRED data, eased to 2.4%.
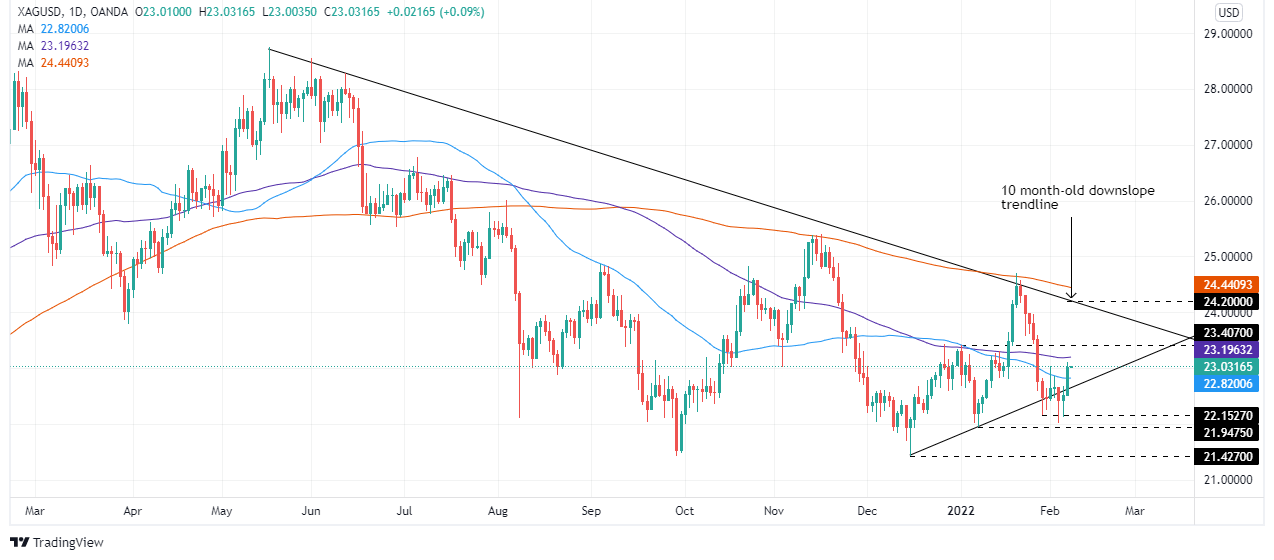
- XAG/USD is neutral biased, but XAG bulls get ready for a test to the 100-DMA.
Silver (XAG/USD) begins the week on higher note rallies more than 2% on Monday. As the Asian Pacific session begins, XAG/ÛSD is trading at $23.01. Financial market sentiment is mixed. The Dow Jones Industrial finished with gains, while the S&P 500 and the Nasdaq closed with losses.
Despite the rise of US T-bond yields, Silver rallied. The 10-year benchmark note dropped one basis point though clung to 1.919%, while US Real Yields, as of February 4, finished at -1.00% but failed to weigh on the non-yielding metal.
In the meantime, as reported by St. Louis Federal Reserve (FRED) data, US Inflation expectations eased to 2.4%.
An absent US economic docket keeps XAG/USD traders assessing the January Nonfarm Payrolls report unveiled last Friday. The figures crushed expectations by large, 467K vs. 150K estimated. However, Fed worries regarding inflation made investors look towards Average Hourly Earnings, which shoot to 5.7%, 0.7% higher than December’s reading. That said, it further cements the US central bank hawkish expectations, as money market futures have prices in five rate hikes.
That said, silver traders’ focus would be on Thursday’s US inflation numbers for January. Estimations by analysts expect the Consumer Price Index (CPI) at 7.3%, while the Core CPI, which excludes food and energy, at 5.9%, both readings on an annual basis.
XAG/USD Price Forecast: Technical outlook
On Monday, XAG/USD broke above the 50-day moving average (DMA), but it faced strong resistance at the $23.00 figure. Nevertheless, the rally broke four resistance levels on its way up, as XAG bulls get ready for a challenge of the 100-DMA at $23.19.
Silver is neutral biased. However, a breach of the 100-DMA could send the non-yielding metal upwards. The first resistance would be January 3 high at $23.40, followed by a tenth-month-old downslope trendline, around the $24.00-$24.20 range.
- GBP/USD probes two-day downtrend inside a bullish chart formation.
- Sustained bounce off 50-SMA, steady MACD line keep buyers hopeful.
- Key Fibonacci retracement levels add to the downside filters.
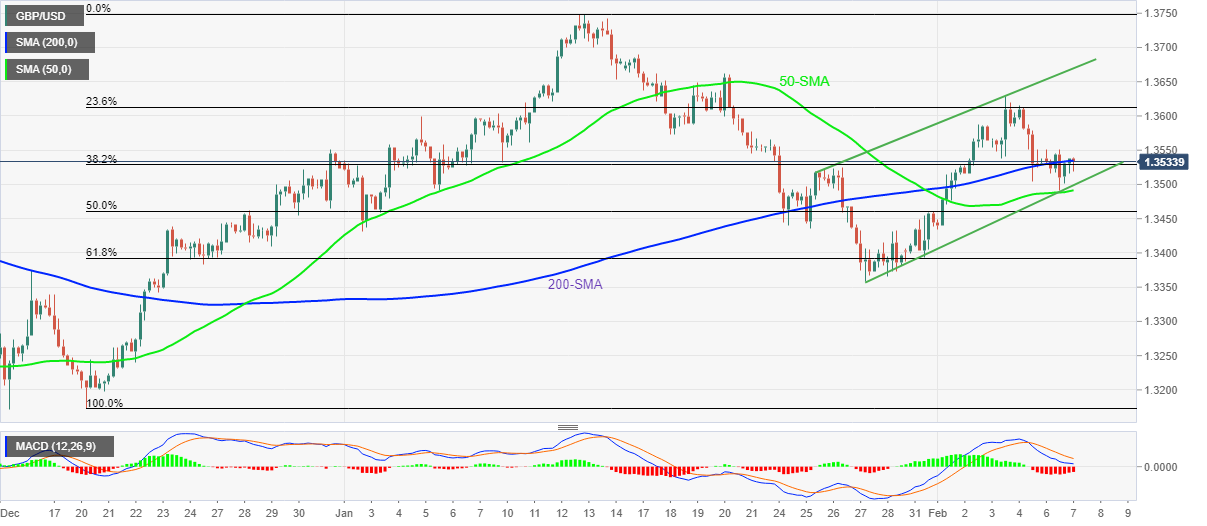
GBP/USD defends the previous day’s bounce off 50-SMA, treading water around 1.3530-35 during Tuesday’s Asian session.
The cable pair dropped to a one-week low on Monday before taking a U-turn from 1.3490, which in turn portrays the two-week-old rising channel formation. Adding to the bullish is the recently steady MACD line in the positive territory.
That said, the pair’s further upside will initially aim for the 1.3600 threshold before challenging 23.6% Fibonacci retracement (Fibo.) of the December-January upside, near 1.3615.
Should GBP/USD buyers cross the 1.3615 hurdle, the upper line of the aforementioned channel near 1.3670 will challenge the additional run-up.
Alternatively, 50-SMA and the support line of the stated bullish channel together offer strong short-term support near 1.3490, a break of which will highlight 50% and 61.8% Fibo. levels for GBP/USD bears, respectively around 1.3460 and 1.3390.
Even if the pair sellers conquer 1.3390 support, the previous month’s low around 1.3355-60 will question the further declines.
GBP/USD: Four-hour chart
Trend: Further recovery expected
Geopolitical tensions between Russia and Ukraine remain fierce even as markets recently witnessed some positives, by a shift in the tone of Russian President Vladimir Putin. Adding to the market fears were comments from UK Prime Minister (PM) Boris Johnson.
During the telephonic talks with French counterpart Emmanuel Macron, Russia’s Putin said, “I hope that the situation in Ukraine can be handled amicably in the future.”
The Russia Boss also mentioned that Russia will do all it can to find middle grounds that suit everyone.
It should be noted, however, that Putin doesn’t step back from warning as he said, “If Ukraine joins NATO, Europe would be pulled into a military clash with Russia, there will be no winners.”
On the other hand, French President Macron mentioned that they can create concrete security guarantees for EU members and Russia's neighbors. “Putin has agreed to review concrete de-escalation initiatives,” added the French leader.
Elsewhere, UK PM Johnson sounds harsh in his latest comments over the issues, shared by The Times. “British sanctions and other measures will be prepared in the event of a new Russian attack on Ukraine.”
Additional comments from UK PM Johnson mentioned, “We are thinking about sending RAF typhoon fighters and royal navy warships to protect Southeastern Europe.”
Further, “The UK is preparing to reinforce the NATO battle group led by Britain in Estonia.”
“Welcome Germany's statement that, in the event of an incursion, NORD Stream 2 would be reconsidered,” adds UK’s Johnson per The Times.
FX implications
Given the risk of a war between Russia and Ukraine, oil prices remain firmer above $90.00, despite the weak-start pullback.
Contrary to the positive surprise provided by the last week’s US jobs report, the US inflation expectations portray a downbeat scenario ahead of the key US Consumer Price Index (CPI) data for January.
That said, the inflation gauge, as measured by the 10-year breakeven inflation rate per the St. Louis Federal Reserve (FRED) data, fades the gradual recovery from September lows tested on January 20, per the FRED website.
Recently, the inflation expectations ease to 2.4% by the end of Monday’s North American session, extending the pullback from the highest level in a fortnight tested by the end of January.
The mixed signals sent by the inflation expectations seem to have been well-received by the US Treasury yields on Monday as the bond coupons pared Friday’s heavy gains around the two-year high, recently near 1.91%.
Given the mixed signals concerning the US CPI, which in turn will help direct the Fed’s next move in March, markets can remain sluggish heading into the key US inflation data.
Read: Forex Today: Market players waiting for the next catalyst
- EUR/USD edges higher past-100-DMA, tests pullback from three-month-old horizontal resistance.
- Hidden bullish divergence, sustained trading above 100-DMA keeps buyers hopeful.
- October-November lows add to the upside filters, 50-DMA also tests sellers.
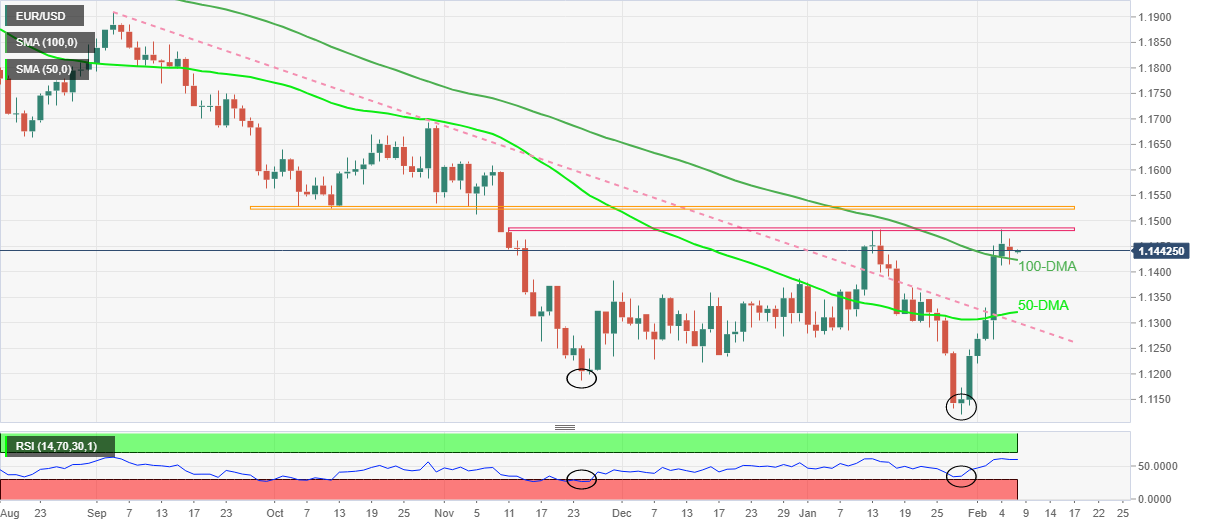
EUR/USD pauses the week-start pullback by stabilizing above 1.1400, taking rounds to 1.1440-50 during the early Asian session on Tuesday.
In doing so, the major currency pair keeps the bounce off the 100-DMA amid a hidden bullish RSI divergence on the daily chart.
A hidden bullish RSI divergence is price-positive formation when the quote makes lower-low but the RSI prints higher lows.
With this, the EUR/USD prices may again battle the immediate hurdle, namely a three-month-old horizontal resistance area near 1.1480-85. However, lows marked during October-November, around 1.1525-30, will challenge the pair buyers afterward.
Alternatively, a daily closing below the 100-DMA level of 1.1420 will direct EUR/USD bears towards the 50-DMA level surrounding 1.1325.
Following that, the previous resistance line from September, close to 1.1300, will restrict the pair’s further downside.
Overall, EUR/USD is up for consolidating losses marked during late 2021.
EUR/USD: Daily chart
Trend: Further upside expected
- AUD/USD consolidates Friday’s heavy losses at a slower pace as markets look for fresh clues.
- Upbeat Aussie data, border reopening news battle fresh US-China tussle on Phase 1 deal to test momentum traders.
- Lack of major data/events ahead of Thursday’s US CPI will keep risk catalysts on the driver’s seat.
AUD/USD prices seesaw around 0.7125-20 during early Tuesday morning in Asia, having reversed most of Friday’s losses the previous day.
The risk barometer cheered multiple upbeat catalysts from home to post notable gains at the week’s start. However, a light calendar and the market’s wait for the US Consumer Price Index (CPI) data on Thursday may test the momentum traders looking forward.
Recently, the US-Japan trade announcements to cut tariffs on Japanese steel and fight excess output battled the Sino-American tensions over the Phase 1 deal to confuse the risk barometer pair. Also challenging the AUD/USD traders are the mixed performance of equities and the US Treasury yields.
On Monday, Australia’s TD Securities Inflation rose past 0.2% to 0.4% in January while ANZ Job Advertisements improved to -0.3% versus the revised down prior figures of -5.8%. Further, the AiG Performance of Services Index also improved past 49.6 to 56.2 whereas Q4 Retail Sales output flashed record growth of 8.2% in Q4 2021 versus 8.1% prior. Hence, Aussie data offered a good start to the bulls.
Elsewhere, Australia Prime Minister Scott Morrison announced the full reopening of the international borders for fully vaxxed visa holders from February 21. Also contributed to the AUD/USD rebound were the recent positive comments from Russian President Vladimir Putin as he said, “Russia will do all it can to find middle grounds that suit everyone.”
Moving on, National Australia Bank’s (NAB) Business Conditions and Business Confidence for January will decorate the economic calendar ahead of the US Goods Trade Balance for December.
Given the absence of major data/events and mixed concerns in the market, mostly positive, not to forget the shift in attention from hawkish central bank story to trade, AUD/USD prices are likely to continue grinding higher.
Technical analysis
AUD/USD pair’s recovery moves from 0.7050-45 horizontal area needs validation from 50-DMA level surrounding 0.7165.
- The Australian dollar advances vs. the Japanese yen in a risk-off market mood.
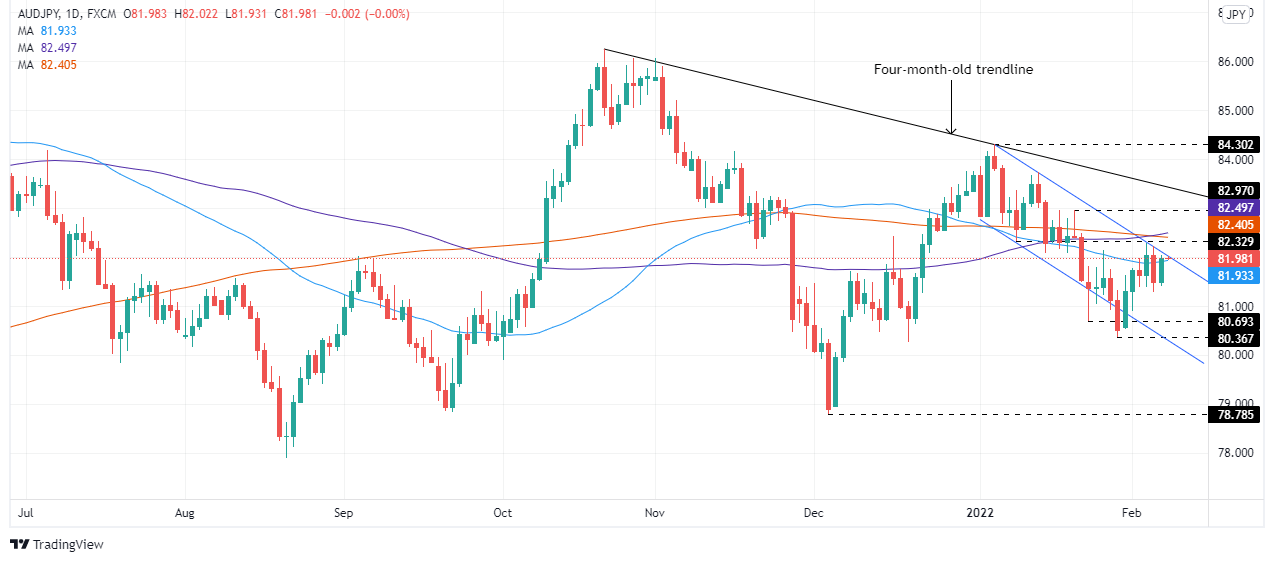
- AUD/JPY is neutral biased, but a daily close above the 50-DMA would exert upward pressure on the pair.
The AUD/JPY climbs during the day as the North American session ends, despite a risk-off market mood, which usually favors the safe-haven status of the Japanese yen. At the time of writing, the AUD/JPY is trading at 82.00.
US equity indices finished mixed, led by losses of the S&P 500 and the Nasdaq Composite, down 0.37% and 0.84%, respectively. Meanwhile, the Dow Jones finished flat.
AUD/JPY Price Forecast: Technical outlook
On Monday’s overnight session, the AUD/JPY began the week on the right foot, advancing from daily lows up to daily highs. AUD/JPY price action in the last two days suggests indecision. However, a daily close above the 50-day moving average (DMA) could spur a jump towards the confluence of the 100 and the 200-DMA lying in the 82.40-50 range, respectively.
That said, a breach of the abovementioned confluence would expose AUD/JPY’s January 20 high at 82.97, which, once broken, will challenge a five-month-old downslope trendline around the 83.40-60 range.
On the flip side, AUD/JPY’s first support would be a February 4 daily low at 81.29, stalling downward moves for four straight days. A downward break of it could pave the way for further losses. The next support would be January 24 swing low at 80.69, followed by January 28 low at 80.36.
“The United States and Japan on Monday announced a deal to remove Trump-era tariffs from about 1.25 million metric tons of Japanese steel imports annually after Washington granted similar access for European Union steelmakers last year,” said Reuters during late Tuesday morning in Asia.
The news quotes US official to mention, “The new deal, which excludes aluminum at Japan's request, will take effect on April 1 and requires Japan to take ‘concrete steps’ to fight global excess steel manufacturing capacity, largely centered in China.”
A joint statement was also mentioned stating that Japan would start to implement within six months "appropriate domestic measures, such as anti-dumping, countervailing duty, and safeguard measures or other measures of at least equivalent effect,” to establish more market-oriented conditions for steel.
Key quotes
US Commerce Secretary Gina Raimondo said the deal ‘will strengthen America’s steel industry and ensure its workforce stays competitive, while also providing more access to cheaper steel and addressing a major irritant between the United States and Japan, one of our most important allies.’
Unlike the EU deal, past steel product exclusions from tariffs will not be added to Japan's quota for two years. Any exclusions must be applied for through the Commerce Department's normal process, according to the U.S. announcement.
Japan also will initially not participate in U.S.-EU talks on a global agreement to discourage trade in steel made with high carbon emissions - another initiative aimed at battling carbon-intensive Chinese steel output. But U.S. officials said that Japan would confer with the United States on methodologies for measuring carbon intensity in steel and aluminum production.
Japan's steel industry also is highly dependent on coal-fired blast furnace production, while more than 70% of U.S. steel is made with electric-arc furnaces that emit less carbon.
FX implications
Considering a lack of major data/events and the market’s wait for Thursday’s US Consumer Price Index (CPI), traders paid a little heed to the news with the USD/JPY prices waiting for Tokyo open after ending the sluggish week-start day near 115.00
- Gold bulls are in control, but the focus is on the downside while below key daily resistance.
- More substantial CTA trend follower liquidations below $1800/oz.
- XAU/USD indecisive as investors assess central banks' rate outlook.
Gold, XAU/USD, was a form performer at the start of the week due to solid demand for safe-haven assets amid rising geopolitical tension. The concerns of imminent monetary policy tightening by the US Federal Reserve was cast aside as a consequence and gold has printed a fresh corrective high at $1,823.59.
The US dollar, despite the risk-off tones, was a touch fragile on the day due to the surprise hawkish rhetoric from the European Central Bank last week. The ECB now sees “upside risk to inflation” and Lagarde noted “things have changed”." President Lagarde's clear signal that the door has opened for rate hikes later this year is a real game-changer for the foreign exchange market," said MUFG analyst Lee Hardman.
"Over the past year the EUR has underperformed on the back of expectations that the ECB will maintain loose policy while the BoE and Fed tighten," Hardman argued. These themes were being digested in slow Monday markets which have led to the US dollar index DXY to steady at around 95.50.
Who's buying gold?
Analysts at ANZ Bank explained that ''the yellow metal has remained stubbornly resilient during China's Spring Festival celebrations against the weight of a decisively hawkish Fed. Even the outstanding beat in last week's US jobs data did not provide enough firepower for gold prices to break below their bull-market-era trendline established since 2018.''
''On the surface, one might assume that a growing appetite for safe-havens amid Russian tensions could be driving prices higher. However, tracking ETF flows suggests little such interest in the yellow metal when accounting for options-related distortions, whereas the Fed's decisively hawkish tone is keeping capital from sustainably flowing into the yellow metal, the analysts added.''
''It remains to be seen whether central bank purchases might be playing a substantial role in keeping gold prices from breaking lower, as the data continues to point to little speculative interest for the yellow metal.''
''Ultimately, the macro regime should keep prices vulnerable to a deeper consolidation, in support of our tactical short gold position.'' However, they expect more substantial CTA trend follower liquidations below $1800/oz.
Gold technical analysis
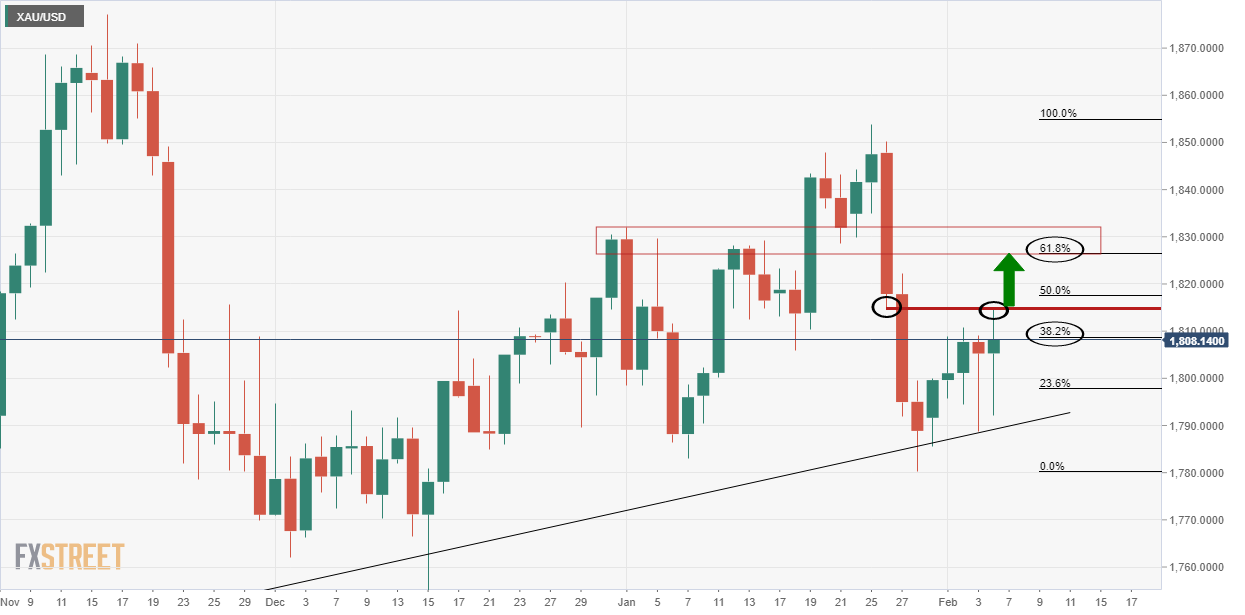
As illustrated on the daily chart, the bulls have overcome the sellers in the $1,810 area and are in pursuit of the 61.8% golden ratio.
Gold, prior analysis
Gold, live market
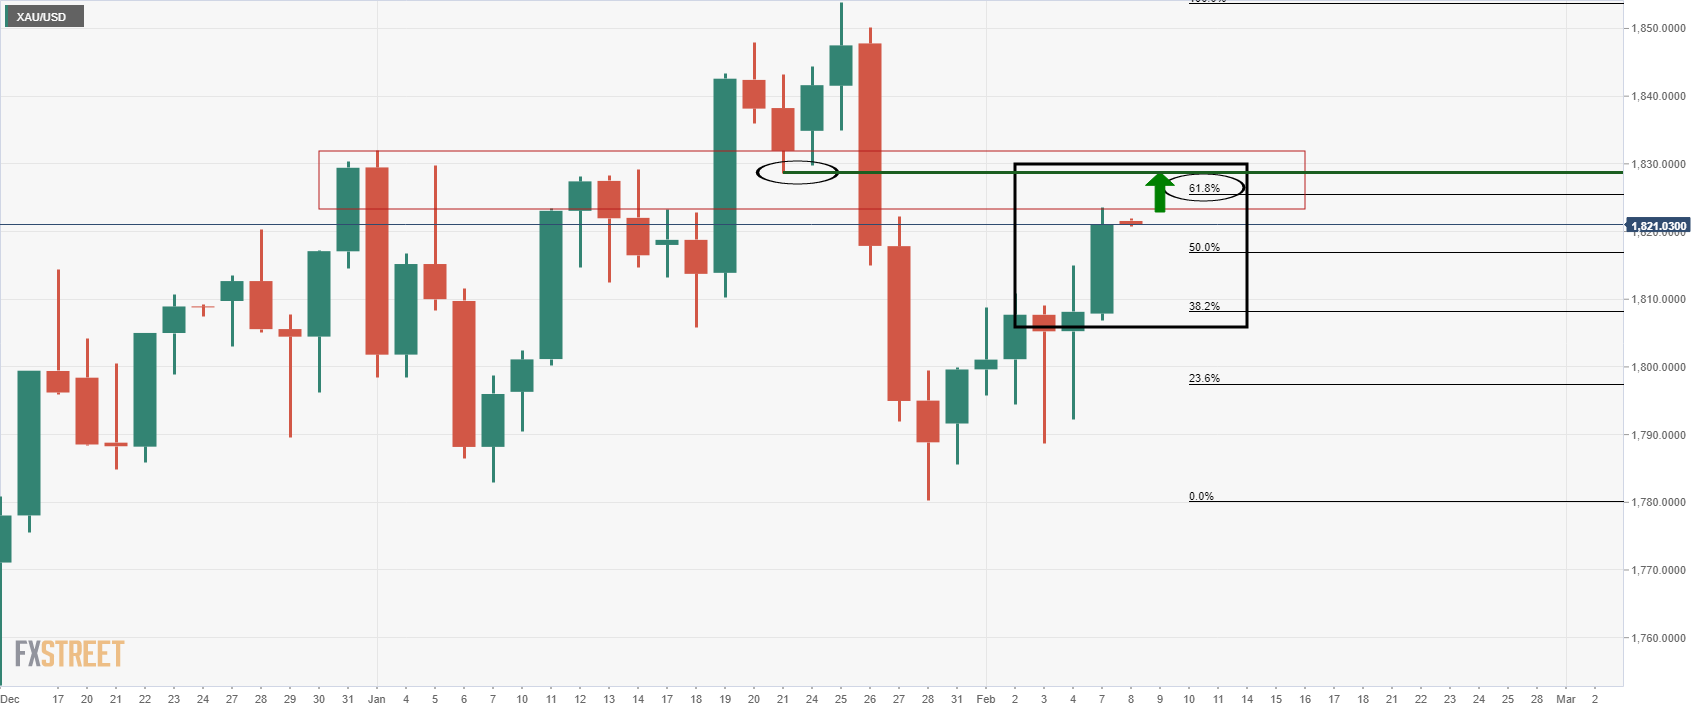
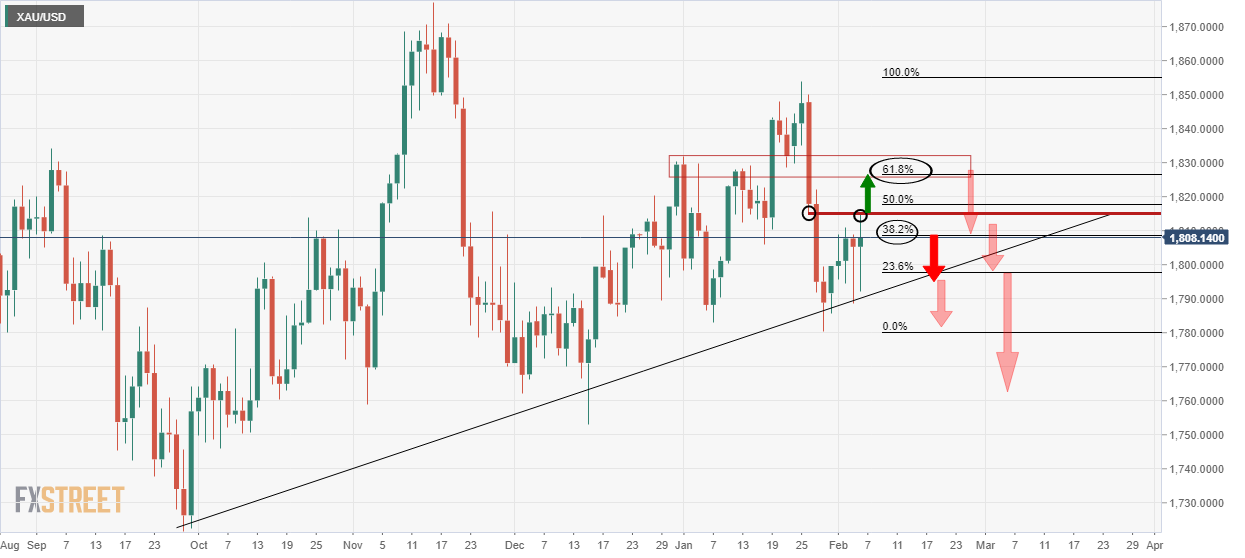
While there are no direct confluences at a specific price target between the neckline of the M-formation and the 61.8% ratio, the area between the two mile-stones near $1,830 will be expected to offer firm resistance.
In any case, until the M-formation's neckline is broken, the focus is on the downside, as illustrated in pre-open markets earlier this week as follows:
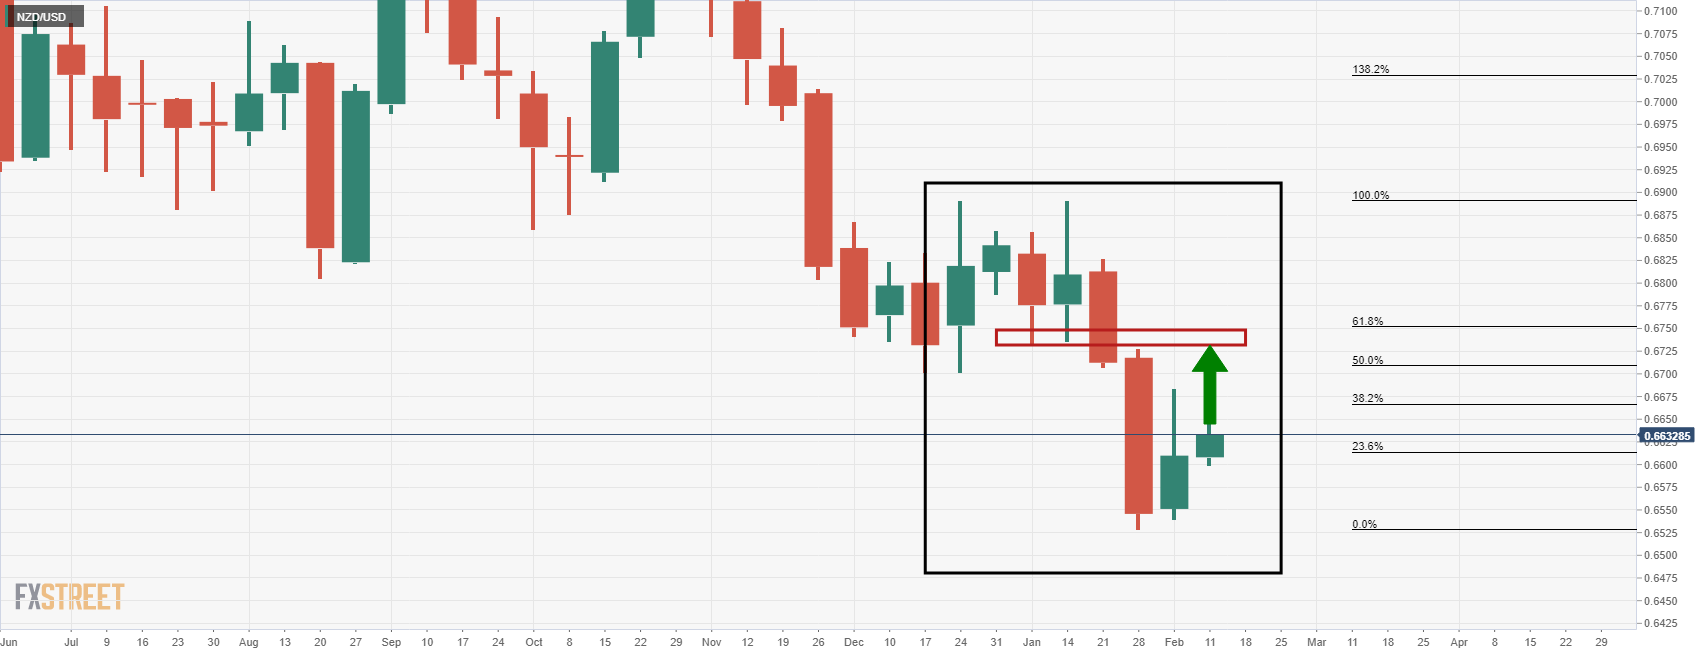
- NZD/USD bulls are hunting down a weekly key target.
- A quiet start to the week, a time to reflect on both domestic ad offshore fundamentals.
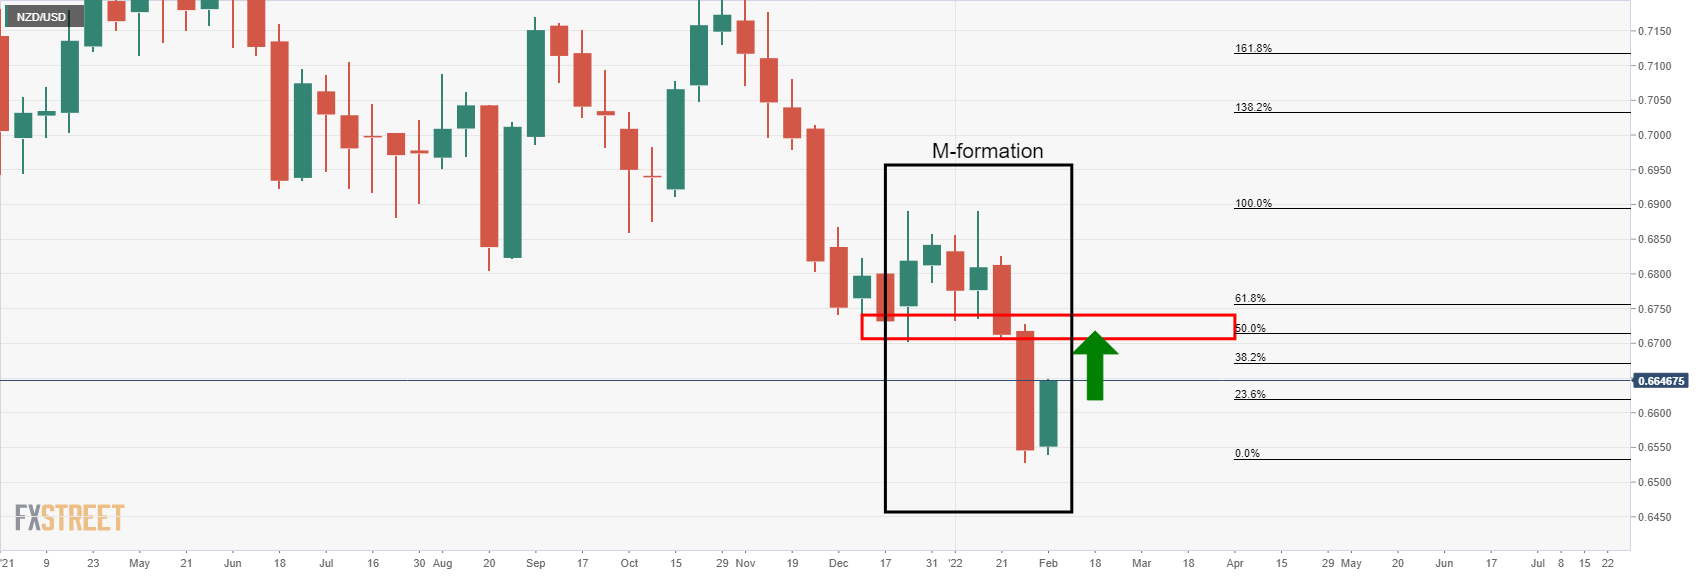
NZD/USD is firm at the start of a new week and has eyes on the weekly targets towards 0.67 the figure. At 0.6630, the pair is trading 0.28% higher on the day towards a critical target on the longer-term time frames, as illustrated below.
However, overall, it has been a quiet start to the week so far as traders digest a busy week of events last week and significant fundamentals that are setting the stage for March and the third round of 2022's central bank meetings.
''FX markets have generally been pretty tame since Friday, and that was despite much stronger-than-expected US data that rattled bonds,'' analysts at ANZ Bank explained. ''This is a quiet week for domestic data, with mostly second-tier data. But US CPI could cause volatility,'' the analysts said.
For an insight into what is to be expected in the data, analysts at TD securities explained, ''Core, as well as total prices likely, slowed on an m/m basis, with the pace still fairly strong. Strength in used vehicles was probably partly offset by weakness in hotels and airfares. Our forecast implies 7.2%/5.8% yoY for total/core prices, up from 7.0%/5.5%. The report will include updated weights and seasonal factors, neither of which should change trends significantly.''
Meanwhile, the ''bigger picture,'' analysts at ANZ argue, ''we still see the NZD as conflicted rather than trending – local data has been very strong, commodity prices are booming and interest rates are best in class, but the rest of the world is experiencing its own “re-awakening”, and fears of a hard landing and/or housing market wobbles never seem to be too far away.''
NZD/USD technical analysis
- NZD/USD Price Analysis: The 50% mean reversion is giving way in Asia
NZD/USD is on the verge of finding itself in a significant area on the charts, as per the prior analysis above.
NZD/USD live market
- EUR/JPY slipped back from earlier highs above 132.00 as ECB’s Lagarde sounded a little more cautious.
- However, the pair remained decently supported above the key 131.50 level, an area that may continue to offer support this week.
EUR/JPY stabilise above a key level of support at 131.50 on Monday, after hitting fresh three-month highs above 132.00 earlier in the session. In wake of her hawkish press conference after last week’s ECB meeting that sent the euro lurching higher versus its G10 counterparts, President Christine Lagarde struck a more measured tone on Monday. This helped bring the EUR/JPY back from earlier session highs and has calmed calls for an imminent test of the Q4 2021 highs in the mid-133.00s.
For reference, Lagarde gave some additional dovish context to last week’s hawkish shift. She continued to imply that a rate hike in 2022 was a possibility and noted the ECB might revise up its inflation forecast to see it remaining above 2.0% at the end of the year. However, she emphasised that there would be no need for major policy tightening, given that inflation is expected to stabilise near 2.0% in the medium term. Rather, she emphasised, it would just be policy normalisation.
EUR/JPY traders will not turn their focus to a speech from ECB Chief Economist Philip Lane on Thursday. Like Lagarde, Lane has consistently underestimated inflation in recent months and was until only very recently pushing the idea it would end 2022 under 2.0%. With Lagarde having now dropped that stance, Lane probably has too. A more hawkish-sounding Lane should thus not be surprising, but could nonetheless continue to offer EUR/JPY support this week, with BoJ policymakers expected to remain as dovish as ever. That might imply the pair remains supported above support at 131.50 this week, barring any catalyst for safe-haven assets that benefit the yen.
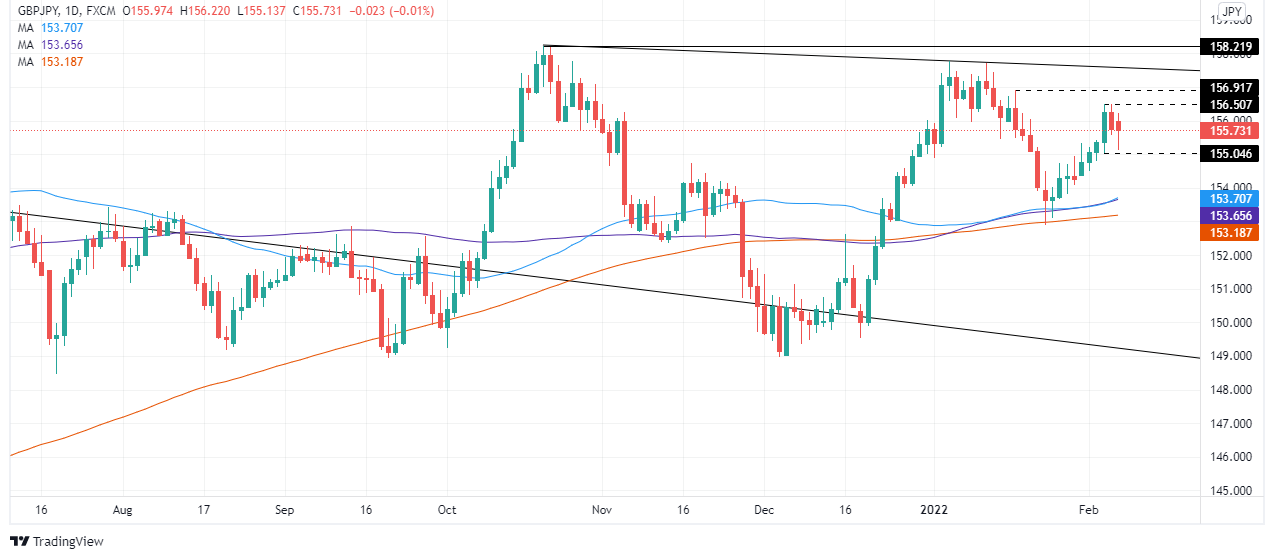
- The GBP/JPY bounces off daily lows, though it loses some 0.06% in the day.
- Market participants’ lack of conviction keeps the GBP/JPY range-bound.
- GBP/JPY is range-bound with no apparent bias, but Monday’s price action gives “hope” to GBP/JPY bulls.
The GBP/JPY consolidated around the 154.30-156.50 range in the last week, as risk-sentiment fluctuates between risk-off/on mood. At the time of writing, the GBP/JPY is trading at 155.78.
As portrayed by US equities, financial markets are mixed, fluctuating between gainers and losers. In the FX complex, a risk-on market mood spurred demand for risk-sensitive currencies, like the British pound. Nevertheless, so far, trimmed earlier losses vs. the Japanese yen.
GBP/JPY Price Forecast: Technical outlook
GBP/JPY Monday’s price action witnessed the pair falling towards 155.13, a daily low, though the GBP bounced off the lows as the North American session progressed.
In the last two days, the GBP/JPY price action has printed lower daily highs/lows, suggesting that the pair is headed downwards, despite that the daily moving averages (DMAs) indicate the GBP/JPY is upward biased.
That said, GBP/JPY traders may wait on the sidelines, expecting a breakout of the 154.30-156.50 trading range.
Nevertheless, the long wick below the candlestick “real body” gave clues that the pair might resume the upward move based on Monday’s price action. The first resistance on the way north would be 156.00. Once that level gives way, the next resistance would be February 3 daily high at 156.50, followed by the 157.00 figure.
On the downside, the break of 155.00 would expose the DMAs as targets for GBP/JPY bears.
- WTI bears eye the 50% mean reversion mark around $88.80.
- Supply-side drivers and US/Iran are the focus.
Trading at $91.22, West Texas Intermediate crude oil, (WTI), is down 0.8% on the day so far after falling from a high of 92.70 to a low of 90.76. The black gold is retreating from its highest levels in seven years as supply risk sentiment takes over amidst a blurry outlook for oil.
The Biden administration is said to have reinstated waivers to sanctions previously imposed on Iran. Signs that the Iran file is marching towards a deal are becoming increasingly apparent which will enable international nuclear cooperation projects. There are therefore prospects to revive the 2015 nuclear deal the US pulled out of under former President Donald Trump, ''further blurring the near-term outlook for supply risk'', analysts at TD Securities explained.
As for the Russia risk, the analysts at TD Securities explained, ''our real-time gauge of Russia supply risks suggests that this risk premium is receding. Instead, we argue that price action is more consistent with a disruption from the Texas Freeze, which is having an outsized impact amid low inventories and spare capacity...As weather disruptions ease, energy prices will again be increasingly vulnerable to de-escalation in supply risk.''
WTI technical analysis
-637798603605560005.png)
The price of oil is receding from the multiyear tops and a correction into a deeper area of what might be regarded as a support target could be on the cards. This falls in at the confluence area between the prior daily highs and at the 50% mean reversion mark around $88.80.
- XAU/USD has recently pushed back above $1820 and, in doing so, moved back above its 21DMA.
- The bulls will be eyeing a move towards the next key resistance area around $1830.
- XAU/USD has been taking advantage of the subdued FX markets and a slight pullback in US government bond yields.
Spot gold (XAU/USD) prices have been picking up steam in recent trade and recently rallied to the north of the 21-Day Moving Average at $1818 and above the $1820 level. At current levels around $1823, the precious metal is trading with on-the-day gains of about 0.8%. Now that resistance in the form of last week’s high at $1815 has been breached, the bulls will be eyeing a move towards the next key resistance area around $1830.
XAU/USD has been taking advantage of the subdued tone to trade in FX markets (where the DXY is flat) and a slight pullback in US government bond yields from multi-month/year highs hit last week after strong US jobs data. Analysts have pointed out that, in recent session’s weeks, the precious metals' negative correlation to the US dollar and US yields has weakened. That implies the precious metal might not be quite as vulnerable as it normally would be to an upside surprise in this week’s US Consumer Price Inflation data, which is scheduled for release on Thursday.
Market commentators have been citing elevated demand for inflation protection (in no small part due to the recent surge in oil prices) and safe-haven demand as geopolitical tensions remain elevated as driving recent upside. Indeed, XAU/USD is now more than 2.0% up from the lows it printed in the $1780s just seven sessions ago.
With the precious metal having found strong uptrend support in the $1780s and now successfully made it back above its major moving averages (21, 50, 200), the technical momentum for a return to and test of annual highs in the $1850s appears to be there. Perhaps gold might even be able to test its November highs near $1880. In the long run, however, it remains to be seen whether XAU/USD can resist the tide of a global rise in interest rates.
What you need to know on Tuesday, February 8:
The week started in slow motion, and the dollar ended the day mixed across the board. It managed to add some ground against its European rivals, although EUR/USD held above 1.1400, while GBP/USD settled at around 1.3530.
European Central Bank President Christine Lagarde poured cold water on rate hikes speculation. Speaking before the EU Parliament she said that there is no sign that inflation will measurably exceed the bank's 2% target in the medium term.
Commodity-linked currencies, on the other hand, managed to advance with AUD/USD trading at around 0.7120 and USD/CAD accelerating its slide at the end of the day to trade in the 1.2660 price zone.
Gold maintained its bullish stance throughout the day, ending the American session at $1,820 a troy ounce. Crude oil prices, however, retreated from their multi-year highs and WTI settled at $91.20 a barrel
Equities traded mixed, unable to find a clear direction. Wall Street is poised to close mixed with the major indexes trading around their opening levels.
US Treasury yields were sharply up ahead of the opening, holding on to gains, but pulling back from intraday highs.
Generally speaking, the week will be light in terms of macroeconomic releases, although the US will publish January Inflation next Thursday.
Shiba Inu Price Prediction: SHIB bulls are back, target $0.000054
Like this article? Help us with some feedback by answering this survey:
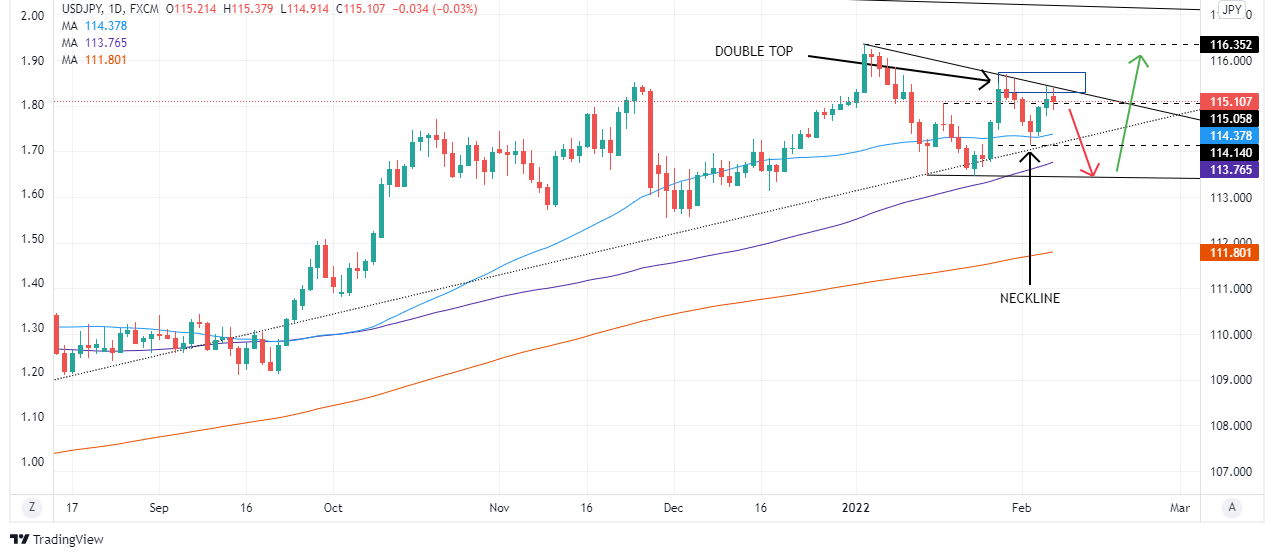
- The USD/JPY is upbeat, but a descending wedge indicates that a downward move lies ahead.
- Despite broad US Dollar strength, the USD failed to capitalize vs. the Japanese yen.
- USD/JPY may print a leg-down before resuming towards new YTD highs.
On Monday, during the North American session, the USD/JPY slides some 0.05%. At the time of writing is trading at 115.13. The market sentiment is mixed, as portrayed by US equity indices fluctuating between gainers/losers.
In the meantime, the US Dolla Index, a gauge of the greenback’s value against a basket of its peers, is up 0.09%, sitting at 05.57. In the meantime, the US 10-year benchmark note retreats from earlier gains slump one and a half basis points, down to 1.916%, a headwind for the USD/JPY, which has a strong positive correlation with it.
USD/JPY Price Forecast: Technical outlook
The USD/JPY is upward biased from a technical perspective. The daily moving averages (DMAs) reside beneath the spot price, suggesting the previous-mentioned. Nevertheless, the possibility of another leg-down before resuming towards YTD highs and above may be on the cards due to a descending wedge formation.
A double-top appears to be formed in the near term, but it would need a daily close below the neckline, located at 114.14, to confirm its validity. In that event, the first support would be the 100-DMA at 113.76. Breach of the latter would target the bottom trendline of a descending wedge, around 113.40.
In that outcome, a move towards 114.00 would open the door for further gains. The next resistance would be February 2 daily low, support-turned-resistance at 114.14, followed by the 50-DMA at 114.48, followed by the downslope-trendline from the descending-wedge, around 115.30.
- USD/CAD bulls are seeking a break of 1.2880's.
- Inverse H&S are taking shape for the week ahead.
As per last week's analysis, USD/CAD Price Analysis: Bulls are firming up at a critical support area, the bulls came out in force and took the price higher, but as illustrated below, the bears are putting up a fight.
USD/CAD prior analysis, daily chart
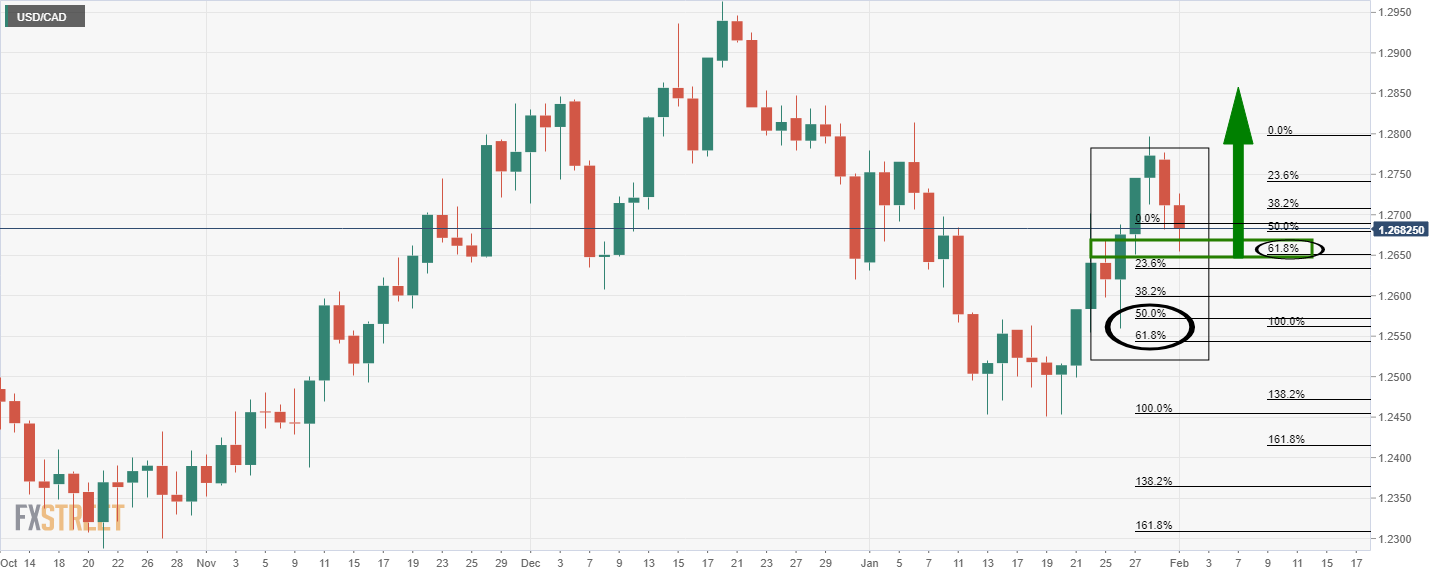
It was illustrated that the bulls will be keen on the discount and to take the price higher.
USD/CAD live market
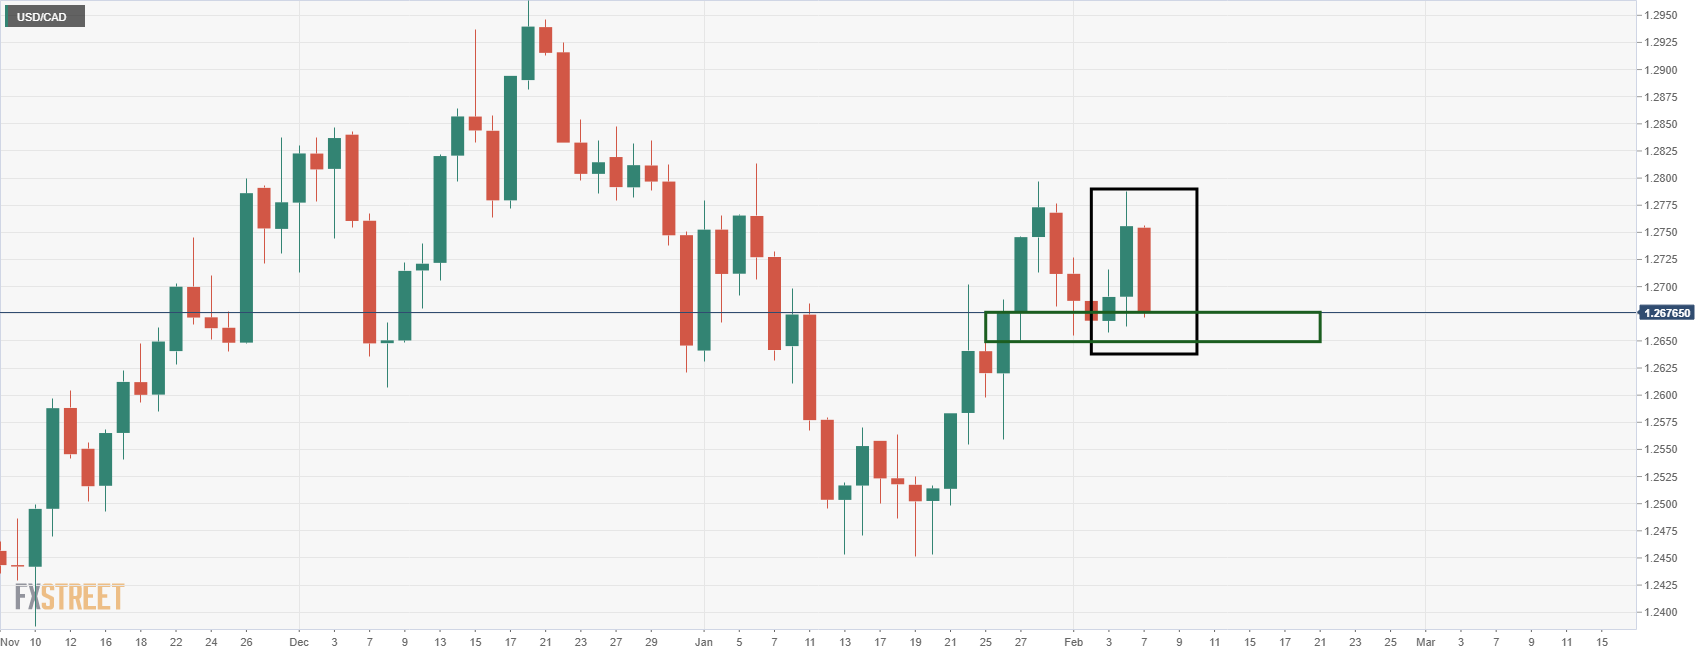
The price rallied but was met with supply at the start of the new week, despite a dip in the price of oil:
-637798574237325558.png)
The move in the Canadian dollar could be down to the market's rethinking for the Bank of Canada in March. Despite Friday's poor Employment for January and subsequent sell-off in the loonie, the BoC is unlikely to have not seen this coming.
''We don't expect this report to derail the BoC in March as the Bank should have incorporated near-term weakness into its latest projections,'' analysts at TD Securities argued, ''We continue to look for four rate hikes in 2022, with balance sheet runoff starting in April.''
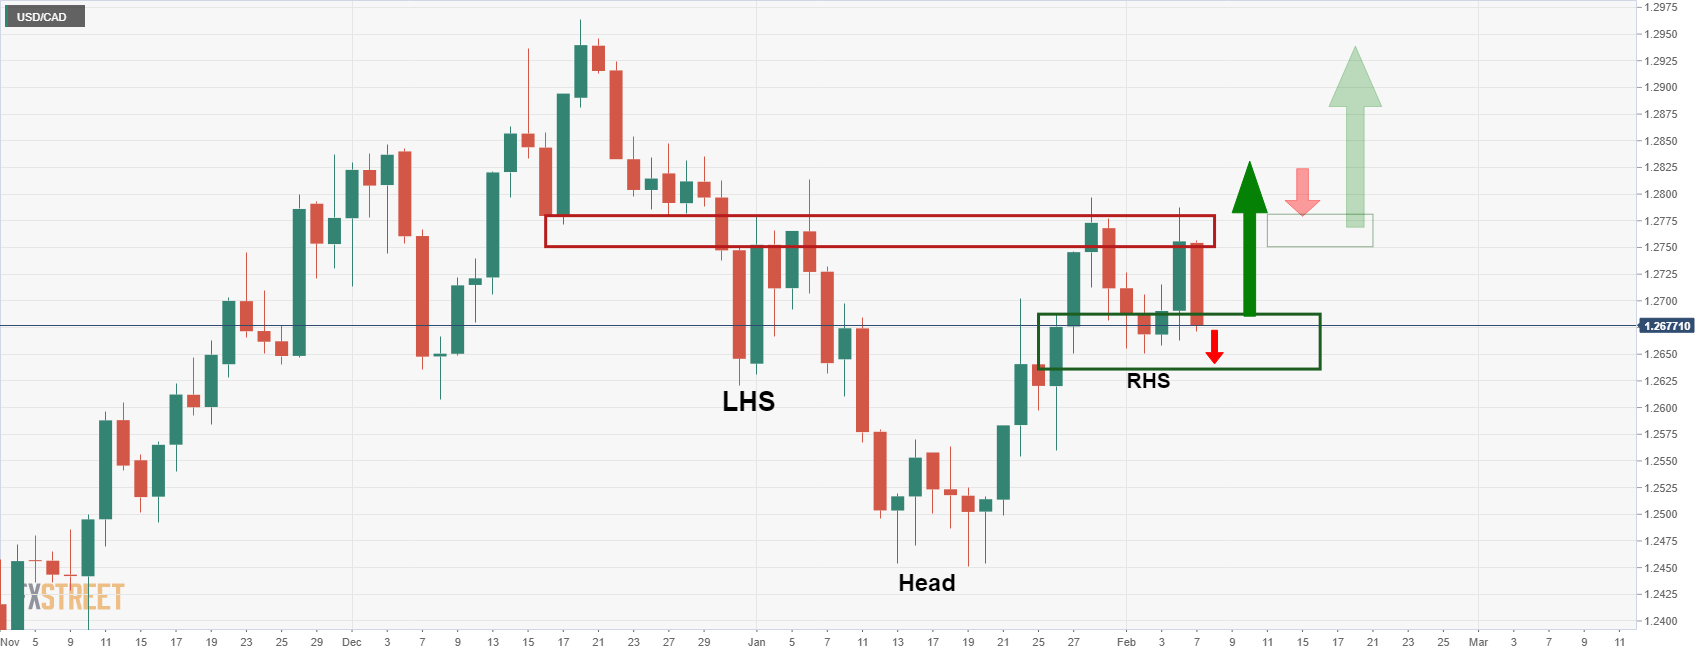
Therefore, staying with the technicals, the bulls might take solace from the formation of the Inverse Head & Shoulders on the daily chart as follows:
- GBP/USD bears are back in play following bullish early morning NY correction.
- From a bearish perspective, bears could be targetting the 1.3450's prior breakout levels.
- US inflation, UK GDP and central banks in focus.
GBP/USD has fallen onto the back foot in recent trade and is pressuring back below 1.3515 following a significant correction to 1.3535 that started in the early New York session from the 1.3490s. It is a US dollar and euro story at the start of the week as traders digest the importance of last week's main events in the central bank meetings and US jobs data.
As expected, the Bank of England (BoE) raised the Bank Rate by 25bp to 0.50% and announced the beginning of "passive QT" (ceasing reinvestments of maturing bonds) last week. However, the big surprise was that four out of nine policymakers voted for a 50bp rate hike. This set cable higher to test 1.3630.
However, on Friday, there was an unexpected jump in US jobs created in January according to Nonfarm Payrolls that bizarrely completely contradicted the ADP report that was also reported last week. Nevertheless, the NFP report has raised the outlook for a faster timetable for Federal Reserve rate hikes.
Payrolls grew 467,000 jobs last month and data for December was revised higher to show 510,000 jobs created instead of the previously reported 199,000. Reuters had forecast 150,000 jobs added in January while estimates ranged from a decrease of 400,000 to a gain of 385,000 jobs.
In stark contrast, the ADP private payroll jobs fell 301k in January, versus expectations for a 180k rise. That drop followed a weak initial claims report for the labour market survey week in January. This had resulted in a wave of downward revisions for Friday’s official nonfarm payrolls release, which was flipped on its head ad traders moved back into the US dollar.
The outcome has resulted in some analysts questioning the reliance of such a gauge. ''I have repeatedly stressed how ridiculous it is to look at US jobs data when they are just estimates of the small monthly delta of a very large number strained through an algorithm and seasonal adjustments,'' an analyst at Rabobank argued.
''Worse,'' the analysts exclaimed, ''there were vast backward revisions for years. The million jobs created last summer now happened this winter. Economic history was just rewritten – and we are supposed to take it seriously.''
Nevertheless, the financial markets depend on the data and the outcome reignites expectations the Fed hikes rates by 50 bps in March. GBP/USD, consequently, fell when the US dollar rallied 0.1% on the back of Friday's data.
For the week ahead, there are two key data events. One, market participants are waiting to see the release of US Consumer Price data for January on Thursday and on Friday, preliminary UK Gross Domestic Product is due for the fourth quarter and December.
''We look for UK GDP to contract 0.8% MoM in December, thus bringing GDP below its pre-COVID level once again,'' analysts at TD Securities said.
''Manufacturing likely declined 0.3% MoM, while we expect the services sector to contract 0.9% moM, in part driven by voluntary COVID measures and a substantial amount of people isolating due to the Omicron surge, but also due to a fade in consumer demand.''
GBP/USD technical analysis
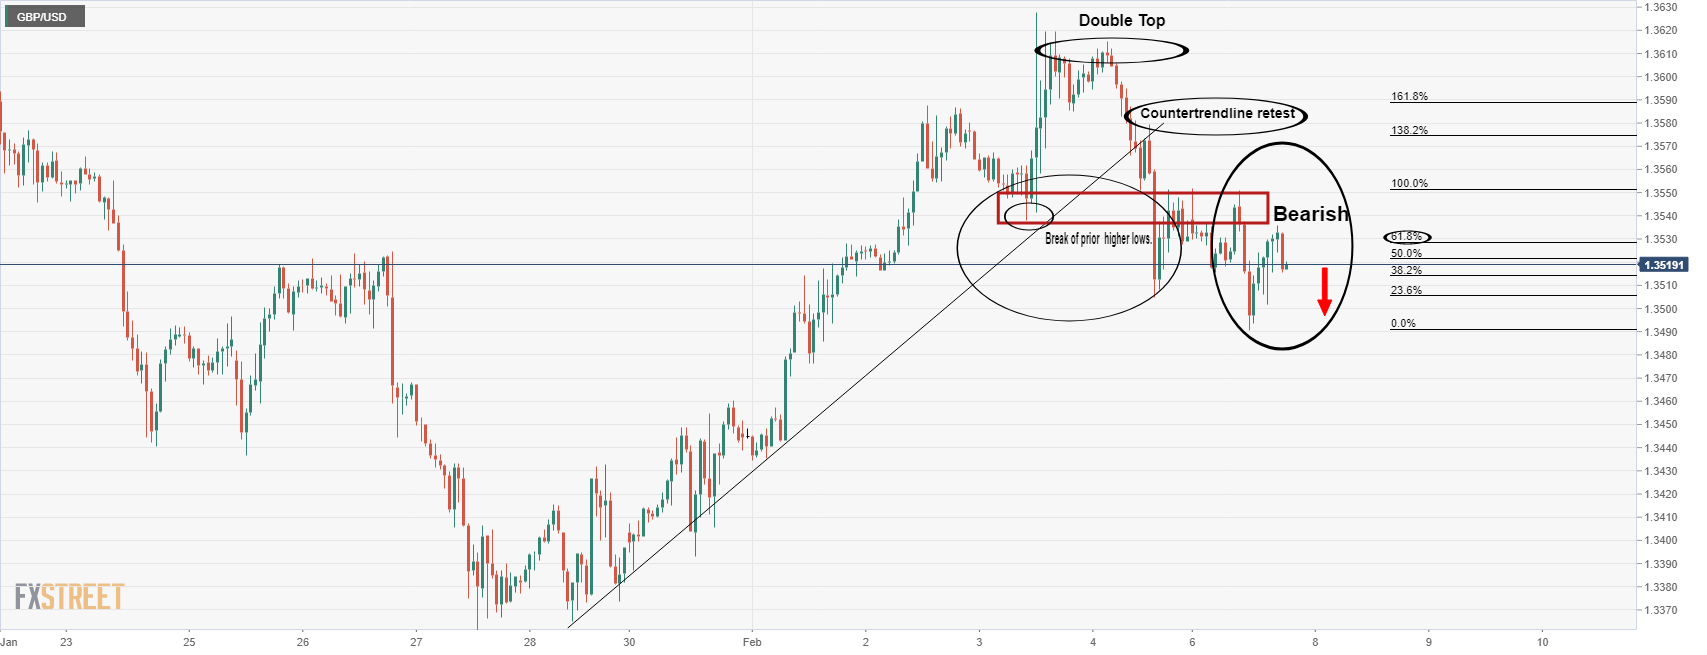
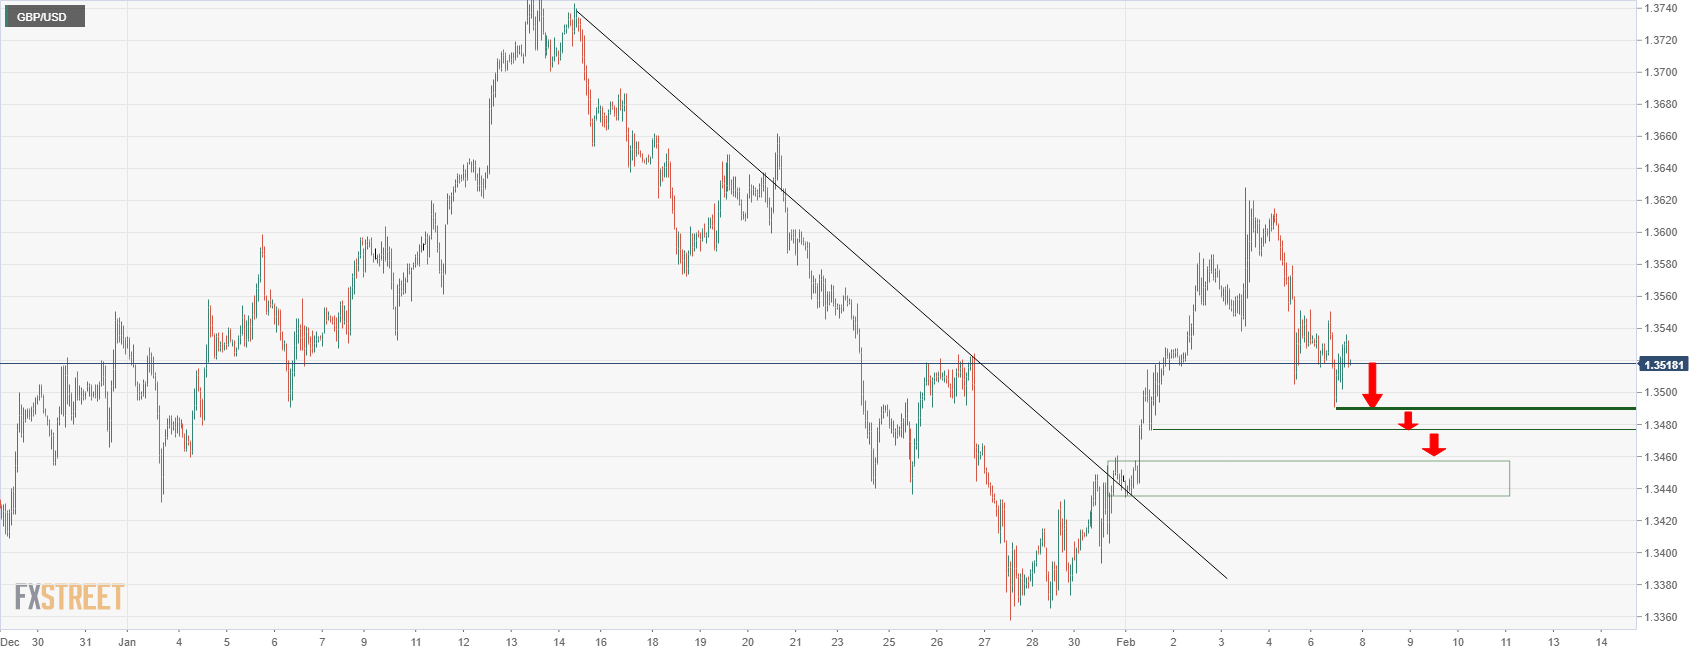
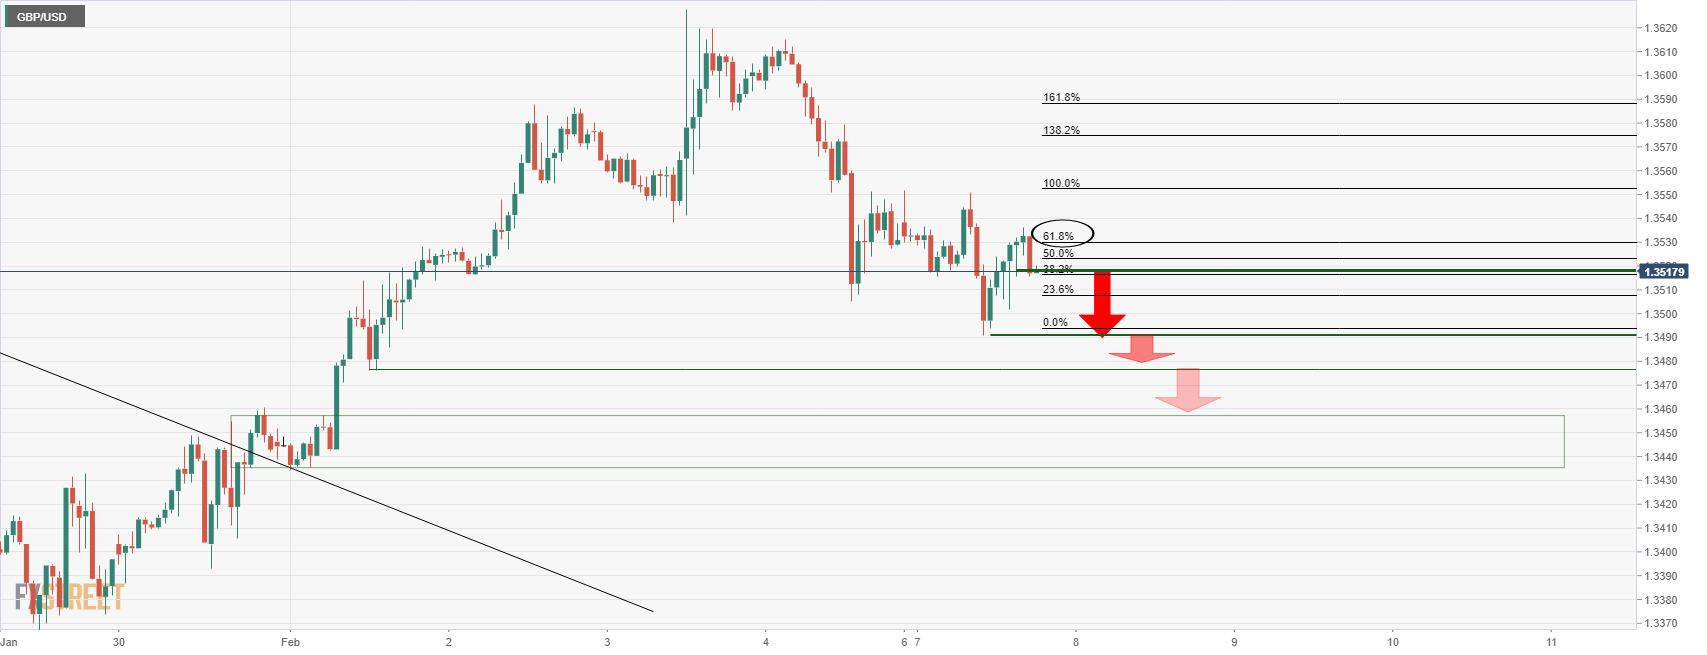
As illustrated above, we have seen a break of the counter trendline and restest that failed. This was followed by a break of the old support structure as the prior higher lows which is now expected to continue acting as a resistance on multiple retests. failures would be expected to lead to a downside continuation for the week ahead. From a bearish perspective, the near term price trajectory on the H1 chart could play out as follows, targetting the 1.3450's:
- On Monday, the shared currency slides 0.24% post-ECB Lagarde remarks.
- A positive market mood keeps the EUR low-yielder on the wrong foot, while the greenback advanced a touch.
- If the EUR/USD prints a daily close under the 100-DMA, it would add further downward pressure on the pair.
On Monday, the EUR/USD trims Friday’s gains in the New York session, down some 14%. At press time is trading at 1.1424, as ECB’s President Christine Lagarde is crossing the wires in the last hour.
The market sentiment is upbeat, though, in the FX complex, the USD recovers in the day, with the US Dollar Index advancing 0.05%, sitting at 95.55, weighing on the EUR/USD.
ECB President Lagarde appears in the EU Parliament
In her appearance at the EU Parliament, ECB’s President Christine Lagarde said that “inflation is likely to remain high, in the near term.” However, she emphasized that “there is no sign that would measurably exceed the 2% target in the medium term.” Furthermore, she noted that “it will remain above the 2% target, but it would be lower than current levels.”
It seems that in the Q&A session, ECB’s Lagarde down-talked the hawkish tone perceived by market participants on last Thursday’s ECB’s monetary policy pivot. Following Lagarde’s quotes, the EUR/USD retreated from 1.1450s to current levels.
Earlier during the European session, the EU economic docket revealed that German Industrial Production for December shrank 0.3% when estimates looked for a 0.4% increase. Alongside macroeconomic releases, ECB’s officials crossed the wries.
ECB member Klaus Knot said that the bank should end the APP and noted that the first-rate hike in Q4 is possible. Meanwhile, ECB’s Kazaks pointed out that a “July hike would imply an extremely quick and unlikely tapering pace, with an increased risk of persistent inflation net-new asset purchases become less necessary.”
Across the pond, an absent economic docket has EUR/USD traders waiting for US inflation figures on Thursday.
EUR/USD Price Forecast: Technical outlook
The EUR/USD threatens to break below Pitchfork’s top-trendline, around 1.1415-20. In the event of a daily close below it, it would exacerbate a downward move towards Pitchfork’s mid-line but first would need to overcome some hurdles on the way south. The first support would be 1.1400. Breach of the latter would expose a four-month-old upslope trendline around 1.1340-50 region, followed by the 50-day moving average (DMA) at 1.1317.
- USD/CHF is consolidating near 0.9250 amid a quiet start to a week that sees the release of US CPI data.
- An upside surprise could further build the case for aggressive Fed tightening and build on last Friday’s post-jobs data rally.
- Bulls may target a return to/test of last week’s highs in the mid-0.9300s.
It’s been a subdued session thus far for USD/CHF, with the pair easing back from Asia Pacific session highs in the 0.9260 area to dip as low as the 0.9220s, before returning back close to the 0.9250 mark. The tone in FX markets on Monday has, for the most part, been a subdued one, with USD/CHF confirming to the lack of volatility seen across most other major G10 currencies on the session. A slight WoW rise in Swiss Sight Deposits last week, implying further SNB forex market interventions, has not impacted sentiment at all, with focus very much on incoming risk events.
Fed policymakers Michelle Bowman and Loretta Mester will be speaking on Wednesday ahead of the release of the January Consumer Price Inflation report on Thursday. Traders will be interested as to whether Bowman or Mester push back against the recent shift in market pricing to imply a roughly one in three chance of a 50bps rate hike in March after last Friday’s strong jobs report. However, more interestingly will be whether US inflation surprises to the upside once more.
If this was to be the case, the USD/CHF’s Friday rebound from under 0.9200 to the mid-0.9200s might extend towards last week’s highs in the 0.9340 area. Recall that dollar weakness in the first part of last week saw the pair pull back to as low as 0.9180. Traders at the time said the move was “positioning-related”. If that is the case, there might even be the case for a move back towards H2 2021 highs in the 0.9360s on strong data.
ECB President Christine Lagarde, during testimony before the EU Parliament, said that inflation at the end of 2022 will remain above the ECB's 2.0% target, though will be lower than current levels. In wake of Lagarde's more hawkish remarks after last week's ECB meeting where she expressed greater levels of concern about inflation, this comment does not come as a surprise, though does mark a shift from the ECB's previously held stance that inflation will fall back under 2.0% by the year's end. We're seeing inflation moving to target leading to policy normalisation, she added, before adding that this would not amount to measurable policy tightening.
Additional Remarks:
"We see little evidence of risk to our monetary transmission process."
"PEPP reinvestment is one of the tools we can use if that happens."
"Growth in Q1 has been slower than anticipated, but will then pick up."
Market Reaction
The euro has not reacted to the latest remarks from Lagarde.
- EUR/GBP is consolidating in the 0.8450 area, with the latest comments from ECB’s Lagarde not provoking any euro reaction.
- The pair did hit fresh annual highs in the 0.8470s earlier in the session.
- Some are calling for further medium-term upside following last week’s surprise hawkish ECB stance shift, despite continued BoE hawkishness.
EUR/GBP hit fresh annual highs in the 0.8470s on Friday but has since pulled back to consolidate around the 0.8450 area, where it trades broadly flat on the session. The latest remarks from ECB President Christine Lagarde before the EU parliament did not add anything new to her remarks in last week’s post-ECB meeting press conference. Recall that, last Thursday, her refusal to reiterate a prior statement that rate hikes in 2022 are unlikely and greater emphasis on upside inflation risks triggered a lurch higher in EUR/GBP from fresh multi-year lows under 0.8300.
Last week also saw the BoE surprise markets in a hawkish manner, with four out of nine Monetary Policy Committee members unexpectedly voting for a 50bps rate hike (the BoE actually hiked rates to 0.5%, as expected). These calls for a bigger move were rooted in near-term inflation fears, with the bank now expecting headline CPI to surpass 7.0% in April when UK energy regulator Ofgem raises the gas price cap. The BoE’s hawkish surprise, while enough to briefly push EUR/GBP under 0.8300 and towards a test of the late-2019/early-2020 lows in the 0.8280 area, was overridden by the surprise shift in the ECB’s stance.
The end result was that EUR/GBP enjoyed its best week since April 2021, rallying more than 1.7% to current levels in the mid-0.8400s. As traders reassess their expectations as to the outlook for BoE/ECB policy divergence, some think EUR/GBP could yet be headed higher. In Q2, the UK faces a cost of living crisis with taxes and energy costs set to rise in tandem, factors which likely help keep the BoE’s terminal interest rate capped relative to elsewhere in the G10.
Meanwhile, if over the same time period the Eurozone continues to face hotter than expected inflation, the likelihood that the ECB accelerates its QE taper and signals a Q4 rate hike are high. That could continue to support EUR/GBP in the medium-term, perhaps facilitating a test of the next key resistance are around 0.8600.
In the short-term, analysts flagged a risk of some euro profit-taking after last week’s big moves, especially if ECB policymakers attempt to push back against excessively hawkish money market pricing. Lagarde’s measures comments on Monday certainly don’t suggest further short-term bullish impetus, and a speech from dovish ECB Chief Economist Philip Lane later in the week will also be of note. Any short-term pullback in EUR/GBP may find support in the 0.8420s in the form of the January highs.
- The non-yielding metal advances half percent in the North American session.
- The rise of US T-bond yields capped upward moves in the yellow metal but failed to push prices lower.
- XAU/USD is neutral-upward biased as depicted by DMAs below the spot price.
Gold (XAU/USD) climbs in the North American session, despite US T-bond yields shooting through the roof after the US Nonfarm Payrolls report smashed expectations. At the time of writing, XAU/USD is trading at $1,816.
Financial markets mood is upbeat. As of late, US Treasury yields move higher in the session, with the 10-year benchmark note rate at 1.936%, underpins the greenback, with the DXY flat at 95.50.
On Friday of the last week, the US Nonfarm Payrolls report showed that the US economy added 467K jobs to the economy, smashing 150K estimations. At the same time, the Unemployment Rate rose to 4%, a tick higher than foreseen. However, Fed concerns about inflation made investors turn their attention to Average Hourly Earnings, which rose more than half-percent, from 5% in December to 5.7% in January, further cementing Fed’s hawkish expectations, as money market futures have priced in at least five rate increases.
That said, the non-yielding metal stayed resilient, despite the outstanding US employment report. Following the announcement, XAU/USD found bids around $1790, followed by a break of the $1800 figure, finishing above it in the last week.
Analysts at TD Securities noted that “… tracking ETF flows suggests little such interest in the yellow metal.” However, they said that “it remains to be seen whether central bank purchases might be playing a substantial role in keeping gold prices from breaking lower, as the data continues to point to little speculative interest for the yellow metal.”
That said, gold traders, attention turns to Thursday US inflation figures, which would give some clues regarding US Treasury yields direction, which significantly influences gold prices.
XAU/USD Price Forecast: Technical outlook
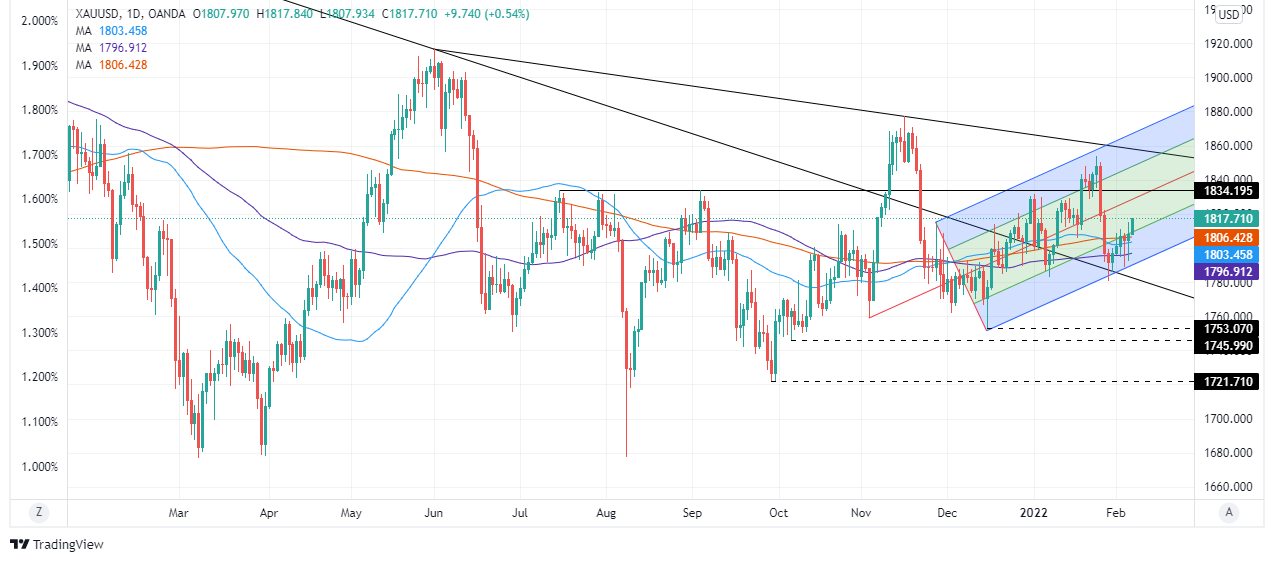
At press time, gold is trading above the 200-day moving average (DMA), which sits at $1,806, suggesting an upward bias. Nevertheless, as most of the daily moving averages (DMAs) reside in the $1,796-$1,806 range, almost horizontal, the yellow metal is neutral.
Upwards, XAU/USD’s first resistance would be the central line of Pitchfork’s channel around $1,825-27. Breach of the latter would expose July 15, 2021, a daily high at $1,834, followed by the mid-line between the top/central Pitchfork’s channel around $1,840-50.
On the other hand, gold’s first support would be $1,800. A downward break would open the door for a fall to the 100-DMA at $1,796, followed by the bottom-trendline of Pitchfork’s channel at $1,790, and January 28 daily low at $1,780.
On Thursday, the Bank of Mexico will annoujnce its decision on monetary policiy. Market participants expect a rate hike (most likely of 50bps), as infaltion continues to run well above Banxico’s 2-4% target. According to analysts at Wells Fargo, the central bank’s statement could sound less hawkish than previously amid weaker-than-expected economic data.
Key Quotes:
“Mexico's central bank announces its monetary policy decision next week, with the consensus forecast for another aggressive rate increase from the central bank. Mexico's central bank surprised the market at its December meeting, increasing its Overnight Rate by 50 bps to 5.50%. The central bank cited "the magnitude and diversity of inflation shocks" as well as "the risk of price formation becoming contaminated." With Mexico's CPI inflation still well above the target range, the consensus forecast is for another 50 bps rate hike to 6.00%.”
“In addition to any rate increase, the focus will be on guidance from Mexico's central bank surrounding future hikes, and whether the pace of tightening could slow going forward. It is certainly possible the central bank's accompanying statement could sound less hawkish than previously. Economic reports this week, for example, show Mexico's Q4 GDP dipping by 0.1% quarter-over-quarter and the January manufacturing and services PMIs declining, while next week Mexico's January CPI is expected to slow to 7.01% year-over-year.
European Central Bank President Christine Lagarde, speaking before the EU Parliament on Monday, said that there is no sign that inflation will measurably exceed the bank's 2.0% target in the medium term. We are not subject to excess demand or labour market overheat, she added.
Analysts at Danske Bank still view that the level of around 0.83 in the EUR/GBP cross was the bottom as relative rates now seem more supportive for euro than the British pound. They continue to forecast EUR/GBP at 0.84 in twelve months.
Key Quotes:
“We now expect the BoE to deliver four additional 25bp rate hikes this year (March, May, August and November) versus two additional hikes previously. Our new BoE call remains slightly less aggressive than markets pricing, where five rate hikes are priced in.”
“We continue to believe that risk is skewed towards more rate hikes (and also a probability of a 50bp rate hike). BoE is now likely to announce some details on “active QT” in connection with the May meeting. Initially, EUR/GBP fell slightly below 0.83 on the hawkish signal but EUR/GBP is now trading closer to 0.85 supported by the ECB.”
“We are still of the view that the level of around 0.83 was the bottom in the cross, as relative rates now seem more supportive for EUR than GBP, as BoE rate hikes are already priced in and the ECB is turning more hawkish.”
“Overall, we still see the 2022 investment environment as USD-positive, which is usually benefitting GBP relative to EUR, which we believe will dominate slightly. Hence, we continue targeting EUR/GBP at 0.84 in 12M.”
- Australian dollar rises versus US dollar and regains 0.7100.
- DXY in negative territory, far from last week lows.
The AUD/USD is trading at daily highs at 0.7116. It has been moving all day with a positive bias supported, recovering after falling sharply on Friday when the greenback rallied on the back of the NFP report.
The dollar is posting mixed results on Monday while the aussie is among the top performers across the G10 space. AUD/NZD erased Friday’s losses and is looking at last week highs above 1.0730 while EUR/AUD is retreating from five-month highs back under 1.6100.
AUD/USD outlook
The AUD/USD is up by almost 50 pips on Monday. The outlook is still biased to the downside. A recovery above 0.7165 would be a positive development for the Aussie as it would break a horizontal resistance and also rise above the 20 and 55-day simple moving average. The next strong resistance stands at 0.7220 followed by 0.7250 (100-day simple moving average).
A slide back under 0.7100 would keep the door open for a test of the recent low at 0.7050, the last protection to 0.7000. A weekly close clearly under 0.7000 should point to further losses over the medium term.
Technical levels
In the introductory remarks section of her testimony before the EU Parliament on Monday, ECB President Christine Lagarde said that we continue to see the risks to the economic outlook as broadly balanced over the medium-term.
Additional Remarks:
"The current pandemic wave and associated restrictions are likely to continue to have a negative impact on growth at the start of this year."
"Our commitment to delivering on our inflation mandate remains absolutely unwavering."
"The economic impact of the current pandemic wave appears to be less damaging to activity than previous ones."
"Bottlenecks will still persist for some time, but there are signs that they may be starting to ease."
"Inflation is likely to remain high in the near term."
"We need more than ever to maintain flexibility and optionality in the conduct of monetary policy."
"The likelihood is that the current price pressures will subside before becoming entrenched, enabling us to deliver on our 2% target over the medium term."
"In the past surges in energy prices weakened the spending power of households, and reduced inflation over the medium term."
Market Reaction
No market reaction to Lagarde's remarks yet, which are very much in fitting with the ECB's usual script, but traders will be keeping an eye out for any juicier nuggets of information that might come during the Q&A.
- The S&P 500 has on Monday enjoyed a modest rebound back above 4500 in quite trade.
- US data and earnings will be in focus this week after big tech earnings spurred large market swings last week.
- If US data triggers a further repricing of hawkish Fed bets, that risks further downside, particularly for growth/tech names.
US equity markets have erased pre-market losses to trade modestly higher early on Monday’s trading session. That means the S&P 500, up about 0.25%, has been able to climb back to the north of the 4500 level, though has so far traded within thin ranges as investors mull incoming US data and Fed speak plus more earnings this week. The Nasdaq 100 index is about 0.8% higher and the 14.75K area, while the Dow is flat but remains decently supported above the 35K mark.
In terms of notable stories, shares of Pelaton, which fell more than 75% over the course of the year as the global economy reopened, hurting demand for at-home exercise equipment, lept more than 20% on Monday. Reportedly, Amazon and Nike are both interested in buying the company out. Otherwise, their arent much by way of other major US equity market stories to update on. The main earnings in focus this week include Nike and Pfizer, while traders will continue to digest last week’s big tech earnings.
Recall that dour Facebook earnings on Thursday halted and partially reversed what had up until then been a very strong and broad equity market recovery on the week, with the co.’s shares now down nearly 30% versus pre-earnings levels. As far as the broader equity market was concerned, strong earnings from Amazon, which is up more than 16% versus pre-earnings levels, saved the day, or week. The S&P 500 still managed to end the week about 1.5% higher.
This week will be a key test as to whether the first week in February was a dead cat bounce or the start of a more meaningful recovery back towards record highs following January’s more than 5.0% pull-back. The same concerns about Fed tightening which motivated the January decline remain elevated and at the forefront of investor minds in wake of strong US labour market figures last week and ahead of US Consumer Price Inflation data this week.
If the upcoming inflation figures further pump already elevated expectations for a 50bps hike from the Fed in March, that means downside risk for growth/big tech names. Last Friday’s lows at the 4450 balance area are a clear level of support to keep an eye on to the downside, with any break below potentially opening the selling floodgates for a move back towards support in the 4300 area.
- The NZD/USD clings to the 0.6600 figure as volatility shrinks post-US NFP report.
- The rise in US Treasury yields stalls upward moves in the NZD/USD, as the 10-year yield sits above 1.90%.
- NZD/USD is downward biased and might test YTD lows if it fails to reclaim 0.6700.
The New Zealand dollar advances as the North American session begins holds above 0.6600 though it faces resistance at a 12 month-old bottom trendline of a descending channel. At the time of writing is trading at 0.6630. The market sentiment is tilted upbeat, though it is mixed in the FX complex.
Rising US Treasury yields across the curve weigh some in risk-sensitive currencies, led by the 10-year US T-bond benchmark note sitting at 1.931%, after a stellar US NFP report. However, the greenback failed to capitalize on that, as global central banks are looking towards tightening monetary conditions.
The Reserve Bank of New Zealand (RBNZ) would meet on February 26, where market analysts expect an increase of 25 bps to the overnight cash rate (OCR) to reach 1%. That would make it the first G8 central bank to reach that threshold, followed by the Bank of England (BoE), sitting at 0.50%.
Absence of New Zealand macroeconomic news, NZD/USD traders, would lean on the dynamics of the buck. Meanwhile, the US economic docket would not report tier one or two information until February 10, where the US Consumer Price Index (CPI) for January will be unveiled, foreseen to rise three tenths to 7.3%, followed by the Core CPI is estimated at 5.9%.
NZD/USD Price Forecast: Technical outlook
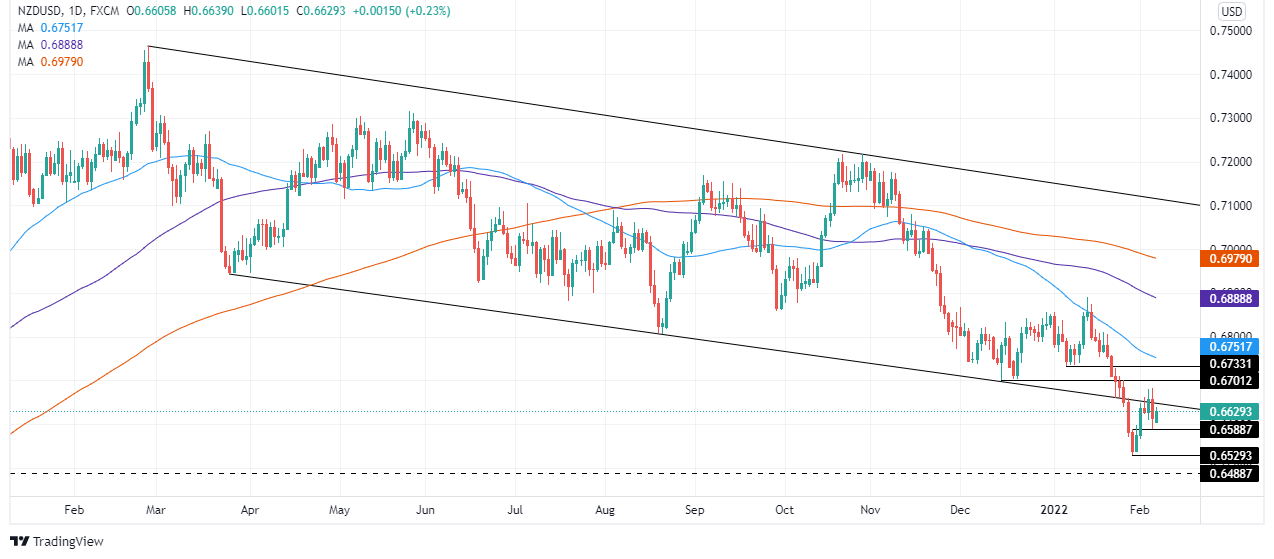
The NZD/USD remains downward biased. On Friday, a downslope bottom-trendline of a descending channel, rejected upward, moves around 0.6680, sending the pair tumbling towards the figure. Nevertheless, USD bulls could not push the pair to the 0.6500 handle, signaling that the pair might be headed in consolidation ahead of the RBNZ meeting late in the month.
Downwards, NZD/USD’s first support would be 0.6600. Breach of the latter would expose February 4 daily low at 0.6588, followed by January 28 cycle low at 0.6528 and then 0.6500.
On the opposite, the 0.6580-85 region, where the twelve-month-old downslope trendline pass, would be the first resistance, followed by January 6 daily low previous support-turned-resistance at 0.6732.
- USD/TRY keeps the broad range bound theme unchanged.
- Turkey’s 10y bond yields drop to multi-day lows near 21%.
- End Year CPI Forecast, Unemployment Rate next of note in the docket.
The Turkish lira depreciates at the beginning of the week and lifts USD/TRY to the 13.60 region.
USD/TRY remains largely within a consolidation mode
USD/TRY resumes the upside and leaves behind Friday’s small dip amidst the tepid recovery in the greenback and alternating risk appetite trends, as traders continue to adjust to the latest US Nonfarm Payrolls figures.
The domestic currency adds to recent losses, particularly after inflation figures in Turkey showed consumer prices rising more than 48% in the year to January, the highest level since April 2002.
On the latter, finmin N.Nebati sees (hopes?) inflation peaking in April and to start a decline to a single-digit print by June 2023. Nebati’s view (wish) of the CPI not hitting 50% will surely be put to the test in the upcoming months, however.
What to look for around TRY
The pair keeps the multi-session consolidative theme well in place, always within the 13.00-14.00 range. While skepticism keeps running high over the effectiveness of the ongoing scheme to promote the de-dollarization of the economy – thus supporting the inflows into the lira - the reluctance of the CBRT to change the (collision?) course and the omnipresent political pressure to favour lower interest rates in the current context of rampant inflation and (very) negative real interest rates are a sure recipe to keep the domestic currency under pressure for the time being.
Key events in Turkey this week: Unemployment Rate (Thursday) - End Year CPI Forecast, Current Account, Industrial Production, Retail Sales (Friday).
Eminent issues on the back boiler: Progress (or lack of it) of the government’s new scheme oriented to support the lira via protected time deposits. Constant government pressure on the CBRT vs. bank’s credibility/independence. Bouts of geopolitical concerns. Much-needed structural reforms. Growth outlook vs. progress of the coronavirus pandemic. Earlier Presidential/Parliamentary elections?
USD/TRY key levels
So far, the pair is advancing 0.50% at 13.5752 and a drop below 13.3054 (55-day SMA) would expose 13.2327 (monthly low Feb.1) and finally 12.7523 (2022 low Jan.3). On the other hand, the next up barrier lines up at 13.9319 (2022 high Jan.10) followed by 18.2582 (all-time high Dec.20) and then 19.0000 (round level).
GBP/USD is coming back from a minor drop under 1.35. However, only a break above the 1.3550 region would alleviate downside pressure on the cable, economists at Scotiabank report.
Important support located at the 1.3450 area
“Cable will have to climb back above ~1.3550 to show signs of a possible reversal of recent losses – and a continuation of its gains since late-Jan.”
“Support after the figure zone is ~1.3475 and then the mid-1.34s where the 50-day MA of 1.3440 also stands.”
EUR’s bullish streak appears to have stalled after six consecutive days of gains. Economists at Scotiabank note that a break below 1.14 would clear the path for a quick dip towards the 1.1350 region.
Initial resistance located at the 1.1450 area
“The 1.1410/15 zone will act as a minor floor ahead of firmer support at the figure area. A break under 1.14 leaves the EUR/USD liable to a quick drop to the mid-1.13s and a test of its 50- day MA of 1.1320.”
“Resistance after ~1.1450 is 1.1470 and 1.1485 followed by the figure.”
The Canadian dollar has picked up a little support on Monday. Nonetheless, economists at Scotiabank view this move as a mere correction and believe that the 1.2780 zone is likely to remain a very sensitive technical point for funds in the next few days.
USD/CAD losses are possibly corrective in nature
“Losses are possibly corrective in nature only and the broader pattern of trade that has developed through late January warns of a potential inverse Head & Shoulders pattern which risks pushing USD/CAD significantly higher on a break above the neckline trigger at 1.2780 currently.”
“USD/CAD losses below intraday support at 1.2715 will help mitigate upward pressure on the pair to some extent.”
- WTI has erased most of an earlier session dip under $91.00 but has been choppy in $91.00-$92.00 ranges
- Some attributed earlier session profit-taking to positive signs in US/Iran nuclear talks.
- Traders are also mulling developments regarding geopolitical, near-term supply concerns and ongoing strong demand.
WTI was hit by profit-taking in early European trade, dipping at one point underneath the $91.00s. However, trade has since been choppier in both directions, with WTI prices more recently swinging between the $91.00-$92.00 area. At current levels around $91.50, front-month WTI futures trade with losses of about 50 cents on the day and remain only a few bucks below recent seven-year highs above $93.00, as the market mood for the most part remains bullish.
Market commentators had cited positive signs on the US/Iran nuclear negotiations front as one trigger for profit-taking earlier in the day; the US restored sanction waivers to Iran that will allow international nuclear cooperation projects. Although the waivers hardly do anything to help the Iranian economy, market commentators said it was a sign of goodwill from the US that showed the country is intent on finding a deal.
Iranian crude oil exports, hobbled by strict US sanctions, currently stand at about 700K barrels per day (BPD) versus pre-US sanction levels of well over 2M BPD. If the US and Iran can agree on a deal to return to the 2015 nuclear pact, this jump in oil exports could help ease upward pressure on crude oil markets in the near term. However, analysts at Fujitomi Securities cautioned that “investors expect more twists and turns in the U.S.-Iranian talks and no agreement to be reached anytime soon.”
WTI’s impressive intra-day recovery speaks to the ongoing bullishness of the mood prevailing in crude oil markets. As the US continues to warn that a Russian military incursion into Ukraine could be imminent, the amount of geopolitical risk premia priced into global oil markets remains high. Oil markets will focus on a meeting in Moscow between French President Emmanuel Macron and Russian President Vladimir Putin later in the day, with no progress towards dialing down tensions expected.
In the meantime, recent cold weather in the US has hampered near-term output, with Reuters reporting that two major refineries with a combined more than 800K BPD in output were knocked offline. That contributes to the narrative of near-term tightness in global oil markets, just as the Saudis were reported (by Bloomberg) to have raised official oil selling prices for Asian, North American and European customers. Many analysts will remain comfortable in the calls for WTI to hit $100.
- Silver gained strong positive traction and shot to the $23.00 mark, or a multi-day high on Monday.
- Technical indicators on the daily chart warrant some caution before placing aggressive bullish bets.
- A convincing break through the $23.40-$23.45 area is needed to support prospects for further gains.
Silver built on Friday's rebound from the post-NFP low to the $22.00 neighbourhood, or a near one-month low, and gained strong positive traction on the first day of a new week. The intraday positive move pushed spot prices back closer to the $23.00 round-figure mark during the early North American session.
From a technical perspective, any subsequent move up beyond the mentioned handle might confront some resistance near the 100-day SMA, currently around the $23.20 area. This is followed by the $23.40-$23.45 horizontal barrier, which should act as a pivotal point and help determine the near-term trend for the XAG/USD.
Technical indicators on the daily chart – though have been recovering from lower levels – are yet to confirm a bullish bias for the XAG/USD. This makes it prudent to wait for a strong follow-through buying before confirming that the recent sharp rejection slide from the very important 200-day SMA has run its course.
A convincing breakthrough the said barriers will negate any bearish bias and trigger a fresh bout of a short-covering move. This should allow the XAG/USD to surpass the $24.00 round-figure mark and climb further towards challenging the YTD high, around the $24.70 region touched on January 20.
On the flip side, the $22.65 area now seems to protect the immediate downside ahead of the $22.40 region, which if broken would expose the $22.00 round figure. Sustained weakness below should pave the way for a further decline and drag the XAG/USD towards challenging the double-bottom support, around the $21.40 zone.
Silver daily chart
-637798387730746900.png)
Technical levels to watch
- GBP/USD is consolidating with 1.3500-1.3550 intra-day ranges ahead of a busy week of central bank speak and US/UK data.
- Ahead of risk events, the pair may continue undulations in the 1.3500-1.3600 range around a key fib level for 2022.
GBP/USD is trading broadly flat at the start of the week within a 1.3500-1.3550 intra-day range, as traders brace for a barrage of further central bank speakers as well as UK and US tier one data releases. After rallying as high as the 1.3620s last week as a result of a weakening US dollar plus a hawkish BoE surprise, the pair reversed back below 1.3550 in wake of a much stronger than expected US labour market report. January’s jobs data has pumped expectations for a 50bps first rate hike from the Fed in March, overshadowing calls from a large minority of BoE members for a 50bps move last week.
Fed tightening bets, which support the dollar last Friday, maybe pumped once again if Thursday’s US Consumer Price Inflation report also comes in hotter than expected. Fed policymakers speaking this week should be monitored just in case there is any push back against recent hawkish market moves. That could help push GBP/USD back towards last week's highs above 1.3600. Otherwise, GBP/USD traders will be monitoring a speech from BoE Governor Andrew Bailey on Thursday ahead of the release of Q4 2021 GDP growth figures and December activity data on Friday.
Technical levels of note include the 1.3550 mark, which is the 50% retracement back from the 2022 highs at 1.3750 and lows at just above 1.3350. As markets weigh Fed/BoE tightening themes, the pair may continue to undulate in the 1.3500-1.3600 area in the coming days. One theme worth keeping an eye on is Boris Johnson’s ongoing will he/won’t he stay on as UK PM saga, as the PM continues to face massive pressure in wake of a string of recent scandals. Most analysts continue not to see a Johnson departure as mattering too much for sterling given the candidates most likely to replace are unlikely to herald much by way of economic policy change.
Friday’s RBA Statement on Monetary Policy (SoMP) reinforced the “patient” stance already seen at the RBA meeting and the subsequent speech by Governor P.Lowe, noted Lee Sue Ann, Economist at UOB Group.
Key Takeaways
“The Reserve Bank of Australia (RBA), at its first monetary policy meeting of the year earlier this week (1 Feb), announced that it will stop buying government bonds from 10 Feb, but stressed that the end to its Quantitative Easing (QE) does not imply a near-term interest rate rise.”
“In its Statement of Monetary Policy released earlier today, in addition to reiterating the statement, RBA Governor Philip Lowe also stated that it is too early to conclude inflation is sustainably within target range.”
“We still look for rate hikes only in 2023, though we now flag the potential risk for that to occur earlier than our projection. A pickup in wage growth will be a crucial factor. In this regard, the RBA is likely to continue to wait until wage growth is closer to 3%. The next RBA meeting is on 1 Mar.”
Analysts at Credit Suisse continue to see further signs of EUR strength with the EUR/GBP surging higher. The pair is expected to enjoy a more sustained recovery towards the 200-day moving average (DMA) at 0.8512/15.
Initial support located at 0.8424/22
“EUR/GBP has surged higher following its successful defense of key long-term support at 0.8281/17 and a base and large bullish ‘reversal week’ have been established. We look for this to provide the platform for a more sustained recovery with resistance seen initially at 0.8471/80, then what we expect to be tougher resistance at the 200-DMA at 0.8512/15, with a cap expected here at first.”
“Support is seen at the ‘neckline’ to the base at 0.8424/22 initially, then 0.8404, with 0.8362 ideally holding to see an immediate upside bias maintained.”
- A combination of factors prompted fresh selling around USD/CAD on Monday.
- Bullish oil prices underpinned the loonie and exerted pressure amid weaker USD.
- A softer tone around the US bond yields acted as a headwind for the greenback.
The USD/CAD pair maintained its offered tone through the mid-European session and was last seen trading near the daily low, just above the 1.2700 mark.
A combination of factors failed to assist the USD/CAD pair to capitalize on Friday's strong rally and led to a modest bearish gap opening on the first day of a new week. As investors looked past disappointing Canadian jobs report, bullish crude oil prices underpinned the commodity-linked loonie. Apart from this, modest US dollar weakness acted as a headwind for the USD/CAD pair and exerted some downward pressure.
Crude oil prices consolidated the recent gains to the seven-year high and remained well supported by expectations that global supply would remain tight amid the post-pandemic recovery in fuel demand. Apart from this, the conflict between Russia and the West over Ukraine acted as a tailwind for the black gold. This, in turn, assisted the commodity to attract some dip-buying on Monday, which benefitted the Canadian dollar.
On the other hand, the USD struggled to build on the post-NFP recovery move from a two-and-half-week low and was pressured by a softer tone around the US Treasury bond yields. That said, renewed speculations for a larger Fed rate hike move at the March policy meeting – boosted by Friday's mostly upbeat US monthly jobs report – should limit any meaningful downside for the US bond yields and the greenback.
Investors now seem convinced that the Fed will adopt a more aggressive policy response to contain stubbornly high inflation. Hence, the market focus now shifts to the release of the US CPI report on Thursday. The data will play a key role in influencing the buck in the near term. Apart from this, oil price dynamics would be looked upon to determine the next leg of a directional move for the USD/CAD pair.
Technical levels to watch
- EUR/USD leaves behind the initial pessimism and retakes 1.1460.
- The YTD high at 1.1483 comes next on the upside.
The rebound in EUR/USD from last week’s YTD lows stays well and sound and now flirts with daily highs near 1.1470 on Monday.
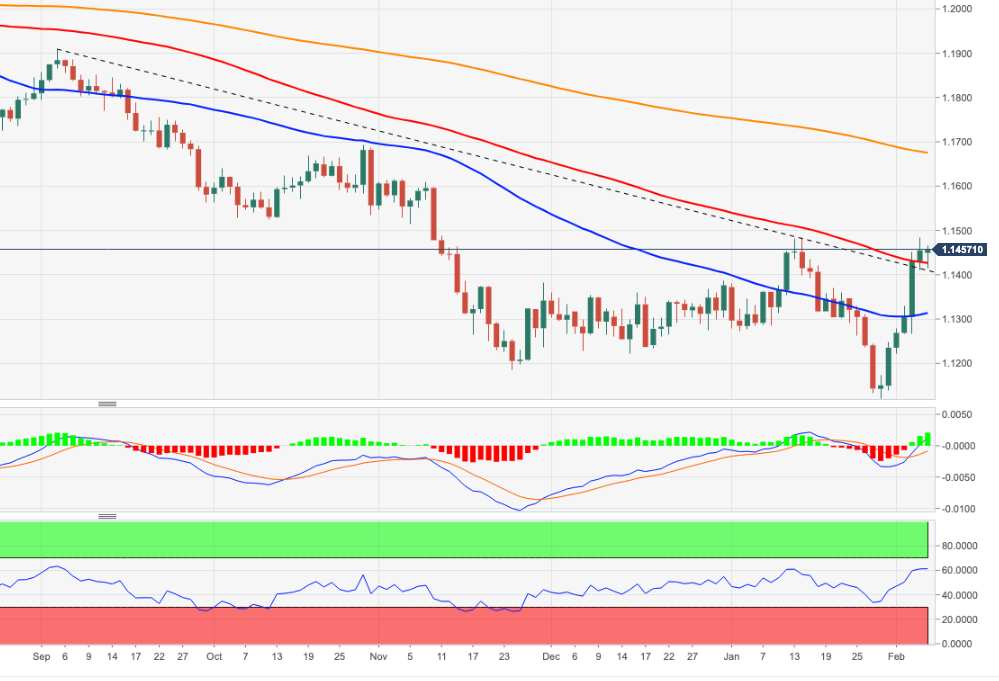
The ongoing strength is now poised to extend further considering the recent price action. Against that, the YTD top at 1.1483 (February 4) emerges as the next target closely followed by the 200-week SMA at 1.1496. Between 1.1500 and 1.1600 there are no resistance levels of note, leaving the October 2021 top at 1.1692 as a potential longer-term target.
The recent breakout of the 5-month resistance line, today near 1.1410, leaves extra gains well on the cards in the near term at least. In the longer run, the negative outlook remains in place while below the key 200-day SMA at 1.1673.
EUR/USD daily chart
- Spot gold has been trading with a positive bias near last week’s $1815 highs on Monday.
- Analysts have been surprised by gold’s strong performance as of late despite rising bond yields on central bank tightening bets.
- The main risk this week is US CPI data on Thursday.
Spot gold (XAU/USD) prices have been trading with a positive bias on Monday, with prices currently around $1813, up about 0.3% on the day, having found support after an earlier dip back towards the 200-Day Moving Average at $1808. For now, last Friday’s pre-US jobs data high around $1815 is capping the price action, but the momentum for an upside break does seem to be there. Should XAU/USD break above $1815 resistance, its clear air to the upside all the way back to the $1830 balance area, which would be the next target for the bulls.
Some analysts are surprised at how well gold has been able to hold up in recent weeks, despite rising US and global bond yields on increasingly hawkish central bank tightening bets (particularly with regards to the Fed and ECB). Case in point; despite last Thursday the ECB opening the door to 2022 rate hikes and last Friday strong US jobs report raising the risk of a 50bps first Fed hike in March, gold ended the week up nearly 1.0%.
“Gold's been a brilliant hedge this past month against falling stocks and rising bond yields so that's adding to the underlying positive case for gold right now” said analysts at Saxo Bank. “It's a combination of inflation obviously not being transitory ... (and) another issue that we cannot really ignore is the geopolitical risks that are currently in the market with regards to Russia and Ukraine,” they continue.
Looking ahead, the main challenge for gold this week, apart from a barrage of G7 central bank speakers, will be the US Consumer Price Inflation report for January. Typically, an upside surprise would be associated with lower gold prices as a more hawkish Fed policy outlook is priced in. With investors seemingly looking for inflation and equity/bond market downside protection, that might mean gold continues to outperform, even if US inflation surprises to the upside. For reference, the YoY rate of inflation is seen hitting 7.3% in January.
- A combination of factors prompted fresh selling around USD/JPY on Monday.
- A softer risk tone underpinned the safe-haven JPY and exerted some pressure.
- Retreating US bond yields weighed on the USD and added to the selling bias.
The USD/JPY pair continued losing ground through the mid-European session and dropped to a fresh daily low, below the key 115.00 psychological mark in the last hour.
The pair struggled to capitalize on last week's goodish rebound from the 114.15 area and met with a fresh supply on Monday, snapping two successive days of the winning streak. The prevalent cautious mood – as depicted by a weaker tone around the equity markets – benefitted the safe-haven Japanese yen and exerted some pressure on the USD/JPY pair. Bearish traders further took cues from retreating US Treasury bond yields, which undermined the US dollar.
That said, speculations for a larger Fed rate hike move at the March policy meeting – boosted by Friday's mostly upbeat US monthly jobs report – should act as a tailwind for the US bond yields. It is worth recalling that the headline NFP showed that the US economy added 467K jobs in January, surpassing consensus estimates pointing to a reading of 150K. Adding to this, the previous month’s reading was also revised sharply higher from 199K to 510K.
Moreover, Average Hourly Earnings posted a strong 0.7% MoM and 5.7% YoY growth during the reported month, which further lifted the market bets that the Fed will be more aggressive in raising rates to contain stubbornly high inflation. Hence, the market focus now shifts to the release of the US CPI report on Thursday. This will influence the near-term USD price dynamics and help determine the next leg of a directional move for the USD/JPY pair.
In the meantime, the US bond yields will drive the USD demand and provide some impetus amid absent relevant market-moving economic releases from the US. Apart from this, traders will take cues from the broader market risk sentiment to grab some short-term opportunities around the USD/JPY pair.
Technical levels to watch
UOB Group’s Economist Lee Sue Ann sees the ECB starting its hiking cycle in the next year.
Key Takeaways
“Despite record rises in inflation, the European Central Bank (ECB) kept key interest rates unchanged. It will, however, discontinue net asset purchases under the Pandemic Emergency Purchase Programme (PEPP).”
“The latest decision comes as market participants have started pricing in two rate hikes for the ECB this year. However, ECB President Christine Lagarde continues to play down that possibility.”
“At this juncture, we still think that the ECB will stick to its road map, and we are still not expecting any rate increases by the ECB until next year. The next monetary policy meeting is on 10 Mar, when the ECB will also be updating its growth and inflation forecasts.”
- DXY struggles to gain convincing upside traction above 95.00.
- Another leg lower could re-visit the YTD low near 94.60.
Friday’s bounce in DXY meets initial resistance near 95.60 at the beginning of the week.
Another bout of weakness could prompt the index to retest the so far monthly low at 95.13 (February 4). If cleared with certain conviction, then a move to the 2022 low at 94.62 (January 14) could start to emerge on the short-term horizon.
In the near term, the 5-month line near 95.10 is expected to hold the downside for the time being. Looking at the broader picture, the longer-term positive stance in the dollar remains unchanged above the 200-day SMA at 93.50.
DXY daily chart
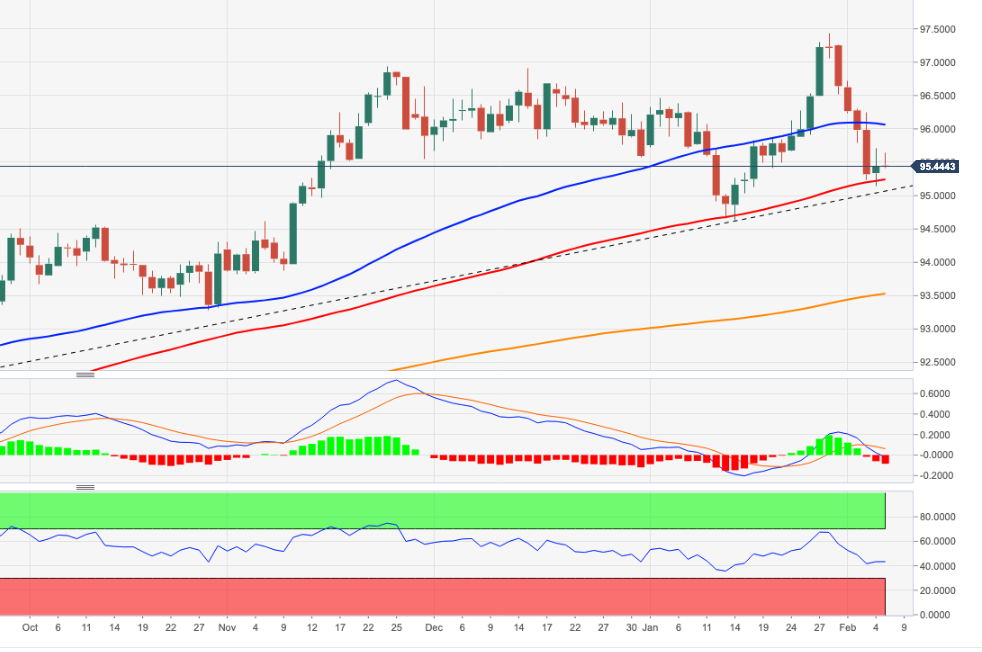
In opinion of Quek Ser Leang at UOB Group’s Global Economics & Markets Research, USD/IDR could edge higher and surpass the 14,405 level.
Key Quotes
“At the time of writing, USD/IDR appears poised to break clearly above the major resistance at 14,405 (declining trend-line resistance). A clear break of this level is likely to lead to further USD/IDR strength.”
“The next resistance level of note is at Dec’s high of 14,448. Support is at 14,345 but only a break of 14,325 would indicate that the current upward pressure has eased.”
- EUR/JPY the initial uptick to the area above the 132.00 mark.
- Immediately to the upside is seen the 133.50 region.
EUR/JPY’s upside bias seems to have run out of steam soon after hitting new peaks near 132.20 during early trade at the beginning of the week.
In light of the recent price action, further recovery in the cross appears likely in the short-term horizon. Against this, further upside initially targets 132.53 (high November 4) followed by 132.91 (high October 29) and finally the October 2021 peak at 133.48 (October 20).
In the near term, extra upside looks likely above the 3-month support line, today near 130.80. In the longer run, and while above the 200-day SMA at 130.45, the outlook for EUR/JPY is expected to remain constructive.
EUR/JPY daily chart
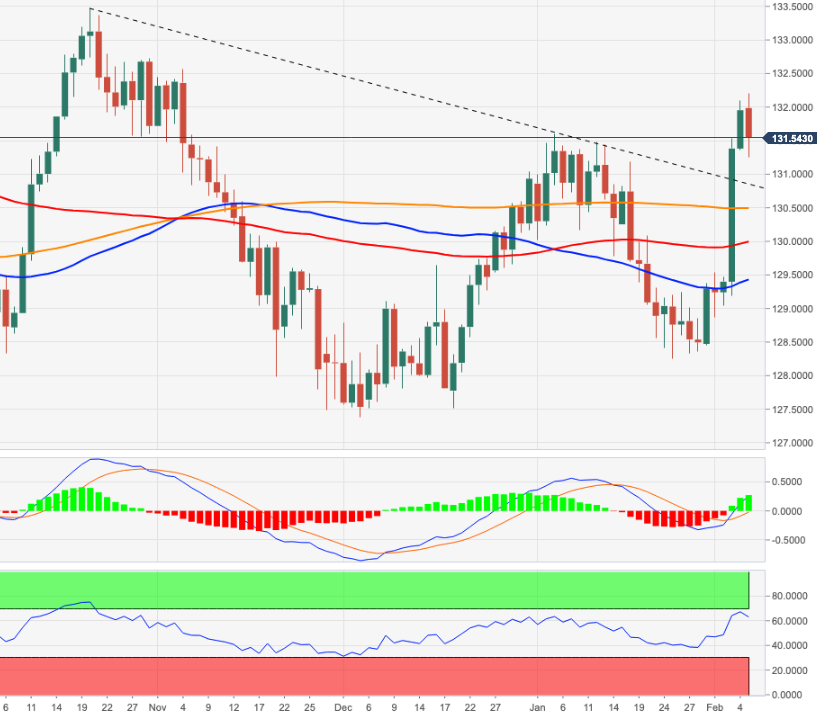
USD/MYR is still seen within the 4.1620-4.2150 range for the time being, noted Quek Ser Leang at UOB Group’s Global Economics & Markets Research.
Key Quotes
“USD/MYR has been trading between 4.1620 and 4.2150 since the start of the year. Daily MACD is ‘flattish’ and USD/MYR could continue to trade between 4.1620 and 4.2150 for a while more.”
“Looking ahead, the downside risk appears to be greater but USD/MYR has to break the major support levels near 4.1610/4.1620 before a sustained decline is likely.”
Quek Ser Leang at UOB Group’s Global Economics & Markets Research noted USD/THB faces a probable pullback in the near term.
Key Quotes
“USD/THB rose to 33.48 early last week before dropping sharply. The decline has gathered momentum and a break of Jan’s low of 32.81 would not be surprising.”
“For this week, the next major support at 32.56 is likely out of reach (there is another support at 32.65). Resistance is at 33.10 but only a breach of 33.25 would indicate that USD/THB is not ready to head lower.”
- EUR/USD fades part of the recent strong rebound to 1.1480.
- ECB’s Knot sees the central bank hiking in Q4 2022.
- ECB’s Lagarde will speak before the European Parliament.
The single currency starts the new trading week on the defensive and drags EUR/USD back to the 1.1420 region.
EUR/USD retreats from recent peaks
Fresh selling pressure around the European currency prompted EUR/USD to give away part of the recent advance to new YTD tops past 1.1480 (February 4), all amidst some mild recovery in the greenback.
On the latter, further upside in US yields, particularly in the belly and the long end of the curve lends support to the demand for the buck while market participants continue to digest Friday’s strong print from US Nonfarm Payrolls (+467K).
In the German money market, the selloff in bonds remains well and sound, lifting yields of the key 10y Bund to fresh highs near 0.24%. Recent comments from ECB’s K.Knot seem to have lent legs to German yields after he suggested the central bank could now move on rates as soon as in Q4 2022. His comments fall in line with the recent hawkish twist seen at the ECB event (February 3), where Chairwoman Lagarde left the door open to a probable lift-off sooner than anticipated.
In the docket, the Investor Confidence in the euro area improved to 16.6 for the month of February (from 14.9). in the NA calendar, the only release of note will be the December Consumer Credit Change.
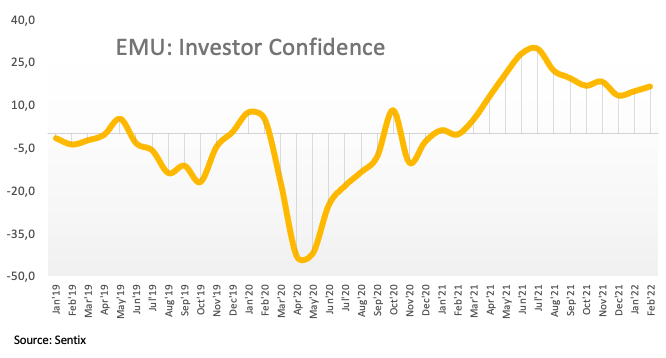
Later in the session, Chairwoman C.Lagarde is expected to speak before the European Parliament.
What to look for around EUR
EUR/USD now faces some downside pressure following recent peaks close to 1.1500 the figure. The optimism around spot seems threatened by the recovery in the greenback, which has particularly regained traction after US Nonfarm Payrolls surprised to the upside in January. The now improved outlook in the pair looks bolstered by prospects of a potential interest rate hike by the ECB at some point by year end, higher German yields, elevated inflation in the region and a decent pace of the rebound in the economic activity and other key fundamentals.
Key events in the euro area this week: Sentix Index, ECB Lagarde (Monday) - Germany Balance of Trade (Wednesday) - Germany Final January CPI (Friday).
Eminent issues on the back boiler: Asymmetric economic recovery post-pandemic in the euro area. Speculation of ECB tightening/tapering later in the year. Presidential elections in France in April. Geopolitical concerns from the Russia-Ukraine conflict.
EUR/USD levels to watch
So far, spot is retreating 0.22% at 1.1421 and faces the next up barrier at 1.1482 (2022 high Jan.14) followed by 1.1496 (200-week SMA) and finally 1.1673 (200-day SMA). On the other hand, a break below 1.1312 (55-day SMA) would target 1.1121 (2022 low Jan.28) en route to 1.1100 (round level).
- AUD/USD gained some positive traction on Monday, albeit lacked bullish conviction.
- Retreating US bond yields undermined the USD and extended support to the major.
- The cautious market mood capped any further gains for the perceived riskier aussie.
The AUD/USD pair maintained its bid tone through the first half of the European session and was last seen hovering near the top end of its daily trading range, just below the 0.7100 mark.
The pair attracted fresh buying on the first day of a new week and built on Friday's late bounce from the 0.7050 area, or a multi-day low touched in the reaction to the stellar US NFP print. As investors digested mostly upbeat US employment details, retreating US Treasury bond yields undermined the US dollar and extended some support to the AUD/USD pair.
The uptick, however, struggled to find acceptance above the 0.7100 mark amid the prevalent cautious market mood, which tends to weigh on the perceived riskier aussie. Apart from this, speculations for a larger Fed rate hike move at the March policy meeting acted as a tailwind for the USD and capped any meaningful upside for the AUD/USD pair, at least for now.
Investors now seem convinced that the Fed would adopt a more aggressive policy response to contain stubbornly high inflation. Hence, the market focus now shifts to the release of the US CPI report for January, due on Thursday. The data will play a key role in influencing the USD price dynamics and help determine the near-term trajectory for the AUD/USD pair.
In the meantime, the US bond yields will drive the USD demand amid absent relevant market-moving economic releases on Monday. Apart from this, traders will take cues from the broader market risk sentiment for some short-term opportunities around the AUD/USD pair.
Technical levels to watch
The GBP/USD pair is having a difficult time making a decisive move in either direction early Monday but a drop below 1.3520 could attract sellers, according to FXStreet’s Eren Sengezer.
Correction could deepen with a drop below 1.3520
“The Fibonacci 38.2% retracement level of the latest uptrend seems to have formed support at 1.3520. In case GBP/USD falls below that level and starts using it as resistance, 1.3500 (Fibonacci 50% retracement, 50-period SMA on the four-hour chart) aligns as the next bearish target before 1.3460 (Fibonacci 61.8% retracement).”
“On the upside, the initial hurdle is located at 1.3560 (Fibonacci 23.6% retracement) ahead of 1.3600 (psychological level) and 1.3630 (Feb. 3 high).”
EUR/CNH has rebounded from projections of 7.0800. Economists at Société Générale expect to see further gains on acceptance above the January peak at 7.3050/7.3100.
Graphical levels of 7.1500 should cushion
“The pair is now probing the interim hurdle of January peak at 7.3050/7.3100. An initial pullback is not ruled out however graphical levels of 7.1500 should cushion.”
“If the pair can cross above 7.3050/7.3100, the bounce could extend towards 7.3790, the 23.6% retracement from 2020 and the upper limit of the channel at 7.4400/7.4600. This could be a significant resistance zone.”
The US dollar likely to continue trending higher as Fed tightening is priced while yield spreads are set to hurt NZD/USD. Economists at Westpac see potential to 0.6500 multi-week.
USD yield support over the long run
“We retain a strong US dollar outlook, based on expected Fed policy tightening.”
“NZD has solid fundamental backing, but the RBNZ cycle is now fully priced and USD movements are likely to dominate.”
“Yield spreads are unlikely to be helpful. NZD/USD could weaken slightly further during the months ahead to 0.6500.”
Eurozone’s investor sentiment extended its upbeat momentum in the second month of 2022; the latest data published by the Sentix research group showed on Monday.
The gauge jumped to 16.6 in February from 14.9 in January vs. an advance to 15.2 expected. The index extended its recovery from the lowest levels since April 2020.
A current conditions index rose to 19.3 in February from 16.3.
An expectations index rebounded to 14.0 from 13.5, the highest reading since July 2021.
Sentix Managing Director Patrick Hussy said: "The development in the USA is problematic. Here the overall index is falling for the third time in a row, which is due to the decline in expectations.”
EUR/USD reaction
The shared currency fails to find any comfort from the encouraging Eurozone Sentix data, as EUR/USD keeps lows near 1.1415, courtesy of the latest leg up in the US dollar. The spot is down 0.26% so far.
About Eurozone Sentix Investor Confidence
Among 1600 financial analysts and institutional investors, the Sentix Investor Confidence is a monthly survey that shows the market opinion about the current economic situation and the expectations for the next semester. The index, released by Sentix GmbH, is composed by 36 different indicators. Usually, a higher reading is seen as positive for the Eurozone, which means positive, or bullish, for the Euro, while a lower number is seen as negative or bearish for the unique currency.
USD/CNH is still seen trading between 6.3400 and 6.3805 in the short term, commented FX Strategists at UOB Group.
Key Quotes
24-hour view: “USD rose to 6.3690 last Friday before easing off. Momentum indicators are mostly neutral and the current movement is likely part of a consolidation phase. For today, USD is likely to trade sideways between 6.3500 and 6.3700.”
Next 1-3 weeks: “While USD soared to a high of 6.3861 early last week, it was unable to hold on to its gains as it pulled back sharply. The price actions suggest USD is likely in a consolidation phase and it is expected to trade between 6.3400 and 6.3805 for now.”
- DXY alternates gains with losses in the mid-95.00s.
- US yields look to extend the recent uptick on Monday.
- Consumer Credit Change next on tap in the US docket.
The greenback, in terms of the US Dollar Index (DXY), looks to extend Friday’s post-NFP corrective upside in the 95.50 region following the opening bell in Euroland on Monday.
US Dollar Index looks to risk trends, yields
Following fresh lows in the 95.15/10 band on Friday, the index managed to regain some upside traction motivated by the solid prints from the January Nonfarm Payrolls (+467K). The corrective move in the buck was also propped up by the strong bounce in US yields across the curve.

The better-than-expected US job creation during last month reinforced the view of a strong labour market and added to the already rising speculation of a probable tighter normalization of the Fed’s monetary conditions.
In the US docket, December Consumer Credit Change will be the sole release later in the NA session in a week that is expected to be dominated by the publication of the inflation figures tracked by the CPI (Thursday).
What to look for around USD
The dollar regained some poise in the wake of the healthy results from the Nonfarm Payrolls for the month of January. While the constructive outlook for the greenback remains well in place for the time being, recent hawkish messages from the BoE and the ECB carry the potential to slow the pace of a move higher in the index in the next months. The view of a stronger dollar remains, in the meantime, underpinned by higher yields, persistent elevated inflation, supportive Fedspeak and the solid pace of the US economic recovery.
Key events in the US this week: Consumer Credit Change (Monday) - Balance of Trade (Tuesday) - Wholesale Inventories, MBA Mortgage Applications (Wednesday) - CPI, Initial Claims (Thursday) - Flash Consumer Sentiment (Friday).
Eminent issues on the back boiler: Fed’s rate path this year. US-China trade conflict under the Biden administration. Debt ceiling issue. Escalating geopolitical effervescence vs. Russia and China.
US Dollar Index relevant levels
Now, the index is gaining 0.09% at 95.56 and a break above 96.07 (55-day SMA) would open the door to 97.44 (2022 high Jan.28) and finally 97.80 (high Jun.30 2020). On the flip side, the next down barrier emerges at 95.13 (weekly low Feb.4) seconded by 95.00 (round level) and then 94.62 (2022 low Jan.14).
- GBP/USD defended the 1.3500 mark and attracted some buying on the first day of a new week.
- Retreating US bond yields acted as a headwind for the USD and extended support to the major.
- Fresh Brexit tensions held back bulls from placing aggressive bets and capped any further gains.
The GBP/USD pair quickly retreated a few pips from the daily high touched in the last hour and was last seen trading with modest intraday gains, around the 1.3530-1.3535 region.
Having defended the key 1.3500 psychological mark, the GBP/USD pair attracted some buying on the first day of a new week and recovered a part of Friday's heavy losses. The US dollar struggled to capitalize on the post-FOMC bounce from a two-and-half-week low amid retreating US Treasury bond yields. This, in turn, was seen as a key factor that extended some support to the major.
That said, renewed speculations for a larger Fed rate hike at the March policy meeting should act as a tailwind for the US bond yields and favour the USD bulls. This, along with fresh tensions over the Northern Ireland Protocol of the Brexit agreement should undermine the British pound and keep a lid on any meaningful upside for the GBP/USD pair, at least for the time being.
Meanwhile, the price action now suggests that the markets have digested a more hawkish Bank of England decision last week, wherein four MPC members voted for an aggressive 50 bps hike in borrowing costs. This, in turn, favours bearish traders and supports prospects for the emergence of some selling at higher levels, warranting caution before positioning for any further gains.
In the absence of any major market-moving economic releases, either from the UK or the US, leaving the GBP/USD pair at the mercy of the USD price dynamics. Hence, traders might take cues from the US bond yields, which, along with the broader market risk sentiment, will drive the USD demand. Apart from this, Brexit-related headlines should provide some impetus to the major.
Technical levels to watch
USD/JPY is now expected to navigate within the 114.55-115.80 range in the next weeks, noted FX Strategists at UOB Group.
Key Quotes
24-hour view: “While USD rose sharply to 115.42 last Friday, upward momentum has barely improved. That said, USD could test 115.50 first before a more sustained pullback is likely. The next resistance at 115.70 is unlikely to come under threat. On the downside, a breach of 114.80 (minor support is at 115.00) would indicate that the current mild upward pressure has eased.”
Next 1-3 weeks: “The price actions in USD the past one week or so have relatively choppy as it rose to 115.68, dropped to 114.14 before rebounding. The outlook is mixed and USD is likely to trade between 114.55 and 115.80 for now. Looking ahead, the upside risk appears to be greater but USD has to break 115.80 first before a sustained advance is likely.”
Considering advanced reading from CME Group for natural gas futures markets, open interest went up by around 2.6K contracts on Friday, resuming the uptrend following the previous day’s retracement. Volume, instead, shrank for the second session in a row, this time by around 15.6K contracts.
Natural Gas now approaches the 200-day SMA
Prices of natural gas extended the leg lower on Friday in tandem with increasing open interest, opening the door to further retracement with the immediate target at the 200-day SMA around the $4.20 per MMBtu. The decline in volume, however, could slow the pace of the move.
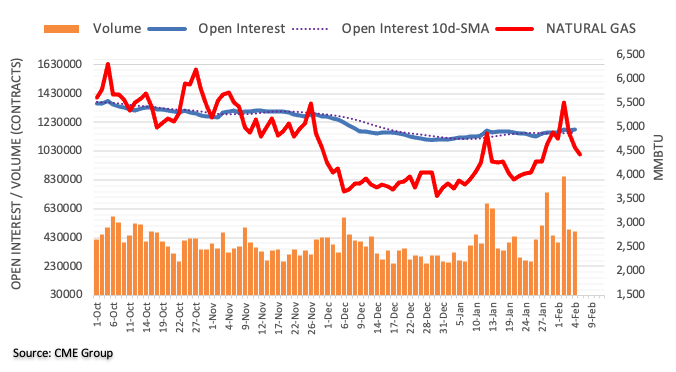
FX option expiries for February 7 NY cut at 10:00 Eastern Time, via DTCC, can be found below.
- EUR/USD: EUR amounts
- 1.1500 667m
- GBP/USD: GBP amounts
- 1.3300 593m
- 1.3400 782m
- 1.3500 586m
- 1.3400 649m
- USD/JPY: USD amounts
- 114.50 930m
- 115.00 572m
- 115.85 450m
- USD/CHF: USD amounts
- 0.9300 300m
- AUD/USD: AUD amounts
- 0.7100 876m
- 0.7170 535m
- 0.7300 1.1b
- NZD/USD: NZD amounts
- 0.6550 394m
- 0.6700 540m
- EUR/GBP: EUR amounts
- 0.8700 400m
EUR/USD has started to edge lower following last week's impressive rally. As long as buyers continue to defend 1.1400, however, the pair is poised for additional gains, according to FXStreet’s Eren Sengezer.
Bullish bias intact as long as 1.1400 support holds
“On the downside, 1.1400 (Fibonacci 23.6% of the latest uptrend, psychological level) aligns as first support. In case this level turns into resistance, additional losses toward 1.1350 (Fibonacci 38.2% retracement) and 1.1320 (200-period SMA) could be witnessed.”
“Resistances are located at 1.1480 (static level), 1.1500 (psychological level, static level) and 1.1550 (static level).”
See: EUR/USD to drift back to the 1.1380 area – ING
Sharp EUR rebound threatens to break downtrend in place since the start of last year. Economists at MUFG Bank see room for EUR strength to extend further in the near-term.
ECB puts in place important bullish pivot point for the EUR
“The price action is threatening to bring an end to the bearish trend that has been in place for the EUR since the start of last year.”
“The latest ECB policy meeting could prove to be an important pivot point for the EUR. We are more confident now that the lows are in place against the USD and GBP at 1.1121 and 0.8285 respectively.”
“We now expect market participants to pare back short EUR funding positions in light of the ECB’s updated policy guidance which will help the EUR to rebound from undervalued levels. As the ECB has not raised rates since 2011, there is a risk of outsized upward moves in the EUR and euro-rate markets. It should favour higher EUR volatility as well.”
“Our initial targets on the topside for EUR/USD and EUR/GBP are provided by their 200-day moving averages which come in at around 1.1680 and 0.8520 respectively.”
See: EUR/USD has the 1.1480/00 zone in its crosshairs – OCBC
Responding to the US’ remarks on the "Phase One" trade deal, the Chinese Foreign Ministry said that “both sides should address issues on basis of mutual respect.”
“In principle, there is no winner from trade frictions,” the Ministry added.
Earlier today, US officials said: “Our patience is wearing thin' in talks with China, seeking concrete action.”
Market reaction
AUD/USD is off the highs, currently trading at 0.7094, still up 0.24% on the day. Markets digest the renewed US-China trade headlines amid fresh weakness in the US dollar.
EUR/USD has started the new week under modest bearish pressure. Economists at ING expect the world’s most popular currency pair to edge lower towards the 1.1380 zone.
Look out for Lagarde comments
“The US runs a large positive output gap (compared to the negative output gap in the eurozone) and the US tightening cycle will likely be far larger than that seen in Europe. That is why we favour EUR/USD proving toppish near the 1.15 area, rather than calling a major upside breakout.”
For today, the main focus will be comments given by President Lagarde. Should she feel the need to correct any of the sharp adjustments seen in European interest rate markets (and correct the pressure on BTP-Bund spreads), today's introductory comments could present such an opportunity.”
“We have a slight preference for EUR/USD drifting back to the 1.1380 area today.”
USD/JPY capitalized on rising US Treasury bond yields last week and climbed above 115.00. Above here, the pair could target the year high of 116.35, economists at OCBC bank report.
Stay positive
“The correlation between USD/JPY and front-end yield differentials has been improving as of late last week, especially as the overall market sentiment appeared to stabilize with equities. This should imply more upside room for the pair as yield differentials have opened up quite significantly of late.”
“Should the pair hold above 115.00, the risk-reward favours a test of the previous peak at 115.68 and potentially the year-high at 116.35.”
The macro highlight of the week will be Thursday's release of US January CPI while investors assess the geopolitical risk – largely Ukraine-related. Any progress on the diplomatic front should lift the S&P 500 Index to the 4590/4600 area, economists at ING report.
Dollar downside should be limited ahead of Thursday's CPI
“US 10-year Treasury yields are now at 1.90% and could edge higher still, especially with a lot of US Treasury issuance due this week. Equally one would expect US rates markets to stay cautious ahead of what should be a new cycle high in US CPI on Thursday.”
“Any progress on the diplomatic front to ease tensions surrounding Ukraine would be very welcome and likely take the S&P 500 back through important resistance at the 4590/4600 area – a key benchmark for the risk environment.”
“For today expect narrow ranges in the DXY – but support at 95.00/95.25 seems a little stronger after Friday's NFP release.”
- EUR/GBP witnessed some selling on Monday and eroded a part of the post-ECB strong gains.
- Disappointing German macro data undermined the euro and contributed to the selling bias.
- Fresh Brexit tensions should act as a headwind for sterling and help limit any deeper losses.
The EUR/GBP cross edged lower during the early European session and dropped to a fresh daily low, around the 0.8440 region in the last hour.
Following an early uptick to the 0.8465-0.8470 region, the EUR/GBP cross witnessed some profit-taking on Monday and for now, seems to have stalled its post-ECB strong recovery from the two-year low. It is worth recalling that the ECB President Christine Lagarde acknowledged mounting inflation risks and did not repeat the previous guidance that a rate hike this year was extremely unlikely. This, in turn, was seen as a key factor that boosted the shared currency and prompted aggressive short-covering around the EUR/GBP cross.
That said, a more hawkish Bank of England (BoE) decision last week continued acting as a tailwind for the British pound and capped the upside for the EUR/GBP cross, at least for the time being. The BoE raised interest rates by 25 bps on expected lines and four out of nine MPC members voted for an aggressive 50 bps hike in borrowing costs. Apart from this, the disappointing release of the German Industrial Production, which unexpectedly fell by 0.3% in December, exerted some downward pressure on the cross on Monday.
The downside, however, seems limited, at least for now, amid fresh tensions over the Northern Ireland protocol of the Brexit agreement. In the latest development, Northern Ireland's Agriculture Minister ordered to halt all post-Brexit checks on agri-food goods coming into the region from the rest of the UK. Adding to this, a German official said on Thursday that Britain should respect post-Brexit trade rules or else face consequences. This, in turn, supports prospects for the emergence of some dip-buying around the EUR/GBP cross.
Hence, it will be prudent to wait for a strong follow-through selling before confirming that the recent strong recovery move has run its course and positioning for any further decline. There isn't any major market-moving economic data due for release from the UK on Monday. Meanwhile, the Eurozone economic docket also features the release of the Sentix Investor Confidence. This, along with ECB President Lagarde's speech, should influence the common currency and produce some trading opportunities around the EUR/GBP cross.
Technical levels to watch
AUD/USD dipped sharply on Friday, leaving the bounce off 0.7000 looking like it has topped off. The aussie needs to surpass the 0.7200/50 zone to to shake off downside bias, in the opinion of analysts at OCBC Bank.
Back to negative bias
“The spectre of 0.7000 cannot be fully lifted just yet, and the relatively dovish RBA will not be providing positive drivers.”
“The pair will need a clearer move towards 0.7200/50 to shake off downside bias.”
Economists at ING expect a 50bp hike in February by the National Bank of Poland (NBP) with upside risk, a 75bp hike. The EUR/PLN pair is forecast to at 4.48 by the end of the quarter.
Gearing up for a hawkish NBP
“We now expect a 50bp hike from the NBP tomorrow – taking the policy rate to 2.75% – with the risk of a 75bp hike. Additionally, it seems that the Polish government is also softening its stance against Brussels and making more conciliatory noises, no doubt to strengthen Western alliances over Ukraine but perhaps also with one eye on the release of EU recovery funds.”
“We see EUR/PLN ending the quarter at 4.48.”
EUR/USD is trading in a tight range below 1.1450. Economists at OCBC bank expect the world's most popular currency pair to test the 1.1480/1.1500 area.
Support located at 1.1400
“The market’s attempt to price in more hawkish ECB expectations is making us more positive on the EUR in the medium term, and perhaps looking for upside in EUR-crosses in the near term.”
“Expect the EUR/USD to continue eyeing the 1.1480/00 zone.”
“Support is higher at 1.1400.”
Brent Crude Oil has seen a clear break above the 2018 and 2021 highs $86.70/74 and is starting to gain momentum, strategists at Credit Suisse report.
Break above psychological $100 resistance to open up the $115.71 high of 2014
“We see resistance at $96.23/75, next, then the psychological $100 resistance, where we would expect a fresh consolidation phase to emerge.”
“Should strength directly extend, we see resistance next at $103.95, then the $115.71 high of 2014.”
The spike in the EUR following the February European Central Bank (ECB) press conference significantly outweighed the gains made by the pound on the back of the Bank of England (BoE) policy meeting. Economists at Rabobank maintain their three-month EUR/GBP 0.85 forecast.
ECB is no longer ruling out the possibility of a rate hike this year
“The ECB is no longer ruling out a rate hike this year. We have been expecting that the EUR would pick up ground this year as focus switched to ECB policy tightening. However, the move has come earlier than we had been expecting.”
“Despite the hawkish overtones from the BoE, we still see GBP as vulnerable medium-term as the increase in the cost of living bites.”
“We retain our three-month forecast of EUR/GBP 0.85.”
- USD/CHF was seen oscillating in a narrow trading band through the early European session.
- A positive risk tone undermined the safe-haven CHF and acted as a tailwind for the major.
- Retreating US bond yields held back the USD bulls from placing fresh bets and capped gains.
The USD/CHF pair lacked any firm directional bias and oscillated in a narrow trading band, around mid-0.9200s through the early European session.
The pair struggled to capitalize on Friday's post-NFP strong move up and witnessed subdued/range-bound price move on the first day of a new week, though a combination of factors helped limit the downside. A generally positive tone around the equity markets undermined the safe-haven Swiss franc and acted as a tailwind for the USD/CHF pair amid modest US dollar strength.
The USD remained well supported by the upbeat US jobs report, which revived speculations for a larger Fed rate hike move at the March policy meeting. Investors now seem convinced that the US central bank will adopt a more aggressive policy stance to contain stubbornly high inflation, which was evident from the recent sharp rise in the US Treasury bond yields.
In fact, the yield on the 2-year and 5-year, which are more sensitive to rate hike expectations, rose to the highest level since February 2020 and July 2019, respectively, on Friday. Hence, the market focus now shifts to the release of the latest US consumer inflation figures for January, due on Thursday, which would provide a fresh impetus to the USD/CHF pair.
In the meantime, a pullback in the US bond yields might hold back the USD bulls from placing aggressive bets. This, in turn, was seen as the only factor that kept a lid on any meaningful upside for the USD/CHF pair, at least for the time being. Nevertheless, the fundamental backdrop seems tilted in favour of bullish traders and supports prospects for additional gains.
There isn't any major market-moving economic data due for release from the US, leaving the USD at the mercy of the US bond yields. Apart from this, traders will take cues from the broader market risk sentiment to grab some short-term opportunities around the USD/CHF pair.
Technical levels to watch
AUD/USD still risks a deeper retracement to the 0.7015 level in the next weeks, suggested FX Strategists at UOB Group.
Key Quotes
24-hour view: “AUD dropped to 0.7052 last Friday before rebounding slightly to close at 0.7078 (-0.88%). While oversold, the weakness in AUD could extend to 0.7040 before stabilization is likely. The next support at 0.7015 is not expected to come into the picture. Resistance is at 0.7100 followed by 0.7120.”
Next 1-3 weeks: “AUD dropped sharply last Friday before closing on a weak note at 0.7078 (-0.88%). Downward momentum has improved somewhat and AUD is likely to trade with a downward bias. However, any weakness is likely limited to a test of 0.7015. On the upside, a breach of 0.7140 (‘strong resistance’ level) would indicate that the current mild downward pressure has eased.”
Here is what you need to know on Monday, February 7:
The greenback is staying resilient against its rivals at the start of the week following Friday's rebound, which was fueled by the upbeat January US jobs report. There won't be any high-tier macroeconomic data releases on Monday and major currency pairs are likely to move sideways. US stock index futures are trading flat and the benchmark 10-year US Treasury bond yield stays calm near 1.9% early Monday, pointing to a neutral market mood.
The US Bureau of Labor Statistics reported on Friday that Nonfarm Payrolls (NFP) rose by 467,000 in January. This print surpassed the market expectation of 150,000 by a wide margin. Additionally, the publication revealed that the annual wage inflation, as measured by the Average hourly Earnings, jumped to 5.7% from 5% in December, beating analysts' estimate of 5.2%. Supported by these figures, the US Dollar Index snapped a five-day losing streak on Friday. The index is clinging to small daily gains above 95.50 on Monday.
NFP Quick Analysis: America overcomes Omicron, more fuel for the Fed and the dollar
EUR/USD retreated modestly from multi-week highs on Friday but ended up gaining more than 300 pips on a weekly basis. The pair is trading in a tight range below 1.1450 heading into the European session.
GBP/USD stays above 1.3500 following Friday's decline. The Bank of England adopted a cautious tone on the UK economic outlook following the rate hike decision, limiting the pound's upside.
USD/JPY capitalized on rising US Treasury bond yields last week and climbed above 115.00. The pair posts small daily gains near 115.30.
Gold continues to trade above $1,800 after closing the previous week in the positive territory. In case US T-bond yields start to retreat, XAU/USD could gather bullish momentum.
Bitcoin climbed above $40,000 on Friday and spent the weekend in a consolidation phase. BTC/USD continues to push higher early Monday and was last seen trading at $42,700. Ethereum closed the previous four trading days in the green and reclaimed $3,000 at the start of the week.
Industrial Production in Germany unexpectedly fell in December, the official data showed on Friday, suggesting that the manufacturing sector is not out of the woods yet.
Eurozone’s economic powerhouse’s industrial output fell by 0.3% MoM, the federal statistics authority Destatis said in figures adjusted for seasonal and calendar effects, vs. a 0.4% increase expected and -0.2% last.
On an annualized basis, the German industrial production slumps by 4.1% in December versus a 2.2% drop registered in November. Markets expected the industrial output to fall by 2.4% in the reported month.
FX implications
The shared currency is pressurizing lows on the downbeat German industrial figures.
At the time of writing, EUR/USD is trading at 1.1428, down 0.14% on the day, having hit the daily lows at 1.1424.
About German Industrial Production
The Industrial Production released by the Statistisches Bundesamt Deutschland measures outputs of the German factories and mines. Changes in industrial production are widely followed as a major indicator of strength in the manufacturing sector. A high reading is seen as positive (or bullish) for the EUR, whereas a low reading is seen as negative (or bearish).
Gold price is consolidating Friday’s turnaround below $1,815. This level remains a tough nut to crack for XAU/USD bulls, as FXStreet’s Dhwani Mehta notes.
21-SMA to cap further declines at $1,806
“Gold has carved out an ascending triangle formation on the four-hour sticks. However, bulls yearn for acceptance above the horizontal trendline resistance at $1,815 to confirm an upside breakout from the triangle. The immediate barrier is seen at the 100-Simple Moving Average (DMA) at $1,817, above which doors will open up towards $1,820. A fresh upswing will be initiated above the latter, calling for a test of the $1,835 supply zone.”
“On the flip side, bullish 21-SMA will likely cap the further declines at $1,806. The next stop for bears is placed at $1,803, the 50-SMA. Further south, the falling trendline support at $1,793 will be the last line of defense for gold buyers.”
- USD/CAD snaps two-day uptrend, retreats from one-week high.
- Oil prices stay firmer on geopolitical fears, struggling USD.
- Canada employment report contrasts US job numbers for January.
- Light calendar keeps risk catalysts in the driver’s seat ahead of Wednesday’s speech from BOC’s Macklem, Thursday’s US CPI.
USD/CAD takes offers to refresh intraday low around 1.2725, down 0.23% on a day during the late Asian session on Monday. In doing so, the loonie pair consolidates the recent gains while extending the previous day’s pullback from a one-week high.
Firmer oil prices and a pullback in the US Treasury yields could be linked to the USD/CAD pair’s latest losses. It’s worth noting that WTI crude oil is Canada’s main export item and is on the north-run since early December 2021, recently up 0.14% intraday around $91.15, near the fresh eight-year high flashed on Friday.
Even so, downbeat employment data from Canada contradicts firmer US jobs report and keeps the pair buyers hopeful. On the same line are escalating concerns over the Fed’s 0.50% rate hike in March. It should be observed that Bank of Canada (BOC) Governor Tiff Macklem has shown discomfort with the rising inflation, which in turn highlights Wednesday’s speech from BOC’s Macklem as the key catalyst for USD/CAD bears.
Additionally, Thursday’s US Consumer Price Index (CPI) for January and chatters around the Russia-Ukraine war are also important for short-term USD/CAD moves.
That said, a sluggish start to the week allowed the US Treasury yields to step back from a two-year high, which in turn allowed USD/CAD to pare recent gains. However, risk catalysts will be important to watch moving forward.
Technical analysis
Despite the recent pullback moves, USD/CAD keeps the ‘Inverse Head & Shoulders” bullish chart pattern on the four-hour play, suggesting brighter hopes of the buyers until the quote stays above the 200-SMA level of 1.2670.
Read: USD/CAD Price Analysis: Inverse Head & Shoulders keep buyers hopeful around 1.2750
- GBP/JPY struggled to capitalize on its modest intraday uptick to the 156.20 area.
- Fresh Brexit-related tensions acted as a headwind for sterling and capped gains.
- A softer risk tone underpinned the safe-haven JPY and kept bulls on the defensive.
The GBP/JPY cross seesawed between tepid gains/minor losses heading into the European session and was last seen trading in the neutral territory, just below the 156.00 mark.
Having found some support ahead of mid-155.00s on Friday, the GBP/JPY cross gained some positive traction during the early part of trading on the first day of a new week. The uptick, however, lacked bullish conviction and lost steam near the 156.20 region amid a generally softer risk tone, which tends to benefit the safe-haven Japanese yen. Apart from this, fresh tensions over the Northern Ireland protocol of the Brexit agreement undermined the British pound and further contribute to capping the upside for the cross.
In the latest development, Northern Ireland's Agriculture Minister ordered a halt from Wednesday midnight to all post-Brexit checks on agri-food goods coming into the region from the rest of the UK. This triggered a fresh political crisis in the region and led to the resignation of Northern Ireland’s first minister Paul Givan on Thursday in protest against the post-Brexit trade rules. Adding to this, a German official said on Thursday that Britain should respect post-Brexit trade rules or else face consequences.
Despite the negative factors, the downside for the GBP/JPY cross remains cushioned amid a more hawkish Bank of England (BoE) decision last week. It is worth recalling that the BoE raised interest rates by 25 bps, as was widely expected, and four out of nine MPC members voted for an aggressive 50 bps hike in borrowing costs. This should continue to act as a tailwind for sterling and warrants some caution before confirming that the recent strong bounce from sub-153.00 levels, or the very important 200-day SMA has run its course.
Technical levels to watch
CME Group’s flash data for crude oil futures markets noted open interest increased for the third consecutive session on Friday, this time by around 16.6K contracts. On the other hand, volume reversed three daily builds in a row and dropped by around 140.5K contracts.
WTI now targets $100.00
The rally in prices of the WTI remains well and sound. Friday’s brief test and subsequent pullback from tops past the $93.00 mark was on the back of rising open interest, which could favour further retracement in the very near term. The ongoing overbought condition of the commodity also adds to the idea of a corrective move.
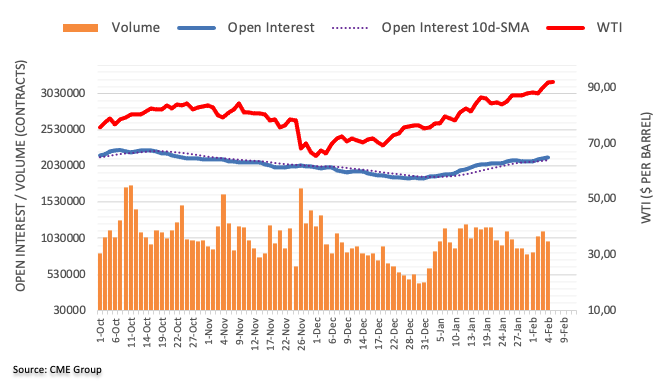
- Gold keeps Friday’s recovery, grinds higher around intraday top.
- US jobs report propelled yields, USD but concerns over Fed, cautious optimism in markets weigh on bond coupons of late.
- US inflation becomes a key weekly event, risk catalysts are important too.
- Gold Weekly Forecast: XAU/USD indecisive as investors assess central banks' rate outlook
Gold (XAU/USD) stays mildly bid around $1,810, extending Friday’s rebound amid the early Monday morning in Europe.
While the US dollar’s lack of ability to track the strong Treasury yields favored gold buyers the previous day, the metal’s latest upside could be linked to the pullback in bond coupons from a multi-day high.
That said, the US Dollar Index (DXY) rebounded from a three-week low after the monthly employment data released on Friday. Even so, the greenback gauge closed on the negative side as far as the weekly chart is concerned, up 0.12% around 95.55 at the latest.
On the other hand, the US 10-year Treasury yields snap two-day run-up to ease from the highest levels since January to 1.91% at the latest.
Mixed concerns over the inflation and the Fed’s next move in March become the key hurdle for the US Treasury yields. Although upbeat US jobs report propelled bond coupons to the fresh multi-day high on Friday, indecisive figures of inflation expectations, as measured by the 10-year breakeven inflation rate per the St. Louis Federal Reserve (FRED) data, tested bulls afterward.
As per the latest US jobs report, the headline Nonfarm Payrolls (NFP) rose by 467K versus the median forecast for a 150K rise and 510K revised prior while the Unemployment Rate rose to 4.0% from 3.9% in December, compared to expectations for a no-change figure. It’s worth noting, however, that the U6 Underemployment Rate extended the south-run to 7.1% from 7.3% previous readouts. Also encouraging was Average Hourly Earnings that jumped strongly to 5.7% versus 4.9%.
Adding to the bullish bias could be the upbeat performance of Chinese equities and a light calendar ahead of Thursday’s US Consumer Price Index (CPI) for January. Also important to watch are concerns over Russia and China.
Technical analysis
A clear bounce from the monthly horizontal support joins firmer oscillators to keep gold buyers hopeful around 200-SMA, near $1,813 at the latest.
Adding to the upside filters is the previous support line from December 15 and 23.6% Fibonacci retracement (Fibo.) level of December-January upside, respectively around $1,824 and $1,830.
Meanwhile, a downside break of the stated horizontal support zone, near $1,783-80, will be crucial for the gold seller’s return.
Following that, the 78.6% Fibo. near $1,761 may test gold bears before directing them to December’s low of $1,753.
It’s worth noting that bullish MACD joins higher-low of the gold prices and RSI to keep buyers positive of late.
Gold: Four-hour chart
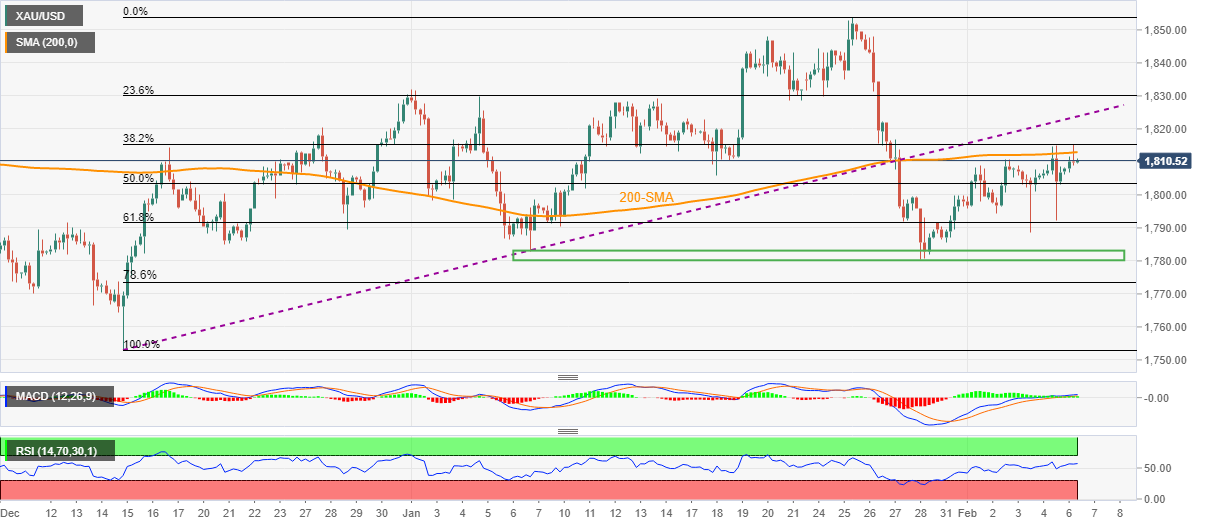
Trend: Further upside expected
In opinion of FX Strategists at UOB Group, Cable could still advance further and revisits the 1.3645 level in the short-term horizon.
Key Quotes
24-hour view: “GBP pulled back to a low of 1.3505 last Friday before closing on a soft note at 1.3525 (-0.54%). While downward momentum has not improved by much, the pullback in GBP could dip below 1.3500 first before stabilization is likely. The next support at 1.3470 is unlikely to come under threat. On the upside, a break of 1.3590 (minor resistance is at 1.3560) would indicate that the current weakness has stabilized.”
Next 1-3 weeks: “Last Friday, GBP snapped its 5-day winning streak as it pulled back and close on a soft note at 1.3525 (-0.54%). While upward momentum is beginning to wane, there is chance, albeit not a high one for GBP to make one more push higher to 1.3645. However, a breach of 1.3470 (‘strong support’ level) would indicate that the risk of another leg higher has dissipated.”
Open interest in gold futures markets extended the downtrend on Friday and shrank by around 1.5K contracts according to preliminary figures from CME Group. Volume, instead, rose for the second session in a row, this time by around 12.7K contracts.
Gold remains supported around $1,780
Gold prices reversed the previous day’s pullback on Friday amidst shrinking open interest, which could be indicating that extra gains from here appear not favoured in the very near term. The uptick in volume, however, could allow for further gains to test the $1,820 area, where sits the 20-day SMA.
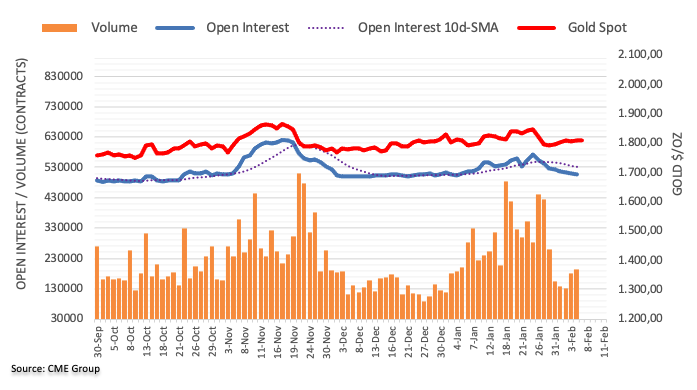
“The European Central Bank (ECB) could end its stimulus programme earlier than planned but it is unlikely to raise its main interest rate in July as investors are expecting,” ECB policymaker Martins Kazaks told Reuters during early Monday morning in Europe.
Latvian Central Bank Governor Kazaks pushed back against market bets on a July hike because this would imply a complete winding down, or "tapering" of the ECB's bond purchases before that date, per Reuters.
Additional quotes
July would imply an extremely and unlikely quick pace of tapering.
But overall, at the current juncture, naming a specific month would be much premature.
If we see that inflation remains high and the labor market remains strong or strengthens further, if we see that the economy keeps going, the direction is clear: we may act sooner than we assumed in the past.
With the economy recovering, inflation at this level and increased risk of persistency of inflation, new net asset purchases become less necessary.
Money markets have priced in a 15 basis point hike in the ECB's deposit rate in July, plus nearly a further 40 basis points by December.
EUR/USD snaps six-day uptrend
In addition to the news that probes ECB hawks, firmer US dollar backed by Friday’s US jobs report also weighs on EUR/USD prices of late.
Read: EUR/USD: Bulls firming, eyes on M-formtion neckline before 1.1410 break
FX Strategists at UOB Group noted EUR/USD could extend to 1.1520 once 1.1485 is cleared.
Key Quotes
24-hour view: “Last Friday, EUR tested the 1.1485 resistance (high of 1.1483) before easing off to close little changed (1.1446, +0.07%). The 1.1485 level is still a solid resistance and with upward momentum beginning to wane, a break of this level appears unlikely. For today, EUR is more likely to consolidate and trade within a range of 1.1410/1.1475.”
Next 1-3 weeks: “While the strong surge in EUR over the past one week or so appears to be running ahead of itself, the rally is not showing any sign of easing just yet. Overbought shorter-term conditions could lead to a couple of days of consolidation first but as long as 1.1360 (‘strong support’ level) is not breached, the rally could extend further. That said, EUR has to break the major resistance at 1.1485 before a move to 1.1520 can be expected.”
“Almost two years after the government closed Australia to the world, the international border is set to reopen to those who are fully vaccinated,” said Australia Prime Minister (PM) Scott Morrison on early Monday in Europe, per ABC News.
Key quotes
The condition is you must be double vaccinated to come to Australia.
That's the rule. Everyone is expected to abide by it.
The government's definition was that people need to have a full course of a vaccine, which in most cases is two doses but for some international vaccines is only one, to be considered vaccinated.
I think events earlier in the year should have sent a very clear message to everyone around the world that (that) is the requirement to enter into Australia.
There are a lot tourism operators in city centers and the regions that have been doing it really tough over the past couple of years and this will see more tourists come to their town, spend money and get local economies going again.
AUD/USD refreshes intraday high
The aforementioned upbeat news from Australia seems to have joined the positive performance of Chinese equities to propel AUD/USD towards a fresh intraday top.
Read: AUD/USD Price Analysis: Corrective pullback battles 200-HMA but bears stay hopeful
USD/JPY prints three-day rebound, pokes intraday high of late.
Bulls cross, firmer MACD keep buyers hopeful to overcome immediate hurdle.
Key moving averages, fortnight-old rising support line restrict short-term declines.
USD/JPY remains on the front foot for the third consecutive day, up 0.15% intraday around 115.35 heading into Monday’s European session.
In doing so, the yen pair justifies a bullish cross between the 50-SMA and 200-SMA amid firmer MACD signals.
However, the pair buyers need to cross a downward sloping trend line from January 04, near 115.50, to keep the reins.
Also acting as an important resistance is a horizontal line from January 11, near 116.00, a break of which will direct USD/JPY buyers towards the last month’s peak of 116.35.
On the flip side, 50-SMA and 200-SMA restrict the quote’s short-term declines around 115.00 and 114.85 in that order.
Following that, an upward sloping support line from January 24, near 114.55, will be crucial to watch.
Overall, USD/JPY bulls remain in the driver’s seat but with a bumpy road ahead.
USD/JPY: Four-hour chart
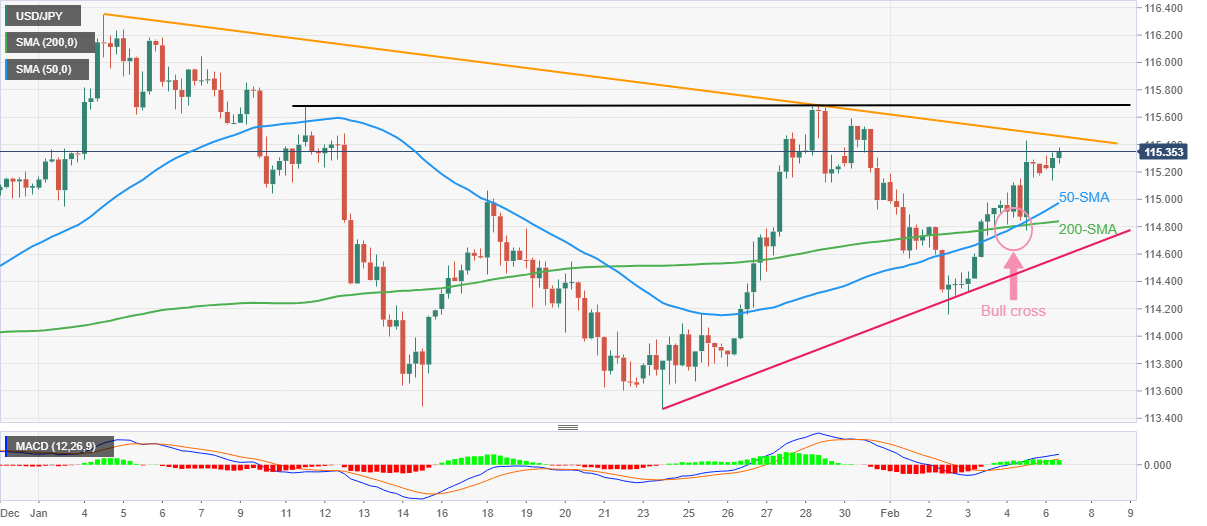
Trend: Further upside expected
- Asian equities trade mixed despite China’s hawkish start to the week after Lunar New Year holidays.
- Upbeat US jobs report keep equity bulls away, geopolitical concerns over Russia play their role as well.
- Indonesia GDP came in upbeat, Australia to open national borders for all double-vaccinated visa holders.
Asian equity markets fail to cheer China’s return from a long break as upbeat US jobs report keep Fed hawks on the table. Adding to the mixed concerns are fears of the Russia-Ukraine war and an absence of major data/events during Monday morning.
That said, MSCI’s index of Asia-Pacific shares outside Japan drops 0.20% intraday while Japan’s Nikkei 225 declines 0.80% heading into Monday’s European session.
Australia’s ASX 200 print mild intraday losses as traders struggle between softer China Caixin Services PMI and Aussie PM Scott Morrison’s border opening plans from February 21. Further, New Zealand’s NZX 50 remains lackluster while Indonesia’s strong Q4 GDP fails to impress traders.
Further, South Korea’s KOSPI drops 0.30% while India’s BSE Sensex drops 0.60% on a day at the latest.
Above all, Chinese stocks are mostly up near 1.0% intraday by the press time as market players welcome the latest comments from China suggesting easy money policies to remain on the table. Also favoring equities from Beijing are downbeat prints of China Caixin Services PMI for January and hints of more market liquidity to battle the hawkish hints from major central banks. In doing so, China’s equity bulls ignore recently downbeat signals over the Sino-American trade deal.
On a broader front, the US 10-year Treasury yields retreat from a two-year high while the S&P 500 Futures pare early Asian losses at the latest. Even so, the US Dollar Index (DXY) extend Friday corrective pullback from a three-week low.
That said, the DXY bounced off a multi-day low after the US Bureau of Labor Statistics (BLS) offered a positive surprise concerning January employment data. Among the key details, Nonfarm Payrolls (NFP) rose by 467K versus the median forecast for a 150K rise and 510K revised prior while the Unemployment Rate rose to 4.0% from 3.9% in December, compared to expectations for a no-change figure. It’s worth noting, however, that the U6 Underemployment Rate extended the south-run to 7.1% from 7.3% previous readouts. Also encouraging was Average Hourly Earnings that jumped strongly to 5.7% versus 4.9%.
Given the full markets and a light calendar, investors may witness a slow start to the week until Thursday’s US inflation data.
Read: US Treasury yields pare NFP-led gains at 25-month high, stock futures stay pressured
Reuters quotes anonymous US officials during an early Monday morning in Europe pushing for "concrete action" from China to make good on its commitment to purchase $200 billion in additional U.S. goods and services in 2020 and 2021 under the "Phase 1" trade deal signed by former President Donald Trump.
Key quotes
Washington was losing patience with Beijing, which had ‘not shown real signs’ in recent months that it would close the gap in the two-year purchase commitments that expired at the end of 2021.
The comments come a day before the U.S. government is due to release full-year trade data that analysts expect to show a significant shortfall in China's pledge to increase purchases of US farm and manufactured goods, energy and services.
Because we inherited this deal, we engaged the (People's Republic of China) on its purchase commitment shortfalls, both to fight for U.S. farmers, ranchers and manufacturers and give China the opportunity to follow through on its commitments. But our patience is wearing thin.
Deputy U.S. Trade Representative Sarah Bianchi told a trade conference on Tuesday that China had failed to meet its purchase commitments under the deal and the conversations between Washington and Beijing had been ‘very difficult.’
A spokesperson for China's embassy in Washington last week said Beijing has worked to implement the Phase 1 agreement 'despite the impact of COVID-19, global recession and supply chain disruptions.'
AUD/USD remains on the front foot
Despite fresh tension surrounding US-China trade ties, the AUD/USD prices refresh intraday high while consolidating recent losses. The up-move could be linked to the upbeat performance by Chinese equities and Australia PM Scott Morrison’s border opening plans.
Read: AUD/USD Price Analysis: Corrective pullback battles 200-HMA but bears stay hopeful
- AUD/USD picks up bids to refresh intraday high, snaps two-day downtrend.
- 50% Fibonacci retracement, weekly support line restrict short-term downside.
- One-week-old horizontal area, 50-HMA add to the upside filters.
- Higher high on prices, RSI favors bulls to battle short-term resistances.
AUD/USD renews intraday high around 0.7090, up 0.20% on a day during early Monday morning in Europe.
In doing so, the Aussie pair portrays a corrective pullback beyond short-term key Fibonacci retracement levels while challenging the 200-HMA. Adding strength to the bullish is the higher low in the RSI line, as well as the AUD/USD prices.
It should be noted, however, that the 200-HMA level of 0.7095 guards the quote’s immediate upside.
Following that, a one-week-old horizontal area joins 50-HMA to challenge AUD/USD bulls around 0.7110, a break of which will confirm short-term bullish bias targeting 0.7170.
Meanwhile, pullback moves may initially test the 50% and 61.8% Fibonacci retracement levels of January 28 to February 03 upside, respectively at 0.7067 and 0.7043.
Also acting as a downside filter is an upward sloping trend line from February 01, near 0.7055.
Should the quote drops below 0.7043, the odds of its further south-run targeting the 0.7000 psychological magnet can’t be ruled out.
AUD/USD: Hourly chart
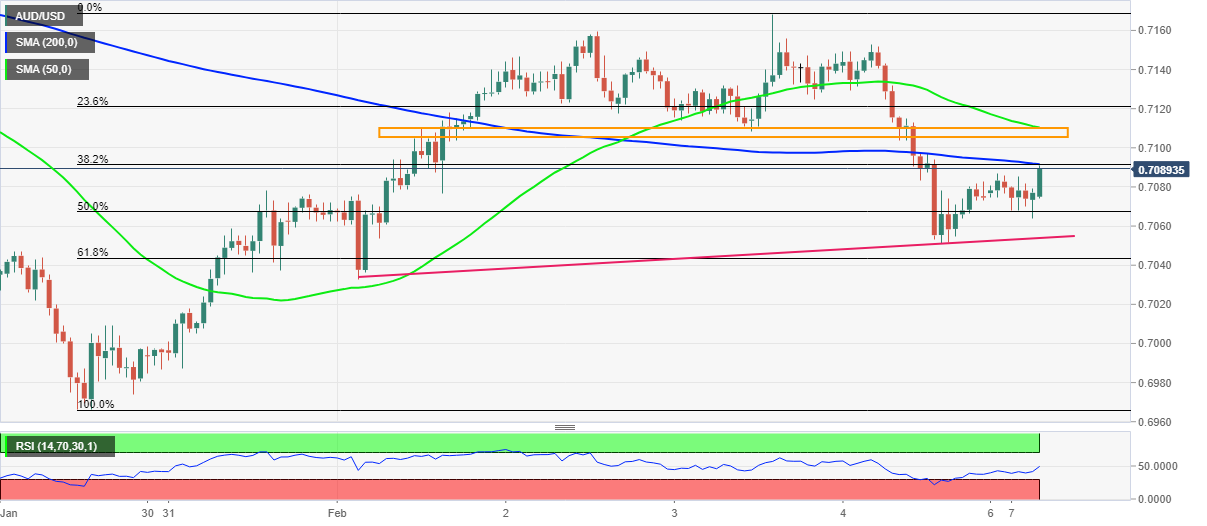
Trend: Pullback expecte
- USD/IDR extends pullback from intraday top, probes three-day uptrend.
- Indonesia Q4 GDP rose past market forecast, prior to 5.02%.
- Traders take a breather as mixed sentiment, light calendar confuse traders after a volatile week.
USD/IDR justifies upbeat Indonesia Q4 GDP release by easing to $14,400 during early Monday in Europe. Even so, the Indonesia rupiah (IDR) pair remains directionless amid mixed clues and a light calendar elsewhere.
Indonesia’s Q4 GDP crossed 4.9% market forcasts and 3.51% previous readouts to 5.2% YoY figures. Reuters quote high commodity prices and the loosening of anti-virus curbs as the key catalysts for the Asian nation’s upbeat GDP figures.
Alternatively, the US dollar also struggles to keep Friday’s rebound as the US Treasury yields retreat from a two-year high amid indecision over the US Federal Reserve’s (Fed) next move.
The US Dollar Index (DXY) rebounded from a three-week low after the monthly employment data release from the US. That said, the headline Nonfarm Payrolls (NFP) rose by 467K versus the median forecast for a 150K rise and 510K revised prior while the Unemployment Rate rose to 4.0% from 3.9% in December, compared to expectations for a no-change figure. It’s worth noting, however, that the U6 Underemployment Rate extended the south-run to 7.1% from 7.3% previous readouts. Also encouraging was Average Hourly Earnings that jumped strongly to 5.7% versus 4.9%.
However, sluggish figures of inflation expectations, as measured by the 10-year breakeven inflation rate per the St. Louis Federal Reserve (FRED) data, tested Fed hawks afterward.
Even so, geopolitical tension linked to Russia and macro fears of inflation keeps the DXY on the front foot ahead of Thursday’s Consumer Price Index (CPI) for January. Additionally, Fedspeak and geopolitics are extra catalysts to determine USD/IDR moves, not to forget China’s reaction to the macro changes that happened during its Lunar New Year holidays.
Technical analysis
Unless crossing a three-month-old horizontal area surrounding $14,455-40, USD/IDR remains on the seller’s radar with the 200-DMA level near $14,335-30 acting as immediate support.
- GBP/USD struggles around intraday low, mildly offered after Friday’s heavy losses.
- WHO’s Kluge hints at a pause in covid infections in Europe, top UK economists criticise BOE’s slow action.
- USD keeps post-NFP rebund from three-week low even as yields retreat from multi-day top.
- UK’s Truss, EU’s Sefcovic will hold Brexit talks this Thursday, UK Q4 GDP will be out on Friday.
GBP/USD pares intraday losses around 1.3530, despite staying on the back foot the second consecutive day heading into London open on Monday.
The cable pair dropped the heaviest in a week the previous day as the US Dollar Index (DXY) rebounded from a three-week low after the monthly employment data release. Also weighing on the quote are the negative concerns surrounding Brexit and the UK politics, as well as cautious sentiment ahead of Thursday’s Brexit talks between UK Foreign Secretary Liz Truss and European Commission vice-president Maros Sefcovic, not to forget Friday’s preliminary reading of the UK Q4 GDP.
Friday’s DXY rebound could well be linked to the positive surprise from the US Bureau of Labor Statistics (BLS), concerning January employment data. That said, the headline Nonfarm Payrolls (NFP) rose by 467K versus the median forecast for a 150K rise and 510K revised prior while the Unemployment Rate rose to 4.0% from 3.9% in December, compared to expectations for a no-change figure. It’s worth noting, however, that the U6 Underemployment Rate extended the south-run to 7.1% from 7.3% previous readouts. Also encouraging was Average Hourly Earnings that jumped strongly to 5.7% versus 4.9%.
At home, fishermen eked out pessimism over Brexit deadlock while UK Prime Minister Boris Johnson is said to have hired a "mastermind" Isaac Levido to save his job, per the UK Express. Elsewhere, the World Health Organization’s (WHO) Europe region Director Dr. Hans Kluge said, per Sky News, “for now, the number of deaths across the region is starting to plateau". Additionally, Gerard Lyons, a former economic advisor to both Gordon Brown and Boris Johnson, criticized Bank of England Governor Andrew Bailey’s slow actions during his interview with The Times on Sunday. The key economist cited Bailey’s failing to “nip inflation in the bud” and taking a “complacent attitude” towards rising prices – as he warned the Bank’s failures will worsen the cost-of-living crisis.
Following the US jobs report, the US 10-year Treasury yields rose to the highest levels in two years before recently easing to 1.90%. The equities, however, remain sluggish after surprising markets with a positive daily close on Friday.
Moving on, a light calendar during the early week may allow GBP/USD traders to take a breather after a volatile week. However, escalating Brexit tension and a disappointment from UK GDP may recall the pair bears.
Technical analysis
GBP/USD remains below 21-DMA and the 61.8% Fibonacci retracement (Fibo.) level of October-December 2021 downside, respectively around 1.3555 and 1.3580.
Given the steady RSI and the pair’s inability to stay beyond the key resistances, the latest declines are likely to extend towards the nearby support, namely the 100-DMA level surrounding 1.3510 and the 1.3500 threshold.
- EUR/USD is pressured in the opening session as the US dollar remains firm, with eye son US CPI.
- A risk-off environment could be a weight for the euro at the start of the week.
EUR/USD is under pressure in the opening session this week, with China returning from holiday's and digesting another bumpy ride on Wall Street on Friday due to upbeat economic data in the form of Nonfarm Payrolls surprises. The US dollar, as measured by the DXY index, is trading at 95.555 and near flat on the day but the euro is heavy and losing some 0.1% at the time of writing.
The greenback is consolidating Friday's price action where it rallied from a two-week low after the Nonfarm Payrolls data showed that the world's largest economy had created far more jobs than expected. The data showed that Payrolls grew 467,000 jobs last month and data for December was revised higher to show 510,000 jobs created instead of the previously reported 199,000. Reuters had forecast 150,000 jobs added in January while estimates ranged from a decrease of 400,000 to a gain of 385,000 jobs.
The case for Federal Reserve rate hikes was cemented This led to gold prices falling under pressure from a firmer dollar and higher US Treasury yields.
Looking ahead, analysts at ANZ Bank commented in a note and explained that ''January Consumer Price Index data this week are expected to show headline and core inflation remain elevated. Any sizable upward surprise would add to the case for the Fed starting off more aggressively.''
''Owing to very high energy prices and a broadening in underlying inflation pressures, the risks lie to the upside of the market’s 7.3% YoY forecast,'' analysts at TD Securities explained. ''Based on the inflation prints in other countries, a number in excess of 7.5% YoY is feasible.''
Meanwhile, there is a focus on Russian headlines from the weekend that could weigh on risk appetite and the euro as a consequence:
Risk-off and stronger US dollar is the opening theme
EUR/USD technical analysis
Meanwhile, EUR/USD is attempting to first in the lastest hour which leaves the neckline of the H1 M-formation vulnerable to a test. The bears will not be far behind, however, and eyes are on a break below 1.1410 for a run to 1.1330 for the sessions ahead.
EUR/USD H1 chart
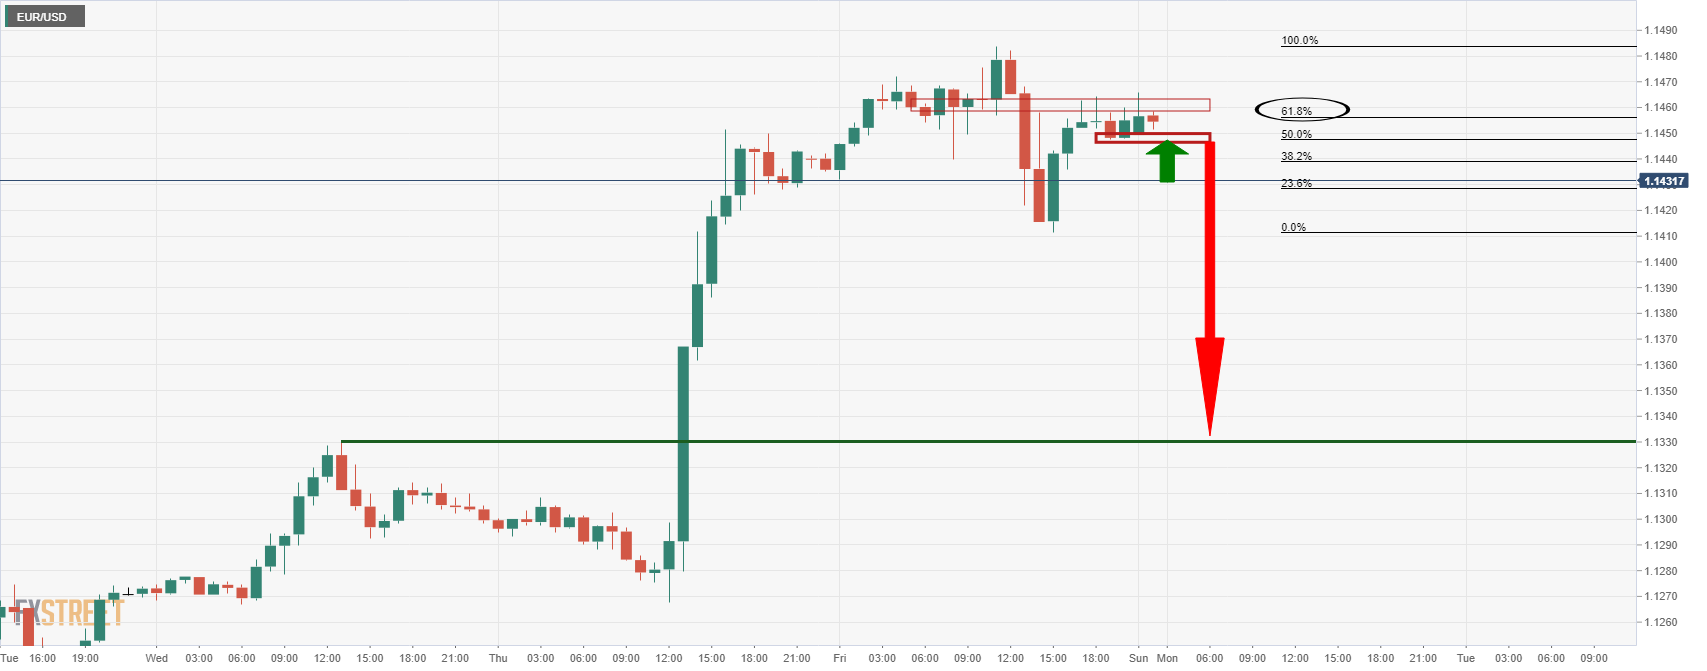
China will maintain reasonably ample market liquidity even though seasonal flows of money injected ahead of the Lunar New Year holiday are recouped, the official Shanghai Securities News said on Monday, citing analysts.
Key takeaways
“A large amount of cash will come back into the banking system, and a relatively big amount of treasury bonds will mature this week, replenishing liquidity.”
“In addition, the central bank, the People's Bank of China (PBOC), will continue to use monetary policy tools such as open market operation flexibly to maintain sufficient liquidity.”
Read: PBOC Adviser: China’s property market has space for development
- NZD/USD stays pressured after breaking one-week-old rising trend line.
- Failures to cross 100-EMA, bearish MACD signals favor sellers.
- 61.8% Fibonacci retracement acts as strong hurdle to the north.
NZD/USD fades the early Asian session rebound while heading into the European session on Monday. That said, the Kiwi pair remains depressed around 0.6610 by the press time.
Although the buyers struggle to defend the 0.6600 threshold, a clear downside break of an ascending trend line from January 28 joins a U-turn from the 100-EMA and bearish MACD signals to keep NZD/USD sellers hopeful.
In addition to the 0.6600 round figure, 0.6570 and the recently flashed multi-month low around 0.6530 may entertain NZD/USD bears.
It should be noted, however, that a clear downside break of the 0.6530 will take an intermediate halt around the 0.6500 round figure ahead of directing the quote towards the 61.8% Fibonacci Expansion (FE) of January 13 to February 04 moves, near 0.6455-60.
Alternatively, recovery moves remain elusive below the 100-EMA level of 0.6670.
Following that, the 50% and 61.8% Fibonacci retracement of the previous month’s downside, around 0.6710 and 0.6750 respectively, will be crucial resistance to challenge the NZD/USD buyers.
NZD/USD: Four-hour chart

Trend: Further weakness expected
A majority of the economists surveyed by Reuters said that they expect the Reserve Bank of India (RBI) to raise repo rate second time this year to 4.50%, lifting the sentiment around the Indian rupee.
Additional findings
“RBI to hike repo rate by 25 bps at April meeting, said 17 of 32 economists.”
“Among the remaining 15, 13 were nearly split between June and August. While only one economist said it would come as early this month, the other said October of this year.”
About half of economists responding to an additional question, 15 of 31, said combating high inflation would steer its moves.
“Another 12, or 39% of respondents, said playing catch-up with the Fed. The rest said the RBI would tighten policy to prop up the rupee.”
“Inflation is expected to remain below the RBI's upper tolerance limit of 6% until at least 2024, according to the poll, but trend above the medium-term target of 4%.”
“Asked if the RBI was behind the curve with its monetary policy strategy, 19 of 29 said it was not, while the rest said it was.”
Market reaction
Meanwhile, USD/INR is rebounding from near the 74.60 region, currently trading at 74.73, up 0.11% so far. The spot is tracking the bounce in the US dollar amid a mixed market mood and the NFP beat.
The trading activity remains limited in the cross, as India’s bond markets are closed in observance of a public holiday in the state of Maharashtra on Monday to mourn the death of Bollywood singer Lata Mangeshkar.
The RBI has rescheduled its monetary policy committee meeting by a day to Feb. 8-10, it said in a statement on Sunday.
- AUD/NZD is in the hands of the central banks.
- Bulls need a break of the Daily M formation while bears seek a break of trendline support.
The market has been very long of the Reserve Bank of New Zealand hawkish sentiment that the Reserve Bank of Australia tightening expectations is ow getting more airtime and will enable the Aussie to remain bid for a while longer.
However, the 50% mean reversion level and the 61.8% Fibonacci golden ratio above there could prove to be a touch ut to crack in the coming week that guards June highs on the weekly chart. The following illustrates the downside potential on failures of a break of the ascending channel resistance.
AUD/NZD daily chart
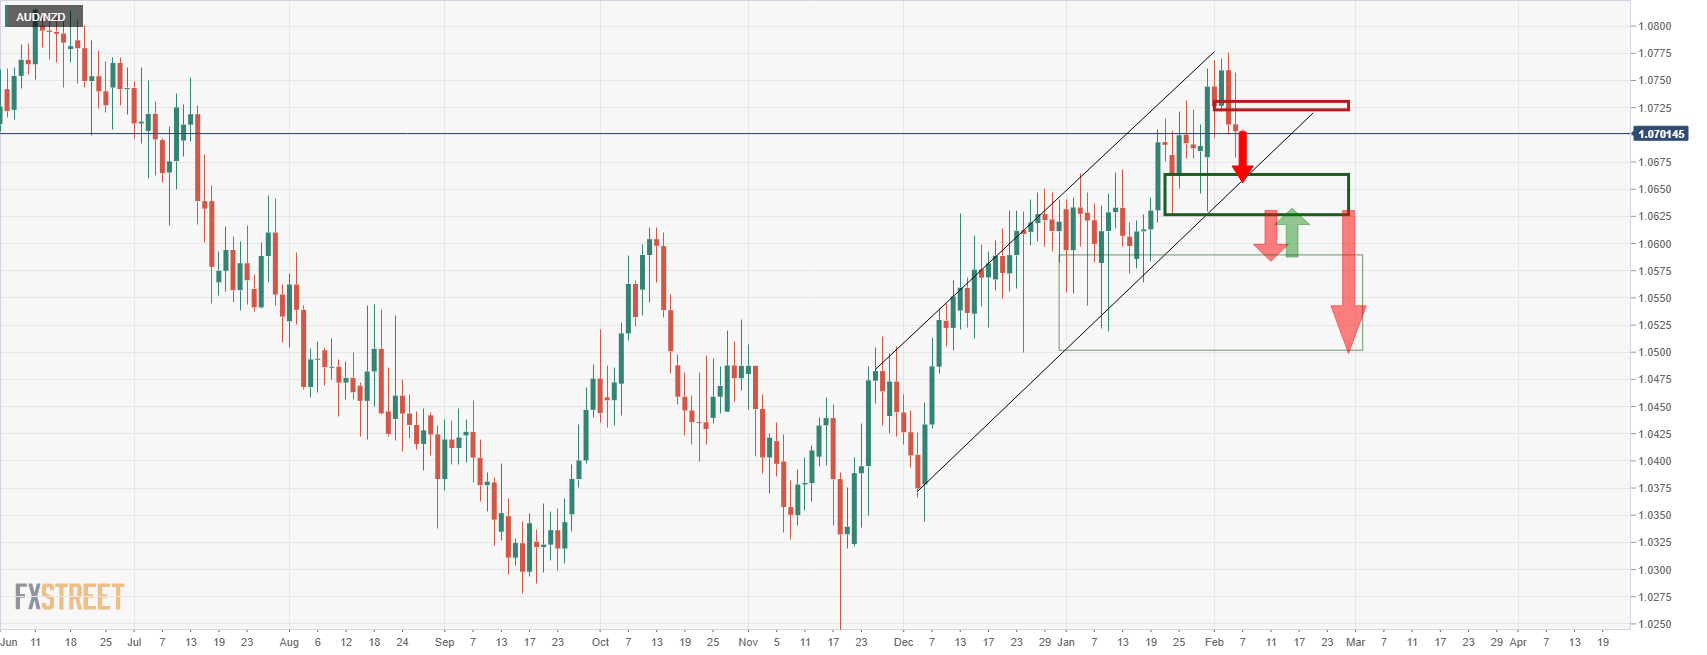
The bears are likely protected below the neckline of the M-formation below 1.0720 ad will seek a break of the channel support and horizontal key area between 1.0665 and 1.0630.
Weekly chart
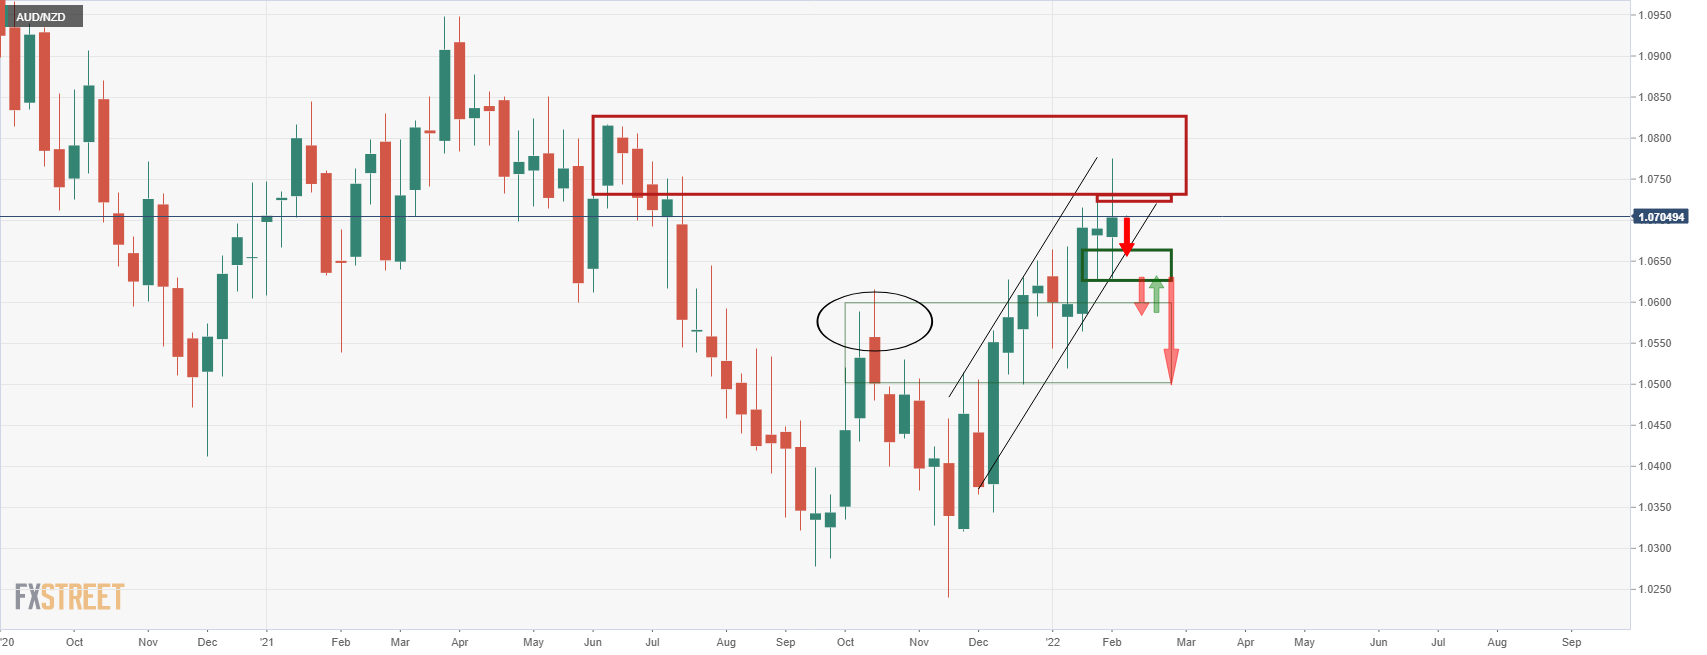
The June highs are a bullish target that could be seen of a break of 1.0750 coming into play in the week ahead. 1.0500 on the downside will otherwise be targeted on a break below 1.0630.
In the wake of the latest hawkish twist from the European Central Bank (ECB), EUR/USD is likely to head higher towards 1.1600, analysts at Societe Generale noted.
Key quotes
“We now expect ECB asset purchases to end by mid-year, and rates to rise in the second half. The March 10 meeting now takes on increased importance as plans will be much clearer by then. The front end of the rates curve prices 40bp by the end of the year now, which seems unlikely, but that's not a reflection of expectations, more of hedging."
"It's the suddenness of the turn, relative to expectations, which matters for Europe bond and currency markets and can increase the short-term support the euro gets from this.”
“Positioning in euros was fairly light going into the meeting, but this was a genuine surprise to the vast majority of market participants.”
“EUR/USD can spike to, say, 1.16, if risk sentiment remains strong.”
“If you want to buy Euros, EUR/GBP is on its way back to 0.85 and beyond. EUR/JPY is also an attractive buy here, as the BOJ is increasingly left as the only dovish central bank around."
- US T-bond yields struggle to extend Friday’s run-up around multi-day top, stock futures remain on the back foot.
- China’s return from week-long holidays fails to entertain markets amid mixed concerns over Fed’s next moves, light calendar.
- US CPI will be crucial for the weak as inflation expectations test Fed hawks.
- Geopolitical tensions surrounding Russia add strength to sluggish sentiment.
Global markets portray a sluggish start to the week, after a volatile one, during early Monday as traders await fresh clues to confirm recent hawkish bias for the key central banks. Also challenging the trading sentiment is China’s downbeat data that dashed hopes of a warm welcome to Beijing –based traders as they return from one-week-long Lunar New Year break.
While portraying the mood, the US 10-year Treasury yields snap two-day run-up to ease from the highest levels since January to 1.91% at the latest. On the same line were stock futures from the US and Europe. Additionally, Asia-Pacific equities remain mixed with gains in China and New Zealand struggle to convince bulls.
Mixed concerns over the inflation and the Fed’s next move in March become the key hurdle for the US Treasury yields. Although upbeat US jobs report propelled bond coupons to the fresh multi-day high on Friday, indecisive figures of inflation expectations, as measured by the 10-year breakeven inflation rate per the St. Louis Federal Reserve (FRED) data, tested bulls afterward.
As per the latest US jobs report, the headline Nonfarm Payrolls (NFP) rose by 467K versus the median forecast for a 150K rise and 510K revised prior while the Unemployment Rate rose to 4.0% from 3.9% in December, compared to expectations for a no-change figure. It’s worth noting, however, that the U6 Underemployment Rate extended the south-run to 7.1% from 7.3% previous readouts. Also encouraging was Average Hourly Earnings that jumped strongly to 5.7% versus 4.9%.
On the other hand, the US inflation expectations remain sluggish around 2.41% while fading the bounce off the lowest levels since late September marked the last week.
It should be noted that China’s downbeat Caixin Services PMI and growing concerns over Russia’s war with Ukraine also weigh on the market sentiment amid a slower start to the week.
Moving on, US Consumer Price Index (CPI) for January will be the week’s important data as hot inflation should propel the yields and the US dollar, which in turn can weigh on commodities and Antipodeans.
Read: Wall Street sags as Americans turn focus to real-world problems
China's property market has "more space" to develop in the future given the growing urban population, a Chinese media outlet reported on Monday, citing comments from Wang Yiming, a member of the central bank's monetary policy committee.
“Urban long-term residents rose by 12 million at the end of last year given that the urbanization rate rose to 64.7% of the population,” Wang said.
The property market has turned more "rational" as the risks in the property sector had been "orderly rooted out," CCTV said.
Meanwhile, CCTV said “China should "fully satisfy" people's housing needs and provide the capital needed for real estate development,” citing Liu Yuanchun, the President of Renmin University.
Market reaction
As Chinese markets reopen on Monday after the Lunar New Year break, the focus now remains on how policymakers will take steps to restore investor confidence in the country’s troubled property sector.
As of writing, USD/CNY is trading at 6.3318, down 0.44% on the day.
| Raw materials | Closed | Change, % |
|---|---|---|
| Brent | 93.18 | 2.15 |
| Silver | 22.493 | 0.29 |
| Gold | 1807.39 | 0.14 |
| Palladium | 2289.31 | -1.93 |
- USD/CNH fades the biggest daily gains in over a week, grinds lower of late.
- China Caixin Services PMI for January dropped below market consensus, prior.
- 100-SMA, weekly support line restricts short-term downside, bulls have a bumpy road to return.
USD/CNH hovers around $6.3620-15 as Chinese traders return from a week-long break on Monday.
The Chinese currency (CNY) pair’s recent weakness ignores softer activity numbers but hopes of easing inflation and chatters surrounding the stronger yuan while paying attention to talks of easing inflation in China.
China’s China Caixin Services PMI dropped to 51.4 in January, versus 52.9 market consensus and 53.1 prior.
Technically, the pair drifts lower between the 200-SMA and 100-SMA, around $6.3645 and $6.3540 respectively.
Also acting as trading filters is a one-week-old descending support line around $6.3470 and a monthly horizontal resistance zone near $6.3760-70.
It should be noted, however, that the USD/CNY buyers remain unconvinced below January’s top surrounding $6.3975 whereas the bears may aim for the multi-month low, marked the previous month around $6.3235, on breaking the $6.3470 support.
USD/CNH: Four-hour chart
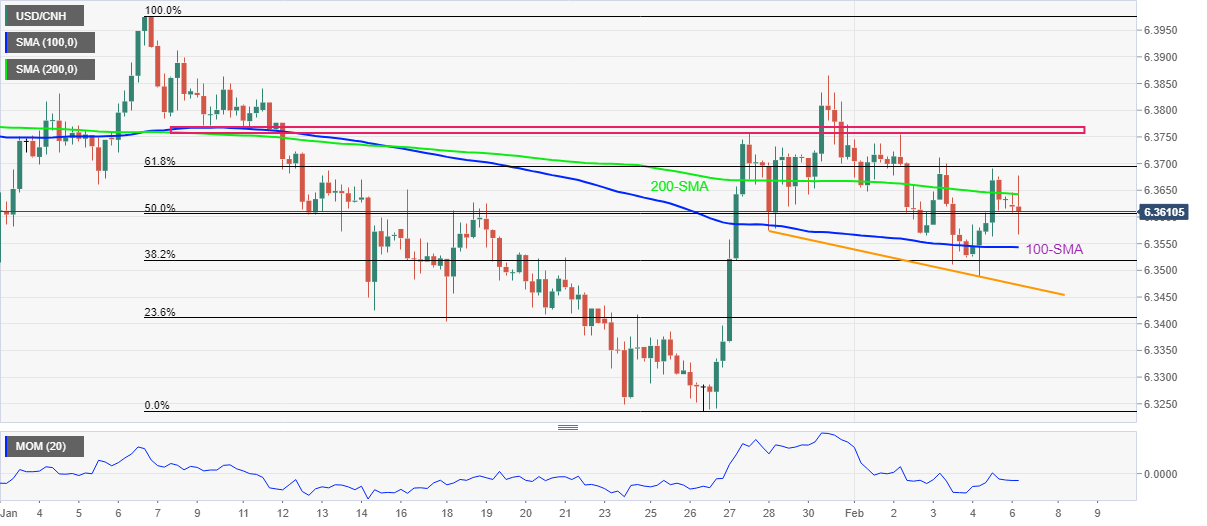
Trend: Further weakness expected
“The Chinese yuan may continue to show strength this year after gaining almost 9% in the past two years supported by China's low inflation, its active fiscal policy, its wider global acceptance and China's strong exports advantage,” Caixin reported on Monday, citing Gao Zhanjun, a senior researcher with the National Institution for Finance Development.
“However, the currency also faces uncertainties stemming from how the US approaches the pace of easing and inflation. which impacts the dollar's strength,” Caixin added.
Related reads
- USD/CNH Price Analysis: Sellers keep reins despite downbeat China data
- Chinese Caixin Services PMI is the lowest since August, AUD heavy
- AUD/USD consolidates recent losses amid softer yields, mixed data from China, Australia.
- China Caixin Services PMI dropped below 52.9 forecast, 53.1 prior in January.
- Australia Q4 Retail Sales Output rallied by the record pace of 8.2%.
- Market sentiment dwindles amid Russia-linked fears, hawkish Fed concerns and wait for China’s reaction to recent market plays.
AUD/USD pauses the corrective pullback around intraday high near 0.7080 after China flashed downbeat data on their return during Monday’s Asian session. Also challenging the AUD/USD prices are geopolitical tension surrounding Russia and the market’s indecision over the next moves of the US Federal Reserve (Fed) and the Reserve Bank of Australia (RBA).
China Caixin Services PMI dropped to 51.4 in January, versus 52.9 market consensus and 53.1 prior.
Earlier in the day, Australia’s Retail Sales output for Q4 impressed AUD/USD buyers as the figures rose to an all-time high. “Figures from the Australian Bureau of Statistics (ABS) on Monday showed retail sales rose 8.2% when adjusted for inflation in the quarter to A$93.2 billion ($65.90 billion). That was easily the largest increase on record and beat forecasts of 8.1%,” said Reuters.
It’s worth noting that the retreat in the US Treasury yields also helps AUD/USD traders to pare the recent losses after declining for the last two consecutive days. It’s worth noting that the surprisingly upbeat US jobs report for January triggered the US dollar’s rebound from a three-week low and cut the Aussie pair’s weekly gains almost by a half.
That said, the US 10-year Treasury yield currently retreats from a two-year high while the US stock futures and Asia-Pacific equities drift lower.
In addition to the data and Treasury yields, indecision over the Fed’s next move, coupled with the hawkish hopes from the Reserve Bank of Australia (RBA) despite the latest cautious communication add to the AUD/USD pair’s recent sideways performance.
Moving on, a light calendar may offer a slow start to the week but China’s return from one-week-long holidays may entertain AUD/USD traders.
Technical analysis
Last week’s U-turn from the 50-DMA, around 0.7165 by the press time, directs AUD/USD sellers towards 2021 bottom surrounding 0.6995 before highlighting January’s low of 0.6966.
The Chinese Caixin Services PMI data has been released as follows:
The Caixin/Markit services Purchasing Managers' Index (PMI) dropped to 51.4 in January. This was the lowest since August from 53.1 back in December.
The 50-point mark separates growth from contraction on a monthly basis.
''Activity in China's services sector in January expanded at the slowest pace in five months, as a surge in local COVID-19 cases and containment measures hit new business and consumer sentiment while employment fell, a private survey showed on Monday,'' Reuters reported.
AUD/USD update
AUD/USD is slighted weighed by the drop in the Composite, but bears need to see a break of 0.7070 as per the following analysis.
Before the Chinese data, which was about the only thing going for the macro forex traders out there on Monday that could move the needle in Asia, AUD/USD was set up for a bearish extension as per the pre-market open analysis:
AUD/USD Price Analysis: Bears sink their teeth into US Nonfarm Payrolls
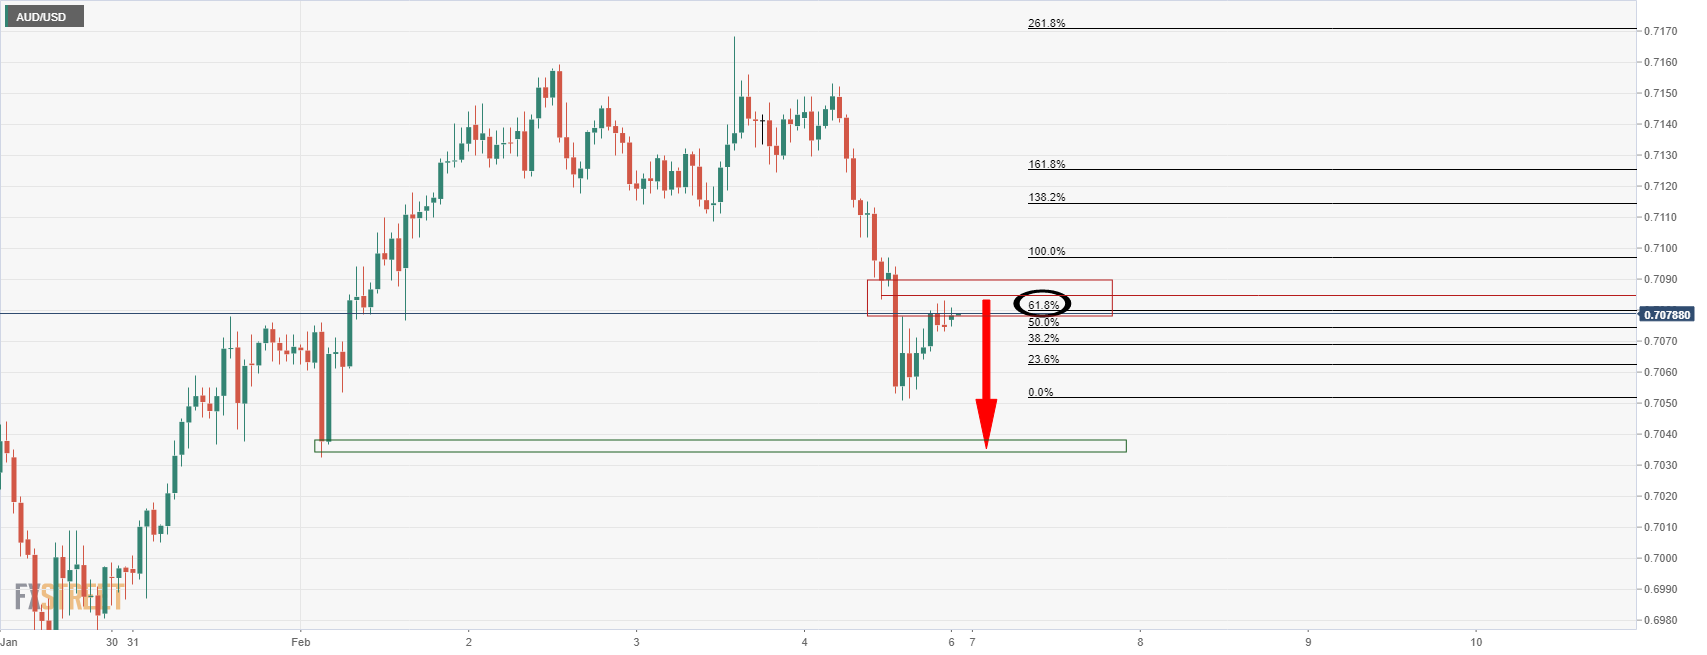
AUD/USD 15-min chart
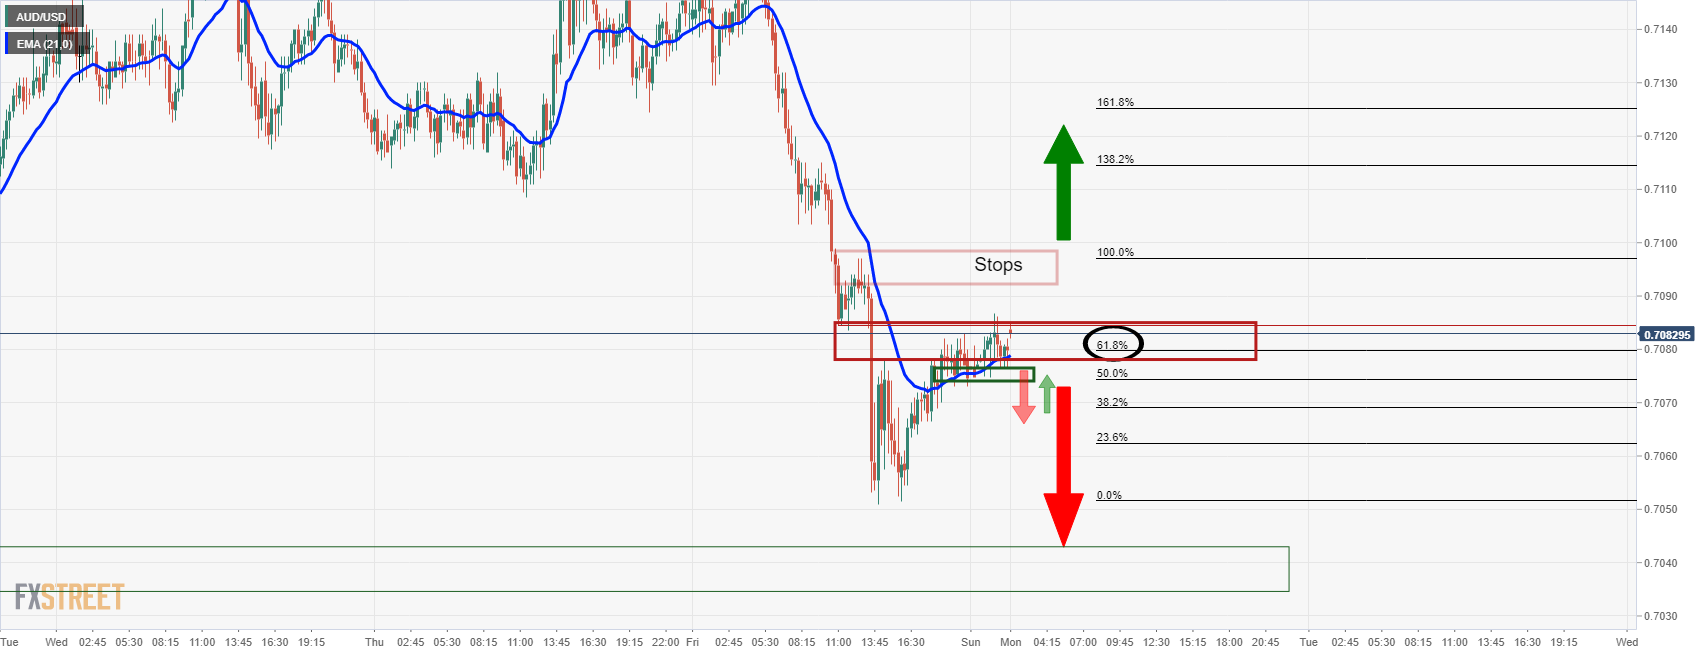
Since the data release, the Aussie is being pressured by some 5 pips. A break of 0.7070 will open up the downside for a potetial continuation as illustrated above on the 15-min chart.
About the Caixin Services PM
The Caixin Services PMI™, released by Markit Economics, is based on data compiled from monthly replies to questionnaires sent to purchasing executives in over 400 private service sector companies. The panel has been carefully selected to accurately replicate the true structure of the services economy.
- Silver extends Friday’s rebound, battles 50-SMA while easing from intraday high.
- Bullish MACD conditions, trend line breakout keep buyers hopeful.
- 200-SMA adds to the upside filters, monthly support line challenges bears.
Silver (XAG/USD) stays on the front foot around $22.70, up 0.80% intraday during Monday’s Asian session.
In doing so, the bright metal crosses a downward sloping trend line from January 20 but battles the 50-SMA level to extend Friday’s recovery from a five-week low.
Given the bullish MACD, silver prices are likely to overcome the immediate hurdle surrounding $22.70. However, a clear upside break of the 200-SMA level close to $23.00 will be needed for the XAG/USD bulls to keep reins.
Following that, a horizontal area comprising multiple levels marked since January 18, near $23.60-65, will be crucial to watch.
Alternatively, pullback moves remain elusive beyond the resistance-turned-support line near $22.50.
Even if the silver sellers break the previous resistance line, an upward sloping trend line from early January, near $22.30 and the $22.00 threshold will challenge the metal’s further weakness.
Silver: Four-hour chart
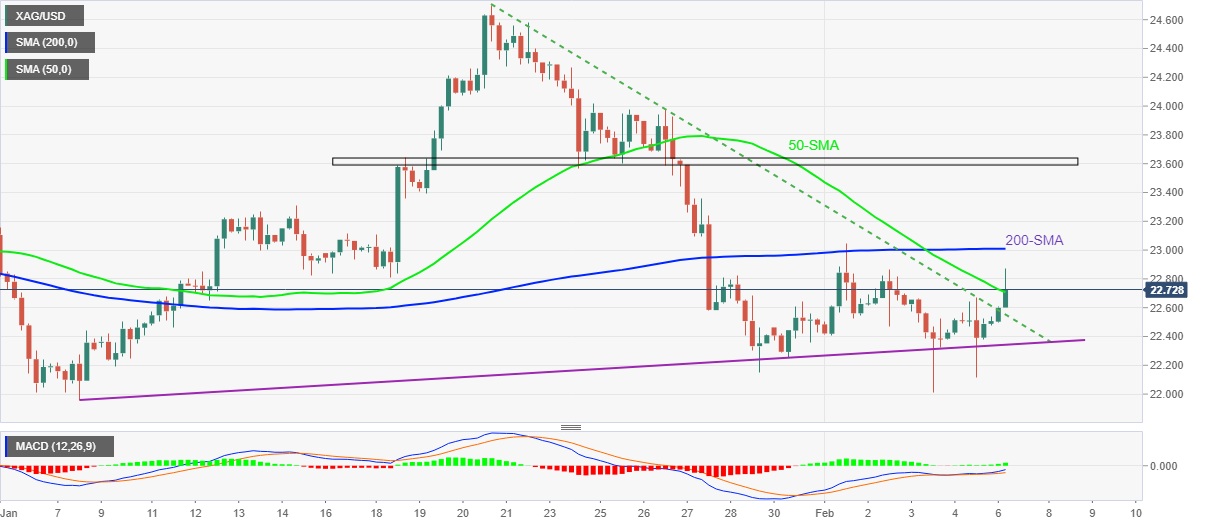
Trend: Further upside expected
| Time | Country | Event | Period | Previous value | Forecast |
|---|---|---|---|---|---|
| 00:30 (GMT) | Australia | ANZ Job Advertisements (MoM) | January | -5.8% | |
| 00:30 (GMT) | Australia | Retail Sales, M/M | December | 7.3% | |
| 01:45 (GMT) | China | Markit/Caixin Services PMI | January | 53.1 | |
| 05:00 (GMT) | Japan | Leading Economic Index | December | 103.2 | |
| 05:00 (GMT) | Japan | Coincident Index | December | 92.8 | |
| 06:45 (GMT) | Switzerland | Unemployment Rate (non s.a.) | January | 2.6% | 2.7% |
| 07:00 (GMT) | United Kingdom | Halifax house price index | January | 1.1% | |
| 07:00 (GMT) | United Kingdom | Halifax house price index 3m Y/Y | January | 9.8% | |
| 07:00 (GMT) | Germany | Industrial Production s.a. (MoM) | December | -0.2% | 0.4% |
| 08:00 (GMT) | Switzerland | Foreign Currency Reserves | January | 944.532 | |
| 15:45 (GMT) | Eurozone | ECB President Lagarde Speaks | |||
| 20:00 (GMT) | U.S. | Consumer Credit | December | 39.99 | 20.9 |
| 23:30 (GMT) | Japan | Labor Cash Earnings, YoY | December | 0.0% | |
| 23:30 (GMT) | Japan | Household spending Y/Y | December | -1.3% | 0.3% |
| 23:50 (GMT) | Japan | Current Account, bln | December | 897.3 | 73.5 |
- DXY seesaws around three-week low, US NFP triggered corrective pullback from multi-day bottom on Friday.
- US 10-year Treasury yields retreat from two-year high, stock futures remain mildly offered.
- Indecision over March rate hike, softer inflation expectations test Fed hawks.
- Light calendar to begin the week comprising US CPI.
US Dollar Index (DXY) picks up bids to refresh intraday high around 95.50, keeping the latest rebound amid Monday’s Asian session.
The greenback dropped the most since early November 2021 on a weekly basis despite snapping a five-day downturn to bounce off a three-week low the previous day.
Friday’s DXY rebound could well be linked to the positive surprise from the US Bureau of Labor Statistics (BLS), concerning January employment data. That said, The headline Nonfarm Payrolls (NFP) rose by 467K versus the median forecast for a 150K rise and 510K revised prior while the Unemployment Rate rose to 4.0% from 3.9% in December, compared to expectations for a no-change figure. It’s worth noting, however, that the U6 Underemployment Rate extended the south-run to 7.1% from 7.3% previous readouts. Also encouraging was Average Hourly Earnings that jumped strongly to 5.7% versus 4.9%.
Following the US jobs report, the US 10-year Treasury yields rose to the highest levels in two years before recently easing to 1.90%. The equities, however, remain sluggish after surprising markets with a positive daily close on Friday.
In addition to the BLS data, hawkish comments from Fed policymakers and Russia-linked fears also keep DXY bulls hopeful. Recently, US national security adviser said that the Russian invasion of Ukraine could be any day now.
On the contrary, the US inflation expectations, as measured by the 10-year breakeven inflation rate per the St. Louis Federal Reserve (FRED) data, remain sluggish around 2.41% while fading the bounce off the lowest levels since late September marked the last week.
That said, DXY bulls need a strong inflation figure on Thursday to defend the US dollar buyers.
Technical analysis
A rebound from the 100-DMA, near 95.25 at the latest, joins a steady RSI line to favor the US Dollar Index run-up towards the 50-DMA level near 96.00.
In recent trade today, the People’s Bank of China (PBOC) set the yuan (CNY) at 6.3580 vs the estimate of 6.3235.
About the fix
China maintains strict control of the yuan’s rate on the mainland.
The onshore yuan (CNY) differs from the offshore one (CNH) in trading restrictions, this last one is not as tightly controlled.
Each morning, the People’s Bank of China (PBOC) sets a so-called daily midpoint fix, based on the yuan’s previous day closing level and quotations taken from the inter-bank dealer.
- As per the H4 chart, 155.40/60 guards a run to 154.00.
- GBP/JPY bulls need to clear the M-formation tops near156.50.
GBP/JPY is consolidating with the bulls holding the fort ear the neckline of the M-formation and refusing to go down without a fight. 156.50 is the M-formaiton's tops that bulls need to clear. While below there, there is a focus on the key supporting structure as follows:
GBP/JPY H4 chart
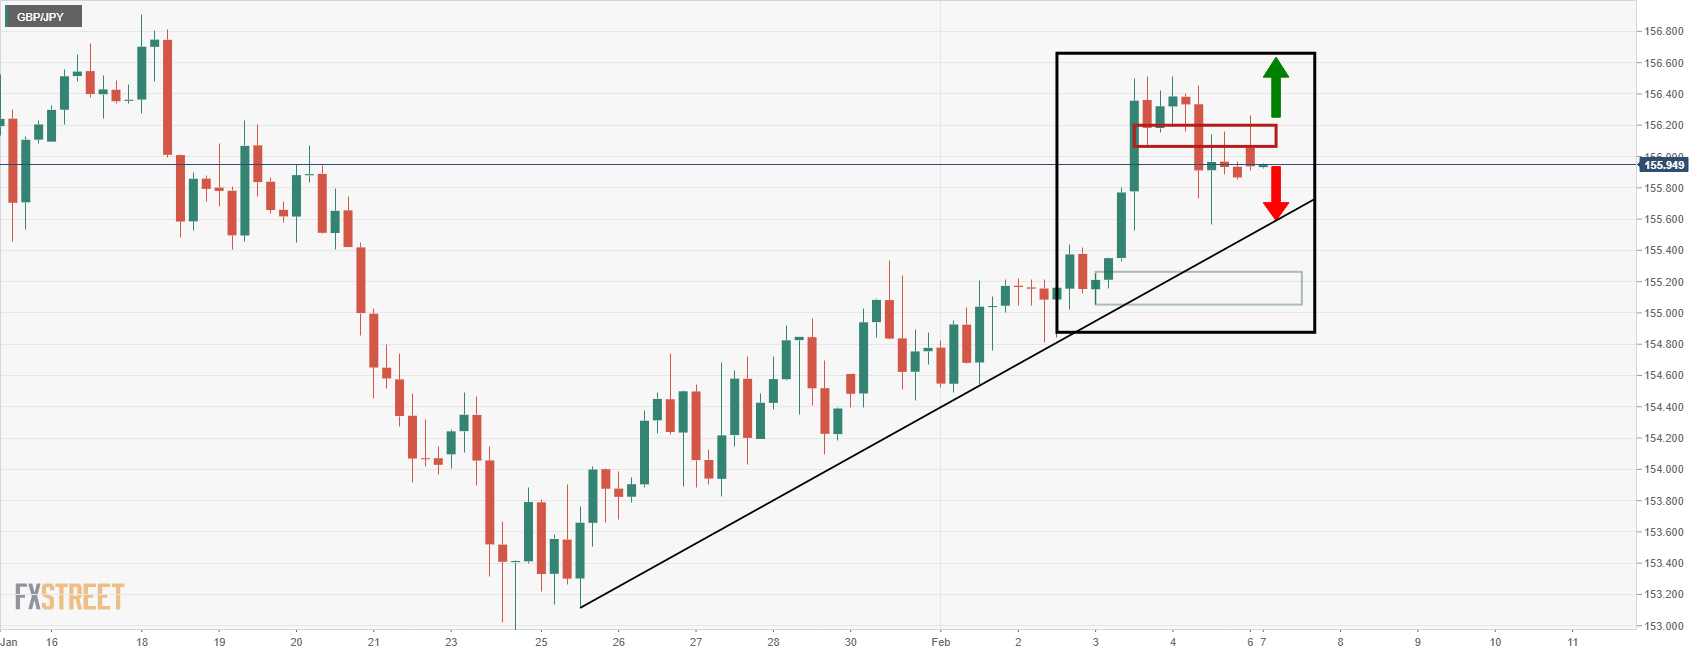
The price is climbing a dynamic trend line support and a break of which would be significantly bearish considering how strengthened the upside, in relative terms, appears to be.
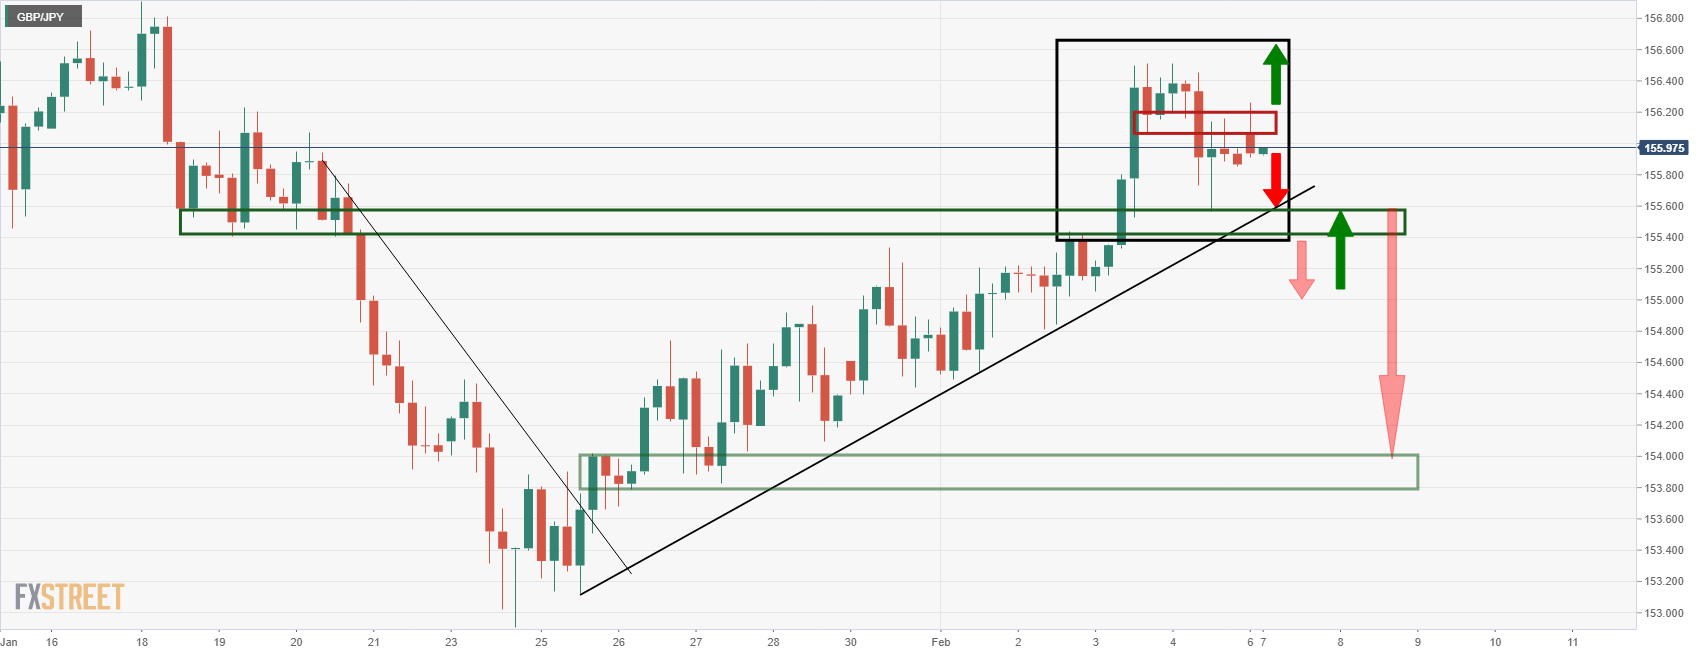
155.40/60 is the area for the bears to break that could open the path for a run all the way back to test the prior breakout area near 154.00.
“Inflation in China will remain modest in 2022 if shifting monetary policies elsewhere weaken the rally in global commodities,” Bloomberg quotes weekend comments from China’s top economic planner National Development and Reform Commission (NDRC).
The news also quotes NDRC's statement expecting the CPI to rise in 2022, following a pullback from a 15-month high in December. That said, the year 2021 average increase in CPI was 0.9%, per Bloomberg.
Key quotes from Bloomberg
The producer price index, up 8.1% last year, is also likely to cool down, the agency said, citing ample domestic supply of industrial and energy products to counter ‘irregular price fluctuation.’
China expects monetary tightness in western countries to weaken price inflation on imports.
Bloomberg economic estimates the Group of Seven central banks will cut total 2022 asset purchases to just 10% of the 2021 level.
FX implications
As China returns from a week-long Lunar New Year holidays, news like this should entertain USD/CNY and AUD/USD traders.
Read: AUD/USD buyers await China’s return below 0.7100
- WTI retreats from eight-year high, consolidates the biggest weekly jump in a month.
- Overbought RSI favor pullback from multi-day-old resistance line.
- 10-DMA, five-week-old support line restricts short-term declines.
- September 2014 peak could lure buyers past nearby resistance.
WTI crude oil prices pare recent gains around the highest level since October 2014, down 0.55% intraday around $90.50 during Monday’s Asian session.
In doing so, the black gold steps back from an ascending resistance line from July 2021 amid overbought RSI conditions, which in turn suggests further weakness.
However, the 10-DMA and a five-week-old support line, respectively around $87.75 and $86.60, challenge the short-term oil sellers. On the same line is the 21-DMA level surrounding $85.25.
It’s worth observing that WTI sellers need caution until the quote drops below October 2021 high of near $85.00.
Meanwhile, further upside may aim for the stated resistance line near $92.00 ahead of challenging October 2014 high surrounding $93.00.
Should oil buyers keep reins past $93.00, tops marked during August and September of 2014, near $95-96, can challenge the upside momentum before the $100 threshold.
WTI: Daily chart
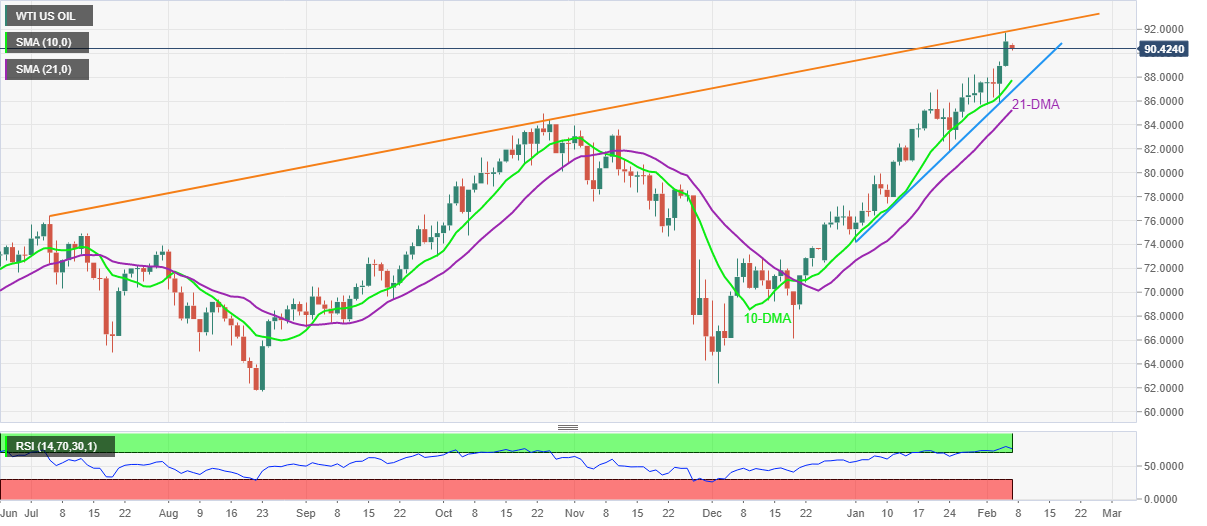
Trend: Pullback expected
- Gold bulls stay in control besides the strength in the US dollar.
- Fed sentiment, US CPI, oil and Russia all in play.
- XAU/USD indecisive as investors assess central banks' rate outlook
Gold has started the day a little bid, keeping the rhythm of Friday going whereby the precious metals managed to rebound despite the rally in the US dollar. At the time of writing, XAU/USD is trading around $1,810 ad higher by some 0.16% having opened near $1,807. The US dollar, as measured by the DXY index, is trading at 95.446 and flat on the day.
The greenback is consolidating Friday's moves from when it advanced from two-week lows after the Nonfarm Payrolls data showed the world's largest economy had created far more jobs than expected. Payrolls grew 467,000 jobs last month and data for December was revised higher to show 510,000 jobs created instead of the previously reported 199,000. Reuters had forecast 150,000 jobs added in January while estimates ranged from a decrease of 400,000 to a gain of 385,000 jobs.
''Labour market data out last week show a hot and tight job market, likely raising the odds of a 50bps hike in March. US Treasuries sold off on the robust January job report,'' analysts at ANZ Bank commented on Monday about the Nonfarm Payrolls outcome, adding:
''January Consumer Price Index data this week are expected to show headline and core inflation remain elevated. Any sizable upward surprise would add to the case for the Fed starting off more aggressively.''
Meanwhile, with regards to rates, analysts at TD Securities explained that investors are now pricing in nearly 5.5 hikes in 2022 and nearly 50% odds of a March 50bp hike. ''The CPI report next week will be key as further strength will likely exacerbate pricing for faster hikes. This should push 10y real rates higher and is likely to keep 2y TIPS BEs elevated (particularly amid the surge in oil prices).''
As for oil prices, this could be a key theme in markets this week. On a monthly basis, WTI is quite literally off the charts:

With an OPEC meeting on the horizon and Russia-Ukraine tensions remaining at a boil, this is a trend that is likely to continue, adding to the case for an aggressive Fed move on the horizon. To date, however, more hawkish-than-expected Federal Reserve messaging, along with the market pricing in more aggressive Fed Funds increases this year, prompted money managers to aggressively cut their gold exposure.
''At the same time, higher yields across the Treasury curve and talk of a possible 50bps move the next time the FOMC meets drove fund managers to cut long exposure an outsized 41k lot,'' analysts at TD Securities said with respect to the last CFTC data.
''However, as oil prices surged and some gold market participants expressed uncertainty surrounding the US central bank's commitment to getting restrictive enough to bring inflation down, likely drove specs back into long exposure, which again drove prices back to above $1,800/oz.''
Gold technical analysis
-
Gold, Chart of the Week: Bulls take on the 38.2% Fibo, now eye the 61.8% golden ratio
In the linked analysis, it is explained that ''until the M-formation's neckline is broken, the focus is on the downside:

On the flip side, a break of the neckline will put a significant focus on the upside as follows:
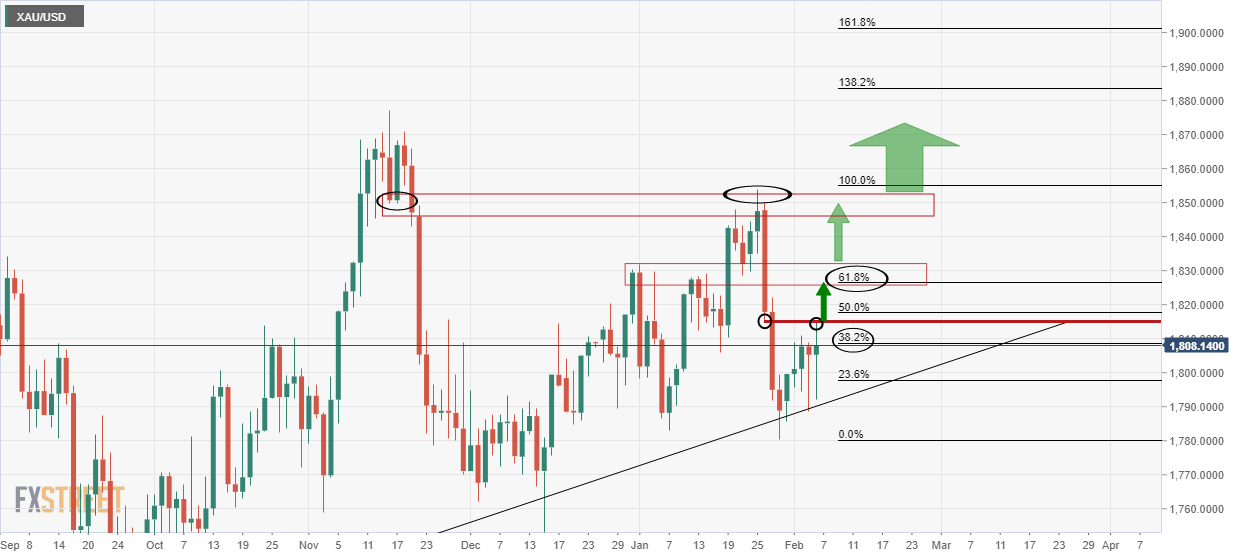
- USD/JPY takes offers to refresh intraday low, snaps two-day run-up.
- US 10-year T-bond yields consolidate recently gains around the highest levels since January 2020.
- Japan mulls extension of activity restrictions in Tokyo and 12 prefectures during this week.
- Russia-Ukraine tussles, hawkish monetary policy concerns should be watched for near-term directions.
USD/JPY stands on slippery ground to refresh intraday low around 115.15 as Tokyo opens for Monday. In doing so, the yen pair snaps the previous two-day uptrend while reversing from a one-week high flashed on Friday.
While tracing the major catalysts, a pullback in the US Treasury yields joins the escalating covid fears in Japan and geopolitical concerns surrounding Russia.
The US 10-year Treasury yields pare gains from the highest level in 25 months flashed on Friday. That said, the benchmark bond coupon drops to 1.90% after rising to the 1.936% mark on the previous day, mainly because of the strong US jobs report.
As per the latest US employment data, the headline Nonfarm Payrolls (NFP) rose by 467K versus the median forecast for a 150K rise and 510K revised prior while the Unemployment Rate rose to 4.0% from 3.9% in December, compared to expectations for a no-change figure. It’s worth noting, however, that the U6 Underemployment Rate extended the south-run to 7.1% from 7.3% previous readouts. Also encouraging was Average Hourly Earnings that jumped strongly to 5.7% versus 4.9%.
It’s worth noting that chatters surrounding the Japanese government’s extension to the quasi emergency state in Tokyo and other 12 prefectures, due to the coronavirus spread, weigh on the risk appetite and the USD/JPY prices. Additionally, Russia-linked fears also exert downside pressure on the quote. Recently, US national security adviser said that the Russian invasion of Ukraine could be any day now.
Alternatively, hawkish comments from Fed policymakers hint at the further upside of the US Treasury yields, which in turn suggests USD/JPY run-up. On the same line could be the equity traders’ refrain to respect the hawkish US data on Friday, although the US stock futures and Asian equities print loss by the press time.
Considering these catalysts, USD/JPY may pare some of their latest gains but the hawkish Fed may keep them in command.
Technical analysis
Failures to cross a five-week-old resistance line, around 115.45 by the press time, direct USD/JPY sellers towards the 50-DMA retest, near 114.40 at the latest.
| Pare | Closed | Change, % |
|---|---|---|
| AUDUSD | 0.70764 | -0.84 |
| EURJPY | 131.979 | 0.43 |
| EURUSD | 1.14561 | 0.2 |
| GBPJPY | 155.904 | -0.19 |
| GBPUSD | 1.35326 | -0.47 |
| NZDUSD | 0.66112 | -0.72 |
| USDCAD | 1.27559 | 0.64 |
| USDCHF | 0.9249 | 0.54 |
| USDJPY | 115.206 | 0.23 |
- USD/CAD grinds higher around one-week top, defends Friday’s stellar run-up.
- Bullish chart pattern joins firmer MACD, sustained trading beyond 200-SMA to favor buyers.
- Monthly horizontal support restricts short-term downside, bulls need validation from 1.2800.
USD/CAD seesaws around 1.2750 during Monday’s Asian session, having jumped the most in a week the previous day.
In doing so, the Loonie pair stays near the breakout point, namely the neckline, of a bullish chart pattern called “Inverse Head & Shoulders”.
Also keeping buyers hopeful are the Bullish MACD signals and the successful trading above 200-SMA.
However, a clear upside break of the 1.2800 level becomes necessary to confirm the bullish formation, which in turn will hint at the theoretical rally towards 1.3150.
During the rise, January’s top near 1.2815 and the 1.3000 round figure may act as intermediate halts.
On the contrary, pullback moves remain elusive beyond the 200-SMA level of 1.2670, a break of which will direct USD/CAD bears towards a horizontal area comprising multiple levels marked since January 11, near 1.2560.
USD/CAD: Four-hour chart
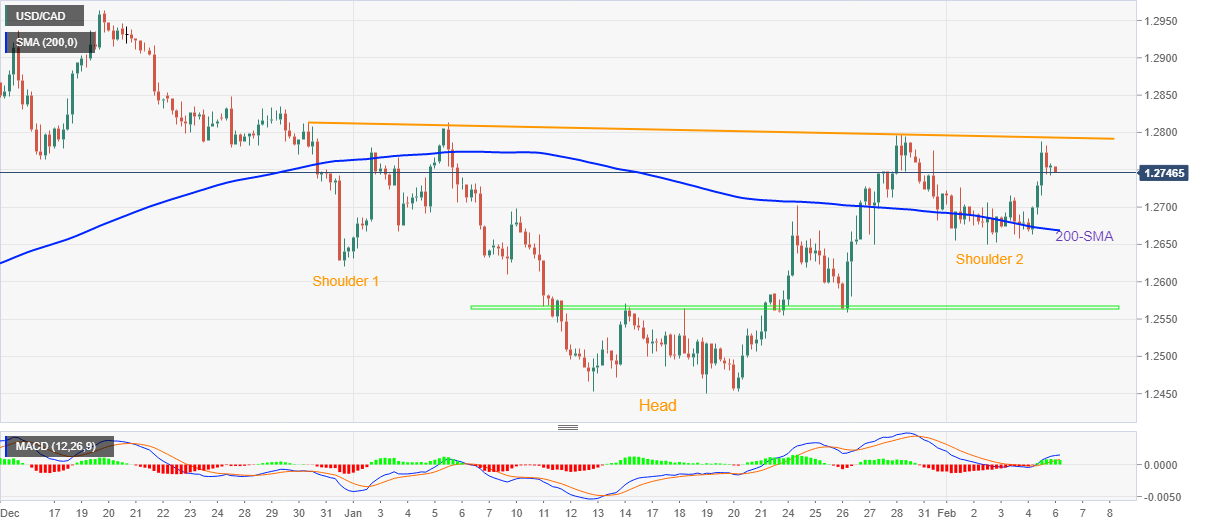
Trend: Further upside expected
© 2000-2026. All rights reserved.
This site is managed by Teletrade D.J. LLC 2351 LLC 2022 (Euro House, Richmond Hill Road, Kingstown, VC0100, St. Vincent and the Grenadines).
The information on this website is for informational purposes only and does not constitute any investment advice.
The company does not serve or provide services to customers who are residents of the US, Canada, Iran, The Democratic People's Republic of Korea, Yemen and FATF blacklisted countries.
Making transactions on financial markets with marginal financial instruments opens up wide possibilities and allows investors who are willing to take risks to earn high profits, carrying a potentially high risk of losses at the same time. Therefore you should responsibly approach the issue of choosing the appropriate investment strategy, taking the available resources into account, before starting trading.
Use of the information: full or partial use of materials from this website must always be referenced to TeleTrade as the source of information. Use of the materials on the Internet must be accompanied by a hyperlink to teletrade.org. Automatic import of materials and information from this website is prohibited.
Please contact our PR department if you have any questions or need assistance at pr@teletrade.global.


