- Analytics
- News and Tools
- Market News
CFD Markets News and Forecasts — 06-09-2024
- The NZD/JPY pair fell sharply on Friday and reaching a low of 87.85.
- The RSI has plunged to 36, indicating that the bears are in full control and the negative momentum is likely to persist.
- Bears have the 87.00 threshold on their sight.
The NZD/JPY pair has maintained its bearish stance, extending the selloff that started in Tuesday's session. Technical indicators strongly suggest that the bears have the upper hand, and the pair could continue to decline in the coming days.
The Relative Strength Index (RSI) has reached 36 and approaches the oversold threshold. However, after the pair shed more than 3% this week, the cross might consolidate in the next sessions, as bears might run out of steam.
NZD/JPY daily chart
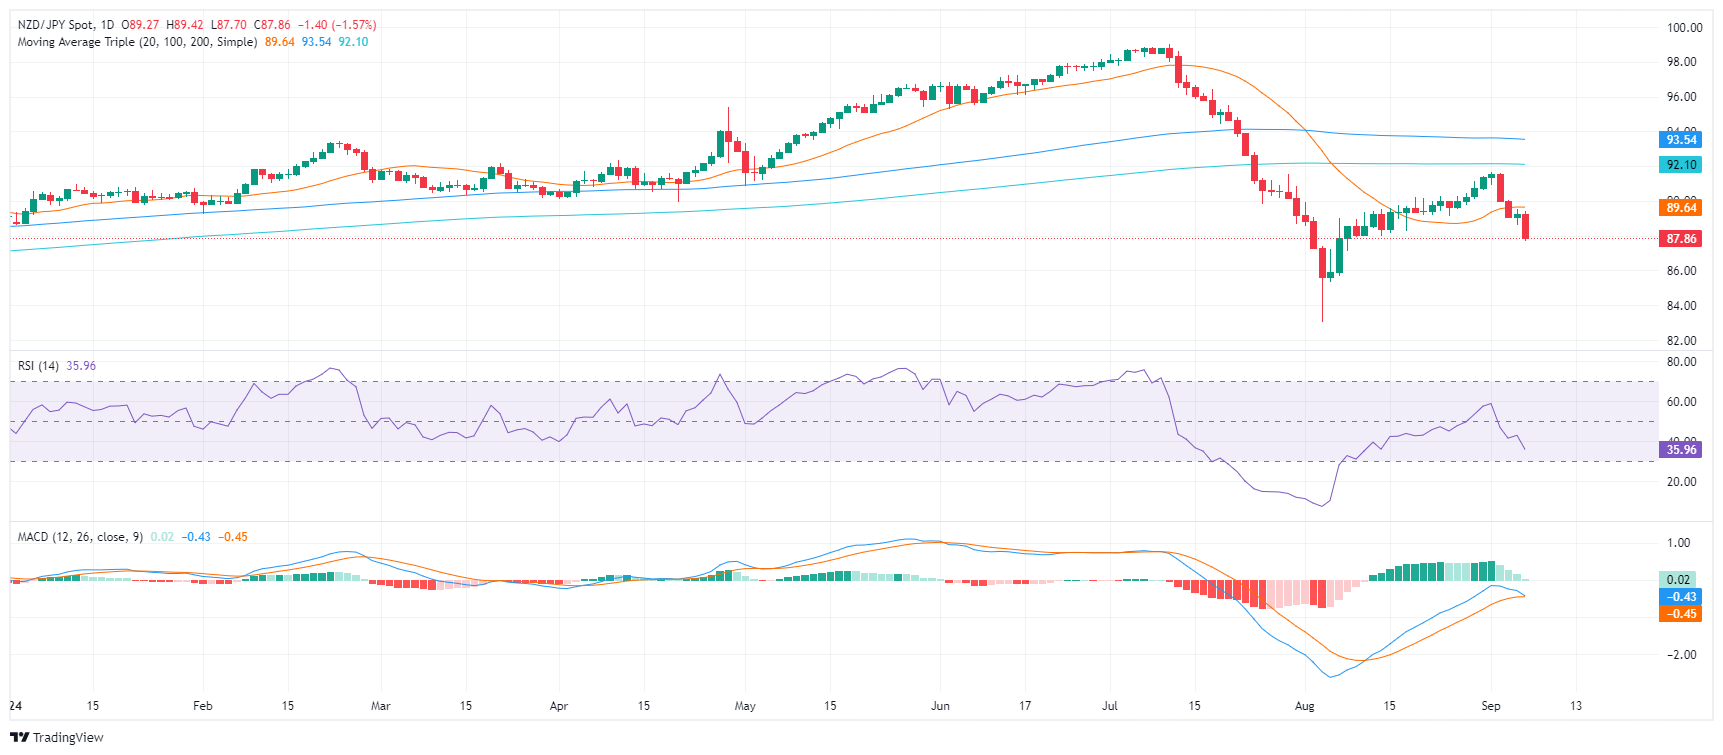
On the daily chart, the NZD/JPY pair is showing signs of sustained weakness. After having fallen below the 20-day Simple Moving Average (SMA) of 89.60, bears seem to have gained sufficient momentum to exert further downward pressure. If the selling continues, critical support levels appear at 87.50, 87.30, and 87.00.
- NZD/USD falls 0.84% on Friday to trade at 0.6170.
- The RSI and MACD indicators align with the bearish outlook, signaling negative momentum.
- The 20-day SMA presents a strong barrier against the sellers.
The NZD/USD pair has been trading lacklusterly within a narrow range, but Friday's sharp decline has shifted the technical outlook to bearish, at least for the short-term, shedding more than 0.80% at the end of the week.
The Relative Strength Index (RSI) has turned sharply lower, indicating that the momentum is shifting in favor of the bears. The RSI is currently trading at 52, which is in neutral territory. However, the sharp decline suggests that the pair is likely to break below the 50 level, which would confirm the bearish trend. The Moving Average Convergence Divergence (MACD) printed a fresh red bar and also suggests that the momentum is negative and that the pair is likely to continue to decline.
NZD/USD daily chart
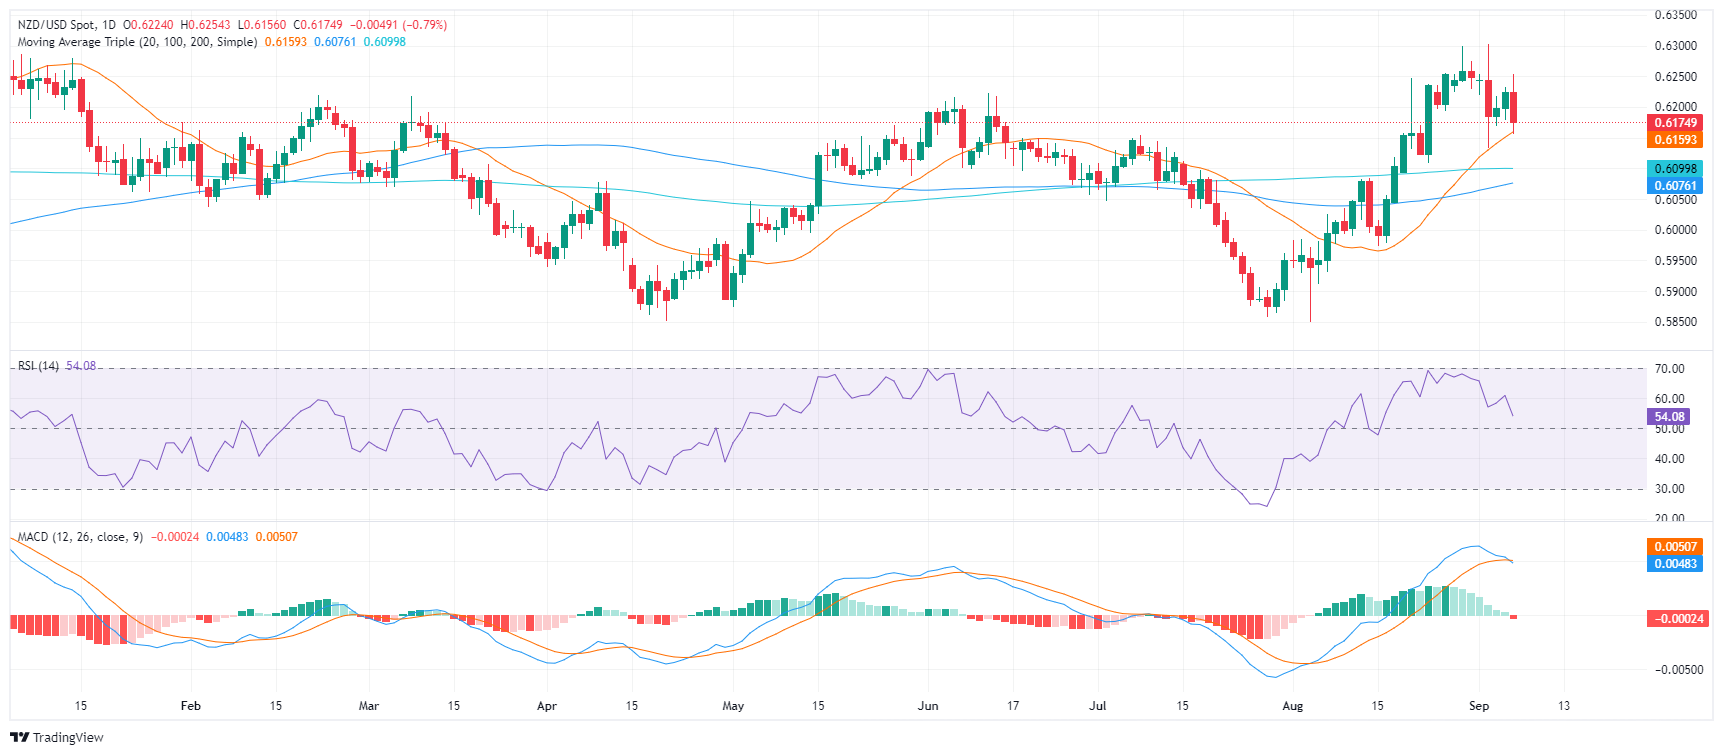
The 20-day SMA at 0.6160 provides strong support against the selling pressure but a break below this level would open the door for further declines toward 0.610-0.6150. However, if the pair manages to hold the line, the 0.6200 could be retested.
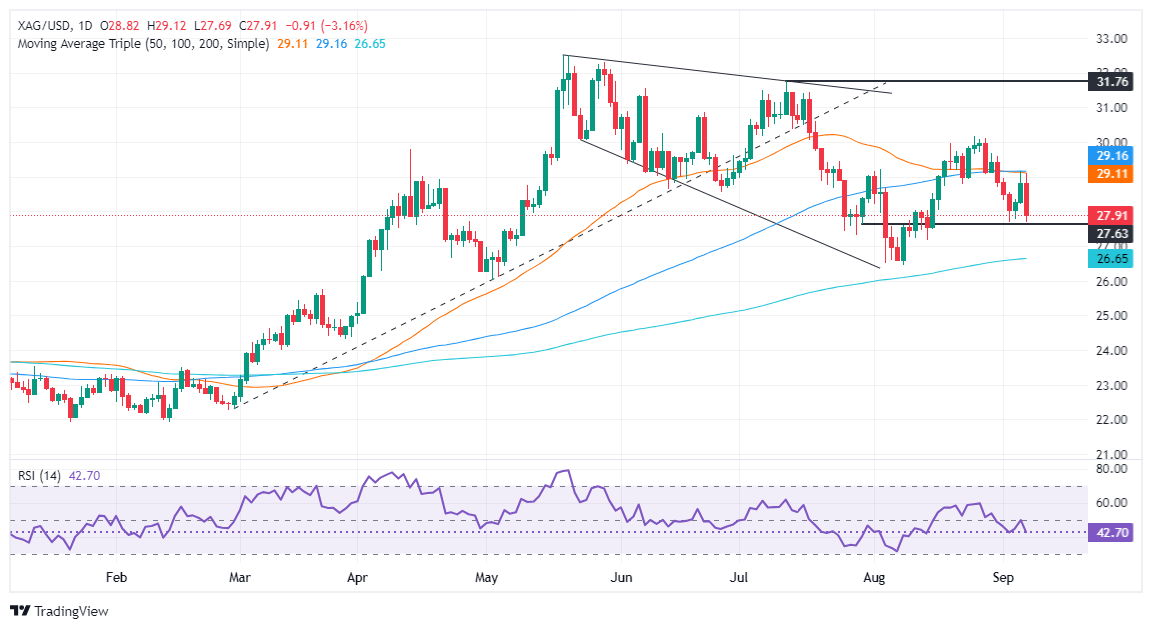
- Silver retreats from $29.11 after failing to clear key resistance at confluence of the 50 and 100-day moving averages.
- RSI signals strong bearish momentum, with next support at $27.18, followed by $27.00 and the 200-DMA at $26.62.
- A rebound above $29.15 could lift Silver toward the key psychological level of $30.00.
The Silver price plunged late in the North American session, down over 3%, and traded at $27.89 after reaching a high of $29.11. Market sentiment turned risk-averse to precious metals, while the Greenback gathered some traction amid falling US yields.
XAG/USD Price Forecast: Technical outlook
Silver prices retreated after testing the confluence of the 50 and 100-day moving averages (DMAs) at around $29.00-$29.15, which exacerbated the precious metal fall of over USD 1.00.
Sellers gathered ground as momentum turned bearish. The Relative Strength Index (RSI) is on a steepest fall, signaling that the downtrend is strong.
Once XAG/USD dropped below $28.00, the next support would be the August 14 swing low of $27.18. If surpassed, bears could drive the spot prices to $27.00 before challenging the 200-DMA at $26.62/
Conversely, if XAG/USD buyers lift prices above $29.15, the precious metal could remain bid. Up next would be the $30.00 figure.
XAG/USD Price Action – Daily Chart
Silver FAQs
Silver is a precious metal highly traded among investors. It has been historically used as a store of value and a medium of exchange. Although less popular than Gold, traders may turn to Silver to diversify their investment portfolio, for its intrinsic value or as a potential hedge during high-inflation periods. Investors can buy physical Silver, in coins or in bars, or trade it through vehicles such as Exchange Traded Funds, which track its price on international markets.
Silver prices can move due to a wide range of factors. Geopolitical instability or fears of a deep recession can make Silver price escalate due to its safe-haven status, although to a lesser extent than Gold's. As a yieldless asset, Silver tends to rise with lower interest rates. Its moves also depend on how the US Dollar (USD) behaves as the asset is priced in dollars (XAG/USD). A strong Dollar tends to keep the price of Silver at bay, whereas a weaker Dollar is likely to propel prices up. Other factors such as investment demand, mining supply – Silver is much more abundant than Gold – and recycling rates can also affect prices.
Silver is widely used in industry, particularly in sectors such as electronics or solar energy, as it has one of the highest electric conductivity of all metals – more than Copper and Gold. A surge in demand can increase prices, while a decline tends to lower them. Dynamics in the US, Chinese and Indian economies can also contribute to price swings: for the US and particularly China, their big industrial sectors use Silver in various processes; in India, consumers’ demand for the precious metal for jewellery also plays a key role in setting prices.
Silver prices tend to follow Gold's moves. When Gold prices rise, Silver typically follows suit, as their status as safe-haven assets is similar. The Gold/Silver ratio, which shows the number of ounces of Silver needed to equal the value of one ounce of Gold, may help to determine the relative valuation between both metals. Some investors may consider a high ratio as an indicator that Silver is undervalued, or Gold is overvalued. On the contrary, a low ratio might suggest that Gold is undervalued relative to Silver.
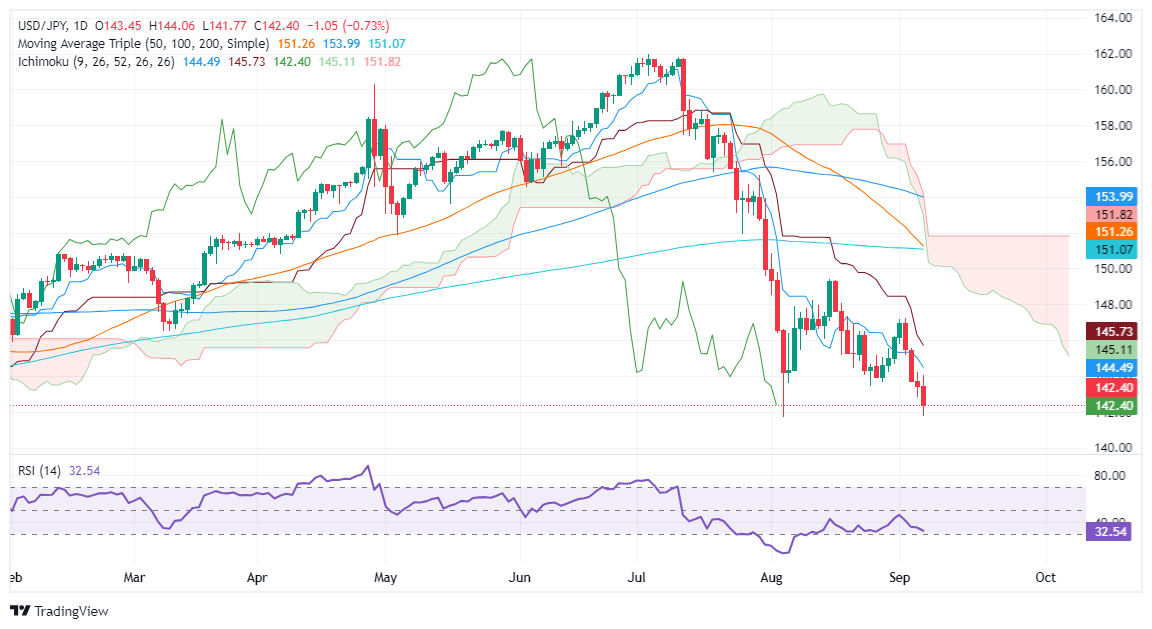
- USD/JPY downtrend continues, as downward momentum accelerates after volatility from US Nonfarm Payrolls data.
- Key support levels include 142.50, 142.00, and today’s low of 141.77, with further downside likely if these are breached.
- Resistance stands at 143.44, with higher targets at 144.49 (Tenkan-Sen) and 145.00 (Senkou Span A) if bulls regain control.
The USD/JPY extended its losses late on Friday's North American session, bolstered by the losses of the yield of the US 10-year T-note. The Greenback recovered some ground against most G8 FX currencies, except safe-haven currencies like the Japanese Yen. At the time of writing, the pair trades at
USD/JPY Price Forecast: Technical outlook
The USD/JPY downtrend continued after the latest US Nonfarm Payrolls report sparked volatility in the pair, which seesawed within a 230-pip range on the day, but as the dust settled, sellers remained in charge.
Momentum had accelerated to the downside, confirmed by the Relative Strength Index (RSI) aiming lower, an indication of a strong trend.
The USD/JPY's first support would be the psychological level of 142.50. Once surpassed, the next stop would be the 142.00 mark, followed by today’s low of 141.77. Once those two levels are cleared, the drop could extend toward the August 5 low of 141.69.
On the other hand, the first resistance would be the August 26 daily low of 143.44. A breach of the latter would expose key resistance levels. First, the Tenkan-Sen will be at 144.49, followed by the Senkou Span A at 145.00. Up next would be the Kijun-Sen at 145.73.
USD/JPY Price Action – Daily Chart
Japanese Yen FAQs
The Japanese Yen (JPY) is one of the world’s most traded currencies. Its value is broadly determined by the performance of the Japanese economy, but more specifically by the Bank of Japan’s policy, the differential between Japanese and US bond yields, or risk sentiment among traders, among other factors.
One of the Bank of Japan’s mandates is currency control, so its moves are key for the Yen. The BoJ has directly intervened in currency markets sometimes, generally to lower the value of the Yen, although it refrains from doing it often due to political concerns of its main trading partners. The current BoJ ultra-loose monetary policy, based on massive stimulus to the economy, has caused the Yen to depreciate against its main currency peers. This process has exacerbated more recently due to an increasing policy divergence between the Bank of Japan and other main central banks, which have opted to increase interest rates sharply to fight decades-high levels of inflation.
The BoJ’s stance of sticking to ultra-loose monetary policy has led to a widening policy divergence with other central banks, particularly with the US Federal Reserve. This supports a widening of the differential between the 10-year US and Japanese bonds, which favors the US Dollar against the Japanese Yen.
The Japanese Yen is often seen as a safe-haven investment. This means that in times of market stress, investors are more likely to put their money in the Japanese currency due to its supposed reliability and stability. Turbulent times are likely to strengthen the Yen’s value against other currencies seen as more risky to invest in.
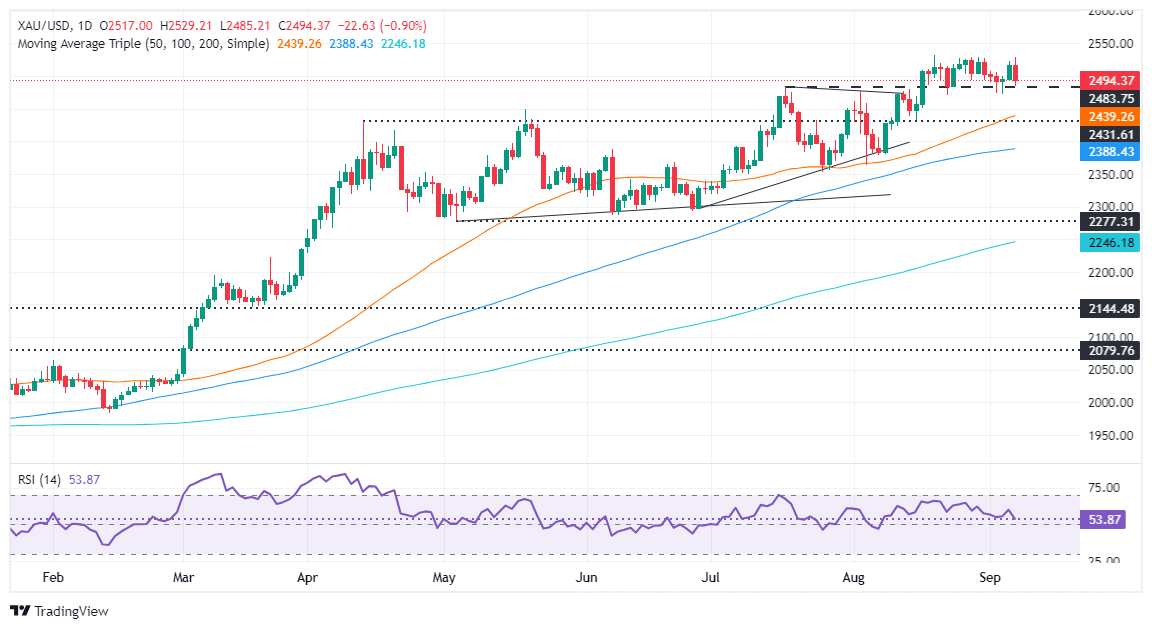
- Gold tumbles after failing to break $2,531 resistance, closing at $2,493 as Fed rate cut speculation intensifies.
- US Nonfarm Payrolls missed estimates, but improved figures and rising hourly earnings fueled uncertainty over a 25 or 50 bps cut.
- Despite falling Treasury yields, the US Dollar Index recovered above 101.00, pressuring Gold prices further.
Gold retreated after failing to test the all-time high of $2,531 and diving more than 0.80% late in the North American session. US economic data cast doubts on a 50 or 25-basis-point (bps) interest rate cut by the Federal Reserve (Fed) at the September meeting. The XAU/USD trades at $2,493 after hitting a high of $2,529.
The US Bureau of Labor Statistics (BLS) revealed that Nonfarm Payrolls (NFP) in August missed their estimate but improved compared to July’s downwardly revised number. Digging deep into the report, the Unemployment Rate dipped compared to the previous month, while Average Hourly Earnings rose.
According to the data, Fed interest rate probabilities fluctuated sharply. Based on CME FedWatch Tool data, at some point, traders priced a 50 bps cut with odds rising as high as 70%. Nevertheless, as the dust settled, market participants estimated that a 25 bps cut was more likely as the chances of it rose by 73%, while for a 50 bps cut they decreased to 27%.
In the meantime, Fed policymakers crossed the newswire. New York Fed President John Williams said that lowering rates soon will help to keep the labor market balanced. Fed Governor Christopher Waller echoed some of his comments at a speech at the University of Notre Dame. He said, “The time has come” to begin easing policy and revealed that he was open to any size of easing.
Recently, Chicago Fed President Austan Goolsbee was dovish, saying policymakers have an “overwhelming” consensus to reduce borrowing costs.
Given all these developments, Gold prices tumbled despite US Treasury yields falling. Lately, the Greenback recovered after sliding below 101.00 and gained over 0.15%, as shown by the US Dollar Index (DXY), which is up at 101.22.
In the geopolitical space, US Secretary of State Antony Blinken said, “90% of the Gaza ceasefire agreement is agreed upon, but critical issues remain where there are gaps; Incumbent on both parties to get to yes on remaining issues,” via Reuters.
Daily digest market movers: Gold price descends as traders ignore mixed US jobs report
- US NFP increased by 142K in August, missing the forecast of 160K. Additionally, July's figures were revised downward from 114K to 89K.
- Unemployment Rate dipped from 4.3% to 4.2%, while Average Hourly Earnings rose from 3.6% to 3.8% YoY in August.
- Data from the Chicago Board of Trade indicates that the Fed is expected to cut at least 104 basis points (bps) this year, up from 103 bps a day ago, based on the December 2024 fed funds rate futures contract.
Technical outlook: Gold price tumbles below $2,500 due to USD strength
Gold prices remain upwardly biased, but in the short term they seem to have shifted negatively. After XAU/USD hit a daily peak above $2,520, it reversed its course and formed a “bearish engulfing” candle chart pattern, which opened the door for additional losses.
Momentum turned bearish as depicted by the Relative Strength Index (RSI). The RSI is about to cross below its neutral level.
If XAU/USD drops below the August 22 low at $2,470, that opens the door for further downside. The next demand zone would be the confluence of the April 12 high, which turned into support, and the 50-day Simple Moving Average (SMA) between $2,435 and $2,431.
On the other hand, if buyers lift prices above $2,500, the next resistance would be the year-to-date high at $2,531. If surpassed, the next stop would be the psychological $2,550 level, followed by the $2,600 mark.
Gold FAQs
Gold has played a key role in human’s history as it has been widely used as a store of value and medium of exchange. Currently, apart from its shine and usage for jewelry, the precious metal is widely seen as a safe-haven asset, meaning that it is considered a good investment during turbulent times. Gold is also widely seen as a hedge against inflation and against depreciating currencies as it doesn’t rely on any specific issuer or government.
Central banks are the biggest Gold holders. In their aim to support their currencies in turbulent times, central banks tend to diversify their reserves and buy Gold to improve the perceived strength of the economy and the currency. High Gold reserves can be a source of trust for a country’s solvency. Central banks added 1,136 tonnes of Gold worth around $70 billion to their reserves in 2022, according to data from the World Gold Council. This is the highest yearly purchase since records began. Central banks from emerging economies such as China, India and Turkey are quickly increasing their Gold reserves.
Gold has an inverse correlation with the US Dollar and US Treasuries, which are both major reserve and safe-haven assets. When the Dollar depreciates, Gold tends to rise, enabling investors and central banks to diversify their assets in turbulent times. Gold is also inversely correlated with risk assets. A rally in the stock market tends to weaken Gold price, while sell-offs in riskier markets tend to favor the precious metal.
The price can move due to a wide range of factors. Geopolitical instability or fears of a deep recession can quickly make Gold price escalate due to its safe-haven status. As a yield-less asset, Gold tends to rise with lower interest rates, while higher cost of money usually weighs down on the yellow metal. Still, most moves depend on how the US Dollar (USD) behaves as the asset is priced in dollars (XAU/USD). A strong Dollar tends to keep the price of Gold controlled, whereas a weaker Dollar is likely to push Gold prices up.
- The Dow Jones fell another 400 points on Friday after NFP jobs data missed the mark.
- US job additions continue to underperform, and downside revisions remain a concern.
- Despite the miss in NFP employment, market bets for a 25 bps cut come out on top.
The Dow Jones Industrial Average (DJIA) shed 400 points on Friday after US Nonfarm Payrolls (NFP) came in below expectations, alongside a downard revision to previous figures. Lopsided jobs growth has dropped further signals that the US economy is slowing down, but not slow enough to spark firmer bets of a double cut from the Federal Reserve (Fed) later this month.
According to the Bureau of Labor Statistics (BLS), US NFP employment rose 142K in August, less than the expected 160K but improved from the previous month, which was also revised lower to just 89K from the initial print of 114K. Despite the overall negative tone in jobs figures, US Average Hourly Earnings rose faster than expected, climbing 3.8% YoY in August, beating the expected 3.7% and rising from the previous period’s 3.6%.
The August NFP jobs report showed a weaker-than-expected pickup in the number of hirings for the month, helping to keep rate cut bets buoyed. However, markets had a hard time drawing a bead on where the overall jobs report landed. The headline number of job additions, despite missing forecasts, was still up from the previous period, but the underlying trend within the jobs report showed most of those gains in employment came from leisure and hospitality, and health care and social assistance.
Manufacturing, retail trade, and information sectors all saw declines in headline employment figures, flashing warning signs that the US economy is indeed heading for a slowdown. The contraction in physical business and production sewered the Dow Jones, an index heavily representing physical manufacturing businesses.
Despite the overall miss in employment figures, and even more warning signs that investors have good reason to be concerned about a looming recession in the quarters to come, markets eased back from bets of a double rate cut on September 18. According to the CME’s FedWatch Tool, rate trades now see 75% odds of an initial 25 bps cut from the Fed this month, with only 25% betting on an initial 50 bps rate trim. Odds have recovered from this week’s previous probabilities of a 40-60 split in favor of a double rate trim after markets decided that Friday’s NFP print, despite not being the greatest, also wasn’t the worst.
Dow Jones news
The Dow Jones was thoroughly softened on Friday, with all but five of the equity board’s listed stocks testing into the low end to wrap up the trading week. McDonald’s (MCD) managed to squeeze out a 1.3% gain to $292.00 per share, with Procter & Gamble (PG) rising one half of one percent to $176.35 per share.
American Express (AXP) fell the hardest on Friday, declining 3.3% to $243.60 per share. The payments and card services company was closely followed by Amazon.com (AMZN), which fell around 3.25% to $ 172.00 per share.
Dow Jones price forecast
Friday’s plunge has put the Dow Jones chart on a collision course with the 50-day Exponential Moving Average (EMA) at 40,283, with the major index chalking in another full percentage point loss off the top. The DJIA has now declined a full 3% in just over a week, after hitting a fresh all-time peak of 41,574 just last week.
Despite near-term losses, the Dow Jones continues to trade well into the high side. Price action would need to fall another 4.65% before reaching the 200-day EMA at 38,434, and bidders are set to defend momentum barriers near the 40,000 major price handle.
Dow Jones daily chart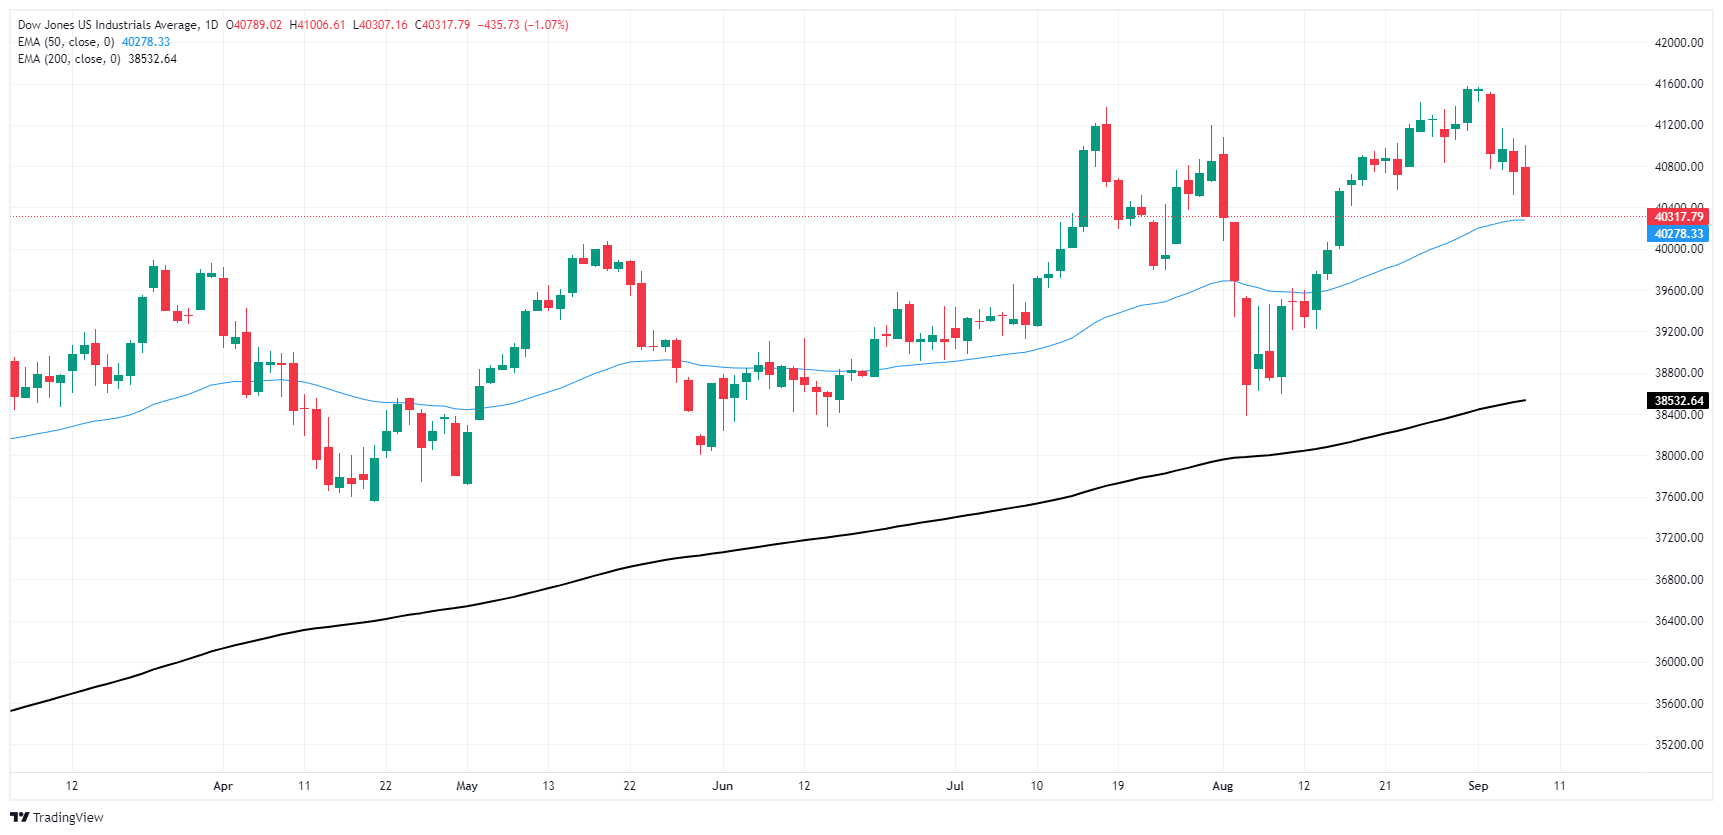
Dow Jones FAQs
The Dow Jones Industrial Average, one of the oldest stock market indices in the world, is compiled of the 30 most traded stocks in the US. The index is price-weighted rather than weighted by capitalization. It is calculated by summing the prices of the constituent stocks and dividing them by a factor, currently 0.152. The index was founded by Charles Dow, who also founded the Wall Street Journal. In later years it has been criticized for not being broadly representative enough because it only tracks 30 conglomerates, unlike broader indices such as the S&P 500.
Many different factors drive the Dow Jones Industrial Average (DJIA). The aggregate performance of the component companies revealed in quarterly company earnings reports is the main one. US and global macroeconomic data also contributes as it impacts on investor sentiment. The level of interest rates, set by the Federal Reserve (Fed), also influences the DJIA as it affects the cost of credit, on which many corporations are heavily reliant. Therefore, inflation can be a major driver as well as other metrics which impact the Fed decisions.
Dow Theory is a method for identifying the primary trend of the stock market developed by Charles Dow. A key step is to compare the direction of the Dow Jones Industrial Average (DJIA) and the Dow Jones Transportation Average (DJTA) and only follow trends where both are moving in the same direction. Volume is a confirmatory criteria. The theory uses elements of peak and trough analysis. Dow’s theory posits three trend phases: accumulation, when smart money starts buying or selling; public participation, when the wider public joins in; and distribution, when the smart money exits.
There are a number of ways to trade the DJIA. One is to use ETFs which allow investors to trade the DJIA as a single security, rather than having to buy shares in all 30 constituent companies. A leading example is the SPDR Dow Jones Industrial Average ETF (DIA). DJIA futures contracts enable traders to speculate on the future value of the index and Options provide the right, but not the obligation, to buy or sell the index at a predetermined price in the future. Mutual funds enable investors to buy a share of a diversified portfolio of DJIA stocks thus providing exposure to the overall index.
- AUD/USD falls and struggles to gain ground against the USD.
- US Nonfarm Payrolls disappoint with 142K new jobs added, below the 160K estimate.
- RBA's hawkish stance suggests no imminent rate cuts, which might support the AUD.
The AUD/USD declined by 0.85% in Friday's session, now hovering near the 0.6700 level following the release of the US Nonfarm Payrolls (NFP) report for August. However, the hawkish stance of the Reserve Bank of Australia (RBA), suggests that no imminent rate cuts are likely, which might limit the downside to the Australian Dollar.
The economic prospects for Australia are uncertain, and the Reserve Bank of Australia's aggressive stance to combat rising inflation has led to market expectations of only a 0.25% interest rate cut in 2024.
Daily digest market movers: Australian Dollar declines against US Dollar after mixed US job data
- US NFP report shows weaker-than-expected job growth, with 142K fresh payrolls against expectations of 160K.
- Unemployment Rate fell to 4.2% as anticipated, from the prior 4.3%.
- Following the data, the likelihood of the Fed starting interest rate cuts this month remained steady, with a 45% chance of a 50 bps reduction to 4.75%-5.00%.
- On the other hand, RBA Governor Bullock's hawkish stance reinforces the belief that interest rates will remain unchanged in the short term.
- Withhile monetary policy divergences between the Fed and RBA becoming ever clearer, the downside for the Aussie is limited.
AUD/USD technical outlook: Bearish momentum tests support at 0.6650
The pair has been in a downtrend since early September and is now testing the key support level of 0.6670. A break below this level could lead to further losses in the coming days.
The Relative Strength Index (RSI) is currently in the negative area and is sloping sharply downward, indicating that the bears are in control of the market. The Moving Average Convergence Divergence (MACD) is also bearish, which confirms mounting selling pressure.
Australian Dollar FAQs
One of the most significant factors for the Australian Dollar (AUD) is the level of interest rates set by the Reserve Bank of Australia (RBA). Because Australia is a resource-rich country another key driver is the price of its biggest export, Iron Ore. The health of the Chinese economy, its largest trading partner, is a factor, as well as inflation in Australia, its growth rate and Trade Balance. Market sentiment – whether investors are taking on more risky assets (risk-on) or seeking safe-havens (risk-off) – is also a factor, with risk-on positive for AUD.
The Reserve Bank of Australia (RBA) influences the Australian Dollar (AUD) by setting the level of interest rates that Australian banks can lend to each other. This influences the level of interest rates in the economy as a whole. The main goal of the RBA is to maintain a stable inflation rate of 2-3% by adjusting interest rates up or down. Relatively high interest rates compared to other major central banks support the AUD, and the opposite for relatively low. The RBA can also use quantitative easing and tightening to influence credit conditions, with the former AUD-negative and the latter AUD-positive.
China is Australia’s largest trading partner so the health of the Chinese economy is a major influence on the value of the Australian Dollar (AUD). When the Chinese economy is doing well it purchases more raw materials, goods and services from Australia, lifting demand for the AUD, and pushing up its value. The opposite is the case when the Chinese economy is not growing as fast as expected. Positive or negative surprises in Chinese growth data, therefore, often have a direct impact on the Australian Dollar and its pairs.
Iron Ore is Australia’s largest export, accounting for $118 billion a year according to data from 2021, with China as its primary destination. The price of Iron Ore, therefore, can be a driver of the Australian Dollar. Generally, if the price of Iron Ore rises, AUD also goes up, as aggregate demand for the currency increases. The opposite is the case if the price of Iron Ore falls. Higher Iron Ore prices also tend to result in a greater likelihood of a positive Trade Balance for Australia, which is also positive of the AUD.
The Trade Balance, which is the difference between what a country earns from its exports versus what it pays for its imports, is another factor that can influence the value of the Australian Dollar. If Australia produces highly sought after exports, then its currency will gain in value purely from the surplus demand created from foreign buyers seeking to purchase its exports versus what it spends to purchase imports. Therefore, a positive net Trade Balance strengthens the AUD, with the opposite effect if the Trade Balance is negative.
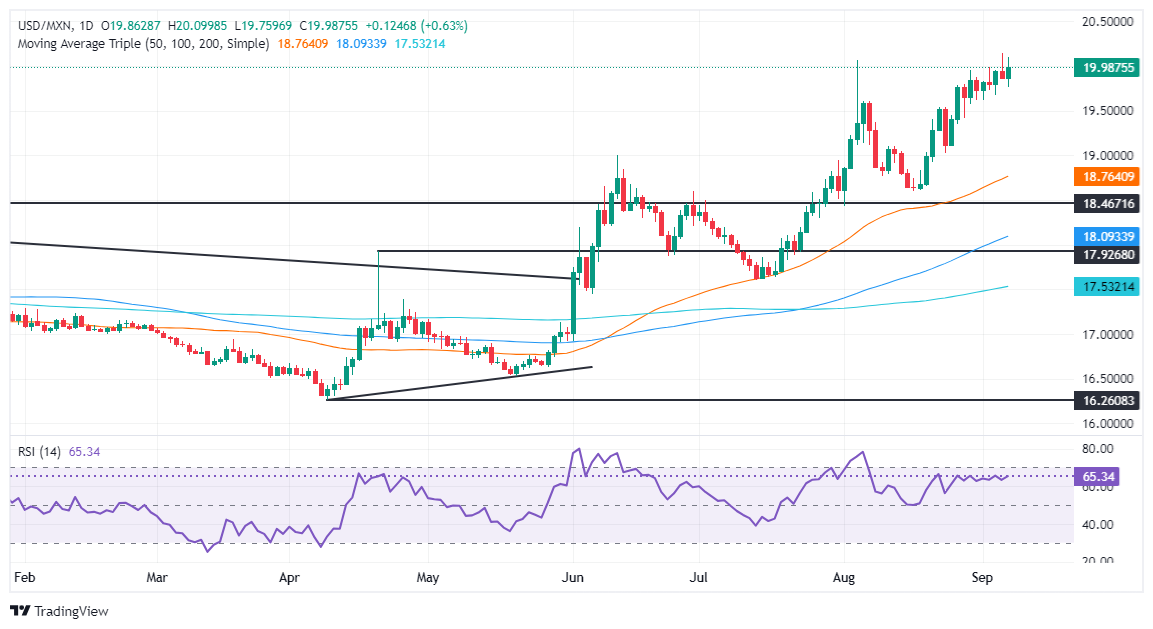
- Mexican Peso tumbles as USD/MXN rallies above 20.00 following mixed US jobs data, hitting a daily high of 20.09 before retreating.
- Fed rate cut expectations remain uncertain, fluctuating between 50 and 25 bps, adding pressure on the Mexican Peso.
- Political instability in Mexico, driven by controversial judicial reforms, keeps traders risk-averse toward the Peso.
The Mexican Peso depreciated against the American currency on Friday after the US Nonfarm Payrolls (NFP) report spurred volatility in the bond market. Fed interest rate probabilities fluctuated between a 50 or 25-basis-point cut. This and Mexico’s political uncertainty around controversial reforms keep the Peso pressured. The USD/MXN trades at 20.00, gaining 0.73%.
The US Bureau of Labor Statistics (BLS) revealed that the US economy created fewer jobs than expected but improved compared to July figures. The same report showed that the Unemployment Rate, which ticked two-tenths higher in July, dipped in August, relieving the Federal Reserve (Fed) from lowering borrowing costs in an “aggressive” way.
After the data, the USD/MXN rallied above 20.00 and hit a daily peak of 20.09 but retreated as US yields retreated and undermined the Greenback.
As of writing, the US Dollar Index (DXY), which tracks the buck’s performance against another six currencies, has recovered and climbed 0.23%, up at 101.29, after hitting a low of 100.58.
Meanwhile in Mexico, the docket featured the release of the Citibanamex Expectations survey, Bank of Mexico Deputy Governor Jonathan Heath's speech and Auto industry data. Politics will likely continue to drive USD/MXN price action for the remainder of September.
Additionally, political uncertainty weighed on the Mexican Peso as traders turned risk-averse to the carry trade involving that currency and bought the USD/MXN. Two days ago, the lower house sent a controversial package of bills to the Senate, including changes to the judicial system pushed by President Andres Manuel Lopez Obrador (AMLO).
If the Senate approves the judicial reform, then “it will be passed to 32 local congresses for their approval. Once the bill is approved in 17 of those states, the changes to the Mexican Constitution will be officially made,” writes FXStreet.
Daily digest market movers: Mexican Peso shrugs off soft US data, drops on risk aversion
- September’s Citibanamex Survey showed that private economists estimated the Mexican economy will grow 1.5% in 202$, down from 1.7%.
- Regarding inflation, the poll revealed that the Mexican Consumer Price Index (CPI) in 2024 would end at 4.60%, and next year it will hit 3.8%. Core CPI is forecast to end 2024 at 3.9%, and by 2025 it is expected to dive to 3.71%.
- The survey added that Banxico is expected to lower rates to 10.25% in 2024 and to 8.25% in 2025. The USD/MXN exchange rate is forecast to end 2024 at 19.50 and 2025 at 19.85.
- INEGI revealed that Mexico’s Auto Exports rose by 1.7% YoY in August after declining 2.7% YoY in July. Auto Production, meanwhile, rose by 8.3% YoY against the 2.7% of July.
- US Nonfarm Payrolls jumped by 142K in August but missed the mark of 160K. Should be said that July’s figures were downwardly revised from 114K to 89K.
- The Unemployment Rate dipped from 4.3% to 4.2%, while Average Hourly Earnings rose from 3.6% to 3.8% YoY in August.
- Data from the Chicago Board of Trade (CBOT) suggests the Fed will cut at least 104 basis points this year, up from 103 bps a day ago, according to the fed funds rate futures contract for December 2024.
Technical outlook: Mexican Peso softens as USD/MXN hovers around 20.00
Price action since the beginning of the rally in late May suggests that the USD/MXN uptrend is set to continue. Two times, buyers have bought the dip, and momentum is in their favor, as portrayed by the Relative Strength Index (RSI).
The RSI is bullish with an upward slope. Therefore, the path of least resistance is up.
If the USD/MXN clears 20.00, the next ceiling level would be the YTD high at 20.22. On further strength, the pair could challenge the daily high of September 28, 2022, at 20.57. If those two levels are surrendered, the next stop would be the swing high at 20.82 on August 2, 2022, ahead of 21.00.
Conversely, if USD/MXN weakens further, the first support would be 19.50. A breach of the latter will expose the August 23 swing low of 19.02 before giving way for sellers eyeing a test of the 50-day Simple Moving Average (SMA) at 18.65.
Mexican Peso FAQs
The Mexican Peso (MXN) is the most traded currency among its Latin American peers. Its value is broadly determined by the performance of the Mexican economy, the country’s central bank’s policy, the amount of foreign investment in the country and even the levels of remittances sent by Mexicans who live abroad, particularly in the United States. Geopolitical trends can also move MXN: for example, the process of nearshoring – or the decision by some firms to relocate manufacturing capacity and supply chains closer to their home countries – is also seen as a catalyst for the Mexican currency as the country is considered a key manufacturing hub in the American continent. Another catalyst for MXN is Oil prices as Mexico is a key exporter of the commodity.
The main objective of Mexico’s central bank, also known as Banxico, is to maintain inflation at low and stable levels (at or close to its target of 3%, the midpoint in a tolerance band of between 2% and 4%). To this end, the bank sets an appropriate level of interest rates. When inflation is too high, Banxico will attempt to tame it by raising interest rates, making it more expensive for households and businesses to borrow money, thus cooling demand and the overall economy. Higher interest rates are generally positive for the Mexican Peso (MXN) as they lead to higher yields, making the country a more attractive place for investors. On the contrary, lower interest rates tend to weaken MXN.
Macroeconomic data releases are key to assess the state of the economy and can have an impact on the Mexican Peso (MXN) valuation. A strong Mexican economy, based on high economic growth, low unemployment and high confidence is good for MXN. Not only does it attract more foreign investment but it may encourage the Bank of Mexico (Banxico) to increase interest rates, particularly if this strength comes together with elevated inflation. However, if economic data is weak, MXN is likely to depreciate.
As an emerging-market currency, the Mexican Peso (MXN) tends to strive during risk-on periods, or when investors perceive that broader market risks are low and thus are eager to engage with investments that carry a higher risk. Conversely, MXN tends to weaken at times of market turbulence or economic uncertainty as investors tend to sell higher-risk assets and flee to the more-stable safe havens.
- US Dollar recovers ground after mixed August Nonfarm Payrolls data.
- Fed official downplayed discussions of a larger rate cut in September than 25 bps.
- Markets are seeing 40% odds of a 50 bps cut in the next Fed meeting.
The US Dollar Index (DXY), a measure of the US Dollar against a basket of six currencies, recovered its footing on Friday after the release of August Nonfarm Payrolls (NFP) data came in mixed. Following the data, the probabilities of the Federal Reserve (Fed) implementing a 50 bps rate cut in September remains high, but Fed officials might not embrace it yet.
Despite positive economic indicators, the market may be exaggerating its expectations for aggressive monetary policy easing. The current growth rate exceeds the long-term trend, signaling that markets may be overestimating the need for such measures. However, a 25 bps cut is a done deal.
Daily digest market movers: US Dollar recovers as markets digest mixed NFPs
- US Dollar held its ground after a weaker-than-expected NFP report for August, which showed 142,000 new jobs created against a forecast of 160,000.
- Despite the headline miss, the Unemployment Rate fell to 4.2% as anticipated, while Average Hourly Earnings rose 3.8% YoY, topping expectations.
- Probability of a 0.50% rate cut by the Fed in September remains at 40%, but a 25 bps cut is now seen as a mere certainty.
- Following the data, Chicago Fed President Austan Goolsbee indicated that the Fed is beginning to align with the market's view on rate cuts.
- However, Goolsbee downplayed the discussion of a larger rate cut in September.
DXY technical outlook: DXY bears maintain dominance, resistance at 101.60
Technical analysis suggests a bearish outlook for the DXY index as indicators remain negative, indicating bearish dominance. A recovery above the 20-day SMA average (currently around 101.60) could signal a shift in sentiment.
Supports: 101.30, 101.15, 101.00
Resistances: 101.60, 102.00, 102.30
US Dollar FAQs
The US Dollar (USD) is the official currency of the United States of America, and the ‘de facto’ currency of a significant number of other countries where it is found in circulation alongside local notes. It is the most heavily traded currency in the world, accounting for over 88% of all global foreign exchange turnover, or an average of $6.6 trillion in transactions per day, according to data from 2022. Following the second world war, the USD took over from the British Pound as the world’s reserve currency. For most of its history, the US Dollar was backed by Gold, until the Bretton Woods Agreement in 1971 when the Gold Standard went away.
The most important single factor impacting on the value of the US Dollar is monetary policy, which is shaped by the Federal Reserve (Fed). The Fed has two mandates: to achieve price stability (control inflation) and foster full employment. Its primary tool to achieve these two goals is by adjusting interest rates. When prices are rising too quickly and inflation is above the Fed’s 2% target, the Fed will raise rates, which helps the USD value. When inflation falls below 2% or the Unemployment Rate is too high, the Fed may lower interest rates, which weighs on the Greenback.
In extreme situations, the Federal Reserve can also print more Dollars and enact quantitative easing (QE). QE is the process by which the Fed substantially increases the flow of credit in a stuck financial system. It is a non-standard policy measure used when credit has dried up because banks will not lend to each other (out of the fear of counterparty default). It is a last resort when simply lowering interest rates is unlikely to achieve the necessary result. It was the Fed’s weapon of choice to combat the credit crunch that occurred during the Great Financial Crisis in 2008. It involves the Fed printing more Dollars and using them to buy US government bonds predominantly from financial institutions. QE usually leads to a weaker US Dollar.
Quantitative tightening (QT) is the reverse process whereby the Federal Reserve stops buying bonds from financial institutions and does not reinvest the principal from the bonds it holds maturing in new purchases. It is usually positive for the US Dollar.
Federal Reserve (Fed) Bank of Chicago President Austan Goolsbee noted on Friday that Fed officials are finally beginning to catch up with the broader market's view that the time has come for movement from the US central bank on policy rates, but downplayed discussion of a larger opening cut in September.
Key highlights
The job market is slowing down.
Today's employment data is a continuation of what we've been seeing.
It raises some serious questions about this meeting and next several months that we make sure not to make labor market turn into something worse.
There is a overwhelming Fed consensus for multiple rate cuts.
When asked about bigger rate cuts: Look at the dot plots, which didn't show inflation coming down as fast or unemployment rising so high.
When asked about 50 bps cut in September: What happens at next meeting alone is not what is most important.
The current employment average is too low for replacement rate.
We have a little more tolerance for an upside surprise on CPI as the longer arc shows inflation coming down.
I am concerned if we maintain this level of restrictiveness, the odds of recession might be rising.
In August, job growth in the US amounted to 142 thousand, which was slightly less than expected (consensus 165 thousand, Commerzbank forecast 150 thousand), Commerzbank’s Senior Economist Dr. Christoph Balz notes.
The labor market remains a cause for concern
“The US labor market barely recovered in August after the disappointing July report. 142 thousand new jobs were created, while the unemployment rate fell to 4.2%. At the same time, however, the increase in jobs in June and July was revised downwards by a total of 86 thousand.”
“The labor market therefore remains a cause for concern. The Federal Reserve is likely to cut interest rates on September 18. However, the report does not provide a clear indication whether policy makers will prefer a move by 25 or 50 basis points.”
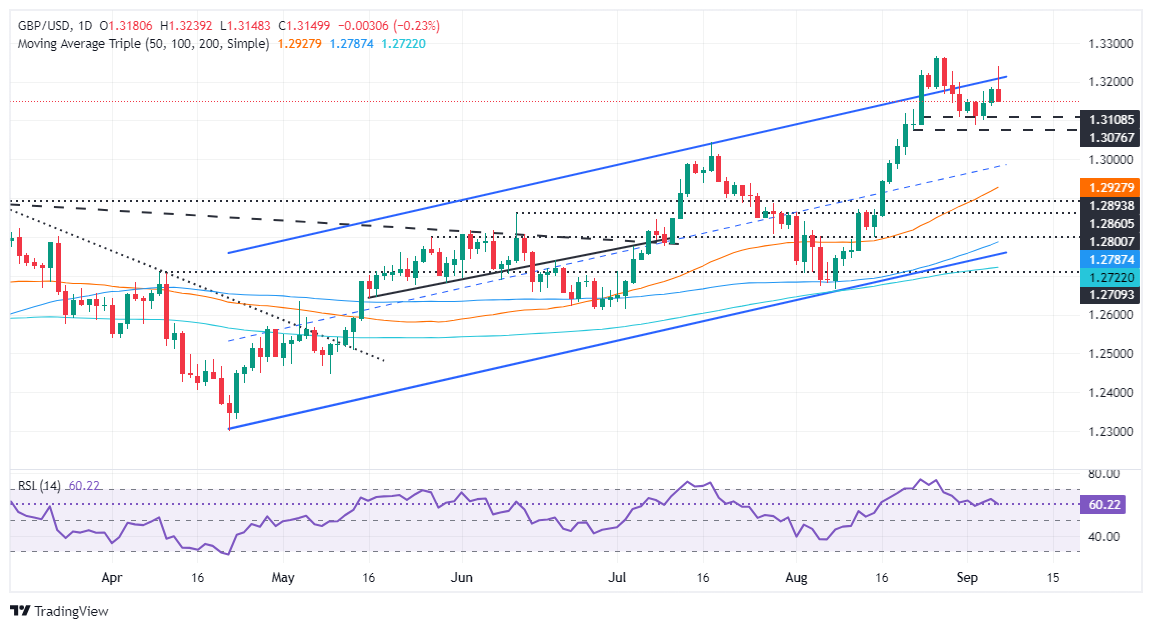
- GBP/USD remains upward biased but struggles to clear key resistance at 1.3200, with YTD high of 1.3266 looming.
- A pullback below 1.3150 could see the pair test support at 1.3087, with further downside to 1.3044 and the 50-DMA at 1.2925.
- Traders' rate cut expectations fluctuate, with a 43% chance for a 50-bps cut and 57% for a 25-bps cut.
The GBP/USD seesawed during the North American session as softer US jobs data increased. This kept investors uncertain of a 50—or 25-basis-point rate cut by the Fed at the September 17-18 meeting. The pair trades at 1.3172, virtually unchanged.
Federal Reserve interest rate expectations fluctuated after the US Nonfarm Payrolls report. Traders of fed funds futures increased their bets to a 70% chance for a 50-bps cut, yet they trimmed those odds. At the time of writing, the chances are 43%, while for a quarter of a percentage point cut, they are at 57%.
GBP/USD Price Forecast: Technical outlook
Given the backdrop, the technical view is that the GBP/USD is upward biased but failed to clear the year-to-date (YTD) peak of 1.3266, which exacerbated a dip below 1.3200 after hitting a high of 1.3239 on Friday.
With that in mind and buying momentum fading as shown by the Relative Strength Index (RSI), the GBP/USD could be headed for a pullback.
If GBP/USD retreats below 1.3150, the next support could be the September 3 low of 1.3087. On further weakness, the pair could aim toward the July 17 high at 1.3044 before moving towards the 50-day moving average (DMA) at 1.2925.
Conversely, if buyers stepped in and pushed prices above 1.3200, the next resistance would be the YTD high at 1.3266.
GBP/USD Price Action – Daily Chart
British Pound PRICE Today
The table below shows the percentage change of British Pound (GBP) against listed major currencies today. British Pound was the strongest against the Australian Dollar.
| USD | EUR | GBP | JPY | CAD | AUD | NZD | CHF | |
|---|---|---|---|---|---|---|---|---|
| USD | 0.12% | 0.20% | -0.64% | 0.29% | 0.59% | 0.38% | -0.09% | |
| EUR | -0.12% | 0.08% | -0.76% | 0.18% | 0.49% | 0.23% | -0.21% | |
| GBP | -0.20% | -0.08% | -0.83% | 0.14% | 0.41% | 0.17% | -0.31% | |
| JPY | 0.64% | 0.76% | 0.83% | 0.95% | 1.20% | 0.96% | 0.53% | |
| CAD | -0.29% | -0.18% | -0.14% | -0.95% | 0.29% | 0.09% | -0.47% | |
| AUD | -0.59% | -0.49% | -0.41% | -1.20% | -0.29% | -0.23% | -0.71% | |
| NZD | -0.38% | -0.23% | -0.17% | -0.96% | -0.09% | 0.23% | -0.44% | |
| CHF | 0.09% | 0.21% | 0.31% | -0.53% | 0.47% | 0.71% | 0.44% |
The heat map shows percentage changes of major currencies against each other. The base currency is picked from the left column, while the quote currency is picked from the top row. For example, if you pick the British Pound from the left column and move along the horizontal line to the US Dollar, the percentage change displayed in the box will represent GBP (base)/USD (quote).
Federal Reserve (Fed) Governor Christopher Waller said on Friday that he is open-minded on the size and the pace of interest rate cuts, adding that they will depend on data, per Reuters.
Key takeaways
"Maintaining the economy's forward momentum means time has come to begin reducing policy rate at upcoming meeting."
"Data in past three days indicates labor market is softening but not deteriorating; this judgment important to upcoming policy decision."
"It is likely a series of reductions in policy rate will be appropriate."
"Determining appropriate pace of cuts will be challenging."
"Will be an advocate for front-loading rate cuts if that is appropriate."
"If future data shows significant deterioration in labor market, Fed can act quickly and forcefully."
"Would also cut at consecutive meetings if data calls for it as I would be for larger cuts if needed."
"I do not believe economy is in a recession or necessarily headed for one soon."
"I stand ready to act promptly to support the economy as needed."
"Sufficient room to cut policy rate and still remain somewhat restrictive to ensure inflation returns to 2%."
"Current batch of data no longer requires patience, it requires action."
"August jobs report and other recent data reinforces view there has been continued moderation in the labor market."
"In light of considerable and ongoing progress toward FOMC's 2% inflation goal, balance of risks has shifted toward employment."
"Monetary policy has to adjust accordingly as balance of risks has shifted to employment side of mandate."
"Softening of labor market pattern consistent with moderate growth in economic activity."
"Labor market and economy performing in a solid manner and future prospects are good."
"See some downside risks to employment, will be watching closely."
Market reaction
The US Dollar stays under modest bearish pressure following these comments and was last seen trading marginally lower on the day near 101.00.
The price of Brent oil has fallen by more than 10% in the last week and a half and is now trading at around $73 per barrel, close to its 9-month low. Although the headlines in recent days have been dominated by developments on the supply side, it is the fundamental demand concerns that have created a kind of ‘imbalance’: Reports of production outages barely caused the oil price to rise, while the prospect of possible higher supply put prices under heavy pressure, Commerzbank commodity strategist Barbara Lambrecht notes.
How much is the demand for oil really weakening?
“The focus of demand concerns is China, where demand has been particularly disappointing in recent months. Chinese crude oil imports, which will be published next Tuesday as part of the foreign trade data, are therefore likely to attract particular attention. A positive surprise would probably lead to a recovery in oil prices. Next week, the three energy agencies will also publish their new monthly outlooks.”
“The US Energy Information Administration's outlook for the US market is likely to attract particular attention next Tuesday. Last month, the agency was more optimistic about US demand for the current year and somewhat more pessimistic for the coming year, but also forecast demand growth of 1% for 2025. If these forecasts are confirmed, this should support sentiment, especially as the outlook for US oil production is probably being downgraded against the backdrop of significantly lower prices.”
“However, the latest hard figures for July were rather disappointing. After the IEA barely adjusted its forecasts last month, China's demand could now be revised downwards. Nevertheless, the same applies here: As OPEC+ has now postponed its production increase by at least two more months and Iraq and Kazakhstan have additionally been forcefully obliged to curb their production, the IEA could report a balanced oil market for the fourth quarter. This is also likely to support the price level because it will prevent an increase in OECD oil inventories.”
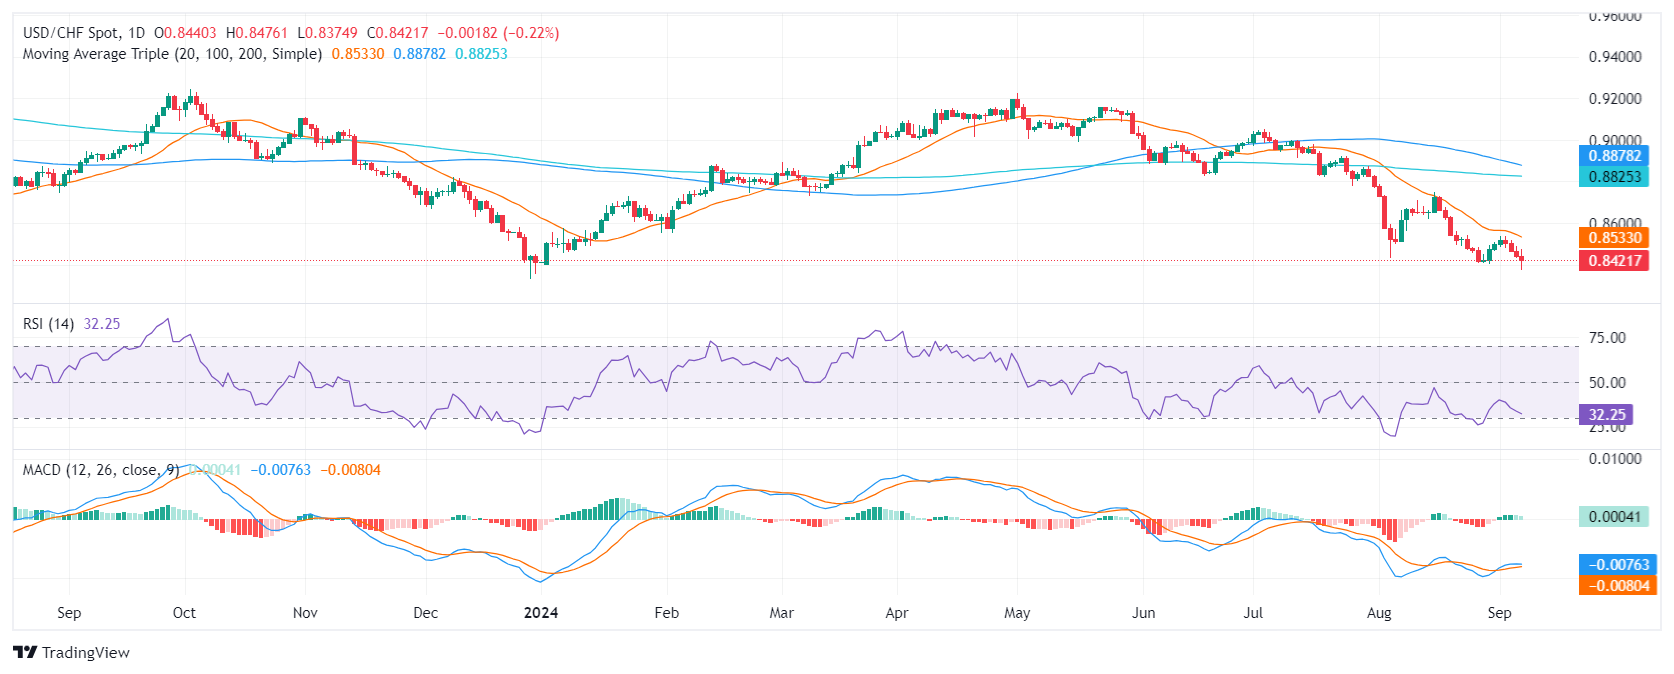
- Pair bottomed at a low of 0.8375 and then recovered above 0.8400 but holds daily losses.
- US August NFPs came in lower than expected, following this weak labor market data trend.
- Investors might bet on a bigger cut in September from the Fed.
On Friday, the USD/CHF fell to a daily low of 0.8375 and then recovered back above 0.8400. The upside, however, is limited as the US reported weak labor market figures.
The US Dollar’s appeal diminished after the release of a lower-than-expected NFP report for August, which showed the creation of 142,000 new jobs, falling short of the 160,000 forecast but surpassing July’s revised figure of 89,000. The Unemployment Rate decreased as anticipated, moving from 4.3% to 4.2%. Additionally, Average Hourly Earnings increased by 3.8% year-over-year, exceeding expectations.
Following the data, based on the CME FedWatch tool, the likelihood of a 0.50% rate cut by the Federal Reserve (Fed) at its September 18 meeting remained steady at around 40%, but what it a done deal is that the easing cycle will start in that month, with a 25 bps cut. Incoming data will justify or not a bigger cut.
USD/CHF Technical Outlook
The outlook for USD/CHF is neutral to bearish as the Relative Strength Index (RSI) hovers deep in negative terrain but with a flat slope, while the Moving Average Convergence Divergence (MACD) is showing flat green bars, further supporting the neutral outlook for the pair. Overall, the bias is still tilted to the downside as the pair hovers below its 20,100 and 200-day Simple Moving Averages (SMAs).
- AUD/USD tumbles to near 0.6700 after the release of the US NFP data for August.
- Disappointment from US job growth data boosts Fed interest rate cut hopes.
- RBA Bullock’s hawkish interest rate guidance failed to uplift the Australian Dollar.
The AUD/USD pair surrenders its intraday gains and turns negative in Friday’s North American session. The Aussie asset slumps to near 0.6700 in the aftermath of the United States (US) Nonfarm Payrolls (NFP) data for August, which increased buying interest in the US Dollar (USD) significantly.
The US Dollar Index (DXY), which tracks the Greenback’s value against six major currencies, reverses its downside move and climbs to near 101.40.
The US NFP report indicated that the job demand remained weaker than expected. Fresh payrolls came in lower at 142K than expectations of 160K but higher than July’s release of 89K, downwardly revised from 114K. The Unemployment Rate fell to 4.2%, as expected, from the prior release of 4.3%.
Disappointing US job data has given a green signal to the Federal Reserve (Fed) to start reducing the policy-easing process this month. Weak US job data has also prompted market expectations that the Fed could begin cutting interest rates aggressively.
According to the CME FedWatch tool, the likelihood for the Fed to begin reducing interest rates by 50 basis points (bps) to 4.75%-5.00% has increased to 45% from 30% recorded a week ago.
In the Asia-Pacific region, the Australian Dollar (AUD) performs weakly despite firm speculation that the Reserve Bank of Australia (RBA) is unlikely to cut interest rates this year. Prospects of RBA keeping interest rates at their current levels by the year-end strengthened after RBA Governor Michele Bullock’s hawkish interest rate guidance. Bullock said in her speech at the Anika Foundation on Thursday, "If the economy evolves broadly as anticipated, the board does not expect that it will be in a position to cut rates in the near term.”
Economic Indicator
Nonfarm Payrolls
The Nonfarm Payrolls release presents the number of new jobs created in the US during the previous month in all non-agricultural businesses; it is released by the US Bureau of Labor Statistics (BLS). The monthly changes in payrolls can be extremely volatile. The number is also subject to strong reviews, which can also trigger volatility in the Forex board. Generally speaking, a high reading is seen as bullish for the US Dollar (USD), while a low reading is seen as bearish, although previous months' reviews and the Unemployment Rate are as relevant as the headline figure. The market's reaction, therefore, depends on how the market assesses all the data contained in the BLS report as a whole.
Read more.Last release: Fri Sep 06, 2024 12:30
Frequency: Monthly
Actual: 142K
Consensus: 160K
Previous: 114K
Source: US Bureau of Labor Statistics
America’s monthly jobs report is considered the most important economic indicator for forex traders. Released on the first Friday following the reported month, the change in the number of positions is closely correlated with the overall performance of the economy and is monitored by policymakers. Full employment is one of the Federal Reserve’s mandates and it considers developments in the labor market when setting its policies, thus impacting currencies. Despite several leading indicators shaping estimates, Nonfarm Payrolls tend to surprise markets and trigger substantial volatility. Actual figures beating the consensus tend to be USD bullish.
- USD/JPY is rebounding from key support near the August 5 lows.
- It is forming a bullish candlestick although it is not possible to be certain until the current 4-hour period ends.
- The trend remains bearish although a correction higher looks likely.
USD/JPY has fallen close to the August 5 lows and bounced. It is forming a large, bullish Hammer Japanese candlestick pattern on the 4-hour chart – if the current period ends with the pattern intact it could signal the start of a substantial pull-back or correction higher.
USD/JPY 4-hour Chart
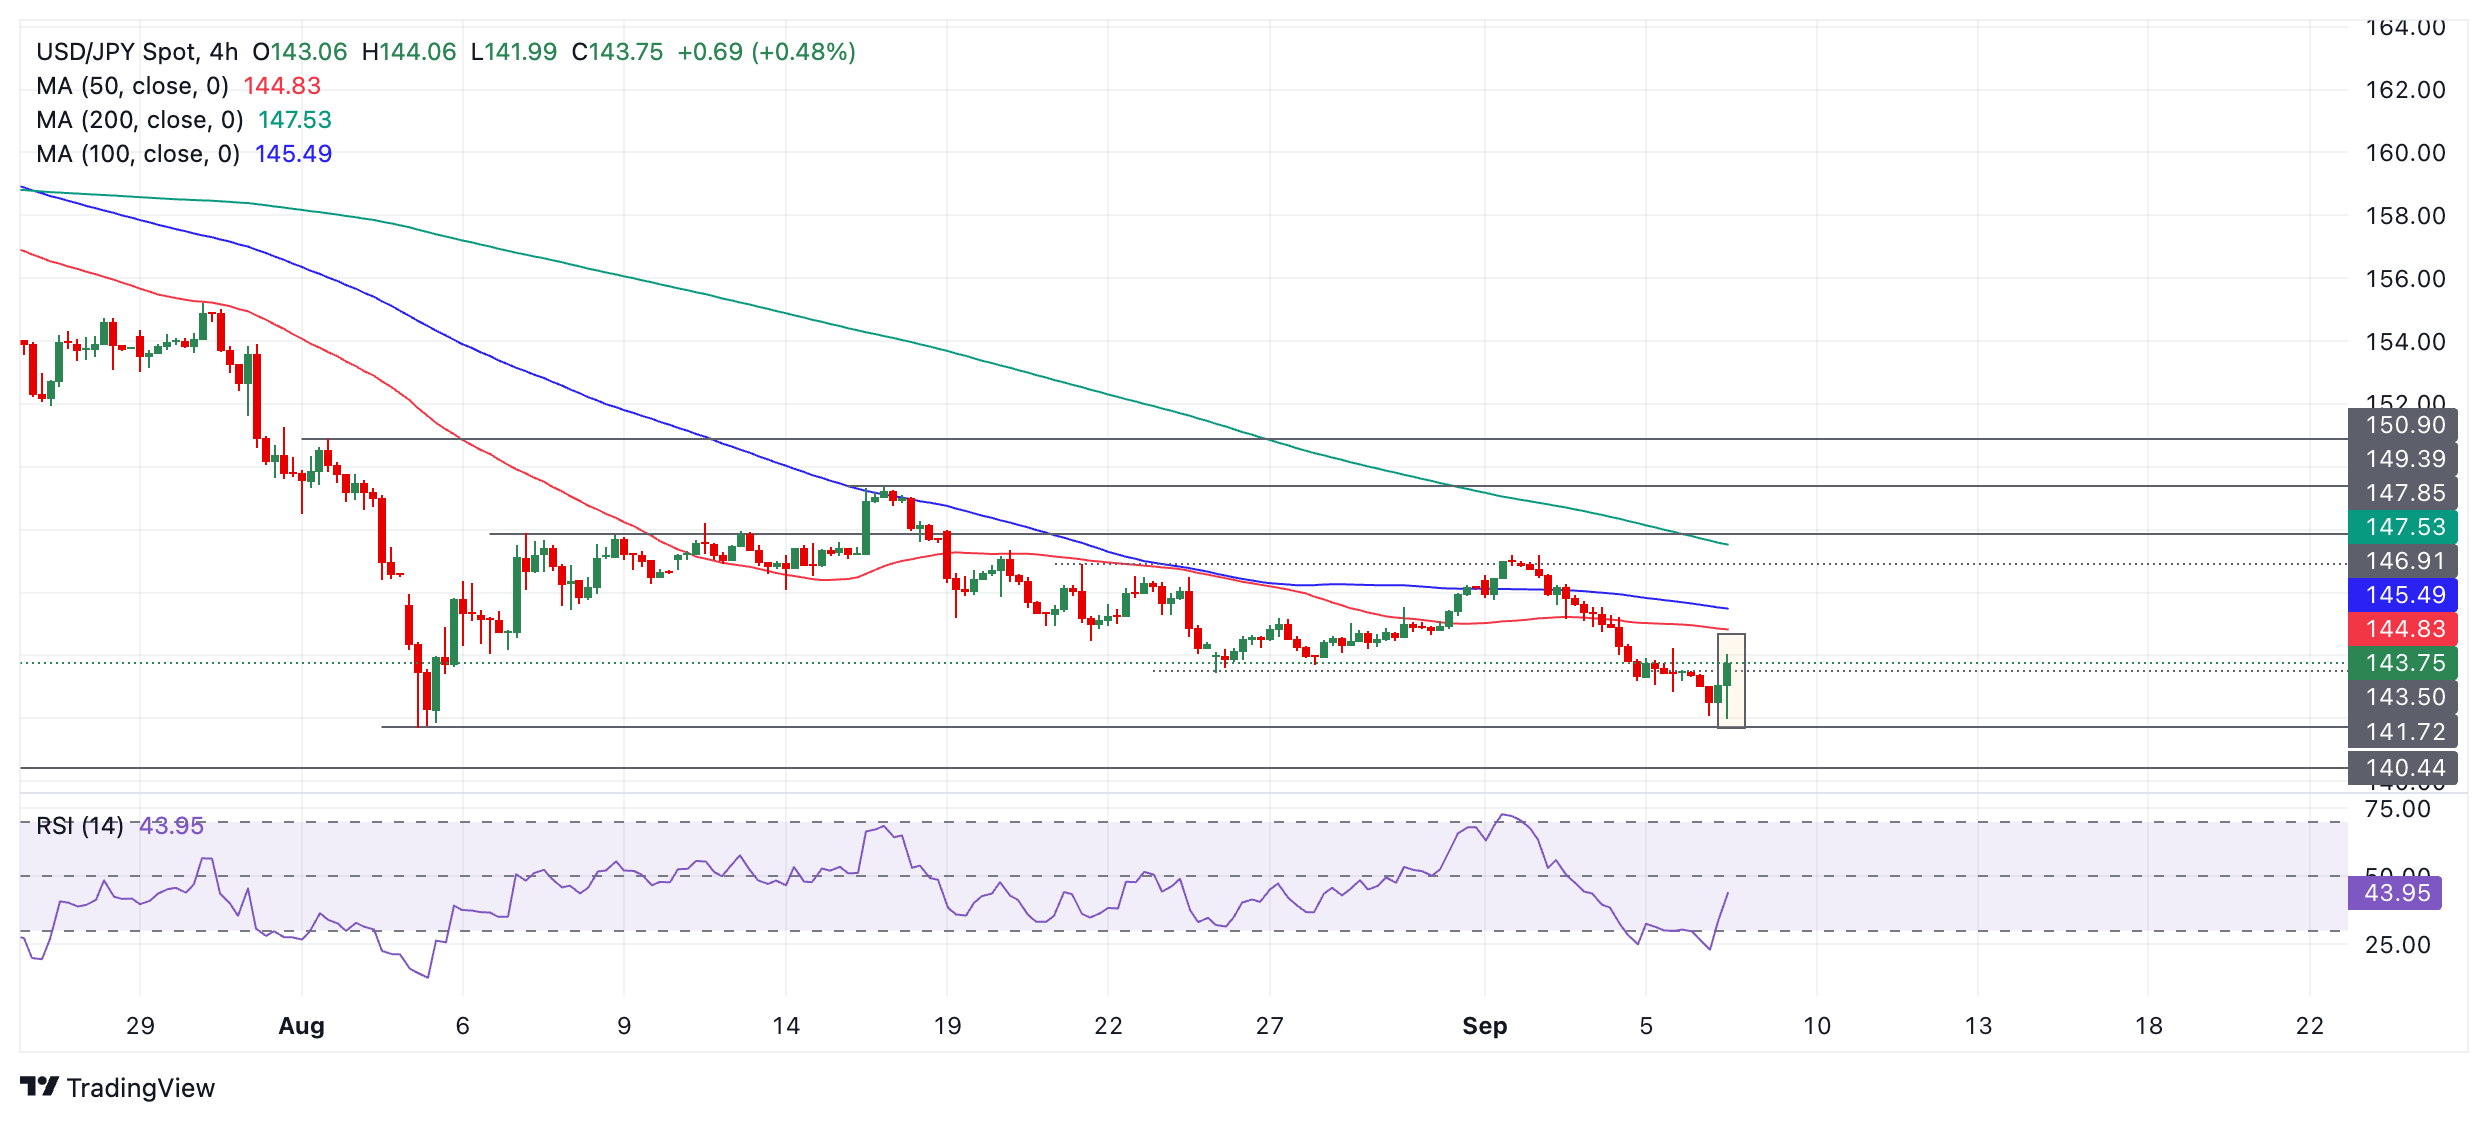
The Relative Strength Index (RSI) momentum indicator has exited oversold, giving a buy signal and indicating a greater chance of a counter-trend correction evolving. The RSI has also itself formed a double bottom pattern when looking at the previous time it was oversold on September 4. This is further evidence strengthening the case for a bullish reaction.
The short-term trend remains down, however, and it is too early to be sure that the pair is reversing the trend fully. The correction higher could soon run out of steam, leading the pair to recapitulate and start falling in line with the trend. It is a major tenet of technical analysis that “the trend is your friend” and the odds favor a continuation lower.
However, it would require a break below the August 5 lows at 141.69 to confirm a continuation lower. Such a move would probably then fall to support at 140.44 initially, the December 2023 lows.
- AUD/USD is pulling back within a short-term downtrend.
- The correction is quite shallow and will probably run out of steam and lead to a resumption of the bear trend.
AUD/USD reversed trend at the August 29 highs and started declining. The pair has since established a sequence of falling peaks and troughs which indicates the short-term trend has probably reversed and is now bearish.
Given it is a cornerstone of technical analysis theory that “the trend is your friend” the odds now favor an extension of the downtrend to lower lows.
AUD/USD 4-hour Chart
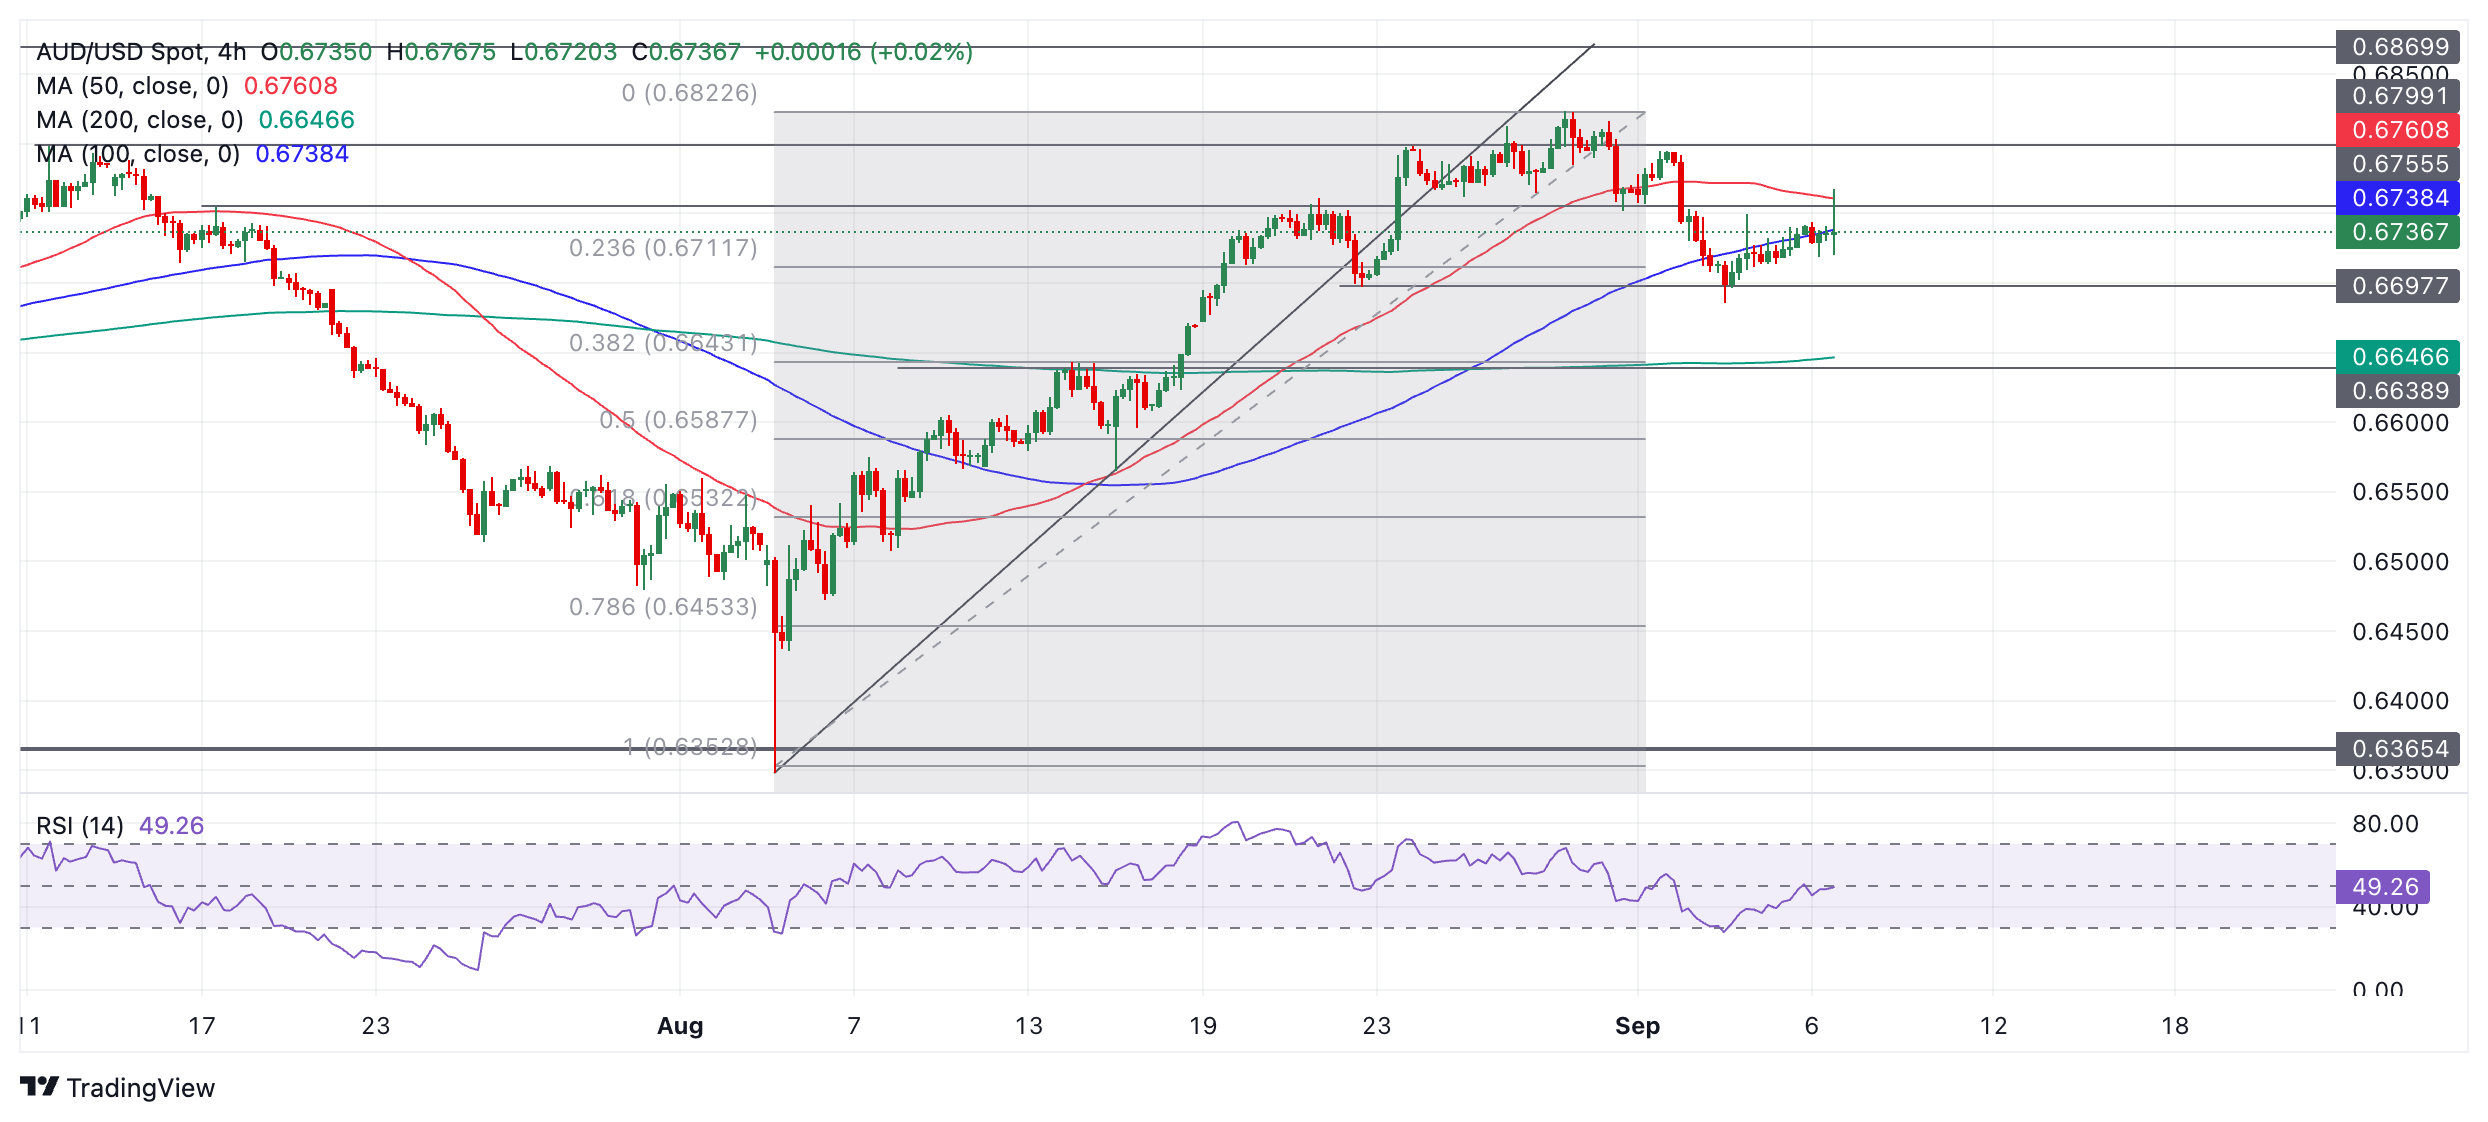
AUD/USD bottomed at 0.6685 on September 4 and has been pulling back higher in a counter-trend reaction since. This correction has been quite shallow, however, and it will probably soon run out of steam, after which bears will push price lower again in line with the trend.
A break below the 0.6685 low would confirm a continuation of the downtrend. The next target below that is 0.6645, followed by 0.6587, the Fibonacci 0.50 ratio retracement level of the August rally.
Markets are now pricing in a coin flip on a 50bp or 25bp cut by the US Federal Reserve (Fed), but more than 175bps of cuts by March has already attracted massive positions into Gold. This explains the tepid reaction to the US Nonfarm Payrolls data, TDS Senior Commodity Strategist Daniel Ghali notes.
Gold remains near all-time highs
“We reiterate that macro fund positioning is at levels only matched by the Brexit referendum in 2016, the ‘stealth QE’ narrative in 2019, or the peak panic of the Covid-19 crisis in March 2020. Extreme positioning from this cohort has historically marked notable local highs in Gold prices and subsequent drawdowns that have ranged in the 7%-10% range.”
“While a notable beat on NFP may have helped to catalyze a repricing in expectations, it is not a necessary condition for Gold prices to fizzle out. Increasingly lackluster price action is also lowering the bar for CTAs to sell, with a big downtape already likely to catalyze selling activity from trend followers, despite the fact that Gold remains near all-time highs.”
The OPEC+ group's decision to defer their planned increases in supply has not been sufficient to halt the bleed in supply risk premia, TDS Senior Commodity Strategist Daniel Ghali notes.
The pressure remains on crude oil prices
“Our return decomposition framework continues to point to the erosion of supply risks from energy market pricing. Combined with a continued deterioration in demand sentiment embedded within prices, the pressure remains on crude oil prices.”
“Historically, implications of OPEC+ decisions have taken a few days to filter through to market pricing, suggesting that these trends could reverse course. Still, while we expect modest-scale buying activity from CTA trend followers in WTI crude, we do not see any signs that OPEC's decision has halted the bleed in supply risk premia for the time being.”
- USD/CAD rebounds strongly to near 1.3500 as the US Dollar reverses losses after the release of the US NFP data for August.
- Fewer-than-expected US job growth boosts expectations of Fed interest rate cuts this month.
- Canadian jobless rate rises further to 6.6%.
The USD/CAD pair recovers swiftly to near the round-level support of 1.3500 in Friday’s American session. The Loonie asset turns volatile after the release of the United States/Canada Employment data for June.
The US Nonfarm Payrolls (NFP) report showed that labor demand turned out weaker-than-expected. Number of workers hired were 142K, lower than the estimates of 16K but higher than the prior release of 89K, downwardly revised from 114K. The Unemployment Rate fell to 4.2%, as expected from the prior release of 4.3%.
Meanwhile, Average Hourly Earnings accelerated at a faster-than-expected pace. Annually, the wage growth momentum rises to 3.8% from the estimates of 3.7% and the prior release of 3.6%. This has renewed fears of price pressures remaining persistent. However, it is unlikely to influence market speculation for Federal Reserve (Fed) interest rate path as the central bank is more focused towards preventing job losses.
The US Dollar Index (DXY), which tracks the Greenback’s value against six major currencies, recovers its intraday losses and rises to near 101.20.
In Canada, the labor market witnessed fresh addition of 22.1K job-seekers. The labor growth was slower than expected as market participants estimated fresh hiring of 25K workers. In July, Canada’s labor market data faced an unexpected drawdown as 1.4K employees were laid-off. Meanwhile, the Unemployment Rate rose further to 6.6%, higher than the estimates of 6.5% and the prior release of 6.4%.
Average Hourly Earnings decelerated sharply to 4.9% from the former reading of 5.2%. Rising jobless rate and easing wage growth momentum would prompt expectations of more interest rate cuts by the Bank of Canada (BoC).
The Chinese data to be released over the next two weeks is likely to be decisive for base metals, Commerzbank commodity strategist Barbara Lambrecht notes.
A part of the sentiment on China is already priced into base metals
“More so than Monday's inflation data, Tuesday's foreign trade data is likely to be particularly important. In addition to exports of Aluminum and Steel products, the focus will be on imports. While imports of Copper ore have recently weakened somewhat, which could also be due to seasonal factors, imports of iron ore have been rising steadily.”
“However, given the recent decline in steel production and the continued build-up of inventories in Chinese ports, we continue to expect imports to decline in the near term. A look at Australian exports in July suggests a decline in August, at least from that side. The focus will also be on the Chinese credit growth figures, which will be released later this week.”
“Credit growth figures have been weak in recent months, with the most recent figure showing credit growth of only around 8%, the slowest on record. If the figures disappoint again, this is likely to continue to weigh on sentiment and expectations for the future development of China's construction and manufacturing sectors. All in all, a good part of the negative sentiment on China is likely already priced into base metals. Positive surprises are therefore likely to have a greater impact on prices than further weak data.”
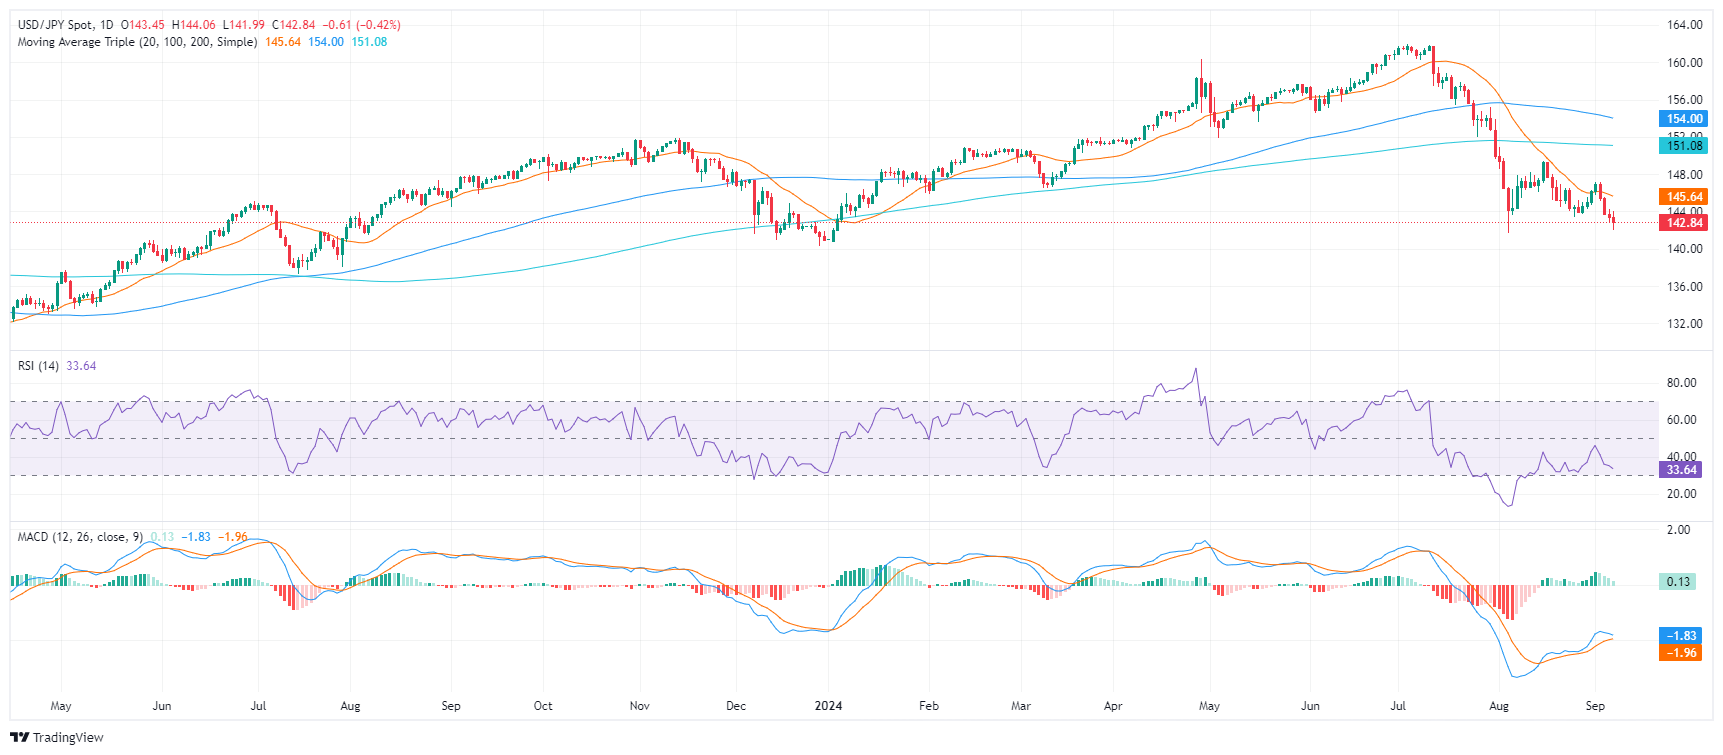
- US Dollar's weakness continues after August Nonfarm Payrolls came in lower than expected, reflecting broader labor market concerns.
- Market expectations for a Federal Reserve interest rate cut have risen, driven by signs of a slowing US labor market and softer job growth.
- The odds of a 50 bps cut in September by the Fed rose to nearly 50%.
The USD/JPY tallies 0.30% losses on Friday as the USD extends its broad weakness after soft Nonfarm Payrolls figures from the US.
The US Dollar's appeal has weakened following a weaker-than-expected August Nonfarm Payrolls (NFP) report, which showed 142K new jobs, below estimates of 160K but above July’s revised 89K. The Unemployment Rate fell as expected to 4.2% from 4.3%. Other data showed that Average Hourly Earnings rose by 3.8% year-on-year, exceeding expectations.
This decline in labor market conditions, alongside disappointing JOLTS Job Openings and ADP Employment data, has fueled concerns about a slowing economy along the week and markets are getting confident about a bigger cut in September by the Federal Reserve (Fed).
USD/JPY technical outlook
The USD/JPY outlook is negative as the Relative Strength Index (RSI) hovers near the oversold level of 30, signaling potential downward momentum which could eventually lead to a correction though. Additionally, the Moving Average Convergence Divergence (MACD) is printing higher red bars, reinforcing the bearish sentiment in the pair.
As stated, the pair saw four sessions of losses and could see an upward correction anytime soon.
Federal Reserve Bank of New York President John Williams said on Friday that they are ready to start the process of rate cuts, per Reuters.
Key takeaways
"Monetary policy can be moved to more neutral stance depending on data."
"Fed policy has been effective in restoring price stability."
"Job market in better balance, not main source of inflation."
"Risks to outlook include further weakening in jobs market."
"Risk to economy includes slowing global growth."
"US GDP likely 2%-2.5% for this year."
"Unemployment rate likely around 4.25% by year-end."
"Longer run expects unemployment to settle around 3.75%."
"Expecting more inflation cooling, inflation at 2.25% this year, near 2% next year."
"Confidence rising that inflation pressures are ebbing."
"Inflation expectations remain well anchored."
"Unemployment rate still low despite rise."
"Cooling in job market retreat from overheated conditions."
Market reaction
The US Dollar Index showed no reaction to these comments and was last seen trading flat on the day at 101.05.
Supply news made the headlines this week. Libya's production losses initially grew from day to day, peaking at 700 thousand barrels per day.
OPEC+ continues its efforts to stabilize prices
“In the second half of the week, after an agreement between the conflicting parties in the east and west of the country became apparent, the first oil producers reported an increase in production. In addition, there were further survey-based estimates for OPEC production in August.”
“According to Bloomberg, this was only 70 thousand barrels per day lower than in the previous month: a drop of 150 thousand barrels per day was recorded for Libya (Reuters had reported a drop of 220 thousand barrels per day at the start of the week), but this was partially compensated for by an increase in Nigeria and Kuwait. Iraq's daily production remained well above target at 4.3 million barrels.”
“Last but not least, the OPEC delegates kept the market in suspense: the speculation as to whether OPEC+ would now withdraw the voluntary production cuts from October or extend the curbs again after all - and if so, until when - lasted longer than expected. The final agreement on a postponement of two months has so far only helped the oil price to a limited extent - after all, ‘postponed is not cancelled’, but it shows that OPEC+ is continuing its efforts to stabilize prices.”
The Pound Sterling (GBP) is a minor underperformer on the day so far after drifting back from its early London peak just under 1.32, Scotiabank’s Chief FX Strategist Shaun Osborne notes.
GBP underperforms slightly in quiet trade
“There were no UK data reports and no comments from policymakers to drive movement—which seems more flow-driven ahead of the US data reports.”
“The GBP’s underperformance in European trade leaves a negative tinge to the intraday chart, with Cable forming a bearish outside range on the 6-hour chart.”
“Minor support sits at 1.3150/60 and weakness below here targets a retest of the 1.3090/00 zone. Resistance is 1.3195/00, ahead of 1.3255/65.”
Significantly weaker than expected French and German Industrial Production data for July will lift concerns about the lack of momentum in the Eurozone economy but the data barely had an impact on the EUR which touched 1.1120 earlier before edging marginally lower, Scotiabank’s Chief FX Strategist Shaun Osborne notes.
Renewed upside momentum in the EUR
“Lower USD yields and narrower EZ/US short-term spreads (2Y at –145bps) have provided the essential support for the EUR’s recent gains and the US rate outlook will continue to drive spot moves in the short run.”
“Spot gains through the low 1.11 zone is helping support renewed upside momentum in the EUR on the short-term chart and aligning the intraday DMI with the bullish orientation of the daily and weekly studies. The technical picture suggests limited downside potential for the EUR and keeps the broader outlook positive.”
“Resistance is 1.1200 but a weekly close above 1.1160 or so would be constructive from a technical point of view.”
The price of Gold climbed back above the $2,500 per troy ounce mark, trading just below its record high, Commerzbank commodity strategist Barbara Lambrecht notes.
ETF investors raise their interest in Gold
“The apparent weakening of the US labor market has raised hopes of faster interest rate cuts. Today's US labor market report could strengthen or dampen expectations accordingly. Meanwhile, the World Gold Council's new monthly statistics show that Gold ETFs recorded inflows for the fourth month in a row in August, albeit not quite as high as in July.”
“Holdings are now as high as they were last in mid-February. All regions recorded rising ETF holdings, with North America and Europe seeing the highest inflows. According to WGC, falling opportunity costs, a weaker US dollar and geopolitical tensions in the Middle East are key factors explaining the interest shown by ETF investors.”
Canadian jobs data may not matter all that much for the CAD today. The consensus anticipates a “standard” 25k gain in jobs but a small uptick in unemployment (to 6.5%) and still lofty wage growth (4.8%).
Canadian jobs and US data come next
“This is the sort of thing that will keep the market from pricing in anything more aggressive than 25bps cuts by the BoC for the time being. There is no obvious need at this point for the BoC to pick up the pace of cuts. US jobs data are clearly more important for the short-term direction of USD and USD/CAD—weak US numbers will pull USD/CAD back to the 1.34 area. On expectations data or better likely means USDCAD pushing higher to 1.36+.”
“Short-term spot trends look fairly tepid with the USD chopping narrowly around the 1.35 area over the past day or so. USD losses from the mid-week peak in the upper 1.35s gives the slightly broader technical picture a negative look, however, and spot is resting a little above key short-term support at 1.3490 (potential bear flag base) as the North American session gets going. Loss of support at 1.3490 should see the USD retest the low 1.34 zone at least. Resistance is 1.3580 and 1.3635.”
- The US Dollar falls for a third day in a row.
- Investors are cautious ahead of the Nonfarm Payrolls report, which could trigger volatility around the US Dollar.
- The US Dollar Index retreats further, nearing the August low at 100.62.
The US Dollar (USD) trades slightly on the back foot on Friday as markets brace for potentially the most volatile event of the week, Nonfarm Payrolls (NFP). Markets are increasingly considering the possibility that the US Federal Reserve (Fed) could opt for a big interest-rate cut compared with the beginning of the week after a streak of labor-market-related data came weaker than expected. A big miss in the Nonfarm Payrolls number will confirm this stance, while a big beat on estimates might see a spicy outcome, with the US Dollar rallying and rate cut bets being quickly unwound.
The Nonfarm Payrolls print will be the main element together with the Unemployment Rate and the monthly Average Hourly Earnings. However, the surprise might come right at the end of the trading day with Federal Reserve Governor Christopher Waller due to speak after the Nonfarm Payrolls print is published. Fed Waller is known for delivering some market-moving comments, and he might be the one to confirm if in September the Fed will go for a 25-basis-point or a 50-basis-point rate cut.
Daily digest market movers: All eyes on payrolls
- At 12:30 GMT, the US Jobs Report for August will be released by the Bureau of Labor Statistics. Here are the main key takeaways to watch:
- Nonfarm Payrolls are expected to have increased by 160,000, accelerating from the tepid 114,000 seen a month earlier.
- Monthly Average Hourly Earnings should tick up to 0.3% from 0.2%.
- The Unemployment Rate should dip to 4.2% from 4.3%.
- Two Fed speakers are on the docket after the US Jobs Report is published:
- Federal Reserve Bank of New York President John Williams delivers keynote remarks and participates in a Q&A session at the C. Peter McColough Series on International Economics around 12:45 GMT.
- Around 15:00 GMT, Federal Reserve Governor Christopher Waller delivers a speech about the US economic outlook and participates in a Q&A session at the University of Notre Dame in Indiana.
- Equities are trading lower again, with Asia already closing off this week’s performance in red. Both European and US equities are also losing ground, although by less than 1%.
- The CME Fedwatch Tool shows a 59.0% chance of a 25 basis points (bps) interest rate cut by the Fed in September against a 41.0% chance for a 50 bps cut. Another 25 bps cut (if September is a 25 bps cut) is expected in November by 29.9%, while there is a 49.9% chance that rates will be 75 bps (25 bps + 50 bps) below the current levels and a 20.2% probability of rates being 100 (25 bps + 75 bps) basis points lower.
- The US 10-year benchmark rate trades at 3.70%, close to the lowest level for this year at 3.66%.
Economic Indicator
Nonfarm Payrolls
The Nonfarm Payrolls release presents the number of new jobs created in the US during the previous month in all non-agricultural businesses; it is released by the US Bureau of Labor Statistics (BLS). The monthly changes in payrolls can be extremely volatile. The number is also subject to strong reviews, which can also trigger volatility in the Forex board. Generally speaking, a high reading is seen as bullish for the US Dollar (USD), while a low reading is seen as bearish, although previous months' reviews and the Unemployment Rate are as relevant as the headline figure. The market's reaction, therefore, depends on how the market assesses all the data contained in the BLS report as a whole.
Read more.Next release: Fri Sep 06, 2024 12:30
Frequency: Monthly
Consensus: 160K
Previous: 114K
Source: US Bureau of Labor Statistics
America’s monthly jobs report is considered the most important economic indicator for forex traders. Released on the first Friday following the reported month, the change in the number of positions is closely correlated with the overall performance of the economy and is monitored by policymakers. Full employment is one of the Federal Reserve’s mandates and it considers developments in the labor market when setting its policies, thus impacting currencies. Despite several leading indicators shaping estimates, Nonfarm Payrolls tend to surprise markets and trigger substantial volatility. Actual figures beating the consensus tend to be USD bullish.
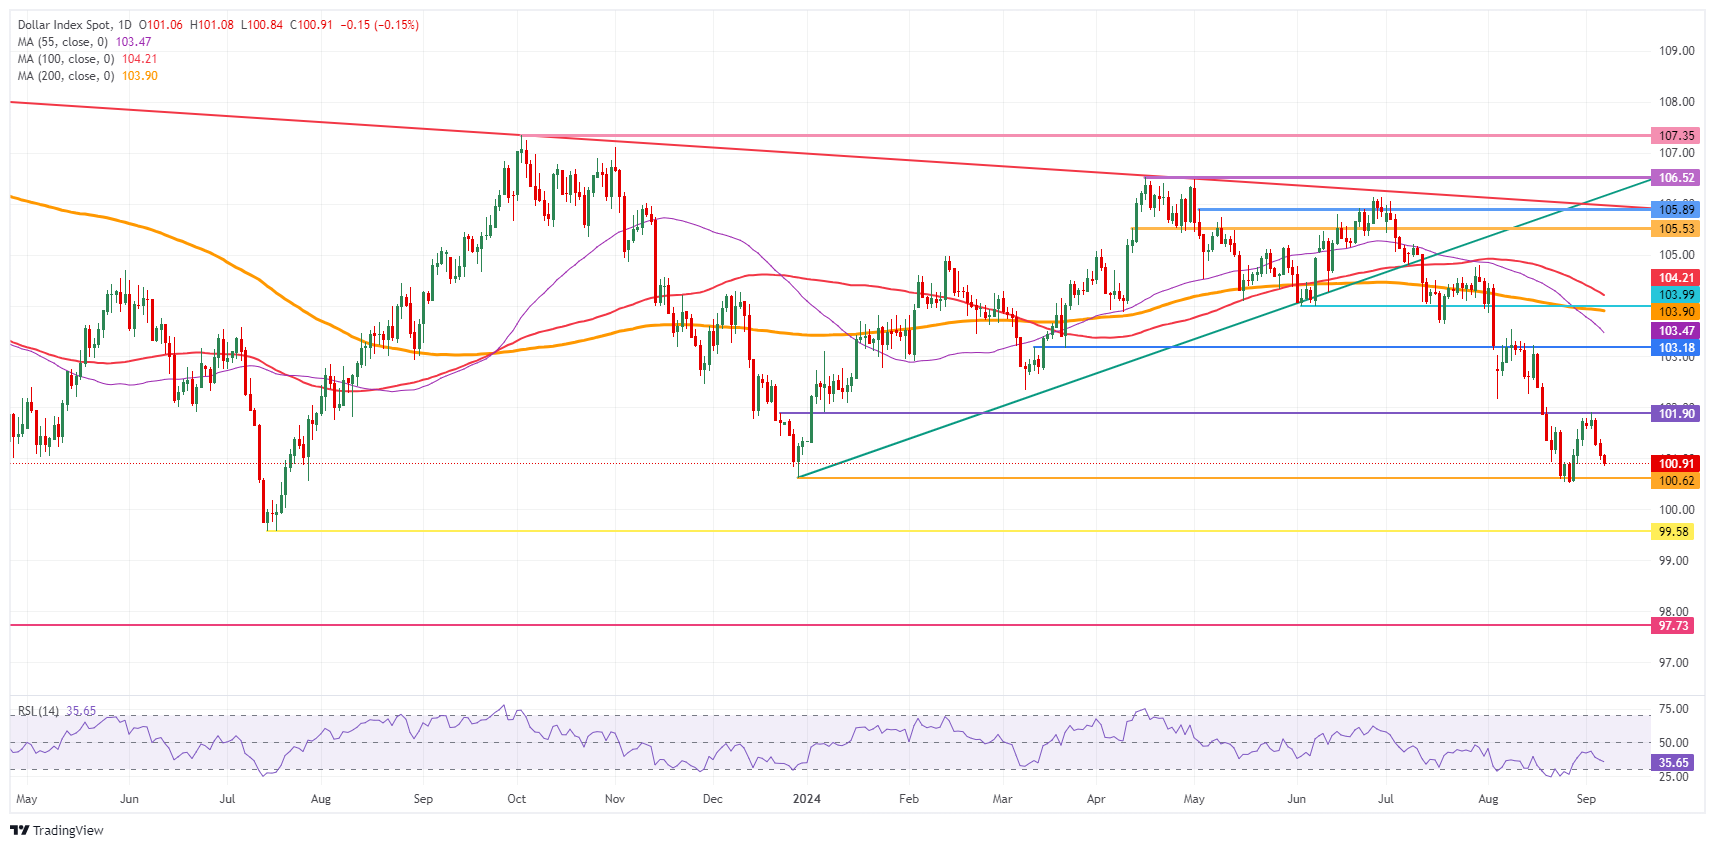
US Dollar Index Technical Analysis: We get it by now
The US Dollar Index (DXY) is the sum of all parts that are taking place in the markets. Investors increasingly price in that the Fed will need to cut interest rates by more than what was anticipated a few weeks ago. Although a rate cut might be granted, the recent US economic data still puts the economy on a glide path for a soft landing, which means the Fed isn’t likely to cut aggressively as that would risk sparking inflation again.
Looking at key technical levels, the first resistance at 101.90 is starting to look very difficult to break through after it already triggered a rejection earlier this week. Further up, a steep 2% uprising would be needed to get the index to 103.18. Finally, a heavy resistance level near 104.00 not only holds a pivotal technical value, but it also bears the 200-day Simple Moving Average (SMA) as the second heavyweight to cap price action.
On the downside, 100.62 (the low from December 28) could soon see a test in case data supports more rate cuts from the Fed. Should it break, the low from July 14, 2023, at 99.58, will be the ultimate level to look out for. Once that level gives way, early levels from 2023 are coming in near 97.73.
US Dollar Index: Daily Chart
It’s payrolls Friday. The USD is soft on the day, but trading off its earlier lows, while stocks are broadly lower and major bond markets are firmer, driving 10Y yields 3-4bps lower. The morose risk mood reflects slowdown concerns ahead of the jobs data but after Fed Chair Powell’s Jackson Hole comments effectively signaled the Fed’s readiness to start cutting rates, payrolls is the data point that many think determines whether the Fed easing cycle will start with a 25 or 50bps cut on the 18th, Scotiabank’s Chief FX Strategist Shaun Osborne notes.
Market awaits US jobs data for guidance on Fed
“The market consensus anticipates OK data—a 165k gain on payrolls and a minor nudge lower for the unemployment rate to 4.2% in August. Scotia is a little below the consensus at 140k. Outcomes in those sorts of ballparks are probably not enough to persuade policy makers that a 1/2-point cut is warranted. A 165k gain is still a bit lower than the 3m average payroll gain and whether it’s a 4.2% or 4.3% may come down to rounding, however.”
“Weak ADP data, soft JOLTS and a sluggish Beige Book suggest some risk of disappointing data overall. A NFP gain closer to July’s 114k would tilt risks more strongly towards a 50bps ease. Markets have priced in around 35bps of easing risk for the September decision and soft data will add to front-load easing expectations but likely not add to the 100bps of anticipated Fed easing already reflected in swaps for the balance of this year.”
“Note that we will get near instant Fed reaction to the jobs data from Fed Governor Waller who speaks at 11ET. With the recent consolidation in the USD relieving its generally oversold condition to some extent, weak data will likely drive the DXY towards the 100 level. On expectations or better will lift the DXY as the Fed easing risks reprice away from the 100bps of cuts currently factored in and pull the DXY higher to the 101.50/102 zone.”
- Crude Oil trades near the year-to-date low recorded on Thursday below $70.00.
- Sketchy OPEC communication leaves traders in the dark for the next movements.
- The US Dollar Index trades just below 101.00 ahead of the US Employment Report.
Crude Oil consolidates this week’s sharp decline to a fresh year-to-date low below $70.00 for a second day in a row on Friday. Crude Oil prices remain subdued mostly because of the sketchy communication from the Organization of the Petroleum Exporting Countries and its allies (OPEC+). Although several delegates from the consortium might have said that a deal is near to delaying production normalization, markets would have thought that OPEC would come up with far more thorough and impactful measures that would support Crude Oil prices more substantially.
The US Dollar Index (DXY), which tracks the performance of the US Dollar (USD) against a basket of currencies, is falling just below 101.00 ahead of the US Employment Report for August. With market expectations stretched to a near 100 basis points cut in the Federal Reserve (Fed) interest rate by November (it looks like markets have priced in a bit too much easing from the Fed), the US Nonfarm Payrolls report on Friday might signal a steady soft landing, which would suggest smaller increments of 25 basis points per Fed meeting. This could see the US Dollar jump higher as yields would soar.
At the time of writing, Crude Oil (WTI) trades at $69.04 and Brent Crude at $72.92
Oil news and market movers: OPEC only acts when it is cornered
- Several traders are reporting to Bloomberg that they are taking recent communication from OPEC+ with a pinch of salt, as OPEC only now reacts when Crude Oil prices are falling below their price floor and starts to feel the pain financially.
- The Options market sees options being skewed to more bearish territory, with Brent 25-delta puts deepening recent moves, Bloomberg reports.
- Reuters reports that the recent decline in Crude Oil prices should steady for now, with the recent chunky US drawdowns matching the concern for oversupply after the Energy Information Administration (EIA) saw a chunky 6.873 million drawdown in Crude stockpile against last week’s 0.846 million drawdown, and snapping above the projected 0.9 million drawdown expected.
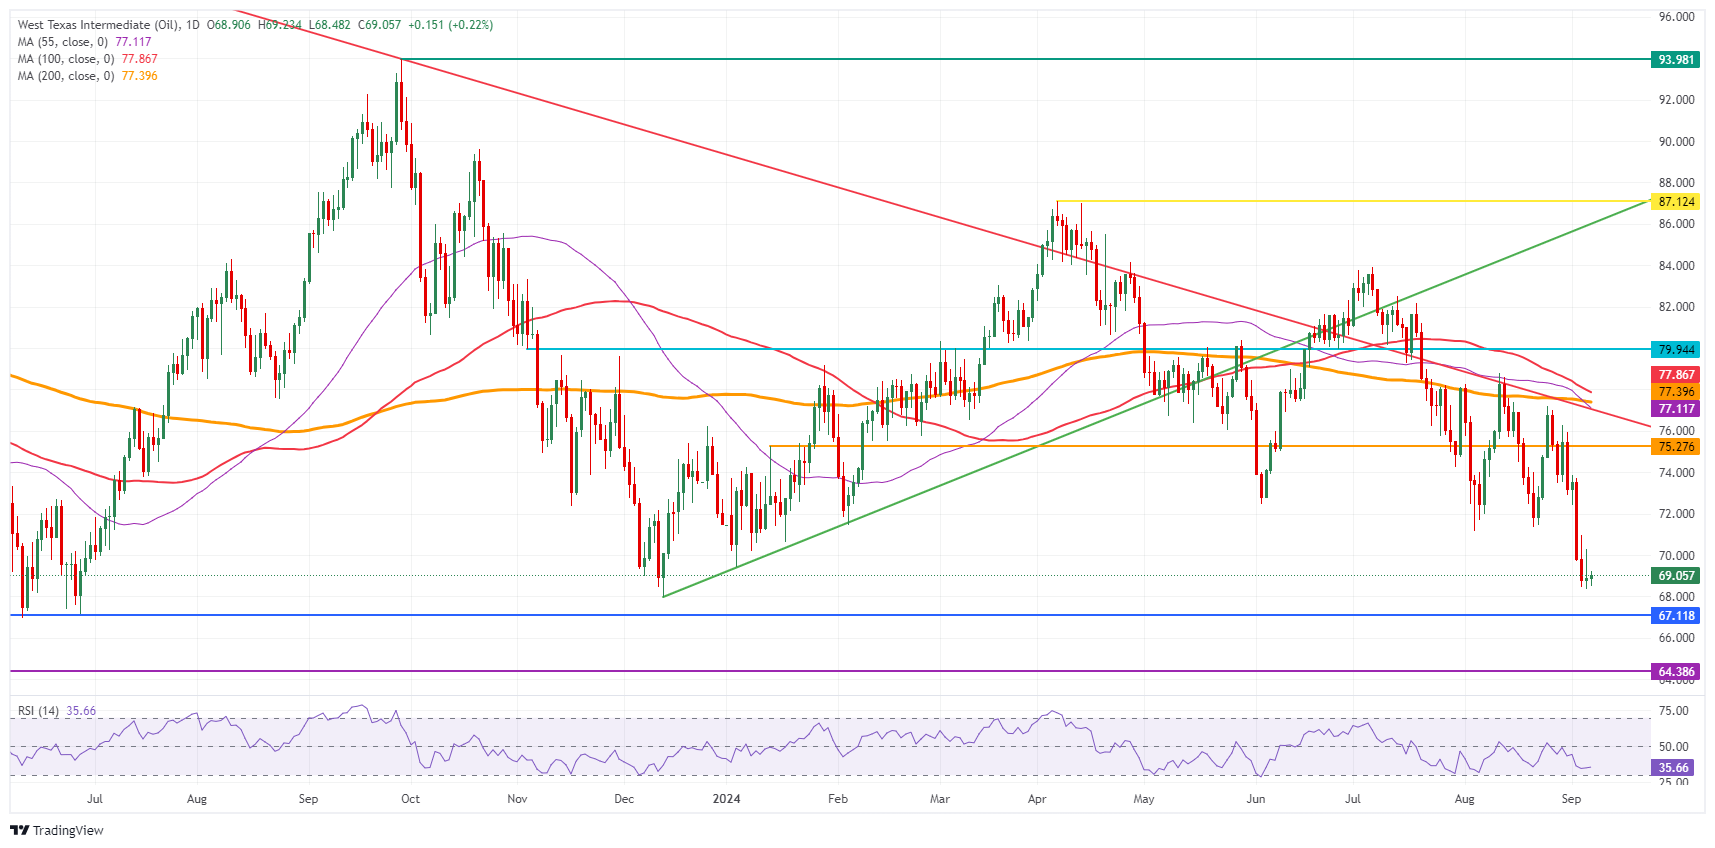
Oil Technical Analysis: OPEC reliance under fire
Crude Oil’s price action could dip a little further as the OPEC+ headlines are often obsolete by the end of the trading day. It paints a very clear picture that markets are only hanging some importance on OPEC communication for a short period of time. Clearly, OPEC is not being considered a reliable communicator, which means they will need to step up their game and act more firmly and swiftly if they want to have that price floor in place.
On the upside, the $75.27 will be the first level to head back to. Next, the $77.43 level aligns with both a descending trendline and the 200-day Simple Moving Average (SMA). In case bulls can break above it, the 100-day SMA at $78.00 could trigger a rejection.
The low from August 5 at $71.17 has been broken. From here, the $68.00 big figure is the first level to watch, followed by $67.11, which is the lowest point from the triple bottom seen back in June 2023.
US WTI Crude Oil: Daily Chart
Brent Crude Oil FAQs
Brent Crude Oil is a type of Crude Oil found in the North Sea that is used as a benchmark for international Oil prices. It is considered ‘light’ and ‘sweet’ because of its high gravity and low sulfur content, making it easier to refine into gasoline and other high-value products. Brent Crude Oil serves as a reference price for approximately two-thirds of the world's internationally traded Oil supplies. Its popularity rests on its availability and stability: the North Sea region has well-established infrastructure for Oil production and transportation, ensuring a reliable and consistent supply.
Like all assets supply and demand are the key drivers of Brent Crude Oil price. As such, global growth can be a driver of increased demand and vice versa for weak global growth. Political instability, wars, and sanctions can disrupt supply and impact prices. The decisions of OPEC, a group of major Oil-producing countries, is another key driver of price. The value of the US Dollar influences the price of Brent Crude Oil, since Oil is predominantly traded in US Dollars, thus a weaker US Dollar can make Oil more affordable and vice versa.
The weekly Oil inventory reports published by the American Petroleum Institute (API) and the Energy Information Agency (EIA) impact the price of Brent Crude Oil. Changes in inventories reflect fluctuating supply and demand. If the data shows a drop in inventories it can indicate increased demand, pushing up Oil price. Higher inventories can reflect increased supply, pushing down prices. API’s report is published every Tuesday and EIA’s the day after. Their results are usually similar, falling within 1% of each other 75% of the time. The EIA data is considered more reliable, since it is a government agency.
OPEC (Organization of the Petroleum Exporting Countries) is a group of 13 Oil producing nations who collectively decide production quotas for member countries at twice-yearly meetings. Their decisions often impact Brent Crude Oil prices. When OPEC decides to lower quotas, it can tighten supply, pushing up Oil prices. When OPEC increases production, it has the opposite effect. OPEC+ refers to an expanded group that includes ten extra non-OPEC members, the most notable of which is Russia.
USD/SGD fell further, tracking the broader softness in USD, OCBC Frances Cheung and Christopher Wong note.
Consolidation likely near recent lows ahead of US jobs data
“Pair breached 1.30 briefly to trade a low of 1.2992 at one point. Pair was last below 1.30 levels. Daily momentum is mild bullish while RSI fell. Consolidation likely near recent lows as markets await US jobs data. Support at 1.2960. Resistance at 1.3090 (21 DMA), 1.3160 levels (23.6% fibo retracement of 2024 high to low).”
“S$NEER was last estimated at ~1.92% above our model-implied mid, with model implied spot lower bound at 1.2990. With S$NEER close to its lower bound, the room for further downside in USD/SGD may be limited intra-day. However, if broader USD takes another leg lower, then the implied lower bound of USD/SGD can be lower.”
- NZD/USD gains to near 0.6230 amid weakness in the US Dollar ahead of the US official employment data for August.
- Investors see the Fed reducing interest rates this month.
- The US Unemployment Rate is seen declining to 4.2% in August.
The NZD/USD pair moves higher to near 0.6230 in Friday’s European session. The Kiwi asset gains as the US Dollar (USD) extends its downside amid growing risks to the United States (US) labor market health due to the long maintenance of restrictive monetary policy stance by the Federal Reserve (Fed).
The US Dollar Index (DXY), which tracks the Greenback’s value against six major currencies, falls below 101.00.
Downside risks to US job market appears to be escalating as new job vacancies and labor demand in the private sector have slowed down significantly. Expanding cracks on the US labor market health has prompted expectations that the Fed could start reducing interest rates this month.
While the Fed is almost certain to begin cutting its key borrowing rates from this month, traders remain split over the likely interest rate cut size. According to the CME Fedwatch tool, the possibility for the Fed to begin reducing interest rates by 50 basis points (bps) to 4.75%-5.00% has increased to 41% from 34% recorded a week ago.
For fresh cues about Fed’s potential rate cut size, investors will focus on the US Nonfarm Payrolls (NFP) data for August, which will be published at 12:30 GMT. The NFP report is expected to show that US employers hired 160K new workers in August, higher from 114K in July. In the same period, the Unemployment Rate is expected to have declined to 4.2% from the former release of 4.3%. Signs of weak labor demand and rising jobless rate would boost Fed large rate cut bets, while upbeat figures would do the opposite.
On the Kiwi front, the New Zealand Dollar (NZD) performs strongly on expectations of liquidity boost from the People’s Bank of China (PBoC). PBoC Deputy Governor Lu Lei said on Thursday, “central bank will continue to implement supportive policy.” He added, “Central bank will steadily lower financing costs for firms, credit costs for residents.”
The continuation of supportive interest rate policy will uplift the economic growth, which will increase foreign flows to the New Zealand, being on of its major trading partners.
New Zealand Dollar FAQs
The New Zealand Dollar (NZD), also known as the Kiwi, is a well-known traded currency among investors. Its value is broadly determined by the health of the New Zealand economy and the country’s central bank policy. Still, there are some unique particularities that also can make NZD move. The performance of the Chinese economy tends to move the Kiwi because China is New Zealand’s biggest trading partner. Bad news for the Chinese economy likely means less New Zealand exports to the country, hitting the economy and thus its currency. Another factor moving NZD is dairy prices as the dairy industry is New Zealand’s main export. High dairy prices boost export income, contributing positively to the economy and thus to the NZD.
The Reserve Bank of New Zealand (RBNZ) aims to achieve and maintain an inflation rate between 1% and 3% over the medium term, with a focus to keep it near the 2% mid-point. To this end, the bank sets an appropriate level of interest rates. When inflation is too high, the RBNZ will increase interest rates to cool the economy, but the move will also make bond yields higher, increasing investors’ appeal to invest in the country and thus boosting NZD. On the contrary, lower interest rates tend to weaken NZD. The so-called rate differential, or how rates in New Zealand are or are expected to be compared to the ones set by the US Federal Reserve, can also play a key role in moving the NZD/USD pair.
Macroeconomic data releases in New Zealand are key to assess the state of the economy and can impact the New Zealand Dollar’s (NZD) valuation. A strong economy, based on high economic growth, low unemployment and high confidence is good for NZD. High economic growth attracts foreign investment and may encourage the Reserve Bank of New Zealand to increase interest rates, if this economic strength comes together with elevated inflation. Conversely, if economic data is weak, NZD is likely to depreciate.
The New Zealand Dollar (NZD) tends to strengthen during risk-on periods, or when investors perceive that broader market risks are low and are optimistic about growth. This tends to lead to a more favorable outlook for commodities and so-called ‘commodity currencies’ such as the Kiwi. Conversely, NZD tends to weaken at times of market turbulence or economic uncertainty as investors tend to sell higher-risk assets and flee to the more-stable safe havens.
- EUR/GBP falls back from the day’s highs after Eurozone GDP growth for Q2 is revised down.
- The data increases the chances the ECB will cut interest rates in September, weighing on the Euro.
- EUR/GBP is capped because of Sterling strength due to expectations the BoE will cut rates more slowly amid stronger growth.
EUR/GBP gives back early gains on Friday as traders sell the Euro (EUR) following the release of Eurozone Gross Domestic Product (GDP) data which showed a downward revision in the second quarter from the initial estimate. This brings the pair back down into the week’s range in the early 0.8420-30s.
Eurozone GDP grew at a slower 0.2% quarterly pace in Q2 compared to the 0.3% of the previous estimate, and below the 0.3% of Q1. The downward revision increases the chances the European Central Bank (ECB) will cut interest rates at its September meeting. This, in turn, weighs on EUR/GBP since lower interest rates are negative for the Euro because they reduce foreign capital inflows.
The slowdown in growth also plays into fears that too-high interest rates are stifling growth, reinforcing comments from ECB Executive Board member Piero Cipollone, who said, in an interview with a French newspaper this week that "there is a real risk that (the ECB) stance could become too restrictive."
EUR/GBP is further capped by the strength of the Pound Sterling (GBP) which sees gains from investors’ view that the Bank of England (BoE) will take a shallower easing path – cutting interest rates at a slower pace – than most other central banks, including the ECB. The BoE is only expected to make a 0.25% cut before the end of 2024 as the recent run of strong data indicates the economy continues growing and services sector inflation remains high.
The ECB, on the other hand, is expected to cut interest rates by at least 0.50% before year end. In a poll by Reuters carried out between August 30 and September 5, 85% of economists anticipate that the ECB will cut interest rates at the meeting in September and again in December.
So far this week, neither the Australian Dollar (AUD) nor the New Zealand Dollar (NZD) have been able to benefit from the general weakness of the US Dollar (USD), and both currencies have weakened slightly over the course of the week, Commerzbank FX strategist Volkmar Baur notes.
AUD to suffer more than on the NZD
“It seems that both are being weighed down more by weak data from China than the USDo is by recession fears in the US itself. A look at the export data shows why. About 35% of all Australian exports over the past 12 months went to China, while the figure for New Zealand was still around 25%. A prolonged slowdown in China is therefore likely to affect both countries – although over time it should become clear that Australia will suffer more than New Zealand.”
“This is because not only is China's share of total exports higher in Australia than in New Zealand. The composition also suggests that Australia will be hit harder. Because while New Zealand exports mainly food, iron ore alone accounts for 26% of all Australian exports - of which around 85% are shipped to China. Together with coal, of which about 11% also goes to China, these two commodities account for about 42% of Australian exports.”
“With Chinese stockpiles of both iron ore and coal recently at very high levels, Australian exports could remain under pressure in the coming months. Especially if the property crisis in China continues. This is likely to weigh on the AUD more than on the NZD.”
USD/JPY extended its move lower, tracking decline in broad USD, OCBC Frances Cheung and Christopher Wong note.
The broader direction of travel for USD/JPY is to the downside
“Pair was last seen at 142.86. Bullish momentum on daily chart faded while RSI fell. Death cross formed with 50DMA cutting 200DMA to the downside. Risks skewed to the downside. Support at 142, 141.70 (Aug low). Resistance at 145.70 (21 DMA), 146.40 (23.6% fibo retracement of Jul high to Aug low) and147.20 (recent high).”
“Earlier in the week, BoJ Governor submitted a document to government panel, which reiterated that the BoJ would continue to raise interest rates if the economy and prices perform as expected by the BoJ.”
“Fed-BoJ policy shifts and growing pace of normalisation can bring about faster narrowing of UST-JGB yield differentials and this should continue to underpin the broader direction of travel for USD/JPY to the downside.”
There is one thing you can count on right now. If you wake up in the morning and USD/JPY is trading lower than the day before, you will have at least three articles in your inbox trying to explain that the unwinding of the Japanese Yen (JPY) carry trade is continuing. Rising interest rates, you will read, are making it unattractive to continue borrowing in JPY, Commerzbank FX strategist Volkmar Baur notes.
JPY is sensitive to USD weakness
“Supposedly supporting this, you will hear about the comments from BoJ Council members, who are currently relentlessly emphasizing that the BoJ will continue to raise interest rates (should the data come in as the bank expects). The problem with this is that the market does not seem to be very interested in the comments made by BoJ members in recent weeks.”
“The market is still not pricing in the likelihood of a BoJ rate hike in September - and the odds of a rate hike by the end of the year are priced at less than 20%. USD/JPY's movements are therefore more likely to be explained by the renewed rise in expectations of Fed rate cuts. Indeed, the exchange rate continues to move in line with the difference in expected year-end Fed funds rates.”
“And since expectations for the BoJ have not changed significantly, the move is logically coming from expectations for the Fed. This is therefore less of a JPY story and more of a USD weakness story. Even though the JPY is more sensitive to USD weakness than other currencies."
The news of the week in the eurozone is that French President Macron has appointed a prime minister: former Brexit Chief Negotiator Michel Barnier. The Euro (EUR) and French bond spreads didn’t really react to the news, which is understandable given broad expectations for a moderate figure in the PM role and recent very muted sensitivity to EU political developments (the German election surprise was a case in point), ING’s FX strategist Francesco Pesole notes.
EUR/USD can take a leap back to the upper half of 1.11-1.12
“Barnier’s appointment can be a EUR-positive on the margin ahead of an intense EU budget season over the next couple of months. The fact that a candidate was finally picked is a signal that the more fringe parties in the French Parliament are opening up to dialogue. Ultimately though, the euro will react to facts more than expectations on the alarming French fiscal situation, and we are not ready to pencil it in as a EUR/USD bullish factor before more clarity on budget negotiations – and each party's priorities – emerges.
“For now, EUR trading remains a strict function of US macro developments. In line with our scenario analysis discussed above, the range of potential swings in EUR/USD is wide today. If our '125k payrolls, 4.4% unemployment' call is right, EUR/USD can take a decisive leap back to the upper half of 1.11-1.12, which can be the prevailing range into the 18 September FOMC.”
“The eurozone calendar will hardly move the euro today and should not influence the ECB’s path to a likely 25bp rate cut next week.”
The day of the US employment report has finally arrived. The market seems to have been holding his breath all week to find out how many new jobs the US economy created last month, Commerzbank FX strategist Volkmar Baur notes.
The US NFP report is nigh
“According to Bloomberg, economists are expecting around 165,000 new jobs. So, let's put aside for a moment the fact that this number is highly volatile and will be revised several times over the next few months before we can say for sure how many jobs were actually created. That's not what's bothering the market today. If the number is significantly weaker, fears of a US recession will rise again.”
“The market would price in a higher probability of a 50-basis point move in September and the US dollar would come under pressure. A much stronger number would allay these concerns, but the focus would shift back to wage developments. A significant acceleration in wage growth could again raise doubts about disinflation. All in all, a move of 25 basis points would become more likely and the US dollar would strengthen again.”
“If, on the other hand, the number comes in as expected, it is more difficult to say. On the one hand, it would clear the way for the Fed to cut rates by 25 basis points. The remaining uncertainty about the start of the rate cut cycle would be removed, paving the way for a weaker USD. However, much of this seems to have been priced in over the past few days. The market is now speculating on more rather than fewer rate cuts by the end of the year. As a result, some of this week's dollar weakness would be likely to be priced out again.”
- USD/CHF falls further to near 0.8400 as the US Dollar weakens ahead of the US NFP.
- Risk-averse market sentiment has improved the Swiss Franc’s safe-haven appeal.
- The Fed is widely anticipated to start reducing interest rates this month.
The USD/CHF pair falls to near the round-level support of 0.8400 in Friday’s European session. The losing streak of the Swiss Franc asset has extended for the fourth trading session amid sheer weakness in the US Dollar (USD). The US Dollar Index (DXY), which tracks the Greenback’s value against six major currencies, refreshes its weekly low below 101.00 amid growing risks to the United States (US) labor market health.
Market sentiment remains risk-averse ahead of the US Nonfarm Payrolls (NFP) data for August, which will be published at 12:30 GMT. The Risk-averse profile has improved the safe-haven appeal of the Swiss Franc (CHF).
Investors keenly await the US NFP data as it will influence the likely size of the interest rate cut by the Federal Reserve (Fed) in its monetary policy meeting this month. Economists estimate that US employers hired 160K new workers in August, higher from 114K in July. In the same period, the Unemployment Rate is expected to have declined to 4.2% from the former release of 4.3%.
Meanwhile, the Swiss National Bank (SNB) is expected to cut interest rates again this month as inflationary pressures in the Swiss region continue to decline. Swiss annual Consumer Price Index (CPI) decelerated at a faster-than-expected pace to 1.1% from the estimates of 1.2% and the former release of 1.3%.
USD/CHF declines toward the horizontal support plotted from 28 December 2023 low of 0.8333 on a daily timeframe. Near-term and broader-term outlook of the Swiss Franc asset remain bearish as all short-to-long-term Exponential Moving Averages (EMAs) are declining.
The 14-day Relative Strength Index (RSI) oscillates in the bearish range of 20.00-40.00, suggesting that a strong bearish momentum is intact.
More downside would appear if the asset breaks below the round-level support of 0.8400, which would drag the major towards the 28 December 2023 low of 0.8333 and round-level support of 0.8300.
On the flip side, a recovery move above the weekly high near 0.8540 will drive the asset toward the round-level resistance of 0.8600, followed by the August 20 high of 0.8632.
USD/CHF daily chart
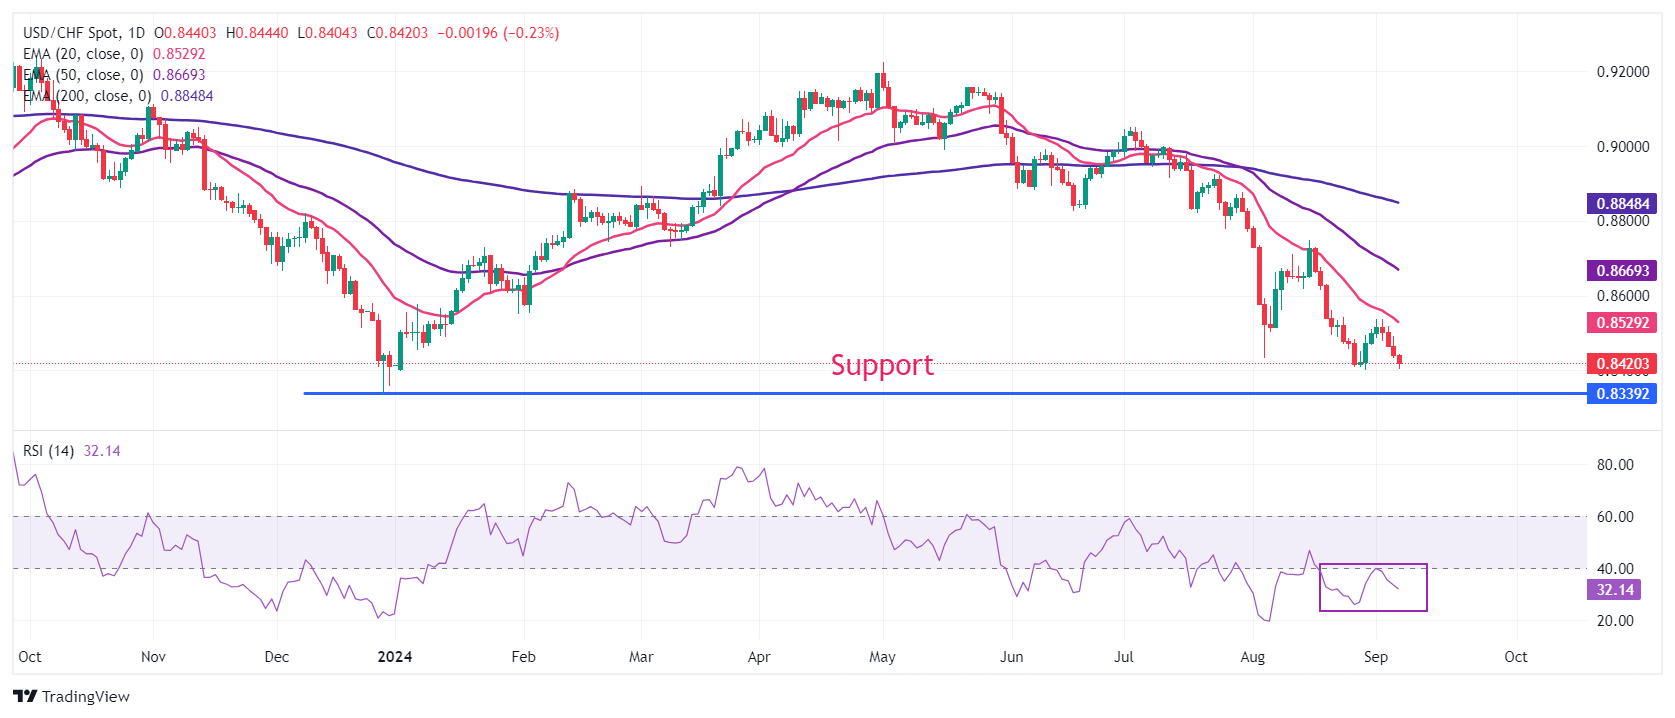
Economic Indicator
Unemployment Rate
The Unemployment Rate, released by the US Bureau of Labor Statistics (BLS), is the percentage of the total civilian labor force that is not in paid employment but is actively seeking employment. The rate is usually higher in recessionary economies compared to economies that are growing. Generally, a decrease in the Unemployment Rate is seen as bullish for the US Dollar (USD), while an increase is seen as bearish. That said, the number by itself usually can't determine the direction of the next market move, as this will also depend on the headline Nonfarm Payroll reading, and the other data in the BLS report.
Read more.
- Gold extends its recovery after the release of more weak jobs’ data out of the US.
- The data increases the chance of the Federal Reserve lowering interest rates aggressively – a plus for Gold.
- US Nonfarm Payrolls data out on Friday will be the most important release in shaping interest-rate expectations.
Gold (XAU/USD) trades back inside familiar territory, exchanging hands in the $2,510s on Friday after extending its rebound following the release of more weak jobs’ data from the US on Thursday, this time in the form of private payrolls data, which grew at a slower pace than expected.
Although the negative data was tempered by a marginal fall in unemployment claims, it still painted a picture of a stagnant jobs market going into Friday’s much-anticipated official Nonfarm Payrolls (NFP) report from the US Bureau of Labor Statistics (BLS), which is scheduled for release at 12:30 GMT.
The NFP is likely to be critical in shaping expectations for the future path of interest rates in the US and the value of the US Dollar (USD), two important factors for determining the price of Gold.
Gold focus on US employment and geopolitics
Gold recovers after the release of lower-than-expected ADP Employment Change data showed the private-sector US economy added 99K new hires in August, a figure that fell below both the previous month’s downwardly-revised 111k (from 122K) and economists’ 145K estimate.
Although US Initial Jobless Claims took some of the sting out of the ADP data after it showed a fall in benefit claimants to 227K, from an upwardly-revised 232K in the previous week and 230K expected, the overall picture was one of a slowing labor market.
The data fed into concerns regarding the fragile US labor market that are driving Federal Reserve (Fed) interest rate expectations. This comes after a recent shift from the Fed to focusing on labor-market risks rather than solely inflation.
It follows weak JOLTS jobs data released on Wednesday and keeps the probability of the Fed cutting interest rates by a larger 0.50% at their September 18 meeting relatively high. This, in turn, is positive for Gold, since lower interest rates reduce the opportunity cost of holding the non-interest paying asset.
Friday’s NFP is likely to provide the last significant piece of evidence for how well the US labor market is managing, and will be critical in setting probabilities for the Fed making a larger 0.50% at its September meeting, as opposed to a standard 0.25% cut.
Current market-based expectations show that the chances of a 0.50% cut stand at just over 40%, whilst a 0.25% cut is fully priced in, according to the CME FedWatch tool. If the NFP data is lower than predicted and stokes fresh concerns, the Fed will be more likely to opt for the bigger half-percent cut, an outcome that is likely to boost Gold’s price.
On the geopolitical front, US negotiators claim to be 90% close to agreeing on a ceasefire deal between Israel and Hamas, according to Bloomberg News. If they are successful, it may reduce safe-haven flows to Gold.
In Ukraine, Russia continues its advance towards the key strategic hub city of Pokrovsk. If successful, it could dramatically impact the war on the eastern front and threaten Ukraine’s whole defensive line in the Donbass. Such an outcome, though still unlikely to occur soon, would nevertheless ratchet up tensions in the region and increase demand for Gold. The Central Bank of Poland (NBP), for example, has been hoarding Gold since the war began, according to data from the World Gold Council (WGC).
Technical Analysis: Hammer candlestick followed by up day confirms bullish bias
Gold (XAU/USD) posted two bullish-looking Japanese Hammer candlesticks in a row (box on the chart below) on Tuesday and Wednesday, and with Thursday ending as a solid green-up day, the pattern also gained bullish confirmation. The pattern suggests the odds favor more upside in the very short term.
XAU/USD Daily Chart
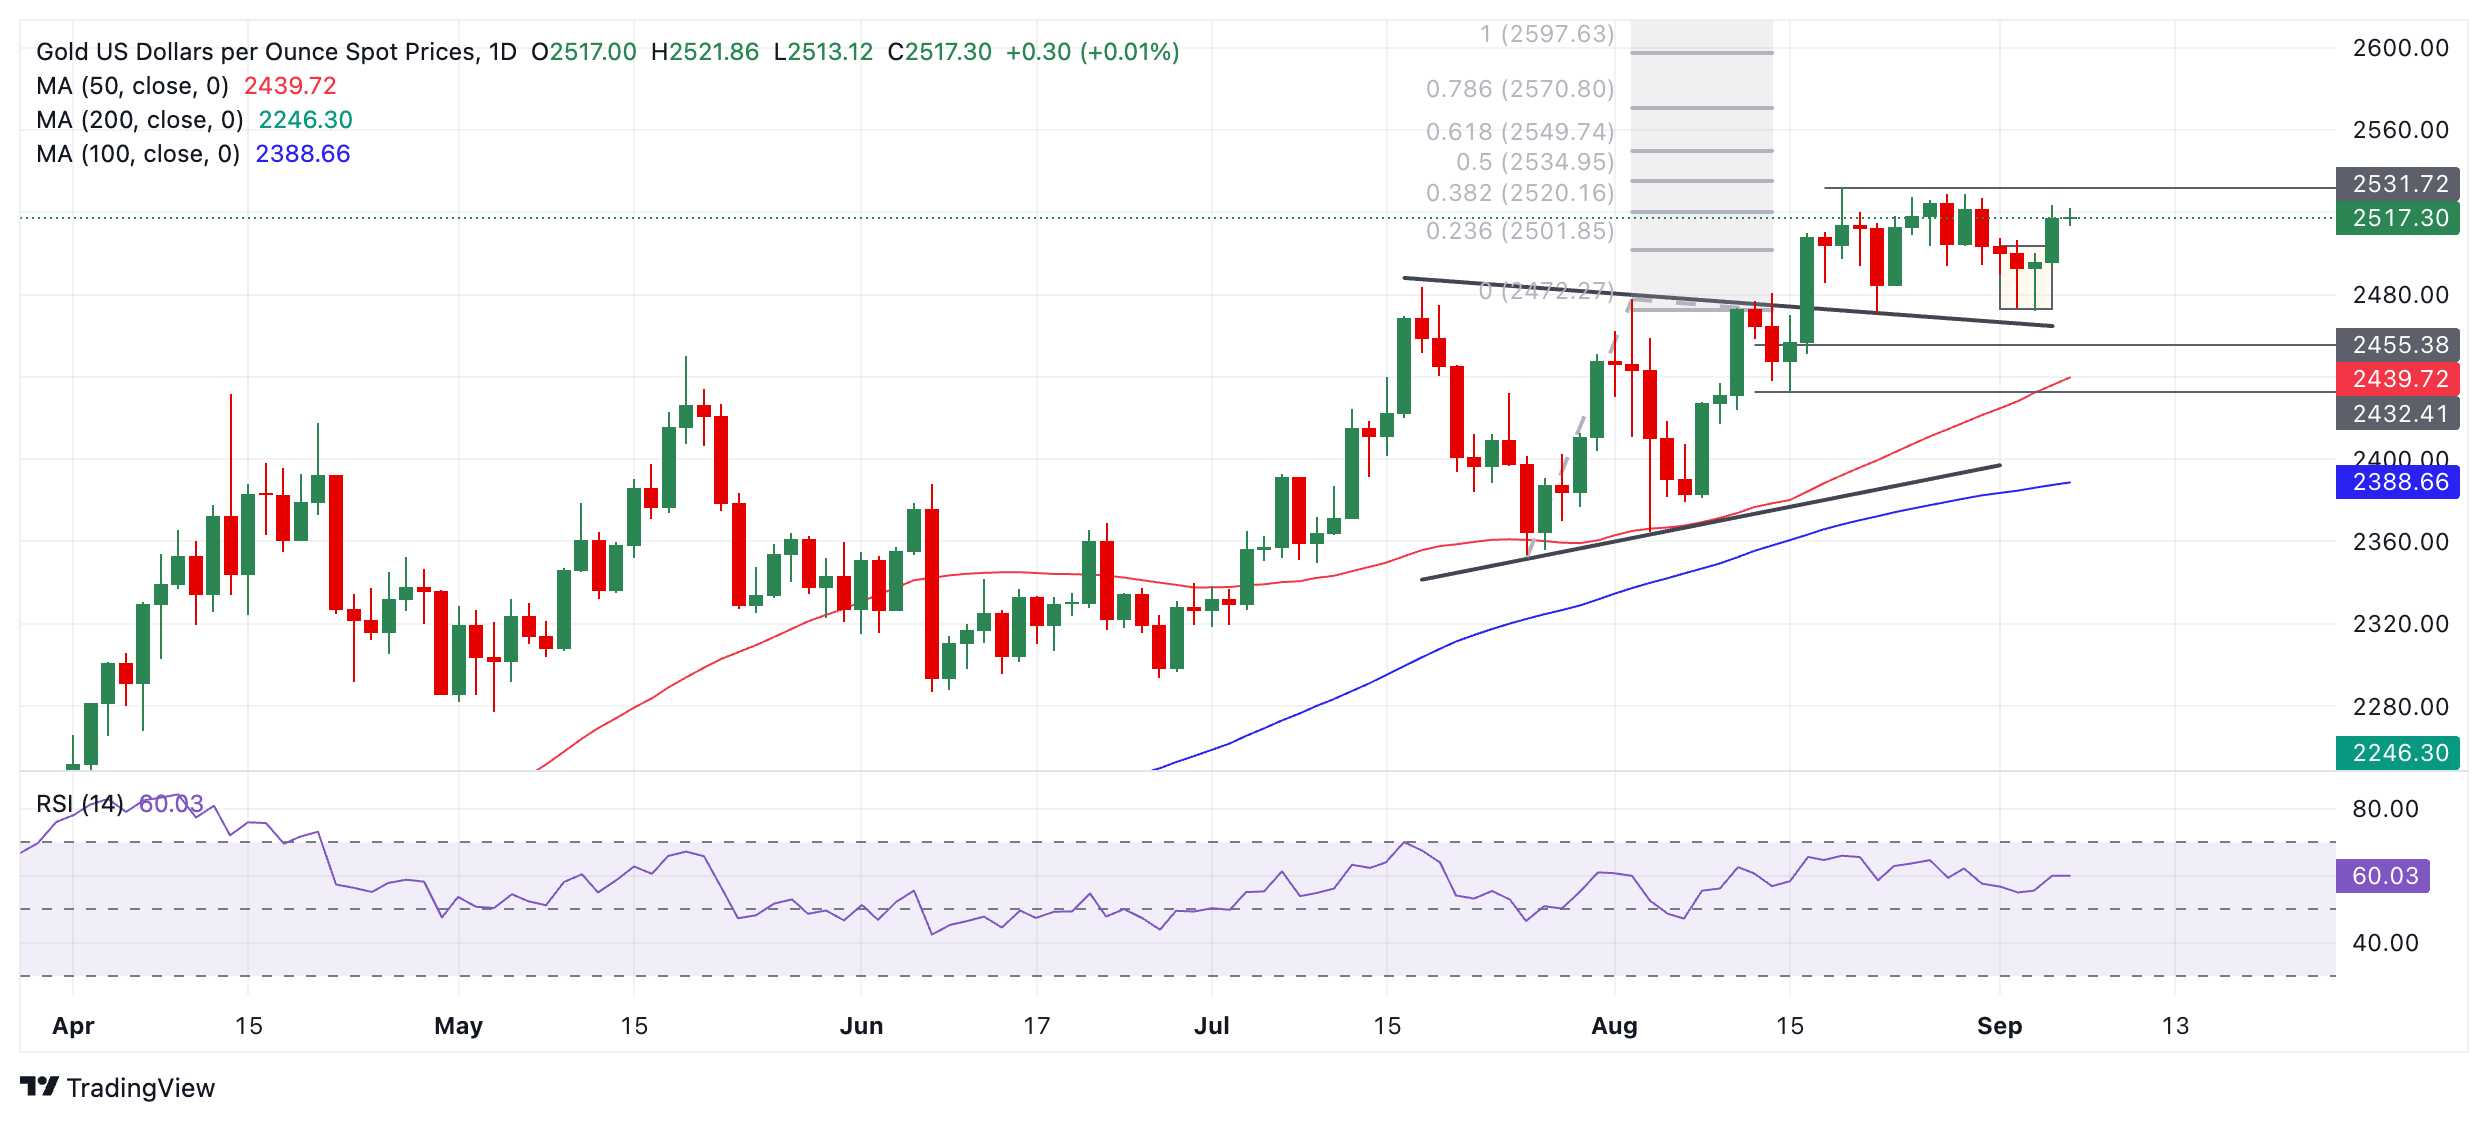
The yellow metal’s price looks poised to rebound to the $2,531 all-time high if it can keep up the bullish recovery momentum.
An upside target for Gold, which has not yet been reached, sits at $2,550 and remains active. The target was generated after the original breakout from the July-August range on August 14.
Gold’s medium and long-term trends also remain bullish, which, given “the trend is your friend,” means the odds still favor an eventual breakout higher materializing.
A break above the August 20 all-time high of $2,531 would provide more confirmation of a continuation higher toward the $2,550 target.
If Gold continues steadily weakening, however, it is likely to find the next support in the $2,470-$2,460 region. A decisive break below that level would change the picture for Gold and suggest that the commodity might be starting a more pronounced downtrend.
The Euro (EUR) continued to inch higher amid broad USD softness, OCBC Frances Cheung and Christopher Wong note.
NFP may move EUR/USD
“Pair was last seen at 1.1110. Bearish momentum on daily chart shows signs of fading while RSI rose slightly. US data risk matters and as such USD moves will dictate direction. Resistance at 1.12 (recent high) and 1.1280 (2023 high).”
“Support at 1.1026 (recent low), 1.10, 1.0930 (61.8% fibo retracement of 2024 high to low). Today brings GDP (Fri). Underwhelming data print could move the needle for markets to price in a more dovish ECB.”
The Bank of Canada delivered a widely expected 25bp rate cut on Wednesday. The BoC event did not move markets significantly, and the USD/CAD dive shortly after the announcement was instead mostly due to soft US JOLT figures, ING’s FX strategist Francesco Pesole notes.
NFP can have a larger impact on USD/CAD than Canadian payrolls
“Today, Canada releases jobs figures at the same time as the US. The consensus for headline Canadian payrolls is 25k, in line with the last few months. The fact that consensus has not adjusted lower following two negative prints tells us it is not a really reliable benchmark for expectations.”
“Incidentally, looking at the unemployment figure is likely more informative at this stage. We expect, in line with consensus, an increase from 6.4% to 6.5%. Remember, this was 5.7% in January, and another tick higher would endorse market pricing for more back-to-back Bank of Canada cuts.”
“The US payrolls can have a larger impact on USD/CAD than Canadian payrolls. However, we remain of the view that the pairs look increasingly cheap as they approach the 1.345 mark. Ultimately, the Canadian dollar should underperform most other high-beta peers if soft US macro news comes through.”
FX markets were somewhat choppy overnight amid mixed US data. ADP employment missing estimates (99k vs. 145k expected) had brought about USD softness but subsequent release of jobless claims (227k vs. 230k) saw a bounce in response. But the USD still turned lower after ISM services data came in largely in line with estimatesc
NFP already weighs on the USD
“This morning, Fed’s Goolsbee said it is pretty clear that the path is not just rate cuts soon but multiple cuts over the next 12 months as Fed has projected in its most recent dot plot. He also cautioned that he saw ‘more’ warning signs about cooling labour market and how persistent weakness raises the possibility that labour market cooling ‘may turn into something worse’. That said, he also said he would not put a lot of weight on one month’s job number.”
“Focus is on payrolls report (830pm SGT), in particular, NFP and unemployment rate. USD should remain sensitive to job data this week given that Fed’s focus has shifted towards supporting labour market. An NFP print that is much hotter than expected and unemployment rate much lower than expect should see dovish bets unwind and is supportive of the USD. A much weaker report further raise concerns about its cooling labour market. This may undermine sentiments. Risk-off trades may pressure high-beta FX.”
“A data that comes in largely in line with estimates would be a case of not good, not bad. This supports soft landing story. US equities can find relief rally while USD can revert back to trading near its lows. This scenario will likely be the least disruptive to markets. DXY was last at 101. Daily momentum is mild bullish but RSI fell. Consolidative price action ahead of data risk. Support at 100.50 levels. Decisive break puts next support at 99.60. Resistance at 101.70 (21 DMA), 102.20 (23.6% fibo retracement of 2023 high to 2024 low).”
Silver prices (XAG/USD) broadly unchanged on Friday, according to FXStreet data. Silver trades at $28.81 per troy ounce, broadly unchanged 0.01% from the $28.82 it cost on Thursday.
Silver prices have increased by 21.09% since the beginning of the year.
| Unit measure | Silver Price Today in USD |
|---|---|
| Troy Ounce | 28.81 |
| 1 Gram | 0.93 |
The Gold/Silver ratio, which shows the number of ounces of Silver needed to equal the value of one ounce of Gold, stood at 87.40 on Friday, broadly unchanged from 87.34 on Thursday.
Silver FAQs
Silver is a precious metal highly traded among investors. It has been historically used as a store of value and a medium of exchange. Although less popular than Gold, traders may turn to Silver to diversify their investment portfolio, for its intrinsic value or as a potential hedge during high-inflation periods. Investors can buy physical Silver, in coins or in bars, or trade it through vehicles such as Exchange Traded Funds, which track its price on international markets.
Silver prices can move due to a wide range of factors. Geopolitical instability or fears of a deep recession can make Silver price escalate due to its safe-haven status, although to a lesser extent than Gold's. As a yieldless asset, Silver tends to rise with lower interest rates. Its moves also depend on how the US Dollar (USD) behaves as the asset is priced in dollars (XAG/USD). A strong Dollar tends to keep the price of Silver at bay, whereas a weaker Dollar is likely to propel prices up. Other factors such as investment demand, mining supply – Silver is much more abundant than Gold – and recycling rates can also affect prices.
Silver is widely used in industry, particularly in sectors such as electronics or solar energy, as it has one of the highest electric conductivity of all metals – more than Copper and Gold. A surge in demand can increase prices, while a decline tends to lower them. Dynamics in the US, Chinese and Indian economies can also contribute to price swings: for the US and particularly China, their big industrial sectors use Silver in various processes; in India, consumers’ demand for the precious metal for jewellery also plays a key role in setting prices.
Silver prices tend to follow Gold's moves. When Gold prices rise, Silver typically follows suit, as their status as safe-haven assets is similar. The Gold/Silver ratio, which shows the number of ounces of Silver needed to equal the value of one ounce of Gold, may help to determine the relative valuation between both metals. Some investors may consider a high ratio as an indicator that Silver is undervalued, or Gold is overvalued. On the contrary, a low ratio might suggest that Gold is undervalued relative to Silver.
(An automation tool was used in creating this post.)
Yesterday’s ADP’s 99k print was the weakest since the reopening of the economy in 2021, as small businesses shed staff in August while medium and large businesses were hiring at a very modest pace. The ISM Services report was steady and in line with consensus at 51.5, but the employment sub-index dropped more than expected to 50.2. The news for the jobs market was not all grim, though; there was a surprising contraction in continuing claims from 1860k to 1838k in the week ending 24 August, ING’s FX strategist Francesco Pesole notes.
Three broad scenarios for Payrolls
“Looking at the soft USD performance over the past couple of sessions, negative job market data has clearly had greater resonance in FX. So even if the consensus figure for payrolls is 165k, markets may be positioned for a lower figure. Ultimately, the question markets need answered today is: what figures would prompt a 50bp Fed cut in September? We identify three broad scenarios.”
“Payrolls below 100k, unemployment up to 4.4% (consensus is 4.2%): 50bp September cut becomes the base case, and the dollar dives. Payrolls softer than consensus, but above 100k, unemployment unchanged at 4.3% or up to 4.4%: markets will be left guessing on the size of the September cut. Payrolls at or above consensus, unemployment declines: 25bp cut in September, room for hawkish repricing in the USD OIS curve, which currently prices in 175bp of cuts over the next five meetings.
“Our US Economist’s estimate is 125k, with unemployment up to 4.4%. If we are right, markets may get to the 18 September Fed announcement pricing in somewhere around 35bp-40bp, which should keep the dollar capped until the binary rate cut event unfolds. Our forecast remains a 50bp cut this month. Expect payroll-driven USD weakness to favour both low-yielding and pro-cyclical currencies today.”
- The Pound Sterling refreshes a five-day high near 1.3200 against the US Dollar with US NFP in focus.
- Weak US JOLTS Job openings and ADP Employment Change suggest US labor market conditions are weakening.
- The BoE is expected to cut interest rates only once in the remainder of the year.
The Pound Sterling (GBP) eases slightly after posting a fresh five-day high near the round-level resistance of 1.3200 in Friday’s European session. The GBP/USD pair broadly consolidates against the US Dollar (USD) ahead of the United States (US) Nonfarm Payrolls (NFP) data for August, which will be published at 12:30 GMT.
The US Dollar Index (DXY), which tracks the Greenback’s value against six major currencies, declines slightly below the crucial support of 101.00.
Economists estimate that US employers hired 160K new workers in August, higher than the 114K increase seen in July. In the same period, the Unemployment Rate is expected to have declined to 4.2% from the former release of 4.3%. Investors will also focus on the Average Hourly Earnings data, a key measure of wage growth that fuels consumer spending and price pressures. Annually, the wage growth measure is estimated to have increased by 3.7%, accelerating slightly from the prior reading of 3.6%. On the month, Average Hourly Earnings data are forecasted to have grown by 0.3%, faster than the 0.2% advance in July.
The US official employment data will shape the Federal Reserve’s (Fed) monetary policy decision this month. The importance of the job data has increased significantly as the Fed said it is more focused on the labor market health given that inflation is on track to return to the bank’s target of 2%.
The Fed is widely anticipated to start reducing interest rates from the September meeting. However, traders remain split over the likely interest rate cut size. The possibility of the Fed opting for a large interest rate cut has increased this week after the publication of poor US JOLTS Job Openings data for July and ADP Employment Change data for August, which added to evidence of significant cracks in the labor market.
Daily digest market movers: Pound Sterling to be influenced by speculation for BoE interest-rate path
- The Pound Sterling eases slightly after almost touching 1.3200 against the US Dollar and exhibits a subdued performance against its other major peers on Friday. The British currency drops slightly as investors turn cautious amid the absence of United Kingdom (UK) top-tier economic data. Therefore, market sentiment and speculation for the Bank of England (BoE) interest rate path are guiding the value of the currency.
- The near-term outlook of the British currency has remained upbeat recently as investors expect that the BoE’s policy-easing cycle will be shallower than that of other central banks. For example, the European Central Bank (ECB) and the Fed are expected to cut their borrowing rates by 50 basis points (bps) and 100 bps in the remainder of the year, respectively, while the BoE is expected to reduce them by just 25 bps.
- The major reason behind firm speculation for BoE’s more gradual easing cycle is that the economy is doing better than previously expected and the fact that inflation in the services sector remains high.
- In next week’s UK calendar, investors will focus on the Employment data for the quarter ending July and the monthly Gross Domestic Product (GDP) data for July. Both indicators could be key in determining what will the BoE decide to do with interest rates when it meets later this month.
Technical Analysis: Pound Sterling gets close to 1.3200
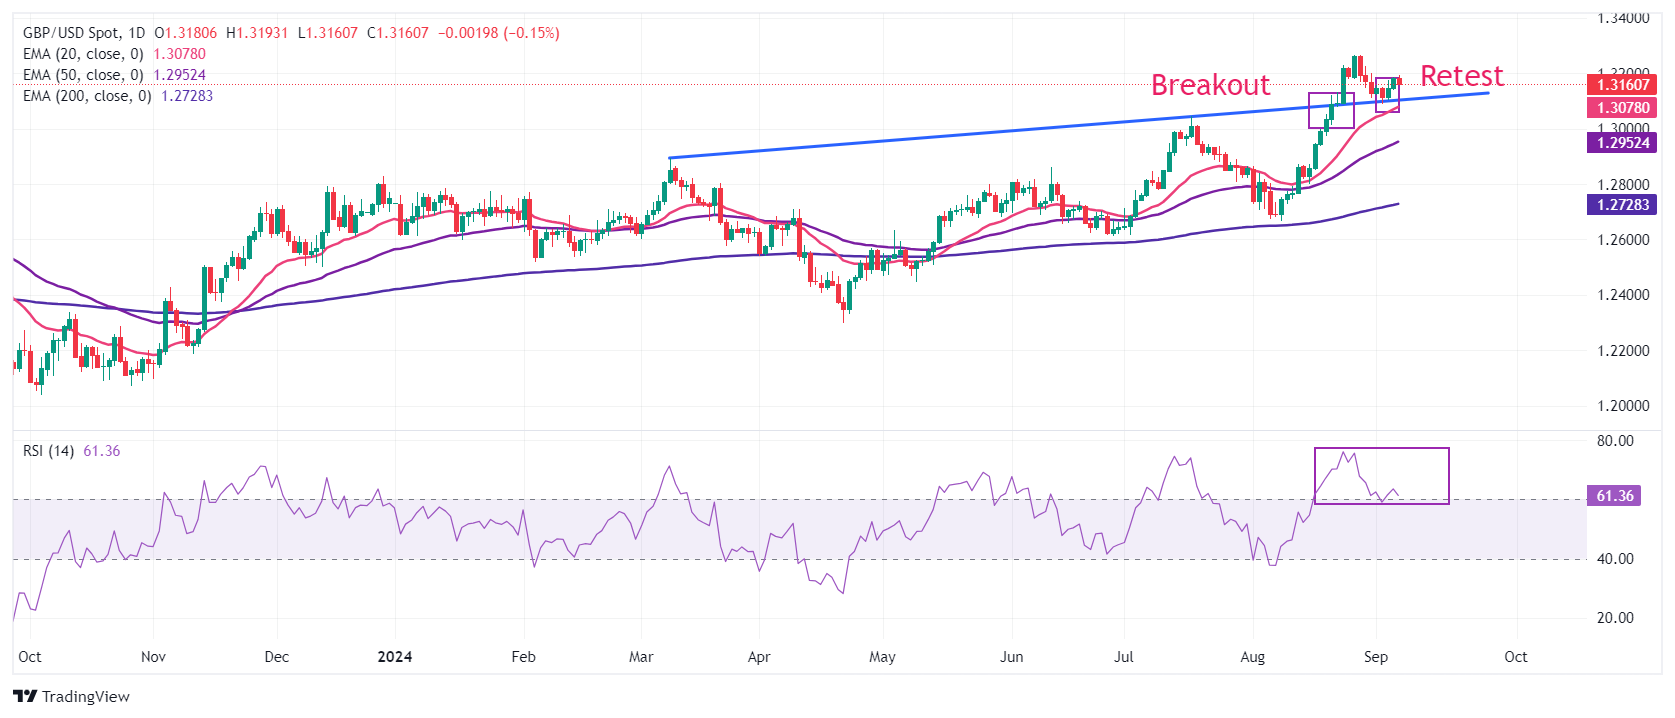
The Pound Sterling softens slightly after rising to nearly 1.3200 against the US Dollar. The GBP/USD discovered strong buying interest near the breakout region of an upward-sloping trendline plotted from the December 28, 2023, high of 1.2828 on the daily time frame.
Upward-sloping short-to-long-term Exponential Moving Averages (EMAs) suggest a strong bullish trend.
The 14-day Relative Strength Index (RSI) remains nearby 60.00, suggesting a resumption in the bullish momentum.
Looking up, the Cable will face resistance near the psychological level of 1.3500 and at the February 4, 2022, high of 1.3640 if it breaks above a fresh two-and-a-half-year high of 1.3266. On the downside, the psychological level of 1.3000 emerges as key support.
Pound Sterling FAQs
The Pound Sterling (GBP) is the oldest currency in the world (886 AD) and the official currency of the United Kingdom. It is the fourth most traded unit for foreign exchange (FX) in the world, accounting for 12% of all transactions, averaging $630 billion a day, according to 2022 data. Its key trading pairs are GBP/USD, aka ‘Cable’, which accounts for 11% of FX, GBP/JPY, or the ‘Dragon’ as it is known by traders (3%), and EUR/GBP (2%). The Pound Sterling is issued by the Bank of England (BoE).
The single most important factor influencing the value of the Pound Sterling is monetary policy decided by the Bank of England. The BoE bases its decisions on whether it has achieved its primary goal of “price stability” – a steady inflation rate of around 2%. Its primary tool for achieving this is the adjustment of interest rates. When inflation is too high, the BoE will try to rein it in by raising interest rates, making it more expensive for people and businesses to access credit. This is generally positive for GBP, as higher interest rates make the UK a more attractive place for global investors to park their money. When inflation falls too low it is a sign economic growth is slowing. In this scenario, the BoE will consider lowering interest rates to cheapen credit so businesses will borrow more to invest in growth-generating projects.
Data releases gauge the health of the economy and can impact the value of the Pound Sterling. Indicators such as GDP, Manufacturing and Services PMIs, and employment can all influence the direction of the GBP. A strong economy is good for Sterling. Not only does it attract more foreign investment but it may encourage the BoE to put up interest rates, which will directly strengthen GBP. Otherwise, if economic data is weak, the Pound Sterling is likely to fall.
Another significant data release for the Pound Sterling is the Trade Balance. This indicator measures the difference between what a country earns from its exports and what it spends on imports over a given period. If a country produces highly sought-after exports, its currency will benefit purely from the extra demand created from foreign buyers seeking to purchase these goods. Therefore, a positive net Trade Balance strengthens a currency and vice versa for a negative balance.
- USD/JPY continues losing ground for the fourth straight day and drops to over a one-month low.
- The divergent Fed-BoJ policy expectations turn out to be a key factor exerting downward pressure.
- Bears take a brief pause and now look to the US NFP report before positioning for further losses.
The USD/JPY pair remains under some selling pressure for the fourth straight day and drops to over a one-month low, around the 142.00 round-figure mark on Friday. Spot prices, however, trim a part of intraday losses and climb back above mid-142.00s during the first half of the European session amid some repositioning trade ahead of the crucial US monthly employment details.
The popularly known Nonfarm Payrolls (NFP) report will play a key role in influencing expectations about the Federal Reserve's (Fed) policy path and drive the US Dollar (USD) demand. Any meaningful recovery for the USD/JPY pair, however, seems elusive in the wake of divergent Fed-Bank of Japan (BoJ) policy outlook. In fact, the markets are pricing in a 40% chance that the US central bank will lower borrowing costs by 50 basis points (bps) at the end of the September 17-18 policy meeting.
The bets were reaffirmed by rather an unimpressive US macro data released this week, which pointed to a cooling labor market and suggested that the economy is at risk of a slowdown. In contrast, BoJ Governor Kazuo Ueda reiterated earlier this week that the central bank will continue to raise interest rates if the economy and prices perform as expected. Furthermore, an unexpected rise in Japan's real wages for the second straight month in July keeps the BoJ on track for another rate hike in 2024.
Apart from this, renewed worries about a US economic downturn, along with persistent geopolitical tensions, might continue to underpin the safe-haven JPY and contribute to capping the upside for the USD/JPY pair. Hence, any meaningful recovery attempt might still be seen as a selling opportunity and run the risk of fizzling out rather quickly. Nevertheless, spot prices remain on track to register heavy weekly losses and seem vulnerable to prolonging a nearly two-month-old downtrend.
Economic Indicator
Nonfarm Payrolls
The Nonfarm Payrolls release presents the number of new jobs created in the US during the previous month in all non-agricultural businesses; it is released by the US Bureau of Labor Statistics (BLS). The monthly changes in payrolls can be extremely volatile. The number is also subject to strong reviews, which can also trigger volatility in the Forex board. Generally speaking, a high reading is seen as bullish for the US Dollar (USD), while a low reading is seen as bearish, although previous months' reviews and the Unemployment Rate are as relevant as the headline figure. The market's reaction, therefore, depends on how the market assesses all the data contained in the BLS report as a whole.
Read more.Next release: Fri Sep 06, 2024 12:30
Frequency: Monthly
Consensus: 160K
Previous: 114K
Source: US Bureau of Labor Statistics
America’s monthly jobs report is considered the most important economic indicator for forex traders. Released on the first Friday following the reported month, the change in the number of positions is closely correlated with the overall performance of the economy and is monitored by policymakers. Full employment is one of the Federal Reserve’s mandates and it considers developments in the labor market when setting its policies, thus impacting currencies. Despite several leading indicators shaping estimates, Nonfarm Payrolls tend to surprise markets and trigger substantial volatility. Actual figures beating the consensus tend to be USD bullish.
- DXY drifts lower for the third successive day and drops to over a one-week low on Friday.
- Bets for a larger Fed rate cut keep the US bond yields depressed and exert some pressure.
- Investors now look forward to the key US NFP report before placing fresh directional bets.
The US Dollar Index (DXY), which tracks the Greenback against a basket of currencies, prolongs this week's downfall from the vicinity of the 102.00 mark and continues losing ground for the third successive day on Friday. The downward trajectory drags the index below the 101.00 round figure, or over a one-week low during the first half of the European session as traders now look to the crucial US employment details for a fresh impetus.
The popularly known Nonfarm Payrolls (NFP) report will play a key role in influencing market expectations about the Federal Reserve's (Fed) policy path and determining the next leg of a directional move for the DXY. In the meantime, bets for a larger interest rate cut later this month, bolstered by a mixed bag of US employment data released this week, which provided evidence of a deteriorating labor market. In fact, a report on Wednesday showed that US job openings dropped to a three-and-a-half-year low of 7.673 million in July.
Adding to this, Automatic Data Processing (ADP) reported on Thursday that private-sector employment registered the smallest rise since January 2021 and increased by 99K in August. Furthermore, Chicago Fed President Austan Goolsbee said on Friday that the longer-run trend of labor market and inflation data justify easing interest-rate policy soon and then steadily over the next year. This keeps the US Treasury bond yields depressed at their lowest levels in more than a year and continues to undermine demand for the Greenback.
With the latest leg down, the DXY has reversed a major part of last week's recovery gains from the YTD trough and remains on track to register a third week of losses in the previous four. Moreover, the aforementioned fundamental backdrop seems tilted firmly in favor of bearish traders and suggests that the path of least resistance for the index remains to the downside. That said, an upbeat US jobs report could trigger a short-covering rally, though the immediate market reaction is more likely to be limited and fizzle out rather quickly.
US Dollar FAQs
The US Dollar (USD) is the official currency of the United States of America, and the ‘de facto’ currency of a significant number of other countries where it is found in circulation alongside local notes. It is the most heavily traded currency in the world, accounting for over 88% of all global foreign exchange turnover, or an average of $6.6 trillion in transactions per day, according to data from 2022. Following the second world war, the USD took over from the British Pound as the world’s reserve currency. For most of its history, the US Dollar was backed by Gold, until the Bretton Woods Agreement in 1971 when the Gold Standard went away.
The most important single factor impacting on the value of the US Dollar is monetary policy, which is shaped by the Federal Reserve (Fed). The Fed has two mandates: to achieve price stability (control inflation) and foster full employment. Its primary tool to achieve these two goals is by adjusting interest rates. When prices are rising too quickly and inflation is above the Fed’s 2% target, the Fed will raise rates, which helps the USD value. When inflation falls below 2% or the Unemployment Rate is too high, the Fed may lower interest rates, which weighs on the Greenback.
In extreme situations, the Federal Reserve can also print more Dollars and enact quantitative easing (QE). QE is the process by which the Fed substantially increases the flow of credit in a stuck financial system. It is a non-standard policy measure used when credit has dried up because banks will not lend to each other (out of the fear of counterparty default). It is a last resort when simply lowering interest rates is unlikely to achieve the necessary result. It was the Fed’s weapon of choice to combat the credit crunch that occurred during the Great Financial Crisis in 2008. It involves the Fed printing more Dollars and using them to buy US government bonds predominantly from financial institutions. QE usually leads to a weaker US Dollar.
Quantitative tightening (QT) is the reverse process whereby the Federal Reserve stops buying bonds from financial institutions and does not reinvest the principal from the bonds it holds maturing in new purchases. It is usually positive for the US Dollar.
- The Mexican Peso is pausing after declining to a new low for the year.
- The Peso fell on investors' concerns regarding the Mexican government’s proposed controversial reforms to the judiciary.
- USD/MXN will be in focus on Friday as critical US Nonfarm Payrolls data will probably impact all US Dollar pairs.
The Mexican Peso (MXN) trades a touch lower in its key pairs on Friday, stabilizing after a volatile 24-hours in which the currency hit new year-to-date (YTD) lows only to bottom out and recover. Investor concerns over controversial new reforms to the way judges are elected were the main cause of the Peso’s sharp sell-off.
On Friday, traders will turn their attention north of the border as the much-anticipated US Bureau of Labor Statistics’ Nonfarm Payrolls (NFP) report for August is scheduled for release at 12:30 GMT. The data could impact expectations for interest rates in the US and the value of the US Dollar (USD), suggesting USD/MXN is likely to experience yet more volatility.
Mexican Peso-US Dollar pair in the spotlight
The Mexican Peso and US Dollar pair is likely to be in focus on Friday ahead of crucial NFP data from the US. The US Federal Reserve (Fed) has stated it is now more concerned about risks to the US labor market than inflation, and further signs of weakness could prompt it to lower interest rates more aggressively than anticipated. This, in turn, could weaken the US Dollar since lower interest rates generally make a currency less attractive to investors who favor higher returns.
Economists are expecting the NFP data to show that the American economy added 160K new hires in August, however, if the data comes out weaker than this estimate – which is itself lower than the average for August – it could sound alarm bells for the economy. This, in turn, will increase the chances of the Fed slashing interest rates by 0.50% at their September 18 meeting – double the standard 0.25%.
Another key metric in the report is the Unemployment Rate, which is slated to fall to 4.2% from 4.3%. However, if it fails to, or even rises, then this too could put pressure on the Fed to cut rates more swiftly than they had expected,
A half percent cut in the fed funds rate would bring the Fed’s base rate down to a range between 4.75% and 5.00%. The anticipation of such a move would lead to a fall in USD/MXN. Currently, market-based probabilities for a 0.50% cut at the September meeting are around 40%, however, if the jobs data on Friday is particularly weak, those chances could surge, leading to a fall in USD/MXN, all other things being equal.
In Mexico, the data will be confined to Auto Export and Production in August. July’s figures showed Exports falling 1.6% and production rising 2.7%.
At the time of writing, one US Dollar (USD) buys 19.94 Mexican Pesos, EUR/MXN trades at 22.16, and GBP/MXN at 26.29.
Mexican Peso under pressure on the back of political reforms
The Mexican Peso is in an established downtrend in most pairs, however, ever since the government sought to push through a controversial bill of reforms to the judiciary.
The reforms seek to counter the perceived corruption in the judiciary by electing judges through popular vote rather than by appointment. However, critics argue the bill will compromise the independence of judges and fail to combat corruption, which is more located among lower-ranking officials and members of law enforcement agencies.
On Wednesday, the government succeeded in passing the bill, winning the vote by 357 in favour versus 130 against.
The reforms will now be debated in Mexico’s upper house, where the government is one seat short of the two-thirds majority it needs to get the bill passed. Most experts believe, however, that it will still get voted through.
After that, it still needs to be “passed to 32 local congresses for their approval. Once the bill is approved in 17 of those states, the changes to the Mexican Constitution will be officially made,” says Christian Borjan Valencia, analyst at FXStreet.
From a financial perspective, the reforms run the risk of leading to a decline in foreign investment. This, in turn, would reduce demand for the Peso, leading to a further depreciation of the currency.
The US ambassador for Mexico, Ken Salazar, said that although reforms to the judiciary were needed, he was against the current bill, which was raising concerns among investors in the US. He warned that it could jeopardize the two countries’ close relationship, which includes a free trade deal.
“If it is not done in the right way, it could cause a lot of damage to the relationship,” said Salazar at a press conference on Tuesday.
Technical Analysis: USD/MXN makes new YTD high of 20.15
USD/MXN broke to new 2024 highs on Thursday, reaching a peak of 20.15 before falling back to close near its opening price. In the process, the price formed a technical set-up called a bearish Shooting Star Japanese candlestick (shaded rectangle on the chart below).
This pattern occurs at market tops when the price moves to a peak and then rolls over all in the same day. It can be evidence of the start of a pullback, correction, or even, in some cases, a reversal of the bull trend. If the following day is also bearish, it provides added bearish confirmation to the Shooting Star. However, until Friday’s close, that will not be known.
USD/MXN Daily Chart
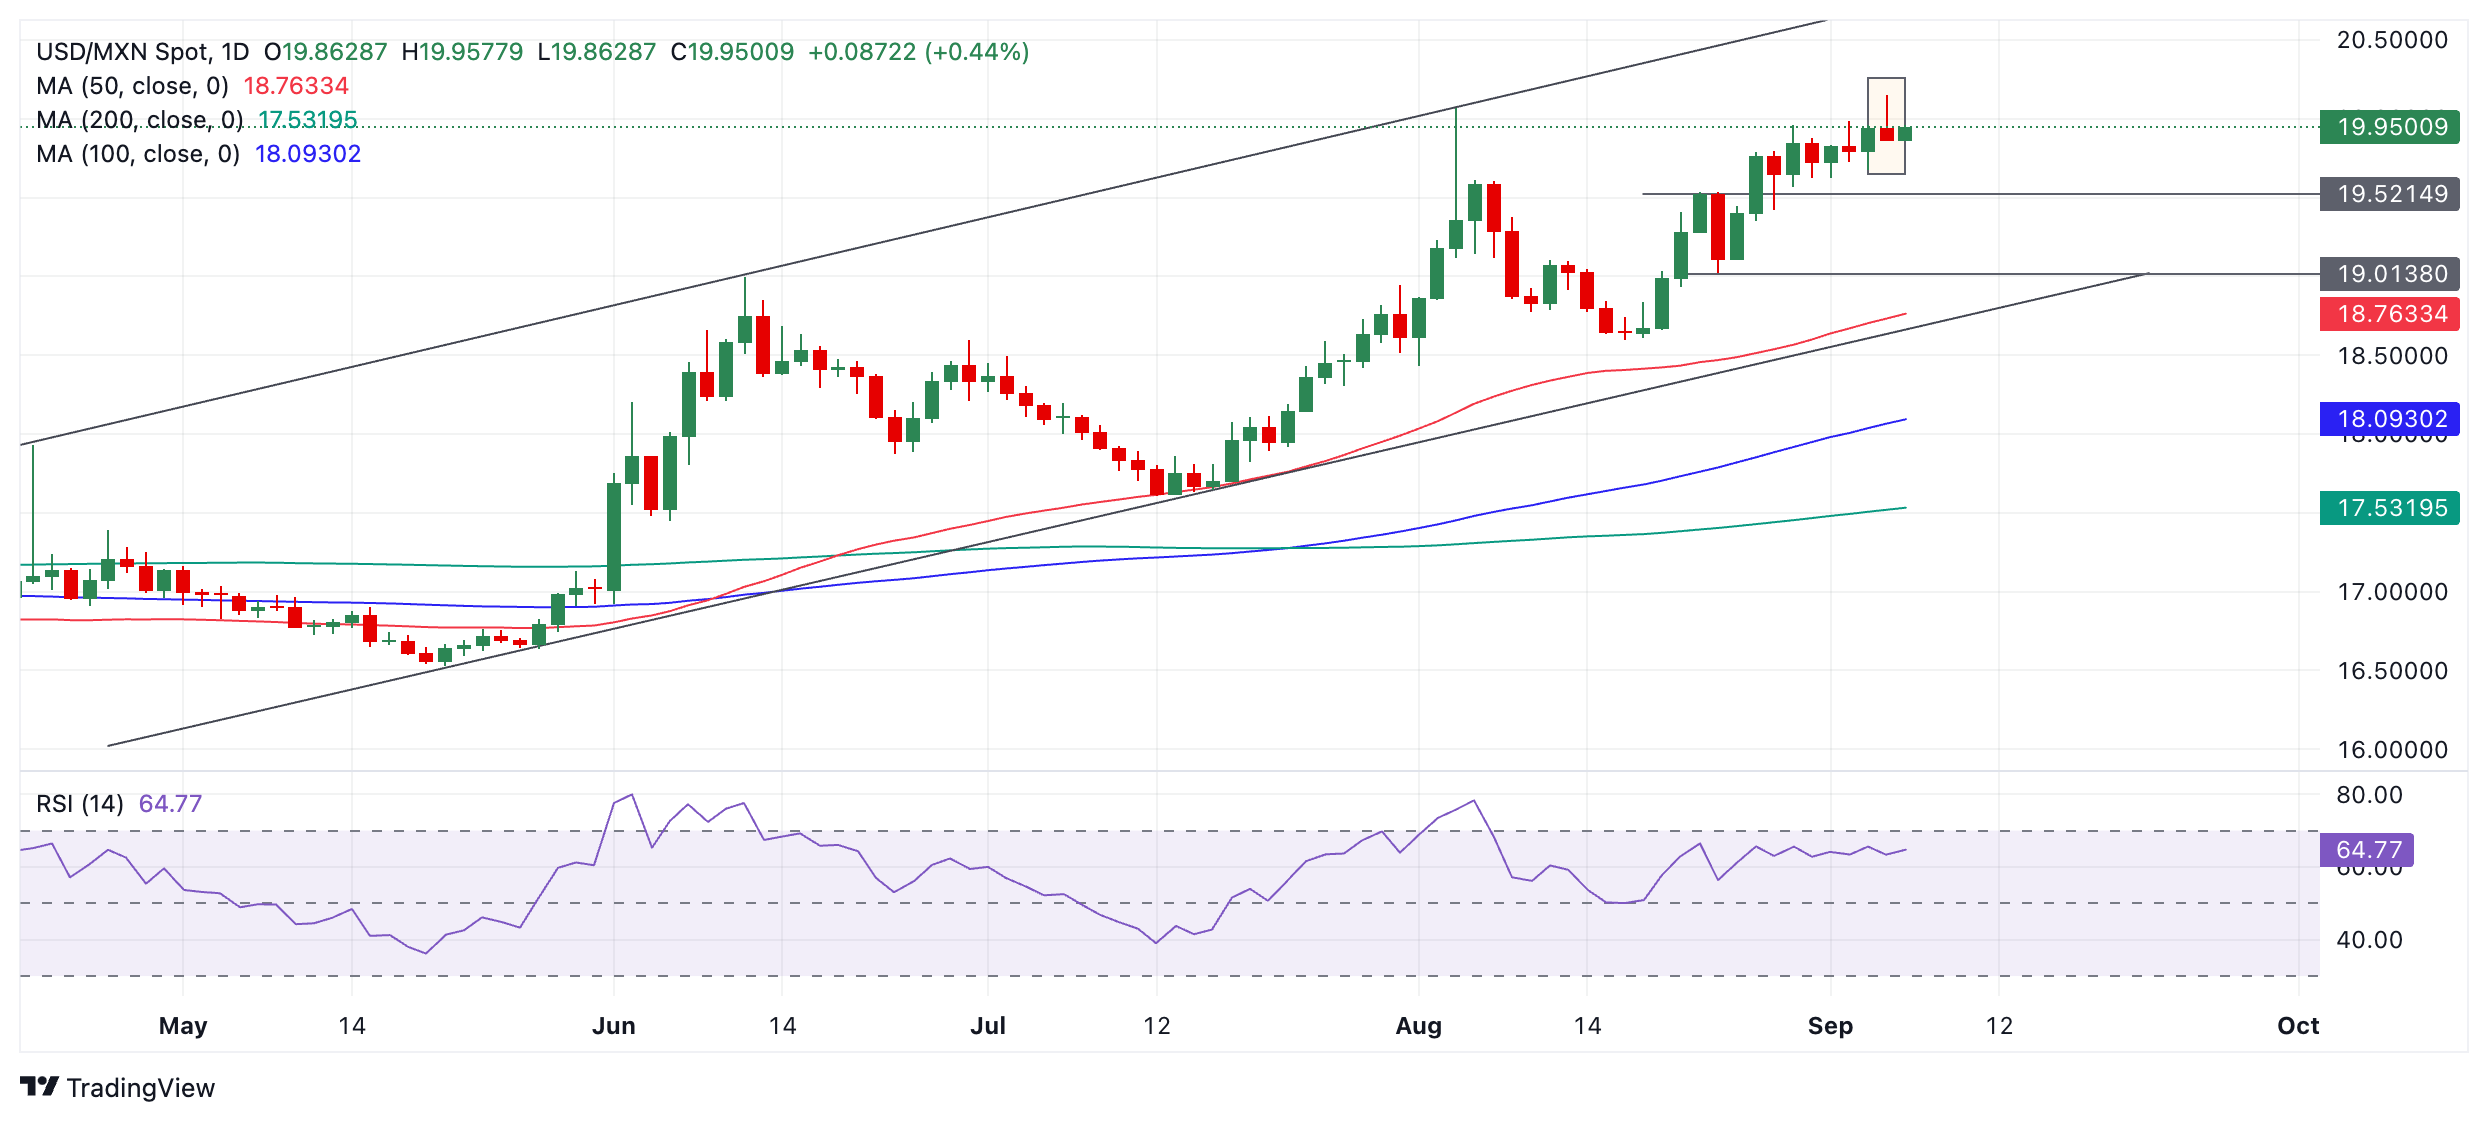
Another quite bearish sign is that the Relative Strength Index (RSI) momentum indicator is diverging with price when compared to the August 5 peak. At the September 5 peak, the RSI was lower than it was on Thursday, even though the price made a higher high. The non-confirmation from RSI suggests a lack of bullish momentum accompanying the September peak, which could be indicative of underlying weakness. Again, it suggests the risk of a pullback evolving.
Despite these bearish signs, however, the overall trend remains bullish, and since according to technical analysis theory “the trend is your friend,” this favors more upside. As such, any weakness may be temporary before the pair rallies again.
A break above the high of the Shooting Star at 20.15 would provide added confirmation of a continuation of the bull trend, with the next target at the upper channel line in the 20.60s.
Economic Indicator
Nonfarm Payrolls
The Nonfarm Payrolls release presents the number of new jobs created in the US during the previous month in all non-agricultural businesses; it is released by the US Bureau of Labor Statistics (BLS). The monthly changes in payrolls can be extremely volatile. The number is also subject to strong reviews, which can also trigger volatility in the Forex board. Generally speaking, a high reading is seen as bullish for the US Dollar (USD), while a low reading is seen as bearish, although previous months' reviews and the Unemployment Rate are as relevant as the headline figure. The market's reaction, therefore, depends on how the market assesses all the data contained in the BLS report as a whole.
Read more.Next release: Fri Sep 06, 2024 12:30
Frequency: Monthly
Consensus: 160K
Previous: 114K
Source: US Bureau of Labor Statistics
America’s monthly jobs report is considered the most important economic indicator for forex traders. Released on the first Friday following the reported month, the change in the number of positions is closely correlated with the overall performance of the economy and is monitored by policymakers. Full employment is one of the Federal Reserve’s mandates and it considers developments in the labor market when setting its policies, thus impacting currencies. Despite several leading indicators shaping estimates, Nonfarm Payrolls tend to surprise markets and trigger substantial volatility. Actual figures beating the consensus tend to be USD bullish.
- AUD/USD edges lower to near 0.6735 in Friday’s European session, down 0.10% on the day.
- RBA’s hawkish remarks fail to boost the Aussie amid the cautious sentiment.
- The US NFP report for August will be the highlight on Friday.
The AUD/USD pair trades on a softer note around 0.6735, snapping the two-day losing streak during the European session on Friday. The markets turn cautious ahead of the US employment reports on Friday.
The Australian Dollar (AUD) weakens on the day despite the softer Greenback and the hawkish comments from Reserve Bank of Australia (RBA) Governor Michele Bullock. RBA’s Bullock said on Thursday, "If the economy evolves broadly as anticipated, the board does not expect that it will be in a position to cut rates in the near term.”
On the other hand, investors see the US Federal Reserve (Fed) start easing its monetary policy at its upcoming meeting in September. The CME FedWatch tool showed that the markets are now pricing in a nearly 59% chance of a 25 basis points (bps) Fed rate cut in September, while the possibility of a 50 bps rate cut stands at 41%.
The disappointing ADP Employment Change data on Thursday weighs on the USD against the AUD. Automatic Data Processing (ADP) revealed on Thursday that private sector employment increased by 99,000 in August, followed by the 111,000 (revised from 122,000) increase reported in July and below the consensus of 145,000 by a wide margin.
Investors will closely watch the US employment data on Friday as it might offer some cues about the size and pace of the Fed easing rate cycle. Investors estimate NFP to rise 160,000 in August following the 114,000 increase seen in July. The Unemployment Rate is projected to edge lower to 4.2% in August. The weaker readings might prompt a 50 bps rate cut by the Fed, which exerts some selling pressure on the US Dollar.
Australian Dollar FAQs
One of the most significant factors for the Australian Dollar (AUD) is the level of interest rates set by the Reserve Bank of Australia (RBA). Because Australia is a resource-rich country another key driver is the price of its biggest export, Iron Ore. The health of the Chinese economy, its largest trading partner, is a factor, as well as inflation in Australia, its growth rate and Trade Balance. Market sentiment – whether investors are taking on more risky assets (risk-on) or seeking safe-havens (risk-off) – is also a factor, with risk-on positive for AUD.
The Reserve Bank of Australia (RBA) influences the Australian Dollar (AUD) by setting the level of interest rates that Australian banks can lend to each other. This influences the level of interest rates in the economy as a whole. The main goal of the RBA is to maintain a stable inflation rate of 2-3% by adjusting interest rates up or down. Relatively high interest rates compared to other major central banks support the AUD, and the opposite for relatively low. The RBA can also use quantitative easing and tightening to influence credit conditions, with the former AUD-negative and the latter AUD-positive.
China is Australia’s largest trading partner so the health of the Chinese economy is a major influence on the value of the Australian Dollar (AUD). When the Chinese economy is doing well it purchases more raw materials, goods and services from Australia, lifting demand for the AUD, and pushing up its value. The opposite is the case when the Chinese economy is not growing as fast as expected. Positive or negative surprises in Chinese growth data, therefore, often have a direct impact on the Australian Dollar and its pairs.
Iron Ore is Australia’s largest export, accounting for $118 billion a year according to data from 2021, with China as its primary destination. The price of Iron Ore, therefore, can be a driver of the Australian Dollar. Generally, if the price of Iron Ore rises, AUD also goes up, as aggregate demand for the currency increases. The opposite is the case if the price of Iron Ore falls. Higher Iron Ore prices also tend to result in a greater likelihood of a positive Trade Balance for Australia, which is also positive of the AUD.
The Trade Balance, which is the difference between what a country earns from its exports versus what it pays for its imports, is another factor that can influence the value of the Australian Dollar. If Australia produces highly sought after exports, then its currency will gain in value purely from the surplus demand created from foreign buyers seeking to purchase its exports versus what it spends to purchase imports. Therefore, a positive net Trade Balance strengthens the AUD, with the opposite effect if the Trade Balance is negative.
- USD/CAD retests the weekly low on Friday and is pressured by a combination of factors.
- Fed rate cut bets weighs on the USD, while an uptick in Oil prices underpins the Loonie.
- The downside remains cushioned ahead of the monthly jobs data from the US and Canada.
The USD/CAD pair attracts sellers for the third straight day and remains depressed below the 1.3500 psychological mark, or the weekly low through the early European session on Friday.
The US Dollar (USD) selling bias remains unabated in the wake of bets for a larger interest rate cut by the Federal Reserve (Fed) in September. Apart from this, an uptick in Crude Oil prices is seen underpinning the commodity-linked Loonie and exerting downward pressure on the USD/CAD pair. The downside, however, seems limited as traders might opt to wait for the release of the crucial monthly employment details from the US and Canada, due later during the North American session.
From a technical perspective, the recent breakdown through the very important 200-day Simple Moving Average (SMA) was seen as a fresh trigger for bearish traders. Moreover, oscillators on the daily chart have recovered from the oversold zone and are still holding deep in negative territory. This suggests that the path of least resistance for the USD/CAD pair is to the downside and supports prospects for an extension of the slide from the 1.3565 area or a nearly two-week high touched on Wednesday.
Traders, however, need to wait for some follow-through selling below the 1.3485 region, or the weekly low, before positioning for any further losses. The USD/CAD pair might then accelerate the slide towards the multi-month trough, around the 1.3440 area touched last week before eventually dropping to the March monthly swing low, around the 1.3420 region. The downward trajectory could extend further towards the 1.3400 mark en route to the next relevant support near the 1.3365-1.3360 zone.
On the flip side, the overnight swing high, around the 1.3525 region, could cap any attempted recovery ahead of the 1.3565 area, or the weekly peak. The subsequent move up has the potential to lift the USD/CAD pair back towards the 200-day SMA support breakpoint, now turned resistance, currently pegged near the 1.3590 zone. A sustained strength beyond the latter could negate the near-term negative bias and trigger a short-covering rally towards the 1.3640-1.3645 resistance.
USD/CAD daily chart
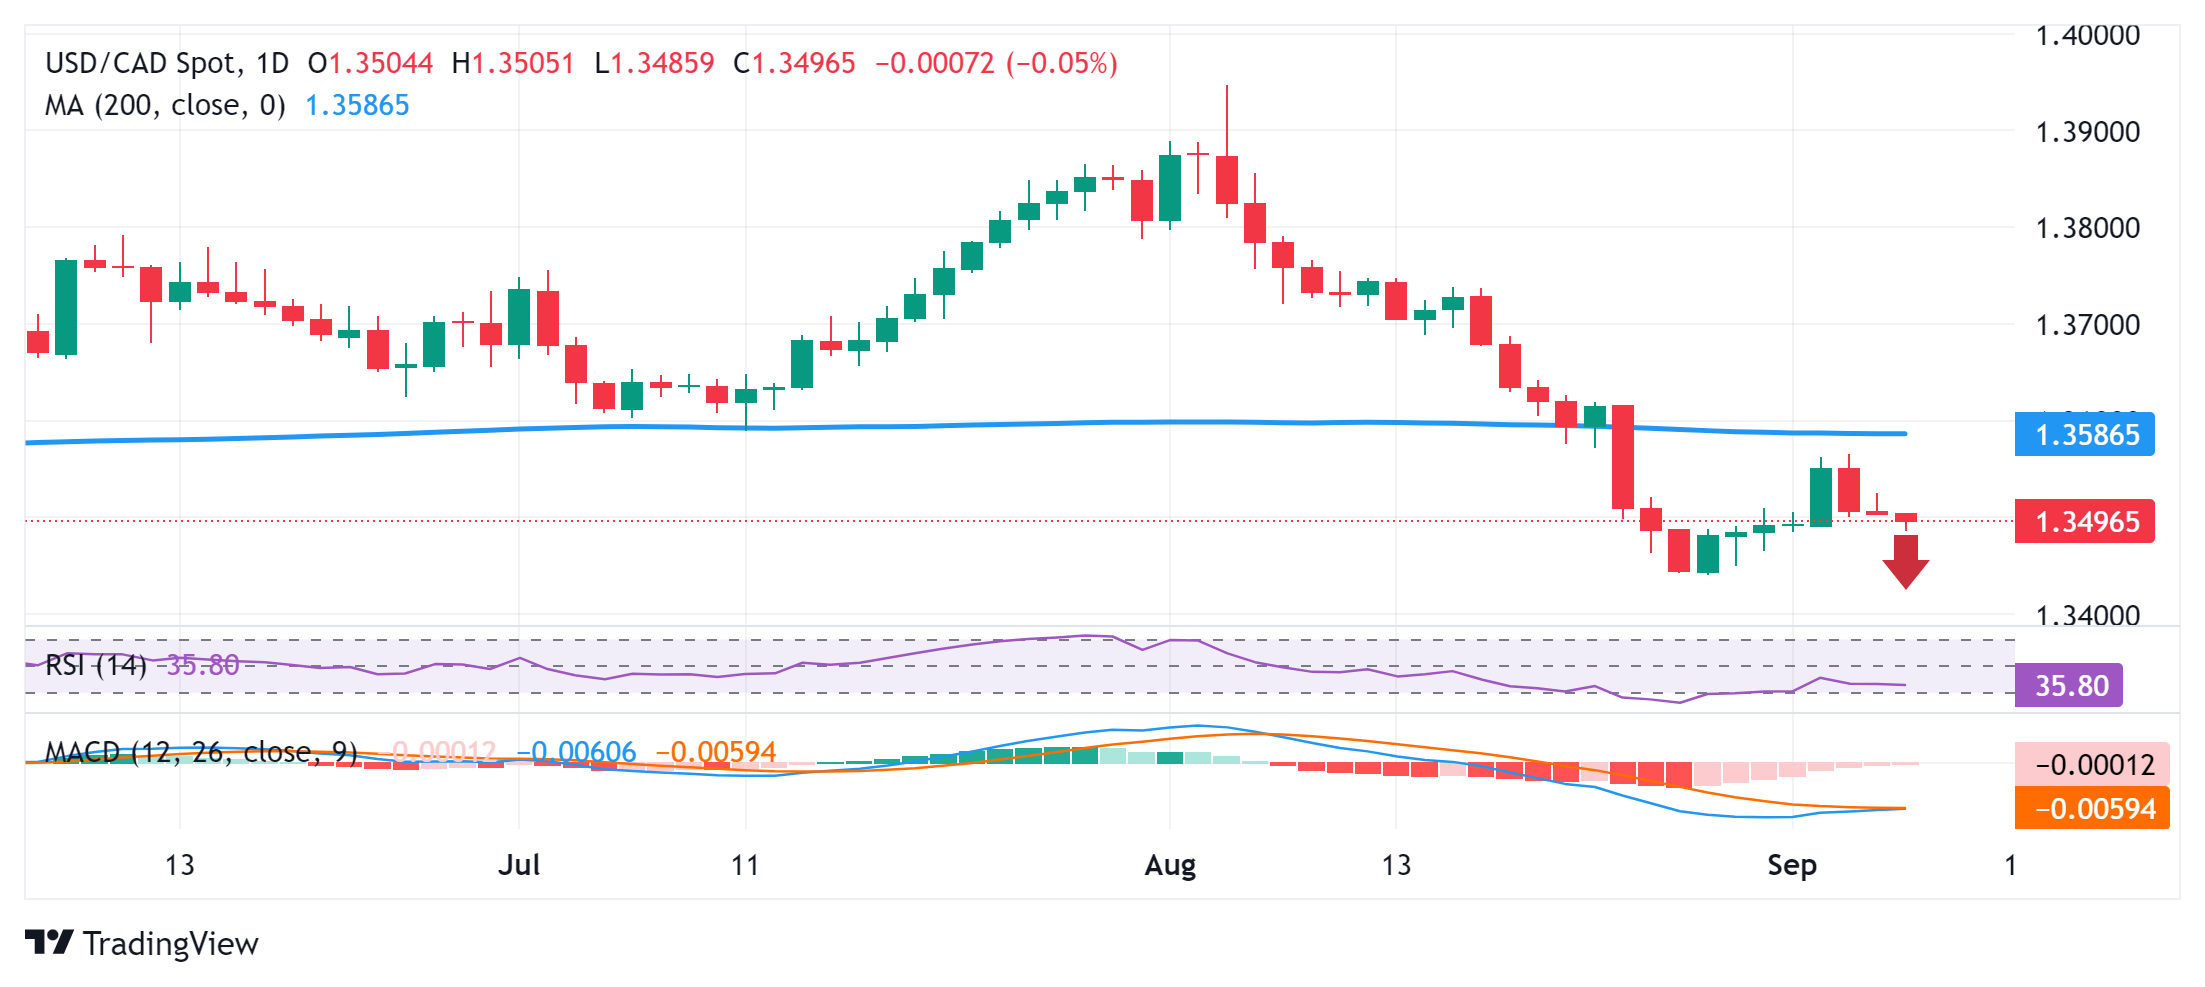
Economic Indicator
Unemployment Rate
The Unemployment Rate, released by Statistics Canada, is the number of unemployed workers divided by the total civilian labor force as a percentage. It is a leading indicator for the Canadian Economy. If the rate is up, it indicates a lack of expansion within the Canadian labor market and a weakening of the Canadian economy. Generally, a decrease of the figure is seen as bullish for the Canadian Dollar (CAD), while an increase is seen as bearish.
Read more.Next release: Fri Sep 06, 2024 12:30
Frequency: Monthly
Consensus: 6.5%
Previous: 6.4%
Source: Statistics Canada
- Silver price appreciates as dovish Fedspeak increases the likelihood of an aggressive rate cut by the Fed in September.
- CME FedWatch Tool showed the likelihood of a 50 basis points rate cut has risen to 41.0%.
- The safe-haven Silver may face challenges as Middle-East tensions ease, following the withdrawal of Israeli forces from Jenin.
Silver price (XAG/USD) extends gains for the third successive day, trading around $28.90 per troy ounce during the early European hours on Friday.
The non-yielding assets like Silver may find support from the dovish comments made by Federal Reserve (Fed) officials, which enhance the chances of an aggressive rate cut by the Fed in September. Lower interest rates could make the commodity assets attractive for investors for better returns.
Chicago Fed President Austan Goolsbee said on Friday that the longer-run trend of the labor market and inflation data justify the Fed easing interest-rate policy soon and then steadily over the next year. FXStreet’s FedTracker, which gauges the tone of Fed officials’ speeches on a dovish-to-hawkish scale from 0 to 10 using a custom AI model, rated Goolsbee’s words as neutral with a score of 3.8.
According to the CME FedWatch Tool, markets are fully anticipating at least a 25 basis point (bps) rate cut by the Federal Reserve at its September meeting. The likelihood of a 50 bps rate cut has risen to 41.0%, up from 30.0% a week ago.
The potential gains for Silver might be limited due to safe-haven flows, given the recent easing of geopolitical tensions in the Middle East. Israeli forces have withdrawn from Jenin and a nearby refugee camp after 10 days of intense conflict, according to Reuters citing the Palestine news agency WAFA.
The Palestinian health ministry reported 21 fatalities in the city and camp. A Reuters observer noted that the departing Israeli forces left behind significant damage to infrastructure.
Silver FAQs
Silver is a precious metal highly traded among investors. It has been historically used as a store of value and a medium of exchange. Although less popular than Gold, traders may turn to Silver to diversify their investment portfolio, for its intrinsic value or as a potential hedge during high-inflation periods. Investors can buy physical Silver, in coins or in bars, or trade it through vehicles such as Exchange Traded Funds, which track its price on international markets.
Silver prices can move due to a wide range of factors. Geopolitical instability or fears of a deep recession can make Silver price escalate due to its safe-haven status, although to a lesser extent than Gold's. As a yieldless asset, Silver tends to rise with lower interest rates. Its moves also depend on how the US Dollar (USD) behaves as the asset is priced in dollars (XAG/USD). A strong Dollar tends to keep the price of Silver at bay, whereas a weaker Dollar is likely to propel prices up. Other factors such as investment demand, mining supply – Silver is much more abundant than Gold – and recycling rates can also affect prices.
Silver is widely used in industry, particularly in sectors such as electronics or solar energy, as it has one of the highest electric conductivity of all metals – more than Copper and Gold. A surge in demand can increase prices, while a decline tends to lower them. Dynamics in the US, Chinese and Indian economies can also contribute to price swings: for the US and particularly China, their big industrial sectors use Silver in various processes; in India, consumers’ demand for the precious metal for jewellery also plays a key role in setting prices.
Silver prices tend to follow Gold's moves. When Gold prices rise, Silver typically follows suit, as their status as safe-haven assets is similar. The Gold/Silver ratio, which shows the number of ounces of Silver needed to equal the value of one ounce of Gold, may help to determine the relative valuation between both metals. Some investors may consider a high ratio as an indicator that Silver is undervalued, or Gold is overvalued. On the contrary, a low ratio might suggest that Gold is undervalued relative to Silver.
Here is what you need to know on Friday, September 6:
Following a two-day selloff, the US Dollar (USD) struggles to find demand in the European session on Friday. Eurostat will release revisions to second quarter Employment Change and Gross Domestic product data later in the session. More importantly, the US Bureau of Labor Statistics will publish the August jobs report, which will include Nonfarm Payrolls, Unemployment Rate and wage inflation figures.
US Dollar PRICE This week
The table below shows the percentage change of US Dollar (USD) against listed major currencies this week. US Dollar was the weakest against the Japanese Yen.
| USD | EUR | GBP | JPY | CAD | AUD | NZD | CHF | |
|---|---|---|---|---|---|---|---|---|
| USD | -0.61% | -0.42% | -2.63% | 0.07% | 0.51% | 0.32% | -0.96% | |
| EUR | 0.61% | 0.21% | -2.04% | 0.65% | 1.12% | 0.92% | -0.39% | |
| GBP | 0.42% | -0.21% | -2.27% | 0.43% | 0.89% | 0.73% | -0.62% | |
| JPY | 2.63% | 2.04% | 2.27% | 2.72% | 3.25% | 3.16% | 1.63% | |
| CAD | -0.07% | -0.65% | -0.43% | -2.72% | 0.48% | 0.25% | -1.04% | |
| AUD | -0.51% | -1.12% | -0.89% | -3.25% | -0.48% | -0.21% | -1.49% | |
| NZD | -0.32% | -0.92% | -0.73% | -3.16% | -0.25% | 0.21% | -1.29% | |
| CHF | 0.96% | 0.39% | 0.62% | -1.63% | 1.04% | 1.49% | 1.29% |
The heat map shows percentage changes of major currencies against each other. The base currency is picked from the left column, while the quote currency is picked from the top row. For example, if you pick the US Dollar from the left column and move along the horizontal line to the Japanese Yen, the percentage change displayed in the box will represent USD (base)/JPY (quote).
The USD Index extended its slide and closed in negative territory for the second consecutive day on Thursday, pressured by the disappointing ADP Employment Change data. In August, payrolls in the private sector rose by 99,000, missing the market expectation of 145,000 by a wide margin. Early Friday, the USD Index trades marginally lower on the day below 101.00. In the meantime, the benchmark 10-year US Treasury bond yield continues to push lower and loses nearly 1% on the day slightly below 3.7%, while US stock index futures lose between 0.2% and 0.8%. Investors expect Nonfarm Payrolls to rise 140,000 following the disappointing 114,000 increase recorded in July.
After rising sharply toward 1.3600 earlier in the week, USD/CAD reversed its direction and erased its gains in the second half of the week. Early Friday, the pair holds steady at around 1.3500. Statistics Canada will publish labor market data for August later in the day.
The data from Germany showed on Friday that Industrial Production contracted by 2.4% on a monthly basis in July. EUR/USD showed no reaction to this figure and was last seen trading above 1.1100.
GBP/USD holds its ground and edges higher toward 1.3200 early Friday after ending the previous two days in positive territory.
USD/JPY registered small losses on Thursday but came under renewed bearish pressure during the Asian trading hours on Friday. At the time of press, the pair was trading at 142.30, losing 0.8% on the day.
Following the bearish action seen in the first half of the week, Gold gathered bullish momentum and reclaimed $2,500. XAU/USD consolidates its gains at around $2,520.
Nonfarm Payrolls FAQs
Nonfarm Payrolls (NFP) are part of the US Bureau of Labor Statistics monthly jobs report. The Nonfarm Payrolls component specifically measures the change in the number of people employed in the US during the previous month, excluding the farming industry.
The Nonfarm Payrolls figure can influence the decisions of the Federal Reserve by providing a measure of how successfully the Fed is meeting its mandate of fostering full employment and 2% inflation. A relatively high NFP figure means more people are in employment, earning more money and therefore probably spending more. A relatively low Nonfarm Payrolls’ result, on the either hand, could mean people are struggling to find work. The Fed will typically raise interest rates to combat high inflation triggered by low unemployment, and lower them to stimulate a stagnant labor market.
Nonfarm Payrolls generally have a positive correlation with the US Dollar. This means when payrolls’ figures come out higher-than-expected the USD tends to rally and vice versa when they are lower. NFPs influence the US Dollar by virtue of their impact on inflation, monetary policy expectations and interest rates. A higher NFP usually means the Federal Reserve will be more tight in its monetary policy, supporting the USD.
Nonfarm Payrolls are generally negatively-correlated with the price of Gold. This means a higher-than-expected payrolls’ figure will have a depressing effect on the Gold price and vice versa. Higher NFP generally has a positive effect on the value of the USD, and like most major commodities Gold is priced in US Dollars. If the USD gains in value, therefore, it requires less Dollars to buy an ounce of Gold. Also, higher interest rates (typically helped higher NFPs) also lessen the attractiveness of Gold as an investment compared to staying in cash, where the money will at least earn interest.
Nonfarm Payrolls is only one component within a bigger jobs report and it can be overshadowed by the other components. At times, when NFP come out higher-than-forecast, but the Average Weekly Earnings is lower than expected, the market has ignored the potentially inflationary effect of the headline result and interpreted the fall in earnings as deflationary. The Participation Rate and the Average Weekly Hours components can also influence the market reaction, but only in seldom events like the “Great Resignation” or the Global Financial Crisis.
- EUR/USD extends its upside above 1.1100 as signs of a slowdown in US labor demand weigh on the US Dollar.
- Investors await the US NFP for August as markets wonder if July’s report was just a bump or the start of a more serious deterioration.
- The ECB is expected to cut interest rates two more times this year.
EUR/USD extends its winning spree for the third consecutive trading session on Friday, trading close to a fresh weekly high of 1.1120. Decent gains in the shared currency pair are driven by sheer weakness in the US Dollar (USD). The US Dollar Index (DXY), which tracks the Greenback’s value against six major currencies, slides further below the crucial support of 101.00.
The appeal for the US Dollar has weakened after United States (US) JOLTS Job Openings data for July and the ADP Employment data for August, released earlier this week, deepened fears of deteriorating labor market conditions. Fresh job vacancies and additions of payrolls in the private sector stood at 7.67 million and 99K, respectively, the lowest in more than three-and-a-half years.
The US ISM Services Purchasing Managers’ Index (PMI) data for August came in better than projected but failed to cushion the US Dollar.
Signs of slowing labor demand prompted market expectations that the Federal Reserve (Fed) could start cutting interest rates aggressively. According to the CME FedWatch tool, the possibility for the Fed to begin reducing interest rates by 50 basis points (bps) to 4.75%-5.00% has increased to 41% from 34% recorded a week ago.
For more cues on the interest rate path, investors will focus on the US Nonfarm Payrolls (NFP) data for August, which will be published at 12:30 GMT. The official employment data is expected to show that US employers hired 160K job-seekers, higher than July’s reading of 114K. The Unemployment Rate is estimated to have declined to 4.2% from the former release of 4.3%.
Investors will also focus on the US Average Hourly Earnings data, a key measure of wage growth that influences consumer spending. Earnings are expected to have accelerated to 3.7% from 3.6% in July on a year-on-year basis. The wage growth measure is seen growing by 0.3% on the month, faster than the prior increase of 0.2%.
Daily digest market movers: EUR/USD rises as US Dollar weakens
- EUR/USD rises on sheer weakness in the US Dollar ahead of the US NFP data. By itself, the Euro (ECB) exhibits a mixed performance against its major peers as traders aren’t sure about the European Central Bank (ECB) interest rate path for the remainder of the year.
- The ECB is widely anticipated to cut interest rates again in the September meeting. The central bank started the policy-easing process in June but kept its key borrowing rates unchanged in July. For the last quarter of this year, traders remain split on whether the ECB will cut in the November or December meeting, or in both of them.
- Economists at Bank of America (BofA) said in their latest viewpoint on the Eurozone: "We still see more cuts in 2025/26 than the markets are pricing, with a return to a deposit rate of 2% by 3Q25 (at the latest) and to 1.5% in 2026." BofA analysts said that the recovery in the Eurozone remains fragile and will likely be shallow, pressured by several economic factors including slowing growth in China as well as political factors.
- Further evidence of economic struggle came from the Eurozone’s two largest economies. Industrial production in Germany fell 2.4% on month in July, much more than the 0.3% decline expected by economists. In France, Industrial Output fell by 0.5%.
- According to a Reuters poll carried out between August 30 and September 5, 85% of economists anticipate that the ECB will cut interest rates next week and again in the December meeting.
- Meanwhile, most ECB officials seem to be comfortable with market speculation for interest rate cuts as they remain worried about growing risks to Eurozone economic growth. ECB Executive Board member Piero Cipollone said in an interview with a French newspaper this week that "there is a real risk that [the ECB] stance could become too restrictive."
Technical Analysis: EUR/USD holds gains above 1.1100
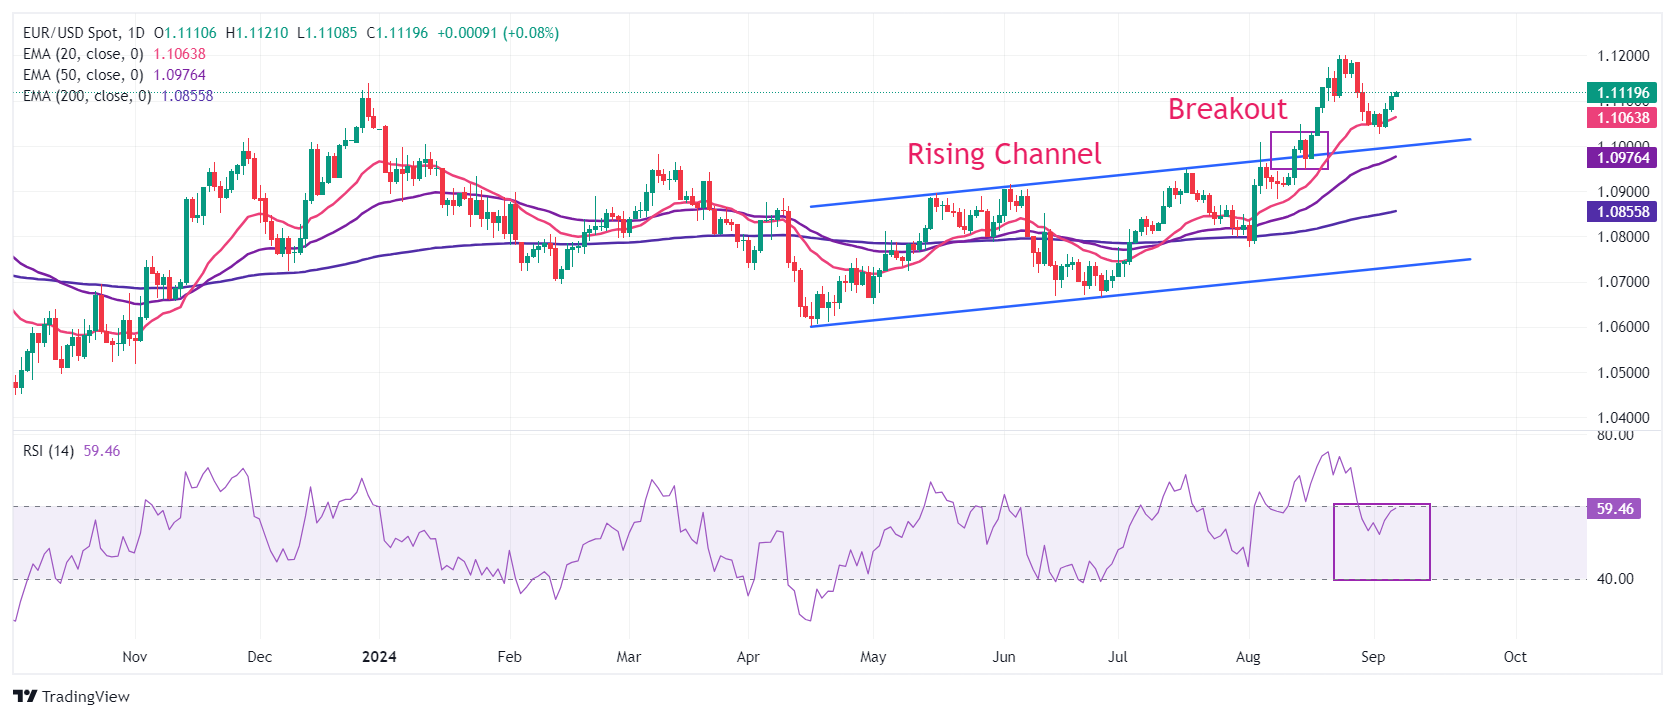
EUR/USD remains steady above the round-level figure of 1.1100. The near-term outlook of the major currency pair remains firm as it manages to gain firm footing near the 20-day Exponential Moving Average (EMA) around 1.1055.
The longer-term outlook is also bullish as the 50-day and 200-day EMAs at 1.0970 and 1.0865, respectively, are sloping higher. Also, the shared currency pair holds the Rising Channel breakout on a daily time frame.
The 14-day Relative Strength Index (RSI) has declined below 60.00 after turning overbought near 75.00.
On the upside, the recent high of 1.1200 and the July 2023 high at 1.1275 will be the next stop for the Euro bulls. Meanwhile, the downside is expected to remain cushioned near the psychological support of 1.1000.
Euro FAQs
The Euro is the currency for the 20 European Union countries that belong to the Eurozone. It is the second most heavily traded currency in the world behind the US Dollar. In 2022, it accounted for 31% of all foreign exchange transactions, with an average daily turnover of over $2.2 trillion a day. EUR/USD is the most heavily traded currency pair in the world, accounting for an estimated 30% off all transactions, followed by EUR/JPY (4%), EUR/GBP (3%) and EUR/AUD (2%).
The European Central Bank (ECB) in Frankfurt, Germany, is the reserve bank for the Eurozone. The ECB sets interest rates and manages monetary policy. The ECB’s primary mandate is to maintain price stability, which means either controlling inflation or stimulating growth. Its primary tool is the raising or lowering of interest rates. Relatively high interest rates – or the expectation of higher rates – will usually benefit the Euro and vice versa. The ECB Governing Council makes monetary policy decisions at meetings held eight times a year. Decisions are made by heads of the Eurozone national banks and six permanent members, including the President of the ECB, Christine Lagarde.
Eurozone inflation data, measured by the Harmonized Index of Consumer Prices (HICP), is an important econometric for the Euro. If inflation rises more than expected, especially if above the ECB’s 2% target, it obliges the ECB to raise interest rates to bring it back under control. Relatively high interest rates compared to its counterparts will usually benefit the Euro, as it makes the region more attractive as a place for global investors to park their money.
Data releases gauge the health of the economy and can impact on the Euro. Indicators such as GDP, Manufacturing and Services PMIs, employment, and consumer sentiment surveys can all influence the direction of the single currency. A strong economy is good for the Euro. Not only does it attract more foreign investment but it may encourage the ECB to put up interest rates, which will directly strengthen the Euro. Otherwise, if economic data is weak, the Euro is likely to fall. Economic data for the four largest economies in the euro area (Germany, France, Italy and Spain) are especially significant, as they account for 75% of the Eurozone’s economy.
Another significant data release for the Euro is the Trade Balance. This indicator measures the difference between what a country earns from its exports and what it spends on imports over a given period. If a country produces highly sought after exports then its currency will gain in value purely from the extra demand created from foreign buyers seeking to purchase these goods. Therefore, a positive net Trade Balance strengthens a currency and vice versa for a negative balance.
- NZD/USD could test the nine-day EMA at 0.6210, followed by the seven-month high of 0.6247.
- The 14-day RSI remains above the 50 level, confirming a persistent bullish trend.
- The immediate support appears around the psychological level of 0.6200, aligned with the 14-day EMA at 0.6190.
NZD/USD retraces its recent gains, trading around 0.6210 during the Asian hours on Friday. On the daily chart, the pair treks above the lower boundary of the ascending channel, which supports a bullish outlook. A move below the lower boundary could weaken the bullish sentiment.
The 14-day Relative Strength Index (RSI) remains above the 50 level, signaling a persistent bullish trend. Furthermore, the nine-day Exponential Moving Average (EMA) is above the 14-day EMA, indicating that the NZD/USD pair is experiencing short-term upward momentum and is expected to continue its rise.
On the upside, the NZD/USD pair faces immediate resistance near the nine-day EMA at 0.6210, with further resistance at the seven-month high of 0.6247 recorded on August 21. A break above this level could drive the pair toward the upper boundary of the ascending channel, around 0.6350.
For support, the NZD/USD pair may test the 14-day EMA at the 0.6190 level, which aligns with the lower boundary of the ascending channel. A drop below this level could diminish the bullish bias and drive the pair toward the psychological level of 0.6100.
NZD/USD: Daily Chart
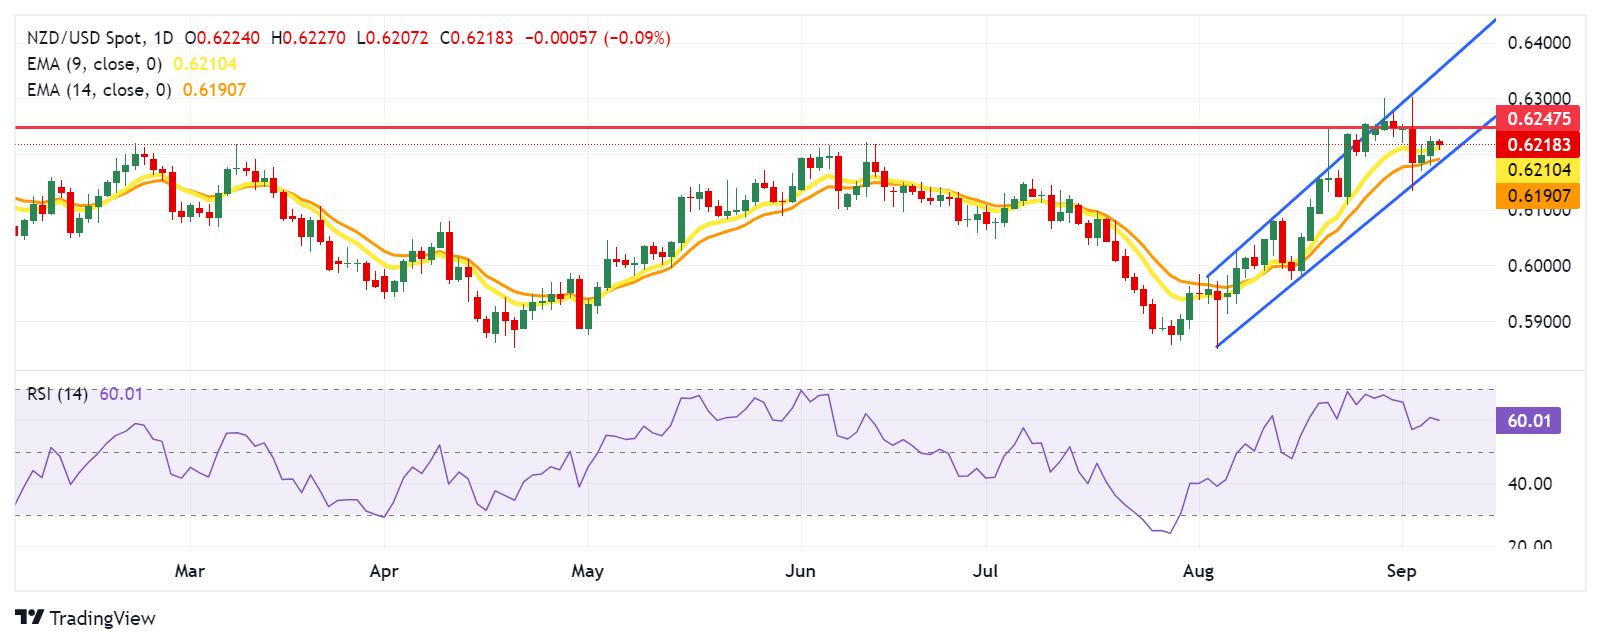
New Zealand Dollar PRICE Today
The table below shows the percentage change of New Zealand Dollar (NZD) against listed major currencies today. New Zealand Dollar was the weakest against the Japanese Yen.
| USD | EUR | GBP | JPY | CAD | AUD | NZD | CHF | |
|---|---|---|---|---|---|---|---|---|
| USD | -0.05% | 0.02% | -0.80% | -0.06% | 0.15% | 0.09% | -0.27% | |
| EUR | 0.05% | 0.07% | -0.76% | -0.03% | 0.20% | 0.13% | -0.22% | |
| GBP | -0.02% | -0.07% | -0.81% | -0.08% | 0.14% | 0.07% | -0.29% | |
| JPY | 0.80% | 0.76% | 0.81% | 0.75% | 0.96% | 0.87% | 0.52% | |
| CAD | 0.06% | 0.03% | 0.08% | -0.75% | 0.20% | 0.16% | -0.21% | |
| AUD | -0.15% | -0.20% | -0.14% | -0.96% | -0.20% | -0.07% | -0.44% | |
| NZD | -0.09% | -0.13% | -0.07% | -0.87% | -0.16% | 0.07% | -0.36% | |
| CHF | 0.27% | 0.22% | 0.29% | -0.52% | 0.21% | 0.44% | 0.36% |
The heat map shows percentage changes of major currencies against each other. The base currency is picked from the left column, while the quote currency is picked from the top row. For example, if you pick the New Zealand Dollar from the left column and move along the horizontal line to the US Dollar, the percentage change displayed in the box will represent NZD (base)/USD (quote).
- WTI prices remain subdued near 68.37, the lowest level since December 2023, which was recorded on Thursday.
- Crude Oil prices lost ground due to demand fears in the United States and China.
- EIA Crude Oil Stocks Change fell by 6.873 million barrels, against the expected decline of 0.9 million barrels.
West Texas Intermediate (WTI) Oil price trades around $68.60 during the Asian hours on Friday, hovering around 68.37 lowest since December 2023, which was recorded on Thursday. Crude Oil prices depreciate due to concerns over demand in both the United States (US) and China.
The US ISM Manufacturing PMI indicated that factory activity contracted for the fifth consecutive month, with the pace of decline slightly exceeding expectations. Additionally, the world's biggest crude importer China showed that manufacturing activity fell to a six-month low in August, with factory gate prices dropping significantly.
On Thursday, the US Energy Information Administration (EIA) reported a Crude Oil Stocks Change, which reduced by 6.873 million barrels of crude Oil inventory for the week ending August 30. This was significantly larger than the market's expectation of a 0.9 million-barrel decrease, following the prior reduction of 0.846 million barrels.
The downside of the Oil prices would be restrained due to ongoing discussions between the Organization of the Petroleum Exporting Countries and its allies led by Russia (OPEC+), regarding a delay in planned output increases set to begin in October. According to Reuters, OPEC+ decided to postpone the scheduled Oil output increase for October and November and indicated that further delays or reversals of the hikes could be considered if necessary.
WTI prices may find support from the dovish comments made by Federal Reserve (Fed) officials, which enhance the chances of an aggressive rate cut by the Fed in September. Lower borrowing costs could stimulate economic activity in the United States, potentially boosting Oil demand.
Chicago Fed President Austan Goolsbee said on Friday that the longer-run trend of the labor market and inflation data justify the Fed easing interest-rate policy soon and then steadily over the next year. FXStreet’s FedTracker, which gauges the tone of Fed officials’ speeches on a dovish-to-hawkish scale from 0 to 10 using a custom AI model, rated Goolsbee’s words as neutral with a score of 3.8.
According to the CME FedWatch Tool, markets are fully anticipating at least a 25 basis point (bps) rate cut by the Federal Reserve at its September meeting. The likelihood of a 50 bps rate cut has risen to 41.0%, up from 30.0% a week ago.
WTI Oil FAQs
WTI Oil is a type of Crude Oil sold on international markets. The WTI stands for West Texas Intermediate, one of three major types including Brent and Dubai Crude. WTI is also referred to as “light” and “sweet” because of its relatively low gravity and sulfur content respectively. It is considered a high quality Oil that is easily refined. It is sourced in the United States and distributed via the Cushing hub, which is considered “The Pipeline Crossroads of the World”. It is a benchmark for the Oil market and WTI price is frequently quoted in the media.
Like all assets, supply and demand are the key drivers of WTI Oil price. As such, global growth can be a driver of increased demand and vice versa for weak global growth. Political instability, wars, and sanctions can disrupt supply and impact prices. The decisions of OPEC, a group of major Oil-producing countries, is another key driver of price. The value of the US Dollar influences the price of WTI Crude Oil, since Oil is predominantly traded in US Dollars, thus a weaker US Dollar can make Oil more affordable and vice versa.
The weekly Oil inventory reports published by the American Petroleum Institute (API) and the Energy Information Agency (EIA) impact the price of WTI Oil. Changes in inventories reflect fluctuating supply and demand. If the data shows a drop in inventories it can indicate increased demand, pushing up Oil price. Higher inventories can reflect increased supply, pushing down prices. API’s report is published every Tuesday and EIA’s the day after. Their results are usually similar, falling within 1% of each other 75% of the time. The EIA data is considered more reliable, since it is a government agency.
OPEC (Organization of the Petroleum Exporting Countries) is a group of 13 Oil-producing nations who collectively decide production quotas for member countries at twice-yearly meetings. Their decisions often impact WTI Oil prices. When OPEC decides to lower quotas, it can tighten supply, pushing up Oil prices. When OPEC increases production, it has the opposite effect. OPEC+ refers to an expanded group that includes ten extra non-OPEC members, the most notable of which is Russia.
- GBP/JPY dives to a fresh multi-week low amid sustained buying surrounding the JPY.
- Hawkish BOJ expectations, along with a softer risk tone, underpin the safe-haven JPY.
- A decisive break below the 188.00 mark supports prospects for further depreciation.
The GBP/JPY cross attracts fresh sellers during the Asian session on Friday and slides further below the 188.00 mark, hitting a three-and-half-week low in the last hour.
This marks the third day of a negative move in the previous four and is sponsored by some follow-through buying surrounding the Japanese Yen (JPY), which continues to be underpinned by hawkish Bank of Japan (BOJ) expectations. In fact, BOJ Governor Kazuo Ueda reiterated earlier this week that the central bank will continue to raise interest rates if the economy and prices perform as expected.
Adding to this, BoJ Board Member Hajime Takata said on Thursday that we must adjust monetary conditions by another gear if we can confirm that firms will continue to increase capital expenditure, wages, and prices. Furthermore, data released on Thursday showed that real wages in Japan unexpectedly rose for the second straight month in July, keeping the BOJ on track for another potential rate hike in 2024.
Meanwhile, a mixed bag of employment data released from the United States (US) this week triggered worries about the health of the economy. This, along with persistent geopolitical tensions, tempers investors' appetite for riskier assets, which is seen as another factor underpinning the safe-haven JPY and exerting additional downward pressure on the GBP/JPY cross amid the lack of any buying around the British Pound (GBP).
With the latest leg down, spot prices confirm an intraday breakdown through the 189.00 horizontal support and a subsequent slide below the 188.00 mark favors bearish traders. Moreover, oscillators on the daily chart are holding in negative territory and are still away from being in the oversold zone. This suggests that the path of least resistance for the GBP/JPY cross is to the downside and supports prospects for further losses.
Bank of Japan FAQs
The Bank of Japan (BoJ) is the Japanese central bank, which sets monetary policy in the country. Its mandate is to issue banknotes and carry out currency and monetary control to ensure price stability, which means an inflation target of around 2%.
The Bank of Japan has embarked in an ultra-loose monetary policy since 2013 in order to stimulate the economy and fuel inflation amid a low-inflationary environment. The bank’s policy is based on Quantitative and Qualitative Easing (QQE), or printing notes to buy assets such as government or corporate bonds to provide liquidity. In 2016, the bank doubled down on its strategy and further loosened policy by first introducing negative interest rates and then directly controlling the yield of its 10-year government bonds.
The Bank’s massive stimulus has caused the Yen to depreciate against its main currency peers. This process has exacerbated more recently due to an increasing policy divergence between the Bank of Japan and other main central banks, which have opted to increase interest rates sharply to fight decades-high levels of inflation. The BoJ’s policy of holding down rates has led to a widening differential with other currencies, dragging down the value of the Yen.
A weaker Yen and the spike in global energy prices have led to an increase in Japanese inflation, which has exceeded the BoJ’s 2% target. With wage inflation becoming a cause of concern, the BoJ looks to move away from ultra loose policy, while trying to avoid slowing the activity too much.
- US Nonfarm Payrolls are forecast to rise 160K in August after gaining merely by 114K in July.
- The United States Bureau of Labor Statistics will release the critical jobs report on Friday at 12:30 GMT.
- The employment data could help gauge the size of the Fed interest-rate cut in September, rocking the US Dollar.
The United States Bureau of Labor Statistics (BLS) will publish August's highly anticipated Nonfarm Payrolls (NFP) data on Friday at 12:30 GMT.
The US labor market data hold the key for markets to gauge the size of the expected interest-rate cut by the US Federal Reserve (Fed) in September, ramping up the volatility around the US Dollar (USD).
What to expect in the next Nonfarm Payrolls report?
The Nonfarm Payrolls report is forecast to show that the US economy added 160,000 jobs in August, after creating 114,000 in July.
The Unemployment Rate is likely to dip to 4.2% in the same period from July’s 4.3% reading. Meanwhile, a closely-watched measure of wage inflation, Average Hourly Earnings, is seen increasing by 3.7% in the year through August after rising 3.6% in July.
The August employment data will offer significant insights into the strength of the US labor market, which are critical to shaping the Fed interest-rate outlook at the September 17-18 policy meeting and beyond.
Fed Chairman Jerome Powell indicated during his opening remarks at the Jackson Hole Symposium last month that an "unwelcome further cooling in the labor market" could warrant more aggressive policy action, fanning a 50 basis point (bps) interest rate cut.
Meanwhile, the Fed tweaked its July policy statement to mention that it is "attentive to the risks to both sides of its dual mandate", rather than previously only noting its attention to inflation risks.
Previewing the August employment situation report, TD Securities analysts said: “We expect US payrolls to rebound just north of the 200k mark in August following July's downside surprise. The UE rate likely retraced a tenth to 4.2% with wages rising a firmer 0.3% MoM.”
How will US August Nonfarm Payrolls affect EUR/USD?
The US Dollar (USD) has resumed its downward momentum against its major rivals, sending the EUR/USD pair back toward the 1.1100 threshold. Will the US NFP report double down on the dovish Fed expectations, perking up EUR/USD at the expense of the USD?
In the lead-up to the US NFP showdown, weak Institute for Supply Management (ISM) Purchasing Managers Index (PMI) data raised concerns over a potential ‘hard landing’ for the US economy amid fresh signs of loosening labor market conditions.
The ISM announced on Tuesday that its headline US Manufacturing Index improved slightly to 47.2 in August from July’s 46.8 but remained in contraction while below the estimated 47.5 print. Data on Wednesday showed that US Job Openings dropped to a 3-1/2-year low in July, arriving at 7.67 million, following the 7.91 million openings in June while below the expected 8.1 million. The Automatic Data Processing (ADP) reported on Thursday that the US private sector employment increased by 99,000 jobs in August after rising by a downwardly revised 111,000 in July.
Discouraging US economic data ramped up bets for a 50 bps interest-rate cut by the Fed at its September meeting. Markets are now pricing in a 47% chance of an outsized 50 bps rate cut by the Fed later this month, up from 31% at the start of this week, according to the CME Group’s FedWatch tool.
If the headline NFP figure surprises with payroll growth below 100,000, it could bolster the odds of a big cut in September, exacerbating the US Dollar’s pain while pushing EUR/USD further north. Conversely, a strong NFP print combined with hot wage inflation data would pour cold water on aggressive Fed rate cut prospects for this month, boosting hopes that the Fed may opt for a more modest 25 bps rate reduction. This could fuel a decent US Dollar comeback, reinforcing fresh EUR/USD selling back toward 1.0900.
Dhwani Mehta, Analyst at FXStreet, offers a brief technical outlook for EUR/USD:
“The EUR/USD pair defends the 21-day Simple Moving Average (SMA) at 1.1061, having recaptured it on Wednesday. The 14-day Relative Strength Index (RSI) points north well above the 50 level, currently near 58, suggesting that buyers are likely to remain in charge in the near future.”
“Buyers need to crack the year-to-date high of 1.1202 recorded last month to take on the 1.1250 psychological barrier. Further up, the July 18, 2023, high of 1.1276 will challenge the bearish commitments. Alternatively, acceptance below the 21-day SMA at 1.1061 is critical for a sustained correction. The next healthy support levels are seen at the 1.1000 round figure and the 50-day SMA at 1.0939,” Dhwani adds.
Economic Indicator
Nonfarm Payrolls
The Nonfarm Payrolls release presents the number of new jobs created in the US during the previous month in all non-agricultural businesses; it is released by the US Bureau of Labor Statistics (BLS). The monthly changes in payrolls can be extremely volatile. The number is also subject to strong reviews, which can also trigger volatility in the Forex board. Generally speaking, a high reading is seen as bullish for the US Dollar (USD), while a low reading is seen as bearish, although previous months' reviews and the Unemployment Rate are as relevant as the headline figure. The market's reaction, therefore, depends on how the market assesses all the data contained in the BLS report as a whole.
Read more.Next release: Fri Sep 06, 2024 12:30
Frequency: Monthly
Consensus: 160K
Previous: 114K
Source: US Bureau of Labor Statistics
America’s monthly jobs report is considered the most important economic indicator for forex traders. Released on the first Friday following the reported month, the change in the number of positions is closely correlated with the overall performance of the economy and is monitored by policymakers. Full employment is one of the Federal Reserve’s mandates and it considers developments in the labor market when setting its policies, thus impacting currencies. Despite several leading indicators shaping estimates, Nonfarm Payrolls tend to surprise markets and trigger substantial volatility. Actual figures beating the consensus tend to be USD bullish.
Nonfarm Payrolls FAQs
Nonfarm Payrolls (NFP) are part of the US Bureau of Labor Statistics monthly jobs report. The Nonfarm Payrolls component specifically measures the change in the number of people employed in the US during the previous month, excluding the farming industry.
The Nonfarm Payrolls figure can influence the decisions of the Federal Reserve by providing a measure of how successfully the Fed is meeting its mandate of fostering full employment and 2% inflation. A relatively high NFP figure means more people are in employment, earning more money and therefore probably spending more. A relatively low Nonfarm Payrolls’ result, on the either hand, could mean people are struggling to find work. The Fed will typically raise interest rates to combat high inflation triggered by low unemployment, and lower them to stimulate a stagnant labor market.
Nonfarm Payrolls generally have a positive correlation with the US Dollar. This means when payrolls’ figures come out higher-than-expected the USD tends to rally and vice versa when they are lower. NFPs influence the US Dollar by virtue of their impact on inflation, monetary policy expectations and interest rates. A higher NFP usually means the Federal Reserve will be more tight in its monetary policy, supporting the USD.
Nonfarm Payrolls are generally negatively-correlated with the price of Gold. This means a higher-than-expected payrolls’ figure will have a depressing effect on the Gold price and vice versa. Higher NFP generally has a positive effect on the value of the USD, and like most major commodities Gold is priced in US Dollars. If the USD gains in value, therefore, it requires less Dollars to buy an ounce of Gold. Also, higher interest rates (typically helped higher NFPs) also lessen the attractiveness of Gold as an investment compared to staying in cash, where the money will at least earn interest.
Nonfarm Payrolls is only one component within a bigger jobs report and it can be overshadowed by the other components. At times, when NFP come out higher-than-forecast, but the Average Weekly Earnings is lower than expected, the market has ignored the potentially inflationary effect of the headline result and interpreted the fall in earnings as deflationary. The Participation Rate and the Average Weekly Hours components can also influence the market reaction, but only in seldom events like the “Great Resignation” or the Global Financial Crisis.
- AUD/JPY edges lower as rising real wages bolster expectations of further BoJ rate hikes before the end of 2024.
- BoJ’s Takata stated that "if the economy and prices move as expected, we will adjust the policy rate in several stages."
- RBA Governor Michele Bullock stated that it is too early to consider rate cuts.
AUD/JPY retraces its recent gains from the previous session, trading around 96.30 during the Asian hours on Friday. The Japanese Yen (JPY) edges higher against the Australian Dollar (AUD) as rising real wages in July fuel speculation that the Bank of Japan (BoJ) may introduce another interest rate hike before the end of 2024.
Japan’s Labor Cash Earnings grew by 3.6% year-on-year, a deceleration from June's 4.5% increase but the highest since January 1997, surpassing market expectations of 3.1%.
The Japanese Yen also received support from the hawkish remarks from the Bank of Japan (BoJ) Board Member Hajime Takata on Thursday. Takata stated that "if the economy and prices move in line with our forecast, we will adjust the policy rate in several stages."
BoJ’s Takata also highlighted that the domestic economy is recovering moderately despite some signs of weakness. Although stock and FX markets have faced considerable volatility, Takata emphasized that the BoJ remains optimistic about achieving its inflation target.
The AUD/JPY cross appreciated as the Aussie Dollar received support from the positive Trade Balance data released on Thursday. Australia’s trade surplus widened to 6,009 million MoM in July, exceeding the expected 5,150 million and 5,589 million in the previous reading.
Additionally, the Reserve Bank of Australia (RBA) Governor Michele Bullock spoke at "The Anika Foundation" in Sydney on "The Costs of High Inflation," stating that it is too early to consider rate cuts. Currently, the board does not anticipate being able to reduce rates in the near term.
Interest rates FAQs
Interest rates are charged by financial institutions on loans to borrowers and are paid as interest to savers and depositors. They are influenced by base lending rates, which are set by central banks in response to changes in the economy. Central banks normally have a mandate to ensure price stability, which in most cases means targeting a core inflation rate of around 2%. If inflation falls below target the central bank may cut base lending rates, with a view to stimulating lending and boosting the economy. If inflation rises substantially above 2% it normally results in the central bank raising base lending rates in an attempt to lower inflation.
Higher interest rates generally help strengthen a country’s currency as they make it a more attractive place for global investors to park their money.
Higher interest rates overall weigh on the price of Gold because they increase the opportunity cost of holding Gold instead of investing in an interest-bearing asset or placing cash in the bank. If interest rates are high that usually pushes up the price of the US Dollar (USD), and since Gold is priced in Dollars, this has the effect of lowering the price of Gold.
The Fed funds rate is the overnight rate at which US banks lend to each other. It is the oft-quoted headline rate set by the Federal Reserve at its FOMC meetings. It is set as a range, for example 4.75%-5.00%, though the upper limit (in that case 5.00%) is the quoted figure. Market expectations for future Fed funds rate are tracked by the CME FedWatch tool, which shapes how many financial markets behave in anticipation of future Federal Reserve monetary policy decisions.
- EUR/GBP strengthens 0.8435 in Friday’s Asian session.
- The cross keeps the bearish vibe below the 100-period EMA, but RSI indicator shows further upside cannot be ruled out.
- The immediate resistance level emerges at 0.8440; 0.8417 acts as an initial support level.
The EUR/GBP cross trades in positive territory for the third consecutive day around 0.8435 during the Asian session on Friday. The Eurozone Gross Domestic Product (GDP) for the second quarter (Q2) will be closely watched, which is estimated to grow 0.3% QoQ and 0.6% YoY in the second quarter (Q2).
According to the 4-hour chart, the negative outlook of EUR/GBP remains intact as the cross holds below the key 100-period Exponential Moving Averages (EMA). However, the further upside cannot be ruled out as the Relative Strength Index (RSI) points higher above the midline near 56.0.
The first upside barrier for EUR/GBP emerges at 0.8440, the upper boundary of the Bollinger Band. Further north, the next hurdle is seen at 0.8457. A decisive break above this level will see a rally to the 0.8500 psychological level.
On the flip side, the initial support level is located at 0.8417, the lower limit of the Bollinger Band. The potential contention level to watch is the 0.8400-0.8405 region, representing the round figure and the low of September 3. The additional downside filter to watch is 0.8383, the low of July 17.
EUR/GBP 4-hour chart
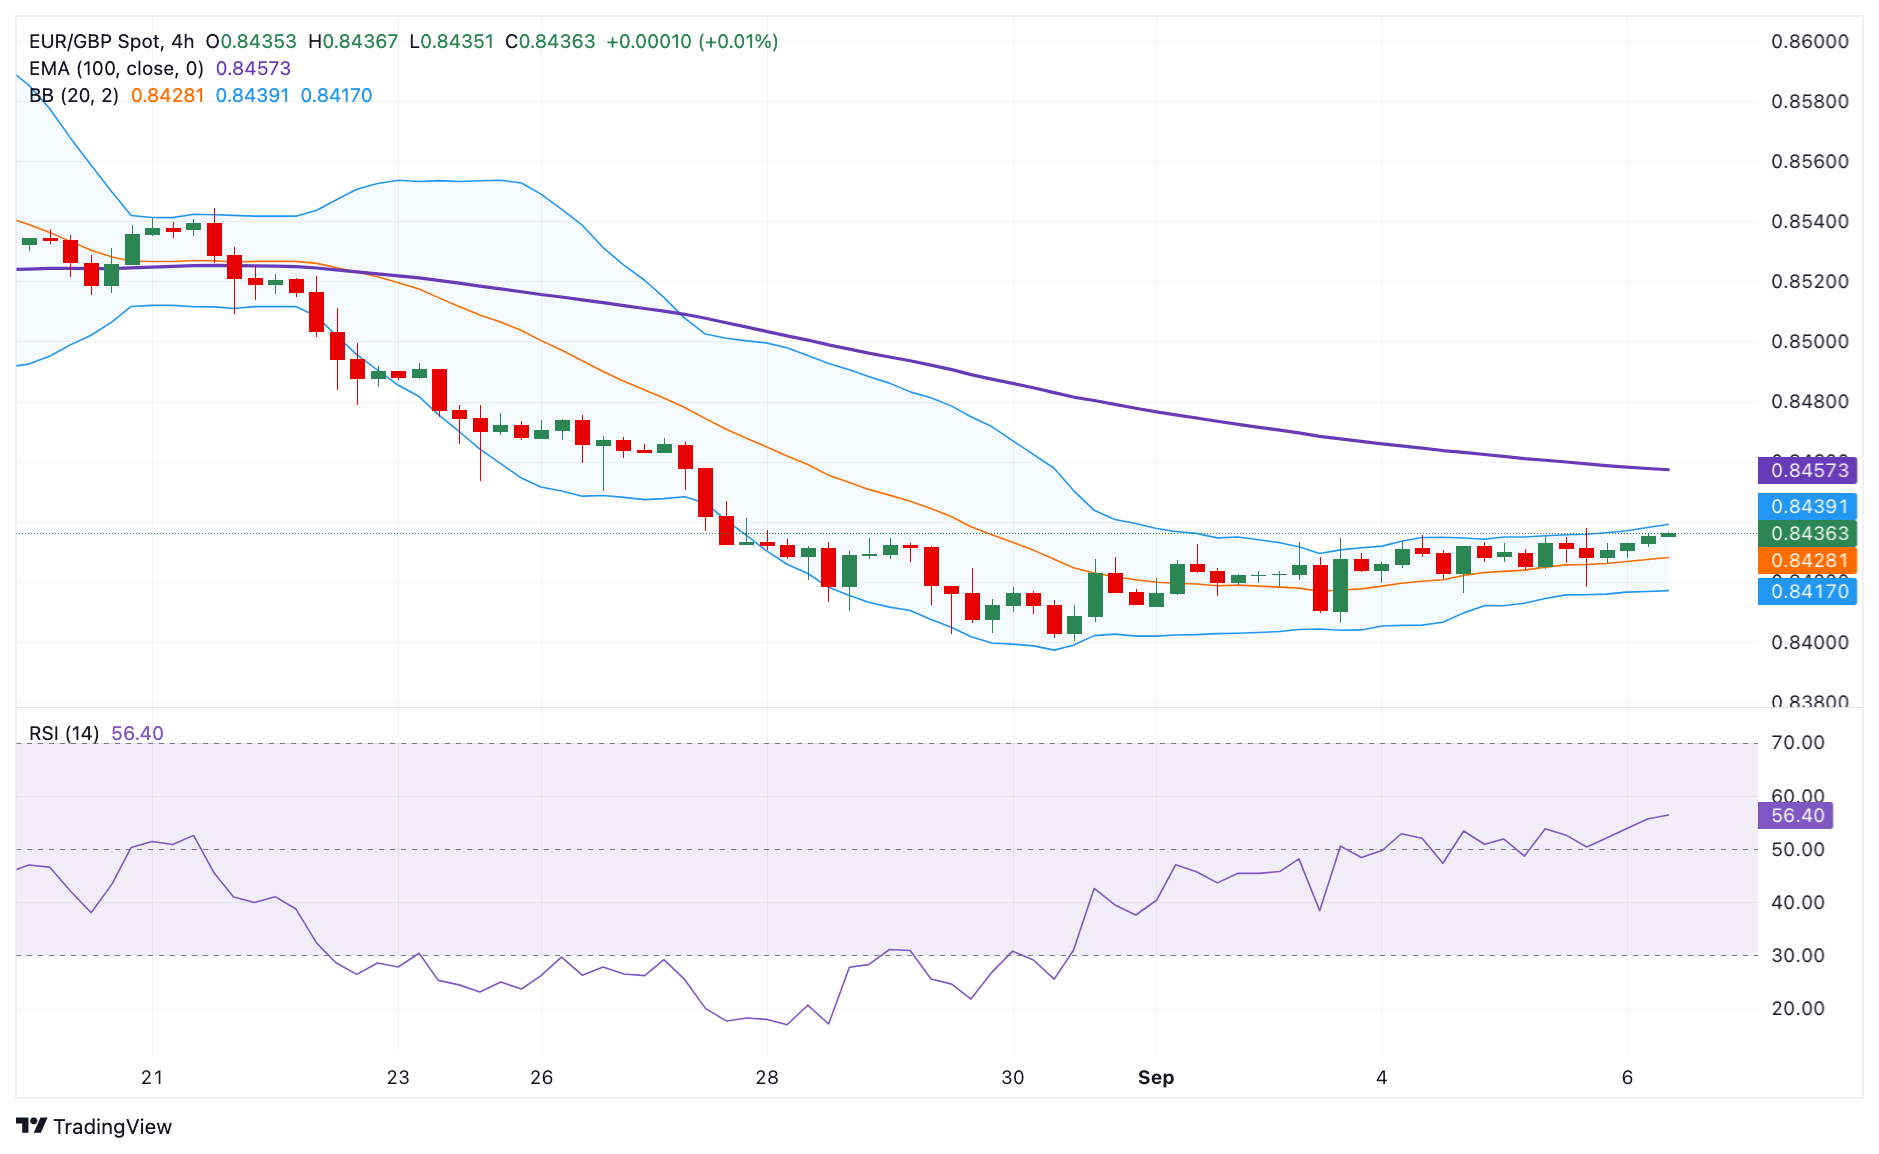
GDP FAQs
A country’s Gross Domestic Product (GDP) measures the rate of growth of its economy over a given period of time, usually a quarter. The most reliable figures are those that compare GDP to the previous quarter e.g Q2 of 2023 vs Q1 of 2023, or to the same period in the previous year, e.g Q2 of 2023 vs Q2 of 2022. Annualized quarterly GDP figures extrapolate the growth rate of the quarter as if it were constant for the rest of the year. These can be misleading, however, if temporary shocks impact growth in one quarter but are unlikely to last all year – such as happened in the first quarter of 2020 at the outbreak of the covid pandemic, when growth plummeted.
A higher GDP result is generally positive for a nation’s currency as it reflects a growing economy, which is more likely to produce goods and services that can be exported, as well as attracting higher foreign investment. By the same token, when GDP falls it is usually negative for the currency. When an economy grows people tend to spend more, which leads to inflation. The country’s central bank then has to put up interest rates to combat the inflation with the side effect of attracting more capital inflows from global investors, thus helping the local currency appreciate.
When an economy grows and GDP is rising, people tend to spend more which leads to inflation. The country’s central bank then has to put up interest rates to combat the inflation. Higher interest rates are negative for Gold because they increase the opportunity-cost of holding Gold versus placing the money in a cash deposit account. Therefore, a higher GDP growth rate is usually a bearish factor for Gold price.
Gold prices remained broadly unchanged in India on Friday, according to data compiled by FXStreet.
The price for Gold stood at 6,797.25 Indian Rupees (INR) per gram, broadly stable compared with the INR 6,792.28 it cost on Thursday.
The price for Gold was broadly steady at INR 79,281.77 per tola from INR 79,223.86 per tola a day earlier.
| Unit measure | Gold Price in INR |
|---|---|
| 1 Gram | 6,797.25 |
| 10 Grams | 67,972.48 |
| Tola | 79,281.77 |
| Troy Ounce | 211,418.20 |
FXStreet calculates Gold prices in India by adapting international prices (USD/INR) to the local currency and measurement units. Prices are updated daily based on the market rates taken at the time of publication. Prices are just for reference and local rates could diverge slightly.
Gold FAQs
Gold has played a key role in human’s history as it has been widely used as a store of value and medium of exchange. Currently, apart from its shine and usage for jewelry, the precious metal is widely seen as a safe-haven asset, meaning that it is considered a good investment during turbulent times. Gold is also widely seen as a hedge against inflation and against depreciating currencies as it doesn’t rely on any specific issuer or government.
Central banks are the biggest Gold holders. In their aim to support their currencies in turbulent times, central banks tend to diversify their reserves and buy Gold to improve the perceived strength of the economy and the currency. High Gold reserves can be a source of trust for a country’s solvency. Central banks added 1,136 tonnes of Gold worth around $70 billion to their reserves in 2022, according to data from the World Gold Council. This is the highest yearly purchase since records began. Central banks from emerging economies such as China, India and Turkey are quickly increasing their Gold reserves.
Gold has an inverse correlation with the US Dollar and US Treasuries, which are both major reserve and safe-haven assets. When the Dollar depreciates, Gold tends to rise, enabling investors and central banks to diversify their assets in turbulent times. Gold is also inversely correlated with risk assets. A rally in the stock market tends to weaken Gold price, while sell-offs in riskier markets tend to favor the precious metal.
The price can move due to a wide range of factors. Geopolitical instability or fears of a deep recession can quickly make Gold price escalate due to its safe-haven status. As a yield-less asset, Gold tends to rise with lower interest rates, while higher cost of money usually weighs down on the yellow metal. Still, most moves depend on how the US Dollar (USD) behaves as the asset is priced in dollars (XAU/USD). A strong Dollar tends to keep the price of Gold controlled, whereas a weaker Dollar is likely to push Gold prices up.
(An automation tool was used in creating this post.)
- USD/CHF extends its decline due to dovish comments from the Fed officials.
- Fed’s Austan Goolsbee said that the longer-run trend of the labor market and inflation data justify the Fed easing soon.
- Swiss Foreign Currency Reserves will be eyed to gain further insights into the SNB’s policy stance regarding the CHF.
USD/CHF extends its losing streak for the fourth successive session, trading around 0.8430 during Friday’s Asian hours. The dovish remarks from the Federal Reserve (Fed) officials put downward pressure on the US Dollar (USD) and undermine the USD/CHF pair.
Chicago Fed President Austan Goolsbee said on Friday that the longer-run trend of the labor market and inflation data justify the Fed easing interest-rate policy soon and then steadily over the next year. FXStreet’s FedTracker, which gauges the tone of Fed officials’ speeches on a dovish-to-hawkish scale from 0 to 10 using a custom AI model, rated Goolsbee’s words as neutral with a score of 3.8.
The US Dollar Index (DXY), which measures the value of the US Dollar against its six major peers, continued to lose ground for the third consecutive day, driven by the decreasing US Treasury yields. The DXY trades around 101.00 with 2-year and 10-year yields on US Treasury bonds standing at 3.73% and 3.71%, respectively, at the time of writing.
On the Swiss front, the seasonally adjusted Unemployment Rate remains steady at 2.5% for August, data showed on Thursday. Traders are now awaiting Friday’s release of Foreign Currency Reserves for August to gain further insights into the Swiss National Bank’s (SNB) policy stance regarding the Swiss Franc (CHF).
Moreover, recent data showed that domestic inflation slowed more than anticipated in August, fueling expectations for another interest rate cut by the Swiss National Bank (SNB). The Swiss Consumer Price Index (CPI) increased by 1.1% year-on-year, down from the previous reading of 1.3% and below the market consensus of 1.2%.
Swiss Franc FAQs
The Swiss Franc (CHF) is Switzerland’s official currency. It is among the top ten most traded currencies globally, reaching volumes that well exceed the size of the Swiss economy. Its value is determined by the broad market sentiment, the country’s economic health or action taken by the Swiss National Bank (SNB), among other factors. Between 2011 and 2015, the Swiss Franc was pegged to the Euro (EUR). The peg was abruptly removed, resulting in a more than 20% increase in the Franc’s value, causing a turmoil in markets. Even though the peg isn’t in force anymore, CHF fortunes tend to be highly correlated with the Euro ones due to the high dependency of the Swiss economy on the neighboring Eurozone.
The Swiss Franc (CHF) is considered a safe-haven asset, or a currency that investors tend to buy in times of market stress. This is due to the perceived status of Switzerland in the world: a stable economy, a strong export sector, big central bank reserves or a longstanding political stance towards neutrality in global conflicts make the country’s currency a good choice for investors fleeing from risks. Turbulent times are likely to strengthen CHF value against other currencies that are seen as more risky to invest in.
The Swiss National Bank (SNB) meets four times a year – once every quarter, less than other major central banks – to decide on monetary policy. The bank aims for an annual inflation rate of less than 2%. When inflation is above target or forecasted to be above target in the foreseeable future, the bank will attempt to tame price growth by raising its policy rate. Higher interest rates are generally positive for the Swiss Franc (CHF) as they lead to higher yields, making the country a more attractive place for investors. On the contrary, lower interest rates tend to weaken CHF.
Macroeconomic data releases in Switzerland are key to assessing the state of the economy and can impact the Swiss Franc’s (CHF) valuation. The Swiss economy is broadly stable, but any sudden change in economic growth, inflation, current account or the central bank’s currency reserves have the potential to trigger moves in CHF. Generally, high economic growth, low unemployment and high confidence are good for CHF. Conversely, if economic data points to weakening momentum, CHF is likely to depreciate.
As a small and open economy, Switzerland is heavily dependent on the health of the neighboring Eurozone economies. The broader European Union is Switzerland’s main economic partner and a key political ally, so macroeconomic and monetary policy stability in the Eurozone is essential for Switzerland and, thus, for the Swiss Franc (CHF). With such dependency, some models suggest that the correlation between the fortunes of the Euro (EUR) and the CHF is more than 90%, or close to perfect.
- EUR/JPY drifts lower on Friday amid sustained buying interest surrounding the JPY.
- Hawkish BoJ expectations, along with a softer risk tone, benefit the safe-haven JPY.
- Bets for a September ECB rate cut undermine the Euro and contribute to the slide.
The EUR/JPY cross struggles to capitalize on the previous day's modest bounce from the vicinity of mid-158.00s or a nearly one-month low and attracts some sellers during the Asian session on Friday. Spot prices currently trade around the 159.00 mark amid the prevalent buying interest surrounding the Japanese Yen (JPY).
Against the backdrop of hawkish Bank of Japan (BOJ) expectations, a generally weaker tone around the equity market is seen as a key factor underpinning the safe-haven JPY. In fact, the markets have been pricing in the possibility of another BOJ rate hike by the end of this year and the bets were reaffirmed by data released on Thursday, showing that real wages in Japan rose for the second straight month in July.
Furthermore, BoJ Board Member Hajime Takata said that we must adjust monetary conditions by another gear if we can confirm that firms will continue to increase capital expenditure, wages, and prices. In contrast, the European Central Bank (ECB) is almost certain to cut interest rates again in September in the wake of declining inflation in the Eurozone. This further contributes to the EUR/JPY pair's downtick.
The shared currency, however, seems to draw some support from a modest US Dollar (USD) weakness, led by bets for a larger interest rate cut by the Federal Reserve (Fed) later this month. This, in turn, might hold back traders from placing aggressive bearish bets around the EUR/JPY cross and help limit deeper losses. Nevertheless, spot prices remain on track to register losses for the third successive week.
Bank of Japan FAQs
The Bank of Japan (BoJ) is the Japanese central bank, which sets monetary policy in the country. Its mandate is to issue banknotes and carry out currency and monetary control to ensure price stability, which means an inflation target of around 2%.
The Bank of Japan has embarked in an ultra-loose monetary policy since 2013 in order to stimulate the economy and fuel inflation amid a low-inflationary environment. The bank’s policy is based on Quantitative and Qualitative Easing (QQE), or printing notes to buy assets such as government or corporate bonds to provide liquidity. In 2016, the bank doubled down on its strategy and further loosened policy by first introducing negative interest rates and then directly controlling the yield of its 10-year government bonds.
The Bank’s massive stimulus has caused the Yen to depreciate against its main currency peers. This process has exacerbated more recently due to an increasing policy divergence between the Bank of Japan and other main central banks, which have opted to increase interest rates sharply to fight decades-high levels of inflation. The BoJ’s policy of holding down rates has led to a widening differential with other currencies, dragging down the value of the Yen.
A weaker Yen and the spike in global energy prices have led to an increase in Japanese inflation, which has exceeded the BoJ’s 2% target. With wage inflation becoming a cause of concern, the BoJ looks to move away from ultra loose policy, while trying to avoid slowing the activity too much.
- GBP/USD gains traction near 1.3180 in Friday’s Asian session.
- US ADP private sector employment rose 99,000 in August vs. 111,000 prior.
- Investors see a roughly one-in-four chance that the BoE will cut rates in the September meeting.
The GBP/USD pair trades in positive territory for the third consecutive day around 1.3180 on Friday during the Asian trading hours. The persistent US Dollar (USD) weakness provides some support to the major pair. Market players will closely monitor the US August Nonfarm Payrolls (NFP) data, which is due later on Friday.
The Automatic Data Processing (ADP) reported on Thursday that private sector payrolls grew at the weakest pace in over three and a half years in August. The US private sector added 99,000 new jobs in August, less than the downwardly revised 111,000 in July and below the forecast of 145,000.
Markets expect the Federal Reserve (Fed) to lower interest rates when it meets on September 17-18. The Bureau of Labor Statistics will release the highly-anticipated Nonfarm Payrolls later in the day, which is expected to see 160,000 job additions in the US economy in August. This report became a key event for shaping market expectations of the Fed’s policy rate. The weaker-than-expected outcome could trigger a large Fed rate cut and further undermine the USD.
On the other hand, the modest Bank of England (BoE) interest rate cut expectations lifts the Pound Sterling (GBP). BoE Governor Andrew Bailey said last month that he thought longer-term inflation pressures were easing but additional rate cuts would not be rushed because it was still too soon to declare victory over inflation. Investors see a nearly 25% chance that the BoE will cut interest rates at its September 12 policy meeting, but the probability of a cut is fully priced for November.
Pound Sterling FAQs
The Pound Sterling (GBP) is the oldest currency in the world (886 AD) and the official currency of the United Kingdom. It is the fourth most traded unit for foreign exchange (FX) in the world, accounting for 12% of all transactions, averaging $630 billion a day, according to 2022 data. Its key trading pairs are GBP/USD, aka ‘Cable’, which accounts for 11% of FX, GBP/JPY, or the ‘Dragon’ as it is known by traders (3%), and EUR/GBP (2%). The Pound Sterling is issued by the Bank of England (BoE).
The single most important factor influencing the value of the Pound Sterling is monetary policy decided by the Bank of England. The BoE bases its decisions on whether it has achieved its primary goal of “price stability” – a steady inflation rate of around 2%. Its primary tool for achieving this is the adjustment of interest rates. When inflation is too high, the BoE will try to rein it in by raising interest rates, making it more expensive for people and businesses to access credit. This is generally positive for GBP, as higher interest rates make the UK a more attractive place for global investors to park their money. When inflation falls too low it is a sign economic growth is slowing. In this scenario, the BoE will consider lowering interest rates to cheapen credit so businesses will borrow more to invest in growth-generating projects.
Data releases gauge the health of the economy and can impact the value of the Pound Sterling. Indicators such as GDP, Manufacturing and Services PMIs, and employment can all influence the direction of the GBP. A strong economy is good for Sterling. Not only does it attract more foreign investment but it may encourage the BoE to put up interest rates, which will directly strengthen GBP. Otherwise, if economic data is weak, the Pound Sterling is likely to fall.
Another significant data release for the Pound Sterling is the Trade Balance. This indicator measures the difference between what a country earns from its exports and what it spends on imports over a given period. If a country produces highly sought-after exports, its currency will benefit purely from the extra demand created from foreign buyers seeking to purchase these goods. Therefore, a positive net Trade Balance strengthens a currency and vice versa for a negative balance.
- USD/CAD loses ground due to dovish comments from the Fed officials.
- Fed’s Austan Goolsbee said that the longer-run trend of the labor market and inflation data justify the Fed easing soon.
- The upside of the commodity-linked Canadian Dollar could be restrained due to lower Oil prices.
USD/CAD continues to lose ground for the third successive day, trading around 1.3500 during the Asian session on Friday. Traders are likely to await Friday's release of employment data from the United States (US) and Canada. The US Nonfarm Payrolls (NFP) will be in the spotlight as it may offer further insights on the potential size of an anticipated rate cut by the Federal Reserve (Fed) this month.
The US Dollar (USD) faces challenges following the dovish comments from Federal Reserve (Fed) officials. Chicago Fed President Austan Goolsbee said on Friday that the longer-run trend of the labor market and inflation data justify the Fed easing interest-rate policy soon and then steadily over the next year. FXStreet’s FedTracker, which gauges the tone of Fed officials’ speeches on a dovish-to-hawkish scale from 0 to 10 using a custom AI model, rated Goolsbee’s words as neutral with a score of 3.8.
Additionally, San Francisco Federal Reserve President Mary Daly stated on Wednesday that "the Fed needs to cut the policy rate as inflation is declining and the economy is slowing." Regarding the size of the potential rate cut in September, Daly noted, "We don't know yet." Atlanta Federal Reserve President Raphael Bostic said that the Fed is in a favorable position but added that they must not maintain a restrictive policy stance for too long, per Reuters.
The upside potential of the commodity-linked Canadian Dollar (CAD) could be limited by falling crude Oil prices, especially given Canada's position as the largest Oil exporter to the United States. West Texas Intermediate (WTI) trades around $68.70 at the time of writing, marking a fresh 2024 low amid concerns over demand in both the US and China. However, a delay in OPEC+ Oil output increases and a significant drawdown in crude oil inventories may help cushion WTI’s losses.
In Canada, the Net Change in Employment for August is expected to show an increase of 26.5K new jobs, recovering from the previous decline of 2.8K. However, the Unemployment Rate is projected to rise slightly to 6.5%, compared to the previous reading of 6.4%.
Canadian Dollar FAQs
The key factors driving the Canadian Dollar (CAD) are the level of interest rates set by the Bank of Canada (BoC), the price of Oil, Canada’s largest export, the health of its economy, inflation and the Trade Balance, which is the difference between the value of Canada’s exports versus its imports. Other factors include market sentiment – whether investors are taking on more risky assets (risk-on) or seeking safe-havens (risk-off) – with risk-on being CAD-positive. As its largest trading partner, the health of the US economy is also a key factor influencing the Canadian Dollar.
The Bank of Canada (BoC) has a significant influence on the Canadian Dollar by setting the level of interest rates that banks can lend to one another. This influences the level of interest rates for everyone. The main goal of the BoC is to maintain inflation at 1-3% by adjusting interest rates up or down. Relatively higher interest rates tend to be positive for the CAD. The Bank of Canada can also use quantitative easing and tightening to influence credit conditions, with the former CAD-negative and the latter CAD-positive.
The price of Oil is a key factor impacting the value of the Canadian Dollar. Petroleum is Canada’s biggest export, so Oil price tends to have an immediate impact on the CAD value. Generally, if Oil price rises CAD also goes up, as aggregate demand for the currency increases. The opposite is the case if the price of Oil falls. Higher Oil prices also tend to result in a greater likelihood of a positive Trade Balance, which is also supportive of the CAD.
While inflation had always traditionally been thought of as a negative factor for a currency since it lowers the value of money, the opposite has actually been the case in modern times with the relaxation of cross-border capital controls. Higher inflation tends to lead central banks to put up interest rates which attracts more capital inflows from global investors seeking a lucrative place to keep their money. This increases demand for the local currency, which in Canada’s case is the Canadian Dollar.
Macroeconomic data releases gauge the health of the economy and can have an impact on the Canadian Dollar. Indicators such as GDP, Manufacturing and Services PMIs, employment, and consumer sentiment surveys can all influence the direction of the CAD. A strong economy is good for the Canadian Dollar. Not only does it attract more foreign investment but it may encourage the Bank of Canada to put up interest rates, leading to a stronger currency. If economic data is weak, however, the CAD is likely to fall.
- The Japanese Yen appreciated as rising Labor Cash Earnings bolstered the odds of further BoJ rate hikes.
- BoJ’s Takata stated that "if the economy and prices move as expected, we will adjust the policy rate in several stages."
- The US Nonfarm Payrolls report is expected to show 160,000 new jobs in August, up from July’s 114,000.
The Japanese Yen (JPY) continues its winning streak for the fourth successive session as rising real wages in July fuel speculation that the Bank of Japan (BoJ) may introduce another interest rate hike before the end of 2024. Additionally, the USD/JPY pair has encountered headwinds due to a softer US Dollar (USD), driven by dovish comments from Federal Reserve (Fed) officials.
Bank of Japan (BoJ) Board Member Hajime Takata stated on Thursday that "if the economy and prices move in line with our forecast, we will adjust the policy rate in several stages." Takata also mentioned that the domestic economy is recovering moderately, despite some signs of weakness. While stock and FX markets have experienced significant volatility, he noted that the BoJ still sees the achievement of its inflation target within reach.
Traders are likely to await Friday's release of labor market data, including the US Nonfarm Payrolls (NFP), to gather further insights on the potential size of an anticipated rate cut by the Federal Reserve (Fed) this month.
Daily Digest Market Movers: Japanese Yen extends upside due to hawkish mood surrounding the BoJ
- Chicago Fed President Austan Goolsbee said on Friday that the longer-run trend of the labor market and inflation data justify the Fed easing interest-rate policy soon and then steadily over the next year. FXStreet’s FedTracker, which gauges the tone of Fed officials’ speeches on a dovish-to-hawkish scale from 0 to 10 using a custom AI model, rated Goolsbee’s words as neutral with a score of 3.8.
- ADP Employment Change showed on Thursday that private-sector employment increased by 99,000 in August, following July’s increase of 111,000 and below the estimate of 145,000. Meanwhile, the weekly US Initial Jobless Claims rose to 227,000 for the week ending August 30, compared to the previous reading of 232,000 and below the initial consensus of 230,000.
- Japan’s Labor Cash Earnings grew by 3.6% year-on-year, a deceleration from June's 4.5% increase but the highest since January 1997, surpassing market expectations of 3.1%.
- San Francisco Federal Reserve President Mary Daly stated on Wednesday that "the Fed needs to cut the policy rate as inflation is declining and the economy is slowing." Regarding the size of the potential rate cut in September, Daly noted, "We don't know yet." FXStreet’s FedTracker, which gauges the tone of Fed officials’ speeches on a dovish-to-hawkish scale from 0 to 10 using a custom AI model, rated Daly’s words as neutral with a score of 3.6.
- Atlanta Federal Reserve President Raphael Bostic said that the Fed is in a favorable position but added that they must not maintain a restrictive policy stance for too long, per Reuters. FXStreet’s FedTracker, which gauges the tone of Fed officials’ speeches on a dovish-to-hawkish scale from 0 to 10 using a custom AI model, rated Bostic’s words as neutral with a score of 4.6.
- Japan’s Chief Cabinet Secretary Yoshimasa Hayashi stated on Wednesday that he is "closely monitoring domestic and international market developments with a sense of urgency." Hayashi emphasized the importance of conducting fiscal and economic policy management in close coordination with the Bank of Japan (BoJ).
- US JOLTS Job Openings dropped to 7.673 million in July, down from 7.910 million in June, marking the lowest level since January 2021 and falling short of market expectations of 8.10 million.
- Jibun Bank Services PMI data on Wednesday. The index was revised to 53.7 in August from an initial estimate of 54.0. Although this marks the seventh consecutive month of expansion in the service sector, the latest figure remains unchanged from July.
Technical Analysis: USD/JPY falls toward 143.00, followed by seven-month lows
USD/JPY trades around 143.30 on Friday. A daily chart review shows that the nine-day Exponential Moving Average (EMA) remains below the 21-day EMA, indicating a persistent bearish trend. Additionally, the 14-day Relative Strength Index (RSI) is near the 30 level, reinforcing the bearish momentum but also hinting at the possibility of an upward correction soon.
In terms of support, the USD/JPY pair is falling toward the seven-month low of 141.69, recorded on August 5. Additional key support appears at 140.25, which is the lowest level since July 2023.
On the upside, the USD/JPY pair might first encounter a barrier at the nine-day EMA around 144.60, followed by the 21-day EMA at 146.02. A break above these EMAs might weaken the bearish sentiment and push the pair toward the psychological level of 150.00.
USD/JPY: Daily Chart
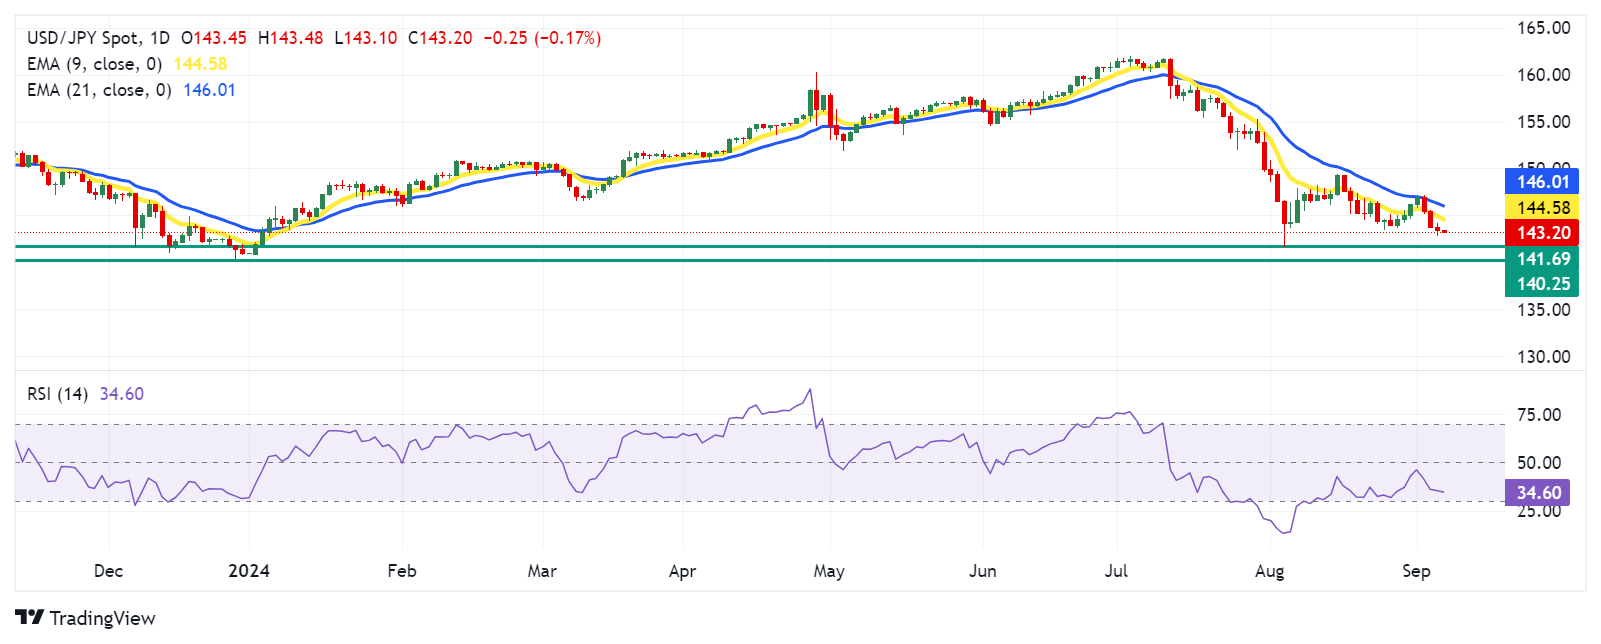
Japanese Yen PRICE Today
The table below shows the percentage change of Japanese Yen (JPY) against listed major currencies today. Japanese Yen was the strongest against the Australian Dollar.
| USD | EUR | GBP | JPY | CAD | AUD | NZD | CHF | |
|---|---|---|---|---|---|---|---|---|
| USD | -0.02% | 0.01% | -0.19% | -0.05% | 0.12% | 0.14% | -0.06% | |
| EUR | 0.02% | 0.03% | -0.19% | -0.04% | 0.14% | 0.14% | -0.04% | |
| GBP | -0.01% | -0.03% | -0.21% | -0.05% | 0.12% | 0.12% | -0.07% | |
| JPY | 0.19% | 0.19% | 0.21% | 0.16% | 0.33% | 0.31% | 0.12% | |
| CAD | 0.05% | 0.04% | 0.05% | -0.16% | 0.16% | 0.19% | -0.02% | |
| AUD | -0.12% | -0.14% | -0.12% | -0.33% | -0.16% | -0.00% | -0.20% | |
| NZD | -0.14% | -0.14% | -0.12% | -0.31% | -0.19% | 0.00% | -0.20% | |
| CHF | 0.06% | 0.04% | 0.07% | -0.12% | 0.02% | 0.20% | 0.20% |
The heat map shows percentage changes of major currencies against each other. The base currency is picked from the left column, while the quote currency is picked from the top row. For example, if you pick the Japanese Yen from the left column and move along the horizontal line to the US Dollar, the percentage change displayed in the box will represent JPY (base)/USD (quote).
Japanese Yen FAQs
The Japanese Yen (JPY) is one of the world’s most traded currencies. Its value is broadly determined by the performance of the Japanese economy, but more specifically by the Bank of Japan’s policy, the differential between Japanese and US bond yields, or risk sentiment among traders, among other factors.
One of the Bank of Japan’s mandates is currency control, so its moves are key for the Yen. The BoJ has directly intervened in currency markets sometimes, generally to lower the value of the Yen, although it refrains from doing it often due to political concerns of its main trading partners. The current BoJ ultra-loose monetary policy, based on massive stimulus to the economy, has caused the Yen to depreciate against its main currency peers. This process has exacerbated more recently due to an increasing policy divergence between the Bank of Japan and other main central banks, which have opted to increase interest rates sharply to fight decades-high levels of inflation.
The BoJ’s stance of sticking to ultra-loose monetary policy has led to a widening policy divergence with other central banks, particularly with the US Federal Reserve. This supports a widening of the differential between the 10-year US and Japanese bonds, which favors the US Dollar against the Japanese Yen.
The Japanese Yen is often seen as a safe-haven investment. This means that in times of market stress, investors are more likely to put their money in the Japanese currency due to its supposed reliability and stability. Turbulent times are likely to strengthen the Yen’s value against other currencies seen as more risky to invest in.
- Silver consolidates its recovery gains from a multi-week low registered over the past two days.
- The overnight failure near the 100-period SMA on the 4-hour chart warrants caution for bulls.
- A sustained move above the $29.00 mark is needed to support prospects for additional gains.
Silver (XAG/USD) oscillates in a narrow trading band, around the $28.80 region during the Asian session on Friday and remains below the weekly top touched the previous day. Traders now seem reluctant and prefer to wait for the release of the crucial US Nonfarm Payrolls (NFP) report before pacing fresh directional bets.
Looking at the broader picture, the overnight failure to find acceptance above the $29.00 mark, or the 100-period Simple Moving Average (SMA) on the 4-hour chart, warrants some caution for bullish traders. Moreover, neutral oscillators on the daily chart make it prudent to wait for a sustained strength beyond the said handle before positioning for an extension of the XAG/USD's recent bounce from the $27.70 area, or a nearly three-week low set on Tuesday.
The subsequent move up has the potential to lift the white metal further towards the $29.65 intermediate hurdle en route to the $30.00 psychological mark. Some follow-through buying beyond the August monthly swing high, around the $30.20 region, will be seen as a fresh trigger for bulls and pave the way for a further appreciating move. The XAG/USD might then climb to the $30.80 horizontal resistance before aiming to reclaim the $31.00 round-figure mark.
On the flip side, immediate support is pegged near the $28.50 region, below which the commodity could accelerate the slide towards the $28.00 mark. This is followed by the weekly trough, around the $27.70 zone. A convincing break below the latter might prompt aggressive technical selling and drag the XAG/USD to the $27.20 intermediate support en route to the $27.00 round figure and the next relevant support near the $26.60 area.
Silver 4-hour chart
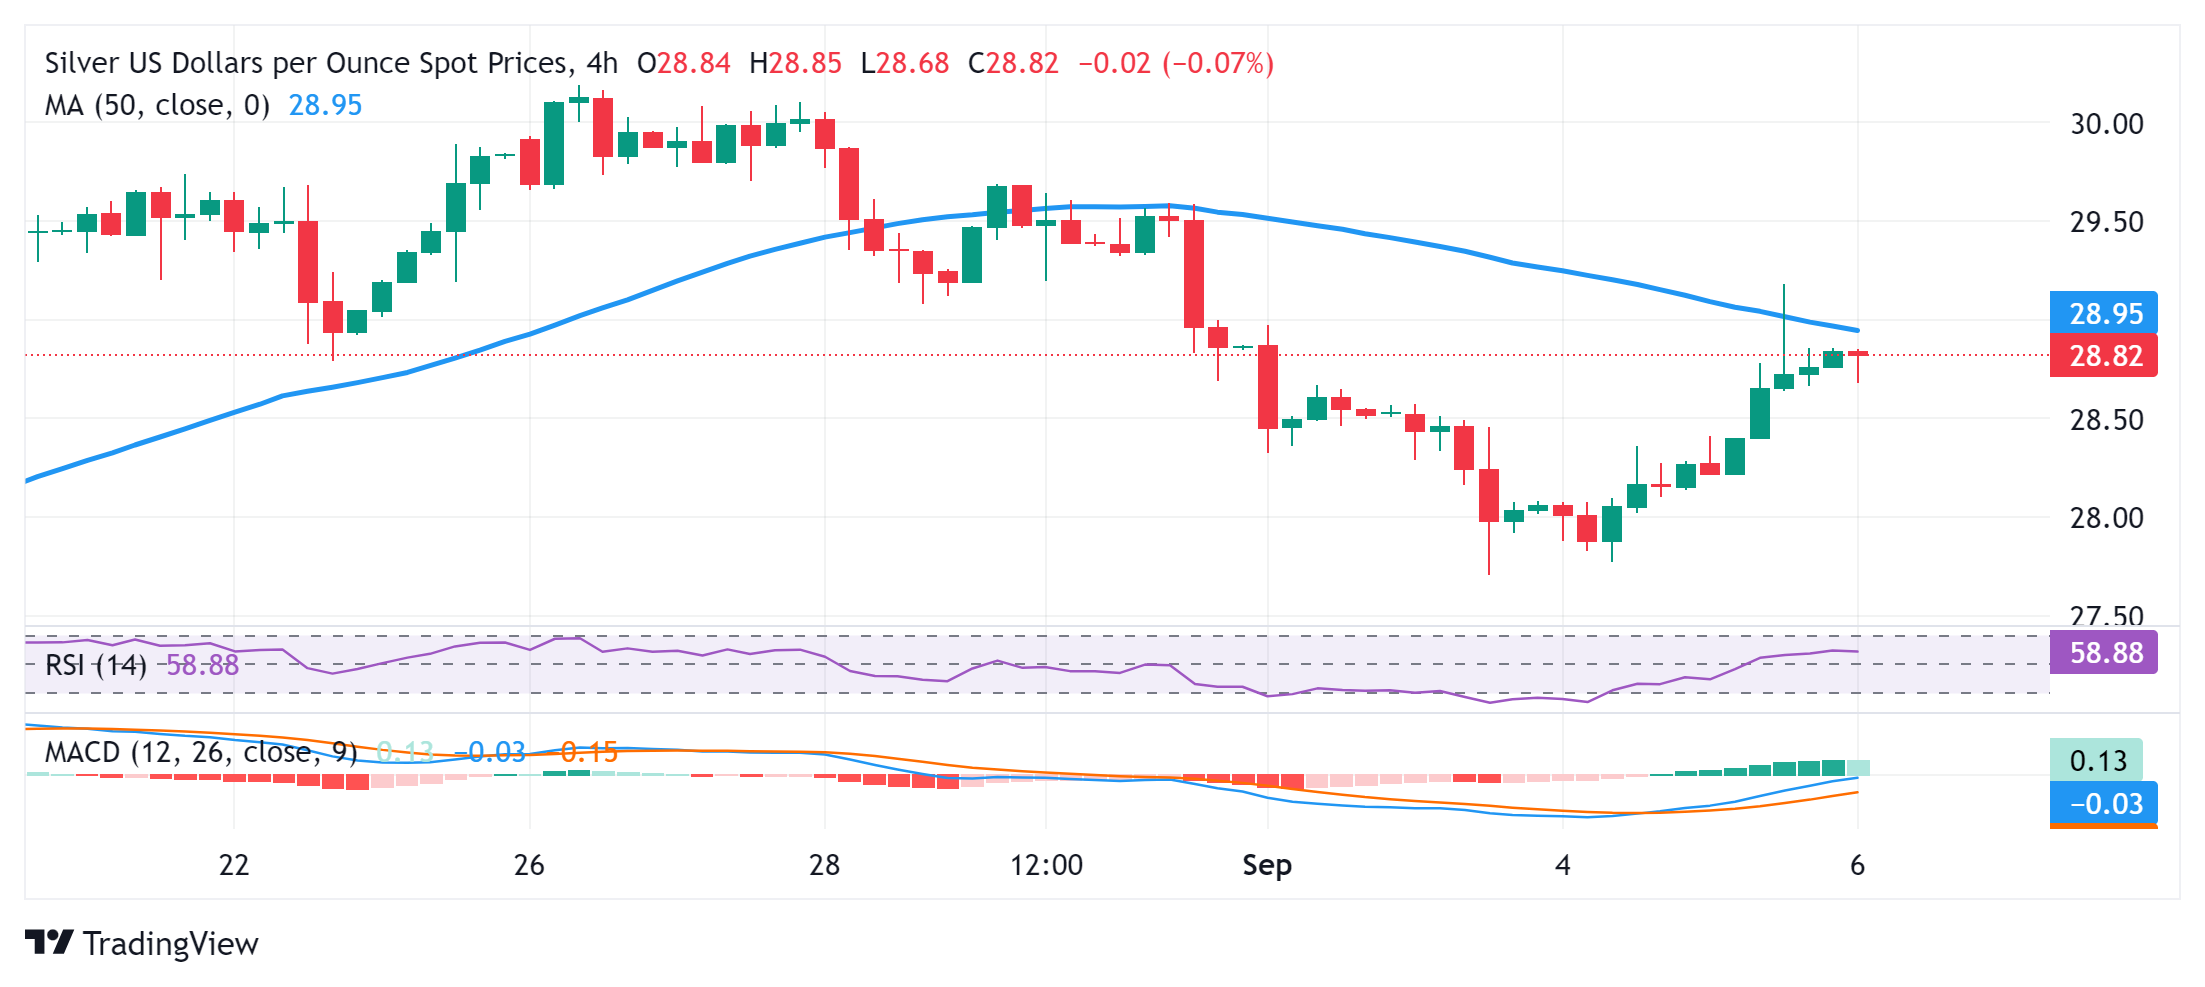
Silver FAQs
Silver is a precious metal highly traded among investors. It has been historically used as a store of value and a medium of exchange. Although less popular than Gold, traders may turn to Silver to diversify their investment portfolio, for its intrinsic value or as a potential hedge during high-inflation periods. Investors can buy physical Silver, in coins or in bars, or trade it through vehicles such as Exchange Traded Funds, which track its price on international markets.
Silver prices can move due to a wide range of factors. Geopolitical instability or fears of a deep recession can make Silver price escalate due to its safe-haven status, although to a lesser extent than Gold's. As a yieldless asset, Silver tends to rise with lower interest rates. Its moves also depend on how the US Dollar (USD) behaves as the asset is priced in dollars (XAG/USD). A strong Dollar tends to keep the price of Silver at bay, whereas a weaker Dollar is likely to propel prices up. Other factors such as investment demand, mining supply – Silver is much more abundant than Gold – and recycling rates can also affect prices.
Silver is widely used in industry, particularly in sectors such as electronics or solar energy, as it has one of the highest electric conductivity of all metals – more than Copper and Gold. A surge in demand can increase prices, while a decline tends to lower them. Dynamics in the US, Chinese and Indian economies can also contribute to price swings: for the US and particularly China, their big industrial sectors use Silver in various processes; in India, consumers’ demand for the precious metal for jewellery also plays a key role in setting prices.
Silver prices tend to follow Gold's moves. When Gold prices rise, Silver typically follows suit, as their status as safe-haven assets is similar. The Gold/Silver ratio, which shows the number of ounces of Silver needed to equal the value of one ounce of Gold, may help to determine the relative valuation between both metals. Some investors may consider a high ratio as an indicator that Silver is undervalued, or Gold is overvalued. On the contrary, a low ratio might suggest that Gold is undervalued relative to Silver.
- NZD/USD softens around 0.6220 in Friday’s Asian session.
- The pessimistic New Zealand growth outlook and cautious mood weigh on the Kiwi.
- Traders will keep an eye on the US employment data for August on Friday.
The NZD/USD pair trades with mild losses near 0.6220 during the Asian session on Friday. The cautious mood ahead of the key US employment data might provide some support to the US Dollar (USD). The US August Nonfarm Payrolls (NFP) will take center stage on Friday.
NZIER forecasts New Zealand’s Gross Domestic Product (GDP) growth to remain weak over the coming year, contributing to a further reduction in inflation. The Reserve Bank of New Zealand (RBNZ) is expected to cut another interest rate in October amid the expectation that inflation will fall within the target band by year’s end. This, in turn, might undermine the Kiwi.
Furthermore, the renewed concerns about the economic slowdown in China and the cautious sentiment weigh on riskier assets like the New Zealand Dollar (NZD). Bank of America Global Research analysts cut China’s GDP forecasts from 5.0% to 4.8%.
On the USD’s front, markets expect the US Federal Reserve (Fed) to start easing its monetary policy in September. The markets are now pricing in nearly 59% odds of a 25 basis points (bps) rate cut by the Fed in September, while the chance of a 50 bps reduction stands at 41%, according to the CME FedWatch tool.
All eyes will be on the US employment data for August, which is due on Friday. A disappointing outcome could prompt the market to price in a 50 basis points (bps) rate cut in September. The Greenback might face further selling pressure amid heightened expectations of Fed rate cuts.
New Zealand Dollar FAQs
The New Zealand Dollar (NZD), also known as the Kiwi, is a well-known traded currency among investors. Its value is broadly determined by the health of the New Zealand economy and the country’s central bank policy. Still, there are some unique particularities that also can make NZD move. The performance of the Chinese economy tends to move the Kiwi because China is New Zealand’s biggest trading partner. Bad news for the Chinese economy likely means less New Zealand exports to the country, hitting the economy and thus its currency. Another factor moving NZD is dairy prices as the dairy industry is New Zealand’s main export. High dairy prices boost export income, contributing positively to the economy and thus to the NZD.
The Reserve Bank of New Zealand (RBNZ) aims to achieve and maintain an inflation rate between 1% and 3% over the medium term, with a focus to keep it near the 2% mid-point. To this end, the bank sets an appropriate level of interest rates. When inflation is too high, the RBNZ will increase interest rates to cool the economy, but the move will also make bond yields higher, increasing investors’ appeal to invest in the country and thus boosting NZD. On the contrary, lower interest rates tend to weaken NZD. The so-called rate differential, or how rates in New Zealand are or are expected to be compared to the ones set by the US Federal Reserve, can also play a key role in moving the NZD/USD pair.
Macroeconomic data releases in New Zealand are key to assess the state of the economy and can impact the New Zealand Dollar’s (NZD) valuation. A strong economy, based on high economic growth, low unemployment and high confidence is good for NZD. High economic growth attracts foreign investment and may encourage the Reserve Bank of New Zealand to increase interest rates, if this economic strength comes together with elevated inflation. Conversely, if economic data is weak, NZD is likely to depreciate.
The New Zealand Dollar (NZD) tends to strengthen during risk-on periods, or when investors perceive that broader market risks are low and are optimistic about growth. This tends to lead to a more favorable outlook for commodities and so-called ‘commodity currencies’ such as the Kiwi. Conversely, NZD tends to weaken at times of market turbulence or economic uncertainty as investors tend to sell higher-risk assets and flee to the more-stable safe havens.
| Raw materials | Closed | Change, % |
|---|---|---|
| Silver | 28.805 | 2.07 |
| Gold | 251.63 | 0.84 |
| Palladium | 939.1 | 0.57 |
- EUR/USD consolidates its recovery gains from over a two-week low touched Tuesday.
- Investors keenly await the US employment details before placing fresh directional bets.
- The setup favors bullish traders and supports prospects for a further appreciating move.
The EUR/USD pair struggles to capitalize on its gains registered over the past two days and oscillates in a narrow trading band during the Asian session on Friday. Spot prices, meanwhile, manage to hold above the 1.1100 round figure, nearly unchanged for the day as traders opt to wait for the release of the US Nonfarm Payrolls (NFP) report before placing fresh directional bets.
From a technical perspective, the recent recovery from the 1.1075-1.1070 area, or over a two-week low touched on Tuesday, stalls near the 50% Fibonacci retracement level of the latest corrective slide from the YTD peak touched in August. That said, the overnight breakout through the 1.1090-1.1095 confluence resistance – comprising the 38.2% Fibo. level and the 50-period Simple Moving Average (SMA) on the 4-hour chart – favors bullish traders.
Moreover, oscillators on the daily chart are holding in positive territory and are still far from being in the overbought zone. This, in turn, validates the positive outlook and suggests that the path of least resistance for the EUR/USD pair is to the upside. Bulls, however, need to wait for a sustained move beyond the 50% Fibo. level resistance before placing fresh bets and positioning for further strength towards the 61.8% Fibo. level, around the 1.1135 region.
The subsequent move-up should allow the EUR/USD pair to aim back towards retesting the YTD peak, around the 1.1200 mark touched in August. Some follow-through buying will confirm a fresh breakout and lift the EUR/USD pair further towards the 1.1240-1.1245 intermediate barrier en route to the July 2023 swing high, around the 1.1275 region.
On the flip side, the 1.1095-1.1090 confluence resistance breakpoint now seems to act as immediate support ahead of the 23.6% Fibo. level, around the 1.1070-1.1065 region. A convincing break below the latter will expose the weekly low, around the 1.1025 area touched on Tuesday, before the EUR/USD pair drops to the 1.1000 psychological mark. The latter should act as a pivotal point, which if broken might shift the near-term bias in favour of bearish traders.
EUR/USD 4-hour chart
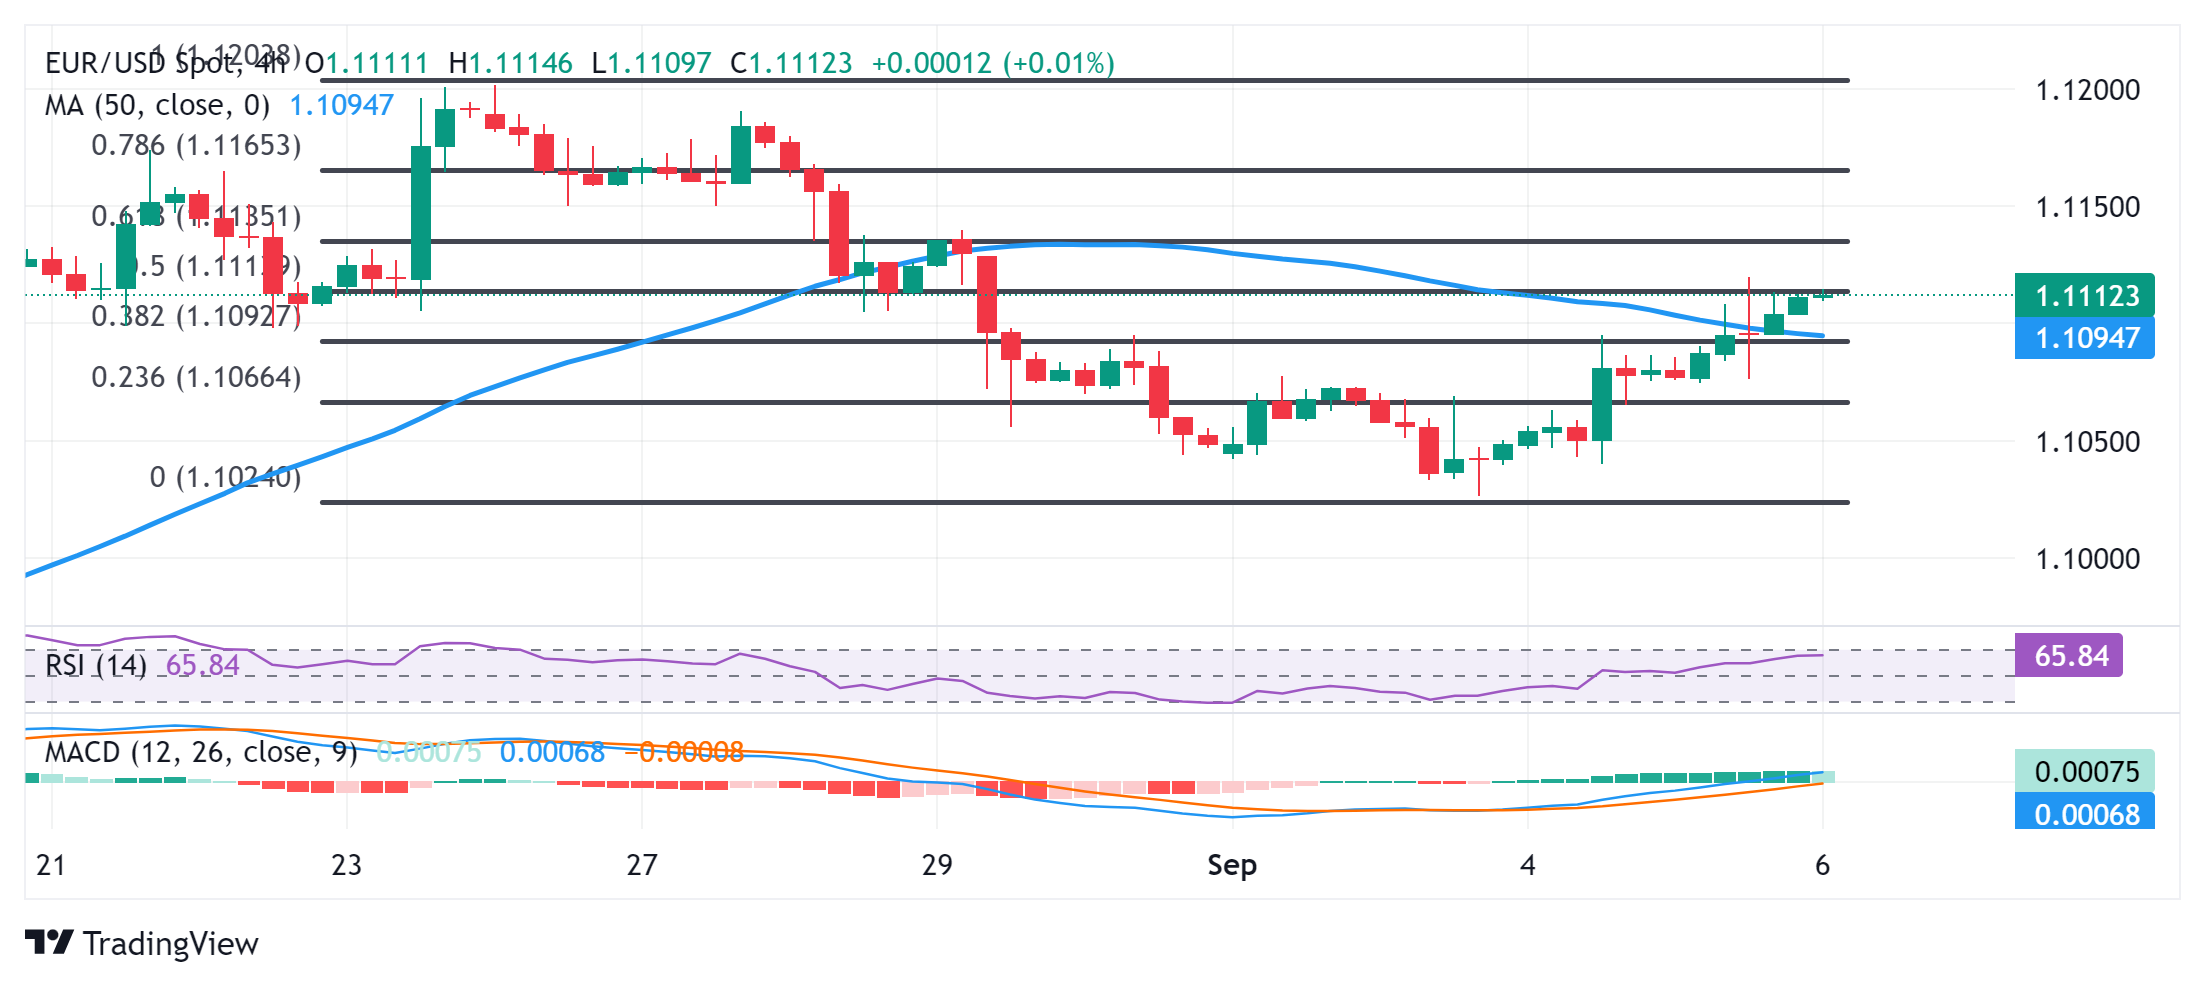
Economic Indicator
Nonfarm Payrolls
The Nonfarm Payrolls release presents the number of new jobs created in the US during the previous month in all non-agricultural businesses; it is released by the US Bureau of Labor Statistics (BLS). The monthly changes in payrolls can be extremely volatile. The number is also subject to strong reviews, which can also trigger volatility in the Forex board. Generally speaking, a high reading is seen as bullish for the US Dollar (USD), while a low reading is seen as bearish, although previous months' reviews and the Unemployment Rate are as relevant as the headline figure. The market's reaction, therefore, depends on how the market assesses all the data contained in the BLS report as a whole.
Read more.Next release: Fri Sep 06, 2024 12:30
Frequency: Monthly
Consensus: 160K
Previous: 114K
Source: US Bureau of Labor Statistics
America’s monthly jobs report is considered the most important economic indicator for forex traders. Released on the first Friday following the reported month, the change in the number of positions is closely correlated with the overall performance of the economy and is monitored by policymakers. Full employment is one of the Federal Reserve’s mandates and it considers developments in the labor market when setting its policies, thus impacting currencies. Despite several leading indicators shaping estimates, Nonfarm Payrolls tend to surprise markets and trigger substantial volatility. Actual figures beating the consensus tend to be USD bullish.
- The Australian Dollar halted its two-day winning streak despite the hawkish RBA outlook.
- RBA Governor Michele Bullock stated that it is too early to consider rate cuts.
- The US Dollar extends its decline following the dovish Fedspeak.
The Australian Dollar (AUD) halts its two days of gains against the US Dollar (USD) as traders adopt caution ahead of the release of US Nonfarm Payrolls (NFP). This data may offer more cues on the potential size of an expected rate cut by the Federal Reserve (Fed) this month.
The Aussie Dollar received support from the positive Trade Balance data released on Thursday. Additionally, the Reserve Bank of Australia (RBA) Governor Michele Bullock spoke at "The Anika Foundation" in Sydney on "The Costs of High Inflation," stating that it is too early to consider rate cuts. Currently, the board does not anticipate being able to reduce rates in the near term.
The US Dollar extends its decline following the dovish comments from the Fed officials. However, the positive key economic data might have limited the downside of the Greenback. US ISM Services PMI rose to 51.5 in August from 51.4 in July, above the market expectation of 51.1.
Chicago Fed President Austan Goolsbee said on Friday that the longer-run trend of the labor market and inflation data justify the Fed easing interest-rate policy soon and then steadily over the next year. FXStreet’s FedTracker, which gauges the tone of Fed officials’ speeches on a dovish-to-hawkish scale from 0 to 10 using a custom AI model, rated Goolsbee’s words as neutral with a score of 3.8.
Daily Digest Market Movers: Australian Dollar depreciates ahead of US Nonfarm Payrolls
- ADP Employment Change showed on Thursday that private-sector employment increased by 99,000 in August, following July’s increase of 111,000 and below the estimate of 145,000. Meanwhile, the weekly US Initial Jobless Claims rose to 227,000 for the week ending August 30, compared to the previous reading of 232,000 and below the initial consensus of 230,000.
- Australia’s trade surplus widened to 6,009 million MoM in July, exceeding the expected 5,150 million and 5,589 million in the previous reading.
- Atlanta Federal Reserve President Raphael Bostic said on Wednesday that the Fed is in a favorable position but added that they must not maintain a restrictive policy stance for too long, per Reuters. FXStreet’s FedTracker, which gauges the tone of Fed officials’ speeches on a dovish-to-hawkish scale from 0 to 10 using a custom AI model, rated Bostic’s words as neutral with a score of 4.6.
- US JOLTS Job Openings dropped to 7.673 million in July, down from 7.910 million in June, marking the lowest level since January 2021 and falling short of market expectations of 8.10 million.
- Bank of America (BoA) has revised its economic growth forecast for China, lowering its 2024 projection to 4.8% from the previous 5.0%. For 2025, the forecast is adjusted to 4.5% growth, while the 2026 outlook remains unchanged at 4.5%.
- Australia’s Gross Domestic Product (GDP) posted a 0.2% reading QoQ for the second quarter, up from the previous quarter’s 0.1% but falling short of the expected 0.3% readings.
- The Judo Bank Composite PMI climbed to 51.7 in August, up from 51.4 in July, signaling the fastest expansion in three months. This growth was primarily fueled by a rise in services activity, with the Services PMI reaching 52.5 in August, up from 52.2 in July, marking the seventh consecutive month of growth in the services sector.
- The US ISM Manufacturing PMI inched up to 47.2 in August from 46.8 in July, falling short of market expectations of 47.5. This marks the 21st contraction in US factory activity over the past 22 months.
Technical Analysis: Australian Dollar holds position above 50-day EMA near 0.6700
The Australian Dollar is trading around 0.6740 on Friday. On the daily chart, the AUD/USD pair is positioned below the nine-day Exponential Moving Average (EMA), indicating a short-term bearish trend. However, the 14-day Relative Strength Index (RSI) is slightly above 50, hinting at a possible bullish inclination. A drop below the 50 level on the RSI could confirm a bearish shift.
On the downside, the AUD/USD pair could test immediate support around the 50-day EMA at 0.6716 level. A break below this level could reinforce the bearish bias and lead the pair to navigate the region around the throwback level near 0.6575, with a deeper decline potentially aiming for the lower support around 0.6470.
Regarding resistance, the AUD/USD pair is testing the nine-day EMA at 0.6743. A break above this level could open the door for a potential retest of the seven-month high at 0.6798.
AUD/USD: Daily Chart
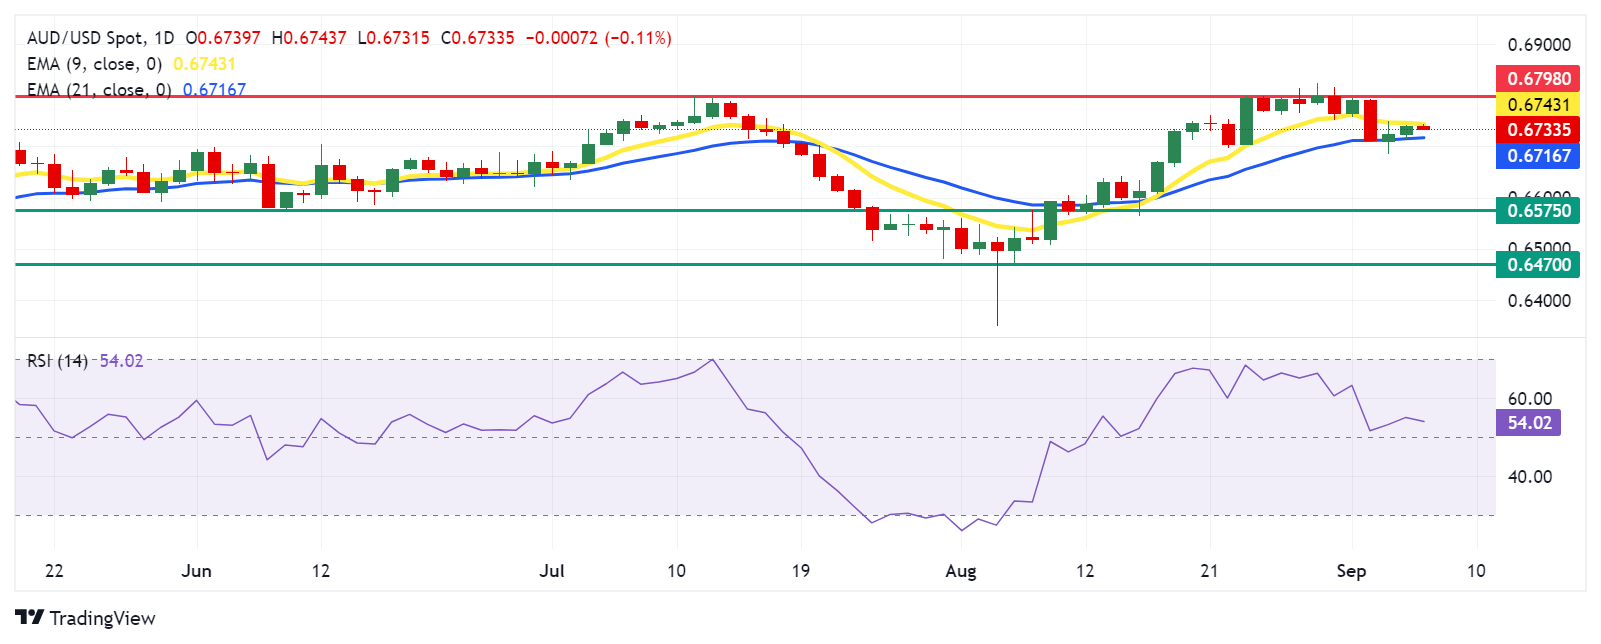
Australian Dollar PRICE Today
The table below shows the percentage change of Australian Dollar (AUD) against listed major currencies today. Australian Dollar was the weakest against the Japanese Yen.
| USD | EUR | GBP | JPY | CAD | AUD | NZD | CHF | |
|---|---|---|---|---|---|---|---|---|
| USD | -0.01% | 0.02% | -0.13% | -0.03% | 0.05% | 0.03% | -0.04% | |
| EUR | 0.01% | 0.03% | -0.13% | -0.04% | 0.06% | 0.03% | -0.03% | |
| GBP | -0.02% | -0.03% | -0.13% | -0.05% | 0.04% | 0.00% | -0.06% | |
| JPY | 0.13% | 0.13% | 0.13% | 0.09% | 0.19% | 0.14% | 0.08% | |
| CAD | 0.03% | 0.04% | 0.05% | -0.09% | 0.08% | 0.06% | -0.01% | |
| AUD | -0.05% | -0.06% | -0.04% | -0.19% | -0.08% | -0.04% | -0.11% | |
| NZD | -0.03% | -0.03% | -0.01% | -0.14% | -0.06% | 0.04% | -0.07% | |
| CHF | 0.04% | 0.03% | 0.06% | -0.08% | 0.00% | 0.11% | 0.07% |
The heat map shows percentage changes of major currencies against each other. The base currency is picked from the left column, while the quote currency is picked from the top row. For example, if you pick the Australian Dollar from the left column and move along the horizontal line to the US Dollar, the percentage change displayed in the box will represent AUD (base)/USD (quote).
Australian Dollar FAQs
One of the most significant factors for the Australian Dollar (AUD) is the level of interest rates set by the Reserve Bank of Australia (RBA). Because Australia is a resource-rich country another key driver is the price of its biggest export, Iron Ore. The health of the Chinese economy, its largest trading partner, is a factor, as well as inflation in Australia, its growth rate and Trade Balance. Market sentiment – whether investors are taking on more risky assets (risk-on) or seeking safe-havens (risk-off) – is also a factor, with risk-on positive for AUD.
The Reserve Bank of Australia (RBA) influences the Australian Dollar (AUD) by setting the level of interest rates that Australian banks can lend to each other. This influences the level of interest rates in the economy as a whole. The main goal of the RBA is to maintain a stable inflation rate of 2-3% by adjusting interest rates up or down. Relatively high interest rates compared to other major central banks support the AUD, and the opposite for relatively low. The RBA can also use quantitative easing and tightening to influence credit conditions, with the former AUD-negative and the latter AUD-positive.
China is Australia’s largest trading partner so the health of the Chinese economy is a major influence on the value of the Australian Dollar (AUD). When the Chinese economy is doing well it purchases more raw materials, goods and services from Australia, lifting demand for the AUD, and pushing up its value. The opposite is the case when the Chinese economy is not growing as fast as expected. Positive or negative surprises in Chinese growth data, therefore, often have a direct impact on the Australian Dollar and its pairs.
Iron Ore is Australia’s largest export, accounting for $118 billion a year according to data from 2021, with China as its primary destination. The price of Iron Ore, therefore, can be a driver of the Australian Dollar. Generally, if the price of Iron Ore rises, AUD also goes up, as aggregate demand for the currency increases. The opposite is the case if the price of Iron Ore falls. Higher Iron Ore prices also tend to result in a greater likelihood of a positive Trade Balance for Australia, which is also positive of the AUD.
The Trade Balance, which is the difference between what a country earns from its exports versus what it pays for its imports, is another factor that can influence the value of the Australian Dollar. If Australia produces highly sought after exports, then its currency will gain in value purely from the surplus demand created from foreign buyers seeking to purchase its exports versus what it spends to purchase imports. Therefore, a positive net Trade Balance strengthens the AUD, with the opposite effect if the Trade Balance is negative.
- Gold price continues to draw support from dovish Fed-inspired USD selling bias.
- Worries about a US economic downturn further underpin the safe-haven metal.
- Traders turn cautious ahead of the release of the crucial US employment details.
Gold price (XAU/USD) climbed closer to the $2,524-2,525 supply zone on Thursday amid some follow-through US Dollar (USD) selling, led by bets for a larger interest rate cut by the Federal Reserve (Fed) later this month. A mixed bag of employment data released from the United States (US) this week suggested that the labor market was losing steam and triggered worries about the health of the economy. This, in turn, lifted market expectations about the possibility of a more aggressive policy easing by the Fed, which dragged the USD away from a two-week high touched on Tuesday and benefited the non-yielding yellow metal.
Meanwhile, renewed fears of a downturn in the world's largest economy tempered investors' appetite for riskier assets. This, along with persistent geopolitical tensions, turned out to be another factor underpinning demand for the safe-haven Gold price. The XAU/USD, however, remains below the all-time peak touched in August as traders opt to wait for the release of the closely-watched US monthly employment details later this Friday. The popularly known as the Nonfarm Payrolls (NFP) report will be looked upon for cues about the Fed's rate-cut path, which, in turn, will provide a fresh directional impetus to the precious metal.
Daily Digest Market Movers: Gold price benefits from bets for a larger interest rate cut by the Fed in September
- The ADP National Employment Report published on Thursday showed that US private-sector employment rose 99,000 in August, marking the smallest gain since January 2021.
- The reading was well below the market expectation of 145,000 and was accompanied by a downward revision of the previous month's print to 111,000 from 122,000 estimated originally.
- This comes on top of a report on Wednesday showing that job openings fell to 7.673 million, or a three-and-a-half-year low in July and provided further evidence of a deteriorating labor market.
- The Institute for Supply Management's (ISM) Services PMI inched up from 51.4 to 51.5 in August, while the Prices Paid Index rose to 57.3 from 57 and the Employment Index declined to 50.2 from 51.1.
- Separately, the US Department of Labor (DoL) reported that Initial Jobless Claims declined more than anticipated, to 227K in the week ending August 31 from the previous weekly figure of 232K.
- San Francisco Fed President Mary Daly said that the US central bank must calibrate policy to the evolving economy and cut policy rates because inflation is falling and the economy is slowing.
- Chicago Fed President Austan Goolsbee said on Friday that the longer-run trend of the labor market and inflation data justify easing interest-rate policy soon and then steadily over the next year.
- According to the CME Group's FedWatch Tool, the markets are pricing in a 40% chance that the Fed will lower borrowing costs by 50 basis points at the September 17-18 monetary policy meeting.
- Dovish expectations, meanwhile, keep the US Treasury bond yields depressed and the US Dollar bulls on the defensive, which, in turn, should act as a tailwind for the non-yielding Gold price.
- The market focus now shifts to the crucial US Nonfarm Payrolls (NFP) report, which is expected to show that the economy added 160K jobs in August and the Unemployment Rate ticked lower to 4.2%.
Technical Analysis: Gold price could accelerate the positive move once the $2,524-2.525 hurdle is cleared decisively
From a technical perspective, momentum beyond the $2,524-2,525 immediate hurdle will be seen as a fresh trigger for bullish traders. Moreover, oscillators on the daily chart are holding in positive territory and are still away from being in the overbought zone. This, in turn, suggests that the path of least resistance for the Gold price is to the upside. Some follow-through buying beyond the all-time peak, around the $2,531-2,532 area touched on August 20, will reaffirm the constructive outlook and pave the way for a further appreciating move.
On the flip side, the $2,500 psychological mark now seems to protect the immediate downside below which the Gold price could slide back to the $2,471-2,470 horizontal support. A convincing break below the latter will set the stage for deeper losses towards the 50-day Simple Moving Average (SMA), currently pegged near the $2,440 region, en route to the $2,400 mark and the 100-day SMA, around the $2,388 zone.
Gold FAQs
Gold has played a key role in human’s history as it has been widely used as a store of value and medium of exchange. Currently, apart from its shine and usage for jewelry, the precious metal is widely seen as a safe-haven asset, meaning that it is considered a good investment during turbulent times. Gold is also widely seen as a hedge against inflation and against depreciating currencies as it doesn’t rely on any specific issuer or government.
Central banks are the biggest Gold holders. In their aim to support their currencies in turbulent times, central banks tend to diversify their reserves and buy Gold to improve the perceived strength of the economy and the currency. High Gold reserves can be a source of trust for a country’s solvency. Central banks added 1,136 tonnes of Gold worth around $70 billion to their reserves in 2022, according to data from the World Gold Council. This is the highest yearly purchase since records began. Central banks from emerging economies such as China, India and Turkey are quickly increasing their Gold reserves.
Gold has an inverse correlation with the US Dollar and US Treasuries, which are both major reserve and safe-haven assets. When the Dollar depreciates, Gold tends to rise, enabling investors and central banks to diversify their assets in turbulent times. Gold is also inversely correlated with risk assets. A rally in the stock market tends to weaken Gold price, while sell-offs in riskier markets tend to favor the precious metal.
The price can move due to a wide range of factors. Geopolitical instability or fears of a deep recession can quickly make Gold price escalate due to its safe-haven status. As a yield-less asset, Gold tends to rise with lower interest rates, while higher cost of money usually weighs down on the yellow metal. Still, most moves depend on how the US Dollar (USD) behaves as the asset is priced in dollars (XAU/USD). A strong Dollar tends to keep the price of Gold controlled, whereas a weaker Dollar is likely to push Gold prices up.
- Indian Rupee trades with bearish bias in Friday’s Asian session.
- Increased importers' USD demand undermines the INR, but RBI’s intervention and rising Fed rate cut bets might cap its downside.
- The US August employment report will be in the spotlight later on Friday.
The Indian Rupee (INR) extends its decline on Friday after retreating to its record closing low in the previous session. Traders remain vigilant for possible interventions from the Reserve Bank of India (RBI) through USD sales, which prevented the INR from depreciating past the crucial 84 level. However, the US Dollar (USD) demand from oil importers and foreign portfolios might weigh on the local currency.
Investors will closely monitor the US August employment data on Friday, including Nonfarm Payrolls (NFP), Unemployment Rate and Average Hourly Earnings. Any sign of further weakening in the labor market could prompt the expectation of a deeper rate cut by the Federal Reserve (Fed). This, in turn, could exert some selling pressure on the Greenback, making other currencies like Indian Rupee more attractive.
Daily Digest Market Movers: Indian Rupee edges lower amid importers' USD demand
- “Rupee makes a new all-time low of Rs 83.99 per dollar as importers, FPIs and oil companies continue buying while RBI ensures that it does not cross Rs 84.00 per dollar, a psychological level,” said Anil Kumar Bhansali, Head of Treasury and Executive Director, Finrex Treasury Advisors LLP.
- Private sector employment increased by 99,000 in August and annual pay was up 4.8% year-over-year, Automatic Data Processing (ADP) reported on Thursday. This figure followed the 111,000 (revised from 122,000) increase seen in July and below the estimation of 145,000 by a wide margin.
- The weekly US Initial Jobless Claims rose to 227,000, compared to the previous reading of 232,000 (revised from 231,000) and below the initial consensus of 231,000).
- US ISM Services PMI increased to 51.5 in August from 51.4 in July, beating the estimation of 51.1.
- Chicago Fed President Austan Goolsbee said on Friday that the longer-run trend of labor market and inflation data justify the Fed easing interest-rate policy soon, and then steadily over the next year.
Technical Analysis: USD/INR’s broader trend remains constructive
The Indian Rupee weakens on the day. The USD/INR pair remains confined within an ascending triangle on the daily chart. However, in the long term, the pair maintains the bullish vibe unchanged as the price holds above the key 100-day Exponential Moving Average (EMA). The upward momentum is reinforced by the 14-day Relative Strength Index (RSI) which stands in bullish territory near 59.55, supporting the buyers in the near term.
Sustained trading close above the 84.00-84.05 zone, the confluence of the psychological figure, the upper boundary of the triangle and the high of September 4, could see an upside breakout that may take USD/INR up to 84.50.
Any follow-through selling could drag the pair down to the ascending triangle support near 83.90. A breach below this level could revisit the 100-day EMA at 83.64.
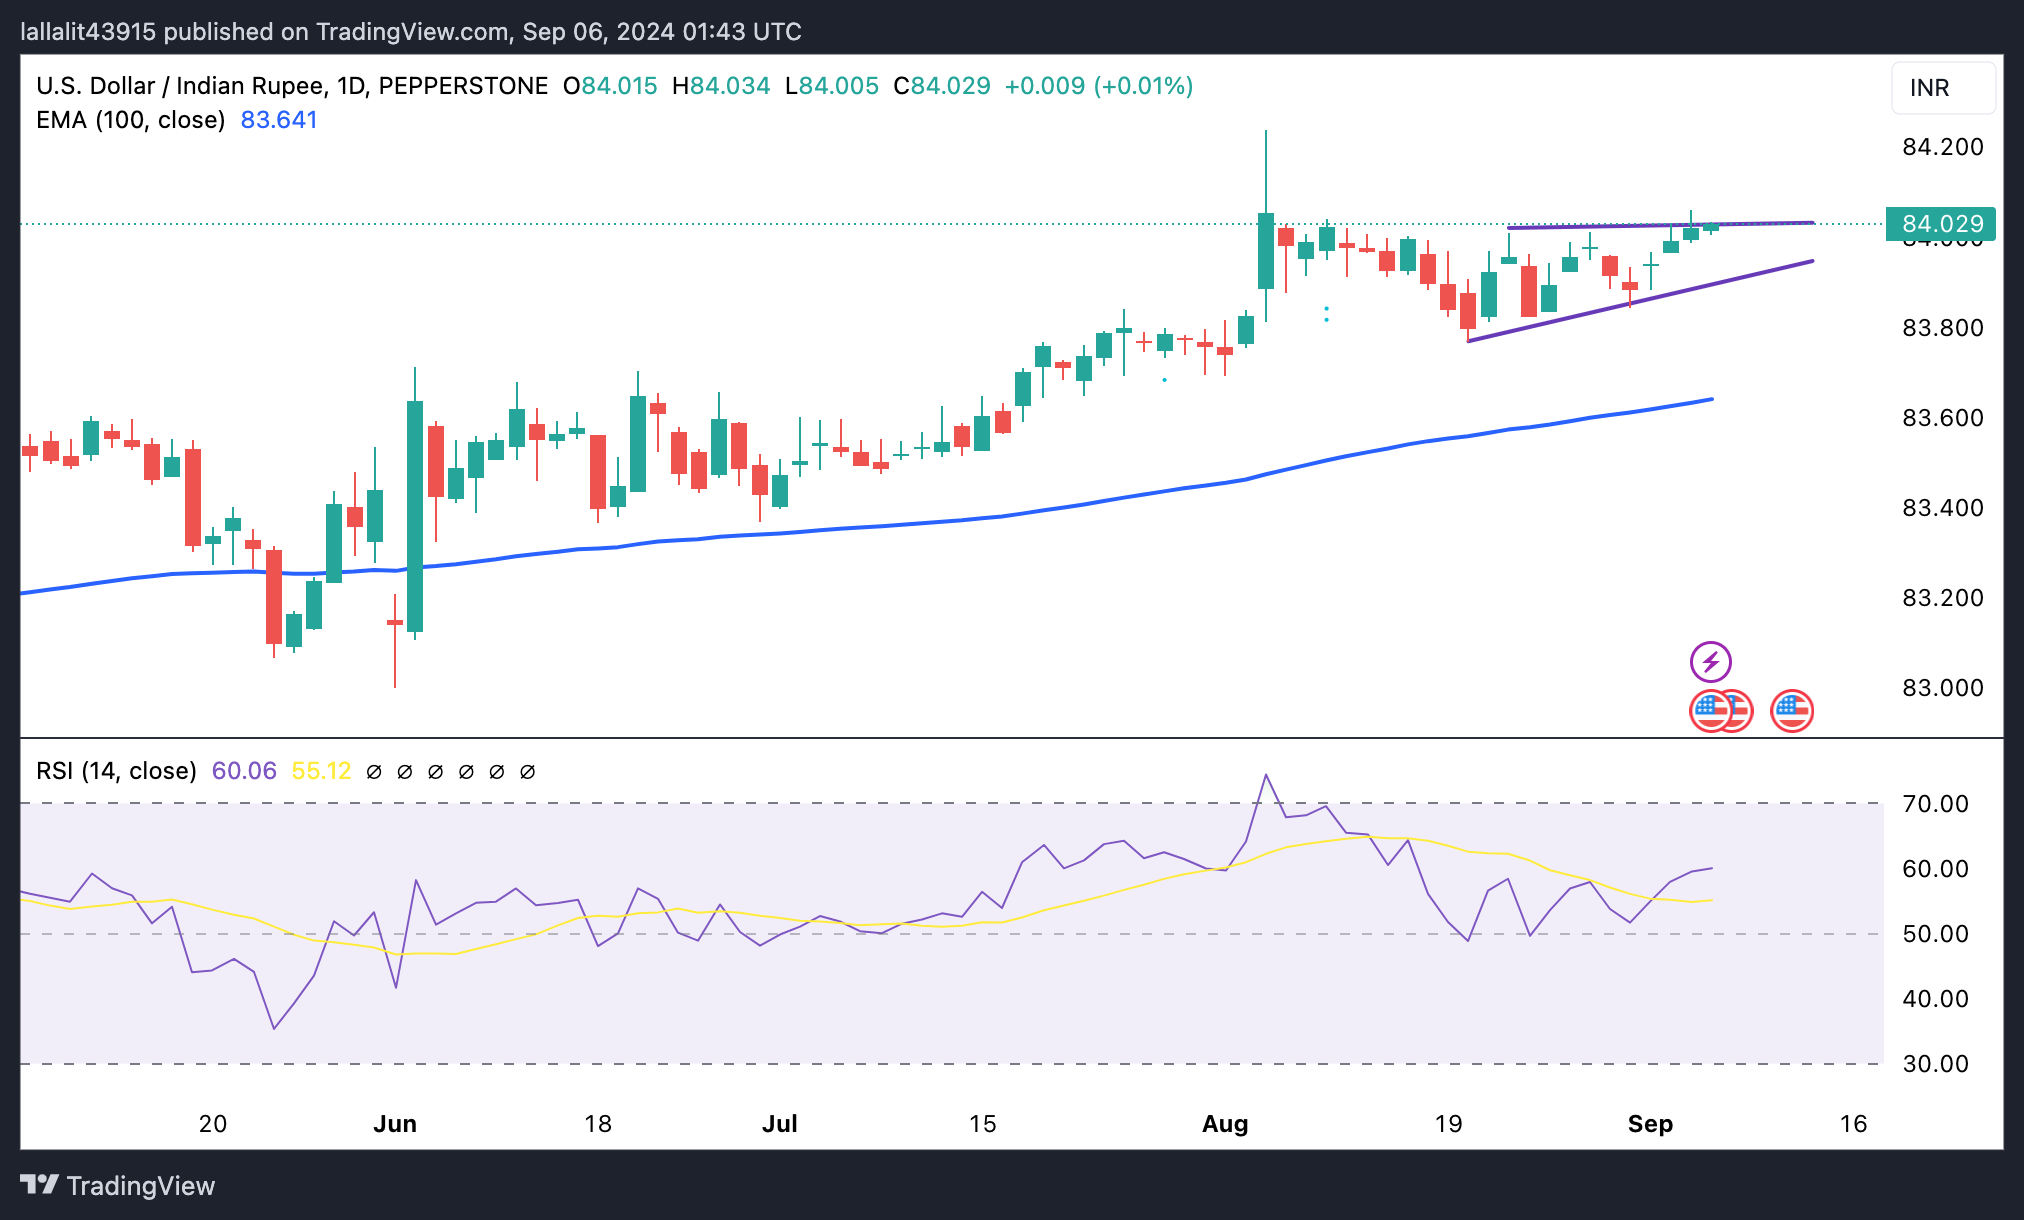
Indian Rupee FAQs
The Indian Rupee (INR) is one of the most sensitive currencies to external factors. The price of Crude Oil (the country is highly dependent on imported Oil), the value of the US Dollar – most trade is conducted in USD – and the level of foreign investment, are all influential. Direct intervention by the Reserve Bank of India (RBI) in FX markets to keep the exchange rate stable, as well as the level of interest rates set by the RBI, are further major influencing factors on the Rupee.
The Reserve Bank of India (RBI) actively intervenes in forex markets to maintain a stable exchange rate, to help facilitate trade. In addition, the RBI tries to maintain the inflation rate at its 4% target by adjusting interest rates. Higher interest rates usually strengthen the Rupee. This is due to the role of the ‘carry trade’ in which investors borrow in countries with lower interest rates so as to place their money in countries’ offering relatively higher interest rates and profit from the difference.
Macroeconomic factors that influence the value of the Rupee include inflation, interest rates, the economic growth rate (GDP), the balance of trade, and inflows from foreign investment. A higher growth rate can lead to more overseas investment, pushing up demand for the Rupee. A less negative balance of trade will eventually lead to a stronger Rupee. Higher interest rates, especially real rates (interest rates less inflation) are also positive for the Rupee. A risk-on environment can lead to greater inflows of Foreign Direct and Indirect Investment (FDI and FII), which also benefit the Rupee.
Higher inflation, particularly, if it is comparatively higher than India’s peers, is generally negative for the currency as it reflects devaluation through oversupply. Inflation also increases the cost of exports, leading to more Rupees being sold to purchase foreign imports, which is Rupee-negative. At the same time, higher inflation usually leads to the Reserve Bank of India (RBI) raising interest rates and this can be positive for the Rupee, due to increased demand from international investors. The opposite effect is true of lower inflation.
The People’s Bank of China (PBOC) set the USD/CNY central rate for the trading session ahead on Friday at 7.0925, as against the previous day's fix of 7.0989 and 7.0927 Reuters estimates.
Federal Reserve Bank of Chicago President Austan Goolsbee said on Friday that the longer-run trend of labor market and inflation data justify the Fed easing interest-rate policy soon and then steadily over the next year, per MarketWatch.
Key quotes
The long arc shows inflation is coming down very significantly, and the unemployment rate is rising faster.
Given the more favorable inflation data and the less favorable unemployment data, it is pretty clear that the path is not just rate cuts soon.
Said he saw "more" warning signs about the cooling labor market.
I don't want us to be basing decisions on one data point.
If we remain tight for too long, we are going to have to deal with the employment side of the mandate.
Persistent weakness has raised the possibility that the labor market will keep cooling, and could "turn into something worse.
Market reaction
The US Dollar Index (DXY) is trading 0.02% lower on the day at 101.04, as of writing.
Fed FAQs
Monetary policy in the US is shaped by the Federal Reserve (Fed). The Fed has two mandates: to achieve price stability and foster full employment. Its primary tool to achieve these goals is by adjusting interest rates. When prices are rising too quickly and inflation is above the Fed’s 2% target, it raises interest rates, increasing borrowing costs throughout the economy. This results in a stronger US Dollar (USD) as it makes the US a more attractive place for international investors to park their money. When inflation falls below 2% or the Unemployment Rate is too high, the Fed may lower interest rates to encourage borrowing, which weighs on the Greenback.
The Federal Reserve (Fed) holds eight policy meetings a year, where the Federal Open Market Committee (FOMC) assesses economic conditions and makes monetary policy decisions. The FOMC is attended by twelve Fed officials – the seven members of the Board of Governors, the president of the Federal Reserve Bank of New York, and four of the remaining eleven regional Reserve Bank presidents, who serve one-year terms on a rotating basis.
In extreme situations, the Federal Reserve may resort to a policy named Quantitative Easing (QE). QE is the process by which the Fed substantially increases the flow of credit in a stuck financial system. It is a non-standard policy measure used during crises or when inflation is extremely low. It was the Fed’s weapon of choice during the Great Financial Crisis in 2008. It involves the Fed printing more Dollars and using them to buy high grade bonds from financial institutions. QE usually weakens the US Dollar.
Quantitative tightening (QT) is the reverse process of QE, whereby the Federal Reserve stops buying bonds from financial institutions and does not reinvest the principal from the bonds it holds maturing, to purchase new bonds. It is usually positive for the value of the US Dollar.
| Index | Change, points | Closed | Change, % |
|---|---|---|---|
| NIKKEI 225 | -390.52 | 36657.09 | -1.05 |
| Hang Seng | -13.04 | 17444.3 | -0.07 |
| KOSPI | -5.3 | 2575.5 | -0.21 |
| ASX 200 | 31.9 | 7982.4 | 0.4 |
| DAX | -15.35 | 18576.5 | -0.08 |
| CAC 40 | -69.01 | 7431.96 | -0.92 |
| Dow Jones | -219.22 | 40755.75 | -0.54 |
| S&P 500 | -16.66 | 5503.41 | -0.3 |
| NASDAQ Composite | 43.36 | 17127.66 | 0.25 |
- WTI price holds steady near $69.75 in Friday’s early Asian session.
- Continued soft demand in China drags the WTI price lower.
- A delay in OPEC+ supply increase and encouraging reports from weekly US crude oil inventories might cap WTI’s downside.
West Texas Intermediate (WTI), the US crude Oil benchmark, is trading around $69.75 on Friday. WTI price edges lower to a fresh 2024 low amid worries about demand in the US and China. However, the delay in OPEC+ oil output increase and a rise in large crude oil inventory draw might help limit WTI’s losses.
The concerns about the Chinese sluggish economy and oil demand undermine the WTI prices as China is the world’s largest importer of crude oil. The weaker-than-expected Chinese NBS Manufacturing PMI released on the weekend and the softer Caixin Manufacturing PMI on Wednesday contributed to the WTI’s downside.
However, the downside of the black gold might be limited due to positive news from the Organization of the Petroleum Exporting Countries and allies (OPEC+) and the rise in large crude inventory draws.
OPEC+ has agreed to delay planned output increases for October and November, per Reuters on Thursday. ''Libyan production is expected to resume after the settlement of disputes in the country, which also weighed on crude oil prices. However, the OPEC+ decision could support crude oil prices at lower levels. The dollar index also plunged amid strength in the Japanese Yen and may support crude oil prices at lower levels,'' said Rahul Kalantri, VP Commodities, Mehta Equities Ltd.
US crude oil inventories fell more than expected last week. According to the US Energy Information Administration (EIA), crude oil stockpiles in the United States for the week ending August 30 declined by 6.873 million barrels, compared to a decrease of 0.846 million barrels in the previous week. The market consensus estimated that stocks would decline by just 0.9 million barrels.
WTI Oil FAQs
WTI Oil is a type of Crude Oil sold on international markets. The WTI stands for West Texas Intermediate, one of three major types including Brent and Dubai Crude. WTI is also referred to as “light” and “sweet” because of its relatively low gravity and sulfur content respectively. It is considered a high quality Oil that is easily refined. It is sourced in the United States and distributed via the Cushing hub, which is considered “The Pipeline Crossroads of the World”. It is a benchmark for the Oil market and WTI price is frequently quoted in the media.
Like all assets, supply and demand are the key drivers of WTI Oil price. As such, global growth can be a driver of increased demand and vice versa for weak global growth. Political instability, wars, and sanctions can disrupt supply and impact prices. The decisions of OPEC, a group of major Oil-producing countries, is another key driver of price. The value of the US Dollar influences the price of WTI Crude Oil, since Oil is predominantly traded in US Dollars, thus a weaker US Dollar can make Oil more affordable and vice versa.
The weekly Oil inventory reports published by the American Petroleum Institute (API) and the Energy Information Agency (EIA) impact the price of WTI Oil. Changes in inventories reflect fluctuating supply and demand. If the data shows a drop in inventories it can indicate increased demand, pushing up Oil price. Higher inventories can reflect increased supply, pushing down prices. API’s report is published every Tuesday and EIA’s the day after. Their results are usually similar, falling within 1% of each other 75% of the time. The EIA data is considered more reliable, since it is a government agency.
OPEC (Organization of the Petroleum Exporting Countries) is a group of 13 Oil-producing nations who collectively decide production quotas for member countries at twice-yearly meetings. Their decisions often impact WTI Oil prices. When OPEC decides to lower quotas, it can tighten supply, pushing up Oil prices. When OPEC increases production, it has the opposite effect. OPEC+ refers to an expanded group that includes ten extra non-OPEC members, the most notable of which is Russia.
| Pare | Closed | Change, % |
|---|---|---|
| AUDUSD | 0.67395 | 0.23 |
| EURJPY | 159.325 | 0.1 |
| EURUSD | 1.11069 | 0.22 |
| GBPJPY | 189.007 | 0.11 |
| GBPUSD | 1.31778 | 0.23 |
| NZDUSD | 0.62208 | 0.35 |
| USDCAD | 1.35024 | -0.03 |
| USDCHF | 0.8439 | -0.27 |
| USDJPY | 143.431 | -0.12 |


© 2000-2026. All rights reserved.
This site is managed by Teletrade D.J. LLC 2351 LLC 2022 (Euro House, Richmond Hill Road, Kingstown, VC0100, St. Vincent and the Grenadines).
The information on this website is for informational purposes only and does not constitute any investment advice.
The company does not serve or provide services to customers who are residents of the US, Canada, Iran, The Democratic People's Republic of Korea, Yemen and FATF blacklisted countries.
Making transactions on financial markets with marginal financial instruments opens up wide possibilities and allows investors who are willing to take risks to earn high profits, carrying a potentially high risk of losses at the same time. Therefore you should responsibly approach the issue of choosing the appropriate investment strategy, taking the available resources into account, before starting trading.
Use of the information: full or partial use of materials from this website must always be referenced to TeleTrade as the source of information. Use of the materials on the Internet must be accompanied by a hyperlink to teletrade.org. Automatic import of materials and information from this website is prohibited.
Please contact our PR department if you have any questions or need assistance at pr@teletrade.global.
transfers