- Analytics
- News and Tools
- Market News
CFD Markets News and Forecasts — 06-05-2024
Japan's top currency diplomat, Masato Kanda, who will instruct the BoJ to intervene, when he judges it necessary, said on Tuesday that the Japanese government may take the necessary steps to deal with excessive market volatility, but declined to comment on US Treasury Secretary Janet Yellen's views on currency policy, per Reuters.
Key quotes
“No comment on Yellen's comments on FX.”
“Important for currencies to move in a stable manner reflecting fundamentals.”
“If there is excessive volatility in the FX market the government must take appropriate steps.”
“Won't comment on FX levels.”
Market reaction
At the time of writing, USD/JPY was trading at 154.17, adding 0.21% on the day.
Japanese Yen FAQs
The Japanese Yen (JPY) is one of the world’s most traded currencies. Its value is broadly determined by the performance of the Japanese economy, but more specifically by the Bank of Japan’s policy, the differential between Japanese and US bond yields, or risk sentiment among traders, among other factors.
One of the Bank of Japan’s mandates is currency control, so its moves are key for the Yen. The BoJ has directly intervened in currency markets sometimes, generally to lower the value of the Yen, although it refrains from doing it often due to political concerns of its main trading partners. The current BoJ ultra-loose monetary policy, based on massive stimulus to the economy, has caused the Yen to depreciate against its main currency peers. This process has exacerbated more recently due to an increasing policy divergence between the Bank of Japan and other main central banks, which have opted to increase interest rates sharply to fight decades-high levels of inflation.
The BoJ’s stance of sticking to ultra-loose monetary policy has led to a widening policy divergence with other central banks, particularly with the US Federal Reserve. This supports a widening of the differential between the 10-year US and Japanese bonds, which favors the US Dollar against the Japanese Yen.
The Japanese Yen is often seen as a safe-haven investment. This means that in times of market stress, investors are more likely to put their money in the Japanese currency due to its supposed reliability and stability. Turbulent times are likely to strengthen the Yen’s value against other currencies seen as more risky to invest in.
- AUD/USD steady at 0.6624; focus on upcoming RBA decision, quiet US data, and UK bank holiday.
- Wall Street ends higher, driven by optimism over potential Fed rate cuts.
- ANZ analysts anticipate RBA will hold rates, possibly adopting a hawkish stance due to inflation trends.
The Australian Dollar registered minuscule gains compared to the US Dollar as traders braced for the Reserve Bank of Australia (RBA) monetary policy meeting. A scarce economic docket in the United States (US) and a bank holiday in the UK were the main drivers behind the “anemic” AUD/USD price action. At the time of writing, the pair trades at 0.6624, virtually unchanged.
Australian Dollar sees limited movement as markets anticipate key RBA monetary policy
Wall Street finished the session with gains amid an upbeat market mood due to investors' confidence that the Federal Reserve would begin to lower rates faster than expected. Meanwhile, on Tuesday, AUD/USD traders brace for the RBA’s monetary policy decision.
The RBA is expected to keep the cash rate unchanged at 4.35%, though there is speculation that the central bank might shift slightly hawkish following higher-than-expected inflation figures for Q1 2024. Analysts at ANZ Bank commented that they expect the RBA to tilt hawkishly in its post-meeting statement.
They added the RBA’s board might choose a form a word, such as “the risks of inflation not returning to the target in a reasonable timeframe has risen,” followed by “accordingly the Board is not ruling anything in our out.”
On the US front, Federal Reserve officials crossed the newswires. President of the Federal Reserve Bank of Richmond, Thomas Barkin expressed that he anticipates high interest rates will further slow the economy and help bring inflation down to the 2% target. Meanwhile, John Williams, the New York Fed President, mentioned that rate cuts are on the horizon, but the timing will be based on a comprehensive review of the data.
- GBP/USD holds positive ground around 1.2560 on the softer USD on Tuesday.
- Slower US job growth has triggered speculation that the Fed will cut the interest rate this year.
- The BoE is expected to hold rates at 5.25% for the fifth time in a row on Thursday.
The GBP/USD pair trades in positive territory for the fifth consecutive day near 1.2560 during the Asian session on Tuesday. The weaker US Dollar (USD) provides some support to the major pair. The Bank of England (BoE) interest rate decision on Thursday will be in the spotlight, with no change in rate expected.
Investors increased their bets that the US Federal Reserve will cut the interest rate this year after US employment data last week slowed more than expected in April. Fedspeak this week might offer some hints about future monetary policy. On Monday, Richmond Fed President Thomas Barkin said that the current interest rate level should cool the economy enough to bring down inflation to the 2% target, with the strength of the job market giving officials time to gain confidence that inflation will fall.
Meanwhile, New York Fed President John Williams stated that while rate cuts would happen, monetary policy was currently in a very good place. Later in the day, Fed Bank of Minneapolis President Neel Kashkari is set to speak. The dovish tone of Fed officials might drag the Greenback lower and create a tailwind for the GBP/USD pair for the time being. According to LSEG's rate probability app, financial markets have priced in rate cuts worth 46 basis points (bps) from the Fed by the end of 2024, with the first cut expected in September or November.
On the other hand, the BoE is expected to hold rates at 5.25% at its May meeting on Thursday. Traders will closely monitor about possible timescale for rate cuts and the BoE’s guidance on interest rates. Nonetheless, the dovish comments from the BoE Governor Andrew Bailey and Deputy Governor Dave Ramsden in April triggered speculation that the easing cycle of the BoE may be closer to the European Central Bank (ECB) than to the Fed. The BoE's Bailey noted that he is confident that headline inflation will return to the desired rate of 2% in April. The dovish stance of the UK central bank might weigh on the Pound Sterling and cap the downside of the pair.
- Interest rate in Australia will likely stay unchanged at 4.35%.
- Reserve Bank of Australia Governor Michele Bullock to keep her options open.
- Australian Dollar bullish case to be supported by a hawkish RBA.
The Reserve Bank of Australia (RBA) will announce its decision on monetary policy early on Tuesday. Australian policymakers are widely anticipated to keep the Official Cash Rate (OCR) unchanged at 4.35%. In the March meeting, the RBA moved away from the tightening bias, scrapping references to potential rate hikes from the Board’s statement. As a result, the Australian Dollar (AUD) plummeted.
But much water has passed under the bridge since then. On the one hand, the Monthly Consumer Price Index (CPI) rose 3.5% YoY in March, while on the other hand, the latest wage growth figure indicated persistent upward pressures. Wages increased 4.2% YoY in the last quarter of 2023.
Reserve Bank of Australia expected to remain on hold, but what else?
The RBA is not expected to change the OCR, but market players are concerned policymakers may reinstate the hawkish stance. The uptick in inflation, coupled with a persistently tight job market, spooks away any chance of a rate cut in the near term. In fact, speculative interest is more keen to bet on upcoming rate hikes before year-end than on a reduction of the interest rate benchmark. The idea seems quite logical as the RBA stalled rate hikes well below its main counterparts.
Ahead of the announcement, speculation mounts that Governor Michele Bullock and co. will opt out to reopen the door for additional tightening, with market participants increasingly beating on a rate hike in November 2024.
Governor Bullock noted in the press conference following the March decision that she wouldn’t rule anything in or out, adding that she needs to be confident that inflation is sustainably moving towards the central bank target range of 2%-3%. Indeed, she sounded confident back then, but the optimism diluted as macroeconomic data did not support the loosening case.
The CPI rose 1.0% in the first quarter of the year, according to the Australian Bureau of Statistics (ABS). The same report showed that, over the twelve months to the March 2024 quarter, the CPI rose 3.6%, actually lower than the 4.1% annual rise in the previous quarter. It was the fifth consecutive quarter of lower annual inflation, although the trimmed mean annual inflation held at 4%, still above the RBA’s goal.
Furthermore, analysts at TD Securities noted that the latest employment data from Australia will not prompt the RBA to lower the policy rate anytime soon. "Australian headline employment fell 6.6k in March, softer than the +10k consensus and TD's +18k f/c. Given the significant increase in jobs posted in February, a much larger giveback could have happened, so the 6.6k drop is not too bad. Driving the negative print was the 34.5k drop in part-time, but full-time rose 27.9k (this is strong) while there were upward revisions to headline and full-time for February.”
Investors have spent most of this year betting on the dates major central banks will trim interest rates, pricing in sooner or later movements. However, that’s not the case in Australia, beyond the 30% odds a rate hike could come in November. Nothing, however, is priced in the country, and Tuesday’s announcement could put speculative interest in a certain path, spurring some aggressive price action around the AUD.
The RBA will include fresh economic forecasts. In February, the central bank was expecting trimmed mean inflation would decline to 3.1% by the end of 2024 and to 2.8% a year later. Inflation was then seen returning to the 2%-3% target by mid-2024. On growth, policymakers forecasted Gross Domestic Product (GDP) growth will slow to 1.3% in the second quarter of the year and slowly pick up afterwards to reach 2.4% by mid-2026.
However, with hotter-than-anticipated inflation in the first quarter of the year, the RBA will likely review its inflation forecasts. Growth figures, on the contrary, will likely suffer minor revisions. Market players will pay more attention to the long-term projections and whether the June 2026 line is moved further away.
How will the RBA interest rate decision impact AUD/USD?
The AUD/USD pair trades above the 0.6600 mark ahead of the announcement, as the US Dollar suffers from a not-that-hawkish Federal Reserve (Fed). The US central bank has made it clear that interest rates will remain high for longer, although policymakers maintain the door open for rate cuts later this year.
Financial markets are optimistic despite global signs of stubbornly high inflation, while stock markets’ strength further underpins AUD/USD.
Valeria Bednarik, FXStreet Chief Analyst, says: “The AUD/USD pair will likely extend its rally, should the RBA deliver a hawkish message. Flipping back to potential rate hikes could be a nice catalyst for those looking to add longs. The pair has met sellers in the 0.6640 price zone in March and in the 0.6660 area in April, meaning large stops should accumulate above the latter. If those get triggered, a rally towards 0.6700 seems likely. The next resistance level is 0.6730, while the final target comes at 0.6770.”
Bednarik adds: “Speculative interest may be quite disappointed if the statement remains the same. AUD/USD could drop towards the 0.6560 price zone, while a break below the latter exposes the 0.6500 mark.”
Australian Dollar FAQs
One of the most significant factors for the Australian Dollar (AUD) is the level of interest rates set by the Reserve Bank of Australia (RBA). Because Australia is a resource-rich country another key driver is the price of its biggest export, Iron Ore. The health of the Chinese economy, its largest trading partner, is a factor, as well as inflation in Australia, its growth rate and Trade Balance. Market sentiment – whether investors are taking on more risky assets (risk-on) or seeking safe-havens (risk-off) – is also a factor, with risk-on positive for AUD.
The Reserve Bank of Australia (RBA) influences the Australian Dollar (AUD) by setting the level of interest rates that Australian banks can lend to each other. This influences the level of interest rates in the economy as a whole. The main goal of the RBA is to maintain a stable inflation rate of 2-3% by adjusting interest rates up or down. Relatively high interest rates compared to other major central banks support the AUD, and the opposite for relatively low. The RBA can also use quantitative easing and tightening to influence credit conditions, with the former AUD-negative and the latter AUD-positive.
China is Australia’s largest trading partner so the health of the Chinese economy is a major influence on the value of the Australian Dollar (AUD). When the Chinese economy is doing well it purchases more raw materials, goods and services from Australia, lifting demand for the AUD, and pushing up its value. The opposite is the case when the Chinese economy is not growing as fast as expected. Positive or negative surprises in Chinese growth data, therefore, often have a direct impact on the Australian Dollar and its pairs.
Iron Ore is Australia’s largest export, accounting for $118 billion a year according to data from 2021, with China as its primary destination. The price of Iron Ore, therefore, can be a driver of the Australian Dollar. Generally, if the price of Iron Ore rises, AUD also goes up, as aggregate demand for the currency increases. The opposite is the case if the price of Iron Ore falls. Higher Iron Ore prices also tend to result in a greater likelihood of a positive Trade Balance for Australia, which is also positive of the AUD.
The Trade Balance, which is the difference between what a country earns from its exports versus what it pays for its imports, is another factor that can influence the value of the Australian Dollar. If Australia produces highly sought after exports, then its currency will gain in value purely from the surplus demand created from foreign buyers seeking to purchase its exports versus what it spends to purchase imports. Therefore, a positive net Trade Balance strengthens the AUD, with the opposite effect if the Trade Balance is negative.
Economic Indicator
RBA Interest Rate Decision
The Reserve Bank of Australia (RBA) announces its interest rate decision at the end of its eight scheduled meetings per year. If the RBA is hawkish about the inflationary outlook of the economy and raises interest rates it is usually bullish for the Australian Dollar (AUD). Likewise, if the RBA has a dovish view on the Australian economy and keeps interest rates unchanged, or cuts them, it is seen as bearish for AUD.
Read more.Next release: Tue May 07, 2024 04:30
Frequency: Irregular
Consensus: 4.35%
Previous: 4.35%
Source: Reserve Bank of Australia
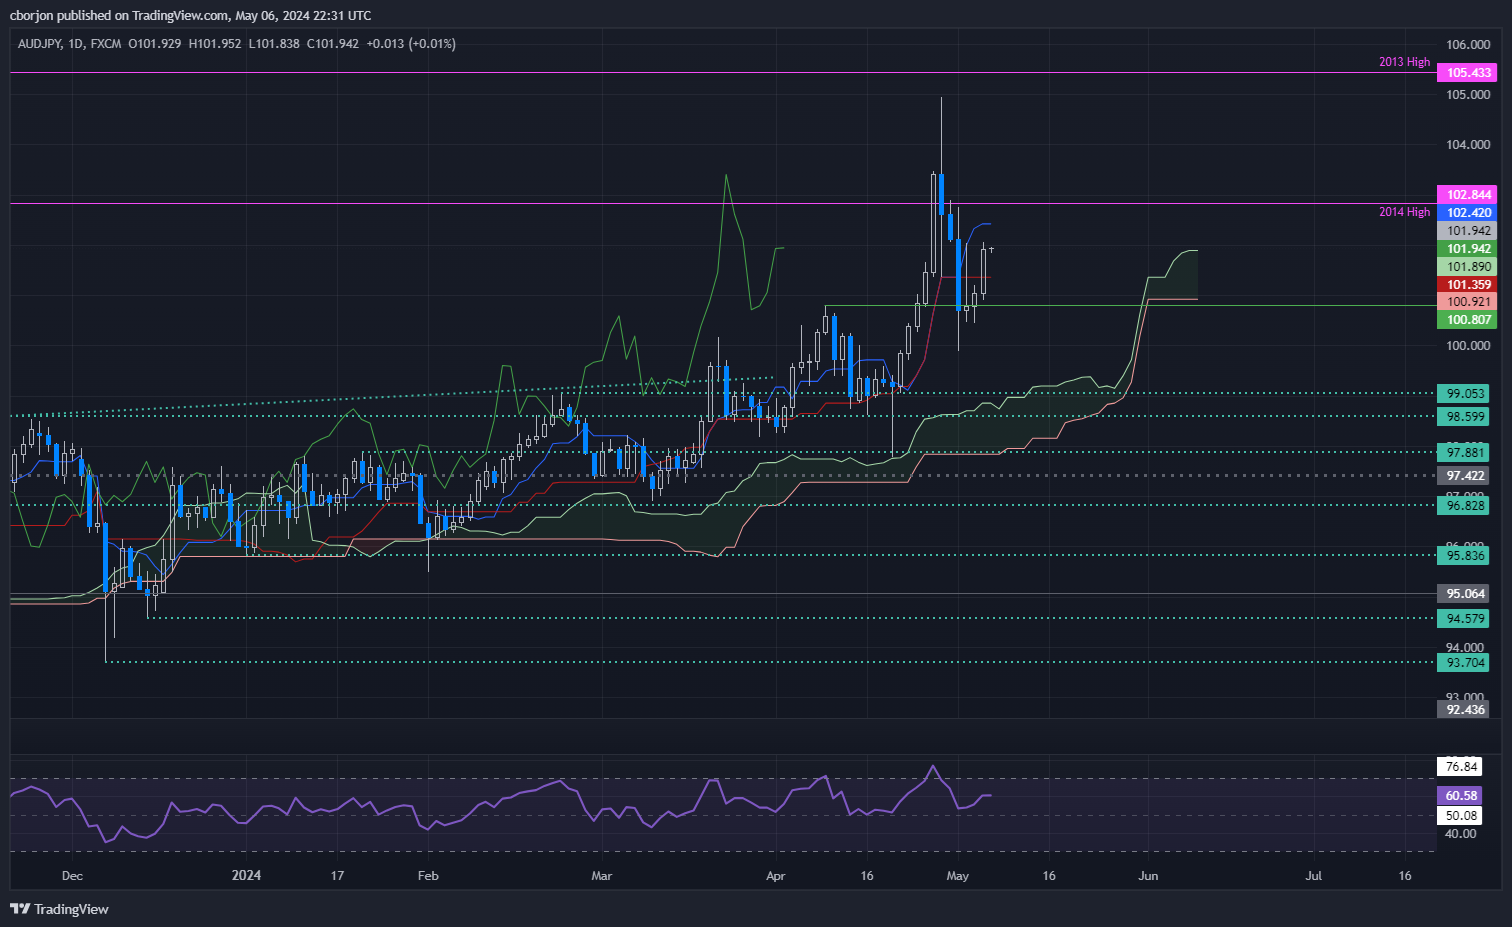
- AUD/JPY up 0.87%, nearing 102.00 due to optimistic global financial outlook.
- Technicals: Upward momentum with RSI above 50 indicates bullish control.
- Resistances at 102.42 (Tenkan-Sen), 102.84 (2014 high), and 103.47 (April 26 high).
The AUD/JPY climbed 0.87% on Monday amid an upbeat market mood, sponsored by increased odds the US Federal Reserve might cut rates sooner than expected. The cross-pair trades at 101.94, shy of the 102.00 figure, as the Asian session begins.
AUD/JPY Price Analysis: Technical outlook
The AUD/JPY is neutral to upward biased, with momentum suggesting that buyers are in charge, with the Relative Strength Index (RSI) indicator standing above the 50-midline. If AUD/JPY buyers would like to extend their gains, they must reclaim 102.00. Once cleared, the next supply zone would be the Tenkan-Sen at 102.42. Once cleared, further gains lie, up at the 2014 yearly high of 102.84, ahead of the April 26 high of 103.47.
On the other hand, if bears drag prices below the Kijun-Sen at 101.36, that will pave the way for testing the Senkou Span B at 100.92. Further losses are seen at the May 1 low of 99.89.
AUD/JPY Price Action – Daily Chart
- EUR/USD cycled above 1.0750 on Monday.
- European Retail Sales figures due on Tuesday.
- Friday’s US consumer sentiment survey to cap off an otherwise quiet week.
EUR/USD churned around 1.0770 to kick off the new trading week, with the pair rising after better-than-expected Purchasing Managers Index (PMI) figures early Monday before settling into familiar chart territory above 1.0750 ahead of Tuesday’s pan-European Retail Sales figures due in the upcoming European market session.
Monday’s HCOB Services PMI for April surprised to the upside, printing at 53.3 MoM versus the forecast steady hold at 52.9. Tuesday’s upcoming European Retail Sales will be the day’s key data print for the day’s session, with markets expecting pan-European Retail Sales for March to rebound to 0.6% after the previous month’s -0.5% decline.
The week’s US data docket remains tepid, leaving Fedspeak from various heads of the Federal Reserve (Fed) giving speeches this week at the forefront. The week will close out with Friday’s University of Michigan Consumer Sentiment Index, which is expected to ease back down to 77.0 in May after the previous month’s 77.2.
EUR/USD technical outlook
EUR/USD is in chart churn near 1.0770 as the pair trades within the technical range established during last Friday’s volatility, with the pair capped off in the near-term by Friday’s high just above 1.0810. Intraday momentum is leaning into the bullish side, with the pair climbing from last week’s bottom bids near 1.0650.
On daily candlesticks, the pair is trading into the high side of a descending trendline from 1.1140, a peak set in late December. EUR/USD is recovering from the last swing low into the 1.0600 handle, though immediate technical resistance is priced in at the 200-day Exponential Moving Average (EMA) at 1.0797.
EUR/USD hourly chart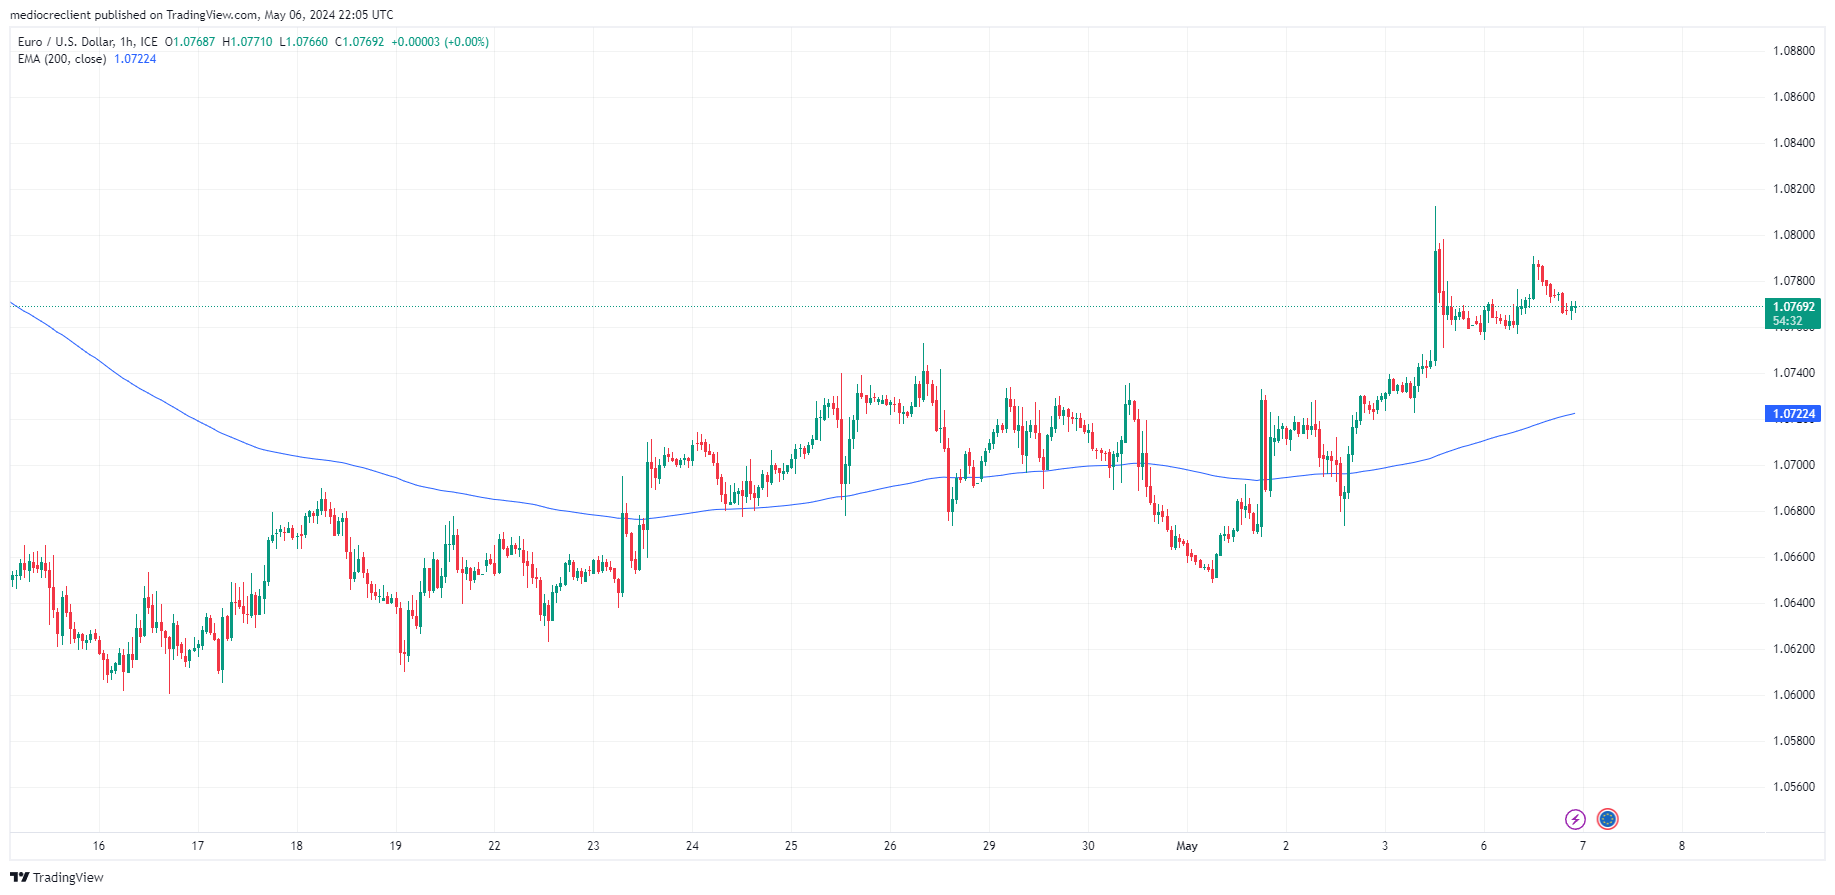
EUR/USD daily chart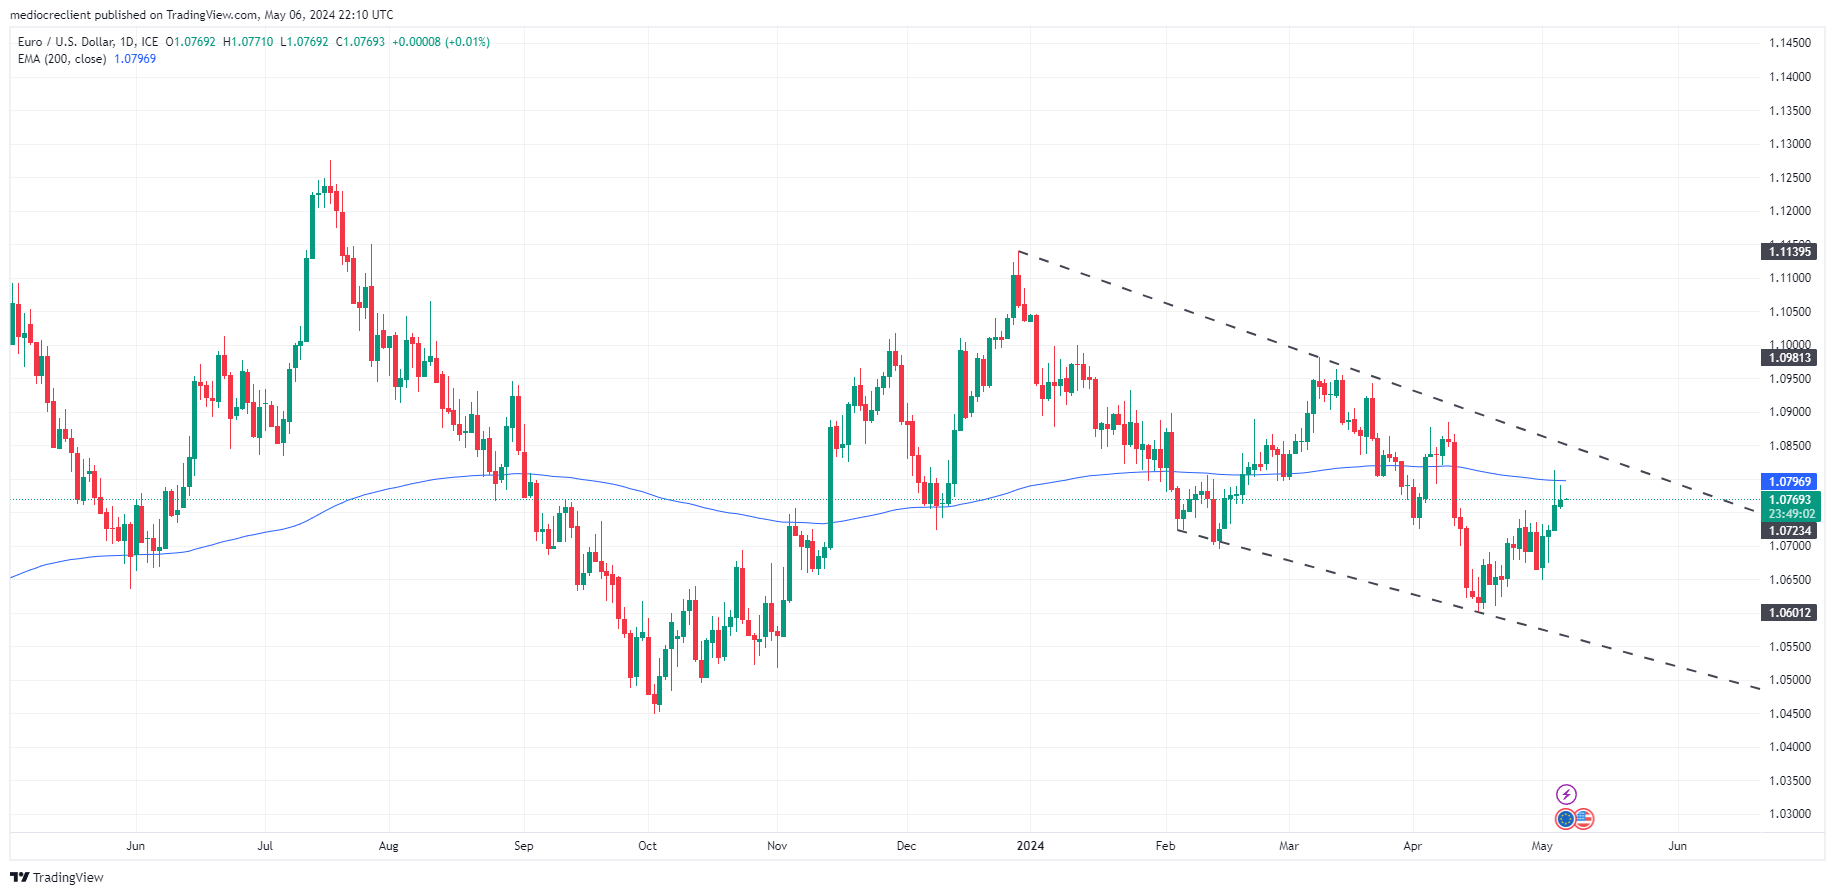
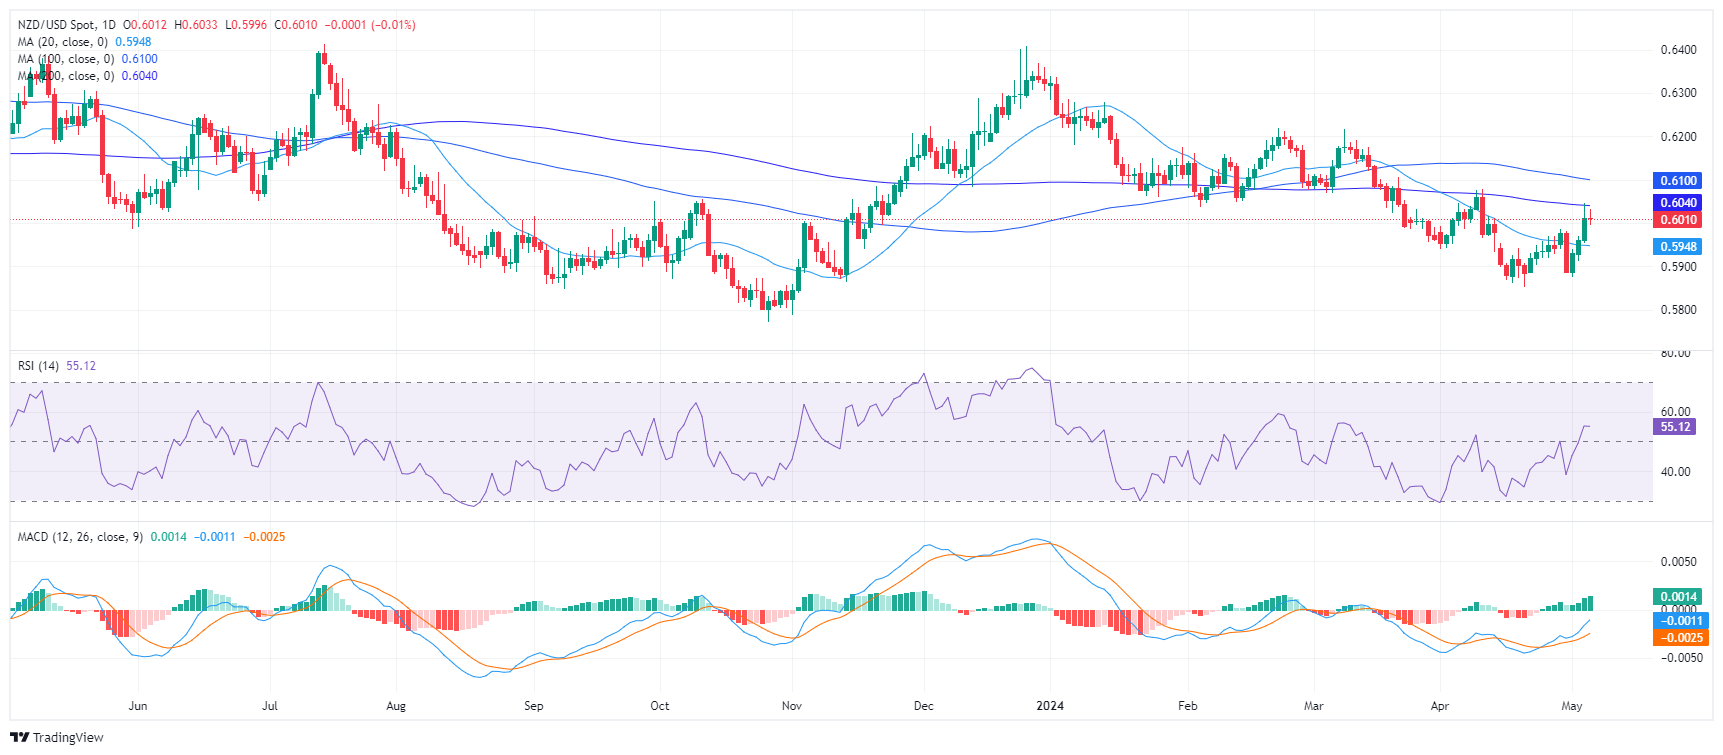
- The daily RSI and MACD show a growing bullish momentum.
- The hourly chart RSI reveals a possible slowdown in growing buying traction.
- The NZD/USD still lags behind other main SMAs, potentially pointing to a long-term bearish prospect.
The NZD/USD pair is seen exhibiting a minor decline, dropping towards the 0.6000 level in Monday's session. The market pattern appears to be dominated by a bullish swing, suggesting an increase in buyer control. Despite this, the possibility of bearish movements remains, as the key Simple Moving Averages (SMAs) and shifting investor sentiment indicate that the bulls need further validation.
On the daily chart, the Relative Strength Index (RSI) points toward the positive territory, signaling that buyers are beginning to gain control. The gradual shift to 56 from a low of 38 indicates dominant bullish momentum. The Moving Average Convergence Divergence (MACD) further confirms this bullish sentiment with its rising green bars which denote positive momentum.
NZD/USD daily chart
While assessing the hourly chart, the RSI depicts moderate fluctuations within the positive region. The most recent reading stands at 51, slightly below its daily counterpart, which could hint at a mild slowdown in buyer momentum. The view is affirmed by the MACD histogram that displays flat red bars, indicating a reduction in positive momentum.
NZD/USD hourly chart
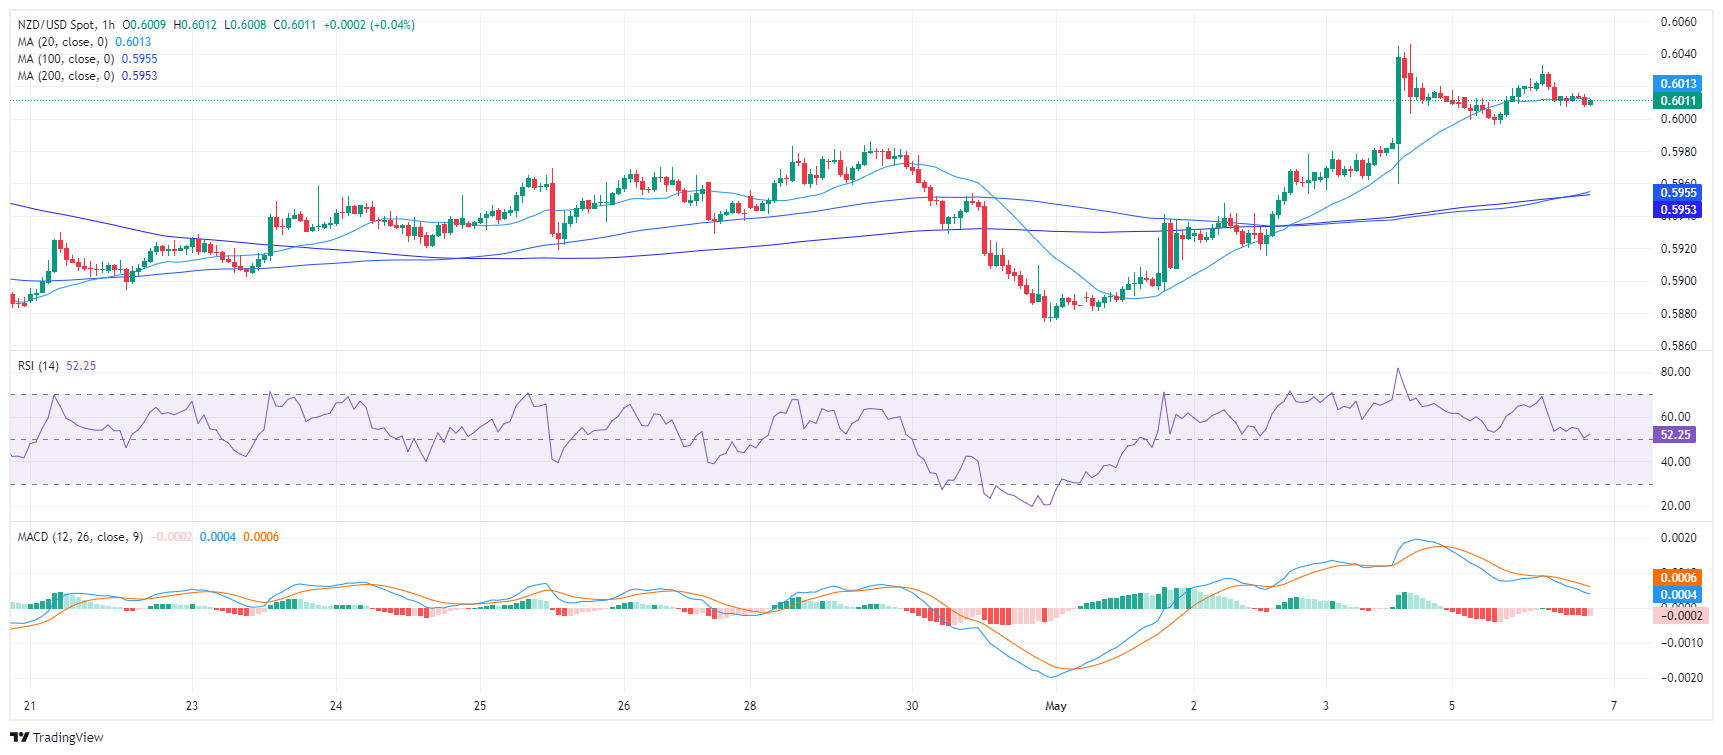
When considering the broader outlook, the NZD/USD position concerning its Simple Moving Averages (SMA) reveals a short-term bullish outset against a potentially long-term bearish trajectory. However, a noted drawback in buyers at the 100-day SMA underscores a potential bearish trend that traders should closely monitor.
- Market sentiment is skewing towards a potential test of the Dollar’s downside this week.
- Last week’s soft NFP report from April continues to weigh on the USD.
- Fed officials hold to Powell’s speech, lack of progress in inflation but that cuts will eventually come.
On Monday, the USD/THB is trading lower on Monday as the USD remains weak following Friday’s weak Nonfarm Payrolls report. Several Federal Reserve (Fed) officials were on the wires, but didn’t provide additional guidance on the Fed’s stance other than the one provided in last week’s decision. The bank remains data-dependant awaiting to gain more confidence to start cutting.
That being said, markets adjusted their expectations on the Fed and now foresee higher chances of the first cut in July and September, which may add pressure to the Dollar in the near term. These factors, along with a lack of major data releases this week for markets to digest, create an ambiance of uncertainty for the US currency, which may push the market towards a Dollar downside test this week.
USD/THB technical analysis
On the daily chart, the Relative Strength Index (RSI) reveals a tendency towards the negative zone, with the latest reading just above 50. This hints at a potential bearish cycle in the absence of a strong buying push. The Moving Average Convergence Divergence (MACD) shows rising red bars, indicating a gradual increase in negative momentum.
USD/THB daily chart
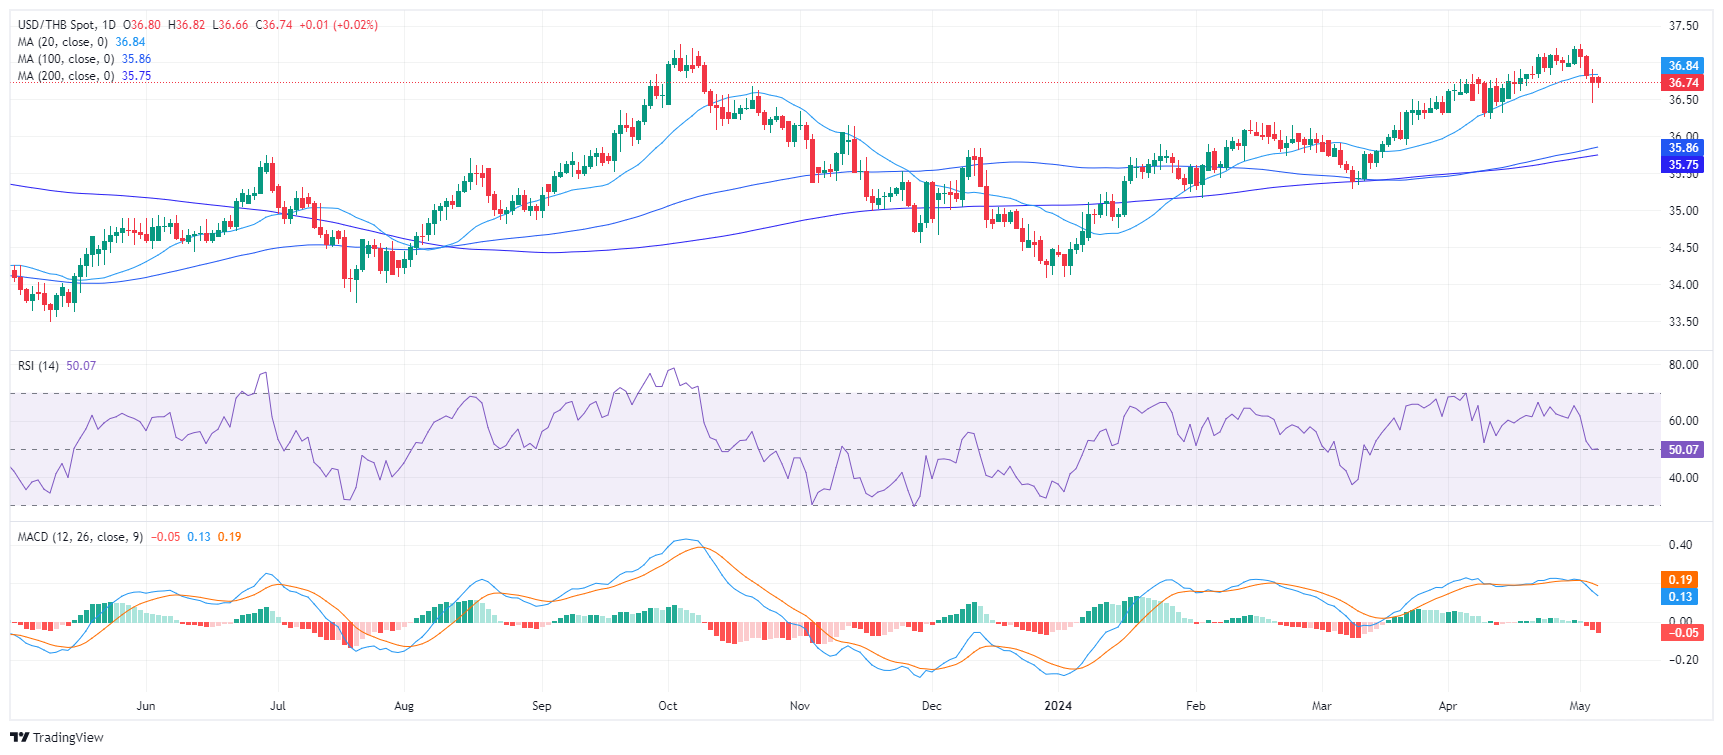
In an overview of the broader performance, the USD/THB is currently exhibiting significant long-term strength. The pair is positioned above both the 100 and 200-day Simple Moving Average (SMA), suggesting a resilient upward trend. On the shorter horizon, the pair remains below the 20-day SMA, which may signify that in the short term, the bear might take the lead. So the daily indicators and the pair’s position below the 20-day SMA may suggest that further downside may be on the horizon.
- GBP/JPY claws back recent declines, but early week remains thin.
- UK holiday Monday will see flow return on Tuesday.
- BoE set to give another rate call on Thursday, broadly expected to hold.
GBP/JPY found some room up top on Monday as markets kick off the new trading week on a quiet note. UK markets were shuttered for a holiday, and UK order volumes are expected to return at the outset of the Tuesday UK session after a long bank weekend.
The Bank of England (BoE) brings its latest rate call to the table this week, slated for Thursday. Markets are broadly forecasting that the BoE will vote 8-to-1 to keep rates unchanged. Swati Dhingra, an external member of the BoE, is expected to be the single holdout looking for a rate trim from the BoE.
Early Tuesday, we will see BRC Like-For-Like Retail Sales figures from the UK for the year ended in April. Markets are expecting UK Retail Sales growth for the year to slow to 1.6% from the previous 2.5%.
UK Gross Domestic Product (GDP) are also due this week, and QoQ GDP growth in the UK is expected to rebound to 0.4% in Q1 compared to the previous quarter’s -0.3% decline.
GBP/JPY technical outlook
The Guppy is slowly rebounding from a recent floor following two back-to-back interventions from the Bank of Japan (BoJ) to intervene on behalf of the badly battered Japanese Yen (JPY). The GBP/JPY has declined 4.6% peak-to-trough from a 34-year high of 200.60 at the end of April.
The pair has recovered some ground, climbing back above 193.00, though the pair still remains on the low side of the 200-hour Exponential Moving Average (EMA) at 194.00.
GBP/JPY hourly chart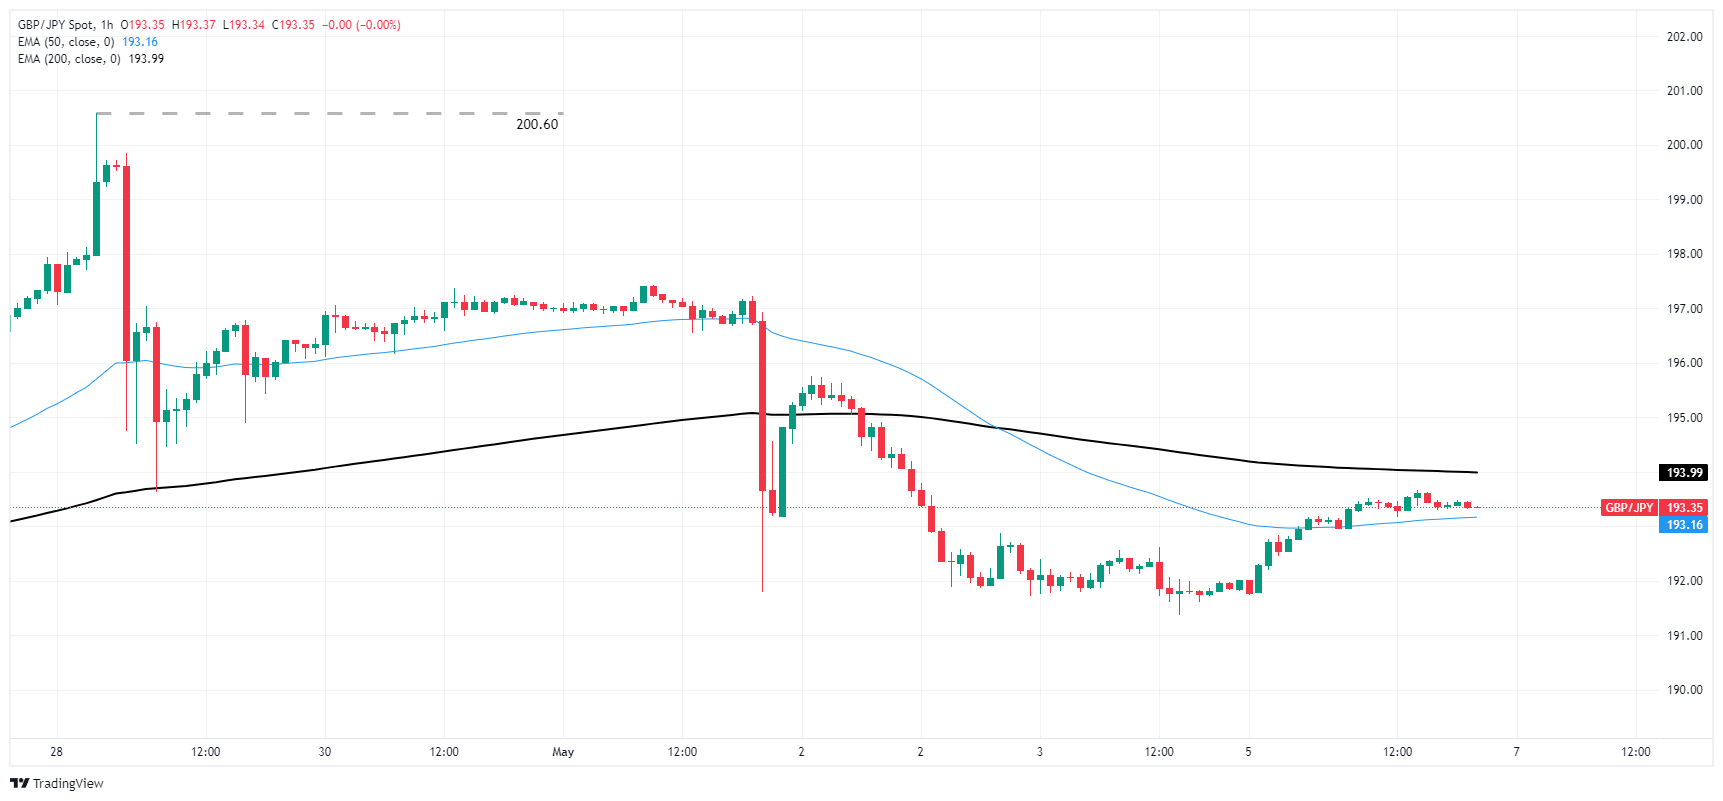
GBP/JPY daily chart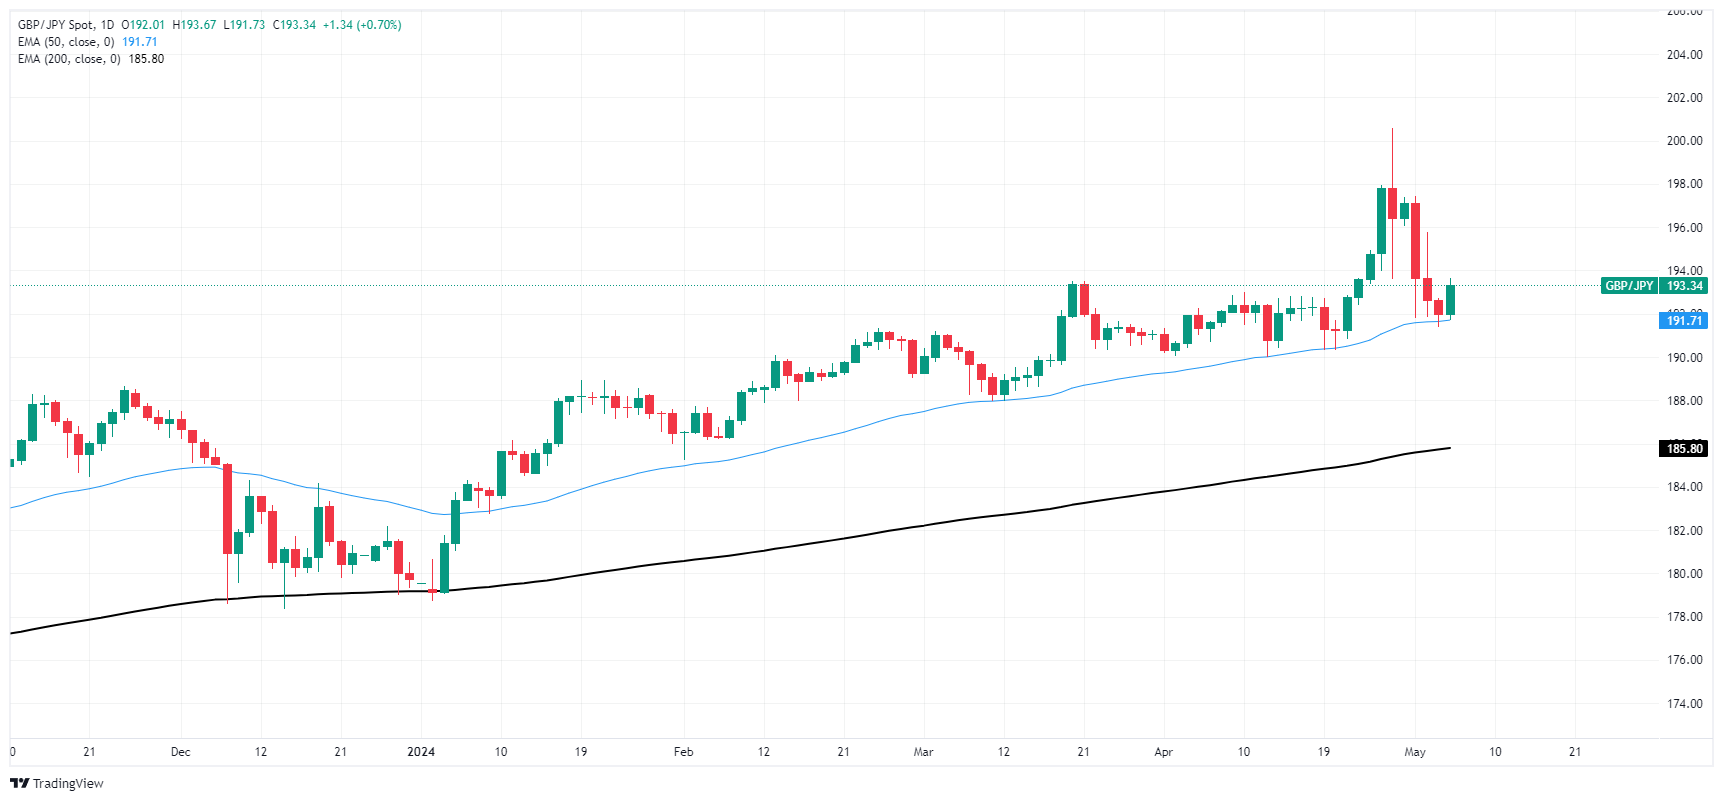
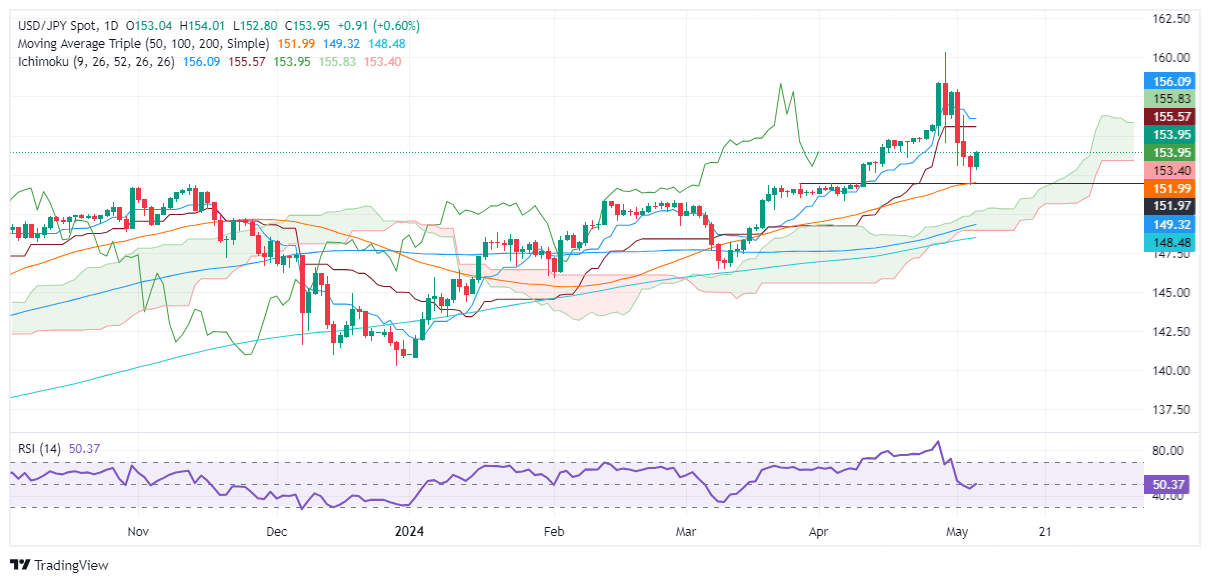
- USD/JPY climbs over 0.60% from two-week low, as positive sentiment reduces yen's safe-haven appeal.
- Hammer candlestick at 152.97 on Friday signals potential upward momentum.
- Resistance seen at 154.00, with further targets at 155.52 (Tenkan-Sen) and 155.78 (Senkou Span A).
The USD/JPY bounced off a two-week low and climbed toward the 153.90ish area, shy of decisively cracking the 154.00 mark. It is trading with gains of more than 0.60%. The market sentiment is upbeat, a headwind for safe-haven currencies like the Japanese Yen (JPY).
USD/JPY Price Analysis: Technical outlook
The USD/JPY remains upward biased. On Friday, the pair hit the two-week low of 151.99, though finished the session at 152.97, forming a ‘hammer,’ a candlestick chart pattern. This chart pattern is bullish when preceded by a downtrend, but it needs to be followed by a candle that breaches the ‘hammer’s’ high.
With that said, the USD/JPY cleared the May 3 high at 153.80, opening the door for further gains. Therefore, the first resistance would be the 154.00 mark. Once cleared, up next would be the Tenkan-Sen at 155.52, followed by the Senkou Span A at 155.78. Further gains are seen at 156.05.
For a bearish resumption, sellers must clear the 50-DMA at 151.99, which could pave the way to testing the following lowest low at 150.81.
USD/JPY Price Action – Daily Chart
Richmond Federal Reserve (Fed) President Thomas Barkin hit newswires for a second time on Monday as the Federal Open Market Committee (FOMC) voting member gave his outlook on economic conditions in the US while taking audience questions during a speech in South Carolina.
Key highlights:
- Business contacts suggest labor market is normalizing, though some sectors are still catching up.
- Neutral rate metrics have moved up, but current policy still feels restrictive.
- Believes that current rates are restrictive enough.
- Barkin feels the risks are weighted towards more inflation.
- It takes a while to corral price-setters.
- Recent data is a stubborn read, less optimistic about how long it will take to get inflation under control.
- Imagines Fed will need to take some edge off of demand to finally finish inflation fight.
- Barkin has not yet seen evidence that inflation is on track.
- GDP growth still seems strong, Fed is now focusing on job market.
Read more: Barkin earlier comments
- WTI softened further, extended backslide to $78 per barrel.
- Ceasefire talks drag down Crude Oil bets.
- US Crude Oil production remains thorn in barrel market’s side.
West Texas Intermediate (WTI) US Crude Oil futures fell on Monday after headlines of a possible ceasefire in the ongoing conflict between Israel and Palestinian Hamas. Crude Oil markets will also be keeping an eye out for weekly production updates from the US as output threatens to outpace demand.
Details are still forthcoming, but negotiations between Israel and Hamas have tilted towards a resolution, dragging down barrel bids that have spent months churning higher on broad-market concerns of a conflict spilling over into neighboring countries and threatening global Crude Oil markets.
Weekly production updates from the American Petroleum Institute (API) and Energy Information Administration (EIA) will be closely watched by Crude Oil markets this week. US Crude Oil production has edged into higher territory in recent weeks, and supply is slowly beginning to outstrip demand. With week-on-week barrel counts slowly building out inventories beyond what demand is able to sop up, energy markets will be looking for a pull down in US production figures.
WTI technical outlook
WTI US Crude Oil is seeing market churn near $78.50 as markets grapple with a potential ceasefire deal on the cards, and barrel bids are pricing in a near-term price floor around the $78.00 price handle.
Recent bearish sentiment in Crude Oil has sent WTI further down from the 200-hour Exponential Moving Average (EMA) at $80.43, and US Crude Oil prices are down 3% in May.
WTI has closed in the red for six consecutive trading sessions, dipping below the 200-day EMA at $79.36. An extended decline will drag barrel prices down to February’s swing low near $72.00 per barrel, while the upside will be capped at the last turnaround near $84.00.
WTI hourly chart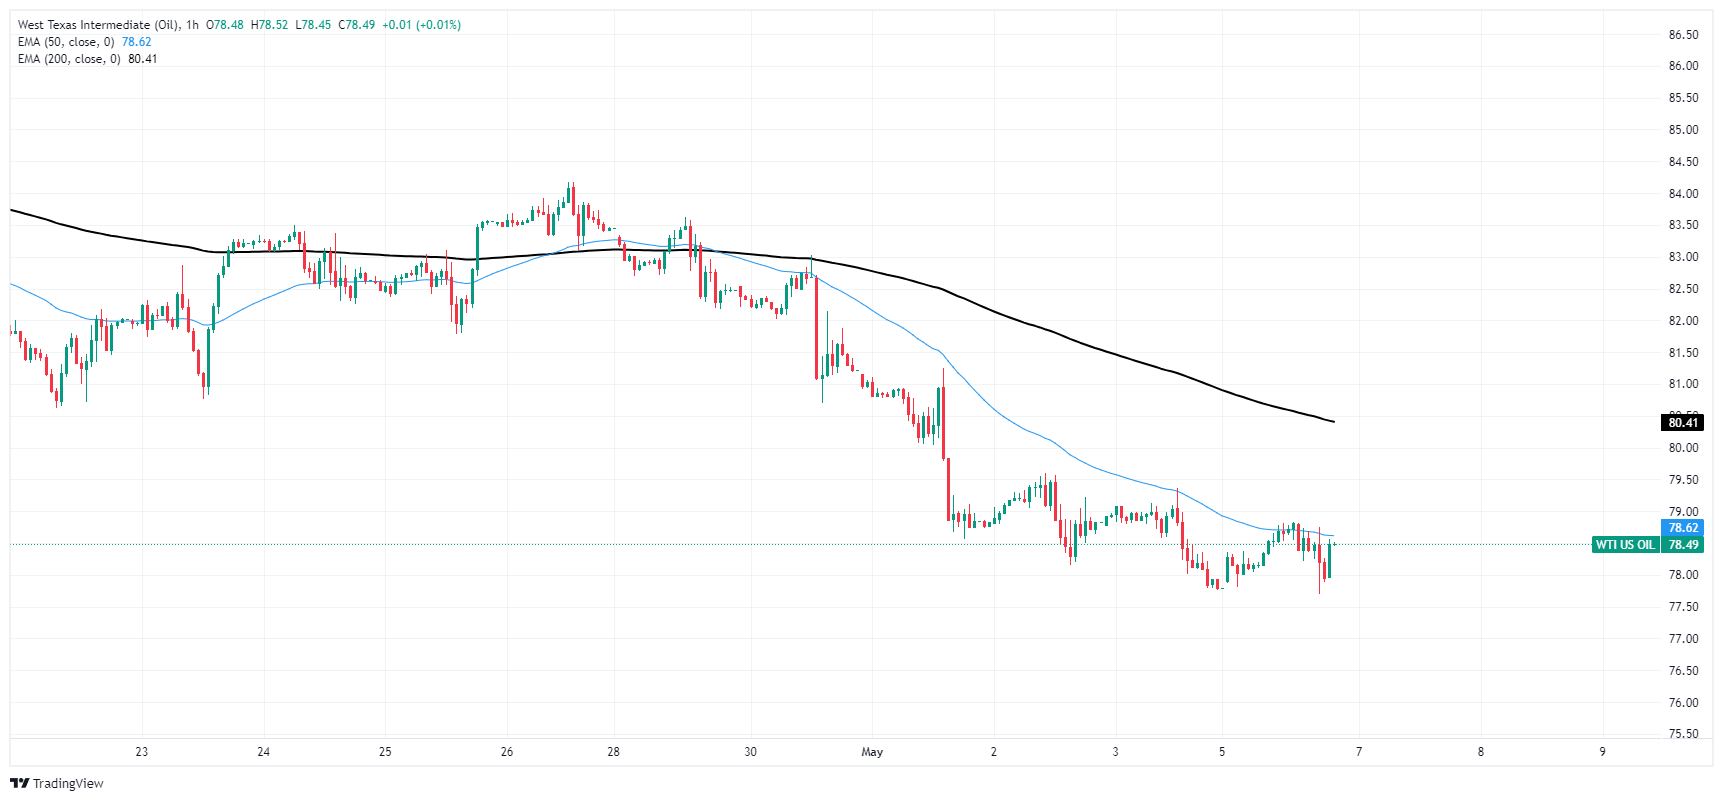
WTI daily chart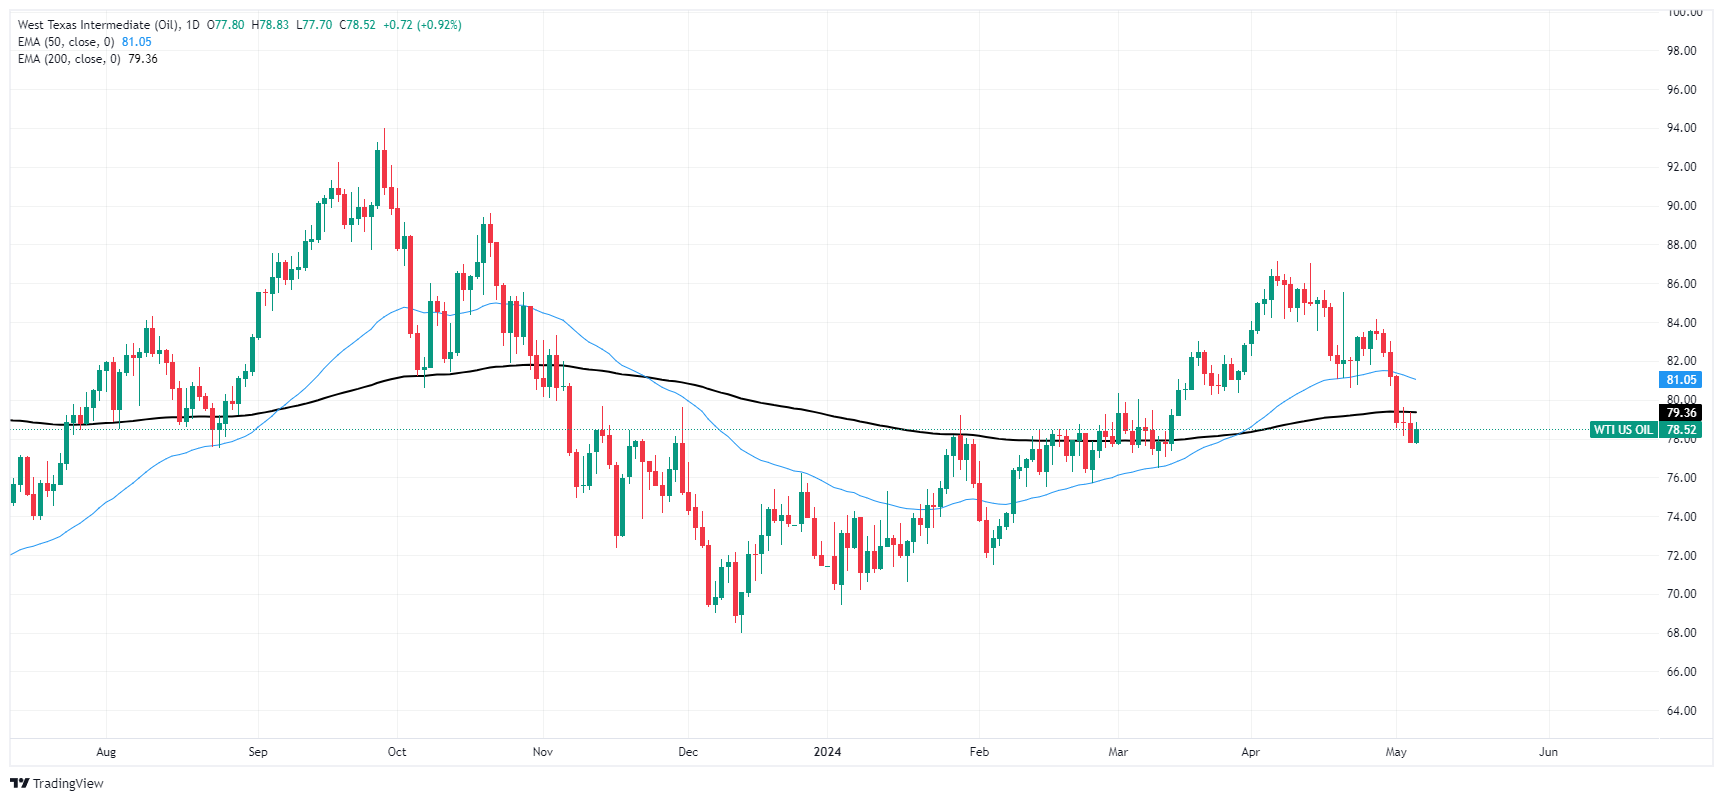
- Gold rebounds strongly, rising nearly 1% in response to increasing optimism that Fed might reduce interest rates sooner.
- Friday’s US Nonfarm Payrolls report, indicating a slowdown in job creation, fuels expectations for September rate cut.
- Comments from Fed officials, including Thomas Barkin and John Williams, highlight ongoing concerns over inflation and employment trends.
Gold price rallied close to 1% on Monday, late in the North American session, bolstered by an improvement in risk appetite due to increased bets that the US Federal Reserve (Fed) might begin to ease policy sooner than foreseen. This follows last Friday’s Nonfarm Payrolls (NFP) report, which showed the economy continues to create jobs but at a slower pace.
The XAU/USD trades at around $2,320 after bouncing off daily lows of $2,291. The latest employment report in the United States (US) increased the odds for a Fed rate cut of a quarter of a percentage point in September 2024.
Market participants continue to digest the latest data from the US as April’s NFP report was softer than expected. If the next inflation report comes in weaker than expected, traders' speculation that the US central bank might lower interest rates during the year will be confirmed.
Recently, Fed officials have crossed the newswires. Richmond Fed President Thomas Barkin said that he has not seen evidence that inflation is on track and added that current policy is restrictive enough. Earlier, New York Fed President John Williams added that the jobs market is moderating and that the Fed is looking at the “totality” of data. He added that there would be rate cuts eventually.
Daily digest market movers: Gold price rises toward $2,320 as US yields fall
- Gold prices remain underpinned by lower US Treasury yields and a softer US Dollar. The US 10-year Treasury note is yielding 4.481%, down three and a half basis points (bps) from its opening level. The US Dollar Index (DXY), which tracks the Greenback’s performance against six other currencies, edged down 0.02% to 105.05.
- Last Friday, April’s US NFP missed estimates and trailed March’s figures. That alongside the Institute for Supply Management (ISM) PMIs in the manufacturing and services sectors entering contractionary territory might undermine the US Dollar, a tailwind for the golden metal.
- Gold advancing more than 12% so far in 2024 is courtesy of expectations that major central banks would begin to reduce rates. Coupled with renewed fears that the Middle East conflict could resume between Israel and Hamas can sponsor a leg up in XAU/USD prices.
- Israel's military has instructed civilians to evacuate certain areas of Rafah, indicating a potential impending offensive in the Gazan city. This directive follows unsuccessful cease-fire negotiations in Cairo between Hamas and Israel. A key issue in these talks was Hamas's demand for a permanent truce.
- After the data release, Fed rate cut probabilities increased with traders expecting 38 basis points of rate cuts toward the end of the year.
- Fed’s first rate cut is expected in September with odds standing at 90% for a 0.25% rate cut. The chances for another quarter point rate cut in December 2024 stands at 79%. This means the fed funds rate would finish the year at the 4.75%-5.00% range.
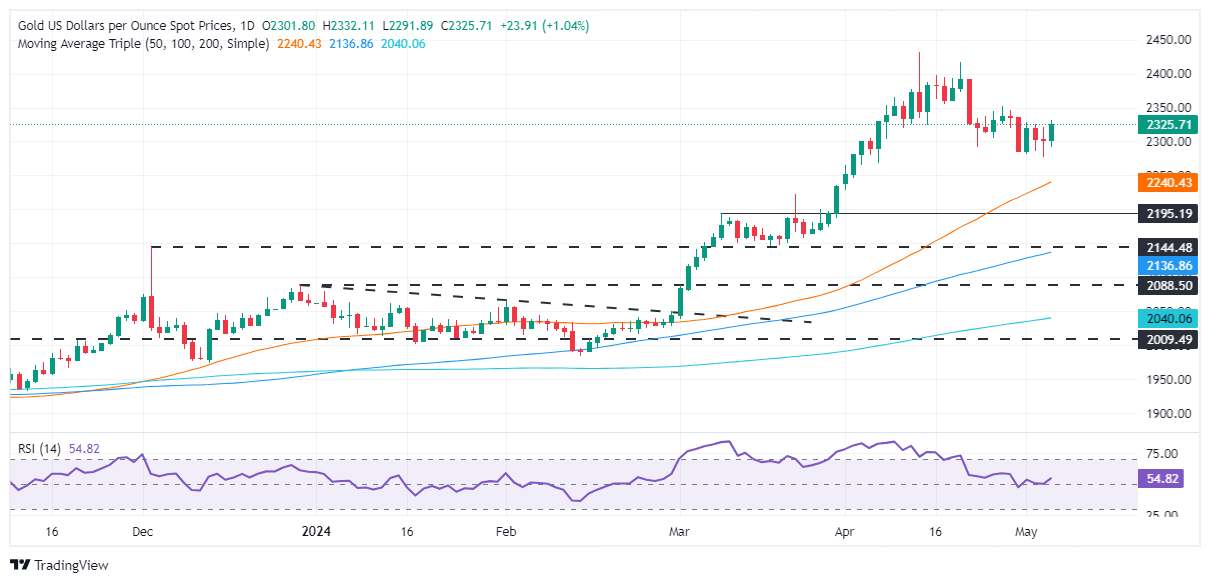
Technical analysis: Gold price rises steadily, stays above $2,320
Gold price is upwardly biased, but it remains shy of retesting the $2,400 mark. For that to happen, buyers must reclaim April’s 26 high, the latest cycle high at $2,352. Once cleared, the next stop would be the $2,400 threshold, followed by the April 19 high at $2,417 and the all-time high of $2,431.
It should be said that momentum is on the side of bulls with the Relative Strength Index (RSI) standing above the 50 midline and aiming higher.
Conversely, if bears drag XAU/USD prices below $2,300, that could pave the way for a pullback toward the April 23 daily low of $2,291. Subsequent losses are expected beneath the March 21 daily high, which turned into support at $2,223, followed by $2,200.
Gold FAQs
Gold has played a key role in human’s history as it has been widely used as a store of value and medium of exchange. Currently, apart from its shine and usage for jewelry, the precious metal is widely seen as a safe-haven asset, meaning that it is considered a good investment during turbulent times. Gold is also widely seen as a hedge against inflation and against depreciating currencies as it doesn’t rely on any specific issuer or government.
Central banks are the biggest Gold holders. In their aim to support their currencies in turbulent times, central banks tend to diversify their reserves and buy Gold to improve the perceived strength of the economy and the currency. High Gold reserves can be a source of trust for a country’s solvency. Central banks added 1,136 tonnes of Gold worth around $70 billion to their reserves in 2022, according to data from the World Gold Council. This is the highest yearly purchase since records began. Central banks from emerging economies such as China, India and Turkey are quickly increasing their Gold reserves.
Gold has an inverse correlation with the US Dollar and US Treasuries, which are both major reserve and safe-haven assets. When the Dollar depreciates, Gold tends to rise, enabling investors and central banks to diversify their assets in turbulent times. Gold is also inversely correlated with risk assets. A rally in the stock market tends to weaken Gold price, while sell-offs in riskier markets tend to favor the precious metal.
The price can move due to a wide range of factors. Geopolitical instability or fears of a deep recession can quickly make Gold price escalate due to its safe-haven status. As a yield-less asset, Gold tends to rise with lower interest rates, while higher cost of money usually weighs down on the yellow metal. Still, most moves depend on how the US Dollar (USD) behaves as the asset is priced in dollars (XAU/USD). A strong Dollar tends to keep the price of Gold controlled, whereas a weaker Dollar is likely to push Gold prices up.
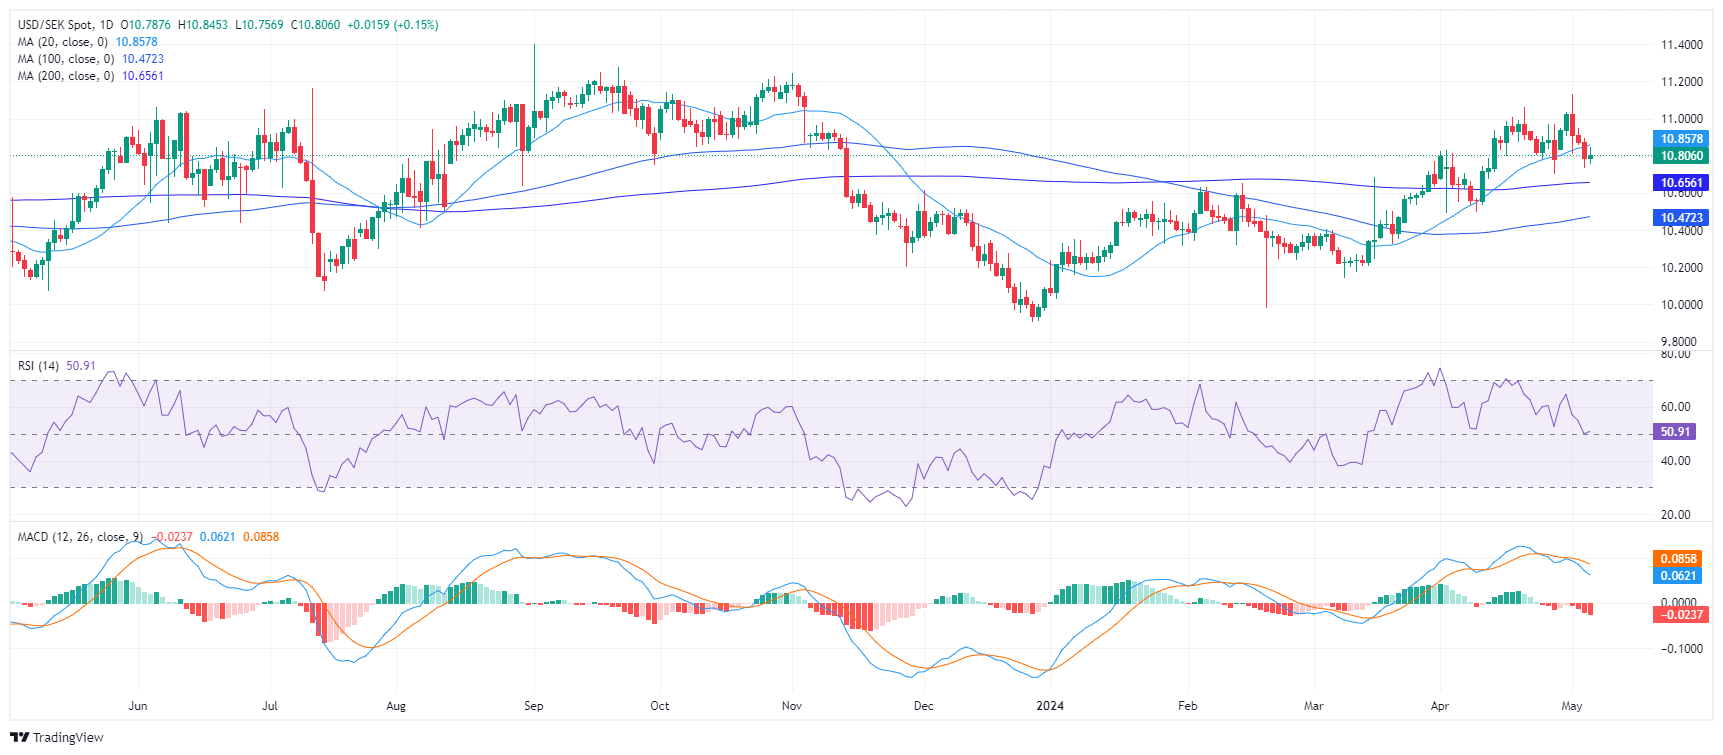
- The USD/SEK pair commences the week with mild gains around 10.80.
- Ahead of the Riksbank decision on Wednesday weak Swedish data pressures down the SEK.
- Markets adjusted their bets on the Fed after the soft NFP report from the US on Friday.
The USD/SEK pair is currently trading with mild gains to begin the week. Despite the optimism from the Federal Reserve's (Fed) projected robust Q2 growth, there are concerns that softer data might impact the USD negatively which may trigger another adjustment of the market's bets on the easing cycle. On the SEK’s side, soft PMIs seem to be applying downward pressure.
On the data front, Sweden's April services and composite PMIs disappointed, with services registering at 48.1 compared to an anticipated 53.8, and a revised figure of 54.1. This decline contributed to a composite PMI of 49.0, down from a revised 53.0 and marked the lowest level since November. As for now, markets anticipate only a 60% chance of a cut this Wednesday from the Riksbank, although a cut becomes fully priced in for June 27.
On the USD side, following the weak job report released on Friday, the likelihood of a July rate cut has surged to 40% from the previous 25%, and the probability of a rate cut in September is near to be price in, after standing at around 55%. The Greenback’s dynamic will be set by the incoming data as Jerome Powell stated that the bank remains data dependent. With no highlights this week, the pair pace will likely be set by the Riksbank’s tone and the market's response to it.
USD/SEK technical analysis
On the daily chart, the Relative Strength Index (RSI) of the USD/SEK pair reveals a transition towards a negative trend falling towards 50. Complementing the RSI effects, the Moving Average Convergence Divergence (MACD) histogram is rising yet printing red bars. This brings to light an increasing negative momentum in the market and a shift of momentum which might start favoring the sellers.
USD/SEK daily chart
The Greenback managed to shrug off part of the recent steep decline on Monday, ending the session barely changed while investors kept assessing the latest release of the US labour market report.
Here is what you need to know on Tuesday, May 7:
The USD Index (DXY) bounced off three-week lows and regained the 105.00 barrier despite lower yields across the curve. On May 7, the RCM/TIPP Economic Optimism Index, Consumer Credit Change, and the speech by N. Kashkari (Minneapolis Fed) are all due.
EUR/USD extended its march north, although another test of the 1.0800 hurdle remained elusive on Monday. Germany’s Balance of Trade and Retail Sales in the euro area are due on May 7, along with the speech by BuBa’s J. Nagel.
GBP/USD maintained its bullish momentum well in place, albeit faltering just ahead of 1.2600 the figure at the beginning of the week. The BRC Retail Sales Monitor and the S&P Global Construction PMI are expected on May 7.
The resurgence of selling pressure in the Japanese yen helped USD/JPY reverse course and reclaim the proximity of the 154.00 region. On May 7, weekly Foreign Bond Investment figures are the only due.
AUD/USD traded in a solid fashion and broke above the 0.6600 level, flirting at the same time with so-far monthly tops. On May 7, the RBA is expected to keep its OCR unchanged at 4.35%.
Reignited geopolitical effervescence motivated WTI prices to rebound from recent peaks in the area below the $78.00 mark per barrel.
Gold prices attempted a move higher and surpassed the $2,300 mark per troy ounce while traders kept assessing the prospects of interest rate cuts by the Fed. By the same token, Silver prices rose sharply to multi-day highs north of the $27.00 mark per ounce.
- Mexican Peso appreciates, trading at 16.90 against US Dollar, a 0.26% decline for USD/MXN amid a busy economic week.
- Mexico’s key economic events include Consumer Confidence and auto data, the Consumer Price Index (CPI) and Banxico’s policy decision.
- External factors like the US employment report's impact and upcoming US economic data could further sway the USD/MXN exchange rate.
The Mexican Peso begins the week on a higher note and appreciates modestly against the US Dollar in a week characterized by a busy economic docket in Mexico. The highlights of the week would be Mexico’s inflation report and the Bank of Mexico (Banxico) monetary policy decision. The USD/MXN trades at 16.90, down 0.26%.
Mexico’s economic docket will be busy. On Tuesday, May 8, Consumer Confidence and automobile data would be revealed. The next day, inflation data is expected, along with Banxico’s decision, followed by Friday’s Industrial Production data.
Last week, Banxico’s April poll showed that private economists estimate inflation to end the year at 4.2% in 2024, underlying prices at 4.1% and the economy to grow by 2.25%. Regarding the USD/MXN, analysts revised their projections downward from 18.10 to 17.
Across the pond, traders continued to digest a softer than expected employment report in the United States (US), which sparked speculation that the Federal Reserve (Fed) might cut rates in 2024, contrary to market participants’ belief. In addition to that, a scarce economic schedule led by Fed officials crossing the newswires, US unemployment claims and the University of Michigan Consumer Sentiment report could help dictate the USD/MXN direction.
Daily digest market movers: Mexican Peso appreciates ahead of busy schedule
- Mexico’s economic calendar will feature the release of the Consumer Price Index (CPI) for April, estimated at 0.18% MoM, below March’s reading and in the twelve months to the last month, is foreseen climbing from 4.42% to 4.63%.
- Banxico is expected to hold rates unchanged at 11.00%.
- Mexico’s Industrial Production is projected to improve from -0.1% in February to 0.7% MoM. On a yearly basis, IP is foreseen plunging to -2.9% from 3.3% in a previous month.
- US Nonfarm Payrolls missing the figures increased the likelihood that the Fed could begin to ease policy faster than expected. The US economy added just 175K people to the workforce in April, missing estimates, and trailing March’s revised 315K figure.
- Data from the futures market see odds for a quarter percentage point Fed rate cut in September at 95%, versus 55% ahead of last week’s Federal Open Market Committee (FOMC) decision.
- Fed speakers this week are led by Richmond Fed’s Thomas Barkin and New York Fed’s John Williams on Monday. On Tuesday, a scarce economic docket will feature Minnesota Fed’s Neil Kashkari and the RCM/TIPP Economic Optimism Index.
- Last Wednesday, the Fed decided to keep the fed funds rate unchanged at 5.25%-5.50%. They acknowledged that risks to achieving the Fed’s dual mandate on employment and inflation “moved toward better balance over the past year.” Although they said there’s progress on inflation, recent data shows that it has stalled.
- Fed policymakers said they would reduce the rate of shrinking its balance sheet beginning in June. This will be done by lowering the cap from $60 billion to $25 billion for the amount of Treasury maturities not reinvested every month.
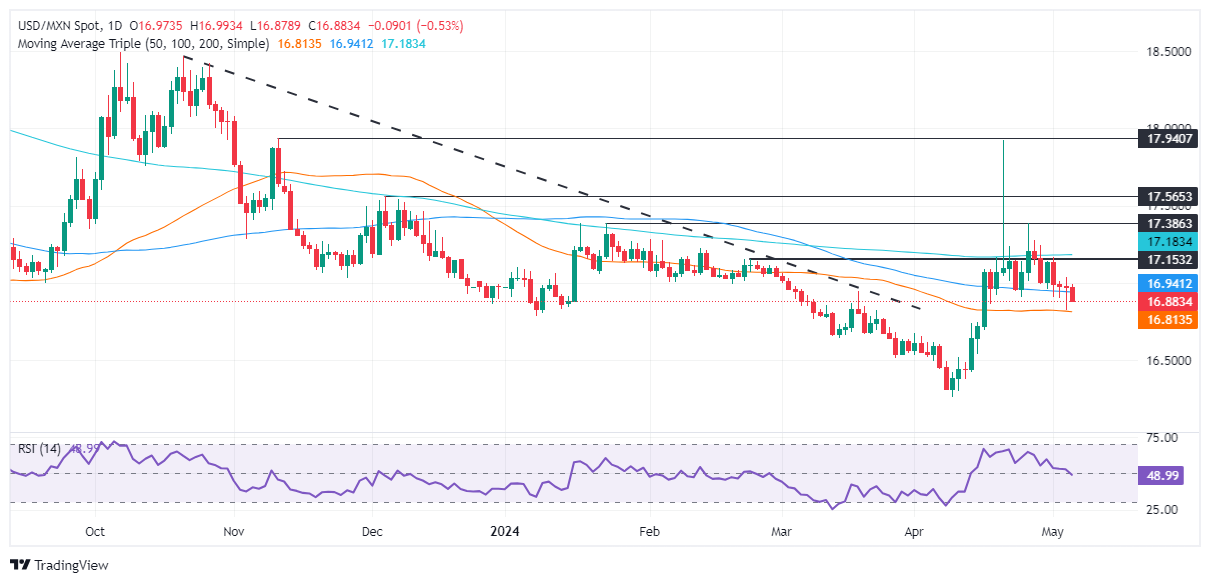
Technical analysis: Mexican Peso gathers steam as USD/MXN plunges below 17.00
From a technical standpoint, the USD/MXN continues to trend lower with sellers gathering momentum as shown by the Relative Strength Index (RSI). The RSI shifted bearish, justifying the recent strength of the Mexican currency, but there’s some key levels to breach before the pair extends to new yearly lows.
If USD/MXN tumbles below the 50-day Simple Moving Average (SMA) at 16.81, that could pave the way to challenge the 2023 low of 16.62, followed by the current year-to-date (YTD) low of 16.25.
On the other hand, buyers need to reclaim the 100-day Simple Moving Average (SMA) at 16.94, followed by the 17.00 figure, if they would like to remain hopeful of higher prices. The next resistance is the 200-day Simple Moving Average at 17.17 that could pave the way to test the January 23 swing high of 17.38 and the year-to-date high of 17.92.
Mexican Peso FAQs
The Mexican Peso (MXN) is the most traded currency among its Latin American peers. Its value is broadly determined by the performance of the Mexican economy, the country’s central bank’s policy, the amount of foreign investment in the country and even the levels of remittances sent by Mexicans who live abroad, particularly in the United States. Geopolitical trends can also move MXN: for example, the process of nearshoring – or the decision by some firms to relocate manufacturing capacity and supply chains closer to their home countries – is also seen as a catalyst for the Mexican currency as the country is considered a key manufacturing hub in the American continent. Another catalyst for MXN is Oil prices as Mexico is a key exporter of the commodity.
The main objective of Mexico’s central bank, also known as Banxico, is to maintain inflation at low and stable levels (at or close to its target of 3%, the midpoint in a tolerance band of between 2% and 4%). To this end, the bank sets an appropriate level of interest rates. When inflation is too high, Banxico will attempt to tame it by raising interest rates, making it more expensive for households and businesses to borrow money, thus cooling demand and the overall economy. Higher interest rates are generally positive for the Mexican Peso (MXN) as they lead to higher yields, making the country a more attractive place for investors. On the contrary, lower interest rates tend to weaken MXN.
Macroeconomic data releases are key to assess the state of the economy and can have an impact on the Mexican Peso (MXN) valuation. A strong Mexican economy, based on high economic growth, low unemployment and high confidence is good for MXN. Not only does it attract more foreign investment but it may encourage the Bank of Mexico (Banxico) to increase interest rates, particularly if this strength comes together with elevated inflation. However, if economic data is weak, MXN is likely to depreciate.
As an emerging-market currency, the Mexican Peso (MXN) tends to strive during risk-on periods, or when investors perceive that broader market risks are low and thus are eager to engage with investments that carry a higher risk. Conversely, MXN tends to weaken at times of market turbulence or economic uncertainty as investors tend to sell higher-risk assets and flee to the more-stable safe havens.
- Dow Jones recovers into fresh high but action remains tight.
- US equities broadly higher on Monday, but momentum is limited.
- Fedspeak to dominate headlines with quiet economic calendar this week.
The Dow Jones Industrial Average (DJIA) managed to gain some ground in today's quiet trading session, following the volatility caused by last week’s Nonfarm Payrolls (NFP) report. However, the market is still showing signs of weakness, with some stocks keeping the averages in check.
Fedspeak will be the key driver this week as investors try to pin down the likelihood of accelerated rate cuts from the Federal Reserve (Fed). The economic calendar is notably thin from the US this week, though traders will watch for Friday’s consumer sentiment survey results from the University of Michigan. The UoM Consumer Sentiment Index for May is expected to tick down to 77.0 from 77.2.
Dow Jones news
The Dow Jones is up a scant sixth of a percent on Monday as investors recover risk appetite on renewed hopes of Fed rate cuts, but upside momentum remains tight. Around half of the 30 securities that make up the Dow Jones Industrial Average are down or flat on the day.
Walt Disney Co. (DIS) leads the top of the Dow Jones gainers on Monday, climbing around 2% and trading near $116.00 per share ahead of Disney’s latest earnings report due Tuesday morning. On the low side, Amgen Inc. (AMGN) fell nearly 4% as traders pull back from the biotech stock following last week’s surge. Amgen is due to bring its own weight loss drug to market, a category of drugs that have seen wild demand surges and investors initally bet that Amgen would be able to carve out some of the high-demand drug market.
Dow Jones technical outlook
The Dow Jones climbed in early Monday trading to test a fresh daily high at 38,872.18 before a midday pullback to 38,687.46. The DJIA continues to trade north of 38,700.00 as equities look for firmer gains.
Longer-term, the Dow Jones is still trading into bullish territory above the 200-day Exponential Moving Average (EMA) at 36,798.86. Despite long-run bullish momentum, the Dow Jones has struggled to recover ground after falling back from March’s record peaks near the 40,000.00 price handle.
Dow Jones five-minute chart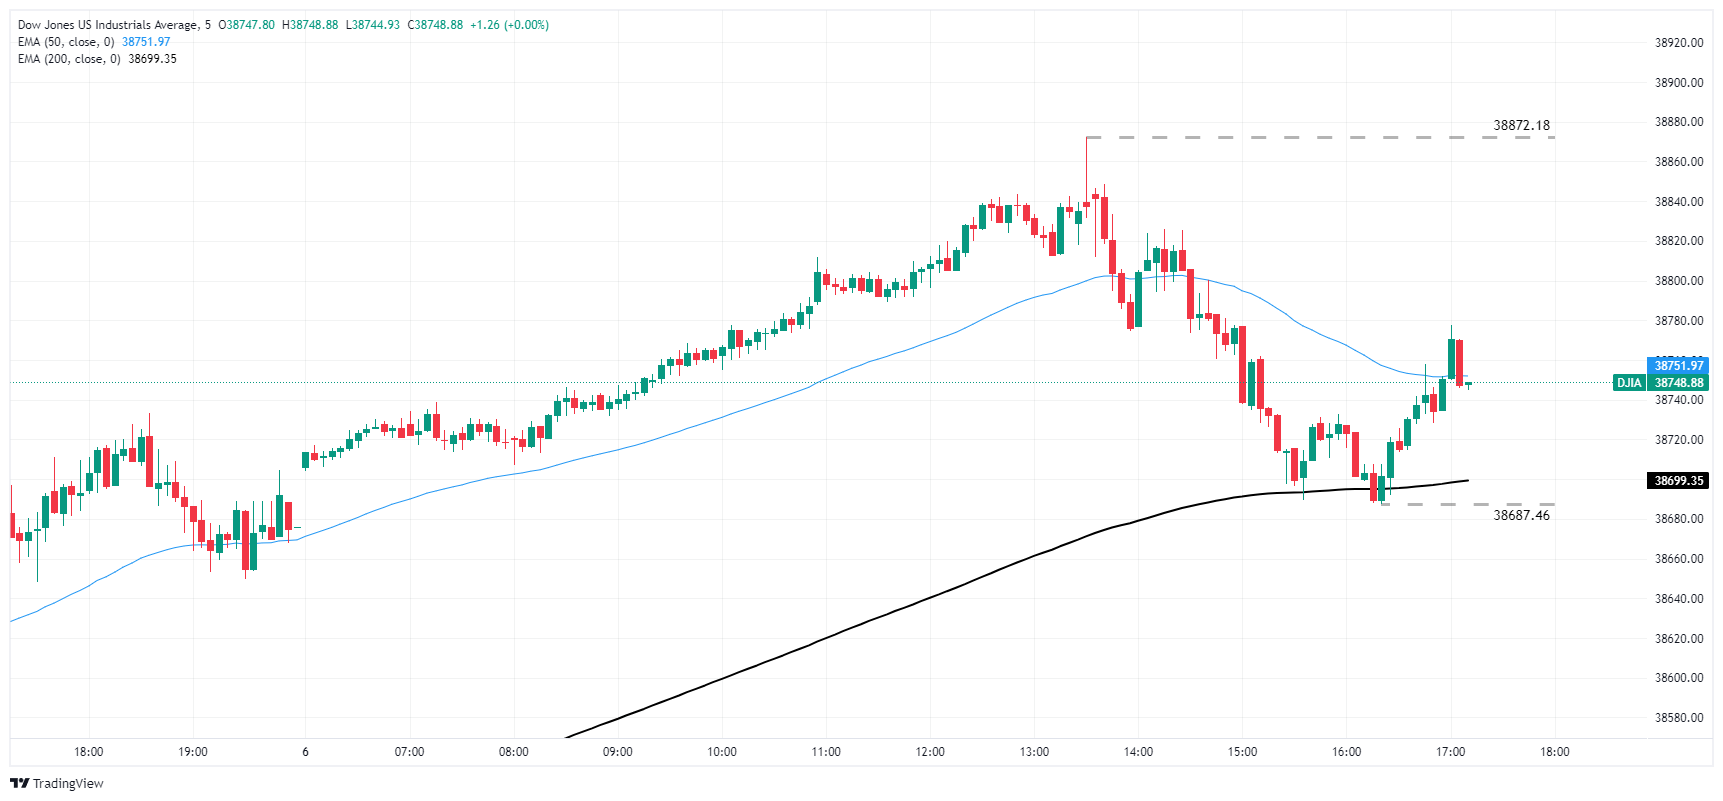
Dow Jones daily chart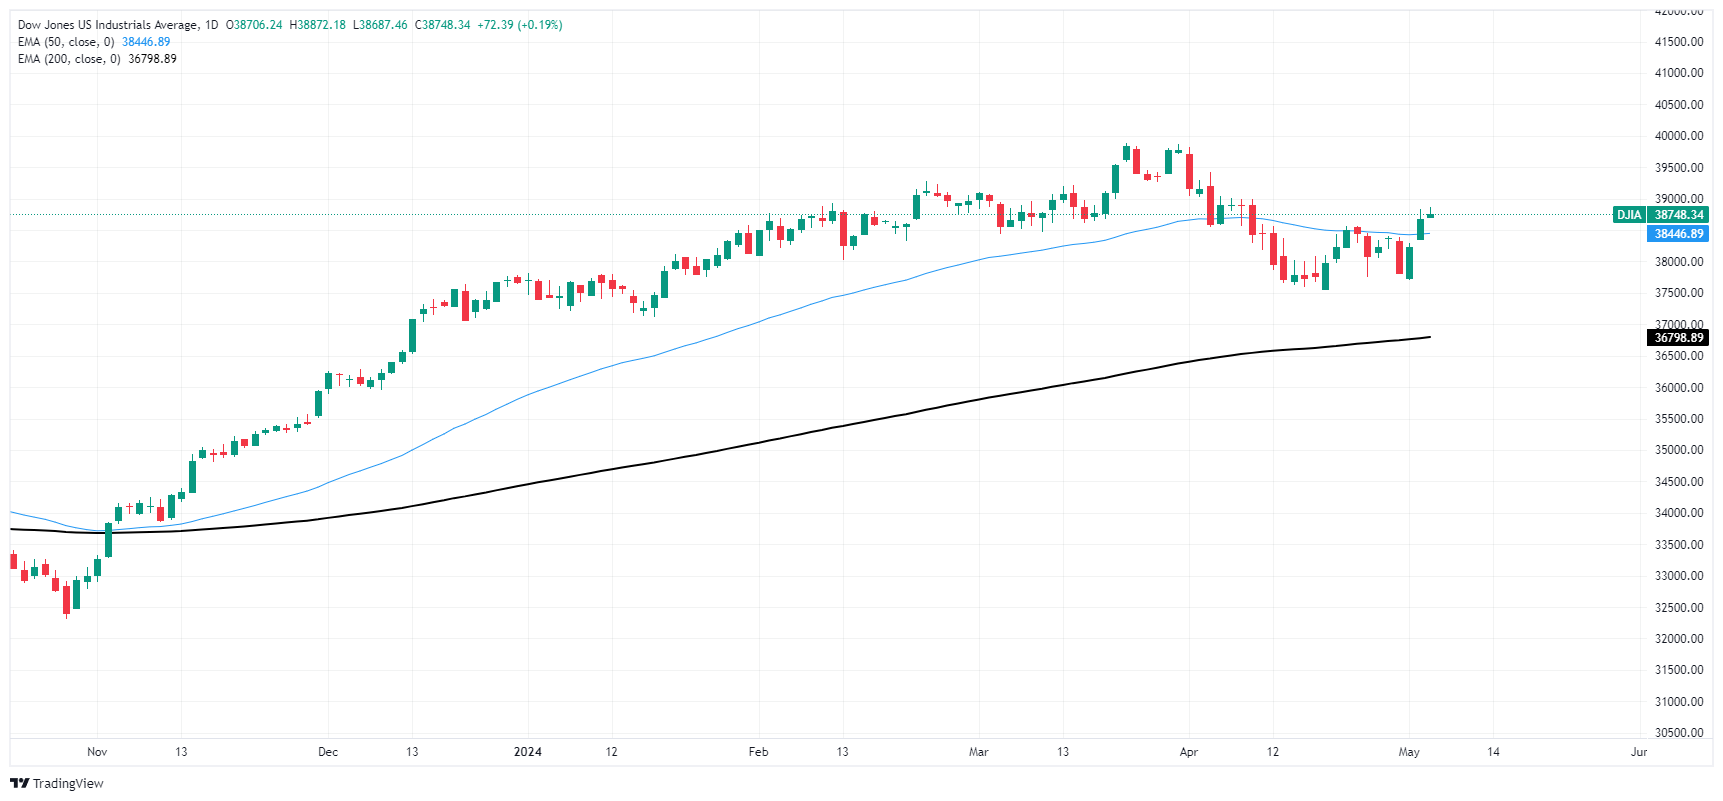
Dow Jones FAQs
The Dow Jones Industrial Average, one of the oldest stock market indices in the world, is compiled of the 30 most traded stocks in the US. The index is price-weighted rather than weighted by capitalization. It is calculated by summing the prices of the constituent stocks and dividing them by a factor, currently 0.152. The index was founded by Charles Dow, who also founded the Wall Street Journal. In later years it has been criticized for not being broadly representative enough because it only tracks 30 conglomerates, unlike broader indices such as the S&P 500.
Many different factors drive the Dow Jones Industrial Average (DJIA). The aggregate performance of the component companies revealed in quarterly company earnings reports is the main one. US and global macroeconomic data also contributes as it impacts on investor sentiment. The level of interest rates, set by the Federal Reserve (Fed), also influences the DJIA as it affects the cost of credit, on which many corporations are heavily reliant. Therefore, inflation can be a major driver as well as other metrics which impact the Fed decisions.
Dow Theory is a method for identifying the primary trend of the stock market developed by Charles Dow. A key step is to compare the direction of the Dow Jones Industrial Average (DJIA) and the Dow Jones Transportation Average (DJTA) and only follow trends where both are moving in the same direction. Volume is a confirmatory criteria. The theory uses elements of peak and trough analysis. Dow’s theory posits three trend phases: accumulation, when smart money starts buying or selling; public participation, when the wider public joins in; and distribution, when the smart money exits.
There are a number of ways to trade the DJIA. One is to use ETFs which allow investors to trade the DJIA as a single security, rather than having to buy shares in all 30 constituent companies. A leading example is the SPDR Dow Jones Industrial Average ETF (DIA). DJIA futures contracts enable traders to speculate on the future value of the index and Options provide the right, but not the obligation, to buy or sell the index at a predetermined price in the future. Mutual funds enable investors to buy a share of a diversified portfolio of DJIA stocks thus providing exposure to the overall index.
John C. Williams, President of the Federal Reserve (Fed) Bank of New York hit newswires during a speech a t the Milken Institute Global Conference in Beverly Hills on Monday. NY Fed President Williams is a voting member of the Federal Open Market Committee (FOMC), the Fed's key body responsible for interest rate decisions.
Key highlights:
- Eventually there will be rate cuts.
- Williams is seeing job growth moderating.
- Fed is looking at totality of economic data.
- It is worrisome when monthly inflation prints come in higher.
- Fed balance sheet wind-down has gone smoothly.
- Consumers are still spending, Williams sees GDP in the 2.0-2.5% range in 2024.
- Expects good though somewhat slower GDP growth.
- Seeing signs of more consumer caution on spending.
- Economy is still healthy, but is growing more slowly.
- Higher government debt means somewhat higher global rates.
Richmond Federal Reserve (Fed) President Thomas Barkin reflected on recent economic developments during a speech in South Carolina on Monday. A member of the Fed's Federal Open Market Committee (FOMC), Barkin is one of the Fed's key voting voices on policy rates.
Key highlights:
- Inflation data this year is disappointing; the job on inflation is not yet done.
- Remains confident that the current restrictive level of rates will curb demand enough to cool inflation.
- Businesses are still looking to raise prices, key risk remains shelter and services inflation keeping headline index above target.
- Given the strong labor market, Fed still has time to gain confidence that inflation will fall.
- Data "whiplash" confirms the value of the Fed being deliberate.
- Barkin doesn't see the economy overheating, but the Fed knows how to respond if it does.
- Market interpretation of Powell's words indicates caution due to unpredictability of inflation trajectory.
- Friday’s Nonfarm Payrolls report showed a slowdown in annual wage inflation, fuelling predictions for imminent Fed rate cuts.
- NFP report also shows that job creation decelerated while unemployment rose.
The US Dollar Index (DXY) is currently trading near 105, reflecting mild losses in Monday’s session. Headwinds from persistent inflation that remains uncomfortably high, as stated by Federal Reserve (Fed) Chair Jerome Powell, hold the US Dollar steady. That being said, the weak jobs report released last Friday gave clues that the US economy might be signaling that the cooling down the Fed needs to start cutting rates has begun. This may trigger further downside for the USD.
The US economy presents a mixed picture with robust demand and a steady labor market, which saw some weakness in April. Fed Chair Powell's cautious stance, noting the uncertainties surrounding future inflation trajectory and the substantial yet not guaranteed progress, might keep the USD afloat in case future data comes in hot.
Daily digest market movers: DXY starts the week on left foot as markets assess labor market data
- Nonfarm Payrolls in the US increased by 175K in April, underperforming market expectations of 243K.
- Unemployment Rate rose slightly to 3.9%, up from previous 3.8%.
- Average Hourly Earnings, a measure of wage inflation, declined to 3.9% from 4.1% on a yearly basis.
- Market expectations pivot toward a lower rate ahead of upcoming Fed meeting, with June rate cut odds holding firm at around 10%.
- However, for the later part of the year, expectations have increased with the odds for a July rate cut rising to 40% from a previous 25%, and almost 95% for a rate cut in September, up from 55% prior to the last meeting.
- Examining bond markets, US Treasury bond yields are down with the 2-year yield falling to 4.81%, the 5-year yield slipping to 4.48%, and the 10-year yield marginally lower at 4.49%.
DXY technical analysis: Dollar Index negatively sloping with bullish possibilities
The technical indicators on the daily chart reflect mixed signals for DXY. The negative slope and negative territory of the Relative Strength Index (RSI) indicate that bears seem to be gaining ground. This trend is further confirmed by the rising red bars of the Moving Average Convergence Divergence (MACD), which signals bearish momentum.
However, despite this negative environment, there are some bullish elements present as well. Notably, the DXY is currently positioned above the 100 and 200-day Simple Moving Averages (SMAs), which generally suggests a bullish trend in the longer term. Yet, it has temporarily fallen below the 20-day SMA, further emphasizing bearish short-term momentum.
In conclusion, the short-term technical outlook of DXY is bear-dominated, given the recent sell-offs and technical configurations. However, its position above the 100 and 200-day SMA underlines that the longer-term bullish momentum still has the potential to resume.
US Dollar FAQs
The US Dollar (USD) is the official currency of the United States of America, and the ‘de facto’ currency of a significant number of other countries where it is found in circulation alongside local notes. It is the most heavily traded currency in the world, accounting for over 88% of all global foreign exchange turnover, or an average of $6.6 trillion in transactions per day, according to data from 2022. Following the second world war, the USD took over from the British Pound as the world’s reserve currency. For most of its history, the US Dollar was backed by Gold, until the Bretton Woods Agreement in 1971 when the Gold Standard went away.
The most important single factor impacting on the value of the US Dollar is monetary policy, which is shaped by the Federal Reserve (Fed). The Fed has two mandates: to achieve price stability (control inflation) and foster full employment. Its primary tool to achieve these two goals is by adjusting interest rates. When prices are rising too quickly and inflation is above the Fed’s 2% target, the Fed will raise rates, which helps the USD value. When inflation falls below 2% or the Unemployment Rate is too high, the Fed may lower interest rates, which weighs on the Greenback.
In extreme situations, the Federal Reserve can also print more Dollars and enact quantitative easing (QE). QE is the process by which the Fed substantially increases the flow of credit in a stuck financial system. It is a non-standard policy measure used when credit has dried up because banks will not lend to each other (out of the fear of counterparty default). It is a last resort when simply lowering interest rates is unlikely to achieve the necessary result. It was the Fed’s weapon of choice to combat the credit crunch that occurred during the Great Financial Crisis in 2008. It involves the Fed printing more Dollars and using them to buy US government bonds predominantly from financial institutions. QE usually leads to a weaker US Dollar.
Quantitative tightening (QT) is the reverse process whereby the Federal Reserve stops buying bonds from financial institutions and does not reinvest the principal from the bonds it holds maturing in new purchases. It is usually positive for the US Dollar.
- Canadian Dollar moves broadly higher in Monday rebound.
- Canada data is thin until Friday’s labor figures.
- Rate markets put odds of September Fed rate cut at 65%.
The Canadian Dollar (CAD) is experiencing a moderate rebound on Monday, recovering ground that was lost late last week during the risk-off plunge as markets pulled away from the CAD. Markets are kicking off the new trading week on the upside, however, with thin Canadian economic data throughout the week until Friday’s labour report.
Canada will deliver this week’s first CAD data on Tuesday with the Ivey Purchasing Managers Index (PMI) for the month of April. Market reaction will be muted at best with the mid-tier data release, and the rest of the week remains thin with strictly low-tier economic data from Canada until Friday’s Canadian Unemployment Rate and wages data for April.
Daily digest market movers: Canadian Dollar finds some bids on quiet Monday start
- Canadian Dollar recovers ground on Monday as CAD rebounds from Friday’s sell-off.
- Tuesday’s Canadian Ivey PMI (seasonally-adjusted) is expected to climb to 58.1 from 57.5, a 12-month high.
- Friday’s Canadian Unemployment Rate is expected to tick upwards in April to 6.2% from 6.1%.
- With little else of meaningful impact on the data docket this week for either CAD or the US Dollar, looking ahead to better data prints and reactions to headlines is all that’s left for markets.
- According to CME’s FedWatch Tool, rate markets are betting around 65% odds of at least a 25-basis-point cut from the Federal Reserve (Fed) in September.
Canadian Dollar price today
The table below shows the percentage change of Canadian Dollar (CAD) against listed major currencies today. Canadian Dollar was the strongest against the Japanese Yen.
| USD | EUR | GBP | CAD | AUD | JPY | NZD | CHF | |
| USD | -0.20% | -0.25% | -0.23% | -0.19% | 0.21% | -0.06% | -0.05% | |
| EUR | 0.19% | -0.05% | -0.04% | -0.01% | 0.39% | 0.13% | 0.14% | |
| GBP | 0.23% | 0.06% | 0.02% | 0.06% | 0.45% | 0.19% | 0.20% | |
| CAD | 0.23% | 0.04% | -0.02% | 0.04% | 0.45% | 0.17% | 0.18% | |
| AUD | 0.19% | 0.01% | -0.06% | -0.04% | 0.40% | 0.13% | 0.15% | |
| JPY | -0.22% | -0.39% | -0.44% | -0.44% | -0.38% | -0.23% | -0.27% | |
| NZD | 0.06% | -0.13% | -0.19% | -0.17% | -0.13% | 0.28% | 0.01% | |
| CHF | 0.07% | -0.14% | -0.20% | -0.18% | -0.16% | 0.29% | -0.01% |
The heat map shows percentage changes of major currencies against each other. The base currency is picked from the left column, while the quote currency is picked from the top row. For example, if you pick the Euro from the left column and move along the horizontal line to the Japanese Yen, the percentage change displayed in the box will represent EUR (base)/JPY (quote).
Technical analysis: Canadian Dollar pushes back, USD/CAD falls into near-term supply zone
The Canadian Dollar (CAD) is broadly higher, gaining ground against nearly all of its major currency peers on Monday. The CAD is up nearly a quarter of a percent against the US Dollar (USD) and has gained around half of a percent against the Japanese Yen (JPY).
USD/CAD has drifted into familiar lows once more, backsliding into a familiar demand zone below 1.3670. The pair is cycling 1.3660 as CAD buying against the US Dollar keeps the pair pinned below the 200-hour Exponential Moving Average (EMA) near 1.3695.
Daily candlesticks leave USD/CAD in slightly more bullish technical shape, trading north of the 200-day EMA at 1.3550. The pair is up 3.1% in 2024 but is still trading on the low side of the YTD peak near 1.3850.
USD/CAD hourly chart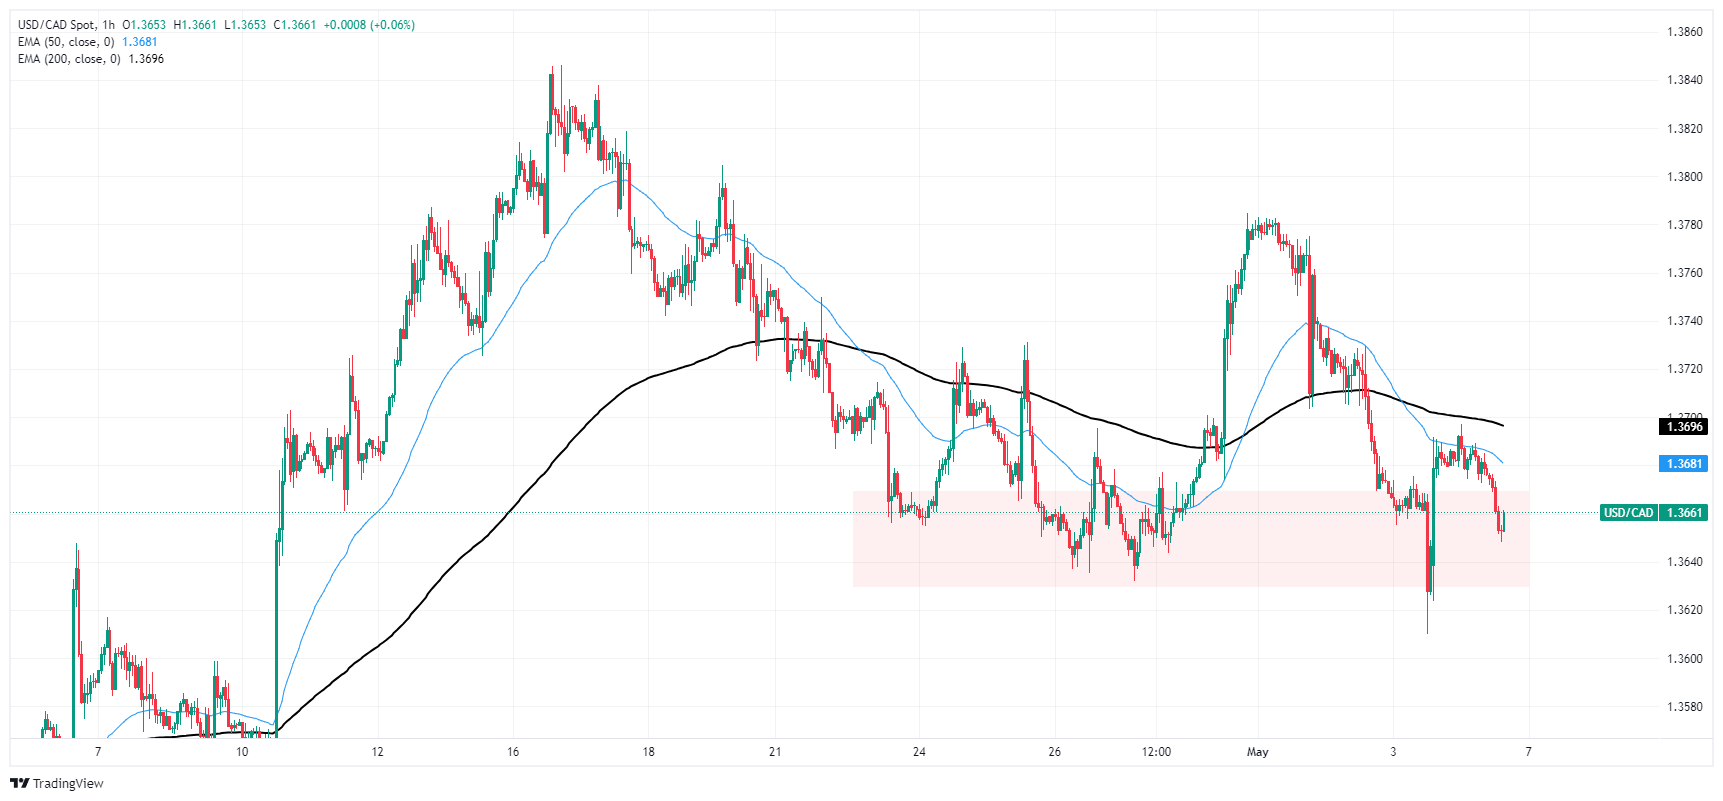
USD/CAD daily chart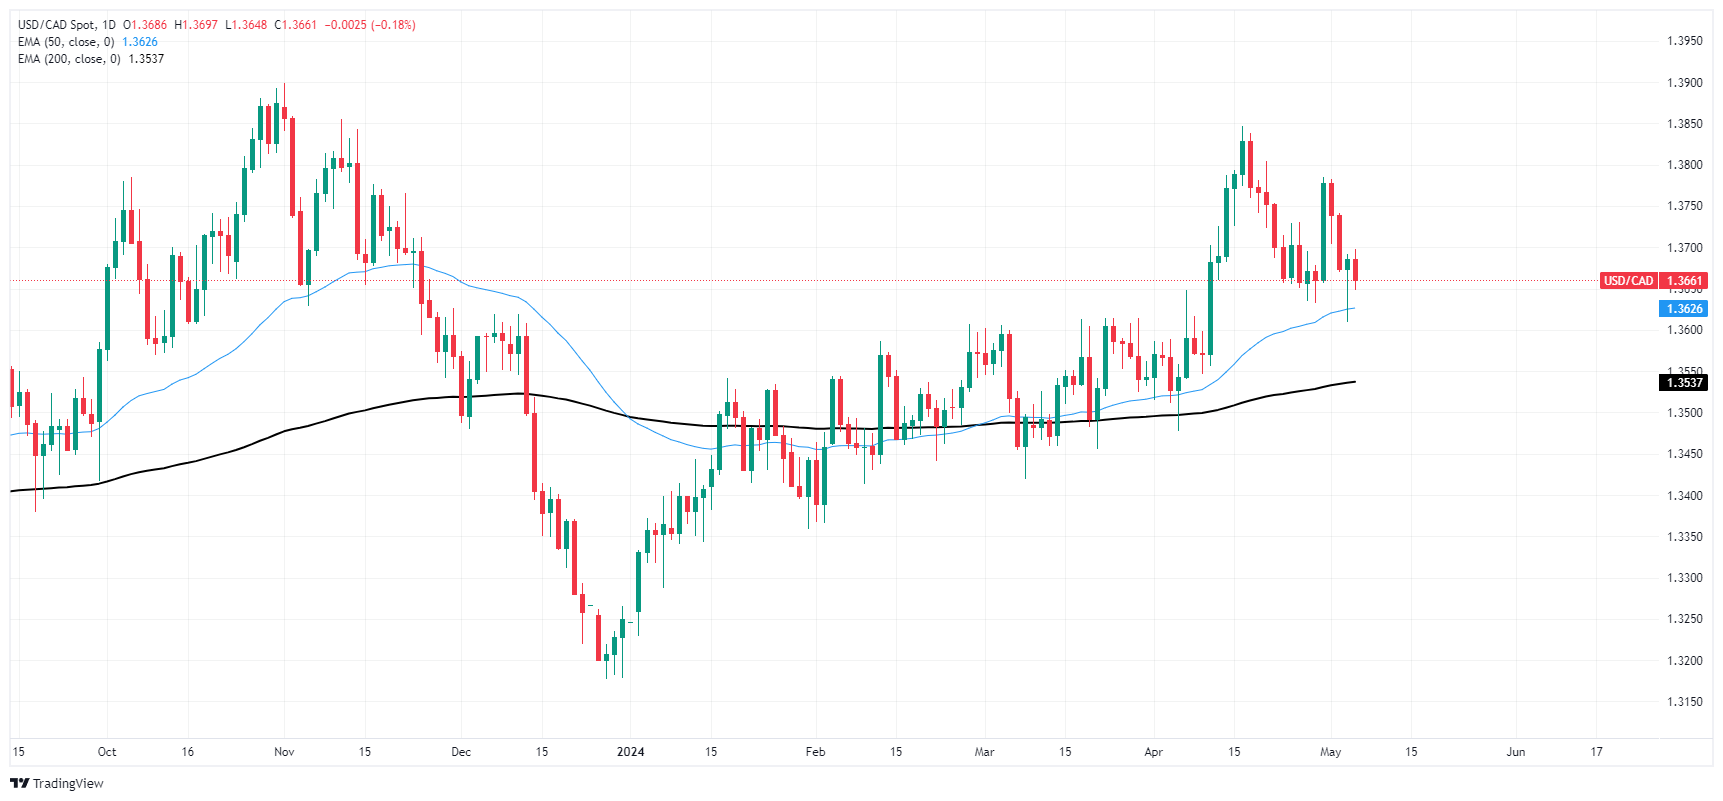
Canadian Dollar FAQs
The key factors driving the Canadian Dollar (CAD) are the level of interest rates set by the Bank of Canada (BoC), the price of Oil, Canada’s largest export, the health of its economy, inflation and the Trade Balance, which is the difference between the value of Canada’s exports versus its imports. Other factors include market sentiment – whether investors are taking on more risky assets (risk-on) or seeking safe-havens (risk-off) – with risk-on being CAD-positive. As its largest trading partner, the health of the US economy is also a key factor influencing the Canadian Dollar.
The Bank of Canada (BoC) has a significant influence on the Canadian Dollar by setting the level of interest rates that banks can lend to one another. This influences the level of interest rates for everyone. The main goal of the BoC is to maintain inflation at 1-3% by adjusting interest rates up or down. Relatively higher interest rates tend to be positive for the CAD. The Bank of Canada can also use quantitative easing and tightening to influence credit conditions, with the former CAD-negative and the latter CAD-positive.
The price of Oil is a key factor impacting the value of the Canadian Dollar. Petroleum is Canada’s biggest export, so Oil price tends to have an immediate impact on the CAD value. Generally, if Oil price rises CAD also goes up, as aggregate demand for the currency increases. The opposite is the case if the price of Oil falls. Higher Oil prices also tend to result in a greater likelihood of a positive Trade Balance, which is also supportive of the CAD.
While inflation had always traditionally been thought of as a negative factor for a currency since it lowers the value of money, the opposite has actually been the case in modern times with the relaxation of cross-border capital controls. Higher inflation tends to lead central banks to put up interest rates which attracts more capital inflows from global investors seeking a lucrative place to keep their money. This increases demand for the local currency, which in Canada’s case is the Canadian Dollar.
Macroeconomic data releases gauge the health of the economy and can have an impact on the Canadian Dollar. Indicators such as GDP, Manufacturing and Services PMIs, employment, and consumer sentiment surveys can all influence the direction of the CAD. A strong economy is good for the Canadian Dollar. Not only does it attract more foreign investment but it may encourage the Bank of Canada to put up interest rates, leading to a stronger currency. If economic data is weak, however, the CAD is likely to fall.
- GBP/USD trades above 200-DMA at 1.2547, lifted by positive sentiment.
- Technicals suggest upward trend, with resistance at 50-DMA (1.2609) and 100-DMA (1.2634/42).
- Fall below 200-DMA could favor sellers, next supports at 1.2500 and May 1 low of 1.2466.
During the North American session, the British Pound registered modest gains versus the US Dollar. The Bank of England (BoE) will decide on monetary policy in a week. That and an upbeat market sentiment underpin the GBP/USD's higher trading at around 1.2579, above a key support level.
GBP/USD Price Analysis: Technical outlook
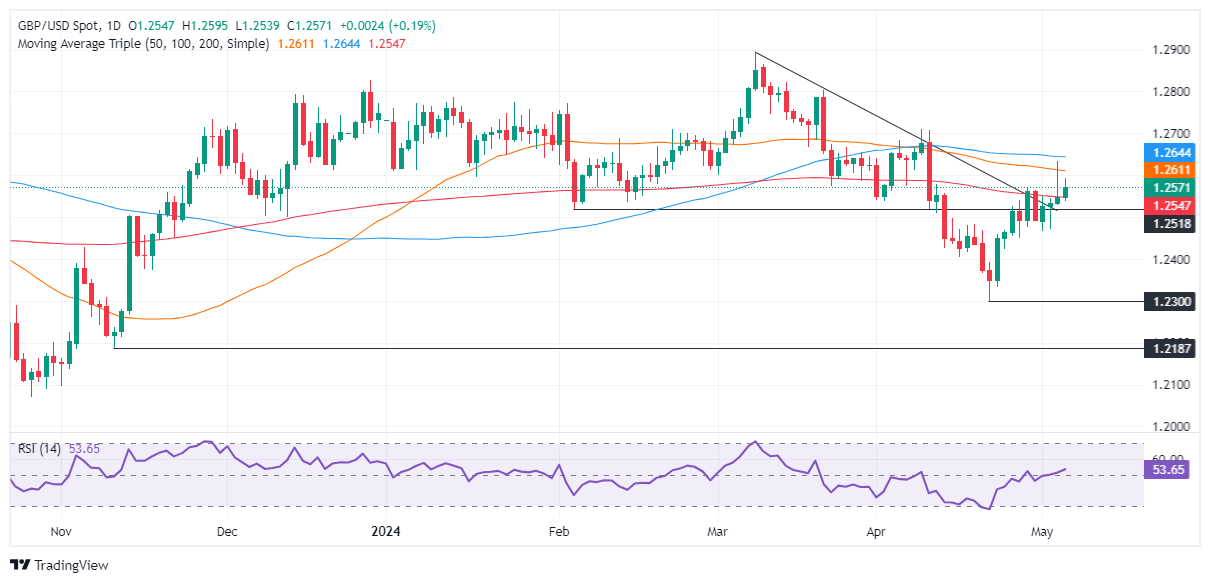
The GBP/USD is neutral to upward biased in the near term after breaching the 200-day moving average (DMA) at 1.2547. From a momentum standpoint, the Relative Strength Index (RSI) shifted bullishly, which could open the door for challenging the 1.2600 mark, slightly below the 50-DMA at 1.2609.
A breach of the latter will expose the confluence of the May 3 high and the 100-DMA at around 1.2634/42 before edging toward 1.2700.
On the other hand, if the GBP/USD tumbles below the 200-DMA, sellers could regain control. The first support would be the 1.2500 figure, followed by the May 1 low of 1.2466. Once cleared, the next stop would be 1.2400, followed by the April 22 low of 1.2299.
GBP/USD Price Action – Daily Chart
- USD/JPY holds gains near 154.00 despite soft US Dollar.
- Weak US data builds pressure on the US Dollar.
- The speculation for Japan intervention to support the Japanese Yen remains firm.
The USD/JPY pair trades sideways slightly below 154.00 in Monday’s early American session. The asset consolidates as trading volume remain thin in Monday’s session due to holiday in Japanese markets on account of Children’s Day. The major struggles to move higher despite weak United States economic data sends the US Dollar on the backfoot
Poor US Nonfarm Payrolls and weak Services PMI have weighed on the US Dollar. The US Dollar Index (DXY), which tracks the Greenback’s value against six major currencies, fell slightly below of 105.00. The US NFP report released on Friday showed that fewer jobs were created and the joblessness rise, suggesting consequences of interest rates remaining higher by the Fed.
The market sentiment is risk-on amid firm expectations that the Federal Reserve (Fed) will start reducing interest rates from the September meeting. The S&P 500 opens on a bullish note, suggesting strong demand for risk-sensitive assets. 10-year US Treasury yields rise slightly to 4.50% but have come down significantly on firm Fed rate-cut prospects.
While investors speculate for the Fed beginning to reduce interest rates from the September meeting. Fed Governor Michelle Bowman said on Friday she would be willing to raise interest rates further if progress in inflation declining to the 2% stalls or reverses.
On the Tokyo front, investors see the Japan intervening to uplift the Japanese Yen against the US Dollar. However, Japan’s intervention is a short-term support and won’t bring any fundamental change in the Japanese Yen. Investors want to see evidence which could bring confidence over wage growth spiral.
- USD/CAD drops to 1.3650 on multiple headwinds.
- Firm speculation for Fed rate cuts in September has uplifted the market mood.
- A sharp recovery in the Oil price improves the Canadian Dollar’s appeal.
The USD/CAD pair falls after failing to recapture the crucial resistance of 1.3700 in Monday’s early New York session. The Loonie asset slips to 1.3650 due to multiple headwinds: a decline in the US Dollar and a sharp recovery in the Oil price.
Market sentiment is quite bullish, as investors’ confidence in the Federal Reserve (Fed) reducing interest rates from the September meeting has improved. The S&P 500 opens on a bullish note, exhibiting a higher risk appetite. The scenario of the Fed pivoting to interest rate cuts is unfavorable for bond yields. 10-year US Treasury yields have come down below the crucial support of 4.50%.
The US Dollar Index (DXY) struggles for a firm footing above 105.00 as weak United States economic data has raised concerns over the economic outlook. The US Nonfarm Payrolls (NFP) and the Services PMI data for April showed that labor demand was weak, the Unemployment Rate rose to 3.9%, wage growth slowed, and Services PMI fell to an almost 16-month low of 49.4. These conditions indicate that the economy is failing to cope with the Fed’s restrictive framework.
Meanwhile, the Canadian Dollar gains as the Oil price rebounds from $77.75. West Texas Intermediate (WTI), futures on NYMEX, ends its six-day losing spell as investors worry about geopolitical risks. Israel is expected to extend operations in Rafah, the southern part of Gaza, as prospects for a Gaza ceasefire appear slim. On Sunday, Hamas reiterated its demand for an end to the war in exchange for the freeing of hostages but Israeli Prime Minister Benjamin Netanyahu flatly ruled that out, Reuters reported.
It is worth noting that Canada is the leading exporter of Oil to the US and higher Oil prices strengthen the Canadian Dollar.
- NZD/USD has reached a key resistance level which it needs to break above to extend.
- Failure to break above the level would probably lead to continuation of the descending channel.
- The MACD has formed a bullish price pattern which adds weight to the upside view.
NZD/USD is trading in the 0.6020s after having risen for the fourth day in a row, on Monday. The pair is encountering significant resistance from the 50-day Simple Moving Average (SMA) and a major trendline. NZD/USD has reached a crossroads where it could either continue higher or revert to the bearish sentiment that has characterized the year so far.
To extend the bullish short-term gains NZD/USD has clocked up since the pivotal April 19 low, the pair will need to make a decisive break above the confluence of resistance it is bumping up against – if not, this could be an inflection point where the price turns and starts going lower again, in line with the medium-term bearish trend.
NZD/USD Daily Chart
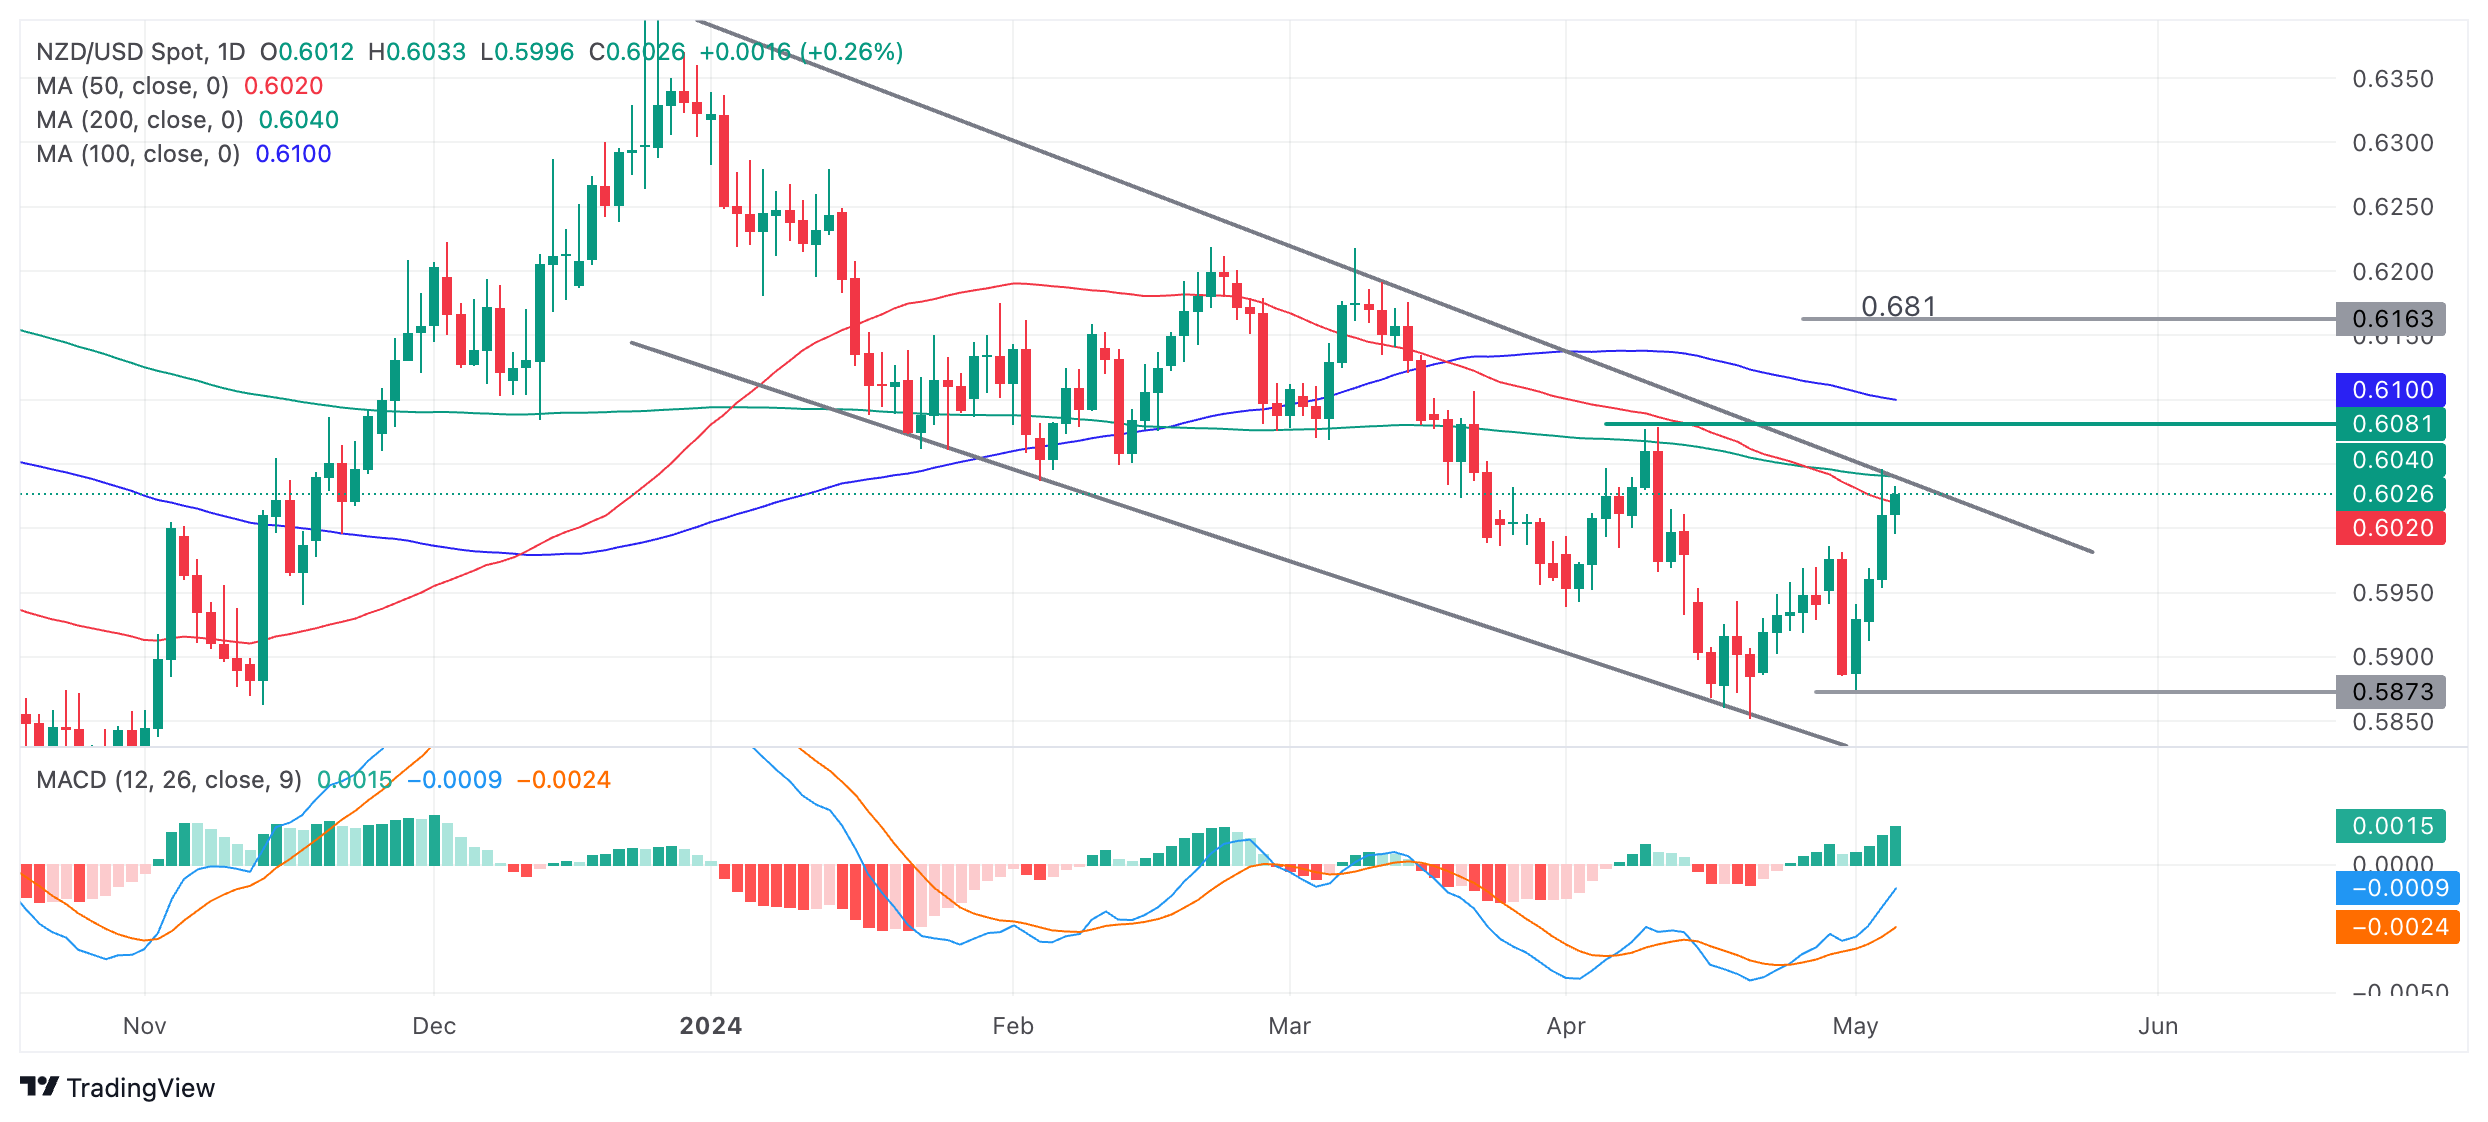
NZD/USD is testing resistance from the 50-day, 200-day SMA and the trendline for the down move since the start of 2024. Unless it breaks out it will probably continue back down to the 0.5870 lows, possibly even lower.
However, there are no signs yet on the chart that indicates the start of a new down-leg.
Given the strength of the move up since the April 19 lows and the strong accompanying bullish momentum reflected in the Moving Average Convergence Divergence (MACD) there is a chance a breakout from the channel could follow on. Further, the MACD has formed a bullish double bottom pattern during April which is a sign of a change in trend in the underlying price as well as the MACD.
A decisive break above the trendline would be required to indicate NZD/USD was going higher. Such a breakout would be signaled by a long bullish green daily candle breaking clearly above the trendline and closing near the high of the day. Alternatively three green candles in a row that broke clearly above could also indicate a decisive breakout. Price trading above the top of the last swing high at 0.6081 would also be a bullish sign.
Such a break, if it were to develop, would signal significant upside. The usual way to estimate how far a move will go following a trendline break is to take the move that directly preceded it and extrapolate that higher. For a conservative estimate the 0.681 Fibonacci ratio can be used. This gives a conservative target of 0.6163 and a full estimate of 0.6213.
- EUR/JPY recovers after over two percent sell-off last week following suspected intervention.
- Euro grinds higher on Monday following upbeat Services PMI data for the Eurozone.
- US Treasury Secretary Janet Yellen warns Japanese authorities about intervention.
EUR/JPY rallies on Monday, trading up over a half a percent in the 165.60s, driven by a stronger Euro (EUR) following an upwards revision to the final estimate for April Eurozone Services PMI.
Eurozone HCOB Services PMI for April was revised up to 53.3 from a preliminary estimate of 59.9, which itself was higher than the 51.5 of March, according to data from S&P Global and Hamburg Commercial Bank (HCOB). Eurozone Composite PMI was also revised up to 51.3 from a 49.9 preliminary estimate.
“The euro area’s economic recovery progressed further at the start of the second quarter…as overall business activity growth accelerated to an 11-month high,” said the report from S&P Global HCOB.
The Japanese Yen, meanwhile, loses ground in most of its major pairs, possibly due to comments from US Treasury Secretary Janet Yellen over the weekend, which could be construed as mildly critical of intervention.
Despite refusing to say whether direct currency intervention lay behind the Yen’s recovery last week, including an over two percent rise against the Euro, Yellen did say, “we would expect these interventions to be rare and consultation to take place”.
EUR/JPY upside is likely to be capped by firming expectations that the European Central Bank (ECB) will cut interest rates at its June meeting. These follow comments by the ECB’s Chief Economist Philip Lane who said inflation was coming down in a “timely manner”.
“Both the April flash estimate for euro area inflation and the Q1 GDP number that came out improve my confidence that inflation should return to target in a timely manner,” he said, adding, “So, as of today, my personal confidence level has improved compared with our April meeting. But of course, more data will arrive between now and June”.
Lane added the final decision as to when the ECB would cut interest rates would depend on a “month-by-month” assessment of the data and that not all relevant metrics had been collected. A June cut by the ECB would weigh on the Euro since lower interest rates tend to attract less capital inflows.
Eurozone factory gate prices, which tend to precede wider price trends, continued to deflate according to data from Eurostat on Monday. The figures showed a 0.4% drop in the Eurozone Producer Price Index (PPI) in March, which was less than the 0.7% forecast. On a year-over-year basis PPI fell 7.8% in March compared to 8.5% in February.
European Central Bank (ECB) policymaker Gediminas Simkus said on Monday that rate cuts should not be limited to just June unless there are surprises in data, per Reuters.
"My thinking is that there are some other interest rate cuts coming in the future, but I will restrict myself from elaborating on how many, even if I have already expressed that this year, I would expect three cuts," Simkus added.
Market reaction
These comments don't seem to be influencing the Euro's valuation in a noticeable way. At the time of press, EUR/USD was up 0.01% on the day at 1.0772.
- WTI capitalizes on multiple tailwinds.
- The weak US job market fuels expectations for the Fed to reduce interest rates from September.
- Geopolitical risks deepen fears of tightening oil supply.
West Texas Intermediate (WTI), futures on NYMEX, extends its recovery to $79.00 in Monday’s European session. The Oil price rebounds after a six-day losing spell on multiple tailwinds. The black gold benefitted from a decline in the US Dollar, a deepening Middle East crisis, and an increase in official selling prices of Oil by Saudi Arabia to various regions.
The dollar-denominated Oil rises as an appeal for the Greenback darkens after the crucial United States official labour market data for April remained weak. The US Nonfarm Payrolls (NFP) data released on Friday reported that fewer jobs were created and the Unemployment Rate rose to 3.9%.
Weak job market status prompts expectations for the Federal Reserve (Fed) to unwind its restrictive interest rate stance. The scenario is favourable for the Oil price as it increases its demand.
Meanwhile, geopolitical risks in the Middle East region have deepened fears of tightening oil supply. The ceasefire between Israel and Palestine is less likely, and the former is expected to extend its operation into Rafah, which is the southern part of Gaza.
Apart from that, Saudi Arabia's move to raise the official selling prices (OSPs) for its crude sold to Asia, Northwest Europe and the Mediterranean in June, signalling expectations of strong demand this summer, reported Reuters.
- The US Dollar trades flat on Monday as the economic calendar takes a quieter turn.
- The Greenback is firmly up against the Chinese Yuan and the Japanese Yen this Monday.
- The US Dollar Index trades near 105.00 and could extend its recovery after its slide on Friday.
The US Dollar (USD) is giving traders some room to digest the recent headlines that came in after the turmoil in Friday’s trading. The US Jobs Reports missed estimates, although the data was not bad either as the Nonfarm Payrolls Change and the Unemployment Rate suggested still good labor market conditions. The week ahead will be light in terms of economic data releases, but Federal Reserve speakers will return to the stage and their interest-rate outlook has the potential to move the needle for the US Dollar.
On Monday, the Fed will publish the Senior Loan Officer Survey (SLOOS), in which the central bank looks at 80 large domestic banks and 24 branches of international banks to measure current credit and lending conditions. The report can impact decisions on setting interest rates and discount rates. Ahead of the SLOOS release, Federal Reserve Bank of New York President John Williams will speak at a Q&A session in California and Federal Reserve Bank of Richmond Thomas Barkin will also take the stage.
Daily digest market movers: Monday snooze
- Both the Japanese Yen and the Chinese Yuan are depreciating nearly 0.50% on the day against the Greenback.
- Over the weekend, Israel’s Prime Minister Benjamin Netanyahu said Israel is open to a ceasefire to exchange hostages, although he pushed against the request from Hamas to make it a lasting ceasefire, Bloomberg reports. Meanwhile, several world leaders came out condemning Israel’s recent attacks on Rafah, where several civilians have fled to, away from other attacked cities in the region.
- The US Treasury is heading to markets again, to auction a 3-month and a 6-month bill near 15:.30 GMT.
- Around 17:00 GMT, Federal Reserve Bank of New York President John Williams will speak at a Q&A session in California. Broadly at the same time, Richmond Fed President Thomas Barkin will also deliver a speech.
- The Fed will release its recent finding from the Senior Loan Officer Survey (SLOOS) at around 18:00 GMT.
- Asian equities are on the green, , with the Shanghai-Shenzhen CSI 300 up over 1.5%. European indices and US equity futures are taking over the positive spirit with a small 0.50% uptick on average.
- The CME Fedwatch Tool suggests a 91.8% probability that June will still see no change to the Federal Reserve's fed fund rate. Odds of a rate cut in July are also out of the cards, while for September the tool shows a 49.9% chance that rates will be 25 basis points lower than current levels.
- The benchmark 10-year US Treasury Note trades around 4.51% and fell out of bed earlier in the Asian-Pacific (APAC) session, sliding to 4.44%.
US Dollar Index Technical Analysis: 60 billion bill
The US Dollar Index (DXY) had a rough ride last week with US Dollar bulls being steamrolled twice by the Japanese government’s intervention in the USD/JPY pair. Although a near $60 billion in cash got burned, according to Bloomberg, to get USD/JPY from 160.00 to 151.86, it brought the US Dollar Index to the 55-day Simple Moving Average (SMA) at 104.52. This is the level where Dollar bulls were eager to get in and triggered a firm bounce in both the DXY and the USD/JPY pair, with room for further recovery.
On the upside, 105.52 (a pivotal level since April 11, 2024) needs to be recovered first through a daily close above this level before targeting the April 16 high at 106.52 for a third time. Further up and above the 107.00 round level, the DXY index could meet resistance at 107.35, the October 3 high.
On the downside, the 55-day and the 200-day Simple Moving Averages (SMAs) at 104.52 and 104.23, respectively should provide ample support. If those levels are unable to hold, the 100-day SMA near 103.86 is the next best candidate.
US Dollar FAQs
The US Dollar (USD) is the official currency of the United States of America, and the ‘de facto’ currency of a significant number of other countries where it is found in circulation alongside local notes. It is the most heavily traded currency in the world, accounting for over 88% of all global foreign exchange turnover, or an average of $6.6 trillion in transactions per day, according to data from 2022. Following the second world war, the USD took over from the British Pound as the world’s reserve currency. For most of its history, the US Dollar was backed by Gold, until the Bretton Woods Agreement in 1971 when the Gold Standard went away.
The most important single factor impacting on the value of the US Dollar is monetary policy, which is shaped by the Federal Reserve (Fed). The Fed has two mandates: to achieve price stability (control inflation) and foster full employment. Its primary tool to achieve these two goals is by adjusting interest rates. When prices are rising too quickly and inflation is above the Fed’s 2% target, the Fed will raise rates, which helps the USD value. When inflation falls below 2% or the Unemployment Rate is too high, the Fed may lower interest rates, which weighs on the Greenback.
In extreme situations, the Federal Reserve can also print more Dollars and enact quantitative easing (QE). QE is the process by which the Fed substantially increases the flow of credit in a stuck financial system. It is a non-standard policy measure used when credit has dried up because banks will not lend to each other (out of the fear of counterparty default). It is a last resort when simply lowering interest rates is unlikely to achieve the necessary result. It was the Fed’s weapon of choice to combat the credit crunch that occurred during the Great Financial Crisis in 2008. It involves the Fed printing more Dollars and using them to buy US government bonds predominantly from financial institutions. QE usually leads to a weaker US Dollar.
Quantitative tightening (QT) is the reverse process whereby the Federal Reserve stops buying bonds from financial institutions and does not reinvest the principal from the bonds it holds maturing in new purchases. It is usually positive for the US Dollar.
- EUR/GBP price has just reversed lower after rising up to near the range highs.
- The sideways trend is likely to extend, with price oscillating within the range.
- EUR/GBP is currently finding support from a cluster of major Moving Averages in the 0.8560s.
EUR/GBP price is trading in the 0.8560s, in the middle of a multi-month range on Monday. It moved lower after rising up to close to the range ceiling.
The pair is in a sideways trend which is expected to extend given the old traders adage that “the trend is your friend”.
EUR/GBP 4-hour Chart
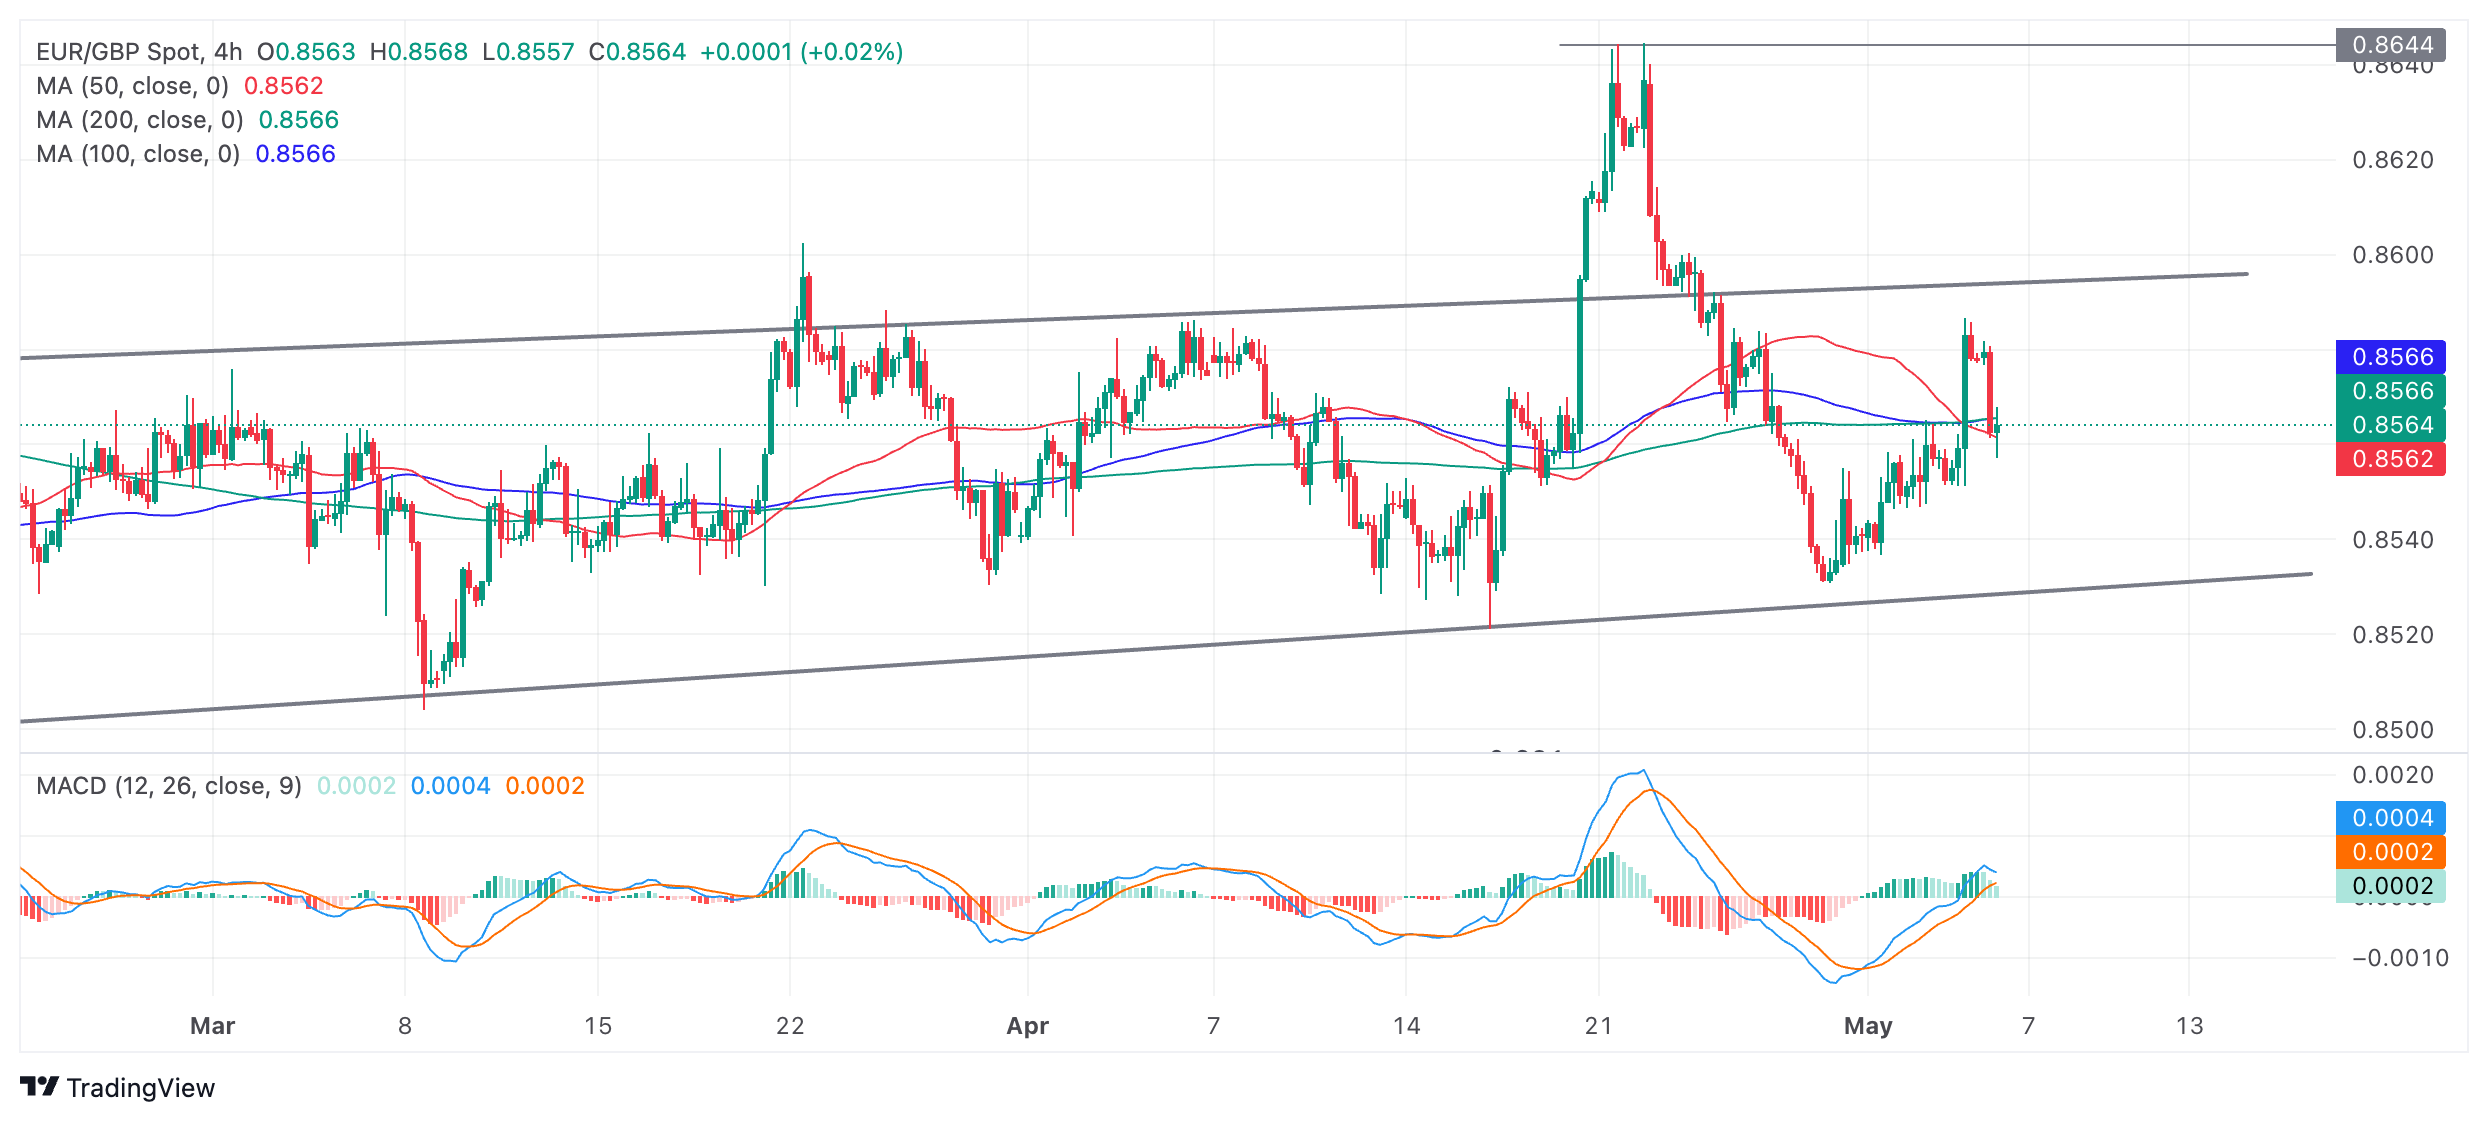
After rising up and almost touching the top of the range on Friday, EUR/GBP reversed and has fallen to a cluster of MAs at 0.8565, where it has temporarily found support. If the pair can decisively break below this cluster of MAs which is made up of the 50, 100 and 200 Simple Moving Averages (SMA) it will probably fall back down to support at 0.8530.
The Moving Average Convergence Divergence (MACD) indicator has moved above the zero line, a bullish sign, however it is turning lower. If it crosses below the red signal line it will give a sell signal and suggest more downside for XAG/USD. The signal would be enhanced by the fact the pair was in a sideways trend and MACD is proven to be a more reliable indicator in non-trending markets.
Change in trend?
For a change of the sideways trend to be confirmed Silver price would need to make a decisive break above or below the range.
In the case of a break below the range floor such a move would open the way for more downside to the next target at 0.8486 – the 0.681 Fibonacci ratio of the height of the range extrapolated lower from the channel’s base. This is the method used by technical analysts to estimate range breakouts. Further weakness could even see price reach the next target at 0.8460, the full height of the range extrapolated lower (1.000).
Likewise a decisive break above the range high at 0.8595 would signal a breakout with an initial target at 0.8635 followed by the 0.8645 highs.
A decisive break would be one characterized by a long candlestick that broke completely above or below the range floor and closed near its high or low, or three consecutive red candlesticks that broke clearly through the level.
- Natural Gas prices are trading flat this Monday, holding onto the prior week’s gains.
- Traders see reasons for both easing and rallying in the price action.
- The US Dollar Index opens above 105.00 in a technical bounce.
Natural Gas (XNG/USD) trades broadly steady on Monday after the rally seen on Friday, when prices escalated to the highest level in more than three months. On the upside, prices are supported by escalating tensions in Gaza as Israel is set to attack the city of Rafah, urging the already relocated refugees to leave the area. However, on the other hand, European Gas storages are filled up by 63.25%, seeing net inflows as the peak demand season draws to a close.
Meanwhile, the US Dollar Index (DXY) seems to be experiencing a technical bounce, particularly against the Japanese Yen and the Chinese Renminbi, up by 0.50% in each pair. The move comes after substantial interventions that triggered appreciation in the Japanese Yen last week, which in turn made the DXY correct to the downside. The DXY is already off the lows from last week and more upside for the Greenback is on the cards.
Natural Gas is trading at $2.26 per MMBtu at the time of writing.
Natural Gas news and market movers: What could stop Israel?
- Over the weekend more and more protests are taking place against Israel after Prime Minister Benjamin Netanyahu issued instructions to vacate Rafah for an upcoming attack. The issued request for the already relocated people in the Gaza region is creating tensions again in the Middle Eastern area.
- Iran-backed Houthi rebels said they are ready to extend their actions against any cargo ships in the Red Sea towards the Mediterranean Sea.
- Russia’s energy industry, mainly Oil and Gas, is facing shortages of manpower after signing bonuses for the Russian Army have taken away much of the sector's available labor force. The revenues of Russia’s stronghold are needed to keep the Ukraine excursion funded, Bloomberg reports.
Natural Gas Technical Analysis: Some easing before the next leg up
Natural Gas had a very good week, closing at a more than three months high on Friday. Over the weekend, several headlines came out from Israel that could further support Gas prices for another few weeks, while European Gas storages are seeing supply come in. This equilibrium should see prices trade in a new bandwidth that is near $2.10 on the downside and $2.50 on the upside for May.
On the upside, the next level to watch is the January 25 high at $2.33. Once through there, prices could steamroll towards the 200-day Simple Moving Average (SMA) at $2.54.
On the downside, a double belt is awaiting to provide support with the 100-day SMA at $2.09 and the pivotal level at $2.11 (low of April 14, 2023).. Should the support not hold above $2.00, then the ascending green trend line near $1.92 together with the 55-day SMA should avoid a further downturn.
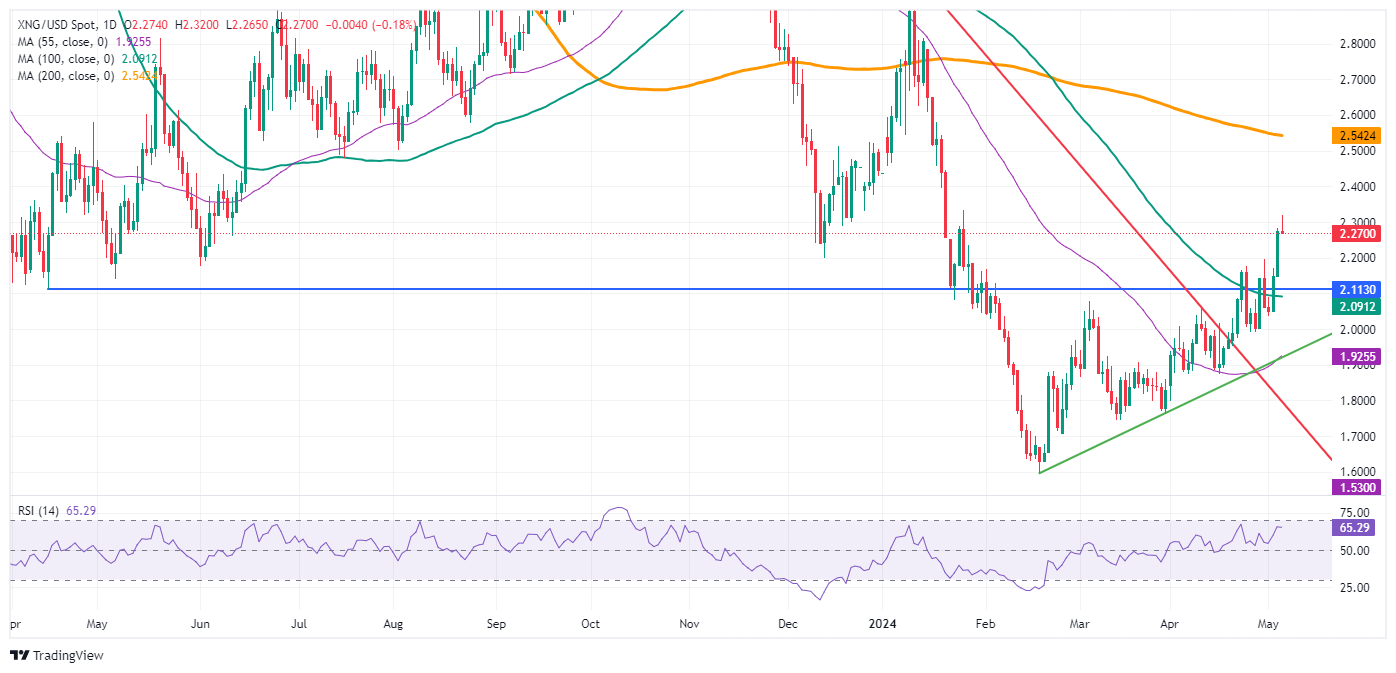
Natural Gas: Daily Chart
Natural Gas FAQs
Supply and demand dynamics are a key factor influencing Natural Gas prices, and are themselves influenced by global economic growth, industrial activity, population growth, production levels, and inventories. The weather impacts Natural Gas prices because more Gas is used during cold winters and hot summers for heating and cooling. Competition from other energy sources impacts prices as consumers may switch to cheaper sources. Geopolitical events are factors as exemplified by the war in Ukraine. Government policies relating to extraction, transportation, and environmental issues also impact prices.
The main economic release influencing Natural Gas prices is the weekly inventory bulletin from the Energy Information Administration (EIA), a US government agency that produces US gas market data. The EIA Gas bulletin usually comes out on Thursday at 14:30 GMT, a day after the EIA publishes its weekly Oil bulletin. Economic data from large consumers of Natural Gas can impact supply and demand, the largest of which include China, Germany and Japan. Natural Gas is primarily priced and traded in US Dollars, thus economic releases impacting the US Dollar are also factors.
The US Dollar is the world’s reserve currency and most commodities, including Natural Gas are priced and traded on international markets in US Dollars. As such, the value of the US Dollar is a factor in the price of Natural Gas, because if the Dollar strengthens it means less Dollars are required to buy the same volume of Gas (the price falls), and vice versa if USD strengthens.
- AUD/USD trades higher on Monday after US data last week surprised to the downside, weighing on USD.
- The RBA could adopt a hawkish tone at their meeting on Tuesday, supporting the AUD.
- AUD/USD is in a short-term uptrend with the bias favoring long holders.
AUD/USD trades higher on Monday, up by a quarter of a percent in the 0.6620s, propelled mainly by a depreciation of the US Dollar (USD) after the release of weaker-than-expected US data at the end of last week.
On Friday, data from the US Bureau of Labor Statistics (BLS) showed US Nonfarm Payrolls in April undershot expectations, Average Hourly Earnings dipped below forecast and the Unemployment Rate ratcheted up a notch.
Additionally, data from S&P Global showed US Services PMI fell in contraction territory. Given Services wage inflation has been a primary concern of the Fed the decline is significant. Overall the data suggests the economy is cooling and the Federal Reserve (Fed) will be much more likely to cut interest rates before the end of the year. This is negative for USD since lower interest rates attract less foreign capital inflows.
The Australian Dollar (AUD), meanwhile, stays firm on expectations the Reserve Bank of Australia (RBA) will keep interest rates unchanged at their meeting on Tuesday and possibly even adopt a more hawkish tone, on the back of continued stubbornly-high inflation data. Recent data showed Inflation in Q1 in Australia surprised to the upside, reinforcing the notion that of all the G10 central banks, the RBA is likely to be the last one to cut interest rates.
There is even a possibility the RBA could surprise markets with a interest-rate hike, according to some analysts.
“Cash rate futures are still pricing in around a 40% chance of another rate hike from the RBA. However, cash rate futures are yet to trade following the market moves in the US,” said analysts at Westpac in a note on Monday.
In such a scenario, the Australian Dollar would surge with AUD/USD extending its short-term uptrend higher, probably surpassing the 0.6686 March high and touching 0.6700.
- Silver price moves higher to $27.20 as weak US data falters US economic strength.
- Traders have priced in the Fed reducing interest rates from September.
- Lower bond yields improve the Silver’s appeal.
Silver price (XAG/USD) stretches recovery to $27.20 in Monday’s European session. The white metal capitalizes on weak United States labor market and Services PMI that raises concerns over the economic strength and prompt expectations for Federal Reserve (Fed) cutting interest rates from the September meeting.
The US Nonfarm Payrolls (NFP) report showed that fewer jobs were added in April than the consensus and the prior reading. The Unemployment Rate rose to 3.9%. Also, wage growth softened sharply. Poor US NFP report indicated deepening consequences of higher interest rates by the Fed. Also, weak Services PMI strengthened expectations for Fed rate cuts in September.
The Services PMI, which represents the service sector that accounts for two-thirds of the economy falls below the 50.0 threshold to 49.4, recorded as the lowest reading since December 2022.
Despite broader data was weak, traders were reluctant to bring forward expectations for Fed rate cuts as the ISM Price Paid subindex rose sharply to 59.4 from 53.4 in March. This is a leading indicator of the US inflation outlook as it exhibits prices paid for inputs businesses.
Weak US data has weighed on the US Dollar Index (DXY) as it struggles for a firm-footing above 105.00. 10-year US Treasury yields fell sharply to 4.47%. A decline in yields on interest-bearing assets uplift demand for non-yielding assets, such as Silver, as the opportunity cost of holding an investment in them diminishes.
Silver technical analysis
Silver price recovers after discovering strong buying interest near the horizontal support plotted from 14 April 2023 high around $26.09 on a daily timeframe. The above-mentioned support was earlier a major resistance for the Silver price bulls. The uncertainty over Silver’s near-term outlook still remains as it has yet not settled above the 20-period Exponential Moving Average (EMA), which trades around $27.20.
The 14-period Relative Strength Index (RSI) slips into the 40.00-60.00, suggesting that the bullish momentum has faded. However, the long-term outlook is still stable.
Silver daily chart
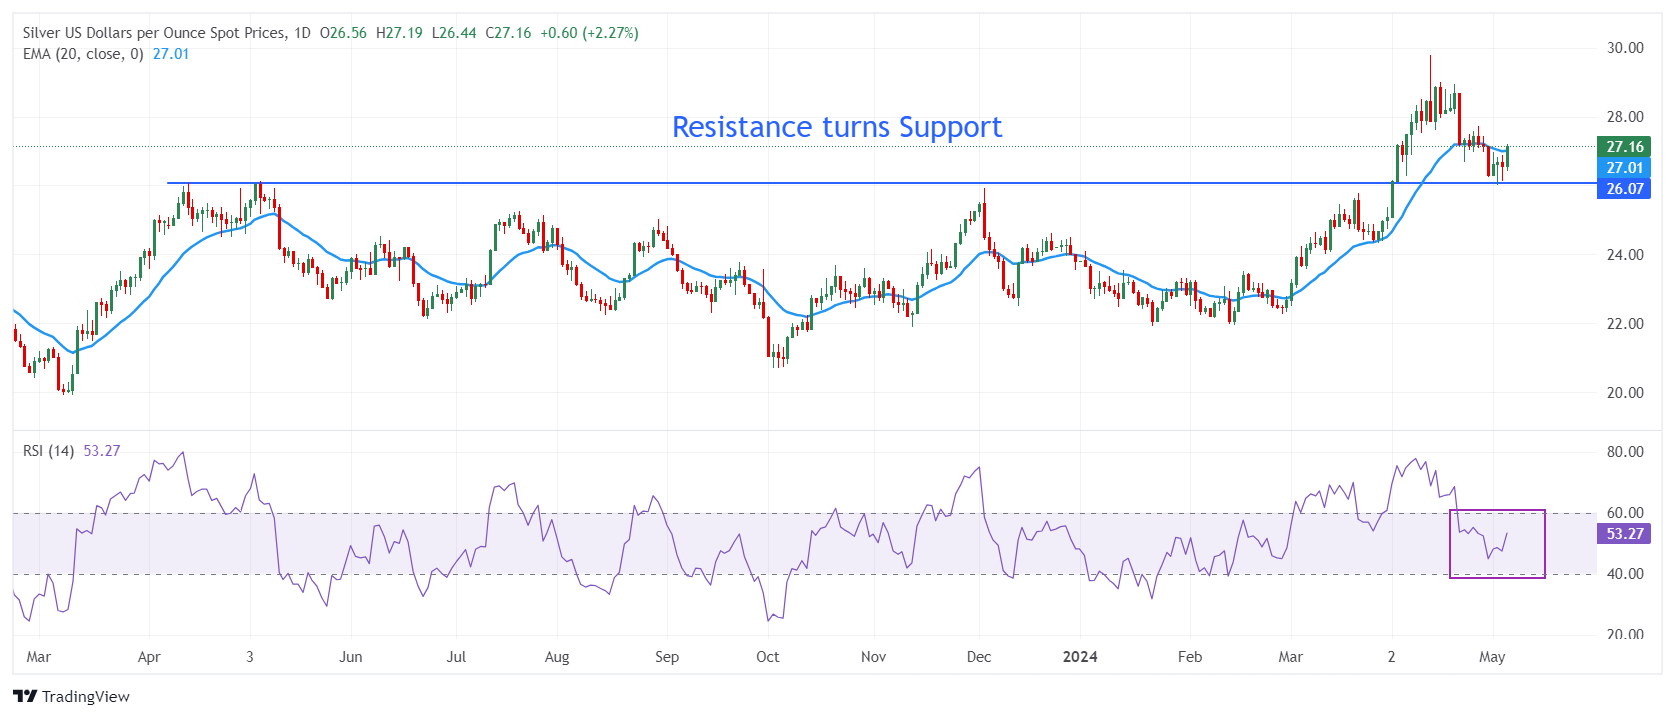
- EUR/USD consolidates around 1.0770 as the US Dollar steadies in the aftermath of US data.
- ECB Stournaras sees the central bank reducing interest rates three times this year.
- Weak US labor market data and poor ISM Services PMI darkens the US economic outlook.
EUR/USD strives for a direction, trading sideways around 1.0770 in Monday’s European session. The major currency pair consolidates as the Eurozone economic calendar lacks tier-1 data this week. The European Central Bank (ECB) is widely anticipated to shift to policy normalization in the June meeting. Therefore, speculation about ECB’s stance on interest rates for the second-half of the year will influence the Euro’s move.
ECB policymakers are divided over extending the interest rate-cut cycle after the June meeting. A few policymakers believe that extending rate cuts from the July meeting could revamp price pressures. For the entire year, ECB policymaker and Bank of Greece Governor Yannis Stournaras said in an interview with a Greek media outlet that he sees three rate cuts this year. He sees a rate cut in July as possible and added that the Eurozone’s economic rebound in the first quarter of the year made three cuts more likely than four. The Eurozone economy expanded by 0.3% in the January-March period, beating expectations of 0.1% gain.
Daily digest market movers: EUR/USD consolidates as US Dollar steadies
- EUR/USD exhibits a sideways move around 1.0770 as the US Dollar remains broadly steady in the aftermath of the United States labor market and the ISM Services Purchasing Managers Index (PMI) data for April released on Friday. The US Nonfarm Payrolls (NFP) report showed that fresh labor additions were significantly lower than the consensus and wage growth softened on a monthly and an annual basis.
- Easing labor market conditions weighed on the US Dollar Index (DXY), which fell to an almost four-week low of 104.60. However, the USD index recovered quickly as the ISM Services PMI showed that businesses pay higher prices for inputs.
- The ISM Services Prices Paid rose to 59.4 in April from 53.4, which suggested a stubborn inflation outlook. The inputs in the service sector are mainly the salaries paid to employees, which often leads to higher consumer spending and eventually prompts price pressures. Though the ISM Services PMI, which represents the service sector that accounts for two-thirds of the economy, falls below the 50.0 threshold to 49.4, the lowest reading since December 2022.
- Easing labor market conditions and weak ISM Service PMI have raised concerns over the US economic outlook. These have strengthened speculation for the Fed reducing interest rates in the September meeting. The CME FedWatch tool shows that traders see a 70% chance that interest rates will be lower than actual levels in September.
- Contrary to market expectations, Fed Governor Michelle Bowman said on Friday she would be willing to raise interest rates further if progress in declining inflation to 2% stalls or reverses Reuters reported. However, she is confident that inflation will decline even if interest rates remain where they are.
Technical Analysis: EUR/USD holds above 20-day EMA
EUR/USD extends its winning spell for the fourth trading session on Monday but is trading inside Friday’s trading range, exhibiting a sideways performance. The near-term appeal of the shared currency pair is upbeat as it is trading above the 20-day Exponential Moving Average (EMA), which trades around 1.0730.
Broadly, EUR/USD exhibits a sharp volatility contraction due to a Symmetrical Triangle formation on a daily timeframe. The upward-sloping border of the triangle pattern is plotted from October 3 low at 1.0448 and the downward-sloping border is placed from December 28 high around 1.1140.
The 14-period Relative Strength Index (RSI) shifts into the 40.00-60.00 range, suggesting indecisiveness among market participants.
Euro FAQs
The Euro is the currency for the 20 European Union countries that belong to the Eurozone. It is the second most heavily traded currency in the world behind the US Dollar. In 2022, it accounted for 31% of all foreign exchange transactions, with an average daily turnover of over $2.2 trillion a day. EUR/USD is the most heavily traded currency pair in the world, accounting for an estimated 30% off all transactions, followed by EUR/JPY (4%), EUR/GBP (3%) and EUR/AUD (2%).
The European Central Bank (ECB) in Frankfurt, Germany, is the reserve bank for the Eurozone. The ECB sets interest rates and manages monetary policy. The ECB’s primary mandate is to maintain price stability, which means either controlling inflation or stimulating growth. Its primary tool is the raising or lowering of interest rates. Relatively high interest rates – or the expectation of higher rates – will usually benefit the Euro and vice versa. The ECB Governing Council makes monetary policy decisions at meetings held eight times a year. Decisions are made by heads of the Eurozone national banks and six permanent members, including the President of the ECB, Christine Lagarde.
Eurozone inflation data, measured by the Harmonized Index of Consumer Prices (HICP), is an important econometric for the Euro. If inflation rises more than expected, especially if above the ECB’s 2% target, it obliges the ECB to raise interest rates to bring it back under control. Relatively high interest rates compared to its counterparts will usually benefit the Euro, as it makes the region more attractive as a place for global investors to park their money.
Data releases gauge the health of the economy and can impact on the Euro. Indicators such as GDP, Manufacturing and Services PMIs, employment, and consumer sentiment surveys can all influence the direction of the single currency. A strong economy is good for the Euro. Not only does it attract more foreign investment but it may encourage the ECB to put up interest rates, which will directly strengthen the Euro. Otherwise, if economic data is weak, the Euro is likely to fall. Economic data for the four largest economies in the euro area (Germany, France, Italy and Spain) are especially significant, as they account for 75% of the Eurozone’s economy.
Another significant data release for the Euro is the Trade Balance. This indicator measures the difference between what a country earns from its exports and what it spends on imports over a given period. If a country produces highly sought after exports then its currency will gain in value purely from the extra demand created from foreign buyers seeking to purchase these goods. Therefore, a positive net Trade Balance strengthens a currency and vice versa for a negative balance.
- Gold price rises as markets increase their bets of interest rates coming down in the US.
- The Chinese Caixin services PMI data remains in expansive territory, supporting the outlook for a key market for Gold.
- Central bank buying of Gold remains strong in March, according to the World Gold Council.
The Gold price (XAU/USD) is trading up by almost a percent, in the $2,320s on Monday, as markets weigh the implications of weaker-than-expected US jobs data on interest rates – a key driver of Gold price – and economic data from China, a major market for Gold, stays in expansive territory.
Gold price rises after US jobs, China data
Gold price rebounds on Monday as markets mull the outlook for interest rates in the light of recent US employment metrics.
Friday’s US Nonfarm Payrolls data from the Bureau of Labor Statistics showed a below-estimated 175K people found work in April. More importantly, wage inflation showed a slowdown, with Average Hourly Earnings both on a yearly and monthly basis ticking down from where economists had expected.
The weaker-than-expected data suggests the Federal Reserve (Fed) may lower interest rates sooner than had been anticipated. This scenario increases the attractiveness of Gold as lower interest rates reduce the opportunity cost of owning the non-yielding precious metal.
Chinese Caixin Services PMI data released Monday showed the sector remaining in expansive territory (above 50) in April, keeping alive hopes of buoyant demand for Gold in China despite the country’s recent economic woes.
Central Bank acquisitions of Gold remain net positive
According to data from the World Gold Council (WGC) tracking central bank acquisitions of Gold in March, buying showed a net positive of 15 tonnes from central banks, who have become one of the largest consumers of Gold in recent years.
The figure was in line with previous months, keeping the positive trend in demand alive.
“Buying strength has continued into 2024, with emerging market banks the main driving force for both purchases and sales,” said Krishan Gopaul Senior Analyst, EMEA
at the World Gold Council.
Technical Analysis: Gold price starts oscillating in a range
Gold price (XAU/USD) has started trading sideways on the 4-hour chart, which is used to analyze the short-term trend.
The pair has just retested the ceiling of a mini-range at around $2,326, and has pulled back during the last period. This is also the level of the 50 Simple Moving Average (SMA), painted in red in the chart below.
XAU/USD 4-hour Chart
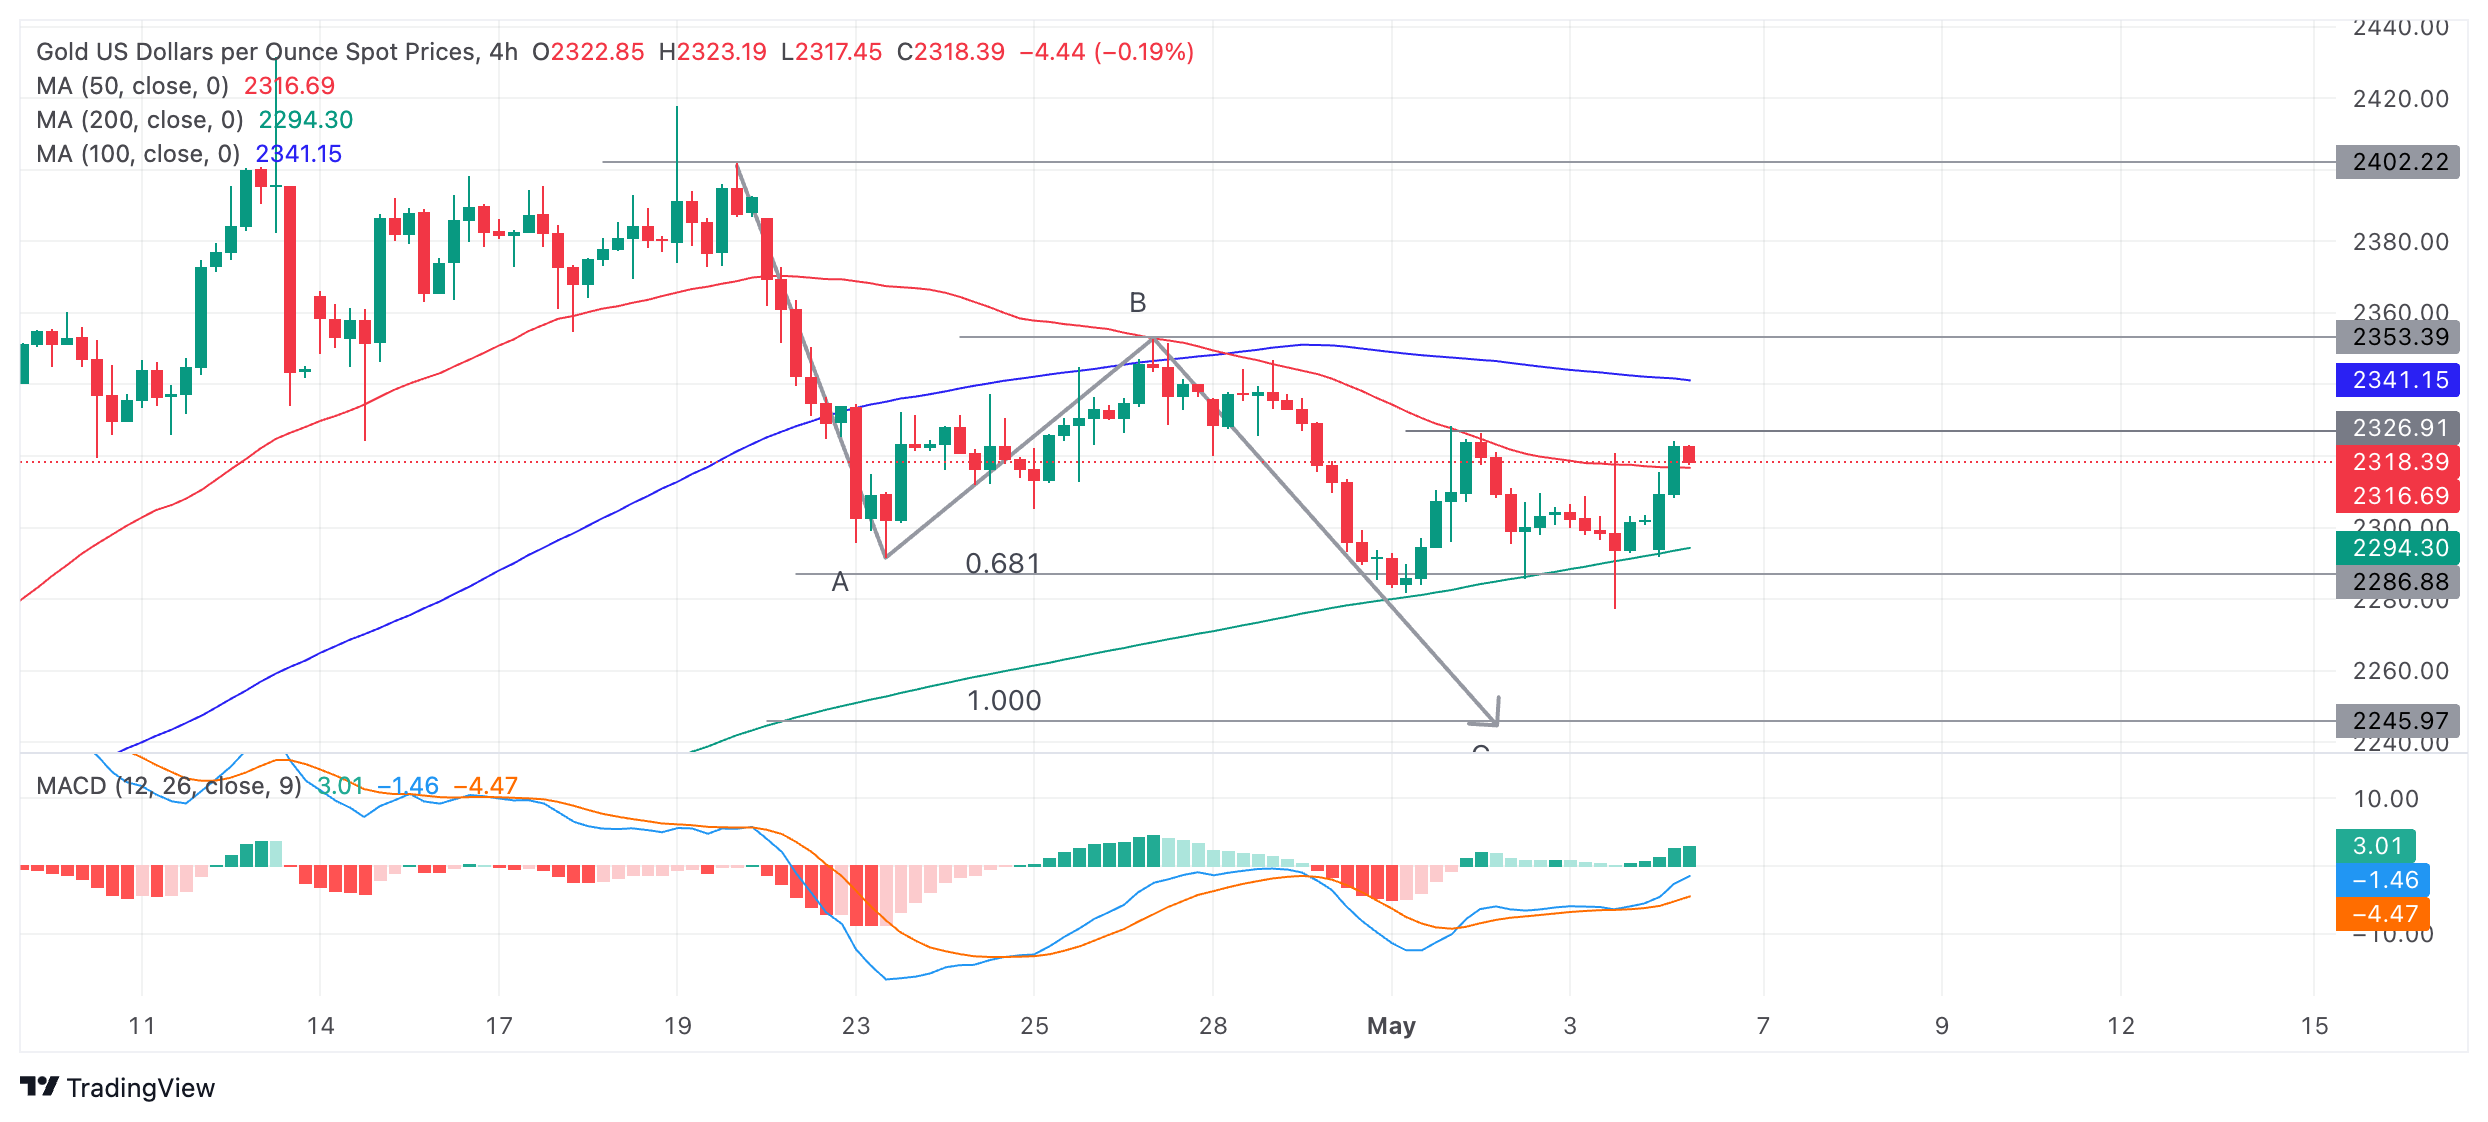
Price could potentially pull back further and fall to the base of the range at around $2,280 or break out of the top of the range and start moving towards resistance at $2,353, which aligns with the top of the late April swing high and top of wave B.
A decisive break out of the top of the range would signal a likely move up to a conservative target at $2,353, (top of wave B) and the 0.681 Fibonacci extension of the height of the range extrapolated higher. In a bullish case, it could even possibly make it to $2,370.
A decisive break would be one characterized by a longer-than-average green candlestick that pierces above the range ceiling, and closes near its high; or three green candlesticks in a row that pierce above the respective level.
Unfinished Measured Move
Gold price is potentially unfolding a bearish Measured Move price pattern which began on April 19.
Measured Moves are zig-zag type patterns composed of three waves labeled A, B and C, with C usually equalling A or a Fibonnaci 0.681 of A. Price has fallen to the conservative estimate for wave C at $2,286, the Fibonacci 0.681 of wave A.
Wave C could still go lower and reach the 100% extrapolation of A at $2,245 (1.000 or where A=C). Such a move would be confirmed by a decisive break below the range and the May 3 low at $2,277.
The trend for Gold price is up on both the medium and long-term charts (daily and weekly), overall supporting the outlook on lower time frames.
Gold FAQs
Gold has played a key role in human’s history as it has been widely used as a store of value and medium of exchange. Currently, apart from its shine and usage for jewelry, the precious metal is widely seen as a safe-haven asset, meaning that it is considered a good investment during turbulent times. Gold is also widely seen as a hedge against inflation and against depreciating currencies as it doesn’t rely on any specific issuer or government.
Central banks are the biggest Gold holders. In their aim to support their currencies in turbulent times, central banks tend to diversify their reserves and buy Gold to improve the perceived strength of the economy and the currency. High Gold reserves can be a source of trust for a country’s solvency. Central banks added 1,136 tonnes of Gold worth around $70 billion to their reserves in 2022, according to data from the World Gold Council. This is the highest yearly purchase since records began. Central banks from emerging economies such as China, India and Turkey are quickly increasing their Gold reserves.
Gold has an inverse correlation with the US Dollar and US Treasuries, which are both major reserve and safe-haven assets. When the Dollar depreciates, Gold tends to rise, enabling investors and central banks to diversify their assets in turbulent times. Gold is also inversely correlated with risk assets. A rally in the stock market tends to weaken Gold price, while sell-offs in riskier markets tend to favor the precious metal.
The price can move due to a wide range of factors. Geopolitical instability or fears of a deep recession can quickly make Gold price escalate due to its safe-haven status. As a yield-less asset, Gold tends to rise with lower interest rates, while higher cost of money usually weighs down on the yellow metal. Still, most moves depend on how the US Dollar (USD) behaves as the asset is priced in dollars (XAU/USD). A strong Dollar tends to keep the price of Gold controlled, whereas a weaker Dollar is likely to push Gold prices up.
- AUD/JPY gains ground due to hawkish sentiment surrounding the RBA.
- RBA is expected to maintain the cash rate at a 12-year high of 4.35% on Tuesday.
- Japanese markets are closed on Monday due to a national holiday, with the potential for intervention by Japanese authorities.
AUD/JPY continues to gain ground, trading around 101.90 during the European trading hours on Monday, buoyed by a hawkish sentiment surrounding the Reserve Bank of Australia (RBA). This investor sentiment bolsters the strength of the Aussie Dollar, providing support to the AUD/JPY cross.
The Australian central bank is widely expected to maintain the cash rate at a 12-year high of 4.35% in its upcoming Tuesday meeting. However, there are anticipations that it might reintroduce a soft tightening bias, especially following last week's inflation data, which surpassed expectations, as reported by The Australian Financial Review.
Australia's inflation declined in the first quarter, marking the fifth consecutive quarter of slowing, although it exceeded forecasts. Additionally, the country's monthly CPI indicator accelerated in March, contrary to market expectations of no change.
On Monday, the Japanese market is closed due to a national holiday, with intervention risks lingering. Last week, the Japanese Yen (JPY) appreciated amidst potential government intervention by Japanese authorities. Reuters reported that data from the Bank of Japan (BoJ) indicated that Japanese authorities may have allocated approximately ¥6.0 trillion on April 29 and ¥3.66 trillion on May 1 to reinforce the JPY.
The perceived market intervention by Japanese authorities provided only temporary relief, as the underlying market fundamentals continue to weigh bearishly on the Japanese Yen. Throughout this year, the JPY has faced pressure due to the Bank of Japan maintaining ultra-low interest rates despite elevated borrowing costs abroad. Consequently, traders have been incentivized to borrow the domestic currency and invest in higher-yielding foreign currencies.
- The Mexican Peso edges up on Monday as the market mood remains positive following US and Chinese data.
- The Mexican economy continues to expand despite restrictive monetary policy – a positive for the Peso.
- Technically, the USD/MXN is trading along the floor of a sideways range in the short-term.
The Mexican Peso (MXN) trades marginally higher on Monday, supported by a rise in risk appetite after lower-than-expected US jobs’ data raised hopes the Federal Reserve (Fed) will move to cut interest rates, reducing borrowing costs for businesses and consumers.
The positive market mood continued into the Asian session on Monday on the back of Chinese data, further supporting the Peso which appreciates in risk-on environments.
USD/MXN is trading at 16.95, EUR/MXN at 18.24 and GBP/MXN at 21.29, at the time of publication.
Mexican Peso trades higher as market mood remains upbeat
The Mexican Peso edges higher on Monday as Asian stock markets rally after the release of the China Caixin Services PMI data shows continued expansion, and following weak US jobs data on Friday, which increased hopes interest rates might fall. In Japan the Nikkei closed 0.93% higher, China’s Shanghai Composite trades 1.16% higher at time of writing and the Hang Seng is up 0.53%.
Mexican data surprisingly good
In Mexico, the flow of recent economic data continues to point to an economy that is performing surprisingly well under the yoke of the historically high interest rates imposed by the Bank of Mexico (Banxico) to curb inflation.
Although the GDP growth rate in Mexico was lower on a yearly basis in Q1 it rose 0.2% quarter-on-quarter; April’s Manufacturing PMI remained in expansive territory; Business Confidence in April edged lower but not by much, and Gross Fixed Investment in February beat expectations.
Additionally, in a recent poll, a majority of private analysts expected inflation to rise to 4.20% in 2024, which was up from the March estimate of 4.10%, revealed Banxico.
The data points to Banxico likely keeping interest rates at their elevated 11.0% for now, which supports the Peso since it boosts foreign capital inflows.
Technical Analysis: USD/MXN lies on the floor of short-term range
USD/MXN – the cost of one US Dollar in Mexican Pesos – is still range bound and trending sideways in the short-term. The pair has been oscillating between a floor at 16.86 and a ceiling at 17.40 since the April 19 blow off.
USD/MXN 4-hour Chart
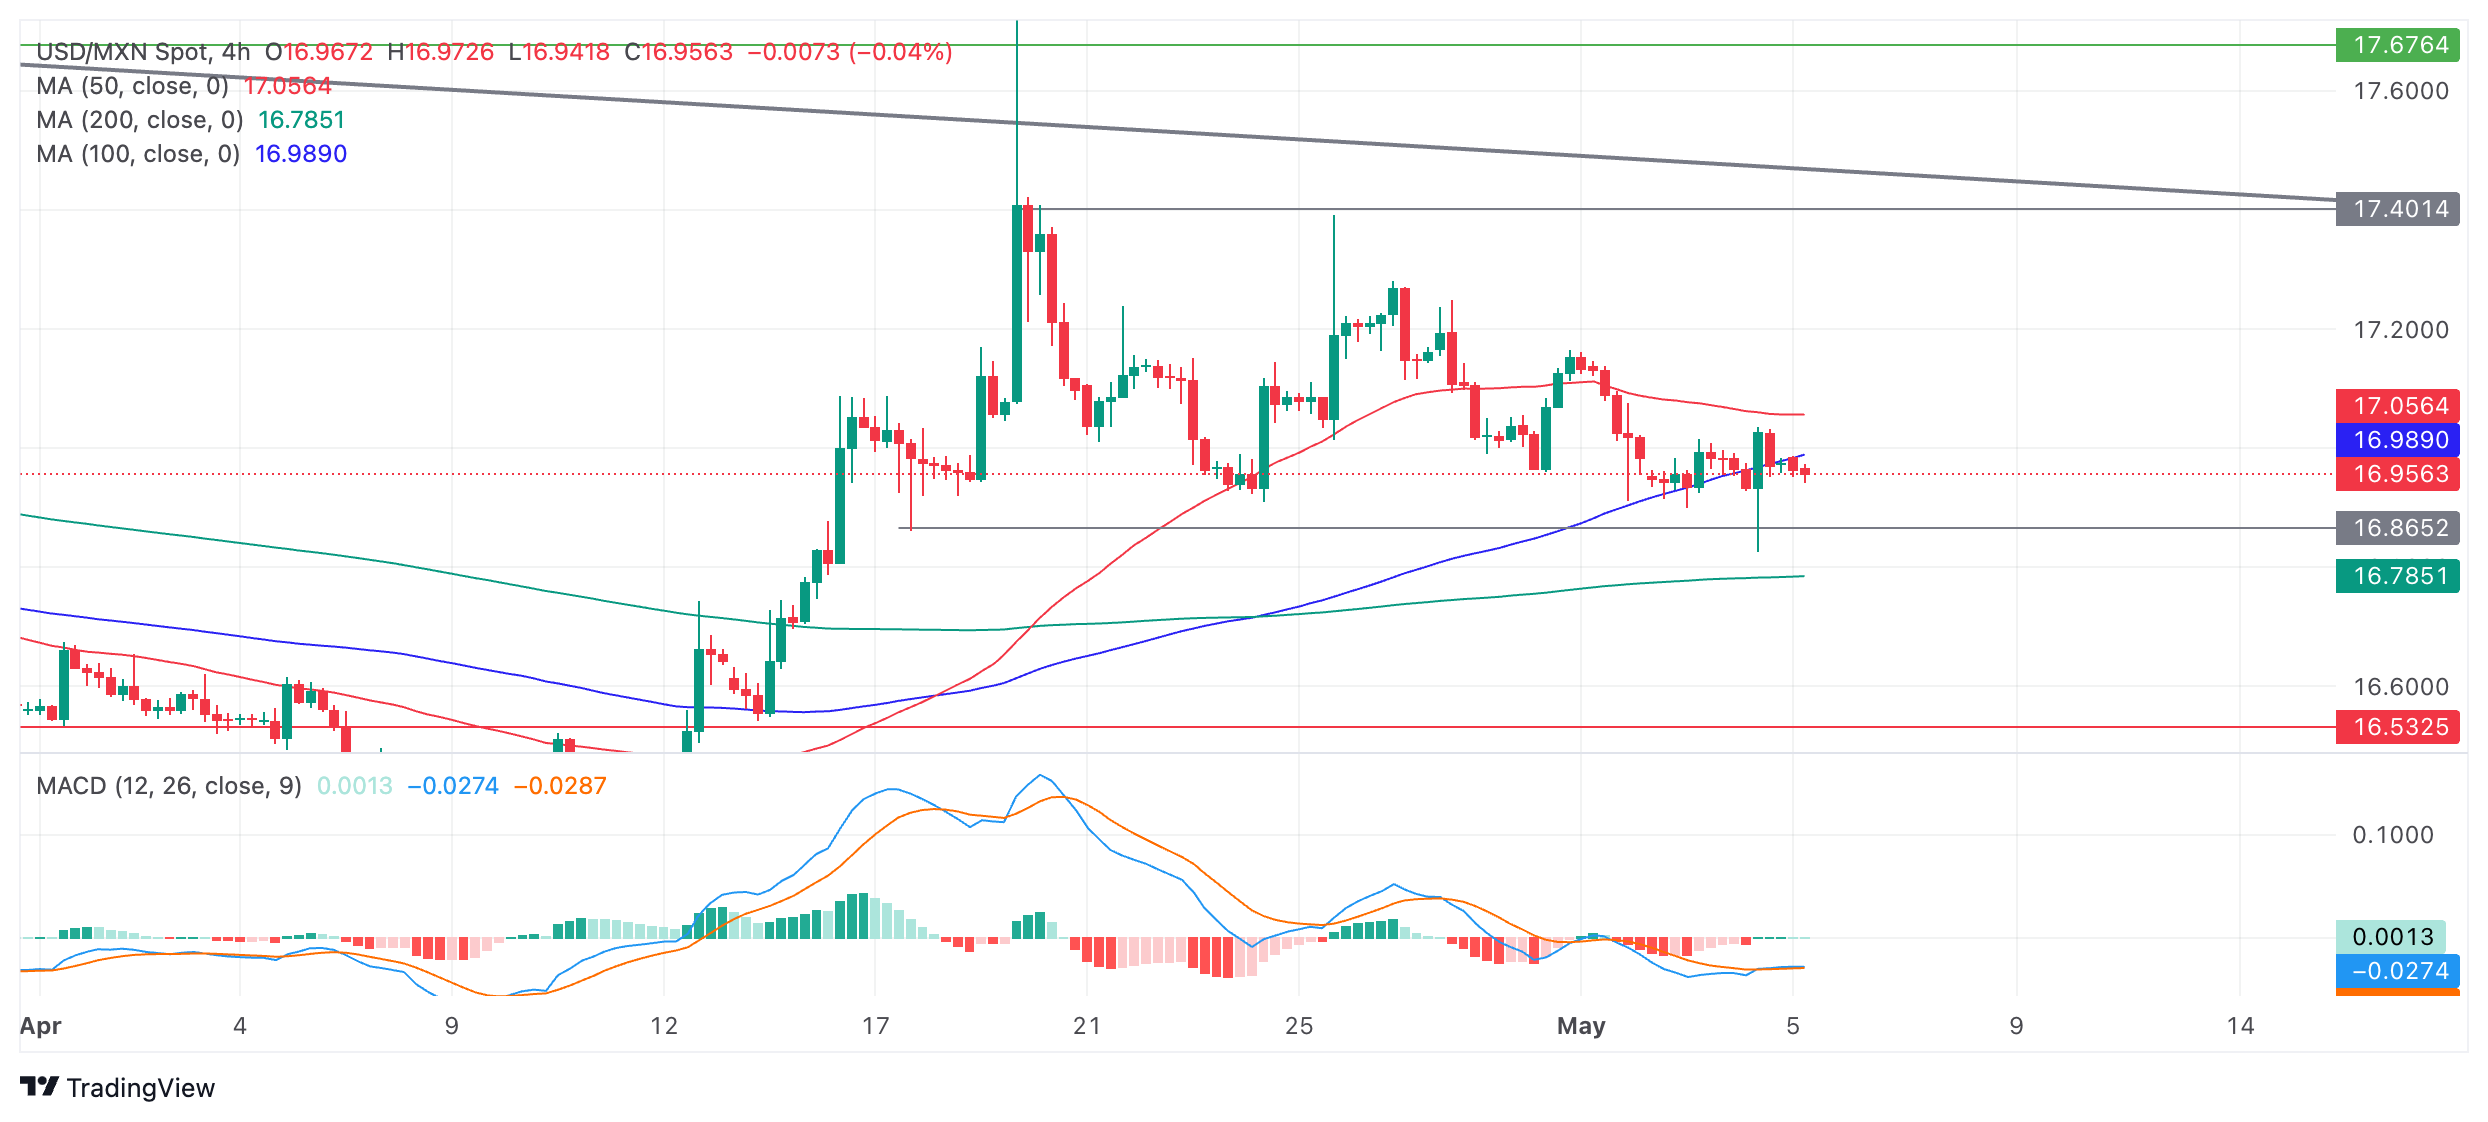
Given the old trading maxim, the “trend is your friend”, the short-term trend is expected to continue until the weight of evidence proves otherwise. Although USD/MXN made an attempt to break out of its range on Friday, bearish pressure was insufficient to push through and prices recovered back inside the range. There is a slight bearish bias, however, given the medium and long-term trends are bearish and these bigger currents influence the shorter-term perspective.
The Moving Average Convergence Divergence (MACD) indicator has crossed above its signal line, offering a buy signal which could suggest the pair is about to start rising back up within its range.
More upside could take the USD/MXN up to the 50 Simple Moving Average (SMA) on the 4-hour chart at 17.06, followed by the lower high at 17.15. A clear break above the zone of resistance around 17.15-17.18 might see further gains up towards the range highs again.
A decisive breakout of the range – either below the floor at 16.86, or the ceiling at 17.40 – would change the directional bias of the pair.
A break below the floor could see further downside to a target at 16.50, followed by the April 9 low at 16.26.
On the other side, a break above the top would activate an upside target first at 17.67, piercing a long-term trendline and then possibly reaching a further target at around 18.15.
A decisive break would be one characterized by a longer-than-average green or red daily candlestick that pierces above or below the range high or low, and that closes near its high or low for the period; or three green/red candlesticks in a row that pierce above/below the respective levels.
Mexican Peso FAQs
The Mexican Peso (MXN) is the most traded currency among its Latin American peers. Its value is broadly determined by the performance of the Mexican economy, the country’s central bank’s policy, the amount of foreign investment in the country and even the levels of remittances sent by Mexicans who live abroad, particularly in the United States. Geopolitical trends can also move MXN: for example, the process of nearshoring – or the decision by some firms to relocate manufacturing capacity and supply chains closer to their home countries – is also seen as a catalyst for the Mexican currency as the country is considered a key manufacturing hub in the American continent. Another catalyst for MXN is Oil prices as Mexico is a key exporter of the commodity.
The main objective of Mexico’s central bank, also known as Banxico, is to maintain inflation at low and stable levels (at or close to its target of 3%, the midpoint in a tolerance band of between 2% and 4%). To this end, the bank sets an appropriate level of interest rates. When inflation is too high, Banxico will attempt to tame it by raising interest rates, making it more expensive for households and businesses to borrow money, thus cooling demand and the overall economy. Higher interest rates are generally positive for the Mexican Peso (MXN) as they lead to higher yields, making the country a more attractive place for investors. On the contrary, lower interest rates tend to weaken MXN.
Macroeconomic data releases are key to assess the state of the economy and can have an impact on the Mexican Peso (MXN) valuation. A strong Mexican economy, based on high economic growth, low unemployment and high confidence is good for MXN. Not only does it attract more foreign investment but it may encourage the Bank of Mexico (Banxico) to increase interest rates, particularly if this strength comes together with elevated inflation. However, if economic data is weak, MXN is likely to depreciate.
As an emerging-market currency, the Mexican Peso (MXN) tends to strive during risk-on periods, or when investors perceive that broader market risks are low and thus are eager to engage with investments that carry a higher risk. Conversely, MXN tends to weaken at times of market turbulence or economic uncertainty as investors tend to sell higher-risk assets and flee to the more-stable safe havens.
- USD/CHF encounters challenges amid renewed expectations for rate cuts by the Fed in 2024.
- Fed is anticipated to execute its initial rate cut in September, against the earlier forecasts in November.
- SNB Chairman Thomas Jordan may offer fresh cues on policy stance during the BIS Innovation Summit 2024.
USD/CHF continues its losing streak for the fourth successive day on Monday, trading around 0.9050 during the European hours. The weaker US Dollar (USD) puts pressure on the USD/CHF pair, which could be attributed to the revived expectations for potential interest rate cuts by the US Federal Reserve (Fed) later this year. This sentiment is derived from the softer-than-expected US jobs data released on Friday.
On Friday, US Nonfarm Payrolls data showed that the United States (US) economy added 175,000 new jobs in April, falling short of the estimated 243,000 and indicating a notable deceleration from March's addition of 315,000 jobs. Additionally, Average Hourly Earnings (YoY) rose by 3.9% in April, slightly below the anticipated 4.0% and the 4.1% prior. Meanwhile, monthly growth stood at 0.2%, compared to the expected 0.3%.
The Federal Reserve (Fed) is expected to implement its first rate cut in September, diverging from previous forecasts indicating November. According to the CME FedWatch Tool, the probability of a 25 basis points (bps) rate reduction by the Fed during September's meeting has increased to 48.8%, up from 43.8% just a week ago.
On the Swiss side, data released on Thursday showed that annual inflation in Switzerland accelerated more rapidly than expected in April. The Swiss Consumer Price Index (CPI) inflation rose to 1.4% year-on-year in April from a previous increase of 1.0% in March, surpassing the market consensus of 1.1%. This unexpected acceleration has lent support to the Swiss Franc (CHF).
Looking ahead to Monday, traders are anticipated to closely monitor a speech by Swiss National Bank (SNB) Chairman Thomas Jordan at the SNB's Project Helvetia III during the BIS Innovation Summit 2024 in Basel. Jordan's remarks may offer fresh insights into the economy and policy direction.
- The Pound Sterling juggles in a tight range around 1.2550 against the US Dollar as investors shift focus to the BoE policy decision.
- The BoE could provide meaningful cues on the timing of rate cuts amid easing price pressures.
- Slower US job growth and a contraction in the Services PMI have raised concerns over the economic outlook.
The Pound Sterling (GBP) is stuck in a tight range around 1.2550 against the US Dollar (USD) in Monday’s London session. The GBP/USD pair is expected to remain less volatile and will be guided by the market sentiment as the United Kingdom markets are closed on account of Early May.
The GBP/USD struggles for a direction as the US Dollar consolidates in the aftermath of United States Nonfarm Payrolls (NFP) and the ISM Services Purchasing Managers Index (PMI) data for April. The US Dollar Index (DXY), which tracks the US Dollar’s value against six major currencies, trades sideways above 105.00.
The overall data indicated that the US economy is losing strength: fewer jobs were added, the Unemployment Rate rose to 3.9%, wage growth slowed, and the ISM Services PMI fell below the 50.0 threshold – the level that separates expansion from contraction – to the lowest reading since December 2022.
Despite the downbeat overall picture presented by Friday’s data, investors didn’t bring forward Federal Reserve (Fed) rate cut bets from September as the ISM Prices Paid subindex for the service sector rose significantly to 59.4 from 53.4 in March. High Prices Paid for service sector inputs renewed fears of inflation remaining higher, which is expected to allow the Fed to emphasize maintaining interest rates restrictive for a longer period. Respondents to the ISM survey said: “Inflation is raising our unit cost on products and services when compared to last year’s expenditures.”
Daily digest market movers: Pound Sterling follows US Dollar’s footprints
- The Pound Sterling consolidates in a tight range around 1.2550 as investors shift focus to the Bank of England’s (BoE) interest rate decision, which will be announced on Thursday. The BoE is widely anticipated to hold interest rates steady at 5.25% for the sixth time in a row. Therefore, investors will keenly focus on the BoE’s guidance on interest rates.
- The recent commentary from BoE Governor Andrew Bailey indicated that he is confident that headline inflation will return to the desired rate of 2% in April. This suggests that the central bank could deliver a slightly dovish commentary on the interest rate outlook and provide a concrete timeframe for starting to reduce interest rates.
- Reuters shows that financial markets anticipate the BoE reducing interest rates from the September meeting. Traders have also priced in one more rate cut by year-end. The speculation for only two rate cuts is significantly lower than the six anticipated at the start of the year. Andrew Baily also commented in the last press conference after the bank’s policy decision that market expectations for two or three rate cuts this year are not unreasonable.
- However, a few BoE policymakers are still worried about stubborn wage growth feeding service inflation. UK Average Earnings excluding bonus are at 6.0%, almost double what the BoE views as required to be consistent for bringing inflation down sustainably to the desired rate of 2%.
- Investors will also focus on how many BoE policymakers will join Swati Dhingra and vote to pivot to interest rate cuts. It is expected that BoE Deputy Governor Dave Ramsden could change its stance from neutral to dovish on interest rates. Investors’ confidence in Ramsden turning dovish escalated after he commented last month that risks of inflation remaining higher have receded. He also pointed out that inflation will not rebound again after returning to 2%, contrary to prior expectations that price pressure could revamp again.
Technical Analysis: Pound Sterling trades back and forth near 1.2550
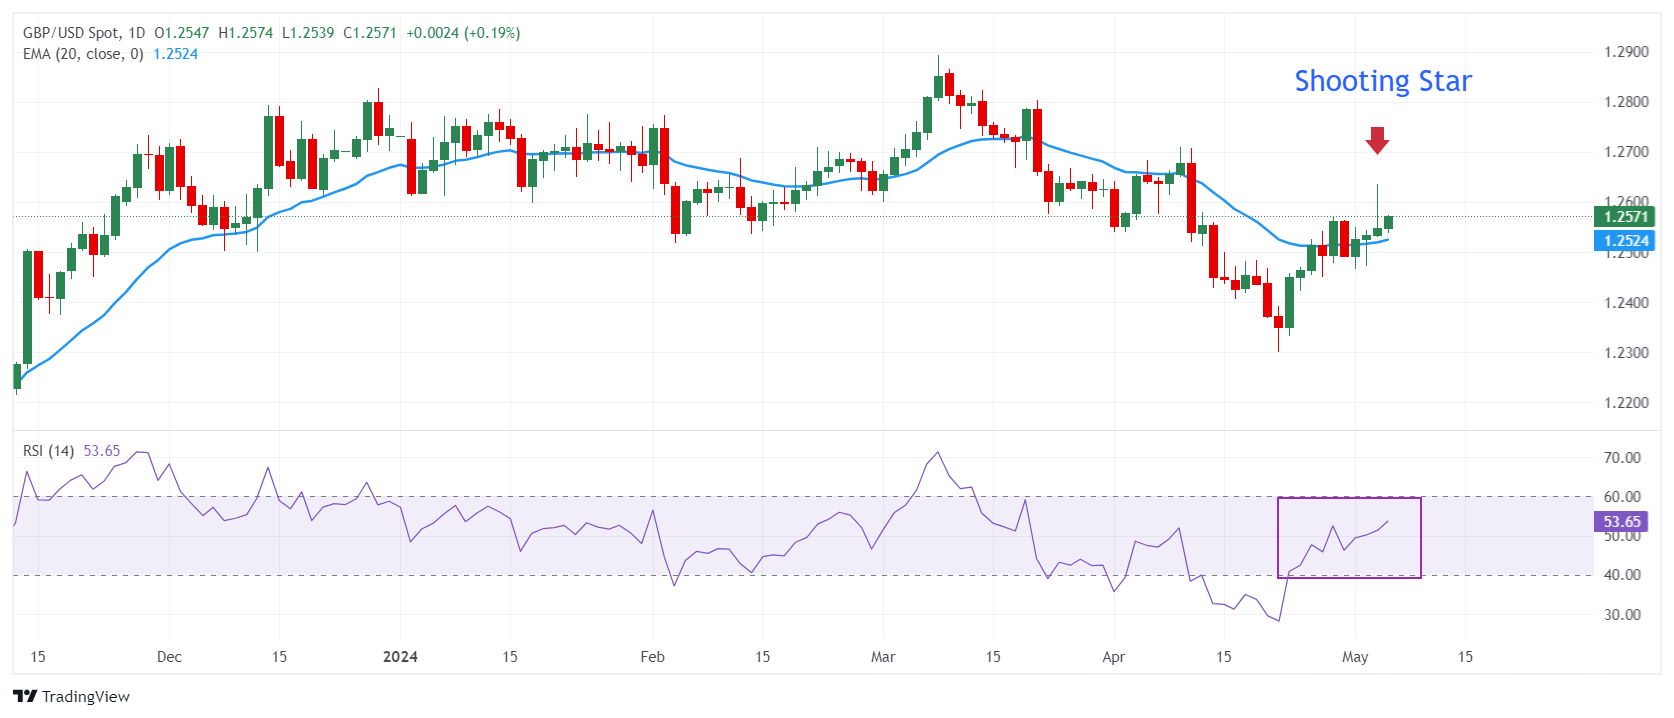
The Pound Sterling trades inside Friday’s trading range during Monday’s European session. The GBP/USD pair formed a Shooting Star candlestick pattern on a daily timeframe on Friday as it reversed its initial gains after the US Services PMI Prices Paid rose significantly. The above-mentioned candlestick is a bearish reversal pattern and its formation near the crucial resistance of 1.2500-1.2600 adds to its strength.
A breakdown of the Shooting Star pattern would trigger if the air breaks below Friday’s low of 1.2522. The near-term outlook of the Cable is still positive as it is trading above the 20-day Exponential Moving Average (EMA), which trades around 1.2520.
The 14-period Relative Strength Index (RSI) oscillates in the 40.00-60.00 range, suggesting indecisiveness among market participants.
Pound Sterling FAQs
The Pound Sterling (GBP) is the oldest currency in the world (886 AD) and the official currency of the United Kingdom. It is the fourth most traded unit for foreign exchange (FX) in the world, accounting for 12% of all transactions, averaging $630 billion a day, according to 2022 data. Its key trading pairs are GBP/USD, aka ‘Cable’, which accounts for 11% of FX, GBP/JPY, or the ‘Dragon’ as it is known by traders (3%), and EUR/GBP (2%). The Pound Sterling is issued by the Bank of England (BoE).
The single most important factor influencing the value of the Pound Sterling is monetary policy decided by the Bank of England. The BoE bases its decisions on whether it has achieved its primary goal of “price stability” – a steady inflation rate of around 2%. Its primary tool for achieving this is the adjustment of interest rates. When inflation is too high, the BoE will try to rein it in by raising interest rates, making it more expensive for people and businesses to access credit. This is generally positive for GBP, as higher interest rates make the UK a more attractive place for global investors to park their money. When inflation falls too low it is a sign economic growth is slowing. In this scenario, the BoE will consider lowering interest rates to cheapen credit so businesses will borrow more to invest in growth-generating projects.
Data releases gauge the health of the economy and can impact the value of the Pound Sterling. Indicators such as GDP, Manufacturing and Services PMIs, and employment can all influence the direction of the GBP. A strong economy is good for Sterling. Not only does it attract more foreign investment but it may encourage the BoE to put up interest rates, which will directly strengthen GBP. Otherwise, if economic data is weak, the Pound Sterling is likely to fall.
Another significant data release for the Pound Sterling is the Trade Balance. This indicator measures the difference between what a country earns from its exports and what it spends on imports over a given period. If a country produces highly sought-after exports, its currency will benefit purely from the extra demand created from foreign buyers seeking to purchase these goods. Therefore, a positive net Trade Balance strengthens a currency and vice versa for a negative balance.
Gold prices rose in India on Monday, according to data from India's Multi Commodity Exchange (MCX).
Gold price stood at 71,326 Indian Rupees (INR) per 10 grams, up INR 420 compared with the INR 70,906 it cost on Friday.
As for futures contracts, Gold prices increased to INR 71,189 per 10 gms from INR 70,646 per 10 gms.
Prices for Silver futures contracts increased to INR 82,308 per kg from INR 81,026 per kg.
| Major Indian city | Gold Price |
|---|---|
| Ahmedabad | 73,850 |
| Mumbai | 73,640 |
| New Delhi | 73,785 |
| Chennai | 73,800 |
| Kolkata | 73,840 |
Global Market Movers: Comex Gold price recovers some lost ground amid downbeat US data
- The US Nonfarm Payrolls (NFP) rose by 175K in April from 315K in March (revised from 303K), missing the market expectation of 243K.
- The Unemployment Rate rose to 3.9% in April from 3.8% in the previous reading, while the Average Hourly Earnings dropped to 3.9% YoY in April from 4.1% in March.
- The US ISM Services PMI slipped into contractionary territory, falling from 51.4 in March to 49.4 in April, below the market estimate of 52.0.
- Fed Governor Michelle Bowman cautioned that there is a real risk that inflation could remain elevated for much longer than many are expecting, adding that she’s willing to hike rates if inflation stalls or reverses.
- Chicago Fed Austan Goolsbee stated that the latest US employment report was solid, emphasizing that current monetary policy is restrictive.
- Fed easing expectations have adjusted, with the odds of a September rate cut rising to nearly 90%, up from 55% ahead of the NFP report, according to the CME FedWatch tool.
Gold FAQs
Gold has played a key role in human’s history as it has been widely used as a store of value and medium of exchange. Currently, apart from its shine and usage for jewelry, the precious metal is widely seen as a safe-haven asset, meaning that it is considered a good investment during turbulent times. Gold is also widely seen as a hedge against inflation and against depreciating currencies as it doesn’t rely on any specific issuer or government.
Central banks are the biggest Gold holders. In their aim to support their currencies in turbulent times, central banks tend to diversify their reserves and buy Gold to improve the perceived strength of the economy and the currency. High Gold reserves can be a source of trust for a country’s solvency. Central banks added 1,136 tonnes of Gold worth around $70 billion to their reserves in 2022, according to data from the World Gold Council. This is the highest yearly purchase since records began. Central banks from emerging economies such as China, India and Turkey are quickly increasing their Gold reserves.
Gold has an inverse correlation with the US Dollar and US Treasuries, which are both major reserve and safe-haven assets. When the Dollar depreciates, Gold tends to rise, enabling investors and central banks to diversify their assets in turbulent times. Gold is also inversely correlated with risk assets. A rally in the stock market tends to weaken Gold price, while sell-offs in riskier markets tend to favor the precious metal.
The price can move due to a wide range of factors. Geopolitical instability or fears of a deep recession can quickly make Gold price escalate due to its safe-haven status. As a yield-less asset, Gold tends to rise with lower interest rates, while higher cost of money usually weighs down on the yellow metal. Still, most moves depend on how the US Dollar (USD) behaves as the asset is priced in dollars (XAU/USD). A strong Dollar tends to keep the price of Gold controlled, whereas a weaker Dollar is likely to push Gold prices up.
- USD/JPY could receive pressure due to revived expectations for the Fed’s interest rate cuts in 2024.
- US Nonfarm Payrolls reported fresh 175K jobs were added in April, lower than the estimated 243K.
- Japanese markets are closed on Monday due to a national holiday, with the possibility of intervention by authorities still present.
USD/JPY snaps its three-day losing streak on Monday, trading around 153.70 during the early European hours. This decline in the USD/JPY pair could be attributed to the rebound in the US Dollar (USD).
The US Dollar Index (DXY), which gauges the performance of the US Dollar (USD) against six major currencies, hovers around 105.10, by the press time. The lower US Treasury yields could limit the advance of the Greenback.
However, the US Dollar struggled due to softer-than-expected US jobs data released on Friday. This development revived hopes for potential interest rate cuts by the US Federal Reserve (Fed) later this year. The prevalent risk appetite may continue this week following Fed Chair Jerome Powell's relatively dovish stance on the monetary policy outlook during Wednesday's session.
Federal Reserve Bank of Chicago President Austan Goolsbee, speaking to Bloomberg TV on Friday, characterized the April labor market data as robust. Goolsbee stressed the importance of the Fed to evaluate its commitment to reducing inflation. He highlighted that if the Fed persists with a restrictive stance for an extended period, it will have to consider the employment aspect of its mandate.
In Japan, markets are closed on Monday due to a national holiday, with intervention risks lingering. Last week, the Japanese Yen (JPY) appreciated amidst potential government intervention by Japanese authorities. Reuters reported that data from the Bank of Japan (BoJ) indicated that Japanese authorities may have allocated approximately ¥6.0 trillion on April 29 and ¥3.66 trillion on May 1 to reinforce the JPY.
FX option expiries for May 6 NY cut at 10:00 Eastern Time, via DTCC, can be found below
- EUR/USD: EUR amounts
- 1.0650 975m
- 1.0700 1.2b
- 1.0715 461m
- 1.0750 1.3b
- 1.0800 825m
- GBP/USD: GBP amounts
- 1.2535 322m
- USD/JPY: USD amounts
- 153.00 1.2b
- 154.00 1.7b
- 155.40 500m
- USD/CHF: USD amounts
- 0.9200 722m
- AUD/USD: AUD amounts
- 0.6500 624m
- 0.6540 492m
- 0.6600 489m
- 0.6610 502m
- 0.6625 1.7b
- USD/CAD: USD amounts
- 1.3900 1.0b
Silver prices (XAG/USD) rose on Monday, according to FXStreet data. Silver trades at $27.10 per troy ounce, up 2.04% from the $26.56 it cost on Friday.
Silver prices have increased by 6.40% since the beginning of the year.
| Unit measure | Today Price |
|---|---|
| Silver price per troy ounce | $27.10 |
| Silver price per gram | $0.87 |
The Gold/Silver ratio, which shows the number of troy ounces of Silver needed to equal the value of one troy ounce of Gold, stood at 85.48 on Monday, down from 86.67 on Friday.
Investors might use this ratio to determine the relative valuation of Gold and Silver. Some may consider a high ratio as an indicator that Silver is undervalued – or Gold is overvalued – and might buy Silver or sell Gold accordingly. Conversely, a low ratio might suggest that Gold is undervalued relative to Silver.
Silver FAQs
Silver is a precious metal highly traded among investors. It has been historically used as a store of value and a medium of exchange. Although less popular than Gold, traders may turn to Silver to diversify their investment portfolio, for its intrinsic value or as a potential hedge during high-inflation periods. Investors can buy physical Silver, in coins or in bars, or trade it through vehicles such as Exchange Traded Funds, which track its price on international markets.
Silver prices can move due to a wide range of factors. Geopolitical instability or fears of a deep recession can make Silver price escalate due to its safe-haven status, although to a lesser extent than Gold's. As a yieldless asset, Silver tends to rise with lower interest rates. Its moves also depend on how the US Dollar (USD) behaves as the asset is priced in dollars (XAG/USD). A strong Dollar tends to keep the price of Silver at bay, whereas a weaker Dollar is likely to propel prices up. Other factors such as investment demand, mining supply – Silver is much more abundant than Gold – and recycling rates can also affect prices.
Silver is widely used in industry, particularly in sectors such as electronics or solar energy, as it has one of the highest electric conductivity of all metals – more than Copper and Gold. A surge in demand can increase prices, while a decline tends to lower them. Dynamics in the US, Chinese and Indian economies can also contribute to price swings: for the US and particularly China, their big industrial sectors use Silver in various processes; in India, consumers’ demand for the precious metal for jewellery also plays a key role in setting prices.
Silver prices tend to follow Gold's moves. When Gold prices rise, Silver typically follows suit, as their status as safe-haven assets is similar. The Gold/Silver ratio, which shows the number of ounces of Silver needed to equal the value of one ounce of Gold, may help to determine the relative valuation between both metals. Some investors may consider a high ratio as an indicator that Silver is undervalued, or Gold is overvalued. On the contrary, a low ratio might suggest that Gold is undervalued relative to Silver.
- USD/CAD trades on a softer note around 1.3685 in Monday’s early European session.
- US NFP rose 175,000 in April from 315,000 in March; Unemployment Rate rose to 3.9% in April from 3.8% prior.
- BoC governor said it may soon cut rates as he is more confident that inflation is moving in the right direction.
The USD/CAD pair remains on the defensive near 1.3685 on Monday during the early European trading hours. The Canadian Dollar (CAD) edges higher amid the rise in crude oil prices, which creates a headwind for USD/CAD. The release of Canada’s Ivey Purchasing Managers Index (PMI) and employment data for April this week might offer some hints about the economic outlook and inflation trajectory in the Canadian economy. Apart from this, traders will monitor Fedspeak, with the Fed’s Thomas Barkin and John Williams set to speak later on Monday.
The downbeat US data on Friday raised the hope that a cooling labour market will prompt the Federal Reserve (Fed) to cut interest rates in September. The Labour Department reported that the US added 175,000 jobs in April from 315,000 in March (revised from 303,000). This figure came in weaker than the market, expectation of 243,000.
Furthermore, the Unemployment Rate climbed from 3.8% in March to 3.9% in April. The Average Hourly Earnings, wage inflation, declined to 3.9% YoY in April from 4.1% in the previous reading. Finally, ISM Services PMI fell to 49.4 in April from 51.4 in March, worse than the protection of 52.0. In response to the data, the Greenback faced some selling pressure across the board as markets expect the Fed to lower its borrowing costs twice this year instead of only once before the data. Financial markets have priced in nearly 68% odds of a September rate cut by the Fed, according to the CME Fedwatch tool.
On the Loonie front, Bank of Canada (BoC) governor Tiff Macklem said last week that the Canadian central bank is more confident that inflation is moving in the right direction and that it may soon be appropriate to begin lowering its borrowing costs. Nonetheless, he poured cold water on hopes that borrowing costs would decline rapidly.
Traders anticipate the BoC to start easing monetary policy at its next meeting in June, according to Refinitiv data. In the event that the Canadian central bank cuts interest rates before the Fed, this might weigh on the Canadian Dollar (CAD) and cap the pair’s downside. Meanwhile, the recovery of oil prices lifted the commodity-linked Loonie against its rivals, as Canada is the largest oil exporter to the United States (US).
Here is what you need to know on Monday, May 6:
The action in financial markets remains subdued at the start of the week. The US Dollar (USD) holds steady and US stock index futures trade little changed. HCOB will release revisions to April PMI data for Germany and the Eurozone on Monday and Eurostat will publish Producer Price Index figures for March. The US economic docket will not offer any high-tier data releases but investors will pay close attention to comments from Federal Reserve (Fed) policymakers.
US Dollar price in the last 7 days
The table below shows the percentage change of US Dollar (USD) against listed major currencies in the last 7 days. US Dollar was the weakest against the Japanese Yen.
| USD | EUR | GBP | CAD | AUD | JPY | NZD | CHF | |
| USD | -0.51% | -0.28% | 0.21% | -1.08% | -2.80% | -0.92% | -0.86% | |
| EUR | 0.51% | 0.23% | 0.72% | -0.57% | -2.25% | -0.40% | -0.33% | |
| GBP | 0.29% | -0.24% | 0.49% | -0.81% | -2.51% | -0.63% | -0.56% | |
| CAD | -0.21% | -0.75% | -0.49% | -1.30% | -3.01% | -1.13% | -1.07% | |
| AUD | 1.07% | 0.57% | 0.80% | 1.29% | -1.68% | 0.17% | 0.23% | |
| JPY | 2.71% | 2.22% | 2.44% | 2.90% | 1.62% | 1.80% | 1.88% | |
| NZD | 0.91% | 0.40% | 0.62% | 1.11% | -0.17% | -1.86% | 0.07% | |
| CHF | 0.85% | 0.34% | 0.56% | 1.05% | -0.23% | -1.92% | -0.07% |
The heat map shows percentage changes of major currencies against each other. The base currency is picked from the left column, while the quote currency is picked from the top row. For example, if you pick the Euro from the left column and move along the horizontal line to the Japanese Yen, the percentage change displayed in the box will represent EUR (base)/JPY (quote).
The USD Index (DXY) came under heavy selling pressure in the American session on Friday following the disappointing labor market data. Although the DXY managed to stage a late rebound, it lost nearly 1% for the week. Early Monday, the index moves sideways slightly above 105.00 and the benchmark 10-year US Treasury bond yield stays deep in negative territory near 4.5%.
AUD/USD gathered bullish momentum and reached its highest level since mid-March at 0.6650 on Friday. The pair retreated slightly at the beginning of the week but managed to stabilize above 0.6600. In the Asian trading hours on Tuesday, the Reserve Bank of Australia (RBA) will announce monetary policy decisions. The RBA is widely forecast to hold the policy rate unchanged at 4.35%.
Australian Dollar remains firmer due to improved risk appetite.
EUR/USD advanced to a fresh multi-week high above 1.0800 on Friday but erased a portion of its daily gains heading into the weekend. Nevertheless, the pair rose over 0.5% for the week. Early Monday, EUR/USD fluctuates in a tight channel above 1.0750.
After spiking above 1.2630 in the early American session on Friday, GBP/USD reversed its direction and closed the day at around 1.2550. The pair holds steady near its weekly closing level in the European morning.
USD/JPY lost more than 3% in the previous week and registered its largest one-week loss since late 2022, pressured by suspected fx interventions. The pair stages a rebound early Monday and was last seen rising more than 0.6% near 154.00.
Gold closed in negative territory for the second consecutive week but managed to hold above $2,300. XAU/USD edged higher in the European morning and was last seen trading above $2,310.
RBA FAQs
The Reserve Bank of Australia (RBA) sets interest rates and manages monetary policy for Australia. Decisions are made by a board of governors at 11 meetings a year and ad hoc emergency meetings as required. The RBA’s primary mandate is to maintain price stability, which means an inflation rate of 2-3%, but also “..to contribute to the stability of the currency, full employment, and the economic prosperity and welfare of the Australian people.” Its main tool for achieving this is by raising or lowering interest rates. Relatively high interest rates will strengthen the Australian Dollar (AUD) and vice versa. Other RBA tools include quantitative easing and tightening.
While inflation had always traditionally been thought of as a negative factor for currencies since it lowers the value of money in general, the opposite has actually been the case in modern times with the relaxation of cross-border capital controls. Moderately higher inflation now tends to lead central banks to put up their interest rates, which in turn has the effect of attracting more capital inflows from global investors seeking a lucrative place to keep their money. This increases demand for the local currency, which in the case of Australia is the Aussie Dollar.
Macroeconomic data gauges the health of an economy and can have an impact on the value of its currency. Investors prefer to invest their capital in economies that are safe and growing rather than precarious and shrinking. Greater capital inflows increase the aggregate demand and value of the domestic currency. Classic indicators, such as GDP, Manufacturing and Services PMIs, employment, and consumer sentiment surveys can influence AUD. A strong economy may encourage the Reserve Bank of Australia to put up interest rates, also supporting AUD.
Quantitative Easing (QE) is a tool used in extreme situations when lowering interest rates is not enough to restore the flow of credit in the economy. QE is the process by which the Reserve Bank of Australia (RBA) prints Australian Dollars (AUD) for the purpose of buying assets – usually government or corporate bonds – from financial institutions, thereby providing them with much-needed liquidity. QE usually results in a weaker AUD.
Quantitative tightening (QT) is the reverse of QE. It is undertaken after QE when an economic recovery is underway and inflation starts rising. Whilst in QE the Reserve Bank of Australia (RBA) purchases government and corporate bonds from financial institutions to provide them with liquidity, in QT the RBA stops buying more assets, and stops reinvesting the principal maturing on the bonds it already holds. It would be positive (or bullish) for the Australian Dollar.
- GBP/USD extends its gains due to revived expectations for the Fed’s interest rate cuts in 2024.
- US Nonfarm Payrolls reported fresh 175K jobs were added in April, lower than the estimated 243K.
- BoE is expected to keep current rates at 5.25% on Thursday due to concerns about robust wage growth in the UK.
GBP/USD continues its winning streak for the fourth consecutive day, trading around 1.2550 during the Asian trading hours on Monday. The appreciation of the GBP/USD pair could be attributed to the recalibrated expectations for the Federal Reserve’s (Fed) interest rate cuts in 2024 following the release of lower-than-expected jobs data from the United States (US).
On Friday, US Nonfarm Payrolls showed that the United States (US) economy added 175,000 jobs in April, lower than the estimated 243,000, signaling a significant slowdown from March's addition of 315,000 jobs. Additionally, Average Hourly Earnings (YoY) increased by 3.9% in April, slightly lower than expected at 4.0% and 4.1% prior. In the meantime, the monthly growth was at 0.2%, slightly falling short of the expected 0.3%.
The Federal Reserve is now anticipated to enact its initial cut in September, a shift from earlier projections pointing toward November. As per the CME FedWatch Tool, the likelihood of a 25 basis points (bps) rate reduction by the Fed during September's meeting has risen to 48.8%, up from 43.8% a week ago.
Across the pond, the Bank of England (BoE) is expected to maintain rates unchanged at 5.25% during Thursday's meeting. Investor sentiment regarding interest rate cuts by the BoE has been postponed to September, as investors express concerns about robust wage growth in the United Kingdom (UK), which is fueling core inflation, the central bank's preferred inflation measure.
In April, BoE Governor Andrew Bailey conveyed optimism as the UK's inflation appeared to be on track to meet the 2% target. The inflation rate dropped to 3.2% in March, marking the lowest rate since September 2021.
- NZD/USD snaps its winning streak due to a rebound in the US Dollar.
- The US Dollar struggled due to softer-than-expected US jobs data revived hopes for the Fed’s interest rate cuts later this year.
- RBNZ signaled to delay any shift toward monetary easing until 2025 due to higher inflation in Q1.
The NZD/USD pair experienced a slight decline after three consecutive days of gains, trading around 0.6000 during the Asian session on Monday. This decline in the pair could be attributed to the rebound in the US Dollar (USD).
The US Dollar Index (DXY), which gauges the performance of the US Dollar (USD) against six major currencies, hovers around 105.20, by the press time. The lower US Treasury yields could limit the advance of the Greenback.
However, the US Dollar struggled due to softer-than-expected US jobs data released on Friday. This development revived hopes for potential interest rate cuts by the US Federal Reserve (Fed) later this year. The prevalent risk appetite may continue this week following Fed Chair Jerome Powell's relatively dovish stance on the monetary policy outlook during Wednesday's session.
On the Kiwi’s side, China's Caixin Services Purchasing Managers' Index (PMI), slightly decreased to 52.5 in April, from 52.7 in March, aligning with expectations. However, it has marked the 16th consecutive month of growth in services activity. This has the potential to boost New Zealand's market, considering its status as one of the largest exporters to China.
Last week, the Reserve Bank of New Zealand (RBNZ) signaled its intention to delay any shift toward monetary easing until 2025, citing higher-than-expected inflation pressures in the first quarter. This stance may continue to provide support for the New Zealand Dollar (NZD), underpinning the NZD/USD pair.
- Gold price attracts some buyers amid the softer USD on Monday.
- The growing expectations that the Fed will start cutting interest rates later in the year lifted the yellow metal.
- The easing Middle East tensions and risk-on mood might cap the gold’s upside.
Gold price (XAU/USD) snaps the two-day losing streak during the Asian session on Monday. The weaker-than-expected US employment reports have boosted the odds of a September rate cut from the US Federal Reserve (Fed). This, in turn, has dragged the US Dollar (USD) lower and lifted the USD-denominated gold. It’s worth noting that a lower interest rate can decrease the opportunity cost of investing in gold, leading to higher demand and price.
On the other hand, the easing fear of geopolitical tensions in the Middle East, particularly the Iran-Israel conflict and the risk-on environment might undermine demand for safe-haven assets and cap the yellow metal’s upside. Gold traders will keep an eye on Fedspeak this week. Fed’s Thomas Barkin and John Williams are set to speak on Monday. The dovish message from Fed officials might further boost the XAU/USD.
Daily Digest Market Movers: Gold price recovers some lost ground amid downbeat US data
- The US Nonfarm Payrolls (NFP) rose by 175K in April from 315K in March (revised from 303K), missing the market expectation of 243K.
- The Unemployment Rate rose to 3.9% in April from 3.8% in the previous reading, while the Average Hourly Earnings dropped to 3.9% YoY in April from 4.1% in March.
- The US ISM Services PMI slipped into contractionary territory, falling from 51.4 in March to 49.4 in April, below the market estimate of 52.0.
- Fed Governor Michelle Bowman cautioned that there is a real risk that inflation could remain elevated for much longer than many are expecting, adding that she’s willing to hike rates if inflation stalls or reverses.
- Chicago Fed Austan Goolsbee stated that the latest US employment report was solid, emphasizing that current monetary policy is restrictive.
- Fed easing expectations have adjusted, with the odds of a September rate cut rising to nearly 90%, up from 55% ahead of the NFP report, according to the CME FedWatch tool.
Technical Analysis: Gold price remains confined within a descending trend channel in the near term
Gold price trades on a stronger note on the day. The bullish outlook of the precious metal remains intact, as XAU/USD is above the key 100-day Exponential Moving Average (EMA) on the daily chart.
In the near term, the gold price has remained capped within a descending trend channel since mid-April, suggesting that further consolidation cannot be ruled out. Additionally, the 14-day Relative Strength Index (RSI) hovers around the 50 midline, indicating indecisiveness among market players.
The first upside barrier for the yellow metal will emerge near the 100-EMA at $2,318. A decisive break above the mentioned level would resume the positive outlook in the short term. The next hurdle is seen at the $2,350–$2,355 region, portraying the confluence of a high of April 26 and the upper boundary of a descending trend channel. A bullish breakout above this level will expose the $2,400 mark en route to an all-time high near $2,432.
On the downside, any follow-through selling below the $2,300 psychological mark will see a drop to a low of May 3 and the lower limit of a descending trend channel at $2,275. Further south, the next contention level is located near a low of April 1 at $2,228, followed by the $2,200 round mark.
US Dollar price today
The table below shows the percentage change of US Dollar (USD) against listed major currencies today. US Dollar was the weakest against the Euro.
| USD | EUR | GBP | CAD | AUD | JPY | NZD | CHF | |
| USD | -0.05% | -0.02% | -0.03% | -0.02% | 0.28% | 0.18% | 0.03% | |
| EUR | 0.04% | 0.02% | 0.02% | 0.03% | 0.31% | 0.22% | 0.07% | |
| GBP | 0.00% | -0.02% | -0.01% | -0.01% | 0.28% | 0.20% | 0.04% | |
| CAD | 0.04% | -0.01% | 0.01% | 0.02% | 0.32% | 0.21% | 0.06% | |
| AUD | 0.03% | -0.01% | 0.02% | 0.01% | 0.31% | 0.21% | 0.07% | |
| JPY | -0.28% | -0.30% | -0.27% | -0.29% | -0.26% | -0.05% | -0.25% | |
| NZD | -0.17% | -0.22% | -0.20% | -0.21% | -0.21% | 0.10% | -0.15% | |
| CHF | -0.04% | -0.06% | -0.05% | -0.06% | -0.04% | 0.26% | 0.15% |
The heat map shows percentage changes of major currencies against each other. The base currency is picked from the left column, while the quote currency is picked from the top row. For example, if you pick the Euro from the left column and move along the horizontal line to the Japanese Yen, the percentage change displayed in the box will represent EUR (base)/JPY (quote).
Gold FAQs
Gold has played a key role in human’s history as it has been widely used as a store of value and medium of exchange. Currently, apart from its shine and usage for jewelry, the precious metal is widely seen as a safe-haven asset, meaning that it is considered a good investment during turbulent times. Gold is also widely seen as a hedge against inflation and against depreciating currencies as it doesn’t rely on any specific issuer or government.
Central banks are the biggest Gold holders. In their aim to support their currencies in turbulent times, central banks tend to diversify their reserves and buy Gold to improve the perceived strength of the economy and the currency. High Gold reserves can be a source of trust for a country’s solvency. Central banks added 1,136 tonnes of Gold worth around $70 billion to their reserves in 2022, according to data from the World Gold Council. This is the highest yearly purchase since records began. Central banks from emerging economies such as China, India and Turkey are quickly increasing their Gold reserves.
Gold has an inverse correlation with the US Dollar and US Treasuries, which are both major reserve and safe-haven assets. When the Dollar depreciates, Gold tends to rise, enabling investors and central banks to diversify their assets in turbulent times. Gold is also inversely correlated with risk assets. A rally in the stock market tends to weaken Gold price, while sell-offs in riskier markets tend to favor the precious metal.
The price can move due to a wide range of factors. Geopolitical instability or fears of a deep recession can quickly make Gold price escalate due to its safe-haven status. As a yield-less asset, Gold tends to rise with lower interest rates, while higher cost of money usually weighs down on the yellow metal. Still, most moves depend on how the US Dollar (USD) behaves as the asset is priced in dollars (XAU/USD). A strong Dollar tends to keep the price of Gold controlled, whereas a weaker Dollar is likely to push Gold prices up.
The European Central Bank (ECB) Chief Economist Philip Lane said on Monday that the recent Eurozone economic data have made him more certain that inflation is returning to the ECB 2% target, boosting the possibility of a first interest-rate cut in June, per Bloomberg.
Key quotes
“Both the April flash estimate for euro area inflation and the Q1 GDP number that came out improve my confidence that inflation should return to target in a timely manner,” he was cited as saying. “So, as of today, my personal confidence level has improved compared with our April meeting. But of course, more data will arrive between now and June.”
“We should not exaggerate the impact,” he said. “The US economy and US interest rates affect the euro area in different ways, and essentially, these different mechanisms work in opposite directions.”
“It is a month-by-month assessment, but in the longer term we have to accept that we live in a world that is going to face a lot of geopolitical tensions over a number of years.”
Market reaction
These comments have little to no market reaction to the Euro. The EUR/USD pair is trading at 1.0763, adding 0.02% on the day.
ECB FAQs
The European Central Bank (ECB) in Frankfurt, Germany, is the reserve bank for the Eurozone. The ECB sets interest rates and manages monetary policy for the region. The ECB primary mandate is to maintain price stability, which means keeping inflation at around 2%. Its primary tool for achieving this is by raising or lowering interest rates. Relatively high interest rates will usually result in a stronger Euro and vice versa. The ECB Governing Council makes monetary policy decisions at meetings held eight times a year. Decisions are made by heads of the Eurozone national banks and six permanent members, including the President of the ECB, Christine Lagarde.
In extreme situations, the European Central Bank can enact a policy tool called Quantitative Easing. QE is the process by which the ECB prints Euros and uses them to buy assets – usually government or corporate bonds – from banks and other financial institutions. QE usually results in a weaker Euro. QE is a last resort when simply lowering interest rates is unlikely to achieve the objective of price stability. The ECB used it during the Great Financial Crisis in 2009-11, in 2015 when inflation remained stubbornly low, as well as during the covid pandemic.
Quantitative tightening (QT) is the reverse of QE. It is undertaken after QE when an economic recovery is underway and inflation starts rising. Whilst in QE the European Central Bank (ECB) purchases government and corporate bonds from financial institutions to provide them with liquidity, in QT the ECB stops buying more bonds, and stops reinvesting the principal maturing on the bonds it already holds. It is usually positive (or bullish) for the Euro.
- WTI price gained ground after Saudi Arabia increased the Official Selling Prices (OSPs) for Oil sold to most regions.
- OPEC+ producers are prepared to prolong voluntary output cuts of 2.2 million barrels per day beyond June.
- Oil prices edged up due to concerns about the potential failure of a Gaza ceasefire deal.
West Texas Intermediate (WTI) crude Oil price snaps its losing streak, trading around $78.20 per barrel during the Asian session on Monday. Oil prices increased after Saudi Arabia raised June crude prices for most regions. Saudi Arabia increased the Official Selling Prices (OSPs) for its crude sold to Asia, Northwest Europe, and the Mediterranean in June, indicating expectations of robust demand during the summer season.
Moreover, the Organization of the Petroleum Exporting Countries and its allies (OPEC+) are expected to maintain oil production levels for an additional three months when ministers reassess output allocations on June 1. The OPEC+ producers announced last week that they are prepared to prolong voluntary output cuts of 2.2 million barrels per day (bpd) beyond June if Oil demand fails to recover as anticipated.
On the geopolitical side, the prices of the liquid Gold gained ground due to the concerns about the possibility of a Gaza ceasefire deal being failed. This has renewed supply fears that the Israel-Hamas conflict could escalate further in the Middle East, as reported by Reuters. Hamas reaffirmed its demand for an end to the conflict in exchange for the release of hostages, a condition Israeli Prime Minister Benjamin Netanyahu firmly rejected.
On the demand side, the lower-than-expected US jobs data has reignited hopes for Federal Reserve interest rate cuts this year, influencing the demand side of the equation. Lower interest rates could stimulate economic activity in the United States (US), consequently enhancing the demand outlook for Oil. Furthermore, this sentiment exerts downward pressure on the US Dollar (USD), effectively lowering the cost of crude Oil for countries utilizing alternative currencies.
| Raw materials | Closed | Change, % |
|---|---|---|
| Silver | 26.544 | -0.57 |
| Gold | 2301.9 | -0.14 |
| Palladium | 945.11 | 1.19 |
- USD/JPY gains ground near 153.55 in Monday’s Asian session.
- US Treasury Secretary counsels caution on currency intervention from Japanese authorities.
- The US NFP increased by 175K in April, compared to 315K in March, missing the estimation of 243K.
The USD/JPY pair snap a three-day losing streak during the Asian trading hours on Monday. The uptick of the pair is bolstered by the modest rebound of the US Dollar (USD) and US Treasury Secretary Janet Yellen’s comments on potential Japanese interventions last week. The pair currently trades around 153.55, adding 0.35% on the day.
US Treasury Secretary Janet Yellen noted on the weekend the sharp movements in the Japanese Yen's value last week but declined to comment on whether Japan intervened to support the currency. “I’m not going to comment on whether they did or didn’t intervene,” Yellen said. Her comments on prospective Japanese interventions have varied over the last two years, often emphasizing a Group of Seven agreement in support of market-determined currency rates. Yellen emphasized that interventions should only try to reduce market volatility rather than manipulate currency rates. Meanwhile, Japan's Finance Minister Shunichi Suzuki did not confirm the interventions, as per Bloomberg.
The growing speculation that the US Federal Reserve (Fed) will cut the interest rate in September after the release of weaker-than-expected US employment data has exerted some selling pressure on the Greenback. According to the CME Fedwatch tool, traders are now pricing in an 85.5% chance that June will still see no change to the Fed fed fund rate, while the odds of a September rate cut rise to 90%.
The US employment report released on Friday showed hints that the US economy is slowing. The Nonfarm Payrolls (NFP) increased by 175K in April, from 315K in March (revised from 303K), falling short of the estimated 243K. The figure was the lowest increase since October 2023. The Unemployment Rate rose to 3.9% in April, while Average Hourly Earnings fell by 3.9% year on year. Finally, the US ISM Services PMI slipped into contractionary territory, dropping from 51.4 in March to 49.4 in April, below the market estimate of 52.0.
- The Australian Dollar rises on risk-on sentiment after softer US jobs data released on Friday.
- The Australian Dollar received strength from the hawkish sentiment surrounding the RBA.
- The Nonfarm Payrolls report indicated fewer jobs added than anticipated in April, marking a notable deceleration from March’s reading.
The Australian Dollar (AUD) maintained its winning streak for the fourth consecutive session on Monday, buoyed by a hawkish sentiment surrounding the Reserve Bank of Australia (RBA). This optimism bolsters the strength of the Aussie Dollar, providing support to the AUD/USD pair.
The Australian central bank is widely anticipated to hold the cash rate steady at a 12-year high of 4.35% in its upcoming Tuesday meeting. However, there are expectations that it may reintroduce a soft tightening bias, particularly after last week's higher-than-expected inflation data, as reported by The Australian Financial Review.
The US Dollar Index (DXY), which gauges the performance of the US Dollar (USD) against six major currencies, remains under pressure due to softer-than-expected US jobs data released on Friday. This development revived hopes for potential interest rate cuts by the US Federal Reserve (Fed) later this year. The prevalent risk appetite could continue this week following Fed Chair Jerome Powell's relatively dovish stance on the monetary policy outlook during Wednesday's session.
Daily Digest Market Movers: Australian Dollar appreciates amid hawkish RBA
- TD Securities Inflation (YoY) released by The University of Melbourne, came down to 3.7% in April, from the previous month’s 3.8%. In the meantime, the monthly rate remained at 0.1%.
- On Friday, Nonfarm Payrolls showed that the US economy added 175,000 jobs in April, lower than the estimated 243,000 and signaling a significant slowdown from March's addition of 315,000 jobs.
- The Judo Bank Australia Composite Purchasing Managers Index (PMI) declined in April, indicating a slightly slower growth in Australian private sector output. The growth in business activity was mainly confined to the service sector while manufacturing output continued to decrease.
- According to forecasts by analysts at Commonwealth Bank and Westpac, the RBA’s interest rate is expected to peak at its highest point at 4.35% in November 2023, then decrease to 3.10% by December 2025.
- Australia’s central bank is expected to maintain its key policy rate at 4.35% for a fourth consecutive meeting on Tuesday, and likely until the end of September, as per a Reuters poll of economists. These economists predict only one interest rate cut this year.
- Federal Reserve Bank of Chicago President Austan Goolsbee commented on the April labor market data, stating to Bloomberg TV that the report was robust. Goolsbee emphasized the need for the Fed to ascertain whether it is still committed to reducing inflation. He noted that if the Fed maintains a restrictive stance for too long, it will need to consider the employment aspect of its mandate.
- According to the CME FedWatch Tool, the probability of the Federal Reserve keeping interest rates within their current range of 5.25%-5.50% during the June meeting has increased to 91.6%, up from 88.9% a week ago.
Technical Analysis: Australian Dollar holds ground above the psychological level of 0.6600
The Australian Dollar trades around 0.6620 on Monday. The pair remains positioned in a symmetrical triangle pattern, with the 14-day Relative Strength Index (RSI) above the 50-level, indicating a bullish bias.
The AUD/USD pair might retest the upper boundary around the level of 0.6649. A breakthrough above this level could lead the pair to explore the region around March’s high of 0.6667.
On the downside, the AUD/USD pair could find immediate support at the psychological level of 0.6600, followed by the nine-day Exponential Moving Average (EMA) at 0.6552. A break below the latter could exert pressure on the pair to test the throwback support at the 0.6480 level, followed by the lower boundary of the symmetrical triangle around the level of 0.6465.
AUD/USD: Daily Chart
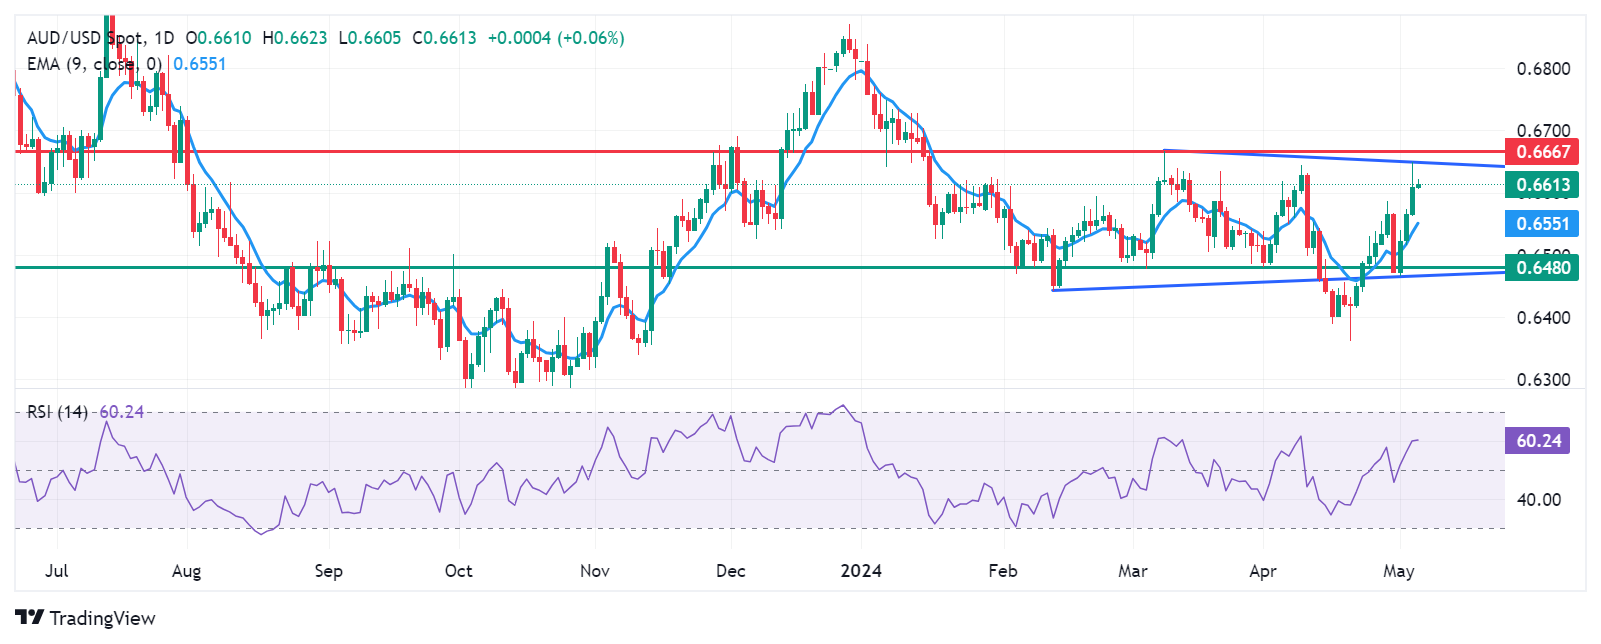
Australian Dollar price today
The table below shows the percentage change of the Australian Dollar (AUD) against listed major currencies today. The Australian Dollar was the strongest against the New Zealand Dollar.
| USD | EUR | GBP | CAD | AUD | JPY | NZD | CHF | |
| USD | -0.08% | -0.05% | -0.06% | -0.09% | 0.02% | 0.05% | -0.02% | |
| EUR | 0.07% | 0.01% | 0.01% | -0.02% | 0.08% | 0.13% | 0.04% | |
| GBP | 0.03% | -0.01% | 0.00% | -0.04% | 0.07% | 0.09% | 0.03% | |
| CAD | 0.15% | 0.05% | 0.09% | 0.28% | -0.15% | 0.08% | 0.04% | |
| AUD | 0.10% | 0.02% | 0.03% | 0.03% | 0.11% | 0.14% | 0.06% | |
| JPY | -0.04% | -0.08% | -0.04% | -0.09% | -0.10% | 0.06% | -0.06% | |
| NZD | -0.05% | -0.11% | -0.09% | -0.10% | -0.16% | -0.02% | -0.06% | |
| CHF | 0.03% | -0.04% | -0.03% | -0.03% | -0.07% | 0.06% | 0.07% |
The heat map shows percentage changes of major currencies against each other. The base currency is picked from the left column, while the quote currency is picked from the top row. For example, if you pick the Euro from the left column and move along the horizontal line to the Japanese Yen, the percentage change displayed in the box will represent EUR (base)/JPY (quote).
Australian Dollar FAQs
One of the most significant factors for the Australian Dollar (AUD) is the level of interest rates set by the Reserve Bank of Australia (RBA). Because Australia is a resource-rich country another key driver is the price of its biggest export, Iron Ore. The health of the Chinese economy, its largest trading partner, is a factor, as well as inflation in Australia, its growth rate, and Trade Balance. Market sentiment – whether investors are taking on more risky assets (risk-on) or seeking safe havens (risk-off) – is also a factor, with risk-on positive for AUD.
The Reserve Bank of Australia (RBA) influences the Australian Dollar (AUD) by setting the level of interest rates that Australian banks can lend to each other. This influences the level of interest rates in the economy as a whole. The main goal of the RBA is to maintain a stable inflation rate of 2-3% by adjusting interest rates up or down. Relatively high interest rates compared to other major central banks support the AUD, and the opposite for relatively low. The RBA can also use quantitative easing and tightening to influence credit conditions, with the former AUD-negative and the latter AUD-positive.
China is Australia’s largest trading partner so the health of the Chinese economy is a major influence on the value of the Australian Dollar (AUD). When the Chinese economy is doing well it purchases more raw materials, goods and services from Australia, lifting demand for the AUD, and pushing up its value. The opposite is the case when the Chinese economy is not growing as fast as expected. Positive or negative surprises in Chinese growth data, therefore, often have a direct impact on the Australian Dollar and its pairs.
Iron Ore is Australia’s largest export, accounting for $118 billion a year according to data from 2021, with China as its primary destination. The price of Iron Ore, therefore, can be a driver of the Australian Dollar. Generally, if the price of Iron Ore rises, AUD also goes up, as aggregate demand for the currency increases. The opposite is the case if the price of Iron Ore falls. Higher Iron Ore prices also tend to result in a greater likelihood of a positive Trade Balance for Australia, which is also positive of the AUD.
The Trade Balance, which is the difference between what a country earns from its exports versus what it pays for its imports, is another factor that can influence the value of the Australian Dollar. If Australia produces highly sought after exports, then its currency will gain in value purely from the surplus demand created from foreign buyers seeking to purchase its exports versus what it spends to purchase imports. Therefore, a positive net Trade Balance strengthens the AUD, with the opposite effect if the Trade Balance is negative.
China's Services Purchasing Managers' Index (PMI) eased to 52.5 in April, compared with the March print of 52.7, the latest data published by Caixin showed on Tuesday.
The data came in line with the market expectations in the reported period.
AUD/USD reaction to China’s Services PMI
At the time of writing, the AUD/USD pair is up 0.08% on the day to trade at 0.6615.
Australian Dollar FAQs
One of the most significant factors for the Australian Dollar (AUD) is the level of interest rates set by the Reserve Bank of Australia (RBA). Because Australia is a resource-rich country another key driver is the price of its biggest export, Iron Ore. The health of the Chinese economy, its largest trading partner, is a factor, as well as inflation in Australia, its growth rate and Trade Balance. Market sentiment – whether investors are taking on more risky assets (risk-on) or seeking safe-havens (risk-off) – is also a factor, with risk-on positive for AUD.
The Reserve Bank of Australia (RBA) influences the Australian Dollar (AUD) by setting the level of interest rates that Australian banks can lend to each other. This influences the level of interest rates in the economy as a whole. The main goal of the RBA is to maintain a stable inflation rate of 2-3% by adjusting interest rates up or down. Relatively high interest rates compared to other major central banks support the AUD, and the opposite for relatively low. The RBA can also use quantitative easing and tightening to influence credit conditions, with the former AUD-negative and the latter AUD-positive.
China is Australia’s largest trading partner so the health of the Chinese economy is a major influence on the value of the Australian Dollar (AUD). When the Chinese economy is doing well it purchases more raw materials, goods and services from Australia, lifting demand for the AUD, and pushing up its value. The opposite is the case when the Chinese economy is not growing as fast as expected. Positive or negative surprises in Chinese growth data, therefore, often have a direct impact on the Australian Dollar and its pairs.
Iron Ore is Australia’s largest export, accounting for $118 billion a year according to data from 2021, with China as its primary destination. The price of Iron Ore, therefore, can be a driver of the Australian Dollar. Generally, if the price of Iron Ore rises, AUD also goes up, as aggregate demand for the currency increases. The opposite is the case if the price of Iron Ore falls. Higher Iron Ore prices also tend to result in a greater likelihood of a positive Trade Balance for Australia, which is also positive of the AUD.
The Trade Balance, which is the difference between what a country earns from its exports versus what it pays for its imports, is another factor that can influence the value of the Australian Dollar. If Australia produces highly sought after exports, then its currency will gain in value purely from the surplus demand created from foreign buyers seeking to purchase its exports versus what it spends to purchase imports. Therefore, a positive net Trade Balance strengthens the AUD, with the opposite effect if the Trade Balance is negative.
The People’s Bank of China (PBoC) set the USD/CNY central rate for the trading session ahead on Monday at 7.0994 as compared to the previous day's fix of 7.1063 and 7.2127 Reuters estimates.
- EUR/USD extends the rally to 1.0765 amid the weaker USD on Monday.
- The US job growth slowed more than expected in April, boosting the odds of a September rate cut from Fed.
- Economists said the prospect of the ECB diverging from the Fed on rate cuts might weigh on the Euro.
The EUR/USD pair trades in positive territory for the fourth consecutive day near 1.0765 on Monday during the early Asian trading hours. The softer US Dollar (USD) provides some support to the major pair. Traders await the HCOB Purchasing Managers’ Index (PMI) data from Germany and the Eurozone, along with the Eurozone Producer Price Index (PPI), due later in the day.
The recent US Employment data from the US Bureau of Labor Statistics (BLS) showed on Friday that US job growth slowed more than expected in April. The Nonfarm Payrolls (NFP) came in weaker than expected, rising by 175K in April from 315K rise (revised from 303K) in March, the smallest gain since October 2023. Meanwhile, wage inflation, as measured by the change in the Average Hourly Earnings, dropped to 3.9% on a yearly basis from 4.1%. The Unemployment Rate ticked up to 3.9% in April from 3.8% in March.
The weaker-than-expected US data boosted the odds of a September rate cut from the US central bank. Financial markets have priced in a nearly 90% chance of September rate cuts, up from 55% last week, according to the CME FedWatch tool. This, in turn, weighs on the Greenback and creates a tailwind for the EUR/USD pair.
Across the pond, the final reading of the Eurozone Services PMI is expected to remain steady at 52.9 in April, while the Composite PMI is projected to remain unchanged at 51.4. Furthermore, the Eurozone March PPI is estimated at -7.7% YoY versus -8.3% in February.
Eurozone inflation held steady as expected in April, triggering the case for the European Central Bank (ECB) to cut interest rates in June. Economists said the prospect of the ECB diverging from the Federal Reserve (Fed) on interest rate cuts is likely to be “particularly negative” for the Eurozone and might exert some selling pressure on the Euro (EUR) against the USD.
| Index | Change, points | Closed | Change, % |
|---|---|---|---|
| Hang Seng | 268.79 | 18475.92 | 1.48 |
| KOSPI | -7.02 | 2676.63 | -0.26 |
| ASX 200 | 42 | 7629 | 0.55 |
| DAX | 105.1 | 18001.6 | 0.59 |
| CAC 40 | 42.92 | 7957.57 | 0.54 |
| Dow Jones | 450.02 | 38675.68 | 1.18 |
| S&P 500 | 63.59 | 5127.79 | 1.26 |
| NASDAQ Composite | 315.37 | 16156.33 | 1.99 |
| Pare | Closed | Change, % |
|---|---|---|
| AUDUSD | 0.661 | 0.64 |
| EURJPY | 164.55 | -0.06 |
| EURUSD | 1.07633 | 0.32 |
| GBPJPY | 191.793 | -0.32 |
| GBPUSD | 1.25464 | 0.06 |
| NZDUSD | 0.60104 | 0.78 |
| USDCAD | 1.36856 | 0.12 |
| USDCHF | 0.90495 | -0.57 |
| USDJPY | 152.868 | -0.38 |


© 2000-2026. All rights reserved.
This site is managed by Teletrade D.J. LLC 2351 LLC 2022 (Euro House, Richmond Hill Road, Kingstown, VC0100, St. Vincent and the Grenadines).
The information on this website is for informational purposes only and does not constitute any investment advice.
The company does not serve or provide services to customers who are residents of the US, Canada, Iran, The Democratic People's Republic of Korea, Yemen and FATF blacklisted countries.
Making transactions on financial markets with marginal financial instruments opens up wide possibilities and allows investors who are willing to take risks to earn high profits, carrying a potentially high risk of losses at the same time. Therefore you should responsibly approach the issue of choosing the appropriate investment strategy, taking the available resources into account, before starting trading.
Use of the information: full or partial use of materials from this website must always be referenced to TeleTrade as the source of information. Use of the materials on the Internet must be accompanied by a hyperlink to teletrade.org. Automatic import of materials and information from this website is prohibited.
Please contact our PR department if you have any questions or need assistance at pr@teletrade.global.
transfers