- Analytics
- News and Tools
- Market News
CFD Markets News and Forecasts — 05-09-2024
- USD/CAD holds steady around 1.3500 in Friday’s early Asian session.
- US ISM Services PMI came in stronger than expected, while private sector payrolls grew the smallest gain since 2021 in August.
- The US and Canadian employment reports will be the highlights on Friday.
The USD/CAD pair trades on a flat note near 1.3500 during the early Asian session on Friday. The US Dollar Index (DXY) extends its decline to near the 101.00 psychological support level. Traders prefer to wait on the sidelines ahead of the key events on Friday. The US and Canadian employment reports will take center stage later in the day.
Data released by Automatic Data Processing (ADP) on Thursday showed that private sector employment increased by 99,000 in August and annual pay was up 4.8% year-over-year. This figure followed the 111,000 (revised from 122,000) increase seen in July and below the estimation of 145,000 by a wide margin.
Meanwhile, the weekly US Initial Jobless Claims rose to 227,000, compared to the previous reading of 232,000 (revised from 231,000) and below the initial consensus of 231,000). On the positive side, US ISM Services PMI rose to 51.5 in August from 51.4 in July, above the market expectation of 51.1.
A rise in the US Unemployment Rate in July sparked fears of a looming recession in the United States and triggered the expectation of a larger rate cut by the Federal Reserve (Fed). The employment data will be released on Friday, including Nonfarm Payrolls (NFP), Unemployment Rate and Average Hourly Earnings. These reports could significantly influence the size and pace of the Fed’s easing cycle. Any signs of a weaker US labor market could exert some selling pressure on the Greenback in the near term.
On the other hand, the speculation that the Bank of Canada (BoC) will cut additional interest rates this year might undermine the Loonie and cap USD/CAD’s downside. The BoC cut its benchmark interest rate for the third consecutive time on Wednesday. The BoC governor Tiff Macklem said “If inflation continues to ease broadly in line with our July forecast, it is reasonable to expect further cuts in our policy rate.” Looking ahead, the Canadian employment data will also be in the spotlight on Friday.
Canadian Dollar FAQs
The key factors driving the Canadian Dollar (CAD) are the level of interest rates set by the Bank of Canada (BoC), the price of Oil, Canada’s largest export, the health of its economy, inflation and the Trade Balance, which is the difference between the value of Canada’s exports versus its imports. Other factors include market sentiment – whether investors are taking on more risky assets (risk-on) or seeking safe-havens (risk-off) – with risk-on being CAD-positive. As its largest trading partner, the health of the US economy is also a key factor influencing the Canadian Dollar.
The Bank of Canada (BoC) has a significant influence on the Canadian Dollar by setting the level of interest rates that banks can lend to one another. This influences the level of interest rates for everyone. The main goal of the BoC is to maintain inflation at 1-3% by adjusting interest rates up or down. Relatively higher interest rates tend to be positive for the CAD. The Bank of Canada can also use quantitative easing and tightening to influence credit conditions, with the former CAD-negative and the latter CAD-positive.
The price of Oil is a key factor impacting the value of the Canadian Dollar. Petroleum is Canada’s biggest export, so Oil price tends to have an immediate impact on the CAD value. Generally, if Oil price rises CAD also goes up, as aggregate demand for the currency increases. The opposite is the case if the price of Oil falls. Higher Oil prices also tend to result in a greater likelihood of a positive Trade Balance, which is also supportive of the CAD.
While inflation had always traditionally been thought of as a negative factor for a currency since it lowers the value of money, the opposite has actually been the case in modern times with the relaxation of cross-border capital controls. Higher inflation tends to lead central banks to put up interest rates which attracts more capital inflows from global investors seeking a lucrative place to keep their money. This increases demand for the local currency, which in Canada’s case is the Canadian Dollar.
Macroeconomic data releases gauge the health of the economy and can have an impact on the Canadian Dollar. Indicators such as GDP, Manufacturing and Services PMIs, employment, and consumer sentiment surveys can all influence the direction of the CAD. A strong economy is good for the Canadian Dollar. Not only does it attract more foreign investment but it may encourage the Bank of Canada to put up interest rates, leading to a stronger currency. If economic data is weak, however, the CAD is likely to fall.
- EUR/USD rose on Thursday, climbing back over 1.1100.
- Gains remain limited after miss in EU Retail Sales.
- US NFP print due on Friday takes the center stage for the week.
EUR/USD stepped into a second straight day of gains on Thursday, recapturing the 1.1100 handle as markets broadly sell off the Greenback in advance of Friday’s hotly-anticipated US Nonfarm Payrolls (NFP) jobs report. Markets are looking for further signs that the Federal Reserve (Fed) is on pace to deliver an initial rate trim and kick off a rate cutting cycle in September, but US data will need to continue softening to keep rate cut hopes on the high side.
European economic data did little to provide additional support for the Fiber after July’s EU Retail Sales missed the mark. YoY Retail Sales came in worse than expected, printing at -0.1% for the year ended in July and missing the expected rebound to 0.1% compared to the revised last -0.4% contraction.
According to payroll processor ADP, the US added 99K net new jobs in August, down from July’s revised 111K and well below the expected 145K. August’s ADP additions are the lowest print since early 2021, sparking a fresh round of risk aversion and reigniting investor concerns that the US could be heading into a recession.
The ADP jobs report serves as a bellwether for what markets can expect from Friday’s upcoming US NFP report, albeit one with a wobbly track record for accuracy. August’s NFP print represents the last significant labor update before the Federal Reserve’s (Fed) upcoming rate call on September 18, when Fed policymakers are broadly expected to kick off a rate-cutting cycle. Friday’s NFP print is slated to come in at 160K compared to the previous month’s 114K.
According to the CME, rate markets are currently betting on 40% odds that the Fed will blow the doors open with a 50 bps cut later in the month. The remaining 60% are betting on a more demure 25 bps opening rate trim. Investors are anticipating using this Friday’s NFP print as a way to gauge the depth of the Fed’s first rate cut since the Fed slashed 100 bps in March of 2020.
EUR/USD price forecast
Bidders continue to come out of the woodwork to keep bids on balance even if they can’t quite pull out a bullish recovery. EUR/USD popped into a 13-month high just above 1.1200 early last week, and a near-term pullback in Greenback flows sees bids scrambling to hold onto bullish chart paper.
The pair still trades well north of the 200-day Exponential Moving Average (EMA) at 1.0845. Despite holding deep in the bull country, EUR/USD still faces a steepening bearish pullback as shorts congregate targets just above the 50-day EMA at 1.0956.
EUR/USD daily chart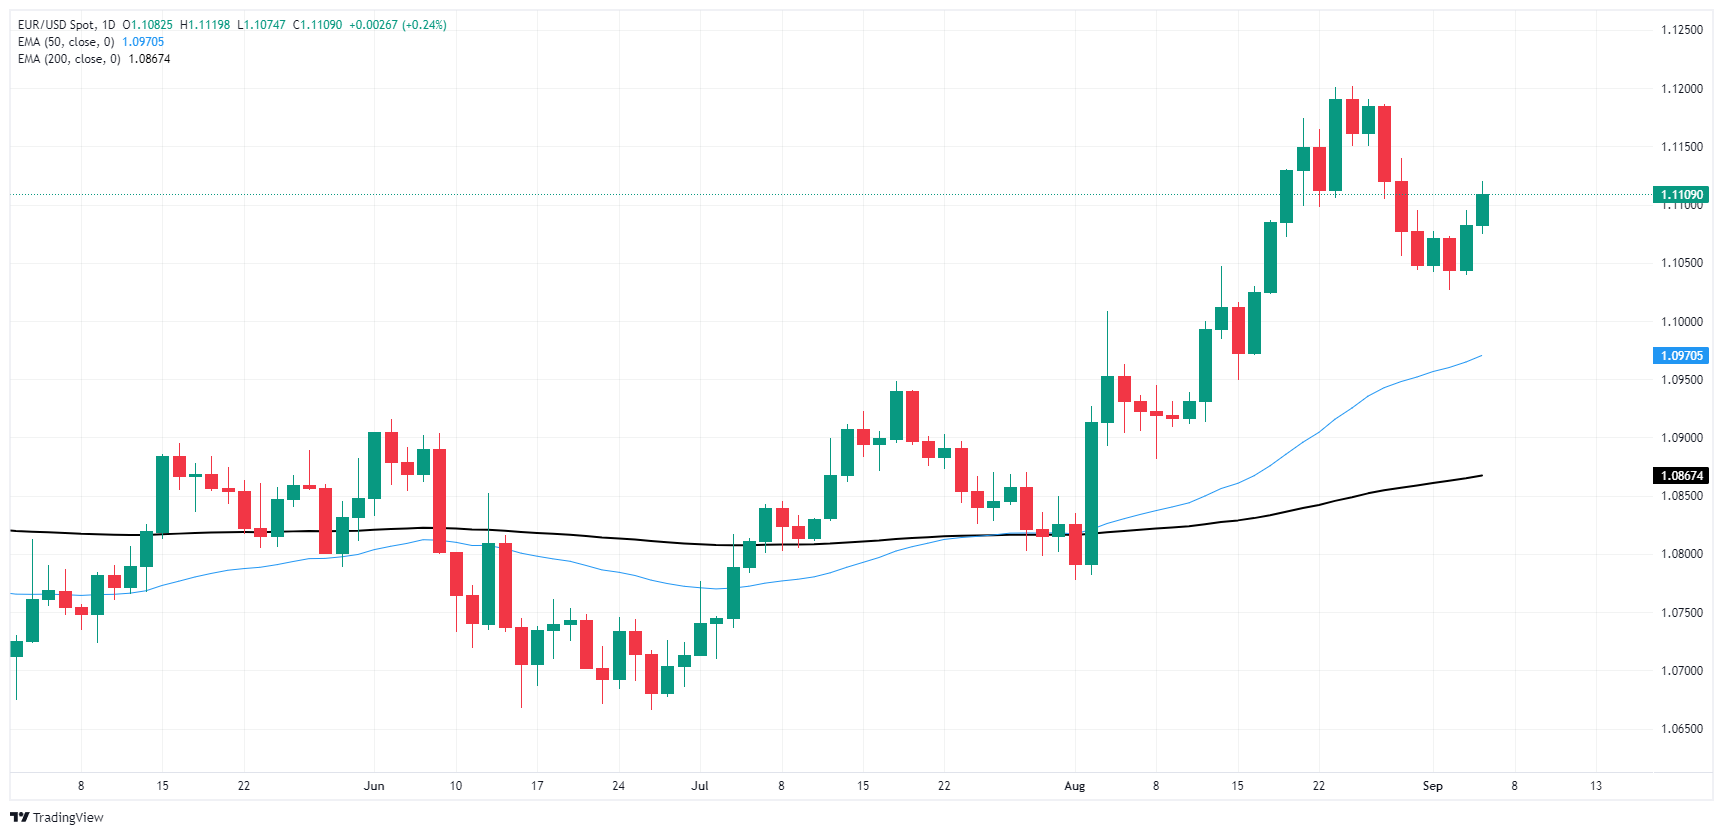
Euro FAQs
The Euro is the currency for the 20 European Union countries that belong to the Eurozone. It is the second most heavily traded currency in the world behind the US Dollar. In 2022, it accounted for 31% of all foreign exchange transactions, with an average daily turnover of over $2.2 trillion a day. EUR/USD is the most heavily traded currency pair in the world, accounting for an estimated 30% off all transactions, followed by EUR/JPY (4%), EUR/GBP (3%) and EUR/AUD (2%).
The European Central Bank (ECB) in Frankfurt, Germany, is the reserve bank for the Eurozone. The ECB sets interest rates and manages monetary policy. The ECB’s primary mandate is to maintain price stability, which means either controlling inflation or stimulating growth. Its primary tool is the raising or lowering of interest rates. Relatively high interest rates – or the expectation of higher rates – will usually benefit the Euro and vice versa. The ECB Governing Council makes monetary policy decisions at meetings held eight times a year. Decisions are made by heads of the Eurozone national banks and six permanent members, including the President of the ECB, Christine Lagarde.
Eurozone inflation data, measured by the Harmonized Index of Consumer Prices (HICP), is an important econometric for the Euro. If inflation rises more than expected, especially if above the ECB’s 2% target, it obliges the ECB to raise interest rates to bring it back under control. Relatively high interest rates compared to its counterparts will usually benefit the Euro, as it makes the region more attractive as a place for global investors to park their money.
Data releases gauge the health of the economy and can impact on the Euro. Indicators such as GDP, Manufacturing and Services PMIs, employment, and consumer sentiment surveys can all influence the direction of the single currency. A strong economy is good for the Euro. Not only does it attract more foreign investment but it may encourage the ECB to put up interest rates, which will directly strengthen the Euro. Otherwise, if economic data is weak, the Euro is likely to fall. Economic data for the four largest economies in the euro area (Germany, France, Italy and Spain) are especially significant, as they account for 75% of the Eurozone’s economy.
Another significant data release for the Euro is the Trade Balance. This indicator measures the difference between what a country earns from its exports and what it spends on imports over a given period. If a country produces highly sought after exports then its currency will gain in value purely from the extra demand created from foreign buyers seeking to purchase these goods. Therefore, a positive net Trade Balance strengthens a currency and vice versa for a negative balance.
- GBP/USD found a second day of gains as bidders return to Cable.
- Despite a miss in US early US jobs data, sentiment remains high on rate cut hopes.
- US NFP data on Friday to serve as a dipstick on the depth of upcoming Fed rate trim.
GBP/USD climbed for a second straight day on Thursday, setting up for a bullish recovery despite failing to recapture the 1.3200 level. Market sentiment held on the high side as a decline in new jobs growth kept hopes for an extended rate cut from the Federal Reserve (Fed) pinned to the ceiling.
UK data remains thin on the economic docket as markets wind into Friday. US Nonfarm Payrolls (NFP) jobs additions due in the last US market session of the week promise to be a big event that will draw plenty of investor eyes.
According to payroll processor ADP, the US added 99K net new jobs in August, down from July’s revised 111K and well below the expected 145K. August’s ADP additions are the lowest print since early 2021, sparking a fresh round of risk aversion and reigniting investor concerns that the US could be heading into a recession.
The ADP jobs report serves as a bellwether for what markets can expect from Friday’s upcoming US NFP report, albeit one with a wobbly track record for accuracy. August’s NFP print represents the last significant labor update before the Federal Reserve’s (Fed) upcoming rate call on September 18, when Fed policymakers are broadly expected to kick off a rate-cutting cycle. Friday’s NFP print is slated to come in at 160K compared to the previous month’s 114K.
According to the CME, rate markets are currently betting on 40% odds that the Fed will blow the doors open with a 50 bps cut later in the month. The remaining 60% are betting on a more demure 25 bps opening rate trim. Investors are anticipating using this Friday’s NFP print as a way to gauge the depth of the Fed’s first rate cut since the Fed slashed 100 bps in March of 2020.
GBP/USD price forecast
Despite an second intraday recovery in a row on Wednesday, Cable remains down from multi-month highs above 1.3250. The pair is sticking stubbornly to recent highs after vaulting to a peak 29-month bid in August. Price action is still tilted firmly into the bullish side above the 200-day Exponential Moving Average (EMA) at 1.2725, while the immediate downside technical target for shorts will be the 50-day EMA just above the 1.2900 handle.
GBP/USD daily chart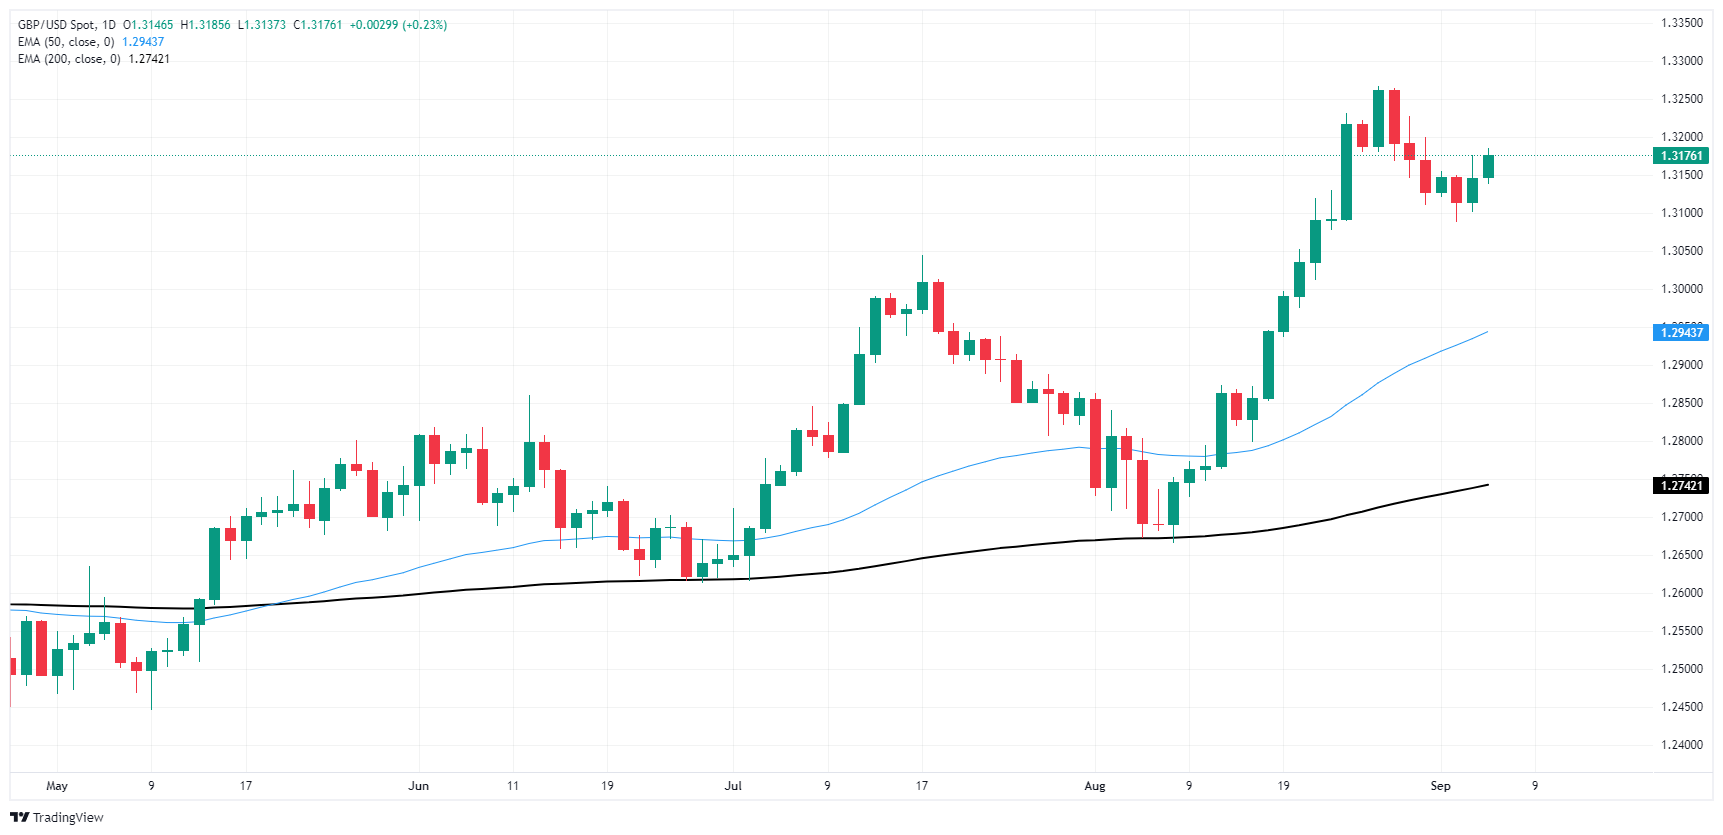
Pound Sterling FAQs
The Pound Sterling (GBP) is the oldest currency in the world (886 AD) and the official currency of the United Kingdom. It is the fourth most traded unit for foreign exchange (FX) in the world, accounting for 12% of all transactions, averaging $630 billion a day, according to 2022 data. Its key trading pairs are GBP/USD, aka ‘Cable’, which accounts for 11% of FX, GBP/JPY, or the ‘Dragon’ as it is known by traders (3%), and EUR/GBP (2%). The Pound Sterling is issued by the Bank of England (BoE).
The single most important factor influencing the value of the Pound Sterling is monetary policy decided by the Bank of England. The BoE bases its decisions on whether it has achieved its primary goal of “price stability” – a steady inflation rate of around 2%. Its primary tool for achieving this is the adjustment of interest rates. When inflation is too high, the BoE will try to rein it in by raising interest rates, making it more expensive for people and businesses to access credit. This is generally positive for GBP, as higher interest rates make the UK a more attractive place for global investors to park their money. When inflation falls too low it is a sign economic growth is slowing. In this scenario, the BoE will consider lowering interest rates to cheapen credit so businesses will borrow more to invest in growth-generating projects.
Data releases gauge the health of the economy and can impact the value of the Pound Sterling. Indicators such as GDP, Manufacturing and Services PMIs, and employment can all influence the direction of the GBP. A strong economy is good for Sterling. Not only does it attract more foreign investment but it may encourage the BoE to put up interest rates, which will directly strengthen GBP. Otherwise, if economic data is weak, the Pound Sterling is likely to fall.
Another significant data release for the Pound Sterling is the Trade Balance. This indicator measures the difference between what a country earns from its exports and what it spends on imports over a given period. If a country produces highly sought-after exports, its currency will benefit purely from the extra demand created from foreign buyers seeking to purchase these goods. Therefore, a positive net Trade Balance strengthens a currency and vice versa for a negative balance.
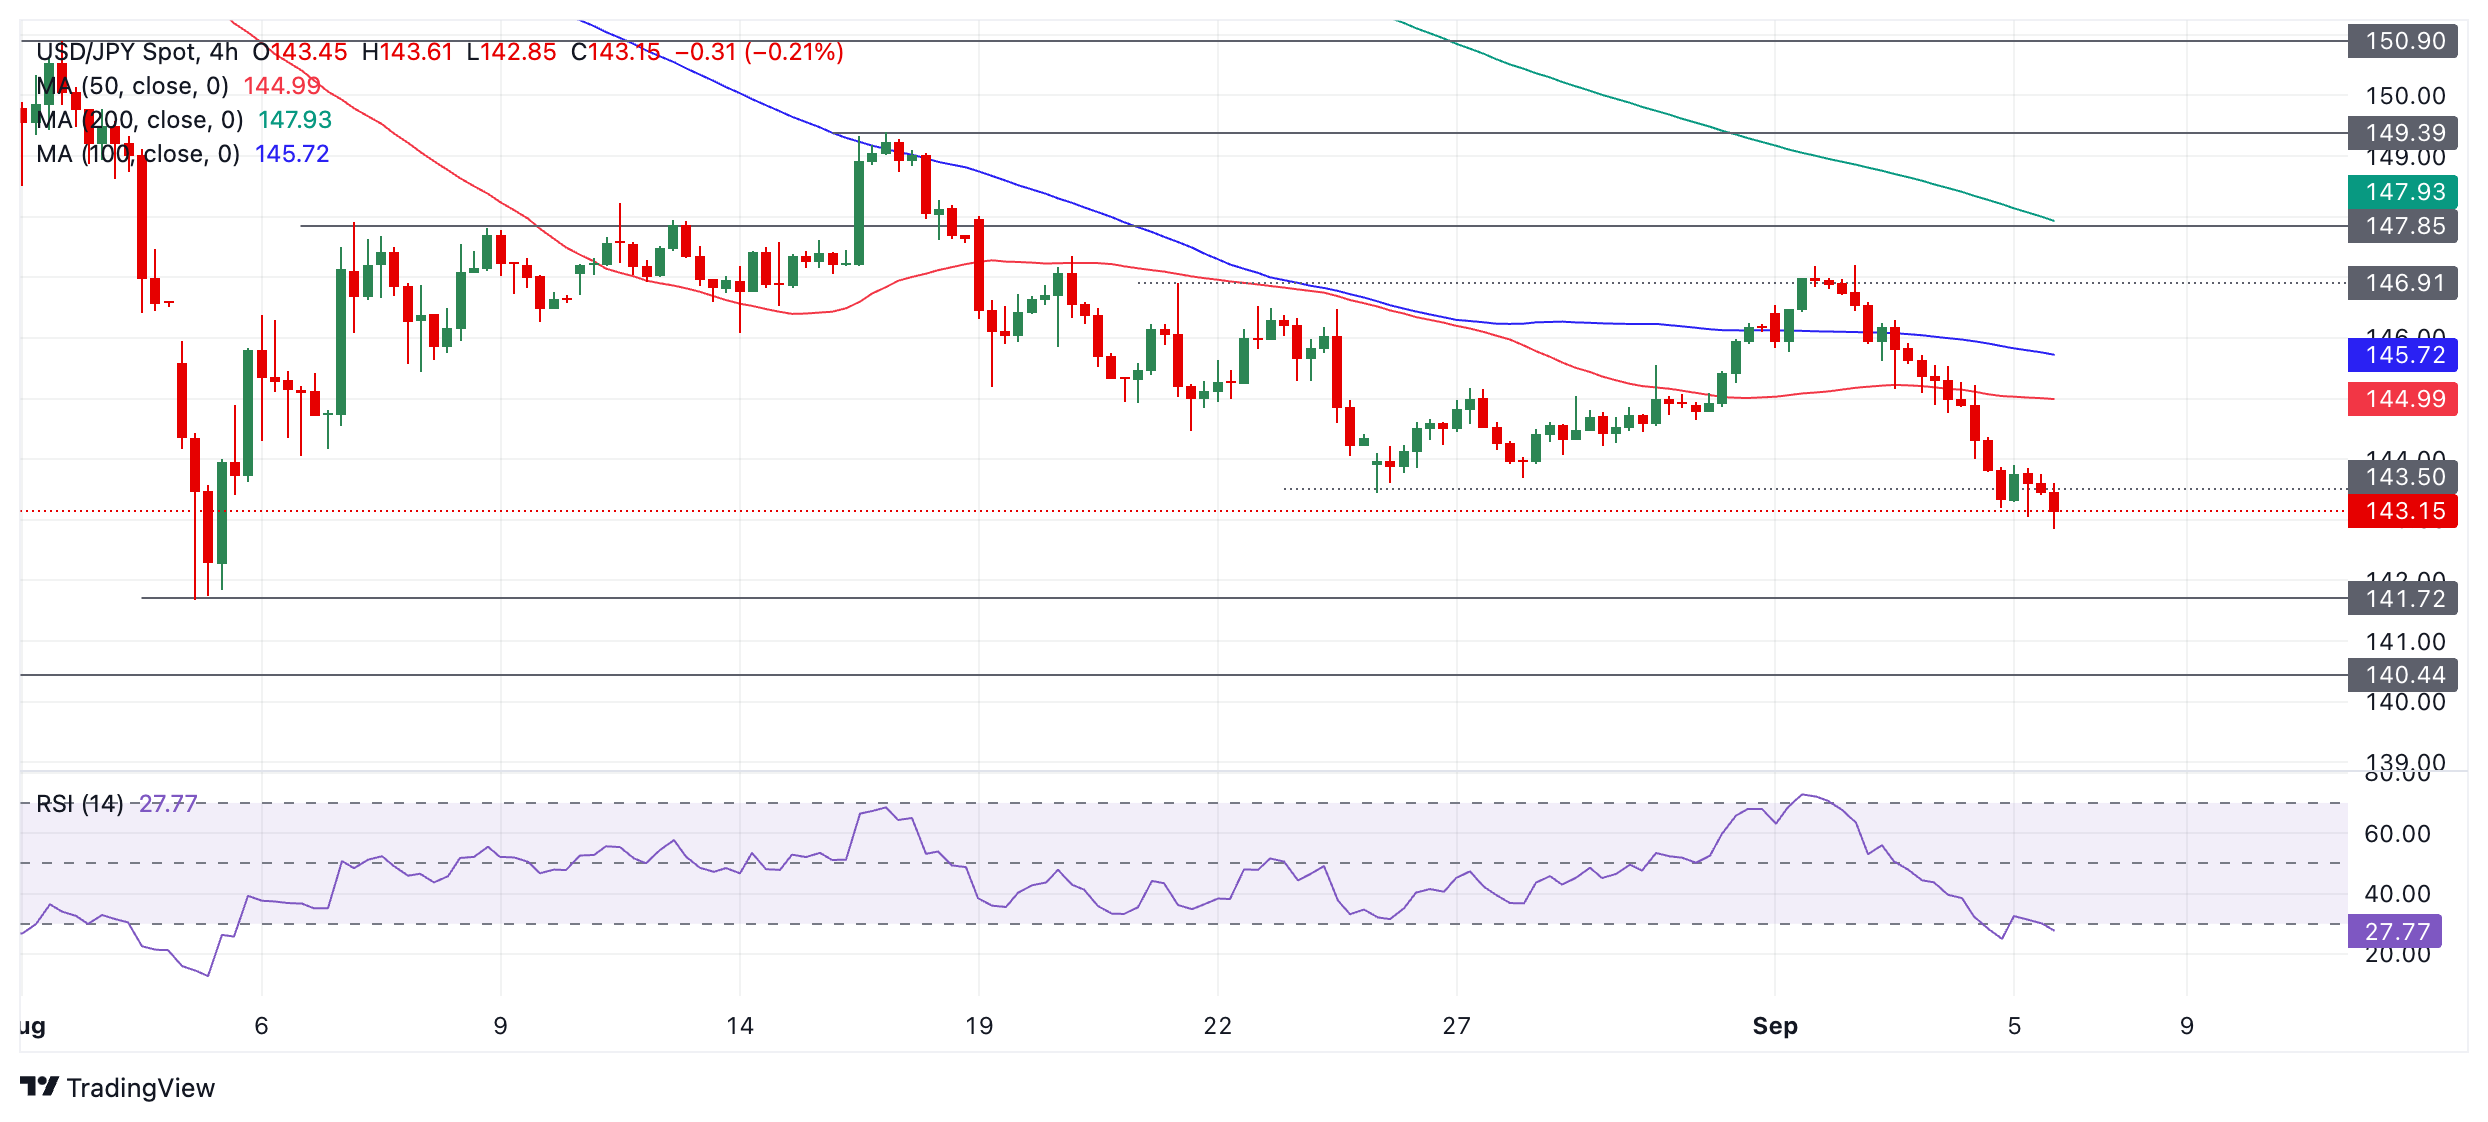
- USD/JPY remains pressured near 143.39, with momentum indicators favoring a bearish continuation toward 143.00 and 142.50 support levels.
- Failure to decisively clear 143.44 may offer a recovery opportunity for USD bulls if US Nonfarm Payrolls data impresses.
- Key resistance sits at 145.03 (Tenkan-Sen), with further hurdles at 145.73 (Kijun-Sen) and the 150.00 figure.
USD/JPY extended its losses for the third consecutive day, hitting a four-week low of 142.85, yet traders lifted the pair, which closed Thursday's session with losses of 0.21%. As Friday’s Asian session begins, the pair trades at 143.39, virtually unchanged.
USD/JPY Price Forecast: Technical outlook
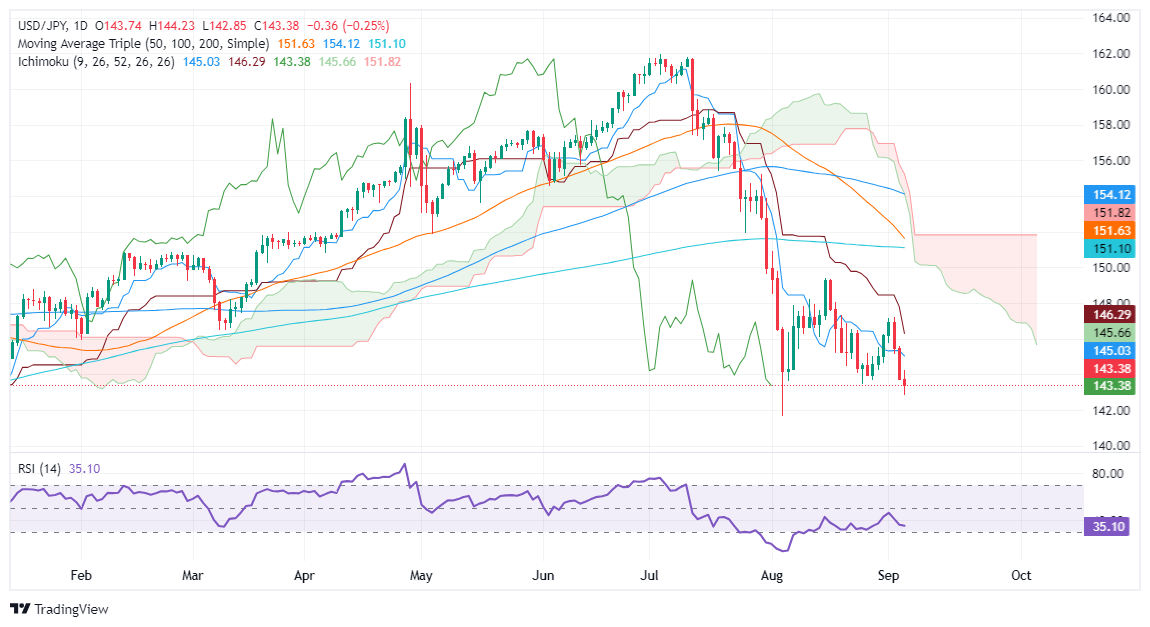
The USD/JPY fell toward multi-week lows but failed to decisively clear the August 26 swing low of 143.44. This can pave the way for a recovery for USD bulls, who struggled with the drop in the US 10-year T-note yield.
Despite this, momentum favors further downside, as shown by the Relative Strength Index (RSI). With this and first-tier US August’s Nonfarm Payrolls report looming, the path of least resistance is for a bearish continuation.
The USD/JPY's first support would be the August 26 daily low of 143.44. A breach of the latter would expose key psychological support levels, like the 143.00 mark. This would be followed by the current week's low of 142.85, ahead of key psychological levels, the 142.50 mark and 142.00.
Conversely, an upbeat US jobs report will expose key resistance levels. First, the Tenkan-Sen will be at 145.03, followed by the Kijun-Sen at 145.73, before reclaiming the 150.00 figure above the latest cycle high of 149.39.
USD/JPY Price Action – Daily Chart
Japanese Yen PRICE Today
The table below shows the percentage change of Japanese Yen (JPY) against listed major currencies today. Japanese Yen was the strongest against the Swiss Franc.
| USD | EUR | GBP | JPY | CAD | AUD | NZD | CHF | |
|---|---|---|---|---|---|---|---|---|
| USD | -0.00% | 0.02% | -0.04% | -0.00% | -0.01% | 0.00% | 0.03% | |
| EUR | 0.00% | 0.02% | -0.06% | -0.02% | 0.02% | -0.01% | 0.02% | |
| GBP | -0.02% | -0.02% | -0.06% | -0.02% | -0.02% | -0.01% | 0.00% | |
| JPY | 0.04% | 0.06% | 0.06% | 0.05% | 0.05% | 0.03% | 0.07% | |
| CAD | 0.00% | 0.02% | 0.02% | -0.05% | -0.01% | 0.00% | 0.02% | |
| AUD | 0.00% | -0.02% | 0.02% | -0.05% | 0.00% | -0.01% | 0.01% | |
| NZD | -0.00% | 0.00% | 0.01% | -0.03% | -0.01% | 0.00% | 0.01% | |
| CHF | -0.03% | -0.02% | -0.01% | -0.07% | -0.02% | -0.01% | -0.01% |
The heat map shows percentage changes of major currencies against each other. The base currency is picked from the left column, while the quote currency is picked from the top row. For example, if you pick the Japanese Yen from the left column and move along the horizontal line to the US Dollar, the percentage change displayed in the box will represent JPY (base)/USD (quote).
- NZD/USD is consolidating around 0.6225 with bullish traction flat.
- The RSI is rising at 60 while the MACD flat green bars paint a neutral to bullish outlook.
The NZD/USD continues consolidating around 0.6225 with bulls taking a breather but seeming to be gathering strength before their next upwards leg. Bears made a stride at the beginning of the week pushing the pair down by nearly 1% but those movements seem to have been only corrective as the overall outlook is on the bull's side.
The Relative Strength Index (RSI) has risen to 60 while the Moving Average Convergence Divergence (MACD) is flat green bars suggesting that while momentum is positive, it seems to be flattening favoring the side-ways movements. The volume is also average, which suggests that the bullish momentum may be limited
NZD/USD daily chart
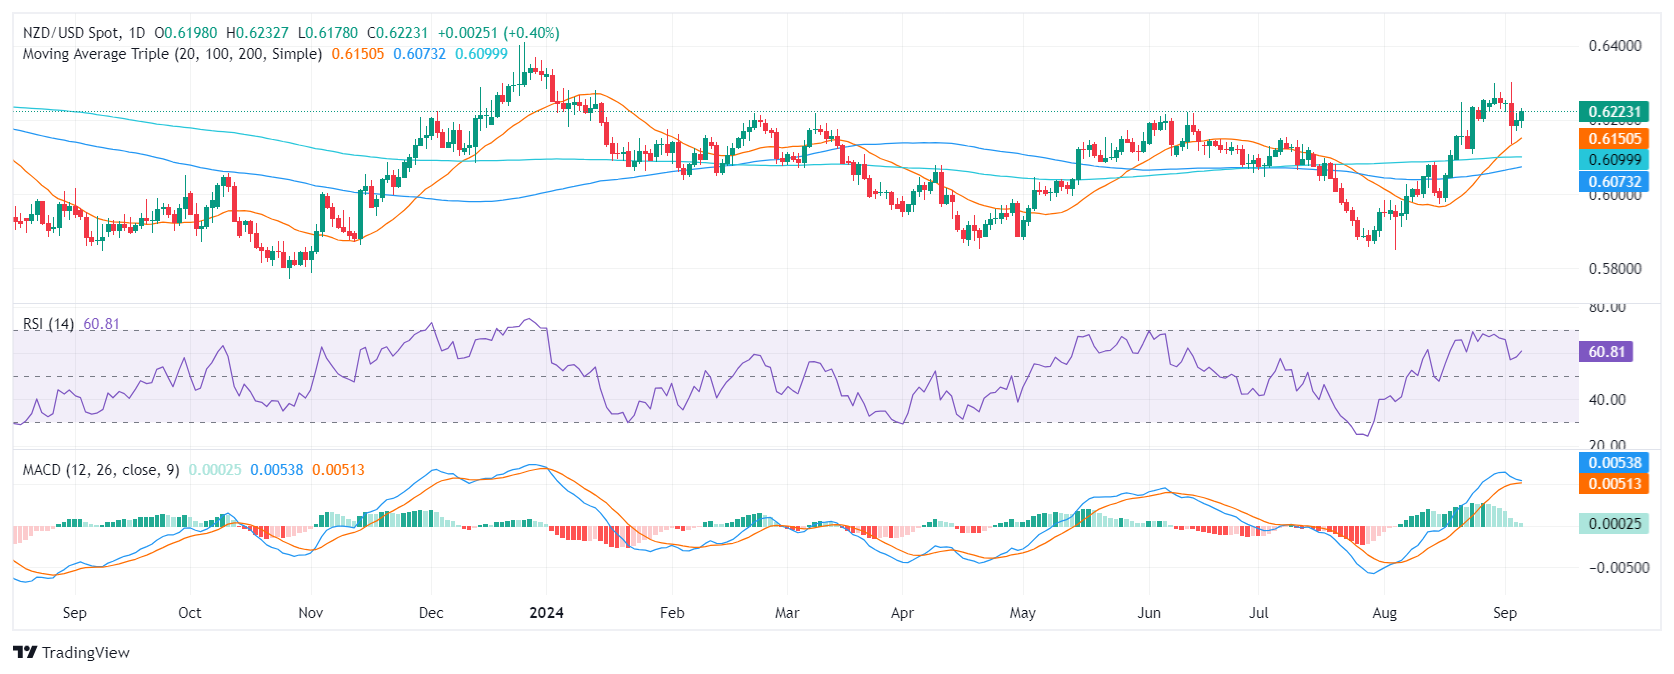
Looking at the support and resistance levels, the pair is facing resistance at the 0.6250 level. A break above this level could open the door for further gains. On the downside, the pair is facing support at the 0.6200-0.6180 level. A break below this level could shift the tide in favor of the bears.
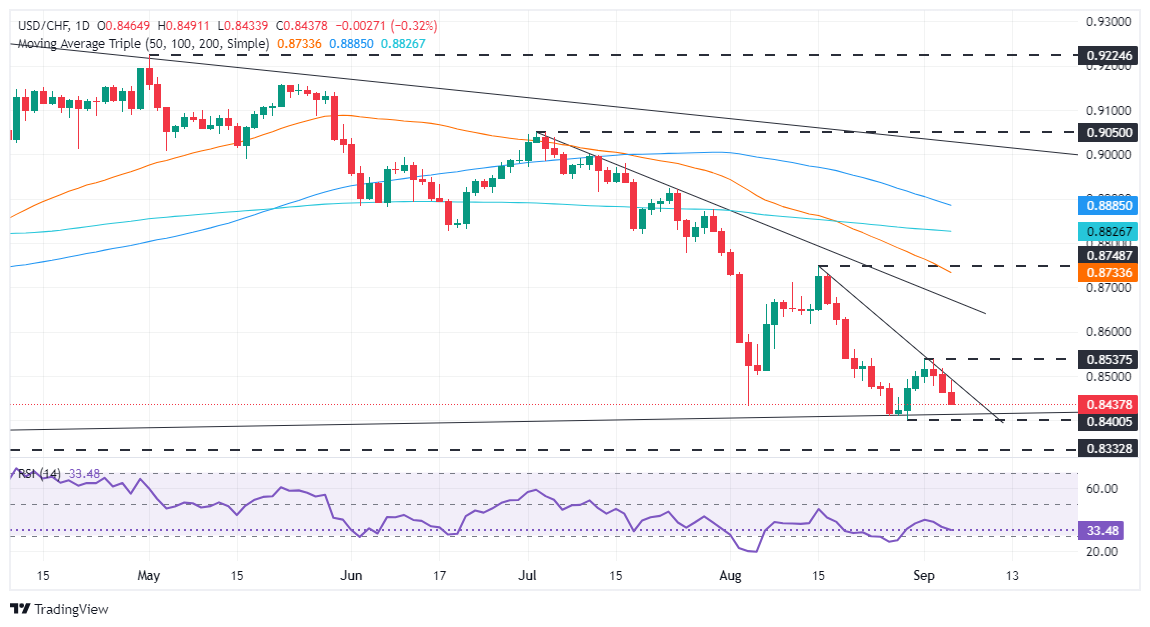
- USD/CHF retreats 0.20%, testing support levels after US labor data fuels expectations of aggressive Fed rate cuts.
- The pair eyes a retest of the year-to-date low of 0.8400, with further downside targeting 0.8332 and 0.8300.
- For a bullish recovery, USD/CHF must clear the August 15 swing high at 0.8748.
The USD/CHF retreated late in the New York session, down 0.20%, as US jobs data revealed the labor market is cooling, which could warrant the Federal Reserve's (Fed) “aggressive” rate cuts. At the time of writing, the pair trades at 0.8447 after hitting a daily high of 0.8490.
USD/CHF Price Forecast: Technical outlook
USD/CHF's failure to clear the key resistance trendline around 0.8530-50 sponsored a leg-down on the pair. On its path toward the current exchange rate, the pair cleared the 0.8500 figure, tested today.
Momentum favors sellers, as the Relative Strength Index (RSI) shows. This could help refresh the year-to-date (YTD) low of 0.8400, hit on August 29.
If USD/CHF clears 0.8400, the next support would be last year’s low of 0.8332 before challenging 0.8300.
The USD/CHF pair must clear the August 15 swing high at 0.8748 for a bullish recovery.
USD/CHF Price Action – Daily Chart
Swiss Franc PRICE Today
The table below shows the percentage change of Swiss Franc (CHF) against listed major currencies today. Swiss Franc was the strongest against the US Dollar.
| USD | EUR | GBP | JPY | CAD | AUD | NZD | CHF | |
|---|---|---|---|---|---|---|---|---|
| USD | -0.25% | -0.23% | -0.24% | -0.02% | -0.22% | -0.41% | -0.32% | |
| EUR | 0.25% | 0.03% | 0.02% | 0.27% | 0.04% | -0.11% | -0.07% | |
| GBP | 0.23% | -0.03% | -0.02% | 0.23% | 0.00% | -0.15% | -0.10% | |
| JPY | 0.24% | -0.02% | 0.02% | 0.22% | 0.02% | -0.15% | -0.07% | |
| CAD | 0.02% | -0.27% | -0.23% | -0.22% | -0.19% | -0.36% | -0.31% | |
| AUD | 0.22% | -0.04% | -0.01% | -0.02% | 0.19% | -0.17% | -0.10% | |
| NZD | 0.41% | 0.11% | 0.15% | 0.15% | 0.36% | 0.17% | 0.06% | |
| CHF | 0.32% | 0.07% | 0.10% | 0.07% | 0.31% | 0.10% | -0.06% |
The heat map shows percentage changes of major currencies against each other. The base currency is picked from the left column, while the quote currency is picked from the top row. For example, if you pick the Swiss Franc from the left column and move along the horizontal line to the US Dollar, the percentage change displayed in the box will represent CHF (base)/USD (quote).
- AUD/USD gains on soft US data and RBA’s hawkish outlook.
- RBA Bullock reiterates hawkish stance, signaling no near-term rate cuts.
- Monetary policy diveargence favors the Aussie as US data softens and RBA remains hawkish.
The AUD/USD pair traded in a tight range on Thursday but tallied daily gains after the USD was seen weak after mixed US data.
The Australian economy's uncertain prospects and the Reserve Bank of Australia's (RBA) aggressive stance on interest rates have led to a shift in market expectations. However, the bank hasn't yet embraced cuts in the near term.
Daily digest market movers: Australian Dollar gains slightly after trade figures and hawkish RBA
- Australian exports rose 0.7% MoM and 1.4% YoY in July, while imports fell by 0.8% MoM and 3.0% YoY.
- Exports to China slumped significantly in July, with coal and iron ore prices continuing to decline.
- On Thursday, RBA Governor Bullock maintained a hawkish stance, reiterating that the Board does not expect to cut rates in the near term.
- Across the Pacific, US labor market data disappointed, while ISM Services PMI figures helped the USD recover some losses.
- Monetary policy divergence continues to favor the Aussie, with RBA cash rate futures pricing in a high probability of a 25 bps cut by December.
AUD/USD technical outlook: Indicators flash mixed signals, overall outlook remains positive
On the daily chart, the Relative Strength Index (RSI) points up while the Moving Average Convergence Divergence (MACD) prints a red bar, and both flash mixed signals. However, with the pair above the Simple Moving Average (SMA), the overall outlook is positive, with the pair set to retest the zone above 0.6780.
Australian Dollar FAQs
One of the most significant factors for the Australian Dollar (AUD) is the level of interest rates set by the Reserve Bank of Australia (RBA). Because Australia is a resource-rich country another key driver is the price of its biggest export, Iron Ore. The health of the Chinese economy, its largest trading partner, is a factor, as well as inflation in Australia, its growth rate and Trade Balance. Market sentiment – whether investors are taking on more risky assets (risk-on) or seeking safe-havens (risk-off) – is also a factor, with risk-on positive for AUD.
The Reserve Bank of Australia (RBA) influences the Australian Dollar (AUD) by setting the level of interest rates that Australian banks can lend to each other. This influences the level of interest rates in the economy as a whole. The main goal of the RBA is to maintain a stable inflation rate of 2-3% by adjusting interest rates up or down. Relatively high interest rates compared to other major central banks support the AUD, and the opposite for relatively low. The RBA can also use quantitative easing and tightening to influence credit conditions, with the former AUD-negative and the latter AUD-positive.
China is Australia’s largest trading partner so the health of the Chinese economy is a major influence on the value of the Australian Dollar (AUD). When the Chinese economy is doing well it purchases more raw materials, goods and services from Australia, lifting demand for the AUD, and pushing up its value. The opposite is the case when the Chinese economy is not growing as fast as expected. Positive or negative surprises in Chinese growth data, therefore, often have a direct impact on the Australian Dollar and its pairs.
Iron Ore is Australia’s largest export, accounting for $118 billion a year according to data from 2021, with China as its primary destination. The price of Iron Ore, therefore, can be a driver of the Australian Dollar. Generally, if the price of Iron Ore rises, AUD also goes up, as aggregate demand for the currency increases. The opposite is the case if the price of Iron Ore falls. Higher Iron Ore prices also tend to result in a greater likelihood of a positive Trade Balance for Australia, which is also positive of the AUD.
The Trade Balance, which is the difference between what a country earns from its exports versus what it pays for its imports, is another factor that can influence the value of the Australian Dollar. If Australia produces highly sought after exports, then its currency will gain in value purely from the surplus demand created from foreign buyers seeking to purchase its exports versus what it spends to purchase imports. Therefore, a positive net Trade Balance strengthens the AUD, with the opposite effect if the Trade Balance is negative.
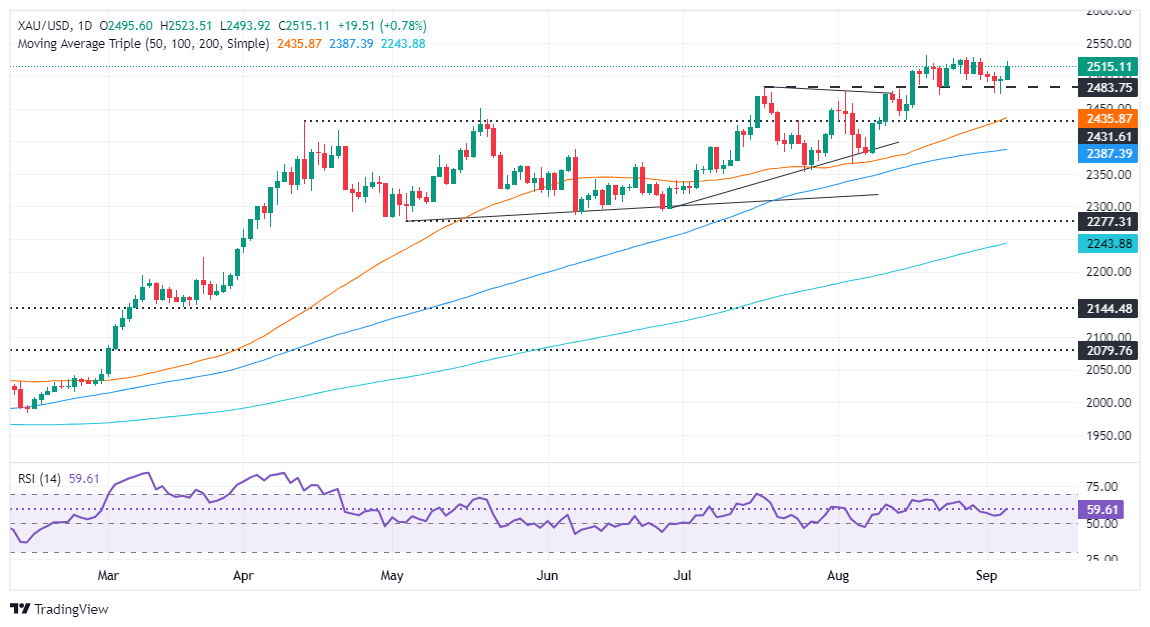
- Gold rises above $2,500, peaking at $2,523 before profit-taking ahead of key US economic data.
- Traders price in over 104 bps of Fed easing, expecting rate cuts to maintain labor market stability.
- Falling US Treasury yields and a weaker US Dollar support further upside in Gold prices.
Gold prices rallied sharply during the North American session, above the $2,500 figure on Thursday, yet remain shy of their daily peak of $2,523 as traders booked profits ahead of first-tier United States (US) data. At the time of writing, XAU/USD trades at $2,516, gaining over 0.80%.
In the early morning, US jobs data showed mixed readings, though it confirmed that the labor market is cooling, fueling speculation for a 50-basis-point (bps) interest rate cut by the Federal Reserve (Fed) in two weeks. On the other hand, the economy remains resilient as business activity in the services segment improved against projections of a slowdown.
However, Gold traders lifted the yellow metal above $2,500, as they priced in over 104 bps of Fed easing, according to the December 2024 Chicago Board of Trade (CBOT) fed funds futures contract.
What is almost certain is that the Fed may lower borrowing costs, according to San Francisco Fed President Mary Daly. She commented that the Fed needs to cut rates to keep the labor market healthy.
US Treasury yields fell after the data with the 10-year Treasury note down three basis points to 3.727%, undermining the buck. The US Dollar Index (DXY), a measure of the Greenback’s value against the other six currencies, tumbles over 0.21% to 101.05.
In the meantime, Gold traders are preparing for the release of the August Nonfarm Payrolls (NFP) report.
Daily digest market movers: Gold price surges ahead of US NFP data
- Figures of the ADP National Employment Change showed that private companies hired fewer people than expected, adding just 99K in August, well beneath the 145K expected and downwardly revised July figures.
- Initial Jobless Claims for the week ending August 31, hit 227K, below the 230K projected and the previous 232K.
- ISM Services Purchasing Managers Index (PMI), a measure of business activity, improved. The index hit 51.5 vs 51.4 in July and above the 51.1 projected by the consensus.
- August’s NFP figures are expected to rise from 114K to 163K, while the Unemployment Rate could dip, according to the consensus, from 4.3% to 4.2%.
Technical outlook: Gold price buyers reclaim $2,500
Gold prices had risen to new two-week highs above $2,500 before the NFP report's release. Price action shows buyers are gathering momentum as demonstrated by the Relative Strength Index (RSI), aiming for the upside in bullish territory.
That said, the XAU/USD path of least resistance is tilted to the upside, and it might challenge the year-to-date (YTD) high at $2,531. If surpassed, the next stop would be the psychological $2,550, followed by the $2,600 mark.
Conversely, if XAU/USD drops below $2,500, the next support would be the August 22 low at $2,470. Once cleared, the next demand zone would be the confluence of the April 12 high, which turned support, and the 50-day Simple Moving Average (SMA) at $2,435-$2,431.
Gold FAQs
Gold has played a key role in human’s history as it has been widely used as a store of value and medium of exchange. Currently, apart from its shine and usage for jewelry, the precious metal is widely seen as a safe-haven asset, meaning that it is considered a good investment during turbulent times. Gold is also widely seen as a hedge against inflation and against depreciating currencies as it doesn’t rely on any specific issuer or government.
Central banks are the biggest Gold holders. In their aim to support their currencies in turbulent times, central banks tend to diversify their reserves and buy Gold to improve the perceived strength of the economy and the currency. High Gold reserves can be a source of trust for a country’s solvency. Central banks added 1,136 tonnes of Gold worth around $70 billion to their reserves in 2022, according to data from the World Gold Council. This is the highest yearly purchase since records began. Central banks from emerging economies such as China, India and Turkey are quickly increasing their Gold reserves.
Gold has an inverse correlation with the US Dollar and US Treasuries, which are both major reserve and safe-haven assets. When the Dollar depreciates, Gold tends to rise, enabling investors and central banks to diversify their assets in turbulent times. Gold is also inversely correlated with risk assets. A rally in the stock market tends to weaken Gold price, while sell-offs in riskier markets tend to favor the precious metal.
The price can move due to a wide range of factors. Geopolitical instability or fears of a deep recession can quickly make Gold price escalate due to its safe-haven status. As a yield-less asset, Gold tends to rise with lower interest rates, while higher cost of money usually weighs down on the yellow metal. Still, most moves depend on how the US Dollar (USD) behaves as the asset is priced in dollars (XAU/USD). A strong Dollar tends to keep the price of Gold controlled, whereas a weaker Dollar is likely to push Gold prices up.
The Greenback added to the weekly leg lower and pierced the key 101.00 barrier against the backdrop of persistently low US yields across the curve and steady speculation of a potential half-point interest rate cut by the Fed.
Here is what you need to know on Friday, September 6:
The US Dollar Index (DXY) added to previous losses and put the 101.00 support to the test amidst rising cautiousness prior to the release of the US labour market report on Friday. The crucial Nonfarm Payrolls, and the Unemployment Rate are due on September 6, along with the speech by the Fed’s Williams (New York).
EUR/USD built on Wednesday’s gains and reclaimed the 1.1100 barrier and beyond on the back of a continuous downward bias in the US Dollar. The German Balance of Trade results and Industrial Production are expected on September 6, followed by the third estimate of the Q2 GDP Growth Rate and final Employment Change data in the broader Euroland.
GBP/USD rose further in line with the rest of its risk peers, coming close to the key 1.3200 hurdle amidst persistent Dollar weakness. On September 6, the Halifax House Price Index is due, along with the BBA Mortgage Rate.
USD/JPY retreated to new four-week lows after breaking below the key 143.00 support following a weaker Dollar, lower yields, and hawkish remarks from a BoJ official. Household Spending data and preliminary Coincident Index and Leading Economic Index will be published on September 6.
AUD/USD rebounded further, maintaining the trade above the key 0.6700 barrier following the selling pressure in the Greenback, a recovery in commodity prices, and the cautious tone from the RBA’s Bullock. Home Loans and Investment Lending for Homes will be unveiled on September 6.
Quite a volatile day saw prices of WTI clinch a new 2024 low near $68.80, although regaining some upside momentum afterwards in response to positive news from the OPEC+ as well as a bullish report from weekly US crude oil inventories by the EIA.
Prices of Gold climbed past the $2,520 mark per ounce troy, adding to Wednesday’s advance on the back of further downside pressure in the US Dollar and shrinking US yields. Silver rallied to weekly tops, surpassing the $29.00 mark per ounce and flirting with the interim 55-day and 100-day SMAs.
- The Dow Jones backslid 400 points on Thursday as economic concerns persist.
- Investors are growing increasingly worried about a recession as hiring slows.
- Friday’s NFP jobs data dump looms over the horizon as investors begin to stress.
The Dow Jones Industrial Average (DJIA) ground 400 points lower on Thursday, shedding weight for the second time this week after US jobs data came in below expectations. Equities have since recovered from the day’s initial shock selloff, but the Dow Jones is struggling to return to flat for the day. ADP Employment Change showed its slowest rate of job additions since February of 2021, sparking a fresh round of risk aversion as investors grapple with the threat of a possible recession within the US economy.
According to payroll processor ADP, the US added 99K net new jobs in August, down from July’s revised 111K and well below the expected 145K. August’s ADP additions are the lowest print since early 2021, sparking a fresh round of risk aversion and reigniting investor concerns that the US could be heading into a recession.
The ADP jobs report serves as a bellwether for what markets can expect from Friday’s upcoming US Nonfarm Payrolls (NFP) report, albeit one with a wobbly track record for accuracy. August’s NFP print represents the last significant labor update before the Federal Reserve’s (Fed) upcoming rate call on September 18, when Fed policymakers are broadly expected to kick off a rate-cutting cycle.
According to the CME, rate markets are currently betting on 40% odds that the Fed will blow the doors open with a 50 bps cut later in the month, with the remaining 60% betting on a more demure 25 bps opening rate trim. Investors are anticipating using this Friday’s NFP print as a way to gauge the depth of the Fed’s first rate cut since the Fed slashed 100 bps in March of 2020.
Economic Indicator
ADP Employment Change
The ADP Employment Change is a gauge of employment in the private sector released by the largest payroll processor in the US, Automatic Data Processing Inc. It measures the change in the number of people privately employed in the US. Generally speaking, a rise in the indicator has positive implications for consumer spending and is stimulative of economic growth. So a high reading is traditionally seen as bullish for the US Dollar (USD), while a low reading is seen as bearish.
Read more.Last release: Thu Sep 05, 2024 12:15
Frequency: Monthly
Actual: 99K
Consensus: 145K
Previous: 122K
Source: ADP Research Institute
Traders often consider employment figures from ADP, America’s largest payrolls provider, report as the harbinger of the Bureau of Labor Statistics release on Nonfarm Payrolls (usually published two days later), because of the correlation between the two. The overlaying of both series is quite high, but on individual months, the discrepancy can be substantial. Another reason FX traders follow this report is the same as with the NFP – a persistent vigorous growth in employment figures increases inflationary pressures, and with it, the likelihood that the Fed will raise interest rates. Actual figures beating consensus tend to be USD bullish.
Dow Jones news
The Dow Jones plunged around 400 points on Thursday before recovering to a more modest 150 point decline. Despite a broad-base recovery bid, the DJIA was still tilted heavily towards the bearish side, with all but five of the equity index’s constituent securities testing into the red. Merch & Co (MRK) managed to squeeze out a 3.28% gain despite Thursday’s bearish overtones, rising to $119.60 per share, while biotech firm Amgen (AMGN) declined 1.62% to $325.28 per share as traders take a breather from bidding up the medical tech firm ,which is still up over 28% for the past year.
Elswhere on the Dow Jones, Verizon (VZ) stumbled after stockholders reacted poorly to the news that VZ will be forking over $20 billion to acquire Frontier Communications (FYBR).
Dow Jones price forecast
Despite a fresh intraday test into the low end, the Dow Jones continues to play in a technical range just south of the 41,000 handle. The DJIA is still trading on the south side of recent all-time highs above 41,500, but the odds of an extended bearish pullback are draining out of the index as bidders continue to challenge downside momentum.
The long-term trend still clearly favors the high side, and even a determined push from collecting short positions will run into trouble at the 50-day Exponential Moving Average (EMA) rising through 40,300.
Dow Jones daily chart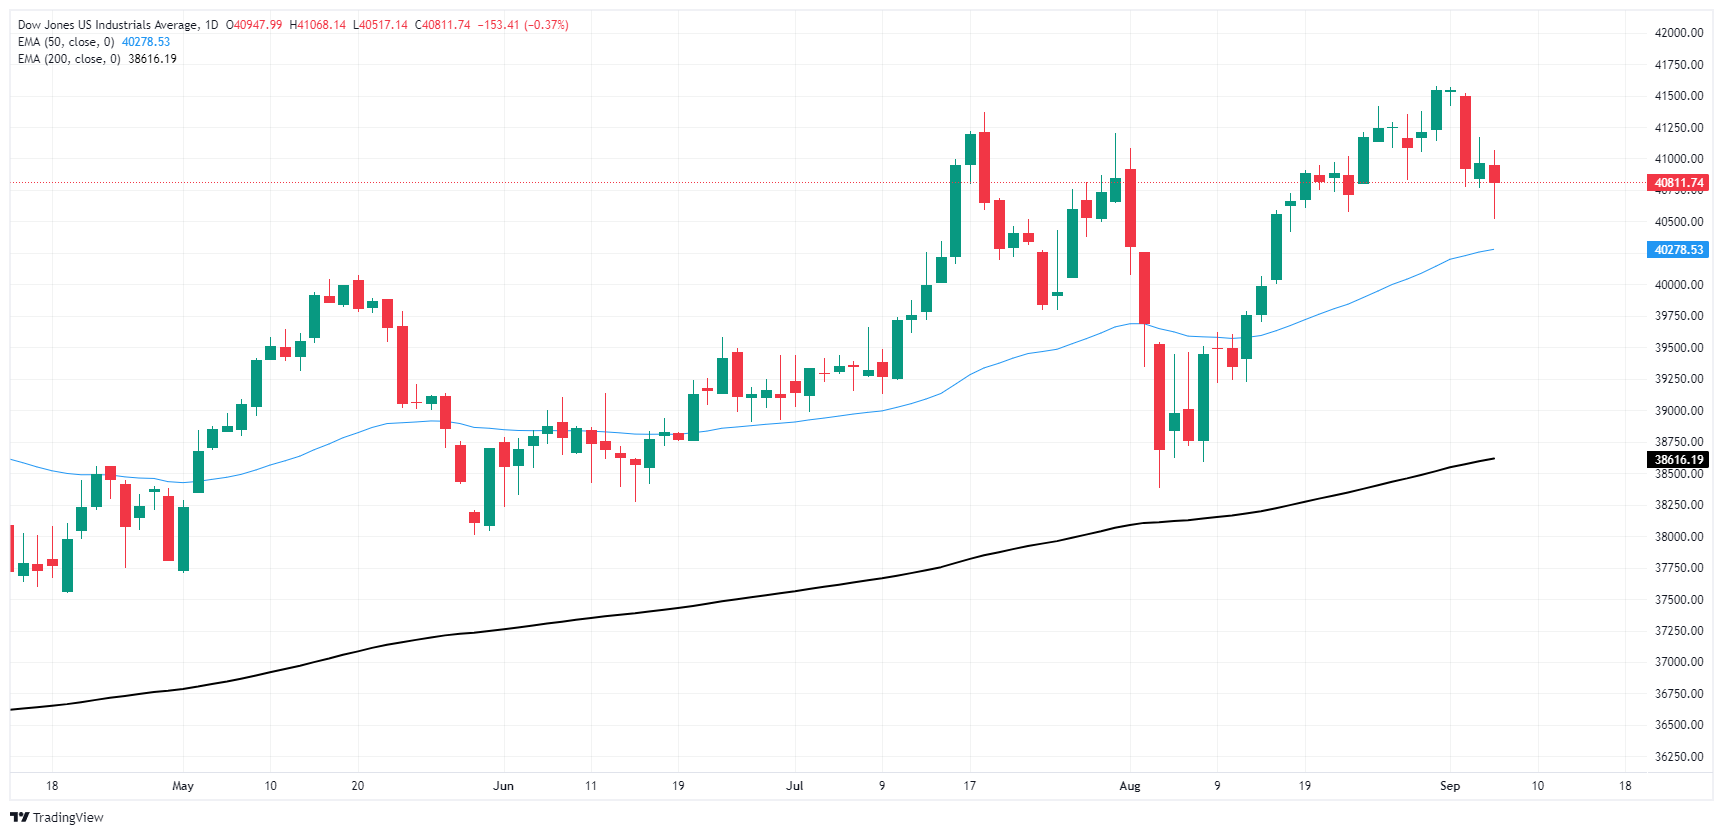
Dow Jones FAQs
The Dow Jones Industrial Average, one of the oldest stock market indices in the world, is compiled of the 30 most traded stocks in the US. The index is price-weighted rather than weighted by capitalization. It is calculated by summing the prices of the constituent stocks and dividing them by a factor, currently 0.152. The index was founded by Charles Dow, who also founded the Wall Street Journal. In later years it has been criticized for not being broadly representative enough because it only tracks 30 conglomerates, unlike broader indices such as the S&P 500.
Many different factors drive the Dow Jones Industrial Average (DJIA). The aggregate performance of the component companies revealed in quarterly company earnings reports is the main one. US and global macroeconomic data also contributes as it impacts on investor sentiment. The level of interest rates, set by the Federal Reserve (Fed), also influences the DJIA as it affects the cost of credit, on which many corporations are heavily reliant. Therefore, inflation can be a major driver as well as other metrics which impact the Fed decisions.
Dow Theory is a method for identifying the primary trend of the stock market developed by Charles Dow. A key step is to compare the direction of the Dow Jones Industrial Average (DJIA) and the Dow Jones Transportation Average (DJTA) and only follow trends where both are moving in the same direction. Volume is a confirmatory criteria. The theory uses elements of peak and trough analysis. Dow’s theory posits three trend phases: accumulation, when smart money starts buying or selling; public participation, when the wider public joins in; and distribution, when the smart money exits.
There are a number of ways to trade the DJIA. One is to use ETFs which allow investors to trade the DJIA as a single security, rather than having to buy shares in all 30 constituent companies. A leading example is the SPDR Dow Jones Industrial Average ETF (DIA). DJIA futures contracts enable traders to speculate on the future value of the index and Options provide the right, but not the obligation, to buy or sell the index at a predetermined price in the future. Mutual funds enable investors to buy a share of a diversified portfolio of DJIA stocks thus providing exposure to the overall index.
- US Dollar weakened on Thursday after mixed US economic data.
- S&P Global Services PMI and ISM Services PMI showed expansion in the service sector.
- Labor data showed some signs of weaknesses.
On Thursday, the US Dollar Index (DXY), a measure of the USD against a basket of six currencies experienced volatility following the release of mixed economic data from the United States. Labor data showed weakness in the sector, while Services figures were strong.
With the US economic outlook mixed, signs of cooling in the labor market are making investors put some bets on a larger cut in September.
Daily digest market movers: US Dollar stands weak after labor figures, steady dovish bets
- ADP Employment Change missed estimates, falling to 99,000 from 122,000, while the prior month was revised down to 111,000.
- Initial Claims came in at 227,000 from 232,000 previously, while Continuing Claims fell from 1.860 million to 1.838 million.
- In addition, Nonfarm Productivity saw a small uptick to 2.5% from 2.3%, while Labor Cost fell from 0.9% to 0.4%.
- S&P Global's Services PMI rose from 55.2 to 55.7, and the Composite PMI increased from 54.1 to 54.6. The ISM's Services PMI improved slightly from 51.4 to 51.5.
- Contributing to the cooling labor market, the Employment Index in the ISM Services PMI declined from 51.1 to 50.2.
- Following the data, the CME Fedwatch Tool indicates a 55% chance of a 25 bps rate cut in September and a 45% chance of a 50 bps cut, with further cuts expected thereafter.
DXY technical outlook: Technicals suggest continued bearish momentum, testing support at 100.50
The DXY index's technical indicators have resumed their downward trajectory and remain in negative territory. Despite a recent recovery attempt, the index encountered resistance at its 20-day Simple Moving Average (SMA), resulting in a rejection of buyers.
As a result, the DXY is poised to revisit the 100.50 (August lows) support level. Above, support levels include 101.30, 101.15, and 101.00, while resistance levels are located at 101.80, 102.00, and 102.30.
Indicators-wise, the Relative Strength Index (RSI) and Moving Average Convergence Divergence (MACD) continue to suggest bearish momentum as they are still in negative terrain.
US Dollar FAQs
The US Dollar (USD) is the official currency of the United States of America, and the ‘de facto’ currency of a significant number of other countries where it is found in circulation alongside local notes. It is the most heavily traded currency in the world, accounting for over 88% of all global foreign exchange turnover, or an average of $6.6 trillion in transactions per day, according to data from 2022. Following the second world war, the USD took over from the British Pound as the world’s reserve currency. For most of its history, the US Dollar was backed by Gold, until the Bretton Woods Agreement in 1971 when the Gold Standard went away.
The most important single factor impacting on the value of the US Dollar is monetary policy, which is shaped by the Federal Reserve (Fed). The Fed has two mandates: to achieve price stability (control inflation) and foster full employment. Its primary tool to achieve these two goals is by adjusting interest rates. When prices are rising too quickly and inflation is above the Fed’s 2% target, the Fed will raise rates, which helps the USD value. When inflation falls below 2% or the Unemployment Rate is too high, the Fed may lower interest rates, which weighs on the Greenback.
In extreme situations, the Federal Reserve can also print more Dollars and enact quantitative easing (QE). QE is the process by which the Fed substantially increases the flow of credit in a stuck financial system. It is a non-standard policy measure used when credit has dried up because banks will not lend to each other (out of the fear of counterparty default). It is a last resort when simply lowering interest rates is unlikely to achieve the necessary result. It was the Fed’s weapon of choice to combat the credit crunch that occurred during the Great Financial Crisis in 2008. It involves the Fed printing more Dollars and using them to buy US government bonds predominantly from financial institutions. QE usually leads to a weaker US Dollar.
Quantitative tightening (QT) is the reverse process whereby the Federal Reserve stops buying bonds from financial institutions and does not reinvest the principal from the bonds it holds maturing in new purchases. It is usually positive for the US Dollar.
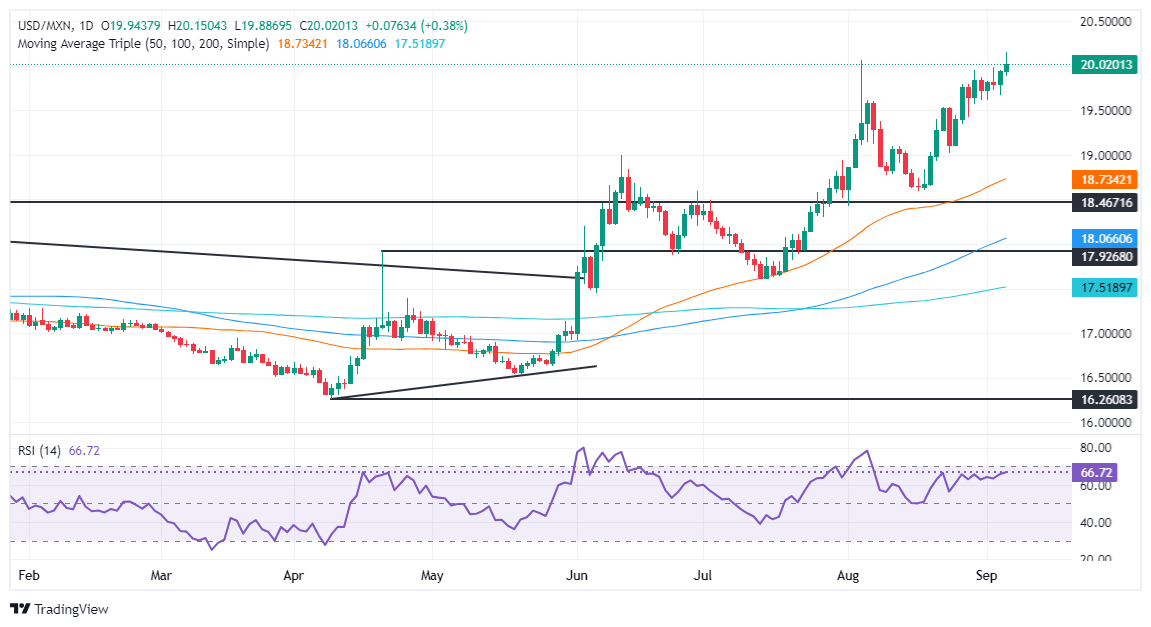
- USD/MXN rises 0.20% to 19.97, hitting a four-week low of 20.14 amid ongoing political turmoil in Mexico.
- Judicial reform bill awaits Senate approval with potential consequences for US-Mexico relations and market sentiment.
- Mexico’s upcoming inflation data and US NFP are key factors that could influence further Peso movement.
The Mexican Peso fell against the Greenback during the New York session, hitting a four-week low of 20.14. The financial markets continued to digest the lower house decision to approve President Andres Manuel Lopez Obrador's (AMLO) bill to make changes to the judicial system. The Peso extended its losses for the third straight day and finally cracked the psychological barrier of 20.00 as traders began to ditch the Mexican currency. The USD/MXN trades at 20.01, up 0.40%.
Mexico’s economic docket is scarce with investors eyeing the release of automobile industry data on Friday. Next week, inflation figures will garner attention after the Bank of Mexico (Banxico) decided to lower borrowing costs despite revising their inflation projections upward.
Back to political developments, two-thirds of the Senate must now approve the judicial reform bill. Morena’s ruling party is shy of one vote, but if the bill is cleared, it will be passed to 32 local congresses for their approval. Once the bill is approved in 17 of those states, the changes to the Mexican Constitution will be officially made.
On Tuesday, the US Ambassador in Mexico, Ken Salazar, expressed that the approval of the judiciary reform could damage relations between Mexico and the United States.
Across the border, the US docket has been busy releasing jobs and the ISM and S&P Global Services PMI data. The ADP National Employment Change for August was dismal with missed estimates and a downward revision of July’s numbers.
Even though the Greenback weakened, it was a short-lived dip. Data released by the US Department of Labor showed that the number of Americans filing for unemployment benefits was lower than expected.
According to the CME FedWatch Tool, odds for a 50 bps Fed rate cut are at 39%; while for a quarter of a percentage point, 61%.
Now that most of the data is out of the way, traders will focus on the release of the August Nonfarm Payrolls (NFP) report.
Daily digest market movers: Mexican Peso extended its losses despite mixed US data
- Mexico’s data revealed during the week show the economy is slowing due to higher interest rates set by the Bank of Mexico.
- Most banks expect the Bank of Mexico (Banxico) to reduce rates by at least 50 basis points (bps) for the remainder of 2024. This would pressure the Mexican currency, which has depreciated 17.38% year to date.
- US ADP Employment Change for August dipped from 111K to 99K, missing estimates of 145K. Contrarily, Initial Jobless Claims for the week ending August 31 slid from 232K to 227K, lower than the 230K expected.
- ISM Services PMI for August was better than projections, increasing by 51.5 from 51.4 in July, above the consensus for a 51.1 drop.
- US Nonfarm Payrolls in August are expected to grow from 114K to 163K, while the Unemployment Rate is foreseen ticking lower from 4.3% to 4.2%.
- Data from the Chicago Board of Trade (CBOT) suggests the Fed will cut at least 104 basis points this year, up from a day ago’s 103 bps, according to the fed funds rate futures contract for December 2024.
Technical outlook: Mexican Peso weakens as USD/MXN rallies above 20.00
Politics is the driver of the USD/MXN exchange rate. As traders digested the lower house approval of the bill, foreign investors had grown worried about changes to the Mexican Constitution.
Therefore, the USD/MXN cleared the 20.00 psychological barrier as buying momentum began to build as seen on the Relative Strength Index (RSI). The RSI registered a new peak, and if the uptrend gains steam, it will exert additional pressure on the Peso.
If USD/MXN clears the YTD high at 20.22, the next stop would be the September 28, 2022, daily high at 20.57. If those two levels are surrendered, the next stop would be August 2, 2022 swing high at 20.82, ahead of 21.00.
Conversely, if USD/MXN weakens further, the first support would be 19.50. A breach of the latter will expose the August 23 swing low of 19.02 before giving way for sellers eyeing a test of the 50-day Simple Moving Average (SMA) at 18.65.
Mexican Peso FAQs
The Mexican Peso (MXN) is the most traded currency among its Latin American peers. Its value is broadly determined by the performance of the Mexican economy, the country’s central bank’s policy, the amount of foreign investment in the country and even the levels of remittances sent by Mexicans who live abroad, particularly in the United States. Geopolitical trends can also move MXN: for example, the process of nearshoring – or the decision by some firms to relocate manufacturing capacity and supply chains closer to their home countries – is also seen as a catalyst for the Mexican currency as the country is considered a key manufacturing hub in the American continent. Another catalyst for MXN is Oil prices as Mexico is a key exporter of the commodity.
The main objective of Mexico’s central bank, also known as Banxico, is to maintain inflation at low and stable levels (at or close to its target of 3%, the midpoint in a tolerance band of between 2% and 4%). To this end, the bank sets an appropriate level of interest rates. When inflation is too high, Banxico will attempt to tame it by raising interest rates, making it more expensive for households and businesses to borrow money, thus cooling demand and the overall economy. Higher interest rates are generally positive for the Mexican Peso (MXN) as they lead to higher yields, making the country a more attractive place for investors. On the contrary, lower interest rates tend to weaken MXN.
Macroeconomic data releases are key to assess the state of the economy and can have an impact on the Mexican Peso (MXN) valuation. A strong Mexican economy, based on high economic growth, low unemployment and high confidence is good for MXN. Not only does it attract more foreign investment but it may encourage the Bank of Mexico (Banxico) to increase interest rates, particularly if this strength comes together with elevated inflation. However, if economic data is weak, MXN is likely to depreciate.
As an emerging-market currency, the Mexican Peso (MXN) tends to strive during risk-on periods, or when investors perceive that broader market risks are low and thus are eager to engage with investments that carry a higher risk. Conversely, MXN tends to weaken at times of market turbulence or economic uncertainty as investors tend to sell higher-risk assets and flee to the more-stable safe havens.
- The EUR/GBP pair faces a mixed outlook despite trading above 0.8400.
- Bearish signals from RSI and MACD, but momentum is flattening.
- The pair might consolidate within a range between 0.8400 and 0.8450.
In Thursday's session, the EUR/GBP pair mildly declined to 0.8425 while the pair faced a mixed technical outlook with indicators flat in negative terrain. It all points out to bears taking a breather after shedding more than 1% in August.
The Relative Strength Index (RSI) remains in negative territory, around 39, with a mildly declining slope, signaling flattening bearish momentum. The Moving Average Convergence Divergence (MACD) prints flat red bars, further reinforcing the flattening bearish traction. Additionally, volumes have been decreasing over the last few sessions.
The EUR/GBP pair is consolidating above the 0.8400 level after August's sharp downward movements, which acts as immediate support, with resistance at 0.8430. If the pair breaks above this level, it could target 0.8450 and 0.8470. On the downside, immediate support is seen at 0.8400, followed by 0.8350.
EUR/GBP Daily chart
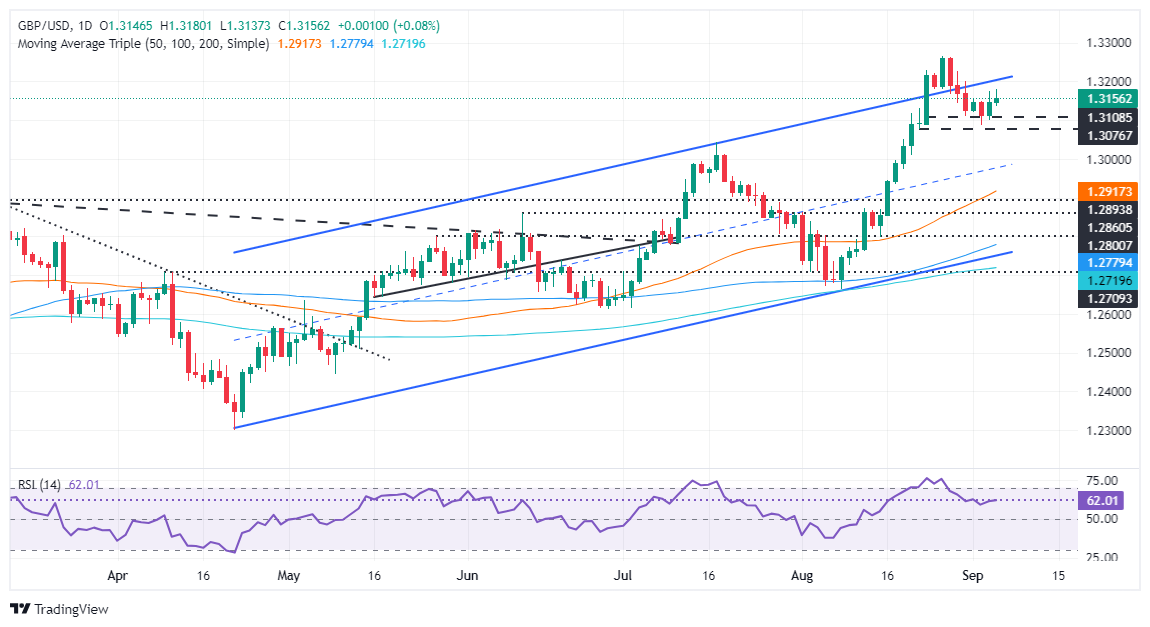
- GBP/USD remains above 1.3100, with RSI showing buyers in control and eyeing 1.3200 resistance.
- Clearing 1.3179 would open the door to challenge the March 2022 high of 1.3298, with further upside to 1.3437.
- A pullback below 1.3150 could lead to testing key support at 1.3100 and 1.3044, with the 50-DMA at 1.2914.
The GBP/USD aims up during the North American session, after jobs data from the United States (US) was mixed, while business activity expanded. Despite this, the pair clings to its gains and trades at 1.3166 above its opening price by 0.15% at the time of writing.
GBP/USD Price Forecast: Technical outlook
The GBP/USD has remained above the 1.3100 figure but has been capped on the upside so far as traders await the release of August’s Nonfarm Payrolls on Friday. The Relative Strength Index (RSI) shows that buyers are in charge and could sponsor a leg-up towards 1.3200.
If GBP/USD resumes to the upside and clears 1.3179, a move to 1.3200 will be made on the cards. A breach of the latter and will expose the March 23, 2022, peak at 1.3298 before challenging the March 1, 2022, cycle high at 1.3437.
Conversely if sellers step in and push GBP/USD below 1.3150, look for a pullback to 1.3100. Despite this, bears must clear the September 3 low of 1.3087 if they remain hopeful of lower exchange rates. The next key support levels would be July 17, high at 1.3044, followed by the 1.3000 figure and the 50-day moving average (DMA) at 1.2914.
GBP/USD Price Action – Daily Chart
British Pound PRICE Today
The table below shows the percentage change of British Pound (GBP) against listed major currencies today. British Pound was the strongest against the Swiss Franc.
| USD | EUR | GBP | JPY | CAD | AUD | NZD | CHF | |
|---|---|---|---|---|---|---|---|---|
| USD | 0.03% | -0.09% | 0.14% | 0.06% | 0.04% | -0.11% | 0.22% | |
| EUR | -0.03% | -0.10% | 0.16% | 0.06% | 0.01% | -0.09% | 0.19% | |
| GBP | 0.09% | 0.10% | 0.23% | 0.17% | 0.11% | 0.00% | 0.29% | |
| JPY | -0.14% | -0.16% | -0.23% | -0.09% | -0.13% | -0.27% | 0.06% | |
| CAD | -0.06% | -0.06% | -0.17% | 0.09% | -0.02% | -0.16% | 0.14% | |
| AUD | -0.04% | -0.01% | -0.11% | 0.13% | 0.02% | -0.12% | 0.18% | |
| NZD | 0.11% | 0.09% | -0.01% | 0.27% | 0.16% | 0.12% | 0.30% | |
| CHF | -0.22% | -0.19% | -0.29% | -0.06% | -0.14% | -0.18% | -0.30% |
The heat map shows percentage changes of major currencies against each other. The base currency is picked from the left column, while the quote currency is picked from the top row. For example, if you pick the British Pound from the left column and move along the horizontal line to the US Dollar, the percentage change displayed in the box will represent GBP (base)/USD (quote).
Signs of extreme upside asymmetry are playing out in Platinum markets, TDS Senior Commodity Strategist Daniel Ghali notes.
CTAs to buy 5% of their max size this session
“We highlighted that even a small reversal in prices can now spark massive CTA buying activity in Platinum markets over the coming week, and today's price action should help to spark the first such CTA buying program. We expect CTAs to buy 5% of their max size this session, which represents only a fraction of the total +60% they could plausibly buy over the coming sessions in an uptape.”
“At current levels, even in a flat tape, CTAs would be set to completely cover their shorts over the coming week. This set-up for algo flows bodes very well for additional upside on the horizon, reinforcing our view that Platinum prices have now already printed their local lows.”
“A substantial increase in SGE Platinum volumes amid the recent slump further suggests dip buyers have emerged in physical markets, in line with our view.”
- ISM Services PMI stood in expansion territory above 50 in August.
- US Dollar Index turns flat on the day above 101.00.
The economic activity in the US service sector expanded at a moderate pace in August, with the ISM Services PMI edging higher to 51.5 from 51.4 in July. This reading came in above the market expectation of 51.1.
Other details of the report showed that the Prices Paid Index, the inflation component, rose to 57.3 from 57, while the Employment Index declined to 50.2 from 51.1.
Assessing the survey's findings, "low-to-moderate growth was cited across many industries, while ongoing high costs and interest-rate pressures were often mentioned as negatively impacting business performance and driving softness in sales and traffic," said Steve Miller, Chair of the Institute for Supply Management (ISM) Services Business Survey Committee.
"Although the Inventories Index increased by 3.1 percentage points into expansion territory in August, many respondents indicated their companies are still actively managing down their inventories," Miller added.
Market reaction
The US Dollar Index recovered modestly with the immediate reaction to the PMI data and was last seen flat on the day at 101.24.
Gold is trading near all-time highs, awaiting the NFP release just weeks ahead of the highly-anticipated start of a rate cutting cycle, TDS Senior Commodity Strategist Daniel Ghali notes.
Gold is trading near all-time highs
“Today's miss on ADP doesn't bode well for a directional beat in NFP, but that is not a necessary condition for Gold prices to fizzle out. Certainly, the beat TD Securities expects on NFP could help catalyze a shift in positions, but our read on positioning dynamics is now already at extreme levels that have historically marked significant turning points in Gold markets.”
“Macro fund positioning is now at levels only seen during the Brexit referendum in 2016, the "stealth QE" narrative in 2019, or in the peak panic of the Covid-19 crisis in March 2020. This time around, physical markets have already fizzled out, whereas we also see extremes in Shanghai trader positions alongside CTA trend followers. Downside risks are more potent.”
- Silver price jumps sharply to near $29.00 as the Fed is expected to deliver a bigger interest rate cut this month.
- Weak private sector employment data weighs on the US Dollar and bond yields.
- Investors await the US NFP data for August, which will be published on Friday.
Silver price (XAG/USD) delivers a vertical upside move to near $29.00 in Thursday’s North American session. The white metal witnesses a strong buying interest as surprisingly weak United States (US) ADP Employment Change data for August renewed fears of deteriorating labor market conditions.
The private employment data that came in the early American session showed that fresh payrolls were lower at 99K than the downwardly revised figure of 111K from 122K in July. Economists estimated fresh private payrolls to have increased to 145K.
Weak private sector employment data has prompted market speculation that the Federal Reserve (Fed) will start the policy-easing cycle this month aggressively. Signs of slowing labor market demand have weighed heavily on the US Dollar (USD) and bond yields.
The US Dollar Index (DXY), which tracks the Greenback’s value against six major currencies, declines to near 101.00. 10-year US Treasury yields plunge to near 3.73%. Lower yields on interest-bearing assets strengthen the appeal of non-yielding assets, such as Silver, given that they reduce the opportunity cost of holding investment in them.
Going forward, the US Nonfarm Payrolls (NFP) data for August will be keenly watched, which will be published on Friday. Meanwhile, investors await the US ISM Services PMI data for August, which will be published at 14:00 GMT.
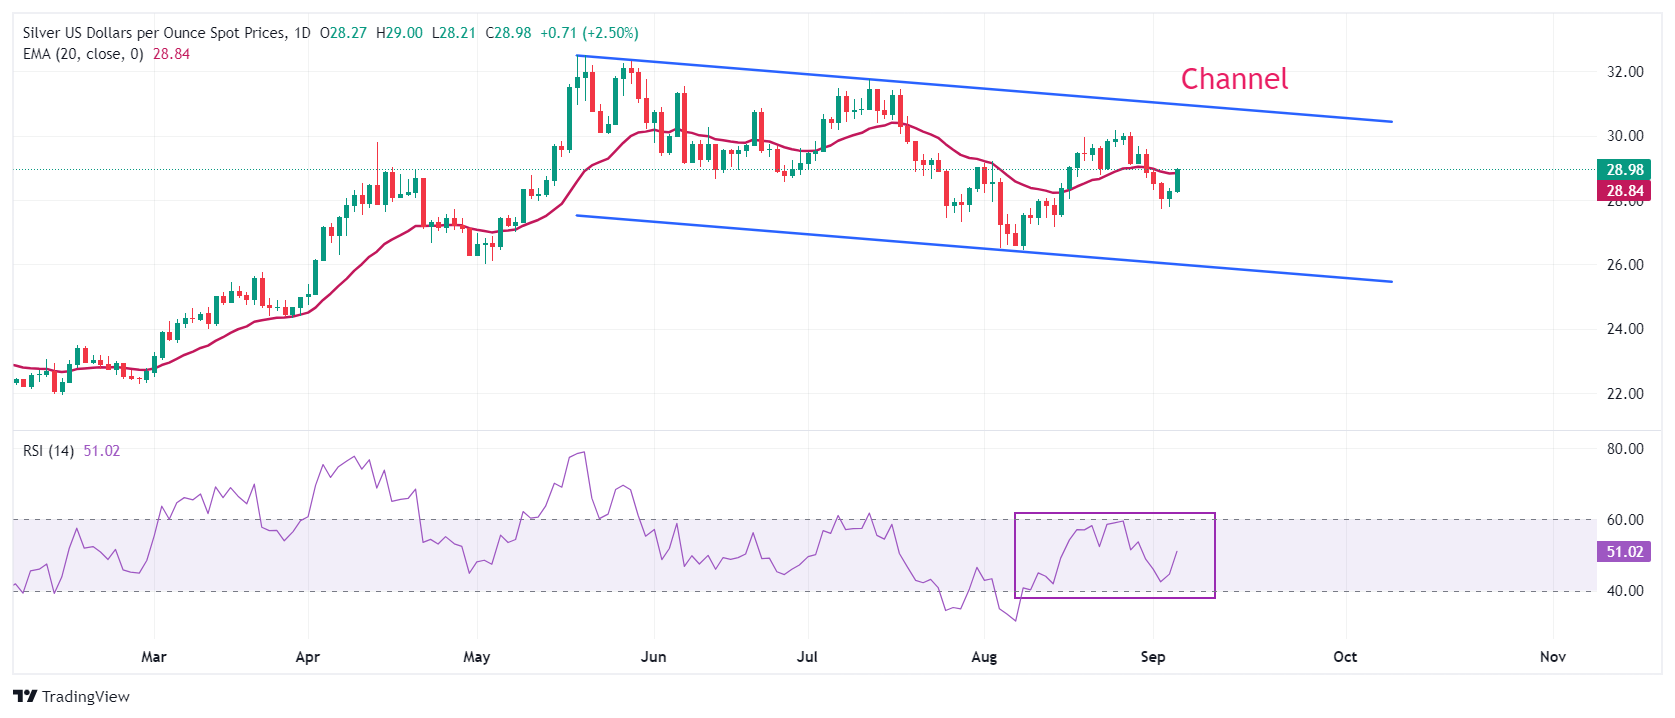
Silver technical analysis
Silver price trades in a Channel formation on a daily timeframe, which is slightly sloping downwards. The asset recovers sharply and attempts to break above the 20-day Exponential Moving Average (EMA), which trades around $28.80.
The 14-day Relative Strength Index (RSI) oscillates inside the 40.00-60.00 range, suggesting a consolidation ahead.
Silver daily chart
Silver FAQs
Silver is a precious metal highly traded among investors. It has been historically used as a store of value and a medium of exchange. Although less popular than Gold, traders may turn to Silver to diversify their investment portfolio, for its intrinsic value or as a potential hedge during high-inflation periods. Investors can buy physical Silver, in coins or in bars, or trade it through vehicles such as Exchange Traded Funds, which track its price on international markets.
Silver prices can move due to a wide range of factors. Geopolitical instability or fears of a deep recession can make Silver price escalate due to its safe-haven status, although to a lesser extent than Gold's. As a yieldless asset, Silver tends to rise with lower interest rates. Its moves also depend on how the US Dollar (USD) behaves as the asset is priced in dollars (XAG/USD). A strong Dollar tends to keep the price of Silver at bay, whereas a weaker Dollar is likely to propel prices up. Other factors such as investment demand, mining supply – Silver is much more abundant than Gold – and recycling rates can also affect prices.
Silver is widely used in industry, particularly in sectors such as electronics or solar energy, as it has one of the highest electric conductivity of all metals – more than Copper and Gold. A surge in demand can increase prices, while a decline tends to lower them. Dynamics in the US, Chinese and Indian economies can also contribute to price swings: for the US and particularly China, their big industrial sectors use Silver in various processes; in India, consumers’ demand for the precious metal for jewellery also plays a key role in setting prices.
Silver prices tend to follow Gold's moves. When Gold prices rise, Silver typically follows suit, as their status as safe-haven assets is similar. The Gold/Silver ratio, which shows the number of ounces of Silver needed to equal the value of one ounce of Gold, may help to determine the relative valuation between both metals. Some investors may consider a high ratio as an indicator that Silver is undervalued, or Gold is overvalued. On the contrary, a low ratio might suggest that Gold is undervalued relative to Silver.
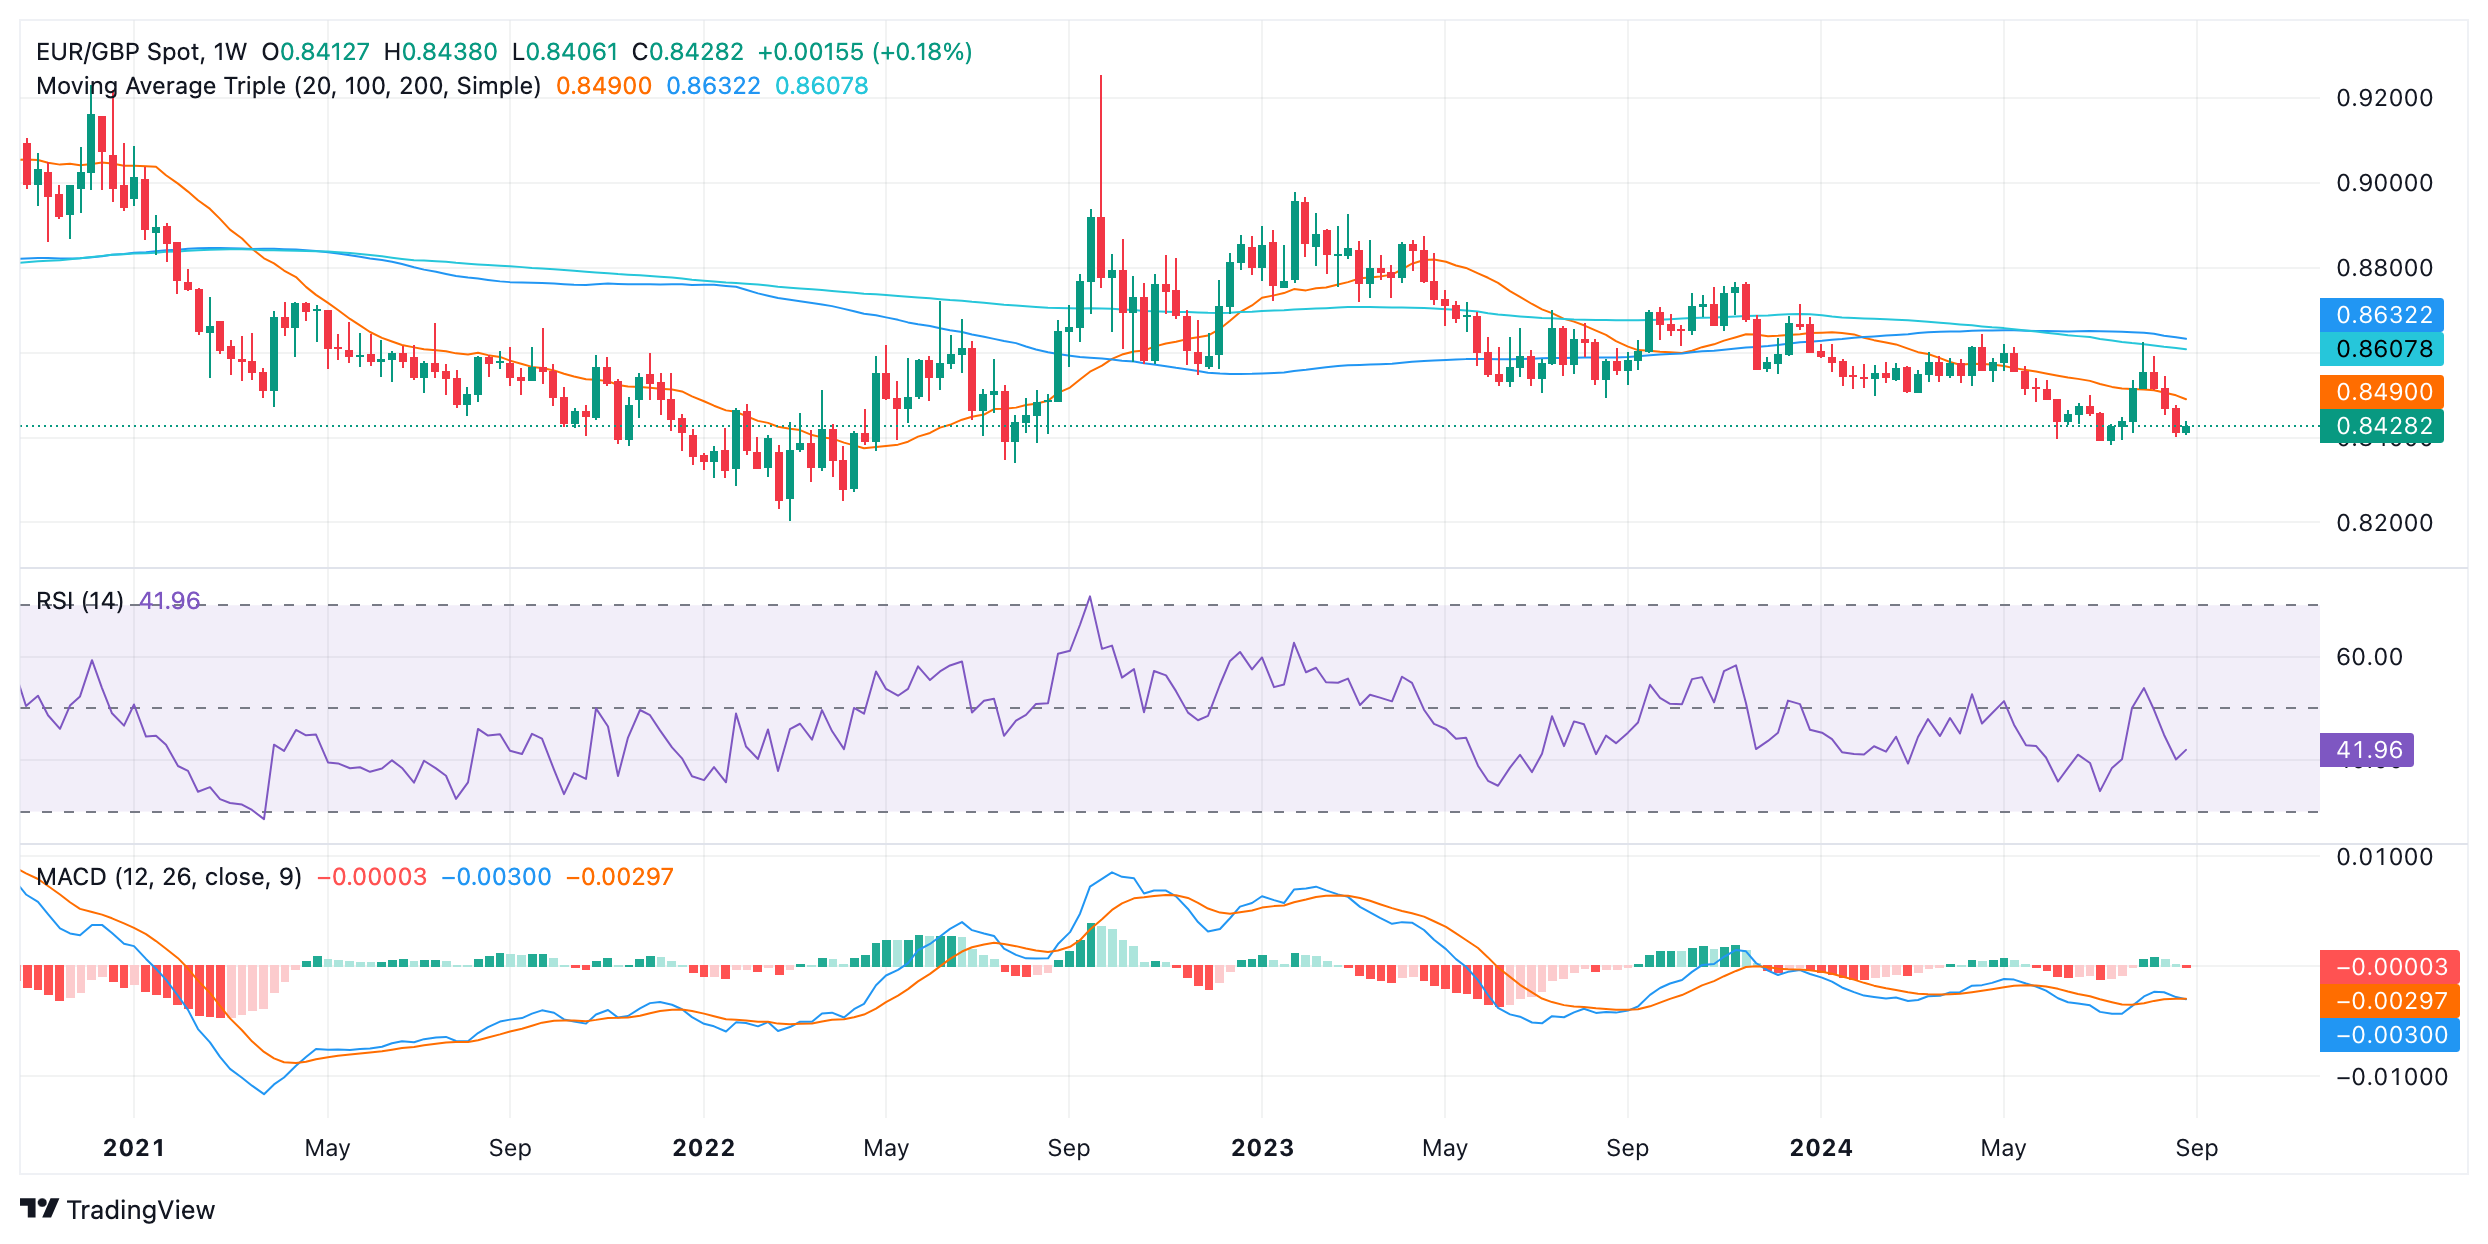
- EUR/GBP saw a steep decline in August but it appears to have found a floor and is consolidating.
- Whilst the trend remains bearish there are signs bears may be exhausted and a reversal could be on the horizon.
EUR/GBP continues its counter-trend reaction after its accelerated decline during the month of August took it temporarily outside the bounds of its falling channel (shaded circle). This breakout is often a sign of exhaustion of the downtrend, however, it is a little too soon to tell.
EUR/GBP has now bottomed out and is evolving a sideways rangebound market mode.
EUR/GBP 4-hour Chart
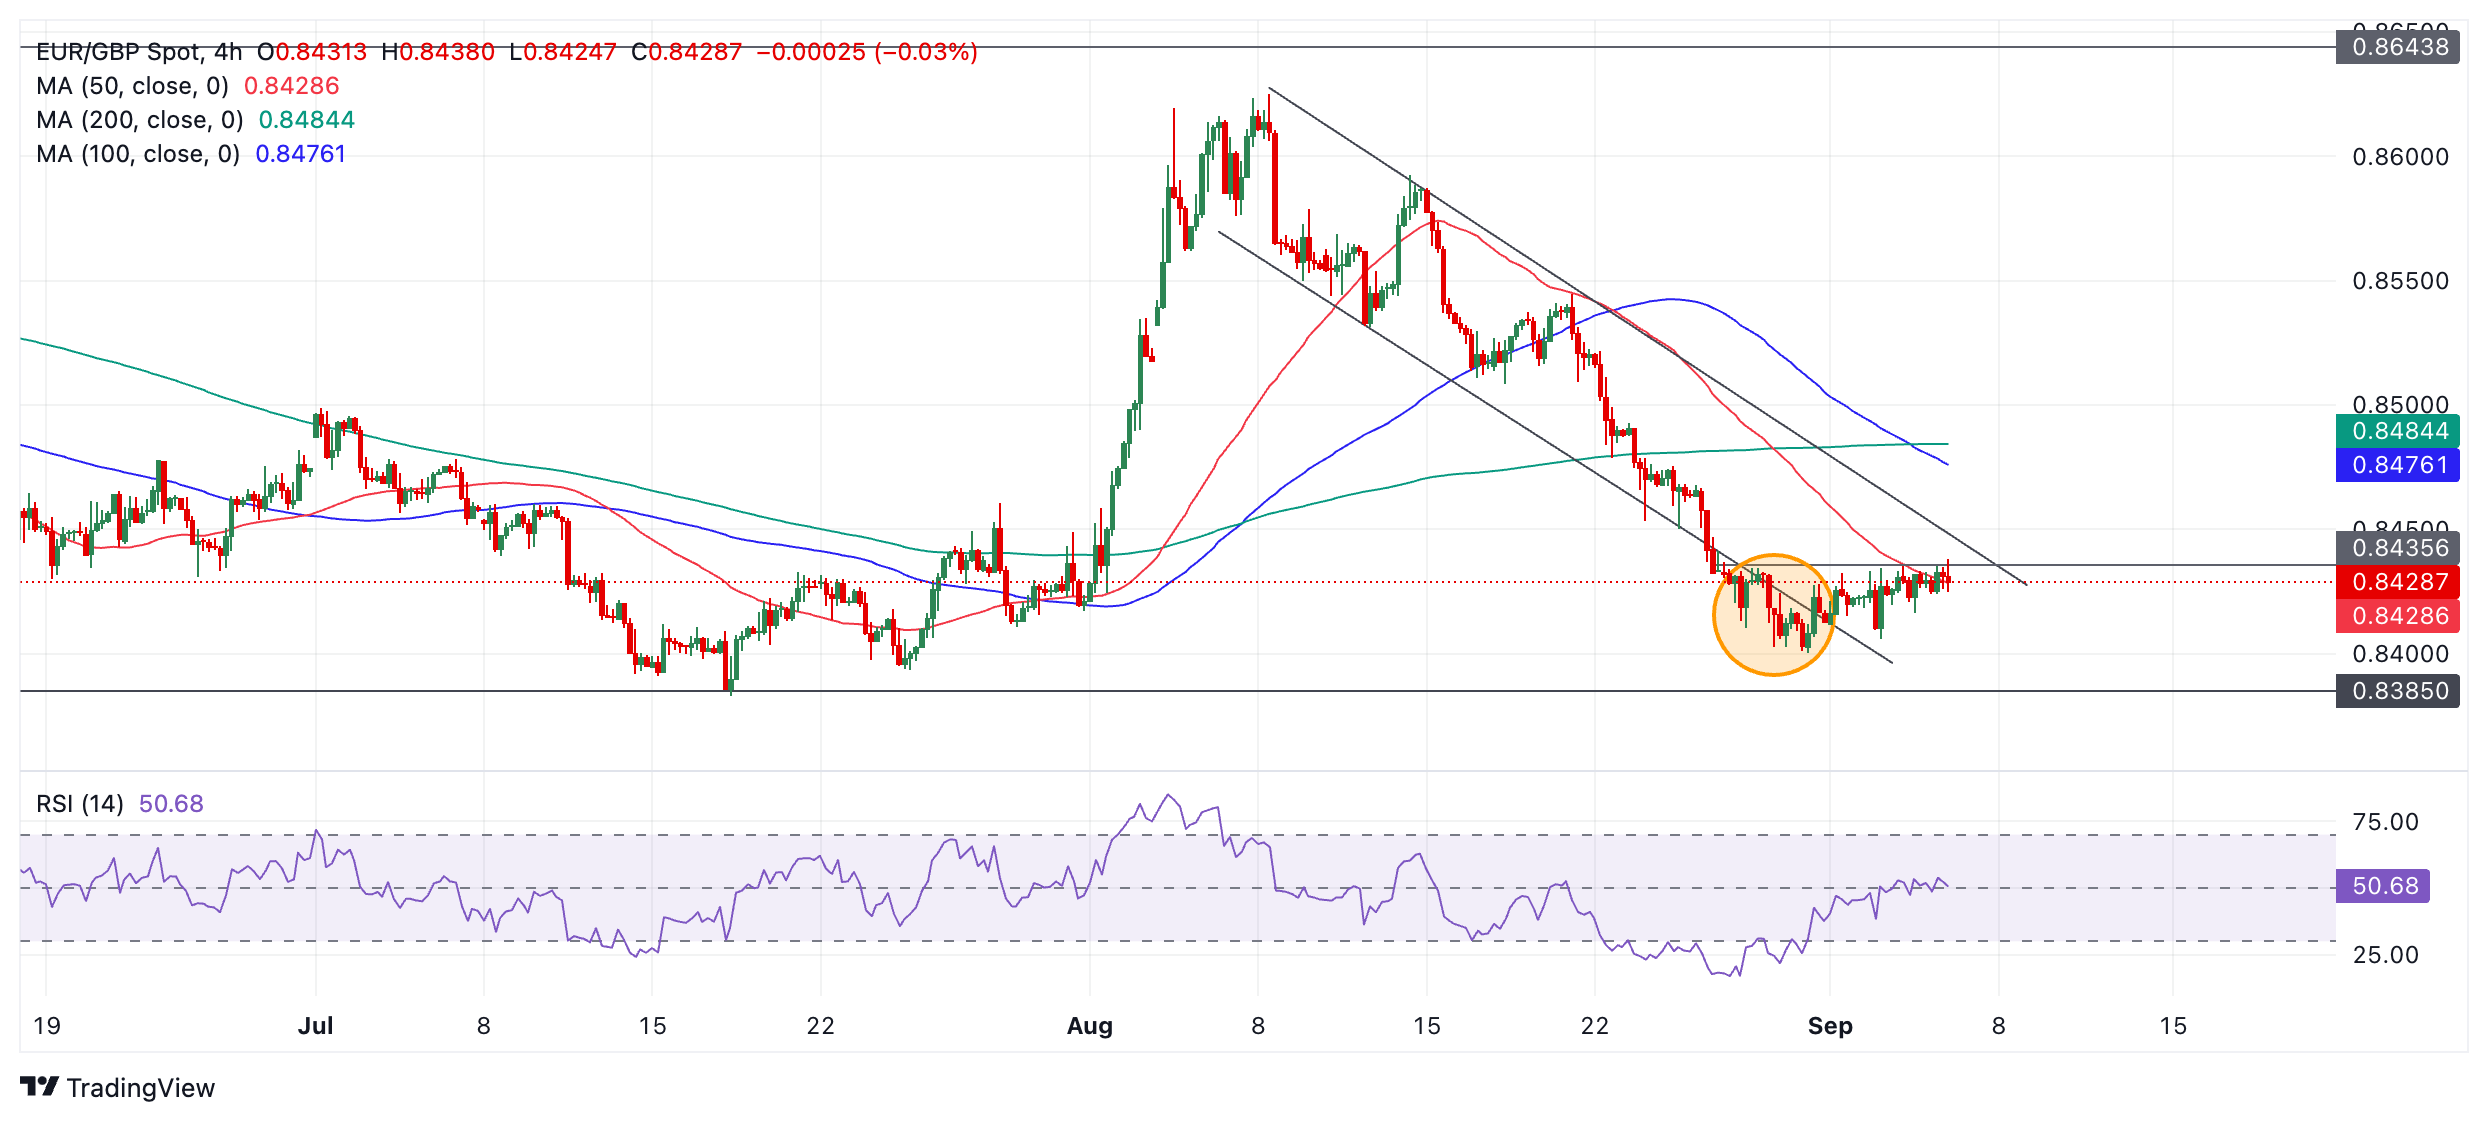
So far the recovery has been quite shallow and it is currently capped by resistance from the 50-period Simple Moving Average (SMA).
EUR/GBP has not been able to break decisively above the SMA or the line of highs at 0.8435 suggesting a reversal remains elusive.
The pair will probably continue sideways until it reaches resistance from the upper channel line at roughly 0.8450.
The medium-term trend remains bearish, however, suggesting there is still a chance of an extension lower, although the channel exhaustion break lowers the odds.
That said, a break below 0.8406 (September 3 low) would pave the way for further weakness to a downside target at 0.8385 (July 17 lows).
In order to reverse the short-term trend, bulls would have to decisively break above the 50 SMA. A decisive break would be one accompanied by a long green candle that closed near its high or three green candles in a row that closed above the SMA.
The long-term trend (weekly chart) is still bearish whilst the medium-term trend is bullish.
UK inflation expectations remain sticky, the latest BoE Decision Maker Panel survey suggests, Scotiabank’s Chief FX Strategist Shaun Osborne notes.
BoE survey data supports cautious rate view
“While the panel expects 3m output prices to moderate slightly (3.6%, down from 3.7% in the last survey), 1Y CPI expectations edged up to 2.6%, from 2.5%. The survey suggested no change in elevated wage growth trends and support the outlook for cautious reductions in UK rates in the next few months.”
“Sterling’s gains yesterday look a little more persuasive from a technical point of view. A sold gain on the day reflects signs of steady accumulation of the pound on dips over the past few sessions. Trend resistance off the late August high was broken yesterday and now serves as support (1.3095). Gains through 1.3175 target 1.3200/25 in the short run.”
- USD/JPY has broken below a key support level and is falling lower.
- The August 5 lows are the next target at 141.69.
USD/JPY is resuming its mid-term downtrend after a punctuated pause during August.
The pair has broken below the key 143.45 swing lows (August 26 low) – a bearish sign that flips the trend. Sellers now have the key August 5 lows at 141.69 in their sights.
USD/JPY 4-hour Chart
USD/JPY is probably in a short-term downtrend and given the saying “the trend is your friend” the odds favor more downside.
The pair will probably reach the 141.69 lows. A break below that would probably lead to further weakness towards the next support level at 140.44.
The Relative Strength Index (RSI) momentum indicator is oversold, however, so traders are advised not to add to their short positions. If RSI exits oversold it will be a signal a counter-trend correction higher is unfolding.
- Initial Jobless Claims rose to 227K, below the previous week's 232K.
- Continuing Jobless Claims increased to 1.838M in the week ending August 24.
US citizens that newly applied for unemployment insurance benefits reached 227K in the week ending August 31, according to the US Department of Labor (DoL) on Thursday. The prints came in below initial consensus (231K) and were lower than the previous weekly figure of 232K (revised from 231K).
Further details of the publication revealed that the advance seasonally-adjusted insured unemployment rate was 1.2% and the 4-week moving average was 230K, a decrease of 1.750K from the previous week's revised average.
In addition, Continuing Claims decreased by 22K to 1.838M in the week ending August 24.
Market reaction
The US Dollar Index (DXY) remains under constant downside pressure and challenges the key support at 101.00.
- CAD/JPY weakens as BoC cuts interest rates for the third meeting in a row.
- The Yen gains support from a rise in real wages in Japan that bolsters the outlook for growth.
- A decline in the price of WTI crude Oil below $70.00 a barrel further weighs on the CAD/JPY.
CAD/JPY trades a quarter of a percent lower in the 106.10s on Thursday, as the Canadian Dollar (CAD) weakens from a combination of falling Oil prices – crude is the country’s largest export – and expectations the Bank of Canada (BoC) will continue cutting interest rates after a 0.25% reduction at its September meeting. Lower interest rates are negative for a currency as they reduce foreign capital inflows.
The CAD/JPY sees its third straight day of losses after declining sharply on Wednesday following the BoC’s decision to cut interest rates by 0.25% for the third meeting in a row, amid falling inflation and growth concerns.
In his press conference after the meeting, Governor Tiff Macklem struck a dovish tone, saying “We need to increasingly guard against the risk that the economy is too weak and inflation falls too much.” Adding, “If inflation continues to ease broadly in line with our July forecast, it is reasonable to expect further rate cuts.”
CAD/JPY saw further downside after data out of Japan showed a rise in real wages, which increased for the second straight month in July and reinforced expectations that the Bank of Japan (BoJ) will raise interest rates again before the year ends. Inflation-adjusted real wages in Japan rose 0.4% year-over-year in July as total cash earnings increased 3.6%.
BoJ Board Member Hajime Takata struck a moderate, data-dependent tone in a speech on Thursday morning, however, that will have tempered downside for CAD/JPY. Takata said that “based on our hearings we expect more rate hikes in October,” but qualified this by adding, “though that was when the Yen was weakening.”
Apart from that Takata remained ambivalent saying, “We (the BoJ) Don't have a preset idea on pace of rate hikes, or on whether we will hike rates several times,” and adding, “We have no choice but to scrutinize at each policy meeting how market moves affect corporate balance sheets, earnings and risks to economy.”
CAD/JPY lost further ground after WTI crude Oil fell below the $70.00 level amid rumors of OPEC+ production increases and the slowdown in China. Lower Oil prices are negative for CAD as its a major crude exporter but positive for Japan which is a major Oil importer.
German Factory Orders rose 2.9% in July—a surprising gain which followed an upwardly revised rise of 4.6% for June.
Intraday chart is leaning a bit more EUR-bullish
“It’s a rare piece of good news for the economy which has shown signs of losing momentum recently. Orders data are volatile, however, and broader economic trends, reflected in recent surveys are clearly soft.”
“That is not subduing the EUR right now, however. Short term volatility is firm and demand for EUR bullish structures is reflected in the bounce in 1 week risk reversal pricing (0.3975 vol premium for calls).”
“Similar considerations apply to the EUR’s technical outlook. Limited movement is likely ahead of Friday morning but the picture on the intraday chart is leaning a bit more EUR-bullish. Solid gains yesterday took the EUR above short-term retracement resistance and target additional gains to the 1.1120/40 area. Support is 1.1070.”
- USD/CAD sees downside below 1.3500 as weak US ADP private payrolls data sent the US Dollar inside the woods.
- Fresh private payrolls surprisingly come in lower at 99K than estimates of 145K.
- The BoC is expected to soften its interest rate policy further.
The USD/CAD pair faces pressures in holding the psychological support of 1.3500 in Thursday’s New York session. The Loonie asset senses selling pressure as the United States (US) Automatic Data Processing (ADP) Employment has surprisingly come in weaker-than-expected.
The agency reported that there were 99K fresh payrolls in the private sector in August. Investors anticipated that private employers hired 145K job-seekers, higher than July’s reading of 111K, downwardly revised from 122K. This has deepened fears of deteriorating labor market conditions and has prompted expectations that the Federal Reserve (Fed) will begin reducing interest rates aggressively this month.
Surging Fed large rate cut bets have weighed heavily on the US Dollar (USD). The US Dollar Index (DXY), which tracks the Greenback’s value against six major currencies, slumps to near 101.00.
Going forward, investors will focus on the US ISM Services PMI data for August, which will be published at 14:00 GMT.
Meanwhile, the Canadian Dollar (CAD) remains under pressure as market participants see the Bank of Canada (BoC) continuing its policy-easing spell further. The BoC reduced its interest rates by 25 basis points (bps) to 4.25% on Wednesday. This was the third straight interest rate cut announcement of 25 bps by the BoC. Analysts at ING said in a note on Wednesday, “We essentially see the BoC cutting rates 25 bps at each meeting until next summer, by which time the policy rate is expected to be down at 3%.”
Going forward, the Canadian Dollar will be influenced by the labor market data for August, which will be published on Friday. The employment report is expected to show that Canadian employers hired fresh 26.5K job-seekers after laying off 2.8K workers in July. The Unemployment Rate is seen rising further to 6.5% from the former release of 6.4%.
Economic Indicator
ADP Employment Change
The ADP Employment Change is a gauge of employment in the private sector released by the largest payroll processor in the US, Automatic Data Processing Inc. It measures the change in the number of people privately employed in the US. Generally speaking, a rise in the indicator has positive implications for consumer spending and is stimulative of economic growth. So a high reading is traditionally seen as bullish for the US Dollar (USD), while a low reading is seen as bearish.
Read more.Last release: Thu Sep 05, 2024 12:15
Frequency: Monthly
Actual: 99K
Consensus: 145K
Previous: 122K
Source: ADP Research Institute
Traders often consider employment figures from ADP, America’s largest payrolls provider, report as the harbinger of the Bureau of Labor Statistics release on Nonfarm Payrolls (usually published two days later), because of the correlation between the two. The overlaying of both series is quite high, but on individual months, the discrepancy can be substantial. Another reason FX traders follow this report is the same as with the NFP – a persistent vigorous growth in employment figures increases inflationary pressures, and with it, the likelihood that the Fed will raise interest rates. Actual figures beating consensus tend to be USD bullish.
The Canadian Dollar (CAD) is unchanged on the session after shrugging off domestic developments with ease yesterday, Scotiabank’s Chief FX Strategist Shaun Osborne notes.
CAD holds Wednesday’s gains
“The BoC rate cut was no surprise and while the policy spread over the Fed is a yawning 125bps now, markets are expecting the Fed to catch up with the BoC’s easing process quickly in the coming months. Meanwhile, the end of the NDP’s “supply and confidence” support agreement with the minority Liberal government failed to move the CAD. The agreement was supposed to last into mid-2025.”
“The breakup does not necessarily accelerate the next federal election but the Liberals will need the support of the NDP or the Bloc on a case-by-case basis to pass legislation and/or avoid losing a confidence vote. Parliament returns on September 16th. Near-term CAD trends hinge primarily on the US jobs report.”
“Markets are unlikely to move too far in the next 24 hours or so but the technical feel of USDCAD is a little softer after spot dropped sharply from resistance in the upper 1.35 area yesterday and cracked short-term trend/consolidation support, now close resistance, at 1.3530/35. Intraday weakness below 1.3495 may see USD losses leak a little more in the short run.”
The USD is tracking a little softer overall but trends across G10 FX are relatively subdued. Broader markets are relatively calm as market participants await Friday’s US jobs data, Scotiabank’s Chief FX Strategist Shaun Osborne notes.
USD mixed as markets steady ahead of Friday’s jobs data
“Stocks are narrowly mixed and major bond markets are little changed on the session. US 10Y Treasury yields have backed up fractionally. But yields fell sharply yesterday after weak JOLTS data added to concerns that the US labour market is slowing while the Beige Book noted flat or weaker activity across most Federal Reserve districts.”
“We get more data this morning in the form of the ADP data and the latest weekly claims figures. The ADP has proven to be a poor guide to the NFP but a weak report today is likely to increase market anxiety ahead of NFP. ISM Services data are out at 10ET. Japan reported stronger than expected wage gains for July overnight; a 3.6% Y/Y rise in Labour Cash earnings was well ahead of forecasts, bolstering expectations that the BoJ will push ahead with another mild rate increase before year end.”
“Lower US short rates (US2Y yields fell 10bps or so in response to yesterday’s developments) will—if sustained—weigh on the USD in the short run at least and may help pull the DXY broadly lower towards our spread-driven fair value estimate of 100.0. Short-term technical pointers are tilting lower again for the index which may have peaked on Tuesday as the late August/early September rebound in the dollar peters out. DXY support is 100.8 and—stronger—100.5.”
- The US Dollar trades sideways ahead of a very chunky data release on Thursday.
- Markets are still worried about headwinds for Europe and the Nvidia subpoena.
- The US Dollar Index retreats and flirts with a break below 101.00.
The US Dollar (USD) trades softer on Thursday, with a lot of data points set to be released in a condensed time span. The Greenback already eased on the back of the JOLTS Job Openings report on Wednesday, when the previous number was revised and the recent print for July came in below the estimation. It was enough for markets to price in more rate cuts by the Federal Reserve (Fed) and devalue the US Dollar on the back of narrowing the interest rate gap between the US and other countries.
On the economic data front, it will be up to experienced traders to navigate the set of data that will be released on Thursday to markets. The monthly ADP Employment Change for the private payrolls release and the weekly Initial/Continuing Jobless Claims stand out, which will move the US Dollar. The Purchasing Managers Index (PMI) Services data from the Institute for Supply Management (ISM) is also of note.
Daily digest market movers: Steer through the data
- At 11:30 GMT, the Challenger Job Cuts for August will be released. The previous number was 25,885.
- At 12:15 GMT, the ADP Employment Change for August will be hitting markets. An uptick to 145,000 is expected from the previous number of 122,000.
- At 12:30 GMT, the weekly Jobless Claims data are due to be released.
- Initial Claims are expected to stay steady at 230,000 in the week of August 30, coming from 231,000 the previous week.
- Continuing Claims are set to head to 1.87 million in the week of August 23 from 1.868 million.
- In the slipstream of the weekly Jobless Claims, the monthly Nonfarm Productivity and Unit Labor Costs for the second quarter will be released. For the Nonfarm Productivity, a steady 2.3% increase is expected, while the Unit Labor Costs should remain at 0.9%.
- At 13:45 GMT, S&P Global will deliver its final reading for the Services and Composite PMI numbers for August. Services are expected to remain stable at 55.2, and the composite is expected to remain at the previous reading of 54.1.
- The Institute for Supply Management (ISM) will close this Thursday's data batch at 14:00 GMT with its August reading for the Services sector:
- The PMI headline number is expected to come in at 51.1, downfrom 51.4 in July.
- The Employment Index was at 51.1 the previous month, with no forecast available.
- The New Orders Index was at 52.4 in July, with no forecast available.
- The Prices Paid Index was at 57, with no estimation pencilled in.
- Equities are floating wreckage after the hit they took on the back of the NVIDIA (NVDA) correction after the company got a subpoena by the US Justice Department for breaching antitrust laws. All major indices are in the red, though they are overall less than 1%.
- The CME Fedwatch Tool shows a 55.0% chance of a 25 basis points (bps) interest rate cut by the Fed in September against a 45.0% chance for a 50 bps cut. Another 25 bps cut (if September is a 25 bps cut) is expected in November by 30.2%, while there is a 49.5% chance that rates will be 75 bps (25 bps + 50 bps) below the current levels and a 20.3% probability of rates being 100 (25 bps + 75 bps) basis points lower.
- The US 10-year benchmark rate trades at 3.76%, the lowest level this week.
US Dollar Index Technical Analysis: That does not look good
The US Dollar Index (DXY) looks to be stuck in a tight range, remaining there for now after Tuesday’s data was unable to move the needle. With the JOLTS Job Openings report on Wednesday, the assumption is the same: any number that comes in substantially above or below consensus will move the DXY in either direction. Meanwhile, markets are giving a bigger chance to a 50 basis point rate cut by the Fed this month.
The first resistance at 101.90 is starting to look very difficult to break through after it already triggered a rejection earlier this week. Further up, a steep 2% uprising would be needed to get the index to 103.18. Finally, a heavy resistance level near 104.00 not only holds a pivotal technical value, but it also bears the 200-day Simple Moving Average (SMA) as the second heavyweight to cap price action.
On the downside, 100.62 (the low from December 28) could soon see a test in case data supports more rate cuts from the US Federal Reserve (Fed). Should it break, the low from July 14, 2023, at 99.58, will be the ultimate level to look out for. Once that level gives way, early levels from 2023 are coming in near 97.73.
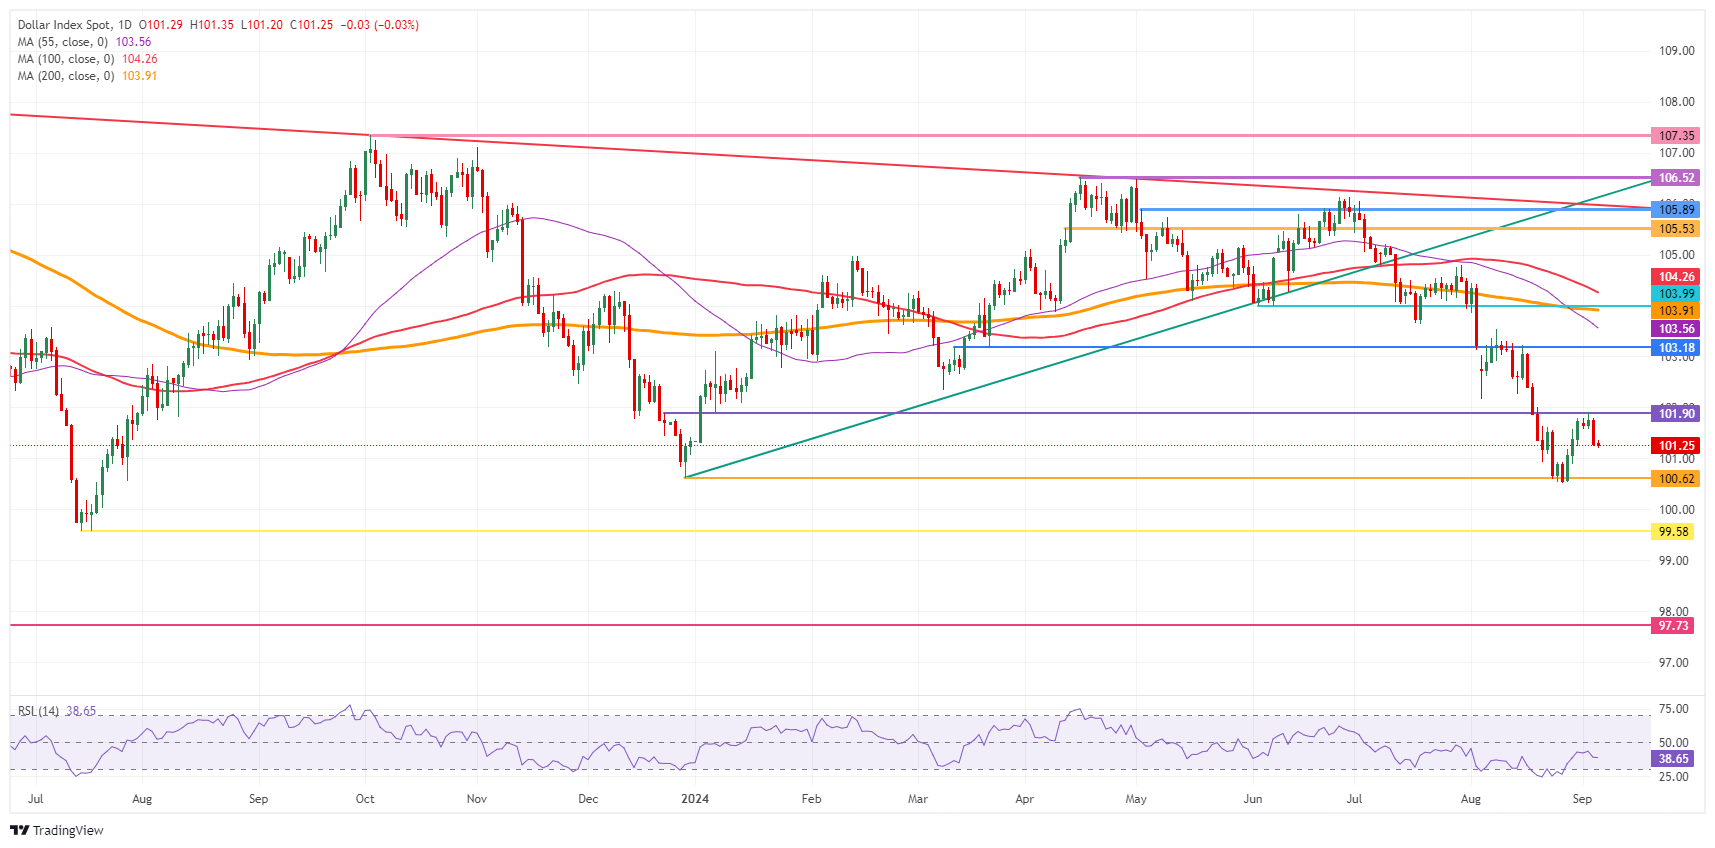
US Dollar Index: Daily Chart
US Dollar FAQs
The US Dollar (USD) is the official currency of the United States of America, and the ‘de facto’ currency of a significant number of other countries where it is found in circulation alongside local notes. It is the most heavily traded currency in the world, accounting for over 88% of all global foreign exchange turnover, or an average of $6.6 trillion in transactions per day, according to data from 2022. Following the second world war, the USD took over from the British Pound as the world’s reserve currency. For most of its history, the US Dollar was backed by Gold, until the Bretton Woods Agreement in 1971 when the Gold Standard went away.
The most important single factor impacting on the value of the US Dollar is monetary policy, which is shaped by the Federal Reserve (Fed). The Fed has two mandates: to achieve price stability (control inflation) and foster full employment. Its primary tool to achieve these two goals is by adjusting interest rates. When prices are rising too quickly and inflation is above the Fed’s 2% target, the Fed will raise rates, which helps the USD value. When inflation falls below 2% or the Unemployment Rate is too high, the Fed may lower interest rates, which weighs on the Greenback.
In extreme situations, the Federal Reserve can also print more Dollars and enact quantitative easing (QE). QE is the process by which the Fed substantially increases the flow of credit in a stuck financial system. It is a non-standard policy measure used when credit has dried up because banks will not lend to each other (out of the fear of counterparty default). It is a last resort when simply lowering interest rates is unlikely to achieve the necessary result. It was the Fed’s weapon of choice to combat the credit crunch that occurred during the Great Financial Crisis in 2008. It involves the Fed printing more Dollars and using them to buy US government bonds predominantly from financial institutions. QE usually leads to a weaker US Dollar.
Quantitative tightening (QT) is the reverse process whereby the Federal Reserve stops buying bonds from financial institutions and does not reinvest the principal from the bonds it holds maturing in new purchases. It is usually positive for the US Dollar.
The euro area economy experienced a solid first half of the year, achieving decent growth after a year of stagnation. Recent indicators, however, have cast doubts on the sustainability of this growth momentum, particularly in the manufacturing sector, Danske Bank’s macro analysts note.
ECB to deliver two more cuts of 25bp in 2024
“We predict growth will continue, driven by a strong labour market and rising real incomes that bolster consumer spending in the coming year, but we see downside risks to the near-term outlook.”
“The disinflationary process in the euro area is still on track, albeit some slowdown has been observed over the summer owing to persistent high services inflation that keeps underlying inflation elevated. Combined with normalizing goods inflation, we expect only a gradual decline in core inflation. We forecast that headline inflation will stabilize close to the 2% target in the second half of 2025, but the final path is set to be bumpy.”
“We expect the ECB to deliver two more cuts of 25bp in 2024, followed by three in 2025. This means a terminal rate of 2.50% at year-end 2025, due to the need to keep a restrictive monetary policy stance.”
The ECB is almost certain to cut rates by 25bp next week. While the central bank is set to refrain from any firm guidance on future steps, we think staff forecasts showing inflation at target in the medium-term support a quarterly pace of rate cuts, Nordea’s economists Jan von Gerich and Tuuli Koivu note.
ECB is set to deliver another 25bp rate cut
“The ECB is set to deliver another 25bp rate cut, and we expect the communication to be in line with our view of continued quarterly rate cuts. No clear signals about the timing of further policy steps should be expected.”
“The staff inflation forecast for the near-term will likely see small upward revisions, while the medium-term numbers are set to point to inflation stabilising around the two per cent target. Financial markets could see somewhat dovish moves on any soft-sounding comments from Lagarde.”
- USD/CHF remains on the backfoot near 0.8450 amid weakness in the US Dollar.
- Investors await the US ADP Employment and ISM Services PMI for August.
- A further slowdown in Swiss inflation boosts expectations of SNB’s more rate cuts.
The USD/CHF pair exhibits a subdued performance near 0.8450 in Thursday’s European session. The Swiss Franc asset remains under pressure as the US Dollar (USD) extends its downside after weak United States (US) JOLTS Job Openings data for July raised red flags on current labor market conditions.
The US Dollar Index (DXY), which tracks the Greenback’s value against six major currencies, slides further below 101.20.
Meanwhile, investors await the US ADP Employment and ISM Services PMI data for August to get fresh cues about the potential Federal Reserve (Fed) interest rate cut size this month. The Fed is widely anticipated to start reducing interest rates in the September meeting but traders remain split over the magnitude of the interest rate cut.
In the Swiss region, consistently easing inflationary pressures have prompted expectations that the Swiss National Bank (SNB) will soften its monetary policy for the third time in a row this month. The SNB has reduced its key borrowing rates by 50 basis points (bps) this year to 1.25%.
USD/CHF declines toward the horizontal support plotted from 28 December 2023 low of 0.8333 on a daily timeframe. The near-term and broader-term outlooks of the Swiss Franc asset remain bearish as all short-to-long-term Exponential Moving Averages (EMAs) are declining.
The 14-day Relative Strength Index (RSI) oscillates in the bearish range of 20.00-40.00, suggesting that a strong bearish momentum is intact.
More downside would appear if the asset breaks below August 5 low of 0.8432, which would drag the major towards the round-level support of 0.8400 and 28 December 2023 low of 0.8333.
On the flip side, a recovery move above the weekly high near 0.8540 will drive the asset toward the round-level resistance of 0.8600, followed by August 20 high of 0.8632.
USD/CHF daily chart
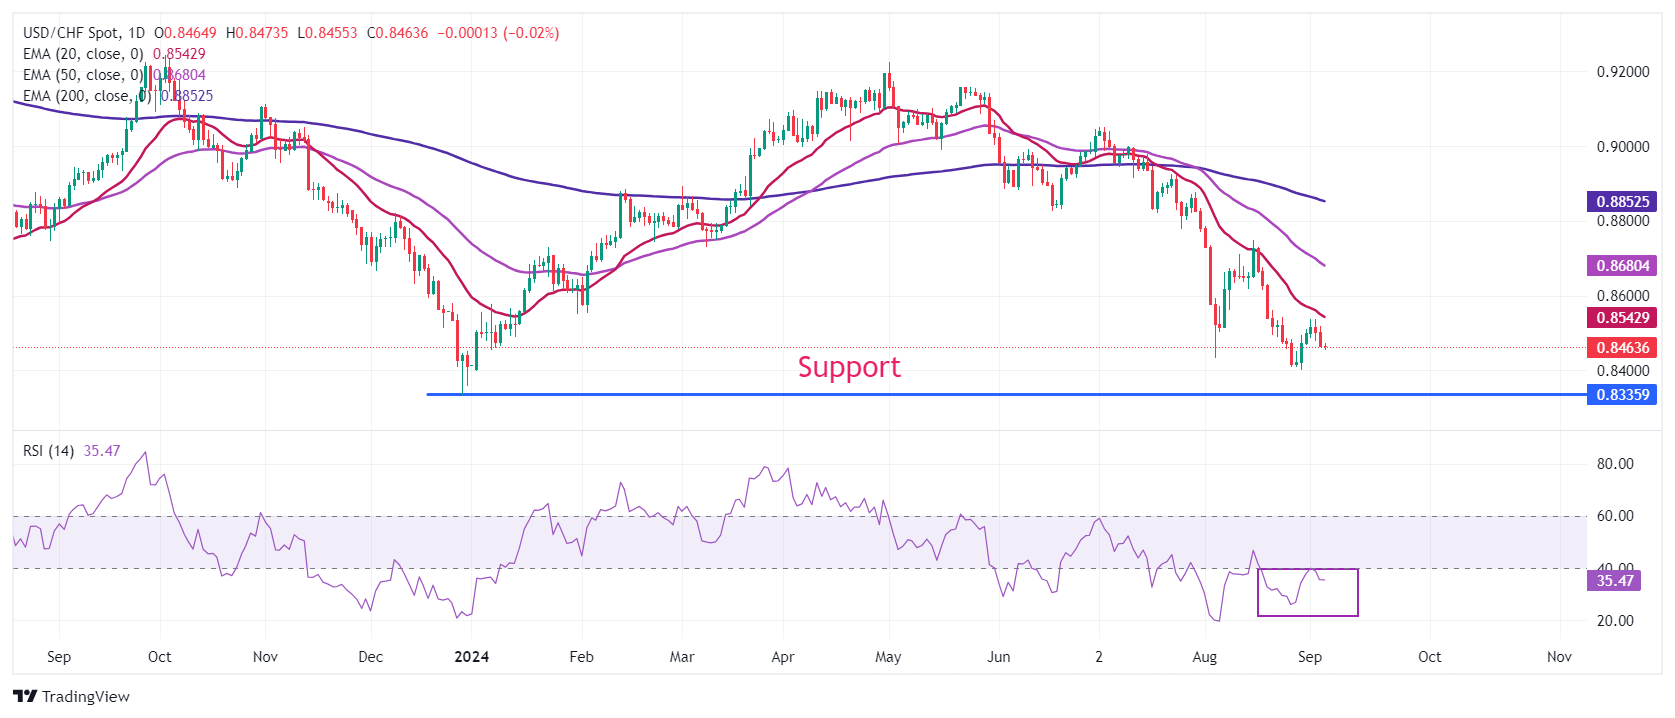
US Dollar PRICE Today
The table below shows the percentage change of US Dollar (USD) against listed major currencies today. US Dollar was the strongest against the Canadian Dollar.
| USD | EUR | GBP | JPY | CAD | AUD | NZD | CHF | |
|---|---|---|---|---|---|---|---|---|
| USD | -0.15% | -0.15% | -0.19% | 0.04% | 0.00% | -0.16% | -0.02% | |
| EUR | 0.15% | 0.01% | -0.02% | 0.24% | 0.16% | 0.03% | 0.13% | |
| GBP | 0.15% | -0.01% | -0.02% | 0.21% | 0.14% | 0.04% | 0.11% | |
| JPY | 0.19% | 0.02% | 0.02% | 0.22% | 0.18% | 0.01% | 0.16% | |
| CAD | -0.04% | -0.24% | -0.21% | -0.22% | -0.03% | -0.19% | -0.07% | |
| AUD | -0.01% | -0.16% | -0.14% | -0.18% | 0.03% | -0.15% | -0.03% | |
| NZD | 0.16% | -0.03% | -0.04% | -0.01% | 0.19% | 0.15% | 0.11% | |
| CHF | 0.02% | -0.13% | -0.11% | -0.16% | 0.07% | 0.03% | -0.11% |
The heat map shows percentage changes of major currencies against each other. The base currency is picked from the left column, while the quote currency is picked from the top row. For example, if you pick the US Dollar from the left column and move along the horizontal line to the Japanese Yen, the percentage change displayed in the box will represent USD (base)/JPY (quote).
- NZD/USD continues trading at around its long-term range highs.
- Despite recent weakness the trend is still probably bullish and therefore likely to extend.
NZD/USD reversed course after breaking out of the top of its consolidation range. It is threatening to fall back down towards the range lows, however, it is too early to say for sure.
Despite the current weakness, the trend remains bullish on the daily chart, and given “the trend is your friend” the odds still favor a recovery and eventual extension to higher highs. Price also remains above the trendline for the August rally, a further sign the uptrend is intact.
NZD/USD Daily Chart
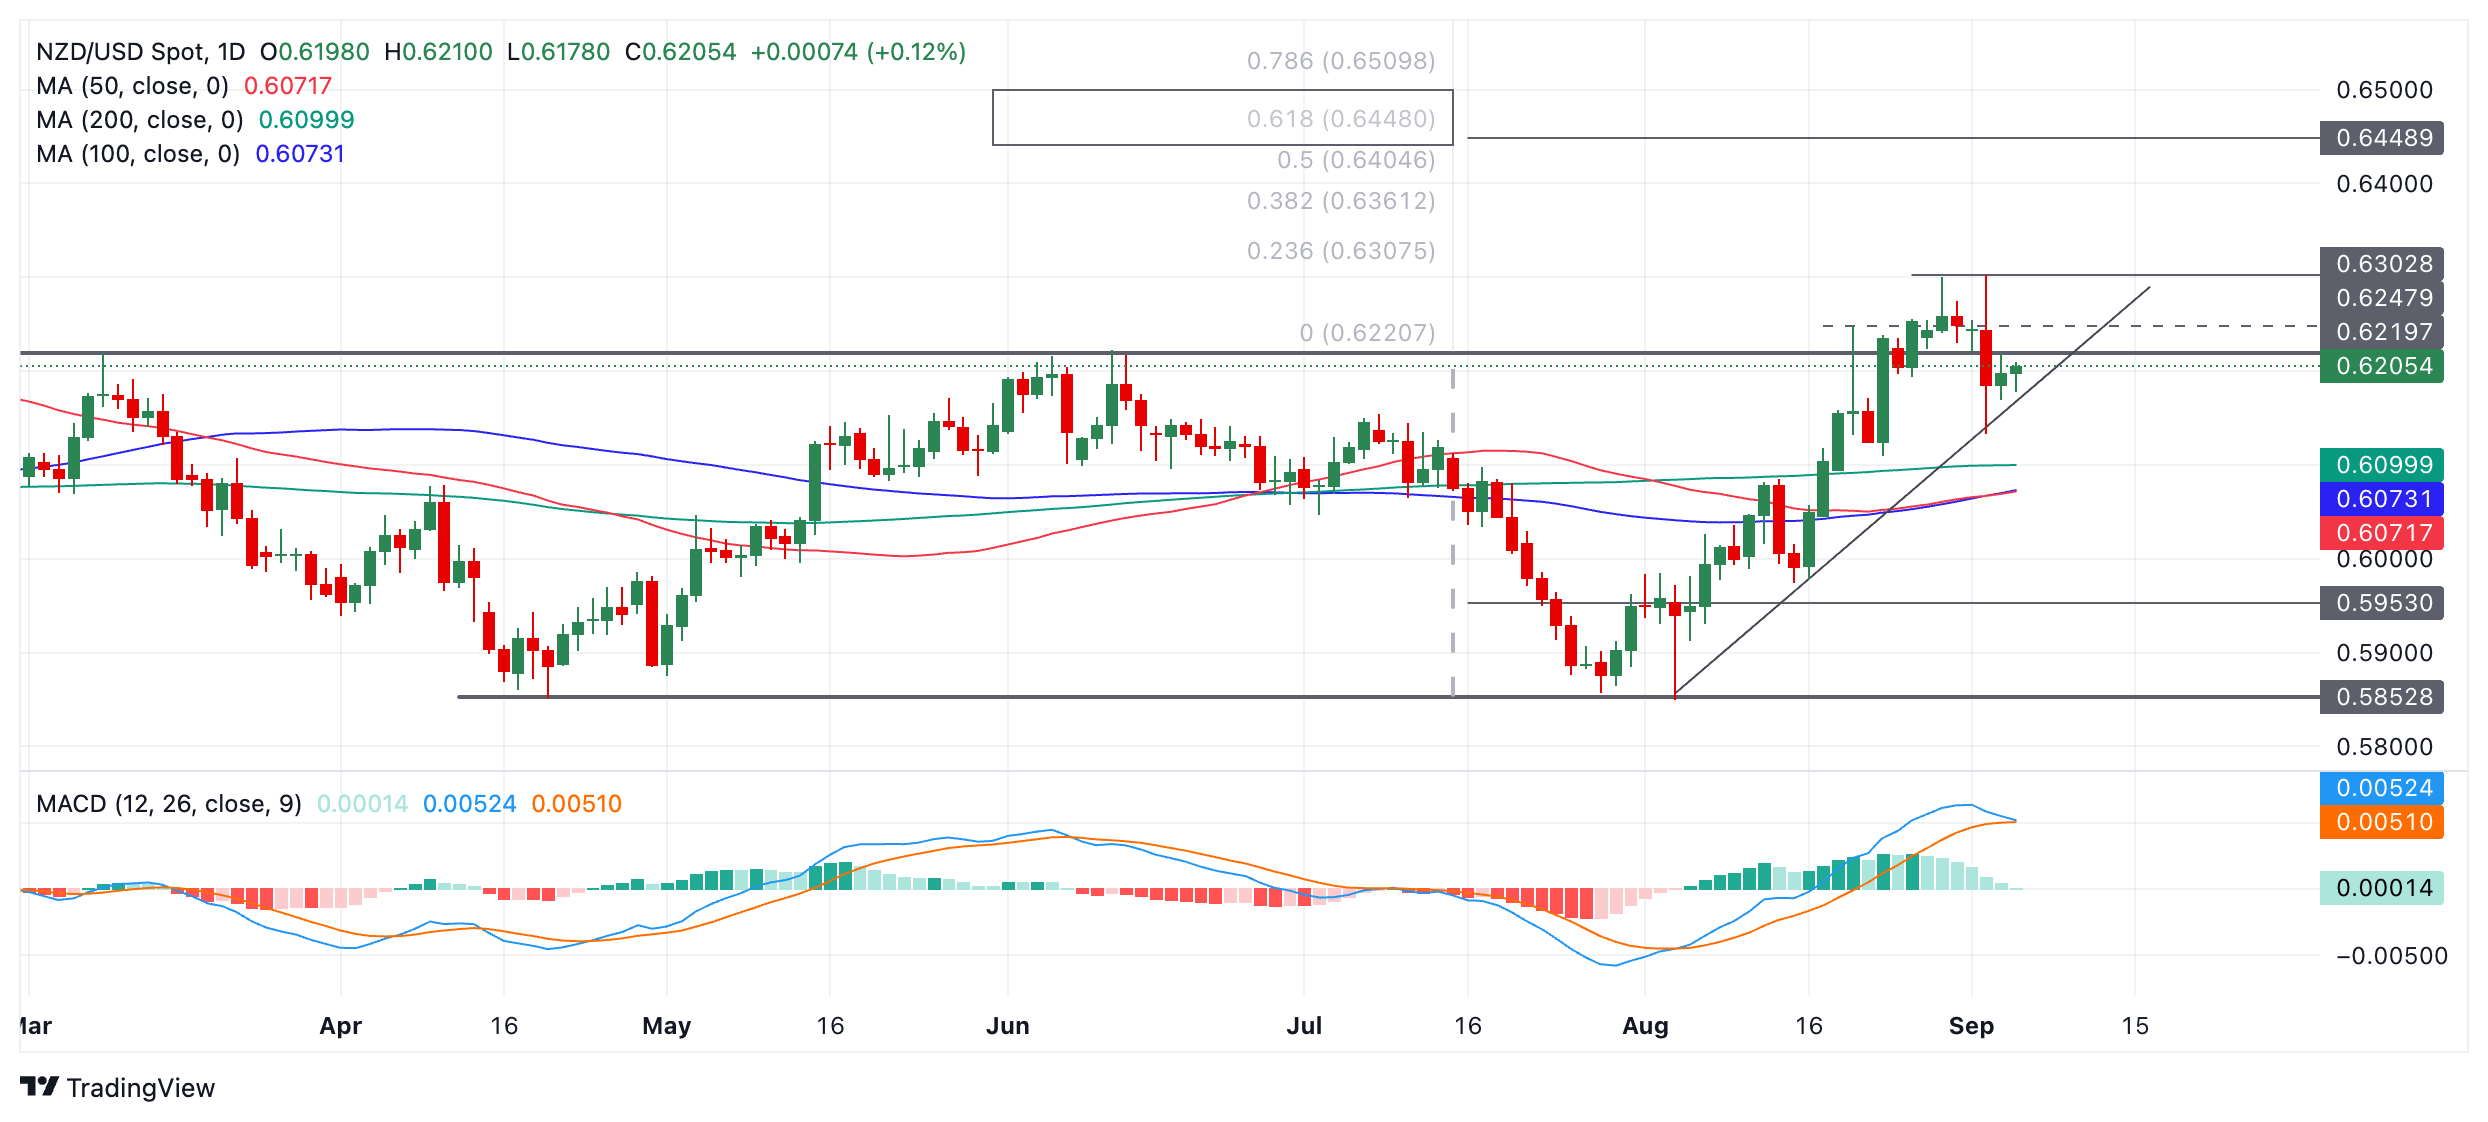
The Kiwi is will probably achieve its next upside target at 0.6409, the December 2023 high. A break above 0.6302 would provide added bullish confirmation. Another target is situated at 0.6448, the 0.618 ratio of the height of the range extrapolated higher.
If NZD/USD closes below the trendline – currently at around 0.6160 – it could mark a reversal lower. A break below 0.6133 (September 3 low) would form a lower low and provide added confirmation. The next target to the downside would be at the cluster of Moving Averages situated at 0.6070, followed by the range lows in the 0.5850s.
The Moving Average Convergence Divergence (MACD) has not yet closed below its red signal line. If it does it will provide a sell signal although such a cross would not be enough alone to signal a change in trend.
USD/SGD fell. Pair was last at 1.3030 levels, OCBC FX strategists Frances Cheung and Christopher Wong note.
Consolidation likely as markets await US jobs data
“Daily momentum is mild bullish while RSI fell. Consolidation likely as markets await US jobs data. Softer print may lead to markets further pricing in 50bp cut for the Fed at upcoming FOMC.”
“That may translate into USD softness. Support at 1.30 (recent low). Resistance at 1.31 (21 DMA), 1.3160 levels (23.6% fibo retracement of 2024 high to low). S$NEER was last estimated at ~1.89% above our model-implied mid.”
Mexico's judicial reform took another step forward yesterday when the lower house of parliament approved the basic text of the legislation. Although the details of the reform will still be debated and voted on in the coming days, meaning that there could still be changes, the bulk of the reform is now likely to remain unchanged, Commerzbank’s FX strategist Michael Pfister notes.
USD/MXN is likely to test higher levels short term
“This should come as no surprise given the coalition's comfortable majority in the lower house. The vote in the Senate is likely to be more exciting, but here too, the coalition has made progress. Two opposition MPs have recently joined the alliance, leaving it just one vote short of the 2/3 majority it needs. The missing vote is likely to be found in the coming weeks.”
“While it has become clearer in recent weeks that the necessary two-thirds majority will be achieved, and the Alliance's desire to push through the changes as quickly as possible, the peso is likely to remain under pressure. On the one hand, incoming president Claudia Sheinbaum recently raised hopes by calling for more time.”
“On the other hand, there is growing opposition to the reform, which could put further pressure on the peso. For example, Supreme Court judges recently joined the judicial staff strike, while there are also claims that the reform violates the North American Free Trade Agreement. We therefore think that USD/MXN is likely to test higher levels in the coming days.”
- Crude Oil edges up slightly towards $70 after extending losses on Wednesday.
- OPEC is close to striking a deal to delay its production boost in order to support Oil prices.
- The US Dollar Index trades just above 101.00 amid renewed downward pressure.
Crude Oil pops higher on Thursday, near 1% on the day, amid headlines that OPEC has a deal within reach to delay the foreseen production normalization. The initial plan for the Oil cartel was to boost production by 180,000 additional barrels per day in October, but the recent downbeat demand outlook could put prices on a further downward trajectory if OPEC opens the floodgates too soon and too quickly.
The US Dollar Index (DXY), which tracks the performance of the US Dollar against a basket of currencies, is falling towards 101.00 after the US JOLTS Job Openings data on Wednesday suggested labor market conditions are easing quickly. Not only the previous month’s numbers were revised downwards, but also the actual July number came in far below 8 million. In this scenario, markets are starting to price in more rate cuts from the US Federal Reserve (Fed), weighing on the US Dollar.
On Thursday, traders will look into the ADP Employment report and Weekly Jobless Claims for more clues about the state of the US labor market.
At the time of writing, Crude Oil (WTI) trades at $69.34 and Brent Crude at $73.21.
Oil news and market movers: OPEC keeps shouting
- Bloomberg reports on Thursday that, according to several delegates, OPEC+ is close to a deal to postpone the increase in Oil supply.
- The Bloomberg Commodity Index might keep sliding lower with US recession fears emerging, which could mean more downturn for Crude Oil prices, Bloomberg reports.
- Reuters reports that Malaysia’s national Oil company Petroliam Nasional Bhd. (Petronas) has posted a 19% decline in first-half net income due to higher taxes and a shrinking of its asset base.
- The Energy Information Administration (EIA) will report on Thursday the US Crude Oil stockpile change for the week ending August 30. The previous number was a draw by 846,000 barrels, with a 900,000 drawdown expected.
- The US Crude Oil Stockpile change from the American Petroleum Institute (API) showed a sharp drawdown of 7.8 million barrels, more than doubling the 3.4 million reduction a week earlier and the 900,000 decline expected by markets.
Oil Technical Analysis: Patience is a virtue
Crude Oil’s price action is likely to be very tricky. From a purely technical standpoint, Crude prices could still inch a little bit lower before finally finding vital support to bounce off on. That thesis is confirmed by the Relative Strength Index (RSI) momentum indicator, which has not touched or tested the oversold region, giving a false impression that the rebound has started already. Still, fundamental factors matter more here and the devil will be in the details of the postponement from OPEC. This delay appears to be the minimum needed to keep Crude Oil prices afloat at the current levels.
On the upside, the lost $75.27 will be the first level to head back to. Next up, the double level at $77.43 aligns with both a descending trendline and the 200-day Simple Moving Average (SMA). In case bulls are able to break above it, the 100-day SMA at $78.00 could trigger a rejection.
On the downside, the low from August 5 at $71.17 has been broken. From here, the $68.00 big figure is the first level to watch, followed by $67.11, which is the lowest point from the triple bottom seen back in June 2023.
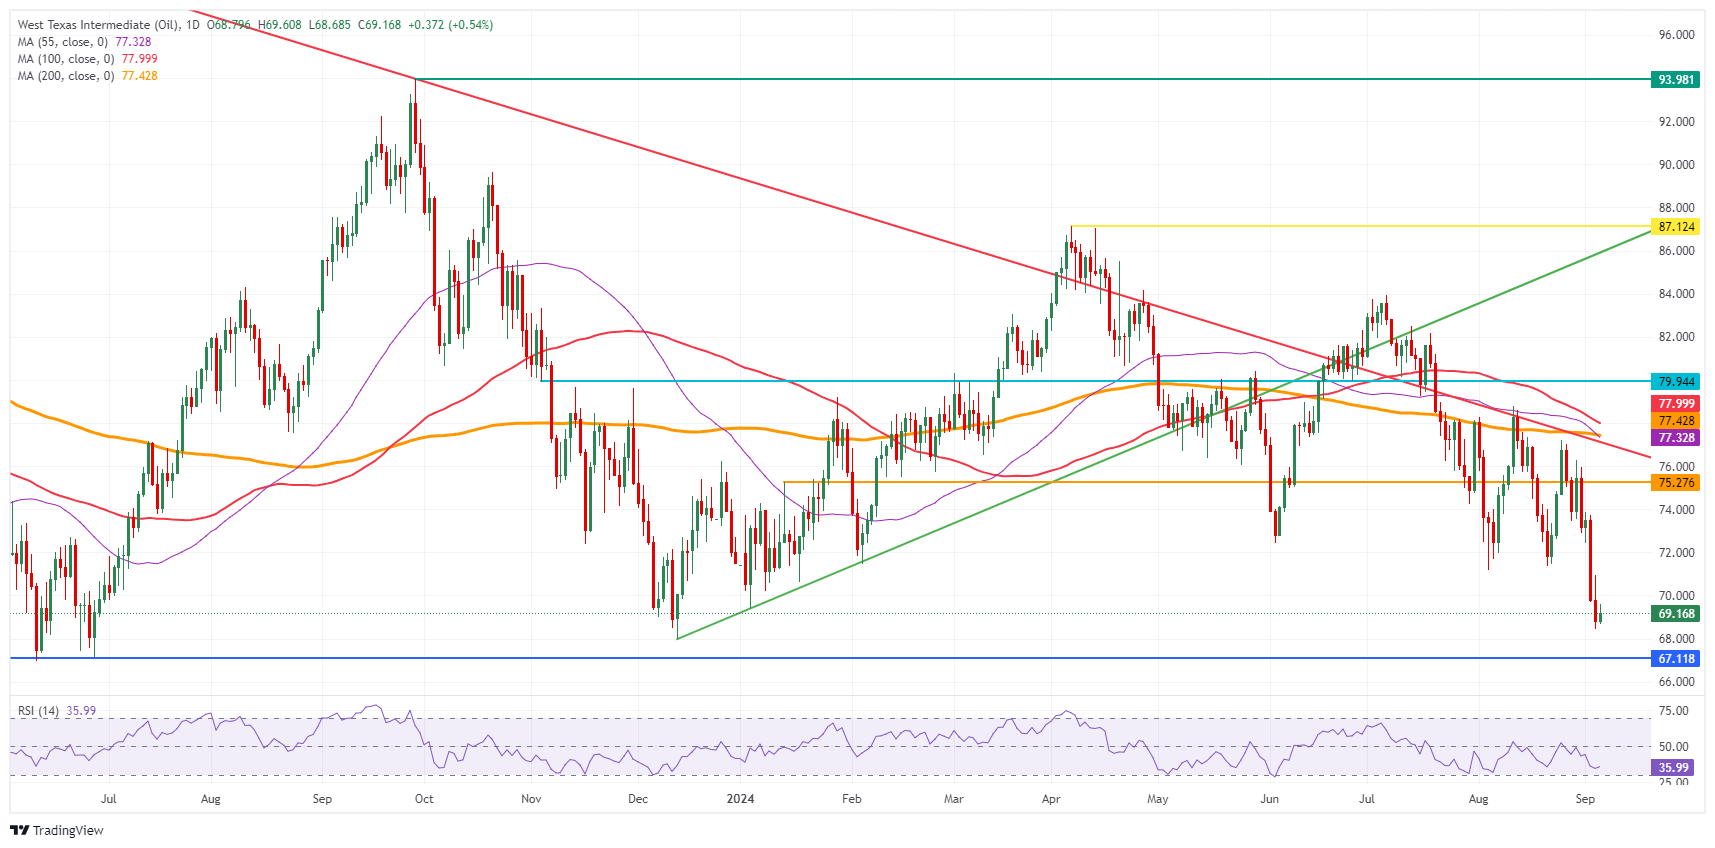
US WTI Crude Oil: Daily Chart
WTI Oil FAQs
WTI Oil is a type of Crude Oil sold on international markets. The WTI stands for West Texas Intermediate, one of three major types including Brent and Dubai Crude. WTI is also referred to as “light” and “sweet” because of its relatively low gravity and sulfur content respectively. It is considered a high quality Oil that is easily refined. It is sourced in the United States and distributed via the Cushing hub, which is considered “The Pipeline Crossroads of the World”. It is a benchmark for the Oil market and WTI price is frequently quoted in the media.
Like all assets, supply and demand are the key drivers of WTI Oil price. As such, global growth can be a driver of increased demand and vice versa for weak global growth. Political instability, wars, and sanctions can disrupt supply and impact prices. The decisions of OPEC, a group of major Oil-producing countries, is another key driver of price. The value of the US Dollar influences the price of WTI Crude Oil, since Oil is predominantly traded in US Dollars, thus a weaker US Dollar can make Oil more affordable and vice versa.
The weekly Oil inventory reports published by the American Petroleum Institute (API) and the Energy Information Agency (EIA) impact the price of WTI Oil. Changes in inventories reflect fluctuating supply and demand. If the data shows a drop in inventories it can indicate increased demand, pushing up Oil price. Higher inventories can reflect increased supply, pushing down prices. API’s report is published every Tuesday and EIA’s the day after. Their results are usually similar, falling within 1% of each other 75% of the time. The EIA data is considered more reliable, since it is a government agency.
OPEC (Organization of the Petroleum Exporting Countries) is a group of 13 Oil-producing nations who collectively decide production quotas for member countries at twice-yearly meetings. Their decisions often impact WTI Oil prices. When OPEC decides to lower quotas, it can tighten supply, pushing up Oil prices. When OPEC increases production, it has the opposite effect. OPEC+ refers to an expanded group that includes ten extra non-OPEC members, the most notable of which is Russia.
The Australian Dollar (AUD) saw a mild rebound amid broad USD softness after jobs data disappointed while AU GDP data held up, OCBC FX strategists Frances Cheung and Christopher Wong note.
Bullish momentum on daily chart fades
“This morning, RBA Governor Bullock reiterated ‘that it is premature to be thinking about rate cuts’. She explained that RBA board is seeking to balance reducing inflation in a reasonable timeframe and maintaining as many of Australia’s recent labour market gains as possible, with unemployment at a low 4.2%.”
“She also spoke about the drawbacks of prolonged periods of high inflation and how the current episode is disproportionately hurting lower income earners and young Australians.”
“Pair was last at 0.6725 levels. Bullish momentum on daily chart faded while decline in RSI moderated. Recent pullback have found an interim support at 0.6690/0.6700 (21 DMA, recent low). Decisive break may open room for further downside towards 0.6640. Resistance at 0.6730, 0.6790.”
As expected, the Bank of Canada (BoC) cut interest rates again yesterday by 25 basis points to 4.25%, Commerzbank’s FX strategist Michael Pfister notes.
BoC to cut rates by 25 b.p. at each of the two remaining meetings
“This means that it has now cut rates at the last three meetings. At the same time, it was clear between the lines that further rate cuts are likely at upcoming meetings. BoC Governor Tiff Macklem emphasised in his opening remarks that further rate cuts can be expected as long as inflation continues to moderate as expected. At the same time, the BoC now wants to see growth pick up.”
“The surprisingly strong growth figures in the second quarter did not change this, as they were mainly driven by government spending and investment, with little contribution from private consumption. In short, unless inflation picks up unexpectedly in the coming months, the BoC is likely to cut rates further. Our baseline scenario remains a rate cut of 25 basis points at each of the two remaining meetings this year.”
- AUD/USD stays in a tight range above 0.6700 despite multiple tailwinds.
- A hawkish guidance from RBA Bullock on interest rates fails to uplift the Australian Dollar (AUD).
- Weak US JOLTS Job Openings data weighs heavily on the US Dollar.
The AUD/USD pair trades in a tight range above the round-level support of 0.6700 in Thursday’s European session. The Aussie asset fails to find bids despite weakness in the US Dollar (USD) and Reserve Bank of Australia (RBA) Governor Michele Bullock’s hawkish guidance on interest rates.
The US Dollar Index (DXY), which tracks the Greenback’s value against six major currencies, extends its downside below 101.20. The US Dollar faced selling pressure after the release of weak United States (US) JOLTS Job Openings data for July, which raised red flags to labor market conditions.
Michele Bullock said in his speech at the Anika Foundation in Thursday’s Asian session, "If the economy evolves broadly as anticipated, the board does not expect that it will be in a position to cut rates in the near term.” Her comments strengthened market speculation that the RBA will unlikely cut interest rates this year.
The Aussie asset consolidates as investors look for fresh cues about how much the Federal Reserve (Fed) will cut interest rates in its September meeting.
The Fed is widely anticipated to start reducing interest rates this month as downside risks to the United States (US) labor market have increased and the progress in the disinflation process towards bank’s target of 2% remains intact. For meaningful cues about the likely interest rate cut size, investors await the US Nonfarm Payrolls (NFP) data for August, which will be published on Friday.
In today’s session, investors will focus the US ADP Employment Change and ISM Services PMI for August. Economists estimate that payrolls in the private sector rose by 145K from 122K in July. In the same period, activities in the service sector, which accounts for two-thirds of the economy, are expected to have expanded at a slower pace to 51.1 from the former reading of 51.4.
In the UK, the focus today will be on the Bank of England's Decision Maker Panel survey of CFOs. The most interesting question for the market will be whether expected and realized wage growth continues to slow, ING’s FX strategist Chris Turner notes.
1.3100 is the risk for GBP/USD today
“If so, the market might be tempted to close the gap between the pricing of the BoE and Fed easing cycles. Looking at what's priced before year-end, we see 107bp priced for Fed easing and just 44bp for the BoE. We suspect more easing can be priced for the BoE, which could leave GBP/USD a little vulnerable.”
“Also today is Bank 1.3100 is the risk for GBP/USD today of England chief economist, Huw Pill, speaking at the Bruegel Institute in Brussels at 11CET. He voted against the rate cut in August. It is unclear whether he will go near monetary policy in his speech today, but if he does, any signs of greater confidence in the disinflation process could also hit the pound.”
“1.3100 is the risk for GBP/USD today and medium term we see the cable rally contained in the low 1.30s.”
News came that the Governor of the Bank of Japan, Kazuo Ueda, had reiterated that further rate hikes are likely to follow as long as the BoJ's outlook is realized. He pointed out that even after the July rate hike, the real interest rate will remain significantly negative, which will continue to support the real economy, Commerzbank’s FX strategist Chris Turner notes.
Yen is likely to come under depreciation pressure again
“The real interest rate is clearly negative. Comparing this with the rest of the G10, it is clear that the Japanese real interest rate is by far the most negative, ergo the most expansionary. All the other central banks have responded to the inflationary shock of recent years by raising interest rates sharply. Inflation is now falling around the world, so their real interest rates are becoming positive. Only the BoJ is known to have missed the cycle.”
“Japanese inflation is mainly externally driven, i.e. a self-sustaining inflation process has not yet started. From this point of view, there is no need to tighten monetary policy. Nor is growth strong enough to warrant tightening the reins. Japan's GDP has only recently returned to pre-pandemic levels. That makes it the worst performer in the G7. The current real interest rate therefore does not appear to be expansive in a way that sufficiently supports the real economy.”
“In the short term, it does not matter for the yen whether the rate hikes are fundamentally justified or not. Either way, the yen benefits from the interest rate differential, as we saw on Tuesday after the announcement. In the medium term, however, if the BoJ unnecessarily ensures that inflationary pressures fizzle out and at the same time puts pressure on the real economy with a more restrictive monetary policy, the yen is likely to come under depreciation pressure again in the medium term.”
Silver prices (XAG/USD) rose on Thursday, according to FXStreet data. Silver trades at $28.74 per troy ounce, up 1.68% from the $28.27 it cost on Wednesday.
Silver prices have increased by 20.79% since the beginning of the year.
| Unit measure | Silver Price Today in USD |
|---|---|
| Troy Ounce | 28.74 |
| 1 Gram | 0.92 |
The Gold/Silver ratio, which shows the number of ounces of Silver needed to equal the value of one ounce of Gold, stood at 87.55 on Thursday, down from 88.28 on Wednesday.
Silver FAQs
Silver is a precious metal highly traded among investors. It has been historically used as a store of value and a medium of exchange. Although less popular than Gold, traders may turn to Silver to diversify their investment portfolio, for its intrinsic value or as a potential hedge during high-inflation periods. Investors can buy physical Silver, in coins or in bars, or trade it through vehicles such as Exchange Traded Funds, which track its price on international markets.
Silver prices can move due to a wide range of factors. Geopolitical instability or fears of a deep recession can make Silver price escalate due to its safe-haven status, although to a lesser extent than Gold's. As a yieldless asset, Silver tends to rise with lower interest rates. Its moves also depend on how the US Dollar (USD) behaves as the asset is priced in dollars (XAG/USD). A strong Dollar tends to keep the price of Silver at bay, whereas a weaker Dollar is likely to propel prices up. Other factors such as investment demand, mining supply – Silver is much more abundant than Gold – and recycling rates can also affect prices.
Silver is widely used in industry, particularly in sectors such as electronics or solar energy, as it has one of the highest electric conductivity of all metals – more than Copper and Gold. A surge in demand can increase prices, while a decline tends to lower them. Dynamics in the US, Chinese and Indian economies can also contribute to price swings: for the US and particularly China, their big industrial sectors use Silver in various processes; in India, consumers’ demand for the precious metal for jewellery also plays a key role in setting prices.
Silver prices tend to follow Gold's moves. When Gold prices rise, Silver typically follows suit, as their status as safe-haven assets is similar. The Gold/Silver ratio, which shows the number of ounces of Silver needed to equal the value of one ounce of Gold, may help to determine the relative valuation between both metals. Some investors may consider a high ratio as an indicator that Silver is undervalued, or Gold is overvalued. On the contrary, a low ratio might suggest that Gold is undervalued relative to Silver.
(An automation tool was used in creating this post.)
USD/JPY continued to trade lower, following the broad decline in USD, UST yields, OCBC FX strategists Frances Cheung and Christopher Wong note.
USD/JPY continues to trade lower
“Earlier in the week, BoJ Governor submitted a document to government panel, which reiterated that the BoJ would continue to raise interest rates if the economy and prices perform as expected by the BoJ. Fed-BoJ policy shifts will bring about a narrowing of UST-JGB yield differentials and this should continue to underpin the broader direction of travel for USD/JPY to the downside.”
“Pair was last seen at 143.53. Bullish momentum on daily chart is fading while RSI fell. Sideways trading likely. Support at 143.45 (recent low), 142 levels. Resistance at 145.90 (21 DMA), 147.20 (recent high).”
- Eurozone Retail Sales drop 0.1% YoY in July vs. +0.1% forecast.
- Retail Sales in the bloc arrived at 0.1% MoM in July vs. 0.1% estimate.
Eurozone’s Retail Sales fell 0.1% over the year in July after dropping by 0.4% in May, the official data released by Eurostat showed on Thursday. The data missed the market consensus of +0.1%.
On a monthly basis, Retail Sales in the old continent increased by 0.1% in the same period vs. June’s -0.4% and +0.1% expected.
FX implications
The mixed Eurozone data fails to move the needle around the Euro. At the time of writing, the EUR/USD pair is trading 0.15% higher on the day at 1.1100.
- The Pound Sterling gains against the US Dollar as lower US job vacancies in July boost chances that the Fed will opt for a large interest-rate cut.
- Weak US job vacancy data raise red flags about labor market conditions.
- Investors see the BoE leaving interest rates unchanged at 5% at this month’s meeting.
The Pound Sterling (GBP) rises above 1.3150 against the US Dollar (USD) in Thursday’s London session. The GBP/USD pair aims to extend Wednesday’s recovery after weak United States (US) JOLTS Job Openings data for July sent the US Dollar (USD) on the back foot. The US Dollar Index (DXY), which tracks the Greenback’s value against six major currencies, falls to near the crucial support of 101.00.
The Job Openings data, released on Wednesday, showed that fresh job vacancies posted by US employers stood at 7.67 million, the lowest in more than three-and-a-half years. Signs of a slowing job market supported expectations that the Federal Reserve (Fed) could start the policy-easing process aggressively.
According to the CME FedWatch tool, the possibility for the Fed to begin reducing interest rates by 50 basis points (bps) to 4.75%-5.00% in the September meeting has increased to 41% from the 34% recorded a week ago.
Going forward, the US Nonfarm Payrolls (NFP) data for August, which will be published on Friday, will be the major trigger for the US Dollar. The importance of the US labor market data has increased significantly as the Fed appears to be more concerned about preventing job losses as there is increasing evidence that inflationary pressures remain on track to sustainably return to the bank’s target of 2%.
In Thursday’s North American session, investors will focus on the ADP Employment Change and the ISM Services Purchasing Managers’ Index (PMI) for August. The Initial Jobless Claims data for the week ending August 30 will also be important.
Daily digest market movers: Pound Sterling outperforms major peers
- The Pound Sterling performs strongly against its major peers on Thursday. The British currency strengthens as the upbeat United Kingdom (UK) economic outlook has boosted market expectations that the Bank of England’s (BoE) policy-easing cycle could be shallower this year compared to that of other central banks.
- The final estimate for S&P Global/CIPS PMI data released on Wednesday showed that overall economic activity in the UK expanded at a faster pace in August. The survey data showed that activity rose at the fastest pace since April, driven by a sharp expansion in manufacturing as well as the services sector.
- Financial market participants expect that the BoE will cut interest rates only once in the remainder of the year. The BoE pivoted to policy normalization in August. The central bank is expected to leave interest rates unchanged at 5% this month, and markets expect another cut in November or December.
- The Pound Sterling will be influenced by market sentiment and speculation for BoE interest rate cuts amid an absence of UK top-tier economic data. Next week, investors will focus on the Employment data for the quarter ending July and the monthly Gross Domestic Product (GDP) data for July.
Technical Analysis: Pound Sterling recovers from weekly low of 1.3090
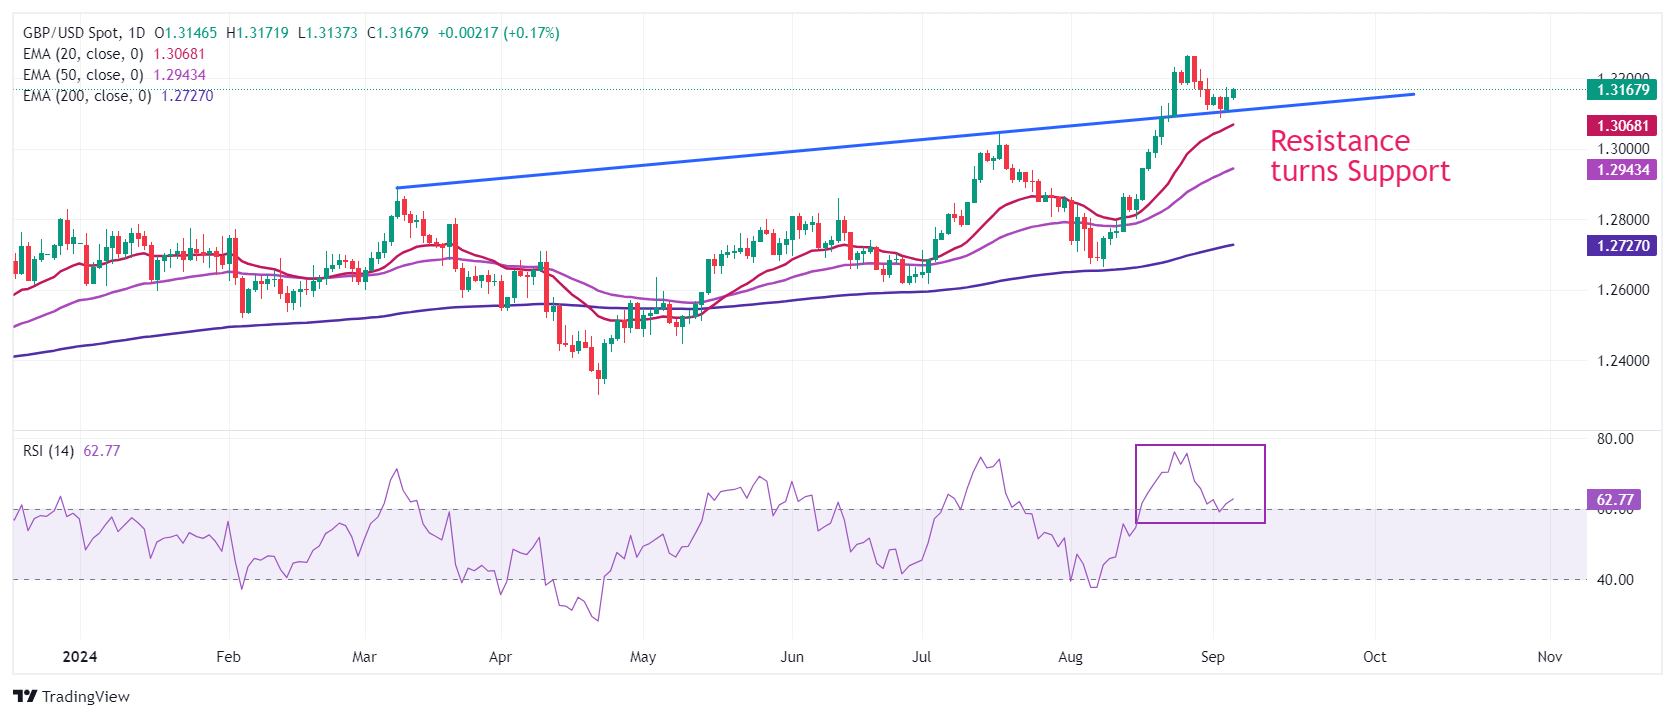
The Pound Sterling bounces back to near 1.3150 from a fresh weekly low of around 1.3090 against the US Dollar. The GBP/USD pair strengthens after discovering strong buying interest near the breakout region of an upward-sloping trendline plotted from December 28, 2023 high of 1.2828 on the daily time frame.
Upward-sloping short-to-long-term Exponential Moving Averages (EMAs) suggest a strong bullish trend.
The 14-day Relative Strength Index (RSI) rebounds from 60.00, suggesting a resumption in the bullish momentum.
Looking up, the Cable will face resistance near the psychological level of 1.3500 and at the February 4, 2022, high of 1.3640 if it breaks above a fresh two-and-a-half-year high of 1.3266. On the downside, the psychological level of 1.3000 emerges as crucial support for the Pound Sterling bulls.
Pound Sterling FAQs
The Pound Sterling (GBP) is the oldest currency in the world (886 AD) and the official currency of the United Kingdom. It is the fourth most traded unit for foreign exchange (FX) in the world, accounting for 12% of all transactions, averaging $630 billion a day, according to 2022 data. Its key trading pairs are GBP/USD, aka ‘Cable’, which accounts for 11% of FX, GBP/JPY, or the ‘Dragon’ as it is known by traders (3%), and EUR/GBP (2%). The Pound Sterling is issued by the Bank of England (BoE).
The single most important factor influencing the value of the Pound Sterling is monetary policy decided by the Bank of England. The BoE bases its decisions on whether it has achieved its primary goal of “price stability” – a steady inflation rate of around 2%. Its primary tool for achieving this is the adjustment of interest rates. When inflation is too high, the BoE will try to rein it in by raising interest rates, making it more expensive for people and businesses to access credit. This is generally positive for GBP, as higher interest rates make the UK a more attractive place for global investors to park their money. When inflation falls too low it is a sign economic growth is slowing. In this scenario, the BoE will consider lowering interest rates to cheapen credit so businesses will borrow more to invest in growth-generating projects.
Data releases gauge the health of the economy and can impact the value of the Pound Sterling. Indicators such as GDP, Manufacturing and Services PMIs, and employment can all influence the direction of the GBP. A strong economy is good for Sterling. Not only does it attract more foreign investment but it may encourage the BoE to put up interest rates, which will directly strengthen GBP. Otherwise, if economic data is weak, the Pound Sterling is likely to fall.
Another significant data release for the Pound Sterling is the Trade Balance. This indicator measures the difference between what a country earns from its exports and what it spends on imports over a given period. If a country produces highly sought-after exports, its currency will benefit purely from the extra demand created from foreign buyers seeking to purchase these goods. Therefore, a positive net Trade Balance strengthens a currency and vice versa for a negative balance.
September is typically a poor month for both EUR/USD and the trade-weighted Euro index, ING’s FX strategist Chris Turner notes.
EUR to consolidate just under 1.1100
“We're not sure what's behind that, but on the EUR/USD side it may relate to the 15 September US corporate tax deadline for those companies with a fiscal year ending 30 June. Unless we get a very sharp rise in the US unemployment rate tomorrow, it feels like very hard work for EUR/USD to break from the 18-month 1.05-1.11 trading range this month.”
“In Europe today, we've seen some surprisingly strong July factory orders data in Germany, with the prior month revised higher too.”
“EUR/USD has just about held support at 1.1040 this week and will probably consolidate just under 1.1100 – unless today's US data surprises on the downside.”
- EUR/GBP struggles to gain any meaningful traction and oscillates in a range on Thursday.
- The formation of a rectangle might still be categorized as a bearish consolidation phase.
- A convincing break below the 0.8400 round figure should pave the way for deeper losses.
The EUR/GBP cross oscillates in a narrow band through the first half of the European session and currently trades around the 0.8425-0.8430 area, just below a one-week high touched earlier this Thursday.
The British Pound (GBP) continues with its relative outperformance in the wake of expectations that the Bank of England's (BoE) rate-cutting cycle is more likely to be slower than in the Eurozone or the United States. This, in turn, is seen as a key factor acting as a headwind for the EUR/GBP cross. That said, the shared currency benefits from the emergence of some follow-through US Dollar (USD) selling, which helps limit the downside for the currency pair.
Looking at the broader picture, the range-bound price action witnessed since last Wednesday constitutes the formation of a rectangle on the daily chart. This might be categorized as a bearish consolidation phase against the backdrop of the recent fall from a multi-month peak touched in August. Moreover, oscillators on the daily chart are holding deep in negative territory, suggesting that the path of least resistance for the EUR/GBP cross is to the downside.
That said, a sustained strength beyond the trading range resistance near the 0.8435 region might prompt some technical buying and lift spot prices to the next relevant hurdle near the 0.8465-0.8470 area. The latter coincides with the 50-day Simple Moving Average (SMA), which if cleared decisively might shift the near-term bias in favor of bullish traders. The EUR/GBP cross might then aim to reclaim the 0.8500 psychological mark and climb further to the 0.8515 resistance zone.
On the flip side, the 0.8415 area is likely to protect the immediate downside ahead of the 0.8400 mark, or over a one-month low touched on August 30. Some follow-through selling will be seen as a fresh trigger for bearish traders and expose the YTD trough, around the 0.8385-0.8380 region touched in July. Spot prices could eventually drop to the August 2022 swing low, around the 0.8410 zone en route to the 0.8400 round-figure mark.
EUR/GBP 4-hour chart
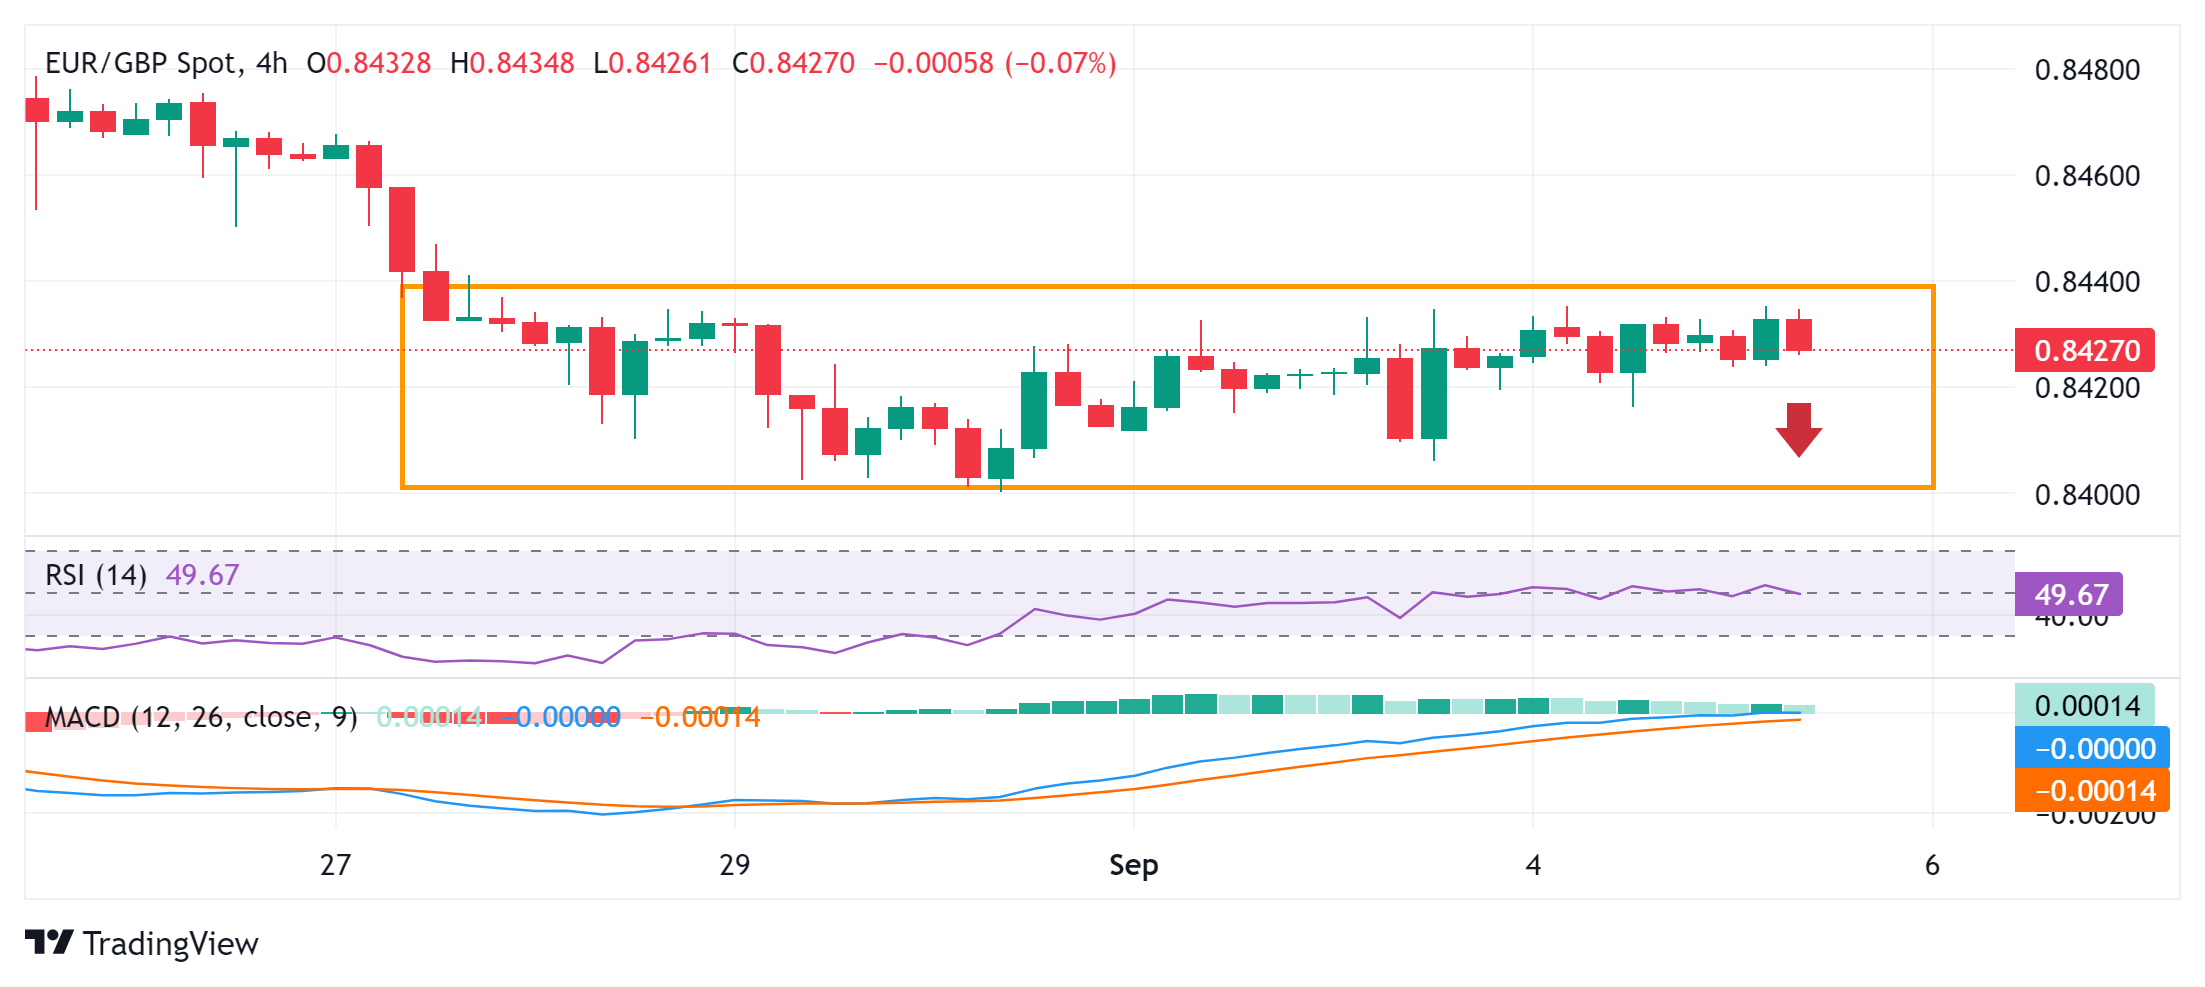
Pound Sterling FAQs
The Pound Sterling (GBP) is the oldest currency in the world (886 AD) and the official currency of the United Kingdom. It is the fourth most traded unit for foreign exchange (FX) in the world, accounting for 12% of all transactions, averaging $630 billion a day, according to 2022 data. Its key trading pairs are GBP/USD, aka ‘Cable’, which accounts for 11% of FX, GBP/JPY, or the ‘Dragon’ as it is known by traders (3%), and EUR/GBP (2%). The Pound Sterling is issued by the Bank of England (BoE).
The single most important factor influencing the value of the Pound Sterling is monetary policy decided by the Bank of England. The BoE bases its decisions on whether it has achieved its primary goal of “price stability” – a steady inflation rate of around 2%. Its primary tool for achieving this is the adjustment of interest rates. When inflation is too high, the BoE will try to rein it in by raising interest rates, making it more expensive for people and businesses to access credit. This is generally positive for GBP, as higher interest rates make the UK a more attractive place for global investors to park their money. When inflation falls too low it is a sign economic growth is slowing. In this scenario, the BoE will consider lowering interest rates to cheapen credit so businesses will borrow more to invest in growth-generating projects.
Data releases gauge the health of the economy and can impact the value of the Pound Sterling. Indicators such as GDP, Manufacturing and Services PMIs, and employment can all influence the direction of the GBP. A strong economy is good for Sterling. Not only does it attract more foreign investment but it may encourage the BoE to put up interest rates, which will directly strengthen GBP. Otherwise, if economic data is weak, the Pound Sterling is likely to fall.
Another significant data release for the Pound Sterling is the Trade Balance. This indicator measures the difference between what a country earns from its exports and what it spends on imports over a given period. If a country produces highly sought-after exports, its currency will benefit purely from the extra demand created from foreign buyers seeking to purchase these goods. Therefore, a positive net Trade Balance strengthens a currency and vice versa for a negative balance.
From their speculative peak in May, base metal prices fell sharply until early August, with the LME index falling by 18.7% peak-to-trough, with Nickel and Copper recording the largest falls, NAB commodity strategists note.
Volatile metals search for direction post correction
“Prices rallied from this relative low – limbing almost 10% by late August, led by Aluminium and Zinc, before the index eased somewhat once again.”
“The Copper-led surge in base metals between early April and mid-May came despite a growing surplus in Copper markets. Data from the International Copper Study Group shows that refined supply exceeded consumption by around 488 kt in the first half of 2024 (compared with around 115 kt for the same period in 2023).”
“Following the steep corrections in metals prices, we have revised our forecasts for base metals lower – albeit we note that the high degree of volatility in these markets means that there is sizeable risk around these forecasts to both the up and downside.”
The spot price of Gold resumed its upward momentum in late July (following a brief retreat from then record highs earlier in the month), pushing above $2500 per troy ounce for the first time in mid-August and remaining above this mark at the end of the month, NAB commodity strategists note.
Central banks appear to be key drivers of Gold
“Gold demand may have benefited from the turbulence in financial markets in early August – with equity markets, other commodity prices and bond yields falling on recession fears in the US and an unwinding of the Yen carry trade (following the Bank of Japan hiking policy rates).”
“Central banks appear to be key drivers of Gold demand over recent quarters. Given that Gold has remained well above our previous price forecasts, we have revised our outlook. We expect Gold to average US$2315/oz in 2024 and edge only marginally lower to US$2290/oz in 2025.”
- The Mexican Peso weakens after the Mexican lower house votes through a set of controversial reforms.
- Investors are concerned about the negative impact of the reforms on the economy.
- USD/MXN restarts its uptrend after a pause and breaks above 20.00.
The Mexican Peso (MXN) edges lower in its most-traded pairs on the day named after the Norse god of thunder, extending the over-one-percent decline clocked up on Wednesday.
The Peso is being sold because investors are fretting about the Mexican parliament passing a controversial bill of reforms that critics say will compromise the independence of the judiciary, undermine democracy and damage international trade and foreign investment.
Mexican Peso depreciates after Mexican congress passes reforms
The Mexican Peso weakened in its key pairs on Wednesday after lawmakers in Mexico’s lower house voted through a controversial bill of reforms to the judiciary.
The reforms seek to counter the perceived corruption in the judiciary by electing judges through popular vote, rather than by appointment. However, critics argue the bill will compromise the independence of judges and fail to combat corruption, which is more located amongst lower-ranking officials and members of law enforcement agencies.
Despite protests and strikes from court employees against the reforms, who blocked the entrance to congress on Wednesday – forcing lawmakers to relocate to a sports hall for the debate and subsequent vote – the government managed to get the bill passed, winning a vote of 357 in favor versus 130 against.
The reforms will now be debated in Mexico’s upper house, where the government is one seat short of a majority. Most experts believe, however, that it will still get voted through.
From a financial perspective, the reforms run the risk of leading to a decline in foreign investment. This, in turn, would reduce demand for the Peso, leading to a further depreciation of the currency.
The US ambassador for Mexico, Ken Salazar, said that although reforms to the judiciary were needed the current bill was raising concerns among investors in his country. He warned it could jeopardize the two countries’ close relationship, which includes a free trade deal.
“If it is not done in the right way, it could cause a lot of damage to the relationship,” said Salazar at a press conference on Tuesday.
At the time of writing, one US Dollar (USD) buys 19.99 Mexican Pesos, EUR/MXN trades at 22.18, and GBP/MXN at 26.30.
Technical Analysis: USD/MXN breaks above 20.00
USD/MXN restarts its uptrend, climbing within a broader rising channel. Given that, according to technical analysis, “the trend is your friend” the odds favor more upside.
On Tuesday, the pair broke briefly above the 19.96 high of the mini-range, making a higher high at 19.98 – on Thursday it breaks above that and touches 20.00.
USD/MXN Daily Chart
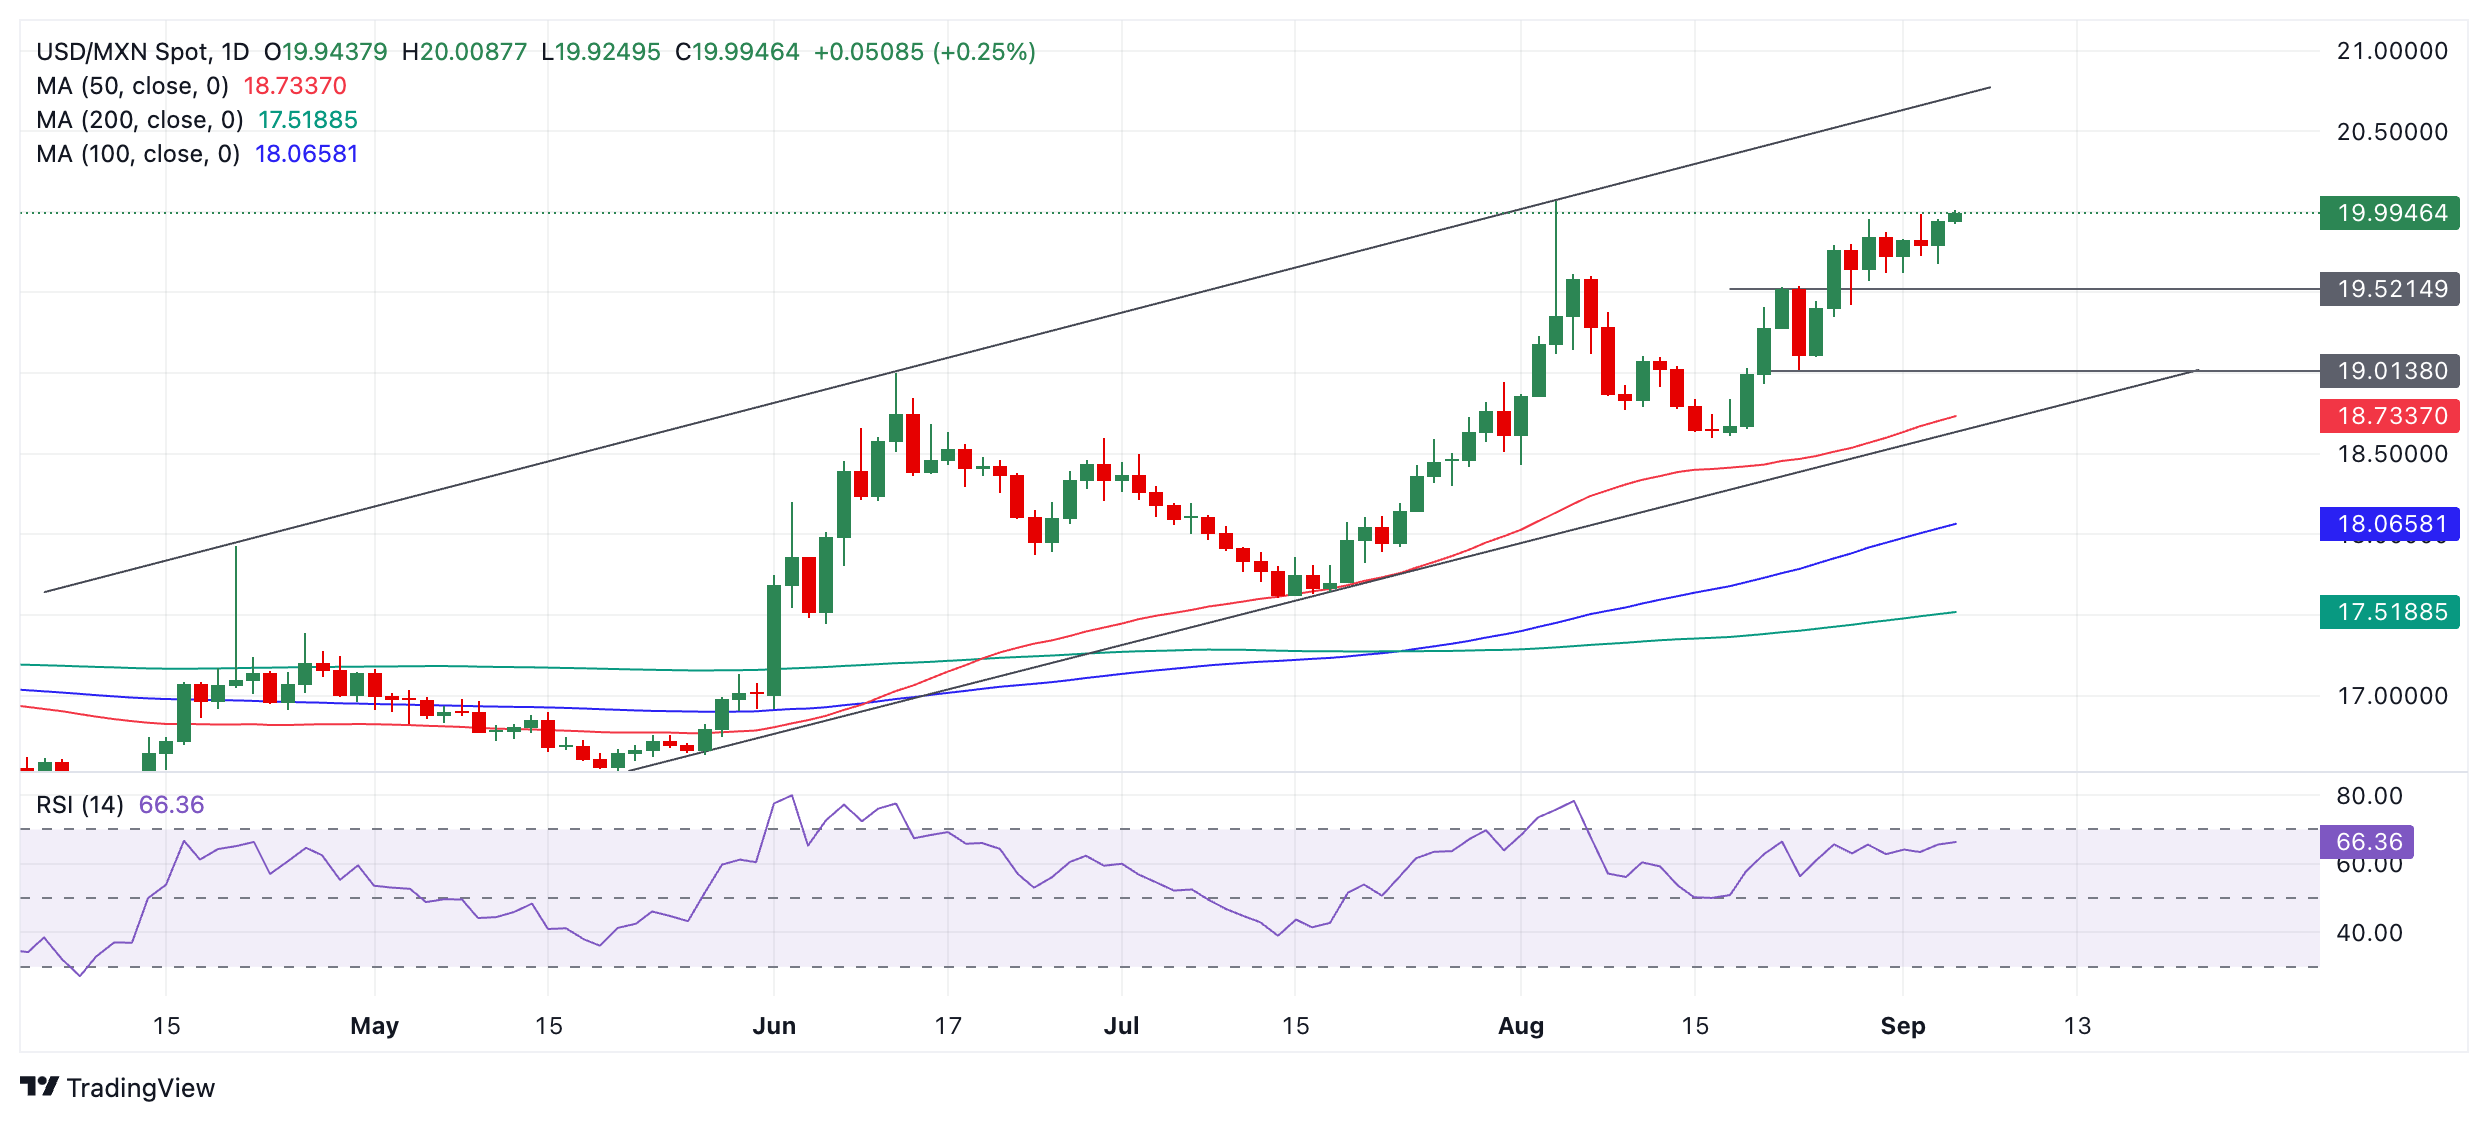
This supplies further confirmation of a continuation of the bull trend, with the next target at the upper channel line in the 20.60s.
Mexican Peso FAQs
The Mexican Peso (MXN) is the most traded currency among its Latin American peers. Its value is broadly determined by the performance of the Mexican economy, the country’s central bank’s policy, the amount of foreign investment in the country and even the levels of remittances sent by Mexicans who live abroad, particularly in the United States. Geopolitical trends can also move MXN: for example, the process of nearshoring – or the decision by some firms to relocate manufacturing capacity and supply chains closer to their home countries – is also seen as a catalyst for the Mexican currency as the country is considered a key manufacturing hub in the American continent. Another catalyst for MXN is Oil prices as Mexico is a key exporter of the commodity.
The main objective of Mexico’s central bank, also known as Banxico, is to maintain inflation at low and stable levels (at or close to its target of 3%, the midpoint in a tolerance band of between 2% and 4%). To this end, the bank sets an appropriate level of interest rates. When inflation is too high, Banxico will attempt to tame it by raising interest rates, making it more expensive for households and businesses to borrow money, thus cooling demand and the overall economy. Higher interest rates are generally positive for the Mexican Peso (MXN) as they lead to higher yields, making the country a more attractive place for investors. On the contrary, lower interest rates tend to weaken MXN.
Macroeconomic data releases are key to assess the state of the economy and can have an impact on the Mexican Peso (MXN) valuation. A strong Mexican economy, based on high economic growth, low unemployment and high confidence is good for MXN. Not only does it attract more foreign investment but it may encourage the Bank of Mexico (Banxico) to increase interest rates, particularly if this strength comes together with elevated inflation. However, if economic data is weak, MXN is likely to depreciate.
As an emerging-market currency, the Mexican Peso (MXN) tends to strive during risk-on periods, or when investors perceive that broader market risks are low and thus are eager to engage with investments that carry a higher risk. Conversely, MXN tends to weaken at times of market turbulence or economic uncertainty as investors tend to sell higher-risk assets and flee to the more-stable safe havens.
In a poll taken during our Economics Live webinar yesterday, 25% of respondents felt EUR/USD would end the year over 1.13, while 46% felt it would remain roughly stable in a 1.10-1.13 range. This was a subtle shift from poll results in early June which showed 47% expected EUR/USD to end the year in a 1.07-1.11 range and 30% expected 1.02-1.07, ING’s FX strategist Chris Turner notes.
DXY to trade well within a 101-102 range
“Stunningly, only 1% of respondents now expect EUR/USD to end the year sub 1.07. The shift in tone no doubt reflects the most recent experience of a 5% dollar sell-off since early July and the certainty that the Fed is about to embark on an easing cycle. As we cautioned in the webinar, we have a slight downside dollar bias ahead of the US elections in early November, but thereafter scenario analysis takes over. “
“In terms of short-term inputs to the dollar story, yesterday's poor JOLTS job opening data saw the Fed's terminal rate in two years' time priced at a new low – the 1m USD OIS priced two years' forward is now 2.85%. In other words, the market is toying with a sub-3% terminal rate, which is dollar-bearish. The discount of the two-year Treasury yield to Fed Funds is currently very deep at 175bp, but presumably once the Fed starts cutting, short-dated US yields can take another leg lower and soften the USD.”
“Today the focus is on ADP employment data, initial claims and the ISM services index. Last night's release of the Fed's Beige Book showed that activity was slowing, but that Fed districts had yet to see a material increase in job layoffs. Let's see what the main event this week – tomorrow's August jobs data – brings us. Unless there is a sharp downside miss to some of today's numbers, expect DXY to trade well within a 101-102 range. But the multi-week bias is bearish.”
- USD/CAD could test the immediate barrier at the nine-day EMA at 1.3521 level, followed by the 14-day EMA at 1.3546 level.
- The momentum indicator MACD shows a convergence below the signal line, suggesting a weakening of the bearish trend.
- The psychological level of 1.3500 appears as the immediate support for the pair.
USD/CAD moves sideways around 1.3510 during European hours on Thursday. Analysis of the daily chart indicates a bearish bias for the USD/CAD pair, as the nine-day Exponential Moving Average (EMA) is positioned below the 14-day EMA.
Additionally, the 14-day Relative Strength Index (RSI) remains near the 30 level, confirming the overall bearish trend in play but also suggesting a potential correction soon.
The momentum indicator Moving Average Convergence Divergence (MACD) suggests a downward trend for the USD/CAD pair, as the MACD line is positioned below the centreline. However, the MACD line may crossover above the signal line, suggesting a potential weakening of the bearish trend.
On the downside, the USD/CAD pair tests the psychological level of 1.3500. A break below this level could reinforce the bearish bias and push the pair to navigate the region around the seven-month low at 1.3441, recorded on August 28.
In terms of resistance, the immediate barrier appears at the nine-day EMA at 1.3521 level, followed by the 14-day EMA at 1.3546 level. A breakthrough above these EMAs could weaken the bearish bias and lead the pair to test the "throwback support turns into a pullback resistance" level at 1.3590, followed by the psychological level of 1.3600.
USD/CAD: Daily Chart
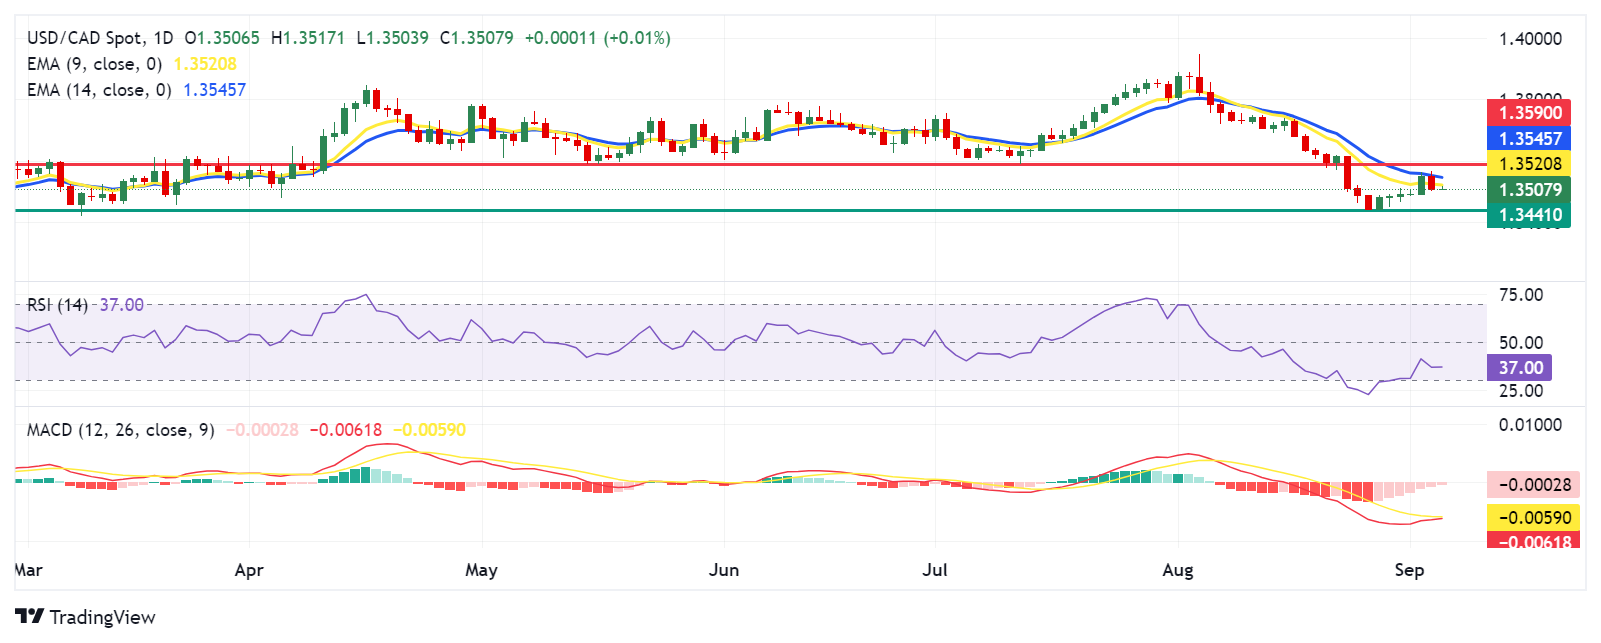
Canadian Dollar PRICE Today
The table below shows the percentage change of Canadian Dollar (CAD) against listed major currencies today. Canadian Dollar was the weakest against the British Pound.
| USD | EUR | GBP | JPY | CAD | AUD | NZD | CHF | |
|---|---|---|---|---|---|---|---|---|
| USD | -0.15% | -0.16% | -0.09% | 0.00% | -0.07% | -0.06% | -0.05% | |
| EUR | 0.15% | 0.00% | 0.10% | 0.17% | 0.08% | 0.13% | 0.10% | |
| GBP | 0.16% | -0.00% | 0.09% | 0.19% | 0.08% | 0.13% | 0.09% | |
| JPY | 0.09% | -0.10% | -0.09% | 0.11% | 0.00% | 0.02% | 0.04% | |
| CAD | -0.00% | -0.17% | -0.19% | -0.11% | -0.07% | -0.05% | -0.07% | |
| AUD | 0.07% | -0.08% | -0.08% | -0.01% | 0.07% | 0.03% | 0.02% | |
| NZD | 0.06% | -0.13% | -0.13% | -0.02% | 0.05% | -0.03% | -0.02% | |
| CHF | 0.05% | -0.10% | -0.09% | -0.04% | 0.07% | -0.02% | 0.02% |
The heat map shows percentage changes of major currencies against each other. The base currency is picked from the left column, while the quote currency is picked from the top row. For example, if you pick the Canadian Dollar from the left column and move along the horizontal line to the US Dollar, the percentage change displayed in the box will represent CAD (base)/USD (quote).
The Euro (EUR) was a touch firmer amid broad USD softness overnight, OCBC FX strategists Frances Cheung and Christopher Wong note.
Daily momentum is mild bearish
“Pair was last seen at 1.1098. Daily momentum is mild bearish while RSI was flat. Sideways trade likely with USD the main driver of direction. Support at 1.1026 (recent low), 1.10, 1.0930 (61.8% fibo retracement of 2024 high to low).”
“Resistance at 1.12 (recent high) and 1.1280 (2023 high). This week, focus is on retail sales (Thu) and GDP (Fri). Underwhelming data print could move the needle for markets to price in a more dovish ECB and for the EUR to trade lower.”
Timo Wollmershaeuser, head of economic research at Gemany’s highly influential IFO institute, said on Thursday that the German economy is seen stagnating this year, compared to a 0.4% growth previously projected.
Additional takeaways
"The German economy is stuck and is bobbing around in the doldrums, while other countries are feeling the upswing.”
“It expects the economy to grow by 0.9% next year, lower than the 1.5% previously forecast.”
“In 2026, Gross Domestic Product is likely to increase by 1.5%, according to the economic institute.”
German inflation is seen falling to 2.2% this year, from 5.9% last year.
"The order situation is poor and the gains in purchasing power are not leading to increased consumption, but to higher savings because people are insecure.”
“Unemployment is likely to go up due to the economic weakness, rising to 6.0% in 2024 from 5.7% in 2023. It will then fall to 5.8% next year and reach 5.3% in 2026.”
Market reaction
The EUR/USD pair shrugs off these comments, adding 0.16% on the day to test 1.1100, at the press time.
Crude oil prices trended lower across most of July, and this continued into early August – with benchmark Brent crude dipping below US$80/barrel before a modest rally took it back above this mark, NAB commodity strategists note.
Supply side pressures persist
“Prices plunged once again at the end of August. Global demand trends have been mixed of late – with China’s apparent consumption of crude oil falling in the past three months (largely on weakness in the petrochemical sector), while US consumption has been unexpectedly strong, with the IEA attributing this to robust service sector activity.”
“Supply side pressures persist, with turmoil in the Middle East driving fears of disruption to oil production in the region, while uncertainty around temporary OPEC+ production cuts – set to expire in Q4 – remains.”
“Recent price trends have fallen below our previous forecasts, so we have revised our outlook lower. Brent is forecast to average US$82.7/barrel in 2024 and US$80/barrel in 2025.”
The US Dollar (USD) fell after job openings disappointed while Fed’s Beige Book showed that economic activity was flat to slightly down in most districts, OCBC FX strategists Frances Cheung and Christopher Wong note.
Daily momentum is mild bullish
“On employment, levels held steady overall, though some firms are becoming more selective in hiring and less likely to expand their workforces, citing concerns about demand and uncertain economic outlook. It was also reported that candidates faced increasing difficulties and longer times to secure a job while firms felt less pressure to increase wage and salaries as competition for works eased and staff turnover has fallen.”
“On net, wage growth was reportedly modest, in line with the slowing trend described in recent reports. Focus shifts to ISM services and ADP employment tonight. We reiterate that USD should remain sensitive to job data this week given that Fed’s focus has shifted towards supporting labour market.”
DXY was last at 101.20. Daily momentum is mild bullish but RSI fell. Consolidative price action. Resistance at 101.82 (21-DMA), 102.20 (23.6% fibo retracement of 2023 high to 2024 low). Support at 100.50 levels.
- WTI attracts some buyers on Thursday, albeit it lacks follow-through.
- Demand concerns overshadow hopes for OPEC+ output hike delay.
- The technical setup still seems tilted firmly in favor of bearish traders.
West Texas Intermediate (WTI) US crude Oil prices trade with a mild positive bias, just above the $69.00/barrel mark during the early European session on Thursday, albeit lack bullish conviction. The commodity remains well within the striking distance of the YTD low, around the $68.45 region touched the previous day and seems vulnerable to prolonging its downtrend witnessed over the past two months or so.
Reports that OPEC+ is discussing delaying its oil output increase scheduled to start in October turn out to be a key factor lending some support to Crude Oil prices. Apart from this, a subdued US Dollar (USD) demand further benefits the USD-denominated commodity. That said, persistent demand worries in China – the world's largest oil importer – and renewed fears about an economic downturn in the US act as a headwind for the commodity. This, along with a bearish technical setup, warrants some caution before confirming that the black liquid has formed a near-term bottom.
Crude Oil prices have been trending lower along a downward-sloping channel since early Jul. Adding to this, the commodity this week broke down through the $71.50 horizontal support. Furthermore, oscillators on the daily chart are holding deep in negative territory and are still away from being in the oversold zone. This, in turn, suggests that the path of least resistance for the commodity is to the downside and any meaningful recovery attempt is likely to get sold into, making it prudent to wait for strong follow-through buying before positioning for a further appreciating move.
From current levels, the $69.80 region, closely followed by the $70.00 psychological mark, might act as an immediate hurdle ahead of the overnight swing high, just below the $71.00 round figure. The subsequent move up could confront a stiff barrier and remain capped near the aforementioned support breakpoint, now turned resistance, near the $71.50 horizontal zone. The latter should act as a key pivotal point, which if cleared decisively should trigger a short-covering rally, which should allow Crude Oil prices to surpass the $72.50 intermediate resistance and aim to reclaim the $73.00 mark.
On the flip side, the YTD low, around the $68.45 region, could protect the immediate downside ahead of the $68.00 mark and the descending channel support, currently pegged near the $67.70-$67.65 area. A convincing break below the latter will be seen as a fresh trigger for bearish traders and drag Crude Oil prices to sub-$67.00 levels, or June 2023 swing low.
WTI daily chart
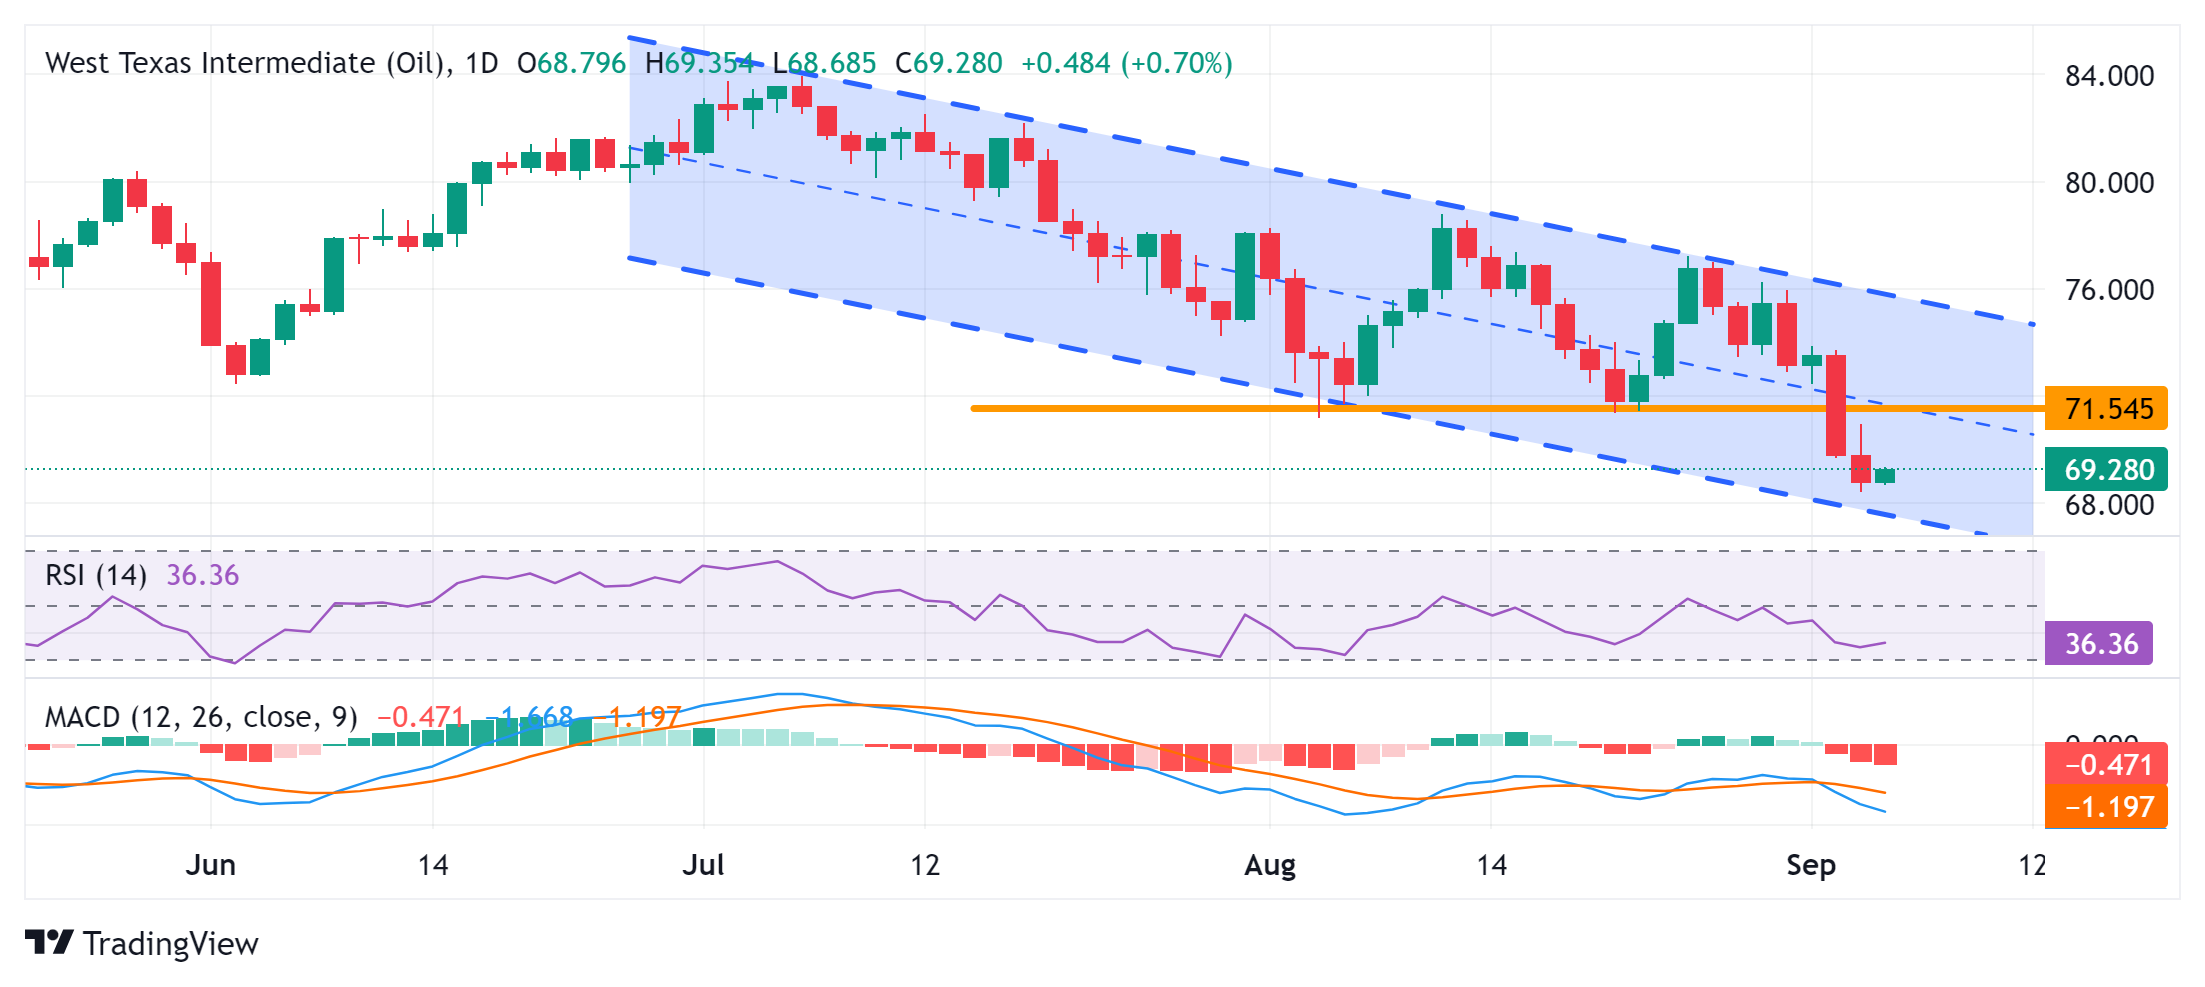
WTI Oil FAQs
WTI Oil is a type of Crude Oil sold on international markets. The WTI stands for West Texas Intermediate, one of three major types including Brent and Dubai Crude. WTI is also referred to as “light” and “sweet” because of its relatively low gravity and sulfur content respectively. It is considered a high quality Oil that is easily refined. It is sourced in the United States and distributed via the Cushing hub, which is considered “The Pipeline Crossroads of the World”. It is a benchmark for the Oil market and WTI price is frequently quoted in the media.
Like all assets, supply and demand are the key drivers of WTI Oil price. As such, global growth can be a driver of increased demand and vice versa for weak global growth. Political instability, wars, and sanctions can disrupt supply and impact prices. The decisions of OPEC, a group of major Oil-producing countries, is another key driver of price. The value of the US Dollar influences the price of WTI Crude Oil, since Oil is predominantly traded in US Dollars, thus a weaker US Dollar can make Oil more affordable and vice versa.
The weekly Oil inventory reports published by the American Petroleum Institute (API) and the Energy Information Agency (EIA) impact the price of WTI Oil. Changes in inventories reflect fluctuating supply and demand. If the data shows a drop in inventories it can indicate increased demand, pushing up Oil price. Higher inventories can reflect increased supply, pushing down prices. API’s report is published every Tuesday and EIA’s the day after. Their results are usually similar, falling within 1% of each other 75% of the time. The EIA data is considered more reliable, since it is a government agency.
OPEC (Organization of the Petroleum Exporting Countries) is a group of 13 Oil-producing nations who collectively decide production quotas for member countries at twice-yearly meetings. Their decisions often impact WTI Oil prices. When OPEC decides to lower quotas, it can tighten supply, pushing up Oil prices. When OPEC increases production, it has the opposite effect. OPEC+ refers to an expanded group that includes ten extra non-OPEC members, the most notable of which is Russia.
- Silver price extends its upside as recent data increase the odds of aggressive rate cuts by the Fed.
- CME FedWatch Tool shows the bets of a 50 basis points rate cut have risen to 41.0%.
- Atlanta Fed President Raphael Bostic emphasizes that the Fed must not maintain a restrictive policy stance for too long.
Silver price (XAG/USD) continues to gain ground for the second successive session, trading around $28.40 per troy ounce during Thursday’s European hours. The non-yielding assets like Silver could advance further as weak US manufacturing and labor market data spurred bets that the Federal Reserve will cut interest rates more aggressively to avert an economic downturn.
July's US JOLTS Job Openings came in below expectations, signaling a further slowdown in the labor market. Additionally, the ISM Manufacturing PMI showed that factory activity contracted for the fifth straight month.
According to the CME FedWatch Tool, markets are fully anticipating at least a 25 basis point (bps) rate cut by the Federal Reserve at its September meeting. The likelihood of a 50 bps rate cut has risen to 41.0%, up from 34.0% a week ago.
Traders now await US ISM Services PMI and Initial Jobless Claims scheduled to be released on Thursday. Attention will shift to Friday’s US Nonfarm Payrolls (NFP) to gain more cues on the potential size of an expected rate cut by the Fed this month.
Atlanta Federal Reserve President Raphael Bostic said on Wednesday that the Fed is in a favorable position but added that they must not maintain a restrictive policy stance for too long, per Reuters. FXStreet’s FedTracker, which gauges the tone of Fed officials’ speeches on a dovish-to-hawkish scale from 0 to 10 using a custom AI model, rated Bostic’s words as neutral with a score of 4.6.
Silver FAQs
Silver is a precious metal highly traded among investors. It has been historically used as a store of value and a medium of exchange. Although less popular than Gold, traders may turn to Silver to diversify their investment portfolio, for its intrinsic value or as a potential hedge during high-inflation periods. Investors can buy physical Silver, in coins or in bars, or trade it through vehicles such as Exchange Traded Funds, which track its price on international markets.
Silver prices can move due to a wide range of factors. Geopolitical instability or fears of a deep recession can make Silver price escalate due to its safe-haven status, although to a lesser extent than Gold's. As a yieldless asset, Silver tends to rise with lower interest rates. Its moves also depend on how the US Dollar (USD) behaves as the asset is priced in dollars (XAG/USD). A strong Dollar tends to keep the price of Silver at bay, whereas a weaker Dollar is likely to propel prices up. Other factors such as investment demand, mining supply – Silver is much more abundant than Gold – and recycling rates can also affect prices.
Silver is widely used in industry, particularly in sectors such as electronics or solar energy, as it has one of the highest electric conductivity of all metals – more than Copper and Gold. A surge in demand can increase prices, while a decline tends to lower them. Dynamics in the US, Chinese and Indian economies can also contribute to price swings: for the US and particularly China, their big industrial sectors use Silver in various processes; in India, consumers’ demand for the precious metal for jewellery also plays a key role in setting prices.
Silver prices tend to follow Gold's moves. When Gold prices rise, Silver typically follows suit, as their status as safe-haven assets is similar. The Gold/Silver ratio, which shows the number of ounces of Silver needed to equal the value of one ounce of Gold, may help to determine the relative valuation between both metals. Some investors may consider a high ratio as an indicator that Silver is undervalued, or Gold is overvalued. On the contrary, a low ratio might suggest that Gold is undervalued relative to Silver.
People's Bank of China's (PBOC) Deputy Governor Lu Lei said on Thursday that the “central bank will continue to implement supportive policy.”
Further comments
Central bank will steadily lower financing costs for firms, credit costs for residents.
Experiments on digital yuan going smoothly.
- EUR/USD clings to recovery near 1.1100 as weak US Job Openings data pushes the US Dollar on the back foot.
- The major trigger for the US Dollar will be the August US NFP report on Friday.
- The ECB is almost certain to cut interest rates this month.
EUR/USD holds onto Wednesday’s recovery slightly below the round-level resistance of 1.1100 in Thursday’s European session. The major currency pair bounced back sharply on Wednesday after the release of the weaker-than-projected United States (US) JOLTS Job Openings data for July boosted market expectations for the Federal Reserve (Fed) to begin the long-awaited policy-easing cycle aggressively.
A sharp increase in market speculation for the Fed’s large interest rate cut this month weighed heavily on the US Dollar (USD). The US Dollar Index (DXY), which tracks the Greenback’s value against six major currencies, extends its downside to near 101.20.
The JOLTS Job Openings data showed that job vacancies posted in July were lower at 7.67 million from a downwardly revised 7.91 million in June and below the estimates of 8.1 million. Weak job market data came in as red flags to the labor market.
For meaningful updates on current labor market conditions, investors await the US Nonfarm Payrolls (NFP) data for August, which will be published on Friday.
In today’s session, the US Dollar will be influenced by the ADP Employment Change and ISM Services Purchasing Managers Index (PMI) data for August, which will be published at 12:15 GMT and 14:00 GMT, respectively. Economists estimate that payrolls in the private sector rose by 145K from 122K in July. In the same period, activity in the service sector is projected to have expanded at a slower pace, with PMI coming in at 51.1 from the prior reading of 51.4. Upbeat private payrolls and Services PMI data would diminish market speculation for Fed large interest rate cuts, while soft data would strengthen them
Daily digest market movers: EUR/USD turns sideways after a sharp recovery ahead of US heavy-data day
- EUR/USD trades in a tight range below 1.1100, with investors focusing on a slew of US economic data. In the Eurozone, investors await the Retail Sales data for July that will influence the next move in the Euro (EUR), which will be published at 09:00 GMT. Majorly, the Euro will be guided by the market speculation for the European Central Bank’s (ECB) September monetary policy, in which the central bank is expected to cut its key borrowing rates.
- Economists estimate the Retail Sales to have grown by 0.1% after contracting 0.3% in June on a monthly as well as annual basis. A slight improvement in sales at retail stores would be insufficient to dampen market speculation that the ECB will resume its policy-easing cycle this month, which started in June, after pausing in July.
- The ECB is widely anticipated to cut interest rates this month as officials have remained worried about poor growth prospects, with confidence that inflationary pressures continue to ease consistently. ECB Governing Council member François Villeroy de Galhau said in an interview with Bloomberg last week, “There are good reasons for the central bank to consider cutting its key interest rates in September.” Villeroy added, "Unfortunately, our growth remains too weak.” He further added, “The balance of risks still needs to be monitored in Europe."
- Meanwhile, Eurozone growth concerns have deepened further as the final estimate HCOB PMI report showed that the overall economic activity expanded at a slower pace of 51.0 from the flash reading of 51.2. The Composite PMI expanded moderately due to slower growth in the service sector and a continuous contraction in the manufacturing sector.
Technical Analysis: EUR/USD aims to recapture 1.1100
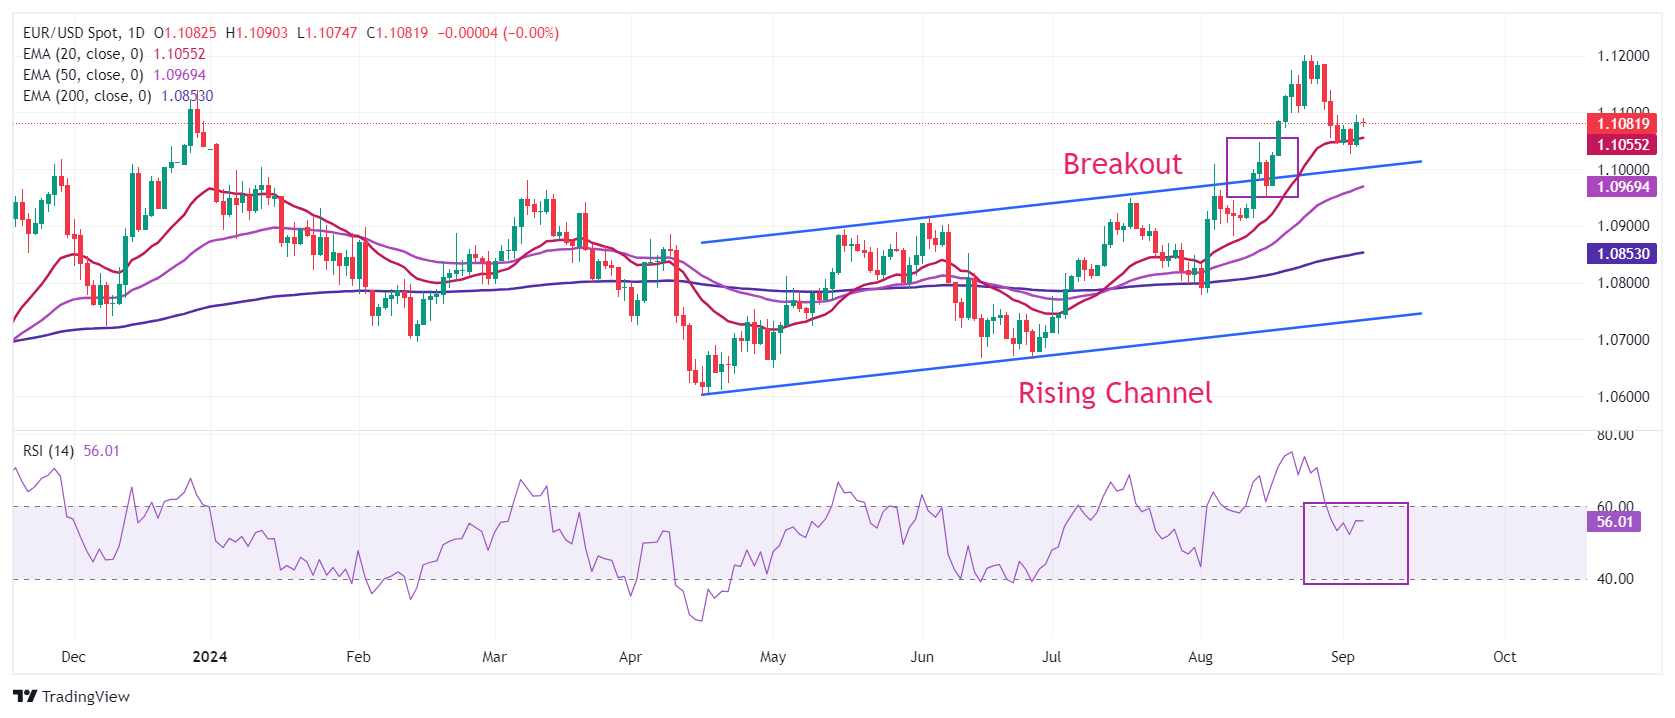
EUR/USD trades sideways near 1.1080 on Thursday after a sharp recovery from a fresh two-week low near 1.1025. The near-term outlook of the major currency pair has improved as it manages to gain firm footing near the 20-day Exponential Moving Average (EMA) around 1.1055.
The longer-term outlook is also bullish as the 50-day and 200-day EMAs at 1.0970 and 1.0865, respectively, are sloping higher. Also, the shared currency pair holds the Rising Channel breakout on a daily time frame.
The 14-day Relative Strength Index (RSI) has declined below 60.00 after turning overbought near 75.00.
On the upside, the recent high of 1.1200 and the July 2023 high at 1.1275 will be the next stop for the Euro bulls. Meanwhile, the downside is expected to remain cushioned near the psychological support of 1.1000.
Euro FAQs
The Euro is the currency for the 20 European Union countries that belong to the Eurozone. It is the second most heavily traded currency in the world behind the US Dollar. In 2022, it accounted for 31% of all foreign exchange transactions, with an average daily turnover of over $2.2 trillion a day. EUR/USD is the most heavily traded currency pair in the world, accounting for an estimated 30% off all transactions, followed by EUR/JPY (4%), EUR/GBP (3%) and EUR/AUD (2%).
The European Central Bank (ECB) in Frankfurt, Germany, is the reserve bank for the Eurozone. The ECB sets interest rates and manages monetary policy. The ECB’s primary mandate is to maintain price stability, which means either controlling inflation or stimulating growth. Its primary tool is the raising or lowering of interest rates. Relatively high interest rates – or the expectation of higher rates – will usually benefit the Euro and vice versa. The ECB Governing Council makes monetary policy decisions at meetings held eight times a year. Decisions are made by heads of the Eurozone national banks and six permanent members, including the President of the ECB, Christine Lagarde.
Eurozone inflation data, measured by the Harmonized Index of Consumer Prices (HICP), is an important econometric for the Euro. If inflation rises more than expected, especially if above the ECB’s 2% target, it obliges the ECB to raise interest rates to bring it back under control. Relatively high interest rates compared to its counterparts will usually benefit the Euro, as it makes the region more attractive as a place for global investors to park their money.
Data releases gauge the health of the economy and can impact on the Euro. Indicators such as GDP, Manufacturing and Services PMIs, employment, and consumer sentiment surveys can all influence the direction of the single currency. A strong economy is good for the Euro. Not only does it attract more foreign investment but it may encourage the ECB to put up interest rates, which will directly strengthen the Euro. Otherwise, if economic data is weak, the Euro is likely to fall. Economic data for the four largest economies in the euro area (Germany, France, Italy and Spain) are especially significant, as they account for 75% of the Eurozone’s economy.
Another significant data release for the Euro is the Trade Balance. This indicator measures the difference between what a country earns from its exports and what it spends on imports over a given period. If a country produces highly sought after exports then its currency will gain in value purely from the extra demand created from foreign buyers seeking to purchase these goods. Therefore, a positive net Trade Balance strengthens a currency and vice versa for a negative balance.
- NZD/USD could encounter immediate resistance around the nine-day EMA at the 0.6203 level.
- The 14-day RSI remains above the 50 level, confirming the overall bullish trend.
- The immediate support appears around the 14-day EMA at 0.6180 level, aligned with the lower boundary.
NZD/USD holds its position around 0.6200 during the European hours on Thursday. On the daily chart, the pair is trekking above the lower boundary of the ascending channel, supporting a bullish bias. A break below the lower boundary would weaken the bullish bias.
The 14-day Relative Strength Index (RSI) remains above the 50 level, confirming the overall bullish trend. Additionally, the nine-day Exponential Moving Average (EMA) is positioned above the 14-day EMA, signaling that the NZD/USD pair is experiencing short-term upward momentum and is likely to continue rising.
On the upside, the NZD/USD pair may encounter immediate resistance around the nine-day EMA at the 0.6203 level, followed by the seven-month high of 0.6247, recorded on August 21. A break above this level could lead the pair to test the upper boundary of the ascending channel at 0.6330.
In terms of support, the NZD/USD pair may find immediate support at the 14-day EMA at 0.6180 level, aligned with the lower boundary of the ascending channel around the 0.6170 level. A break below this level could weaken the bullish bias and lead the pair to navigate the area around the psychological level of 0.6100.
NZD/USD: Daily Chart
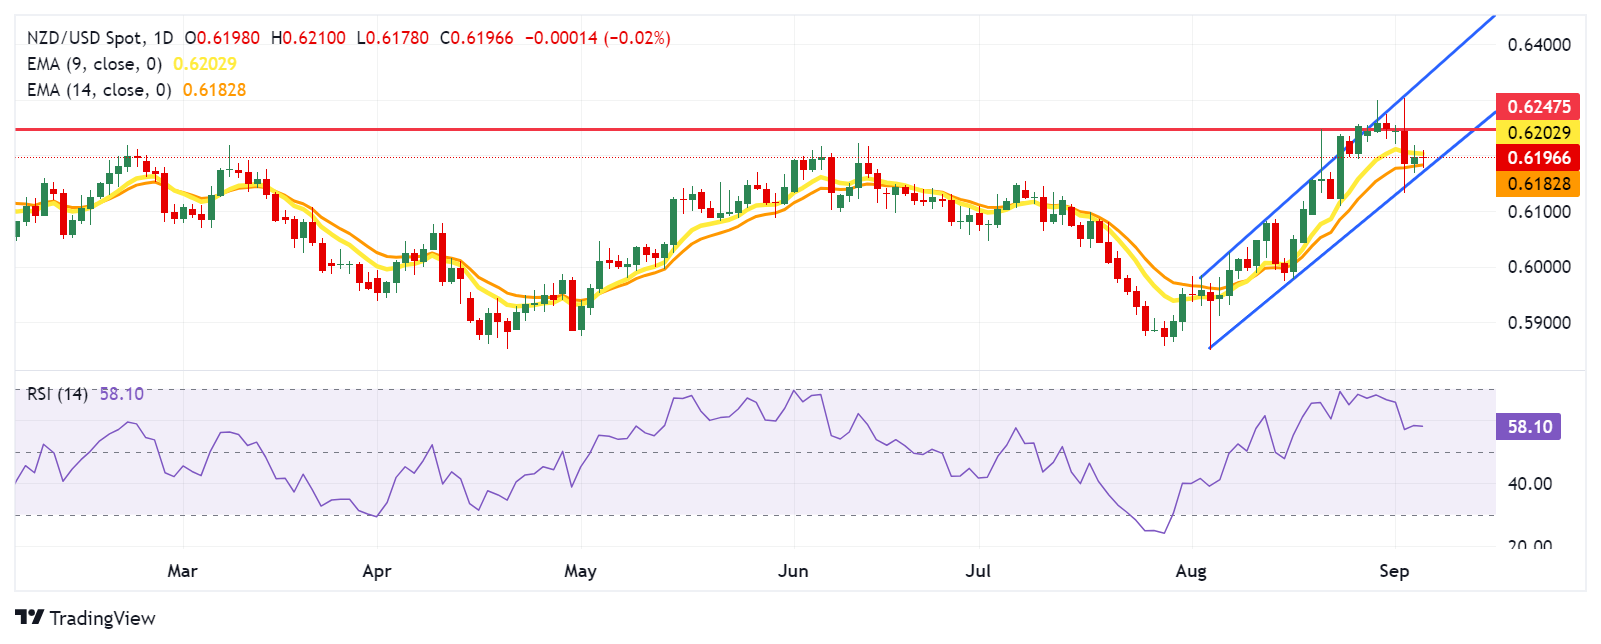
New Zealand Dollar PRICE Today
The table below shows the percentage change of New Zealand Dollar (NZD) against listed major currencies today. New Zealand Dollar was the weakest against the Japanese Yen.
| USD | EUR | GBP | JPY | CAD | AUD | NZD | CHF | |
|---|---|---|---|---|---|---|---|---|
| USD | 0.00% | 0.04% | -0.06% | 0.04% | 0.12% | 0.03% | 0.06% | |
| EUR | -0.01% | 0.05% | -0.06% | 0.06% | 0.12% | 0.06% | 0.05% | |
| GBP | -0.04% | -0.05% | -0.11% | 0.03% | 0.07% | 0.02% | 0.00% | |
| JPY | 0.06% | 0.06% | 0.11% | 0.11% | 0.18% | 0.10% | 0.14% | |
| CAD | -0.04% | -0.06% | -0.03% | -0.11% | 0.08% | 0.00% | 0.00% | |
| AUD | -0.12% | -0.12% | -0.07% | -0.18% | -0.08% | -0.07% | -0.06% | |
| NZD | -0.03% | -0.06% | -0.02% | -0.10% | 0.00% | 0.07% | 0.00% | |
| CHF | -0.06% | -0.05% | -0.01% | -0.14% | -0.01% | 0.06% | -0.01% |
The heat map shows percentage changes of major currencies against each other. The base currency is picked from the left column, while the quote currency is picked from the top row. For example, if you pick the New Zealand Dollar from the left column and move along the horizontal line to the US Dollar, the percentage change displayed in the box will represent NZD (base)/USD (quote).
- ADP Employment Change is forecast to arrive at 145,000 in August.
- Labor market conditions could influence the Fed’s policy outlook.
- The US Dollar stays resilient against its rivals after posting large losses in August.
The Automatic Data Processing (ADP) Research Institute will release its monthly report on private-sector job creation for August on Thursday. The announcement, known as the ADP Employment Change, is expected to show that the country’s private sector added 145,000 new positions in August following the 122,000 increase recorded in July.
The survey is usually released a couple of days before the official Nonfarm Payrolls (NFP) data (not this month, as it will be released the prior day), and despite random divergences in the outcome, market participants tend to read it as an advanced indicator of the Bureau of Labor Statistics’ (BLS) jobs report.
ADP Jobs Report: Employment and the Federal Reserve
After leaving monetary policy settings unchanged in July, the Federal Reserve (Fed) seemingly shifted its focus toward the labor market, with inflation readings giving enough confidence to policymakers about further progress toward the 2% central bank’s target. In its policy statement, the Fed noted that it is attentive to risks on both sides of its dual mandate, a change from the June statement, in which it said it was 'highly attentive' to inflation risks.
While speaking at the Jackson Hole Economic Symposium on August 23, Fed Chairman Jerome Powell acknowledged that the time has come for the monetary policy to adjust. "We will do everything we can to support a strong labor market as we make further progress toward price stability,” Powell said.
According to the CME FedWatch Tool, markets are currently pricing in a nearly 30% probability of the Fed lowering the policy rate by 50 basis points (bps) at the upcoming policy meeting. In case the ADP report suggests that employment in the private sector increased at a stronger pace than forecast in August, market participants could refrain from pricing in a large rate reduction in September. On the other hand, a disappointing ADP print, close to 100,000, could feed into growing fears over cooling conditions in the labor market and allow markets to remain hopeful about a 50 bps rate cut, at least until the BLS publishes the jobs figures for August on Friday.
Interest rates FAQs
Interest rates are charged by financial institutions on loans to borrowers and are paid as interest to savers and depositors. They are influenced by base lending rates, which are set by central banks in response to changes in the economy. Central banks normally have a mandate to ensure price stability, which in most cases means targeting a core inflation rate of around 2%. If inflation falls below target the central bank may cut base lending rates, with a view to stimulating lending and boosting the economy. If inflation rises substantially above 2% it normally results in the central bank raising base lending rates in an attempt to lower inflation.
Higher interest rates generally help strengthen a country’s currency as they make it a more attractive place for global investors to park their money.
Higher interest rates overall weigh on the price of Gold because they increase the opportunity cost of holding Gold instead of investing in an interest-bearing asset or placing cash in the bank. If interest rates are high that usually pushes up the price of the US Dollar (USD), and since Gold is priced in Dollars, this has the effect of lowering the price of Gold.
The Fed funds rate is the overnight rate at which US banks lend to each other. It is the oft-quoted headline rate set by the Federal Reserve at its FOMC meetings. It is set as a range, for example 4.75%-5.00%, though the upper limit (in that case 5.00%) is the quoted figure. Market expectations for future Fed funds rate are tracked by the CME FedWatch tool, which shapes how many financial markets behave in anticipation of future Federal Reserve monetary policy decisions.
When will the ADP Report be released, and how could it affect the USD Index?
ADP will release the Employment Change report on Thursday, September 5. Investors expect an increase of 145,000 in private sector payrolls.
Following the 208,000 increase recorded in March, employment growth in the private sector has been growing at a softening pace, hitting 122,000 in July. In case there is a noticeable rebound in this data, with a reading close to 200,000, the US Dollar (USD) could outperform its major rivals with the immediate reaction. Another disappointing print, however, could have the opposite effect on the USD’s valuation.
Eren Sengezer, European Session Lead Analyst at FXStreet, shares a brief technical outlook for the USD Index (DXY):
“The DXY lost over 2% in August and touched its weakest level since July 2023 near 100.50 on August 27. Although the index managed to stage a rebound from this level, the near-term technical outlook is yet to provide a convincing sign of a reversal of the bearish trend.”
“On the upside, the 20-day Simple Moving Average (SMA) aligns as immediate resistance at 102.00. In case the DXY rises above this level and confirms it as support, technical buyers could show interest. In this scenario, 102.65 (Fibonacci 38.2% retracement of the latest uptrend) could be seen as the next bullish target before 103.30 (Fibonacci 50% retracement). On the flip side, 101.00 (static level) aligns as the first support before 100.50 (end-point of the downtrend) and 100.00 (psychological level).”
Economic Indicator
ADP Employment Change
The ADP Employment Change is a gauge of employment in the private sector released by the largest payroll processor in the US, Automatic Data Processing Inc. It measures the change in the number of people privately employed in the US. Generally speaking, a rise in the indicator has positive implications for consumer spending and is stimulative of economic growth. So a high reading is traditionally seen as bullish for the US Dollar (USD), while a low reading is seen as bearish.
Read more.Next release: Thu Sep 05, 2024 12:15
Frequency: Monthly
Consensus: 145K
Previous: 122K
Source: ADP Research Institute
Traders often consider employment figures from ADP, America’s largest payrolls provider, report as the harbinger of the Bureau of Labor Statistics release on Nonfarm Payrolls (usually published two days later), because of the correlation between the two. The overlaying of both series is quite high, but on individual months, the discrepancy can be substantial. Another reason FX traders follow this report is the same as with the NFP – a persistent vigorous growth in employment figures increases inflationary pressures, and with it, the likelihood that the Fed will raise interest rates. Actual figures beating consensus tend to be USD bullish.
Here is what you need to know on Thursday, September 5:
The US Dollar (USD) finds it difficult to stage a rebound after weakening against its major rivals on Wednesday. The US economic docket will feature ADP Employment Change for August, weekly Initial Jobless Claims and August ISM Services PMI data later in the day. Ahead of these releases, Eurostat will publish Retail Sales data for July.
On Wednesday, the data published by the US Bureau of Labor Statistics showed that job openings stood at 7.67 million on the last business day of July. This reading came in below the market expectation of 8.1 million and caused the USD come under selling pressure. After touching a fresh two-week high at 101.91 on Tuesday, the USD Index turned south and lost 0.5% on Wednesday. In the European morning, the index holds steady above 101.00. Meanwhile, the benchmark 10-year US Treasury bond yield dropped below 3.8% and Wall Street's main indexes closed the day mixed. Early Thursday, US stock index futures trade marginally lower.
US Dollar PRICE This week
The table below shows the percentage change of US Dollar (USD) against listed major currencies this week. US Dollar was the strongest against the New Zealand Dollar.
| USD | EUR | GBP | JPY | CAD | AUD | NZD | CHF | |
|---|---|---|---|---|---|---|---|---|
| USD | -0.33% | -0.12% | -1.82% | 0.20% | 0.74% | 0.75% | -0.30% | |
| EUR | 0.33% | 0.23% | -1.51% | 0.51% | 1.08% | 1.07% | 0.02% | |
| GBP | 0.12% | -0.23% | -1.74% | 0.27% | 0.82% | 0.87% | -0.23% | |
| JPY | 1.82% | 1.51% | 1.74% | 2.00% | 2.64% | 2.75% | 1.48% | |
| CAD | -0.20% | -0.51% | -0.27% | -2.00% | 0.59% | 0.55% | -0.49% | |
| AUD | -0.74% | -1.08% | -0.82% | -2.64% | -0.59% | -0.02% | -1.01% | |
| NZD | -0.75% | -1.07% | -0.87% | -2.75% | -0.55% | 0.02% | -1.04% | |
| CHF | 0.30% | -0.02% | 0.23% | -1.48% | 0.49% | 1.01% | 1.04% |
The heat map shows percentage changes of major currencies against each other. The base currency is picked from the left column, while the quote currency is picked from the top row. For example, if you pick the US Dollar from the left column and move along the horizontal line to the Japanese Yen, the percentage change displayed in the box will represent USD (base)/JPY (quote).
While speaking at an event organized by the Anika Foundation earlier in the day, Reserve Bank of Australia (RBA) Governor Michele Bullock said that they need to see inflation slowing in the actual numbers before acting on interest rates. AUD/USD showed no reaction to these remarks and was last seen moving sideways above 0.6700.
The data from Germany showed on Thursday that Factory Orders expanded by 2.9% on a monthly basis in July. This reading came in much better than the market expectation for a contraction of 1.5%. Following Wednesday's rebound, EUR/USD holds its ground in the European morning and trades slightly below 1.1100.
Bank of Japan (BoJ) Board Member Hajime Takata noted on Thursday that Japan's current real interest rate is below estimated natural rate of interest, adding that this means monetary conditions remain accommodative. USD/JPY registered large losses for the second consecutive day on Wednesday and lost over 2% in that time frame. The pair stays under modest bearish pressure and trades at its lowest level since early August at around 143.50.
GBP/USD benefited from the selling pressure surrounding the USD and closed in positive territory on Wednesday. The pair holds steady near 1.3150 on Thursday.
Gold registered small gains on Wednesday and continued to stretch higher during the Asian trading hours on Thursday. XAU/USD was last seen trading above $2,500.
Employment FAQs
Labor market conditions are a key element in assessing the health of an economy and thus a key driver for currency valuation. High employment, or low unemployment, has positive implications for consumer spending and economic growth, boosting the value of the local currency. Moreover, a very tight labor market – a situation in which there is a shortage of workers to fill open positions – can also have implications on inflation levels because low labor supply and high demand leads to higher wages.
The pace at which salaries are growing in an economy is key for policymakers. High wage growth means that households have more money to spend, usually leading to price increases in consumer goods. In contrast to more volatile sources of inflation such as energy prices, wage growth is seen as a key component of underlying and persisting inflation as salary increases are unlikely to be undone. Central banks around the world pay close attention to wage growth data when deciding on monetary policy.
The weight that each central bank assigns to labor market conditions depends on its objectives. Some central banks explicitly have mandates related to the labor market beyond controlling inflation levels. The US Federal Reserve (Fed), for example, has the dual mandate of promoting maximum employment and stable prices. Meanwhile, the European Central Bank’s (ECB) sole mandate is to keep inflation under control. Still, and despite whatever mandates they have, labor market conditions are an important factor for policymakers given their significance as a gauge of the health of the economy and their direct relationship to inflation.
Responding to the US imposing tariffs on Chinese goods, China's Commerce Ministry spokesperson said on Thursday that the action is 'adding insult to injury'
The spokesperson said that they “urge the US to correct 'wrongdoings', immediately lift all tariffs on Chinese goods.”
Market reaction
Following these comments, AUD/USD loses 0.12% on the day to trade near 0.6715.
Australian Dollar FAQs
One of the most significant factors for the Australian Dollar (AUD) is the level of interest rates set by the Reserve Bank of Australia (RBA). Because Australia is a resource-rich country another key driver is the price of its biggest export, Iron Ore. The health of the Chinese economy, its largest trading partner, is a factor, as well as inflation in Australia, its growth rate and Trade Balance. Market sentiment – whether investors are taking on more risky assets (risk-on) or seeking safe-havens (risk-off) – is also a factor, with risk-on positive for AUD.
The Reserve Bank of Australia (RBA) influences the Australian Dollar (AUD) by setting the level of interest rates that Australian banks can lend to each other. This influences the level of interest rates in the economy as a whole. The main goal of the RBA is to maintain a stable inflation rate of 2-3% by adjusting interest rates up or down. Relatively high interest rates compared to other major central banks support the AUD, and the opposite for relatively low. The RBA can also use quantitative easing and tightening to influence credit conditions, with the former AUD-negative and the latter AUD-positive.
China is Australia’s largest trading partner so the health of the Chinese economy is a major influence on the value of the Australian Dollar (AUD). When the Chinese economy is doing well it purchases more raw materials, goods and services from Australia, lifting demand for the AUD, and pushing up its value. The opposite is the case when the Chinese economy is not growing as fast as expected. Positive or negative surprises in Chinese growth data, therefore, often have a direct impact on the Australian Dollar and its pairs.
Iron Ore is Australia’s largest export, accounting for $118 billion a year according to data from 2021, with China as its primary destination. The price of Iron Ore, therefore, can be a driver of the Australian Dollar. Generally, if the price of Iron Ore rises, AUD also goes up, as aggregate demand for the currency increases. The opposite is the case if the price of Iron Ore falls. Higher Iron Ore prices also tend to result in a greater likelihood of a positive Trade Balance for Australia, which is also positive of the AUD.
The Trade Balance, which is the difference between what a country earns from its exports versus what it pays for its imports, is another factor that can influence the value of the Australian Dollar. If Australia produces highly sought after exports, then its currency will gain in value purely from the surplus demand created from foreign buyers seeking to purchase its exports versus what it spends to purchase imports. Therefore, a positive net Trade Balance strengthens the AUD, with the opposite effect if the Trade Balance is negative.
- Gold recovers after the release of under par US job’s data stokes fresh concerns about a hard landing.
- The probability the Fed will cut interest rates by half a percent at its September meeting rises to 45%.
- Technically, Gold forms two bullish Hammer candlesticks in a row, suggesting a chance of a recovery.
Gold (XAU/USD) trades back above $2,500 on Thursday after rebounding from the $2,471 previous day’s lows, following the release of lower-than-expected job openings data in July from the US, which stoked fresh hard-landing fears.
Gold price finds its feet after job’s data
Gold recovers after the release of weaker-than-expected US job’s data. This increased safe-haven demand for the yellow metal and implied interest rates could fall faster than previously anticipated in the US – another positive for Gold, as it reduces the opportunity cost of holding the non-interest-paying asset.
US JOLTS Job Openings fell to 7.673 million in July from a downwardly revised 7.910 million in June and below estimates of 8.100 million, according to data from the US Bureau of Labor Statistics on Wednesday.
The data feeds into the fragile US labor market narrative that is driving Federal Reserve (Fed) interest rate expectations after Fed Chairman Jerome Powell sounded the warning on jobs in his speech at the Jackson Hole Symposium last month.
It follows weak US manufacturing data on Tuesday, which triggered a global market flash crash that was further exacerbated by fears about the Artificial Intelligence (AI) tech bubble bursting.
From around 31% before the Manufacturing and JOLTS data, the probability of the Fed cutting interest rates by 0.50% at their September 18 meeting, rather than the standard 0.25%, has risen to 45%.
ADP Employment Change and Jobless Claims follow on Thursday, but the main event on the calendar will be US Nonfarm Payrolls (NFP) on Friday. If NFPs increase less than expected, it would further support the case of the larger rate cut.
On the geopolitical front, Reuters reports that US negotiators are preparing another ceasefire deal in Gaza whilst the war in Ukraine continues unabated.
Technical Analysis: Two Hammer candlesticks in a row could signal recovery
Gold (XAU/USD) posts two bullish-looking Japanese Hammer candlesticks in a row (box on the chart below), and if Thursday closes as a solid green-up day, that would confirm a possible resumption of the broader uptrend.
XAU/USD Daily Chart
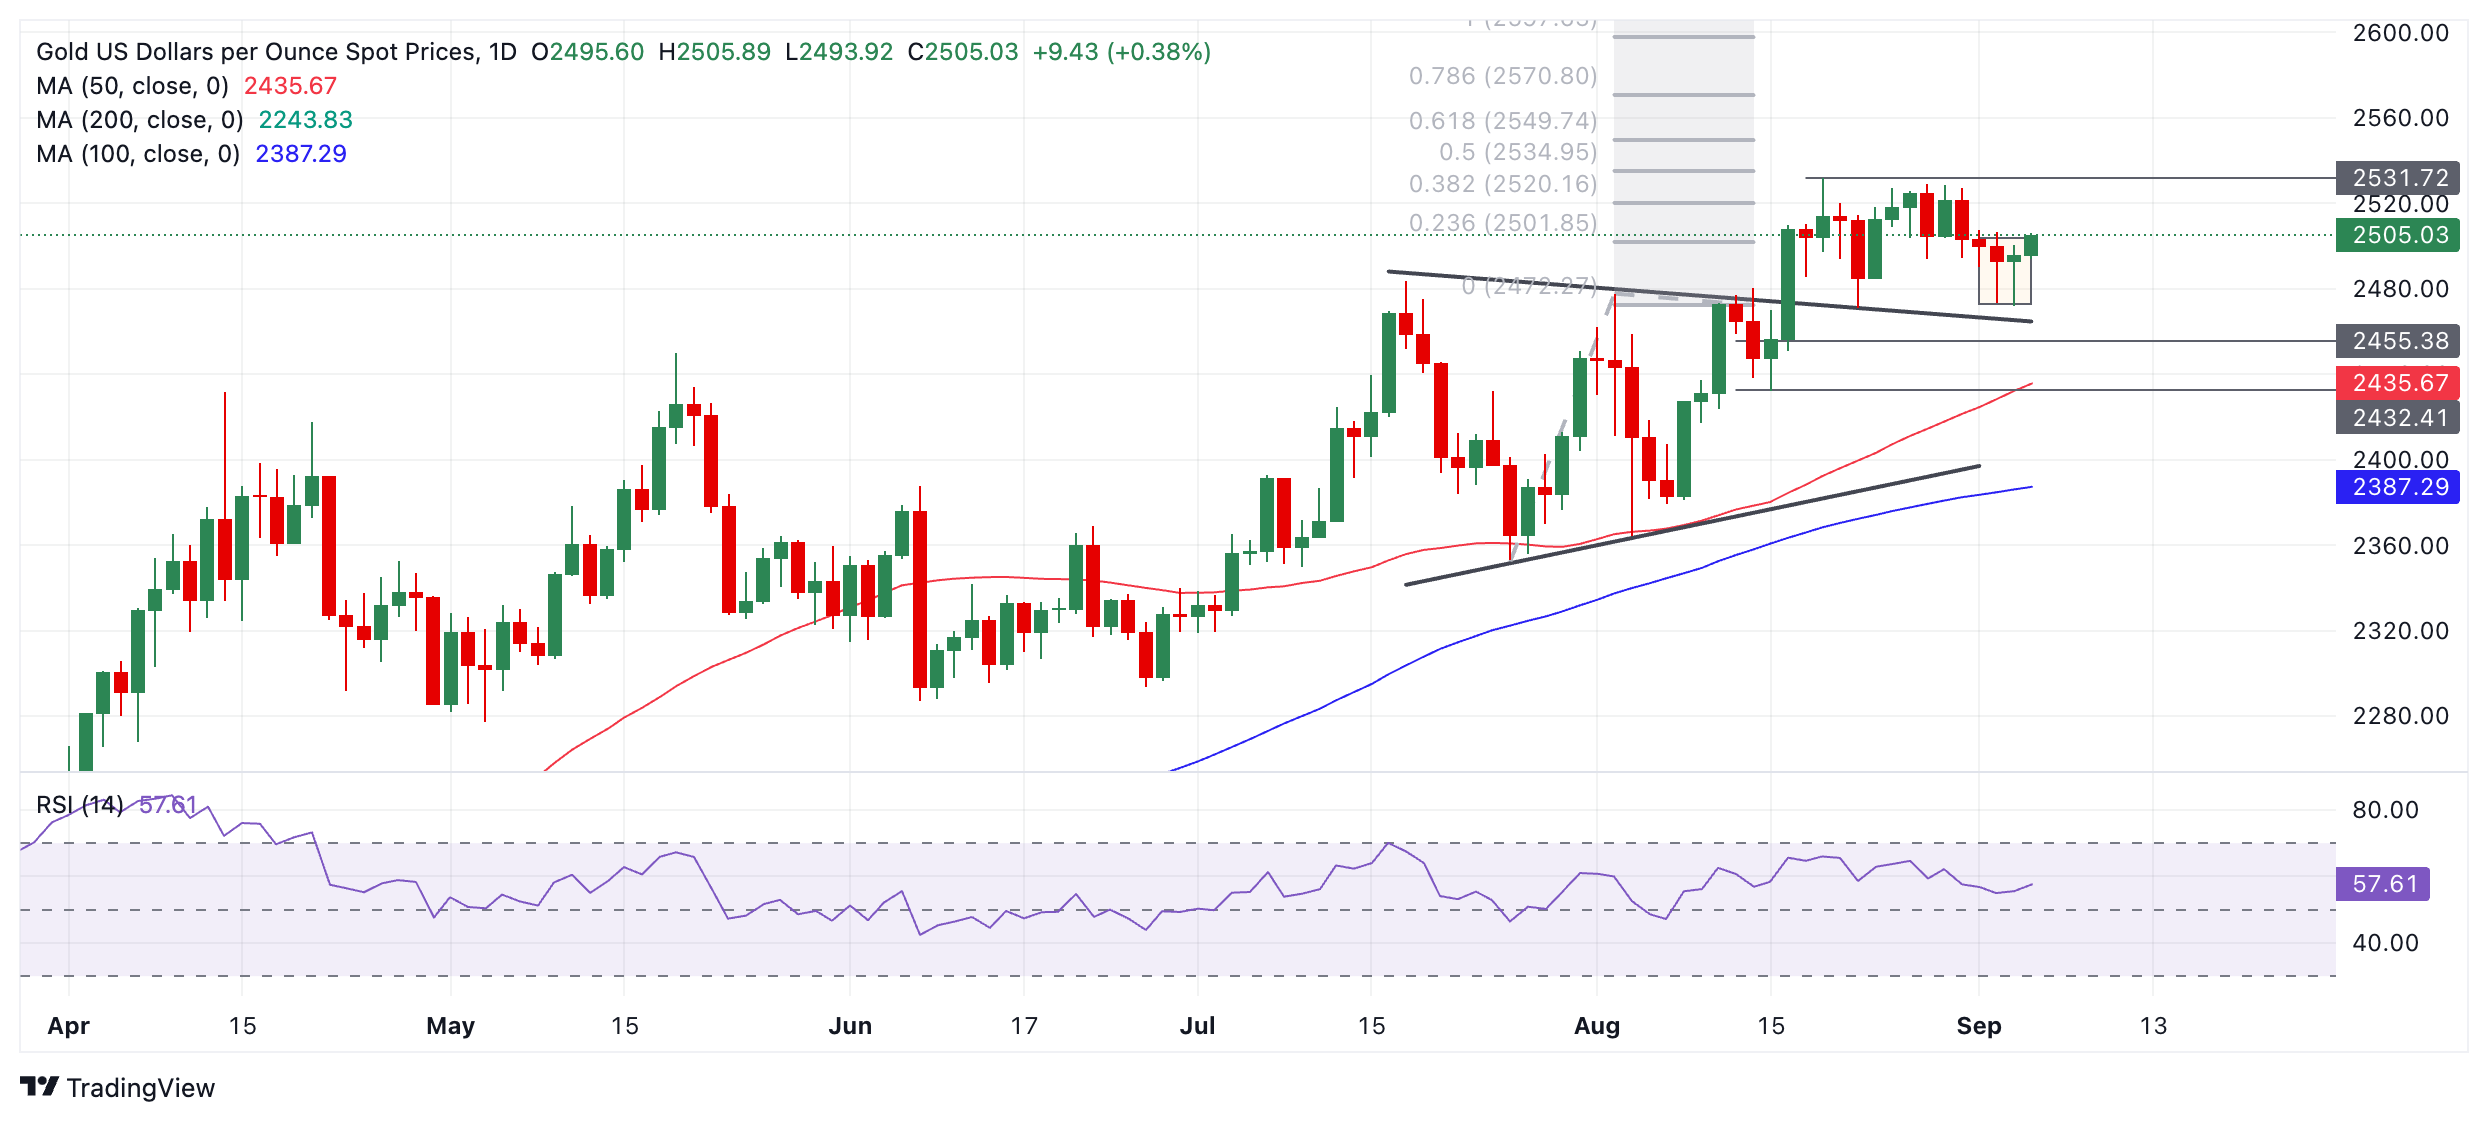
The yellow metal’s price looks poised to rebound to the $2,531 all-time high if it can keep up the bullish recovery momentum.
An upside target for Gold, which has not yet been reached, sits at $2,550 and remains active. The target was generated after the original breakout from the July-August range on August 14.
Gold’s medium and long-term trends also remain bullish, which, given “the trend is your friend,” means the odds still favor an eventual breakout higher materializing.
A break above the August 20 all-time high of $2,531 would provide more confirmation of a continuation higher toward the $2,550 target.
If Gold continues steadily weakening, however, it is likely to find the next support in the $2,470-$2,460 region. A decisive break below that level would change the picture for Gold and suggest that the commodity might be starting a more pronounced downtrend.
Economic Indicator
ADP Employment Change
The ADP Employment Change is a gauge of employment in the private sector released by the largest payroll processor in the US, Automatic Data Processing Inc. It measures the change in the number of people privately employed in the US. Generally speaking, a rise in the indicator has positive implications for consumer spending and is stimulative of economic growth. So a high reading is traditionally seen as bullish for the US Dollar (USD), while a low reading is seen as bearish.
Read more.Next release: Thu Sep 05, 2024 12:15
Frequency: Monthly
Consensus: 145K
Previous: 122K
Source: ADP Research Institute
Traders often consider employment figures from ADP, America’s largest payrolls provider, report as the harbinger of the Bureau of Labor Statistics release on Nonfarm Payrolls (usually published two days later), because of the correlation between the two. The overlaying of both series is quite high, but on individual months, the discrepancy can be substantial. Another reason FX traders follow this report is the same as with the NFP – a persistent vigorous growth in employment figures increases inflationary pressures, and with it, the likelihood that the Fed will raise interest rates. Actual figures beating consensus tend to be USD bullish.
- GBP/JPY weakens around 188.15 in Thursday’s early European session, down 0.45% on the day.
- The BoJ official leaves the door open for further interest-rate hikes, lifting the Japanese Yen.
- The upbeat UK Services PMI might help limit GBP’s losses.
The GBP/JPY cross trades in negative territory for the third consecutive day near 188.15 during the early European session on Thursday. The Japanese Yen (JPY) strengthens as Japan’s rising real wages report reinforces market expectations for further hikes in borrowing costs.
Data released by the Ministry of Health, Labor and Welfare showed on Thursday that Japan’s Labor Cash Earnings climbed by 3.6% YoY in July, compared with a rise of 4.5% in June, beating the estimation of 3.1%. This upbeat reading has prompted speculation that the Bank of Japan (BoJ) would implement another interest rate hike before the end of 2024.
The BoJ board member Hajime Takata said on Thursday, “If the economy and prices move in line with our forecast, we will adjust policy rates in several stages.” Takata further stated that the Japanese economy recovered moderately, although some weak signs were seen.
On the other hand, interest rate cut expectations by the Bank of England (BoE) weigh on the Pound Sterling (GBP) against the JPY. According to money market pricing data, the BoE is expected to cut interest rates once more this year, leaving borrowing costs at 4.75%. However, the publication of the UK’s latest services PMI might support the GBP and cap the downside for the cross. S&P Global showed that the UK Services PMI for August accelerated at its fastest pace since April.
Japanese Yen FAQs
The Japanese Yen (JPY) is one of the world’s most traded currencies. Its value is broadly determined by the performance of the Japanese economy, but more specifically by the Bank of Japan’s policy, the differential between Japanese and US bond yields, or risk sentiment among traders, among other factors.
One of the Bank of Japan’s mandates is currency control, so its moves are key for the Yen. The BoJ has directly intervened in currency markets sometimes, generally to lower the value of the Yen, although it refrains from doing it often due to political concerns of its main trading partners. The current BoJ ultra-loose monetary policy, based on massive stimulus to the economy, has caused the Yen to depreciate against its main currency peers. This process has exacerbated more recently due to an increasing policy divergence between the Bank of Japan and other main central banks, which have opted to increase interest rates sharply to fight decades-high levels of inflation.
The BoJ’s stance of sticking to ultra-loose monetary policy has led to a widening policy divergence with other central banks, particularly with the US Federal Reserve. This supports a widening of the differential between the 10-year US and Japanese bonds, which favors the US Dollar against the Japanese Yen.
The Japanese Yen is often seen as a safe-haven investment. This means that in times of market stress, investors are more likely to put their money in the Japanese currency due to its supposed reliability and stability. Turbulent times are likely to strengthen the Yen’s value against other currencies seen as more risky to invest in.
FX option expiries for Sept 5 NY cut at 10:00 Eastern Time, via DTCC, can be found below.
EUR/USD: EUR amounts
- 1.0940 1.3b
- 1.0955 1b
- 1.0975 1.2b
- 1.0985 1.3b
- 1.1000 937m
- 1.1005 1.4b
- 1.1020 911m
- 1.1060 1b
- 1.1075 2.5b
- 1.1080 1.4b
- 1.1090 1b
- 1.1100 1.7b
- 1.1120 1.2b
- 1.1125 1.2b
- 1.1145 2.9b
- 1.1155 901m
GBP/USD: GBP amounts
- 1.3075 739m
USD/JPY: USD amounts
- 142.00 1.1b
- 144.00 1.2b
- 145.00 1.8b
- 145.50 1.2b
- 146.00 2.2b
USD/CHF: USD amounts
- 0.8450 614m
- 0.8475 1.5b
- 0.8500 535m
- 0.8650 535m
AUD/USD: AUD amounts
- 0.6550 1.3b
- 0.6570 1.9b
- 0.6625 1.8b
- 0.6640 1.6b
- 0.6690 1.9b
- 0.6700 1b
- 0.6730 951m
USD/CAD: USD amounts
- 1.3565 793m
- 1.3630 749m
- 1.3835 1.6b
NZD/USD: NZD amounts
- 0.5940 1.3b
- 0.6065 1b
- 0.6070 1.9b
- 0.6150 1.1b
- 0.6175 1.6b
EUR/GBP: EUR amounts
- 0.8480 458m
- 0.8590 940m
Bank of Japan (BoJ) Board Member Hajime Takata is back on the wires early Europe on Thursday, noting that “if the economy, prices move in line with our forecast, we will adjust policy rate in several stages.”
Additional quotes
Don't have specific image in mind when I say we need to spend "sufficient time" to scrutinize economy, price developments.
Current market moves are second round of the volatility we saw in early August, which reflects concern over the US economic outlook.
Our basic stance is to adjust degree of monetary support if economy, prices on track but that is not without some qualifications.
If markets are volatile, we must gauge the moves' impact on economy, prices in setting policy.
Based on our hearings, we expect there to be more price hikes in October though that was when the Yen was weakening.
We have seen some change in FX, market moves so must need to take fresh look at impact on economy, prices.
We won't directly respond to FX moves but we are aware they could affect economy, prices and risks.
Don't have preset idea on pace of rate hikes, or on whether we will hike rates several times.
We have no choice but to scrutinize at each policy meeting how market moves affect corporate balance sheets, earnings and risks to economy.
Market reaction
At the time of writing, USD/JPY is holding its pullback to near 143.35, losing 0.26% on the day. The BoJ official leaves the door ajar for further interest-rate hikes, putting a fresh bid under the Japanese Yen.
Germany’s Factory Orders unexpectedly rose in July, according to the official data published by the Federal Statistics Office on Thursday, suggesting that the German manufacturing sector recovery holds momentum.
Over the month, contracts for goods ‘Made in Germany’ climbed by 2.9% in July, having registered a 4.6% growth in June while beating the estimates of a 1.5% drop.
Germany’s Industrial Orders jumped 3.7% in the year through July, as against the previous slump of 11.2%.
FX implications
The Euro remains unmoved by the upbeat German data, as the EUR/USD pair keeps its range near 1.1080, almost unchanged on the day, as of writing.
- USD/CHF trades in negative territory for the third consecutive day near 0.8460 in Thursday’s early Asian session.
- Weaker US economic data and dovish Fed weigh on the US Dollar.
- Softer inflation in Switzerland supports the case for another rate cut by the SNB.
The USD/CHF pair extends its decline around 0.8460 during the early European session on Thursday. The growing speculation that the US Federal Reserve (Fed) will cut a larger interest rate in September exerts some selling pressure on the US Dollar (USD). Investors will focus on the release of the US ISM Services Purchasing Managers Index (PMI), the ADP report on private-sector employment and weekly Initial Jobless Claims on Thursday ahead of the highly anticipated August Nonfarm Payrolls (NFP).
The recent weaker US economic data and the dovish stance of the Fed continue to undermine the Greenback broadly. The US Job Openings and Labor Turnover Survey showed that available positions declined to 7.67 million in July, compared with 7.91 million openings in June, the Labor Department revealed Wednesday. This report came in worse than the estimation of 8.1 million.
Meanwhile, Atlanta Fed President Raphael Bostic said on Wednesday that he is ready to start cutting interest rates even though inflation remains above the 2% target. San Francisco Fed President Mary Daly said early Thursday that the central bank needs to cut interest rates to keep the labor market healthy, but she needs more data, including Friday's job market report and CPI, to determine the size of a rate cut.
On the Swiss front, Swiss inflation slowed more than expected in August, prompting the expectation for another interest rate cut by the Swiss National Bank (SNB). Switzerland’s Consumer Price Index (CPI) rose 1.1% YoY in August, compared to the previous reading of 1.3%, below the market consensus of 1.2%. On a monthly basis, the CPI inflation remains unchanged in August from a decline of 0.2% in July, softer than the expectation of a 0.1% increase.
Swiss Franc FAQs
The Swiss Franc (CHF) is Switzerland’s official currency. It is among the top ten most traded currencies globally, reaching volumes that well exceed the size of the Swiss economy. Its value is determined by the broad market sentiment, the country’s economic health or action taken by the Swiss National Bank (SNB), among other factors. Between 2011 and 2015, the Swiss Franc was pegged to the Euro (EUR). The peg was abruptly removed, resulting in a more than 20% increase in the Franc’s value, causing a turmoil in markets. Even though the peg isn’t in force anymore, CHF fortunes tend to be highly correlated with the Euro ones due to the high dependency of the Swiss economy on the neighboring Eurozone.
The Swiss Franc (CHF) is considered a safe-haven asset, or a currency that investors tend to buy in times of market stress. This is due to the perceived status of Switzerland in the world: a stable economy, a strong export sector, big central bank reserves or a longstanding political stance towards neutrality in global conflicts make the country’s currency a good choice for investors fleeing from risks. Turbulent times are likely to strengthen CHF value against other currencies that are seen as more risky to invest in.
The Swiss National Bank (SNB) meets four times a year – once every quarter, less than other major central banks – to decide on monetary policy. The bank aims for an annual inflation rate of less than 2%. When inflation is above target or forecasted to be above target in the foreseeable future, the bank will attempt to tame price growth by raising its policy rate. Higher interest rates are generally positive for the Swiss Franc (CHF) as they lead to higher yields, making the country a more attractive place for investors. On the contrary, lower interest rates tend to weaken CHF.
Macroeconomic data releases in Switzerland are key to assessing the state of the economy and can impact the Swiss Franc’s (CHF) valuation. The Swiss economy is broadly stable, but any sudden change in economic growth, inflation, current account or the central bank’s currency reserves have the potential to trigger moves in CHF. Generally, high economic growth, low unemployment and high confidence are good for CHF. Conversely, if economic data points to weakening momentum, CHF is likely to depreciate.
As a small and open economy, Switzerland is heavily dependent on the health of the neighboring Eurozone economies. The broader European Union is Switzerland’s main economic partner and a key political ally, so macroeconomic and monetary policy stability in the Eurozone is essential for Switzerland and, thus, for the Swiss Franc (CHF). With such dependency, some models suggest that the correlation between the fortunes of the Euro (EUR) and the CHF is more than 90%, or close to perfect.
- EUR/GBP inches lower amid rising odds of the ECB reducing rates in September.
- Eurozone Producer Price Index increased by 0.8% MoM in July, the largest increase since December 2022.
- The British Pound strengthens as expectations grow that the BoE will remain more hawkish compared to the ECB.
EUR/GBP offers its recent gains from the previous session, trading around 0.8420 during Thursday’s Asian hours. Traders await Eurozone Retail Sales data scheduled to be released later in the day.
The downside of the EUR/GBP cross could be attributed to rising speculation that the European Central Bank (ECB) will cut interest rates in September. The ECB’s rate cut would mark the second interest rate cut by the ECB since it began shifting toward policy normalization in June.
In the Euro Area, the Producer Price Index (PPI) rose by 0.8% month-over-month in July, the largest increase since December 2022. This follows an upwardly revised 0.6% rise in June and significantly exceeds market forecasts of 0.3%.
However, the Eurozone Services PMI fell to 52.9 in August, from 53.3 in the previous month. Meanwhile, the Composite PMI decreased to 51.0, missing expectations and falling below the previous reading of 51.2.
The British Pound (GBP) advances further by rising expectations that the Bank of England's (BoE) rate-cutting cycle is more likely to be slower than the European Central Bank. The bets were lifted by Tuesday’s BRC Like-for-Like Retail Sales, which increased by 0.8% year-on-year in August, up from a 0.3% rise in July, marking the fastest growth in five months.
Meanwhile, there was positive sentiment from the UK macroeconomic front, as a Purchasing Managers Index (PMI) survey showed that business activity in August accelerated at its fastest pace since April.
On Wednesday, the S&P Global UK Composite PMI increased to 53.8 in August, up from 53.4 in the previous month and revised higher from the preliminary estimate of 53.4. The Services PMI rose to 53.7 in August, compared to 53.3 in the prior month. The data showed on Monday that the Manufacturing PMI held steady at 52.5 for August, consistent with preliminary estimates.
Interest rates FAQs
Interest rates are charged by financial institutions on loans to borrowers and are paid as interest to savers and depositors. They are influenced by base lending rates, which are set by central banks in response to changes in the economy. Central banks normally have a mandate to ensure price stability, which in most cases means targeting a core inflation rate of around 2%. If inflation falls below target the central bank may cut base lending rates, with a view to stimulating lending and boosting the economy. If inflation rises substantially above 2% it normally results in the central bank raising base lending rates in an attempt to lower inflation.
Higher interest rates generally help strengthen a country’s currency as they make it a more attractive place for global investors to park their money.
Higher interest rates overall weigh on the price of Gold because they increase the opportunity cost of holding Gold instead of investing in an interest-bearing asset or placing cash in the bank. If interest rates are high that usually pushes up the price of the US Dollar (USD), and since Gold is priced in Dollars, this has the effect of lowering the price of Gold.
The Fed funds rate is the overnight rate at which US banks lend to each other. It is the oft-quoted headline rate set by the Federal Reserve at its FOMC meetings. It is set as a range, for example 4.75%-5.00%, though the upper limit (in that case 5.00%) is the quoted figure. Market expectations for future Fed funds rate are tracked by the CME FedWatch tool, which shapes how many financial markets behave in anticipation of future Federal Reserve monetary policy decisions.
- AUD/JPY drifts lower for the third successive day and drops to a multi-week low.
- Hawkish remarks by RBA’s Bullock boost the Aussie and lend support to the cross.
- Bets for another BoJ rate hike in 2024 underpin the JPY and cap any further gains.
The AUD/JPY cross remains under some selling pressure for the third successive day on Thursday and drops to a three-and-half-week low during the Asian session on Thursday. Spot prices currently trade just below mid-96.00s and seem vulnerable to prolong this week's rejection slide from the key 200-day Simple Moving Average (SMA).
The Australian Dollar (AUD) did get a minor lift following Reserve Bank of Australia (RBA) Governor Michele Bullock's hawkish remarks, saying that the board remains vigilant to upside risks to inflation and does not expect to be in a position to cut rates in the near term. That said, unimpressive Australian Trade Balance data, showing that the surplus rose to A$6,009 million in July amid a 0.8% fall in imports and a 7% increase in exports, keeps a lid on any meaningful appreciating move.
Apart from this, expectations that the Bank of Japan (BoJ) will hike rates again in 2024, bolstered by data showing that real wages in Japan rose for the second straight month in July, continue to underpin the Japanese Yen (JPY) and further contribute to capping the upside for the AUD/JPY cross. Moreover, BoJ Board Member Hajime Takata said that the central bank must adjust monetary conditions by another gear if it can confirm that firms will continue to increase capital expenditure, wages, and prices.
Meanwhile, the cautious market mood is seen as another factor benefitting the JPY's relative safe-haven status against its Australian counterpart. This, in turn, suggests that the path of least resistance for the AUD/JPY cross is to the downside and suggests that the the recent goodish recovery move from the vicinity of the 90.00 psychological mark, or over a one-year low touched in August has run out of steam already.
Economic Indicator
RBA Governor Bullock speech
Michele Bullock is the the ninth Governor of the Reserve Bank of Australia. She commenced her current position in September 2023, replacing Philip Lowe. Bullock was the Assistant Governor (Financial System) at the Reserve Bank of Australia, a position she held since October 2016.
Read more.
- USD/CAD inches higher as traders adopt caution ahead of US Initial Jobless Claims and ISM Services PMI.
- The US Dollar received support from the improved US Treasury yields.
- BoC reduced interest rates by 25 basis points to 4.25% at September’s meeting held on Wednesday.
USD/CAD retraces its recent losses, trading around 1.3510 during the Asian hours on Thursday. The US Dollar (USD) remains solid as traders adopt caution ahead of the release of US ISM Services PMI and Initial Jobless Claims scheduled to be released later in the North American session.
Attention will shift to Friday’s US Nonfarm Payrolls (NFP) to gain more cues on the potential size of an expected rate cut by the Federal Reserve (Fed) this month.
The US Dollar Index (DXY), which measures the value of the US Dollar against six other major currencies, trades around 101.30. The Greenback receives support from improving 2-year and 10-year yields on US Treasury bonds standing at 3.76% and 3.75, respectively, at the time of writing.
However, the US Dollar faced challenges after the release of July's US JOLTS Job Openings, which fell short of expectations and indicated a further slowdown in the labor market. The number of job openings dropped to 7.673 million in July, down from 7.910 million in June. This marked the lowest level since January 2021 and was below the market expectation of 8.10 million.
On Wednesday, the Bank of Canada (BoC) lowered its benchmark interest rate by 25 basis points (bps) to 4.25%, as expected, at September’s meeting held on Wednesday. BoC Governor Tiff Macklem commented, “If inflation continues to ease broadly in line with our July forecast, further cuts to our policy rate are likely.”
Governor Macklem also noted that a 25 basis points (bps) reduction seemed appropriate and observed that the divergence with the US Federal Reserve on rates has not significantly affected the exchange rate.
Canadian Dollar FAQs
The key factors driving the Canadian Dollar (CAD) are the level of interest rates set by the Bank of Canada (BoC), the price of Oil, Canada’s largest export, the health of its economy, inflation and the Trade Balance, which is the difference between the value of Canada’s exports versus its imports. Other factors include market sentiment – whether investors are taking on more risky assets (risk-on) or seeking safe-havens (risk-off) – with risk-on being CAD-positive. As its largest trading partner, the health of the US economy is also a key factor influencing the Canadian Dollar.
The Bank of Canada (BoC) has a significant influence on the Canadian Dollar by setting the level of interest rates that banks can lend to one another. This influences the level of interest rates for everyone. The main goal of the BoC is to maintain inflation at 1-3% by adjusting interest rates up or down. Relatively higher interest rates tend to be positive for the CAD. The Bank of Canada can also use quantitative easing and tightening to influence credit conditions, with the former CAD-negative and the latter CAD-positive.
The price of Oil is a key factor impacting the value of the Canadian Dollar. Petroleum is Canada’s biggest export, so Oil price tends to have an immediate impact on the CAD value. Generally, if Oil price rises CAD also goes up, as aggregate demand for the currency increases. The opposite is the case if the price of Oil falls. Higher Oil prices also tend to result in a greater likelihood of a positive Trade Balance, which is also supportive of the CAD.
While inflation had always traditionally been thought of as a negative factor for a currency since it lowers the value of money, the opposite has actually been the case in modern times with the relaxation of cross-border capital controls. Higher inflation tends to lead central banks to put up interest rates which attracts more capital inflows from global investors seeking a lucrative place to keep their money. This increases demand for the local currency, which in Canada’s case is the Canadian Dollar.
Macroeconomic data releases gauge the health of the economy and can have an impact on the Canadian Dollar. Indicators such as GDP, Manufacturing and Services PMIs, employment, and consumer sentiment surveys can all influence the direction of the CAD. A strong economy is good for the Canadian Dollar. Not only does it attract more foreign investment but it may encourage the Bank of Canada to put up interest rates, leading to a stronger currency. If economic data is weak, however, the CAD is likely to fall.
- Silver price trades with mild losses around $28.25 in Thursday’s early Asian session.
- The US August Nonfarm Payrolls (NFP) will be closely watched on Friday.
- USD rebound and China’s growth pessimism drag the Silver price lower, but firmer Fed rate cut bets might cap its downside.
Silver price (XAG/USD) trades with a mild bearish bias near $28.25 on Thursday during the early Asian session. The modest recovery of the US Dollar (USD) weighs on the white metal. However, the rising speculation that the US Federal Reserve (Fed) will cut a deeper interest rate in its upcoming meeting this month might help limit Silver’s losses.
The weaker US JOLTS report released on Wednesday increased the odds for a 50 basis points (bps) rate cut by the Fed. According to the CME FedWatch tool, which acts as a barometer for the market's expectation of the Fed funds target rate, the chance of the Federal Reserve (Fed) cutting rates by 25 basis points (bps) at the September meeting is 57%, while the odds of the Fed cutting rates by 50 bps is 43%. The imminent Fed rate cuts might cap the precious metal’s downside in the near term as it makes XAG/USD cheaper for most buyers.
The US August Nonfarm Payrolls (NFP) will be in the spotlight on Friday, and it is expected to see 161,000 job additions in the US economy. In case of a weaker outcome, this could exert some selling pressure on the Greenback and lift the USD-denominated Silver price.
On the other hand, China’s growth pessimism and demand concerns might undermine the white metal as China is the top silver exporter globally. Bank of America Global Research analysts cut China’s Gross Domestic Product (GDP) forecasts from 5.0% to 4.8% in 2024. Meanwhile, the downbeat Chinese Caixin Services PMI contributes to the downside, dropping to 51.6 from 52.1 in July.
Silver FAQs
Silver is a precious metal highly traded among investors. It has been historically used as a store of value and a medium of exchange. Although less popular than Gold, traders may turn to Silver to diversify their investment portfolio, for its intrinsic value or as a potential hedge during high-inflation periods. Investors can buy physical Silver, in coins or in bars, or trade it through vehicles such as Exchange Traded Funds, which track its price on international markets.
Silver prices can move due to a wide range of factors. Geopolitical instability or fears of a deep recession can make Silver price escalate due to its safe-haven status, although to a lesser extent than Gold's. As a yieldless asset, Silver tends to rise with lower interest rates. Its moves also depend on how the US Dollar (USD) behaves as the asset is priced in dollars (XAG/USD). A strong Dollar tends to keep the price of Silver at bay, whereas a weaker Dollar is likely to propel prices up. Other factors such as investment demand, mining supply – Silver is much more abundant than Gold – and recycling rates can also affect prices.
Silver is widely used in industry, particularly in sectors such as electronics or solar energy, as it has one of the highest electric conductivity of all metals – more than Copper and Gold. A surge in demand can increase prices, while a decline tends to lower them. Dynamics in the US, Chinese and Indian economies can also contribute to price swings: for the US and particularly China, their big industrial sectors use Silver in various processes; in India, consumers’ demand for the precious metal for jewellery also plays a key role in setting prices.
Silver prices tend to follow Gold's moves. When Gold prices rise, Silver typically follows suit, as their status as safe-haven assets is similar. The Gold/Silver ratio, which shows the number of ounces of Silver needed to equal the value of one ounce of Gold, may help to determine the relative valuation between both metals. Some investors may consider a high ratio as an indicator that Silver is undervalued, or Gold is overvalued. On the contrary, a low ratio might suggest that Gold is undervalued relative to Silver.
Gold prices remained broadly unchanged in India on Thursday, according to data compiled by FXStreet.
The price for Gold stood at 6,735.57 Indian Rupees (INR) per gram, broadly stable compared with the INR 6,738.33 it cost on Wednesday.
The price for Gold was broadly steady at INR 78,562.38 per tola from INR 78,594.51 per tola a day earlier.
| Unit measure | Gold Price in INR |
|---|---|
| 1 Gram | 6,735.57 |
| 10 Grams | 67,355.71 |
| Tola | 78,562.38 |
| Troy Ounce | 209,499.80 |
FXStreet calculates Gold prices in India by adapting international prices (USD/INR) to the local currency and measurement units. Prices are updated daily based on the market rates taken at the time of publication. Prices are just for reference and local rates could diverge slightly.
Gold FAQs
Gold has played a key role in human’s history as it has been widely used as a store of value and medium of exchange. Currently, apart from its shine and usage for jewelry, the precious metal is widely seen as a safe-haven asset, meaning that it is considered a good investment during turbulent times. Gold is also widely seen as a hedge against inflation and against depreciating currencies as it doesn’t rely on any specific issuer or government.
Central banks are the biggest Gold holders. In their aim to support their currencies in turbulent times, central banks tend to diversify their reserves and buy Gold to improve the perceived strength of the economy and the currency. High Gold reserves can be a source of trust for a country’s solvency. Central banks added 1,136 tonnes of Gold worth around $70 billion to their reserves in 2022, according to data from the World Gold Council. This is the highest yearly purchase since records began. Central banks from emerging economies such as China, India and Turkey are quickly increasing their Gold reserves.
Gold has an inverse correlation with the US Dollar and US Treasuries, which are both major reserve and safe-haven assets. When the Dollar depreciates, Gold tends to rise, enabling investors and central banks to diversify their assets in turbulent times. Gold is also inversely correlated with risk assets. A rally in the stock market tends to weaken Gold price, while sell-offs in riskier markets tend to favor the precious metal.
The price can move due to a wide range of factors. Geopolitical instability or fears of a deep recession can quickly make Gold price escalate due to its safe-haven status. As a yield-less asset, Gold tends to rise with lower interest rates, while higher cost of money usually weighs down on the yellow metal. Still, most moves depend on how the US Dollar (USD) behaves as the asset is priced in dollars (XAU/USD). A strong Dollar tends to keep the price of Gold controlled, whereas a weaker Dollar is likely to push Gold prices up.
(An automation tool was used in creating this post.)
Reserve Bank of Australia (RBA) Governor Michele Bullock is responding to the questions from the audience following her speech at the Anika Foundation, in Sydney on Thursday.
Key quotes
Level of demand for goods and services higher than supply.
Need to see results on inflation before lowering rates.
Trying to manage demand down to where it is in line with supply.
Trying to manage demand so unemployment does not rise too much.
Interest rate policy is clearly working.
Board is not going to focus on one inflation number.
Slightly elevated A$ is positive for inflation fight.
Will be looking closely at Q3 CPI, but there are other indicators.
Need to see inflation slowing in the actual numbers before acting.
Market reaction
AUD/USD was last seen trading at 0.6720, flat on the day, unmoved by these comments.
Australian Dollar PRICE Today
The table below shows the percentage change of Australian Dollar (AUD) against listed major currencies today. Australian Dollar was the strongest against the Euro.
| USD | EUR | GBP | JPY | CAD | AUD | NZD | CHF | |
|---|---|---|---|---|---|---|---|---|
| USD | 0.07% | 0.01% | 0.01% | 0.03% | 0.04% | -0.02% | 0.04% | |
| EUR | -0.07% | -0.04% | -0.05% | -0.02% | -0.02% | -0.04% | -0.03% | |
| GBP | -0.01% | 0.04% | 0.00% | 0.04% | 0.02% | 0.00% | 0.01% | |
| JPY | -0.01% | 0.05% | 0.00% | 0.03% | 0.02% | -0.04% | 0.03% | |
| CAD | -0.03% | 0.02% | -0.04% | -0.03% | 0.02% | -0.03% | -0.00% | |
| AUD | -0.04% | 0.02% | -0.02% | -0.02% | -0.02% | -0.04% | -0.00% | |
| NZD | 0.02% | 0.04% | 0.00% | 0.04% | 0.03% | 0.04% | 0.03% | |
| CHF | -0.04% | 0.03% | -0.01% | -0.03% | 0.00% | 0.00% | -0.03% |
The heat map shows percentage changes of major currencies against each other. The base currency is picked from the left column, while the quote currency is picked from the top row. For example, if you pick the Australian Dollar from the left column and move along the horizontal line to the US Dollar, the percentage change displayed in the box will represent AUD (base)/USD (quote).
- EUR/USD depreciates as traders adopt caution ahead of key economic figures from the United States.
- Atlanta Fed President Raphael Bostic said that the Fed must not maintain a restrictive policy stance for too long.
- The Euro edges lower amid rising odds of the ECB reducing interest rates in September.
EUR/USD inches lower to near 1.1070 during the Asian session on Thursday. The downside of the EUR/USD pair could be attributed to improved US Dollar (USD) amid rising US Treasury yields.
However, the Greenback weakened following the release of July's US JOLTS Job Openings, which fell short of expectations and indicated a further slowdown in the labor market. The number of job openings dropped to 7.673 million in July, down from 7.910 million in June. This marked the lowest level since January 2021 and was below the market expectation of 8.10 million.
Traders now await US ISM Services PMI and Initial Jobless Claims scheduled to be released on Thursday. Attention will shift to Friday’s US Nonfarm Payrolls (NFP) to gain more cues on the potential size of an expected rate cut by the Federal Reserve (Fed) this month.
Atlanta Federal Reserve President Raphael Bostic said on Wednesday that the Fed is in a favorable position but added that they must not maintain a restrictive policy stance for too long, per Reuters. FXStreet’s FedTracker, which gauges the tone of Fed officials’ speeches on a dovish-to-hawkish scale from 0 to 10 using a custom AI model, rated Bostic’s words as neutral with a score of 4.6.
In the Euro Area, the Producer Price Index rose by 0.8% month-over-month in July, the largest increase since December 2022. This follows an upwardly revised 0.6% rise in June and significantly exceeds market forecasts of 0.3%. However, the Eurozone Services PMI decreased to 52.9 in August, from 53.3 in the previous month. Meanwhile, the Composite PMI dropped to 51.0, missing expectations and falling below the previous reading of 51.2, which was expected to remain unchanged.
The Euro may face challenges amid strong speculation that the European Central Bank (ECB) will cut interest rates in September. This would mark the second interest rate cut by the ECB since it began shifting toward policy normalization in June. Policymakers remain confident that inflation will gradually return to the bank's 2% target by 2025.
Euro FAQs
The Euro is the currency for the 20 European Union countries that belong to the Eurozone. It is the second most heavily traded currency in the world behind the US Dollar. In 2022, it accounted for 31% of all foreign exchange transactions, with an average daily turnover of over $2.2 trillion a day. EUR/USD is the most heavily traded currency pair in the world, accounting for an estimated 30% off all transactions, followed by EUR/JPY (4%), EUR/GBP (3%) and EUR/AUD (2%).
The European Central Bank (ECB) in Frankfurt, Germany, is the reserve bank for the Eurozone. The ECB sets interest rates and manages monetary policy. The ECB’s primary mandate is to maintain price stability, which means either controlling inflation or stimulating growth. Its primary tool is the raising or lowering of interest rates. Relatively high interest rates – or the expectation of higher rates – will usually benefit the Euro and vice versa. The ECB Governing Council makes monetary policy decisions at meetings held eight times a year. Decisions are made by heads of the Eurozone national banks and six permanent members, including the President of the ECB, Christine Lagarde.
Eurozone inflation data, measured by the Harmonized Index of Consumer Prices (HICP), is an important econometric for the Euro. If inflation rises more than expected, especially if above the ECB’s 2% target, it obliges the ECB to raise interest rates to bring it back under control. Relatively high interest rates compared to its counterparts will usually benefit the Euro, as it makes the region more attractive as a place for global investors to park their money.
Data releases gauge the health of the economy and can impact on the Euro. Indicators such as GDP, Manufacturing and Services PMIs, employment, and consumer sentiment surveys can all influence the direction of the single currency. A strong economy is good for the Euro. Not only does it attract more foreign investment but it may encourage the ECB to put up interest rates, which will directly strengthen the Euro. Otherwise, if economic data is weak, the Euro is likely to fall. Economic data for the four largest economies in the euro area (Germany, France, Italy and Spain) are especially significant, as they account for 75% of the Eurozone’s economy.
Another significant data release for the Euro is the Trade Balance. This indicator measures the difference between what a country earns from its exports and what it spends on imports over a given period. If a country produces highly sought after exports then its currency will gain in value purely from the extra demand created from foreign buyers seeking to purchase these goods. Therefore, a positive net Trade Balance strengthens a currency and vice versa for a negative balance.
- EUR/JPY attracts some buyers on Thursday amid a modest JPY downtick.
- The divergent BoJ-ECB policy expectations keep a lid on any further upside.
- The cautious market mood also warrants some caution for aggressive bulls.
The EUR/JPY cross stages a modest bounce of over 50 pips from the 158.70 region, or a four-week low touched during the Asian session on Thursday, albeit lacks strong follow-through buying. Spot prices currently trade around the 159.20-159.25 area, and for now, seem to have stalled this week's retracement slide from the vicinity of the 163.00 round figure.
The emergence of some selling around the Japanese Yen (JPY) turns out to be a key factor lending some support to the EUR/JPY cross, though the fundamental backdrop warrants some caution before positioning for any further appreciating move. That said, the divergent Bank of Japan (BOJ)-European Central Bank (ECB) policy expectations should help limit the JPY losses and keep a lid on the currency pair.
The markets have been pricing in the possibility of another BoJ rate hike by the end of this year and the bets were reaffirmed by data showing that real wages in Japan rose for the second straight month in July. Adding to this, BoJ Board Member Hajime Takata said that we must adjust monetary conditions by another gear if we can confirm that firms will continue to increase capital expenditure, wages, and prices.
In contrast, the ECB is almost certain to cut interest rates again in September in the wake of declining inflation in the Eurozone. Apart from this, the cautious market mood might underpin the safe-haven JPY and contribute to capping the upside for the EUR/JPY cross. Hence, it will be prudent to wait for strong follow-through buying before confirming a near-term bottom and positioning for any meaningful upside.
Bank of Japan FAQs
The Bank of Japan (BoJ) is the Japanese central bank, which sets monetary policy in the country. Its mandate is to issue banknotes and carry out currency and monetary control to ensure price stability, which means an inflation target of around 2%.
The Bank of Japan has embarked in an ultra-loose monetary policy since 2013 in order to stimulate the economy and fuel inflation amid a low-inflationary environment. The bank’s policy is based on Quantitative and Qualitative Easing (QQE), or printing notes to buy assets such as government or corporate bonds to provide liquidity. In 2016, the bank doubled down on its strategy and further loosened policy by first introducing negative interest rates and then directly controlling the yield of its 10-year government bonds.
The Bank’s massive stimulus has caused the Yen to depreciate against its main currency peers. This process has exacerbated more recently due to an increasing policy divergence between the Bank of Japan and other main central banks, which have opted to increase interest rates sharply to fight decades-high levels of inflation. The BoJ’s policy of holding down rates has led to a widening differential with other currencies, dragging down the value of the Yen.
A weaker Yen and the spike in global energy prices have led to an increase in Japanese inflation, which has exceeded the BoJ’s 2% target. With wage inflation becoming a cause of concern, the BoJ looks to move away from ultra loose policy, while trying to avoid slowing the activity too much.
- The Japanese Yen appreciated as Labor Cash Earnings grew by 3.6% YoY in July.
- BoJ Board Member Hajime Takata stated that the domestic economy is recovering moderately although some weak signs were seen.
- The upside in US Treasury yields provides support for the US Dollar.
The Japanese Yen (JPY) holds ground against the US Dollar (USD), buoyed by a second straight month of rising real wages in Japan. In July, Japan’s Labor Cash Earnings grew by 3.6% year-on-year, a deceleration from June's 4.5% increase but the highest since January 1997, surpassing market expectations of 3.1%. This strong performance reinforces speculation that the Bank of Japan (BoJ) may implement another interest rate hike before the end of 2024.
Bank of Japan (BoJ) Board Member Hajime Takata made some comments on the bank’s policy outlook and economic prospects during his speech on Thursday. Japan's economy is recovering moderately although some weak signs were seen. Stock and FX markets have seen big volatility but we still see achievement of our inflation target in sight.
The US Dollar recovers its recent losses, driven by improved US Treasury yields. However, the Greenback faced challenges after July's US JOLTS Job Openings came in below expectations, signaling a further slowdown in the labor market. Traders now await US ISM Services PMI and Initial Jobless Claims scheduled to be released on Thursday.
Daily Digest Market Movers: Japanese Yen remains solid as real wages increased in July
- San Francisco Federal Reserve President Mary Daly stated on Wednesday that "the Fed needs to cut the policy rate as inflation is declining and the economy is slowing." Regarding the size of the potential rate cut in September, Daly noted, "We don't know yet." FXStreet’s FedTracker, which gauges the tone of Fed officials’ speeches on a dovish-to-hawkish scale from 0 to 10 using a custom AI model, rated Daly’s words as neutral with a score of 3.6.
- Atlanta Federal Reserve President Raphael Bostic said that the Fed is in a favorable position but added that they must not maintain a restrictive policy stance for too long, per Reuters. FXStreet’s FedTracker, which gauges the tone of Fed officials’ speeches on a dovish-to-hawkish scale from 0 to 10 using a custom AI model, rated Bostic’s words as neutral with a score of 4.6.
- Japan’s Chief Cabinet Secretary Yoshimasa Hayashi stated on Wednesday that he is "closely monitoring domestic and international market developments with a sense of urgency." Hayashi emphasized the importance of conducting fiscal and economic policy management in close coordination with the Bank of Japan (BoJ).
- US JOLTS Job Openings dropped to 7.673 million in July, down from 7.910 million in June, marking the lowest level since January 2021 and falling short of market expectations of 8.10 million.
- Jibun Bank Services PMI data on Wednesday. The index was revised to 53.7 in August from an initial estimate of 54.0. Although this marks the seventh consecutive month of expansion in the service sector, the latest figure remains unchanged from July.
- The US ISM Manufacturing PMI inched up to 47.2 in August from 46.8 in July, falling short of market expectations of 47.5. This marks the 21st contraction in US factory activity over the past 22 months.
- On Tuesday, Japan announced plans to allocate ¥989 billion to fund energy subsidies in response to rising energy costs and the resulting cost-of-living pressures.
- The US Bureau of Economic Analysis reported on Friday that the headline Personal Consumption Expenditures (PCE) Price Index increased by 2.5% year-over-year in July, matching the previous reading of 2.5% but falling short of the estimated 2.6%. Meanwhile, the core PCE, which excludes volatile food and energy prices, rose by 2.6% year-over-year in July, consistent with the prior figure of 2.6% but slightly below the consensus forecast of 2.7%.
Technical Analysis: USD/JPY remains below 144.00, support appears around seven-month lows
USD/JPY trades around 143.80 on Thursday. An analysis of the daily chart shows that the nine-day Exponential Moving Average (EMA) remains below the 21-day EMA, signaling a sustained bearish trend in the market. Furthermore, the 14-day Relative Strength Index (RSI) is hovering near the 30 level, confirming the ongoing bearish momentum but also suggesting a potential upward correction in the near term.
On the downside, support could be found near the seven-month low of 141.69, recorded on August 5. Additional key support appears at 140.25, which is the lowest level since July 2023.
In terms of resistance, the pair might first encounter a barrier at the nine-day EMA around 145.00, followed by the 21-day EMA at 146.32. A break above these EMAs might diminish the bearish sentiment and help the pair move toward the psychological level of 150.00.
USD/JPY: Daily Chart
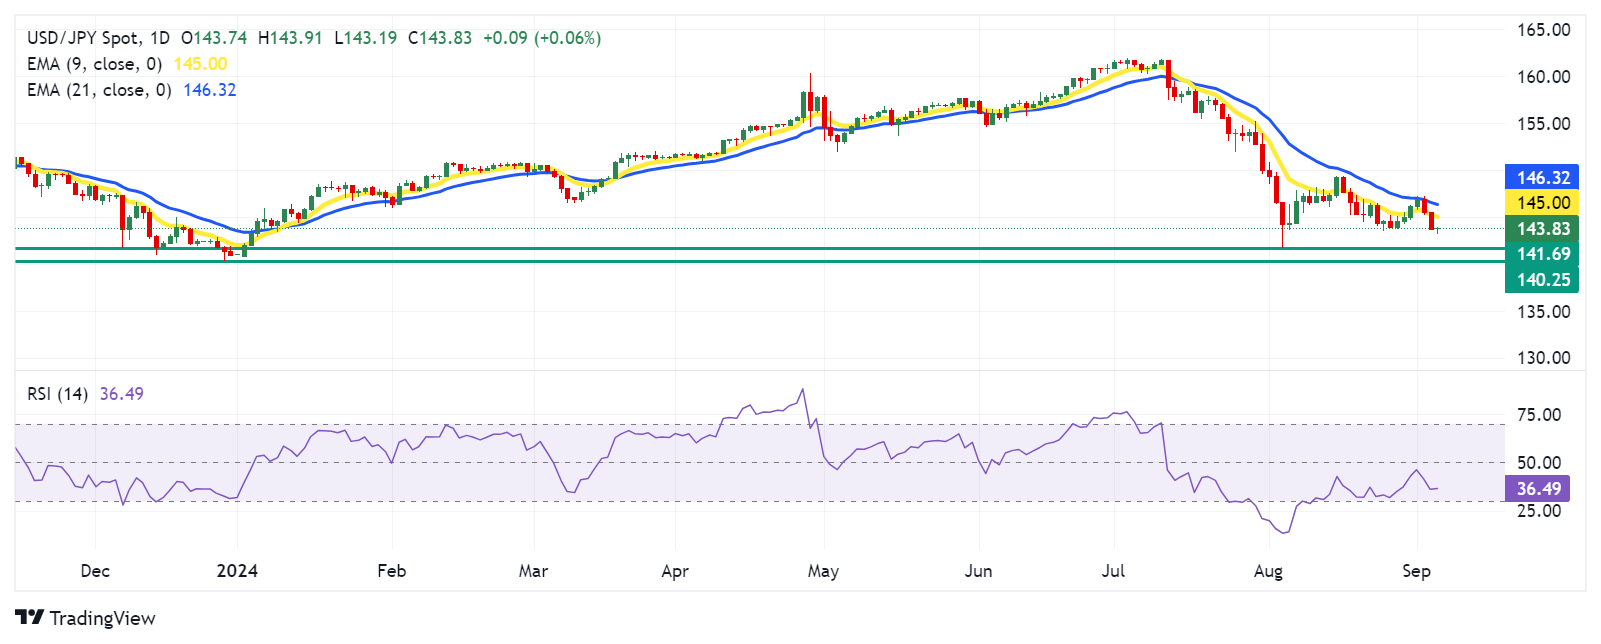
Japanese Yen PRICE Today
The table below shows the percentage change of Japanese Yen (JPY) against listed major currencies today. Japanese Yen was the strongest against the Swiss Franc.
| USD | EUR | GBP | JPY | CAD | AUD | NZD | CHF | |
|---|---|---|---|---|---|---|---|---|
| USD | 0.06% | 0.00% | 0.04% | 0.03% | 0.00% | -0.03% | 0.07% | |
| EUR | -0.06% | -0.04% | 0.02% | 0.01% | -0.03% | -0.04% | -0.00% | |
| GBP | -0.00% | 0.04% | 0.04% | 0.05% | 0.00% | 0.00% | 0.04% | |
| JPY | -0.04% | -0.02% | -0.04% | -0.01% | -0.06% | -0.09% | 0.00% | |
| CAD | -0.03% | -0.01% | -0.05% | 0.00% | -0.02% | -0.05% | 0.00% | |
| AUD | -0.00% | 0.03% | 0.00% | 0.06% | 0.02% | -0.01% | 0.05% | |
| NZD | 0.03% | 0.04% | -0.00% | 0.09% | 0.05% | 0.01% | 0.05% | |
| CHF | -0.07% | 0.00% | -0.04% | -0.01% | -0.01% | -0.05% | -0.05% |
The heat map shows percentage changes of major currencies against each other. The base currency is picked from the left column, while the quote currency is picked from the top row. For example, if you pick the Japanese Yen from the left column and move along the horizontal line to the US Dollar, the percentage change displayed in the box will represent JPY (base)/USD (quote).
Japanese Yen FAQs
The Japanese Yen (JPY) is one of the world’s most traded currencies. Its value is broadly determined by the performance of the Japanese economy, but more specifically by the Bank of Japan’s policy, the differential between Japanese and US bond yields, or risk sentiment among traders, among other factors.
One of the Bank of Japan’s mandates is currency control, so its moves are key for the Yen. The BoJ has directly intervened in currency markets sometimes, generally to lower the value of the Yen, although it refrains from doing it often due to political concerns of its main trading partners. The current BoJ ultra-loose monetary policy, based on massive stimulus to the economy, has caused the Yen to depreciate against its main currency peers. This process has exacerbated more recently due to an increasing policy divergence between the Bank of Japan and other main central banks, which have opted to increase interest rates sharply to fight decades-high levels of inflation.
The BoJ’s stance of sticking to ultra-loose monetary policy has led to a widening policy divergence with other central banks, particularly with the US Federal Reserve. This supports a widening of the differential between the 10-year US and Japanese bonds, which favors the US Dollar against the Japanese Yen.
The Japanese Yen is often seen as a safe-haven investment. This means that in times of market stress, investors are more likely to put their money in the Japanese currency due to its supposed reliability and stability. Turbulent times are likely to strengthen the Yen’s value against other currencies seen as more risky to invest in.
Reserve Bank of Australia (RBA) Governor Michele Bullock speaks at the Anika Foundation, in Sydney on Thursday. An audience Q&A session is set to follow.
Key quotes
It is premature to be thinking about rate cuts.
As of now, board does not expect to be in a position to cut rates in the near term.
Our highest priority has been and remains to bring inflation down.
Board remains vigilant to upside risks to inflation.
Our full employment goal is not served by letting inflation stay above target indefinitely.
Substantial uncertainty around central outlook, with risks on both sides.
If circumstances change, the board will respond accordingly.
Labor market remains relatively tight, expected to ease gradually.
Labor cost growth strong reflecting wage increases, weak productivity.
Key drivers of elevated inflation are housing costs, market services.
CPI rents inflation is likely to be high for some time.
Market reaction
The Australian Dollar (AUD) pays little heed to the hawkish commentary from the RBA Chief, with AUD/USD trading sideway at around 0.6725, at the time of writing.
Australian Dollar FAQs
One of the most significant factors for the Australian Dollar (AUD) is the level of interest rates set by the Reserve Bank of Australia (RBA). Because Australia is a resource-rich country another key driver is the price of its biggest export, Iron Ore. The health of the Chinese economy, its largest trading partner, is a factor, as well as inflation in Australia, its growth rate and Trade Balance. Market sentiment – whether investors are taking on more risky assets (risk-on) or seeking safe-havens (risk-off) – is also a factor, with risk-on positive for AUD.
The Reserve Bank of Australia (RBA) influences the Australian Dollar (AUD) by setting the level of interest rates that Australian banks can lend to each other. This influences the level of interest rates in the economy as a whole. The main goal of the RBA is to maintain a stable inflation rate of 2-3% by adjusting interest rates up or down. Relatively high interest rates compared to other major central banks support the AUD, and the opposite for relatively low. The RBA can also use quantitative easing and tightening to influence credit conditions, with the former AUD-negative and the latter AUD-positive.
China is Australia’s largest trading partner so the health of the Chinese economy is a major influence on the value of the Australian Dollar (AUD). When the Chinese economy is doing well it purchases more raw materials, goods and services from Australia, lifting demand for the AUD, and pushing up its value. The opposite is the case when the Chinese economy is not growing as fast as expected. Positive or negative surprises in Chinese growth data, therefore, often have a direct impact on the Australian Dollar and its pairs.
Iron Ore is Australia’s largest export, accounting for $118 billion a year according to data from 2021, with China as its primary destination. The price of Iron Ore, therefore, can be a driver of the Australian Dollar. Generally, if the price of Iron Ore rises, AUD also goes up, as aggregate demand for the currency increases. The opposite is the case if the price of Iron Ore falls. Higher Iron Ore prices also tend to result in a greater likelihood of a positive Trade Balance for Australia, which is also positive of the AUD.
The Trade Balance, which is the difference between what a country earns from its exports versus what it pays for its imports, is another factor that can influence the value of the Australian Dollar. If Australia produces highly sought after exports, then its currency will gain in value purely from the surplus demand created from foreign buyers seeking to purchase its exports versus what it spends to purchase imports. Therefore, a positive net Trade Balance strengthens the AUD, with the opposite effect if the Trade Balance is negative.
- NZD/USD trades softer near 0.6195 in Thursday’s early Asian session.
- The US Job Openings were weaker than expected in July.
- China's growth pessimism weighs on the Kiwi.
The NZD/USD pair loses traction around 0.6195 during the early Asian session on Thursday. The concerns about the Chinese economic slowdown weigh on the China-proxy New Zealand Dollar (NZD). Traders will keep an eye on the release of the US ISM Services Purchasing Managers Index (PMI), which is due later on Thursday.
The US Job openings fell more than expected in July, adding a sign of the labor market softening. The Job Openings and Labor Turnover Survey showed that available positions fell to 7.67 million in July from 7.91 million openings in June, the lowest level since January 2021.
Traders will closely watch the US labor market data on Friday, including the US Nonfarm Payrolls (NFP) and the Unemployment Rate. The US economy is expected to see 161,000 job additions in August, while the unemployment rate is projected to tick lower to 4.2%. Deutsche Bank economists suggested that a weaker NFP reading or a rise in the Unemployment Rate could reinforce market expectations for a 50 bps rate cut by the Federal Reserve (Fed), which might further undermine the Greenback.
On the Kiwi front, Bank of America Global Research analysts cut China’s GDP forecasts from 5.0% to 4.8%, raising concern about the economic slowdown. Additionally, the Chinese Caixin Services PMI was weaker than expected in August, dropping to 51.6 from 52.1 in July. The negative outlook surrounding the Chinese economy might cap the pair’s upside as China is a major trading partner to New Zealand.
New Zealand Dollar FAQs
The New Zealand Dollar (NZD), also known as the Kiwi, is a well-known traded currency among investors. Its value is broadly determined by the health of the New Zealand economy and the country’s central bank policy. Still, there are some unique particularities that also can make NZD move. The performance of the Chinese economy tends to move the Kiwi because China is New Zealand’s biggest trading partner. Bad news for the Chinese economy likely means less New Zealand exports to the country, hitting the economy and thus its currency. Another factor moving NZD is dairy prices as the dairy industry is New Zealand’s main export. High dairy prices boost export income, contributing positively to the economy and thus to the NZD.
The Reserve Bank of New Zealand (RBNZ) aims to achieve and maintain an inflation rate between 1% and 3% over the medium term, with a focus to keep it near the 2% mid-point. To this end, the bank sets an appropriate level of interest rates. When inflation is too high, the RBNZ will increase interest rates to cool the economy, but the move will also make bond yields higher, increasing investors’ appeal to invest in the country and thus boosting NZD. On the contrary, lower interest rates tend to weaken NZD. The so-called rate differential, or how rates in New Zealand are or are expected to be compared to the ones set by the US Federal Reserve, can also play a key role in moving the NZD/USD pair.
Macroeconomic data releases in New Zealand are key to assess the state of the economy and can impact the New Zealand Dollar’s (NZD) valuation. A strong economy, based on high economic growth, low unemployment and high confidence is good for NZD. High economic growth attracts foreign investment and may encourage the Reserve Bank of New Zealand to increase interest rates, if this economic strength comes together with elevated inflation. Conversely, if economic data is weak, NZD is likely to depreciate.
The New Zealand Dollar (NZD) tends to strengthen during risk-on periods, or when investors perceive that broader market risks are low and are optimistic about growth. This tends to lead to a more favorable outlook for commodities and so-called ‘commodity currencies’ such as the Kiwi. Conversely, NZD tends to weaken at times of market turbulence or economic uncertainty as investors tend to sell higher-risk assets and flee to the more-stable safe havens.
- GBP/USD draws support from a combination of factors, albeit it lacks bullish conviction.
- Expectations for a slower BoE rate-cutting cycle continue to underpin the British Pound.
- Bets for a larger Fed rate cut in September weigh on the USD and further lend support.
The GBP/USD pair trades with a positive bias around mid-1.3100s during the Asian session on Thursday, albeit it lacks strong follow-through buying and remains below the weekly top touched the previous day.
The British Pound (GBP) continues to be underpinned by expectations that the Bank of England's (BoE) rate-cutting cycle is more likely to be slower than in the Eurozone or the United States. The bets were lifted by a survey from the British Retail Consortium, which showed that spending in August increased by 1.0% YoY – marking the strongest uptick since March. This, along with a softer US Dollar (USD), turns out to be a key factor acting as a tailwind for the GBP/USD pair.
The Job Openings and Labor Turnover Survey (JOLTS) published on Wednesday showed that job openings fell to 7.673 million in July, or the lowest level since January 2021. Apart from this, dovish remarks by Fed officials lifted bets for a larger interest rate cut at the upcoming FOMC policy meeting on September 17-18 and dragged the US Treasury bond yields to over a one-year low. This, in turn, keeps the USD bulls on the defensive and offers some support to the GBP/USD pair.
That said, the cautious market mood helps limit the downside for the safe-haven Greenback. Traders also seem reluctant to place aggressive directional bets ahead of the crucial US monthly employment data – popularly known as the Nonfarm Payrolls (NPF) report on Friday. This, in turn, is seen capping the upside for the GBP/USD pair. Nevertheless, the fundamental backdrop seems tilted in favor of bulls and suggests that the path of least resistance for spot prices is to the upside.
Heading into the key data risk, investors on Thursday will take cues from the US economic docket – featuring the ADP report on private-sector employment, the usual Weekly Initial Jobless Claims and the ISM Services PMI. This, along with the US bond yields and the broader risk sentiment, might drive the USD demand and produce short-term trading opportunities around the GBP/USD pair later during the early North American session.
BoE FAQs
The Bank of England (BoE) decides monetary policy for the United Kingdom. Its primary goal is to achieve ‘price stability’, or a steady inflation rate of 2%. Its tool for achieving this is via the adjustment of base lending rates. The BoE sets the rate at which it lends to commercial banks and banks lend to each other, determining the level of interest rates in the economy overall. This also impacts the value of the Pound Sterling (GBP).
When inflation is above the Bank of England’s target it responds by raising interest rates, making it more expensive for people and businesses to access credit. This is positive for the Pound Sterling because higher interest rates make the UK a more attractive place for global investors to park their money. When inflation falls below target, it is a sign economic growth is slowing, and the BoE will consider lowering interest rates to cheapen credit in the hope businesses will borrow to invest in growth-generating projects – a negative for the Pound Sterling.
In extreme situations, the Bank of England can enact a policy called Quantitative Easing (QE). QE is the process by which the BoE substantially increases the flow of credit in a stuck financial system. QE is a last resort policy when lowering interest rates will not achieve the necessary result. The process of QE involves the BoE printing money to buy assets – usually government or AAA-rated corporate bonds – from banks and other financial institutions. QE usually results in a weaker Pound Sterling.
Quantitative tightening (QT) is the reverse of QE, enacted when the economy is strengthening and inflation starts rising. Whilst in QE the Bank of England (BoE) purchases government and corporate bonds from financial institutions to encourage them to lend; in QT, the BoE stops buying more bonds, and stops reinvesting the principal maturing on the bonds it already holds. It is usually positive for the Pound Sterling.
| Raw materials | Closed | Change, % |
|---|---|---|
| Silver | 28.272 | 0.87 |
| Gold | 249.653 | 0.15 |
| Palladium | 936.76 | -0.95 |
- Indian Rupee weakens in Thursday’s early Asian session, pressured by a sell-off in Indian equities.
- RBI’s intervention and lower crude oil prices might cap the INR’s downside.
- Investors await the US ISM Services PMI, which is due later on Thursday.
The Indian Rupee (INR) extends its downside on Thursday despite the weaker US Dollar (USD). A sell-off in domestic equities tracking global cues weighed on the INR, dragging the local currency to near all-time lows. However, the possible intervention by the Reserve Bank of India (RBI) through USD sales might prevent the Indian Rupee from breaching the 84 mark. Additionally, a fall in crude oil prices could help limit the INR’s losses as India is the world's third-largest oil-consuming and importing nation.
The US ISM Services Purchasing Managers Index (PMI) is due later on Thursday, which is estimated to ease to 51.1 in August from 51.4 in July. On Friday, the attention will shift to the US Nonfarm Payrolls (NFP) for August. This event might offer some cues about the size and pace of rate cuts by the Federal Reserve (Fed) this year.
Daily Digest Market Movers: Indian Rupee seems vulnerable ahead of US NFP data
- The HSBC India Services Purchasing Managers Index (PMI) improved to 60.9 in August from 60.3 in July, above the market consensus of 60.4. This figure registered the highest since March.
- “The Indian rupee was again stopped near 83.9750, its lowest closing, possibly by RBI as it sold dollars to ensure it remains a touch away from the psychological level of 84.00. Risk-off sentiments ensured that markets kept buying dollars and RBI supplying them,” said Anil Kumar Bhansali, head of treasury and executive director at Finrex Treasury Advisors LLP.
- Job Openings and Labor Turnover Survey showed that available positions fell to 7.67 million in July, compared with 7.91 million openings (revised from 8.1 million) seen in June, the Labor Department reported on Wednesday. This figure came in below the market consensus of 8.1 million.
- Atlanta Fed President Raphael Bostic stated on Wednesday that he is ready to start cutting interest rates even though inflation is still running above the US central bank’s target.
- The markets are now pricing in nearly 57% chance of a 25 basis points (bps) rate cut by the Fed in September, while the odds of a 50 bps reduction stands at 43%, according to the CME FedWatch tool.
Technical Analysis: USD/INR’s outlook remains positive
The Indian Rupee softens on the day. According to the daily chart, the USD/INR pair remains stuck within an ascending triangle. Nonetheless, the constructive view of the pair prevails as the price holds above the key 100-day Exponential Moving Average (EMA), with the 14-day Relative Strength Index (RSI) pointing higher above the midline near 59.55.
A major resistance level emerges at the 84.00-84.05 region, portraying the 84.00 psychological figure, the upper boundary of the triangle and the high of September 4. Sustained trading above this level might set USD/INR up to 84.50.
On the downside, the ascending triangle support near 83.90 acts as an initial support level for the pair. A breach of the mentioned level could revisit the 100-day EMA at 83.63.
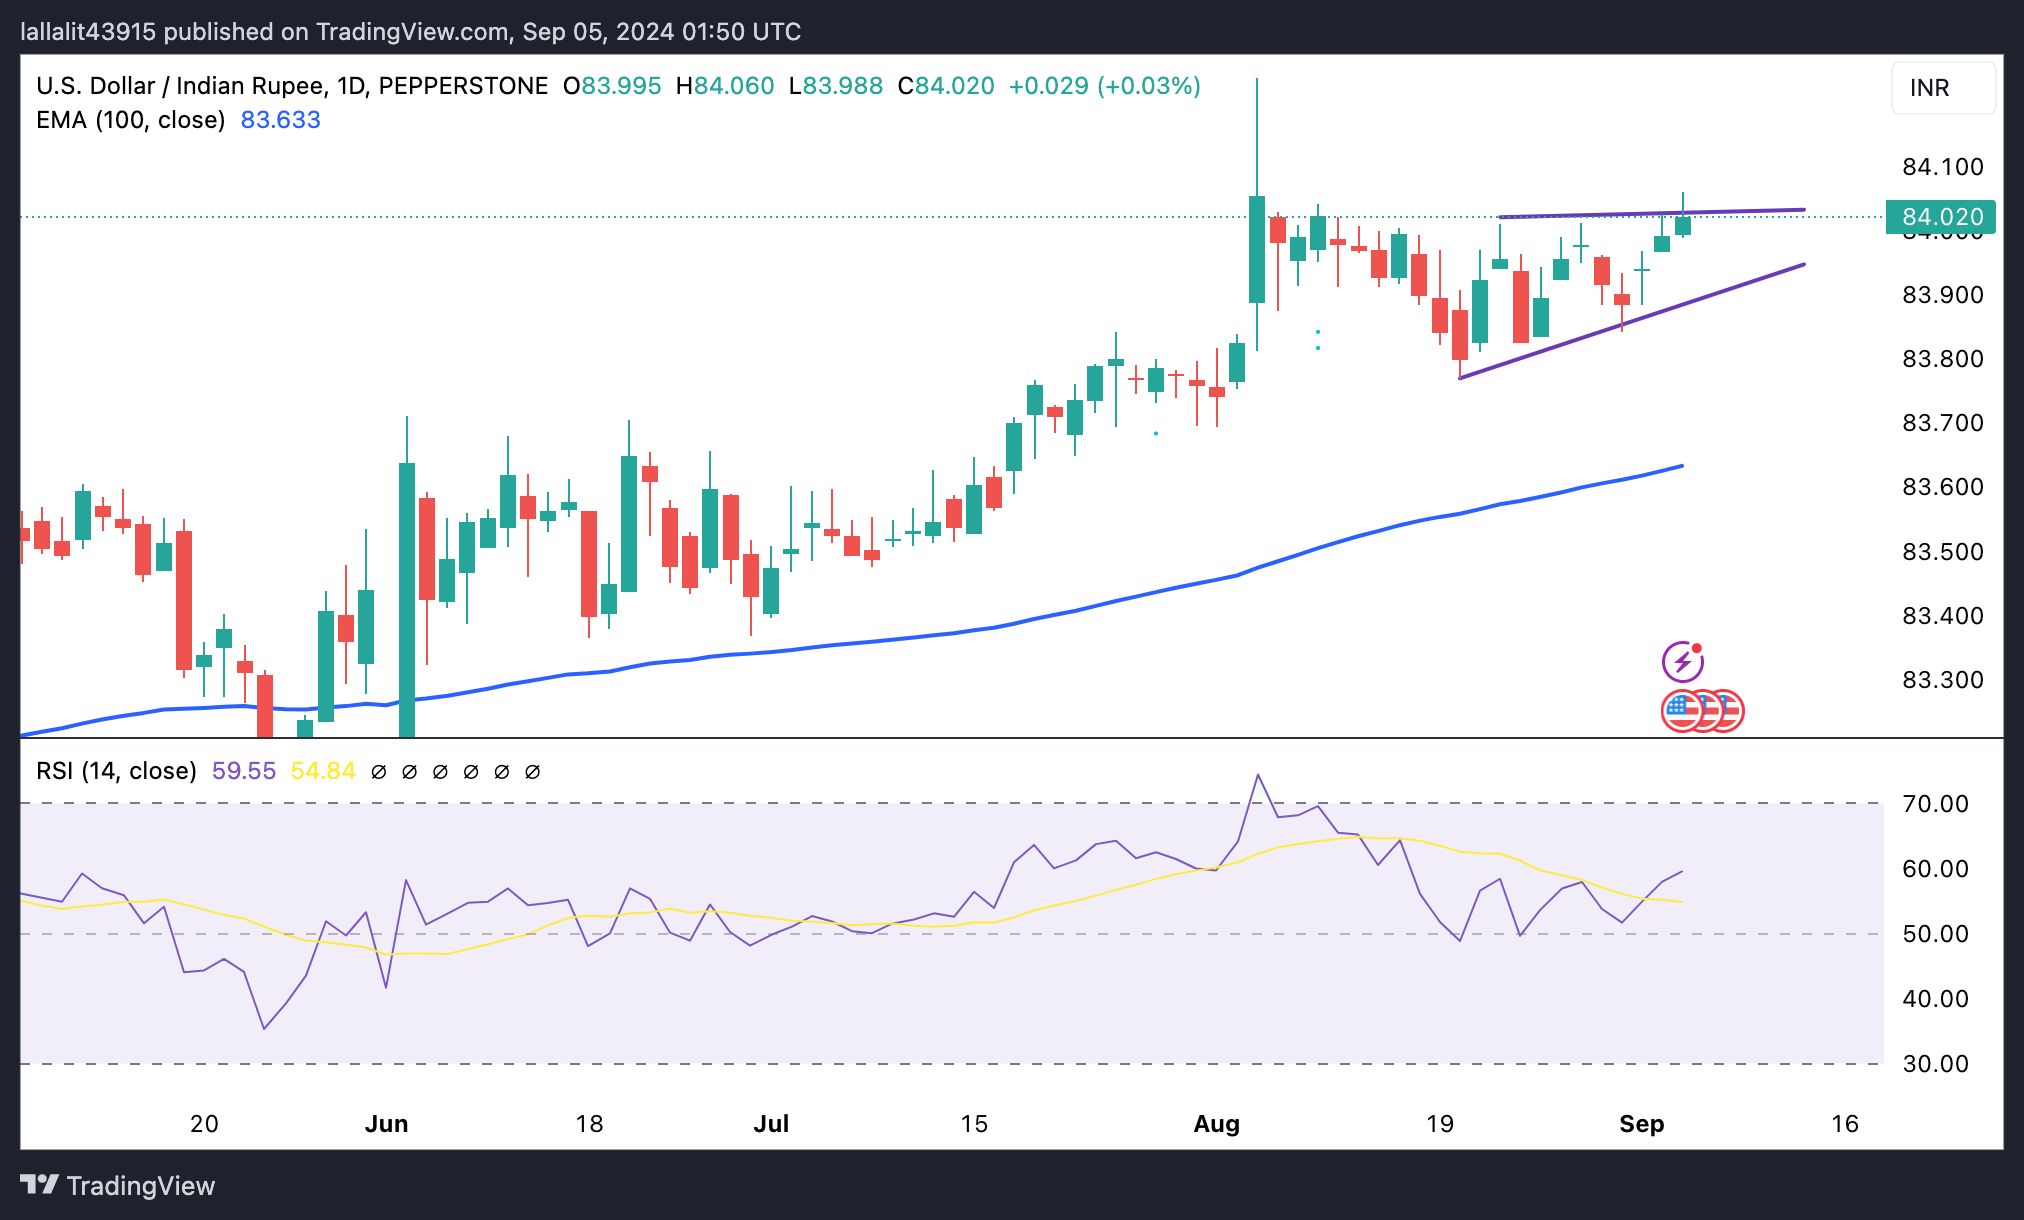
Indian Rupee FAQs
The Indian Rupee (INR) is one of the most sensitive currencies to external factors. The price of Crude Oil (the country is highly dependent on imported Oil), the value of the US Dollar – most trade is conducted in USD – and the level of foreign investment, are all influential. Direct intervention by the Reserve Bank of India (RBI) in FX markets to keep the exchange rate stable, as well as the level of interest rates set by the RBI, are further major influencing factors on the Rupee.
The Reserve Bank of India (RBI) actively intervenes in forex markets to maintain a stable exchange rate, to help facilitate trade. In addition, the RBI tries to maintain the inflation rate at its 4% target by adjusting interest rates. Higher interest rates usually strengthen the Rupee. This is due to the role of the ‘carry trade’ in which investors borrow in countries with lower interest rates so as to place their money in countries’ offering relatively higher interest rates and profit from the difference.
Macroeconomic factors that influence the value of the Rupee include inflation, interest rates, the economic growth rate (GDP), the balance of trade, and inflows from foreign investment. A higher growth rate can lead to more overseas investment, pushing up demand for the Rupee. A less negative balance of trade will eventually lead to a stronger Rupee. Higher interest rates, especially real rates (interest rates less inflation) are also positive for the Rupee. A risk-on environment can lead to greater inflows of Foreign Direct and Indirect Investment (FDI and FII), which also benefit the Rupee.
Higher inflation, particularly, if it is comparatively higher than India’s peers, is generally negative for the currency as it reflects devaluation through oversupply. Inflation also increases the cost of exports, leading to more Rupees being sold to purchase foreign imports, which is Rupee-negative. At the same time, higher inflation usually leads to the Reserve Bank of India (RBI) raising interest rates and this can be positive for the Rupee, due to increased demand from international investors. The opposite effect is true of lower inflation.
- Gold price continues to draw support from bets for a 50 bps Fed rate cut in September.
- Falling US bond yields and softer USD also act as a tailwind for the non-yielding metal.
- Bulls, however, seem reluctant and await the release of the US NFP report on Friday.
Gold price (XAU/USD) struggles to capitalize on the overnight bounce from the $2,472-2,471 area or a nearly two-week low and oscillates in a narrow trading band during the Asian session on Thursday. The downside, however, remains cushioned in the wake of rising bets for a larger interest rate cut by the Federal Reserve (Fed), bolstered by a US labor market report showing that job openings fell to a three-and-a-half-year low in July. This comes on top of soft US manufacturing data on Tuesday and raises concerns about the health of the economy, which tempers investors' appetite for riskier assets and should further act as a tailwind for the safe-haven precious metal.
Despite the aforementioned supportive fundamental backdrop, traders seem reluctant to place aggressive bullish bets around the Gold price ahead of the crucial US monthly employment details – popularly known as the Nonfarm Payrolls (NFP) report on Friday. In the meantime, Thursday's US economic docket – featuring the release of the ADP report on private sector employment and the usual Weekly Jobless Claims – will be looked upon for short-term trading opportunities. Nevertheless, expectations for an imminent start of the Fed's policy-easing cycle might continue to lend support to the XAU/USD and support prospects for the emergence of dip-buying at lower levels.
Daily Digest Market Movers: Gold price is underpinned by a dovish Fed-inspired fall in the US bond yields and the USD
- The Job Openings and Labor Turnover Survey (JOLTS) published by the US Bureau of Labor Statistics showed that job openings fell to 7.673 million in July, or the lowest level since January 2021.
- Adding to this, the reading for June was revised lower to show there were 7.910 million unfilled positions against the previously reported 8.184 million, further pointing to a softening labor market.
- Furthermore, the Federal Reserve’s Beige Book revealed that nine out of 12 regional districts reported flat or declining economic activity in August, up from five that reported weak conditions in mid-July.
- Meanwhile, Atlanta Federal Reserve President Raphael Bostic said that price pressures are diminishing quickly and that the US central bank must not maintain a restrictive policy stance for too long.
- Separately, San Francisco Fed President Mary Daly said that the central bank needs to cut rates to keep the labor market healthy, but it is now down to incoming data to determine by how much.
- According to the CME Group's FedWatch Tool, markets are pricing in around a 45% chance that the Fed will lower borrowing costs by 50 basis points at the upcoming policy meeting on September 17-18.
- The dovish outlook drags the yield on the rate-sensitive two-year US government bond to its lowest level since May 2023 and the benchmark 10-year US Treasury yield to its lowest since July 2023.
- This keeps the US Dollar bulls on the defensive and turns out to be a key factor acting as a tailwind for the non-yielding Gold price amid a generally softer tone surrounding the global equity markets.
- Traders now look to Thursday's release of the US ADP report on private-sector employment and Weekly Initial Jobless Claims for some impetus ahead of the Nonfarm Payrolls report on Friday.
Technical Outlook: Gold price bulls might wait for a move beyond the $2,524-2,525 supply zone before placing fresh bets
From a technical perspective, any subsequent strength beyond the $2,500 psychological mark is likely to confront some resistance near the $2,524-2,425 supply zone ahead of the all-time peak, around the $2,531-2,532 area touched last month. Some follow-through buying will be seen as a fresh trigger for bulls and set the stage for the resumption of the recent well-established uptrend amid positive oscillators on the daily chart.
On the flip side, the $2,471-2,470 horizontal zone seems to have emerged as an immediate strong support, below which the Gold price could slide to the 50-day Simple Moving Average (SMA), currently pegged near the $2,435 region. A convincing break below the latter might prompt some technical selling and expose the 100-day SMA, around the $2,386 area, with some intermediate support near the $2,400 round figure.
Gold FAQs
Gold has played a key role in human’s history as it has been widely used as a store of value and medium of exchange. Currently, apart from its shine and usage for jewelry, the precious metal is widely seen as a safe-haven asset, meaning that it is considered a good investment during turbulent times. Gold is also widely seen as a hedge against inflation and against depreciating currencies as it doesn’t rely on any specific issuer or government.
Central banks are the biggest Gold holders. In their aim to support their currencies in turbulent times, central banks tend to diversify their reserves and buy Gold to improve the perceived strength of the economy and the currency. High Gold reserves can be a source of trust for a country’s solvency. Central banks added 1,136 tonnes of Gold worth around $70 billion to their reserves in 2022, according to data from the World Gold Council. This is the highest yearly purchase since records began. Central banks from emerging economies such as China, India and Turkey are quickly increasing their Gold reserves.
Gold has an inverse correlation with the US Dollar and US Treasuries, which are both major reserve and safe-haven assets. When the Dollar depreciates, Gold tends to rise, enabling investors and central banks to diversify their assets in turbulent times. Gold is also inversely correlated with risk assets. A rally in the stock market tends to weaken Gold price, while sell-offs in riskier markets tend to favor the precious metal.
The price can move due to a wide range of factors. Geopolitical instability or fears of a deep recession can quickly make Gold price escalate due to its safe-haven status. As a yield-less asset, Gold tends to rise with lower interest rates, while higher cost of money usually weighs down on the yellow metal. Still, most moves depend on how the US Dollar (USD) behaves as the asset is priced in dollars (XAU/USD). A strong Dollar tends to keep the price of Gold controlled, whereas a weaker Dollar is likely to push Gold prices up.
- The Australian Dollar continues to face downward pressure following the release of Trade Balance data on Thursday.
- Australia’s Trade Balance posted a surplus of 6,009 million MoM in July, against the expected 5,150 million.
- The US Dollar received downward pressure following recent downbeat economic data.
The Australian Dollar (AUD) inches higher against the US Dollar (USD) following the release of the Trade Balance data on Thursday. Australia’s trade surplus widened to 6,009 million MoM in July, exceeding the expected 5,150 million and 5,589 million in the previous reading. Traders await Reserve Bank of Australia (RBA) Governor Michele Bullock’s speech later in the day.
The Australian Dollar received downward pressure as recent figures showed that Australia’s Gross Domestic Product (GDP) grew in the second quarter but fell short of the market expectations. A private survey also showed that the country’s manufacturing activity remained contractionary in August, extending the sector’s deterioration to two years.
The US Dollar depreciated after July's US JOLTS Job Openings came in below expectations, signaling a further slowdown in the labor market. Additionally, the ISM Manufacturing PMI showed that factory activity contracted for the fifth straight month.
Traders now await US ISM Services PMI and Initial Jobless Claims scheduled to be released on Thursday. Attention will shift to Friday’s US Nonfarm Payrolls (NFP) to gain more cues on the potential size of an expected rate cut by the Fed this month.
Daily Digest Market Movers: Australian Dollar appreciates due to widened trade surplus
- Atlanta Federal Reserve President Raphael Bostic said on Wednesday that the Fed is in a favorable position but added that they must not maintain a restrictive policy stance for too long, per Reuters. FXStreet’s FedTracker, which gauges the tone of Fed officials’ speeches on a dovish-to-hawkish scale from 0 to 10 using a custom AI model, rated Bostic’s words as neutral with a score of 4.6.
- US JOLTS Job Openings dropped to 7.673 million in July, down from 7.910 million in June, marking the lowest level since January 2021 and falling short of market expectations of 8.10 million.
- Bank of America (BoA) has revised its economic growth forecast for China, lowering its 2024 projection to 4.8% from the previous 5.0%. For 2025, the forecast is adjusted to 4.5% growth, while the 2026 outlook remains unchanged at 4.5%.
- China's Services Purchasing Managers' Index (PMI) fell from 52.1 in July to 51.6 in August, which is notable considering the close trade relationship between China and Australia.
- Australia’s Gross Domestic Product (GDP) posted a 0.2% reading QoQ for the second quarter, up from the previous quarter’s 0.1% but falling short of the expected 0.3% readings.
- The Judo Bank Composite PMI climbed to 51.7 in August, up from 51.4 in July, signaling the fastest expansion in three months. This growth was primarily fueled by a rise in services activity, with the Services PMI reaching 52.5 in August, up from 52.2 in July, marking the seventh consecutive month of growth in the services sector.
- The US ISM Manufacturing PMI inched up to 47.2 in August from 46.8 in July, falling short of market expectations of 47.5. This marks the 21st contraction in US factory activity over the past 22 months.
Technical Analysis: Australian Dollar holds ground above 0.6700
The Australian Dollar trades around 0.6720 on Thursday. Analyzing the daily chart, the AUD/USD pair is positioned below the nine-day Exponential Moving Average (EMA), suggesting a short-term bearish trend. However, the 14-day Relative Strength Index (RSI) has moved above the 50 level, suggesting that the asset price is leaning toward the bullish side.
On the downside, the AUD/USD pair could test the throwback level near 0.6575, with a deeper decline potentially aiming for the lower support around 0.6470.
In terms of resistance, the AUD/USD pair may first encounter the immediate barrier at the 14-day EMA around 0.6731, followed by the nine-day EMA at 0.6742. A break above these levels could pave the way for a test of the seven-month high at 0.6798.
AUD/USD: Daily Chart
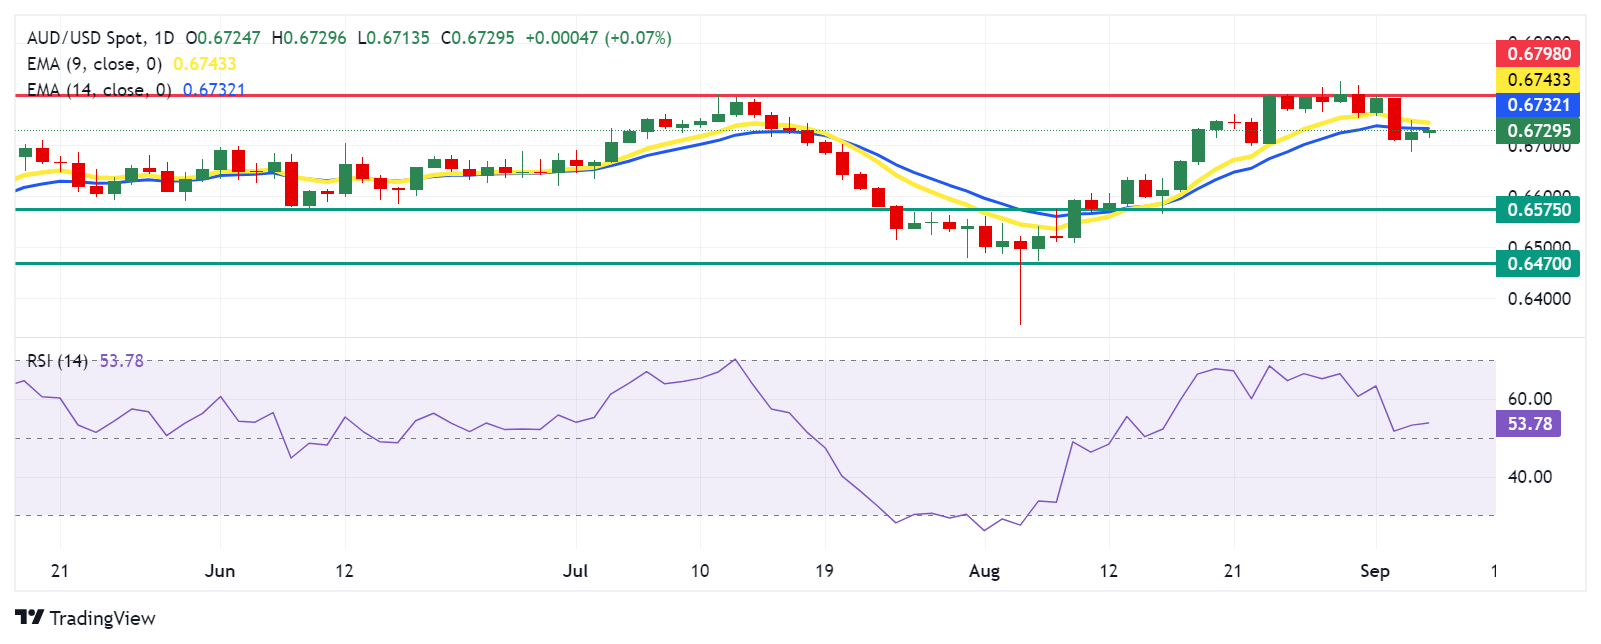
Australian Dollar PRICE Today
The table below shows the percentage change of Australian Dollar (AUD) against listed major currencies today. Australian Dollar was the strongest against the Swiss Franc.
| USD | EUR | GBP | JPY | CAD | AUD | NZD | CHF | |
|---|---|---|---|---|---|---|---|---|
| USD | 0.00% | -0.07% | -0.01% | -0.01% | -0.09% | -0.01% | 0.04% | |
| EUR | 0.00% | -0.05% | -0.02% | 0.00% | -0.08% | 0.04% | 0.04% | |
| GBP | 0.07% | 0.05% | 0.04% | 0.08% | -0.02% | 0.09% | 0.09% | |
| JPY | 0.01% | 0.02% | -0.04% | 0.00% | -0.09% | -0.00% | 0.05% | |
| CAD | 0.01% | -0.01% | -0.08% | -0.01% | -0.07% | 0.02% | 0.04% | |
| AUD | 0.09% | 0.08% | 0.02% | 0.09% | 0.07% | 0.10% | 0.12% | |
| NZD | 0.00% | -0.04% | -0.09% | 0.00% | -0.02% | -0.10% | 0.02% | |
| CHF | -0.04% | -0.04% | -0.09% | -0.05% | -0.04% | -0.12% | -0.02% |
The heat map shows percentage changes of major currencies against each other. The base currency is picked from the left column, while the quote currency is picked from the top row. For example, if you pick the Australian Dollar from the left column and move along the horizontal line to the US Dollar, the percentage change displayed in the box will represent AUD (base)/USD (quote).
Australian Dollar FAQs
One of the most significant factors for the Australian Dollar (AUD) is the level of interest rates set by the Reserve Bank of Australia (RBA). Because Australia is a resource-rich country another key driver is the price of its biggest export, Iron Ore. The health of the Chinese economy, its largest trading partner, is a factor, as well as inflation in Australia, its growth rate and Trade Balance. Market sentiment – whether investors are taking on more risky assets (risk-on) or seeking safe-havens (risk-off) – is also a factor, with risk-on positive for AUD.
The Reserve Bank of Australia (RBA) influences the Australian Dollar (AUD) by setting the level of interest rates that Australian banks can lend to each other. This influences the level of interest rates in the economy as a whole. The main goal of the RBA is to maintain a stable inflation rate of 2-3% by adjusting interest rates up or down. Relatively high interest rates compared to other major central banks support the AUD, and the opposite for relatively low. The RBA can also use quantitative easing and tightening to influence credit conditions, with the former AUD-negative and the latter AUD-positive.
China is Australia’s largest trading partner so the health of the Chinese economy is a major influence on the value of the Australian Dollar (AUD). When the Chinese economy is doing well it purchases more raw materials, goods and services from Australia, lifting demand for the AUD, and pushing up its value. The opposite is the case when the Chinese economy is not growing as fast as expected. Positive or negative surprises in Chinese growth data, therefore, often have a direct impact on the Australian Dollar and its pairs.
Iron Ore is Australia’s largest export, accounting for $118 billion a year according to data from 2021, with China as its primary destination. The price of Iron Ore, therefore, can be a driver of the Australian Dollar. Generally, if the price of Iron Ore rises, AUD also goes up, as aggregate demand for the currency increases. The opposite is the case if the price of Iron Ore falls. Higher Iron Ore prices also tend to result in a greater likelihood of a positive Trade Balance for Australia, which is also positive of the AUD.
The Trade Balance, which is the difference between what a country earns from its exports versus what it pays for its imports, is another factor that can influence the value of the Australian Dollar. If Australia produces highly sought after exports, then its currency will gain in value purely from the surplus demand created from foreign buyers seeking to purchase its exports versus what it spends to purchase imports. Therefore, a positive net Trade Balance strengthens the AUD, with the opposite effect if the Trade Balance is negative.
Bank of Japan (BoJ) Board Member Hajime Takata made some comments on the bank’s policy outlook and economic prospects during his speech on Thursday.
Key quotes
Japan's economy recovering moderately although some weak signs seen
Stock, FX markets have seen big volatility but we still see achievement of our inflation target in sight.
We are seeing renewed rises in import prices.
We must be vigilant to chance of renewed wave of price hikes, while taking into account impact of Yen rise in early august.
Hard to pin down precise level of Japan's natural rate of interest.
Japan's current real interest rate is below estimated natural rate of interest, which means monetary conditions remain accommodative.
Fallout from market turbulence in early august remains, so we must scrutinize the impact for time being.
Market reaction
At the time of writing, USD/JPY holds its renewed uptick, still flat on the day at 143.70.
Bank of Japan FAQs
The Bank of Japan (BoJ) is the Japanese central bank, which sets monetary policy in the country. Its mandate is to issue banknotes and carry out currency and monetary control to ensure price stability, which means an inflation target of around 2%.
The Bank of Japan has embarked in an ultra-loose monetary policy since 2013 in order to stimulate the economy and fuel inflation amid a low-inflationary environment. The bank’s policy is based on Quantitative and Qualitative Easing (QQE), or printing notes to buy assets such as government or corporate bonds to provide liquidity. In 2016, the bank doubled down on its strategy and further loosened policy by first introducing negative interest rates and then directly controlling the yield of its 10-year government bonds.
The Bank’s massive stimulus has caused the Yen to depreciate against its main currency peers. This process has exacerbated more recently due to an increasing policy divergence between the Bank of Japan and other main central banks, which have opted to increase interest rates sharply to fight decades-high levels of inflation. The BoJ’s policy of holding down rates has led to a widening differential with other currencies, dragging down the value of the Yen.
A weaker Yen and the spike in global energy prices have led to an increase in Japanese inflation, which has exceeded the BoJ’s 2% target. With wage inflation becoming a cause of concern, the BoJ looks to move away from ultra loose policy, while trying to avoid slowing the activity too much.
Australia’s trade surplus widened to 6,009M MoM in July versus 5,150M expected and 5,589M in the previous reading, according to the latest Aussie foreign trade data published by the Australian Bureau of Statistics on Thursday.
Further details reveal that Australia's May Goods/Services Exports reprint 0.7% figures on a monthly basis versus 1.7% prior. The nation’s Goods/Services Imports declined 0.8% in July MoM versus 0.5% prior.
Market reaction to Australia’s Trade Balance
At the press time, the AUD/USD pair is up 0.01% on the day to trade at 0.6725.
Australian Dollar FAQs
One of the most significant factors for the Australian Dollar (AUD) is the level of interest rates set by the Reserve Bank of Australia (RBA). Because Australia is a resource-rich country another key driver is the price of its biggest export, Iron Ore. The health of the Chinese economy, its largest trading partner, is a factor, as well as inflation in Australia, its growth rate and Trade Balance. Market sentiment – whether investors are taking on more risky assets (risk-on) or seeking safe-havens (risk-off) – is also a factor, with risk-on positive for AUD.
The Reserve Bank of Australia (RBA) influences the Australian Dollar (AUD) by setting the level of interest rates that Australian banks can lend to each other. This influences the level of interest rates in the economy as a whole. The main goal of the RBA is to maintain a stable inflation rate of 2-3% by adjusting interest rates up or down. Relatively high interest rates compared to other major central banks support the AUD, and the opposite for relatively low. The RBA can also use quantitative easing and tightening to influence credit conditions, with the former AUD-negative and the latter AUD-positive.
China is Australia’s largest trading partner so the health of the Chinese economy is a major influence on the value of the Australian Dollar (AUD). When the Chinese economy is doing well it purchases more raw materials, goods and services from Australia, lifting demand for the AUD, and pushing up its value. The opposite is the case when the Chinese economy is not growing as fast as expected. Positive or negative surprises in Chinese growth data, therefore, often have a direct impact on the Australian Dollar and its pairs.
Iron Ore is Australia’s largest export, accounting for $118 billion a year according to data from 2021, with China as its primary destination. The price of Iron Ore, therefore, can be a driver of the Australian Dollar. Generally, if the price of Iron Ore rises, AUD also goes up, as aggregate demand for the currency increases. The opposite is the case if the price of Iron Ore falls. Higher Iron Ore prices also tend to result in a greater likelihood of a positive Trade Balance for Australia, which is also positive of the AUD.
The Trade Balance, which is the difference between what a country earns from its exports versus what it pays for its imports, is another factor that can influence the value of the Australian Dollar. If Australia produces highly sought after exports, then its currency will gain in value purely from the surplus demand created from foreign buyers seeking to purchase its exports versus what it spends to purchase imports. Therefore, a positive net Trade Balance strengthens the AUD, with the opposite effect if the Trade Balance is negative.
On Thursday, San Francisco Federal Reserve President Mary Daly said that the “Fed needs to cut policy rate because inflation is falling and the economy is slowing.”
Additional comments
On size of Sept Fed rate cut, 'we don't know yet'.
Need more data, including friday's job market report and CPI
Fed must calibrate policy to the evolving economy.
Labor market has softened but still healthy, and that 'has to be sustained and protected'.
Hard to find evidence that labor market is faltering.
Overly tight policy could mean additional, unwelcome labor market slowing.
We have not restored price stability; inflation is still people's number one concern.
Businesses are being 'frugal' on hiring, but not yet 'dusting off their layoff manuals'.
We are at an inflection point in the economy, and data will be volatile.
Fed can take aggressive action when outlook is clear, but current outlook is uncertain.
Market reaction
The US Dollar has come under renewed selling pressure aganst its major rivals following these comments, with the US Dollar Index (DXY) losing 0.08% on the day to currently trade near 101.30.
Fed FAQs
Monetary policy in the US is shaped by the Federal Reserve (Fed). The Fed has two mandates: to achieve price stability and foster full employment. Its primary tool to achieve these goals is by adjusting interest rates. When prices are rising too quickly and inflation is above the Fed’s 2% target, it raises interest rates, increasing borrowing costs throughout the economy. This results in a stronger US Dollar (USD) as it makes the US a more attractive place for international investors to park their money. When inflation falls below 2% or the Unemployment Rate is too high, the Fed may lower interest rates to encourage borrowing, which weighs on the Greenback.
The Federal Reserve (Fed) holds eight policy meetings a year, where the Federal Open Market Committee (FOMC) assesses economic conditions and makes monetary policy decisions. The FOMC is attended by twelve Fed officials – the seven members of the Board of Governors, the president of the Federal Reserve Bank of New York, and four of the remaining eleven regional Reserve Bank presidents, who serve one-year terms on a rotating basis.
In extreme situations, the Federal Reserve may resort to a policy named Quantitative Easing (QE). QE is the process by which the Fed substantially increases the flow of credit in a stuck financial system. It is a non-standard policy measure used during crises or when inflation is extremely low. It was the Fed’s weapon of choice during the Great Financial Crisis in 2008. It involves the Fed printing more Dollars and using them to buy high grade bonds from financial institutions. QE usually weakens the US Dollar.
Quantitative tightening (QT) is the reverse process of QE, whereby the Federal Reserve stops buying bonds from financial institutions and does not reinvest the principal from the bonds it holds maturing, to purchase new bonds. It is usually positive for the value of the US Dollar.
On Thursday, the People’s Bank of China (PBOC) set the USD/CNY central rate for the trading session ahead at 7.0989, as against the previous day's fix of 7.1148 and 7.1010 Reuters estimates.
- WTI price falls to fresh YTD lows of $68.85 in Thursday’s early Asian session.
- OPEC+ could delay the planned oil output increase.
- Concerns of weak demand from China weigh on the WTI price.
West Texas Intermediate (WTI), the US crude Oil benchmark, is trading around $68.85 on Thursday. WTI price remains under selling pressure and hits the lowest level since December 13, 2023, due to a negative outlook about oil demand in the coming months.
The Organization of the Petroleum Exporting Countries and allies, or OPEC+, was discussing delaying an oil output increase scheduled to start in October as Libyan production is expected to rise. “With demand growth uncertain and significant supply outages looking unlikely, all eyes are again on OPEC+,” said Svetlana Tretyakova, senior analyst at Rystad Energy.
The recent weaker Chinese economic data has prompted concerns about the economic outlook of the world's biggest crude importer. Chinese NBS manufacturing activity fell to a six-month low in August, while the Caixin Manufacturing PMI released on Wednesday came in worse than expected.
The US crude inventories fell significantly last week. According to the American Petroleum Institute (API), crude oil stockpiles in the United States for the week ending August 30 declined by 7.8 million barrels, compared to a decrease of 3.4 million barrels in the previous week. The market consensus estimated that stocks would decline by just 0.9 million barrels.
Looking ahead, traders will keep an eye on the US ISM Services PMI and weekly EIA Crude Oil stockpiles report, which are due later on Thursday. On Friday, US Nonfarm Payrolls (NFP) for August will take center stage.
WTI Oil FAQs
WTI Oil is a type of Crude Oil sold on international markets. The WTI stands for West Texas Intermediate, one of three major types including Brent and Dubai Crude. WTI is also referred to as “light” and “sweet” because of its relatively low gravity and sulfur content respectively. It is considered a high quality Oil that is easily refined. It is sourced in the United States and distributed via the Cushing hub, which is considered “The Pipeline Crossroads of the World”. It is a benchmark for the Oil market and WTI price is frequently quoted in the media.
Like all assets, supply and demand are the key drivers of WTI Oil price. As such, global growth can be a driver of increased demand and vice versa for weak global growth. Political instability, wars, and sanctions can disrupt supply and impact prices. The decisions of OPEC, a group of major Oil-producing countries, is another key driver of price. The value of the US Dollar influences the price of WTI Crude Oil, since Oil is predominantly traded in US Dollars, thus a weaker US Dollar can make Oil more affordable and vice versa.
The weekly Oil inventory reports published by the American Petroleum Institute (API) and the Energy Information Agency (EIA) impact the price of WTI Oil. Changes in inventories reflect fluctuating supply and demand. If the data shows a drop in inventories it can indicate increased demand, pushing up Oil price. Higher inventories can reflect increased supply, pushing down prices. API’s report is published every Tuesday and EIA’s the day after. Their results are usually similar, falling within 1% of each other 75% of the time. The EIA data is considered more reliable, since it is a government agency.
OPEC (Organization of the Petroleum Exporting Countries) is a group of 13 Oil-producing nations who collectively decide production quotas for member countries at twice-yearly meetings. Their decisions often impact WTI Oil prices. When OPEC decides to lower quotas, it can tighten supply, pushing up Oil prices. When OPEC increases production, it has the opposite effect. OPEC+ refers to an expanded group that includes ten extra non-OPEC members, the most notable of which is Russia.
| Index | Change, points | Closed | Change, % |
|---|---|---|---|
| NIKKEI 225 | -1638.7 | 37047.61 | -4.24 |
| Hang Seng | -194.15 | 17457.34 | -1.1 |
| KOSPI | -83.83 | 2580.8 | -3.15 |
| ASX 200 | -152.7 | 7950.5 | -1.88 |
| DAX | -155.26 | 18591.85 | -0.83 |
| CAC 40 | -74.13 | 7500.97 | -0.98 |
| Dow Jones | 38.04 | 40974.97 | 0.09 |
| S&P 500 | -8.86 | 5520.07 | -0.16 |
| NASDAQ Composite | -52 | 17084.3 | -0.3 |
| Pare | Closed | Change, % |
|---|---|---|
| AUDUSD | 0.67235 | 0.23 |
| EURJPY | 159.189 | -0.87 |
| EURUSD | 1.10819 | 0.38 |
| GBPJPY | 188.837 | -0.94 |
| GBPUSD | 1.31463 | 0.31 |
| NZDUSD | 0.6199 | 0.27 |
| USDCAD | 1.35068 | -0.32 |
| USDCHF | 0.84634 | -0.49 |
| USDJPY | 143.643 | -1.24 |


© 2000-2026. All rights reserved.
This site is managed by Teletrade D.J. LLC 2351 LLC 2022 (Euro House, Richmond Hill Road, Kingstown, VC0100, St. Vincent and the Grenadines).
The information on this website is for informational purposes only and does not constitute any investment advice.
The company does not serve or provide services to customers who are residents of the US, Canada, Iran, The Democratic People's Republic of Korea, Yemen and FATF blacklisted countries.
Making transactions on financial markets with marginal financial instruments opens up wide possibilities and allows investors who are willing to take risks to earn high profits, carrying a potentially high risk of losses at the same time. Therefore you should responsibly approach the issue of choosing the appropriate investment strategy, taking the available resources into account, before starting trading.
Use of the information: full or partial use of materials from this website must always be referenced to TeleTrade as the source of information. Use of the materials on the Internet must be accompanied by a hyperlink to teletrade.org. Automatic import of materials and information from this website is prohibited.
Please contact our PR department if you have any questions or need assistance at pr@teletrade.global.
transfers