- Analytics
- News and Tools
- Market News
CFD Markets News and Forecasts — 05-06-2024
- GBP/USD holds positive ground around 1.2790 amid the firmer USD on Thursday.
- The ISM said on Wednesday that its US Services PMI rebounded to 53.8% in May from 49.4% in April.
- The UK S&P Global Services PMI reached a six-month low of 52.9 from 55.0 in April.
The GBP/USD pair resumes upside near 1.2790 despite the rebound of US Dollar (USD). Traders started to price in two interest rate cuts by the Federal Reserve (Fed) this year as the US economy grew at a slower pace in the first quarter than projected earlier. Later on Thursday, the US weekly Initial Jobless Claims and Balance of Trade will be published.
In the past few months, Fed officials emphasized the need to hold the rate higher for longer until the central bank gains confidence that inflation is moving toward the Fed’s 2% target. However, the downbeat US May ISM Manufacturing PMI report and weaker Q1 Gross Domestic Product (GDP) data have triggered the expectation of easing policy from the Fed in September, which weighs on the Greenback broadly. The markets are now pricing in a nearly 70% chance of a Fed rate cut in September, up from 54.9% at the beginning of the week, according to the CME FedWatch tool.
The Institute for Supply Management (ISM) reported on Wednesday that the US Services PMI improved to 53.8 in May from 49.4 in April. This figure came in better than the estimation of 50.8.
On the other hand, the UK services sector reported slower growth in May. The UK S&P Global Services PMI reached a six-month low of 52.9 from 55.0 in April, in line with the expectation. Meanwhile, the Composite PMI dropped to a two-month low of 53.0 in May from a one-year high of 54.1 in April. Amid the absence of the top-tier UK economic data releases, the GBP/USD pair will be influenced by the USD.
- AUD/USD stays flat at 0.6648 after mixed US data and speculations of Fed rate cuts.
- US ISM Services PMI rises to 53.8, while ADP private hiring misses estimates at 155K.
- Australian Q1 GDP growth at 0.1% QoQ and 1.1% YoY; RBA outlook unchanged by ANZ analysts.
- Upcoming data: Australia's Balance of Trade, Home Loans, Private Housing Approvals.
The Australian Dollar finished Wednesday’s session unchanged after mixed economic data from the United States fueled interest rate cut speculations by the Federal Reserve. As Thursday’s Asian session begins, the AUD/USD trades at 0.6648, unchanged.
AUD/USD is subdued at around 0.6648 as market awaits fresh catalysts
On Wednesday, US economic data provided mixed signals, though market players continued to price in 40 basis points of easing throughout the year. This weighed on US Treasury yields, which plunged around 5 basis points (bps), with the 10-year Treasury note rate down to 4.277%.
Data-wise, the Institute for Supply Management (ISM) revealed that business activity in the services sector jumped to its highest reading since August 2023. The ISM Services PMI rose by 53.8, exceeding estimates of 50.8 and April’s 49.4.
“Survey respondents indicated that overall business is increasing, with growth rates continuing to vary by company and industry,” wrote Anthony Nieves, ISM Services Business Survey Committee Chair.
Earlier, data from Automatic Data Processing (ADP) revealed that private hiring increased by 155K, lower than estimates of 175K, and missed April’s 188K, according to the National Employment Change report.
On the Aussie’s front, Wednesday's Gross Domestic Product (GDP) data for the first quarter of 2024 came at 0.1% QoQ, while yearly figures rose by 1.1%.
ANZ analysts wrote, “We see little in this release that would change our view on the RBA or the general outlook for the economy. The pace of GDP growth over the past six months is a little weaker than we anticipated, but labour market conditions have only eased slowly over the same period while recent inflation data have shown some stickiness.”
Ahead of the week, Australia’s economic docket will feature the Balance of Trade, which is expected to print a surplus of A%5.40 billion in April. Other data, like Home Loans and Private housing approvals, are also expected.
On the US front, the schedule will feature last week's initial jobless claims and the Balance of Trade on Thursday.
AUD/USD Price Analysis: Technical outlook
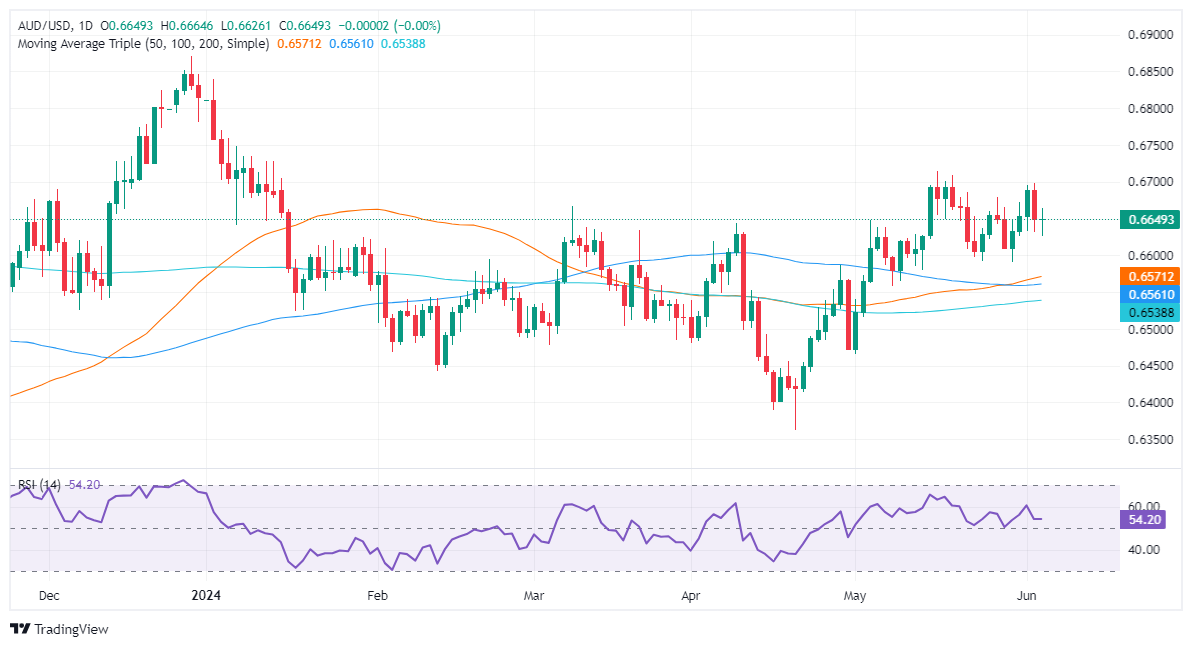
The AUD/USD is neutral to upward biased, though consolidated within the 0.6600 – 0.6714 range.
Momentum favors buyers, as depicted by the Relative Strength Index (RSI) standing in bullish territory, though it has shifted flat. That said, the pair will remain trading in a narrow range in the short term.
If buyers lift the exchange rate above 0.6700, the next resistance would be 0.6714. Once cleared, the next stop would be 0.6750, followed by the 0.6800 figure. On the flip side, if sellers push the exchange rate3 below 0.6600, the next stop would be the 50-day moving average (DMA) at 0.6571, followed by the 100-DMA at 0.6561 and the 200-DMA at 0.6536.
- The Kiwi retakes control against the Yen on Wednesday, bouncing off the 20-day SMA and surging towards 96.75.
- Despite the buyers' push, the pair is likely bound to a consolidation period.
- The established fortification around the 20-day SMA serves as a guard against further declines.
On Wednesday, the NZD/JPY pair saw a formidable rebound from the 20-day Simple Moving Average (SMA) at 95.50, launching upward towards 96.75. But despite the buyers' effort, it appears that the pair is firmly locked within a consolidation phase, limiting the chances of a quick overrunning of the multi-year high at around 97.00.
The Relative Strength Index (RSI) on the daily chart, currently at 64, has navigated upward from Tuesday's modest reading of 54, indicating a positive momentum shift. Now residing comfortably in the positive territory, this demonstrates an uptick in buying pressure. Meanwhile, the Moving Average Convergence Divergence (MACD) continues to print flat red bars, suggesting moderating selling momentum and reinforcing the likelihood of a continuation of the consolidation period rather than a full reversal.
NZD/JPY daily chart
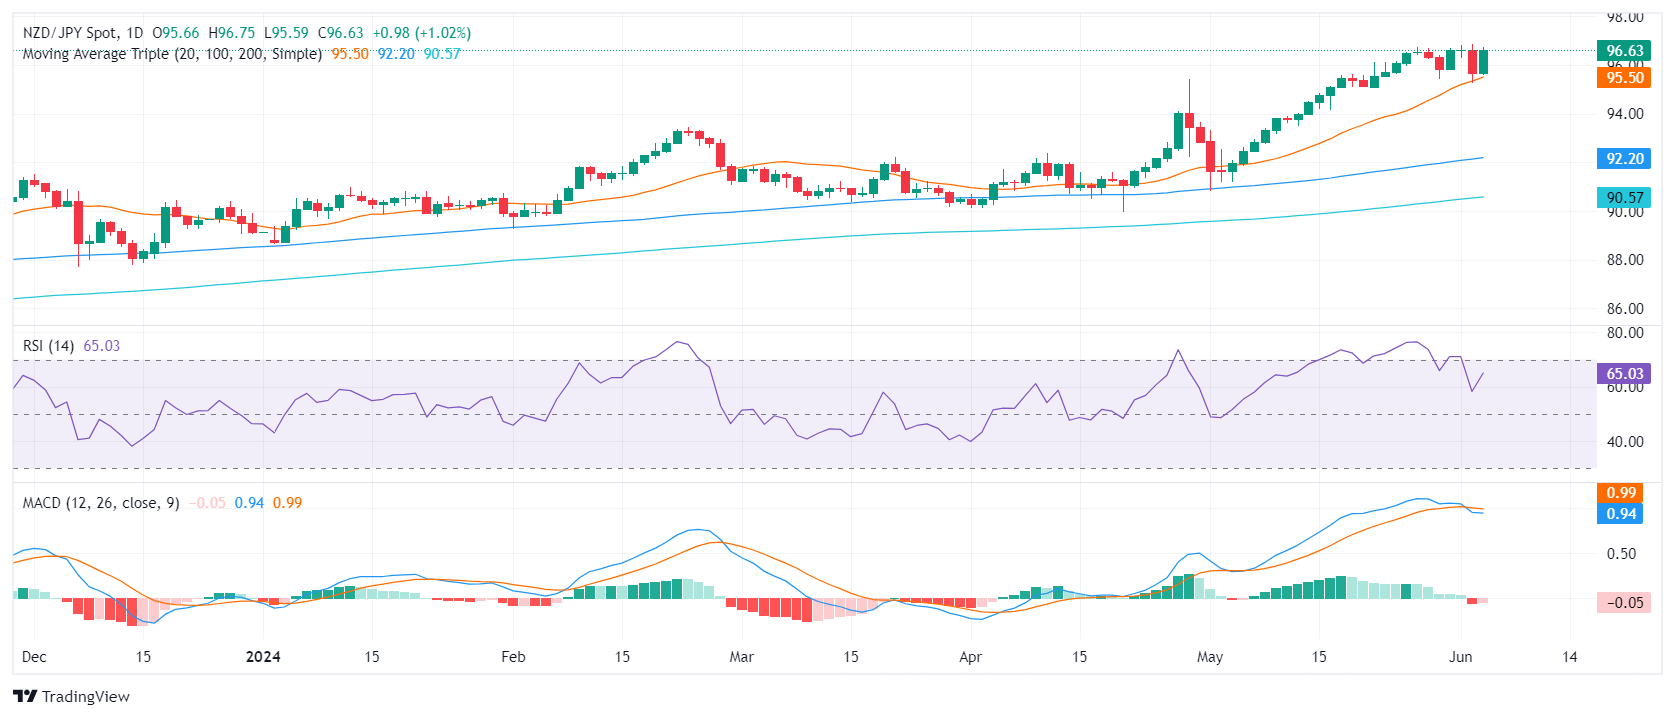
While buyers displayed renewed energy, the consolidation phase established after the impressive sprint from near 91.00 to 96.00 in May seems to hold sway. This likely indicates that the bullish contingent may need a breather before mounting further upward movements.
For buyers to reaffirm their hold, they would need to overcome the 97.00 resistance, opening the gates for another ascension towards new highs. However, until such a rally materializes, the pair may continue to tread water as it digests the recent spike in buying pressure.
- The daily RSI has shifted its course upwards, backed by the flat red bars on the MACD.
- Buyers stepped in to recover 20-Day SMA, shifting the short-term outlook from bearish to neutral.
- The underlying bullish trend is still safeguarded by the 100 and 200-day SMAs.
In Wednesday's session, the EUR/JPY pair witnessed a shift in momentum as buyers stepped in to recover the 20-day Simple Moving Average (SMA) at 169.40, supported by a recovery in the Yen against its peers. This bullish shift counters the bearish momentum from Tuesday's session as the pair emerges from local lows of 168.50.
The Relative Strength Index (RSI) on the daily chart has shown an upward shift from 48 to 54. This suggests an increase in buying momentum, potentially paving the way for a more substantial upside movement. The flat red bars on the daily Moving Average Convergence Divergence (MACD) further support this improving outlook.
EUR/JPY daily chart
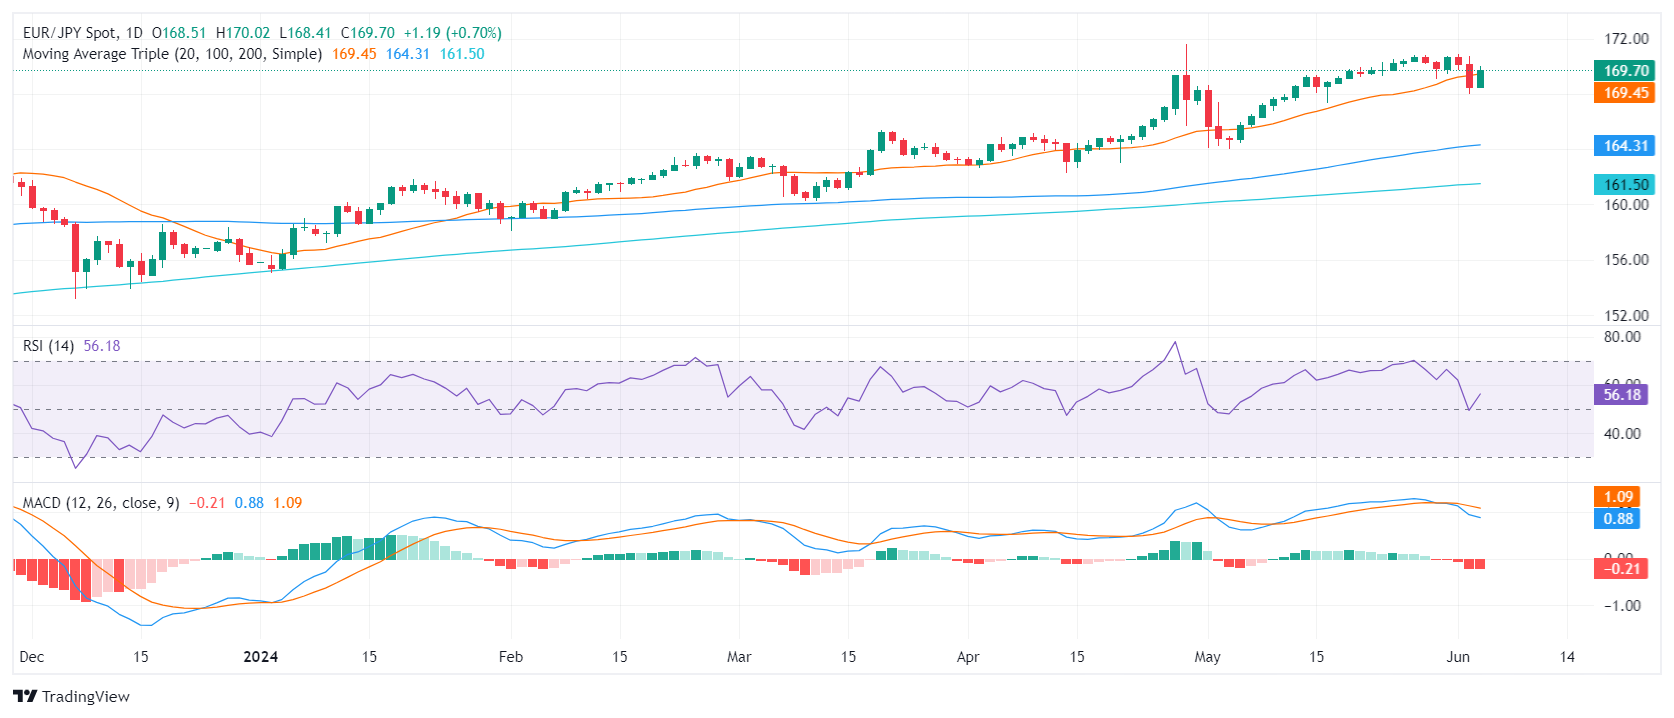
Despite the bearish undertones in the short term, the overall bullish trend remains unaffected. The support offered by the 100 and 200-day Simple Moving Averages (SMAs) at 164.00 and 161.00, respectively, still serve as a barrier to any prolonged downside movements. While sellers have made significant ground in previous sessions, these movements could be corrective rather than trend-reversing.
Although the cross managed to recover ground, the picture could quickly shift back to bearish if the cross fails to hold the recently-gained 169.40 resistance level. For the bulls to maintain momentum, a break back above this level is necessary, which would allow the pair to target the next key level of 170.00.
- Silver climbs to $29.98, gaining 1.69%, supported by weaker-than-expected US jobs data.
- Technical outlook shows a double top pattern, indicating potential for further losses.
- Key levels to watch: Resistance at $30.05; support at $29.79, $29.00, $28.74, $28.34, and the double top objective at $27.80.
Silver recovered some ground on Wednesday as US Treasury bond yields plunged due to weaker-than-expected US jobs data. At the time of writing, the XAG/USD trades at $29.98 and gains 1.69%.
XAG/USD Price Analysis: Technical outlook
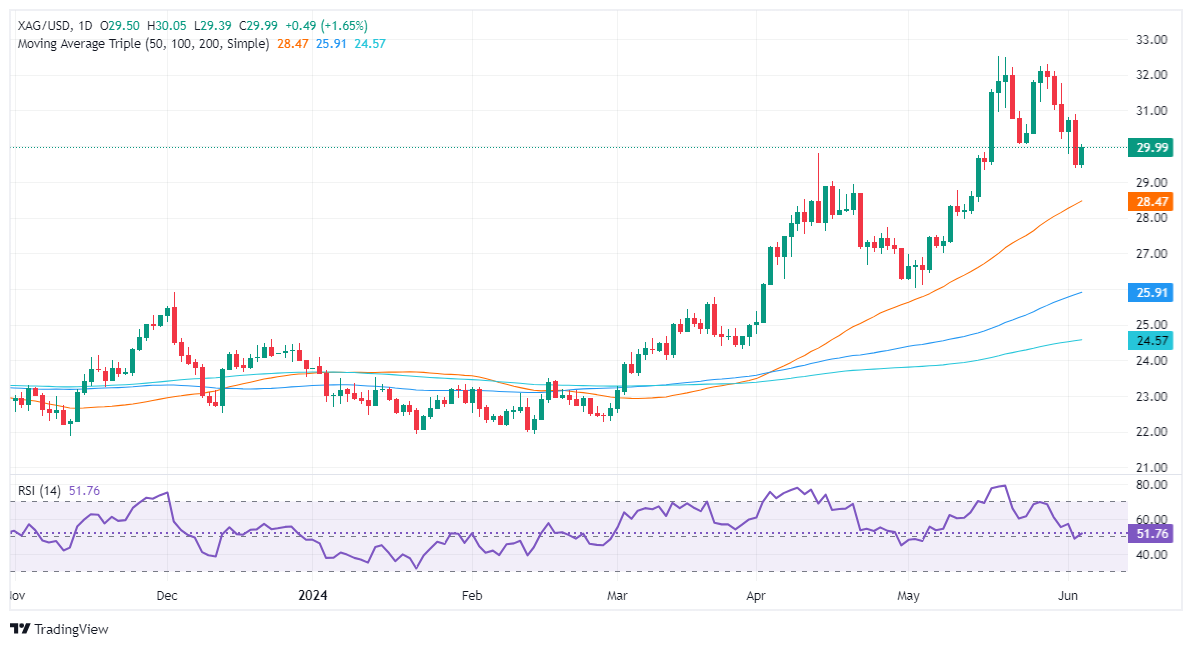
A double top chart pattern emerged in Silver’s daily chart, opening the door for further losses. Although the grey metal climbed toward the May 24 low, turning resistance at $30.05, buyers are struggling to reclaim $30.00, paving the way for further downside.
If the XAG/USD falls below the latest cycle high seen on April 12 at $29.79, that would open the door to challenging $29.00. A breach of the latter will expose previous key resistance levels that turned support, like the May 18, 2021, high of $28.74, followed by the June 10, 2021, high of $28.34. Up next would be the ‘double top’ objective at $27.80.
XAG/USD Price Action – Daily Chart
- The daily RSI increase denotes a slight uptick in momentum.
- Signs of bullish fatigue emerge after renewed gains, reinforcing the ongoing consolidation outlook.
- The pair currently focuses on the stronghold of the 20-day SMA around the 103.80 area which acts as a resistance.
In Wednesday's trading session, the AUD/JPY pair bounced to 103.80, reflective of a resurgence in upward momentum. However, the buyers met resistance at the 20-day Simple Moving Average (SMA) and retreated.
According to the daily Relative Strength Index (RSI) analysis, the index increased to 52 from the previous session's 46, demonstrating a gain in momentum. Meanwhile, the Moving Average Convergence Divergence (MACD) prints flat red bars, indicating steady selling traction.
AUD/JPY daily chart
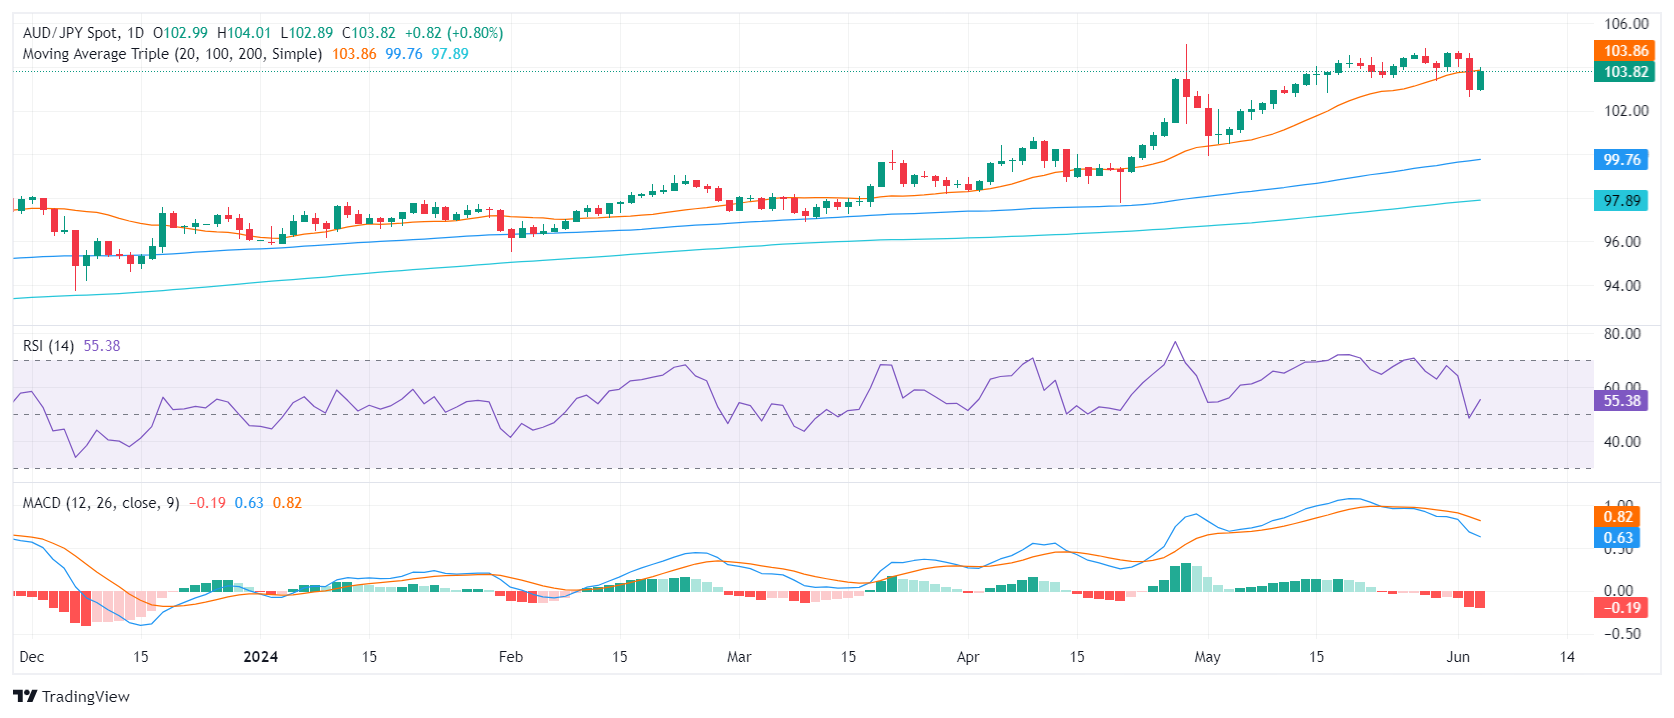
On the downside, further losses will find the 100 and 200-day SMAs at their disposal as shielding units. On the other hand, buyers will encounter resistance trying to propel the pair back above the 20-day SMA at 103.80 and further to the 105.00 mark. If these resistance points remain intact, the market could witness the AUD/JPY pair maintain a consolidation phase.
What is not in discussion, is that the cross has entered a consolidation phase, following an aggressive rally that took it to multi-year highs.
- Crude Oil markets are struggling to recover from sharp declines.
- US Crude Oil supplies delivered another buildup in measured stocks.
- OPEC+ set to ease production caps in the coming months.
West Texas Intermediate (WTI) US Crude Oil is grinding higher on Wednesday as energy markets attempt to shrug off another buildup in US Crude Oil stocks. The Organization of the Petroleum Exporting Countries (OPEC) and its extended group of non-member ally states, OPEC+, cautioned this week that the global oil cartel is set to phasing out voluntary production cuts as Crude Oil producers grow frustrated at OPEC’s inability to engineer broad-market support for barrel prices.
As oil-heavy nations prepare to pivot away from OPEC+ production limits in favor of balancing their government budgets, Crude Oil markets are balking at the prospect of even further risks of oversupply as global demand fails to materialize in-line with energy market expectations.
US Crude Oil stocks rose on a weekly basis once again after the American Petroleum Institute (API) reported a 4.052 million barrel buildup in Weekly Crude Oil Stocks, shrugging off a forecast -1.9 million barrel decline and chewing a significant hole in the previous week’s -6.49 million decline. The Energy Information Administration (EIA) reported similar results, with EIA Crude Oil Stocks Change for the week ended May 31 rising 1.233 million when investors were forecasting a -2.3 million barrel decline. Week-on-week EIA barrel counts previously showed a drawdown of -4.156 million barrels.
Crude Oil technical outlook
WTI barrel bids clawed back to $74.00 per barrel on Wednesday, but topside momentum remains thin and US Crude Oil is steeply off near-term highs. Daily candlesticks closed in the red for the last five consecutive trading days, and meagre grains represent the best Crude Oil bidders can do.
WTI remains trapped under near-term technical resistance at the 200-hour Exponential Moving Average (EMA) at $76.10. US Crude Oil tested into its lowest bids since February, and the upside is looking thin.
WTI hourly chart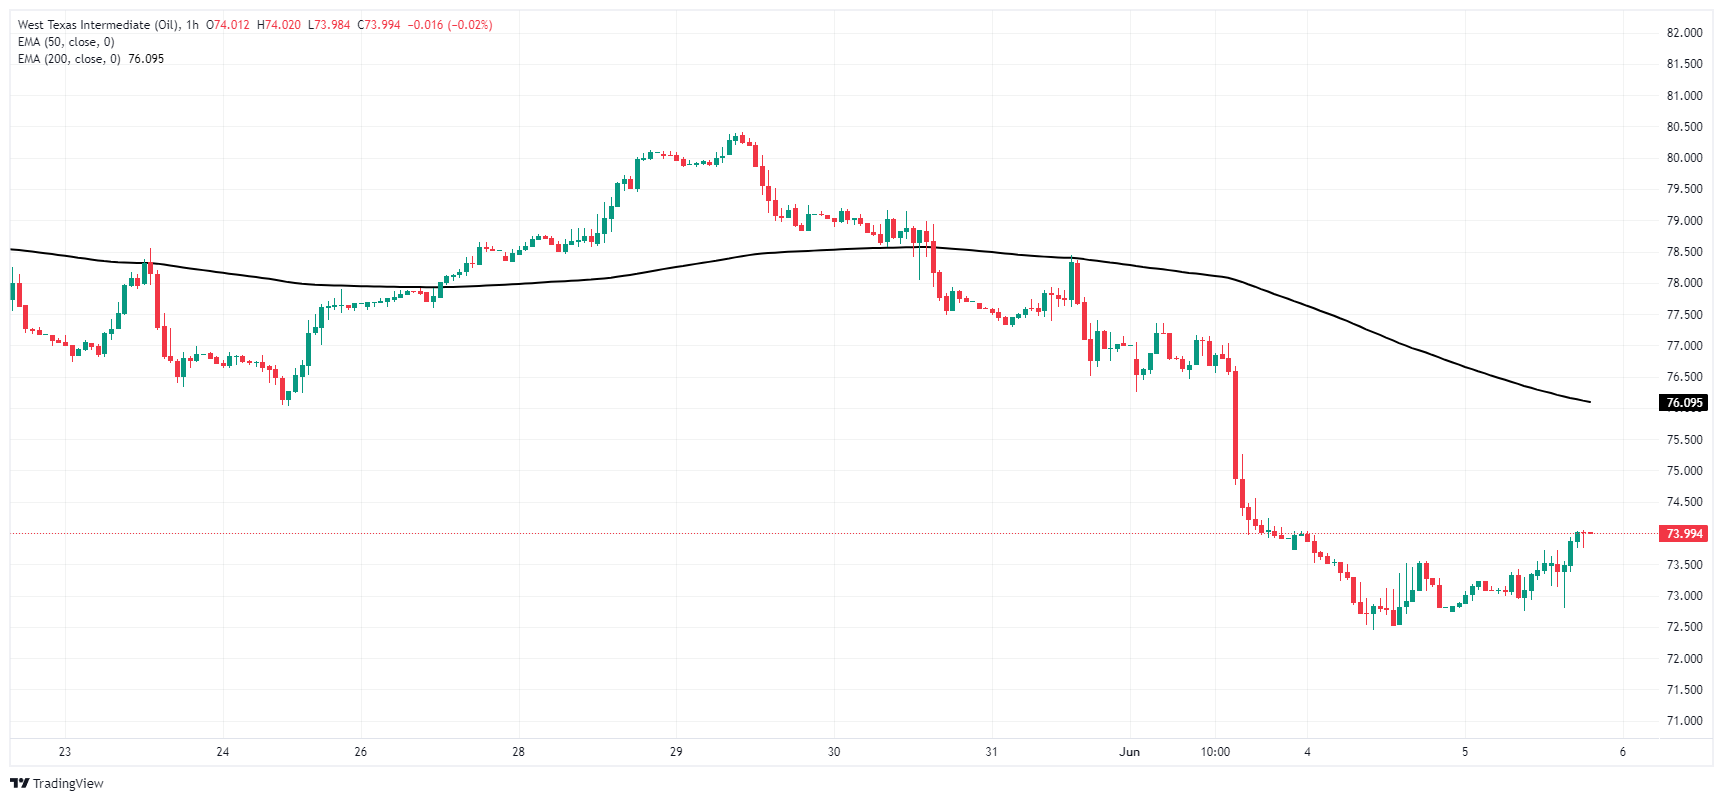
WTI daily chart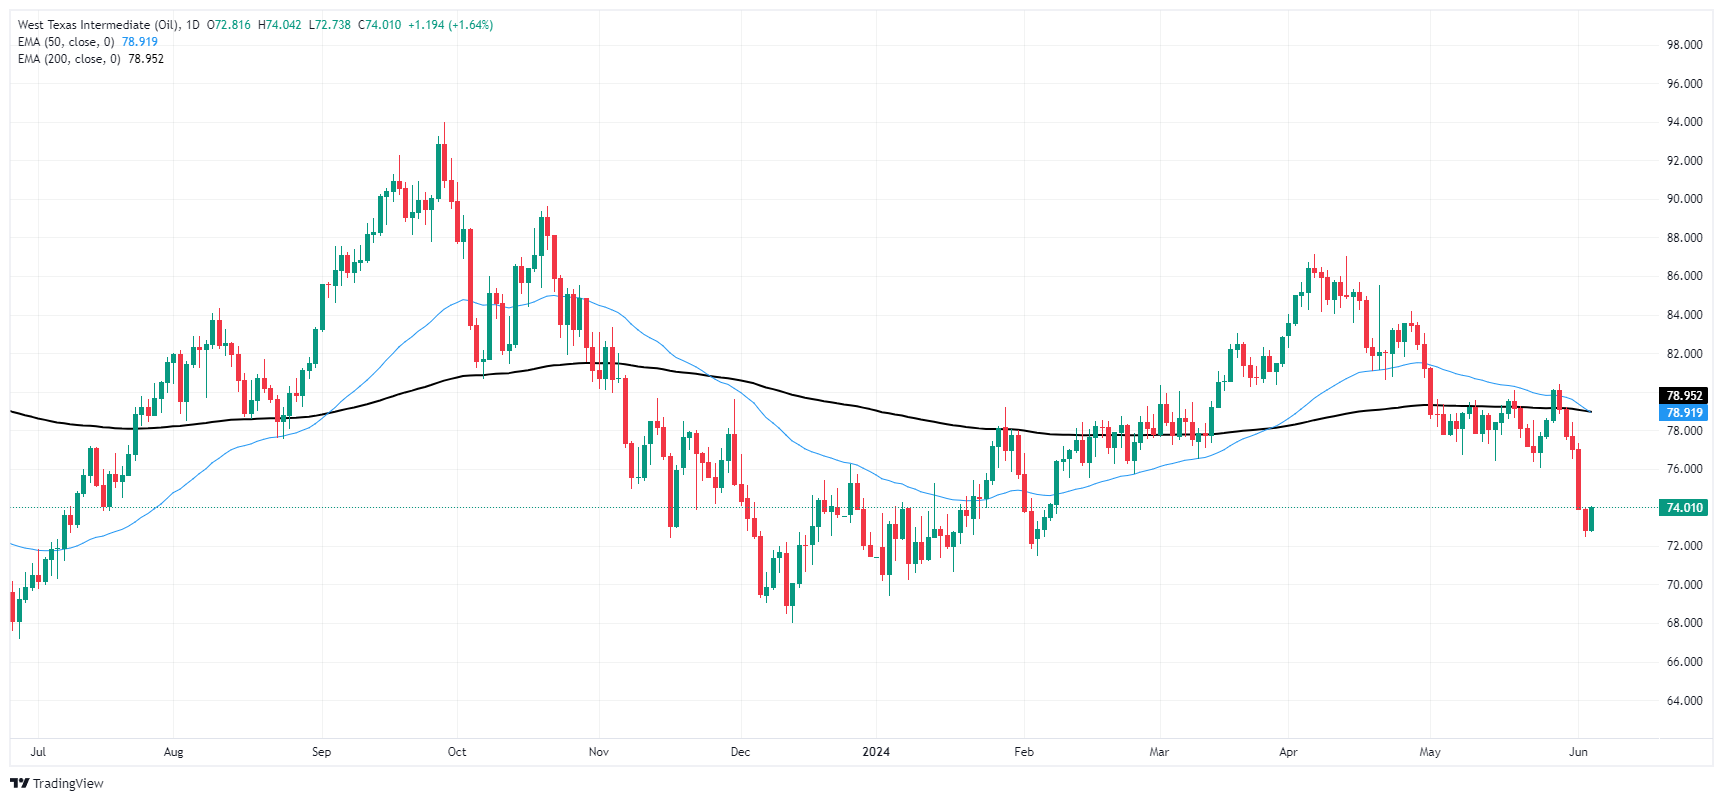
- USD/JPY climbs and gains 0.79%, supported by strong US economic data.
- Technical outlook shows a bullish harami pattern, indicating potential for further gains.
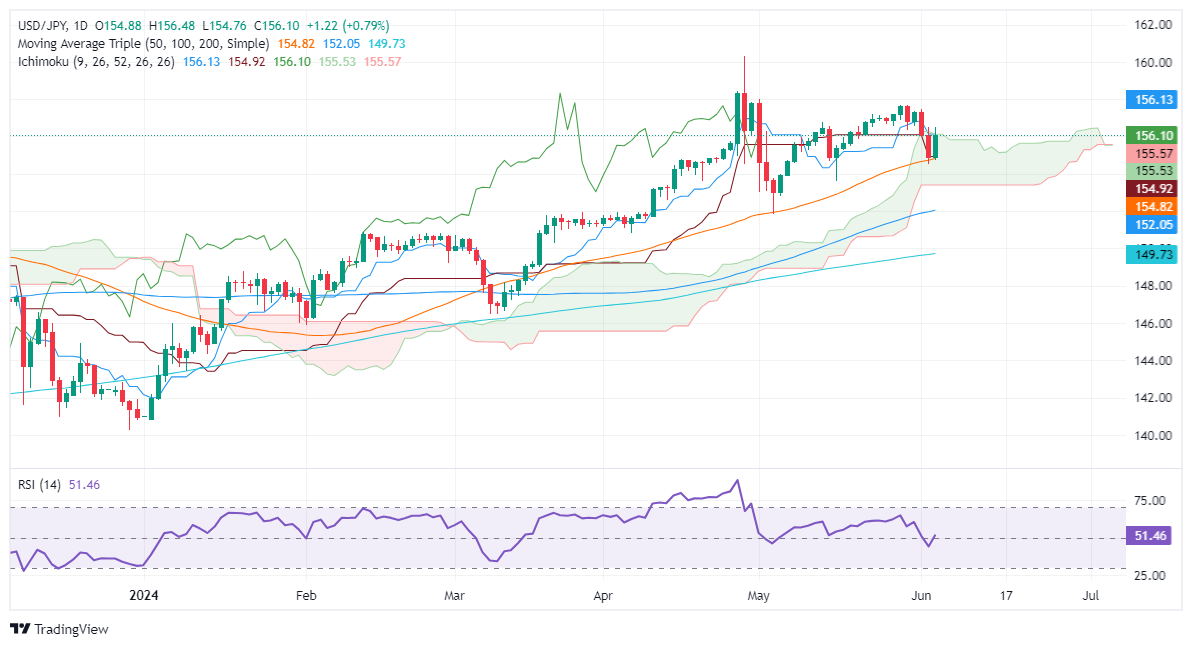
- Key resistance levels: 156.50, May 30 high at 157.68, and YTD high at 160.32; support at 156.00, 155.00, and confluence of Tenkan-Sen and 50-DMA at 154.81/92.
The USD/JPY recovered some ground and advanced towards the top of the Ichimoku Cloud (Kumo) on Wednesday, gaining some 0.79% and trading at 156.11 at the time of writing. Data from the United States kept the Greenback bid while falling Japanese Government Bond (JGB) yields undermined the Yen.
USD/JPY Price Analysis: Technical outlook
From a technical perspective, the USD/JPY remains upward biased despite retreating toward the 50-day moving average (DMA) at 154.82 on Tuesday. However, buyers lifted the exchange rate towards current levels, forming a ‘bullish harami’ candlestick chart pattern that could open the door for further gains.
Short-term momentum is on the buyers’ side, as depicted by the Relative Strength Index (RSI) standing in bullish territory.
The USD/JPY first resistance would be the 156.50 mark. A breach of the latte will expose the May 30 high of 157.68 before rallying toward the April 26 high of 158.44. Up next would be the year-to-date (YTD) high of 160.32.
On the flip side, the USD/JPY's first support would be 156.00. Once surpassed, the next stop would be 155.00, before testing the confluence of the Tenkan-Sen and the 50-DMA at around 154.81/92.
USD/JPY Price Action – Daily Chart
- On Wednesday, the AUD/NZD dropped significantly, reaching its lowest level since March around 1.0740.
- Australian Q1 GDP growth was reported slightly below expectations, signaling a slowdown in the economy.
- The RBA is set to keep an eye on inflation, which might be the primary focus for monetary policy decisions.
The AUD/NZD continued its bearish trajectory on Wednesday, declining to its lowest level since March, registered at around 1.0740 amid the newly released Australian Gross Domestic Product (GDP) Q1 data.
In Australia, reported Q1 GDP figures came in slightly below market anticipations, with sluggish growth of 0.1% QoQ below the predicted 0.2%, indicating a moderated pace in the economy. Also, the YoY rate landed at 1.1%, lower than the projected figure and down from the corrected 1.6% in Q4 of the previous year. Furthermore, recent services and composite PMI readings for May appeared softer than preliminary estimates.
Despite these developments, the RBA, accentuated by Governor Michele Bullock, is likely to maintain its attention on bringing inflation back to its target. In that sense, future monetary policy decisions are probably more influenced by this goal rather than short-term economic oscillations. While tightening monetary policy was a point of discussion in the last meeting, investors took those off the table those odds and for the next meeting in June are just seeing around 30% odds of a cut.
AUD/NZD technical analysis
The technical outlook has further deepened into bearish territory. However, the daily Relative Strength Index (RSI) showed oversold conditions, indicating a potential upward correction may be on the horizon. This is further supported by the Moving Average Convergence Divergence (MACD), which shows a reduction in red bars, confirming the potential of an uptrend.
As the bearish trend persists with the pair below its 20,100 and 200-day Simple Moving Averages (SMAs) and in multi-month lows, the focus will be whether the downward trend continues or an upward correction happens.
AUD/NZD daily chart

The Greenback extended its weekly recovery and added to Tuesday’s advance despite the mixed tone of US yields across the curve, as investors started to price in two interest rate cuts by the Fed this year. Meanwhile, traders fully anticipate a 25 bps rate reduction by the ECB on Thursday.
Here is what you need to know on Thursday, June 6:
The USD Index (DXY) maintained its bullish stance in place and retested the 200-day SMA in the 104.40 area. On June 6, Balance of Trade results are due seconded by the usual weekly Initial Jobless Claims.
Further gains in the US Dollar kept the EUR/USD’s price action subdued ahead of the ECB gathering. The ECB’s interest rate decision and the subsequent press conference by President C. Lagarde take centre stage on June 6. Additionally, Retail Sales in the broader euro bloc are also due.
GBP/USD resumed its uptrend and managed to advance modestly despite the firm tone in the Greenback. The S&P Global Construction PMI is expected on June 6.
USD/JPY left behind two sessions in a row of losses and sparked a marked rebound past the 156.00 barrier. The weekly Foreign Bond Investment figures are due on June 6 seconded by the speech by BoJ’s Nakamura.
AUD/USD trimmed earlier losses, although it ended the session slightly on the defensive near 0.6640. On June 6, the Balance of Trade comes first ahead of Home Loans and Investment Lending for Homes.
Quite a decent rebound saw WTI prices partially set aside a multi-session bearish trend and reclaim the $74.00 mark per barrel despite the weekly build in US inventories and unabated demand jitters.
Gold prices kept its side-lined trade in place, reversing Tuesday’s pullback and climbing to the $2,350 area per troy ounce helped by diminishing US yields. Silver, in addition, reversed part of the steep pullback recorded in the previous session and flirted once again with the key $30.00 mark per ounce.
- Gold price is gaining 1.18% amid mixed US economic data and lower Treasury yields.
- US 10-year Treasury yield drops to lowest level since April, following a softer-than-expected jobs report.
- US Dollar Index increases 0.22% to 104.7 but fails to curb Gold’s advance.
Gold’s price remains range-bound and advanced on Wednesday, making a U-turn to Tuesday’s price action following the release of mixed US economic data that could warrant lower borrowing costs set by the US Federal Reserve (Fed). Therefore, US Treasury yields dropped, and the Greenback rose, yet failed to put a lid on the yellow metal. The XAU/USD trades at $2,353, up 1.18%.
The US 10-year benchmark note coupon added to its weekly losses as it went down three basis points to 4.297%, its lowest level since April, following a softer-than-expected US jobs report.
The Institute for Supply Management (ISM) showed the US economy continues to expand in its service sector, boosting both the Greenback and the golden metal.
The US Dollar Index (DXY), which tracks the Greenback’s performance against a basket of six currencies, rises 0.22% to 104.7.
US yields continued to edge lower due to investors beginning to price in more than a 25-basis-point (bps) rate cut toward the end of 2024. Via data from the Chicago Board of Trade (CBOT), specifically the December 2024 fed funds futures contract, traders project 37 bps of easing.
The golden metal was also boosted by commodity prices stabilizing following Tuesday's plunge, which witnessed a more than 4% drop during the first two days of the week. Additionally, upbeat Caixin PMI data from China hints that the economy might continue to grow.
Consequently, US Treasury bond yields dropped, and the Greenback extended its losses to three straight days. The US 10-year Treasury bond yields plunged eleven basis points to 4.392%.
Daily digest market movers: Gold price capitalizes on falling US Treasury yields
- US ISM Services PMI in May expanded by 53.8 to its highest level since August 2023, exceeding estimates of 50.8 and April’s 49.4.
- “Survey respondents indicated that overall business is increasing, with growth rates continuing to vary by company and industry,” wrote Anthony Nieves, ISM Services Business Survey Committee Chair.
- ADP Employment Change revealed that private US hiring in May rose by 152K, below estimates of 175K and missing April’s 188K.
- Last week, the US Core Personal Consumption Expenditure Price Index (PCE), the Fed’s preferred inflation gauge, stabilized, boosting hopes for potential rate cuts.
- Traders are currently pricing about a 57.4% chance of a rate cut in September, according to the CME FedWatch Tool.
- The US economic docket during the week will feature Initial Jobless Claims for the previous week on Thursday, followed by May’s Nonfarm Payrolls on Friday.
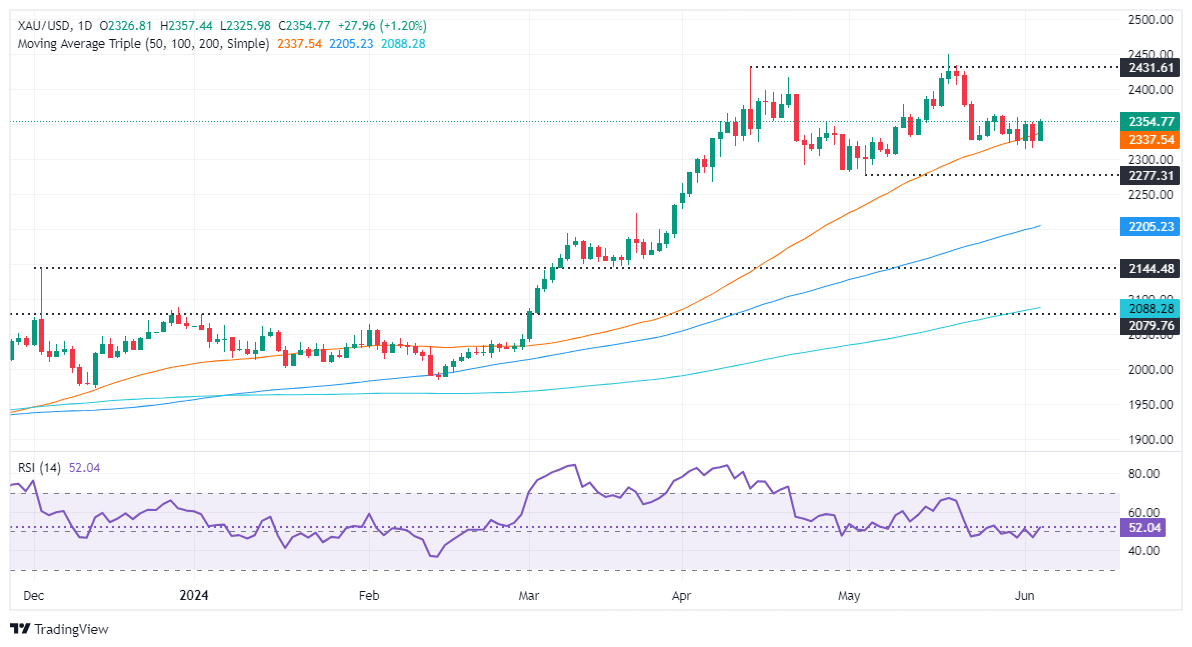
Technical analysis: Gold price shrugs off strong US Dollar and edges higher above $2,350
Gold’s uptrend remains in place yet consolidates within the $2,320 to $2,360 area, with neither buyers nor sellers able to push prices beyond the boundaries. Momentum suggests that buyers are in charge, as portrayed by the Relative Strength Index (RSI), which could pave the way for a bullish continuation.
In that event, Gold’s first resistance would be $2,360. Once cleared, the next stop would be $2,400, followed by the year-to-date high of $2,450.
Conversely, if XAU/USD drops below the 50-day Simple Moving Average (SMA) of $2,337, the next stop would be the May 8 low of $2,303, followed by the May 3 cycle low of $2,277.
Gold FAQs
Gold has played a key role in human’s history as it has been widely used as a store of value and medium of exchange. Currently, apart from its shine and usage for jewelry, the precious metal is widely seen as a safe-haven asset, meaning that it is considered a good investment during turbulent times. Gold is also widely seen as a hedge against inflation and against depreciating currencies as it doesn’t rely on any specific issuer or government.
Central banks are the biggest Gold holders. In their aim to support their currencies in turbulent times, central banks tend to diversify their reserves and buy Gold to improve the perceived strength of the economy and the currency. High Gold reserves can be a source of trust for a country’s solvency. Central banks added 1,136 tonnes of Gold worth around $70 billion to their reserves in 2022, according to data from the World Gold Council. This is the highest yearly purchase since records began. Central banks from emerging economies such as China, India and Turkey are quickly increasing their Gold reserves.
Gold has an inverse correlation with the US Dollar and US Treasuries, which are both major reserve and safe-haven assets. When the Dollar depreciates, Gold tends to rise, enabling investors and central banks to diversify their assets in turbulent times. Gold is also inversely correlated with risk assets. A rally in the stock market tends to weaken Gold price, while sell-offs in riskier markets tend to favor the precious metal.
The price can move due to a wide range of factors. Geopolitical instability or fears of a deep recession can quickly make Gold price escalate due to its safe-haven status. As a yield-less asset, Gold tends to rise with lower interest rates, while higher cost of money usually weighs down on the yellow metal. Still, most moves depend on how the US Dollar (USD) behaves as the asset is priced in dollars (XAU/USD). A strong Dollar tends to keep the price of Gold controlled, whereas a weaker Dollar is likely to push Gold prices up.
- Dow Jones cycles 38,700.00 after US labor preview eases.
- US ISM Services PMI accelerated to multi-month highs.
- Mixed data hinted enough softness to bolster rate cut hopes further.
The Dow Jones Industrial Average (DJIA) is treading water on Wednesday, grappling with 38,750.00. After US data printed mixed, rate cut expectations held on the high side but gains in the Dow Jones index remain limited.
US ADP Employment Change in May eased to 152K compared to the forecast 173K, and the previous month’s print also saw a downside revision to 188K from 192K. US ISM Services Purchasing Managers Index (PMI) jumped to a nine-month high of 53.8, well above the forecast 50.8 and vaulting over the previous 16-month low of 49.4.
Despite a healthy uptick in services activities, markets are focusing on the cooling effect of easing ADP labor figures. According to the CME’s FedWatch Tool, rate markets are pricing in 80% odds of a rate cut of at least 25 basis points at the Federal Reserve’s (Fed) September rate meeting.
Broader markets will be pivoting to look ahead to Friday’s upcoming US Nonfarm Payrolls (NFP) print, which is forecast to increase to 185K from the previous month’s 175K. With rate cut hopes pinning into the high side once more, investors will be looking for a softer NFP print and downside revisions to previous figures.
Dow Jones news
The Dow Jones is holding steady on Wednesday, with roughly half of the index’s stocks in the green during the midweek market session. Intel Corp (INTC) rose around 2.0%, climbing over $30.00 per share. On the low end, Cisco Systems Inc. (CSCO) tumbled -3.26% to $45.88 per share on Wednesday, falling to a new 52-week low as investors remain skeptical about the profitability of Cisco System’s newly-unveiled AI-driven ThousandEyes internet monitoring unit. Cisco’s ThousandEyes is billed as an internet-mapping and automated security tool.
Dow Jones technical outlook
Dow Jones is trading tightly near 38,700.00 on Wednesday as the major equity index struggles to share gains found by similar US indexes. The DJIA is struggling under the weight of near-term losses after tumbling from record highs above 40,000.00.
Daily candlesticks are knocking on a supply zone below 38,000.00, and long-term technical support is priced in at the 200-day Exponential Moving Average (EMA) at 37,297.33. The Dow Jones has arrest a near-term decline, but still remains down -3.35% from record high bids set in mid-May.
Dow Jones five minute chart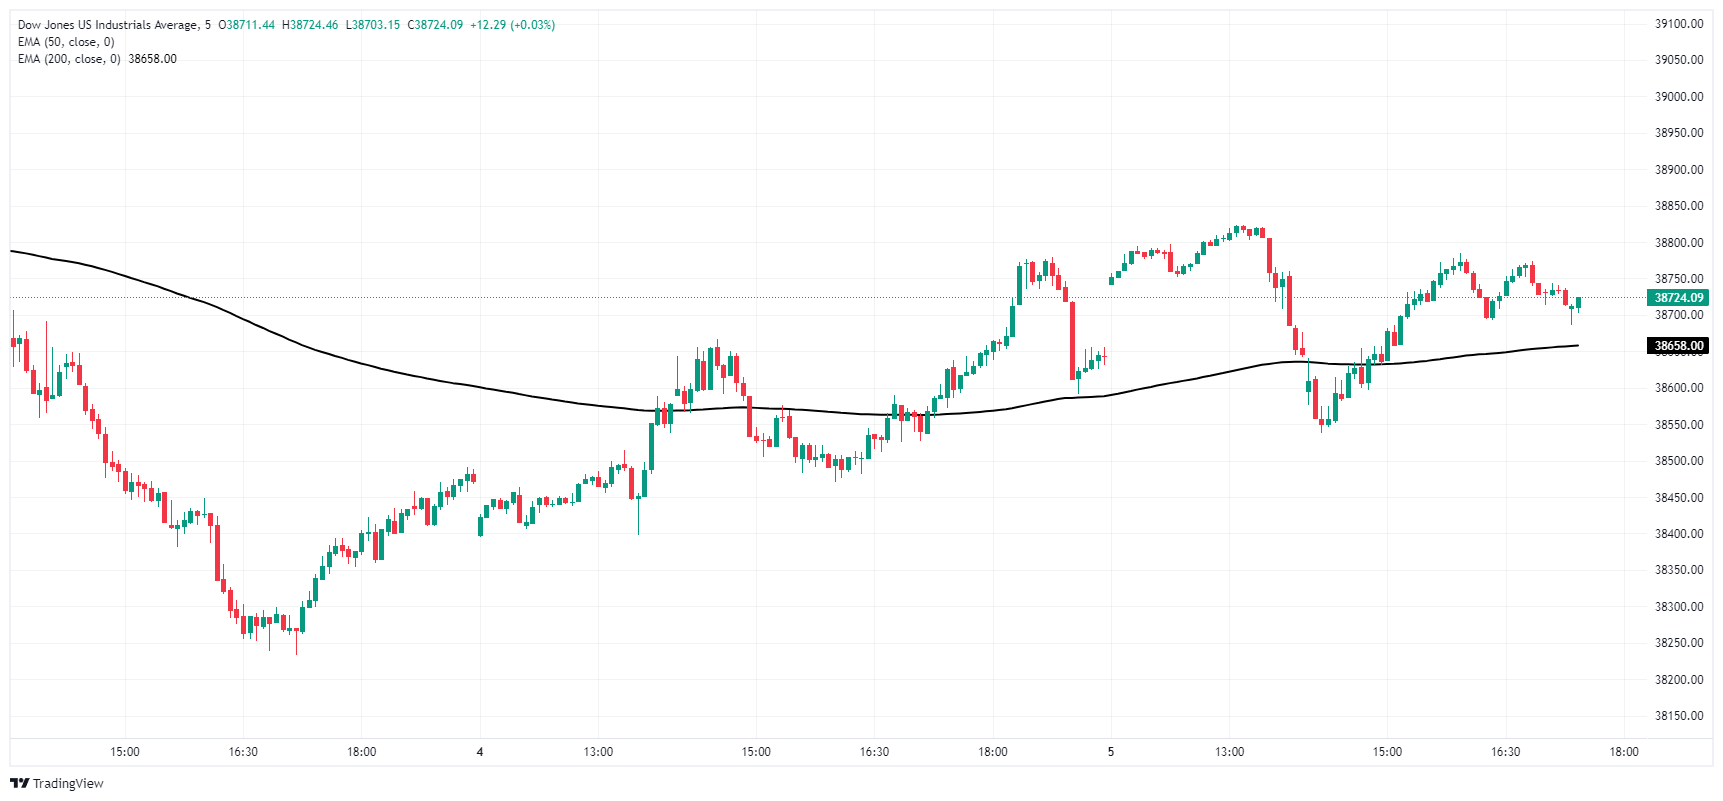
Dow Jones daily chart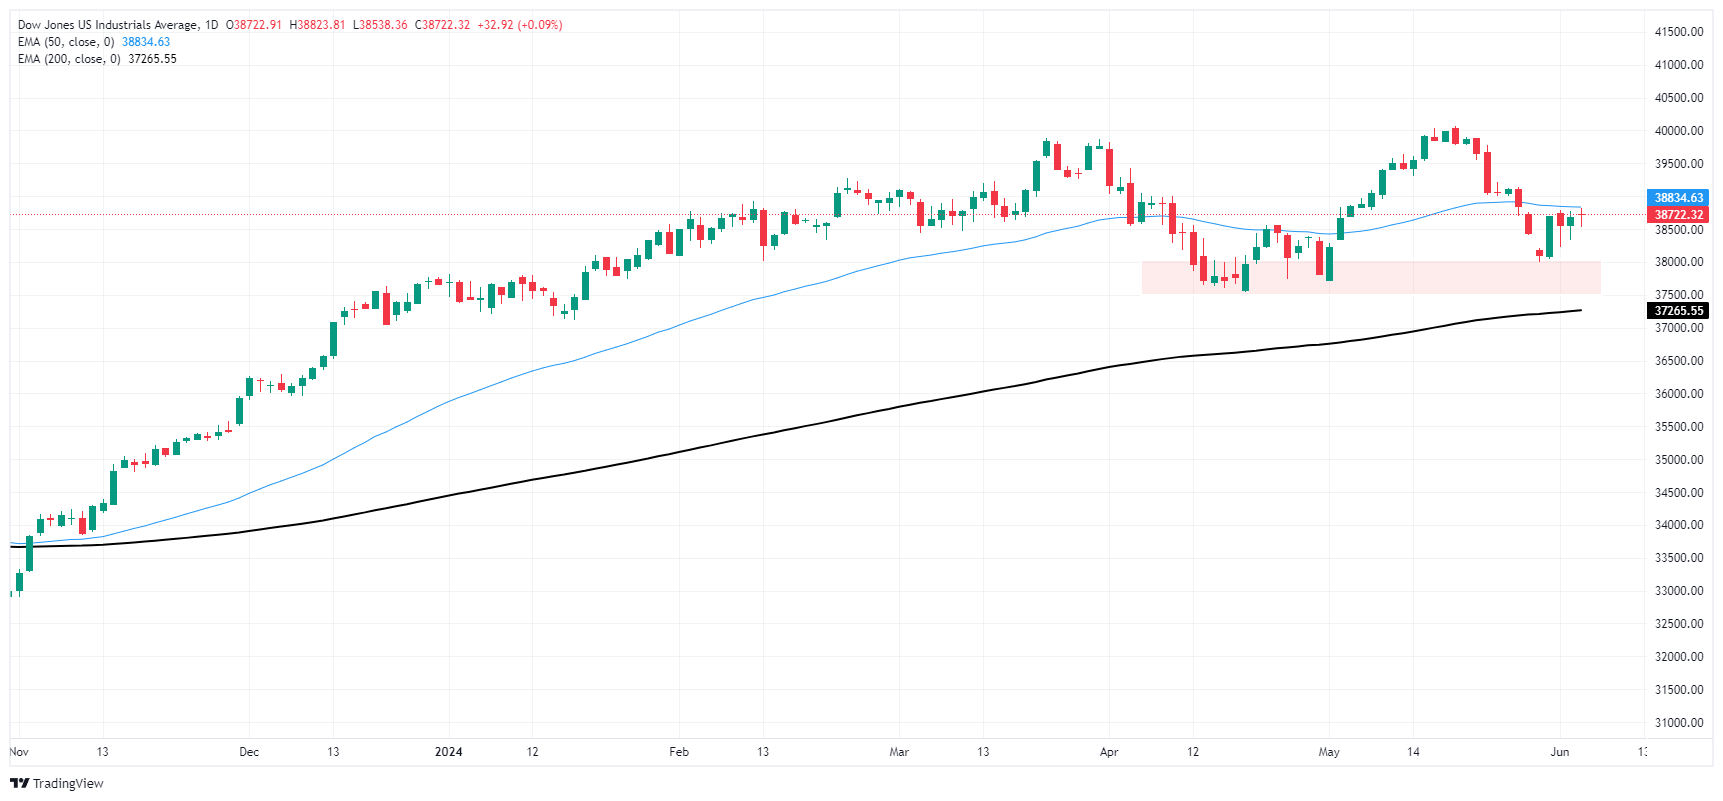
Dow Jones FAQs
The Dow Jones Industrial Average, one of the oldest stock market indices in the world, is compiled of the 30 most traded stocks in the US. The index is price-weighted rather than weighted by capitalization. It is calculated by summing the prices of the constituent stocks and dividing them by a factor, currently 0.152. The index was founded by Charles Dow, who also founded the Wall Street Journal. In later years it has been criticized for not being broadly representative enough because it only tracks 30 conglomerates, unlike broader indices such as the S&P 500.
Many different factors drive the Dow Jones Industrial Average (DJIA). The aggregate performance of the component companies revealed in quarterly company earnings reports is the main one. US and global macroeconomic data also contributes as it impacts on investor sentiment. The level of interest rates, set by the Federal Reserve (Fed), also influences the DJIA as it affects the cost of credit, on which many corporations are heavily reliant. Therefore, inflation can be a major driver as well as other metrics which impact the Fed decisions.
Dow Theory is a method for identifying the primary trend of the stock market developed by Charles Dow. A key step is to compare the direction of the Dow Jones Industrial Average (DJIA) and the Dow Jones Transportation Average (DJTA) and only follow trends where both are moving in the same direction. Volume is a confirmatory criteria. The theory uses elements of peak and trough analysis. Dow’s theory posits three trend phases: accumulation, when smart money starts buying or selling; public participation, when the wider public joins in; and distribution, when the smart money exits.
There are a number of ways to trade the DJIA. One is to use ETFs which allow investors to trade the DJIA as a single security, rather than having to buy shares in all 30 constituent companies. A leading example is the SPDR Dow Jones Industrial Average ETF (DIA). DJIA futures contracts enable traders to speculate on the future value of the index and Options provide the right, but not the obligation, to buy or sell the index at a predetermined price in the future. Mutual funds enable investors to buy a share of a diversified portfolio of DJIA stocks thus providing exposure to the overall index.
- USD extends its gains to second day following mixed signals from ADP, ISM Services PMIs.
- Business activity in the US service sector expanded in May, ISM Services PMI showing signs of recovering in April.
- Markets gear up for Nonfarm Payrolls and Wage inflation data to give additional insight into US economy.
On Wednesday, the US Dollar Index (DXY) extended its gains despite mixed signals about the US economy. The solid performance of the service sector, coupled with lower-than-expected private sector employment data, caused a moderate stir in the market. However, the overall outlook for the US economy remains resilient.
All eyes are now on the upcoming labor market data such as Nonfarm Payrolls, Wage inflation, and Unemployment numbers on Friday, which will provide deeper insights into the state of the US economy. The markets will closely monitor these cues to readjust their bets on rate cuts from the Federal Reserve (Fed).
Daily digest market movers: DXY extends gains amid mixed economic signals
- ISM Services PMI for May recovered to 53.8, exceeding the market expectation of 50.8 and marking considerable growth from April's reading of 49.4.
- ADP Employment Change report shows US private sector employment rose by 152K in May.
- This increase falls short of the market expectation of 173K and lower than the revised 188K additions in April.
- Likelihood of interest rate cuts in June and July remain low, while those odds stand at around 60% for September.
DXY technical analysis: USD rebound is in sight despite underlying bearish sentiment
Even though the DXY index has slipped below the 20,100 and 200-day Simple Moving Averages (SMAs), there have been signals of a possible recovery in the last two sessions. The Relative Strength Index (RSI) has risen but still stays below 50, while the Moving Average Convergence Divergence (MACD) depicts lower red bars, reflecting some buying interest.
Despite the overall negative sentiment in the market, bulls are gradually gaining ground. Should they succeed in recovering the convergence of the lost 100 and 200-day SMAs at 104.40, this would considerably brighten the outlook for the DXY index.
US Dollar FAQs
The US Dollar (USD) is the official currency of the United States of America, and the ‘de facto’ currency of a significant number of other countries where it is found in circulation alongside local notes. It is the most heavily traded currency in the world, accounting for over 88% of all global foreign exchange turnover, or an average of $6.6 trillion in transactions per day, according to data from 2022. Following the second world war, the USD took over from the British Pound as the world’s reserve currency. For most of its history, the US Dollar was backed by Gold, until the Bretton Woods Agreement in 1971 when the Gold Standard went away.
The most important single factor impacting on the value of the US Dollar is monetary policy, which is shaped by the Federal Reserve (Fed). The Fed has two mandates: to achieve price stability (control inflation) and foster full employment. Its primary tool to achieve these two goals is by adjusting interest rates. When prices are rising too quickly and inflation is above the Fed’s 2% target, the Fed will raise rates, which helps the USD value. When inflation falls below 2% or the Unemployment Rate is too high, the Fed may lower interest rates, which weighs on the Greenback.
In extreme situations, the Federal Reserve can also print more Dollars and enact quantitative easing (QE). QE is the process by which the Fed substantially increases the flow of credit in a stuck financial system. It is a non-standard policy measure used when credit has dried up because banks will not lend to each other (out of the fear of counterparty default). It is a last resort when simply lowering interest rates is unlikely to achieve the necessary result. It was the Fed’s weapon of choice to combat the credit crunch that occurred during the Great Financial Crisis in 2008. It involves the Fed printing more Dollars and using them to buy US government bonds predominantly from financial institutions. QE usually leads to a weaker US Dollar.
Quantitative tightening (QT) is the reverse process whereby the Federal Reserve stops buying bonds from financial institutions and does not reinvest the principal from the bonds it holds maturing in new purchases. It is usually positive for the US Dollar.
- Canadian Dollar loses minor ground against Greenback after BoC rate cut.
- Canada delivers broadly expected rate trim, but BoC sticks to per meeting outlook.
- Markets set to pivot to Friday’s US NFP and Canadian labor figures.
The Canadian Dollar (CAD) backslid against the US Dollar (USD) during Wednesday’s US market session, briefly sending USD/CAD to a near-term high of 1.3740 before markets faded the move back to the 1.3700 handle. The Bank of Canada (BoC) delivered a broadly expected quarter-point rate cut, but US ISM Services Purchasing Managers Index (PMI) figures in June unexpectedly rose to a nine-month high.
Canada has notched a first rate cut from the BoC on Wednesday, and CAD traders will pivot to focus on Friday’s upcoming Canadian labor figures. However, another US Nonfarm Payrolls (NFP) jobs print will likely overshadow Canadian employment data in that session.
Daily digest market movers: BoC moves on rates, meets market expectations
- BoC cut its main reference rate by 25 basis points to 4.75% from 5.0%.
- During the BoC’s Monetary Policy Statement, BoC Governor Tiff Macklem noted that the BoC’s policy decisions on future rate cuts will be considered one meeting at a time.
- US ISM Services PMI rebounds to nine-month high of 53.8 in May, above forecast of 50.8 and recovering from April’s 16-month low of 49.4.
- US ADP Employment Change in May came in lower than expected, printing at 152K in May and missing the 173K forecast. The previous month was also revised slightly lower to 188K from 192K.
- Interest rate market bets of a November Federal Reserve rate cut have risen to 80%.
- BoC's Macklem: Confidence on inflation returning to 2.0% remains in place
- Macklem speech: It is looking like a soft landing for the economy
Canadian Dollar PRICE Today
The table below shows the percentage change of Canadian Dollar (CAD) against listed major currencies today. Canadian Dollar was the strongest against the Japanese Yen.
| USD | EUR | GBP | JPY | CAD | AUD | NZD | CHF | |
|---|---|---|---|---|---|---|---|---|
| USD | 0.12% | -0.07% | 0.80% | 0.19% | 0.09% | -0.14% | 0.43% | |
| EUR | -0.12% | -0.19% | 0.68% | 0.07% | -0.02% | -0.24% | 0.27% | |
| GBP | 0.07% | 0.19% | 0.86% | 0.27% | 0.17% | -0.05% | 0.48% | |
| JPY | -0.80% | -0.68% | -0.86% | -0.61% | -0.71% | -0.95% | -0.41% | |
| CAD | -0.19% | -0.07% | -0.27% | 0.61% | -0.09% | -0.31% | 0.21% | |
| AUD | -0.09% | 0.02% | -0.17% | 0.71% | 0.09% | -0.23% | 0.31% | |
| NZD | 0.14% | 0.24% | 0.05% | 0.95% | 0.31% | 0.23% | 0.54% | |
| CHF | -0.43% | -0.27% | -0.48% | 0.41% | -0.21% | -0.31% | -0.54% |
The heat map shows percentage changes of major currencies against each other. The base currency is picked from the left column, while the quote currency is picked from the top row. For example, if you pick the Canadian Dollar from the left column and move along the horizontal line to the US Dollar, the percentage change displayed in the box will represent CAD (base)/USD (quote).
Economic Indicator
BoC Interest Rate Decision
The Bank of Canada (BoC) announces its interest rate decision at the end of its eight scheduled meetings per year. If the BoC believes inflation will be above target (hawkish), it will raise interest rates in order to bring it down. This is bullish for the CAD since higher interest rates attract greater inflows of foreign capital. Likewise, if the BoC sees inflation falling below target (dovish) it will lower interest rates in order to give the Canadian economy a boost in the hope inflation will rise back up. This is bearish for CAD since it detracts from foreign capital flowing into the country.
Read more.Last release: Wed Jun 05, 2024 13:45
Frequency: Irregular
Actual: 4.75%
Consensus: 4.75%
Previous: 5%
Source: Bank of Canada
Technical analysis: Canadian Dollar edges lower on Wednesday as Greenback gains
The Canadian Dollar is mixed on Wednesday, rising nearly half a percent against the Japanese Yen but falling around a quarter of a percent against the US Dollar. The CAD’s backslide sparked a brief rise in the pair to 1.3740 before cooler heads prevailed and pushed the pair back toward the 1.37000.
Daily candlesticks reveal the pair mired in near-term congestion with bids waffling close to the 50-day Exponential Moving Average (EMA) at 1.3649. 2024’s high currently sits at 1.3846, while overall USD/CAD remains up around 3.5% for the year.
USD/CAD hourly chart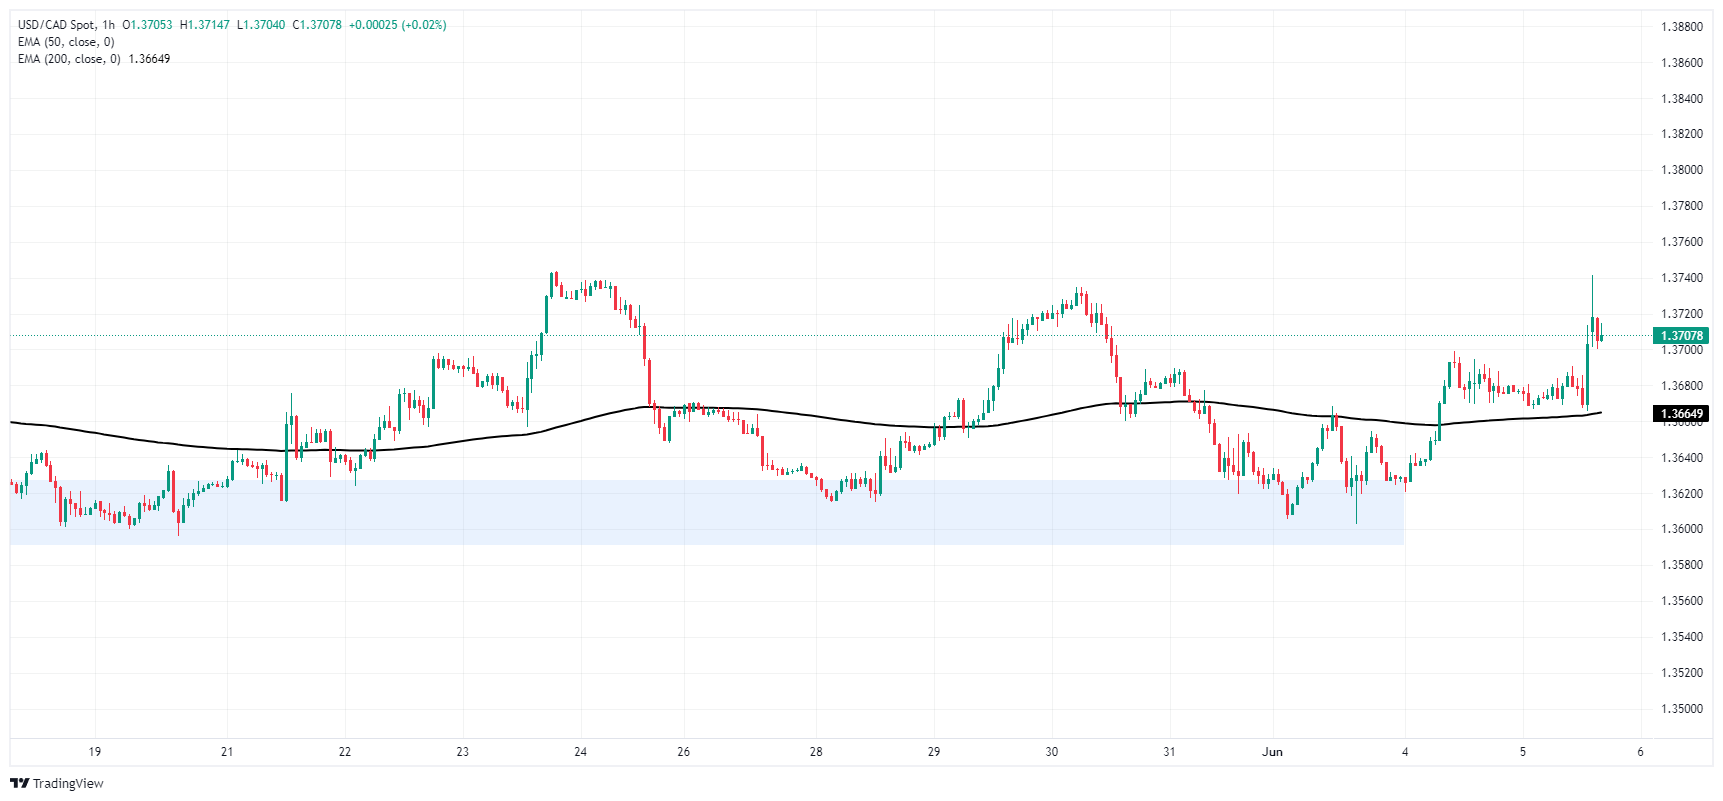
USD/CAD daily chart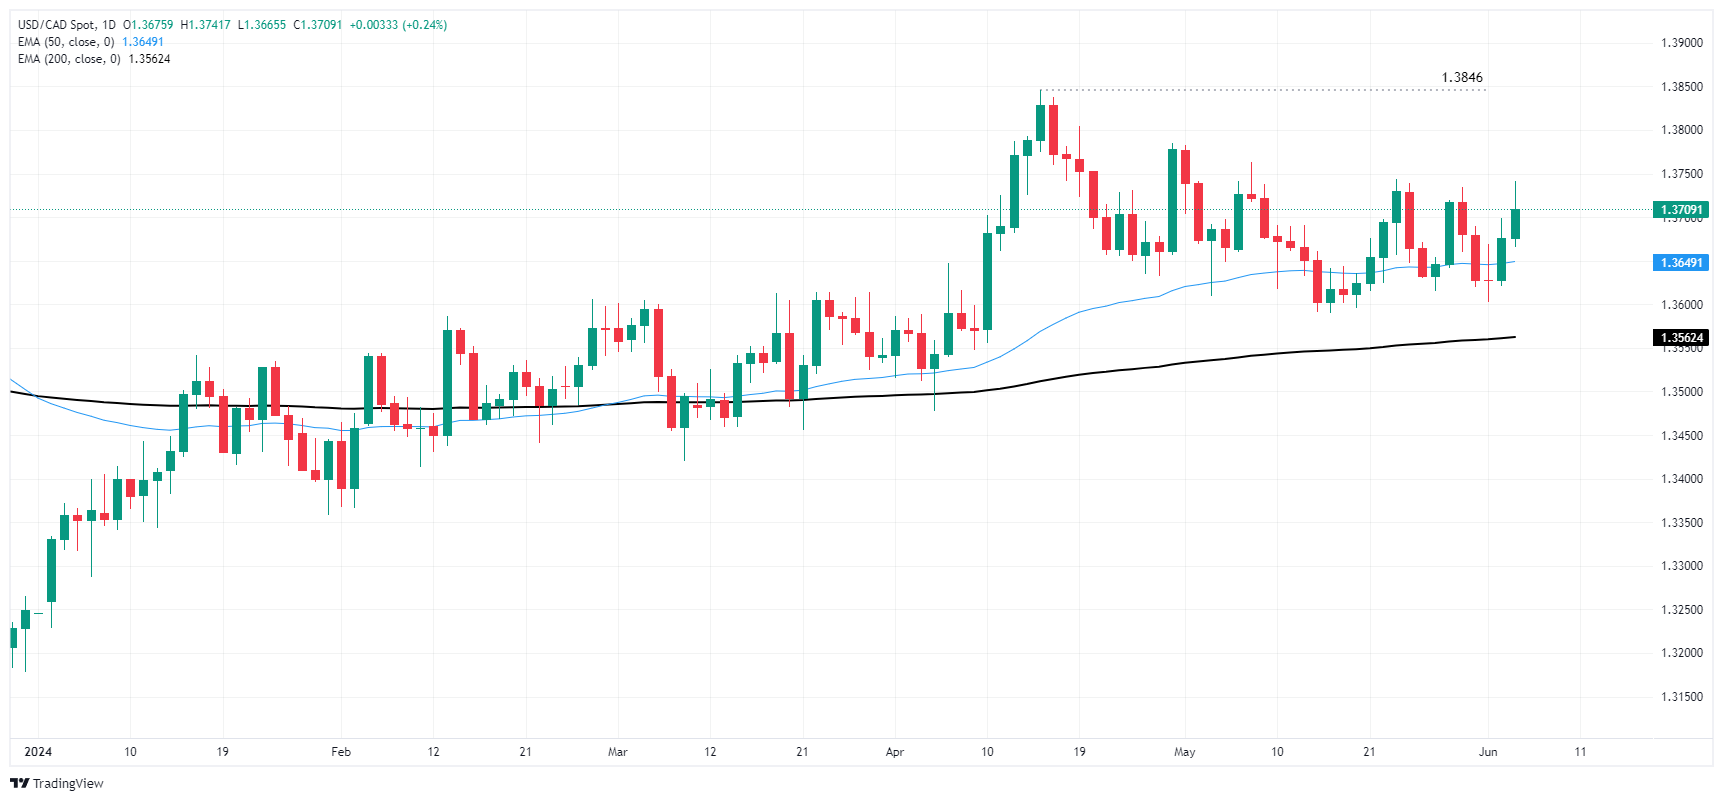
Canadian Dollar FAQs
The key factors driving the Canadian Dollar (CAD) are the level of interest rates set by the Bank of Canada (BoC), the price of Oil, Canada’s largest export, the health of its economy, inflation and the Trade Balance, which is the difference between the value of Canada’s exports versus its imports. Other factors include market sentiment – whether investors are taking on more risky assets (risk-on) or seeking safe-havens (risk-off) – with risk-on being CAD-positive. As its largest trading partner, the health of the US economy is also a key factor influencing the Canadian Dollar.
The Bank of Canada (BoC) has a significant influence on the Canadian Dollar by setting the level of interest rates that banks can lend to one another. This influences the level of interest rates for everyone. The main goal of the BoC is to maintain inflation at 1-3% by adjusting interest rates up or down. Relatively higher interest rates tend to be positive for the CAD. The Bank of Canada can also use quantitative easing and tightening to influence credit conditions, with the former CAD-negative and the latter CAD-positive.
The price of Oil is a key factor impacting the value of the Canadian Dollar. Petroleum is Canada’s biggest export, so Oil price tends to have an immediate impact on the CAD value. Generally, if Oil price rises CAD also goes up, as aggregate demand for the currency increases. The opposite is the case if the price of Oil falls. Higher Oil prices also tend to result in a greater likelihood of a positive Trade Balance, which is also supportive of the CAD.
While inflation had always traditionally been thought of as a negative factor for a currency since it lowers the value of money, the opposite has actually been the case in modern times with the relaxation of cross-border capital controls. Higher inflation tends to lead central banks to put up interest rates which attracts more capital inflows from global investors seeking a lucrative place to keep their money. This increases demand for the local currency, which in Canada’s case is the Canadian Dollar.
Macroeconomic data releases gauge the health of the economy and can have an impact on the Canadian Dollar. Indicators such as GDP, Manufacturing and Services PMIs, employment, and consumer sentiment surveys can all influence the direction of the CAD. A strong economy is good for the Canadian Dollar. Not only does it attract more foreign investment but it may encourage the Bank of Canada to put up interest rates, leading to a stronger currency. If economic data is weak, however, the CAD is likely to fall.
- Mexican Peso gains over 1.50% Wednesday after peaking at 17.85 earlier.
- Finance Minister Rogelio Ramirez de la O reassures markets about financial discipline and investment facilitation.
- US economic data was mixed as ADP employment figures disappoint, while ISM Services PMI exceeds estimates.
The Mexican Peso stages a recovery against the US Dollar, printing gains of more than 1.50% on Wednesday following Mexican Finance Minister Rogelio Ramirez de la O’s press conference on Tuesday that attempted to calm the financial markets.
Although data from Mexico and the United States would warrant further upside, the pair seems to have stabilized after two days of volatile sessions following Sunday’s presidential election that saw Dr. Claudia Sheinbaum lead the ruling Morena party to victory. The USD/MXN trades at 17.54 after hitting a daily high of 17.85.
“We want to confirm to international organizations and private investors that our project is based on financial discipline, abiding by the autonomy of the Bank of Mexico, adherence to the rule of law and facilitating national and foreign private investment,” said Ramirez de la O, according to a translation by El Financiero.
Some analysts considered his message vague, and doubts continue to cloud Dr. Claudia Sheinbaum’s upcoming presidency due to the strong majority of the Morena party.
USD/MXN traders ditched the emerging market currency because they feared Morena’s overwhelming victory in Congress could threaten to eliminate autonomous regulators like the National Elections Institute and push a bill for direct election of Supreme Court judges.
Meanwhile, Mexico’s economic docket revealed that consumer confidence deteriorated further in May than in April.
Across the border, US employment figure estimates in the ADP Employment Change report came below estimates, reaffirming that the US labor market is cooling. However, May's latest ISM Services PMI figures exceeded estimates and expanded sharply, boosting appetite for the Greenback.
Daily digest market movers: Mexican Peso shrugs off election fears and advances
- Mexican Consumer Confidence fell to a seven-month low of 46.7 in May, below April’s 47.7.
- September would be a crucial month for the Mexican Congress. Morena’s majority could push bills blocked by the opposition, including the reduction of lawmakers and plans for direct election of the Supreme Court members.
- Morgan Stanley noted that if Mexico’s upcoming government and Congress adopted an unorthodox agenda, it would undermine Mexican institutions and be bearish for the Mexican Peso, which could weaken to 19.20.
- Speculation of another Banxico rate cut in June could pave the way for further upside in the USD/MXN.
- Institute for Supply Management (ISM) revealed that business activity in the US service sector expanded. The ISM Services PMI was 53.8 in May, the highest reading since August 2023, surpassing the 50.8 projected by the consensus and April’s 49.4 contraction.
- The US ADP National Employment Change in May missed the estimates of 175K and came in at 152K, lower than April’s 188K.
- Alongside a softer April JOLTS report, ADP data hints that jobs market is cooling ahead of the release of May Nonfarm Payrolls data on Friday.
- The futures market suggests the Federal Reserve might cut rates by 35 basis points in 2024, according to the December 2024 fed funds future rate contract.
Technical analysis: Mexican Peso counterattacks as USD/MXN slides below 17.60
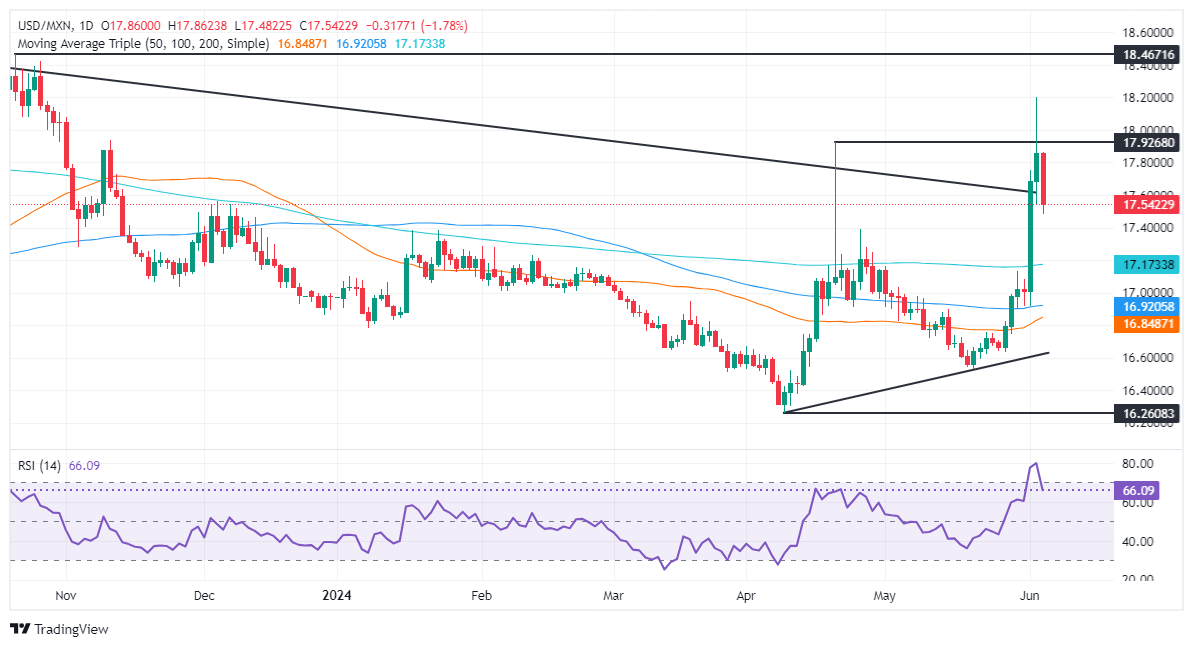
The USD/MXN shifts to neutral bias despite posting losses close to 1.80% on Wednesday. However, Monday’s Japanese Marabuzo candlestick suggests that buyers are in charge and that the exotic pair might head back to levels below the already broken 200-day Displaced Moving Average (DMA) near 17.16.
The USD/MXN’s first resistance level would be the June 3 high at 17.74, followed by the 18.00 psychological level. Once surpassed, the next stop would be the year-to-date high of 18.19.
Momentum favors further upside as the Relative Strength Index (RSI) sits at the higher end of the graph. But RSI’s exiting from overbought conditions opened the door for a pullback toward the current day’s low of 17.48.
In the event of further losses, the next support would be the 200-DMA at 17.16, followed by the 17.00 figure, ahead of the 100-day DMA at 16.91. Once cleared, up next would be the 50-day DMA at 16.84.
Mexican Peso FAQs
The Mexican Peso (MXN) is the most traded currency among its Latin American peers. Its value is broadly determined by the performance of the Mexican economy, the country’s central bank’s policy, the amount of foreign investment in the country and even the levels of remittances sent by Mexicans who live abroad, particularly in the United States. Geopolitical trends can also move MXN: for example, the process of nearshoring – or the decision by some firms to relocate manufacturing capacity and supply chains closer to their home countries – is also seen as a catalyst for the Mexican currency as the country is considered a key manufacturing hub in the American continent. Another catalyst for MXN is Oil prices as Mexico is a key exporter of the commodity.
The main objective of Mexico’s central bank, also known as Banxico, is to maintain inflation at low and stable levels (at or close to its target of 3%, the midpoint in a tolerance band of between 2% and 4%). To this end, the bank sets an appropriate level of interest rates. When inflation is too high, Banxico will attempt to tame it by raising interest rates, making it more expensive for households and businesses to borrow money, thus cooling demand and the overall economy. Higher interest rates are generally positive for the Mexican Peso (MXN) as they lead to higher yields, making the country a more attractive place for investors. On the contrary, lower interest rates tend to weaken MXN.
Macroeconomic data releases are key to assess the state of the economy and can have an impact on the Mexican Peso (MXN) valuation. A strong Mexican economy, based on high economic growth, low unemployment and high confidence is good for MXN. Not only does it attract more foreign investment but it may encourage the Bank of Mexico (Banxico) to increase interest rates, particularly if this strength comes together with elevated inflation. However, if economic data is weak, MXN is likely to depreciate.
As an emerging-market currency, the Mexican Peso (MXN) tends to strive during risk-on periods, or when investors perceive that broader market risks are low and thus are eager to engage with investments that carry a higher risk. Conversely, MXN tends to weaken at times of market turbulence or economic uncertainty as investors tend to sell higher-risk assets and flee to the more-stable safe havens.
Tiff Macklem, Governor of the Bank of Canada (BoC), explains the BoC decision to lower the interest rate by 25 basis points to 4.75% after the June policy meeting and responds to questions from the press.
Key quotes
"We don't need to move lock and step with the Federal Reserve."
"There are limits to how far we can diverge from the US and we are not close to those limits."
"So far, it is looking like a soft landing for the economy."
"There is room for the economy to grow faster than potential for a period."
Market reaction
USD/CAD continues to trade in positive territory at around 1.3720 following these comments.
Tiff Macklem, Governor of the Bank of Canada (BoC), explains the BoC decision to lower the interest rate by 25 basis points to 4.75% after the June policy meeting and responds to questions from the press.
Key quotes
"We're going to be taking decisions one meeting at a time."
"Timing of any further interest rate cuts will depend on data."
"The work is not done."
"Path of any future interest rate cuts likely to be gradual."
Market reaction
USD/CAD continues to trade in positive territory above 1.3700 following these comments.
- USD/CAD rallies after the Bank of Canada decides to cut its key interest rate at its June meeting.
- The decision was widely expected but still weighs on the Canadian Dollar, lifting USD/CAD.
- The pair also gets a second boost after US ISM Services PMIs surprise to the upside, showing sector resilience.
USD/CAD spikes to a high of 1.3742 on Wednesday after the Bank of Canada (BoC) governing council decides to reduce its key interest rate by 0.25% to 4.75%, following its June policy meeting. The decision weighs on the Canadian Dollar (CAD) since lower interest rates attract less foreign capital inflows. The US Dollar (USD) meanwhile gains a shot in the arm from a higher-then-expected reading for the ISM Services PMI in May, which continues to portray the sector in vibrant health.
USD/CAD rallies after BoC decision
USD/CAD rose by over 0.2% on Wednesday straight after the BoC governing council decided to make a cut to its key interest rate at its June policy meeting.
“With continued evidence that underlying inflation is easing, the Governing Council agreed that monetary policy no longer needs to be as restrictive and reduced the policy interest rate by 25 basis points,” the BoC said in its policy statement.
The decision means the interest rate differential between the BoC and the US Federal Reserve (Fed) has widened. The Fed’s key interest rate is 5.0% - 5.25%. The higher interest available in the US is a draw for foreign capital and benefits the US Dollar, which in turn is positive for USD/CAD.
The governing council noted that the BoC’s preferred gauge of inflation stood at 2.7% in April which, although above the BoC’s 2% target, was low enough to warrant a rate cut. In addition supply was overall greater than demand in the economy.
The Canadian economy’s 1.7% growth in Q1 was slower than the BoC had forecast. Further “weaker inventory investment had dampened activity” and wage pressures had “moderated” the governing council noted.
On the other hand, “Consumption growth was solid at about 3%, and business investment and housing activity also increased. Labour market data show businesses continue to hire, although employment has been growing at a slower pace than the working-age population,” the BoC statement said.
In addition to cutting the target for its key overnight policy rate to 4.75%, the BoC also cut the Deposit Rate to 4.75% whilst its Bank Rate at 5.0%.
USD/CAD gets second wind after ISM Services PMI surprises to the upside
USD/CAD gained a further boost following the release of higher-than-forecast ISM Services PMI data which showed the US services sector remained in rude health, in contrast to manufacturing which contracted during the same period.
ISM Services PMI in the US rose to 53.8 in May, up from 50.8 in April and beating forecasts of 49.4. It was the highest reading in nine months. The growth was driven by a rise in New Orders. Firms held back on employing new staff, however, but wages increased.
“A return to growth of new orders spurred US service providers,” the ISM report stated. “Less positive was a second successive reduction in employment as firms remained reluctant to replace departing staff. Higher wages for existing workers, meanwhile, was the key driver of a further sharp increase in input costs, with the rate of inflation quickening from that seen in April,” it went on.
Despite the growth in New Orders and rise in wages Services inflation actually expanded at a slower rate as the Prices Paid component fell to 58.1 in May from 59.2 in April.
- GBP/USD remains unchanged after ISM Services PMI indicates economic expansion in May.
- Technical outlook shows neutral to upward bias, but resistance at 1.2800 limits gains.
- Key levels: Support at 1.2742, 1.2700, and 1.2634; Resistance at 1.2800, YTD high at 1.2893, and 1.2900.
The GBP/USD is virtually unchanged in early trading during the North American session, following the release of the Institute for Supply Management (ISM) Services PMI, which showed the economy remains resilient, expanded in May above estimates and the previous month's reading, contrarily to manufacturing activity. Therefore, the major trades at 1.2768, almost flat.
GBP/USD Price Analysis: Technical outlook
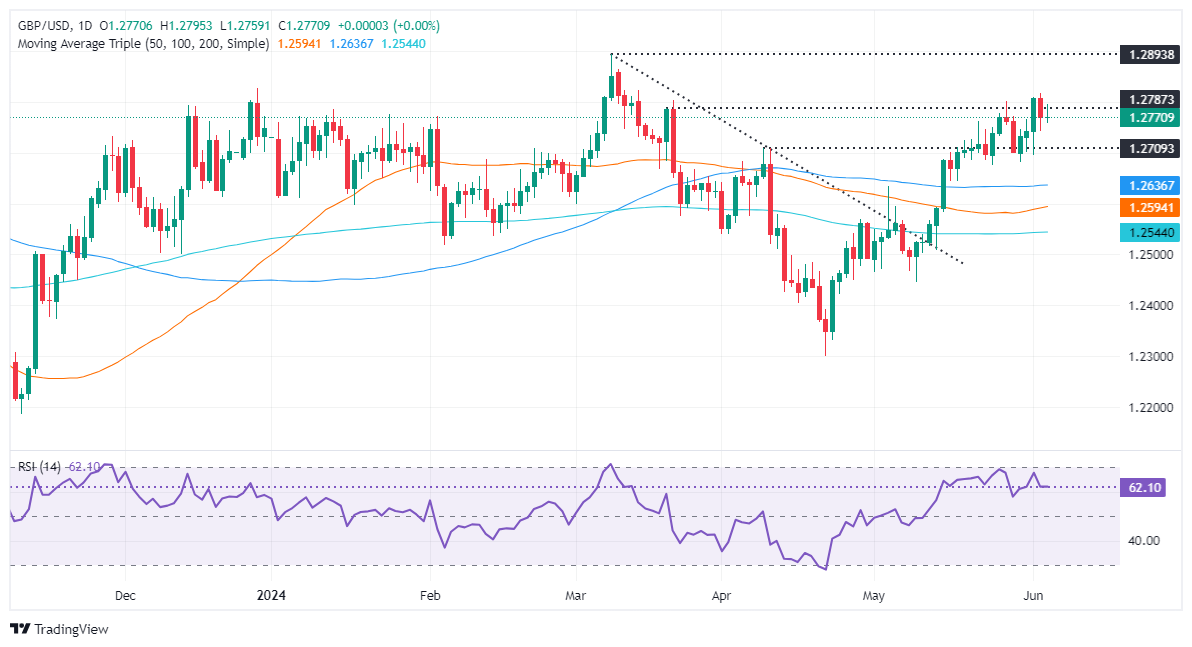
Looking at the daily chart, the GBP/USD is showing a neutral to upward bias. However, the failure to break through the confluence of a three-month-old downslope resistance trendline and the 1.2800 figure has led to a further decline in Cable’s value.
Momentum remains supportive of buyers, as the Relative Strength Index (RSI) shifted almost flat, though in bullish territory, while price action hints at bearish signals.
If sellers push the GBP/USD below yesterday’s low of 1.2742, a drop toward 1.2700 is on the cards. Further losses are seen beneath the June 3 low of 1.2694, like the confluence of the 100-day moving average (DMA) and the May 3 high of 1.2634.
Conversely, if buyers keep the exchange rate within the 1.2740 – 1.2800 range, they could lift the spot prices and challenge the abovementioned confluence, at around the top of the range. Gains lie overhead at the year-to-date (YTD) high of 1.2893, followed by the 1.2900 mark.
GBP/USD Price Action – Daily Chart
- US ISM Services PMI rose more than expected in May.
- US Dollar Index edges higher toward 104.50 after the data.
Business activity in the US service sector expanded in May, with the ISM Services PMI recovering to 53.8 from 49.4 in April. This reading came in above the market expectation of 50.8.
Other details of the report showed that the Prices Paid Index, the inflation component, edged lower to 58.1 from 59.2, while the Employment Index recovered to 47.1 from 45.9.
Assessing the survey's findings, "the increase in the composite index in May is a result of notably higher business activity, faster new orders growth, slower supplier deliveries and despite the continued contraction in employment," said Anthony Nieves, Chair of the Institute for Supply Management Services Business Survey Committee, and continued:
"Survey respondents indicated that overall business is increasing, with growth rates continuing to vary by company and industry. Employment challenges remain, primarily attributed to difficulties in backfilling positions and controlling labor expenses. The majority of respondents indicate that inflation and the current interest rates are an impediment to improving business conditions."
Market reaction
The US Dollar Index recovered from session lows following the upbeat PMI data and was last seen rising 0.2% on the day at 104.35.
- USD/CHF gains ground near 0.8900 as the USD Index holds key support of 104.00.
- Weak US ADP Employment has limited the US Dollar’s upside.
- The SNB is expected to intervene amid fears that the weak Swiss Franc could revamp inflation again.
The USD/CHF pair finds cushion near the round-level support of 0.8900 in Wednesday’s New York session. The Swiss Franc asset finds support even though there is a firm speculation that the Swiss National Bank (SNB) will intervene in currency markets to support the Swiss Franc.
The Swiss Franc is up 3.6% against the US Dollar from May 1 but is overall down 6%, which has made Swiss exports competitive globally. This could feed inflationary pressures and push the annual Consumer Price Index (CPI) back above the 2% threshold.
Meanwhile, the US Dollar Index (DXY) retreated from 104.30 after the release of the weaker-than-expected United States (US) Automatic Data Processing (ADP) Employment data for May but holds the crucial support of 104.00. The agency reported that private employers hired 152K job-seekers, which was lower than estimates of 173K and the former release of 188K. This has deepened fears of easing labor market strength. Earlier, the USD rebounded from 104.00
This week, the major event for the US Dollar will be the US Nonfarm payrolls (NFP) report for May, which will be published on Friday. The NFP report will significantly influence market speculation for the Federal Reserve (Fed) reducing interest rates from the September meeting.
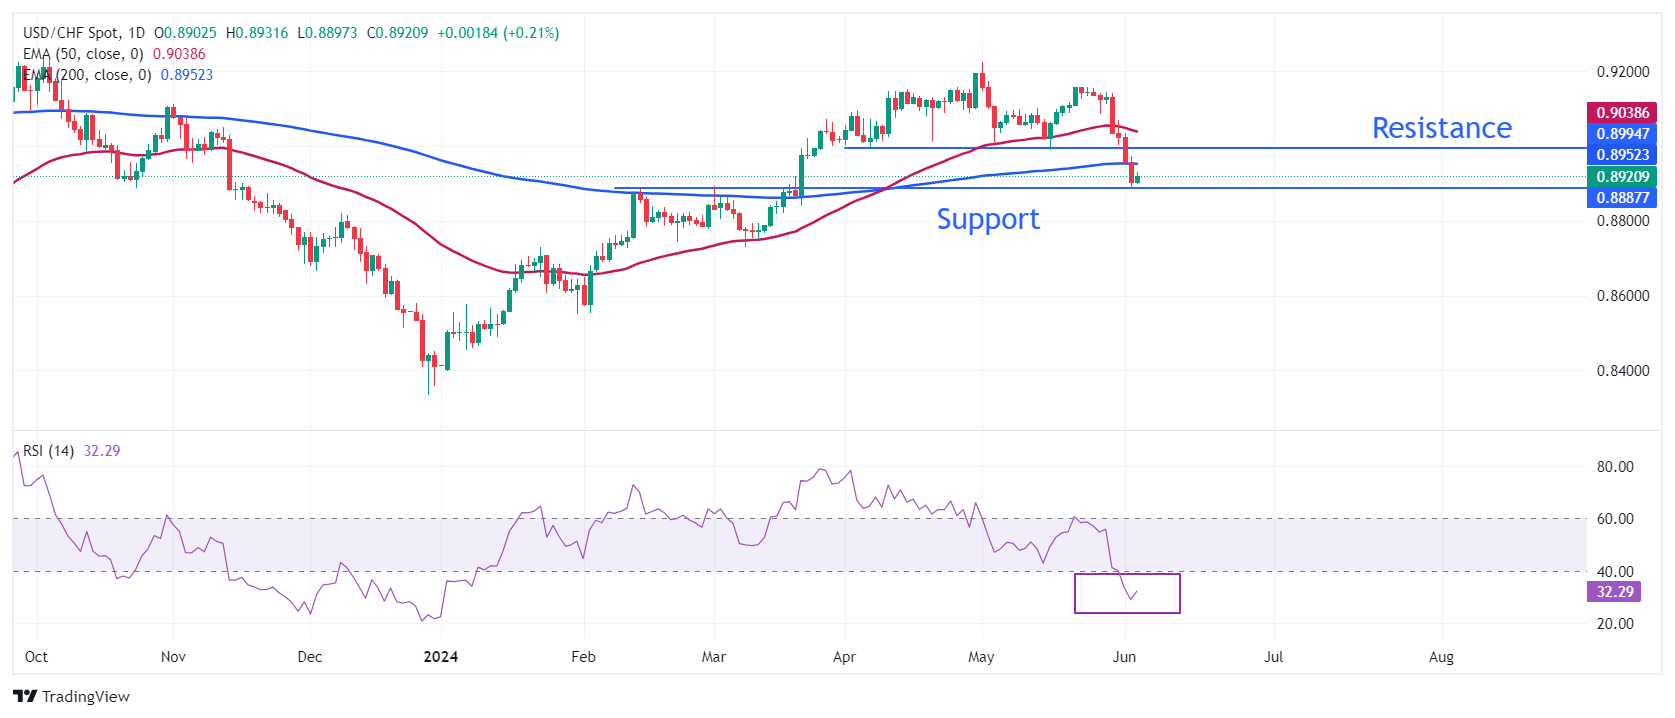
USD/CHF discovers buying interest near the horizontal support plotted from February 14 high at 0.8886. Earlier, the Swiss Franc asset weakened after breaking below the horizontal support marked from April 5 near 0.9000, which has become a major resistance for the US Dollar bulls.
The overall trend is bearish as the major stays below the 50- and 200-day Exponential Moving Averages (EMAs), which trade around 0.9038 and 0.8590, respectively.
The 14-period Relative Strength Index (RSI) shifts into the bearish range of 20.00-40.00, indicating that momentum has leaned towards the downside.
Fresh downside would appear if the asset breaks below June 4 low of 0.8900, which will open room for March 21 low at 0.8840 and the round-level support of 0.8800.
On the flip side, a recovery move above the psychological resistance of 0.9000 will drive the asset towards June 3 high at 0.9036, followed by May 28 low at 0.9086.
USD/CHF daily chart
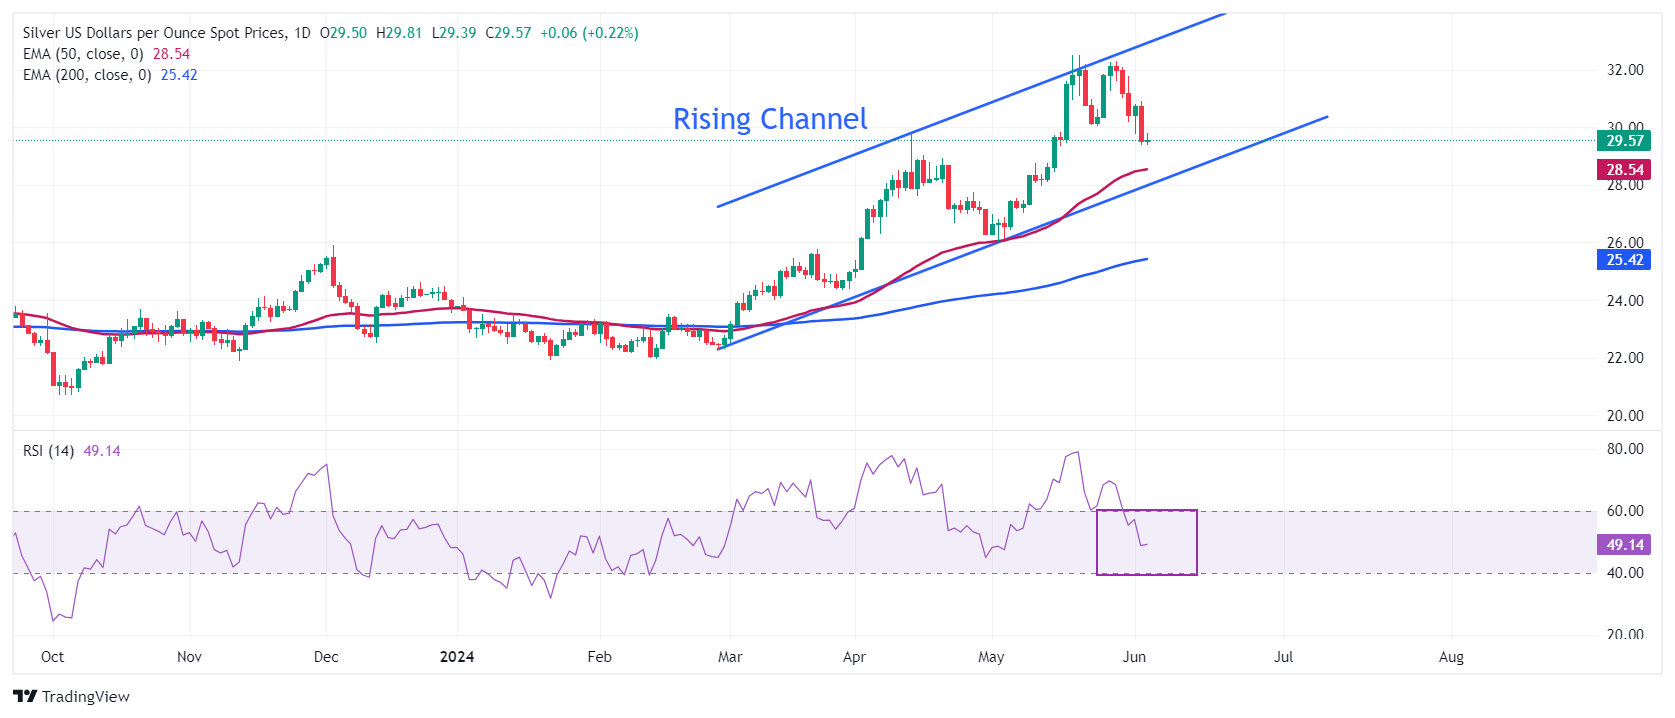
- Silver price remains sideways below $30.00 with a focus on the US ISM Services PMI data.
- The US ADP reported that private payrolls were 152K, lower than the estimates of 173K.
- Fed’s restrictive monetary policy framework is unfavorable amid normalizing labor market conditions.
Silver price (XAG/USD) fails to find direction and remains sideways below the psychological resistance of $30.00 despite the United States (US) Automatic Data Processing (ADP) has reported weaker-than-expected private payroll data for May.
The agency reported that private employers recruited 152K jobs, which were lower than the estimates of 173K and the prior release of 188K, downwardly revised from 192K. This exhibit normalizing labor market conditions, which fuels expectations of the Federal Reserve (Fed) reducing interest rates from the September meeting and weighs on the US Dollar. The US Dollar Index (DXY), which tracks the Greenback’s value against six major currencies, faces pressure while attempting to extend recovery above 104.30.
Volatility in the US Dollar is expected to remain high as investors await the US ISM Services PMI data for May, which will be published at 14:00 GMT. Economists have forecasted that the Services PMI is estimated to have returned to expansion, seen at 50.5, higher than the former release of 49.4.
Apart from that, investors will also focus on other sub-components such as New Orders and Prices Paid Indices, which reflects the demand outlook and change in input prices. In the service sector, major allocation of expenditure goes in wages paid to workers, which has remained a key driver to persistent price pressures.
Silver technical analysis
Silver price trades in a Rising Channel chart pattern, formed on a daily timeframe, in which each pullback is considered as buying opportunity by market participants. Upward-sloping 50 and 200-day Exponential Moving Averages (EMAs) around $28.50 and $25.40, respectively, indicate that the overall trend is bullish.
The 14-period Relative Strength Index (RSI) falls back into the 40.00-60.00 range, suggesting that upside momentum has faded. However, the upside bias remains intact.
Silver daily chart
- USD/JPY is recovering after finding support on the 50-day SMA.
- A positive market mood and weak Japanese real wage data are supporting the pair.
- Rumors the BoJ could cut bond purchases – a move that would support the Yen – are a headwind for the pair.
USD/JPY bounces off the 50-day Simple Moving Average (SMA) and pumps higher as the US Dollar (USD) continues its resurrection after the recent post-ISM Manufacturing PMI miss sell-off. The pair is trading above 156.00 on Wednesday, up 0.8% on the day.
USD/JPY bulls are further encouraged by a weakening Japanese Yen (JPY) following data that shows real wages declining for the 25th straight month in April as domestic inflation in Japan continues to outpace wage growth. The data will make it harder for the Bank of Japan (BoJ) to normalize policy, as it hopes to lift the bank’s policy rate from an ultra-low 0.0% - 0.1% range and support its beleaguered currency.
Indeed, both the safe-haven JPY and Swiss Franc (CHF) are falling on Wednesday as market morale improves. Most European equity indexes are trading higher and in the commodity sphere, Oil, softs and precious metals are up but non-precious metals and lumber are down.
Rumors that the Bank of Japan (BoJ) is poised to reduce its bond purchases at its June policy meeting benefited JPY (negative for USD/JPY) on Tuesday. Such a move would put upward pressure on Japanese bond yields which are highly correlated to the JPY. However, it remains to be seen whether the rumors materialize on the day.
The risk of intervention is also a constant threat to USD/JPY bulls. On Tuesday, Deputy Governor of the BoJ Ryozo Himino repeated concerns about how a weak JPY could negatively impact the economy. His comments suggested the BoJ might be preparing for another direct intervention in Forex markets to prop up JPY (negative for USD/JPY).
Himino also discussed how the weak Yen was impacting inflation. Although it drove up the price of imported goods, thereby generating inflation – which is what the BoJ wants – Himino said. This is not the sort of inflation the BoJ wishes to encourage as it makes imported goods unaffordable for ordinary shoppers. The BoJ would prefer inflation from higher wages instead as this would lead to more spending and a more dynamic economy.
According to analysts at Rabobank, Himino’s remarks “ratcheted up concerns that the BoJ could confront the market with a hawkish policy move at its June 14 policy meeting.”
USD/JPY seems unfazed by US jobs data on Wednesday, after Automatic Data Processing (ADP) released its payrolls figures for the private sector. The data showed payrolls increased by only 152K which was below the 173K forecast and the revised down 188K of April.
US ISM Services PMIs is also out on Wednesday whilst on Friday, The US Bureau of Labor Statistics will release US Nonfarm Payrolls (NFP) which could be a major USD mover.
If the US data is weak in line with the general trend of late, it could undo the USD/JPY’s recovery rally and plunge the pair back down below 155.00 again.
- Private sector employment in the US rose less than expected in May.
- US Dollar Index continues to fluctuate above 104.00.
Private sector employment in the US rose by 152,000 in May and annual pay was up 5%, the Automatic Data Processing (ADP) reported on Wednesday. This reading followed the 188,000 increase (revised from 192,000) recorded in April and came in below the market expectation of 173,000.
Commenting on the report's findings, "job gains and pay growth are slowing going into the second half of the year," said Nela Richardson, chief economist, ADP. "The labor market is solid, but we're monitoring notable pockets of weakness tied to both producers and consumers."
Market reaction
This report failed to trigger a noticeable market reaction. At the time of press, the US Dollar Index was up 0.12% on the day at 104.27.
- The US Dollar moves higher against its peers on Wednesday.
- Markets are supporting the Greenback for a second day despite another softer-than-expected JOLTS data on Tuesday.
- The US Dollar Index holds above 104.00 and looks to test nearby upside resistance.
The US Dollar (USD) edges higher for a second day on Wednesday, with the US Dollar Index (DXY), which tracks the Greenback’s value against six major currencies, still negative in the week after Monday’s meltdown. Although the JOLTS Job Openings report for April published on Tuesday showed another decline, even falling below consensus, the fact that the wages element in the report still pointed to a willingness to pay higher salaries is an issue and main driver for the US inflation outlook.
On the economic front, all eyes are on Automatic Data Processing (ADP) and the Institute for Supply Management (ISM). ADP will release its monthly Employment Change ahead of the official US Employment report on Friday, while the ISM will give markets more insights on the Services sector. It is worth noting that the lacklustre performance of the ISM release about the Manufacturing sector was a main driver for the meltdown in the Greenback on Monday.
Daily digest market movers: DXY faces key moment ahead ISM data
- Earlier in the day, the Mortgage Bankers Association (MBA) released its Mortgage Applications number for the last week of May. Data showed a -5.2% concerning the previous week against -5.7% already from the week before.
- The ADP Employment Change data for May will be released at 12:15 GMT. Economists expect a 173,000 increase against the previous reading of 192,000 in April.
- At 13:45 GMT, S&P Global will release its final reading for the Services and Composite Purchasing Managers Index (PMI) for May. Services are expected to remain unchanged at 54.8. The Composite should come in at 54.4, in line with preliminary readings.
- At 14:00 GMT, the ISM releases the Services sector PMI for May:
- Services Employment component was at 45.9 in April, with no forecast available.
- New Orders index was at 52.2 in April.
- Headline Services PMI should jump back into expansion, seen at 50.5, from 49.4 in April.
- Prices Paid index was 59.2 in April, with no forecast available.
- Equities trade mixed on Wednesday, looking for some direction with mild losses or gains, though no real outliers to report in the European trading session.
- According to the CME Fedwatch Tool, Fed Fund futures pricing data suggests a 35.1% chance for keeping rates unchanged in September, against a 55.3% chance for a 25 basis points (bps) rate cut and a 9.6% chance for an even 50 bps rate cut. An interest rate hike is no longer considered an option since this week. For the upcoming meeting on June 12, futures are fully pricing in an unchanged result.
- The benchmark 10-year US Treasury Note trades around 4.35%, near its monthly low at 4.32%.
US Dollar Index Technical Analysis: JOLTS kept a hidden element for Dollar bulls
The US Dollar Index (DXY)tries to recover for a second day all its losses that got booked on Monday. Although the US Dollar weakness looks to be trickling through more and more in the price action, the decline in the JOLTS report held another element that markets did not pick up on immediately. That is, employers, even with fewer job openings than in previous months and weeks, are still willing to pay higher salaries for the right people in the right job, which means that one of the main drivers in US inflation is still alive.
On the upside, the DXY first faces double resistance in the form of the 200-day Simple Moving Average (SMA) at 104.43 and the 100-day SMA at 104.42. Next up, the pivotal level near 104.60 comes into play. For now, the topside is forming around 105.00, with the 55-day SMA coinciding with this round number and the peak from recent weeks at 105.12.
On the downside, the Greenback is trading in that air pocket area in which the 104.00 big figure looks to be holding. Once through there, another decline to 103.50 and even 103.00 are the levels to watch. With the Relative Strength Index (RSI) still not oversold, more downsides are still under consideration.
US Dollar FAQs
The US Dollar (USD) is the official currency of the United States of America, and the ‘de facto’ currency of a significant number of other countries where it is found in circulation alongside local notes. It is the most heavily traded currency in the world, accounting for over 88% of all global foreign exchange turnover, or an average of $6.6 trillion in transactions per day, according to data from 2022. Following the second world war, the USD took over from the British Pound as the world’s reserve currency. For most of its history, the US Dollar was backed by Gold, until the Bretton Woods Agreement in 1971 when the Gold Standard went away.
The most important single factor impacting on the value of the US Dollar is monetary policy, which is shaped by the Federal Reserve (Fed). The Fed has two mandates: to achieve price stability (control inflation) and foster full employment. Its primary tool to achieve these two goals is by adjusting interest rates. When prices are rising too quickly and inflation is above the Fed’s 2% target, the Fed will raise rates, which helps the USD value. When inflation falls below 2% or the Unemployment Rate is too high, the Fed may lower interest rates, which weighs on the Greenback.
In extreme situations, the Federal Reserve can also print more Dollars and enact quantitative easing (QE). QE is the process by which the Fed substantially increases the flow of credit in a stuck financial system. It is a non-standard policy measure used when credit has dried up because banks will not lend to each other (out of the fear of counterparty default). It is a last resort when simply lowering interest rates is unlikely to achieve the necessary result. It was the Fed’s weapon of choice to combat the credit crunch that occurred during the Great Financial Crisis in 2008. It involves the Fed printing more Dollars and using them to buy US government bonds predominantly from financial institutions. QE usually leads to a weaker US Dollar.
Quantitative tightening (QT) is the reverse process whereby the Federal Reserve stops buying bonds from financial institutions and does not reinvest the principal from the bonds it holds maturing in new purchases. It is usually positive for the US Dollar.
- Gold strengthens on the back of a decline in global interest-rate expectations.
- Overall weaker growth and cooler inflation in many countries is indicating central banks are about to start cutting interest rates.
- This is positive for non-yielding Gold, which tends to appreciate when interest rates fall.
Gold (XAU/USD) is trading in a mini-range inside the $2,330s and is showing a daily gain of around a quarter of a percent on Wednesday. A string of poor economic data releases from the US have increased bets the Federal Reserve (Fed) will cut interest rates before the end of the year, and at a global level inflation is falling and several central banks are preparing to cut interest rates as well. This lowers the opportunity cost of holding non-yielding Gold, making it overall more attractive to investors.
Gold edges higher as rate cuts loom
Gold drifts higher on Wednesday as more incoming macroeconomic data indicates the global economy is cooling and interest rates might be set to fall.
Eurozone factory-gate prices fell by 1.0% in April month-over-month, Producer Price Index (PPI) data from Eurostat showed on Wednesday. The result was lower than the 0.5% decline expected by economists and the revised 0.5% fall in the previous month. Although lower energy prices were responsible for the decline, other core costs also cooled, such as non-durables, which slowed to 0.1% from 0.6% previously.
Inflation data has been generally undershooting globally. Friday’s US core PCE data missed expectations and Swiss inflation similarly missed the mark on Tuesday, after coming out at 0.3% month-over-month in May when economists had estimated a 0.4% rise.
In Australia, first quarter GDP growth data out on Wednesday undershot estimates of 0.2% MoM and 1.2% YoY, coming out at 0.1% and 1.1% respectively instead.
US JOLTS Job openings data out Tuesday showed a sharp fall below estimates, coming out at 8.059 million when 8.340 million had been expected, and was well below the 8.355 million in March. The data suggested the US labor market is “further normalizing,” according to Thomas Ryan, North America Economist at Capital Economics.
Several central banks are tipped to lower interest rates in June, including the European Central Bank (ECB) – which holds its meeting on Thursday –, the Bank of Canada (BoC) – which holds its meeting today (Wednesday) – and the Swiss National Bank (SNB), which will meet later in June. The trend supports Gold.
Gold short-term bearish but fundamentals solid – TD Securities
Despite a firm fundamental backdrop supporting Gold, Ryan McKay, Senior Commodity Strategist at TD Securities is bearish in the short-term.
“Trend signals in Gold are no longer unilaterally pointing to the upside, and in fact, CTAs have become modest sellers in the yellow metal amid the recent correction in prices. However, this deterioration in short-term trend signals is expected to remain contained with a large margin of safety still remaining before the next selling trigger at the $2,209/oz mark,” says McKay.
The negative short-term bias is balanced, however, by solid Asian demand for the purposes of currency hedging, especially against the US Dollar.
“We see Gold on a solid footing as our tracking of trading activity in Chinese Gold ETFs suggest inflows have resumed at the fastest pace since the epic buying activity that hit the tapes in April,” says McKay. “Precious metals have increasingly morphed into a currency depreciation hedge, with resumed pressures in Asia pointing to nascent signs of notable buying activity,” he adds.
Technical Analysis: Gold trades along 50-day SMA
Gold price is trading in a mini-range over the last four to five days around the 50-day Simple Moving Average (SMA) which is acting as a kind of tether.
XAU/USD’s break below a major trendline, however, might have ushered in a short-term downtrend, which given “the trend is your friend” could extend.
XAU/USD Daily Chart
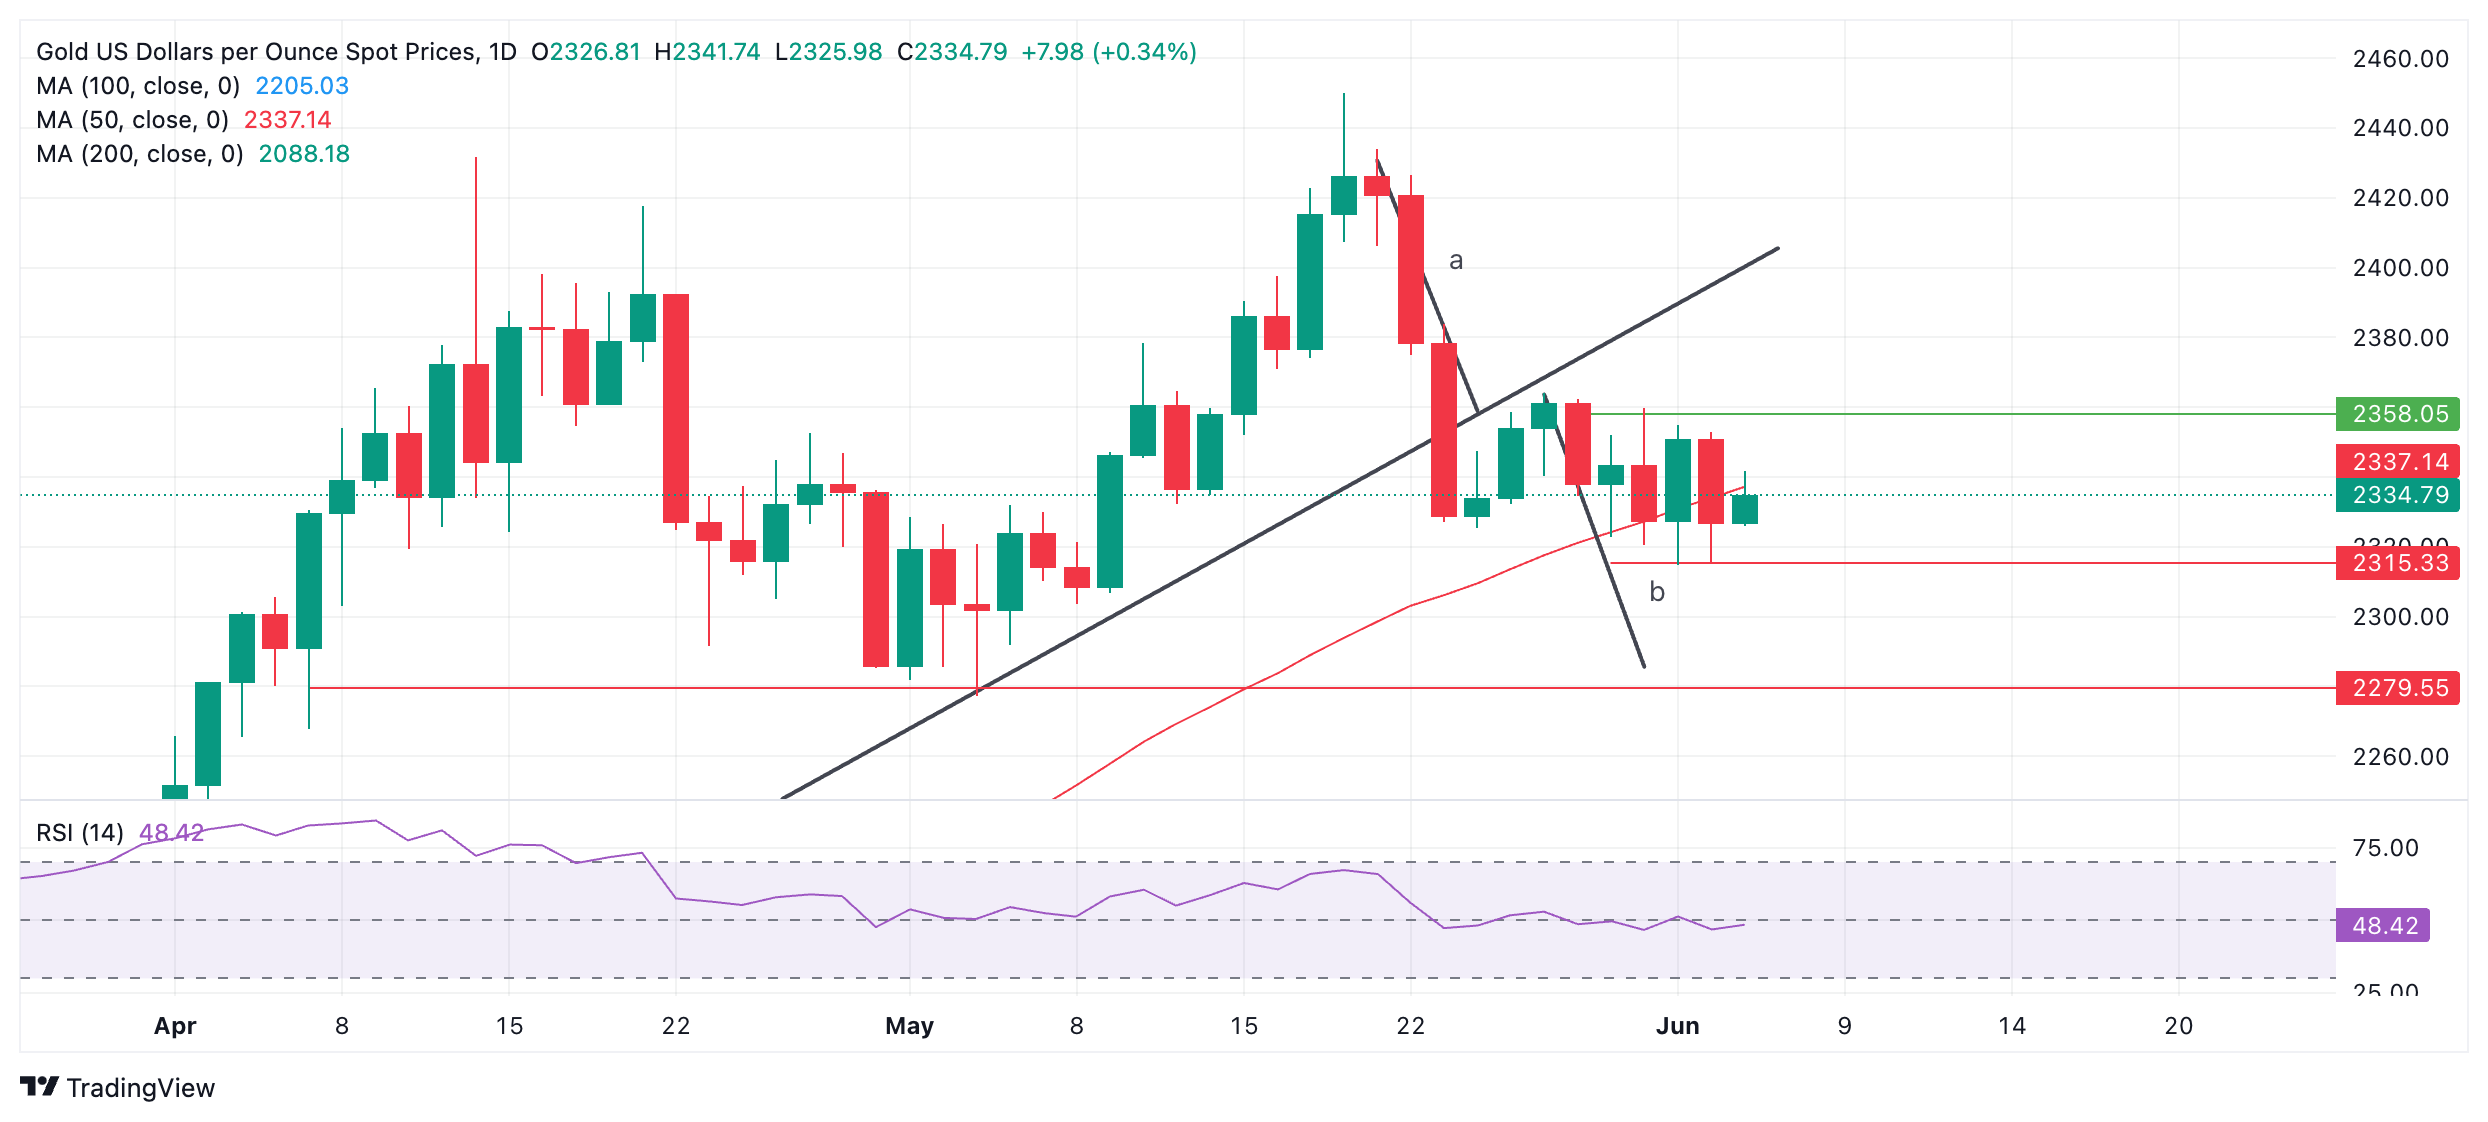
The break below the trendline generated downside targets. The length of the move prior to a break can be used as a guide to the follow-through move after a break, according to technical analysis. In the case of Gold, the prior move is labeled “a” and the follow-through “b”.
The first target for the follow-through is at $2,303, which is the 0.618 Fibonacci extrapolation of “a”.
Gold could even fall to $2,272-$2,279, the 100% extrapolation of “a” and the end of “b”. This also happens to be an area of historical support (red line).
The precious metal’s medium and long-term trends, however, are still bullish and the risk of a recovery remains high. That said, price action is not supporting a resumption hypothesis at the moment.
A break above $2,362 (May 29 high) would be required to bring into doubt the integrity of the short-term downtrend, otherwise further weakness is foreseen.
Economic Indicator
Producer Price Index (YoY)
The Producer Price Index (PPI) released by the Eurostat is an index that measures the change in prices received by domestic producers of commodities in all stages of processing (crude materials, intermediate materials, and finished goods). Generally, a high reading is seen positive (or bullish) for the EUR, while a low reading is seen as negative (or bearish).
Read more.Last release: Wed Jun 05, 2024 09:00
Frequency: Monthly
Actual: -5.7%
Consensus: -5.1%
Previous: -7.8%
Source: Eurostat
- Natural Gas price starts to consolidate after a sharp rally in May.
- Egypte is importing more Gas ahead of the summer session to meet energy demand.
- The US Dollar Index jumps higher on Tuesday and is on track to recover initial weekly losses.
Natural Gas price (XNG/USD) trades roughly flat at around $2.70 during the European trading session on Wednesday. The price action is starting to turn choppy with market participants starting to unwind their overextended long positions in Natural Gas via options and futures contracts. The main driver for the unwind is the European gas storage reserve, which has broken above 70% for the first time since last winter.
Meanwhile, the US Dollar Index (DXY), which tracks the Greenback’s value against six major currencies, moves higher for a second straight day of gains after Monday’s decline. For the week, the DXY index still trades in a loss, ahead of the ADP private payroll number and the Institute for Supply Management’s (ISM) Services Purchasing Managers Index (PMI) data for May scheduled on Wednesday.
Natural Gas is trading at $2.68 per MMBtu at the time of writing.
Natural Gas news and market movers: Europe is building up reserves
- As mentioned above, European overall Gas storage reserves are back above 70%, according to Bloomberg data.
- Egypt will import around 20 additional Liquefied Natural Gas (LNG) cargoes this summer to meet energy demand during the hottest period of the year. Gas Exports out of Egypt are still banned, Reuters reports.
- According to port data, demand for LNG is set to fall in June as both Asia and Europe take fewer deliveries than last month. Bloomberg Energy reports that global LNG imports will fall by 3% this month compared to May data.
Natural Gas Technical Analysis: Time to consolidate
Natural Gas is trading back in the middle of the range that is starting to form between $2.60 and $2.82. This consolidation is more than welcome after the wild and steep ride in May. With some profit-taking and reassessments taking place, some additional retracement might be welcomed first before investors start to buy in again.
The $3.00 marker as a big figure was tested in May. The pivotal level near $3.07 ( March 6, 2023, high) remains key as prices failed to post a daily close above it. Further up, the fresh year-to-date high at $3.16 is the level to beat.
On the downside, the 200-day Simple Moving Average (SMA) acts as the first support near $2.53. Should that support area fail to hold, the next target could be the pivotal level near $2.14, with interim support by the 55-day SMA near $2.25. Further down, the biggest support comes at $2.11 with the 100-day SMA.
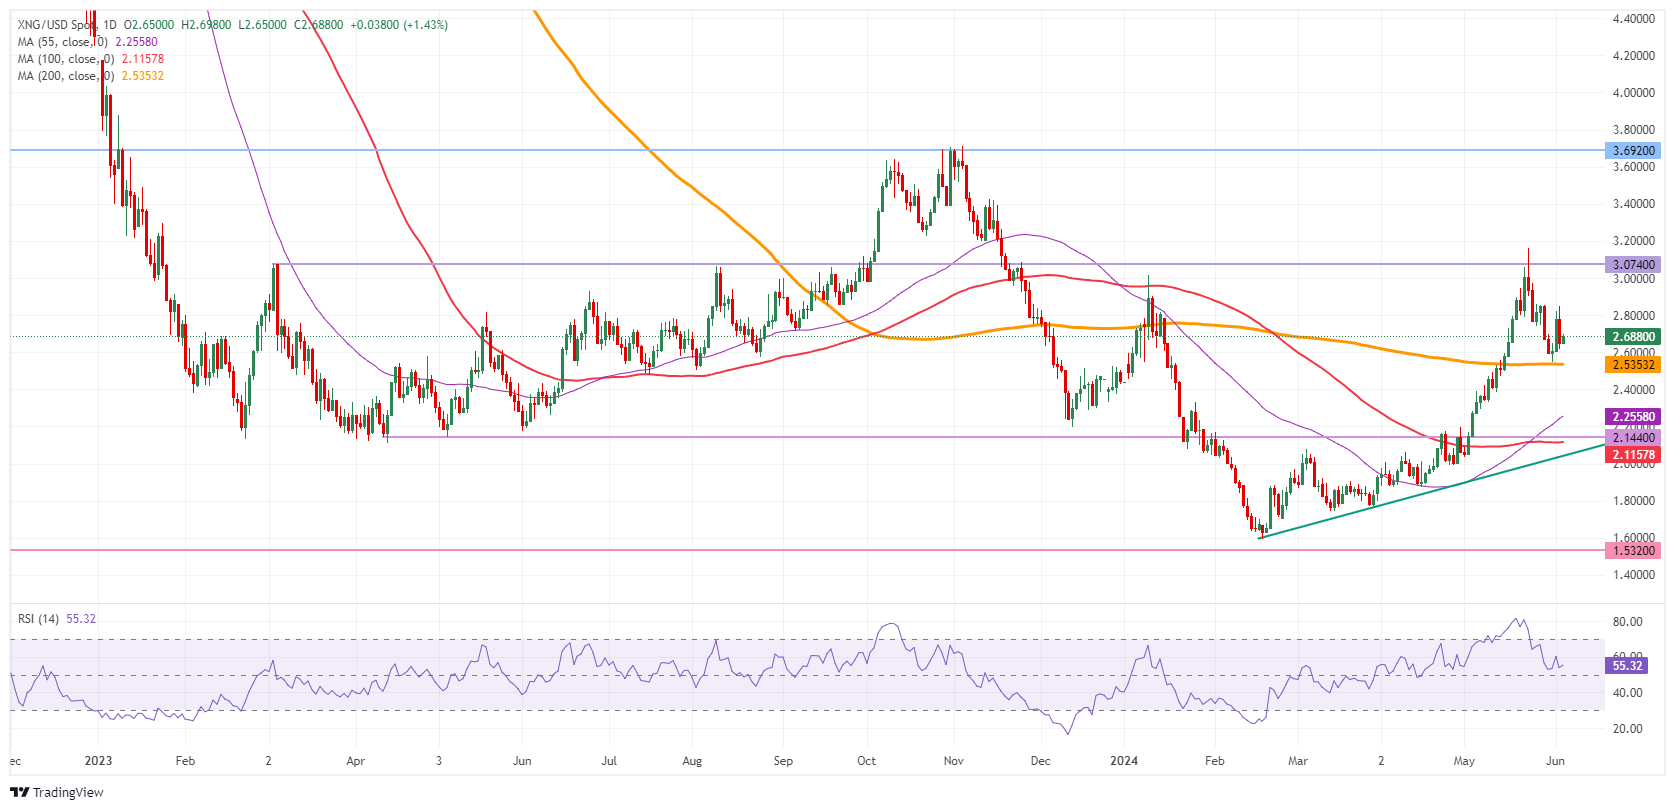
Natural Gas: Daily Chart
Natural Gas FAQs
Supply and demand dynamics are a key factor influencing Natural Gas prices, and are themselves influenced by global economic growth, industrial activity, population growth, production levels, and inventories. The weather impacts Natural Gas prices because more Gas is used during cold winters and hot summers for heating and cooling. Competition from other energy sources impacts prices as consumers may switch to cheaper sources. Geopolitical events are factors as exemplified by the war in Ukraine. Government policies relating to extraction, transportation, and environmental issues also impact prices.
The main economic release influencing Natural Gas prices is the weekly inventory bulletin from the Energy Information Administration (EIA), a US government agency that produces US gas market data. The EIA Gas bulletin usually comes out on Thursday at 14:30 GMT, a day after the EIA publishes its weekly Oil bulletin. Economic data from large consumers of Natural Gas can impact supply and demand, the largest of which include China, Germany and Japan. Natural Gas is primarily priced and traded in US Dollars, thus economic releases impacting the US Dollar are also factors.
The US Dollar is the world’s reserve currency and most commodities, including Natural Gas are priced and traded on international markets in US Dollars. As such, the value of the US Dollar is a factor in the price of Natural Gas, because if the Dollar strengthens it means less Dollars are required to buy the same volume of Gas (the price falls), and vice versa if USD strengthens.
- USD/CAD edges higher ahead of BoC’s interest rate decision and US Employment, and ISM Services PMI data.
- The BoC is universally expected to cut interest rates by 25 bps to 4.75%.
- The US data will influence Fed rate-cut prospects for September.
The USD/CAD pair rises toward the round-level resistance of 1.3700 in Wednesday’s European session. The Loonie asset ticks higher ahead of the Bank of Canada’s (BoC) interest rate policy in which it is expected to announce a rate-cut decision of 25 basis points (bps). This would be the first dovish interest rate decision by the BoC after maintaining a hawkish rhetoric for more than two years.
In the last six meetings, the BoC holds interest rates steady at 5%. The BoC was maintaining a status-quo as policymakers were not convinced that inflation will sustainably return to the desired rate of 2%.
The reasoning behind firm speculation for the BoC to begin reducing interest rates is the decline in central banks’ preferred inflation measure-which is core Consumer Price Index (CPI)- to 1.6% on a year-on-year basis. Also, cooling labor market conditions prompt expectations of BoC pivoting to policy normalization. Canada’s Unemployment Rate rises to 6.1% above the 5% threshold.
Meanwhile, mild strength in the Loonie asset is also driven by further recovery in the US Dollar (USD) ahead of the United States (US) ISM Services PMI and the ADP Employment data for May, which will be published in the New York session.
The ADP agency is expected to show that fresh private payrolls were 173K, lower than 192K in April. The Services PMI, which gauges the service sector activity that accounts for the two-third of the economy, is estimated to have returned to expansion, seen at 50.5, higher than the former release of 49.4. The economic data will influence market speculation for the Federal Reserve (Fed) to begin reducing interest rates from the September meeting.
- AUD/USD edges down as the US Dollar exhibits stability ahead of US economic data.
- Upbeat Caixin PMI data has improved the global demand outlook.
- The Australian economy grew at a slower pace of 0.1% in the January-March period.
The AUD/USD pair exhibits a subdued performance near 0.6650 in Wednesday’s European session. The Aussie asset has come under pressure as the US Dollar (USD) gathers strength ahead of the United States (US) ISM Services PMI and the ADP Employment data for May, which will be published in the New York session.
The US economic data will significantly influence market speculation for the Federal Reserve (Fed) to begin reducing interest rates from the September meeting.
The US Dollar Index (DXY), which tracks the Greenback’s value against six major currencies, rises to 104.30. Meanwhile, market sentiment shows an asset-specific action as US equity futures post decent gains in the London session while risk-perceived currencies appear on the backfoot.
Global equities also see a strong demand as upbeat China’s Caixin PMI Index for May has improved worldwide demand outlook. Caixin Services PMI at a faster pace to 54.0 from expectations of 52.6. This was the highest reading since July 2023. Also, Caixin Manufacturing PMI reached to two-year high at 51.7.
Being a proxy to China’s economy, the Australian Dollar strengthens on strong PMI data. However, it fails to capitalize due to weak domestic Q1 Gross Domestic Product (GDP) data. The Australian economy expanded at a slower pace of 0.1% from the estimates of 0.2% and the former release of 0.3%, upwardly revised from 0.2%.
This has pushed back expectations of the Reserve Bank of Australia (RBA) raising its Official Cash Rate (OCR) one more time this year.
Silver prices (XAG/USD) rose on Wednesday, according to FXStreet data. Silver trades at $29.60 per troy ounce, up 0.34% from the $29.50 it cost on Tuesday.
Silver prices have increased by 16.22% since the beginning of the year.
| Unit measure | Today Price |
|---|---|
| Silver price per troy ounce | $29.60 |
| Silver price per gram | $0.95 |
The Gold/Silver ratio, which shows the number of troy ounces of Silver needed to equal the value of one troy ounce of Gold, stood at 78.81 on Wednesday, down from 78.87 on Tuesday.
Investors might use this ratio to determine the relative valuation of Gold and Silver. Some may consider a high ratio as an indicator that Silver is undervalued – or Gold is overvalued – and might buy Silver or sell Gold accordingly. Conversely, a low ratio might suggest that Gold is undervalued relative to Silver.
Silver FAQs
Silver is a precious metal highly traded among investors. It has been historically used as a store of value and a medium of exchange. Although less popular than Gold, traders may turn to Silver to diversify their investment portfolio, for its intrinsic value or as a potential hedge during high-inflation periods. Investors can buy physical Silver, in coins or in bars, or trade it through vehicles such as Exchange Traded Funds, which track its price on international markets.
Silver prices can move due to a wide range of factors. Geopolitical instability or fears of a deep recession can make Silver price escalate due to its safe-haven status, although to a lesser extent than Gold's. As a yieldless asset, Silver tends to rise with lower interest rates. Its moves also depend on how the US Dollar (USD) behaves as the asset is priced in dollars (XAG/USD). A strong Dollar tends to keep the price of Silver at bay, whereas a weaker Dollar is likely to propel prices up. Other factors such as investment demand, mining supply – Silver is much more abundant than Gold – and recycling rates can also affect prices.
Silver is widely used in industry, particularly in sectors such as electronics or solar energy, as it has one of the highest electric conductivity of all metals – more than Copper and Gold. A surge in demand can increase prices, while a decline tends to lower them. Dynamics in the US, Chinese and Indian economies can also contribute to price swings: for the US and particularly China, their big industrial sectors use Silver in various processes; in India, consumers’ demand for the precious metal for jewellery also plays a key role in setting prices.
Silver prices tend to follow Gold's moves. When Gold prices rise, Silver typically follows suit, as their status as safe-haven assets is similar. The Gold/Silver ratio, which shows the number of ounces of Silver needed to equal the value of one ounce of Gold, may help to determine the relative valuation between both metals. Some investors may consider a high ratio as an indicator that Silver is undervalued, or Gold is overvalued. On the contrary, a low ratio might suggest that Gold is undervalued relative to Silver.
(An automation tool was used in creating this post.)
- EUR/USD juggles in a tight range with the focus on the ECB policy meeting and US economic data.
- The ECB is widely expected to deliver a rate-cut move with a data-dependent approach for the interest rate path.
- Normalizing US labor market conditions has boosted Fed rate-cut bets for September.
EUR/USD is stuck in a tight range around 1.0880 in Wednesday’s European session. The major currency pair turns rangebound amid caution ahead of the European Central Bank’s (ECB) interest rate decision, which will be announced on Thursday.
The ECB is widely anticipated to cut its Deposit Facility rate by 25 basis points (bps) to 3.75%. Therefore, investors will focus on the ECB’s guidance on the interest rate outlook to project the next move in the Euro.
Higher-than-expected increase in the Eurozone’s annual Harmonized Index of Consumer Prices (HICP) data, service inflation and Q1 Gross Domestic Product (GDP) suggest that price pressures could become persistent in the coming months. Therefore, ECB officials would prefer to remain data-dependent and push back expectations for subsequent rate cuts. Currently, financial markets expect that the ECB will cut interest rates at least twice this year.
Daily digest market movers: EUR/USD remains sideways ahead of US ISM Services PMI
- EUR/USD trades sideways around 1.0880 as the US Dollar index (DXY) holds the crucial support ahead of the crucial United States (US) economic calendar on Wednesday: The ADP Employment Change and the Institute for Supply Management’s (ISM) Services Purchasing Managers Index (PMI) data for May, which will be published at 12:15 and 14:00 GMT, respectively.
- Economists have forecasted that US private employers hired 173K job-seekers in May, lower than the former reading of 192K. A slower hiring pace would deepen fears of normalizing labor market conditions. On Tuesday, the US JOLTS Job Opening report showed that job postings came in lower at 8.06 million in April, from the expectations of 8.34 million and the former release of 8.35 million.
- The perception of normalizing labor market conditions and the economy’s growth prospects have fuelled expectations that the Federal Reserve (Fed) will begin lowering interest rates from the September meeting. The CME FedWatch tool shows that the probability of a rate cut in the September meeting has increased to 65% from 47% a week ago.
- Meanwhile, the US ISM Services PMI is estimated to have returned to expansion, seen at 50.5, higher than the former reading of 49.4. Investors will keenly focus on the Services PMI as it gauges the service sector activity, which accounts for two-thirds of the economy. In addition to services PMI, investors will also focus on other subcomponents, such as New Orders and Prices Paid indices, which reflect forward demand and changes in input prices.
- Later this week, the release of the US Nonfarm Payrolls (NFP) report for May will significantly influence market speculation about the Fed reducing interest rates from the September meeting.
Technical Analysis: EUR/USD exhibits sideways trend
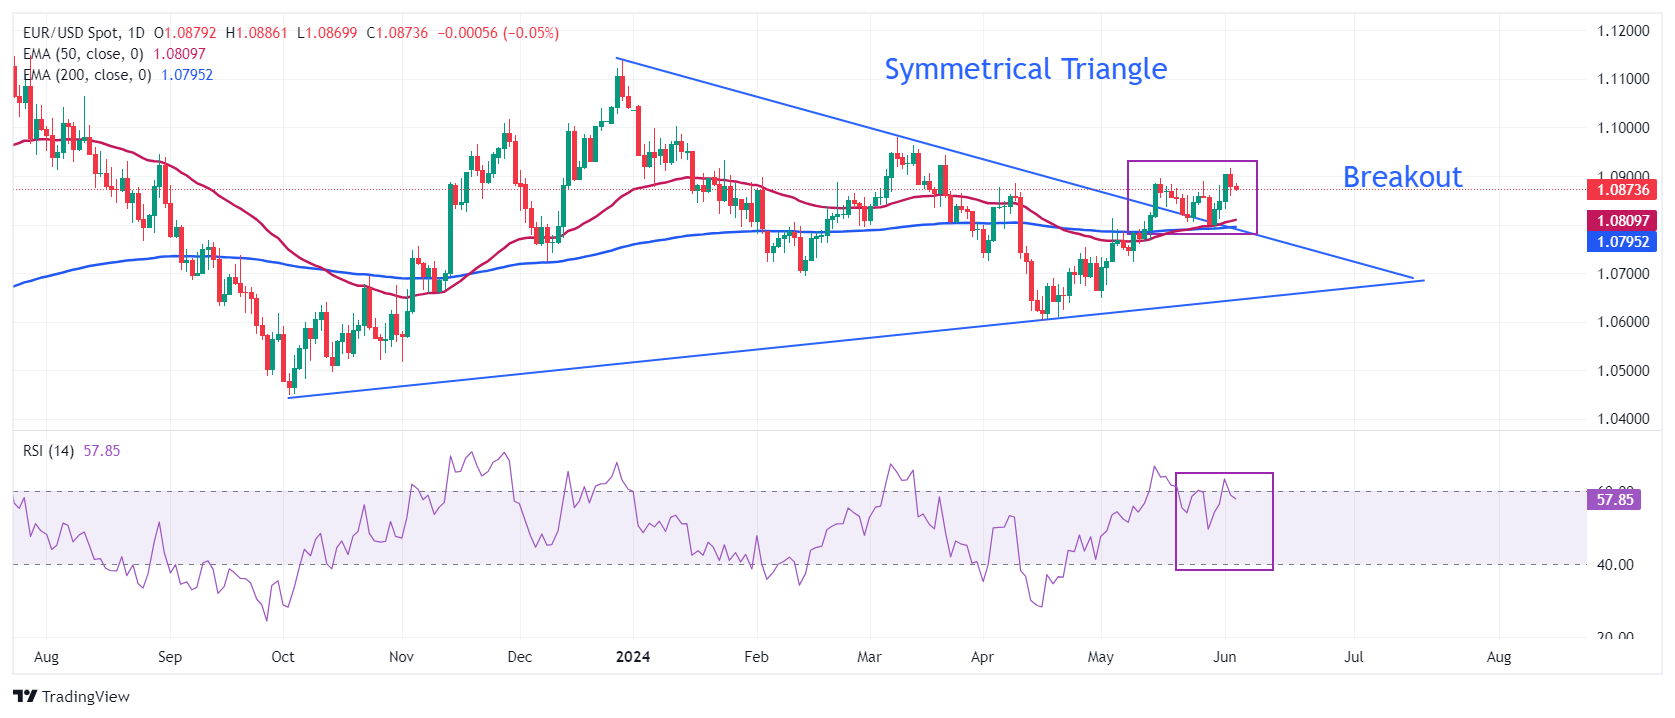
EUR/USD hovers around 1.0880 ahead of crucial US economic data. The major currency pair trades inside Tuesday’s trading range. The near-term outlook of the pair remains firm due to the Symmetrical Triangle breakout on a daily timeframe and upward-sloping 50-day Exponential Moving Average (EMA), which trades around 1.0800.
The 14-period Relative Strength Index (RSI) has slipped into the 40.00-60.00 range, suggesting that the momentum, which was leaned toward the upside, has faded for now.
The major currency pair is expected to extend its upside towards the March 21 high, around 1.0950, and the psychological resistance of 1.1000 if it breaks above the round-level resistance of 1.0900 decisively. However, a downside move below the 200-day EMA at 1.0800 could push it into the bearish trajectory.
Euro FAQs
The Euro is the currency for the 20 European Union countries that belong to the Eurozone. It is the second most heavily traded currency in the world behind the US Dollar. In 2022, it accounted for 31% of all foreign exchange transactions, with an average daily turnover of over $2.2 trillion a day. EUR/USD is the most heavily traded currency pair in the world, accounting for an estimated 30% off all transactions, followed by EUR/JPY (4%), EUR/GBP (3%) and EUR/AUD (2%).
The European Central Bank (ECB) in Frankfurt, Germany, is the reserve bank for the Eurozone. The ECB sets interest rates and manages monetary policy. The ECB’s primary mandate is to maintain price stability, which means either controlling inflation or stimulating growth. Its primary tool is the raising or lowering of interest rates. Relatively high interest rates – or the expectation of higher rates – will usually benefit the Euro and vice versa. The ECB Governing Council makes monetary policy decisions at meetings held eight times a year. Decisions are made by heads of the Eurozone national banks and six permanent members, including the President of the ECB, Christine Lagarde.
Eurozone inflation data, measured by the Harmonized Index of Consumer Prices (HICP), is an important econometric for the Euro. If inflation rises more than expected, especially if above the ECB’s 2% target, it obliges the ECB to raise interest rates to bring it back under control. Relatively high interest rates compared to its counterparts will usually benefit the Euro, as it makes the region more attractive as a place for global investors to park their money.
Data releases gauge the health of the economy and can impact on the Euro. Indicators such as GDP, Manufacturing and Services PMIs, employment, and consumer sentiment surveys can all influence the direction of the single currency. A strong economy is good for the Euro. Not only does it attract more foreign investment but it may encourage the ECB to put up interest rates, which will directly strengthen the Euro. Otherwise, if economic data is weak, the Euro is likely to fall. Economic data for the four largest economies in the euro area (Germany, France, Italy and Spain) are especially significant, as they account for 75% of the Eurozone’s economy.
Another significant data release for the Euro is the Trade Balance. This indicator measures the difference between what a country earns from its exports and what it spends on imports over a given period. If a country produces highly sought after exports then its currency will gain in value purely from the extra demand created from foreign buyers seeking to purchase these goods. Therefore, a positive net Trade Balance strengthens a currency and vice versa for a negative balance.
- The Mexican Peso recovers on Wednesday after the Mexican Finance Minister gives an interview seeking to calm investor fears.
- Rogelio Ramírez de la O says the newly elected government will exercise fiscal discipline and encourage investment.
- USD/MXN pulls back after becoming overbought and touching a major Moving Average in the weekly timeframe, but bulls still dominate.
The Mexican Peso (MXN) recovers by more than one percent in its most traded pairs on Wednesday, after the Mexican Finance Minister, Rogelio Ramírez de la O, steps in to prevent a further depreciation of the Peso following the 5.0% election-related decline on Monday and Tuesday.
Ramírez de la O emphasized that the newly elected government would exercise fiscal discipline and ensure the continued smooth flow of foreign and domestic investment. His remarks helped ease investor fears about the sweeping changes the left-leaning Claudia Sheinbaum administration might make given its predicted large majority.
USD/MXN is exchanging hands at 17.61 at the time of writing, EUR/MXN is trading at 19.15 and GBP/MXN at 22.50.
Mexican Peso recovers after De la O intervention
The Mexican Peso recovers on Wednesday after a massive decline following Sunday’s election after Finance Minister De la O said: “We want to confirm to international organizations and private investors that our project is based on financial discipline, abiding by the autonomy of the Bank of Mexico, adherence to the rule of law and facilitating national and foreign private investment,” according to El Financiero.
Although all the votes from the Mexican election have not yet been counted – final results are expected on June 8 – estimates suggest the Morena party has probably won a supermajority (over two-thirds) in the lower house of the Mexican Parliament and an almost-supermajority in the Senate. It is now also certain Dr. Claudia Sheinbaum will be the next president of Mexico.
The Mexican Peso dropped like a stone on the news of the election, however, as investors feared that with a supermajority, Sheinbaum’s legislation would be able to enact changes to the constitution that could hurt the economy.
As if to prove investors right, economic data out from Mexico on Tuesday showed an unexpected slowdown in Gross Fixed Investment, which grew 3.0% year-over-year in March from 12.5% in February. Whilst investment in construction remained strong (9.4%), it fell 4.7% for transportation equipment. On a monthly basis, however, the metric showed a faster 0.8% growth rate compared to the previous month’s 0.7%, according to data from INEGI.
Investors will be watching Mexican Consumer Confidence data for May, which will be released on Wednesday at 12:00 GMT for more information about the economy.
Technical Analysis: USD/MXN retreats from 100-week SMA
USD/MXN – or the number of Pesos that can be bought with one US Dollar – soared and hit its second upside target at 18.12 (100-week Simple Moving Average) on Tuesday. It has retreated back down to below the April 19 high of 17.82 since then.
The pair surged following the presidential election on Sunday, and both the short and intermediate-term trends are probably now bullish, overall favoring bullish over bearish bets and more upside over those time frames (up to six months).
USD/MXN Daily Chart
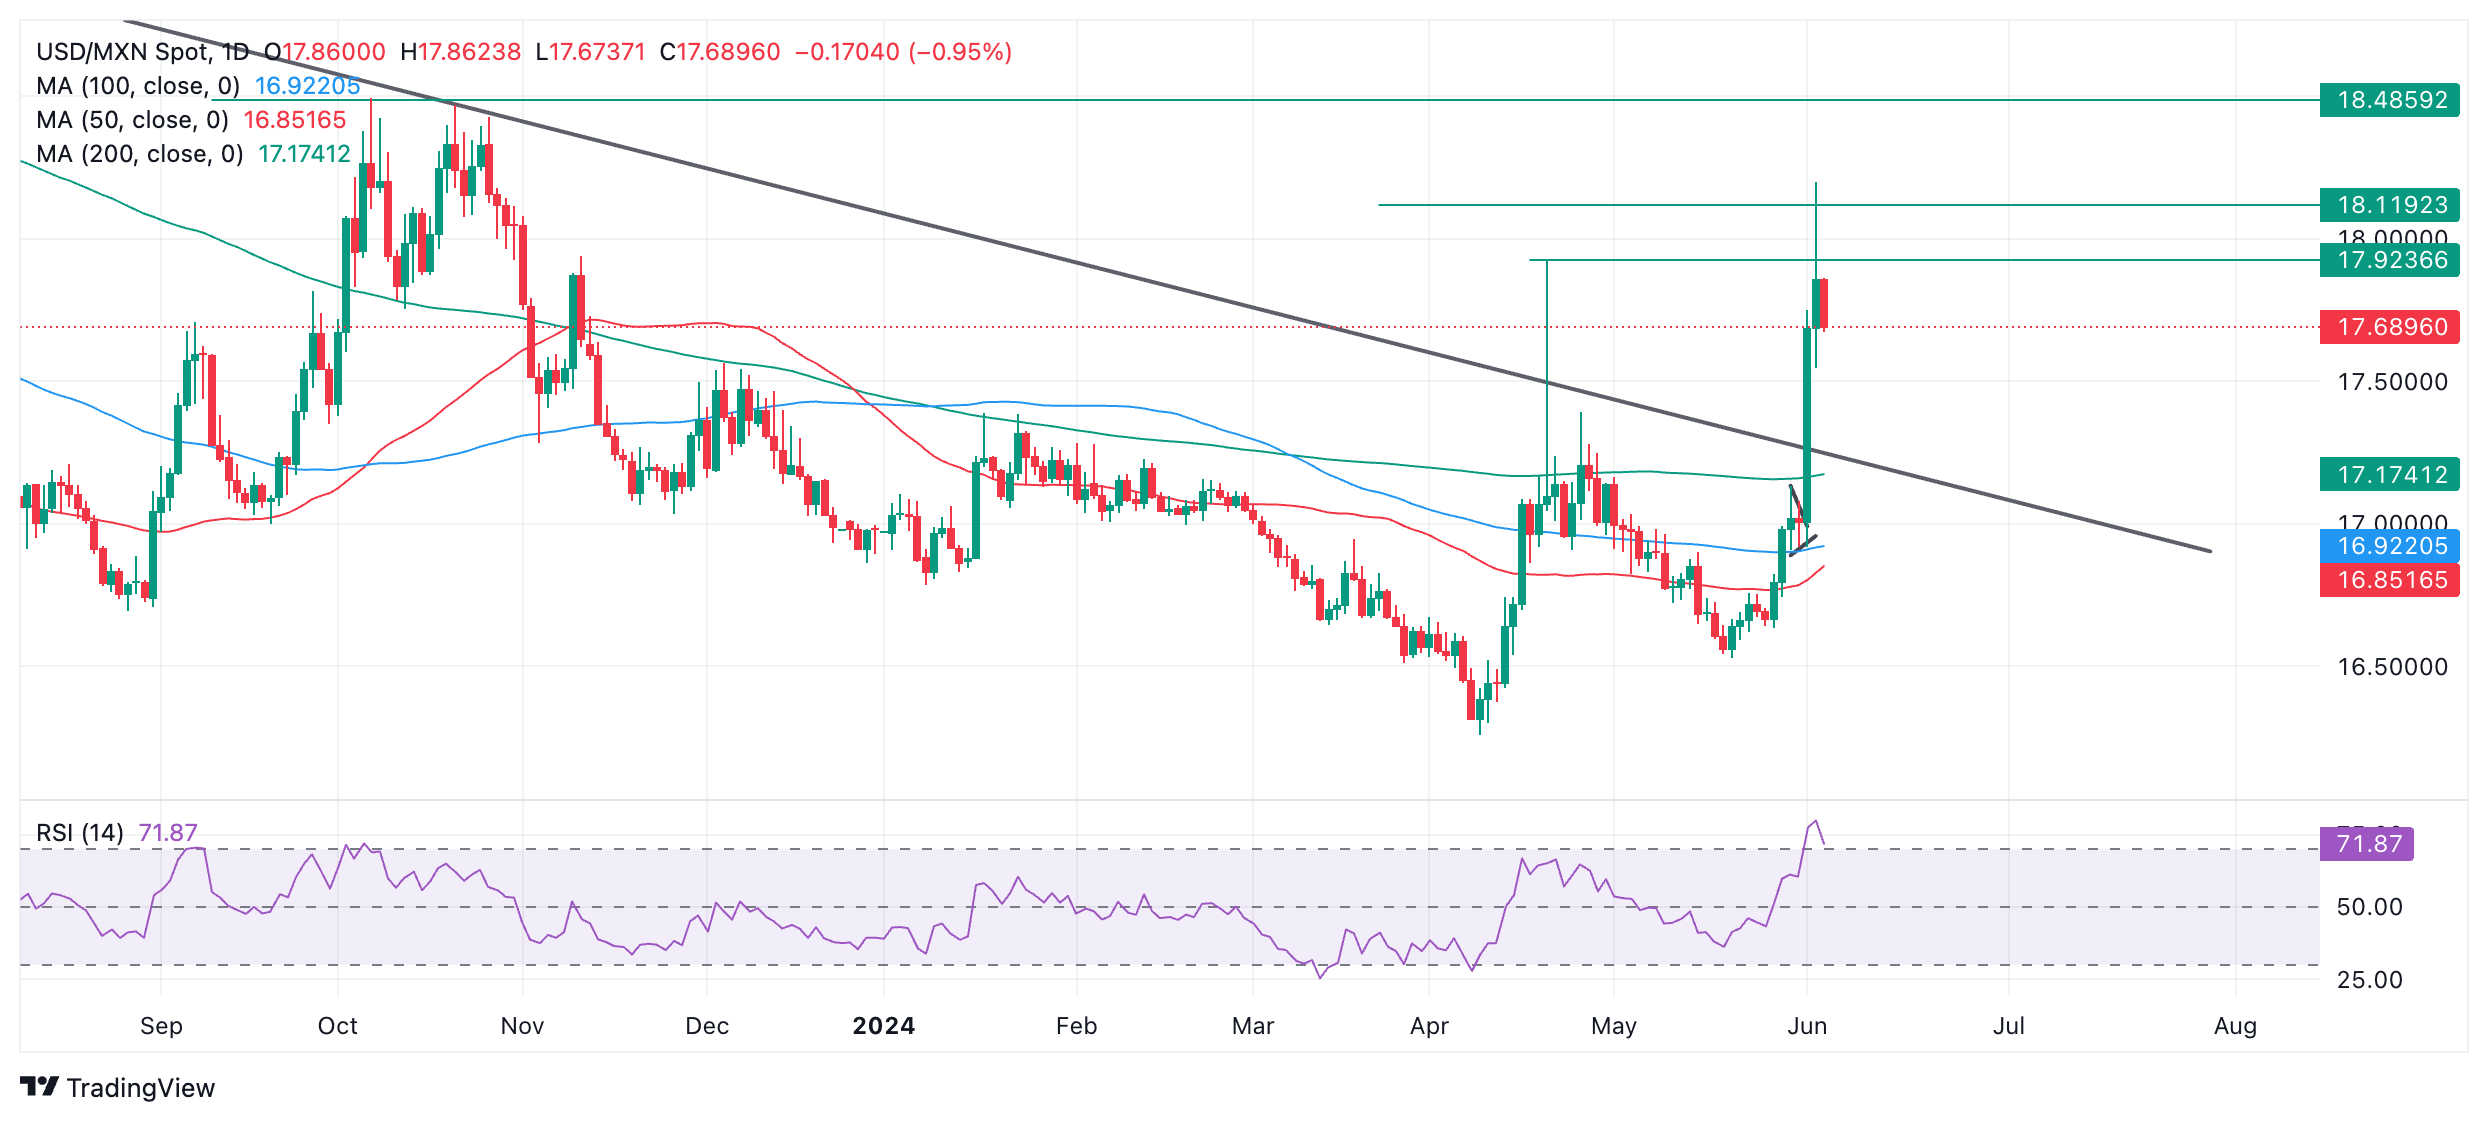
A continuation of the uptrend could see USD/MXN reach the next target at 18.49 (October 2023 high).
USD/MXN is overbought according to the Relative Strength Index (RSI), and this increases the chances of a deeper correction unfolding. Given the dominance of the bullish trend, however, the pair is expected to recover and continue pushing higher. However, there are no signs yet that the pullback has ended, suggesting more downside could come before the pair finds its feet.
One possible level where the pullback could find support is at 17.34, the midpoint of the long green Japanese Marabuzo candlestick pattern that formed during Monday’s rally (June 3). If that level is surpassed, the old trendline in the 17.10s is likely to offer support. If that area is broken, it could be a sign the short and intermediate-term trends may have reversed.
The long-term trend is probably still bearish, suggesting a risk of a reversal lower remains in the background if the uptrend runs out of steam and price starts to plummet. Although price is pulling back, it is not strong enough yet to suggest a change of trend.
Mexican Peso FAQs
The Mexican Peso (MXN) is the most traded currency among its Latin American peers. Its value is broadly determined by the performance of the Mexican economy, the country’s central bank’s policy, the amount of foreign investment in the country and even the levels of remittances sent by Mexicans who live abroad, particularly in the United States. Geopolitical trends can also move MXN: for example, the process of nearshoring – or the decision by some firms to relocate manufacturing capacity and supply chains closer to their home countries – is also seen as a catalyst for the Mexican currency as the country is considered a key manufacturing hub in the American continent. Another catalyst for MXN is Oil prices as Mexico is a key exporter of the commodity.
The main objective of Mexico’s central bank, also known as Banxico, is to maintain inflation at low and stable levels (at or close to its target of 3%, the midpoint in a tolerance band of between 2% and 4%). To this end, the bank sets an appropriate level of interest rates. When inflation is too high, Banxico will attempt to tame it by raising interest rates, making it more expensive for households and businesses to borrow money, thus cooling demand and the overall economy. Higher interest rates are generally positive for the Mexican Peso (MXN) as they lead to higher yields, making the country a more attractive place for investors. On the contrary, lower interest rates tend to weaken MXN.
Macroeconomic data releases are key to assess the state of the economy and can have an impact on the Mexican Peso (MXN) valuation. A strong Mexican economy, based on high economic growth, low unemployment and high confidence is good for MXN. Not only does it attract more foreign investment but it may encourage the Bank of Mexico (Banxico) to increase interest rates, particularly if this strength comes together with elevated inflation. However, if economic data is weak, MXN is likely to depreciate.
As an emerging-market currency, the Mexican Peso (MXN) tends to strive during risk-on periods, or when investors perceive that broader market risks are low and thus are eager to engage with investments that carry a higher risk. Conversely, MXN tends to weaken at times of market turbulence or economic uncertainty as investors tend to sell higher-risk assets and flee to the more-stable safe havens.
- The Oil price finds support near $72.50 after falling consecutively for five trading session.
- The OPEC+ would pause rollback of production cuts if demand appears to remain relatively weak.
- WTI shifts into the bearish trajectory after an Inverted Flag breakdown.
West Texas Intermediate (WTI), futures on NYMEX, find a temporary cushion near $72.50 in Wednesday’s European session. The Oil price remains offered for an entire week due to deepening demand concerns and OPEC’s communication to shore up the market with more supply.
The OPEC’s meeting on June 2 indicated a decline in production cuts by 2.2 million barrels per day (bpd) from September this year. Excess supply of Oil negatively influences its price. However, Saudi Arabia's energy minister, Prince Abdulaziz bin Salman, has said OPEC+ would pause the unwinding of the cuts or reverse them if demand wasn't strong enough to absorb the barrels, Reuters reported.
Meanwhile, investors shift focus to the United States (US) Nonfarm Payrolls (NFP) data for May that will provide cues about when the Federal Reserve (Fed) will start reducing interest rates. The situation of Fed maintaining a restrictive interest rate framework for a longer period weigh on the Oil price as it negatively influences its demand outlook.
The US Dollar Index (DXY), which tracks the US Dollar’s value against six major currencies, steadies above 104.00. In today’s session, investors will focus on the US ISM Services PMI and ADP Employment Change data for May.
WTI weakens after a breakdown of the Inverted Flag chart pattern formed on a daily timeframe. The Inverted Flag formation reflects an inventory adjustment process that follows the ongoing trend after the completion, which in this case is down.
Declining 20-day Exponential Moving Average (EMA) near $77.35 suggests that the near-term outlook is vulnerable.
The 14-period Relative Strength Index (RSI) shifts into the bearish range of 20.00-40.00, indicating that momentum has leaned towards the downside.
Going forward, the upward-sloping trendline marked from 4 May 2023 low near $64.30 will act as major support for the Oil price bulls.
As the overall trend of the Oil price is bearish, investors should look for sell-at-rise opportunity to build fresh shorts. A pullback move to near June 4 high around $74.00 should be used as a selling opportunity for targets of February 5 low at $71.46 and the psychological support of $70.00.
WTI daily chart
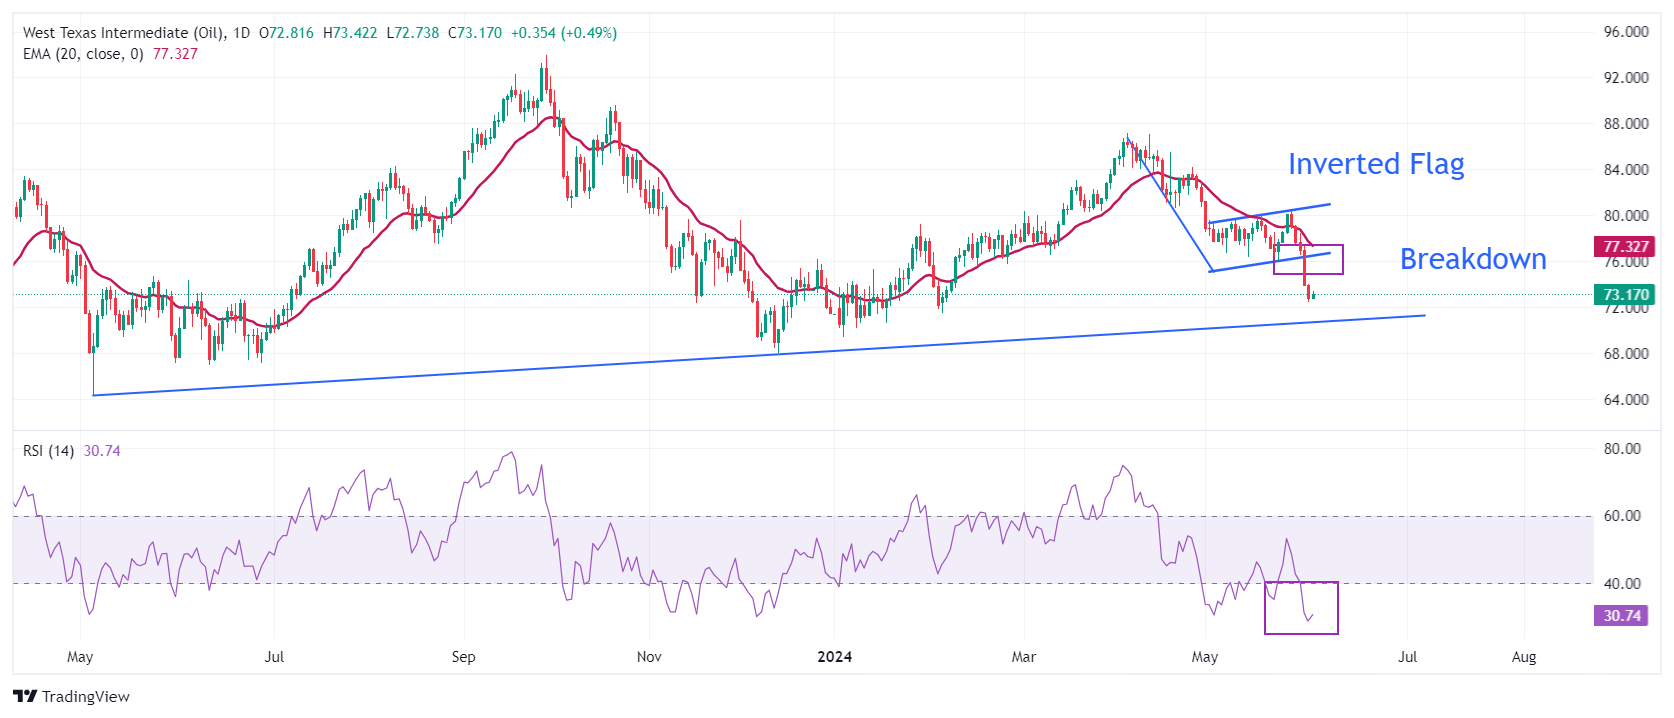
European Central Bank (ECB) policymaker and Slovakian central bank Governor Peter Kazimir said on Wednesday, he “believes that ECB is nearing its first interest rate cut.”
“Inflation is on a good trajectory,” Kazimir said while presenting the Slovakian central bank's financial stability report (FSR).
These comments come as a surprise, as the ECB is in its quiet period ahead of Thursday’s policy announcements.
EUR/USD stays modestly flat near 1.0880 on these above comments.
ECB FAQs
The European Central Bank (ECB) in Frankfurt, Germany, is the reserve bank for the Eurozone. The ECB sets interest rates and manages monetary policy for the region. The ECB primary mandate is to maintain price stability, which means keeping inflation at around 2%. Its primary tool for achieving this is by raising or lowering interest rates. Relatively high interest rates will usually result in a stronger Euro and vice versa. The ECB Governing Council makes monetary policy decisions at meetings held eight times a year. Decisions are made by heads of the Eurozone national banks and six permanent members, including the President of the ECB, Christine Lagarde.
In extreme situations, the European Central Bank can enact a policy tool called Quantitative Easing. QE is the process by which the ECB prints Euros and uses them to buy assets – usually government or corporate bonds – from banks and other financial institutions. QE usually results in a weaker Euro. QE is a last resort when simply lowering interest rates is unlikely to achieve the objective of price stability. The ECB used it during the Great Financial Crisis in 2009-11, in 2015 when inflation remained stubbornly low, as well as during the covid pandemic.
Quantitative tightening (QT) is the reverse of QE. It is undertaken after QE when an economic recovery is underway and inflation starts rising. Whilst in QE the European Central Bank (ECB) purchases government and corporate bonds from financial institutions to provide them with liquidity, in QT the ECB stops buying more bonds, and stops reinvesting the principal maturing on the bonds it already holds. It is usually positive (or bullish) for the Euro.
- Silver price edges higher due to the growing expectations of the Fed implementing a rate cut in September.
- CME FedWatch Tool indicates the Fed rate cut odds by at least 25 basis points has risen to nearly 64.9%.
- Any failure to secure a peace agreement between Israel and Hamas could bolster the safe-haven Silver.
Silver price rebounds from a three-week low of $29.38 recorded on Tuesday, now trading around $29.60 per troy ounce during the European session on Wednesday. This upward correction in Silver prices is likely due to increasing speculation that the Federal Reserve (Fed) will begin reducing interest rates starting from the September meeting, following a series of weak US economic data.
On Tuesday, the JOLTS US Job Openings declined by 296,000 to 8.059 million in April, down from March's 8.355 million, marking the lowest level since February 2021. This figure also missed the market consensus of 8.340 million.
As per the CME FedWatch Tool, the probability of a Fed rate cut by at least 25 basis points has increased to nearly 64.9%, up from 46.3% a week earlier. Investors await the key US data releases later on Wednesday, including the US ADP Employment Change and ISM Services PMI reports.
On Tuesday in the Middle East, Osama Hamdan, a Hamas official, stated in a televised press conference, as reported by Reuters, that Hamas cannot agree to any deal unless Israel makes a "clear" commitment to a permanent ceasefire and a full withdrawal from the Gaza Strip.
Qatar, mediating talks between Hamas and Israel, has also urged Israel to provide a clear position backed by its entire government to help reach a deal. A failure to secure a peace agreement could increase the value of safe-haven assets like Silver.
- USD/CAD could extend its gains as the 14-day RSI indicates a momentum shift toward the upside.
- The momentum indicator MACD also suggests a weakening bearish bias as converging below the signal line.
- A break below the 1.3600 could exert downward pressure on the pair.
USD/CAD treads water to continue its gains for the second consecutive session, trading around 1.3680 during the European hours on Wednesday. Analysis of the daily chart suggests a bearish bias for the USD/CAD pair, as it remains within a descending channel. However, the 14-day Relative Strength Index (RSI) has slightly moved above the 50 level, and further upward movement may indicate a weakening of this bearish bias.
The Moving Average Convergence Divergence (MACD) indicator suggests a potential momentum shift for the USD/CAD pair. While the MACD line is positioned below the centerline, it shows convergence below the signal line. A break above the centerline could further weaken the bearish trend.
The USD/CAD pair could find key support around the psychological level of 1.3600 and the throwback support at 1.3590. A break below the latter could exert downward pressure on the pair, leading it to test the psychological level of 1.3500, followed by the lower threshold of the descending channel.
On the upside, the USD/CAD pair could break above the upper boundary of the descending channel, followed by a psychological level of 1.3700 and a pullback resistance of 1.3740. A breakthrough above this resistance could lead the pair to explore the region around the key level of 1.3800, followed by April’s high of 1.3846.
USD/CAD: Daily Chart
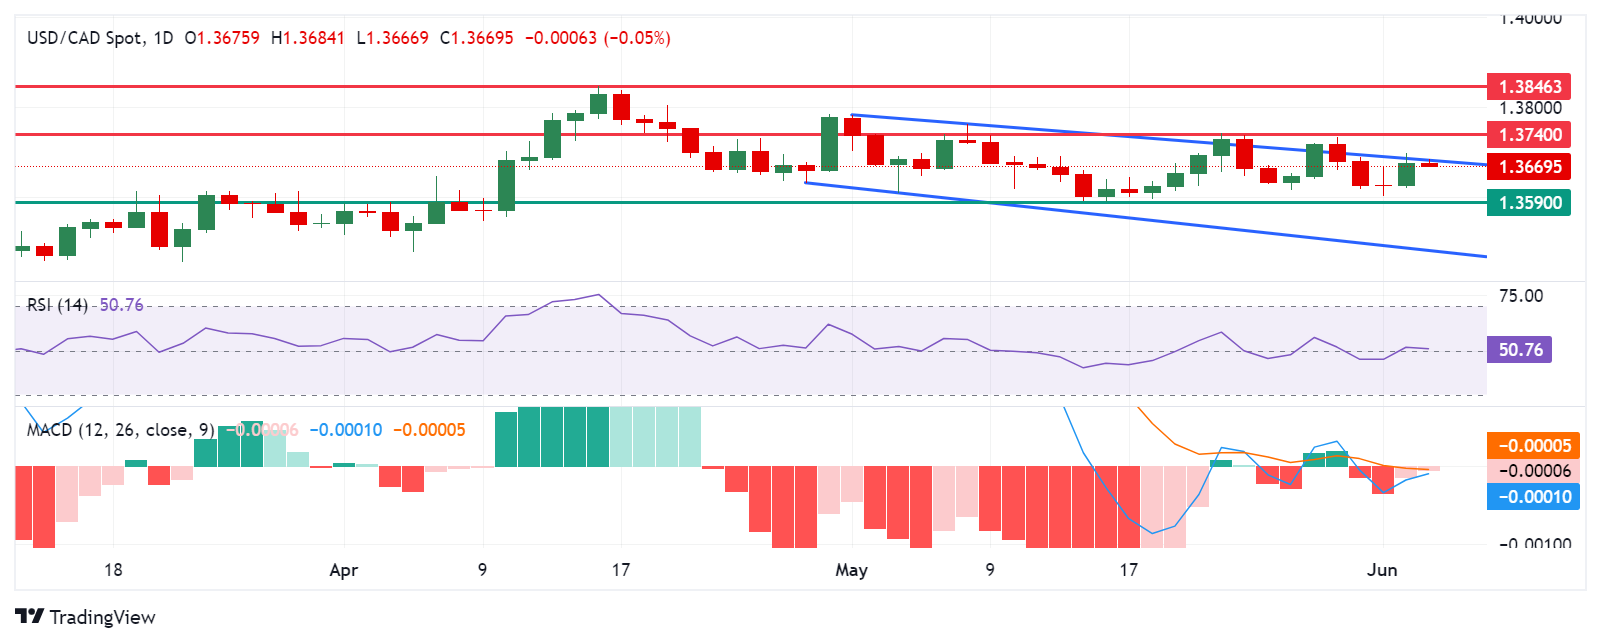
- The Bank of Canada (BoC) is anticipated to cut its policy rate by 25 bps.
- The Canadian Dollar maintains its consolidative phase vs. the US Dollar.
- Inflation in Canada has accelerated its downtrend since December.
- Money markets see around 21 bps of easing at the June meeting.
There is universal anticipation that the Bank of Canada (BoC) will reduce its policy rate by 25 bps at its upcoming gathering on Wednesday, June 5. It will be the first rate cut after six consecutive meetings of keeping rates unchanged at 5.00%.
Since the start of the year, the Canadian Dollar (CAD) has been gradually depreciating against its US counterpart (USD), though it has mostly been in a broader consolidation phase for the last couple of months.
In April, annual domestic inflation tracked by the headline Consumer Price Index (CPI) showed another downtick, while the BoC's Core CPI dropped below the 2.0% threshold (1.6% YoY).
The reasoning behind the potential rate cut by the central bank may be found in the persistent decline in consumer prices, while further cooling of the Canadian labour market is also expected to contribute to the decision to reduce rates.
Inflation has been below 3% since January, in keeping with the central bank's prediction for the first half of 2024, with carefully watched core consumer price indicators also falling steadily.
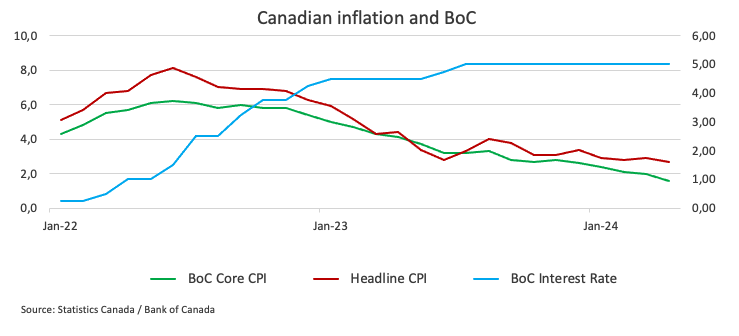
It is also expected that the BoC maintain its data dependency when it comes to future moves on rates. So far, money markets see around 30 bps of easing in July and nearly 42 bps in September. The BoC is expected to keep a cautious approach, it may also show some flexibility given the ongoing decline in domestic inflation.
A hawkish cut?
Despite the expected rate cut, the overall tone from the central bank could lean towards the cautious side, highlighting the current data-dependent stance while keeping a close eye on inflation developments.
In fact, BoC’s Governor Tiff Macklem told the House of Commons finance committee early in May that there is a limit to how much US and Canadian interest rates can diverge, but he emphasized that they are certainly not near that limit.
Furthermore, in his testimony to the Senate banking committee on May 1, Macklem mentioned that inflation was decreasing and acknowledged that Canadians were eager to know when the central bank would begin cutting interest rates. He stated that "the short answer is that we are getting closer."
When will the BoC release its monetary policy decision, and how could it affect USD/CAD?
The Bank of Canada will announce its policy decision at 13:45 GMT on Wednesday, June 5, followed by Governor Macklem’s press conference at 14:30 GMT.
Eliminating any potential surprises, the impact on the Canadian currency is expected to come mainly from the message of the bank rather than the move on the interest rate per se. Taking a conservative approach may result in more support for CAD and a subsequent dip in USD/CAD. If the bank indicates that it intends to decrease interest rates further, the Canadian Dollar may see a significant drop in the near future.
According to Pablo Piovano, Senior Analyst at FXStreet.com, "the gradual uptrend in USD/CAD that has been in place since the beginning of the year appears to be reinforced by the recent surpass of the key 200-day SMA (1.3506)." However, this trend has so far encountered significant resistance around the year-to-date highs at 1.3650. A sustained break above this zone might drive the pair to go for the November 2023 high of 1.3898 (November 1).
Pablo adds: "If sellers get the upper hand, the 200-day SMA should provide excellent support until the March low of 1.3419 (March 8). Extra weakening from here might lead to a move below the weekly low of 1.3358 (January 31)."
Economic Indicator
BoC Interest Rate Decision
The Bank of Canada (BoC) announces its interest rate decision at the end of its eight scheduled meetings per year. If the BoC believes inflation will be above target (hawkish), it will raise interest rates in order to bring it down. This is bullish for the CAD since higher interest rates attract greater inflows of foreign capital. Likewise, if the BoC sees inflation falling below target (dovish) it will lower interest rates in order to give the Canadian economy a boost in the hope inflation will rise back up. This is bearish for CAD since it detracts from foreign capital flowing into the country.
Read more.Next release: Wed Jun 05, 2024 13:45
Frequency: Irregular
Consensus: 4.75%
Previous: 5%
Source: Bank of Canada
Bank of Canada FAQs
The Bank of Canada (BoC), based in Ottawa, is the institution that sets interest rates and manages monetary policy for Canada. It does so at eight scheduled meetings a year and ad hoc emergency meetings that are held as required. The BoC primary mandate is to maintain price stability, which means keeping inflation at between 1-3%. Its main tool for achieving this is by raising or lowering interest rates. Relatively high interest rates will usually result in a stronger Canadian Dollar (CAD) and vice versa. Other tools used include quantitative easing and tightening.
In extreme situations, the Bank of Canada can enact a policy tool called Quantitative Easing. QE is the process by which the BoC prints Canadian Dollars for the purpose of buying assets – usually government or corporate bonds – from financial institutions. QE usually results in a weaker CAD. QE is a last resort when simply lowering interest rates is unlikely to achieve the objective of price stability. The Bank of Canada used the measure during the Great Financial Crisis of 2009-11 when credit froze after banks lost faith in each other’s ability to repay debts.
Quantitative tightening (QT) is the reverse of QE. It is undertaken after QE when an economic recovery is underway and inflation starts rising. Whilst in QE the Bank of Canada purchases government and corporate bonds from financial institutions to provide them with liquidity, in QT the BoC stops buying more assets, and stops reinvesting the principal maturing on the bonds it already holds. It is usually positive (or bullish) for the Canadian Dollar.
Gold prices rose in India on Wednesday, according to data compiled by FXStreet.
The price for Gold stood at 6,247.90 Indian Rupees (INR) per gram, up INR 7.78 compared with the INR 6,240.12 it cost on Tuesday.
The price for Gold increased to INR 72,874.29 per tola from INR 72,783.58 per tola.
| Unit measure | Gold Price in INR |
|---|---|
| 1 Gram | 6,247.90 |
| 10 Grams | 62,479.28 |
| Tola | 72,874.29 |
| Troy Ounce | 194,331.60 |
FXStreet calculates Gold prices in India by adapting international prices (USD/INR) to the local currency and measurement units. Prices are updated daily based on the market rates taken at the time of publication. Prices are just for reference and local rates could diverge slightly.
Global Market Movers: Comex Gold price treads water amid USD uptick
- The US Dollar staged a modest bounce from over a two-month low touched on Tuesday and exerted downward pressure on the Comex Gold price, though dismal US macro data helped limit losses.
- The Job Openings and Labor Turnover Survey, or JOLTS report, showed that job openings fell more than expected, by 296K to 8.059 million in April, or the lowest in more than three years.
- This follows the disappointing release of the US ISM Manufacturing PMI on Monday, which showed a surprising weakness in business activity and pointed to signs of a cooling US economy.
- Meanwhile, there is a risk that the US economy might be softening more than anticipated cemented bets for a September rate cut by the Federal Reserve, dragging the US Treasury bond yields lower.
- The rate-sensitive two-year US government bond and the benchmark 10-year Treasury yield languish near a two-week low, capping the USD and lending support to the non-yielding yellow metal.
- Traders now look forward to Wednesday's US economic docket, featuring the release of the ADP report on private-sector employment and the ISM Services PMI to grab short-term opportunities.
- The focus, however, remains glued to the official monthly employment data, popularly known as the Nonfarm Payrolls report, which will determine the next leg of a directional move for the XAU/USD.
Gold FAQs
Gold has played a key role in human’s history as it has been widely used as a store of value and medium of exchange. Currently, apart from its shine and usage for jewelry, the precious metal is widely seen as a safe-haven asset, meaning that it is considered a good investment during turbulent times. Gold is also widely seen as a hedge against inflation and against depreciating currencies as it doesn’t rely on any specific issuer or government.
Central banks are the biggest Gold holders. In their aim to support their currencies in turbulent times, central banks tend to diversify their reserves and buy Gold to improve the perceived strength of the economy and the currency. High Gold reserves can be a source of trust for a country’s solvency. Central banks added 1,136 tonnes of Gold worth around $70 billion to their reserves in 2022, according to data from the World Gold Council. This is the highest yearly purchase since records began. Central banks from emerging economies such as China, India and Turkey are quickly increasing their Gold reserves.
Gold has an inverse correlation with the US Dollar and US Treasuries, which are both major reserve and safe-haven assets. When the Dollar depreciates, Gold tends to rise, enabling investors and central banks to diversify their assets in turbulent times. Gold is also inversely correlated with risk assets. A rally in the stock market tends to weaken Gold price, while sell-offs in riskier markets tend to favor the precious metal.
The price can move due to a wide range of factors. Geopolitical instability or fears of a deep recession can quickly make Gold price escalate due to its safe-haven status. As a yield-less asset, Gold tends to rise with lower interest rates, while higher cost of money usually weighs down on the yellow metal. Still, most moves depend on how the US Dollar (USD) behaves as the asset is priced in dollars (XAU/USD). A strong Dollar tends to keep the price of Gold controlled, whereas a weaker Dollar is likely to push Gold prices up.
(An automation tool was used in creating this post.)
- The Pound Sterling remains sideways against the US Dollar with eyes on crucial US economic data.
- Market speculation for the Fed reducing interest rates in September strengthens.
- The BoE is expected to deliver two rate cuts this year.
The Pound Sterling (GBP) trades in a tight range above 1.2750 in Wednesday’s London session. The United Kingdom's (UK) economic calendar lacks top-tier events this week. Therefore, potential moves in the GBP/USD pair will be guided by the US Dollar (USD), which is expected to remain active due to a data-packed week in the United States (US).
The US Dollar Index (DXY), which tracks the Greenback’s value against six major currencies, manages to hold above the crucial support of 104.00. However, the near-term outlook of the US Dollar remains uncertain amid growing speculation that the US Federal Reserve (Fed) will start cutting interest rates in the September meeting.
According to the CME FedWatch tool, 30-day Fed Funds futures pricing data suggests a 65% chance of interest rates declining from their current levels in September. The probability has risen significantly from 47% recorded a week ago. Weak US ISM Manufacturing PMI report for May and downwardly revised Q1 Gross Domestic Product (GDP) data have prompted Fed rate-cut bets for September.
Daily digest market movers: Pound Sterling remains sideways while US Dollar stabilizes above 104.00
- The Pound Sterling consolidates in a tight range near 1.2770 against the US Dollar. The GBP/USD pair struggles for a direction as investors shift focus to the US ADP Employment Change and the Institute for Supply Management’s (ISM) Services Purchasing Managers Index (PMI) data for May, which will be published at 12:15 and 14:00 GMT, respectively.
- The Automatic Data Processing (ADP) agency is expected to show that fresh private payrolls increased by 173K, lower than 192K in April. The ISM Services PMI, which gauges the service sector activity that accounts for two-thirds of the economy, is estimated to have returned to expansion, seen at 50.5, higher than the former release of 49.4.
- Apart from Services PMI figures, investors will also focus on other subcomponents, such as New Orders and Prices Paid Indexes, which will reflect the demand outlook and change in input prices. In the service sector, the major expenditure allocation goes into wages paid to workers, which has remained a key driver of persistent price pressures.
- This week, the major event will be the Nonfarm Payrolls (NFP) data for May, which will be published on Friday. The labor market data will provide fresh cues about the interest rate outlook. It is justified to say that the US labor market is normalizing. The US JOLTS Job Opening data for April showed that job postings were lower at 8.06 million from the expectations of 8.34 million and the former release of 8.35 million.
- In the United Kingdom, investors look for fresh cues about when the Bank of England (BoE) will start reducing interest rates. Currently, financial markets expect that the BoE will deliver two rate cuts this year and will choose the August meeting as the earliest point to start the policy normalization process.
Technical Analysis: Pound Sterling holds 20-DEMA
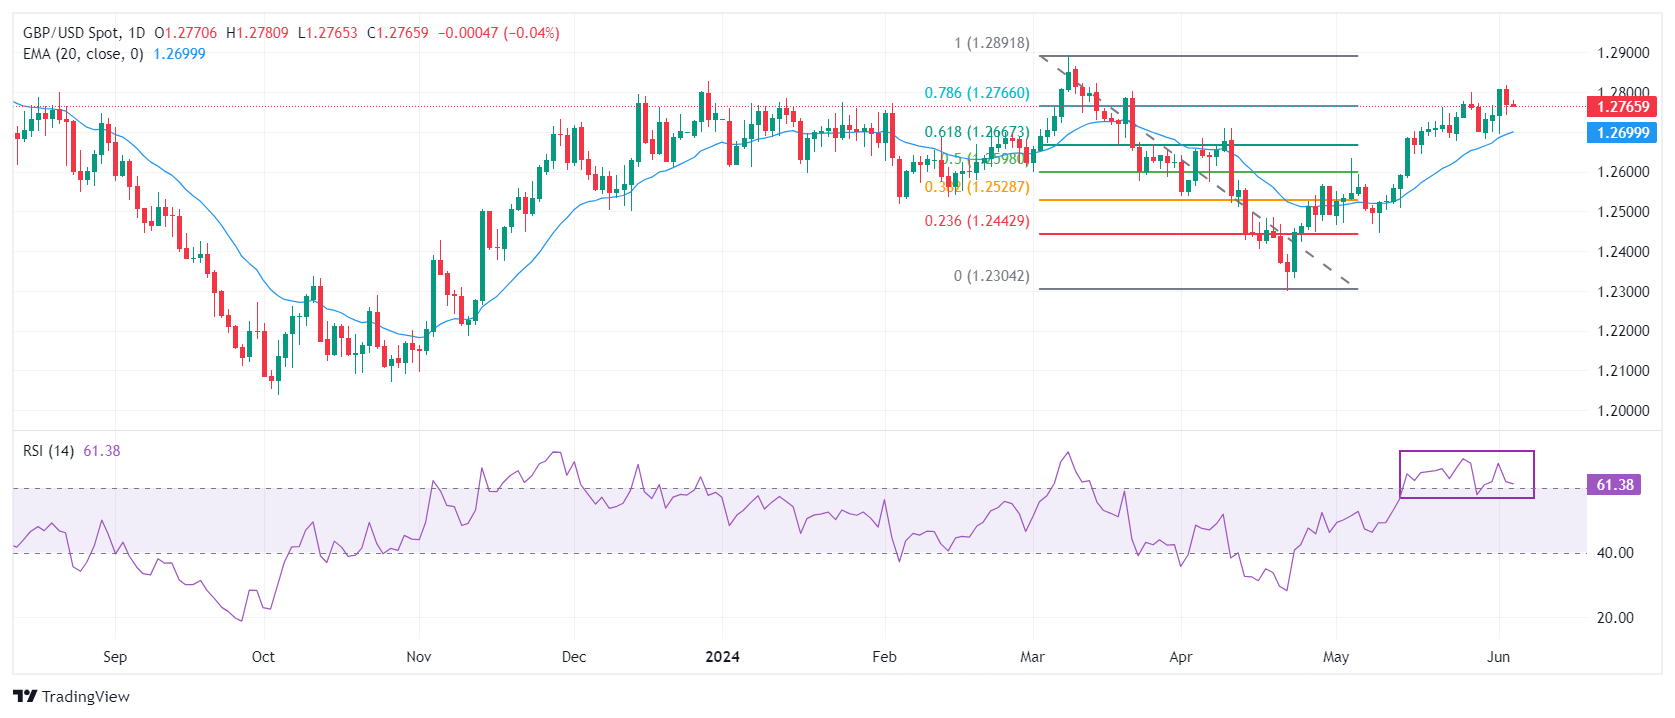
The Pound Sterling trades inside Tuesday’s trading range, suggesting indecisiveness among market participants. The GBP/USD pair struggles to sustain above the 78.6% Fibonacci retracement support (plotted from the March 8 high of 1.2900 to the April 22 low at 1.2300) at 1.2770.
The Cable is expected to remain bullish as the 20-day Exponential Moving Average (EMA) at 1.2700 is sloping higher, indicating a strong uptrend.
The 14-period Relative Strength Index (RSI) has shifted into the 40.00-60.00 range, suggesting that the momentum has leaned toward the upside.
Pound Sterling FAQs
The Pound Sterling (GBP) is the oldest currency in the world (886 AD) and the official currency of the United Kingdom. It is the fourth most traded unit for foreign exchange (FX) in the world, accounting for 12% of all transactions, averaging $630 billion a day, according to 2022 data. Its key trading pairs are GBP/USD, aka ‘Cable’, which accounts for 11% of FX, GBP/JPY, or the ‘Dragon’ as it is known by traders (3%), and EUR/GBP (2%). The Pound Sterling is issued by the Bank of England (BoE).
The single most important factor influencing the value of the Pound Sterling is monetary policy decided by the Bank of England. The BoE bases its decisions on whether it has achieved its primary goal of “price stability” – a steady inflation rate of around 2%. Its primary tool for achieving this is the adjustment of interest rates. When inflation is too high, the BoE will try to rein it in by raising interest rates, making it more expensive for people and businesses to access credit. This is generally positive for GBP, as higher interest rates make the UK a more attractive place for global investors to park their money. When inflation falls too low it is a sign economic growth is slowing. In this scenario, the BoE will consider lowering interest rates to cheapen credit so businesses will borrow more to invest in growth-generating projects.
Data releases gauge the health of the economy and can impact the value of the Pound Sterling. Indicators such as GDP, Manufacturing and Services PMIs, and employment can all influence the direction of the GBP. A strong economy is good for Sterling. Not only does it attract more foreign investment but it may encourage the BoE to put up interest rates, which will directly strengthen GBP. Otherwise, if economic data is weak, the Pound Sterling is likely to fall.
Another significant data release for the Pound Sterling is the Trade Balance. This indicator measures the difference between what a country earns from its exports and what it spends on imports over a given period. If a country produces highly sought-after exports, its currency will benefit purely from the extra demand created from foreign buyers seeking to purchase these goods. Therefore, a positive net Trade Balance strengthens a currency and vice versa for a negative balance.
- NZD/USD gains ground due to an increase in export volumes and a strong rebound in the Terms of Trade in Q1.
- The New Zealand Dollar received support from China Services PMI, which marked the 17th consecutive month of expansion in services activity.
- Speculation is strengthening that the Fed will begin reducing interest rates starting from the September meeting.
NZD/USD retraces its recent losses, trading around 0.6180 during the early European hours on Wednesday. New Zealand's data for the first quarter showed a significant increase in export volumes and a strong rebound in Terms of Trade, providing support to the New Zealand Dollar (NZD). The index, which measures the ratio of export prices to import prices, rose by 5.1%, following a 7.8% decline in the previous quarter and surpassing market forecasts of a 3.1% increase.
Caixin China Services PMI came in at 54.0 in May, surpassing expectations of 52.6 and the previous figure of 52.5. This marked the 17th consecutive month of expansion in services activity, indicating the fastest pace since July 2023. This could have supported the New Zealand Dollar (NZD) as any change in the Chinese economy could impact the Kiwi market as both countries are close trade partners.
The appreciation of the NZD/USD pair could be attributed to rising speculation that the Federal Reserve (Fed) will start reducing interest rates from the September meeting, following a series of weak US economic data.
On Tuesday, the JOLTS US Job Openings declined by 296,000 to 8.059 million in April, down from March's 8.355 million, marking the lowest level since February 2021. This figure also missed the market consensus of 8.340 million.
As per the CME FedWatch Tool, the probability of a Fed rate cut by at least 25 basis points has increased to nearly 64.9%, up from 46.3% a week earlier.
Here is what you need to know on Wednesday, June 5:
Following the sharp decline seen on Monday, the US Dollar (USD) Index edged slightly higher on Tuesday but failed to gather momentum amid retreating US Treasury bond yields. The US economic docket will feature ADP Employment Change and the ISM Services PMI data for May on Wednesday. In the American session, the Bank of Canada (BoC) will announce monetary policy decisions as well.
The data from the US showed on Tuesday that JOLTS Job Openings declined to 8.059 million in April from 8.35 million in March. On a positive note, Factory Orders expanded by 0.7% on a monthly basis in April, matching March's increase. The bearish opening seen in Wall Street helped the USD hold its ground against its rivals in the early American session. With the benchmark 10-year US Treasury bond yield falling more than 1% on the day, however, the USD struggled to gather further strength. Early Wednesday, the 10-year yield recovers modestly but remains below 4.4%. Meanwhile, US stock index futures trade marginally higher on the day, while the USD Index holds steady above 104.00.
US Dollar PRICE This week
The table below shows the percentage change of US Dollar (USD) against listed major currencies this week. US Dollar was the weakest against the Swiss Franc.
| USD | EUR | GBP | JPY | CAD | AUD | NZD | CHF | |
|---|---|---|---|---|---|---|---|---|
| USD | -0.26% | -0.22% | -0.86% | 0.34% | -0.03% | -0.76% | -1.28% | |
| EUR | 0.26% | 0.07% | -0.59% | 0.63% | 0.10% | -0.51% | -1.03% | |
| GBP | 0.22% | -0.07% | -0.60% | 0.55% | 0.10% | -0.63% | -1.10% | |
| JPY | 0.86% | 0.59% | 0.60% | 1.19% | 0.87% | 0.24% | -0.25% | |
| CAD | -0.34% | -0.63% | -0.55% | -1.19% | -0.41% | -1.12% | -1.63% | |
| AUD | 0.03% | -0.10% | -0.10% | -0.87% | 0.41% | -0.61% | -1.19% | |
| NZD | 0.76% | 0.51% | 0.63% | -0.24% | 1.12% | 0.61% | -0.56% | |
| CHF | 1.28% | 1.03% | 1.10% | 0.25% | 1.63% | 1.19% | 0.56% |
The heat map shows percentage changes of major currencies against each other. The base currency is picked from the left column, while the quote currency is picked from the top row. For example, if you pick the US Dollar from the left column and move along the horizontal line to the Japanese Yen, the percentage change displayed in the box will represent USD (base)/JPY (quote).
During the Asian trading hours, the data from Australia showed that the country's Gross Domestic Product (GDP) expanded at an annual rate of 1.1% in the first quarter. This reading followed the 1.6% growth recorded in the previous quarter and came in below the market expectation for an expansion of 1.2%. Australian Treasurer Jim Chalmers said after the data releases that he expects the second-quarter GDP to be similarly difficult, noting that the drop in the savings ratio drop shows Australians are under pressure. AUD/USD's reaction was muted to this data and the pair was last seen trading little changed on the day at around 0.6650.
Japan's Ministry of Health, Labor and Welfare reported earlier in the day that Labor Cash Earnings rose 2.1% on a yearly basis, above the 1% increase recorded in March and the market expectation of 1.7%. After falling nearly 0.8% on Tuesday, USD/JPY reversed its direction and was last seen trading slightly below 156.00, where it was up 0.6% on the day.
The BoC is forecast to lower the policy rate by 25 basis points to 4.75% following the June policy meeting. Following Monday's indecisive action, USD/CAD gained nearly 0.4% on Tuesday. The pair stays relatively quiet and fluctuated in a tight channel below 1.3700 early Wednesday.
EUR/USD turned south and closed in negative territory on Tuesday, snapping a three-day winning streak. The pair moves up and down in a narrow band above 1.0850 in the European morning on Wednesday. Eurostat will release Producer Price Index (PPI) data for April later in the session.
After failing to stabilize above 1.2800, GBP/USD registered modest losses on Tuesday. The pair trades sideways near 1.2770 in the early European session.
Gold lost 1% on Tuesday and erased all the gains it recorded on Monday. XAU/USD fluctuates at around $2,330 in the European morning.
Bank of Canada FAQs
The Bank of Canada (BoC), based in Ottawa, is the institution that sets interest rates and manages monetary policy for Canada. It does so at eight scheduled meetings a year and ad hoc emergency meetings that are held as required. The BoC primary mandate is to maintain price stability, which means keeping inflation at between 1-3%. Its main tool for achieving this is by raising or lowering interest rates. Relatively high interest rates will usually result in a stronger Canadian Dollar (CAD) and vice versa. Other tools used include quantitative easing and tightening.
In extreme situations, the Bank of Canada can enact a policy tool called Quantitative Easing. QE is the process by which the BoC prints Canadian Dollars for the purpose of buying assets – usually government or corporate bonds – from financial institutions. QE usually results in a weaker CAD. QE is a last resort when simply lowering interest rates is unlikely to achieve the objective of price stability. The Bank of Canada used the measure during the Great Financial Crisis of 2009-11 when credit froze after banks lost faith in each other’s ability to repay debts.
Quantitative tightening (QT) is the reverse of QE. It is undertaken after QE when an economic recovery is underway and inflation starts rising. Whilst in QE the Bank of Canada purchases government and corporate bonds from financial institutions to provide them with liquidity, in QT the BoC stops buying more assets, and stops reinvesting the principal maturing on the bonds it already holds. It is usually positive (or bullish) for the Canadian Dollar.
FX option expiries for June 5 NY cut at 10:00 Eastern Time, via DTCC, can be found below
- EUR/USD: EUR amounts
- 1.0780 1b
- 1.0795 706m
- 1.0800 529m
- 1.0835 645m
- 1.0855 1.8b
- 1.0890 1b
- 1.0900 1.4b
- 1.0920 1.4b
- 1.0950 548m
- USD/JPY: USD amounts
- 154.60 970m
- 155.30 1.1b
- 156.60 509m
- 159.00 552m
- AUD/USD: AUD amounts
- 0.66000 1.1b
- USD/CAD: USD amounts
- 1.3655 446m
- EUR/JPY attracts some buyers near 169.30 in Wednesday’s early European session, up 0.50% on the day.
- The cross keeps the negative picture unchanged below the 100-period EMA, with the bearish RSI on 4-hour chart.
- The key upside barrier is seen at the 170.00 psychological level; the initial support level is located at 168.15.
The EUR/JPY cross snaps the two-day losing streak around 169.30 during the early European session on Wednesday. Traders closely watch the European Central Bank (ECB) interest rate decision on Thursday, which is more likely to cut interest rates by 25 basis points (bps).
Technically, EUR/JPY maintains the bearish outlook as the cross holds below the 100-period Exponential Moving Averages (EMA) on the four-hour chart. The downward momentum is backed by the Relative Strength Index (RSI), which stands in the bearish zone near 44.00, indicating the path of least resistance is to the downside.
The cross could resume the upside if it can break above the 100-period EMA at 169.35. Further north, the crucial hurdle is seen at the 170.00 psychological round mark. Any follow-through buying will see a rally to a high of June 4 at 170.72 en route to the upper boundary of Bollinger Band at 171.43.
On the other hand, the initial support level is located near the lower limit of Bollinger Band at 168.15. A breach of the mentioned level could expose a low of May 16 at 167.33. The additional downside filter to watch is a low of May 7 at 165.64.
EUR/JPY 4-hour chart
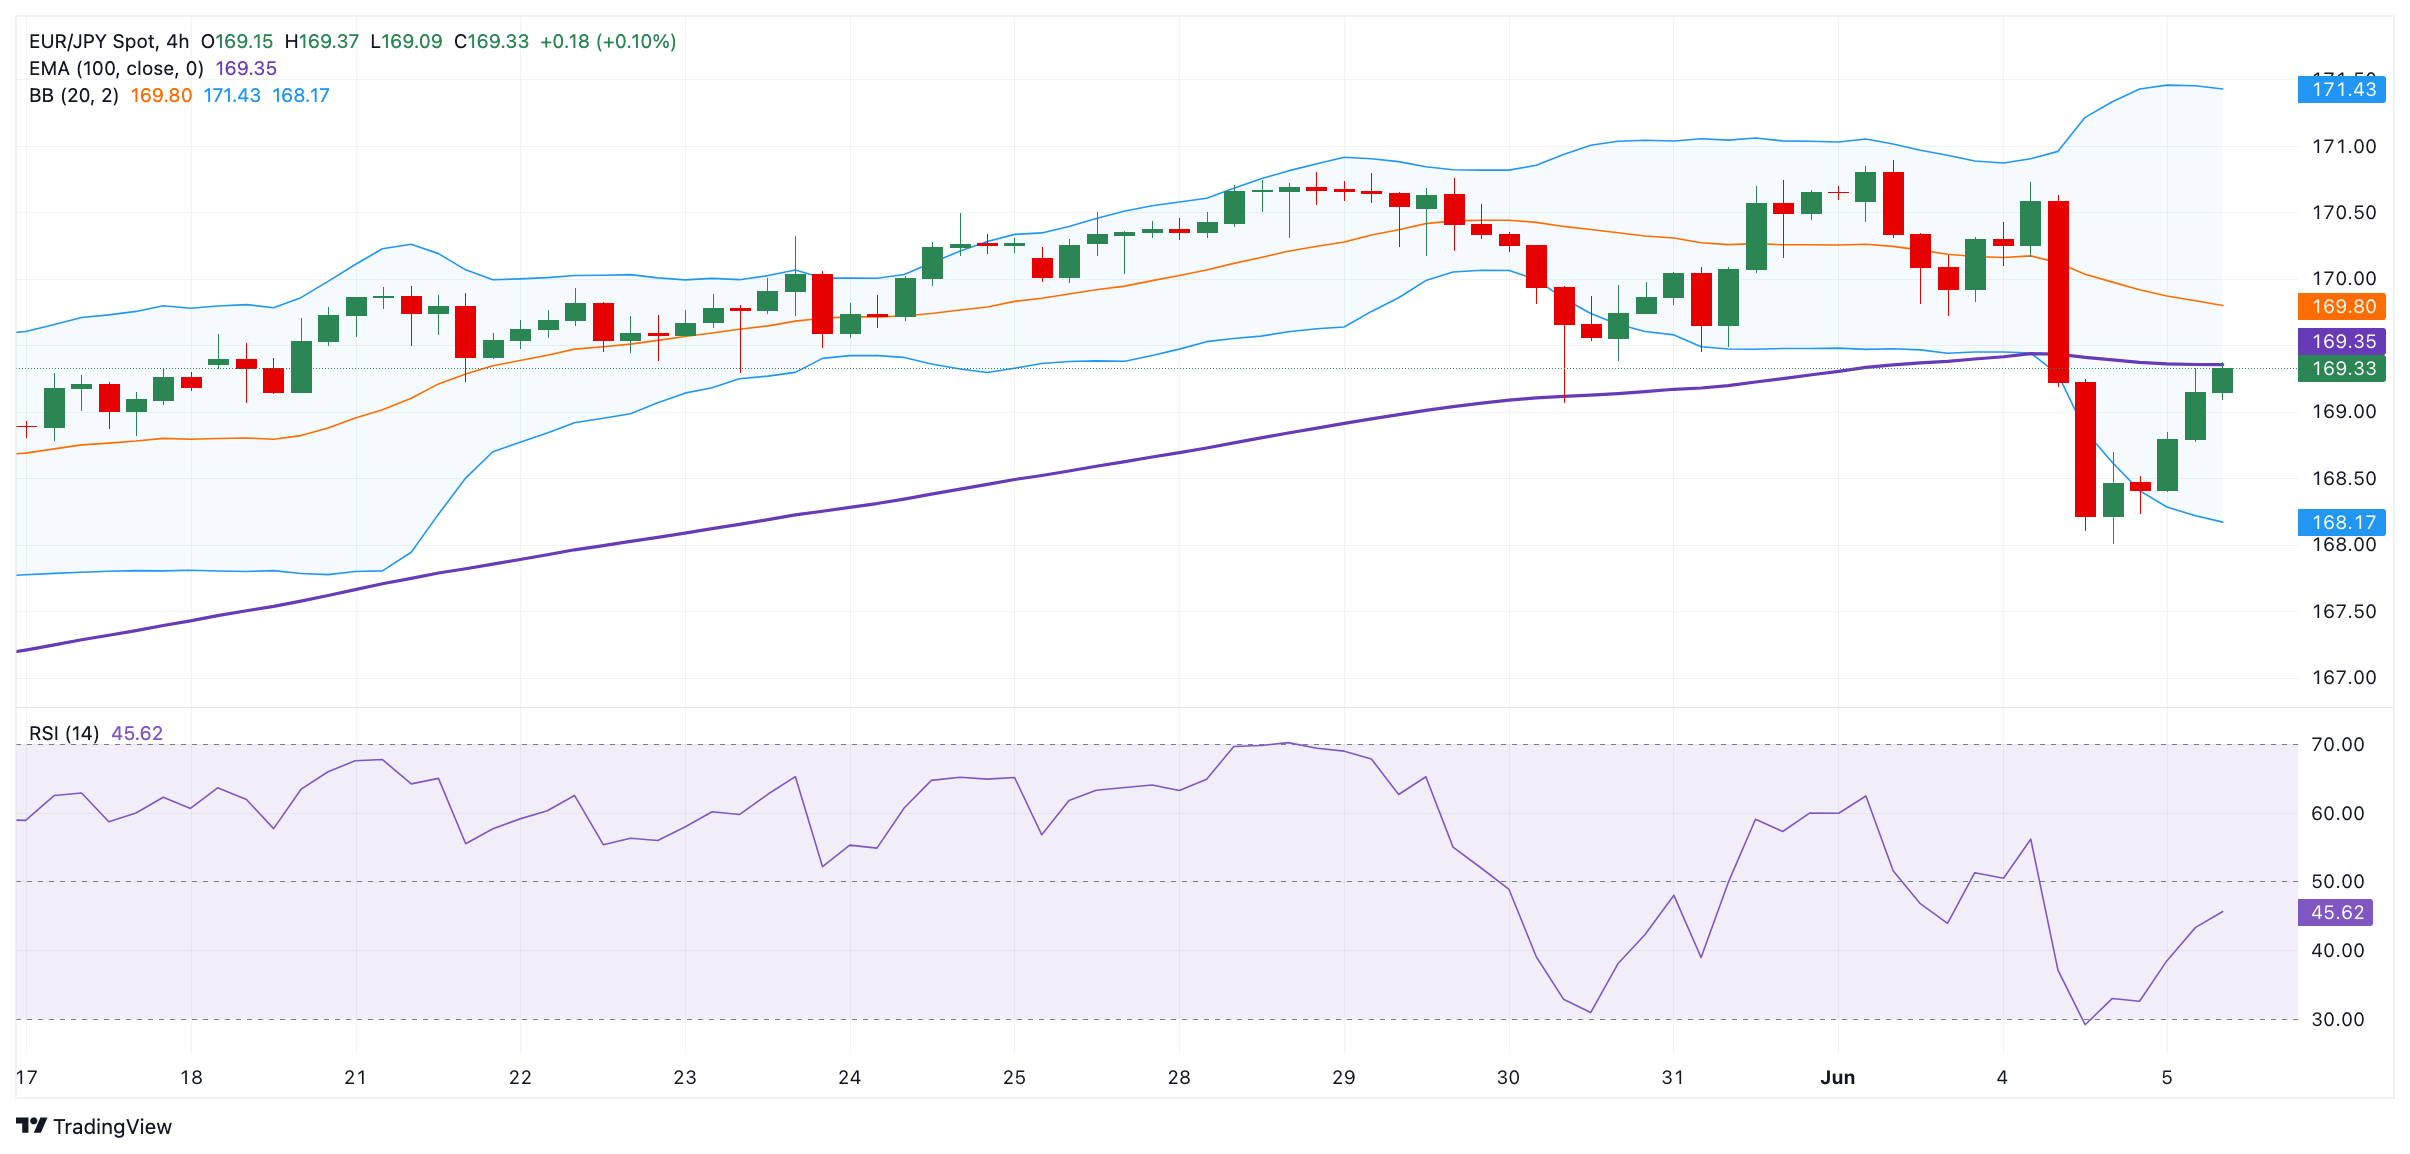
- USD/CHF is prone to more downside due to firm speculation that the Fed will start lowering rates in September.
- The next move in the US Dollar will be guided by the US Services PMI data for May.
- Fears of SNB’s stealth intervention in currency markets have strengthened the Swiss Franc.
The USD/CHF pair finds temporary support near 0.8900 in Wednesday’s Asian session. The outlook of the Swiss Franc asset appears to be vulnerable as the recovery move in the US Dollar (USD) seems stalling amid growing speculation that the Federal Reserve (Fed) will start reducing interest rates from the September meeting.
Market sentiment is positive for risk-perceived assets due to firm Fed rate-cut hopes. S&P 500 futures have posted decent gains in the Asian session. The US Dollar Index (DXY), which tracks the Greenback’s value against six major currencies, consolidates near an almost two-month low of around 104.00.
Traders raise bets in favor of the Fed lowering current interest rates from September as the US economic outlook appears to be losing strength. The perception is based on weak US ISM Manufacturing PMI report and downwardly revised Q1 Gross Domestic Product (GDP) data.
Going forward, investors shift focus to the US ADP Employment Change and the ISM Services PMI data for May, which will be published at 12:15 and 14:00 GMT. Economists have forecasted that private employers hired 173K job-seekers, lower than the prior reading of 192K. The Services PMI, which gauges the service sector activity that accounts for the two-third of the economy, is estimated to have returned to expansion. The economic data is seen at 50.5, higher than the former release of 49.4.
On the Swiss front, the Swiss Franc has strength amid expectations that the Swiss National Bank (SNB) could intervene in currency markets to support the Swiss Franc. Swiss exports have become more competitive in global markets due to weak currency, which could deepen fears of upside risks to inflation.
Meanwhile, the Swiss annual and monthly Consumer Price Index (CPI) grew steadily by 1.4% and 0.3% in May. Monthly inflation missed estimates of 0.4%.
- The Japanese Yen depreciates as investors adopt caution ahead of the US ADP Employment Change and ISM PMI.
- JPY could find support as Labor Cash Earnings surged by 2.1% YoY in April, marking the highest level since June last year.
- The US Dollar may find trouble due to the rising possibility of the Fed implementing its first rate cut in September.
The Japanese Yen (JPY) edges lower on Wednesday due to investors' caution ahead of key US data releases later in the day, including the US ADP Employment Change and ISM Services PMI reports. Attention is expected to shift toward the Nonfarm Payrolls (NFP) report due on Friday.
The JPY could face further downward pressure due to the interest rate differential between the United States (US) and Japan, which supports the USD/JPY pair. However, the upside potential of the USD/JPY pair may be limited by higher-than-expected data from Japan released on Wednesday.
The Jibun Bank Japan Services PMI was revised higher to 53.8 in May from the previous figure of 53.6. Despite the upward revision, it fell short of April's 8-month peak of 54.3, indicating the softest growth in the service sector since February. Additionally, Labor Cash Earnings surged by 2.1% year-on-year in April, surpassing forecasts for a 1.7% gain. This latest figure also marked the highest level since June last year.
The US Dollar Index (DXY), which gauges the value of the US Dollar (USD) against six other major currencies, has edged higher due to the improvement in US Treasury yields. However, the weaker US Manufacturing PMI in May has raised the possibility of the US Federal Reserve (Fed) implementing its first rate cut in September.
Traders are now pricing in nearly 64.9% odds of a Fed rate cut of at least 25 basis points, up from 46.3% a week earlier, according to the CME FedWatch Tool.
Daily Digest Market Movers: Japanese Yen depreciates due to risk-off mood
- The JOLTS US Job Openings declined by 296,000 to 8.059 million in April, down from March's 8.355 million, marking the lowest level since February 2021. This figure also missed the market consensus of 8.340 million, data showed on Tuesday.
- Bank of Japan (BoJ) Governor Kazuo Ueda said on Tuesday that the central bank will conduct "nimble" market operations if long-term interest rates spike, signaling the BoJ's readiness to ramp up bond buying when necessary. Ueda also stated that the BoJ will adjust the degree of monetary support if underlying inflation accelerates in line with its forecast, per Reuters.
- Reuters also reported that Japan's government will highlight the challenges a weak Yen poses for households in this year's long-term economic policy roadmap. This focus on the Yen's impact is expected to maintain pressure on the Bank of Japan to either raise interest rates or reduce its extensive bond-buying program.
- The ISM Manufacturing PMI unexpectedly dropped to 48.7 in May, down from April's reading of 49.2 and below the forecast of 49.6. The US manufacturing sector experienced its second consecutive month of contraction.
- Reuters reported on Monday that Japanese Economy Minister Yoshitaka Shindo announced that the government will “continue efforts for primary balance to reach within surplus territory in FY 2025.” Shindo also expressed optimism, stating that “Real economic growth of 1.3% in FY 2025 is not so unrealistic.”
- Last week, Atlanta Fed President Raphael Bostic stated in an interview with Fox Business that he does not think additional rate increases are necessary to achieve the Fed's 2% annual inflation target. Furthermore, New York Fed President John Williams stated as per Reuters that inflation is currently too high but should start to decline in the second half of 2024. Williams believes that monetary policy action is not urgently needed.
Technical Analysis: USD/JPY rebounds to near 155.50
The USD/JPY pair trades around 155.50 on Wednesday. Analysis of the daily chart suggests a weakening bullish bias as the pair breaks below the lower boundary of the symmetrical triangle pattern. Additionally, the 14-day Relative Strength Index (RSI) is slightly below the 50 level, indicating a potential for further decline that may confirm a bearish bias.
Immediate support for the USD/JPY pair could be found at the psychological level of 155.00, followed by the 50-day Exponential Moving Average (EMA) at 154.70. A break below the latter could increase pressure on the pair, potentially leading it toward the region around throwback support at 151.86.
On the upside, a key barrier is evident at the psychological level of 156.00, followed by the lower threshold of the symmetrical triangle. If the USD/JPY pair returns into the symmetrical triangle, it would reinforce the bullish bias and could lead the pair to test the upper boundary of the pattern. A break above the psychological barrier of 157.00 would support the pair in retesting 160.32, its highest level in over thirty years.
USD/JPY: Daily Chart
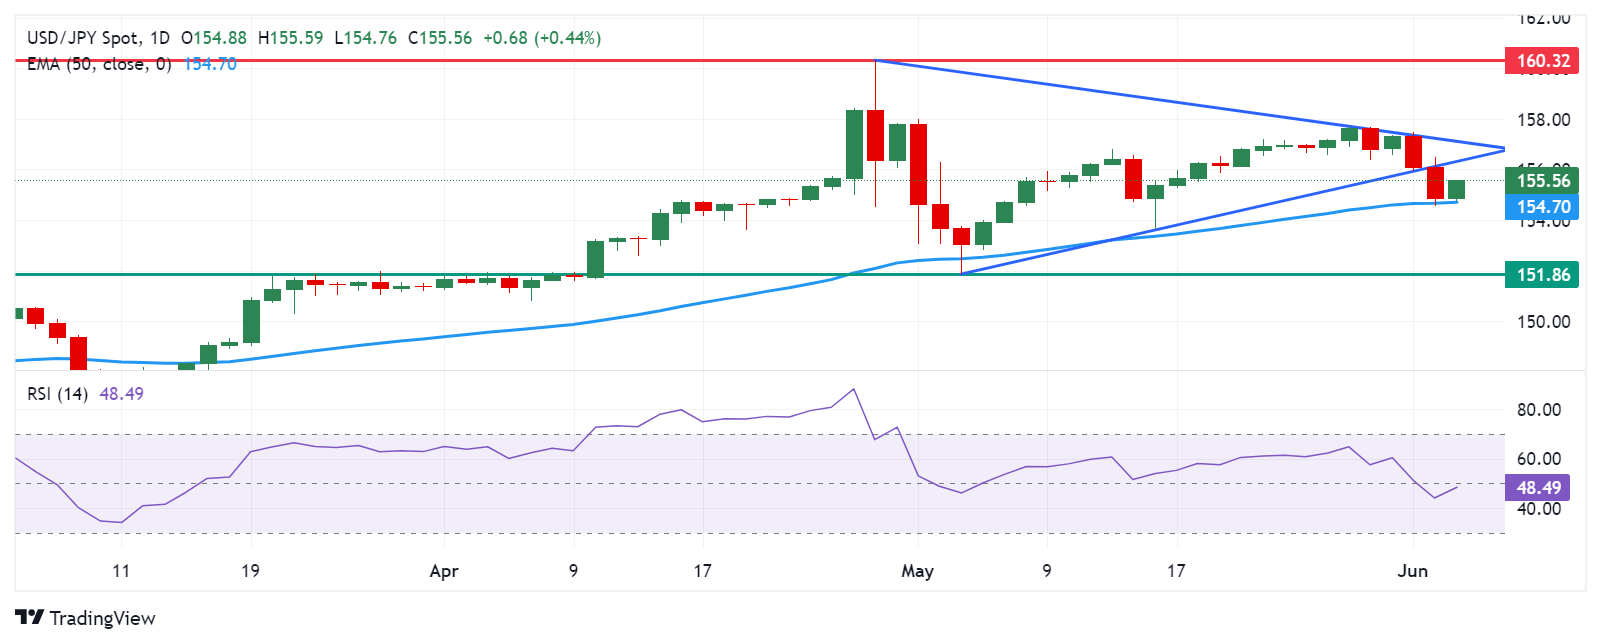
Japanese Yen price today
The table below shows the percentage change of Japanese Yen (JPY) against listed major currencies today. Japanese Yen was the weakest against the Australian Dollar.
| USD | EUR | GBP | CAD | AUD | JPY | NZD | CHF | |
| USD | 0.03% | 0.01% | -0.02% | -0.20% | 0.22% | -0.19% | 0.09% | |
| EUR | -0.03% | -0.03% | -0.06% | -0.22% | 0.21% | -0.21% | 0.07% | |
| GBP | 0.00% | 0.03% | -0.03% | -0.19% | 0.24% | -0.19% | 0.10% | |
| CAD | 0.02% | 0.06% | 0.03% | -0.17% | 0.29% | -0.16% | 0.15% | |
| AUD | 0.20% | 0.22% | 0.20% | 0.18% | 0.44% | 0.01% | 0.30% | |
| JPY | -0.21% | -0.21% | -0.22% | -0.26% | -0.43% | -0.43% | -0.14% | |
| NZD | 0.19% | 0.22% | 0.20% | 0.17% | -0.01% | 0.41% | 0.28% | |
| CHF | -0.10% | -0.07% | -0.10% | -0.13% | -0.29% | 0.14% | -0.28% |
The heat map shows percentage changes of major currencies against each other. The base currency is picked from the left column, while the quote currency is picked from the top row. For example, if you pick the Euro from the left column and move along the horizontal line to the Japanese Yen, the percentage change displayed in the box will represent EUR (base)/JPY (quote).
Japanese Yen FAQs
The Japanese Yen (JPY) is one of the world’s most traded currencies. Its value is broadly determined by the performance of the Japanese economy, but more specifically by the Bank of Japan’s policy, the differential between Japanese and US bond yields, or risk sentiment among traders, among other factors.
One of the Bank of Japan’s mandates is currency control, so its moves are key for the Yen. The BoJ has directly intervened in currency markets sometimes, generally to lower the value of the Yen, although it refrains from doing it often due to political concerns of its main trading partners. The current BoJ ultra-loose monetary policy, based on massive stimulus to the economy, has caused the Yen to depreciate against its main currency peers. This process has exacerbated more recently due to an increasing policy divergence between the Bank of Japan and other main central banks, which have opted to increase interest rates sharply to fight decades-high levels of inflation.
The BoJ’s stance of sticking to ultra-loose monetary policy has led to a widening policy divergence with other central banks, particularly with the US Federal Reserve. This supports a widening of the differential between the 10-year US and Japanese bonds, which favors the US Dollar against the Japanese Yen.
The Japanese Yen is often seen as a safe-haven investment. This means that in times of market stress, investors are more likely to put their money in the Japanese currency due to its supposed reliability and stability. Turbulent times are likely to strengthen the Yen’s value against other currencies seen as more risky to invest in.
- EUR/USD attracts fresh buyers on Wednesday amid a modest USD downtick.
- Fed rate cut bets keep the US bond yields depressed and undermine the buck.
- Wednesday’s US data might provide some impetus ahead of the ECB on Thursday.
The EUR/USD pair builds on the overnight bounce from the 1.0860-1.0855 region and ticks higher during the Asian session on Wednesday amid subdued US Dollar (USD) price action. Spot prices currently trade just below the 1.0900 mark and remain well within the striking distance of the highest level since March 21 touched on Tuesday.
The incoming softer US macro data pointed to signs of a cooling economy and cemented bets for an imminent interest rate cut by the Federal Reserve (Fed) later this year. The expectations keep the US Treasury bond yields depressed and undermine the USD, which, in turn, is seen lending some support to the EUR/USD pair. The upside, however, seems limited as traders might prefer to wait on the sidelines ahead of the crucial European Central Bank (ECB) monetary policy meeting on Thursday.
As widely signalled in recent weeks by policymakers, the ECB is more likely to cut interest rates by 25 basis points at the end of its June 6 meeting. This will mark the first cut since March 2016 and will be accompanied by the latest economic projections. This, along with comments by ECB President Christine Lagarde will be scrutinized for cues about future rate cuts on the back of a rise in Eurozone inflation in May. This, in turn, will play a key role in driving the shared currency and the EUR/USD pair.
The market attention will then shift to the release of the closely-watched US monthly employment details, popularly known as the Nonfarm Payrolls (NFP) report on Friday. The crucial US jobs data might influence expectations about the Fed's next policy move and the USD. Heading into the key central bank event and US macro data risks, Wednesday's US economic docket, featuring the ADP report and ISM Services PMI, might produce short-term opportunities around the EUR/USD pair.
- Indian Rupee (INR) trades on a stronger note on Wednesday.
- Lower oil prices and optimism about foreign fund inflows support the INR after facing the uncertainty surrounding Indian election.
- Traders will closely watch the Indian HSBC Services PMI and US ISM Services PMI for May, which are due on Wednesday.
Indian Rupee (INR) trims losses on Wednesday after facing some selling pressure in the previous session. On Tuesday, the uncertainty surrounding a majority win for the BJP-led government triggered a significant sell-off in Indian equities and the INR. Nevertheless, the decline in crude oil prices and optimism about foreign fund inflows due to India's inclusion in the JPMorgan bond indices are likely to support the Indian Rupee.
Investors will keep an eye on the Indian HSBC Services PMI, which is expected to rise to 61.4 in May from 60.8 in April. On the US docket, the US ISM Services PMI will be published, along with the ADP Employment Change. In case of the stronger-than-expected reading, this might boost the US Dollar (USD) and create a tailwind for the USD/INR pair.
Daily Digest Market Movers: Indian Rupee remains firm amid the uncertainties
- The NSE Nifty 50 closed down nearly 6% at 21,884.5 points on Tuesday, its steepest fall since India's first Covid lockdowns in March 2020. The S&P BSE Sensex also fell sharply, closing 5.7% lower at 72,079.05.
- The biggest fall for over four years for Indian stocks came after vote counting in India's general election indicated Prime Minister Narendra Modi's party might not be able to form a majority government, per BBC.
- Modi is set to negotiate with coalition partners in order to form a government. The BJP and its political allies, known as the National Democratic Alliance (NDA), have enough seats to form a majority government to rule for the next five years and return Modi to office for a third term, per the Guardian.
- "USD-INR to stabilize around current levels in the near term; strong service exports, index flows and FX reserves to support INR," said Standard Chartered Economist and FX Analyst Jonathan Koh
- The US JOLTs Job Openings declined from 8.355 million to 8.059 million in April, below the market consensus of 8.34 million.
- The final reading US ISM Services PMI is estimated to improve to 50.5 in May from 49.4 in April.
Technical analysis: USD/INR climbs above the descending trend channel on the daily chart
The Indian Rupee trades firmer on the day. The USD/INR pair has broken above the descending trend channel that has been established since mid-April and crossed back above the key 100-day Exponential Moving Average (EMA) on the daily chart, turning the outlook to the upside. Additionally, the 14-day Relative Strength Index (RSI) stands in bullish territory at around 55.80, and it supports buyers for the time being.
A high of June 4 at 83.62 acts as an immediate resistance level for the pair. Any follow-through buying will see a rally to a high of April 17 at 83.72 en route to the 84.00 psychological level.
On the downside, the resistance-turned-support level of 83.40 will be the first downside target for USD/INR. The next contention level to watch is the 100-day EMA at 83.20. A breach of this level will see a drop to the 83.00 round mark, followed by a low of January 15 at 82.78.
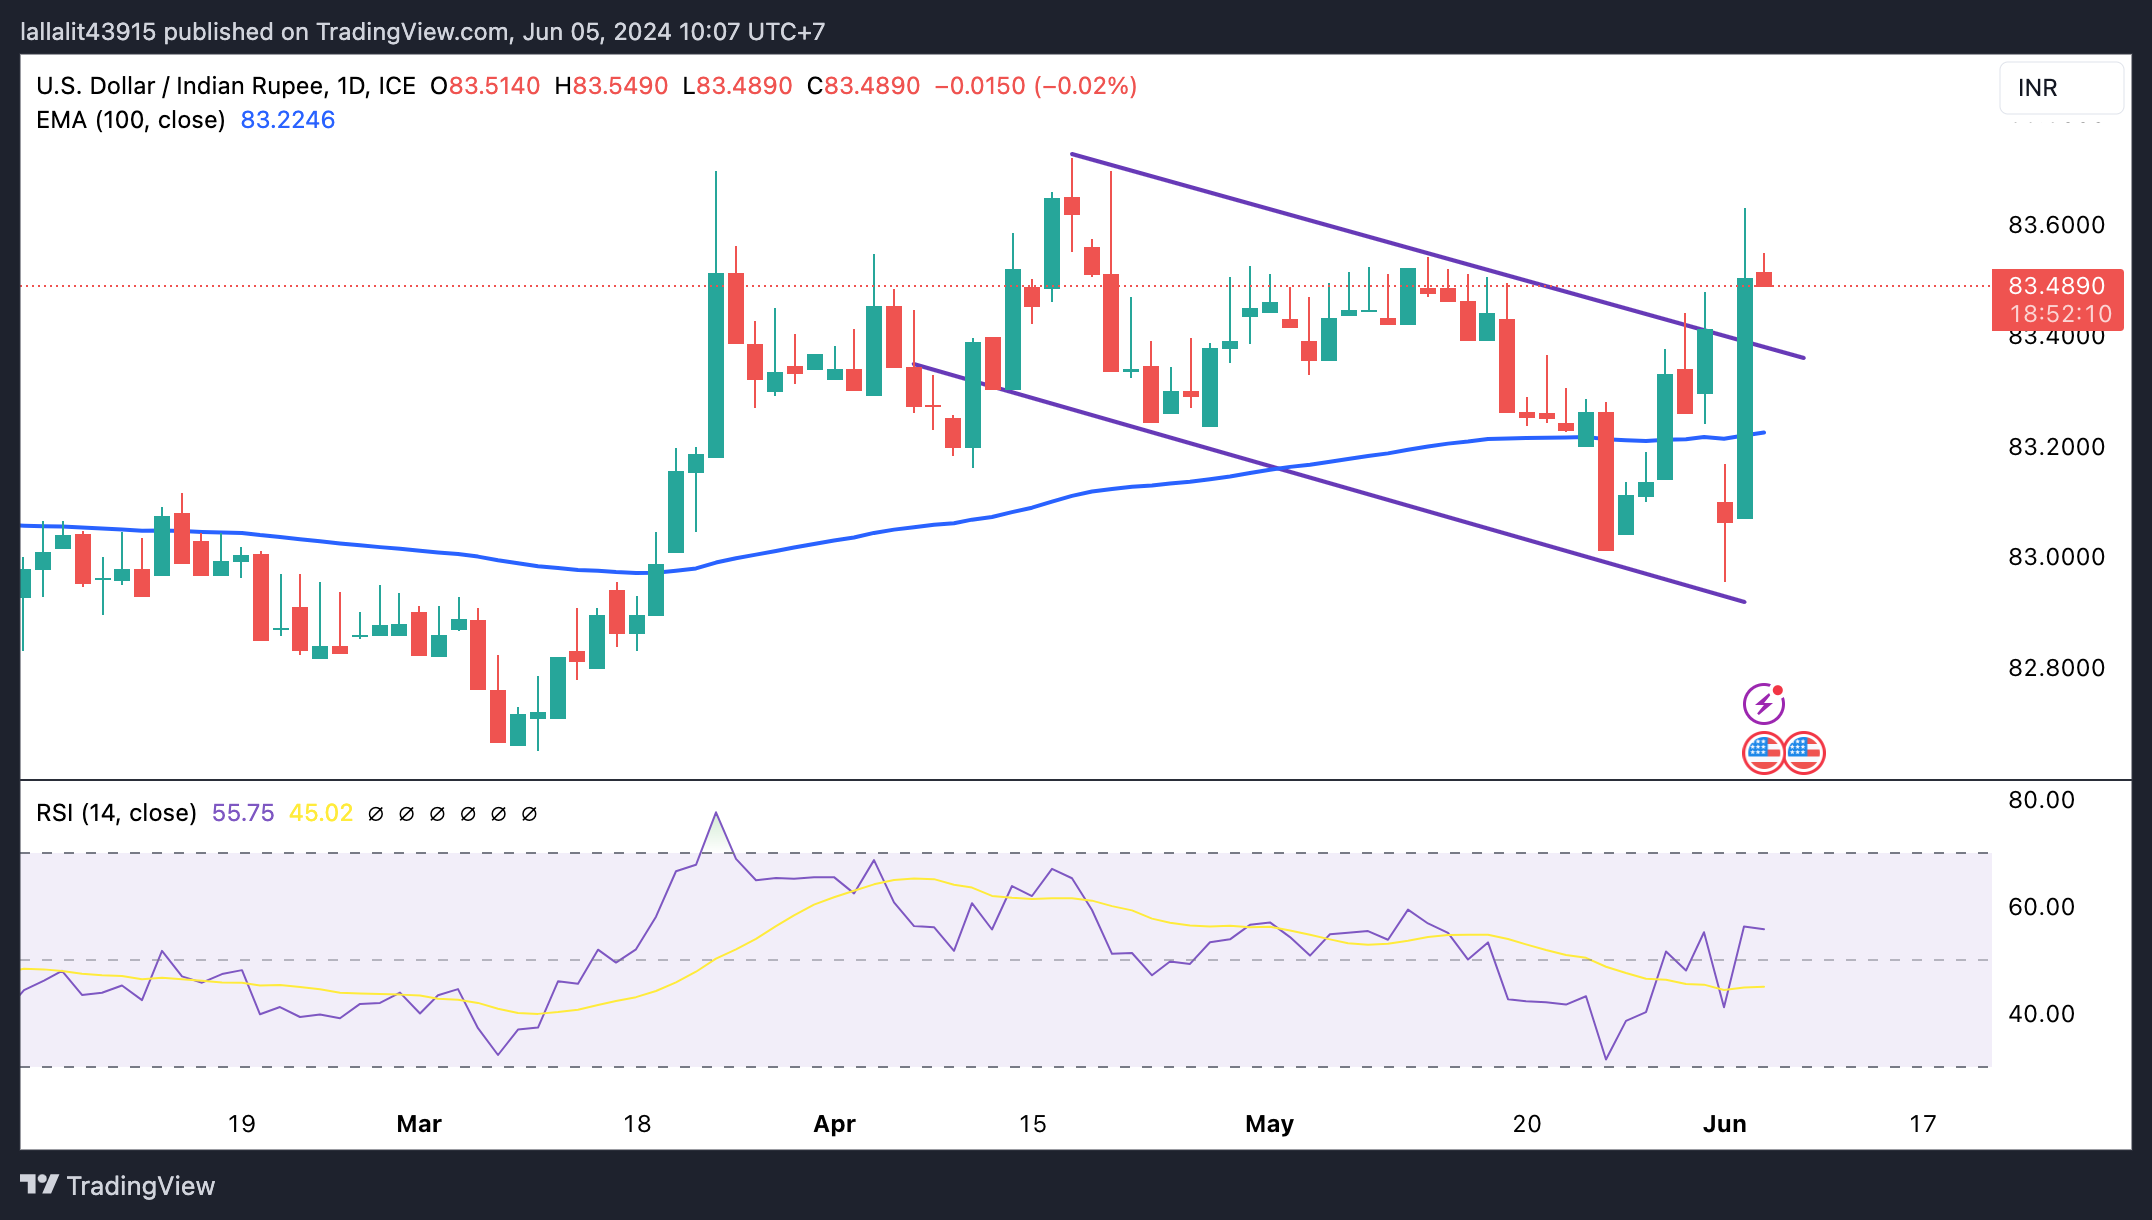
Indian Rupee FAQs
The Indian Rupee (INR) is one of the most sensitive currencies to external factors. The price of Crude Oil (the country is highly dependent on imported Oil), the value of the US Dollar – most trade is conducted in USD – and the level of foreign investment, are all influential. Direct intervention by the Reserve Bank of India (RBI) in FX markets to keep the exchange rate stable, as well as the level of interest rates set by the RBI, are further major influencing factors on the Rupee.
The Reserve Bank of India (RBI) actively intervenes in forex markets to maintain a stable exchange rate, to help facilitate trade. In addition, the RBI tries to maintain the inflation rate at its 4% target by adjusting interest rates. Higher interest rates usually strengthen the Rupee. This is due to the role of the ‘carry trade’ in which investors borrow in countries with lower interest rates so as to place their money in countries’ offering relatively higher interest rates and profit from the difference.
Macroeconomic factors that influence the value of the Rupee include inflation, interest rates, the economic growth rate (GDP), the balance of trade, and inflows from foreign investment. A higher growth rate can lead to more overseas investment, pushing up demand for the Rupee. A less negative balance of trade will eventually lead to a stronger Rupee. Higher interest rates, especially real rates (interest rates less inflation) are also positive for the Rupee. A risk-on environment can lead to greater inflows of Foreign Direct and Indirect Investment (FDI and FII), which also benefit the Rupee.
Higher inflation, particularly, if it is comparatively higher than India’s peers, is generally negative for the currency as it reflects devaluation through oversupply. Inflation also increases the cost of exports, leading to more Rupees being sold to purchase foreign imports, which is Rupee-negative. At the same time, higher inflation usually leads to the Reserve Bank of India (RBI) raising interest rates and this can be positive for the Rupee, due to increased demand from international investors. The opposite effect is true of lower inflation.
- WTI price continues its losing streak as US crude Oil stocks surged by 4.052 million barrels in the last week.
- OPEC+ allowed eight member countries to gradually unwound Oil cuts starting in October.
- Oil traders monitor the Israel-Hamas situation, as the failure of a peace deal could bolster crude Oil prices.
West Texas Intermediate (WTI) Oil price has dropped to four-month lows, trading around $73.10 per barrel during the Asian session on Wednesday. The American Petroleum Institute’s (API) Weekly Statistical Bulletin (WSB) reported that crude Oil stocks surged by 4.052 million barrels for the week ending May 31, reversing a prior week's decline of 6.490 million barrels and defying market expectations of a 1.900 million-barrel draw.
Crude Oil prices are being pressured by signs of rising global supplies coupled with an uncertain demand outlook. On Sunday, the Organization of the Petroleum Exporting Countries and its allies (OPEC+) agreed to extend most of their supply cuts into 2025 but allowed for voluntary cuts from eight member countries to be gradually unwound starting in October. By December, more than 500,000 barrels per day (bpd) are expected to re-enter the market, with a total of 1.8 million bpd returning by June 2025, according to Reuters.
In the Middle East on Tuesday, Osama Hamdan, a Hamas official, stated during a televised press conference, as reported by Reuters, that Hamas cannot agree to any deal unless Israel makes a "clear" commitment to a permanent ceasefire and a complete withdrawal from the Gaza Strip.
Qatar, which has been mediating talks between Hamas and Israel alongside the United States and Egypt, has also urged Israel to provide a clear position that is backed by its entire government to facilitate reaching a deal. Oil traders will be closely monitoring further developments, as the failure of a peace deal could lead to an increase in crude Oil prices.
Australian Treasurer Jim Chalmers said on Wednesday that he expects “the second-quarter GDP to be `similarly difficult'.
“Savings ratio drop shows Australians under pressure,” he added.
Market reaction
AUD/USD is unperturbed by the cautious remarks, holding 0.29% gains on the day to trade at 0.6662, as of writing.
- GBP/USD attracts fresh buying on Wednesday amid the underlying USD bearish tone.
- Divergent Fed-BoE policy expectations turn out to be another factor lending support.
- The technical setup favors bullish traders and supports prospects for additional gains.
The GBP/USD pair trades with a mild positive bias around the 1.2775-1.2780 area during the Asian session on Wednesday and remains well within the striking distance of its highest level since March 14 touched the previous day.
The US Dollar (USD) struggles to capitalize on the overnight bounce from over a two-month low in the wake of rising bets for an imminent interest rate cut by the Federal Reserve (Fed) later this year. Furthermore, expectations that the Bank of England (BoE) might keep interest rates at their current level for a little bit longer continue to underpin the British Pound (GBP) and act as a tailwind for the GBP/USD pair.
From a technical perspective, oscillators on the daily chart are holding in the positive territory and are still away from being in the overbought zone. This, in turn, supports prospects for further gains. Some follow-through buying beyond the 1.2800 mark will reaffirm the positive bias and lift the GBP/USD pair to the 1.2855-1.2860 area en route to the 1.2900 neighborhood or the YTD peak touched in March.
On the flip side, the overnight swing low, around the 1.2745-1.2740 region, now seems to protect the immediate downside ahead of the 1.2725-1.2720 area. The latter is followed by the 1.2700 mark, which if broken should pave the way for a slide towards the next relevant support near mid-1.2600s. Spot prices might eventually drop to test sub-1.2600 levels, or the 50-day Simple Moving Average (SMA) support.
GBP/USD daily chart
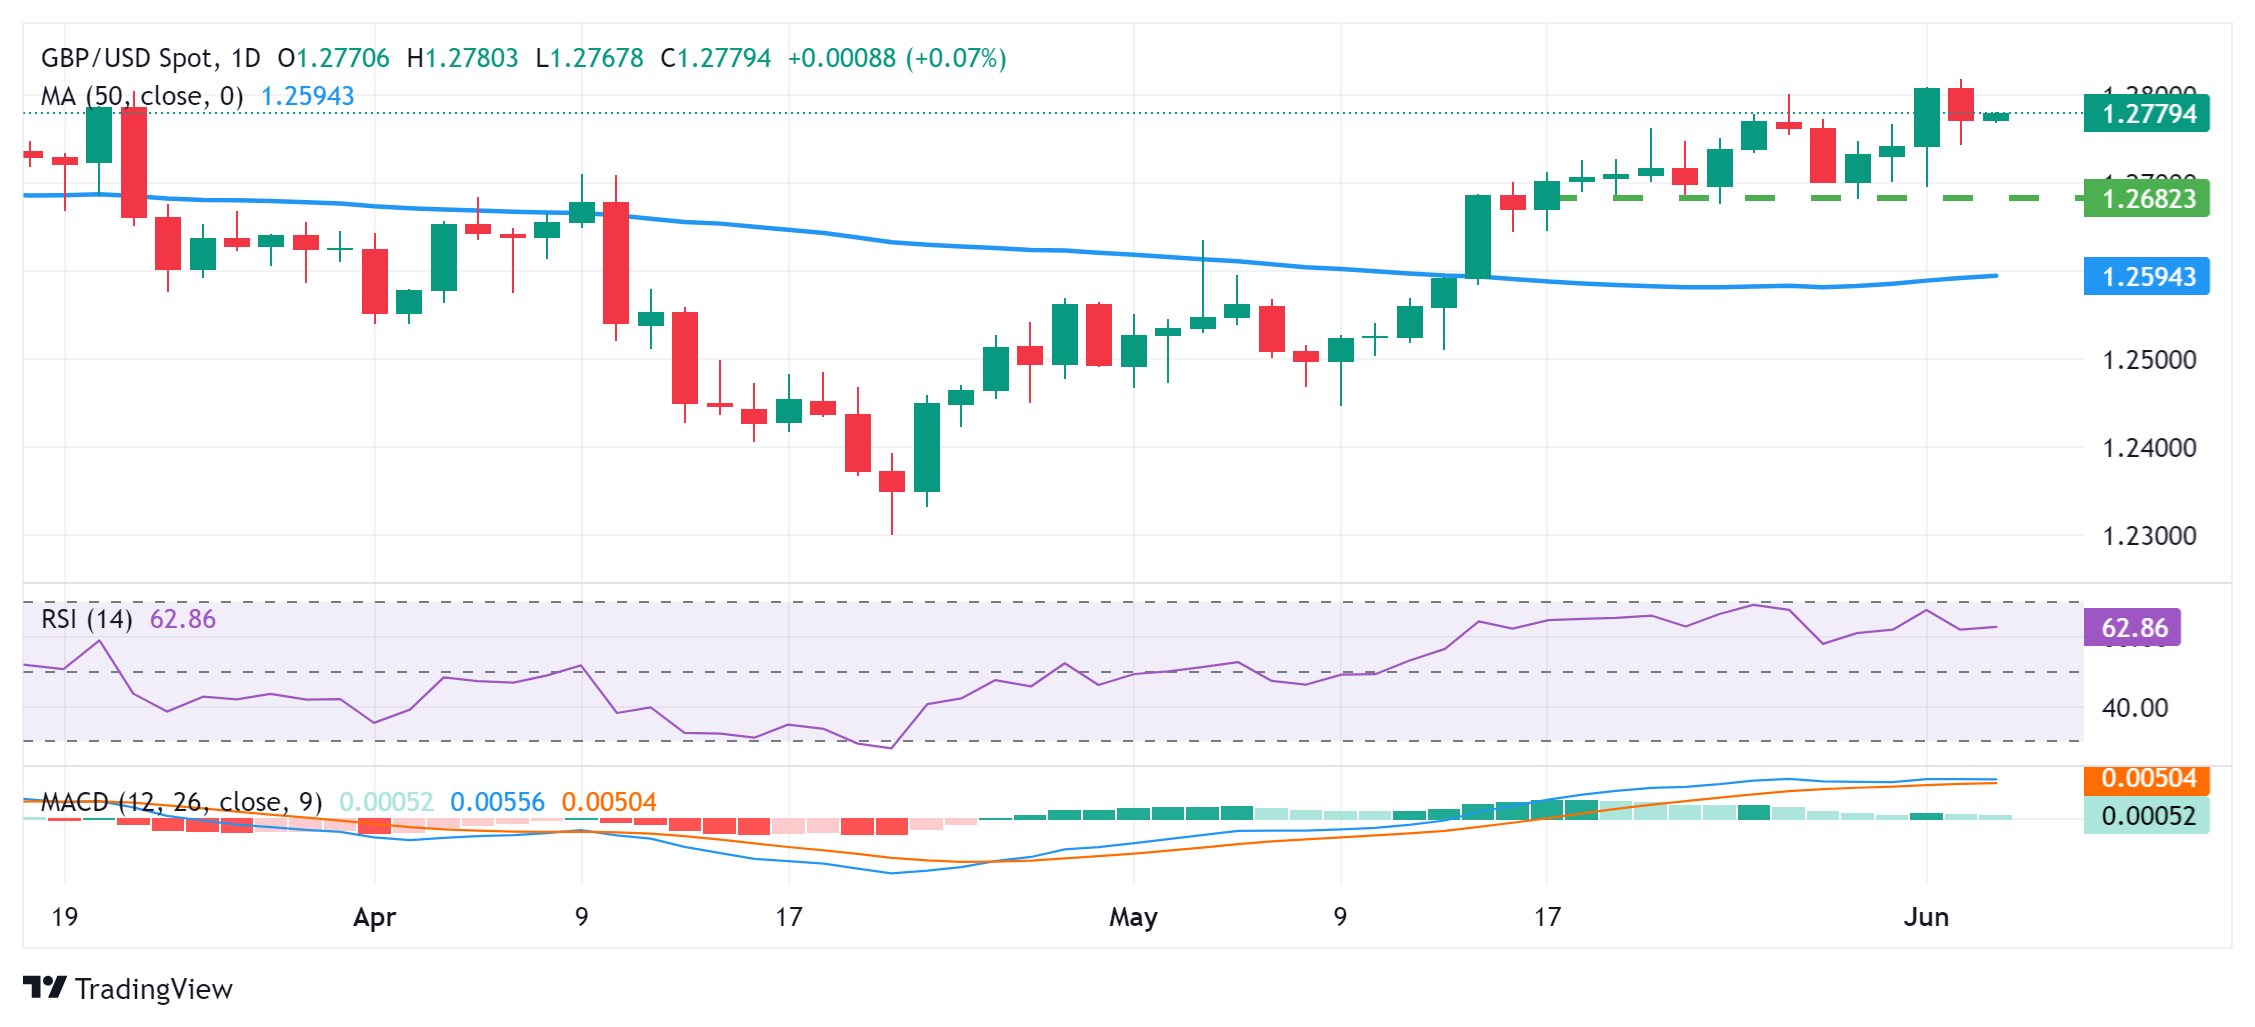
| Raw materials | Closed | Change, % |
|---|---|---|
| Silver | 29.476 | -4.07 |
| Gold | 2326.72 | -1.05 |
| Palladium | 914.68 | -1.24 |
- The Australian Dollar appreciates after the release of the lower-than-expected GDP data on Wednesday.
- Australia's GDP grew 0.1% QoQ in the first quarter, falling short of the expected 0.2% reading.
- The US Dollar could rebound due to the higher US Treasury yields.
The Australian Dollar (AUD) gains ground following the lower-than-expected Gross Domestic Product data, which grew 0.1% QoQ in the first quarter, against the expected 0.2% reading. On an annual basis, the economy grew 1.1%, slightly below the expected 1.2%. The AUD/USD pair received pressure as the Judo Bank Purchasing Managers Index (PMI) came in at 52.5, lower than the expected reading of 53.1 for May.
The Reserve Bank of Australia (RBA) Governor Michele Bullock stated on Wednesday that she anticipates GDP growth for the first quarter to be quite low. Bullock also emphasized that the central bank is prepared to take action if the Consumer Price Index (CPI) does not return to the target range, as reported by NCA NewsWire.
The US Dollar (USD) could rebound due to the upward correction in US Treasury yields. The USD weakened on the back of rising speculation of an interest rate cut by the Federal Reserve (Fed) this year. Investors await the key US data releases later on Wednesday, including the US ADP Employment Change and ISM Services PMI reports.
Daily Digest Market Movers: Australian Dollar appreciates despite softer economic growth
- The Judo Bank Composite PMI recorded a reading of 52.1 in May, a slight decrease from 53.0 in April. This shows that Australia's private sector output continued to grow for the fourth consecutive month, though at a slower rate.
- Caixin China Services PMI came in at 54 in May, exceeding the expected 52.6 and 52.5 prior.
- Australia reported on Tuesday, a current account deficit of A$4.9 billion (USD 3.2 billion) in the first quarter, marking a significant shift from a downwardly revised surplus of A$2.7 billion in the previous quarter. This result missed market expectations, which had anticipated a surplus of A$5.9 billion.
- The ISM Manufacturing PMI unexpectedly dropped to 48.7 in May, down from April's reading of 49.2 and below the forecast of 49.6. The US manufacturing sector experienced its second consecutive month of contraction, marking 18th in the last 19 months.
- Australia’s Judo Bank Manufacturing PMI was released on Monday, edging up slightly to 49.7 in May from 49.6 in April, marking the fourth consecutive month of declining conditions in the manufacturing sector.
- On Monday, the Caixin China Manufacturing PMI rose to 51.7 in May from 51.4 in April, marking the seventh consecutive month of expansion in factory activity and surpassing the estimates of 51.5. Friday’s NBS PMI data showed that manufacturing activity fell to 49.5 in May from 50.4 in April, missing the market consensus of an increase to 50.5. Meanwhile, the Non-Manufacturing PMI declined to 51.1 from the previous reading of 51.2, falling short of the estimated 51.5.
- Last week, Atlanta Fed President Raphael Bostic remarked in an interview with Fox Business that he doesn't believe further rate hikes should be required to reach the Fed's 2% annual inflation target. Additionally, New York Fed President John Williams stated that inflation is still too high but should moderate over the second half of 2024. Williams doesn't feel the urgency to act on monetary policy, per Reuters.
Technical Analysis: Australian Dollar hovers around 0.6650
The Australian Dollar trades around 0.6650 on Wednesday. A daily chart analysis indicates a bullish bias for the AUD/USD pair, as it remains within a rising wedge pattern. Additionally, the 14-day Relative Strength Index (RSI) is slightly above the 50 level, reinforcing this bullish bias.
The AUD/USD pair could potentially target the psychological level of 0.6700, followed by the four-month high of 0.6714 and the upper limit of the rising wedge around 0.6750.
On the downside, immediate support is seen at the 21-day Exponential Moving Average (EMA) at 0.6632, followed by the lower boundary of the rising wedge and the psychological level of 0.6600. A further decline could exert pressure on the AUD/USD pair, potentially pushing it toward the throwback support region at 0.6470.
AUD/USD: Daily Chart
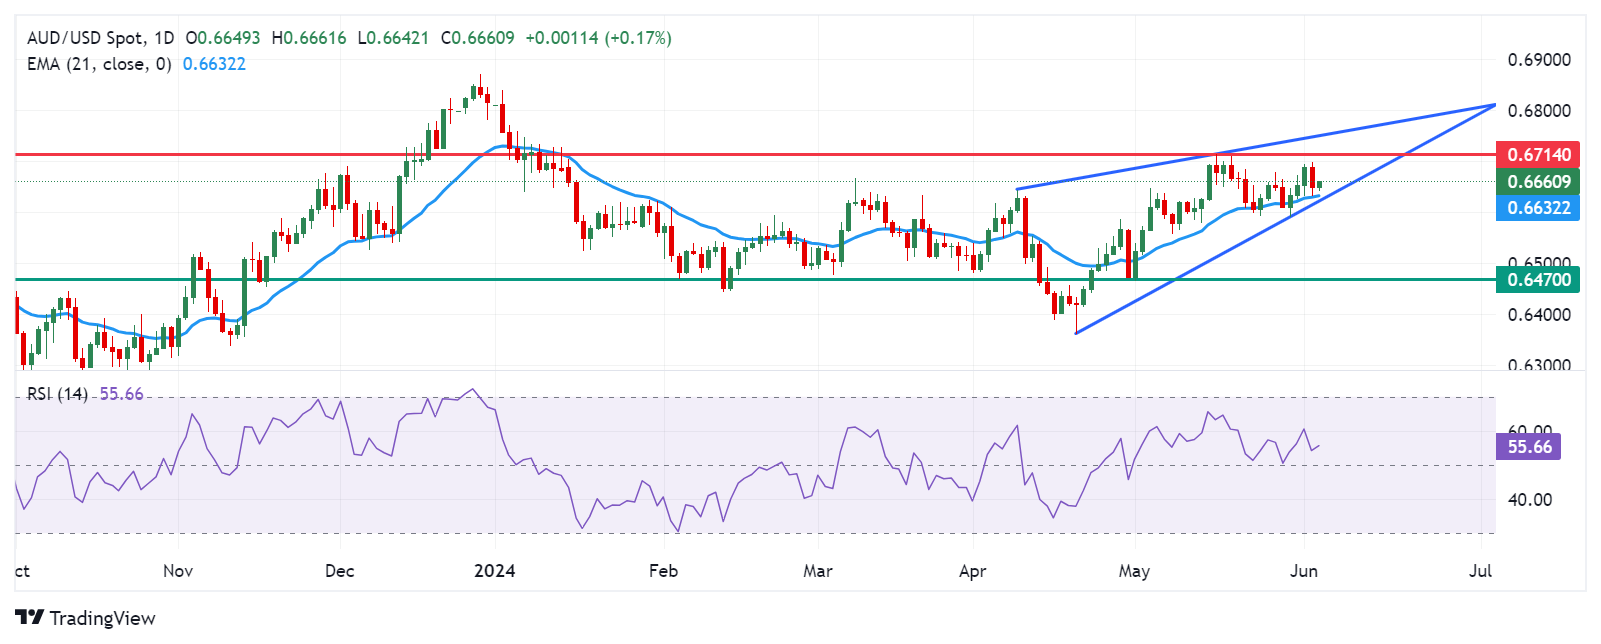
Australian Dollar price today
The table below shows the percentage change of the Australian Dollar (AUD) against listed major currencies today. The Australian Dollar was the strongest against the Japanese Yen.
| USD | EUR | GBP | CAD | AUD | JPY | NZD | CHF | |
| USD | -0.03% | -0.04% | -0.05% | -0.23% | 0.13% | -0.22% | 0.03% | |
| EUR | 0.03% | -0.01% | -0.02% | -0.18% | 0.19% | -0.16% | 0.07% | |
| GBP | 0.05% | 0.01% | -0.01% | -0.17% | 0.20% | -0.15% | 0.08% | |
| CAD | 0.05% | 0.01% | 0.00% | -0.18% | 0.23% | -0.16% | 0.10% | |
| AUD | 0.23% | 0.19% | 0.17% | 0.18% | 0.38% | 0.01% | 0.27% | |
| JPY | -0.12% | -0.20% | -0.20% | -0.19% | -0.35% | -0.37% | -0.12% | |
| NZD | 0.22% | 0.18% | 0.17% | 0.17% | -0.01% | 0.34% | 0.24% | |
| CHF | -0.03% | -0.07% | -0.08% | -0.08% | -0.25% | 0.13% | -0.23% |
The heat map shows percentage changes of major currencies against each other. The base currency is picked from the left column, while the quote currency is picked from the top row. For example, if you pick the Euro from the left column and move along the horizontal line to the Japanese Yen, the percentage change displayed in the box will represent EUR (base)/JPY (quote).
Australian Dollar FAQs
One of the most significant factors for the Australian Dollar (AUD) is the level of interest rates set by the Reserve Bank of Australia (RBA). Because Australia is a resource-rich country another key driver is the price of its biggest export, Iron Ore. The health of the Chinese economy, its largest trading partner, is a factor, as well as inflation in Australia, its growth rate and Trade Balance. Market sentiment – whether investors are taking on more risky assets (risk-on) or seeking safe-havens (risk-off) – is also a factor, with risk-on positive for AUD.
The Reserve Bank of Australia (RBA) influences the Australian Dollar (AUD) by setting the level of interest rates that Australian banks can lend to each other. This influences the level of interest rates in the economy as a whole. The main goal of the RBA is to maintain a stable inflation rate of 2-3% by adjusting interest rates up or down. Relatively high interest rates compared to other major central banks support the AUD, and the opposite for relatively low. The RBA can also use quantitative easing and tightening to influence credit conditions, with the former AUD-negative and the latter AUD-positive.
China is Australia’s largest trading partner so the health of the Chinese economy is a major influence on the value of the Australian Dollar (AUD). When the Chinese economy is doing well it purchases more raw materials, goods and services from Australia, lifting demand for the AUD, and pushing up its value. The opposite is the case when the Chinese economy is not growing as fast as expected. Positive or negative surprises in Chinese growth data, therefore, often have a direct impact on the Australian Dollar and its pairs.
Iron Ore is Australia’s largest export, accounting for $118 billion a year according to data from 2021, with China as its primary destination. The price of Iron Ore, therefore, can be a driver of the Australian Dollar. Generally, if the price of Iron Ore rises, AUD also goes up, as aggregate demand for the currency increases. The opposite is the case if the price of Iron Ore falls. Higher Iron Ore prices also tend to result in a greater likelihood of a positive Trade Balance for Australia, which is also positive of the AUD.
The Trade Balance, which is the difference between what a country earns from its exports versus what it pays for its imports, is another factor that can influence the value of the Australian Dollar. If Australia produces highly sought after exports, then its currency will gain in value purely from the surplus demand created from foreign buyers seeking to purchase its exports versus what it spends to purchase imports. Therefore, a positive net Trade Balance strengthens the AUD, with the opposite effect if the Trade Balance is negative.
China's Services Purchasing Managers' Index (PMI) jumped from 52.5 in April to 54.0 in May, the latest data published by Caixin showed on Wednesday.
The data beat the market expectations of 52.6 by a wide margin in the reported period.
AUD/USD reaction to China’s Services PMI
At the time of writing, the AUD/USD pair is trading 0.23% on the day to retest intraday highs near 0.6660.
Australian Dollar FAQs
One of the most significant factors for the Australian Dollar (AUD) is the level of interest rates set by the Reserve Bank of Australia (RBA). Because Australia is a resource-rich country another key driver is the price of its biggest export, Iron Ore. The health of the Chinese economy, its largest trading partner, is a factor, as well as inflation in Australia, its growth rate and Trade Balance. Market sentiment – whether investors are taking on more risky assets (risk-on) or seeking safe-havens (risk-off) – is also a factor, with risk-on positive for AUD.
The Reserve Bank of Australia (RBA) influences the Australian Dollar (AUD) by setting the level of interest rates that Australian banks can lend to each other. This influences the level of interest rates in the economy as a whole. The main goal of the RBA is to maintain a stable inflation rate of 2-3% by adjusting interest rates up or down. Relatively high interest rates compared to other major central banks support the AUD, and the opposite for relatively low. The RBA can also use quantitative easing and tightening to influence credit conditions, with the former AUD-negative and the latter AUD-positive.
China is Australia’s largest trading partner so the health of the Chinese economy is a major influence on the value of the Australian Dollar (AUD). When the Chinese economy is doing well it purchases more raw materials, goods and services from Australia, lifting demand for the AUD, and pushing up its value. The opposite is the case when the Chinese economy is not growing as fast as expected. Positive or negative surprises in Chinese growth data, therefore, often have a direct impact on the Australian Dollar and its pairs.
Iron Ore is Australia’s largest export, accounting for $118 billion a year according to data from 2021, with China as its primary destination. The price of Iron Ore, therefore, can be a driver of the Australian Dollar. Generally, if the price of Iron Ore rises, AUD also goes up, as aggregate demand for the currency increases. The opposite is the case if the price of Iron Ore falls. Higher Iron Ore prices also tend to result in a greater likelihood of a positive Trade Balance for Australia, which is also positive of the AUD.
The Trade Balance, which is the difference between what a country earns from its exports versus what it pays for its imports, is another factor that can influence the value of the Australian Dollar. If Australia produces highly sought after exports, then its currency will gain in value purely from the surplus demand created from foreign buyers seeking to purchase its exports versus what it spends to purchase imports. Therefore, a positive net Trade Balance strengthens the AUD, with the opposite effect if the Trade Balance is negative.
- Gold price manages to hold its neck above a multi-week low touched on Monday.
- Fed rate cut bets cap the attempted USD recovery and lend support to the metal.
- Traders now look to the US ADP report and ISM Services PMI for a fresh impetus.
Gold price (XAU/USD) came under renewed selling pressure on Tuesday and dropped to the $2,316-2,315 area, back closer to a multi-week low touched the previous day in the wake of a modest US Dollar (USD) strength. The attempted USD recovery from over a two-month low, however, lacked follow-through on the back of growing acceptance that the Federal Reserve (Fed) will start cutting interest rates later this year, bolstered by softer US macro data. The expectations keep the US Treasury bond yields depressed, which, in turn, is seen lending some support to the non-yielding yellow metal
Apart from this, geopolitical risks stemming from the ongoing conflicts in the Middle East further assist the safe-haven Gold price to hold steady around the $2,330 area during the Asian session on Wednesday. Despite a combination of supporting factors, the XAU/USD struggles to attract any meaningful buyers as investors prefer to wait for the release of the crucial US monthly jobs data, or the Nonfarm Payrolls (NFP) report on Friday. In the meantime, the US ADP report on private-sector employment and the US ISM Services PMI might produce short-term opportunities later today.
Daily Digest Market Movers: Gold price struggles to lure buyers despite firming Fed rate cut bets
- The US Dollar staged a modest bounce from over a two-month low touched on Tuesday and exerted downward pressure on the Gold price, though dismal US macro data helped limit losses.
- The Job Openings and Labor Turnover Survey, or JOLTS report showed that job openings fell more than expected, by 296K to 8.059 million in April, or the lowest in more than three years.
- This follows the disappointing release of the US ISM Manufacturing PMI on Monday, which showed a surprising weakness in business activity and pointed to signs of a cooling US economy.
- Meanwhile, the risk that the US economy might be softening more than anticipated cemented bets for a September rate cut by the Federal Reserve, dragging the US Treasury bond yields lower.
- The rate-sensitive two-year US government bond and the benchmark 10-year Treasury yield languish near a two-week low, capping the USD and lending support to the non-yielding yellow metal.
- Traders now look forward to Wednesday's US economic docket, featuring the release of the ADP report on private-sector employment and the ISM Services PMI to grab short-term opportunities.
- The focus, however, remains glued to the official monthly employment data, popularly known as the Nonfarm Payrolls report, which will determine the next leg of a directional move for the XAU/USD.
Technical Analysis: Gold price seems vulnerable below 50-day SMA, $2,315 holds the key for bulls
From a technical perspective, the Gold price now seems to have found acceptance below the 50-day Simple Moving Average (SMA). Moreover, oscillators on the daily chart have just started gaining negative traction and support prospects for further losses. A subsequent slide below the multi-week low, around the $2,315-2,314 area touched on Tuesday, will reaffirm the bearish bias and drag the XAU/USD below the $2,300 mark, towards testing the $2,280 horizontal support. Some follow-through selling will be seen as a fresh trigger for bearish traders and pave the way for an extension of the recent corrective decline witnessed over the past two weeks or so.
On the flip side, any meaningful upside now seems to confront stiff resistance near the $2,349-2,350 supply zone. The next relevant hurdle is pegged near the $2,360-2,364 area, which if cleared decisively should allow the Gold price to climb further towards the $2,385 intermediate hurdle en route to the $2,400 mark. The momentum could extend towards the $2,425 zone and eventually lift the XAU/USD to the $2,450 region, or the all-time peak touched in May.
Gold FAQs
Gold has played a key role in human’s history as it has been widely used as a store of value and medium of exchange. Currently, apart from its shine and usage for jewelry, the precious metal is widely seen as a safe-haven asset, meaning that it is considered a good investment during turbulent times. Gold is also widely seen as a hedge against inflation and against depreciating currencies as it doesn’t rely on any specific issuer or government.
Central banks are the biggest Gold holders. In their aim to support their currencies in turbulent times, central banks tend to diversify their reserves and buy Gold to improve the perceived strength of the economy and the currency. High Gold reserves can be a source of trust for a country’s solvency. Central banks added 1,136 tonnes of Gold worth around $70 billion to their reserves in 2022, according to data from the World Gold Council. This is the highest yearly purchase since records began. Central banks from emerging economies such as China, India and Turkey are quickly increasing their Gold reserves.
Gold has an inverse correlation with the US Dollar and US Treasuries, which are both major reserve and safe-haven assets. When the Dollar depreciates, Gold tends to rise, enabling investors and central banks to diversify their assets in turbulent times. Gold is also inversely correlated with risk assets. A rally in the stock market tends to weaken Gold price, while sell-offs in riskier markets tend to favor the precious metal.
The price can move due to a wide range of factors. Geopolitical instability or fears of a deep recession can quickly make Gold price escalate due to its safe-haven status. As a yield-less asset, Gold tends to rise with lower interest rates, while higher cost of money usually weighs down on the yellow metal. Still, most moves depend on how the US Dollar (USD) behaves as the asset is priced in dollars (XAU/USD). A strong Dollar tends to keep the price of Gold controlled, whereas a weaker Dollar is likely to push Gold prices up.
- USDCAD edges higher to 1.3678 in Wednesday’s early Asian session.
- The BoC is anticipated to cut its overnight rate to 4.75% at its June meeting on Wednesday.
- JOLT's Job Openings declined from 8.355M to 8.059M in April, worse than expected.
The USDCAD pair trades stronger on the day around 1.3678 in the early Asian session on Wednesday. The downtick of the pair is pressured by the softer US Dollar (USD) to reach the 104.00 support level on Tuesday. The Bank of Canada's (BoC) interest rate decision on Wednesday will be in the spotlight.
The BoC has kept its policy rate on hold at 5.0% since July 2023, and the markets expect the BoC to cut its overnight rate by 25 basis points (bps) to 4.75% due to signs of cooling inflation in Canada. The BoC Governor Tiff Macklem said during the last rate meeting that an initial cut in its June meeting would be “within the realm of possibilities.”. If the Canadian central bank decides to lower its borrowing costs in the June meeting, this could widen the divergence of policy rates between the BoC and Fed, which might exert more pressure on the Greenback. Meanwhile, the rise in crude oil prices could undermine the commodity-linked Loonie, as Canada is the largest oil exporter to the United States.
On the USD’s front, the poor inflation readings earlier this year prompted speculation that the Fed will cut rates from September this year. Traders in derivative markets expect only a 14% chance of a rate cut in July, but it's just above 50% for September, according to the CME FedWatch tool. The Fed will hold the next monetary policy meeting again on July 30-31. On Tuesday, the US JOLTs Job Openings declined from 8.355 million to 8.059 million in April, below the market consensus of 8.34 million.
Australia’s Gross Domestic Product (GDP) grew 0.1% QoQ in the first quarter of 2024 compared with the 0.2% growth in Q4 of 2023, the Australian Bureau of Statistics (ABS) showed on Wednesday. This reading came in below expectations of 0.2%.
The annual first-quarter GDP expanded by 1.1%, compared with the 1.5% growth in Q4 while missing estimates of a 1.2% increase.
Market reaction to Australia’s GDP data
Following the weaker Australian GDP growth numbers, the AUD/USD is down 0.03% on the day to trade at 0.6647, as of writing.
GDP FAQs
A country’s Gross Domestic Product (GDP) measures the rate of growth of its economy over a given period of time, usually a quarter. The most reliable figures are those that compare GDP to the previous quarter e.g Q2 of 2023 vs Q1 of 2023, or to the same period in the previous year, e.g Q2 of 2023 vs Q2 of 2022. Annualized quarterly GDP figures extrapolate the growth rate of the quarter as if it were constant for the rest of the year. These can be misleading, however, if temporary shocks impact growth in one quarter but are unlikely to last all year – such as happened in the first quarter of 2020 at the outbreak of the covid pandemic, when growth plummeted.
A higher GDP result is generally positive for a nation’s currency as it reflects a growing economy, which is more likely to produce goods and services that can be exported, as well as attracting higher foreign investment. By the same token, when GDP falls it is usually negative for the currency. When an economy grows people tend to spend more, which leads to inflation. The country’s central bank then has to put up interest rates to combat the inflation with the side effect of attracting more capital inflows from global investors, thus helping the local currency appreciate.
When an economy grows and GDP is rising, people tend to spend more which leads to inflation. The country’s central bank then has to put up interest rates to combat the inflation. Higher interest rates are negative for Gold because they increase the opportunity-cost of holding Gold versus placing the money in a cash deposit account. Therefore, a higher GDP growth rate is usually a bearish factor for Gold price.
The People’s Bank of China (PBoC) set the USD/CNY central rate for the trading session ahead on Wednesday at 7.1097, as against the previous day's fix of 7.1083 and 7.2418 Reuters estimates.
- USD/JPY edges higher to 155.30 on Wednesday, up 0.28% on the day.
- Japan's Labor Cash Earnings rose 2.1% YoY in April, compared to a 1.0% increase prior, higher than expected.
- The downbeat US Manufacturing PMI in May triggered the possibility of first rate cuts from the Fed in September.
The USD/JPY pair gathers strength near 155.30 trading during the early Asian trading hours on Wednesday. The interest rate differential between the Fed and BoJ continues to create a tailwind for the pair. The US ISM services PMI data will be closely watched on Wednesday ahead of the highly-anticipated Nonfarm Payrolls (NFP), which is due on Friday.
Japan's Labor Cash Earnings climbed 2.1% YoY in April from the previous reading of a 1.0% increase (revised from 0.6%), above the market consensus of 1.7%. With labor cash earnings rising faster than estimated, the Bank of Japan (BoJ) will be under pressure to begin clamping down on an easy monetary policy stance, which has exerted some selling pressure on the JPY through 2024. Meanwhile, the divergence of interest rates between the US and Japan continued to undermine the JPY and cap the downside for the USD/JPY pair.
On Tuesday, BoJ Deputy Governor Ryozo Himino said that the central bank must be "very vigilant" to the impact the JPY's moves could have on the economy. Himino added that the Japanese Yen’s weakness will be among the factors affecting the timing of its next interest rate hike.
The weaker US Manufacturing PMI in May triggered the possibility of first rate cuts from the US Federal Reserve (Fed) in September. Traders are now pricing in nearly 54.9% odds of a Fed rate cut in September, up from 49% at the end of last week, according to the CME FedWatch Tool. Investors will take more cues from the US ISM services PMI data, which is projected to rise to 50.5 in May from 49.4 in the previous reading. On Tuesday, the US JOLTs Job Openings decreased from 8.355 million to 8.059 million in April, missing the market expectation of 8.34 million.
| Index | Change, points | Closed | Change, % |
|---|---|---|---|
| NIKKEI 225 | -85.57 | 38837.46 | -0.22 |
| Hang Seng | 41.07 | 18444.11 | 0.22 |
| KOSPI | -20.42 | 2662.1 | -0.76 |
| ASX 200 | -23.9 | 7737.1 | -0.31 |
| DAX | -202.52 | 18405.64 | -1.09 |
| CAC 40 | -60.12 | 7937.9 | -0.75 |
| Dow Jones | 140.26 | 38711.29 | 0.36 |
| S&P 500 | 7.94 | 5291.34 | 0.15 |
| NASDAQ Composite | 28.38 | 16857.05 | 0.17 |
| Pare | Closed | Change, % |
|---|---|---|
| AUDUSD | 0.66475 | -0.66 |
| EURJPY | 168.458 | -1.08 |
| EURUSD | 1.08786 | -0.27 |
| GBPJPY | 197.706 | -1.14 |
| GBPUSD | 1.27684 | -0.32 |
| NZDUSD | 0.61762 | -0.28 |
| USDCAD | 1.36785 | 0.38 |
| USDCHF | 0.88988 | -0.62 |
| USDJPY | 154.839 | -0.82 |


© 2000-2026. All rights reserved.
This site is managed by Teletrade D.J. LLC 2351 LLC 2022 (Euro House, Richmond Hill Road, Kingstown, VC0100, St. Vincent and the Grenadines).
The information on this website is for informational purposes only and does not constitute any investment advice.
The company does not serve or provide services to customers who are residents of the US, Canada, Iran, The Democratic People's Republic of Korea, Yemen and FATF blacklisted countries.
Making transactions on financial markets with marginal financial instruments opens up wide possibilities and allows investors who are willing to take risks to earn high profits, carrying a potentially high risk of losses at the same time. Therefore you should responsibly approach the issue of choosing the appropriate investment strategy, taking the available resources into account, before starting trading.
Use of the information: full or partial use of materials from this website must always be referenced to TeleTrade as the source of information. Use of the materials on the Internet must be accompanied by a hyperlink to teletrade.org. Automatic import of materials and information from this website is prohibited.
Please contact our PR department if you have any questions or need assistance at pr@teletrade.global.
transfers