- Analytics
- News and Tools
- Market News
CFD Markets News and Forecasts — 03-10-2024
- GBP/USD trades on a firmer note around 1.3125 in Friday’s early Asian session.
- The US Nonfarm Payrolls (NFP) data will be in the spotlight on Friday.
- BoE’s Bailey said he sees a chance of a more aggressive rate reduction.
The GBP/USD pair posts modest gains to near 1.3125, snapping the three-day losing streak during the early Asian session on Friday. However, the upside for the major pair might be limited as traders brace for the highly-anticipated US Nonfarm Payrolls (NFP) data, which is due later on Friday.
Federal Reserve (Fed) Chair Jerome Powell said earlier this week that the recent half-percentage point interest rate cut shouldn’t be interpreted as a sign that future moves will be as aggressive. Powell further stated that if the economic data remains consistent, there are likely two more rate cuts coming this year, but they will be smaller. The reduced bets of jumbo Fed rate cuts might underpin the Greenback in the near term.
The encouraging US economic data on Thursday supports the USD. Data released by the Institute for Supply Management (ISM) showed that the US Services Purchasing Managers Index (PMI) rose to 54.9 in September versus 51.5 prior. This figure came in above the market consensus of 51.7.
The Pound Sterling (GBP) edged lower to the two-week lows on Thursday after Bank of England (BoE) Governor Andrew Bailey’s speech. Bailey noted that the UK central bank could take a more aggressive approach to lowering interest rates as inflation stayed subdued. The remarks from Bailey have triggered the expectation of a quarter-point cut in November and a solid chance of a consecutive reduction in December.
Pound Sterling FAQs
The Pound Sterling (GBP) is the oldest currency in the world (886 AD) and the official currency of the United Kingdom. It is the fourth most traded unit for foreign exchange (FX) in the world, accounting for 12% of all transactions, averaging $630 billion a day, according to 2022 data. Its key trading pairs are GBP/USD, also known as ‘Cable’, which accounts for 11% of FX, GBP/JPY, or the ‘Dragon’ as it is known by traders (3%), and EUR/GBP (2%). The Pound Sterling is issued by the Bank of England (BoE).
The single most important factor influencing the value of the Pound Sterling is monetary policy decided by the Bank of England. The BoE bases its decisions on whether it has achieved its primary goal of “price stability” – a steady inflation rate of around 2%. Its primary tool for achieving this is the adjustment of interest rates. When inflation is too high, the BoE will try to rein it in by raising interest rates, making it more expensive for people and businesses to access credit. This is generally positive for GBP, as higher interest rates make the UK a more attractive place for global investors to park their money. When inflation falls too low it is a sign economic growth is slowing. In this scenario, the BoE will consider lowering interest rates to cheapen credit so businesses will borrow more to invest in growth-generating projects.
Data releases gauge the health of the economy and can impact the value of the Pound Sterling. Indicators such as GDP, Manufacturing and Services PMIs, and employment can all influence the direction of the GBP. A strong economy is good for Sterling. Not only does it attract more foreign investment but it may encourage the BoE to put up interest rates, which will directly strengthen GBP. Otherwise, if economic data is weak, the Pound Sterling is likely to fall.
Another significant data release for the Pound Sterling is the Trade Balance. This indicator measures the difference between what a country earns from its exports and what it spends on imports over a given period. If a country produces highly sought-after exports, its currency will benefit purely from the extra demand created from foreign buyers seeking to purchase these goods. Therefore, a positive net Trade Balance strengthens a currency and vice versa for a negative balance.
- EUR/USD struggles to gain ground around 1.1035 in Friday’s early Asian session.
- The US Services PMI came in better than expected in September.
- The cautious mood and rising bets of another ECB rate cut weigh on the Euro.
The EUR/USD pair remains on the defensive near 1.1035 amid the stronger Greenback during the early Asian session on Friday. The cautious mood in the markets ahead of the key US economic data weighs on the major pair. All eyes will be on the release of US employment data, which is due later on Friday.
The upbeat US Services Purchasing Managers Index (PMI) released on Thursday provides some support to the US Dollar (USD). The Services PMI climbed to 54.9 in September from 51.5 in August, exceeding the market forecast of 51.7, the Institute for Supply Management (ISM) showed.
Meanwhile, Initial Jobless Claims in the US rose by 6,000 to 225,000 in the week ending September 28. This figure followed the previous week's print of 219,000 (revised from 218,000) and came worse than the market expectation of 220,000.
Fed Chair Jerome Powell indicated this week that policymakers would likely stick with 25 basis points (bps) rate cuts going forward. The markets have priced in nearly 68.9% odds of a 25 bps Fed rate cut, while the chance of 50 bps reductions stands at 31.1%, according to the CME FedWatch Tool.
The US Nonfarm Payrolls (NFP) on Friday could offer some hints about the US interest rate path. The US economy is estimated to see 140K job additions in September, while the Unemployment Rate is projected to hold steady at 4.2%. If the jobs report showed a weaker-than-expected outcome, this could prompt the central bank to consider cutting rates deeper, which might exert some selling pressure on the USD.
Across the pond, the European Central Bank (ECB) policymakers continue to hint that another cut could be coming in the near future. This, in turn, might undermine the Euro (EUR) against the USD. Kyle Chapman, FX analyst at Ballinger Group, noted, "Policy is far too restrictive given the tough macro environment, and a switch to consecutive rate cuts seems to be a given now that disinflation is in its late stages.
Euro FAQs
The Euro is the currency for the 19 European Union countries that belong to the Eurozone. It is the second most heavily traded currency in the world behind the US Dollar. In 2022, it accounted for 31% of all foreign exchange transactions, with an average daily turnover of over $2.2 trillion a day. EUR/USD is the most heavily traded currency pair in the world, accounting for an estimated 30% off all transactions, followed by EUR/JPY (4%), EUR/GBP (3%) and EUR/AUD (2%).
The European Central Bank (ECB) in Frankfurt, Germany, is the reserve bank for the Eurozone. The ECB sets interest rates and manages monetary policy. The ECB’s primary mandate is to maintain price stability, which means either controlling inflation or stimulating growth. Its primary tool is the raising or lowering of interest rates. Relatively high interest rates – or the expectation of higher rates – will usually benefit the Euro and vice versa. The ECB Governing Council makes monetary policy decisions at meetings held eight times a year. Decisions are made by heads of the Eurozone national banks and six permanent members, including the President of the ECB, Christine Lagarde.
Eurozone inflation data, measured by the Harmonized Index of Consumer Prices (HICP), is an important econometric for the Euro. If inflation rises more than expected, especially if above the ECB’s 2% target, it obliges the ECB to raise interest rates to bring it back under control. Relatively high interest rates compared to its counterparts will usually benefit the Euro, as it makes the region more attractive as a place for global investors to park their money.
Data releases gauge the health of the economy and can impact on the Euro. Indicators such as GDP, Manufacturing and Services PMIs, employment, and consumer sentiment surveys can all influence the direction of the single currency. A strong economy is good for the Euro. Not only does it attract more foreign investment but it may encourage the ECB to put up interest rates, which will directly strengthen the Euro. Otherwise, if economic data is weak, the Euro is likely to fall. Economic data for the four largest economies in the euro area (Germany, France, Italy and Spain) are especially significant, as they account for 75% of the Eurozone’s economy.
Another significant data release for the Euro is the Trade Balance. This indicator measures the difference between what a country earns from its exports and what it spends on imports over a given period. If a country produces highly sought after exports then its currency will gain in value purely from the extra demand created from foreign buyers seeking to purchase these goods. Therefore, a positive net Trade Balance strengthens a currency and vice versa for a negative balance.
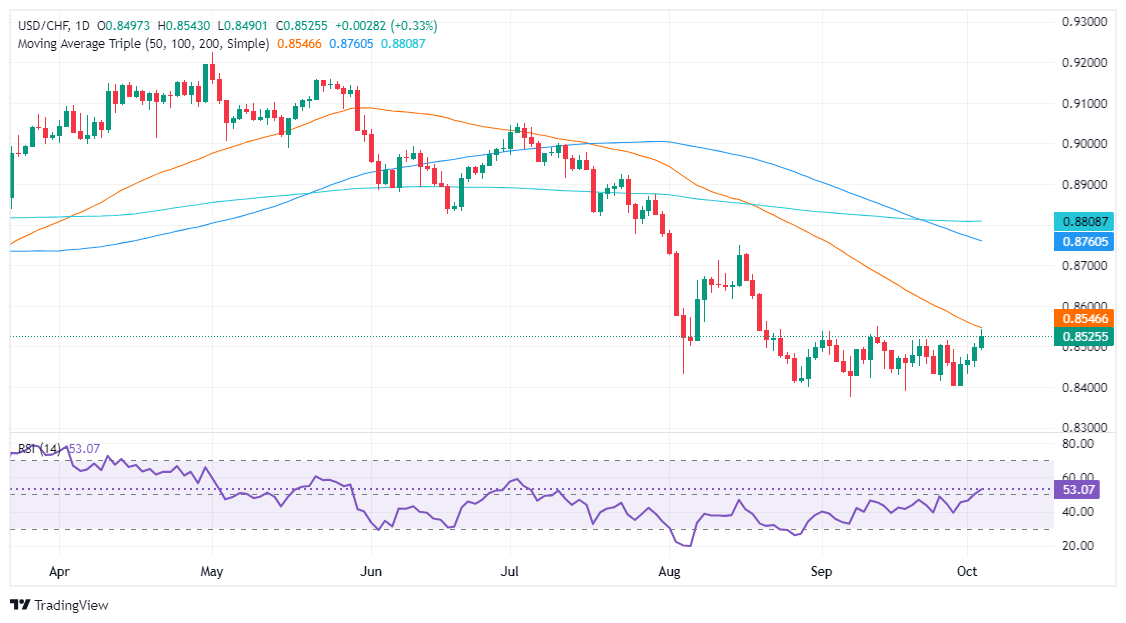
- USD/CHF consolidates between 0.8400-0.8550, with bullish momentum suggesting potential for higher prices.
- Buyers need to clear the 50-DMA at 0.8537 and the September 12 peak of 0.8550 to target 0.8600 and 0.8748.
- A downside break below 0.8500 could see a retreat toward 0.8400, where buyers may look for a bounce back to 50-DMA levels.
The USD/CHF posted solid gains of over 0.30% on Thursday as the Greenback recovers some ground, aimed to finish the week with solid gains. As the Friday’s Asian session begins, the pair trades at 0.8522, virtually unchanged.
USD/CHF Price Forecast: Technical outlook
The USD/CHF is neutral to upward biased, after consolidating within the 0.8400-0.8550 area during September and the first four days of October.
Momentum favors buyers as the Relative Strength Index (RSI) turned bullish, hinting that higher prifces lie ahead.
However, USD/CHF buyers need to clear the 50-day moving average (DMA) at 0.8537. If surpassed, the immediate ceiling level to be broken will be the September 12 peak at 0.8550. A breach of the latter will expose the 0.8600 figure, followed by the next cycle high seen at 0.8748. the August 15 high.
On the other hand, if sellers drag prices below 0.8500, the pair could aim toward 0.8400, looking for a bounce, that could push prices to the 50-DMA.
USD/CHF Price Action – Daily Chart
Swiss Franc FAQs
The Swiss Franc (CHF) is Switzerland’s official currency. It is among the top ten most traded currencies globally, reaching volumes that well exceed the size of the Swiss economy. Its value is determined by the broad market sentiment, the country’s economic health or action taken by the Swiss National Bank (SNB), among other factors. Between 2011 and 2015, the Swiss Franc was pegged to the Euro (EUR). The peg was abruptly removed, resulting in a more than 20% increase in the Franc’s value, causing a turmoil in markets. Even though the peg isn’t in force anymore, CHF fortunes tend to be highly correlated with the Euro ones due to the high dependency of the Swiss economy on the neighboring Eurozone.
The Swiss Franc (CHF) is considered a safe-haven asset, or a currency that investors tend to buy in times of market stress. This is due to the perceived status of Switzerland in the world: a stable economy, a strong export sector, big central bank reserves or a longstanding political stance towards neutrality in global conflicts make the country’s currency a good choice for investors fleeing from risks. Turbulent times are likely to strengthen CHF value against other currencies that are seen as more risky to invest in.
The Swiss National Bank (SNB) meets four times a year – once every quarter, less than other major central banks – to decide on monetary policy. The bank aims for an annual inflation rate of less than 2%. When inflation is above target or forecasted to be above target in the foreseeable future, the bank will attempt to tame price growth by raising its policy rate. Higher interest rates are generally positive for the Swiss Franc (CHF) as they lead to higher yields, making the country a more attractive place for investors. On the contrary, lower interest rates tend to weaken CHF.
Macroeconomic data releases in Switzerland are key to assessing the state of the economy and can impact the Swiss Franc’s (CHF) valuation. The Swiss economy is broadly stable, but any sudden change in economic growth, inflation, current account or the central bank’s currency reserves have the potential to trigger moves in CHF. Generally, high economic growth, low unemployment and high confidence are good for CHF. Conversely, if economic data points to weakening momentum, CHF is likely to depreciate.
As a small and open economy, Switzerland is heavily dependent on the health of the neighboring Eurozone economies. The broader European Union is Switzerland’s main economic partner and a key political ally, so macroeconomic and monetary policy stability in the Eurozone is essential for Switzerland and, thus, for the Swiss Franc (CHF). With such dependency, some models suggest that the correlation between the fortunes of the Euro (EUR) and the CHF is more than 90%, or close to perfect.
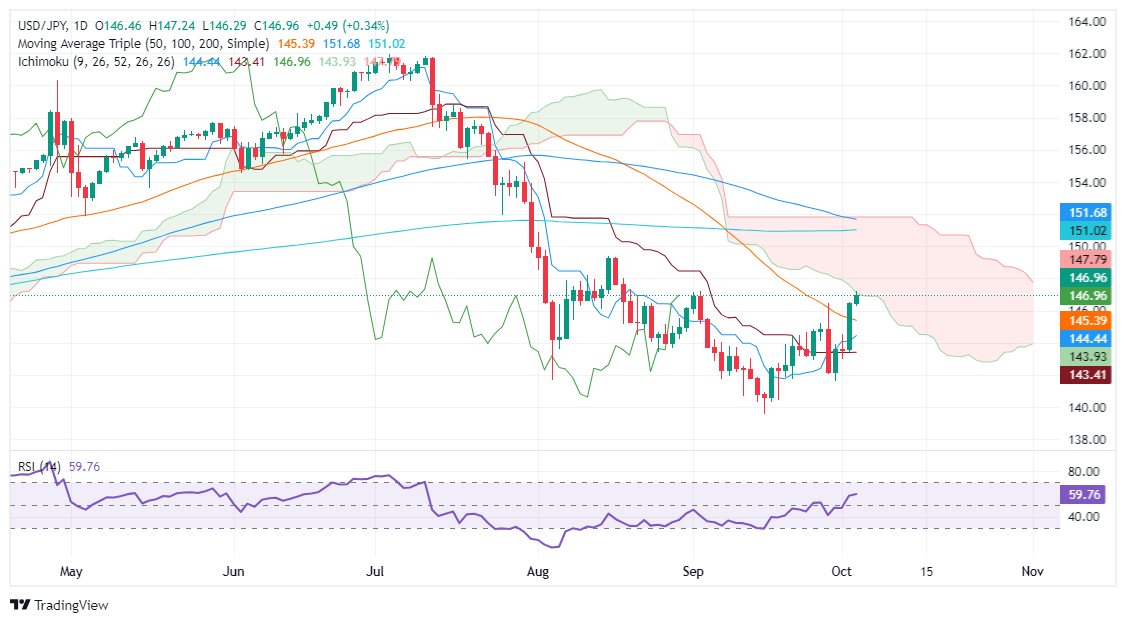
- USD/JPY rises above 147 for the first time since September, driven by escalating Middle East tensions.
- Bullish RSI signals further upside potential, with buyers eyeing resistance at 147.25, followed by 147.78 and 148.00.
- A reversal could see USD/JPY testing support at the 50-DMA of 145.38, with further downside risk at 145.00 and 143.93.
The USD/JPY edges higher on Thursday, climbs above 147.00 for the first time since September, trades at 146.92 and gains 0.31% at the time of writing. The financial markets narrative hasn’t changed, as traders hear war drums beating, as the Middle East conflict escalates, triggering a flow to haven currencies, boosting the Greenback.
USD/JPY Price Forecast: Technical outlook
The USD/JPY daily chart is neutral to downward biased, as buyers tested the bottom of the Ichimoku Cloud (Kumo) at 147.25. Momentum hints that buyers remain in charge, and might push prices higher.
The Relative Strength Index (RSI) is bullish, aiming to the upside. This means, the USD/JPY is tilted to the upside, in the near-term.
The USD/JPY must clear the top of the Kumo at 147.25. In that outcome, the next resistance would be the Senkou Span B at 147.78, followed by 148.00. If those levels are cleared, the 200-day moving average (DMA) would be next at 151.02.
Conversely, if the pair reverses its course, the first support would be the 50-DMA at 145.38. Once surpassed, the next stop would be the 145.00 figure, followed by the Senkou Span A at 143.93.
USD/JPY Price Action – Daily Chart
Japanese Yen PRICE Today
The table below shows the percentage change of Japanese Yen (JPY) against listed major currencies today. Japanese Yen was the strongest against the British Pound.
| USD | EUR | GBP | JPY | CAD | AUD | NZD | CHF | |
|---|---|---|---|---|---|---|---|---|
| USD | 0.14% | 1.10% | 0.34% | 0.40% | 0.65% | 0.83% | 0.37% | |
| EUR | -0.14% | 0.97% | 0.19% | 0.24% | 0.51% | 0.67% | 0.23% | |
| GBP | -1.10% | -0.97% | -0.75% | -0.72% | -0.45% | -0.29% | -0.71% | |
| JPY | -0.34% | -0.19% | 0.75% | 0.07% | 0.31% | 0.46% | 0.03% | |
| CAD | -0.40% | -0.24% | 0.72% | -0.07% | 0.25% | 0.43% | -0.02% | |
| AUD | -0.65% | -0.51% | 0.45% | -0.31% | -0.25% | 0.16% | -0.26% | |
| NZD | -0.83% | -0.67% | 0.29% | -0.46% | -0.43% | -0.16% | -0.43% | |
| CHF | -0.37% | -0.23% | 0.71% | -0.03% | 0.02% | 0.26% | 0.43% |
The heat map shows percentage changes of major currencies against each other. The base currency is picked from the left column, while the quote currency is picked from the top row. For example, if you pick the Japanese Yen from the left column and move along the horizontal line to the US Dollar, the percentage change displayed in the box will represent JPY (base)/USD (quote).
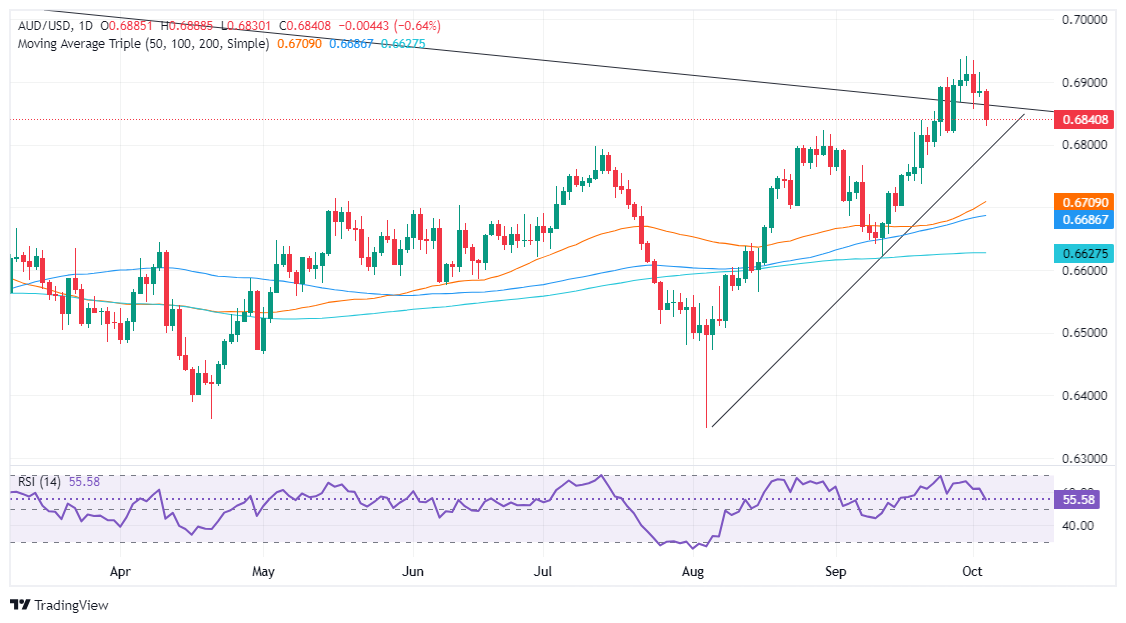
- The Australian Dollar losses steam after failing to hold gains above 0.6900.
- Geopolitical tensions between Israel and Iran spur safe-haven demand for the US Dollar.
- US unemployment claims rising above estimates, and strong ISM Services PMI data reduces chances of further aggressive Fed rate cuts.
The Australian Dollar (AUD) loses more than 0.50% against the US Dollar on Thursday, dropping after hitting a daily high of 0.6888 amid concerns that the Israel-Iran war could broaden in the Middle East. This spurred flows toward the Greenback, which briefly topped 102.00 via the US Dollar Index (DXY), but mixed US data capped its gains. The AUD/USD trades at 0.6844.
A risk-off impulse is weighing on the Aussie Dollar. Discussions between the US and Israel continued on how to retaliate against Iran. A headline that US President Joe Biden discussed with Israel a possible attack on Iran’s oil facilities dented appetite for riskier assets like the AUD.
Data revealed by the US Department of Labor showed that the number of people filing for unemployment benefits increased above estimates. Meanwhile, business activity data in the services sectors, revealed by the Institute for Supply Management (ISM) exceeded estimates in September, portraying a robust economy, which could erase the chances for a further 50 basis points (bps) of rate cuts by the Federal Reserve (Fed).
In the meantime, the Balance of Trade in Australia printed a surplus in August, which exceeded estimates of A$5.5 billion, came at A$5.64 billion, up from July’s A$5.636 billion.
Besides that, Australia’s Judo Bank Services Purchasing Managers Index (PMI) decelerates from 52.5 to 50.5 in September. This could refrain the Reserve Bank of Australia (RBA) from adopting a hawkish stance amid concerns that the economy is cooling.
Ahead in the calendar, the Australian economic docket will feature Home Loans and Investment Lending for Homes in August.
Daily digest market movers: Australian Dollar tumbles on risk aversion ahead of US NFP
- US Initial Jobless Claims for the week ending September 28 increased from 219K to 225K, surpassing the estimate of 220K.
- The ISM Services PMI for September expanded from 51.5 to 54.9, while Factory Orders for August declined by -0.2%, missing the 0% estimate and down from the previous month's 4.9% increase.
- US Nonfarm Payrolls, due on Friday, are expected to show 140K jobs added in September, slightly below the 142K jobs in August, with the Unemployment Rate projected to remain unchanged.
- Market participants have placed the odds of a 25 bps rate cut at 66.7%, while the chances of a larger 50 bps cut have decreased to 33.3%, according to the CME FedWatch Tool.
- China’s business activity has deteriorated, which has led to increased stimulus from the People’s Bank of China (PBoC) and the Politburo.
- To stimulate the economy, the PBoC cut loan rates, reduced bank reserve capital requirements and even lowered property down payments. If China’s economy continues to print deflationary readings, it could miss its Gross Domestic Product (GDP) 5% goal for 2024.
Technical outlook: Australian Dollar extends its losses below 0.6850
The AUD/USD remains upwardly biased, but in the short-term the Aussie could test lower prices. The ongoing pullback broke the first support level at 0.6871, exacerbating a drop toward the 0.6800 figure.
From a momentum standpoint, the Relative Strength Index (RSI) is mixed, remaining in bullish territory. However, the RSI is falling almost vertically toward its neutral line. Hence, further AUD/USD downside is seen.
Once AUD/USD cleared the October 1, 2024 low of 0.6856, that has opened the door to challenge the 0.6800 figure. Once surpassed, the next stop would be the 50-day Simple Moving Average (SMA) at 0.6707.
Conversely, if AUD/USD aims higher and closes above 0.6900, look for a retest of the year-to-date high of 0.6934.
Australian Dollar FAQs
One of the most significant factors for the Australian Dollar (AUD) is the level of interest rates set by the Reserve Bank of Australia (RBA). Because Australia is a resource-rich country another key driver is the price of its biggest export, Iron Ore. The health of the Chinese economy, its largest trading partner, is a factor, as well as inflation in Australia, its growth rate and Trade Balance. Market sentiment – whether investors are taking on more risky assets (risk-on) or seeking safe-havens (risk-off) – is also a factor, with risk-on positive for AUD.
The Reserve Bank of Australia (RBA) influences the Australian Dollar (AUD) by setting the level of interest rates that Australian banks can lend to each other. This influences the level of interest rates in the economy as a whole. The main goal of the RBA is to maintain a stable inflation rate of 2-3% by adjusting interest rates up or down. Relatively high interest rates compared to other major central banks support the AUD, and the opposite for relatively low. The RBA can also use quantitative easing and tightening to influence credit conditions, with the former AUD-negative and the latter AUD-positive.
China is Australia’s largest trading partner so the health of the Chinese economy is a major influence on the value of the Australian Dollar (AUD). When the Chinese economy is doing well it purchases more raw materials, goods and services from Australia, lifting demand for the AUD, and pushing up its value. The opposite is the case when the Chinese economy is not growing as fast as expected. Positive or negative surprises in Chinese growth data, therefore, often have a direct impact on the Australian Dollar and its pairs.
Iron Ore is Australia’s largest export, accounting for $118 billion a year according to data from 2021, with China as its primary destination. The price of Iron Ore, therefore, can be a driver of the Australian Dollar. Generally, if the price of Iron Ore rises, AUD also goes up, as aggregate demand for the currency increases. The opposite is the case if the price of Iron Ore falls. Higher Iron Ore prices also tend to result in a greater likelihood of a positive Trade Balance for Australia, which is also positive of the AUD.
The Trade Balance, which is the difference between what a country earns from its exports versus what it pays for its imports, is another factor that can influence the value of the Australian Dollar. If Australia produces highly sought after exports, then its currency will gain in value purely from the surplus demand created from foreign buyers seeking to purchase its exports versus what it spends to purchase imports. Therefore, a positive net Trade Balance strengthens the AUD, with the opposite effect if the Trade Balance is negative.
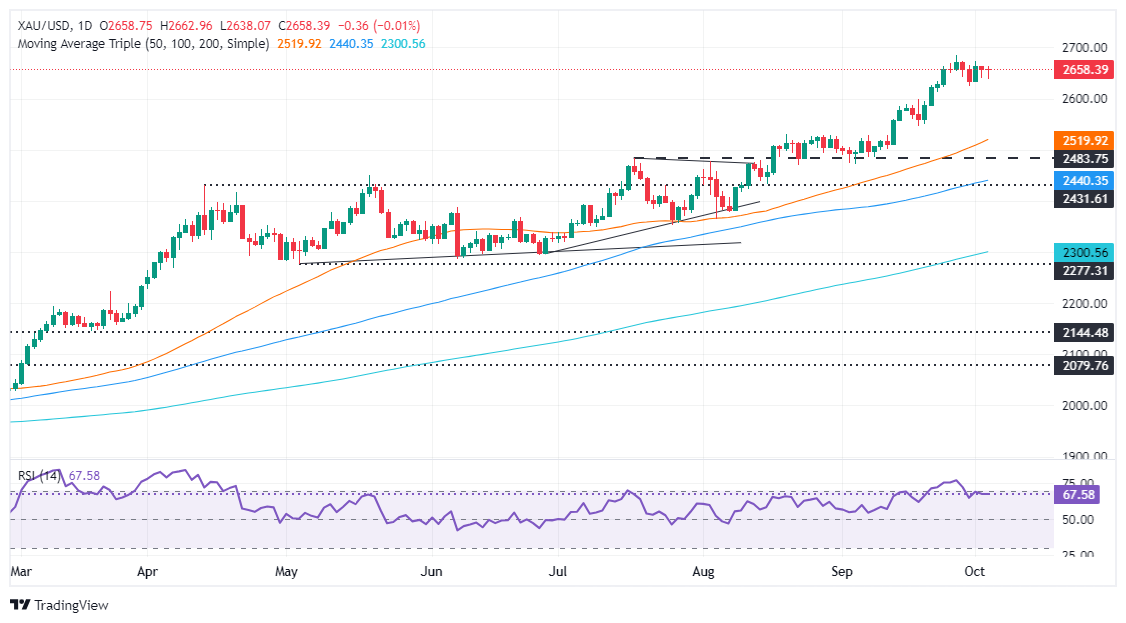
- Gold rises from $2,638 to $2,659, fueled by escalating tension between Israel and Iran and increasing US Treasury yields.
- US labor market data softens; however, ISM Services PMI reflects better business activity in September.
- US Dollar Index (DXY) up 0.35%, 10-year Treasury yields climb to 3.84%, tempering market expectations for big November rate cut.
Gold price recovers in the mid-North American session on Thursday after hitting a daily low of $2,638. The golden metal rose on rising fears over the Israel–Iran conflict along with a stronger US Dollar. In addition, bets that the Federal Reserve (Fed) will ease policy aggressively faded and boosted US yields. The XAU/USD trades at $2,659.
Wall Street trades with losses amid rising geopolitical risk. The market mood remains downbeat as Israel advanced its military into Lebanon despite Iran’s significant missile attack on Tuesday. Meanwhile, US President Joe Biden commented publicly that he discussed attacking Iranian oil facilities with Israeli officials. After the headline, bullion prices rose toward $2,650 and above.
Earlier, US data revealed that the labor market continued to soften. The US Department of Labor revealed that the number of people filing for unemployment benefits rose above estimates. Last but not least, the Institute for Supply Management (ISM) revealed that business activity, measured by the ISM Services PMI, improved in September compared to August’s number.
Other data showed that Factory Orders for August contracted, while traders eye the release of the latest US jobs report on Friday, which is projected to spur volatility in the financial markets.
Meanwhile, Fed officials have crossed the newswires. The Atlanta Fed’s Raphael Bostic stated that the natural employment rate has shifted, and it could be lower. Chicago Fed President Austan Goolsbee said the latest inflation numbers are at the Fed’s target, while the labor market is at full employment.
Regarding lowering rates by 50 or 25 basis points, Goolsbee said it is not as important as getting rates down over the next 12 months to get to neutral.
US Treasury yields continued to rise as traders trimmed their odds for a 50 bps cut in November. The US 10-year Treasury note yields 3.84%, up five basis points. At the same time, the US Dollar Index (DXY), which tracks the buck’s performance against a basket of six peers, gains 0.35% to 101.95.
Daily digest market movers: Gold prices maintain gains as US data hints further easing
- US Initial Jobless Claims for the week ending September 28 rose from 219K to 225K, exceeding estimates of 220K.
- The ISM Services PMI for September expanded from 51.5 to 54.9, while Factory Orders for August contracted by -0.2%, missing the estimate of 0% and down from the previous month's 4.9% increase.
- On Friday, Nonfarm Payrolls are expected to show that the economy added 140K jobs in September, slightly less than the 142K jobs created in August, with the unemployment rate forecast to remain unchanged.
- Market participants have placed the odds of a 25 bps rate cut at 66.7%. According to the CME FedWatch Tool, the chances of a larger 50 bps cut have decreased to 33.3%.
XAU/USD technical analysis: Gold price hovers near $2,650-60
The Gold price uptrend is intact, although registered losses see it edging below $2,650. The Relative Strength Index (RSI) shows momentum remains bullish despite turning flat during the last two trading days.
With that said, XAU/USD might trade within familiar levels. If XAU/USD slides underneath $2,650, this would pave the way for further downside, exposing the September 30 daily low of $2,624, followed by the September 18 peak at $2,600. A breach of those levels and the 50-day Simple Moving Average (SMA) would be up next at $2,519.
On further strength, if it clears the all-time high of $2,685, it could extend its gains to $2,700.
Gold FAQs
Gold has played a key role in human’s history as it has been widely used as a store of value and medium of exchange. Currently, apart from its shine and usage for jewelry, the precious metal is widely seen as a safe-haven asset, meaning that it is considered a good investment during turbulent times. Gold is also widely seen as a hedge against inflation and against depreciating currencies as it doesn’t rely on any specific issuer or government.
Central banks are the biggest Gold holders. In their aim to support their currencies in turbulent times, central banks tend to diversify their reserves and buy Gold to improve the perceived strength of the economy and the currency. High Gold reserves can be a source of trust for a country’s solvency. Central banks added 1,136 tonnes of Gold worth around $70 billion to their reserves in 2022, according to data from the World Gold Council. This is the highest yearly purchase since records began. Central banks from emerging economies such as China, India and Turkey are quickly increasing their Gold reserves.
Gold has an inverse correlation with the US Dollar and US Treasuries, which are both major reserve and safe-haven assets. When the Dollar depreciates, Gold tends to rise, enabling investors and central banks to diversify their assets in turbulent times. Gold is also inversely correlated with risk assets. A rally in the stock market tends to weaken Gold price, while sell-offs in riskier markets tend to favor the precious metal.
The price can move due to a wide range of factors. Geopolitical instability or fears of a deep recession can quickly make Gold price escalate due to its safe-haven status. As a yield-less asset, Gold tends to rise with lower interest rates, while higher cost of money usually weighs down on the yellow metal. Still, most moves depend on how the US Dollar (USD) behaves as the asset is priced in dollars (XAU/USD). A strong Dollar tends to keep the price of Gold controlled, whereas a weaker Dollar is likely to push Gold prices up.
Speaking to Chicago public radio station WBEZ, Chicago Federal Reserve Bank President Austan Goolsbee warned on Thursday that if the strike continues, supply-chain disruptions could exert upward pressure on prices and negatively impact the economy.
Key Quotes
Dockworkers' strike was predicted, retailers have been stockpiling and have about two weeks of supplies. After that, we will see more of an effect.
Dockworkers' strike could have supply-chain issue effects, leading to some price increases.
Dockworkers' strike could start as an inconvenience but get worse as it continues.
We have largely gotten inflation down.
The new inflation numbers are at the Fed's target; the labour market is at full employment.
25 bps vs. 50 bps cut is not as important as significantly reducing rates over the next 12 months to reach neutral.
There has been a 'partisanization' of consumer confidence readings, making them less informative for consumer spending.
- Mexican Peso snaps two days of gains and falls on Israel/Iran hostilities.
- Banxico’s September poll revised USD/MXN exchange rate expectations upward, while inflation projections were lowered.
- Traders await September’s Nonfarm Payrolls data, with strong results likely boosting the Greenback and further impacting the Peso.
The Mexican Peso registers losses in early trading against the Greenback on Thursday amid increasing geopolitical risks as President Joe Biden is discussing with Israel how to attack Iranian oil facilities. Data from Mexico witnessed an increase in Foreign Exchange Reserves, according to the Bank of Mexico (Banxico). The USD/MXN trades at 19.53, gaining over 0.60%.
Market sentiment has slightly deteriorated by the conflict in the Middle East. The clashes between Israel and Hezbollah continue in southern Lebanon on Thursday. Meanwhile, Israel struck central Beirut and is expected to launch a separate attack on Iranian assets in the near future.
This has impacted the risk-sensitive Mexican Peso, due to its status of an emerging market currency. The US Dollar Index (DXY), which reflects the buck’s performance against a basket of six currencies, has soared 0.43% on the safe-haven flows, regaining the 102.00 figure for the first time since August 20.
Meanwhile, Banxico’s September poll of 40 private groups of analysts and economists revealed that the USD/MXN exchange rate was revised up and would end higher, compared to August poll. The same survey showed that expectations on headline and underlying inflation were lowered, while the main reference rate set by the Mexican central bank is projected to end at around 10%.
President Claudia Sheinbaum has proposed an increase of 12% to wages in 2025, according to newswires.
In the US, the Department of Labor revealed that the number of Americans filing for unemployment benefits jumped, exceeding forecasts and the previous reading. S&P Global and the Institute for Supply Management (ISM) showed that Services PMI readings were mixed. The former missed estimates, while the latter crushed estimates, expanding at its highest level since February 2023.
On Friday, USD/MXN traders will eye the release of September’s Nonfarm Payrolls figures. If data surpasses estimates, this would be positive for the Greenback and could sponsor a leg-up in the pair. Conversely if data comes as expected, and risk appetite has improved, it would be positive for the Mexican Peso.
Daily digest market movers: Mexican Peso tumbles on risk aversion to Middle East conflict
- Mexico’s Foreign Exchange Reserves in August grew from $227 billion to $231 billion.
- Banxico’s poll showed economists expect the USD/MXN exchange rate to end at 19.69 in 2024. Inflation expectations were revised down from 4.69% to 4.48%, and core is expected to drop to 3.84% from 3.94%.
- Mexico’s economy is foreseen growing 1.45% in 2024, lower than August’s 1.57%. Economists estimate Banxico to lower rates to 10%, down from 10.25% on the previous survey.
- On Tuesday, Banxico Deputy Governor Jonathan Heath said that interest rates should remain higher for “more time” while acknowledging that core inflation is coming toward the target. He added that the US central bank’s rate cut wouldn’t directly impact Banxico’s policy path and does not believe Mexico is close to a recession.
- Mexican data shows the economy might slow down sharply. Business Confidence continued to deteriorate, while business activity, measured by the S&P Global Manufacturing PMI, contracted sharply.
- US Initial Jobless Claims for the week ending September 28 jumped from 219K to 225K, exceeding estimates of 220K.
- The ISM Services PMI in September expanded from 51.5 to 54.9; Factory Orders for August shrank, missing estimates of 0% to arrive at -0.2%, down from the previous 4.9%.
- Market participants have put the odds of a 25 bps cut at 66.7%. According to the CME FedWatch Tool, the chances for a larger 50 bps cut diminished to 33.3%.
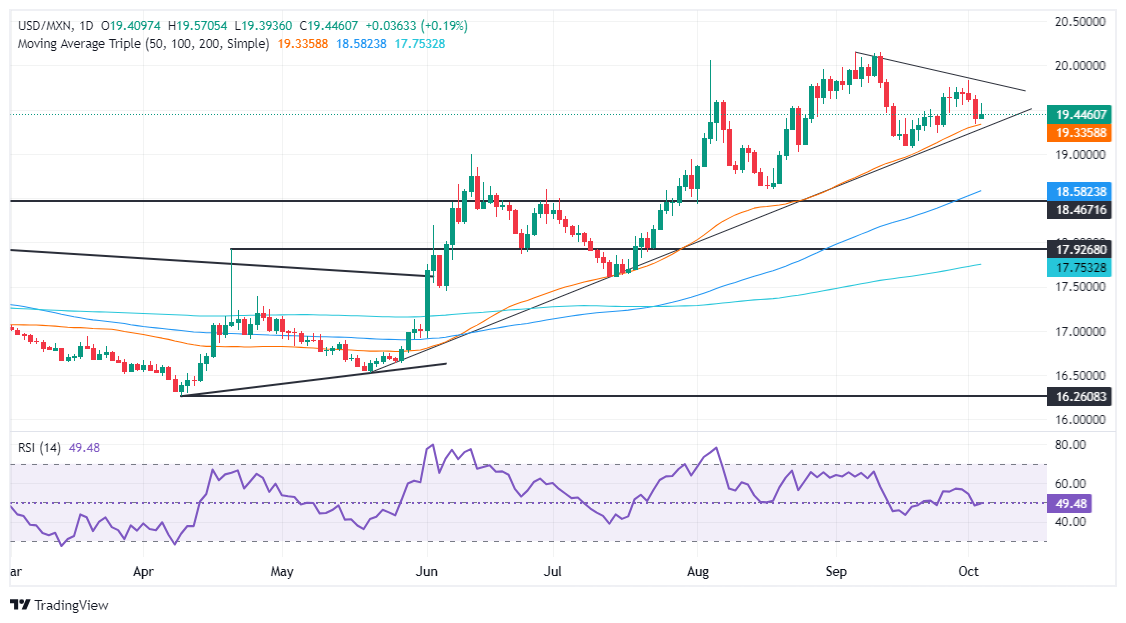
Technical analysis: Mexican Peso falls as USD/MXN climbs above 19.40
The USD/MXN uptrend remains intact, but buyers have lost steam as shown by the Relative Strength Index (RSI). The RSI slipped below its neutral line, an indication that sellers have the upper hand. Hence, the path of least resistance is skewed to the downside.
If USD/MXN clears the 50-day Simple Moving Average (SMA) at 19.32, the next support would be the September 24 swing low of 19.23 before the pair moves toward the September 18 daily low of 19.06. Once those levels are surpassed, the 19.00 figure emerges as the following line of defense.
Conversely, for a bullish resumption, the USD/MXN needs to surpass the October 1 daily high of 19.82. On further strength, the next resistance will be the psychological 20.00 figure, followed by the YTD peak of 20.22.
Mexican Peso FAQs
The Mexican Peso (MXN) is the most traded currency among its Latin American peers. Its value is broadly determined by the performance of the Mexican economy, the country’s central bank’s policy, the amount of foreign investment in the country and even the levels of remittances sent by Mexicans who live abroad, particularly in the United States. Geopolitical trends can also move MXN: for example, the process of nearshoring – or the decision by some firms to relocate manufacturing capacity and supply chains closer to their home countries – is also seen as a catalyst for the Mexican currency as the country is considered a key manufacturing hub in the American continent. Another catalyst for MXN is Oil prices as Mexico is a key exporter of the commodity.
The main objective of Mexico’s central bank, also known as Banxico, is to maintain inflation at low and stable levels (at or close to its target of 3%, the midpoint in a tolerance band of between 2% and 4%). To this end, the bank sets an appropriate level of interest rates. When inflation is too high, Banxico will attempt to tame it by raising interest rates, making it more expensive for households and businesses to borrow money, thus cooling demand and the overall economy. Higher interest rates are generally positive for the Mexican Peso (MXN) as they lead to higher yields, making the country a more attractive place for investors. On the contrary, lower interest rates tend to weaken MXN.
Macroeconomic data releases are key to assess the state of the economy and can have an impact on the Mexican Peso (MXN) valuation. A strong Mexican economy, based on high economic growth, low unemployment and high confidence is good for MXN. Not only does it attract more foreign investment but it may encourage the Bank of Mexico (Banxico) to increase interest rates, particularly if this strength comes together with elevated inflation. However, if economic data is weak, MXN is likely to depreciate.
As an emerging-market currency, the Mexican Peso (MXN) tends to strive during risk-on periods, or when investors perceive that broader market risks are low and thus are eager to engage with investments that carry a higher risk. Conversely, MXN tends to weaken at times of market turbulence or economic uncertainty as investors tend to sell higher-risk assets and flee to the more-stable safe havens.
- NZD/USD has rolled over and fallen to key support at around 0.6220.
- It may have formed a bearish Japanese candlestick pattern and the MACD has crossed below its signal line.
NZD/USD reaches a key resistance band at around the 0.6400 level and promptly reverses lower. It is in the process of forming three consecutive bearish days which in Japanese candlestick analysis is a bearish reversal sign called a “Three Black Crows” pattern (light blue shaded rectangle on chart below). If Thursday (today) ends as a long red candle it will confirm completion of such a pattern.
NZD/USD Daily Chart
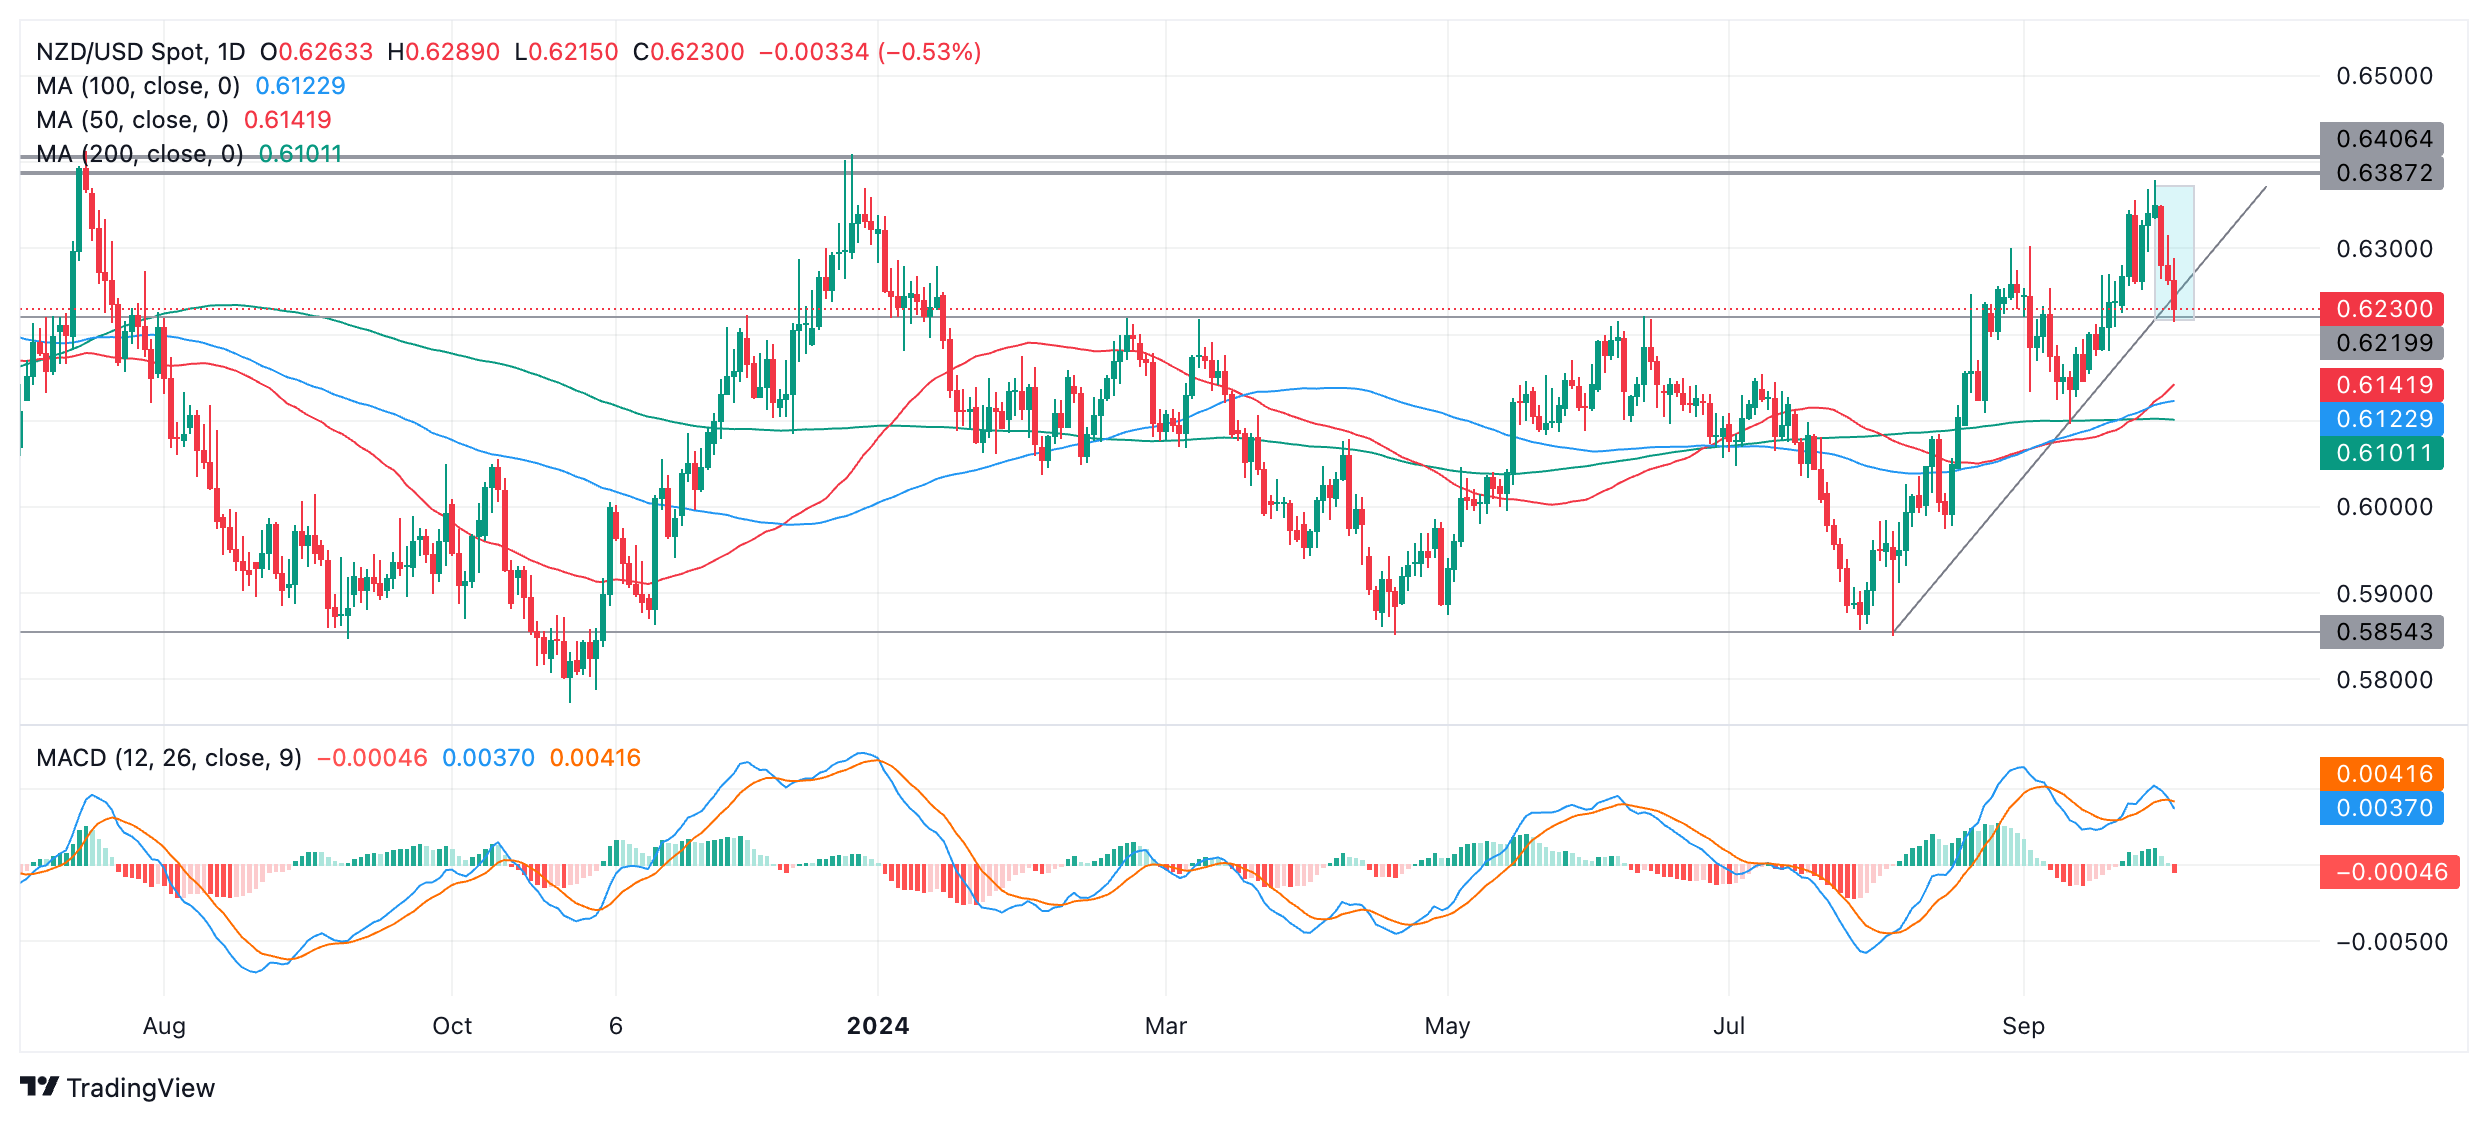
The move down from the September 30 peak has been sharp and accompanied by equally bearish momentum, increasing the chances it could extend further. However, it has just met a formidable support level at around 0.6220 composed of multiple price peaks in the first half of 2024. This is likely to pose an obstacle to bears wishing to push prices lower.
The blue Moving Average Divergence Convergence (MACD) has crossed below its red signal line which is a bearish signal.
There is a risk the market may be reversing and further downside could follow. This would particularly be the case if prices closed substantially below the 0.6220 support level, perhaps at 0.6200 or lower.
However, such a move would soon meet further tough support from the cluster of major Simple Moving Averages (SMA) not far below, starting with the 50-day SMA at 0.6141, but followed by the 100 and 200-days at roughly 0.6120 and 0.6101 respectively.
Further, it is also possible the Kiwi pair could rally from the current support level in the 0.6220s and resume its prior more-bullish trend. Yet any substantial upside progress is likely to be stymied by tough resistance at around 0.6400 from prior highs in July and December 2023.
- AUD/USD stalls at upside resistance and reverses lower, falling back inside its range.
- It is threatening a short-term trend reversal and MACD is about to cross below its signal line.
AUD/USD reverses and starts falling after what appears to be a false breakout above the top of the range.
AUD/USD Daily Chart
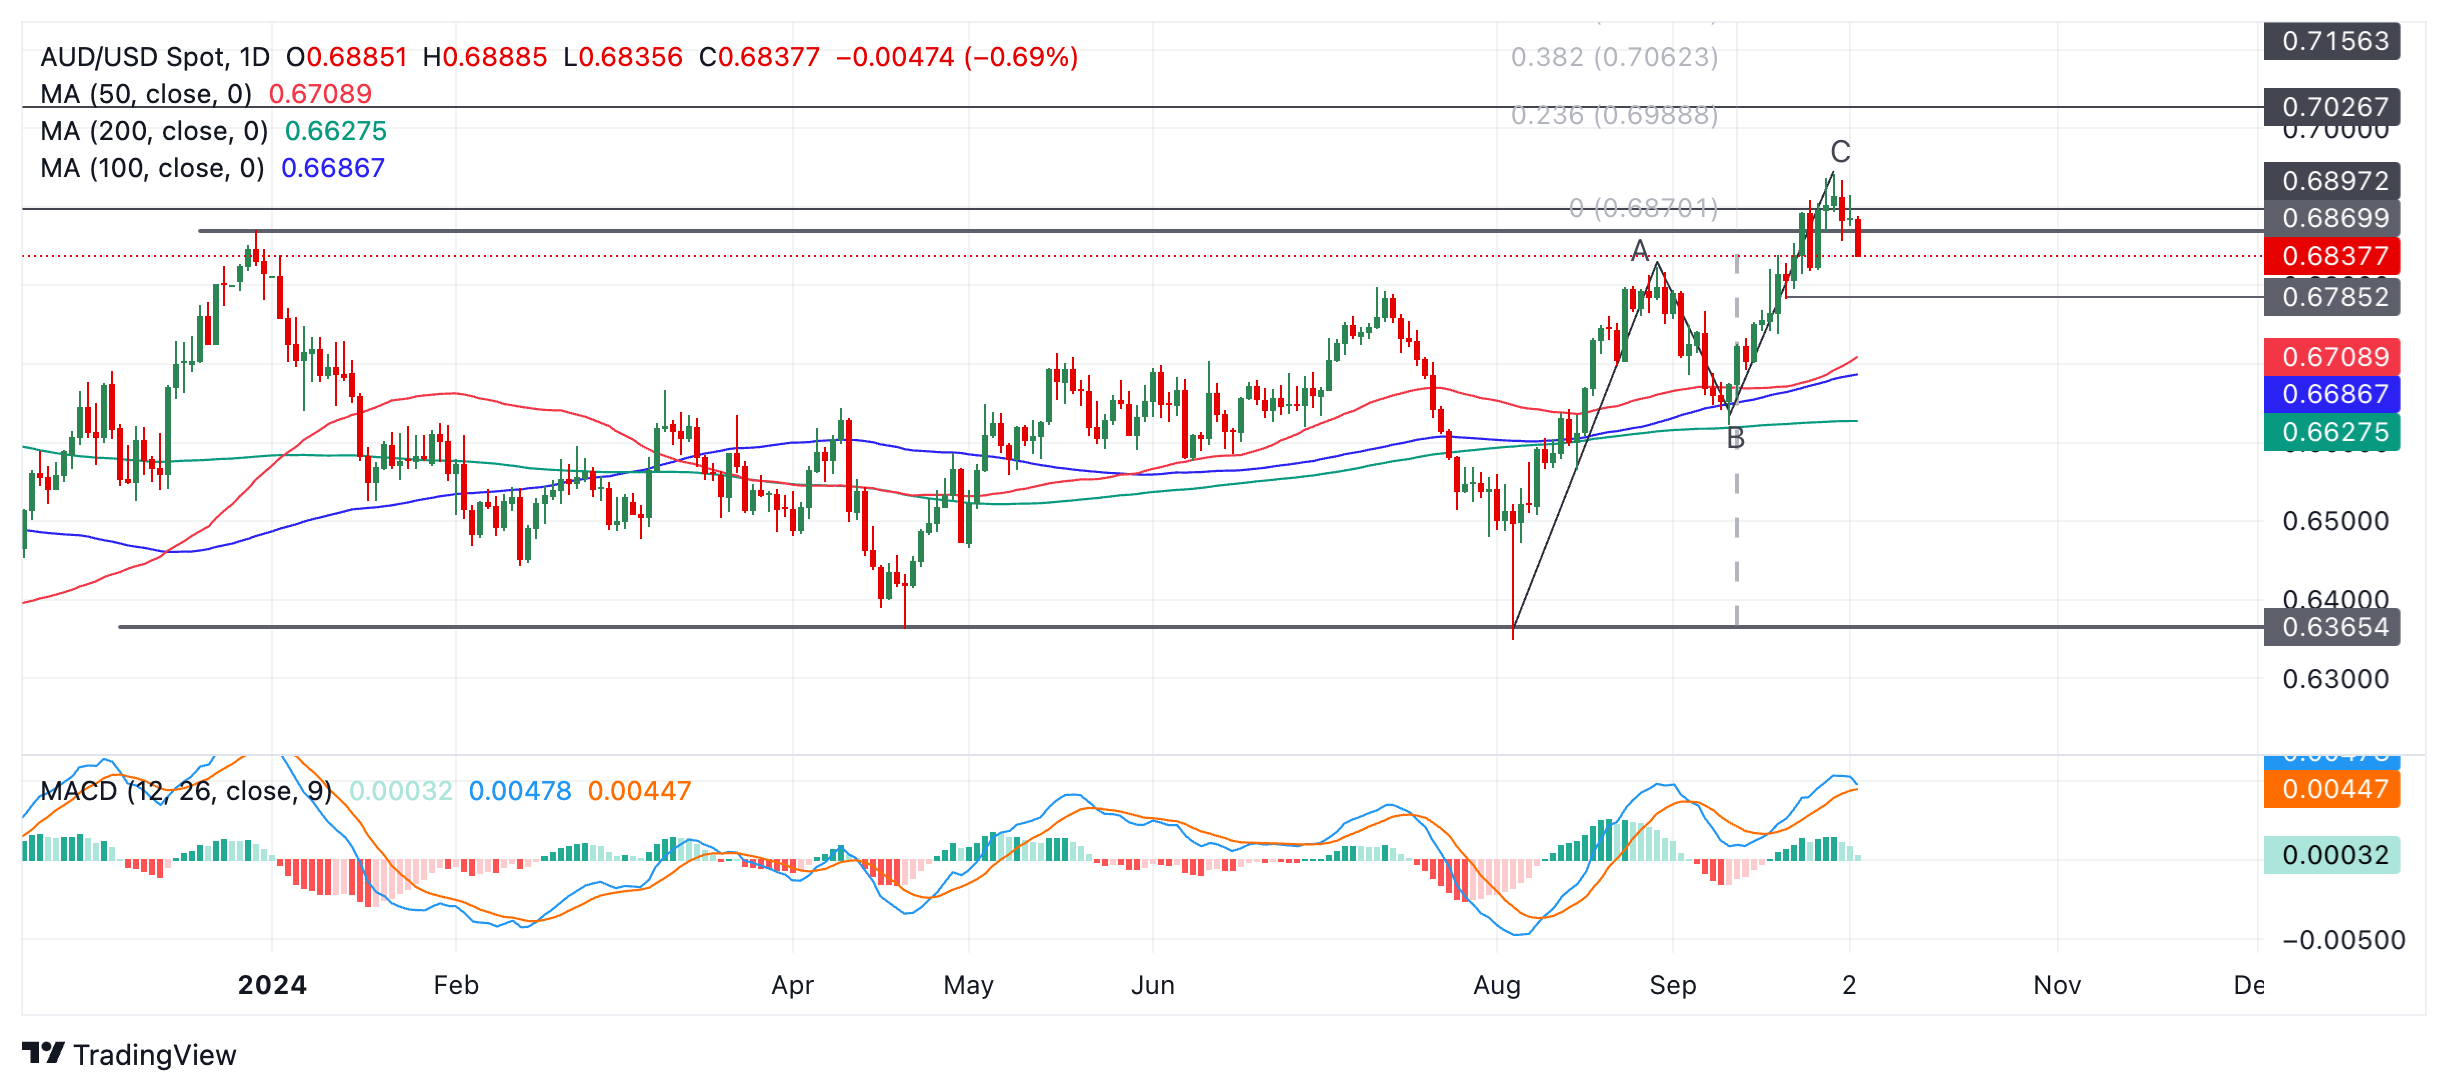
The Aussie pair has now started falling back inside the range. It is possible this could be the start of a new short-term downtrend that might take AUD/USD back down towards the range lows in the 0.63s, however, it is still too early to say with any confidence.
The blue Moving Average Convergence Divergence (MACD) line is threatening to cross below the red signal line and if it does that would add further evidence to the argument that AUD/USD is reversing trend.
AUD/USD may have formed a Measured Move pattern during August and September as it rose from the bottom to the top of the range. Such patterns resemble zig-zags and lengths of waves A and C are similar or related by Fibonacci.
The Aussie pair reached an initial upside target based on extrapolating wave A of the Measured Move higher by a 61.8% Fibonacci. This target lies at around 0.6115. This is further evidence the uptrend may have reached its zenith and a new downtrend is currently forming. For more confirmation price would have to break below the 0.6785 level (September 20 swing low). Such a move would be expected to reach an initial downside target of 0.6709, the level of the 50-day Simple Moving Average (SMA).
Until then, there is still a risk the move down could stall and the uptrend resume, taking AUD/USD higher again. A break above the 0.6942 September 30 peak would confirm a resumption of the uptrend and target 0.6988 (14 February ‘23 swing high), followed by 0.7156 in a bullish case (2 February ‘23 high).
- Initial Jobless Claims in the US rose by 6,000 in the week ending September 28.
- US Dollar Index stays in positive territory slightly below 102.00.
There were 225,000 initial jobless claims in the week ending September 28, the weekly data published by the US Department of Labor (DOL) showed on Thursday. This print followed the previous week's print of 219,000 (revised from 218,000) and came in slightly worse than the market expectation of 220,000.
Further details of the publication revealed that the advance seasonally adjusted insured unemployment rate was 1.2% and the 4-week moving average stood at 224,250, a decrease of 750 from the previous week's revised average.
"The advance number for seasonally adjusted insured unemployment during the week ending September 21 was 1,826,000, a decrease of 1,000 from the previous week's revised level." the DOL further noted in its publication.
Market reaction
The US Dollar showed no immediate reaction to these figures. At the time of press, the USD Index was up 0.3% on the day at 101.90.
- EUR/GBP is undergoing a short squeeze higher.
- Upside will likely be capped at the cluster of Moving Averages situated in the 0.8450s.
EUR/GBP has suddenly reversed and shot higher on Thursday, gaining over 1.0% on the day so far. The explosive rally suggests a short squeeze is happening and the short-term trend has reversed “on a dime”. Bulls are now back in control.
EUR/GBP Daily Chart
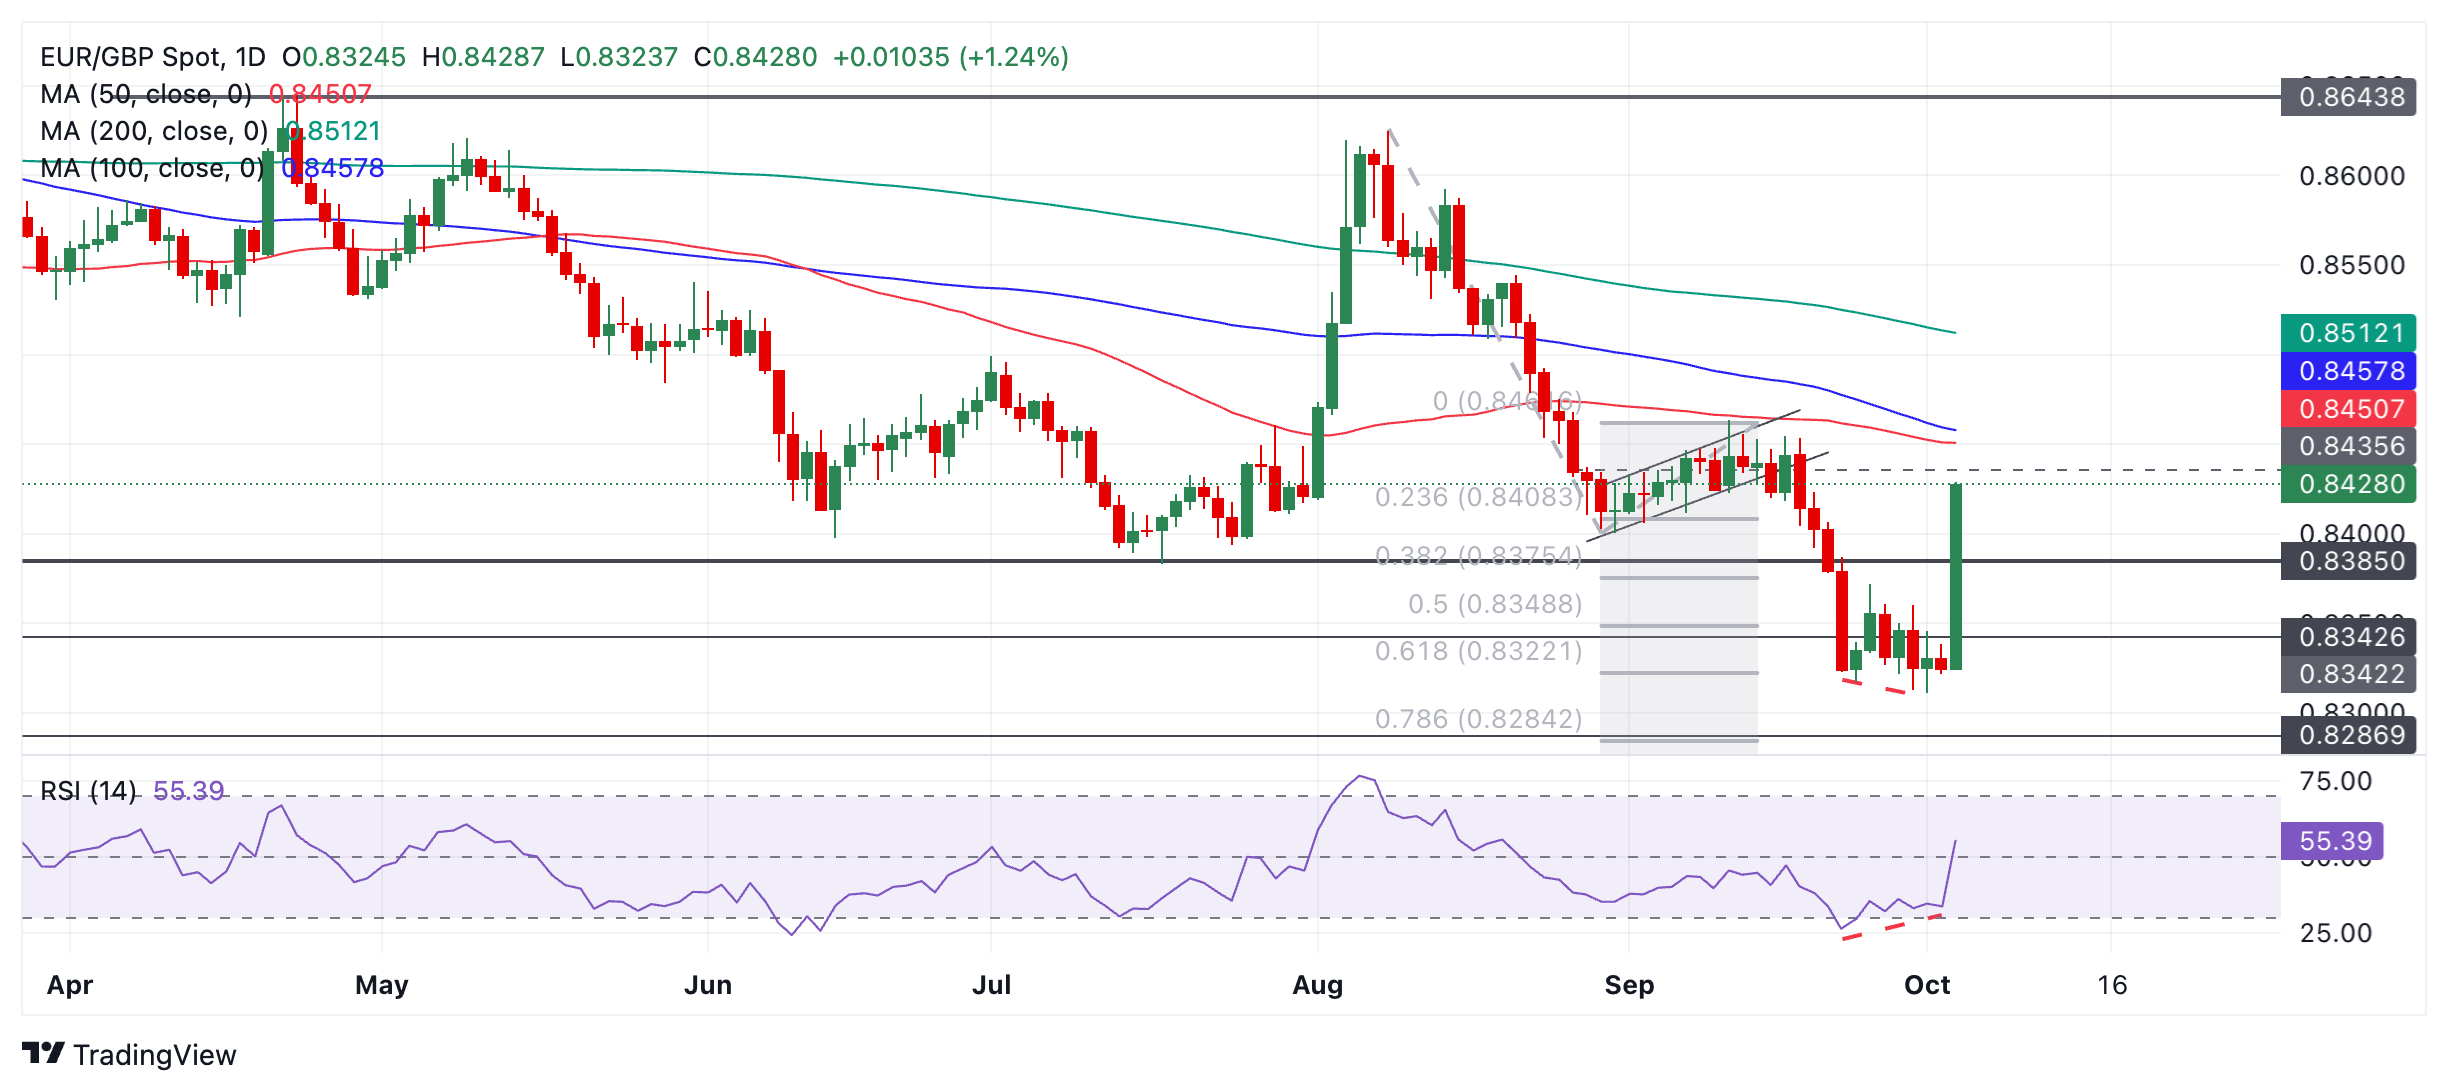
EUR/GBP will probably go higher. The next key resistance level lies at the cluster of Moving Averages in 0.8450s. From there, a temporary pullback is likely given the speed of the ascent. Any corrections are likely to encounter support at around 0.8385, the July lows.
One warning of the sudden reversal came from the fact that the Relative Strength Index (RSI) was converging bullishly with price (red dashed lines on chart). This signified a lack of downside momentum and increased chances of a pullback.
Another warning sign was that EUR/GBP has already reached the conservative target for the bear move that began at the August 5 high, at 0.8322. This raised the possibility that the whole move might have completely run its course, which appears to be the case given today’s price action.
- The US Dollar rallies for a fourth straight day this week.
- Tensions in the Middle East together with political comments in Japan are firing up Dollar inflows.
- The US Dollar Index tests the upper band of its September range and could pop above it if current conditions hold.
The US Dollar (USD) trades firmly stronger again on Thursday, fuelled by safe-haven flows due to increased geopolitical tensions in the Middle East, a weaker Japanese Yen (JPY), and diminishing chances of another large interest-rate cut by the US Federal Reserve (Fed) in November.
The US Dollar already received a nudge higher this Thursday in Asian trading after new prime minister Shigeru Ishiba said on Wednesday that the economy isn’t ready for another interest-rate increase, sending the JPY lower. The turmoil in Lebanon is also underpinning the Greenback with safe-haven inflows.
The economic calendar is ready for another very full day. Besides the weekly Jobless Claims, markets brace for the S&P Global Services Purchasing Managers index and the Institute for Supply Management (ISM) September numbers.
Daily digest market movers: Outside help for the US Dollar
- New Japanese prime minister Shigeru Ishiba said on Wednesday the economy isn’t ready for another interest-rate increase, sending the yen lower, Bloomberg reported. Bank of Japan (BoJ) board member Asahi Noguchi was quick to comment that markets should not respond to each comment politicians make.
- There were surprising comments as well from Bank of England (BoE) Governor Andrew Bailey, who said to the Guardian newspaper that the BoE might need to start cutting soon and aggressively, Bloomberg reports.
- The US economic calendar started early with the Challenger Job Cuts data for September. Around 72,821 jobs were cut against the 75,891 layoffs in August .
- At 12:30 GMT, the weekly Jobless Claims are due, with Initial Claims set to marginally rise to 220,000 from 218,000.
- Around 13:45 GMT, the final S&P Global Services Purchasing Managers Index (PMI) for September is expected to remain unchanged from its preliminary reading of 55.4. The Composite PMI should also remain steady at 54.4.
- The Institute for Supply Management (ISM) will release its September numbers for the Services sector at 14:00 GMT:
- The headline PMI should come in a little bit higher at 51.7 against 51.5 a month earlier.
- As for the main subindexes, Employment was at 50.2 in August, New Orders stood at 53 and Prices Paid came in at 57.3.
- At 14:40 GMT, Federal Reserve Bank of Atlanta Raphael Bostic participates in a discussion with Minneapolis Fed President Neel Kashkari as part of the Opportunity and Growth Institute's 2024 Fall Research Conference.
- European equities are falling more than US futures after French President Emannuel Macron has announced new taxes. US equity futures are down less than 0.5% with markets still at unease over the situation in Lebanon and the Middle East.
- The CME Fedwatch Tool shows a 67.4% chance of a 25 basis-point rate cut at the next Fed meeting on November 7, while 32.6% is pricing in another 50-basis-point rate cut.
- The US 10-year benchmark rate trades at 3.80%, looking to test the three-week high at 3.81%.
US Dollar Index Technical Analysis: Winning streak hitting bump
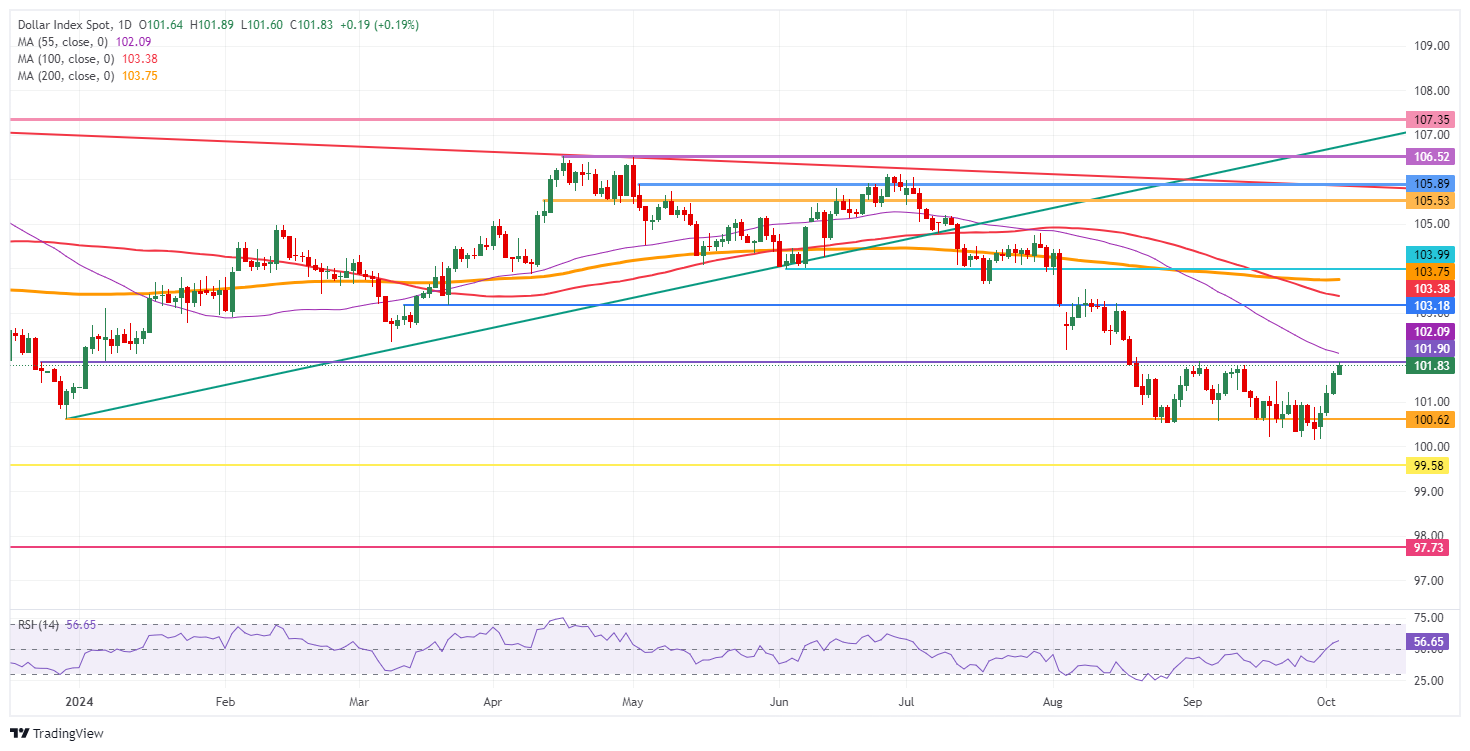
The US Dollar Index (DXY) has made a stellar recovery this week, though be it with a bit of outside help. With the DXY now hitting the upper cap at 101.90, risk could take place that a rejection takes place, with the DXY unable to break above the September range. Ideally, the DXY would be able to remain around these levels and have the Nonfarm Payrolls number as a catalyst to either push the DXY higher or send it back lower towards the lower end of this month.
The recovery has performed well and could be facing the end of the line for now. expect this September high at 101.90 to remain the first resistance level on the upside for now. Just above there, the 55-day Simple Moving Average (SMA) at 102.09 will come in. A leg higher the chart identifies 103.18 as the very final level for this week on the upside.
On the downside, 100.62 is flipping back from resistance into support in case the DXY closes above it this Tuesday. The fresh low of 2024 is at 100.16, so a test will take place before more downside takes place. Further down, and that means giving up the big 100.00 level, the July 14, 2023, low at 99.58 comes into play.
US Dollar Index: Daily Chart
US Dollar FAQs
The US Dollar (USD) is the official currency of the United States of America, and the ‘de facto’ currency of a significant number of other countries where it is found in circulation alongside local notes. It is the most heavily traded currency in the world, accounting for over 88% of all global foreign exchange turnover, or an average of $6.6 trillion in transactions per day, according to data from 2022. Following the second world war, the USD took over from the British Pound as the world’s reserve currency. For most of its history, the US Dollar was backed by Gold, until the Bretton Woods Agreement in 1971 when the Gold Standard went away.
The most important single factor impacting on the value of the US Dollar is monetary policy, which is shaped by the Federal Reserve (Fed). The Fed has two mandates: to achieve price stability (control inflation) and foster full employment. Its primary tool to achieve these two goals is by adjusting interest rates. When prices are rising too quickly and inflation is above the Fed’s 2% target, the Fed will raise rates, which helps the USD value. When inflation falls below 2% or the Unemployment Rate is too high, the Fed may lower interest rates, which weighs on the Greenback.
In extreme situations, the Federal Reserve can also print more Dollars and enact quantitative easing (QE). QE is the process by which the Fed substantially increases the flow of credit in a stuck financial system. It is a non-standard policy measure used when credit has dried up because banks will not lend to each other (out of the fear of counterparty default). It is a last resort when simply lowering interest rates is unlikely to achieve the necessary result. It was the Fed’s weapon of choice to combat the credit crunch that occurred during the Great Financial Crisis in 2008. It involves the Fed printing more Dollars and using them to buy US government bonds predominantly from financial institutions. QE usually leads to a weaker US Dollar.
Quantitative tightening (QT) is the reverse process whereby the Federal Reserve stops buying bonds from financial institutions and does not reinvest the principal from the bonds it holds maturing in new purchases. It is usually positive for the US Dollar.
- GBP/CAD is undergoing a sharp decline within a rising channel.
- It is likely to continue lower as the counter-trend reaction runs its course.
GBP/CAD is unfolding a down leg within a rising channel. It will probably continue lower to at least the blue 100-day Simple Moving Average (SMA) at 1.7641.
The pair is in a short-term downtrend and given the principle that “the trend is your friend” the odds favor a continuation of that trend.
GBP/CAD Daily Chart
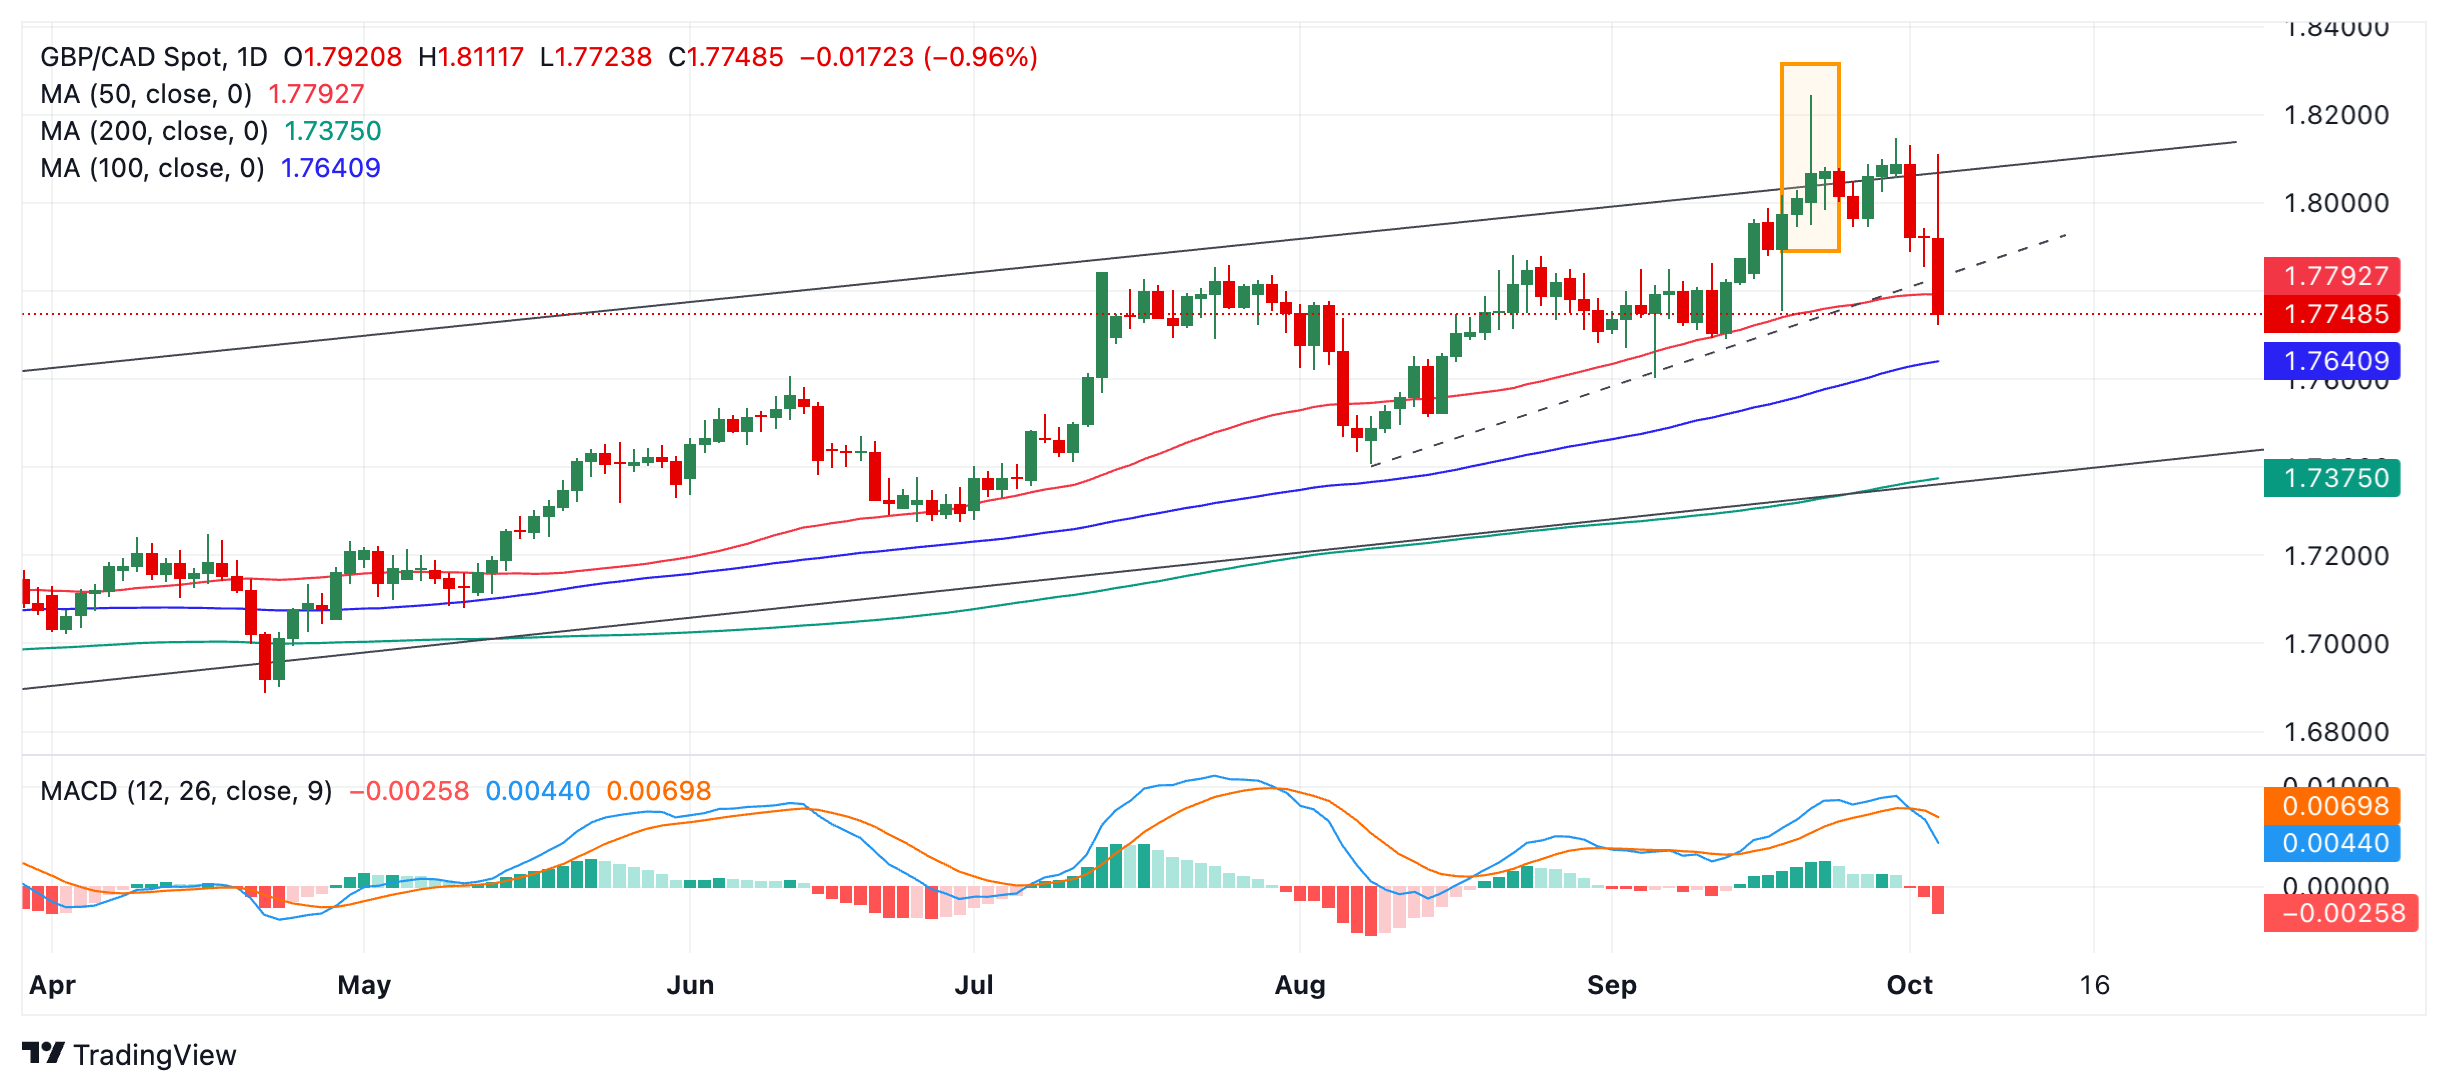
Subsequent downside targets lie at 1.7603 (September 4 low) and 1.7407 (August 8 low). In the most bearish scenario price could fall to the lower channel line at 1.7375.
GBP/CAD is in an uptrend on the medium and long-term timeframes, as it oscillates higher within an ascending channel. There is a risk, therefore, of a reversal higher occurring unless the current sell-off marks the beginning of a deeper downtrend. This is possible given its steepness.
The Moving Average Divergence Convergence (MACD) has crossed below its signal line providing added evidence that prices are going to push lower.
The first signs of weakness came when the pair tested the upper channel line and formed a bearish Shooting Star Japanese candlestick reversal pattern on September 20 (orange rectangle on chart above). It then consolidated for a while before starting to fall properly on Tuesday.
- Crude Oil trade over 1% higher on Thursday as traders look at the escalating conflict between Israel and Iran.
- Traders sent Oil prices higher after Iran sent ballistic missiles into Israel as retaliation for the Lebanon ground incursion.
- The US Dollar Index is heading into its fourth day of consecutive gains.
Crude Oil jumps another 1% on Thursday as tensions in the Middle East continue to run high and despite the surprise buildup in US inventories. Traders try to assess what the next step could be in the standoff between Israel and Iran, either further escalation or easing in tensions. Meanwhile, the unexpected buildup in US Crude stockpiles on Wednesday was completely ignored by markets.
The US Dollar Index (DXY), which tracks the performance of the Greenback against six other currencies, is set for a fourth straight day of gains and is testing the September high at 101.90. Another big batch of data will be released on Thursday, with special importance to the Institute for Supply Management (ISM) numbers for the Services sector. The weekly Jobless Claims will also be closely watched in the light of the Nonfarm Payrolls number on Friday.
At the time of writing, Crude Oil (WTI) trades at $70.86 and Brent Crude at $74.71.
Oil news and market movers: OPEC tries to save the situation
- OPEC has said via Twitter that a Wall Street Journal (WSJ) published on October 2 – which mentioned that Saudi Arabia expected Oil prices could fall to $50 per barrel if OPEC members fail to uphold their production cuts – was “inaccurate and misleading”.
- Russia’s own data show its crude production in September fell just below its monthly target under the OPEC+ deal, according to people familiar with figures from the country’s Energy Ministry. Russia allegedly produced 8.97 million barrels a day last month, Reuters reports.
- The US Energy Information Administration (EIA) reported a surprise build of 3.889 million barrels on Wednesday against an expected drawdown of 1.25 million barrels.
Oil Technical Analysis: You can’t buy the dip
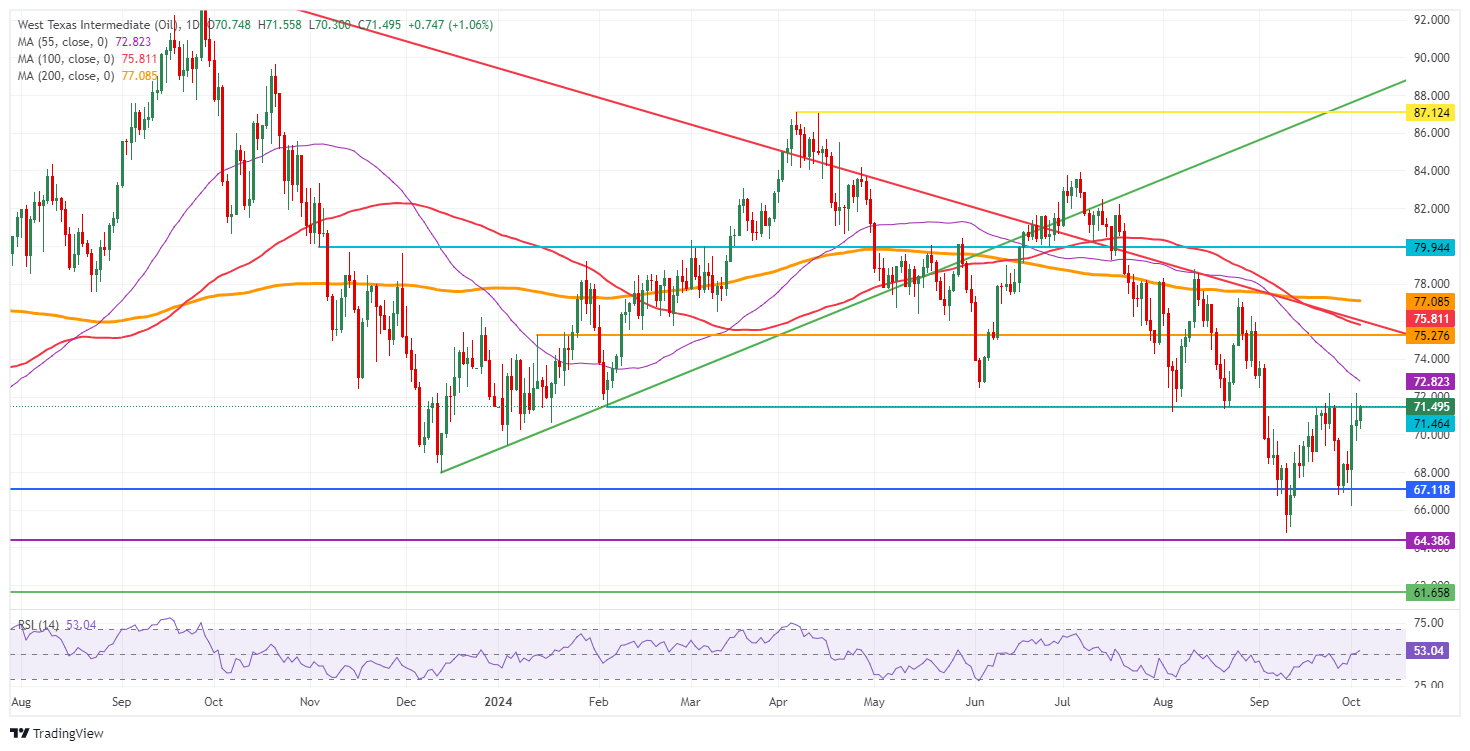
Crude Oil prices are hitting a small curb at $71.46, a level that was also tested and rejected. on September 24 and 25. In case the situation does not further escalate in the Middle East, a quick unwind could happen on the back of this risk premium trade, with a slide back to $67.11 possible.
At current levels, $71.46 remains in focus after a brief false break last week. If a supportive catalyst remains present, a return to $75.27 (the January 12 high) could play out. Along the way towards that level, the 55-day Simple Moving Average (SMA) at $72.80 could ease the rally a bit. Once above $75.27, the first resistance to follow is $75.80, which aligns with the 100-day SMA.
On the downside, $67.11, a triple bottom in the summer of 2023, could still hold as support. If that is not the case, further down the next level is $64.38, the low from March and May 2023. Even $61.65 could come into play should a ceasefire emerge or if Israel signals it is done with its special operation into Lebanon.
US WTI Crude Oil: Daily Chart
WTI Oil FAQs
WTI Oil is a type of Crude Oil sold on international markets. The WTI stands for West Texas Intermediate, one of three major types including Brent and Dubai Crude. WTI is also referred to as “light” and “sweet” because of its relatively low gravity and sulfur content respectively. It is considered a high quality Oil that is easily refined. It is sourced in the United States and distributed via the Cushing hub, which is considered “The Pipeline Crossroads of the World”. It is a benchmark for the Oil market and WTI price is frequently quoted in the media.
Like all assets, supply and demand are the key drivers of WTI Oil price. As such, global growth can be a driver of increased demand and vice versa for weak global growth. Political instability, wars, and sanctions can disrupt supply and impact prices. The decisions of OPEC, a group of major Oil-producing countries, is another key driver of price. The value of the US Dollar influences the price of WTI Crude Oil, since Oil is predominantly traded in US Dollars, thus a weaker US Dollar can make Oil more affordable and vice versa.
The weekly Oil inventory reports published by the American Petroleum Institute (API) and the Energy Information Agency (EIA) impact the price of WTI Oil. Changes in inventories reflect fluctuating supply and demand. If the data shows a drop in inventories it can indicate increased demand, pushing up Oil price. Higher inventories can reflect increased supply, pushing down prices. API’s report is published every Tuesday and EIA’s the day after. Their results are usually similar, falling within 1% of each other 75% of the time. The EIA data is considered more reliable, since it is a government agency.
OPEC (Organization of the Petroleum Exporting Countries) is a group of 12 Oil-producing nations who collectively decide production quotas for member countries at twice-yearly meetings. Their decisions often impact WTI Oil prices. When OPEC decides to lower quotas, it can tighten supply, pushing up Oil prices. When OPEC increases production, it has the opposite effect. OPEC+ refers to an expanded group that includes ten extra non-OPEC members, the most notable of which is Russia.
Silver prices (XAG/USD) fell on Thursday, according to FXStreet data. Silver trades at $31.54 per troy ounce, down 0.93% from the $31.84 it cost on Wednesday.
Silver prices have increased by 32.55% since the beginning of the year.
| Unit measure | Silver Price Today in USD |
|---|---|
| Troy Ounce | 31.54 |
| 1 Gram | 1.01 |
The Gold/Silver ratio, which shows the number of ounces of Silver needed to equal the value of one ounce of Gold, stood at 83.84 on Thursday, up from 83.52 on Wednesday.
Silver FAQs
Silver is a precious metal highly traded among investors. It has been historically used as a store of value and a medium of exchange. Although less popular than Gold, traders may turn to Silver to diversify their investment portfolio, for its intrinsic value or as a potential hedge during high-inflation periods. Investors can buy physical Silver, in coins or in bars, or trade it through vehicles such as Exchange Traded Funds, which track its price on international markets.
Silver prices can move due to a wide range of factors. Geopolitical instability or fears of a deep recession can make Silver price escalate due to its safe-haven status, although to a lesser extent than Gold's. As a yieldless asset, Silver tends to rise with lower interest rates. Its moves also depend on how the US Dollar (USD) behaves as the asset is priced in dollars (XAG/USD). A strong Dollar tends to keep the price of Silver at bay, whereas a weaker Dollar is likely to propel prices up. Other factors such as investment demand, mining supply – Silver is much more abundant than Gold – and recycling rates can also affect prices.
Silver is widely used in industry, particularly in sectors such as electronics or solar energy, as it has one of the highest electric conductivity of all metals – more than Copper and Gold. A surge in demand can increase prices, while a decline tends to lower them. Dynamics in the US, Chinese and Indian economies can also contribute to price swings: for the US and particularly China, their big industrial sectors use Silver in various processes; in India, consumers’ demand for the precious metal for jewellery also plays a key role in setting prices.
Silver prices tend to follow Gold's moves. When Gold prices rise, Silver typically follows suit, as their status as safe-haven assets is similar. The Gold/Silver ratio, which shows the number of ounces of Silver needed to equal the value of one ounce of Gold, may help to determine the relative valuation between both metals. Some investors may consider a high ratio as an indicator that Silver is undervalued, or Gold is overvalued. On the contrary, a low ratio might suggest that Gold is undervalued relative to Silver.
(An automation tool was used in creating this post.)
- Gold oscillates in a tight range after bets fade that the Fed will continue slashing interest rates aggressively.
- Support for Gold comes from increasing geopolitical risks and lower interest rates globally.
- Technically, XAU/USD begins a leg lower within a tight range.
Gold (XAU/USD) edges lower to trade in the $2,640s per troy ounce on Thursday as it continues its line dance below the record high of $2,685 set last week. Sellers have the edge over buyers as bets fade that the Federal Reserve (Fed) will continue slashing interest rates aggressively in the United States (US), which, in turn, takes the shine off non-interest-bearing assets like Gold.
The downside is limited, however, by support from two key factors: safe-haven flows into Gold due to the fear of an escalation of the conflict in the Middle East and the general trend lower in global interest rates – notwithstanding the Fed’s newfound caution – which enables Gold to still retain its overall attractiveness to investors.
Gold stalls in its ascent as Fed backtracks
Gold continues to see upside capped by seesawing expectations regarding the future course of interest rates in the US. From the chances of the Fed cutting interest rates by another double-dose 50 basis points (0.50%) again in November, standing above 60% last week, these have now fallen to a much less certain level of around mid-30%.
The fall in market bets comes after the release of stronger-than-expected US jobs data, which suggests the US economy is not tilting on a cliff edge. This, in turn, has enabled the Dollar to resurface from its deep dive in August, providing a further headwind to Gold, which is mostly priced and traded in USD. Regarding the health of the US labor market, the release of the most important US employment report, the Nonfarm Payrolls (NFP), will be a critical deciding factor on Friday.
Technical Analysis: Gold enters short-term sideways mode
Gold enters a sideways market mode on the 4-hour chart (below) between the all-time high of $2,685 and a floor at around Monday’s low of $2,625. The short-term trend is unclear and could now possibly be sideways. It would require a breakout either above the top of the range or below the bottom to confirm a new directional bias.
XAU/USD 4-hour Chart
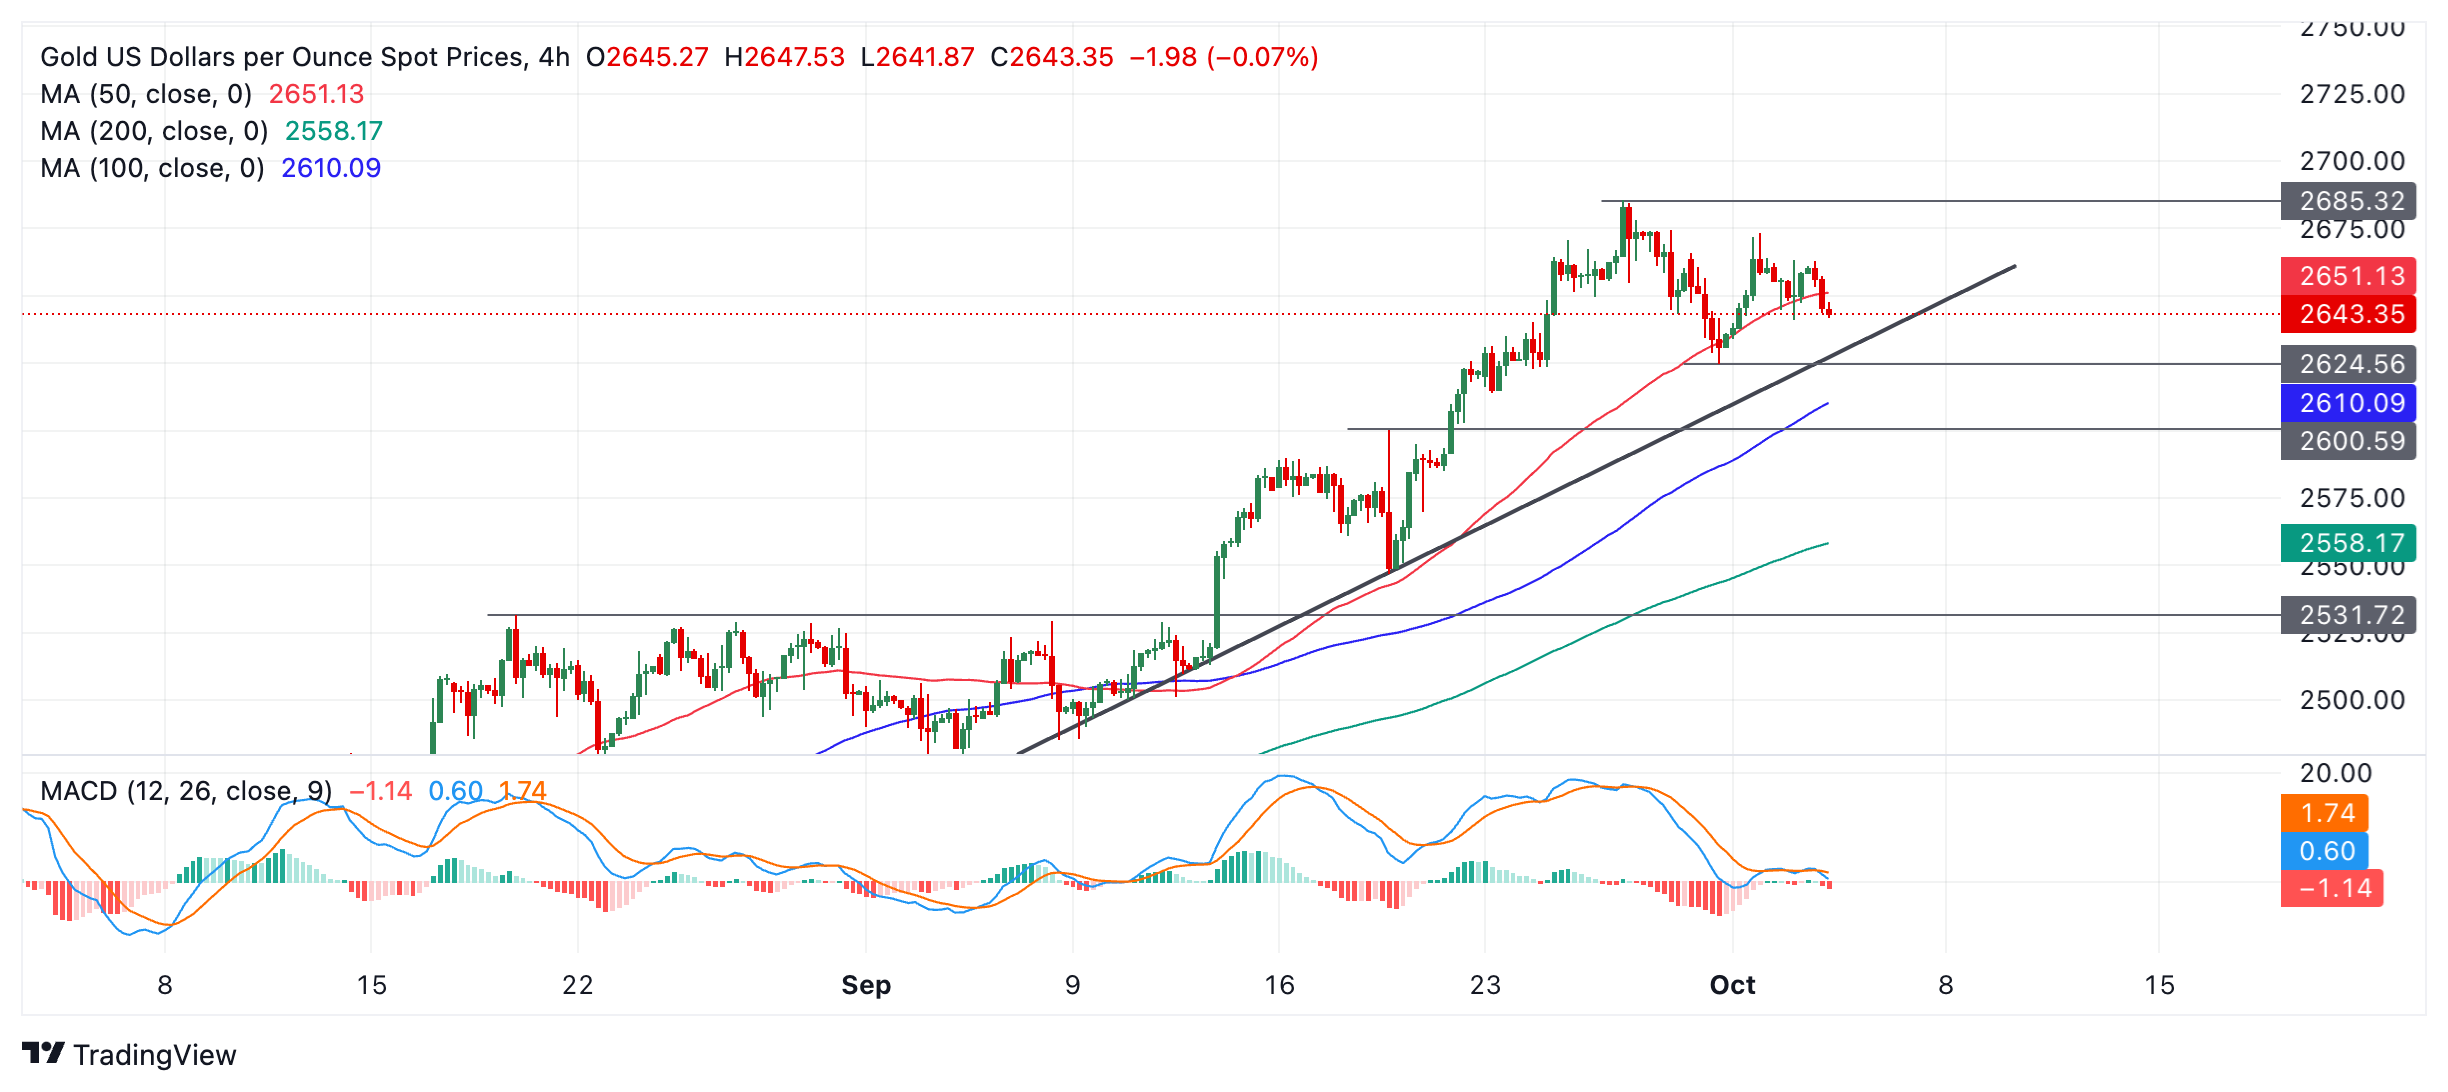
A break above the $2,673 Tuesday’s high would, however, increase the odds of a resumption of the old uptrend, probably leading to a continuation up to the round-number target at $2,700.
Gold is attempting to pierce the red 50-period Simple Moving Average (SMA) on the chart above, however, which suggests building downside pressure.
If a break through the SMA ensues, it will probably take prices down to support from the trendline at $2,630. A break below the $2,625 swing low would likely see prices give way to support at $2,600 (August 20 high, round number).
On a medium and long-term basis, Gold remains in an uptrend and, since it is a foundational principle of technical analysis that “the trend is your friend,” the odds favor resumption higher eventually once the current period of consolidation has ended.
Economic Indicator
Nonfarm Payrolls
The Nonfarm Payrolls release presents the number of new jobs created in the US during the previous month in all non-agricultural businesses; it is released by the US Bureau of Labor Statistics (BLS). The monthly changes in payrolls can be extremely volatile. The number is also subject to strong reviews, which can also trigger volatility in the Forex board. Generally speaking, a high reading is seen as bullish for the US Dollar (USD), while a low reading is seen as bearish, although previous months' reviews and the Unemployment Rate are as relevant as the headline figure. The market's reaction, therefore, depends on how the market assesses all the data contained in the BLS report as a whole.
Read more.Next release: Fri Oct 04, 2024 12:30
Frequency: Monthly
Consensus: 140K
Previous: 142K
Source: US Bureau of Labor Statistics
America’s monthly jobs report is considered the most important economic indicator for forex traders. Released on the first Friday following the reported month, the change in the number of positions is closely correlated with the overall performance of the economy and is monitored by policymakers. Full employment is one of the Federal Reserve’s mandates and it considers developments in the labor market when setting its policies, thus impacting currencies. Despite several leading indicators shaping estimates, Nonfarm Payrolls tend to surprise markets and trigger substantial volatility. Actual figures beating the consensus tend to be USD bullish.
- USD/CHF gains ground as recent labor data decreased the chances of an aggressive rate cut by the Fed in November.
- CME FedWatch Tool suggests 31.4% odds of a 50 basis point Fed rate cut, down from 49.3% a week ago.
- Swiss CPI slowed to 0.8% YoY in September, down from both expected and August's reading of 1.1%.
USD/CHF continues its winning streak for the fourth successive session, trading around 0.8510 during the European hours on Thursday. This upside of the USD/CHF pair could be attributed to recent strong US labor data, which decreased the likelihood of the Federal Reserve (Fed) delivering another aggressive rate cut in November.
The ADP US Employment Change reported an increase of 143,000 jobs in September, exceeding the anticipated 120,000 jobs. Furthermore, annual pay increased by 4.7% year-over-year. The total number of jobs added in August was revised upward from 99,000 to 103,000. This report indicates that the labor market is in better condition than previously perceived at the start of the third quarter.
The CME FedWatch Tool indicates that markets are assigning a 65.9% probability to a 25 basis point rate cut by the Federal Reserve in November, while the likelihood of a 50 basis point cut is 31.4%, down from 49.3% a week ago.
The Swiss Franc (CHF) might have received downward pressure following weaker-than-expected inflation data released on Thursday. Switzerland's Consumer Price Index slowed to 0.8% year-over-year in September, down from both market expectations and August's figure of 1.1%. This is the lowest inflation rate since September 2021. Additionally, the monthly inflation rate dropped by 0.3%, exceeding forecasts of a 0.1% decline, after remaining flat in August.
The downside of the Swiss Franc (CHF) could be restrained due to safe-haven flows amid escalating Middle-East tensions. The Israeli Broadcasting Authority (IBA) reported that Israel's security cabinet has resolved to take decisive action in response to the recent Iranian attack. On Tuesday night, Iran launched more than 200 ballistic missiles and drone strikes targeting Israel.
Swiss Franc FAQs
The Swiss Franc (CHF) is Switzerland’s official currency. It is among the top ten most traded currencies globally, reaching volumes that well exceed the size of the Swiss economy. Its value is determined by the broad market sentiment, the country’s economic health or action taken by the Swiss National Bank (SNB), among other factors. Between 2011 and 2015, the Swiss Franc was pegged to the Euro (EUR). The peg was abruptly removed, resulting in a more than 20% increase in the Franc’s value, causing a turmoil in markets. Even though the peg isn’t in force anymore, CHF fortunes tend to be highly correlated with the Euro ones due to the high dependency of the Swiss economy on the neighboring Eurozone.
The Swiss Franc (CHF) is considered a safe-haven asset, or a currency that investors tend to buy in times of market stress. This is due to the perceived status of Switzerland in the world: a stable economy, a strong export sector, big central bank reserves or a longstanding political stance towards neutrality in global conflicts make the country’s currency a good choice for investors fleeing from risks. Turbulent times are likely to strengthen CHF value against other currencies that are seen as more risky to invest in.
The Swiss National Bank (SNB) meets four times a year – once every quarter, less than other major central banks – to decide on monetary policy. The bank aims for an annual inflation rate of less than 2%. When inflation is above target or forecasted to be above target in the foreseeable future, the bank will attempt to tame price growth by raising its policy rate. Higher interest rates are generally positive for the Swiss Franc (CHF) as they lead to higher yields, making the country a more attractive place for investors. On the contrary, lower interest rates tend to weaken CHF.
Macroeconomic data releases in Switzerland are key to assessing the state of the economy and can impact the Swiss Franc’s (CHF) valuation. The Swiss economy is broadly stable, but any sudden change in economic growth, inflation, current account or the central bank’s currency reserves have the potential to trigger moves in CHF. Generally, high economic growth, low unemployment and high confidence are good for CHF. Conversely, if economic data points to weakening momentum, CHF is likely to depreciate.
As a small and open economy, Switzerland is heavily dependent on the health of the neighboring Eurozone economies. The broader European Union is Switzerland’s main economic partner and a key political ally, so macroeconomic and monetary policy stability in the Eurozone is essential for Switzerland and, thus, for the Swiss Franc (CHF). With such dependency, some models suggest that the correlation between the fortunes of the Euro (EUR) and the CHF is more than 90%, or close to perfect.
Japan’s Finance Minister Katsunobu Kato on Thursday that he “wants to watch forex market with a sense of urgency including speculative moves.”
Further comments
Will communicate thoroughly with markets.
Will aim to exit deflation soon working closely with boj based on joint govt-BoJ statement.
Market reaction
USD/JPY holds the rebound near 146.85 following these above comments, adding 0.26% on the day.
The latest Bank of England (BoE) Decision Maker Panel (DMP) survey showed on Thursday that “one-year ahead expected CPI inflation by the UK firms dropped by another 0.1 percentage points to 2.6% in the quarter to September.”
Key takeaways
Expected year-ahead wage growth remained unchanged at 4.1% on a three-month moving-average basis in September.
Business uncertainty fell in the three months to September.
The survey is one of the most closely watched by members of the BoE's Monetary Policy Committee (MPC).
Market reaction
The Pound Sterling sell-off extends on the UK businesses’ inflation expectations, as GBP/USD sheds 1.15% on the day to trade near 1.3115, at the press time.
- GBP/JPY witnessed heavy selling in reaction to the BoE Governor Bailey’s dovish remarks.
- Bailey said that the central bank could become "a bit more activist" on interest rate cuts.
- Middle East tensions benefit the JPY’s relative safe-haven status and weigh on the cross.
The GBP/JPY cross continues with its struggle to find acceptance above the 195.00 psychological mark for the second time in two weeks and retreats sharply from a one-week high touched earlier this Thursday. The downward trajectory drags spot prices to the 192.25-192.20 area during the first half of the European session and is exclusively sponsored by the emergence of heavy selling around the British Pound (GBP).
In an interview with the Guardian, the Bank of England (BoE) Governor Andrew Bailey said that there was a chance that the central bank could become a bit more aggressive in cutting rates if there's further good news on inflation. Traders upped their bets for another 25-basis points interest rate cut by the BoE at its November meeting. This, in turn, drags UK gilts lower, along with the GBP, and prompts aggressive selling around the GBP/JPY cross.
Apart from this, a further escalation of geopolitical tensions in the Middle East benefits the Japanese Yen's (JPY) relative safe-haven status and contributes to the offered tone surrounding the currency pair. Iran launched over 200 ballistic missiles at Israel on Tuesday, while the latter conducted a precise air strike and bombed central Beirut in Lebanon during the early hours of Thursday, raising the risk of a full-blown war and undermining the risk sentiment.
The JPY bulls, however, refrain from placing aggressive bets in the wake of the uncertainty over future interest rate hikes by the Bank of Japan (BoJ). In fact, Japan's new Prime Minister Shigeru Ishiba said on Wednesday that the country is not in an environment for an additional rate increase. Adding to this, Japan's newly appointed economy minister, Ryosei Akazawa, expects the BoJ to make careful economic assessments when raising interest rates again.
Furthermore, BoJ board member Asahi Noguchi stated that the central bank must patiently maintain loose monetary conditions and will make gradual adjustments while carefully assessing whether inflation sustainably reaches the 2% target. This, in turn, warrants some caution before positioning for any further depreciating move for the GBP/JPY cross and supports prospects for an extension of the range-bound price action witnessed since the beginning of the current week.
BoE FAQs
The Bank of England (BoE) decides monetary policy for the United Kingdom. Its primary goal is to achieve ‘price stability’, or a steady inflation rate of 2%. Its tool for achieving this is via the adjustment of base lending rates. The BoE sets the rate at which it lends to commercial banks and banks lend to each other, determining the level of interest rates in the economy overall. This also impacts the value of the Pound Sterling (GBP).
When inflation is above the Bank of England’s target it responds by raising interest rates, making it more expensive for people and businesses to access credit. This is positive for the Pound Sterling because higher interest rates make the UK a more attractive place for global investors to park their money. When inflation falls below target, it is a sign economic growth is slowing, and the BoE will consider lowering interest rates to cheapen credit in the hope businesses will borrow to invest in growth-generating projects – a negative for the Pound Sterling.
In extreme situations, the Bank of England can enact a policy called Quantitative Easing (QE). QE is the process by which the BoE substantially increases the flow of credit in a stuck financial system. QE is a last resort policy when lowering interest rates will not achieve the necessary result. The process of QE involves the BoE printing money to buy assets – usually government or AAA-rated corporate bonds – from banks and other financial institutions. QE usually results in a weaker Pound Sterling.
Quantitative tightening (QT) is the reverse of QE, enacted when the economy is strengthening and inflation starts rising. Whilst in QE the Bank of England (BoE) purchases government and corporate bonds from financial institutions to encourage them to lend; in QT, the BoE stops buying more bonds, and stops reinvesting the principal maturing on the bonds it already holds. It is usually positive for the Pound Sterling.
- AUD/JPY depreciates due to risk-off mood amid rising geopolitical tensions.
- Israel's security cabinet decided to take decisive action in response to the recent Iranian attack.
- The Japanese Yen struggles as PM Ishiba expressed that the current environment doesn’t require further interest rate increases.
AUD/JPY trims its intraday gains, holding some gains around 100.50 during the European hours on Thursday. The risk-sensitive Australian Dollar (AUD) depreciates as the rising geopolitical tensions have dampened the risk appetite and undermined the AUD/JPY cross.
The Israeli Broadcasting Authority (IBA) reported that Israel's security cabinet has resolved to take decisive action in response to the recent Iranian attack. On Tuesday night, Iran launched more than 200 ballistic missiles and drone strikes targeting Israel.
However, the downside risk for the AUD may be limited due to the hawkish outlook surrounding the Reserve Bank of Australia (RBA). Data released earlier this week showed stronger-than-expected retail sales growth for August, lowering the likelihood of an early rate cut by the RBA.
On Thursday, Australia’s Trade Balance for August stood at 5,644 million month-over-month, surpassing market expectations of 5,500 million and slightly higher than July’s surplus of 5,636 million. However, both Exports and Imports declined by 0.2% month-over-month in August. Markets have almost fully discounted the possibility of a rate cut in November.
The AUD/JPY cross received support as the Japanese Yen (JPY) faced challenges following blunt comments on monetary policy from the new Prime Minister (PM) Shigeru Ishiba, who met with Bank of Japan (BoJ) Governor Kazuo Ueda on Wednesday.
Japan’s Prime Minister Ishiba stated, "I do not believe that we are in an environment that would require us to raise interest rates further," according to Reuters. In the previous session, the Japanese Yen fell nearly 2% against the US Dollar (USD), marking its largest drop since February of last year.
Interest rates FAQs
Interest rates are charged by financial institutions on loans to borrowers and are paid as interest to savers and depositors. They are influenced by base lending rates, which are set by central banks in response to changes in the economy. Central banks normally have a mandate to ensure price stability, which in most cases means targeting a core inflation rate of around 2%. If inflation falls below target the central bank may cut base lending rates, with a view to stimulating lending and boosting the economy. If inflation rises substantially above 2% it normally results in the central bank raising base lending rates in an attempt to lower inflation.
Higher interest rates generally help strengthen a country’s currency as they make it a more attractive place for global investors to park their money.
Higher interest rates overall weigh on the price of Gold because they increase the opportunity cost of holding Gold instead of investing in an interest-bearing asset or placing cash in the bank. If interest rates are high that usually pushes up the price of the US Dollar (USD), and since Gold is priced in Dollars, this has the effect of lowering the price of Gold.
The Fed funds rate is the overnight rate at which US banks lend to each other. It is the oft-quoted headline rate set by the Federal Reserve at its FOMC meetings. It is set as a range, for example 4.75%-5.00%, though the upper limit (in that case 5.00%) is the quoted figure. Market expectations for future Fed funds rate are tracked by the CME FedWatch tool, which shapes how many financial markets behave in anticipation of future Federal Reserve monetary policy decisions.
- GBP/USD comes under intense selling pressure in reaction to Bailey’s dovish remarks.
- Bailey hints at more aggressive rate cuts and weighs heavily on GBP amid a bullish USD.
- Reduced bets for a 50 bps Fed rate cut in November and geopolitical risks benefit the buck.
The GBP/USD pair continues losing ground for the third straight day – also marking the fourth day of a negative move in the previous four – and plummets to over a two-week low during the first half of the European session on Thursday. Spot prices currently trade below mid-1.3100s, down nearly 1.0% for the day, and seem vulnerable to decline further in the wake of Bank of England (BoE) Governor Andrew Bailey's dovish remarks.
In an interview with the Guardian newspaper published this Thursday, Bailey said that there was a chance that the BoE could become a bit more aggressive in cutting rates if there's further good news on inflation. The markets were quick to react and are now pricing in a 90% chance of a 25 basis points interest cut at the next BoE meeting in November. This, in turn, weighs heavily on the British Pound (GBP), which, along with sustained US Dollar (USD) buying, contributes to the GBP/USD pair's steep intraday fall.
The incoming US data pointed to a still resilient labor market and forced investors to scale back their expectations for a more aggressive policy easing by the Federal Reserve (Fed). This, along with geopolitical risks stemming from the ongoing conflicts in the Middle East, assists the safe-haven USD to prolong this week's recovery from its lowest level since July 2023. The USD Index (DXY), which tracks the Greenback against a basket of currencies, climbs to a three-week top and exerts additional pressure on the GBP/USD pair.
With the latest leg down, spot prices now seem to have confirmed a breakdown below the 61.8% Fibonacci retracement level of the recent rally from the 1.3000 psychological mark, or the September monthly swing low. Furthermore, oscillators on the daily chart have just started gaining negative traction and suggest that the path of least resistance for the GBP/USD pair is to the downside. Traders now look to the US economic docket – featuring Weekly Jobless Claims and the ISM Services PMI – for short-term opportunities.
Pound Sterling FAQs
The Pound Sterling (GBP) is the oldest currency in the world (886 AD) and the official currency of the United Kingdom. It is the fourth most traded unit for foreign exchange (FX) in the world, accounting for 12% of all transactions, averaging $630 billion a day, according to 2022 data. Its key trading pairs are GBP/USD, also known as ‘Cable’, which accounts for 11% of FX, GBP/JPY, or the ‘Dragon’ as it is known by traders (3%), and EUR/GBP (2%). The Pound Sterling is issued by the Bank of England (BoE).
The single most important factor influencing the value of the Pound Sterling is monetary policy decided by the Bank of England. The BoE bases its decisions on whether it has achieved its primary goal of “price stability” – a steady inflation rate of around 2%. Its primary tool for achieving this is the adjustment of interest rates. When inflation is too high, the BoE will try to rein it in by raising interest rates, making it more expensive for people and businesses to access credit. This is generally positive for GBP, as higher interest rates make the UK a more attractive place for global investors to park their money. When inflation falls too low it is a sign economic growth is slowing. In this scenario, the BoE will consider lowering interest rates to cheapen credit so businesses will borrow more to invest in growth-generating projects.
Data releases gauge the health of the economy and can impact the value of the Pound Sterling. Indicators such as GDP, Manufacturing and Services PMIs, and employment can all influence the direction of the GBP. A strong economy is good for Sterling. Not only does it attract more foreign investment but it may encourage the BoE to put up interest rates, which will directly strengthen GBP. Otherwise, if economic data is weak, the Pound Sterling is likely to fall.
Another significant data release for the Pound Sterling is the Trade Balance. This indicator measures the difference between what a country earns from its exports and what it spends on imports over a given period. If a country produces highly sought-after exports, its currency will benefit purely from the extra demand created from foreign buyers seeking to purchase these goods. Therefore, a positive net Trade Balance strengthens a currency and vice versa for a negative balance.
- The USD/CAD pair tests 21-day EMA at 1.3534 level, followed by the upper boundary of an ascending channel at 1.3570.
- If the 14-day RSI crosses above the 50 level, it could reinforce the bullish bias, indicating increasing upward momentum.
- A break below the lower boundary of an ascending channel at 1.3490 could cause the emergence of the bearish bias.
USD/CAD extends its gains for the second consecutive day, trading around 1.3530 during Thursday’s European hours. Analysis of the daily chart shows that the pair consolidates within the ascending channel, suggesting an ongoing bullish bias.
However, the 14-day Relative Strength Index (RSI) remains below the 50 level, indicating that the bearish trend is still in effect. A breach above the 50 mark would strengthen the ongoing bullish sentiment.
Regarding the upside, the immediate barrier appears at the 21-day Exponential Moving Average (EMA) at the 1.3534 level, followed by the upper boundary of an ascending channel at the 1.3570 level. A breach above the ascending channel would strengthen the bullish bias and lead the USD/CAD pair to test the "throwback support turns into a pullback resistance" level of 1.3590, followed by the psychological level of 1.3600.
On the downside, the USD/CAD may find support around the region around the lower boundary of an ascending channel at 1.3490. A break below this level could cause the emergence of the bearish bias and push the pair to test the eight-month low of 1.3418 level, recorded on September 25.
USD/CAD: Daily Chart
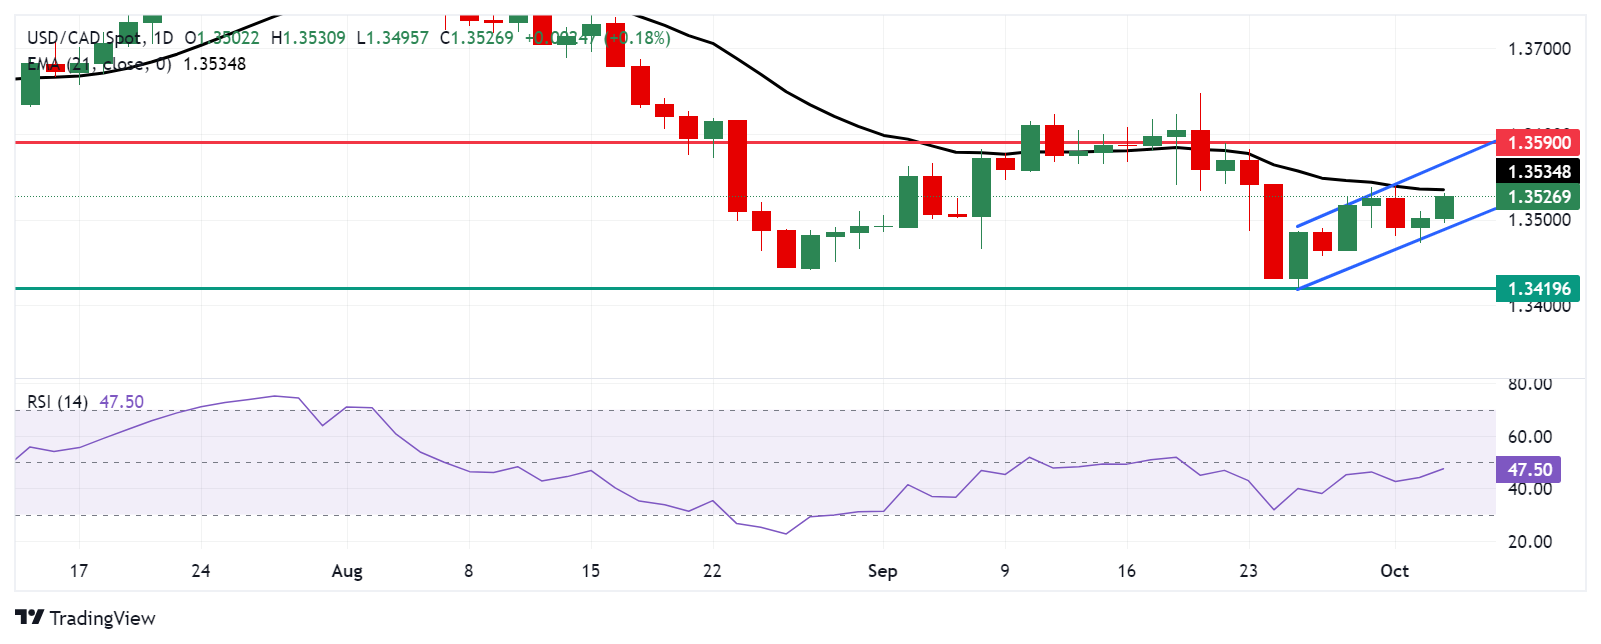
Canadian Dollar PRICE Today
The table below shows the percentage change of Canadian Dollar (CAD) against listed major currencies today. Canadian Dollar was the weakest against the US Dollar.
| USD | EUR | GBP | JPY | CAD | AUD | NZD | CHF | |
|---|---|---|---|---|---|---|---|---|
| USD | 0.10% | 0.97% | 0.06% | 0.18% | 0.36% | 0.53% | 0.28% | |
| EUR | -0.10% | 0.87% | -0.03% | 0.06% | 0.26% | 0.41% | 0.18% | |
| GBP | -0.97% | -0.87% | -0.89% | -0.80% | -0.61% | -0.45% | -0.67% | |
| JPY | -0.06% | 0.03% | 0.89% | 0.13% | 0.31% | 0.43% | 0.23% | |
| CAD | -0.18% | -0.06% | 0.80% | -0.13% | 0.18% | 0.35% | 0.11% | |
| AUD | -0.36% | -0.26% | 0.61% | -0.31% | -0.18% | 0.15% | -0.06% | |
| NZD | -0.53% | -0.41% | 0.45% | -0.43% | -0.35% | -0.15% | -0.22% | |
| CHF | -0.28% | -0.18% | 0.67% | -0.23% | -0.11% | 0.06% | 0.22% |
The heat map shows percentage changes of major currencies against each other. The base currency is picked from the left column, while the quote currency is picked from the top row. For example, if you pick the Canadian Dollar from the left column and move along the horizontal line to the US Dollar, the percentage change displayed in the box will represent CAD (base)/USD (quote).
- EUR/USD is declining on Thursday as the Euro weakens on the back of a worsening growth outlook.
- A stronger US Dollar is speeding its ascent amid falling market bets of another aggressive rate cut from the Fed.
- USD is further strengthening from haven flows as the conflict in the Middle East intensifies.
EUR/USD trades in the 1.1030s on Thursday, about a tenth of a percent down on the day as geopolitical risks increase demand for the safe-haven US Dollar (USD) while the Euro (EUR) weakens amid a gloomy economic outlook for the old continent.
EUR/USD slides on tighter Fed, haven flows
EUR/USD opens Thursday on the back foot after closing lower for three consecutive days. A single Euro now will buy almost two cents less than it did at the start of the week.
The Euro is weakening after lower-than-expected inflation data for September brings the official headline rate of inflation in the Eurozone to 1.8%, the first time it has fallen below the European Central Bank’s (ECB) target of 2.0% in 39 months. The data increases the chances the ECB will cut interest rates more aggressively, which, in turn, would be negative for the Euro as it discourages foreign capital inflows.
In the US, conversely, market bets are falling that the US Federal Reserve (Fed) will follow up their “jumbo” 50 basis points (0.50%) cut with an equal-sized cut in November, and this is supporting the US Dollar.
Strong US jobs data is helping to reassure investors that the US economy will not experience a hard landing. JOLTS Job Openings rose to 8.04 million in August from a revised-up 7.71 million in July, and ADP Employment Change – an estimate of private payrolls growth – came out at 142K in September, beating the previous month’s 103K and expectations of 120K. Markets now await the US’s most important labor report, the Nonfarm Payrolls (NFP) scheduled for release on Friday.
Rising geopolitical tensions in the Middle East further support the US Dollar because the Greenback is viewed as a safe-haven in times of crisis, further weighing on the EUR/USD pair. Israel has stepped up its multi-front war against Iran and its proxies – Hamas, Hezbollah and the Houthi of Yemen. After Iran’s bombardment of Israel on Tuesday, fears are increasing that Israel will retaliate with targeted attacks on Iranian Oil installations and possibly even nuclear development sites.
Europe faces an uncertain future
The Euro is suffering because of a pessimistic longer-term economic growth outlook for Europe. On Wednesday, these concerns crystallized in a speech that President Emmanuel Macron of France gave in Berlin. Macron warned about the existential risks for Europe if it failed to invest in its future in order to stay competitive in a rapidly changing new world order headed by the United States and China.
Europe, he said, was facing “an existential risk” unless it increased investment in innovation and Artificial Intelligence (AI), imposed tariffs to ensure a level playing field with subsidy-backed competitors, simplified complex regulation and integrated member states at a capital market and governance level. His speech echoed proposals made by former Prime Minister of Italy Mario Draghi in his recent report on EU competitiveness, which was similarly pessimistic in its conclusions.
Technical Analysis: EUR/USD continues descent within long-term range
EUR/USD continues unfolding a down leg within a broad multi-year range capped by a ceiling at roughly 1.1200 and a floor at about 1.0500.
EUR/USD Daily Chart
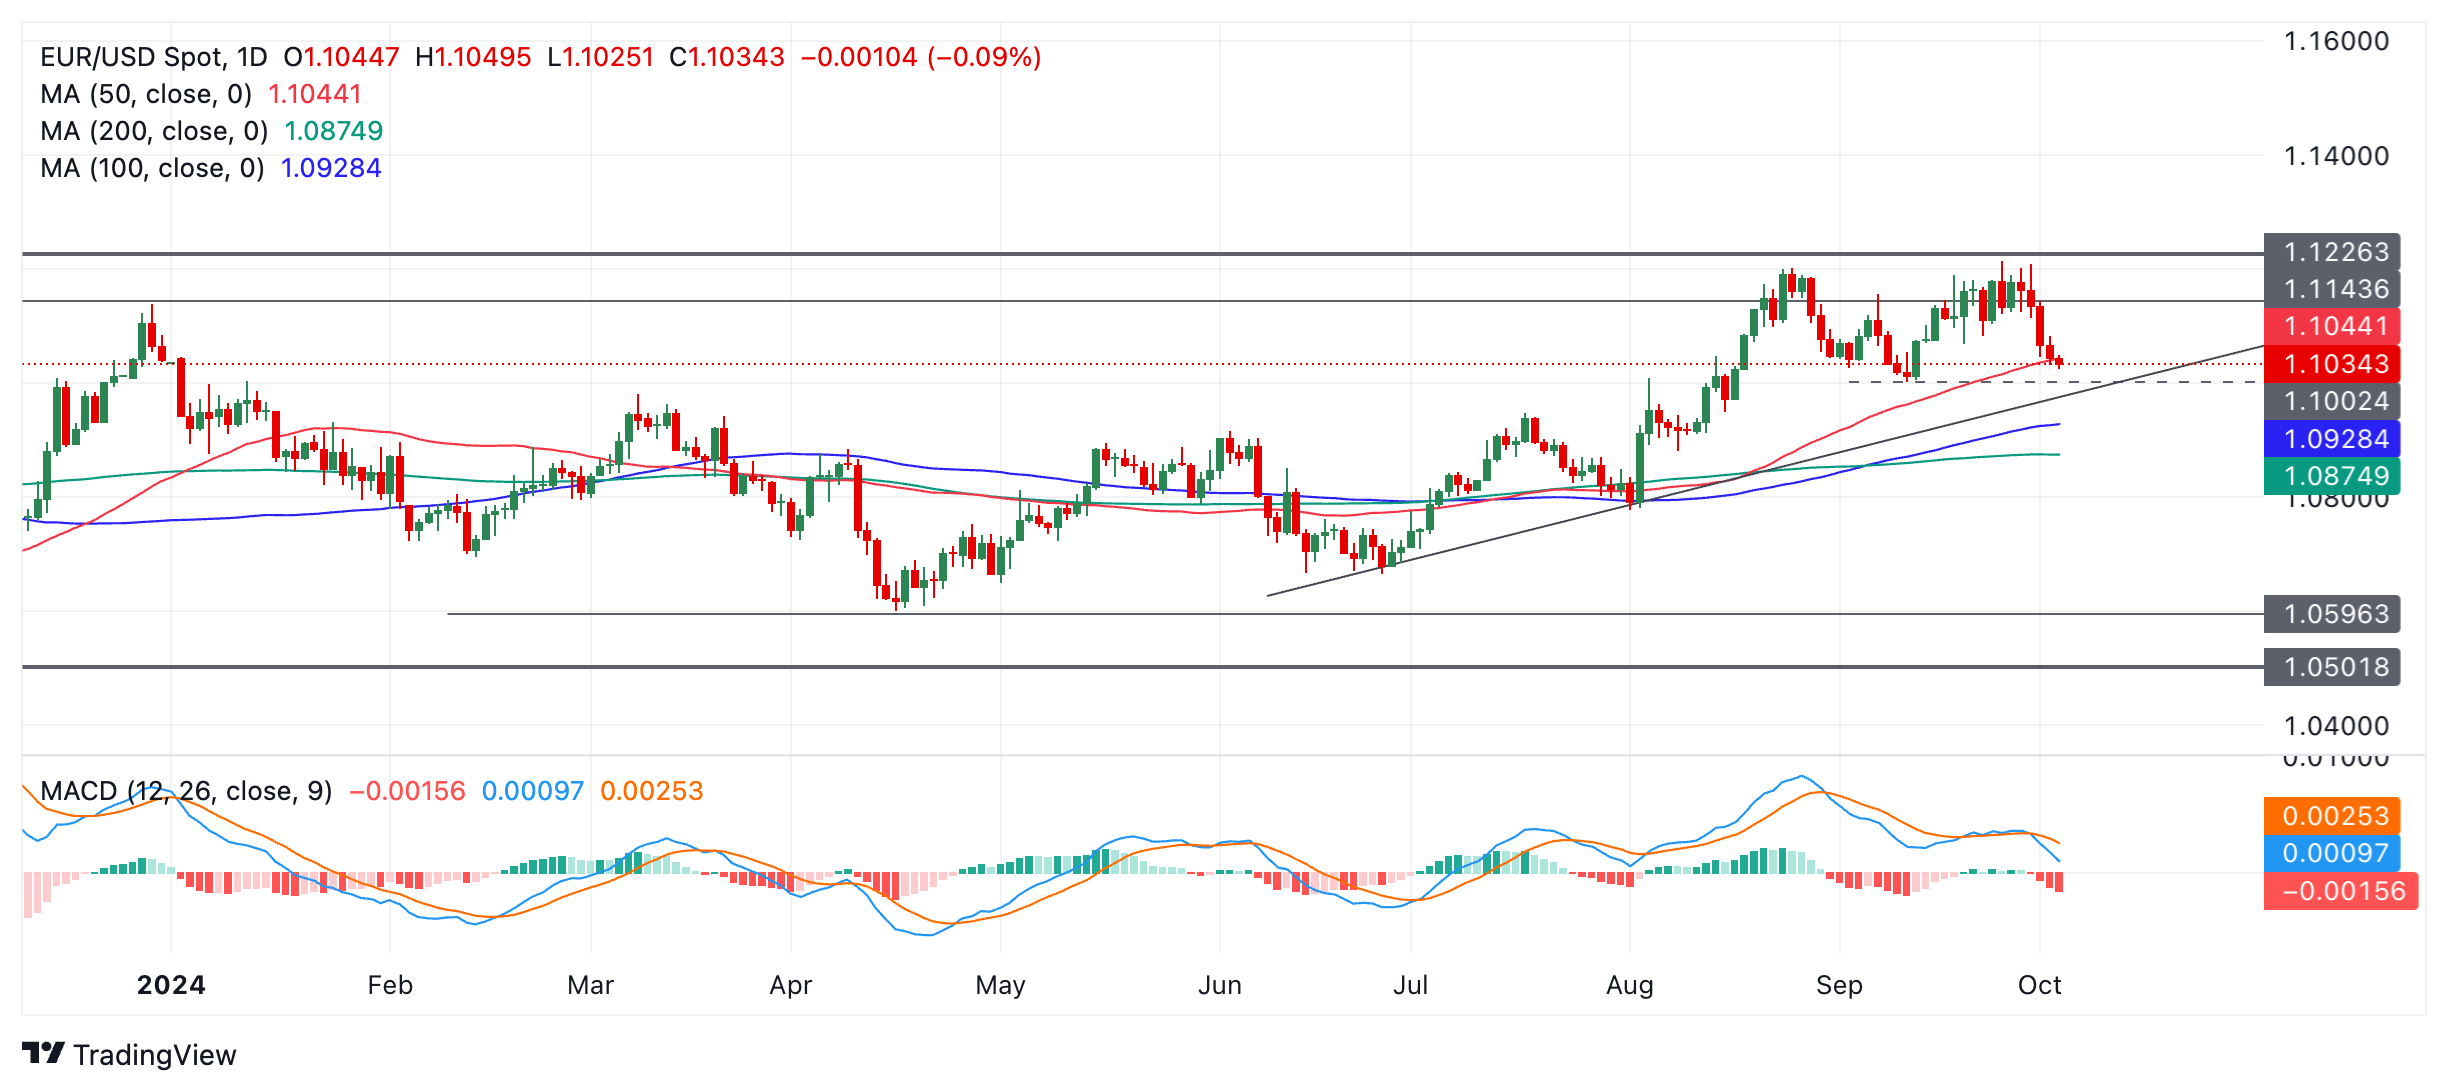
The pair is in a sideways trend on all its key timeframes (short, medium, and long-term) and since it is a principle of technical analysis that “the trend is your friend,” the odds favor a continuation of this sideways trend, suggesting an elongation of the down leg currently unfolding.
Prices are currently trying to penetrate below support provided by the red 50-day Simple Moving Average (SMA) at 1.1044. A close below the 50-day SMA would help confirm more weakness. A close below the trendline and the September 11 swing low at 1.1002 would provide further bearish confirmation. The downside target for the leg currently unfolding is 1.0875, the 200-day SMA, followed by 1.0777 (August 1 low) and 1.0600 in an especially bearish scenario.
Momentum, as measured by the Moving Average Convergence Divergence (MACD), is relatively bearish as the blue MACD line has crossed below the red signal line, suggesting more evidence the pair could be vulnerable to further weakness.
Economic Indicator
Nonfarm Payrolls
The Nonfarm Payrolls release presents the number of new jobs created in the US during the previous month in all non-agricultural businesses; it is released by the US Bureau of Labor Statistics (BLS). The monthly changes in payrolls can be extremely volatile. The number is also subject to strong reviews, which can also trigger volatility in the Forex board. Generally speaking, a high reading is seen as bullish for the US Dollar (USD), while a low reading is seen as bearish, although previous months' reviews and the Unemployment Rate are as relevant as the headline figure. The market's reaction, therefore, depends on how the market assesses all the data contained in the BLS report as a whole.
Read more.Next release: Fri Oct 04, 2024 12:30
Frequency: Monthly
Consensus: 140K
Previous: 142K
Source: US Bureau of Labor Statistics
America’s monthly jobs report is considered the most important economic indicator for forex traders. Released on the first Friday following the reported month, the change in the number of positions is closely correlated with the overall performance of the economy and is monitored by policymakers. Full employment is one of the Federal Reserve’s mandates and it considers developments in the labor market when setting its policies, thus impacting currencies. Despite several leading indicators shaping estimates, Nonfarm Payrolls tend to surprise markets and trigger substantial volatility. Actual figures beating the consensus tend to be USD bullish.
- US ISM Services PMI is seen improving a tad in September.
- The US services sector is expected to remain within the expansionary territory.
- Investors continue to favour a soft-landing scenario of the US economy.
The United States is set to release the Institute for Supply Management’s (ISM) Services Purchasing Managers Index (PMI) on Thursday, with the September index expected to tick higher to 51.7 from the previous 51.5.
In August, the economic activity in the United States (US) services sector improved for the second month in a row, showing the sector's resilience and thus reinforcing the view of a healthy US economy.
Moreover, the ISM Business Activity Index eased to 53.3 in August (from 54.5), suggesting some loss of momentum in business operations, while the ISM Services New Orders Index increased by 1.14 percentage points to 53.0, pointing to stronger demand for services. On a less positive note, the ISM Services Prices Paid Index rose marginally to 57.3 (from 57.0), highlighting still unabated price pressures.
What to expect from the ISM Services PMI report?
Inflation in the US has been on a clear downtrend, allowing the Federal Reserve (Fed) to shift its focus to the domestic labour market when it comes to deciding on future interest rate moves. That said, inflation gauged by the Personal Consumption Expenditures (PCE) Price Index last week reinforced that view. While the core PCE Index remained sticky and rose by 2.7% in the year to August (from the prior month of 2.6%), the headline PCE rose by 2.2%, coming in below consensus and lower than the previous 2.5% increase.
Previewing the release, an ISM Services PMI reading in line with expectations is likely to have minimal impact on the US Dollar (USD), as it would confirm the current market view that a soft landing is totally achievable amidst inflationary pressures, which even remaining above the Fed’s 2% target, are gradually moving in the right direction. A sharper-than-expected decline, however, could have a more significant impact, as the services sector has been a key driver of the economy in recent years. A sudden contraction could wake up risk aversion, threatening the idea of a smooth economic transition and waking up the demand for safe-haven assets like the Greenback.
When will the ISM Services Purchasing Managers’ Index report be released, and how could it affect EUR/USD?
The Institute for Supply Management’s (ISM) Services Purchasing Managers Index (PMI) will be published on Thursday at 14:00 GMT.
According to Pablo Piovano, Senior Analyst at FXStreet, “[T]he continuation of the selling process could initially drag EUR/USD to the 55-day Simple Moving Average (SMA), currently at 1.1024, which comes ahead of the September low at 1.1001 (September 11)”.
Bouts of strength, on the other hand, should motivate the spot to challenge its yearly top of 1.1214 (September 25). Once this region is cleared, the pair could embark on a probable move to the 2023 high of 1.1275 (July 18)”, Pablo adds.
Finally, Pablo suggests that “while above the 200-day SMA of 1.0874, the pair’s constructive outlook should remain unchanged.”
Economic Indicator
ISM Services PMI
The Institute for Supply Management (ISM) Services Purchasing Managers Index (PMI), released on a monthly basis, is a leading indicator gauging business activity in the US services sector, which makes up most of the economy. The indicator is obtained from a survey of supply executives across the US based on information they have collected within their respective organizations. Survey responses reflect the change, if any, in the current month compared to the previous month. A reading above 50 indicates that the services economy is generally expanding, a bullish sign for the US Dollar (USD). A reading below 50 signals that services sector activity is generally declining, which is seen as bearish for USD.
Read more.Next release: Thu Oct 03, 2024 14:00
Frequency: Monthly
Consensus: 51.7
Previous: 51.5
Source: Institute for Supply Management
The Institute for Supply Management’s (ISM) Services Purchasing Managers Index (PMI) reveals the current conditions in the US service sector, which has historically been a large GDP contributor. A print above 50 shows expansion in the service sector’s economic activity. Stronger-than-expected readings usually help the USD gather strength against its rivals. In addition to the headline PMI, the Employment Index and the Prices Paid Index numbers are also watched closely by investors as they provide useful insights regarding the state of the labour market and inflation.
GDP FAQs
A country’s Gross Domestic Product (GDP) measures the rate of growth of its economy over a given period of time, usually a quarter. The most reliable figures are those that compare GDP to the previous quarter e.g Q2 of 2023 vs Q1 of 2023, or to the same period in the previous year, e.g Q2 of 2023 vs Q2 of 2022. Annualized quarterly GDP figures extrapolate the growth rate of the quarter as if it were constant for the rest of the year. These can be misleading, however, if temporary shocks impact growth in one quarter but are unlikely to last all year – such as happened in the first quarter of 2020 at the outbreak of the covid pandemic, when growth plummeted.
A higher GDP result is generally positive for a nation’s currency as it reflects a growing economy, which is more likely to produce goods and services that can be exported, as well as attracting higher foreign investment. By the same token, when GDP falls it is usually negative for the currency. When an economy grows people tend to spend more, which leads to inflation. The country’s central bank then has to put up interest rates to combat the inflation with the side effect of attracting more capital inflows from global investors, thus helping the local currency appreciate.
When an economy grows and GDP is rising, people tend to spend more which leads to inflation. The country’s central bank then has to put up interest rates to combat the inflation. Higher interest rates are negative for Gold because they increase the opportunity-cost of holding Gold versus placing the money in a cash deposit account. Therefore, a higher GDP growth rate is usually a bearish factor for Gold price.
Here is what you need to know on Thursday, October 3:
The US Dollar (USD) continues to gather strength against its rivals for the fourth consecutive day on Thursday as market focus shifts to the next set of macroeconomic data releases from the US. The US Department of Labor will publish the weekly Initial Jobless Claims data in the early American session. Later in the day, August Factory Orders and September ISM Services PMI data will also be featured in the US economic docket. Additionally, Federal Reserve Bank of Minneapolis President Neel Kashkari and Federal Reserve Bank of Atlanta Raphael Bostic will be delivering speeches.
US Dollar PRICE This week
The table below shows the percentage change of US Dollar (USD) against listed major currencies this week. US Dollar was the strongest against the Japanese Yen.
| USD | EUR | GBP | JPY | CAD | AUD | NZD | CHF | |
|---|---|---|---|---|---|---|---|---|
| USD | 1.21% | 1.69% | 2.90% | 0.09% | 0.59% | 1.64% | 1.30% | |
| EUR | -1.21% | 0.48% | 1.68% | -1.08% | -0.56% | 0.46% | 0.15% | |
| GBP | -1.69% | -0.48% | 1.31% | -1.55% | -1.03% | -0.02% | -0.33% | |
| JPY | -2.90% | -1.68% | -1.31% | -2.67% | -2.28% | -1.18% | -1.51% | |
| CAD | -0.09% | 1.08% | 1.55% | 2.67% | 0.55% | 1.55% | 1.24% | |
| AUD | -0.59% | 0.56% | 1.03% | 2.28% | -0.55% | 1.02% | 0.71% | |
| NZD | -1.64% | -0.46% | 0.02% | 1.18% | -1.55% | -1.02% | -0.33% | |
| CHF | -1.30% | -0.15% | 0.33% | 1.51% | -1.24% | -0.71% | 0.33% |
The heat map shows percentage changes of major currencies against each other. The base currency is picked from the left column, while the quote currency is picked from the top row. For example, if you pick the US Dollar from the left column and move along the horizontal line to the Japanese Yen, the percentage change displayed in the box will represent USD (base)/JPY (quote).
After closing the first two days of the week in positive territory, the USD Index pushed higher and gained nearly 0.4% on Wednesday. Early Thursday, the index continues to stretch higher and was last seen trading at its highest level in a month at around 101.80. In the meantime, US stock index futures stay in negative territory early Thursday, reflecting a cautious market mood.
EUR/USD extended its weekly downtrend and closed below 1.1050 on Wednesday. The pair stays on the back foot early Thursday and trades near 1.1030. Eurostat will publish Producer Price Index data for August later in the session.
GBP/USD remains under heavy bearish pressure after posting losses on Wednesday and trades at its lowest level in over two weeks near 1.3150 in the European morning, losing over 0.8% on a daily basis. In an interview with the Guardian newspaper, Bank of England Governor Andrew Bailey said that they could become "a bit more activist on rate cuts if there’s further good news on inflation," triggering a Pound Sterling selloff.
USD/JPY surged higher and gained over 2% on Wednesday. After touching its strongest level since late August at 147.24 during the Asian trading hours on Thursday, the pair lost its traction and was last seen trading flat on the day slightly below 146.50.
The data from Australia showed earlier in the day that Exports and Imports both declined by 0.2% on a monthly basis in August. AUD/USD ignored these data and was last seen trading in the red at around 0.6860.
Despite the persistent USD strength, Gold managed to hold its ground and registered marginal losses on Wednesday, supported by the escalating geopolitical tensions. XAU/USD struggles to gain traction on Thursday and trades below $2,650.
US Dollar FAQs
The US Dollar (USD) is the official currency of the United States of America, and the ‘de facto’ currency of a significant number of other countries where it is found in circulation alongside local notes. It is the most heavily traded currency in the world, accounting for over 88% of all global foreign exchange turnover, or an average of $6.6 trillion in transactions per day, according to data from 2022. Following the second world war, the USD took over from the British Pound as the world’s reserve currency. For most of its history, the US Dollar was backed by Gold, until the Bretton Woods Agreement in 1971 when the Gold Standard went away.
The most important single factor impacting on the value of the US Dollar is monetary policy, which is shaped by the Federal Reserve (Fed). The Fed has two mandates: to achieve price stability (control inflation) and foster full employment. Its primary tool to achieve these two goals is by adjusting interest rates. When prices are rising too quickly and inflation is above the Fed’s 2% target, the Fed will raise rates, which helps the USD value. When inflation falls below 2% or the Unemployment Rate is too high, the Fed may lower interest rates, which weighs on the Greenback.
In extreme situations, the Federal Reserve can also print more Dollars and enact quantitative easing (QE). QE is the process by which the Fed substantially increases the flow of credit in a stuck financial system. It is a non-standard policy measure used when credit has dried up because banks will not lend to each other (out of the fear of counterparty default). It is a last resort when simply lowering interest rates is unlikely to achieve the necessary result. It was the Fed’s weapon of choice to combat the credit crunch that occurred during the Great Financial Crisis in 2008. It involves the Fed printing more Dollars and using them to buy US government bonds predominantly from financial institutions. QE usually leads to a weaker US Dollar.
Quantitative tightening (QT) is the reverse process whereby the Federal Reserve stops buying bonds from financial institutions and does not reinvest the principal from the bonds it holds maturing in new purchases. It is usually positive for the US Dollar.
- USD/IDR rises due to risk aversion amid rising Middle-East tensions.
- The US Dollar receives support from the decreasing odds of a Fed’s bumper rate cut in November.
- Bank Indonesia might have intervened in the FX market to support the Rupiah by ensuring the balance of supply and demand.
USD/IDR extends its winning streak for the third successive day, trading around 15,400.00 during the early European hours on Thursday. The Indonesian Rupiah lost around 1% against the US Dollar (USD) as the rising geopolitical tensions have dampened the risk appetite.
The waning likelihood of an aggressive rate cut by the Federal Reserve (Fed) in November helps the US Treasury yields to continue to gain ground and support the US Dollar (USD). The CME FedWatch Tool indicates that markets are assigning a 65.9% probability to a 25 basis point rate cut by the Federal Reserve in November, while the likelihood of a 50-basis-point cut is 31.4%, down from 49.3% a week ago.
The US Dollar Index (DXY), which measures the value of the US Dollar (USD) against its six major peers, continues to gain ground for the fourth successive session. The DXY trades around 101.80 with 2-year and 10-year yields on US bonds standing at 3.65% and 3.80%, respectively, at the time of writing.
On the IDR’s front, Bank Indonesia, the Indonesian central bank, has intervened in the forex market to support the Indonesian Rupiah by ensuring the balance of supply and demand.
On Tuesday, Indonesia’s Inflation rate fell to 1.84% in September, down from 2.12% in the previous month, reaching its lowest level since November 2021. This decline keeps inflation within the central bank’s target range of 1.5% to 3.5%.
Risk sentiment FAQs
In the world of financial jargon the two widely used terms “risk-on” and “risk off'' refer to the level of risk that investors are willing to stomach during the period referenced. In a “risk-on” market, investors are optimistic about the future and more willing to buy risky assets. In a “risk-off” market investors start to ‘play it safe’ because they are worried about the future, and therefore buy less risky assets that are more certain of bringing a return, even if it is relatively modest.
Typically, during periods of “risk-on”, stock markets will rise, most commodities – except Gold – will also gain in value, since they benefit from a positive growth outlook. The currencies of nations that are heavy commodity exporters strengthen because of increased demand, and Cryptocurrencies rise. In a “risk-off” market, Bonds go up – especially major government Bonds – Gold shines, and safe-haven currencies such as the Japanese Yen, Swiss Franc and US Dollar all benefit.
The Australian Dollar (AUD), the Canadian Dollar (CAD), the New Zealand Dollar (NZD) and minor FX like the Ruble (RUB) and the South African Rand (ZAR), all tend to rise in markets that are “risk-on”. This is because the economies of these currencies are heavily reliant on commodity exports for growth, and commodities tend to rise in price during risk-on periods. This is because investors foresee greater demand for raw materials in the future due to heightened economic activity.
The major currencies that tend to rise during periods of “risk-off” are the US Dollar (USD), the Japanese Yen (JPY) and the Swiss Franc (CHF). The US Dollar, because it is the world’s reserve currency, and because in times of crisis investors buy US government debt, which is seen as safe because the largest economy in the world is unlikely to default. The Yen, from increased demand for Japanese government bonds, because a high proportion are held by domestic investors who are unlikely to dump them – even in a crisis. The Swiss Franc, because strict Swiss banking laws offer investors enhanced capital protection.
FX option expiries for Oct 3 NY cut at 10:00 Eastern Time, via DTCC, can be found below.
EUR/USD: EUR amounts
- 1.1000 2b
- 1.1060 2.4b
- 1.1100 4b
GBP/USD: GBP amounts
- 1.3130 340m
- 1.3300 381m
USD/JPY: USD amounts
- 145.75 1.1b
- 148.00 1.7b
USD/CHF: USD amounts
- 0.8500 789m
AUD/USD: AUD amounts
- 0.6785 1.2b
- 0.6950 740m
USD/CAD: USD amounts
- 1.3550 1b
NZD/USD: NZD amounts
- 0.6310 1.4b
- EUR/GBP gains traction to around 0.8380 in Thursday’s early European session, up 0.65% on the day.
- BoE’s Bailey said the UK central bank may become a bit more aggressive on rate cuts.
- Traders anticipate the ECB to cut the interest rates in October.
The EUR/GBP cross rebounds to near 0.8380 during the early European session on Thursday. The Pound Sterling (GBP) loses ground after Bank of England (BoE) Governor Andrew Bailey’s speech.
On Thursday, the BoE’s Bailey said that the UK central bank could become a “bit more aggressive” and “more activist” on rate reduction if there’s further progress on inflation. Bailey further stated that he will closely monitor the Middle East developments. The dovish remarks from Bailey exert some selling pressure on the GBP and create a tailwind for EUR/GBP.
The BoE held interest rates at 5.0% in the September meeting after the first cut in borrowing rates in four years in August. However, investors expect another quarter-point reduction at its November meeting.
The European Central Bank (ECB) president Christine Lagarde reiterated last month that the central bank was “not pre-committing” to additional rates cut, emphasizing that the policymakers will stick to their “data-dependent. The recent Eurozone economic data earlier this week triggers the chance of the ECB rate cuts. The Eurozone inflation fell to 1.8% in September, below the 2% target.
ECB Governing Council member Kazaks stated that “recent data clearly point in the direction of a cut, but leaned against “exaggerated” market expectations for easing. The markets have priced in nearly 95% odds of an October cut, up from a 25% chance after the September ECB decision.
Investors await the HCOB September Purchasing Managers’ Index (PMI) from Germany and the Eurozone, along with the Producer Price Index (PPI), which is due on Thursday. If the report shows a weaker-than-expected outcome, this could drag the shared currency lower against the GBP.
Pound Sterling FAQs
The Pound Sterling (GBP) is the oldest currency in the world (886 AD) and the official currency of the United Kingdom. It is the fourth most traded unit for foreign exchange (FX) in the world, accounting for 12% of all transactions, averaging $630 billion a day, according to 2022 data. Its key trading pairs are GBP/USD, also known as ‘Cable’, which accounts for 11% of FX, GBP/JPY, or the ‘Dragon’ as it is known by traders (3%), and EUR/GBP (2%). The Pound Sterling is issued by the Bank of England (BoE).
The single most important factor influencing the value of the Pound Sterling is monetary policy decided by the Bank of England. The BoE bases its decisions on whether it has achieved its primary goal of “price stability” – a steady inflation rate of around 2%. Its primary tool for achieving this is the adjustment of interest rates. When inflation is too high, the BoE will try to rein it in by raising interest rates, making it more expensive for people and businesses to access credit. This is generally positive for GBP, as higher interest rates make the UK a more attractive place for global investors to park their money. When inflation falls too low it is a sign economic growth is slowing. In this scenario, the BoE will consider lowering interest rates to cheapen credit so businesses will borrow more to invest in growth-generating projects.
Data releases gauge the health of the economy and can impact the value of the Pound Sterling. Indicators such as GDP, Manufacturing and Services PMIs, and employment can all influence the direction of the GBP. A strong economy is good for Sterling. Not only does it attract more foreign investment but it may encourage the BoE to put up interest rates, which will directly strengthen GBP. Otherwise, if economic data is weak, the Pound Sterling is likely to fall.
Another significant data release for the Pound Sterling is the Trade Balance. This indicator measures the difference between what a country earns from its exports and what it spends on imports over a given period. If a country produces highly sought-after exports, its currency will benefit purely from the extra demand created from foreign buyers seeking to purchase these goods. Therefore, a positive net Trade Balance strengthens a currency and vice versa for a negative balance.
Bank of Japan (BoJ) board member Asahi Noguchi said on Thursday that the “timing of next rate hike is data dependent.”
Additional quotes
No comment on PM Shigeru Ishiba’s remarks on monetary policy .
Expect the Bank of Japan (BoJ) to adjust degree of monetary policy if economy moves in line with forecast, even at a very slow pace.
Personally feel we need to proceed very carefully in adjusting degree of monetary support.
Can't say now when the BoJ will raise rates again.
Need to scrutinize whether consumers' sentiment will shift to one where they can swallow price hikes.
As Governor Ueda has said, we have time to scrutiniae economic developments, before contemplating rate hike.
Current financial environment is sufficiently easy.
One-sided, sharp Yen fall seen in July has subsided.
Upside inflation risk from weak Yen has subsided.
Outlook of trend inflation, wages key to BoJ’s future policy decisions.
Very important that momentum seen in this year's wage negotiation is sustained next year.
Believe it's safe to expect the US economy to make soft landing, fed to gradually lower rates.
BoJ’s 2% inflation target is a framework agreed upon between BoJ, govt.
We will respect that framework in guiding monetary policy, and communicate closely with govt.
We must acknowledge politicians' remarks on monetary policy as likely reflecting public's view.
See need to improve BoJ’s communication to avoid repeat of confusion that happened in July.
One idea would be to set opportunities for board members to express their views more frequently in public.
Market reaction
The Japanese Yen is recovering further ground on the BoJ official’s latest comments, which eases rate hike concerns. USD/JPY was last seen trading at 146.55, still up 0.07% on the day.
“The Bank of England (BoE) could become a bit more activist on rate cuts if there’s further good news on inflation,” Governor Andrew Bailey said in an interview with the Guardian newspaper published on Thursday.
Additional quotes
Watching Middle East developments extremely closely.
Watching how geopolitics might interact with some still quite stretched markets in places.
Market reaction
The Pound Sterling has come under intense selling pressure following these comments, currently trading 0.71% lower at 1.3175.
BoE FAQs
The Bank of England (BoE) decides monetary policy for the United Kingdom. Its primary goal is to achieve ‘price stability’, or a steady inflation rate of 2%. Its tool for achieving this is via the adjustment of base lending rates. The BoE sets the rate at which it lends to commercial banks and banks lend to each other, determining the level of interest rates in the economy overall. This also impacts the value of the Pound Sterling (GBP).
When inflation is above the Bank of England’s target it responds by raising interest rates, making it more expensive for people and businesses to access credit. This is positive for the Pound Sterling because higher interest rates make the UK a more attractive place for global investors to park their money. When inflation falls below target, it is a sign economic growth is slowing, and the BoE will consider lowering interest rates to cheapen credit in the hope businesses will borrow to invest in growth-generating projects – a negative for the Pound Sterling.
In extreme situations, the Bank of England can enact a policy called Quantitative Easing (QE). QE is the process by which the BoE substantially increases the flow of credit in a stuck financial system. QE is a last resort policy when lowering interest rates will not achieve the necessary result. The process of QE involves the BoE printing money to buy assets – usually government or AAA-rated corporate bonds – from banks and other financial institutions. QE usually results in a weaker Pound Sterling.
Quantitative tightening (QT) is the reverse of QE, enacted when the economy is strengthening and inflation starts rising. Whilst in QE the Bank of England (BoE) purchases government and corporate bonds from financial institutions to encourage them to lend; in QT, the BoE stops buying more bonds, and stops reinvesting the principal maturing on the bonds it already holds. It is usually positive for the Pound Sterling.
- EUR/JPY holds positive ground near 161.85 in Thursday’s early Asian session.
- Japan’s PM Ishiba’s dovish turn exerts some selling pressure on the Japanese Yen.
- Investors expect the ECB to cut the rates in the October meeting.
The EUR/JPY cross gains traction to around 161.85 during the early European session on Thursday. The Japanese Yen (JPY) weakens as Japan’s Prime Minister Shigeru Ishiba said that the country is not ready for a rate hike.
Prime Minister Shigeru Ishiba said after a meeting with Bank of Japan (BoJ) Governor Kazuo Ueda on Wednesday that Japan is not in an environment for a further rate increase. Traders reduce their bets on a near-term interest rate hike following Ishiba's remarks.
Meanwhile, Ueda stated that the Japanese central bank would move cautiously about the monetary policy in the future. BOJ board member Asahi Noguchi said on Thursday that the central bank should continue its accommodative monetary policy for the time being, adding that it would take time to shift the perception that prices will not rise significantly in the future. Traders are now pricing in less than 50% odds that the BoJ would hike by 10 basis points (bps) before the year-end, according to LSEG data.
The rising speculation that the European Central Bank (ECB) will cut interest rates in October might undermine the Euro (EUR) and cap the upside of the cross. Earlier this week, the Eurozone inflation fell to 1.8% YoY in September, below the central bank's 2% target. ECB policymaker Martins Kazaks said on Wednesday that the central bank has a "clear-cut" argument for rate reduction at its next meeting as the Eurozone's economy might reach a tipping point.
Japanese Yen FAQs
The Japanese Yen (JPY) is one of the world’s most traded currencies. Its value is broadly determined by the performance of the Japanese economy, but more specifically by the Bank of Japan’s policy, the differential between Japanese and US bond yields, or risk sentiment among traders, among other factors.
One of the Bank of Japan’s mandates is currency control, so its moves are key for the Yen. The BoJ has directly intervened in currency markets sometimes, generally to lower the value of the Yen, although it refrains from doing it often due to political concerns of its main trading partners. The BoJ ultra-loose monetary policy between 2013 and 2024 caused the Yen to depreciate against its main currency peers due to an increasing policy divergence between the Bank of Japan and other main central banks. More recently, the gradually unwinding of this ultra-loose policy has given some support to the Yen.
Over the last decade, the BoJ’s stance of sticking to ultra-loose monetary policy has led to a widening policy divergence with other central banks, particularly with the US Federal Reserve. This supported a widening of the differential between the 10-year US and Japanese bonds, which favored the US Dollar against the Japanese Yen. The BoJ decision in 2024 to gradually abandon the ultra-loose policy, coupled with interest-rate cuts in other major central banks, is narrowing this differential.
The Japanese Yen is often seen as a safe-haven investment. This means that in times of market stress, investors are more likely to put their money in the Japanese currency due to its supposed reliability and stability. Turbulent times are likely to strengthen the Yen’s value against other currencies seen as more risky to invest in.
- GBP/USD depreciates due to risk aversion amid rising geopolitical tensions in the Middle East.
- The US Dollar receives support as Treasury yields continue to gain ground.
- The BoE advocates a cautious approach to reducing rates, considering the persistently high inflation in the services sector.
GBP/USD extends its losing streak for the third consecutive day, trading around 1.3200 during the Asian session on Thursday. The risk-sensitive GBP/USD pair receives downward pressure due to the safe-haven flows amid escalating Middle-East tensions.
The Israeli Broadcasting Authority (IBA) reported that Israel's security cabinet has decided to issue a strong response to the recent Iranian attack. On Tuesday night, Iran launched over 200 ballistic missiles and drone strikes on Israel.
The improved US Treasury yields are supporting the US Dollar and undermining the GBP/USD pair. The US Dollar Index (DXY), which measures the value of the US Dollar (USD) against its six major peers, continues to gain ground for the fourth successive session. The DXY trades around 101.80 with 2-year and 10-year yields on US bonds standing at 3.65% and 3.79%, respectively, at the time of writing.
On the data front, the ADP US Employment Change reported an increase of 143,000 jobs in September, exceeding the anticipated 120,000 jobs. Furthermore, annual pay increased by 4.7% year-over-year. The total number of jobs added in August was revised upward from 99,000 to 103,000.
The Bank of England (BoE) has been advocating a cautious approach to reducing interest rates, considering the still-high inflation in the services sector and relatively robust economic growth. In its quarterly statement released on Wednesday, the BoE's Financial Policy Committee (FPC) noted that “risks to UK financial stability are broadly unchanged since June.”
BoE policymaker Megan Greene warned that a consumption-driven recovery in the United Kingdom (UK) could trigger a new wave of inflation. However, Greene noted that further interest rate cuts are likely, as prices are "moving in the right direction."
Pound Sterling FAQs
The Pound Sterling (GBP) is the oldest currency in the world (886 AD) and the official currency of the United Kingdom. It is the fourth most traded unit for foreign exchange (FX) in the world, accounting for 12% of all transactions, averaging $630 billion a day, according to 2022 data. Its key trading pairs are GBP/USD, also known as ‘Cable’, which accounts for 11% of FX, GBP/JPY, or the ‘Dragon’ as it is known by traders (3%), and EUR/GBP (2%). The Pound Sterling is issued by the Bank of England (BoE).
The single most important factor influencing the value of the Pound Sterling is monetary policy decided by the Bank of England. The BoE bases its decisions on whether it has achieved its primary goal of “price stability” – a steady inflation rate of around 2%. Its primary tool for achieving this is the adjustment of interest rates. When inflation is too high, the BoE will try to rein it in by raising interest rates, making it more expensive for people and businesses to access credit. This is generally positive for GBP, as higher interest rates make the UK a more attractive place for global investors to park their money. When inflation falls too low it is a sign economic growth is slowing. In this scenario, the BoE will consider lowering interest rates to cheapen credit so businesses will borrow more to invest in growth-generating projects.
Data releases gauge the health of the economy and can impact the value of the Pound Sterling. Indicators such as GDP, Manufacturing and Services PMIs, and employment can all influence the direction of the GBP. A strong economy is good for Sterling. Not only does it attract more foreign investment but it may encourage the BoE to put up interest rates, which will directly strengthen GBP. Otherwise, if economic data is weak, the Pound Sterling is likely to fall.
Another significant data release for the Pound Sterling is the Trade Balance. This indicator measures the difference between what a country earns from its exports and what it spends on imports over a given period. If a country produces highly sought-after exports, its currency will benefit purely from the extra demand created from foreign buyers seeking to purchase these goods. Therefore, a positive net Trade Balance strengthens a currency and vice versa for a negative balance.
- EUR/USD continues to lose ground for the fifth straight day amid sustained USD buying interest.
- Diminishing odds for an aggressive Fed policy easing and geopolitical risks underpin the buck.
- Bets that the ECB will cut rates in October weigh on the Euro and exert pressure on the major.
The EUR/USD pair attracts sellers for the fifth successive day and touches a fresh three-week low, around the 1.1030 area during the Asian session on Thursday. Bearish traders now look to extend the downward momentum further below the 50-day Simple Moving Average (SMA) amid broad-based US Dollar (USD) strength.
Against the backdrop of the upbeat US JOLTS Job Openings survey, the better-than-expected ADP report on Wednesday pointed to a still resilient labor market. This, along with the Federal Reserve (Fed) Chair Jerome Powell's hawkish tone earlier this week, forced investors to scale back their bets for another oversized rate cut at the November FOMC meeting. Apart from this, the risk of a full-blown war in the Middle East assists the safe-haven Greenback to build on this week's goodish recovery from its lowest level since July 2023 and climb to a three-week top on Thursday. This, in turn, is seen as a key factor that continues to exert downward pressure on the EUR/USD pair.
The shared currency is further undermined by increased bets that the European Central Bank (ECB) will cut interest rates in October after data released earlier this week showed that the Eurozone inflation fell to 1.8% in September, below the 2% target. ECB Governing Council member Martins Kazaks noted that risks to the economy have become more pronounced and the need for cautious monetary policy adjustments. This contributes to the offered tone surrounding the EUR/USD pair and supports prospects for an extension of this week’s sharp pullback from a 19-month peak.
Even from a technical perspective, acceptance below the 50-day SMA for the first time since early August could be seen as a fresh trigger for bearish traders and validate the negative outlook. Market participants now look forward to Thursday's economic docket – featuring the final PMI prints from the Eurozone and the US, followed by the usual US Weekly Initial Jobless Claims and the US ISM Services PMI. This, along with speeches by influential FOMC members, will drive the USD demand and allow traders to grab short-term opportunities around the EUR/USD pair.
Euro FAQs
The Euro is the currency for the 19 European Union countries that belong to the Eurozone. It is the second most heavily traded currency in the world behind the US Dollar. In 2022, it accounted for 31% of all foreign exchange transactions, with an average daily turnover of over $2.2 trillion a day. EUR/USD is the most heavily traded currency pair in the world, accounting for an estimated 30% off all transactions, followed by EUR/JPY (4%), EUR/GBP (3%) and EUR/AUD (2%).
The European Central Bank (ECB) in Frankfurt, Germany, is the reserve bank for the Eurozone. The ECB sets interest rates and manages monetary policy. The ECB’s primary mandate is to maintain price stability, which means either controlling inflation or stimulating growth. Its primary tool is the raising or lowering of interest rates. Relatively high interest rates – or the expectation of higher rates – will usually benefit the Euro and vice versa. The ECB Governing Council makes monetary policy decisions at meetings held eight times a year. Decisions are made by heads of the Eurozone national banks and six permanent members, including the President of the ECB, Christine Lagarde.
Eurozone inflation data, measured by the Harmonized Index of Consumer Prices (HICP), is an important econometric for the Euro. If inflation rises more than expected, especially if above the ECB’s 2% target, it obliges the ECB to raise interest rates to bring it back under control. Relatively high interest rates compared to its counterparts will usually benefit the Euro, as it makes the region more attractive as a place for global investors to park their money.
Data releases gauge the health of the economy and can impact on the Euro. Indicators such as GDP, Manufacturing and Services PMIs, employment, and consumer sentiment surveys can all influence the direction of the single currency. A strong economy is good for the Euro. Not only does it attract more foreign investment but it may encourage the ECB to put up interest rates, which will directly strengthen the Euro. Otherwise, if economic data is weak, the Euro is likely to fall. Economic data for the four largest economies in the euro area (Germany, France, Italy and Spain) are especially significant, as they account for 75% of the Eurozone’s economy.
Another significant data release for the Euro is the Trade Balance. This indicator measures the difference between what a country earns from its exports and what it spends on imports over a given period. If a country produces highly sought after exports then its currency will gain in value purely from the extra demand created from foreign buyers seeking to purchase these goods. Therefore, a positive net Trade Balance strengthens a currency and vice versa for a negative balance.
Gold prices fell in India on Thursday, according to data compiled by FXStreet.
The price for Gold stood at 7,167.26 Indian Rupees (INR) per gram, down compared with the INR 7,174.57 it cost on Wednesday.
The price for Gold decreased to INR 83,601.93 per tola from INR 83,682.82 per tola a day earlier.
| Unit measure | Gold Price in INR |
|---|---|
| 1 Gram | 7,167.26 |
| 10 Grams | 71,676.38 |
| Tola | 83,601.93 |
| Troy Ounce | 222,925.20 |
FXStreet calculates Gold prices in India by adapting international prices (USD/INR) to the local currency and measurement units. Prices are updated daily based on the market rates taken at the time of publication. Prices are just for reference and local rates could diverge slightly.
Gold FAQs
Gold has played a key role in human’s history as it has been widely used as a store of value and medium of exchange. Currently, apart from its shine and usage for jewelry, the precious metal is widely seen as a safe-haven asset, meaning that it is considered a good investment during turbulent times. Gold is also widely seen as a hedge against inflation and against depreciating currencies as it doesn’t rely on any specific issuer or government.
Central banks are the biggest Gold holders. In their aim to support their currencies in turbulent times, central banks tend to diversify their reserves and buy Gold to improve the perceived strength of the economy and the currency. High Gold reserves can be a source of trust for a country’s solvency. Central banks added 1,136 tonnes of Gold worth around $70 billion to their reserves in 2022, according to data from the World Gold Council. This is the highest yearly purchase since records began. Central banks from emerging economies such as China, India and Turkey are quickly increasing their Gold reserves.
Gold has an inverse correlation with the US Dollar and US Treasuries, which are both major reserve and safe-haven assets. When the Dollar depreciates, Gold tends to rise, enabling investors and central banks to diversify their assets in turbulent times. Gold is also inversely correlated with risk assets. A rally in the stock market tends to weaken Gold price, while sell-offs in riskier markets tend to favor the precious metal.
The price can move due to a wide range of factors. Geopolitical instability or fears of a deep recession can quickly make Gold price escalate due to its safe-haven status. As a yield-less asset, Gold tends to rise with lower interest rates, while higher cost of money usually weighs down on the yellow metal. Still, most moves depend on how the US Dollar (USD) behaves as the asset is priced in dollars (XAU/USD). A strong Dollar tends to keep the price of Gold controlled, whereas a weaker Dollar is likely to push Gold prices up.
(An automation tool was used in creating this post.)
- Silver price loses ground as recent solid US labor data could increase the odds for another Fed’s bumper rate cut.
- Richmond Fed President Barkin warned that the fight against inflation may not be over as risks persist.
- The safe-haven Silver could regain its ground following the rising geopolitical tensions in the Middle East.
Silver price (XAG/USD) retraces its gains recorded in the last two sessions, trading around $31.60 per troy ounce during the Asian hours on Thursday. This downside of the Silver price could be attributed to recent strong US labor data, which could increase the odds of the Federal Reserve (Fed) delivering another bumper rate cut in November. Lower interest rates reduce the opportunity cost of holding non-yielding assets like Silver, making it more appealing to investors.
The ADP US Employment Change reported an increase of 143,000 jobs in September, exceeding the anticipated 120,000 jobs. Furthermore, annual pay increased by 4.7% year-over-year. The total number of jobs added in August was revised upward from 99,000 to 103,000. This report indicates that the labor market is in better condition than previously perceived at the start of the third quarter.
Federal Reserve Bank of Richmond President Tom Barkin addressed the Fed's recent rate actions on Wednesday, warning that the fight against inflation may not be over, as risks persist. Barkin noted that the 50 basis point rate cut in September was justified because rates had become "out of sync" with the decline in inflation, while the unemployment rate was near its sustainable level.
However, the downside of safe-haven assets like Silver could be limited following the rising geopolitical tensions in the Middle East. The Israeli Broadcasting Authority (IBA) reported that Israel's security cabinet has decided to issue a strong response to the recent Iranian attack. On Tuesday night, Iran launched over 200 ballistic missiles and drone strikes on Israel.
Silver FAQs
Silver is a precious metal highly traded among investors. It has been historically used as a store of value and a medium of exchange. Although less popular than Gold, traders may turn to Silver to diversify their investment portfolio, for its intrinsic value or as a potential hedge during high-inflation periods. Investors can buy physical Silver, in coins or in bars, or trade it through vehicles such as Exchange Traded Funds, which track its price on international markets.
Silver prices can move due to a wide range of factors. Geopolitical instability or fears of a deep recession can make Silver price escalate due to its safe-haven status, although to a lesser extent than Gold's. As a yieldless asset, Silver tends to rise with lower interest rates. Its moves also depend on how the US Dollar (USD) behaves as the asset is priced in dollars (XAG/USD). A strong Dollar tends to keep the price of Silver at bay, whereas a weaker Dollar is likely to propel prices up. Other factors such as investment demand, mining supply – Silver is much more abundant than Gold – and recycling rates can also affect prices.
Silver is widely used in industry, particularly in sectors such as electronics or solar energy, as it has one of the highest electric conductivity of all metals – more than Copper and Gold. A surge in demand can increase prices, while a decline tends to lower them. Dynamics in the US, Chinese and Indian economies can also contribute to price swings: for the US and particularly China, their big industrial sectors use Silver in various processes; in India, consumers’ demand for the precious metal for jewellery also plays a key role in setting prices.
Silver prices tend to follow Gold's moves. When Gold prices rise, Silver typically follows suit, as their status as safe-haven assets is similar. The Gold/Silver ratio, which shows the number of ounces of Silver needed to equal the value of one ounce of Gold, may help to determine the relative valuation between both metals. Some investors may consider a high ratio as an indicator that Silver is undervalued, or Gold is overvalued. On the contrary, a low ratio might suggest that Gold is undervalued relative to Silver.
- NZD/USD drifts lower for the third straight day amid a further USD recovery from the YTD low.
- Reduced bets for a 50 bps Fed rate cut in November and geopolitical risks boost the Greenback.
- Expectations that the RBNZ will start cutting rates next week favor bears ahead of the US data.
The NZD/USD pair prolongs this week's retracement slide from the 0.6375-0.6380 region, or its highest level since July 2023 and remains under some selling pressure for the third successive day on Thursday. The downward trajectory drags spot prices below mid-0.6200s, or a one-and-half-week low during the Asian session and is sponsored by some follow-through US Dollar (USD) buying.
In fact, the USD Index (DXY), which tracks the Greenback against a basket of currencies, prolongs this week's recovery from its lowest level since July 2023 for the third successive day and climbs to a three-week top. The incoming US data pointed to a still resilient labor market and forced investors to scale back their expectations for a more aggressive policy easing by the Federal Reserve (Fed). This, along with persistent geopolitical risks stemming from the ongoing conflicts in the Middle East, benefits the safe-haven buck and contributes to driving flows away from the risk-sensitive Kiwi.
Iran launched over 200 ballistic missiles at Israel on Tuesday, while the latter conducted a precise air strike and bombed central Beirut in Lebanon during the early hours of Thursday. This raises the risk of a full-blown war in the region and tempers investors' appetite for perceived riskier currencies, including the New Zealand Dollar (NZD). Apart from this, expectations that the Reserve Bank of New Zealand (RBNZ) will start cutting interest rates next week suggest that the path of least resistance for the NZD/USD pair is to the downside and supports prospects for a further downfall.
Market participants now look to the US economic docket – featuring the release of the usual Weekly Initial Jobless Claims and the ISM Services PMI. This, along with speeches by influential FOMC members and the broader risk sentiment, will drive the USD demand and provide a fresh impetus to the NZD/USD pair later during the North American session. The focus, however, remains glued to the closely-watched US monthly employment details, popularly known as the Nonfarm Payrolls (NFP) report on Friday, which should help in determining the next leg of a directional move.
New Zealand Dollar FAQs
The New Zealand Dollar (NZD), also known as the Kiwi, is a well-known traded currency among investors. Its value is broadly determined by the health of the New Zealand economy and the country’s central bank policy. Still, there are some unique particularities that also can make NZD move. The performance of the Chinese economy tends to move the Kiwi because China is New Zealand’s biggest trading partner. Bad news for the Chinese economy likely means less New Zealand exports to the country, hitting the economy and thus its currency. Another factor moving NZD is dairy prices as the dairy industry is New Zealand’s main export. High dairy prices boost export income, contributing positively to the economy and thus to the NZD.
The Reserve Bank of New Zealand (RBNZ) aims to achieve and maintain an inflation rate between 1% and 3% over the medium term, with a focus to keep it near the 2% mid-point. To this end, the bank sets an appropriate level of interest rates. When inflation is too high, the RBNZ will increase interest rates to cool the economy, but the move will also make bond yields higher, increasing investors’ appeal to invest in the country and thus boosting NZD. On the contrary, lower interest rates tend to weaken NZD. The so-called rate differential, or how rates in New Zealand are or are expected to be compared to the ones set by the US Federal Reserve, can also play a key role in moving the NZD/USD pair.
Macroeconomic data releases in New Zealand are key to assess the state of the economy and can impact the New Zealand Dollar’s (NZD) valuation. A strong economy, based on high economic growth, low unemployment and high confidence is good for NZD. High economic growth attracts foreign investment and may encourage the Reserve Bank of New Zealand to increase interest rates, if this economic strength comes together with elevated inflation. Conversely, if economic data is weak, NZD is likely to depreciate.
The New Zealand Dollar (NZD) tends to strengthen during risk-on periods, or when investors perceive that broader market risks are low and are optimistic about growth. This tends to lead to a more favorable outlook for commodities and so-called ‘commodity currencies’ such as the Kiwi. Conversely, NZD tends to weaken at times of market turbulence or economic uncertainty as investors tend to sell higher-risk assets and flee to the more-stable safe havens.
- The Japanese Yen declined as PM Ishiba expressed that the current environment doesn’t require further interest rate increases.
- Japan’s Hayashi clarified that Prime Minister Ishiba did not request any specifics regarding monetary policy from BoJ Governor Ueda.
- Futures suggest less than a 50% chance of the BoJ implementing a 10 basis point rate hike by December.
The Japanese Yen (JPY) continues to decline on Thursday following straightforward comments on monetary policy from new Prime Minister (PM) Shigeru Ishiba, who met with Bank of Japan (BoJ) Governor Kazuo Ueda on Wednesday.
Japan’s Prime Minister Ishiba stated, "I do not believe that we are in an environment that would require us to raise interest rates further," according to Reuters. In the previous session, the Japanese Yen fell nearly 2% against the US Dollar (USD), marking its largest drop since February of last year.
Japan’s Chief Cabinet Secretary Yoshimasa Hayashi clarified on Thursday that “Prime Minister Ishiba did not ask BoJ Governor Ueda for any specifics regarding monetary policy during their meeting on Wednesday.” On Wednesday, Japan's Economic Revitalization Minister Ryosei Akazawa stated that PM Ishiba expects the Bank of Japan to conduct thorough economic assessments before considering another interest rate hike.
Futures indicate that there is less than a 50% chance the Bank of Japan will raise rates by 10 basis points by December. Additionally, rates are projected to reach only 0.5% by the end of next year, up from the current 0.25%, per Reuters.
Daily Digest Market Movers: Japanese Yen depreciates due to dovish sentiment surrounding the BoJ
- The US Dollar receives support from the safe-haven flows amid rising geopolitical tensions in the Middle East. The Israeli Broadcasting Authority (IBA) reported that Israel's security cabinet has decided to issue a strong response to the recent Iranian attack. On Tuesday night, Iran launched over 200 ballistic missiles and drone strikes on Israel.
- The CME FedWatch Tool indicates that markets are assigning a 65.4% probability to a 25 basis point rate cut by the Federal Reserve in November, while the likelihood of a 50-basis-point cut is 34.6%, down from 57.4% a week ago.
- Bank of Japan board member Asahi Noguchi stated that the central bank "must patiently maintain loose monetary conditions." Noguchi indicated that the BoJ will likely make gradual adjustments to the level of monetary support while carefully assessing whether inflation sustainably reaches the 2% target, supported by wage growth.
- Federal Reserve Bank of Richmond President Tom Barkin addressed the Fed's recent rate actions on Wednesday, warning that the fight against inflation may not be over, as risks persist. Barkin noted that the 50 basis point rate cut in September was justified because rates had become "out of sync" with the decline in inflation, while the unemployment rate was near its sustainable level.
- The ADP US Employment Change report showed an increase of 143,000 jobs in September, surpassing the forecasted 120,000 jobs. Additionally, annual pay rose by 4.7% year-over-year. The total number of jobs added in August was revised upward from 99,000 to 103,000.
- US ISM Manufacturing PMI came at 47.2 for September, matching the reading with August's print but came in below the market expectation of 47.5, data showed on Tuesday.
- On Tuesday, BoJ’s Summary of Opinions from September’s Monetary Policy Meeting indicates no immediate plans for additional rate hikes. The central bank intends to maintain its accommodative stance but remains open to adjustments if economic conditions show significant improvement.
- Federal Reserve (Fed) Chairman Jerome Powell said on Monday the central bank is not in a hurry and will lower its benchmark rate ‘over time.’ Fed Chair Powell added that the recent 50 basis point interest rate cut should not be seen as an indication of similarly aggressive future actions, noting that upcoming rate changes are likely to be more modest.
Technical Analysis: USD/JPY tests 147.00, the upper boundary of the ascending channel
USD/JPY trades around 146.80 on Thursday. Analysis of the daily chart indicates that the pair tests to breach above the ascending channel pattern, suggesting a strengthening bullish bias. The 14-day Relative Strength Index (RSI) also moves above the 50 level, confirming the bullish trend's continuation.
The USD/JPY pair encountered resistance near the upper boundary of the ascending channel near the five-week high of 147.21, last reached on September 3. A break above this level could support the pair to test its seven-week high at 149.40.
On the downside, the USD/JPY pair could find support at the nine-day Exponential Moving Average (EMA) around 144.60, followed by the lower boundary of the ascending channel at 143.20. A break below this level could push the USD/JPY pair toward the 139.58 level, marking the lowest since June 2023.
USD/JPY: Daily Chart
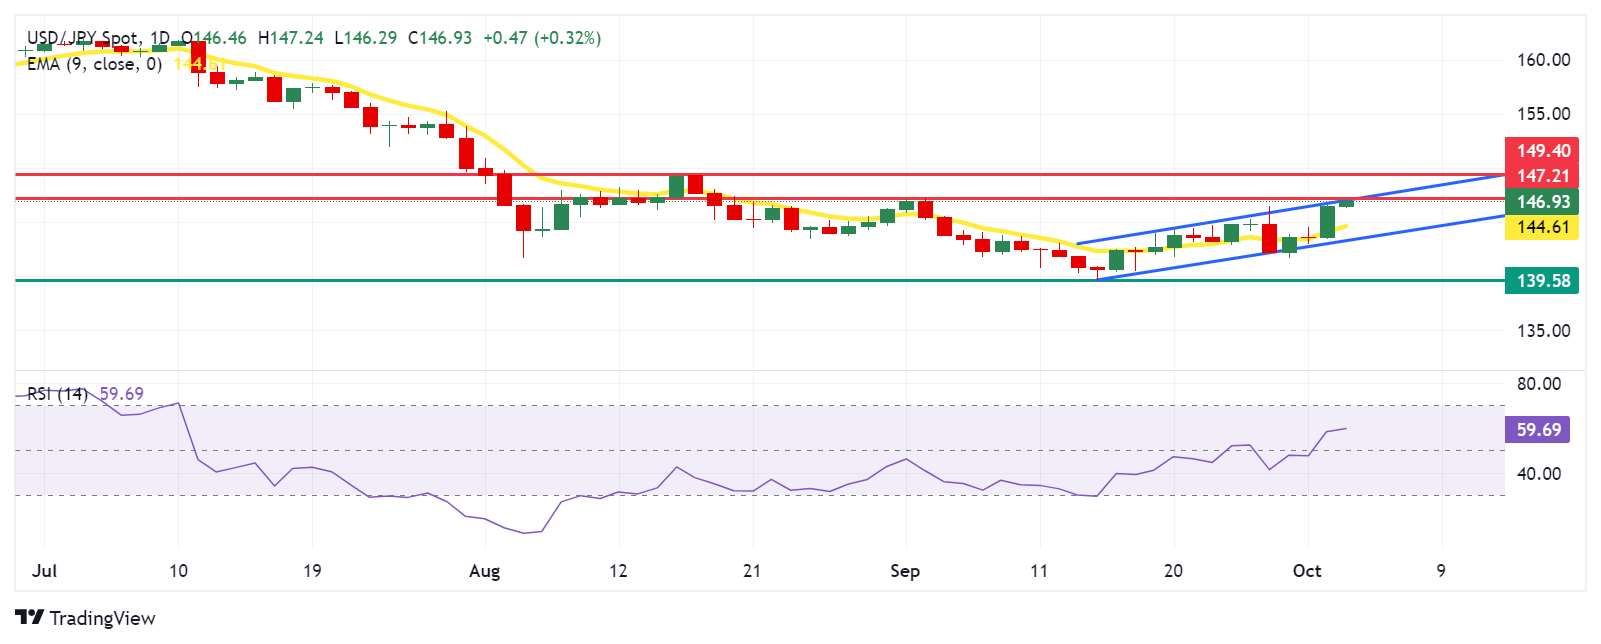
Japanese Yen PRICE Today
The table below shows the percentage change of Japanese Yen (JPY) against listed major currencies today. Japanese Yen was the weakest against the US Dollar.
| USD | EUR | GBP | JPY | CAD | AUD | NZD | CHF | |
|---|---|---|---|---|---|---|---|---|
| USD | 0.11% | 0.15% | 0.26% | 0.15% | 0.33% | 0.38% | 0.07% | |
| EUR | -0.11% | 0.05% | 0.16% | 0.02% | 0.22% | 0.25% | -0.04% | |
| GBP | -0.15% | -0.05% | 0.12% | -0.02% | 0.18% | 0.21% | -0.06% | |
| JPY | -0.26% | -0.16% | -0.12% | -0.11% | 0.07% | 0.07% | -0.19% | |
| CAD | -0.15% | -0.02% | 0.02% | 0.11% | 0.18% | 0.23% | -0.07% | |
| AUD | -0.33% | -0.22% | -0.18% | -0.07% | -0.18% | 0.04% | -0.24% | |
| NZD | -0.38% | -0.25% | -0.21% | -0.07% | -0.23% | -0.04% | -0.28% | |
| CHF | -0.07% | 0.04% | 0.06% | 0.19% | 0.07% | 0.24% | 0.28% |
The heat map shows percentage changes of major currencies against each other. The base currency is picked from the left column, while the quote currency is picked from the top row. For example, if you pick the Japanese Yen from the left column and move along the horizontal line to the US Dollar, the percentage change displayed in the box will represent JPY (base)/USD (quote).
Japanese Yen FAQs
The Japanese Yen (JPY) is one of the world’s most traded currencies. Its value is broadly determined by the performance of the Japanese economy, but more specifically by the Bank of Japan’s policy, the differential between Japanese and US bond yields, or risk sentiment among traders, among other factors.
One of the Bank of Japan’s mandates is currency control, so its moves are key for the Yen. The BoJ has directly intervened in currency markets sometimes, generally to lower the value of the Yen, although it refrains from doing it often due to political concerns of its main trading partners. The BoJ ultra-loose monetary policy between 2013 and 2024 caused the Yen to depreciate against its main currency peers due to an increasing policy divergence between the Bank of Japan and other main central banks. More recently, the gradually unwinding of this ultra-loose policy has given some support to the Yen.
Over the last decade, the BoJ’s stance of sticking to ultra-loose monetary policy has led to a widening policy divergence with other central banks, particularly with the US Federal Reserve. This supported a widening of the differential between the 10-year US and Japanese bonds, which favored the US Dollar against the Japanese Yen. The BoJ decision in 2024 to gradually abandon the ultra-loose policy, coupled with interest-rate cuts in other major central banks, is narrowing this differential.
The Japanese Yen is often seen as a safe-haven investment. This means that in times of market stress, investors are more likely to put their money in the Japanese currency due to its supposed reliability and stability. Turbulent times are likely to strengthen the Yen’s value against other currencies seen as more risky to invest in.
- Indian Rupee edges lower in Thursday’s Asian session.
- The risk-off sentiment and higher crude oil prices drag the INR lower.
- Investors await the US September ISM Services PMI on Thursday ahead of employment data.
The Indian Rupee (INR) softens on the day, pressured by the renewed US Dollar (USD) demand. The risk-off mood amid the escalating geopolitical tensions in the Middle East boosts the safe-haven flows, benefiting the Greenback. Additionally, the rise in crude oil prices exerts some selling pressure on the INR as India is the third-largest oil consumer after the United States (US) and China.
Looking ahead, investors will keep an eye on the US September ISM Services Purchasing Managers Index (PMI), the weekly Initial Jobless Claims and the final S&P Global Services PMI, which are due later on Thursday. The attention will shift to the US September employment data on Friday, including Nonfarm Payrolls (NFP), Unemployment Rate and the Average Hourly Earnings. If the jobs report showed a weaker-than-expected outcome, this could prompt the central bank to consider cutting rates deeper, which might exert some selling pressure on the USD.
Daily Digest Market Movers: Indian Rupee remains vulnerable amid multiple headwinds
- The HSBC final India Manufacturing PMI eased to an eight-month low of 56.5 in September. This figure was below the market consensus of 56.7 and the previous reading of 57.5.
- "Momentum in India's manufacturing sector softened in September from the very strong growth in the summer months," said Pranjul Bhandari, chief India economist at HSBC.
- According to the Reserve Bank of India’s (RBI) real effective exchange rate (REER) index, the Indian Rupee stood at 5.5% above its fair value in August, down from 7.7% in the previous month.
- The US ADP Employment Change data for September exceeded expectations, with 143,000 new jobs added. This figure was above the median forecast of 120,000 and the previous reading of 103,000 (revised from 99,000).
- Richmond Fed President Thomas Barkin said on Wednesday that the Fed's fight to return inflation to its 2% target may take longer than expected to complete and limit how far interest rates can be cut, per Reuters.
Technical Analysis: USD/INR maintains its constructive bias
The Indian Rupee softens on the day. According to the daily timeframe, the positive view of the USD/INR pair prevails as the price holds above the key 100-day Exponential Moving Average (EMA). Furthermore, the 14-day Relative Strength Index (RSI) crosses above the midline near 60.30, suggesting that the uptrend is more likely to resume than to reverse.
The crucial resistance level for the pair emerges at the 84.00 psychological mark. Sustained bullish momentum above this level could pave the way to 84.15, the high of August 5. The next upside barrier is seen at 84.50.
On the flip side, the initial support level for USD/INR is seen at 83.80, the low of October 1. A break lower could drag the pair further south to the 100-day EMA at 83.64, followed by 83.00, representing the round mark and the low of May 24.
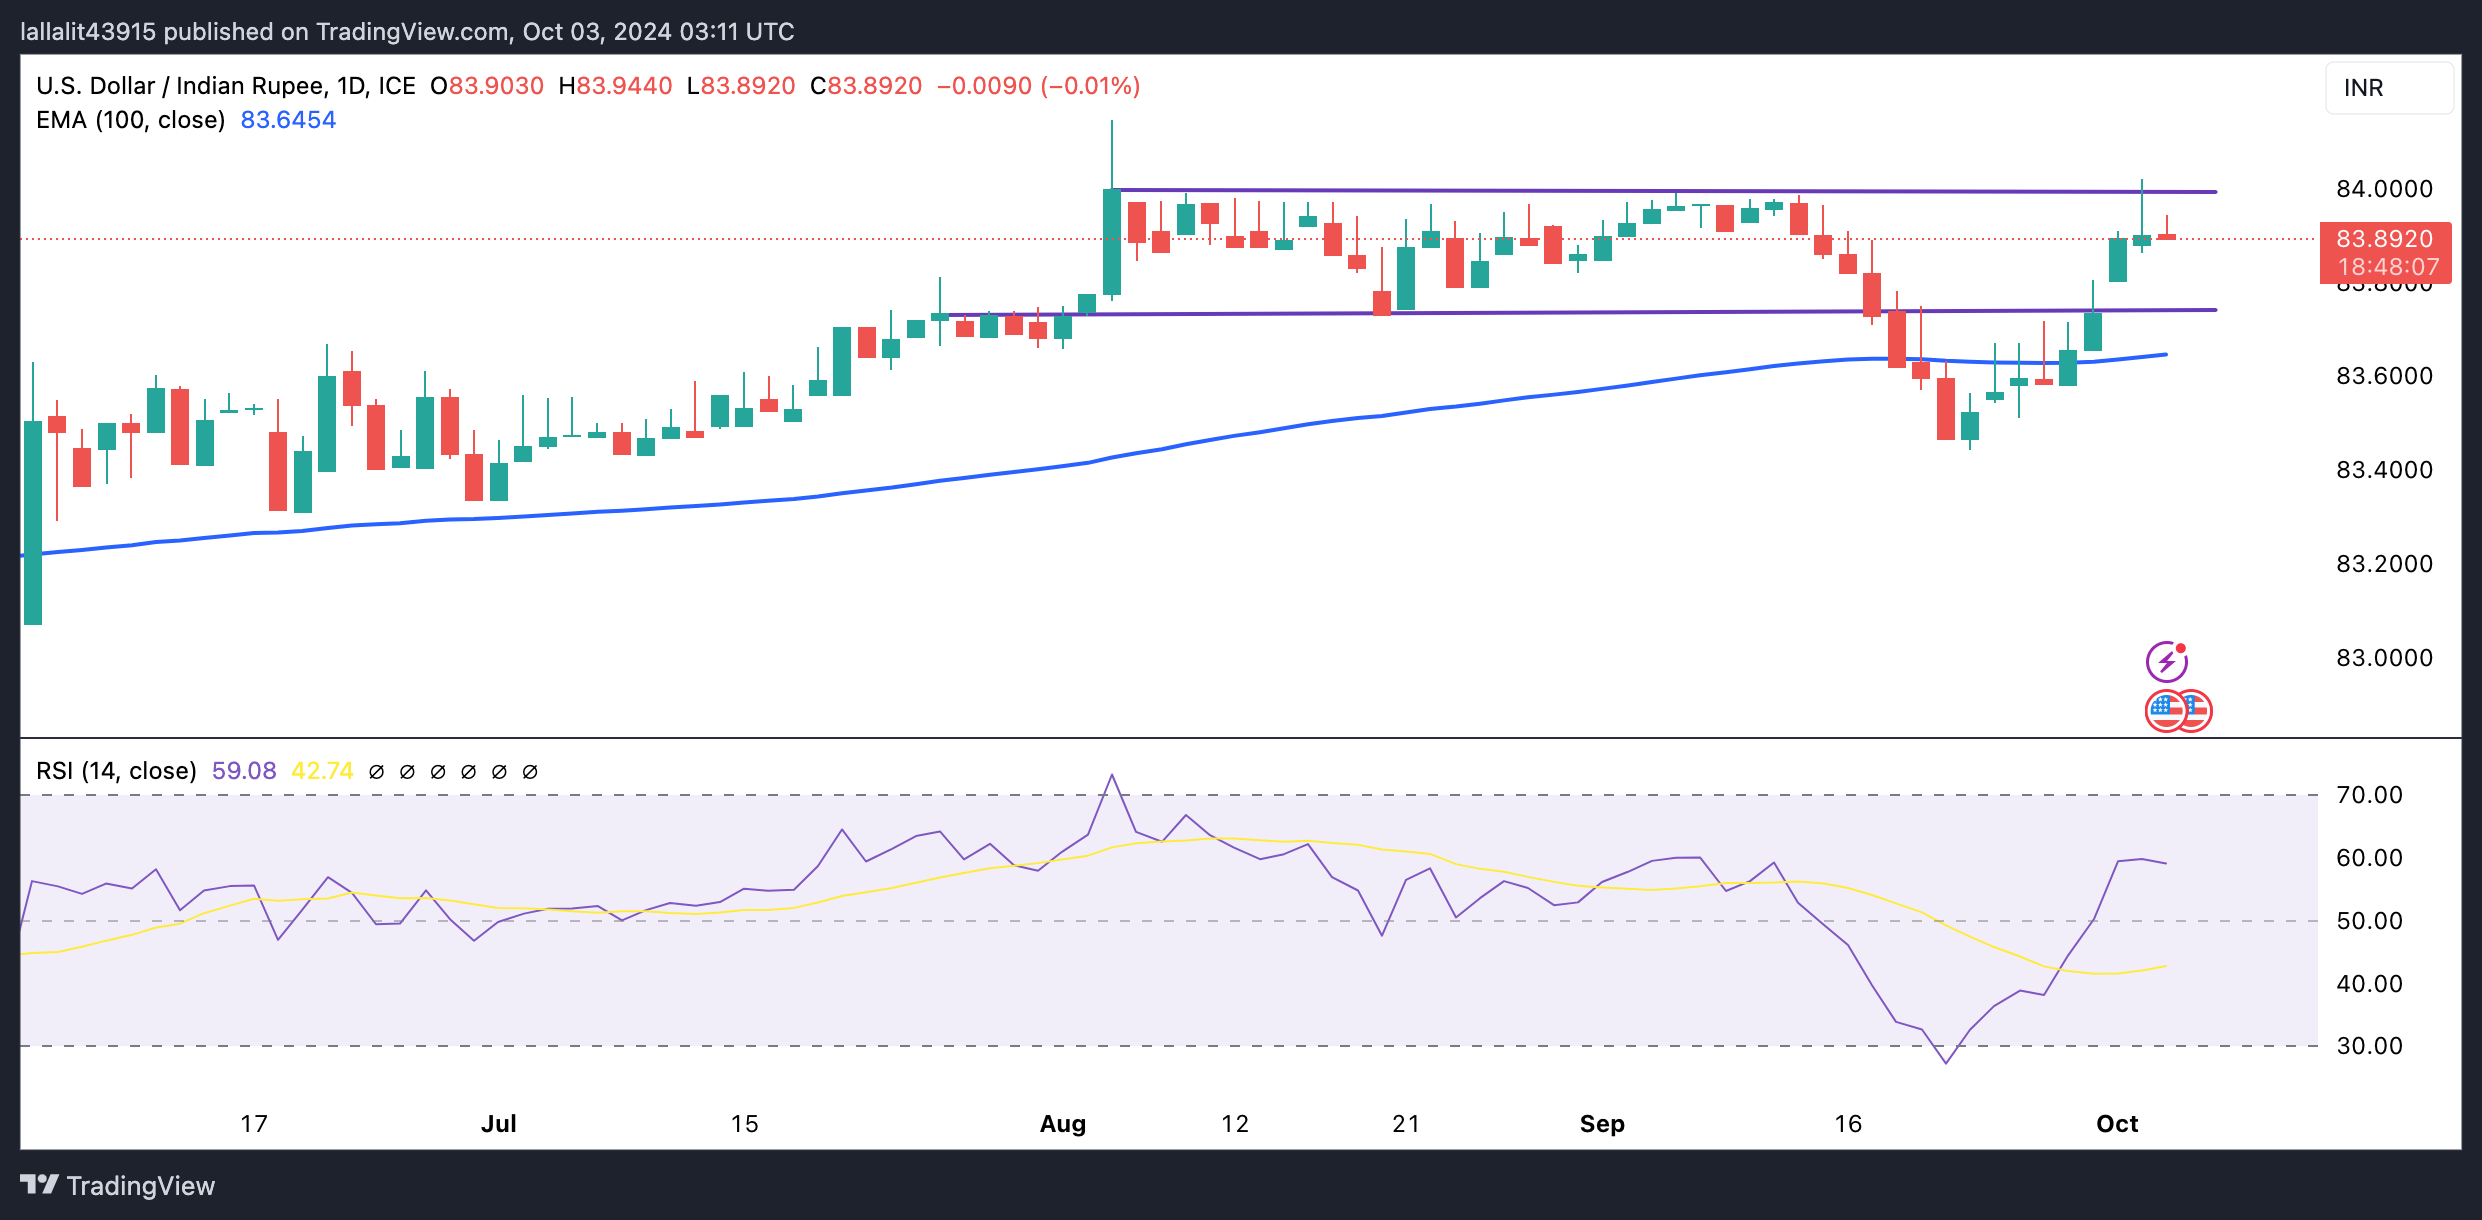
Indian Rupee FAQs
The Indian Rupee (INR) is one of the most sensitive currencies to external factors. The price of Crude Oil (the country is highly dependent on imported Oil), the value of the US Dollar – most trade is conducted in USD – and the level of foreign investment, are all influential. Direct intervention by the Reserve Bank of India (RBI) in FX markets to keep the exchange rate stable, as well as the level of interest rates set by the RBI, are further major influencing factors on the Rupee.
The Reserve Bank of India (RBI) actively intervenes in forex markets to maintain a stable exchange rate, to help facilitate trade. In addition, the RBI tries to maintain the inflation rate at its 4% target by adjusting interest rates. Higher interest rates usually strengthen the Rupee. This is due to the role of the ‘carry trade’ in which investors borrow in countries with lower interest rates so as to place their money in countries’ offering relatively higher interest rates and profit from the difference.
Macroeconomic factors that influence the value of the Rupee include inflation, interest rates, the economic growth rate (GDP), the balance of trade, and inflows from foreign investment. A higher growth rate can lead to more overseas investment, pushing up demand for the Rupee. A less negative balance of trade will eventually lead to a stronger Rupee. Higher interest rates, especially real rates (interest rates less inflation) are also positive for the Rupee. A risk-on environment can lead to greater inflows of Foreign Direct and Indirect Investment (FDI and FII), which also benefit the Rupee.
Higher inflation, particularly, if it is comparatively higher than India’s peers, is generally negative for the currency as it reflects devaluation through oversupply. Inflation also increases the cost of exports, leading to more Rupees being sold to purchase foreign imports, which is Rupee-negative. At the same time, higher inflation usually leads to the Reserve Bank of India (RBI) raising interest rates and this can be positive for the Rupee, due to increased demand from international investors. The opposite effect is true of lower inflation.
- USD/CAD scales higher for the second straight day amid sustained USD buying interest.
- Reduced bets for aggressive Fed policy easing and geopolitical risks underpin the buck.
- A modest downtick in Oil prices weighs on the Loonie and contributes to the move-up.
The USD/CAD pair attracts some follow-through buying for the second successive day on Thursday and climbs back above the 1.3500 psychological mark during the Asian session. The move up is sponsored by a stronger US Dollar (USD), which continues to draw support from a combination of factors and supports prospects for a further intraday appreciating move.
The USD Index (DXY), which tracks the Greenback against a basket of currencies, advanced to a three-week high amid reduced bets for a more aggressive policy easing by the Federal Reserve (Fed). The markets continue scaling back their expectations for another oversized interest rate cut by the US central bank in the wake of this week's upbeat US data, which pointed to a still resilient labor market. This, along with rising conflicts in the Middle East, further benefits the safe-haven buck, which is seen as a key factor acting as a tailwind for the USD/CAD pair.
Meanwhile, an unexpected build in US crude inventories on Wednesday indicates that the market is well supplied and could withstand any disruptions caused by the ongoing conflicts in the Middle East. This, in turn, drags Crude Oil prices away from over a one-week high touched on Wednesday and undermines the commodity-linked Loonie. Apart from this, expectations for a bigger interest rate cut by the Bank of Canada (BoC) turn out to be another factor weighing on the Canadian Dollar (CAD) and contributing to the bid tone surrounding the USD/CAD pair.
The aforementioned fundamental backdrop favors bullish traders and suggests that the path of least resistance for spot prices is to the upside. Hence, a subsequent strength back towards testing the weekly top, around the 1.3535-1.3540 region, looks like a distinct possibility. Traders now look forward to the US economic docket – featuring Weekly Initial Jobless Claims data and the ISM Services PMI. Apart from this, Fedspeak will drive the USD demand, which, along with Oil price dynamics, should produce short-term trading opportunities around the USD/CAD pair.
US Dollar PRICE Today
The table below shows the percentage change of US Dollar (USD) against listed major currencies today. US Dollar was the strongest against the Japanese Yen.
| USD | EUR | GBP | JPY | CAD | AUD | NZD | CHF | |
|---|---|---|---|---|---|---|---|---|
| USD | 0.09% | 0.12% | 0.28% | 0.12% | 0.21% | 0.26% | 0.07% | |
| EUR | -0.09% | 0.04% | 0.16% | 0.01% | 0.13% | 0.16% | -0.01% | |
| GBP | -0.12% | -0.04% | 0.14% | -0.02% | 0.10% | 0.13% | -0.02% | |
| JPY | -0.28% | -0.16% | -0.14% | -0.14% | -0.05% | -0.05% | -0.19% | |
| CAD | -0.12% | -0.01% | 0.02% | 0.14% | 0.10% | 0.14% | -0.03% | |
| AUD | -0.21% | -0.13% | -0.10% | 0.05% | -0.10% | 0.03% | -0.14% | |
| NZD | -0.26% | -0.16% | -0.13% | 0.05% | -0.14% | -0.03% | -0.16% | |
| CHF | -0.07% | 0.01% | 0.02% | 0.19% | 0.03% | 0.14% | 0.16% |
The heat map shows percentage changes of major currencies against each other. The base currency is picked from the left column, while the quote currency is picked from the top row. For example, if you pick the US Dollar from the left column and move along the horizontal line to the Japanese Yen, the percentage change displayed in the box will represent USD (base)/JPY (quote).
- Gold price struggles to attract any meaningful buying amid sustained US Dollar strength.
- Reduced bets for a 50 bps Fed rate cut in November lifted the USD to a multi-week high.
- Geopolitical risks continue to act as a tailwind for the XAU/USD ahead of the US data.
Gold price (XAU/USD) remains on the defensive during the Asian session on Thursday amid a stronger US Dollar (USD), which continues to draw support from diminishing odds for a more aggressive policy easing by the Federal Reserve (Fed). The upbeat US ADP report released on Wednesday pointed to the underlying stability in the labor market and forced investors to further scale back their bets for another oversized Fed rate cut in November. This, in turn, pushes the USD Index (DXY), which tracks the Greenback against a basket of currencies, to a three-week top and turns out to be a key factor undermining demand for the non-yielding yellow metal.
The downside for the Gold price, however, seems cushioned in the wake of a further escalation of conflicts in the Middle East. Iran launched over 200 ballistic missiles at Israel on Tuesday, while the latter conducted a precise air strike and bombed central Beirut in Lebanon during the early hours of Thursday. This raises the risk of a full-blown war in the region, which, in turn, may continue to act as a tailwind for the safe-haven precious metal. Meanwhile, traders may also refrain from placing aggressive directional bets and prefer to wait for the release of the closely-watched US monthly employment details – the Nonfarm Payrolls (NFP) report on Friday.
Daily Digest Market Movers: Gold price bulls remain on the sidelines amid stronger USD, geopolitical risks help limit losses
- The incoming stronger US labor market reports and the Federal Reserve Chair Jerome Powell's relatively hawkish remarks on Monday assist the US Dollar in prolonging its recovery move from the lowest level since July 2023.
- The US JOLTS Job Openings survey published on Tuesday showed that the number of available jobs unexpectedly jumped by 329K from an upwardly revised 7.711 million in the previous month to 8.040 million in August.
- Furthermore, Automatic Data Processing (ADP) reported on Wednesday that private-sector employers added 143K jobs in September against expectations for a rise of 120K and August's upwardly revised reading of 103K.
- This provided evidence of a still resilient US labor market and forced investors to reassess the likelihood of another 50-basis points interest rate cut by the US central bank at its next monetary policy meeting in November.
- Adding to this hopes that China's massive stimulus measures will ignite a lasting recovery in the world's second-largest economy and further act as a headwind for the safe-haven Gold price on Thursday.
- On the geopolitical front, an Israeli strike on central Beirut, Lebanon, early this Thursday comes after Iran fired more than 180 ballistic missiles at Israel on Tuesday, raising the risk of a full-out war in the Middle East.
- The mixed fundamental backdrop warrants some caution before placing aggressive directional bets around the XAU/USD ahead of important US macro data, including the closely-watched Nonfarm Payrolls report on Friday.
- In the meantime, Thursday's US economic docket – featuring Initial Jobless Claims and ISM Services PMI – and speeches by influential FOMC members might produce short-term opportunities around the precious metal.
Technical Outlook: Gold price setup remains tilted in favor of bulls, the $2,625-2,624 throwback holds the key
From a technical perspective, the range-bound price action since the beginning of this week comes on the back of the recent strong rally to a record high and might still be categorized as a bullish consolidation phase. Moreover, oscillators on the daily chart are holding comfortably in positive territory and have also eased from the overbought zone. This, in turn, favors bullish traders and suggests that the path of least resistance for the Gold price remains to the upside. Meanwhile, the $2,672-$2,673 area might continue to offer immediate resistance ahead of the $2,685-2,686 zone, or the all-time peak touched last week. This is closely followed by the $2,700 mark, which if conquered will be seen as a fresh trigger for bulls and set the stage for an extension of a well-established multi-month-old uptrend.
On the flip side, the weekly low, around the $2,625-2,624 area, which coincides with a short-term ascending channel resistance breakpoint, might continue to offer support and act as a key pivotal point. A convincing break below might prompt aggressive technical selling and drag the Gold price below the $2,600 mark, towards the next relevant support near the $2,560 zone. The corrective decline could extend further towards the $2,535-2,530 support before the XAU/USD eventually drops to the $2,500 psychological mark.
Gold FAQs
Gold has played a key role in human’s history as it has been widely used as a store of value and medium of exchange. Currently, apart from its shine and usage for jewelry, the precious metal is widely seen as a safe-haven asset, meaning that it is considered a good investment during turbulent times. Gold is also widely seen as a hedge against inflation and against depreciating currencies as it doesn’t rely on any specific issuer or government.
Central banks are the biggest Gold holders. In their aim to support their currencies in turbulent times, central banks tend to diversify their reserves and buy Gold to improve the perceived strength of the economy and the currency. High Gold reserves can be a source of trust for a country’s solvency. Central banks added 1,136 tonnes of Gold worth around $70 billion to their reserves in 2022, according to data from the World Gold Council. This is the highest yearly purchase since records began. Central banks from emerging economies such as China, India and Turkey are quickly increasing their Gold reserves.
Gold has an inverse correlation with the US Dollar and US Treasuries, which are both major reserve and safe-haven assets. When the Dollar depreciates, Gold tends to rise, enabling investors and central banks to diversify their assets in turbulent times. Gold is also inversely correlated with risk assets. A rally in the stock market tends to weaken Gold price, while sell-offs in riskier markets tend to favor the precious metal.
The price can move due to a wide range of factors. Geopolitical instability or fears of a deep recession can quickly make Gold price escalate due to its safe-haven status. As a yield-less asset, Gold tends to rise with lower interest rates, while higher cost of money usually weighs down on the yellow metal. Still, most moves depend on how the US Dollar (USD) behaves as the asset is priced in dollars (XAU/USD). A strong Dollar tends to keep the price of Gold controlled, whereas a weaker Dollar is likely to push Gold prices up.
| Raw materials | Closed | Change, % |
|---|---|---|
| Silver | 31.824 | 1.36 |
| Gold | 265.889 | -0.11 |
| Palladium | 1020.24 | 1.78 |
- The Australian Dollar edges lower as rising Middle East tensions dampen the risk appetite.
- Australia’s Trade Balance stood at 5,644 million month-over-month in August, exceeding the expected 5,500 million and July’s 5,636 million readings.
- The Israeli Broadcasting Authority reported that the security cabinet would issue a strong response to the recent Iranian attack.
The Australian Dollar (AUD) edges lower against the US Dollar (USD) following the key economic data released on Thursday. Additionally, the risk-sensitive AUD/USD pair receives downward pressure as rising geopolitical tensions in the Middle East dampen the risk appetite.
Australia’s Trade Balance for August stood at 5,644 million month-over-month, surpassing market expectations of 5,500 million and slightly higher than July’s surplus of 5,636 million. However, both Exports and Imports declined by 0.2% month-over-month in August.
However, the downside risk for the AUD may be limited due to the hawkish outlook surrounding the Reserve Bank of Australia (RBA). Data released earlier this week showed stronger-than-expected retail sales growth for August, lowering the likelihood of an early rate cut by the RBA. Markets have almost fully discounted the possibility of a rate cut in November. Additionally, the AUD is supported by stimulus measures from China, Australia's largest trading partner, which have boosted commodity prices.
Traders are expected to closely monitor a series of key economic data from the United States (US) scheduled to be released on Thursday, including September's ISM Services Purchasing Managers' Index (PMI) and the weekly Initial Jobless Claims for the previous week.
Daily Digest Market Movers: Australian Dollar depreciates due to risk-off sentiment
- The CME FedWatch Tool indicates that markets are assigning a 65.4% probability to a 25 basis point rate cut by the Federal Reserve in November, while the likelihood of a 50-basis-point cut is 34.6%, down from 57.4% a week ago.
- The Israeli Broadcasting Authority (IBA) reported that Israel's security cabinet has decided to issue a strong response to the recent Iranian attack. On Tuesday night, Iran launched over 200 ballistic missiles and drone strikes on Israel. Citing political sources in Tel Aviv, the report indicated that while the response will be severe, it is not expected to escalate into a regional war.
- Australia's Judo Bank Services Purchasing Managers' Index (PMI) posted a reading of 50.5 in September, down from 52.5 in August. This indicates the eighth consecutive month of growth in services activity, albeit at a slower and marginal rate. Meanwhile, the Composite PMI declined slightly to 49.6 in September, compared to 49.8 in the previous month, data showed on Thursday.
- Federal Reserve Bank of Richmond President Tom Barkin addressed the Fed's recent rate actions on Wednesday, warning that the fight against inflation may not be over, as risks still persist. Barkin noted that the 50 basis points (bps) rate cut in September was justified because rates had become "out of sync" with the decline in inflation, while the unemployment rate was near its sustainable level.
- The ADP Employment Change report showed an increase of 143,000 jobs in September, surpassing the forecasted 120,000 jobs. Additionally, annual pay rose by 4.7% year-over-year. The total number of jobs added in August was revised upward from 99,000 to 103,000.
- The AiG Industry Index slightly improved in September, rising 4.9 points to -18.6 from the previous reading of -23.5, though it still signals contraction for the 29th consecutive month. Meanwhile, the AiG Manufacturing PMI continued its decline, falling 2.8 points to -33.6 from -30.8 prior, marking the lowest level in trend terms since the series began.
- On Tuesday, US ISM Manufacturing PMI came at 47.2 for September, matching the reading with August's print but came in below the market expectation of 47.5.
- The Australian Bureau of Statistics (ABS) reported the Retail Sales on Tuesday, the primary gauge of Australia’s consumer spending, which rose 0.7% month-over-month in August, exceeding the market expectations of a 0.4% increase.
- Federal Reserve (Fed) Chairman Jerome Powell said on Monday that the central bank is not in a hurry and will lower its benchmark rate ‘over time.’ Powell added that the recent half-point interest rate cut should not indicate similarly aggressive future actions, noting that upcoming rate changes are likely to be more modest.
Technical Analysis: Australian Dollar moves below 0.6900, ascending channel
The AUD/USD pair trades near 0.6870 on Thursday. A daily chart technical analysis shows that the pair has breached below the ascending channel. This shows a weakening bullish bias. However, the 14-day Relative Strength Index (RSI) is positioned above the 50 level, supporting the bullish sentiment.
In terms of resistance, a return to the ascending channel would reinforce the bullish bias and support the AUD/USD pair to aim for the area near the upper boundary of the channel, around the psychological level of 0.7020.
On the downside, the AUD/USD pair is testing the immediate support at the nine-day Exponential Moving Average (EMA) at the 0.6865 level. A break below this level could cause an emergence of a bearish bias and lead the pair to navigate the region around its seven-week low of 0.6622.
AUD/USD: Daily Chart
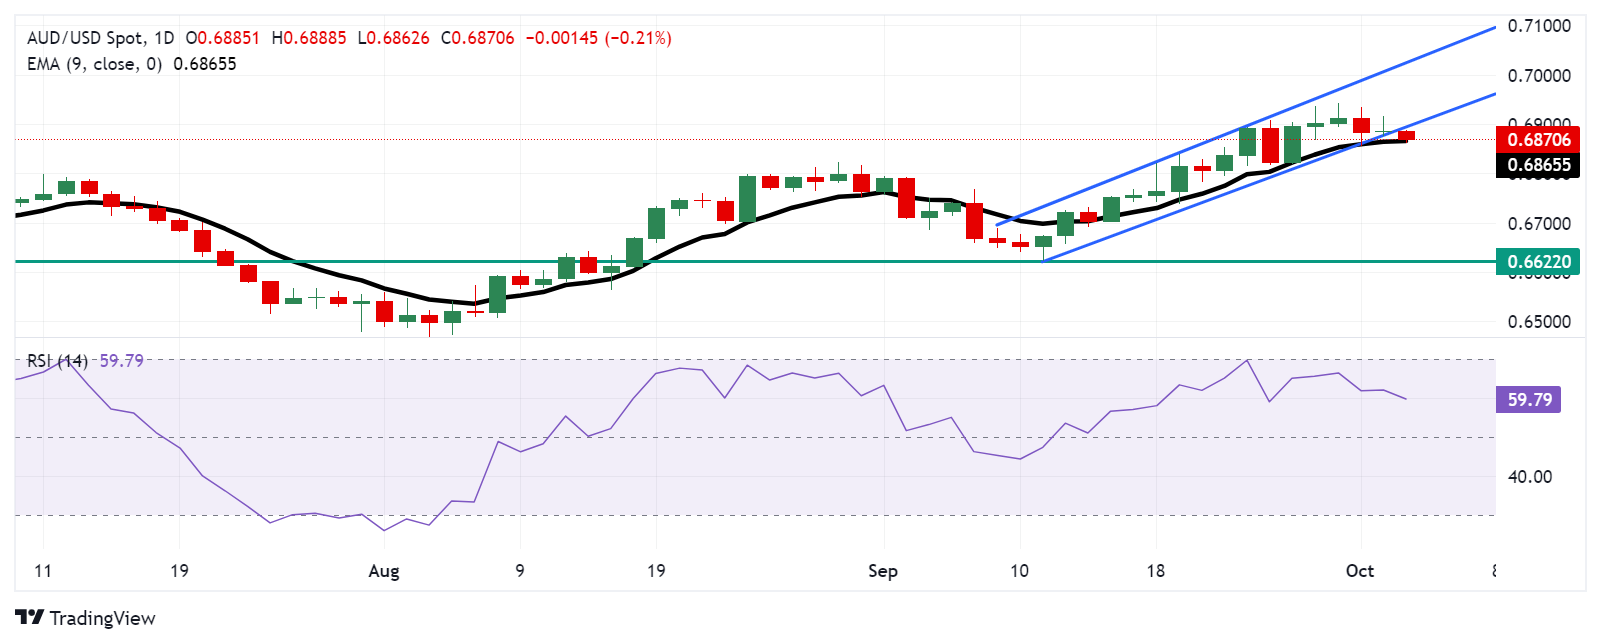
Australian Dollar PRICE Today
The table below shows the percentage change of Australian Dollar (AUD) against listed major currencies today. Australian Dollar was the weakest against the US Dollar.
| USD | EUR | GBP | JPY | CAD | AUD | NZD | CHF | |
|---|---|---|---|---|---|---|---|---|
| USD | 0.08% | 0.11% | 0.18% | 0.11% | 0.30% | 0.36% | 0.07% | |
| EUR | -0.08% | 0.04% | 0.10% | 0.00% | 0.22% | 0.27% | -0.00% | |
| GBP | -0.11% | -0.04% | 0.06% | -0.02% | 0.19% | 0.24% | -0.02% | |
| JPY | -0.18% | -0.10% | -0.06% | -0.07% | 0.12% | 0.14% | -0.10% | |
| CAD | -0.11% | -0.01% | 0.02% | 0.07% | 0.20% | 0.26% | -0.02% | |
| AUD | -0.30% | -0.22% | -0.19% | -0.12% | -0.20% | 0.05% | -0.21% | |
| NZD | -0.36% | -0.27% | -0.24% | -0.14% | -0.26% | -0.05% | -0.26% | |
| CHF | -0.07% | 0.00% | 0.02% | 0.10% | 0.02% | 0.21% | 0.26% |
The heat map shows percentage changes of major currencies against each other. The base currency is picked from the left column, while the quote currency is picked from the top row. For example, if you pick the Australian Dollar from the left column and move along the horizontal line to the US Dollar, the percentage change displayed in the box will represent AUD (base)/USD (quote).
Australian Dollar FAQs
One of the most significant factors for the Australian Dollar (AUD) is the level of interest rates set by the Reserve Bank of Australia (RBA). Because Australia is a resource-rich country another key driver is the price of its biggest export, Iron Ore. The health of the Chinese economy, its largest trading partner, is a factor, as well as inflation in Australia, its growth rate and Trade Balance. Market sentiment – whether investors are taking on more risky assets (risk-on) or seeking safe-havens (risk-off) – is also a factor, with risk-on positive for AUD.
The Reserve Bank of Australia (RBA) influences the Australian Dollar (AUD) by setting the level of interest rates that Australian banks can lend to each other. This influences the level of interest rates in the economy as a whole. The main goal of the RBA is to maintain a stable inflation rate of 2-3% by adjusting interest rates up or down. Relatively high interest rates compared to other major central banks support the AUD, and the opposite for relatively low. The RBA can also use quantitative easing and tightening to influence credit conditions, with the former AUD-negative and the latter AUD-positive.
China is Australia’s largest trading partner so the health of the Chinese economy is a major influence on the value of the Australian Dollar (AUD). When the Chinese economy is doing well it purchases more raw materials, goods and services from Australia, lifting demand for the AUD, and pushing up its value. The opposite is the case when the Chinese economy is not growing as fast as expected. Positive or negative surprises in Chinese growth data, therefore, often have a direct impact on the Australian Dollar and its pairs.
Iron Ore is Australia’s largest export, accounting for $118 billion a year according to data from 2021, with China as its primary destination. The price of Iron Ore, therefore, can be a driver of the Australian Dollar. Generally, if the price of Iron Ore rises, AUD also goes up, as aggregate demand for the currency increases. The opposite is the case if the price of Iron Ore falls. Higher Iron Ore prices also tend to result in a greater likelihood of a positive Trade Balance for Australia, which is also positive of the AUD.
The Trade Balance, which is the difference between what a country earns from its exports versus what it pays for its imports, is another factor that can influence the value of the Australian Dollar. If Australia produces highly sought after exports, then its currency will gain in value purely from the surplus demand created from foreign buyers seeking to purchase its exports versus what it spends to purchase imports. Therefore, a positive net Trade Balance strengthens the AUD, with the opposite effect if the Trade Balance is negative.
Japan’s Chief Cabinet Secretary Yoshimasa Hayashi came out on the wires early Thursday, clarifying Wednesday’s conversation between Prime Minister (PM) Shigeru Ishiba and Bank of Japan (BoJ) Governor Kazuo Ueda
Hayashi said that “PM Ishiba didn't request BoJ Governor Ueda any specifics of monetary policy when they met on Wednesday.”
The Israeli Broadcasting Authority (IBA) reported that "Israel's" security cabinet decided to deliver a harsh response to the recent Iranian attack.
On Tuesday night, Iran launched over 200 ballistic missiles and drone attacks at Israel after the US had warned just hours before that a strike was imminent.
Citing political sources in Tel Aviv, the report mentioned that the response will be severe. However, it is not expected to lead to a regional war.
Market reaction
At the time of press, the Gold price was down 0.06% on the day at $2,657.
Risk sentiment FAQs
In the world of financial jargon the two widely used terms “risk-on” and “risk off'' refer to the level of risk that investors are willing to stomach during the period referenced. In a “risk-on” market, investors are optimistic about the future and more willing to buy risky assets. In a “risk-off” market investors start to ‘play it safe’ because they are worried about the future, and therefore buy less risky assets that are more certain of bringing a return, even if it is relatively modest.
Typically, during periods of “risk-on”, stock markets will rise, most commodities – except Gold – will also gain in value, since they benefit from a positive growth outlook. The currencies of nations that are heavy commodity exporters strengthen because of increased demand, and Cryptocurrencies rise. In a “risk-off” market, Bonds go up – especially major government Bonds – Gold shines, and safe-haven currencies such as the Japanese Yen, Swiss Franc and US Dollar all benefit.
The Australian Dollar (AUD), the Canadian Dollar (CAD), the New Zealand Dollar (NZD) and minor FX like the Ruble (RUB) and the South African Rand (ZAR), all tend to rise in markets that are “risk-on”. This is because the economies of these currencies are heavily reliant on commodity exports for growth, and commodities tend to rise in price during risk-on periods. This is because investors foresee greater demand for raw materials in the future due to heightened economic activity.
The major currencies that tend to rise during periods of “risk-off” are the US Dollar (USD), the Japanese Yen (JPY) and the Swiss Franc (CHF). The US Dollar, because it is the world’s reserve currency, and because in times of crisis investors buy US government debt, which is seen as safe because the largest economy in the world is unlikely to default. The Yen, from increased demand for Japanese government bonds, because a high proportion are held by domestic investors who are unlikely to dump them – even in a crisis. The Swiss Franc, because strict Swiss banking laws offer investors enhanced capital protection.
Bank of Japan (BoJ) board member Asahi Noguchi said on Thursday that the central bank “must patiently maintain loose monetary conditions.”
Additional quotes
Will take considerable time for public to shift to mindset where inflation can sustainably hit 2%.
Personally believe consumption's uptrend likely to become clearer.
Cost pressure from wage hikes gradually being reflected in service price rises.
BoJ will likely gradually adjust degree of monetary support while cautiously examining whether inflation stably hits 2% accompanied by wage gains.
BoJ’s policy adjustment aimed at smoothening path toward achieving potential growth that helps inflation durably hit 2%.
BoJ’s tapering of bond buying is aimed at recovering flexibility in markets without causing turbulence.
BoJ can spend time, move cautiously, in reducing its balance sheet.
Market reaction
At the time of writing, USD/JPY is trading just below 147.00, adding 0.30% on the day. Theses comments had little to no impact on the Japanese Yen.
Australia’s trade surplus increased to 5,644M MoM in August versus 5,510M expected and 5,636M in the previous reading, according to the latest foreign trade data published by the Australian Bureau of Statistics on Thursday.
Further details reveal that Australia's Exports fell by 0.2% in August from the 0.3% advance seen a month earlier. Meanwhile, Imports declined by 0.2% in August MoM, compared to a fall of 0.6% seen in July.
Market reaction to Australia’s Trade Balance
At the press time, the AUD/USD pair is down 0.22% on the day to trade at 0.6870.
Australian Dollar FAQs
One of the most significant factors for the Australian Dollar (AUD) is the level of interest rates set by the Reserve Bank of Australia (RBA). Because Australia is a resource-rich country another key driver is the price of its biggest export, Iron Ore. The health of the Chinese economy, its largest trading partner, is a factor, as well as inflation in Australia, its growth rate and Trade Balance. Market sentiment – whether investors are taking on more risky assets (risk-on) or seeking safe-havens (risk-off) – is also a factor, with risk-on positive for AUD.
The Reserve Bank of Australia (RBA) influences the Australian Dollar (AUD) by setting the level of interest rates that Australian banks can lend to each other. This influences the level of interest rates in the economy as a whole. The main goal of the RBA is to maintain a stable inflation rate of 2-3% by adjusting interest rates up or down. Relatively high interest rates compared to other major central banks support the AUD, and the opposite for relatively low. The RBA can also use quantitative easing and tightening to influence credit conditions, with the former AUD-negative and the latter AUD-positive.
China is Australia’s largest trading partner so the health of the Chinese economy is a major influence on the value of the Australian Dollar (AUD). When the Chinese economy is doing well it purchases more raw materials, goods and services from Australia, lifting demand for the AUD, and pushing up its value. The opposite is the case when the Chinese economy is not growing as fast as expected. Positive or negative surprises in Chinese growth data, therefore, often have a direct impact on the Australian Dollar and its pairs.
Iron Ore is Australia’s largest export, accounting for $118 billion a year according to data from 2021, with China as its primary destination. The price of Iron Ore, therefore, can be a driver of the Australian Dollar. Generally, if the price of Iron Ore rises, AUD also goes up, as aggregate demand for the currency increases. The opposite is the case if the price of Iron Ore falls. Higher Iron Ore prices also tend to result in a greater likelihood of a positive Trade Balance for Australia, which is also positive of the AUD.
The Trade Balance, which is the difference between what a country earns from its exports versus what it pays for its imports, is another factor that can influence the value of the Australian Dollar. If Australia produces highly sought after exports, then its currency will gain in value purely from the surplus demand created from foreign buyers seeking to purchase its exports versus what it spends to purchase imports. Therefore, a positive net Trade Balance strengthens the AUD, with the opposite effect if the Trade Balance is negative.
- USD/JPY gains positive traction for the second straight day and seems poised to climb further.
- The uncertainty over future BoJ rate hikes weighs on the JPY and acts as a tailwind for the pair.
- Reduced bets for an oversized Fed rate cut in November underpin the USD and remain supportive.
The USD/JPY pair builds on the previous day's breakout momentum through the 50-day Simple Moving Average (SMA) and attracts some follow-through buyers for the second straight day on Thursday. This also marks the third day of a positive move in the previous four and lifts spot prices to the 147.20-147.25 region, or the highest level since August 20 during the Asian session.
The Japanese Yen (JPY) is undermined by blunt comments on monetary policy from the new Prime Minister Shigeru Ishiba on Wednesday, saying that Japan is not in an environment for an additional rate increase. Adding to this, Japan's newly appointed economy minister, Ryosei Akazawa, expects the Bank of Japan (BoJ) to make careful economic assessments when raising interest rates again. This, along with the political uncertainty ahead of the October 27 snap election, continues to weigh on the JPY and acts as a tailwind for the USD/JPY pair.
Meanwhile, the US Dollar (USD) manages to preserve this week's strong recovery gains and stands tall near a three-week high amid diminishing odds for a more aggressive policy easing by the Federal Reserve (Fed). In fact, the markets have been scaling back their bets for another oversized Fed rate cut in November in the wake of a still resilient US labor market, reaffirmed by the upbeat ADP report on Wednesday. This is seen as another factor contributing to the bid tone surrounding the USD/JPY pair and supports prospects for additional gains.
Even from a technical perspective, the overnight sustained break and close above the 50-day SMA, for the first time since mid-July, was seen as a fresh trigger for bulls. Furthermore, positive oscillators on the daily chart validate the constructive outlook and suggest that the path of least resistance for the USD/JPY pair is to the upside. Traders now look forward to the US economic docket – featuring Weekly Initial Jobless Claims and the ISM Services PMI. This, along with Fedspeak, will influence the buck and provide some impetus to the currency pair.
Bank of Japan FAQs
The Bank of Japan (BoJ) is the Japanese central bank, which sets monetary policy in the country. Its mandate is to issue banknotes and carry out currency and monetary control to ensure price stability, which means an inflation target of around 2%.
The Bank of Japan embarked in an ultra-loose monetary policy in 2013 in order to stimulate the economy and fuel inflation amid a low-inflationary environment. The bank’s policy is based on Quantitative and Qualitative Easing (QQE), or printing notes to buy assets such as government or corporate bonds to provide liquidity. In 2016, the bank doubled down on its strategy and further loosened policy by first introducing negative interest rates and then directly controlling the yield of its 10-year government bonds. In March 2024, the BoJ lifted interest rates, effectively retreating from the ultra-loose monetary policy stance.
The Bank’s massive stimulus caused the Yen to depreciate against its main currency peers. This process exacerbated in 2022 and 2023 due to an increasing policy divergence between the Bank of Japan and other main central banks, which opted to increase interest rates sharply to fight decades-high levels of inflation. The BoJ’s policy led to a widening differential with other currencies, dragging down the value of the Yen. This trend partly reversed in 2024, when the BoJ decided to abandon its ultra-loose policy stance.
A weaker Yen and the spike in global energy prices led to an increase in Japanese inflation, which exceeded the BoJ’s 2% target. The prospect of rising salaries in the country – a key element fuelling inflation – also contributed to the move.
- WTI gains traction to near $70.60 in Thursday’s early Asian session.
- Middle East geopolitical tensions lift WTI price.
- Large US crude inventories built last week might cap the upside for WTI.
West Texas Intermediate (WTI), the US crude oil benchmark, is trading around $70.60 on Thursday. The WTI price extends its upside as traders assess oil supply risks in the Middle East after Iran’s missile attack on Israel earlier this week.
Israel’s Prime Minister Benjamin Netanyahu vowed to retaliate against Iran after the Islamic Republic fired scores of ballistic missiles at Israel on Tuesday. Oil traders are concerned the latest escalation could hit flows if energy facilities are attacked or supply routes blocked, which boosts the WTI price.
According to Citigroup, a major attack by Israel on Iran's oil-exporting capabilities might remove 1.5 million barrels per day from the market. “This fresh escalation is serious and justifies oil’s jump,” said Bill Farren-Price, a veteran oil market watcher and senior research fellow at the Oxford Institute for Energy Studies.
Nonetheless, a large build in US crude inventories last week might limit the black gold’s gains. According to the Energy Information Administration, crude oil stockpiles in the United States for the week ending September 27 rose by 3.889 million barrels, compared to a fall of 4.471 million barrels in the previous week. The market consensus estimated that stocks would decline by 1.25 million barrels.
WTI Oil FAQs
WTI Oil is a type of Crude Oil sold on international markets. The WTI stands for West Texas Intermediate, one of three major types including Brent and Dubai Crude. WTI is also referred to as “light” and “sweet” because of its relatively low gravity and sulfur content respectively. It is considered a high quality Oil that is easily refined. It is sourced in the United States and distributed via the Cushing hub, which is considered “The Pipeline Crossroads of the World”. It is a benchmark for the Oil market and WTI price is frequently quoted in the media.
Like all assets, supply and demand are the key drivers of WTI Oil price. As such, global growth can be a driver of increased demand and vice versa for weak global growth. Political instability, wars, and sanctions can disrupt supply and impact prices. The decisions of OPEC, a group of major Oil-producing countries, is another key driver of price. The value of the US Dollar influences the price of WTI Crude Oil, since Oil is predominantly traded in US Dollars, thus a weaker US Dollar can make Oil more affordable and vice versa.
The weekly Oil inventory reports published by the American Petroleum Institute (API) and the Energy Information Agency (EIA) impact the price of WTI Oil. Changes in inventories reflect fluctuating supply and demand. If the data shows a drop in inventories it can indicate increased demand, pushing up Oil price. Higher inventories can reflect increased supply, pushing down prices. API’s report is published every Tuesday and EIA’s the day after. Their results are usually similar, falling within 1% of each other 75% of the time. The EIA data is considered more reliable, since it is a government agency.
OPEC (Organization of the Petroleum Exporting Countries) is a group of 12 Oil-producing nations who collectively decide production quotas for member countries at twice-yearly meetings. Their decisions often impact WTI Oil prices. When OPEC decides to lower quotas, it can tighten supply, pushing up Oil prices. When OPEC increases production, it has the opposite effect. OPEC+ refers to an expanded group that includes ten extra non-OPEC members, the most notable of which is Russia.
| Index | Change, points | Closed | Change, % |
|---|---|---|---|
| NIKKEI 225 | -843.21 | 37808.76 | -2.18 |
| Hang Seng | 1310.05 | 22443.73 | 6.2 |
| KOSPI | -31.58 | 2561.69 | -1.22 |
| ASX 200 | -10.7 | 8198.2 | -0.13 |
| DAX | -48.39 | 19164.75 | -0.25 |
| CAC 40 | 3.52 | 7577.59 | 0.05 |
| Dow Jones | 39.55 | 42196.52 | 0.09 |
| S&P 500 | 0.79 | 5709.54 | 0.01 |
| NASDAQ Composite | 14.76 | 17925.12 | 0.08 |
| Pare | Closed | Change, % |
|---|---|---|
| AUDUSD | 0.68831 | 0.05 |
| EURJPY | 161.666 | 1.75 |
| EURUSD | 1.10459 | -0.2 |
| GBPJPY | 194.206 | 1.85 |
| GBPUSD | 1.32673 | -0.12 |
| NZDUSD | 0.62593 | -0.3 |
| USDCAD | 1.34997 | 0.05 |
| USDCHF | 0.84933 | 0.35 |
| USDJPY | 146.363 | 1.96 |
- GBP/USD weakens to near 1.3265 in Thursday’s early Asian session.
- The risk-off mood and upbeat US ADP report lift the US Dollar.
- A less dovish stance of the BoE might cap the pair’s downside.
The GBP/USD pair extends its downside to around 1.3265 during the early Asian session on Thursday. The renewed demand for the US dollar (USD) amid the rising geopolitical tensions in the Middle East provides some support to the major pair. The US September ISM Services Purchasing Managers Index (PMI), the weekly Initial Jobless Claims, and the final S&P Global Services PMI will be in the spotlight on Thursday.
Iran fired more than 180 missiles at Israel on Tuesday, its biggest-ever direct attack on the country. Israel and the United States vowed retribution for the attack. A sign that conflict in the region is intensifying and the fear of wider war boosts the safe-haven flows, benefiting the Greenback against the Pound Sterling (GBP).
The US ADP Employment Change data for September was better than expectations, with 143,000 new jobs added. This figure was above the median forecast of 120,000 and the revised August figure of 103,000. The attention will shift to the US employment data on Friday for fresh catalysts.
The expectation that the easing cycle of the Bank of England (BoE) will be lower than other central banks from Group of Seven (G-7) nations might cap the downside for the GBP. The financial market expects the BoE to cut interest rates one more time by 25 bps in the remainder of this year.
Pound Sterling FAQs
The Pound Sterling (GBP) is the oldest currency in the world (886 AD) and the official currency of the United Kingdom. It is the fourth most traded unit for foreign exchange (FX) in the world, accounting for 12% of all transactions, averaging $630 billion a day, according to 2022 data. Its key trading pairs are GBP/USD, also known as ‘Cable’, which accounts for 11% of FX, GBP/JPY, or the ‘Dragon’ as it is known by traders (3%), and EUR/GBP (2%). The Pound Sterling is issued by the Bank of England (BoE).
The single most important factor influencing the value of the Pound Sterling is monetary policy decided by the Bank of England. The BoE bases its decisions on whether it has achieved its primary goal of “price stability” – a steady inflation rate of around 2%. Its primary tool for achieving this is the adjustment of interest rates. When inflation is too high, the BoE will try to rein it in by raising interest rates, making it more expensive for people and businesses to access credit. This is generally positive for GBP, as higher interest rates make the UK a more attractive place for global investors to park their money. When inflation falls too low it is a sign economic growth is slowing. In this scenario, the BoE will consider lowering interest rates to cheapen credit so businesses will borrow more to invest in growth-generating projects.
Data releases gauge the health of the economy and can impact the value of the Pound Sterling. Indicators such as GDP, Manufacturing and Services PMIs, and employment can all influence the direction of the GBP. A strong economy is good for Sterling. Not only does it attract more foreign investment but it may encourage the BoE to put up interest rates, which will directly strengthen GBP. Otherwise, if economic data is weak, the Pound Sterling is likely to fall.
Another significant data release for the Pound Sterling is the Trade Balance. This indicator measures the difference between what a country earns from its exports and what it spends on imports over a given period. If a country produces highly sought-after exports, its currency will benefit purely from the extra demand created from foreign buyers seeking to purchase these goods. Therefore, a positive net Trade Balance strengthens a currency and vice versa for a negative balance.


© 2000-2026. All rights reserved.
This site is managed by Teletrade D.J. LLC 2351 LLC 2022 (Euro House, Richmond Hill Road, Kingstown, VC0100, St. Vincent and the Grenadines).
The information on this website is for informational purposes only and does not constitute any investment advice.
The company does not serve or provide services to customers who are residents of the US, Canada, Iran, The Democratic People's Republic of Korea, Yemen and FATF blacklisted countries.
Making transactions on financial markets with marginal financial instruments opens up wide possibilities and allows investors who are willing to take risks to earn high profits, carrying a potentially high risk of losses at the same time. Therefore you should responsibly approach the issue of choosing the appropriate investment strategy, taking the available resources into account, before starting trading.
Use of the information: full or partial use of materials from this website must always be referenced to TeleTrade as the source of information. Use of the materials on the Internet must be accompanied by a hyperlink to teletrade.org. Automatic import of materials and information from this website is prohibited.
Please contact our PR department if you have any questions or need assistance at pr@teletrade.global.
transfers